Gummic acid stabilized γ-Fe2O3 aqueous suspensions for biomedical applications
Upload
independentCategory
view
0download
0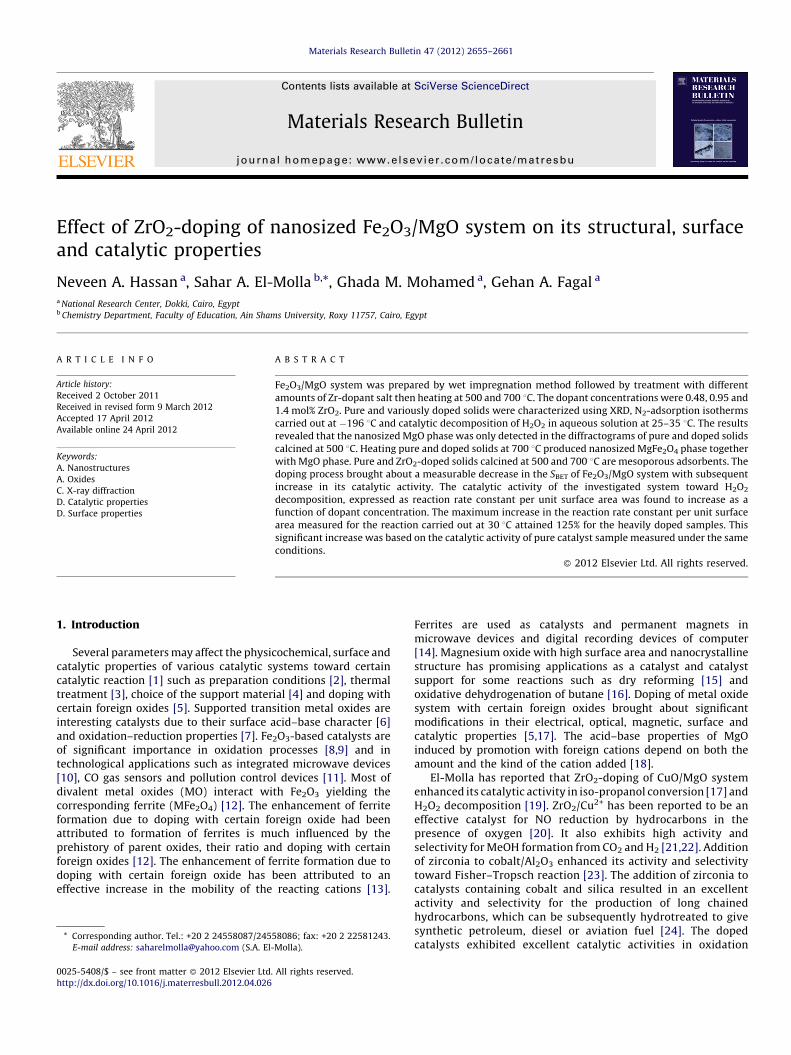
Materials Research Bulletin 47 (2012) 2655–2661
Effect of ZrO2-doping of nanosized Fe2O3/MgO system on its structural, surfaceand catalytic properties
Neveen A. Hassan a, Sahar A. El-Molla b,*, Ghada M. Mohamed a, Gehan A. Fagal a
a National Research Center, Dokki, Cairo, Egyptb Chemistry Department, Faculty of Education, Ain Shams University, Roxy 11757, Cairo, Egypt
A R T I C L E I N F O
Article history:
Received 2 October 2011
Received in revised form 9 March 2012
Accepted 17 April 2012
Available online 24 April 2012
Keywords:
A. Nanostructures
A. Oxides
C. X-ray diffraction
D. Catalytic properties
D. Surface properties
A B S T R A C T
Fe2O3/MgO system was prepared by wet impregnation method followed by treatment with different
amounts of Zr-dopant salt then heating at 500 and 700 8C. The dopant concentrations were 0.48, 0.95 and
1.4 mol% ZrO2. Pure and variously doped solids were characterized using XRD, N2-adsorption isotherms
carried out at �196 8C and catalytic decomposition of H2O2 in aqueous solution at 25–35 8C. The results
revealed that the nanosized MgO phase was only detected in the diffractograms of pure and doped solids
calcined at 500 8C. Heating pure and doped solids at 700 8C produced nanosized MgFe2O4 phase together
with MgO phase. Pure and ZrO2-doped solids calcined at 500 and 700 8C are mesoporous adsorbents. The
doping process brought about a measurable decrease in the SBET of Fe2O3/MgO system with subsequent
increase in its catalytic activity. The catalytic activity of the investigated system toward H2O2
decomposition, expressed as reaction rate constant per unit surface area was found to increase as a
function of dopant concentration. The maximum increase in the reaction rate constant per unit surface
area measured for the reaction carried out at 30 8C attained 125% for the heavily doped samples. This
significant increase was based on the catalytic activity of pure catalyst sample measured under the same
conditions.
� 2012 Elsevier Ltd. All rights reserved.
Contents lists available at SciVerse ScienceDirect
Materials Research Bulletin
jo u rn al h om ep age: ww w.els evier .c o m/lo c ate /mat res b u
1. Introduction
Several parameters may affect the physicochemical, surface andcatalytic properties of various catalytic systems toward certaincatalytic reaction [1] such as preparation conditions [2], thermaltreatment [3], choice of the support material [4] and doping withcertain foreign oxides [5]. Supported transition metal oxides areinteresting catalysts due to their surface acid–base character [6]and oxidation–reduction properties [7]. Fe2O3-based catalysts areof significant importance in oxidation processes [8,9] and intechnological applications such as integrated microwave devices[10], CO gas sensors and pollution control devices [11]. Most ofdivalent metal oxides (MO) interact with Fe2O3 yielding thecorresponding ferrite (MFe2O4) [12]. The enhancement of ferriteformation due to doping with certain foreign oxide had beenattributed to formation of ferrites is much influenced by theprehistory of parent oxides, their ratio and doping with certainforeign oxides [12]. The enhancement of ferrite formation due todoping with certain foreign oxide has been attributed to aneffective increase in the mobility of the reacting cations [13].
* Corresponding author. Tel.: +20 2 24558087/24558086; fax: +20 2 22581243.
E-mail address: [email protected] (S.A. El-Molla).
0025-5408/$ – see front matter � 2012 Elsevier Ltd. All rights reserved.
http://dx.doi.org/10.1016/j.materresbull.2012.04.026
Ferrites are used as catalysts and permanent magnets inmicrowave devices and digital recording devices of computer[14]. Magnesium oxide with high surface area and nanocrystallinestructure has promising applications as a catalyst and catalystsupport for some reactions such as dry reforming [15] andoxidative dehydrogenation of butane [16]. Doping of metal oxidesystem with certain foreign oxides brought about significantmodifications in their electrical, optical, magnetic, surface andcatalytic properties [5,17]. The acid–base properties of MgOinduced by promotion with foreign cations depend on both theamount and the kind of the cation added [18].
El-Molla has reported that ZrO2-doping of CuO/MgO systemenhanced its catalytic activity in iso-propanol conversion [17] andH2O2 decomposition [19]. ZrO2/Cu2+ has been reported to be aneffective catalyst for NO reduction by hydrocarbons in thepresence of oxygen [20]. It also exhibits high activity andselectivity for MeOH formation from CO2 and H2 [21,22]. Additionof zirconia to cobalt/Al2O3 enhanced its activity and selectivitytoward Fisher–Tropsch reaction [23]. The addition of zirconia tocatalysts containing cobalt and silica resulted in an excellentactivity and selectivity for the production of long chainedhydrocarbons, which can be subsequently hydrotreated to givesynthetic petroleum, diesel or aviation fuel [24]. The dopedcatalysts exhibited excellent catalytic activities in oxidation
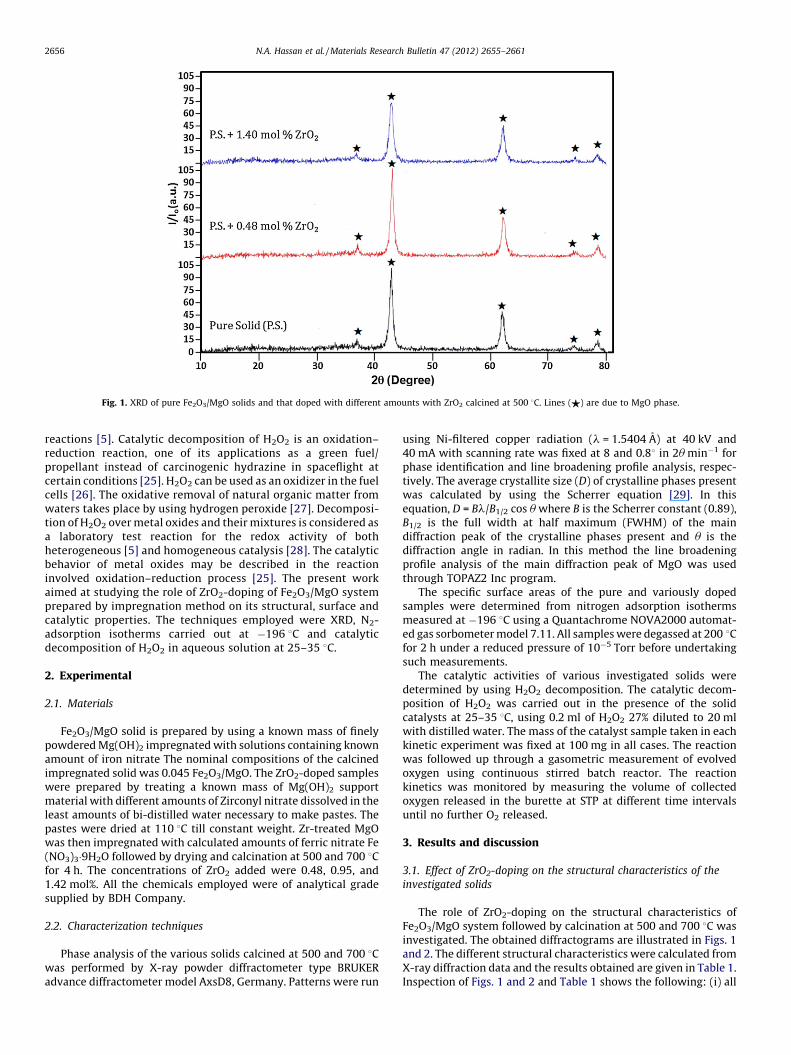
Fig. 1. XRD of pure Fe2O3/MgO solids and that doped with different amounts with ZrO2 calcined at 500 8C. Lines ($) are due to MgO phase.
N.A. Hassan et al. / Materials Research Bulletin 47 (2012) 2655–26612656
reactions [5]. Catalytic decomposition of H2O2 is an oxidation–reduction reaction, one of its applications as a green fuel/propellant instead of carcinogenic hydrazine in spaceflight atcertain conditions [25]. H2O2 can be used as an oxidizer in the fuelcells [26]. The oxidative removal of natural organic matter fromwaters takes place by using hydrogen peroxide [27]. Decomposi-tion of H2O2 over metal oxides and their mixtures is considered asa laboratory test reaction for the redox activity of bothheterogeneous [5] and homogeneous catalysis [28]. The catalyticbehavior of metal oxides may be described in the reactioninvolved oxidation–reduction process [25]. The present workaimed at studying the role of ZrO2-doping of Fe2O3/MgO systemprepared by impregnation method on its structural, surface andcatalytic properties. The techniques employed were XRD, N2-adsorption isotherms carried out at �196 8C and catalyticdecomposition of H2O2 in aqueous solution at 25–35 8C.
2. Experimental
2.1. Materials
Fe2O3/MgO solid is prepared by using a known mass of finelypowdered Mg(OH)2 impregnated with solutions containing knownamount of iron nitrate The nominal compositions of the calcinedimpregnated solid was 0.045 Fe2O3/MgO. The ZrO2-doped sampleswere prepared by treating a known mass of Mg(OH)2 supportmaterial with different amounts of Zirconyl nitrate dissolved in theleast amounts of bi-distilled water necessary to make pastes. Thepastes were dried at 110 8C till constant weight. Zr-treated MgOwas then impregnated with calculated amounts of ferric nitrate Fe(NO3)3�9H2O followed by drying and calcination at 500 and 700 8Cfor 4 h. The concentrations of ZrO2 added were 0.48, 0.95, and1.42 mol%. All the chemicals employed were of analytical gradesupplied by BDH Company.
2.2. Characterization techniques
Phase analysis of the various solids calcined at 500 and 700 8Cwas performed by X-ray powder diffractometer type BRUKERadvance diffractometer model AxsD8, Germany. Patterns were run
using Ni-filtered copper radiation (l = 1.5404 A) at 40 kV and40 mA with scanning rate was fixed at 8 and 0.88 in 2u min�1 forphase identification and line broadening profile analysis, respec-tively. The average crystallite size (D) of crystalline phases presentwas calculated by using the Scherrer equation [29]. In thisequation, D = Bl/B1/2 cos u where B is the Scherrer constant (0.89),B1/2 is the full width at half maximum (FWHM) of the maindiffraction peak of the crystalline phases present and u is thediffraction angle in radian. In this method the line broadeningprofile analysis of the main diffraction peak of MgO was usedthrough TOPAZ2 Inc program.
The specific surface areas of the pure and variously dopedsamples were determined from nitrogen adsorption isothermsmeasured at �196 8C using a Quantachrome NOVA2000 automat-ed gas sorbometer model 7.11. All samples were degassed at 200 8Cfor 2 h under a reduced pressure of 10�5 Torr before undertakingsuch measurements.
The catalytic activities of various investigated solids weredetermined by using H2O2 decomposition. The catalytic decom-position of H2O2 was carried out in the presence of the solidcatalysts at 25–35 8C, using 0.2 ml of H2O2 27% diluted to 20 mlwith distilled water. The mass of the catalyst sample taken in eachkinetic experiment was fixed at 100 mg in all cases. The reactionwas followed up through a gasometric measurement of evolvedoxygen using continuous stirred batch reactor. The reactionkinetics was monitored by measuring the volume of collectedoxygen released in the burette at STP at different time intervalsuntil no further O2 released.
3. Results and discussion
3.1. Effect of ZrO2-doping on the structural characteristics of the
investigated solids
The role of ZrO2-doping on the structural characteristics ofFe2O3/MgO system followed by calcination at 500 and 700 8C wasinvestigated. The obtained diffractograms are illustrated in Figs. 1and 2. The different structural characteristics were calculated fromX-ray diffraction data and the results obtained are given in Table 1.Inspection of Figs. 1 and 2 and Table 1 shows the following: (i) all
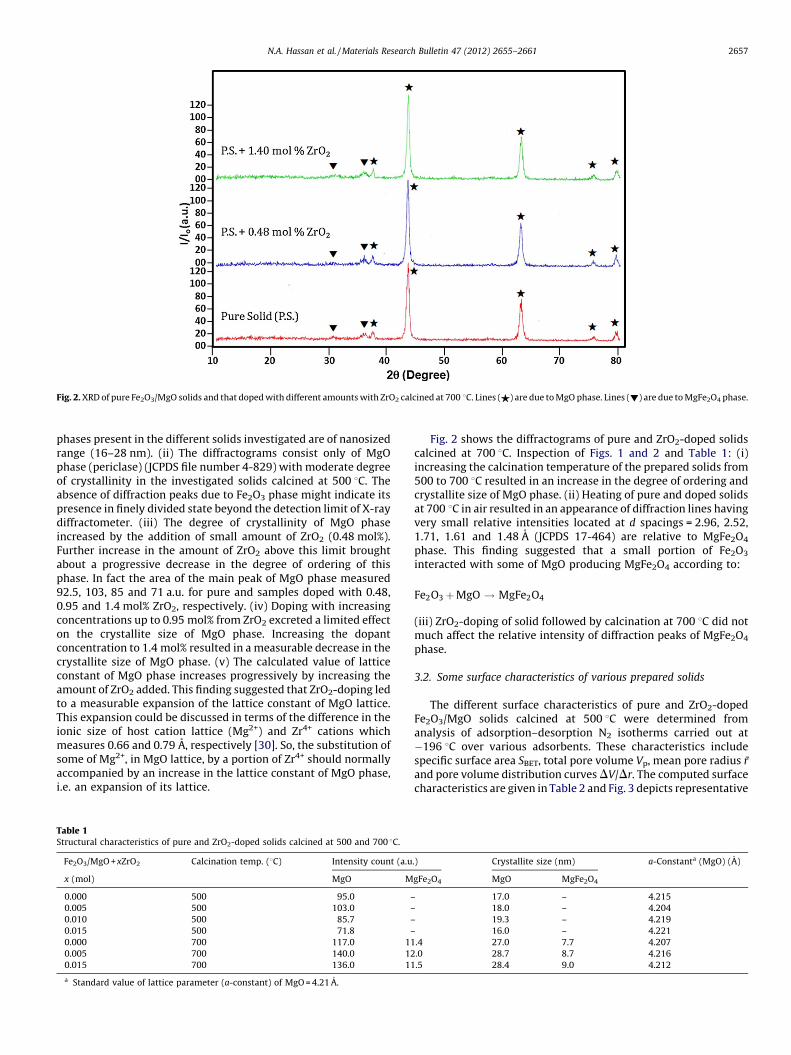
Fig. 2. XRD of pure Fe2O3/MgO solids and that doped with different amounts with ZrO2 calcined at 700 8C. Lines ($) are due to MgO phase. Lines (!) are due to MgFe2O4 phase.
N.A. Hassan et al. / Materials Research Bulletin 47 (2012) 2655–2661 2657
phases present in the different solids investigated are of nanosizedrange (16–28 nm). (ii) The diffractograms consist only of MgOphase (periclase) (JCPDS file number 4-829) with moderate degreeof crystallinity in the investigated solids calcined at 500 8C. Theabsence of diffraction peaks due to Fe2O3 phase might indicate itspresence in finely divided state beyond the detection limit of X-raydiffractometer. (iii) The degree of crystallinity of MgO phaseincreased by the addition of small amount of ZrO2 (0.48 mol%).Further increase in the amount of ZrO2 above this limit broughtabout a progressive decrease in the degree of ordering of thisphase. In fact the area of the main peak of MgO phase measured92.5, 103, 85 and 71 a.u. for pure and samples doped with 0.48,0.95 and 1.4 mol% ZrO2, respectively. (iv) Doping with increasingconcentrations up to 0.95 mol% from ZrO2 excreted a limited effecton the crystallite size of MgO phase. Increasing the dopantconcentration to 1.4 mol% resulted in a measurable decrease in thecrystallite size of MgO phase. (v) The calculated value of latticeconstant of MgO phase increases progressively by increasing theamount of ZrO2 added. This finding suggested that ZrO2-doping ledto a measurable expansion of the lattice constant of MgO lattice.This expansion could be discussed in terms of the difference in theionic size of host cation lattice (Mg2+) and Zr4+ cations whichmeasures 0.66 and 0.79 A, respectively [30]. So, the substitution ofsome of Mg2+, in MgO lattice, by a portion of Zr4+ should normallyaccompanied by an increase in the lattice constant of MgO phase,i.e. an expansion of its lattice.
Table 1Structural characteristics of pure and ZrO2-doped solids calcined at 500 and 700 8C.
Fe2O3/MgO + xZrO2 Calcination temp. (8C) Intensity count (a.u
x (mol) MgO M
0.000 500 95.0 –
0.005 500 103.0 –
0.010 500 85.7 –
0.015 500 71.8 –
0.000 700 117.0 11
0.005 700 140.0 12
0.015 700 136.0 11
a Standard value of lattice parameter (a-constant) of MgO = 4.21 A.
Fig. 2 shows the diffractograms of pure and ZrO2-doped solidscalcined at 700 8C. Inspection of Figs. 1 and 2 and Table 1: (i)increasing the calcination temperature of the prepared solids from500 to 700 8C resulted in an increase in the degree of ordering andcrystallite size of MgO phase. (ii) Heating of pure and doped solidsat 700 8C in air resulted in an appearance of diffraction lines havingvery small relative intensities located at d spacings = 2.96, 2.52,1.71, 1.61 and 1.48 A (JCPDS 17-464) are relative to MgFe2O4
phase. This finding suggested that a small portion of Fe2O3
interacted with some of MgO producing MgFe2O4 according to:
Fe2O3þ MgO ! MgFe2O4
(iii) ZrO2-doping of solid followed by calcination at 700 8C did notmuch affect the relative intensity of diffraction peaks of MgFe2O4
phase.
3.2. Some surface characteristics of various prepared solids
The different surface characteristics of pure and ZrO2-dopedFe2O3/MgO solids calcined at 500 8C were determined fromanalysis of adsorption–desorption N2 isotherms carried out at�196 8C over various adsorbents. These characteristics includespecific surface area SBET, total pore volume Vp, mean pore radius r
and pore volume distribution curves DV/Dr. The computed surfacecharacteristics are given in Table 2 and Fig. 3 depicts representative
.) Crystallite size (nm) a-Constanta (MgO) (A)
gFe2O4 MgO MgFe2O4
17.0 – 4.215
18.0 – 4.204
19.3 – 4.219
16.0 – 4.221
.4 27.0 7.7 4.207
.0 28.7 8.7 4.216
.5 28.4 9.0 4.212
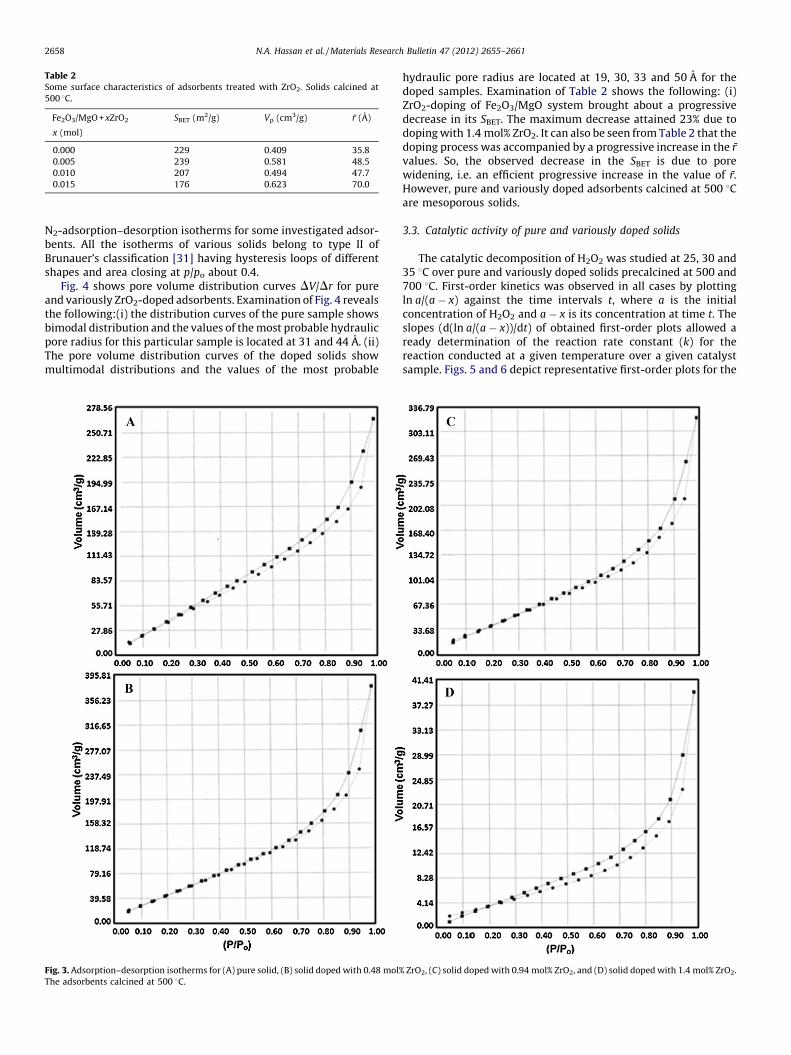
Table 2Some surface characteristics of adsorbents treated with ZrO2. Solids calcined at
500 8C.
Fe2O3/MgO + xZrO2 SBET (m2/g) Vp (cm3/g) r (A)
x (mol)
0.000 229 0.409 35.8
0.005 239 0.581 48.5
0.010 207 0.494 47.7
0.015 176 0.623 70.0
N.A. Hassan et al. / Materials Research Bulletin 47 (2012) 2655–26612658
N2-adsorption–desorption isotherms for some investigated adsor-bents. All the isotherms of various solids belong to type II ofBrunauer’s classification [31] having hysteresis loops of differentshapes and area closing at p/po about 0.4.
Fig. 4 shows pore volume distribution curves DV/Dr for pureand variously ZrO2-doped adsorbents. Examination of Fig. 4 revealsthe following:(i) the distribution curves of the pure sample showsbimodal distribution and the values of the most probable hydraulicpore radius for this particular sample is located at 31 and 44 A. (ii)The pore volume distribution curves of the doped solids showmultimodal distributions and the values of the most probable
Fig. 3. Adsorption–desorption isotherms for (A) pure solid, (B) solid doped with 0.48 mol%
The adsorbents calcined at 500 8C.
hydraulic pore radius are located at 19, 30, 33 and 50 A for thedoped samples. Examination of Table 2 shows the following: (i)ZrO2-doping of Fe2O3/MgO system brought about a progressivedecrease in its SBET. The maximum decrease attained 23% due todoping with 1.4 mol% ZrO2. It can also be seen from Table 2 that thedoping process was accompanied by a progressive increase in the r
values. So, the observed decrease in the SBET is due to porewidening, i.e. an efficient progressive increase in the value of r.However, pure and variously doped adsorbents calcined at 500 8Care mesoporous solids.
3.3. Catalytic activity of pure and variously doped solids
The catalytic decomposition of H2O2 was studied at 25, 30 and35 8C over pure and variously doped solids precalcined at 500 and700 8C. First-order kinetics was observed in all cases by plottingln a/(a � x) against the time intervals t, where a is the initialconcentration of H2O2 and a � x is its concentration at time t. Theslopes (d(ln a/(a � x))/dt) of obtained first-order plots allowed aready determination of the reaction rate constant (k) for thereaction conducted at a given temperature over a given catalystsample. Figs. 5 and 6 depict representative first-order plots for the
ZrO2, (C) solid doped with 0.94 mol% ZrO2, and (D) solid doped with 1.4 mol% ZrO2.
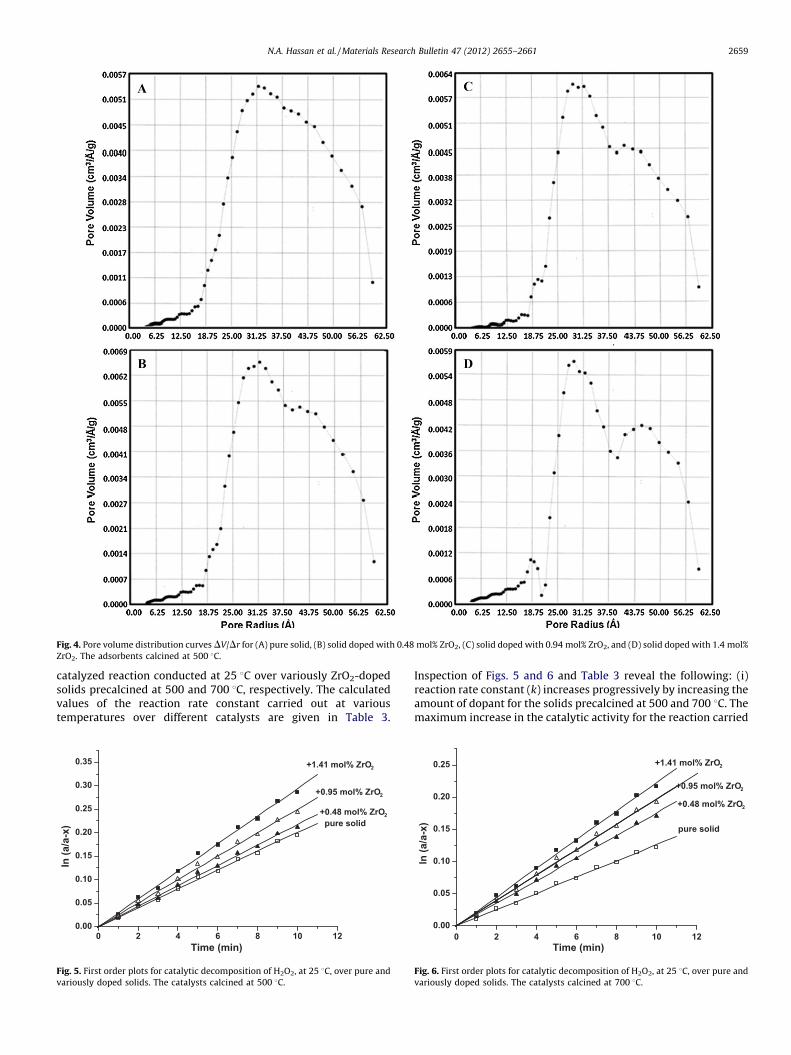
Fig. 4. Pore volume distribution curves DV/Dr for (A) pure solid, (B) solid doped with 0.48 mol% ZrO2, (C) solid doped with 0.94 mol% ZrO2, and (D) solid doped with 1.4 mol%
ZrO2. The adsorbents calcined at 500 8C.
N.A. Hassan et al. / Materials Research Bulletin 47 (2012) 2655–2661 2659
catalyzed reaction conducted at 25 8C over variously ZrO2-dopedsolids precalcined at 500 and 700 8C, respectively. The calculatedvalues of the reaction rate constant carried out at varioustemperatures over different catalysts are given in Table 3.
1210864200.00
0.05
0.10
0.15
0.20
0.25
0.30
0.35
Time (min)
ln (
a/a
-x) pure solid
+0.48 mol% ZrO2
+0.95 mol% ZrO2
+1.41 mol% ZrO2
Fig. 5. First order plots for catalytic decomposition of H2O2, at 25 8C, over pure and
variously doped solids. The catalysts calcined at 500 8C.
Inspection of Figs. 5 and 6 and Table 3 reveal the following: (i)reaction rate constant (k) increases progressively by increasing theamount of dopant for the solids precalcined at 500 and 700 8C. Themaximum increase in the catalytic activity for the reaction carried
121086420
0.00
0.05
0.10
0.15
0.20
0.25
Time (min)
ln (
a/a
-x)
pure solid
+0.48 mol% ZrO2
+0.95 mol% ZrO2
+1.41 mol% ZrO2
Fig. 6. First order plots for catalytic decomposition of H2O2, at 25 8C, over pure and
variously doped solids. The catalysts calcined at 700 8C.
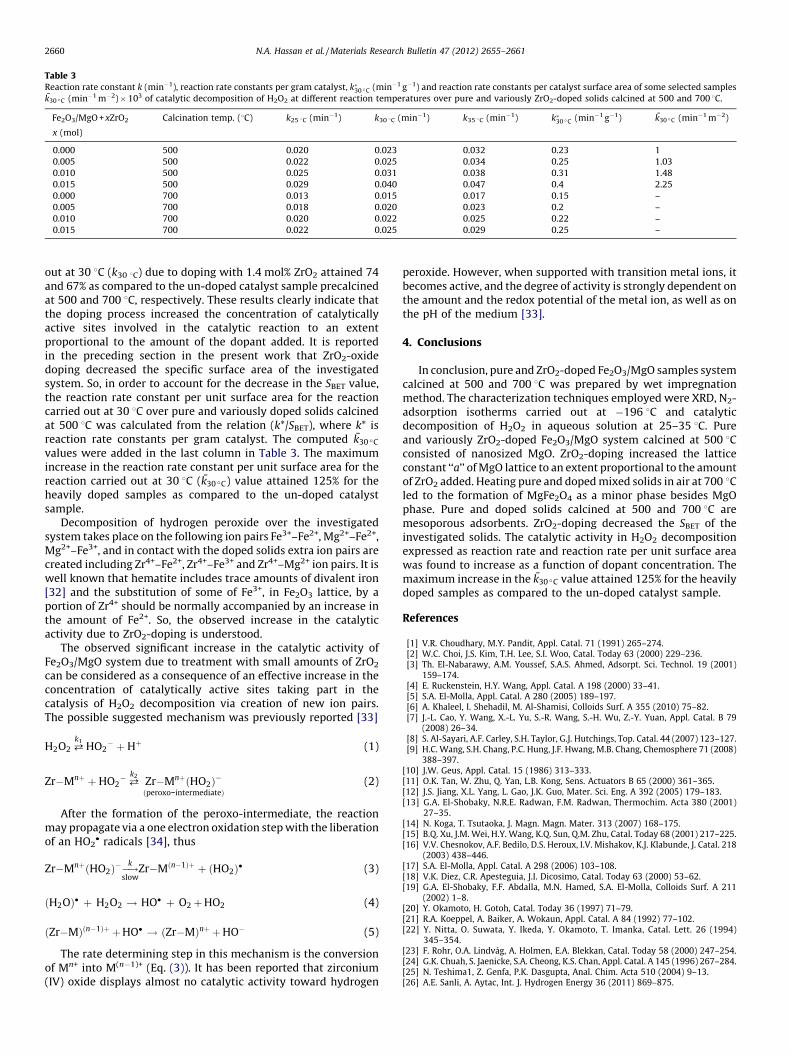
Table 3Reaction rate constant k (min�1), reaction rate constants per gram catalyst, k�30 �C (min�1 g�1) and reaction rate constants per catalyst surface area of some selected samples
k30 �C (min�1 m�2) � 103 of catalytic decomposition of H2O2 at different reaction temperatures over pure and variously ZrO2-doped solids calcined at 500 and 700 8C.
Fe2O3/MgO + xZrO2 Calcination temp. (8C) k25 8C (min�1) k30 8C (min�1) k35 8C (min�1) k�30 �C (min�1 g�1) k30 �C (min�1 m�2)
x (mol)
0.000 500 0.020 0.023 0.032 0.23 1
0.005 500 0.022 0.025 0.034 0.25 1.03
0.010 500 0.025 0.031 0.038 0.31 1.48
0.015 500 0.029 0.040 0.047 0.4 2.25
0.000 700 0.013 0.015 0.017 0.15 –
0.005 700 0.018 0.020 0.023 0.2 –
0.010 700 0.020 0.022 0.025 0.22 –
0.015 700 0.022 0.025 0.029 0.25 –
N.A. Hassan et al. / Materials Research Bulletin 47 (2012) 2655–26612660
out at 30 8C (k30 8C) due to doping with 1.4 mol% ZrO2 attained 74and 67% as compared to the un-doped catalyst sample precalcinedat 500 and 700 8C, respectively. These results clearly indicate thatthe doping process increased the concentration of catalyticallyactive sites involved in the catalytic reaction to an extentproportional to the amount of the dopant added. It is reportedin the preceding section in the present work that ZrO2-oxidedoping decreased the specific surface area of the investigatedsystem. So, in order to account for the decrease in the SBET value,the reaction rate constant per unit surface area for the reactioncarried out at 30 8C over pure and variously doped solids calcinedat 500 8C was calculated from the relation (k*/SBET), where k* isreaction rate constants per gram catalyst. The computed k30 �C
values were added in the last column in Table 3. The maximumincrease in the reaction rate constant per unit surface area for thereaction carried out at 30 8C (k30 �C) value attained 125% for theheavily doped samples as compared to the un-doped catalystsample.
Decomposition of hydrogen peroxide over the investigatedsystem takes place on the following ion pairs Fe3+–Fe2+, Mg2+–Fe2+,Mg2+–Fe3+, and in contact with the doped solids extra ion pairs arecreated including Zr4+–Fe2+, Zr4+–Fe3+ and Zr4+–Mg2+ ion pairs. It iswell known that hematite includes trace amounts of divalent iron[32] and the substitution of some of Fe3+, in Fe2O3 lattice, by aportion of Zr4+ should be normally accompanied by an increase inthe amount of Fe2+. So, the observed increase in the catalyticactivity due to ZrO2-doping is understood.
The observed significant increase in the catalytic activity ofFe2O3/MgO system due to treatment with small amounts of ZrO2
can be considered as a consequence of an effective increase in theconcentration of catalytically active sites taking part in thecatalysis of H2O2 decomposition via creation of new ion pairs.The possible suggested mechanism was previously reported [33]
H2O2 @k1
HO2� þ Hþ (1)
Zr�Mnþ þ HO2�@k2
Zr�MnþðHO2Þ�ðperoxo-intermediateÞ
(2)
After the formation of the peroxo-intermediate, the reactionmay propagate via a one electron oxidation step with the liberationof an HO2
� radicals [34], thus
Zr�MnþðHO2Þ��!k
slowZr�Mðn�1Þþ þ ðHO2Þ� (3)
ðH2OÞ� þ H2O2 ! HO� þ O2þ HO2 (4)
ðZr�MÞðn�1Þþ þ HO� ! ðZr�MÞnþ þ HO� (5)
The rate determining step in this mechanism is the conversionof Mn+ into M(n�1)+ (Eq. (3)). It has been reported that zirconium(IV) oxide displays almost no catalytic activity toward hydrogen
peroxide. However, when supported with transition metal ions, itbecomes active, and the degree of activity is strongly dependent onthe amount and the redox potential of the metal ion, as well as onthe pH of the medium [33].
4. Conclusions
In conclusion, pure and ZrO2-doped Fe2O3/MgO samples systemcalcined at 500 and 700 8C was prepared by wet impregnationmethod. The characterization techniques employed were XRD, N2-adsorption isotherms carried out at �196 8C and catalyticdecomposition of H2O2 in aqueous solution at 25–35 8C. Pureand variously ZrO2-doped Fe2O3/MgO system calcined at 500 8Cconsisted of nanosized MgO. ZrO2-doping increased the latticeconstant ‘‘a’’ of MgO lattice to an extent proportional to the amountof ZrO2 added. Heating pure and doped mixed solids in air at 700 8Cled to the formation of MgFe2O4 as a minor phase besides MgOphase. Pure and doped solids calcined at 500 and 700 8C aremesoporous adsorbents. ZrO2-doping decreased the SBET of theinvestigated solids. The catalytic activity in H2O2 decompositionexpressed as reaction rate and reaction rate per unit surface areawas found to increase as a function of dopant concentration. Themaximum increase in the k30 �C value attained 125% for the heavilydoped samples as compared to the un-doped catalyst sample.
References
[1] V.R. Choudhary, M.Y. Pandit, Appl. Catal. 71 (1991) 265–274.[2] W.C. Choi, J.S. Kim, T.H. Lee, S.I. Woo, Catal. Today 63 (2000) 229–236.[3] Th. El-Nabarawy, A.M. Youssef, S.A.S. Ahmed, Adsorpt. Sci. Technol. 19 (2001)
159–174.[4] E. Ruckenstein, H.Y. Wang, Appl. Catal. A 198 (2000) 33–41.[5] S.A. El-Molla, Appl. Catal. A 280 (2005) 189–197.[6] A. Khaleel, I. Shehadil, M. Al-Shamisi, Colloids Surf. A 355 (2010) 75–82.[7] J.-L. Cao, Y. Wang, X.-L. Yu, S.-R. Wang, S.-H. Wu, Z.-Y. Yuan, Appl. Catal. B 79
(2008) 26–34.[8] S. Al-Sayari, A.F. Carley, S.H. Taylor, G.J. Hutchings, Top. Catal. 44 (2007) 123–127.[9] H.C. Wang, S.H. Chang, P.C. Hung, J.F. Hwang, M.B. Chang, Chemosphere 71 (2008)
388–397.[10] J.W. Geus, Appl. Catal. 15 (1986) 313–333.[11] O.K. Tan, W. Zhu, Q. Yan, L.B. Kong, Sens. Actuators B 65 (2000) 361–365.[12] J.S. Jiang, X.L. Yang, L. Gao, J.K. Guo, Mater. Sci. Eng. A 392 (2005) 179–183.[13] G.A. El-Shobaky, N.R.E. Radwan, F.M. Radwan, Thermochim. Acta 380 (2001)
27–35.[14] N. Koga, T. Tsutaoka, J. Magn. Magn. Mater. 313 (2007) 168–175.[15] B.Q. Xu, J.M. Wei, H.Y. Wang, K.Q. Sun, Q.M. Zhu, Catal. Today 68 (2001) 217–225.[16] V.V. Chesnokov, A.F. Bedilo, D.S. Heroux, I.V. Mishakov, K.J. Klabunde, J. Catal. 218
(2003) 438–446.[17] S.A. El-Molla, Appl. Catal. A 298 (2006) 103–108.[18] V.K. Diez, C.R. Apesteguia, J.I. Dicosimo, Catal. Today 63 (2000) 53–62.[19] G.A. El-Shobaky, F.F. Abdalla, M.N. Hamed, S.A. El-Molla, Colloids Surf. A 211
(2002) 1–8.[20] Y. Okamoto, H. Gotoh, Catal. Today 36 (1997) 71–79.[21] R.A. Koeppel, A. Baiker, A. Wokaun, Appl. Catal. A 84 (1992) 77–102.[22] Y. Nitta, O. Suwata, Y. Ikeda, Y. Okamoto, T. Imanka, Catal. Lett. 26 (1994)
345–354.[23] F. Rohr, O.A. Lindvag, A. Holmen, E.A. Blekkan, Catal. Today 58 (2000) 247–254.[24] G.K. Chuah, S. Jaenicke, S.A. Cheong, K.S. Chan, Appl. Catal. A 145 (1996) 267–284.[25] N. Teshima1, Z. Genfa, P.K. Dasgupta, Anal. Chim. Acta 510 (2004) 9–13.[26] A.E. Sanli, A. Aytac, Int. J. Hydrogen Energy 36 (2011) 869–875.

N.A. Hassan et al. / Materials Research Bulletin 47 (2012) 2655–2661 2661
[27] M. Kitis, S.S. Kaplan, Chemosphere 68 (2007) 1846–1853.[28] S.P. Jiang, W.R. Ashton, A.C.C. Tseung, J. Catal. 131 (1991) 88–93.[29] B.D. Cullity, Elements of X-ray Diffraction, 2nd edition, Addison-Wesley Pub-
lishing Co., MA, USA, 1978.[30] C. Robert, CRC Handbook of Chemistry and Physics, 65th edition, CRC Press Inc.,
Florida, 1985, p. F-165.
[31] S. Brunauer, P.H. Emmet, E. Teller, J. Am. Chem. Soc. 60 (1938) 309–318.[32] A. Boudjemaa, S. Boumaza, M. Traric, R. Bouarab, A. Bouguelia, Int. J. Hydrogen
Energy 34 (2009) 4268–4274.[33] I.A. Salem, R.I. Elhag, K.M.S. Khalil, Transit. Met. Chem. 25 (2000) 260–264.[34] M. Uehara, M. Urade, A. Ueda, N. Sakagami, Y. Abe, Bull. Chem. Soc. 71 (1998)
1081.
Copyright © 2022 FDOKUMEN