Density Dependence Influences the Efficacy of Wastewater ...
17
plants Article Density Dependence Influences the Efficacy of Wastewater Remediation by Lemna minor Éamonn Walsh 1,2, *, Neil E. Coughlan 1,2 , Seán O’Brien 1,2 , Marcel A. K. Jansen 1,2 and Holger Kuehnhold 3 Citation: Walsh, É.; Coughlan, N.E.; O’Brien, S.; Jansen, M.A.K.; Kuehnhold, H. Density Dependence Influences the Efficacy of Wastewater Remediation by Lemna minor. Plants 2021, 10, 1366. https://doi.org/ 10.3390/plants10071366 Academic Editors: Viktor Oláh, Klaus-Jürgen Appenroth and K. Sowjanya Sree Received: 25 May 2021 Accepted: 30 June 2021 Published: 3 July 2021 Publisher’s Note: MDPI stays neutral with regard to jurisdictional claims in published maps and institutional affil- iations. Copyright: © 2021 by the authors. Licensee MDPI, Basel, Switzerland. This article is an open access article distributed under the terms and conditions of the Creative Commons Attribution (CC BY) license (https:// creativecommons.org/licenses/by/ 4.0/). 1 School of Biological, Earth and Environmental Science, University College Cork, Distillery Fields, North Mall, T23N73K Cork, Ireland; [email protected] (N.E.C.); [email protected] (S.O.); [email protected] (M.A.K.J.) 2 Environmental Research Institute, University College Cork, Lee Road, T23XE10 Cork, Ireland 3 Department of Ecology, Leibniz Centre for Tropical Marine Research (ZMT), 28359 Bremen, Germany; [email protected] * Correspondence: [email protected] Abstract: As part of a circular economy (CE) approach to food production systems, Lemnaceae, i.e., duckweed species, can be used to remediate wastewater due to rapid nutrient assimilation and tolerance of non-optimal growing conditions. Further, given rapid growth rates and high protein content, duckweed species are a valuable biomass. An important consideration for duckweed- mediated remediation is the density at which the plants grow on the surface of the wastewater, i.e., how much of the surface of the medium they cover. Higher duckweed density is known to have a negative effect on duckweed growth, which has implications for the development of duckweed- based remediation systems. In the present study, the effects of density (10–80% plant surface coverage) on Lemna minor growth, chlorophyll fluorescence and nutrient remediation of synthetic dairy processing wastewater were assessed in stationary (100 mL) and re-circulating non-axenic (11.7 L) remediation systems. Overall, L. minor growth, and TN and TP removal rates decreased as density increased. However, in the stationary system, absolute TN and TP removal were greater at higher densities (50–80% coverage). The exact cause of density related growth reduction in duckweed is unclear, especially at densities well below 100% surface coverage. A further experiment comparing duckweed grown at ‘low’ and ‘high’ density conditions with the same biomass and media volume conditions, showed that photosynthetic yield, Y(II), is reduced at high density despite the same nutrient availability at both densities, and arguably similar shading. The results demonstrate a negative effect of high density on duckweed growth and nutrient uptake, and point towards signals from neighbouring duckweed colonies as the possible cause. Keywords: duckweed; wastewater; remediation; density; surface cover; circular economy; lemna 1. Introduction Globally, the provision of nutritious food is a challenging endeavour [1,2]. Climate change, a reduction in the per capita availability of arable land, as well as soil erosion, chemical overuse and finite resources have decreased food security [3–6]. In recent years, the adoption of circular economy (CE) principles in food production systems has been suggested as a mechanism to improve resource-efficiency and the sustainability of food production [7]. In essence, CE promotes long-term retention and reuse of resources, as well as minimisation of waste generation, resulting in a reduced need for raw materials [8]. Thus, CE principles encourage the adoption of closed-loop production patterns, whereby waste is appropriated as a resource [8], reducing emissions and energy consumption in the process [9]. Dairy products are a major and important source of nutrition, employment and trade worldwide [10,11]. However, large volumes of wastewater are created as a consequence of dairy production and processing. It is estimated that up to 10 L of wastewater is created per Plants 2021, 10, 1366. https://doi.org/10.3390/plants10071366 https://www.mdpi.com/journal/plants
-
Upload
khangminh22 -
Category
Documents
-
view
0 -
download
0
Transcript of Density Dependence Influences the Efficacy of Wastewater ...
plants
Article
Density Dependence Influences the Efficacy of WastewaterRemediation by Lemna minor
Éamonn Walsh 1,2,*, Neil E. Coughlan 1,2 , Seán O’Brien 1,2, Marcel A. K. Jansen 1,2 and Holger Kuehnhold 3
�����������������
Citation: Walsh, É.; Coughlan, N.E.;
O’Brien, S.; Jansen, M.A.K.;
Kuehnhold, H. Density Dependence
Influences the Efficacy of Wastewater
Remediation by Lemna minor. Plants
2021, 10, 1366. https://doi.org/
10.3390/plants10071366
Academic Editors: Viktor Oláh,
Klaus-Jürgen Appenroth and K.
Sowjanya Sree
Received: 25 May 2021
Accepted: 30 June 2021
Published: 3 July 2021
Publisher’s Note: MDPI stays neutral
with regard to jurisdictional claims in
published maps and institutional affil-
iations.
Copyright: © 2021 by the authors.
Licensee MDPI, Basel, Switzerland.
This article is an open access article
distributed under the terms and
conditions of the Creative Commons
Attribution (CC BY) license (https://
creativecommons.org/licenses/by/
4.0/).
1 School of Biological, Earth and Environmental Science, University College Cork, Distillery Fields, North Mall,T23N73K Cork, Ireland; [email protected] (N.E.C.); [email protected] (S.O.);[email protected] (M.A.K.J.)
2 Environmental Research Institute, University College Cork, Lee Road, T23XE10 Cork, Ireland3 Department of Ecology, Leibniz Centre for Tropical Marine Research (ZMT), 28359 Bremen, Germany;
[email protected]* Correspondence: [email protected]
Abstract: As part of a circular economy (CE) approach to food production systems, Lemnaceae, i.e.,duckweed species, can be used to remediate wastewater due to rapid nutrient assimilation andtolerance of non-optimal growing conditions. Further, given rapid growth rates and high proteincontent, duckweed species are a valuable biomass. An important consideration for duckweed-mediated remediation is the density at which the plants grow on the surface of the wastewater, i.e.,how much of the surface of the medium they cover. Higher duckweed density is known to havea negative effect on duckweed growth, which has implications for the development of duckweed-based remediation systems. In the present study, the effects of density (10–80% plant surfacecoverage) on Lemna minor growth, chlorophyll fluorescence and nutrient remediation of syntheticdairy processing wastewater were assessed in stationary (100 mL) and re-circulating non-axenic(11.7 L) remediation systems. Overall, L. minor growth, and TN and TP removal rates decreased asdensity increased. However, in the stationary system, absolute TN and TP removal were greater athigher densities (50–80% coverage). The exact cause of density related growth reduction in duckweedis unclear, especially at densities well below 100% surface coverage. A further experiment comparingduckweed grown at ‘low’ and ‘high’ density conditions with the same biomass and media volumeconditions, showed that photosynthetic yield, Y(II), is reduced at high density despite the samenutrient availability at both densities, and arguably similar shading. The results demonstrate anegative effect of high density on duckweed growth and nutrient uptake, and point towards signalsfrom neighbouring duckweed colonies as the possible cause.
Keywords: duckweed; wastewater; remediation; density; surface cover; circular economy; lemna
1. Introduction
Globally, the provision of nutritious food is a challenging endeavour [1,2]. Climatechange, a reduction in the per capita availability of arable land, as well as soil erosion,chemical overuse and finite resources have decreased food security [3–6]. In recent years,the adoption of circular economy (CE) principles in food production systems has beensuggested as a mechanism to improve resource-efficiency and the sustainability of foodproduction [7]. In essence, CE promotes long-term retention and reuse of resources, aswell as minimisation of waste generation, resulting in a reduced need for raw materials [8].Thus, CE principles encourage the adoption of closed-loop production patterns, wherebywaste is appropriated as a resource [8], reducing emissions and energy consumption in theprocess [9].
Dairy products are a major and important source of nutrition, employment and tradeworldwide [10,11]. However, large volumes of wastewater are created as a consequence ofdairy production and processing. It is estimated that up to 10 L of wastewater is created per
Plants 2021, 10, 1366. https://doi.org/10.3390/plants10071366 https://www.mdpi.com/journal/plants
Plants 2021, 10, 1366 2 of 17
litre of milk processed, making dairy processing waste one of the most significant wastestreams in the food industry [12]. Dairy processing wastewaters tend to contain particu-larly high concentrations of organic matter, measured as chemical oxygen demand (COD):2000–6000 mg L−1 COD [13]; 4420 mg L−1 COD [14]; 55,430–70,150 mg L−1 COD [15].Moreover, these wastewaters generally contain high concentrations of nutrients, espe-cially ammonium (64–270 mg L−1 NH4-N), nitrate (9–30 mg L−1 NO3-N) and phosphate(20–356 mg L−1 PO4-P) [13,15,16]. The disposal of such wastewater often lacks value-capture in the treatment process [17]. For example, valuable nitrogen-containing nutrientssuch as nitrate and ammonium are commonly released as gaseous N2 [12]. Phosphate istypically precipitated using aluminium chloride, lime and similar additives, to generate aprecipitate sludge [18]. The resulting non-soluble form of phosphate has arguably limitedfurther benefit as a fertiliser [19].
Phytoremediation has been proposed as a viable alternative to traditional wastewatertreatments, as phytoremediation removes plant nutrients from wastewaters and also retainsthese elements in a chemical form suitable for further use [20,21]. Dairy processing wastew-ater is considered to be a good candidate for phytoremediation as it generally contains anabundance of essential plant nutrients, such as ammonium, nitrate and phosphate [22].
Duckweed, Lemnaceae, are a family of floating aquatic plants with excellent potentialfor phytoremediation due to a tolerance of wastewater conditions [23–25], fast growthrates [26] and high protein or starch content [27,28], as well as demonstrated use as feed,food and biofuel [29–31]. Thus, these plants can combine efficient wastewater remediationwith the creation of a valuable plant biomass. To date, few studies have attempted to assessthe suitability of duckweed for remediation of dairy processing wastewater. However,in principle duckweed has been shown to remediate dairy processing wastewater thatlacks organic components, such as sugars and fats [32]. As a high proportion of theseorganic components are generally removed by existing microbial-based treatment tech-nologies, such as sequential batch reactors or anaerobic digesters [33,34], the incorporationof duckweed into the remediation process is a realistic approach.
Wastewater remediation by duckweed is a surface process, whereby a layer of duck-weed takes up nutrients from the underlying water column. In their natural habitats, mostduckweed species grow in dense, floating mats [35]. Once mats have filled the availablespace, individual colonies begin to overlap and shade each other. Such highly crowdedconditions negatively impact duckweed growth rates [36,37], and duckweed may evenstart to senesce and release nutrients back into the water column [38]. Conversely, a higherduckweed plant density can increase the potential for uptake of nitrogen and phospho-rus [39]. Given the implications for biomass production and wastewater remediation [40],an improved understanding of the relationship between plant surface density and biomassyield, as well as net nutrient uptake is required. Earlier work has shown that a low growthrate at a high plant density does not necessarily imply a low biomass yield or low Nand P removal [37]. Accordingly, to achieve effective phytoremediation, determinationof optimal duckweed density for nutrient removal, plant growth and biomass yield perwater surface area is required. In the present study, the effects of density on duckweedgrowth and remediation were quantified. This was done under axenic conditions, usingstationary tanks containing either synthetic dairy processing wastewater or an optimalmedium (half-strength Hutner’s). Furthermore, with the aim of reproducing some of theconditions of large-scale duckweed phytoremediation systems, L. minor was cultivatedon synthetic dairy wastewater using a larger scale non-axenic re-circulatory system. Theresults will inform management of duckweed-based remediation systems.
2. Materials and Methods2.1. Stock Cultivation
The duckweed strain used in this study was Lemna minor L.–Blarney, strain number5500 in the Rutgers Duckweed Stock Cooperative database [41]. A sterile stock of L. minorwas cultivated on half-strength Hutner’s medium [42] under an average light intensity of
Plants 2021, 10, 1366 3 of 17
50 µmol m−2 s−1 photosynthetically active radiation (PAR) in a controlled growth-room(22 ◦C, 14 h:10 h light:dark photoperiod).
2.2. Experimental Design2.2.1. Synthetic Dairy Processing Wastewater
The synthetic dairy processing wastewater used in this study is based on the composi-tion of real dairy processing wastewater found in dairy wastewater treatment facilities [43],with modifications as detailed in Walsh et al. [21]. The pH was reduced to, and main-tained at, around 5.0 from a natural value of 8 with 1 M H2SO4 to facilitate optimal L.minor growth [44]. H2SO4 was chosen to decrease pH as SO4-S has a wide ‘optimal’ range(0.5–20 mM) in which it does not cause adverse or beneficial effects towards duckweed,with a high maximum tolerated concentration of 60 mM, as per Walsh et al. [21].
2.2.2. Manipulation of Plant Density
In this paper, the term “plant density” is used to refer to the relative surface coverof the medium by Lemna minor, i.e., the proportional cover by duckweed as a fractionof the total available surface area. Plant density, i.e., surface cover, is linked to plantbiomass per m2. Plant biomass always refers to fresh duckweed biomass. Plant density waseither measured directly, or estimated based on biomass per surface area. Direct densitymeasurements were performed using the imaging software Easy Leaf Area [45] whichdistinguishes duckweed frond surface cover from non-duckweed covered surface area.This non-invasive technique could be used throughout the duration of an experiment.Alternatively, plant density, i.e., relative surface cover, was estimated based on biomass perm2 of surface area. In this scenario, the latter values were calculated using a calibrationcurve for L. minor biomass versus surface area. To generate a calibration curve, a numberof colonies were taken at random from a stock culture acclimated to the relevant medium.The total surface area and mass of these ‘representative’ colonies were measured and thearea/mass ratio was calculated.
2.2.3. Stationary Remediation Experiment 1: Growth and Remediation at VariablePlant Densities
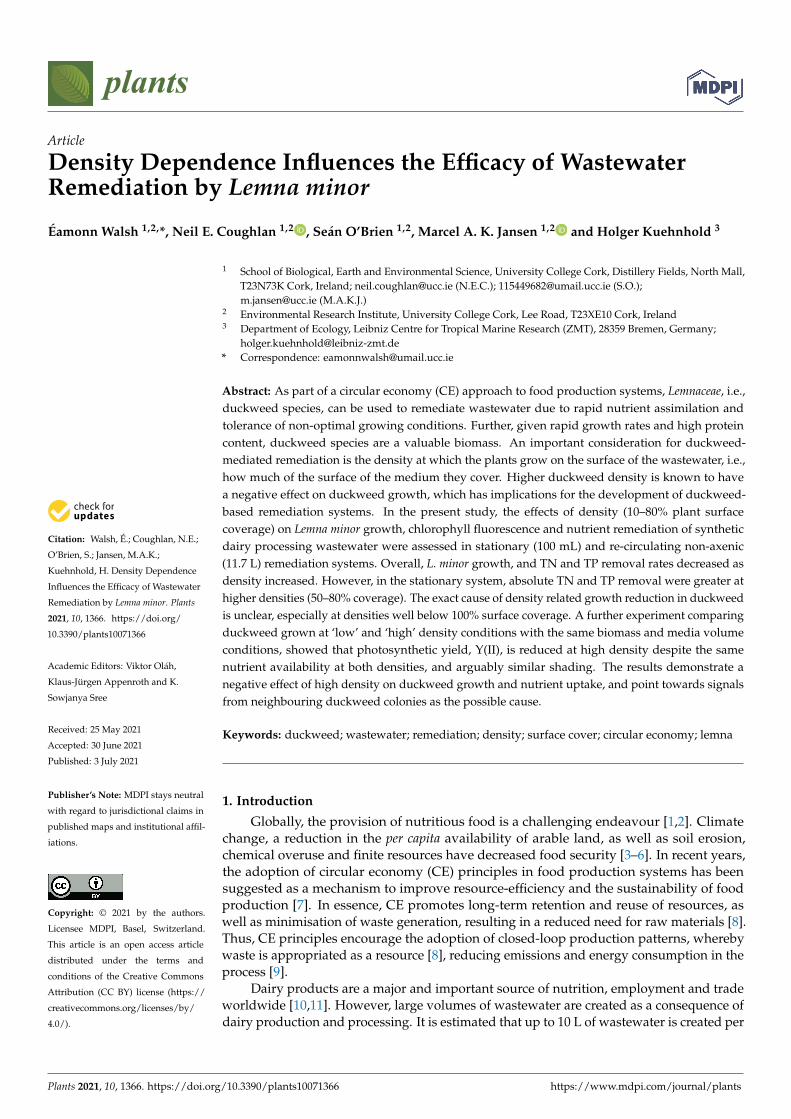
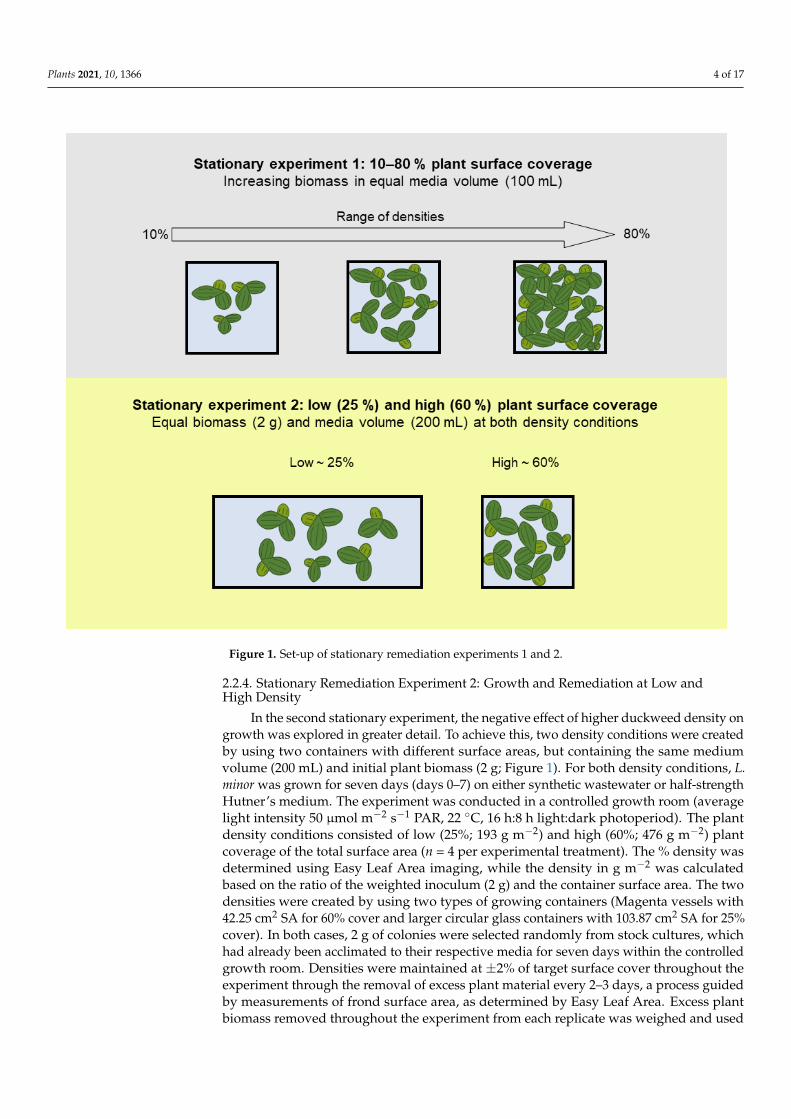
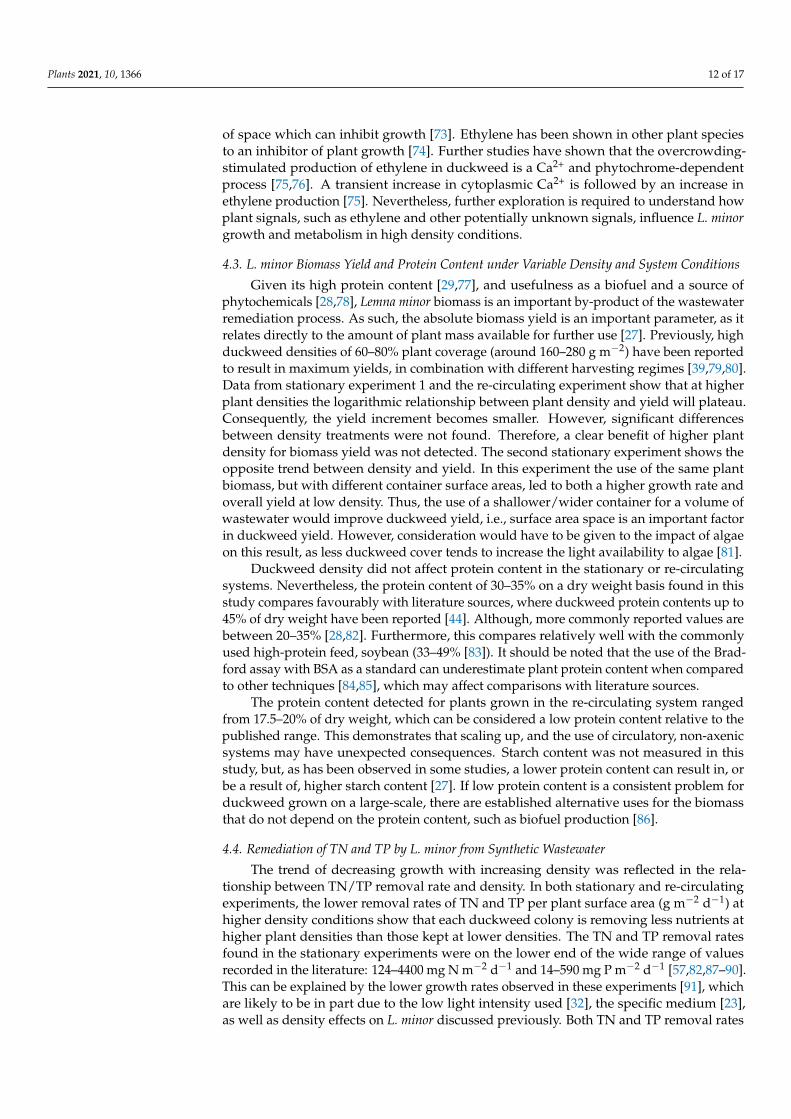
Two stationary experiments were conducted. In the first, scoping, experiment L. minorwas grown on 100 mL of synthetic dairy wastewater for seven days (days 0–7) using a rangeof eight density conditions (10, 20, 30, 40, 50, 60, 70, 80% plant coverage of total surfacearea, n = 6; Figure 1). The corresponding biomass per container surface area (ranging from21 to 154 g m−2) was estimated based on a mass/area ratio of L. minor biomass. Plants werekept in Magenta vessels (GA-7, surface area (SA) 42.24 cm2) in a controlled growth room(average light intensity 50 µmol m−2 s−1 PAR, 22 ◦C, 16 h:8 h light:dark photoperiod). Tostart experiments, L. minor colonies were taken at random from stock cultures that hadbeen acclimated to synthetic wastewater for seven days. The range of density conditionswas created by adding varying numbers of L. minor colonies and determining the totalfrond surface cover using Easy Leaf Area imaging. Plant densities were maintained at±2% of target surface cover throughout the experiment by removing excess plant materialevery 2–3 days, and this process was guided by measurements of frond surface area, asdetermined by Easy Leaf Area. Excess plant biomass removed throughout the experimentwas weighed and used to calculate specific growth rate (SGR) and relative growth rate(RGR) (n = 6, except for 40% where n = 4). Total nitrogen (TN) and total phosphorous (TP)were measured from medium samples taken on days 0 and 7 (n = 6, except for 40% wheren = 4). Protein content was measured from plant samples taken on day 7 (n = 6, except for40% where n = 4).
Plants 2021, 10, 1366 4 of 17Plants 2021, 10, x FOR PEER REVIEW 5 of 18
Figure 1. Set-up of stationary remediation experiments 1 and 2.
2.2.5. Re-circulating remediation system: growth and remediation at variable plant
densities.
To determine the effect of plant density on duckweed growth and remediation ca-
pacity under more realistic operating conditions, L. minor was grown in a non-axenic, re-
circulating system containing 11.7 L of synthetic dairy wastewater, for five days (days 0–
5), and at three densities (20, 50 and 80% plant coverage of total surface area of 600 cm2, n
= 4). Plant density was measured using Easy Leaf Area, whilst the corresponding biomass
per container surface area (ranging from 50 to 187 g m−2) was estimated based on a
mass/area ratio of L. minor biomass. The experiment was conducted within a controlled
environment room (300 µmol m−2 s−1 PAR, 16h:8h light:dark photoperiod). In this experi-
mental system, synthetic wastewater was re-circulated between two tanks, an upper
duckweed tank and a lower sump tank at a rate of 125 L per hour. The upper tanks of each
replicate treatment were seeded at their respective plant surface densities on the initial
day of the experiment, using stock plants acclimated to synthetic wastewater for seven
days. Excess biomass grown over the course of the experiment was removed twice over
the five-day experiment to maintain densities within ± 2% of target surface coverage, as
determined using Easy Leaf Area imaging. Excess plant biomass removed throughout the
experiment from each replicate was weighed and used to calculate SGR (n = 4). TN and
TP were measured from medium samples taken on days 0 and 5 (n = 4). Protein content
was measured from plant samples taken on day 5 (n = 4).
Figure 1. Set-up of stationary remediation experiments 1 and 2.
2.2.4. Stationary Remediation Experiment 2: Growth and Remediation at Low andHigh Density
In the second stationary experiment, the negative effect of higher duckweed density ongrowth was explored in greater detail. To achieve this, two density conditions were createdby using two containers with different surface areas, but containing the same mediumvolume (200 mL) and initial plant biomass (2 g; Figure 1). For both density conditions, L.minor was grown for seven days (days 0–7) on either synthetic wastewater or half-strengthHutner’s medium. The experiment was conducted in a controlled growth room (averagelight intensity 50 µmol m−2 s−1 PAR, 22 ◦C, 16 h:8 h light:dark photoperiod). The plantdensity conditions consisted of low (25%; 193 g m−2) and high (60%; 476 g m−2) plantcoverage of the total surface area (n = 4 per experimental treatment). The % density wasdetermined using Easy Leaf Area imaging, while the density in g m−2 was calculatedbased on the ratio of the weighted inoculum (2 g) and the container surface area. The twodensities were created by using two types of growing containers (Magenta vessels with42.25 cm2 SA for 60% cover and larger circular glass containers with 103.87 cm2 SA for 25%cover). In both cases, 2 g of colonies were selected randomly from stock cultures, whichhad already been acclimated to their respective media for seven days within the controlledgrowth room. Densities were maintained at ±2% of target surface cover throughout theexperiment through the removal of excess plant material every 2–3 days, a process guidedby measurements of frond surface area, as determined by Easy Leaf Area. Excess plantbiomass removed throughout the experiment from each replicate was weighed and used
Plants 2021, 10, 1366 5 of 17
to calculate SGR and RGR (n = 4). Chlorophyll a fluorescence measurements were taken onrandomly selected plants on days 0 and 7 (n = 4). TN and TP were measured from mediumsamples taken on days 0 and 7 (n = 4). In both stationary experiments, any water loss dueto evaporation was countered by adding deionised water to maintain original volumes.
2.2.5. Re-Circulating Remediation System: Growth and Remediation at VariablePlant Densities
To determine the effect of plant density on duckweed growth and remediation ca-pacity under more realistic operating conditions, L. minor was grown in a non-axenic, re-circulating system containing 11.7 L of synthetic dairy wastewater, for five days (days 0–5),and at three densities (20, 50 and 80% plant coverage of total surface area of 600 cm2, n = 4).Plant density was measured using Easy Leaf Area, whilst the corresponding biomass percontainer surface area (ranging from 50 to 187 g m−2) was estimated based on a mass/arearatio of L. minor biomass. The experiment was conducted within a controlled environmentroom (300 µmol m−2 s−1 PAR, 16 h:8 h light:dark photoperiod). In this experimentalsystem, synthetic wastewater was re-circulated between two tanks, an upper duckweedtank and a lower sump tank at a rate of 125 L per hour. The upper tanks of each replicatetreatment were seeded at their respective plant surface densities on the initial day of theexperiment, using stock plants acclimated to synthetic wastewater for seven days. Excessbiomass grown over the course of the experiment was removed twice over the five-day ex-periment to maintain densities within ±2% of target surface coverage, as determined usingEasy Leaf Area imaging. Excess plant biomass removed throughout the experiment fromeach replicate was weighed and used to calculate SGR (n = 4). TN and TP were measuredfrom medium samples taken on days 0 and 5 (n = 4). Protein content was measured fromplant samples taken on day 5 (n = 4).
2.3. Measured Parameters2.3.1. Growth
All plant biomass was dried with absorbent tissue-paper to remove excess water andensure reliable measurements before weight measurements. A specific growth rate (SGR),for growth comparisons within the present study, was calculated from estimations andmeasurements of fresh biomass using the formula [46]:
SGR =W2/W1
∆T(1)
where W1 is starting mass, W2 is the increase in mass over the course of the entire ex-periment and ∆T is the length of the experiment. Except for stationary experiment 2,starting mass (W1) was estimated rather than measured directly and this was guided by acalibration curve of biomass versus plant surface area.
For comparison with literature sources, a relative growth rate (RGR) was calculatedfrom estimations and measurements of fresh biomass using the formula [47]:
RGR =ln W3
W1
∆T(2)
where ln is the natural log, W1 is starting biomass, W3 is total biomass on day 3 and ∆Tis the length of time. As biomass was removed throughout each experiment to maintaina constant plant density, this formula was only used to calculate the RGR up to the firstinstance of removal (day 3). The total increase in mass over the course of the experiment ispresented as the yield.
Plants 2021, 10, 1366 6 of 17
2.3.2. Chlorophyll a Fluorescence
Chlorophyll a fluorescence measurements were taken for randomly selected plants ondays 0 and 7, using a pulse amplitude modulated fluorometer (WALZ Imaging fluorometer,Effeltrich, Germany). The procedure that was followed is detailed in Walsh et al. [32].
2.3.3. Total Nitrogen and Total Phosphorous Analysis
A sample of medium was taken for total nitrogen (TN) and total phosphorous (TP)analysis on the initial and final days of each experiment. For TN analysis, Hach test LCK138was used with a Hach DR3900 spectrophotometer. Firstly, the sample was digested withperoxo-disulphate for one hour at 100 ◦C causing inorganically and organically bondednitrogen to oxidise to nitrate (Koroleff digestion). The resulting oxidised nitrate was thenanalysed photometrically in a reaction with 2,6-dimethylphenol. For TP analysis, Hachtest LCK348 was used. Firstly, the medium was digested using the persulphate digestionmethod for one hour at 100 ◦C. The resulting solution was then analysed photometricallythrough the ascorbic acid/phosphomolybdenum blue method.
2.3.4. Protein Analysis
Lemna minor samples, taken on the final day of experiments, were kept at −20 ◦C untilused for protein extraction and analysis. Protein was extracted using 50 mM potassiumphosphate buffer (pH 7, containing 0.1 mM polyvinylpyrrolidone (PVP) and 0.1 mM EDTA).Between 50–80 mg of fresh plant material was homogenised in cold potassium phosphatebuffer (1 mL of buffer to 80 mg of plant sample). The homogenised sample was thencentrifuged at 20,000× g for 30 min at 4 ◦C [48]. The resulting supernatant was used forprotein analysis using the Bradford method with bovine serum albumin as a standard [49].For absorbance measurements, 5 µL of sample was added to 1 mL of Bradford reagent in acuvette and left for five minutes in dark conditions. Absorbance was measured at 595 nmusing a spectrophotometer (UV-160A Shimadzu). In order to calculate the proportion ofprotein based on dry plant biomass, 4% dry weight content of fresh duckweed weight wasused [28].
2.4. Data Analysis
Statistical analyses were conducted using R (version 3.4.3 [50]). One- and two-wayANOVAs were used to analyse differences between treatments for the measured parameters.Post hoc Tukey tests were used for pairwise comparisons of treatment groups. Normalitywas assessed through a graphical assessment of the distribution of the residual values fordata points (i.e., histogram). Homoscedasticity was assessed with ‘residuals vs. predictedvalues’ plots as well as Fligner-Killeen and Levene’s tests.
3. Results3.1. Stationary Remediation Experiment 1: Growth and Remediation at Variable Plant Densities
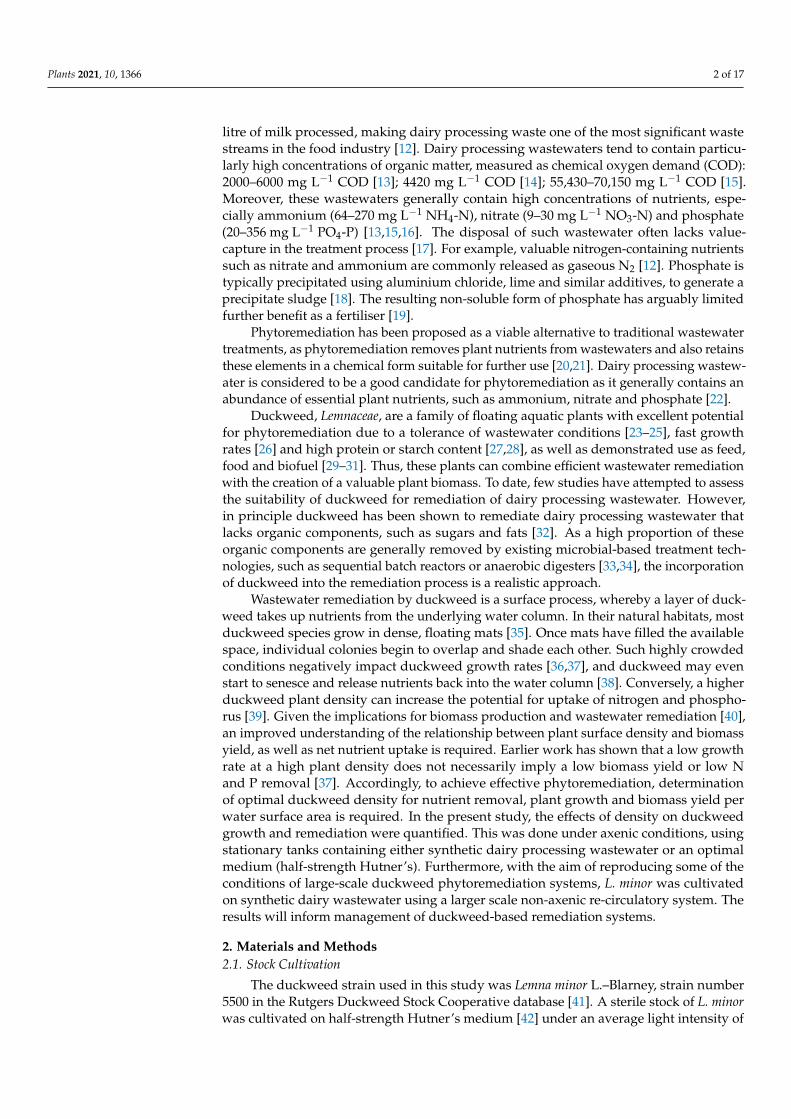
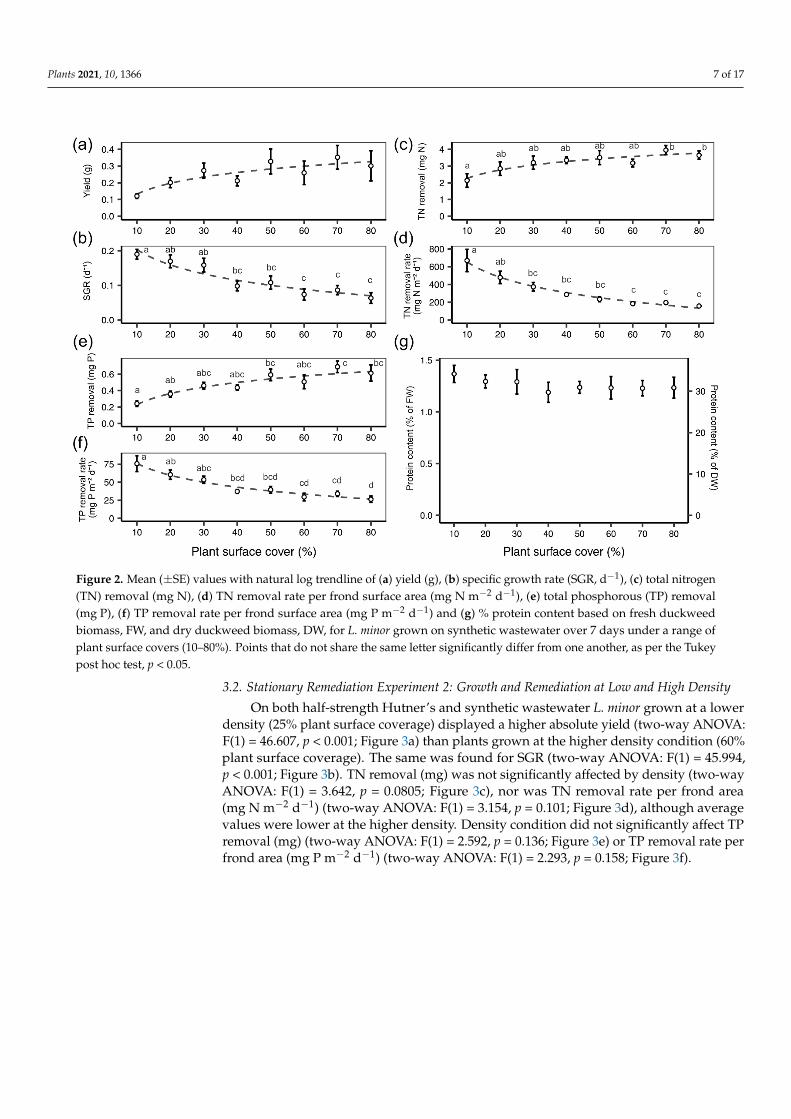
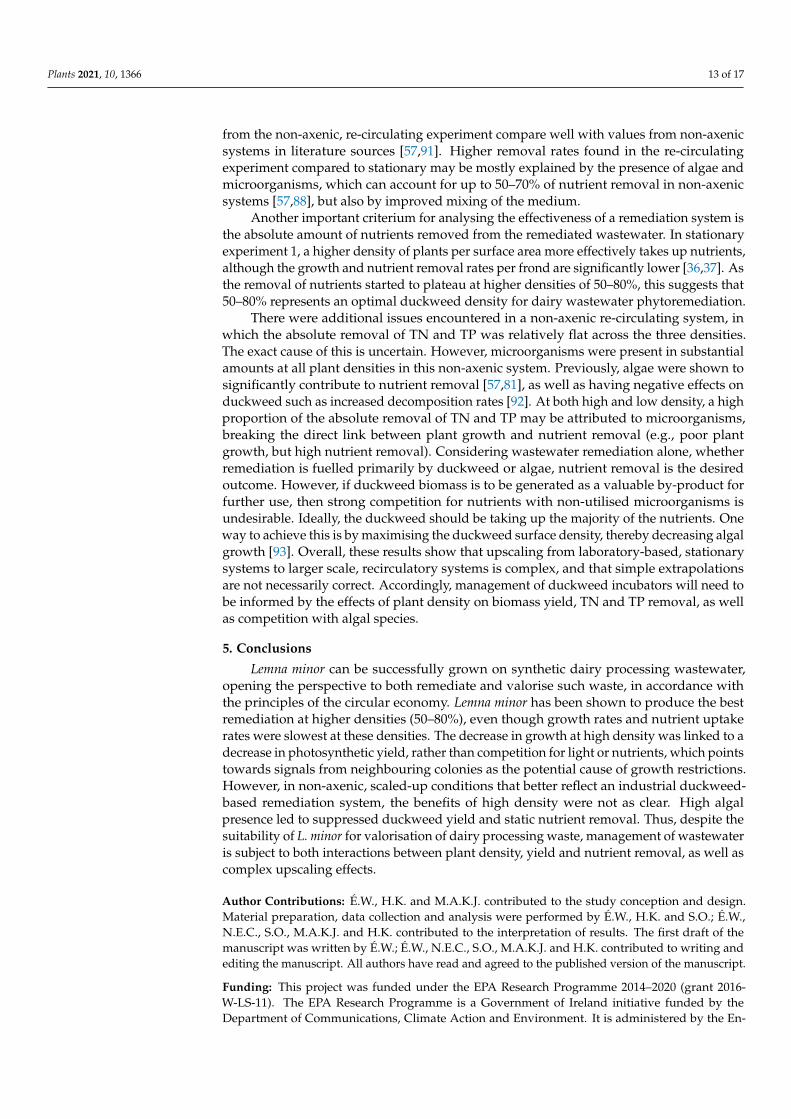
The absolute plant biomass yield (g) did not significantly vary over the course ofthe experiment although the general trend of the average yield increased with increasingdensity (one-way ANOVA: F(7) = 1.57, p = 0.174; Figure 2a). SGR (d−1) exhibited the oppo-site trend; rates decreased as density increased (one-way ANOVA: F(7) = 8.357, p < 0.001;Figure 2b). The overall removal of TN (mg) from synthetic dairy wastewater increased asplant density increased (one-way ANOVA: F(7) = 2.574, p < 0.05; Figure 2c). However, whenTN removal was expressed per frond surface area (mg N m−2 day−1), the rate decreased asdensity increased (one-way ANOVA: F(7) = 9.287, p < 0.001; Figure 2d). A similar patternwas found for TP removal in which the overall removal of TP (mg) from synthetic dairywastewater increased as plant density increased (one-way ANOVA: F(7) = 5.11, p < 0.001;Figure 2e). While the TP removal rate per frond surface area (mg P m−2 day−1) decreasedas density increased (one-way ANOVA: F(7) = 8.158, p < 0.001; Figure 2f). There was nodifference in protein content (% dry duckweed mass) detected in relation to plant density(one-way ANOVA: F(7) = 0.334, p = 0.933; Figure 2g).
Plants 2021, 10, 1366 7 of 17Plants 2021, 10, x FOR PEER REVIEW 8 of 18
Figure 2. Mean (± SE) values with natural log trendline of (a) yield (g), (b) specific growth rate (SGR, d−1), (c) total nitrogen
(TN) removal (mg N), (d) TN removal rate per frond surface area (mg N m−2 d−1), (e) total phosphorous (TP) removal (mg
P), (f) TP removal rate per frond surface area (mg P m−2 d−1) and (g) % protein content based on fresh duckweed biomass,
FW, and dry duckweed biomass, DW, for L. minor grown on synthetic wastewater over 7 days under a range of plant
surface covers (10–80%). Points that do not share the same letter significantly differ from one another, as per the Tukey
post hoc test, p < 0.05.
3.2. Stationary Remediation Experiment 2: Growth and Remediation at Low and High Density
On both half-strength Hutner’s and synthetic wastewater L. minor grown at a lower
density (25% plant surface coverage) displayed a higher absolute yield (two-way
ANOVA: F(1) = 46.607, p < 0.001; Figure 3a) than plants grown at the higher density con-
dition (60% plant surface coverage). The same was found for SGR (two-way ANOVA: F(1)
= 45.994, p < 0.001; Figure 3b). TN removal (mg) was not significantly affected by density
(two-way ANOVA: F(1) = 3.642, p = 0.0805; Figure 3c), nor was TN removal rate per frond
area (mg N m−2 d−1) (two-way ANOVA: F(1) = 3.154, p = 0.101; Figure 3d), although average
values were lower at the higher density. Density condition did not significantly affect TP
removal (mg) (two-way ANOVA: F(1) = 2.592, p = 0.136; Figure 3e) or TP removal rate per
frond area (mg P m−2 d−1) (two-way ANOVA: F(1) = 2.293, p = 0.158; Figure 3f).
Figure 2. Mean (±SE) values with natural log trendline of (a) yield (g), (b) specific growth rate (SGR, d−1), (c) total nitrogen(TN) removal (mg N), (d) TN removal rate per frond surface area (mg N m−2 d−1), (e) total phosphorous (TP) removal(mg P), (f) TP removal rate per frond surface area (mg P m−2 d−1) and (g) % protein content based on fresh duckweedbiomass, FW, and dry duckweed biomass, DW, for L. minor grown on synthetic wastewater over 7 days under a range ofplant surface covers (10–80%). Points that do not share the same letter significantly differ from one another, as per the Tukeypost hoc test, p < 0.05.
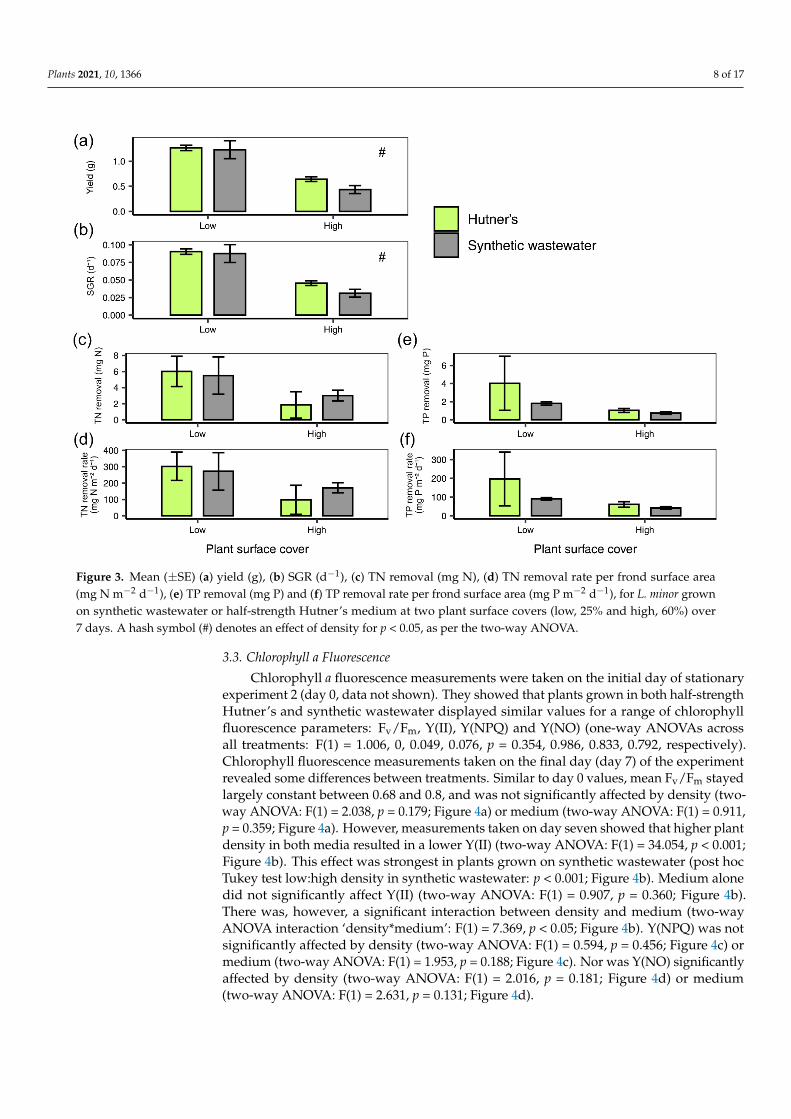
3.2. Stationary Remediation Experiment 2: Growth and Remediation at Low and High Density
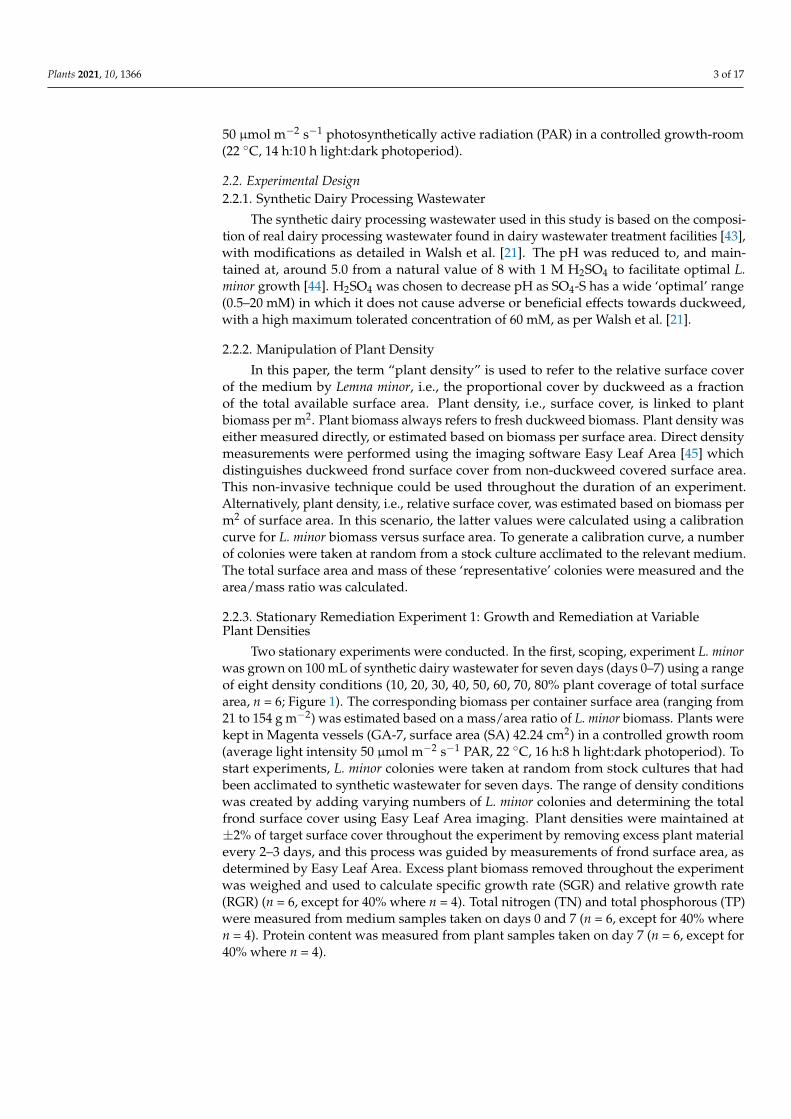
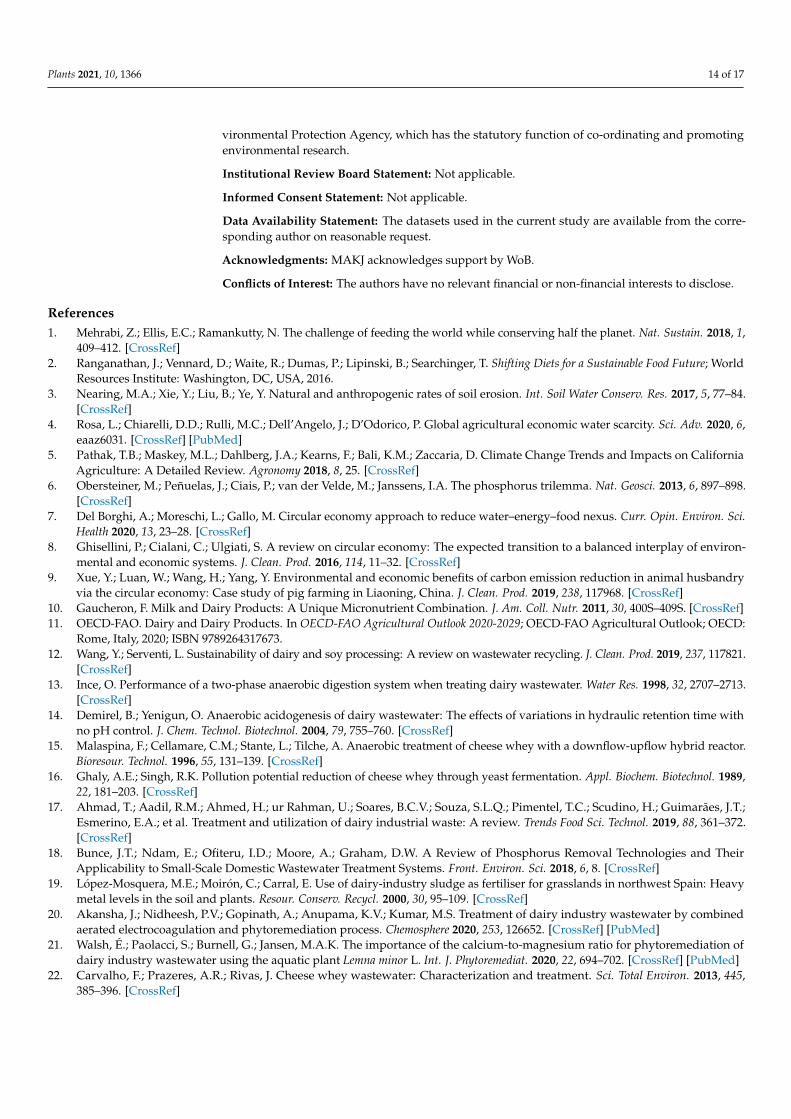
On both half-strength Hutner’s and synthetic wastewater L. minor grown at a lowerdensity (25% plant surface coverage) displayed a higher absolute yield (two-way ANOVA:F(1) = 46.607, p < 0.001; Figure 3a) than plants grown at the higher density condition (60%plant surface coverage). The same was found for SGR (two-way ANOVA: F(1) = 45.994,p < 0.001; Figure 3b). TN removal (mg) was not significantly affected by density (two-wayANOVA: F(1) = 3.642, p = 0.0805; Figure 3c), nor was TN removal rate per frond area(mg N m−2 d−1) (two-way ANOVA: F(1) = 3.154, p = 0.101; Figure 3d), although averagevalues were lower at the higher density. Density condition did not significantly affect TPremoval (mg) (two-way ANOVA: F(1) = 2.592, p = 0.136; Figure 3e) or TP removal rate perfrond area (mg P m−2 d−1) (two-way ANOVA: F(1) = 2.293, p = 0.158; Figure 3f).
Plants 2021, 10, 1366 8 of 17Plants 2021, 10, x FOR PEER REVIEW 9 of 18
Figure 3. Mean (± SE) (a) yield (g), (b) SGR (d−1), (c) TN removal (mg N), (d) TN removal rate per frond surface area (mg
N m−2 d−1), (e) TP removal (mg P) and (f) TP removal rate per frond surface area (mg P m−2 d−1), for L. minor grown on
synthetic wastewater or half-strength Hutner’s medium at two plant surface covers (low, 25% and high, 60%) over 7 days.
A hash symbol (#) denotes an effect of density for p < 0.05, as per the two-way ANOVA.
3.3. Chlorophyll a Fluorescence
Chlorophyll a fluorescence measurements were taken on the initial day of stationary
experiment 2 (day 0, data not shown). They showed that plants grown in both half-
strength Hutner’s and synthetic wastewater displayed similar values for a range of chlo-
rophyll fluorescence parameters: Fv/Fm, Y(II), Y(NPQ) and Y(NO) (one-way ANOVAs
across all treatments: F(1) = 1.006, 0, 0.049, 0.076, p = 0.354, 0.986, 0.833, 0.792, respectively).
Chlorophyll fluorescence measurements taken on the final day (day 7) of the experiment
revealed some differences between treatments. Similar to day 0 values, mean Fv/Fm stayed
largely constant between 0.68 and 0.8, and was not significantly affected by density (two-
way ANOVA: F(1) = 2.038, p = 0.179; Figure 4a) or medium (two-way ANOVA: F(1) =
0.911, p = 0.359; Figure 4a). However, measurements taken on day seven showed that
higher plant density in both media resulted in a lower Y(II) (two-way ANOVA: F(1) =
34.054, p < 0.001; Figure 4b). This effect was strongest in plants grown on synthetic
wastewater (post hoc Tukey test low:high density in synthetic wastewater: p < 0.001; Fig-
ure 4b). Medium alone did not significantly affect Y(II) (two-way ANOVA: F(1) = 0.907, p
= 0.360; Figure 4b). There was, however, a significant interaction between density and me-
dium (two-way ANOVA interaction ‘density*medium’: F(1) = 7.369, p < 0.05; Figure 4b).
Y(NPQ) was not significantly affected by density (two-way ANOVA: F(1) = 0.594, p =
0.456; Figure 4c) or medium (two-way ANOVA: F(1) = 1.953, p = 0.188; Figure 4c). Nor was
Y(NO) significantly affected by density (two-way ANOVA: F(1) = 2.016, p = 0.181; Figure
4d) or medium (two-way ANOVA: F(1) = 2.631, p = 0.131; Figure 4d).
Figure 3. Mean (±SE) (a) yield (g), (b) SGR (d−1), (c) TN removal (mg N), (d) TN removal rate per frond surface area(mg N m−2 d−1), (e) TP removal (mg P) and (f) TP removal rate per frond surface area (mg P m−2 d−1), for L. minor grownon synthetic wastewater or half-strength Hutner’s medium at two plant surface covers (low, 25% and high, 60%) over7 days. A hash symbol (#) denotes an effect of density for p < 0.05, as per the two-way ANOVA.
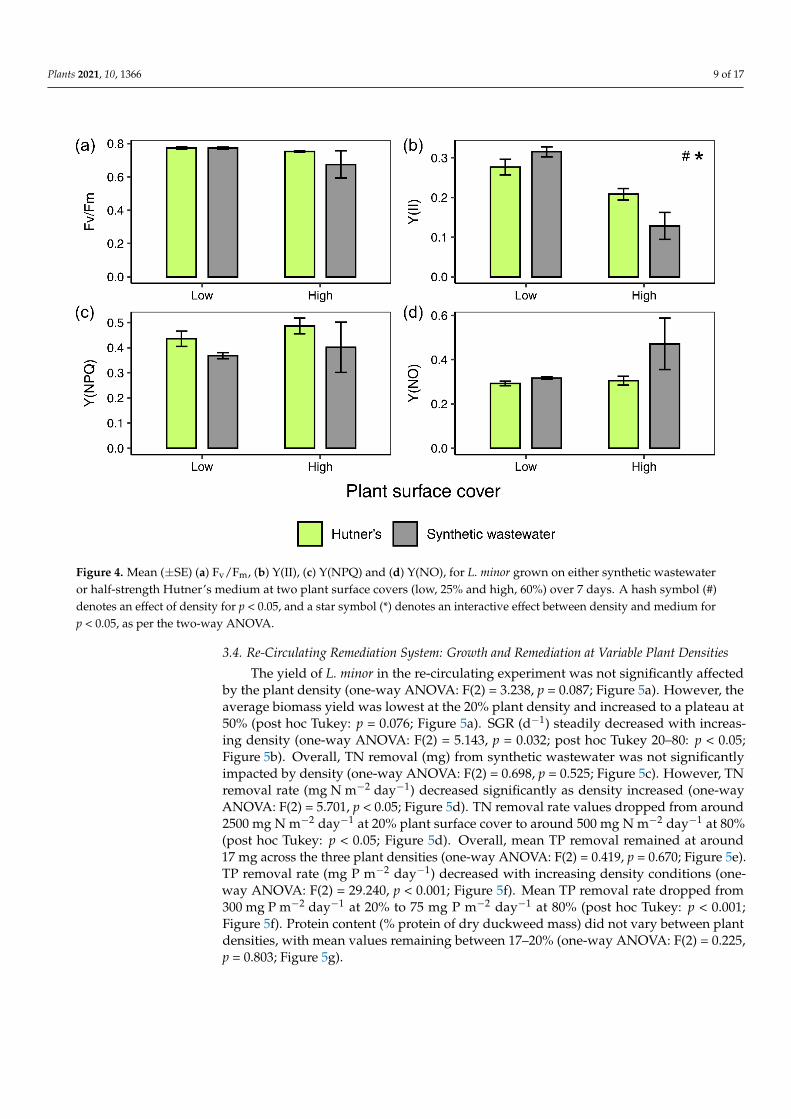
3.3. Chlorophyll a Fluorescence
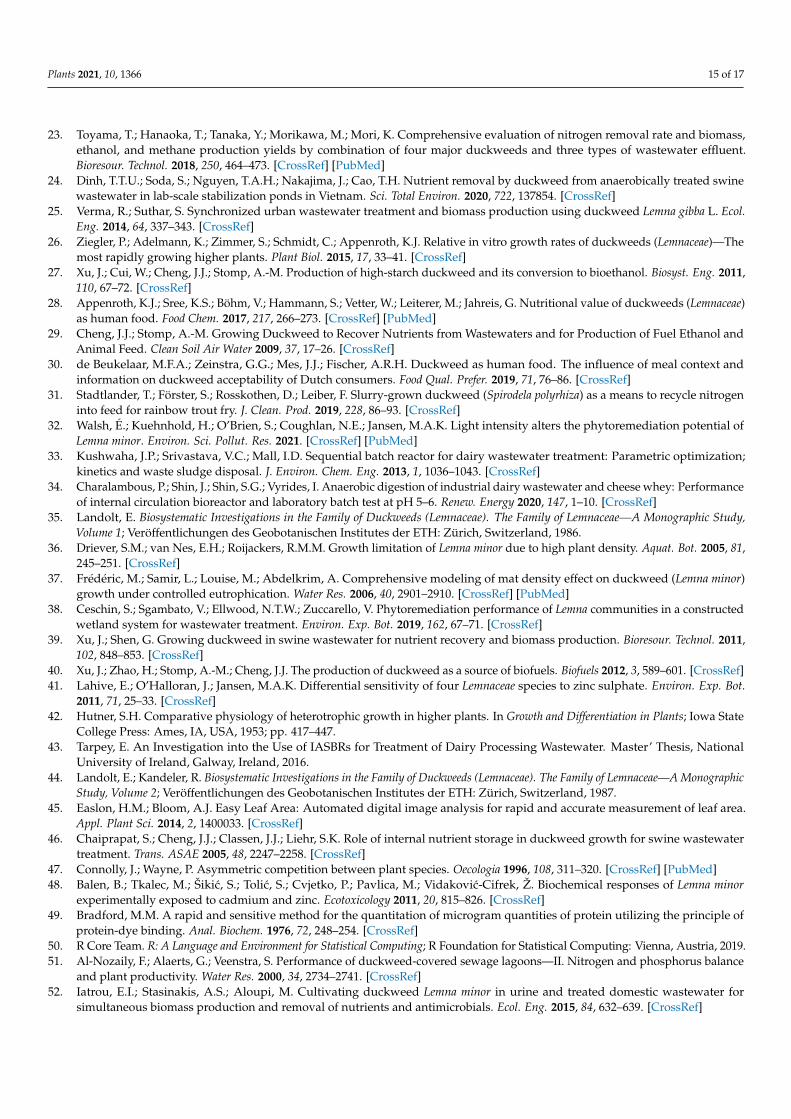
Chlorophyll a fluorescence measurements were taken on the initial day of stationaryexperiment 2 (day 0, data not shown). They showed that plants grown in both half-strengthHutner’s and synthetic wastewater displayed similar values for a range of chlorophyllfluorescence parameters: Fv/Fm, Y(II), Y(NPQ) and Y(NO) (one-way ANOVAs acrossall treatments: F(1) = 1.006, 0, 0.049, 0.076, p = 0.354, 0.986, 0.833, 0.792, respectively).Chlorophyll fluorescence measurements taken on the final day (day 7) of the experimentrevealed some differences between treatments. Similar to day 0 values, mean Fv/Fm stayedlargely constant between 0.68 and 0.8, and was not significantly affected by density (two-way ANOVA: F(1) = 2.038, p = 0.179; Figure 4a) or medium (two-way ANOVA: F(1) = 0.911,p = 0.359; Figure 4a). However, measurements taken on day seven showed that higher plantdensity in both media resulted in a lower Y(II) (two-way ANOVA: F(1) = 34.054, p < 0.001;Figure 4b). This effect was strongest in plants grown on synthetic wastewater (post hocTukey test low:high density in synthetic wastewater: p < 0.001; Figure 4b). Medium alonedid not significantly affect Y(II) (two-way ANOVA: F(1) = 0.907, p = 0.360; Figure 4b).There was, however, a significant interaction between density and medium (two-wayANOVA interaction ‘density*medium’: F(1) = 7.369, p < 0.05; Figure 4b). Y(NPQ) was notsignificantly affected by density (two-way ANOVA: F(1) = 0.594, p = 0.456; Figure 4c) ormedium (two-way ANOVA: F(1) = 1.953, p = 0.188; Figure 4c). Nor was Y(NO) significantlyaffected by density (two-way ANOVA: F(1) = 2.016, p = 0.181; Figure 4d) or medium(two-way ANOVA: F(1) = 2.631, p = 0.131; Figure 4d).
Plants 2021, 10, 1366 9 of 17Plants 2021, 10, x FOR PEER REVIEW 10 of 18
Figure 4. Mean (± SE) (a) Fv/Fm, (b) Y(II), (c) Y(NPQ) and (d) Y(NO), for L. minor grown on either synthetic wastewater or
half-strength Hutner’s medium at two plant surface covers (low, 25% and high, 60%) over 7 days. A hash symbol (#)
denotes an effect of density for p < 0.05, and a star symbol (*) denotes an interactive effect between density and medium
for p < 0.05, as per the two-way ANOVA.
3.4. Re-Circulating Remediation System: Growth and Remediation at Variable Plant Densities
The yield of L. minor in the re-circulating experiment was not significantly affected
by the plant density (one-way ANOVA: F(2) = 3.238, p = 0.087; Figure 5a). However, the
average biomass yield was lowest at the 20% plant density and increased to a plateau at
50% (post hoc Tukey: p = 0.076; Figure 5a). SGR (d−1) steadily decreased with increasing
density (one-way ANOVA: F(2) = 5.143, p = 0.032; post hoc Tukey 20–80: p < 0.05; Figure
5b). Overall, TN removal (mg) from synthetic wastewater was not significantly impacted
by density (one-way ANOVA: F(2) = 0.698, p = 0.525; Figure 5c). However, TN removal
rate (mg N m−2 day−1) decreased significantly as density increased (one-way ANOVA: F(2)
= 5.701, p < 0.05; Figure 5d). TN removal rate values dropped from around 2500 mg N m−2
day−1 at 20% plant surface cover to around 500 mg N m−2 day−1 at 80% (post hoc Tukey: p <
0.05; Figure 5d). Overall, mean TP removal remained at around 17 mg across the three
plant densities (one-way ANOVA: F(2) = 0.419, p = 0.670; Figure 5e). TP removal rate (mg
P m−2 day−1) decreased with increasing density conditions (one-way ANOVA: F(2) =
29.240, p < 0.001; Figure 5f). Mean TP removal rate dropped from 300 mg P m−2 day−1 at
20% to 75 mg P m−2 day−1 at 80% (post hoc Tukey: p < 0.001; Figure 5f). Protein content (%
protein of dry duckweed mass) did not vary between plant densities, with mean values
remaining between 17–20% (one-way ANOVA: F(2) = 0.225, p = 0.803; Figure 5g).
Figure 4. Mean (±SE) (a) Fv/Fm, (b) Y(II), (c) Y(NPQ) and (d) Y(NO), for L. minor grown on either synthetic wastewateror half-strength Hutner’s medium at two plant surface covers (low, 25% and high, 60%) over 7 days. A hash symbol (#)denotes an effect of density for p < 0.05, and a star symbol (*) denotes an interactive effect between density and medium forp < 0.05, as per the two-way ANOVA.
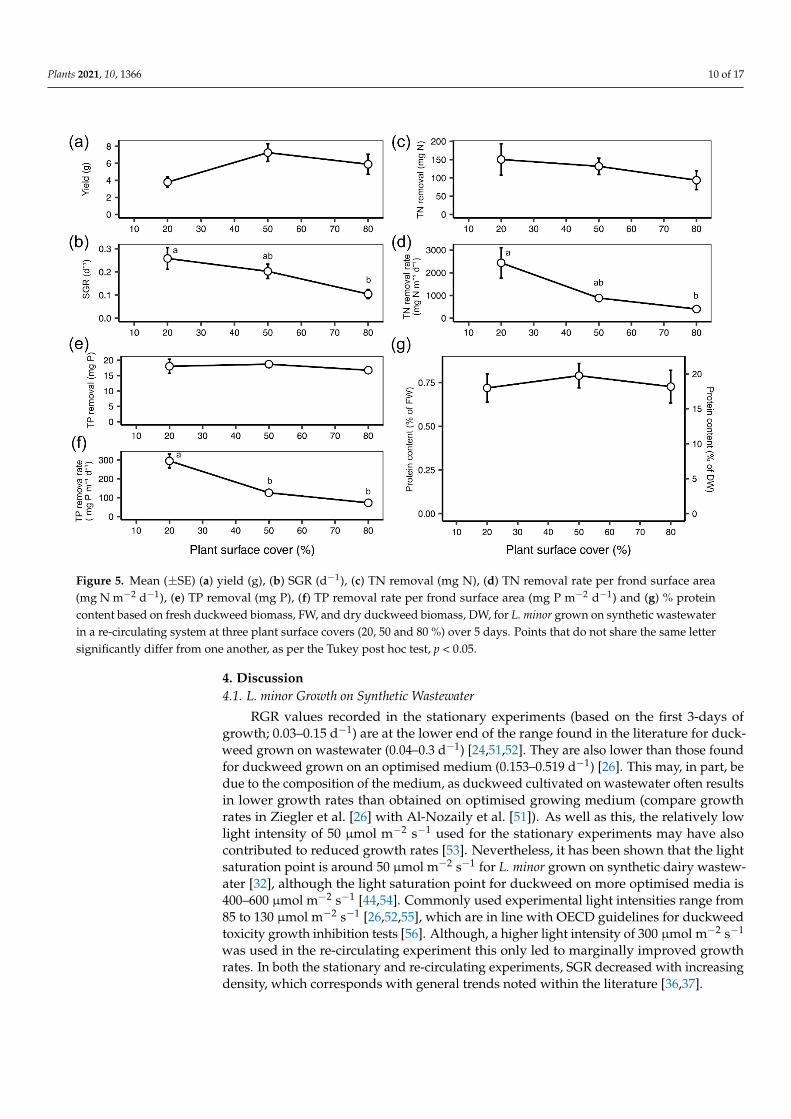
3.4. Re-Circulating Remediation System: Growth and Remediation at Variable Plant Densities
The yield of L. minor in the re-circulating experiment was not significantly affectedby the plant density (one-way ANOVA: F(2) = 3.238, p = 0.087; Figure 5a). However, theaverage biomass yield was lowest at the 20% plant density and increased to a plateau at50% (post hoc Tukey: p = 0.076; Figure 5a). SGR (d−1) steadily decreased with increas-ing density (one-way ANOVA: F(2) = 5.143, p = 0.032; post hoc Tukey 20–80: p < 0.05;Figure 5b). Overall, TN removal (mg) from synthetic wastewater was not significantlyimpacted by density (one-way ANOVA: F(2) = 0.698, p = 0.525; Figure 5c). However, TNremoval rate (mg N m−2 day−1) decreased significantly as density increased (one-wayANOVA: F(2) = 5.701, p < 0.05; Figure 5d). TN removal rate values dropped from around2500 mg N m−2 day−1 at 20% plant surface cover to around 500 mg N m−2 day−1 at 80%(post hoc Tukey: p < 0.05; Figure 5d). Overall, mean TP removal remained at around17 mg across the three plant densities (one-way ANOVA: F(2) = 0.419, p = 0.670; Figure 5e).TP removal rate (mg P m−2 day−1) decreased with increasing density conditions (one-way ANOVA: F(2) = 29.240, p < 0.001; Figure 5f). Mean TP removal rate dropped from300 mg P m−2 day−1 at 20% to 75 mg P m−2 day−1 at 80% (post hoc Tukey: p < 0.001;Figure 5f). Protein content (% protein of dry duckweed mass) did not vary between plantdensities, with mean values remaining between 17–20% (one-way ANOVA: F(2) = 0.225,p = 0.803; Figure 5g).
Plants 2021, 10, 1366 10 of 17Plants 2021, 10, x FOR PEER REVIEW 11 of 18
Figure 5. Mean (± SE) (a) yield (g), (b) SGR (d−1), (c) TN removal (mg N), (d) TN removal rate per frond surface area (mg
N m−2 d−1), (e) TP removal (mg P), (f) TP removal rate per frond surface area (mg P m−2 d−1) and (g) % protein content based
on fresh duckweed biomass, FW, and dry duckweed biomass, DW, for L. minor grown on synthetic wastewater in a re-
circulating system at three plant surface covers (20, 50 and 80 %) over 5 days. Points that do not share the same letter
significantly differ from one another, as per the Tukey post hoc test, p < 0.05.
4. Discussion
4.1. L. minor Growth on Synthetic Wastewater
RGR values recorded in the stationary experiments (based on the first 3-days of
growth; 0.03–0.15 d−1) are at the lower end of the range found in the literature for duck-
weed grown on wastewater (0.04–0.3 d−1) [24,51,52]. They are also lower than those found
for duckweed grown on an optimised medium (0.153–0.519 d−1) [26]. This may, in part, be
due to the composition of the medium, as duckweed cultivated on wastewater often re-
sults in lower growth rates than obtained on optimised growing medium (compare
growth rates in Ziegler et al. [26] with Al-Nozaily et al. [51]). As well as this, the relatively
low light intensity of 50 µmol m−2 s−1 used for the stationary experiments may have also
contributed to reduced growth rates [53]. Nevertheless, it has been shown that the light
saturation point is around 50 µmol m−2 s−1 for L. minor grown on synthetic dairy
wastewater [32], although the light saturation point for duckweed on more optimised me-
dia is 400–600 µmol m−2 s−1 [44,54]. Commonly used experimental light intensities range
from 85 to 130 µmol m−2 s−1 [26,52,55], which are in line with OECD guidelines for duck-
weed toxicity growth inhibition tests [56]. Although, a higher light intensity of 300 µmol
m−2 s−1 was used in the re-circulating experiment this only led to marginally improved
growth rates. In both the stationary and re-circulating experiments, SGR decreased with
increasing density, which corresponds with general trends noted within the literature
[36,37].
Figure 5. Mean (±SE) (a) yield (g), (b) SGR (d−1), (c) TN removal (mg N), (d) TN removal rate per frond surface area(mg N m−2 d−1), (e) TP removal (mg P), (f) TP removal rate per frond surface area (mg P m−2 d−1) and (g) % proteincontent based on fresh duckweed biomass, FW, and dry duckweed biomass, DW, for L. minor grown on synthetic wastewaterin a re-circulating system at three plant surface covers (20, 50 and 80 %) over 5 days. Points that do not share the same lettersignificantly differ from one another, as per the Tukey post hoc test, p < 0.05.
4. Discussion4.1. L. minor Growth on Synthetic Wastewater
RGR values recorded in the stationary experiments (based on the first 3-days ofgrowth; 0.03–0.15 d−1) are at the lower end of the range found in the literature for duck-weed grown on wastewater (0.04–0.3 d−1) [24,51,52]. They are also lower than those foundfor duckweed grown on an optimised medium (0.153–0.519 d−1) [26]. This may, in part, bedue to the composition of the medium, as duckweed cultivated on wastewater often resultsin lower growth rates than obtained on optimised growing medium (compare growthrates in Ziegler et al. [26] with Al-Nozaily et al. [51]). As well as this, the relatively lowlight intensity of 50 µmol m−2 s−1 used for the stationary experiments may have alsocontributed to reduced growth rates [53]. Nevertheless, it has been shown that the lightsaturation point is around 50 µmol m−2 s−1 for L. minor grown on synthetic dairy wastew-ater [32], although the light saturation point for duckweed on more optimised media is400–600 µmol m−2 s−1 [44,54]. Commonly used experimental light intensities range from85 to 130 µmol m−2 s−1 [26,52,55], which are in line with OECD guidelines for duckweedtoxicity growth inhibition tests [56]. Although, a higher light intensity of 300 µmol m−2 s−1
was used in the re-circulating experiment this only led to marginally improved growthrates. In both the stationary and re-circulating experiments, SGR decreased with increasingdensity, which corresponds with general trends noted within the literature [36,37].
Plants 2021, 10, 1366 11 of 17
4.2. Exploring the Mechanism Underlying Density Dependent Changes in Growth UsingChlorophyll Fluorometry
The negative effect of high density on growth may be a result of greater competition fornutrients [57], a quicker depletion of nutrients [58], or self-shading between colonies [59].Yet, plant-plant competition has also been related to plant neighbour detection, includingplant responses such as shade avoidance, root foraging, and use/induction of chemicaldefences [60,61]. Therefore, it is possible that L. minor senses the closeness of other plantsand switches to a more defensive growth strategy, the trade-off of which is a reductionin growth rate. To explore the mechanism underlying the observed decrease in SGR withincreasing plant surface density, plants were grown at lower and higher plant surfacedensities, but with identical biomass per medium volume (stationary experiment 2). Thisexperiment confirmed the impediment of growth rate at higher plant surface densities.However, as plants at each surface density had access to the same volume of medium, thedata imply that the growth impediment was due to factors other than nutrient depletion.Indeed, this point is further confirmed by the observation that similar growth impedimentsoccurred at high plant density irrespective of whether nutrient rich Hutner’s medium ormore oligotrophic dairy wastewater was used.
Analysis of photosynthetic parameters in stationary experiment 2, measured afterseven days of growth, showed that at high density the photosynthetic quantum yield ofPSII, Y(II), was significantly depressed. A reduction in Y(II) for L. minor grown at highdensity means that the plants were using light energy less efficiently compared to thoseat a lower plant surface density [62]; an effect which was stronger for plants grown onsynthetic wastewater. Y(II), together with Y(NPQ) and Y(NO) account for the partitioningof absorbed light energy in PSII [63], the sum of which equals 1 [64]. Accordingly, areduction in Y(II) implies a concurrent increase in Y(NPQ) and/or Y(NO). The data revealnon-significant increases in Y(NPQ) at higher plant densities for both media, indicatingminor increases in the amount of light energy dissipated in a regulated manner, i.e.,through thermal dissipation [63], at these higher densities. Thus, a key finding is a density-dependent decrease in Y(II) which is not matched by clear significant parallel increases inY(NO) and Y(NPQ), nor a clear effect on Fv/Fm.
Overall, the data indicate that duckweed density can affect aspects of the plant’smetabolism (e.g., carbon assimilation or nitrogen metabolism), rather than having a directeffect on PSII activity (i.e., Fv/Fm). As such, this would indirectly reduce photosyntheticyield (Y(II)) and therefore biomass growth [65]. Previously, Kufel et al. [66] describedcomplex changes in plant morphology in L. minor grown at different plant densities. WhileZhang et al. [67] described morphological responses of Spirodela polyrhiza to populationdensity that included decreased frond and root size, as well as increased frond thickness.It is possible that shading is a driver of these changes and induces a shade avoidanceresponse in plants at higher densities [60,61]. Nevertheless, acclimation to shade typicallyresults in increased Y(II) and decreased Y(NPQ) at low measuring light intensities [68,69].However, the chlorophyll fluorescence data in this study show decreased Y(II) at higherplant densities where shading might potentially have been an issue. Therefore, neither alack of nutrient nor light supply, two well-advocated explanations, adequately explain thehigh-density induced impediment of growth. Rather, the data point to plant neighbourdetection between Lemna-colonies as the most likely explanation of this [60,61]. At present,touch, volatile organic compounds, chemical exudates and possibly even acoustic signals,have all been associated with neighbour detection [70]. Although it is not known towhat extent these apply to duckweed, which tend to produce dense mats in naturalhabitats [35]. Jang et al. [71] reported that Lemna japonica may release interfering chemicalsvia its root systems, although the effects were interspecific. Similarly, Bich and Kato-Noguchi [72] reported on interspecific allelopathic signals from Lemna minor. It is less clearhow allelopathic signals manifest between neighbouring duckweed colonies of the samespecies or clone. In some duckweed species high density, or ‘overcrowding’, has beenassociated with the production of ethylene, a possible early signal for an increasing lack
Plants 2021, 10, 1366 12 of 17
of space which can inhibit growth [73]. Ethylene has been shown in other plant speciesto an inhibitor of plant growth [74]. Further studies have shown that the overcrowding-stimulated production of ethylene in duckweed is a Ca2+ and phytochrome-dependentprocess [75,76]. A transient increase in cytoplasmic Ca2+ is followed by an increase inethylene production [75]. Nevertheless, further exploration is required to understand howplant signals, such as ethylene and other potentially unknown signals, influence L. minorgrowth and metabolism in high density conditions.
4.3. L. minor Biomass Yield and Protein Content under Variable Density and System Conditions
Given its high protein content [29,77], and usefulness as a biofuel and a source ofphytochemicals [28,78], Lemna minor biomass is an important by-product of the wastewaterremediation process. As such, the absolute biomass yield is an important parameter, as itrelates directly to the amount of plant mass available for further use [27]. Previously, highduckweed densities of 60–80% plant coverage (around 160–280 g m−2) have been reportedto result in maximum yields, in combination with different harvesting regimes [39,79,80].Data from stationary experiment 1 and the re-circulating experiment show that at higherplant densities the logarithmic relationship between plant density and yield will plateau.Consequently, the yield increment becomes smaller. However, significant differencesbetween density treatments were not found. Therefore, a clear benefit of higher plantdensity for biomass yield was not detected. The second stationary experiment shows theopposite trend between density and yield. In this experiment the use of the same plantbiomass, but with different container surface areas, led to both a higher growth rate andoverall yield at low density. Thus, the use of a shallower/wider container for a volume ofwastewater would improve duckweed yield, i.e., surface area space is an important factorin duckweed yield. However, consideration would have to be given to the impact of algaeon this result, as less duckweed cover tends to increase the light availability to algae [81].
Duckweed density did not affect protein content in the stationary or re-circulatingsystems. Nevertheless, the protein content of 30–35% on a dry weight basis found in thisstudy compares favourably with literature sources, where duckweed protein contents up to45% of dry weight have been reported [44]. Although, more commonly reported values arebetween 20–35% [28,82]. Furthermore, this compares relatively well with the commonlyused high-protein feed, soybean (33–49% [83]). It should be noted that the use of the Brad-ford assay with BSA as a standard can underestimate plant protein content when comparedto other techniques [84,85], which may affect comparisons with literature sources.
The protein content detected for plants grown in the re-circulating system rangedfrom 17.5–20% of dry weight, which can be considered a low protein content relative to thepublished range. This demonstrates that scaling up, and the use of circulatory, non-axenicsystems may have unexpected consequences. Starch content was not measured in thisstudy, but, as has been observed in some studies, a lower protein content can result in, orbe a result of, higher starch content [27]. If low protein content is a consistent problem forduckweed grown on a large-scale, there are established alternative uses for the biomassthat do not depend on the protein content, such as biofuel production [86].
4.4. Remediation of TN and TP by L. minor from Synthetic Wastewater
The trend of decreasing growth with increasing density was reflected in the rela-tionship between TN/TP removal rate and density. In both stationary and re-circulatingexperiments, the lower removal rates of TN and TP per plant surface area (g m−2 d−1) athigher density conditions show that each duckweed colony is removing less nutrients athigher plant densities than those kept at lower densities. The TN and TP removal ratesfound in the stationary experiments were on the lower end of the wide range of valuesrecorded in the literature: 124–4400 mg N m−2 d−1 and 14–590 mg P m−2 d−1 [57,82,87–90].This can be explained by the lower growth rates observed in these experiments [91], whichare likely to be in part due to the low light intensity used [32], the specific medium [23],as well as density effects on L. minor discussed previously. Both TN and TP removal rates
Plants 2021, 10, 1366 13 of 17
from the non-axenic, re-circulating experiment compare well with values from non-axenicsystems in literature sources [57,91]. Higher removal rates found in the re-circulatingexperiment compared to stationary may be mostly explained by the presence of algae andmicroorganisms, which can account for up to 50–70% of nutrient removal in non-axenicsystems [57,88], but also by improved mixing of the medium.
Another important criterium for analysing the effectiveness of a remediation system isthe absolute amount of nutrients removed from the remediated wastewater. In stationaryexperiment 1, a higher density of plants per surface area more effectively takes up nutrients,although the growth and nutrient removal rates per frond are significantly lower [36,37]. Asthe removal of nutrients started to plateau at higher densities of 50–80%, this suggests that50–80% represents an optimal duckweed density for dairy wastewater phytoremediation.
There were additional issues encountered in a non-axenic re-circulating system, inwhich the absolute removal of TN and TP was relatively flat across the three densities.The exact cause of this is uncertain. However, microorganisms were present in substantialamounts at all plant densities in this non-axenic system. Previously, algae were shown tosignificantly contribute to nutrient removal [57,81], as well as having negative effects onduckweed such as increased decomposition rates [92]. At both high and low density, a highproportion of the absolute removal of TN and TP may be attributed to microorganisms,breaking the direct link between plant growth and nutrient removal (e.g., poor plantgrowth, but high nutrient removal). Considering wastewater remediation alone, whetherremediation is fuelled primarily by duckweed or algae, nutrient removal is the desiredoutcome. However, if duckweed biomass is to be generated as a valuable by-product forfurther use, then strong competition for nutrients with non-utilised microorganisms isundesirable. Ideally, the duckweed should be taking up the majority of the nutrients. Oneway to achieve this is by maximising the duckweed surface density, thereby decreasing algalgrowth [93]. Overall, these results show that upscaling from laboratory-based, stationarysystems to larger scale, recirculatory systems is complex, and that simple extrapolationsare not necessarily correct. Accordingly, management of duckweed incubators will need tobe informed by the effects of plant density on biomass yield, TN and TP removal, as wellas competition with algal species.
5. Conclusions
Lemna minor can be successfully grown on synthetic dairy processing wastewater,opening the perspective to both remediate and valorise such waste, in accordance withthe principles of the circular economy. Lemna minor has been shown to produce the bestremediation at higher densities (50–80%), even though growth rates and nutrient uptakerates were slowest at these densities. The decrease in growth at high density was linked to adecrease in photosynthetic yield, rather than competition for light or nutrients, which pointstowards signals from neighbouring colonies as the potential cause of growth restrictions.However, in non-axenic, scaled-up conditions that better reflect an industrial duckweed-based remediation system, the benefits of high density were not as clear. High algalpresence led to suppressed duckweed yield and static nutrient removal. Thus, despite thesuitability of L. minor for valorisation of dairy processing waste, management of wastewateris subject to both interactions between plant density, yield and nutrient removal, as well ascomplex upscaling effects.
Author Contributions: É.W., H.K. and M.A.K.J. contributed to the study conception and design.Material preparation, data collection and analysis were performed by É.W., H.K. and S.O.; É.W.,N.E.C., S.O., M.A.K.J. and H.K. contributed to the interpretation of results. The first draft of themanuscript was written by É.W.; É.W., N.E.C., S.O., M.A.K.J. and H.K. contributed to writing andediting the manuscript. All authors have read and agreed to the published version of the manuscript.
Funding: This project was funded under the EPA Research Programme 2014–2020 (grant 2016-W-LS-11). The EPA Research Programme is a Government of Ireland initiative funded by theDepartment of Communications, Climate Action and Environment. It is administered by the En-
Plants 2021, 10, 1366 14 of 17
vironmental Protection Agency, which has the statutory function of co-ordinating and promotingenvironmental research.
Institutional Review Board Statement: Not applicable.
Informed Consent Statement: Not applicable.
Data Availability Statement: The datasets used in the current study are available from the corre-sponding author on reasonable request.
Acknowledgments: MAKJ acknowledges support by WoB.
Conflicts of Interest: The authors have no relevant financial or non-financial interests to disclose.
References1. Mehrabi, Z.; Ellis, E.C.; Ramankutty, N. The challenge of feeding the world while conserving half the planet. Nat. Sustain. 2018, 1,
409–412. [CrossRef]2. Ranganathan, J.; Vennard, D.; Waite, R.; Dumas, P.; Lipinski, B.; Searchinger, T. Shifting Diets for a Sustainable Food Future; World
Resources Institute: Washington, DC, USA, 2016.3. Nearing, M.A.; Xie, Y.; Liu, B.; Ye, Y. Natural and anthropogenic rates of soil erosion. Int. Soil Water Conserv. Res. 2017, 5, 77–84.
[CrossRef]4. Rosa, L.; Chiarelli, D.D.; Rulli, M.C.; Dell’Angelo, J.; D’Odorico, P. Global agricultural economic water scarcity. Sci. Adv. 2020, 6,
eaaz6031. [CrossRef] [PubMed]5. Pathak, T.B.; Maskey, M.L.; Dahlberg, J.A.; Kearns, F.; Bali, K.M.; Zaccaria, D. Climate Change Trends and Impacts on California
Agriculture: A Detailed Review. Agronomy 2018, 8, 25. [CrossRef]6. Obersteiner, M.; Peñuelas, J.; Ciais, P.; van der Velde, M.; Janssens, I.A. The phosphorus trilemma. Nat. Geosci. 2013, 6, 897–898.
[CrossRef]7. Del Borghi, A.; Moreschi, L.; Gallo, M. Circular economy approach to reduce water–energy–food nexus. Curr. Opin. Environ. Sci.
Health 2020, 13, 23–28. [CrossRef]8. Ghisellini, P.; Cialani, C.; Ulgiati, S. A review on circular economy: The expected transition to a balanced interplay of environ-
mental and economic systems. J. Clean. Prod. 2016, 114, 11–32. [CrossRef]9. Xue, Y.; Luan, W.; Wang, H.; Yang, Y. Environmental and economic benefits of carbon emission reduction in animal husbandry
via the circular economy: Case study of pig farming in Liaoning, China. J. Clean. Prod. 2019, 238, 117968. [CrossRef]10. Gaucheron, F. Milk and Dairy Products: A Unique Micronutrient Combination. J. Am. Coll. Nutr. 2011, 30, 400S–409S. [CrossRef]11. OECD-FAO. Dairy and Dairy Products. In OECD-FAO Agricultural Outlook 2020-2029; OECD-FAO Agricultural Outlook; OECD:
Rome, Italy, 2020; ISBN 9789264317673.12. Wang, Y.; Serventi, L. Sustainability of dairy and soy processing: A review on wastewater recycling. J. Clean. Prod. 2019, 237, 117821.
[CrossRef]13. Ince, O. Performance of a two-phase anaerobic digestion system when treating dairy wastewater. Water Res. 1998, 32, 2707–2713.
[CrossRef]14. Demirel, B.; Yenigun, O. Anaerobic acidogenesis of dairy wastewater: The effects of variations in hydraulic retention time with
no pH control. J. Chem. Technol. Biotechnol. 2004, 79, 755–760. [CrossRef]15. Malaspina, F.; Cellamare, C.M.; Stante, L.; Tilche, A. Anaerobic treatment of cheese whey with a downflow-upflow hybrid reactor.
Bioresour. Technol. 1996, 55, 131–139. [CrossRef]16. Ghaly, A.E.; Singh, R.K. Pollution potential reduction of cheese whey through yeast fermentation. Appl. Biochem. Biotechnol. 1989,
22, 181–203. [CrossRef]17. Ahmad, T.; Aadil, R.M.; Ahmed, H.; ur Rahman, U.; Soares, B.C.V.; Souza, S.L.Q.; Pimentel, T.C.; Scudino, H.; Guimarães, J.T.;
Esmerino, E.A.; et al. Treatment and utilization of dairy industrial waste: A review. Trends Food Sci. Technol. 2019, 88, 361–372.[CrossRef]
18. Bunce, J.T.; Ndam, E.; Ofiteru, I.D.; Moore, A.; Graham, D.W. A Review of Phosphorus Removal Technologies and TheirApplicability to Small-Scale Domestic Wastewater Treatment Systems. Front. Environ. Sci. 2018, 6, 8. [CrossRef]
19. López-Mosquera, M.E.; Moirón, C.; Carral, E. Use of dairy-industry sludge as fertiliser for grasslands in northwest Spain: Heavymetal levels in the soil and plants. Resour. Conserv. Recycl. 2000, 30, 95–109. [CrossRef]
20. Akansha, J.; Nidheesh, P.V.; Gopinath, A.; Anupama, K.V.; Kumar, M.S. Treatment of dairy industry wastewater by combinedaerated electrocoagulation and phytoremediation process. Chemosphere 2020, 253, 126652. [CrossRef] [PubMed]
21. Walsh, É.; Paolacci, S.; Burnell, G.; Jansen, M.A.K. The importance of the calcium-to-magnesium ratio for phytoremediation ofdairy industry wastewater using the aquatic plant Lemna minor L. Int. J. Phytoremediat. 2020, 22, 694–702. [CrossRef] [PubMed]
22. Carvalho, F.; Prazeres, A.R.; Rivas, J. Cheese whey wastewater: Characterization and treatment. Sci. Total Environ. 2013, 445,385–396. [CrossRef]
Plants 2021, 10, 1366 15 of 17
23. Toyama, T.; Hanaoka, T.; Tanaka, Y.; Morikawa, M.; Mori, K. Comprehensive evaluation of nitrogen removal rate and biomass,ethanol, and methane production yields by combination of four major duckweeds and three types of wastewater effluent.Bioresour. Technol. 2018, 250, 464–473. [CrossRef] [PubMed]
24. Dinh, T.T.U.; Soda, S.; Nguyen, T.A.H.; Nakajima, J.; Cao, T.H. Nutrient removal by duckweed from anaerobically treated swinewastewater in lab-scale stabilization ponds in Vietnam. Sci. Total Environ. 2020, 722, 137854. [CrossRef]
25. Verma, R.; Suthar, S. Synchronized urban wastewater treatment and biomass production using duckweed Lemna gibba L. Ecol.Eng. 2014, 64, 337–343. [CrossRef]
26. Ziegler, P.; Adelmann, K.; Zimmer, S.; Schmidt, C.; Appenroth, K.J. Relative in vitro growth rates of duckweeds (Lemnaceae)—Themost rapidly growing higher plants. Plant Biol. 2015, 17, 33–41. [CrossRef]
27. Xu, J.; Cui, W.; Cheng, J.J.; Stomp, A.-M. Production of high-starch duckweed and its conversion to bioethanol. Biosyst. Eng. 2011,110, 67–72. [CrossRef]
28. Appenroth, K.J.; Sree, K.S.; Böhm, V.; Hammann, S.; Vetter, W.; Leiterer, M.; Jahreis, G. Nutritional value of duckweeds (Lemnaceae)as human food. Food Chem. 2017, 217, 266–273. [CrossRef] [PubMed]
29. Cheng, J.J.; Stomp, A.-M. Growing Duckweed to Recover Nutrients from Wastewaters and for Production of Fuel Ethanol andAnimal Feed. Clean Soil Air Water 2009, 37, 17–26. [CrossRef]
30. de Beukelaar, M.F.A.; Zeinstra, G.G.; Mes, J.J.; Fischer, A.R.H. Duckweed as human food. The influence of meal context andinformation on duckweed acceptability of Dutch consumers. Food Qual. Prefer. 2019, 71, 76–86. [CrossRef]
31. Stadtlander, T.; Förster, S.; Rosskothen, D.; Leiber, F. Slurry-grown duckweed (Spirodela polyrhiza) as a means to recycle nitrogeninto feed for rainbow trout fry. J. Clean. Prod. 2019, 228, 86–93. [CrossRef]
32. Walsh, É.; Kuehnhold, H.; O’Brien, S.; Coughlan, N.E.; Jansen, M.A.K. Light intensity alters the phytoremediation potential ofLemna minor. Environ. Sci. Pollut. Res. 2021. [CrossRef] [PubMed]
33. Kushwaha, J.P.; Srivastava, V.C.; Mall, I.D. Sequential batch reactor for dairy wastewater treatment: Parametric optimization;kinetics and waste sludge disposal. J. Environ. Chem. Eng. 2013, 1, 1036–1043. [CrossRef]
34. Charalambous, P.; Shin, J.; Shin, S.G.; Vyrides, I. Anaerobic digestion of industrial dairy wastewater and cheese whey: Performanceof internal circulation bioreactor and laboratory batch test at pH 5–6. Renew. Energy 2020, 147, 1–10. [CrossRef]
35. Landolt, E. Biosystematic Investigations in the Family of Duckweeds (Lemnaceae). The Family of Lemnaceae—A Monographic Study,Volume 1; Veröffentlichungen des Geobotanischen Institutes der ETH: Zürich, Switzerland, 1986.
36. Driever, S.M.; van Nes, E.H.; Roijackers, R.M.M. Growth limitation of Lemna minor due to high plant density. Aquat. Bot. 2005, 81,245–251. [CrossRef]
37. Frédéric, M.; Samir, L.; Louise, M.; Abdelkrim, A. Comprehensive modeling of mat density effect on duckweed (Lemna minor)growth under controlled eutrophication. Water Res. 2006, 40, 2901–2910. [CrossRef] [PubMed]
38. Ceschin, S.; Sgambato, V.; Ellwood, N.T.W.; Zuccarello, V. Phytoremediation performance of Lemna communities in a constructedwetland system for wastewater treatment. Environ. Exp. Bot. 2019, 162, 67–71. [CrossRef]
39. Xu, J.; Shen, G. Growing duckweed in swine wastewater for nutrient recovery and biomass production. Bioresour. Technol. 2011,102, 848–853. [CrossRef]
40. Xu, J.; Zhao, H.; Stomp, A.-M.; Cheng, J.J. The production of duckweed as a source of biofuels. Biofuels 2012, 3, 589–601. [CrossRef]41. Lahive, E.; O’Halloran, J.; Jansen, M.A.K. Differential sensitivity of four Lemnaceae species to zinc sulphate. Environ. Exp. Bot.
2011, 71, 25–33. [CrossRef]42. Hutner, S.H. Comparative physiology of heterotrophic growth in higher plants. In Growth and Differentiation in Plants; Iowa State
College Press: Ames, IA, USA, 1953; pp. 417–447.43. Tarpey, E. An Investigation into the Use of IASBRs for Treatment of Dairy Processing Wastewater. Master’ Thesis, National
University of Ireland, Galway, Ireland, 2016.44. Landolt, E.; Kandeler, R. Biosystematic Investigations in the Family of Duckweeds (Lemnaceae). The Family of Lemnaceae—A Monographic
Study, Volume 2; Veröffentlichungen des Geobotanischen Institutes der ETH: Zürich, Switzerland, 1987.45. Easlon, H.M.; Bloom, A.J. Easy Leaf Area: Automated digital image analysis for rapid and accurate measurement of leaf area.
Appl. Plant Sci. 2014, 2, 1400033. [CrossRef]46. Chaiprapat, S.; Cheng, J.J.; Classen, J.J.; Liehr, S.K. Role of internal nutrient storage in duckweed growth for swine wastewater
treatment. Trans. ASAE 2005, 48, 2247–2258. [CrossRef]47. Connolly, J.; Wayne, P. Asymmetric competition between plant species. Oecologia 1996, 108, 311–320. [CrossRef] [PubMed]48. Balen, B.; Tkalec, M.; Šikic, S.; Tolic, S.; Cvjetko, P.; Pavlica, M.; Vidakovic-Cifrek, Ž. Biochemical responses of Lemna minor
experimentally exposed to cadmium and zinc. Ecotoxicology 2011, 20, 815–826. [CrossRef]49. Bradford, M.M. A rapid and sensitive method for the quantitation of microgram quantities of protein utilizing the principle of
protein-dye binding. Anal. Biochem. 1976, 72, 248–254. [CrossRef]50. R Core Team. R: A Language and Environment for Statistical Computing; R Foundation for Statistical Computing: Vienna, Austria, 2019.51. Al-Nozaily, F.; Alaerts, G.; Veenstra, S. Performance of duckweed-covered sewage lagoons—II. Nitrogen and phosphorus balance
and plant productivity. Water Res. 2000, 34, 2734–2741. [CrossRef]52. Iatrou, E.I.; Stasinakis, A.S.; Aloupi, M. Cultivating duckweed Lemna minor in urine and treated domestic wastewater for
simultaneous biomass production and removal of nutrients and antimicrobials. Ecol. Eng. 2015, 84, 632–639. [CrossRef]
Plants 2021, 10, 1366 16 of 17
53. Paolacci, S.; Harrison, S.; Jansen, M.A.K. The invasive duckweed Lemna minuta Kunth displays a different light utilisation strategythan native Lemna minor Linnaeus. Aquat. Bot. 2018, 146, 8–14. [CrossRef]
54. Wedge, R.M.; Burris, J.E. Effects of light and temperature on duckweed photosynthesis. Aquat. Bot. 1982, 13, 133–140. [CrossRef]55. Al-Nozaily, F.; Alaerts, G.; Veenstra, S. Performance of duckweed-covered sewage lagoons—I. Oxygen balance and COD removal.
Water Res. 2000, 34, 2727–2733. [CrossRef]56. OECD. Test No. 221: Lemna sp. Growth Inhibition Test; OECD Guidelines for the Testing of Chemicals, Section 2; OECD: Paris,
France, 2006.57. Körner, S.; Vermaat, J.E. The relative importance of Lemna gibba L., bacteria and algae for the nitrogen and phosphorus removal in
duckweed-covered domestic wastewater. Water Res. 1998, 32, 3651–3661. [CrossRef]58. Porath, D.; Hepher, B.; Koton, A. Duckweed as an aquatic crop: Evaluation of clones for aquaculture. Aquat. Bot. 1979, 7, 273–278.
[CrossRef]59. Debusk, T.A.; Ryther, J.H.; Hanisak, M.D.; Williams, L.D. Effects of seasonality and plant density on the productivity of some
freshwater macrophytes. Aquat. Bot. 1981, 10, 133–142. [CrossRef]60. Kong, C.-H.; Zhang, S.-Z.; Li, Y.-H.; Xia, Z.-C.; Yang, X.-F.; Meiners, S.J.; Wang, P. Plant neighbor detection and allelochemical
response are driven by root-secreted signaling chemicals. Nat. Commun. 2018, 9, 3867. [CrossRef]61. Pierik, R.; Mommer, L.; Voesenek, L.A.C.J. Molecular mechanisms of plant competition: Neighbour detection and response
strategies. Funct. Ecol. 2013, 27, 841–853. [CrossRef]62. Murchie, E.H.; Lawson, T. Chlorophyll fluorescence analysis: A guide to good practice and understanding some new applications.
J. Exp. Bot. 2013, 64, 3983–3998. [CrossRef] [PubMed]63. Klughammer, C.; Schreiber, U. Complementary PS II quantum yields calculated from simple fluorescence parameters measured
by PAM fluorometry and the Saturation Pulse method. PAM Appl. Notes 2008, 1, 27–35.64. Kramer, D.M.; Johnson, G.; Kiirats, O.; Edwards, G.E. New fluorescence parameters for the determination of QA redox state and
excitation energy fluxes. Photosynth. Res. 2004, 79, 209–218. [CrossRef] [PubMed]65. Juneau, P.; Qiu, B.; Deblois, C.P. Use of chlorophyll fluorescence as a tool for determination of herbicide toxic effect: Review.
Toxicol. Environ. Chem. 2007, 89, 609–625. [CrossRef]66. Kufel, L.; Strzałek, M.; Przetakiewicz, A. Plant response to overcrowding–Lemna minor example. Acta Oecologica 2018, 91, 73–80.
[CrossRef]67. Zhang, L.-M.; Jin, Y.; Yao, S.-M.; Lei, N.-F.; Chen, J.-S.; Zhang, Q.; Yu, F.-H. Growth and Morphological Responses of Duckweed to
Clonal Fragmentation, Nutrient Availability, and Population Density. Front. Plant Sci. 2020, 11, 618. [CrossRef] [PubMed]68. Huang, D.; Wu, L.; Chen, J.R.; Dong, L. Morphological plasticity, photosynthesis and chlorophyll fluorescence of Athyrium
pachyphlebium at different shade levels. Photosynthetica 2011, 49, 611–618. [CrossRef]69. Hallik, L.; Niinemets, Ü.; Kull, O. Photosynthetic acclimation to light in woody and herbaceous species: A comparison of
leaf structure, pigment content and chlorophyll fluorescence characteristics measured in the field. Plant Biol. 2012, 14, 88–99.[CrossRef] [PubMed]
70. Bilas, R.D.; Bretman, A.; Bennett, T. Friends, neighbours and enemies: An overview of the communal and social biology of plants.Plant. Cell Environ. 2021, 44, 997–1013. [CrossRef]
71. Jang, M.-H.; Ha, K.; Takamura, N. Reciprocal allelopathic responses between toxic cyanobacteria (Microcystis aeruginosa) andduckweed (Lemna japonica). Toxicon 2007, 49, 727–733. [CrossRef]
72. Bich, T.T.N.; Kato-Noguchi, H. Allelopathic potential of two aquatic plants, duckweed (Lemna minor L.) and water lettuce (Pistiastratiotes L.), on terrestrial plant species. Aquat. Bot. 2012, 103, 30–36. [CrossRef]
73. Färber, E.; Königshofer, H.; Kandeler, R. Ethylene Production and Overcrowding in Lemnaceae. J. Plant Physiol. 1986, 124, 379–384.[CrossRef]
74. Dubois, M.; Van den Broeck, L.; Inzé, D. The Pivotal Role of Ethylene in Plant Growth. Trends Plant Sci. 2018, 23, 311–323.[CrossRef] [PubMed]
75. Färber, E.; Kandeler, R. Significance of Calcium Ions in the Overcrowding Effect in Spirodela Polyrrhiza P 143. J. Plant Physiol. 1989,135, 94–98. [CrossRef]
76. Färber, E.; Kandeler, R. Phytochrome effect on ethylene production after overcrowding in Spirodela (Lemnaceae). Phyton Ann. ReiBot. Austria 1990, 30, 89–95.
77. Anderson, K.E.; Lowman, Z.; Stomp, A.M.; Chang, J. Duckweed as a Feed Ingredient in Laying Hen Diets and its Effect on EggProduction and Composition. Int. J. Poult. Sci. 2011, 10, 4–7. [CrossRef]
78. Ge, X.; Zhang, N.; Phillips, G.C.; Xu, J. Growing Lemna minor in agricultural wastewater and converting the duckweed biomass toethanol. Bioresour. Technol. 2012, 124, 485–488. [CrossRef]
79. Verma, R.; Suthar, S. Impact of density loads on performance of duckweed bioreactor: A potential system for synchronizedwastewater treatment and energy biomass production. Environ. Prog. Sustain. Energy 2015, 34, 1596–1604. [CrossRef]
80. Xu, J.; Shen, G. Effects of Harvest Regime and Water Depth on Nutrient Recovery from Swine Wastewater by Growing Spirodelaoligorrhiza. Water Environ. Res. 2011, 83, 2049–2056. [CrossRef] [PubMed]
81. Roijackers, R.; Szabó, S.; Scheffer, M. Experimental analysis of the competition between algae and duckweed. Arch. Hydrobiol.2004, 160, 401–412. [CrossRef]
Plants 2021, 10, 1366 17 of 17
82. Mohedano, R.A.; Costa, R.H.R.; Tavares, F.A.; Belli Filho, P. High nutrient removal rate from swine wastes and protein biomassproduction by full-scale duckweed ponds. Bioresour. Technol. 2012, 112, 98–104. [CrossRef]
83. Hymowitz, T.; Collins, F.I.; Panczner, J.; Walker, W.M. Relationship between the content of oil, protein, and sugar in soybean seed.Agron. J. 1972, 64, 613–616. [CrossRef]
84. Rekowski, A.; Langenkämper, G.; Dier, M.; Wimmer, M.A.; Scherf, K.A.; Zörb, C. Determination of soluble wheat protein fractionsusing the Bradford assay. Cereal Chem. 2021. [CrossRef]
85. Mæhre, H.K.; Dalheim, L.; Edvinsen, G.K.; Elvevoll, E.O.; Jensen, I.-J. Protein Determination—Method Matters. Foods 2018, 7, 5.[CrossRef] [PubMed]
86. Cui, W.; Cheng, J.J. Growing duckweed for biofuel production: A review. Plant Biol. 2015, 17, 16–23. [CrossRef]87. Zimmo, O.R.; van der Steen, N.P.; Gijzen, H.J. Nitrogen mass balance across pilot-scale algae and duckweed-based wastewater
stabilisation ponds. Water Res. 2004, 38, 913–920. [CrossRef] [PubMed]88. Zhao, Y.; Fang, Y.; Jin, Y.; Huang, J.; Ma, X.; He, K.; He, Z.; Wang, F.; Zhao, H. Microbial community and removal of nitrogen via
the addition of a carrier in a pilot-scale duckweed-based wastewater treatment system. Bioresour. Technol. 2015, 179, 549–558.[CrossRef]
89. Benjawan, L.; Koottatep, T. Nitrogen removal in recirculated duckweed ponds system. Water Sci. Technol. 2007, 55, 103–110.[CrossRef] [PubMed]
90. Cheng, J.; Landesman, L.; Bergmann, B.; Classen, J.J.; Howard, J.W.; Yamamoto, Y.T. Nutrient Removal from swine lagoon liquidby Lemna minor 8627. Trans. ASAE 2002, 45, 1003–1010. [CrossRef]
91. Cheng, J.; Bergmann, B.A.; Classen, J.J.; Stomp, A.M.; Howard, J.W. Nutrient recovery from swine lagoon water by Spirodelapunctata. Bioresour. Technol. 2002, 81, 81–85. [CrossRef]
92. Szabó, S.; Braun, M.; Nagy, P.; Balázsy, S.; Reisinger, O. Decomposition of duckweed (Lemna gibba) under axenic and microbial[-2pt] conditions: Flux of nutrients between litter water and sediment, the impact of leaching and microbial degradation.Hydrobiologia 2000, 434, 201–210. [CrossRef]
93. Szabó, S.; Braun, M.; Borics, G. Elemental flux between algae and duckweeds (Lemna gibba) during competition. Arch. Hydrobiol.1999, 146, 355–367. [CrossRef]