Social influences on spatial memory
16
Imagine exploring downtown Boston. You begin in a neighborhood with narrow streets lined with churches, res- idences, and cafés. The air is filled with the aroma of fresh pastries and the sound of conversations in what seems like Italian. After stopping for espresso, you travel past an enor- mous construction project on a major thoroughfare. Even- tually, you emerge in a transformed landscape with wider roads, tall office buildings, and lunch counters. The faces look similar, but the attire is more businesslike. The conver- sations are in English, but the business-related discussions are as unfamiliar as a foreign language. Continuing your journey, you notice that the roads narrow again, shops and restaurants replace high-rises, and the street and business signs increasingly contain Chinese characters. Many of the faces and voices you encounter are distinctly Chinese, and the tantalizing smell of Peking duck fills the air. Your tour, beginning in Boston’s Italian North End, passing across the Big Dig to the Financial District, and ending in Chinatown, provides a variety of implicit and explicit perceptual cues about spatial information (e.g., Shelton & McNamara, 2004). Each spatial cue, such as viewer perspective, borders, and landmark location, in- fluences spatial memory construction during and fol- lowing exploration (e.g., McNamara, Halpin, & Hardy, 1992; McNamara, Ratcliff, & McKoon, 1984; Stevens & Coupe, 1978; H. A. Taylor, Naylor, & Chechile, 1999). The perceptual information provided by these cues can affect spatial memory not only for experiences in actual environments, but also for experiences with maps (e.g., Hommel, Gehrke, & Knuf, 2000). Much of spatial cogni- tion research has focused on how different presentation modalities (e.g., navigation, maps, spatial descriptions) change spatial cue use, how those cues influence mental representation construction, and how the resulting repre- sentations affect the use of environment information. In other words, this work has focused on the cognitive maps that individuals construct when they learn about spatial environments (Downs & Stea, 1973). However, in the real world, the composition of streets, the condition of buildings, and the smells, faces, and voices in our surroundings often distinguish locations from one another and provide valuable nonspatial cues for remembering the environment. Symbolic environments (e.g., maps) may also contain information that suggests social categories, such as road names or other landmarks. As such, associations may be built between locations and 479 Copyright 2008 Psychonomic Society, Inc. Social influences on spatial memory KEITH B. MADDOX Tufts University, Medford, Massachusetts DAVID N. RAPP Northwestern University, Evanston, Illinois SEBASTIEN BRION University of California, Berkeley, California AND HOLLY A. TAYLOR Tufts University, Medford, Massachusetts Three experiments were performed to examine the joint influences of spatial and social categories on memory for maps. Participants learned a map and descriptive information about small town businesses and, afterward, completed distance estimation and person–location matching tasks. Experiments 1 and 2 demonstrated that social (i.e., racial) and spatial information influenced memory, but not equivalently: Social information affected dis- tance and matching task performance, whereas spatial information affected only distance estimates. This pattern was obtained for racially segregated and racially integrated neighborhoods and when the salience of the spatial categories was heightened. The social information influence did not generalize to political affiliation categories (Experiment 3). These results demonstrate that spatial and nonspatial information may interact to structure mental maps but that the salience of the social category is critically important. Furthermore, these findings suggest the applicability of a model of category salience (Blanz, 1999) for interactive products of spatial experiences—in this case, map learning. Norms for this article may be downloaded from www.psychonomic.org/archive. Memory & Cognition 2008, 36 (3), 479-494 doi: 10.3758/MC.36.3.479 K. B. Maddox, [email protected]
Transcript of Social influences on spatial memory
Imagine exploring downtown Boston. You begin in a neighborhood with narrow streets lined with churches, res-idences, and cafés. The air is filled with the aroma of fresh pastries and the sound of conversations in what seems like Italian. After stopping for espresso, you travel past an enor-mous construction project on a major thoroughfare. Even-tually, you emerge in a transformed landscape with wider roads, tall office buildings, and lunch counters. The faces look similar, but the attire is more businesslike. The conver-sations are in English, but the business-related discussions are as unfamiliar as a foreign language. Continuing your journey, you notice that the roads narrow again, shops and restaurants replace high-rises, and the street and business signs increasingly contain Chinese characters. Many of the faces and voices you encounter are distinctly Chinese, and the tantalizing smell of Peking duck fills the air.
Your tour, beginning in Boston’s Italian North End, passing across the Big Dig to the Financial District, and ending in Chinatown, provides a variety of implicit and explicit perceptual cues about spatial information (e.g., Shelton & McNamara, 2004). Each spatial cue, such as viewer perspective, borders, and landmark location, in-fluences spatial memory construction during and fol-
lowing exploration (e.g., McNamara, Halpin, & Hardy, 1992; McNamara, Ratcliff, & McKoon, 1984; Stevens & Coupe, 1978; H. A. Taylor, Naylor, & Chechile, 1999). The perceptual information provided by these cues can affect spatial memory not only for experiences in actual environments, but also for experiences with maps (e.g., Hommel, Gehrke, & Knuf, 2000). Much of spatial cogni-tion research has focused on how different presentation modalities (e.g., navigation, maps, spatial descriptions) change spatial cue use, how those cues influence mental representation construction, and how the resulting repre-sentations affect the use of environment information. In other words, this work has focused on the cognitive maps that individuals construct when they learn about spatial environments (Downs & Stea, 1973).
However, in the real world, the composition of streets, the condition of buildings, and the smells, faces, and voices in our surroundings often distinguish locations from one another and provide valuable nonspatial cues for remembering the environment. Symbolic environments (e.g., maps) may also contain information that suggests social categories, such as road names or other landmarks. As such, associations may be built between locations and
479 Copyright 2008 Psychonomic Society, Inc.
Social influences on spatial memory
Keith B. MaddoxTufts University, Medford, Massachusetts
david N. RappNorthwestern University, Evanston, Illinois
SeBaStieN BRioNUniversity of California, Berkeley, California
aNd
holly a. tayloRTufts University, Medford, Massachusetts
Three experiments were performed to examine the joint influences of spatial and social categories on memory for maps. Participants learned a map and descriptive information about small town businesses and, afterward, completed distance estimation and person–location matching tasks. Experiments 1 and 2 demonstrated that social (i.e., racial) and spatial information influenced memory, but not equivalently: Social information affected dis-tance and matching task performance, whereas spatial information affected only distance estimates. This pattern was obtained for racially segregated and racially integrated neighborhoods and when the salience of the spatial categories was heightened. The social information influence did not generalize to political affiliation categories (Experiment 3). These results demonstrate that spatial and nonspatial information may interact to structure mental maps but that the salience of the social category is critically important. Furthermore, these findings suggest the applicability of a model of category salience (Blanz, 1999) for interactive products of spatial experiences—in this case, map learning. Norms for this article may be downloaded from www.psychonomic.org/archive.
Memory & Cognition2008, 36 (3), 479-494doi: 10.3758/MC.36.3.479
K. B. Maddox, [email protected]

480 Maddox, Rapp, BRion, and TayloR
themselves. With this more mediated relationship, could social information organize spatial memory?
Structuring Social InformationThe categorical processes critical to spatial cognition
also appear to underlie social cognition. Like the work on spatial representation and judgment discussed previ-ously, research has shown that social information influ-ences memory for and judgments about social targets (for reviews, see Brewer & Feinstein, 1999; Fiske, 1998; Fiske, Lin, & Neuberg, 1999; Hamilton & Sherman, 1994; Macrae & Bodenhausen, 2000). Relevant to the present study is social categorization and stereotyping, character-ized as the association of descriptive personality traits and behaviors with people on the basis of their social category membership. Social targets may be categorized on the basis of a variety of cues, including their appearance and/or behavior. Name, skin color, hair color, clothing, and/or mannerisms may activate race, ethnicity, gender, age, and a wealth of other categories. Such categorical organiza-tion leads to category-based memory errors, including a failure to differentiate individuals within a social category (e.g., Hamilton, 1981; S. E. Taylor, 1981). Like the earlier described spatial effects resulting from boundary group-ings, social categorization affects similarity judgments within and across social groupings (e.g., Klauer & Weg-ener, 1998; Maddox & Gray, 2002; S. E. Taylor, Fiske, Etcoff, & Ruderman, 1978). S. E. Taylor et al. asked par-ticipants to watch a simulated discussion between Black and White males and then recall individuating behavioral information during a surprise statement-matching task (sometimes referred to as the who-said-what task). The participants were more likely to confuse individuals in the same racial category than individuals from different racial categories. Thus, processes of social categorization influence mental representations of social groups, with consequences for memory and judgment (Fiske, 1998; Hamilton & Sherman, 1994).
The Interaction of Spatial and Social StructuresIt seems clear, perhaps even obvious, that spatial in-
formation structures spatial memory and social informa-tion similarly structures social memory. Yet, because real-world environments generally include both spatial and social information, the potential exists for these informa-tion types to interact. There is some evidence to suggest that social and spatial information do interact. A person’s own racial membership and accompanying experiences influence the cognitive map of his or her own neighbor-hood (Ladd, 1970; Orleans, 1967). To our knowledge, however, no published research has systematically exam-ined whether these information types interact in memory, particularly information learned from a novel map that provides information about, but no direct experience with, unfamiliar individuals.
Specific AimsIn the present research, we tested whether both spatial
and social cues influence representations of (1) the indi-viduals associated with map locations and (2) the relative
the people and objects connected to them. In the present research, we examined whether one type of nonspatial cue associated with a map—in particular, social categories—influences a cognitive map’s structure and, conversely, whether spatial categories affect memory for people within an environment. The overarching goal of examin-ing the social cues available in maps is to detail the ways in which spatial memories are a function not only of the spatial features of environments, but also of the integra-tion of nonspatial information into mental representations. In the experiments presented here, we addressed this goal by honing in on the specific influences of social cues on spatial memory. We will begin by reviewing research on the role of spatial cues in spatial cognition, followed by an examination of the role of social cues in social cognition. We then will provide hypotheses about similarities and interactions between spatial and social cues in cognitive map construction and associative memory.
Structuring Spatial InformationSeveral factors contribute to spatial memory’s being
more or less accessible and, ultimately, useful. The way an environment is learned affects the resulting cognitive map’s structure (Evans & Pezdek, 1980; Leiser, Tzelgov, & Henik 1987; Perrig & Kintsch, 1985; Sholl, 1987; H. A. Taylor et al., 1999; Thorndyke & Hayes-Roth, 1982). Cognitive maps are affected by learning goals and methods (Curiel & Radvansky, 1998; H. A. Taylor et al., 1999). In addition, people use spatial information, such as roads (McNamara et al., 1984), artificial boundaries (McNamara, 1986), and even landmarks grouped by color or shape (Hommel et al., 2000), to organize their mental representations (Friedman & Montello, 2006; McNamara, Hardy, & Hirtle, 1989). For example, Stevens and Coupe (1978) demonstrated that perceptual boundaries (e.g., state borders) promoted use of categorical knowledge; judgments about the relative location of cities relied on knowledge about the relative locations of the states con-taining the cities. Locations that share membership in a superordinate region are perceived to be more similar to one another and more distinct from locations not sharing such membership, regardless of their own specific charac-teristics (Hirtle & Jonides, 1985; Maki, 1982; McNamara, 1986; McNamara et al., 1989). These findings suggest that spatial-learning goals and an environment’s spatial and perceptual features impact the content and structure of spatial mental representations.
But cognitive map construction incorporates more than just spatial features. Nonspatial characteristics of an en-vironment are perceived and incorporated into one’s cog-nitive map along with spatial features (McNamara et al., 1992; McNamara & LeSueur, 1989). When this informa-tion has categorical structure, people cluster locations on the basis of their function (Hirtle & Jonides, 1985; Merrill & Baird, 1987), their physical similarity (Hirtle & Kall-man, 1988), and the semantic category into which they fall (Hirtle & Mascolo, 1986). Social information, unlike function, physical similarity, or semantic identity, is indi-rectly linked to locations; it has stronger associations to people associated with the locations than to the locations

Social influenceS on SpaTial MeMoRy 481
Hypotheses. In considering how spatial and social in-formation may interact in memory, three broad hypotheses emerge: (1) the modularity hypothesis, (2) the interaction hypothesis, and (3) the modularity plus hypothesis. The spatial and social cognition literatures describe similar underlying processes and consequences when discussing categorical perception but only consider spatial categories as applied to spatial information and social categories as applied to social information. The following hypotheses are concerned with how category information fits with the information needed for a task in potentially interactive ways.
The modularity hypothesis suggests information speci-ficity when categories are applied. Specifically, although both spatial and nonspatial information can be associated in memory (McNamara et al., 1992), their organizational influences remain separate; category application is lim-ited to appropriately relevant situations. Thus, spatial information will influence distance estimates, and social information will affect memory for associations between people and businesses; critically, social and spatial infor-mation will not interact. The modularity hypothesis pre-dicts that accessible category information is applied only to category- relevant judgments.
In contrast, the interaction hypothesis predicts a com-plete interaction between the two information types. Thus, spatial information will influence both spatial and social memory; social information will also influence both social and spatial memory. According to this hypothesis, perfor-mance on both the who-works-where and the distance esti-mation tasks will vary as a function of the neighborhood(s) in which the locations are found and the race of the people associated with those locations. The interaction hypothesis predicts that the categories available to organize informa-tion will be used, regardless of task relevance.
A third hypothesis, the modularity plus hypothesis, like the modularity hypothesis, suggests application of the most relevant category. Thus, the who-works-where task will primarily show effects of social categories, and distances estimates will be influenced by spatial catego-ries. The plus of this hypothesis connotes that a particular category may exert an additional influence under certain circumstances, such as when it is highly accessible or when a correlation exists between categories. This may be particularly evident in the case of social categories applied to spatial memory, since some social categories, such as race, sex, and age, tend to be used across a wide vari-ety of contexts (Fiske & Taylor, 1991). This hypothesis is further derived from the fact that the social category application can vary depending on context. For example, Maddox and Chase (2004) showed that application of the racial category in the who-said-what task is exaggerated in race-relevant conversations. Applying this hypothesis to the present experiments, the results should show in-fluences of social and spatial information on the tasks to which they are, respectively, relevant, with an additional influence of one type of information (i.e., social or spatial) on the less relevant task. Simply put, category information that is salient will also influence performance on the task with less category relevance (i.e., race information will
distances between map locations. We examined whether these two types of cues are salient in map learning, whether they interact to influence map representations and, if so, the nature of their interaction. This overarching goal can be broken down into two subgoals linked to the primary ways people were asked to use the learned information.
Spatial influence on social representation. One subgoal was to examine how spatial cues may affect so-cial representations—in this case, associations between people’s names and the businesses that they own or oper-ate. The task we implemented, verifying matches between people and businesses, was adapted from the who-said-what paradigm in social psychology, also known as the category confusion paradigm (S. E. Taylor et al., 1978). The who-said-what task is designed to detect influences of social categories. In our adaptation, called the who-works-where task, participants saw a person’s name and a busi-ness name and verified whether the information had been paired during learning.
This task addressed a novel question: Do neighbor-hood groupings affect memory for the people within an environment? On the surface, neighborhood information might seem irrelevant to the processing demands of a social-matching task. As was exemplified in our earlier tour through Boston, though, it is not uncommon to have neighborhoods defined by their dominant social makeup (e.g., the Italian North End). These neighborhood-based racial and ethnic associations build up contextually when an environment is explored; people pick up on similari-ties (and differences) among the people they meet within a neighborhood. We adopted this neighborhood context in our learning protocol, providing social information to participants as they “met” the people in each neighbor-hood. If the participants used neighborhood groupings to remember people in those locations, task performance should show an interaction between social and spatial in-formation. Furthermore, the contextual strength of that social information may vary as a function of such factors as the racial diversity of the neighborhoods. That is, social information may exert a greater influence when neighbor-hood information is more predictive of the types of indi-viduals associated with the neighborhood.
Social influence on spatial representation. For a second subgoal, distance estimation was used to examine how social information might influence spatial representa-tions. In this task, taken from the spatial cognition litera-ture (e.g., McNamara, 1986), participants saw the names of two locations and estimated the distance between them. Perceptual boundaries that divide and organize neighbor-hoods are known to affect distance estimates (McNamara et al., 1984), as do conceptual spatial boundaries, such as the state affiliations of cities (Maki, 1982). The novel issue addressed here was whether social information affects dis-tance estimates. Social information, such as race, is second-arily associated with locations; people are associated with specific locations, and races are associated with people. Again, on the basis of individuals’ natural tendencies to define neighborhoods by a dominant social composition, racial information may become associated with locations and, consequently, affect distance estimates.

482 Maddox, Rapp, BRion, and TayloR
annotated descriptions, social category information for an individual associated with the business. In all the experiments, we assessed category influences by exam-ining the degree to which judgments for items (people and locations) that shared category membership differed from judgments for items that did not share category membership.
influence distance estimates and/or space information will influence person–location matching).
To test these hypotheses, we conducted three experi-ments evaluating the influence of spatial and social cat-egories on spatial and social representations. Participants studied maps of business locations divided into three neighborhoods. For each business, they learned, through
Figure 1. Example of a description map, providing descriptive information about a particular location, from Experiment 1. The overview map presented locations and roads only, without the gray overlay and description information bubble.

Social influenceS on SpaTial MeMoRy 483
and came from a different neighborhood than the actual person asso-ciated with the location. This design allowed us to examine not only the independent effects of racial and spatial categories, but also any possible interaction between the two category types. The distance estimation task used location–location pairs, which could be divided into four categories, completely crossing the levels of race (within and across) and neighborhood (within and across).
Demographics questionnaire. A demographics questionnaire asked the participants to indicate their age, year in college, major, and race/ethnicity.
Design and ProcedureThe participants read instructions explaining that they would study
a map and associated information and then complete the test tasks.During learning, the maps were presented on a Macintosh com-
puter running Superlab software. The participants progressed through the maps in a self-paced manner. They first saw the overview map. Next, they saw a focus map highlighting a particular location, followed by the description map for that location. The participants worked through the focus and description maps for all 36 locations twice in succession. The presentation order of the locations was the same for both learning cycles for a given participant, presented sys-tematically through locations within a neighborhood before moving on to another neighborhood. The order of neighborhood presentation across participants was counterbalanced. At the end of the learning phase, the participants again studied the overview map. Finally, they completed the who-works-where and distance estimation tasks, in counterbalanced order.
Person–location matching. In the who-works-where task, the participants viewed various person–business pairs, centered on the screen and separated by approximately 2 in., and determined whether the person had been originally described in association with the business. If they believed so, they pressed the yes key, and if not, the no key. The task included 84 pairs. The incorrect matches were
ExPErIMEnT 1 race and neighborhoods
Throughout metropolitan areas of the United States, major roadways and landmarks separate distinct neighbor-hoods. In many of these neighborhoods, individuals from a variety of racial or ethnic groups make up the residents. In Experiment 1, we used a map that reflects this interac-tion between spatial and racial boundaries to examine the use of racial and spatial categories.
MethodParticipants
Thirty-six Tufts undergraduates (18 of them female, 18 male) participated for course credit. Of these students, 24 self-identified as White, 4 as African-American, 4 as Asian, 3 as Hispanic, and 1 as Middle Eastern. The participants were tested individually or in groups of up to 4.
MaterialsMaps and descriptions. We designed a map depicting 36 busi-
ness locations typically found in a community (e.g., a video store, a police station, a grocery; see Figure 1). Each location included a three-sentence description that followed a standard format. The first statement gave basic information about the business. The sec-ond presented the name and race of the male proprietor, using one of three racial category labels to activate categorical knowledge: African- American, Asian, and White. The names were selected to convey a sense of the race of the proprietor (e.g., Henry Atsumi was Asian, Rasheed Morehouse was African-American, William Miller was White). A survey conducted with a separate sample of partici-pants showed that (1) the names used were stereotypically associated with distinct racial groups, as designed, and (2) the professions as-sociated with locations did not, in general, have stereotypic associa-tions with particular races (e.g., an African-American minister of a church would be a stereotypic association; the norms may be down-loaded from www.psychonomic.org/archive). The last statement of the description gave additional information about the business.
The 36 locations were equally organized into three neighbor-hoods; major roadways perceptually separated the neighborhoods (McNamara, 1986). Minor roadways were included to increase map realism. Of the 12 locations within a neighborhood, 4 were associ-ated with each racial group. In other words, each neighborhood had a balanced racial composition.
The maps included an overview map and focus and description maps for each location. Focus maps highlighted individual loca-tions while keeping the other locations visible, as if viewed through a transparent gray filter. Description maps included a text box de-scribing the focus location (see Figure 1 and Table 1 for sample descriptions).
Test pairs. A matching task (who-works-where) and a distance estimation task assessed memory for the map and associated de-scriptions. The who-works-where task used person–business name pairs. Some pairs correctly matched the person to the busi-ness, whereas others reflected incorrect pairings. Correct pairings showed the name of the individual who had been described in con-text with the business, and incorrect pairings showed the name of a person different from the one originally described with the busi-ness. Incorrect pairings fell into one of four categories. In within- race/within-neighborhood pairs, the person had the same race and had been associated with the same neighborhood, albeit at a dif-ferent location, as the originally described person. In within-race/across-neighborhood pairs, the person had the same race but was associated with a different neighborhood. In across-race/within-neighborhood pairs, the person had a different race but had been associated with the same neighborhood. Finally, in across-race/across- neighborhood pairs, the listed person had a different race
Table 1 Sample Location Descriptions Presented on
Description Maps in Experiment 1
Location
Name of Associated Individual
Description
School Rasheed Morehouse This school houses both junior high and high school classes. The principal is Rasheed Morehouse, an African American man, who has a doctorate in education. The school has recently been evaluated by the state under a new system of educational reform.
Dry cleaner Scott Chu The dry cleaner cleans all garments as well as making minor repairs and alterations. The owner is Scott Chu, an Asian man, who boasts of his ability to get out any stain. The dry cleaner has same day service for those in a hurry.
Police station
William Miller
The police station houses the entire police force. The chief of police is William Miller, a White male, who has twenty-five years of service with the force. The station contains a small holding cell and a firing range for training.

484 Maddox, Rapp, BRion, and TayloR
spatial information source (e.g., map vs. actual navigation vs. virtual navigation; Hegarty, Montello, Richardson, Ishikawa, & Lovelace, 2006; Montello, Hegarty, Richardson, & Waller, 2004). Although our predictions were guided by these classic findings, differences between methodology and materials, including the scale of the environments and the learning methods, precluded the assumption that distance esti-mates in the present experiments would necessarily fit those findings. Category influences, either spatial or social, may be obtained for the directionality or magnitude of the distance estimation errors, or for both. The scale of the environment may lead to a general tendency to over- or underestimate (Crompton & Brown, 2006), suggesting the importance of examining a signed measure and an absolute measure.
After completing both memory tasks, the participants filled out the demographics questionnaire and were debriefed and thanked for their participation.
results
Five participants showed chance who-works-where accuracy and were eliminated from all analyses. The in-terpretation of our findings assumes that both spatial loca-tions and associated information were learned. To establish this learning, we determined the who-works-where hit rate (proportion of yes responses to correct matches), which equaled .69 (see Table 2 for hit and false alarm data). A t test indicated this hit rate to be greater than chance [.50; t(29) 5 10.56, p , .001]. To ensure that this hit rate did not reflect a yes response bias, we calculated the hit rate minus the false alarm rate to see whether this differed from zero, which it did [t(29) 5 10.61, p , .001]. These
evenly distributed across the pair types with 12 of each; the remain-ing matching trials were correct matches. The primary dependent measure was accuracy, but response time (RT) was also recorded.
Distance estimation. The participants completed the distance estimation task, using pencil and paper, with one trial per page. Trials were randomized across participants. Each page presented a location– location pair, one location above the other on the left side of the page, with a reference line denoting the farthest possible distance on the map. The participants were instructed to anchor one location at the leftmost edge of the reference line and to draw a tick mark on the line indicating the distance to the second location. The participants completed 96 distance estimates, 24 of each type. The average actual distances across pair types ranged from 63 to 80 mm.
From the participants’ estimates, we calculated two dependent measures that provided different information about distance esti-mates: signed and absolute estimation error. Signed estimation error was computed by subtracting the participant’s distance estimate from the actual distance between locations. This measure, associ-ated with more classic demonstrations of category effects, revealed whether the participants tended to overestimate (negative values) or underestimate (positive values) distance and the degree to which they did so. However, because this signed measure averages over positive and negative values, it may underestimate the magnitude of the discrepancy between estimates and actual distances (Friedman & Montello, 2006).
To determine the estimation error magnitude (absolute estimation error), we averaged absolute values of actual distances minus esti-mates. Classic category effects for distance estimation have shown overestimation across categories and underestimation within catego-ries. However, factors such as the environment scale (room-sized lay-out vs. village vs. city vs. continent) have affected distance estimates (Crompton & Brown, 2006; Friedman & Montello, 2006), as has the
Table 2 Who-Works-Where Task Mean Hit and False Alarm rates (With Standard Deviations)
False Hits MinusHits Alarms False Alarms
M SD M SD M SD
Experiment 1: Race and neighborhoods .69 .10 .31 .17 .38 .20Experiment 2: Race and labeled neighborhoods .74 .11 .33 .16 .41 .20Experiment 3: Political affiliation and neighborhoods .69 .13 .29 .17 .40 .28
Table 3 Who-Works-Where Task Mean Accuracy Data
(With Standard Deviations)
Race
Within Across
Neighborhood M SD M SD
Experiment 1: Race and Neighborhoods Within .57 .24 .59 .22 Across .83 .20 .80 .19
Race
Within Across
M SD M SD
Experiment 2: Race and Labeled Neighborhoods Within .52 .25 .51 .24 Across .82 .14 .84 .14
Affiliation
Within Across
M SD M SD
Experiment 3: Political Affiliation and Neighborhoods Within .72 .21 .67 .21 Across .73 .22

Social influenceS on SpaTial MeMoRy 485
p , .005]. The interaction between racial and spatial cat-egories did not reach significance.
Discussion
In Experiment 1, the participants studied a map of busi-ness locations and descriptions about the businesses, in-
analyses, together, suggest that the participants generally learned the person–location associations, although the as-sociations were clearly not learned to ceiling levels.
Who-Works-Where TaskA 2 (race: within or across) 2 (neighborhood: within
or across) repeated measures ANOVA showed an effect of racial information on accuracy [F(1,29) 5 41.44, MSe 5 0.04, p , .001]. As was predicted, the participants more accurately rejected incorrect across-race (M 5 .82) than in-correct within-race (M 5 .58) mismatches. No other main effects or interactions reached significance for either the accuracy or the RT data (see Tables 3 and 4, respectively).
Distance Estimation TaskThe doubly multivariate, repeated measures ANOVA
showed a spatial category effect [F(2,28) 5 9.07, p , .005], qualified by an interaction between the racial and the spatial categories [F(2,28) 5 5.82, p , .01]. Univari-ate analyses followed up on these effects.
Signed estimation error. The univariate analysis showed the spatial category effect [F(1,29) 5 4.47, MSe 5 215.54, p , .05]. The participants overestimated, but they did so to a lesser extent within than across neighborhoods. Thus, locations within neighborhoods were perceived to be closer together than those across neighborhoods. This analysis also showed an interaction between neighborhood and race [F(1,29) 5 11.95, MSe 5 45.75, p , .005; see Figure 2]. This interaction showed greater overestimation within than across race when locations fell in different neighborhoods [t(29) 5 3.59, p , .005], but not when they fell in the same neighborhood ( p . .25). In other words, among locations that fell across neighborhood boundaries, those that shared racial category membership were per-ceived to be closer together than those that did not.
Absolute estimation error. The analysis revealed the spatial category effect [F(1,29) 5 14.62, MSe 5 108.42,
Table 4 Who-Works-Where Task Mean response Time Data
(in Milliseconds, With Standard Deviations)
Race
Within Across
Neighborhood M SD M SD
Experiment 1: Race and Neighborhoods Within 2,895 737 2,885 863 Across 2,677 656 2,815 758
Race
Within Across
M SD M SD
Experiment 2: Race and Labeled Neighborhoods Within 2,719 681 3,090 839 Across 2,573 945 2,792 2,718
Affiliation
Within Across
M SD M SD
Experiment 3: Political Affiliation and Neighborhoods Within 2,852 995 2,584 921 Across 2,423 813
Figure 2. Interaction between spatial and racial categories on signed estimation error in Experiment 1. Effect of racial category is evident only in across-neighborhood pairs.
–40
–35
–30
–25
–20
–15
–10
–5
0
Within Across
Within race
Across raceSi
gn
ed E
stim
atio
n E
rro
r (in
Mill
imet
ers)
Neighborhood
486 Maddox, Rapp, BRion, and TayloR
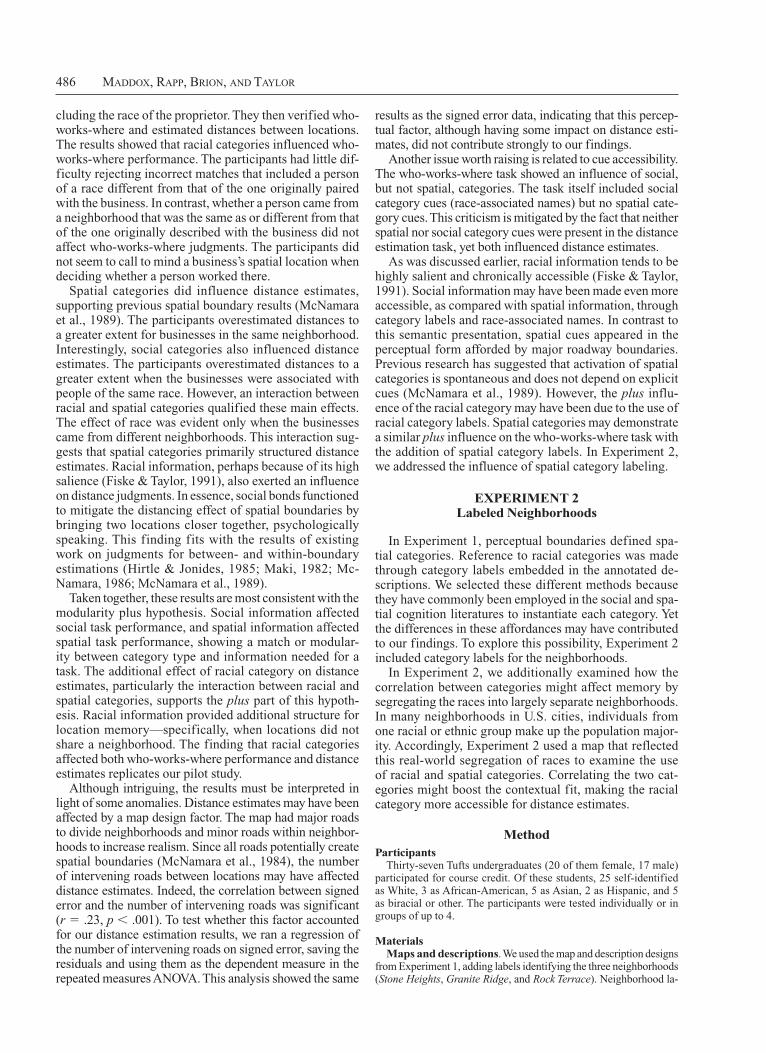
results as the signed error data, indicating that this percep-tual factor, although having some impact on distance esti-mates, did not contribute strongly to our findings.
Another issue worth raising is related to cue accessibility. The who-works-where task showed an influence of social, but not spatial, categories. The task itself included social category cues (race-associated names) but no spatial cate-gory cues. This criticism is mitigated by the fact that neither spatial nor social category cues were present in the distance estimation task, yet both influenced distance estimates.
As was discussed earlier, racial information tends to be highly salient and chronically accessible (Fiske & Taylor, 1991). Social information may have been made even more accessible, as compared with spatial information, through category labels and race-associated names. In contrast to this semantic presentation, spatial cues appeared in the perceptual form afforded by major roadway boundaries. Previous research has suggested that activation of spatial categories is spontaneous and does not depend on explicit cues (McNamara et al., 1989). However, the plus influ-ence of the racial category may have been due to the use of racial category labels. Spatial categories may demonstrate a similar plus influence on the who-works-where task with the addition of spatial category labels. In Experiment 2, we addressed the influence of spatial category labeling.
ExPErIMEnT 2 Labeled neighborhoods
In Experiment 1, perceptual boundaries defined spa-tial categories. Reference to racial categories was made through category labels embedded in the annotated de-scriptions. We selected these different methods because they have commonly been employed in the social and spa-tial cognition literatures to instantiate each category. Yet the differences in these affordances may have contributed to our findings. To explore this possibility, Experiment 2 included category labels for the neighborhoods.
In Experiment 2, we additionally examined how the correlation between categories might affect memory by segregating the races into largely separate neighborhoods. In many neighborhoods in U.S. cities, individuals from one racial or ethnic group make up the population major-ity. Accordingly, Experiment 2 used a map that reflected this real-world segregation of races to examine the use of racial and spatial categories. Correlating the two cat-egories might boost the contextual fit, making the racial category more accessible for distance estimates.
MethodParticipants
Thirty-seven Tufts undergraduates (20 of them female, 17 male) participated for course credit. Of these students, 25 self-identified as White, 3 as African-American, 5 as Asian, 2 as Hispanic, and 5 as biracial or other. The participants were tested individually or in groups of up to 4.
MaterialsMaps and descriptions. We used the map and description designs
from Experiment 1, adding labels identifying the three neighborhoods (Stone Heights, Granite Ridge, and Rock Terrace). Neighborhood la-
cluding the race of the proprietor. They then verified who-works-where and estimated distances between locations. The results showed that racial categories influenced who-works-where performance. The participants had little dif-ficulty rejecting incorrect matches that included a person of a race different from that of the one originally paired with the business. In contrast, whether a person came from a neighborhood that was the same as or different from that of the one originally described with the business did not affect who-works-where judgments. The participants did not seem to call to mind a business’s spatial location when deciding whether a person worked there.
Spatial categories did influence distance estimates, supporting previous spatial boundary results (McNamara et al., 1989). The participants overestimated distances to a greater extent for businesses in the same neighborhood. Interestingly, social categories also influenced distance estimates. The participants overestimated distances to a greater extent when the businesses were associated with people of the same race. However, an interaction between racial and spatial categories qualified these main effects. The effect of race was evident only when the businesses came from different neighborhoods. This interaction sug-gests that spatial categories primarily structured distance estimates. Racial information, perhaps because of its high salience (Fiske & Taylor, 1991), also exerted an influence on distance judgments. In essence, social bonds functioned to mitigate the distancing effect of spatial boundaries by bringing two locations closer together, psychologically speaking. This finding fits with the results of existing work on judgments for between- and within-boundary estimations (Hirtle & Jonides, 1985; Maki, 1982; Mc-Namara, 1986; McNamara et al., 1989).
Taken together, these results are most consistent with the modularity plus hypothesis. Social information affected social task performance, and spatial information affected spatial task performance, showing a match or modular-ity between category type and information needed for a task. The additional effect of racial category on distance estimates, particularly the interaction between racial and spatial categories, supports the plus part of this hypoth-esis. Racial information provided additional structure for location memory—specifically, when locations did not share a neighborhood. The finding that racial categories affected both who-works-where performance and distance estimates replicates our pilot study.
Although intriguing, the results must be interpreted in light of some anomalies. Distance estimates may have been affected by a map design factor. The map had major roads to divide neighborhoods and minor roads within neighbor-hoods to increase realism. Since all roads potentially create spatial boundaries (McNamara et al., 1984), the number of intervening roads between locations may have affected distance estimates. Indeed, the correlation between signed error and the number of intervening roads was significant (r 5 .23, p , .001). To test whether this factor accounted for our distance estimation results, we ran a regression of the number of intervening roads on signed error, saving the residuals and using them as the dependent measure in the repeated measures ANOVA. This analysis showed the same
Social influenceS on SpaTial MeMoRy 487
racial information on accuracy [F(1,31) 5 75.01, MSe 5 0.04, p , .001]. As in the first experiment, the participants more accurately rejected incorrect across-race matches (M 5 .83), as compared with within-race matches (M 5 .51). No other main effects or interactions reached signifi-cance for either the accuracy or the RT data (see Tables 3 and 4, respectively).
Distance Estimation TaskThe doubly multivariate, repeated measures ANOVA
showed main effects of spatial category [F(2,31) 5 11.59, p , .001] and racial category [F(2,31) 5 6.71, p , .01], qualified by an interaction between racial and spatial cat-egories [F(2,31) 5 4.78, p , .05]. Univariate tests fol-lowed up on these findings.
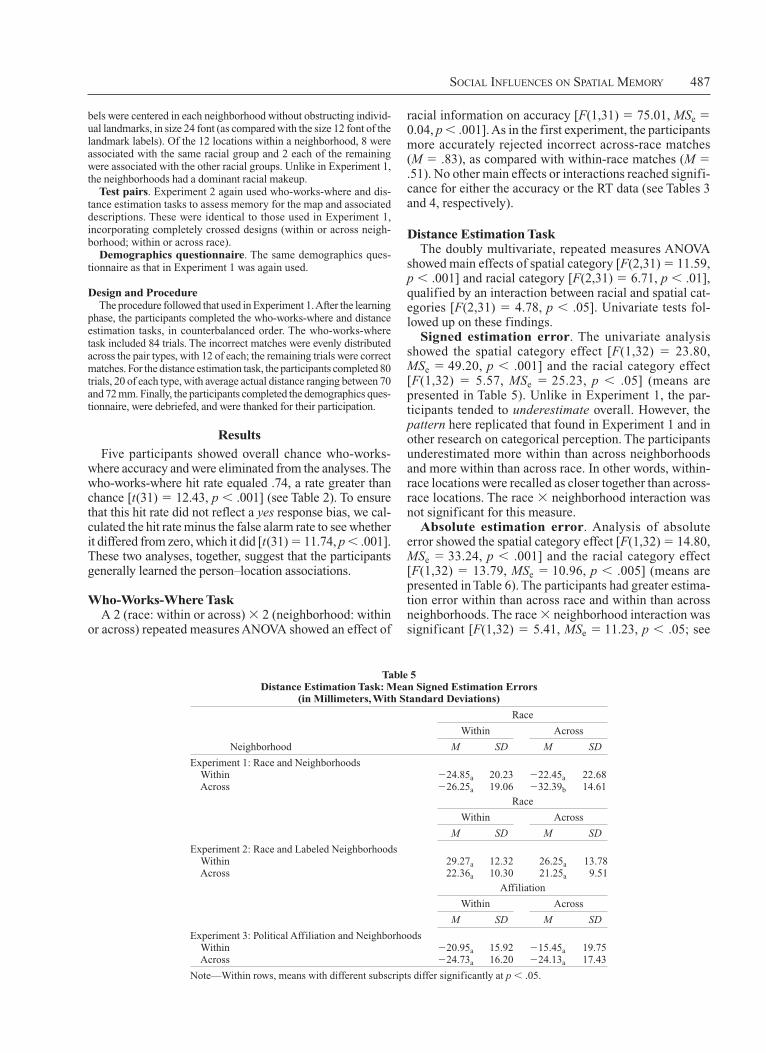
Signed estimation error. The univariate analysis showed the spatial category effect [F(1,32) 5 23.80, MSe 5 49.20, p , .001] and the racial category effect [F(1,32) 5 5.57, MSe 5 25.23, p , .05] (means are presented in Table 5). Unlike in Experiment 1, the par-ticipants tended to underestimate overall. However, the pattern here replicated that found in Experiment 1 and in other research on categorical perception. The participants underestimated more within than across neighborhoods and more within than across race. In other words, within-race locations were recalled as closer together than across-race locations. The race neighborhood interaction was not significant for this measure.
Absolute estimation error. Analysis of absolute error showed the spatial category effect [F(1,32) 5 14.80, MSe 5 33.24, p , .001] and the racial category effect [F(1,32) 5 13.79, MSe 5 10.96, p , .005] (means are presented in Table 6). The participants had greater estima-tion error within than across race and within than across neighborhoods. The race neighborhood interaction was significant [F(1,32) 5 5.41, MSe 5 11.23, p , .05; see
bels were centered in each neighborhood without obstructing individ-ual landmarks, in size 24 font (as compared with the size 12 font of the landmark labels). Of the 12 locations within a neighborhood, 8 were associated with the same racial group and 2 each of the remaining were associated with the other racial groups. Unlike in Experiment 1, the neighborhoods had a dominant racial makeup.
Test pairs. Experiment 2 again used who-works-where and dis-tance estimation tasks to assess memory for the map and associated descriptions. These were identical to those used in Experiment 1, incorporating completely crossed designs (within or across neigh-borhood; within or across race).
Demographics questionnaire. The same demographics ques-tionnaire as that in Experiment 1 was again used.
Design and ProcedureThe procedure followed that used in Experiment 1. After the learning
phase, the participants completed the who-works-where and distance estimation tasks, in counterbalanced order. The who-works-where task included 84 trials. The incorrect matches were evenly distributed across the pair types, with 12 of each; the remaining trials were correct matches. For the distance estimation task, the participants completed 80 trials, 20 of each type, with average actual distance ranging between 70 and 72 mm. Finally, the participants completed the demographics ques-tionnaire, were debriefed, and were thanked for their participation.
results
Five participants showed overall chance who-works-where accuracy and were eliminated from the analyses. The who-works-where hit rate equaled .74, a rate greater than chance [t(31) 5 12.43, p , .001] (see Table 2). To ensure that this hit rate did not reflect a yes response bias, we cal-culated the hit rate minus the false alarm rate to see whether it differed from zero, which it did [t(31) 5 11.74, p , .001]. These two analyses, together, suggest that the participants generally learned the person–location associations.
Who-Works-Where TaskA 2 (race: within or across) 2 (neighborhood: within
or across) repeated measures ANOVA showed an effect of
Table 5 Distance Estimation Task: Mean Signed Estimation Errors
(in Millimeters, With Standard Deviations)
Race
Within Across
Neighborhood M SD M SD
Experiment 1: Race and Neighborhoods Within 24.85a 20.23 22.45a 22.68 Across 26.25a 19.06 32.39b 14.61
Race
Within Across
M SD M SD
Experiment 2: Race and Labeled Neighborhoods Within 29.27a 12.32 26.25a 13.78 Across 22.36a 10.30 21.25a 9.51
Affiliation
Within Across
M SD M SD
Experiment 3: Political Affiliation and Neighborhoods Within 20.95a 15.92 15.45a 19.75 Across 24.73a 16.20 24.13a 17.43
Note—Within rows, means with different subscripts differ significantly at p , .05.

488 Maddox, Rapp, BRion, and TayloR
tial categories did not appear to affect category use. In ad-dition, labeling applied to neighborhoods did not increase spatial category accessibility to the point where it also af-fected who-works-where performance.
Experiment 2 also provided evidence that the partici-pants were sensitive to the correlation between categories set up in segregated neighborhoods. A main effect of ra-cial categories on distance estimates appeared here, but not in Experiment 1, when race and neighborhood were uncorrelated. It is not surprising that people both detect and use this correlation, since humans are consummate pattern seekers (Wolford, Miller, & Gazzaniga, 2000).
Distance estimation performance differed from that in the previous experiment in that the participants gener-ally underestimated distances, whereas previously they
Figure 3]. This interaction shows that the effect of ra-cial category was significant only across neighborhoods [t(32) 5 4.03, p , .001; p . .30 within neighborhood].
Discussion
Experiment 2 again supports the modularity plus hypoth-esis. Racial categories alone affected who-works-where performance. Spatial categories affected distance esti-mates, but racial categories also influenced these estimates, specifically for across-neighborhood locations. The results suggest that the plus effect of racial category, relative to the spatial category, cannot be explained by increased accessi-bility due to category labeling; in this study, both spatial and racial categories had labels. Put another way, our method of labeling racial categories without a parallel labeling of spa-
Figure 3. Interaction between spatial and racial categories on absolute esti-mation error in Experiment 2. Effect of racial category is evident only in across-neighborhood pairs.
0
5
10
15
20
25
30
35
40Within raceAcross race
Ab
solu
te E
stim
atio
n E
rro
r (in
Mill
imet
ers)
Within Across
Neighborhood
Table 6 Distance Estimation Task: Mean Absolute Estimation Errors
(in Millimeters, With Standard Deviations)
Race
Within Across
Neighborhood M SD M SD
Experiment 1: Race and Neighborhoods Within 39.18a 20.23 38.08a 22.68 Across 45.23a 13.65 46.56a 14.26
Race
Within Across
M SD M SD
Experiment 2: Race and Labeled Neighborhoods Within 34.22a 8.65 33.43a 8.41 Across 31.71a 5.67 28.22b 5.42
Affiliation
Within Across
M SD M SD
Experiment 3: Political Affiliation and Neighborhoods Within 32.42a 10.79 35.01a 13.99 Across 41.69a 13.24 38.30a 12.57
Note—Within rows, means with different subscripts differ significantly at p , .05.

Social influenceS on SpaTial MeMoRy 489
their political attitudes than about their racial attitudes (McCon ahay, 1986; Sears, 1988). When asked about their racial attitudes directly, people often mask their true feel-ings (Sigall & Page, 1971); the same does not seem to be generally true for political attitudes.
Although less reactive, political affiliation is still a so-cial category that fits with spatial contexts. Spatial regions of cities (voting districts) and countries have well-known associations with particular political leanings (e.g., conser-vatism in the South, liberalism in the Northeast). Accord-ingly, we replaced racial labels in the annotated descrip-tions with political affiliation labels. Predictions again were based on the modularity, interaction, and modularity plus hypotheses. Although the evidence thus far had sup-ported the modularity plus hypothesis, the use of a social category with less extreme affective associations served as a useful test of the hypothesis’s generalizability.
MethodParticipants
Forty-two Tufts University undergraduates (31 of them female, 11 male) participated for partial course credit. Thirty participants self-identified as White, 6 as Asian, 3 as multiracial, 1 as African- American, 1 as Hispanic, and 1 as Middle Eastern. The self- identified political affiliation breakdown showed that 18 self-identified as Democrats, 11 as Independents, 7 as Republicans, and 6 as having no affiliation. The participants were tested individually or in groups of up to 4.
MaterialsMaps and descriptions. We used maps and descriptions similar
to those in the previous experiments, with two changes. For the so-cial category, we used political affiliation (Democrat, Republican, and Independent), instead of race. Second, the individuals’ names were changed to be racially neutral (e.g., Rasheed Morehouse was changed to Randall Morton). As in Experiment 2, each neighbor-hood was dominated by a social category, with 8 of 12 locations within a neighborhood associated with the same political affiliation and 2 of the remaining 4 associated with each of the others.
Test pairs. The who-works-where task used 68 person– business pairs, divided into three types. Of these trials, half were correct matches and half were incorrect (10 within-affiliation/within- neighborhood pairs, 12 across-affiliation/within-neighborhood pairs, and 12 within-affiliation/across-neighborhood pairs). Choice of location– location pairs for the distance estimation task used all combinations of the social (within or across) and neighborhood (within or across) category definitions, equating for average actual distance across category definitions, resulting in 80 trials (20 of each type), the average actual distances of which ranged from 70 to 72 mm.
Demographics questionnaire. The demographics questionnaire used in Experiments 1 and 2 was again used, with the addition of a political affiliation question.
Design and ProcedureThe design and procedure followed those described for the earlier
experiments.
results
Thirteen participants showed chance accuracy on the matching task and were eliminated from the analyses. The who-works-where hit rate equaled 69% and differed significantly from chance [t(28) 5 7.966, p , .001] (see Table 2). To ensure that this hit rate did not reflect a yes response bias, we also calculated the hit minus false
had overestimated. Although we have no definitive ex-planation for this difference, it is known that translations across spatial scales can be difficult and translation by using the reference line as a distance estimation scale may introduce error (Crompton & Brown, 2006). Despite the overall change, the distance estimation pattern matched that in Experiment 1 (and the extant literature), showing that people perceived within-category locations as being closer together than across-category locations.
Overall, the results provided support for the modularity plus hypothesis. The consistent support for the influence of social information on spatial judgments, as an interac-tion with spatial information, is interesting and unique in the literature. The experiments to this point have focused on racial categories, which are known to be highly salient (Fiske & Taylor, 1991). We suggest that, in the modularity plus hypothesis, many factors may contribute to category salience, potentially allowing them to take on the plus role, thus implying that not all social categories may have the same influence on spatial memory. Thus, an important issue remaining is whether the results obtained so far are par-ticular to race or whether they might extend to other social categories typically associated with environments. In Ex-periment 3, we addressed this issue by examining a differ-ent and less readily accessible category associated with the groupings of people in environments: political affiliation.
ExPErIMEnT 3 Is race Special?
Is there something unique about race that promotes its application to distance estimations? Recent evidence allows some speculation about a link between racial in-formation, affective responses, and spatial memory; ra-cial information may elicit negative affective (e.g., Fazio, Jackson, Dunton, & Williams, 1995) and behavioral (e.g., Bargh, Chen, & Burrows, 1996) responses. In a study ex-amining affective influences on spatial representations, Crawford and Cacioppo (2002) showed that mental repre-sentations can be structured by both affective and spatial information, particularly when the affective stimuli range from neutral to negative. Racial relations have a regret-table history of violence and subjugation in the United States. As a result, many people attempt to distance them-selves from accusations of racial bias, as is evidenced by the various methods developed to implicitly measure ra-cial bias (e.g., Fazio et al., 1995; Greenwald, McGhee, & Schwartz, 1998; Sigall & Page, 1971). Thus, it is possible that strong affective sensitivity to racial information may have contributed to its influence in our experiments.
As such, we sought a less reactive social category to evaluate the generality of our results, selecting political affiliation. Although sometimes heated, political affili-ations, particularly party affiliations, have no history of violence and subjugation comparable to that associated with racial discrimination. Although no research, to our knowledge, has directly compared affective responses to racial versus political affiliation information, inferences about such responses can be made from people’s reactiv-ity to these topics. People are more willing to talk about

490 Maddox, Rapp, BRion, and TayloR
time, do not completely rule it out. The results are some-what consistent with the modularity part of this hypothesis but fall short, in that the social category did not affect the more social who-works-where task. As compared with race, political affiliation appears to be a weaker social cat-egory, contributing little or no structure to memory. This occurred despite the fact that political affiliation has fairly common associations with maps. People, particularly after the last presidential election, have had experience with conceiving of spatial areas (e.g., states) in terms of political affiliation (or at least majority voting patterns). Who can forget the red and blue United States map on election nights, as well as the implications of the rhetoric now common in national political discussions (Indiana is a red state, Massachusetts is a blue state, etc.)? And yet, political affiliation failed to exert an influence on memory for map information.
In the introduction to this experiment, we offered the hypothesis that race and political affiliation may differ in their baseline levels of affective associations, with political affiliation being the less reactive of the two. Apart from affective associations, what other factors could explain the noninfluence of political affiliation? One possibility is that political affiliation may not have the same level of chronic accessibility that race does. Research has demonstrated that the social categories of race, gender, and age tend to be highly accessible across social contexts (Fiske & Taylor, 1991). Age and gender show influences similar to those of race on the who-said-what task (e.g., Maddox & Chase, 2004). These categories could well show modularity by af-fecting who-works-where performance yet fail to have the plus influence, due to reduced affective responses, lower reactivity, or lower salience. This is not to say that the ac-cessibility of political affiliation (or any other social cate-gory) cannot wax and wane over time and across situations, such as during particular presidential campaign cycles or politically charged policy debates. Perhaps our efforts to make political affiliation accessible would be augmented if the present experiment were conducted in the context of a political/policy debate or during a contentious election year. Admittedly, political affiliation has less commonly known linkages with local neighborhood maps (e.g., gerrymander-ing). It is also possible that the use of political affiliation for processing information on a U.S. map, which reflects the more commonly understood relationship between political parties and spatial regions, would result in the increased use of political affiliation to structure map memory. These questions could be addressed in future research but will be discussed in the context of a theory of social category salience (Blanz, 1999) in the General Discussion section. Overall, Experiment 3 suggests that racial information is distinct from political affiliation in the context of map learning.
GEnErAL DIScuSSIon
Overall, the present experiments provide support for the modularity plus hypothesis. For modularity, social in-formation influenced social task performance, whereas spatial information influenced spatial task performance.
alarm rate to see whether it differed from zero, which it did [t(28) 5 7.695, p , .001]. These two analyses, together, suggest that the participants generally learned the person–business association.
Who-Works-Where TaskAnalyses revealed no significant effects for either ac-
curacy or RT measures (all ps . .10; see Tables 3 and 4, respectively).
Distance Estimation TaskThe doubly multivariate, repeated measures ANOVA
showed only a spatial category effect [F(2,27) 5 12.024, p , .001]. As in Experiment 1, the participants overesti-mated overall.
Signed estimation error. Univariate tests showed only a spatial category effect [F(1,28) 5 24.94, MSe 5 146.65, p , .001] (means are presented in Table 5). The partici-pants overestimated to a greater extent across than within neighborhoods.
Absolute estimation error. The absolute estimation error showed the spatial category effect [F(1,28) 5 10.81, MSe 5 105.65, p , .005] (means are presented in Table 6). The participants had greater estimation error across than within neighborhoods.
Discussion
With the change from race to political affiliation, the social category showed no influence on distance estima-tion or who-works-where performance. The latter oc-curred despite the fact that, by correlating the spatial and social categories, the deck was stacked to potentially ob-tain a social category effect for distance estimates. Each neighborhood had a dominant political affiliation, as was the case with race in Experiment 2. Yet, unlike in Experi-ment 2, the participants did not seem to use the correlation between categories. Only the spatial information affected distance estimates. Again, as in Experiment 1, the partici-pants overestimated as a whole. This occurred to a greater extent across spatial categories than within.
The failure of the social category to influence who-works-where performance most likely stems from the lack of social cues within the task, a change from the previous experiments. Experiments 1 and 2 used race-associated names, which then served as cues to race in the who-works-where task. With the change to political affiliation, we changed the names to be race neutral. Creating parallel name cues for political affiliation would have been impos-sible, since, with a few exceptions (e.g., Bush, Clinton, Reagan), equivalent politically associated names do not exist. This suggests that the availability of cues to race at the time of judgment influenced the accessibility and use of race for the who-works-where task. The within-task cues, however, cannot completely account for racial cat-egory use, since the distance estimation task contained no cues, either social or spatial, and in our earlier experi-ments showed effects of race.
The results of Experiment 3 are not completely consis-tent with the modularity plus hypothesis but, at the same

Social influenceS on SpaTial MeMoRy 491
at hand. Fit, like accessibility, is a product of the individu-alized knowledge that perceivers possess and aspects of the judgment context. The 1st-year medical student has a knowledge base that represents the correlation between certain symptoms and diseases. The presence of those symptoms in a patient make some classes of disease bet-ter fits than are others. Similarly, an individual who holds racial stereotypes has a knowledge base that represents the perceived correlation between traits and racial groups. The presence of certain traits in the judgment context may make racial categories more plausible than other bases of categorization.
Accessibility fit. The principles of situational ac-cessibility and perceived fit work in concert to determine category salience. For example, faced with two competing categorizations that are each highly accessible, the one that is perceived to better fit the judgment context is more likely to be salient and subsequently applied. Of the dis-eases that come to the medical student’s mind, the one that “wins out” is the one that best fits his or her understanding of the symptoms. Alternatively, among multiple potential categorizations that fit equally well with the judgment context, the one that is more cognitively accessible will win the salience sweepstakes. Thus, the relationship be-tween the two is multiplicative; a concept that is not at all accessible will not become salient regardless of its fit with the judgment context (the medical student who has not yet learned about a certain disease). Similarly, even highly accessible concepts that do not fit the judgment context are unlikely to be salient (diseases whose symptoms are not present).
The accessibility fit model has implications for the present experiments and for considering future experiments with which to explore the interaction between social and spatial categories. Race was made temporarily accessible through the introduction of racial category labels and race-related names (Experiments 1 and 2), political affiliation through the use of category labels (Experiment 3), and neigh-borhood through spatial boundaries (Experiments 1–3) and category labels (Experiment 2). As we have discussed, re-search has demonstrated that category labels are sufficient to make social categories salient in the minds of perceivers (e.g., Hamilton, 1981; S. E. Taylor, 1981). Similarly, physi-cal boundaries create spatial categories, which, in turn, bias spatial judgments (e.g., Friedman & Montello, 2006; Mc-Namara et al., 1989). The novel aspect of our experiments was to explore the degree to which participants believed that race and political affiliation are relevant to (perceived to fit with) the spatial organizations of people. The perceived fit might arise from, for example, knowledge of the historical and/or contemporary significance of racial segregation in housing (perceived fit), coupled with the presentation of a map that presents opportunities (accessibility) for both racial and spatial organization. Thus, although both social and spatial categories are accessible, to what extent do they fit both general map learning and specific task demands?
In terms of obvious fit, each task had a best fit with one category type; spatial categorizations fit with the task of estimating distance, and social categorizations fit with associating people with businesses (who-works-where).
Using race as the target social category, it took on a plus role, influencing distance estimates as well. Racial and spatial categories consistently interacted in distance es-timation performance, wherein locations from different neighborhoods showed effects of race. This finding held true both when racial and spatial categories were corre-lated (i.e., racially segregated neighborhoods in Experi-ment 2) and when they were not (i.e., racially diverse neighborhoods in Experiment 1), although the presence of a main effect of racial category on distance estimates only when the categories were correlated suggests that people were sensitive to this relationship (Experiment 2). Our main findings also held true when neighborhoods were delineated only via major roads (Experiment 1) and when they were labeled (Experiment 2).
What might predict when a category may serve in the plus role? A recent model of social category salience (Blanz, 1999) provides a framework for considering this question. Although this theory was developed in the con-text of person perception, it seems generalizable to situa-tions in which single entities (people or places) could be categorized in multiple ways and, as such, seems appli-cable to the present experiments.
Determinants of category SalienceIn order for a categorization to influence judgments, it
must be activated in the mind of a perceiver and deemed relevant for the judgment task at hand. One intriguing as-pect of social categorization is the fact that most social targets can be categorized in multiple ways. On the basis of a variety of cues, a person may be categorized by race, sex, age, sexual orientation, occupation, nationality, and so forth. The present experiments also introduce multiple categorizations. With multiple potential categorizations comes a selection problem. Which category (or combi-nations of categories) will influence judgments? Blanz’s (1999) accessibility fit model suggests that categori-zation use is determined by the interaction between situ-ational accessibility and perceived fit of the category to the situation (cf. Bruner, 1957; Oakes, 1987).
Situational accessibility. The situational accessibility of a potential categorization is defined as the ease with which that category comes to mind. In general, the more accessible a potential categorization is, the more salient it is, and the more likely it is that it will be used. Individual differences in the chronic accessibility of a particular cat-egorization contribute to situational accessibility. Due to immersion in their studies, 1st-year medical students are prone to see complex diseases on the basis of relatively simple symptoms. Likewise, individuals who regularly experience racial discrimination may be more likely to see race as contributing to the behavior of others. Tempo-rary aspects of the immediate situation also make a poten-tial categorization accessible, such as the introduction of category labels, the creation of spatial boundaries, or the manipulation of processing goals. Thus, situational acces-sibility depends on knowledge that an individual brings to the situation, as well as on cues present in that setting.
Perceived fit. Perceived fit is the extent to which any accessible knowledge is deemed relevant to the situation

492 Maddox, Rapp, BRion, and TayloR
model as a predictive framework for describing perfor-mance on a variety of tasks.
Alternative Explanations and Dangling PointsDoes the observed effect of social information reflect
the semantic, rather than the social, nature of the category cues presented? Evidence against this perspective comes from that fact that political affiliation did not affect partici-pants’ performance on tasks involving map layouts. If this had been merely a semantic effect, the results across the two categories would have been similar. Second, overall distance estimation performance showed some anomalies and inconsistencies. These differences most likely arose on the basis of normal variability in making distance estimates and the many factors that influence them (Crompton & Brown, 2006) or variability introduced by imperfect learn-ing of the information. Although these across- experiment differences leave “dangling effects” unexplained, we be-lieve that the consistent interaction showing the effect of race on distance estimates only for across-neighborhood locations suggests that these anomalies are more bother-some than contradictory to our main points.
conclusionNonspatial information is ubiquitous, part and parcel
of the exploration of environments. The present findings build on the small but growing list of studies in which the interaction between spatial and nonspatial information has been examined. Researchers have argued that the inte-gration between these types of information may have both evolutionary and neural bases (Crawford & Cacioppo, 2002) and that their association in memory likely influ-ences processes of comprehension (Rapp & Taylor, 2004). Integrated knowledge is necessary to engage in everyday activities that combine spatial and social features, such as when a person chooses where to look for a good Italian restaurant, which parts of town to avoid late at night, or perhaps where to purchase a home. However, research on stereotyping has shown that the use of social information can lead to overgeneralizations, which may explain why we fail to identify a great Italian restaurant in a predomi-nantly Jewish neighborhood or avoid a part of town with an unsavory reputation. We argue that such expectations and generalizations arise, at least partially, as a function of our integration of spatial and social information in the construction of cognitive maps.
AuTHor noTE
We thank Arlette Duguid, Michael Jacoby, Dave Wallace, and Kwadwo Thompson for assistance in data collection and coding. We also thank Sam Sommers, members of the Tufts University Social Cognition (TUSC) Lab, and several anonymous reviewers for helpful comments on the manuscript. Please address correspondence to K. B. Maddox, Department of Psychology, Tufts University, 490 Boston Ave., Medford, MA 02155 (e-mail: [email protected]).
rEFErEncES
Bargh, J. A., Chen, M., & Burrows, L. (1996). Automaticity of social behavior: Direct effects of trait construct and stereotype activation on action. Journal of Personality & Social Psychology, 71, 230-244.
Blanz, M. (1999). Accessibility and fit as determinants of the salience
Our results reflected this obvious fit for both category types when the social category was race. In other words, the participants used the category that fit the processing demands of the current task, consistent with modularity in the modularity plus hypothesis. At the same time, race, a chronically accessible category (Fiske & Taylor, 1991), consistently interacted with the spatial categories to influ-ence distance estimates. Thus, race took on the plus role for the spatial task.
Additional factors associated with perceived fit were manipulated across experiments. First, social and spatial categories were either uncorrelated with integrated neigh-borhoods (Experiment 1) or correlated with racially seg-regated neighborhoods (Experiment 2). Perceived fit ap-peared sensitive to this information, since the influence of racial category was more pronounced with segregated neighborhoods. The second factor associated with fit in-volved using a different social category, political affiliation, in the context of a neighborhood map (Experiment 3). As we argued earlier, the significance of political parties and spatial boundaries (red and blue states, gerrymandering) are commonly known, but perhaps less so than racial and spatial associations. Accordingly, we found little evidence for the influence of political affiliation in the organization of either social or spatial memory. However, this may also be due to the relatively weaker chronic accessibility of po-litical affiliation, as compared with race (Fiske & Taylor, 1991). Alternatively, it could be due to the fact that race was made accessible through both category labels and names, whereas political affiliation was introduced using only cat-egory labels. Thus, there are both accessibility and fit ex-planations for the outcomes of Experiment 3.
Future Tests of the Accessibility Fit ModelAlthough the present experiments did not specifically
manipulate accessibility and fit of the available categories, the framework provided by the accessibility fit model helps conceptualize the findings. Future experiments ex-ploring individual differences among participants, as well as manipulating various aspects of the experimental set-ting, will provide important tests of the applicability of this model. Any manipulation of the design that affects the temporary accessibility of any basis of categorization (e.g., length or frequency of exposure) should alter the salience and likelihood that the category will influence judgments. Perceived fit can be influenced by changes to the spatial or social judgment context. Changing the spatial context from neighborhoods to states of the U.S. may increase the perceived fit and subsequent salience of political affilia-tion. Considering a change in the social context from race to gender, we would hypothesize that fewer people would perceive an association with gender and spatial location in the context of a neighborhood, although we would not rule it out for other spatial contexts, such as a college dorm. There are other examples of manipulations that may also influence accessibility and perceived fit (e.g., altering pro-cessing goals or the nature of the judgment task). Clearly, such work would have implications not just for our under-standing of the factors that influence the construction and use of cognitive maps, but also for the accessibility fit

Social influenceS on SpaTial MeMoRy 493
Thinking categorically about others. Annual Review of Psychology, 51, 93-120.
Maddox, K. B., & Chase, S. G. (2004). Manipulating subcategory sa-lience: Exploring the link between skin tone and social perception of Blacks. European Journal of Social Psychology, 34, 533-546.
Maddox, K. B., & Gray, S. A. (2002). Cognitive representations of Black Americans: Reexploring the role of skin tone. Personality & Social Psychology Bulletin, 28, 250-259.
Maki, R. H. (1982). Why do categorization effects occur in comparative judgment tasks? Memory & Cognition, 10, 252-264.
McConahay, J. B. (1986). Modern racism, ambivalence, and the Mod-ern Racism Scale. In J. F. Dovidio & S. L. Gaertner (Eds.), Prejudice, discrimination, and racism (pp. 91-125). Orlando, FL: Academic Press.
McNamara, T. P. (1986). Mental representation of spatial relations. Cognitive Psychology, 18, 87-121.
McNamara, T. P., Halpin, J. A., & Hardy, J. K. (1992). The representa-tion and integration in memory of spatial and nonspatial information. Memory & Cognition, 20, 519-532.
McNamara, T. P., Hardy, J. K., & Hirtle, S. C. (1989). Subjective hierarchies in spatial memory. Journal of Experimental Psychology: Learning, Memory, & Cognition, 15, 211-227.
McNamara, T. P., & LeSueur, L. L. (1989). Mental representations of spatial and nonspatial relations. Quarterly Journal of Experimental Psychology, 41A, 215-233.
McNamara, T. P., Ratcliff, R., & McKoon, G. (1984). The mental representation of knowledge acquired from maps. Journal of Experi-mental Psychology: Learning, Memory, & Cognition, 10, 723-732.
Merrill, A. A., & Baird, J. C. (1987). Semantic and spatial factors in environmental memory. Memory & Cognition, 15, 101-108.
Montello, D. R., Hegarty, M., Richardson, A. E., & Waller, D. (2004). Spatial memory of real environments, virtual environments, and maps. In G. L. Allen (Ed.), Human spatial memory: Remembering where (pp. 251-285). Mahwah, NJ: Erlbaum.
Oakes, P. J. (1987). The salience of social categories. In J. C. Turner, M. A. Hogg, P. J. Oakes, S. D. Reicher, & M. S. Wetherell (Eds.), Redis-covering the social group: A self-categorization theory (pp. 117-141). Cambridge, MA: Blackwell.
Orleans, P. (1967). Differential cognition of urban residents: Science, engineering and the city (Pub. 1498). Washington, DC: National Academy of Engineering.
Perrig, W., & Kintsch, W. (1985). Propositional and situational repre-sentations of text. Journal of Memory & Language, 24, 503-518.
Rapp, D. N., & Taylor, H. A. (2004). Interactive dimensions in the con-struction of mental representations from text. Journal of Experimental Psychology: Learning, Memory, & Cognition, 30, 988-1001.
Sears, D. O. (1988). Symbolic racism. In P. A. Katz & D. A. Taylor (Eds.), Eliminating racism: Profiles in controversy (pp. 53-84). New York: Plenum.
Shelton, A. L., & McNamara, T. P. (2004). Spatial memory and per-spective taking. Memory & Cognition, 32, 416-426.
Sholl, M. J. (1987). Cognitive maps as orienting schemata. Journal of Experimental Psychology: Learning, Memory, & Cognition, 13, 615-628.
Sigall, H., & Page, R. (1971). Current stereotypes: A little fading, a lit-tle faking. Journal of Personality & Social Psychology, 18, 247-255.
Stevens, A., & Coupe, P. (1978). Distortions in judged spatial relations. Cognitive Psychology, 10, 422-437.
Taylor, H. A., Naylor, S. J., & Chechile, N. A. (1999). Goal-specific influences on the representation of spatial perspective. Memory & Cognition, 27, 309-319.
Taylor, S. E. (1981). A categorization approach to stereotyping. In D. L. Hamilton (Ed.), Cognitive processes in stereotyping and intergroup behavior (pp. 83-114). Hillsdale, NJ: Erlbaum.
Taylor, S. E., Fiske, S. T., Etcoff, N. L., & Ruderman, A. J. (1978). Categorical and contextual bases of person memory and stereotyping. Journal of Personality & Social Psychology, 36, 778-793.
Thorndyke, P. W., & Hayes-Roth, B. (1982). Differences in spatial knowledge acquired from maps and navigation. Cognitive Psychol-ogy, 14, 560-589.
Wolford, G. [L.], Miller, M. B., & Gazzaniga, M. (2000). The left hemisphere’s role in hypothesis formation. Journal of Neuroscience, 20, 1-6.
of social categorizations. European Journal of Social Psychology, 29, 43-74.
Brewer, M. B., & Feinstein, A. S. H. (1999). Dual processes in the cognitive representation of persons and social categories. In S. Chai-ken & Y. Trope (Eds.), Dual-process theories in social psychology (pp. 255-270). New York: Guilford.
Bruner, J. S. (1957). On perceptual readiness. Psychological Review, 64, 123-152.
Crawford, L. E., & Cacioppo, J. T. (2002). Learning where to look for danger: Integrating affective and spatial information. Psychological Science, 13, 449-453.
Crompton, A., & Brown, F. (2006). Distance estimation in a small-scale environment. Environment & Behavior, 38, 656-666.
Curiel, J. M., & Radvansky, G. A. (1998). Mental organization of maps. Journal of Experimental Psychology: Learning, Memory, & Cognition, 24, 202-214.
Downs, R. M., & Stea, D. (1973). Image and environment: Cognitive mapping and spatial behavior. Chicago: Aldine.
Evans, G. W., & Pezdek, K. (1980). Cognitive mapping: Knowledge of real-world distance and location information. Journal of Experimental Psychology: Human Learning & Memory, 6, 13-24.
Fazio, R. H., Jackson, J. R., Dunton, B. C., & Williams, C. J. (1995). Variability in automatic activation as an unobtrusive measure of racial attitudes: A bona fide pipeline? Journal of Personality & Social Psy-chology, 69, 1013-1027.
Fiske, S. T. (1998). Stereotyping, prejudice, and discrimination. In D. T. Gilbert, S. T. Fiske, & G. Lindzey (Eds.), The handbook of social psy-chology (4th ed., Vol. 2, pp. 357-411). Boston: McGraw-Hill.
Fiske, S. T., Lin, M., & Neuberg, S. L. (1999). The continuum model: Ten years later. In S. Chaiken & Y. Trope (Eds.), Dual-process theories in social psychology (pp. 231-254). New York: Guilford.
Fiske, S. T., & Taylor, S. E. (1991). Social cognition (2nd ed.). New York: McGraw-Hill.
Friedman, A., & Montello, D. R. (2006). Global-scale location and distance estimates: Common representations and strategies in abso-lute and relative judgments. Journal of Experimental Psychology: Learning, Memory, & Cognition, 32, 333-346.
Greenwald, A. G., McGhee, D. E., & Schwartz, J. L. K. (1998). Measuring individual differences in implicit cognition: The implicit association test. Journal of Personality & Social Psychology, 74, 1464-1480.
Hamilton, D. L. (1981). Stereotyping and intergroup behavior: Some thoughts on the cognitive approach. In D. L. Hamilton (Ed.), Cogni-tive processes in stereotyping and intergroup behavior (pp. 333-354). Hillsdale, NJ: Erlbaum.
Hamilton, D. L., & Sherman, J. W. (1994). Stereotypes. In R. S. Wyer, Jr. & T. K. Srull (Eds.), Handbook of social cognition (2nd ed., Vol. 2, pp. 1-68). Hillsdale, NJ: Erlbaum.
Hegarty, M., Montello, D. R., Richardson, A. E., Ishikawa, T., & Lovelace, K. (2006). Spatial abilities at different scales: Individual differences in aptitude-test performance and spatial-layout learning. Intelligence, 34, 151-176.
Hirtle, S. C., & Jonides, J. (1985). Evidence of hierarchies in cognitive maps. Memory & Cognition, 13, 208-217.
Hirtle, S. C., & Kallman, H. J. (1988). Memory for the locations of pictures: Evidence for hierarchical clustering. American Journal of Psychology, 101, 159-170.
Hirtle, S. C., & Mascolo, M. F. (1986). Effect of semantic clustering on the memory of spatial locations. Journal of Experimental Psychol-ogy: Learning, Memory, & Cognition, 12, 182-189.
Hommel, B., Gehrke, J., & Knuf, L. (2000). Hierarchical coding in the perception and memory of spatial layouts. Psychological Research, 64, 1-10.
Klauer, K. C., & Wegener, I. (1998). Unraveling social categorization in the “who said what?” paradigm. Journal of Personality & Social Psychology, 75, 1155-1178.
Ladd, F. C. (1970). Black youths view their environment: Neighborhood maps. Environment & Behavior, 2, 74-99.
Leiser, D., Tzelgov, J., & Henik, A. (1987). A comparison of map study methods: Simulated travel vs. conventional study. Cahiers de Psychologie Cognitive/Current Psychology of Cognition, 7, 317-334.
Macrae, C. N., & Bodenhausen, G. V. (2000). Social cognition:

494 Maddox, Rapp, BRion, and TayloR
ArcHIVED MATErIALS
The following materials associated with this article may be accessed through the Psychonomic Society’s Norms, Stimuli, and Data archive, www.psychonomic.org/archive.
To access these files, search the archive for this article using the jour-nal name (Memory & Cognition), the first author’s name (Maddox), and the publication year (2008).
file: Maddox-M&C-2008.zip.deScRipTion: The compressed archive file contains four files:Maddox-M&C-2008APP-A1.txt, containing stereotypicality ratings
of proper names as a function of race.
Madddox-M&C-2008APP-A1.xls, containing the above information in Excel spreadsheet format.
Maddox-M&C-2008APP-A2.txt, containing stereotypicality ratings of professions as a function of race.
Maddox-M&C-2008APP-A2.xls, containing the above information in Excel spreadsheet format.
auThoR’S e-Mail addReSS: [email protected].
(Manuscript received October 6, 2006; revision accepted for publication October 12, 2007.)