Delocation in the Manufacturing Sectors in the EU: A Regional Overview
29
Electronic copy available at: http://ssrn.com/abstract=1714301 DELOCATION IN THE MANUFACTURING SECTORS IN THE EU. A REGIONAL OVERVIEW M.ª Elisa Álvarez López† Rafael Myro Sánchez†† Josefa Vega Crespo† Abstract The question of delocation in main industrial regions across the EU is approached here, and its effects on jobs losses estimated. Seventy five regions are selected following the double criteria of size of the manufacturing industries and high per capita income levels. Taken together, the selected regions account for 65% of total manufacturing GVA in the EU-15. Delocation affected half of them in the period 2000-2005 when competition in the international markets rose and shows higher intensity in most of the British, French and Italian regions although its aggregate effect on employment seems have being offset for growth in services sectors. On the other hand, regions located in the continental area with more market potential have the highest concentration of location effects. Therefore delocation has changed the location of European manufacturing industry, benefitting those latter regions and perhaps bringing higher spatial concentration. JEL Classification: L6, R3, O4. Key words: manufacturing industry, delocation, regions, European Union † University of Valladolid, Department of Applied Economy, Avda. Valle Esgueva 6, 47011 Valladolid (e- mail: [email protected] ; [email protected] ). †† Complutense University of Madrid, Department of Applied Economy II, Campus de Somosaguas s/n, Pozuelo de Alarcón, 28223 Madrid (e-mail: [email protected] ).
-
Upload
independent -
Category
Documents
-
view
0 -
download
0
Transcript of Delocation in the Manufacturing Sectors in the EU: A Regional Overview

Electronic copy available at httpssrncomabstract=1714301
DELOCATION IN THE MANUFACTURING SECTORS IN THE EU A
REGIONAL OVERVIEW
Mordf Elisa Aacutelvarez Loacutepezdagger
Rafael Myro Saacutenchezdaggerdagger
Josefa Vega Crespodagger
Abstract
The question of delocation in main industrial regions across the EU is approached
here and its effects on jobs losses estimated Seventy five regions are selected following
the double criteria of size of the manufacturing industries and high per capita income
levels Taken together the selected regions account for 65 of total manufacturing GVA
in the EU-15 Delocation affected half of them in the period 2000-2005 when competition
in the international markets rose and shows higher intensity in most of the British French
and Italian regions although its aggregate effect on employment seems have being offset
for growth in services sectors On the other hand regions located in the continental area
with more market potential have the highest concentration of location effects Therefore
delocation has changed the location of European manufacturing industry benefitting those
latter regions and perhaps bringing higher spatial concentration
JEL Classification L6 R3 O4
Key words manufacturing industry delocation regions European Union
dagger University of Valladolid Department of Applied Economy Avda Valle Esgueva 6 47011 Valladolid (e-mail elsaecouvaes josefaecouvaes) daggerdagger Complutense University of Madrid Department of Applied Economy II Campus de Somosaguas sn Pozuelo de Alarcoacuten 28223 Madrid (e-mail Rmyrocceeucmes)
Electronic copy available at httpssrncomabstract=1714301
Delocation in the manufacturing sectors in the EU A regional overview
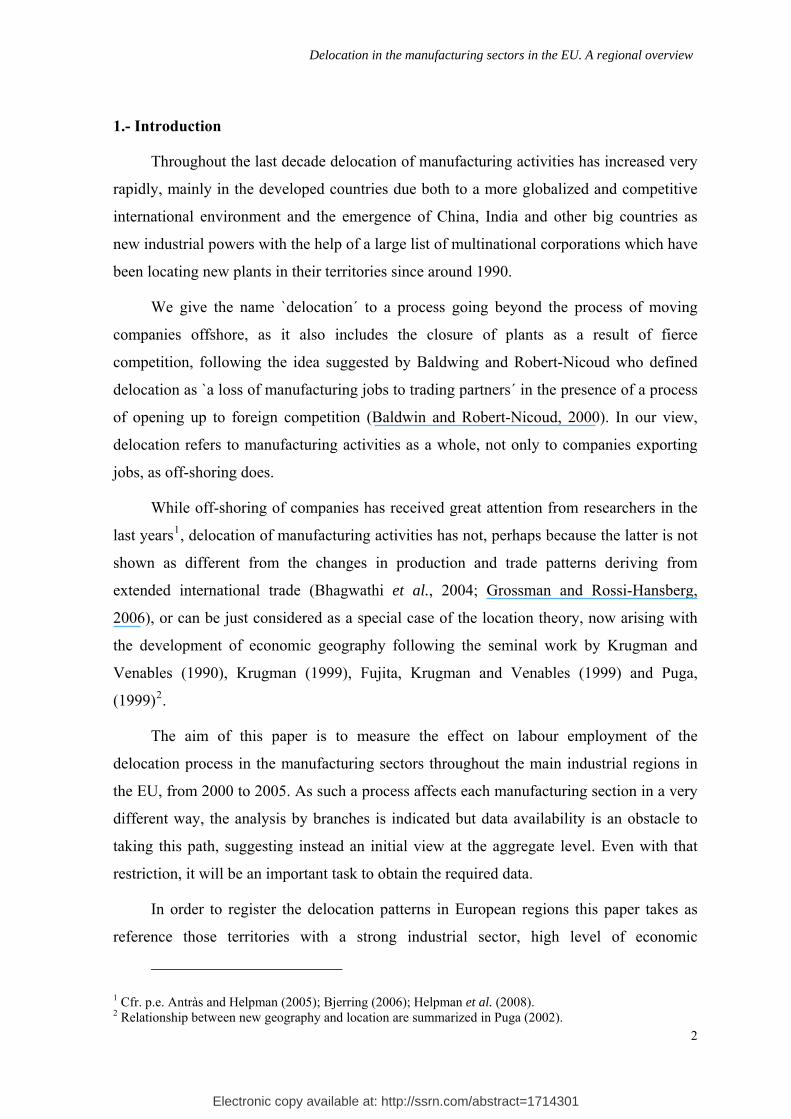
1- Introduction
Throughout the last decade delocation of manufacturing activities has increased very
rapidly mainly in the developed countries due both to a more globalized and competitive
international environment and the emergence of China India and other big countries as
new industrial powers with the help of a large list of multinational corporations which have
been locating new plants in their territories since around 1990
We give the name `delocationacute to a process going beyond the process of moving
companies offshore as it also includes the closure of plants as a result of fierce
competition following the idea suggested by Baldwing and Robert-Nicoud who defined
delocation as `a loss of manufacturing jobs to trading partnersacute in the presence of a process
of opening up to foreign competition (Baldwin and Robert-Nicoud 2000) In our view
delocation refers to manufacturing activities as a whole not only to companies exporting
jobs as off-shoring does
While off-shoring of companies has received great attention from researchers in the
last years1 delocation of manufacturing activities has not perhaps because the latter is not
shown as different from the changes in production and trade patterns deriving from
extended international trade (Bhagwathi et al 2004 Grossman and Rossi-Hansberg
2006) or can be just considered as a special case of the location theory now arising with
the development of economic geography following the seminal work by Krugman and
Venables (1990) Krugman (1999) Fujita Krugman and Venables (1999) and Puga
(1999)2
The aim of this paper is to measure the effect on labour employment of the
delocation process in the manufacturing sectors throughout the main industrial regions in
the EU from 2000 to 2005 As such a process affects each manufacturing section in a very
different way the analysis by branches is indicated but data availability is an obstacle to
taking this path suggesting instead an initial view at the aggregate level Even with that
restriction it will be an important task to obtain the required data
In order to register the delocation patterns in European regions this paper takes as
reference those territories with a strong industrial sector high level of economic
1 Cfr pe Antragraves and Helpman (2005) Bjerring (2006) Helpman et al (2008) 2 Relationship between new geography and location are summarized in Puga (2002)
2
Delocation in the manufacturing sectors in the EU A regional overview
development and homogeneous space dimension So the sample contains only
geographical areas at NUTS 2 level3 whose industrial production represents at least 04
of total EU manufacturing GVA and at the same time has a per capita income of over
90 of the EU-15 average Therefore they are developed regions that have a powerful
industry at the Community level
Consistently the resulting list from applying to the set of EU-27 territories the three
already mentioned selection criteria includes a total of seventy-five regions of thirteen
Member States distributed as follows 23 from Germany 14 the United Kingdom 10 from
France 7 from Italy 4 Holland 4 Sweden 3 Spain 2 from Austria Belgium Denmark
and Finland 1 Greek and 1 Irish On the whole they accounted for 64 of real GVA in
2005 and almost three-fifths of manufacturing employment in the EU-15 (60 and 45
respectively taking as reference the EU-27) The complete catalogue of regions grouped
by country and their characteristics are set out in Appendixes 1 and 2 As is shown there
regions included in the sample are principally in sizes over 05 of EU-15 industrial
production and above the average EU-15 per capita income although a significant number
of them lay below those levels particularly in the per capita income Looking more closely
at the industrial size although most of the NUTS 2 examined move in around 05 there
are a group of fifteen regions located in Italy Germany Ireland France and Spain with a
strong industrial sector (more than 1) among them Lombardy in Italy with about 4 of
total EU-15 manufacturing GVA
After this first introductory section the paper is organized as follows In a second
section the model to capture the delocation patterns is introduced Then in a third section
the data sources are commented on In section four we try to asses the impact of delocation
in each region in terms of jobs affected and examine whether their location patterns have
altered its position in the European industrial scene contrasting country trends with
regional performances Concluding remarks round up the paper
3 The term NUTS corresponds to the French acronym for Nomenclature of Statistical Territorial Units used by the European Union This classification has a hierarchic structure at three levels which among other factors comes from demographic thresholds In particular the NUTS2 level covers regions of an average size between 08 to 3 million inhabitants In Spain the nineteen units included in this level coincide with the different AACC more than Ceuta and Melilla
3
Delocation in the manufacturing sectors in the EU A regional overview
2- Measuring delocation
As was posed in the introduction following Baldwin and Robert-Nicoud (2000)
delocation of activities has to be assessed in terms of losses of productive activity within
each region The variables which approximate these losses are gross added value and
number of jobs or total employment The first one is the most suitable since the latter is
dependent on advances registered in labour productivity mainly in the face of strong
competitive pressures forcing companies to achieve greater efficiency gains
In spite of that jobs continue to be a useful measure since its calculation is simpler
and is often more reliable In addition this indicator has received greater attention and is
more easily interpreted by the analysts and especially the social partners
Nevertheless if evolution of jobs is chosen as a measure of delocation it is necessary
to discount the effect on it of an increase in labour productivity (which reduces the need for
labour) and of the economic cycle (which may reduce or expand the existing employment)
The remaining reduction in the number of jobs measures the delocation effect on
employment
Furthermore when average values for quite a long time interval are taken it is
possible to ignore almost completely the impact of the cycle that otherwise would be
estimated using econometric techniques to isolate the trend In this way the delocation
effect can be just approximated after deducting the change in jobs caused by the increase in
labour productivity
Therefore the change in total employment may be split up into two effects one of
them due to the increased of labour productivity and the other to a location effect -
delocation if it is negative- Box 1 shows that decomposition
In fact the location effect reflects the impact on jobs of an increase or decrease in
value added estimated through the primitive rate of labour productivity and as has been
mentioned above may be positive (location) or negative (delocation) In the first case an
expansion in activity has taken place while in the second a reduction of the productive
scope has occurred
4
Delocation in the manufacturing sectors in the EU A regional overview
∆ N = GVA N(0) ⎯ π N(0)
Delocalisation ProductivityEffect Effect
Box 1 GVA= Labor Productivity Employment GVA = π N where π represents productivity and N employment
N = GVA - π
∆ N = N N(0)
N = GVAπ
where a hat over the variable denotes its rate of change
and and and
and
and and
Delocation of activities that can result from this calculation is compatible with the
absence of off-shoring companies and it may be due as noted above to the closure of
establishments as a result of their being uncompetitive In the same way the location of
activities in a territory is compatible with off-shoring of companies
Thus analysis of delocation does not necessarily tell us much about the importance
of firmsrsquo off-shoring a matter that has to be studied on a different basis However when
off-shoring reaches a large-scale dimension it affects the extension of manufacturing
industries
3- Database
As was said before to achieve aggregate data on manufacturing activities by regions
even just those of real GVA and total employment has demanded a laborious task of
collecting information provided by Eurostat (REGIO database) and the National Statistical
Offices of member countries to which the different regions belong as well as the
estimation in most cases of the product in real terms
Looking first at the GVA since the data offered by REGIO include those related to
energy and mining only access to the National Statistics of every member country has
allowed us to isolate the manufacturing sectors Nevertheless additional work has been
applied to transform the data of GVA into real values as only Germany Spain Finland
5
Delocation in the manufacturing sectors in the EU A regional overview
Holland and Italy provide such information or at least indexes of volume In the rest of the
countries real values of GVA have been estimated by applying the national price deflators
to the regional series at current values
As regards total employment significant discrepancies between the data published
by Eurostat and that country itself (particularly in the United Kingdom) are found as well
as the gaps found in several NUTS 2 of some Member States such as in Germany forced
to complete regional series and correct such deficiencies with the help of the information
coming from the National Statistics Offices
To sum up most of the information used (especially production data) comes from
National Statistical Offices but this is commonly close to the Eurostat database as this is
built mainly with data coming from the regional accounts of each country
By the way one of the problems arising from taking the National Statistics as the
main source of data is that the time intervals for which they provide information do not
always coincide That explains that despite having more recent data from some areas the
analysis must conclude in 2005
4- Delocation of manufacturing industries in European regions
As noted above in the introduction the group of regions examined reached just over
64 of EU-15 industrial GVA and about 60 of jobs in 2005 figures slightly lower than
in 2000 Thus despite nearly half of regionsrsquo industrial output at constant prices having
achieved positive growth rates the group accumulated throughout the period a decrease of
about 1 similar to EU-15 average4 Regarding employment the evolution has been even
more negative Throughout the first five years of the current century destruction of jobs in
the aggregate industry has been a common feature in the vast majority (90) of the
seventy-five NUTS 2 examined as well as for each of the Member States where they are
located except Spain accumulating the total sample a decline of close to 8
4 It must be noted that the EU average has been calculated from the aggregate industrial GVA at constant prices of thirteen countries included in the sample Thus Portugal and Luxembourg have been excluded and the values from other countries have been estimated by adding figures of all their regions So the above mentioned growth rate differs from that provided by Eurostat exhibiting a positive increase of 46
6
Delocation in the manufacturing sectors in the EU A regional overview
Focusing on employment the most dynamic areas are located mostly in France
Spain Austria and Italy while the Netherlands and especially the British regions exhibit
the largest job losses (Table 1)
Registered unemployment seems to be related to good performance in labour
productivity pointing to the fierce competition faced by the manufacturing sector in the
analyzed period Thus higher job losses are found in regions with stronger labour
productivity increases although some French and most of the British regions escaped from
this rule as large losses in employment are not accompanied by significant gains in labour
productivity suggesting delocation effects of a particular intensity
That reveals a very different growth path in employment and labour productivity by
regions differences which can be explored in a more detail to isolate the attractive regions
to locate manufacturing activities from the others characterized by a delocation process
To go deeply into this latter question Table 1 contains the results of estimating the
impact on total employment of location and delocation forces in the manufacturing sectors
across the seventy-five regions included in the sample over the period 2001-2005 by using
the procedure proposed in the second section that is discounting from the total change in
jobs the reduction corresponding to the increase in labour productivity Therefore the
location effect shows the effect on employment of GVA change calculated by applying the
initial rate of labour productivity
In about half of the regions with job losses all of those considered in the
Netherlands Finland Greece and Ireland three-quarters of the Germans two British two
Swedish and Madrid in Spain the decline in employment has been due entirely to
increased labour productivity so a positive effect of location appears This behaviour
extends to Finnish German and Swedish economies as a whole as well as Greece Ireland
and Austria Therefore all those regions have proved attractive for the location of
manufacturing firms
7
Delocation in the manufacturing sectors in the EU A regional overview
8
Productivity Location Productivity Locationeffect effect effect effect
at22 Steiermark 372 -108 480 36 -11 47at31 Oberoumlsterreich 097 -837 934 06 -56 62
Austria -1104 -2649 1545 -18 -42 25be21 Prov Antwerpen -1010 079 -1089 -70 05 -75be23 Prov Oost-Vlaanderen -750 -627 -123 -74 -61 -12
Belgium -5740 -2219 -3521 -84 -32 -51de11 Stuttgart -3157 -8244 5087 -48 -125 77de12 Karlsruhe -2036 -3585 1550 -57 -101 44de13 Freiburg -1291 -1301 011 -45 -45 00de14 Tuumlbingen -585 -1805 1219 -23 -72 49de21 Oberbayern -1630 -7976 6346 -37 -179 142de22 Niederbayern -490 -3270 2781 -33 -218 186de23 Oberpfalz -538 -1716 1178 -38 -120 83de24 Oberfranken -1957 -3131 1175 -116 -186 70de25 Mittelfranken -1184 -1770 586 -53 -80 26de26 Unterfranken -819 -3157 2338 -49 -189 140de27 Schwaben -932 -3335 2403 -41 -148 106de60 Hamburg -760 -1222 463 -60 -97 37de71 Darmstadt -5343 -4720 -623 -149 -132 -17de73 Kassel -1059 -1396 336 -78 -103 25de91 Braunschweig -947 -500 -447 -47 -25 -22de92 Hannover -1900 -1544 -356 -106 -86 -20dea1 Duumlsseldorf -6272 -8787 2515 -126 -177 51dea2 Koumlln -5428 -4971 -457 -150 -137 -13dea4 Detmold -3026 -3112 086 -107 -110 03dea5 Arnsberg -5824 -5502 -322 -129 -122 -07deb3 Rheinhessen-Pfalz -2099 -3016 917 -106 -152 46dec0 Saarland -360 -1810 1450 -32 -160 128def0 Schleswig-Holstein -1867 -2485 617 -101 -135 33
Germany -60300 -112275 51975 -74 -138 64dk01 Hovedstaden -1300 -1216 -084 -134 -125 -09dk04 Midtjylland -2000 -1622 -378 -146 -118 -28
Denmark -6100 -3428 -2672 -130 -73 -57es21 Pais Vasco 1840 -331 2171 74 -13 87es30 Comunidad de Madrid -1060 -2180 1120 -31 -63 32es51 Cataluntildea 660 -1914 2574 09 -25 34
Spain 13970 -3927 17897 47 -13 60fi18 Etelauml-Suomi -1807 -7159 5352 -86 -339 253fi19 Laumlnsi-Suomi -701 -3886 3185 -54 -297 244
Finland -1798 -12006 10208 -43 -286 243fr10 Icircle de France 12652 17868 -5216 218 307 -90fr23 Haute-Normandie -2418 -1093 -1325 -171 -77 -94fr24 Centre -2016 -120 -1896 -106 -06 -100fr42 Alsace -2489 -988 -1501 -154 -61 -93fr51 Pays de la Loire -217 1794 -2011 -08 67 -75fr52 Bretagne -415 -215 -200 -23 -12 -11fr61 Aquitaine -199 742 -941 -14 50 -64fr62 Midi-Pyreacuteneacutees 209 3318 -3109 15 245 -229fr71 Rhocircne-Alpes -2919 2759 -5678 -61 57 -118fr82 Provence-Alpes-Cocircte dAzur -097 262 -359 -06 18 -24
France -15306 31566 -46872 -40 83 -123gr30 Attiki -360 -5072 4712 -17 -234 217
Greece -730 -11989 11259 -14 -222 208ie02 Southern and Eastern -1840 -9985 8145 -78 -426 347
Ireland -2420 -12274 9854 -76 -387 311itc1 Piemonte -6869 2539 -9407 -129 48 -177itc4 Lombardia -7940 -7682 -258 -63 -61 -02itd3 Veneto -3967 -211 -3756 -62 -03 -58itd5 Emilia-Romagna -860 -840 -020 -16 -16 00ite1 Toscana -3620 078 -3697 -98 02 -101ite3 Marche 164 -555 719 08 -28 36ite4 Lazio -733 956 -1689 -36 47 -82
Italy -21761 6310 -28071 -45 13 -58nl22 Gelderland -2164 -2506 341 -178 -206 28nl32 Noord-Holland -1555 -2034 479 -138 -180 42nl33 Zuid-Holland -1734 -3980 2246 -129 -296 167nl41 Noord-Brabant -3539 -5515 1976 -173 -269 96
Netherlands -14767 -24690 9923 -161 -270 108se11 Stockholm -1570 -4183 2613 -136 -363 227se12 Oumlstra Mellansverige -2170 -2387 217 -151 -166 15se22 Sydsverige -1010 -690 -320 -91 -62 -29se23 Vaumlstsverige -460 134 -594 -26 07 -33
Sweden -7500 -9400 1900 -95 -119 24ukd3 Greater Manchester -4900 -1907 -2993 -232 -90 -142ukd4 Lancashire -4600 -5082 482 -317 -350 33uke4 West Yorkshire -3700 -1192 -2508 -186 -60 -126ukf1 Derbyshire and Nottinghamshire -3700 -4965 1265 -179 -240 61ukf2 Leicestershire Rutland and Northan -4400 -3607 -793 -233 -191 -42ukg3 West Midlands -8700 -4999 -3701 -313 -180 -133ukh1 East Anglia -2500 -1292 -1208 -137 -71 -66uki1 Inner London -1919 -1381 -538 -142 -102 -40uki2 Outer London -4481 1106 -5587 -271 67 -338ukj1 Berkshire Bucks and Oxfordshire -4600 -3898 -702 -246 -208 -38ukj3 Hampshire and Isle of Wight -1100 -689 -411 -81 -51 -30ukk1 Gloucestershire Wiltshire and Brist -3400 -1253 -2147 -169 -62 -107ukm2 Eastern Scotland -1100 1402 -2502 -91 116 -207ukm3 South Western Scotland -3400 -2107 -1293 -207 -128 -79
United Kingdom -89800 -48574 -41226 -196 -106 -90
Table 1 Importance of manufacturing delocation in European regions 2001-2005 (Decomposition of change in employment)
Total effect
Source Elaborated from Eurostat and National Statistical offices
Number of jobs (thousands)
Total effect
Percent share of 2000 employmentRegions
Delocation in the manufacturing sectors in the EU A regional overview
By contrast thirty-eight remaining regions that also show reductions in
manufacturing employment have been affected by delocation processes to different
extents although only in a small number of them have they been accompanied by
decreases in labour productivity which could make the prospects for economic growth
tougher (four from France Piamonte Toscana and Lazio in Italy Outer London and
Eastern Scotland in the United Kingdom the Swedish Vaumlstsverige and Antwerp in
Belgium)
Regions with positive location effects are shown in Map 1 Most of them are large
industrial regions and are located in the traditional industrial growth centres5 those
characterized by high market potential (Combes and Overman 2003) although there are
also some intermediate and peripheral territories mainly located in the north of Italy
United Kingdom and Spain and in the south of Sweden and Norway This means that the
delocation process has contributed to concentrating the European manufacturing industries
in that privileged area of faster growth apart from some other changes inside every
country
To compare now the intensity of such effects of location and delocation across
regions avoiding the differences they have in size we built a relative measure of them the
ratio of job losses in the period to the volume of employment in the first year 2000 (Table
1)
Following this ratio delocation effects are revealed to be particularly strong in
France United Kingdom Italy and in one region of Belgium with declines in
employment exceeding 20 in some of them
Conversely the regions of Finland and several of the German and the Dutch ones
exhibit strong location effects
In any case as was pointed above the importance of location effects seems to lie in
labour productivity gains In fact higher increases in productivity (over 15) are found
precisely in those regions of Ireland Finland Sweden Netherlands and Germany besides
the Greek Attiki where the location effect has in general reached its greatest extent
(Figure 1)
5 Note that the map of winning regions is clearly influenced by the large number (30) of German NUTS 2 in the sample
9
Delocation in the manufacturing sectors in the EU A regional overview
fi19
fi18
ie02
dec0
gr30
se11
nl33
de21
de22
de26
de25
de12
de14
de11
dea4
dea1de73
def0
de60
deb3
de27
de23
itd5
ite3
se12
nl22
es 30
ukd4
es51
nl32
at22
ukf1
at31
es21
Map 1 Regions with positive location effect ( of 2000 employment)
Above 10 0 to 10
nl41
de13de27
Nevertheless productivity also grows faster in most of the regions belonging to the
United Kingdom Belgium and Denmark in spite of the strong delocation effects registered
10
Delocation in the manufacturing sectors in the EU A regional overview
which disturbs the above-mentioned positive relationship suggesting the harsh process of
industrial restructuring involved
Figure 1 Location effect and productivity growth in select regions manufacturing sector 2001-2005 (percentages)
UKi2
EU 15
FR6 2
UKm2
ITc1
UKg3UKd 3
UKe4
UKk1FR71F R
FR10UKm3
UKj1UKf2
UKd 4
UKi1
D K
DK01
UKh1U K
FR2 3FR4 2
FR24ITe1
BE2 1ITe4FR51
FR61
ITITd 3
SE2 2FR8 2
SE23
NL2 2
UKf1DE2 4
NL3 2DEa1
DEf0
UKj3DE9 1 DE92
DEa2DE71DK0 4
S EDE25
DE6 0DE12
A T
DE14
ITe3
AT2 2
AT3 1ESD E
DE 11DE2 3
NL41N LDE2 7
DEc0
NL3 3
DE2 6DE2 1
ES3 0ES51
SE11
DE2 2
ES21
GR
FI19F I
FI18
IE
GR3 0
B E
DE73
DEb 3
IE0 2
ITd 5 DE13SE12
FR52ITc4BE2 3
DEa4DEa5
y = 07x - 59R2 = 06
-35
-30
-25
-20
-15
-10
-5
0
5
10
15
20
25
30
35
40
-35 -30 -25 -20 -15 -10 -5 0 5 10 15 20 25 30 35 40 45
Productivity grothw Source Elaborated from Eurostat and National Statistical offices
Loca
tion
effe
ct (
of 2
000
empl
oym
ent)
11
Delocation in the manufacturing sectors in the EU A regional overview
In contrast the productivity decline in half of the French and Italian regions albeit
with a positive impact on employment is largely offset by destruction of industrial
activity except in Icircle de France and Midi -Pyreacuteneacutees the two territories in which
productivity has a more negative trajectory
These results closely match those reported by Cuadrado Roura et al (2000) based on
the growth rates for regional productivity and employment during the period 1980-1993
grouping European regions in four typologies comparing the growth rates of these two
variables with their respective European averages
According to this approach and including the location effect in the analysis the
group of regions that are examined in this work would be categorized as follows (Table 2)
The first group includes areas with productivity and employment growth rates above
sample average and show positive location effect (Quadrant 1) So as has been underlined
in that work possibly this reflects the fact that the technological and organizational
changes introduced during the period would have been successful promoting the
diversification and specialization in activities with high growth levels and attracting new
investments which are less labour-intensive
In a second stage are those regions that as the above mentioned authors suggest
have implemented restructuring processes to eliminate the most inefficient outputs
achieving higher levels of productivity and in about half of them increased industrial
production at the expense of a notable decline in employment (Quadrant 4) They named
this typology `restructuring via productivityacute
With a few exceptions (those where the location effect is negative) the regions in
both groups are the winners of industrial dynamic during the period Most of them are
large industrial regions and are located in the traditional industrial growth centres As
demonstrated above they are mainly Finish German and Dutch as well as Greek and Irish
regions
In contrast another large group of regions due to different factors6 have opted for
more labour-intensive industrial models which in a few cases (especially in Spanish and
Austrian regions) have been accompanied by output increases so they can also be included
6 See Cuadrado et al (2000)
12
Delocation in the manufacturing sectors in the EU A regional overview
in the winners (Map 1) while in other the result has been a loss of productive activity
(Quadrant 2)
(1) (2)Employment Productivity Employment Productivity
de11 Stuttgart -48 125 at22 Steiermark 36 11de12 Karlsruhe -57 101 at31 Oberoumlsterreich 06 56de21 Oberbayern -37 179 be21 Prov Antwerpen -70 -05de22 Niederbayern -33 218 be23 Prov Oost-Vlaanderen -74 61de23 Oberpfalz -38 120 de13 Freiburg -45 45de25 Mittelfranken -53 80 de14 Tuumlbingen -23 72de26 Unterfranken -49 189 de91 Braunschweig -47 25de27 Schwaben -41 148 es21 Pais Vasco 74 13de60 Hamburg -60 97 es30 Comunidad de Madrid -31 63dec0 Saarland -32 160 es51 Cataluntildea 09 25fi19 Laumlnsi-Suomi -54 297 fr10 Icircle de France 218 -307gr30 Attiki -17 234 fr51 Pays de la Loire -08 -67
fr52 Bretagne -23 12fr61 Aquitaine -14 -50fr62 Midi-Pyreacuteneacutees 15 -245fr71 Rhocircne-Alpes -61 -57fr82 Provence-Alpes-Cocircte dAzur -06 -18itc4 Lombardia -63 61itd3 Veneto -62 03itd5 Emilia-Romagna -16 16ite3 Marche 08 28ite4 Lazio -36 -47se23 Vaumlstsverige -26 -07
(4) (3)Employment Productivity Employment Productivity
de24 Oberfranken -116 186 fr24 Centre -106 06de71 Darmstadt -149 132 fr42 Alsace -154 61de73 Kassel -78 103 itc1 Piemonte -129 -48de92 Hannover -106 86 ite1 Toscana -98 -02dea1 Duumlsseldorf -126 177 se22 Sydsverige -91 62dea2 Koumlln -150 137 uke4 West Yorkshire -186 60dea4 Detmold -107 110 ukh1 East Anglia -137 71dea5 Arnsberg -129 122 uki2 Outer London -271 -67deb3 Rheinhessen-Pfalz -106 152 ukj3 Hampshire and Isle of Wight -81 51def0 Schleswig-Holstein -101 135 ukk1 Gloucestershire Wiltshire -169 62dk01 Hovedstaden -134 125 ukm2 Eastern Scotland -91 -116dk04 Midtjylland -146 118fi18 Etelauml-Suomi -86 339fr23 Haute-Normandie -171 77ie02 Southern and Eastern -78 426nl22 Gelderland -178 206nl32 Noord-Holland -138 180nl33 Zuid-Holland -129 296nl41 Noord-Brabant -173 269se11 Stockholm -136 363se12 Oumlstra Mellansverige -151 166ukd3 Greater Manchester -232 90ukd4 Lancashire -317 350ukf1 Derbyshire and Nottinghamshire -179 240ukf2 Leicestershire Rutland and Northants -233 191ukg3 West Midlands -313 180uki1 Inner London -142 102ukj1 Berkshire Bucks and Oxfordshire -246 208ukm3 South Western Scotland -207 128
Source Elaborated from Eurostat and national Statistical officesNote Shaded areas indicate regions with positive location effect
Em
ploy
men
t gro
wth
lt A
vera
ge v
alue
Productivity growth gt Average value Productivity growth lt Average value
Em
ploy
men
t gro
wth
gt A
vera
ge v
alue
Table 2 Employment and productivity growth rates in select regions manufacturing sector 2001-2005 (Averages of all regions +74 productivity -77 employment)
13
Delocation in the manufacturing sectors in the EU A regional overview
Finally the worst results can be seen in a fourth type of region with growth rates of
GVA and productivity below average and serious job destruction (Quadrant 3) This would
occur in regions with problems in restructuring their manufacturing sector or with low
levels of activity So together with those that are either restructuring via productivity or
via employment but without achieving a positive location effect they are clearly the
losers These include mainly British French Italian Belgian and Danish regions
To sum up these results confirm the direct relationship between growth in labour
efficiency and progress in the creation of productive industrial activity as pointed out
above and which can be more clearly by looking at Figure 1 In other words regions with
higher levels of productivity growth in general show a greater attractiveness for new
manufacturing firms
These differences in the behaviour of productivity and employment across regions
have led to remarkable disparities in rates of change of their industrial output during the
period Thus while a few increased their real manufacturing GVA by more than 20 in
the less dynamic ones the loss of industrial output is between a sixth and a third of the
initial value So significant changes had taken place in the relative position of some of
them (Figure 2)
Growth is led by a group of twenty regions located in Ireland Finland Greece
Germany Sweden Netherlands Spain and Austria with real GVA growth rates that are
more than five points above average As a result they increased their share in the industrial
output of the sample Looking at the complete list we see that the growth deviation from
the mean exhibits positive values in just over half of the regions examined among them
seven of the ten with the largest industrial scale in 2005 Thus the top ten regions have
increased their share from 32 to 33 percent in the last five years
Conversely among the less dynamic regions are found a great number of British and
some French and Italian ones which consequently have fallen back in the ranking of
NUTS 2 arranged by their contribution to aggregate manufacturing output
Between both groups there are approximately twenty regions mainly in Germany
with growth rates not far from average so their positions have hardly changed during the
last five years
14
Delocation in the manufacturing sectors in the EU A regional overview
Figure 2 Regional shares in the total sample manufacturing GVA(percentage at 2000 prices)
ITc4
UKf2
UKm3
Uke4
UKf1
UKk1
UKh1
AT22
ITe1
ES21
ES51
FR71
FR62
IT e4
DE24
DE26
SE23
FR61
FR51
FR82
SE22
ITe3
AT31
DK04
DE11
DE23
GR30
DEc0
ES30DEb3DEf0
DEa4
DE92
BE21
DE73
IE02
ITd3
FR52
DE91
DE13DE25
DE 12DE60
DE27
DE21
DE22
BE23DEa2
DE71
DE 14
SE12
ITd5
SE11
FI19
FR10
FR 24
ITe1
FI18
DK01 DEa5
FR4 2
DEa1NL32
NL3 3
FR2 3
NL22
NL 41
UKd3
UKj3
UKi1
UKm2
UKj1
UKd4
UKi2
Ukg3
-35
-30
-25
-20
-15
-10
-5
0
5
10
15
20
25
30
35
Share in 2005
Source Elaborated from Eurostat and National Statistical offices
Rat
e of
cha
nge
200
1-20
05
70403530252015100500
Finally when the question is analyzed at Member State level (Table 1) it is possible
to check out the disparities among the above mentioned regions Thus while in some
15
Delocation in the manufacturing sectors in the EU A regional overview
countries such as Spain manufacturing growth has been clearly labour-intensive
something which can be extended to its regions as also happens in Greece and Austria
which both boast positive location effect and a job destruction rate far below the average
in others such as Holland Sweden and to a lesser extent Belgium Ireland and Finland
increasing of industrial activity is only due by advances in productivity so has been
accompanied by heavy job losses and these are patterns repeated in most of their regions
with noticeable relevance in the Netherlands As for the United Kingdom Belgium and
Denmark all share declining industrial production together with strong job cuts a pattern
that is replicated in many of their regions In this situation are the bulk of French and
Italian NUTS 2 just like the countries to which they belong although in this case job
destruction has been much less pronounced and below the group average Close to this
mean is Germany as well as most of their regions
Thus the analysis at Member States level also confirms the positive relationship
between the advance of industrial productivity and the attractiveness for new
manufacturing firms As demonstrated for their regions Ireland Finland Netherlands and
Greece following at quite distance from Germany are Member States showing a better
performance in productivity and with high location effects (see Figure 1)
In fact similarities between performances in the regions and in the Member States
they belong to suggest that the trend in regional industrial employment is to some extent
influenced by belonging to the same country in other words the locational attractions of
each area and its effort to improve productivity is partly due to national specificities or
idiosyncratic factors In fact as shown in Appendix 3 most European industrialized
regions follow the location patterns of the country they belong to reproducing its
productivity behaviour too In summary the evolution of these variables in each region
seems to have a clear `country effectacute that is different behaviours motivated by specific
factors andor differentiated industrial policies
For example in order to correctly interpret the results for Spanish regions it can not
be overlooked that during the period analyzed as in the whole country regions have
absorbed large numbers of immigrants which has boosted the proliferation of lower
productivity and lower wages in industrial activities However it may be thought that this
phenomenon has tended to conceal productivity increases in larger and better equipped
16
Delocation in the manufacturing sectors in the EU A regional overview
firms which could have been significant in the light of their results7 On the other hand
countries like Finland or Ireland with the lowest population increase have opted for high-
tech manufacturing sectors as a way to improve national competitiveness8 Nonetheless
this positive location effect has not reached in these countriesrsquo NUTS 2 enough magnitude
to offset completely the job losses arising from productivity improvements
On the other hand this `national effectacute has also played an important role in
explaining the economic outcomes of European regions in terms of per capita GDP in
accordance with the results obtained by Cuadrado-Roura (2001) using the data available
for 109 EU regions over the 1977-1994 period
Table 3 Export growth in key sectors by countries 2000-2005 (percentages)Impact ITon Total
Spain 65 91 72 158 38 111 04Germany 116 138 61 111 111 130 14United Kingdom 09 85 29 32 23 61 02France -09 102 25 94 118 78 -01Ireland -09 -102 01 25 -34 77 -03Finland 47 152 45 49 56 73 13Italy 40 88 41 90 56 89 02EU-15 70 141 59 91 67 111 11Source Elaborated from Comtrade
Shoes TotalIT Auto Textile Clothes
This importance of the `national effectacute should allow us to make a better approach to
the determinants of above-mentioned delocation patterns in future research One of such
determinants might be found in the different importance and performance by countries of
some manufacturing branches particularly affected by the increase in global competition as
their development has being receiving strong support in emerging countries from both
domestic policies and the location of big multinational companies This is the case of IT
manufacturing sectors or that of automobiles clothes textiles and shoes (Sachwald 2004)
Table 3 shows how the exports of these key sectors have evolved in some of the European
countries considered here It is amazing to see the poor results registered by IT sectors in
United Kingdom France and Ireland compared to the other countries mentioned Germany
in particular This evolution could be behind the stronger effects of delocation in France
and the United Kingdom although it must have produced similar results in the case of
Ireland Furthermore on such a basis what has happened in Italy would remain
7 For details see Myro et al (2008) 8 See Aacutelvarez Loacutepez et al (2007)
17
Delocation in the manufacturing sectors in the EU A regional overview
unexplained as the selected key sectors do not show a bad performance in terms of exports
in the latter country
One reason for such contradictory results lies in the possibility that production
instead of export reflects accurately what has been happening in every sector in terms of
activity However Aacutelvarez et al (2007) show very similar patterns in production and
export specialization from 1995 to 2005 except in the case of Ireland which thus appears
as a very particular one This is because IT specialization in production increases at the
same time as it decreases in exports Perhaps the strong growth in domestic demand
prevents IT exports from growing The opposite case could be that of Italy where slow
growth in domestic demand might have been pushing up IT export9
Anyway further developments on the determinants of delocation patterns require the
preparation of disaggregated data on production a task beyond the objectives of this paper
That could allow us to update the available manufacturing specialization analysis As the
two countries exhibiting higher delocation effects France and the United Kingdom
showed the lowest rates of specialization compared with the EU (Milderfart and Overman
2002 Combes and Overman 2003) something could have changed in the last few years
which would merit a fresh look based on more recent data
On the other hand it is now clear that insofar as delocation in manufacturing
activities has affected each country in a different way a relocation process inside the EU
and between countries has taken place This process deserved to be deeply analyzed
including a perspective by sectors updating what we know about changes in the
distribution of manufacturing industry in the EU and offering the possibility of exploring
whether the European Common Policy has influenced them in some way as was already
suggested by Milderfart-Knarvik and Overman (2002)
9 In Finland IT activities grows much more in production than in exports but in both aspects a positive growth is registered
18
Delocation in the manufacturing sectors in the EU A regional overview
19
Figure 3 Employment growth rates in selected regions 2001-2005 manufacturing and total economy (percentages)
Ukg3
UKi2
UKd4
UKj1
UKm2
UKi1 UKj3
UKd3
NL 41
NL22
FR23
NL33
NL32
DEa1
FR42
DEa5
DK01
FI18
ITe1
FR 24FR10
FI19
SE11
ITd5FR52
DE 14
DE71
DEa2
BE23
DE22
DE21
DE27
IC c4
DE60DE 12
DE25
DE13
DE9 1SE12
ITd3
IE02
DE73
BE21
DE92DEa4
DEf0
DEb3
ES30
DEc0
GR30
DE23
DE11
DK04
AT31
ITe3
SE22
FR82
FR51FR61
SE2 3
DE26
DE24
IT e4
FR62
FR71
ES51
ES2 1
ITe1
AT22
UKh1
UKk1
UKf1
Uke4
UKm3
UKf2
-20
-15
-10
-5
0
5
10
15
20
25
-40 -30 -20 -10 0 10 20 30
Manufacturing
Source Elaborated from Eurostat and National Statistical offices
Tota
l em
ploy
men
t
Delocation in the manufacturing sectors in the EU A regional overview
One last question that deserves consideration is the effect of industrial delocation
process on the regional economies Surprisingly manufacturing job losses have not been
translated into total employment which exhibit positive growth for most of the chosen
regions with the exceptions of some Germans and all the Netherlands (Figure 3) That
means the regions have been able to compensate the negative effect on the employment
from shrinking manufacturing allocating more resources inside the services sectors In fact
a substitution of manufacturing by services seems to have happened as are the region
showing more delocation in manufacturing those that increase in a higher measure the
employment in the service sectors that is the French British and Italian However the
relation is not accurate as there are not a strict quantitative correlation region by region
between rates of delocation and increase in the employment in the service activities
These good results in terms of general employment shown by the regions affected in
a higher measure by manufacturing delocation suggest the convenience of a more general
analysis of regional economic growth beyond the manufacturing sector as some regions
strongly shrinking manufacturing activities in favour of those of services might be leading
an interesting process of structural change that could light up one of the ways of facing the
increasing competition coming from emerging economies
5- Final remarks
Comparative analysis of location patterns for a large sample of European regions -
characterized by having an upper-middle level income and a strong industrial sector-
during the last few years has revealed that only half of them have shown locational
attractions for manufacturing activities The regional patterns found clearly show the
influence of `national effectacute the regions showing location effects corresponding to most
of those located in Austria Germany the Netherlands Ireland Finland Sweden Spain and
Greece
On the contrary the delocation process has affected another half of the regions
included most of them French British and Italian Therefore delocation has contributed to
concentrating the European manufacturing industry in the areas with higher market
potential in the centre of continental Europe It has contributed furthermore to relocating
manufacturing activities inside every country something that requires further analysis
from future research
20
Delocation in the manufacturing sectors in the EU A regional overview
Attractiveness to location of manufacturing industries has been encouraged by
significant increases in labor productivity so in most of the regions showing positive
location patterns production increases have been compatibles with a decline in aggregate
manufacturing total employment More specifically in this situation are all regions in the
Netherlands Finland Greece and Ireland three quarters of the German ones two from the
United Kingdom two from Sweden and Madrid in Spain
On the contrary in the regions where delocation has taken place the increase in
labour productivity has been lower In fact thirteen of such regions show reductions in
labour productivity six of them placed in France three Italian the British Eastern Scotland
and Greater London Vaumlstsverige in Sweden and the Belgian Antwerp Besides the
positive impact of this rare performance on employment has been largely offset by
destruction of industrial activity except in the Icircle de France and Midi-Pyreacuteneacutees the two
territories in which productivity has a more negative trajectory
The positive link between location and labour productivity increase confirm the
result reached by other authors particularly Cuadrado Roura et al (2002) who referring
their analysis to previous years distinguish two groups of winners among the European
regions the first grouping regions with increased employment and labour productivity
perhaps reflecting the success of technological and organizational changes introduced
during the period promoting the diversification and specialization in activities with high
growth levels and attracting new investments less labour-intensive and a second one
formed by regions capable of implementing restructuring processes to eliminate the most
inefficient outputs achieve higher levels of productivity and increased industrial
production at the expense of a notable decline in employment
Nevertheless discrepancies in delocation patterns outlined above and different
achievements in terms of productivity improvement have not only been the result of
companiesacute response to intensified competition in each region but also of differential
features On the one hand is size which in larger regions like some of Italy Germany
France and Spain reduces the chances of scoring high growth rates On the other hand are
the national specificities such as the massive migrations received by the Spanish regions a
key to explain their model of industrial growth and the different public policies The
influence of the two latter factors appears remarkable given the similarities among the
location patterns of each of the regions examined and the Member States they belong to
21
Delocation in the manufacturing sectors in the EU A regional overview
Anyway the lack of data has prevented us from going further into a preliminary
explanatory analysis of the delocation patters found when looking at the different
manufacturing activities but the role played by the IT manufacturing sector and other
branches affected by intense international competition (automobile clothes and textiles
and shoes) might have been important
To finish just to point up that the effect of manufacturing delocation on aggregate
employment has been offset by growth of services sectors suggesting the convenience of a
more general analysis of regional economic growth beyond the manufacturing sector as
some regions showing greater change in employment between sectors might be leading an
interesting process of structural change that could light up one of the ways of facing the
increasing competition coming from emerging economies
22
Delocation in the manufacturing sectors in the EU A regional overview
References
Aacutelvarez Loacutepez ME R Myro and J Vega Crespo (2007) ldquoCambios Recientes en la
Especializacioacuten Inter-industrial de las Manufacturas Espantildeolasrdquo Papeles de Economiacutea
Espantildeola 112 2-21
Antragraves P and E Helpman (2004) ldquoGlobal Sourcingrdquo Journal of Political Economy
112(3) 552-580
Bjerring Olsen K (2006) Productivity Impacts of Offshoring and Outsourcing A Review
OECD Directorate for Science Technology and Industry
Baldwin RE and F Robert-Nicoud (2000) ldquoFree trade agreements without delocationrdquo
Canadian Journal of Economics 33(3) 766-786
Bhagwati J A Panagariya and TN Srinivasan (2004) ldquoThe Muddles over Outsourcingrdquo
Journal of Economic Perspectives 18(4) 93-114
Combes PP and HG Overman (2003) ldquoThe Spatial Distribution of Economic Activities
in the EUrdquo Center for Economic Performance London School of Economics and
Political Science
Cuadrado-Roura JR T Mancha-Navarro and R Garrido-Yserte (2000) ldquoRegional
Productivity Patterns in Europe An Alternative Approachrdquo The Annals of Regional
Science 34(3) 365-384
Cuadrado Roura JR (2001) Regional convergence in the European Union From
hypothesis to the actual trends The Annals of Regional Science 35(3) 333-356
Cuadrado-Roura JR T Mancha-Navarro and R Garrido-Yserte (2002) ldquoRegional
Dynamics in the European Union Winners and Losersrdquo in Cuadrado-Roura JR and
M Parellada (eds) Regional Convergente in the European Union Springer-Verlag
Berlin 23-52
Fujita M P Krugman and A Venables (1999) The Spatial Economy Cambridge MA
The MIT Press
Grossman GM and E Rossi-Hansberg (2006) The Rise of Offshoring Itacutes Not Wine for
Cloth Anymore Princeton University unpublished
Helpman E D Marin and T Verdier (2008) The organization of firms in a global
economy Harvard University Press
Krugman P and AJ Venables (1990) ldquoIntegration and the Competitiveness of Peripheral
Industryrdquo in C Bliss and J Braga de Macedo (eds) Unity with Diversity in the
European Community Cambridge University Press
23
Delocation in the manufacturing sectors in the EU A regional overview
Krugman P (1999) Geography and Trade Cambridge MA The MIT Press
Midelfart-Knarvik KH and HG Overman (2002) Delocation and European Integration
is structural spending justified Economic Policy 17(35) 321-359
Myro R CM Fernaacutendez-Otheo L Labrador AB Baides Tudela ME Aacutelvarez Loacutepez
and Vega Crespo J (2008) Globalizacioacuten y Deslocalizacioacuten Importancia y Efectos
para la Industria Espantildeola Direccioacuten General de Poliacutetica de la PYME Ministerio de
Industria Turismo y Comercio (httpwwwipymeorgNRrdonlyresAD74121A-
DD3C-4564-92AD-17A2872508CA0GlobalizacionDeslocalizacionpdf)
Puga D (1999) The Rise and Fall of Regional Inequalities European Economic Review
43(2) 303-334
Puga D (2002) European Regional Policy in Light of Recent Location Theories Journal
of Economic Geography 2(4) 373-406
Sachwald F (2004) ldquoThe impact of EU enlargement on Firmsacute Strategies and the
Location of Production in Europerdquo Tokyo Club Research Meeting
24
Delocation in the manufacturing sectors in the EU A regional overview
25
Appendix 1 European regions NUTS2 in the sampleCode Region name Code Region name
NUTS2 and country to which it belong NUTS2 and country to which it belongat22 Steiermark gr30 Attikiat31 Oberoumlsterreich Greece
Austriaie02 Southern and Eastern
be21 Prov Antwerpen Irelandbe23 Prov Oost-Vlaanderen
Belgium itc1 Piemonteitc4 Lombardia
de11 Stuttgart itd3 Venetode12 Karlsruhe itd5 Emilia-Romagnade13 Freiburg ite1 Toscanade14 Tuumlbingen ite3 Marchede21 Oberbayern ite4 Laziode22 Niederbayern Italyde23 Oberpfalzde24 Oberfranken nl22 Gelderlandde25 Mittelfranken nl32 Noord-Hollandde26 Unterfranken nl33 Zuid-Hollandde27 Schwaben nl41 Noord-Brabantde60 Hamburg Netherlandsde71 Darmstadtde73 Kassel se11 Stockholmde91 Braunschweig se12 Oumlstra Mellansverigede92 Hannover se22 Sydsverigedea1 Duumlsseldorf se23 Vaumlstsverigedea2 Koumlln Swedendea4 Detmolddea5 Arnsberg ukd3 Greater Manchesterdeb3 Rheinhessen-Pfalz ukd4 Lancashiredec0 Saarland uke4 West Yorkshiredef0 Schleswig-Holstein ukf1 Derbyshire and Nottinghamshire
Germany ukf2 Leicestershire Rutland and Northantsukg3 West Midlands
dk01 Hovedstaden ukh1 East Angliadk04 Midtjylland uki1 Inner London
Denmark uki2 Outer Londonukj1 Berkshire Bucks and Oxfordshire
es21 Pais Vasco ukj3 Hampshire and Isle of Wightes30 Comunidad de Madrid ukk1 Gloucestershire Wiltshire and Bristoles51 Cataluntildea ukm2 Eastern Scotland
Spain ukm3 South Western ScotlandUnited Kingdom
fi18 Etelauml-Suomifi19 Laumlnsi-Suomi
Finland
fr10 Icircle de Francefr23 Haute-Normandiefr24 Centrefr42 Alsacefr51 Pays de la Loirefr52 Bretagnefr61 Aquitainefr62 Midi-Pyreacuteneacuteesfr71 Rhocircne-Alpesfr82 Provence-Alpes-Cocircte dAzur
France
Delocation in the manufacturing sectors in the EU A regional overview
26
Manufacturing GVA GDPpc( of total EU-15) (Index EU-15=100)
at22 Steiermark 040 9647at31 Oberoumlsterreich 063 10641be21 Prov Antwerpen 064 12780be23 Prov Oost-Vlaanderen 040 9589de11 Stuttgart 241 12296de12 Karlsruhe 132 11674de13 Freiburg 099 10018de14 Tuumlbingen 095 10780de21 Oberbayern 205 14684de22 Niederbayern 051 10090de23 Oberpfalz 046 10475de24 Oberfranken 047 9885de25 Mittelfranken 079 12022de26 Unterfranken 056 10283de27 Schwaben 084 10593de60 Hamburg 062 17922de71 Darmstadt 130 13985de73 Kassel 041 10006de91 Braunschweig 081 9675de92 Hannover 058 10000dea1 Duumlsseldorf 176 11397dea2 Koumlln 129 10387dea4 Detmold 085 9742dea5 Arnsberg 143 9395deb3 Rheinhessen-Pfalz 082 9505dec0 Saarland 040 9778def0 Schleswig-Holstein 061 9099dk01 Hovedstaden 043 18287dk04 Midtjylland 041 13581es21 Pais Vasco 070 9977es30 Comunidad de Madrid 093 10213es51 Cataluntildea 180 9310fi18 Etelauml-Suomi 123 13009fi19 Laumlnsi-Suomi 064 9954fr10 Icircle de France 221 15821fr23 Haute-Normandie 043 9333fr24 Centre 052 9211fr42 Alsace 048 9664fr51 Pays de la Loire 072 9353fr52 Bretagne 051 9124fr61 Aquitaine 044 9276fr62 Midi-Pyreacuteneacutees 040 9221fr71 Rhocircne-Alpes 140 10349fr82 Provence-Alpes-Cocircte dAzur 055 9715gr30 Attiki 039 9144ie02 Southern and Eastern 196 16068itc1 Piemonte 128 9973itc4 Lombardia 390 11863itd3 Veneto 176 10747itd5 Emilia-Romagna 164 11132ite1 Toscana 090 9929ite3 Marche 047 9078ite4 Lazio 062 11123nl22 Gelderland 043 9892nl32 Noord-Holland 051 13804nl33 Zuid-Holland 077 12003nl41 Noord-Brabant 098 11722se11 Stockholm 062 17037se12 Oumlstra Mellansverige 056 10433se22 Sydsverige 044 10865se23 Vaumlstsverige 074 11743ukd3 Greater Manchester 055 10374ukd4 Lancashire 046 9161uke4 West Yorkshire 054 10378ukf1 Derbyshire and Nottinghamshire 065 10283ukf2 Leicestershire Rutland and Northants 053 11179ukg3 West Midlands 071 10596ukh1 East Anglia 050 10169uki1 Inner London 067 28535uki2 Outer London 055 10231ukj1 Berkshire Bucks and Oxfordshire 058 15836ukj3 Hampshire and Isle of Wight 043 11334ukk1 Gloucestershire Wiltshire and Bristol 061 12628ukm2 Eastern Scotland 044 10947ukm3 South Western Scotland 053 10097
Source Elaborated from Eurostat and national Statistical offices
Appendix 2 GDP per Capita and regions share in EU-15 manufacturing GVA 2005
Delocation in the manufacturing sectors in the EU A regional overview
Appendix 2 (Continued)
0
5
10
15
20
25
30
100 120 140 160 180 200 220 240 260 280
26
23
9
54
12
12
10 0 0 0 0 0 0 0 0
1
Reg iona l GD P per Ca pita (EU-1 5 =1 0 0 ) Histo g ra m
0
10
20
30
40
05 10 15 20 25 30 35 40
14
34
9
3
6
13 3
10 0 0 0 0
1
Industrial size of selected regions ( of EU-15 manufacturing GVA)Histogram
27
Delocation in the manufacturing sectors in the EU A regional overview
Appendix 3 Location effect and productivity growth rates in European manufacturing sector
(percentages)
Loca
tion
effe
ct (
of 2
000
empl
oym
ent)
Productivity grothw
AUSTRIA
AT
AT31AT221
-5
0
5
10
-5 0 5 10
GERMANY
DE91
DEa4
Dec0
EDf0
DE 24
DE71DE92
DE14
DE 26
DE73DE 60
DE 22
DE23
DE25
DE 13
DE a1
DEa2
DE27
DE 21
DE a5
DE12DE
DEb3
DE11
-5
0
5
10
15
20
-5 0 5 10 15 20 25 30
BELGIUM
BE21
BE
BE23
-10
-5
0
5
-5 0 5 10 15
DENMARK
DK04
DK
DK01
-10
-5
0
5
-5 0 5 10 15
SPAIN
ES
ES30
ES21
ES51
-5
0
5
10
-5 0 5 10
FRANCE
FR51
FR71
FR42
FR23
FR62
FR61
FR82FR52
FR24FR
FR10
-25
-20
-15
-10
-5
0
5
-35 -30 -25 -20 -15 -10 -5 0 5 10
HOLAND
NL33
NL22
NL41
NL32
NL
-5
0
5
10
15
20
-5 0 5 10 15 20 25 30
ITALY
ITe4
ITc1
ITe1
ITd3
ITd5
ITe3
ITc4
IT
-25
-20
-15
-10
-5
0
5
-10 -5 0 5 10
28
Delocation in the manufacturing sectors in the EU A regional overview
Productivity grothw
Source Elaborated from Eurostat and National Statistical offices
Appendix 3 (continued)Lo
catio
n ef
fect
( o
f 200
0 em
ploy
men
t)FINLAND
FI FI19
FI18
-5
0
5
10
15
20
25
30
-5 0 5 10 15 20 25 30 35
GREECE
GR30GR
-5
0
5
10
15
20
25
30
-5 0 5 10 15 20 25 30 35
IRELAND
IEIE02
-5
0
5
10
15
20
25
30
35
-5 0 5 10 15 20 25 30 35 40 45
UNITED KINDOGDOM
UKh1
UKm2
UKf1
UKj3
UKd3
UKf2
UKi2
UKk1
UKg3UKe4
UKm3
UKj1
UKd4
UKi1
UK
-35
-30
-25
-20
-15
-10
-5
0
5
10
-15 -10 -5 0 5 10 15 20 25 30 35 40
SWEDEN
SE11
SE12
SE23 SE22
SE
-5
0
5
10
15
20
25
30
35
-5 0 5 10 15 20 25 30 35 40 45
29
Electronic copy available at httpssrncomabstract=1714301
Delocation in the manufacturing sectors in the EU A regional overview
1- Introduction
Throughout the last decade delocation of manufacturing activities has increased very
rapidly mainly in the developed countries due both to a more globalized and competitive
international environment and the emergence of China India and other big countries as
new industrial powers with the help of a large list of multinational corporations which have
been locating new plants in their territories since around 1990
We give the name `delocationacute to a process going beyond the process of moving
companies offshore as it also includes the closure of plants as a result of fierce
competition following the idea suggested by Baldwing and Robert-Nicoud who defined
delocation as `a loss of manufacturing jobs to trading partnersacute in the presence of a process
of opening up to foreign competition (Baldwin and Robert-Nicoud 2000) In our view
delocation refers to manufacturing activities as a whole not only to companies exporting
jobs as off-shoring does
While off-shoring of companies has received great attention from researchers in the
last years1 delocation of manufacturing activities has not perhaps because the latter is not
shown as different from the changes in production and trade patterns deriving from
extended international trade (Bhagwathi et al 2004 Grossman and Rossi-Hansberg
2006) or can be just considered as a special case of the location theory now arising with
the development of economic geography following the seminal work by Krugman and
Venables (1990) Krugman (1999) Fujita Krugman and Venables (1999) and Puga
(1999)2
The aim of this paper is to measure the effect on labour employment of the
delocation process in the manufacturing sectors throughout the main industrial regions in
the EU from 2000 to 2005 As such a process affects each manufacturing section in a very
different way the analysis by branches is indicated but data availability is an obstacle to
taking this path suggesting instead an initial view at the aggregate level Even with that
restriction it will be an important task to obtain the required data
In order to register the delocation patterns in European regions this paper takes as
reference those territories with a strong industrial sector high level of economic
1 Cfr pe Antragraves and Helpman (2005) Bjerring (2006) Helpman et al (2008) 2 Relationship between new geography and location are summarized in Puga (2002)
2
Delocation in the manufacturing sectors in the EU A regional overview
development and homogeneous space dimension So the sample contains only
geographical areas at NUTS 2 level3 whose industrial production represents at least 04
of total EU manufacturing GVA and at the same time has a per capita income of over
90 of the EU-15 average Therefore they are developed regions that have a powerful
industry at the Community level
Consistently the resulting list from applying to the set of EU-27 territories the three
already mentioned selection criteria includes a total of seventy-five regions of thirteen
Member States distributed as follows 23 from Germany 14 the United Kingdom 10 from
France 7 from Italy 4 Holland 4 Sweden 3 Spain 2 from Austria Belgium Denmark
and Finland 1 Greek and 1 Irish On the whole they accounted for 64 of real GVA in
2005 and almost three-fifths of manufacturing employment in the EU-15 (60 and 45
respectively taking as reference the EU-27) The complete catalogue of regions grouped
by country and their characteristics are set out in Appendixes 1 and 2 As is shown there
regions included in the sample are principally in sizes over 05 of EU-15 industrial
production and above the average EU-15 per capita income although a significant number
of them lay below those levels particularly in the per capita income Looking more closely
at the industrial size although most of the NUTS 2 examined move in around 05 there
are a group of fifteen regions located in Italy Germany Ireland France and Spain with a
strong industrial sector (more than 1) among them Lombardy in Italy with about 4 of
total EU-15 manufacturing GVA
After this first introductory section the paper is organized as follows In a second
section the model to capture the delocation patterns is introduced Then in a third section
the data sources are commented on In section four we try to asses the impact of delocation
in each region in terms of jobs affected and examine whether their location patterns have
altered its position in the European industrial scene contrasting country trends with
regional performances Concluding remarks round up the paper
3 The term NUTS corresponds to the French acronym for Nomenclature of Statistical Territorial Units used by the European Union This classification has a hierarchic structure at three levels which among other factors comes from demographic thresholds In particular the NUTS2 level covers regions of an average size between 08 to 3 million inhabitants In Spain the nineteen units included in this level coincide with the different AACC more than Ceuta and Melilla
3
Delocation in the manufacturing sectors in the EU A regional overview
2- Measuring delocation
As was posed in the introduction following Baldwin and Robert-Nicoud (2000)
delocation of activities has to be assessed in terms of losses of productive activity within
each region The variables which approximate these losses are gross added value and
number of jobs or total employment The first one is the most suitable since the latter is
dependent on advances registered in labour productivity mainly in the face of strong
competitive pressures forcing companies to achieve greater efficiency gains
In spite of that jobs continue to be a useful measure since its calculation is simpler
and is often more reliable In addition this indicator has received greater attention and is
more easily interpreted by the analysts and especially the social partners
Nevertheless if evolution of jobs is chosen as a measure of delocation it is necessary
to discount the effect on it of an increase in labour productivity (which reduces the need for
labour) and of the economic cycle (which may reduce or expand the existing employment)
The remaining reduction in the number of jobs measures the delocation effect on
employment
Furthermore when average values for quite a long time interval are taken it is
possible to ignore almost completely the impact of the cycle that otherwise would be
estimated using econometric techniques to isolate the trend In this way the delocation
effect can be just approximated after deducting the change in jobs caused by the increase in
labour productivity
Therefore the change in total employment may be split up into two effects one of
them due to the increased of labour productivity and the other to a location effect -
delocation if it is negative- Box 1 shows that decomposition
In fact the location effect reflects the impact on jobs of an increase or decrease in
value added estimated through the primitive rate of labour productivity and as has been
mentioned above may be positive (location) or negative (delocation) In the first case an
expansion in activity has taken place while in the second a reduction of the productive
scope has occurred
4
Delocation in the manufacturing sectors in the EU A regional overview
∆ N = GVA N(0) ⎯ π N(0)
Delocalisation ProductivityEffect Effect
Box 1 GVA= Labor Productivity Employment GVA = π N where π represents productivity and N employment
N = GVA - π
∆ N = N N(0)
N = GVAπ
where a hat over the variable denotes its rate of change
and and and
and
and and
Delocation of activities that can result from this calculation is compatible with the
absence of off-shoring companies and it may be due as noted above to the closure of
establishments as a result of their being uncompetitive In the same way the location of
activities in a territory is compatible with off-shoring of companies
Thus analysis of delocation does not necessarily tell us much about the importance
of firmsrsquo off-shoring a matter that has to be studied on a different basis However when
off-shoring reaches a large-scale dimension it affects the extension of manufacturing
industries
3- Database
As was said before to achieve aggregate data on manufacturing activities by regions
even just those of real GVA and total employment has demanded a laborious task of
collecting information provided by Eurostat (REGIO database) and the National Statistical
Offices of member countries to which the different regions belong as well as the
estimation in most cases of the product in real terms
Looking first at the GVA since the data offered by REGIO include those related to
energy and mining only access to the National Statistics of every member country has
allowed us to isolate the manufacturing sectors Nevertheless additional work has been
applied to transform the data of GVA into real values as only Germany Spain Finland
5
Delocation in the manufacturing sectors in the EU A regional overview
Holland and Italy provide such information or at least indexes of volume In the rest of the
countries real values of GVA have been estimated by applying the national price deflators
to the regional series at current values
As regards total employment significant discrepancies between the data published
by Eurostat and that country itself (particularly in the United Kingdom) are found as well
as the gaps found in several NUTS 2 of some Member States such as in Germany forced
to complete regional series and correct such deficiencies with the help of the information
coming from the National Statistics Offices
To sum up most of the information used (especially production data) comes from
National Statistical Offices but this is commonly close to the Eurostat database as this is
built mainly with data coming from the regional accounts of each country
By the way one of the problems arising from taking the National Statistics as the
main source of data is that the time intervals for which they provide information do not
always coincide That explains that despite having more recent data from some areas the
analysis must conclude in 2005
4- Delocation of manufacturing industries in European regions
As noted above in the introduction the group of regions examined reached just over
64 of EU-15 industrial GVA and about 60 of jobs in 2005 figures slightly lower than
in 2000 Thus despite nearly half of regionsrsquo industrial output at constant prices having
achieved positive growth rates the group accumulated throughout the period a decrease of
about 1 similar to EU-15 average4 Regarding employment the evolution has been even
more negative Throughout the first five years of the current century destruction of jobs in
the aggregate industry has been a common feature in the vast majority (90) of the
seventy-five NUTS 2 examined as well as for each of the Member States where they are
located except Spain accumulating the total sample a decline of close to 8
4 It must be noted that the EU average has been calculated from the aggregate industrial GVA at constant prices of thirteen countries included in the sample Thus Portugal and Luxembourg have been excluded and the values from other countries have been estimated by adding figures of all their regions So the above mentioned growth rate differs from that provided by Eurostat exhibiting a positive increase of 46
6
Delocation in the manufacturing sectors in the EU A regional overview
Focusing on employment the most dynamic areas are located mostly in France
Spain Austria and Italy while the Netherlands and especially the British regions exhibit
the largest job losses (Table 1)
Registered unemployment seems to be related to good performance in labour
productivity pointing to the fierce competition faced by the manufacturing sector in the
analyzed period Thus higher job losses are found in regions with stronger labour
productivity increases although some French and most of the British regions escaped from
this rule as large losses in employment are not accompanied by significant gains in labour
productivity suggesting delocation effects of a particular intensity
That reveals a very different growth path in employment and labour productivity by
regions differences which can be explored in a more detail to isolate the attractive regions
to locate manufacturing activities from the others characterized by a delocation process
To go deeply into this latter question Table 1 contains the results of estimating the
impact on total employment of location and delocation forces in the manufacturing sectors
across the seventy-five regions included in the sample over the period 2001-2005 by using
the procedure proposed in the second section that is discounting from the total change in
jobs the reduction corresponding to the increase in labour productivity Therefore the
location effect shows the effect on employment of GVA change calculated by applying the
initial rate of labour productivity
In about half of the regions with job losses all of those considered in the
Netherlands Finland Greece and Ireland three-quarters of the Germans two British two
Swedish and Madrid in Spain the decline in employment has been due entirely to
increased labour productivity so a positive effect of location appears This behaviour
extends to Finnish German and Swedish economies as a whole as well as Greece Ireland
and Austria Therefore all those regions have proved attractive for the location of
manufacturing firms
7
Delocation in the manufacturing sectors in the EU A regional overview
8
Productivity Location Productivity Locationeffect effect effect effect
at22 Steiermark 372 -108 480 36 -11 47at31 Oberoumlsterreich 097 -837 934 06 -56 62
Austria -1104 -2649 1545 -18 -42 25be21 Prov Antwerpen -1010 079 -1089 -70 05 -75be23 Prov Oost-Vlaanderen -750 -627 -123 -74 -61 -12
Belgium -5740 -2219 -3521 -84 -32 -51de11 Stuttgart -3157 -8244 5087 -48 -125 77de12 Karlsruhe -2036 -3585 1550 -57 -101 44de13 Freiburg -1291 -1301 011 -45 -45 00de14 Tuumlbingen -585 -1805 1219 -23 -72 49de21 Oberbayern -1630 -7976 6346 -37 -179 142de22 Niederbayern -490 -3270 2781 -33 -218 186de23 Oberpfalz -538 -1716 1178 -38 -120 83de24 Oberfranken -1957 -3131 1175 -116 -186 70de25 Mittelfranken -1184 -1770 586 -53 -80 26de26 Unterfranken -819 -3157 2338 -49 -189 140de27 Schwaben -932 -3335 2403 -41 -148 106de60 Hamburg -760 -1222 463 -60 -97 37de71 Darmstadt -5343 -4720 -623 -149 -132 -17de73 Kassel -1059 -1396 336 -78 -103 25de91 Braunschweig -947 -500 -447 -47 -25 -22de92 Hannover -1900 -1544 -356 -106 -86 -20dea1 Duumlsseldorf -6272 -8787 2515 -126 -177 51dea2 Koumlln -5428 -4971 -457 -150 -137 -13dea4 Detmold -3026 -3112 086 -107 -110 03dea5 Arnsberg -5824 -5502 -322 -129 -122 -07deb3 Rheinhessen-Pfalz -2099 -3016 917 -106 -152 46dec0 Saarland -360 -1810 1450 -32 -160 128def0 Schleswig-Holstein -1867 -2485 617 -101 -135 33
Germany -60300 -112275 51975 -74 -138 64dk01 Hovedstaden -1300 -1216 -084 -134 -125 -09dk04 Midtjylland -2000 -1622 -378 -146 -118 -28
Denmark -6100 -3428 -2672 -130 -73 -57es21 Pais Vasco 1840 -331 2171 74 -13 87es30 Comunidad de Madrid -1060 -2180 1120 -31 -63 32es51 Cataluntildea 660 -1914 2574 09 -25 34
Spain 13970 -3927 17897 47 -13 60fi18 Etelauml-Suomi -1807 -7159 5352 -86 -339 253fi19 Laumlnsi-Suomi -701 -3886 3185 -54 -297 244
Finland -1798 -12006 10208 -43 -286 243fr10 Icircle de France 12652 17868 -5216 218 307 -90fr23 Haute-Normandie -2418 -1093 -1325 -171 -77 -94fr24 Centre -2016 -120 -1896 -106 -06 -100fr42 Alsace -2489 -988 -1501 -154 -61 -93fr51 Pays de la Loire -217 1794 -2011 -08 67 -75fr52 Bretagne -415 -215 -200 -23 -12 -11fr61 Aquitaine -199 742 -941 -14 50 -64fr62 Midi-Pyreacuteneacutees 209 3318 -3109 15 245 -229fr71 Rhocircne-Alpes -2919 2759 -5678 -61 57 -118fr82 Provence-Alpes-Cocircte dAzur -097 262 -359 -06 18 -24
France -15306 31566 -46872 -40 83 -123gr30 Attiki -360 -5072 4712 -17 -234 217
Greece -730 -11989 11259 -14 -222 208ie02 Southern and Eastern -1840 -9985 8145 -78 -426 347
Ireland -2420 -12274 9854 -76 -387 311itc1 Piemonte -6869 2539 -9407 -129 48 -177itc4 Lombardia -7940 -7682 -258 -63 -61 -02itd3 Veneto -3967 -211 -3756 -62 -03 -58itd5 Emilia-Romagna -860 -840 -020 -16 -16 00ite1 Toscana -3620 078 -3697 -98 02 -101ite3 Marche 164 -555 719 08 -28 36ite4 Lazio -733 956 -1689 -36 47 -82
Italy -21761 6310 -28071 -45 13 -58nl22 Gelderland -2164 -2506 341 -178 -206 28nl32 Noord-Holland -1555 -2034 479 -138 -180 42nl33 Zuid-Holland -1734 -3980 2246 -129 -296 167nl41 Noord-Brabant -3539 -5515 1976 -173 -269 96
Netherlands -14767 -24690 9923 -161 -270 108se11 Stockholm -1570 -4183 2613 -136 -363 227se12 Oumlstra Mellansverige -2170 -2387 217 -151 -166 15se22 Sydsverige -1010 -690 -320 -91 -62 -29se23 Vaumlstsverige -460 134 -594 -26 07 -33
Sweden -7500 -9400 1900 -95 -119 24ukd3 Greater Manchester -4900 -1907 -2993 -232 -90 -142ukd4 Lancashire -4600 -5082 482 -317 -350 33uke4 West Yorkshire -3700 -1192 -2508 -186 -60 -126ukf1 Derbyshire and Nottinghamshire -3700 -4965 1265 -179 -240 61ukf2 Leicestershire Rutland and Northan -4400 -3607 -793 -233 -191 -42ukg3 West Midlands -8700 -4999 -3701 -313 -180 -133ukh1 East Anglia -2500 -1292 -1208 -137 -71 -66uki1 Inner London -1919 -1381 -538 -142 -102 -40uki2 Outer London -4481 1106 -5587 -271 67 -338ukj1 Berkshire Bucks and Oxfordshire -4600 -3898 -702 -246 -208 -38ukj3 Hampshire and Isle of Wight -1100 -689 -411 -81 -51 -30ukk1 Gloucestershire Wiltshire and Brist -3400 -1253 -2147 -169 -62 -107ukm2 Eastern Scotland -1100 1402 -2502 -91 116 -207ukm3 South Western Scotland -3400 -2107 -1293 -207 -128 -79
United Kingdom -89800 -48574 -41226 -196 -106 -90
Table 1 Importance of manufacturing delocation in European regions 2001-2005 (Decomposition of change in employment)
Total effect
Source Elaborated from Eurostat and National Statistical offices
Number of jobs (thousands)
Total effect
Percent share of 2000 employmentRegions
Delocation in the manufacturing sectors in the EU A regional overview
By contrast thirty-eight remaining regions that also show reductions in
manufacturing employment have been affected by delocation processes to different
extents although only in a small number of them have they been accompanied by
decreases in labour productivity which could make the prospects for economic growth
tougher (four from France Piamonte Toscana and Lazio in Italy Outer London and
Eastern Scotland in the United Kingdom the Swedish Vaumlstsverige and Antwerp in
Belgium)
Regions with positive location effects are shown in Map 1 Most of them are large
industrial regions and are located in the traditional industrial growth centres5 those
characterized by high market potential (Combes and Overman 2003) although there are
also some intermediate and peripheral territories mainly located in the north of Italy
United Kingdom and Spain and in the south of Sweden and Norway This means that the
delocation process has contributed to concentrating the European manufacturing industries
in that privileged area of faster growth apart from some other changes inside every
country
To compare now the intensity of such effects of location and delocation across
regions avoiding the differences they have in size we built a relative measure of them the
ratio of job losses in the period to the volume of employment in the first year 2000 (Table
1)
Following this ratio delocation effects are revealed to be particularly strong in
France United Kingdom Italy and in one region of Belgium with declines in
employment exceeding 20 in some of them
Conversely the regions of Finland and several of the German and the Dutch ones
exhibit strong location effects
In any case as was pointed above the importance of location effects seems to lie in
labour productivity gains In fact higher increases in productivity (over 15) are found
precisely in those regions of Ireland Finland Sweden Netherlands and Germany besides
the Greek Attiki where the location effect has in general reached its greatest extent
(Figure 1)
5 Note that the map of winning regions is clearly influenced by the large number (30) of German NUTS 2 in the sample
9
Delocation in the manufacturing sectors in the EU A regional overview
fi19
fi18
ie02
dec0
gr30
se11
nl33
de21
de22
de26
de25
de12
de14
de11
dea4
dea1de73
def0
de60
deb3
de27
de23
itd5
ite3
se12
nl22
es 30
ukd4
es51
nl32
at22
ukf1
at31
es21
Map 1 Regions with positive location effect ( of 2000 employment)
Above 10 0 to 10
nl41
de13de27
Nevertheless productivity also grows faster in most of the regions belonging to the
United Kingdom Belgium and Denmark in spite of the strong delocation effects registered
10
Delocation in the manufacturing sectors in the EU A regional overview
which disturbs the above-mentioned positive relationship suggesting the harsh process of
industrial restructuring involved
Figure 1 Location effect and productivity growth in select regions manufacturing sector 2001-2005 (percentages)
UKi2
EU 15
FR6 2
UKm2
ITc1
UKg3UKd 3
UKe4
UKk1FR71F R
FR10UKm3
UKj1UKf2
UKd 4
UKi1
D K
DK01
UKh1U K
FR2 3FR4 2
FR24ITe1
BE2 1ITe4FR51
FR61
ITITd 3
SE2 2FR8 2
SE23
NL2 2
UKf1DE2 4
NL3 2DEa1
DEf0
UKj3DE9 1 DE92
DEa2DE71DK0 4
S EDE25
DE6 0DE12
A T
DE14
ITe3
AT2 2
AT3 1ESD E
DE 11DE2 3
NL41N LDE2 7
DEc0
NL3 3
DE2 6DE2 1
ES3 0ES51
SE11
DE2 2
ES21
GR
FI19F I
FI18
IE
GR3 0
B E
DE73
DEb 3
IE0 2
ITd 5 DE13SE12
FR52ITc4BE2 3
DEa4DEa5
y = 07x - 59R2 = 06
-35
-30
-25
-20
-15
-10
-5
0
5
10
15
20
25
30
35
40
-35 -30 -25 -20 -15 -10 -5 0 5 10 15 20 25 30 35 40 45
Productivity grothw Source Elaborated from Eurostat and National Statistical offices
Loca
tion
effe
ct (
of 2
000
empl
oym
ent)
11
Delocation in the manufacturing sectors in the EU A regional overview
In contrast the productivity decline in half of the French and Italian regions albeit
with a positive impact on employment is largely offset by destruction of industrial
activity except in Icircle de France and Midi -Pyreacuteneacutees the two territories in which
productivity has a more negative trajectory
These results closely match those reported by Cuadrado Roura et al (2000) based on
the growth rates for regional productivity and employment during the period 1980-1993
grouping European regions in four typologies comparing the growth rates of these two
variables with their respective European averages
According to this approach and including the location effect in the analysis the
group of regions that are examined in this work would be categorized as follows (Table 2)
The first group includes areas with productivity and employment growth rates above
sample average and show positive location effect (Quadrant 1) So as has been underlined
in that work possibly this reflects the fact that the technological and organizational
changes introduced during the period would have been successful promoting the
diversification and specialization in activities with high growth levels and attracting new
investments which are less labour-intensive
In a second stage are those regions that as the above mentioned authors suggest
have implemented restructuring processes to eliminate the most inefficient outputs
achieving higher levels of productivity and in about half of them increased industrial
production at the expense of a notable decline in employment (Quadrant 4) They named
this typology `restructuring via productivityacute
With a few exceptions (those where the location effect is negative) the regions in
both groups are the winners of industrial dynamic during the period Most of them are
large industrial regions and are located in the traditional industrial growth centres As
demonstrated above they are mainly Finish German and Dutch as well as Greek and Irish
regions
In contrast another large group of regions due to different factors6 have opted for
more labour-intensive industrial models which in a few cases (especially in Spanish and
Austrian regions) have been accompanied by output increases so they can also be included
6 See Cuadrado et al (2000)
12
Delocation in the manufacturing sectors in the EU A regional overview
in the winners (Map 1) while in other the result has been a loss of productive activity
(Quadrant 2)
(1) (2)Employment Productivity Employment Productivity
de11 Stuttgart -48 125 at22 Steiermark 36 11de12 Karlsruhe -57 101 at31 Oberoumlsterreich 06 56de21 Oberbayern -37 179 be21 Prov Antwerpen -70 -05de22 Niederbayern -33 218 be23 Prov Oost-Vlaanderen -74 61de23 Oberpfalz -38 120 de13 Freiburg -45 45de25 Mittelfranken -53 80 de14 Tuumlbingen -23 72de26 Unterfranken -49 189 de91 Braunschweig -47 25de27 Schwaben -41 148 es21 Pais Vasco 74 13de60 Hamburg -60 97 es30 Comunidad de Madrid -31 63dec0 Saarland -32 160 es51 Cataluntildea 09 25fi19 Laumlnsi-Suomi -54 297 fr10 Icircle de France 218 -307gr30 Attiki -17 234 fr51 Pays de la Loire -08 -67
fr52 Bretagne -23 12fr61 Aquitaine -14 -50fr62 Midi-Pyreacuteneacutees 15 -245fr71 Rhocircne-Alpes -61 -57fr82 Provence-Alpes-Cocircte dAzur -06 -18itc4 Lombardia -63 61itd3 Veneto -62 03itd5 Emilia-Romagna -16 16ite3 Marche 08 28ite4 Lazio -36 -47se23 Vaumlstsverige -26 -07
(4) (3)Employment Productivity Employment Productivity
de24 Oberfranken -116 186 fr24 Centre -106 06de71 Darmstadt -149 132 fr42 Alsace -154 61de73 Kassel -78 103 itc1 Piemonte -129 -48de92 Hannover -106 86 ite1 Toscana -98 -02dea1 Duumlsseldorf -126 177 se22 Sydsverige -91 62dea2 Koumlln -150 137 uke4 West Yorkshire -186 60dea4 Detmold -107 110 ukh1 East Anglia -137 71dea5 Arnsberg -129 122 uki2 Outer London -271 -67deb3 Rheinhessen-Pfalz -106 152 ukj3 Hampshire and Isle of Wight -81 51def0 Schleswig-Holstein -101 135 ukk1 Gloucestershire Wiltshire -169 62dk01 Hovedstaden -134 125 ukm2 Eastern Scotland -91 -116dk04 Midtjylland -146 118fi18 Etelauml-Suomi -86 339fr23 Haute-Normandie -171 77ie02 Southern and Eastern -78 426nl22 Gelderland -178 206nl32 Noord-Holland -138 180nl33 Zuid-Holland -129 296nl41 Noord-Brabant -173 269se11 Stockholm -136 363se12 Oumlstra Mellansverige -151 166ukd3 Greater Manchester -232 90ukd4 Lancashire -317 350ukf1 Derbyshire and Nottinghamshire -179 240ukf2 Leicestershire Rutland and Northants -233 191ukg3 West Midlands -313 180uki1 Inner London -142 102ukj1 Berkshire Bucks and Oxfordshire -246 208ukm3 South Western Scotland -207 128
Source Elaborated from Eurostat and national Statistical officesNote Shaded areas indicate regions with positive location effect
Em
ploy
men
t gro
wth
lt A
vera
ge v
alue
Productivity growth gt Average value Productivity growth lt Average value
Em
ploy
men
t gro
wth
gt A
vera
ge v
alue
Table 2 Employment and productivity growth rates in select regions manufacturing sector 2001-2005 (Averages of all regions +74 productivity -77 employment)
13
Delocation in the manufacturing sectors in the EU A regional overview
Finally the worst results can be seen in a fourth type of region with growth rates of
GVA and productivity below average and serious job destruction (Quadrant 3) This would
occur in regions with problems in restructuring their manufacturing sector or with low
levels of activity So together with those that are either restructuring via productivity or
via employment but without achieving a positive location effect they are clearly the
losers These include mainly British French Italian Belgian and Danish regions
To sum up these results confirm the direct relationship between growth in labour
efficiency and progress in the creation of productive industrial activity as pointed out
above and which can be more clearly by looking at Figure 1 In other words regions with
higher levels of productivity growth in general show a greater attractiveness for new
manufacturing firms
These differences in the behaviour of productivity and employment across regions
have led to remarkable disparities in rates of change of their industrial output during the
period Thus while a few increased their real manufacturing GVA by more than 20 in
the less dynamic ones the loss of industrial output is between a sixth and a third of the
initial value So significant changes had taken place in the relative position of some of
them (Figure 2)
Growth is led by a group of twenty regions located in Ireland Finland Greece
Germany Sweden Netherlands Spain and Austria with real GVA growth rates that are
more than five points above average As a result they increased their share in the industrial
output of the sample Looking at the complete list we see that the growth deviation from
the mean exhibits positive values in just over half of the regions examined among them
seven of the ten with the largest industrial scale in 2005 Thus the top ten regions have
increased their share from 32 to 33 percent in the last five years
Conversely among the less dynamic regions are found a great number of British and
some French and Italian ones which consequently have fallen back in the ranking of
NUTS 2 arranged by their contribution to aggregate manufacturing output
Between both groups there are approximately twenty regions mainly in Germany
with growth rates not far from average so their positions have hardly changed during the
last five years
14
Delocation in the manufacturing sectors in the EU A regional overview
Figure 2 Regional shares in the total sample manufacturing GVA(percentage at 2000 prices)
ITc4
UKf2
UKm3
Uke4
UKf1
UKk1
UKh1
AT22
ITe1
ES21
ES51
FR71
FR62
IT e4
DE24
DE26
SE23
FR61
FR51
FR82
SE22
ITe3
AT31
DK04
DE11
DE23
GR30
DEc0
ES30DEb3DEf0
DEa4
DE92
BE21
DE73
IE02
ITd3
FR52
DE91
DE13DE25
DE 12DE60
DE27
DE21
DE22
BE23DEa2
DE71
DE 14
SE12
ITd5
SE11
FI19
FR10
FR 24
ITe1
FI18
DK01 DEa5
FR4 2
DEa1NL32
NL3 3
FR2 3
NL22
NL 41
UKd3
UKj3
UKi1
UKm2
UKj1
UKd4
UKi2
Ukg3
-35
-30
-25
-20
-15
-10
-5
0
5
10
15
20
25
30
35
Share in 2005
Source Elaborated from Eurostat and National Statistical offices
Rat
e of
cha
nge
200
1-20
05
70403530252015100500
Finally when the question is analyzed at Member State level (Table 1) it is possible
to check out the disparities among the above mentioned regions Thus while in some
15
Delocation in the manufacturing sectors in the EU A regional overview
countries such as Spain manufacturing growth has been clearly labour-intensive
something which can be extended to its regions as also happens in Greece and Austria
which both boast positive location effect and a job destruction rate far below the average
in others such as Holland Sweden and to a lesser extent Belgium Ireland and Finland
increasing of industrial activity is only due by advances in productivity so has been
accompanied by heavy job losses and these are patterns repeated in most of their regions
with noticeable relevance in the Netherlands As for the United Kingdom Belgium and
Denmark all share declining industrial production together with strong job cuts a pattern
that is replicated in many of their regions In this situation are the bulk of French and
Italian NUTS 2 just like the countries to which they belong although in this case job
destruction has been much less pronounced and below the group average Close to this
mean is Germany as well as most of their regions
Thus the analysis at Member States level also confirms the positive relationship
between the advance of industrial productivity and the attractiveness for new
manufacturing firms As demonstrated for their regions Ireland Finland Netherlands and
Greece following at quite distance from Germany are Member States showing a better
performance in productivity and with high location effects (see Figure 1)
In fact similarities between performances in the regions and in the Member States
they belong to suggest that the trend in regional industrial employment is to some extent
influenced by belonging to the same country in other words the locational attractions of
each area and its effort to improve productivity is partly due to national specificities or
idiosyncratic factors In fact as shown in Appendix 3 most European industrialized
regions follow the location patterns of the country they belong to reproducing its
productivity behaviour too In summary the evolution of these variables in each region
seems to have a clear `country effectacute that is different behaviours motivated by specific
factors andor differentiated industrial policies
For example in order to correctly interpret the results for Spanish regions it can not
be overlooked that during the period analyzed as in the whole country regions have
absorbed large numbers of immigrants which has boosted the proliferation of lower
productivity and lower wages in industrial activities However it may be thought that this
phenomenon has tended to conceal productivity increases in larger and better equipped
16
Delocation in the manufacturing sectors in the EU A regional overview
firms which could have been significant in the light of their results7 On the other hand
countries like Finland or Ireland with the lowest population increase have opted for high-
tech manufacturing sectors as a way to improve national competitiveness8 Nonetheless
this positive location effect has not reached in these countriesrsquo NUTS 2 enough magnitude
to offset completely the job losses arising from productivity improvements
On the other hand this `national effectacute has also played an important role in
explaining the economic outcomes of European regions in terms of per capita GDP in
accordance with the results obtained by Cuadrado-Roura (2001) using the data available
for 109 EU regions over the 1977-1994 period
Table 3 Export growth in key sectors by countries 2000-2005 (percentages)Impact ITon Total
Spain 65 91 72 158 38 111 04Germany 116 138 61 111 111 130 14United Kingdom 09 85 29 32 23 61 02France -09 102 25 94 118 78 -01Ireland -09 -102 01 25 -34 77 -03Finland 47 152 45 49 56 73 13Italy 40 88 41 90 56 89 02EU-15 70 141 59 91 67 111 11Source Elaborated from Comtrade
Shoes TotalIT Auto Textile Clothes
This importance of the `national effectacute should allow us to make a better approach to
the determinants of above-mentioned delocation patterns in future research One of such
determinants might be found in the different importance and performance by countries of
some manufacturing branches particularly affected by the increase in global competition as
their development has being receiving strong support in emerging countries from both
domestic policies and the location of big multinational companies This is the case of IT
manufacturing sectors or that of automobiles clothes textiles and shoes (Sachwald 2004)
Table 3 shows how the exports of these key sectors have evolved in some of the European
countries considered here It is amazing to see the poor results registered by IT sectors in
United Kingdom France and Ireland compared to the other countries mentioned Germany
in particular This evolution could be behind the stronger effects of delocation in France
and the United Kingdom although it must have produced similar results in the case of
Ireland Furthermore on such a basis what has happened in Italy would remain
7 For details see Myro et al (2008) 8 See Aacutelvarez Loacutepez et al (2007)
17
Delocation in the manufacturing sectors in the EU A regional overview
unexplained as the selected key sectors do not show a bad performance in terms of exports
in the latter country
One reason for such contradictory results lies in the possibility that production
instead of export reflects accurately what has been happening in every sector in terms of
activity However Aacutelvarez et al (2007) show very similar patterns in production and
export specialization from 1995 to 2005 except in the case of Ireland which thus appears
as a very particular one This is because IT specialization in production increases at the
same time as it decreases in exports Perhaps the strong growth in domestic demand
prevents IT exports from growing The opposite case could be that of Italy where slow
growth in domestic demand might have been pushing up IT export9
Anyway further developments on the determinants of delocation patterns require the
preparation of disaggregated data on production a task beyond the objectives of this paper
That could allow us to update the available manufacturing specialization analysis As the
two countries exhibiting higher delocation effects France and the United Kingdom
showed the lowest rates of specialization compared with the EU (Milderfart and Overman
2002 Combes and Overman 2003) something could have changed in the last few years
which would merit a fresh look based on more recent data
On the other hand it is now clear that insofar as delocation in manufacturing
activities has affected each country in a different way a relocation process inside the EU
and between countries has taken place This process deserved to be deeply analyzed
including a perspective by sectors updating what we know about changes in the
distribution of manufacturing industry in the EU and offering the possibility of exploring
whether the European Common Policy has influenced them in some way as was already
suggested by Milderfart-Knarvik and Overman (2002)
9 In Finland IT activities grows much more in production than in exports but in both aspects a positive growth is registered
18
Delocation in the manufacturing sectors in the EU A regional overview
19
Figure 3 Employment growth rates in selected regions 2001-2005 manufacturing and total economy (percentages)
Ukg3
UKi2
UKd4
UKj1
UKm2
UKi1 UKj3
UKd3
NL 41
NL22
FR23
NL33
NL32
DEa1
FR42
DEa5
DK01
FI18
ITe1
FR 24FR10
FI19
SE11
ITd5FR52
DE 14
DE71
DEa2
BE23
DE22
DE21
DE27
IC c4
DE60DE 12
DE25
DE13
DE9 1SE12
ITd3
IE02
DE73
BE21
DE92DEa4
DEf0
DEb3
ES30
DEc0
GR30
DE23
DE11
DK04
AT31
ITe3
SE22
FR82
FR51FR61
SE2 3
DE26
DE24
IT e4
FR62
FR71
ES51
ES2 1
ITe1
AT22
UKh1
UKk1
UKf1
Uke4
UKm3
UKf2
-20
-15
-10
-5
0
5
10
15
20
25
-40 -30 -20 -10 0 10 20 30
Manufacturing
Source Elaborated from Eurostat and National Statistical offices
Tota
l em
ploy
men
t
Delocation in the manufacturing sectors in the EU A regional overview
One last question that deserves consideration is the effect of industrial delocation
process on the regional economies Surprisingly manufacturing job losses have not been
translated into total employment which exhibit positive growth for most of the chosen
regions with the exceptions of some Germans and all the Netherlands (Figure 3) That
means the regions have been able to compensate the negative effect on the employment
from shrinking manufacturing allocating more resources inside the services sectors In fact
a substitution of manufacturing by services seems to have happened as are the region
showing more delocation in manufacturing those that increase in a higher measure the
employment in the service sectors that is the French British and Italian However the
relation is not accurate as there are not a strict quantitative correlation region by region
between rates of delocation and increase in the employment in the service activities
These good results in terms of general employment shown by the regions affected in
a higher measure by manufacturing delocation suggest the convenience of a more general
analysis of regional economic growth beyond the manufacturing sector as some regions
strongly shrinking manufacturing activities in favour of those of services might be leading
an interesting process of structural change that could light up one of the ways of facing the
increasing competition coming from emerging economies
5- Final remarks
Comparative analysis of location patterns for a large sample of European regions -
characterized by having an upper-middle level income and a strong industrial sector-
during the last few years has revealed that only half of them have shown locational
attractions for manufacturing activities The regional patterns found clearly show the
influence of `national effectacute the regions showing location effects corresponding to most
of those located in Austria Germany the Netherlands Ireland Finland Sweden Spain and
Greece
On the contrary the delocation process has affected another half of the regions
included most of them French British and Italian Therefore delocation has contributed to
concentrating the European manufacturing industry in the areas with higher market
potential in the centre of continental Europe It has contributed furthermore to relocating
manufacturing activities inside every country something that requires further analysis
from future research
20
Delocation in the manufacturing sectors in the EU A regional overview
Attractiveness to location of manufacturing industries has been encouraged by
significant increases in labor productivity so in most of the regions showing positive
location patterns production increases have been compatibles with a decline in aggregate
manufacturing total employment More specifically in this situation are all regions in the
Netherlands Finland Greece and Ireland three quarters of the German ones two from the
United Kingdom two from Sweden and Madrid in Spain
On the contrary in the regions where delocation has taken place the increase in
labour productivity has been lower In fact thirteen of such regions show reductions in
labour productivity six of them placed in France three Italian the British Eastern Scotland
and Greater London Vaumlstsverige in Sweden and the Belgian Antwerp Besides the
positive impact of this rare performance on employment has been largely offset by
destruction of industrial activity except in the Icircle de France and Midi-Pyreacuteneacutees the two
territories in which productivity has a more negative trajectory
The positive link between location and labour productivity increase confirm the
result reached by other authors particularly Cuadrado Roura et al (2002) who referring
their analysis to previous years distinguish two groups of winners among the European
regions the first grouping regions with increased employment and labour productivity
perhaps reflecting the success of technological and organizational changes introduced
during the period promoting the diversification and specialization in activities with high
growth levels and attracting new investments less labour-intensive and a second one
formed by regions capable of implementing restructuring processes to eliminate the most
inefficient outputs achieve higher levels of productivity and increased industrial
production at the expense of a notable decline in employment
Nevertheless discrepancies in delocation patterns outlined above and different
achievements in terms of productivity improvement have not only been the result of
companiesacute response to intensified competition in each region but also of differential
features On the one hand is size which in larger regions like some of Italy Germany
France and Spain reduces the chances of scoring high growth rates On the other hand are
the national specificities such as the massive migrations received by the Spanish regions a
key to explain their model of industrial growth and the different public policies The
influence of the two latter factors appears remarkable given the similarities among the
location patterns of each of the regions examined and the Member States they belong to
21
Delocation in the manufacturing sectors in the EU A regional overview
Anyway the lack of data has prevented us from going further into a preliminary
explanatory analysis of the delocation patters found when looking at the different
manufacturing activities but the role played by the IT manufacturing sector and other
branches affected by intense international competition (automobile clothes and textiles
and shoes) might have been important
To finish just to point up that the effect of manufacturing delocation on aggregate
employment has been offset by growth of services sectors suggesting the convenience of a
more general analysis of regional economic growth beyond the manufacturing sector as
some regions showing greater change in employment between sectors might be leading an
interesting process of structural change that could light up one of the ways of facing the
increasing competition coming from emerging economies
22
Delocation in the manufacturing sectors in the EU A regional overview
References
Aacutelvarez Loacutepez ME R Myro and J Vega Crespo (2007) ldquoCambios Recientes en la
Especializacioacuten Inter-industrial de las Manufacturas Espantildeolasrdquo Papeles de Economiacutea
Espantildeola 112 2-21
Antragraves P and E Helpman (2004) ldquoGlobal Sourcingrdquo Journal of Political Economy
112(3) 552-580
Bjerring Olsen K (2006) Productivity Impacts of Offshoring and Outsourcing A Review
OECD Directorate for Science Technology and Industry
Baldwin RE and F Robert-Nicoud (2000) ldquoFree trade agreements without delocationrdquo
Canadian Journal of Economics 33(3) 766-786
Bhagwati J A Panagariya and TN Srinivasan (2004) ldquoThe Muddles over Outsourcingrdquo
Journal of Economic Perspectives 18(4) 93-114
Combes PP and HG Overman (2003) ldquoThe Spatial Distribution of Economic Activities
in the EUrdquo Center for Economic Performance London School of Economics and
Political Science
Cuadrado-Roura JR T Mancha-Navarro and R Garrido-Yserte (2000) ldquoRegional
Productivity Patterns in Europe An Alternative Approachrdquo The Annals of Regional
Science 34(3) 365-384
Cuadrado Roura JR (2001) Regional convergence in the European Union From
hypothesis to the actual trends The Annals of Regional Science 35(3) 333-356
Cuadrado-Roura JR T Mancha-Navarro and R Garrido-Yserte (2002) ldquoRegional
Dynamics in the European Union Winners and Losersrdquo in Cuadrado-Roura JR and
M Parellada (eds) Regional Convergente in the European Union Springer-Verlag
Berlin 23-52
Fujita M P Krugman and A Venables (1999) The Spatial Economy Cambridge MA
The MIT Press
Grossman GM and E Rossi-Hansberg (2006) The Rise of Offshoring Itacutes Not Wine for
Cloth Anymore Princeton University unpublished
Helpman E D Marin and T Verdier (2008) The organization of firms in a global
economy Harvard University Press
Krugman P and AJ Venables (1990) ldquoIntegration and the Competitiveness of Peripheral
Industryrdquo in C Bliss and J Braga de Macedo (eds) Unity with Diversity in the
European Community Cambridge University Press
23
Delocation in the manufacturing sectors in the EU A regional overview
Krugman P (1999) Geography and Trade Cambridge MA The MIT Press
Midelfart-Knarvik KH and HG Overman (2002) Delocation and European Integration
is structural spending justified Economic Policy 17(35) 321-359
Myro R CM Fernaacutendez-Otheo L Labrador AB Baides Tudela ME Aacutelvarez Loacutepez
and Vega Crespo J (2008) Globalizacioacuten y Deslocalizacioacuten Importancia y Efectos
para la Industria Espantildeola Direccioacuten General de Poliacutetica de la PYME Ministerio de
Industria Turismo y Comercio (httpwwwipymeorgNRrdonlyresAD74121A-
DD3C-4564-92AD-17A2872508CA0GlobalizacionDeslocalizacionpdf)
Puga D (1999) The Rise and Fall of Regional Inequalities European Economic Review
43(2) 303-334
Puga D (2002) European Regional Policy in Light of Recent Location Theories Journal
of Economic Geography 2(4) 373-406
Sachwald F (2004) ldquoThe impact of EU enlargement on Firmsacute Strategies and the
Location of Production in Europerdquo Tokyo Club Research Meeting
24
Delocation in the manufacturing sectors in the EU A regional overview
25
Appendix 1 European regions NUTS2 in the sampleCode Region name Code Region name
NUTS2 and country to which it belong NUTS2 and country to which it belongat22 Steiermark gr30 Attikiat31 Oberoumlsterreich Greece
Austriaie02 Southern and Eastern
be21 Prov Antwerpen Irelandbe23 Prov Oost-Vlaanderen
Belgium itc1 Piemonteitc4 Lombardia
de11 Stuttgart itd3 Venetode12 Karlsruhe itd5 Emilia-Romagnade13 Freiburg ite1 Toscanade14 Tuumlbingen ite3 Marchede21 Oberbayern ite4 Laziode22 Niederbayern Italyde23 Oberpfalzde24 Oberfranken nl22 Gelderlandde25 Mittelfranken nl32 Noord-Hollandde26 Unterfranken nl33 Zuid-Hollandde27 Schwaben nl41 Noord-Brabantde60 Hamburg Netherlandsde71 Darmstadtde73 Kassel se11 Stockholmde91 Braunschweig se12 Oumlstra Mellansverigede92 Hannover se22 Sydsverigedea1 Duumlsseldorf se23 Vaumlstsverigedea2 Koumlln Swedendea4 Detmolddea5 Arnsberg ukd3 Greater Manchesterdeb3 Rheinhessen-Pfalz ukd4 Lancashiredec0 Saarland uke4 West Yorkshiredef0 Schleswig-Holstein ukf1 Derbyshire and Nottinghamshire
Germany ukf2 Leicestershire Rutland and Northantsukg3 West Midlands
dk01 Hovedstaden ukh1 East Angliadk04 Midtjylland uki1 Inner London
Denmark uki2 Outer Londonukj1 Berkshire Bucks and Oxfordshire
es21 Pais Vasco ukj3 Hampshire and Isle of Wightes30 Comunidad de Madrid ukk1 Gloucestershire Wiltshire and Bristoles51 Cataluntildea ukm2 Eastern Scotland
Spain ukm3 South Western ScotlandUnited Kingdom
fi18 Etelauml-Suomifi19 Laumlnsi-Suomi
Finland
fr10 Icircle de Francefr23 Haute-Normandiefr24 Centrefr42 Alsacefr51 Pays de la Loirefr52 Bretagnefr61 Aquitainefr62 Midi-Pyreacuteneacuteesfr71 Rhocircne-Alpesfr82 Provence-Alpes-Cocircte dAzur
France
Delocation in the manufacturing sectors in the EU A regional overview
26
Manufacturing GVA GDPpc( of total EU-15) (Index EU-15=100)
at22 Steiermark 040 9647at31 Oberoumlsterreich 063 10641be21 Prov Antwerpen 064 12780be23 Prov Oost-Vlaanderen 040 9589de11 Stuttgart 241 12296de12 Karlsruhe 132 11674de13 Freiburg 099 10018de14 Tuumlbingen 095 10780de21 Oberbayern 205 14684de22 Niederbayern 051 10090de23 Oberpfalz 046 10475de24 Oberfranken 047 9885de25 Mittelfranken 079 12022de26 Unterfranken 056 10283de27 Schwaben 084 10593de60 Hamburg 062 17922de71 Darmstadt 130 13985de73 Kassel 041 10006de91 Braunschweig 081 9675de92 Hannover 058 10000dea1 Duumlsseldorf 176 11397dea2 Koumlln 129 10387dea4 Detmold 085 9742dea5 Arnsberg 143 9395deb3 Rheinhessen-Pfalz 082 9505dec0 Saarland 040 9778def0 Schleswig-Holstein 061 9099dk01 Hovedstaden 043 18287dk04 Midtjylland 041 13581es21 Pais Vasco 070 9977es30 Comunidad de Madrid 093 10213es51 Cataluntildea 180 9310fi18 Etelauml-Suomi 123 13009fi19 Laumlnsi-Suomi 064 9954fr10 Icircle de France 221 15821fr23 Haute-Normandie 043 9333fr24 Centre 052 9211fr42 Alsace 048 9664fr51 Pays de la Loire 072 9353fr52 Bretagne 051 9124fr61 Aquitaine 044 9276fr62 Midi-Pyreacuteneacutees 040 9221fr71 Rhocircne-Alpes 140 10349fr82 Provence-Alpes-Cocircte dAzur 055 9715gr30 Attiki 039 9144ie02 Southern and Eastern 196 16068itc1 Piemonte 128 9973itc4 Lombardia 390 11863itd3 Veneto 176 10747itd5 Emilia-Romagna 164 11132ite1 Toscana 090 9929ite3 Marche 047 9078ite4 Lazio 062 11123nl22 Gelderland 043 9892nl32 Noord-Holland 051 13804nl33 Zuid-Holland 077 12003nl41 Noord-Brabant 098 11722se11 Stockholm 062 17037se12 Oumlstra Mellansverige 056 10433se22 Sydsverige 044 10865se23 Vaumlstsverige 074 11743ukd3 Greater Manchester 055 10374ukd4 Lancashire 046 9161uke4 West Yorkshire 054 10378ukf1 Derbyshire and Nottinghamshire 065 10283ukf2 Leicestershire Rutland and Northants 053 11179ukg3 West Midlands 071 10596ukh1 East Anglia 050 10169uki1 Inner London 067 28535uki2 Outer London 055 10231ukj1 Berkshire Bucks and Oxfordshire 058 15836ukj3 Hampshire and Isle of Wight 043 11334ukk1 Gloucestershire Wiltshire and Bristol 061 12628ukm2 Eastern Scotland 044 10947ukm3 South Western Scotland 053 10097
Source Elaborated from Eurostat and national Statistical offices
Appendix 2 GDP per Capita and regions share in EU-15 manufacturing GVA 2005
Delocation in the manufacturing sectors in the EU A regional overview
Appendix 2 (Continued)
0
5
10
15
20
25
30
100 120 140 160 180 200 220 240 260 280
26
23
9
54
12
12
10 0 0 0 0 0 0 0 0
1
Reg iona l GD P per Ca pita (EU-1 5 =1 0 0 ) Histo g ra m
0
10
20
30
40
05 10 15 20 25 30 35 40
14
34
9
3
6
13 3
10 0 0 0 0
1
Industrial size of selected regions ( of EU-15 manufacturing GVA)Histogram
27
Delocation in the manufacturing sectors in the EU A regional overview
Appendix 3 Location effect and productivity growth rates in European manufacturing sector
(percentages)
Loca
tion
effe
ct (
of 2
000
empl
oym
ent)
Productivity grothw
AUSTRIA
AT
AT31AT221
-5
0
5
10
-5 0 5 10
GERMANY
DE91
DEa4
Dec0
EDf0
DE 24
DE71DE92
DE14
DE 26
DE73DE 60
DE 22
DE23
DE25
DE 13
DE a1
DEa2
DE27
DE 21
DE a5
DE12DE
DEb3
DE11
-5
0
5
10
15
20
-5 0 5 10 15 20 25 30
BELGIUM
BE21
BE
BE23
-10
-5
0
5
-5 0 5 10 15
DENMARK
DK04
DK
DK01
-10
-5
0
5
-5 0 5 10 15
SPAIN
ES
ES30
ES21
ES51
-5
0
5
10
-5 0 5 10
FRANCE
FR51
FR71
FR42
FR23
FR62
FR61
FR82FR52
FR24FR
FR10
-25
-20
-15
-10
-5
0
5
-35 -30 -25 -20 -15 -10 -5 0 5 10
HOLAND
NL33
NL22
NL41
NL32
NL
-5
0
5
10
15
20
-5 0 5 10 15 20 25 30
ITALY
ITe4
ITc1
ITe1
ITd3
ITd5
ITe3
ITc4
IT
-25
-20
-15
-10
-5
0
5
-10 -5 0 5 10
28
Delocation in the manufacturing sectors in the EU A regional overview
Productivity grothw
Source Elaborated from Eurostat and National Statistical offices
Appendix 3 (continued)Lo
catio
n ef
fect
( o
f 200
0 em
ploy
men
t)FINLAND
FI FI19
FI18
-5
0
5
10
15
20
25
30
-5 0 5 10 15 20 25 30 35
GREECE
GR30GR
-5
0
5
10
15
20
25
30
-5 0 5 10 15 20 25 30 35
IRELAND
IEIE02
-5
0
5
10
15
20
25
30
35
-5 0 5 10 15 20 25 30 35 40 45
UNITED KINDOGDOM
UKh1
UKm2
UKf1
UKj3
UKd3
UKf2
UKi2
UKk1
UKg3UKe4
UKm3
UKj1
UKd4
UKi1
UK
-35
-30
-25
-20
-15
-10
-5
0
5
10
-15 -10 -5 0 5 10 15 20 25 30 35 40
SWEDEN
SE11
SE12
SE23 SE22
SE
-5
0
5
10
15
20
25
30
35
-5 0 5 10 15 20 25 30 35 40 45
29
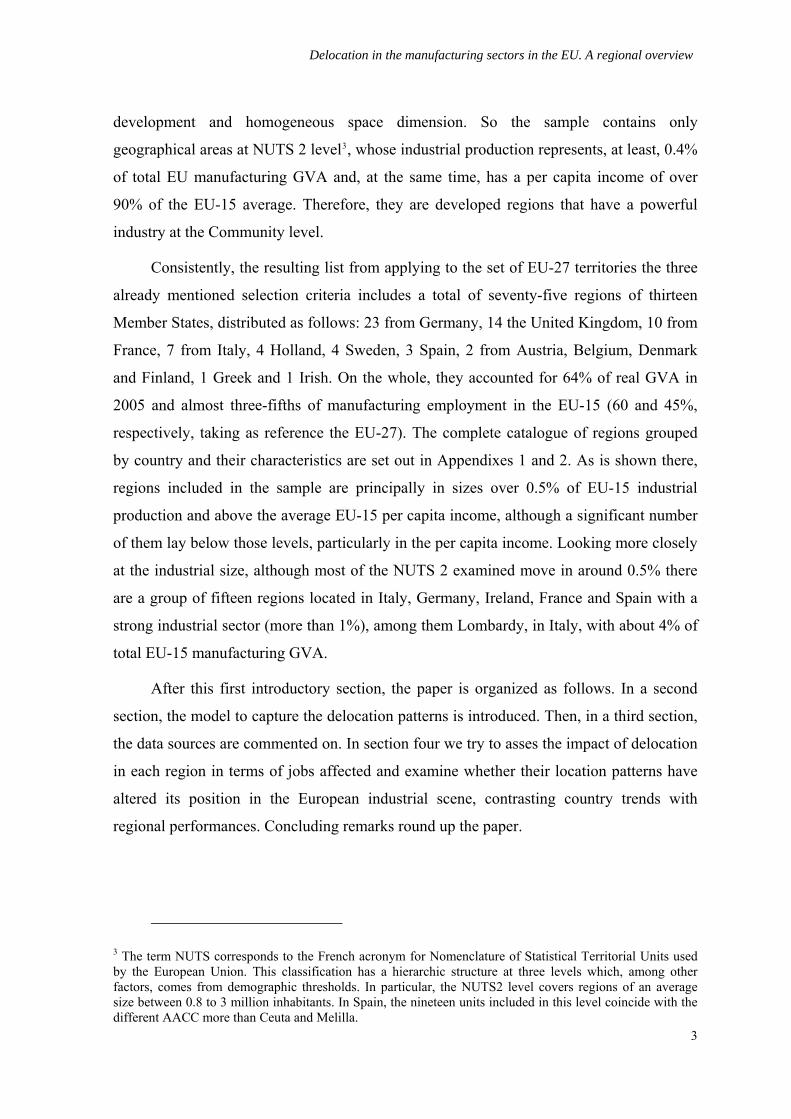
Delocation in the manufacturing sectors in the EU A regional overview
Holland and Italy provide such information or at least indexes of volume In the rest of the
countries real values of GVA have been estimated by applying the national price deflators
to the regional series at current values
As regards total employment significant discrepancies between the data published
by Eurostat and that country itself (particularly in the United Kingdom) are found as well
as the gaps found in several NUTS 2 of some Member States such as in Germany forced
to complete regional series and correct such deficiencies with the help of the information
coming from the National Statistics Offices
To sum up most of the information used (especially production data) comes from
National Statistical Offices but this is commonly close to the Eurostat database as this is
built mainly with data coming from the regional accounts of each country
By the way one of the problems arising from taking the National Statistics as the
main source of data is that the time intervals for which they provide information do not
always coincide That explains that despite having more recent data from some areas the
analysis must conclude in 2005
4- Delocation of manufacturing industries in European regions
As noted above in the introduction the group of regions examined reached just over
64 of EU-15 industrial GVA and about 60 of jobs in 2005 figures slightly lower than
in 2000 Thus despite nearly half of regionsrsquo industrial output at constant prices having
achieved positive growth rates the group accumulated throughout the period a decrease of
about 1 similar to EU-15 average4 Regarding employment the evolution has been even
more negative Throughout the first five years of the current century destruction of jobs in
the aggregate industry has been a common feature in the vast majority (90) of the
seventy-five NUTS 2 examined as well as for each of the Member States where they are
located except Spain accumulating the total sample a decline of close to 8
4 It must be noted that the EU average has been calculated from the aggregate industrial GVA at constant prices of thirteen countries included in the sample Thus Portugal and Luxembourg have been excluded and the values from other countries have been estimated by adding figures of all their regions So the above mentioned growth rate differs from that provided by Eurostat exhibiting a positive increase of 46
6
Delocation in the manufacturing sectors in the EU A regional overview
Focusing on employment the most dynamic areas are located mostly in France
Spain Austria and Italy while the Netherlands and especially the British regions exhibit
the largest job losses (Table 1)
Registered unemployment seems to be related to good performance in labour
productivity pointing to the fierce competition faced by the manufacturing sector in the
analyzed period Thus higher job losses are found in regions with stronger labour
productivity increases although some French and most of the British regions escaped from
this rule as large losses in employment are not accompanied by significant gains in labour
productivity suggesting delocation effects of a particular intensity
That reveals a very different growth path in employment and labour productivity by
regions differences which can be explored in a more detail to isolate the attractive regions
to locate manufacturing activities from the others characterized by a delocation process
To go deeply into this latter question Table 1 contains the results of estimating the
impact on total employment of location and delocation forces in the manufacturing sectors
across the seventy-five regions included in the sample over the period 2001-2005 by using
the procedure proposed in the second section that is discounting from the total change in
jobs the reduction corresponding to the increase in labour productivity Therefore the
location effect shows the effect on employment of GVA change calculated by applying the
initial rate of labour productivity
In about half of the regions with job losses all of those considered in the
Netherlands Finland Greece and Ireland three-quarters of the Germans two British two
Swedish and Madrid in Spain the decline in employment has been due entirely to
increased labour productivity so a positive effect of location appears This behaviour
extends to Finnish German and Swedish economies as a whole as well as Greece Ireland
and Austria Therefore all those regions have proved attractive for the location of
manufacturing firms
7
Delocation in the manufacturing sectors in the EU A regional overview
8
Productivity Location Productivity Locationeffect effect effect effect
at22 Steiermark 372 -108 480 36 -11 47at31 Oberoumlsterreich 097 -837 934 06 -56 62
Austria -1104 -2649 1545 -18 -42 25be21 Prov Antwerpen -1010 079 -1089 -70 05 -75be23 Prov Oost-Vlaanderen -750 -627 -123 -74 -61 -12
Belgium -5740 -2219 -3521 -84 -32 -51de11 Stuttgart -3157 -8244 5087 -48 -125 77de12 Karlsruhe -2036 -3585 1550 -57 -101 44de13 Freiburg -1291 -1301 011 -45 -45 00de14 Tuumlbingen -585 -1805 1219 -23 -72 49de21 Oberbayern -1630 -7976 6346 -37 -179 142de22 Niederbayern -490 -3270 2781 -33 -218 186de23 Oberpfalz -538 -1716 1178 -38 -120 83de24 Oberfranken -1957 -3131 1175 -116 -186 70de25 Mittelfranken -1184 -1770 586 -53 -80 26de26 Unterfranken -819 -3157 2338 -49 -189 140de27 Schwaben -932 -3335 2403 -41 -148 106de60 Hamburg -760 -1222 463 -60 -97 37de71 Darmstadt -5343 -4720 -623 -149 -132 -17de73 Kassel -1059 -1396 336 -78 -103 25de91 Braunschweig -947 -500 -447 -47 -25 -22de92 Hannover -1900 -1544 -356 -106 -86 -20dea1 Duumlsseldorf -6272 -8787 2515 -126 -177 51dea2 Koumlln -5428 -4971 -457 -150 -137 -13dea4 Detmold -3026 -3112 086 -107 -110 03dea5 Arnsberg -5824 -5502 -322 -129 -122 -07deb3 Rheinhessen-Pfalz -2099 -3016 917 -106 -152 46dec0 Saarland -360 -1810 1450 -32 -160 128def0 Schleswig-Holstein -1867 -2485 617 -101 -135 33
Germany -60300 -112275 51975 -74 -138 64dk01 Hovedstaden -1300 -1216 -084 -134 -125 -09dk04 Midtjylland -2000 -1622 -378 -146 -118 -28
Denmark -6100 -3428 -2672 -130 -73 -57es21 Pais Vasco 1840 -331 2171 74 -13 87es30 Comunidad de Madrid -1060 -2180 1120 -31 -63 32es51 Cataluntildea 660 -1914 2574 09 -25 34
Spain 13970 -3927 17897 47 -13 60fi18 Etelauml-Suomi -1807 -7159 5352 -86 -339 253fi19 Laumlnsi-Suomi -701 -3886 3185 -54 -297 244
Finland -1798 -12006 10208 -43 -286 243fr10 Icircle de France 12652 17868 -5216 218 307 -90fr23 Haute-Normandie -2418 -1093 -1325 -171 -77 -94fr24 Centre -2016 -120 -1896 -106 -06 -100fr42 Alsace -2489 -988 -1501 -154 -61 -93fr51 Pays de la Loire -217 1794 -2011 -08 67 -75fr52 Bretagne -415 -215 -200 -23 -12 -11fr61 Aquitaine -199 742 -941 -14 50 -64fr62 Midi-Pyreacuteneacutees 209 3318 -3109 15 245 -229fr71 Rhocircne-Alpes -2919 2759 -5678 -61 57 -118fr82 Provence-Alpes-Cocircte dAzur -097 262 -359 -06 18 -24
France -15306 31566 -46872 -40 83 -123gr30 Attiki -360 -5072 4712 -17 -234 217
Greece -730 -11989 11259 -14 -222 208ie02 Southern and Eastern -1840 -9985 8145 -78 -426 347
Ireland -2420 -12274 9854 -76 -387 311itc1 Piemonte -6869 2539 -9407 -129 48 -177itc4 Lombardia -7940 -7682 -258 -63 -61 -02itd3 Veneto -3967 -211 -3756 -62 -03 -58itd5 Emilia-Romagna -860 -840 -020 -16 -16 00ite1 Toscana -3620 078 -3697 -98 02 -101ite3 Marche 164 -555 719 08 -28 36ite4 Lazio -733 956 -1689 -36 47 -82
Italy -21761 6310 -28071 -45 13 -58nl22 Gelderland -2164 -2506 341 -178 -206 28nl32 Noord-Holland -1555 -2034 479 -138 -180 42nl33 Zuid-Holland -1734 -3980 2246 -129 -296 167nl41 Noord-Brabant -3539 -5515 1976 -173 -269 96
Netherlands -14767 -24690 9923 -161 -270 108se11 Stockholm -1570 -4183 2613 -136 -363 227se12 Oumlstra Mellansverige -2170 -2387 217 -151 -166 15se22 Sydsverige -1010 -690 -320 -91 -62 -29se23 Vaumlstsverige -460 134 -594 -26 07 -33
Sweden -7500 -9400 1900 -95 -119 24ukd3 Greater Manchester -4900 -1907 -2993 -232 -90 -142ukd4 Lancashire -4600 -5082 482 -317 -350 33uke4 West Yorkshire -3700 -1192 -2508 -186 -60 -126ukf1 Derbyshire and Nottinghamshire -3700 -4965 1265 -179 -240 61ukf2 Leicestershire Rutland and Northan -4400 -3607 -793 -233 -191 -42ukg3 West Midlands -8700 -4999 -3701 -313 -180 -133ukh1 East Anglia -2500 -1292 -1208 -137 -71 -66uki1 Inner London -1919 -1381 -538 -142 -102 -40uki2 Outer London -4481 1106 -5587 -271 67 -338ukj1 Berkshire Bucks and Oxfordshire -4600 -3898 -702 -246 -208 -38ukj3 Hampshire and Isle of Wight -1100 -689 -411 -81 -51 -30ukk1 Gloucestershire Wiltshire and Brist -3400 -1253 -2147 -169 -62 -107ukm2 Eastern Scotland -1100 1402 -2502 -91 116 -207ukm3 South Western Scotland -3400 -2107 -1293 -207 -128 -79
United Kingdom -89800 -48574 -41226 -196 -106 -90
Table 1 Importance of manufacturing delocation in European regions 2001-2005 (Decomposition of change in employment)
Total effect
Source Elaborated from Eurostat and National Statistical offices
Number of jobs (thousands)
Total effect
Percent share of 2000 employmentRegions
Delocation in the manufacturing sectors in the EU A regional overview
By contrast thirty-eight remaining regions that also show reductions in
manufacturing employment have been affected by delocation processes to different
extents although only in a small number of them have they been accompanied by
decreases in labour productivity which could make the prospects for economic growth
tougher (four from France Piamonte Toscana and Lazio in Italy Outer London and
Eastern Scotland in the United Kingdom the Swedish Vaumlstsverige and Antwerp in
Belgium)
Regions with positive location effects are shown in Map 1 Most of them are large
industrial regions and are located in the traditional industrial growth centres5 those
characterized by high market potential (Combes and Overman 2003) although there are
also some intermediate and peripheral territories mainly located in the north of Italy
United Kingdom and Spain and in the south of Sweden and Norway This means that the
delocation process has contributed to concentrating the European manufacturing industries
in that privileged area of faster growth apart from some other changes inside every
country
To compare now the intensity of such effects of location and delocation across
regions avoiding the differences they have in size we built a relative measure of them the
ratio of job losses in the period to the volume of employment in the first year 2000 (Table
1)
Following this ratio delocation effects are revealed to be particularly strong in
France United Kingdom Italy and in one region of Belgium with declines in
employment exceeding 20 in some of them
Conversely the regions of Finland and several of the German and the Dutch ones
exhibit strong location effects
In any case as was pointed above the importance of location effects seems to lie in
labour productivity gains In fact higher increases in productivity (over 15) are found
precisely in those regions of Ireland Finland Sweden Netherlands and Germany besides
the Greek Attiki where the location effect has in general reached its greatest extent
(Figure 1)
5 Note that the map of winning regions is clearly influenced by the large number (30) of German NUTS 2 in the sample
9
Delocation in the manufacturing sectors in the EU A regional overview
fi19
fi18
ie02
dec0
gr30
se11
nl33
de21
de22
de26
de25
de12
de14
de11
dea4
dea1de73
def0
de60
deb3
de27
de23
itd5
ite3
se12
nl22
es 30
ukd4
es51
nl32
at22
ukf1
at31
es21
Map 1 Regions with positive location effect ( of 2000 employment)
Above 10 0 to 10
nl41
de13de27
Nevertheless productivity also grows faster in most of the regions belonging to the
United Kingdom Belgium and Denmark in spite of the strong delocation effects registered
10
Delocation in the manufacturing sectors in the EU A regional overview
which disturbs the above-mentioned positive relationship suggesting the harsh process of
industrial restructuring involved
Figure 1 Location effect and productivity growth in select regions manufacturing sector 2001-2005 (percentages)
UKi2
EU 15
FR6 2
UKm2
ITc1
UKg3UKd 3
UKe4
UKk1FR71F R
FR10UKm3
UKj1UKf2
UKd 4
UKi1
D K
DK01
UKh1U K
FR2 3FR4 2
FR24ITe1
BE2 1ITe4FR51
FR61
ITITd 3
SE2 2FR8 2
SE23
NL2 2
UKf1DE2 4
NL3 2DEa1
DEf0
UKj3DE9 1 DE92
DEa2DE71DK0 4
S EDE25
DE6 0DE12
A T
DE14
ITe3
AT2 2
AT3 1ESD E
DE 11DE2 3
NL41N LDE2 7
DEc0
NL3 3
DE2 6DE2 1
ES3 0ES51
SE11
DE2 2
ES21
GR
FI19F I
FI18
IE
GR3 0
B E
DE73
DEb 3
IE0 2
ITd 5 DE13SE12
FR52ITc4BE2 3
DEa4DEa5
y = 07x - 59R2 = 06
-35
-30
-25
-20
-15
-10
-5
0
5
10
15
20
25
30
35
40
-35 -30 -25 -20 -15 -10 -5 0 5 10 15 20 25 30 35 40 45
Productivity grothw Source Elaborated from Eurostat and National Statistical offices
Loca
tion
effe
ct (
of 2
000
empl
oym
ent)
11
Delocation in the manufacturing sectors in the EU A regional overview
In contrast the productivity decline in half of the French and Italian regions albeit
with a positive impact on employment is largely offset by destruction of industrial
activity except in Icircle de France and Midi -Pyreacuteneacutees the two territories in which
productivity has a more negative trajectory
These results closely match those reported by Cuadrado Roura et al (2000) based on
the growth rates for regional productivity and employment during the period 1980-1993
grouping European regions in four typologies comparing the growth rates of these two
variables with their respective European averages
According to this approach and including the location effect in the analysis the
group of regions that are examined in this work would be categorized as follows (Table 2)
The first group includes areas with productivity and employment growth rates above
sample average and show positive location effect (Quadrant 1) So as has been underlined
in that work possibly this reflects the fact that the technological and organizational
changes introduced during the period would have been successful promoting the
diversification and specialization in activities with high growth levels and attracting new
investments which are less labour-intensive
In a second stage are those regions that as the above mentioned authors suggest
have implemented restructuring processes to eliminate the most inefficient outputs
achieving higher levels of productivity and in about half of them increased industrial
production at the expense of a notable decline in employment (Quadrant 4) They named
this typology `restructuring via productivityacute
With a few exceptions (those where the location effect is negative) the regions in
both groups are the winners of industrial dynamic during the period Most of them are
large industrial regions and are located in the traditional industrial growth centres As
demonstrated above they are mainly Finish German and Dutch as well as Greek and Irish
regions
In contrast another large group of regions due to different factors6 have opted for
more labour-intensive industrial models which in a few cases (especially in Spanish and
Austrian regions) have been accompanied by output increases so they can also be included
6 See Cuadrado et al (2000)
12
Delocation in the manufacturing sectors in the EU A regional overview
in the winners (Map 1) while in other the result has been a loss of productive activity
(Quadrant 2)
(1) (2)Employment Productivity Employment Productivity
de11 Stuttgart -48 125 at22 Steiermark 36 11de12 Karlsruhe -57 101 at31 Oberoumlsterreich 06 56de21 Oberbayern -37 179 be21 Prov Antwerpen -70 -05de22 Niederbayern -33 218 be23 Prov Oost-Vlaanderen -74 61de23 Oberpfalz -38 120 de13 Freiburg -45 45de25 Mittelfranken -53 80 de14 Tuumlbingen -23 72de26 Unterfranken -49 189 de91 Braunschweig -47 25de27 Schwaben -41 148 es21 Pais Vasco 74 13de60 Hamburg -60 97 es30 Comunidad de Madrid -31 63dec0 Saarland -32 160 es51 Cataluntildea 09 25fi19 Laumlnsi-Suomi -54 297 fr10 Icircle de France 218 -307gr30 Attiki -17 234 fr51 Pays de la Loire -08 -67
fr52 Bretagne -23 12fr61 Aquitaine -14 -50fr62 Midi-Pyreacuteneacutees 15 -245fr71 Rhocircne-Alpes -61 -57fr82 Provence-Alpes-Cocircte dAzur -06 -18itc4 Lombardia -63 61itd3 Veneto -62 03itd5 Emilia-Romagna -16 16ite3 Marche 08 28ite4 Lazio -36 -47se23 Vaumlstsverige -26 -07
(4) (3)Employment Productivity Employment Productivity
de24 Oberfranken -116 186 fr24 Centre -106 06de71 Darmstadt -149 132 fr42 Alsace -154 61de73 Kassel -78 103 itc1 Piemonte -129 -48de92 Hannover -106 86 ite1 Toscana -98 -02dea1 Duumlsseldorf -126 177 se22 Sydsverige -91 62dea2 Koumlln -150 137 uke4 West Yorkshire -186 60dea4 Detmold -107 110 ukh1 East Anglia -137 71dea5 Arnsberg -129 122 uki2 Outer London -271 -67deb3 Rheinhessen-Pfalz -106 152 ukj3 Hampshire and Isle of Wight -81 51def0 Schleswig-Holstein -101 135 ukk1 Gloucestershire Wiltshire -169 62dk01 Hovedstaden -134 125 ukm2 Eastern Scotland -91 -116dk04 Midtjylland -146 118fi18 Etelauml-Suomi -86 339fr23 Haute-Normandie -171 77ie02 Southern and Eastern -78 426nl22 Gelderland -178 206nl32 Noord-Holland -138 180nl33 Zuid-Holland -129 296nl41 Noord-Brabant -173 269se11 Stockholm -136 363se12 Oumlstra Mellansverige -151 166ukd3 Greater Manchester -232 90ukd4 Lancashire -317 350ukf1 Derbyshire and Nottinghamshire -179 240ukf2 Leicestershire Rutland and Northants -233 191ukg3 West Midlands -313 180uki1 Inner London -142 102ukj1 Berkshire Bucks and Oxfordshire -246 208ukm3 South Western Scotland -207 128
Source Elaborated from Eurostat and national Statistical officesNote Shaded areas indicate regions with positive location effect
Em
ploy
men
t gro
wth
lt A
vera
ge v
alue
Productivity growth gt Average value Productivity growth lt Average value
Em
ploy
men
t gro
wth
gt A
vera
ge v
alue
Table 2 Employment and productivity growth rates in select regions manufacturing sector 2001-2005 (Averages of all regions +74 productivity -77 employment)
13
Delocation in the manufacturing sectors in the EU A regional overview
Finally the worst results can be seen in a fourth type of region with growth rates of
GVA and productivity below average and serious job destruction (Quadrant 3) This would
occur in regions with problems in restructuring their manufacturing sector or with low
levels of activity So together with those that are either restructuring via productivity or
via employment but without achieving a positive location effect they are clearly the
losers These include mainly British French Italian Belgian and Danish regions
To sum up these results confirm the direct relationship between growth in labour
efficiency and progress in the creation of productive industrial activity as pointed out
above and which can be more clearly by looking at Figure 1 In other words regions with
higher levels of productivity growth in general show a greater attractiveness for new
manufacturing firms
These differences in the behaviour of productivity and employment across regions
have led to remarkable disparities in rates of change of their industrial output during the
period Thus while a few increased their real manufacturing GVA by more than 20 in
the less dynamic ones the loss of industrial output is between a sixth and a third of the
initial value So significant changes had taken place in the relative position of some of
them (Figure 2)
Growth is led by a group of twenty regions located in Ireland Finland Greece
Germany Sweden Netherlands Spain and Austria with real GVA growth rates that are
more than five points above average As a result they increased their share in the industrial
output of the sample Looking at the complete list we see that the growth deviation from
the mean exhibits positive values in just over half of the regions examined among them
seven of the ten with the largest industrial scale in 2005 Thus the top ten regions have
increased their share from 32 to 33 percent in the last five years
Conversely among the less dynamic regions are found a great number of British and
some French and Italian ones which consequently have fallen back in the ranking of
NUTS 2 arranged by their contribution to aggregate manufacturing output
Between both groups there are approximately twenty regions mainly in Germany
with growth rates not far from average so their positions have hardly changed during the
last five years
14
Delocation in the manufacturing sectors in the EU A regional overview
Figure 2 Regional shares in the total sample manufacturing GVA(percentage at 2000 prices)
ITc4
UKf2
UKm3
Uke4
UKf1
UKk1
UKh1
AT22
ITe1
ES21
ES51
FR71
FR62
IT e4
DE24
DE26
SE23
FR61
FR51
FR82
SE22
ITe3
AT31
DK04
DE11
DE23
GR30
DEc0
ES30DEb3DEf0
DEa4
DE92
BE21
DE73
IE02
ITd3
FR52
DE91
DE13DE25
DE 12DE60
DE27
DE21
DE22
BE23DEa2
DE71
DE 14
SE12
ITd5
SE11
FI19
FR10
FR 24
ITe1
FI18
DK01 DEa5
FR4 2
DEa1NL32
NL3 3
FR2 3
NL22
NL 41
UKd3
UKj3
UKi1
UKm2
UKj1
UKd4
UKi2
Ukg3
-35
-30
-25
-20
-15
-10
-5
0
5
10
15
20
25
30
35
Share in 2005
Source Elaborated from Eurostat and National Statistical offices
Rat
e of
cha
nge
200
1-20
05
70403530252015100500
Finally when the question is analyzed at Member State level (Table 1) it is possible
to check out the disparities among the above mentioned regions Thus while in some
15
Delocation in the manufacturing sectors in the EU A regional overview
countries such as Spain manufacturing growth has been clearly labour-intensive
something which can be extended to its regions as also happens in Greece and Austria
which both boast positive location effect and a job destruction rate far below the average
in others such as Holland Sweden and to a lesser extent Belgium Ireland and Finland
increasing of industrial activity is only due by advances in productivity so has been
accompanied by heavy job losses and these are patterns repeated in most of their regions
with noticeable relevance in the Netherlands As for the United Kingdom Belgium and
Denmark all share declining industrial production together with strong job cuts a pattern
that is replicated in many of their regions In this situation are the bulk of French and
Italian NUTS 2 just like the countries to which they belong although in this case job
destruction has been much less pronounced and below the group average Close to this
mean is Germany as well as most of their regions
Thus the analysis at Member States level also confirms the positive relationship
between the advance of industrial productivity and the attractiveness for new
manufacturing firms As demonstrated for their regions Ireland Finland Netherlands and
Greece following at quite distance from Germany are Member States showing a better
performance in productivity and with high location effects (see Figure 1)
In fact similarities between performances in the regions and in the Member States
they belong to suggest that the trend in regional industrial employment is to some extent
influenced by belonging to the same country in other words the locational attractions of
each area and its effort to improve productivity is partly due to national specificities or
idiosyncratic factors In fact as shown in Appendix 3 most European industrialized
regions follow the location patterns of the country they belong to reproducing its
productivity behaviour too In summary the evolution of these variables in each region
seems to have a clear `country effectacute that is different behaviours motivated by specific
factors andor differentiated industrial policies
For example in order to correctly interpret the results for Spanish regions it can not
be overlooked that during the period analyzed as in the whole country regions have
absorbed large numbers of immigrants which has boosted the proliferation of lower
productivity and lower wages in industrial activities However it may be thought that this
phenomenon has tended to conceal productivity increases in larger and better equipped
16
Delocation in the manufacturing sectors in the EU A regional overview
firms which could have been significant in the light of their results7 On the other hand
countries like Finland or Ireland with the lowest population increase have opted for high-
tech manufacturing sectors as a way to improve national competitiveness8 Nonetheless
this positive location effect has not reached in these countriesrsquo NUTS 2 enough magnitude
to offset completely the job losses arising from productivity improvements
On the other hand this `national effectacute has also played an important role in
explaining the economic outcomes of European regions in terms of per capita GDP in
accordance with the results obtained by Cuadrado-Roura (2001) using the data available
for 109 EU regions over the 1977-1994 period
Table 3 Export growth in key sectors by countries 2000-2005 (percentages)Impact ITon Total
Spain 65 91 72 158 38 111 04Germany 116 138 61 111 111 130 14United Kingdom 09 85 29 32 23 61 02France -09 102 25 94 118 78 -01Ireland -09 -102 01 25 -34 77 -03Finland 47 152 45 49 56 73 13Italy 40 88 41 90 56 89 02EU-15 70 141 59 91 67 111 11Source Elaborated from Comtrade
Shoes TotalIT Auto Textile Clothes
This importance of the `national effectacute should allow us to make a better approach to
the determinants of above-mentioned delocation patterns in future research One of such
determinants might be found in the different importance and performance by countries of
some manufacturing branches particularly affected by the increase in global competition as
their development has being receiving strong support in emerging countries from both
domestic policies and the location of big multinational companies This is the case of IT
manufacturing sectors or that of automobiles clothes textiles and shoes (Sachwald 2004)
Table 3 shows how the exports of these key sectors have evolved in some of the European
countries considered here It is amazing to see the poor results registered by IT sectors in
United Kingdom France and Ireland compared to the other countries mentioned Germany
in particular This evolution could be behind the stronger effects of delocation in France
and the United Kingdom although it must have produced similar results in the case of
Ireland Furthermore on such a basis what has happened in Italy would remain
7 For details see Myro et al (2008) 8 See Aacutelvarez Loacutepez et al (2007)
17
Delocation in the manufacturing sectors in the EU A regional overview
unexplained as the selected key sectors do not show a bad performance in terms of exports
in the latter country
One reason for such contradictory results lies in the possibility that production
instead of export reflects accurately what has been happening in every sector in terms of
activity However Aacutelvarez et al (2007) show very similar patterns in production and
export specialization from 1995 to 2005 except in the case of Ireland which thus appears
as a very particular one This is because IT specialization in production increases at the
same time as it decreases in exports Perhaps the strong growth in domestic demand
prevents IT exports from growing The opposite case could be that of Italy where slow
growth in domestic demand might have been pushing up IT export9
Anyway further developments on the determinants of delocation patterns require the
preparation of disaggregated data on production a task beyond the objectives of this paper
That could allow us to update the available manufacturing specialization analysis As the
two countries exhibiting higher delocation effects France and the United Kingdom
showed the lowest rates of specialization compared with the EU (Milderfart and Overman
2002 Combes and Overman 2003) something could have changed in the last few years
which would merit a fresh look based on more recent data
On the other hand it is now clear that insofar as delocation in manufacturing
activities has affected each country in a different way a relocation process inside the EU
and between countries has taken place This process deserved to be deeply analyzed
including a perspective by sectors updating what we know about changes in the
distribution of manufacturing industry in the EU and offering the possibility of exploring
whether the European Common Policy has influenced them in some way as was already
suggested by Milderfart-Knarvik and Overman (2002)
9 In Finland IT activities grows much more in production than in exports but in both aspects a positive growth is registered
18
Delocation in the manufacturing sectors in the EU A regional overview
19
Figure 3 Employment growth rates in selected regions 2001-2005 manufacturing and total economy (percentages)
Ukg3
UKi2
UKd4
UKj1
UKm2
UKi1 UKj3
UKd3
NL 41
NL22
FR23
NL33
NL32
DEa1
FR42
DEa5
DK01
FI18
ITe1
FR 24FR10
FI19
SE11
ITd5FR52
DE 14
DE71
DEa2
BE23
DE22
DE21
DE27
IC c4
DE60DE 12
DE25
DE13
DE9 1SE12
ITd3
IE02
DE73
BE21
DE92DEa4
DEf0
DEb3
ES30
DEc0
GR30
DE23
DE11
DK04
AT31
ITe3
SE22
FR82
FR51FR61
SE2 3
DE26
DE24
IT e4
FR62
FR71
ES51
ES2 1
ITe1
AT22
UKh1
UKk1
UKf1
Uke4
UKm3
UKf2
-20
-15
-10
-5
0
5
10
15
20
25
-40 -30 -20 -10 0 10 20 30
Manufacturing
Source Elaborated from Eurostat and National Statistical offices
Tota
l em
ploy
men
t
Delocation in the manufacturing sectors in the EU A regional overview
One last question that deserves consideration is the effect of industrial delocation
process on the regional economies Surprisingly manufacturing job losses have not been
translated into total employment which exhibit positive growth for most of the chosen
regions with the exceptions of some Germans and all the Netherlands (Figure 3) That
means the regions have been able to compensate the negative effect on the employment
from shrinking manufacturing allocating more resources inside the services sectors In fact
a substitution of manufacturing by services seems to have happened as are the region
showing more delocation in manufacturing those that increase in a higher measure the
employment in the service sectors that is the French British and Italian However the
relation is not accurate as there are not a strict quantitative correlation region by region
between rates of delocation and increase in the employment in the service activities
These good results in terms of general employment shown by the regions affected in
a higher measure by manufacturing delocation suggest the convenience of a more general
analysis of regional economic growth beyond the manufacturing sector as some regions
strongly shrinking manufacturing activities in favour of those of services might be leading
an interesting process of structural change that could light up one of the ways of facing the
increasing competition coming from emerging economies
5- Final remarks
Comparative analysis of location patterns for a large sample of European regions -
characterized by having an upper-middle level income and a strong industrial sector-
during the last few years has revealed that only half of them have shown locational
attractions for manufacturing activities The regional patterns found clearly show the
influence of `national effectacute the regions showing location effects corresponding to most
of those located in Austria Germany the Netherlands Ireland Finland Sweden Spain and
Greece
On the contrary the delocation process has affected another half of the regions
included most of them French British and Italian Therefore delocation has contributed to
concentrating the European manufacturing industry in the areas with higher market
potential in the centre of continental Europe It has contributed furthermore to relocating
manufacturing activities inside every country something that requires further analysis
from future research
20
Delocation in the manufacturing sectors in the EU A regional overview
Attractiveness to location of manufacturing industries has been encouraged by
significant increases in labor productivity so in most of the regions showing positive
location patterns production increases have been compatibles with a decline in aggregate
manufacturing total employment More specifically in this situation are all regions in the
Netherlands Finland Greece and Ireland three quarters of the German ones two from the
United Kingdom two from Sweden and Madrid in Spain
On the contrary in the regions where delocation has taken place the increase in
labour productivity has been lower In fact thirteen of such regions show reductions in
labour productivity six of them placed in France three Italian the British Eastern Scotland
and Greater London Vaumlstsverige in Sweden and the Belgian Antwerp Besides the
positive impact of this rare performance on employment has been largely offset by
destruction of industrial activity except in the Icircle de France and Midi-Pyreacuteneacutees the two
territories in which productivity has a more negative trajectory
The positive link between location and labour productivity increase confirm the
result reached by other authors particularly Cuadrado Roura et al (2002) who referring
their analysis to previous years distinguish two groups of winners among the European
regions the first grouping regions with increased employment and labour productivity
perhaps reflecting the success of technological and organizational changes introduced
during the period promoting the diversification and specialization in activities with high
growth levels and attracting new investments less labour-intensive and a second one
formed by regions capable of implementing restructuring processes to eliminate the most
inefficient outputs achieve higher levels of productivity and increased industrial
production at the expense of a notable decline in employment
Nevertheless discrepancies in delocation patterns outlined above and different
achievements in terms of productivity improvement have not only been the result of
companiesacute response to intensified competition in each region but also of differential
features On the one hand is size which in larger regions like some of Italy Germany
France and Spain reduces the chances of scoring high growth rates On the other hand are
the national specificities such as the massive migrations received by the Spanish regions a
key to explain their model of industrial growth and the different public policies The
influence of the two latter factors appears remarkable given the similarities among the
location patterns of each of the regions examined and the Member States they belong to
21
Delocation in the manufacturing sectors in the EU A regional overview
Anyway the lack of data has prevented us from going further into a preliminary
explanatory analysis of the delocation patters found when looking at the different
manufacturing activities but the role played by the IT manufacturing sector and other
branches affected by intense international competition (automobile clothes and textiles
and shoes) might have been important
To finish just to point up that the effect of manufacturing delocation on aggregate
employment has been offset by growth of services sectors suggesting the convenience of a
more general analysis of regional economic growth beyond the manufacturing sector as
some regions showing greater change in employment between sectors might be leading an
interesting process of structural change that could light up one of the ways of facing the
increasing competition coming from emerging economies
22
Delocation in the manufacturing sectors in the EU A regional overview
References
Aacutelvarez Loacutepez ME R Myro and J Vega Crespo (2007) ldquoCambios Recientes en la
Especializacioacuten Inter-industrial de las Manufacturas Espantildeolasrdquo Papeles de Economiacutea
Espantildeola 112 2-21
Antragraves P and E Helpman (2004) ldquoGlobal Sourcingrdquo Journal of Political Economy
112(3) 552-580
Bjerring Olsen K (2006) Productivity Impacts of Offshoring and Outsourcing A Review
OECD Directorate for Science Technology and Industry
Baldwin RE and F Robert-Nicoud (2000) ldquoFree trade agreements without delocationrdquo
Canadian Journal of Economics 33(3) 766-786
Bhagwati J A Panagariya and TN Srinivasan (2004) ldquoThe Muddles over Outsourcingrdquo
Journal of Economic Perspectives 18(4) 93-114
Combes PP and HG Overman (2003) ldquoThe Spatial Distribution of Economic Activities
in the EUrdquo Center for Economic Performance London School of Economics and
Political Science
Cuadrado-Roura JR T Mancha-Navarro and R Garrido-Yserte (2000) ldquoRegional
Productivity Patterns in Europe An Alternative Approachrdquo The Annals of Regional
Science 34(3) 365-384
Cuadrado Roura JR (2001) Regional convergence in the European Union From
hypothesis to the actual trends The Annals of Regional Science 35(3) 333-356
Cuadrado-Roura JR T Mancha-Navarro and R Garrido-Yserte (2002) ldquoRegional
Dynamics in the European Union Winners and Losersrdquo in Cuadrado-Roura JR and
M Parellada (eds) Regional Convergente in the European Union Springer-Verlag
Berlin 23-52
Fujita M P Krugman and A Venables (1999) The Spatial Economy Cambridge MA
The MIT Press
Grossman GM and E Rossi-Hansberg (2006) The Rise of Offshoring Itacutes Not Wine for
Cloth Anymore Princeton University unpublished
Helpman E D Marin and T Verdier (2008) The organization of firms in a global
economy Harvard University Press
Krugman P and AJ Venables (1990) ldquoIntegration and the Competitiveness of Peripheral
Industryrdquo in C Bliss and J Braga de Macedo (eds) Unity with Diversity in the
European Community Cambridge University Press
23
Delocation in the manufacturing sectors in the EU A regional overview
Krugman P (1999) Geography and Trade Cambridge MA The MIT Press
Midelfart-Knarvik KH and HG Overman (2002) Delocation and European Integration
is structural spending justified Economic Policy 17(35) 321-359
Myro R CM Fernaacutendez-Otheo L Labrador AB Baides Tudela ME Aacutelvarez Loacutepez
and Vega Crespo J (2008) Globalizacioacuten y Deslocalizacioacuten Importancia y Efectos
para la Industria Espantildeola Direccioacuten General de Poliacutetica de la PYME Ministerio de
Industria Turismo y Comercio (httpwwwipymeorgNRrdonlyresAD74121A-
DD3C-4564-92AD-17A2872508CA0GlobalizacionDeslocalizacionpdf)
Puga D (1999) The Rise and Fall of Regional Inequalities European Economic Review
43(2) 303-334
Puga D (2002) European Regional Policy in Light of Recent Location Theories Journal
of Economic Geography 2(4) 373-406
Sachwald F (2004) ldquoThe impact of EU enlargement on Firmsacute Strategies and the
Location of Production in Europerdquo Tokyo Club Research Meeting
24
Delocation in the manufacturing sectors in the EU A regional overview
25
Appendix 1 European regions NUTS2 in the sampleCode Region name Code Region name
NUTS2 and country to which it belong NUTS2 and country to which it belongat22 Steiermark gr30 Attikiat31 Oberoumlsterreich Greece
Austriaie02 Southern and Eastern
be21 Prov Antwerpen Irelandbe23 Prov Oost-Vlaanderen
Belgium itc1 Piemonteitc4 Lombardia
de11 Stuttgart itd3 Venetode12 Karlsruhe itd5 Emilia-Romagnade13 Freiburg ite1 Toscanade14 Tuumlbingen ite3 Marchede21 Oberbayern ite4 Laziode22 Niederbayern Italyde23 Oberpfalzde24 Oberfranken nl22 Gelderlandde25 Mittelfranken nl32 Noord-Hollandde26 Unterfranken nl33 Zuid-Hollandde27 Schwaben nl41 Noord-Brabantde60 Hamburg Netherlandsde71 Darmstadtde73 Kassel se11 Stockholmde91 Braunschweig se12 Oumlstra Mellansverigede92 Hannover se22 Sydsverigedea1 Duumlsseldorf se23 Vaumlstsverigedea2 Koumlln Swedendea4 Detmolddea5 Arnsberg ukd3 Greater Manchesterdeb3 Rheinhessen-Pfalz ukd4 Lancashiredec0 Saarland uke4 West Yorkshiredef0 Schleswig-Holstein ukf1 Derbyshire and Nottinghamshire
Germany ukf2 Leicestershire Rutland and Northantsukg3 West Midlands
dk01 Hovedstaden ukh1 East Angliadk04 Midtjylland uki1 Inner London
Denmark uki2 Outer Londonukj1 Berkshire Bucks and Oxfordshire
es21 Pais Vasco ukj3 Hampshire and Isle of Wightes30 Comunidad de Madrid ukk1 Gloucestershire Wiltshire and Bristoles51 Cataluntildea ukm2 Eastern Scotland
Spain ukm3 South Western ScotlandUnited Kingdom
fi18 Etelauml-Suomifi19 Laumlnsi-Suomi
Finland
fr10 Icircle de Francefr23 Haute-Normandiefr24 Centrefr42 Alsacefr51 Pays de la Loirefr52 Bretagnefr61 Aquitainefr62 Midi-Pyreacuteneacuteesfr71 Rhocircne-Alpesfr82 Provence-Alpes-Cocircte dAzur
France
Delocation in the manufacturing sectors in the EU A regional overview
26
Manufacturing GVA GDPpc( of total EU-15) (Index EU-15=100)
at22 Steiermark 040 9647at31 Oberoumlsterreich 063 10641be21 Prov Antwerpen 064 12780be23 Prov Oost-Vlaanderen 040 9589de11 Stuttgart 241 12296de12 Karlsruhe 132 11674de13 Freiburg 099 10018de14 Tuumlbingen 095 10780de21 Oberbayern 205 14684de22 Niederbayern 051 10090de23 Oberpfalz 046 10475de24 Oberfranken 047 9885de25 Mittelfranken 079 12022de26 Unterfranken 056 10283de27 Schwaben 084 10593de60 Hamburg 062 17922de71 Darmstadt 130 13985de73 Kassel 041 10006de91 Braunschweig 081 9675de92 Hannover 058 10000dea1 Duumlsseldorf 176 11397dea2 Koumlln 129 10387dea4 Detmold 085 9742dea5 Arnsberg 143 9395deb3 Rheinhessen-Pfalz 082 9505dec0 Saarland 040 9778def0 Schleswig-Holstein 061 9099dk01 Hovedstaden 043 18287dk04 Midtjylland 041 13581es21 Pais Vasco 070 9977es30 Comunidad de Madrid 093 10213es51 Cataluntildea 180 9310fi18 Etelauml-Suomi 123 13009fi19 Laumlnsi-Suomi 064 9954fr10 Icircle de France 221 15821fr23 Haute-Normandie 043 9333fr24 Centre 052 9211fr42 Alsace 048 9664fr51 Pays de la Loire 072 9353fr52 Bretagne 051 9124fr61 Aquitaine 044 9276fr62 Midi-Pyreacuteneacutees 040 9221fr71 Rhocircne-Alpes 140 10349fr82 Provence-Alpes-Cocircte dAzur 055 9715gr30 Attiki 039 9144ie02 Southern and Eastern 196 16068itc1 Piemonte 128 9973itc4 Lombardia 390 11863itd3 Veneto 176 10747itd5 Emilia-Romagna 164 11132ite1 Toscana 090 9929ite3 Marche 047 9078ite4 Lazio 062 11123nl22 Gelderland 043 9892nl32 Noord-Holland 051 13804nl33 Zuid-Holland 077 12003nl41 Noord-Brabant 098 11722se11 Stockholm 062 17037se12 Oumlstra Mellansverige 056 10433se22 Sydsverige 044 10865se23 Vaumlstsverige 074 11743ukd3 Greater Manchester 055 10374ukd4 Lancashire 046 9161uke4 West Yorkshire 054 10378ukf1 Derbyshire and Nottinghamshire 065 10283ukf2 Leicestershire Rutland and Northants 053 11179ukg3 West Midlands 071 10596ukh1 East Anglia 050 10169uki1 Inner London 067 28535uki2 Outer London 055 10231ukj1 Berkshire Bucks and Oxfordshire 058 15836ukj3 Hampshire and Isle of Wight 043 11334ukk1 Gloucestershire Wiltshire and Bristol 061 12628ukm2 Eastern Scotland 044 10947ukm3 South Western Scotland 053 10097
Source Elaborated from Eurostat and national Statistical offices
Appendix 2 GDP per Capita and regions share in EU-15 manufacturing GVA 2005
Delocation in the manufacturing sectors in the EU A regional overview
Appendix 2 (Continued)
0
5
10
15
20
25
30
100 120 140 160 180 200 220 240 260 280
26
23
9
54
12
12
10 0 0 0 0 0 0 0 0
1
Reg iona l GD P per Ca pita (EU-1 5 =1 0 0 ) Histo g ra m
0
10
20
30
40
05 10 15 20 25 30 35 40
14
34
9
3
6
13 3
10 0 0 0 0
1
Industrial size of selected regions ( of EU-15 manufacturing GVA)Histogram
27
Delocation in the manufacturing sectors in the EU A regional overview
Appendix 3 Location effect and productivity growth rates in European manufacturing sector
(percentages)
Loca
tion
effe
ct (
of 2
000
empl
oym
ent)
Productivity grothw
AUSTRIA
AT
AT31AT221
-5
0
5
10
-5 0 5 10
GERMANY
DE91
DEa4
Dec0
EDf0
DE 24
DE71DE92
DE14
DE 26
DE73DE 60
DE 22
DE23
DE25
DE 13
DE a1
DEa2
DE27
DE 21
DE a5
DE12DE
DEb3
DE11
-5
0
5
10
15
20
-5 0 5 10 15 20 25 30
BELGIUM
BE21
BE
BE23
-10
-5
0
5
-5 0 5 10 15
DENMARK
DK04
DK
DK01
-10
-5
0
5
-5 0 5 10 15
SPAIN
ES
ES30
ES21
ES51
-5
0
5
10
-5 0 5 10
FRANCE
FR51
FR71
FR42
FR23
FR62
FR61
FR82FR52
FR24FR
FR10
-25
-20
-15
-10
-5
0
5
-35 -30 -25 -20 -15 -10 -5 0 5 10
HOLAND
NL33
NL22
NL41
NL32
NL
-5
0
5
10
15
20
-5 0 5 10 15 20 25 30
ITALY
ITe4
ITc1
ITe1
ITd3
ITd5
ITe3
ITc4
IT
-25
-20
-15
-10
-5
0
5
-10 -5 0 5 10
28
Delocation in the manufacturing sectors in the EU A regional overview
Productivity grothw
Source Elaborated from Eurostat and National Statistical offices
Appendix 3 (continued)Lo
catio
n ef
fect
( o
f 200
0 em
ploy
men
t)FINLAND
FI FI19
FI18
-5
0
5
10
15
20
25
30
-5 0 5 10 15 20 25 30 35
GREECE
GR30GR
-5
0
5
10
15
20
25
30
-5 0 5 10 15 20 25 30 35
IRELAND
IEIE02
-5
0
5
10
15
20
25
30
35
-5 0 5 10 15 20 25 30 35 40 45
UNITED KINDOGDOM
UKh1
UKm2
UKf1
UKj3
UKd3
UKf2
UKi2
UKk1
UKg3UKe4
UKm3
UKj1
UKd4
UKi1
UK
-35
-30
-25
-20
-15
-10
-5
0
5
10
-15 -10 -5 0 5 10 15 20 25 30 35 40
SWEDEN
SE11
SE12
SE23 SE22
SE
-5
0
5
10
15
20
25
30
35
-5 0 5 10 15 20 25 30 35 40 45
29
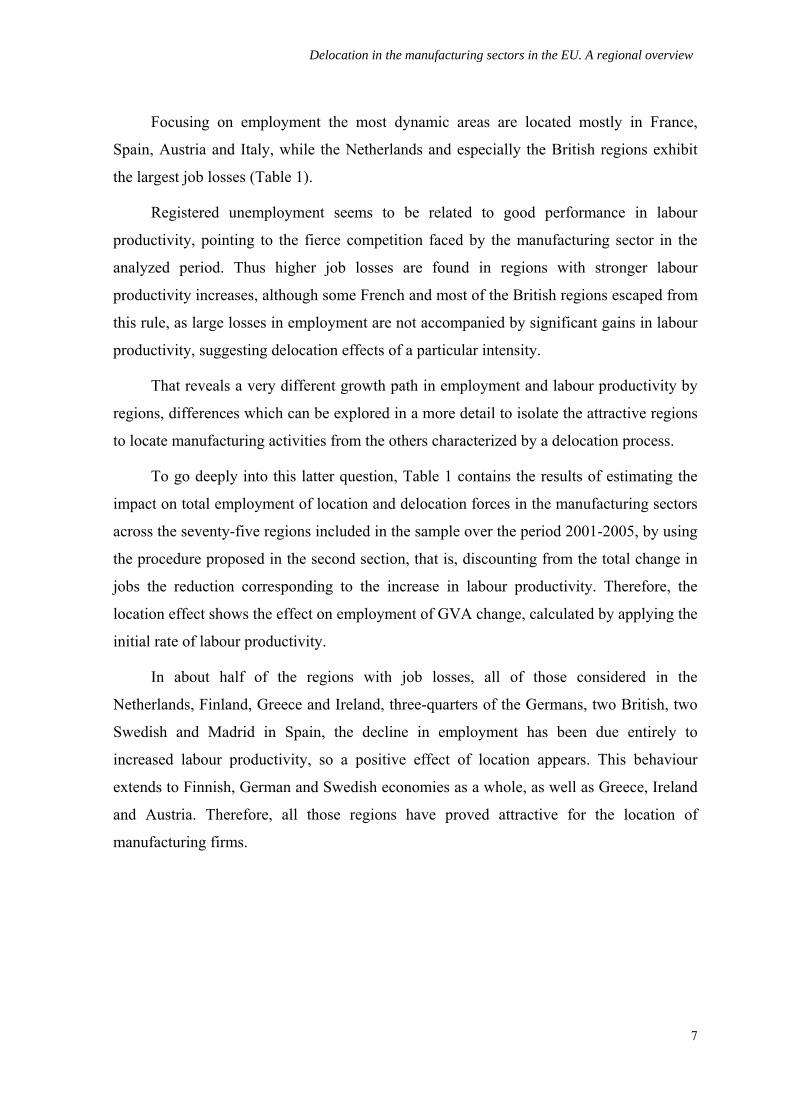
Delocation in the manufacturing sectors in the EU A regional overview
By contrast thirty-eight remaining regions that also show reductions in
manufacturing employment have been affected by delocation processes to different
extents although only in a small number of them have they been accompanied by
decreases in labour productivity which could make the prospects for economic growth
tougher (four from France Piamonte Toscana and Lazio in Italy Outer London and
Eastern Scotland in the United Kingdom the Swedish Vaumlstsverige and Antwerp in
Belgium)
Regions with positive location effects are shown in Map 1 Most of them are large
industrial regions and are located in the traditional industrial growth centres5 those
characterized by high market potential (Combes and Overman 2003) although there are
also some intermediate and peripheral territories mainly located in the north of Italy
United Kingdom and Spain and in the south of Sweden and Norway This means that the
delocation process has contributed to concentrating the European manufacturing industries
in that privileged area of faster growth apart from some other changes inside every
country
To compare now the intensity of such effects of location and delocation across
regions avoiding the differences they have in size we built a relative measure of them the
ratio of job losses in the period to the volume of employment in the first year 2000 (Table
1)
Following this ratio delocation effects are revealed to be particularly strong in
France United Kingdom Italy and in one region of Belgium with declines in
employment exceeding 20 in some of them
Conversely the regions of Finland and several of the German and the Dutch ones
exhibit strong location effects
In any case as was pointed above the importance of location effects seems to lie in
labour productivity gains In fact higher increases in productivity (over 15) are found
precisely in those regions of Ireland Finland Sweden Netherlands and Germany besides
the Greek Attiki where the location effect has in general reached its greatest extent
(Figure 1)
5 Note that the map of winning regions is clearly influenced by the large number (30) of German NUTS 2 in the sample
9
Delocation in the manufacturing sectors in the EU A regional overview
fi19
fi18
ie02
dec0
gr30
se11
nl33
de21
de22
de26
de25
de12
de14
de11
dea4
dea1de73
def0
de60
deb3
de27
de23
itd5
ite3
se12
nl22
es 30
ukd4
es51
nl32
at22
ukf1
at31
es21
Map 1 Regions with positive location effect ( of 2000 employment)
Above 10 0 to 10
nl41
de13de27
Nevertheless productivity also grows faster in most of the regions belonging to the
United Kingdom Belgium and Denmark in spite of the strong delocation effects registered
10
Delocation in the manufacturing sectors in the EU A regional overview
which disturbs the above-mentioned positive relationship suggesting the harsh process of
industrial restructuring involved
Figure 1 Location effect and productivity growth in select regions manufacturing sector 2001-2005 (percentages)
UKi2
EU 15
FR6 2
UKm2
ITc1
UKg3UKd 3
UKe4
UKk1FR71F R
FR10UKm3
UKj1UKf2
UKd 4
UKi1
D K
DK01
UKh1U K
FR2 3FR4 2
FR24ITe1
BE2 1ITe4FR51
FR61
ITITd 3
SE2 2FR8 2
SE23
NL2 2
UKf1DE2 4
NL3 2DEa1
DEf0
UKj3DE9 1 DE92
DEa2DE71DK0 4
S EDE25
DE6 0DE12
A T
DE14
ITe3
AT2 2
AT3 1ESD E
DE 11DE2 3
NL41N LDE2 7
DEc0
NL3 3
DE2 6DE2 1
ES3 0ES51
SE11
DE2 2
ES21
GR
FI19F I
FI18
IE
GR3 0
B E
DE73
DEb 3
IE0 2
ITd 5 DE13SE12
FR52ITc4BE2 3
DEa4DEa5
y = 07x - 59R2 = 06
-35
-30
-25
-20
-15
-10
-5
0
5
10
15
20
25
30
35
40
-35 -30 -25 -20 -15 -10 -5 0 5 10 15 20 25 30 35 40 45
Productivity grothw Source Elaborated from Eurostat and National Statistical offices
Loca
tion
effe
ct (
of 2
000
empl
oym
ent)
11
Delocation in the manufacturing sectors in the EU A regional overview
In contrast the productivity decline in half of the French and Italian regions albeit
with a positive impact on employment is largely offset by destruction of industrial
activity except in Icircle de France and Midi -Pyreacuteneacutees the two territories in which
productivity has a more negative trajectory
These results closely match those reported by Cuadrado Roura et al (2000) based on
the growth rates for regional productivity and employment during the period 1980-1993
grouping European regions in four typologies comparing the growth rates of these two
variables with their respective European averages
According to this approach and including the location effect in the analysis the
group of regions that are examined in this work would be categorized as follows (Table 2)
The first group includes areas with productivity and employment growth rates above
sample average and show positive location effect (Quadrant 1) So as has been underlined
in that work possibly this reflects the fact that the technological and organizational
changes introduced during the period would have been successful promoting the
diversification and specialization in activities with high growth levels and attracting new
investments which are less labour-intensive
In a second stage are those regions that as the above mentioned authors suggest
have implemented restructuring processes to eliminate the most inefficient outputs
achieving higher levels of productivity and in about half of them increased industrial
production at the expense of a notable decline in employment (Quadrant 4) They named
this typology `restructuring via productivityacute
With a few exceptions (those where the location effect is negative) the regions in
both groups are the winners of industrial dynamic during the period Most of them are
large industrial regions and are located in the traditional industrial growth centres As
demonstrated above they are mainly Finish German and Dutch as well as Greek and Irish
regions
In contrast another large group of regions due to different factors6 have opted for
more labour-intensive industrial models which in a few cases (especially in Spanish and
Austrian regions) have been accompanied by output increases so they can also be included
6 See Cuadrado et al (2000)
12
Delocation in the manufacturing sectors in the EU A regional overview
in the winners (Map 1) while in other the result has been a loss of productive activity
(Quadrant 2)
(1) (2)Employment Productivity Employment Productivity
de11 Stuttgart -48 125 at22 Steiermark 36 11de12 Karlsruhe -57 101 at31 Oberoumlsterreich 06 56de21 Oberbayern -37 179 be21 Prov Antwerpen -70 -05de22 Niederbayern -33 218 be23 Prov Oost-Vlaanderen -74 61de23 Oberpfalz -38 120 de13 Freiburg -45 45de25 Mittelfranken -53 80 de14 Tuumlbingen -23 72de26 Unterfranken -49 189 de91 Braunschweig -47 25de27 Schwaben -41 148 es21 Pais Vasco 74 13de60 Hamburg -60 97 es30 Comunidad de Madrid -31 63dec0 Saarland -32 160 es51 Cataluntildea 09 25fi19 Laumlnsi-Suomi -54 297 fr10 Icircle de France 218 -307gr30 Attiki -17 234 fr51 Pays de la Loire -08 -67
fr52 Bretagne -23 12fr61 Aquitaine -14 -50fr62 Midi-Pyreacuteneacutees 15 -245fr71 Rhocircne-Alpes -61 -57fr82 Provence-Alpes-Cocircte dAzur -06 -18itc4 Lombardia -63 61itd3 Veneto -62 03itd5 Emilia-Romagna -16 16ite3 Marche 08 28ite4 Lazio -36 -47se23 Vaumlstsverige -26 -07
(4) (3)Employment Productivity Employment Productivity
de24 Oberfranken -116 186 fr24 Centre -106 06de71 Darmstadt -149 132 fr42 Alsace -154 61de73 Kassel -78 103 itc1 Piemonte -129 -48de92 Hannover -106 86 ite1 Toscana -98 -02dea1 Duumlsseldorf -126 177 se22 Sydsverige -91 62dea2 Koumlln -150 137 uke4 West Yorkshire -186 60dea4 Detmold -107 110 ukh1 East Anglia -137 71dea5 Arnsberg -129 122 uki2 Outer London -271 -67deb3 Rheinhessen-Pfalz -106 152 ukj3 Hampshire and Isle of Wight -81 51def0 Schleswig-Holstein -101 135 ukk1 Gloucestershire Wiltshire -169 62dk01 Hovedstaden -134 125 ukm2 Eastern Scotland -91 -116dk04 Midtjylland -146 118fi18 Etelauml-Suomi -86 339fr23 Haute-Normandie -171 77ie02 Southern and Eastern -78 426nl22 Gelderland -178 206nl32 Noord-Holland -138 180nl33 Zuid-Holland -129 296nl41 Noord-Brabant -173 269se11 Stockholm -136 363se12 Oumlstra Mellansverige -151 166ukd3 Greater Manchester -232 90ukd4 Lancashire -317 350ukf1 Derbyshire and Nottinghamshire -179 240ukf2 Leicestershire Rutland and Northants -233 191ukg3 West Midlands -313 180uki1 Inner London -142 102ukj1 Berkshire Bucks and Oxfordshire -246 208ukm3 South Western Scotland -207 128
Source Elaborated from Eurostat and national Statistical officesNote Shaded areas indicate regions with positive location effect
Em
ploy
men
t gro
wth
lt A
vera
ge v
alue
Productivity growth gt Average value Productivity growth lt Average value
Em
ploy
men
t gro
wth
gt A
vera
ge v
alue
Table 2 Employment and productivity growth rates in select regions manufacturing sector 2001-2005 (Averages of all regions +74 productivity -77 employment)
13
Delocation in the manufacturing sectors in the EU A regional overview
Finally the worst results can be seen in a fourth type of region with growth rates of
GVA and productivity below average and serious job destruction (Quadrant 3) This would
occur in regions with problems in restructuring their manufacturing sector or with low
levels of activity So together with those that are either restructuring via productivity or
via employment but without achieving a positive location effect they are clearly the
losers These include mainly British French Italian Belgian and Danish regions
To sum up these results confirm the direct relationship between growth in labour
efficiency and progress in the creation of productive industrial activity as pointed out
above and which can be more clearly by looking at Figure 1 In other words regions with
higher levels of productivity growth in general show a greater attractiveness for new
manufacturing firms
These differences in the behaviour of productivity and employment across regions
have led to remarkable disparities in rates of change of their industrial output during the
period Thus while a few increased their real manufacturing GVA by more than 20 in
the less dynamic ones the loss of industrial output is between a sixth and a third of the
initial value So significant changes had taken place in the relative position of some of
them (Figure 2)
Growth is led by a group of twenty regions located in Ireland Finland Greece
Germany Sweden Netherlands Spain and Austria with real GVA growth rates that are
more than five points above average As a result they increased their share in the industrial
output of the sample Looking at the complete list we see that the growth deviation from
the mean exhibits positive values in just over half of the regions examined among them
seven of the ten with the largest industrial scale in 2005 Thus the top ten regions have
increased their share from 32 to 33 percent in the last five years
Conversely among the less dynamic regions are found a great number of British and
some French and Italian ones which consequently have fallen back in the ranking of
NUTS 2 arranged by their contribution to aggregate manufacturing output
Between both groups there are approximately twenty regions mainly in Germany
with growth rates not far from average so their positions have hardly changed during the
last five years
14
Delocation in the manufacturing sectors in the EU A regional overview
Figure 2 Regional shares in the total sample manufacturing GVA(percentage at 2000 prices)
ITc4
UKf2
UKm3
Uke4
UKf1
UKk1
UKh1
AT22
ITe1
ES21
ES51
FR71
FR62
IT e4
DE24
DE26
SE23
FR61
FR51
FR82
SE22
ITe3
AT31
DK04
DE11
DE23
GR30
DEc0
ES30DEb3DEf0
DEa4
DE92
BE21
DE73
IE02
ITd3
FR52
DE91
DE13DE25
DE 12DE60
DE27
DE21
DE22
BE23DEa2
DE71
DE 14
SE12
ITd5
SE11
FI19
FR10
FR 24
ITe1
FI18
DK01 DEa5
FR4 2
DEa1NL32
NL3 3
FR2 3
NL22
NL 41
UKd3
UKj3
UKi1
UKm2
UKj1
UKd4
UKi2
Ukg3
-35
-30
-25
-20
-15
-10
-5
0
5
10
15
20
25
30
35
Share in 2005
Source Elaborated from Eurostat and National Statistical offices
Rat
e of
cha
nge
200
1-20
05
70403530252015100500
Finally when the question is analyzed at Member State level (Table 1) it is possible
to check out the disparities among the above mentioned regions Thus while in some
15
Delocation in the manufacturing sectors in the EU A regional overview
countries such as Spain manufacturing growth has been clearly labour-intensive
something which can be extended to its regions as also happens in Greece and Austria
which both boast positive location effect and a job destruction rate far below the average
in others such as Holland Sweden and to a lesser extent Belgium Ireland and Finland
increasing of industrial activity is only due by advances in productivity so has been
accompanied by heavy job losses and these are patterns repeated in most of their regions
with noticeable relevance in the Netherlands As for the United Kingdom Belgium and
Denmark all share declining industrial production together with strong job cuts a pattern
that is replicated in many of their regions In this situation are the bulk of French and
Italian NUTS 2 just like the countries to which they belong although in this case job
destruction has been much less pronounced and below the group average Close to this
mean is Germany as well as most of their regions
Thus the analysis at Member States level also confirms the positive relationship
between the advance of industrial productivity and the attractiveness for new
manufacturing firms As demonstrated for their regions Ireland Finland Netherlands and
Greece following at quite distance from Germany are Member States showing a better
performance in productivity and with high location effects (see Figure 1)
In fact similarities between performances in the regions and in the Member States
they belong to suggest that the trend in regional industrial employment is to some extent
influenced by belonging to the same country in other words the locational attractions of
each area and its effort to improve productivity is partly due to national specificities or
idiosyncratic factors In fact as shown in Appendix 3 most European industrialized
regions follow the location patterns of the country they belong to reproducing its
productivity behaviour too In summary the evolution of these variables in each region
seems to have a clear `country effectacute that is different behaviours motivated by specific
factors andor differentiated industrial policies
For example in order to correctly interpret the results for Spanish regions it can not
be overlooked that during the period analyzed as in the whole country regions have
absorbed large numbers of immigrants which has boosted the proliferation of lower
productivity and lower wages in industrial activities However it may be thought that this
phenomenon has tended to conceal productivity increases in larger and better equipped
16
Delocation in the manufacturing sectors in the EU A regional overview
firms which could have been significant in the light of their results7 On the other hand
countries like Finland or Ireland with the lowest population increase have opted for high-
tech manufacturing sectors as a way to improve national competitiveness8 Nonetheless
this positive location effect has not reached in these countriesrsquo NUTS 2 enough magnitude
to offset completely the job losses arising from productivity improvements
On the other hand this `national effectacute has also played an important role in
explaining the economic outcomes of European regions in terms of per capita GDP in
accordance with the results obtained by Cuadrado-Roura (2001) using the data available
for 109 EU regions over the 1977-1994 period
Table 3 Export growth in key sectors by countries 2000-2005 (percentages)Impact ITon Total
Spain 65 91 72 158 38 111 04Germany 116 138 61 111 111 130 14United Kingdom 09 85 29 32 23 61 02France -09 102 25 94 118 78 -01Ireland -09 -102 01 25 -34 77 -03Finland 47 152 45 49 56 73 13Italy 40 88 41 90 56 89 02EU-15 70 141 59 91 67 111 11Source Elaborated from Comtrade
Shoes TotalIT Auto Textile Clothes
This importance of the `national effectacute should allow us to make a better approach to
the determinants of above-mentioned delocation patterns in future research One of such
determinants might be found in the different importance and performance by countries of
some manufacturing branches particularly affected by the increase in global competition as
their development has being receiving strong support in emerging countries from both
domestic policies and the location of big multinational companies This is the case of IT
manufacturing sectors or that of automobiles clothes textiles and shoes (Sachwald 2004)
Table 3 shows how the exports of these key sectors have evolved in some of the European
countries considered here It is amazing to see the poor results registered by IT sectors in
United Kingdom France and Ireland compared to the other countries mentioned Germany
in particular This evolution could be behind the stronger effects of delocation in France
and the United Kingdom although it must have produced similar results in the case of
Ireland Furthermore on such a basis what has happened in Italy would remain
7 For details see Myro et al (2008) 8 See Aacutelvarez Loacutepez et al (2007)
17
Delocation in the manufacturing sectors in the EU A regional overview
unexplained as the selected key sectors do not show a bad performance in terms of exports
in the latter country
One reason for such contradictory results lies in the possibility that production
instead of export reflects accurately what has been happening in every sector in terms of
activity However Aacutelvarez et al (2007) show very similar patterns in production and
export specialization from 1995 to 2005 except in the case of Ireland which thus appears
as a very particular one This is because IT specialization in production increases at the
same time as it decreases in exports Perhaps the strong growth in domestic demand
prevents IT exports from growing The opposite case could be that of Italy where slow
growth in domestic demand might have been pushing up IT export9
Anyway further developments on the determinants of delocation patterns require the
preparation of disaggregated data on production a task beyond the objectives of this paper
That could allow us to update the available manufacturing specialization analysis As the
two countries exhibiting higher delocation effects France and the United Kingdom
showed the lowest rates of specialization compared with the EU (Milderfart and Overman
2002 Combes and Overman 2003) something could have changed in the last few years
which would merit a fresh look based on more recent data
On the other hand it is now clear that insofar as delocation in manufacturing
activities has affected each country in a different way a relocation process inside the EU
and between countries has taken place This process deserved to be deeply analyzed
including a perspective by sectors updating what we know about changes in the
distribution of manufacturing industry in the EU and offering the possibility of exploring
whether the European Common Policy has influenced them in some way as was already
suggested by Milderfart-Knarvik and Overman (2002)
9 In Finland IT activities grows much more in production than in exports but in both aspects a positive growth is registered
18
Delocation in the manufacturing sectors in the EU A regional overview
19
Figure 3 Employment growth rates in selected regions 2001-2005 manufacturing and total economy (percentages)
Ukg3
UKi2
UKd4
UKj1
UKm2
UKi1 UKj3
UKd3
NL 41
NL22
FR23
NL33
NL32
DEa1
FR42
DEa5
DK01
FI18
ITe1
FR 24FR10
FI19
SE11
ITd5FR52
DE 14
DE71
DEa2
BE23
DE22
DE21
DE27
IC c4
DE60DE 12
DE25
DE13
DE9 1SE12
ITd3
IE02
DE73
BE21
DE92DEa4
DEf0
DEb3
ES30
DEc0
GR30
DE23
DE11
DK04
AT31
ITe3
SE22
FR82
FR51FR61
SE2 3
DE26
DE24
IT e4
FR62
FR71
ES51
ES2 1
ITe1
AT22
UKh1
UKk1
UKf1
Uke4
UKm3
UKf2
-20
-15
-10
-5
0
5
10
15
20
25
-40 -30 -20 -10 0 10 20 30
Manufacturing
Source Elaborated from Eurostat and National Statistical offices
Tota
l em
ploy
men
t
Delocation in the manufacturing sectors in the EU A regional overview
One last question that deserves consideration is the effect of industrial delocation
process on the regional economies Surprisingly manufacturing job losses have not been
translated into total employment which exhibit positive growth for most of the chosen
regions with the exceptions of some Germans and all the Netherlands (Figure 3) That
means the regions have been able to compensate the negative effect on the employment
from shrinking manufacturing allocating more resources inside the services sectors In fact
a substitution of manufacturing by services seems to have happened as are the region
showing more delocation in manufacturing those that increase in a higher measure the
employment in the service sectors that is the French British and Italian However the
relation is not accurate as there are not a strict quantitative correlation region by region
between rates of delocation and increase in the employment in the service activities
These good results in terms of general employment shown by the regions affected in
a higher measure by manufacturing delocation suggest the convenience of a more general
analysis of regional economic growth beyond the manufacturing sector as some regions
strongly shrinking manufacturing activities in favour of those of services might be leading
an interesting process of structural change that could light up one of the ways of facing the
increasing competition coming from emerging economies
5- Final remarks
Comparative analysis of location patterns for a large sample of European regions -
characterized by having an upper-middle level income and a strong industrial sector-
during the last few years has revealed that only half of them have shown locational
attractions for manufacturing activities The regional patterns found clearly show the
influence of `national effectacute the regions showing location effects corresponding to most
of those located in Austria Germany the Netherlands Ireland Finland Sweden Spain and
Greece
On the contrary the delocation process has affected another half of the regions
included most of them French British and Italian Therefore delocation has contributed to
concentrating the European manufacturing industry in the areas with higher market
potential in the centre of continental Europe It has contributed furthermore to relocating
manufacturing activities inside every country something that requires further analysis
from future research
20
Delocation in the manufacturing sectors in the EU A regional overview
Attractiveness to location of manufacturing industries has been encouraged by
significant increases in labor productivity so in most of the regions showing positive
location patterns production increases have been compatibles with a decline in aggregate
manufacturing total employment More specifically in this situation are all regions in the
Netherlands Finland Greece and Ireland three quarters of the German ones two from the
United Kingdom two from Sweden and Madrid in Spain
On the contrary in the regions where delocation has taken place the increase in
labour productivity has been lower In fact thirteen of such regions show reductions in
labour productivity six of them placed in France three Italian the British Eastern Scotland
and Greater London Vaumlstsverige in Sweden and the Belgian Antwerp Besides the
positive impact of this rare performance on employment has been largely offset by
destruction of industrial activity except in the Icircle de France and Midi-Pyreacuteneacutees the two
territories in which productivity has a more negative trajectory
The positive link between location and labour productivity increase confirm the
result reached by other authors particularly Cuadrado Roura et al (2002) who referring
their analysis to previous years distinguish two groups of winners among the European
regions the first grouping regions with increased employment and labour productivity
perhaps reflecting the success of technological and organizational changes introduced
during the period promoting the diversification and specialization in activities with high
growth levels and attracting new investments less labour-intensive and a second one
formed by regions capable of implementing restructuring processes to eliminate the most
inefficient outputs achieve higher levels of productivity and increased industrial
production at the expense of a notable decline in employment
Nevertheless discrepancies in delocation patterns outlined above and different
achievements in terms of productivity improvement have not only been the result of
companiesacute response to intensified competition in each region but also of differential
features On the one hand is size which in larger regions like some of Italy Germany
France and Spain reduces the chances of scoring high growth rates On the other hand are
the national specificities such as the massive migrations received by the Spanish regions a
key to explain their model of industrial growth and the different public policies The
influence of the two latter factors appears remarkable given the similarities among the
location patterns of each of the regions examined and the Member States they belong to
21
Delocation in the manufacturing sectors in the EU A regional overview
Anyway the lack of data has prevented us from going further into a preliminary
explanatory analysis of the delocation patters found when looking at the different
manufacturing activities but the role played by the IT manufacturing sector and other
branches affected by intense international competition (automobile clothes and textiles
and shoes) might have been important
To finish just to point up that the effect of manufacturing delocation on aggregate
employment has been offset by growth of services sectors suggesting the convenience of a
more general analysis of regional economic growth beyond the manufacturing sector as
some regions showing greater change in employment between sectors might be leading an
interesting process of structural change that could light up one of the ways of facing the
increasing competition coming from emerging economies
22
Delocation in the manufacturing sectors in the EU A regional overview
References
Aacutelvarez Loacutepez ME R Myro and J Vega Crespo (2007) ldquoCambios Recientes en la
Especializacioacuten Inter-industrial de las Manufacturas Espantildeolasrdquo Papeles de Economiacutea
Espantildeola 112 2-21
Antragraves P and E Helpman (2004) ldquoGlobal Sourcingrdquo Journal of Political Economy
112(3) 552-580
Bjerring Olsen K (2006) Productivity Impacts of Offshoring and Outsourcing A Review
OECD Directorate for Science Technology and Industry
Baldwin RE and F Robert-Nicoud (2000) ldquoFree trade agreements without delocationrdquo
Canadian Journal of Economics 33(3) 766-786
Bhagwati J A Panagariya and TN Srinivasan (2004) ldquoThe Muddles over Outsourcingrdquo
Journal of Economic Perspectives 18(4) 93-114
Combes PP and HG Overman (2003) ldquoThe Spatial Distribution of Economic Activities
in the EUrdquo Center for Economic Performance London School of Economics and
Political Science
Cuadrado-Roura JR T Mancha-Navarro and R Garrido-Yserte (2000) ldquoRegional
Productivity Patterns in Europe An Alternative Approachrdquo The Annals of Regional
Science 34(3) 365-384
Cuadrado Roura JR (2001) Regional convergence in the European Union From
hypothesis to the actual trends The Annals of Regional Science 35(3) 333-356
Cuadrado-Roura JR T Mancha-Navarro and R Garrido-Yserte (2002) ldquoRegional
Dynamics in the European Union Winners and Losersrdquo in Cuadrado-Roura JR and
M Parellada (eds) Regional Convergente in the European Union Springer-Verlag
Berlin 23-52
Fujita M P Krugman and A Venables (1999) The Spatial Economy Cambridge MA
The MIT Press
Grossman GM and E Rossi-Hansberg (2006) The Rise of Offshoring Itacutes Not Wine for
Cloth Anymore Princeton University unpublished
Helpman E D Marin and T Verdier (2008) The organization of firms in a global
economy Harvard University Press
Krugman P and AJ Venables (1990) ldquoIntegration and the Competitiveness of Peripheral
Industryrdquo in C Bliss and J Braga de Macedo (eds) Unity with Diversity in the
European Community Cambridge University Press
23
Delocation in the manufacturing sectors in the EU A regional overview
Krugman P (1999) Geography and Trade Cambridge MA The MIT Press
Midelfart-Knarvik KH and HG Overman (2002) Delocation and European Integration
is structural spending justified Economic Policy 17(35) 321-359
Myro R CM Fernaacutendez-Otheo L Labrador AB Baides Tudela ME Aacutelvarez Loacutepez
and Vega Crespo J (2008) Globalizacioacuten y Deslocalizacioacuten Importancia y Efectos
para la Industria Espantildeola Direccioacuten General de Poliacutetica de la PYME Ministerio de
Industria Turismo y Comercio (httpwwwipymeorgNRrdonlyresAD74121A-
DD3C-4564-92AD-17A2872508CA0GlobalizacionDeslocalizacionpdf)
Puga D (1999) The Rise and Fall of Regional Inequalities European Economic Review
43(2) 303-334
Puga D (2002) European Regional Policy in Light of Recent Location Theories Journal
of Economic Geography 2(4) 373-406
Sachwald F (2004) ldquoThe impact of EU enlargement on Firmsacute Strategies and the
Location of Production in Europerdquo Tokyo Club Research Meeting
24
Delocation in the manufacturing sectors in the EU A regional overview
25
Appendix 1 European regions NUTS2 in the sampleCode Region name Code Region name
NUTS2 and country to which it belong NUTS2 and country to which it belongat22 Steiermark gr30 Attikiat31 Oberoumlsterreich Greece
Austriaie02 Southern and Eastern
be21 Prov Antwerpen Irelandbe23 Prov Oost-Vlaanderen
Belgium itc1 Piemonteitc4 Lombardia
de11 Stuttgart itd3 Venetode12 Karlsruhe itd5 Emilia-Romagnade13 Freiburg ite1 Toscanade14 Tuumlbingen ite3 Marchede21 Oberbayern ite4 Laziode22 Niederbayern Italyde23 Oberpfalzde24 Oberfranken nl22 Gelderlandde25 Mittelfranken nl32 Noord-Hollandde26 Unterfranken nl33 Zuid-Hollandde27 Schwaben nl41 Noord-Brabantde60 Hamburg Netherlandsde71 Darmstadtde73 Kassel se11 Stockholmde91 Braunschweig se12 Oumlstra Mellansverigede92 Hannover se22 Sydsverigedea1 Duumlsseldorf se23 Vaumlstsverigedea2 Koumlln Swedendea4 Detmolddea5 Arnsberg ukd3 Greater Manchesterdeb3 Rheinhessen-Pfalz ukd4 Lancashiredec0 Saarland uke4 West Yorkshiredef0 Schleswig-Holstein ukf1 Derbyshire and Nottinghamshire
Germany ukf2 Leicestershire Rutland and Northantsukg3 West Midlands
dk01 Hovedstaden ukh1 East Angliadk04 Midtjylland uki1 Inner London
Denmark uki2 Outer Londonukj1 Berkshire Bucks and Oxfordshire
es21 Pais Vasco ukj3 Hampshire and Isle of Wightes30 Comunidad de Madrid ukk1 Gloucestershire Wiltshire and Bristoles51 Cataluntildea ukm2 Eastern Scotland
Spain ukm3 South Western ScotlandUnited Kingdom
fi18 Etelauml-Suomifi19 Laumlnsi-Suomi
Finland
fr10 Icircle de Francefr23 Haute-Normandiefr24 Centrefr42 Alsacefr51 Pays de la Loirefr52 Bretagnefr61 Aquitainefr62 Midi-Pyreacuteneacuteesfr71 Rhocircne-Alpesfr82 Provence-Alpes-Cocircte dAzur
France
Delocation in the manufacturing sectors in the EU A regional overview
26
Manufacturing GVA GDPpc( of total EU-15) (Index EU-15=100)
at22 Steiermark 040 9647at31 Oberoumlsterreich 063 10641be21 Prov Antwerpen 064 12780be23 Prov Oost-Vlaanderen 040 9589de11 Stuttgart 241 12296de12 Karlsruhe 132 11674de13 Freiburg 099 10018de14 Tuumlbingen 095 10780de21 Oberbayern 205 14684de22 Niederbayern 051 10090de23 Oberpfalz 046 10475de24 Oberfranken 047 9885de25 Mittelfranken 079 12022de26 Unterfranken 056 10283de27 Schwaben 084 10593de60 Hamburg 062 17922de71 Darmstadt 130 13985de73 Kassel 041 10006de91 Braunschweig 081 9675de92 Hannover 058 10000dea1 Duumlsseldorf 176 11397dea2 Koumlln 129 10387dea4 Detmold 085 9742dea5 Arnsberg 143 9395deb3 Rheinhessen-Pfalz 082 9505dec0 Saarland 040 9778def0 Schleswig-Holstein 061 9099dk01 Hovedstaden 043 18287dk04 Midtjylland 041 13581es21 Pais Vasco 070 9977es30 Comunidad de Madrid 093 10213es51 Cataluntildea 180 9310fi18 Etelauml-Suomi 123 13009fi19 Laumlnsi-Suomi 064 9954fr10 Icircle de France 221 15821fr23 Haute-Normandie 043 9333fr24 Centre 052 9211fr42 Alsace 048 9664fr51 Pays de la Loire 072 9353fr52 Bretagne 051 9124fr61 Aquitaine 044 9276fr62 Midi-Pyreacuteneacutees 040 9221fr71 Rhocircne-Alpes 140 10349fr82 Provence-Alpes-Cocircte dAzur 055 9715gr30 Attiki 039 9144ie02 Southern and Eastern 196 16068itc1 Piemonte 128 9973itc4 Lombardia 390 11863itd3 Veneto 176 10747itd5 Emilia-Romagna 164 11132ite1 Toscana 090 9929ite3 Marche 047 9078ite4 Lazio 062 11123nl22 Gelderland 043 9892nl32 Noord-Holland 051 13804nl33 Zuid-Holland 077 12003nl41 Noord-Brabant 098 11722se11 Stockholm 062 17037se12 Oumlstra Mellansverige 056 10433se22 Sydsverige 044 10865se23 Vaumlstsverige 074 11743ukd3 Greater Manchester 055 10374ukd4 Lancashire 046 9161uke4 West Yorkshire 054 10378ukf1 Derbyshire and Nottinghamshire 065 10283ukf2 Leicestershire Rutland and Northants 053 11179ukg3 West Midlands 071 10596ukh1 East Anglia 050 10169uki1 Inner London 067 28535uki2 Outer London 055 10231ukj1 Berkshire Bucks and Oxfordshire 058 15836ukj3 Hampshire and Isle of Wight 043 11334ukk1 Gloucestershire Wiltshire and Bristol 061 12628ukm2 Eastern Scotland 044 10947ukm3 South Western Scotland 053 10097
Source Elaborated from Eurostat and national Statistical offices
Appendix 2 GDP per Capita and regions share in EU-15 manufacturing GVA 2005
Delocation in the manufacturing sectors in the EU A regional overview
Appendix 2 (Continued)
0
5
10
15
20
25
30
100 120 140 160 180 200 220 240 260 280
26
23
9
54
12
12
10 0 0 0 0 0 0 0 0
1
Reg iona l GD P per Ca pita (EU-1 5 =1 0 0 ) Histo g ra m
0
10
20
30
40
05 10 15 20 25 30 35 40
14
34
9
3
6
13 3
10 0 0 0 0
1
Industrial size of selected regions ( of EU-15 manufacturing GVA)Histogram
27
Delocation in the manufacturing sectors in the EU A regional overview
Appendix 3 Location effect and productivity growth rates in European manufacturing sector
(percentages)
Loca
tion
effe
ct (
of 2
000
empl
oym
ent)
Productivity grothw
AUSTRIA
AT
AT31AT221
-5
0
5
10
-5 0 5 10
GERMANY
DE91
DEa4
Dec0
EDf0
DE 24
DE71DE92
DE14
DE 26
DE73DE 60
DE 22
DE23
DE25
DE 13
DE a1
DEa2
DE27
DE 21
DE a5
DE12DE
DEb3
DE11
-5
0
5
10
15
20
-5 0 5 10 15 20 25 30
BELGIUM
BE21
BE
BE23
-10
-5
0
5
-5 0 5 10 15
DENMARK
DK04
DK
DK01
-10
-5
0
5
-5 0 5 10 15
SPAIN
ES
ES30
ES21
ES51
-5
0
5
10
-5 0 5 10
FRANCE
FR51
FR71
FR42
FR23
FR62
FR61
FR82FR52
FR24FR
FR10
-25
-20
-15
-10
-5
0
5
-35 -30 -25 -20 -15 -10 -5 0 5 10
HOLAND
NL33
NL22
NL41
NL32
NL
-5
0
5
10
15
20
-5 0 5 10 15 20 25 30
ITALY
ITe4
ITc1
ITe1
ITd3
ITd5
ITe3
ITc4
IT
-25
-20
-15
-10
-5
0
5
-10 -5 0 5 10
28
Delocation in the manufacturing sectors in the EU A regional overview
Productivity grothw
Source Elaborated from Eurostat and National Statistical offices
Appendix 3 (continued)Lo
catio
n ef
fect
( o
f 200
0 em
ploy
men
t)FINLAND
FI FI19
FI18
-5
0
5
10
15
20
25
30
-5 0 5 10 15 20 25 30 35
GREECE
GR30GR
-5
0
5
10
15
20
25
30
-5 0 5 10 15 20 25 30 35
IRELAND
IEIE02
-5
0
5
10
15
20
25
30
35
-5 0 5 10 15 20 25 30 35 40 45
UNITED KINDOGDOM
UKh1
UKm2
UKf1
UKj3
UKd3
UKf2
UKi2
UKk1
UKg3UKe4
UKm3
UKj1
UKd4
UKi1
UK
-35
-30
-25
-20
-15
-10
-5
0
5
10
-15 -10 -5 0 5 10 15 20 25 30 35 40
SWEDEN
SE11
SE12
SE23 SE22
SE
-5
0
5
10
15
20
25
30
35
-5 0 5 10 15 20 25 30 35 40 45
29
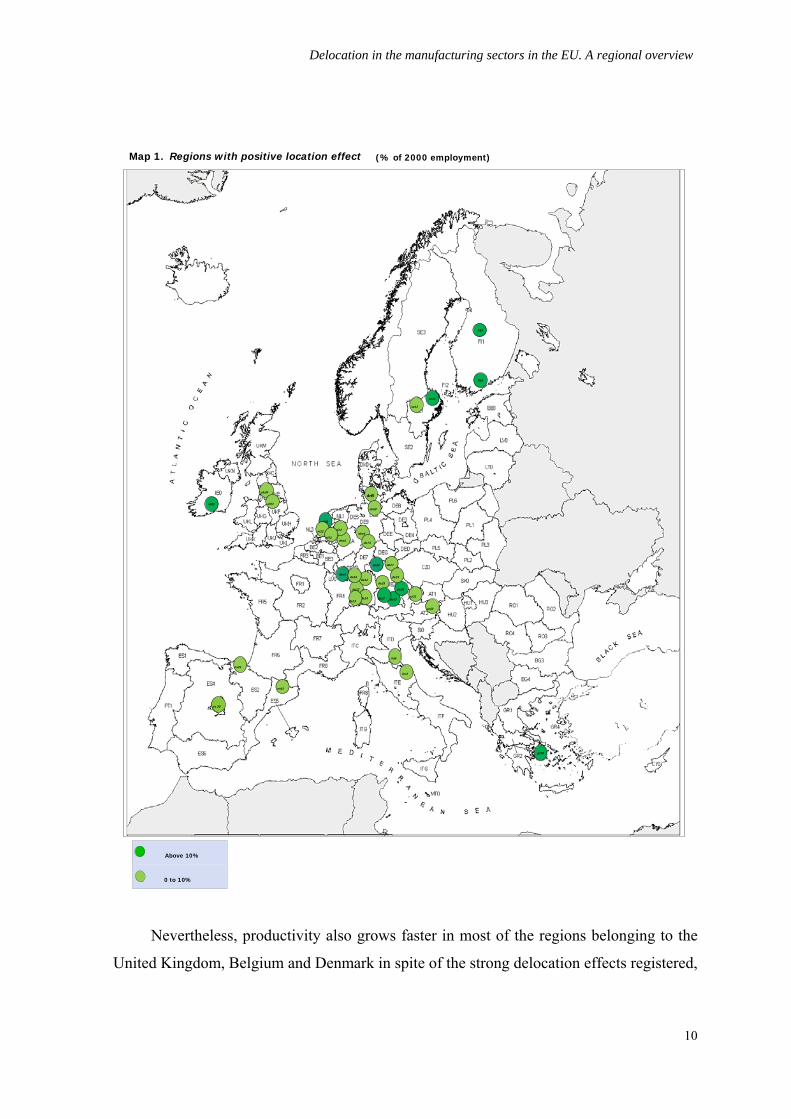
Delocation in the manufacturing sectors in the EU A regional overview
In contrast the productivity decline in half of the French and Italian regions albeit
with a positive impact on employment is largely offset by destruction of industrial
activity except in Icircle de France and Midi -Pyreacuteneacutees the two territories in which
productivity has a more negative trajectory
These results closely match those reported by Cuadrado Roura et al (2000) based on
the growth rates for regional productivity and employment during the period 1980-1993
grouping European regions in four typologies comparing the growth rates of these two
variables with their respective European averages
According to this approach and including the location effect in the analysis the
group of regions that are examined in this work would be categorized as follows (Table 2)
The first group includes areas with productivity and employment growth rates above
sample average and show positive location effect (Quadrant 1) So as has been underlined
in that work possibly this reflects the fact that the technological and organizational
changes introduced during the period would have been successful promoting the
diversification and specialization in activities with high growth levels and attracting new
investments which are less labour-intensive
In a second stage are those regions that as the above mentioned authors suggest
have implemented restructuring processes to eliminate the most inefficient outputs
achieving higher levels of productivity and in about half of them increased industrial
production at the expense of a notable decline in employment (Quadrant 4) They named
this typology `restructuring via productivityacute
With a few exceptions (those where the location effect is negative) the regions in
both groups are the winners of industrial dynamic during the period Most of them are
large industrial regions and are located in the traditional industrial growth centres As
demonstrated above they are mainly Finish German and Dutch as well as Greek and Irish
regions
In contrast another large group of regions due to different factors6 have opted for
more labour-intensive industrial models which in a few cases (especially in Spanish and
Austrian regions) have been accompanied by output increases so they can also be included
6 See Cuadrado et al (2000)
12
Delocation in the manufacturing sectors in the EU A regional overview
in the winners (Map 1) while in other the result has been a loss of productive activity
(Quadrant 2)
(1) (2)Employment Productivity Employment Productivity
de11 Stuttgart -48 125 at22 Steiermark 36 11de12 Karlsruhe -57 101 at31 Oberoumlsterreich 06 56de21 Oberbayern -37 179 be21 Prov Antwerpen -70 -05de22 Niederbayern -33 218 be23 Prov Oost-Vlaanderen -74 61de23 Oberpfalz -38 120 de13 Freiburg -45 45de25 Mittelfranken -53 80 de14 Tuumlbingen -23 72de26 Unterfranken -49 189 de91 Braunschweig -47 25de27 Schwaben -41 148 es21 Pais Vasco 74 13de60 Hamburg -60 97 es30 Comunidad de Madrid -31 63dec0 Saarland -32 160 es51 Cataluntildea 09 25fi19 Laumlnsi-Suomi -54 297 fr10 Icircle de France 218 -307gr30 Attiki -17 234 fr51 Pays de la Loire -08 -67
fr52 Bretagne -23 12fr61 Aquitaine -14 -50fr62 Midi-Pyreacuteneacutees 15 -245fr71 Rhocircne-Alpes -61 -57fr82 Provence-Alpes-Cocircte dAzur -06 -18itc4 Lombardia -63 61itd3 Veneto -62 03itd5 Emilia-Romagna -16 16ite3 Marche 08 28ite4 Lazio -36 -47se23 Vaumlstsverige -26 -07
(4) (3)Employment Productivity Employment Productivity
de24 Oberfranken -116 186 fr24 Centre -106 06de71 Darmstadt -149 132 fr42 Alsace -154 61de73 Kassel -78 103 itc1 Piemonte -129 -48de92 Hannover -106 86 ite1 Toscana -98 -02dea1 Duumlsseldorf -126 177 se22 Sydsverige -91 62dea2 Koumlln -150 137 uke4 West Yorkshire -186 60dea4 Detmold -107 110 ukh1 East Anglia -137 71dea5 Arnsberg -129 122 uki2 Outer London -271 -67deb3 Rheinhessen-Pfalz -106 152 ukj3 Hampshire and Isle of Wight -81 51def0 Schleswig-Holstein -101 135 ukk1 Gloucestershire Wiltshire -169 62dk01 Hovedstaden -134 125 ukm2 Eastern Scotland -91 -116dk04 Midtjylland -146 118fi18 Etelauml-Suomi -86 339fr23 Haute-Normandie -171 77ie02 Southern and Eastern -78 426nl22 Gelderland -178 206nl32 Noord-Holland -138 180nl33 Zuid-Holland -129 296nl41 Noord-Brabant -173 269se11 Stockholm -136 363se12 Oumlstra Mellansverige -151 166ukd3 Greater Manchester -232 90ukd4 Lancashire -317 350ukf1 Derbyshire and Nottinghamshire -179 240ukf2 Leicestershire Rutland and Northants -233 191ukg3 West Midlands -313 180uki1 Inner London -142 102ukj1 Berkshire Bucks and Oxfordshire -246 208ukm3 South Western Scotland -207 128
Source Elaborated from Eurostat and national Statistical officesNote Shaded areas indicate regions with positive location effect
Em
ploy
men
t gro
wth
lt A
vera
ge v
alue
Productivity growth gt Average value Productivity growth lt Average value
Em
ploy
men
t gro
wth
gt A
vera
ge v
alue
Table 2 Employment and productivity growth rates in select regions manufacturing sector 2001-2005 (Averages of all regions +74 productivity -77 employment)
13
Delocation in the manufacturing sectors in the EU A regional overview
Finally the worst results can be seen in a fourth type of region with growth rates of
GVA and productivity below average and serious job destruction (Quadrant 3) This would
occur in regions with problems in restructuring their manufacturing sector or with low
levels of activity So together with those that are either restructuring via productivity or
via employment but without achieving a positive location effect they are clearly the
losers These include mainly British French Italian Belgian and Danish regions
To sum up these results confirm the direct relationship between growth in labour
efficiency and progress in the creation of productive industrial activity as pointed out
above and which can be more clearly by looking at Figure 1 In other words regions with
higher levels of productivity growth in general show a greater attractiveness for new
manufacturing firms
These differences in the behaviour of productivity and employment across regions
have led to remarkable disparities in rates of change of their industrial output during the
period Thus while a few increased their real manufacturing GVA by more than 20 in
the less dynamic ones the loss of industrial output is between a sixth and a third of the
initial value So significant changes had taken place in the relative position of some of
them (Figure 2)
Growth is led by a group of twenty regions located in Ireland Finland Greece
Germany Sweden Netherlands Spain and Austria with real GVA growth rates that are
more than five points above average As a result they increased their share in the industrial
output of the sample Looking at the complete list we see that the growth deviation from
the mean exhibits positive values in just over half of the regions examined among them
seven of the ten with the largest industrial scale in 2005 Thus the top ten regions have
increased their share from 32 to 33 percent in the last five years
Conversely among the less dynamic regions are found a great number of British and
some French and Italian ones which consequently have fallen back in the ranking of
NUTS 2 arranged by their contribution to aggregate manufacturing output
Between both groups there are approximately twenty regions mainly in Germany
with growth rates not far from average so their positions have hardly changed during the
last five years
14
Delocation in the manufacturing sectors in the EU A regional overview
Figure 2 Regional shares in the total sample manufacturing GVA(percentage at 2000 prices)
ITc4
UKf2
UKm3
Uke4
UKf1
UKk1
UKh1
AT22
ITe1
ES21
ES51
FR71
FR62
IT e4
DE24
DE26
SE23
FR61
FR51
FR82
SE22
ITe3
AT31
DK04
DE11
DE23
GR30
DEc0
ES30DEb3DEf0
DEa4
DE92
BE21
DE73
IE02
ITd3
FR52
DE91
DE13DE25
DE 12DE60
DE27
DE21
DE22
BE23DEa2
DE71
DE 14
SE12
ITd5
SE11
FI19
FR10
FR 24
ITe1
FI18
DK01 DEa5
FR4 2
DEa1NL32
NL3 3
FR2 3
NL22
NL 41
UKd3
UKj3
UKi1
UKm2
UKj1
UKd4
UKi2
Ukg3
-35
-30
-25
-20
-15
-10
-5
0
5
10
15
20
25
30
35
Share in 2005
Source Elaborated from Eurostat and National Statistical offices
Rat
e of
cha
nge
200
1-20
05
70403530252015100500
Finally when the question is analyzed at Member State level (Table 1) it is possible
to check out the disparities among the above mentioned regions Thus while in some
15
Delocation in the manufacturing sectors in the EU A regional overview
countries such as Spain manufacturing growth has been clearly labour-intensive
something which can be extended to its regions as also happens in Greece and Austria
which both boast positive location effect and a job destruction rate far below the average
in others such as Holland Sweden and to a lesser extent Belgium Ireland and Finland
increasing of industrial activity is only due by advances in productivity so has been
accompanied by heavy job losses and these are patterns repeated in most of their regions
with noticeable relevance in the Netherlands As for the United Kingdom Belgium and
Denmark all share declining industrial production together with strong job cuts a pattern
that is replicated in many of their regions In this situation are the bulk of French and
Italian NUTS 2 just like the countries to which they belong although in this case job
destruction has been much less pronounced and below the group average Close to this
mean is Germany as well as most of their regions
Thus the analysis at Member States level also confirms the positive relationship
between the advance of industrial productivity and the attractiveness for new
manufacturing firms As demonstrated for their regions Ireland Finland Netherlands and
Greece following at quite distance from Germany are Member States showing a better
performance in productivity and with high location effects (see Figure 1)
In fact similarities between performances in the regions and in the Member States
they belong to suggest that the trend in regional industrial employment is to some extent
influenced by belonging to the same country in other words the locational attractions of
each area and its effort to improve productivity is partly due to national specificities or
idiosyncratic factors In fact as shown in Appendix 3 most European industrialized
regions follow the location patterns of the country they belong to reproducing its
productivity behaviour too In summary the evolution of these variables in each region
seems to have a clear `country effectacute that is different behaviours motivated by specific
factors andor differentiated industrial policies
For example in order to correctly interpret the results for Spanish regions it can not
be overlooked that during the period analyzed as in the whole country regions have
absorbed large numbers of immigrants which has boosted the proliferation of lower
productivity and lower wages in industrial activities However it may be thought that this
phenomenon has tended to conceal productivity increases in larger and better equipped
16
Delocation in the manufacturing sectors in the EU A regional overview
firms which could have been significant in the light of their results7 On the other hand
countries like Finland or Ireland with the lowest population increase have opted for high-
tech manufacturing sectors as a way to improve national competitiveness8 Nonetheless
this positive location effect has not reached in these countriesrsquo NUTS 2 enough magnitude
to offset completely the job losses arising from productivity improvements
On the other hand this `national effectacute has also played an important role in
explaining the economic outcomes of European regions in terms of per capita GDP in
accordance with the results obtained by Cuadrado-Roura (2001) using the data available
for 109 EU regions over the 1977-1994 period
Table 3 Export growth in key sectors by countries 2000-2005 (percentages)Impact ITon Total
Spain 65 91 72 158 38 111 04Germany 116 138 61 111 111 130 14United Kingdom 09 85 29 32 23 61 02France -09 102 25 94 118 78 -01Ireland -09 -102 01 25 -34 77 -03Finland 47 152 45 49 56 73 13Italy 40 88 41 90 56 89 02EU-15 70 141 59 91 67 111 11Source Elaborated from Comtrade
Shoes TotalIT Auto Textile Clothes
This importance of the `national effectacute should allow us to make a better approach to
the determinants of above-mentioned delocation patterns in future research One of such
determinants might be found in the different importance and performance by countries of
some manufacturing branches particularly affected by the increase in global competition as
their development has being receiving strong support in emerging countries from both
domestic policies and the location of big multinational companies This is the case of IT
manufacturing sectors or that of automobiles clothes textiles and shoes (Sachwald 2004)
Table 3 shows how the exports of these key sectors have evolved in some of the European
countries considered here It is amazing to see the poor results registered by IT sectors in
United Kingdom France and Ireland compared to the other countries mentioned Germany
in particular This evolution could be behind the stronger effects of delocation in France
and the United Kingdom although it must have produced similar results in the case of
Ireland Furthermore on such a basis what has happened in Italy would remain
7 For details see Myro et al (2008) 8 See Aacutelvarez Loacutepez et al (2007)
17
Delocation in the manufacturing sectors in the EU A regional overview
unexplained as the selected key sectors do not show a bad performance in terms of exports
in the latter country
One reason for such contradictory results lies in the possibility that production
instead of export reflects accurately what has been happening in every sector in terms of
activity However Aacutelvarez et al (2007) show very similar patterns in production and
export specialization from 1995 to 2005 except in the case of Ireland which thus appears
as a very particular one This is because IT specialization in production increases at the
same time as it decreases in exports Perhaps the strong growth in domestic demand
prevents IT exports from growing The opposite case could be that of Italy where slow
growth in domestic demand might have been pushing up IT export9
Anyway further developments on the determinants of delocation patterns require the
preparation of disaggregated data on production a task beyond the objectives of this paper
That could allow us to update the available manufacturing specialization analysis As the
two countries exhibiting higher delocation effects France and the United Kingdom
showed the lowest rates of specialization compared with the EU (Milderfart and Overman
2002 Combes and Overman 2003) something could have changed in the last few years
which would merit a fresh look based on more recent data
On the other hand it is now clear that insofar as delocation in manufacturing
activities has affected each country in a different way a relocation process inside the EU
and between countries has taken place This process deserved to be deeply analyzed
including a perspective by sectors updating what we know about changes in the
distribution of manufacturing industry in the EU and offering the possibility of exploring
whether the European Common Policy has influenced them in some way as was already
suggested by Milderfart-Knarvik and Overman (2002)
9 In Finland IT activities grows much more in production than in exports but in both aspects a positive growth is registered
18
Delocation in the manufacturing sectors in the EU A regional overview
19
Figure 3 Employment growth rates in selected regions 2001-2005 manufacturing and total economy (percentages)
Ukg3
UKi2
UKd4
UKj1
UKm2
UKi1 UKj3
UKd3
NL 41
NL22
FR23
NL33
NL32
DEa1
FR42
DEa5
DK01
FI18
ITe1
FR 24FR10
FI19
SE11
ITd5FR52
DE 14
DE71
DEa2
BE23
DE22
DE21
DE27
IC c4
DE60DE 12
DE25
DE13
DE9 1SE12
ITd3
IE02
DE73
BE21
DE92DEa4
DEf0
DEb3
ES30
DEc0
GR30
DE23
DE11
DK04
AT31
ITe3
SE22
FR82
FR51FR61
SE2 3
DE26
DE24
IT e4
FR62
FR71
ES51
ES2 1
ITe1
AT22
UKh1
UKk1
UKf1
Uke4
UKm3
UKf2
-20
-15
-10
-5
0
5
10
15
20
25
-40 -30 -20 -10 0 10 20 30
Manufacturing
Source Elaborated from Eurostat and National Statistical offices
Tota
l em
ploy
men
t
Delocation in the manufacturing sectors in the EU A regional overview
One last question that deserves consideration is the effect of industrial delocation
process on the regional economies Surprisingly manufacturing job losses have not been
translated into total employment which exhibit positive growth for most of the chosen
regions with the exceptions of some Germans and all the Netherlands (Figure 3) That
means the regions have been able to compensate the negative effect on the employment
from shrinking manufacturing allocating more resources inside the services sectors In fact
a substitution of manufacturing by services seems to have happened as are the region
showing more delocation in manufacturing those that increase in a higher measure the
employment in the service sectors that is the French British and Italian However the
relation is not accurate as there are not a strict quantitative correlation region by region
between rates of delocation and increase in the employment in the service activities
These good results in terms of general employment shown by the regions affected in
a higher measure by manufacturing delocation suggest the convenience of a more general
analysis of regional economic growth beyond the manufacturing sector as some regions
strongly shrinking manufacturing activities in favour of those of services might be leading
an interesting process of structural change that could light up one of the ways of facing the
increasing competition coming from emerging economies
5- Final remarks
Comparative analysis of location patterns for a large sample of European regions -
characterized by having an upper-middle level income and a strong industrial sector-
during the last few years has revealed that only half of them have shown locational
attractions for manufacturing activities The regional patterns found clearly show the
influence of `national effectacute the regions showing location effects corresponding to most
of those located in Austria Germany the Netherlands Ireland Finland Sweden Spain and
Greece
On the contrary the delocation process has affected another half of the regions
included most of them French British and Italian Therefore delocation has contributed to
concentrating the European manufacturing industry in the areas with higher market
potential in the centre of continental Europe It has contributed furthermore to relocating
manufacturing activities inside every country something that requires further analysis
from future research
20
Delocation in the manufacturing sectors in the EU A regional overview
Attractiveness to location of manufacturing industries has been encouraged by
significant increases in labor productivity so in most of the regions showing positive
location patterns production increases have been compatibles with a decline in aggregate
manufacturing total employment More specifically in this situation are all regions in the
Netherlands Finland Greece and Ireland three quarters of the German ones two from the
United Kingdom two from Sweden and Madrid in Spain
On the contrary in the regions where delocation has taken place the increase in
labour productivity has been lower In fact thirteen of such regions show reductions in
labour productivity six of them placed in France three Italian the British Eastern Scotland
and Greater London Vaumlstsverige in Sweden and the Belgian Antwerp Besides the
positive impact of this rare performance on employment has been largely offset by
destruction of industrial activity except in the Icircle de France and Midi-Pyreacuteneacutees the two
territories in which productivity has a more negative trajectory
The positive link between location and labour productivity increase confirm the
result reached by other authors particularly Cuadrado Roura et al (2002) who referring
their analysis to previous years distinguish two groups of winners among the European
regions the first grouping regions with increased employment and labour productivity
perhaps reflecting the success of technological and organizational changes introduced
during the period promoting the diversification and specialization in activities with high
growth levels and attracting new investments less labour-intensive and a second one
formed by regions capable of implementing restructuring processes to eliminate the most
inefficient outputs achieve higher levels of productivity and increased industrial
production at the expense of a notable decline in employment
Nevertheless discrepancies in delocation patterns outlined above and different
achievements in terms of productivity improvement have not only been the result of
companiesacute response to intensified competition in each region but also of differential
features On the one hand is size which in larger regions like some of Italy Germany
France and Spain reduces the chances of scoring high growth rates On the other hand are
the national specificities such as the massive migrations received by the Spanish regions a
key to explain their model of industrial growth and the different public policies The
influence of the two latter factors appears remarkable given the similarities among the
location patterns of each of the regions examined and the Member States they belong to
21
Delocation in the manufacturing sectors in the EU A regional overview
Anyway the lack of data has prevented us from going further into a preliminary
explanatory analysis of the delocation patters found when looking at the different
manufacturing activities but the role played by the IT manufacturing sector and other
branches affected by intense international competition (automobile clothes and textiles
and shoes) might have been important
To finish just to point up that the effect of manufacturing delocation on aggregate
employment has been offset by growth of services sectors suggesting the convenience of a
more general analysis of regional economic growth beyond the manufacturing sector as
some regions showing greater change in employment between sectors might be leading an
interesting process of structural change that could light up one of the ways of facing the
increasing competition coming from emerging economies
22
Delocation in the manufacturing sectors in the EU A regional overview
References
Aacutelvarez Loacutepez ME R Myro and J Vega Crespo (2007) ldquoCambios Recientes en la
Especializacioacuten Inter-industrial de las Manufacturas Espantildeolasrdquo Papeles de Economiacutea
Espantildeola 112 2-21
Antragraves P and E Helpman (2004) ldquoGlobal Sourcingrdquo Journal of Political Economy
112(3) 552-580
Bjerring Olsen K (2006) Productivity Impacts of Offshoring and Outsourcing A Review
OECD Directorate for Science Technology and Industry
Baldwin RE and F Robert-Nicoud (2000) ldquoFree trade agreements without delocationrdquo
Canadian Journal of Economics 33(3) 766-786
Bhagwati J A Panagariya and TN Srinivasan (2004) ldquoThe Muddles over Outsourcingrdquo
Journal of Economic Perspectives 18(4) 93-114
Combes PP and HG Overman (2003) ldquoThe Spatial Distribution of Economic Activities
in the EUrdquo Center for Economic Performance London School of Economics and
Political Science
Cuadrado-Roura JR T Mancha-Navarro and R Garrido-Yserte (2000) ldquoRegional
Productivity Patterns in Europe An Alternative Approachrdquo The Annals of Regional
Science 34(3) 365-384
Cuadrado Roura JR (2001) Regional convergence in the European Union From
hypothesis to the actual trends The Annals of Regional Science 35(3) 333-356
Cuadrado-Roura JR T Mancha-Navarro and R Garrido-Yserte (2002) ldquoRegional
Dynamics in the European Union Winners and Losersrdquo in Cuadrado-Roura JR and
M Parellada (eds) Regional Convergente in the European Union Springer-Verlag
Berlin 23-52
Fujita M P Krugman and A Venables (1999) The Spatial Economy Cambridge MA
The MIT Press
Grossman GM and E Rossi-Hansberg (2006) The Rise of Offshoring Itacutes Not Wine for
Cloth Anymore Princeton University unpublished
Helpman E D Marin and T Verdier (2008) The organization of firms in a global
economy Harvard University Press
Krugman P and AJ Venables (1990) ldquoIntegration and the Competitiveness of Peripheral
Industryrdquo in C Bliss and J Braga de Macedo (eds) Unity with Diversity in the
European Community Cambridge University Press
23
Delocation in the manufacturing sectors in the EU A regional overview
Krugman P (1999) Geography and Trade Cambridge MA The MIT Press
Midelfart-Knarvik KH and HG Overman (2002) Delocation and European Integration
is structural spending justified Economic Policy 17(35) 321-359
Myro R CM Fernaacutendez-Otheo L Labrador AB Baides Tudela ME Aacutelvarez Loacutepez
and Vega Crespo J (2008) Globalizacioacuten y Deslocalizacioacuten Importancia y Efectos
para la Industria Espantildeola Direccioacuten General de Poliacutetica de la PYME Ministerio de
Industria Turismo y Comercio (httpwwwipymeorgNRrdonlyresAD74121A-
DD3C-4564-92AD-17A2872508CA0GlobalizacionDeslocalizacionpdf)
Puga D (1999) The Rise and Fall of Regional Inequalities European Economic Review
43(2) 303-334
Puga D (2002) European Regional Policy in Light of Recent Location Theories Journal
of Economic Geography 2(4) 373-406
Sachwald F (2004) ldquoThe impact of EU enlargement on Firmsacute Strategies and the
Location of Production in Europerdquo Tokyo Club Research Meeting
24
Delocation in the manufacturing sectors in the EU A regional overview
25
Appendix 1 European regions NUTS2 in the sampleCode Region name Code Region name
NUTS2 and country to which it belong NUTS2 and country to which it belongat22 Steiermark gr30 Attikiat31 Oberoumlsterreich Greece
Austriaie02 Southern and Eastern
be21 Prov Antwerpen Irelandbe23 Prov Oost-Vlaanderen
Belgium itc1 Piemonteitc4 Lombardia
de11 Stuttgart itd3 Venetode12 Karlsruhe itd5 Emilia-Romagnade13 Freiburg ite1 Toscanade14 Tuumlbingen ite3 Marchede21 Oberbayern ite4 Laziode22 Niederbayern Italyde23 Oberpfalzde24 Oberfranken nl22 Gelderlandde25 Mittelfranken nl32 Noord-Hollandde26 Unterfranken nl33 Zuid-Hollandde27 Schwaben nl41 Noord-Brabantde60 Hamburg Netherlandsde71 Darmstadtde73 Kassel se11 Stockholmde91 Braunschweig se12 Oumlstra Mellansverigede92 Hannover se22 Sydsverigedea1 Duumlsseldorf se23 Vaumlstsverigedea2 Koumlln Swedendea4 Detmolddea5 Arnsberg ukd3 Greater Manchesterdeb3 Rheinhessen-Pfalz ukd4 Lancashiredec0 Saarland uke4 West Yorkshiredef0 Schleswig-Holstein ukf1 Derbyshire and Nottinghamshire
Germany ukf2 Leicestershire Rutland and Northantsukg3 West Midlands
dk01 Hovedstaden ukh1 East Angliadk04 Midtjylland uki1 Inner London
Denmark uki2 Outer Londonukj1 Berkshire Bucks and Oxfordshire
es21 Pais Vasco ukj3 Hampshire and Isle of Wightes30 Comunidad de Madrid ukk1 Gloucestershire Wiltshire and Bristoles51 Cataluntildea ukm2 Eastern Scotland
Spain ukm3 South Western ScotlandUnited Kingdom
fi18 Etelauml-Suomifi19 Laumlnsi-Suomi
Finland
fr10 Icircle de Francefr23 Haute-Normandiefr24 Centrefr42 Alsacefr51 Pays de la Loirefr52 Bretagnefr61 Aquitainefr62 Midi-Pyreacuteneacuteesfr71 Rhocircne-Alpesfr82 Provence-Alpes-Cocircte dAzur
France
Delocation in the manufacturing sectors in the EU A regional overview
26
Manufacturing GVA GDPpc( of total EU-15) (Index EU-15=100)
at22 Steiermark 040 9647at31 Oberoumlsterreich 063 10641be21 Prov Antwerpen 064 12780be23 Prov Oost-Vlaanderen 040 9589de11 Stuttgart 241 12296de12 Karlsruhe 132 11674de13 Freiburg 099 10018de14 Tuumlbingen 095 10780de21 Oberbayern 205 14684de22 Niederbayern 051 10090de23 Oberpfalz 046 10475de24 Oberfranken 047 9885de25 Mittelfranken 079 12022de26 Unterfranken 056 10283de27 Schwaben 084 10593de60 Hamburg 062 17922de71 Darmstadt 130 13985de73 Kassel 041 10006de91 Braunschweig 081 9675de92 Hannover 058 10000dea1 Duumlsseldorf 176 11397dea2 Koumlln 129 10387dea4 Detmold 085 9742dea5 Arnsberg 143 9395deb3 Rheinhessen-Pfalz 082 9505dec0 Saarland 040 9778def0 Schleswig-Holstein 061 9099dk01 Hovedstaden 043 18287dk04 Midtjylland 041 13581es21 Pais Vasco 070 9977es30 Comunidad de Madrid 093 10213es51 Cataluntildea 180 9310fi18 Etelauml-Suomi 123 13009fi19 Laumlnsi-Suomi 064 9954fr10 Icircle de France 221 15821fr23 Haute-Normandie 043 9333fr24 Centre 052 9211fr42 Alsace 048 9664fr51 Pays de la Loire 072 9353fr52 Bretagne 051 9124fr61 Aquitaine 044 9276fr62 Midi-Pyreacuteneacutees 040 9221fr71 Rhocircne-Alpes 140 10349fr82 Provence-Alpes-Cocircte dAzur 055 9715gr30 Attiki 039 9144ie02 Southern and Eastern 196 16068itc1 Piemonte 128 9973itc4 Lombardia 390 11863itd3 Veneto 176 10747itd5 Emilia-Romagna 164 11132ite1 Toscana 090 9929ite3 Marche 047 9078ite4 Lazio 062 11123nl22 Gelderland 043 9892nl32 Noord-Holland 051 13804nl33 Zuid-Holland 077 12003nl41 Noord-Brabant 098 11722se11 Stockholm 062 17037se12 Oumlstra Mellansverige 056 10433se22 Sydsverige 044 10865se23 Vaumlstsverige 074 11743ukd3 Greater Manchester 055 10374ukd4 Lancashire 046 9161uke4 West Yorkshire 054 10378ukf1 Derbyshire and Nottinghamshire 065 10283ukf2 Leicestershire Rutland and Northants 053 11179ukg3 West Midlands 071 10596ukh1 East Anglia 050 10169uki1 Inner London 067 28535uki2 Outer London 055 10231ukj1 Berkshire Bucks and Oxfordshire 058 15836ukj3 Hampshire and Isle of Wight 043 11334ukk1 Gloucestershire Wiltshire and Bristol 061 12628ukm2 Eastern Scotland 044 10947ukm3 South Western Scotland 053 10097
Source Elaborated from Eurostat and national Statistical offices
Appendix 2 GDP per Capita and regions share in EU-15 manufacturing GVA 2005
Delocation in the manufacturing sectors in the EU A regional overview
Appendix 2 (Continued)
0
5
10
15
20
25
30
100 120 140 160 180 200 220 240 260 280
26
23
9
54
12
12
10 0 0 0 0 0 0 0 0
1
Reg iona l GD P per Ca pita (EU-1 5 =1 0 0 ) Histo g ra m
0
10
20
30
40
05 10 15 20 25 30 35 40
14
34
9
3
6
13 3
10 0 0 0 0
1
Industrial size of selected regions ( of EU-15 manufacturing GVA)Histogram
27
Delocation in the manufacturing sectors in the EU A regional overview
Appendix 3 Location effect and productivity growth rates in European manufacturing sector
(percentages)
Loca
tion
effe
ct (
of 2
000
empl
oym
ent)
Productivity grothw
AUSTRIA
AT
AT31AT221
-5
0
5
10
-5 0 5 10
GERMANY
DE91
DEa4
Dec0
EDf0
DE 24
DE71DE92
DE14
DE 26
DE73DE 60
DE 22
DE23
DE25
DE 13
DE a1
DEa2
DE27
DE 21
DE a5
DE12DE
DEb3
DE11
-5
0
5
10
15
20
-5 0 5 10 15 20 25 30
BELGIUM
BE21
BE
BE23
-10
-5
0
5
-5 0 5 10 15
DENMARK
DK04
DK
DK01
-10
-5
0
5
-5 0 5 10 15
SPAIN
ES
ES30
ES21
ES51
-5
0
5
10
-5 0 5 10
FRANCE
FR51
FR71
FR42
FR23
FR62
FR61
FR82FR52
FR24FR
FR10
-25
-20
-15
-10
-5
0
5
-35 -30 -25 -20 -15 -10 -5 0 5 10
HOLAND
NL33
NL22
NL41
NL32
NL
-5
0
5
10
15
20
-5 0 5 10 15 20 25 30
ITALY
ITe4
ITc1
ITe1
ITd3
ITd5
ITe3
ITc4
IT
-25
-20
-15
-10
-5
0
5
-10 -5 0 5 10
28
Delocation in the manufacturing sectors in the EU A regional overview
Productivity grothw
Source Elaborated from Eurostat and National Statistical offices
Appendix 3 (continued)Lo
catio
n ef
fect
( o
f 200
0 em
ploy
men
t)FINLAND
FI FI19
FI18
-5
0
5
10
15
20
25
30
-5 0 5 10 15 20 25 30 35
GREECE
GR30GR
-5
0
5
10
15
20
25
30
-5 0 5 10 15 20 25 30 35
IRELAND
IEIE02
-5
0
5
10
15
20
25
30
35
-5 0 5 10 15 20 25 30 35 40 45
UNITED KINDOGDOM
UKh1
UKm2
UKf1
UKj3
UKd3
UKf2
UKi2
UKk1
UKg3UKe4
UKm3
UKj1
UKd4
UKi1
UK
-35
-30
-25
-20
-15
-10
-5
0
5
10
-15 -10 -5 0 5 10 15 20 25 30 35 40
SWEDEN
SE11
SE12
SE23 SE22
SE
-5
0
5
10
15
20
25
30
35
-5 0 5 10 15 20 25 30 35 40 45
29
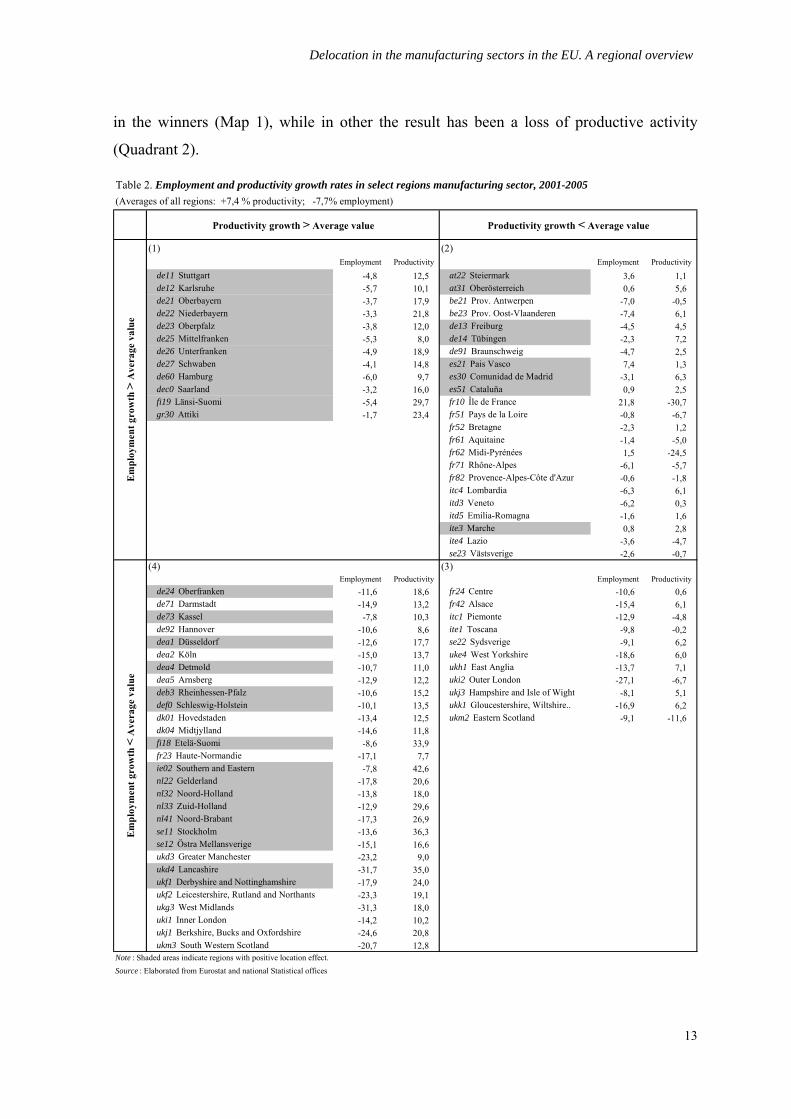
Delocation in the manufacturing sectors in the EU A regional overview
in the winners (Map 1) while in other the result has been a loss of productive activity
(Quadrant 2)
(1) (2)Employment Productivity Employment Productivity
de11 Stuttgart -48 125 at22 Steiermark 36 11de12 Karlsruhe -57 101 at31 Oberoumlsterreich 06 56de21 Oberbayern -37 179 be21 Prov Antwerpen -70 -05de22 Niederbayern -33 218 be23 Prov Oost-Vlaanderen -74 61de23 Oberpfalz -38 120 de13 Freiburg -45 45de25 Mittelfranken -53 80 de14 Tuumlbingen -23 72de26 Unterfranken -49 189 de91 Braunschweig -47 25de27 Schwaben -41 148 es21 Pais Vasco 74 13de60 Hamburg -60 97 es30 Comunidad de Madrid -31 63dec0 Saarland -32 160 es51 Cataluntildea 09 25fi19 Laumlnsi-Suomi -54 297 fr10 Icircle de France 218 -307gr30 Attiki -17 234 fr51 Pays de la Loire -08 -67
fr52 Bretagne -23 12fr61 Aquitaine -14 -50fr62 Midi-Pyreacuteneacutees 15 -245fr71 Rhocircne-Alpes -61 -57fr82 Provence-Alpes-Cocircte dAzur -06 -18itc4 Lombardia -63 61itd3 Veneto -62 03itd5 Emilia-Romagna -16 16ite3 Marche 08 28ite4 Lazio -36 -47se23 Vaumlstsverige -26 -07
(4) (3)Employment Productivity Employment Productivity
de24 Oberfranken -116 186 fr24 Centre -106 06de71 Darmstadt -149 132 fr42 Alsace -154 61de73 Kassel -78 103 itc1 Piemonte -129 -48de92 Hannover -106 86 ite1 Toscana -98 -02dea1 Duumlsseldorf -126 177 se22 Sydsverige -91 62dea2 Koumlln -150 137 uke4 West Yorkshire -186 60dea4 Detmold -107 110 ukh1 East Anglia -137 71dea5 Arnsberg -129 122 uki2 Outer London -271 -67deb3 Rheinhessen-Pfalz -106 152 ukj3 Hampshire and Isle of Wight -81 51def0 Schleswig-Holstein -101 135 ukk1 Gloucestershire Wiltshire -169 62dk01 Hovedstaden -134 125 ukm2 Eastern Scotland -91 -116dk04 Midtjylland -146 118fi18 Etelauml-Suomi -86 339fr23 Haute-Normandie -171 77ie02 Southern and Eastern -78 426nl22 Gelderland -178 206nl32 Noord-Holland -138 180nl33 Zuid-Holland -129 296nl41 Noord-Brabant -173 269se11 Stockholm -136 363se12 Oumlstra Mellansverige -151 166ukd3 Greater Manchester -232 90ukd4 Lancashire -317 350ukf1 Derbyshire and Nottinghamshire -179 240ukf2 Leicestershire Rutland and Northants -233 191ukg3 West Midlands -313 180uki1 Inner London -142 102ukj1 Berkshire Bucks and Oxfordshire -246 208ukm3 South Western Scotland -207 128
Source Elaborated from Eurostat and national Statistical officesNote Shaded areas indicate regions with positive location effect
Em
ploy
men
t gro
wth
lt A
vera
ge v
alue
Productivity growth gt Average value Productivity growth lt Average value
Em
ploy
men
t gro
wth
gt A
vera
ge v
alue
Table 2 Employment and productivity growth rates in select regions manufacturing sector 2001-2005 (Averages of all regions +74 productivity -77 employment)
13
Delocation in the manufacturing sectors in the EU A regional overview
Finally the worst results can be seen in a fourth type of region with growth rates of
GVA and productivity below average and serious job destruction (Quadrant 3) This would
occur in regions with problems in restructuring their manufacturing sector or with low
levels of activity So together with those that are either restructuring via productivity or
via employment but without achieving a positive location effect they are clearly the
losers These include mainly British French Italian Belgian and Danish regions
To sum up these results confirm the direct relationship between growth in labour
efficiency and progress in the creation of productive industrial activity as pointed out
above and which can be more clearly by looking at Figure 1 In other words regions with
higher levels of productivity growth in general show a greater attractiveness for new
manufacturing firms
These differences in the behaviour of productivity and employment across regions
have led to remarkable disparities in rates of change of their industrial output during the
period Thus while a few increased their real manufacturing GVA by more than 20 in
the less dynamic ones the loss of industrial output is between a sixth and a third of the
initial value So significant changes had taken place in the relative position of some of
them (Figure 2)
Growth is led by a group of twenty regions located in Ireland Finland Greece
Germany Sweden Netherlands Spain and Austria with real GVA growth rates that are
more than five points above average As a result they increased their share in the industrial
output of the sample Looking at the complete list we see that the growth deviation from
the mean exhibits positive values in just over half of the regions examined among them
seven of the ten with the largest industrial scale in 2005 Thus the top ten regions have
increased their share from 32 to 33 percent in the last five years
Conversely among the less dynamic regions are found a great number of British and
some French and Italian ones which consequently have fallen back in the ranking of
NUTS 2 arranged by their contribution to aggregate manufacturing output
Between both groups there are approximately twenty regions mainly in Germany
with growth rates not far from average so their positions have hardly changed during the
last five years
14
Delocation in the manufacturing sectors in the EU A regional overview
Figure 2 Regional shares in the total sample manufacturing GVA(percentage at 2000 prices)
ITc4
UKf2
UKm3
Uke4
UKf1
UKk1
UKh1
AT22
ITe1
ES21
ES51
FR71
FR62
IT e4
DE24
DE26
SE23
FR61
FR51
FR82
SE22
ITe3
AT31
DK04
DE11
DE23
GR30
DEc0
ES30DEb3DEf0
DEa4
DE92
BE21
DE73
IE02
ITd3
FR52
DE91
DE13DE25
DE 12DE60
DE27
DE21
DE22
BE23DEa2
DE71
DE 14
SE12
ITd5
SE11
FI19
FR10
FR 24
ITe1
FI18
DK01 DEa5
FR4 2
DEa1NL32
NL3 3
FR2 3
NL22
NL 41
UKd3
UKj3
UKi1
UKm2
UKj1
UKd4
UKi2
Ukg3
-35
-30
-25
-20
-15
-10
-5
0
5
10
15
20
25
30
35
Share in 2005
Source Elaborated from Eurostat and National Statistical offices
Rat
e of
cha
nge
200
1-20
05
70403530252015100500
Finally when the question is analyzed at Member State level (Table 1) it is possible
to check out the disparities among the above mentioned regions Thus while in some
15
Delocation in the manufacturing sectors in the EU A regional overview
countries such as Spain manufacturing growth has been clearly labour-intensive
something which can be extended to its regions as also happens in Greece and Austria
which both boast positive location effect and a job destruction rate far below the average
in others such as Holland Sweden and to a lesser extent Belgium Ireland and Finland
increasing of industrial activity is only due by advances in productivity so has been
accompanied by heavy job losses and these are patterns repeated in most of their regions
with noticeable relevance in the Netherlands As for the United Kingdom Belgium and
Denmark all share declining industrial production together with strong job cuts a pattern
that is replicated in many of their regions In this situation are the bulk of French and
Italian NUTS 2 just like the countries to which they belong although in this case job
destruction has been much less pronounced and below the group average Close to this
mean is Germany as well as most of their regions
Thus the analysis at Member States level also confirms the positive relationship
between the advance of industrial productivity and the attractiveness for new
manufacturing firms As demonstrated for their regions Ireland Finland Netherlands and
Greece following at quite distance from Germany are Member States showing a better
performance in productivity and with high location effects (see Figure 1)
In fact similarities between performances in the regions and in the Member States
they belong to suggest that the trend in regional industrial employment is to some extent
influenced by belonging to the same country in other words the locational attractions of
each area and its effort to improve productivity is partly due to national specificities or
idiosyncratic factors In fact as shown in Appendix 3 most European industrialized
regions follow the location patterns of the country they belong to reproducing its
productivity behaviour too In summary the evolution of these variables in each region
seems to have a clear `country effectacute that is different behaviours motivated by specific
factors andor differentiated industrial policies
For example in order to correctly interpret the results for Spanish regions it can not
be overlooked that during the period analyzed as in the whole country regions have
absorbed large numbers of immigrants which has boosted the proliferation of lower
productivity and lower wages in industrial activities However it may be thought that this
phenomenon has tended to conceal productivity increases in larger and better equipped
16
Delocation in the manufacturing sectors in the EU A regional overview
firms which could have been significant in the light of their results7 On the other hand
countries like Finland or Ireland with the lowest population increase have opted for high-
tech manufacturing sectors as a way to improve national competitiveness8 Nonetheless
this positive location effect has not reached in these countriesrsquo NUTS 2 enough magnitude
to offset completely the job losses arising from productivity improvements
On the other hand this `national effectacute has also played an important role in
explaining the economic outcomes of European regions in terms of per capita GDP in
accordance with the results obtained by Cuadrado-Roura (2001) using the data available
for 109 EU regions over the 1977-1994 period
Table 3 Export growth in key sectors by countries 2000-2005 (percentages)Impact ITon Total
Spain 65 91 72 158 38 111 04Germany 116 138 61 111 111 130 14United Kingdom 09 85 29 32 23 61 02France -09 102 25 94 118 78 -01Ireland -09 -102 01 25 -34 77 -03Finland 47 152 45 49 56 73 13Italy 40 88 41 90 56 89 02EU-15 70 141 59 91 67 111 11Source Elaborated from Comtrade
Shoes TotalIT Auto Textile Clothes
This importance of the `national effectacute should allow us to make a better approach to
the determinants of above-mentioned delocation patterns in future research One of such
determinants might be found in the different importance and performance by countries of
some manufacturing branches particularly affected by the increase in global competition as
their development has being receiving strong support in emerging countries from both
domestic policies and the location of big multinational companies This is the case of IT
manufacturing sectors or that of automobiles clothes textiles and shoes (Sachwald 2004)
Table 3 shows how the exports of these key sectors have evolved in some of the European
countries considered here It is amazing to see the poor results registered by IT sectors in
United Kingdom France and Ireland compared to the other countries mentioned Germany
in particular This evolution could be behind the stronger effects of delocation in France
and the United Kingdom although it must have produced similar results in the case of
Ireland Furthermore on such a basis what has happened in Italy would remain
7 For details see Myro et al (2008) 8 See Aacutelvarez Loacutepez et al (2007)
17
Delocation in the manufacturing sectors in the EU A regional overview
unexplained as the selected key sectors do not show a bad performance in terms of exports
in the latter country
One reason for such contradictory results lies in the possibility that production
instead of export reflects accurately what has been happening in every sector in terms of
activity However Aacutelvarez et al (2007) show very similar patterns in production and
export specialization from 1995 to 2005 except in the case of Ireland which thus appears
as a very particular one This is because IT specialization in production increases at the
same time as it decreases in exports Perhaps the strong growth in domestic demand
prevents IT exports from growing The opposite case could be that of Italy where slow
growth in domestic demand might have been pushing up IT export9
Anyway further developments on the determinants of delocation patterns require the
preparation of disaggregated data on production a task beyond the objectives of this paper
That could allow us to update the available manufacturing specialization analysis As the
two countries exhibiting higher delocation effects France and the United Kingdom
showed the lowest rates of specialization compared with the EU (Milderfart and Overman
2002 Combes and Overman 2003) something could have changed in the last few years
which would merit a fresh look based on more recent data
On the other hand it is now clear that insofar as delocation in manufacturing
activities has affected each country in a different way a relocation process inside the EU
and between countries has taken place This process deserved to be deeply analyzed
including a perspective by sectors updating what we know about changes in the
distribution of manufacturing industry in the EU and offering the possibility of exploring
whether the European Common Policy has influenced them in some way as was already
suggested by Milderfart-Knarvik and Overman (2002)
9 In Finland IT activities grows much more in production than in exports but in both aspects a positive growth is registered
18
Delocation in the manufacturing sectors in the EU A regional overview
19
Figure 3 Employment growth rates in selected regions 2001-2005 manufacturing and total economy (percentages)
Ukg3
UKi2
UKd4
UKj1
UKm2
UKi1 UKj3
UKd3
NL 41
NL22
FR23
NL33
NL32
DEa1
FR42
DEa5
DK01
FI18
ITe1
FR 24FR10
FI19
SE11
ITd5FR52
DE 14
DE71
DEa2
BE23
DE22
DE21
DE27
IC c4
DE60DE 12
DE25
DE13
DE9 1SE12
ITd3
IE02
DE73
BE21
DE92DEa4
DEf0
DEb3
ES30
DEc0
GR30
DE23
DE11
DK04
AT31
ITe3
SE22
FR82
FR51FR61
SE2 3
DE26
DE24
IT e4
FR62
FR71
ES51
ES2 1
ITe1
AT22
UKh1
UKk1
UKf1
Uke4
UKm3
UKf2
-20
-15
-10
-5
0
5
10
15
20
25
-40 -30 -20 -10 0 10 20 30
Manufacturing
Source Elaborated from Eurostat and National Statistical offices
Tota
l em
ploy
men
t
Delocation in the manufacturing sectors in the EU A regional overview
One last question that deserves consideration is the effect of industrial delocation
process on the regional economies Surprisingly manufacturing job losses have not been
translated into total employment which exhibit positive growth for most of the chosen
regions with the exceptions of some Germans and all the Netherlands (Figure 3) That
means the regions have been able to compensate the negative effect on the employment
from shrinking manufacturing allocating more resources inside the services sectors In fact
a substitution of manufacturing by services seems to have happened as are the region
showing more delocation in manufacturing those that increase in a higher measure the
employment in the service sectors that is the French British and Italian However the
relation is not accurate as there are not a strict quantitative correlation region by region
between rates of delocation and increase in the employment in the service activities
These good results in terms of general employment shown by the regions affected in
a higher measure by manufacturing delocation suggest the convenience of a more general
analysis of regional economic growth beyond the manufacturing sector as some regions
strongly shrinking manufacturing activities in favour of those of services might be leading
an interesting process of structural change that could light up one of the ways of facing the
increasing competition coming from emerging economies
5- Final remarks
Comparative analysis of location patterns for a large sample of European regions -
characterized by having an upper-middle level income and a strong industrial sector-
during the last few years has revealed that only half of them have shown locational
attractions for manufacturing activities The regional patterns found clearly show the
influence of `national effectacute the regions showing location effects corresponding to most
of those located in Austria Germany the Netherlands Ireland Finland Sweden Spain and
Greece
On the contrary the delocation process has affected another half of the regions
included most of them French British and Italian Therefore delocation has contributed to
concentrating the European manufacturing industry in the areas with higher market
potential in the centre of continental Europe It has contributed furthermore to relocating
manufacturing activities inside every country something that requires further analysis
from future research
20
Delocation in the manufacturing sectors in the EU A regional overview
Attractiveness to location of manufacturing industries has been encouraged by
significant increases in labor productivity so in most of the regions showing positive
location patterns production increases have been compatibles with a decline in aggregate
manufacturing total employment More specifically in this situation are all regions in the
Netherlands Finland Greece and Ireland three quarters of the German ones two from the
United Kingdom two from Sweden and Madrid in Spain
On the contrary in the regions where delocation has taken place the increase in
labour productivity has been lower In fact thirteen of such regions show reductions in
labour productivity six of them placed in France three Italian the British Eastern Scotland
and Greater London Vaumlstsverige in Sweden and the Belgian Antwerp Besides the
positive impact of this rare performance on employment has been largely offset by
destruction of industrial activity except in the Icircle de France and Midi-Pyreacuteneacutees the two
territories in which productivity has a more negative trajectory
The positive link between location and labour productivity increase confirm the
result reached by other authors particularly Cuadrado Roura et al (2002) who referring
their analysis to previous years distinguish two groups of winners among the European
regions the first grouping regions with increased employment and labour productivity
perhaps reflecting the success of technological and organizational changes introduced
during the period promoting the diversification and specialization in activities with high
growth levels and attracting new investments less labour-intensive and a second one
formed by regions capable of implementing restructuring processes to eliminate the most
inefficient outputs achieve higher levels of productivity and increased industrial
production at the expense of a notable decline in employment
Nevertheless discrepancies in delocation patterns outlined above and different
achievements in terms of productivity improvement have not only been the result of
companiesacute response to intensified competition in each region but also of differential
features On the one hand is size which in larger regions like some of Italy Germany
France and Spain reduces the chances of scoring high growth rates On the other hand are
the national specificities such as the massive migrations received by the Spanish regions a
key to explain their model of industrial growth and the different public policies The
influence of the two latter factors appears remarkable given the similarities among the
location patterns of each of the regions examined and the Member States they belong to
21
Delocation in the manufacturing sectors in the EU A regional overview
Anyway the lack of data has prevented us from going further into a preliminary
explanatory analysis of the delocation patters found when looking at the different
manufacturing activities but the role played by the IT manufacturing sector and other
branches affected by intense international competition (automobile clothes and textiles
and shoes) might have been important
To finish just to point up that the effect of manufacturing delocation on aggregate
employment has been offset by growth of services sectors suggesting the convenience of a
more general analysis of regional economic growth beyond the manufacturing sector as
some regions showing greater change in employment between sectors might be leading an
interesting process of structural change that could light up one of the ways of facing the
increasing competition coming from emerging economies
22
Delocation in the manufacturing sectors in the EU A regional overview
References
Aacutelvarez Loacutepez ME R Myro and J Vega Crespo (2007) ldquoCambios Recientes en la
Especializacioacuten Inter-industrial de las Manufacturas Espantildeolasrdquo Papeles de Economiacutea
Espantildeola 112 2-21
Antragraves P and E Helpman (2004) ldquoGlobal Sourcingrdquo Journal of Political Economy
112(3) 552-580
Bjerring Olsen K (2006) Productivity Impacts of Offshoring and Outsourcing A Review
OECD Directorate for Science Technology and Industry
Baldwin RE and F Robert-Nicoud (2000) ldquoFree trade agreements without delocationrdquo
Canadian Journal of Economics 33(3) 766-786
Bhagwati J A Panagariya and TN Srinivasan (2004) ldquoThe Muddles over Outsourcingrdquo
Journal of Economic Perspectives 18(4) 93-114
Combes PP and HG Overman (2003) ldquoThe Spatial Distribution of Economic Activities
in the EUrdquo Center for Economic Performance London School of Economics and
Political Science
Cuadrado-Roura JR T Mancha-Navarro and R Garrido-Yserte (2000) ldquoRegional
Productivity Patterns in Europe An Alternative Approachrdquo The Annals of Regional
Science 34(3) 365-384
Cuadrado Roura JR (2001) Regional convergence in the European Union From
hypothesis to the actual trends The Annals of Regional Science 35(3) 333-356
Cuadrado-Roura JR T Mancha-Navarro and R Garrido-Yserte (2002) ldquoRegional
Dynamics in the European Union Winners and Losersrdquo in Cuadrado-Roura JR and
M Parellada (eds) Regional Convergente in the European Union Springer-Verlag
Berlin 23-52
Fujita M P Krugman and A Venables (1999) The Spatial Economy Cambridge MA
The MIT Press
Grossman GM and E Rossi-Hansberg (2006) The Rise of Offshoring Itacutes Not Wine for
Cloth Anymore Princeton University unpublished
Helpman E D Marin and T Verdier (2008) The organization of firms in a global
economy Harvard University Press
Krugman P and AJ Venables (1990) ldquoIntegration and the Competitiveness of Peripheral
Industryrdquo in C Bliss and J Braga de Macedo (eds) Unity with Diversity in the
European Community Cambridge University Press
23
Delocation in the manufacturing sectors in the EU A regional overview
Krugman P (1999) Geography and Trade Cambridge MA The MIT Press
Midelfart-Knarvik KH and HG Overman (2002) Delocation and European Integration
is structural spending justified Economic Policy 17(35) 321-359
Myro R CM Fernaacutendez-Otheo L Labrador AB Baides Tudela ME Aacutelvarez Loacutepez
and Vega Crespo J (2008) Globalizacioacuten y Deslocalizacioacuten Importancia y Efectos
para la Industria Espantildeola Direccioacuten General de Poliacutetica de la PYME Ministerio de
Industria Turismo y Comercio (httpwwwipymeorgNRrdonlyresAD74121A-
DD3C-4564-92AD-17A2872508CA0GlobalizacionDeslocalizacionpdf)
Puga D (1999) The Rise and Fall of Regional Inequalities European Economic Review
43(2) 303-334
Puga D (2002) European Regional Policy in Light of Recent Location Theories Journal
of Economic Geography 2(4) 373-406
Sachwald F (2004) ldquoThe impact of EU enlargement on Firmsacute Strategies and the
Location of Production in Europerdquo Tokyo Club Research Meeting
24
Delocation in the manufacturing sectors in the EU A regional overview
25
Appendix 1 European regions NUTS2 in the sampleCode Region name Code Region name
NUTS2 and country to which it belong NUTS2 and country to which it belongat22 Steiermark gr30 Attikiat31 Oberoumlsterreich Greece
Austriaie02 Southern and Eastern
be21 Prov Antwerpen Irelandbe23 Prov Oost-Vlaanderen
Belgium itc1 Piemonteitc4 Lombardia
de11 Stuttgart itd3 Venetode12 Karlsruhe itd5 Emilia-Romagnade13 Freiburg ite1 Toscanade14 Tuumlbingen ite3 Marchede21 Oberbayern ite4 Laziode22 Niederbayern Italyde23 Oberpfalzde24 Oberfranken nl22 Gelderlandde25 Mittelfranken nl32 Noord-Hollandde26 Unterfranken nl33 Zuid-Hollandde27 Schwaben nl41 Noord-Brabantde60 Hamburg Netherlandsde71 Darmstadtde73 Kassel se11 Stockholmde91 Braunschweig se12 Oumlstra Mellansverigede92 Hannover se22 Sydsverigedea1 Duumlsseldorf se23 Vaumlstsverigedea2 Koumlln Swedendea4 Detmolddea5 Arnsberg ukd3 Greater Manchesterdeb3 Rheinhessen-Pfalz ukd4 Lancashiredec0 Saarland uke4 West Yorkshiredef0 Schleswig-Holstein ukf1 Derbyshire and Nottinghamshire
Germany ukf2 Leicestershire Rutland and Northantsukg3 West Midlands
dk01 Hovedstaden ukh1 East Angliadk04 Midtjylland uki1 Inner London
Denmark uki2 Outer Londonukj1 Berkshire Bucks and Oxfordshire
es21 Pais Vasco ukj3 Hampshire and Isle of Wightes30 Comunidad de Madrid ukk1 Gloucestershire Wiltshire and Bristoles51 Cataluntildea ukm2 Eastern Scotland
Spain ukm3 South Western ScotlandUnited Kingdom
fi18 Etelauml-Suomifi19 Laumlnsi-Suomi
Finland
fr10 Icircle de Francefr23 Haute-Normandiefr24 Centrefr42 Alsacefr51 Pays de la Loirefr52 Bretagnefr61 Aquitainefr62 Midi-Pyreacuteneacuteesfr71 Rhocircne-Alpesfr82 Provence-Alpes-Cocircte dAzur
France
Delocation in the manufacturing sectors in the EU A regional overview
26
Manufacturing GVA GDPpc( of total EU-15) (Index EU-15=100)
at22 Steiermark 040 9647at31 Oberoumlsterreich 063 10641be21 Prov Antwerpen 064 12780be23 Prov Oost-Vlaanderen 040 9589de11 Stuttgart 241 12296de12 Karlsruhe 132 11674de13 Freiburg 099 10018de14 Tuumlbingen 095 10780de21 Oberbayern 205 14684de22 Niederbayern 051 10090de23 Oberpfalz 046 10475de24 Oberfranken 047 9885de25 Mittelfranken 079 12022de26 Unterfranken 056 10283de27 Schwaben 084 10593de60 Hamburg 062 17922de71 Darmstadt 130 13985de73 Kassel 041 10006de91 Braunschweig 081 9675de92 Hannover 058 10000dea1 Duumlsseldorf 176 11397dea2 Koumlln 129 10387dea4 Detmold 085 9742dea5 Arnsberg 143 9395deb3 Rheinhessen-Pfalz 082 9505dec0 Saarland 040 9778def0 Schleswig-Holstein 061 9099dk01 Hovedstaden 043 18287dk04 Midtjylland 041 13581es21 Pais Vasco 070 9977es30 Comunidad de Madrid 093 10213es51 Cataluntildea 180 9310fi18 Etelauml-Suomi 123 13009fi19 Laumlnsi-Suomi 064 9954fr10 Icircle de France 221 15821fr23 Haute-Normandie 043 9333fr24 Centre 052 9211fr42 Alsace 048 9664fr51 Pays de la Loire 072 9353fr52 Bretagne 051 9124fr61 Aquitaine 044 9276fr62 Midi-Pyreacuteneacutees 040 9221fr71 Rhocircne-Alpes 140 10349fr82 Provence-Alpes-Cocircte dAzur 055 9715gr30 Attiki 039 9144ie02 Southern and Eastern 196 16068itc1 Piemonte 128 9973itc4 Lombardia 390 11863itd3 Veneto 176 10747itd5 Emilia-Romagna 164 11132ite1 Toscana 090 9929ite3 Marche 047 9078ite4 Lazio 062 11123nl22 Gelderland 043 9892nl32 Noord-Holland 051 13804nl33 Zuid-Holland 077 12003nl41 Noord-Brabant 098 11722se11 Stockholm 062 17037se12 Oumlstra Mellansverige 056 10433se22 Sydsverige 044 10865se23 Vaumlstsverige 074 11743ukd3 Greater Manchester 055 10374ukd4 Lancashire 046 9161uke4 West Yorkshire 054 10378ukf1 Derbyshire and Nottinghamshire 065 10283ukf2 Leicestershire Rutland and Northants 053 11179ukg3 West Midlands 071 10596ukh1 East Anglia 050 10169uki1 Inner London 067 28535uki2 Outer London 055 10231ukj1 Berkshire Bucks and Oxfordshire 058 15836ukj3 Hampshire and Isle of Wight 043 11334ukk1 Gloucestershire Wiltshire and Bristol 061 12628ukm2 Eastern Scotland 044 10947ukm3 South Western Scotland 053 10097
Source Elaborated from Eurostat and national Statistical offices
Appendix 2 GDP per Capita and regions share in EU-15 manufacturing GVA 2005
Delocation in the manufacturing sectors in the EU A regional overview
Appendix 2 (Continued)
0
5
10
15
20
25
30
100 120 140 160 180 200 220 240 260 280
26
23
9
54
12
12
10 0 0 0 0 0 0 0 0
1
Reg iona l GD P per Ca pita (EU-1 5 =1 0 0 ) Histo g ra m
0
10
20
30
40
05 10 15 20 25 30 35 40
14
34
9
3
6
13 3
10 0 0 0 0
1
Industrial size of selected regions ( of EU-15 manufacturing GVA)Histogram
27
Delocation in the manufacturing sectors in the EU A regional overview
Appendix 3 Location effect and productivity growth rates in European manufacturing sector
(percentages)
Loca
tion
effe
ct (
of 2
000
empl
oym
ent)
Productivity grothw
AUSTRIA
AT
AT31AT221
-5
0
5
10
-5 0 5 10
GERMANY
DE91
DEa4
Dec0
EDf0
DE 24
DE71DE92
DE14
DE 26
DE73DE 60
DE 22
DE23
DE25
DE 13
DE a1
DEa2
DE27
DE 21
DE a5
DE12DE
DEb3
DE11
-5
0
5
10
15
20
-5 0 5 10 15 20 25 30
BELGIUM
BE21
BE
BE23
-10
-5
0
5
-5 0 5 10 15
DENMARK
DK04
DK
DK01
-10
-5
0
5
-5 0 5 10 15
SPAIN
ES
ES30
ES21
ES51
-5
0
5
10
-5 0 5 10
FRANCE
FR51
FR71
FR42
FR23
FR62
FR61
FR82FR52
FR24FR
FR10
-25
-20
-15
-10
-5
0
5
-35 -30 -25 -20 -15 -10 -5 0 5 10
HOLAND
NL33
NL22
NL41
NL32
NL
-5
0
5
10
15
20
-5 0 5 10 15 20 25 30
ITALY
ITe4
ITc1
ITe1
ITd3
ITd5
ITe3
ITc4
IT
-25
-20
-15
-10
-5
0
5
-10 -5 0 5 10
28
Delocation in the manufacturing sectors in the EU A regional overview
Productivity grothw
Source Elaborated from Eurostat and National Statistical offices
Appendix 3 (continued)Lo
catio
n ef
fect
( o
f 200
0 em
ploy
men
t)FINLAND
FI FI19
FI18
-5
0
5
10
15
20
25
30
-5 0 5 10 15 20 25 30 35
GREECE
GR30GR
-5
0
5
10
15
20
25
30
-5 0 5 10 15 20 25 30 35
IRELAND
IEIE02
-5
0
5
10
15
20
25
30
35
-5 0 5 10 15 20 25 30 35 40 45
UNITED KINDOGDOM
UKh1
UKm2
UKf1
UKj3
UKd3
UKf2
UKi2
UKk1
UKg3UKe4
UKm3
UKj1
UKd4
UKi1
UK
-35
-30
-25
-20
-15
-10
-5
0
5
10
-15 -10 -5 0 5 10 15 20 25 30 35 40
SWEDEN
SE11
SE12
SE23 SE22
SE
-5
0
5
10
15
20
25
30
35
-5 0 5 10 15 20 25 30 35 40 45
29
Delocation in the manufacturing sectors in the EU A regional overview
Finally the worst results can be seen in a fourth type of region with growth rates of
GVA and productivity below average and serious job destruction (Quadrant 3) This would
occur in regions with problems in restructuring their manufacturing sector or with low
levels of activity So together with those that are either restructuring via productivity or
via employment but without achieving a positive location effect they are clearly the
losers These include mainly British French Italian Belgian and Danish regions
To sum up these results confirm the direct relationship between growth in labour
efficiency and progress in the creation of productive industrial activity as pointed out
above and which can be more clearly by looking at Figure 1 In other words regions with
higher levels of productivity growth in general show a greater attractiveness for new
manufacturing firms
These differences in the behaviour of productivity and employment across regions
have led to remarkable disparities in rates of change of their industrial output during the
period Thus while a few increased their real manufacturing GVA by more than 20 in
the less dynamic ones the loss of industrial output is between a sixth and a third of the
initial value So significant changes had taken place in the relative position of some of
them (Figure 2)
Growth is led by a group of twenty regions located in Ireland Finland Greece
Germany Sweden Netherlands Spain and Austria with real GVA growth rates that are
more than five points above average As a result they increased their share in the industrial
output of the sample Looking at the complete list we see that the growth deviation from
the mean exhibits positive values in just over half of the regions examined among them
seven of the ten with the largest industrial scale in 2005 Thus the top ten regions have
increased their share from 32 to 33 percent in the last five years
Conversely among the less dynamic regions are found a great number of British and
some French and Italian ones which consequently have fallen back in the ranking of
NUTS 2 arranged by their contribution to aggregate manufacturing output
Between both groups there are approximately twenty regions mainly in Germany
with growth rates not far from average so their positions have hardly changed during the
last five years
14
Delocation in the manufacturing sectors in the EU A regional overview
Figure 2 Regional shares in the total sample manufacturing GVA(percentage at 2000 prices)
ITc4
UKf2
UKm3
Uke4
UKf1
UKk1
UKh1
AT22
ITe1
ES21
ES51
FR71
FR62
IT e4
DE24
DE26
SE23
FR61
FR51
FR82
SE22
ITe3
AT31
DK04
DE11
DE23
GR30
DEc0
ES30DEb3DEf0
DEa4
DE92
BE21
DE73
IE02
ITd3
FR52
DE91
DE13DE25
DE 12DE60
DE27
DE21
DE22
BE23DEa2
DE71
DE 14
SE12
ITd5
SE11
FI19
FR10
FR 24
ITe1
FI18
DK01 DEa5
FR4 2
DEa1NL32
NL3 3
FR2 3
NL22
NL 41
UKd3
UKj3
UKi1
UKm2
UKj1
UKd4
UKi2
Ukg3
-35
-30
-25
-20
-15
-10
-5
0
5
10
15
20
25
30
35
Share in 2005
Source Elaborated from Eurostat and National Statistical offices
Rat
e of
cha
nge
200
1-20
05
70403530252015100500
Finally when the question is analyzed at Member State level (Table 1) it is possible
to check out the disparities among the above mentioned regions Thus while in some
15
Delocation in the manufacturing sectors in the EU A regional overview
countries such as Spain manufacturing growth has been clearly labour-intensive
something which can be extended to its regions as also happens in Greece and Austria
which both boast positive location effect and a job destruction rate far below the average
in others such as Holland Sweden and to a lesser extent Belgium Ireland and Finland
increasing of industrial activity is only due by advances in productivity so has been
accompanied by heavy job losses and these are patterns repeated in most of their regions
with noticeable relevance in the Netherlands As for the United Kingdom Belgium and
Denmark all share declining industrial production together with strong job cuts a pattern
that is replicated in many of their regions In this situation are the bulk of French and
Italian NUTS 2 just like the countries to which they belong although in this case job
destruction has been much less pronounced and below the group average Close to this
mean is Germany as well as most of their regions
Thus the analysis at Member States level also confirms the positive relationship
between the advance of industrial productivity and the attractiveness for new
manufacturing firms As demonstrated for their regions Ireland Finland Netherlands and
Greece following at quite distance from Germany are Member States showing a better
performance in productivity and with high location effects (see Figure 1)
In fact similarities between performances in the regions and in the Member States
they belong to suggest that the trend in regional industrial employment is to some extent
influenced by belonging to the same country in other words the locational attractions of
each area and its effort to improve productivity is partly due to national specificities or
idiosyncratic factors In fact as shown in Appendix 3 most European industrialized
regions follow the location patterns of the country they belong to reproducing its
productivity behaviour too In summary the evolution of these variables in each region
seems to have a clear `country effectacute that is different behaviours motivated by specific
factors andor differentiated industrial policies
For example in order to correctly interpret the results for Spanish regions it can not
be overlooked that during the period analyzed as in the whole country regions have
absorbed large numbers of immigrants which has boosted the proliferation of lower
productivity and lower wages in industrial activities However it may be thought that this
phenomenon has tended to conceal productivity increases in larger and better equipped
16
Delocation in the manufacturing sectors in the EU A regional overview
firms which could have been significant in the light of their results7 On the other hand
countries like Finland or Ireland with the lowest population increase have opted for high-
tech manufacturing sectors as a way to improve national competitiveness8 Nonetheless
this positive location effect has not reached in these countriesrsquo NUTS 2 enough magnitude
to offset completely the job losses arising from productivity improvements
On the other hand this `national effectacute has also played an important role in
explaining the economic outcomes of European regions in terms of per capita GDP in
accordance with the results obtained by Cuadrado-Roura (2001) using the data available
for 109 EU regions over the 1977-1994 period
Table 3 Export growth in key sectors by countries 2000-2005 (percentages)Impact ITon Total
Spain 65 91 72 158 38 111 04Germany 116 138 61 111 111 130 14United Kingdom 09 85 29 32 23 61 02France -09 102 25 94 118 78 -01Ireland -09 -102 01 25 -34 77 -03Finland 47 152 45 49 56 73 13Italy 40 88 41 90 56 89 02EU-15 70 141 59 91 67 111 11Source Elaborated from Comtrade
Shoes TotalIT Auto Textile Clothes
This importance of the `national effectacute should allow us to make a better approach to
the determinants of above-mentioned delocation patterns in future research One of such
determinants might be found in the different importance and performance by countries of
some manufacturing branches particularly affected by the increase in global competition as
their development has being receiving strong support in emerging countries from both
domestic policies and the location of big multinational companies This is the case of IT
manufacturing sectors or that of automobiles clothes textiles and shoes (Sachwald 2004)
Table 3 shows how the exports of these key sectors have evolved in some of the European
countries considered here It is amazing to see the poor results registered by IT sectors in
United Kingdom France and Ireland compared to the other countries mentioned Germany
in particular This evolution could be behind the stronger effects of delocation in France
and the United Kingdom although it must have produced similar results in the case of
Ireland Furthermore on such a basis what has happened in Italy would remain
7 For details see Myro et al (2008) 8 See Aacutelvarez Loacutepez et al (2007)
17
Delocation in the manufacturing sectors in the EU A regional overview
unexplained as the selected key sectors do not show a bad performance in terms of exports
in the latter country
One reason for such contradictory results lies in the possibility that production
instead of export reflects accurately what has been happening in every sector in terms of
activity However Aacutelvarez et al (2007) show very similar patterns in production and
export specialization from 1995 to 2005 except in the case of Ireland which thus appears
as a very particular one This is because IT specialization in production increases at the
same time as it decreases in exports Perhaps the strong growth in domestic demand
prevents IT exports from growing The opposite case could be that of Italy where slow
growth in domestic demand might have been pushing up IT export9
Anyway further developments on the determinants of delocation patterns require the
preparation of disaggregated data on production a task beyond the objectives of this paper
That could allow us to update the available manufacturing specialization analysis As the
two countries exhibiting higher delocation effects France and the United Kingdom
showed the lowest rates of specialization compared with the EU (Milderfart and Overman
2002 Combes and Overman 2003) something could have changed in the last few years
which would merit a fresh look based on more recent data
On the other hand it is now clear that insofar as delocation in manufacturing
activities has affected each country in a different way a relocation process inside the EU
and between countries has taken place This process deserved to be deeply analyzed
including a perspective by sectors updating what we know about changes in the
distribution of manufacturing industry in the EU and offering the possibility of exploring
whether the European Common Policy has influenced them in some way as was already
suggested by Milderfart-Knarvik and Overman (2002)
9 In Finland IT activities grows much more in production than in exports but in both aspects a positive growth is registered
18
Delocation in the manufacturing sectors in the EU A regional overview
19
Figure 3 Employment growth rates in selected regions 2001-2005 manufacturing and total economy (percentages)
Ukg3
UKi2
UKd4
UKj1
UKm2
UKi1 UKj3
UKd3
NL 41
NL22
FR23
NL33
NL32
DEa1
FR42
DEa5
DK01
FI18
ITe1
FR 24FR10
FI19
SE11
ITd5FR52
DE 14
DE71
DEa2
BE23
DE22
DE21
DE27
IC c4
DE60DE 12
DE25
DE13
DE9 1SE12
ITd3
IE02
DE73
BE21
DE92DEa4
DEf0
DEb3
ES30
DEc0
GR30
DE23
DE11
DK04
AT31
ITe3
SE22
FR82
FR51FR61
SE2 3
DE26
DE24
IT e4
FR62
FR71
ES51
ES2 1
ITe1
AT22
UKh1
UKk1
UKf1
Uke4
UKm3
UKf2
-20
-15
-10
-5
0
5
10
15
20
25
-40 -30 -20 -10 0 10 20 30
Manufacturing
Source Elaborated from Eurostat and National Statistical offices
Tota
l em
ploy
men
t
Delocation in the manufacturing sectors in the EU A regional overview
One last question that deserves consideration is the effect of industrial delocation
process on the regional economies Surprisingly manufacturing job losses have not been
translated into total employment which exhibit positive growth for most of the chosen
regions with the exceptions of some Germans and all the Netherlands (Figure 3) That
means the regions have been able to compensate the negative effect on the employment
from shrinking manufacturing allocating more resources inside the services sectors In fact
a substitution of manufacturing by services seems to have happened as are the region
showing more delocation in manufacturing those that increase in a higher measure the
employment in the service sectors that is the French British and Italian However the
relation is not accurate as there are not a strict quantitative correlation region by region
between rates of delocation and increase in the employment in the service activities
These good results in terms of general employment shown by the regions affected in
a higher measure by manufacturing delocation suggest the convenience of a more general
analysis of regional economic growth beyond the manufacturing sector as some regions
strongly shrinking manufacturing activities in favour of those of services might be leading
an interesting process of structural change that could light up one of the ways of facing the
increasing competition coming from emerging economies
5- Final remarks
Comparative analysis of location patterns for a large sample of European regions -
characterized by having an upper-middle level income and a strong industrial sector-
during the last few years has revealed that only half of them have shown locational
attractions for manufacturing activities The regional patterns found clearly show the
influence of `national effectacute the regions showing location effects corresponding to most
of those located in Austria Germany the Netherlands Ireland Finland Sweden Spain and
Greece
On the contrary the delocation process has affected another half of the regions
included most of them French British and Italian Therefore delocation has contributed to
concentrating the European manufacturing industry in the areas with higher market
potential in the centre of continental Europe It has contributed furthermore to relocating
manufacturing activities inside every country something that requires further analysis
from future research
20
Delocation in the manufacturing sectors in the EU A regional overview
Attractiveness to location of manufacturing industries has been encouraged by
significant increases in labor productivity so in most of the regions showing positive
location patterns production increases have been compatibles with a decline in aggregate
manufacturing total employment More specifically in this situation are all regions in the
Netherlands Finland Greece and Ireland three quarters of the German ones two from the
United Kingdom two from Sweden and Madrid in Spain
On the contrary in the regions where delocation has taken place the increase in
labour productivity has been lower In fact thirteen of such regions show reductions in
labour productivity six of them placed in France three Italian the British Eastern Scotland
and Greater London Vaumlstsverige in Sweden and the Belgian Antwerp Besides the
positive impact of this rare performance on employment has been largely offset by
destruction of industrial activity except in the Icircle de France and Midi-Pyreacuteneacutees the two
territories in which productivity has a more negative trajectory
The positive link between location and labour productivity increase confirm the
result reached by other authors particularly Cuadrado Roura et al (2002) who referring
their analysis to previous years distinguish two groups of winners among the European
regions the first grouping regions with increased employment and labour productivity
perhaps reflecting the success of technological and organizational changes introduced
during the period promoting the diversification and specialization in activities with high
growth levels and attracting new investments less labour-intensive and a second one
formed by regions capable of implementing restructuring processes to eliminate the most
inefficient outputs achieve higher levels of productivity and increased industrial
production at the expense of a notable decline in employment
Nevertheless discrepancies in delocation patterns outlined above and different
achievements in terms of productivity improvement have not only been the result of
companiesacute response to intensified competition in each region but also of differential
features On the one hand is size which in larger regions like some of Italy Germany
France and Spain reduces the chances of scoring high growth rates On the other hand are
the national specificities such as the massive migrations received by the Spanish regions a
key to explain their model of industrial growth and the different public policies The
influence of the two latter factors appears remarkable given the similarities among the
location patterns of each of the regions examined and the Member States they belong to
21
Delocation in the manufacturing sectors in the EU A regional overview
Anyway the lack of data has prevented us from going further into a preliminary
explanatory analysis of the delocation patters found when looking at the different
manufacturing activities but the role played by the IT manufacturing sector and other
branches affected by intense international competition (automobile clothes and textiles
and shoes) might have been important
To finish just to point up that the effect of manufacturing delocation on aggregate
employment has been offset by growth of services sectors suggesting the convenience of a
more general analysis of regional economic growth beyond the manufacturing sector as
some regions showing greater change in employment between sectors might be leading an
interesting process of structural change that could light up one of the ways of facing the
increasing competition coming from emerging economies
22
Delocation in the manufacturing sectors in the EU A regional overview
References
Aacutelvarez Loacutepez ME R Myro and J Vega Crespo (2007) ldquoCambios Recientes en la
Especializacioacuten Inter-industrial de las Manufacturas Espantildeolasrdquo Papeles de Economiacutea
Espantildeola 112 2-21
Antragraves P and E Helpman (2004) ldquoGlobal Sourcingrdquo Journal of Political Economy
112(3) 552-580
Bjerring Olsen K (2006) Productivity Impacts of Offshoring and Outsourcing A Review
OECD Directorate for Science Technology and Industry
Baldwin RE and F Robert-Nicoud (2000) ldquoFree trade agreements without delocationrdquo
Canadian Journal of Economics 33(3) 766-786
Bhagwati J A Panagariya and TN Srinivasan (2004) ldquoThe Muddles over Outsourcingrdquo
Journal of Economic Perspectives 18(4) 93-114
Combes PP and HG Overman (2003) ldquoThe Spatial Distribution of Economic Activities
in the EUrdquo Center for Economic Performance London School of Economics and
Political Science
Cuadrado-Roura JR T Mancha-Navarro and R Garrido-Yserte (2000) ldquoRegional
Productivity Patterns in Europe An Alternative Approachrdquo The Annals of Regional
Science 34(3) 365-384
Cuadrado Roura JR (2001) Regional convergence in the European Union From
hypothesis to the actual trends The Annals of Regional Science 35(3) 333-356
Cuadrado-Roura JR T Mancha-Navarro and R Garrido-Yserte (2002) ldquoRegional
Dynamics in the European Union Winners and Losersrdquo in Cuadrado-Roura JR and
M Parellada (eds) Regional Convergente in the European Union Springer-Verlag
Berlin 23-52
Fujita M P Krugman and A Venables (1999) The Spatial Economy Cambridge MA
The MIT Press
Grossman GM and E Rossi-Hansberg (2006) The Rise of Offshoring Itacutes Not Wine for
Cloth Anymore Princeton University unpublished
Helpman E D Marin and T Verdier (2008) The organization of firms in a global
economy Harvard University Press
Krugman P and AJ Venables (1990) ldquoIntegration and the Competitiveness of Peripheral
Industryrdquo in C Bliss and J Braga de Macedo (eds) Unity with Diversity in the
European Community Cambridge University Press
23
Delocation in the manufacturing sectors in the EU A regional overview
Krugman P (1999) Geography and Trade Cambridge MA The MIT Press
Midelfart-Knarvik KH and HG Overman (2002) Delocation and European Integration
is structural spending justified Economic Policy 17(35) 321-359
Myro R CM Fernaacutendez-Otheo L Labrador AB Baides Tudela ME Aacutelvarez Loacutepez
and Vega Crespo J (2008) Globalizacioacuten y Deslocalizacioacuten Importancia y Efectos
para la Industria Espantildeola Direccioacuten General de Poliacutetica de la PYME Ministerio de
Industria Turismo y Comercio (httpwwwipymeorgNRrdonlyresAD74121A-
DD3C-4564-92AD-17A2872508CA0GlobalizacionDeslocalizacionpdf)
Puga D (1999) The Rise and Fall of Regional Inequalities European Economic Review
43(2) 303-334
Puga D (2002) European Regional Policy in Light of Recent Location Theories Journal
of Economic Geography 2(4) 373-406
Sachwald F (2004) ldquoThe impact of EU enlargement on Firmsacute Strategies and the
Location of Production in Europerdquo Tokyo Club Research Meeting
24
Delocation in the manufacturing sectors in the EU A regional overview
25
Appendix 1 European regions NUTS2 in the sampleCode Region name Code Region name
NUTS2 and country to which it belong NUTS2 and country to which it belongat22 Steiermark gr30 Attikiat31 Oberoumlsterreich Greece
Austriaie02 Southern and Eastern
be21 Prov Antwerpen Irelandbe23 Prov Oost-Vlaanderen
Belgium itc1 Piemonteitc4 Lombardia
de11 Stuttgart itd3 Venetode12 Karlsruhe itd5 Emilia-Romagnade13 Freiburg ite1 Toscanade14 Tuumlbingen ite3 Marchede21 Oberbayern ite4 Laziode22 Niederbayern Italyde23 Oberpfalzde24 Oberfranken nl22 Gelderlandde25 Mittelfranken nl32 Noord-Hollandde26 Unterfranken nl33 Zuid-Hollandde27 Schwaben nl41 Noord-Brabantde60 Hamburg Netherlandsde71 Darmstadtde73 Kassel se11 Stockholmde91 Braunschweig se12 Oumlstra Mellansverigede92 Hannover se22 Sydsverigedea1 Duumlsseldorf se23 Vaumlstsverigedea2 Koumlln Swedendea4 Detmolddea5 Arnsberg ukd3 Greater Manchesterdeb3 Rheinhessen-Pfalz ukd4 Lancashiredec0 Saarland uke4 West Yorkshiredef0 Schleswig-Holstein ukf1 Derbyshire and Nottinghamshire
Germany ukf2 Leicestershire Rutland and Northantsukg3 West Midlands
dk01 Hovedstaden ukh1 East Angliadk04 Midtjylland uki1 Inner London
Denmark uki2 Outer Londonukj1 Berkshire Bucks and Oxfordshire
es21 Pais Vasco ukj3 Hampshire and Isle of Wightes30 Comunidad de Madrid ukk1 Gloucestershire Wiltshire and Bristoles51 Cataluntildea ukm2 Eastern Scotland
Spain ukm3 South Western ScotlandUnited Kingdom
fi18 Etelauml-Suomifi19 Laumlnsi-Suomi
Finland
fr10 Icircle de Francefr23 Haute-Normandiefr24 Centrefr42 Alsacefr51 Pays de la Loirefr52 Bretagnefr61 Aquitainefr62 Midi-Pyreacuteneacuteesfr71 Rhocircne-Alpesfr82 Provence-Alpes-Cocircte dAzur
France
Delocation in the manufacturing sectors in the EU A regional overview
26
Manufacturing GVA GDPpc( of total EU-15) (Index EU-15=100)
at22 Steiermark 040 9647at31 Oberoumlsterreich 063 10641be21 Prov Antwerpen 064 12780be23 Prov Oost-Vlaanderen 040 9589de11 Stuttgart 241 12296de12 Karlsruhe 132 11674de13 Freiburg 099 10018de14 Tuumlbingen 095 10780de21 Oberbayern 205 14684de22 Niederbayern 051 10090de23 Oberpfalz 046 10475de24 Oberfranken 047 9885de25 Mittelfranken 079 12022de26 Unterfranken 056 10283de27 Schwaben 084 10593de60 Hamburg 062 17922de71 Darmstadt 130 13985de73 Kassel 041 10006de91 Braunschweig 081 9675de92 Hannover 058 10000dea1 Duumlsseldorf 176 11397dea2 Koumlln 129 10387dea4 Detmold 085 9742dea5 Arnsberg 143 9395deb3 Rheinhessen-Pfalz 082 9505dec0 Saarland 040 9778def0 Schleswig-Holstein 061 9099dk01 Hovedstaden 043 18287dk04 Midtjylland 041 13581es21 Pais Vasco 070 9977es30 Comunidad de Madrid 093 10213es51 Cataluntildea 180 9310fi18 Etelauml-Suomi 123 13009fi19 Laumlnsi-Suomi 064 9954fr10 Icircle de France 221 15821fr23 Haute-Normandie 043 9333fr24 Centre 052 9211fr42 Alsace 048 9664fr51 Pays de la Loire 072 9353fr52 Bretagne 051 9124fr61 Aquitaine 044 9276fr62 Midi-Pyreacuteneacutees 040 9221fr71 Rhocircne-Alpes 140 10349fr82 Provence-Alpes-Cocircte dAzur 055 9715gr30 Attiki 039 9144ie02 Southern and Eastern 196 16068itc1 Piemonte 128 9973itc4 Lombardia 390 11863itd3 Veneto 176 10747itd5 Emilia-Romagna 164 11132ite1 Toscana 090 9929ite3 Marche 047 9078ite4 Lazio 062 11123nl22 Gelderland 043 9892nl32 Noord-Holland 051 13804nl33 Zuid-Holland 077 12003nl41 Noord-Brabant 098 11722se11 Stockholm 062 17037se12 Oumlstra Mellansverige 056 10433se22 Sydsverige 044 10865se23 Vaumlstsverige 074 11743ukd3 Greater Manchester 055 10374ukd4 Lancashire 046 9161uke4 West Yorkshire 054 10378ukf1 Derbyshire and Nottinghamshire 065 10283ukf2 Leicestershire Rutland and Northants 053 11179ukg3 West Midlands 071 10596ukh1 East Anglia 050 10169uki1 Inner London 067 28535uki2 Outer London 055 10231ukj1 Berkshire Bucks and Oxfordshire 058 15836ukj3 Hampshire and Isle of Wight 043 11334ukk1 Gloucestershire Wiltshire and Bristol 061 12628ukm2 Eastern Scotland 044 10947ukm3 South Western Scotland 053 10097
Source Elaborated from Eurostat and national Statistical offices
Appendix 2 GDP per Capita and regions share in EU-15 manufacturing GVA 2005
Delocation in the manufacturing sectors in the EU A regional overview
Appendix 2 (Continued)
0
5
10
15
20
25
30
100 120 140 160 180 200 220 240 260 280
26
23
9
54
12
12
10 0 0 0 0 0 0 0 0
1
Reg iona l GD P per Ca pita (EU-1 5 =1 0 0 ) Histo g ra m
0
10
20
30
40
05 10 15 20 25 30 35 40
14
34
9
3
6
13 3
10 0 0 0 0
1
Industrial size of selected regions ( of EU-15 manufacturing GVA)Histogram
27
Delocation in the manufacturing sectors in the EU A regional overview
Appendix 3 Location effect and productivity growth rates in European manufacturing sector
(percentages)
Loca
tion
effe
ct (
of 2
000
empl
oym
ent)
Productivity grothw
AUSTRIA
AT
AT31AT221
-5
0
5
10
-5 0 5 10
GERMANY
DE91
DEa4
Dec0
EDf0
DE 24
DE71DE92
DE14
DE 26
DE73DE 60
DE 22
DE23
DE25
DE 13
DE a1
DEa2
DE27
DE 21
DE a5
DE12DE
DEb3
DE11
-5
0
5
10
15
20
-5 0 5 10 15 20 25 30
BELGIUM
BE21
BE
BE23
-10
-5
0
5
-5 0 5 10 15
DENMARK
DK04
DK
DK01
-10
-5
0
5
-5 0 5 10 15
SPAIN
ES
ES30
ES21
ES51
-5
0
5
10
-5 0 5 10
FRANCE
FR51
FR71
FR42
FR23
FR62
FR61
FR82FR52
FR24FR
FR10
-25
-20
-15
-10
-5
0
5
-35 -30 -25 -20 -15 -10 -5 0 5 10
HOLAND
NL33
NL22
NL41
NL32
NL
-5
0
5
10
15
20
-5 0 5 10 15 20 25 30
ITALY
ITe4
ITc1
ITe1
ITd3
ITd5
ITe3
ITc4
IT
-25
-20
-15
-10
-5
0
5
-10 -5 0 5 10
28
Delocation in the manufacturing sectors in the EU A regional overview
Productivity grothw
Source Elaborated from Eurostat and National Statistical offices
Appendix 3 (continued)Lo
catio
n ef
fect
( o
f 200
0 em
ploy
men
t)FINLAND
FI FI19
FI18
-5
0
5
10
15
20
25
30
-5 0 5 10 15 20 25 30 35
GREECE
GR30GR
-5
0
5
10
15
20
25
30
-5 0 5 10 15 20 25 30 35
IRELAND
IEIE02
-5
0
5
10
15
20
25
30
35
-5 0 5 10 15 20 25 30 35 40 45
UNITED KINDOGDOM
UKh1
UKm2
UKf1
UKj3
UKd3
UKf2
UKi2
UKk1
UKg3UKe4
UKm3
UKj1
UKd4
UKi1
UK
-35
-30
-25
-20
-15
-10
-5
0
5
10
-15 -10 -5 0 5 10 15 20 25 30 35 40
SWEDEN
SE11
SE12
SE23 SE22
SE
-5
0
5
10
15
20
25
30
35
-5 0 5 10 15 20 25 30 35 40 45
29
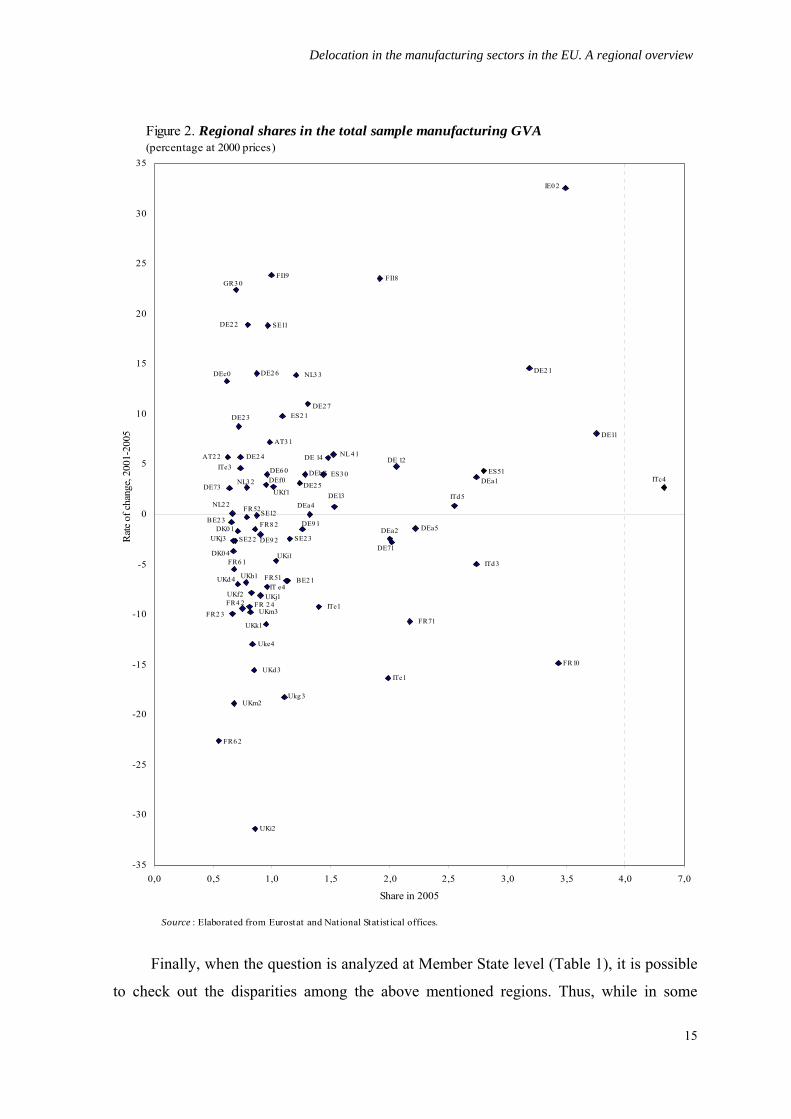
Delocation in the manufacturing sectors in the EU A regional overview
25
Appendix 1 European regions NUTS2 in the sampleCode Region name Code Region name
NUTS2 and country to which it belong NUTS2 and country to which it belongat22 Steiermark gr30 Attikiat31 Oberoumlsterreich Greece
Austriaie02 Southern and Eastern
be21 Prov Antwerpen Irelandbe23 Prov Oost-Vlaanderen
Belgium itc1 Piemonteitc4 Lombardia
de11 Stuttgart itd3 Venetode12 Karlsruhe itd5 Emilia-Romagnade13 Freiburg ite1 Toscanade14 Tuumlbingen ite3 Marchede21 Oberbayern ite4 Laziode22 Niederbayern Italyde23 Oberpfalzde24 Oberfranken nl22 Gelderlandde25 Mittelfranken nl32 Noord-Hollandde26 Unterfranken nl33 Zuid-Hollandde27 Schwaben nl41 Noord-Brabantde60 Hamburg Netherlandsde71 Darmstadtde73 Kassel se11 Stockholmde91 Braunschweig se12 Oumlstra Mellansverigede92 Hannover se22 Sydsverigedea1 Duumlsseldorf se23 Vaumlstsverigedea2 Koumlln Swedendea4 Detmolddea5 Arnsberg ukd3 Greater Manchesterdeb3 Rheinhessen-Pfalz ukd4 Lancashiredec0 Saarland uke4 West Yorkshiredef0 Schleswig-Holstein ukf1 Derbyshire and Nottinghamshire
Germany ukf2 Leicestershire Rutland and Northantsukg3 West Midlands
dk01 Hovedstaden ukh1 East Angliadk04 Midtjylland uki1 Inner London
Denmark uki2 Outer Londonukj1 Berkshire Bucks and Oxfordshire
es21 Pais Vasco ukj3 Hampshire and Isle of Wightes30 Comunidad de Madrid ukk1 Gloucestershire Wiltshire and Bristoles51 Cataluntildea ukm2 Eastern Scotland
Spain ukm3 South Western ScotlandUnited Kingdom
fi18 Etelauml-Suomifi19 Laumlnsi-Suomi
Finland
fr10 Icircle de Francefr23 Haute-Normandiefr24 Centrefr42 Alsacefr51 Pays de la Loirefr52 Bretagnefr61 Aquitainefr62 Midi-Pyreacuteneacuteesfr71 Rhocircne-Alpesfr82 Provence-Alpes-Cocircte dAzur
France
Delocation in the manufacturing sectors in the EU A regional overview
26
Manufacturing GVA GDPpc( of total EU-15) (Index EU-15=100)
at22 Steiermark 040 9647at31 Oberoumlsterreich 063 10641be21 Prov Antwerpen 064 12780be23 Prov Oost-Vlaanderen 040 9589de11 Stuttgart 241 12296de12 Karlsruhe 132 11674de13 Freiburg 099 10018de14 Tuumlbingen 095 10780de21 Oberbayern 205 14684de22 Niederbayern 051 10090de23 Oberpfalz 046 10475de24 Oberfranken 047 9885de25 Mittelfranken 079 12022de26 Unterfranken 056 10283de27 Schwaben 084 10593de60 Hamburg 062 17922de71 Darmstadt 130 13985de73 Kassel 041 10006de91 Braunschweig 081 9675de92 Hannover 058 10000dea1 Duumlsseldorf 176 11397dea2 Koumlln 129 10387dea4 Detmold 085 9742dea5 Arnsberg 143 9395deb3 Rheinhessen-Pfalz 082 9505dec0 Saarland 040 9778def0 Schleswig-Holstein 061 9099dk01 Hovedstaden 043 18287dk04 Midtjylland 041 13581es21 Pais Vasco 070 9977es30 Comunidad de Madrid 093 10213es51 Cataluntildea 180 9310fi18 Etelauml-Suomi 123 13009fi19 Laumlnsi-Suomi 064 9954fr10 Icircle de France 221 15821fr23 Haute-Normandie 043 9333fr24 Centre 052 9211fr42 Alsace 048 9664fr51 Pays de la Loire 072 9353fr52 Bretagne 051 9124fr61 Aquitaine 044 9276fr62 Midi-Pyreacuteneacutees 040 9221fr71 Rhocircne-Alpes 140 10349fr82 Provence-Alpes-Cocircte dAzur 055 9715gr30 Attiki 039 9144ie02 Southern and Eastern 196 16068itc1 Piemonte 128 9973itc4 Lombardia 390 11863itd3 Veneto 176 10747itd5 Emilia-Romagna 164 11132ite1 Toscana 090 9929ite3 Marche 047 9078ite4 Lazio 062 11123nl22 Gelderland 043 9892nl32 Noord-Holland 051 13804nl33 Zuid-Holland 077 12003nl41 Noord-Brabant 098 11722se11 Stockholm 062 17037se12 Oumlstra Mellansverige 056 10433se22 Sydsverige 044 10865se23 Vaumlstsverige 074 11743ukd3 Greater Manchester 055 10374ukd4 Lancashire 046 9161uke4 West Yorkshire 054 10378ukf1 Derbyshire and Nottinghamshire 065 10283ukf2 Leicestershire Rutland and Northants 053 11179ukg3 West Midlands 071 10596ukh1 East Anglia 050 10169uki1 Inner London 067 28535uki2 Outer London 055 10231ukj1 Berkshire Bucks and Oxfordshire 058 15836ukj3 Hampshire and Isle of Wight 043 11334ukk1 Gloucestershire Wiltshire and Bristol 061 12628ukm2 Eastern Scotland 044 10947ukm3 South Western Scotland 053 10097
Source Elaborated from Eurostat and national Statistical offices
Appendix 2 GDP per Capita and regions share in EU-15 manufacturing GVA 2005
Delocation in the manufacturing sectors in the EU A regional overview
Appendix 2 (Continued)
0
5
10
15
20
25
30
100 120 140 160 180 200 220 240 260 280
26
23
9
54
12
12
10 0 0 0 0 0 0 0 0
1
Reg iona l GD P per Ca pita (EU-1 5 =1 0 0 ) Histo g ra m
0
10
20
30
40
05 10 15 20 25 30 35 40
14
34
9
3
6
13 3
10 0 0 0 0
1
Industrial size of selected regions ( of EU-15 manufacturing GVA)Histogram
27
Delocation in the manufacturing sectors in the EU A regional overview
Appendix 3 Location effect and productivity growth rates in European manufacturing sector
(percentages)
Loca
tion
effe
ct (
of 2
000
empl
oym
ent)
Productivity grothw
AUSTRIA
AT
AT31AT221
-5
0
5
10
-5 0 5 10
GERMANY
DE91
DEa4
Dec0
EDf0
DE 24
DE71DE92
DE14
DE 26
DE73DE 60
DE 22
DE23
DE25
DE 13
DE a1
DEa2
DE27
DE 21
DE a5
DE12DE
DEb3
DE11
-5
0
5
10
15
20
-5 0 5 10 15 20 25 30
BELGIUM
BE21
BE
BE23
-10
-5
0
5
-5 0 5 10 15
DENMARK
DK04
DK
DK01
-10
-5
0
5
-5 0 5 10 15
SPAIN
ES
ES30
ES21
ES51
-5
0
5
10
-5 0 5 10
FRANCE
FR51
FR71
FR42
FR23
FR62
FR61
FR82FR52
FR24FR
FR10
-25
-20
-15
-10
-5
0
5
-35 -30 -25 -20 -15 -10 -5 0 5 10
HOLAND
NL33
NL22
NL41
NL32
NL
-5
0
5
10
15
20
-5 0 5 10 15 20 25 30
ITALY
ITe4
ITc1
ITe1
ITd3
ITd5
ITe3
ITc4
IT
-25
-20
-15
-10
-5
0
5
-10 -5 0 5 10
28
Delocation in the manufacturing sectors in the EU A regional overview
Productivity grothw
Source Elaborated from Eurostat and National Statistical offices
Appendix 3 (continued)Lo
catio
n ef
fect
( o
f 200
0 em
ploy
men
t)FINLAND
FI FI19
FI18
-5
0
5
10
15
20
25
30
-5 0 5 10 15 20 25 30 35
GREECE
GR30GR
-5
0
5
10
15
20
25
30
-5 0 5 10 15 20 25 30 35
IRELAND
IEIE02
-5
0
5
10
15
20
25
30
35
-5 0 5 10 15 20 25 30 35 40 45
UNITED KINDOGDOM
UKh1
UKm2
UKf1
UKj3
UKd3
UKf2
UKi2
UKk1
UKg3UKe4
UKm3
UKj1
UKd4
UKi1
UK
-35
-30
-25
-20
-15
-10
-5
0
5
10
-15 -10 -5 0 5 10 15 20 25 30 35 40
SWEDEN
SE11
SE12
SE23 SE22
SE
-5
0
5
10
15
20
25
30
35
-5 0 5 10 15 20 25 30 35 40 45
29

Delocation in the manufacturing sectors in the EU A regional overview
26
Manufacturing GVA GDPpc( of total EU-15) (Index EU-15=100)
at22 Steiermark 040 9647at31 Oberoumlsterreich 063 10641be21 Prov Antwerpen 064 12780be23 Prov Oost-Vlaanderen 040 9589de11 Stuttgart 241 12296de12 Karlsruhe 132 11674de13 Freiburg 099 10018de14 Tuumlbingen 095 10780de21 Oberbayern 205 14684de22 Niederbayern 051 10090de23 Oberpfalz 046 10475de24 Oberfranken 047 9885de25 Mittelfranken 079 12022de26 Unterfranken 056 10283de27 Schwaben 084 10593de60 Hamburg 062 17922de71 Darmstadt 130 13985de73 Kassel 041 10006de91 Braunschweig 081 9675de92 Hannover 058 10000dea1 Duumlsseldorf 176 11397dea2 Koumlln 129 10387dea4 Detmold 085 9742dea5 Arnsberg 143 9395deb3 Rheinhessen-Pfalz 082 9505dec0 Saarland 040 9778def0 Schleswig-Holstein 061 9099dk01 Hovedstaden 043 18287dk04 Midtjylland 041 13581es21 Pais Vasco 070 9977es30 Comunidad de Madrid 093 10213es51 Cataluntildea 180 9310fi18 Etelauml-Suomi 123 13009fi19 Laumlnsi-Suomi 064 9954fr10 Icircle de France 221 15821fr23 Haute-Normandie 043 9333fr24 Centre 052 9211fr42 Alsace 048 9664fr51 Pays de la Loire 072 9353fr52 Bretagne 051 9124fr61 Aquitaine 044 9276fr62 Midi-Pyreacuteneacutees 040 9221fr71 Rhocircne-Alpes 140 10349fr82 Provence-Alpes-Cocircte dAzur 055 9715gr30 Attiki 039 9144ie02 Southern and Eastern 196 16068itc1 Piemonte 128 9973itc4 Lombardia 390 11863itd3 Veneto 176 10747itd5 Emilia-Romagna 164 11132ite1 Toscana 090 9929ite3 Marche 047 9078ite4 Lazio 062 11123nl22 Gelderland 043 9892nl32 Noord-Holland 051 13804nl33 Zuid-Holland 077 12003nl41 Noord-Brabant 098 11722se11 Stockholm 062 17037se12 Oumlstra Mellansverige 056 10433se22 Sydsverige 044 10865se23 Vaumlstsverige 074 11743ukd3 Greater Manchester 055 10374ukd4 Lancashire 046 9161uke4 West Yorkshire 054 10378ukf1 Derbyshire and Nottinghamshire 065 10283ukf2 Leicestershire Rutland and Northants 053 11179ukg3 West Midlands 071 10596ukh1 East Anglia 050 10169uki1 Inner London 067 28535uki2 Outer London 055 10231ukj1 Berkshire Bucks and Oxfordshire 058 15836ukj3 Hampshire and Isle of Wight 043 11334ukk1 Gloucestershire Wiltshire and Bristol 061 12628ukm2 Eastern Scotland 044 10947ukm3 South Western Scotland 053 10097
Source Elaborated from Eurostat and national Statistical offices
Appendix 2 GDP per Capita and regions share in EU-15 manufacturing GVA 2005
Delocation in the manufacturing sectors in the EU A regional overview
Appendix 2 (Continued)
0
5
10
15
20
25
30
100 120 140 160 180 200 220 240 260 280
26
23
9
54
12
12
10 0 0 0 0 0 0 0 0
1
Reg iona l GD P per Ca pita (EU-1 5 =1 0 0 ) Histo g ra m
0
10
20
30
40
05 10 15 20 25 30 35 40
14
34
9
3
6
13 3
10 0 0 0 0
1
Industrial size of selected regions ( of EU-15 manufacturing GVA)Histogram
27
Delocation in the manufacturing sectors in the EU A regional overview
Appendix 3 Location effect and productivity growth rates in European manufacturing sector
(percentages)
Loca
tion
effe
ct (
of 2
000
empl
oym
ent)
Productivity grothw
AUSTRIA
AT
AT31AT221
-5
0
5
10
-5 0 5 10
GERMANY
DE91
DEa4
Dec0
EDf0
DE 24
DE71DE92
DE14
DE 26
DE73DE 60
DE 22
DE23
DE25
DE 13
DE a1
DEa2
DE27
DE 21
DE a5
DE12DE
DEb3
DE11
-5
0
5
10
15
20
-5 0 5 10 15 20 25 30
BELGIUM
BE21
BE
BE23
-10
-5
0
5
-5 0 5 10 15
DENMARK
DK04
DK
DK01
-10
-5
0
5
-5 0 5 10 15
SPAIN
ES
ES30
ES21
ES51
-5
0
5
10
-5 0 5 10
FRANCE
FR51
FR71
FR42
FR23
FR62
FR61
FR82FR52
FR24FR
FR10
-25
-20
-15
-10
-5
0
5
-35 -30 -25 -20 -15 -10 -5 0 5 10
HOLAND
NL33
NL22
NL41
NL32
NL
-5
0
5
10
15
20
-5 0 5 10 15 20 25 30
ITALY
ITe4
ITc1
ITe1
ITd3
ITd5
ITe3
ITc4
IT
-25
-20
-15
-10
-5
0
5
-10 -5 0 5 10
28
Delocation in the manufacturing sectors in the EU A regional overview
Productivity grothw
Source Elaborated from Eurostat and National Statistical offices
Appendix 3 (continued)Lo
catio
n ef
fect
( o
f 200
0 em
ploy
men
t)FINLAND
FI FI19
FI18
-5
0
5
10
15
20
25
30
-5 0 5 10 15 20 25 30 35
GREECE
GR30GR
-5
0
5
10
15
20
25
30
-5 0 5 10 15 20 25 30 35
IRELAND
IEIE02
-5
0
5
10
15
20
25
30
35
-5 0 5 10 15 20 25 30 35 40 45
UNITED KINDOGDOM
UKh1
UKm2
UKf1
UKj3
UKd3
UKf2
UKi2
UKk1
UKg3UKe4
UKm3
UKj1
UKd4
UKi1
UK
-35
-30
-25
-20
-15
-10
-5
0
5
10
-15 -10 -5 0 5 10 15 20 25 30 35 40
SWEDEN
SE11
SE12
SE23 SE22
SE
-5
0
5
10
15
20
25
30
35
-5 0 5 10 15 20 25 30 35 40 45
29

Delocation in the manufacturing sectors in the EU A regional overview
Productivity grothw
Source Elaborated from Eurostat and National Statistical offices
Appendix 3 (continued)Lo
catio
n ef
fect
( o
f 200
0 em
ploy
men
t)FINLAND
FI FI19
FI18
-5
0
5
10
15
20
25
30
-5 0 5 10 15 20 25 30 35
GREECE
GR30GR
-5
0
5
10
15
20
25
30
-5 0 5 10 15 20 25 30 35
IRELAND
IEIE02
-5
0
5
10
15
20
25
30
35
-5 0 5 10 15 20 25 30 35 40 45
UNITED KINDOGDOM
UKh1
UKm2
UKf1
UKj3
UKd3
UKf2
UKi2
UKk1
UKg3UKe4
UKm3
UKj1
UKd4
UKi1
UK
-35
-30
-25
-20
-15
-10
-5
0
5
10
-15 -10 -5 0 5 10 15 20 25 30 35 40
SWEDEN
SE11
SE12
SE23 SE22
SE
-5
0
5
10
15
20
25
30
35
-5 0 5 10 15 20 25 30 35 40 45
29