Deformation, hydration, and anisotropy of the lithospheric mantle in an active rift: Constraints...
22
Deformation, hydration, and anisotropy of the lithospheric mantle in an active rift: Constraints from mantle xenoliths from the North Tanzanian Divergence of the East African Rift Virginie Baptiste a, ⁎, Andréa Tommasi a , Alain Vauchez a , Sylvie Demouchy a , Roberta L. Rudnick b a Géosciences Montpellier, Université Montpellier 2 & CNRS, CC 60, Place E. Bataillon, 34095 Montpellier cedex 5, France b Department of Geology, University of Maryland, College Park, MD 20742, USA abstract article info Article history: Received 7 July 2014 Received in revised form 31 October 2014 Accepted 3 November 2014 Available online 15 November 2014 Keywords: East African Rift Peridotite Deformation Olivine crystal preferred orientations Water contents Seismic properties We have analyzed the microstructures and crystal preferred orientations (CPO), and calculated the seismic properties of 53 mantle xenoliths from four localities within the North Tanzanian Divergence of the East African rift: two within the rift axis and two in the transverse volcanic belt. Olivine OH concentrations were measured in 15 xenoliths. Most samples have harzburgitic to dunitic compositions and high olivine Mg#. Microstructures and olivine CPO patterns vary strongly depending on the location. In-axis peridotites display mylonitic to porphyroclastic micro- structures, which record recent deformation by dislocation creep. Highly stretched orthopyroxenes in mylonites indicate that the deformation was initiated under high stress and probably low temperature. Orthopyroxene replacement by olivine in mylonitic and porphyroclastic peridotites suggest syn-kinematic melt–rock reactions and further deformation under near-solidus conditions. Exsolutions in orthopyroxene imply significant cooling between melt-assisted deformation and xenolith extraction. Late metasomatism is evidenced by the occurrence of veins crosscutting the microstructure and interstitial clinopyroxene and phlogopite. Axial-[100] olivine CPOs predominate, suggesting activation of the high temperature, low pressure [100] {0kl} slip systems and, probably, transtensional deformation. In the volcanic belt, Lashaine peridotites display very coarse-granular textures, indicating deformation by dislocation creep under low deviatoric stress conditions followed by annealing. Axial-[010] olivine CPOs are consistent with transpressional deformation or simultaneous activation of the [100](010) and [001](010) slip systems. Intermediate microstructures and CPOs in Olmani suggests heteroge- neous deformation within the volcanic belt. Olivine OH concentrations range between 2 and 12 ppm wt. H 2 O. No systematic variations are observed between in- and off-axis samples. Maximum P wave azimuthal anisotropy (AVp) ranges between 3.3 and 18.4%, and the maximum S wave polarization anisotropy (AVs) between 2.3 and 13.2%. Comparison between seismic properties of in-axis peridotites and SKS splitting data suggests transtensional deformation in the lithospheric mantle beneath the rift. © 2014 Published by Elsevier B.V. 1. Introduction Continental rifting is a complex process that results in localized thinning and, in some cases, in disruption of a continental plate. While the surface expression of this deformation is clear and usually well understood, little is known about how the lithospheric mantle deforms to accommodate rifting. The widely differing surface expression of con- tinental rifting has led to contrasting lithospheric extension models. McKenzie (1978) proposed a symmetrical rift model, where the litho- sphere deforms by homogeneous thinning and stretching in response to far field extensional forces. To account for the observations in the Basin and Range, Wernicke (1981, 1985) proposed an asymmetrical extension model, in which the deformation is localized on a lithospheric-scale detachment fault. However, such models cannot account for the narrow rift valley and the strong mantle lithosphere thinning observed in East Africa (Dugda et al., 2007, 2009). The latter observations are in better agreement with the Nicolas et al. (1994) model, where rifting occurs via lithospheric rupture and rise of an asthenospheric wedge within the lithospheric mantle. The later model has been further developed by Vauchez et al. (1997) and Tommasi and Vauchez (2001), who, based on the analysis of the influence of inherited structures on the localization of continental breakup, suggested that most major rifts start forming through a transtensional deformation regime produced by the reactivation of the olivine crystal- lographic fabric frozen in the lithospheric mantle. Numerical models in which the upper mantle has an anisotropic viscosity controlled by the evolution of olivine crystallographic orientations corroborate this Tectonophysics 639 (2015) 34–55 ⁎ Corresponding author. Tel.: +33 467144912; fax: +33 467143603. E-mail address: [email protected] (V. Baptiste). http://dx.doi.org/10.1016/j.tecto.2014.11.011 0040-1951/© 2014 Published by Elsevier B.V. Contents lists available at ScienceDirect Tectonophysics journal homepage: www.elsevier.com/locate/tecto
Transcript of Deformation, hydration, and anisotropy of the lithospheric mantle in an active rift: Constraints...

Tectonophysics 639 (2015) 34–55
Contents lists available at ScienceDirect
Tectonophysics
j ourna l homepage: www.e lsev ie r .com/ locate / tecto
Deformation, hydration, and anisotropy of the lithospheric mantle in anactive rift: Constraints from mantle xenoliths from the North TanzanianDivergence of the East African Rift
Virginie Baptiste a,⁎, Andréa Tommasi a, Alain Vauchez a, Sylvie Demouchy a, Roberta L. Rudnick b
a Géosciences Montpellier, Université Montpellier 2 & CNRS, CC 60, Place E. Bataillon, 34095 Montpellier cedex 5, Franceb Department of Geology, University of Maryland, College Park, MD 20742, USA
⁎ Corresponding author. Tel.: +33 467144912; fax: +3E-mail address: [email protected]
http://dx.doi.org/10.1016/j.tecto.2014.11.0110040-1951/© 2014 Published by Elsevier B.V.
a b s t r a c t
a r t i c l e i n f oArticle history:Received 7 July 2014Received in revised form 31 October 2014Accepted 3 November 2014Available online 15 November 2014
Keywords:East African RiftPeridotiteDeformationOlivine crystal preferred orientationsWater contentsSeismic properties
We have analyzed the microstructures and crystal preferred orientations (CPO), and calculated the seismicproperties of 53 mantle xenoliths from four localities within the North Tanzanian Divergence of the EastAfrican rift: two within the rift axis and two in the transverse volcanic belt. Olivine OH concentrations weremeasured in 15 xenoliths.Most samples have harzburgitic to dunitic compositions and high olivine Mg#. Microstructures and olivine CPOpatterns vary strongly depending on the location. In-axis peridotites display mylonitic to porphyroclastic micro-structures, which record recent deformation by dislocation creep. Highly stretched orthopyroxenes inmylonitesindicate that the deformation was initiated under high stress and probably low temperature. Orthopyroxenereplacement by olivine in mylonitic and porphyroclastic peridotites suggest syn-kinematic melt–rock reactionsand further deformation under near-solidus conditions. Exsolutions in orthopyroxene imply significant coolingbetween melt-assisted deformation and xenolith extraction. Late metasomatism is evidenced by the occurrenceof veins crosscutting the microstructure and interstitial clinopyroxene and phlogopite. Axial-[100] olivine CPOspredominate, suggesting activation of the high temperature, low pressure [100] {0kl} slip systems and, probably,transtensional deformation. In the volcanic belt, Lashaine peridotites display very coarse-granular textures,indicating deformation by dislocation creep under low deviatoric stress conditions followed by annealing.Axial-[010] olivine CPOs are consistent with transpressional deformation or simultaneous activation of the[100](010) and [001](010) slip systems. Intermediate microstructures and CPOs in Olmani suggests heteroge-neous deformation within the volcanic belt. Olivine OH concentrations range between 2 and 12 ppm wt. H2O.No systematic variations are observed between in- and off-axis samples. Maximum Pwave azimuthal anisotropy(AVp) ranges between 3.3 and 18.4%, and the maximum S wave polarization anisotropy (AVs) between 2.3 and13.2%. Comparison between seismic properties of in-axis peridotites and SKS splitting data suggeststranstensional deformation in the lithospheric mantle beneath the rift.
© 2014 Published by Elsevier B.V.
1. Introduction
Continental rifting is a complex process that results in localizedthinning and, in some cases, in disruption of a continental plate. Whilethe surface expression of this deformation is clear and usually wellunderstood, little is known about how the lithospheric mantle deformsto accommodate rifting. The widely differing surface expression of con-tinental rifting has led to contrasting lithospheric extension models.McKenzie (1978) proposed a symmetrical rift model, where the litho-sphere deforms by homogeneous thinning and stretching in responseto far field extensional forces. To account for the observations in theBasin and Range, Wernicke (1981, 1985) proposed an asymmetrical
3 467143603.(V. Baptiste).
extension model, in which the deformation is localized on alithospheric-scale detachment fault. However, such models cannotaccount for the narrow rift valley and the strong mantle lithospherethinning observed in East Africa (Dugda et al., 2007, 2009). The latterobservations are in better agreement with the Nicolas et al. (1994)model, where rifting occurs via lithospheric rupture and rise of anasthenospheric wedge within the lithospheric mantle. The later modelhas been further developed by Vauchez et al. (1997) and Tommasiand Vauchez (2001), who, based on the analysis of the influence ofinherited structures on the localization of continental breakup,suggested that most major rifts start forming through a transtensionaldeformation regime produced by the reactivation of the olivine crystal-lographic fabric frozen in the lithospheric mantle. Numerical models inwhich the upper mantle has an anisotropic viscosity controlled by theevolution of olivine crystallographic orientations corroborate this

35V. Baptiste et al. / Tectonophysics 639 (2015) 34–55
assumption (Tommasi et al., 2009). Rheological heterogeneities, both inthe crust and in the mantle, also have a major effect on the localizationof rifting (e.g., Dunbar and Sawyer, 1989; Nyblade and Brazier, 2002;Vauchez et al., 1997).
In addition to being deformed by an extensional regime, the litho-sphere within an active rift is often subjected to extensive magma per-colation. Dyke intrusions have been proposed to help initiate extensionin a thick continental lithosphere (Buck, 2006). The major role ofmagmas in rifting has been corroborated by seismic anisotropy data inthe Afars, which unambiguously point to alignedmelt pockets through-out the crust and lithosphericmantle (Bastow et al., 2010; Kendall et al.,2005). At smaller scales, the presence of melt may result in weakeningof mantle rocks (Hirth and Kohlstedt, 2003; Zimmerman andKohlstedt, 2004). It may trigger strain localization if melt is heteroge-neously distributed (e.g., Le Roux et al., 2008) or promote homogeneousdeformation if it is homogeneously distributed through a large volume(Vauchez et al., 2012). Melt- or fluid-rock reaction may also result insoftening through crystallization of weaker phases and/or associatedgrain size reduction and phase mixing (e.g., Dijkstra et al., 2002;Soustelle et al., 2010).
Mantle xenoliths provide a valuable means by which to studythe deformation of mantle lithosphere during rifting. They allow forquantification of the hydration state and characterization of melt–rockreactions and of their timing relative to the deformation. Moreover,the analysis of themicrostructures and crystallographic preferred orien-tations (CPO) bring constraints on the deformation mechanisms andconditions in the lithospheric mantle below active rifts. In the presentstudy,we explore the relations between deformation,melt orfluids per-colation, and hydration in a series of mantle xenoliths from four locali-ties in the North Tanzanian Divergence region (East African Rift). Thisregion, still in the early stages of rifting, offers favorable conditions tostudy the expression of rifting on the lithospheric mantle. In addition,we estimate the seismic anisotropy of these rocks based on their CPOand mineralogical composition and compare these results to seismic
35°E 36°E
TanzanianCraton
P E
L
Eyasi basin
Yaida basin
Nat
ron
basi
n
MonduNgorongoro
Hanang
Ketumbeine
Labait
Gelai
Fig. 1. Digital topographic map (http://www.geomapapp.org, topography data from Ryan et al.studied here (P: Pello Hill, E: Eledoi, L: Lashaine, and O: Olmani), as well as the Tanzanian crawhich microstructures and crystal preferred orientations were studied by Vauchez et al. (2005
anisotropy measurements performed within and around the EastAfrican Rift.
2. Geological setting
The East African Rift is one of the few active continental rifts onEarth. It extends over ~4000 km, from the Afar triple junction in theRed Sea to the Gulf of Mozambique (Fig. 1), mostly following thetrend of older orogenic belts (Nyblade and Brazier, 2002; Vauchezet al., 1997 and references therein). Rifting and volcanism started35 Ma ago in Ethiopia and northern Kenya (MacDonald et al., 2001;Morley et al., 1992). It migrated southwards, reaching southern Kenya8–5 Ma ago (Cerling and Powers, 1977; Crossley and Knight, 1981).The youngest section of the East African Rift splits into two branchesaround the Tanzania craton. In the Eastern branch, extension is accom-panied by intense magmatic activity concentrated within the rift valley.The region experiences relatively intense present-day seismic activity,with earthquakes mainly located within the rift valley or in its immedi-ate surroundings (e.g., Albaric et al., 2010; Nyblade et al., 1996). Amajorfaulting episode at 1.0 ± 0.2Ma (MacIntyre et al., 1974) gave rise to thepresent-day rift valleymorphology. In addition, off-axis volcanic activityis observed in the North Tanzanian Divergence, south of which riftingoccurs in a more diffuse manner, with deformation accommodated inmany branches (Fig. 1). Seismic studies show that crustal and litho-spheric thicknesses in this young rifting domain vary between36–44 km and 100–150 km, respectively (Dugda et al., 2009; Juliàet al., 2005).
Mantle xenoliths occur in both in- and off-axis volcanoes, providingan exceptional opportunity to study the tectono-thermal evolution ofthe mantle lithosphere in response to the progression of the EastAfrican Rift along the boundary between the Tanzanian craton and theNeoproterozoic Mozambique Belt. The present study focuses on 53mantle xenoliths from four localities from the North Tanzanian Diver-gence (Fig. 1): two within the rift valley (Pello Hill and Eledoi) and
37°E 38°E
2°S
3°S
4°S
O
Pangani G
raben
Kilimandjaro
Meruli
(2009) showing the North Tanzania Divergence and the location of the xenolith localitieston and main volcanoes. Labait is another locality containing abundant mantle xenoliths,).

36 V. Baptiste et al. / Tectonophysics 639 (2015) 34–55
two within the transverse volcanic belt (Lashaine and Olmani). Thexenoliths from the cratered tuff cone of Pello Hill and from the Eledoiexplosion crater were collected in fine-grained scoria with a bulk-rockchemistry similar to olivine-melilitites and olivine-nephelinites(Dawson and Smith, 1988). The formation of these craters postdatesthe major rift faulting episode at 1.2 Ma (Dawson and Smith, 1988).The Lashaine tuff cone and the Olmani cinder cone are ankaramiterift-related volcanoes erupted during the Neogene. They are located ina part of theMozambiqueBelt characterized byArchean crustalmaterialreworked in the Neoproterozoic by the Mozambique orogeny (Mansuret al., 2014 and references therein; Möller et al., 1998).
3. Methods
3.1. Pressure and temperature estimates
Major elements composition of olivine, orthopyroxene, clinopyrox-ene, garnet, and spinel were analyzed in 15 samples using a CamecaSX100 electron microprobe at Microsonde Sud facility, in Montpellier(France). Analytical conditions were a 20 kV accelerating voltage and a10 nAprobe current. Core and rim composition of 3 to 4 grainsweremea-sured for each mineral (mineral compositions of the analyzed samplespresented in the online Supplementary Material Table 1).
When orthopyroxene and clinopyroxene were both present, thesample equilibrium temperature was calculated using the two pyroxenesFe-Mg exchange geothermometer from Brey and Köhler (1990), whichhas an uncertainty of ±50 °C. However, many of the samples areclinopyroxene-free harzburgites to dunites. To verify if other thermome-ters (Brey and Köhler, 1990; Fabriès, 1979; Li et al., 1995; Sachtleben andSeck, 1981;Wells, 1977;Witt-Eickschen and Seck, 1991) could be used tocalculate the equilibrium temperatures for the clinopyroxene-free perido-tites, the consistency between the temperatures calculated with the twopyroxenes geothermometer of Brey and Köhler (1990) and these ther-mometers was tested for the clinopyroxene-bearing peridotites. Becausethe discrepancies between the equilibrium temperatures obtained usingdifferent thermometers were large, we choose not to present tempera-tures calculated for the clinopyroxene-free samples. The equilibriumpressure was estimated in one garnet-bearing harzburgite from Lashaine(LS11) using the orthopyroxene-garnet barometer of Nickel and Green(1985), which has uncertainties of 0.2 GPa.
3.2. Electron-backscattered diffraction (EBSD)
The crystallographic preferred orientation (CPO) of olivine, pyroxenes,pargasite, phlogopite, spinel, and garnet was measured by indexation ofelectronback-scattereddiffraction (EBSD)patterns at the SEM-EBSD facil-ity, Geosciences Montpellier. These patterns are produced by interactionof a vertical incident electron beam and a carefully polished thin sectiontilted at 70° to the horizontal. Measurements were performed in a JEOLJSM 5600 scanning electron microscope using an acceleration voltage of17 kV and a working distance of 23mm. For each sample, maps coveringnearly the entire thin sectionwere obtained using steps between 100 and30 μm, depending on grain size. Indexing rates varied between 60 to 90%depending of the mineral species and degree of fracturing present inthe thin section. Phlogopite, when present, was usually poorly indexed.Orthopyroxene was sometimes misindexed as clinopyroxene. Carefulpost-acquisition data treatment controlled by comparison betweenEBSDmaps and microscopic observations was performed to reduce inac-curate mineral determination as well as misindexation due to olivinepseudosymmetry. Modal composition, grain sizes, and shape-preferredorientations were also obtained from the EBSD maps.
Crystal-preferred orientation data are displayed in pole figures, pre-sented as lower hemisphere stereographic projections. Data were plot-ted as one point per grain to prevent over-representation of large grains.When the foliation and lineation could be identified, the orientation ofthe main crystallographic directions: [100], [010] and [001] for olivine
and pyroxenes, was plotted relatively to the principal axes of the defor-mation ellipsoids X, Y, and Z. Because the foliation and lineation couldnot be identified in coarse-grained samples, thin sections were cut inrandom orientations. To make comparison between different sampleseasier, we rotated the CPO of randomly oriented samples into a com-mon orientation in which the maximum concentration of olivine [100]and [010] axes are parallel to the E–W and the N–S directions of thepole figure, respectively.
To characterize the olivine CPO symmetry we computed the dimen-sionless BA index (where B andA stand for [010] and [100] axes, respec-tively, Mainprice et al., 2014) defined as:
BAindex ¼ 12
2− P010G010þ P010
� �− G100
G100þ P100
� �� �ð1Þ
where P and G are the Point and Girdle fabric indices (Vollmer, 1990)of the olivine principal axes [100] and [010]. These indexes were cal-culated from the eigenvalues of the normalized orientation matrixusing the MTEX texture analysis Matlab toolbox (Hielscher andSchaeben, 2008; Mainprice et al., 2011). The BA index allows a clas-sification of the olivine CPO symmetry into 3 types: axial-[010] (BAindex b 0.35), orthorhombic (0.35 b BA index b 0.65), and axial-[100] (BA index N 0.65).
The strength of the fabric was quantified using the dimensionlessJ-index, which is the volume-averaged integral of squared orientationdensities:
JODF ¼ ∫ f gð Þj j2dg ð2Þ
where f(g) is the orientation distribution function (ODF) and dg =dφ1dφdφ2 sinφπ2 (Bunge, 1982). φ1, ψ, and φ2 are the Euler angles thatdefine the rotations allowing for coincidence between the crystallo-graphic and external reference frames. Olivine CPO in natural perido-tites is characterized by J-indexes mostly between 2 and 20, with apeak at 8–10 (Ben Ismaïl and Mainprice, 1998; Tommasi et al.,2000). The J-index for each sample was calculated based on the meanorientation of each grain using theMTEX texture analysis Matlab toolbox(Hielscher and Schaeben, 2008).
3.3. Seismic properties
Seismic properties of Tanzanian xenoliths were calculated using theCPO of all major phases and their respective modal content estimatedfrom EBSD maps (Mainprice, 1990). For olivine, orthopyroxene,clinopyroxene, garnet, amphibole, and phlogopite single-crystal elasticconstant tensors at ambient conditions were used (Abramson et al.,1997; Bezacier et al., 2010; Chai et al., 1997a, 1997b; Collins andBrown, 1998). A Voigt-Reuss-Hill averaging was applied in all calcula-tions. The seismic anisotropy parameters and the elastic constants ofall samples are presented in Table 1 and online SupplementaryMaterial2, respectively.
Average seismic properties were also calculated for Lashaine,Olmani, and rift axis localities by averaging the individual sampleselastic constant tensors for each locality. This calculation results in amaximum estimation of the seismic anisotropy for the locality, as itrelies on the assumption of a common orientation of the foliation andlineation for all samples.
3.4. Fourier transform infrared spectroscopy (FTIR)
Fifteen double-polished thin sectionswere prepared for unpolarizedFTIR analysis. Before analysis, the sections were immersed in pureacetone for at least 12 h to dissolve any intergranular CrystalBondglue. FTIR spectroscopy analyses were performed at the Laboratoiredes Colloïdes, Verres, Nanomatériaux at Montpellier University usinga Bruker IFS66v coupled with a Bruker HYPERION microscope and

37V. Baptiste et al. / Tectonophysics 639 (2015) 34–55
mercury-cadmium-telluride (MCT) detector cooled by liquid nitrogen.A Globar light source and a Ge-KBr beam splitter were used to generateunpolarized mid-infrared radiation. A background measurement wasperformed at the beginning of the analysis of each sample and repeatedwhen necessary. Measurements were done on olivine, orthopyroxene,and garnet crystals with beam spots of 30 to 100 μm. No measurementcould bemade on clinopyroxene crystals, which were too small and tooaltered. Two hundred scans were accumulated with a resolution of4 cm−1 for each measurement. A baseline correction was applied oneach spectrum using the OPUS software. Spectra were then normalizedto a sample thickness of 1 cm. The sample thickness was measuredusing a micrometer with a tolerance of ±1 μm, and was always near500 μm (Table 2). Fractures and inclusions were strictly avoided.
The calibration of Paterson (1982) was used to quantify the OHconcentration:
COH ¼ Xi
150ζ
Zk vð Þ
3780−vð Þdv ð3Þ
where COH is the hydroxyl concentration (inmol H/l), ζ is an orientationfactor (1/3 for unpolarized measurements), and k(ν) is the absorptioncoefficient in cm−1 for a given wavenumber v. Xi is a density factor,which depends on the mineral phase (Xi(ol, Fo90) = 2695 wt. ppm H2O,Xi(orthopyroxene) = 2812 wt. ppm H2O). The uncertainty in the resultingOH concentrations is ~30% (Kohlstedt et al., 1996).
We also converted the olivine OH concentrations (See Table 2) ob-tained using the calibration of Paterson (1982) to the new calibrationofWithers et al. (2012). The conversion factor between the two calibra-tions is a function of the sample thickness and of the OH concentrationobtained with the calibration of Paterson (1982). Here, the samplethickness ranges between 476 and 567 μm and the olivine OH concen-trations range between 1 and 18 wt. ppm H2O. Therefore, the olivineOH concentrations must be multiplied by a factor of 1.8 (see Witherset al., 2012, Supplementary material Fig. 1).
4. Results
4.1. Compositions and equilibrium conditions
All samples are garnet-free peridotites, except for four Lashaine pe-ridotites (LS11, LS4, L1, and 89–680). Most samples have harzburgiticto dunitic compositions (Fig. 2 and Table 1). Orthopyroxene contentsvary mainly between 0 and 20%, but several samples from Lashaine,Olmani and Pello Hill display higher modal orthopyroxene contents(22 to 32%) and two samples from Olmani have N50% orthopyroxene(OL3 and 03TZ14K). Secondary minerals present in diffuse veins orpockets include clinopyroxene, amphibole, phlogopite, and spinel.Veins may comprise up to 15% of the total rock (modal contents includ-ing the veins are given in parentheses in Table 1).
Mineral compositions are presented in the online SupplementaryMaterial Table 1. In most samples, olivine has a highMg# (Mg#: atomicMg/(Fe + Mg)), which varies between 90.1 and 94.4 (Table 1). Sevensamples (out of the forty-one for which the olivine Mg# has beenmeasured) have more Fe-rich olivines (Fo≤89). Among these samples,4 are very-coarse granular dunites from Olmani or from the rift axislocalities (EL14, PEL11, PEL41, 89–772). The 3 other Fe-rich samplesare: a harzburgite from Olmani with high orthopyroxene contents(N50%; 03TZ14K), a granular dunite from Lashaine (LS15), and aporphyroclastic harzburgite from Pello Hill (PEL1). There is no signifi-cant difference between olivine Mg# for samples from the in-axisand off-axis localities. Olivine always has NiO N0.25 wt.% and lowCaO (≤0.11 wt.%). Orthopyroxenes are enstatite, with Mg# N90.Clinopyroxenes are Cr-bearing diopside (Cr2O3 comprised between 1.0and 3.7 wt.%) with Mg# N90, except for sample EL15 whereCr2O3 b 0.1 wt.% and lower Mg# are measured. Spinels have high MgO
(10–17 wt.%) and variable Cr# (atomic Cr/(Cr + Al)), ranging between36 and 89.
We have been able to estimate equilibrium temperatures for only 9of the 15 samples analyzed, because the others lacked clinopyroxene.Independently of their provenance or microstructure, all these sampleshave core equilibrium temperatures (calculated from core compositionsin orthopyroxene and clinopyroxene) between 1000 and 1100 °C±50 °C(Table 1). Rim equilibrium temperatures (calculated from rim composi-tions in orthopyroxene and clinopyroxene) tend to be slightly, but sys-tematically lower (by 5–21 °C), except for sample PEL22 from Pello Hill,where rim equilibrium temperature is lower than core equilibrium tem-perature by N100 °C (960 °C versus 1090 °C). In a garnet harzburgitefrom Lashaine (LS11), core and rim equilibrium pressures of 3.3 GPaand 3.1 GPa were obtained, respectively.
4.2. Microstructures
Because of their very different characteristics, the xenoliths micro-structures will be described as a function of their provenance: the riftaxis (Pello Hill and Eledoi) or the transverse volcanic belt (Lashaineand Olmani).
4.2.1. Rift axis samplesThe xenoliths from volcanic localities within the rift axis display
variablemicrostructures. Among the27 studiedxenoliths, 2 aremylonitic,22 are porphyroclastic, and 3 are coarse-granular to tabular.
Mylonitic microstructures are only observed in 2 samples from PelloHill (PEL15 and PEL17; Fig. 3a). These rocks are characterized bycentimeter-sized orthopyroxenes, which are highly elongated (aspectratios of up to 15:1), defining the lineation. These orthopyroxenesalways display well-defined kink bands and undulose extinctions.They have indented grain boundaries, with olivine grains fillingthe embayments or even forming vein-like inclusions parallel to theorthopyroxene elongation (Fig. 4a). Exsolution in orthopyroxene isubiquitous. Olivine is present as plurimillimetric porphyroclasts and asrecrystallized grains with sizes ranging from 0.4 to 2 mm. It displayscurvilinear boundaries, evolving sometimes to polygonal shapes.Subgrain boundaries in olivine are highly oblique to perpendicular tothe grains elongation. The frequency and extent of deformation featuresin the porphyroclasts vary, however, between the 2 samples. Inmylonite PEL17, subgrain boundaries are well developed and closelyspaced. In mylonite PEL15, there are fewer subgrain boundaries. Inboth mylonites, the olivine neoblasts exhibit few subgrain boundariesand sometimes form 120° triple junctions.
The porphyroclastic peridotites (Fig. 3b, c) are themost common tex-tural type at Pello Hill and Eledoi. They display plurimillimetric elongat-ed olivine porphyroclasts (Fig. 3b), with common subgrain boundaries,undulose extinction, and sutured grain boundaries. Subgrain bound-aries in olivine are dominantly at high angle to the foliation, but inmany grains 2 orthogonal subgrain boundary families are observed(Fig. 4b). Small olivine neoblasts have fewer intracrystalline deforma-tion features and tend to have more polygonal shapes, sometimesforming triple junctions. The frequency of the triple junctions in the re-crystallized matrix and the subgrain boundaries spacing inporphyroclasts vary from sample to sample. For example, in samplePEL7, olivine porphyroclasts exhibit closely spaced subgrain boundariesand serrated grain boundaries (Fig. 4b), whereas olivine porphyroclastsin sample PEL1 display fewer subgrain boundaries and have polygonalgrain boundaries (Fig. 3c). In the porphyroclastic peridotites fromEledoi, olivine porphyroclasts are rare, giving to the rock a more homo-geneous microstructure. Interpenetrating olivine–olivine grain bound-aries are common (Fig. 3b, c), suggesting grain boundary migration. Inboth sites, when present, orthopyroxene is anhedral, withintracrystalline deformation features, such as kink bands and unduloseextinction. Exsolutions and corrosion embayments filled with olivineare common (Figs. 3b and 4c).

Table 1Texture, equilibrium temperatures, olivine Mg#, modal contents, olivine CPO, olivine J-index, olivine BA index, and calculated density and seismic properties of the studied Tanzanian peridotites.
Locality Sample Thinsection
Texture Temperature OlMg#
OpxMg#
Referencefor Mg# andT data
Modal compositions⁎ (%) Olivine Olivine Olivine Density MaxAVp
Max AVspol
MaxAVS1
MaxAVS2
(°C) (%) (%) ol opx cpx gt phl amph CPO type J-index BAindex
(g.cm−3) (%) (%) (%) (%)
Eledoi EL3 EL3 Porphyroclastic 1068 92.1 92.5 This study 88 11 1 0 0 0 Axial-[100] to ortho 3.31 0.73 3.3493 9.0 6.1 3.0 5.1EL6 EL6 Porphyroclastic – 90.3 – LCT01 98 (86) 2 (2) 0 (10) 0 (0) 0 (2) 0 (0) Axial-[100] to ortho 4.63 0.78 3.3401 10.7 7.0 3.5 5.6EL8 EL8 Porphyroclastic 1063 92.4 93.3 This study 92 6 2 0 0 0 Axial-[100] 3.82 0.78 3.3515 11.4 8.1 3.8 6.2EL10 EL10 Porphyroclastic – 92.4 – LCT01 97 1 2 0 0 0 Ortho 3.15 0.62 3.3540 9.4 5.8 2.8 5.5EL11 EL11 Porphyroclastic – 90.8 – LCT01 92 7 1 0 0 0 Axial-[100] 2.88 0.69 3.3515 8.8 5.6 3.2 4.2EL12 EL12 Porphyroclastic 1060 91.8 92.5 This study 88 10 2 0 0 0 Axial-[100] 4.34 0.90 3.3495 11.2 7.6 3.4 6.0EL14 EL14 Coarse-granular – 84.1 – LCT01 100 (93) 0 (0) 0 (4) 0 (0) 0 (3) 0 (0) Axial-[100] 4.46 0.87 3.3372 9.4 3.1 3.1 6.0EL15 EL15 Porphyroclastic 1052 90.1 91.5 This study 85 (61) 15 (11) 0 (23) 0 0 (5) 0 Axial-[100] 3.31 0.74 3.3154 4.1 3.9 3.3 1.8EL16 EL16 Porphyroclastic – 92.1 – LCT01 91 0 9 0 0 0 Axial-[100] 2.14 0.84 3.3525 7.5 4.9 1.6 4.5
Pello Hill PEL1 PEL1 Porphyroclastic – 88.4 – LCT01 95 4 1 0 0 0 Ortho 3.38 0.84 3.3528 9.9 6.3 2.9 5.4PEL7 PEL7 Porphyroclastic – 92.3 92.9 This study 86 13 1 0 0 0 Ortho 5.38 0.70 3.3484 12.3 8.0 4.1 6.6PEL9 PEL9 Porphyroclastic – 93.3 – LCT01 96 (95) 4 (4) 0 (0) 0 (0) 0 (1) 0 (0) Axial-[100] 4.77 0.87 3.3475 12.2 8.2 5.0 6.1
PEL9-bis Porphyroclastic – – – 93 7 0 0 0 0 Axial-[100] 4.71 0.90 3.3516 12.0 7.9 4.3 6.2PEL11 PEL11 Coarse-granular – 86.7 – LCT01 100 0 0 0 0 0 Ortho 3.27 0.45 3.3550 4.8 4.9 3.6 2.1PEL12 PEL12A Porphyroclastic – 92.6 – LCT01 83 (78) 16 (15) 1 (1) 0 (0) 0 (1) 0 (5) Axial-[100] 3.40 0.86 3.3276 8.7 5.9 2.3 5.0
PEL12B Porphyroclastic – – – 82 (77) 17 (16) 1 (1) 0 (0) 0 (2) 0 (4) Axial-[100] 3.16 0.89 3.3244 8.3 5.6 3.0 4.6PEL15 PEL15 Mylonitic – 92.4 92.9 LCT01 77 21 2 0 0 0 Ortho 3.64 0.61 3.3441 7.4 5.5 3.1 4.2PEL16 PEL16 Porphyroclastic – 92.5 93.2 LCT01 90 9 1 0 0 0 Axial-[100] to ortho 6.69 0.82 3.3506 13.5 8.9 5.0 6.6PEL17 PEL17 Mylonitic – 92.4 92.6 LCT01 87 (86) 12 (12) 1 (1) 0 (0) 0 (0) 0 (1) Axial-[100] 4.71 0.79 3.3434 9.6 6.5 2.1 6.1
PEL17A Mylonitic – – – 76 (75) 23 (23) 1 (1) 0 (0) 0 (0) 0 (1) Axial-[100] 3.29 0.84 3.3434 9.6 6.5 2.1 6.1PEL17B Mylonitic – – – 75 (74) 25 (25) 0 (0) 0 (0) 0 (0) 0 (1) Axial-[100] 4.23 0.79 3.3428 9.7 6.9 2.7 5.9
PEL20 PEL20 Porphyroclastic – 92.3 – LCT01 97 0 3 0 0 0 Ortho 3.79 0.69 3.3542 9.0 7.3 3.8 6.1PEL21 PEL21A Porphyroclastic – 91.3 – LCT01 100 (84) 0 (0) 0 (8) 0 (0) 0 (0) 0 (8) Axial-[100] 3.20 0.78 3.3300 10.0 6.5 3.1 5.2
PEL21B Porphyroclastic – – – 100 (86) 0 (0) 0 (8) 0 (0) 0 (1) 0 (5) Axial-[100] 3.31 0.81 3.3330 9.4 6.2 3.1 5.1PEL22 PEL22A Porphyroclastic 1090 91.5 91.6 This study 96 (90) 4 (4) 0 (5) 0 (0) 0 (0) 0 (1) Axial-[100] to ortho 4.26 0.70 3.3488 11.0 7.1 4.0 5.3
PEL22B Porphyroclastic – – – 95 (88) 5 (5) 0 (6) 0 (0) 0 (0) 0 (1) Axial-[100] to ortho 4.21 0.70 3.3457 10.5 7.0 3.9 5.2PEL27 PEL27 Porphyroclastic – 92.3 – LCT01 95 0 5 0 0 0 Axial-[100] to ortho 3.76 0.79 3.3536 11.8 7.5 3.5 6.5PEL33 PEL33 Porphyroclastic 1090 92.4 93.1 This study 83 16 1 0 0 0 Axial-[100] 3.79 0.64 3.3469 9.1 6.5 3.8 4.8PEL34 PEL34A Porphyroclastic – 92.4 – LCT01 86 (85) 12 (12) 2 (2) 0 (0) 0 (0) 0 (1) Axial-[100] 4.01 0.89 3.3457 10.8 7.2 3.0 6.1
PEL34B Porphyroclastic – – – 86 (85) 13 (13) 1 (1) 0 (0) 0 (0) 0 (1) Axial-[100] 4.17 0.91 3.3455 10.6 7.0 2.9 6.1PEL38 PEL38 Porphyroclastic – 91.2 – LCT01 93 (92) 7 (7) 0 (0) 0 (0) 0 (0) 0 (1) Axial-[100] 4.99 0.83 3.3516 11.3 7.6 3.6 6.3PEL39 PEL39 Porphyroclastic – 90.1 – LCT01 100 (78) 0 (0) 0 (21) 0 (0) 0 (1) 0 (0) Axial-[100] 3.16 0.90 3.3436 7.8 4.5 2.5 3.4PEL40 PEL40A Porphyroclastic – 91.0 – LCT01 89 (75) 11 (9) 0 (12) 0 (0) 0 (3) 0 (1) Ortho 4.55 0.66 3.3277 10.0 7.6 5.0 5.5
PEL40B Porphyroclastic – – – 88 (76) 12 (10) 0 (12) 0 (0) 0 (1) 0 (1) Ortho 4.71 0.69 3.3383 10.2 7.1 4.0 5.7PEL41 PEL41 Coarse-granular – 87.9 – LCT01 100 (79) 0 (0) 0 (15) 0 (0) 0 (3) 0 (3) Axial-[100] 3.16 0.79 3.3256 6.4 4.9 1.8 4.4
38V.Baptiste
etal./Tectonophysics639
(2015)34
–55

Lashaine 89-664 89-664 Very coarse-granular – – – – 93 7 0 0 0 0 Axial-[010] to ortho 5.97 0.67 3.3518 8.0 6.5 2.8 4.989-664A Very coarse-granular 1075 90.2 91.0 This study 85 13 2 0 0 0 Axial-[010] to ortho 5.47 0.66 3.3484 5.9 4.5 2.6 3.889-664B Very coarse-granular – – – – 94 5 1 0 0 0 Axial-[010] to ortho 5.42 0.66 3.3523 6.8 5.1 1.7 4.0
89-680 89-680 Coarse-granular 1150 93.0 R94 73 24 2 0 1 0 Axial-[010] 1.86 0.40 3.3371 4.1 3.4 2.4 1.8L1 L1A Very coarse-granular – – – – 75 15 10 0 0 0 Ortho 21.3⁎⁎ 0.49 3.3449 9.1 6.6 4.1 5.8
L1B Very coarse-granular – – – – 68 29 3 0 0 0 Ortho 4.27 0.74 3.3399 6.1 4.7 1.1 4.1LS4 LS4A Very coarse-granular – 92.4 – LCT01 78 14 3 5 0 0 Ortho 24.7⁎⁎ 0.46 3.3700 10.0 7.2 4.5 6.3
LS4B Very coarse-granular – – – – 72 21 2 5 0 0 Ortho 13.7⁎⁎ 0.48 3.3669 3.4 3.7 2.3 2.9LS9 LS9B Very coarse-granular 1015 92.1 93.0 This study 73 (72) 19 (19) 8 (8) 0 (0) 0 (1) 0 (0) Axial-[010] 4.57 0.32 3.3379 3.3 3.5 2.2 2.4LS11 LS11A Very coarse-granular – 92.3 92.9 This study 82 13 3 2 0 0 Axial-[010] to ortho 11.6⁎⁎ 0.39 3.3569 10.1 6.7 4.3 5.1
LS11B Very coarse-granular – – – – 71 (70) 24 (24) 2 (2) 3 (3) 0 (1) 0 (0) Axial-[010] to ortho 10.5⁎⁎ 0.30 3.3563 6.8 6.2 4.7 3.8LS15 LS15 Granular – 88.2 – LCT01 100 0 0 0 0 0 Axial-[010] 2.19 0.32 3.3550 8.1 4.9 4.0 2.1
Olmani 03-TZ-14E 03-TZ-14E1 Coarse-porphyroclastic – – – – 68 32 0 0 0 0 Axial-[100] to ortho 6.00 0.80 3.3462 11.2 7.6 3.9 6.003-TZ-14E2 Coarse-porphyroclastic – – – – 89 10 0 0 0 0 Axial-[100] to ortho 7.41 0.67 3.6493 11.4 7.2 3.9 5.9
03-TZ-14H 03-TZ-14H Porphyroclastic – – – – 90 9 1 0 0 0 Axial-[100] 5.31 0.86 3.3503 12.4 7.9 3.7 6.703-TZ-14I 03-TZ-14I Coarse-porphyroclastic – – – – 97 3 0 0 0 0 Axial-[100] to ortho 3.78 0.64 3.3540 11.1 8.2 5.3 5.403-TZ-14J 03-TZ-14J1 Coarse-porphyroclastic – – – – 99 1 0 0 0 0 Axial-[100] to ortho 43.2⁎⁎ 0.66 3.3545 18.4 13.3 8.3 8.5
03-TZ-14J2 Coarse-porphyroclastic – – – – 100 0 0 0 0 0 Axial-[100] to ortho 44.5⁎⁎ 0.66 3.3550 13.5 9.2 5.0 7.803-TZ-14K 03-TZ-14K Coarse-granular – 87.6 88.8 This study 43 53 4 0 0 0 Axial-[100] to ortho 1.81 0.45 3.3279 3.9 2.6 2.1 1.803-TZ-14L 03-TZ-14L Coarse-granular – – – – 89 10 1 0 0 0 Axial-[100] to ortho 4.57 0.79 3.3498 11.7 7.8 3.8 6.303-TZ-14M 03-TZ-14M1 Coarse-porphyroclastic – – – – 82 18 0 0 0 0 Axial-[100] 5.59 0.79 3.3462 12.5 7.5 3.9 6.3
03-TZ-14M2 Coarse-porphyroclastic – – – – 84 16 0 0 0 0 Axial-[100] 5.75 0.71 3.3472 12.7 7.4 4.2 6.103-TZ-14N 03-TZ-14N1 Very coarse-granular – – – – 100 0 0 0 0 0 Ortho 5.24 0.47 3.3547 10.2 7.7 5.5 4.3
03-TZ-14N2 Very coarse-granular – – – – 100 0 0 0 0 0 Ortho 5.41 0.64 3.3550 10.1 6.5 4.2 4.5OL3 OL3A Coarse-granular 1066 92.1 92.4 This study 44 53 3 0 0 0 Axial-[100] 1.87 0.88 3.3282 3.7 2.3 0.6 2.2
OL3B Coarse-granular – – – – 44 53 3 0 0 0 Axial-[100] 1.87 0.88 3.3282 3.7 2.3 0.6 2.1OL10 OL10 Very coarse-granular – 93.1 – LCT01 95 5 0 0 0 0 Axial-[100] 5.28 0.92 3.3525 11.6 7.3 3.4 6.2OL-NN1 OL-NN1 Porphyroclastic – – – – 98 (97) 2 (2) 0 (0) 0 (0) 0 (1) 0 (0) Axial-[100] 5.45 0.80 3.3485 13.8 9.8 5.0 7.1OL-NN2 OL-NN2 Coarse-granular – – – – 98 (97) 0 (0) 2 (2) 0 (0) 0 (1) 0 (0) Axial-[100] to ortho 4.00 0.59 3.3544 12.0 8.5 4.9 6.0OL-NN3 OL-NN3 Porphyroclastic – – – – 97 0 3 0 0 0 Axial-[100] to ortho 8.95 0.72 3.3542 14.5 9.1 5.4 6.889-772 89-772 Very coarse-granular 950 87.6 – R94 98 0 2 0 0 0 Axial-[010] 3.11 0.30 3.3544 6.1 3.9 2.7 2.589-773 89-773 Very coarse-granular 1080 93.6 – R94 85 15 0 0 0 0 Axial-[100] to ortho 6.51 0.93 3.3471 12.5 7.8 3.8 6.489-774 89-774 Very coarse-granular – 93.5 – R94 100 0 0 0 0 0 Ortho 8.08 0.48 3.3550 10.6 7.5 5.2 4.189-776 89-776 Very coarse-granular 1120 94.4 – R94 97 0 3 0 0 0 Axial-[100] 7.85 0.62 3.3544 11.8 8.2 3.8 6.4
Reference for Mg# and T data: R94 = Rudnick et al., 1994; LCT01 = Lee, 2001.CPO types: ortho = orthorhombic, axial-[100], axial-[010], axial-[100] to orthorhombic, and axial-[010] to orthorhombic crystal-preferred orientations, see main text for details.⁎ Modal compositions determined from EBSD maps. Values between parentheses give the modal contents including veins.⁎⁎ Olivine J-index values probably overestimated because of the small number of grains indexed in very coarse-granular peridotites.
39V.Baptiste
etal./Tectonophysics639
(2015)34
–55

Table 2NAMs OH concentrations in ppm H2O wt. (calibration of Paterson, 1982 and converted to the calibration of Withers et al., 2012) derived from FTIR analyses.
Locality Sample Temperature(°C)
Ol Mg # Referencefor Mg#and T data
Texture Texturecomplement
Olivine CPO Mineral Sectionthickness(μm)
Paterson calibrationa Olivine — Withers calibrationb
OHconcentrations(H/106 Si)
OHconcentrations(wt. ppm H2O)
Average OHconcentrations(wt. ppm H2O)
OHconcentrations(wt. ppm H2O)
Average OHconcentrations(wt. ppm H2O)
Eledoi EL6 – 90.3 LCT01 Porphyroclastic Vein-bearing Axial-[100] to ortho ol-4 538 114 7 9 13 15ol-8 538 160 10 18ol-12 538 151 9 17ol-13 538 192 12 21ol-14 538 74 5 8
EL15a 1052 90.1 This study Porphyroclastic Vein-bearing Axial-[100] ol-1 541 65 4 8 7 14ol-2 541 103 6 11ol-5 541 126 8 14ol-11 541 185 11 20ol-12 541 178 11 20opx-2 541 2204 198 209 – -opx-3 541 2507 225 –
opx-4 541 1657 149 –
opx-5 541 2031 182 –
opx-9 541 2121 190 –
opx-10 541 3427 308 –
EL15b 1052 90.1 This study Porphyroclastic Vein-bearing Axial-[100] ol-2 527 70 4 4 8ol-3 527 48 3 5ol-4 527 56 3 6ol-5 527 49 3 5ol-7 527 46 3 5ol-10 527 49 3 5ol-11 527 109 7 12opx-1 527 2482 223 186 – –
opx-3 527 1902 171 –
opx-4 527 1862 167 –
opx-7 527 2043 183 –
Pello Hill PEL7 – 92.3 LCT01 Porphyroclastic – Ortho ol-5 528 99 6 6 11 11ol-8 528 78 5 9ol-9 528 160 10 18ol-10 528 43 3 5opx-2 528 1538 138 133 – –
opx-3 528 1419 127 –
PEL15 – 92.4 LCT01 Mylonitic – Ortho ol-2 496 77 5 3 8 5ol-5 496 28 2 3ol-8 496 32 2 4opx-1 496 1727 155 212 – –
opx-2 496 2764 248 –
opx-3 496 1930 173 –
opx-4 496 2488 223 –
opx-5 496 2561 230 –
opx-6 496 2789 250 –
opx-7 496 2416 217 –
opx-8 496 2233 201 –
opx-10 496 2313 208 –
PEL16 – 92.5 This study Porphyroclastic – Axial-[100] to ortho ol-2 506 46 3 4 5 7ol-4 506 59 4 6ol-5 506 51 3 6
40V.Baptiste
etal./Tectonophysics639
(2015)34
–55

ol-7 506 78 5 9ol-8 506 91 6 10
PEL17 – 92.4 This study Mylonitic – Axial-[100] ol-2 543 24 1 2 3 4ol-3 543 49 2 5opx-1 543 1053 65 97 – –
opx-2 543 1632 100 –
opx-4 543 2739 168 –
opx-6 543 1268 78 –
opx-7 543 1231 75 –
PEL34 – – LCT01 Porphyroclastic – Axial-[100] ol-1 537 46 3 3 – –
ol-2 537 33 2 –
ol-3 537 63 4 –
ol-5 537 36 2 –
ol-6 537 48 3 –
ol-7 537 50 3 –
ol-8 537 42 3 –
ol-9 537 57 4 –
PEL39 – 90.1 LCT01 Porphyroclastic – Axial-[100] ol-5 476 28 2 3 3 5ol-6 476 46 3 5ol-9 476 49 3 5ol-10 476 67 4 7
PEL40 – 91.0 LCT01 Porphyroclastic Vein-bearing Ortho ol-1 567 52 3 5 6 10ol-2 567 131 8 14ol-4 567 79 5 9
PEL41 - 87.9 LCT01 Coarse-granular Vein-bearing Axial-[100] ol-1 499 216 13 12 24 21ol-2 499 259 16 29ol-3 499 288 18 32ol-4 521 171 10 19ol-5 521 182 11 20ol-6 521 158 10 17ol-7 499 239 15 26ol-9 499 45 3 5ol-10 521 179 11 20
Olmani 89-772 950 87.6 R94 Very coarse-granular – Axial-[010] ol-2 528 86 5 5 9 10OL10 – 93.1 LCT01 Very coarse-granular – Axial-[100] ol-1 564 50 3 3 6 6
ol-2 564 75 5 8ol-3 564 50 3 6ol-4 564 51 3 6ol-8 564 43 3 5
03TZ14J – – – Coarse porphyroclastic – Axial-[100] to ortho ol-1 500 85 5 4 9 –
ol-2 500 75 5 8ol-3 500 72 4 –
ol-5 500 57 3 –
ol-6 500 85 5 –
Lashaine LS11 – 92.3 This study Very coarse-granular – Axial-[010] to ortho ol-1 491 203 12 12 22 21ol-2 491 215 13 24ol-3 491 204 13 22ol-4 491 196 12 22ol-5 491 154 9 17opx-2 491 1133 98 121 – –
opx-3 491 1648 143 –
Reference for Mg# and T data: R94 = Rudnick et al. (1994); LCT01 = Lee (2001).CPO types: Ortho = orthorhombic, axial-[100], axial-[010], axial-[100] to orthorhombic, and axial-[010] to orthorhombic crystal-preferred orientations, see text for details.
a OH concentrations from this study calculated using the calibration of Paterson (1982) have ±30% uncertainty (Kohlstedt et al., 1996).b OH concentrations corrected by a factor of 1.8 according to Withers et al. (2012).
41V.Baptiste
etal./Tectonophysics639
(2015)34
–55

42 V. Baptiste et al. / Tectonophysics 639 (2015) 34–55
All coarse-granular to tabular peridotites are dunites (Fig. 3d, e). Theyexhibit coarse olivine grains (1–8 mm) with equant to tabular shapes.Olivine has curvilinear to polygonal boundaries and is often devoid ofany substructure. 120° triple junctions are common. Three coarse-granular to tabular dunites (EL14, PEL11 and PEL41) are crosscut by dif-fuse veins composed of millimeter-sized clinopyroxene, phlogopite, am-phibole and spinel (Figs. 3d and 4d). Intracrystalline deformationfeatures are very rarely observed in phlogopite and amphibole grains.The orthopyroxene crystals in contact with the vein are partiallyreplaced by diopside.
In the porphyroclastic and mylonitic samples, the distribution ofmetasomatic minerals (phlogopite, amphibole, clinopyroxene, andspinel) is usually more diffuse. They form irregular pockets (Fig. 4e) oroccur as small interstitial grains dispersed in the rock. When these min-erals are dispersed in the rock, they may display subgrain boundaries.They are usually associated with fine-grained olivines, forming “bands”with smaller grain sizes. In the pockets, spinel is associated withclinopyroxene, pargasite or phlogopite (Fig. 4e).
4.2.2. Xenoliths from the transverse volcanic beltThe xenoliths from the two localities (Olmani and Lashaine) within
the divergence exhibit different microstructures. We will thus describethem separately.
4.2.2.1. Lashaine. The xenoliths from Lashaine show mainly very coarsegranular microstructures (Fig. 3f). Olivine grain size ranges from fewmillimeters to more than a centimeter. They have curvilinear bound-aries and widely spaced subgrain boundaries. Interpenetrating grainboundaries are common. Orthopyroxene is usually smaller (1–8 mm)than olivine, with rare kink bands or undulose extinction. Exsolutionin orthopyroxene is only observed in sample LS4. Lashaine is the only lo-cation where garnet peridotites (samples LS4, LS11, 89–680, and L1)were sampled. Garnet is present as irregularly-shaped crystals, severalmm long, most often rimming orthopyroxene (marked by arrows inFig. 3f). Kelyphitic rims are always present. In sample L1, garnet hasbeen entirely replaced by kelyphite. Clinopyroxene is present as exsolu-tions in orthopyroxene or as very small interstitial crystals associatedwith pargasite and spinel. Olivine with interpenetrating boundariesis commonly observed (Figs. 3f and 4g), as well as orthopyroxeneembaymentsfilledwith olivine. Peridotite LS9 displays slightly differentcharacteristics: it contains recrystallized zones with finer-grainedolivine showing curvilinear to polygonal boundaries (Fig. 4f). Olivinetablets free of any substructure are present on other olivine crystals(Fig. 4f). Orthopyroxene often contains olivine inclusions.
Two samples have granular microstructures but smaller grainsizes: the coarse-granular harzburgite 89–680 and the granular du-nite LS15. In harzburgite 89–680, olivine grain size ranges mainlybetween 1 and 4 mm. Olivine displays curvilinear to polygonalboundaries, and few subgrain boundaries. Orthopyroxene grainsize varies between 0.5 and 2 mm. It has irregular shapes with curvi-linear boundaries and may contain kink bands. Small interstitialclinopyroxene, phlogopite and amphibole grains are present. DuniteLS15 displays even smaller olivine grain sizes, ranging between 0.5and 2 mm. Olivine has curvilinear, sometimes interpenetratinggrain boundaries and a higher proportion of subgrain boundariesthan the other samples from Lashaine.
4.2.2.2. Olmani. The peridotites from Olmani display microstructuresintermediate between those described for peridotites from the rift-axislocalities and from Lashaine. Among the 17 studied xenoliths, 3 areporphyroclastic, 4 are coarse-porphyroclastic, 4 are coarse-granular,and 6 are very coarse -granular.
The porphyroclastic harzburgites display elongated olivineporphyroclasts with millimetric grain sizes (Fig. 3g), which mark thefoliation, and small olivine neoblasts (0.2–1 mm) with curvilinear topolygonal boundaries. The frequency of subgrain boundaries and the
degree of polygonization of the grain boundaries vary from sample tosample. For instance, sample 03TZ14H shows interpenetrating olivine–olivine grain boundaries, whereas polygonal olivine grains characterizesample OL-NN4. Orthopyroxene occurs as small (b1 mm), interstitialcrystals displaying rare kink bands.
In coarse-porphyroclastic harzburgites, olivine grains are millimetricto centimetric and elongated. They commonly display closely spacedsubgrain boundaries and interpenetrating grain boundaries. Small oliv-ine grains rim the porphyroclasts. These neoblasts display curvilinear topolygonal grain boundaries. Orthopyroxene usually displays irregularshapes, rare kink bands and undulose extinction, aswell as common ex-solutions and corrosion embayments filledwith olivine. Olivine crystalsincluded in orthopyroxene grains are sometimes observed. In sample03TZ14M, spinel-pyroxene symplectites are observed.
In coarse-granular harzburgites, olivine and orthopyroxene grainsizes vary between 0.5 and 3 mm. Two of these samples (OL3 and03TZ14K) display very high orthopyroxene content (N50%). Olivine ischaracterized by curvilinear to polygonal boundaries and commonsubgrain boundaries. In 2 samples (03TZ14K and 03TZ14L), olivine isoccasionally included in orthopyroxene. Orthopyroxene grains areanhedral. They display well-defined kink bands and undulose extinc-tion, as well as exsolutions. In several orthopyroxene grains, corrosionembayments filled with olivine are present.
The very coarse-granular peridotites from Olmani are similar to thesamples from Lashaine (Fig. 3h). They displaymillimetric to centimetricolivine grains. The density of subgrain boundaries and their spacing varyconsiderably fromone sample to another. Interpenetrating olivine grainboundaries are always observed. Orthopyroxene is present in only 1 ofthese samples (89–773). In this sample, orthopyroxene has millimetergrain sizes, curvilinear boundaries, and displays well-defined kinkbands.
4.3. Crystallographic preferred orientations (CPO)
As for the microstructures, we describe separately the CPOs of peri-dotites from the rift axis, Lashaine, and Olmani.
4.3.1. Rift axisMost rift-axis samples have low to moderate olivine CPO strength,
with J-indexes varyingmainly between 2–6 (Fig. 5). There is no correla-tion between the olivine CPO symmetry, its strength, and the micro-structure. Peridotites from Pello Hill and Eledoi exhibit olivineCPO symmetries ranging from axial-[100] to orthorhombic (Fig. 5).Axial-[100] symmetry predominates. These patterns are characterizedby a point concentration of [100], which in the mylonites andporphyroclastic peridotites is close to the lineation, and a girdle distri-bution of [010] and [001] normal to it. One sample has a clear ortho-rhombic olivine CPO, exhibiting a point concentration of the 3crystallographic axes, with [100] showing the strongest concentrationsubparallel to the lineation. [010] is usually more concentrated than[001] and tends to align normal to the foliation. Many samples, likePEL27, display an intermediate pattern characterized by weak girdlesof [010] and [001] normal to the maximum concentration of [100],with a concentration of [010] normal to the foliation plane and a con-centration of [001] in the foliation plane parallel to the Y structural axis.
When present, orthopyroxene has more dispersed CPO, but cor-related to the olivine CPO: the maximum concentration of [001] oforthopyroxene is parallel or slightly oblique to the olivine [100] maxi-mum, except for one sample (PEL22). Orthorhombic CPOpredominates,with [001] showing the strongest point concentration, which, in themylonites and porphyroclastic peridotites, is subparallel to the linea-tion. In most samples, [100] axes are aligned normal to the foliation,but in some samples [010] is preferentially oriented perpendicular tothe foliation.
Clinopyroxene crystals in the veins or as interstitial grains display aweak orthorhombic CPO pattern, with [001] axes showing the strongest

Opx Cpx
Ol
Pello Hill Eledoi Olmani Lashaine
20
40
80
60
4060
100
Fig. 2.Olivine–orthopyroxene–clinopyroxenemodal ratios in the studied peridotites stud-ied here. Modal compositions are derived from EBSDmaps, not considering metasomaticveins and pockets, and recalculated for a total of 100% of olivine + orthopyroxene +clinopyroxene.
43V. Baptiste et al. / Tectonophysics 639 (2015) 34–55
point concentration, which is usually subparallel to the orthopyroxene[001] maximum and to the olivine [100] maximum. The clinopyroxeneCPO is thus coherent with those of olivine and orthopyroxene. In12 samples, [100] axes are perpendicular to the foliation plane. In theother samples, [010] tends to be preferentially oriented normal to thefoliation.
4.3.2. Transverse volcanic belt
4.3.2.1. Lashaine. Olivine CPO strength of Lashaine samples is morevariable than for the rift axis peridotites. J-index ranges between 2and 8 for those sampleswheremore than 100 grains could bemeasured(Fig. 5). In some very-coarse grained peridotites, the number of mea-sured grains was b100, leading to a possible overestimation of the J-index (Ben Ismail and Mainprice, 1998). These values are marked bydashed arrows in Fig. 5. Olivine CPO in Lashaine peridotites variesfrom axial-[100] to axial-[010] patterns, with a predominance of ortho-rhombic patterns (BA indexes vary between 0.3 and 0.74, Fig. 5). Threesamples (LS9, LS15, and 89–680) display axial-[010] CPO, characterizedby a point concentration of [010] and a girdle distribution of [100] and[001] normal to it. Two samples (L1 and LS4) display orthorhombicCPO. In 2 other samples (89–664 and LS11), CPOs with a pattern inter-mediate between orthorhombic and axial-[100] are observed. In theserocks, the CPO is generally weak, but a point concentration of [100]and incomplete girdles of [010] axes are observed.
Orthopyroxene CPOs aremore dispersed than olivine CPOs. They arecharacterized by a weak point concentration of [001] axes parallel to[100] of olivine. In most samples, the maximum concentration of [100]is parallel to [010] maximum of olivine.
4.3.2.2. Olmani. The peridotites from Olmani display olivine CPO withvariable strength (J-indexes vary between 2 and 9; Fig. 5). They showmainly axial-[100] to orthorhombic olivine CPO patterns (Fig. 5).Porphyroclastic samples tend to exhibit axial-[100] patterns, that is,higher olivine BA indexes, as well as higher J-indexes than granularsamples. A single coarse-granular sample (89–772) is characterized byaxial-[010] pattern.
When present, orthopyroxene has a CPO correlated to the olivineone. In three samples, weak axial-[010] patterns can be observed (seeFig. 5, sample OL3). They are characterized by a girdle distributionof [100] and [001] in the foliation plane and point concentration of
[010] normal to it. The other samples display weak orthorhombic CPOsymmetry (Fig. 5, sample 03TZ14E1).
4.4. Seismic properties
Average anisotropic seismic properties for rift-axis and off-axissamples are illustrated in Fig. 6. To a first order, all localities sharecommon seismological characteristics. The P-wave propagation isfastest close to the olivine [100] maximum, which corresponds tothe lineation in the samples where it has been identified, and slowestclose to [010] maxima, then normal to the foliation. The slowestpropagation directions of the slow S-wave (S2) are in the YZ struc-tural plane. The fast split shear wave (S1) is polarized in a plane con-taining the main concentration of olivine [100] and the propagationdirection. The highest Vp/Vs1 ratio is also parallel to the preferredorientation of olivine [100] and the lowest Vp/Vs1 is observed forwaves propagating normal to this direction.
Changes in olivine CPO symmetry result in second order varia-tions of the seismic anisotropy pattern. Within the rift axis and atOlmani, where axial-[100] and orthorhombic olivine CPOs predomi-nate, P-wave velocities are slow and S-wave azimuthal anisotropy ishigh within the YZ plane. The fastest velocities of S2-waves are ob-served for directions close to the lineation. The slowest propagationof the S1-wave occurs for directions either close or normal to the lin-eation, while the fastest S1 propagation are expected for directions at45° to the lineation.
At Lashaine, where axial-[010] to orthorhombic olivine CPOs domi-nate, slow P-wave velocities are found for propagation directionsnormal to the foliation plane. In contrast to the average properties com-puted for the rift axis, the S-wave polarization anisotropy is very low forpropagation directions at high angle to the plane containing the concen-trations of [100] and [001] (corresponding to the foliation when ob-served), with a minimum within the XZ plane at ~45° to the lineation.The maximum S-wave polarization anisotropy lies within the foliationat 90° to the lineation. The fastest propagation directions of S1-waveare contained in the foliation plane, while the slowest directions areparallel to the Z structural direction. Slow and fast S2-wave propagationdirections are observed in a plane normal to the lineation and in the XZplane, at 45° to the lineation, respectively.
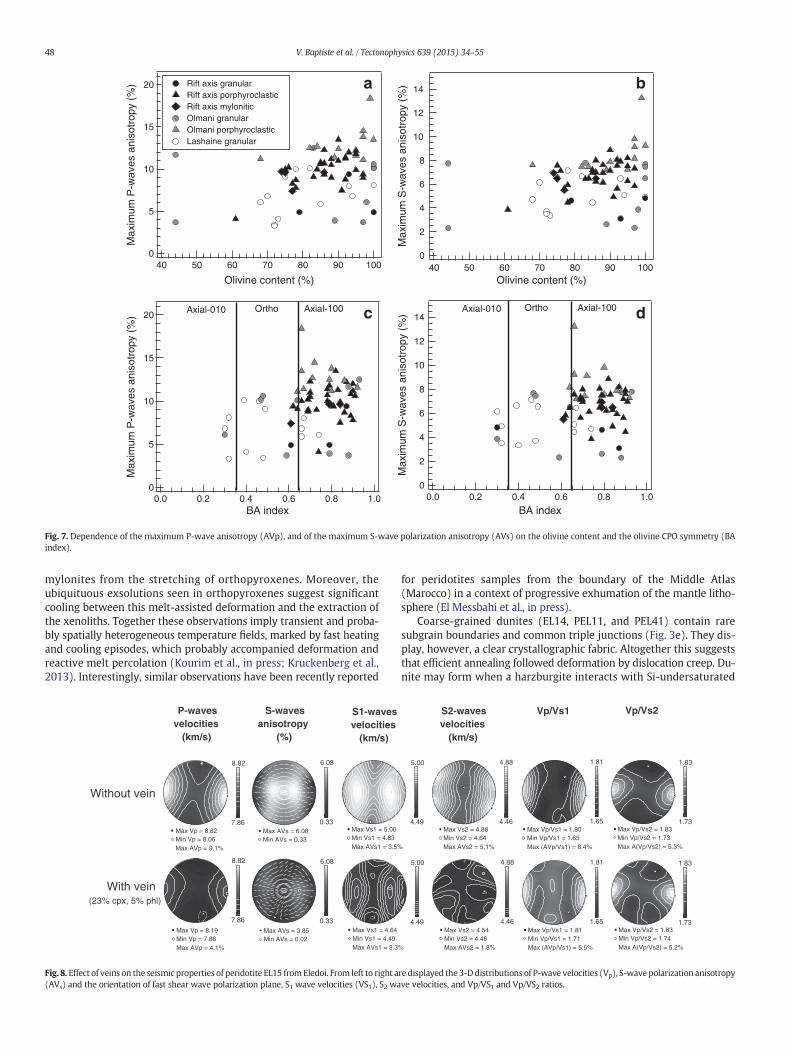
Seismic anisotropy intensities for individual samples are highlyvariable (Fig. 7, Table 1). Maximum P-wave anisotropies are comprisedbetween 3.3 and 18.4%, while maximum S-wave polarization anisot-ropies range between 2.3 and 13.3%. Porphyroclastic peridotites, whichhave the strongest olivine CPO, tend to have the highest anisotropies,whereas granular peridotites yield the lowest anisotropies (Fig. 7).With-in a microstructural group, however, there is no systematic variation inanisotropy as a function of the provenance.
We observe no simple relationship between P- and S-wave anisotro-py intensities and the olivine CPO symmetry (characterized by theBA index; Fig. 7c, d). Most porphyroclastic peridotites, which haveaxial-[100] olivine CPO, are strongly anisotropic (Fig. 5).
Crystallization of large volumes of metasomatic phases (N25% vol.)may considerably reduce P-, S1- and S2-wave velocities, and themaximum P- and S-wave anisotropy, as illustrated by Fig. 8,in which we compare the seismic properties of sample EL15calculated by taking into account or not a phlogopite-bearingclinopyroxenite vein that crosscuts this sample. It reduces the Vp/VS1 range, by increasing the minimum values, but it has no effecton Vp/VS2 ratios.
4.5. OH concentrations
4.5.1. OlivineThe olivine spectra of xenoliths from Pello Hill, Eledoi, Olmani, and
Lashaine exhibit many absorption bandswith highly variable intensities(Fig. 9a), suggesting H incorporation in a variety of point defects (Berry

44 V. Baptiste et al. / Tectonophysics 639 (2015) 34–55
et al., 2005, 2007; Kovacs et al., 2010;Miller et al., 1987; Padrón-Navartaet al., 2014). In a first group of samples (LS11, PEL41, 03TZ14J, EL6,PEL39), the absorption band at 3571 cm−1 displays the maximum O-H
a
c
e
g
5 mm
5 mm
5 mm
5 mm
Fig. 3. Photomicrographs in cross-polarized light showing typical microstructures for the studiedstrong intracrystalline deformation (undulose extinction, subgrains, kinks) surrounded by a finerolivine porphyroclasts displaying closely-spaced subgrain boundaries, surrounded by small polygonwith widely-spaced subgrains and polygonal neoblasts devoid of substructure. (d) Porphyroclastidiffusemetasomatic veins that crosscut the foliation. (e) Coarse-granular dunite PEL11 showing larand, locally, subautomorphic olivine crystals devoid of any substructure (marked by arrows). (f) Veboundaries and widely spaced subgrain boundaries and orthopyroxenes rimmed by garnet (porphyroclasts with well-defined subgrain boundaries. (h) Very coarse-grained harzburgite 89–7
absorbance, while the intensity of the absorption bands at 3596 and3525 cm−1 varies. Absorption bands between 3450 and 3200 cm−1
have minor peaks, except for the band at 3226 cm−1, which can be
b
d
f
h
5 mm
5 mm
5 mm
5 mm
xenoliths. (a) Mylonite PEL17B, showing highly elongated orthopyroxenes and olivines, with-grained matrix composed mainly by olivine. (b) Porphyroclastic peridotite PEL7, with largeal olivineneoblasts. (c) Porphyroclastic peridotite PEL1, showing large olivine porphyroclastsc peridotite EL15, displaying olivine grains with well-defined subgrain boundaries, as well asge olivine grainswith rare subgrains, frequent polygonal grain boundaries and triple junctionsry coarse-grainedperidotite LS4A fromLashaine, showing large olivine grainswith curvilineararrows). (g) Porphyroclastic peridotite OL-NN4 from Olmani showing elongated olivine73 from Olmani, showing large olivines with curvilinear boundaries.

a
b c
2 mm
1 mm
d e
f
1 mm
1 mm 1 mm
1 mm 1 mm
g
Fig. 4. Photomicrographs in cross-polarized (a, b, c, f, and g) and plane-polarized light (d and e) of: (a) Highly elongated orthopyroxene in mylonite PEL15 from Pello Hill displaying em-bayments filledwith olivine in crystalline continuitywith the surrounding grains, aswell as olivine inclusions elongated parallel to the orthopyroxene elongation anddisplaying subgrains.(b) Elongated olivine porphyroclastswith closely-spaced subgrain boundaries in peridotite PEL1 fromPelloHill. Small neoblasts forming triple junctions are also visible. (c) Orthopyroxenedisplaying inclusions and embayments filled with olivine in peridotite PEL7 from Pello Hill. (d) Diffuse veins composed of clinopyroxene, phlogopite, amphibole, spinel, and olivine inperidotite PEL39 from Pello Hill. The same phases are also present as interstitial grains between the veins. (e) Phlogopite, amphibole, clinopyroxene, and spinel “pockets” in peridotitePEL12 from Pello Hill. Note the smaller grain size and more polygonal shapes of olivine within these metasomatic pockets and veins. (f) Peridotite LS9 from Lashaine, characterized bycoexistence of large olivine grains and of “recrystallized” zones composed of small olivine neoblastswith polygonal shapes. Olivine tablets (arrows) growing onother grains are also visible.(g) Interpenetrating olivine–olivine grain boundaries, indicating active grain boundary migration in peridotite LS9 from Lashaine.
45V. Baptiste et al. / Tectonophysics 639 (2015) 34–55
more developed. In a second group of samples (EL15a, PEL17, PEL7,PEL15), absorption bands between 3450 and 3200 cm−1 present majorpeaks, with variable intensities. Finally, in a third group of samples(PEL16, EL15b, 89-772, OL10, PEL40, PEL34), both absorption bandsgroups are observed.
4.5.2. Orthopyroxene and garnetOrthopyroxene spectra aremore homogeneous (Fig. 9b) than those of
olivine. They display up to seven absorption bands. The four major bandsare found at 3600, 3544, 3517 and 3410 cm−1. Their intensities are vari-able. Minor peaks are also present around 3473, 3324 and 3060 cm−1.

RIF
T A
XIS
PEL12
PEL15
PEL27
N=5236 3.97
0.31
2.13
0.35
1.73
0.30
N=1669 3.73
0.21
3.71
0.38
2.66
0.42N=3140
0.13
5.43 3.73
0.02
2.35
0.18
N=296 6.72
0.00
6.95
0.00
6.61
0.00
[100] [010] [001] [100] [010] [001]
Olivine Orthopyroxene
Axial-100
Ortho
LA
SH
AIN
E
LS15
89-664
N=12072 2.38
0.27
4.39
0.15
2.17
0.31
N=482 4.82
0.02
6.48
0.00 0.03
4.53 N=141 7.44
0.00
6.55
0.00 0.00
12.01
89-680
N=1808 2.20
0.41
3.05
0.10
2.77
0.41
N=1170 2.81
0.35
3.25
0.15 0.23
4.57
OL
MA
NI
OL3
03TZ4E1
03TZ14N
89-772
N=5462.37
0.15
4.20
0.23
2.82
0.09
N=601 6.61
0.07 0.01
4.88 3.35
0.15
N=962 N=4368.07
0.01 0.05
5.00 4.99
0.02
2.62
0.05
3.49
0.13
2.76
0.19
N=2236 2.85
0.19
1.93
0.37
2.30
0.32
N=2088 2.23
0.17
2.70
0.34
1.86
0.59
5.25
0.06
3.57
0.13
2.78
0.24
N=24242.35
0.21
2.94
0.32
2.31
0.17
N=1539
Ol C
PO
sym
met
ry(B
A in
dex)
Ol C
PO
sym
met
ry(B
A in
dex)
Ol C
PO
sym
met
ry(B
A in
dex)
Ol CPO strength (J-index)
1.0
0.8
0.6
0.4
0.2
0.012840
Axial-010
Axial-100
Ortho
Axial-010
Axial-100
Ortho
Axial-010
1.0
0.8
0.6
0.4
0.2
0.012840
Ol CPO strength (J-index)12840
1.0
0.8
0.6
0.4
0.2
0.0
Z
X
Fig. 5. Olivine and orthopyroxene crystal preferred orientations (CPO): Olivine CPO strength (J-index) vs. symmetry (BA index) for all samples (granular, porphyroclastic and myloniticmicrostructures symbolized by circles, squares, and diamonds, respectively) andpolefigures of selected representative samples from the rift axis, Lashaine, andOlmani localities. Contoursat 1 multiple of a uniform distribution. Dashed arrows indicate the samples in Lashaine where olivine J-index is overestimated because of the small number of indexed grains in coarse-grained peridotites.
46 V. Baptiste et al. / Tectonophysics 639 (2015) 34–55
Severalmillimeters long clear garnet grainswere present in only oneof the analyzed samples (harzburgite xenolith from Lashaine LS11).Their spectra are flat, indicating anhydrous garnet.
4.5.3. OH concentrationsOlivine OH concentrations are heterogeneous both between and
within samples. They range between 2 and 12 wt. ppm H2O (Table 2,Figs. 10 and 11) and are in the range of concentrations previously mea-sured for spinel peridotites (Denis et al., 2013; Falus et al., 2008; Grantet al., 2007; Kurosawa et al., 1997; Li et al., 2008; Peslier, 2010; Peslierand Luhr, 2006; Soustelle et al., 2010, 2013; Yang et al., 2008). Olivinesfrom Pello Hill xenoliths are more heterogeneous than those fromOlmani and Eledoi. However, there is no systematic correlation betweenolivine OH concentrations and provenance (Fig. 10). The lowest olivineOH concentrations are found inmylonites, in agreementwith data fromprevious studies (Baptiste et al., 2012; Falus et al., 2008). The highestaverage olivine OH concentrations (12 wt. ppm H2O) are observed indunite PEL41 from Pello Hill and harzburgite LS11 from Lashaine.
Although both samples are coarse-granular, in thewhole set of analyzedsamples, there is no systematic correlation between olivine OH concen-tration and microstructure. There is also no correlation between theolivine OH concentration and Mg# (Fig. 11). The homogeneity of OHconcentrations in olivine was tested by analyses with 50 to 150 μmstep sizes along transects (850 to 3450 μm long) on randomly orientedolivine grains in three samples: one mylonite from Pello Hill (PEL17),one garnet-bearing harzburgite from Lashaine (LS11), and one vein-bearing sample from Pello Hill (PEL41). These profiles indicatehomogeneous concentrations plateaus within grains, incompatiblewith significant dehydration (Thoraval and Demouchy, 2014).
Average orthopyroxene OH concentrations range between 97 and212wt. ppmH2O (Table 2), being in the range of concentrations reportedby previous studies (Falus et al., 2008; Peslier, 2010; Peslier et al., 2002).In rift axis samples, orthopyroxene OH concentrations are more hetero-geneous, but there is no systematic correlation between orthopyroxeneOH concentration and xenolith locality or microstructure. Indeed, thelowest orthopyroxene OH concentrations are measured in mylonite

P-wavesvelocities (km/s)
S-waves anisotropy
(%)
Vs1Polarisation
Planes
Max Vp = 8.64Min Vp = 7.93Max AVp = 8.6%
Max AVs = 5.44Min AVs = 0.06
Rift axis
S1-waves velocities
(km/s)
S2-waves velocities
(km/s)
Vp/VS1
Max Vs1 = 4.86Min Vs1 = 4.74Max AVs1 = 2.5%
Max Vs2 = 4.75Min Vs2 = 4.7Max AVs2 = 4.7%
Max Vp/Vs1 = 1.82Min Vp/Vs1 = 1.67Max A(Vp/Vs1) = 4.1%
Max Vp = 8.18Min Vp = 7.77Max AVp = 5.1%
Max AVs = 3.50Min AVs = 0.17
Max Vs1 = 4.72Min Vs1 = 4.60Max AVs1 = 2.6%
Max Vs2 = 4.63Min Vs2 = 4.55Max AVs2 = 1.8%
Max Vp/Vs1 = 1.74Min Vp/Vs1 = 1.69Max A(Vp/Vs1) = 2.8%
Lashaine
Max Vp = 8.68Min Vp = 7.82Max AVp = 10.5%
Max 1Vs = 6.51Min AVs = 0.21
Max Vs1 = 4.90Min Vs1 = 4.74Max AVs1 = 3.3%
Max Vs2 = 4.77Min Vs2 = 4.52Max AVs2 = 5.3%
Max Vp/Vs1 = 1.81Min Vp/Vs1 = 1.65Max A(Vp/Vs1) = 9.4%
Olmani
Z
X
8.68
7.77
6.51
0.06
6.51
0.06
4.90
4.60
4.77
4.52
1.82
1.65
8.68
7.77
6.51
0.06
6.51
0.06
4.90
4.60
4.77
4.52
1.82
1.65
8.68
7.77
6.51
0.06
6.51
0.06
4.90
4.60
4.77
4.52
1.82
1.65
Fig. 6. Calculated seismic properties of average samples for the rift axis, Lashaine, and Olmani localities. From left to right are displayed the 3-D distributions of P-wave velocities (Vp), S-wavepolarization anisotropy (AVs) and the orientation of fast shear wave polarization plane, S1 wave velocities (VS1), S2 wave velocities, and Vp/VS1 ratio. Black squares and white spots indicatemaximum and minimum values, respectively.
47V. Baptiste et al. / Tectonophysics 639 (2015) 34–55
PEL17 and the highest, in mylonite PEL15. There is also no correlationbetween the olivine and orthopyroxene OH concentrations.
5. Discussion
5.1. Thermomechanical and metasomatic evolution of North TanzanianDivergence peridotites
5.1.1. Rift Axis (Pello Hill and Eledoi)The peridotites from the rift axis localities show a variety of micro-
structures, frommylonitic to porphyroclastic and coarse-granular. All ex-hibit evidence for plastic deformation and both dynamic and for staticrecrystallization, but the deformation conditions and the extent of staticrecrystallization vary from one sample to another. The obliquity betweenthe lineation and subgrain boundaries in olivine suggests simple shear de-formation in both porphyroclastic peridotites and mylonites, but thehigher elongation of orthopyroxenes imply deformation under higherstresses in the mylonites. The heterogeneity in microstructures mayindicate a spatial or a temporal variation of deformation conditions andintensity within the mantle below Eledoi and Pello Hill.
In both mylonites and porphyroclastic peridotites, the frequency andspacing between subgrain boundaries in olivine porphyroclasts and theextent of grain boundary polygonization vary from sample to sample(Fig. 3a and b). These microstructural features support a deformationfollowed by variable degree of annealing. The well-preservedintracrystalline deformation features in most porphyroclastic peridotitessuggest, however, that the time span between the deformation and theextraction by the magma was too short to allow for complete annealingof the deformation microstructures. The recent character of the deforma-tion is further supported by the rather high equilibration temperatures(1050–1100 °C) recorded by these peridotites. The variable degree of an-nealing observed in these rocks may be explained by variable interactionwith fluids or melts, by sampling of different depths, or by transient andspatially heterogeneous heating events.
Mylonites also record a temporal variation of deformation condi-tions. Highly stretched orthopyroxenes are a characteristic feature ofthe mylonites (Fig. 3a). Similar highly stretched orthopyroxenes havebeen described, in mylonitic peridotites from the Lanzo (Nicolas et al.,1972), Ronda (Soustelle et al., 2009; Tubìa et al., 2004), and BeniBousera massifs (Frets et al., 2014), and were interpreted as the resultof deformation under high stress at moderate temperature (850–950 °Cestimated from thermobarometry in the peridotites and associatedpyroxenites; Frets et al., 2014; Garrido et al., 2011). Closely spacedkinks in orthopyroxene also indicate deformation under high stressconditions. However, the stretched orthopyroxenes from themyloniteshave indented shapes, with embaymentsfilled by vein-like olivine crys-tals, which are often subparallel to the orthopyroxene elongation(Fig. 4a). In porphyroclastic peridotites, orthopyroxene embaymentsfilled with olivine and olivine inclusions in orthopyroxene (Fig. 4c)are also present. These microstructures suggest reactions leading toconsumption of orthopyroxene and crystallization of olivine. In bothmylonites and porphyroclastic peridotites, the olivine crystals thatreplace orthopyroxene display ubiquituous undulose extinction andsubgrain boundaries dominantly oriented normal to the crystals' elon-gation. This suggests that this reaction is synkinematic. Three processesmay produce replacement of orthopyroxene by olivine: (1) incongruentmelting of orthopyroxene (Kubo, 2002); (2) reaction between the peri-dotite and a Si-undersaturated melt (Kelemen, 1990; Kelemen et al.,1995), (3) percolation of aqueous fluids (Padrón-Navarta et al., 2010).The last process may occur at low temperatures (650–700 °C), but im-plies very large volumes of aqueous fluids (Padrón-Navarta et al.,2010),which are plausible in a subduction zone, but not in a continentalrift.
In summary, the recent deformation event recorded by the rift axisxenoliths started under high stress and probably low temperature. Thedeformation was later coupled with partial melting or reactive percola-tion of Si-undersaturatedmelts. Both processes imply high, near-solidustemperatures, which are at odds with the high stresses inferred in the
20
15
10
5
0
Max
imum
P-w
aves
ani
sotr
opy
(%)
1.00.80.60.40.20.0BA index
14
12
10
8
6
4
2
0
Max
imum
S-w
aves
ani
sotr
opy
(%)
1.00.80.60.40.20.0
BA index
20
15
10
5
0
Max
imum
P-w
aves
ani
sotr
opy
(%)
100908070605040
Olivine content (%)
14
12
10
8
6
4
2
0
Max
imum
S-w
aves
ani
sotr
opy
(%)
100908070605040Olivine content (%)
Axial-010 Axial-010Axial-100 Axial-100Ortho Ortho
a b
c d
Rift axis granularRift axis porphyroclasticRift axis myloniticOlmani granularOlmani porphyroclasticLashaine granular
Fig. 7. Dependence of the maximum P-wave anisotropy (AVp), and of the maximum S-wave polarization anisotropy (AVs) on the olivine content and the olivine CPO symmetry (BAindex).
48 V. Baptiste et al. / Tectonophysics 639 (2015) 34–55
mylonites from the stretching of orthopyroxenes. Moreover, theubiquituous exsolutions seen in orthopyroxenes suggest significantcooling between this melt-assisted deformation and the extraction ofthe xenoliths. Together these observations imply transient and proba-bly spatially heterogeneous temperature fields, marked by fast heatingand cooling episodes, which probably accompanied deformation andreactive melt percolation (Kourim et al., in press; Kruckenberg et al.,2013). Interestingly, similar observations have been recently reported
P-wavesvelocities
(km/s)
S-wavesanisotropy
(%)
S1-wavesvelocities
(km/s)
Max AVp = 9.1%
Max Vp = 8.82Min Vp = 8.06
Max AVs = 6.08Min AVs = 0.33
Max AVs1 = 3.5%
Max Vs1 = 5.00Min Vs1 = 4.83
Max AVp = 4.1%
Max Vp = 8.19Min Vp = 7.86
Max AVs = 3.85Min AVs = 0.02
Max AVs1 = 3.3
Max Vs1 = 4.64Min Vs1 = 4.49
8.82
7.86
8.82
7.86
6.08
0.33
6.08
0.33
Without vein
With vein(23% cpx, 5% phl)
Fig. 8. Effect of veins on the seismic properties of peridotite EL15 fromEledoi. From left to right a(AVs) and the orientation of fast shear wave polarization plane, S1 wave velocities (VS1), S2 wa
for peridotites samples from the boundary of the Middle Atlas(Marocco) in a context of progressive exhumation of the mantle litho-sphere (El Messbahi et al., in press).
Coarse-grained dunites (EL14, PEL11, and PEL41) contain raresubgrain boundaries and common triple junctions (Fig. 3e). They dis-play, however, a clear crystallographic fabric. Altogether this suggeststhat efficient annealing followed deformation by dislocation creep. Du-nite may form when a harzburgite interacts with Si-undersaturated
S2-wavesvelocities
(km/s)
Vp/Vs1 Vp/Vs2
Max AVs2 = 5.1%
Max Vs2 = 4.88Min Vs2 = 4.64
Max (AVp/Vs1) = 8.4%
Max Vp/Vs1 = 1.80Min Vp/Vs1 = 1.65
Max A(Vp/Vs2) = 5.3%
Max Vp/Vs2 = 1.83Min Vp/Vs2 = 1.73
% Max AVs2 = 1.8%
Max Vs2 = 4.54Min Vs2 = 4.46
Max (AVp/Vs1) = 5.5%
Max Vp/Vs1 = 1.81Min Vp/Vs1 = 1.71
Max A(Vp/Vs2) = 5.2%
Max Vp/Vs2 = 1.83Min Vp/Vs2 = 1.74
5.00
4.49
5.00
4.49
4.88
4.46
4.88
4.46
1.81
1.65
1.81
1.65
1.83
1.73
1.83
1.73
re displayed the 3-D distributions of P-wave velocities (Vp), S-wave polarization anisotropyve velocities, and Vp/VS1 and Vp/VS2 ratios.

49V. Baptiste et al. / Tectonophysics 639 (2015) 34–55
melts (Berger, 1985; Berger and Vannier, 1984; Kelemen, 1990;Morganand Liang, 2003). The coarse-grained dunites from Pello Hill and Eledoicontain olivineswith significantly lowerMg# (84–88,while the averagefor the other microstructures in these localities is ~92, Table 1). Such astrong enrichment in Fe suggests interaction with very large volumesof melts. The coarse-grained dunites might thus represent melt chan-nels or melt accumulation levels within the mantle lithosphere(Berger, 1985; Berger and Vannier, 1984; Kelemen and Dick, 1995;Kelemen et al., 1995; Tommasi et al., 2004).
In mylonitic, porphyroclastic and coarse-granular peridotites, thewell-defined olivine CPO indicates dislocation creep as the dominantdeformation process. The olivine CPO patterns range from axial-[100]to orthorhombic. These olivine CPOs are consistent with deformationby simple or pure shear with dominant activation of (010)[100] or
30
20
10
0
4000 3800 3600 3400 3200 3000
Orthopyroxene and garnet
PEL7
PEL15
PEL17
EL15a
EL15b
LS11
LS11 garnet
10
8
6
4
2
0
OL10
89-772
LS11
EL15b
EL15a
EL6
PEL41
PEL40
PEL39
PEL17
PEL16
PEL15
PEL7
Olivine
PEL34
03TZ14J
Group 1
Group 2
Group 3
a
b
Wavenumber (cm-1)
Abs
orpt
ion
coef
ficie
ntA
bsor
ptio
n co
effic
ient
4000 3800 3600 3400 3200 3000
Wavenumber (cm-1)
Fig. 9. Representative unpolarized FT infrared spectra of nominally anhydrous mineralsin xenoliths from Tanzania. (a) Olivine; (b) orthopyroxene and garnet. All spectra arenormalized to a sample thickness of 1 cm.
(0kl)[100] slip systems under high temperature, low pressure and anhy-drous conditions (Tommasi et al., 1999, 2000). Axial-[100] CPO symmetrylikely denotes a strain regime producing a well-defined stretching direc-tion, such as transtension; Kruckenberg et al. (2014) have recentlyshown the correlation between axial-[100] CPO symmetry and prolatestrain ellipsoids due to constructional deformation. Orthopyroxene CPOsindicate deformation by dislocation creep with activation of the [001](100) slip system. They are always correlated to the olivine CPO, indicat-ing that both minerals underwent the same deformation event.
In addition to the olivine-forming reactive melt percolation, texturalevidence for metasomatism by hydrous melts has also been identifiedin many peridotites from Pello Hill and Eledoi. For instance, Dawsonand Smith (1988) first analyzed the composition of the veins fromPello Hill mantle xenoliths and concluded that they bear asthenosphericNd and Sr isotopic signatures and imparted REE, K, Fe, Ti metasomatismon the surrounding peridotite. It encompasses: (1) veins with diffusemargins that comprise clinopyroxene, amphibole, phlogopite, and spinelthat crosscut deformation microstructures (Fig. 3d), (2) irregularly-shaped pockets of clinopyroxene, amphibole, phlogopite, and spinel(Fig. 4e). In these minerals, deformation substructures are uncommon.However, clinopyroxene crystals in veins do exhibit a clear CPO that iscoherent with the CPO of olivine and orthopyroxene from the surround-ing peridotite. Two hypotheses may explain this observation. First, veinintrusion may be synkinematic, but this hypothesis is at odds with theorientation of the veins that crosscut the foliation and with the lack ofplastic deformation of the metasomatic phases. Thus, we propose thatthe vein intrusion was post-kinematic and the minerals crystallized ina preferential orientation controlled by the orientation of the preexistingorthopyroxene.
5.1.2. LashaineMantle xenoliths from Lashaine mainly display very coarse-grained
microstructures characterized by millimeter- to centimeter-sized grainswith curvilinear, interpenetrating boundaries and low densities ofsubgrain boundaries (Figs. 3f and 4g). These observations point to effi-cient grain boundary migration. Together with the well-defined olivineand orthopyroxene CPOs, they support deformation by dislocationcreep at high temperature and effective annealing. In LS9, the frequentolivine–orthopyroxene interpenetrating boundaries suggest reactionwith percolating melts. In addition, the olivine tablets growing onother crystals (Fig. 4f) have been previously interpreted as resultingfrom fast grain growth in presence of fluids (Drury and Van Roermund,1989).
Among the studied samples, the xenoliths from Lashaine arethe only ones containing garnet, implying that deeper parts of theTanzanian lithosphere have been sampled. Garnet crystals in peridotitesLS4 and LS11 display interstitial shapes and usually rim orthopyroxene.This morphology led Gibson et al. (2013) to interpret these pyrope gar-nets as the product of exsolution from orthopyroxene due to cooling.
Well-defined olivine and orthopyroxene CPOs in Lashaine perido-tites indicate that dislocation creep was the main deformation process.Orthopyroxene CPOs are consistent with deformation by dislocationcreep with dominant activation of [001](100), as usually observed indeformed mantle peridotites and pyroxenites (e.g., Frets et al., 2012,2014; Vauchez et al., 2005). Olivine CPO patterns are dominantly ortho-rhombic to axial-[010] (Fig. 5). Axial-[010] olivine CPO symmetry,though less common than orthorhombic and axial-[100] symmetries(Tommasi et al., 2000), has been described in many xenoliths suitesfrom continental and oceanic environments (e.g., Bascou et al., 2008;Tommasi et al., 2008; Vauchez et al., 2005; Zaffarana et al., 2014) andin peridotite massifs (e.g., Frets et al., 2014; Soustelle et al., 2010). Itmay result from similar activation of [100](010) and [001](010) slipsystems as a result of changes in physical parameters (e.g., olivinewater contents, pressure, differential stresses, presence of melt) duringdeformation or from a deformation regime characterized by an oblatestrain ellipsoid (Kruckenberg et al., 2014) such as pure shear or

50 V. Baptiste et al. / Tectonophysics 639 (2015) 34–55
transpression (Tommasi et al., 1999). A dispersion of olivine [100] axeshas also been observed in rocks undergoing dynamic and static recrys-tallization (Falus et al., 2011; Tommasi et al., 2008). Experiments on ol-ivine single crystals and polycrystals have shown that [001]-glide isfavored at low temperature and high differential stresses (Demouchyet al., 2009, 2013, 2014; Durham and Goetze, 1977; Phakey et al.,1972; Raleigh, 1968). However, this explanation is inconsistent withthe very-coarse granular microstructures of Lashaine peridotites. TheOH concentrations measured in olivine are too low (b20 wt. ppmH2O) to induce the transition from dominant [100] to dominant [001]glide suggested by Jung et al. (2006). Transition from [100] to [001]glide have also been observed as a result of increasing pressure in defor-mation experiments at high confining pressure (Couvy et al., 2004; Junget al., 2006; Raterron et al., 2009). Occurrence of axial-[010] CPO ingarnet-bearing harzburgite LS11 may suggest a change in dominantmechanism with increasing pressure, an interpretation similar to theoneproposed byVauchez et al. (2005) for the deepest Labait peridotites.However, this explanation cannot account for the common axial-[010]patterns in the Lashaine spinel peridotites. Deformation in presence ofmelt, accompanied by refertilization reactions, also results in develop-ment of axial-[010] olivine CPO (Higgie and Tommasi, 2012, 2014; LeRoux et al., 2008). Yet, there is no clear evidence for synkinematicrefertilisation reactions in the studied peridotites. Thus axial-[010] oliv-ine CPO in Lashaine peridotites probably results from eithertranspression or recrystallization. Transpression should also result indispersion of orthopyroxene [001] axes in the foliation plane, but thesmall number of orthopyroxene crystals present in most samples doesnot allow corroborating or excluding this hypothesis. Evidence for staticrecrystallization and grain boundary migration is, on the other hand,widespread in these peridotites.
5.1.3. OlmaniXenoliths from Olmani display microstructures and CPOs intermedi-
ate between those found in peridotites from rift-axis localities and fromLashaine (Figs. 3 and 7). Half of the Olmani samples display coarse-grained to very coarse-grained sizes, similar to the microstructuresobserved in Lashaine. The other half of Olmani samples exhibits coarse-porphyroclastic to porphyroclastic microstructures, with characteristicssimilar to those observed in rift axis peridotites. All textural types fromOlmani show evidence for olivine crystallization at the expenses oforthopyroxene. Chemical evidence for interaction with carbonatites wasidentified in several of the studied peridotites (89–772, 89–774, 89–776,and 89–773) by Rudnick et al. (1993). These samples display coarse-granular microstructures, suggesting that the carbonatitic metasomatismis not directly related to the recent deformation (probably rift-related),recorded by the porphyroclastic microstructures.
The well-defined olivine CPOs measured in Olmani peridotites sug-gests that dislocation creep was the main deformation process. Allthree olivine CPO symmetries are observed. Interestingly, Olmani gran-ular peridotites tend to display axial-[010] olivine CPO, similar to thoseof the granular peridotites from Lashaine, whereas porphyroclastic tocoarse-porphyroclastic samples show dominantly axial-[100] patterns,similar to rift axis peridotites. Moreover, the weak annealing observedin the porphyroclastic peridotites suggests that deformation occurredshortly before extraction. The orthopyroxene CPO is consistent with de-formation by dislocation creep with dominant activation of [001](100)and [001](010) slip systems. Olivine and orthopyroxene CPOs arealways correlated, implying that they record the same deformation event.
A variation inmicrostructures and olivine CPO patterns between thelocalities of Olmani and Lashainewas not expected, as both localities arewithin the Tanzanian Divergence and distant of less than 30 km. Thisvariation may be explained by: (1) younger eruption ages in Olmanithan Lashaine, inwhich caseOlmani peridotiteswould record the recentdeformation associated with the rifting, (2) a bias in xenolith sampling,(3) Olmani and Lashaine sample lithospheric domains with differenttectonic ages, or (4) heteregeneous deformation of the lithospheric
mantle at the scale of few tens of km within the transverse volcanicbelt. The eruption age of Olmani and Lashaine is poorly constrained.However, neighboring volcanic centers with similar morphologieshave eruption ages between 2.5 and 1.56 Ma (Evans et al., 1971; LeGall et al., 2008;MacIntyre et al., 1974;Wilkinson et al., 1986). Hypoth-esis (1) is therefore improbable. A bias in xenolith sampling (2) cannotbe definitely excluded, but is unlikely, since in spite of the large numberof xenoliths collected, Lashaine xenoliths have very homogeneousmicrostructures. The presence of lithospheric domains of differentages (3) within the Mozambique belt is possible. Indeed, Lashaineand Olmani are located in a domain of the Mozambique belt that isinterpreted as a remnant of cratonic lithosphere reworked during theNeoproterozoic Orogeny (Mansur et al., 2014; Möller et al., 1998). Sim-ilarities between Lashaine and cratonic peridotites are numerous.Rudnick et al. (1994) first highlighted similarities in mineral composi-tions between Lashaine and the Kaapvaal craton peridotites. Minimumages of 3.4 and 2.9 Ga were obtained from Re–Os studies of sulfides inmantle xenoliths from both Lashaine and Labait, a Quaternary volcanolocated on the eastern boundary of the Tanzanian craton (Fig. 1;Burton et al., 2000; Chesley et al., 1999). Comparison of themicrostruc-tures and the olivine CPOs of the Labait and Lashaine peridotites pro-vides additional evidence for a common origin. Vauchez et al. (2005)described three textural types in the Labait peridotites, among whichthe garnet-free, coarse-grained peridotites display microstructures andolivine CPO very similar to those observed in the Lashaine peridotites.However, the similarities between Lashaine and Olmani coarse-granularperidotites make hypothesis (3) unlikely. Heterogeneous rift-relateddeformation within the volcanic belt is the most probable explanationto Lashaine and Olmani microstructural and CPO difference. Indeed, thedeformation recorded by the Olmani porphyroclastic peridotites mightbe related to localized deformation in a strain transfer zone connectingthe main rift to the Pangani Graben (Fig. 1) or to reactivation of theneoproterozoic Aswa shear zone (e.g., Corti et al., 2007; Ruotoistenmäki,2014 and references therein) in a transtensional regime that resulted inthe opening of the Pangani Graben.
5.2. Hydration state of the Tanzanian lithosphere
Diffusion data from experimentation and dehydration profiles frombasalt-borne peridotite xenoliths point out to a very fast hydrogenionic diffusion in olivine at high temperature (Mackwell andKohlstedt, 1990; Demouchy and Mackwell, 2006; Demouchy et al.,2006; Peslier and Luhr, 2006; Denis et al., 2013). However, the homoge-neity of OH concentrations along profiles in olivine in three samples sug-gests that the measured concentrations were not modified duringxenolith extraction (Demouchy et al., 2006; Thoraval and Demouchy,2014).
Average OH concentrations in olivine measured in the Tanzaniansamples vary from very low to moderate (up to 12 wt. ppm H2O;Fig. 10, Table 2). Average orthopyroxene OH concentrations range be-tween 97 and 212 wt. ppmH2O. In xenoliths from Pello Hill, the olivineOH concentrations are more heterogeneous than in those from Eledoiand Olmani. However, this difference might be related to the fact thatwe analyzed more samples from Pello Hill than from other localities.We also observe no clear relationship between the microstructure orthe olivine CPO pattern and OH concentrations (Table 2, Fig. 10). Wealso do not observe significant differences in olivine OH concentrationsbetween in- and off-axis samples (Fig. 10). The 2 samples that exhibitthe highest OH concentrations in olivine are a garnet-bearingharzburgite LS11 from Lashaine and a vein-bearing dunite PEL41 fromPello Hill. We discuss below the potential origin of these relativelyhigher OH concentrations.
The harzburgitic to dunitic compositions and high olivine Mg# inmost samples suggest extensive partial melting, which might be as oldas 3.4 Ga, based on Os isotopic dating of sulfides in a garnet lherzolitefrom Lashaine (Burton et al., 2000). Since H behaves as an incompatible

20
15
10
5
Oliv
ine
OH
con
cent
ratio
n (w
t. pp
m H
2O)
(Cal
ibra
tion
of P
ater
son,
198
2)Coarse-granularPorphyroclasticMyloniticAverage per locality
PE
L7
RIFTAXIS AWAY FROMTHE RIFT AXIS
PELLO HILL
PE
L15
PE
L16
PE
L17
PE
L39
PE
L40
PE
L41
EL6
EL1
5aE
L15b
89-7
72O
L10
LS11
ELEDOI OLMANI LASHAINE
AV
PE
L
AV
EL
AV
LS
AV
OL
PE
L34
03T
Z14
J
Fig. 10. OH concentrations in olivine in wt. ppm H2O (calibration of Paterson, 1982) as afunction of xenolith provenance and texture.
51V. Baptiste et al. / Tectonophysics 639 (2015) 34–55
element during partial melting (Bolfan-Casanova, 2005; Dixon et al.,2002; Hirschmann et al., 2005), olivine with high Mg# should havethe lowest OH concentrations. However, we observe no correlation be-tween olivine Mg# and OH concentrations (Fig. 11), implying that theTanzanian samples were potentially hydrated or rehydrated duringlater metasomatic events.
Geochemical studies have provided evidence for multiple metaso-matic events inmantle xenoliths from the sampled localities. Carbonatitemetasomatism led to enrichment in REE, increase in Mg#, and the crys-tallization of clinopyroxene and phosphate in Olmani xenoliths (Rudnicket al., 1993, 1994). However, this carbon-rich metasomatism should notresult in extensive hydration of Nominally Anhydrous Minerals (NAM)because a high CO2 fugacity will lower H2O fugacity in the system andthus minimize the hydration of NAMs (Dixon et al., 1995; Sokol et al.,2010). In Lashaine peridotites, an episode of metasomatism, which
50
40
30
20
10
0
Con
cent
ratio
n w
t. pp
m H
2O(C
alib
ratio
n of
Pat
erso
n, 1
982)
Con
cent
ratio
n w
t. pp
m H
2O(C
alib
ratio
n of
With
ers
et a
l., 2
012)
9492908886
Ol Mg#
0
20
40
60
80
Olivine from: Pello HillEledoi Olmani LashaineOff-craton(rejuvenated) China cratonCraton
Fig. 11. OH concentrations in wt. ppm H2O (calibration of Paterson, 1982) versus Mg# inolivine. For comparison, data obtained in previous studies on peridotite xenoliths fromvarious localities are also shown as open symbols and crosses (Baptiste et al., 2012;Demouchy et al., 2006; Denis et al., 2013; Falus et al., 2008; Grant et al., 2007; Kurosawaet al., 1997; Matsyuk et al., 1998; Matsyuk and Langer, 2004; Peslier and Luhr, 2006;Peslier et al., 2008; Peslier et al., 2010; Yang et al., 2008).
enriched the peridotites in K, Fe Ca, Ti, Rb and REE, was dated at ~2 Gabased on Re–Os isotope data on sulfides (Burton et al., 2000; Dawson,2002). A more recent metasomatism led to addition of Si, K, Ti, Ca, Fe,Nb, and Ta (Dawson, 2002). Rudnick et al. (1994) suggested that theSiO2 enrichment in Lashaine garnet peridotites was caused by the inter-actionwith silicicmelts derived frompartialmelting of a subducting slab,during the major subduction on the eastern edge of the Kaapvaal cratonaround 2 Gy ago (Möller et al., 1995). Such a process may modifythe trace element contents of NAMs andallow forOH incorporation in ol-ivine. It might therefore explain the relatively high OH concentration inolivine from garnet-bearing harzburgite LS11 (Fig. 10). Moreover, LS11harzburgite is a garnet-bearing peridotite. Its deeper origin may also ex-plain the higher OH concentration, since higher pressure implies higherwater fugacity, favoring OH incorporation in olivine (Férot andBolfan-Casanova, 2012; Kohlstedt et al., 1996).
The presence of undeformed hydrous phases in veins or diffusepockets (Figs. 3d and 4d, e) in xenoliths from all sites implies extensivepost-kinematic metasomatism by hydrous fluids or melts. Indeed, thevein-bearing dunite PEL41 from Pello Hill shows the highest OH concen-trations in olivine from all analyzed samples (Fig. 10). However, mea-surement of the OH concentration in olivine at different distances fromthe veins in dunite PEL41 shows no systematic increase in olivine OHconcentrations in the vicinity of the vein (Fig. 12). Similarmeasurementswere performed for samples EL15 and PEL40. These data suggest thathydration of olivine is not related to the metasomatic event that formedthe veins. The actual nature of the metasomatic agent and the timing ofthe hydration of olivine remain therefore undetermined.
5.3. Upper mantle deformation and seismic anisotropy in the NorthTanzanian Divergence
Microstructures and CPO analysis of the Tanzanian xenoliths showthat the lithospheric mantle in the Northern Tanzanian Divergence ispervasively deformed. However, the strong heterogeneity in micro-structures and olivine CPO suggests that this deformation was acquiredduring multiple tectonic events, probably separated by quiescenceepisodes, which allowed for annealing. The observed microstructuralheterogeneity could also be explained by spatial variations in strainrate. The mylonitic to granular microstructures of the rift axis perido-tites, despite rather high equilibrium temperatures, underwent limitedannealing, which suggests that they were deformed shortly beforeextraction. Therefore, these samples likely record the deformation asso-ciated with the rift propagation in this region. Among the peridotites
15
10
5
0121086420
Distance from veins (mm)
EL15aEL15bPEL40PEL41
Con
cent
ratio
n w
t. pp
m H
2O(C
alib
ratio
n of
Pat
erso
n, 1
982)
Fig. 12. Olivine OH concentrations in wt. ppm H2O, (calibration of Paterson, 1982) as afunction of the distance from hydrous mineral-rich veins.
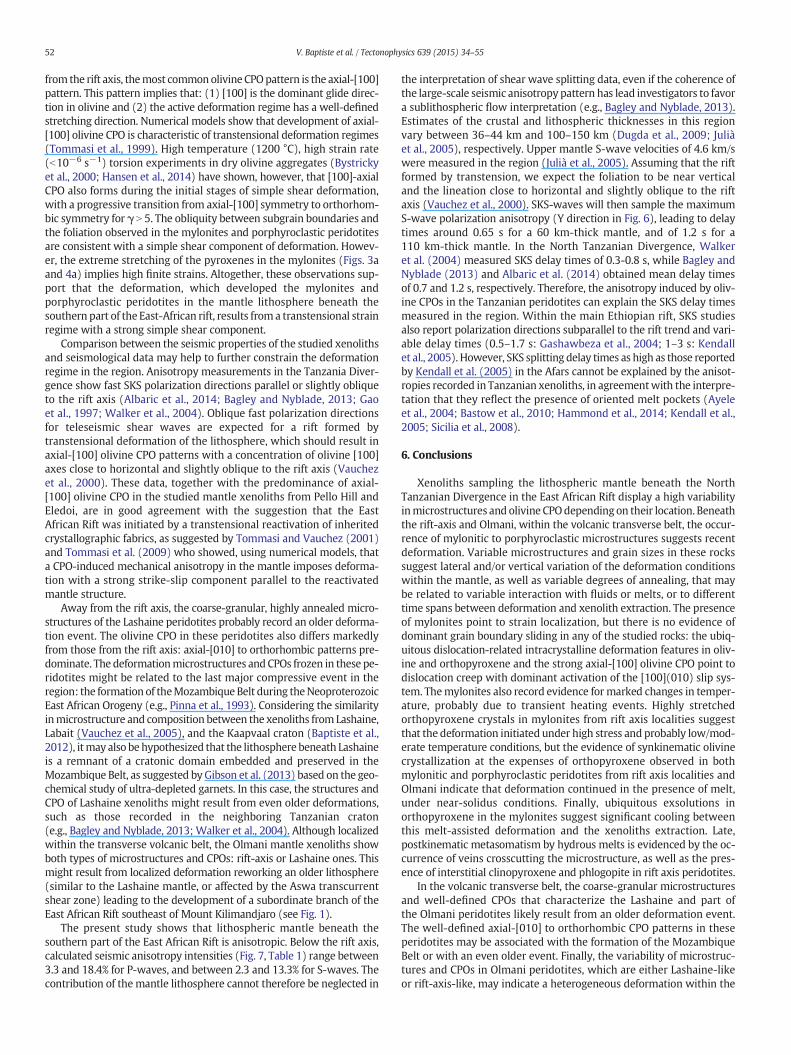
52 V. Baptiste et al. / Tectonophysics 639 (2015) 34–55
from the rift axis, themost commonolivine CPOpattern is the axial-[100]pattern. This pattern implies that: (1) [100] is the dominant glide direc-tion in olivine and (2) the active deformation regime has a well-definedstretching direction. Numerical models show that development of axial-[100] olivine CPO is characteristic of transtensional deformation regimes(Tommasi et al., 1999). High temperature (1200 °C), high strain rate(b10−6 s−1) torsion experiments in dry olivine aggregates (Bystrickyet al., 2000; Hansen et al., 2014) have shown, however, that [100]-axialCPO also forms during the initial stages of simple shear deformation,with a progressive transition from axial-[100] symmetry to orthorhom-bic symmetry for γ N 5. The obliquity between subgrain boundaries andthe foliation observed in the mylonites and porphyroclastic peridotitesare consistent with a simple shear component of deformation. Howev-er, the extreme stretching of the pyroxenes in the mylonites (Figs. 3aand 4a) implies high finite strains. Altogether, these observations sup-port that the deformation, which developed the mylonites andporphyroclastic peridotites in the mantle lithosphere beneath thesouthern part of the East-African rift, results froma transtensional strainregime with a strong simple shear component.
Comparison between the seismic properties of the studied xenolithsand seismological data may help to further constrain the deformationregime in the region. Anisotropy measurements in the Tanzania Diver-gence show fast SKS polarization directions parallel or slightly obliqueto the rift axis (Albaric et al., 2014; Bagley and Nyblade, 2013; Gaoet al., 1997; Walker et al., 2004). Oblique fast polarization directionsfor teleseismic shear waves are expected for a rift formed bytranstensional deformation of the lithosphere, which should result inaxial-[100] olivine CPO patterns with a concentration of olivine [100]axes close to horizontal and slightly oblique to the rift axis (Vauchezet al., 2000). These data, together with the predominance of axial-[100] olivine CPO in the studied mantle xenoliths from Pello Hill andEledoi, are in good agreement with the suggestion that the EastAfrican Rift was initiated by a transtensional reactivation of inheritedcrystallographic fabrics, as suggested by Tommasi and Vauchez (2001)and Tommasi et al. (2009) who showed, using numerical models, thata CPO-induced mechanical anisotropy in the mantle imposes deforma-tion with a strong strike-slip component parallel to the reactivatedmantle structure.
Away from the rift axis, the coarse-granular, highly annealed micro-structures of the Lashaine peridotites probably record an older deforma-tion event. The olivine CPO in these peridotites also differs markedlyfrom those from the rift axis: axial-[010] to orthorhombic patterns pre-dominate. The deformationmicrostructures and CPOs frozen in these pe-ridotites might be related to the last major compressive event in theregion: the formation of theMozambique Belt during theNeoproterozoicEast African Orogeny (e.g., Pinna et al., 1993). Considering the similarityinmicrostructure and composition between the xenoliths from Lashaine,Labait (Vauchez et al., 2005), and the Kaapvaal craton (Baptiste et al.,2012), itmay also be hypothesized that the lithosphere beneath Lashaineis a remnant of a cratonic domain embedded and preserved in theMozambique Belt, as suggested byGibson et al. (2013) based on the geo-chemical study of ultra-depleted garnets. In this case, the structures andCPO of Lashaine xenoliths might result from even older deformations,such as those recorded in the neighboring Tanzanian craton(e.g., Bagley and Nyblade, 2013; Walker et al., 2004). Although localizedwithin the transverse volcanic belt, the Olmani mantle xenoliths showboth types of microstructures and CPOs: rift-axis or Lashaine ones. Thismight result from localized deformation reworking an older lithosphere(similar to the Lashaine mantle, or affected by the Aswa transcurrentshear zone) leading to the development of a subordinate branch of theEast African Rift southeast of Mount Kilimandjaro (see Fig. 1).
The present study shows that lithospheric mantle beneath thesouthern part of the East African Rift is anisotropic. Below the rift axis,calculated seismic anisotropy intensities (Fig. 7, Table 1) range between3.3 and 18.4% for P-waves, and between 2.3 and 13.3% for S-waves. Thecontribution of themantle lithosphere cannot therefore be neglected in
the interpretation of shear wave splitting data, even if the coherence ofthe large-scale seismic anisotropy pattern has lead investigators to favora sublithospheric flow interpretation (e.g., Bagley and Nyblade, 2013).Estimates of the crustal and lithospheric thicknesses in this regionvary between 36–44 km and 100–150 km (Dugda et al., 2009; Juliàet al., 2005), respectively. Upper mantle S-wave velocities of 4.6 km/swere measured in the region (Julià et al., 2005). Assuming that the riftformed by transtension, we expect the foliation to be near verticaland the lineation close to horizontal and slightly oblique to the riftaxis (Vauchez et al., 2000). SKS-waves will then sample the maximumS-wave polarization anisotropy (Y direction in Fig. 6), leading to delaytimes around 0.65 s for a 60 km-thick mantle, and of 1.2 s for a110 km-thick mantle. In the North Tanzanian Divergence, Walkeret al. (2004) measured SKS delay times of 0.3-0.8 s, while Bagley andNyblade (2013) and Albaric et al. (2014) obtained mean delay timesof 0.7 and 1.2 s, respectively. Therefore, the anisotropy induced by oliv-ine CPOs in the Tanzanian peridotites can explain the SKS delay timesmeasured in the region. Within the main Ethiopian rift, SKS studiesalso report polarization directions subparallel to the rift trend and vari-able delay times (0.5–1.7 s: Gashawbeza et al., 2004; 1–3 s: Kendallet al., 2005). However, SKS splitting delay times as high as those reportedby Kendall et al. (2005) in the Afars cannot be explained by the anisot-ropies recorded in Tanzanian xenoliths, in agreementwith the interpre-tation that they reflect the presence of oriented melt pockets (Ayeleet al., 2004; Bastow et al., 2010; Hammond et al., 2014; Kendall et al.,2005; Sicilia et al., 2008).
6. Conclusions
Xenoliths sampling the lithospheric mantle beneath the NorthTanzanian Divergence in the East African Rift display a high variabilityinmicrostructures and olivine CPOdependingon their location. Beneaththe rift-axis and Olmani, within the volcanic transverse belt, the occur-rence of mylonitic to porphyroclastic microstructures suggests recentdeformation. Variable microstructures and grain sizes in these rockssuggest lateral and/or vertical variation of the deformation conditionswithin the mantle, as well as variable degrees of annealing, that maybe related to variable interaction with fluids or melts, or to differenttime spans between deformation and xenolith extraction. The presenceof mylonites point to strain localization, but there is no evidence ofdominant grain boundary sliding in any of the studied rocks: the ubiq-uitous dislocation-related intracrystalline deformation features in oliv-ine and orthopyroxene and the strong axial-[100] olivine CPO point todislocation creep with dominant activation of the [100](010) slip sys-tem. Themylonites also record evidence for marked changes in temper-ature, probably due to transient heating events. Highly stretchedorthopyroxene crystals in mylonites from rift axis localities suggestthat the deformation initiated under high stress and probably low/mod-erate temperature conditions, but the evidence of synkinematic olivinecrystallization at the expenses of orthopyroxene observed in bothmylonitic and porphyroclastic peridotites from rift axis localities andOlmani indicate that deformation continued in the presence of melt,under near-solidus conditions. Finally, ubiquitous exsolutions inorthopyroxene in the mylonites suggest significant cooling betweenthis melt-assisted deformation and the xenoliths extraction. Late,postkinematic metasomatism by hydrous melts is evidenced by the oc-currence of veins crosscutting the microstructure, as well as the pres-ence of interstitial clinopyroxene and phlogopite in rift axis peridotites.
In the volcanic transverse belt, the coarse-granular microstructuresand well-defined CPOs that characterize the Lashaine and part ofthe Olmani peridotites likely result from an older deformation event.The well-defined axial-[010] to orthorhombic CPO patterns in theseperidotites may be associated with the formation of the MozambiqueBelt or with an even older event. Finally, the variability of microstruc-tures and CPOs in Olmani peridotites, which are either Lashaine-likeor rift-axis-like, may indicate a heterogeneous deformation within the

53V. Baptiste et al. / Tectonophysics 639 (2015) 34–55
volcanic transverse belt, probably related to localized deformation associ-ated to the development of the Pangani Graben through transtensionalreactivation of the Aswa shear zone (Fig. 1).
Tanzanian xenoliths are variably hydrated (OH contents in olivinevary between 2 and 18 ppm H2O wt., Paterson calibration), but olivineOH concentrations do not vary systematically neither between in- andoff-axis samples, nor as a function of themicrostructure or CPOpatterns.Occurrence of OH in olivines with highMg# implies hydration bymeta-somatism after partial melting. However, the lack of spatial correlationbetween OH contents in olivine and the veins containing hydrousphases, implies that the olivine hydration is not directly due to thevein-forming metasomatism.
Maximum P wave azimuthal anisotropy (AVp) ranges between 3.3and 18.4% and the maximum S wave polarization anisotropy (AVs),between 2.3 and 13.2%. The change in olivine CPO symmetry from a lo-cality to another results in a variation in the seismic anisotropy patterns.Comparison between olivine CPOs and polarization direction of the fastSKS wave is consistent with a rift formed by a transtensional deforma-tion involving reactivation of inherited tectonic fabric.
Supplementary data to this article can be found online at http://dx.doi.org/10.1016/j.tecto.2014.11.011.
Acknowledgments
Julien Baticle is thanked for analyzing several thin sections with theEBSD and Philippe Nonnotte for lending several mantle xenoliths fromhis collection. W. Behr and an anonymous reviewer are thanked fortheir constructive reviews. D. Mainprice provided the programs fortreating the CPO data and calculating seismic properties. C. Nevadoand D. Delmas prepared high-quality polished thin sections for FTIRand EBSD measurements. EBSD measurements were performed withthe help of F. Barou at the EBSD-SEM national facility at GeosciencesMontpellier. Electron microprobe analyses were carried out with thehelp of C. Merlet at the ServiceMicrosonde Sud, Montpellier University.FTIR analyses were performed with the assistance of D. Maurin at theLab. Colloids, Verre et Nanomateriaux, atMontpellier University, France.
References
Abramson, E.H., Brown, J.M., Slutsky, L.J., Zaug, J., 1997. The elastic constants of San Carlosolivine to 17 GPa. J. Geophys. Res. 102 (B6), 12,253–12,263.
Albaric, J., Perrot, J., Déverchère, J., Deschamps, A., Le Gall, B., Ferdinand, R.W., Petit, C.,Tiberi, C., Sue, C., Songo, M., 2010. Contrasted seismogenic and rheological behavioursfrom shallow and deep earthquake sequence in the North Tanzanian Divergence, EastAfrica. J. Afr. Earth Sci. 58 (5), 799–811.
Albaric, J., Déverchère, J., Perrot, J., Jakovlev, A., Deschamps, A., 2014. Deep crustalearthquakes in North Tanzania, East Africa: interplay between tectonic andmagmaticprocesses in an incipient rift. Geochem. Geophys. Geosyst. 15 (2), 374–394.
Ayele, A., Stuart, G.W., Kendall, J.-M., 2004. Insights into rifting from shear wave splittingand receiver functions: an example from Ethiopia. Geophys. J. Int. 157, 354–362.
Bagley, B., Nyblade, A., 2013. Seismic anisotropy in eastern Africa, mantle flow, and theAfrican superplume. Geophys. Res. Lett. 40, 1500–1505.
Baptiste, V., Tommasi, A., Demouchy, S., 2012. Deformation and hydration of thelithospheric mantle beneath the Kaapvaal craton, South Africa. Lithos 149, 31–50.
Bascou, J., Delpech, G., Vauchez, A., Moine, B.N., Cottin, J.Y., Barruol, G., 2008. An integratedstudy of microstructural, geochemical, and seismic properties of the lithosphericmantle above the Kerguelen plume (Indian Ocean). Geochem. Geophys. Geosyst. 9(4), 1–26.
Bastow, I.D., Pilidou, S., Kendall, J.-M., Stuart, G.W., 2010. Melt-induced seismic anisotropyand magma assisted rifting in Ethiopia: evidence from surface waves. Geochem.Geophys. Geosyst. 11 (6), Q0AB05.
Ben Ismaïl, W., Mainprice, D., 1998. An olivine fabric database: an overview of uppermantle fabrics and seismic anisotropy. Tectonophysics 296 (1–2), 145–157.
Berger, E.T., 1985. Petrographic heterogeneities of the South Pacific mantle below theAustral archipelago: evidence and interpretation using ultramafic investigations.Bull. Soc. Geol. Fr. 1, 207–216.
Berger, E.T., Vannier, M., 1984. Les dunites en enclaves dans les basaltes alcalins des îlesocéaniques: approche pétrologique. Bull. Mineral. 107, 649–663.
Berry, A.J., Hermann, J., O'Neill, H.S.C., Foran, G.J., 2005. Fingerprinting the water site inmantle olivine. Geology 33 (11), 869–872.
Berry, A.J., O'Neill, H.S.C., Hermann, J., Scott, D.R., 2007. The infrared signature of waterassociatedwith trivalent cations in olivine. Earth Planet. Sci. Lett. 261 (1–2), 134–142.
Bezacier, L., Reynard, B., Bass, J.D., Wang, J., Mainprice, D., 2010. Elasticity of glaucophane,seismic velocities and anisotropy of the subducted oceanic crust. Tectonophysics 494(3–4), 201–210.
Bolfan-Casanova, N., 2005. Water in the Earth's mantle. Mineral. Mag. 69 (3), 229–257.Brey, G.P., Köhler, T., 1990. Geothermobarometry in four-phase lherzolites II. New
thermobarometers, and practical assessment of existing thermobarometers. J. Petrol.31 (6), 1353–1378.
Buck, W.R., 2006. The role of magma in the development of the Afro-Arabian Rift System.Geol. Soc. Lond., Spec. Publ. 259, 43–54.
Bunge, H.J., 1982. Texture Analysis in Materials Sciences. Buttleworth, London (593 pp.).Burton, K.W., et al., 2000. The distribution and behaviour of rhenium and osmium
amongst mantle minerals and the age of the lithospheric mantle beneath Tanzania.Earth Planet. Sci. Lett. 183, 93–106.
Bystricky, M., Kunze, K., Burlini, L., Burg, J.-P., 2000. High shear strain in olivineagreggates: rheological and seismic consequences. Science 290, 1564–1567.
Cerling, T.E., Powers, D.W., 1977. Paleorifting between the Gregory and the Ethiopian rifts.Geology 5, 441–444.
Chai, M., Brown, J.M., Slutsky, L.J., 1997a. The elastic constants of pyrope–grossular–almandine garnets to 20 GPa. Geophys. Res. Lett. 24 (4), 523–526.
Chai, M., Brown, J.M., Slutsky, L.J., 1997b. The elastic constants of an aluminousorthopyroxene to 12.5 GPa. J. Geophys. Res. 102 (B7), 14,779–14,785.
Chesley, J.T., Rudnick, R.L., Lee, C.-T., 1999. Re–Os systematics of mantle xenoliths from theEast African Rift: age, structure, and history of the Tanzanian craton. Geochim.Cosmochim. Acta 63, 1203–1217.
Collins, M.D., Brown, J.M., 1998. Elasticity of an upper mantle clinopyroxene. Phys. Chem.Miner. 26, 7–13.
Corti, G., van Wijk, J., Cloetingh, S., Morley, C.K., 2007. Tectonic inheritance and continen-tal rift architecture: numerical and analogue models of the East African Rift system.Tectonics 26, TC6006.
Couvy, H., et al., 2004. Shear deformation experiments of forsterite at 11 GPa–1400 °C inthe multianvil apparatus. Eur. J. Mineral. 16 (6), 877–889.
Crossley, R., Knight, R.M., 1981. Volcanism in the western part of the Rift valley inSouthern Kenya. Bull. Volcanol. 44, 117–128.
Dawson, J.B., 2002. Metasomatism and partial melting in the upper-mantle peridotitexenoliths from the Lashaine Volcano, Northern Tanzania. J. Petrol. 43 (9),1749–1777.
Dawson, J.B., Smith, J.V., 1988. Metasomatised and veined upper-mantle xenoliths fromPello Hill, Tanzania: evidence for anomalously-light mantle beneath the Tanzaniansector of the East African Rift Valley. Contrib. Mineral. Petrol. 100, 510–527.
Demouchy, S., Mackwell, S., 2006. Mechanisms of hydrogen incorporation and diffusionin iron-bearing olivine. Physics and Chemistry of Minerals 33, 347–355.
Demouchy, S., Jacobsen, S.D., Gaillard, F., Stern, C.R., 2006. Rapid magma ascent recordedby water diffusion profiles in mantle olivine. Geology 34 (6), 429–432.
Demouchy, S., Schneider, S.E., Mackwell, S.J., Zimmerman, M.E., Kohlstedt, D.L., 2009. Ex-perimental deformation of olivine single crystals at lithospheric temperatures.Geophys. Res. Lett. 36 (4), 1–5.
Demouchy, S., Tommasi, A., Boffa-Ballaran, T., Cordier, P., 2013. Low strength of Earth'suppermost mantle inferred from tri-axial deformation experiments on dry olivinecrystals. Phys. Earth Planet. Inter. 220 (37–49).
Demouchy, S., Mussi, A., Barou, F., Tommasi, A., Cordier, P., 2014. Viscoplasticity of poly-crystalline olivine at high pressure and 900 °C. Tectonophysics 623, 123–135.
Denis, C.M., Demouchy, S., Shaw, C.S., 2013. Evidence of dehydration in peridotites fromEifel Volcanic Field and estimates of the rate of magma ascent. J. Volcanol. Geotherm.Res. 258, 85–99.
Dijkstra, A.H., Drury, M.R., Vissers, R.L.M., Newman, J., 2002. On the role of melt-rock re-action in mantle shear zone formation in the Othris Peridotite Massif (Greece). Jour-nal of Structural Geology 24, 1431–1450.
Dixon, J.E., Stolper, E.M., Holloway, J.R., 1995. An experimental study of water and carbondioxide solubilities in mid-ocean ridge basaltic liquids. Part I: calibration and solubil-ity models. J. Petrol. 36 (6), 1607–1631.
Dixon, J.E., Leist, L., Langmuir, C., Schilling, J.-G., 2002. Recycled dehydrated lithosphereobserved in plume-influenced mid-ocean-ridge basalt. Nature 420 (6914), 385–389.
Drury, M.R., Van Roermund, H.L.M., 1989. Fluid assisted recrystallization in upper mantleperidotite xenoliths from kimberlites. J. Petrol. 30, 133–152.
Dugda, M.T., Nyblade, A., Julià, J., 2007. Thin lithosphere beneath the Ethiopian Plateau re-vealed by a joint inversion of Rayleigh wave group velocities and receiver functions.J. Geophys. Res. 112, B08305.
Dugda, M.T., Nyblade, A., Julià, J., 2009. S-wave velocity structure of the crust andupper mantle beneath Kenya in comparison to Tanzania and Ethiopia: implicationsfor the formation of the East African and Ethiopian Plateaus. S. Afr. J. Geol. 112, 241–250.
Dunbar, J.A., Sawyer, D.S., 1989. How preexisting weaknesses control the styles of conti-nental breakup. J. Geophys. Res. 94, 7278–7292.
Durham, W.B., Goetze, C., 1977. Plastic flow of oriented single crystals of olivine 1.Mechanical data. J. Geophys. Res. (82), 5737–5754.
El Messbahi, H., Bodinier, J.-L., Vauchez, A., Dautria, J.-M., Ouali, H., Garrido, C.J., 2014.Short wavelength lateral variability of lithospheric mantle beneath the Middle Atlas(Morocco) as recorded by mantle xenoliths. Tectonophysics http://dx.doi.org/10.1016/j.tecto.2014.11.020 (in press).
Evans, A.L., Fairhead, J.D., Mitchell, J.G., 1971. Potassium-argon ages from the volcanicprovince of Northern Tanzania. Nature 229, 19–20.
Fabriès, J., 1979. Spinel-olivine geothermometry in peridotites from ultramafic com-plexes. Contrib. Mineral. Petrol. 69, 329–336.
Falus, G., Tommasi, A., Ingrin, J., Csaba, S., 2008. Deformation and seismic anisotropy of thelithospheric mantle in the southeastern Carpathians as inferred from the study ofmantle xenoliths. Earth Planet. Sci. Lett. 272, 50–64. http://dx.doi.org/10.1016/j.epsl.2008.04.035.

54 V. Baptiste et al. / Tectonophysics 639 (2015) 34–55
Falus, G., Tommasi, A., Soustelle, V., 2011. Effect of dynamic recrystallization on olivinecrystal preferred orientations in mantle xenoliths deformed under varied stressconditions. J. Struct. Geol. 33, 1528–1540.
Férot, A., Bolfan-Casanova, N., 2012. Water storage capacity in olivine and pyroxene to14 GPa: implications for the water content of the Earth's upper mantle and natureof seismic discontinuities. Earth Planet. Sci. Lett. 349–350, 218–230.
Frets, E., Tommasi, A., Garrido, C.J., Padron-Navarta, J.A., Amri, I., Targuisti, K., 2012. Defor-mation processes and rheology of pyroxenites deformed under lithospheric mantleconditions. J. Struct. Geol. 39, 138–157. http://dx.doi.org/10.1016/j.jsg.2012.02.019.
Frets, E.C., Tommasi, A., Garrido, C.J., Vauchez, A., Mainprice, D., Targuisti, K., Amri, I., 2014.The Beni Bousera Peridotite (Rift Belt, Morocco): an oblique-slip low angle shear zonethinning the subcontinental mantle lithosphere. J. Petrol. 55 (2), 283–313.
Gao, S., et al., 1997. SKS splitting beneath continental rift zones. J. Geophys. Res. 102(B10), 22781–22797.
Garrido, C.J., Gueydan, F., Booth-Rea, G., Précigout, J., Hidas, K., Padrón-Navarta, J.A.,Marchesi, C., 2011. Garnet lherzolite and garnet-spinel mylonite in the Ronda perido-tite: vestiges of Oligocene backarc mantle lithospheric extension in the westernMediterranean. Geology 39, 927–930.
Gashawbeza, E.M., Klemperer, S.L., Nyblade, A.A., Walker, K.T., Keranen, K.M., 2004. Shear-wave splitting in Ethiopia: Precambrian mantle anisotropy locally modified byNeogene rifting. Geophys. Res. Lett. 31, 1–4.
Gibson, S.A., McMahon, S.C., Day, J.A., Dawson, J.B., 2013. Highly refractory lithosphericmantle beneath the Tanzanian Craton: evidence from Lashaine pre-metasomaticgarnet-bearing peridotites. J. Petrol. 54, 1503–1546.
Grant, K., Ingrin, J., Lorand, J., Dumas, P., 2007. Water partitioning between mantleminerals from peridotite xenoliths. Contrib. Mineral. Petrol. 154 (1), 15–34.
Hammond, J.O.S., Kendall, J.-M., Wookey, J., Stuart, G.W., Keir, D., Ayele, A., 2014. Differen-tiating flow, melt, or fossil seismic anisotropy beneath Ethiopia. Geochem. Geophys.Geosyst. 15, 1878–1894.
Hansen, S., Zhao, Y., Zimmerman, M.E., Kohlstedt, D.L., 2014. Protracted fabric evolution inolivine: implications for the relationship among strain, crystallographic fabric, andseismic anisotropy. Earth Planet. Sci. Lett. 387, 157–168.
Hielscher, R., Schaeben, H., 2008. A novel pole figure inversion method: specification ofthe MTEX algorithm. J. Appl. Crystallogr. 41, 1024–1037.
Higgie, K., Tommasi, A., 2012. Feedbacks between deformation and melt distribution inthe crust–mantle transition zone of the Oman ophiolite. Earth Planet. Sci. Lett.359–360, 61–72.
Higgie, K., Tommasi, A., 2014. Deformation in a partially molten mantle: constraints fromplagioclase-lherzolites from Lanzo, western Alps. Tectonophysics 615–616, 167–181.
Hirschmann, M.M., Aubaud, C., Withers, A.C., 2005. Storage capacity of H2O in nominallyanhydrous minerals in the upper mantle. Earth Planet. Sci. Lett. 236 (1–2), 167–181.
Hirth, G., Kohlstedt, D., 2003. Rheology of the uppermantle and themantlewedge: a viewfrom the experimentalists. Geophysical Monograph 138, 83–105.
Julià, J., Ammon, C.J., Nyblade, A., 2005. Evidence for mafic lower crust in Tanzania, EastAfrica, from joint inversion of receiver functions and Rayleigh wave dispersion veloc-ities. Geophys. J. Int. 162, 555–569.
Jung, H., Katayama, I., Jiang, Z., Hiraga, T., Karato, S., 2006. Effect of water and stress on thelattice-preferred orientation of olivine. Tectonophysics 421 (1–2), 1–22.
Kelemen, P.B., 1990. Reaction between ultramafic rock and fractionating basalticmagma I.Phase relations, the origin of calc-alkalinemagma series, and the formation of discor-dant dunite. J. Petrol. 31 (1), 51–98.
Kelemen, P.B., Dick, H.J.B., 1995. Focused melt flow and localized deformation inthe upper-mantle juxtaposition of replacive dunite and ductile shear zones in thejosephine peridotite, SW oregon. J. Geophys. Res. 100 (B1), 423–438.
Kelemen, P.B., Shimizu, N., Salters, V.J.M., 1995. Extraction of mid-ocean-ridge basalt fromthe upwelling mantle by focused flow of melt in dunite channels. Nature 375,747–753.
Kendall, J.-M., Stuart, G.W., Ebinger, C., Bastow, I.D., Keir, D., 2005. Magma-assisted riftingin Ethiopia. Nature 433, 146–148.
Kohlstedt, D.L., Zimmerman, M.E., 1996. Rheology of partially molten mantle rocks. Annu.Rev. Earth Planet. Sci. 24 (1), 41–62.
Kohlstedt, D.L., Keppler, H., Rubie, D.C., 1996. Solubility of water in the alpha, beta, and Yphases of (Mg, Fe)2SiO4. Reviews in Mineralogy & Geochemistry 123, 345–357.
Kovacs, I., O'Neill, H.C.J., Hermann, J., Hauri, E.H., 2010. Site-specific infrared O–Habsorption coefficients for water substitution into olivine. Am. Mineral. 95,292–299.
Kourim, F., Vauchez, A., Bodinier, J.-L., Alard, O., Bendaoud, A., 2014. Subcontinental litho-sphere reactivation beneath the Hoggar swell (Algeria): localized deformation, meltchanneling and heat advection. Tectonophysics http://dx.doi.org/10.1016/j.tecto.2014.11.012 (in press).
Kruckenberg, S.C., Tikoff, B., Toy, V.G., Newman, J., Young, L.I., 2013. Strain localization as-sociated with channelized melt migration in upper mantle lithosphere: Insights fromthe Twin Sisters ultramafic complex, Washington, USA. Journal of Structural Geology50, 133–147.
Kruckenberg, S.C., Chatzaras, V., Gordon Medaris Jr., L., 2014. Correlations between straingeometry, shape fabric, and crystallographic preferred orientation revealed bymicrotomography and textural analyses: heterogeneous deformation of mantle xe-noliths from Marie Byrd Land, Antarctica (abstract). In: 6th Orogenic Lherzolite Con-ference, Marrakesh, pp. 4–15 (May 2014).
Kubo, K., 2002. Dunite formation processes in highly depleted peridotite: case study ofthe Iwanaidake peridotite, Hokkaido, Japan. J. Petrol. 43 (3), 423–448.
Kurosawa, M., Yurimoto, H., Sueno, S., 1997. Patterns in the hydrogen and trace elementcompositions of mantle olivines. Phys. Chem. Miner. 24 (6), 385–395.
Le Gall, B., et al., 2008. Rift propagation at craton margin. Distribution of faulting andvolcanism in the North Tanzanian Divergence (East Africa) during Neogene times.Tectonophysics 448, 1–19.
Le Roux, V., Tommasi, A., Vauchez, A., 2008. Feedback between deformation and meltpercolation in an exhumed lithosphere–asthenosphere boundary. Earth Planet. Sci.Lett. 274, 401–413. http://dx.doi.org/10.1016/j.epsl.2008.07.053.
Lee, C.-T., 2001. The Origin, Evolution, and Demise of Continental Lithospheric Mantle:Perspectives from Re–Os Isotopes, Geochemistry, Petrology, and Modeling. HarvardUniversity, (PhD Thesis).
Li, J., Kornprobst, J., Vielzeuf, D., Fabriès, J., 1995. An improved experimental calibration ofthe olivine–spinel geothermometer. Chin. J. Geochem. 14 (1), 68–77.
Li, Z.-X.A., Lee, C.-T.A., Peslier, A.H., Lenardic, A., Mackwell, S.J., 2008. Water contents inmantle xenoliths from the Colorado Plateau and vicinity: implications for the mantlerheology and hydration-induced thinning of continental lithosphere. J. Geophys. Res.113 (B9), B09210.
MacDonald, R., Rogers, N.W., Fitton, J.G., Black, S., Smith, M., 2001. Plume-lithosphereinteractions in the generation of the basalts of the Kenya Rift, East Africa. J. Petrol.42, 877–900.
MacIntyre, R.M., Mitchell, J.G., Dawson, J.B., 1974. Age of the fault movements in theTanzanian sector of the East African rift system. Nature 247, 354–356.
Mackwell, S.J., Kohlstedt, D.L., 1990. Diffusion of Hydrogen in Olivine: Implications forWater in the Mantle. J. Geophys. Res. 95, 5079–5088.
Mainprice, D., 1990. A FORTRAN program to calculate seismic anisotropy from the latticepreferred orientation of minerals. Comp. Geosci. 16, 385–393.
Mainprice, D., Hielscher, R., Schaeben, H., 2011. Calculating anisotropic physical proper-ties from texture data using the MTEX open source package. In: Prior, D.J., Rutter,E.H., Tatham, D.J. (Eds.), Deformation Mechanisms, Rheology and Tectonics: Micro-structures, Mechanics and AnisotropyGeol. Soc. Lond., Spec. Publ. 175–192.
Mainprice, D., Bachmann, F., Hielscher, R., Schaeben, H., 2014. Descriptive tools for theanalysis of texture projects with large datasets using MTEX — strength, symmetryand components. Geological Society of London Special Publication. Field Experimentand Theory: In Honour of Ernest Rutter.
Mansur, A.T., Shukrani, M., Timpa, S., Rudnick, R.L., 2014. Granulite-facies xenoliths in riftbasalts of Northern Tanzania: age, composition and origin of Archean lower crust. J.Petrol. 55, 1243–1286.
Matsyuk, S.S., Langer, K., 2004. Hydroxyl in olivines from mantle xenoliths in kimberlitesof the Siberian platform. Contrib. Mineral. Petrol. 147 (4), 413–437.
Matsyuk, S.S., Langer, K., Hösch, A., 1998. Hydroxyl defects in garnets frommantle xenolithsin kimberlites of the Siberian platform. Contrib. Mineral. Petrol. 132 (2), 163–179.
McKenzie, D., 1978. Some remarks on the development of sedimentary basins. EarthPlanet. Sci. Lett. 40, 25–32.
Miller, G.H., Rossman, G.R., Harlow, G.E., 1987. The natural occurrence of hydroxide in ol-ivine. Phys. Chem. Miner. 14 (5), 461–472.
Möller, A., Appel, P., Mezger, K., Schenk, V., 1995. Evidence for a 2 Ga subduction zone:eclogites in the Usagaran belt of Tanzania. Geology 23, 1067–1070.
Möller, A., Mezger, K., Schenk, V., 1998. Crustal age domains and the evolution of thecontinental crust in the Mozambique Belt of Tanzania: combined Sm–Nd, Rb–Sr,and Pb–Pb isotopic evidence. J. Petrol. 39, 749–783.
Morgan, Z.T., Liang, Y., 2003. An experimental and numerical study of the kinetics ofharzburgite reactive dissolution with applications to dunite dike formation. EarthPlanet. Sci. Lett. 214, 59–74.
Morley, C.K., Wescott, W.A., Stone, D.M., Harper, R.M., Wigger, S.T., Karanga, F.M., 1992. Tec-tonic evolution of the northern Kenya rift. J. Geol. Soc. Lond. 149, 333–348.
Nickel, K.G., Green, D.H., 1985. Empirical geothermobarometry for garnet peridotites andimplications for the nature of the lithosphere, kimberlites and diamonds. Earth andPlanetary Science Letters 73, 158–170.
Nicolas, A., Bouchez, J.L., Boudier, F., 1972. Interprétation cinématique des déformationsplastiques dans le massif de lherzolite de Lanzo (Alpes piémontaises)— comparaisonavec d'autres massifs. Tectonophysics 14, 143–171.
Nicolas, A., Achauer, U., Daignieres, M., 1994. Rift initiation by lithospheric rupture. EarthPlanet. Sci. Lett. 123, 281–298.
Nyblade, A.A., Brazier, R.A., 2002. Precambrian lithospheric controls on the developmentof the East African rift system. Geology 30 (8), 755–758.
Nyblade, A., Birt, C., Langston, C.A., Owens, T.J., Last, R.J., 1996. Seismic experiment revealsrifting of craton in Tanzania. Eos Trans. Am. Geophys. Union 77 (51), 517–521.
Padrón-Navarta, J.A., Tommasi, A., Garrido, C.J., López Sánchez-Vizcaíno, V., Gómez-Pugnaire, M.T., Jabaloy, A., Vauchez, A., 2010. Fluid transfer into the wedge controlledby high-pressure hydrofracturing in the cold top-slab mantle. Earth Planet. Sci. Lett.297 (1–2), 271–286.
Padrón-Navarta, J.A., Hermann, J., O'Neill, H., 2014. Site-specific hydrogen diffusion ratesin Forsterite. Earth Planet. Sci. Lett. 392, 100–112.
Paterson, M.S., 1982. The determination of hydroxyl by infrared absorption in quartz,silicate glasses and similar materials. Bull. Mineral. 105 (1), 20–29.
Peslier, A.H., 2010. A review ofwater contents of nominally anhydrous naturalminerals inthe mantles of Earth, Mars and the Moon. J. Volcanol. Geotherm. Res. 197 (1–4),239–258.
Peslier, A.H., Luhr, J.F., 2006. Hydrogen loss from olivines inmantle xenoliths from Simcoe(USA) and Mexico: mafic alkalic magma ascent rates and water budget of the sub-continental lithosphere. Earth Planet. Sci. Lett. 242 (3–4), 302–319.
Peslier, A.H., Luhr, J.F., Post, J., 2002. Lowwater contents in pyroxenes from spinel-peridotitesof the oxidized, sub-arc mantle wedge. Earth Planet. Sci. Lett. 201 (1), 69–86.
Peslier, A.H., Woodland, A.B., Wolff, J.A., 2008. Fast kimberlite ascent rates estimated fromhydrogen diffusion profiles in xenolithic mantle olivines from southern Africa.Geochim. Cosmochim. Acta 72 (11), 2711–2722.
Peslier, A.H., Woodland, A.B., Bell, D.R., Lazarov, M., 2010. Olivine water contents in thecontinental lithosphere and the longevity of cratons. Nature 467, 78–81.
Phakey, P., Dollinger, G., Christie, J.M., 1972. Transmission electron microscopy of experi-mentally deformed olivine. Flow and fracture of rocks. Geophys. Monogr. 16,117–138.

55V. Baptiste et al. / Tectonophysics 639 (2015) 34–55
Pinna, P., Jourde, G., Calvez, J.Y., Mroz, J.P., Marques, J.M., 1993. The Mozambique Belt innorthern Mozambique: Neoproterozoic (1100–850 Ma) crustal growth andtectogenesis, and superimposed Pan-African (800–550 Ma) tectonism. PrecambrianRes. 62, 1–59.
Raleigh, C.B., 1968. Mechanisms of plastic deformation of olivine. J. Geophys. Res. 73 (16),5391–5406.
Raterron, P., Amiguet, E., Chen, J.H., Li, L., Cordier, P., 2009. Experimental deformation ofolivine single crystals at mantle pressures and temperatures. Phys. Earth Planet.Inter. 172 (1–2), 74–83.
Rudnick, R.L., McDonough, W.F., Chappell, B.W., 1993. Carbonite metasomatism in thenorthern Tanzanian mantle: petrographic and geochemical characteristics. EarthPlanet. Sci. Lett. 114, 463–475.
Rudnick, R.L., McDonough,W.F., Orpin, A., 1994. Northern Tanzanian peridotite xenoliths:a comparison with Kaapvaal peridotites and inferences of metasomatic interactions.In: Meyer, H.O.A., Leonardos, O.H. (Eds.), Kimberlites, Related Rocks and MantleXenoliths. Proceedings of the 5th International Kimberlite Conference, pp. 336–353.
Ruotoistenmäki, T., 2014. Geophysical characteristics of Aswa shear, Nagasongola discon-tinuity and ring dyke complex in Uganda. J. Afr. Earth Sci. 93, 23–41.
Ryan, W.B.F., Carbotte, S.M., Coplan, J.O., O'Hara, S., Melkonian, A., Arko, R., Weissel, R.A.,Ferrini, V., Goodwillie, A., Nitsche, F., Bonczkowski, J., Zemsky, R., 2009. Globalmulti-resolution topography synthesis. Geochem. Geophys. Geosyst. 10, Q03014.http://dx.doi.org/10.1029/2008GC002332.
Sachtleben, T., Seck, H.A., 1981. Chemical control of Al-solubility in orthopyroxene and itsimplications on pyroxene geothermometry. Contrib. Mineral. Petrol. 78, 157–165.
Sicilia, D., Montagner, J.-P., Cara, M., Stutzmann, E., Debayle, E., Lépine, J.-C., Lévêque, J.-J.,Beucler, E., Sebai, A., Roult, G., Ayele, A., Sholan, J.M., 2008. Upper mantle structure ofshear-waves velocities and stratification of anisotropy in the Afar Hotspot region.Tectonophysics 462, 164–177.
Sokol, A.G., Palyanov, Y.N., Kupriyanov, I.N., Litasov, K.D., Polovinka, M.P., 2010. Effect ofoxygen fugacity on the H2O storage capacity of forsterite in the carbon-saturatedsystems. Geochim. Cosmochim. Acta 74, 4793–4806.
Soustelle, V., Tommasi, A., Bodinier, J.-L., Garrido, C.J., Vauchez, A., 2009. Deformation andreactive melt transport in the mantle lithosphere above a large-scale partial meltingdomain: the Ronda peridotite massif, southern Spain. J. Petrol. 50 (7), 1235–1266.
Soustelle, V., Tommasi, A., Demouchy, S., Ionov, D.A., 2010. Deformation and fluid‚ a rockinteraction in the supra-subduction mantle: microstructures and water contents inperidotite xenoliths from the Avacha Volcano, Kamchatka. J. Petrol. 51 (1–2),363–394.
Soustelle, V., Tommasi, A., Demouchy, S., Franz, L., 2013. Melt–rock interactions, deforma-tion, hydration and seismic properties in the sub-arc lithospheric mantle inferredfrom xenoliths from seamounts near Lihir, Papua New Guinea. Tectonophysics 608,330–345.
Thoraval, C., Demouchy, S., 2014. Numerical models of ionic diffusion in one and threedimensions: application to dehydration of mantle olivine. Phys. Chem. Miner. 41,709–723.
Tommasi, A., Vauchez, A., 2001. Continental rifting parallel to ancient collisional belts: aneffect of the mechanical anisotropy of the lithospheric mantle. Earth Planet. Sci. Lett.185, 199–210.
Tommasi, A., Tikoff, B., Vauchez, A., 1999. Upper mantle tectonics: three-dimensionaldeformation, olivine crystallographic fabrics and seismic properties. Earth Planet.Sci. Lett. 168 (1–2), 173–186.
Tommasi, A., Mainprice, D., Canova, G., Chastel, Y., 2000. Viscoplastic self-consistent andequilibrium-based modeling of olivine lattice preferred orientations: implicationsfor the upper mantle seismic anisotropy. J. Geophys. Res. 105 (B4), 7893–7908.
Tommasi, A., Godard, M., Coromina, G., Dautria, J.-M., Barsczus, H., 2004. Seismic anisotro-py and compositionally induced velocity anomalies in the lithosphere above mantleplumes: a petrological and microstructural study of mantle xenoliths from FrenchPolynesia. Earth Planet. Sci. Lett. 227 (3–4), 539–556.
Tommasi, A., Vauchez, A., Ionov, D.A., 2008. Deformation, static recrystallisation, and reac-tivemelt transport in shallow subcontinentalmantle xenoliths (Tol Cenozoic volcanicfield, SE Siberia). Earth Planet. Sci. Lett. 272 (1–2), 65–77.
Tommasi, A., Knoll, M., Vauchez, A., Signorelli, J., Thoraval, C., Loge, R., 2009. Structuralreactivation in plate tectonics controlled by olivine crystals anisotropy. Nat. Geosci.2, 423–427.
Tubìa, J.M., Cuevas, J., Esteban, J.J., 2004. Tectonic evidence in the Ronda peridotites, Spain,for mantle diapirism related to delamination. Geology 32 (11), 941–944.
Vauchez, A., Barruol, G., Tommasi, A., 1997. Why do continents break-up parallel toancient orogenic belts? Terra Nova 9, 62–66.
Vauchez, A., Tommasi, A., Barruol, G., Maumus, J., 2000. Upper mantle deformation andseismic anisotropy in continental rifts. Phys. Chem. Earth 25 (2), 111–117.
Vauchez, A., Dineur, F., Rudnick, R.L., 2005. Microstructure, texture and seismic anisotropyof the lithospheric mantle above a mantle plume: insights from the Labait volcanoxenoliths. Earth Planet. Sci. Lett. 232 (3–4), 295–314.
Vauchez, A., Tommasi, A., Mainprice, D., 2012. Faults (shear zones) in the Earth's mantle.Tectonophysics 558–559, 1–27.
Vollmer, F.W., 1990. An application of eigenvalue methods to structural domain analysis.Geol. Soc. Am. Bull. 102, 786–791.
Walker, K.T., Nyblade, A.A., Klemperer, S.L., Bokelmann, G.H.R., Owens, T.J., 2004. On therelationship between extension and anisotropy: constraints from shear wavesplitting across the East African Plateau. J. Geophys. Res. 109 (B08302), 1–21.
Wells, P.R.A., 1977. Pyroxene thermometry in simple and complex systems. Contrib.Mineral. Petrol. 62, 129–139.
Wernicke, B., 1981. Low angle normal faults in Bassin and Range province. Nappe tecton-ics in an extending orogen. Nature 291, 645–648.
Wernicke, B., 1985. Uniform-sense normal simple shear of the continental lithosphere.Can. J. Earth Sci. 22, 108–125.
Wilkinson, P., Mitchell, J.G., Cattermole, P.J., Downie, C., 1986. Volcanic chronology of theMeru–Kilimanjaro region, Northern Tanzania. J. Geol. Soc. Lond. 143, 601–605.
Withers, A.C., Bureau, H., Raepsaet, C., Hirschmann, M.M., 2012. Calibration of infraredspectroscopy by elastic recoil detection analysis of H in synthetic olivine. Chem.Geol. 334, 92–98.
Witt-Eickschen, G., Seck, H.A., 1991. Solubility of Ca and Al in orthopyroxene from spinelperidotite: an improved version of an empirical geothermometer. Contrib. Mineral.Petrol. 106 (4), 431–439.
Yang, X.-Z., Xia, Q.-K., Deloule, E., Dallai, L., Fan, Q.-C., Feng, M., 2008. Water in minerals ofthe continental lithospheric mantle and overlying lower crust: a comparative studyof peridotite and granulite xenoliths from the North China Craton. Chem. Geol. 256(1–2), 33–45.
Zaffarana, C., Tommasi, A., Vauchez, A., Grégoire, M., 2014. Microstructures and seismicproperties of south Patagonian mantle xenoliths (Gobernador Gregores and PaliAike). Tectonophysics 621, 175–197. http://dx.doi.org/10.1016/j.tecto.2014.02.017.
Zimmerman, M.E., Kohlstedt, D.L., 2004. Rheological properties of partially moltenlherzolite. J. Petrol. 45 (2), 275–298.