Splitting the Academy: The Emotions of Intersectionality at Work

Geophysical Journal InternationalGeophys. J. Int. (2014) doi: 10.1093/gji/ggu117
GJI
Sei
smol
ogy
Upper mantle seismic anisotropy beneath the West Antarctic RiftSystem and surrounding region from shear wave splitting analysis
Natalie J. Accardo,1,∗ Douglas A. Wiens,1 Stephen Hernandez,2 Richard C. Aster,3
Andrew Nyblade,4 Audrey Huerta,5 Sridhar Anandakrishnan,4 Terry Wilson,6
David S. Heeszel7 and Ian W. D. Dalziel81 Department of Earth & Planetary Sciences, Washington University in St. Louis, St. Louis, MO 63130, USA. E-mail: [email protected] Department of Earth & Planetary Sciences, University of California, Santa Cruz, CA 95064, USA3 Geosciences Department, Colorado State University, Fort Collins, CO 80523, USA4 Department of Geosciences, The Pennsylvania State University, University Park, PA 16801, USA5 Department of Geological Sciences, Central Washington University, Ellensburg, WA 98926, USA6 Department of Geological Sciences, The Ohio State University, Columbus, OH 43210, USA7 Scripps Institution of Oceanography, University of California, San Diego, La Jolla, CA 92037, USA8 Institute for Geophysics, Jackson School of Geosciences, The University of Texas at Austin, Austin, TX 78712, USA
Accepted 2014 March 25. Received 2014 March 15; in original form 2013 October 26
S U M M A R YWe constrain azimuthal anisotropy in the West Antarctic upper mantle using shear wavesplitting parameters obtained from teleseismic SKS, SKKS and PKS phases recorded at 37broad-band seismometres deployed by the POLENET/ANET project. We use an eigenvaluetechnique to linearize the rotated and shifted shear wave horizontal particle motions and deter-mine the fast direction and delay time for each arrival. High-quality measurements are stackedto determine the best fitting splitting parameters for each station. Overall, fast anisotropicdirections are oriented at large angles to the direction of Antarctic absolute plate motion inboth hotspot and no-net-rotation frameworks, showing that the anisotropy does not result fromshear due to plate motion over the mantle. Further, the West Antarctic directions are substan-tially different from those of East Antarctica, indicating that anisotropy across the continentreflects multiple mantle regimes. We suggest that the observed anisotropy along the centralTransantarctic Mountains (TAM) and adjacent West Antarctic Rift System (WARS), one ofthe largest zones of extended continental crust on Earth, results from asthenospheric mantlestrain associated with the final pulse of western WARS extension in the late Miocene. Strongand consistent anisotropy throughout the WARS indicate fast axes subparallel to the inferredextension direction, a result unlike reports from the East African rift system and rifts withinthe Basin and Range, which show much greater variation. We contend that ductile shearingrather than magmatic intrusion may have been the controlling mechanism for accumulationand retention of such coherent, widespread anisotropic fabric. Splitting beneath the MarieByrd Land Dome (MBL) is weaker than that observed elsewhere within the WARS, butshows a consistent fast direction, possibly representative of anisotropy that has been ‘frozen-in’ to remnant thicker lithosphere. Fast directions observed inland from the Amundsen Seaappear to be radial to the dome and may indicate radial horizontal mantle flow associatedwith an MBL plume head and low upper mantle velocities in this region, or alternativelyto lithospheric features associated with the complex Cenozoic tectonics at the far-easternend of the WARS.
Key words: Seismic anisotropy; Dynamics of lithosphere and mantle; Antarctica.
∗Now at: Department of Earth and Environmental Sciences, Columbia University, New York, NY 10027, USA.
C⃝ The Authors 2014. Published by Oxford University Press on behalf of The Royal Astronomical Society. 1
Geophysical Journal International Advance Access published May 21, 2014
at Columbia U
niversity on May 22, 2014
http://gji.oxfordjournals.org/D
ownloaded from

2 N. J. Accardo et al.
1 I N T RO D U C T I O N
Seismic anisotropy, the dependence of seismic velocities on prop-agation and polarization direction, has emerged as one of the bestindicators of both past and present mantle deformation and flow(e.g. Silver & Chan 1988; Fischer et al. 1998; for a review seeLong and Silver 2009). Mantle deformation often leads to seismicanisotropy; either through lattice preferred orientation (LPO) ofanisotropic minerals or through shape preferred orientation (SPO)of materials having different seismic velocity. Because of the linkbetween deformation and anisotropy, the mapping of anisotropicstructure can yield some of the most direct constraints available onconvection, deep tectonically induced deformation and generallyon the coarse- and finer-scale fabric of Earth’s mantle (Silver 1996;Savage 1999; Long & Becker 2010).
Olivine constitutes over 65 per cent of the upper mantle and,because it has a large single-crystal anisotropy (∼18 per cent; e.g.Mainprice et al. 2005), it is thought to make the primary contri-bution to the observed anisotropy. Laboratory studies of artificiallydeformed olivine aggregates indicate that multiple deformationalfabrics (A-, B-, C-, D- and E-type) for olivine exist (for a reviewsee Karato et al. 2008). The well-known A-type fabric promotesthe alignment of the olivine fast axis with the direction of maxi-mum shear, which may be in the extension and/or flow direction(Zhang & Karato 1995). Conversely, B-type fabric (favoured byhigh-stresses, low temperatures and the presence of water) predictsthat fast axes will align normal to the direction of maximum shear(Jung & Karato 2001). Experimental studies have shown that thedevelopment of olivine fabrics depends greatly on the conditionsof deformation, including, stress, water content, temperature andpressure (e.g. Katayama et al. 2004; Mainprice et al. 2005). Thereare multiple models that explain the presence of mantle seismicanisotropy, including: (1) mantle anisotropy induced by ongoingextension/compression due to the LPO of olivine, (2) anisotropydue to the alignment of parallel dikes or melt-filled lenses, (3) fos-silized anisotropy in the lithospheric mantle due to LPO from pasttectonic events. The detailed interpretation of anisotropic observa-tions in terms of stress, strain, hydration, temperature and composi-tion throughout the mantle is a complex and active area of research(e.g. Long & Silver 2009). Thus, while anisotropic fabrics are in-herently complex, they provide unique information on the fabric ofthe mantle and hence on its deformational history and present state.
To date, very few seismic investigations have probed the mantlebeneath Antarctica due to the harsh conditions of working thereand the only recently resolved issues of maintaining seismographicstations there. Furthermore, no prior studies have examined theanisotropic nature of the West Antarctic Rift System (WARS),one of the largest regions of extended continental crust on Earth(Behrendt et al. 1991). Thus, determining the anisotropic characterof the WARS has much to contribute to our understanding of man-tle deformational fabrics associated with continental rifts, whichare shown to vary significantly between different continental riftsettings (e.g. Vinnik et al. 1992; Gao et al. 1997; Kendall et al.2005; Obrebski et al. 2006; Wang et al. 2008; Eilon et al. 2014).
This study examines the seismic anisotropy beneath West Antarc-tica using shear wave splitting of SKS, SKKS and PKS phases ob-tained from 37 broad-band seismometres deployed in the WARS andthroughout the rest of West Antarctica, including Marie Byrd Land(MBL) and in the Transantarctic Mountains (TAM). These data al-low us to better understand the deformational history and mantleflow patterns of a largely unexplored continental region where ge-ologic exposures occupy less than 2 per cent of the surface area.
Inferences on mantle flow processes beneath West Antarctica pro-vides unique constraints on the deformational history of the geologythat underlies and strongly influences the West Antarctic Ice Sheet(e.g. Winberry & Anandakrishnan 2004; Bingham et al. 2012).
2 G E O L O G I C S E T T I N G
Antarctica is naturally divided into two distinct major provinces:East Antarctica and West Antarctica. East Antarctica is comprisedof a large stable continental craton composed mainly of Precambrianbasement rocks that are uncomformably overlain by sedimentaryunits. In contrast, West Antarctica comprises a number of discretemountainous crustal blocks that moved relative to East Antarcticaand each other during broad extension dating back to the Jurassic(Dalziel & Elliot 1982; Dalziel 1992; Anderson 1999). They werederived from the margin of the East Antarctic craton and from thePacific convergent margin. The TAM, the largest non-compressionalmountain belt in the world, separates the two provinces (e.g. tenBrink et al. 1997).
2.1 The Transantarctic Mountains
The TAM are a gently tilted to block-faulted mountain range char-acterized by an absence of folding or thrust faulting. They extendfor over 3500 km from the Ross Sea to the Weddell Sea, promi-nently separating the Ross Embayment, a vast submerged regionof extended continental crust that is partially covered by Earth’slargest ice shelf, from the icecap-covered Wilkes subglacial basin(ten Brink et al. 1997). The TAM owes its earliest origins to the Neo-proterozoic Beardmore Orogen and was later intensely deformed bythe early Paleozoic Ross Orogeny (Borg et al. 1990). The exact tim-ing of the uplift(s) of the present TAM remains poorly constrained.Apatite fission track thermochronology from Victoria Land and theSouth Pole indicates that separate blocks of the TAM have expe-rienced varying amounts of uplift and erosion at different times,ranging from Early Cretaceous to Cenozoic (Fitzgerald 1992, 1994;Stump & Fitzgerald 1992; Balestrieri et al. 1994). The relation-ship between the formation of the TAM and the WARS remainsunclear despite their obvious spatial relationship (Fig. 1). MajorWARS extension during the Cretaceous was apparently accompa-nied by relatively little denudation in the TAM, whereas limitedextension during the Cenozoic was accompanied by large amountsof denudation (Karner et al. 2005; Huerta & Harry 2007). Geody-namic models of the WARS evolution suggest that the TAM may bethe abandoned margin of a Mesozoic West Antarctic plateau, andthe Cretaceous through Cenozoic crustal cooling ages of the TAMrecord initial subsidence of the WARS region followed by fluvialand glacial denudation of the mountain range (Bialas et al. 2007;Huerta & Harry 2007).
2.2 The West Antarctic Rift System
The WARS abuts the TAM and is generally characterized by a topo-graphic trough 750–1000 km wide and 3000 km long (e.g. Behrendtet al. 1991). It is often described as an asymmetric rift system thatis proposed to run from the Ellsworth-Whitmore mountains crustalblock (EWM) to the edge of the Ross Embayment where it meetsnorthern Victoria Land (Fig. 1). The region is characterized bya regional positive Bouguer gravity anomaly that extends from theRoss Sea throughout the Byrd Subglacial Basin (Behrendt & Cooper1994). Uncertainty still persists on the timing and evolution of the
at Columbia U
niversity on May 22, 2014
http://gji.oxfordjournals.org/D
ownloaded from

Seismic anisotropy beneath W. Antarctica 3
Figure 1. POLENET/ANET station locations (red circles) used in this studyand geologic regions of interest; WARS, West Antarctic Rift System; EWM,Ellsworth-Whitmore Mountains crustal block; PCM, Pensacola Mountains;MBL, Marie Byrd Land; THR, Thurston Island crustal block. The bound-aries for the East Antarctic Craton, the EWM crustal block, and the MBLcrustal block from Dalziel & Elliot (1982) are drawn in blue. Backgroundcolour scale shows bed elevation beneath the ice sheets (Fretwell et al. 2013).Black bar indicates the scale of 500 km.
WARS because of extensive ice cover and limited number of geo-logical and geophysical studies conducted in this region. The totalextension accommodated by the WARS crust is poorly constrained,and estimates vary widely. Busetti et al. (1999) estimate 120–250 km, Grindley & Oliver (1983) estimate 200–500 km, numerousauthors (e.g. Fitzgerald et al. 1986; Behrendt & Cooper 1994) esti-mate 255–300 and Trey et al. (1999) estimate 480–500 km. Recentstudies show that portions of the WARS are underlain by extremelythin continental crust, as thin as ∼20 km near the Bentley Trench,in the vicinity of Ross Island and the Byrd Basin (Winberry &Anandakrishnan 2004; Chaput et al. 2014), indicating significantlocalized crustal thinning separating the East Antarctic craton andthe EWM crustal block from the MBL and Thurston Island crustalblocks.
Studies suggest extension has occurred in two major pulses, withthe first during the Jurassic-Cretaceous, inducing major distributedcrustal thinning over the entire WARS. A second pulse later inthe Cenozoic is widely documented in the Ross Sea region (e.g.Behrendt 1999; Karner et al. 2005; Wilson & Luyendyk 2006).Cenozoic extension may thus have itself occurred in two stages,with an earlier period from 41 to 26 Ma concentrated in the RossSea region and a Miocene pulse affecting mostly regions furtherinland (Granot et al. 2010; Granot et al. 2013). Whether or not therifting occurred in several pulses, it is generally accepted that themajor extension of the region commenced ca. 105 Ma (Luyendyk1995; Siddoway et al. 2004) and slowed by ca. 17 Ma (Cande et al.2000; Hamilton et al. 2001; Granot et al. 2010). Presently, the lowlevel of seismicity (Winberry & Anandakrishnan 2004) and GPSmeasurements indicating low strain rates between East and WestAntarctica (e.g. Donnellan & Luyendyk 2004; Wilson et al. 2011)suggest that the rift is currently inactive or extending very slowly.
The WARS differs from other continental rifts in several im-portant respects. The diffuse Jurassic-Cretaceous extension of theWARS affected a much wider region relative to most continentalrifts (Huerta & Harry 2007), such as the Baikal Rift, East AfricanRift and North American Midcontinent Rift (Logatchev et al. 1983;
Ingersoll et al. 1990; Keller et al. 1991). Also the extremely deepWARS rift floors are at much lower elevations than other conti-nental rift zones, even when deglaciated and rebound is consid-ered (LeMasurier 2008). The WARS crust is generally thin, withaforementioned areas of very thin crust beneath much of the WestAntarctic Ice Sheet, increasing to a maximum near 30 km in west-ern MBL (Chaput et al. 2014). Comparisons of rift floor elevationsin conjunction with the unique extensional history of the WARSshow that the system does not conform to the behaviour expectedfrom previously investigated continental rifts or broad regions ofextension like the U.S. Basin and Range.
Cenozoic bimodal alkali volcanic rocks, commonly found withincontinental rifts, characterize the MBL shoulder of the WARS (e.g.LeMasurier 1990), and aeromagnetic surveys suggest the presenceof these rocks over an area of >5 × 10⁵ km2 within the rift itself. Theabsence of abundant exposures makes it difficult to estimate whenthe bulk of late Cenozoic volcanic rocks erupted. Nevertheless,available radiometric ages extend from the present back to 30 Ma(LeMasurier 1990). An active mantle plume (Behrendt et al. 1991),intraplate tectonic displacements induced by the plate circuit of theSouthern Hemisphere (Rocchi et al. 2002), and thermal perturba-tion of metasomatized lithosphere (Finn et al. 2005) have all beenproposed as mechanisms of magma generation and emplacement,although these hypotheses remain largely untested.
The extent of the WARS towards the Antarctic Peninsula remainsconjectural, as most geophysical campaigns to date have concen-trated on the more accessible and better geologically exposed RossSea region (e.g. Behrendt et al. 1996; Trey et al. 1999; Karneret al. 2005). However, it seems likely from ice rebound-adjustedtopography (e.g. Chaput et al. 2014) that the WARS extensionalzone continues to the Pacific coast in the Amundsen Sea region.Subglacial basins in the Bentley Trench/Amundsen Sea region arecomparable in lateral extent to those within the Ross Sea, yet reachmuch greater surface depths. The deepest portions of these basinsextend more than 1500 m below sea level, making them the lowestelevation continental topographic features on Earth. These basinsand troughs likely accommodated lateral motion during the Eocene-Oligocene when the region underwent a period of significant con-vergence (Granot et al. 2013). Recent aeromagnetic and aerogravitysurveys have identified rifts in the Pine Island and Ferrigno areas,both locations of gravity and magnetic anomalies consistent withother recently active rifts, that are mechanically related to the centralWARS (Jordan et al. 2010; Bingham et al. 2012). These featuresshow evidence for only small amounts of sediment infill, suggest-ing that they may have only opened during the last pulse of WARSextension in the Neogene (Bingham et al. 2012).
2.3 The Ellsworth-Whitmore Mountains crustal blockand Pensacola Mountains
The EWM, located at the head of the Weddell Sea embayment, rep-resent a geologically and geophysically distinct crustal block withinWest Antarctica (Dalziel & Elliot 1982). The EWM are anomalousin stratigraphy, structural grain and deformational history relativeto their surroundings. Geologic and palaeomagnetic investigationsstrongly indicate that the EWM underwent extensive translation androtation from their initial location prior to the breakup of Gondwana(e.g. Clarkson & Brook 1977; Watts & Bramall 1981; Curtis 2001;Randall & Niocaill 2004). The stratigraphy of the EWM does notcorrelate with that of any other part of West Antarctica but insteadexhibits obvious ties to the Gondwana craton margin sequences seen
at Columbia U
niversity on May 22, 2014
http://gji.oxfordjournals.org/D
ownloaded from
4 N. J. Accardo et al.
within the TAM (Schopf 1969). The structural trend of the EWMstrikes close to transverse to both the TAM and, in a reconstructedGondwana supercontinent, the Cape Fold Belt in Africa. Beginningin the 1960s, numerous authors have suggested that these enig-mas can be resolved if the EWM originated at a location adjacentto the palaeo-Pacific margin of Gondwana, between South Africaand the Coats Land coast of Antarctica, and later underwent lateraltranslation and rotation along the Antarctic margin during Gond-wana breakup (e.g. Schopf 1969; Dalziel 1992; Goldstrand et al.1994). More recent palaeomagnetic and stratigraphic investigationshave largely confirmed that the EWM previously sat adjacent toSouth Africa in a proposed continental rift basin prior to Gond-wana breakup (Curtis 2001; Randall & Niocaill 2004). The EWMcrustal block composes thicker crust and seismically faster uppermantle than the surrounding WARS (Heeszel et al. 2011; Lloydet al. 2012; Chaput et al. 2014), consistent with the idea that it isindeed a fragment of older pre-extensional continental lithosphere.
The Pensacola Mountains (PCM) lie between the northern TAMtermination and the Weddell Sea margin (Fig. 1). The PCM showmany geologic features common along the TAM, such as late Neo-proterozoic to Late Paleozoic magmatic and sedimentary sequencesdeformed during a series of Neoproterozoic to early Paleozoic oro-genic events related to the end of the Ross Orogeny (Stump 1995;Rowell et al. 2001). In a large-scale sense, the PCM are a continua-tion of the TAM, also representing an extensional uplift of the olderorogeny formed along the edge of the East Antarctic Craton.
2.4 The Marie Byrd Land Dome
The MBL intraplate volcanic province is a large region definedby a 1000 × 550 km dome that broadly rises to approximately2000 m in deglaciated surface elevation and is punctuated by volca-noes reaching deglaciated elevations over 4000 m. The main MBLdome is approximately centred on a belt of mid-to-late Cenozoicalkaline volcanoes that extends along Antarctica’s Pacific Coast.The MBL province is one of two regions within this belt wherelarge central vent volcanoes with more than 2000 m of relief arefound (LeMasurier & Rex 1989). The WARS lies polewards of MBLand separates it from the TAM and the EWM. Crustal thicknesses(26–28 km) beneath the volcanic province are 2–5 km greater thanthey are within much of the WARS (Chaput et al. 2014). Thinnercrust is also found to the east of MBL in the region of Pine IslandGlacier (Jordan et al. 2010; Chaput et al. 2014).
Lines of volcanoes divided by subglacial basins characterizethe landscape within the MBL dome (LeMasurier & Rex 1989).The Cenozoic volcanic deposits of the MBL overlie mid- and pre-Cretaceous rocks. The exposed Jurassic and Lower Cretaceous rocksin the MBL dome region are mostly igneous I-type granites and re-lated volcanic rocks, while the mid-Cretaceous rocks are A-typegranitoids thought to have formed at mid-crustal levels and thenexposed during extension before the breakup of Gondwana in thisregion. These formations are thought to reflect a transition betweensubduction- to rift-related magmatism prior to the separation of theNew Zealand microcontinent (Weaver et al. 1994). Volcanic activitycontinued in the Holocene (i.e. Dunbar et al. 2008) and recent stud-ies have identified deep earthquakes polewards of Mount Sidley andMount Waesche, indicating that the region remains magmaticallyactive today (Lough et al. 2013).
Prior to Gondwana breakup, MBL sat between East Antarc-tica and New Zealand, where the Phoenix Plate was subducting.The separation of New Zealand from the Antarctic core of Gond-wana in the Late Cretaceous was the last in a series of fragmenta-
tion events during the breakup of the supercontinent (Storey 1995).Granites from the Ruppert and Hobbs coasts of MBL indicate a pro-longed period of subduction-related magmatism beginning at 320± 3 Ma or earlier (Mukasa & Dalziel 2000). Subduction ceasedat ca. 108 Ma as a result of either collision of the Pacific-Phoenixspreading ridge with the subduction zone (Bradshaw 1989) or aban-donment of the spreading ridge by slab capture (Luyendyk 1995).After subduction stopped, plate boundary forces changed dramat-ically and separation accelerated. Evidence for ocean floor devel-opment between New Zealand and MBL by 81 Ma suggests thatcomplete separation of the continental blocks had occurred by thattime (Mukasa & Dalziel 2000).
Many authors have proposed the existence of a mantle plumebeneath MBL beginning in the Cenozoic (LeMasurier & Rex 1989;Behrendt et al. 1991; Hole & LeMasurier 1994; Sieminski et al.2003) to account for the intraplate MBL Cenozoic alkaline basalticprovince. It has also been suggested that a mantle plume mighthave existed beneath MBL beginning in the mid-Cretaceous andcoincident with initial WARS opening (Storey et al. 1999) but thisearlier plume hypothesis is more controversial. Mantle plumes havebeen linked to lithospheric extension in both the East African rift(e.g. Schilling 1973a; Ritsema et al. 1999) and the Reykjanes Ridge(e.g. Schilling 1973b; Gaherty 2001) and thus could be expected topotentially play a role within the WARS. High heat flow measure-ments in the Ross Sea (66–114 mW m−2; Blackman et al. 1987)and at the West Antarctic Ice Sheet drill site (240 mW m−2; Clow& Cuffey 2012), limited Cenozoic extension that, to first order,seems unable to account for the volume of observed volcanism,and geochemical similarity between the MBL basalts and oceanicisland basalts can be taken to be supportive of the plume hypothesis(LeMasurier & Rex 1989; Hole & LeMasurier 1994).
3 DATA A N D M E T H O D S
3.1 Data
Data from 37 broad-band seismic stations installed throughout WestAntarctica between 2007 and 2011 as part of the POLENET/ANETproject are examined here. Table 1 gives station names and locations.Many of the stations form a part of the POLENET/ANET backbonearray, and most are co-located with GPS sensors near nunataks andlarger rock outcrops. A number of temporary stations deployed for2 yr (station names beginning with ST and hereafter referred toas the POLENET transect) operated for a shorter time than back-bone stations in a line extending from the Whitmore Mountains,through the WARS, and across the MBL dome. Fig. 1 shows stationlocations as well as prominent geologic and geographic featureswithin West Antarctica. Reliable year-round station operation wasaccomplished using a combination of lead-acid batteries, speciallyinsulated enclosures, and winter-use primary lithium batteries de-signed and supported by the IRIS PASSCAL program (Nybladeet al. 2012).
Earthquake sources used for this study were selected for USGSNEIC-determined Mw > 6.0 and epicentral distances between 90◦
and 140◦. SKS, SKKS and PKS phases were carefully examined,and only those with a sufficient signal-to-noise ratio (SNR) and thatwere clearly separated from other phases were chosen for analysis.The highest SNR seismograms were analysed without filtering;these were generally evaluated as the highest quality results. Recordswith lower SNR were bandpass filtered with a low frequency cornerof 0.02 Hz and a variable high frequency corner between 0.15 and0.5 Hz.
at Columbia U
niversity on May 22, 2014
http://gji.oxfordjournals.org/D
ownloaded from

Seismic anisotropy beneath W. Antarctica 5
Table 1. Summary of anisotropic parameters determined in this study. Grid fast direction indicates the fast direction relative to a rectangular Grid stereographicconvention where north is taken to be along the prime meridian, south becomes the 180◦ meridian, east becomes 90◦E, and west becomes 270◦E. Values inparentheses under the ‘Phases Used’ column indicate the number of null observations reported for each station. Null observations were not utilized whenstacking for the final splitting parameters.
Station Latitude Longitude Geographic fast Phi standard Grid fast Splitting Splitting time Phases used Gradedirection (degree) error (+/−) direction (degree) time (s) standard error (+/−)
BEAR −74.548 −111.851 61 5 −51 0.75 0.1125 4 (2) BBYRD −80.017 −119.473 −38 2 22 0.68 0.0625 5 (3) BCLRK −77.323 −141.849 7 13 45 0.70 0.275 3 (0) BDEVL −81.476 161.975 25 15 6 0.60 0.25 2 (2) BDNTW −76.457 −107.780 −84 1 −12 0.60 0.0375 5 (3) BDUFK −82.862 −53.201 −42 0 84 0.95 0.0375 20 (2) AFALL −85.307 −143.628 −2 2 34 0.50 0.0375 8 (2) AFISH −78.928 162.565 53 15 35 0.40 0.1125 4 (2) BHOWD −77.529 −86.769 −65 4 28 0.55 0.05 9 (2) AKOLR −76.155 −120.728 – – – – – – CLONW −81.347 152.735 −75 5 77 0.60 0.0625 4 (0) BMECK −75.281 −72.185 – – – – – – CMILR −83.306 156.252 – – – – – – CMPAT −78.030 −155.022 21 7 45 0.45 0.0625 4 (1) BPECA −85.612 −68.553 −70 1 41 0.90 0.0375 10 (0) ASILY −77.133 −125.966 −42 3 12 0.55 0.0375 11 (0) ASIPL −81.641 −148.956 −18 1 13 0.73 0.0375 15 (3) AST01 −83.228 −98.742 −72 3 9 1.15 0.0375 7 (3) AST02 −82.069 −109.124 −42 2 28 1.30 0.04 12 (2) AST03 −81.407 −113.150 −37 0 29 1.28 0.025 11 (3) AST04 −80.715 −116.578 −38 1 25 1.43 0.075 5 (1) AST06 −79.332 −121.820 – – – – – – CST07 −78.639 −123.795 −13 4 43 0.70 0.0625 5 (6) BST08 −77.948 −125.531 −17 5 37 0.55 0.075 6 (2) AST09 −76.531 −128.473 −36 2 15 0.70 0.05 5 (0) BST10 −75.814 −129.749 −39 1 11 0.90 0.05 3 (3) BST12 −76.897 −123.816 −55 5 1 0.55 0.05 4 (2) BST13 −77.561 −130.514 −5 3 44 0.63 0.0375 5 (2) BST14 −77.838 −134.080 – – – – – – CSURP −84.720 −171.202 22 1 30 0.68 0.0375 11 (3) ATHUR −72.530 −97.561 73 4 −25 0.90 0.0625 5 (1) BUNGL −79.775 −82.524 – – – – – – CUPTW −77.580 −109.040 −64 0.15 6 0.68 0.225 3 (1) BWAIS −79.418 −111.778 −29 1 39 0.73 0.0375 13 (2) AWHIT −82.682 −104.387 −58 9 17 0.78 0.225 3 (2) BWILS −80.040 −80.559 −76 2 23 1.13 0.075 5 (0) BWNDY −82.370 −119.413 −42 3 18 1.08 0.1125 3 (2) B
3.2 Methods
We determine the anisotropic parameters using the widely-appliedmethod of Silver & Chan (1991) which aims to determine the ap-propriate splitting parameters via the minimization of energy on thetransverse component. This method analyses ground particle mo-tion by calculating the covariance matrix of the horizontal compo-nents for all possible splitting directions and reasonable delay times.The most linear-restored particle motion, and thus the preferredfast anisotropy direction and delay time parameters for reversingthe effect of simple anisotropy at a given station, are found byminimizing the magnitude of the smaller eigenvalue of the particlemotion covariance matrix. The process of picking windows aroundthe individual phases and then calculating the splitting parameterswas automated using the method of Teanby et al. (2004). This al-gorithm performs splitting analysis on a range of window lengthsand then finds those measurements that are stable over many dif-ferent windows. These windows are then placed into clusters, withthe final window chosen from the splitting analysis with the lowesterror in the cluster with the lowest variance. We then evaluate the
result from displays showing unrotated and rotated waveforms, theground particle motion and the misfit contour plot for the predictedfast axis (Fig. 2).
Following the methodology of Silver & Chan (1991), the misfitcontour region is constructed from the α confidence level from thefollowing expression:
Et (φ, δt)Em
t≤ 1 + k
n − kfk,n−k(1 − α), (1)
where Et(φ,δt) represents the n-point time-series containing the SKSphase, k represents the number of parameters (in this instance φ &δt), and f represents the inverse F probability distribution. For the95 per cent confidence level α = 0.05.
All results were individually inspected and assigned a qualityrating of A, B or C based on several factors including: (1) SNR,(2) linearization of particle motion, (3) waveform coherence be-tween the two horizontal components rotated into the fast and slowdirections and (4) tightness of the misfit contours as a function ofsplitting parameter. To be rated as A quality, measurements had to
at Columbia U
niversity on May 22, 2014
http://gji.oxfordjournals.org/D
ownloaded from
6 N. J. Accardo et al.
Figure 2. Example SKS splitting analysis for a single, A quality, non-null event. (a) Event processing reduces the energy on the transverse component. (b)The windowed waveforms and the particle motion plots for the raw data (left) and the data corrected for observed anisotropy (right). (c) Contour plot showingmisfit as a function of splitting parameter. (d) Contour plot for the stacked solution for the station with observed anisotropy parameters. Values on the contourinterval indicate the nσ value of the given contour. The contour labelled 2 indicates the 95 per cent confidence interval.
satisfy certain criteria for each of the four factors described above.Measurements had to have a SNR > 8 to satisfy criterion (1). Abandpass filter was applied to noisy records with initially low SNRto improve their quality but no distinction between unfiltered andfiltered records was made when judging criterion (1). To satisfycriterion (2), measurements that showed elliptical particle motionon the uncorrected seismogram had to show nearly linear particlemotion on the corrected seismogram.
To be rated as B quality, measurements had to have SNR > 3to satisfy criterion (1). To satisfy criterion (2), measurements thatshowed elliptical particle motion on the uncorrected seismogramhad to show a general reduction in ellipticity on the corrected seis-mograms. Criteria for A and B quality measurements for both wave-form coherence and tightness of misfit contours were qualitativelyjudged. Only results rated B or higher were included in the finalanalyses.
Measurements judged to be ‘null’ were those that did not showenergy on the transverse component, and thus a near-radially-oriented horizontal particle motion prior to analysis. Such eventsoften yield erroneously large delay times when analysed. Null mea-surements can result when the initial polarization of the incom-ing wave is parallel or orthogonal to the fast anisotropic direction,when there is no anisotropy along the ray path, or when the SNR islow. Null measurements are most confidently captured when mul-tiple simultaneous shear wave splitting techniques are used (i.e.the rotation-correlation method and the transverse minimizationmethod; Wustefeld & Bokelman 2007; Long & Silver 2009). Be-cause we utilized a single method for our shear wave splittinganalysis, those measurements identified as null were not incorpo-rated into the final stacked solution for splitting parameters. Thenumber of null measurements observed at each station is givenin Table 1.
A stacking method (Wolfe & Silver 1998) was used to increasethe robustness of the results relative to analysis of individual events.This program produces a weighted sum of the individual misfitsurfaces and computes a global solution for each station. Only Aand B quality events were used in the stacking procedure.
Final stacked solutions for each station were assigned a qualityof A, B or C based on (1) the quality of the single events included inthe stack and (2) the backazimuth sampling of the station. Stationsare categorized as A if the global solution consists of at least fourindividual measurements and are sampled only with single eventratings of A. Stations are categorized as B if the global solutionconsists of at least two individual measurement and is sampledonly with single event ratings of A or B. A quality stations areplotted as thick vectors and B quality stations are plotted as thinvectors in Fig. 3. Stations that did not meet the above criteria werecategorized as C. Note that comparison of splitting directions canbe difficult in geographic coordinates for stations near the SouthPole; for convenience we have also converted fast directions to therectangular Grid coordinate system, with north oriented along thePrime Meridian and east along longitude 90◦ E, as is common forwork near the poles. We will refer to splitting directions using this‘Grid’ coordinate system in the following discussion. Both Grid andgeographical directions are given in Table 1.
4 R E S U LT S
Stacked shear wave splitting parameters with a grade of B or betterwere determined for 31 out of 37 stations of the POLENET/ANETarray. Six stations collected insufficient data or poor quality data andwere not used in the subsequent analysis and discussion. Table 1shows the fast direction of anisotropy, delay time and associated
at Columbia U
niversity on May 22, 2014
http://gji.oxfordjournals.org/D
ownloaded from

Seismic anisotropy beneath W. Antarctica 7
Figure 3. Splitting results for West Antarctica. The region of interest is outlined in the green box on the inset map of Antarctica. Thick red vectors representA quality results and thin red vectors represent B quality results. Black vectors represent shear wave splitting results assembled from a variety of studies(Muller 2001; Barklage et al. 2009; Hernandez et al. 2009). Only A quality results and results from stations with multiple high quality phases were includedfrom previous studies. Vector azimuths denote fast direction of the event stacks. The length of the vector is proportional to the splitting time, with splittingtime scale indicated at right. Given the close proximity of many seismic stations, we have only labelled station names not shown in Fig. 4. Grid directions allowfor simpler discussion of azimuthal values at high latitudes, and this map projection is aligned Grid N. Solid green arrows indicate the direction of Antarcticabsolute plate motion in the hotspot reference frame calculated using HS3-NUVEL; at 75◦S 120◦W APM has an azimuth of 281.6◦ W and a velocity of1.89 cm yr−1. In comparison, no-net rotation reference frames calculated for the same location show APM with an azimuth of 91◦E and a velocity of 1.77 cmyr−1. Generally, fast directions across the West Antarctic Rift System are oriented roughly Grid NE-SW and splitting times average ∼1 s. Decreased delaytimes and variable fast directions are notable in the vicinity of the MBL dome and volcanic province. Background colour scale indicates bedrock elevation fromFretwell et al. 2013. Blue labels indicate locations of subglacial basins; PIR, Pine Island Rift; BSB, Byrd Subglacial Basin; BST, Bentley Subglacial Trench.
errors for each station. Also listed is the number of null observationsand stacked events used at each station as well as the final qualityrating for the station.
4.1 The TAM, EWM and PCM
The four stations located at the base of the TAM, near the boundarybetween the TAM and the Ross Ice Shelf (FISH, DEVL, FALL andSURP) show relatively consistent fast directions, ranging from Grid6◦ to 35◦ (Fig. 3). The fast directions in the central TAM are orientedroughly perpendicular to the TAM front. The fast direction at FISHis consistent with fast directions found in the McMurdo Dry Valleysarea by Barklage et al. (2009). Station LONW, located at the crestof the TAM further towards East Antarctica, shows a very differentorientation of Grid 77◦.
Stations located in the EWM block (HOWD, WILS, WHIT andST01) show similar fast directions but the splitting magnitudesare variable; fast directions range from Grid 9◦ to 28◦ and delaytimes range from 0.55 to 1.15 s. Splitting magnitudes for the two
stations located in the PCM (PECA and DUFK) are uniform andfast directions are variable. Fast directions at these locations areGrid 41◦ and 84◦ and delay times are 0.90 and 0.95 s, respectively.Both stations located in this region are A quality and are among thebest constrained results due to both the number of usable events aswell as the quality of those events.
4.2 The West Antarctic Rift System
Results from the seven stations located along and near thePOLENET transect show extremely similar fast directions andregionally uniform splitting magnitudes (Fig. 4a). Stations ST02,ST03 and ST04 show fast directions between Grid 25◦ and 29◦ andsplitting times between 1.28 and 1.43 s (Fig. 5). Together with sta-tion WNDY (Grid 18◦, 1.08 s) somewhat to the west, they form anarea of remarkably large and consistent splitting, indicating strongand uniform anisotropy across this region. Further north along thetransect, BYRD and ST07, as well as station WAIS to the east, showsimilar if less tightly clustered splitting directions (Grid 22◦–43◦)
at Columbia U
niversity on May 22, 2014
http://gji.oxfordjournals.org/D
ownloaded from
8 N. J. Accardo et al.
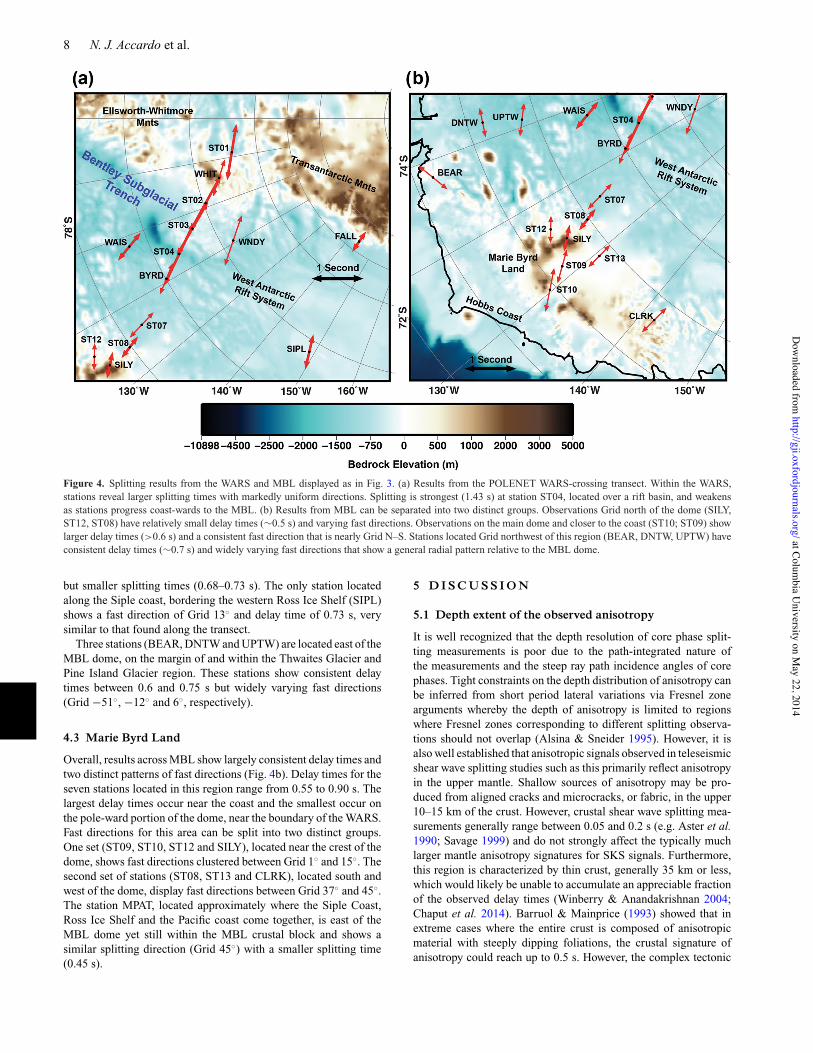
Figure 4. Splitting results from the WARS and MBL displayed as in Fig. 3. (a) Results from the POLENET WARS-crossing transect. Within the WARS,stations reveal larger splitting times with markedly uniform directions. Splitting is strongest (1.43 s) at station ST04, located over a rift basin, and weakensas stations progress coast-wards to the MBL. (b) Results from MBL can be separated into two distinct groups. Observations Grid north of the dome (SILY,ST12, ST08) have relatively small delay times (∼0.5 s) and varying fast directions. Observations on the main dome and closer to the coast (ST10; ST09) showlarger delay times (>0.6 s) and a consistent fast direction that is nearly Grid N–S. Stations located Grid northwest of this region (BEAR, DNTW, UPTW) haveconsistent delay times (∼0.7 s) and widely varying fast directions that show a general radial pattern relative to the MBL dome.
but smaller splitting times (0.68–0.73 s). The only station locatedalong the Siple coast, bordering the western Ross Ice Shelf (SIPL)shows a fast direction of Grid 13◦ and delay time of 0.73 s, verysimilar to that found along the transect.
Three stations (BEAR, DNTW and UPTW) are located east of theMBL dome, on the margin of and within the Thwaites Glacier andPine Island Glacier region. These stations show consistent delaytimes between 0.6 and 0.75 s but widely varying fast directions(Grid −51◦, −12◦ and 6◦, respectively).
4.3 Marie Byrd Land
Overall, results across MBL show largely consistent delay times andtwo distinct patterns of fast directions (Fig. 4b). Delay times for theseven stations located in this region range from 0.55 to 0.90 s. Thelargest delay times occur near the coast and the smallest occur onthe pole-ward portion of the dome, near the boundary of the WARS.Fast directions for this area can be split into two distinct groups.One set (ST09, ST10, ST12 and SILY), located near the crest of thedome, shows fast directions clustered between Grid 1◦ and 15◦. Thesecond set of stations (ST08, ST13 and CLRK), located south andwest of the dome, display fast directions between Grid 37◦ and 45◦.The station MPAT, located approximately where the Siple Coast,Ross Ice Shelf and the Pacific coast come together, is east of theMBL dome yet still within the MBL crustal block and shows asimilar splitting direction (Grid 45◦) with a smaller splitting time(0.45 s).
5 D I S C U S S I O N
5.1 Depth extent of the observed anisotropy
It is well recognized that the depth resolution of core phase split-ting measurements is poor due to the path-integrated nature ofthe measurements and the steep ray path incidence angles of corephases. Tight constraints on the depth distribution of anisotropy canbe inferred from short period lateral variations via Fresnel zonearguments whereby the depth of anisotropy is limited to regionswhere Fresnel zones corresponding to different splitting observa-tions should not overlap (Alsina & Sneider 1995). However, it isalso well established that anisotropic signals observed in teleseismicshear wave splitting studies such as this primarily reflect anisotropyin the upper mantle. Shallow sources of anisotropy may be pro-duced from aligned cracks and microcracks, or fabric, in the upper10–15 km of the crust. However, crustal shear wave splitting mea-surements generally range between 0.05 and 0.2 s (e.g. Aster et al.1990; Savage 1999) and do not strongly affect the typically muchlarger mantle anisotropy signatures for SKS signals. Furthermore,this region is characterized by thin crust, generally 35 km or less,which would likely be unable to accumulate an appreciable fractionof the observed delay times (Winberry & Anandakrishnan 2004;Chaput et al. 2014). Barruol & Mainprice (1993) showed that inextreme cases where the entire crust is composed of anisotropicmaterial with steeply dipping foliations, the crustal signature ofanisotropy could reach up to 0.5 s. However, the complex tectonic
at Columbia U
niversity on May 22, 2014
http://gji.oxfordjournals.org/D
ownloaded from

Seismic anisotropy beneath W. Antarctica 9
Figure 5. Individual splitting results for all events stacked in the final so-lution for A-quality stations along the northern portion of the POLENETtransect (ST01, ST02, ST03, ST04). The BAZ of the event is representedby angle clockwise from 0◦, the delay time by the radial distance from theorigin of the plot, and the direction of the fast axis by the azimuth of the redvector. Individual splitting results for the remaining stations are available inthe supplementary material.
history of the region suggests that retention of such large-scalecoherent crustal structure would be difficult. Growing evidencesuggests that anisotropy may be present in the lower mantle andat the core-mantle boundary (e.g. Garnero et al. 2004; Panning &Romanowicz 2006). However, consistency in splitting parametersbetween rays with different backazimuths (thus different samplingregions of the lower mantle) strongly suggests that such effects donot contribute appreciably to these observations. Individual plotsof backazimuth against fast axis and delay time are included in theSupporting Information, a subset of the stations are shown in Fig. 5.Our final measurements are produced by stacking arrivals from avariety of backazimuths when available, so that any bias from mid-
or lower mantle anisotropy along a particular azimuth should bedown-weighted in the final, averaged result.
5.2 Relationship of anisotropy to absolute plate motionover the mantle
The motion of plates over the mantle may induce asthenosphericshear strain beneath the plate with the axis of shear aligned inthe direction of plate motion relative to the ambient mantle (e.g.Wang et al. 2008). This plate basal shear mantle deformation mech-anism should cause seismic anisotropy such that the olivine fastaxis becomes oriented in the direction of plate motion in an abso-lute mantle reference frame, thus producing fast anisotropy direc-tions parallel to absolute plate motion (APM; e.g. Savage 1999).However, the fast anisotropic directions from the splitting measure-ments consistently show large angles with APM directions in bothno-net-rotation (NNR) and hotspot (HS) absolute reference frames(Argus et al. 2010; Fig. 3). The NNR frame represents the plate ve-locity relative to the weighted average of all the plate velocities onthe earth’s surface (Argus & Gordon 1991). In comparison, the HSreference frame minimizes the movement of hotspots, and its use asan absolute reference frame assumes that hotspots are fixed relativeto the lower mantle (e.g. Minster et al. 1974). The inferred basalshear direction for both HS and NNR absolute reference frames ishighly inconsistent with most of the observed splitting results, withthe exception of a few far Grid west sites (e.g. THUR and DNTW).This suggests that the anisotropic fabric does not broadly resultfrom shear associated with the motion of Antarctic lithosphere overthe mantle. The lack of signal from Antarctica motion relative to themantle is not surprising seeing that Antarctica moves slowly in boththe NNR (1.77 cm yr−1 in a direction of 91.2◦E) and HS (1.89 cmyr−1 in a direction of 281.6◦W) reference frames. Debayle & Yanick(2013) note that only fast moving plates (velocity >4 cm yr−1) pro-duce sufficient shearing at their base to organize anisotropy withinthe asthenosphere beneath the entire tectonic plate. Further, beneathslow moving plates (like Antarctica), plate motion is predicted toonly partially control mantle asthenospheric flow, given that theuppermost mantle is subject to other secondary convection mecha-nisms.
5.3 Anisotropy in East Antarctica versus West Antarctica
Splitting results from West Antarctica are highly distinct from thosereported for East Antarctica, particularly compared to the South Poleregion and the East Antarctic highlands (Muller 2001; Bayer et al.2007; Reading & Heintz 2008; Barklage et al. 2009; Fig. 6). Fastdirections reported from the PCM and along the TAM (e.g. DUFK,PECA and LONW) are also distinct from the overall Grid NE–SWdirection seen across much of West Antarctica. Mantle shear veloc-ity maps show that these three stations lie outside of the low velocityupper mantle that underlies most of West Antarctica (e.g. Heeszelet al. 2011; Fig. 7). These patterns are consistent with the dissimi-lar tectonic conditions across Antarctica, whereby East Antarcticarepresents a stable continental craton underlain by thick continentallithosphere (Heeszel et al. 2011) and West Antarctica is composedof crustal blocks that have undergone Mesozoic and Cenozoic tec-tonism, with a relatively hot, shallow mantle asthenosphere. Poten-tially, the disparate splitting patterns reflect large-scale deflectionof mantle flow around the East Antarctic craton. This mechanismhas been suggested for other locations in close proximity to cratons(e.g. Clitheroe & van der Hilst 1998; Walker et al. 2004; Miller
at Columbia U
niversity on May 22, 2014
http://gji.oxfordjournals.org/D
ownloaded from

10 N. J. Accardo et al.
Figure 6. Antarctica, showing splitting vectors from this and a variety ofother studies (Muller 2001; Bayer et al. 2007; Usui et al. 2007; Reading &Heinz 2008; Barklage et al. 2009; Hernandez et al. 2009). Only results fromstations with multiple high-quality observations were plotted. Backgroundcolour scale indicates bedrock elevation from Fretwell et al. 2013.
et al. 2013). In this scenario, asthenospheric flow is directed aroundthe edge of the cratonic keel rather than beneath it, leading to fastdirections oriented approximately parallel to the craton edge (Fouchet al. 2000; Miller & Becker 2012). However, splitting results fromthe boundary of the East Antarctic craton are oriented normal ratherthan parallel to the margin, suggesting that simple edge driven flowcannot explain the observations. Further, the small magnitude APMreported for Antarctica and absence of vigorous mantle flow due tolarge-scale tectonics likely results in insufficient shearing within theasthenosphere needed to coherently deflect flow around the cratonickeel (Miller & Becker 2012; Miller et al. 2013). These observationssuggest that, as is observed in other cratonic regions, the split-ting of East Antarctica results largely from anisotropy frozen intothick and cold continental lithosphere (e.g. Barklage et al. 2009),whereas splitting seen in most of West Antarctica largely resultsfrom asthenospheric fabric that reflects recent and ongoing mantleprocesses. As discussed below, the same interpretation may not bevalid for the EWM crustal block.
5.4 WARS anisotropy resulting from Cenozoic extension
5.4.1 Extension induced mantle anisotropy
It is well accepted that rift systems develop via extension and ulti-mately rupture of thick continental lithosphere, however, the mech-anisms that control the character and style of rifting remain con-tentious. Specifically, a new model of rift development in whichmagmatic products (i.e. dikes and magma-filled lenses) accommo-date a considerable proportion of extension (e.g. Buck 2004; Thybo& Neilson 2009; Bialis et al. 2010) has been offered up in con-trast to previous models of passive rifting (i.e. extension driven byfar field stresses). Simple 2-D orthogonal extension in the mantlelithosphere associated with plate stretching should produce olivineLPO and shear wave azimuthal anisotropy in the direction of exten-sion (McKenzie 1979; Blackman et al. 1996; Vauchez et al. 2000).However, due to the conflicting effects of strain accumulation andlithospheric thinning, this signal is expected to be weak. Extension-parallel fast directions have been reported for multiple continental
rift systems (Vinnik et al. 1992; Gao et al. 1997) and portions ofthe Basin and Range (Obrebski et al. 2006; Xue & Allen 2006),one of the few continental extensional systems of similar size andscale to the WARS. Studies at oceanic spreading centres also reportextension parallel fast axes which are likely due to flow inducedLPO of anisotropic minerals within the asthenospheric mantle (e.g.Blackman & Kendall 1997; Wolfe & Solomon 1998).
Conversely, if extension is accommodated largely by magmaticintrusion, splitting fast directions will align parallel to strike of thebodies and hence be rotated 90◦ to the direction of shearing. Studiesof the Main Ethiopian Rift, the northernmost portion of the EastAfrican rift system (EARS), reveal shear-wave-splitting directionsaligned parallel to the rift axes indicative of the presence of orientedmelt pockets in the uppermost mantle and crust (Walker et al. 2004;Kendall et al. 2005) or alternatively indicating large-scale, orientedmantle flow in the presence of a superplume (Bagley & Nyblade2013).
Recently, Eilon et al. (2014) reported extension parallel fast axeswith large delay times (>1 s) from the highly extended continentwithin the Woodlark Rift. They suggest that the anisotropic signalthere represents extension driven LPO of olivine within the astheno-spheric mantle similar to mechanisms inferred at mid-ocean ridges.Further, they propose that the anisotropic fabric within highly ex-tended continental rift regimes may characterize a transition fromsmall-strain continental rifts (where fast axes may be expected toparallel the strike of melt bodies and hence the rift axis) to mid-ocean ridges (where fast axes parallel the extension direction).
5.4.2 Anisotropic signature of Cenozoic WARS extension
Rifting within the Ross Sea sector of the WARS during the Eoceneand Oligocene was multiphase with extension occurring largelytranscurrently with isolated periods and locations of orthogonal ex-tension (Wilson 1995; Miller et al. 2001, Granot et al. 2013). Polesof East Antarctica–West Antarctica rotation for that time period(40–26 Ma) are located in central West Antarctica and suggest thatthe western sector of the WARS and specifically the locations ofthe remarkably deep subglacial basins (i.e. Pine Island Rift and theBentley Trench) underwent a significant period of oblique conver-gence (Granot et al. 2013). These poles predict roughly east-westconvergence in the vicinity of the POLENET transect, which is atlarge angles to the observed fast directions. This indicates that theanisotropy is not correlated with the inferred transcurrent and con-vergent deformation during Eocene–Oligocene time in the centraland southern WARS.
Limited extension within the Adare Basin (northern WARS),coeval with the opening of the Terror Rift (Henrys et al. 2007;Fielding et al. 2008) during the mid-Miocene, suggests that a majorchange in relative plate motion between East and West Antarcticaoccurred at ∼17 Ma. This change in tectonic framework is proposedto be concomitant with the final pulse of extension within the WARSwhere rifting increased towards the interior of the WARS (Granotet al. 2010). The WARS extension direction during this final pulseof rifting is not known, as magnetic anomalies in the Adare Troughdo not allow a pole of rotation to be calculated for this time period(Granot et al. 2010). However, it is a reasonable assumption thatthe extension would have been orthogonal or at high angle to welldeveloped rift structures in the Pine Island Glacier basin and BentleyTrench.
Fast directions along and near the POLENET transect in theWARS are seen to indeed be oriented approximately orthogonal
at Columbia U
niversity on May 22, 2014
http://gji.oxfordjournals.org/D
ownloaded from

Seismic anisotropy beneath W. Antarctica 11
Figure 7. S-wave velocity variation at 180 km depth (after Heeszel et al.2011) with splitting parameters from this study in black and previous studies(Muller 2001; Barklage et al. 2009; Hernandez et al. 2009) in white. Theboundary of the Pagano Shear Zone (PSZ; Jordan et al. 2013) are representedby the purple solid and dashed lines; solid line indicates where the PSZ hasbeen identified from aerogeophysical data, dashed line indicates inferredcontinuation of the PSZ towards West and East Antarctica, respectively. Thelowest velocity region directly underlies the MBL dome, and the highestvelocities are found across the TAM and into the East Antarctic craton.
to the topographic axis of the Bentley Trench (Fig. 4). The largestsplitting time (1.43 s) occurs at station ST04, which is located abovethe Bentley Trench and also shows the smallest crustal thickness(21 km) and greatest amount of crustal thinning along the transect(Chaput et al. 2014). The delay times decrease coast-wards alongthe transect towards MBL, consistent with higher elevation, thickercrust and decreasing extension (Chaput et al. 2014). This prelim-inarily suggests that the anisotropy across this region results fromdeformational fabric accrued during the last (Neogene) phase ofstrong WARS rifting, potentially focused within the Bentley Trench.
Splitting measurements towards the Pine Island Glacier region(UPTW, DNTW, BEAR, THUR) do not show a similar correspon-dence between fast directions and the inferred extension direction.This may be partly due to the complex tectonic history in this region;Eocene-Oligocene rotation poles predict increasing convergence inthis direction and Granot et al. (2013) proposed that Pine Islandand other present rift basins were transform fault features at thattime. Some of the fast directions (e.g. DNTW) are oriented approx-imately in the expected shear direction of these transform faults.Alternatively, fast directions in this region may be related to radialflow associated with the MBL plume, as discussed in Section 5.6.
If continental extension produces mantle anisotropy with strongextension-parallel fast directions in West Antarctica, an importantquestion is why are similar extension parallel orientations not foundat some other prominent continental rift zones such as the EARS?Along-strike fast directions in the EARS are hypothesized to be dueto SPO anisotropy due to melt-filled extensional cracks (Walkeret al. 2004; Kendall et al. 2005) and/or to large-scale along-strikeflow from the African superplume (Bagley & Nyblade 2013). TheAfrican superplume explanation suggests that perhaps the EastAfrica observations cannot be generalized to other continental rifts.Melt-filled cracks are certainly a possibility in any extensional re-gion, but most evidence suggests that the WARS is not currentlyundergoing significant extension (Donnellan & Luyendyk 2004;Winberry & Anandakrishnan 2004; Wilson et al. 2011), whereasthe East African Rift is currently extending at rates of up to 6 mmyr−1 (Stamps et al. 2008).
We alternatively suggest that the anisotropic signature ob-served within the WARS was jointly imparted to the lithosphereand asthenosphere via ductile shearing associated with the large-magnitude extension between East and West Antarctica. Deforma-tion within the lithosphere and asthenosphere leading to the accu-mulation of pervasive anisotropy likely dominated over competingmechanisms like lithospheric thinning which would have otherwiseacted to obstruct the retention of a coherent anisotropic fabric. Thisis in good agreement with the study of Eilon et al. (2014) whichsuggested that extension parallel fast axes within the highly ex-tended Woodlark Rift in Papua New Guinea represent widespreadcoherent anisotropic fabric within the asthenosphere accumulatedvia extension controlled LPO. They point out that the observationof extension parallel fast axes with large delay times (>1 s) beneathhighly extended continental rifts represent mantle anisotropic fab-rics dominated by flow produced LPO rather than fabrics character-ized by melt or pre-existing structure. We suggest that the anisotropyobserved within the WARS resulted from extensive Cenozoic ex-tension including the final pulse of western WARS rifting in theMiocene, the signature of which has since been preserved withinthe asthenospheric mantle owing to the weak influence of shearfrom small-magnitude APM associated with Antarctica.
5.5 Anisotropy resulting from the rotationof the Ellsworth-Whitmore crustal block
Splitting parameters in the EWM are consistent with results fromthe adjacent stations in the WARS potentially suggesting that thesame extensional mantle deformational fabric producing the stronganisotropy in the WARS extends beneath the EWM block. However,mantle shear velocities in the region are higher beneath the EWMthan the rest of West Antarctica, suggesting the EWM, as indicatedby the geology and palaeomagnetic data, may be underlain by oldercontinental lithosphere not present within the WARS (Heeszel et al.2011; Lloyd et al. 2013; Fig. 7). Further, mantle seismic velocitiesfound in the EWM are significantly lower than those for the EastAntarctic craton or even the PCM region, suggesting nonethelesssome tectonic modification of the continental lithosphere. Com-bined this evidence suggests that the translocation and rotation ofthe EWM likely induced additional deformation and alteration ofthe continental lithosphere compared to the surrounding regions.
Alternatively, splitting parameters in the EWM region may reflectdeformation due to shear motion within the long inferred (Storey &Dalziel 1987) and recently aeromagnetically imaged Pagano ShearZone (PSZ), a major left-lateral strike-slip fault system between Eastand West Antarctica (Jordan et al. 2013; Fig. 7). The PSZ strikesapproximately Grid NE-SW at the juncture of the EWM and theTAM. Elongate, structurally controlled Jurassic granite intrusionsalong the flanks of the PSZ suggest that the fault system accommo-dated motion primarily during the Mesozoic. Gravity and magneticanomaly mapping show no evidence for a connection between theMesozoic rifting events and the Cenozoic WARS rifting, althoughthe Early Jurassic Ferrar-Karoo Large Igneous Province suggestsrifting in the WARS may have originated at that time. Addition-ally, shear velocity maps reveal that the PSZ boundary, imaged byJordan et al. (2013), sits exactly along the boundary between thefast velocities in East Antarctica and the slow velocities in WestAntarctica (Fig. 7). Results from ST01, located within the PSZ,show fast axes subparallel to the proposed strike of the PSZ anddissimilar from observations along the remainder of the POLENETtransect (Fig. 5). Thus, anisotropic fabric beneath the PSZ may be
at Columbia U
niversity on May 22, 2014
http://gji.oxfordjournals.org/D
ownloaded from
12 N. J. Accardo et al.
representative of Mesozoic shearing from this feature. In contrast,in the simplest interpretation, anisotropy within the larger EWMresults from mantle deformation associated with the same Neogenelarge-scale extensional processes that produced the WARS whichis either coincidentally aligned with, or has been sufficient to over-print, prior deformation associated with the tectonic history of theblock.
Additionally, a third possibility exists. While details of the tec-tonic history of the EWM remain enigmatic it is now largely ac-cepted that this tectonic block originated adjacent to the SouthAfrican Cape Fold Belt prior to Gondwana breakup (e.g. Dalziel2007) and has translated and rotated as a microplate. In this scenario,the EWM crustal block rotated as much as 90◦ counterclockwiserelative to East Antarctica (Grunow et al. 1987; Randall & Niocaill2004) and was laterally translated to its present day position at thehead of the Weddell Sea embayment. Fast anisotropic directions inthis crustal block are consistently oriented at approximately Grid25◦, similar to splitting directions in the WARS, and systematicallydifferent from results in the PCM. The EWM splitting directionsmay represent anisotropy frozen into the continental lithosphere ofthe EWM block, which would have originally been parallel withPCM lithospheric anisotropy. The azimuths of the splitting direc-tions in the EWM crustal block and in the PCM are in each case afew degrees clockwise with respect to the strike of the early Meso-zoic Gondwanide structural trends. This suggests that restorationof the EWM crustal block within a reconstruction of the Gond-wana supercontinent would bring them into parallelism, implyingthe anisotropy in the EWM crustal block may have been ‘frozen’into the lithosphere prior to breakup of the supercontinent.
5.6 Anisotropy resulting from a mantle plume
MBL exhibits splitting times and directions that depart systemati-cally and are locally discordant with observations within the WARSand TAM. Mantle shear velocity maps highlight an upper man-tle low velocity region associated with the MBL, and suggest thatsplitting in this region may represent processes associated with aMBL mantle plume (Heeszel et al. 2011). Models for anisotropyat mantle plumes suggest that fast anisotropic directions shouldbe oriented vertically within the central upwelling and radiallywithin the expanding plume head (e.g. Rumpker & Silver 2000;Xue & Allen 2005). With the superimposed influence from ab-solute plate motion, horizontal flow away from the central plumehead upwelling is predicted to be parabolic (Walker et al. 2005).Conversely, recent experimental studies suggest that despite radi-ally outward flow of material within the plume head, olivine fastaxes will coherently align perpendicular to the flow in an azimuthalpattern. Specifically, it is proposed that the interchange betweenradial shortening and azimuthal stretching within the expandingplume head induces extensional pure strain, thus locking the crys-talline alignment into a flow normal orientation (Druken et al.,in preparation).
Anisotropy within the central upwelling of the MBL hot spotshould be weak with small delay times and varied fast directionsdue to the vertical orientation of the olivine crystals. Splitting abovethe eastern MBL dome is indeed small in magnitude (delay timesaverage ∼0.6 s) in comparison to those observed in the WARS yetshows a consistent fast direction (e.g. ST13, CLRK, ST08) of ∼40◦.Mantle xenoliths from MBL indicate that portions of the sampledlithospheric mantle have minimum ages of 1.3–1.5 Ga (Handleret al. 2003). Thus, the thicker MBL crust and/or the preservation of
MBL Proterozoic lithosphere implies that consistent fast directionsin this region may represent an older signature of anisotropy thathas been ‘frozen into’ the lithospheric mantle prior to the onset ofplume activity and Mesozoic-Cenozoic extension.
Anisotropy outside of the proposed plume axis, but influenced byplume head processes should show fast axes oriented either parallelor normal to radial flow from the proposed plume head. However,only partial indications of a radially or flow normal oriented patternof fast directions is observed. Results from the Amundsen Searegion (BEAR, DNTW, UPTW, WAIS) are consistent in delay time(∼0.75 s) and have fast directions that are approximately radiallyoriented with respect to the central MBL dome. Shear velocity mapsof the region at depth further emphasize the spatial relationshipbetween the radial anisotropic pattern and the low upper mantlevelocities extending Grid northwest from the centre of the MBLdome (Heeszel et al. 2011; Fig. 7). However, this radial pattern ofanisotropic directions is not reported at stations Grid southeast ofMBL (e.g. CLRK, MPAT), which display fast directions that aresubparallel to those observed along the central TAM and within theWARS, where upper mantle shear velocities are somewhat higher.
6 C O N C LU S I O N S
Core phase-derived splitting results from West Antarctica generallyshow a large number of stations with distinct (∼1 s) anisotropy andfast axes oriented Grid NE–SW, orthogonal to the trend of the TAM.We suggest that anisotropy in this region is strongly influenced bymantle fabrics that were established during Cenozoic WARS exten-sion, crustal thinning and associated mantle flow. Specifically, split-ting along the relatively dense transect of POLENET/ANET seismicstations within the WARS (between the MBL dome and the EWM) issubparallel to the apparent direction of Neogene WARS extension,indicating the absence of partial melt or other influences withinthe rift system that would result in a rift axis parallel or obliquefast direction trends. Rather, plate stretching within the highly ex-tended WARS led to the accumulation of pervasive anisotropic fab-rics within the uppermost mantle and dominated over competingprocesses like lithospheric thinning which would have otherwisehindered the retention of a widespread, coherent anisotropic signal.The weak influence of shear from small-magnitude APM likely al-lowed for the preservation of such widespread coherent fabric afterWARS extension shut down.
Multiple hypotheses exist to explain the pattern of splittingwithin the EWM crustal block. Broadly the EWM microplate showsanisotropy that is consistent with the WARS, suggesting either coin-cident underlying alignment with WARS trends or underlying man-tle that has participated in WARS-oriented flow. Alternatively, theanisotropic fabric may be related to the deformation within the PSZbetween the East Antarctic craton and the EWM block or perhapsbe evidence for fabric frozen into the mantle lithosphere prior tofragmentation of the Gondwanaland supercontinent. Although theobservations are ambiguous, weaker splitting parameters observedat the MBL dome are compatible with less pervasive Cenozoic ex-tension and somewhat thicker lithosphere, or with variable splittingassociated with upper mantle plume and plume head influences.Fast directions in the Amundsen Sea region are approximately ra-dial to the MBL dome and may indicate a mantle flow pattern awayfrom the dome, or less clearly, from the complicated Cenozoic tec-tonics associated with Eocene-Oligocene convergence followed byNeogene extension responsible for the formation of extremely deepsubglacial basins and troughs in the region.
at Columbia U
niversity on May 22, 2014
http://gji.oxfordjournals.org/D
ownloaded from

Seismic anisotropy beneath W. Antarctica 13
A C K N OW L E D G E M E N T S
We thank Patrick Shore from Washington University, Tim Parker,Brian Bonnett, Guy Tytgat, Paul Carpenter from the IRIS PASS-CAL Instrument Center and many other individuals for field andtechnical assistance in acquiring POLENET data. We thank NickTeanby for use of his shear wave splitting analysis code. We thankTom Jordan for productive discussion concerning the Pagano ShearZone. Finally, we thank two anonymous reviewers for constructivecomments that improved this manuscript. Seismic instrumentationprovided and supported by the Incorporated Research Institutionsfor Seismology (IRIS) through the PASSCAL Instrument Centerat New Mexico Tech. Seismic data are available through the IRISData Management Center. The facilities of the IRIS Consortiumare supported by the National Science Foundation under Cooper-ative Agreement EAR-1063471, by NSF Polar Programs and theDOE National Nuclear Secuxstrity Administration. This researchwas funded by the National Science Foundation under grants ANT-0632209, ANT-0632185 and ANT-0632330.
R E F E R E N C E S
Alsina, D. & Snieder, R., 1995. Small-scale sublithospheric mantle deforma-tion: constraints from SKS splitting observations, Geophys. J. Int., 123,431–448.
Anderson, J.B., 1999. Antarctic Marine Geology, pp. 28–57, CambridgeUniv. Press.
Argus, D.F. & Gordon, R.G., 1991. No-net-rotation model of current platevelocities incorporating plate motion model NUVEL-1, Geophys. Res.Lett., 18(11), 2039–2042.
Argus, D.F., Gordon, R.G., Heflin, M.B., Ma, C., Eanes, R.J., Willis, P.,Peltier, W.R. & Owen, S.E., 2010. The angular velocities of the platesand the velocity of Earth’s center from space geodesy, Geophys. J. Int.,180(3), 913–960.
Aster, R., Shearer, P. & Berger, J., 1990. Quantitative measurements ofshear-wave polarizations at the Anza seismic network, southern Califor-nia – implications for shear-wave splitting and earthquake prediction,J. geophys. Res., 95, 12 449–12 474.
Bagley, B. & Nyblade, A.A., 2013. Seismic anisotropy in eastern Africa,mantle flow, and the African superplume, Geophys. Res. Lett., 40,1–6.
Balestrieri, M.L., Bigazzi, G., Ghezzo, C. & Lombardo, B., 1994. Fissiontrack dating from Granite Harbor Intrusive Suite and uplift-denudationhistory of the Transantarctic Mountains in the area between the Marinerand David Glaciers (Northern Victoria Land, Antarctica), Terra Antarc.,1, 82–87.
Barklage, M., Wiens, D.A., Nyblade, A. & Anandakrishnan, S., 2009. Uppermantle seismic anisotropy of South Victoria Land and the Ross Sea coast,Antarctica from SKS and SKKS splitting analysis, Geophys. J. Int., 178,729–741.
Barruol, G. & Mainprice, D., 1993. A quantitative evaluation of the con-tribution of crustal rocks to the shear-wave splitting of teleseismic SKSwaves, Earth planet. Sci. Lett., 78, 281–300.
Bayer, B., Muller, C., Eaton, D.W. & Jokat, W., 2007. Seismic anisotropy be-neath Dronning Maud Land, Antarctica, revealed by shear wave splitting,Geophys. J. Int., 171, 339–351.
Behrendt, J., 1999. Crustal and lithospheric structure of the West Antarcticrift system from geophysical investigations – a review, Global Planet.Change, 23(1–4), 25–44.
Behrendt, J.C. & Cooper, A.K., 1994. Evidence of rapid Cenzoic uplift of theshoulder of the West Antarctic rift system and a speculation on possibleclimate forcing, Geology, 19, 315–319.
Behrendt, J.C., LeMasurier, W.E., Cooper, A.K., Tessensohn, F., Trehu, A. &Damaske, D., 1991. Geophysical studies of the West Antarctic rift system,Tectonics, 10, 1257–1273.
Behrendt, J.C., Saltus, R., Damaske, D., McCafferty, A., Finn, C.A.,Blankenship, D. & Bell, R.E., 1996. Patterns of Late Cenozoic volcanicand tectonic activity in the West Antarctic rift system revealed by aero-magnetic surveys, Tectonics, 15, 660–676.
Bialas, R.W., Buck, W.R., Studinger, M. & Fitzgerald, P., 2007. Plateau Col-lapse model for the Transantarctic Mountains/West Antarctic rift system:insights from numerical experiments, Geology, 35(8), 687–690.
Bialis, R.W., Buck, W.P. & Qin, R., 2010. How much magma is required torift a continent? Earth planet. Sci. Lett., 292, 68–78.
Bingham, R.G., Ferraccioli, F., King, E.C., Larter, R.D., Pritchard, H.D.,Smith, A.M. & Vaughan, D.G., 2012. Inland thinning of the West AntarcticIce Sheet steered along subglacial rifts, Nature, 487, 468–471.
Blackman, D.K., Von Herzen, R.P. & Lawver, L.A., 1987. Heat flow andtectonics in the western Ross Sea, Antarctica, Earth Sci. Ser., 5B, 179–189.
Blackman, D.K. & Kendall, J.M., 1997. Sensitivity of teleseismic bodywaves to mineral texture and melt in the mantle beneath a mid-oceanridge, Phil. Trans. R. Soc. Lond., A, 355, 217–231.
Blackman, D.K., Kendall, J.M., Dawson, P.R., Wenk, H.R., Boyce, D. &Morgan, J.P., 1996. Teleseismic imaging of subaxial flow at mid-oceanridges: traveltime effects of anisotropic mineral texture in the mantle,Geophys. J. Int., 127, 415–426.
Borg, S.C., DePaolo, D.J. & Smith, B.M., 1990. Isotopic structure andtectonics of the central Transantarctic Mountains, J. geophys. Res., 95,6647–6667.
Bradshaw, J.D., 1989. Cretaceous geotectonic patterns in the New Zealandregion, Tectonics, 8(4), 803–820.
Buck, W.R., 2004. Consequences of asthenospheric variability on continen-tal rifting, in Rheology and Deformation of the Lithosphere at ContinentalMargins, eds Karner, G.D., Taylor, B., Driscoll, N.W. & Kohlstedt, D.L.,pp. 1–30, Columbia Univ. Press.
Busetti, M., Spadini, G., van der Wateren, F.M., Cloetingh, C. & Zonolla,C., 1999. Kinematic modeling of the West Antarctic rift system, RossSea, Antarctica, Global Planet. Change, 23, 79–103.
Cande, S.C., Stock, J.M., Mueller, R.D. & Ishihara, T., 2000. Cenozoicmotion between east and West Antarctica, Nature, 404, 145–150.
Chaput, J. et al., 2014. Crustal thickness across West Antarctica, J. geophys.Res., 119, 1–18.
Clarkson, P.D. & Brook, M., 1977. Age and position of the Ellsworth Moun-tains crustal fragment, Antarctica, Nature, 265(5595), 615–616.
Clitheroe, G. & van der Hilst, R.D., 1998. Complex anisotropy in the Aus-tralian lithosphere from shear-wave splitting in broad-band SKS records,in Structure and Evolution of the Australian Continent, Geodyn. Ser., vol.26, Braun, J. et al. pp. 73–78, AGU, Washington, D.C.
Clow, G.D. & Cuffey, K.M., 2012. High heat-flow beneath the central portionof the West Antarctic ice sheet, Abstract C31A-0577 presented at 2012Fall Meeting, AGU, San Francisco, CA, 3–7 Dec.
Curtis, M.L., 2001. Tectonic history of the Ellsworth Mountains, WestAntarctica: reconciling a Gondwana enigma, Geol. Soc. Am. Bull., 113(7),939–958.
Dalziel, I.W.D., 1992. Antarctica; a tale of two supercontinents, Ann. Res.Earth planet. Sci., 201, 501–526.
Dalziel, I.W.D., 2007. The Ellsworth Mountains: critical and enduringlyenigmatic, Antarctica: A Keystone in a Changing World—Online Pro-ceedings of the 10th ISAES, eds Cooper, A.K. & Raymond, C.R. et al.,U.S. Geol. Surv. Open-File Rep. 2007–1047, Short Research Paper 004,Santa Barbara, CA.
Dalziel, I.W.D. & Elliot, D.H., 1982. West Antarctica: problem child ofGondwanaland, Tectonics, 1, 3–19.
Debayle, E. & Yanick, R., 2013. Seismic observations of large-scale defor-mation at the bottom of fast-moving plates, Earth planet. Sci. Lett., 376,165–177.
Donnellan, A. & Luyendyk, B.P., 2004. GPS evidence for a coherent Antarc-tic plate and for postglacial rebound in Marie Byrd Land, Global Planet.Change, 42(1–4), 305–311.
Dunbar, N.W., McIntosh, W.C. & Esser, R.P., 2008. Physical setting andtephrochronology of the summit caldera ice record at Mount Moulton,West Antarctica, Geol. Soc. Am. Bull., 120(7–8), 796–812.
at Columbia U
niversity on May 22, 2014
http://gji.oxfordjournals.org/D
ownloaded from

14 N. J. Accardo et al.
Eilon, Z., Abers, G.A., Jin, G. & Gaherty, J.B., 2014. Anisotropy beneath ahighly extended continental rift, Geochem. Geophys. Geosyst., 15, 545–564.
Fielding, C.R., Whittaker, J., Henrys, S.A., Wilson, T.J. & Naish, T.R., 2008.Seismic facies and stratigraphy of the Cenozoic succession in McMurdosound, Antarctica: implications for tectonic, climatic and glacial history,Palaeogeog. Palaeclimat. Palaeoecol., 260, 8–29.
Finn, C.A., Mueller, R.D. & Panter, K.S., 2005. A Cenozoic diffuse alkalinemagmatic province (DAMP) in the southwest pacific without rift or plumeorigin, Geochem. Geophys. Geosyst., 6, 26–26.
Fischer, K.M., Fouch, M.J., Wiens, D.A. & Boettcher, M.S., 1998.Anisotropy and flow in Pacific subduction zone back-arcs, Pure appl.Geophys., 151, 463–475.
Fitzgerald, P.G., 1992. The Transantarctic Mountains of southern VictoriaLand: the application of apatite fission track analysis to a rift shoulderuplift, Tectonics, 11, 634–662.
Fitzgerald, P.G., 1994. Thermochronologic constraints on post-Paleozoictectonic evolution of the central Transantarctic Mountains, Antarctica,Tectonics, 13, 818–836.
Fitzgerald, P.G., Sandford, M., Barrett, P.J. & Gleadow, A.J., 1986. Asym-metric extension associated with uplift and subsidence in the Transantarc-tic Mountains and Ross Embayment, Earth planet. Sci. Lett., 81, 67–78.
Fouch, M.J., Fischer, K.M., Parmentier, E.M., Wysession, M.E. & Clarke,T.J., 2000. Shear wave splitting, continental keels, and patterns of mantleflow, J. geophys. Res., 105, 6255–6275.
Fretwell, P. et al., 2013. Bedmap2: improved ice bed, surface and thicknessdatasets for Antarctica, Cryosphere, 7(1), 375–393.
Gaherty, J.B., 2001. Seismic evidence for hotspot-induced buoyant flowbeneath the reykjanes ridge, Science, 293(5535), 1645–1647.
Gao, S., Davis, P.M., Slack, P.D., Rigor, A.W., Zorin, Y.A., Mordvinova,V.V., Kozhevnikov, V.M. & Logatchev, N.A., 1997. SKS splitting beneathcontinental rift zones, J. geophys. Res., 102, 22 781–22 797.
Garnero, E.J., Maupin, V., Lay, T. & Fouch, M.J., 2004. Variable azimuthalanisotropy in Earth’s lowermost mantle, Science, 306(5694), 259–261.
Goldstrand, P.M., Fitzgerald, P.G., Redfield, T.F., Stump, E. & Hobbs, C.,1994. Stratigraphic evidence for the Ross Orogeny in the Ellsworth Moun-tains, West Antarctica: implication for the evolution of the paleo-Pacificmargin of Gondwana, Geology, 22, 427–430
Granot, R., Cande, S.C., Stock, J.M., Davey, F.J. & Clayton, R.W.,2010. Postspreading rifting in the Adare Basin, Antarctica: regionaltec- tonic consequences, Geochem. Geophys. Geosyst., 11, Q08005,doi:10.1029/2010GC003105.
Granot, R., Cande, S.C., Stock, J.M. & Damaske, D., 2013. Revised Eocene-Oligocene kinematics for the West Antarctic rift system, Geophys. Res.Lett., 40, 279–284.
Grindley, G.W. & Oliver, P.J., 1983. Palaeomagnetism of Cretaceous vol-canic rocks from Marie Byrd Land, Antarctica, in Antarctic Earth Science,pp. 573–578, eds Oliver, R.L. et al., Aust. Acad. Sci.
Grunow, A.M., Dalziel, I.W.D. & Kent, D.V., 1987. Ellsworth-WhitmoreMountains crustal block, western Antarctica: new paleomagnetic resultsand their tectonic significance, in Gondwana Six: Structure, Tectonics andGeophysics, Geophysical Monograph vol. 40, pp. 161–171, ed. McKen-zie, G.D., American Geophysical Union.
Hamilton, R.J., Luyendyk, B.P., Sorlien, C.C. & Bartek, L.R., 2001. Ceno-zoic tectonics of the Cape Roberts rift basin and transantarctic mountainsfront, southwestern Ross Sea, Antarctica, Tectonics, 20(3), 325–342.
Handler, M.R., Wysoczanski, R.J., Gamble, J.A., Horan, M.F., Brandon,A.D. & Neal, C.R., 2003. Proterozoic lithosphere in Marie Byrd Land,West Antarctica: Re-Os systematics of spinel peridotite xenoliths, Chem.Geol., 196(1–4), 131–145.
Henrys, S., Wilson, T., Whittaker, J.M., Fielding, C.R., Hall, J. & Naish, T.R.,2007. Tectonic history of mid-miocene to present southern victoria landbasin, inferred from seismic stratigraphy in McMurdo Sound, Antarctica,Open-File Rep, U.S. Geol. Surv., Short Research Paper 049.
Hernandez, S., Wiens, D., Anandakrishnan, S., Aster, R., Huerta, A.,Nyblade, A. & Wilson, T., 2009. Seismic anisotropy of the Antarcticupper mantle from shear wave splitting analysis of POLENET and AGAPseismograms, EOS, Trans. Am. geophys. Un., Fall Meet. Suppl.
Heeszel, D. et al., , 2011. Seismic velocity structure of Antarctica from datacollected during IPY, In Proceedings of the 11th International Symposiumon Antarctic Earth Sciences, Edinburgh, Scotland, 10–16 July, 2011.
Hole, M.J. & LeMasurier, ,W.E., 1994. Tectonic controls on the geochem-ical composition of Cenozoic, mafic alkaline volcanic rocks from WestAntarctica, Contri. Mineral. Petrol., 117(2), 187–202.
Huerta, A.D. & Harry, D.L., 2007. The transition from diffuse to focusedextension: modeled evolution of the West Antarctic rift system, Earthplanet. Sci. Lett., 255, 133–147.
Ingersoll, R.V., Cavazza, W., Baldridge, W.S. & Shafiqullah, M., 1990. Ceno-zoic sedimentation and paleotectonics of north-central New Mexico: im-plications for initiation and evolution of the Rio Grande Rift, Geol. Soc.Am. Bull., 102 (9),1280–1296.
Jordan, T.A., Ferraccioli, F., Vaughan, D.G., Holt, J.W., Corr, H., Blanken-ship, D.D. & Diehl, T.M., 2010. Aerogravity evidence for major crustalthinning under the Pine Island Glacier region (West Antarctica), Geol.Soc. Am. Bull., 122(5–6), 714–726.
Jordan, T.A. et al., 2013. Inland Extent of the Weddell Sea Rift imaged bynew aerogeophysical data, Tectonophysics, 585, 137–160.
Jung, H. & Karato, S., 2001. Water-induced fabric transitions in olivine,Science, 293, 1460–1463.
Katayama, I., Jung, H. & Karato, S., 2004. New type of olivine fabric fromdeformation experiments at modest water content and low stress, Geology,32, 1045–1048.
Karner, G.D., Studinger, M. & Bell, R.E., 2005. Gravity anomalies of sed-imentary basins and their mechanical implications: Application to theRoss Sea basins, West Antarctica, Earth planet. Sci. Lett., 235(3–4), 577–596.
Keller, G.R., Khan, M.A., Morgan, P., Wendlandt, R.F., Baldridge, W.S.,Olsen, K.H. & Braile, L.W., 1991. A comparative study of the Rio Grandeand Kenya rifts, Tectonophysics, 197, 355–371.
Karato, S., Jung, H., Katayama, I. & Skemer, P., 2008. Geodynamic sig-nificance of seismic anisotropy of the upper mantle: new insights fromlaboratory studies, Annu. Rev. Earth planet. Sci., 36, 59–95.
Kendall, J., Stuart, G.W., Ebinger, C.J., Bastow, I.D. & Keir, D., 2005.Magma-assisted rifting in Ethiopia, Nature, 433, 146–148.
LeMasurier, W.E., 1990. Late Cenozoic volcanism on the Antarctic plate:an overview, Antarctic Res. Ser., 48, 1–17.
LeMasurier, W.E., 2008. Neogene extension and basin deepening in thewest antarctic rift inferred from comparisons with the East African riftand other analogs, Geology, 36, 247–250.
LeMasurier, W.E. & Rex, D.C., 1989. Evolution of linear volcanic ranges inMarie Byrd Land, West Antarctica, J. geophys. Res., 94, 7223–7236.
Lloyd, A. et al., 2012. Reconciling geophysical and geochemical observa-tions to understand craton lithosphere architecture, Abstract T23C-2695presented at 2012 Fall Meeting, AGU, San Francisco, CA, 3–7 Dec.
Lloyd, A.J., Nyblade, A.A., Wiens, D.A., Hansen, S.E., Kanao, M., Shore,P.J. & Zhao, D., 2013. Upper mantle seismic structure beneath centralEast Antarctica from body wave tomography: implications for the originof the Gamburtsev Subglacial Mountains, Geochem. Geophys. Geosyst.,14, 902–920.
Logatchev, N.A., Zorin, Y.A. & Rogozhina, V.A., 1983. Baikal Rift: active orpassive? Comparison of the Baikal and Kenya rift zones, Tectonophysics,94, 223–240.
Long, M.D. & Becker, T.W., 2010. Mantle dynamics and seismic anisotropy,Earth planet. Sci. Lett., 297, 341–354.
Long, M.D. & Silver, P.G., 2009. Shear wave splitting and mantle anisotropy:measurements, interpretations, and new directions, Surv. Geophys., 30,407–461.
Lough, A.C. et al., 2013. Seismic detection of an active subglacial magmaticcomplex in Marie Byrd Land, Antarctica, Nature Geosci., 6, 1031–1035.
Luyendyk, B.P., 1995. Hypothesis for cretaceous rifting of east Gondwanacaused by subducted slab capture, Geology, 23, 373–376.
McKenzie, D., 1979. Finite deformation during fluid flow, Geophys. J. R.astr. Soc., 58, 689–715.
Mainprice, D., Tommasi, A., Couvy, H., Cordier, P. & Frost, D.J., 2005.Pressure sensitivity of olivine slip systems and seismic anisotropy ofEarth’s upper mantle, Nature, 433, 731–733.
at Columbia U
niversity on May 22, 2014
http://gji.oxfordjournals.org/D
ownloaded from

Seismic anisotropy beneath W. Antarctica 15
Miller, M.S. & Becker, T.W., 2012. Mantle flow deflected by interactionsbetween subducted slabs and cratonic keels, Nature Geosci., 5, 726–730.
Miller, S.R., Fitzgerald, P.G. & Baldwin, S.L., 2001. Structure and kine-matics of the central transantarctic mountains: constraints from structuralgeology and geomorphology near cape surprise, Terra Antarc., 8(1), 11–24.
Miller, M.S., Allam, A.A., Becker, T.W., Di Leo, J.F. & Wookey, J., 2013.Constraints on the tectonic evolution of the westernmost Mediterraneanand northwestern Africa from shear wave splitting analysis, Earth planet.Sci. Lett., 375, 234–243.
Minster, J.B., Jordan, T.H., Molnar, P. & Haines, E., 1974. Numerical mod-elling of instantaneous plate tectonics-, Geophys. J. R. astr. Soc., 36,541–576.
Mukasa, S.B. & Dalziel, I.W.D., 2000. Marie Byrd Land, West Antarc-tica: evolution of Gondwana’s Pacific margin constrained by zircon U-Pbgeochronology and feldspar common-Pb isotopic compositions, Geol.Soc. Am. Bull., 112, 611–627.
Muller, C., 2001. Upper mantle seismic anisotropy beneath Antarctica andthe Scotia Sea region, Geophys. J. Int., 147, 105–122.
Nyblade, A. et al. 2012. A facility plan for polar seismic and geodeticscience: meeting community needs through IRIS and UNAVCO polarservices, Facility working plan and report for the National Science Foun-dation, Polar Networks Science Committee.
Obrebski, M., Castro, R.R., Valenzuela, R.W., van Benthem, S. & Rebollar,C.J., 2006. Shear-wave splitting observations at the regions of NorthernBaja California and southern basin and range in Mexico, Geophys. Res.Lett., 33(5), doi:10.1029/2005GL024720.
Panning, M. & Romanowicz, B., 2006. A three-dimensional radiallyanisotropic model of shear velocity in the whole mantle, Geophys. J.Int., 167, 361–379.
Randall, D.E. & Mac Niocaill, C., 2004. Cambrian palaeomagnetic dataconfirm a natal embayment location for the Ellsworth-Whitmore moun-tains, Antarctica, in Gondwana reconstructions, Geophys. J. Int., 157(1),105–116.
Reading, A.M. & Heintz, M., 2008. Seismic anisotropy of East Antarc-tica from shear-wave splitting: spatially varying contributions from litho-spheric structural fabric and mantle flow? Earth planet. Sci. Lett., 268,433–443.
Ritsema, J., Heijst, H.J. van & Woodhouse, J.H., 1999. Complex shear wavevelocity structure imaged beneath Africa and Iceland, Science, 286, 1925–1928.
Rocchi, S., Amienti, P., D’Orazio, M., Tonarini, S., Wijbrans, J.R. &Vincenzo, G.D., 2002. Cenozoic magmatism in the western Ross Em-bayment: role of mantle plume versus plate dynamics in the developmentof the West Antarctic rift system, J. geophys. Res., 107, ECV 5-1–ECV5-22.
Rowell, A.J., Van Schmus, W.R., Storey, B.C., Fetter, A.H. & Evans, K.R.,2001. Latest neoproterozoic to mid-cambrian age for the main deforma-tion phases of the transantarctic mountains: new stratigraphic and isotopicconstraints from the Pensacola mountains, Antarctica, J. geol. Soc. Lond.,158(2), 295–308
Rumpker, G. & Silver, P.G., 2000. Calculating splitting parameters forplume-type anisotropic structures of the upper mantle, Geophys. J. Int.,143, 507–520
Savage, M.K., 1999. Seismic anisotropy and mantle deformation: what havewe learned from shear wave splitting? Rev. Geophys., 37, 65–106.
Schilling, J.G., 1973a. Afar Mantle Plume: rare earth evidence, Nature, 242,2–5.
Schilling, J.G., 1973b. Iceland mantle plume: geochemical study of Reyk-janes Ridge, Nature, 242, 565–571.
Schopf, J.M., 1969. Ellsworth Mountains: position in West Antarctica dueto sea-floor spreading, Science, 164(3875), 63–66.
Siddoway, C.S., Baldwin, S.L., Fitzgerald, P.G., Fanning, C.M. & Luyendyk,B.P., 2004. Ross Sea mylonites and the timing of intracontinental exten-sion within the West Antarctic rift system, Geology, 32, 57–60.
Sieminski, A., Debayle, E. & Leveque, J.J., 2003. Seismic evidence for deeplow-velocity anomalies in the transition zone beneath West Antarctica,Earth planet. Sci. Lett., 216, 645–661.
Silver, P.G., 1996. Seismic anisotropy beneath the continents: probing thedepths of geology, Ann. Rev. Earth planet. Sci., 24, 385–432.
Silver, P.G. & Chan, W.W., 1988. Implications for continental structure andevolution from seismic anisotropy, Nature, 335, 34–39.
Silver, P.G. & Chan, W.W., 1991. Shear wave splitting and subcontinentalmantle deformation, J. geophys. Res., 96, 16 429–16 454.
Stamps, D.S., Calais, E., Saria, E., Hartnady, C., Nocquet, J.-M., Ebinger,C.J. & Fernandes, R.M., 2008. A kinematic model for the East AfricanRift, Geophys. Res. Lett., 35, L05304, doi:10.1029/2007GL032781.
Storey, B.C. & Dalziel, I.W.D., 1987. Outline of the structural and tec-tonic history of the Ellsworth Mountains-Thiel Mountains Ridge, WestAntarctica, in Gondwana Six: Structure, Tectonics, and Geophysics, pp.117–128, ed. McKenzie, G.D., American Geophysical Union, Geophys-ical Monograph Number 40.
Storey, B.C., 1995. The role of mantle plumes in continental breakup: casehistories from gondwanaland, Nature, 377(6547), 301–308.
Storey, B.C., Leat, P.T., Weaver, S.D., Pankhurst, R.J., Bradshaw, J.D. &Kelley, S., 1999. Mantle plumes and Antarctica-New Zealand rifting:evidence from mid-cretaceous mafic dykes, J. geol. Soc. Lond., 156, 659–671.
Stump, E., 1995. The Ross Orogen of the Transantarctic Mountains, Cam-bridge Univ. Press.
Stump, E. & Fitzgerald, P.G., 1992. Episodic uplift of the TransantarcticMountains, Geology, 20, 161–164.
Teanby, N.A., Kendall, J.M. & Van Der Baan, M., 2004. Automation ofshear-wave splitting measurements using cluster analysis, Bull. seism.Soc. Am., 94, 453–463.
Ten Brink, U.T., Hackeny, R.I., Bannister, S., Stern, T.A. & Makowsky, Y.,1997. Uplift of the Transantarctic Mountains and the bedrock beneath theEast Antarctic ice sheet, J. geophys. Res., 102, 27 603–27 622.
Thybo, H. & Nielsen, C., 2009, Magma-compensated crustal thinning incontinental rift zones, Nature, 457, 873–876.
Trey, H., Cooper, A.K., Pellis, G., della Vedova, B., Cochrane, G., Brancol-ini, G. & Makris, J., 1999. Transect across the West Antarctic rift systemin the Ross Sea, Antarctica, Tectonophysics, 301, 61–74.
Usui, Y., Kanao, M., Kubo, A., Hiramatsu, Y. & Negishi, H., 2007. Uppermantle anisotropy from teleseismic SKS splitting beneath Lutzow-HolmBay region, East Antarctica: a keystone in a changing world-online pro-ceedings of the 10th ISAES, eds Cooper, A.K. et al., Open-File Rep, U.S.Geol. Surv. 2007–1047, Short Research Paper 013, 4 p.
Vauchez, A., Tommasi, A., Barruol, G. & Maumus, J., 2000. Upper man-tle deformation and seismic anisotropy in continental rifts, Phys. Chem.Earth, 25, 111–117.
Vinnik, L.P., Makeyeva, L.I., Milev, A. & Usenko, A.Y., 1992. Global pat-terns of azimuthal anisotropy and deformations in the continental mantle,Geophys. J. Int., 111, 433–447.
Walker, K.T., Nyblade, A.A., Klemperer, S.L., Bokelmann, G.H.R. &Owens, T.J., 2004. On the relationship between extension and anisotropy:constraints from shear wave splitting across the East African plateau, J.geophys. Res., 109, 1–21.
Walker, K.T., Bokelmann, G.H. R., Klemperer, S.L. & Bock, G., 2005.Shear-wave splitting around the Eifel hotspot: evidence for a mantle up-welling, Geophys. J. Int., 163, 962–980.
Wang, X., Ni, J., Aster, R., Sandvol, E., Wilson, D., Sine, C., Grand, S. &Baldridge, W.S., 2008. Shear wave splitting and mantle flow beneath theColorado Plateau and its boundary with the Great Basin, Bull. seism. Soc.Am., 98, 2526–2532.
Watts, D.R. & Bramall, A.M., 1981. Paleomagnetic evidence for a displacedterrain in western Antarctica, Nature, 293(5834), 638–641.
Weaver, S.D., Storey, B.C., Pankhurst, R.J., Mukasa, S.B., DiVenere, V.J. &Bradshaw, J.D., 1994. Antarctica-New Zealand rifting and Marie ByrdLand lithospheric magmatism linked to ridge subduction and mantleplume activity, Geology, 22, 811–814.
Wilson, T.J., 1995. Cenozoic transtension along the TransantarcticMountains-West Antarctic rift boundary, southern Victoria Land, Antarc-tica, Tectonics, 14, 531–545.
Wilson, D.S. & Luyendyk, B.P., 2006. Bedrock platforms within the rossembayment, west antarctica: hypotheses for ice sheet history, wave
at Columbia U
niversity on May 22, 2014
http://gji.oxfordjournals.org/D
ownloaded from

16 N. J. Accardo et al.
erosion, cenozoic extension, and thermal subsidence, Geochem. Geophys.Geosyst., 7(12), doi:10.1029/2006GC001294.
Wilson, T. & The POLENET Group, 2011. The Antarctic-POLENET(ANET) GPS Network in West Antarctica, In Proceedings ofthe 11th International Symposium on Antarctic Earth Sciences,Edinburgh, 10–16 July, 189. Available at: http://www.isaes2011.org.uk/abstracts_v4_20_07_2011.pdf (last accessed 2 March 2014).
Winberry, J.P. & Anandakrishnan, S., 2004. Crustal structure of the WestAntarctic rift system and Marie Byrd Land hotspot, Geology, 32, 977–980.
Wolfe, C.J. & Silver, P.G., 1998. Seismic anisotropy of oceanic upper mantle:shear wave splitting methodologies and observations, J. geophys. Res.,103, 749–771
Wolfe, C.J. & Solomon, S.C., 1998. Shear-wave splitting and implicationsfor mantle flow beneath the MELT region of the East Pacific Rise, Science,280, 1230–1232.
Wustefeld, A. & Bokelmann, G., 2007. Null detection in shear-wave splittingmeasurements, Bull. seism. Soc. Am., 97, 1204–1211,
Xue, M. & Allen, R., 2005. Asthenospheric channeling of the Icelandicupwelling: evidence from seismic anisotropy, Earth planet. Sci. Lett.,235, 167–182.
Xue, M. & Allen, R.M., 2006. Origin of the newberry hotspot track; evidencefrom shear-wave splitting, Earth planet. Sci. Lett., 244, 315–322.
Zhang, S. & Karato, S., 1995. Lattice preferred orientation of olivine aggre-gates deformed in simple shear, Nature, 375, 774–777.
S U P P O RT I N G I N F O R M AT I O N
Additional Supporting Information may be found in the online ver-sion of this article:
Figure S1. Individual A and B quality splitting results for all eventsstacked in the final solutions for all stations used in this study.Table S1. A summary of individual splitting results for all eventsstacked in the final solutions for all stations used in this study.Parameters listed include the station of interest, the event time,the core-phase used, the SNR for the radial (R-SNR), transverse(T-SNR), and vertical (Z-SNR) components, the back-azimuth forthe event-station pair (BAZ), the polarization azimuth (PAZ), theorientation of the fast axis, the magnitude of the delay time (Lag),and the graded quality of the measurement (Grade).(http://gji.oxfordjournals.org/lookup/suppl/doi:10.1093/gji/ggu117/-/ DC1).
Please note: Oxford University Press is not responsible for the con-tent or functionality of any supporting materials supplied by theauthors. Any queries (other than missing material) should be di-rected to the corresponding author for the article.
at Columbia U
niversity on May 22, 2014
http://gji.oxfordjournals.org/D
ownloaded from
Copyright © 2022 FDOKUMEN