Deformation coupling between the Archean Pukaskwa intrusive complex and the Hemlo shear zone,...
12
Deformation coupling between the Archean Pukaskwa intrusive complex and the Hemlo shear zone, Superior Province, Canada Nathaniel T. Liodas a , Aude Gébelin b,c , Eric C. Ferré a, ⁎, Girmay M. Misgna d a Department of Geology, Southern Illinois University, Carbondale, IL 62901, USA b Biodiversity and Climate Research Centre (BiK-F), Senckenberganlage 25, 60325 Frankfurt/Main, Germany c Department of Earth Sciences, University of Waterloo, Waterloo, Ontario N2L3G1, Canada d Environmental Resources and Policy, Southern Illinois University, Carbondale, IL 62901, USA abstract article info Article history: Received 19 February 2013 Received in revised form 12 June 2013 Accepted 20 June 2013 Available online 28 June 2013 Keywords: Archean Pukaskwa Hemlo TTG Superior Province AMS Archean greenstone belts typically form narrow sheared basins separating bulbous tonalo–trondjhemo– granodioritic (TTG) intrusive complexes. The role played by gravity in the development of such dome-and-keel structures constitutes a key question in Archean tectonics. The Pukaskwa intrusive complex (PIC)–Hemlo green- stone belt system stands as a remarkable example of the dome-and-keel architecture that commonly occurs in Archean terrains. Abundant strain markers in the greenstone belt and in the Hemlo shear zone (HSZ) attest of late sinistral strike-slip kinematics (D 2 ) whereas, in general, the quartzofeldspathic coarse-grained rocks of the Pukaskwa intrusive complex bear little macroscopically visible kinematic indicators, most likely due to pervasive recrystallization. The PIC consists dominantly of a heterogeneous assemblage of TTG plutonic rocks and gneisses, which overall are less dense than the greenstone rocks. The study of anisotropy of magnetic susceptibility (AMS), based on 120 stations and 1947 specimens from the PIC, reveals east–west trending prolate and plano-linear fabrics across the northern margin of the complex, i.e., along the HSZ. Since geotherms were higher in the Archean than in the present, the effective viscosity of the TTG units would have been sufficiently low to allow their diapiric ascent through denser greenstone rocks. Here we propose an alternative model where thrust tectonics is responsible for the early structuration of the PIC. Later transpressive tectonics causes strain localiza- tion along internal strike-slip shear zones and along lithological boundaries. © 2013 Elsevier B.V. All rights reserved. 1. Introduction Density contrasts in a thin and hot lithosphere might have been the main force driving Archean orogenesis rather than plate tectonics (e.g., Chardon et al., 2009; Hamilton, 1998). Yet evidence for early plate tectonics makes this issue rather controversial (de Wit, 1998; Percival, 1994). The dynamic relationship between greenstone belts and tonalo–trondjhemo–granodioritic (TTG) complexes appears cen- tral in the “vertical tectonics” vs “horizontal tectonics” debate. The rela- tively low density of TTG complexes and associated anatectic gneisses might have allowed their diapiric rise through an overburden made of higher density mafic to ultramafic greenstone volcano-sedimentary rocks (Dixon and Summers, 1983). The geometry resulting from such process would resemble that of metamorphic core complexes (Lister and Davis, 1989). Alternatively, greenstone belts may have provided a buttress against which TTG complexes were emplaced. These two tec- tonic scenarios are not fundamentally incompatible and might have oc- curred simultaneously in the same region (Lin, 2005). Density-driven tectonics resulted in formation of large-scale dome-and-keel structures that characterize Archean terrains (Chardon et al., 1996; Harris et al., 2012; Lana et al., 2010; Lin, 2005; Sandiford et al., 2004; Shackleton, 1995; Van Kranendonk et al., 2010). Interference folding has also been proposed as a mechanism to explain structural domes within the Archean Chinamora batholith in Zimbabwe (Snowden and Bickle, 1976). In order to advance our understanding of these important tectonic issues, we chose to study a representative example of a dome-and- keel structure in the Archean Superior Province, the Pukaskwa intru- sive complex (PIC)–Hemlo shear zone (HSZ) system (Fig. 1). The Hemlo greenstone belt is part of the Wawa subprovince to the south of the Superior Province and is bounded to the south by the Pukaskwa granodiorite. A strong deformation can be defined along the northern margin of the granitic complex while moving away from the contact zone macroscopic structural markers become scarce. With the anisot- ropy of magnetic susceptibility study (AMS) being recognized as a powerful technique for quantifying strain in weakly deformed rocks, particularly in granitic, gneissic and migmatitic domains (Charles et al., 2009; Ferré et al., 2003, 2004; Gébelin et al., 2006; Hasalova et al., 2008; Kruckenberg et al., 2010, 2011; Polteau et al., 2008; Schulmann et al., 2009), we conducted a AMS study in the northern margin of the PIC to better understand its mechanism of emplacement and to investigate the role played by vertical and horizontal tectonics Tectonophysics 608 (2013) 1226–1237 ⁎ Corresponding author. Tel.: +1 6184537368; fax: +1 6184537393. E-mail address: [email protected] (E.C. Ferré). 0040-1951/$ – see front matter © 2013 Elsevier B.V. All rights reserved. http://dx.doi.org/10.1016/j.tecto.2013.06.022 Contents lists available at ScienceDirect Tectonophysics journal homepage: www.elsevier.com/locate/tecto
Transcript of Deformation coupling between the Archean Pukaskwa intrusive complex and the Hemlo shear zone,...

Tectonophysics 608 (2013) 1226–1237
Contents lists available at ScienceDirect
Tectonophysics
j ourna l homepage: www.e lsev ie r .com/ locate / tecto
Deformation coupling between the Archean Pukaskwa intrusive complex and theHemlo shear zone, Superior Province, Canada
Nathaniel T. Liodas a, Aude Gébelin b,c, Eric C. Ferré a,⁎, Girmay M. Misgna d
a Department of Geology, Southern Illinois University, Carbondale, IL 62901, USAb Biodiversity and Climate Research Centre (BiK-F), Senckenberganlage 25, 60325 Frankfurt/Main, Germanyc Department of Earth Sciences, University of Waterloo, Waterloo, Ontario N2L3G1, Canadad Environmental Resources and Policy, Southern Illinois University, Carbondale, IL 62901, USA
⁎ Corresponding author. Tel.: +1 6184537368; fax: +E-mail address: [email protected] (E.C. Ferré).
0040-1951/$ – see front matter © 2013 Elsevier B.V. Allhttp://dx.doi.org/10.1016/j.tecto.2013.06.022
a b s t r a c t
a r t i c l e i n f oArticle history:Received 19 February 2013Received in revised form 12 June 2013Accepted 20 June 2013Available online 28 June 2013
Keywords:ArcheanPukaskwaHemloTTGSuperior ProvinceAMS
Archean greenstone belts typically form narrow sheared basins separating bulbous tonalo–trondjhemo–granodioritic (TTG) intrusive complexes. The role played by gravity in the development of such dome-and-keelstructures constitutes a key question in Archean tectonics. The Pukaskwa intrusive complex (PIC)–Hemlo green-stone belt system stands as a remarkable example of the dome-and-keel architecture that commonly occurs inArchean terrains. Abundant strain markers in the greenstone belt and in the Hemlo shear zone (HSZ) attest oflate sinistral strike-slip kinematics (D2) whereas, in general, the quartzofeldspathic coarse-grained rocks of thePukaskwa intrusive complex bear little macroscopically visible kinematic indicators, most likely due to pervasiverecrystallization. The PIC consists dominantly of a heterogeneous assemblage of TTG plutonic rocks and gneisses,which overall are less dense than the greenstone rocks. The study of anisotropy of magnetic susceptibility(AMS), based on 120 stations and 1947 specimens from the PIC, reveals east–west trending prolate andplano-linear fabrics across the northernmargin of the complex, i.e., along the HSZ. Since geotherms were higherin the Archean than in the present, the effective viscosity of the TTG units would have been sufficiently low toallow their diapiric ascent through denser greenstone rocks. Herewe propose an alternativemodel where thrusttectonics is responsible for the early structuration of the PIC. Later transpressive tectonics causes strain localiza-tion along internal strike-slip shear zones and along lithological boundaries.
© 2013 Elsevier B.V. All rights reserved.
1. Introduction
Density contrasts in a thin and hot lithosphere might have beenthe main force driving Archean orogenesis rather than plate tectonics(e.g., Chardon et al., 2009; Hamilton, 1998). Yet evidence for earlyplate tectonics makes this issue rather controversial (de Wit, 1998;Percival, 1994). The dynamic relationship between greenstone beltsand tonalo–trondjhemo–granodioritic (TTG) complexes appears cen-tral in the “vertical tectonics” vs “horizontal tectonics” debate. The rela-tively low density of TTG complexes and associated anatectic gneissesmight have allowed their diapiric rise through an overburden made ofhigher density mafic to ultramafic greenstone volcano-sedimentaryrocks (Dixon and Summers, 1983). The geometry resulting from suchprocess would resemble that of metamorphic core complexes (Listerand Davis, 1989). Alternatively, greenstone belts may have provided abuttress against which TTG complexes were emplaced. These two tec-tonic scenarios are not fundamentally incompatible andmight have oc-curred simultaneously in the same region (Lin, 2005). Density-driventectonics resulted in formation of large-scale dome-and-keel structures
1 6184537393.
rights reserved.
that characterize Archean terrains (Chardon et al., 1996; Harris et al.,2012; Lana et al., 2010; Lin, 2005; Sandiford et al., 2004; Shackleton,1995; Van Kranendonk et al., 2010). Interference folding has also beenproposed as amechanism to explain structural domeswithin theArcheanChinamora batholith in Zimbabwe (Snowden and Bickle, 1976).
In order to advance our understanding of these important tectonicissues, we chose to study a representative example of a dome-and-keel structure in the Archean Superior Province, the Pukaskwa intru-sive complex (PIC)–Hemlo shear zone (HSZ) system (Fig. 1). TheHemlo greenstone belt is part of the Wawa subprovince to the southof the Superior Province and is bounded to the south by the Pukaskwagranodiorite. A strong deformation can be defined along the northernmargin of the granitic complex while moving away from the contactzone macroscopic structural markers become scarce. With the anisot-ropy of magnetic susceptibility study (AMS) being recognized as apowerful technique for quantifying strain in weakly deformed rocks,particularly in granitic, gneissic and migmatitic domains (Charleset al., 2009; Ferré et al., 2003, 2004; Gébelin et al., 2006; Hasalovaet al., 2008; Kruckenberg et al., 2010, 2011; Polteau et al., 2008;Schulmann et al., 2009), we conducted a AMS study in the northernmargin of the PIC to better understand its mechanism of emplacementand to investigate the role played by vertical and horizontal tectonics
50
50
Heron Bay
17
Black-Pic Batholith
Gowan Lake Pluton
Fig. 10
Pukaskwa IntrusiveComplex
Heron Bay Pluton
LakeSuperior
Creek Cedar Lake PlutonStock
Cedar 48°4
5'N
48°3
5'N
85°30'W
86°00'W
White Lake
2678 Ma
2695 Ma
2688 Ma
2719 Ma
2688 Ma
2677 Ma
2697 Ma
2679 Ma
2698 Ma
2684 Ma
0 4 62
km
108
Manitoba
Quebec
Ontario
Wawa
U.S.A.
U.S.A.
study area
Hemlo deposit
Marathon
2688 Ma
Coldwell Alkalic Complex(Proterozoic)
Archean
Ultramafic intrusions
Mafic intrusions
dominated granodioritedominated tonalite
Metasedimentary rocks
& related metasedimentary rocksIntermediate to felsic metavolcanicMafic metavolcanic rocks
Fault
Hemlo gold deposit
Foliation
Lineation
U-Pb zircon age2688 Ma
Hemlo shear zone(H.S.Z.)
2718 Ma
1 12
2
Wawa
H.S.Z.
H.S.Z.H.S.Z.
H.S.Z.
6060
60 60
35
80
15
20 6525
20
6025
6030
5055
20
40
50
3035
3055
25
30
50
1025
25
30
4530 40
20 50 65
3585
80
55
5070
70
112A
29A
10A07A
57A
45
50
50
65
45
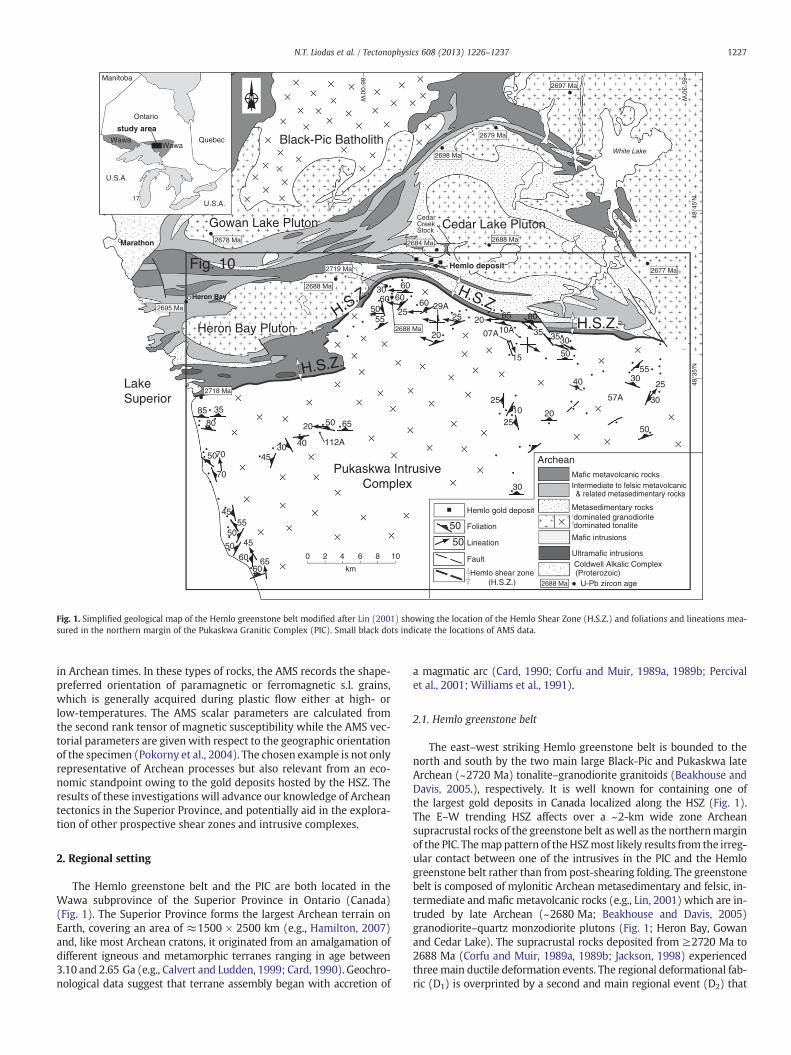
Fig. 1. Simplified geological map of the Hemlo greenstone belt modified after Lin (2001) showing the location of the Hemlo Shear Zone (H.S.Z.) and foliations and lineations mea-sured in the northern margin of the Pukaskwa Granitic Complex (PIC). Small black dots indicate the locations of AMS data.
1227N.T. Liodas et al. / Tectonophysics 608 (2013) 1226–1237
in Archean times. In these types of rocks, the AMS records the shape-preferred orientation of paramagnetic or ferromagnetic s.l. grains,which is generally acquired during plastic flow either at high- orlow-temperatures. The AMS scalar parameters are calculated fromthe second rank tensor of magnetic susceptibility while the AMS vec-torial parameters are given with respect to the geographic orientationof the specimen (Pokorny et al., 2004). The chosen example is not onlyrepresentative of Archean processes but also relevant from an eco-nomic standpoint owing to the gold deposits hosted by the HSZ. Theresults of these investigations will advance our knowledge of Archeantectonics in the Superior Province, and potentially aid in the explora-tion of other prospective shear zones and intrusive complexes.
2. Regional setting
The Hemlo greenstone belt and the PIC are both located in theWawa subprovince of the Superior Province in Ontario (Canada)(Fig. 1). The Superior Province forms the largest Archean terrain onEarth, covering an area of ≈1500 × 2500 km (e.g., Hamilton, 2007)and, like most Archean cratons, it originated from an amalgamation ofdifferent igneous and metamorphic terranes ranging in age between3.10 and 2.65 Ga (e.g., Calvert and Ludden, 1999; Card, 1990). Geochro-nological data suggest that terrane assembly began with accretion of
a magmatic arc (Card, 1990; Corfu and Muir, 1989a, 1989b; Percivalet al., 2001; Williams et al., 1991).
2.1. Hemlo greenstone belt
The east–west striking Hemlo greenstone belt is bounded to thenorth and south by the two main large Black-Pic and Pukaskwa lateArchean (~2720 Ma) tonalite–granodiorite granitoids (Beakhouse andDavis, 2005.), respectively. It is well known for containing one ofthe largest gold deposits in Canada localized along the HSZ (Fig. 1).The E–W trending HSZ affects over a ~2-km wide zone Archeansupracrustal rocks of the greenstone belt aswell as the northernmarginof the PIC. Themap pattern of the HSZmost likely results from the irreg-ular contact between one of the intrusives in the PIC and the Hemlogreenstone belt rather than from post-shearing folding. The greenstonebelt is composed of mylonitic Archean metasedimentary and felsic, in-termediate and mafic metavolcanic rocks (e.g., Lin, 2001) which are in-truded by late Archean (~2680 Ma; Beakhouse and Davis, 2005)granodiorite–quartz monzodiorite plutons (Fig. 1; Heron Bay, Gowanand Cedar Lake). The supracrustal rocks deposited from ≥2720 Ma to2688 Ma (Corfu and Muir, 1989a, 1989b; Jackson, 1998) experiencedthree main ductile deformation events. The regional deformational fab-ric (D1) is overprinted by a second and main regional event (D2) that
N075N075
N075N075
E
A B
C
E
D
F
N28
0N
280
HG
G´
1228 N.T. Liodas et al. / Tectonophysics 608 (2013) 1226–1237

A
C
Mag
Bt
Plag
Qtz
Kfs
Hbl
100 µm
B
D
Fig. 3. Photographs of the Pukaskwa intrusive complex. (A) Amphibolite intruded by fine-grained leucocratic layers. Note the boudinage deforming the two rock types; (B) Biotite–hornblende–alkali feldspar–plagioclase–quartz–magnetite paragenesis observed on granodiorite to quartz monzodiorite rocks; (C) amphibolite facies metamorphic rocksexperiencing partial melting. (D) Migmatite outcrop on the shoreline of Lake Superior (Oiseau Bay).
1229N.T. Liodas et al. / Tectonophysics 608 (2013) 1226–1237
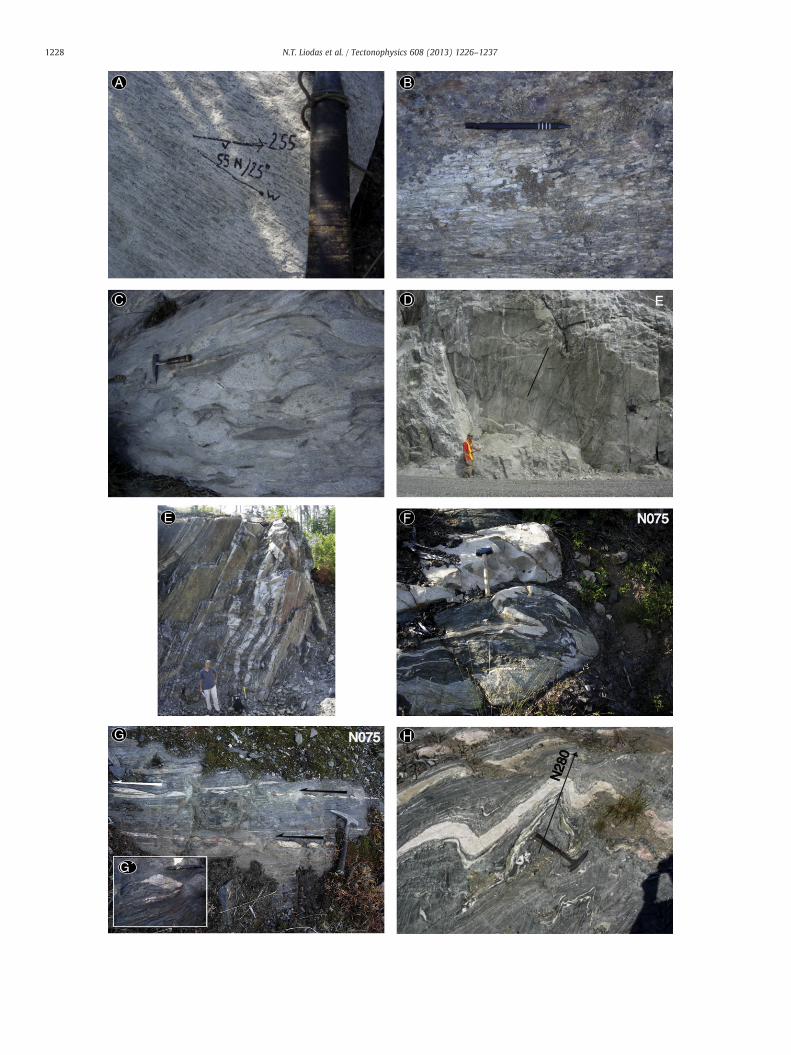
affects rocks within the HSZ. The foliation (S2) dips steeply to the north(Fig. 1) and the lineation (L2) defined by a preferred orientation of bio-tite and hornblende (Fig. 2A) and/or by elongate clasts in conglomerate(Fig. 2B) and/or volcaniclastic rocks (Fig. 2C) plunges steeply to thenorthwest in the shear zone center (Fig. 2D) tomoderatelymove south-ward to the contact with the PIC (Fig. 2A). The foliation (S2) is very wellobserved at the contact between the HSZ and the PICwhere it is definedby compositional layering with layers rich in biotite and/or hornblendealternating with those rich in feldspar ± quartz (Fig. 2E). Associatedfolds F2 are tight to isoclinal (Fig. 2F) and present a well-developedaxial planar foliation (S2). Kinematic criteria such as asymmetricfolds (Fig. 2F) or boudins (Fig. 2G) indicate a top-to-the west sense ofshearing. Based on the geometry of the main and possibly syn-D2 oredeposit and observation of both cigar-shaped and pancake-shapedstrain markers within the HSZ, Lin (2001) described it as a sinistraltranspressional zone. A third event D3, characterized by open to tightfolds with a well-developed axial planar crenulation cleavage(Fig. 2H) is coeval with an oblique dextral shearing event (Lin, 2001).The peak metamorphism of amphibolite facies that characterizedrocks of this region is dated at ~2677 Ma (Corfu and Muir, 1989a,1989b), late or after D2 but before D3 (Lin, 2001).
Fig. 2. Field photographs of the Hemlo shear zone. (A) Mineral lineation defined by biotite aPIC contact); (B) elongate clasts in conglomerate; (C) elongate clasts in volcaniclastic rocks; (layering of mafic (tonalite to granodiorite) and felsic layers at the contact between the HSZand fine-grained leucocratic layers, HSZ/PIC); (G) and (G′) Asymmetric boudins displaying aand fine-grained leucocratic layers. Note the well-developed axial planar crenulation cleava
2.2. Pukaskwa intrusive complex (PIC)
The PIC is bounded to the north by the Hemlo greenstone belt(Fig. 1) and to the south by the Mishibishu and Michipicoten green-stone belts. The lithologic diversity relates to the presence of pre-,syn-, and post-tectonic phases emplaced over an interval of 50 Mafrom 2718 to 2667 Ma (Beakhouse and Davis, 2005; Beakhouse etal., 2011; Corfu and Muir, 1989a, 1989b). Five main lithologic unitsare distinguished based on their petrological and geochemical fea-tures: 1) mafic amphibolite (Fig. 3A); 2) foliated to gneissic tonaliteto granodiorite (Fig. 2E); 3) granodiorite to quartz monzodiorite(Fig. 2A); 4) granite to granodiorite; and 5) pegmatite to aplite. Theamphibolites of probablemaficmetavolcanic origin are usually associ-ated with granitic pegmatitic to aplitic dikes (Fig. 3A). The gneissictonalites to granodiorites are thought to represent the pre-tectonicphases and derive from partial melting of basaltic crust at lower crustalor upper mantle depths. The granodiorite to quartz monzodiorite,which are more Mg-rich than the tonalite–granodiorite, but similarwith respect to the high-Al, show evidences of increasing ultramaficcomponents in their petrogenesis. Biotite and hornblende are the dom-inant minerals in equilibrium with titanomagnetite, alkali feldspar,
nd hornblende plunging gently to the west (granodiorite to quartz monzodiorite, HSZ/D) Graywacke displaying northwesterly plunging down-dip lineation; (E) Near verticaland the PIC; (F) Asymmetric fold indicating a sinistral sense of shearing (amphibolitic-top-to-the west; (H) Third fold generation overprinting the S2 foliation in amphiboliticge.

1230 N.T. Liodas et al. / Tectonophysics 608 (2013) 1226–1237
plagioclase and quartz (Fig. 3B). Granites and granodiorites representthe youngest phase and typically display a medium grained texture as-sociated with a weak foliation. These granites and granodiorites mostlikely derive from partial melting of intermediate to felsicmeta-igneous rocks. The lithological heterogeneities observed withinthe PIC must have caused significant rheological contrasts betweenrock types at high temperature leading to strain partitioning, particular-ly in areas around large amphibolite masses.
Most rocks show mineral assemblages typical of high-grade am-phibolite facies metamorphic rocks (Fig. 3B) with abundant evidenceof partial melting (Fig. 3C), giving rise to spectacular migmatites partic-ularly well exposed on the shoreline of Lake Superior (Fig. 3D). Mostoutcrops exhibit a prominent and constant metamorphic foliation dip-ping steeply to the north at the contact with the greenstone belt thatbecome variable away from it (Fig. 1). Mineral lineations trending~E–W and plunging from 25° to 60° preferentially to the west in thenorthern margin are hardly definable within the granitic complex.
At the microscopic scale, a few areas display distinctively smallgrain size (5–50 μm). Quartz rarely displays undulose extinction andplagioclase does not exhibit mechanical twins. Plagioclase is commonlypartially sericitized. Both hornblende and biotite form large subhedral,non-recrystallized grains (50–300 μm) that collectively mark a meta-morphic foliation (Fig. 3B). Titanomagnetite forms stocky to prismatic,euhedral grains ranging in size from 5 to 200 μm. These elongated
Heron Bay
17
Black-Pic Batholith
Gowan Lake Pluton
Pukaskwa IntrComplex
Heron Bay Pluton
LakeSuperior
86°00'W
2678 Ma
2695 Ma
2688 Ma 2719 Ma
2
0 4 62
km
108
Manitoba
Quebec
Ontario
Wawa
U.S.A.
U.S.A.
study area
Marathon
2688
2718 Ma
Wawa
H.S.Z.
150C
148A149
147A,C
146A145A144A143A
141A
142
140A139A
138137
126
134
136A135B
125A133B
105A106A107A
114A
112A
21A19A
18A17A14A
15A12A
22A
23A11C,D
113A
111A109A
108AFig.3D
Fig.3AFig.2F
Fig.2B
Fig.2A
Fig.2E
Fig.2G
FigF
Fig. 4. Simplified geological map of the Hemlo greenstone belt modified after Lin (200
grains are free of exsolutions and are generally parallel to the longaxis of mafic minerals (Fig. 3B).
Samples for AMS measurements were collected as most represen-tative in volume and attitude of metamorphic/plutonic structure forthe whole outcrop. This structural study excludes amphibolites, peg-matites and aplite dikes because these lithologic types represent lessthan 5% in volume of themain lithological phase. Due to limited acces-sibility in certain areas, sampling sites are heterogeneously distributedand concentrated on the northern margin of the PIC (Fig. 4).
3. Methods
3.1. Sampling procedure and sample preparation
A hundred and twenty oriented blocks (2–5 kg) were collected inthe northwestern part of the PIC for AMS measurements. The scarcityof rock exposure in this heavily forested region constitutes a problemfor sampling along a uniform grid. Oriented blocks were collectedmostly along the lake shore, creeks and a few rare roadcuts. Sampleswere located using a portable global positioning system unit andoriented with respect to true north using a Brunton compass withaccuracy better than 2°. At least two blocks were collected at eachsampling locality. Each blocked yielded between 15 and 25 cubes.The sampleswere first reoriented and cut into 18.5 mm-thick horizontal
usive
Creek Cedar Lake PlutonStock
Cedar 48°4
5'N
48°3
5'N
85°30'W
White Lake
2688 Ma
2677 Ma
2697 Ma
2679 Ma
2698 Ma
684 Ma
Hemlo deposit
Ma
Coldwell Alkalic Complex(Proterozoic)
Archean
Ultramafic intrusions
Mafic intrusions
dominated granodioritedominated tonalite
Metasedimentary rocks
& related metasedimentary rocksIntermediate to felsic metavolcanicMafic metavolcanic rocks
Fault
Stations
Hemlo gold deposit
U-Pb zircon age2688 Ma
Hemlo shear zone(H.S.Z.)
1 12
2
H.S.Z.
H.S.Z.
20 65
70A
118A117A
116A
56A
115A
69B
72B
83A24A25A
26A
29A
27A28A
33B
30A,B31B32A
91B 89A 04A
05A
10A
08C 09A
07A
03B
67A66A
80A76A
37A39A42B
35A
36A43A
44B
52A
50A 49A
48A47A 45A
57A
74B62A
61A
60A
59A
63A
38C
70A
.3Cig.2H
Fig.2C-2D
1) showing the location of sampling sites and photographs seen in Figs. 2 and 3.
1231N.T. Liodas et al. / Tectonophysics 608 (2013) 1226–1237
slabs, then cut into cubes. This process yielded 1947 oriented cubicspecimens.
3.2. Measurements
AMS measurements were carried out on a KLY-4S Kappabridgemagnetic susceptometer (Agico, Brno) under an alternating field of300 A/m, 875 Hz. Each specimen was measured while slowly rotatingabout three mutually perpendicular axes (Pokorny et al., 2004). Weprovide the complete set of AMS data (AMS station averages of scalarand directional parameters) in Supplementary data 2; and AMSstereonets with confidence ellipses in Supplementary data 4. Ther-momagnetic experiments (25–700 °C), under a field of 80 A/m andan operating frequency of 0.696 Hz, using a Bartington MS2 furnace,provided the Curie temperature of the representative specimens. Themagnetic hysteresis properties were measured on the same cubes asfor AMS using a Princeton Measurements Micromag 3900-04 vibratingsample magnetometer with a sensitivity of ≈5 · 10−9 Am2, up toan applied direct field of 1.2 × 10⁶ A/m. First Order Reversal Curve(FORC) data were processed using FORCinel (Harrison and Feinberg,2008).
4. Results
4.1. Thermomagnetic experiment
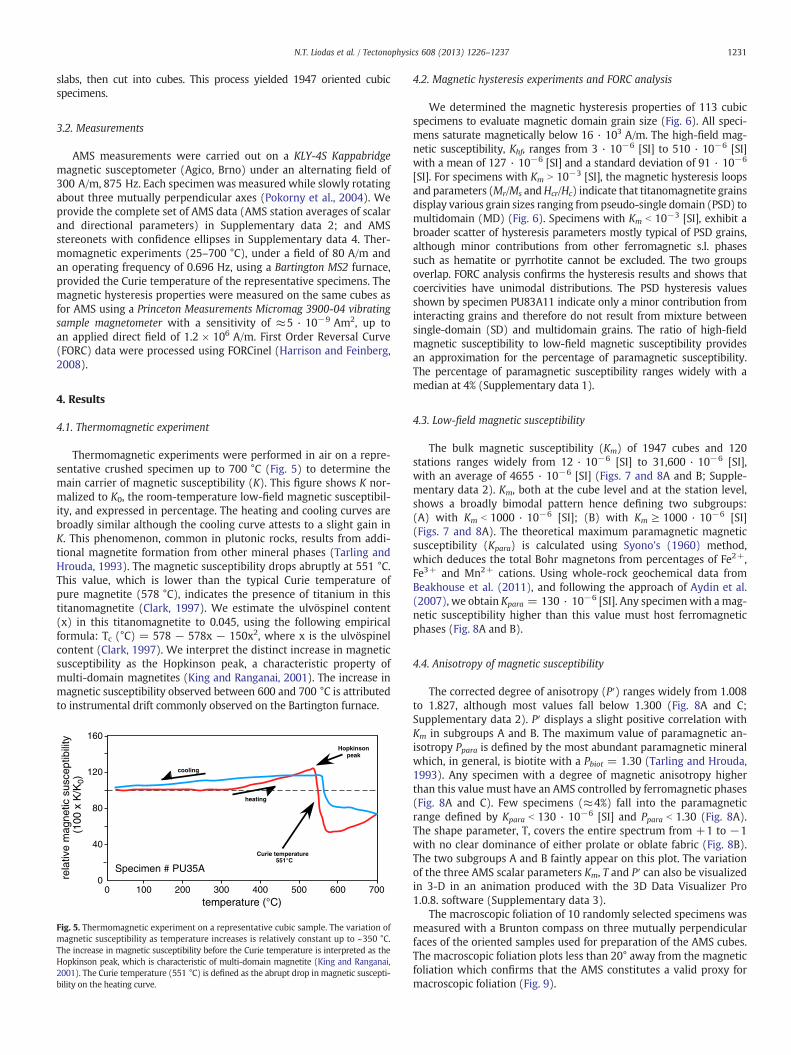
Thermomagnetic experiments were performed in air on a repre-sentative crushed specimen up to 700 °C (Fig. 5) to determine themain carrier of magnetic susceptibility (K). This figure shows K nor-malized to K0, the room-temperature low-field magnetic susceptibil-ity, and expressed in percentage. The heating and cooling curves arebroadly similar although the cooling curve attests to a slight gain inK. This phenomenon, common in plutonic rocks, results from addi-tional magnetite formation from other mineral phases (Tarling andHrouda, 1993). The magnetic susceptibility drops abruptly at 551 °C.This value, which is lower than the typical Curie temperature ofpure magnetite (578 °C), indicates the presence of titanium in thistitanomagnetite (Clark, 1997). We estimate the ulvöspinel content(x) in this titanomagnetite to 0.045, using the following empiricalformula: Tc (°C) = 578 − 578x − 150x2, where x is the ulvöspinelcontent (Clark, 1997). We interpret the distinct increase in magneticsusceptibility as the Hopkinson peak, a characteristic property ofmulti-domain magnetites (King and Ranganai, 2001). The increase inmagnetic susceptibility observed between 600 and 700 °C is attributedto instrumental drift commonly observed on the Bartington furnace.
0
40
80
120
160
0 100 200 300 400 500 600 700
Hopkinsonpeak
Curie temperature
heating
cooling
551°C
temperature (°C)
rela
tive
mag
netic
sus
cept
ibili
ty(1
00 x
K/K
0)
Specimen # PU35A
Fig. 5. Thermomagnetic experiment on a representative cubic sample. The variation ofmagnetic susceptibility as temperature increases is relatively constant up to ~350 °C.The increase in magnetic susceptibility before the Curie temperature is interpreted as theHopkinson peak, which is characteristic of multi-domain magnetite (King and Ranganai,2001). The Curie temperature (551 °C) is defined as the abrupt drop in magnetic suscepti-bility on the heating curve.
4.2. Magnetic hysteresis experiments and FORC analysis
We determined the magnetic hysteresis properties of 113 cubicspecimens to evaluate magnetic domain grain size (Fig. 6). All speci-mens saturate magnetically below 16 · 103 A/m. The high-field mag-netic susceptibility, Khf, ranges from 3 · 10−6 [SI] to 510 · 10−6 [SI]with a mean of 127 · 10−6 [SI] and a standard deviation of 91 · 10−6
[SI]. For specimens with Km N 10−3 [SI], the magnetic hysteresis loopsand parameters (Mr/Ms andHcr/Hc) indicate that titanomagnetite grainsdisplay various grain sizes ranging from pseudo-single domain (PSD) tomultidomain (MD) (Fig. 6). Specimens with Km b 10−3 [SI], exhibit abroader scatter of hysteresis parameters mostly typical of PSD grains,although minor contributions from other ferromagnetic s.l. phasessuch as hematite or pyrrhotite cannot be excluded. The two groupsoverlap. FORC analysis confirms the hysteresis results and shows thatcoercivities have unimodal distributions. The PSD hysteresis valuesshown by specimen PU83A11 indicate only a minor contribution frominteracting grains and therefore do not result from mixture betweensingle-domain (SD) and multidomain grains. The ratio of high-fieldmagnetic susceptibility to low-field magnetic susceptibility providesan approximation for the percentage of paramagnetic susceptibility.The percentage of paramagnetic susceptibility ranges widely with amedian at 4% (Supplementary data 1).
4.3. Low-field magnetic susceptibility
The bulk magnetic susceptibility (Km) of 1947 cubes and 120stations ranges widely from 12 · 10−6 [SI] to 31,600 · 10−6 [SI],with an average of 4655 · 10−6 [SI] (Figs. 7 and 8A and B; Supple-mentary data 2). Km, both at the cube level and at the station level,shows a broadly bimodal pattern hence defining two subgroups:(A) with Km b 1000 · 10−6 [SI]; (B) with Km ≥ 1000 · 10−6 [SI](Figs. 7 and 8A). The theoretical maximum paramagnetic magneticsusceptibility (Kpara) is calculated using Syono's (1960) method,which deduces the total Bohr magnetons from percentages of Fe2+,Fe3+ and Mn2+ cations. Using whole-rock geochemical data fromBeakhouse et al. (2011), and following the approach of Aydin et al.(2007), we obtain Kpara = 130 · 10−6 [SI]. Any specimenwith a mag-netic susceptibility higher than this value must host ferromagneticphases (Fig. 8A and B).
4.4. Anisotropy of magnetic susceptibility
The corrected degree of anisotropy (P′) ranges widely from 1.008to 1.827, although most values fall below 1.300 (Fig. 8A and C;Supplementary data 2). P′ displays a slight positive correlation withKm in subgroups A and B. The maximum value of paramagnetic an-isotropy Ppara is defined by the most abundant paramagnetic mineralwhich, in general, is biotite with a Pbiot = 1.30 (Tarling and Hrouda,1993). Any specimen with a degree of magnetic anisotropy higherthan this value must have an AMS controlled by ferromagnetic phases(Fig. 8A and C). Few specimens (≈4%) fall into the paramagneticrange defined by Kpara b 130 · 10−6 [SI] and Ppara b 1.30 (Fig. 8A).The shape parameter, T, covers the entire spectrum from +1 to −1with no clear dominance of either prolate or oblate fabric (Fig. 8B).The two subgroups A and B faintly appear on this plot. The variationof the three AMS scalar parameters Km, T and P′ can also be visualizedin 3-D in an animation produced with the 3D Data Visualizer Pro1.0.8. software (Supplementary data 3).
The macroscopic foliation of 10 randomly selected specimens wasmeasured with a Brunton compass on three mutually perpendicularfaces of the oriented samples used for preparation of the AMS cubes.The macroscopic foliation plots less than 20° away from the magneticfoliation which confirms that the AMS constitutes a valid proxy formacroscopic foliation (Fig. 9).

10 100
0.010
Hcr/Hc
Mr / M
s
SD
MD
PSD
0.001
0.100
1.000
n=113Km<10-3 [SI]
Km>10-3 [SI]
Hc(Tesla)
Hu
(Tes
la)
SF=5
SF=5
SF=5
PU83A11
PU08C18
PU05B5
0.04
0.02
0.00
-0.04
-0.02
0.04
0.02
0.00
-0.04
-0.02
0.04
0.02
0.00
-0.02
-0.04
0 20 40 60 80X10-3
Fig. 6.Magnetic hysteresis ratios plotted in a Dunlop (2002) plot. Mr/Ms versus Hcr/Hc from 113 samples (one from each station). This plot indicates a mixture of multidomain (MD)and pseudo-single domain (PSD) grain sizes. The First Order Reversal Curve (FORC) diagrams are plotted using FORCinel (Harrison and Feinberg, 2008). See text for details.
1232 N.T. Liodas et al. / Tectonophysics 608 (2013) 1226–1237
Three types of AMS fabric can be distinguished based on theirsymmetry (Fig. 10, Supplementary data 2 and 4): (A) dominantlyoblate AMS fabrics at the cube scale define planar symmetry at thestation scale; the symmetry is illustrated by a relatively wide girdleof K1 lineations and tightly clustered K3 foliations (Fig. 10A); (B) dom-inantly prolate AMS fabrics at the cube scale define linear symmetry atthe station scale; the symmetry is shown by a cluster of K1 lineationsand a relatively wide girdle of K3 foliations (Fig. 10B); and (C) otherAMS fabrics display relatively clustered K1 and K3 axes that define a
150
100
50
010 100 1000 10000
bulk magnetic susceptibility, Km (10-6 [SI])
freq
uenc
y
n = 1947 (cubes)
n = 120 (stations)
subgroup A subgroup B
Fig. 7. Histogram of bulk magnetic susceptibility, Km. The bimodal distribution definestwo subgroups, A and B, above and below 10−3 [SI] respectively.
plano-linear symmetry (Fig. 10C). Seventy seven percent of stationsdisplay a plano-linear symmetry, while planar and linear symmetriesrespectively account for 17% and 7% of stations.
Most stations near the HSZ show a plano-linear symmetry, with K1
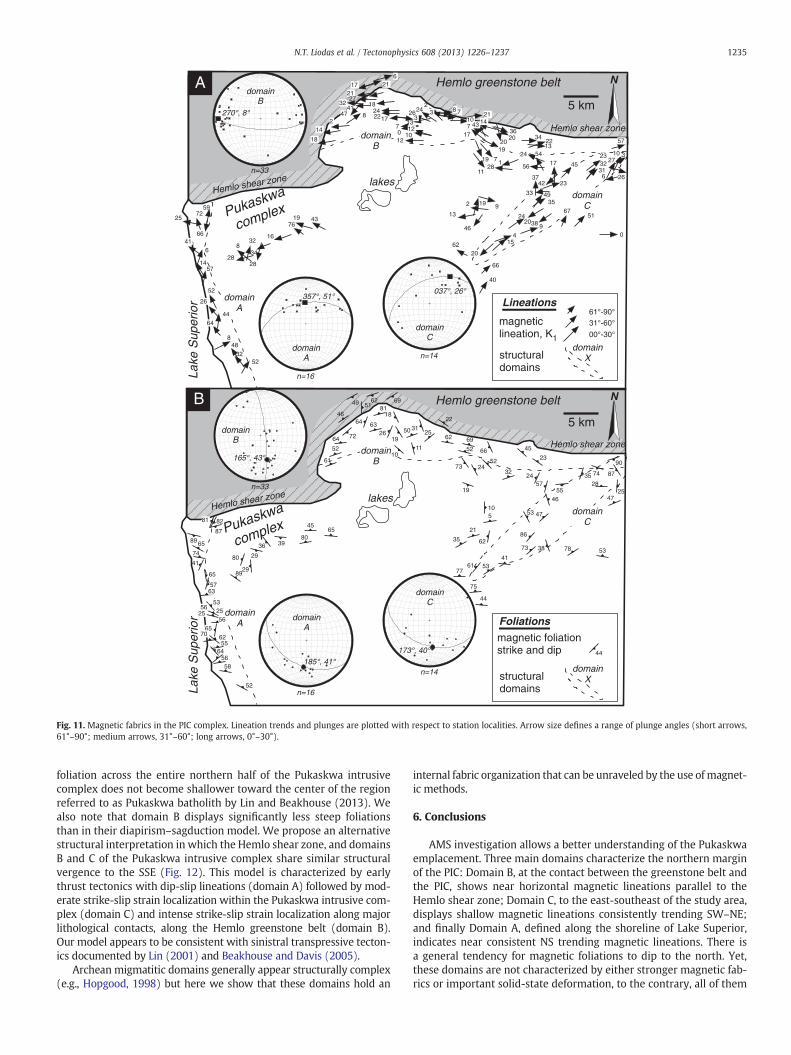
lineations parallel to the HSZ contact (Fig. 11). This fabric definesstructural domain B. Away from the contact with the greenstone belt,lineations and foliations are generally oriented in different attitudes ina less organized fashion and generally show a planar symmetry fabric.Magnetic lineations consistently trend SW–NE and are relativelyshallow within a 3 to 5 km-wide domain referred to as domain C(Fig. 11). Magnetic lineations broadly trend NS along the shoreline ofLake Superior (Domain A in Fig. 11). The degree of magnetic anisotropy(P′) in all three structural domains remains similar to the rest of thecomplex. Conversely, microstructures in these domains are highlyequilibrated and similar to the main part of the complex. These micro-structures support the absence of low- to medium temperature defor-mation and to the contrary indicate magmatic to high-temperatureplastic deformation.
5. Interpretation and discussion
The relatively large grain size of titanomagnetite grains (5–200 μm,Fig. 3B) along with their euhedral shape supports a primary magmaticorigin. The thermomagnetic data in Fig. 5 establishes the presence ofa strongly ferromagnetic phase with a Curie temperature of 551 °C.Further, the distinct Hopkinson peak characterizes populations ofmultidomain titanomagnetite (King and Ranganai, 2001). Also, themagnetic hysteresis data in Fig. 6 supports that mixtures of pseudo-single domain and multidomain titanomagnetite form the main ferro-magnetic source. The contributions of ferromagnetic and paramagneticphases to magnetic susceptibility, deduced from magnetic hysteresisdata (Supplementary data 1) vary greatly between specimens buthave medians at about 96% and 4% respectively. The paramagnetic con-tribution, evaluated through the method of Syono, yields a maximumvalue of Kpara ≈ 130 · 10−6 [SI]. This value also corresponds to 4%

bulk magnetic susceptibility, Km (10-6 [SI])
1.0
0.8
0.6
0.2
0.4
-0.2
-0.6
-0.8
-0.4
-1.0
0.0
shap
e pa
ram
eter
, T
Bp
aram
agn
etic
ferr
om
agn
etic
10 100 1000 10000 100000
10 100 1000 10000 100000
1.0
1.1
1.2
1.3
1.4
1.5
1.6
1.7
1.8
1.9
degr
ee o
f mag
netic
ani
sotr
opy,
P’
A
1.0
0.8
0.6
0.2
0.4
-0.2
-0.6
-0.8
-0.4
-1.0
0.0
shap
e pa
ram
eter
, T oblate
prolate
degree of magnetic anisotropy, P’
C
1.0 1.1 1.2 1.3 1.4 1.5 1.6 1.7 1.8 1.9
ferromagnetic
paramagnetic
oblate
prolate
par
amag
net
ic
ferr
om
agn
eti c
subgroup A subgroup B
A B
n = 1947
n = 1947
n = 1947
bulk magnetic susceptibility, Km (10-6 [SI])
Fig. 8. Bulk anisotropy of magnetic susceptibility for all PIC specimens. A — The degree of magnetic anisotropy, P′, versus bulk magnetic susceptibility, Km. B — Shape parameter,T, versus bulk magnetic susceptibility, Km, showing comparable numbers of prolate and oblate specimens. C— Shape parameter, T, versus degree of magnetic anisotropy, P′, illustratingthat T is independent from P′.
1233N.T. Liodas et al. / Tectonophysics 608 (2013) 1226–1237
of the median low-field magnetic susceptibility of 3180 · 10−6 [SI](Supplementary data 2). Out of 1947 specimens, 150 (7.7%) have amagnetic susceptibility less than 130 · 10−6 [SI] and therefore couldpotentially be paramagnetic only. In summary, all magnetic measure-ments and calculations point to multidomain titanomagnetite as themain source of low-field magnetic susceptibility.
Since titanomagnetite grains dominate the magnetic susceptibilityand form elongate grains parallel to mafic silicates (Fig. 3B), they shouldcollectively form a magnetostatic anisotropy and control the AMS. Con-sidering that the intrinsicmagnetic anisotropies of biotite and amphiboleare Pbiot = 1.35 and Pamph = 1.65 (Tarling andHrouda, 1993), and that avolume x ≈ 0.15% at most of these minerals would contribute to lattice
preferred orientation (LPO), the anisotropic component ofmagnetic sus-ceptibility due to these silicates (Kpara) would range approximatelybetween (x · (Pbiot − 1)). PparaMax in biotite-dominated gneisses and(x · (Pamph − 1)). PparaMax, in amphibole-dominated rocks, i.e., a mod-est directional variation of magnetic susceptibility (7 to 13 · 10−6
[SI]). Therefore, even if the PIC rocks had preserved a strong silicatelattice-preferred orientation (LPO) of paramagnetic silicates through re-crystallization, the modest contribution of paramagnetic minerals toAMS would be insignificant in comparison to the large contribution oftitanomagnetite.
The Pukaskwa quartzo-feldspathic gneisses exhibit microstruc-tures similar to those formed during high-temperature plastic flow

Fig. 9. Lower hemisphere, equal area stereonets comparing macroscopic foliation mea-sured on three mutually perpendicular faces of 10 oriented samples with the magneticfoliation (plane to K3). The excellent correspondence (b20° departure) validates theuse of AMS as a proxy for macroscopic structures.
T
+1
-1
N
126, 29
K1
K3
K2
Key
228, 20
N
068, 52
236, 38
N
317, 01
226, 42
Linear symmetryStation PU74B
fine grained graniten=20
Planar symmetryStation PU67A
fine grained graniten=23
Plano-linear symmetryStation PU57B
coarse grained graniten=12
T
+1
-1
T
+1
-1
Oblate
Prolate
A
B
C
120, 40
macroscopic foliation
070, 50
P’
P’
P’
140, 00
Fig. 10. Stereonets of magnetic fabric symmetries (planar, linear and plano-linear) atthe station scale that arise from the distribution of AMS fabrics (oblate, prolate andgeneral) at the cube scale. A — Dominantly oblate shape parameter showing girdled K1
axes and clusteredK3 axes. B—Dominantly prolate shape parameter showing strong clus-tered K1 axes and girdled K3 axes. C— Plano-linear specimens show a maxima for K1 andK3 axes.
1234 N.T. Liodas et al. / Tectonophysics 608 (2013) 1226–1237
in a magma or in a metamorphic rock (e.g., Ferré and Améglio, 2000;Ferré et al., 2003; Gébelin et al., 2006; Kruckenberg et al., 2010,2011). In general, plutonic rocks emplaced near shear zones displaymicrostructures indicative of high strain-rate and high-temperature(e.g., Nouar et al., 2011). In contrast, most PIC rocks exhibit highlyequilibrated microstructures. Also, previous studies on similar rockshave shown that multidomain titanomagnetite grains, deformed insimilar high-temperature and low strain rate conditions, develop ashape-preferred orientation (SPO) due to dislocation creep, which inturn causes the magnetostatic anisotropy of titanomagnetite (Charleset al., 2009; Ferré et al., 2003, 2004; Kruckenberg et al., 2010, 2011;Schulmann et al., 2009; Till et al., 2012). The same studies also showedthat magnetite-controlled AMS fabrics display general AMS ellipsoids,such as those shown in Fig. 10A and B, instead of planar and linear ellip-soids that more commonly originate from magnetocrystalline anisot-ropy. Also, the increase of P′ with increasing Km observed mostly forsubgroup B is typical of AMS carried by magnetite (e.g., Bouchez,1997). The variations in degree of magnetic anisotropy (P′) or shapefactor (T) across the PIC do not display a consistent spatial pattern.The lack of significant post-emplacement deformation in the PIC(Beakhouse et al., 2011; Lin, 2001) suggests that the AMS represents afabric acquired during high-temperature plastic or magmatic deforma-tion in the Archean.
In this study, the AMS provides new structural information onfinite strain in the PIC that, away from the HSZ, lacks macroscopicstrain markers. The AMS principal axes, obtained from a large numberof specimens (about 20), are statistically significant as illustrated byAMS ellipses (Fig. 10 and Supplementary data 4). Previous studiesshow that in high-grade gneisses, the AMS K1 axis parallels the mineralstretching lineation (Charles et al., 2009; Ferré et al., 2003, 2004;Kruckenberg et al., 2010, 2011; Schulmann et al., 2009) and thereforeprovides precious kinematic information on high-temperature flow. Ingeneral, in the PIC, K1 axes plunge shallowly to moderately (Fig. 10A),including in the vicinity of the HSZ.
The AMS of granitic and metamorphic rocks always records finitestrain, including the last increment of deformation. In the case of
the PIC, AMS fabrics are very consistent at the scale of several squarekilometers. The lack of medium or low-temperature plastic deforma-tion in these rocks indicates that these AMS fabrics actually representlate Archean (D2) high-temperature plastic flow. The dip-slipstretching lineations observed in somemetasedimentary rocks withinthe HSZ (Fig. 2D) may reflect early kinematics (D1) or syn D2transpressional deformation. The corridors of homogeneous magneticfabric orientation (e.g., domain C in Figs. 11 and 12) may record ductilestrain localization, a structural feature documented in other anatecticdomes in Brazil (Archanjo et al., 2013).
The structural and AMS fabric data indicate a systematic vergenceof foliations dipping 40–45° to the North (Fig. 10). The dip angle of
Pukaskwa
complex
lakes
N
5 km
magneticlineation, K1
61°-90°31°-60°
00°-30°
structuraldomains
domainX
Hemlo shear zone
Lake
Sup
erio
r
3620
20
717
14
19
11
7
17
47
3241
82
14
18
2132
18242217 3
10120
713
26242
3 8 7
3
266
27
313256
1322
34
128
9
17
2337
4935
2024
415
66
40
62
93851
0
621
21109
28
328
28
34
16
7619 43
2
46
19
13
57
52
26
6
848
3252
25
59
66
72
41
14
64
Hemlo shear zone
domainA
domainB
domainC
Pukaskwa
complex
lakes
Hemlo greenstone belt
Hemlo shear zone
62
81 82
87
8965
74
41
65
57
56
65
55
70
645658
25
6610
11
31
64
49
46
62
52
18
51
73
52
2452
69
81
62
87
47
2835
55
2550
24
45
32 74
2546
47
86
73
44
5
38 78 53
5361
75
21
353936
29
2989
80
6545
80
69
64
72
6326
19
22
10
62
19
77
41
53
57
239061
A
B
27
Hemlo greenstone belt
domainC
19
12
2324
20
44
57
10
43
54
45
33
42
Lineations
Foliations
magnetic foliationstrike and dip 44
Lake
Sup
erio
r
5 km
structuraldomains
domainX
domainA
domainB
domainC
Hemlo shear zone
n=14
037°, 26°
domainB
n=33
270°, 8°
domainA
357°, 51°
n=16
67
domainC
n=14
domainB
n=33
domainA
n=16
173°, 40°
165°, 43°
185°, 41°
44
56
63
5325
52
N
Fig. 11. Magnetic fabrics in the PIC complex. Lineation trends and plunges are plotted with respect to station localities. Arrow size defines a range of plunge angles (short arrows,61°–90°; medium arrows, 31°–60°; long arrows, 0°–30°).
1235N.T. Liodas et al. / Tectonophysics 608 (2013) 1226–1237
foliation across the entire northern half of the Pukaskwa intrusivecomplex does not become shallower toward the center of the regionreferred to as Pukaskwa batholith by Lin and Beakhouse (2013). Wealso note that domain B displays significantly less steep foliationsthan in their diapirism–sagduction model. We propose an alternativestructural interpretation in which the Hemlo shear zone, and domainsB and C of the Pukaskwa intrusive complex share similar structuralvergence to the SSE (Fig. 12). This model is characterized by earlythrust tectonics with dip-slip lineations (domain A) followed by mod-erate strike-slip strain localization within the Pukaskwa intrusive com-plex (domain C) and intense strike-slip strain localization along majorlithological contacts, along the Hemlo greenstone belt (domain B).Our model appears to be consistent with sinistral transpressive tecton-ics documented by Lin (2001) and Beakhouse and Davis (2005).
Archean migmatitic domains generally appear structurally complex(e.g., Hopgood, 1998) but here we show that these domains hold an
internal fabric organization that can be unraveled by the use of magnet-ic methods.
6. Conclusions
AMS investigation allows a better understanding of the Pukaskwaemplacement. Three main domains characterize the northern marginof the PIC: Domain B, at the contact between the greenstone belt andthe PIC, shows near horizontal magnetic lineations parallel to theHemlo shear zone; Domain C, to the east-southeast of the study area,displays shallow magnetic lineations consistently trending SW–NE;and finally Domain A, defined along the shoreline of Lake Superior,indicates near consistent NS trending magnetic lineations. There isa general tendency for magnetic foliations to dip to the north. Yet,these domains are not characterized by either stronger magnetic fab-rics or important solid-state deformation, to the contrary, all of them

Fig. 12. Schematic tectonic model for the Hemlo shear zone and Pukaskwa intrusive complex. Foliations in the Pukaskwa intrusive complex generally dip NNWwith dip-slip lineations,except along domain C where lineations display a strike-slip attitude.
1236 N.T. Liodas et al. / Tectonophysics 608 (2013) 1226–1237
exhibit fabrics acquired at high temperature. Our AMS data supportthe idea that the Pukaskwa emplacement occurred by rapid succes-sive and small heterogeneous magma increments. The new datasetdoes not support a diapiric emplacement as suggested by Lin andBeakhouse (2013). Rather our AMS data indicate that the PIC wasemplaced within a sinistral transpressive setting (Fig. 12) as recordedby mylonitic Archean metasedimentary and mafic metavolcanic rocksof the greenstone belt.
Supplementary data to this article can be found online at http://dx.doi.org/10.1016/j.tecto.2013.06.022.
Acknowledgments
We gratefully acknowledge the logistical support from variousmining companies. This study was funded by a grant from the NaturalSciences and Engineering Research Council of Canada (NSERC) toS. Lin. Sarah A. Friedman provided assistance in the high-fieldmagneticmeasurements. The AMS data and ellipses of confidence were plottedusing Anisoft 4.2 (Chadima and Jelínek, 2008). We thank R. Enjolvyfor assistance during field work. The comments made by CarlosArchanjo and an anonymous reviewer greatly improved this research.
References
Archanjo, C.J., Viegas, L.G.F., Hollanda, M.H.B.M., Souza, L.C., Liu, D., 2013. Timing of theHT/LP transpression in the Neoproterozoic Serido Belt (Borborema Province, Brazil):Constraints fromU/Pb (SHRIMP) geochronology and implications for the connectionsbetween NE Brazil and West Africa. Gondwana Research 23 (2), 701–714.
Aydin, A., Ferré, E.C., Aslan, Z., 2007. The magnetic susceptibility of granitic rocks asa proxy for geochemical composition: Example from the Sahuran granitoids, NETurkey. Tectonophysics 441, 85–95.
Beakhouse, G.P., Davis, D.W., 2005. Evolution and tectonic significance of intermediateto felsic plutonism associated with the Hemlo greenstone belt, Superior Province,Canada. Precambrian Research 137, 61–92.
Beakhouse, G.P., Lin, S., Kamo, S.L., 2011. Magmatic and tectonic emplacement of thePukaskwa batholith, Superior Province, Ontario, Canada. Canadian Journal of EarthSciences 48 (2), 187–204.
Bouchez, J.L., 1997. Granite is never isotropic: An introduction to AMS studies of gra-nitic rocks. In: Bouchez, J.L., Hutton, D.H.W., Stephens, W.E. (Eds.), Granite: fromsegregation of melt to emplacement fabrics, 8. Kluwer Publishing Co., Dordrecht,pp. 95–112.
Calvert, A.J., Ludden, J.N., 1999. Archean continental assembly in the southeasternSuperior Province of Canada. Tectonics 18 (3), 412–429.
Card, K.D., 1990. A review of the Superior Province of the Canadian Shield, a product ofArchean accretion. Precambrian Research 48, 99–156.
Chadima, M., Jelínek, V., 2008. Anisoft 4.2.— Anisotropy data browser. In: Hvožďara, M.(Ed.), Paleo, Rock and Environmental Magnetism, 11th Castle Meeting. Contribution
to Geophysics andGeodesy, Special issue. Geophysical Institute of the SlovakAcademyof Sciences, Bojnice Castle, Slovac Republic (41 pp.).
Chardon, D., Choukroune, P., Jayananda, M., 1996. Strain patterns, decollement andincipient sagducted greenstone terrains in the Archaean Dharwar craton (southIndia). Journal of Structural Geology 18 (8), 991–1004.
Chardon, D., Gapais, D., Cagnard, F., 2009. Flow of ultra-hot orogens: A view from thePrecambrian, clues for the Phanerozoic. Tectonophysics 477 (3–4), 105–118.
Charles, N., Faure, M., Chen, Y., 2009. The Montagne Noire migmatitic dome emplace-ment (French Massif Central): New insights from petrofabric and AMS studies.Journal of Structural Geology 31 (11), 1423–1440.
Clark, D.A., 1997. Magnetic petrophysics and magnetic petrology: Aids to geologicalinterpretation of magnetic surveys. Journal of Australian Geology and Geophysics17 (2), 83–103.
Corfu, F., Muir, T.L., 1989a. The Hemlo–Heron Bay greenstone belt and Hemlo Au–Modeposit, Superior Province, Ontario, Canada 1. Sequence of igneous activity deter-mined by zircon U–Pb geochronology. Chemical Geology: Isotope Geoscience Section79 (3), 183–200.
Corfu, F., Muir, T.L., 1989b. The Hemlo–Heron Bay greenstone belt and Hemlo Au–Modeposit, Superior Province, Ontario, Canada 2. Timing of metamorphism, alterationand Au mineralization from titanite, rutile, and monazite U–Pb geochronology.Chemical Geology: Isotope Geoscience Section 79 (3), 201–223.
de Wit, M.J., 1998. On Archean granites, greenstones, cratons and tectonics: Does theevidence demand a verdict? Precambrian Research 91, 181–226.
Dixon, J.M., Summers, J.M., 1983. Patterns of total and incremental strain in subsidingtroughs: Experimental centrifugedmodels of inter-diapir synclines. Canadian Journalof Earth Sciences 20 (12), 1843–1861.
Dunlop, D.J., 2002. Theory and application of the Day plo (Mrs/Ms versus Hcr/Hc) 2.Application to data for rocks, sediments, and soils. Journal of GeophysicalResearch: Solid Earth 107, 5–15. http://dx.doi.org/10.10129/2001JB000486.
Ferré, E.C., Améglio, L., 2000. Preserved magnetic fabrics vs. annealed microstructuresin the syntectonic recrystallised George granite, South Africa. Journal of StructuralGeology 22 (8), 1199–1219.
Ferré, E.C., Teyssier, C., Jackson, M.J., Thill, J.V., Rainey, E.S.G., 2003. Magnetic suscepti-bility anisotropy: A new petrofabric tool in migmatites. Journal of GeophysicalResearch 108 (B2). http://dx.doi.org/10.1029/2002JB001790.
Ferré, E.C., Martín-Hernández, F., Teyssier, C., Jackson, M.J., 2004. Paramagnetic andferromagnetic anisotropy of magnetic susceptibility in migmatites: Measurementsin high and low fields and kinematic implications. Geophysical Journal International157 (3), 1119–1129.
Gébelin, A., Martelet, G., Chen, Y., Brunel, M., Faure, M., 2006. Structure of late VariscanMillevaches leucogranite massif in the French Massif Central: AMS and gravitymodelling results. Journal of Structural Geology 28 (1), 148–169.
Hamilton, W.B., 1998. Archean magmatism and deformation were not products of platetectonics. Precambrian Research 91, 143–179.
Hamilton, W.B., 2007. Earth's first two billion years—The era of internally mobile crust.Geological Society of America Memoirs 200, 233–296.
Harris, L.B., Godin, L., Yakymchuk, C., 2012. Regional shortening followed by channel flowinduced collapse: A new mechanism for dome and keel geometries in Neoarchaeangranite-greenstone terrains. Precambrian Research 212–213, 139–154.
Harrison, R.J., Feinberg, J.M., 2008. FORCinel: An improved algorithm for calculatingfirst-order reversal curve distributions using locally weighted regression smoothing.Geochemistry, Geophysics, Geosystems 9 (Q05016). http://dx.doi.org/10.1029/2008GC001987.
Hasalova, P., et al., 2008. Origin of migmatites by deformation-enhanced melt infiltra-tion of orthogneiss: A new model based on quantitative microstructural analysis.Journal of Metamorphic Geology 26 (1), 29–53.

1237N.T. Liodas et al. / Tectonophysics 608 (2013) 1226–1237
Hopgood, A.M., 1998. Determination of Structural Successions inMigmatites andGneisses.Kluwer Academic Pub., Dordrecht (346 pp.).
Jackson, S.L., 1998. Stratigraphy, structure and metamorphism, Part 1. Regional Settingof the Hemlo Gold Deposit: An Interim Progress Report, p. 5977.
King, J.G., Ranganai, R.T., 2001. Determination of magnetite grain-size using theHopkinson effect — Examples from Botswana rocks. Botswana Journal of EarthSciences 5, 35–38.
Kruckenberg, S.C., et al., 2010. Viscoplastic flow in migmatites deduced from fabricanisotropy: An example from the Naxos dome, Greece. Journal of GeophysicalResearch: Solid Earth 115 (B9), B09401.
Kruckenberg, S.C., Vanderhaeghe, O., Ferré, E.C., Teyssier, C., Whitney, D.L., 2011. Flowof partially molten crust and the internal dynamics of a migmatite dome, Naxos,Greece. Tectonics. http://dx.doi.org/10.1029/2010TC002751.
Lana, C., Tohver, E., Cawood, P., 2010. Quantifying rates of dome-and-keel formation inthe Barberton granitoid-greenstone belt, South Africa. Precambrian Research 177(1–2), 199–211.
Lin, S., 2001. Stratigraphic and structural setting of the Hemlo gold deposit, Ontario,Canada. Economic Geology 96 (3), 477–507.
Lin, S., 2005. Synchronous vertical and horizontal tectonism in the Neoarchean: Kinematicevidence from a synclinal keel in the northwestern Superior craton, Canada. Precam-brian Research 139 (3–4), 181–194.
Lin, S., Beakhouse, G.P., 2013. Synchronous vertical and horizontal tectonism at latestages of Archean cratonization and genesis of Hemlo gold deposit, Superior cra-ton, Ontario, Canada. Geology 41 (3), 359–362.
Lister, G.S., Davis, G.A., 1989. The origin of metamorphic core complexes and detach-ment faults formed during Tertiary continental extension in the northern ColoradoRiver region, U.S.A. Journal of Structural Geology 11 (1–2), 65–94.
Martín-Hernández, F., Ferré, E.C., 2007. Separation of paramagnetic and ferrimagneticanisotropies: A review. Journal of Geophysical Research: Solid Earth 112. http://dx.doi.org/10.1029/2006JB004340.
Nouar, O., Henry, B., Liégeois, J.P., Derder, M.E.M., Bayou, B., Bruguier, O., Ouabadi, A.,Amenna, M., Hemmi, A., Ayache, M., 2011. Eburnean and Pan-African granitoidsand the Raghane mega-shear zone evolution: Image analysis, U–Pb zircon ageand AMS study in the Arokam Ténéré (Tuareg shield, Algeria). Journal of AfricanEarth Sciences 60 (3), 133–152.
Percival, J.A., 1994. Archean high-grademetamorphism. In: Condie, K.C. (Ed.), Developmentsin Precambrian Geology, Chapter 9. Elsevier, pp. 357–410.
Percival, J.A., Stern, R.A., Skulski, T., 2001. Crustal growth through successive arcmagmatism:Reconnaissance U–Pb SHRIMP data from the northeastern Superior Province, Canada.Precambrian Research 109 (3–4), 203–238.
Pokorny, J., Suza, P., Hrouda, F., 2004. Anisotropy of magnetic susceptibility of rocksmeasured in variable weak magnetic fields using the KLY-4S Kappabridge. GeologicalSociety, London, Special Publications 238 (1), 69–76.
Polteau, S., Ferré, E.C., Planke, S., Neumann, E.R., Chevallier, L., 2008. How are saucer-shaped sills emplaced? Constraints from the Golden Valley Sill, South Africa. Journalof Geophysical Research: Solid Earth 113 (B12104). http://dx.doi.org/10.1029/2008JB005620.
Sandiford, M., Van Kranendonk, M.J., Bodorkos, S., 2004. Conductive incubation andthe origin of dome-and-keel structure in Archean granite-greenstone terrains:A model based on the eastern Pilbara Craton, Western Australia. Tectonics 23.http://dx.doi.org/10.1029/2002TC001452.
Schulmann, K., Edel, J.B., Hasalova, P., Cosgrove, J., Jezek, J., Lexa, O., 2009. Influenceof melt induced mechanical anisotropy on the magnetic fabrics and rheology ofdeforming migmatites, Central Vosges, France. Journal of Structural Geology 31(10), 1223–1237.
Shackleton, R.M., 1995. Tectonic evolution of greenstone belts. Geological Society, London,Special Publications 95 (1), 53–65.
Snowden, P.A., Bickle, M.J., 1976. The Chinamora Batholith: Diapiric intrusion or inter-ference fold? Journal of the Geological Society 132 (2), 131–137.
Syono, Y., 1960. Magnetic susceptibility of some rock forming silicate minerals suchas amphiboles, biotites, cordierites and garnets. Journal of Geomagnetism andGeoelectricity 11, 85–93.
Tarling, D.H., Hrouda, F., 1993. The magnetic anisotropy of rocks. Chapman & Hall, London(217 pp.).
Till, J.L., Moskowitz, B.M., Jackson, M.J., 2012. High-temperature magnetic fabric develop-ment from plastically deformed magnetite in experimental shear zones. GeophysicalJournal International 189 (1), 229–239.
Van Kranendonk, M.J., Hugh Smithies, R., Hickman, A.H., Wingate, M.T.D., Bodorkos,S., 2010. Evidence for Mesoarchean (3.2 Ga) rifting of the Pilbara Craton: Themissing link in an early Precambrian Wilson cycle. Precambrian Research 177(1–2), 145–161.
Williams, H.R., Stott, G.M., Heather, K., Muir, T.L., Sage, R.P., 1991. Wawa Subprovince.In: Thurston, P.C., Williams, H.R., Sutcliffe, R.H., Stott, G.M. (Eds.), Geology of Ontario.Ontario Geological Survey, pp. 485–539.