A Study in The Tuolumne Intrusive Complex, Yosemite
87
Feldspar Megacrysts as a Window into the Crystallization of Silicic Magmas: A Study in The Tuolumne Intrusive Complex, Yosemite National Park, CA By Sebastian A. Belfanti Thesis Submitted to the Faculty of the Graduate School of Vanderbilt University in partial fulfillment of the requirements for the degree of MASTER OF SCIENCE in Earth and Environmental Sciences August 9, 2019 Nashville, Tennessee Approved: Guilherme Gualda, Ph.D. Calvin Miller, Ph.D.
-
Upload
khangminh22 -
Category
Documents
-
view
0 -
download
0
Transcript of A Study in The Tuolumne Intrusive Complex, Yosemite

Feldspar Megacrysts as a Window into the Crystallization of Silicic Magmas: A Study in The
Tuolumne Intrusive Complex, Yosemite National Park, CA
By
Sebastian A. Belfanti
Thesis
Submitted to the Faculty of the
Graduate School of Vanderbilt University
in partial fulfillment of the requirements
for the degree of
MASTER OF SCIENCE
in
Earth and Environmental Sciences
August 9, 2019
Nashville, Tennessee
Approved:
Guilherme Gualda, Ph.D.
Calvin Miller, Ph.D.

ii
ACKNOWLEDGEMENTS
This work would not have been possible without the financial support of the Vanderbilt
University Earth and Environmental Sciences department and the Geological Society of
America. Nor could the field components have been completed without permits and
campgrounds provided by the United States National Parks Service and Yosemite National Park.
Thanks to all of those whom I worked with on this thesis. Each of the members of my
committee for their support, the members of the Vanderbilt University Earth and Environmental
Sciences department, and the many mentors who helped me reach this goal. I would especially
like to thank Guilherme Gualda for his near endless support and guidance, Calvin Miller for
guiding me through numerous conundrums, and Robert Wiebe and Jonathan Miller for
introducing me to the Tuolumne Intrusive Complex. Thanks to those students and friends who
assisted me directly in this work, especially Austin Higuera for volunteering his time to help me
in the field, Michelle Foley for showing me the ropes, and Lydia Harmon for her guidance and
friendship. Thanks also to Kristy Barnes, Elli Ronay, Eva Biedron, and George Duffy for their
friendship, support, and comradery throughout this process.
Finally, to my parents, for their lifelong support through my graduate studies and outside
of them. I certainly wouldn’t have made it here without them.

iii
TABLE OF CONTENTS
Page
ACKNOWLEDGEMENTS ............................................................................................................ ii
LIST OF FIGURES .........................................................................................................................v
Chapter
1. Introduction ..................................................................................................................................1
Feldspar Megacrysts ..................................................................................................................3
What do Feldspars Experience? .................................................................................................3
The Tuolumne Intrusive Complex .............................................................................................3
Structure and Relationships .......................................................................................................4
2. Method Development and Data Collection .................................................................................6
Overview ....................................................................................................................................6
The Field Component ................................................................................................................6
Detailed Imaging and Dimensionality .......................................................................................6
Value of Three-Dimensional Imaging .......................................................................................7
Value of Two-Dimensional Imaging .........................................................................................7
Value of One-Dimensional Imaging ..........................................................................................8
X-Ray Computed Tomography..................................................................................................8
Scanning Electron Microscopy ................................................................................................10
Backscattered Electron Imaging ..............................................................................................11
Energy Dispersive X-ray Spectroscopy ...................................................................................13
Laser Ablation Inductively Coupled Plasma Mass Spectrometry ...........................................14
Products of Laser Ablation Inductively Coupled Mass Spectrometry.....................................14
3. Discussion ..................................................................................................................................15
Imaging Feldspar Megacrysts ..................................................................................................15
Crystal Geometries and Distributions in the Field ...................................................................15
Filtering X-Rays with Metal Foils ...........................................................................................17
Comparing Scans with and Without Foils ...............................................................................20
Conclusions on Foils ................................................................................................................22
Core Structures and Characteristics .........................................................................................22
Zone Structures and Characteristics .........................................................................................25
4. Future Work ...............................................................................................................................27
5. Conclusions ................................................................................................................................28

iv
Appendix
A. Sample Collection ....................................................................................................................30
B. Observations of X-Ray Computed Tomography Scans ...........................................................36
C. Standard Operating Procedures for X-ray Computed Tomography ........................................59
D. Units of the Tuolumne Intrusive Complex ..............................................................................63
REFERENCES ..............................................................................................................................78

v
LIST OF FIGURES
Figure Page
1. Map of the Tuolumne Intrusive Complex....................................................................................4
2. Feldspar megacryst viewed in x-ray computed tomography .......................................................9
3. Comparison of x-ray computed tomography profiles with and without foils ...........................10
4. Backscattered electron image of megacryst with zones ............................................................11
5. Backscattered electron image intensity profile ..........................................................................12
6. Energy dispersive x-ray spectroscopy image.............................................................................13
7. Geometries of alkali feldspar megacrysts ..................................................................................16
8. Feldspar waterfall structure .......................................................................................................17
9. X-ray computed tomography image after isolation of inclusions..............................................19
10. Effects of foil thickness on scan time ......................................................................................20
11. Comparison of x-ray computed tomography images with different foils ................................21
12. Comparison of x-ray computed tomography profiles with and without foil ...........................22
13. Varieties of megacryst cores in the Tuolumne Intrusive Complex .........................................24
14. Zonation patterns in megacrysts ..............................................................................................25
15. Satellite image displaying sampling locations .........................................................................31
16. Waterfall dome ........................................................................................................................35
17. X-ray computed tomography image of alkali feldspar megacryst TIC-2001-01A ..................38
18. X-ray computed tomography image of alkali feldspar megacryst TIC-2002-01A ..................40
19. X-ray computed tomography image of alkali feldspar megacryst TIC-2002-01B ..................42
20. X-ray computed tomography image of alkali feldspar megacryst TIC-2008-01A ..................44
21. X-ray computed tomography image of alkali feldspar megacryst TIC-2009-03A ..................46

vi
22. X-ray computed tomography image of alkali feldspar megacryst TIC-2016-01A ..................48
23. X-ray computed tomography image of alkali feldspar megacryst TIC-2019-01B ..................50
24. X-ray computed tomography image of alkali feldspar megacryst TIC-2019-01G ..................52
25. X-ray computed tomography image of alkali feldspar megacryst TIC-2019-01J ..................54
26. X-ray computed tomography image of alkali feldspar megacryst TIC-2020-01C ..................56
27. X-ray computed tomography image of alkali feldspar megacryst TIC-2020-01D ..................58
28. Mafic blob and surrounding schlieren in Half Dome ..............................................................65
29. Mafic concentration in Half Dome ..........................................................................................66
30. Megacryst size transect ............................................................................................................68
31. Inclusion of porphyritic Half Dome in Kuna Crest .................................................................69
32. Schlieren complex on Polly Dome ..........................................................................................70
33. Schlieren structure on Polly Dome ..........................................................................................71
34. Comparison of modal abundances in units of the Tuolumne Intrusive Complex ...................72
35. Large megacryst on Lambert Dome ........................................................................................73
36. Log-jam on Lambert Dome .....................................................................................................74
37. Cathedral Peak being incorporated into Johnson Peak ............................................................76
38. Atop Johnson Peak...................................................................................................................77

1
CHAPTER 1
INTRODUCTION
The volcanic-plutonic connection – or the lack of a clear connection – is one of the most
significant questions facing igneous petrologists today. Without question volcanic rocks start off
as magmas at depth. They are sourced from the same general regions and proceed to coalesce
and rise by similar or even identical means to their ultimately plutonic counterparts (Brown
2013, Lundstrom & Glazner 2016, Miller et al. 1988, Miller et al. 2011). This implies that
plutonic and volcanic rocks are deeply inter-related, with little but the end result separating their
histories from one another. It is also consistent with the expectation that volcanism inevitably
leaves behind some residue of early to mid-stage crystallization in the crust where it was stored.
The common understanding of magma transport largely rejects the idea that magmas move
directly and quickly from source to surface (Menand et al. 2015). The majority of silicic volcanic
products are believed to have resided in the underlying crust for at least a short time, where at
minimum some outer portions will begin to solidify (Barboni & Schoene 2014, Lundstrom &
Glazner 2016). Additionally, there is growing support for the incremental formation of magma
bodies (Barnes et al. 2016, Paterson et al. 2016). Models of incrementally formed magmatic
systems suggest that they maintain low melt fractions during the majority of their history, only
containing eruptible material in volume directly before eruption (Miller et al. 2011, Paterson et
al. 2011, Swilinski et al. 2017). This supports a significant link at the depths where plutons form
and volcanic materials reside before eruption and strongly suggests that plutonic bodies may
contain records of plutonic and volcanic events within a given magmatic system (Annen 2011,
Annen et al. 2015, Blundy & Annen 2018).
This work aims to develop a methodology and initial basis of observation through which
a record of volcanic events might be extracted from information recorded in the mineral grains
that make up plutonic bodies they (presumably) leave behind. In order to achieve this, we aim to
develop a more complete understanding of magmatic systems and how their sources, growth,
evolution, and eruption affect, and are recorded within, the crystals present when these events
take place. We address the practicality of using these minerals to determine if a magma body
served as a source for volcanic activity and analyze the growth patterns of megacrysts to this
end. We use x-ray computed tomography, backscattered electron (backscatter) imaging, energy
dispersive x-ray spectroscopy, and laser ablation inductively coupled plasma mass spectrometry
to map the compositions of feldspar megacrysts and their inclusions. We aim to identify and
characterize zones in alkali feldspar megacrysts formed during solidification, following eruptive
decompression events or following magma recharge events.
This work aims to accomplish the following:
1. Use the records contained in alkali-feldspar megacrysts to identify recharge or eruption
events experienced by individual crystals, and understand how these records could relate
to the outcrops and units containing these crystals.

2
2. Develop an understanding of the origin of feldspar megacrysts in the Tuolumne Intrusive
Complex and gain insight on the means by which megacrysts reached their exceptional
size.
3. Use individual crystal histories to determine a generalized history for the construction of
plutonic bodies and overlying volcanics within the test system.
4. Correlate certain types of recharging magmas (as evidenced by varying trace element
concentrations over time) with extraction events (Gelman et al. 2014). If possible,
determining these relationships would help to address the question of what causes magma
segregation and mobilization within plutonic magma bodies that would otherwise remain
in place and freeze.
5. Begin exploring the potential uses of mapping mineral inclusions and the specific mineral
zones and zone patterns within megacrysts with which each mineral inclusion present is
associated. This includes working to determine any patterns in the frequency of given
phases throughout the crystal, and relative to the other phases present.
In order to answer these questions, we have developed a detailed methodology for
characterization of feldspar megacrysts by spatial analysis of mineral inclusions and
compositional zonation by thoroughly imaging samples collected from the Tuolumne Intrusive
Complex, Yosemite National Park, California. We have developed operating procedures for
producing 3D images of feldspar crystals, digitally separating and identifying mineral inclusions,
and analyzing the resulting data to identify any patterns present in the resulting dataset. We have
also produced programs capable of correcting imperfections and stitching collections of
backscatter images in 2D sections of these exceptionally large crystals. Additionally, we
obtained major-element maps and trace-element profiles. In addition, we used approaches to
distinguishing pre-eruptive and syn-eruptive crystal growth developed by Pamukchu et al. (2016)
in an attempt to identify crystal zones associated with the extraction of melt from systems
containing feldspar megacrysts. Barium variation and other chemical tracers are used to identify
zones produced as a result of intrusion of fresh magmas into the host magma body from which
the feldspars are presumed to have originated (Moore & Sisson 2008).
High-resolution imaging can produce valuable data that allows for a more thorough
understanding of samples and their associated systems. Throughout method development, we
aimed to minimize noise and collection times while gathering the highest quality data possible.
This became a balance between a few competing factors. (1) What is the minimum cost in time
and effort to produce data that meets our needs? (2) Can reducing image resolution actually
increase the usefulness of an image in some cases? (3) Is the equipment required for better image
collection accessible? (4) Are the analytical techniques that we want to use practical, and are the
costs worth the collected data? We aim to identify an imaging protocol that produces highly
useful data while keeping collection times and cumbersome procedures to a minimum wherever
possible. We will discuss the procedures we attempted below, and detail those which proved to
be the most useful in the study of megacrysts. These procedures provide tools for understanding
both the development of intrusive bodies and the volcanic history of regions where volcanic
deposits have been erased, but plutonic ones remain.

3
Feldspar Megacrysts
Both alkali feldspar and plagioclase are capable of growing to unusually large sizes;
however, while the extent to which this occurs in plagioclase in silicic rocks is limited, alkali
feldspars reach impressive volumes rather frequently (e.g., Higgins & Chandrasekharam 2007,
Li et al. 2016, Memeti et al. 2010, Perini et al. 2003, Vernon 1986, Vernon & Paterson 2006).
These large crystals reach 20 cm and can be an occasional occurrence or a significant fraction of
the total alkali feldspar in a system (Johnson & Glazner 2010). We define a megacryst as any
crystal of such significant size that it does not appear to be part of the general matrix of a rock,
typically one that is more than 500% larger along its c-axis than the next largest phase in the
matrix. Megacrysts frequently coexist with smaller crystals of the same phase in a unit of
porphyritic or seriate texture, but when referring to size distributions we refer to all crystals of
the phase as megacrysts for simplicity’s sake as long as they are distinct from the matrix and a
significant portion meet the required dimensions.
What do Feldspars Experience?
We aim to explore connections between exposed granites and historic volcanism by
studying alkali feldspar megacrysts. Due to their size and presumably extensive crystallization
histories, these crystals may experience a significant portion of a magma system’s history that
could include multiple periods of cooling, extraction, and recharge, along with other less
common events. Extraction events involve removal of material from the magma body and might
be either catastrophic in the form of eruptions or more gradual magma migrations. These events
can cause enrichments of slow-diffusing elements in megacrysts that are growing at a
sufficiently fast rate (Pamukcu et al. 2016). Injection events also produce changes in melt
compositions. They do so slowly, adding material to the system that must then be incorporated
into the larger magma body before affecting the composition of individual crystalizing feldspars.
Cooling magma systems experience gradual decreases in concentrations of compatible elements
as they are depleted by crystallization. These events should all be reflected within megacrysts
growing during such events. While not every crystal in a system will experience every event in
that system’s history, individual crystals may record a plethora of events occurring in the system
from its nucleation up to its final stage of growth. Taken as a group, these crystals can provide a
detailed history of the magmatic system that contained them during growth.
The Tuolumne Intrusive Complex
The Tuolumne Intrusive Complex covers an area of approximately 1200 square
kilometers, mostly within Yosemite National Park as shown in Figure 1 (Coleman et al. 2004).
The complex was selected as an initial focus area for this study based on the extensive volume of
work already completed there, making it one of the world’s best studied – not to mention most
recognizable – granitic bodies (Annen et al. 2015, Barnes et al. 2016, Bateman & Chappell 1979,
Burgess & Miller 2008, Challener & Glazner 2017, Coleman et al. 2004, Economos et al. 2009,
Glazner & Johnson 2013, Hodge et al. 2011, Johnson & Glazner 2010, Moore & Sisson 2008,
Paterson et al. 2005, Paterson et al. 2016, Ratajeski et al. 2001, Vernon & Peterson 2008, Vernon

4
1986). Use of such a well-studied field site has allowed for a greater degree of collaboration and
a more extensive body of work to reference than would otherwise be available.
Figure 1: Map of the Tuolumne Intrusive Complex with select dating adapted from Paterson et al. (2011) (left)
shows the structure of the complex’s five units: Kuna Crest (KC), equigranular Half Dome (eHD), porphyritic Half
Dome (pHD), Cathedral Peak (CP), and Johnson Peak (JP). Lighter lines indicate more gradual transitions from one
unit into the next (Paterson et al. 2011). Map of East-central California, displaying the location of Yosemite
National Park in the region and the United States as a whole (right) (National Park Service 2017).
Structure and Relationships
The Tuolumne Intrusive Complex is a concentrically formed granitic batholith. It
displays what is commonly referred to as an “onion” structure, in which each unit envelops all
units younger than itself; however, the second to innermost unit, the Cathedral Peak
Granodiorite, breaks this rule, breaching the enclosing Half Dome Granodiorite for tens of
kilometers in the Northwest. In addition, Kuna Crest appears only as thin slivers reaching widths
of a few hundred meters or less around the outer edges of Half Dome if it outcrops at all, with
the major exception of the Kuna Crest Lobe which is composed exclusively of the Tuolumne’s
mafic outer unit (Barnes et al. 2016, Bateman & Chappell 1979, Paterson et al. 2016).

5
The Tuolumne Intrusive Complex was emplaced from the outside units inward
chronologically from Kuna Crest (95-92 Ma) to equigranular Half Dome (92-90 Ma) to
porphyritic Half Dome (90-88 Ma) to Cathedral Peak (88-85 Ma) and then finally Johnson Peak
(~87 Ma) (Barnes et al. 2016, Coleman et al. 2004, Economos et al. 2009, Paterson et al. 2016).
However, the amount of magma present at any given moment in the units remains a topic of
debate (Johnson & Glazner 2010, Memeti et al. 2010). Kuna Crest has multiple sub-units, most
of which are not continuous, but all of which were intruded at approximately the same time with
very similar compositions. Kuna Crest also comes in a variety of constituent units within the
Kuna Crest Lobe, as described by Barnes et. al. (2016). The Half Dome Granodiorite, while fully
continuous, has two facies, one porphyritic and the other equigranular. The contact between the
two units is generally gradual, though it is sharp locally. Porphyritic Half Dome then grades into
the Cathedral Peak granodiorite, and Cathedral Peak surrounds the Johnson Peak Leucogranite.
Contacts between Cathedral Peak and Johnson Peak are generally sharp, though gradational
contacts are present locally (Bateman & Chappell 1979). Conversely to its internal contacts,
most contacts between the Tuolumne and host rocks are quite sharp (Barnes et al. 2016, Bateman
& Chappell 1979). Contacts sometimes incorporate stoped blocks, and some country rocks are
present between adjacent granites, with as little as a cm of country rock separating the Tuolumne
Intrusive Complex from the El Capitan granite and others associated with it (Paterson et al.
2016).

6
CHAPTER 2
METHOD DEVELOPMENT AND DATA COLLECTION
Overview
Over the course of this work we aimed to collect samples and develop a method for
effectively processing them. The following elements of that process are discussed below: (1)
Field work and Exploration, which took place primarily in August and September 2017, with
some preliminary work in October 2016, aimed to develop a more complete understanding of the
field area, locate ideal collection sites and gather the proper samples from them, and locate
interesting features of outcrops that might assist in interpretation of the analytical data. (2)
Three-dimensional imaging using x-ray computed tomography used to get 3D images of whole
crystals before destructive analysis. (3) Two-dimensional imaging using backscattered electrons
and energy dispersive spectroscopy, both of which are obtained using detectors attached to a
scanning electron microscope. These images provide higher-resolution data compared to three-
dimensional images and allow for precise mineral inclusion identification. (4) One-dimensional
imaging using laser ablation inductively coupled plasma mass spectrometry to acquire detailed
profiles across samples of trace elements used to differentiate the processes of growth between
samples and sample zones.
The Field Component
Field work was completed from October 12, 2016 to October 15, 2016 and from August
20, 2017 to September 5, 2017. Collection and travel throughout Yosemite National Park was
aided by a collection permit, without which many locations would not be accessible.
Observations were made over much of the Tuolumne Intrusive Complex, and a transect was
completed to observe patterns in megacryst sizes throughout the Half Dome and Cathedral Peak
units. This transect aimed to test findings of Johnson & Glazner (2010) which did not seem
consistent with my initial observations. A ~ 2 km long path was selected that began at the
equigranular-porphyritic Half Dome boundary and extend into Cathedral Peak in a reasonably
straight line. At each of the 35 outcrops exposed along the path, I selected an observation area of
roughly 4 m2. In each area, I identified and measured the longest exposed dimension of what
appeared to be the largest and smallest visible megacrysts, and, based on visual inspection of the
area, estimated a median size. Each of the major units of the Tuolumne Intrusive Complex is
discussed in detail in Appendix D, as are the specifics of this transect.
Detailed Imaging and Dimensionality
Detailed imaging at high resolutions and in 3D provides significant value for this project.
High-resolutions allow for fine-scale analysis that is critical when studying small-scale features
such as the many zones of crystallization within a single alkali feldspar megacryst. Getting high

7
quality images in one, two, and three-dimensions allows for the most thorough characterization
of crystals possible today. We use x-ray computed tomography to capture three dimensional
volumes, two different scanning electron microscope sensors for two-dimensional maps, and
laser ablation inductively coupled plasma mass spectroscopy to capture one-dimensional line
scans.
Value of Three-Dimensional Imaging
Three-dimensional images are valuable for a number of reasons when compared to other
more traditional one- and two-dimensional options. Most importantly, three-dimensional
imaging via x-ray tomography is non-destructive, allowing samples to be reanalyzed multiple
times if necessary, for either testing or data collection. This non-destructive nature also means
that the images collected using this method can preserve a full view of the sample that can be
returned to after destructive processes have been performed, providing a sort of preservation, and
allowing lower dimensional imaging to be related back to three-dimensions more easily.
Secondly, three-dimensional imaging provides a means of viewing a whole sample’s internal
features, and how they relate to one another, in full. This allows for better comparisons of crystal
geometries and growth patterns than would otherwise be possible. For alkali feldspar, whose
triclinic nature means that variability in internal geometry can be quite significant, this could
provide meaningful insight into processes of formation. Finally, three-dimensional imaging can
provide better measures of inclusion volume percentage than any other method since volumes
are calculated directly from data without any need for extrapolation to three dimensions.
Value of Two-Dimensional Imaging
Imaging in two-dimensions may appear to be redundant to three-dimensional techniques
at first glance; however, there are a number of reasons why it is worthwhile to collect lower
dimensional images in addition to three-dimensional ones. Backscattered electron images
provide very similar data to tomography; but are much higher in resolution, making them
worthwhile. Collection of backscatter images occurs on similar timescales to tomography, 4 to 8
hours, and provides easily processed and utilized data. Additionally, in two-dimensional
sections, it is possible to collect quantitative energy dispersive x-ray spectroscopy maps, which
provide compositional maps for all major elements over the entire plane on which the sample
was cut. This makes the identification of crystal inclusions much simpler than in other methods
and provides a wealth of information while simultaneously enabling cross-referencing with
tomographic data which is virtually required to make confident estimations of the included
volume of various phases and to make other similar observations. Both backscatter and energy
dispersive x-ray spectroscopy also provide much clearer quantitative analysis of zonation in
megacrysts as compared to what is currently possible in tomographic images, which on its own
makes the additional collection time worthwhile in almost all cases.

8
Value of One-Dimensional Imaging
One-dimensional imaging is used in this work in addition to higher-dimensional imaging
because the higher-dimensional techniques are limited as to what specific elements they are able
to identify. Backscattered electron imaging and x-ray computed tomography both provide maps
of variation in mean atomic number, which offer very limited information on exact composition.
Energy dispersive x-ray spectroscopy, while much more detailed, can only consistently provide
data on elements present in concentrations greater than ~0.1 wt.% of the oxide. For feldspars
analyzed here, this includes the major elements, and a few other select elements, including Ba.
Laser ablation inductively coupled plasma mass spectrometry adds to these techniques by
providing high-quality data for rare-earth elements and a variety of other elements present in
trace concentrations. While the one-dimensionality of these data is somewhat limiting, it
provides invaluable information on dispersed elements that would not be otherwise available.
X-Ray Computed Tomography
X-Ray Computed Tomography is a method of three-dimensional imaging that utilizes the
variable x-ray attenuation of materials and an x-ray sensor to collect intensity images of a sample
at various angles, in a very similar method as is used in medical cat scans, except with a much
more powerful x-ray emitter, that while harmful for humans, is needed for penetration of more
dense material (Fig. 2). Sample sizes are limited by the machine used – in this case a North Star
Imaging ImagiX located at Vanderbilt University. The North Star Imaging ImagiX utilizes a
voltage range of 10 kV – 130 kV with some limitations based on spot size, a 20 by 25 cm (2000
by 1800 pixel) flat panel detector, has a variable focal distance up to 61 cm, and can support
samples of up to 20 cm and 4.5 kg in a single field of view. X-ray computed tomography
provides a reasonably fast and easy collection process; however, processing times can be
excessively long for certain techniques, and so cost-benefit analyses were required to determine
what could be done within reasonable constraints.

9
Figure 2: A feldspar megacryst viewed through x-ray computed tomography. Highly attenuating minerals (such as
magnetite) are highlighted in red, zonation is visible, as is an artificial brightening from core to rim caused by a
collection error called beam hardening that becomes significant in high-density samples. The crystal is digitally cut
in this image so that the center is visible; however, the image was taken using a whole crystal.
While testing x-ray computed tomography techniques, we found that beam hardening, a
change in brightness from the center to the edge of a sample resulting from the polychromatic x-
ray beam used, limited our ability to make meaningful analyses of mineral inclusion distributions
by specific mineral. While general inclusions are simple to locate and separate, separating each
mineral requires further work. Through extensive testing, we found that filtering incident x-rays
through a foil sheet of aluminum about 0.1 to 1.0 cm thick could be used to create a sharper
image, and that filtering through copper sheets about 1.0 mm to 3.0 mm thick could dramatically
reduce beam hardening. The use of copper as a filter produces some other imaging problems,
mainly in the form of increased collection time and ring-shaped artifacts, but provides a means
for three-dimensional mineral species distribution analysis not otherwise possible at this time. As
can be seen in figure 3, the use of a copper foil significantly reduced beam hardening (curvature)
through the sample.

10
Figure 3: These two plots show the same approximate transect of x-ray intensity across a crystal with and without a
20.5 mm aluminum foil. The foil significantly reduces the curvature of the transect, which is caused by beam
hardening, providing a much clearer image that can be analyzed more easily and to greater effect.
Scanning Electron Microscopy
The scanning electron microscope uses an electron beam to excite electrons in the top
few microns of the polished surface of a sample in order to yield a number of different types of
images. In this study we used backscattered electron and energy dispersive spectroscopic
imaging to collect maps of planes within feldspars previously scanned using x-ray computed
tomography in order to produce images of the sample’s mean atomic number and major element
composition. Because of the presence and importance of high-atomic number elements such as
iron in the studied samples, high electron beam energies of approximately 15 kV were utilized in
this study. The microscope utilized is a Tescan Vega 3 LM Variable Pressure Scanning Electron
Microscope with secondary electron, backscatter, Tescan low-vac secondary electron,
panchromatic cathodoluminescence, Oxford X-max 50 mm2 EDS, Oxford EBSD, and Gatan
MonoCL detectors.

11
Backscattered Electron Imaging
Backscattered electron (backscatter) imaging provides highly detailed images, but lacks
the quantitative compositional data, and thus information on phases and certain zoning patterns,
provided by other techniques. Backscatter does provide some compositional information by two
methods. Average atomic number allows differentiation of certain obvious phases (magnetite,
titanite), but helps much more for phases with similar mean atomic number (plagioclase, quartz)
that are very challenging to distinguish in x-ray computed tomography. In alkali feldspar
specifically, mean atomic number can actually be used as a proxy for Ba concentration (Fig 4).
While imperfect due to other possible substitutions such as that of Na and K, the estimate is
reasonably close because Ba is common in silicic melts, is very strongly partitioned into alkali
feldspar, and has very high Z and thus significantly influences the mean atomic number of alkali
feldspar.
Fig 4: A backscattered electron image showing a megacryst with concentric rings of varying Ba concentration
(zones) and inclusions. While inclusions cannot be identified specifically in backscatter, brighter inclusions are of a
higher atomic number (zircon, magnetite, titanite, apatite, biotite), while the dark inclusions are of lower atomic
number (quartz, plagioclase).
Backscatter, then, serves to provide clear and highly detailed images for use in finding
and categorizing zone boundaries in terms of Ba when imaging alkali feldspar megacrysts. As a
result, it tends to be the most effective method for comparing fine-detail zone structures. While

12
comparing these fine detail structures – primarily the slope of brightness change at various places
within a single zone – is most effective in backscatter, it can only be done using the Ba
equivalency assumption, and laser ablation inductively coupled mass spectroscopy is effectively
required to do any detailed compositional zoning comparison, though energy dispersive x-ray
spectroscopy can be used in some cases.
Backscatter images, while helpful on their own, are most useful when complemented
with intensity profiles taken across sections of the image that allow an observer to identify and
interpret patterns in the data. Various methods exist for extracting profiles, including the IDL
programs written by Gualda and Blob 3D’s profile function that were utilized in this study
(Ketcham 2005). Profiles, in the form of backscatter intensity vs. distance in pixels, provide a
means for identifying zone structures and boundaries in backscatter that are challenging to
comprehend in 2D maps. Profile data can be obscured in areas of high inclusion concentration,
as these inclusions, frequently concentrated on zone boundaries, can interrupt critical data (Fig
5). However, this problem can be circumvented by producing a profile from the average values
of a few parallel profiles, which can help to reduce the influence of any inclusions that don’t
transect all of the averaged lines. Backscatter also provides a very useful reference for other
imaging techniques, providing a base image with which to guide further analysis using energy
dispersive x-ray spectroscopy and laser ablation inductively coupled plasma mass spectroscopy.
Figure 5: This backscattered electron image shows how abundant inclusions can significantly impede profiling of a
megacryst. The alkali feldspar that composes the megacryst is highlighted in blue and inclusions are highlighted in
purple. Importantly, slopes and trends in the alkali feldspar often change on either side of an inclusion. These
transitions are important, and inclusions frequently collect on them, obscuring the patterns.

13
Energy Dispersive X-ray Spectroscopy
Energy dispersive x-ray spectroscopy provides compositional maps of major element
compositions, and despite reduced resolution in comparison to backscatter, provides high-
confidence inclusion identification and can give helpful information on zoning. Energy
dispersive x-ray spectroscopy profiles can provide useful and easy-to-use data, especially in
conjunction with laser ablation inductively coupled plasma mass spectroscopy, at the cost of
about 20 – 100 hours for samples of the size studied during this project.
Energy dispersive x-ray spectroscopy maps of individual elements can be easily
combined in the Aztec software created by Oxford Instruments, as well as in any other standard
imaging processing program (ImageJ, Adobe product line, etc.). False-color maps can be created
by combining elemental maps using color channels to show compositional variations that allow
for the differentiation of specific mineral phases, most of which can be differentiated using only
one or two such maps if care is taken when selecting the elements to display (Fig 6). Maps are
generally limited to three channels so that each color is unique to a specific composition, but.
they can be “resampled” so that all desired compositional options can be obtained. Profiles using
this technique can be useful in quantifying changes in feldspar composition from the core to rim
of a crystal, augmenting understanding of the magmatic systems evolution during crystal growth.
Figure 6: An energy dispersive x-ray spectroscopy image showing potassium in yellow, silica in magenta, and
aluminum in cyan. This particular combination helps to separate the dark inclusions in figure 4 into quartz and
plagioclase, as well as highlighting titanite in bright blue.

14
Laser Ablation Inductively Coupled Plasma Mass Spectrometry
Laser ablation inductively coupled plasma mass spectrometry uses a laser to ablate small
volumes of a sample in-situ in order to produce elemental concentration data of specific locations
within a sample. This method can be used to gather data in a number of different ways, including
individual analyses and the long lines of spots that have been utilized in this study. Collection is
also relatively fast, with about an hour and a half of set-up time followed by a few hours of
scanning. Data processing is a bit more time consuming but usually only adds another two to
four hours (Jenner & Arevalo 2016, Ketcham 2005, Gualda & Rivers 2006).
Through testing by lab manager Richard Bradshaw (2017), it was determined that a line
of spots collection technique was most viable for use in this project. Extensive testing of various
methods showed that quicker methods such as line scans resulted in analytical errors far too high
for use in this study. Individual spot analysis was impractical considering the distances that
needed to be covered, and the desire for clear and consistent profiles across crystals. Therefore,
all discussion of laser ablation inductively coupled plasma mass spectrometry here is specifically
concerned with the line of spots collection process, though much of it is generally applicable.
Products of Laser Ablation Inductively Coupled Mass Spectrometry
Data produced by laser ablation inductively coupled plasma mass spectrometry is of a
very high resolution, with each point on the resultant profile corresponding to a rectangular spot
of 10 by 50 micrometers for the megacrysts used in this study. The method provides data for
various trace elements in-situ, allowing for unparalleled opportunities to collect the data
necessary to understand how these elements vary within each zone of a studied crystal. While
imperfect due to high analytical uncertainty, this highly important procedure allows for a deep
understanding of the micrometer-scale variations of trace elements within a given crystal. Data
produced by laser ablation inductively coupled mass spectrometry consists of concentration
profiles for any elements selected when setting up a scan. After processing, these profiles are
easily plotted and compared to one another. Because collection leaves a scar on the crystal, it
would also be relatively simple to return to energy dispersive x-ray spectroscopy and
backscattered electron maps to get data from those sources on the exact site of a laser ablation
inductively coupled mass spectrometry profile. Plots of laser ablation inductively coupled mass
spectrometry data are produced using concentration against length, further expediting
comparison between this technique and the previously discussed forms of 2D and 3D imaging.

15
CHAPTER 3
DISCUSSION
Imaging Feldspar Megacrysts
This study aims to understand how feldspar megacrysts could be imaged such that the
insight provided by a single image can be coordinated across 1D, 2D, and 3D techniques in order
to develop deeper understandings than could be achieved by any technique in isolation. The
greatest challenges derive from the density of alkali feldspar, which limits the quality of images
collected using penetrative techniques like x-ray computed tomography. The development of a
process by which the x-rays are filtered through metal foils in order to improve image quality
largely rectified this issue, and is described in detail below. Once this process was complete, we
confirmed that a cut in a crystal scanned in 3D could be matched with a 2D map of that cut, and
that the same could be done from that 2D map to a 1D profile.
The coordinated imaging used in this work allows a worker to incorporate detailed
understandings of the crystals 3D structures and inclusion distributions with observations of
composition, and compositional variation, of megacrysts and their inclusions. A more complete
understanding of how compositions change throughout a crystal could help future investigators
understand the complex histories of megacrysts. This potential is magnified by the use of
multiple methods to gain data on both trace and major elements of interest, and importantly, both
compatible and incompatible elements, that should display patterns that in conjunction could be
matched to originating processes.
Crystal Geometries and Distributions in the Field
Megacrysts of various shapes and sizes are visible in outcrops throughout the Tuolumne
Intrusive Complex. In cross-section, long rectangles with aspect ratios between 3:1 and about 3:2
are most common in the northern portion of the complex (the Central Cathedral Peak Lobe). In
the south-central portion of the unit cross-sections in the form of rectangles, elongate hexagons,
diamonds, and Carlsbad twinned crystals are also visible (Fig. 7). Magmatically broken crystals,
which can be identified by their unusual shapes and broken interior zones, occur mainly in the
south-central portion of the complex and are reasonably easy to identify due to the exposure of
internal crystal structures to the groundmass. The greatly reduced variety in crystal geometries in
the northern portion of the complex is notable and may be indicative of physical sorting or an
actual increase in the variety of crystallization histories closer to the central point of Cathedral
Peak’s formation where new magma was introduced until the end of injection as illustrated by
Johnson Peak’s proximity (Bateman & Chappell 1979).
Megacrysts occur in a number of physical distributions. Most outcrops display crystals
distributed uniformly; however, many outcrops in our selected field area display log-jam and
waterfall features. Log-jams are tight concentrations of crystals extending for up to ~10 meters

16
and displaying distinct contacts with surrounding rock that is not as rich in megacrysts.
Waterfalls, as defined by Dr. Jonathan Miller (San Jose State Univ., personal communication,
2016), are similar but lack distinct boundaries and grade gradually into distributions typical of
their unit at large (Fig. 8). The two features can also coexist, and waterfalls sometimes connect
log-jam features.
Figure 7: Feldspar megacrysts display a large variety of geometries when exposed in outcrops. These include long
rectangles (purple), squares (green), long hexagons (blue), short hexagons (red), Carlsbad twins (yellow), and
magmatically broken crystals (orange) that form diamonds and other unusual geometries.

17
Figure 8: This boulder contains a small-scale feldspar waterfall. The waterfall is a gradual decrease in concentration
of megacrysts away from a region of high concentration. They form the boundary layer between the groundmass and
some log jam features, though abrupt boundaries are more common. Yellow arrows highlight the feature, pointing in
the direction of decreasing concentration. Hat for scale.
Filtering X-Rays with Metal Foils
As discussed in the previous section, the use of three-dimensional imaging has the
potential to illuminate a significant amount about both zones and cores in megacrysts. However,
a significant challenge when imaging using polychromatic x-ray computed tomography comes in
the form of the beam hardening artifact, wherein images brighten from the center outward as a
result of lower energy x-rays being able to penetrate only the thinner portions of any given

18
sample. While this has little effect on studies that do not rely on quantitative analysis of three-
dimensional data, or use samples with low densities (such as sandstones or fossils) for which the
problem is minor or can be corrected by some simple image processing, in dense materials the
variability in brightness means that each phase in the sample has a large range in x-ray intensity
that frequently overlaps other phases rendering accurate identification of individual crystal
phases virtually impossible. This effect can also lead to an apparent zonation of included phases
with distance to the core that is actually just a result of the artifact (Fig. 9). To remove this issue
one either needs to perform analysis with an x-ray of more uniform energy, or at least with a
higher minimum energy. This can be accomplished by using a monochromatic beam in the case
of Synchrotron radiation sources, but such setups present other limitations, particularly with
regard to sample size. For instruments using a polychromatic x-ray source (such as the
instrument used in this study), the range of energies in the incident beam can be reduced by using
filters. The use of filters greatly reduces beam-hardening artifacts, at the cost of increasing scan
times due to the reduced number of x-rays crossing the sample – in this study, scan times
increase from 0.3-4 hours to 6-24 hours when comparing unfiltered versus filtered incident
beams (Fig. 10). While such an increase in scan time is substantial, the improvement in data
quality can justify this. The use of metal foils can, however, cause issues with another artifact, a
radiating circular pattern created during reconstruction called a ring artifact. The ring artifact is
intensified by lower signals and samples that are positioned too perfectly at the center of the
scanning area. As centering is necessary for higher resolution images and enhances image quality
under lower x-ray emission, it is somewhat necessary for high resolution imaging, especially of
small samples and in small machines. In addition, because smaller machines lack the capability
to offset the axis on which a sample is rotated from the center of the beam – a common method
of mitigating the artifact in larger constructions – the ring artifact can be quite challenging to
avoid when imaging small, dense samples at higher resolutions. The problem is only
compounded by the use of metal foils, which further reduce the beam intensity. Additionally,
lower counts on the detector hurt image quality and make it impractical to reduce frame
averaging and other time-saving methods that would otherwise prove tempting considering the
greatly increased time of imaging (Fig. 10).

19
Figure 9: This slice of an x-ray computed tomography scanned megacryst processed using Blob 3D, shows how
inclusions are distributed throughout the scanned crystal. Different colors are meant to represent differing minerals,
distinguished by brightness in x-ray computed tomography; however, beam-hardening distorts brightness throughout
the scans volume such that colors fade out artificially, and fail to accurately represent distinct mineral phases.
Aluminum, titanium, and copper foils were tested in purities of 95% or higher in this
study. These tests used a variety of thicknesses of the given metal to determine what the best
options for imaging alkali feldspar megacrysts are. A discussion of the effectiveness of various
foils and foil thicknesses follows.

20
Figure 10: This figure illustrates the increasing amount of time required to complete a scan in x-ray computed
tomography using various types of foils. Larger circles provide a visual representation of the relative thicknesses of
foils and labels provide exact thicknesses in millimeters. As can be seen, scan times increase dramatically with the
thickness and density of foil applied. Note that thicker copper foils are rarely worth the scanning at larger
thicknesses because of issues with artifacts that compound with excessive scan times to make copper foil
thicknesses greater than about 2.5 mm highly impractical.
Comparing Scans With and Without Foils
Metal foils improve the consistency with which an image registers the brightness of any
phase throughout the analyzed mass to be the same, as it should. An image with no foil displays
progressive darkening from core to rim (Fig. 11). This is due to beam hardening, as the
composition of analyzed alkali feldspars studied here does not vary significantly from core to rim
(except for the oscillatory zoning in Ba). Changes in brightness from core to rim due to actual
compositional changes can easily be confirmed after completing 2D analysis. However, avoiding
the use of foils carries some benefits. For example, ring artifact are not present due to high
counts on the detector. Unfortunately, extensive experimentation has shown that this method
fails to isolate individual mineral phases, somewhat counteracting this benefit. Figure 9, created
in Blob 3D, shows how “phases” represented by different colors become more and less common
based on their distance from the crystal’s (and scan’s) center. These images are very helpful
when observing internal structures and inclusion distributions but are of limited use in
quantitative analysis because the recorded brightness of a given substance vary widely through
the volume, resulting in “phases” being identified not only by mean atomic number, but also by
distance from the core, producing the perceived pattern of phases being included only in certain
distances from the core when this is not actually the case.
Foils produce images that can be clearer, though they are also more prone to artifacts that
may require re-scanning. Many examples of this are available in appendix B. The boundaries of
inclusions are much sharper when a foil is used, and different inclusions are more easily
differentiated. Even plagioclase and quartz can be separated from alkali feldspar consistently,
though doing so remains challenging for various reasons including similar x-ray penetration and
difficulties resulting from their brightness’ being lower than that of alkali feldspar. The effects of
foils discussed above are progressive, increasing with greater thicknesses and less easily
3:36:00
8:24:00
13:12:00
18:00:00
22:48:00
27:36:00
32:24:00
37:12:00
0 2 4 6 8 10 12 14
Tim
e (h
h:m
m:s
s)
Scan Number
720 Frames withCopper Foil
720 Frames withTitanium
720 Frames withAluminum
1440 Frames withCopper Foil
1440 Frames withTitanium
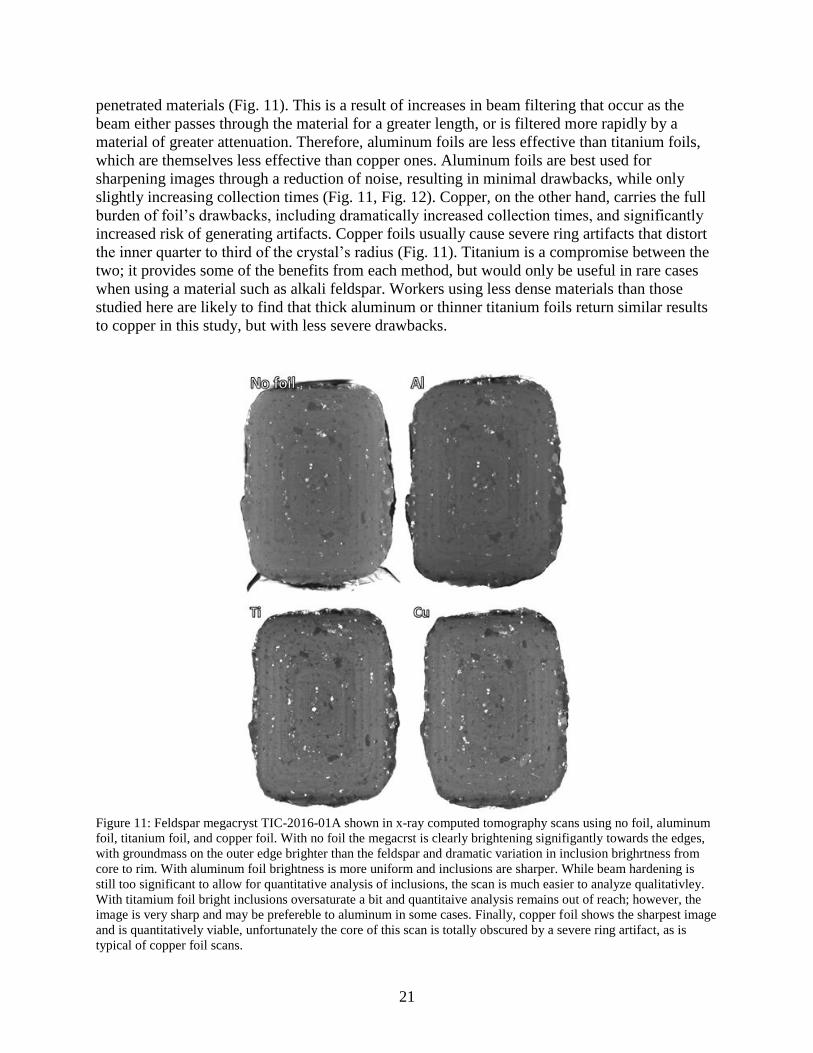
21
penetrated materials (Fig. 11). This is a result of increases in beam filtering that occur as the
beam either passes through the material for a greater length, or is filtered more rapidly by a
material of greater attenuation. Therefore, aluminum foils are less effective than titanium foils,
which are themselves less effective than copper ones. Aluminum foils are best used for
sharpening images through a reduction of noise, resulting in minimal drawbacks, while only
slightly increasing collection times (Fig. 11, Fig. 12). Copper, on the other hand, carries the full
burden of foil’s drawbacks, including dramatically increased collection times, and significantly
increased risk of generating artifacts. Copper foils usually cause severe ring artifacts that distort
the inner quarter to third of the crystal’s radius (Fig. 11). Titanium is a compromise between the
two; it provides some of the benefits from each method, but would only be useful in rare cases
when using a material such as alkali feldspar. Workers using less dense materials than those
studied here are likely to find that thick aluminum or thinner titanium foils return similar results
to copper in this study, but with less severe drawbacks.
Figure 11: Feldspar megacryst TIC-2016-01A shown in x-ray computed tomography scans using no foil, aluminum
foil, titanium foil, and copper foil. With no foil the megacrst is clearly brightening signifigantly towards the edges,
with groundmass on the outer edge brighter than the feldspar and dramatic variation in inclusion brighrtness from
core to rim. With aluminum foil brightness is more uniform and inclusions are sharper. While beam hardening is
still too significant to allow for quantitative analysis of inclusions, the scan is much easier to analyze qualitativley.
With titamium foil bright inclusions oversaturate a bit and quantitaive analysis remains out of reach; however, the
image is very sharp and may be prefereble to aluminum in some cases. Finally, copper foil shows the sharpest image
and is quantitatively viable, unfortunately the core of this scan is totally obscured by a severe ring artifact, as is
typical of copper foil scans.

22
Figure 12: X-ray computed tomography profiles illustrating the significant reduction in beam hardening that can be
achieved through the utilization of filtering the x-ray bean through a 20.5mm aluminum foil.
Conclusions on Foils
Moderate thicknesses of easily penetrated foils are useful for producing slightly improved
images of dense materials. Thin layers of denser foils may be necessary when imaging for
quantitative analysis, though they bring serious downsides. That said, many of the major artifacts
can be removed if images are taken in a larger machine that allows for three-dimensional stage
motion. Being able to image a crystal off center and off its central axis could allow for most
downsides of dense foils to be mitigated, with the single exception of scan times. However, in
small machines the author does not recommend committing much time to the use of high density,
low penetration foils.
Core Structures and Characteristics
The core of a megacryst can be defined as the innermost or original zone of the crystal. It
is the first period of growth visible in the crystal’s structure, and it is generally uniform in
composition, though it may be interrupted by signs of resorption. It is distinguished from the
interior, which surrounds the core and represents subsequent periods of growth during the
crystal’s formation. The rim is the last of these rings to form, and so makes up the outermost
portion of any given crystal.
We observe megacrysts of the Tuolumne Intrusive Complex to display four variations in
the construction of their cores: full cores, whole cores, resorbed cores, and double-resorbed cores
(Fig. 13). Each core is unique in structure and displays its patterns in slightly different ways. We
aim here only to outline the most general groups of cores found in the fourteen crystals imaged

23
in this study. Specific core patterns provide insight into a crystal’s earliest history and help to
refine the potential growth history of the given crystal. Full cores show no evidence of
resorption, implying that core formation may have simply been the “first zone” of the crystal,
and it is most likely to have formed under similar conditions to the rest of the given crystal’s
volume. Whole-core crystals also lack resorption patterns, but the core structure extends
uninterrupted throughout the entire crystal, with no distinct zonation and only gradual
compositional changes from core to rim. This suggests that such a crystal crystalized fully in a
single event. This is surprising, especially considering that the only available example is an
impressive 10 cm in length.
Cores more frequently display disequilibrium patterns. Resorption patterns, in the form of
unusually bright bands or poorly formed habit, have been found as single or multiple events
within the core, frequently leading to anhedral core structures that are surrounded by successive
euhedral zones. They can also exhibit anomalous structures such as a sudden jump to a
significantly less potassic composition, before returning to something closer to the megacryst’s
mean composition. This implies a complex origin, which might include recharge magmas
capable of causing resorption or transport from depth within the magma system. In addition,
some cores are exceptionally inclusion rich. Such cores are challenging to categorize due to their
other traits being obscured by inclusions; however, these likely reflect either crystallization late
enough that the necessary number of crystals of other phases was present and available for
inclusion within the megacryst. Some evidence for this is present in other uncommon inclusion
patterns that are found in the observed instance of this core structure. All crystals observed thus
far can be grouped in the preceding categories; however, as work continues, we will continue to
search for additional forms of megacryst core structures.

24
Figure 13: Four varieties of core structure were observed in megacrysts of the Tuolumne Intrusive Complex. Full
cores (top left) show no signs of resorption in their early history and maintain an euhedral structure. Whole-core
crystals (upper right) do not have a core structure distinct form the crystal body, and lack the strong zonation of
other megacrysts, making the entire crystal part of the “core”. Resorbed cores (bottom left) are similar to full cores
internally; however, they are subhederal, implying a period of disequilibrium before subsequent zonation began to
accumulate. Double-resorbed cores (bottom right) show multiple resorption events, usually in the form of a bright
ring in the core, and a mis-shaped core on the exterior, suggesting a second phase of partial resorption before the
crystal body began to grow.

25
Zone Structures and Characteristics
The vast majority of the Tuolumne Intrusive Complex’s megacrysts display some form of
repeating zonation structure within thin layers of crystal called zones. Only one analyzed crystal
breaks from this, containing only a single crystallization event, as discussed above. The
remaining crystals consist of many thin zones that are either oscillatory – in that they generally
repeat the same pattern of high-low-high-low Ba content – or bands of notably different
compositions. Zones that diverge significantly from the oscillatory pattern are less common, and
occur as anomalies in crystals that are otherwise characterized by the standard oscillatory zoning.
However, roughly 20-50% of zones in most crystals display one of the unusual zone patterns
discussed below. We observe four varieties of these unusual zones, each displaying an
anomalous concentration profile forming either a peak, valley, plain, or reverse sawtooth pattern.
The standard oscillatory zone is referred to as a sawtooth zone in this work. Zones in this section
manifest in compatible elements unless otherwise noted.
Figure 14: This backscatter profile of a feldspar megacryst illustrates the various patterns present in the megacryst’s
zones. From left to right: The valley is either a unique gradual decrease in concentration followed by a gradual
increase or adjacent sawtooth and reverse sawtooth patterns. The sawtooth is a steady decrease away from the core,
often preceded by a rapid increase in intensity. The peak is a local maximum, either formed by a specific process or
a sawtooth and reverse sawtooth adjacent to one another. The reverse sawtooth is a gradual increase in intensity
away from the core generally followed by a sudden decrease. The plain is a region of relatively constant intensity.
These patterns are visible in nearly every megacryst imaged in this study.
The sawtooth pattern displays a sharp increase in the concentration profile of a megacryst
followed by steadily decreasing concentrations towards the crystal rim (Fig. 14). This is

26
considered the standard not just because it is the most common compositional structure, but also
because it is the expected one for simple magmatic crystallization. As crystallization occurs
elements that are compatible with actively crystalizing phases will decrease in concentration in
the melt, resulting in a gradual decrease in concentration as the crystal draws from a melt with an
ever-reducing concentration of the compatible element.
The reverse sawtooth is exactly like the sawtooth pattern except that the concentration of
compatible elements is found to increase as distance from the core increases, then fall suddenly
at the rim side of the zone (Fig. 14). This phenomenon is found at least occasionally in virtually
all megacrysts of the Tuolumne Intrusive Complex that we have observed.
The peak structure is a local maximum of compatible element concentration with gradual
decreases away from it both towards the core and the rim (Fig. 14). This structure may be
something of a technicality formed by the joining of a reverse sawtooth and a sawtooth pattern.
However, it is equally possible that the peak is a unique structure.
The valley structure displays a gradual decrease in compatible element concentration
followed by a gradual increase, creating a concave up curve in the concentration profile (Fig.
14). The pattern may appear as a sort of “false zone” when sawtooth, reverse sawtooth, and/or
peak structures meet, or it could be a unique feature.
Finally, the plain structure is a simple flat line of constant concentration across the
concentration profile (Fig. 14). This is perplexing as the occurrence of crystallization requires
that the system is evolving. Therefore, the changes that are occurring must either be perfectly
balanced by some other source that is unlikely to be sensitive to the minutia of concentration
changes in the melt or the crystal was able to maintain internal equilibrium throughout the zone
by diffusion as it crystalized, which is very rare. We find the plain pattern remains the hardest to
understand of any feature found in these megacrysts.

27
CHAPTER 4
FUTURE WORK
This work establishes a methodology through which alkali feldspar megacrysts can be
analyzed. As work with these techniques progresses their full potential will become clearer. The
following outlines a few applications which the authors intend to pursue in future work:
1. Development of a quantitative method for analyzing patterns in megacryst zones,
which would serve to either verify patterns observed in this study or reveal new ones
as yet unobserved.
2. Develop a better understanding of which elements are most effectively utilized to
identify zonation patterns, specifically which compatible and incompatible elements
are most easily compared.
3. Understand which specific zonation patterns could result from each magmatic event,
allowing for the development of highly detailed histories of individual crystals.
4. Using individual histories, create generalized histories of regional or unit-wide events
in the magma chamber in which megacrysts grew.
5. By observing relations of individual zones to their neighbors, identify unique events
that precede or follow others consistently.
6. Use crystal histories to improve understanding of megacryst origins. Especially if the
crystals originate in the bodies in which they are found, or if they nucleated at greater
depth within the magmatic system.
7. Develop a means of consistently and effectively mapping included mineral phases to
identify patterns and relative frequencies. Especially, determine if some inclusions
occur primarily with certain zonation patterns or compositions, or in certain regions
of the crystal structure.
Of course, many other projects may result from these works. These targets simply show
the potential next steps that can be taken following this work.

28
CHAPTER 5
CONCLUSIONS
Alkali feldspar megacrysts contain within them veritable time capsules capable of
revealing the histories of silicic plutonic rocks generally hidden by time and the complexities of
these often-massive geologic bodies. By applying modern analytical techniques megacrysts can
be studied at greater depth than ever before, and the procedures outlined in this work serve as a
means of effectively doing so.
Application of x-ray computed tomography with the use of metal foils as filters allows
for the creation of 3D non-destructive images that can be used to isolate included phases for
observation and allows for a more complete understanding of zone structures than could ever be
possible using 2D techniques. Once taken, the image provides a record of a megacryst before
destructive processing and helps to reveal the nature of the crystals core, which is likely to play a
key role in understanding its origins.
Analytical techniques in a scanning electron microscope allow for higher resolution
images of a crystal’s zones and inclusions, and provide a means for identifying included phases.
The use of backscatter profiles as a qualitative proxy for Ba concentration provides a simplified
initial view of zonation in a crystal, and elemental maps from electron dispersive spectroscopy
provide more detailed data for major element compositions.
Finally, laser ablation inductively coupled mass spectrometry allows for high resolution
profiles of dispersed elements that can be matched to profiles taken from 2D techniques. These
data are key to understanding individual zones within a megacryst, how they relate to each other,
and what processes initiated the associated crystallization event.
Taken together, these collection methods provide an extremely detailed picture of an
individual alkali feldspar megacryst. In the future, these techniques will be applied to further
develop our understanding of these exceptional crystals, the processes by which they form, and
the wealth of information they record about the magmatic bodies in which they grow.

29
APPENDICES

30
APPENDIX A
SAMPLE COLLECTION
Sample collection was aimed at acquisition of whole alkali feldspar megacrysts from the
Cathedral Peak Granodiorite and the porphyritic phase of the Half Dome Granodiorite, with a
focus on Cathedral Peak; however, the boundary between these units is often gradual, causing a
number of samples to be better classified as transitional rather than purely of one unit or another.
While simply locating sites where samples could be collected effectively was a challenge in
itself, the greater concern was for collection of easily processed samples, a challenge which will
likely justify return trips for re-sampling in the future. Collecting large crystals in excess of 5 cm
in length is relatively simple, as these are generally capable of holding themselves together
during removal, whereas smaller crystals often shatter during collection. This means that samples
that are easier to process in the laboratory setting can be very difficult to collect whole, and many
of the best sampling spots hold a strong bias towards larger sample collection despite having a
wide distribution of sizes. Ideal sampling spots are weathered and unfractured, making it easy to
“pop” crystals out of the groundmass with a few taps of the hammer. In challenging locations
where rocks are strong, collecting a single crystal could easily become a multi-hour project, and
retains the potential to end with fragments or subsections rather than whole crystals. Below is a
brief discussion of each sampling location, and an assessment of its viability for resampling in
the future.
Samples were named in the format TIC-NXXX-YY L, where NXXX denotes either a
GPS location taken during the 2016 trip, or – when N is 2 – a identifier of the second visit to the
park, with the three X’s as place holders for a unique identifier incremented starting at 001 for
the first sample collected. The YY places then hold the sample number at a given location, and
the L is a letter denoting each individual within a sampling group.

31
Figure 15: This satellite image of the central-western portion of Yosemite National Park, CA shows the sampling
locations discussed below. Each locations identifier is trimmed to a number for simplicity. The yellow line running
through the map represents Route-120, and green icons locate park services to serve as reference points (Google
Earth 2019).

32
Collection Sites
Lambert Dome (TIC-2001 group, TIC-2002 group, TIC-2003 group)
Samples collected on Lambert Dome (Fig. 15) were gathered during an ascent up the
Southern face of the dome. The peak is more accessible via a trailhead starting to the East of the
Lambert Dome parking lot, which is recommended as climbing is a bit dangerous without proper
equipment. Samples collected on the slopes of Lambert consisted of megacrysts and groundmass
of the Cathedral Peak unit. Collection is challenging on the steep side of Lambert and the lower
portions of the dome offer few sampling opportunities, making these areas of limited value for
any further sampling. Conversely, there are plenty of easily accessible locations along the trail to
its peak and on the peak itself that are easily accessible. TIC-2003-01 is a schlieren collected at
the peak of Lambert, where these structures create a number of interesting patterns, other
samples from the dome included megacrysts and groundmass.
Pothole Dome (TIC-2004 group, TIC-2005-01, TIC-2022-01)
Pothole dome is an easily accessible location for collection of alkali feldspar megacrysts
embedded in groundmass, but offers few opportunities to collect individuals, with any that are
accessible being detrital and thus frequently partial. Pothole Dome does offer some interesting
opportunities for future work, but for the most part it is not an ideal location for collection.
The TIC-2004 group consists primarily of chunks of Cathedral Peak Granodiorite with
embedded megacrysts, along with a few individuals and groundmass samples. TIC-2005-01 is an
aplite from the dome’s peak, collected with the intent of gathering a whole rock composition that
might be used in place of a late-stage melt for rhyolite-MELTS model runs (Gualda & Ghiorso
2014). This is outside the scope of this work but is likely to be completed at a later date. TIC-
2022-01 is a sample of a “generic” Cathedral Peak groundmass intended for use as reference
after returning to Vanderbilt.
Roadside Outcrops (TIC-2006 group, TIC-2007 group, TIC-2009 group, TIC-2010 group, TIC-
2013-01, TIC-2014 group)
Roadside outcrops proved to be of varying quality, but the series discussed here are all
easily accessible and provide at least moderate quality samples at minimal effort. Each locality
would also be easily used when traveling to the site with collaborators, as they could all be
accessed in a single day and give an acceptable picture of the various units in the Tuolumne
Intrusive Complex.
The TIC-2006 group was collected at a polished Cathedral Peak surface with a small
ledge that made collection reasonably simple. There is nothing particularly exceptional about the
site, but it is a perfectly good collection site to return to for the outer Cathedral Peak.

33
The TIC-2007, 2010, and 2013 samples were all taken at useful reference sites for further
work, but do not contain megacrysts. They are outcrops of Johnson Peak, equigranular Half
Dome, and Kuna Crest respectively.
The TIC-2009 site provides easily accessible detrital samples along with easy in-situ
sampling; however, caution must be taken as the site contains popular bouldering routes that
should be left undamaged. If possible, resampling here should probably be avoided, but it is an
excellent site to see some very large megacrysts in a very accessible location.
The sampling area for TIC-2014, by a parking lot on the North end of Tenaya Lake, is
easily accessible but somewhat too public for re-sampling considering the National Park
guidelines, especially since it resulted in samples where megacrysts were heavily embedded
within granodiorite. Separation is challenging due to the lakeside boulders weathering patterns.
Interestingly, previous authors have claimed that this area is home to the Tuolumne’s largest
megacrysts; however, this author was not able to find any evidence for this during fieldwork,
with the vast majority of megacrysts being unexceptional in size or quality (Bateman & Chappell
1979).
Polly Dome (TIC-2008 group)
Polly Dome is large and challenging to access safely as sampling either requires climbing
on cliffs just above Route-120, hugging very close to curves on the Road, or taking about a half-
day hike to get to the backside, which is additionally inaccessible without proper permitting.
Polly Dome will be discussed in detail below, but as a sampling location it’s likely not worth the
effort. The one exception to this is if a sample is required of the very beginning of the porphyritic
Half Dome to Cathedral Peak transition, which is most easily identified and accessed on Polly
Dome at the North end of Tenaya Lake, or on its Northwestern side.
Valley NW of Polly Dome (TIC-2011 group)
While not readily accessible, with frequent swamps, insect swarms, and relatively poor
exposure, there are many outcrops that provide excellent sampling opportunities to the
Northwest of Polly Dome. The area also gives access to a full transect of the porphyritic Half
Dome to Cathedral Peak transition that is more clearly visible than is the same sequence nearer
to roadways.
Johnson Peak (TIC-2012 group)
Access to the eastern slopes of Johnson peak are easily accessible by trail; however, the
eastern slope requires special research or backcountry permitting and the summit is somewhat
treacherous to climb. Fortunately, the eastern slopes are representative of the unit, and are the
recommended point of study and sampling for the unit.

34
Banks of the Tuolumne River between Tuolumne Meadows and Glen Aulen (TIC-2015 group,
TIC-2016 group)
These sites were visited in both 2016, 2017, and briefly in 2015 for a short trip for which
the author was not present. The large polished surfaces in these locations provide surprisingly
decent sampling opportunities and can be accessed either via an easy portion of the Glen Aulen
trail or the Pacific Crest Trail, or via a cut-through that allows for viewing some interesting
geology such as the only basalt deposit in Yosemite. This is another good area for quick trips and
introductory work that may not be an ideal use of time on return trips focused on seeing the
absolute best that the Tuolumne has to offer; however, it does provide one of the park’s highest
concentrations of schlieren.
Aplite Dike (TIC-2017-01)
This sample, taken from one of a series of multi-kilometer aplite dikes that transect the
Western portion of the Half Dome granodiorite, is poor and the dikes are shockingly challenging
to locate despite their size – the process took upwards of three hours hiking on steep slopes – and
the samples collected are likely adequate. There is little other value to visiting this site beyond
collecting a sample for future whole rock analysis, as the outcrop is no more than 3 m by 200 cm
with next to no relief.
Tresider and Tenaya Peaks (TIC-2019 group, TIC-2020 group)
The area around these two sampling sites is by far the best we have found thus far in the
Cathedral Peak Unit. While collecting smaller samples here can be challenging, as one
approaches Tenaya Peak from Tresider (easily accessible via the Cathedral Lakes Trail)
weathering patterns have resulted in large crystals being easily removed from the groundmass by
hand, without the need for chisels or even a hammer, collection of beautiful whole crystals is as
simple as grabbing a bag and tossing samples in. Views from this location are also spectacular,
and thus it is the single most recommended location (at least from this author’s perspective) for
anyone studying megacrysts in the Tuolumne Intrusive Complex. Unfortunately, smaller crystals
are less common and harder to collect than in many other locations.
Waterfall Dome (TIC-2021 group)
This small unnamed dome, referred to as Waterfall Dome for its megacryst waterfalls, is
a good sampling site that also provides insight into the physical histories of individual crystals
and crystal groups within the granitic body. The outcrop features (Fig. 16) are the most notable
thing about the deposit, but sampling is also good and might as well be done considering that this
is a must-see location.

35
Figure 16: Waterfall dome exhibits 3D elements of the log jam and waterfall features that are rarely exposed. The
domes many vertical log jam networks (A), which are connected to a ~ 15 m long lag jam on top of the dome (B) by
feldspar waterfalls (C & D) display the interconnected nature of log jams that can unusually only be viewed as
individual features. The dome is only ~100 m long on its longest side, but displays regions of very high megacryst
concentration (A, B, & C) and regions of about average concentration relative to the surrounding area (D),
exhibiting how much concentrations can change from one area to the next over a relatively small distance. This view
of log jams as interconnected networks as opposed to localized channels may be helpful in understanding how the
unusual features form within magma bodies.

36
APPENDIX B
OBSERVATIONS OF X-RAY COMPUTED TOMOGRAPHY SCANS
TIC-2001-01A
• Core:
o Classification: Double-Resorbed
o Resorption: The core of the megacryst exhibits an inner region that is highly
anhedral and is surrounded by a thin highly potassic layer. Surrounding this is a
subhedral core that mostly intact.
o Brightness: The core is significantly darker (less potassic) than the majority of the
crystal.
o Inclusions: Inclusion density is low to moderate, with two sizable and very bright
ellipsoids. Both are likely magnetite. Most other larger inclusions are plagioclase,
and are probably a result of low-temperature phase separation of feldspar, not a
formation process.
• Zonation:
o A- and B-axis Geometry: Zones are close to perfectly rectangular. Four corners
are just slightly rounded while the other two are clipped. This originates at the
center of the crystals and is most likely a result of damage to the core early in the
crystal’s history. The crystal thins to its ends in accordance with its triclinic
geometry.
o C-axis Geometry: For most of the c-axis’s length zones are uniformly thin and
roughly square. Towards its ends it thins in accordance with its triclinic geometry.
o Brightness: Brightness appears to vary sinusoidally at first glance; however, some
individual zones are significantly brighter or darker than the average. These are
seemingly distributed at random, but are all of moderate thickness relative to the
total population of zone thicknesses in the crystal. Two of the three darker zones
are grouped together, as are the third dark zone and one of the two lighter zones
for half the crystal before a zone that covers only half the crystal cuts in.
o Unusual Zones: At least one zone in the crystal clearly only covers about half of
the full circumference. Such a disappearing zone implies resorption and may help
to explain the anomalously bright and dark zones mentioned above, especially
considering their proximity. In addition, the three zones surrounding the core are
3 to four times thicker than the average, and some zones thicken by a significant
amount (as much as 5-7 times) along the A and B axis of some outer zones. As is
typical of megacrysts in the Tuolumne Intrusive Complex, the outermost zone is
unique, making a pattern resembling tendrils reaching out into the groundmass.
• Inclusions:
o Frequency and Size: There are many inclusions, as is typical in these crystals,
most of which are small. Inclusions darker than the potassium feldspar
(plagioclase, quartz) can be unusually large, though most are not, a few very large
inclusions are likely original inclusions of plagioclase expanded during

37
exsolution. Bright phases are more-or-less evenly distributed, but may slightly
prefer the regions where zones are parallel with the a- and b-axis.
o Alignment: Many inclusions, especially exsolution lamella, are aligned parallel to
the c-axis. This may also be true for mica, but the phase is hard to differentiate
form other moderately bright phases, so it’s hard to make that claim with
confidence.
o Oddities: The crystal contains a few included voids that are apparently
unassociated with any cracking. While it’s highly unlikely that these are genuine
volatile inclusions, they are curious, and may carry information about some of the
alteration undergone by the crystal at depth.
• Artifacts:
o There is a minimal ring artifact affecting several dozen voxels around the rotation
axis.

38
Figure 17: X-ray computed tomography image of alkali feldspar megacryst TIC-2001-01A.

39
TIC-2002-01A
• Core:
o Classification: Resorbed (Mild)
o Resorption: The core of the megacryst is slightly obscured by an imaging artifact,
but appears to exhibit slight resorption causing it to be slightly less than euhedral.
There is no zonation in the core, indicating a single phase of growth.
o Brightness: The core is somewhat darker (less potassic) than the majority of the
crystal. It is also very uniform in brightness, lightening only very slightly towards
the edges.
o Inclusions: Inclusion density is very low in the core compared to other crystals.
• Zonation:
o A- and B-axis Geometry: Zones are roughly square in four corners, and clipped
on the other two. The zone structure is tilted so it’s rectangular on one cut, but
closer to a parallelogram on the other. Unlike in TIC-2001-01A this pattern
originates in the first zone outside the core, with the core itself being more regular
in its geometry.
o C-axis Geometry: While not always clear in the A- and B- axis when looking
down the c-axis it is very clear that zone widths vary quite a bit. Some are more
than half the cores width, while others are a fifth or less of that width. The
distribution of thicker and thinner zones seems random.
o Brightness: Brightness varies much less than is typical within zones, saying quite
uniform until the very edge of the outer bound. However, groups of zones switch
from being dark to light five times thought the crystal. Each grouping of zones
maintains relatively uniform brightness.
o Unusual Zones: Unusually for a Tuolumne Intrusive Complex megacryst, the
outermost zone is sharp and does not penetrate the groundmass much at all.
• Inclusions:
o Frequency and Size: There are a very large number of inclusions in this crystal,
along with large clumps of bright-phase, mixed-phase, and dark-phase crystals.
While exsolution lamellae are common, there are a good number of large,
presumably independent, dark-phase inclusions. Inclusions are reasonably even in
distribution, though a few areas appear to lack bright phases.
o Alignment: Most exsolution lamellae are parallel to the c-axis, but otherwise
alignment is not prevalent, partially because there are few non-ellipsoidal
inclusions.
o Oddities: No oddities were viewed; any voids appear to connect with cracks
resulting from weathering processes.
• Artifacts:
o There is a ring artifact affecting the central rotation axis, but it only disrupts
viewing of the central core.
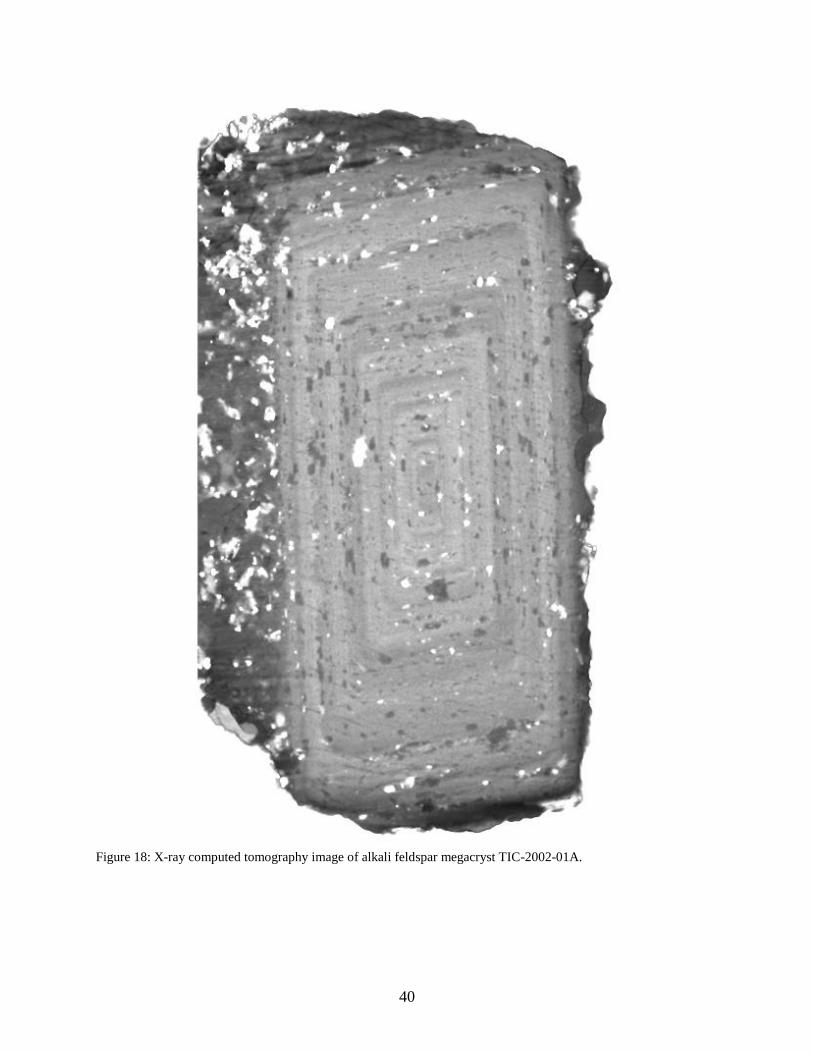
40
Figure 18: X-ray computed tomography image of alkali feldspar megacryst TIC-2002-01A.

41
TIC-2002-01B
• Core:
o Classification: Most likely double resorbed (heavily obscured)
o Resorption: The core of the megacryst is heavily obscured by inclusions, but
appears to exhibit two resorption periods represented by highly potassic regions
around darker-than-average felspar core structures.
o Brightness: The core is somewhat darker (less potassic) than the majority of the
crystal, but displays a couple of very bright bands as discussed above.
o Inclusions: Inclusion density is high enough that it is challenging to see the core’s
structure. Large clumps of bright inclusions, exceptionally large low-brightness
inclusions, and large void spaces.
• Zonation:
o A- and B-axis Geometry: Half of zone corners are clipped and half are roughly
rectangular. Zones in the inner half are thick, sometimes as much so as the core
itself, but their average thickness decreases steadily throughout the middle third of
the crystals volume eventually becoming very thin. This likely indicates a change
in conditions with shorter periods of growth and more stress applied to the crystal
late in its life. The crystal also displays Carlsbad twinning.
o C-axis Geometry: Zones are very nearly squares looking down most of the c-axis,
though this does change as you approach the clipped corners of some zones.
o Brightness: Brightness is reasonably consistent through the megacryst, with only
a small grouping of 3 bands at roughly the midpoint between the core and rim
returning to the brightness of the core.
o Unusual Zones: The thicknesses of inner zones are unusual, as is the consistency
through which zones lose width from core to rim.
• Inclusions:
o Frequency and Size: Inclusions are abundant and their sizes range from very small
to exceptionally large. Both bright and low-brightness crystals are represented at
the upper echelons of their size ranges. Most clumped groups are moderate or
small. There are few, if any massive clumps of a dozen or more individuals.
o Alignment: Most exsolution lamellae, linearly structured crystals, and even
clumps are parallel to the direction of zonation, regardless of how that zonation
relates any of the axes of symmetry.
o Oddities: Large void spaces unassociated with any cracking are present
intermittently throughout the crystal. In addition, voids are concentrated in and
around the core. About a dozen occur in this area, a number that would be highly
unusual for a whole crystal let alone a small region.
• Artifacts:
o There is a bright ring artifact affecting the central rotation axis, but it is localized
enough to prevent issues in interpretation.

42
Figure 19: X-ray computed tomography image of alkali feldspar megacryst TIC-2002-01B.

43
TIC-2008-01A
• Core:
o Classification: Full
o Nature: The core is not resorbed though it may display a magmatically broken
corner. It is extremely large taking up the internal half of the crystal’s diameter.
o Brightness: The core of average brightness for the crystal, which is rather unusual,
and is almost fully uniform thought it’s significant mass.
o Inclusions: The core of this megacryst contains many hundreds if not thousands of
inclusions including clumps that may include as many as 50 or more individual
crystals on their own.
• Zonation:
o A- and B-axis Geometry: While zones appear thin, artifacts make any
interpretation challenging. To avoid publishing a false observation or
interpretation we will simply leave the observation there. The crystal also displays
Carlsbad twinning.
o C-axis Geometry: There are two thick zones surrounding the core, one brighter
and one darker than the core. After this, zones become muddled as previously
noted.
o Brightness: Brightness is reasonably consistent throughout the megacryst. Only
the two zones mentioned above seem to break with a roughly average brightness.
o Unusual Zones: All apparent zonation in this crystal is unusual. Very thick zones
around the core give way to (apparently) very thin ones afterward without any
transition. Again, if not for the severe deficiencies in the image, interpretations
might be different.
• Inclusions:
o Frequency and Size: Inclusions are extraordinarily abundant and their sizes range
from very small to exceptionally large. Though there are few very large inclusions
they include what appears to be titanite, a generally small phase. Massive clumps
of crystals occur in the core and elsewhere.
o Alignment: Liner inclusions are aligned with zones, but they make up a minority
of crystals. Many obolid inclusions appear to be on zone boundaries but they are
so dense that this may be more coincidence then anything.
o Oddities: The number of inclusions in this crystal isn’t just unusual its
exceptional, the number appears to be two or three times greater than normal.
• Artifacts:
o There is a bright ring artifact affecting the central rotation axis, but it is localized
enough to prevent issues in interpretation. There is also severe streaking on the
top and bottom of the crystal, making some interpretations challenging and
heavily obscuring those areas in which it occurs. This probably indicates some
shifting of the crystal during the scan. This is reinforced by the generally
smoothed look of the entire scan.

44
Figure 20: X-ray computed tomography image of alkali feldspar megacryst TIC-2008-01A.

45
TIC-2009-03A
• Core:
o Classification: Full
o Nature: The core is not, or only very slightly, resorbed. A dark outer region may
be the first zone or evidence for resorption.
o Brightness: While it varies a bit, the core is generally slightly brighter than the
average for the crystal.
o Inclusions: The core of this megacryst contains a few inclusions, primarily in a
single clump.
• Zonation:
o A- and B-axis Geometry: Zones are thin, and corners are roughly right angles.
Inner zones are generally lighter than those on the outer two third of the crystal’s
volume, which is unusual in that such regions usually occur multiple times when
they are present.
o C-axis Geometry: Zones seem to be of generally uniform thickness, and all appear
to darken towards the outer edge of the megacryst.
o Brightness: Brightness is reasonably consistent throughout the megacryst’s two
sections. The inner section is slightly brighter than the outer, a change that seems
too abrupt to attribute to beam hardening. Also, very dark zone separates the
bright core and from the inner third of zones.
o Unusual Zones: The nearly right-angled nature of all corners in the crystal is
unusual, although image errors may be obscuring a more regular structure.
• Inclusions:
o Frequency and Size: Inclusions are abundant. Unfortunately blurring makes size
determinations challenging. There are certainly small crystals, but those that
appear massive may actually be clumps that have been blended together by poor
scan quality. There is a region roughly two thirds into the crystal where low-
brightness phases are dominant, creating a marker between bright inner zones and
slightly darker outer rings.
o Alignment: Clump geometries are aligned parallel to zones, and many of the
elongate crystals are as well. Inclusions are not; however, limited in any way to
zone boundaries as they are in some crystals.
o Oddities: There are an abnormal number of large clumps of crystals, though scan
quality limits observations.
• Artifacts:
o There is only a very slight ring artifact; however, there are regions of severe
streaking on the top and bottom of the crystal, making some interpretations
challenging and heavily obscuring those areas in which it occurs. This probably
indicates some shifting of the crystal during the scan. This is reinforced by the
generally blurred look of the entire scan.

46
Figure 21: X-ray computed tomography image of alkali feldspar megacryst TIC-2009-03A.

47
TIC-2016-01A
• Core:
o Classification: Full
o Nature: The core of this crystal is almost fully obscured by inclusions, but there
are no visible signs of resorption. Also, a flipped geometry implies a Carlsbad
Twin.
o Brightness: Brightness appears consistent throughout, though inclusions make it
challenging to make this claim with confidence.
o Inclusions: The core of this megacryst contains abundant megacrysts, their
volume may actually exceed that of alkai-feldspar in the core region.
• Zonation:
o A- and B-axis Geometry: Zones are thin on inside of the megacryst, but become
thick and somewhat uniform roughly one-third of the way from the core to the
rim. Some zones show a very distinct bright streak, but are otherwise typical,
darkening towards the outside. The Crystal is A Carlsbad twin.
o C-axis Geometry: Low scan quality is very apparent looking down the c-axis.
Patterns are the same as on the A- and B-axes, with squared corners and the rest.
Bright streaks are less apparent.
o Brightness: Brightness is variable from zone to zone, and within zones. It also
appears to change direction, sometimes brightening towards the core and other
times towards the rim. At least once it appears to change smoothly from dark to
light and back to dark within a single zone.
o Unusual Zones: The anomalies in brightness are unusual only in their clarity, this
seems to be the standard based on further study discussed in this work, but such
features are rarely apparent in x-ray computed tomography.
• Inclusions:
o Frequency and Size: Inclusions occur at about average abundance. A region about
half-way between the edge and core sees a concentration of inclusions, unsorted
by brightness as in some other cases, occurring roughly along a zone boundary,
but also overlapping the adjacent zones and boundaries somewhat. Bright phases
are more common towards the center, becoming uncommon in the outer 5-10% of
the crystal’s volume.
o Alignment: Inclusions are grouped on zone boundaries as is typical, but are not
strongly aligned. Only exsolution lamellae are consistently parallel to zonation.
o Oddities: There are very large dark-phase crystals in this megacryst, possibly
paired with a slightly reduced volume of exsolution lamellae. Some are close to
euhedral while others are highly anhedral, even containing holes or tendrils.

48
Figure 22: X-ray computed tomography image of alkali feldspar megacryst TIC-2016-01A.

49
TIC-2019-01B
• Core:
o Classification: Resorbed (Unclear)
o Nature: The core of this crystal is heavily obscured by inclusions and artifacts.
Even observations of brightness are challenging to make with confidence, not to
say anything of structure.
o Brightness: It appears to be brighter than the average portion of the megacryst, but
only slightly so if this is the case.
o Inclusions: The core of this megacryst is full of inclusions, potentially including
some quartz or plagioclase brought in through cracks long after the crystal’s
magmatic history concluded. There are many clumps of bright and dark-phases,
and an alkali feldspar inclusion discussed below.
• Zonation:
o A- and B-axis Geometry: Zone thickness is fairly consistent, and display the
typical two clipped corners. The crystal is also probably a Carlsbad Twin,
although obscurement of the core makes it a bit hard to tell.
o C-axis Geometry: A very typical c-axis geometry displaying rectangular zonation
around a slightly rounded core.
o Brightness: Brightness of individual zones is mostly consistent. A single much
darker zone occurs roughly 15% of the way into the crystal. Most zones darken to
the outside, though some appear to be a bit more static. Certainly, some zones
change more dramatically than others, though few diverge much from the average
brightness on either of their extremes.
o Unusual Zones: Zones in this crystal all fall within the general range of expected
forms.
• Inclusions:
o Frequency and Size: Inclusions are of average to slightly above average
frequency. Bright phases appear to favor clumps to individuality, while likely a
result of observation bias, clumping is certainly highly prevalent in these phases.
Dark phases (plagioclase and quartz) don’t clump much, but can be very large.
This isn’t particularly rare as exsolution adds to their volume significantly in
some crystals.
o Alignment: Clump geometries are aligned parallel to zones, and many of the
elongate crystals are as well. Inclusions are not limited to zone boundaries, but do
appear to favor them.
o Oddities: One of the most unique features found during this study, this megacryst
contains a sizable alkali-feldspar megacryst that extends from the core to outside
the mostly-surrounding crystal. It has a five-sided structure ending in points on
each side and mirrored around a base that is about the shape of a princess-cut
diamond in profile. This feature, not observed in any other sample, highlights the
extreme complexity of these crystals’ formation histories.
• Artifacts:
o There is a moderate ring artifact along with moderate streaking and blurring
throughout the crystal. These don’t seriously impair observation except in the
core.
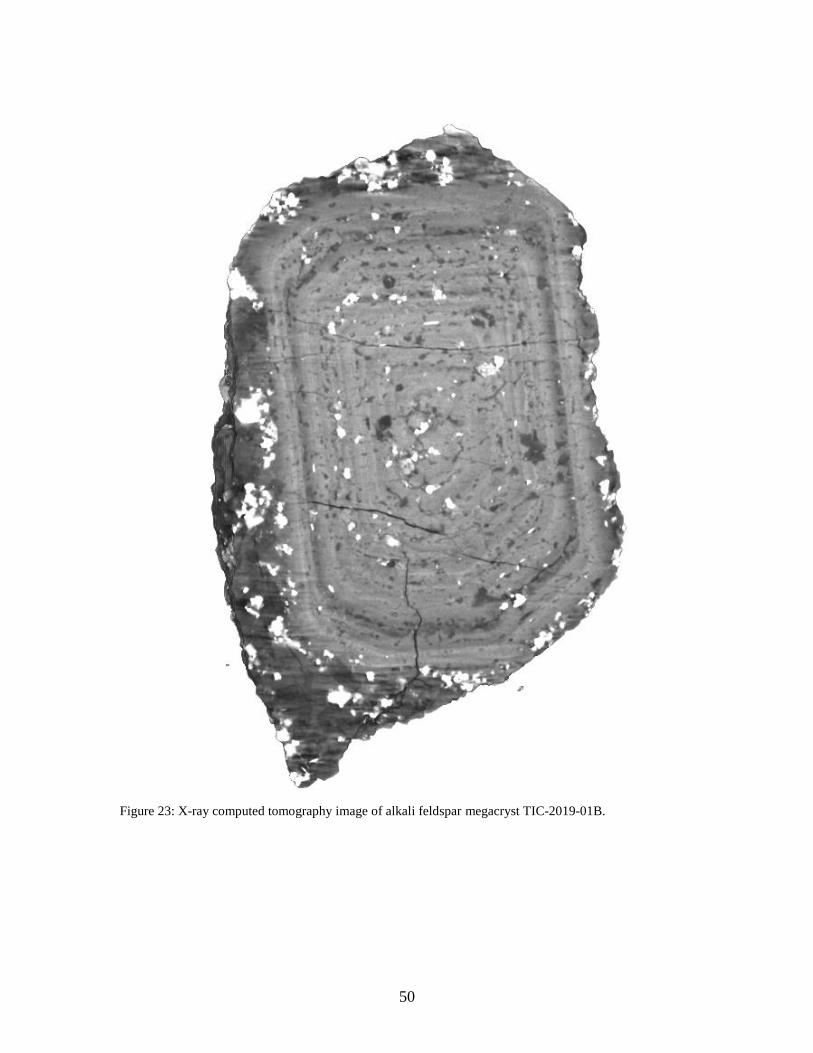
50
Figure 23: X-ray computed tomography image of alkali feldspar megacryst TIC-2019-01B.

51
TIC-2019-01G
• Core:
o Classification: Full
o Nature: The core moderately large and very uniform, showing little sign of
disturbance. It also transitions into zones very smoothly, supporting the
interpretation that it has not experienced any sort of resorption or other trauma.
o Brightness: The core’s brightness is exceptionally uniform, with the only apparent
variation likely resulting for small inclusions. These momentary variations are
non-linear, just small blotches, meaning they are at most small imperfections.
o Inclusions: A good number of inclusions surround the core, perhaps indicating
some elapsed time between core formation and subsequent growth. However, the
core only contains scattered inclusions, and many are likely exsolution lamellae.
• Zonation:
o A- and B-axis Geometry: Zones vary in thickness a bit. Most are quite thin at the
outside, where as those near the middle are a bit thick, and those in the interior are
in-between. The clipped corners in this crystal are somewhat muted compared to
the average.
o C-axis Geometry: Zones are rectangular, and in fact very close to square. They’re
nothing particularly distinct here.
o Brightness: Ironically, a high scan quality highlights the beam hardening present
in all samples discussed in this section. Despite this we can observe a single very
bright and very dark zone, each within the outer quarter of the crystal.
Interestingly the bright zone fades out to average brightness while the dark one
starts at an average brightness and darkens towards the outside. Otherwise
brightness is very consistent once beam-hardening is accounted for. A few zones
are unusually constant in brightness throughout their width.
o Unusual Zones: The internal change in zone in the inner half of the crystal is
somewhat unusual, though not surprising id crystallization conditions were more-
or-less consistent during the time when those zones came into being.
• Inclusions:
o Frequency and Size: Inclusions are of about average size and frequency with only
a few very large dark-phase inclusions. Bright phases are clumped about a quarter
to a third of the time which is about standard. If anything, the average inclusion
size might be slightly below average.
o Alignment: With the exception of exsolution lamellae there is minimal alignment
of inclusions, even clumps don’t seem to favor a particular directionality.
o Oddities: There are regions at roughly half and three-quarters distance from the
core to rim where inclusions are concentrated. This is somewhat unusual, but not
unexpected, as this should be a simple indicator of a longer break in the crystal’s
formation history, or a period of resorption.
• Artifacts:
o Artifacts are present but quite mild, and the scan is very clear overall.

52
Figure 24: X-ray computed tomography image of alkali feldspar megacryst TIC-2019-01G.

53
TIC-2019-01J
• Core:
o Classification: Unknown
o Nature: The core of this crystal is not visible in the scan.
o Brightness: There’s a small chance that the core isn’t visible because it is so
similar in brightness to surrounding zones; however, it is more likely that the
blurred scan is simple obscuring these details.
o Inclusions: The region where the core of this megacryst presumably is contains an
approximately average number of inclusions. The area seems to favor dark
inclusions like plagioclase over bright ones by an uncommon degree.
• Zonation:
o A- and B-axis Geometry: Only one zone is clearly visible. It is reasonably thick,
much darker than the rest of the crystal, and becomes darker gradually from the
inside out. It’s shape also reveals that the crystal is a Carlsbad twin, and has a
more complex internal structure then the standard offset rectangular prisms
formed by most megacrysts in the Tuolumne; though this pattern is not
uncommon at all based on field observations. Pieces of a few other zones are also
visible at certain angles, and appear to thicken on planes parallel to the c-axis.
o C-axis Geometry: Zones are somewhat more distinct form this angle, and are
arranged as concentric and slightly distorted hexagons. Only the one dark zone is
clearly visible here, but enough roughly four or five others can be discerned
partially.
o Brightness: Brightness varies a bit throughout the crystal, but as discussed above,
it’s challenging to make any confident observations in specific.
o Unusual Zones: Impossible to determine with confidence.
• Inclusions:
o Frequency and Size: Inclusions are roughly typical in size, but bright phases are
less common than in most crystals, and dark phases may be slightly more
abundant than usual, though the majority of them appear to be evolution lamellae.
o Alignment: A majority of bright phases occur in clumps of indeterminate numbers
of individuals. Many clumps are longer in one direction than the other, and these,
as well as linear phases (both bright and dark) are parallel with zonation.
o Oddities: The ratio of dark to light inclusions is unusually high.
• Artifacts:
o Much of the crystal is blurred to the degree that zones aren’t at all discernable
whatsoever through a significant portion of the crystal’s volume.

54
Figure 25: X-ray computed tomography image of alkali feldspar megacryst TIC-2019-01J.

55
TIC-2020-01C
• Core:
o Classification: Whole-Core
o Nature: N/A
o Brightness: N/A
o Inclusions: N/A
• Zonation:
o A- and B-axis Geometry: There is no true zonation as this is a whole-core crystal,
though some slight variations in brightness are visible.
o C-axis Geometry: As above, there is no true zonation as this is a whole-core
crystal, though some slight variations in brightness are visible.
o Brightness: Brightness is reasonably consistent throughout the megacryst, much
more so than for any other discussed here, but there are slight variations
perpendicular to the growth direction of each surface. This isn’t surprising as
there is inevitably not perfect consistency throughout the crystal’s formation
history, though this is incredibly close.
o Unusual Zones: The whole-core structure is in itself very rare as far as we can tell,
but beyond that there’s little to make note of.
• Inclusions:
o Frequency and Size: Inclusion frequency is above average. Dark-phase inclusions
are somewhat smaller than in a typical megacryst, and bright phases can reach
larger-than-average sizes though they rarely do.
o Alignment: Inclusions generally occur on planes parallel to the crystal structure,
with exsolution lamellae more-or-less showing where zones would be in the
crystal where they present.
o Oddities: Inclusions are generally very typical except as noted above.
• Artifacts:
o None visible.

56
Figure 26: X-ray computed tomography image of alkali feldspar megacryst TIC-2020-01C.

57
TIC-2020-01D
• Core:
o Classification: Full or Resorbed (Unclear)
o Nature: Blurred edges make it unclear where the core ends or whether or not it
has experienced resorption.
o Brightness: The core is darker than the megacryst’s average brightness. It may
become brighter as you move towards the edge, but this can’t be said with much
confidence.
o Inclusions: If one interprets the core to be very large than it is lined by a large
concentration of inclusions. More likely it contains a few, roughly 60 to 80% of
the average for these crystals.
• Zonation:
o A- and B-axis Geometry: Zones appear thin on one axis but thick on the other
when they can be distinguished confidently. They are arranged hexagonally on
one axis as rectangles on the other while showing evidence for Carlsbad twining
from either.
o C-axis Geometry: Zones are hexagonal with about a 1:1.5 ratio, remaining largely
consistent throughout the crystal’s center. Towards the top and bottom of the c-
axis geometry shifts to hexagons of the same ratios, just with one point of the
hexagon cut off.
o Brightness: The inner half of the crystal is much darker than the outer half, though
the zone second from the outside shades from light to very dark as well. The rest
of the crystal is quite bright, and those zones that are visible darken to the outside.
o Unusual Zones: Zones in the central region of the crystal blend together. This may
be a result of poor scan quality or very similar composition.
• Inclusions:
o Frequency and Size: With the exception of one extremely large dark phase crystal
and one very large bright phase crystal (possibly a blurred clump) inclusions are
of about average size and frequency.
o Alignment: As many as a third of the total inclusions occur at a single zone
boundary where the brightness switches from the darker center to the brighter
outer region. More than half of crystals also align parallel to zonation, although
many also resist this trend.
o Oddities: The degree to which so many inclusions are concentrated in a single
area of the crystal is unusual, though not unheard of.
• Artifacts:
o There is a reasonably minor ring artifact in this scan along with a bit of blurring.

58
Figure 27: X-ray computed tomography image of alkali feldspar megacryst TIC-2020-01D.

59
APPENDIX C
STANDARD OPERATING PROCEDURES FOR X-RAY COMPUTED TOMOGRAPHY
Machine Preparation
1. Open Varian
2. Right-click the view screen and select Technique…
3. Make sure the beam blocker is in place and press X-Ray ON, Press OK on the pop-up
window
4. Remove the x-ray blocker
5. Set the Table Rotate Degree to zero
Sample Preparation
1. Make a three-inch-tall platform using x-ray transparent foam, the platform should be
approximately 3 in x 1 in x 1 in to reduce the chance of collisions with the machinery
2. Place a square of double-sided tape on top of the platform
3. Observe the bottom of your sample, and score the top of the platform (with the tape on it)
so that the foam can better accommodate your sample. Avoid scoring more than
necessary to maximize the foams ability to support the sample
4. Place tape around the top of the platform and press in around the samples base, creating a
support for the crystal while minimizing the surface of the sample obscured by tape
5. Gently shake the platform, the sample should be perfectly stationary
Set-Up Project & Detect Dead Pixels
1. Press CT Project and create a folder with the appropriate sample name
2. In the project window select Detector Corrections
3. Turn fps to 10 in the technique window
4. Right-click the display window and select Histogram
5. Move the right bar on the histogram screen to the left until it sits just to the right of the
portion of the histogram where values are displayed
6. Double-click the area between the bars on the histogram that is still highlighted
7. Adjust the right bar so that it falls between the two humps in the histogram, cutting the
one to the right out of the highlighted area
8. Right-click the display screen and select Defect Map > Add all clamped pixels
9. Look at the project image corrections window, it should display a number between 1500
and 1510, if it is not:
a. If low by less than 10, re-select Defect Map > Add all clamped pixels 4 or 5
times, if this doesn’t work act as if the value is more than 10 below 1500
b. If low by >10, move the histogram’s right bar further to the left and repeat steps 8
& 9
c. If high, select clear all on the project images correction window, move the
histogram’s right bar further to the right, and repeat steps 8 & 9
10. Right-click the display window and select Defect Map > Save, if you forget to save and
the number of dead pixels is no longer displayed, repeat steps 3 through 10

60
11. On the histogram window check the box next to min/max, then set min to 0 and max to
65550
12. Double click the histogram
Collect Gains & Radiographs
1. Place the sample into the XCT so that it is centered perfectly on the stage
2. Click X-Ray ON
3. Set Table Down to 117
4. Decrease the Table Mag (distance from detector) in the Technique window until the
sample fills the display window. If necessary, adjust the Table Down if the top or bottom
of the sample exits while there is spare space on the opposite edge
5. Type 360 into the Table Rotate Degree box in the Technique window, press the ENTER
key
6. Watch the sample rotate, making sure no part of it touches the edge of the display
window. If it does click X-Ray OFF, adjust the sample, and repeat steps 2 through 5
7. Set the focal spot to medium, the kV to 130, and the uA to 124
8. On the histogram window move the left bar to nmz = 0.15 and the right bar to 0.85
9. Adjust the fps so that the histogram’s minimum value is by the left bar, no lower than
nmz = 0.1 at the absolute minimum
10. Decrease the fps to create the widest possible range of values while not allowing the
minimum value to increase above nmz = 0.2 or the maximum to exceed nmz = 0.995.
The ideal image will have a minimum nmz between 0.1 and 0.2 and a maximum range
between 0.85 and 0.995. If this is not possible simply create the widest possible range
without exceeding nmz = 0.995
11. Record the Table Down value, then type 0 into the entry box and press ENTER
12. Right-click the Detector Corrections button in the project window
13. In the pop-up window delete whatever is in the text box and type 124
14. Select the uA box in the Techniques window so that the flashing cursor is to the far right
15. Place the cursor over the center detection window and scroll, adjusting the uA down until
the RAW_VALUE is ~0.5, enter this number into the entry field in the pop-up window,
separated from the previous value by a space
16. Repeat steps 14 & 15, now reaching RAW_VALUE = 0.15
17. Enter two zeros after your third number also separated by spaces (ex. 124 62 23 0 0)
18. Copy the line of numbers you just created into the gains box on the Technique screen,
this has no effect on image collection, but your gains will not be recorded in the metadata
unless you enter them now
19. Adjust the fr. avg. to 200, if the duration is under 11 minutes click go, if not reduce the fr.
avg. until it is below 11 minutes, but to no lower than 30. If you would reduce the
number below 30, simply use 30 instead (NOTE: You can always use 30, but higher
numbers are better when reasonable)
20. Click Go…
21. Wait for the scans to finish without pressing anything in the Varian Program, adjusting
things now can cause issues
22. When the scans are complete click OK on the pop-up window, set kV to 130 and uA to
124 if they are no longer at these values
23. Enter the number recorded earlier into Table Down, press ENTER

61
24. Set # projections to 1440, delay to 0, and fr. average to 10 in the project window, check
the box by Continuous Scan (Use 720 projections instead if you don’t need the best
possible image)
25. Click CT Start and wait for the scan to complete
26. Remove the sample and place the calibration tool so that it is to the far left of the detector
window.
27. Move the Table Down to 132 (Do not adjust Table Mag under any circumstances)
28. Rotate the table 360 degrees to confirm the calibration tool doesn’t go out, and repeat
steps 25 & 26 if need be
29. Click CT Geometry, and wait for the process to complete
30. Close the project window, then move to the reconstruction computer
Reconstruction
1. Log on to the computer using password: efX-user
2. Open efX-ct, select Reconstruction > New Project from the menu bar
3. By Object Radiographs select Browse… and the radiograph from your project folder
with 00000 in its name, repeat for Geometry
4. CLick Find (if the dark spots on the calibration stick are not automatically selected,
adjust the selected area manually and then press Find Again)
5. Click Track
6. Click Size
7. Select 127-Varian and the calibration tool you used in the drop-down menus, then select
Next
8. Check the box next to Display Shift Correction Translation, then press the Auto button
(adjust further only if you have a definite reason to)
9. Click Next
10. Adjust the histogram bars around the left hump, drag the image so that a corner is facing
you, then press SPECEBAR and push the sides of the volume in to remove any excess
air. Press SPACEBAR again, rotate to the opposite corner, and repeat the trimming
process
11. Click Next
12. Click Compute and wait for processing to complete (do not do anything in the efx-ct
program while you wait, this can crash the program)
13. Click Next
14. Click Compute and wait for processing to complete (do not do anything in the efx-ct
program while you wait, this can crash the program)
15. Drag the slider on the bottom of the screen all the way to the left, if you are not using the
image for quantitative work, you may adjust to bar back somewhat until the beam
hardening effect has been removed, but note that this correction is highly imperfect
16. Click Next
17. Click Reconstruct
a. If reconstructing multiple projects, you may choose to click Add to Job List
instead, this allows multiple reconstructions to be completed while the user is
away, however, be aware that if the job window is closed or the program crashes,
the job list is not saved

62
Miscellaneous Tips
1. If the sample hits the detector or falls, do not click stop, instead open hatch and pick up
the sample quickly, allowing the rotation complete
2. Avoid using the Home button in the Technique window, it can cause significant
problems
3. When viewing reconstruction, mouse over the histogram bars to see the translucency
slider, moving this slider to the bottom of every other bar can help when viewing
zonation
4. If transects of the XCT image are needed, export slices and then collect the transect using
either Blob3D or IDL
5. If completing multiple projects, it can be helpful to determine the Table Mag and fps for
each sample ahead of time, this can save time and if these scans use the same fps, you can
simply copy the Corrections folder from the first project with that fps instead of repeating
the gains collection, the same is true for geometry of samples with equal Table Mags

63
APPENDIX D
UNITS OF THE TUOLUMNE INTRUSIVE COMPLEX
The Kuna Crest Granodiorite
The Kuna Crest Granodiorite, which constitutes the outer unit of the Tuolumne Intrusive
Complex (and has also been referred to by the regional names Glen Aulen Tonalite and Glacier
Point Tonalite) is the most mafic unit in the complex. Bateman and Chappell (1979) completed
detailed field work which found that the unit has a modal composition of 15-25% quartz, 8-15%
alkali feldspar, 43-50% plagioclase, 9-13% biotite, 7-13% hornblende, and less than 1%
magnetite, titanite, and apatite (Bateman & Chappell 1979, Memeti et al. 2010). The Kuna Crest
Lobe, where most of the volume of the unit resides, is challenging to access. As a result of this
and this project’s focus on the more felsic units in the complex, the unit was viewed primarily
from roadside exposures, except when traveling to May Lake while visiting important sites from
the transect completed by Bateman & Chappell (1979). The unit is as little as 5 m thick at Tioga
Pass and along the May Lake trail, where it shows signs of mixing with the Half Dome
granodiorite. In the Tioga Pass area, Kuna Crest also displays lineation in biotite parallel to its
boundary with adjacent leucocratic metamorphic rocks. Kuna Crest is crosscut by leucocratic
dike structures that carry greenschist xenoliths as well as pieces of Kuna Crest. The boundary
between Kuna Crest and Half Dome at Tioga pass is sharp on the outcrop scale, but Half Dome
has intruded into Kuna Crest, resulting in a transitional region on the map scale. In contrast, at
May Lake the boundary is so gradual that it becomes challenging to confidently determine a
boundary, and Kuna Crest can only be definitively recognized for about 5 m between the
transition zone and the country rock. Within the Half Dome-Kuna Crest transition near May
Lake there are a number of concentrated pipes of mafic inclusions in a highly rusted (presumably
highly ferric) host that is banded with schlieren and finer grained than the host rock. This
material may be associated with later volcanism in the region or could be a more juvenile phase
of the Tuolumne Intrusive Complex.
The Half Dome Granodiorite – Equigranular Facies
The equigranular facies of the Half Dome granodiorite is sandwiched between the Kuna
Crest and porphyritic Half Dome units and represents the second stage of growth in the
Tuolumne Intrusive Complex following Kuna Crest (Bateman & Chappell 1979, Paterson et al.
2016). The unit is composed of 20-26% quartz, 15-24% alkali feldspar, 39-45% plagioclase, 5-
9% biotite, 4-8% hornblende, 0.5-1.5 magnetite, and less than 1% of titanite and apatite
(Bateman & Chappell, 1979). Along with porphyritic Half Dome its equigranular counterpart is
notable for eu-to-subhedral and larger-than-average biotite, hornblende, and titanite compared to
other units in the Tuolumne Intrusive Complex, along with consistently sub-to-anhedral quartz
and feldspar. The unit has few sharp contacts with its porphyritic counterpart, and while they are
present locally, the vast majority of the boundary occurs over a gradation of as much as a
kilometer. Aplitic and pegmatitic dikes in equigranular Half Dome can reach up to 10 m widths

64
locally, as can be seen at outcrops along Route-120 between Tenaya Lake and Olmstead Point
they are thinner, and at the Point they are 0.75 m at most, and they are exclusively aplite. These
dikes are also parallel with each other and schlieren that can either be directly adjacent to them,
or distinct entities. Near these structures a 20 m by 30 m mafic blob can be observed with
schlieren radiating parallel to its edge. These schlieren come in two forms, either consistent
through, or becoming less cohesive towards the inclusion (Fig. 28). While this example is
extreme, equigranular Half Dome is generally more inclusion rich than any other unit in the
Tuolumne as well as being relatively schlieren poor. Mafic inclusions in the unit come in three
primary varieties, all with similar modal percentages, being either (1) fine grained equigranular,
(2) coarse grained equigranular, or (3) coarse grained porphyritic, with a larger feldspar phase
along with some of the same size as those found in the other two varieties. Olmstead Point
provides an excellent opportunity to view most of the Western portion of equigranular Half
Dome, including its namesake, and a place to easily observe all these varieties of inclusions.
Additionally, some interesting mafic features are present in the area (Fig. 29) that display
physical separation of phases late enough in the cooling history of the unit that distinct channels
could form. Interestingly, the feature pictured in figure 29 maintains nearly identical ratios
between each mafic mineral phase as those found in the host, while having a significantly
reduced concentrations of quartz and feldspar.

65
Figure 28: Schlieren structures surrounding a mafic blob in the Half Dome granodiorite. (A) A schlieren with one
sharp edge, with the opposite edge fading into the groundmass. (B) The edge of the large mafic blob. Schlieren
boarder the blob, and may have interacted, or even have been derived from it. (C) bands of schlieren in a sub-
parallel array around the blob. Some schlieren show well defined edges while others fade out to one side as in (A).

66
Figure 29: A mafic mineral concentration structure at Olmstead point. The ratios of mafic minerals to one another
within the structure is consistent with the groundmass, but felsic minerals occur at dramatically reduced frequencies.
The Half Dome Granodiorite – Porphyritic Facies and Cathedral Peak Transition
The porphyritic facies of Half Dome granodiorite, which comprises the 3rd of the
Tuolumne’s 5 phases, displays both the large euhedral biotite, hornblende, and titanite of the
equigranular facies while also containing alkali feldspar megacrysts similar to, though somewhat
smaller on average than those of the Cathedral Peak Granodiorite. The unit’s modal composition
also falls between its neighboring units with similar quartz (17-25%), alkali feldspar (21-25 %),
plagioclase (45-48%), and magnetite (0.5-1.5%) compositions, and biotite (4-6%), hornblende
(1-2.5%), titanite (0.5-0.75%), and apatite (0.2-0.3%) compositions that fall between the values
of Cathedral Peak and equigranular Half Dome (Fig. 34). Interestingly, while porphyritic Half
Dome is generally considered a separate phase of growth within the Tuolumne’s history, field
relations sometimes suggest that it interacted with other units while they were still largely molten
(Burgess & Miller 2008). For example, inclusions of porphyritic Half Dome can be found
everywhere from the Kuna Crest-equigranular Half Dome contact at Tioga Pass (Fig. 31) to the
area where Cathedral Peak and Johnson Peak meet on the slope of the latter’s namesake.
Contacts between porphyritic Half Dome and its neighbors are generally gradual, but some sharp
boundaries exist, such as one located on the Western side of Polly Dome. However, contacts on
the Eastern side of the unit are virtually impossible to locate along route-120 due to a long

67
gradational transition from equigranular Half Dome to Cathedral Peak, and the Eastern side of
Polly Dome reflects a similar trend. A transect including 18 outcrops taken parallel to Polly
Dome’s Western side (Fig. 30) shows that crystal sizes measured as part of this work do not
rapidly drop off from either side of the Cathedral Peak-Half Dome contact as implied by Johnson
& Glazner (2010); in fact, megacryst-size trends remain constant across that contact, and are
quite consistent throughout large swaths of Cathedral Peak’s northern lobes as shown by Memeti
et al. (2010).

68
Figure 30: (Top) Transect across the three central units of the Tuolumne Intrusive Complex showing the range of
megacryst sizes at each sampling location along with a black line showing the approximate median size of
megacrysts at each waypoint. Megacrysts generally increase in diameter from W to E in the transect, in clear
contradiction to the previously published transect of Johnson & Glazner (2010) which depicts a rapid drop off in
volume moving away from the Cathedral Peak-Helf Dome contact. Satellite images show (A) Location of field area
in southwestern United States, (B) the Eastern side of Yosemite National Park and the Mono Lake area, and (C)
waypoint locations with Polly Dome at the bottom of the (Google Earth Pro 2019).

69
Polly Dome, an elongate structure primarily composed of porphyritic Half Dome,
displays a couple of unique features not commonly visible in the Tuolumne complex. First is a
schlieren complex on the dome’s western side (Fig. 32), which displays a pattern similar to that
predicted by Wiebe (2016). The structure of steeply dipping folds provides further evidence for
the methods of schlieren formation laid out in that work. A second schlieren structure on the
Eastern side of the dome shows what we believe to be a flow structure within the granodiorite
(Fig. 33). The large schlieren displayed in figure 33 contains near-parallel alkali-feldspar
megacrysts and is bordered on the bottom by a large parallel log-jam structure. Additional
parallel schlieren and log-jams surround the main structure, and faint schlieren are also visible
within its arc. Small ladder dike like structures boarder the body on the left and right (NE and
SE) one of which shows its arc in the same direction as the main body, while the other displays
the opposite concavity. This structure implies a method of log-jam creation and megacryst
sorting whereby falling sections of the magma body collect the tabular minerals as they sink,
accumulating them due to their size relative to other phases, and then depositing them in these
pipe-like structures at the location where flow halted.
Figure 31: Inclusion of the megacryst-bearing porphyritic Half Dome in the Kuna Crest- equigranular Half Dome
transition zone. This inclusion suggests that porphyritic Half Dome interacted with equigranular Half Dome when
the two were still largely molten, and contradicts the idea of the two Half Dome units as fully separate phases of the
Tuolumne Intrusive Complex’s formation (Paterson et al. 2011).
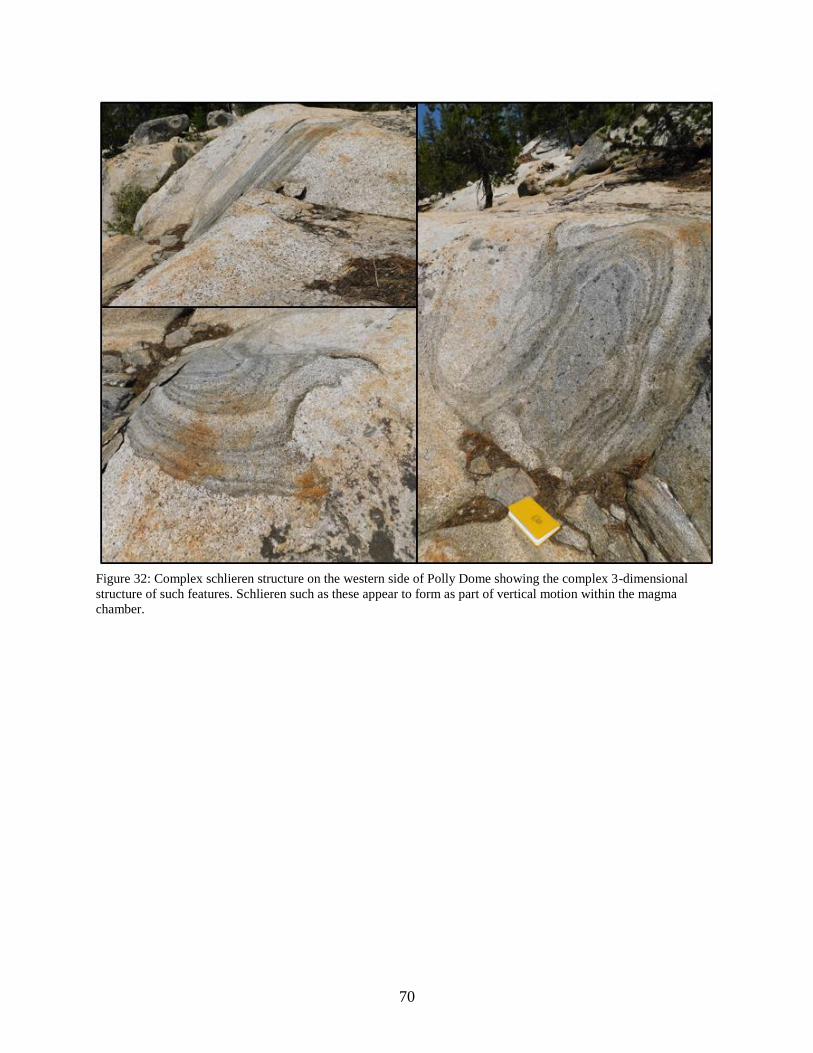
70
Figure 32: Complex schlieren structure on the western side of Polly Dome showing the complex 3-dimensional
structure of such features. Schlieren such as these appear to form as part of vertical motion within the magma
chamber.

71
Figure 33: Schlieren structure on the eastern side of Polly dome. The geometry of the feature, with layers of log-
jams and other schlieren below, seems to imply that this is the bottom of a sinking magma lobe within porphyritic
Half Dome. On top (A) the uniformly parallel relationship between schlieren and megacrysts within and below it,
imply a large region experiencing similar stresses. Note that above the schlieren no such alignment is visible. On the
bottom (B) shows the entire structure with a geologist for scale.

72
Figure 34: Comparison of modal abundances of minerals in the units of the Tuolumne Intrusive Complex using data
from Bateman & Chappell (1979). Each bar represents the average midpoint of Bateman & Chappell’s (1979)
measurements, with error bars reaching to the extremes. These modal abundances show relative consistency in the
Half Dome and Cathedral Peak for feldspar and quartz, but steadily decreasing modes in minerals with
concentrations under 6 percent of the total volume of the unit. Johnson Peak, a leucogranite, does not conform with
the trend.
The Cathedral Peak Granodiorite
The Cathedral Peak granodiorite comprises the vast majority of the megacryst-bearing
Tuolumne Intrusive Complex and represents the second to last phase of the complex’s
emplacement. Cathedral Peak’s groundmass is somewhat finer grained than the Half Dome
units’, as it lacks large euhedral biotite, hornblende, and titanite; however, the largest megacrysts
in the complex occur in this unit. Cathedral Peak modal abundances of 23-28% quartz, 17-25%
alkali feldspar, 40-50% plagioclase, 3-5% biotite, 0-2.5% hornblende, and less than 1%
magnetite, titanite, and apatite, makes it the second most felsic unit in the Tuolumne Intrusive
Complex. Cathedral Peak also displays abundant schlieren and log-jam features, as well as
megacryst waterfalls, where concentrations decrease gradually away from a concentrated area.
0.00
1.00
2.00
3.00
4.00
5.00
6.00
7.00
8.00
9.00
Biotite Hornblende Magnetite Sphene Apatite Muscovite
Comparison of Modal Abundances in Geologic Units of the Tuolumne Intrusive Complex
Equigranular Half Dome Porphyritic Half Dome Cathedral Peak Johnson Peak
0.00
10.00
20.00
30.00
40.00
50.00
60.00
Quartz Alkali Feldspar Plagioclase
Equigranular Half Dome Porphyritic Half Dome Cathedral Peak Johnson Peak

73
Cathedral Peak is also more variable than other units and displays multiple phases with varying
megacryst sizes (Memeti et al. 2010). Generally, megacrysts average 4-6 cm when the unit is
considered as a whole, and larger crystals (up to 12 cm) tend to be outliers when they are present.
Based both on field observations and the literature, we note that outcrops easily accessible by
road display generally larger crystals than is the trend for the unit, so caution must be taken when
making wide-reaching assumptions based only on a consideration of areas near Route-120
(Memeti et al. 2010). However, some accessible spots are more representative than others, with
Pothole Dome an excellent example for general studies, at least in the opinion of the author.
Pothole Dome displays the log-jam and waterfall features present throughout most of
Cathedral Peak, while mostly only hosting smaller megacrysts between 4 and 6 cm in length.
Schlieren on Pothole can be either aligned or unaligned with megacrysts, with some being
largely parallel, others generally orthogonal, and still others showing a mix, making the
relationships between the two challenging to sort out. While not at all unique to the dome, it
provides large polished areas where all of these can easily be observed. Mafic inclusions mantled
by log-jams, as well as megacryst concentrations with attached schlieren—generally only on one
side—are also reasonably easy to find here, as are typical fading schlieren that show a greater
mafic concentration on one side, implying some form of directionality either from settling or
flow.
Figure 35: This megacryst on Lambert Dome is more than 10 cm long, such crystals are limited to a range in the
central portion of the Cathedral Peak unit that surrounds Johnson Peak and parts of Route -120. Megacrysts of this
size are almost always outliers, and highlight the huge range of sizes in alkali feldspar crystals present in Cathedral
Peak and the Tuolumne Intrusive Complex as a whole.

74
Lambert Dome, Tresider Peak, and Tenaya Peak, all display megacrysts that reach or
exceed 10 cm (Fig. 35), but rarely exhibit large log-jams. Log-jams on Lambert Dome can
display groundmass clumps of a small enough grain size to be indistinguishable using hand
lenses, with grains not visible to the eye, caught within log-jams (Fig. 36) which might provide
insight into the conditions under which the associated structures formed, though they would
require a significant effort to collect. All three of these summits also display both aplite and
pegmatite dikes; schlieren density is generally lower, with the exception of local areas of high
abundance.
Figure 36: A log-jam feature at the base of Lambert dome, displaying very fine-grained mafic groundmass between
megacrysts. Features such as these may provide opportunities to gain insight into the processes by which log-jams
form.
Northern Cathedral Peak displays smaller average megacryst sizes than the southern
portion that along with a bimodality of form. Megacrysts at the upper size limit are either
hexagonal and elongate, with approximately 3:2 aspect ratios, or tabular with about 4:1 aspect
ratio. Tabular crystals are larger, exceeding 6 cm in length, and thus exceeding prior estimates
from the literature (Memeti et al. 2010). Long parallel schlieren are common in the north as well,
though these trends can be made more complicated within an outcrop by one or two schlieren

75
that completely ignore the general trend. Some megacrysts also show signs of resorption, and
internal unit contacts can be seen on freshly cut cliff faces where trail work is being done. Also,
while rare, one can find dikes in this portion of Cathedral Peak that cut through the unit far
enough after crystallization as to cut megacrysts, implying that magmatic injection into the unit
was either incremental or if continuous, occurred at a very low rate.
Cathedral Peak can also provide some excellent insight into the formation of log-jams
and megacryst waterfalls at a small 100 m x 30 m dome informally referred to as Waterfall
Dome in this text. Almost the whole of Waterfall Dome’s surface displays concentrated
megacrysts in one of the aforementioned forms, with circular and pipe-like log-jams joined by
waterfalls and surrounded by higher-than-average concentration areas. Concentrations are
estimated to reach as high as 70% locally and large sections appear to maintain concentrations
over 50%. Only a few small sections of the dome display megacryst concentrations typical of the
Cathedral Peak unit as a whole, and these concentrations are elevated even compared to other
outcrops only a few hundred meters away. Waterfall Dome also displays some of the largest
feldspar crystals that can be seen in the Tuolumne Intrusive Complex, exceeding 12 cm in
length, though average sizes fall between 4 and 6 cm. In addition, mafic inclusions on the dome
sometimes incorporate megacrysts, and schlieren weave in and out of log-jams, sometimes
fading away, and other times maintaining themselves, further deepening the complex
relationships that can be observed between the two features throughout the Tuolumne. Even
when their forms are more typical, schlieren can exceed 3 m, unexpected considering the rarity
in which they generally occur within megacryst concentrations (Fig. 16).
The Johnson Peak Leucogranite
Johnson Peak Leucogranite is fine grained and generally uniform, with very occasional
megacrysts, and it makes up the centermost portion of the Tuolumne Intrusive Complex (Fig.
38). Based on work by Bateman & Chappell (1979) modal abundances for Johnson Peak, the
Tuolumne Intrusive Complex’s most felsic unit, are as follows: 27.5-33 % quartz, 29-40.5%
alkali feldspar, 26-44% plagioclase, 0.5-1.5% biotite, and less than 0.5% each of magnetite,
titanite, apatite, and muscovite. Megacrysts in the unit have been attributed to incorporation of
portions of Cathedral Peak, a notion supported by this author after discovering not only the
Cathedral Peak rimmed feldspars referenced by previous authors but also larger inclusions of
Cathedral Peak that show clear signs of physical incorporation by Johnson Peak (Fig. 37).

76
Figure 37: Field pictures of sections of Cathedral Peak granodiorite isolated and incorporating into the Johnson Peak
Leucogranite. (A) A large xenolith of Cathedral Peak that remains identifiable as such despite being isolated within
the Johnson Peak unit. (B) A bit of Cathedral Peak-like granodiorite showing signs of physical mixing and
incorporation into Johnson Peak.

77
Figure 38: The summit of Johnson Peak. The leucogranite is equigranular and very distinct from the other granitoids
in the Tuolumne, which share many similarities. Megacrysts in the Johnson Peak unit are rare, at 0.2 per square
meter or less, and may be inherited from the Cathedral Peak unit.

78
REFERENCES
Annen, C. (2011). Tectonophysics Implications of incremental emplacement of magma bodies
for magma differentiation, thermal aureole dimensions and plutonism – volcanism
relationships. Tectonophysics, 500(1–4), 3–10.
Annen, C., Blundy, J. D., Leuthold, J., & Sparks, R. S. J. (2015). Construction and evolution of
igneous bodies: Towards an integrated perspective of crustal magmatism. LITHOS, 230,
206–221.
Barboni, M., & Schoene, B. (2014). Short eruption window revealed by absolute crystal growth
rates in a granitic magma. Nature Geoscience, 7(7), 524–528.
Barnes, C. G., Memeti, V., & Coint, N. (2016). Deciphering magmatic processes in calc-alkaline
plutons using trace element zoning in hornblende. American Mineralogist, 101(2), 328–342.
Bateman, P. C., & Chappell, B. W. (1979). Crystallization, fractionation, and solidification of the
Tuolumne Intrusive Series, Yosemite National Park, California. GSA Bulletin, 90, 465–482.
Blundy, J. D., & Annen, C. J. (2018). Crustal Magmatic Systems from the Perspective of Heat
Transfer. Elements, 12(October), 115–120.
Bradshaw, R. W. (2017). Crystal Records of the Origin, Evolution, and Thermal Histories of
Magmas. Oregon State University, Dissertation.
Brown, M. (2013). Granite: From genesis to emplacement. Bulletin of the Geological Society of
America, 125(7–8).
Burgess, S. D., & Miller, J. S. (2008). Construction, solidification and internal differentiation of
a large felsic arc pluton: Cathedral Peak granodiorite, Sierra Nevada Batholith. Geological
Society, London, Special Publications, 304(November), 203–233.
Challener, S. C., & Glazner, A. F. (2017). Igneous or metamorphic? Hornblende phenocrysts as
greenschist facies reaction cells in the Half Dome Granodiorite, California. American
Mineralogist.
Coleman, D. S., Gray, W., & Glazner, A. F. (2004). Rethinking the emplacement and evolution
of zoned plutons: Geochronologic evidence for incremental assembly of the Tuolumne
Intrusive Suite, California. Geology, 32(5), 433–436.
Economos, R. C., Memeti, V., Paterson, S. R., Miller, J. S., Erdmann, S., & Žák, J. (2009).
Causes of compositional diversity in a lobe of the Half Dome granodiorite, Tuolumne
Batholith, Central Sierra Nevada, California. Earth and Environmental Science
Transactions of the Royal Society of Edinburgh, 100(1–2), 173–183.

79
Google Earth Pro V 7.3. (2019). Yosemite National Park, CA.
Gualda, G. A. R., & Ghiorso, M. S. (2014). Phase-equilibrium geobarometers for silicic rocks
based on rhyolite-MELTS. Part 1: Principles, procedures, and evaluation of the method.
Contributions to Mineralogy and Petrology, 168(1), 1–17.
Gualda, G. A. R., & Rivers, M. L. (2006). Quantitative 3D petrography using x-ray tomography:
Application to Bishop Tuff pumice clasts. Journal of Volcanology and Geothermal
Research, 154(1–2), 48–62.
Higgins, M. D., & Chandrasekharam, A. D. (2007). Nature of Sub-volcanic Magma Chambers,
Deccan Province, India: Evidence from Quantitative Textural Analysis of Plagioclase
Megacrysts in the Giant Plagioclase Basalts. Journal of Petrology, 48(5), 885–900.
Hodge, K. F., Carazzo, G., Montague, X., & Jellinek, A. M. (2011). Magmatic structures in the
Tuolumne Intrusive Suite, California: a new model for the formation and deformation of
ladder dikes. Contributions to Mineralogy and Petrology, 162(1).
Jenner, F. E., & Arevalo, R. D. (2016). Major and Trace Element using LA – ICP – MS FOR
ANALYZING GEOLOGIC MATERIALS. Elements, 12(5), 311–316.
Johnson, B. R., & Glazner, A. F. (2010). Formation of K-feldspar megacrysts in granodioritic
plutons by thermal cycling and late-stage textural coarsening. Contributions to Mineralogy
and Petrology, 159(5), 599–619.
Ketcham, R. A. (2005). Computational methods for quantitative analysis of three-dimensional
features in geological specimens. Geosphere, 1(1), 32–41.
Li, X., Mo, X., Scheltens, M., & Guan, Q. (2016). Mineral Chemistry and Crystallization
Conditions of the Late Cretaceous Mamba Pluton from the Eastern Gangdese, Southern
Tibetan Plateau. Journal of Earth Science, 27(4), 545–570.
Lundstrom, C. C., & Glazner, A. F. (2016). Silicic Magmatism and the Volcanic-Plutonic
Connection. Elements, 12, 121–127.
Memeti, V., Paterson, S., Matzel, J., Mundil, R., & Okaya, D. (2010). Magmatic lobes as
“snapshots” of magma chamber growth and evolution in large, composite batholiths: An
example from the Tuolumne intrusion, Sierra Nevada, California. GSA Bulletin, 122(11–
12), 1912–1931.
Menand, T., Annen, C., & Blanquat, M. de Saint. (2015). Rates of magma transfer in the crust:
Insights into magma reservoir recharge and pluton growth. Geology, 43(3).
Miller, C. F., Furbish, D. J., Walker, B. A., Claiborne, L. L., Koteas, G. C., Bleick, H. A., &
Miller, J. S. (2011). Growth of plutons by incremental emplacement of sheets in crystal-rich

80
host: Evidence from Miocene intrusions of the Colorado River region, Nevada, USA.
Tectonophysics, 500(1–4), 65–77.
Miller, C. F., Watson, E. B., & Harrison, T. M. (1988). Perspectives on the source, segregation
and and transport of granitoid magmas. Transactions - Royal Society of Edinburgh: Earth
Sciences, 79(2–3), 135–156.
Miller, J. (2016). Discussion in field.
Moore, J. G., & Sisson, T. W. (2008). Igneous phenocrystic origin of K-feldspar megacrysts in
granitic rocks from the Sierra Nevada batholith. Geosphere, 4(2), 387–400.
Munnikhuis, J. K. (2016). VARIATION OF SR AND PB ISOTOPES IN MEGACRYSTIC K-
FELDSPAR FROM THE CATHEDRAL PEAK GRANODIORITE, CALIFORNIA.
Thesis.
National Park Trips Media, 2017. Yosemite National Park Location. MyYosemitePark.com,
Web. 10 May 2017.
Pamukcu, A. S., Ghiorso, M. S., & Gualda, G. A. R. (2016). High-Ti, bright-CL rims in volcanic
quartz: a result of very rapid growth. Contributions to Mineralogy and Petrology, 171(12),
1–9.
Paterson, S. R., Memeti, V., Mundil, R., & Žák, J. (2016). Repeated, multiscale, magmatic
erosion and recycling in an upper-crustal pluton: Implications for magma chamber
dynamics and magma volume estimates. American Mineralogist, 101(10), 2176–2198.
Paterson, S. R., Okaya, D., Memeti, V., Economos, R., & Miller, R. B. (2011). Magma addition
and fl ux calculations of incrementally constructed magma chambers in continental margin
arcs: Combined fi eld , geochronologic , and thermal modeling studies. Geosphere,
(November), 1439–1468.
Paterson, S. R., Vernon, R. H., & Žák, J. (2005). Mechanical Instabilities and Physical
Accumulation of K-feldspar Megacrysts in Granitic Magma, Tuolumne Batholith,
California, USA. Journal of the Virtual Explorer, 18(1).
Perini, G., Tepley III, F. J., Davidson, J. P., & Conticelli, S. (2003). The origin of K-feldspar
megacrysts hosted in alkaline potassic rocks from central Italy: A track for low-pressure
processes in mafic magmas. Lithos, 66(3–4), 223–240.
Ratajeski, K., Glazner, A. F., & Miller, B. V. (2001). Geology and geochemistry of mafic to
felsic plutonic rocks in the Cretaceous intrusive suite of Yosemite Valley, California. GSA
Bulletin, 113(11), 1486–1502.
Sliwinski, J. T., Bachmann, O., Dungan, M. A., Huber, C., Deering, C. D., Lipman, P. W., …
Liebske, C. (2017). Rapid pre-eruptive thermal rejuvenation in a large silicic magma body:

81
the case of the Masonic Park Tuff, Southern Rocky Mountain volcanic field, CO, USA.
Contributions to Mineralogy and Petrology, 172(5), 30.
Vernon, R. H. (1986). K-feldspar megacrysts in granites - Phenocrysts, not porphyroblasts.
Earth-Science Reviews, 23(1), 1–63.
Vernon, R. H., & Paterson, S. R. (2008). How late are K-feldspar megacrysts in granites? Lithos,
104(1–4), 327–336.
Vernon, R. H., & Paterson, S. R. (2006). Mesoscopic structures resulting from crystal
accumulation and melt movement in granites. Transactions of the Royal Society of
Edinburgh-Earth Sciences, 97(August), 369–381.
Wiebe, R. A., Jellinek, A. M., & Hodge, K. F. (2016). New insights into the origin of ladder
dikes: Implications for punctuated growth and crystal accumulation in the Cathedral Peak
granodiorite. Lithos, 277, 241–258.