Landscape-scale effects of fire severity on mixed-conifer and red fir forest structure in Yosemite...
15
Author's personal copy Landscape-scale effects of fire severity on mixed-conifer and red fir forest structure in Yosemite National Park Van R. Kane a,⇑ , James A. Lutz b , Susan L. Roberts c , Douglas F. Smith d , Robert J. McGaughey e , Nicholas A. Povak f , Matthew L. Brooks c a School of Environmental and Forest Sciences, University of Washington, Box 352100, Seattle, WA 98195, USA b College of the Environment, University of Washington, Box 352100, Seattle, WA 98195, USA c U.S. Geological Survey, Western Ecological Research Center, Yosemite Field Station, El Portal, CA 95318, USA d Yosemite National Park, P.O. Box 577, Yosemite, CA 95389, USA e USDA Forest Service, Pacific Northwest Research Station, University of Washington, Box 352100, Seattle, WA 98195, USA f USDA Forest Service, Pacific Northwest Research Station, Wenatchee Forestry Sciences Laboratory, 1133 N. Western Ave., Wenatchee, WA 98801, USA article info Article history: Received 6 May 2012 Received in revised form 22 August 2012 Accepted 28 August 2012 Available online xxxx Keywords: Fire severity Forest structure Relativized differenced Normalized Burn Ratio (RdNBR) LiDAR Gaps Yosemite abstract While fire shapes the structure of forests and acts as a keystone process, the details of how fire modifies forest structure have been difficult to evaluate because of the complexity of interactions between fires and forests. We studied this relationship across 69.2 km 2 of Yosemite National Park, USA, that was subject to 32 fires P40 ha between 1984 and 2010. Forests types included ponderosa pine (Pinus ponderosa), white fir-sugar pine (Abies concolor/Pinus lambertiana), and red fir (Abies magnifica). We estimated and stratified burned area by fire severity using the Landsat-derived Relativized differenced Normalized Burn Ratio (RdNBR). Airborne LiDAR data, acquired in July 2010, measured the vertical and horizontal structure of canopy material and landscape patterning of canopy patches and gaps. Increasing fire severity changed structure at the scale of fire severity patches, the arrangement of canopy patches and gaps within fire severity patches, and vertically within tree clumps. Each forest type showed an individual trajectory of structural change with increasing fire severity. As a result, the relationship between estimates of fire severity such as RdNBR and actual changes appears to vary among forest types. We found three arrange- ments of canopy patches and gaps associated with different fire severities: canopy-gap arrangements in which gaps were enclosed in otherwise continuous canopy (typically unburned and low fire severities); patch-gap arrangements in which tree clumps and gaps alternated and neither dominated (typically moderate fire severity); and open-patch arrangements in which trees were scattered across open areas (typically high fire severity). Compared to stands outside fire perimeters, increasing fire severity generally resulted first in loss of canopy cover in lower height strata and increased number and size of gaps, then in loss of canopy cover in higher height strata, and eventually the transition to open areas with few or no trees. However, the estimated fire severities at which these transitions occurred differed for each forest type. Our work sug- gests that low severity fire in red fir forests and moderate severity fire in ponderosa pine and white fir- sugar pine forests would restore vertical and horizontal canopy structures believed to have been common prior to the start of widespread fire suppression in the early 1900s. The fusion of LiDAR and Landsat data identified post-fire structural conditions that would not be identified by Landsat alone, suggesting a broad applicability of combining Landsat and LiDAR data for landscape-scale structural analysis for fire management. Ó 2012 Elsevier B.V. All rights reserved. 1. Introduction Fire is a dynamic keystone process that influences ecosystem function and the structural and compositional heterogeneity of for- ests throughout the world (Bond et al., 2005; Swetnam, 1993; Whitlock et al., 2003; Wright and Bailey, 1982). However, fire does not act alone, and the interplay between fire and vegetation over space and time – encompassed in the concept of fire regime (Sugihara et al., 2006) – is what ultimately affects many of the bio- logical and physical characteristics of the forested landscape. When characteristics of either the fire regime or vegetation are altered, the effects can be far-reaching. 0378-1127/$ - see front matter Ó 2012 Elsevier B.V. All rights reserved. http://dx.doi.org/10.1016/j.foreco.2012.08.044 ⇑ Corresponding author. Tel.: +1 425 890 7826; fax: +1 206 543 7295. E-mail address: [email protected] (V.R. Kane). Forest Ecology and Management 287 (2013) 17–31 Contents lists available at SciVerse ScienceDirect Forest Ecology and Management journal homepage: www.elsevier.com/locate/foreco
Transcript of Landscape-scale effects of fire severity on mixed-conifer and red fir forest structure in Yosemite...

Author's personal copy
Landscape-scale effects of fire severity on mixed-conifer and red fir forest structurein Yosemite National Park
Van R. Kane a,⇑, James A. Lutz b, Susan L. Roberts c, Douglas F. Smith d, Robert J. McGaughey e,Nicholas A. Povak f, Matthew L. Brooks c
a School of Environmental and Forest Sciences, University of Washington, Box 352100, Seattle, WA 98195, USAb College of the Environment, University of Washington, Box 352100, Seattle, WA 98195, USAc U.S. Geological Survey, Western Ecological Research Center, Yosemite Field Station, El Portal, CA 95318, USAd Yosemite National Park, P.O. Box 577, Yosemite, CA 95389, USAe USDA Forest Service, Pacific Northwest Research Station, University of Washington, Box 352100, Seattle, WA 98195, USAf USDA Forest Service, Pacific Northwest Research Station, Wenatchee Forestry Sciences Laboratory, 1133 N. Western Ave., Wenatchee, WA 98801, USA
a r t i c l e i n f o
Article history:Received 6 May 2012Received in revised form 22 August 2012Accepted 28 August 2012Available online xxxx
Keywords:Fire severityForest structureRelativized differenced Normalized BurnRatio (RdNBR)LiDARGapsYosemite
a b s t r a c t
While fire shapes the structure of forests and acts as a keystone process, the details of how fire modifiesforest structure have been difficult to evaluate because of the complexity of interactions between firesand forests. We studied this relationship across 69.2 km2 of Yosemite National Park, USA, that was subjectto 32 fires P40 ha between 1984 and 2010. Forests types included ponderosa pine (Pinus ponderosa),white fir-sugar pine (Abies concolor/Pinus lambertiana), and red fir (Abies magnifica). We estimated andstratified burned area by fire severity using the Landsat-derived Relativized differenced Normalized BurnRatio (RdNBR). Airborne LiDAR data, acquired in July 2010, measured the vertical and horizontal structureof canopy material and landscape patterning of canopy patches and gaps. Increasing fire severity changedstructure at the scale of fire severity patches, the arrangement of canopy patches and gaps within fireseverity patches, and vertically within tree clumps. Each forest type showed an individual trajectory ofstructural change with increasing fire severity. As a result, the relationship between estimates of fireseverity such as RdNBR and actual changes appears to vary among forest types. We found three arrange-ments of canopy patches and gaps associated with different fire severities: canopy-gap arrangements inwhich gaps were enclosed in otherwise continuous canopy (typically unburned and low fire severities);patch-gap arrangements in which tree clumps and gaps alternated and neither dominated (typicallymoderate fire severity); and open-patch arrangements in which trees were scattered across open areas(typically high fire severity).
Compared to stands outside fire perimeters, increasing fire severity generally resulted first in loss ofcanopy cover in lower height strata and increased number and size of gaps, then in loss of canopy coverin higher height strata, and eventually the transition to open areas with few or no trees. However, theestimated fire severities at which these transitions occurred differed for each forest type. Our work sug-gests that low severity fire in red fir forests and moderate severity fire in ponderosa pine and white fir-sugar pine forests would restore vertical and horizontal canopy structures believed to have been commonprior to the start of widespread fire suppression in the early 1900s. The fusion of LiDAR and Landsat dataidentified post-fire structural conditions that would not be identified by Landsat alone, suggesting abroad applicability of combining Landsat and LiDAR data for landscape-scale structural analysis for firemanagement.
� 2012 Elsevier B.V. All rights reserved.
1. Introduction
Fire is a dynamic keystone process that influences ecosystemfunction and the structural and compositional heterogeneity of for-
ests throughout the world (Bond et al., 2005; Swetnam, 1993;Whitlock et al., 2003; Wright and Bailey, 1982). However, fire doesnot act alone, and the interplay between fire and vegetation overspace and time – encompassed in the concept of fire regime(Sugihara et al., 2006) – is what ultimately affects many of the bio-logical and physical characteristics of the forested landscape.When characteristics of either the fire regime or vegetation arealtered, the effects can be far-reaching.
0378-1127/$ - see front matter � 2012 Elsevier B.V. All rights reserved.http://dx.doi.org/10.1016/j.foreco.2012.08.044
⇑ Corresponding author. Tel.: +1 425 890 7826; fax: +1 206 543 7295.E-mail address: [email protected] (V.R. Kane).
Forest Ecology and Management 287 (2013) 17–31
Contents lists available at SciVerse ScienceDirect
Forest Ecology and Management
journal homepage: www.elsevier .com/locate / foreco

Author's personal copy
In the frequent-fire forests of the western United States, dec-ades of fire exclusion has altered the fire regime and led to a shiftfrom a patchy, open forest structure to a more homogeneous one(Hessburg et al., 2005). Prior to Euro-American settlement in theearly 1900s, these forests experienced frequent, low severity firesthat removed many smaller diameter trees and reduced ladderfuels that would otherwise facilitate fire spread from surface tocanopy fuels (Scholl and Taylor, 2010; van Wagtendonk, 2007).Stands often comprised assemblages of individual larger treesand small clumps of trees with a high proportion of open spacein the understory (Larson and Churchill, 2012). Currently, manyof these forests have substantially higher densities of small-diam-eter trees providing both horizontal and vertical fuel continuity.Gaps, which both moderate fire behavior and serve as regenerationsites for shade-intolerant species, are less prevalent than they werea century ago (Hessburg et al., 2005; Lutz et al., 2012; Scholl andTaylor, 2010). Forest managers often seek to return vegetation, fireregime, and other forest characteristics to conditions that prevailedprior to fire exclusion (Larson and Churchill, 2012), and to do thatthey need to understand the effects of fires on forest structure(Miller et al., 2012).
Understanding how fire modifies forest structure can be diffi-cult because of the inherent complexity of the interaction betweenfires and forests. Fires interact with the existing vegetation, fuelbed, and forest structure. The resulting tree mortality and post-firevegetation depend on the stochastic combination of fire effects,post-fire propagule availability, and the post-fire climate. Firecould act to perpetuate a vegetation type or mediate forest change(Pyne et al., 1996). Individual trees, tree patches, and forest standsare continually restructured by fires that burn at less than stand-replacing severity (Agee, 1998; Romme, 1982; Turner and Romme,1994; Turner et al., 1994). Mosaics of unburned and burnedpatches are particularly complex in areas where fires burn withmixed severities, and where severities differ from fire to fire andacross the landscape, such as in the forests of the Sierra NevadaMountains in California, USA (Collins et al., 2007; Lutz et al., 2009).
Fire regimes are controlled by a mixture of regional controlssuch as prevailing climate and local controls such as dominant veg-etation, topography, and pre-existing forest structure (McKenzieet al., 2011). The post-fire landscapes of mixed severity fires arecharacterized by many small patches, within which burn severitywas similar, and relatively few large patches (Collins and Stephens,2010; Hessburg et al., 2005, 2007; Moritz et al., 2011; Perry et al.,2011). The complex spatial patterns of mixed severity fires are lar-gely due to heterogeneity in the fuel bed, forest structure, andtopography (Collins and Stephens, 2010; Collins et al., 2007;McKenzie and Kennedy, 2011). Pre-fire forest structure such asthe size and arrangement of trees and fuel laddering is a particu-larly important factor leading to mixed severity fires (Moritzet al., 2011; Perry et al., 2011). However, the relationship betweenfire and pre-fire forest structure has rarely been quantified becauseof the lack of information on both pre- and post-fire structures.Quantifying fire-mediated changes in both the vertical structureof the forest and the arrangement of patches and gaps across aheterogeneous landscape would greatly improve our ability tomanage the reintroduction of fire to these landscapes as well asproviding a mechanism to assess likely post-fire forestdevelopment.
A better understanding of the interaction between fire severityand forest structure in mixed severity regime forests would alsoimprove our understanding of post-fire conditions for herbaceousand vertebrate taxa of concern to managers for many forests. Thepost-fire forest structure influences plant establishment and com-munity composition (Donato et al., 2009; Turner et al., 1997) aswell as vertebrate abundance (Roberts et al., 2008). Gaps betweenpatches of contiguous tree canopy are especially important
regeneration sites for shade-intolerant species (Graham, 1990;Kinloch and Scheuner, 1990; Oliver and Ryker, 1990). However,exceedingly large gaps or limited connectivity between forestpatches could reduce progagule dispersal into the middle of thegaps, potentially leading to a post-fire vegetation change (i.e., fromforest to shrub) (Kolden et al., 2012; Turner et al., 1997).
Determining how fire restructures forests requires the ability tomap both fire severity and forest structure with high resolutionand fidelity. The development of burn severity indices that relateLandsat satellite images to estimated changes in vegetation follow-ing fire has allowed quantitative estimation of severity of fires thatburned since 1984 at 0.09 ha resolution (Key, 2006; Key andBenson, 2006; Thode et al., 2011; White et al., 1996). For example,Thode et al. (2011) used Landsat-derived burn severity records toassign fire regimes to the major vegetation types within andaround Yosemite National Park. Collins and his colleagues used fireseverity maps to explore the relationship between dominant vege-tation type, weather during the fire, time since last fire, and slopeposition to patterns of fire severity (Collins and Stephens, 2010;Collins et al., 2007, 2009).
To date, we have lacked corresponding high fidelity landscape-scale measurements of forest structure. Measurements from satel-lites lack the required spatial resolution to accurately map changesin structure following fire (Bergen et al., 2009; Frolking et al.,2009). Post-fire monitoring plots, such as those used for the Com-posite Burn Index (Key, 2006) can sample only small areas and,therefore may under sample the heterogeneity in fire severityand structure across the landscape. Furthermore, researchers mea-suring trees from the ground typically make only coarse summarymeasurements of vertical canopy structure.
Airborne Light Detection and Ranging (LiDAR) provides highresolution measurement of forest structure over large areas(Hudak et al., 2009; Lefsky et al., 2002; Reutebuch et al., 2005).As scientists have gained experience with this technology, researchhas moved from validation of the LiDAR measurements for foreststudies (e.g., Lefsky et al., 1999; Naesset and Okland, 2002), to esti-mations of continuous variables such as basal area and biomass(e.g., Andersen et al., 2005; Gobakken and Naesset, 2004), and tostudies of forests across very large areas (e.g., Asner et al., 2011).Increasingly, LiDAR data have been used to quantify and study can-opy gaps (Kellner and Asner, 2009; Vepakomma et al., 2008) andpatch dynamics (Kane et al., 2011) within forests. Several research-ers have used LiDAR data to develop regressions for estimatingspecific fuel parameters such as crown bulk density or height tolive crown for use in fire behavior models (Agca et al., 2011;Andersen et al., 2005; Erdody and Moskal, 2010; Riano et al., 2004).
LiDAR instruments measure the heights of vegetation surfacesthat lie between the instruments mounted on the plane and theground. LiDAR’s strength is the high resolution (typically severalmeasurements per square meter) and consistent measurement offorest structure over large areas with greater fidelity to structuralattributes than possible with satellite images (Asner et al., 2011;Hummel et al., 2011). Most LiDAR returns measure the 3-D posi-tion of canopy material (foliage and living and dead branches)rather than the boles. This is the reverse of many field studies thatfocus on measurements of boles with no or few measurements ofcanopy structure. However, just as field measurements of treediameters have been regularly used to estimate canopy conditionssuch as canopy bulk density using allometric equations (Scott andReinhardt, 2001), LiDAR measurements of canopy structure havebeen used to estimate values such as mean diameter and treeheight (Naesset, 2002; Reutebuch et al., 2005).
In this study, we combined Landsat estimations of burn severitywith airborne LiDAR measurements of forest structure to evaluaterelationships between fire and forest structure. We quantified thevertical distribution of canopy material and spatial characteristics
18 V.R. Kane et al. / Forest Ecology and Management 287 (2013) 17–31
Author's personal copy
of canopy patches and gaps in unburned forests and in burnedpatches of varying severity. We used a 69.2 km2 study area thatexperienced 32 mixed severity fires P40 ha in size between1984 and 2010 that contained large areas of three forests typesthat are widely distributed throughout the Sierra Nevada. Byincluding only areas that were unburned or that experienced a sin-gle fire in our study, we sought to isolate the impact of a single fireseverity on forest structure in each forest patch. We then usedthese data to address four questions:
1. What is the post-fire patch structure associated with differentfire severities in three common Sierra Nevada forest types?
2. How does fire severity influence the vertical structure of eachforest type with respect to canopy height, canopy cover, andvariability in height and cover?
3. How does fire severity alter the horizontal structure of each for-est type in terms of canopy patches and gaps?
4. Are observed differences in forest structure across severity clas-ses most likely caused by fire or are they most likely reflectiveof pre-fire conditions?
2. Methods
2.1. Overview
Preliminary analysis of fire severity data derived from Landsatand forest structure data measured by LiDAR showed that firechanged the forest landscape in three dimensions and at multiplescales: vertically within clumps of trees (few tens of meters) andhorizontally by the distribution of canopy patches and gaps (10square meters to hundreds of hectares). As a result, we selectedmethods to look at structure at multiple scales in combinationwith two explanatory factors. In this subsection, we preview ourmethods so that the individual details presented in the followingsections can be read in context.
We conducted our study in Yosemite National Park, USA (Sub-section 2.2 and Fig. 1) in an area that experienced a number of firesover a 24 year period while retaining substantial unburned areasoutside of fire perimeters for comparison (Subsection 2.3). Westratified our study area by three forest types common in the SierraNevada range. In parallel, we stratified the study area into patchesunburned during the study period and into patches of four fireseverities estimated using Landsat data (Subsection 2.4). We thencombined the two stratifications into combinations of forest typeand fire severities that were our basic unit of analysis (Fig. 2).For example, all patches of ponderosa pine that burned at lowseverity were combined for analysis of this forest type-fire severitycombination.
We arranged for the canopy structure of the area to be mea-sured by airborne LiDAR (Subsection 2.4). To analyze vertical struc-ture within clumps of trees, we processed the LiDAR data tomeasure height distributions and canopy cover within 30 m(0.09 ha) grid cells across the study area (Subsection 2.5). To ana-lyze patterns of canopy patches and gaps, we mapped these struc-tures across the study area with a minimum mapping unit of 1 mwith results reported for patches and gaps as small as 0.001 ha(10 m2) and as large as found in the study area. All results for ver-tical structure and canopy patch and gap structure were analyzedby each forest type-fire severity combination.
2.2. Yosemite National Park
Yosemite National Park (3027 km2) lies in the central SierraNevada range, California, USA. As a protected area with 94% classifiedas wilderness, the forests in Yosemite currently experience no pre-or post-fire logging. Some land now within park boundaries was
logged in the early 20th century, but there has been limited thin-ning and development since the finalization of the park boundariesin 1937. As a result, Yosemite is one of the best remaining naturallaboratories to evaluate the effects of fire severity on forest struc-ture with minimal confounding influences. The western portion ofYosemite possesses a Mediterranean climate with July mean min-imum and maximum temperatures of 2–13 �C at higher elevationsand 16–35 �C at lower elevations. Most precipitation falls as snowwith annual precipitation ranging from 800 mm to 1720 mm (Lutzet al., 2010). The forest vegetation of Yosemite comprises a mosaicof forest types, species, and structural stages (Fites-Kaufman et al.,2007; Thode et al., 2011; van Wagtendonk and Fites-Kaufman,2006; van Wagtendonk et al., 2002). Each forest type, as well aswoodlands and shrub fields, exhibits a characteristic fire severitydistribution (Thode et al., 2011; van Wagtendonk et al., 2002).
Yosemite experiences multiple wildland fires each year, andsince 1972 many naturally ignited fires have been allowed to burnunder prescribed conditions (van Wagtendonk and Lutz, 2007). Thehistoric fire return interval for the forested ecosystems of Yosemiteranges from 4 to 187 years, depending on the forest type (Caprioand Lineback, 1997; Caprio and Swetnam, 1995; Collins andStephens, 2007; van Wagtendonk et al., 2002).
2.3. Study area
We selected a LiDAR acquisition area within Yosemite NationalPark of 10,895 ha ranging in elevation from 1290 m to 2526 m tospan the lower mixed-conifer to red fir ecotone and to include arange of fire severities while providing substantial unburned areasoutside the fire perimeters for comparison (Fig. 1 and SupplementFigs. 1–3). We assigned forest types within the study area based oneither the 1997 park vegetation map (Keeler-Wolf et al., 2012) orthe 1937 vegetation map (Walker, 2000; Wieslander, 1935). Weused the 1997 vegetation map if the area was forested in 1997.We used the 1937 map for areas delineated as meadow or shrubin 1997 but delineated as forested in 1937 under the assumptionthat fire had caused a shift in vegetation type. We did not includeareas that were delineated as meadow or shrub in both 1937 and1997.
We located our study area to minimize the number of fires inthe decades prior to our study period while maximizing thenumber of fires and range of fire severity during the study period.Between 1930, when comprehensive park fire records began, andthe date of the LiDAR acquisition (21 July 2010), there were 327fires of all sizes in the acquisition area (4.1 fires/year), with 40 firesP40 ha. We excluded from our study any area that was within thefire perimeter of a fire P40 ha between 1930 and 1983. Between1984 and 21 July 2010, there were 169 fires with 32 firesP40 ha. In our study area, the unique area that burned at leastonce between 1984 and 21 July 2010, was 6857 ha of which1082.1 ha burned two or more times (Table 1 and SupplementTable 1). We excluded from our study any area that was withinthe fire perimeters of two or more fires between 1984 and July2010.
To make meaningful comparisons among forest structural clas-ses, we limited our analysis to forest types >1000 ha within ourstudy area: Ponderosa pine (Pinus ponderosa, PIPO) forest, whitefir-sugar pine (Abies concolor/Pinus lambertiana, ABCO/PILA) forest,and red fir (Abies magnifica, ABMA) forest. While substantial standsof Jeffrey pine (Pinus jeffreyi) were present, they occurred on rockyoutcrops where the distribution of germination sites controlledforest structure and rock barriers control the spread of fire. Preli-minary analysis of P. Jeffrey stands showed that forest structurewas primarily controlled by rock outcrops or edaphic conditionsand that fire had minimal effects. We dropped this forest type fromthe study. The three remaining forest types totaled 6962 ha (64% of
V.R. Kane et al. / Forest Ecology and Management 287 (2013) 17–31 19

Author's personal copy
LiDAR acquisition area) (Table 1) representing the area of thesethree forest types that either were unburned (outside all fireperimeters) between 1930 and July 2010 or that burned just onceafter 1984.
2.4. Patterns of burn severity
We used the Yosemite fire atlas assembled by Lutz et al. (2011),processed by and available from the Monitoring Trends in Burn
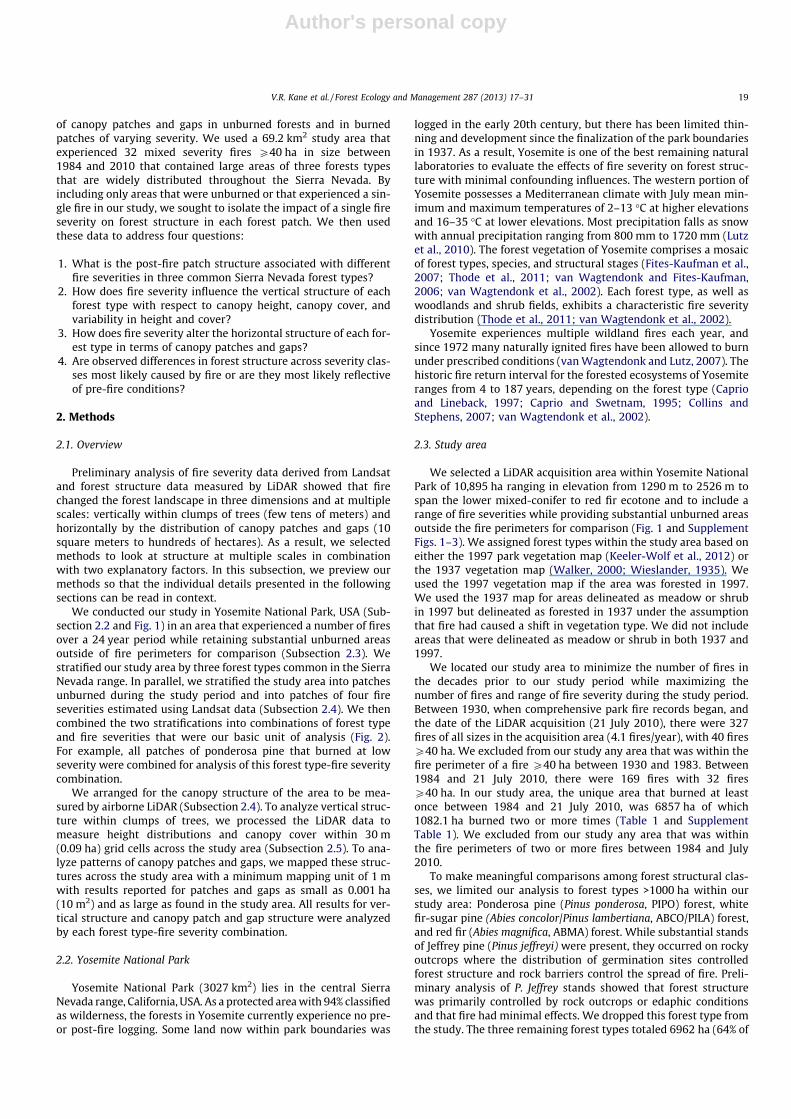
Fig. 1. Location of LiDAR data collection (bold lines) within Yosemite National Park. Insert shows location of park within the state of California. Supplement Figs. 1–4 showhigher resolution maps of the study area.
Fig. 2. This study related differences in ecological process (fire severity) with differences in ecological response (forest structure). Maps of fire severity patches were preparedby combining maps of Landsat-derived fire severity classes (unburned, undifferentiated, low, moderate, and high) with existing 30 m resolution maps of ponderosa pine,white fir/sugar pine, and red fir forest types. Then LiDAR data was used to identify and map five classes of vertical forest structure (open, sparse, shorter, multistory, and topstory) and proportions of canopy patches and gaps for each combination of fire severity and forest type. (For interpretation of the references to color in this figure legend, thereader is referred to the web version of this article.)
20 V.R. Kane et al. / Forest Ecology and Management 287 (2013) 17–31
Author's personal copy
Severity (MTBS) project (Eidenshink et al., 2007). This atlas in-cludes all fires P40 ha from 1984 through June 2010 prior to theLiDAR acquisition, which comprised 97% of area within fire perim-eters (Lutz et al., 2009). We used the Relativized differenced Nor-malized Burn Ratio, RdNBR, (Miller and Thode, 2007) which is anextension of the differenced Normalized Burn Ratio, dNBR (Key,2006; Key and Benson, 2006). These severity measurements calcu-late Normalized Burn Ratios (NBRs) from Landsat bands 4 (nearinfrared) and 7 (mid infrared) to stratify estimated fire severity:
NBR ¼ ðBand4� Band7Þ=ðBand4þ Band7Þ ð1Þ
The dNBR values for each pixel were calculated by subtractingthe post fire NBR from the pre-fire NBR:
dNBR ¼ prefireNBR � postfireNBR ð2Þ
Miller and Thode (2007) determined that the estimate of fireseverity could be enhanced by calibrating severity measurementsby removing the biasing of the pre-fire vegetation using thesquare-root of the pre-fire NBR:
RdNBR ¼ dNBR=ðSQRTðABSðprefireNBR=1000ÞÞÞ ð3Þ
Higher values of these satellite-derived burn indices indicate adecrease in photosynthetic materials and surface materials holdingwater and an increase in ash, carbon, and soil cover. Miller andThode (2007) and Miller et al. (2009) demonstrated that RdNBRproduced more accurate classifications of fire severity in Sierra Ne-vada forests, particularly for areas with lower pre-fire canopy cov-er. We classified the satellite-derived RdNBR values into standardburn severity classes originally calibrated with ground CompositeBurn Index plots (Key, 2006; Key and Benson, 2006; Thode et al.,2011; Lutz et al., 2009; Miller and Thode, 2007; Miller et al., 2009).
We stratified the burned portion of the study area into the fivestandard MTBS fire severity classes (Table 2) using the field-validated RdNBR thresholds from Miller and Thode (2007). Weclassified forest patches outside of all fire perimeters for fires be-tween 1930 and July 2010 as unburned. We found only 8.4 ha witha classification of enhanced greenness indicating a herbaceousbloom in the year following the fire, and we dropped these pixelsfrom subsequent analysis. Areas of no detectable change werewithin fire perimeters, but the burn severity as measured by Land-sat RdNBR was undifferentiated from unburned area. This Landsat-undifferentiated burn severity class comprises both portions of thelandscape within the fire perimeter that did not burn and areasthat burned as a surface fire while leaving the canopy intact (seeKolden et al. (2012) for a summary of interpretations of Landsat-undifferntiated pixels). We combined both forest type and fireseverity into a landscape-scale delineation of patches, where eachpatch was a contiguous area having the same fire severity and for-est type (Fig. 2). The minimum measuring unit was a single Landsatpixel (0.09 ha).
2.5. LiDAR data
Watershed Sciences, Inc. (Corvallis, OR) collected LiDAR datausing a dual-mounted Leica ALS50 Phase II instrument on 21 and22 July 2010 with an average pulse density of 10.9 pulses persquare meter and up to four returns per pulse. Using the TerraScanv.10.009 and TerraModeler v.10.004 software packages (Terrasolid,Helsinki, Finland), Watershed Sciences used the LiDAR data to cre-ate the 1 m resolution digital terrain model (DTM). We processedthe LiDAR return point cloud data to generate metrics relevant tothe measurement of forest canopies using the US Forest Service’sFUSION software package, beta version derived from version 3.00(http://www.forsys.cfr.washington.edu/fusion.html). WatershedSciences also collected true-color orthographic images with a15 cm resolution to serve as an interpretive aid.
2.6. Analysis of vertical canopy material distribution
We estimated the vertical canopy material distribution (percen-tile heights, heterogeneity of heights, and canopy cover) using sta-tistical metrics of the distribution of return heights. We calculatedthese metrics using all returns for 30 m grid cells to match the res-olution of the fire severity and vegetation cover maps. The Fusionsoftware had an average of 9810 returns per 30 m grid cell onwhich to calculate the metrics.
We normalized LiDAR return elevations to heights aboveground by subtracting the elevation of the underlying ground sur-face model from each return height. We calculated canopy covermetrics as the proportion of returns within a height stratum, suchas 2–16 m, divided by all returns in that stratum and below. Wehypothesized that fire would preferentially remove canopy mate-rial in lower height strata. To test this, we initially calculated coverfor five height strata: 2–4 m, 4–8 m, 8–16 m, and >16 m. Prelimin-ary analysis showed high correlation among cover measurementsin height strata below 16 m, and that the effects of fire were similarfor canopy cover strata below 16 m. We therefore combined thelower three height strata into a single 2–16 m cover measurement.We did not include returns below 2 m in the calculation of heightmeasurements, and we did not calculate cover below 2 m. This re-sulted in the height and cover metrics representing only the can-opy of trees with canopy material >2 m in height.
We used rumple (canopy surface rugosity) as a measure of thestructural heterogeneity of stand structural complexity (Birnbaum,2001; Ishii et al., 2004; Kane et al., 2008, 2010a,b; Ogunjemiyoet al., 2005; Parker and Russ, 2004; Parker et al., 2004). We useda 1 m resolution canopy surface model (CSM) created using themaximum return height with each 1-m grid cell and smoothedwith a 3 � 3 low pass filter in computing rumple. The rumple met-ric was measured as the ratio of the area of the 1 m CSM to the areaof the underlying digital terrain model reported over the study areain 30 m grid cells.
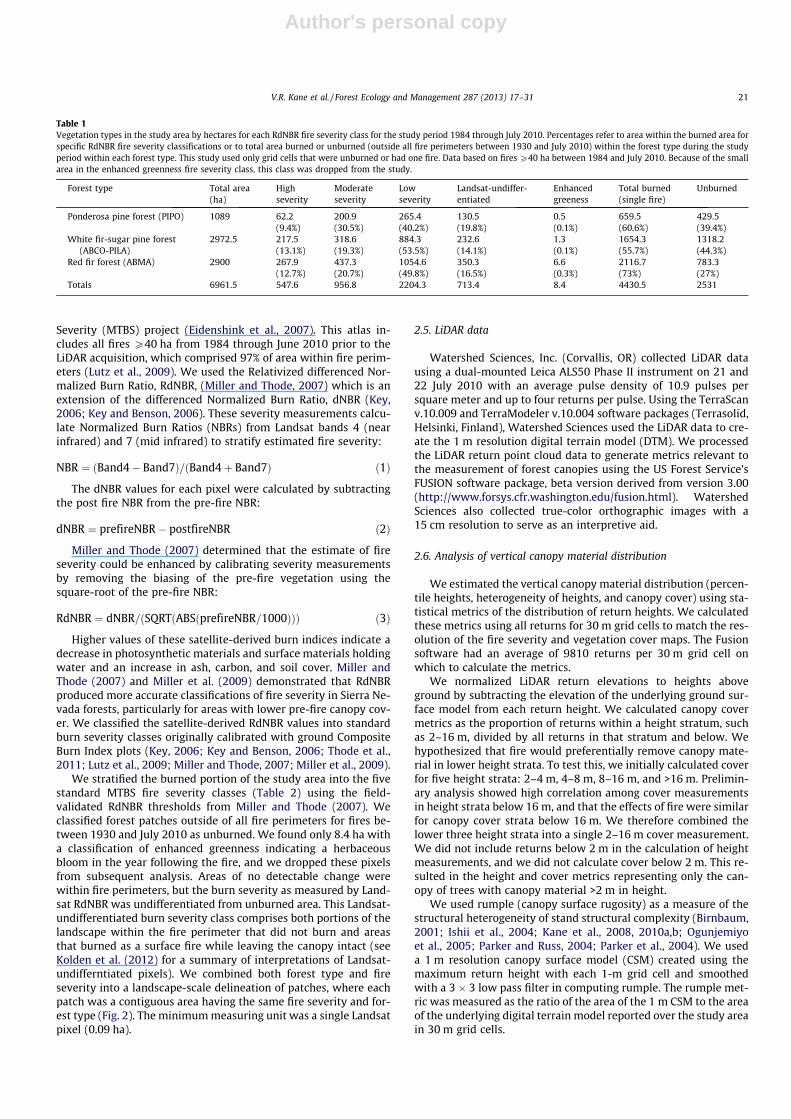
Table 1Vegetation types in the study area by hectares for each RdNBR fire severity class for the study period 1984 through July 2010. Percentages refer to area within the burned area forspecific RdNBR fire severity classifications or to total area burned or unburned (outside all fire perimeters between 1930 and July 2010) within the forest type during the studyperiod within each forest type. This study used only grid cells that were unburned or had one fire. Data based on fires P40 ha between 1984 and July 2010. Because of the smallarea in the enhanced greenness fire severity class, this class was dropped from the study.
Forest type Total area(ha)
Highseverity
Moderateseverity
Lowseverity
Landsat-undiffer-entiated
Enhancedgreeness
Total burned(single fire)
Unburned
Ponderosa pine forest (PIPO) 1089 62.2(9.4%)
200.9(30.5%)
265.4(40.2%)
130.5(19.8%)
0.5(0.1%)
659.5(60.6%)
429.5(39.4%)
White fir-sugar pine forest(ABCO-PILA)
2972.5 217.5(13.1%)
318.6(19.3%)
884.3(53.5%)
232.6(14.1%)
1.3(0.1%)
1654.3(55.7%)
1318.2(44.3%)
Red fir forest (ABMA) 2900 267.9(12.7%)
437.3(20.7%)
1054.6(49.8%)
350.3(16.5%)
6.6(0.3%)
2116.7(73%)
783.3(27%)
Totals 6961.5 547.6 956.8 2204.3 713.4 8.4 4430.5 2531
V.R. Kane et al. / Forest Ecology and Management 287 (2013) 17–31 21

Author's personal copy
We examined correlation among a candidate set of LiDAR met-rics using Pearson correlation (Supplement Table 2) and a principalcomponents analysis (PCA) ordination (results not shown) to find aparsimonious set of metrics that describe the heterogeneity of for-est structure within our study area (Kane et al., 2010a,b; Lefskyet al., 2005). We chose five metrics calculated within 30 m gridcells to analyze vertical structure: 95th percentile return height,which corresponds to the height of dominant trees; 25th percentilereturn height, which is related to canopy base height (Andersenet al., 2005; Erdody and Moskal, 2010); rumple, which measuresthe heterogeneity of heights both vertically and horizontally (Kaneet al., 2010b); canopy cover in the 2–16 m height strata; and can-opy cover in the >16 m height strata (Fig. 3).
We used these five metrics to define classes of vertical foreststructure based on a random sample of 10,000 grid cells (11.7%of the study area). Because of colinearity between the metrics,we used the axes of variation from a principle components analysis(PCA) to define the vertical forest structure classes. We used hier-archical clustering to classify the study area at a � 30 � 30 m(0.09 ha) resolution using the PCA axes of variation (Legendreand Legendre, 1998). We used Euclidean distances and Ward’slinkage method within the ‘‘hclust’’ function of the R statisticalpackage (release 2.6.1) (R Development Core Team, 2007) for thisanalysis. To ensure that our vertical structure classes were statisti-cally distinct, we performed a Tukey HSD test with a Bonferronicorrection for multiple tests (20) at an alpha level of 0.05 resultingin a critical value of P < 0.002 on the individual metrics used to de-fine the classes. We used the classified random sample of 10,000grid cells as training data to classify the vertical structure of all gridcells within the study area using the Random Forest algorithm(Breiman, 2001) in the yaImpute R statistical package (Crookstonand Finley, 2008). The yaImpute package reported a misclassifi-cation error based on the Random Forest out of bag error assess-ment (Breiman, 2001) of 7.1%.
Over the 26 year period of our study, vegetation regrowth fol-lowing fire could have changed the structure of forests as mea-sured by any of the metrics we used to study vertical structure.To explore for trends for an individual metric with time since fire,we performed linear regressions using time since fire in years asthe predictor variable and the structural metric value as the re-sponse variable. The regressions were repeated for each combina-tion of metric forest type, and fire severity resulting in a total of 60regressions. Because the area burned each year varied, we per-formed regressions both using the median value for each metricby year, forest type, and severity and using values for all grid cellsfor each metric by year, forest type, and severity. This allowed us toboth examine trends with normalized (median values) and to usetreat each burned grid cell as an independent sample of the inter-action of fire severity and forest structure. We performed a TukeyHSD test with a Bonferroni correction for multiple tests (20) at analpha level of 0.05 resulting in a critical P value of P < 0.
2.7. Analysis of canopy patch and gap structure
We analyzed post-fire canopy patch and gap structure by map-ping both gaps (areas with no trees >2 m tall) and areas of canopy(areas with continuous canopy >2 m tall; canopy patches). Weidentified canopy patches and gaps using an unsmoothed 1 m res-olution CSM with heights P2 m identified as canopy and heights<2 m identified as gaps. The Fusion software assigned each 1 mCSM grid cell the height of the highest return within that grid cell.To ensure consistency between the analysis done with 30 m gridcells (see Section 2.5) and this analysis with 1 m grid cells, we en-sured that the grid cells were aligned so that each 1 m grid cell fellentirely with a single 30 m grid cell.
We coded each grid cell by forest type and as either unburnedor with the fire severity class experienced in that forest type. Weconverted the resulting 1 m resolution raster map into an ArcMappolygon file without shape simplification using ESRI ArcMap 10.0(ESRI, Redlands, CA, USA). This preserved the resolution of the ras-ter map and identified contiguous canopy patches or gaps as allcontiguous grid cells with the same fire severity and forest type.As a consequence, we identified canopy patches and gaps thatcrossed the boundaries of different forest type-fire severity patchesas separate canopy patches and gaps within their severity-forestcombinations. We used ArcMap to calculate the area and perimeterof each canopy patch and gap (Fig. 2).
In forests prone to fires, fire-created gaps are often equated tohigh severity fire patches because these patches, by definition,have had most of their canopy cover removed. In our study, we fol-lowed Runkle’s (1982, 1992) definition of a gap as any area withoutcanopy cover greater than 2 m in height. This approach allowed usto include gaps caused by any condition, including edaphic factors,rock outcrops, spacing between trees caused by competition forwater or other resources, or the death of individual trees causedby insects, pathogens, wind, or fire. We chose this approach basedon the hypothesis that forests that experienced other than highseverity fire would also show an increase in both the numberand cumulative area of gaps compared to unburned patches dueto direct fire mortality or delayed mortality of fire-weakened trees.
3. Results
3.1. Patterns of burn severity
The distribution of forest types and fire severity patches re-sulted in a mosaic landscape across the study area (Fig. 4 and Sup-plement Fig. 2). Unburned patches represented 27–44% of each ofthe three forest types (Table 1). For each forest type, the largestpercentage of burned area was in the lower two severity classes:low severity patches (40–54%) and Landsat-undifferentiatedpatches (14–20%). Moderate (19–31%) and high (9–13%) severitypatches represented smaller portions of the burned area.
Table 2Fire severity classes applied to forest types. Field characteristics are from Thode et al. (2011) and associated ranges for Relativized differenced Normalized Burn Ratio (RdNBR)from Miller and Thode (2007). Areas with a classified severity of enhanced greeness class were excluded from this study because they were found only in 8.4 ha within the studyarea.
Severity class Field characteristics RdNBR ranges
Unburned Unburned forest patches outside of fire perimetersEnhanced greeness Bloom of plant growth following fire <�150Landsat-undifferentiated No detected change in post-fire vegetation �150 to 68Low Fine fuels removed and some scorching of understory trees 69–315Moderate Some fuels remain on forest floor, mortality of small trees, scorching of crowns for
medium and large-sized trees316–640
High Near-complete combustion of ground fuels, near total mortality of small and medium-sized trees, and severe needle scorch and/or mortality of large trees
P641
22 V.R. Kane et al. / Forest Ecology and Management 287 (2013) 17–31

Author's personal copy
Large patches >10 ha dominated (78–94%) the area of unburnedforest for all three forest types (Fig. 4). With fire, however, the pro-portion of area in different size classes varied by both severity andforest type with no consistent trends.
3.2. Distribution of vertical canopy material
We identified an initial set of nine statistically distinct classes ofvertical forest structure using hierarchical cluster analysis. Wemerged five of the candidate classes into two new classes basedon similarities in canopy cover in the two height strata becausethe primary effect of increasing fire severity was to remove canopycover. We defined the five final classes as: open, sparse, shorter,multistory, and top story (Figs. 5 and 6 and Supplement Figs. 4and 5). The open forest class was characterized as having few orno erect trees, with trees and shrubs primarily being below 2 min height. The sparse forest class was characterized by low densi-ties of trees separated by relatively large areas where vegetationdid not exceed 2 m in height. The shorter forest class was charac-terized as predominantly tree covered, but with trees of lower stat-ure. The multistory forest class was characterized by trees of manydifferent heights. The top story forest class was characterized bylow densities of taller trees with distinct vertical separation be-tween the tall trees and the lower forest strata.
Both ponderosa pine and white fir-sugar pine patches had apreponderance of their unburned patches in the multistory class(65% and 60% respectively) (Fig. 7). For Landsat-undifferentiatedand low severity fire patches, both these forest types showed re-duced area in the multistory class. However, ponderosa pinepatches showed increases in the shorter class while white fir/sugarpine patches showed increases in the top story class for these twofire severity classes. Unburned red fir patches were an approxi-mately equal mixture of the sparse, shorter, multistory, and topstory classes (total of 100%). In Landsat-undifferentiated and lowseverity patches, the percentage of red fir area in the shorter and
multistory classes decreased with corresponding increases in thesparse and the top story classes. All forest types showed an increas-ing percentage of area in the open and sparse structural classeswithin moderate and high severity fire patches.
The changes in forest structure as measured by fire structureclasses were collaborated by trends in the mean values of theLiDAR metrics used to define the classes (Table 3). Ponderosa pinestands showed loss of structure as measured by all metrics for allfire severities. The white fir-sugar pine and red fir forests, however,either showed increases in values or smaller losses than ponderosapine stands for Landsat-undifferentiated and low severity patchesfor all metrics except for canopy cover in the 2–16 m stratum. Allthree forest types showed increasing loss of cover in the 2–16 mstratum for all fire severities. Similarly, all three forest typesshowed increasing loss of structure for all metrics for moderateand high severity fires.
When values for vertical structure metrics were examined byyear of fire, forest type, and severity, ranges of values 95th and25th percentile heights and rumple were usually similar forLandsat-undifferentiated and low severity fires (SupplementFigs. 8–12). Ranges for these metrics showed greater variation formoderate and high severity fires. Ranges of values for cover inthe >16 m and 2–16 m strata showed considerable variation forall fire severities. Correlations between metrics and years since fireas measured by single linear regressions (n = 25) using median va-lue for each metric by year, forest type, and severity were not sig-nificant (P > 0.001). Regressions using all grid cell values (n variedby year, forest type, and fire severity) generally either were not sig-nificant (P > 0.001) or had little correlation (R2
6 0.1) (Table 4). Allsignificant coefficients of determination with R2 P 0.1 were formoderate and high severity patches where more recent fires hadhigher 95th and 25th percentile height, cover >16 m, and higherrumple values than older fires indicating a loss of structure (nee-dles, branches, and boles) with time since fire. The exception wasfor ponderosa pine canopy cover 2–16 m in moderate and highseverity patches, where more recent fires had lower values thanolder fires (R2 = 0.12) indicating regrowth in this height strata withtime since fire.
3.3. Analysis of canopy patch and gap structure
For all forest areas, canopy patches >1 ha (>10 ha for sugarpine-white fir forests) constituted the majority of the area and gapsgenerally were small inclusions within these patches (Fig. 8 andSupplement Figs. 6 and 7). With increasing fire severity, canopypatches represented an increasingly smaller proportion of the areaand the patch sizes became progressively smaller on average. Thetrend for gaps was reversed with increasing fire severity as gapsrepresented an increasingly larger proportion of the area and gapsizes became progressively larger on average.
We found three archetypical patterns of canopy patches andgaps that illustrated points on a continuous range in the relativeproportion of canopy patches and gaps (Fig. 9): (1) Canopy/gappatterns have the majority of their area in canopy with gaps assmall breaks in the otherwise continuous canopy (the classic gappattern found by Runkle (1982) in his eastern US study areas);(2) Patch/gap patterns have similar proportions of canopy andgap with the two interspersed across the area; (3) Open/patch pat-terns are the reverse of canopy-gap systems with open spaceessentially a continuous gap interspersed with small patches ofcanopy that are single trees or small tree clumps. These canopypatch and gap patterns are emergent properties that becomerecognizable only at scales of �100 m or greater; they cannot berecognized at the scale of 30 m grid cells or most field plots,which sample forests at the scale of individual tree clumps ormoderate-sized gaps.
Fig. 3. LiDAR metrics used in the study to measure vertical forest structureincluding canopy material height, cover, and canopy complexity at a 30 m � 30 mscale. The height and cover metrics were calculated from the LiDAR return pointcloud within each 30 m pixel, while the rumple value for each 30 m pixel wascalculated from a 1 m canopy surface model (CSM) derived from the point cloud.Each stripe on the height pole is 5 m in length.
V.R. Kane et al. / Forest Ecology and Management 287 (2013) 17–31 23

Author's personal copy
4. Discussion
4.1. Key findings
We expected stands that had not recently experienced firewould be dominated by a single structural class, either becauseof species physiology and the moisture gradient (Lutz et al.,2010; Stephenson, 1998; Stephenson et al., 2006) or because a cen-tury of fire suppression had led to a homogenization of structure(Hessburg et al., 2005; van Wagtendonk and Fites-Kaufman,2006). We expected little change in structure for areas that hadburned at low severities, consistent with results from CompositeBurn Index plots (Thode et al., 2011) and more extensive structuralchange in areas that burned at moderate or, especially, at highseverity.
We were surprised on two accounts. First, each forest typeshowed an individual response to increasing fire severity in thevertical structure of its forests. Second, Landsat-undifferentiatedand low severity patches had substantially different vertical andhorizontal structure than did unburned patches. We introducethe discussion of these topics in this subsection followed by moredetailed discussions of changes in vertical and horizontal structurechanges in the following two subsections and conclude with a dis-cussion of management implications.
We found changes at all three scales we examined: fire severitypatches, canopy patches and gaps within fire severity patches, andclumps of trees (0.09 ha grid cells). With increasing fire severity inour study area, severity patch size shifted to increasingly smallerpatches, with a partial reversal for high severity fire that increasedthe area in larger patches compared to moderate severity fire.Within severity patches, the proportion of area that were gaps also
increased with increasing fire severity, with a transition fromunburned patches dominated by canopy enclosing small gaps (can-opy/gap), to approximately equal areas of canopy patch and gap(patch/gap), to open areas with scattered trees and tree clumps(open/patch). At the scale of tree clumps (our 30 m grid cells), low-er fire severities removed canopy cover leading to structural shiftstoward the shorter (ponderosa pine), top story (white fir-sugarpine), or top story and sparse (red fir) structural classes. With mod-erate and high severity, fire further removed canopy cover, leadingto increases in the sparse and open structural classes.
We found differences in forest structure for all fire severitiescompared to the structure for unburned patches and these changesformed a pattern with increasing fire severity. Fires burned in aheterogeneous pattern creating a mosaic of canopy patches, gaps,and vertical forest structures. Fire generally thinned from belowwith higher fire severities resulting in the loss of canopy materialin progressively higher height strata that presumably correlatedwith loss of progressively larger trees (Table 3 (especially trendsin cover in the two height strata) and Fig. 7). (However, see the dis-cussion in Subsection 4.2 of changes for ponderosa pine Landsat-undifferentiated and low severity for an exception to thinning frombelow that highlights the individual response of each forest type.)Low severity fire patches, for example, had 9–35% less cover in the>16 m stratum than unburned patches and 22–46% less cover inthe 2–16 m stratum. Thinning in this manner will lead to progres-sively greater area in gaps and reduced canopy cover, first in thelower strata and then in higher strata.
We did not expect the degree to which Landsat-undifferenti-ated and low severity patches fires changed forest structure at allthree scales. Thode and colleagues (2011) characterized RdNBR fireseverity classes through field work in the Sierra Nevada range, and
Fig. 4. Frequency of fire severity (unburned through high severity) patches by forest type – ponderosa pine (PIPO), white fir-sugar pine (ABCO-PILA), red fir (ABMA) (blackcircles) – and cumulative proportion of area (lines) for each fire severity and forest type. Cumulative proportions within each forest type sum to 1.0. Legend within each panelshows percentage of area within that forest type-fire severity combination in patches <1 ha, 1–10 ha, and >10 ha. A patch was defined as a contiguous area of the same fireseverity class and forest type. The minimum measuring unit was a single Landsat pixel (0.09 ha).
24 V.R. Kane et al. / Forest Ecology and Management 287 (2013) 17–31

Author's personal copy
they described low severity fire patches as ‘‘lightly burned withonly the fine fuels removed and some scorching of the understorytrees.’’ However, we found substantial changes, such as an almostdoubling to more than tripling of the proportion of area in gaps,depending on forest type, between unburned patches and theLandsat-undifferentiated and low severity patches. Our resultssuggest that measuring the full impact of lower severity fire mayrequire either measurements over large areas or measurements anumber of years after a fire for delayed mortality to occur.
These results suggest a more complicated relationship betweentree species characteristics such as bark thickness, pre-fire struc-ture, and fuel characteristics among other aspects than is usuallyconsidered in evaluating patterns of fire severity and resulting for-est changes. Fuller exploration of these considerations will come asLiDAR becomes available for larger areas and additional foresttypes are analyzed (although we discuss some aspects of theseissues in Subsection 4.2). In the meantime, researchers and manag-ers should recognize that the relationship between estimates offire severity such as dNBR and RdNBR and actual changes appearsto vary among forest types.
A complication of relating differences in fire severity to changesin forest structure is that pre-fire and post-fire measures of struc-ture near the time of a fire are rare except for prescribed fireswhere managers determine the timing of the fire. Collins et al.(2011), for example, attributed the differences between their lowand moderate severity fire plots to the effects of fire and assumedtheir unburned plots represented the typical pre-fire conditions fortheir burned plots (the same assumption we make for our study).While this hypothesis is reasonable given the known effects of fireon forest structure, alternate explanations would be that pre-firedifferences in structure caused the differences in fire severity orthat the post-fire condition resembled the pre-fire condition. Thelarge samples enabled by LiDAR can test for heterogeneity in struc-ture within unburned patches to test for similarities between largenumbers of areas that did not burn and patches that burned withdifferent severities. Substantial differences across numerous firesin the equivalent of tens of thousands of field plots associated withdifferent fire severities would strengthen the case for fire as thecause. The changes in vertical and horizontal structure we foundacross many fires and three forest types were those expected fromincreasing fire severities. As a result, we accept the hypothesis that
fire was a dominant process creating these differences associatedwith different fire severity levels.
In reporting our results, we have focused on major trends toavoid both the limitations of no pre-fire structural measurementsand a second concern, limitations in the accuracy of modeled fireseverity. Readers should keep these limitations in mind in inter-preting our results. For example, a pixel may be classified as highseverity if understory shrubs were present pre-fire in a sparsestand even though no or few trees were killed if the shrubs werekilled. Also, minor registration errors between pre- and post-fireimages for a site with visible bare ground or rock and lead to incor-rectly classified high severity pixels. In fires with little or no actualhigh-severity these anomalous pixels could lead to the incorrectconclusions about changes in forest structure due to high-severityfire.
4.2. Analysis of vertical canopy material distribution
We began our analysis of the impact of fire severity on foreststructure by examining changes in forest structure for each ofthe 0.09 ha grid cells covering our three forest types. This grainof measurement captured structure at of the scale of all or a por-tion of clumps of trees (Larson and Churchill, 2012). Because each0.09 ha grid cell was similar in size to the plot sizes of many fieldstudies of fire severity (Key and Benson, 2006; Key, 2006), this por-tion of the study is most directly comparable to the field studiesthat have studied the relationships between fire severity and foreststructure. Our large sample size, however, allowed us to observevariability and heterogeneity in structure that would be impracti-cal in a field study.
We identified five statistically distinct vertical structure classes:open, sparse, shorter, multistory, and top story (Fig. 5). Height andmetrics associated with taller trees (95th and 25th percentileheight, rumple, and canopy cover >16 m) were the strongest differ-entiators in defining classes (Supplement Fig. 5). Within ranges ofvalues for these height-related metrics, the density of cover 2–16 m was a secondary differentiator. Fire changed the aggregatevertical structure for all forest types with the amount of changeincreasing with increasing fire severity. Each forest type, however,showed a different pattern of change.
Fig. 5. Five forest structure classes derived from cluster analysis of LiDAR structural metrics. Each stripe on the height poles is 5 m in length.
V.R. Kane et al. / Forest Ecology and Management 287 (2013) 17–31 25

Author's personal copy
We were surprised to see substantial differences between theponderosa pine and white fir-sugar pine forest types in their re-sponse to Landsat-undifferentiated and low severity fires. Boththe ponderosa pine and white fir-sugar pine forest types includedominant tree species that have thicker bark that are more resis-tant to fire (ponderosa pine and sugar pine) as well as species thathave thinner bark less resistant to fire (such as white fir), especiallyfor smaller to medium diameter trees (van Wagtendonk andFites-Kaufman, 2006). (Red fir is less fire resistant than eitherponderosa or sugar pine.) For these two lower fire severities,ponderosa pine patches showed higher levels of change in 95th and25th percentile heights, cover in the >16 m stratum, and rumplethan did white fir-sugar pine patches. (However, this pattern wasreversed for cover in the 2–16 m stratum with white fir-sugar pinepatches showing greater loss over than ponderosa pine patches.)
These results suggests that the lower fire severities were creat-ing a greater loss of larger overstory trees in ponderosa pinepatches than the white fir-sugar pine forest types. We would
expect even low severity fires to kill a portion of less fire toleranttrees, but were puzzled by the substantial difference between theponderosa pine and the white fir-sugar pine forest types sincewhite fir is common in both. Several potential explanations forthe apparent higher mortality for larger trees in ponderosa pinepatches are plausible. One explanation may be that ponderosa pinestands tend to have less compacted ground surface fuels (needleand litter) than the other forest types leading to more intense firesand higher mortality (J. van Wagtendonk personal communica-tion). Ponderosa pine stands also tend to be on lower productivitysites than white fir-sugar pine stands, and trees in the former mayhave less vigor and may be more susceptible to fire mortality (M.North, personal communication). In addition, our study periodspanned an extended drought in the Sierra (1987–1992) in whicha substantial proportion of large ponderosa pine trees died dueto beetle outbreaks, independent of fire. The combination of fireand drought might have facilitated beetle outbreaks in larger pon-derosa pine trees (N. Stephenson personal communication).
Fig. 6. Height and canopy cover characteristics of forest structural classes. Mean values and letters indicate statistically distinguishable structural classes (Tukey HSDp 6 0.002). Total canopy cover >2 m was not used in the classification but is shown to aid in interpretation of the classes. Figure was produced with the boxplot function of theR statistical package. Bold lines show median values; the bottom and top of the boxes show the 25th and 75th percentile values; the upper and lower whiskers show eitherminimum and maximum values or 1.5 times the interquartile range (approximately two standard deviations), whichever is nearer to the mean; and circles show outliers.
26 V.R. Kane et al. / Forest Ecology and Management 287 (2013) 17–31

Author's personal copy
With these explanations for ponderosa pine stands, the changesin structural classes with different fire severities between foresttypes can be largely explained by differences in fire tolerance ofdominant species (Fig. 7). Ponderosa pine patches shifted from adominance of the multistory class for unburned patches to a dom-inance of the shorter class for undifferentiated and low severityclasses presumably because of a loss of larger overstory trees. Withmoderate and high severity fire, ponderosa pine patches retained asubstantial proportion of the shorter class (41–32%) with a grow-ing dominance of the sparse class (24–40%). However, the open
class with its loss of most trees remained a minor proportion ofthese patches (2–10%). An explanation for this pattern could bethat increasing fire severity beyond low severity killed relativelyfew of the larger fire tolerant ponderosa pine trees. (Alternativeexplanations could be that the pre-fire structure of the patcheswere substantially different than the unburned patches we usedat as reference conditions or that the severity was misclassified.)
White fir-sugar pine patches, by comparison, showed a slow de-cline in the proportion of area in the shorter class with increasingfire severity. Instead, this forest type showed an increase in the top
Fig. 7. Proportion of structural classes associated with forest type and fire severity (ponderosa pine (PIPO), white fir-sugar pine (ABCO-PILA), red fir (ABMA)). Differencesgreater or equal to an absolute difference of 0.1 compared to next lower fire severity class indicated with a plus (+) or minus (�) as an interpretive aide. Fig. 6 shows ranges ofvalues for each metric used to define the classes.
Table 3Mean values and change in mean values for LiDAR metrics by forest type and fire severity. First number in each entry shows the mean LiDAR metric value followed by thepercentage change in that metric compared to unburned (outside all fire perimeters) value for that forest type. Species codes are ponderosa pine (PIPO), white fir-sugar pine(ABCO-PILA), red fir (ABMA).
P95 (m) PIPO ABCO-PILA ABAM P25 (m) PIPO ABCO-PILA ABAM
Unburned 40.6 40.3 35.3 Unburned 11.9 13.4 11.7Undifferentiated 37/�8.9% 40.6/0.7% 37.4/5.9% Undifferentiated 11.4/�4.3% 15.5/15.6% 13.1/11.9%Low 33.5/�17.5% 42.5/5.4% 39.3/11.3% Low 10.5/�11.8% 16.7/24.6% 14.9/27.3%Moderate 33.5/�17.5% 37.1/�8% 35.6/0.8% Moderate 9.7/�18.5% 14.6/8.9% 13.1/11.9%High 28.6/�29.6% 28.5/�29.3% 24.7/�30.1% High 7.7/�20.7% 9.4/�35.7% 7.4/�43.6%
Cover >16 m (%) PIPO ABCO-PILA ABAM Cover 2–16 m (%) PIPO ABCO-PILA ABAM
Unburned 42.3 45.5 32.8 Unburned 49.2 45.9 35.2Undifferentiated 38.4/�9.3% 46.7/2.6% 31.9/�2.8% Undifferentiated 48.1/�2.3% 36.1/�21.4% 27.3/�22.5%Low 27.5/�28.4% 41.3/�11.6% 29.6/�7.3% Low 38.2/�20.6% 26.3/�27.2% 19.2/�29.7%Moderate 18.5/�51.9% 24.4/�47.8% 16.7/�47.7% Moderate 27/�43.9% 15.8/�56.3% 10.8/�60.5%High 9.7/�74.8% 9.9/�78.9% 4.3/�86.6% High 17.7/�63.3% 7.7/�78.7% 4.6/�83.2%
Rumple (ratio) PIPO ABCO-PILA ABAM
Unburned 4.1 4.2 4.1Undifferentiated 3.8/�7.4% 4.3/2.3% 4.3/4.8%Low 3.5/�7.9% 4.6/6.9% 4.2/�2.4%Moderate 3.1/�18.5% 3.7/�14% 3.3/�23.3%High 2.6/�31.6% 2.6/�39.6% 2/�53.5%
V.R. Kane et al. / Forest Ecology and Management 287 (2013) 17–31 27

Author's personal copy
story class for undifferentiated and low severity fires. This suggeststhat fire was primarily killing smaller trees and opening the lowercanopy, consistent with fire killing the typically smaller and lessfire tolerant white fir. For high severity fire, the white fir-sugarpine patches had a similar proportion of area in the sparse class(42% versus 39%), but a larger proportion in the open class (32%versus 10%) suggesting a higher mortality of larger trees for thesefire severities than for ponderosa pine patches. These results areconsistent with lowered fire resistance for large sugar pines in longunburned stands due to smoldering of deep duff patches at theirbases (Nesmith et al., 2010).
Red fir is less fire tolerant than either ponderosa pine or sugarpine. In red fir forests, undifferentiated and low severity fire
resulted in an increase in both the sparse and top story classes,consistent with fire killing smaller trees present the unburnedpatches with the shorter and multistory classes. Moderate andespecially high severity fire resulted in strong increases in the areaof the sparse and open classes, suggesting high mortality rates forlarger trees.
Following a fire, surviving trees will continue to add height, andmay show an increase in growth rates in the years immediately fol-lowing the fire as the result of decreased competition (Sala et al.,2005). Canopy cover will increase both from the establishment ofnew trees and from remaining trees extending their crowns to fillgaps created by the fire (Fites-Kaufman et al., 2006). For most met-rics, we found no or weak trends in metric values with time since
Table 4Correlation (R2) of structural metrics with change in metrics with years since fire based on linear regressions. Regressions were run for all grid cells for each metric by year, foresttype, and severity resulting in uneven numbers of samples per year. Adjusted R2/slope shown. Positive slope indicates metric value for more recent fires greater than for olderfires; negatives slopes indicates metric value for more recent fires lower than for older fires. Correlations P0.20 in bold for emphasis. Regressions that were not significant atP < 0.001 not shown. Species codes are: PIPO – ponderosa pine, ABCO-PILA – white fir-sugar pine, ABMA – red fir.
Landsat-undifferentiated Low severity
PIPO ABCO-PILA ABMA PIPO ABCO-PILA ABMA
95th Percentile height 0/0 0/025th Percentile height 0.01/0 0/0 0/0Rumple 0/0Cover >16 m 0/0Cover 2–16 m 0.01/0 0.01/0 0/�0.01 0/�0.01
Moderate severity High severity
PIPO ABCO-PILA ABMA PIPO ABCO-PILA ABMA
95th Percentile height 0.11/0.69 0.28/1.23 0.32/1.13 0.36/1.1625th Percentile height 0.07/0.33 0.2/0.47 0.3/0.54 0.16/0.33Rumple 0.11/0.06 0.43/0.12 0.64/0.15 0.32/0.08Cover >16 m 0.05/0.53 0.23/0.82 0.51/1.16 0.13/0.33Cover 2–16 m 0.12/�0.98 0/�0.01 0.12/�0.77 0.17/0.4 0.03/0.12
Fig. 8. Cumulative area of canopy patches (solid line) and gaps (dashed line) by size. Patch and gap cumulative areas shown in top right of each panel. A canopy patch wasdefined as any contiguous area with a return >2 m while gaps had no returns above this height break. Species codes are ponderosa pine (PIPO), white fir-sugar pine (ABCO-PILA), red fir (ABMA). Supplement Figs. 6 and 7 show canopy patch and gap frequency by size.
28 V.R. Kane et al. / Forest Ecology and Management 287 (2013) 17–31

Author's personal copy
fire (Table 4 and Supplement Figs. 8–12). In fact, the frequent widerange of values between years for the same forest type and fireseverity suggests that the individual circumstances of each firesuch as fire weather, topography, and pre-existing forest structuremay have had substantial influence on post fire structure even forareas assigned the same Landsat estimated fire severity. However,in depth examination of trends by fire year and individual fires wasbeyond the scope of our study.
We did not find significant relationships (P > 0.001) using linearregressions with median values by year, and this likely is a conse-quence of the variation in results by year and the small number ofyears (n = 25). Linear regressions using all grid cell values individ-ually (resulting in linear regressions using unequal sample num-bers per year) resulted in few significant regressions and evenfewer with meaningful coefficients of determination (R2 > 0.2)(Table 4). However, we report the results because they suggestan important trend in forest structure change with time for moder-ate and high severity fire patches that can be followed up in subse-quent studies. A detailed examination of these regressions showedthat the pattern was one of loss of structure (needles, branches,and boles) over time that was approximately linear over time.We believe that these trends may represent both delayed mortalityfrom fire damage and the decay of snags. Because trees can retaintheir needles and branches immediately following death, earlymortality snags can appear to have similar structure in the LiDARheight metrics as living trees. As needles and branches drop andsnags decay and eventually fall, areas of mortality should becomeincreasingly different over time as measured by the LiDAR heightmetrics.
4.3. Analysis of canopy patch and gap structure
We found that canopy patch and gap patterns were not uniqueto any forest type, but rather were associated with different fireseverity classes. The canopy-gap pattern was found predominantlyin unburned, Landsat-undifferentiated, and low severity patches,although some red fir patches in these severity classes hadpatch/gap patterns. In these latter cases, examination of the ortho-graphic images suggested these stands were on light-toned soilsassociated with granitic parent material that are generally thinand poorly developed, and the spatial structure may have beenedaphically controlled. The patch/gap pattern was associated withmoderate fire severity for ponderosa pine and white fir-sugar pinepatches and with Landsat-undifferentiated and low fire severitypatches for red fir. The open/gap pattern was associated with highseverity fire for all forest types and also moderate severity fire forred fir patches.
4.4. Management implications and conclusion
Managers have been using fire as a management tool to thinforests for decades (van Wagtendonk, 2007). Our data suggest thateven the low severities associated with prescribed burns (vanWagtendonk and Lutz, 2007) will thin forests and create new gaps.With our data, we can also examine the question of what level offire severity is likely needed to return forests to structural condi-tions similar to those prior to fire suppression. Larson and Churchill(2012) analyzed the results of 50 studies that examined tree spatialpatterns in western US pine and mixed-conifer forests that re-tained natural fire regimes. Their synthesis identified three struc-tural elements in fire-frequent forests: openings, individual trees,and clumps of trees with overlapping canopies at scales of0.0003–0.64 ha. Unfortunately, the studies they examined did notuse methods to examine the spatial arrangement of these struc-tures. Based on studies by Hessburg et al. (2005) and analysis byLarson and Churchill (2012), we believe that these structures likelywere arranged in the patch-gap pattern identified in our study. Ifthis was the case, then low severity fire would result in the crea-tion of patch-gap structure in red fir forests while moderate sever-ity fire would be needed for ponderosa pine and white fir-sugarpine forests to obtain the same structural goals. Collins et al.(2011) also concluded from field plot-based data that moderateseverity fire would recreate pre-fire suppression vertical foreststructure within Yosemite’s forests.
This study was the first we are aware of to combine a multi-decade history of fire severity with LiDAR-derived forest structuremeasurements over a large contiguous area. We employed a un-ique fusion of Landsat data to map fire severity patterns and LiDARdata to map forest structure. We sought dominant patterns that arelikely to hold across a number of forest types, a broad range of indi-vidual fires, and local conditions of pre-fire forest structures andtopographies. The fusion of LiDAR and Landsat data identifiedpost-fire structural conditions that could not be identified by Land-sat alone, suggesting a broad applicability for landscape-scalestructural analysis for fire management. This approach will helpcreate models of how fire restructures forests a multiple scalesfrom local clumps of trees to stands and to landscapes.
Acknowledgements
C.A. Cansler (University of Washington), M. North (US ForestService Pacific Southwest Research Station), N. Stephenson (USGeological Survey), J.W. van Wagtendonk (US Geological Survey,Retired) and two anonymous reviewers provided valuable com-ments that improved the paper. We thank Yosemite National Parkfor data and assistance with field logistics. Funding was provided
Fig. 9. Examples of the ranges of canopy patch and gap patterns present within the study area. Proportions of canopy patch and gaps for each combination of forest type andfire severity are shown in Fig. 8. Light green represents canopy and black represents gaps (no canopy greater than 2 m in height). Each example pattern is 9 ha (300 � 300 m)from the study area. Canopy and gap areas calculated from a 1 m resolution canopy surface model derived from LiDAR data. (For interpretation of the references to color inthis figure legend, the reader is referred to the web version of this article.)
V.R. Kane et al. / Forest Ecology and Management 287 (2013) 17–31 29

Author's personal copy
by the National Park Service, Fire and Aviation ManagementBranch, Fuels and Ecology Program (Interagency AgreementF8803100015) and the U.S. Geological Survey Terrestrial, Freshwa-ter, and Marine Ecosystems Program. Any use of trade, product, orfirm names is for descriptive purposes only and does not implyendorsement by the US Government.
Appendix A. Supplementary material
Supplementary data associated with this article can be found, inthe online version, at http://dx.doi.org/10.1016/j.foreco.2012.08.044.
References
Agca, M., Popescu, S.C., Harper, C.W., 2011. Deriving forest canopy fuel parametersfor loblolly pine forests in eastern Texas. Canadian Journal of Forest Research41, 1618–1625.
Agee, J.K., 1998. The landscape ecology of Western forest fire regimes. NorthwestScience 72, 24–34.
Andersen, H.E., McGaughey, R.J., Reutebuch, S.E., 2005. Estimating forest canopyfuel parameters using LIDAR data. Remote Sensing of Environment 94, 441–449.
Asner, G.P., Hughes, R.F., Mascaro, J., Uowolo, A.L., Knapp, D.E., Jacobson, J., Kennedy-Bowdoin, T., Clark, J.K., 2011. High-resolution carbon mapping on the million-hectare Island of Hawaii. Frontiers in Ecology and the Environment 9, 434–439.
Bergen, K.M., Goetz, S.J., Dubayah, R.O., Henebry, G.M., Hunsaker, C.T., Imhoff, M.L.,Nelson, R.F., Parker, G.G., Radeloff, V.C., 2009. Remote sensing of vegetation 3-Dstructure for biodiversity and habitat: review and implications for lidar and radarspaceborne missions. Journal of Geophysical Research-Biogeosciences 114.
Birnbaum, P., 2001. Canopy surface topography in a French Guiana forest and thefolded forest theory. Plant Ecology 153, 293–300.
Bond, W.J., Woodwart, F.I., Midgley, G.F., 2005. The global distribution ofecosystems in a world without fire. New Phytologist 165, 525–538.
Breiman, L., 2001. Random forests. Machine Learning 45, 5–32.Caprio, A., Lineback, P., 1997. Pre-twentieth century fire history of Sequoia and
Kings Canyon national parks: a review and evaluation of our knowledge. In:Sugihara, N.G., Morales, M.A., Morales, T.J. (Eds.), Proceedings of the Conferenceon Fire in California Ecosystems: Integrating Ecology, Prevention, andManagement. Association for Fire Ecology Miscellaneous Publication 1.Association for Fire Ecology, Sacramento, California, USA, pp. 180–199.
Caprio, A.C., Swetnam, T.W., 1995. Historic fire regimes along an elevationalgradient on the west slope of the Sierra Nevada, California. In: Brown, J.K.,Mutch, R.W., Spoon, C.W., Wakimoto, R.H. (Eds.), Proceedings of the Symposiumon Fire in Wilderness and Park Management. USDA Forest Service GeneralTechnical Report INT-GTR-320. Intermountain Research Station, Ogden, Utah,USA.
Collins, B.M., Stephens, S.L., 2007. Managing natural wildfires in Sierra Nevadawilderness areas. Frontiers in Ecology and the Environment 5, 523–527.
Collins, B.M., Stephens, S.L., 2010. Stand-replacing patches within a ‘mixed severity’fire regime: quantitative characterization using recent fires in a long-established natural fire area. Landscape Ecology 25, 927–939.
Collins, B.M., Kelly, M., van Wagtendonk, J.W., Stephens, S.L., 2007. Spatial patternsof large natural fires in Sierra Nevada wilderness areas. Landscape Ecology 22,545–557.
Collins, B.M., Miller, J.D., Thode, A.E., Kelly, M., van Wagtendonk, J.W., Stephens, S.L.,2009. Interactions among wildland gires in a long-established Sierra Nevadanatural fire area. Ecosystems 12, 114–128.
Collins, B.M., Everett, R.G., Stephens, S.L., 2011. Impacts of fire exclusion and recentmanaged fire on forest structure in old growth Sierra Nevada mixed-coniferforests. Ecosphere 2, art51.
Crookston, N.L., Finley, A.O., 2008. yaImpute: an R package for kNN imputation.Journal of Statistical Software 23.
Donato, D.C., Fontaine, J.B., Campbell, J.L., Robinson, W.D., Kauffman, J.B., Law, B.E.,2009. Conifer regeneration in stand-replacement portions of a large mixed-severity wildfire in the Klamath-Siskiyou Mountains. Canadian Journal of ForestResearch 39, 823–838.
Eidenshink, J., Schwind, B., Brewer, K., Zhu, Z., Quayle, B., Howard, S., 2007. A projectfor monitoring trends in burn severity. Fire Ecology 3 (1), 3–21. http://dx.doi.org/10.4996/fireecology.0301003.
Erdody, T.L., Moskal, L.M., 2010. Fusion of LiDAR and imagery for estimating forestcanopy fuels. Remote Sensing of Environment 114, 725–737.
Fites-Kaufman, J., Bradley, A.F., Merrill, A.G., 2006. Fire and plant interactions. In:Sugihhara, N., Wagtenkonk, J.V., Shaffer, K.E., Fites-Kaufman, J., Thode, A.E.(Eds.), Fire in California’s Ecosystem. University of California Press, Berkeley, CA.
Fites-Kaufman, J., Rundel, P., Stephenson, N., Weixelman, D.A., 2007. Montane andsubalpine vegetation of the Sierra Nevada and Cascade Ranges. In: Barbour, M.,Keeler-Wolf, T., Schoenherr, A.A. (Eds.), Terrestrial Vegetation of California.University of California Press, Berkeley, CA, USA, pp. 456–501.
Frolking, S., Palace, M.W., Clark, D.B., Chambers, J.Q., Shugart, H.H., Hurtt, G.C., 2009.Forest disturbance and recovery: a general review in the context of spaceborneremote sensing of impacts on aboveground biomass and canopy structure.Journal of Geophysical Research-Biogeosciences 114.
Gobakken, T., Naesset, E., 2004. Estimation of diameter and basal area distributionsin coniferous forest by means of airborne laser scanner data. ScandinavianJournal of Forest Research 19, 529–542.
Graham, R.T., 1990. Pinus monticola Dougl. Ex D. Don Western White Pine. In:Burns, R.M., Honkala, B.H. (Eds.), Silvics of North America. USDA Forest SeviceHandbook 654, vol. 1. USDA Forest Service, Washington DC.
Hessburg, P.F., Agee, J.K., Franklin, J.F., 2005. Dry forests and wildland fires of theinland Northwest USA: contrasting the landscape ecology of the pre-settlementand modem eras. Forest Ecology and Management 211, 117–139.
Hessburg, P.F., Salter, R.B., James, K.M., 2007. Re-examining fire severity relations inpre-management era mixed conifer forests: inferences from landscape patternsof forest structure. Landscape Ecology 22, 5–24.
Hudak, A.T., Evans, J.S., Stuart Smith, A.M., 2009. LiDAR utility for natural resourcemanagers. Remote Sensing 1, 934–951.
Hummel, S., Hudak, A.T., Uebler, E.H., Falkowski, M.J., Megown, K.A., 2011. Acomparison of accuracy and cost of LiDAR versus stand exam data for landscapemanagement on the Malheur National Forest. Journal of Forestry 109, 267–273.
Ishii, H.T., Van Pelt, R., Parker, G.G., Nadkarni, N.M., 2004. Age-related developmentof canopy structure and its ecological functions. In: Lowman, M.D., Rinker, H.B.(Eds.), Forest Canopies. Elsevier Academic Press, Burlington, MA.
Kane, V.R., Gillespie, A.R., McGaughey, R., Lutz, J.A., Ceder, K., Franklin, J.F., 2008.Interpretation and topographic compensation of conifer canopy self-shadowing.Remote Sensing of Environment 112, 3820–3832.
Kane, V.R., Bakker, J.D., McGaughey, R.J., Lutz, J.A., Gersonde, R.F., Franklin, J.F.,2010a. Examining conifer canopy structural complexity across forest ages andelevations with LiDAR data. Canadian Journal of Forest Research 40, 774–787.
Kane, V.R., McGaughey, R.J., Bakker, J.D., Gersonde, R.F., Lutz, J.A., Franklin, J.F.,2010b. Comparisons between field- and LiDAR-based measures of standstructural complexity. Canadian Journal of Forest Research 40, 761–773.
Kane, V.R., Gersonde, R.F., Lutz, J.A., McGaughey, R.J., Bakker, J.D., Franklin, J.F., 2011.Patch dynamics and the development of structural and spatial heterogeneityin Pacific Northwest forests. Canadian Journal of Forest Research 41, 2276–2291.
Keeler-Wolf, T., Moore, P.E., Reyes, E.T., Menke, J.M., Johnson, D.N., Karavidas, D.L.,2012. Yosemite National Park Vegetation Classification and Mapping ProjectReport. Natural Resource Report NPS/YOSE/NRTR-2012/598. National ParkService, Fort Collins, Colorado.
Kellner, J.R., Asner, G.P., 2009. Convergent structural responses of tropical forests todiverse disturbance regimes. Ecology Letters 12, 887–897.
Key, C.H., 2006. Ecological and sampling constraints on defining landscape fireseverity. Fire Ecology 2 (2), 34–59. http://dx.doi.org/10.4996/fireecology.0202034.
Key, C.H., Benson, N.C., 2006. Landscape assessment: ground measure of severity,the composite burn index, and remote sensing of severity, the normalized burnratio. In: Lutes, D.C., Keane, R.E., Caratti, J.F., Key, C.H., Benson, N.C., Sutherland,S., Gangi, L.J. (Eds.), FIREMON: Fire Effects Monitoring and Inventory System.Rocky Mountain Research Station, Fort Collins, Colorado, USA.
Kinloch, B.B., Scheuner, W.H., 1990. Pinus lambertiana dougl. Sugar pine. In: Burn,R.M., Honkala, B.H. (Eds.), Silvics of North America, USDA Forest SeviceHandbook 654, vol. 1. USDA Forest Sevice, Washington DC.
Kolden, C.A., Lutz, J.A., Key, C.H., Kane, J.T., van Wagtendonk, J.W., 2012. Mappedversus actual burned area within wildfire perimeters: characterizing theunburned. Forest Ecology and Management. http://dx.doi.org/10.1016/j.foreco.2012.08.020.
Larson, A.J., Churchill, D., 2012. Tree spatial patterns in fire-frequent forests ofwestern North America, including mechanisms of pattern formation andimplications for designing fuel reduction and restoration treatments. ForestEcology and Management 267, 74–92.
Lefsky, M.A., Cohen, W.B., Acker, S.A., Parker, G.G., Spies, T.A., Harding, D., 1999. Lidarremote sensing of the canopy structure and biophysical properties of Douglas-firwestern hemlock forests. Remote Sensing of Environment 70, 339–361.
Lefsky, M.A., Cohen, W.B., Parker, G.G., Harding, D.J., 2002. Lidar remote sensing forecosystem studies. Bioscience 52, 19–30.
Lefsky, M.A., Hudak, A.T., Cohen, W.B., Acker, S.A., 2005. Patterns of covariancebetween forest stand and canopy structure in the Pacific Northwest. RemoteSensing of Environment 95, 517–531.
Legendre, P., Legendre, L., 1998. Numerical Ecology, second english ed. Amsterdam,The Netherlands.
Lutz, J.A., van Wagtendonk, J.W., Thode, A.E., Miller, J.D., Franklin, J.F., 2009. Climate,lightning ignitions, and fire severity in Yosemite National Park, California, USA.International Journal of Wildland Fire 18, 765–774. http://dx.doi.org/10.1071/WF08117.
Lutz, J.A., van Wagtendonk, J.W., Franklin, J.F., 2010. Climatic water deficit, treespecies ranges, and climate change in Yosemite National Park. Journal ofBiogeography 37, 936–950. http://dx.doi.org/10.1111/j.1365-2699.2009.02268.x.
Lutz, J.A., Key, C.H., Kolden, C.A., Kane, J.T., van Wagtendonk, J.W., 2011. Firefrequency, area burned, and severity: a quantitative approach to defining anormal fire year. Fire Ecology 7 (2), 51–65. http://dx.doi.org/10.4996/fireecology.0702051.
Lutz, J.A., Larson, A.J., Swanson, M.E., Freund, J.A., 2012. Ecological importance oflarge-diameter trees in a temperate mixed-conifer forest. PLoS ONE. http://dx.doi.org/10.1371/journal.pone.0036131.
McKenzie, D., Kennedy, M.C., 2011. Scaling laws and complexity in fire regimes. In:McKenzie, D., Miller, C., Falk, D.A. (Eds.), The Landscape Ecology of Fire.Springer, New York.
30 V.R. Kane et al. / Forest Ecology and Management 287 (2013) 17–31

Author's personal copy
McKenzie, D., Miller, C., Falk, D.A., 2011. Toward a theory of landscape fire. In:McKenzie, D., Miller, C., Falk, D.A. (Eds.), Landscape Ecology of Fire. Springer,New York, pp. 3–25.
Miller, J.D., Thode, A.E., 2007. Quantifying burn severity in a heterogeneouslandscape with a relative version of the delta normalized burn ratio (dNBR).Remote Sensing of Environment 109, 66–80.
Miller, J.D., Safford, H.D., Crimmins, M., Thode, A.E., 2009. Quantitative evidence forincreasing forest fire severity in the Sierra Nevada and Southern CascadeMountains, California and Nevada, USA. Ecosystems 12, 16–32.
Miller, J.D., Skinner, C.N., Safford, H.D., Knapp, E.E., Ramirez, C.M., 2012. Trends andcauses of severity, size and number of fires in northwestern California, USA.Ecological Applications 22, 184–203.
Moritz, M.A., Hessburg, P.F., Povak, N.A., 2011. Native fire regimes and landscaperesilience. In: McKenzie, D., Miller, C., Falk, D.A. (Eds.), The Landscape Ecology ofFire. Springer, New York.
Naesset, E., 2002. Predicting forest stand characteristics with airborne scanninglaser using a practical two-stage procedure and field data. Remote Sensing ofEnvironment 80, 88–99.
Naesset, E., Okland, T., 2002. Estimating tree height and tree crown properties usingairborne scanning laser in a boreal nature reserve. Remote Sensing ofEnvironment 79, 105–115.
Nesmith, J.B., O’Hara, K.L., van Mantgem, P.J., de Valpine, P., 2010. The effects ofraking on sugar pine mortality following prescribed fire in Sequoia and KingsCanyon national parks, California, USA. Fire Ecology 6 (3), 97–116. http://dx.doi.org/10.4996/fireecology.0603097.
Ogunjemiyo, S., Parker, G., Roberts, D., 2005. Reflections in bumpy terrain:Implications of canopy surface variations for the radiation balance ofvegetation. IEEE Geoscience and Remote Sensing Letters 2, 90–93.
Oliver, W.W., Ryker, R.A., 1990. Pinus ponderosa dougl. Ex laws. Ponderosa pine. In:Burn, R.M., Honkala, B.H. (Eds.), Silvics of North America, USDA Forest SeviceHandbook 654, vol. 1. USDA Forest Service Washington DC.
Parker, G.G., Russ, M.E., 2004. The canopy surface and stand development: assessingforest canopy structure and complexity with near-surface altimetry. ForestEcology and Management 189, 307–315.
Parker, G.G., Harmon, M.E., Lefsky, M.A., Chen, J.Q., Van Pelt, R., Weis, S.B.,Thomas, S.C., Winner, W.E., Shaw, D.C., Franklin, J.F., 2004. Three-dimensional structure of an old-growth Pseudotsuga-tsuga canopy and itsimplications for radiation balance, microclimate, and gas exchange.Ecosystems 7, 440–453.
Perry, D.A., Hessburg, P.F., Skinner, C.N., Spies, T.A., Stephens, S.L., Taylor, A.H.,Franklin, J.F., McComb, B., Riegel, G., 2011. The ecology of mixed severity fireregimes in Washington, Oregon, and Northern California. Forest Ecology andManagement 262, 703–717.
Pyne, S.J., Andrews, P.L., Laven, R.D., 1996. Introduction to Wildland Fire, second ed.John Wiley & Sons, Inc., New York.
R Development Core Team, 2007. R: A Language and Environment for StatisticalComputing. R Foundation for Statistical Computing, Vienna, Austria.
Reutebuch, S.E., Andersen, H.E., McGaughey, R.J., 2005. Light detection and ranging(LIDAR): an emerging tool for multiple resource inventory. Journal of Forestry103, 286–292.
Riano, D., Chuvieco, E., Condes, S., Gonzalez-Matesanz, J., Ustin, S.L., 2004.Generation of crown bulk density for Pinus sylvestris L. from lidar. RemoteSensing of Environment 92, 345–352.
Roberts, S.L., van Wagtendonk, J.W., Miles, A.K., Kelt, D.A., Lutz, J.A., 2008. Modelingthe effects of fire severity and spatial complexity on small mammals inYosemite National Park, California. Fire Ecology 4 (2), 83–104. http://dx.doi.org/10.4996/fireecology.0402083.
Romme, W.H., 1982. Fire and landscape diversity in subalpine forests ofYellowstone National Park. Ecological Monographs 52, 199–221.
Runkle, J.R., 1982. Patterns of disturbance in some old-growth mesic forests ofeastern North-America. Ecology 63, 1533–1546.
Runkle, J.R., 1992. Guidelines and Sample Protocol for Sampling Forest Gaps. USDepartment of Agriculture, Forest Service, Pacific Northwest Research Station,Portland, OR.
Sala, A., Peters, G.D., McIntyre, L.R., Harrington, M.G., 2005. Physiological responsesof ponderosa pine in western Montana to thinning, prescribed fire and burningseason. Tree Physiology 25, 339–348.
Scholl, A.E., Taylor, A.H., 2010. Fire regimes, forest change, and self-organization inan old-growth mixed-conifer forest, Yosemite National Park, USA. EcologicalApplications 20, 362–380.
Scott, J., Reinhardt, E., 2001. Assessing crown fire potential by linking models ofsurface and crown fire behavior. Research Paper RMRS-RP-29. Forest Service,R.M.R.S. US Department of Agriculture, Fort Collins, Colorado, p. 59.
Stephenson, N.L., 1998. Actual evapotranspiration and deficit: biologicallymeaningful correlates of vegetation distribution across spatial scales. Journalof Biogeography 25, 855–870.
Stephenson, N.L., Allen, C.D., McKenzie, D., Fagre, D., Baron, J., O’Brien, K., 2006.Response of western mountain ecosystems to climatic variability and change:the western mountain initiative. Park Science 24, 24–29.
Sugihara, N.G., van Wagtendonk, J.W., Fites-Kaufman, J., 2006. Fire as an ecologicalprocess. In: Sugihara, N.G., Wagtendonk, J.W.V., Shaffer, K.E., Fites-Kaufman, J.,Thode, A.E. (Eds.), Fire in California’s Ecosystems. University of California Press,Berkeley, CA, USA.
Swetnam, T.W., 1993. Fire history and climate-change in giant Sequoia groves.Science 262, 885–889.
Thode, A.E., van Wagtendonk, J.W., Miller, J.D., Quinn, J.F., 2011. Quantifying the fireregime distributions for severity in Yosemite National Park, California, USA.International Journal of Wildland Fire 20, 223–239.
Turner, M.G., Romme, W.H., 1994. Landscape dynamics in crown fire ecosystems.Landscape Ecology 9, 59–77.
Turner, M.G., Hargrove, W.W., Gardner, R.H., Romme, W.H., 1994. Effects of fire onlandscape heterogeneity in Yellowstone National Park, Wyoming. Journal ofVegetation Science 5, 731–742.
Turner, M.G., Romme, W.H., Gardner, R.H., Hargrove, W.W., 1997. Effects of fire sizeand pattern on early succession in Yellowstone National Park. EcologicalMonographs 67, 411–433.
van Wagtendonk, J.W., 2007. The history and evolution of wildland fire use. FireEcology 3 (2), 3–17. http://dx.doi.org/10.4996/fireecology.0302003.
van Wagtendonk, J.W., Fites-Kaufman, J., 2006. Sierra Nevada bioregion. In:Sugihara, N.G., van Wagtendonk, J.W., Shaffer, K.E., Fites-Kaufman, J., Thode,A.E. (Eds.), Fire in California’s Ecosystems. University of California Press,Berkely, CA, USA, pp. 264–294.
van Wagtendonk, J.W., Lutz, J.A., 2007. Fire regime attributes of wildland fires inYosemite National Park, USA. Fire Ecology 3 (2), 34–52. http://dx.doi.org/10.4996/fireecology.0302034.
van Wagtendonk, J.W., van Wagtendonk, K.A., Meyer, J.B., Painter, K., 2002. The useof geographic information for fire management in Yosemite National Park.George Wright Forum 19, 19–39.
Vepakomma, U., St-Onge, B., Kneeshaw, D., 2008. Spatially explicit characterizationof boreal forest gap dynamics using multi-temporal lidar data. Remote Sensingof Environment 112, 2326–2340.
Walker, R.E., 2000. Investigations in Vegetation Map Rectification, and the RemotelySensed Detection and Measurement of Natural Vegetation Changes. Universityof California Santa Barbara, Santa Barbara, CA.
White, J.D., Ryan, K.C., Key, C.C., Running, S.W., 1996. Remote sensing of forest fireseverity and vegetation recovery. International Journal of Wildland Fire 6, 125–136.
Whitlock, C., Shafer, S.L., Marlon, J., 2003. The role of climate and vegetation change inshaping past and future fire regimes in the northwestern US and the implicationsfor ecosystem management. Forest Ecology and Management 178, 5–21.
Wieslander, A.E., 1935. A vegetation type map of California. Madroño 3, 140–144.Wright, H.A., Bailey, A.W., 1982. Fire Ecology, United States and Southern Canada.
John Wiley and Sons, New York, New York, USA.
V.R. Kane et al. / Forest Ecology and Management 287 (2013) 17–31 31