An analysis of probability of area techniques for missing persons in Yosemite National Park.
13
This article appeared in a journal published by Elsevier. The attached copy is furnished to the author for internal non-commercial research and education use, including for instruction at the authors institution and sharing with colleagues. Other uses, including reproduction and distribution, or selling or licensing copies, or posting to personal, institutional or third party websites are prohibited. In most cases authors are permitted to post their version of the article (e.g. in Word or Tex form) to their personal website or institutional repository. Authors requiring further information regarding Elsevier’s archiving and manuscript policies are encouraged to visit: http://www.elsevier.com/authorsrights
-
Upload
independent -
Category
Documents
-
view
1 -
download
0
Transcript of An analysis of probability of area techniques for missing persons in Yosemite National Park.

This article appeared in a journal published by Elsevier. The attachedcopy is furnished to the author for internal non-commercial researchand education use, including for instruction at the authors institution
and sharing with colleagues.
Other uses, including reproduction and distribution, or selling orlicensing copies, or posting to personal, institutional or third party
websites are prohibited.
In most cases authors are permitted to post their version of thearticle (e.g. in Word or Tex form) to their personal website orinstitutional repository. Authors requiring further information
regarding Elsevier’s archiving and manuscript policies areencouraged to visit:
http://www.elsevier.com/authorsrights
Author's personal copy
An analysis of probability of area techniques for missing personsin Yosemite National Park
Paul J. Doherty a, Quinghua Guo a, Jared Doke b, Don Ferguson c,*
a School of Engineering, Sierra Nevada Research Institute, University of California, Merced, CA 95344, USAbDepartment of Geography, University of Kansas, 213 Lindley Hall, 1475 Jayhawk Blvd, Lawrence, KS 66045-7613, USAcMountaineer Area Rescue Group, PO Box 204, Kingwood, WV 26537-0204, USA
Keywords:Search theoryTime geographyTravel costWildland search and rescue
a b s t r a c t
Study of wilderness search and rescue (WiSAR) incidents suggests a dependency on demographics aswell as physical geography in relation to decisions made before/after becoming lost and subsequentlocations in which subjects are found. Thus an understanding of the complex relationship betweendemographics and physical geography could enhance the responders’ ability to locate the subject in atimely manner. Various global datasets have been organized to provide general distance and featurebased geostatistical methods for describing this relationship. However, there is some question as to theapplicability of these generalized datasets to local incidents that are dominated by a specific physicalgeography. This study consists of two primary objectives related to the allocation of geographic proba-bility intended to manage the overall size of the search area. The first objective considers the applicabilityof a global dataset of lost person incidents to a localized environment with limited geographic diversity.This is followed by a comparison between a commonly used Euclidean distance statistic and an alter-native travel-cost model that accounts for the influence of anthropogenic and landscape features onsubject mobility and travel time. In both instances, lost person incident data from years 2000 to 2010 forYosemite National Park is used and compared to a large pool of internationally compiled cases consistingof similar subject profiles.
� 2013 Elsevier Ltd. All rights reserved.
Introduction
Wilderness search and rescue (WiSAR) consists of four basicprocesses that are defined as: Locate, Access, Stabilize and Trans-port. Each of these elements presents a unique geographic problemwhich provides a novel and largely unexplored testing ground forthe spatial sciences. Of these elements, “Locating” the lost sub-ject(s) can often prove particularly challenging as a result of thepotential interaction between time and geography as defined byWinter and Yin (2010). Statedmore succinctly, in order to find a lostsubject the responder must overlap the subject in both time andspace. This issue is further exacerbated by the often dispropor-tionately limited number of responders for the large geographicalarea that is defined as the search area. The need to search such largeareas often times contributes to the delay in locating the lost sub-ject and subsequently impacts their chances of survival. In fact, if
missing subject is not found within the first 51-h of a search, thechances of surviving decline significantly (Adams et al., 2007).
Several options are available to the responder for improvingtheir response capability including: 1) increasing the number ofresponders available to search, 2) enhancing the available re-sponders’ Probability of Detection (POD e likelihood of detectingthe subject if they were present) or 3) reducing the size of thesearch area through improved assignment of geographic Proba-bility of Area (POAe likelihood of the search being present in a sub-region within the search area) (Cooper, Frost, & Robe, 2003). Lim-itations on personnel and capabilities forces attention on tomethods that can be used to better define POA.
Demographics and the environment have a strong influence onwhere lost persons are ultimately found, and the decision that aremade by the subject(s) both before and after becoming lost. Thedemographics, or category, of a lost subject includes the activity inwhich they were involved in prior to becoming lost, their age andtheir medical condition particularly as it relates to their cognitiveability. These factors greatly influence the relationship between thelost subject and their environment. For example, individuals char-acterized as “Hikers” are more prone to rely on linear features suchas roads and trails for travel. These individuals often become lost as
* Corresponding author. Tel.: þ1 304 290 9118.E-mail addresses: [email protected] (P.J. Doherty), [email protected]
(Q. Guo), [email protected] (J. Doke), [email protected] (D. Ferguson).
Contents lists available at ScienceDirect
Applied Geography
journal homepage: www.elsevier .com/locate/apgeog
0143-6228/$ e see front matter � 2013 Elsevier Ltd. All rights reserved.http://dx.doi.org/10.1016/j.apgeog.2013.11.001
Applied Geography 47 (2014) 99e110

Author's personal copy
a result of active or passive decisions made in relation to thesetravel aides (ie decision to leave the travel aide for some purpose orconfusion along the feature). And when lost these individuals tendto focus locating some form of linear feature to assist with re-orientation (Koester, 2008; Syrotuck, 2000). Both before and afterbecoming lost, individuals are forced to make decisions based ontheir immediate environment. This would suggest that geograph-ical knowledge of the search area could enhance responders’ abilityto located lost persons or at least more accurately assign POA toregions within the search area.
To assist the responder in better understanding complex in-teractions between subject and environment, several global data-sets have been compiled that span a variety of subject categories(Hill, 1999; Koester, 2008; Syrotuck, 2000). Currently the largest ofthese datasets, consisting of over 50,000 incidents from around theworld is the International Search and Rescue Database (ISRID -Koester, 2008). ISRID contains forty-one different subject categorieswith sub-divisions based on Bailey’s terrestrial eco-region domains(Bailey & Ropes, 1998 e Fig. 1) and population density of the loca-tion of the Initial Planning Point (IPP). The IPP is typically defined aseither the Point Last Seen (PLS) or the Last Known Point (LKP)(Ferguson, 2008; Theodore, 2009). Utilizing the categorized
datasets within ISRID basic geostatistical analyses were performedto consider such parameters as distance from IPP to Find Location(Euclidean Distance e ring model), geographical description of thefind location, difference in elevation between the IPP and FindLocation and distance from nearest linear feature (road, trail,drainage) to Find Location. Additionally post-search interviews ofsearch subjects were conducted to obtain an estimate of the timethe subject was mobile and how far the subject had deviated fromtheir intended destination. Cumulative information was used byKoester to develop a generic lost person behavioral profile based onsubject category (Koester, 2008).
As the ISRID database is composed of world-wide incident data,there is some concern as to its accuracy for local incidents thatoccur within an area with limited geographic diversity. This studyprovides a comparison of search incident data for the “Hiker”category from ISRID (n¼ 568) and Yosemite National Park for years2000e2010 (n¼ 130). The ring model (Euclidean Distance fromIPP) is often used to assist in assigning probability to regions withinthe search area. This metric provides an easy to use format forcomparing the global and local datasets. Additionally, comparisonsare made between the ring model and a mobility (cost-distance)model that accounts for the influence of terrain, vegetation, travel
Fig. 1. Bailey Eco-Region Domains used in classifying the search area within the International Search and Rescue Database (Bailey & Ropes, 1998; Koester, 2008).
P.J. Doherty et al. / Applied Geography 47 (2014) 99e110100

Author's personal copy
aides and travel barriers. Arguments are made suggesting that themobility model provides a more realistic interpretation of lostperson behavior compared to simple Euclidean distance.
Probability of area
It is common for WiSAR incidents that extend beyond the firstoperational period to encompass large geographical areas. Assuminga nominal walking speed of 5.1 km/h (Browning et al., 2005), thesearch area could theoretical expand to 82 km2 (20,200 acres) in just1 h not knowingwhich direction the subjectmay have traveled fromthe IPP (Fig. 2). In order to effectively manage such operations, re-sponders must establish a method of prioritizing the search area,often times utilizing some interpretation of lost person behavior(Koester, 2008). This typically leads to the establishment of region ofprobability suggesting themost likely locations of where the subjectis to be found. These concepts are grounded in Operations Researchthat were initially developed as maritime and aviation search tech-niques (Cooper et al., 2005; Koester, Cooper, Frost, & Robe, 2004;Koopman, 1980; Stone, 1989, 2007). The formal study of “SearchTheory” as a discipline grew out of military operations conductedduring World War II. The mathematical driven process of how tosearch formissing, lost, andhiddenobjectswas used to locate enemysubmarines as well as to recover lost allied ships and downed pilots(Frost,1999). These initial conceptshavebeenadapted to thenuancesof ground-based search operations by Cooper (Cooper et al., 2005)and others, and has been adopted into the National SAR Plan withinthe United States (Land SAR Addendum, 2011).
In WiSAR, grid-based searches are often not possible due toterrain features, large geographical areas or the limited number ofresources available. Based on this, the first step in allocating re-sources to find these missing persons is to begin searching the
immediate vicinity of the IPP which is typically either the Point LastSeen (PLS) or Last Known Point (LKP) based on the availability ofsubstantial evidence. These strategies assist in defining the generalextent of the search area which then must be divided into feature-based polygons known as Planning Regions where experts use theircollective knowledge to prioritize resource allocation. Searchplanners utilize a combination of knowledge on Lost PersonBehavior (LPB), investigative methods, consensus techniques(Bownds, Ebersole, Lovelock, O’Connor, & Toman, 2007; Mattson,1976) and terrain analysis to assign quantitative values to Regionsbased on the probability that it contains the subject (aka Probabilityof Area [POA], Cooper, 2005). These Regions are than sub-dividedinto Segments that can be assigned to Search Teams, Fig. 3. Animportant distinction is that the boundaries of the Planning Re-gions are defined entirely on anticipated subject behavior while theSearch Segments boundaries are defined based on how the area isto be searched. For example, in establishing a manageable sizeSegment easy to recognize terrain features such as drainages orsignificant changes in slope alongwith shifts in land cover are oftenused as boundaries for but these features may not impact the sizeor shape of the Region. Thus geographic information plays a criticalrole in both estimating the most probable location of the subject asdeveloping tactics for effectively searching an area.
The search planning process incorporates several probabilisticconcepts: Probability of Area (POA), Probability of Detection (POD),and Probability of Success (POS) as described in equation (1) below(NSARC, 2011)
POS ¼ POA� POD (1)
The Probability of Success (POS) in search theory is completelydependent upon the boundary of the area (polygon) being searched
Fig. 2. Assuming a nominal walking speed of 5.1 km/h produces a search area that could theoretical expand to 82 km2 (20,200 acres) in just 1 h not knowing which direction thesubject may have traveled from the IPP.
P.J. Doherty et al. / Applied Geography 47 (2014) 99e110 101

Author's personal copy
actually containing the missing person (known as POA) and anaccurate assessment of how well a search area was covered by ateam (Probability of Detection [POD]). POD can be explained usingthe following equation.
POD ¼ 1� e�c (2)
where c is the coverage and e is the base of the natural logarithm.Coverage is the ratio of two areas: search effort as track lengthmultiplied by width (the polyline representing searchers move-ments and the buffer indicating where they can effectively search),divided by the total area searched. In search planning like mostcomplex decision making processes, errors in judgment (under-estimated POA, overestimated POD) early in the planning stagessignificantly hampers the search effort despite subsequent de-cisions. The objective of any search operation is to maximize POS asquickly as possible by increasing POA and POD. At this time, mostWiSAR operations utilize these concepts in a variety of ways butwith little geospatial resources to accurately measure either POA orPOD. With the integration of Global Position Systems (GPS) forsearchers, a quantitative index of POD can be obtained bymeasuring coverage based on searchers’ GPS receiver track-log, butthe POA is still very much subjective.
Several authors have compiled results from the analysis of his-torical search incidents the intent of providing the responder abasic understanding of lost person behavior to facilitate the prior-itization of the search area (Koester & Stooksbury, 1995; Syrotuck,2000). A systematic collection of information from missing per-son incidents was conducted by Koester in the formation of theInternational Search and Rescue Database (ISRID; Koester). Analysisof the nearly 50,000 incidents contained within ISRID resulted in atext by the same author (Koester, 2008). In summarizing the find-ings, the text categorizes missing person by demographics (e.g. age,
gender, mental status), participating activity (e.g. hiking, hunting,skiing) and environment (eco-region and generalized terrain). Basicstatistical analyses provides responders with a variety of parame-ters that can be used to assist in prioritizing the search area, andincludes: measured dispersion from intended direction of travel,elevation change between IPP and Find location, distance subjectswere found from travel aides such as roads/trails, and a feature typefor the find location (e.g. structure, field, trail). While comprehen-sive, the analysis provided by Koester has several limitations, suchas a lack of discrimination between subjects categorized as lostversus those that suffered from a medical condition resulting inrescue. Additionally, given the coarseness of the geographical ref-erences (eco-region and generalized terrain: Mountainous versusFlat) studies have shown some discrepancy between ISRID’s globalaverage findings and those from a localized dataset (Doke, 2012).
Ring model
The ring model, amassed from a categorized statistical analysisof past incidents, consists of a series of concentric rings originatingfrom the IPP that represent the quartile and 95% Euclidean dis-tances to the find locations (Syrotuck, 2000). An example of the ring
Fig. 3. Example of Probability Regions color coded based on the likelihood of it containing the subject based on subjective analyses. Search Segments (dashed border) are defined soboundaries are easily identifiable by teams in the field. (For interpretation of the references to colour in this figure legend, the reader is referred to the web version of this article.)
Table 1Comparison of Euclidean distances traveled from the IPP to the found location forhikers.
Yosemite (km) ISRID (km)
n 130 56825% 1.1 1.150% 1.8 3.175% 4.0 5.895% 16.9 18.3
P.J. Doherty et al. / Applied Geography 47 (2014) 99e110102

Author's personal copy
model using the ISRID data for the “Hiker” subject category isshown in tabular form in Table 1 and graphically in Fig. 4.
Mobility model
Mobility is defined in ISRID as “the amount of time the subjectwas moving”, and is based primarily on post-search interviewswith the subject. Thus the reported values are highly subjective andlimited to those cases in which post-search interviews werepossible (i.e. non-fatality). Table 2 recreates the Mobility data asreported in Koester’s text on LPB for the Hiker category in a“Temperate” environment (Koester, 2008).
Mobility models have been proposed as a POAmethod, howeverto date, little GIS integration has been employed in this process (forexceptions see Filipkowska, Koester, Chrustek, & Zaród, 2012;Magyari-Sáska & Dombay, 2012). The mobility models attempt toestimate how far the subject may have traveled following a path inany direction from the IPP. Unlike the previously defined area asshown in Fig. 2, in reality it is understood that subject travel ishampered and aided by various terrain features and vegetation,thus the distance traveled in a given amount of time would bedependent on the path followed. This approach is equivalent tocost-distance which has been used extensively for infrastructuredevelopment (Van den Broek et al., 2010), wildlife habitat analysis(Nikolakaki, 2004), and anthropological studies (Whitley & Hicks,2003). In these models, costs are calculated by applying a least-cost path algorithm to a speed raster and a resistance raster(Adriaensen et al., 2003). Tobler (1965) was the first to use theImhof (1950) “hiking function” (equation (3)) to calculate the costassociated with traversing a landscape with slope. The ‘‘hikingfunction’’ estimates the velocity of travel for hikers across differentslopes assuming a nominal walking speed of 5.0 km/h. According toTobler (1991) in his overview of non-isotropic modeling betweenpedestrian movement and slope, travel speed can be estimated as:
vs ¼ 6 e�3:5absðSlopeþ0:05Þ (3)
where e is the natural logarithm and vs is pedestrian velocitydefined by a mathematical function based on the slope of terrain indegrees. This yields a function that is asymmetric about zero slopesbecause it is generally faster to travel down hills than up hills.Naismith’s Rule with an additional correction developed by Lang-muir offers an alternative algorithm for predicting hiking times inmountainous terrain (Langmuir, 1984). The corrected algorithmassumes a nominal walking speed of 4.0 km/h with 30 min addedfor every 600 m of ascent. Descent rates are also impact by sub-tracting 10 min for every 300 m of descent for slopes between0� and 12�, and adding 10 min when the slope is greater than 12�.
Often times it is not the hike speeds or travel times that aredetermined but energy expended to cross the terrain. Minetti et al.considered the energy costs of walking and running across variousslopes (Minetti, Moia, Roi, Susta, & Ferretti, 2002) and found apreferred walking speed (4.0 kph on level ground) minimum en-ergy output occurred at a slope of approximately �6�. The empir-ical results fromMinetti et al. were extrapolated to a slope of 60� asa cost-distance model was used to suggest accessibility bias inecology sampling (Jobe &White, 2009). However, the use of energyexpenditure as a metric for modeling lost person behavior may notbe appropriate. While habitual travelers in a given area may
Fig. 4. Rings based on Euclidean distance (crow’s flight distance) are often plotted from the Initial Planning Point (IPP). These distances correspond to the lower quartile, median,upper quartile, and 95th percentile of distance (measured in ether miles or kilometers) of lost subjects collected by the ISRID.
Table 2Comparison ofmobility values for hikers in Yosemite derived from isochrones versusa global dataset (ISRID) based on reported mobility.
Yosemite (h) ISRID (h)
n 130 23225% 0.5 0.050% 1.0 3.075% 1.5 6.095% 6.0 14
P.J. Doherty et al. / Applied Geography 47 (2014) 99e110 103

Author's personal copy
attempt to identify the path of least resistance and thus lowestenergy output, the lost person unfamiliar with their surroundingsonly knows their immediate environment, and thus could not beexpected to necessarily follow the path of least resistance. Thiswould seem to support the use of a cost-distance model to predictdistance traveled in a given amount of time assuming a knownspeed along level, unimpeded terrain. An earlier study conductedby Ralston (1958) considered energy-speed relation during levelwalking and provided a method for converting energy expended towalking speed given an assumed level walking speed. Utilizing thisrelationship the functions provided by JobeeWhite are comparedto Tobler’s Function and Naismith’s Rule shown in Fig. 5. Results forthe JobeeWhite and Naismith’s Rule are shown with their derivedlevel ground preferred walking speeds (4.0 km/h) and scaled toTobler’s preferred walking speed of 5.0 km/h.
The functions provided above do not account for the effects ofland cover, the availability of travel aides or the presence of travelbarriers. Anecdotally one could anticipate that regardless of slope,travel through a heavily vegetated area could be considerablyslower than along a road or pathway. The effect of land cover on off-trail hiking velocity has been estimated by Imhof (1950) to be areduction factor of 0.6x. Other studies have provided a moredetailed classification of the impact of off-trail travel but none haveattempted to utilize a standard definition land cover (Demczuk,1998; Jobe &White, 2009; Soule & Goldman, 1972). Table 3 outlinesthree classifications found in literature.
Land cover impedance can be described as the area between thecurve for Tobler’s on and off-trail functions. This calibration of theimpedance grid will help avoid using crude oversimplifications forslope and land cover impedance that often reduces the usefulness ofsuch models (Bateman, Garrod, Brainard, & Lovett, 1996). If thesemethods represent actual pedestrian capabilities the impedanceraster grid can then be used for travel-cost simulationwhere distancetraveled is a function of estimated travel time (time since last seen),the coordinates of the IPP, and the impedance values of surroundingraster grids. The product would be a minimum potential path area.
Materials and methods
Study area
Yosemite National Park encompasses nearly 1882 km2 and islocated on the western slope of the Sierra Nevada mountain range
in central California. To the west is the San Joaquin Valley and to theeast is the Great Basin. It is fairly accessible as it lies 241 km east ofSan Francisco and about 482 miles north of Los Angeles (Fig. 6).Although, there are approximately 344 km of paved roads servicedby five separate entrance stations, more than 95% of the park, orroughly 1771 km2, is designated as wilderness. About 1287 km oftrails cut through this wilderness, including the Pacific Crest Trailand the John Muir Trail, within the park (National Park Service,2011).
The park’s physical landscape is a product of glaciation, andincludes granite cliffs, deep narrow canyons, and a U-shaped valleythat has become the focal point of the park. Elevation ranges fromabout 2000 ft to 13,123 ft. Yosemite is characterized by a Mediter-ranean climate with long hot summers and mild winters, with aBailey’s Eco-Region Domain of Temperate e Mountainous extend-ing almost the entire region. Precipitation can vary from 36 inchesat 4000 ft to 50 inches at 8600 ft. This climate, coupled with thevariations in elevation, creates five major vegetation zones: chap-arral/oak woodland, lower montane, upper montane, subalpine,and alpine (National Park Service, 2011).
Georeferencing
The data obtained for this analysis are derived from YosemiteNational Park’s Search and Rescue Case Incident reports for theyears 2000e2010. Access to these reports was granted by the Na-tional Park Service Division of Visitor Protection (Permit 1024-0236). During this eleven year span, Yosemite National Parkresponded to 2308 total SAR Incidents. This includes both genuinesearches for lost people as well as rescues in which the actuallocation of the individual was known. Of these SAR incidents, 2201incident reports were available for review. Out of these reports, 393true search incidents were identified and considered for this study;the remainder were excluded because the location of the victimwas known from the beginning . Each search incident was criticallyanalyzed and must meet all of the following criteria in order to beretained for the current study:
1. The incident must have been a ground-based search incident.Searches for downed aircraft or searches involving bodies ofwater were not included.
2. The incident must have had a distinct PLS/LKP/IPP that can begeoreferenced within the Yosemite National Park boundary.
3. The incident must have a distinct found location that is geore-ferenced within, or within walking distance of, the YosemiteNational Park boundary.
4. An official SAR response must have been initiated by the Na-tional Park Service.
A total of 213 search incidents met these criteria and incidentswere georeferenced from text based information as part of GISresearch described in Doherty, Guo, Liu, Wieczorek, and Doke
Fig. 5. Comparison of the various slope speed based functions for human foot travel atpreferred walking speeds.
Table 3Comparison of energetic cost coefficients for different terrains.
Land cover SouleeGoldman Demczuk JobeeWhite
Road (blacktop) 1.0 1.0 1.0Dirt (trail e hardpack) 1.36 1.2Light brush 1.64 1.31Heavy brush 1.81 1.8 1.59Swamp 2.13 1.87Sand 2.5Stream Function of stream
order
P.J. Doherty et al. / Applied Geography 47 (2014) 99e110104

Author's personal copy
(2011) using the point-radius method (Wieczorek, Guo, & Hijmans,2004).
Ring model
Descriptions and details provided in the incident reports wereused to georeference locations for the IPP and Find creating anincident data pair. The Euclidean distance (D) for each data pair ofall 130 Hiker incidents was determined and provided a measure ofthe lower quartile, median, upper quartile, and 95th percentile. Thisobserved distribution of D for Yosemite was then compared withthe expected distribution of the ISRID data (n¼ 538) using a Chi-square Goodness of Fit Test with a significance level of 0.05. Stan-dard geoprocessing and calculation of Dwas done using ArcGIS 10.1(Esri, 2012).
Mobility model
The mobility model used in this study is similar to the TravelTime Cost SurfaceModel (TTCSM) used by the National Park Service(Sherrill, Frakes, & Schupbach, 2010). The model provides an esti-mate of travel time using readily available geospatial products suchas road, trail, and stream networks (StreamOrder), digital elevationmodels and land cover data (National Land Cover Dataset). Themodel consists of two basic components: speed surface and costsurface. First a simple speed surface is created based on Tobler’sHiking Function as is defined earlier (using equation (3)) with slope
derived from a 10 m digital elevation model of the park. Slopesgreater than 60� were consider impassable by conventional foottraffic. This speed surface does not account for energy expenditureand assumes the subject would be able to maintain a nominalspeed across a flat surface (slope¼ 0�) of 5.0 km per hour (kph).
The cost surface is defined as a function of the impedance to foottraffic that would be imposed by the presence of variousgeographical features compared to a nominal paved surface such asa side walk or roadway. Impedance values range from 0 to 100%,with 0% being no impedance (e.g. paved roadway or a well-maintained trail) and 100% being absolute impedance (e.g. highfenceline or large body of water). A value of 25 would represent afeature that was 25% slower to cross (e.g. pasture/field) than thenominal surface (paved roadway).
The impedance raster is formulated using both vector and rasterdata layers. Vector layers include roads, trails, utility right-of-ways,fencelines (actual and virtual), streams and bodies of water utiliz-ing data acquired from the NPS Integrated Resource ManagementApplications (IRMA) Data Portal (NPS, 2013). While maintainedroadways offered 0% impedance, the maintenance level of the trailas recorded in the feature attribute table was used to assignimpedance values with poorly maintained or unmaintained trailsgiven a higher impedance value, Table 4.
The ability to cross streams will depend on its size and flowaccumulation. First order streams that at higher elevations arerarely impossible to cross. However, at lower elevations the flowaccumulation increases and streams become more difficult to cross
Fig. 6. Yosemite National Park.
P.J. Doherty et al. / Applied Geography 47 (2014) 99e110 105

Author's personal copy
(Jobe & White, 2009). To account for this variation, streamimpedance was assigned based on Strahler Stream Order. A com-bination of hydrological vector data and DEM derived features areused to represent streams and provide an estimate of stream order(Strahler) using the Stream Order function within the Spatial An-alyst Toolbox in ArcGIS 10.1. The higher the Stream Order thegreater the impedance, Table 5. Large bodies of water (lakes, ponds,etc) were considered absolute barriers since only foot traffic wasbeing considered.
As noted above, previous studies did not consider the use ofstandardized definitions of land cover in considering their impacton a cost-distance model. The underlying land cover for this studywas derived from the National Land Cover Dataset (Fry et al., 2011)with features being reclassified similar to costs defined in Sherrill(Sherrill et al. classify cost with respect to Percent of MaximumTravel Speede PMTS, where themodel used in this study is definedas impedance, 1/PMTS) (Table 6).
Once all vector layers were reclassified, they were combinedusing a hierarchical overlay method that prioritizes layers based ontheir importance. The final impedance raster is created using ahierarchical overlay method where factors are listed in decreasingpriority: fenceline, road, trail, impassable slope, bodies of water,streams (Strahler order), utility right-of-ways and land cover. Thisimpedance (cost surface) layer is then combined with the speedlayer to obtain an estimated travel speed surface (km per hour) forthe area of interest with foot travel speeds ranging from slightlyabove the nominal speed (maximum speed at a slope of �0.05) tozero. Because the Path Distance Tool within ArcGIS 10.1 assumesthe cost surface defines ease of crossing a cell as opposed to theimpedance represented by the cell, the inverse of the cost surface asdefined above is used as input. Starting at the IPP, the accumulatedcost to travel across the cost surface is evaluated in an anisotropicmanner in order to account for traveling either up or downslope inmoving away from the IPP. The Path Distance tool within ArcGISprovides a means of considering travel in all directions producing atravel time surface suggesting the minimal time required to reach adestination starting from the IPP.
Based on the algorithm discussed above, a Cost Surface for all ofYosemite National Park was generated and used to produce PathDistance surfaces from the IPP of all 130 missing Hiker incidentswith isochrones representing distance traveled in a specifiedamount of time, Fig. 7.
Subject mobility was determined by sampling the Path Distancesurface isochrones at the Find location providing an estimate forthe minimum amount of time (Tmin) for the subject to reach theFind location from the IPP based on the Path Distance Cost Surface.The model is not intended to take into account the fact that aperson may wander, stay in one place, leave an area and return, orany impact fromweather but rather it is an empirical model basedon physical limitations imposed by terrain and environmentalfeatures. Nor does it account for energy expenditure, as previouslynoted, which could potentially increase Tmin. We summarized hikermobility statistics in a format that could be directly compared to theISRID as defined by Koester (2008). The lower quartile, median,
upper quartile, and 95th percentile were calculated for each for thehiker category and Tmin values are compared to the global datasetcompiled in the ISRID using a Chi-square Goodness of Fit Test. Westatistically compared the ring and mobility models using bivariatecorrelation of D and Tmin for each hiker search incident, Fig. 8.
Results and discussion
Ring model
Of the 213 incidents georeferenced from the Yosemite data, 130were cases involving lost hikers were included in the analysis.Overall, the Euclidean distance (D) from each georeferenced IPP toits corresponding georeferenced found location was calculated(n¼ 130, mean¼ 3.34 km� 0.25). When the local Yosemite hikersample was compared to the global ISRID data (considering onlythe data from Temperate, Mountainous Eco-Region), there werestatistically significant differences (Table 1; n¼ 130, c2¼15.4,P< 0.01). This means that the distances that hikers travel, as thecrow flies, from the IPP to the found location in Yosemite wassignificantly different than the same corresponding distances thathikers travel at the global scale. The values in the first quartile (25%)were equal, but were greater in the ISRID for 50%, 75%, and 95%values.
Table 4Assigned impedance based on trail maintenance level.
Trail_Class Description Walking impedance
1 Minimal/undeveloped trail 252 Simple/minor development trail 203 Developed/improved trail 154 Highly developed trail 55 Fully developed trail 0
Table 5Assigned impedance based on stream size and difficulty crossing(Strahler stream order).
Strahler stream order Impedance
1 302 403 504 705 806 907 99
Table 6Assigned impedance value based on land cover classification code.
LCCC Description Impedance
11 Open water 9912 Perennial ice/snow 8021 Developed, open space 2022 Developed, low intensity 2023 Developed, medium intensity 3024 Developed, high intensity 4031 Barren land (rock/sand/clay) 6032 Unconsolidated Shore 7041 Deciduous forest 5042 Evergreen forest 5043 Mixed forest 5051 Dwarf scrub 7552 Shrub/scrub 7571 Grassland/herbaceous 5072 Sedge/herbaceous 5073 Lichens 2074 Moss 2081 Pasture/hay 2082 Cultivated crops 3090 Woody wetlands 8091 Palustrine forested wetland 8092 Palustrine scrub/shrub wetland 8093 Estuarine forested wetland 8094 Estuarine scrub/shrub wetland 8095 Emergent herbaceous wetlands 8096 Palustrine emergent wetland (persistent) 8097 Estuarine emergent wetland 8098 Palustrine aquatic bed 9999 Estuarine aquatic bed 99
P.J. Doherty et al. / Applied Geography 47 (2014) 99e110106

Author's personal copy
This would suggest that relying solely on the ISRID ring modelmay lead searchers to plan a larger POA than expected from locallyderived data. This is not a critical error as it would be better toslightly overestimate POA rather than underestimate POA and riskdrawing a boundary that excluded the missing person. However,deriving ringmodels based on local datamay refine POA techniquesand help to better allocate resources. Once data has been collectedand formatted, the ring model, is simple to apply using a GIS (oreven hand-drawn on a paper map) and can be considered a goodstarting point for defining a crude search boundary in the firstminutes of a search. In all cases, we suggest that ringmodels shouldnot be used alonewithout considering other sources of informationsuch as mobility models discussed below. Overall, the ring modelstill provides an adequate starting point for areas that do not havegeoreferenced datasets and it is important that the 25% quartileswere similar since these should be the highest priority in the earlyphases of a search.
Mobility model
ThemeanTmin value for the 130missing hikers (Tmin¼ 1.5 h) andthe median (Tmin¼ 1.0) were widely separated by 30 min whichmay in part be due to the 15 min resolution of the Path Distance
Surface. In addition when compared to the ISRID, the Yosemitedataset differed significantly (Table 2; n¼ 130, c2¼ 91.4, P< 0.01).These differences may be due to differences in the way data werecollected. In ISRID, mobility values were taken from directly fromincident report narratives, whereas Yosemite Tminwas derived froma modeling process (actual mobility values were not found inincident reports). The ISRID data is inherently biased in thatmobility values were estimated and only available from hikers whowere found alive (the subjects found deceased on arrival cannotprovide this information unless a GPS recorded such data). Analysisof the Yosemite data suggests 50% of hikers should be found in the1.0 h travel time from the IPP as opposed to the 3.0 h recommen-dation provided from ISRID. This would suggest that search areasshould be prioritized close to the IPP with a maximum distance ofapproximately 6 h, since hikers seldom are found further than 6 hfrom IPP (95%< 6 h). Overall, the travel-cost model does present auseful GIS tool for visualizing probability areas and can be createdusing readily available base data.
Comparison of the ring and mobility model
When the ring model and mobility models were comparedstatistically, we found a significant correlation between D and Tmin
Fig. 7. Cost-distance surface for Yosemite National Park based on Tobler Hiking Function, impassable slope (<60�), availability of travel aides, land cover and presence of travelbarriers assuming a nominal walking speed of 4.5 km/h on level, unimpeded path.
P.J. Doherty et al. / Applied Geography 47 (2014) 99e110 107
Author's personal copy
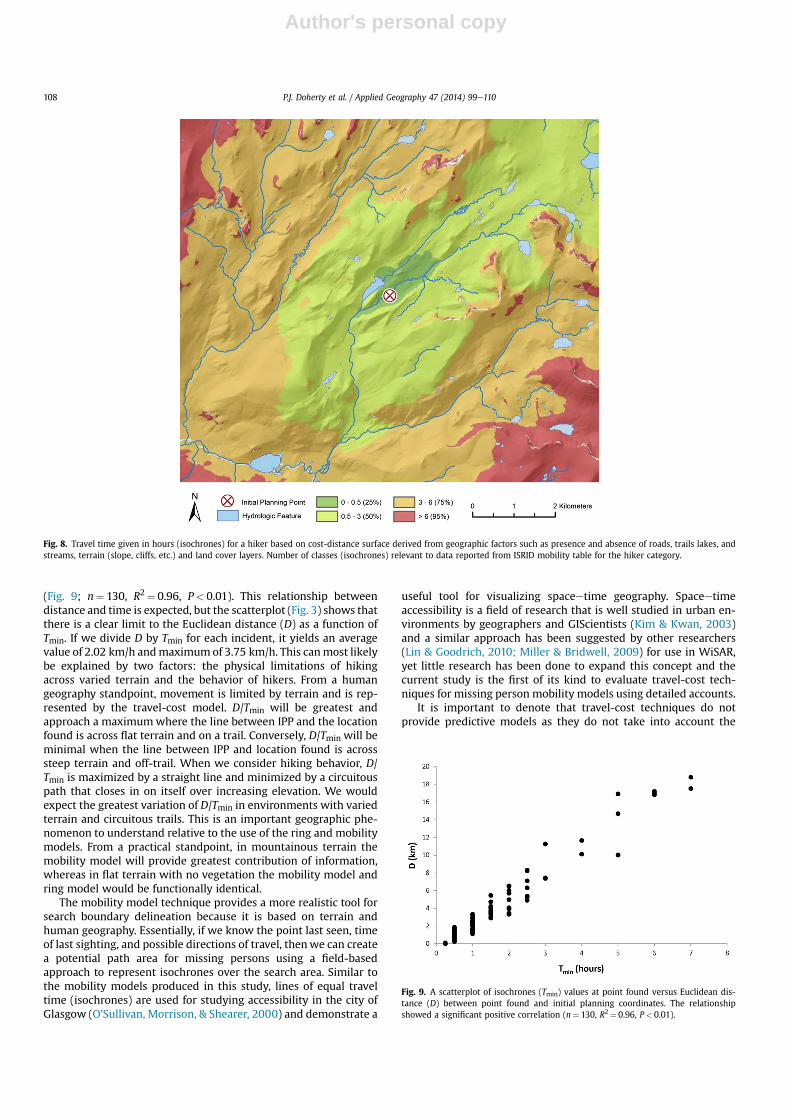
(Fig. 9; n¼ 130, R2¼ 0.96, P< 0.01). This relationship betweendistance and time is expected, but the scatterplot (Fig. 3) shows thatthere is a clear limit to the Euclidean distance (D) as a function ofTmin. If we divide D by Tmin for each incident, it yields an averagevalue of 2.02 km/h andmaximum of 3.75 km/h. This canmost likelybe explained by two factors: the physical limitations of hikingacross varied terrain and the behavior of hikers. From a humangeography standpoint, movement is limited by terrain and is rep-resented by the travel-cost model. D/Tmin will be greatest andapproach a maximumwhere the line between IPP and the locationfound is across flat terrain and on a trail. Conversely, D/Tmin will beminimal when the line between IPP and location found is acrosssteep terrain and off-trail. When we consider hiking behavior, D/Tmin is maximized by a straight line and minimized by a circuitouspath that closes in on itself over increasing elevation. We wouldexpect the greatest variation of D/Tmin in environments with variedterrain and circuitous trails. This is an important geographic phe-nomenon to understand relative to the use of the ring and mobilitymodels. From a practical standpoint, in mountainous terrain themobility model will provide greatest contribution of information,whereas in flat terrain with no vegetation the mobility model andring model would be functionally identical.
The mobility model technique provides a more realistic tool forsearch boundary delineation because it is based on terrain andhuman geography. Essentially, if we know the point last seen, timeof last sighting, and possible directions of travel, thenwe can createa potential path area for missing persons using a field-basedapproach to represent isochrones over the search area. Similar tothe mobility models produced in this study, lines of equal traveltime (isochrones) are used for studying accessibility in the city ofGlasgow (O’Sullivan, Morrison, & Shearer, 2000) and demonstrate a
useful tool for visualizing spaceetime geography. Spaceetimeaccessibility is a field of research that is well studied in urban en-vironments by geographers and GIScientists (Kim & Kwan, 2003)and a similar approach has been suggested by other researchers(Lin & Goodrich, 2010; Miller & Bridwell, 2009) for use in WiSAR,yet little research has been done to expand this concept and thecurrent study is the first of its kind to evaluate travel-cost tech-niques for missing person mobility models using detailed accounts.
It is important to denote that travel-cost techniques do notprovide predictive models as they do not take into account the
Fig. 8. Travel time given in hours (isochrones) for a hiker based on cost-distance surface derived from geographic factors such as presence and absence of roads, trails lakes, andstreams, terrain (slope, cliffs, etc.) and land cover layers. Number of classes (isochrones) relevant to data reported from ISRID mobility table for the hiker category.
Fig. 9. A scatterplot of isochrones (Tmin) values at point found versus Euclidean dis-tance (D) between point found and initial planning coordinates. The relationshipshowed a significant positive correlation (n¼ 130, R2¼ 0.96, P< 0.01).
P.J. Doherty et al. / Applied Geography 47 (2014) 99e110108
Author's personal copy
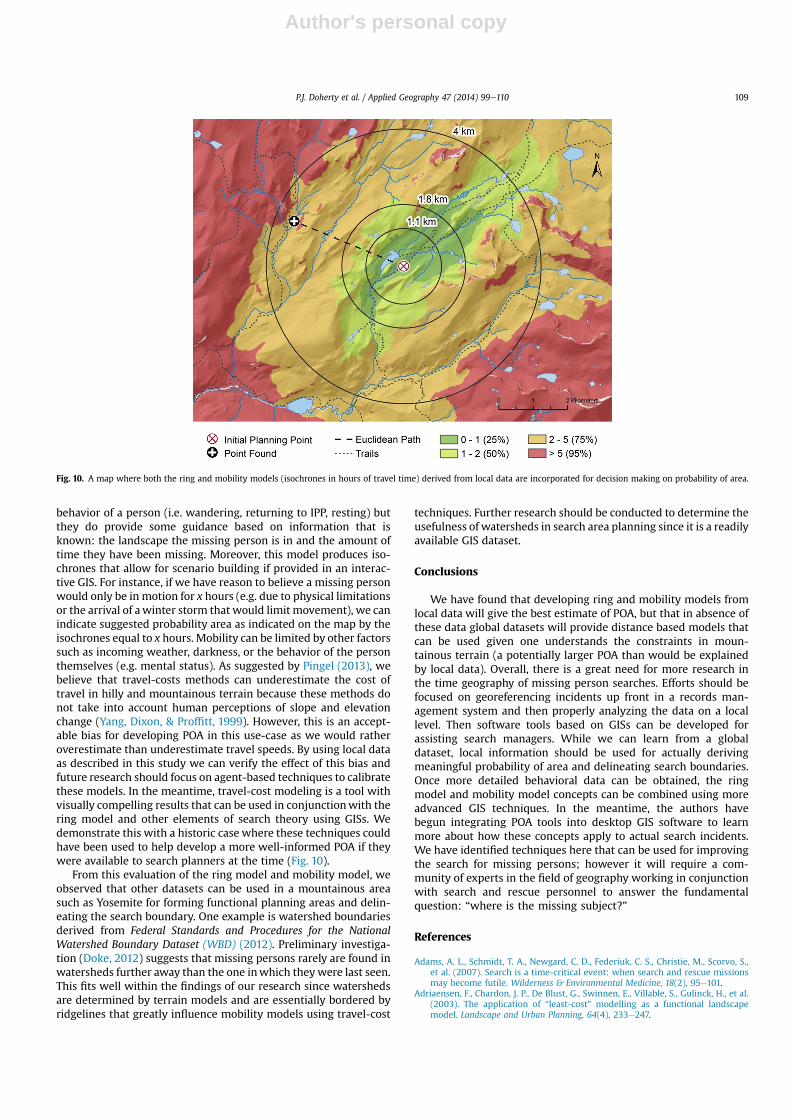
behavior of a person (i.e. wandering, returning to IPP, resting) butthey do provide some guidance based on information that isknown: the landscape the missing person is in and the amount oftime they have been missing. Moreover, this model produces iso-chrones that allow for scenario building if provided in an interac-tive GIS. For instance, if we have reason to believe a missing personwould only be in motion for x hours (e.g. due to physical limitationsor the arrival of awinter storm that would limit movement), we canindicate suggested probability area as indicated on the map by theisochrones equal to x hours. Mobility can be limited by other factorssuch as incoming weather, darkness, or the behavior of the personthemselves (e.g. mental status). As suggested by Pingel (2013), webelieve that travel-costs methods can underestimate the cost oftravel in hilly and mountainous terrain because these methods donot take into account human perceptions of slope and elevationchange (Yang, Dixon, & Proffitt, 1999). However, this is an accept-able bias for developing POA in this use-case as we would ratheroverestimate than underestimate travel speeds. By using local dataas described in this study we can verify the effect of this bias andfuture research should focus on agent-based techniques to calibratethese models. In the meantime, travel-cost modeling is a tool withvisually compelling results that can be used in conjunctionwith thering model and other elements of search theory using GISs. Wedemonstrate this with a historic case where these techniques couldhave been used to help develop a more well-informed POA if theywere available to search planners at the time (Fig. 10).
From this evaluation of the ring model and mobility model, weobserved that other datasets can be used in a mountainous areasuch as Yosemite for forming functional planning areas and delin-eating the search boundary. One example is watershed boundariesderived from Federal Standards and Procedures for the NationalWatershed Boundary Dataset (WBD) (2012). Preliminary investiga-tion (Doke, 2012) suggests that missing persons rarely are found inwatersheds further away than the one inwhich theywere last seen.This fits well within the findings of our research since watershedsare determined by terrain models and are essentially bordered byridgelines that greatly influence mobility models using travel-cost
techniques. Further research should be conducted to determine theusefulness of watersheds in search area planning since it is a readilyavailable GIS dataset.
Conclusions
We have found that developing ring and mobility models fromlocal data will give the best estimate of POA, but that in absence ofthese data global datasets will provide distance based models thatcan be used given one understands the constraints in moun-tainous terrain (a potentially larger POA than would be explainedby local data). Overall, there is a great need for more research inthe time geography of missing person searches. Efforts should befocused on georeferencing incidents up front in a records man-agement system and then properly analyzing the data on a locallevel. Then software tools based on GISs can be developed forassisting search managers. While we can learn from a globaldataset, local information should be used for actually derivingmeaningful probability of area and delineating search boundaries.Once more detailed behavioral data can be obtained, the ringmodel and mobility model concepts can be combined using moreadvanced GIS techniques. In the meantime, the authors havebegun integrating POA tools into desktop GIS software to learnmore about how these concepts apply to actual search incidents.We have identified techniques here that can be used for improvingthe search for missing persons; however it will require a com-munity of experts in the field of geography working in conjunctionwith search and rescue personnel to answer the fundamentalquestion: “where is the missing subject?”
References
Adams, A. L., Schmidt, T. A., Newgard, C. D., Federiuk, C. S., Christie, M., Scorvo, S.,et al. (2007). Search is a time-critical event: when search and rescue missionsmay become futile. Wilderness & Environmental Medicine, 18(2), 95e101.
Adriaensen, F., Chardon, J. P., De Blust, G., Swinnen, E., Villable, S., Gulinck, H., et al.(2003). The application of “least-cost” modelling as a functional landscapemodel. Landscape and Urban Planning, 64(4), 233e247.
Fig. 10. A map where both the ring and mobility models (isochrones in hours of travel time) derived from local data are incorporated for decision making on probability of area.
P.J. Doherty et al. / Applied Geography 47 (2014) 99e110 109

Author's personal copy
Bailey, R. G., & Ropes, L. (1998). Ecoregions: The ecosystem geography of the oceansand continents: With 106 illustrations, with 55 in color. Springer.
Bateman, I. J., Garrod, G. D., Brainard, J. S., & Lovett, A. A. (1996). Measurement is-sues in the travel cost method: a geographical information systems approach.Journal of Agricultural Economics, 47(1e4), 191e205.
Bownds, J. W., Ebersole, M. J., Lovelock, D., O’Connor, D. J., & Toman, R. J. (2007). WinCASIE III: computer aided search information exchange.
Cooper, D. C., Frost, J. R., & Robe, R. Q. (2003). Capability of land SAR procedures withsearch theory. Retrieved 24.09.13 from http://www.dtic.mil/dtic/tr/fulltext/u2/a511658.pdf.
Doherty, P., Guo, Q., Liu, Y., Wieczorek, J., & Doke, J. (2011). Georeferencing incidentsfrom locality descriptions and its applications: a case study from YosemiteNational Park search and rescue. Transactions in GIS, 15(6), 775e793.
Doke, J. (2012). Analysis of search incidents and lost person behavior in YosemiteNational Park. Esri. ArcGIS 10.1.
Federal Standards and Procedures for the National Watershed Boundary Dataset(WBD). (2012). Reston, Virginia.
Ferguson, D. (2008). GIS for wilderness search and rescue. In 2008 ESRI federal userconference. Retrieved 03.04.12 from http://proceedings.esri.com/library/userconf/feduc08/papers/gis_for_wilderness_search_and_rescue.pdf.
Filipkowska, E., Koester, R. J., Chrustek, R., & Zaród, M. (2012). Lost and found in thePolish Carpathian Mountains. ArcNews, 34(3).
Frost, J. R. (1999). Principles of search theory. Response, 17(2), 1e23.Fry, J., Xian, G., Jin, S., Dewitz, J., Homer, C., Yang, L., et al. (2011). Completion of the
2006 National Land Cover Database for the conterminous United States. PE&RS,77(9), 858e864.
Hill, K. (1999). Lost person behavior. Ottawa, Canada: National Search and RescueSecretariat.
Imhof, E. (1950). Gelaende und Karte. Zurich, Switzerland: Rentsch.Jobe, R. T., & White, P. S. (2009). A new cost-distance model for human accessibility
and an evaluation of accessibility bias in permanent vegetation plots in GreatSmoky Mountains National Park, USA. Journal of Vegetation Science, 20(6),1099e1109. http://dx.doi.org/10.1111/j.1654-1103.2009.01108.x.
Kim, H.-M., & Kwan, M.-P. (2003). Spaceetime accessibility measures: a geo-computational algorithm with a focus on the feasible opportunity set andpossible activity duration. Journal of Geographical Systems, 5(1), 71e91.
Koester, R. (2008). Lost person behavior. Search. Charlottesville, VA: dbS Productions.Koester, R. J., Cooper, D. C., Frost, J. R., & Robe, R. Q. (2004). Sweep width estimation
for ground search and rescue. Washington.Koester, R. J., & Stooksbury, D. E. (1995). Behavioral profile of possible Alzheimer’s
disease patients in Virginia search and rescue incidents. Wilderness & Envi-ronmental Medicine, 6, 34e43.
Koopman, B. O. (1980). Search and screening. New York: Pergamon Press.Langmuir, Eric (1984). Mountaincraft and leadership. Official handbook of the
Mountain Leader Training Boards of Great Britain and Northern Ireland. Edin-burgh, Scotland: Britain & Scottish Sports Council.
Lin, L., & Goodrich, M. A. (2010). A Bayesian approach to modeling lost personbehaviors based on terrain features in wilderness search and rescue. Compu-tational and Mathematical Organization Theory, 16(3), 300e323.
Magyari-Sáska, Zs., & Dombay, S. (2012). Determining minimum hiking time usingDEM. Geographia Napocensis, anul VI. Nr. 2, Cluj-Napoca.
Mattson, R. J. (1976). Establishing search areas. Search and Rescue Magazine, Spring1976, 7e8.
Miller, H. J., & Bridwell, S. A. (2009). A field-based theory for time geography. Annalsof the Association of American Geographers, 99(1), 49e75.
Minetti, A. E., Moia, C., Roi, G. S., Susta, D., & Ferretti, G. (2002). Energy cost ofwalking and running at extreme uphill and downhill slopes. Journal of AppliedPhysiology (Bethesda, Md.: 1985), 93(3), 1039e1046. http://dx.doi.org/10.1152/japplphysiol.01177.2001.
Nikolakaki, P. (2004). A GIS site-selection process for habitat creation: esti-mating connectivity of habitat patches. Landscape and Urban Planning,68(1), 77e94.
NSARC. (2011). Land search and rescue addendum to the national search and rescuesupplement to the international aeronautical and maritime search and rescuemanual. version 1.0 http://www.uscg.mil/nsarc.
O’Sullivan, D., Morrison, A., & Shearer, J. (2000). Using desktop GIS for the inves-tigation of accessibility by public transport: an isochrone approach. Interna-tional Journal of Geographical Information Science, 14(1), 85e104.
Pingel, T. J. (2013). Cartography and geographic information science. Cartographyand Geographic Information Science, 37(2), 37e41.
Ralston, H. J. (1958). Energy-speed relation and optimal speed during level walking.Internationale Zeitschrift für Angewandte Physiologie Einschließlich Arbeit-sphysiologie, 17(4), 277e283. http://dx.doi.org/10.1007/BF00698754.
Sherrill, K. R., Frakes, B., & Schupbach, S. (2010). Travel time cost surface model:Standard operating procedure. Natural resource report NPS/NRPC/IMD/NRR-2010/238. Fort Collins, Colorado.
Stone, L. D. (1989). What’s happened in search theory since the 1975 LanchesterPrize? Operations Research, 37(3), 501.
Stone, L. D. (2007). Theory of optimal search (2nd ed.). In Mathematics in science andengineering. New York: Academic Press.
Syrotuck, W. G. (2000). Analysis of lost person behavior. Mechanicsburg, PA: Bar-kleigh Productions, Inc.
Theodore, J. (March 2009). When every second counts. ArcNews, 66e69.Tobler, W. (1965). Non-isotropic geographic modeling. Information systems.Tobler, W. (1991). Non-isotropic geographic modeling. In W. Tobler (Ed.), Geographic
information systems in the social sciences. Santa Barbara.Van den Broek, M., Brederode, E., Ramírez, A., Kramers, L., Van der Kuip, M.,
Wildenborg, T., et al. (2010). Designing a cost-effective CO2 storage infrastruc-ture using a GIS based linear optimization energy model. EnvironmentalModelling & Software, 25(12), 1754e1768.
Whitley, T., & Hicks, L. (2003). A geographic information systems approach to un-derstanding potential prehistoric and historic travel corridors. SoutheasternArchaeology (those 1994).
Wieczorek, J., Guo, Q., & Hijmans, R. (2004). The point-radius method for geore-ferencing locality descriptions and calculating associated uncertainty. Interna-tional Journal of Geographical Information Science, 18(8), 745e767.
Winter, S., & Yin, Z.-C. (2010). Directed movements in probabilistic time geog-raphy. International Journal of Geographical Information Science, 24(9), 1349e1365.
Yang, T. L., Dixon, M. W., & Proffitt, D. R. (1999). Seeing big things: overestimation ofheights is greater for real objects than for objects in pictures. Perception, 28(4),445e467.
P.J. Doherty et al. / Applied Geography 47 (2014) 99e110110