Rare-earth-element geochemistry of some Archean iron formations north of Lake Superior, Ontario
Upload
khangminh22Category
view
3download
0
Louisiana State UniversityLSU Digital Commons
LSU Master's Theses Graduate School
2015
Chlorine Enrichment of Hydrous Minerals inArchean Granulite Facies Ironstone from theBeartooth Mountains, Montana, USA:Implications for High-Grade Metamorphic FluidsNicholas Michael DaigleLouisiana State University and Agricultural and Mechanical College, [email protected]
Follow this and additional works at: https://digitalcommons.lsu.edu/gradschool_theses
Part of the Earth Sciences Commons
This Thesis is brought to you for free and open access by the Graduate School at LSU Digital Commons. It has been accepted for inclusion in LSUMaster's Theses by an authorized graduate school editor of LSU Digital Commons. For more information, please contact [email protected].
Recommended CitationDaigle, Nicholas Michael, "Chlorine Enrichment of Hydrous Minerals in Archean Granulite Facies Ironstone from the BeartoothMountains, Montana, USA: Implications for High-Grade Metamorphic Fluids" (2015). LSU Master's Theses. 1188.https://digitalcommons.lsu.edu/gradschool_theses/1188

CHLORINE ENRICHMENT OF HYDROUS MINERALS IN ARCHEAN GRANULITE FACIES IRONSTONES FROM THE BEARTOOTH MOUNTAINS, MONTANA, USA:
IMPLICATIONS FOR HIGH-GRADE METAMORPHIC FLUIDS
A Thesis
Submitted to the Graduate Faculty of the Louisiana State University and
Agricultural and Mechanical College in partial fulfillment of the
requirements for the degree of Master of Science
in
The Department of Geology and Geophysics
by Nicholas M. Daigle
B.S., Louisiana State University, 2013 August 2015

ii
ACKNOWLEDGMENTS
First and foremost I would like to thank my advisor, Dr. Darrell Henry, for his
constant guidance and support over the last two years, and also my committee
members, Dr. Barbara Dutrow and Dr. Jianwei Wang, for their suggestions and valuable
feedback. My fellow classmates are also greatly appreciated for discussions and
constructive criticism.
The saintly individuals who aided me in my attempt to keep the microprobe alive
and running deserve special recognition: Celina Will, who instructed me on how to run
the probe and was always willing to help in any way she could even after leaving LSU;
Clayton Loehn, for spending hours of his time away from the SIF to help brainstorm and
fix the endless issues with the probe; Rick Young and Wanda Leblanc, for assisting me
with maintenance and upkeep for the machines in the probe lab as well as various other
tasks I asked of them; and Joe Geller and Chuck Herrington, for being patient and not
ignoring the constant barrage of emails I sent them when the probe started acting funny.
Lastly I would like to graciously thank The Red River Desk and Derrick Club,
New Orleans Geologic Society, Geologic Society of America, the AAPG LSU student
chapter, and the LSU Department of Geology and Geophysics for various monetary
support during my research efforts.

iii
TABLE OF CONTENTS ACKNOWLEDGMENTS ................................................................................................... ii LIST OF TABLES ............................................................................................................ v LIST OF FIGURES ......................................................................................................... vii ABSTRACT .................................................................................................................... xii CHAPTER I. INTRODUCTION ........................................................................................ 1 CHAPTER II. GEOLOGIC SETTING ............................................................................... 7
2.1 Wyoming Province .......................................................................................... 7 2.2 Beartooth Mountains .................................................................................... 10
CHAPTER III. METHODS ............................................................................................. 15
3.1 Sample Collection and Preparation .............................................................. 15 3.2 Petrographic and Microanalytical Methods ................................................... 15
3.2.1 Petrographic Analysis ..................................................................... 15 3.2.2 Mineral Chemical Analysis .............................................................. 19
3.3 Determination of Pressure-Temperature-Fluid Conditions ........................... 22 3.3.1 Thermobarometers ......................................................................... 22 3.3.2 Equilibrium Assemblage Diagrams (Pseudosections) ..................... 24
3.4 Halogen Fugacity Calculations………………………………………………….. 26 CHAPTER IV. RESULTS .............................................................................................. 27
4.1 Sample Locations ......................................................................................... 27 4.2 Sample Descriptions and Petrographic Observations .................................. 27
4.2.1 Non-banded Samples ..................................................................... 33 4.2.2 Banded Samples............................................................................. 34 4.2.3 Petrography .................................................................................... 36
4.3 Backscattered Electron Imaging (BEI) .......................................................... 44 4.4 Mineral Chemistry ......................................................................................... 47
4.4.1 Garnet ............................................................................................. 48 4.4.2 Pyroxene ......................................................................................... 52 4.4.3 Feldspar .......................................................................................... 59 4.4.4 Amphibole ....................................................................................... 59
4.4.4.1 Peak Metamorphic Amphibole .......................................... 61 4.4.4.2 Secondary Amphibole ....................................................... 67
4.4.5 Biotite .............................................................................................. 69 4.5 Bulk Rock Chemistry .................................................................................... 72
CHAPTER V. DISCUSSION ......................................................................................... 74 CHAPTER VI. CONCLUSION ....................................................................................... 85

iv
REFERENCES .............................................................................................................. 86 APPENDIX A: GARNET EPMA DATA .......................................................................... 94 APPENDIX B: PYROXENE EPMA DATA ................................................................... 111 APPENDIX C: FELDSPAR EPMA DATA .................................................................... 129 APPENDIX D: AMPHIBOLE EPMA DATA .................................................................. 133 APPENDIX E: BIOTITE EPMA DATA ......................................................................... 151 VITA ............................................................................................................................ 158

v
LIST OF TABLES
1.1. Some recorded occurrences of Cl-rich amphibole and biotite in various high- grade metamorphic terranes ........................................................................................... 2 3.1. List of minerals and their abbreviations .................................................................. 17 3.2. Mineral standards used for electron microprobe analyses ..................................... 20 4.1. Iron-formation sample locations in the Beartooth Mountains .................................. 27 4.2. Visually Estimated Mineral Modes for Quad Creek Samples ................................. 29 4.3. Visually Estimated Mineral Modes for Rock Creek Samples .................................. 30 4.4. Visually Estimated Mineral Modes for Hellroaring Plateau Samples ...................... 30 4.5. Mineral Modes Determined by Point Counts (based on 1000 points) .............................. 31 4.6. Mineral Modes Determined with ImageJ ................................................................ 31 4.7. Representative Garnet Compositions in wt% ......................................................... 49 4.8. Representative Orthopyroxene Compositions in wt% ............................................ 53 4.9. Representative Clinopyroxene Compositions in wt% ............................................. 55 4.10. Representative Feldspar Compositions in wt% .................................................... 60 4.11. Structural Formulae for Primary Calcium Amphibole Endmembers ..................... 61 4.12. Representative Amphibole Compositions in wt% ................................................. 62 4.13. Species and Representative Formulae from Amphiboles in Table 4.12. .............. 65 4.14. Representative Biotite Compositions in wt% ........................................................ 70 4.15. Summary of Representative Biotite Compositions in Table 4.14 .......................... 70 4.16. Bulk Compositions in wt% oxides .................................................................... 73 5.1. Results of Garnet-amphibole-plagioclase-quartz Barometry .................................. 77 5.2. Results of Hornblende-plagioclase Thermometry................................................... 78 5.3. Results of Garnet-orthopyroxene Thermometry ..................................................... 78

vi
5.4. Results of Garnet-clinopyroxene Thermometry ...................................................... 79

vii
LIST OF FIGURES
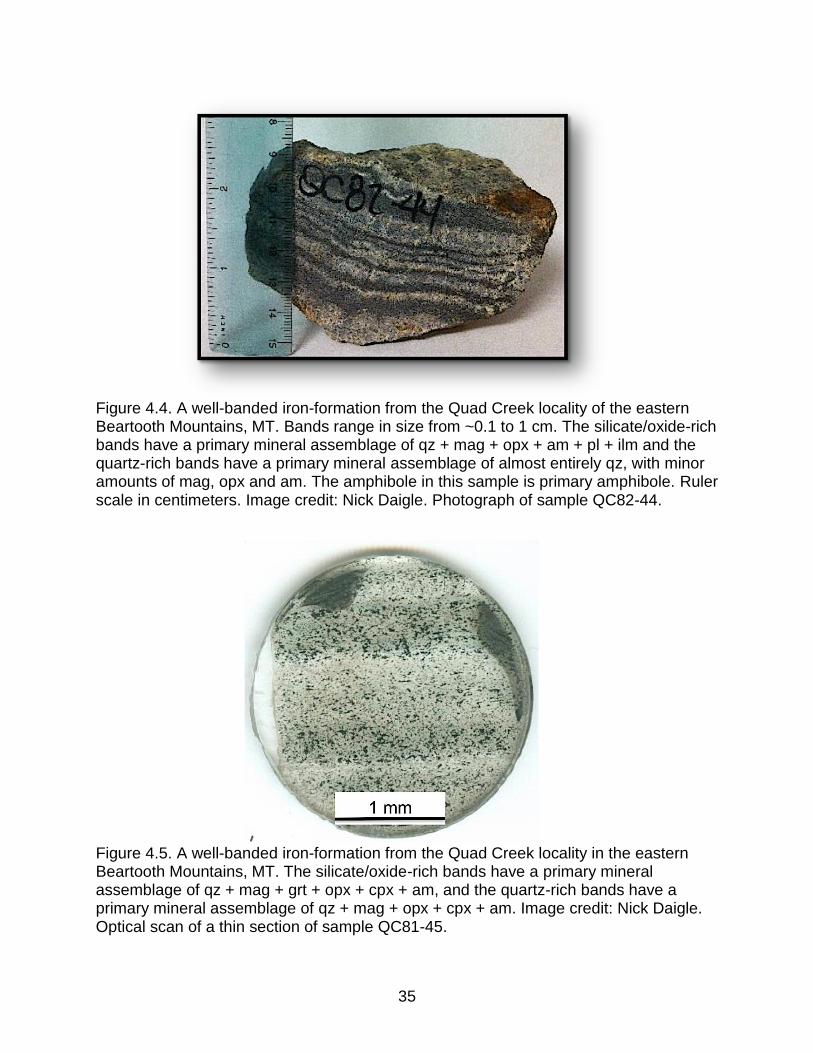
1.1. Relative abundance of Precambrian BIFs vs. time, with calculated curves for the atmospheric evolution for oxygen and carbon dioxide............................................... 5 2.1. Schematic map of Archean and Proterozoic basement terranes of southwest Laurentia ......................................................................................................................... 8 2.2. Outlines of the major exposures of Archean crystalline basement and generalized approximate sub-province boundaries in the Wyoming Province: Montana Metasedimentary Terrane, Beartooth-Bighorn magmatic zone, and the Wyoming Greenstone Province ....................................................................................... 9 2.3. (a) The Wyoming Province and its sub-provinces, including the location of the Beartooth Mountains; (b) The four geographically and geologically distinct domains of the Beartooth Mountains ............................................................................. 11 2.4. Petrogenetic grid showing dehydration reactions, H2O-saturated melting reactions, dehydration-melting reactions, and aluminosilicate polymorph boundaries in pressure-temperature space ................................................................... 14 3.1. Google Earth image showing the three areas from which the iron-formations were collected. MT-WY state line is shown for reference. Yellow line indicates the Beartooth Highway (Highway 212) ................................................................................ 16 4.1. Google Earth image showing specific sample locations of iron-formation from the Quad Creek and Hellroaring Plateau localities. MT-WY state line is shown for reference. Yellow line indicates the Beartooth Highway (Highway 212). Not pictured is the Rock Creek sample location .................................................................. 28 4.2. A non-banded iron-formation from Hellroaring Plateau of the eastern Beartooth Mountains, MT. The primary mineral assemblage is qz + mag+ grt + opx + bt + ilm. Ruler scale in centimeters. Photograph of sample HP81-82 .................................. 33 4.3. A homogeneous non-banded iron-formation from Hellroaring Plateau of the eastern Beartooth Mountains, MT. The primary mineral assemblage is qz + mag + grt + opx + ilm. Optical scan of a thin section of sample HR02-3 ............................... 34 4.4. A well-banded iron-formation from the Quad Creek locality of the eastern Beartooth Mountains, MT. Bands range in size from ~0.1 to 1 cm. The silicate/oxide- rich bands have a primary mineral assemblage of qz + mag + opx + am + pl + ilm and the quartz-rich bands have a primary mineral assemblage of almost entirely qz, with minor amounts of mag, opx and am. The amphibole in this sample is primary amphibole. Ruler scale in centimeters. Photograph of sample QC82-44 ...................... 35

viii
4.5. A well-banded iron-formation from the Quad Creek locality in the eastern Beartooth Mountains, MT. The silicate/oxide-rich bands have a primary mineral assemblage of qz + mag + grt + opx + cpx + am, and the quartz-rich bands have a primary mineral assemblage of qz + mag + opx + cpx + am. Optical scan of a thin section of sample QC81-45 .................................................................................... 35 4.6. A granoblastic iron-formation with the mineral assemblage of qz + mag + grt + opx + cpx + am that is commonly seen in iron-formations from the Quad Creek locality in the eastern Beartooth Mountains, MT. Carbonate-quartz-bearing veins are also seen cross-cutting this area. Photomicrograph of sample QC-IS taken in PPL…. ........................................................................................................................... 36 4.7. View from Figure 4.6 shown in XPL ....................................................................... 37 4.8. A representative area of a banded iron-formation from the Quad Creek locality in the eastern Beartooth Mountains, MT. The primary mineral assemblage in the silicate/oxide-rich band is qz + mag + opx + am + pl. The quartz areas on either side are composed of almost entirely quartz, along with minor amounts of mag/ilm, opx and am. Grain sizes tend to be larger in the qz-rich areas. This sample lacks garnet, but contains plagioclase. Photomicrograph of sample QC82-44 taken in XPL .............. 38 4.9. Alteration of opx by carbonate minerals (in fracture) and secondary amphibole (grunerite on rims) in an iron-formation from the Hellroaring Plateau locality in the eastern Beartooth Mountains, MT. The primary mineral assemblage in this sample is qz + mag + grt + opx. Photomicrograph of sample HR02-71 taken in PPL ............... 40 4.10. View from Figure 4.9 shown in XPL ..................................................................... 40 4.11. A banded iron-formation from Hellroaring Plateau with green-blue secondary amphibole (actinolite) altering the rims of orthopyroxene grains. Photomicrograph of sample HP82-59 taken in XPL .................................................................................. 41 4.12. A banded iron-formation from Hellroaring Plateau showing complete replacement of pyroxene by secondary amphibole (actinolite and cummingtonite). Note the high birefringent colors and fine, acicular shape of the amphibole on the rims. Photomicrograph of sample HP82-59 taken in XPL ............................................. 42 4.13. A non-banded iron-formation from Hellroaring Plateau showing a cluster of matrix biotite grains interstitial to orthopyroxene, garnet and magnetite. Photomicrograph of sample HP81-82 taken in PPL ...................................................... 43 4.14. A non-banded iron-formation with a primary mineral assemblage of qz + mag + grt + opx + am + ilm. Notice the ilmenite laths growing with associated magnetite grains. BSE image of sample QC82-45 ......................................................................... 45

ix
4.15. A banded iron-formation with pyroxene exsolution. The primary mineral assemblage of the silicate/oxide-rich bands in this sample is qz + mag + grt + opx + cpx + ilm. The darker-gray clinopyroxene grain exhibits distinct thin, lighter-gray exsolution lamellae of orthopyroxene. This grain is also cut by later-stage alteration phases of amphibole/carbonate. BSE image of sample QC-JW3.................. 45 4.16. A silicate/oxide-rich band from a banded iron-formation with a primary mineral assemblage of qz + mag + grt + opx + bt + ilm. Secondary amphibole (actinolite) is shown altering the rims and fractured areas of the orthopyroxene grains. Magnetite can also be seen forming on the edge of these alteration areas. BSE image from a silicate/oxide-rich band in sample HP82-59 .................................................................. 46 4.17. A silicate/oxide-rich band from a banded iron-formation with a primary mineral assemblage of qz + mag + grt + opx + bt + ilm. Orthopyroxene is being completely replaced by secondary amphibole (actinolite). BSE image from a silicate/oxide-rich band in sample HP82-59 ............................................................................................... 47 4.18. Variations in XFe and XCa in garnets from each sample. Mole fractions calculated using compositions in Table 4.7. Symbols denote different mineral assemblages: opx + cpx + am; opx + cpx + am + bt; opx + am; Δ opx + bt; opx + cpx + am + bt + pl; opx; asterisk = opx + cpx + bt ......................................... 51 4.19. Variations in XFe and XMn in garnets from each sample. Mole fractions calculated using compositions in Table 4.7. Symbols denote different mineral assemblages: opx + cpx + am; opx + cpx + am + bt; opx + am; Δ opx + bt; opx + cpx + am + bt + pl; opx; asterisk = opx + cpx + bt ......................................... 51 4.20. Wollastonite-enstatite-ferrosilite diagram showing locations of representative orthopyroxene and clinopyroxene compositions from each sample .............................. 56 4.21. Variations in XFe and XCa in representative orthopyroxene compositions from each sample. Mole fractions calculated using compositions in Table 4.8. Symbols denote different mineral assemblages: grt + cpx + am; grt + cpx + am + bt; grt + am; Δ grt + bt; grt + cpx + am + bt + pl; grt; asterisk = grt + cpx + bt; − am + pl ....................................................................................................................... 57 4.22. Variations in XFe and XCa in representative clinopyroxene compositions from each clinopyroxene-bearing sample. Mole fractions calculated using compositions in Table 4.9. Symbols denote different mineral assemblages: grt + opx + am; grt + opx + am + bt + pl ............................................................................................. 57 4.23. Variations in XFe and XMn in representative orthopyroxene compositions from each sample. Mole fractions calculated using compositions in Table 4.8. Symbols denote different mineral assemblages: grt + cpx + am; grt + cpx + am + bt; grt + am; Δ grt + bt; grt + cpx + am + bt + pl; grt; asterisk = grt + cpx + bt; − am + pl ....................................................................................................................... 58

x
4.24. Variations in XFe and XMn in representative clinopyroxene compositions from each clinopyroxene-bearing sample. Mole fractions calculated using compositions in Table 4.9. Symbols denote different mineral assemblages: grt + opx + am; grt + opx + am + bt + pl ............................................................................................. 58 4.25. Ab-An-Or ternary diagram showing locations of representative plagioclase and alkali feldspar compositions from QC82-44 (purple dot) and QC82-49b (white dots).. ............................................................................................................................ 61 4.26. Relations between Cl and XFe
2+ concentrations found in amphibole from iron-formations in the eastern Beartooth Mountains. Each dot represents a separate analysis. Maximum XFe and Cl (apfu) values are 0.8 and 0.78, respectively ................. 68 4.27. Variation in Cl concentration between matrix amphibole and amphibole present as inclusions in orthopyroxene and garnet from one iron-formation sample (QC82-45). Cl concentration in amphibole: matrix grains ≥ inclusions in opx > inclusions in grt. Each point represents an individual analysis. The stars represent averages for each type of amphibole ............................................................................ 68 4.28. Cl and Ba concentrations found in biotite from iron-formation samples in the Beartooth Mountains. Cl concentrations are higher than Ba concentrations ................. 71 4.29. Cl and K concentrations found in biotite from iron-formation samples in the Beartooth Mountains. Cl concentrations are lower than K concentrations .................... 71 4.30. Variation in Cl concentration between matrix biotite and biotite present as inclusions in orthopyroxene and garnet from one iron-formation sample (QC82-45). Cl concentration in amphibole: inclusions in grt > matrix grains > inclusions in opx. Each point represents an individual analysis. The stars represent averages for each type of biotite ........................................................................................................ 72 5.1. Crystal structure of a Cl-rich hastingsite (looking down the c-axis) showing locations and sizes of selected ions: Cl- (1.81Å), K+ (1.64Å), Ca2+ (1.12Å), Fe2+ (0.78Å), Al3+ (0.39Å) and Si4+ (0.26Å). Ions not pictured in figure include Ba2+ (1.61Å), Na+ (1.18Å), Mg2+ (0.72Å), Ti4+ (0.61Å), F- (1.33Å) and OH- (1.53Å) .............. 75 5.2. Same crystal structure from Figure 5.1 viewed looking down the a-axis to better illustrate the placement of Cl- in the hydroxyl site in the amphibole structure ..... 76

xi
5.3. Compilation of P-T data from meta-iron-formations in this study and previous work. The orange triangle represents likely conditions of peak metamorphism based on the convergence of multiple lithologies in the Will (2013) study with previous work. The black arrow points to the bottom area across this triangle, representing the overlap of likely peak conditions determined by Will (2013) with the hbl-pl thermometry and grt-am-pl-qz barometry of the iron-formations in this study. Blue arrows represent the proposed P-T path by Mueller et al., 2014. Stability fields of the aluminosilicate polymorphs are superimposed for reference ........ 77 5.4. Pseudosection for sample QC-IS illustrating area of stability field for the primary mineral assemblage of grt + opx + cpx + am. Garnet isopleths are shown in green (almandine component in this sample is 0.64) and clinopyroxene isopleths are shown in blue (hedenbergite component in this sample is 0.43). Results from grt-opx and grt-cpx thermometry are also plotted (blue dots). Orange circle indicates the likely area of peak metamorphism conditions based on the intersection of the isopleth values with the stability area of the primary mineral assemblage .................... 80 5.5. Pseudosection for sample QC82-45 illustrating area of stability field for the primary mineral assemblage of grt + opx + cpx + am. Garnet isopleths are shown in green (almandine component in this sample is 0.67). Results from grt-opx and grt-cpx thermometry are also plotted in blue. Orange circle indicates the likely area of peak metamorphic conditions based on the intersection of the isopleth values with the stability area of the primary mineral assemblage ............................................. 81 5.6. Relationship between log(XF/XCl) vs. XMg in the octahedral site from multiple suites of biotite-bearing rocks assuming an equilibrium temperature of 750 °C. Diagonal lines represent lines of constant log(fHF/fHCl)fluid. Each sample represents the average value from all analysis points in that sample. Biotite analyses containing 0 wt% fluorine were not included ................................................................. 83 5.7. Relationship between log(XF/XCl) vs. XMg in the octahedral site from multiple suites of biotite-bearing rocks assuming an equilibrium temperature of 800 °C. Diagonal lines represent lines of constant log(fHF/fHCl)fluid. Each sample represents the average value from all analysis points in that sample. Biotite analyses containing 0 wt% fluorine were not included ................................................................. 83 5.8. Relationship between log(XF/XCl) vs. XMg, octa in biotites from sample QC82-45, illustrating how this correlates to changing fluid composition. The stars represent the average values for each type of biotite grain ........................................................... 84

xii
ABSTRACT
The amount of chlorine present in hydrous minerals influences mineral stability
and may serve as a monitor of the evolving fluid phase during progressive
metamorphism. Chlorine contents of amphibole and biotite vary as a function of
temperature, pressure, crystallochemical factors, and fluid composition. The sensitivity
of these minerals to serve as a monitor of Cl in aqueous fluids is particularly effective in
Fe-rich amphibole and biotite such as those found in iron-formations.
Iron-formations from the eastern Beartooth Mountains, Montana are typified by
the dominantly anhydrous mineral assemblages of quartz + magnetite + orthopyroxene
+ garnet ± clinopyroxene. Thermobarometry suggests equilibration conditions of ~775–
800 °C at pressures of ~6–6.5 kbar (granulite facies). These relatively anhydrous iron-
formations contain minor amounts of prograde metamorphic amphibole and biotite that
occur as inclusions in orthopyroxene and garnet and as matrix minerals. The
amphiboles (primarily potassic-hastingsite) and biotites contain high levels of Cl
(reaching up to 2.9 wt% and 3.4 wt%, respectively). A positive correlation between Cl
and XFe2+, Al[IV], K[XIII] and Ba[XIII] exists. The biotites also contain up to 10.5 wt% BaO
and 6.9 wt% TiO2. Matrix amphiboles and biotites are more chlorine-rich than
amphiboles and biotites present as inclusions in orthopyroxene and garnet in the same
sample. Calculated halogen fugacity ratios of log(XF/XCl) vs. XMg in biotite range from -
2.7 to -3.9, demonstrating that the metamorphic fluid coexisting with biotite was
enriched in Cl.
The variations in chlorine content from pyroxene and garnet inclusions to matrix
grains suggest that the fluid evolved to be more chlorine-rich during prograde

xiii
metamorphism. These data also provide new evidence for fluid compositions of high-
grade brines. High chlorine contents increase the stability field of hydrous minerals and
explain their occurrence in granulite facies terranes.

1
CHAPTER I. INTRODUCTION
Chlorine enrichment of typically hydrous minerals has been observed in a variety
of geologic environments, such as skarns, granulites, granofels, volcaniclastics,
eclogites and gold-porphyry deposits (e.g. Krutov, 1936; Kamineni et al., 1982; Mora
and Valley, 1989; Jiang et al., 1994; Liu et al., 2009; Uher et al., 2014). Two minerals
that show this enrichment are amphibole and biotite (Table 1.1). The amount of halogen
incorporation in amphibole and biotite is a function of temperature, pressure, fluid
composition and crystal chemistry (e.g. Volfinger et al., 1985; Morrison, 1991; Zhu and
Sverjensky, 1991, 1992; Manning and Aranovich, 2014). Under high-grade
metamorphic conditions, these hydrous minerals tend to either break down to
anhydrous minerals (e.g. pyroxene, garnet, feldspar), deprotonate (lose the H in the OH
site), and/or incorporate halogens such as F- and Cl- into the OH site. Deprotonation
and halogen incorporation tends to extend the thermal stability of the nominally
“hydrous” minerals (e.g. Volfinger et al., 1985; Morrison, 1991; Makino et al., 1993).
Chlorine-enriched amphibole and biotite are found in iron-rich rocks
metamorphosed at granulite facies conditions (Henry, 1988). The iron-rich hydrous
silicates found in these rocks have mineral structural features that enhance the
incorporation of Cl in the minerals (e.g. Vielzeuf, 1982; Volfinger et al., 1985, Henry,
1988). Of further significance is that Cl is generally partitioned preferentially into
aqueous fluids relative to coexisting solid phases (e.g. Yardley, 1985; Mora and Valley,
1989; Zhu and Sverjensky, 1991, 1992; Léger et al., 1996). Partitioning studies between
fluids and minerals allow for Cl contents in amphibole and biotite to serve as particularly
sensitive indicators of fluid-rock interactions in the Earth’s crust.

2
Table 1.1. Some recorded occurrences of Cl-rich amphibole and biotite in various high-grade metamorphic terranes
Locality Setting/Rock
Type Am Bt Range of Cl Reference
Transcaucasia, Russia
Skarn x Up to 7.24 wt% Krutov (1936)
Transcaucasia, Russia
Skarn x Up to 5.34 wt% Jacobsen (1975)
St. Pauls Rocks, equatorial
Atlantic
Ultrabasic intrusion
x Up to 6.51 wt% Jacobsen (1975)
Southern Yukon Sphalerite skarn x 1.15 – 3.09 wt% Dick and
Robinson (1979)
Rajastan, NW India
Calcareous meta-sediment
x Up to 3.6 wt% Sharma (1981)
Visakpatnam, India
Hypersthene-garnet granulite
x x
Am: up to 4.18 wt%
Bt: up to 2.07 wt%
Kamineni et al. (1982)
Mathematician Ridge, East
Pacific Ocean
Oceanic metabasic rocks
x Up to 4.0 wt% Vanko (1986)
West Ongul Island, East Antarctica
Amphibolite and carbonate-pegmatite
x Up to 3.27 wt% Suwa et al.
(1987); Makino et al. (1993)
Sesia-Lanzo, Italy
Marbles x Up to 4.21 wt% Castelli (1988)
Idaho, USA Carbonate-
bearing granofels
x 0.05 – 0.51 wt% Mora and Valley
(1989)
Adirondack Mountains, USA
Marcy anorthosite
massif x 0.05 – 3.0 wt% Morrison (1991)
Sterling Hill, New Jersey, USA
Skarn in association with
Zn-ore x 0.89 to 7.15 wt% Tracy (1991)
Salton Sea, California, USA
Metabasic rocks x Up to 2.7 wt% Enami et al.
(1992)
Skaergaard intrusion,
Greenland
Anorthosites and pegmatites
x 0.15 – 2.02 wt% Sonnenthal
(1992)
Quinling, China Pb-Zn deposit, volcanoclastic
rocks x x
Am: 3.55 – 4.37 wt%
Bt: 0.3 – 1.2 wt%
Jiang et al. (1994, 1996)

3
(Table 1.1 continued)
Locality Setting/Rock
Type Am Bt Range of Cl Reference
Lofoten, Norway Ductile shear
zones in gabbro x x
Am: 0.59 – 3.78 wt%
Bt: 0.10 – 1.49 wt%
Kullerud (1995, 1996)
Black Rock Forest, New York, USA
Amphibolite to granulite facies
gneisses x x
Am: up to 5.1 wt%
Bt: 1.02 – 4.64 wt%
Léger et al. (1996)
Ramnes Cauldron, Norway
Hydrothermally altered
porphyritic alkali granitic rocks
x 0.01 – 2.96 wt% Sato et al. (1997)
Dronning Maud Land, East Antarctica
Syenites and high-grade
marbles x x
Am: up to 0.36 apfu
Bt: 0 – 0.56 wt%
Markl and Piazolo (1998)
Sudbury, Ontario, Canada
Contact Ni-Cu ore deposits
x <0.5 – 4.0 wt% McCormick and
McDonald (1999)
North Dabie Shan, China
Felsic granulites x 0.0 – 4.2 wt% Xiao et al. (2005)
Tarfala Valley, Northern Swedish
Caledonides
Ductile shear zones of the Kebne Dyke
Complex
x 0.4 – 0.76 wt% Baird et al. (2006)
Sulu ultrahigh-pressure
metamorphic terrane,
Yangkou, China
Eclogites x 0.05 – 3.0 wt% Liu et al. (2009)
Northern Central Indian Ridge, Indian Ocean
Mylonitic and altered gabbros
x 0.0 – 0.62 wt% Ray et al. (2009)
Eastern Dharwar Craton (EDC), Southern India
Crystalline basement rocks
below the Deccan trap
basalts
x x
Am: 0.72 – 0.85 wt%
Bt: 0.09 – 0.14 wt%
Pandey et al. (2014)
Slovakia Biely Vrch Au-
porphyry deposit
x x Am: up to 5 wt% Bt: 0.6–7.45 wt%
Uher et al. (2014)
* Rows colored in green represent the highest recorded chlorine concentrations in amphibole (am) and biotite (bt).
4
The term ironstone, or iron-formation, is defined as: “a chemical sediment,
typically thin bedded or laminated, whose principal chemical characteristic is an
anomalously high content of iron (over 15 wt%), commonly but not necessarily
containing layers of chert” (e.g. James, 1954; Trendall, 1983; Klein, 2005). The terms
ironstone and iron-formation are frequently used interchangeably; however, ironstone
typically refers to iron-rich rocks from Phanerozoic time (0.54 Ga to present), and iron-
formation encompasses the time span preceding the Phanerozoic. Therefore, the
Archean iron-rich rocks examined in this study will be referred to as iron-formation in the
remainder of this document. Iron-formations are considered unusual chemical
sediments because of their high contents of total Fe and SiO2. Iron-formations tend to
be found in Precambrian terranes over a wide time span (Figure 1.1). They first appear
in the rock record at ~3.8 Ga in Archean cratons (e.g. Isua, West Greenland) with their
overall volume reaching a maximum at ~2.5 Ga (iron-formations in the Hamersley Basin
of Western Australia; Klein, 2005). Around 1.8 Ga the iron-formations disappear from
the geologic record for roughly one billion years before briefly reemerging between 0.8–
0.6 Ga (Klein, 2005). Although large amounts of dissolved iron were present in the deep
oceans of the Archean (likely due to hydrothermal input), the environment was too
anoxic for iron-oxides (e.g. magnetite) to readily precipitate from seawater. Large
amounts of oxygen in the ocean began appearing at ~2.5 Ga (around the time of the
Great Oxidation Event), resulting in large quantities of iron-oxide precipitation, causing
greater numbers of banded iron-formations (BIF) to be produced in the Proterozoic as
compared to the Archean (Klein, 2005).

5
Figure 1.1. Relative abundance of Precambrian BIFs vs. time, with calculated curves for the atmospheric evolution for oxygen and carbon dioxide (Klein, 2005). Abundance of iron-formation is relative to a maximum (at ~2.5 Ga) represented by the total iron-formation volume of the Hamersley Range of Western Australia.
Because of the general association of Cl-enrichment with Fe-rich minerals
(Volfinger et al., 1985), a useful petrologic environment to examine enhanced chlorine
content in minerals is in high-grade iron-formations such as those found in the
Beartooth Mountains of Montana and Wyoming. These lithologies are also useful
because iron-formations tend to develop Fe-rich anhydrous assemblages at lower
temperatures than the more magnesian minerals. For crystallochemical reasons they
contain enhanced chlorine contents in minerals, which can be used as a probe into any
aqueous metamorphic fluid. Although studies have been done on Cl-rich amphibole and
biotite found in various other lithologies and geologic environments (Table 1.1), the
literature is relatively limited in examples of Cl-rich hydrous silicate minerals occurring in
high-grade Archean meta-iron-formations (e.g. Henry, 1988).

6
The purpose of this study is to examine the assemblage and mineral chemistry of
the chlorine-rich minerals as well as their coexisting minerals in the iron-formations, to
investigate the chemical relationship between the incorporation of Cl- and other ions, to
determine the pressure and temperature conditions of metamorphism using
geothermobarometry and phase equilibrium calculations, and to establish the utility of
chlorine-rich hydrous silicates to monitor the evolution of the fluid phase during high-
grade metamorphism.

7
CHAPTER II. GEOLOGIC SETTING 2.1 Wyoming Province
Samples used in this study are collected from the Beartooth Mountains, located
in the northwestern part of the Wyoming Province (Figure 2.1). The Wyoming Province
is a ~500,000 km2 area encompassing the majority of Wyoming as well as portions of
adjacent states (Figure 2.1; e.g. Mueller and Frost, 2006). The Wyoming Province is
bounded on three sides by Proterozoic collisional orogens: the Great Falls Tectonic
Zone (GFTZ) to the north, Dakota segment of the Trans-Hudson Orogen to the east,
and Cheyenne Belt to the south. To the west of the Wyoming Province are various
Proterozoic and Archean terranes, which probably extend to the rifted Neoproterozoic
margin, now marked by the 87Sr/86Sr = 0.706 line (Figure 2.1; Mueller and Frost, 2006).
This line represents a separation of older cratonic rocks of Laurentia in the east from
younger accreted terranes (e.g. flood basalts and volcanics) to the west (e.g. Armstrong
et al., 1977). Recent studies by Mueller and Wooden (2012) and Mueller et al. (2014) on
Lu-Hf isotopic compositions for 3.3-4.0 Ga detrital zircons in quartzites from the
Wyoming Province show decreasing minimum εHf values between 4.0 to ~3.6-3.5 Ga
and then a steady increase in minimum εHf values between ~3.6-3.5 to 3.3 Ga
suggesting that 4.0 to ~3.6 Ga reflects a more primitive (undepleted) source of material
for crustal growth. The sudden change to increasing εHf values from ~3.6 to 3.3 Ga is
representative of crustal growth forming from a more juvenile (depleted) source (Mueller
and Wooden, 2012; Mueller et al., 2014).

8
Figure 2.1. Schematic map of Archean and Proterozoic basement terranes of southwest Laurentia (modified from Foster et al., 2006). BTM = Beartooth Mountains, located in the gray box.
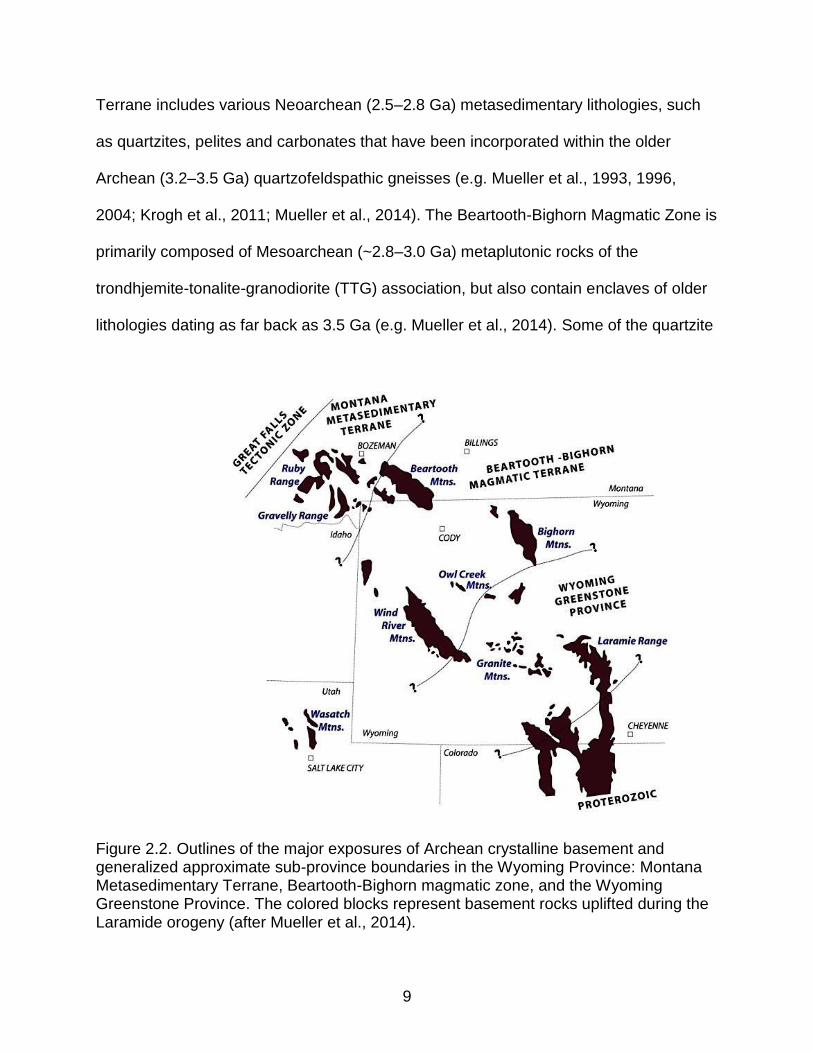
The Wyoming Province can be subdivided into three sub-provinces: the Montana
Metasedimentary Terrane (MMT), also called the Montana Metasedimentary Province
(MMP); the Beartooth-Bighorn Magmatic Zone (BBMZ); and the Southern Accreted
Terranes (SAT), otherwise known as the Wyoming Greenstone Province (WGP) (Figure
2.2; e.g. Mueller and Frost, 2006; Mueller et al., 2014). The Montana Metasedimentary
9
Terrane includes various Neoarchean (2.5–2.8 Ga) metasedimentary lithologies, such
as quartzites, pelites and carbonates that have been incorporated within the older
Archean (3.2–3.5 Ga) quartzofeldspathic gneisses (e.g. Mueller et al., 1993, 1996,
2004; Krogh et al., 2011; Mueller et al., 2014). The Beartooth-Bighorn Magmatic Zone is
primarily composed of Mesoarchean (~2.8–3.0 Ga) metaplutonic rocks of the
trondhjemite-tonalite-granodiorite (TTG) association, but also contain enclaves of older
lithologies dating as far back as 3.5 Ga (e.g. Mueller et al., 2014). Some of the quartzite
Figure 2.2. Outlines of the major exposures of Archean crystalline basement and generalized approximate sub-province boundaries in the Wyoming Province: Montana Metasedimentary Terrane, Beartooth-Bighorn magmatic zone, and the Wyoming Greenstone Province. The colored blocks represent basement rocks uplifted during the Laramide orogeny (after Mueller et al., 2014).
10
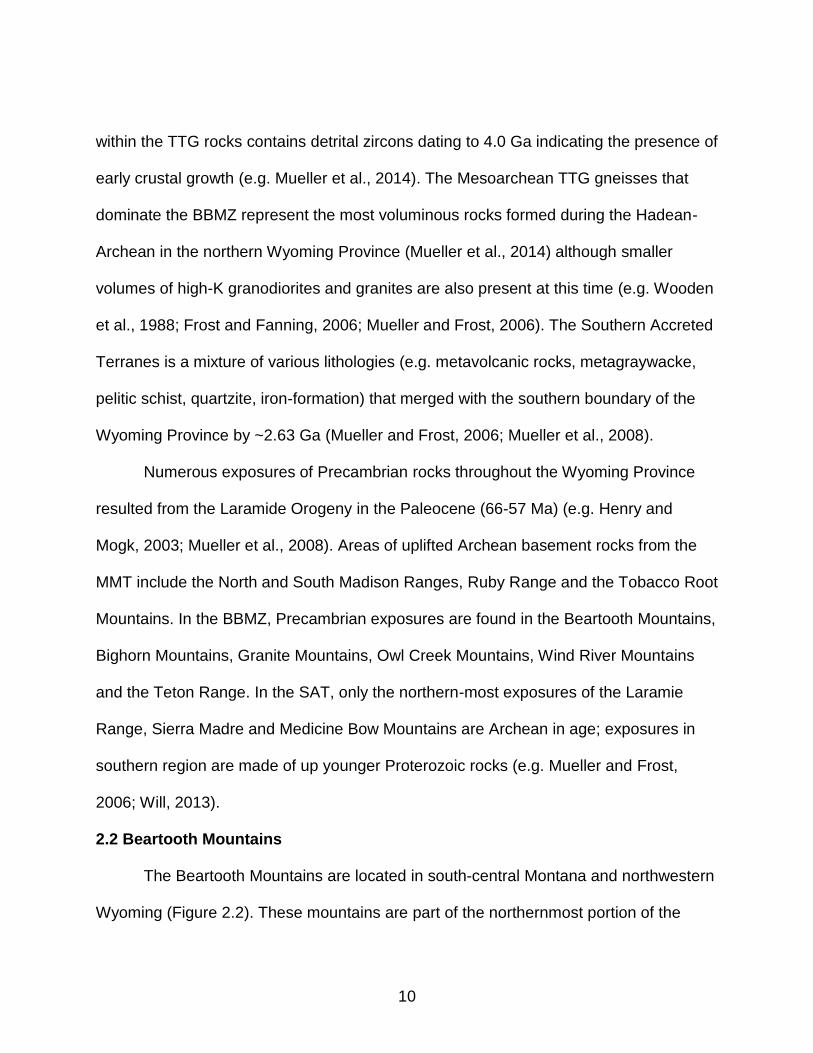
within the TTG rocks contains detrital zircons dating to 4.0 Ga indicating the presence of
early crustal growth (e.g. Mueller et al., 2014). The Mesoarchean TTG gneisses that
dominate the BBMZ represent the most voluminous rocks formed during the Hadean-
Archean in the northern Wyoming Province (Mueller et al., 2014) although smaller
volumes of high-K granodiorites and granites are also present at this time (e.g. Wooden
et al., 1988; Frost and Fanning, 2006; Mueller and Frost, 2006). The Southern Accreted
Terranes is a mixture of various lithologies (e.g. metavolcanic rocks, metagraywacke,
pelitic schist, quartzite, iron-formation) that merged with the southern boundary of the
Wyoming Province by ~2.63 Ga (Mueller and Frost, 2006; Mueller et al., 2008).
Numerous exposures of Precambrian rocks throughout the Wyoming Province
resulted from the Laramide Orogeny in the Paleocene (66-57 Ma) (e.g. Henry and
Mogk, 2003; Mueller et al., 2008). Areas of uplifted Archean basement rocks from the
MMT include the North and South Madison Ranges, Ruby Range and the Tobacco Root
Mountains. In the BBMZ, Precambrian exposures are found in the Beartooth Mountains,
Bighorn Mountains, Granite Mountains, Owl Creek Mountains, Wind River Mountains
and the Teton Range. In the SAT, only the northern-most exposures of the Laramie
Range, Sierra Madre and Medicine Bow Mountains are Archean in age; exposures in
southern region are made of up younger Proterozoic rocks (e.g. Mueller and Frost,
2006; Will, 2013).
2.2 Beartooth Mountains
The Beartooth Mountains are located in south-central Montana and northwestern
Wyoming (Figure 2.2). These mountains are part of the northernmost portion of the

11
Beartooth-Bighorn Magmatic Zone and are dominated by the Late Archean (~2.8 Ga)
gneissic and migmatitic rocks of the TTG suite together with a range of older
metasupracrustal (meta-igneous and metasedimentary) rocks (e.g. Mueller et al., 2014).
The Beartooth Mountains are typically divided into four geographically and geologically
distinct domains: the Stillwater Block, the North Snowy Block, the South Snowy Block,
and the Beartooth Plateau Block, which is sometimes referred to as the Main Beartooth
Massif (Figure 2.3; e.g. Mueller et al., 2014).
Figure 2.3. (a) The Wyoming Province and its sub-provinces, including the location of the Beartooth Mountains (adapted from Foster et al., 2006); (b) The four geographically and geologically distinct domains of the Beartooth Mountains (adapted from Mueller et al., 2014). BBMZ = Beartooth-Bighorn Magmatic Zone, HRP = Hellroaring Plateau, and QC = Quad Creek.
12
The Stillwater Block is dominated by the mafic igneous layered Stillwater
complex (2.7 Ga) and its contact aureole in older metasediments (e.g. Henry and Mogk,
2003). The North Snowy Block, originally thought to have undergone numerous
metamorphic events, was later determined to be comprised of an assortment of
lithologic units that were formed elsewhere and tectonically assembled together (e.g.
Reid et al., 1975; Wooden et al., 1988; Henry and Mogk, 2003). The South Snowy Block
comprises most of the southwestern part of the Beartooth Mountains. This area
contains numerous exposures of Late Archean granitic plutonic rocks that were intruded
into a thick sequence of metasedimentary rocks (e.g. pelitic schists, quartzites and
banded iron formation) known as the Jardine Metasedimentary Sequence (JMS; e.g.
Mueller et al., 2014).
The Beartooth Plateau Block is the eastern-most subdivision of the
Beartooth Mountains and comprises the majority of the mountain range (Figure 2.3).
The samples used in this study are from the Quad Creek (QC), Hellroaring Plateau
(HRP) and Rock Creek (RC) localities in the eastern portion of the Beartooth Plateau
Block. The area is lithologically dominated by the TTG rocks that characterize the
BBMZ, but also contains other meta-igneous and metasedimentary lithologies of varying
compositions and metamorphic grade (e.g. Henry and Mogk, 2003; Mueller et al., 2008,
2010). The TTG suite rocks in the eastern Beartooth Plateau Block are typified by an
intrusive body called the Long Lake magmatic complex (LLMC). The intrusion of the
LLMC occurred over a brief time span (2.79-2.83 Ga), and incorporated older (~3.5 Ga)
high-grade rocks into the LLMC lithologies as both xenoliths and tectonically interleaved
units. These older xenolithic lithologies in the Beartooth Plateau Block consist of

13
metabasites, peraluminous gneisses (migmatites), meta-iron-formations, meta-
ultramafic rocks, pelitic to psammatic schists, and quartzites, in addition to metaplutonic
quartzofeldspathic gneisses (e.g. Henry et al., 1982; Maier et al., 2012; Mueller et al.,
2014).
The tectonic setting of the Beartooth Mountains began ~4.0 Ga as a plume-
dominated area and later developed into a region of subduction-driven crustal growth at
~3.5–3.4 Ga, which eventually resulted in a tectonic mixing of supracrustal and meta-
igneous lithologies along high-grade ductile shear zones (e.g. Mueller et al., 2014). This
mixing event led to prograde metamorphism that reached granulite facies conditions of
~775-850 °C and ~6-8 kbar (Figure 2.4; e.g. Mueller et al., 2014). Late Archean
intrusions of subsolvus granites and granodiorites associated with the LLMC resulted in
an amphibolite-facies overprint of the original granulite facies conditions. This overprint
is most easily distinguished by the presence of pyroxene being partially and/or
completely replaced by secondary amphibole phases. In some lithologies a second
episode of granulite facies metamorphism can be seen locally overprinting the
amphibolite facies metamorphic event (e.g. Henry and Mogk, 2003; Mueller et al.,
2014).

14
Figure 2.4. Petrogenetic grid adapted from Spear et al. (1999) showing dehydration reactions (gold), H2O-saturated melting reactions (orange), dehydration-melting reactions (red), and aluminosilicate polymorph boundaries (blue) in pressure-temperature space. The gray-pink arrows suggest the approximate pressure-temperature path experienced by the metamorphic rocks in this area. The gray box indicates the results and standard deviation of the classic geothermobarometry for peak metamorphic conditions (Mueller et al., 2014).
15
CHAPTER III. METHODS 3.1 Sample Collection and Preparation
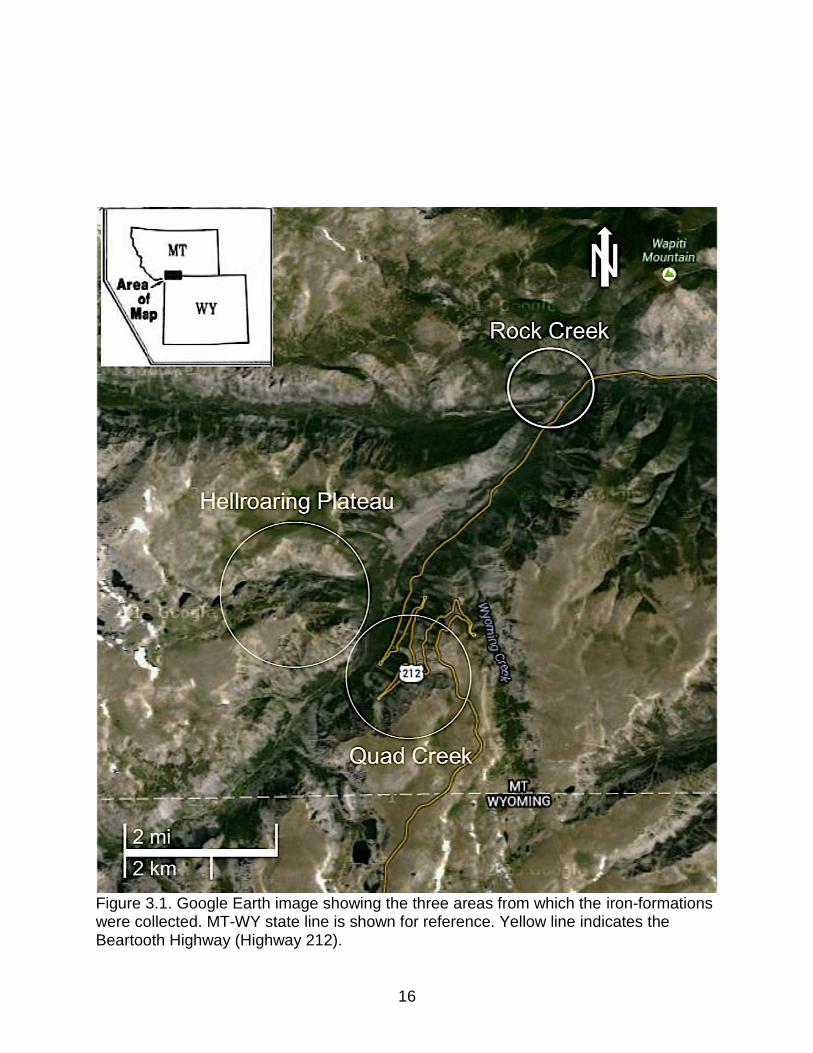
Twenty-six meta-iron-formation samples from the eastern portion of the
Beartooth Plateau Block are investigated in this study. The majority of these samples
were collected by Dr. Darrell Henry between 1981 and 2002. Nineteen of the iron-
formations were collected from the Quad Creek area, six from Hellroaring Plateau, and
one from Rock Creek.
Samples were labeled with an abbreviation of the locality (e.g. ‘QC’ for Quad
Creek; ‘HR’ or ‘HP’ for Hellroaring Plateau; ‘RC’ for Rock Creek) followed by ‘81,’ ‘82’ or
‘02’ to represent the year the sample was collected, and a dash followed by the
chronological number of the collected sample in that particular locale. The latitude and
longitude for all samples were recorded in the field or later established with Google
Earth using the locations established on topographic maps. A Google Earth map with
general locations of all samples is shown in Figure 3.1.
3.2 Petrographic and Microanalytical Methods 3.2.1 Petrographic Analysis
Rock chips from each sample were cut using a diamond-embedded rock saw.
Billets were made into polished thin sections that are approximately 30 micrometers
thick. Petrographic analyses of the thin sections were completed in plane-polarized light
(PPL), cross-polarized light (XPL) and reflected light using Olympus BH-2 and Olympus
BX50 petrographic microscopes to gather information on minerals, modes and
associations, textural features, and alterations. The petrography was used to establish
the optimal grains to analyze for mineral chemistry using the electron microprobe.
16
Figure 3.1. Google Earth image showing the three areas from which the iron-formations were collected. MT-WY state line is shown for reference. Yellow line indicates the Beartooth Highway (Highway 212).

17
Commonly observed minerals (and their abbreviations) in these samples are given in
Table 3.1. Whole thin section scans were acquired using a HP Scan Jet G4010 and
used as an additional [larger] base map reference for electron microprobe analyses.
Thin section photomicrographs were taken at 4-, 10-, 20- and 40-times magnifications
using a Nikon Coolpix 995 digital camera.
Table 3.1. List of minerals and their abbreviations (from Whitney and Evans, 2010)
Act Actinolite Cum Cummingtonite Opx Orthopyroxene
Amp Amphibole Grt Garnet Pl Plagioclase
Ank Ankerite Gru Grunerite Py Pyrite
Ap Apatite Hst Hastingsite Qz Quartz
Bt Biotite Hem Hematite Sd Siderite
Chl Chlorite Hbl Hornblende Tur Tourmaline
Cam Clinoamphibole Ilm Ilmenite Zrn Zircon
Cpx Clinopyroxene Mag Magnetite
Backscattered electron (BSE) images were taken using the JEOL 733 electron
microprobe (EPMA) at Louisiana State University (LSU). The images were taken under
high vacuum conditions of 10-7 torr, at an accelerating potential of 15 kV, using a 10–11
nA beam current. The BSE image gray levels are a function of the mean atomic weight
of the minerals such that minerals with lower mean atomic weights (e.g. quartz) appear
darker than minerals with a higher mean atomic weight (e.g. magnetite). These images
18
aid in mineral identification and can provide additional information regarding textures
(e.g. pyroxene exsolution) and chemical zoning.
Modal amounts of minerals in thin section were determined for many of the iron-
formation samples using three different techniques: visual estimates, point counting,
and the image analysis software, ImageJ® (Schneider et al., 2012). Visual estimations
were done by scanning the samples using a simple petrographic microscope. For point
counting, 1000 points were counted across entire thin sections. Point counts were done
on two samples (QC-IS and HR02-3) to cross-check the validity of the ImageJ® software
and to compare the determined modal amounts with the other two techniques. The
ImageJ® software allows a user to assign gray-scale values from BSE images to
specific mineral phases. When analyzing non-banded samples with ImageJ, BSE
images from three representative areas were averaged together to get the best
representative modes for each sample. In banded samples, BSE images from 2-3
representative areas were averaged from both the silicate/oxide-rich bands and the
quartz-rich bands. The different bands were treated as separate rock systems and
averages from each type of band were calculated to generate the best modal estimates
of each mineral in both types of band. For sample HR02-71, modes were determined
separately for the amphibole band and for the remainder of the rock. Alteration
amphibole was counted as orthopyroxene for all three techniques.
Visually estimating modal amounts of minerals is the least accurate method of
determination of modes. The point counting and ImageJ approach are relatively
accurate, but also both have room for error. The accuracy of mineral modes determined
by point counts is function of the petrographer’s ability to adequately distinguish mineral

19
phases from one another. Thus, a more experienced petrographer may generate
different modal amounts than someone less experienced. With ImageJ, the modal
amounts may be slightly skewed if certain mineral phases have a similar mean atomic
weight, causing the shades of gray to slightly overlap. However, this software makes it
easier to distinguish minerals by gray levels if they appear similar under the
petrographic microscope. For this reason, the image analysis software is the easier and
quicker approach to gathering modal amounts. In this study, BSE images were
analyzed in ImageJ® while simultaneously being viewed under a petrographic
microscope to help with distinguishing minerals in the case of overlapping gray levels.
3.2.2 Mineral Chemical Analysis
Amphibole, biotite, pyroxene, garnet and plagioclase were quantitatively
analyzed by wavelength-dispersive spectrometry (WDS) using the electron probe micro-
analyzer (EPMA) at LSU. The WDS analyses were done using a 2 μm electron-beam
diameter at high vacuum conditions of 10-7 torr, with an accelerating potential of 15 kV,
and using a 10–11 nA beam current. For each type of mineral, ~4-6 grains were
analyzed in each thin section, with ~2-4 analysis points on each grain. A set of well-
characterized natural mineral standards were used as standards and routinely analyzed
as unknowns to check for instrument drift (standards are listed in Table 3.2). The
empirical method of Bence-Albee (1968) was used for matrix corrections. In addition,
correction factors were applied to weight percent oxide data if instrument drift was
substantial. This was done by averaging values from each element from the standards
that were analyzed as ‘unknowns’ and subtracting those averages from the known
values of the elements in the standard. If this difference was larger than two relative
20
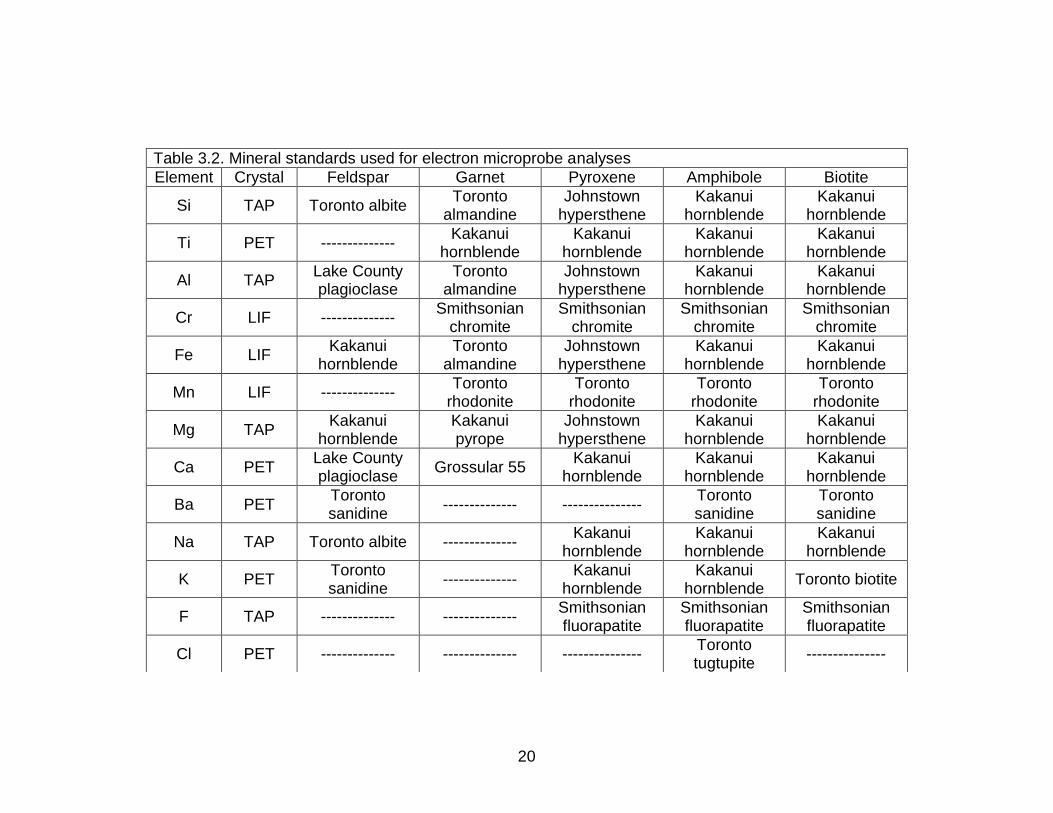
Table 3.2. Mineral standards used for electron microprobe analyses
Element Crystal Feldspar Garnet Pyroxene Amphibole Biotite
Si TAP Toronto albite Toronto
almandine Johnstown
hypersthene Kakanui
hornblende Kakanui
hornblende
Ti PET -------------- Kakanui
hornblende Kakanui
hornblende Kakanui
hornblende Kakanui
hornblende
Al TAP Lake County plagioclase
Toronto almandine
Johnstown hypersthene
Kakanui hornblende
Kakanui hornblende
Cr LIF -------------- Smithsonian
chromite Smithsonian
chromite Smithsonian
chromite Smithsonian
chromite
Fe LIF Kakanui
hornblende Toronto
almandine Johnstown
hypersthene Kakanui
hornblende Kakanui
hornblende
Mn LIF -------------- Toronto
rhodonite Toronto
rhodonite Toronto
rhodonite Toronto
rhodonite
Mg TAP Kakanui
hornblende Kakanui pyrope
Johnstown hypersthene
Kakanui hornblende
Kakanui hornblende
Ca PET Lake County plagioclase
Grossular 55 Kakanui
hornblende Kakanui
hornblende Kakanui
hornblende
Ba PET Toronto sanidine
-------------- --------------- Toronto sanidine
Toronto sanidine
Na TAP Toronto albite -------------- Kakanui
hornblende Kakanui
hornblende Kakanui
hornblende
K PET Toronto sanidine
-------------- Kakanui
hornblende Kakanui
hornblende Toronto biotite
F TAP -------------- -------------- Smithsonian fluorapatite
Smithsonian fluorapatite
Smithsonian fluorapatite
Cl PET -------------- -------------- --------------- Toronto tugtupite
---------------

21
weight percent, a correction factor [of standard element value/average of ‘unknown’]
was applied to the data points analyzed in a given sample. Data gathered from EPMA
analyses was supplemented by chemical data previously collected by Dr. Darrell Henry
(personal communication).
Weight percent oxide analyses from the EPMA were normalized to atoms per
formula unit (apfu) based on specified numbers of oxygens or cations. Pyroxene,
garnet, feldspar and biotite data were normalized and classified using Excel
spreadsheets created by Darrell Henry (personal communication). The amphibole
spreadsheet was initially created by Locock (2013) and later modified by Darrell Henry.
Pyroxene analyses were normalized on the basis of 6 oxygen atoms, garnet on the
basis of 12 oxygen atoms, and feldspar on the basis of 8 oxygen atoms. Biotite was
normalized on the basis of 22 oxygens, with the amount of OH calculated to make (OH
+ F + Cl) = 4. All iron present in the chemical analyses was initially assumed to be FeO
(Fe2+); however, these spreadsheets calculate the amount of Fe3+ based on charge
balance and stoichiometry assuming no vacancies.
Amphibole analyses were normalized and classified on the basis of cation sums
using the following [potential] cations: Si, P, Ti, Zr, Al, Sc, V3+, Cr, Mn2+, Mn3+, Fe2+,
Fe3+, Co, Ni, Zn, Be, Mg, Ca, Sr, Li, Na, Pb, K. From this list of cations, one or more of
the following normalization schemes is used: (1) Sum of cations from Si to Ca, plus Li =
15; (2) Sum of cations from Si to Mg, plus Li = 13; (3) Sum of cations from Si to Na =
15; (4) Sum of cations from Si to K = 16 (Locock, 2013). To account for the more Ba-
rich minerals, Darrell Henry modified this spreadsheet using Ba in place of Pb. The
amphibole spreadsheet can also be set up to calculate values for Fe3+ and OH

22
assuming no vacancy. Typically, valence states of Fe are not differentiated by EPMA
analyses and all iron is assumed to be FeO. The Locock spreadsheet calculates a Fe3+
value using the Fe3+/ΣFe ratio (adjusted for charge balance) and the normalized
amphibole formula based on the cations sums chosen from the classification schemes
mentioned previously. Due to elevated Ti concentrations in some amphibole analyses,
the OH calculations are estimated on the basis of Ti content with the assumption that
(OH, F, Cl) = 2-2Ti apfu.
3.3 Determination of Pressure-Temperature-Fluid Conditions
To determine the pressure, temperature and fluid conditions during a rock’s
metamorphic history a variety of thermobarometers, phase equilibrium diagrams and
fluid model calculations were done. Each of these approaches is discussed
subsequently.
3.3.1 Thermobarometers
Mineral chemical data acquired from the EPMA was used to calculate P-T
metamorphic conditions of selected iron-formations using a variety of robust
geothermobarometers including a hornblende-plagioclase [net transfer] thermometer
(Holland and Blundy, 1994), an orthopyroxene-garnet [Fe-Mg exchange] thermometer
(Sen and Bhattacharya, 1984) and a garnet-clinopyroxene [Fe-Mg exchange]
thermometer. The temperatures were calculated using assumed pressures of 5.0, 6.0,
6.5 and 7.0 kbar consistent with earlier estimates of peak metamorphic pressures
experienced by rocks in the study area (e.g. Henry, 1988; Mueller et al., 2014). One
geobarometer (the garnet-amphibole- plagioclase-quartz barometer) was used to gather
pressure conditions (e.g. Kohn and Spear, 1990).

23
The formulation of the hornblende-plagioclase thermometer of Holland and
Blundy (1994) includes two separate thermometric expressions based on net-transfer
reactions involving components of amphibole and plagioclase. The two
geothermometers, known as ‘HB1’ and ‘HB2,’ refer to the following thermometry
calibration reactions:
NaCa2Mg5Si7AlO22(OH)2 + 4SiO2 = Ca2Mg5Si8O22(OH)2 + NaAlSi3O8 (HB1)
Edenite + 4 Quartz = Tremolite + Albite NaCa2Mg5Si7AlO22(OH)2 + 2NaAlSi3O8 = Na(CaNa)Mg5Si8O22(OH)2 + CaAl2Si2O8 (HB2)
Edenite + 2 Albite = Richterite + Anorthite Both HB1 and HB2 can be used for silica-saturated mineral assemblages, but only HB2
(the quartz-free calibration) can be used on rocks without SiO2. Although both of these
hornblende-plagioclase thermometers perform well (with uncertainties of ±40°C) for
equilibrium conditions of 400-1000°C and 1-15 kbar over a broad range of bulk
compositions (Holland and Blundy, 1994), temperatures calculated using the HB2
calibration are preferred because HB2 can be used for both silica-saturated and silica-
undersaturated rocks. An accompanying Excel spreadsheet was created by Anderson
et al. (2008) and later modified by Darrell Henry (personal communication) to calculate
peak metamorphic temperature based on weight percent oxide, plagioclase mole
fraction, and arbitrary pressure values input by the user.
The orthopyroxene-garnet thermometer (Sen and Bhattacharya, 1984) is an Mg-
Fe2+ exchange thermometer. This geothermometer is formulated for varying lithologies

24
that have been metamorphosed at granulite facies conditions and has an uncertainty of
±60°C (Sen and Bhattacharya, 1984).
The garnet-clinopyroxene thermometer formulated by Nakamura (2009) is also
an Mg-Fe2+ exchange thermometer. This thermometer was formulated using 333
garnet-clinopyroxene pairs from published experimental data (experiments done
between 800 and 1820°C). The temperatures calculated for the experimental grt-cpx
pairs using Nakamura’s thermometer gave comparable results to the experimental data,
with an uncertainty of ±74°C.
The garnet-amphibole-plagioclase-quartz geobarometer (Kohn and Spear, 1990)
can be applied to a wide range of lithologies that contain garnet, amphibole, plagioclase
and quartz in their mineral assemblage. This barometer was calibrated based on 37
natural samples that equilibrated between 2.5–13 kbar and 500–800°C and has an
uncertainty of ±0.5 to ±1 kbar.
3.3.2 Equilibrium Assemblage Diagrams (Pseudosections)
An equilibrium assemblage diagram, also called a pseudosection, is a type of
phase diagram that plots the stability fields of different equilibrium mineral assemblages
in pressure-temperature space for a single bulk-rock composition (e.g. de Capitani and
Petrakakis, 2010). The assemblages in these diagrams are calculated from internally
consistent thermodynamic databases (e.g. de Capitani and Petrakakis, 2010). Multiple
programs have been created to calculate these phase relationships (e.g.
THERMOCALC (Powell and Holland, 1988); Perple_X (Connolly, 1987)). The
Theriak/Domino (de Capitani and Petrakakis, 2010) program is used for this study. The
database used here is a THERMOCALC format file (‘tcds55.txt’) originally created by

25
Powell and Holland (2003) that was later converted into a Theriak-Domino format file
(‘tcd55dt.txt’) by Doug Tinkham (2008). Solution models used from this database are:
clinoamphibole (Diener et al., 2007), clinopyroxene (Green et al., 2007), orthopyroxene
(Holland and Powell, 1996), garnet (White et al., 2007), chlorite (Holland et al., 1998),
feldspar (Holland and Powell, 2003), olivine (Holland and Powell, 1998) and melt
(Holland and Powell, 1998, plus updates from White et al., 2007). The results from the
diagrams generated in this study are compared with thermobarometric calculations.
A user-specified bulk-rock composition, required as input for Theriak/Domino,
was determined by the Rock Maker program (Büttner, 2012) using mineral modes and
electron microprobe data for the major mineral phases in these samples. The Rock
Maker program converts modal amounts of minerals into molar amounts of each
element, allowing for the determination of the whole rock’s (or one type of band’s) bulk
composition. Standard pure end-member compositions for quartz and magnetite, as
well as representative microprobe compositions for pyroxene(s) and garnet were used
as input for these calculations. The quartz was assumed to be 100 wt% SiO2 and the
magnetite was assumed to be 68.97 wt% Fe2O3 and 31.03 wt% FeO.
For all samples used for pseudosection calculation, total modes with magnetite
and without magnetite (i.e. renormalized modes removing the magnetite contributions)
were reported. The magnetite in these iron-formations essentially contains as much iron
as possible such that this iron does not interact with any of the surrounding minerals
during progressive metamorphism. Therefore, the magnetite acts as an inert phase and
can be subtracted from the modal amounts, providing a more accurate “effective bulk
composition” of each sample. This “effective bulk composition” (the composition of the
26
remaining minerals, excluding magnetite) is the preferred method to determine the
reactive composition for further calculations.
3.4 Halogen Fugacity Calculations
The replacement of OH by variable amounts of F and Cl in amphibole and biotite
can be a potential indicator of the relative activities of HF and HCl in a hydrothermal
fluid (e.g. Munoz and Swenson, 1981). Munoz and Swenson developed a quantitative
approach for determining relative HF and HCl fugacities of a metamorphic fluid based
on Cl and F in biotite. The relative amount of Cl or F in a metamorphic fluid interacting
with biotite can is determined using log values of halogen fugacity ratios (calculated
from mole fractions of Cl, F and Mg[VI]), and the temperature (‘T’) at which a rock
equilibrated. The biotites used in their study were found in molybdenite deposits and
porphyry copper deposits, with fugacity ratios ranging from ~0 to -1.5. Log values of
halogen fugacity ratios for three of the samples in this study were calculated using mole
fractions of Cl, F and Mg (determined from electron microprobe analyses) and specified
temperature values chosen based on results from geothermometry calculations. Results
are compared to the Munoz and Swenson study.

27
CHAPTER IV. RESULTS 4.1 Sample Locations Twenty-six iron-formation samples from the eastern Beartooth Mountains
(Montana) were analyzed: nineteen from the Quad Creek area, six from the Hellroaring
Plateau area and one from the Rock Creek area. Sample locations are shown in Table
4.1 and general areas in Figure 4.1.
4.2 Sample Descriptions and Petrographic Observations Based on the macroscopic appearance, the iron-formations can generally be
divided into banded and granoblastic varieties. Although some variations exist among
and within samples, the mineral assemblages are typically quartz (qz) + magnetite
(mag) + orthopyroxene (opx) + garnet (grt) ± clinopyroxene (cpx) ± calcic clino-
Table 4.1. Iron-formation sample locations in the Beartooth Mountains*
Sample Latitude Longitude Sample Latitude Longitude
QC-IS 45.028143 -109.415692 QC82-46 45.024602 -109.418431
QC-JW3 45.028143 -109.415692 QC82-47 45.024602 -109.418431
QC81-1 45.028143 -109.415692 QC82-48a 45.024602 -109.418431
QC81-4c 45.028143 -109.415692 QC82-48b 45.024602 -109.418431
QC81-5 45.028143 -109.415692 QC82-49a 45.024602 -109.418431
QC81-6 45.028143 -109.415692 QC82-49b 45.024602 -109.418431
QC81-40a 45.028143 -109.415692 RC81-168a 45.083396 -109.382075
QC81-40b 45.028143 -109.415692 HR02-3 45.045008 -109.446468
QC81-45 45.028143 -109.415692 HR02-71 45.047767 -109.450651 QC81-66 45.028162 -109.415984 HR02-72 45.047767 -109.450651 QC81-113 45.027785 -109.415547 HP81-77 45.040435 -109.451776 QC82-44 45.024602 -109.418431 HP81-82 45.040468 -109.451768
QC82-45 45.024602 -109.418431 HP82-59 45.047778 -109.450744 * Latitude and longitude locations determined by Darrell Henry (personal communication)

28
Figure 4.1. Google Earth image showing specific sample locations of iron-formation from the Quad Creek and Hellroaring Plateau localities. MT-WY state line is shown for reference. Yellow line indicates the Beartooth Highway (Highway 212). Not pictured is the Rock Creek sample location.
amphibole (cam) ± biotite (bt) ± plagioclase (pl). A variety of trace minerals (e.g. apatite,
ilmenite) and alteration minerals (e.g. carbonate in fractures, amphibole altering
pyroxene rims) are observed as well. Mineral modes determined based on the three
previously mentioned techniques are given in Tables 4.2-4.6.

29
Table 4.2. Visually Estimated Mineral Modes for Quad Creek Samples NB
25
31
13
20
6
5
tr tr
tr
in mag
x
x x
---associated with fractures/rims---
Sample B or NB
Qz Mag Grt Opx Cpx Cam Bt Pl Ap Zrn Tur Ilm Hem Py Gru-Cum-Act Sd-Ank Cpx
QC-IS NB 25 31 13 20 6 5 tr tr tr x x x x
QC-JW3 B x x x x x x tr tr x x x
x
----- Fe 8 40 8 20 24 ----- qz 85 7 3 3 2
QC81-1 ----- x x x x x x x QC81-4c NB 27 30 18 21 4 tr tr x QC81-5 ----- x x x x x x x
QC81-6 NB 29 26 21 16 4 4 tr x
QC81-40a B x x x x x x x x x x
----- Fe 40 10 25 25 tr tr tr
----- qz 75 3 22 tr tr tr
QC81-40b NB 30 26 13 29 tr 2 QC81-45 B x x x x x tr tr x x x
x
----- Fe 19 30 27 18 6 tr ----- qz 65 18 14 3 tr
QC81-66 NB 25 18 27 30 tr tr tr x x x
x QC81-113 NB 23 20 23 34 tr tr tr tr x QC82-44 B x x x x tr x tr tr x x
x
----- Fe 13 44 32 5 tr 4 tr tr 2
----- qz 93 3 1 2 1 tr tr tr
QC82-45 NB 13 8 34 38 tr 4 3 tr x x
x
x QC82-46 ----- x x x x x x tr tr tr tr tr tr QC82-47 ----- x x x x x tr tr tr
QC82-48a B x x x x x x tr x tr tr
----- Fe 10 8 4 2 1 70 5 tr tr
----- qz 95 4 tr tr tr tr tr 1 tr x
30
(Table 4.2 continued)
---associated with fractures/rims---
Sample B or NB
Qz Mag Grt Opx Cpx Cam Bt Pl Ap Zrn Tur Ilm Hem Py Gru-Cum-Act Sd-Ank Cpx
QC82-48b ----- x x x x x tr tr QC82-49a ----- x x x x x x tr tr
QC82-49b ----- x x x x x x x x tr tr
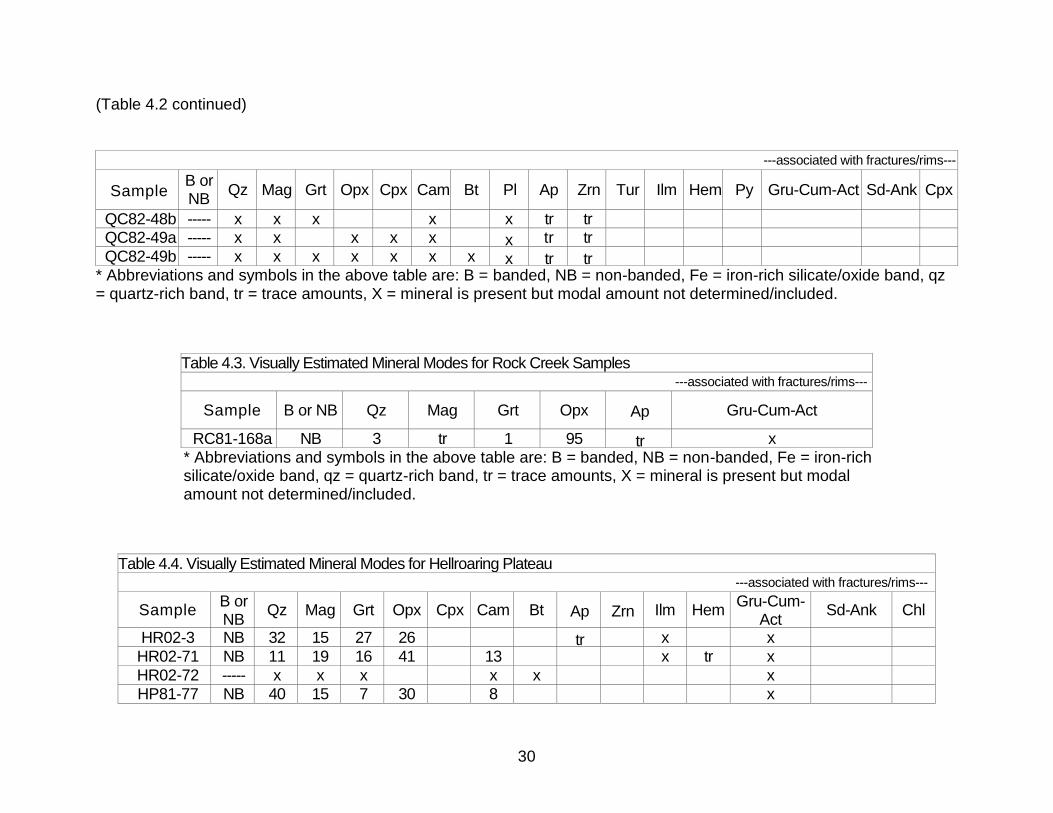
* Abbreviations and symbols in the above table are: B = banded, NB = non-banded, Fe = iron-rich silicate/oxide band, qz = quartz-rich band, tr = trace amounts, X = mineral is present but modal amount not determined/included.
Table 4.3. Visually Estimated Mineral Modes for Rock Creek Samples ---associated with fractures/rims---
Sample B or NB Qz Mag Grt Opx Ap Gru-Cum-Act
RC81-168a NB 3 tr 1 95 tr x * Abbreviations and symbols in the above table are: B = banded, NB = non-banded, Fe = iron-rich silicate/oxide band, qz = quartz-rich band, tr = trace amounts, X = mineral is present but modal amount not determined/included.
Table 4.4. Visually Estimated Mineral Modes for Hellroaring Plateau ---associated with fractures/rims---
Sample B or NB
Qz Mag Grt Opx Cpx Cam Bt Ap Zrn Ilm Hem Gru-Cum-
Act Sd-Ank Chl
HR02-3 NB 32 15 27 26 tr x x
HR02-71 NB 11 19 16 41 13 x tr x
HR02-72 ----- x x x x x x HP81-77 NB 40 15 7 30 8 x

31
(Table 4.4 continued)
HP81-82 NB 10 6 55 10 15 4 tr tr tr x x x
HP82-59 B x x x x x tr x
----- Fe 11 8 50 28 3 x
----- qz 95 2 1 2 x
* Abbreviations and symbols in the above table are: B = banded, NB = non-banded, Fe = iron-rich silicate/oxide band, qz = quartz-rich band, tr = trace amounts, X = mineral is present but modal amount not determined/included.
Table 4.5. Mineral Modes Determined by Point Counts (based on 1000 points) ---associated with fractures/rims---
Sample B or NB Qz Mag Grt Opx Cpx Cam Ap Hem Gru-Cum-Act Sd-Ank
QC-IS NB 29.7 30.4 10.2 15.6 4.8 9.2 0.1 x x x HR02-3 NB 36.8 14.3 23.7 25.2 tr x
x
* Abbreviations and symbols in the above table are: B = banded, NB = non-banded, Fe = iron-rich silicate/oxide band, qz = quartz-rich band, tr = trace amounts, X = mineral is present but modal amount not determined/included.
Table 4.6. Mineral Modes Determined with ImageJ ---associated with fractures/rims---
Sample B or NB Qz Mag Grt Opx Cpx Cam Bt Pl Ilm Hem Gru-Cum-Act Sd-Ank Other (holes)
QC-IS NB 25.8 18.7 7.8 28.6 9.56 4.84 2.15 x 1.77 1.41
QC-JW3 Fe 12.2 38.0 14.9 7.72 22.95 0.33 x 3.02 1.92
----- qz 86.5 4.71 1.84 3.81 0.87 0.21 x 2.56
QC82-44 Fe 24.1 31.8 32.7 4.17 0.71 1.60 0.48 x 4.41
----- qz 93.3 1.50 0.07 1.08 3.92
QC82-45 NB 37.5 2.98 23.6 31.8 0.23 0.62 x 1.95 0.97
32
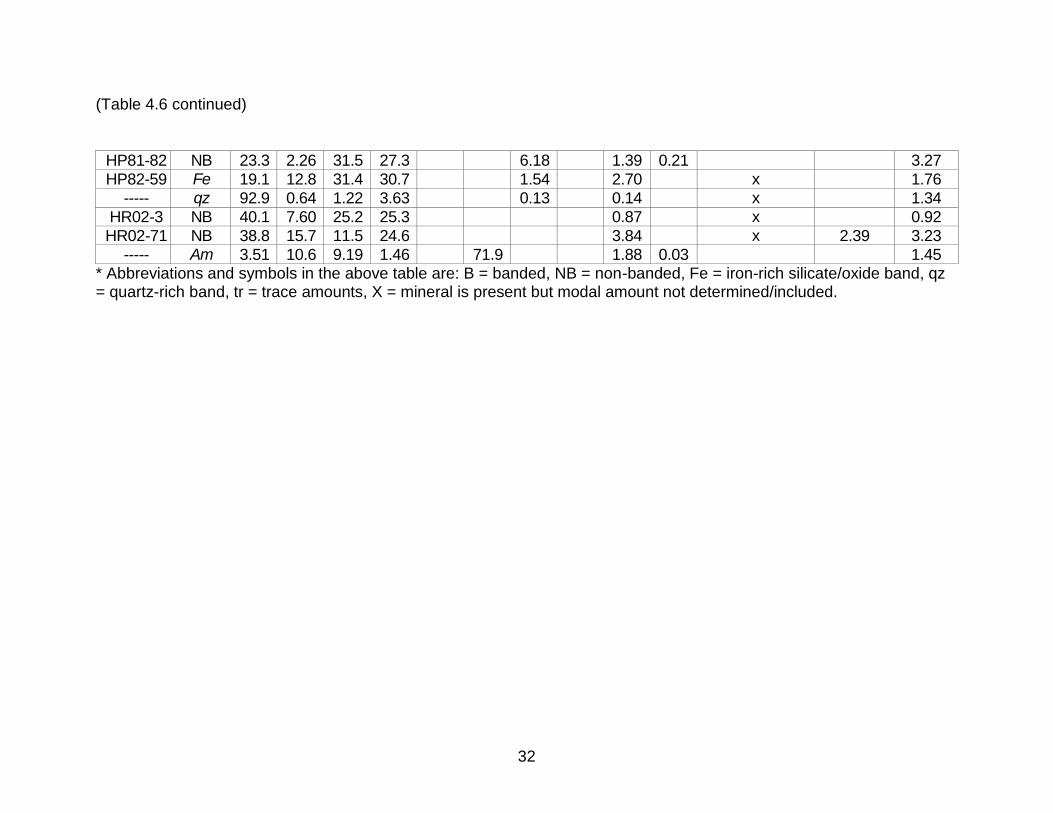
(Table 4.6 continued)
HP81-82 NB 23.3 2.26 31.5 27.3 6.18 1.39 0.21 3.27
HP82-59 Fe 19.1 12.8 31.4 30.7 1.54 2.70 x x
1.76
----- qz 92.9 0.64 1.22 3.63 0.13 0.14 x x
1.34
HR02-3 NB 40.1 7.60 25.2 25.3 0.87 x x
0.92
HR02-71 NB 38.8 15.7 11.5 24.6 3.84 x x
2.39 3.23
----- Am 3.51 10.6 9.19 1.46 71.9 1.88 0.03 1.45 * Abbreviations and symbols in the above table are: B = banded, NB = non-banded, Fe = iron-rich silicate/oxide band, qz = quartz-rich band, tr = trace amounts, X = mineral is present but modal amount not determined/included.

33
4.2.1 Non-banded Samples
Twelve of the investigated meta-iron-formations are non-banded (Figures 4.2 and
4.3). These are typically fine- to medium-grained rocks with a dark grayish-blue color
resulting from the abundance of mafic minerals and iron oxide. The dominant minerals
in these samples are quartz, magnetite, garnet and pyroxene, with lesser amounts of
amphibole or biotite, and, in some cases, plagioclase. Trace amounts of apatite, zircon
and ilmenite are locally present. Tourmaline and pyrite have been rarely observed
(Darrell Henry, personal communication). With the exception of a singular sample from
Figure 4.2. A non-banded iron-formation from Hellroaring Plateau of the eastern Beartooth Mountains, MT. The primary mineral assemblage is qz + mag+ grt + opx + bt + ilm. Ruler scale in centimeters. Image credit: Nick Daigle. Photograph of sample HP81-82.

34
Figure 4.3. A homogeneous non-banded iron-formation from Hellroaring Plateau of the eastern Beartooth Mountains, MT. The primary mineral assemblage is qz + mag + grt + opx + ilm. Image credit: Nick Daigle. Optical scan of a thin section of sample HR02-3.
the Rock Creek locality, there is little variation in the dominant mineral assemblage
between the non-banded and banded samples. The sample from Rock Creek is almost
entirely comprised of orthopyroxene and is lacking abundant magnetite and quartz.
Sample HR02-71, although primarily non-banded, does contain a relatively large, green
amphibole-rich band that is easily seen macroscopically.
4.2.2 Banded Samples
The banded meta-iron-formations typically contain similar mineral assemblages
as the non-banded samples. Modal amounts of these minerals vary considerably
among the Fe-rich silicate and oxide bands and the quartz-rich bands (Table 4.2).
Lighter-colored bands are dominated by quartz and darker colored bands are comprised
mainly of magnetite and ferromagnesian silicate phases. Distinct banding is easily seen
in some samples, whereas others may appear to be non-banded until viewed in thin
section. Examples of a well-banded hand sample and thin section are shown in Figures
4.4 and 4.5.
35
Figure 4.4. A well-banded iron-formation from the Quad Creek locality of the eastern Beartooth Mountains, MT. Bands range in size from ~0.1 to 1 cm. The silicate/oxide-rich bands have a primary mineral assemblage of qz + mag + opx + am + pl + ilm and the quartz-rich bands have a primary mineral assemblage of almost entirely qz, with minor amounts of mag, opx and am. The amphibole in this sample is primary amphibole. Ruler scale in centimeters. Image credit: Nick Daigle. Photograph of sample QC82-44.
Figure 4.5. A well-banded iron-formation from the Quad Creek locality in the eastern Beartooth Mountains, MT. The silicate/oxide-rich bands have a primary mineral assemblage of qz + mag + grt + opx + cpx + am, and the quartz-rich bands have a primary mineral assemblage of qz + mag + opx + cpx + am. Image credit: Nick Daigle. Optical scan of a thin section of sample QC81-45.

36
4.2.3 Petrography
Petrographic analyses show the iron-formations contain a general metamorphic
mineral assemblage of qz + mag + opx + grt ± cpx ± am ± bt ± pl (Figures 4.6 and 4.7)
with some trace amounts of apatite, zircon, ilmenite, and rarely hematite and chlorite
alteration. Carbonate minerals are commonly associated with fracture zones (mostly in
pyroxenes, but also garnet, plagioclase and magnetite) and quartz veins. Many of the
pyroxene grains in the samples are altered to secondary amphibole phases of actinolite,
grunerite and cummingtonite.
Figure 4.6. A granoblastic iron-formation with the mineral assemblage of qz + mag + grt + opx + cpx + am that is commonly seen in iron-formations from the Quad Creek locality in the eastern Beartooth Mountains, MT. Carbonate-quartz-bearing veins are also seen cross-cutting this area. Image credit: Nick Daigle. Photomicrograph of sample QC-IS taken in PPL.

37
Figure 4.7. View from Figure 4.6 shown in XPL. Image credit: Nick Daigle
Quartz grains vary widely in size from small (~50 μm) to relatively large (~4.25
mm). The largest of quartz grains are typically confined to quartz-rich bands of the
banded samples, with the smaller grains more commonly found in more massive
samples or the silicate/oxide-rich bands of banded samples. . The quartz in the non-
banded samples and the silicate/oxide-rich bands of banded samples are typically
equant and granoblastic with sharp, well-defined boundaries. The grains present in
quartz-rich bands appear to be recrystallized, with more irregular, lobate grain
boundaries. Undulatory extinction is commonly visible in quartz.
Plagioclase grains can typically be distinguished from quartz in these samples
due to the well-developed albite twinning present (Figure 4.8), as well as their alteration
to ankerite. The grains range in size from ~50 μm to ~750 μm with blocky shapes and

38
Figure 4.8. A representative area of a banded iron-formation from the Quad Creek locality in the eastern Beartooth Mountains, MT. The primary mineral assemblage in the silicate/oxide-rich band is qz + mag + opx + am + pl. The quartz areas on either side are composed of almost entirely quartz, along with minor amounts of mag/ilm, opx and am. Grain sizes tend to be larger in the qz-rich areas. This sample lacks garnet, but contains plagioclase. Image credit: Nick Daigle. Photomicrograph of sample QC82-44 taken in XPL.
commonly have inclusions of apatite. In plagioclase-bearing samples with abundant
garnet or amphibole, the plagioclase will occur adjacent to or near to the garnet or
amphibole. In samples that have lesser amounts of garnet or amphibole the plagioclase
tends to occur near magnetite, quartz and orthopyroxene.
Magnetite is the dominant iron oxide present. Magnetite ranges in size from ~25
μm to ~1,750 μm. The smaller grains usually have a well-defined cubic shape while the
larger grains are more subhedral-to-anhedral and are typically found in the
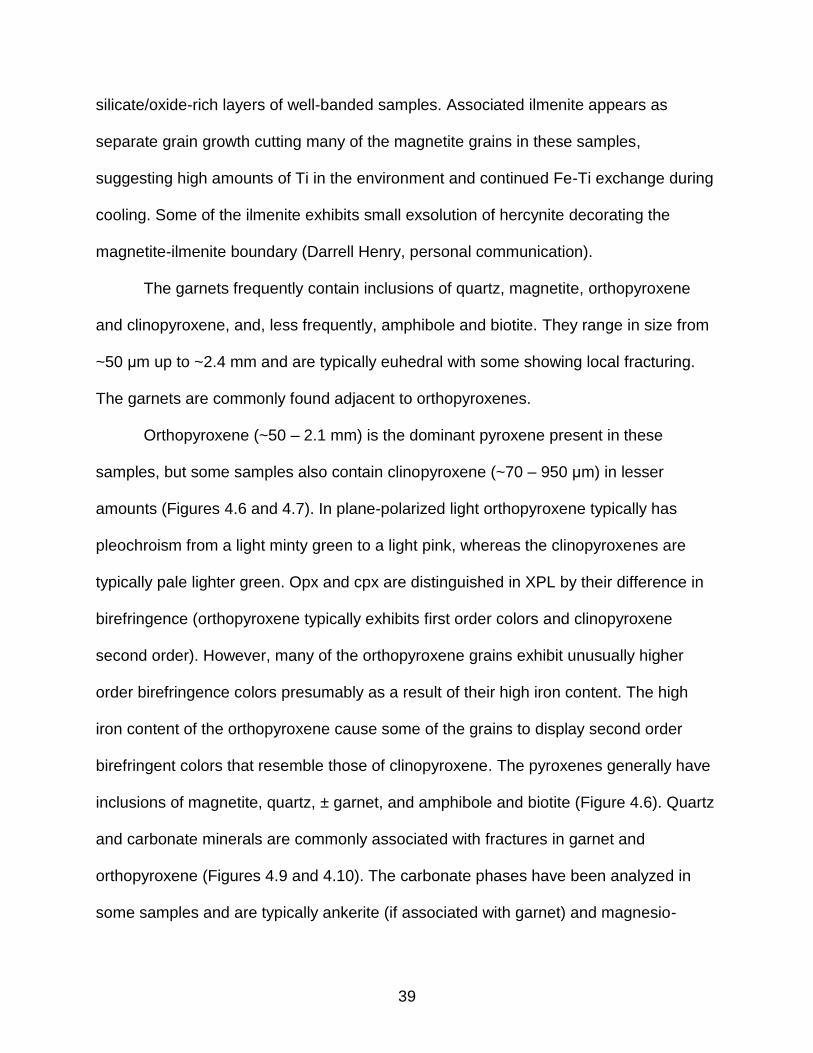
39
silicate/oxide-rich layers of well-banded samples. Associated ilmenite appears as
separate grain growth cutting many of the magnetite grains in these samples,
suggesting high amounts of Ti in the environment and continued Fe-Ti exchange during
cooling. Some of the ilmenite exhibits small exsolution of hercynite decorating the
magnetite-ilmenite boundary (Darrell Henry, personal communication).
The garnets frequently contain inclusions of quartz, magnetite, orthopyroxene
and clinopyroxene, and, less frequently, amphibole and biotite. They range in size from
~50 μm up to ~2.4 mm and are typically euhedral with some showing local fracturing.
The garnets are commonly found adjacent to orthopyroxenes.
Orthopyroxene (~50 – 2.1 mm) is the dominant pyroxene present in these
samples, but some samples also contain clinopyroxene (~70 – 950 μm) in lesser
amounts (Figures 4.6 and 4.7). In plane-polarized light orthopyroxene typically has
pleochroism from a light minty green to a light pink, whereas the clinopyroxenes are
typically pale lighter green. Opx and cpx are distinguished in XPL by their difference in
birefringence (orthopyroxene typically exhibits first order colors and clinopyroxene
second order). However, many of the orthopyroxene grains exhibit unusually higher
order birefringence colors presumably as a result of their high iron content. The high
iron content of the orthopyroxene cause some of the grains to display second order
birefringent colors that resemble those of clinopyroxene. The pyroxenes generally have
inclusions of magnetite, quartz, ± garnet, and amphibole and biotite (Figure 4.6). Quartz
and carbonate minerals are commonly associated with fractures in garnet and
orthopyroxene (Figures 4.9 and 4.10). The carbonate phases have been analyzed in
some samples and are typically ankerite (if associated with garnet) and magnesio-

40
Figure 4.9. Alteration of opx by carbonate minerals (in fracture) and secondary amphibole (grunerite on rims) in an iron-formation from the Hellroaring Plateau locality in the eastern Beartooth Mountains, MT. The primary mineral assemblage in this sample is qz + mag + grt + opx. Image credit: Nick Daigle. Photomicrograph of sample HR02-71 taken in PPL.
Figure 4.10. View from Figure 4.9 shown in XPL. Image credit: Nick Daigle.

41
siderite (if associated with orthopyroxene; Darrell Henry, personal communication). In
some samples, the pyroxene rims are altered or replaced by secondary amphibole of
actinolite, grunerite and/or cummingtonite (Figures 4.11 and 4.12). Additionally, some of
the clinopyroxene in the iron-formations contain exsolution lamellae of orthopyroxene,
interpreted to result from slow cooling.
Figure 4.11. A banded iron-formation from Hellroaring Plateau with green-blue secondary amphibole (actinolite) altering the rims of orthopyroxene grains. The purple-pink area in the lower left is a marker. Image credit: Nick Daigle. Photomicrograph of sample HP82-59 taken in XPL.

42
Figure 4.12. A banded iron-formation from Hellroaring Plateau showing complete replacement of pyroxene by secondary amphibole (actinolite and cummingtonite). Note the high birefringent colors and fine, acicular shape of the amphibole on the rims. Image credit: Nick Daigle. Photomicrograph of sample HP82-59 taken in XPL.
Amphiboles in these samples are distinguished by their characteristic 60/120
cleavage angles (when visible) and also the color of the grains in PPL. The pleochroic
scheme of the grains ranges from colorless-to-light green to a blue-green teal. In XPL,
many of the amphiboles have the same blue-green teal color, but grains with a
brownish-yellow color were also common. The amphiboles occur in the matrix and as
inclusions in pyroxene and garnet (Figure 4.6). In many samples, a secondary

43
amphibole (most commonly actinolite or grunerite) alters orthopyroxene rims (Figures
4.10 and 4.11), and in some cases completely replaces the pyroxenes (Figure 4.12).
The replacement amphibole typically has an acicular habit and higher XPL birefringence
colors than the primary amphibole, and appears essentially colorless in PPL. Some of
the primary amphibole grains are also extensively replaced by carbonate minerals.
Simple twinning is also observed in some of the primary amphibole grains.
Biotite grains are typically small, ranging from ~50-500 μm, with dark brown to
dark brownish-red pleochroism (Figure 4.13). Biotite grains occur as matrix minerals
(near pyroxene and garnet) as well as inclusions in both pyroxene and garnet. Small
biotite grains are occasionally observed adjacent to magnetite.
Figure 4.13. A non-banded iron-formation from Hellroaring Plateau showing a cluster of matrix biotite grains interstitial to orthopyroxene, garnet and magnetite. Image credit: Nick Daigle. Photomicrograph of sample HP81-82 taken in PPL.

44
Apatite, zircon and tourmaline are small, high relief minerals found in minor
amounts in some samples. Ilmenite commonly occurs in trace amounts in many of the
samples, sometimes with hercynite exsolution. Pyrite has also been observed rarely.
Many of the samples also contain a different suite of minerals associated with
fracture zones, most commonly in the form of replacement amphibole or carbonate
phases, with chlorite and clinopyroxene occurring less frequently. The amphibole is
usually a bright blue-green color altering pyroxene grains and the carbonate phases are
present as a yellowish-brown color altering pyroxene, garnet and magnetite grains.
4.3 Backscattered Electron Imaging (BEI)
Backscattered electron images enhance petrographic observations. These
images were used for mineral identification and to better observe any significant
textures, alteration or chemical zoning that may not be seen with a petrographic
microscope. None of the images show signs of identifiable chemical zoning in minerals,
but some minerals exhibit fine exsolution and alteration.
Magnetite grains from most samples show laths of ilmenite associated with the
magnetite (Figure 4.14). This texture is sometimes observed in reflected light. In some
samples, exsolution textures can be seen in pyroxene grains. The darker-gray
clinopyroxene grains contain fine, lighter-gray exsolution lamellae of orthopyroxene
(Figure 4.15). These lamellae are sometimes visible when using the petrographic
microscope, but are much more distinct and easily seen in backscattered images.

45
Figure 4.14. A non-banded iron-formation with a primary mineral assemblage of qz + mag + grt + opx + am + ilm. Notice the ilmenite laths growing with associated magnetite grains. Image credit: Nick Daigle. BSE image of sample QC82-45.
Figure 4.15. A banded iron-formation with pyroxene exsolution. The primary mineral assemblage of the silicate/oxide-rich bands in this sample is qz + mag + grt + opx + cpx + ilm. The darker-gray clinopyroxene grain exhibits distinct thin, lighter-gray exsolution lamellae of orthopyroxene. This grain is also cut by later-stage alteration phases of amphibole/carbonate. Image credit: Nick Daigle. BSE image of sample QC-JW3.

46
Alteration of pyroxene grains by amphibole phases is readily visible in
backscattered images and is a common feature found in many of the meta-iron-
formations. The amphibole (mainly actinolite and grunerite) is typically seen forming on
the rims and in fracture zones of pyroxenes (Figure 4.16), but in some instances
completely replaces the pyroxene (Figure 4.17).
Figure 4.16. A silicate/oxide-rich band from a banded iron-formation with a primary mineral assemblage of qz + mag + grt + opx + bt + ilm. Secondary amphibole (actinolite) is shown altering the rims and fractured areas of the orthopyroxene grains. Magnetite can also be seen forming on the edge of these alteration areas. Image credit: Nick Daigle. BSE image from a silicate/oxide-rich band in sample HP82-59.
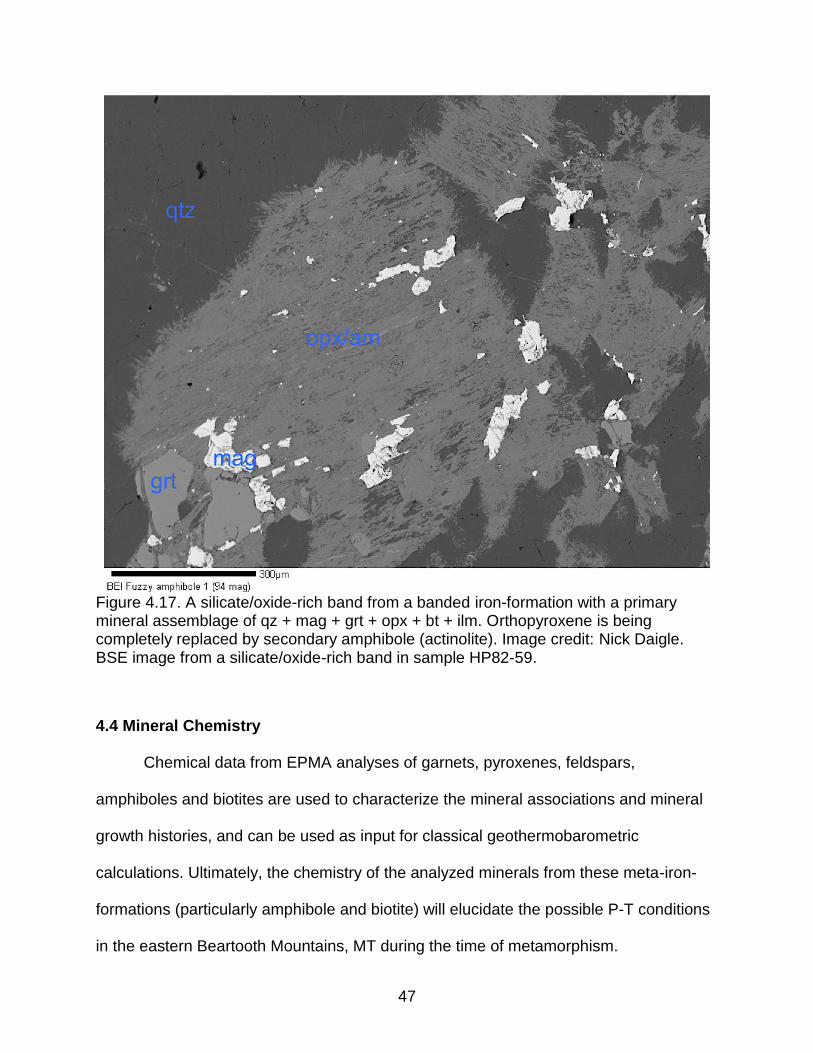
47
Figure 4.17. A silicate/oxide-rich band from a banded iron-formation with a primary mineral assemblage of qz + mag + grt + opx + bt + ilm. Orthopyroxene is being completely replaced by secondary amphibole (actinolite). Image credit: Nick Daigle. BSE image from a silicate/oxide-rich band in sample HP82-59.
4.4 Mineral Chemistry Chemical data from EPMA analyses of garnets, pyroxenes, feldspars,
amphiboles and biotites are used to characterize the mineral associations and mineral
growth histories, and can be used as input for classical geothermobarometric
calculations. Ultimately, the chemistry of the analyzed minerals from these meta-iron-
formations (particularly amphibole and biotite) will elucidate the possible P-T conditions
in the eastern Beartooth Mountains, MT during the time of metamorphism.

48
4.4.1 Garnet
The chemistry of garnets is a complex solid solution representing endmember
components rich in Mg2+ (pyrope), Fe2+ (almandine), Mn2+ (spessartine) and Ca2+
(grossular). Mole fractions for Fe2+, Mg2+, Mn2+ and Ca2+ were calculated using
representative compositions of garnets in each sample. Almandine garnets (the iron-rich
component) are consistently the dominant endmember component in all samples,
ranging from 55.76-79.22. The molecular percentages of pyrope, spessartine and
grossular endmember components range from 5.91-13.32, 1.56-14.58 and 2.45-20.22,
respectively. XFe values range from 0.85-0.91, XCa values ranged from 0.06-0.25, XMg
values ranged from 0.088-0.151 and XMn values ranged from 0.02-0.18. Minor zoning in
garnet rims has been observed in samples from other lithologies in the Beartooth
Mountains, MT (Darrell Henry, personal communication). The garnets studied here do
not exhibit compositional zoning; therefore, average values from all analyses in each
sample are used as representative compositions (Table 4.7). Representative structural
formulae for each sample are also given in Table 4.7. Tables of element wt% oxides for
analyses in each sample are found in Appendix A.
The relationship between modal amounts of pyroxene and amphibole and the
composition of theses coexisting minerals with garnet have compositional effects on
garnet chemistry. Two binary plots illustrate these correlations. In the XFe vs. XCa plot
the garnets with higher values of XCa (above ~0.15) occur in clinopyroxene-bearing
samples (Figure 4.18). QC81-66 falls below 0.15 XCa even though clinopyroxene is
present; however, the modal amount of clinopyroxene is low (Tables 4.2-4.6). The
clinopyroxene in sample QC81-1 was most likely rare as well. In the same figure, HR02-

49
Table 4.7. Representative Garnet Compositions in wt%
Sample QC82-
45* QC81-66*
QC81-40b*
HP82-59 HR02-3 QC82-49b*
Analysis # avg of 68 grt-1 avg of 2 avg of 20 avg of 18 avg of 6
SiO2 37.36 37.78 37.69 37.09 37.14 37.54
Al2O3 20.29 21.31 20.6 20.77 20.82 20.50
TiO2 0.02 ----- ----- 0.02 0.01 0.01
Cr2O3 0.05 0.03 0.04 0.03 0.01 0.01
Fe2O3 (calculated)
1.14 ----- 1.29 1.38 1.48 1.76
FeO (calculated)
29.76 30.63 28.88 33.05 30.59 26.47
MnO 3.22 4.67 4.4 0.69 2.70 3.87
MgO 1.61 2.54 2.57 2.28 3.03 2.64
CaO 6.86 4.08 5.59 5.12 4.45 7.64
Total 100.31 101.04 101.04 100.42 100.24 100.44
Molecular Percent of Components
Almandine 66.83 67.93 64.07 74.49 68.87 58.96
Pyrope 6.46 10.04 10.17 9.17 12.16 10.50
Spessartine 7.32 10.49 9.89 1.56 6.14 8.74
Grossular 15.71 11.44 12.50 13.72 11.92 18.35
Andradite 3.45 ----- 3.27 0.92 0.84 3.41
Schorlomite 0.06 ----- ----- 0.06 0.04 0.02
Uvarovite 0.16 0.09 0.11 0.08 0.03 0.03
Structural Formulae for Representative Compositions
QC82-45 (Fe2+2Ca0.59Mn0.22Mg0.19)(Al1.92Fe3+
0.07)Si3O12
QC81-66 (Fe2+2.04Ca0.35Mn0.31Mg0.3)Al2Si3O12
QC81-40b (Fe2+1.92Ca0.48Mg0.31Mn0.3)(Al1.93Fe3+
0.08)Si3O12
HP82-59 (Fe2+2.22Ca0.44Mg0.27Mn0.05)(Al1.94Fe3+
0.08)(Si2.98Al0.02)O12
HR02-3 (Fe2+2.05Ca0.38Mg0.36Mn0.18)(Al1.94Fe3+
0.09)(Si2.97Al0.03)O12
QC82-49b (Fe2+1.76Ca0.65Mg0.31Mn0.26)(Al1.91Fe3+
0.11)(Si2.99Al0.01)O12
Sample QC-IS* QC-JW3* QC81-1* QC81-5* QC81-6* HR02-71*
Analysis # avg of 10 avg of 5 grt-2 grt-4 avg of 2
SiO2 37.20 37.18 37.17 36.85 37.59 36.94
Al2O3 20.72 20.67 20.32 20.44 20.57 20.38
TiO2 0.01 0.01 0.04 ----- 0.01 -----
Cr2O3 0.01 0.02 0.07 0.08 0.01 -----
Fe2O3 (calculated)
1.91 2.48 0.09 2.76 1.47 1.89
FeO (calculated)
28.00 24.80 34.24 29.82 27.81 26.50
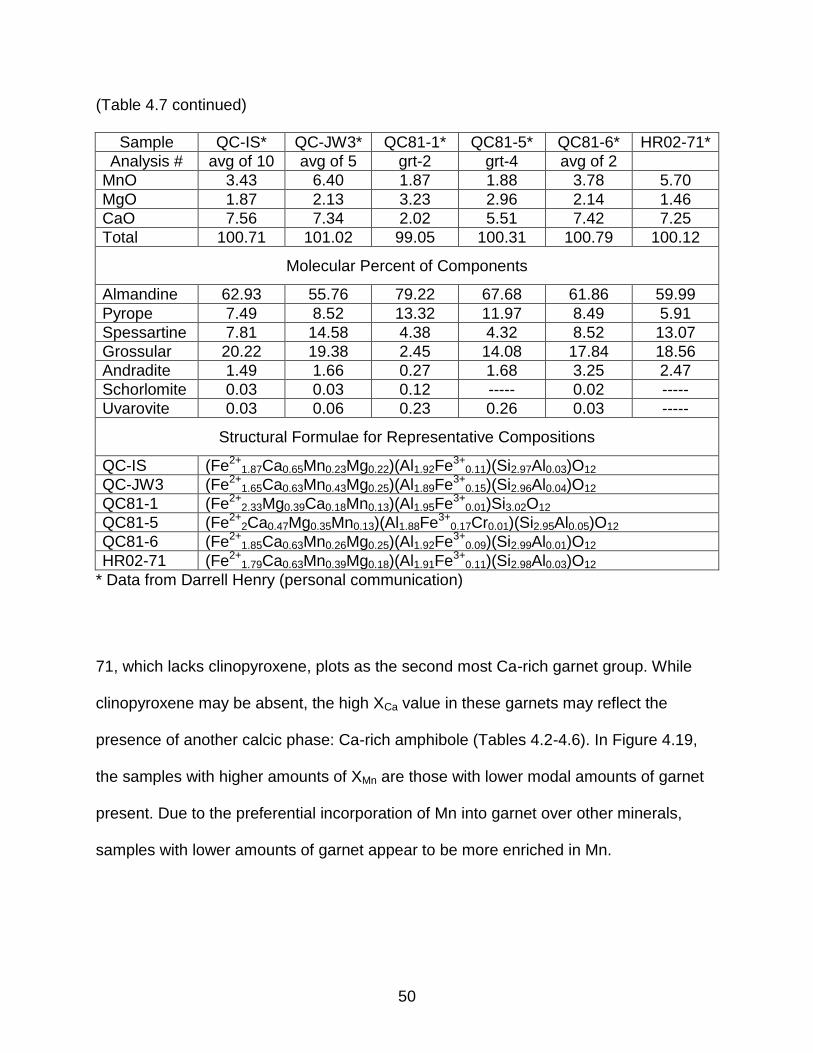
50
(Table 4.7 continued)
Sample QC-IS* QC-JW3* QC81-1* QC81-5* QC81-6* HR02-71*
Analysis # avg of 10 avg of 5 grt-2 grt-4 avg of 2
MnO 3.43 6.40 1.87 1.88 3.78 5.70
MgO 1.87 2.13 3.23 2.96 2.14 1.46
CaO 7.56 7.34 2.02 5.51 7.42 7.25
Total 100.71 101.02 99.05 100.31 100.79 100.12
Molecular Percent of Components
Almandine 62.93 55.76 79.22 67.68 61.86 59.99
Pyrope 7.49 8.52 13.32 11.97 8.49 5.91
Spessartine 7.81 14.58 4.38 4.32 8.52 13.07
Grossular 20.22 19.38 2.45 14.08 17.84 18.56
Andradite 1.49 1.66 0.27 1.68 3.25 2.47
Schorlomite 0.03 0.03 0.12 ----- 0.02 -----
Uvarovite 0.03 0.06 0.23 0.26 0.03 -----
Structural Formulae for Representative Compositions
QC-IS (Fe2+1.87Ca0.65Mn0.23Mg0.22)(Al1.92Fe3+
0.11)(Si2.97Al0.03)O12
QC-JW3 (Fe2+1.65Ca0.63Mn0.43Mg0.25)(Al1.89Fe3+
0.15)(Si2.96Al0.04)O12
QC81-1 (Fe2+2.33Mg0.39Ca0.18Mn0.13)(Al1.95Fe3+
0.01)Si3.02O12
QC81-5 (Fe2+2Ca0.47Mg0.35Mn0.13)(Al1.88Fe3+
0.17Cr0.01)(Si2.95Al0.05)O12
QC81-6 (Fe2+1.85Ca0.63Mn0.26Mg0.25)(Al1.92Fe3+
0.09)(Si2.99Al0.01)O12
HR02-71 (Fe2+1.79Ca0.63Mn0.39Mg0.18)(Al1.91Fe3+
0.11)(Si2.98Al0.03)O12
* Data from Darrell Henry (personal communication)
71, which lacks clinopyroxene, plots as the second most Ca-rich garnet group. While
clinopyroxene may be absent, the high XCa value in these garnets may reflect the
presence of another calcic phase: Ca-rich amphibole (Tables 4.2-4.6). In Figure 4.19,
the samples with higher amounts of XMn are those with lower modal amounts of garnet
present. Due to the preferential incorporation of Mn into garnet over other minerals,
samples with lower amounts of garnet appear to be more enriched in Mn.

51
Figure 4.18. Variations in XFe and XCa in garnets from each sample. Mole fractions calculated using compositions in Table 4.7. Symbols denote different mineral assemblages: opx + cpx + am; opx + cpx + am + bt; opx + am; Δ opx + bt; opx + cpx + am + bt + pl; opx; asterisk = opx + cpx + bt.
Figure 4.19. Variations in XFe and XMn in garnets from each sample. Mole fractions calculated using compositions in Table 4.7. Symbols denote different mineral assemblages: opx + cpx + am; opx + cpx + am + bt; opx + am; Δ opx + bt; opx + cpx + am + bt + pl; opx; asterisk = opx + cpx + bt.
0.00
0.05
0.10
0.15
0.20
0.25
0.30
0.84 0.86 0.88 0.90 0.92 0.94
XC
a =
Ca
/(C
a +
Fe
2+ +
Mg
)
XFe = Fe2+/(Fe2+ + Mg)
XFe vs. XCa in Garnets
HP82-59
QC82-45
HR02-71
QC-IS QC81-6
QC81-66
QC-JW3
QC81-1
QC81-40b
HR02-3
QC81-5
QC82-49b
0.00
0.04
0.08
0.12
0.16
0.20
0.84 0.86 0.88 0.90 0.92 0.94
XM
n =
Mn
/(M
n +
Fe
2+ +
Mg
)
XFe = Fe2+/(Fe2+ + Mg)
XFe vs. XMn in Garnets
QC82-49b
QC-JW3
HR02-3
QC81-1
QC81-5
QC81-6
QC81-66
QC81-40b
HP82-59
QC-IS
HR02-71
QC82-45

52
4.4.2 Pyroxene
Orthopyroxene is the dominant pyroxene found in all of these samples, however
both orthopyroxene and clinopyroxene were analyzed in five of the twenty-six samples.
The pyroxenes from these rocks are unzoned, and representative analyses (with
structural formulae) of each pyroxene type in each sample are given in Tables 4.8 and
4.9. Tables of element wt% oxides from each analysis point in each sample can be
found in Appendix B.
In the orthopyroxenes, XFe values range from 0.53-0.69, XCa values ranged from
0.002-0.037, XMg values ranged from 0.31-0.47 and XMn values ranged from 0.006-
0.052. Ferrosilite is consistently the dominant orthopyroxene endmember component in
all samples, with molecular percentages ranging from 53.98 to 71.12. The enstatite and
wollastonite endmember components range from 26.99 to 45.13 and 0.24 to 3.99
percent respectively. Other cations like Mn2+, Fe3+ and Al3+ can be incorporated into the
orthopyroxene mineral structure and lead to elevated molecular components such as
kanoite and aegerine. All representative orthopyroxene compositions plot within the
ferrosilite field of Figure 4.20.
In the clinopyroxenes, XFe values are 0.46-0.53, XCa values are 0.45-0.47, XMg
values are 0.47-0.54 and XMn values are 0.01-0.04. The clinopyroxenes are consistently
dominated by the wollastonite endmember component, with molecular percentages
ranging from 43.84 to 45.96. The enstatite and ferrosilite endmember components
range from 25.23 to 29.85 and 25.25 to 29.42 percent respectively. Other cations like
Mn2+, Fe3+ and Al3+ can be incorporated into the clinopyroxene mineral structure and
lead to elevated molecular components such as johannsenite (1.52-3.90), aegerine (0-

53
Table 4.8. Representative Orthopyroxene Compositions in wt%
Sample QC82-
45* QC81-
66* QC81-40b*
HP82-59
HR02-3 QC82-49b*
QC82-44
Analysis # avg of
15 opx-1 avg of 4
avg of 11
avg of 16
avg of 7 avg of
10
SiO2 48.54 49.86 50.30 48.86 49.31 49.76 49.28
Al2O3 0.40 0.59 0.71 0.75 0.85 0.59 0.78
TiO2 0.06 0.04 0.01 0.03 0.01 0.01 0.01
Cr2O3 0.01 0.02 0.02 0.01 0.01 ----- 0.02
Fe2O3 (calculated)
1.23 1.38 ----- 3.12 2.95 1.26 1.63
FeO (calculated)
37.98 34.14 34.77 37.09 33.09 32.29 30.48
MnO 1.08 1.48 1.48 0.32 0.79 1.49 1.17
MgO 10.11 13.23 12.80 11.35 13.74 13.99 14.97
NiO ----- ----- ----- ----- ----- 0.01 -----
CaO 0.77 0.34 0.45 0.55 0.34 0.59 0.38
Na2O ----- ----- 0.01 0.02 0.03 ----- 0.02
K2O ----- ----- ----- 0.01 0.01 ----- 0.01
Total 100.18 101.08 100.54 102.11 101.12 99.99 98.74
Molecular Percent of Components
Enstatite 28.04 35.68 34.70 32.42 38.25 37.70 41.26
Ferrosilite 62.91 55.17 56.68 60.43 53.45 52.04 49.38
Aegerine ----- ----- ----- 0.12 0.22 0.01 0.12
Esseneite ----- ----- ----- ----- ----- ----- -----
Diopside 1.09 0.59 0.76 0.84 0.62 1.10 0.77
Hedenbergite 2.29 0.85 1.16 1.53 0.84 1.42 0.87
Johannsenite ----- ----- ----- ----- ----- ----- -----
Kanoite 3.74 4.96 4.98 1.10 2.65 5.00 3.93
Molecular Percent of Components (renormalized by subtracting “other” species)
Wollastonite 1.79 0.78 1.03 1.24 0.78 1.36 0.89
Enstatite 30.30 38.98 37.60 34.49 41.39 41.46 45.13
Ferrosilite 67.91 60.24 61.37 64.27 57.83 57.17 53.98
Structural Formulae for Representative Compositions
QC82-45 (Fe2+1.29Mg0.61Mn0.04Ca0.03Fe3+
0.03)(Si1.97Al0.02Fe3+0.01)O6
QC81-66 (Fe2+1.13Mg0.78Mn0.05Fe3+
0.03Ca0.01)(Si1.96Al0.03Fe3+0.01)O6
QC81-40b (Fe2+1.15Mg0.76Mn0.05Al0.03Ca0.02)(Si1.99Al0.01)O6
HP82-59 (Fe2+1.23Mg0.67Fe3+
0.06Ca0.02Mn0.01)(Si1.94Al0.04Fe3+0.03)O6
HR02-3 (Fe2+1.09Mg0.81Fe3+
0.06Mn0.03Ca0.01)(Si1.94Al0.04Fe3+0.02)O6
QC82-49b (Fe2+1.07Mg0.83Mn0.05Fe3+
0.03Ca0.03)(Si1.97Al0.03Fe3+0.01)O6
QC82-44 (Fe2+1.01Mg0.89Fe3+
0.04Mn0.04Ca0.02)(Si1.96Al0.04Fe3+0.01)O6
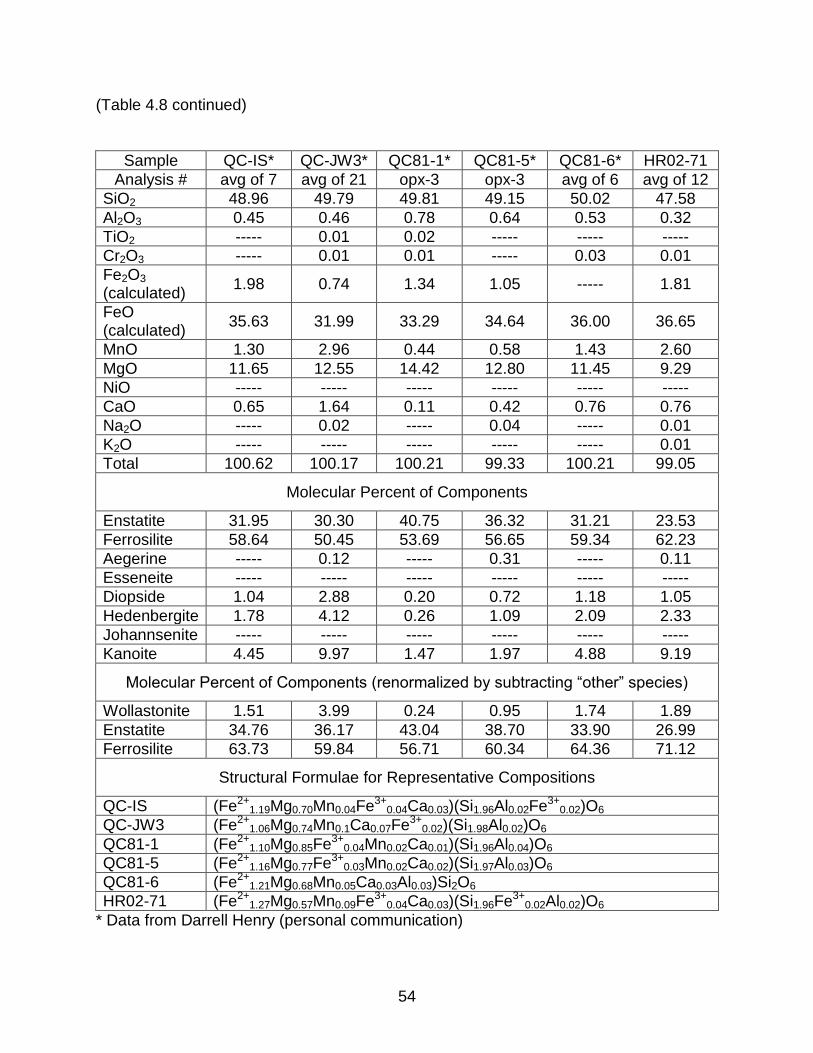
54
(Table 4.8 continued)
Sample QC-IS* QC-JW3* QC81-1* QC81-5* QC81-6* HR02-71
Analysis # avg of 7 avg of 21 opx-3 opx-3 avg of 6 avg of 12
SiO2 48.96 49.79 49.81 49.15 50.02 47.58
Al2O3 0.45 0.46 0.78 0.64 0.53 0.32
TiO2 ----- 0.01 0.02 ----- ----- -----
Cr2O3 ----- 0.01 0.01 ----- 0.03 0.01
Fe2O3 (calculated)
1.98 0.74 1.34 1.05 ----- 1.81
FeO (calculated)
35.63 31.99 33.29 34.64 36.00 36.65
MnO 1.30 2.96 0.44 0.58 1.43 2.60
MgO 11.65 12.55 14.42 12.80 11.45 9.29
NiO ----- ----- ----- ----- ----- -----
CaO 0.65 1.64 0.11 0.42 0.76 0.76
Na2O ----- 0.02 ----- 0.04 ----- 0.01
K2O ----- ----- ----- ----- ----- 0.01
Total 100.62 100.17 100.21 99.33 100.21 99.05
Molecular Percent of Components
Enstatite 31.95 30.30 40.75 36.32 31.21 23.53
Ferrosilite 58.64 50.45 53.69 56.65 59.34 62.23
Aegerine ----- 0.12 ----- 0.31 ----- 0.11
Esseneite ----- ----- ----- ----- ----- -----
Diopside 1.04 2.88 0.20 0.72 1.18 1.05
Hedenbergite 1.78 4.12 0.26 1.09 2.09 2.33
Johannsenite ----- ----- ----- ----- ----- -----
Kanoite 4.45 9.97 1.47 1.97 4.88 9.19
Molecular Percent of Components (renormalized by subtracting “other” species)
Wollastonite 1.51 3.99 0.24 0.95 1.74 1.89
Enstatite 34.76 36.17 43.04 38.70 33.90 26.99
Ferrosilite 63.73 59.84 56.71 60.34 64.36 71.12
Structural Formulae for Representative Compositions
QC-IS (Fe2+1.19Mg0.70Mn0.04Fe3+
0.04Ca0.03)(Si1.96Al0.02Fe3+0.02)O6
QC-JW3 (Fe2+1.06Mg0.74Mn0.1Ca0.07Fe3+
0.02)(Si1.98Al0.02)O6
QC81-1 (Fe2+1.10Mg0.85Fe3+
0.04Mn0.02Ca0.01)(Si1.96Al0.04)O6
QC81-5 (Fe2+1.16Mg0.77Fe3+
0.03Mn0.02Ca0.02)(Si1.97Al0.03)O6
QC81-6 (Fe2+1.21Mg0.68Mn0.05Ca0.03Al0.03)Si2O6
HR02-71 (Fe2+1.27Mg0.57Mn0.09Fe3+
0.04Ca0.03)(Si1.96Fe3+0.02Al0.02)O6
* Data from Darrell Henry (personal communication)

55
Table 4.9. Representative Clinopyroxene Compositions in wt%
Sample QC82-45* QC82-49b* QC-IS* QC-JW3* QC81-6*
Analysis # cpx-16 avg of 5 avg of 19 avg of 19 avg of 3
SiO2 50.53 50.43 51.21 51.02 51.12
Al2O3 0.62 0.84 0.76 0.59 0.78
TiO2 0.08 0.02 ----- ----- -----
Cr2O3 0.01 0.01 ----- ----- 0.01
Fe2O3 (calculated)
0.72 0.94 0.41 1.52 0.84
FeO (calculated)
17.22 16.58 17.28 14.41 16.11
MnO 0.46 0.61 0.66 1.19 0.58
MgO 8.59 8.15 8.81 9.55 8.99
CaO 21.46 21.81 21.06 21.58 21.61
Na2O ----- 0.14 0.13 ----- 0.16
Total 99.69 99.53 100.32 100.02 100.18
Molecular Percent of Components
Enstatite 4.82 3.55 5.58 5.10 4.66
Ferrosilite 5.42 4.05 6.14 4.31 4.69
Aegerine ----- 1.06 0.98 1.16 1.17
Esseneite 2.12 1.71 0.23 2.70 1.27
Diopside 40.24 40.37 39.66 44.86 42.46
Hedenbergite 45.26 46.09 43.64 37.96 42.69
Johannsenite 1.52 2.01 2.16 3.90 1.90
Kanoite ----- ----- ----- ----- -----
Molecular Percent of Components (renormalized by subtracting “other” species)
Wollastonite 44.65 45.96 43.84 44.90 45.05
Enstatite 26.05 25.23 26.74 29.85 27.40
Ferrosilite 29.30 28.81 29.42 25.25 27.55
Structural Formulae for Representative Compositions
QC82-45 (Ca0.90Fe2+0.56Mg0.50Fe3+
0.02Mn0.02)(Si1.97Al0.03)O6
QC82-49b (Ca0.91Fe2+0.54Mg0.48Fe3+
0.03Mn0.02Na0.01Al0.01)(Si1.97Al0.03)O6
QC-IS (Ca0.87Fe2+0.56Mg0.51Mn0.02Al0.02Fe3+
0.01Na0.01)(Si1.98Al0.02)O6
QC-JW3 (Ca0.89Mg0.55Fe2+0.47Fe3+
0.04Mn0.04Na0.01)(Si1.97Al0.03)O6
QC81-6 (Ca0.90Fe2+0.52Mg0.52Fe3+
0.02Mn0.02Na0.01Al0.01)(Si1.98Al0.02)O6
* Data from Darrell Henry (personal communication)

56
Figure 4.20. Wollastonite-enstatite-ferrosilite diagram showing locations of representative orthopyroxene and clinopyroxene compositions from each sample. Diagram taken from Professor Stephen A. Nelson: (www.tulane.edu/~sanelson/eens211/mineral_chemistry.htm)
1.17) and esseneite (0.23-2.70). Four of the representative clinopyroxene compositions
fall within the hedenbergite field, and one falls within the diopside field (Figure 4.20).
As with the garnets, there are chemical trends in the pyroxene data that relate to
compositional factors associated with coexisting mineral assemblages (Figures 4.21-
4.24). High XCa orthopyroxene values like those shown by QC-JW3 are likely a
consequence of a more calcic bulk composition reflected by the abundance of
clinopyroxene in that sample (refer to Tables 4.2-4.6). Additionally, lower modal
amounts of garnet in some samples (e.g. QC-JW3, HR02-71) are associated with the
orthopyroxenes being more enriched in Mn (almost double that of samples with higher
garnet modes). Mole fraction values of Fe, Mg and Mn from coexisting orthopyroxenes

57
Figure 4.21. Variations in XFe and XCa in representative orthopyroxene compositions from each sample. Mole fractions calculated using compositions in Table 4.8. Symbols denote different mineral assemblages: grt + cpx + am; grt + cpx + am + bt; grt + am; Δ grt + bt; grt + cpx + am + bt + pl; grt; asterisk = grt + cpx + bt; − am + pl.
Figure 4.22. Variations in XFe and XCa in representative clinopyroxene compositions from each clinopyroxene-bearing sample. Mole fractions calculated using compositions in Table 4.9. Symbols denote different mineral assemblages: grt + opx + am; grt + opx + am + bt + pl.
0.000
0.005
0.010
0.015
0.020
0.025
0.030
0.035
0.040
0.50 0.55 0.60 0.65 0.70
XC
a =
Ca
/(C
a +
Fe
2+ +
Mg
)
XFe = Fe2+/(Fe2+ + Mg)
XFe vs. XCa in Orthopyroxenes
QC-JW3
QC82-45 QC82-49b
QC-IS
QC81-6
QC81-1
QC82-44
HR02-71
HP82-59 QC81-40b HR02-3
QC81-66 QC81-5
0.440
0.445
0.450
0.455
0.460
0.465
0.470
0.475
0.480
0.45 0.46 0.47 0.48 0.49 0.50 0.51 0.52 0.53 0.54 0.55
XC
a =
Ca
/(C
a +
Fe
2+ +
Mg
)
XFe = Fe2+/(Fe2+ + Mg)
XFe vs. XCa in Clinopyroxenes
QC-JW3
QC82-45
QC82-49b
QC-IS
QC81-6
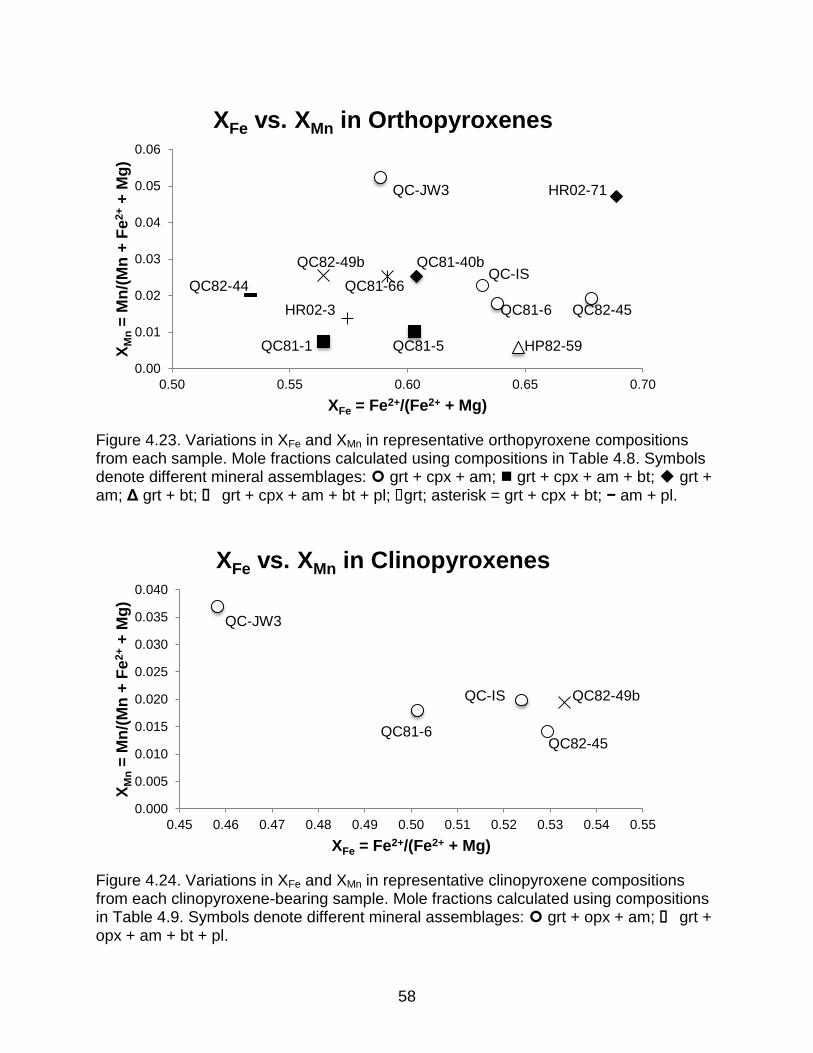
58
Figure 4.23. Variations in XFe and XMn in representative orthopyroxene compositions from each sample. Mole fractions calculated using compositions in Table 4.8. Symbols denote different mineral assemblages: grt + cpx + am; grt + cpx + am + bt; grt + am; Δ grt + bt; grt + cpx + am + bt + pl; grt; asterisk = grt + cpx + bt; − am + pl.
Figure 4.24. Variations in XFe and XMn in representative clinopyroxene compositions from each clinopyroxene-bearing sample. Mole fractions calculated using compositions in Table 4.9. Symbols denote different mineral assemblages: grt + opx + am; grt + opx + am + bt + pl.
0.00
0.01
0.02
0.03
0.04
0.05
0.06
0.50 0.55 0.60 0.65 0.70
XM
n =
Mn
/(M
n +
Fe
2+ +
Mg
)
XFe = Fe2+/(Fe2+ + Mg)
XFe vs. XMn in Orthopyroxenes
QC-JW3
QC82-45
QC82-49b QC-IS
QC81-6
QC81-1
QC82-44
HR02-71
HP82-59
QC81-40b
HR02-3
QC81-66
QC81-5
0.000
0.005
0.010
0.015
0.020
0.025
0.030
0.035
0.040
0.45 0.46 0.47 0.48 0.49 0.50 0.51 0.52 0.53 0.54 0.55
XM
n =
Mn
/(M
n +
Fe
2+ +
Mg
)
XFe = Fe2+/(Fe2+ + Mg)
XFe vs. XMn in Clinopyroxenes
QC-JW3
QC82-45
QC82-49b QC-IS
QC81-6
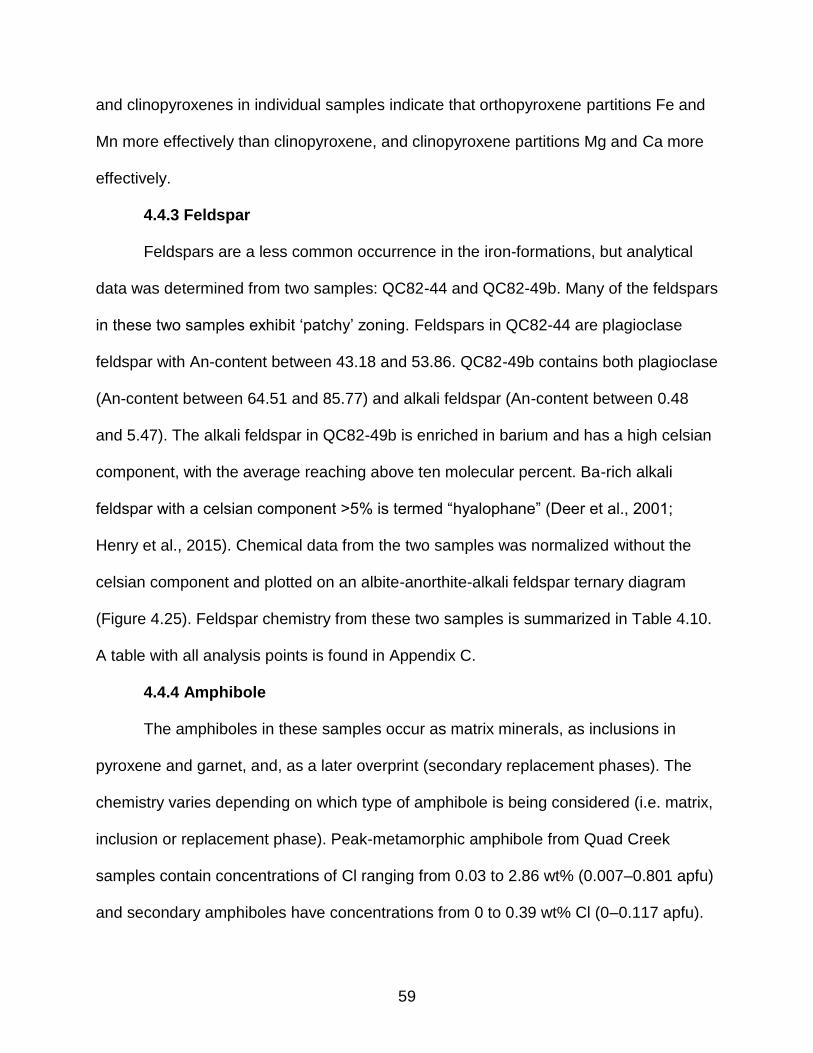
59
and clinopyroxenes in individual samples indicate that orthopyroxene partitions Fe and
Mn more effectively than clinopyroxene, and clinopyroxene partitions Mg and Ca more
effectively.
4.4.3 Feldspar
Feldspars are a less common occurrence in the iron-formations, but analytical
data was determined from two samples: QC82-44 and QC82-49b. Many of the feldspars
in these two samples exhibit ‘patchy’ zoning. Feldspars in QC82-44 are plagioclase
feldspar with An-content between 43.18 and 53.86. QC82-49b contains both plagioclase
(An-content between 64.51 and 85.77) and alkali feldspar (An-content between 0.48
and 5.47). The alkali feldspar in QC82-49b is enriched in barium and has a high celsian
component, with the average reaching above ten molecular percent. Ba-rich alkali
feldspar with a celsian component >5% is termed “hyalophane” (Deer et al., 2001;
Henry et al., 2015). Chemical data from the two samples was normalized without the
celsian component and plotted on an albite-anorthite-alkali feldspar ternary diagram
(Figure 4.25). Feldspar chemistry from these two samples is summarized in Table 4.10.
A table with all analysis points is found in Appendix C.
4.4.4 Amphibole The amphiboles in these samples occur as matrix minerals, as inclusions in
pyroxene and garnet, and, as a later overprint (secondary replacement phases). The
chemistry varies depending on which type of amphibole is being considered (i.e. matrix,
inclusion or replacement phase). Peak-metamorphic amphibole from Quad Creek
samples contain concentrations of Cl ranging from 0.03 to 2.86 wt% (0.007–0.801 apfu)
and secondary amphiboles have concentrations from 0 to 0.39 wt% Cl (0–0.117 apfu).

60
Cl concentrations from Hellroaring Plateau samples range between 0.1 and 0.11 wt%
(0.025–0.027 apfu) in primary amphibole and 0 to 0.02 wt% (0–0.005 apfu) in
secondary amphibole analyses. For reference, structural formulae for selected calcic
amphibole endmembers found in the iron-formations are given in Table 4.11 (from
Hawthorne et al., 2012). The chemistry and species classification of representative
amphiboles from each sample are given in Tables 4.12 and 4.13. Complete tables of
analysis points can be found in Appendix D.
Table 4.10. Representative Feldspar Compositions in wt%
Sample QC82-44 (plag) QC82-49b (plag)* QC82-49b (kspar)*
Analysis # avg of 18 avg of 13 avg of 7
SiO2 56.79 47.97 60.81
Al2O3 27.40 32.42 19.79
FeO (measured) 0.18 0.16 0.07
MnO ----- 0.01 0.01
CaO 9.60 16.29 0.36
BaO 0.10 0.03 5.56
SrO ----- 0.08 0.07
Na2O 5.73 2.09 1.05
K2O 0.19 0.07 12.53
Total 99.98 99.12 100.25
Molecular Percent of Components
Albite 51.25 18.76 9.90
Anorthite 47.47 80.80 1.89
Orthoclase 1.10 0.39 77.64
Celsian 0.18 0.05 10.57
Structural Formulae for Representative Feldspar Compositions
QC82-44 (plagioclase) (Na0.50Ca0.46K0.01Fe2+0.01)(Si2.55Al1.45)O8
QC82-49b (plagioclase) (Ca0.81Na0.19Fe2+0.01)(Si2.22Al1.77)O8
QC82-49b (hyalophane) (K0.76Ba0.10Na0.10Ca0.02)(Si2.89Al1.11)O8
* Data from Darrell Henry (personal communication)
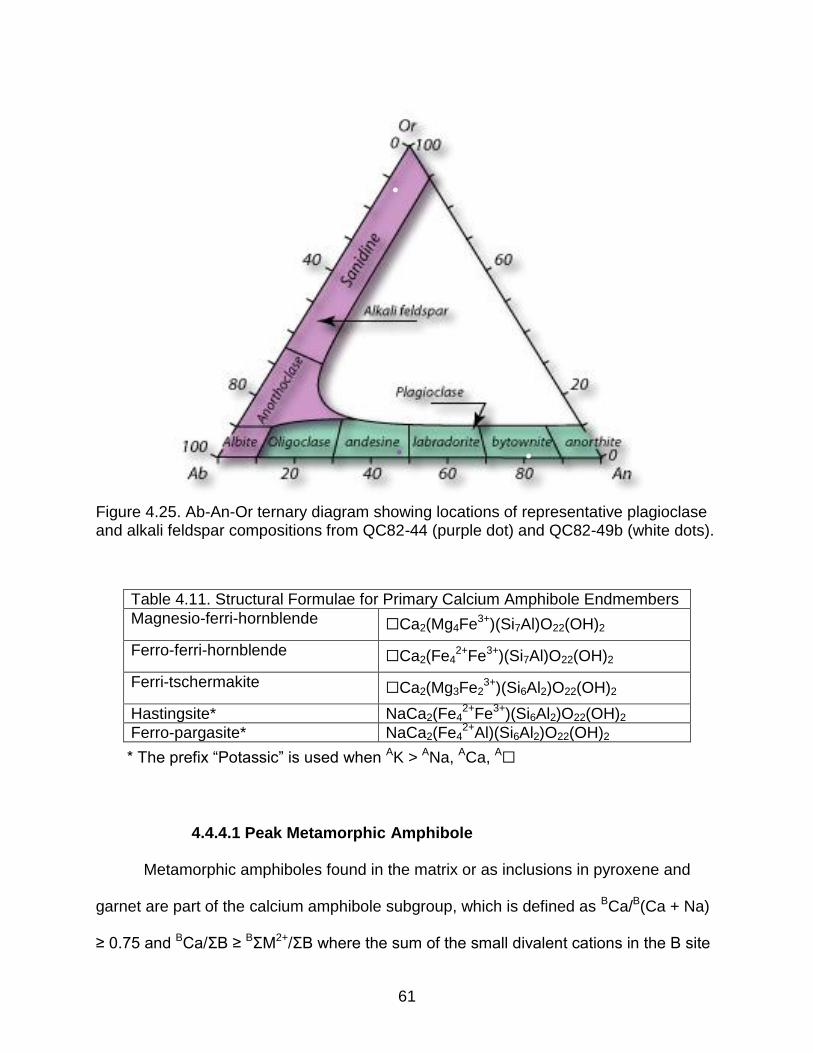
61
Figure 4.25. Ab-An-Or ternary diagram showing locations of representative plagioclase and alkali feldspar compositions from QC82-44 (purple dot) and QC82-49b (white dots).
Table 4.11. Structural Formulae for Primary Calcium Amphibole Endmembers
Magnesio-ferri-hornblende ☐Ca2(Mg4Fe3+)(Si7Al)O22(OH)2
Ferro-ferri-hornblende ☐Ca2(Fe42+Fe3+)(Si7Al)O22(OH)2
Ferri-tschermakite ☐Ca2(Mg3Fe23+)(Si6Al2)O22(OH)2
Hastingsite* NaCa2(Fe42+Fe3+)(Si6Al2)O22(OH)2
Ferro-pargasite* NaCa2(Fe42+Al)(Si6Al2)O22(OH)2
* The prefix “Potassic” is used when AK > ANa, ACa, A☐
4.4.4.1 Peak Metamorphic Amphibole
Metamorphic amphiboles found in the matrix or as inclusions in pyroxene and
garnet are part of the calcium amphibole subgroup, which is defined as BCa/B(Ca + Na)
≥ 0.75 and BCa/ΣB ≥ BΣM2+/ΣB where the sum of the small divalent cations in the B site

62
Table 4.12. Representative Amphibole Compositions in wt%
Sample QC-IS* QC-JW3* QC-JW3* QC81-1* QC81-5* QC81-5* QC81-6* QC81-6* QC81-
45*
Type of Amphibole
matrix matrix alteration alteration incl. in
opx alteration matrix
incl. in opx
matrix
Analysis # avg of 13 avg of 7 am-2 am-4 am-1 am-3 avg of 3 am-3 avg of 3
SiO2 39.70 41.19 52.37 52.96 37.51 53.02 39.19 39.42 39.34
TiO2 0.12 0.02 ----- 0.01 0.52 0.01 0.09 0.10 0.08
Al2O3 11.78 12.17 1.45 0.26 12.81 0.16 11.73 12.12 11.53
Cr2O3 0.01 ----- 0.02 ----- 0.01 ----- ----- ----- -----
MnO 0.26 0.59 0.78 0.24 0.05 0.46 0.25 0.26 0.37
FeO (calculated)
19.74 17.10 15.74 27.66 19.37 29.36 19.53 20.65 18.86
Fe2O3 (calculated)
5.80 6.44 3.02 ----- 7.02 ----- 5.63 4.24 6.44
NiO 0.01 0.01 0.04 ----- ----- ----- 0.01 0.01 0.02
MgO 5.70 6.56 12.95 15.27 4.57 13.55 5.47 5.09 5.73
CaO 11.52 11.30 11.57 0.15 11.23 0.07 11.41 11.46 11.41
Na2O 0.61 0.97 0.07 0.01 1.04 ----- 0.71 0.82 0.75
BaO 0.19 0.03 ----- ----- ----- ----- 0.11 0.11 0.13
K2O 2.97 1.22 0.05 ----- 2.30 ----- 2.57 2.51 2.41
F 0.21 0.04 ----- 0.01 ----- ----- 0.13 0.12 0.12
Cl 1.34 1.09 0.06 ----- 0.98 ----- 1.53 1.56 1.69
H2O+
(calculated) 1.44 1.65 2.02 2.01 1.52 2.00 1.43 1.42 1.39
Total 101.00 100.13 100.13 98.58 98.71 98.63 99.37 99.50 99.82
* Data from Darrell Henry (personal communication) o Data from Darrel Henry (personal communication) and Nick Daigle

63
(Table 4.12 continued)
Sample QC81-
45* QC82-44
QC82-45*
QC82-45*
QC82-45*
QC82-45*
QC82-46*
QC82-46*
QC82-47*
Type of Amphibole
incl. in opx
matrix matrix incl. in
opx incl. in grt alteration matrix alteration matrix
Analysis # am-1 avg of 12 avg of 12 avg of 7 avg of 4 avg of 5 hbl-2 act-2 avg of 2
SiO2 40.05 43.40 36.98 36.73 38.18 49.16 46.83 55.04 46.62
TiO2 0.08 0.27 1.41 1.46 1.92 0.05 0.32 0.02 0.04
Al2O3 12.14 12.25 11.35 11.85 10.70 0.99 8.04 0.28 8.44
Cr2O3 0.08 0.02 0.04 0.02 0.04 0.01 ----- ----- 0.01
MnO 0.46 0.31 0.16 0.19 0.17 0.83 0.36 0.19 0.18
FeO (calculated)
19.28 12.45 20.61 21.48 18.63 33.29 12.58 12.55 12.80
Fe2O3 (calculated)
6.55 8.27 6.84 7.21 7.78 1.07 8.11 2.98 6.33
NiO ----- ----- 0.01 ----- 0.01 0.01 ----- ----- -----
MgO 5.49 9.48 3.83 3.20 4.94 9.13 11.23 15.84 11.06
CaO 11.46 10.81 11.46 11.48 11.38 0.67 11.32 12.80 11.43
Na2O 0.74 1.01 0.58 0.61 1.02 0.02 0.67 0.02 0.79
BaO 0.09 ----- 0.54 0.91 0.56 ----- ----- 0.03 0.03
K2O 2.31 0.72 3.26 3.25 2.37 0.03 0.50 ----- 0.25
F 0.12 ----- 0.05 0.11 0.12 0.02 0.04 0.05 -----
Cl 1.81 0.10 2.55 2.58 1.80 011 0.03 0.01 0.05
H2O+
(calculated) 1.38 1.93 0.85 0.80 0.92 1.89 1.92 2.04 2.01
Total 101.58 100.99 99.91 101.25 100.08 97.23 101.93 101.83 99.98

64
(Table 4.12 continued)
Sample QC82-47* QC82-48a*
QC82-48b*
QC82-49a*
QC82-49b*
HP82-59 HR02-71* HR02-71o
Type of Amphibole
incl. in opx matrix matrix matrix matrix alteration matrix alteration
Analysis # am-1 am-26 avg of 3 am-2 avg of 3 avg of 18 avg of 2 avg of 5
SiO2 46.70 43.74 43.63 41.34 41.71 53.47 44.70 53.13
TiO2 ----- 0.12 0.17 0.14 0.18 0.06 0.23 0.01
Al2O3 8.59 10.82 10.57 12.42 12.50 1.44 8.23 0.29
Cr2O3 ----- 0.01 0.01 0.01 0.01 0.01 0.05 -----
MnO 0.15 0.72 0.65 0.68 0.48 0.25 0.53 2.55
FeO (calculated)
13.51 11.89 13.20 14.96 15.64 20.15 17.84 32.47
Fe2O3 (calculated)
5.39 7.21 7.53 7.50 5.95 0.60 6.29 -----
NiO ----- ----- ----- ----- ----- 0.01 ----- -----
MgO 11.12 10.08 9.52 7.75 7.73 11.98 7.71 10.15
CaO 12.03 11.23 11.60 11.60 11.33 10.93 11.34 0.51
Na2O 0.88 1.12 1.06 1.07 1.02 0.13 0.89 0.03
BaO ----- 0.02 0.03 0.08 0.02 0.02 0.03 0.02
K2O 0.37 0.50 0.74 1.28 1.41 0.14 0.78 0.02
F ----- ----- ----- ----- 0.02 ----- ----- 0.04
Cl 0.05 0.09 0.14 0.33 0.37 0.06 0.10 0.01
H2O+
(calculated) 2.01 1.97 1.92 1.85 1.83 1.99 1.89 1.93
Total 100.79 99.50 100.74 100.94 100.11 101.23 100.59 101.14

65
Table 4.13. Species and Representative Formulae from Amphiboles in Table 4.12
Sample Type of Amphibole Amphibole Species Structural Formulae for Representative Compositions
QC-IS matrix Potassic-hastingsite (K0.59Na0.15Ba0.01)(Ca1.93Na0.04Mn0.03)(Fe2+
2.59Mg1.33
Fe3+0.68Al0.39Ti0.01)(Si6.21Al1.79)O22((OH)1.51Cl0.36F0.10O0.03)
QC-JW3 matrix Ferro-ferri-hornblende
(K0.24Na0.22)(Ca1.86Na0.07Mn0.06) (Fe2+2.2 Mg1.5Fe3+
0.74Al0.54
Mn0.01)(Si6.33Al1.67)O22((OH)1.69Cl0.29F0.02)
alteration Actinolite (Na0.01K0.01)(Ca1.82Mn0.1Fe2+
0.07Na0.01)(Mg2.84Fe2+1.87
Fe3+0.29Ni0.01)(Si7.7Al0.25Fe3+
0.05)O22((OH)1.98Cl0.02)
QC81-1 alteration Grunerite (Fe2+
1.94Mn0.03Ca0.02)(Mg3.43Fe2+1.54Al0.03)(Si7.98Al0.02)O22
((OH)1.99F0.01)
QC81-5 incl. in opx Potassic-hastingsite
(K0.47Na0.28)(Ca1.93Na0.04Fe2+0.03Mn0.01)(Fe2+
2.57Mg1.09
Fe3+0.85Al0.43 Ti0.06)(Si6.01Al1.99)O22((OH)1.61Cl0.27O0.13)
alteration Grunerite (Fe2+
1.82Mn0.06Ca0.01)(Mg3.07Fe2+1.91Al0.03)(Si8.05)O22
(OH)2.0
QC81-6 matrix Potassic-hastingsite
(K0.52Na0.19Ba0.01)(Ca1.94Na0.03Mn0.03)(Fe2+2.59Mg1.29
Fe3+0.67Al0.42Ti0.01Mn0.01)(Si6.22Al1.78)O22((OH)1.5Cl0.41F0.06
O0.02)
incl. in opx Potassic-ferro-pargasite (K0.51Na0.23Ba0.01)(Ca1.95Na0.03Mn0.02)(Fe2+
2.74Mg1.2Al0.52
Fe3+0.51Ti0.01 Mn0.01)(Si6.26Al1.74)O22((OH)1.5Cl0.42F0.06O0.02)
QC81-45 matrix Potassic-hastingsite (K0.49Na0.19Ba0.01)(Ca1.93Na0.04Mn0.03)(Fe2+
2.49Mg1.35
Fe3+0.77Al0.36Mn0.02Ti0.01)(Si6.22Al1.78)O22((OH)1.47Cl0.45F0.06
O0.02)
QC81-45 incl. in opx Potassic-hastingsite (K0.46Na0.17)(Ca1.9Na0.05Mn0.04)(Fe2+
2.5Mg1.27Fe3+0.76Al0.43
Mn0.02 Cr0.01Ti0.01)(Si6.21Al1.79)O22((OH)1.45Cl0.48F0.06O0.02)
QC82-44 matrix Magnesio-ferri-hornblende (Na0.15K0.14)(Ca1.71Na0.14Fe2+
0.11Mn0.04)(Mg2.09Fe2+1.43
Fe3+0.92Al0.54 Ti0.03)(Si6.41Al1.6)O22((OH)1.92O0.06Cl0.03)
QC82-45
matrix Potassic-hastingsite (K0.68Na0.19Ba0.02)(Ca2)(Fe2+
2.81Mg0.93Fe3+0.84Al0.21Ti0.17
Mn0.02Cr0.01)(Si6.03Al1.97)O22((OH)0.92Cl0.71O0.35F0.03)
incl. in opx Potassic-hastingsite (K0.67Na0.19Ba0.04)(Ca2Na0.01)(Fe2+
2.92Fe3+0.88Mg0.77Al0.22
Ti0.18Mn0.03)(Si5.96Al2.04)O22((OH)0.88Cl0.71O0.36F0.06)
incl. in grt Potassic-hastingsite (K0.48Na0.29Ba0.02)(Ca1.96Na0.03Mn0.02)(Fe2+
2.5Mg1.18Fe3+0.94
Ti0.23Al0.14Mn0.01Cr0.01)(Si6.12Al1.88)O22((OH)0.99Cl0.49O0.46
F0.06)
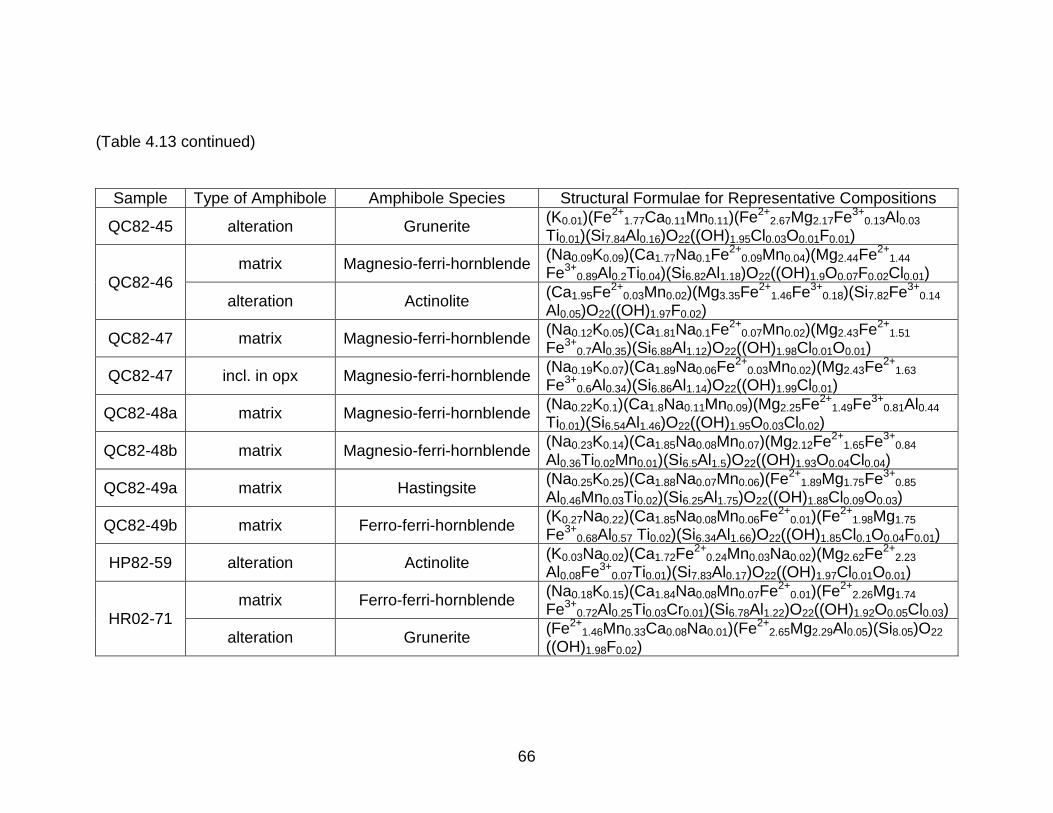
66
(Table 4.13 continued)
Sample Type of Amphibole Amphibole Species Structural Formulae for Representative Compositions
QC82-45 alteration Grunerite (K0.01)(Fe2+
1.77Ca0.11Mn0.11)(Fe2+2.67Mg2.17Fe3+
0.13Al0.03
Ti0.01)(Si7.84Al0.16)O22((OH)1.95Cl0.03O0.01F0.01)
QC82-46 matrix Magnesio-ferri-hornblende
(Na0.09K0.09)(Ca1.77Na0.1Fe2+0.09Mn0.04)(Mg2.44Fe2+
1.44
Fe3+0.89Al0.2Ti0.04)(Si6.82Al1.18)O22((OH)1.9O0.07F0.02Cl0.01)
alteration Actinolite (Ca1.95Fe2+
0.03Mn0.02)(Mg3.35Fe2+1.46Fe3+
0.18)(Si7.82Fe3+0.14
Al0.05)O22((OH)1.97F0.02)
QC82-47 matrix Magnesio-ferri-hornblende (Na0.12K0.05)(Ca1.81Na0.1Fe2+
0.07Mn0.02)(Mg2.43Fe2+1.51
Fe3+0.7Al0.35)(Si6.88Al1.12)O22((OH)1.98Cl0.01O0.01)
QC82-47 incl. in opx Magnesio-ferri-hornblende (Na0.19K0.07)(Ca1.89Na0.06Fe2+
0.03Mn0.02)(Mg2.43Fe2+1.63
Fe3+0.6Al0.34)(Si6.86Al1.14)O22((OH)1.99Cl0.01)
QC82-48a matrix Magnesio-ferri-hornblende (Na0.22K0.1)(Ca1.8Na0.11Mn0.09)(Mg2.25Fe2+
1.49Fe3+0.81Al0.44
Ti0.01)(Si6.54Al1.46)O22((OH)1.95O0.03Cl0.02)
QC82-48b matrix Magnesio-ferri-hornblende (Na0.23K0.14)(Ca1.85Na0.08Mn0.07)(Mg2.12Fe2+
1.65Fe3+0.84
Al0.36Ti0.02Mn0.01)(Si6.5Al1.5)O22((OH)1.93O0.04Cl0.04)
QC82-49a matrix Hastingsite (Na0.25K0.25)(Ca1.88Na0.07Mn0.06)(Fe2+
1.89Mg1.75Fe3+0.85
Al0.46Mn0.03Ti0.02)(Si6.25Al1.75)O22((OH)1.88Cl0.09O0.03)
QC82-49b matrix Ferro-ferri-hornblende (K0.27Na0.22)(Ca1.85Na0.08Mn0.06Fe2+
0.01)(Fe2+1.98Mg1.75
Fe3+0.68Al0.57 Ti0.02)(Si6.34Al1.66)O22((OH)1.85Cl0.1O0.04F0.01)
HP82-59 alteration Actinolite (K0.03Na0.02)(Ca1.72Fe2+
0.24Mn0.03Na0.02)(Mg2.62Fe2+2.23
Al0.08Fe3+0.07Ti0.01)(Si7.83Al0.17)O22((OH)1.97Cl0.01O0.01)
HR02-71 matrix Ferro-ferri-hornblende
(Na0.18K0.15)(Ca1.84Na0.08Mn0.07Fe2+0.01)(Fe2+
2.26Mg1.74
Fe3+0.72Al0.25Ti0.03Cr0.01)(Si6.78Al1.22)O22((OH)1.92O0.05Cl0.03)
alteration Grunerite (Fe2+
1.46Mn0.33Ca0.08Na0.01)(Fe2+2.65Mg2.29Al0.05)(Si8.05)O22
((OH)1.98F0.02)

67
is BΣM2+ = BMg + BFe2+ + BMn2+ and the sum of all cations in the B site is ΣB = BLi + BNa
+ BΣM2+ + BCa (Hawthorne et al., 2012). The calcic amphiboles are assigned a species
name depending on their overall chemistry. Species present in these samples include
potassic-hastingsite, magnesio-ferri-hornblende, ferro-ferri-hornblende, ferri-
tschermakite, hastingsite and potassic-ferro-pargasite. Grains occurring as inclusions
are exclusively potassic-hastingsite (refer to Tables 4.11-4.13 for structural
compositions), whereas the matrix amphibole grains occur as various species. Primary
amphiboles contain very significant amounts of Cl (up to 2.9 wt%) and also show
elevated levels of K (up to 3.46 wt%), Ba (up to 1.09 wt%) and Ti (up to 2.0 wt%).
Trends between Cl and various cations are presented for the primary amphibole
data. There is a positive correlation between Cl and XFe2+, Al[IV], K[XII] and Ba[XII] (Figure
4.26). In addition, increasing the amounts of XMg[VI], Si[IV] and Na[XII] correlate with
decreasing levels of Cl. Only one sample (QC82-45) has chemical data from the three
types of primary amphibole (matrix, inclusion in pyroxene, inclusion in garnet). These
data show noticeable trends between levels of Cl and the type of amphibole analyzed
(Figure 4.27). Amphibole included in garnet are generally lower in wt% Cl (average of
~1.8) than amphibole included in pyroxene and matrix amphibole (averages of ~2.5 wt%
Cl).
4.4.4.2 Secondary Amphibole Secondary replacement amphibole phases (the ones mainly found altering
pyroxenes) are actinolite, grunerite and/or cummingtonite. Actinolite falls within the
calcic amphibole subgroup. Grunerite and cummingtonite, however, are placed within a

68
Figure 4.26. Relations between Cl and XFe
2+ concentrations found in amphibole from iron-formations in the eastern Beartooth Mountains. Each dot represents a separate analysis. Maximum XFe and Cl (apfu) values are 0.8 and 0.78, respectively.
Figure 4.27. Variation in Cl concentration between matrix amphibole and amphibole present as inclusions in orthopyroxene and garnet from one iron-formation sample (QC82-45). Cl concentration in amphibole: matrix grains ≥ inclusions in opx > inclusions in grt. Each point represents an individual analysis. The stars represent averages for each type of amphibole.
0.00
0.10
0.20
0.30
0.40
0.50
0.60
0.70
0.80
0.35 0.45 0.55 0.65 0.75 0.85
Cl
(ap
fu)
XFe2+ = Fe2+/(Mg + Fe2+)
QC82-45
QC81-45
QC81-6
QC81-5 QC-IS
QC-JW3
HR02-71 QC82-44 QC82-48b
QC82-46 QC82-47 QC82-48a
0.40
0.45
0.50
0.55
0.60
0.65
0.70
0.75
0.80
0.67 0.69 0.71 0.73 0.75 0.77 0.79 0.81
Cl
(ap
fu)
XFe2+ = Fe2+/(Mg + Fe2+)
matrix
incl. in grt
incl. in opx

69
separate group known as the magnesium-iron-manganese (Mg-Fe-Mn) subgroup of
amphibole, defined as B(Ca + ΣM2+)/ΣB ≥ 0.75 and BΣM2+/ΣB > BCa/ΣB. The secondary
amphiboles contain relatively small amounts of Cl relative to primary amphibole, ranging
from 0.01 to 0.39 wt%. They also contain much lower amounts of K2O, BaO and TiO2,
all of which do not exceed more than 0.07 wt% in any of the analyses.
4.4.5 Biotite
Similar to metamorphic amphibole, the unusual occurrence and chemistry of the
biotites in these samples can provide useful information on mineral
associations/assemblages as well as on interactions with the metamorphic fluid. The
biotite occurs as matrix grains and as inclusions in pyroxene and garnet, and, as with
the amphiboles, the chemical composition of biotite differs depending whether or not it
is in the matrix or an inclusion. Some biotite analyses from Quad Creek samples contain
up to 3.4 wt% Cl. Hellroaring Plateau biotite analyses range from 0.16 to 0.26 wt% Cl.
High amounts of BaO (up to 10.5 wt%) and TiO2 (up to 6.9 wt%) are also present in
these samples. Results are summarized in Tables 4.14 and 4.15. Tables showing each
analytical point in these samples are provided in Appendix E.
Cl has systematic compositional variations with respect to other crystal chemical
features. An increase in Cl in biotite is accompanied with increases in XFe2+, Al[IV], K[XII]
and Ba[XII] (Figure 4.28). Decreasing Cl content correlates with increasing XMg[VI], Si[IV]
and Na[XII] (Figure 4.29). Sample QC82-45 has chemical data from all three types of
biotite grains. For this sample, the biotites included in garnet are highest in Cl (~2.6–2.9
wt%), but overlap with matrix biotite (~2.4–2.8 wt%) and biotite included in
orthopyroxene (~1.6–2.6 wt%) (Figure 4.30).

70
Table 4.14. Representative Biotite Compositions in wt%
Sample QC82-
45* QC82-
45* QC82-
45* QC81-113*
HR02-72*
HP81-82*
QC81-1*
Type of Biotite
matrix incl. in
grt incl. in
opx incl. in
opx matrix matrix matrix
Analysis # avg of
16 avg of 9 avg of 9 avg of 3 bt-2 avg of 3 bt-1
SiO2 29.60 29.06 30.95 33.21 34.84 35.21 33.51
Al2O3 13.82 14.07 13.49 15.07 15.19 14.17 15.56
TiO2 6.00 4.83 5.98 1.04 3.01 4.55 3.85
Cr2O3 0.02 ----- 0.03 0.02 0.01 0.06 0.01
FeO (measured)
29.13 30.02 29.59 27.15 23.52 24.04 24.38
MnO 0.08 0.13 0.11 0.13 0.05 0.04 0.07
MgO 3.07 3.25 3.45 6.66 8.49 8.56 7.58
NiO 0.02 ----- 0.01 0.02 ----- 0.01 -----
CaO 0.01 0.04 ----- 0.04 0.01 ----- 0.01
BaO 8.78 9.60 6.20 2.84 0.64 ----- -----
Na2O 0.04 0.04 0.05 0.09 0.13 0.05 0.11
K2O 6.17 5.66 7.14 8.13 9.20 9.83 9.64
F 0.09 0.14 0.11 0.05 ----- 0.08 -----
Cl 2.53 2.69 2.18 2.39 0.16 0.25 0.42
H2O+
(calculated) 2.83 2.73 2.99 3.02 3.77 3.76 3.66
Total 102.19 102.27 102.28 99.86 99.02 100.61 98.80
* Data from Darrell Henry (personal communication)
Table 4.15. Summary of Representative Biotite Compositions in Table 4.14
Sample Type of Biotite Structural Formulae for Representative Compositions
QC82-45
matrix (K1.34Ba0.59☐0.06Na0.01)(Fe2+
4.15Mg0.78Ti0.77☐0.28Mn0.01) (Si5.04Al2.78)O20((OH)3.22Cl0.73F0.05)
incl. in opx (K1.52Ba0.41☐0.06Na0.02)(Fe2+
4.13Mg0.86Ti0.75☐0.24Mn0.02) (Si5.17Al2.65)O20((OH)3.33Cl0.62F0.06)
incl. in grt (K1.24Ba0.65☐0.09Na0.01Ca0.01)(Fe2+
4.32Mg0.84Ti0.63☐0.2Mn0.02
)(Si5Al2.85)O20((OH)3.14Cl0.79F0.08)
QC81-113 incl in opx (K1.71Ba0.18☐0.08Na0.03Ca0.01)(Fe2+
3.73Mg1.63Al0.38Ti0.13☐0.11
Mn0.02)(Si5.46Al2.54)O20((OH)3.31Cl0.67F0.03)
HR02-72 matrix (K1.85☐0.07Na0.04Ba0.04)(Fe2+
3.1Mg1.99Ti0.36Al0.31☐0.24Mn0.01)(Si5.49Al2.51)O20((OH)3.96Cl0.04)
HP81-82 matrix (K1.95☐0.04Na0.02)(Fe2+
3.12Mg1.98Ti0.53☐0.28Al0.07Cr0.01Mn0.01)(Si5.47Al2.53)O20((OH)3.9Cl0.07F0.04)
QC81-1 matrix (K1.96Na0.03☐0.01)(Fe2+
3.24Mg1.8Ti0.46Al0.25☐0.25Mn0.01) (Si5.33Al2.67)O20((OH)3.89Cl0.11)

71
Figure 4.28. Cl and Ba concentrations found in biotite from iron-formation samples in the Beartooth Mountains. Cl concentrations are higher than Ba concentrations.
Figure 4.29. Cl and K concentrations found in biotite from iron-formation samples in the Beartooth Mountains. Cl concentrations are lower than K concentrations.
0.00
0.20
0.40
0.60
0.80
1.00
1.20
0.00 0.10 0.20 0.30 0.40 0.50 0.60 0.70 0.80
Cl
(ap
fu)
Ba (apfu)
QC82-45
QC81-113
HP81-82
HR02-72 QC81-1
0.00
0.20
0.40
0.60
0.80
1.00
1.20
1.10 1.20 1.30 1.40 1.50 1.60 1.70 1.80 1.90 2.00
Cl
(ap
fu)
K (apfu)
QC82-45
QC81-113
HR02-72 HP81-82
QC81-1

72
Figure 4.30. Variation in Cl concentration between matrix biotite and biotite present as inclusions in orthopyroxene and garnet from one iron-formation sample (QC82-45). Cl concentration in amphibole: inclusions in grt > matrix grains > inclusions in opx. Each point represents an individual analysis. The stars represent averages for each type of biotite.
4.5 Bulk Rock Chemistry Bulk compositions for selected iron-formations from the Beartooth Mountains
were calculated using a combination of mineral modes and mineral compositions (refer
to methods). Because the composition of magnetite rarely changes during
metamorphism, two separate bulk composition were calculated for each selected
sample: one that incorporates magnetite and one that excludes magnetite (Table 4.16).
The values in these tables are converted to moles of each element and are then
0.00
0.20
0.40
0.60
0.80
1.00
1.20
0.80 0.81 0.82 0.83 0.84 0.85 0.86 0.87 0.88
Cl
(ap
fu)
XFe2+ = Fe2+/(Mg + Fe2+)
incl. in grt
incl. in opx
matrix

73
subsequently used as the input values for pseudosection calculations in Theriak
Domino (de Capitani and Petrakakis, 2010).
Table 4.16. Bulk Compositions in wt% oxides
With Magnetite
Sample SiO2 Al2O3 Fe2O3 Cr2O3 TiO2 FeO MgO MnO CaO Na2O
QC-IS 44.08 2.17 20.99 ----- ----- 24.43 4.63 0.79 2.89 0.01
QC-JW3 (Fe-band)
27.07 3.30 35.45 ----- ----- 24.40 3.02 1.41 5.32 0.03
QC-JW3 (Qz-band)
87.59 0.04 6.28 ----- ----- 4.21 0.73 0.13 1.01 0.01
QC81-6 39.17 4.78 25.77 0.01 ----- 23.99 2.61 1.10 2.57 0.01
QC81-40b 40.30 3.10 25.41 0.01 ----- 25.24 3.98 1.04 0.91 -----
QC81-66 42.15 6.45 17.41 0.01 0.01 26.37 4.50 1.80 1.30 ----- QC82-45 58.17 6.12 4.08 0.02 0.03 23.86 4.09 1.34 2.30 ----- HR02-3 55.03 6.63 9.31 0.01 0.01 21.89 4.61 1.04 1.46 0.01 HR02-71 47.88 2.85 21.37 ----- ----- 22.59 2.66 1.46 1.18 -----
HP82-59 (Fe-band)
42.39 7.73 14.11 0.01 0.02 29.05 4.32 0.35 2.02 0.01
HP82-59 (Qz-band)
94.94 0.43 1.04 ----- ----- 2.84 0.60 0.03 0.12 -----
Without Magnetite
QC-IS 62.29 3.07 1.18 ----- ----- 21.70 6.54 1.12 4.09 0.02
QC-JW3 (Fe-band)
54.54 6.64 1.45 0.01 ----- 17.67 6.08 2.84 10.72 0.06
QC-JW3 (Qz-band)
96.23 0.04 0.10 ----- ----- 1.57 0.81 0.14 1.11 0.01
QC81-6 62.01 7.56 0.57 0.01 ----- 19.89 4.13 1.75 4.06 0.01
QC81-40b 63.54 4.89 0.29 0.02 ----- 21.91 6.28 1.64 1.44 -----
QC81-66 55.96 8.56 0.52 0.02 0.02 24.84 5.98 2.38 1.72 -----
QC82-45 61.09 6.43 0.82 0.02 0.03 23.50 4.30 1.40 2.41 -----
HR02-3 62.77 7.41 1.39 0.01 0.01 20.44 5.16 1.16 1.63 0.01
HR02-71 68.32 4.06 1.05 ----- ----- 18.98 3.79 2.09 1.69 -----
HP82-59 (Fe-band)
51.91 9.47 1.79 0.02 0.02 28.60 5.29 0.42 2.47 0.01
HP82-59 (Qz-band)
96.13 0.44 0.18 ----- ----- 2.48 0.61 0.03 0.13 -----

74
CHAPTER V. DISCUSSION The iron-formations investigated in this study are one of many Archean (~3.5 Ga)
xenolithic lithologies (e.g. schists, migmatites, quartzites, metabasites) from the
Beartooth Mountains, MT that were metamorphosed to peak conditions in the granulite
facies (e.g. Mueller et al., 2014). These granulite-facies conditions are well-preserved in
the meta-iron-formations as indicated by the dominance of anhydrous minerals (e.g.
pyroxenes and garnets). However, the presence of amphibole and biotite associated
with pyroxenes and garnets implies that the generally “hydrous” phases are stabilized in
these rocks. Therefore, an unusual fluid must have been interacting with these rocks
during peak metamorphism. The replacement of amphibole after pyroxene suggests
that the meta-iron-formations underwent a subsequent episode of retrograde
metamorphism at amphibolite-facies conditions. Evidence for this event is indicated by
the late-stage alteration amphiboles rimming or partially/completely replacing pyroxene
grains. A likely fluid source for the formation of these amphiboles is the emplacement of
the ~2.8 Ga granitic LLMC intrusion (Henry et al., 2014).
The primary amphibole and biotite in this study are among some of the most
chlorine-rich ever recorded, reaching up to 2.9 and 3.4 wt% Cl respectively. The
maximum Cl observed in these minerals in other studies is 7.24 wt% and 7.45 wt%
respectively (Table 1.1). Compositional and structural factors have been shown to have
significant influences on the incorporation of Cl into these “hydrous” minerals (e.g.
Volfinger et al., 1985; Morrison, 1991; Oberti et al., 1993; Makino et al., 1993). The
positive correlations between Cl- and larger cations like Fe2+ [VI] (0.78Å), Al[IV] (0.39Å),
K[XII] (1.64Å) and Ba{XII] (1.61Å) suggest that, in sufficient concentrations, these larger

75
cations may help facilitate Cl incorporation by increasing the size of their respective
structural sites in the crystal lattice, thus also expanding the anion site in amphibole and
biotite (Figures 5.1 and 5.2). As granulite-facies temperatures are reached and hydrous
minerals begin to dehydrate (lose OH-) and break down, the increased amounts of
these larger cations over smaller cations like Mg[VI] (0.72Å), Si[IV] (0.26Å) and Na[XII]
(1.18Å) may expand the crystal lattice allowing the larger Cl- (1.81Å) to replace OH-
(1.53Å) (Figure 5.2; e.g. Henry, 1988). The replacement of OH- by Cl- may in turn
increase the stability field of these hydrous minerals into higher temperature conditions.
Figure 5.1. Crystal structure of a Cl-rich hastingsite (looking down the c-axis) showing locations and sizes of selected ions: Cl- (1.81Å), K+ (1.64Å), Ca2+ (1.12Å), Fe2+ (0.78Å), Al3+ (0.39Å) and Si4+ (0.26Å). Ions not pictured in figure include Ba2+ (1.61Å), Na+ (1.18Å), Mg2+ (0.72Å), Ti4+ (0.61Å), F- (1.33Å) and OH- (1.53Å). Ionic radii from Klein et al., 2008. Data from Makino et al. 1993. Image generated using CrystalMaker®.

76
Figure 5.2. Same crystal structure from Figure 5.1 viewed looking down the a-axis to better illustrate the placement of Cl- in the hydroxyl site in the amphibole structure.
A compilation of previous thermobarometry done on proximal lithologies from the
eastern Beartooth Mountains indicates peak metamorphic conditions of 6-8 kbar and
775-850 °C (Figure 5.3; Henry et al., 1982; Maas and Henry, 2002; Will, 2013; Mueller
et al., 2014). The garnet-amphibole-plagioclase-quartz barometer of Kohn and Spear
(1990) suggests pressure conditions on the lower end of this range (~5-6 kbar),
although barometry was only done on a single sample (Table 5.1). Hornblende-
plagioclase thermometry and pyroxene-garnet thermometry indicate temperature

77
Figure 5.3. Compilation of P-T data from meta-iron-formations in this study and previous work (Henry et al., 1982; Maas and Henry, 2002; Will, 2013; Mueller et al., 2014). The orange triangle represents likely conditions of peak metamorphism based on the convergence of multiple lithologies in the Will (2013) study with previous work. The black arrow points to the bottom area across this triangle, representing the overlap of likely peak conditions determined by Will (2013) with the hbl-pl thermometry and grt-am-pl-qz barometry of the iron-formations in this study. Blue arrows represent the proposed P-T path by Mueller et al., 2014. Stability fields of the aluminosilicate polymorphs are superimposed for reference.
Table 5.1. Results of Garnet-amphibole-plagioclase-quartz Barometry*
Sample Analyses Used Pressures (kbar) at assumed temperatures
QC82-49b
Grt Am Pl 650°C 700°C 750°C 800°C 850°C
grt-12 am-11 avg of
pl-10,11
5.14 5.37 5.6 5.83 6.06
* Kohn and Spear (1990) calibration; uncertainty is ±0.5 to ±1 kbar.

78
ranges of about 740-960 °C and 540-700 °C, respectively (Tables 5.2-5.4). The lower
temperature values from pyroxene-garnet thermometry is most likely a result of
continued exchange of iron and magnesium between garnet and pyroxenes during slow
Table 5.2. Results of Hornblende-plagioclase Thermometry*
Sample Analyses Used Temperatures (°C) at assumed pressures
Hbl Pl 5 kbar 6 kbar 6.5 kbar 7 kbar
QC82-44 avg of 12 avg of pl-
12,13,14,15,20
724 724 724 724
742 750 754 758
QC82-49b
avg of am-1,3
avg of pl-6,7 962 962 961 961
930 939 944 949
am-11 avg of pl-
10,11
886 885 884 883
882 890 895 899
* HB2 ’94 calibration of Holland and Blundy (1994); uncertainty is ± 40°C.
Table 5.3. Results of Garnet-orthopyroxene Thermometry*
Sample Analyses Used Temperatures (°C) at assumed pressures
Grt Opx 5 kbar 6 kbar 6.5 kbar 7 kbar
HP82-59 avg of 20 avg of 11 610 616 619 622
HR02-3 avg of 18 avg of 16 619 625 628 631
HR02-71 avg of 12 604 609 612 615
QC-IS avg of 10 avg of 7 581 586 588 591
QC-JW3 grt-1 opx-1 (core)
582 587 589 592
QC81-1 grt-2 opx-3 531 537 539 542
QC81-5 grt-4 opx-3 677 683 686 689
QC81-6 grt-1 opx-5 648 654 656 659
QC82-45
grt-20 opx-19 612 617 620 623
grt-8 (traverse 1)
opx-9 666 671 674 677
QC82-49b
avg of grt-1,2,3
avg of opx-6,7,8
669 674 677 680
avg of grt-11,12
avg of opx-9,10
602 607 610 613
grt-12 opx-13 613 619 622 624
* Sen and Bhattacharya (1984) calibration; uncertainty is ± 60°C.

79
Table 5.4. Results of Garnet-clinopyroxene Thermometry*
Sample Analyses Used Temperatures (°C) at assumed pressures
Grt Cpx 5 kbar 6 kbar 6.5 kbar 7 kbar
QC-IS avg of 10 avg of 19 687 692 694 697
QC-JW3
grt-1 cpx-6 (core)
684 689 691 694
grt-1 cpx-8 (core)
686 691 693 695
grt-1 cpx-1 (core)
670 674 677 679
grt-6 cpx-5 604 608 611 613
grt-2’ cpx-1’ 689 694 696 699
QC81-6 grt-1 cpx-7 691 696 698 701
QC82-45 avg of 68 cpx-16 637 642 645 647
QC82-49b avg of grt-
1,2,3 avg of cpx-
4,5 632 637 639 641
grt-12 cpx-14 628 633 636 638
* Nakamura (2009) calibration; uncertainty is ± 74°C.
cooling of the rocks. Rehydration associated with the amphibolite-facies overprinting
event may have also locally reset some of the garnets and pyroxenes, causing them to
be out of equilibrium with one another and reflect retrograde metamorphic conditions.
Equilibrium assemblage diagrams were generated using the effective bulk
composition (without magnetite) for two samples containing primary amphibole to use
as comparisons with thermobarometric calculations (QC-IS and QC82-45). The primary
mineral assemblage for both of these samples is grt + opx + cpx + am, resulting in a
large stability field ranging from ~3-13 kbar and ~500-760 °C for sample QC-IS (Figure
5.4). Isopleths for the almandine component of garnet and hedenbergite component of
clinopyroxene were used to better constrain a probable P-T range. This results in a
pressure of ~5 kbar and temperature of ~700 °C. For sample QC82-45 (Figure 5.5), the
primary mineral assemblage is only found at ~755 °C from 5-10 kbar. The use of garnet

80
Figure 5.4. Pseudosection for sample QC-IS illustrating area of stability field for the primary mineral assemblage of grt + opx + cpx + am. Garnet isopleths are shown in green (almandine component in this sample is 0.64) and clinopyroxene isopleths are shown in blue (hedenbergite component in this sample is 0.43). Results from grt-opx and grt-cpx thermometry are also plotted (blue dots). Orange circle indicates the likely area of peak metamorphism conditions based on the intersection of the isopleth values with the stability area of the primary mineral assemblage. The circle does not coincide with P-T calculations (explained in text). Non-standard abbreviations are: CAmp = calcic amphibole, q = quartz, Fsp = feldspar, Ol = olivine, LIQtc = melt.
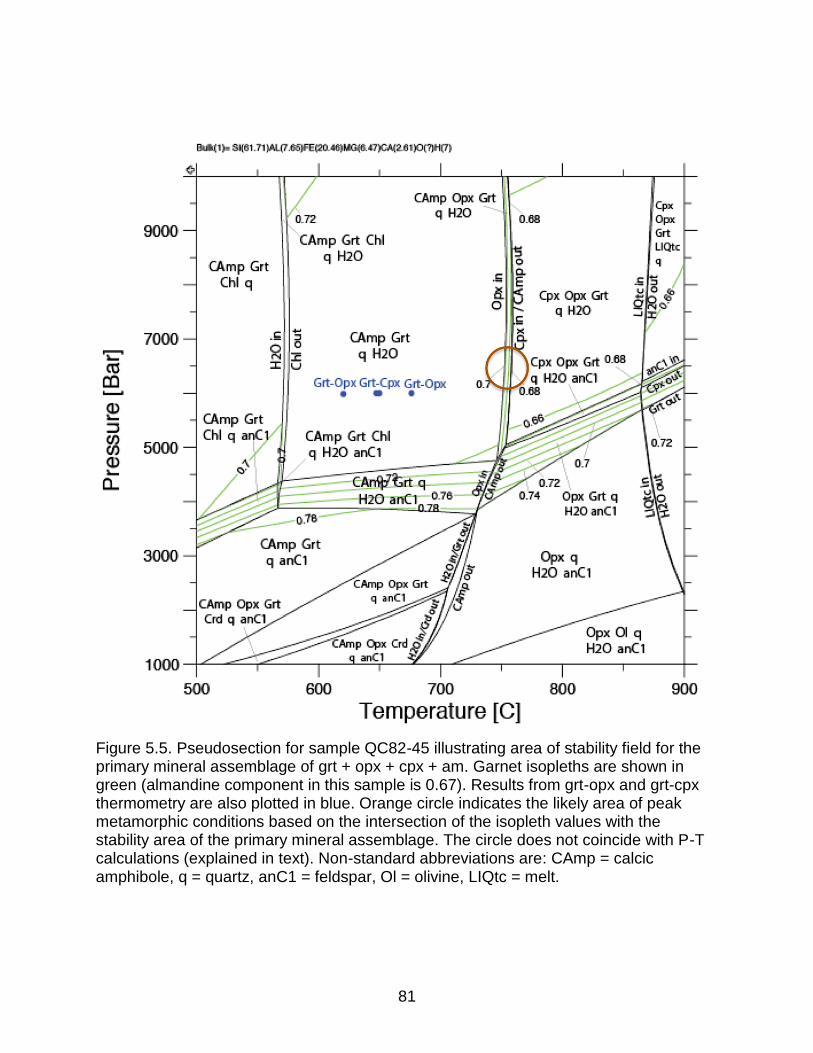
81
Figure 5.5. Pseudosection for sample QC82-45 illustrating area of stability field for the primary mineral assemblage of grt + opx + cpx + am. Garnet isopleths are shown in green (almandine component in this sample is 0.67). Results from grt-opx and grt-cpx thermometry are also plotted in blue. Orange circle indicates the likely area of peak metamorphic conditions based on the intersection of the isopleth values with the stability area of the primary mineral assemblage. The circle does not coincide with P-T calculations (explained in text). Non-standard abbreviations are: CAmp = calcic amphibole, q = quartz, anC1 = feldspar, Ol = olivine, LIQtc = melt.

82
isopleths results in a similar stability field. Amphiboles are generally stable up to
~750°C, at which point hydrous minerals tend to dehydrate into more anhydrous
minerals. According to these pseudosections, the maximum temperature experienced
by both of these samples is close to/right on the upper boundary of amphibole stability.
However, the amphiboles from these iron-formations are atypical in that they contain
elevated levels of Cl, Ti and Ba. The addition of these components can extend the
stability field of the amphiboles and prevent them from breaking down until higher
temperatures are reached. Therefore, with additional components, the maximum
temperature boundary at which the amphiboles will dehydrate may actually be slightly
higher than ~750 °C in these rocks.
Log values of halogen fugacity ratio calculations for coexisting aqueous fluids
from biotites indicate samples from the Quad Creek and Hellroaring Plateau areas were
in contact with a Cl-rich fluid aqueous phase. Mole fraction of fluorine in selected
biotites was relatively low, ranging from 0 to 0.04. Mole fraction of chlorine in these
biotites was significantly higher, ranging from 0.01 to 0.25. Fugacity ratios from the
meta-iron-formations become increasing negative as temperature rises, with ratios
falling between ~ -2.7 and -3.6 at a temperature of 750 °C (Figure 5.6), and between ~ -
3.0 and -3.9 at a temperature of 800 °C (Figure 5.7). The numbers calculated for the
Beartooth iron-formations are more negative than the values in the Munoz and
Swenson study, suggesting the biotites in this study were interacting with a more Cl-rich
fluid than the biotites used by Munoz and Swenson (1981).

83
Figure 5.6. adapted from Munoz and Swenson (1981). Relationship between log(XF/XCl) vs. XMg in the octahedral site from multiple suites of biotite-bearing rocks assuming an equilibrium temperature of 750 °C. Diagonal lines represent lines of constant log(fHF/fHCl)fluid. Each sample represents the average value from all analysis points in that sample. Biotite analyses containing 0 wt% fluorine were not included.
Figure 5.7. adapted from Munoz and Swenson (1981). Relationship between log(XF/XCl) vs. XMg in the octahedral site from multiple suites of biotite-bearing rocks assuming an equilibrium temperature of 800 °C. Diagonal lines represent lines of constant log(fHF/fHCl)fluid. Each sample represents the average value from all analysis points in that sample. Biotite analyses containing 0 wt% fluorine were not included.
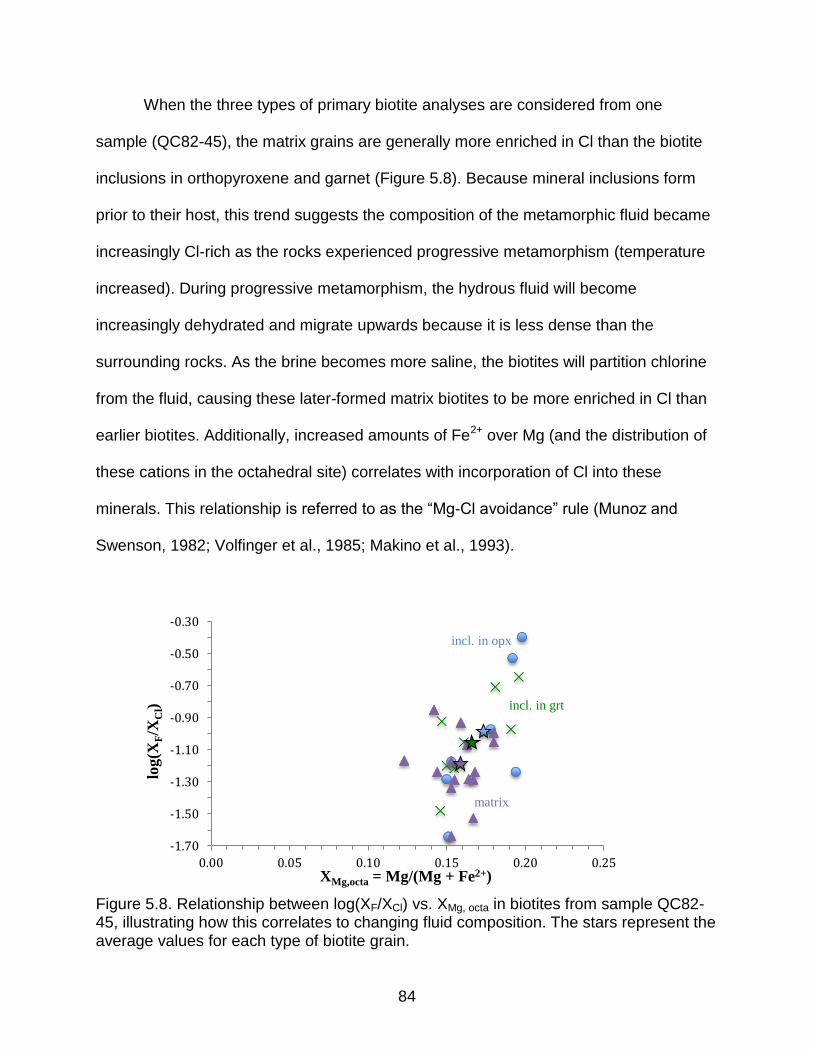
84
When the three types of primary biotite analyses are considered from one
sample (QC82-45), the matrix grains are generally more enriched in Cl than the biotite
inclusions in orthopyroxene and garnet (Figure 5.8). Because mineral inclusions form
prior to their host, this trend suggests the composition of the metamorphic fluid became
increasingly Cl-rich as the rocks experienced progressive metamorphism (temperature
increased). During progressive metamorphism, the hydrous fluid will become
increasingly dehydrated and migrate upwards because it is less dense than the
surrounding rocks. As the brine becomes more saline, the biotites will partition chlorine
from the fluid, causing these later-formed matrix biotites to be more enriched in Cl than
earlier biotites. Additionally, increased amounts of Fe2+ over Mg (and the distribution of
these cations in the octahedral site) correlates with incorporation of Cl into these
minerals. This relationship is referred to as the “Mg-Cl avoidance” rule (Munoz and
Swenson, 1982; Volfinger et al., 1985; Makino et al., 1993).
Figure 5.8. Relationship between log(XF/XCl) vs. XMg, octa in biotites from sample QC82-45, illustrating how this correlates to changing fluid composition. The stars represent the average values for each type of biotite grain.
-1.70
-1.50
-1.30
-1.10
-0.90
-0.70
-0.50
-0.30
0.00 0.05 0.10 0.15 0.20 0.25
log(X
F/X
Cl)
XMg,octa = Mg/(Mg + Fe2+)
incl. in grt
incl. in opx
matrix

85
CHAPTER VI. CONCLUSION
Chlorine enrichment of hydrous minerals is a function of pressure, temperature,
fluid composition and crystal chemistry. The amphibole and biotite present in the
Archean granulite-facies iron-formations of the eastern Beartooth Mountains, Montana
are some of the most Cl-rich amphibole and biotite recorded, making these samples
ideal for investigating the evolving fluid compositions in these rocks. Thermobarometric
calculations and equilibrium phase diagrams indicate peak metamorphism at granulite-
facies conditions (~775-800 °C and 6 kbar), which falls within the previously determined
range of P-T conditions in this area.
Three important conclusions can be determined as a result of this study. (1) The
variation in chlorine content in amphibole and biotite in this study is a consequence of
the interplay between crystallochemical influences on the incorporation of Cl and
changing fluid compositions during progressive metamorphism. While the former is
important in facilitating the Cl OH exchange, the latter is the stronger influence on
incorporation of Cl. During progressive metamorphism into granulite-facies conditions,
hydrous silicates undergo dehydration and the residual aqueous fluid that is present will
become enriched in chlorine, thus producing a more saline brine and lowering the
activity of H2O. (2) The incorporation of Cl into the hydroxyl site of the hydrous minerals
will preserve the crystal structure and extend their stability field into high-grade
metamorphic conditions. (3) The presence of “hydrous” silicates at these metamorphic
conditions indicates that these minerals are extremely sensitive to changing fluid
composition and can be used to monitor aqueous fluids in high-grade metamorphic
environments.

86
REFERENCES Armstrong R.L., Taubeneck, W.H. and Hales, P.O. (1977) Rb–Sr and K-Ar
geochronometry of Mesozoic granitic rocks and their Sr isotopic composition, Oregon, Washington, and Idaho. Geological Society of America Bulletin, 88, 397–411.
Anderson, J.L., Barth, A.P., Wooden, J.L. and Mazdab, F. (2008) Thermometers and
Thermobarometers in Granitic Systems. Reviews in Mineralogy and Geochemistry, 69, 121-142.
Baird, G.B., Bhattacharyya, P. Whitney, D.L. and Hudleston, P.J. (2006) Chlorine-
bearing fluid flow, deformation, and metamorphism in ductile shear zones of the Seve Nappe, northern Swedish Caledonides. To be submitted to the Amer. J. Science.
Bence, A.E. and Albee, A.L. (1968) Empirical correction factors for the electron
microanalysis of silicates and oxides, Journal of Geology v.76, 382-403. Blundy, J. D. and Holland, T. (1990) Calcic Amphibole Equilibria and a New Amphibole-
plagioclase Geothermometer. Contributions to Mineralogy and Petrology 104.2, 208-224.
Büttner, S. H. (2012) Rock Maker: an MS ExcelTM spreadsheet for the calculation of
rock compositions from proportional whole rock analyses, mineral compositions, and modal abundance. Contributions to Mineralogy and Petrology v.104, 129-135.
Castelli, D. (1988) Chloropotassium ferro-pargasite from Sesia-Lanzo marbles (Western
Italian Alps): a record of highly saline fluids. Rend. Soc. Ital. Mineral. Petrol. 43, 129-138.
Condie, K. C. (1976) The Wyoming Archean Province in the western United States. In
Windley, B. F. (ed.) The Early History of the Earth. John Wiley: London, 499-511. Connolly, J.A.D, and Kerrick, D.M. (1987) An algorithm and computer program for
calculating composition phase diagrams. CALPHAD v.11, p. 1-55. Connor and Harrison (2003) The Laramide Orogeny. The Traprock. Vol. 2, 10 – 14. CrystalMaker® 9.0.4: a crystal and molecular structures program for Mac and Windows.
CrystalMaker Software Ltd, Oxford, England (www.crystalmaker.com). de Capitani, C., and Petrakakis, K. (2010) The computation of equilibrium assemblage
diagrams with Theriak/Domino software. American Mineralogist, 95(7), 1006-1016.

87
Deer, W.A., Howie, R.A., and Zussman, J. (2001) Rock-Forming Minerals, Volume 4A:
Framework Silicates – Feldspars. The Geological Society of London, London, United Kingdom, 972 p.
Dick, L.A. and Robinson, G.W. (1979) Chlorine-bearing potassian hastingsite from a
sphalerite skarn in southern Yukon. Cand. Mineral. 17, 25-26. Diener, J.F.A., Powell, R., White, R.W. and Holland, T.J.B. (2007) A new
thermodynamic model for clino- and orthoamphiboles in the system Na2O-CaO-FeO-MgO-Al2O3-SiO2-H2O-O. Journal of Metamorphic Geology 25, 631-56.
Enami, M., Liou, J.G., and Bird, D.K. (1992) Cl-bearing amphibole in the Salton Sea
geothermal system, California. Cand. Mineral. 30, 1077-1092. Foster, D. A., Mueller, P. A., Mogk, D. W., Wooden, J. L. and Vogl, J. J. (2006)
Proterozoic evolution of the western margin of the Wyoming craton: implications for the tectonic and magmatic evolution of the northern Rocky Mountains. Canadian Journal of Earth Sciences 43, 1601-1619.
Green, E., Holland, T., and Powell, R. (2007) An order-disorder model for omphacitic
pyroxenes in the system jadeite-diopside-hedenbergite-acmite, with applications to eclogitic rocks. American Mineralogist 92, 1181-9.
Hawthorne, F. C., Oberti, R., Harlow, G. E., Maresch, W. V., Martin, R. F., Schumacher,
J. C., and Welch, M. D. (2012) Nomenclature of the amphibole supergroup. American Mineralogist, 97, 2031-2048.
Henry, D. and Mogk, D. (2003) Selected Features of the Precambrian Rocks of the
eastern Beartooth Mountains, Montana and Wyoming. Teaching Petrology in the 21st Century Workbook, section 3, 18 pp.
Henry, D., Mueller, P., and Will, C. (2015) [IN PRESS] Hyalophane from mafic xenoliths
within Mesoarchean granitic rocks, Beartooth Mountains, Montana, USA: Indicators for barium metasomatism. Canadian Mineralogist.
Henry, D.J. (1988) Cl-rich minerals in Archean granulite facies ironstones from the
Beartooth Mountains, Montana, USA: Implications for fluids involved in granulite metamorphism. p. 67-69.
Henry, D.J., Mogk, D.W., Mueller, D.A., Foster, D.A., and Wooden, J.L. (2014) Upper-
to-middle level exposure of a 2.8 Ga continent in the northern Wyoming Province, USA. Geological Society of America Abstracts with Program, 46, 19.
88
Henry, D. J., Mueller, P. A., Wooden, J. L., Warner, J. L., and Lee-Berman, R. (1982) Granulite facies supracrustal assemblages of the Quad Creek area, eastern Beartooth Mountains, Montana: In Mueller, P. A. and Wooden, J. L., eds., Precambrian Geology of the Beartooth Mountains, Montana and Wyoming, Montana Bureau of Mines and Geology Special Publication, v.84, 147-156.
Holland, T., Baker, J. and Powell, R. (1998) Mixing properties and activity-composition
relationships of chlorites in the system MgO-FeO-Al2O3-SiO2-H2O. European Journal of Mineralogy 10, 395-406.
Holland, T. and Blundy, J. (1994) Non-ideal Interactions in Calcic Amphiboles and Their
Bearing on Amphibole-Plagioclase Thermometry. Contributions to Mineralogy and Petrology 116.4, 433-447.
Holland, T. and Powell, R. (1996) Thermodynamics of order-disorder in minerals. 2.
Symmetric formalism applied to solid solutions. American Mineralogist 81, 1425-37.
Holland, T. and Powell, R. (2003) Activity-composition relations for phases in
petrological calculations: an asymmetric multicomponent formulation. Contributions to Mineralogy and Petrology 145, 492-501.
Holland, T.J.B. and Powell, R. (1998) An internally consistent thermodynamic data set
for phases of petrological interest. Journal of Metamorphic Geology 16, 309-43. Jacobsen, S.S. (1975) Dashkesanite: High-chlorine amphibole from St. Paul’s rocks,
Equatorial Atlantic, and Transcaucasia, U.S.S.R. Min. Sci. Invest., Contrib. Earth Sci., Smithsonian Inst. 14, 17-20.
James, H.L. (1954) Sedimentary facies of iron-formation. Economic Geology, 49, 235-
293. Jiang, S.-Y., Palmer, M.R., Li, Y.-H., and Xue, C.-J. (1996) Ba-rich micas from the
Yindongzi-Daxigou Pb-Zn-Ag and Fe deposits, Qinling, northwestern China. Mineral. Mag. 60, 433-445.
Jiang, S.-Y., Palmer, M.R., Xue, C.-J., and Li, Y.-H. (1994) Halogen-rich scapolite-
biotite rocks from the Tongmugou Pb-Zn deposit, Qinling, north-western China: implications for the ore-forming processes. Mineral. Mag. 58, 543-552.
Kamineni, D.C., Bonardi, M., and Rao, A.T. (1982) Halogen-bearing minerals from
Airport Hill, Visakpatnam, India. Amer. Mineral. 67, 1001-1004. Klein, C. (2005) Some Precambrian Banded Iron-formations (BIFs) from around the
world: Their age, geologic setting, mineralogy, metamorphism, geochemistry, and origins. American Mineralogist, 90.10, 1473-1499.

89
Klein, C., Dutrow, B. and Dana, J. D. (2008) The 23rd Edition of the Manual of Mineral
Science: (after James D. Dana). John Wiley. Kohn, M.J., and Spear, F.S. (1990) 2 new geobarometers for garnet amphibolites, with
applications to southeastern Vermont. American Mineralogist, v.75, 89-96. Krogh T, Kamo S, Hanley T, Hess D, Dahl P, Johnson, R. (2011) Geochronology and
geochemistry of Precambrian Gneisses, metabasites, and pegmatite from the Tobacco Root Mountains, northwestern Wyoming craton, Montana. Can J Earth Sci 46:161–185.
Krutov, G.A. (1936) Dashkesanite: a new chlorine amphibole of the hastingsite group.
Mineral. Abstr. 6, 438. Kullerud, K. (1995) Chlorine, titanium and barium-rich biotites: factors controlling biotite
composition and implications for garnet-biotite geothermometry. Contrib. Minerl. Petrol. 120, 42-59.
Kullerud, K. (1996) Chlorine-rich amphiboles: interplay between amphibole composition
and an evolving fluid. Eur. J. Mineral. 8, 355-370. Kullerud, K. (2000) Occurrence and origin of Cl-rich amphibole and biotite in the Earth’s
crust – implications for fluid composition and evolution. In Stober, I. and Bucher, K. (eds.) Hydrogeology of Crystalline Rocks, 205-225.
Léger, A., Rebbert, C., and Webster, J. (1996) Cl-rich biotite and amphibole from Black
Rock Forest, Cornwall, New York. American Mineralogist, 81, 495-504. Liu, J., Liu, W., Ye, K. and Mao, Q. (2009) Chlorine-rich amphibole in Yangkou eclogite,
Sulu ultrahigh-pressure metamorphic terrane, China. Eur. J. Mineral. 21, 1265-1285.
Locock, A. J. (2014) An Excel spreadsheet to classify chemical analyses of amphiboles
following the IMA 2012 recommendations. Computers and Geosciences 62, 1-11.
Maas and Henry (2002) Heterogeneous growth and dissolution of sillimanite in
migmatites: evidence from cathodoluminescence imaging: GSA Abstracts with Programs 189, p. 17.
Maier, A., Cates, N., Trail, D. and Mojzis, S. (2012) Geology, age and field relations of
Hadean zircon-bearing supracrustal rocks from Quad Creek, eastern Beartooth Mountains (Montana-Wyoming). Chem Geol. doi: 10 1016/j chemgeo 2012 04 005.
90
Makino, K., Tomita K. and Suwa, K. (1993) Effect of chlorine on the crystal structure of a chlorine-rich hastingsite. Mineralogical Magazine, 57, 677-685.
Manning, C. E. and Aranovich, L. Y. (2014) Brines at High Pressure and Temperature:
Thermodynamic, Petrologic and Geochemical Effects. Precambrian Research 253, 6-16.
Markl, G. and Piazolo, S. (1998) Halogen-bearing minerals in syenites and high-grade
marbles of Dronning Maud Land, Antarctica: monitors of fluid compositional changes during late-magmatic fluid-rock interaction processes. Contrib. Mineral. Petrol. 132, 246-268.
McCormick, K.A. and McDonald, A.M. (1999) Chlorine-bearing amphiboles from the
Fraser Mine, Sudbury, Ontario, Canada: Description and crystal chemistry. Cand. Mineral. 37, 1385-1403.
Mora, C.I. and Valley, J.W. (1989) Halogen-rich scapolite and biotite: Implications for
metamorphic fluid-rock interactions. Amer. Mineral. 74, 721-737. Morrison, J. M. (1991) Compositional constraints on the incorporation of Cl into
amphiboles. American Mineralogist 76, 1920-1930. Mueller, P. and Frost, C. (2006) The Wyoming Province: A distinctive Archean craton in
Laurentian North America. Can. J. Earth Sci. 43, 1391–1397. Mueller, P., Mogk, D., Henry, D., Wooden, J. and Foster, D. (2008) Geologic evolution
of the Beartooth Mountains: Insights from petrology and geochemistry. Northwest Geol. 37, 5 – 20.
Mueller, P. and Wooden, J. (2012) Trace Element and Lu-Hf Systematics in Hadean-
Archean Detrital Zircons: Implications for Crustal Evolution: Journal of Geology, v.120, 15-29.
Mueller, P., Wooden, J., Mogk, D., Henry, D. and Bowes, D. (2010) Rapid Growth of an
Archean continent by arc magmatism. Precambrian Res. 183:70-88. Mueller, P. A., Mogk, D. W., Henry, D. J., Wooden, J. L. and Foster, D. A. (2014) The
Plume to Plate Transition: Hadean and Archean Crustal Evolution in the Northern Wyoming Province, U.S.A. Modern Approaches in Solid Earth Sciences 7, 23-54.
Munoz, J. L. and Swenson, A. (1981) Chloride-hydroxyl exchange in biotite and
estimation of relative HCl/HF activities in hydrothermal fluids. Economic Geology 76, 22 12-222 1.
Munoz, J. L. and Swenson, A. (1982) F-Cl-OH partitioning between biotite and apatite.
Geochimica et Cosmochimica Acta 56, 3435-3467.

91
Nakamura, D. (2009) A new formulation of garnet–clinopyroxene geothermometer
based on accumulation and statistical analysis of a large experimental data set. Journal of Metamorphic Geology, 27: 495–508.
Oberti, R., Ungaretti, L., Cannillo, E., and Hawthorne, F.C. (1993) The mechanism of Cl
incorporation in amphibole. American Mineralogist 78, 746-752. Pandey, O.P., Tripathi, P., Parthasarathy, G., Rajagopalan, V. and Sreedhar, B. (2014)
Geochemical and Mineralogical Studies of Chlorine-rich Amphibole and Biotite from the 2.5 Ga Mid-crustal Basement Beneath the 1993 Killari Earthquake Region, Maharashtra: Evidence for Mantle Metasomatism Beneath the Deccan Trap. J. Geol. Soc. India. 83, 599-612.
Powell, R. and Holland, T.J.B. (1988) An internally consistent thermodynamic dataset
with uncertainties and correlations: 3: application methods, worked examples and a computer program. Journal of Metamorphic Geology, v.6, 173-204.
Ray, D., Mevel, C. and Banerjee, R. (2009) Hydrothermal alteration studies of gabbros
from Northern Central Indian Ridge and their geodynamic implications. J. Earth Syst. Sci. 118, 659-676.
Reid, R., McMannis, W., and Palmquist, J. (1975) Precambrian geology of North Snowy
Block, Beartooth Mountains, Montana. In GSA Special Papers, 157, 1-135. Sato, H., Yamaguchi, Y. and Makino, K. (1997) Cl incorporation into successively zoned
amphiboles from the Ramnes Cauldron, Norway. Amer. Mineral. 82, 316-324. Schneider C.A., Rasband W.S. and Eliceiri K.W. (2012) NIH Image to ImageJ: 25 years
of image analysis. Nat Methods 9 (7): 671–675. Sen, S. K. and Bhattacharya, A. (1984) An Orthopyroxene-Garnet Thermometer and Its
Application to the Madras Charnockites. Contributions to Mineralogy and Petrology 88.1-2, 64-71.
Sharma, R.S., (1981) Mineralogy of a scapolite-bearing rocks from Rajastan, northwest
peninsular India. Lithos. 14, 165-172. Sonnenthal, E.L. (1992) Geochemistry of dendritic anorthosites and associated
pegmatites in the Skaergaard Intrusion, East Greenland: Evidence for metasomatism by a chlorine-rich fluid. J. Volc. Geotherm. Res. 52, 209-230.
Suwa, K., Enami, M. and Horiuchi, T. (1987) Chlorine-rich potassium hastingsite from
West Onguil Island, Lützow-Holm Bay, East Antarctica. Mineral. Mag. 51, 709-714.

92
Tracy, R.J. (1991) Ba-rich micas from the Franklin marble, Lime Crest and Sterling Hill, New Jersey. Amer. Mineral. 76, 1683-1693.
Trendall, A.F. (1983) Introduction. In A.F. Trendall and R.C. Morris, Eds., Iron-
Formation: Facts and Problems, 1-11. Elsevier, Amsterdam. Uher, P., Kodera, P., Lexa, J. and Bacik, P. (2014) Halogen-rich biotites from the Detva,
Biely Vrch Au-porphyry deposit (Slovakia): Compositional variations and genetic aspects. Central European Mineralogical Conference. 146-147.
Vanko, D. (1986) High chlorine amphiboles from oceanic rocks: product of highly-saline
hydrothermal fluids? Amer. Mineral. 71, 51-59. Vielzeuf, D. (1982) The retrogressive breakdown of orthopyroxene in an intermediate
charnockite from Salcix (French Pyrénées). Bull. Minéral. 105, 681-690. Volfinger, M., Robert J. L., Vielzeuf D. and Neiva, A. M. R. (1985) Structural control of
the chlorine content of OH-bearing silicates (micas and amphiboles). Geochimica et Cosmochimica Acta. 49.1, 37-48.
White, R.W., Powell, R. and Holland, T.J.B. (2007) Progress relating to calculation of
partial melting equilibria for metapelites. Journal Of Metamorphic Geology 25, 511-27.
Whitney, D. L. and Evans, B. W. (2010) Abbreviations for names of rock-forming
minerals. American Mineralogist 95, 185-187. Will, C.N. (2013) Temperature and pressure conditions of Archean amphibolite-granulite
facies metamorphic xenoliths from the eastern Beartooth Mountains, Montana and Wyoming, USA Geology and Geophysics, M.S. thesis, 131 pp. Louisiana State University.
Winter, J. D. (2001) An Introduction to Igneous and Metamorphic Petrology: Prentice
Hall. Wooden, J.L., Mueller, P.A., Mogk, D.W., and Bowes, D.R. (1988) A review of the
geochemistry and geochronology of Archean rocks of the Beartooth Mountains, Montana-Wyoming. In Precambrian and Mesozoic plate margins: Montana, Idaho and Wyoming. Edited by S.E. Lewis and R.B. Berg. Montana Bureau of Mines and Geology, Special Publication 96, p. 23-42.
Xiao, Y., Hoefs, J. and Kronz, A. (2005) Compositionally zoned Cl-rich amphiboles from
North Dabie Shan, China: Monitor of high-pressure metamorphic fluid/rock interaction processes. Lithos. 81, 279-295.

93
Yardley, B.W.D (1985) Apatite composition and the fugacities of HF and HCI in metamorphic fluids. Mineralogical Magazine 49, 77-79.
Zhu, C. and Sverjensky, D. A. (1991) Partitioning of F-Cl-Oh between Minerals and
Hydrothermal Fluids. Geochimica et Cosmochimica Acta 55(7), 1837-1858. Zhu, C. and Sverjensky, D. A. (1992) F-Cl-OH partitioning between biotite and apatite.
Geochimica et Cosmochimica Acta 56, 3435-3467.
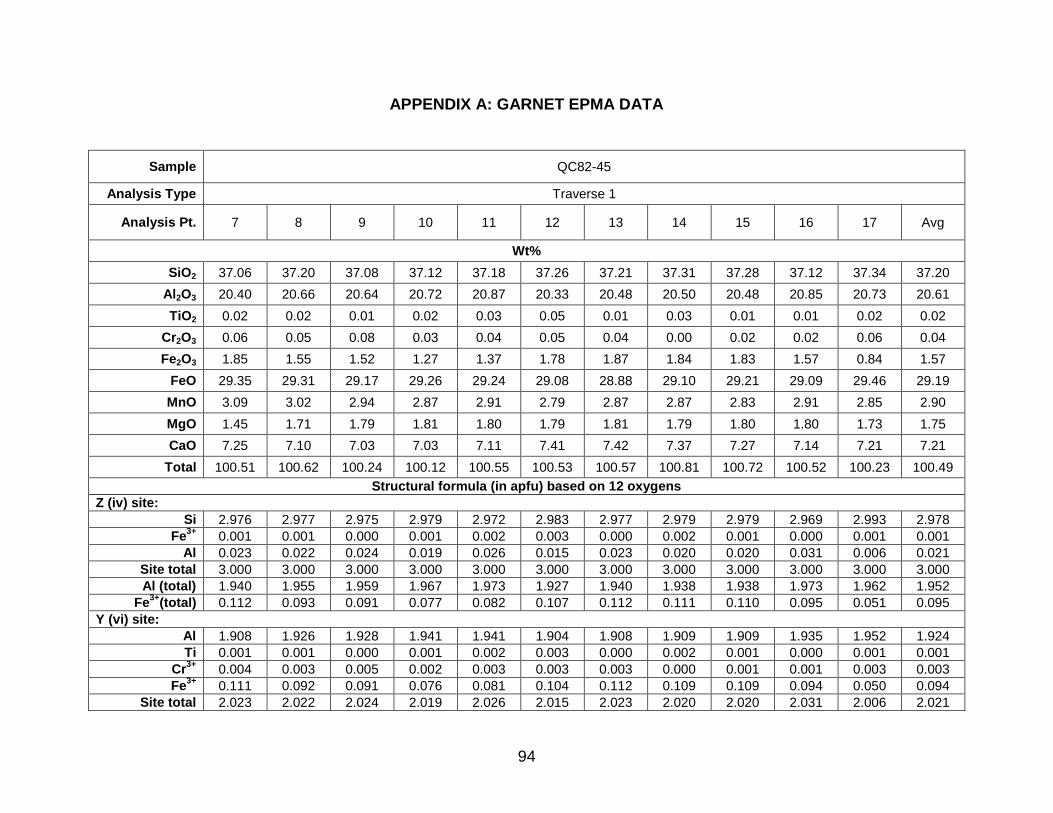
94
APPENDIX A: GARNET EPMA DATA
Sample QC82-45
Analysis Type Traverse 1
Analysis Pt. 7 8 9 10 11 12 13 14 15 16 17 Avg
Wt%
SiO2 37.06 37.20 37.08 37.12 37.18 37.26 37.21 37.31 37.28 37.12 37.34 37.20
Al2O3 20.40 20.66 20.64 20.72 20.87 20.33 20.48 20.50 20.48 20.85 20.73 20.61
TiO2 0.02 0.02 0.01 0.02 0.03 0.05 0.01 0.03 0.01 0.01 0.02 0.02
Cr2O3 0.06 0.05 0.08 0.03 0.04 0.05 0.04 0.00 0.02 0.02 0.06 0.04
Fe2O3 1.85 1.55 1.52 1.27 1.37 1.78 1.87 1.84 1.83 1.57 0.84 1.57
FeO 29.35 29.31 29.17 29.26 29.24 29.08 28.88 29.10 29.21 29.09 29.46 29.19
MnO 3.09 3.02 2.94 2.87 2.91 2.79 2.87 2.87 2.83 2.91 2.85 2.90
MgO 1.45 1.71 1.79 1.81 1.80 1.79 1.81 1.79 1.80 1.80 1.73 1.75
CaO 7.25 7.10 7.03 7.03 7.11 7.41 7.42 7.37 7.27 7.14 7.21 7.21
Total 100.51 100.62 100.24 100.12 100.55 100.53 100.57 100.81 100.72 100.52 100.23 100.49
Structural formula (in apfu) based on 12 oxygens
Z (iv) site:
Si 2.976 2.977 2.975 2.979 2.972 2.983 2.977 2.979 2.979 2.969 2.993 2.978
Fe3+
0.001 0.001 0.000 0.001 0.002 0.003 0.000 0.002 0.001 0.000 0.001 0.001
Al 0.023 0.022 0.024 0.019 0.026 0.015 0.023 0.020 0.020 0.031 0.006 0.021
Site total 3.000 3.000 3.000 3.000 3.000 3.000 3.000 3.000 3.000 3.000 3.000 3.000
Al (total) 1.940 1.955 1.959 1.967 1.973 1.927 1.940 1.938 1.938 1.973 1.962 1.952
Fe3+
(total) 0.112 0.093 0.091 0.077 0.082 0.107 0.112 0.111 0.110 0.095 0.051 0.095
Y (vi) site:
Al 1.908 1.926 1.928 1.941 1.941 1.904 1.908 1.909 1.909 1.935 1.952 1.924
Ti 0.001 0.001 0.000 0.001 0.002 0.003 0.000 0.002 0.001 0.000 0.001 0.001
Cr3+
0.004 0.003 0.005 0.002 0.003 0.003 0.003 0.000 0.001 0.001 0.003 0.003
Fe3+
0.111 0.092 0.091 0.076 0.081 0.104 0.112 0.109 0.109 0.094 0.050 0.094
Site total 2.023 2.022 2.024 2.019 2.026 2.015 2.023 2.020 2.020 2.031 2.006 2.021
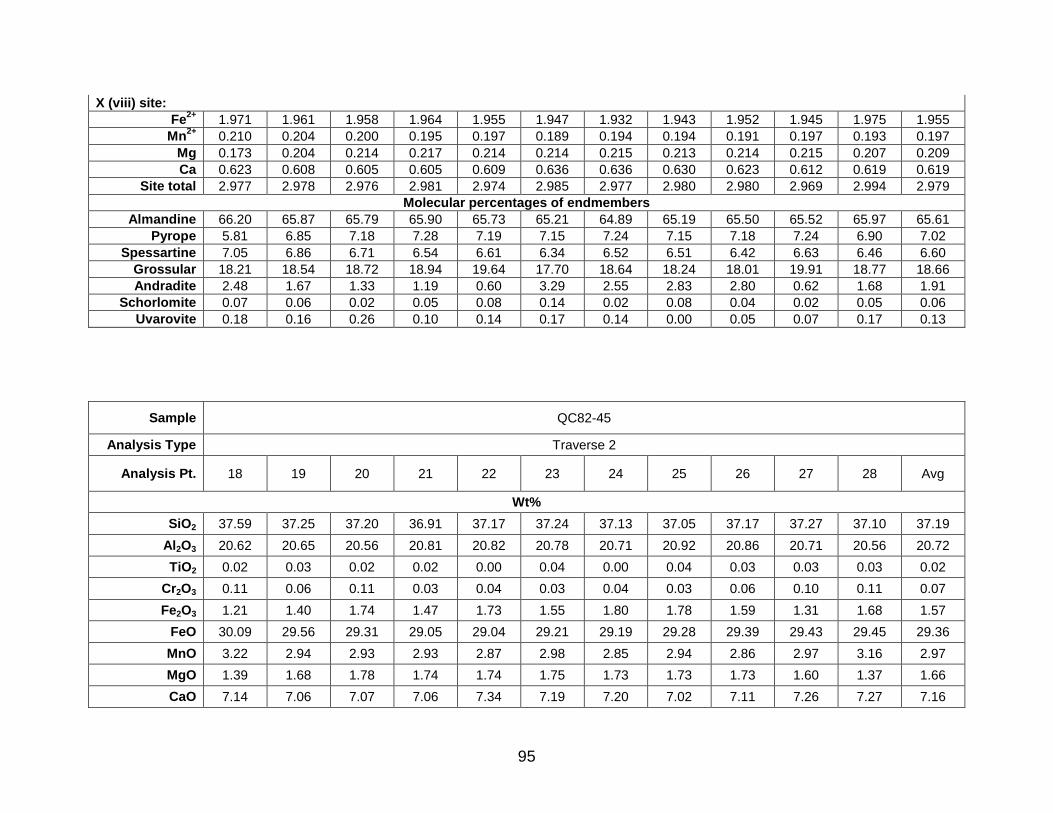
95
X (viii) site:
Fe2+
1.971 1.961 1.958 1.964 1.955 1.947 1.932 1.943 1.952 1.945 1.975 1.955
Mn2+
0.210 0.204 0.200 0.195 0.197 0.189 0.194 0.194 0.191 0.197 0.193 0.197
Mg 0.173 0.204 0.214 0.217 0.214 0.214 0.215 0.213 0.214 0.215 0.207 0.209
Ca 0.623 0.608 0.605 0.605 0.609 0.636 0.636 0.630 0.623 0.612 0.619 0.619
Site total 2.977 2.978 2.976 2.981 2.974 2.985 2.977 2.980 2.980 2.969 2.994 2.979
Molecular percentages of endmembers
Almandine 66.20 65.87 65.79 65.90 65.73 65.21 64.89 65.19 65.50 65.52 65.97 65.61
Pyrope 5.81 6.85 7.18 7.28 7.19 7.15 7.24 7.15 7.18 7.24 6.90 7.02
Spessartine 7.05 6.86 6.71 6.54 6.61 6.34 6.52 6.51 6.42 6.63 6.46 6.60
Grossular 18.21 18.54 18.72 18.94 19.64 17.70 18.64 18.24 18.01 19.91 18.77 18.66
Andradite 2.48 1.67 1.33 1.19 0.60 3.29 2.55 2.83 2.80 0.62 1.68 1.91
Schorlomite 0.07 0.06 0.02 0.05 0.08 0.14 0.02 0.08 0.04 0.02 0.05 0.06
Uvarovite 0.18 0.16 0.26 0.10 0.14 0.17 0.14 0.00 0.05 0.07 0.17 0.13
Sample QC82-45
Analysis Type Traverse 2
Analysis Pt. 18 19 20 21 22 23 24 25 26 27 28 Avg
Wt%
SiO2 37.59 37.25 37.20 36.91 37.17 37.24 37.13 37.05 37.17 37.27 37.10 37.19
Al2O3 20.62 20.65 20.56 20.81 20.82 20.78 20.71 20.92 20.86 20.71 20.56 20.72
TiO2 0.02 0.03 0.02 0.02 0.00 0.04 0.00 0.04 0.03 0.03 0.03 0.02
Cr2O3 0.11 0.06 0.11 0.03 0.04 0.03 0.04 0.03 0.06 0.10 0.11 0.07
Fe2O3 1.21 1.40 1.74 1.47 1.73 1.55 1.80 1.78 1.59 1.31 1.68 1.57
FeO 30.09 29.56 29.31 29.05 29.04 29.21 29.19 29.28 29.39 29.43 29.45 29.36
MnO 3.22 2.94 2.93 2.93 2.87 2.98 2.85 2.94 2.86 2.97 3.16 2.97
MgO 1.39 1.68 1.78 1.74 1.74 1.75 1.73 1.73 1.73 1.60 1.37 1.66
CaO 7.14 7.06 7.07 7.06 7.34 7.19 7.20 7.02 7.11 7.26 7.27 7.16

96
Total 101.38 100.62 100.72 100.01 100.75 100.78 100.66 100.78 100.80 100.69 100.72 100.72
Structural formula (in apfu) based on 12 oxygens
Z (iv) site:
Si 2.992 2.981 2.974 2.968 2.967 2.973 2.969 2.959 2.967 2.980 2.973 2.973
Fe3+
0.001 0.002 0.001 0.001 0.000 0.002 0.000 0.002 0.002 0.002 0.002 0.001
Al 0.007 0.018 0.024 0.031 0.033 0.025 0.031 0.039 0.031 0.018 0.025 0.026
Site total 3.000 3.000 3.000 3.000 3.000 3.000 3.000 3.000 3.000 3.000 3.000 3.000
Al (total) 1.940 1.954 1.945 1.979 1.967 1.962 1.960 1.978 1.970 1.958 1.950 1.960
Fe3+
(total) 0.072 0.084 0.105 0.089 0.104 0.093 0.108 0.107 0.095 0.079 0.101 0.094
Y (vi) site:
Al 1.928 1.929 1.912 1.940 1.926 1.930 1.920 1.930 1.932 1.933 1.917 1.927
Ti 0.001 0.002 0.001 0.001 0.00 0.002 0.00 0.002 0.002 0.002 0.002 0.001
Cr3+
0.007 0.004 0.007 0.002 0.003 0.002 0.003 0.002 0.004 0.007 0.007 0.004
Fe3+
0.071 0.083 0.104 0.088 0.104 0.091 0.108 0.105 0.094 0.077 0.099 0.093
Site total 2.007 2.018 2.024 2.031 2.033 2.025 2.031 2.039 2.031 2.018 2.025 2.026
X (viii) site:
Fe2+
2.003 1.978 1.959 1.953 1.939 1.950 1.952 1.955 1.962 1.968 1.973 1.963
Mn2+
0.217 0.199 0.199 0.200 0.194 0.201 0.193 0.199 0.193 0.201 0.214 0.201
Mg 0.164 0.200 0.212 0.208 0.207 0.208 0.207 0.206 0.206 0.191 0.164 0.198
Ca 0.609 0.605 0.605 0.608 0.628 0.615 0.617 0.601 0.608 0.622 0.624 0.613
Site total 2.993 2.982 2.976 2.969 2.967 2.975 2.969 2.961 2.969 2.982 2.975 2.974
Molecular percentages of endmembers
Almandine 66.91 66.34 65.85 65.78 65.34 65.55 65.74 66.03 66.08 66.00 66.33 66.00
Pyrope 5.49 6.70 7.13 7.00 6.97 7.00 6.96 6.97 6.92 6.41 5.50 6.64
Spessartine 7.26 6.68 6.67 6.72 6.54 6.77 6.51 6.71 6.51 6.73 7.20 6.76
Grossular 17.28 18.22 17.98 20.09 20.14 19.24 19.38 20.02 19.64 19.01 18.87 19.08
Andradite 2.67 1.77 1.94 0.25 0.88 1.23 1.26 0.08 0.56 1.42 1.66 1.25
Schorlomite 0.04 0.08 0.07 0.06 0.00 0.11 0.00 0.11 0.08 0.10 0.09 0.07
Uvarovite 0.34 0.20 0.36 0.09 0.13 0.11 0.13 0.09 0.20 0.33 0.35 0.21
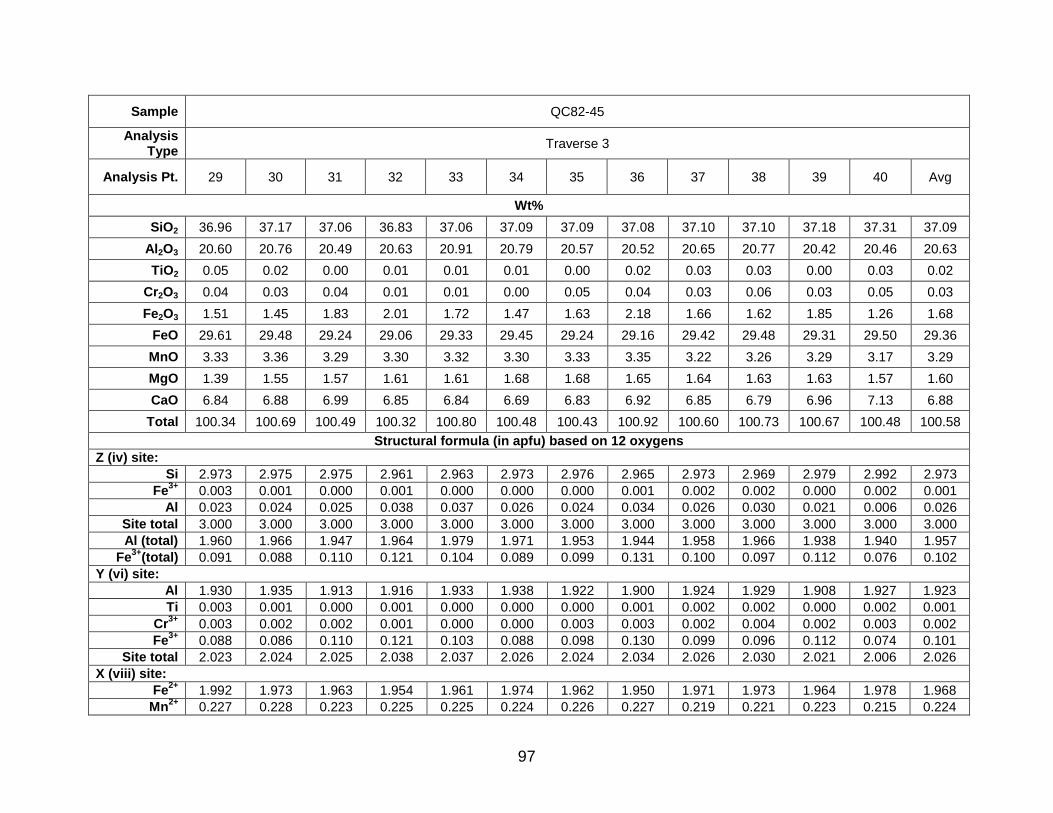
97
Sample QC82-45
Analysis Type
Traverse 3
Analysis Pt. 29 30 31 32 33 34 35 36 37 38 39 40 Avg
Wt%
SiO2 36.96 37.17 37.06 36.83 37.06 37.09 37.09 37.08 37.10 37.10 37.18 37.31 37.09
Al2O3 20.60 20.76 20.49 20.63 20.91 20.79 20.57 20.52 20.65 20.77 20.42 20.46 20.63
TiO2 0.05 0.02 0.00 0.01 0.01 0.01 0.00 0.02 0.03 0.03 0.00 0.03 0.02
Cr2O3 0.04 0.03 0.04 0.01 0.01 0.00 0.05 0.04 0.03 0.06 0.03 0.05 0.03
Fe2O3 1.51 1.45 1.83 2.01 1.72 1.47 1.63 2.18 1.66 1.62 1.85 1.26 1.68
FeO 29.61 29.48 29.24 29.06 29.33 29.45 29.24 29.16 29.42 29.48 29.31 29.50 29.36
MnO 3.33 3.36 3.29 3.30 3.32 3.30 3.33 3.35 3.22 3.26 3.29 3.17 3.29
MgO 1.39 1.55 1.57 1.61 1.61 1.68 1.68 1.65 1.64 1.63 1.63 1.57 1.60
CaO 6.84 6.88 6.99 6.85 6.84 6.69 6.83 6.92 6.85 6.79 6.96 7.13 6.88
Total 100.34 100.69 100.49 100.32 100.80 100.48 100.43 100.92 100.60 100.73 100.67 100.48 100.58
Structural formula (in apfu) based on 12 oxygens
Z (iv) site:
Si 2.973 2.975 2.975 2.961 2.963 2.973 2.976 2.965 2.973 2.969 2.979 2.992 2.973
Fe3+
0.003 0.001 0.000 0.001 0.000 0.000 0.000 0.001 0.002 0.002 0.000 0.002 0.001
Al 0.023 0.024 0.025 0.038 0.037 0.026 0.024 0.034 0.026 0.030 0.021 0.006 0.026
Site total 3.000 3.000 3.000 3.000 3.000 3.000 3.000 3.000 3.000 3.000 3.000 3.000 3.000
Al (total) 1.960 1.966 1.947 1.964 1.979 1.971 1.953 1.944 1.958 1.966 1.938 1.940 1.957
Fe3+
(total) 0.091 0.088 0.110 0.121 0.104 0.089 0.099 0.131 0.100 0.097 0.112 0.076 0.102
Y (vi) site:
Al 1.930 1.935 1.913 1.916 1.933 1.938 1.922 1.900 1.924 1.929 1.908 1.927 1.923
Ti 0.003 0.001 0.000 0.001 0.000 0.000 0.000 0.001 0.002 0.002 0.000 0.002 0.001
Cr3+
0.003 0.002 0.002 0.001 0.000 0.000 0.003 0.003 0.002 0.004 0.002 0.003 0.002
Fe3+
0.088 0.086 0.110 0.121 0.103 0.088 0.098 0.130 0.099 0.096 0.112 0.074 0.101
Site total 2.023 2.024 2.025 2.038 2.037 2.026 2.024 2.034 2.026 2.030 2.021 2.006 2.026
X (viii) site:
Fe2+
1.992 1.973 1.963 1.954 1.961 1.974 1.962 1.950 1.971 1.973 1.964 1.978 1.968
Mn2+
0.227 0.228 0.223 0.225 0.225 0.224 0.226 0.227 0.219 0.221 0.223 0.215 0.224

98
Mg 0.167 0.185 0.188 0.193 0.192 0.201 0.201 0.196 0.196 0.195 0.195 0.188 0.191
Ca 0.590 0.590 0.601 0.590 0.585 0.575 0.587 0.593 0.588 0.582 0.597 0.613 0.591
Site total 2.977 2.976 2.975 2.962 2.963 2.974 2.976 2.966 2.974 2.970 2.979 2.994 2.974
Molecular percentages of endmembers
Almandine 66.94 66.30 65.98 65.97 66.17 66.39 65.93 65.74 66.29 66.41 65.91 66.09 66.18
Pyrope 5.62 6.22 6.32 6.53 6.49 6.76 6.74 6.61 6.60 6.55 6.55 6.27 6.44
Spessartine 7.63 7.65 7.51 7.59 7.58 7.53 7.61 7.65 7.35 7.43 7.48 7.18 7.52
Grossular 18.23 18.54 17.92 18.90 19.49 18.39 17.75 17.78 18.09 18.50 17.16 17.35 18.17
Andradite 1.29 1.15 2.16 0.93 0.23 0.91 1.79 2.02 1.50 0.84 2.82 2.87 1.54
Schorlomite 0.16 0.05 0.00 0.04 0.02 0.02 0.01 0.05 0.08 0.08 0.00 0.08 0.05
Uvarovite 0.13 0.09 0.12 0.04 0.02 0.00 0.16 0.14 0.09 0.19 0.08 0.17 0.10
Sample QC82-45
Analysis Type
Traverse 4
Analysis Pt. 8 9 10 11 12 13 14 15 16 17 18 19 20 21
Wt%
SiO2 37.29 37.29 37.29 37.33 37.32 37.39 37.35 37.39 37.14 37.47 37.22 37.38 37.26 37.43
Al2O3 20.24 20.42 20.25 20.39 20.44 20.46 20.48 20.53 20.50 20.59 20.56 20.62 20.55 20.58
TiO2 0.04 0.00 0.01 0.00 0.02 0.04 0.01 0.00 0.00 0.02 0.00 0.02 0.01 0.00
Cr2O3 0.07 0.06 0.10 0.08 0.07 0.04 0.06 0.00 0.03 0.02 0.00 0.00 0.02 0.01
Fe2O3 0.86 0.44 0.83 0.58 1.16 0.81 0.64 0.60 0.98 0.31 0.46 0.25 0.82 0.83
FeO 29.82 29.93 29.50 29.63 29.51 29.52 29.63 29.80 29.58 30.12 29.84 29.89 29.43 29.55
MnO 3.03 2.87 2.95 2.78 2.85 2.78 2.83 2.83 2.83 2.72 2.62 2.71 2.81 2.71
MgO 1.54 1.58 1.69 1.77 1.77 1.79 1.86 1.85 1.84 1.88 1.82 1.81 1.83 1.80
CaO 7.02 6.97 7.11 7.06 7.10 7.19 6.92 6.83 6.77 6.71 6.84 6.91 7.04 7.23
Total 99.89 99.58 99.73 99.63 100.23 100.02 99.76 99.84 99.67 99.84 99.38 99.59 99.77 100.15
Structural formula (in apfu) based on 12 oxygens
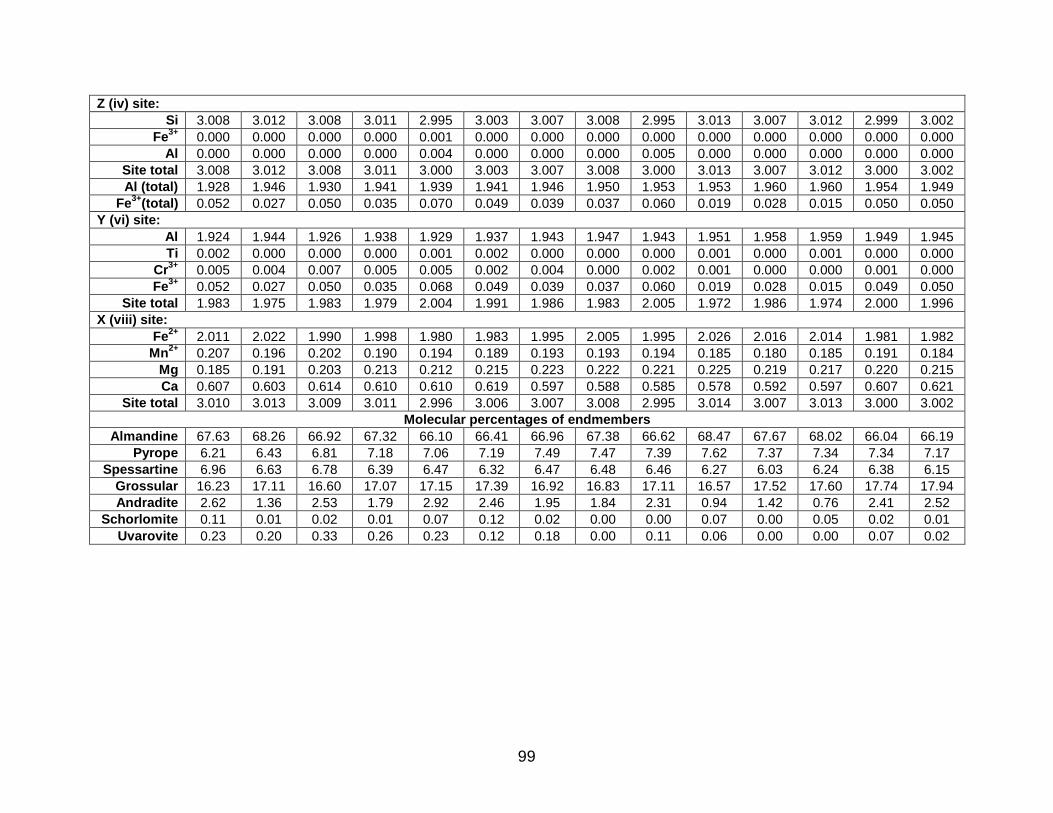
99
Z (iv) site:
Si 3.008 3.012 3.008 3.011 2.995 3.003 3.007 3.008 2.995 3.013 3.007 3.012 2.999 3.002
Fe3+
0.000 0.000 0.000 0.000 0.001 0.000 0.000 0.000 0.000 0.000 0.000 0.000 0.000 0.000
Al 0.000 0.000 0.000 0.000 0.004 0.000 0.000 0.000 0.005 0.000 0.000 0.000 0.000 0.000
Site total 3.008 3.012 3.008 3.011 3.000 3.003 3.007 3.008 3.000 3.013 3.007 3.012 3.000 3.002
Al (total) 1.928 1.946 1.930 1.941 1.939 1.941 1.946 1.950 1.953 1.953 1.960 1.960 1.954 1.949
Fe3+
(total) 0.052 0.027 0.050 0.035 0.070 0.049 0.039 0.037 0.060 0.019 0.028 0.015 0.050 0.050
Y (vi) site:
Al 1.924 1.944 1.926 1.938 1.929 1.937 1.943 1.947 1.943 1.951 1.958 1.959 1.949 1.945
Ti 0.002 0.000 0.000 0.000 0.001 0.002 0.000 0.000 0.000 0.001 0.000 0.001 0.000 0.000
Cr3+
0.005 0.004 0.007 0.005 0.005 0.002 0.004 0.000 0.002 0.001 0.000 0.000 0.001 0.000
Fe3+
0.052 0.027 0.050 0.035 0.068 0.049 0.039 0.037 0.060 0.019 0.028 0.015 0.049 0.050
Site total 1.983 1.975 1.983 1.979 2.004 1.991 1.986 1.983 2.005 1.972 1.986 1.974 2.000 1.996
X (viii) site:
Fe2+
2.011 2.022 1.990 1.998 1.980 1.983 1.995 2.005 1.995 2.026 2.016 2.014 1.981 1.982
Mn2+
0.207 0.196 0.202 0.190 0.194 0.189 0.193 0.193 0.194 0.185 0.180 0.185 0.191 0.184
Mg 0.185 0.191 0.203 0.213 0.212 0.215 0.223 0.222 0.221 0.225 0.219 0.217 0.220 0.215
Ca 0.607 0.603 0.614 0.610 0.610 0.619 0.597 0.588 0.585 0.578 0.592 0.597 0.607 0.621
Site total 3.010 3.013 3.009 3.011 2.996 3.006 3.007 3.008 2.995 3.014 3.007 3.013 3.000 3.002
Molecular percentages of endmembers
Almandine 67.63 68.26 66.92 67.32 66.10 66.41 66.96 67.38 66.62 68.47 67.67 68.02 66.04 66.19
Pyrope 6.21 6.43 6.81 7.18 7.06 7.19 7.49 7.47 7.39 7.62 7.37 7.34 7.34 7.17
Spessartine 6.96 6.63 6.78 6.39 6.47 6.32 6.47 6.48 6.46 6.27 6.03 6.24 6.38 6.15
Grossular 16.23 17.11 16.60 17.07 17.15 17.39 16.92 16.83 17.11 16.57 17.52 17.60 17.74 17.94
Andradite 2.62 1.36 2.53 1.79 2.92 2.46 1.95 1.84 2.31 0.94 1.42 0.76 2.41 2.52
Schorlomite 0.11 0.01 0.02 0.01 0.07 0.12 0.02 0.00 0.00 0.07 0.00 0.05 0.02 0.01
Uvarovite 0.23 0.20 0.33 0.26 0.23 0.12 0.18 0.00 0.11 0.06 0.00 0.00 0.07 0.02

100
Sample QC82-45
Analysis Type
Traverse 4 (continued)
Analysis Pt. 22 23 28 29 30 31 32 33 34 35 36 37 38 39 Avg
Wt%
SiO2 37.38 37.86 37.41 37.27 37.25 37.38 37.48 37.45 37.03 37.34 37.37 37.12 37.33 37.36 37.34
Al2O3 20.57 19.44 20.14 20.28 20.12 20.23 20.26 20.30 20.44 20.19 20.35 20.16 20.36 20.26 20.35
TiO2 0.00 0.03 0.02 0.08 0.02 0.05 0.00 0.01 0.02 0.03 0.01 0.04 0.04 0.07 0.02
Cr2O3 0.05 0.06 0.05 0.02 0.01 0.00 0.00 0.01 0.00 0.02 0.00 0.00 0.02 0.03 0.03
Fe2O3 0.00 0.36 0.86 0.73 1.29 0.92 0.78 0.81 1.39 0.50 0.49 1.28 0.61 0.93 0.40
FeO 30.29 30.15 29.91 29.79 29.35 29.56 29.42 29.59 29.04 29.78 29.69 29.14 29.60 29.61 29.97
MnO 2.90 2.68 2.75 2.76 2.86 2.77 2.88 2.79 2.82 2.65 2.73 2.83 2.67 2.70 2.79
MgO 1.72 1.91 1.63 1.69 1.80 1.79 1.76 1.85 1.85 1.80 1.84 1.86 1.86 1.86 1.79
CaO 0.00 7.05 7.15 7.05 7.11 7.16 7.30 7.07 7.11 7.03 7.00 7.11 7.07 7.07 6.78
Total 92.91 99.52 99.93 99.66 99.80 99.86 99.88 99.88 99.70 99.34 99.47 99.53 99.57 99.90 99.47
Structural formula (in apfu) based on 12 oxygens
Z (iv) site:
Si 3.250 3.060 3.014 3.008 3.003 3.009 3.016 3.012 2.986 3.020 3.017 2.999 3.011 3.006 3.017
Fe3+
0.000 0.000 0.000 0.000 0.000 0.000 0.000 0.000 0.001 0.000 0.000 0.001 0.000 0.000 0.000
Al 0.000 0.000 0.000 0.000 0.000 0.000 0.000 0.000 0.013 0.000 0.000 0.000 0.000 0.000 0.000
Site total 3.250 3.060 3.014 3.008 3.003 3.009 3.016 3.012 3.000 3.020 3.017 3.000 3.011 3.006 3.017
Al (total) 2.056 1.853 1.917 1.933 1.918 1.924 1.925 1.928 1.949 1.927 1.939 1.925 1.938 1.926 1.939
Fe3+
(total) 0.000 0.022 0.052 0.044 0.078 0.056 0.047 0.049 0.084 0.030 0.029 0.078 0.037 0.056 0.024
Y (vi) site:
Al 2.108 1.852 1.913 1.929 1.912 1.920 1.921 1.924 1.929 1.925 1.936 1.919 1.936 1.921 1.937
Ti 0.000 0.002 0.001 0.005 0.001 0.003 0.000 0.001 0.001 0.002 0.000 0.002 0.002 0.004 0.001
Cr3+
0.004 0.004 0.003 0.001 0.001 0.000 0.000 0.000 0.000 0.001 0.000 0.000 0.001 0.002 0.002
Fe3+
0.000 0.022 0.052 0.044 0.078 0.056 0.047 0.049 0.083 0.030 0.029 0.077 0.037 0.056 0.024
Site total 2.111 1.879 1.970 1.980 1.992 1.979 1.968 1.974 2.013 1.958 1.966 1.998 1.976 1.984 1.965
X (viii) site:
Fe2+
2.203 2.038 2.015 2.011 1.979 1.990 1.979 1.991 1.958 2.014 2.005 1.969 1.996 1.993 2.025

101
Mn2+
0.213 0.184 0.188 0.188 0.196 0.189 0.196 0.190 0.193 0.182 0.186 0.194 0.183 0.184 0.191
Mg 0.223 0.230 0.196 0.204 0.216 0.215 0.211 0.222 0.222 0.217 0.221 0.224 0.224 0.223 0.215
Ca 0.000 0.610 0.617 0.609 0.614 0.618 0.629 0.609 0.614 0.609 0.605 0.615 0.611 0.610 0.587
Site total 2.639 3.061 3.016 3.013 3.005 3.012 3.016 3.013 2.987 3.022 3.017 3.002 3.013 3.010 3.018
Molecular percentages of endmembers
Almandine 83.48 72.32 68.21 67.73 66.24 67.07 67.04 67.23 65.55 68.58 67.96 65.66 67.34 66.98 68.70
Pyrope 8.44 8.14 6.63 6.86 7.23 7.25 7.16 7.51 7.43 7.39 7.49 7.46 7.54 7.51 7.30
Spessartine 8.08 6.51 6.36 6.34 6.55 6.36 6.65 6.43 6.45 6.18 6.32 6.45 6.16 6.19 6.48
Grossular 0.00 11.57 15.91 16.53 15.96 16.37 16.75 16.30 18.08 16.15 16.70 16.42 16.90 16.17 16.12
Andradite 0.00 1.16 2.66 2.24 3.93 2.82 2.39 2.48 2.42 1.55 1.50 3.89 1.87 2.84 1.23
Schorlomite 0.00 0.10 0.07 0.24 0.06 0.14 0.01 0.04 0.06 0.10 0.02 0.12 0.12 0.21 0.06
Uvarovite 0.00 0.20 0.17 0.06 0.04 0.00 0.00 0.02 0.00 0.05 0.00 0.00 0.06 0.09 0.10
Sample QC82-45 QC81-40b QC81-
66 QC81-1 QC-IS QC81-5
Analysis Type In opx In biot-7 w/ biot
inc. Rim
By opx 19
Near biot-2
Typical Typical Core Typical Avg of
10 Typical
Analysis Pt. grt-5 grt-8 grt-13 grt-15 grt-20 grt-25 grt-1 grt-1 grt-1 grt-2 grt-1 grt-4
Wt%
SiO2 37.32 37.33 37.41 37.78 37.58 37.64 37.73 37.65 37.78 37.17 37.20 36.85
Al2O3 19.95 20.11 19.90 20.43 19.72 19.92 20.61 20.59 21.31 20.32 20.72 20.44
TiO2 0.00 0.04 0.04 0.02 0.05 0.00 0.00 0.00 0.00 0.04 0.01 0.00
Cr2O3 0.13 0.05 0.04 0.03 0.06 0.02 0.03 0.04 0.03 0.07 0.01 0.08
Fe2O3 0.94 1.70 1.11 0.50 0.85 0.70 1.31 1.27 0.00 0.09 1.91 2.76
FeO 30.56 29.84 29.93 30.16 29.94 29.85 28.94 28.81 30.63 34.24 28.00 29.82
MnO 3.84 3.45 3.25 3.33 3.11 3.73 4.16 4.64 4.67 1.87 3.43 1.88
MgO 1.34 1.49 1.64 1.57 1.68 1.46 2.44 2.70 2.54 3.23 1.87 2.96
CaO 6.08 6.77 6.73 6.91 6.94 6.86 5.94 5.23 4.08 2.02 7.56 5.51
Total 100.16 100.78 100.04 100.73 99.93 100.17 101.16 100.93 101.04 99.05 100.71 100.31
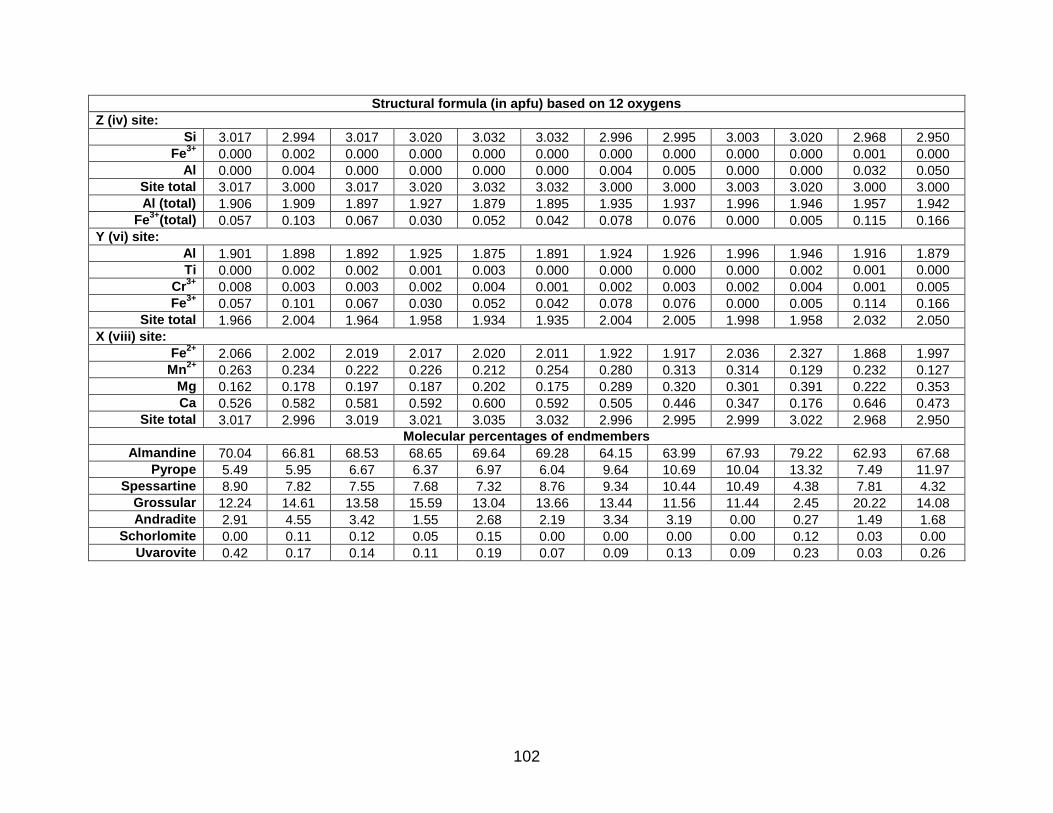
102
Structural formula (in apfu) based on 12 oxygens
Z (iv) site:
Si 3.017 2.994 3.017 3.020 3.032 3.032 2.996 2.995 3.003 3.020 2.968 2.950
Fe3+
0.000 0.002 0.000 0.000 0.000 0.000 0.000 0.000 0.000 0.000 0.001 0.000
Al 0.000 0.004 0.000 0.000 0.000 0.000 0.004 0.005 0.000 0.000 0.032 0.050
Site total 3.017 3.000 3.017 3.020 3.032 3.032 3.000 3.000 3.003 3.020 3.000 3.000
Al (total) 1.906 1.909 1.897 1.927 1.879 1.895 1.935 1.937 1.996 1.946 1.957 1.942
Fe3+
(total) 0.057 0.103 0.067 0.030 0.052 0.042 0.078 0.076 0.000 0.005 0.115 0.166
Y (vi) site:
Al 1.901 1.898 1.892 1.925 1.875 1.891 1.924 1.926 1.996 1.946 1.916 1.879
Ti 0.000 0.002 0.002 0.001 0.003 0.000 0.000 0.000 0.000 0.002 0.001 0.000
Cr3+
0.008 0.003 0.003 0.002 0.004 0.001 0.002 0.003 0.002 0.004 0.001 0.005
Fe3+
0.057 0.101 0.067 0.030 0.052 0.042 0.078 0.076 0.000 0.005 0.114 0.166
Site total 1.966 2.004 1.964 1.958 1.934 1.935 2.004 2.005 1.998 1.958 2.032 2.050
X (viii) site:
Fe2+
2.066 2.002 2.019 2.017 2.020 2.011 1.922 1.917 2.036 2.327 1.868 1.997
Mn2+
0.263 0.234 0.222 0.226 0.212 0.254 0.280 0.313 0.314 0.129 0.232 0.127
Mg 0.162 0.178 0.197 0.187 0.202 0.175 0.289 0.320 0.301 0.391 0.222 0.353
Ca 0.526 0.582 0.581 0.592 0.600 0.592 0.505 0.446 0.347 0.176 0.646 0.473
Site total 3.017 2.996 3.019 3.021 3.035 3.032 2.996 2.995 2.999 3.022 2.968 2.950
Molecular percentages of endmembers
Almandine 70.04 66.81 68.53 68.65 69.64 69.28 64.15 63.99 67.93 79.22 62.93 67.68
Pyrope 5.49 5.95 6.67 6.37 6.97 6.04 9.64 10.69 10.04 13.32 7.49 11.97
Spessartine 8.90 7.82 7.55 7.68 7.32 8.76 9.34 10.44 10.49 4.38 7.81 4.32
Grossular 12.24 14.61 13.58 15.59 13.04 13.66 13.44 11.56 11.44 2.45 20.22 14.08
Andradite 2.91 4.55 3.42 1.55 2.68 2.19 3.34 3.19 0.00 0.27 1.49 1.68
Schorlomite 0.00 0.11 0.12 0.05 0.15 0.00 0.00 0.00 0.00 0.12 0.03 0.00
Uvarovite 0.42 0.17 0.14 0.11 0.19 0.07 0.09 0.13 0.09 0.23 0.03 0.26
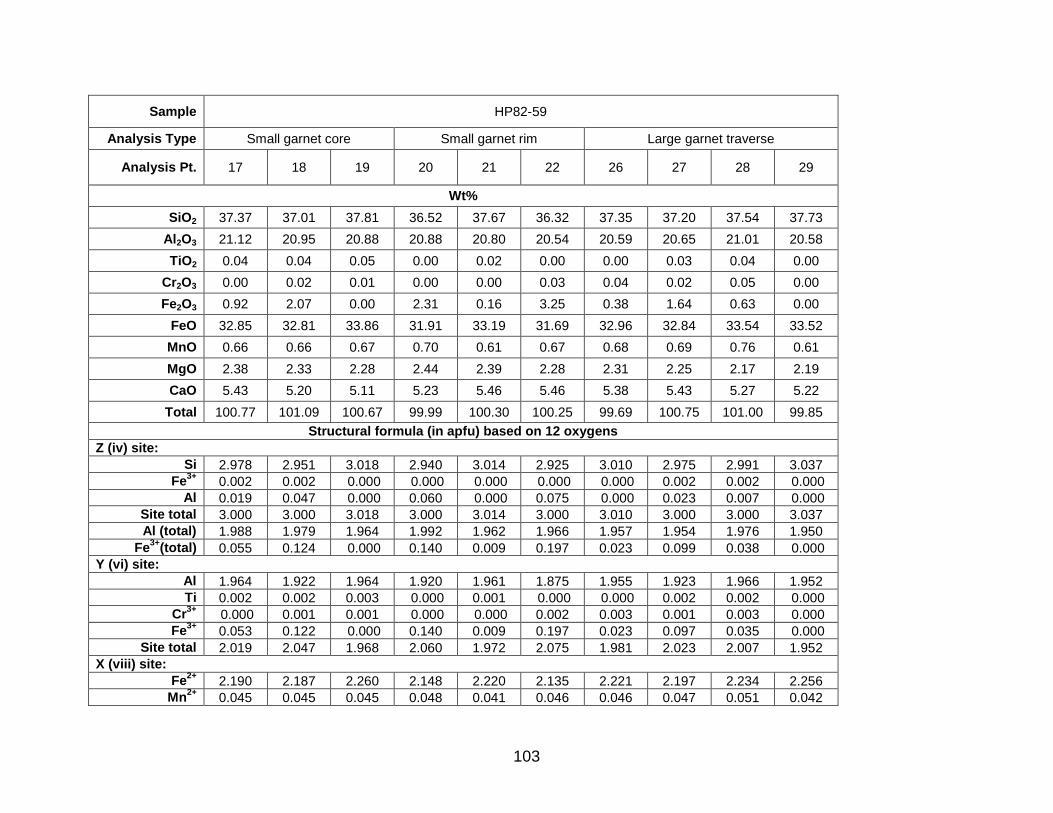
103
Sample HP82-59
Analysis Type Small garnet core Small garnet rim Large garnet traverse
Analysis Pt. 17 18 19 20 21 22 26 27 28 29
Wt%
SiO2 37.37 37.01 37.81 36.52 37.67 36.32 37.35 37.20 37.54 37.73
Al2O3 21.12 20.95 20.88 20.88 20.80 20.54 20.59 20.65 21.01 20.58
TiO2 0.04 0.04 0.05 0.00 0.02 0.00 0.00 0.03 0.04 0.00
Cr2O3 0.00 0.02 0.01 0.00 0.00 0.03 0.04 0.02 0.05 0.00
Fe2O3 0.92 2.07 0.00 2.31 0.16 3.25 0.38 1.64 0.63 0.00
FeO 32.85 32.81 33.86 31.91 33.19 31.69 32.96 32.84 33.54 33.52
MnO 0.66 0.66 0.67 0.70 0.61 0.67 0.68 0.69 0.76 0.61
MgO 2.38 2.33 2.28 2.44 2.39 2.28 2.31 2.25 2.17 2.19
CaO 5.43 5.20 5.11 5.23 5.46 5.46 5.38 5.43 5.27 5.22
Total 100.77 101.09 100.67 99.99 100.30 100.25 99.69 100.75 101.00 99.85
Structural formula (in apfu) based on 12 oxygens
Z (iv) site:
Si 2.978 2.951 3.018 2.940 3.014 2.925 3.010 2.975 2.991 3.037
Fe3+
0.002 0.002 0.000 0.000 0.000 0.000 0.000 0.002 0.002 0.000
Al 0.019 0.047 0.000 0.060 0.000 0.075 0.000 0.023 0.007 0.000
Site total 3.000 3.000 3.018 3.000 3.014 3.000 3.010 3.000 3.000 3.037
Al (total) 1.988 1.979 1.964 1.992 1.962 1.966 1.957 1.954 1.976 1.950
Fe3+
(total) 0.055 0.124 0.000 0.140 0.009 0.197 0.023 0.099 0.038 0.000
Y (vi) site:
Al 1.964 1.922 1.964 1.920 1.961 1.875 1.955 1.923 1.966 1.952
Ti 0.002 0.002 0.003 0.000 0.001 0.000 0.000 0.002 0.002 0.000
Cr3+
0.000 0.001 0.001 0.000 0.000 0.002 0.003 0.001 0.003 0.000
Fe3+
0.053 0.122 0.000 0.140 0.009 0.197 0.023 0.097 0.035 0.000
Site total 2.019 2.047 1.968 2.060 1.972 2.075 1.981 2.023 2.007 1.952
X (viii) site:
Fe2+
2.190 2.187 2.260 2.148 2.220 2.135 2.221 2.197 2.234 2.256
Mn2+
0.045 0.045 0.045 0.048 0.041 0.046 0.046 0.047 0.051 0.042

104
Mg 0.283 0.277 0.271 0.293 0.285 0.274 0.277 0.268 0.258 0.263
Ca 0.464 0.444 0.437 0.451 0.468 0.471 0.464 0.465 0.450 0.450
Site total 2.981 2.953 3.014 2.940 3.015 2.925 3.010 2.977 2.993 3.011
Molecular percentages of endmembers
Almandine 73.46 74.07 76.57 73.07 75.07 72.97 74.76 73.79 74.65 77.05
Pyrope 9.49 9.38 9.19 9.96 9.64 9.36 9.34 9.01 8.61 8.97
Spessartine 1.49 1.51 1.53 1.62 1.40 1.56 1.56 1.57 1.71 1.42
Grossular 15.39 14.86 12.52 15.34 13.35 16.01 13.06 13.71 13.89 12.56
Andradite 0.05 0.00 0.00 0.00 0.48 0.00 1.15 1.77 0.86 0.00
Schorlomite 0.12 0.12 0.15 0.00 0.06 0.00 0.00 0.09 0.12 0.00
Uvarovite 0.00 0.06 0.03 0.00 0.00 0.10 0.13 0.06 0.16 0.00
Sample HP82-59
Analysis Type Large garnet traverse (continued)
Analysis Pt. 30 31 32 33 34 35 36 37 38 39
Wt%
SiO2 37.14 36.72 36.75 37.15 37.34 37.02 36.98 36.93 36.37 36.89
Al2O3 20.27 20.75 20.56 21.14 20.95 20.93 20.70 20.80 20.48 20.74
TiO2 0.01 0.02 0.02 0.00 0.00 0.03 0.03 0.03 0.02 0.00
Cr2O3 0.00 0.01 0.02 0.03 0.07 0.03 0.05 0.05 0.05 0.05
Fe2O3 1.13 1.25 2.90 0.83 2.95 2.92 0.00 1.96 1.55 1.60
FeO 33.57 32.75 33.37 33.45 33.79 33.02 33.25 33.11 32.27 32.46
MnO 0.75 0.68 0.60 0.77 0.75 0.64 0.74 0.64 0.82 0.61
MgO 2.13 2.29 2.21 2.27 2.30 2.30 2.20 2.28 2.29 2.35
CaO 4.91 5.00 4.72 4.80 4.68 5.09 4.71 4.97 4.94 5.34
Total 99.91 99.46 101.15 100.43 102.84 101.98 98.66 100.77 98.79 100.04
Structural formula (in apfu) based on 12 oxygens
Z (iv) site:

105
Si 3.000 2.971 2.941 2.976 2.939 2.933 3.013 2.956 2.966 2.967
Fe3+
0.000 0.001 0.001 0.000 0.000 0.002 0.000 0.002 0.001 0.000
Al 0.000 0.028 0.058 0.024 0.061 0.065 0.000 0.042 0.033 0.033
Site total 3.000 3.000 3.000 3.000 3.000 3.000 3.013 3.000 3.000 3.000
Al (total) 1.935 1.985 1.953 2.000 1.958 1.969 1.986 1.972 1.976 1.974
Fe3+
(total) 0.069 0.076 0.175 0.050 0.175 0.174 0.000 0.118 0.095 0.097
Y (vi) site:
Al 1.930 1.951 1.882 1.972 1.882 1.889 1.988 1.921 1.935 1.933
Ti 0.001 0.001 0.001 0.000 0.000 0.002 0.002 0.002 0.001 0.000
Cr3+
0.000 0.001 0.001 0.002 0.004 0.002 0.003 0.003 0.003 0.003
Fe3+
0.069 0.075 0.174 0.050 0.175 0.172 0.000 0.116 0.094 0.097
Site total 1.999 2.028 2.058 2.024 2.061 2.065 1.993 2.042 2.033 2.033
X (viii) site:
Fe2+
2.268 2.216 2.233 2.241 2.224 2.188 2.265 2.216 2.200 2.184
Mn2+
0.051 0.047 0.041 0.052 0.050 0.043 0.051 0.043 0.057 0.042
Mg 0.256 0.276 0.264 0.271 0.270 0.272 0.267 0.272 0.278 0.282
Ca 0.425 0.433 0.405 0.412 0.395 0.432 0.411 0.426 0.432 0.460
Site total 3.001 2.972 2.942 2.976 2.939 2.935 2.995 2.958 2.967 2.967
Molecular percentages of endmembers
Almandine 75.63 74.56 75.90 75.29 75.69 74.56 75.79 74.92 74.16 73.59
Pyrope 8.55 9.29 8.96 9.11 9.18 9.26 8.94 9.20 9.38 9.50
Spessartine 1.71 1.57 1.38 1.76 1.70 1.46 1.71 1.47 1.91 1.40
Grossular 10.63 14.44 12.62 13.75 12.62 14.53 13.31 13.92 14.05 14.90
Andradite 3.44 0.05 1.01 0.00 0.59 0.00 0.00 0.24 0.27 0.45
Schorlomite 0.03 0.06 0.06 0.00 0.00 0.09 0.09 0.09 0.06 0.00
Uvarovite 0.00 0.03 0.06 0.10 0.22 0.10 0.16 0.16 0.16 0.16

106
Sample HR02-3
Analysis Type Cores
Analysis Pt. 42 43 44 45 46 47 48 49 50
Wt%
SiO2 36.41 37.43 36.61 37.66 37.21 37.50 36.86 37.88 37.08
Al2O3 21.24 20.97 20.89 20.84 20.56 20.92 20.48 20.98 20.79
TiO2 0.00 0.03 0.00 0.00 0.02 0.00 0.00 0.02 0.04
Cr2O3 0.00 0.00 0.00 0.00 0.00 0.00 0.03 0.04 0.01
Fe2O3 2.41 1.07 1.48 0.13 0.52 1.33 1.50 0.42 0.37
FeO 30.02 30.89 30.11 31.43 30.89 30.90 30.59 31.58 30.93
MnO 2.55 2.63 2.51 2.57 2.49 2.53 2.71 2.64 2.60
MgO 2.95 3.15 2.92 2.97 3.00 3.05 2.94 3.09 2.94
CaO 4.43 4.38 4.62 4.45 4.49 4.64 4.29 4.33 4.35
Total 100.01 100.56 99.14 100.05 99.18 100.86 99.40 100.98 99.11
Structural formula (in apfu) based on 12 oxygens
Z (iv) site:
Si 2.923 2.982 2.960 3.013 3.005 2.981 2.978 3.004 2.996
Fe3+
0.000 0.002 0.000 0.000 0.000 0.000 0.000 0.000 0.002
Al 0.077 0.017 0.040 0.000 0.000 0.019 0.022 0.000 0.001
Site total 3.000 3.000 3.000 3.013 3.005 3.000 3.000 3.004 3.000
Al (total) 2.022 1.974 1.998 1.966 1.959 1.966 1.958 1.963 1.982
Fe3+
(total) 0.146 0.064 0.090 0.008 0.032 0.079 0.091 0.025 0.022
Y (vi) site:
Al 1.932 1.952 1.950 1.965 1.957 1.940 1.929 1.961 1.978
Ti 0.000 0.002 0.000 0.000 0.001 0.000 0.000 0.001 0.002
Cr3+
0.000 0.000 0.000 0.000 0.000 0.000 0.002 0.003 0.001
Fe3+
0.146 0.063 0.090 0.008 0.032 0.079 0.091 0.025 0.020
Site total 2.077 2.017 2.040 1.973 1.990 2.019 2.022 1.990 2.001
X (viii) site:
Fe2+
2.015 2.058 2.036 2.103 2.086 2.054 2.067 2.095 2.090
Mn2+
0.173 0.177 0.172 0.174 0.170 0.170 0.185 0.177 0.178

107
Mg 0.353 0.374 0.352 0.354 0.361 0.361 0.354 0.365 0.354
Ca 0.381 0.374 0.400 0.382 0.388 0.395 0.371 0.368 0.377
Site total 2.923 2.983 2.960 3.013 3.006 2.981 2.978 3.006 2.999
Molecular percentages of endmembers
Almandine 68.95 68.98 68.78 71.07 69.90 68.90 69.41 70.19 69.70
Pyrope 12.08 12.54 11.89 11.97 12.10 12.12 11.89 12.24 11.81
Spessartine 5.93 5.95 5.81 5.89 5.71 5.71 6.23 5.94 5.93
Grossular 13.04 11.51 13.52 10.68 10.64 11.88 10.69 10.19 11.60
Andradite 0.00 0.93 0.00 0.39 1.59 1.38 1.68 1.25 0.81
Schorlomite 0.00 0.09 0.00 0.00 0.06 0.00 0.00 0.06 0.12
Uvarovite 0.00 0.00 0.00 0.00 0.00 0.00 0.10 0.13 0.03
Sample HR02-3
Analysis Type Cores
Analysis Pt. 54 55 56 57 58 59 60 61 62
Wt%
SiO2 37.05 37.68 37.22 36.88 37.23 37.19 36.93 37.02 36.74
Al2O3 20.52 20.97 20.74 21.03 20.81 20.83 21.14 20.65 20.48
TiO2 0.04 0.00 0.01 0.02 0.00 0.00 0.01 0.03 0.00
Cr2O3 0.00 0.03 0.00 0.02 0.01 0.00 0.00 0.00 0.02
Fe2O3 2.47 0.00 1.37 2.96 2.31 1.34 2.96 1.75 2.28
FeO 30.00 30.90 30.48 30.01 30.73 30.31 30.29 30.30 30.32
MnO 2.74 2.79 2.85 2.76 2.71 2.75 2.86 2.95 2.87
MgO 3.14 3.18 3.05 3.07 3.04 3.21 2.96 3.00 2.88
CaO 4.66 4.40 4.46 4.56 4.39 4.41 4.45 4.42 4.35
Total 100.62 99.95 100.18 101.31 101.23 100.04 101.61 100.12 99.94
Structural formula (in apfu) based on 12 oxygens

108
Z (iv) site:
Si 2.958 3.012 2.980 2.926 2.957 2.977 2.925 2.969 2.958
Fe3+
0.002 0.000 0.001 0.001 0.000 0.000 0.001 0.002 0.000
Al 0.040 0.000 0.020 0.072 0.043 0.023 0.075 0.029 0.042
Site total 3.000 3.012 3.000 3.000 3.000 3.000 3.000 3.000 3.000
Al (total) 1.943 1.976 1.964 1.981 1.959 1.972 1.988 1.961 1.955
Fe3+
(total) 0.148 0.000 0.082 0.177 0.138 0.081 0.177 0.106 0.138
Y (vi) site:
Al 1.891 1.976 1.937 1.894 1.905 1.942 1.898 1.923 1.902
Ti 0.002 0.000 0.001 0.001 0.000 0.000 0.001 0.002 0.000
Cr3+
0.000 0.002 0.000 0.001 0.001 0.000 0.000 0.000 0.001
Fe3+
0.146 0.000 0.082 0.175 0.138 0.081 0.176 0.104 0.138
Site total 2.040 1.978 2.020 2.072 2.043 2.023 2.075 2.029 2.042
X (viii) site:
Fe2+
2.003 2.066 2.041 1.991 2.041 2.029 2.006 2.032 2.042
Mn2+
0.185 0.189 0.193 0.186 0.182 0.186 0.192 0.200 0.196
Mg 0.374 0.379 0.364 0.363 0.360 0.383 0.349 0.359 0.346
Ca 0.399 0.377 0.383 0.388 0.374 0.378 0.378 0.380 0.375
Site total 2.960 3.010 2.980 2.928 2.957 2.977 2.925 2.971 2.958
Molecular percentages of endmembers
Almandine 67.65 69.64 68.47 68.02 69.03 68.16 68.59 68.40 69.01
Pyrope 12.62 12.78 12.21 12.40 12.17 12.87 11.95 12.07 11.69
Spessartine 6.26 6.37 6.48 6.34 6.17 6.26 6.56 6.75 6.62
Grossular 11.30 11.12 11.33 13.12 11.45 11.72 12.88 11.34 11.23
Andradite 2.05 0.00 1.48 0.00 1.15 0.98 0.00 1.36 1.39
Schorlomite 0.12 0.00 0.03 0.06 0.00 0.00 0.03 0.09 0.00
Uvarovite 0.00 0.10 0.00 0.06 0.03 0.00 0.00 0.00 0.06

109
Sample QC82-49b QC-JW3 QC81-6 HR02-
71
Analysis Type
area 1 area 4 core core rim
Analysis Pt. grt-1 grt-2 grt-3 grt-11 grt-12 grt-12 grt-1 grt-8 grt-6 grt-2’ grt-7’ grt-1 grt-2
Wt%
SiO2 37.60 37.57 37.52 37.41 37.14 37.97 37.29 37.35 37.05 37.36 36.87 37.66 37.52 36.94
Al2O3 20.73 20.61 20.54 20.47 20.12 20.54 20.18 21.02 20.85 20.81 20.48 20.61 20.52 20.38
TiO2 0.00 0.00 0.00 0.01 0.01 0.02 0.00 0.00 0.02 0.02 0.01 0.01 0.00 0.00
Cr2O3 0.03 0.01 0.00 0.00 0.01 0.00 0.02 0.00 0.00 0.00 0.00 0.00 0.02 0.00
Fe2O3 2.61 1.92 1.55 1.78 2.21 0.52 2.18 1.20 2.68 2.73 3.59 1.48 1.47 1.89
FeO 25.69 26.20 25.98 26.47 26.88 27.58 24.96 25.29 24.64 24.68 24.41 28.12 27.50 26.50
MnO 3.95 3.61 3.68 3.85 4.37 3.77 6.30 6.14 6.53 6.52 6.53 3.87 3.69 5.70
MgO 2.96 2.68 2.69 2.68 2.23 2.62 2.04 2.01 2.25 2.18 2.15 2.17 2.11 1.46
CaO 7.80 8.03 8.09 7.49 7.13 7.30 7.50 7.47 7.07 7.43 7.21 7.13 7.70 7.25
Total 101.3
7 100.6
3 100.04 100.16 100.10
100.32
100.48 100.48 101.09 101.73 101.2
5 101.0
5 100.53 100.12
Structural formula (in apfu) based on 12 oxygens
Z (iv) site:
Si 2.960 2.979 2.989 2.984 2.981 3.020 2.982 2.977 2.943 2.950 2.932 2.991 2.991 2.975
Fe3+
0.000 0.000 0.000 0.001 0.001 0.000 0.000 0.000 0.001 0.001 0.001 0.001 0.000 0.000
Al 0.040 0.021 0.011 0.016 0.019 0.000 0.018 0.023 0.056 0.049 0.067 0.009 0.009 0.025
Site total 3.000 3.000 3.000 3.000 3.000 3.020 3.000 3.000 3.000 3.000 3.000 3.000 3.000 3.000
Al (total) 1.936 1.935 1.936 1.933 1.914 1.928 1.913 1.980 1.965 1.949 1.937 1.936 1.935 1.944
Fe3+
(total) 0.155 0.115 0.093 0.107 0.133 0.031 0.132 0.072 0.160 0.162 0.215 0.088 0.088 0.114
Y (vi) site:
Al 1.883 1.906 1.918 1.909 1.885 1.926 1.885 1.951 1.896 1.887 1.853 1.920 1.919 1.910
Ti 0.000 0.000 0.000 0.001 0.001 0.001 0.000 0.000 0.001 0.001 0.001 0.001 0.000 0.000
Cr3+
0.002 0.001 0.000 0.000 0.001 0.000 0.001 0.000 0.000 0.000 0.000 0.000 0.001 0.000
Fe3+
0.155 0.115 0.093 0.106 0.133 0.031 0.132 0.072 0.159 0.161 0.214 0.088 0.088 0.114
Site total 2.040 2.021 2.011 2.016 2.019 1.958 2.018 2.023 2.056 2.049 2.067 2.009 2.009 2.025
X (viii) site:

110
Fe2+
1.691 1.738 1.731 1.766 1.804 1.835 1.670 1.686 1.637 1.630 1.624 1.867 1.834 1.785
Mn2+
0.263 0.242 0.248 0.260 0.297 0.254 0.427 0.414 0.439 0.436 0.440 0.260 0.249 0.389
Mg 0.347 0.317 0.319 0.319 0.267 0.311 0.243 0.239 0.266 0.257 0.255 0.257 0.251 0.176
Ca 0.658 0.682 0.691 0.640 0.613 0.622 0.643 0.638 0.602 0.628 0.614 0.607 0.658 0.626
Site total 2.960 2.979 2.989 2.984 2.981 3.022 2.982 2.977 2.944 2.951 2.933 2.991 2.991 2.975
Molecular percentages of endmembers
Almandine 57.14 58.33 57.90 59.16 60.52 62.47 55.99 56.63 55.59 55.23 55.36 62.43 61.30 59.99
Pyrope 11.74 10.63 10.69 10.68 8.95 10.58 8.16 8.02 9.05 8.70 8.69 8.59 8.38 5.91
Spessartine 8.90 8.14 8.31 8.72 9.96 8.65 14.31 13.92 14.92 14.78 15.00 8.70 8.33 13.07
Grossular 19.69 19.88 19.88 18.16 16.32 16.65 17.22 20.92 19.88 19.73 19.13 17.01 18.67 18.56
Andradite 2.44 2.99 3.22 3.26 4.19 1.60 4.27 0.51 0.49 1.51 1.79 3.24 3.25 2.47
Schorlomite 0.00 0.00 0.00 0.03 0.03 0.06 0.00 0.00 0.06 0.06 0.03 0.03 0.00 0.00
Uvarovite 0.09 0.03 0.00 0.00 0.03 0.00 0.06 0.00 0.00 0.00 0.00 0.00 0.06 0.00

111
APPENDIX B: PYROXENE EPMA DATA
Sample QC82-45
Analysis Type opx incl. opx incl. opx incl. w/ biot incl.
by grt-8 by biot-
18 grt incl. opx opx opx opx opx
Analysis Pt. 4/24 4/25 4/26 opx-4 opx-9 opx-19 opx-24 1 2 3 4 5
Wt%
SiO2 49.04 48.92 48.83 48.49 48.88 48.44 48.69 48.25 48.13 48.20 48.32 48.22
Al2O3 0.33 0.38 0.34 0.37 0.33 0.48 0.42 0.41 0.42 0.42 0.46 0.44
TiO2 0.07 0.08 0.04 0.07 0.03 0.07 0.00 0.07 0.05 0.06 0.07 0.09
Cr2O3 0.01 0.00 0.02 0.00 0.02 0.01 0.01 0.00 0.03 0.00 0.04 0.03
Fe2O3 0.57 0.60 0.76 0.37 0.94 1.50 1.11 2.15 1.89 2.06 2.00 2.05
FeO 37.01 37.27 36.94 40.59 39.55 38.24 39.07 37.43 37.28 37.46 37.63 37.48
MnO 0.85 0.84 0.94 1.50 1.32 1.20 1.28 1.07 1.08 1.03 0.97 1.04
MgO 11.22 11.00 11.02 8.39 9.37 9.81 9.52 10.20 10.20 10.17 10.19 10.19
CaO 0.65 0.65 0.69 0.77 0.68 0.82 0.70 0.82 0.82 0.84 0.84 0.80
Total 99.75 99.74 99.57 100.53 101.11 100.57 100.78 100.40 99.90 100.23 100.50 100.34
Structural formula (in apfu) based on 6 oxygens
T (iv) site:
Si 1.981 1.979 1.979 1.983 1.977 1.963 1.973 1.956 1.959 1.957 1.956 1.955
Al 0.016 0.018 0.016 0.017 0.016 0.023 0.020 0.019 0.020 0.020 0.022 0.021
Fe3+
0.003 0.002 0.005 0.000 0.007 0.014 0.007 0.025 0.021 0.023 0.022 0.024
Site total 2.000 2.000 2.000 2.000 2.000 2.000 2.000 2.000 2.000 2.000 2.000 2.000
Al (total) 0.016 0.018 0.016 0.018 0.016 0.023 0.020 0.019 0.020 0.020 0.022 0.021
Fe3+
(total) 0.017 0.018 0.023 0.011 0.029 0.046 0.034 0.065 0.058 0.063 0.061 0.063
M (vi) site:
Al 0.000 0.000 0.000 0.001 0.000 0.000 0.000 0.000 0.000 0.000 0.000 0.000
Ti 0.002 0.002 0.001 0.002 0.001 0.002 0.000 0.002 0.002 0.002 0.002 0.003
Fe3+
0.014 0.016 0.018 0.011 0.021 0.032 0.027 0.040 0.037 0.040 0.039 0.039
Fe2+
1.250 1.261 1.252 1.388 1.338 1.296 1.324 1.269 1.269 1.272 1.274 1.271

112
Mn2+
0.029 0.029 0.032 0.052 0.045 0.041 0.044 0.037 0.037 0.035 0.033 0.036
Mg 0.676 0.664 0.666 0.511 0.565 0.593 0.575 0.616 0.619 0.615 0.615 0.616
Ca 0.028 0.028 0.030 0.034 0.030 0.036 0.030 0.036 0.036 0.036 0.036 0.035
Site total 2.000 2.000 2.000 2.000 1.999 2.000 2.000 2.000 1.999 2.000 1.999 1.999
Molecular percentages of major components
Diopside 0.99 0.97 1.05 0.91 0.88 1.13 0.92 1.18 1.18 1.20 1.19 1.15
Hedenbergite 1.83 1.85 1.97 2.46 2.09 2.47 2.12 2.43 2.41 2.48 2.47 2.38
Enstatite 31.63 30.97 30.94 22.28 25.40 26.84 25.89 28.42 28.48 28.41 28.44 28.46
Ferrosilite 61.08 61.49 61.19 67.51 65.49 63.12 64.67 62.26 62.13 62.31 62.31 62.29
Kanoite 2.90 2.89 3.25 5.18 4.55 4.14 4.40 3.73 3.75 3.57 3.37 3.60
Sample QC82-45 QC-IS QC81-1 QC81-5
Analysis Type opx opx opx cpx in amph
core rim core rim core
Analysis Pt. 1 2 3 cpx-16 opx-1 opx-2 opx-3 cpx-4 cpx-5 opx-1 opx-3 opx-3
Wt%
SiO2 48.45 48.51 48.69 50.53 49.46 49.91 49.66 50.75 50.91 48.79 49.81 49.15
Al2O3 0.42 0.43 0.42 0.62 0.49 0.51 0.48 0.73 0.88 0.45 0.78 0.64
TiO2 0.04 0.06 0.06 0.08 0.00 0.00 0.00 0.00 0.00 0.05 0.02 0.00
Cr2O3 0.00 0.03 0.00 0.01 0.00 0.00 0.00 0.00 0.00 0.00 0.01 0.00
Fe2O3 1.06 1.08 0.31 0.72 0.00 0.00 0.00 0.83 0.72 1.32 1.34 1.05
FeO 37.74 37.88 38.09 17.22 37.25 36.82 37.36 16.63 17.33 35.95 33.29 34.64
MnO 1.00 1.07 1.05 0.46 1.34 1.41 1.39 0.61 0.60 1.50 0.44 0.58
MgO 10.18 10.14 10.12 8.59 10.73 10.95 10.45 8.54 8.37 11.18 14.42 12.80
CaO 0.83 0.81 0.85 21.46 0.75 0.60 0.69 21.41 21.18 0.70 0.11 0.42
Na2O 0.00 0.00 0.00 0.00 0.02 0.05 0.02 0.17 0.19 0.02 0.00 0.04
Total 99.71 99.99 99.59 99.69 100.04 100.25 100.05 99.66 100.18 99.96 100.21 99.33
Structural formula (in apfu) based on 6 oxygens

113
T (iv) site:
Si 1.973 1.971 1.983 1.973 1.995 2.005 2.006 1.978 1.976 1.969 1.961 1.971
Al 0.020 0.020 0.017 0.027 0.005 0.000 0.000 0.022 0.024 0.021 0.036 0.029
Fe3+
0.007 0.008 0.000 0.000 0.000 0.000 0.000 0.000 0.000 0.010 0.002 0.000
Site total 2.000 2.000 2.000 2.000 2.000 2.005 2.006 2.000 2.000 2.000 2.000 2.000
Al (total) 0.020 0.020 0.020 0.029 0.023 0.024 0.023 0.034 0.040 0.021 0.036 0.030
Fe3+
(total) 0.032 0.033 0.010 0.021 0.000 0.000 0.000 0.024 0.021 0.040 0.040 0.032
M (vi) site:
Al 0.000 0.000 0.003 0.001 0.018 0.024 0.023 0.011 0.017 0.000 0.000 0.001
Ti 0.001 0.002 0.002 0.002 0.000 0.000 0.000 0.000 0.000 0.002 0.001 0.000
Fe3+
0.025 0.025 0.010 0.021 0.000 0.000 0.000 0.024 0.021 0.030 0.037 0.032
Fe2+
1.285 1.287 1.297 0.562 1.257 1.237 1.262 0.542 0.563 1.213 1.096 1.162
Mn2+
0.034 0.037 0.036 0.015 0.046 0.048 0.048 0.020 0.020 0.051 0.015 0.020
Mg 0.618 0.614 0.614 0.500 0.645 0.656 0.629 0.496 0.484 0.672 0.846 0.765
Ca 0.036 0.035 0.037 0.898 0.032 0.026 0.030 0.894 0.881 0.030 0.005 0.018
Na 0.000 0.000 0.000 0.000 0.002 0.004 0.002 0.013 0.014 0.002 0.000 0.003
Site total 2.000 1.999 2.000 2.000 2.000 1.995 1.994 2.000 2.000 2.000 2.000 2.000
Molecular percentages of major components
Diopside 1.17 1.14 1.19 40.24 1.10 0.90 1.00 40.69 38.76 1.08 0.20 0.72
Hedenbergite 2.44 2.39 2.51 45.26 2.15 1.70 2.01 44.44 45.02 1.96 0.26 1.09
Enstatite 28.38 28.08 28.01 4.82 29.33 30.00 28.66 4.46 4.84 30.29 40.75 36.32
Ferrosilite 62.53 62.66 62.98 5.42 61.58 61.15 62.30 4.87 5.63 59.21 53.69 56.65
Jadeite 0.00 0.00 0.00 0.00 0.16 0.39 0.16 0.00 0.00 0.00 0.00 0.00
Aegerine 0.00 0.00 0.00 0.00 0.00 0.00 0.00 1.28 1.43 0.16 0.00 0.31
Esseneite 0.00 0.00 0.00 2.12 0.00 0.00 0.00 1.14 0.67 0.00 0.00 0.00
Johannsenite 0.00 0.00 0.00 1.52 0.00 0.00 0.00 2.01 1.97 0.00 0.00 0.00
Kanoite 3.45 3.68 3.63 0.00 4.59 4.84 4.80 0.00 0.00 5.15 1.47 1.97

114
Sample QC82-44 QC81-40b
Analysis Type opx-1 opx-1 opx-1 opx-1 opx-1 opx-1 opx-1 opx-2 opx-2 opx-2 opx opx
Analysis Pt. 10 11 12 13 14 15 16 17 18 19 opx-2 opx-3
Wt%
SiO2 49.43 49.01 48.61 49.06 49.55 49.06 49.58 49.52 48.95 50.07 50.39 50.06
Al2O3 0.72 0.77 0.76 0.82 0.79 0.80 0.75 0.72 0.88 0.81 0.71 0.69
TiO2 0.00 0.00 0.02 0.00 0.02 0.00 0.00 0.03 0.00 0.00 0.00 0.00
Cr2O3 0.02 0.00 0.00 0.02 0.00 0.00 0.01 0.03 0.07 0.00 0.02 0.02
Fe2O3 1.01 0.48 1.72 1.58 1.35 0.87 2.81 2.88 2.26 1.37 0.00 0.00
FeO 31.67 30.12 30.00 29.97 30.61 30.36 30.33 30.42 30.26 31.02 34.36 34.79
MnO 1.08 1.13 1.17 1.36 1.15 1.15 1.17 1.12 1.15 1.17 1.33 1.58
MgO 14.43 14.96 14.75 15.03 15.12 14.85 15.29 15.21 14.90 15.13 13.10 12.49
CaO 0.48 0.45 0.41 0.24 0.40 0.39 0.32 0.28 0.40 0.47 0.43 0.39
Na2O 0.00 0.00 0.03 0.04 0.00 0.03 0.01 0.02 0.00 0.02 0.00 0.02
K2O 0.00 0.03 0.00 0.01 0.01 0.01 0.02 0.04 0.01 0.00 0.00 0.00
Total 98.84 96.96 97.47 98.13 99.00 97.52 100.29 100.27 98.89 100.06 100.34 100.04
Structural formula (in apfu) based on 6 oxygens
T (iv) site:
Si 1.968 1.975 1.956 1.959 1.961 1.969 1.942 1.941 1.945 1.962 1.994 1.994
Al 0.032 0.025 0.036 0.039 0.037 0.031 0.035 0.033 0.041 0.037 0.006 0.006
Fe3+
0.000 0.000 0.007 0.003 0.002 0.000 0.023 0.025 0.014 0.001 0.000 0.000
Site total 2.000 2.000 2.000 2.000 2.000 2.000 2.000 2.000 2.000 2.000 2.000 2.000
Al (total) 0.034 0.037 0.036 0.039 0.037 0.038 0.035 0.033 0.041 0.037 0.033 0.032
Fe3+
(total) 0.030 0.015 0.052 0.047 0.040 0.026 0.083 0.085 0.068 0.040 0.000 0.000
M (vi) site:
Al 0.002 0.012 0.000 0.000 0.000 0.007 0.000 0.000 0.000 0.000 0.027 0.027
Ti 0.000 0.000 0.001 0.000 0.001 0.000 0.000 0.001 0.000 0.000 0.000 0.000
Fe3+
0.030 0.015 0.045 0.044 0.038 0.026 0.060 0.060 0.054 0.040 0.000 0.000
Fe2+
1.055 1.015 1.010 1.001 1.013 1.019 0.993 0.997 1.006 1.017 1.137 1.159
Mn2+
0.036 0.039 0.040 0.046 0.039 0.039 0.039 0.037 0.039 0.039 0.045 0.053
Mg 0.856 0.899 0.885 0.894 0.892 0.889 0.893 0.889 0.882 0.884 0.773 0.742

115
Ca 0.020 0.019 0.018 0.010 0.017 0.017 0.013 0.012 0.017 0.020 0.018 0.017
Na 0.000 0.000 0.002 0.003 0.000 0.002 0.001 0.002 0.000 0.002 0.000 0.002
K 0.000 0.002 0.000 0.001 0.001 0.001 0.001 0.002 0.001 0.000 0.000 0.000
Site total 1.999 2.000 2.000 1.999 2.000 2.000 2.000 1.999 1.998 2.000 1.999 1.999
Molecular percentages of major components
Diopside 0.92 0.91 0.83 0.49 0.80 0.78 0.64 0.56 0.80 0.92 0.74 0.65
Hedenbergite 1.13 1.03 0.95 0.54 0.90 0.90 0.72 0.63 0.91 1.06 1.09 1.02
Enstatite 39.81 42.00 41.15 41.35 41.47 41.38 42.10 42.13 41.14 40.93 35.89 33.97
Ferrosilite 51.27 49.63 49.21 48.84 49.28 49.70 49.03 49.38 49.10 49.32 56.10 57.26
Jadeite 0.00 0.00 0.00 0.00 0.00 0.00 0.00 0.00 0.00 0.00 0.00 0.09
Aegerine 0.00 0.00 0.23 0.31 0.00 0.23 0.08 0.15 0.00 0.15 0.00 0.00
Kanoite 3.64 3.86 4.00 4.61 3.86 3.91 3.93 3.77 3.90 3.88 4.48 5.36
Sample QC81-40b QC81-
66 QC81-6
Analysis Type opx opx core core rim cpx opx opx opx opx cpx cpx
Analysis Pt. opx-4 opx-6 opx-1 opx-1 opx-2 cpx-3 opx-3 opx-4 opx-5 opx-6 cpx-6 cpx-7
Wt%
SiO2 50.61 50.12 49.86 49.74 50.10 50.68 50.11 50.01 49.88 50.29 51.53 51.14
Al2O3 0.72 0.73 0.59 0.52 0.53 0.79 0.49 0.52 0.54 0.56 0.78 0.77
TiO2 0.00 0.02 0.04 0.00 0.00 0.00 0.00 0.00 0.00 0.01 0.00 0.00
Cr2O3 0.02 0.00 0.02 0.02 0.02 0.01 0.01 0.02 0.04 0.04 0.00 0.02
Fe2O3 0.00 0.12 1.38 0.00 0.00 1.01 0.00 0.00 0.00 0.00 0.45 1.06
FeO 34.63 35.19 34.14 35.98 35.96 15.83 36.14 36.05 35.84 36.03 16.24 16.25
MnO 1.40 1.61 1.48 1.45 1.44 0.61 1.41 1.35 1.45 1.46 0.59 0.54
MgO 13.04 12.56 13.23 11.42 11.53 8.88 11.59 11.32 11.40 11.46 9.00 9.08
CaO 0.44 0.54 0.34 0.82 0.70 21.49 0.74 0.78 0.75 0.75 21.89 21.44
Na2O 0.01 0.01 0.00 0.00 0.00 0.17 0.00 0.00 0.00 0.00 0.15 0.15

116
Total 100.87 100.90 101.08 99.95 100.28 99.47 100.49 100.05 99.90 100.60 100.62 100.46
Structural formula (in apfu) based on 6 oxygens
T (iv) site:
Si 1.993 1.981 1.964 1.998 2.005 1.973 2.001 2.008 2.004 2.007 1.981 1.972
Al 0.007 0.019 0.027 0.002 0.000 0.027 0.000 0.000 0.000 0.000 0.019 0.028
Fe3+
0.000 0.000 0.008 0.000 0.000 0.000 0.000 0.000 0.000 0.000 0.000 0.000
Site total 2.000 2.000 2.000 2.000 2.005 2.000 2.001 2.008 2.004 2.007 2.000 2.000
Al (total) 0.033 0.034 0.027 0.025 0.025 0.036 0.023 0.025 0.026 0.026 0.035 0.035
Fe3+
(total) 0.000 0.004 0.041 0.000 0.000 0.030 0.000 0.000 0.000 0.000 0.013 0.031
M (vi) site:
Al 0.027 0.015 0.000 0.022 0.025 0.010 0.023 0.025 0.026 0.026 0.017 0.007
Ti 0.000 0.001 0.001 0.000 0.000 0.000 0.000 0.000 0.000 0.000 0.000 0.000
Fe3+
0.000 0.004 0.033 0.000 0.000 0.030 0.000 0.000 0.000 0.000 0.013 0.031
Fe2+
1.141 1.163 1.125 1.209 1.203 0.516 1.207 1.210 1.204 1.202 0.522 0.524
Mn2+
0.047 0.054 0.049 0.049 0.049 0.020 0.048 0.046 0.049 0.049 0.019 0.018
Mg 0.766 0.740 0.777 0.684 0.688 0.515 0.690 0.677 0.683 0.682 0.516 0.522
Ca 0.019 0.023 0.014 0.035 0.030 0.897 0.032 0.034 0.032 0.032 0.902 0.886
Na 0.001 0.001 0.000 0.000 0.000 0.013 0.000 0.000 0.000 0.000 0.011 0.011
Site total 1.999 2.000 1.999 1.999 1.995 2.000 1.999 1.992 1.994 1.992 2.000 1.999
Molecular percentages of major components
Diopside 0.75 0.89 0.59 1.28 1.10 42.48 1.16 1.22 1.18 1.17 42.94 41.95
Hedenbergite 1.12 1.40 0.85 2.27 1.93 42.50 2.03 2.17 2.08 2.07 43.46 42.13
Enstatite 35.42 33.48 35.68 31.02 31.44 4.53 31.52 31.06 31.12 31.10 4.32 5.13
Ferrosilite 56.27 56.86 55.17 59.21 59.32 4.53 59.33 59.64 59.28 59.25 4.37 5.15
Jadeite 0.01 0.00 0.00 0.00 0.00 0.00 0.00 0.00 0.00 0.00 0.00 0.00
Aegerine 0.00 0.08 0.00 0.00 0.00 1.28 0.00 0.00 0.00 0.00 1.12 1.12
Esseneite 0.00 0.00 0.00 0.00 0.00 1.67 0.00 0.00 0.00 0.00 0.18 1.96
Johannsenite 0.00 0.00 0.00 0.00 0.00 2.01 0.00 0.00 0.00 0.00 1.92 1.76
Kanoite 4.69 5.39 4.96 4.96 4.92 0.00 4.80 4.64 4.98 4.99 0.00 0.00

117
Sample HR02-3
Analysis Type opx opx opx opx opx opx opx opx opx opx opx opx
Analysis Pt. 5 6 7 8 9 10 11 12 13 14 18 19
Wt%
SiO2 48.77 49.23 49.38 49.22 50.03 49.78 49.21 49.32 50.09 49.27 49.48 49.16
Al2O3 0.92 0.94 0.98 0.88 0.82 0.86 0.82 0.86 0.82 0.83 0.77 0.84
TiO2 0.01 0.00 0.03 0.02 0.03 0.02 0.01 0.00 0.00 0.03 0.00 0.01
Cr2O3 0.04 0.05 0.03 0.00 0.01 0.02 0.00 0.00 0.01 0.00 0.00 0.00
Fe2O3 3.93 3.09 2.00 2.93 1.53 3.33 2.90 2.99 1.66 3.67 3.22 1.61
FeO 32.82 32.34 33.50 32.60 34.25 32.90 33.17 33.48 34.27 33.64 33.38 32.94
MnO 0.74 0.74 0.82 0.85 0.74 0.77 0.80 0.71 0.73 0.83 0.84 0.78
MgO 13.65 13.87 13.60 13.82 13.72 14.27 13.69 13.45 13.55 13.36 13.68 13.82
CaO 0.33 0.39 0.33 0.38 0.31 0.33 0.34 0.37 0.33 0.36 0.32 0.31
Na2O 0.00 0.12 0.01 0.05 0.00 0.00 0.00 0.07 0.06 0.04 0.03 0.00
K2O 0.00 0.00 0.01 0.02 0.00 0.00 0.01 0.00 0.01 0.00 0.00 0.01
Total 101.21 100.77 100.69 100.76 101.43 102.28 100.95 101.25 101.53 102.03 101.72 99.48
Structural formula (in apfu) based on 6 oxygens
T (iv) site:
Si 1.920 1.936 1.947 1.938 1.958 1.931 1.938 1.939 1.959 1.928 1.936 1.956
Al 0.043 0.044 0.046 0.041 0.038 0.039 0.038 0.040 0.038 0.038 0.036 0.039
Fe3+
0.038 0.020 0.008 0.021 0.005 0.030 0.024 0.022 0.003 0.034 0.029 0.004
Site total 2.000 2.000 2.000 2.000 2.000 2.000 2.000 2.000 2.000 2.000 2.000 2.000
Al (total) 0.043 0.044 0.046 0.041 0.038 0.039 0.038 0.040 0.038 0.038 0.036 0.039
Fe3+
(total) 0.116 0.092 0.059 0.087 0.045 0.097 0.086 0.088 0.049 0.108 0.095 0.048
M (vi) site:
Ti 0.000 0.000 0.001 0.001 0.001 0.001 0.000 0.000 0.000 0.001 0.000 0.000
Fe3+
0.079 0.071 0.052 0.066 0.040 0.067 0.062 0.067 0.046 0.074 0.066 0.044
Fe2+
1.080 1.064 1.105 1.073 1.121 1.067 1.093 1.101 1.121 1.101 1.092 1.096
Mn2+
0.025 0.025 0.027 0.028 0.025 0.025 0.027 0.024 0.024 0.028 0.028 0.026
Mg 0.801 0.813 0.799 0.811 0.800 0.825 0.804 0.788 0.790 0.779 0.798 0.820
Ca 0.014 0.016 0.014 0.016 0.013 0.014 0.014 0.016 0.014 0.015 0.013 0.013

118
Na 0.000 0.009 0.001 0.004 0.000 0.000 0.000 0.005 0.005 0.003 0.002 0.000
K 0.000 0.000 0.001 0.001 0.000 0.000 0.001 0.000 0.000 0.000 0.000 0.001
Site total 1.999 1.998 1.999 2.000 2.000 1.999 2.000 2.000 2.000 2.000 2.000 2.000
Molecular percentages of major components
Diopside 0.60 0.72 0.59 0.70 0.54 0.61 0.62 0.66 0.57 0.64 0.57 0.57
Hedenbergite 0.81 0.94 0.81 0.92 0.76 0.79 0.84 0.92 0.81 0.90 0.79 0.76
Enstatite 38.33 38.52 37.49 38.35 37.82 39.42 38.21 37.47 37.30 37.11 38.01 38.65
Ferrosilite 53.39 52.01 53.71 52.64 54.63 52.63 53.78 54.00 54.65 54.35 53.97 53.44
Aegerine 0.00 0.92 0.08 0.39 0.00 0.00 0.00 0.54 0.46 0.31 0.23 0.00
Kanoite 2.51 2.49 2.75 2.87 2.46 2.57 2.70 2.39 2.42 2.80 2.82 2.64
Sample HR02-3 HR02-71
Analysis Type opx opx opx opx opx opx opx opx opx opx opx opx
Analysis Pt. 20 21 22 23 28 29 30 31 32 33 34 35
Wt%
SiO2 49.06 48.99 48.95 48.95 48.34 48.03 48.61 47.57 47.27 47.12 47.72 47.36
Al2O3 0.68 0.80 0.83 0.92 0.35 0.22 0.38 0.28 0.30 0.35 0.37 0.35
TiO2 0.00 0.02 0.00 0.01 0.00 0.00 0.00 0.00 0.00 0.02 0.00 0.02
Cr2O3 0.00 0.00 0.00 0.00 0.00 0.01 0.00 0.03 0.00 0.01 0.03 0.03
Fe2O3 4.10 3.61 3.81 2.75 1.66 2.06 0.58 1.17 1.95 2.45 0.86 0.52
FeO 32.98 32.66 31.43 33.07 36.93 36.62 37.55 36.34 36.41 36.05 37.33 37.00
MnO 0.86 0.75 0.82 0.82 2.63 2.67 2.56 2.57 2.53 2.63 2.67 2.53
MgO 13.66 13.90 14.31 13.53 9.64 9.67 9.53 9.46 9.28 9.34 8.99 8.88
CaO 0.30 0.31 0.38 0.38 0.80 0.68 0.78 0.74 0.74 0.78 0.67 0.91
Na2O 0.01 0.00 0.06 0.00 0.00 0.00 0.00 0.02 0.00 0.00 0.03 0.02
K2O 0.01 0.00 0.00 0.01 0.00 0.00 0.00 0.01 0.02 0.00 0.00 0.00
Total 101.66 101.04 100.59 100.45 100.35 99.96 99.99 98.20 98.49 98.75 98.68 97.62

119
Structural formula (in apfu) based on 6 oxygens
T (iv) site:
Si 1.924 1.927 1.927 1.938 1.966 1.963 1.982 1.975 1.963 1.953 1.978 1.983
Al 0.031 0.037 0.038 0.043 0.017 0.011 0.018 0.014 0.015 0.017 0.018 0.017
Fe3+
0.044 0.035 0.035 0.020 0.017 0.026 0.000 0.011 0.023 0.030 0.004 0.000
Site total 2.000 2.000 2.000 2.000 2.000 2.000 2.000 2.000 2.000 2.000 2.000 2.000
Al (total) 0.031 0.037 0.038 0.043 0.017 0.011 0.018 0.014 0.015 0.017 0.018 0.017
Fe3+
(total) 0.121 0.107 0.113 0.082 0.051 0.063 0.018 0.037 0.061 0.076 0.027 0.017
M (vi) site:
Ti 0.000 0.001 0.000 0.000 0.000 0.000 0.000 0.000 0.000 0.001 0.000 0.001
Fe3+
0.077 0.071 0.078 0.062 0.034 0.037 0.018 0.026 0.038 0.046 0.023 0.017
Fe2+
1.082 1.075 1.034 1.095 1.256 1.252 1.280 1.262 1.264 1.249 1.294 1.295
Mn2+
0.029 0.025 0.027 0.027 0.091 0.092 0.088 0.090 0.089 0.092 0.094 0.090
Mg 0.799 0.815 0.840 0.798 0.585 0.589 0.579 0.586 0.574 0.577 0.556 0.554
Ca 0.013 0.013 0.016 0.016 0.035 0.030 0.034 0.033 0.033 0.035 0.030 0.041
Na 0.001 0.000 0.005 0.000 0.000 0.000 0.000 0.002 0.000 0.000 0.002 0.002
K 0.001 0.000 0.000 0.001 0.000 0.000 0.000 0.001 0.001 0.000 0.000 0.000
Site total 2.000 2.000 2.000 2.000 2.000 2.000 2.000 1.999 2.000 2.000 1.999 1.999
Molecular percentages of major components
Diopside 0.55 0.57 0.73 0.69 1.12 0.97 1.06 1.05 1.04 1.11 0.90 1.22
Hedenbergite 0.74 0.76 0.90 0.94 2.40 2.05 2.35 2.26 2.29 2.41 2.09 2.86
Enstatite 38.44 39.12 40.09 37.68 24.08 24.51 23.73 24.17 23.82 23.78 22.41 22.35
Ferrosilite 54.05 53.22 51.11 53.58 61.57 62.03 62.22 61.89 62.35 61.60 63.16 62.72
Aegerine 0.08 0.00 0.47 0.00 0.00 0.00 0.00 0.16 0.00 0.00 0.24 0.16
Kanoite 2.92 2.54 2.78 2.78 9.14 9.37 8.84 9.09 9.01 9.37 9.39 8.97

120
Sample HR02-71 HP82-59
Analysis Type opx opx opx opx opx opx opx opx opx opx opx opx
Analysis Pt. 36 37 38 39 opx-1 opx-2 46 47 48 49 50 51
Wt%
SiO2 47.57 47.41 46.98 46.99 48.41 48.53 50.09 49.15 49.58 48.84 49.55 48.47
Al2O3 0.28 0.30 0.36 0.28 0.27 0.24 0.92 0.67 0.69 0.73 0.71 0.96
TiO2 0.01 0.00 0.00 0.00 0.02 0.01 0.02 0.02 0.03 0.00 0.04 0.07
Cr2O3 0.00 0.01 0.00 0.03 0.00 0.02 0.02 0.00 0.02 0.00 0.01 0.00
Fe2O3 3.00 2.29 1.58 3.65 1.16 1.11 2.86 3.55 2.44 2.14 0.85 3.68
FeO 36.76 36.70 36.34 35.78 37.57 37.57 36.22 36.50 37.72 35.98 37.69 35.82
MnO 2.58 2.63 2.60 2.61 2.52 2.32 0.26 0.30 0.27 0.21 0.26 0.17
MgO 9.26 9.05 9.11 9.30 9.46 9.58 12.73 11.98 11.55 12.08 11.54 11.79
CaO 0.74 0.79 0.68 0.76 0.69 0.65 0.48 0.47 0.52 0.50 0.56 0.49
Na2O 0.00 0.04 0.02 0.04 0.00 0.04 0.02 0.00 0.00 0.00 0.01 0.07
K2O 0.02 0.00 0.00 0.01 0.01 0.00 0.01 0.01 0.02 0.01 0.00 0.02
Total 100.22 99.22 97.67 99.45 100.10 100.08 103.63 102.65 102.84 100.49 101.21 101.54
Structural formula (in apfu) based on 6 oxygens
T (iv) site:
Si 1.947 1.958 1.967 1.938 1.975 1.978 1.938 1.932 1.947 1.951 1.970 1.924
Al 0.014 0.015 0.018 0.014 0.013 0.012 0.042 0.031 0.032 0.034 0.030 0.045
Fe3+
0.039 0.027 0.015 0.048 0.011 0.010 0.020 0.037 0.021 0.015 0.000 0.031
Site total 2.000 2.000 2.000 2.000 2.000 2.000 2.000 2.000 2.000 2.000 2.000 2.000
Al (total) 0.014 0.015 0.018 0.014 0.013 0.012 0.042 0.031 0.032 0.034 0.033 0.045
Fe3+
(total) 0.092 0.071 0.050 0.113 0.036 0.034 0.083 0.105 0.072 0.064 0.025 0.110
M (vi) site:
Al 0.000 0.000 0.000 0.000 0.000 0.000 0.000 0.000 0.000 0.000 0.003 0.000
Ti 0.000 0.000 0.000 0.000 0.001 0.000 0.001 0.001 0.001 0.000 0.001 0.002
Fe3+
0.053 0.044 0.035 0.065 0.024 0.024 0.063 0.068 0.051 0.050 0.025 0.079
Fe2+
1.259 1.268 1.272 1.234 1.282 1.281 1.172 1.200 1.239 1.202 1.253 1.189
Mn2+
0.089 0.092 0.092 0.091 0.087 0.080 0.009 0.010 0.009 0.007 0.009 0.006
Mg 0.565 0.557 0.569 0.572 0.575 0.582 0.734 0.702 0.676 0.719 0.684 0.698

121
Ca 0.032 0.035 0.031 0.034 0.030 0.029 0.020 0.020 0.022 0.021 0.024 0.021
Na 0.000 0.003 0.002 0.003 0.000 0.003 0.001 0.000 0.000 0.000 0.001 0.005
K 0.001 0.000 0.000 0.001 0.000 0.000 0.000 0.001 0.001 0.001 0.000 0.001
Site total 2.000 2.000 2.000 1.999 2.000 1.999 1.999 2.000 1.999 2.000 2.000 2.000
Molecular percentages of major components
Diopside 1.03 1.08 0.95 1.09 0.94 0.90 0.77 0.74 0.78 0.81 0.84 0.78
Hedenbergite 2.29 2.46 2.12 2.35 2.09 1.97 1.24 1.27 1.43 1.35 1.54 1.33
Enstatite 23.55 22.81 23.25 23.87 23.88 24.60 35.46 34.30 32.77 34.84 32.78 33.91
Ferrosilite 62.62 62.51 62.43 61.61 62.97 62.96 57.28 59.50 60.88 58.82 60.86 58.28
Aegerine 0.00 0.32 0.16 0.33 0.03 0.34 0.15 0.00 0.00 0.00 0.08 0.55
Kanoite 9.13 9.33 9.29 9.35 8.76 8.05 0.86 1.02 0.91 0.72 0.88 0.58
Sample HP82-59 QC82-49b
Analysis Type opx opx opx opx opx opx incl. – area 1
opx incl. – area 1
near cpx – area 1
near cpx – area 1
near cpx – area 1
near grt – area 1
near grt – area 1
Analysis Pt. 52 53 54 55 56 cpx-4 cpx-5 opx-6 opx-7 opx-8 opx-9 opx-10
Wt%
SiO2 48.83 48.37 48.46 48.24 47.84 50.69 50.76 49.55 49.50 49.57 49.64 49.34
Al2O3 0.92 0.59 0.69 0.71 0.69 0.88 0.88 0.51 0.56 0.51 0.55 0.58
TiO2 0.07 0.00 0.03 0.01 0.04 0.03 0.02 0.01 0.01 0.04 0.01 0.00
Cr2O3 0.00 0.00 0.01 0.01 0.00 0.00 0.02 0.00 0.00 0.01 0.02 0.00
Fe2O3 4.49 2.75 4.16 3.71 3.75 1.54 1.90 1.55 1.73 1.32 1.27 2.08
FeO 36.26 37.82 38.04 38.20 37.75 12.45 12.03 31.90 31.83 32.05 32.21 31.84
MnO 0.22 0.46 0.49 0.46 0.46 0.54 0.59 1.32 1.26 1.32 1.38 1.43
MgO 11.81 10.52 10.42 10.20 10.23 10.94 10.92 14.14 14.22 14.14 13.99 14.02
CaO 0.64 0.59 0.60 0.62 0.58 21.95 22.34 0.64 0.58 0.56 0.64 0.56
Na2O 0.02 0.01 0.02 0.01 0.01 0.00 0.00 0.00 0.00 0.00 0.00 0.00

122
Total 103.26 101.11 102.92 102.17 101.35 99.03 99.46 99.62 99.69 99.52 99.71 99.85
Structural formula (in apfu) based on 6 oxygens
T (iv) site:
Si 1.911 1.945 1.922 1.927 1.926 1.957 1.952 1.965 1.961 1.967 1.968 1.955
Al 0.042 0.028 0.032 0.033 0.033 0.040 0.040 0.024 0.026 0.024 0.026 0.027
Fe3+
0.046 0.027 0.046 0.039 0.041 0.003 0.008 0.011 0.013 0.009 0.007 0.017
Site total 2.000 2.000 2.000 2.000 2.000 2.000 2.000 2.000 2.000 2.000 2.000 2.000
Al (total) 0.042 0.028 0.032 0.033 0.033 0.040 0.040 0.024 0.026 0.024 0.026 0.027
Fe3+
(total) 0.132 0.083 0.124 0.111 0.113 0.045 0.055 0.046 0.052 0.040 0.038 0.062
M (vi) site:
Ti 0.002 0.000 0.001 0.000 0.001 0.001 0.001 0.000 0.000 0.001 0.000 0.000
Fe3+
0.086 0.056 0.078 0.072 0.072 0.042 0.047 0.035 0.039 0.030 0.031 0.045
Fe2+
1.187 1.272 1.262 1.277 1.271 0.402 0.387 1.058 1.055 1.064 1.068 1.055
Mn2+
0.007 0.016 0.016 0.016 0.016 0.018 0.019 0.044 0.042 0.044 0.046 0.048
Mg 0.689 0.631 0.616 0.608 0.614 0.630 0.626 0.836 0.840 0.836 0.827 0.828
Ca 0.027 0.025 0.025 0.027 0.025 0.908 0.920 0.027 0.025 0.024 0.027 0.024
Na 0.002 0.001 0.002 0.001 0.001 0.000 0.000 0.000 0.000 0.000 0.000 0.000
Site total 2.000 2.000 2.000 2.000 2.000 2.000 1.999 2.000 2.000 2.000 1.999 2.000
Molecular percentages of major components
Diopside 1.01 0.85 0.86 0.87 0.83 51.96 53.45 1.21 1.10 1.05 1.19 1.05
Hedenbergite 1.74 1.72 1.75 1.83 1.72 33.17 33.03 1.53 1.38 1.34 1.54 1.34
Enstatite 33.60 30.27 29.71 29.20 29.58 5.53 4.68 38.67 39.00 38.73 37.99 38.23
Ferrosilite 58.41 62.65 62.53 63.01 62.84 3.53 2.89 51.74 51.63 52.02 52.06 51.79
Aegerine 0.16 0.08 0.16 0.08 0.08 0.00 0.00 0.00 0.00 0.00 0.00 0.00
Esseneite 0.00 0.00 0.00 0.00 0.00 4.03 4.00 0.00 0.00 0.00 0.00 0.00
Johannsenite 0.00 0.00 0.00 0.00 0.00 1.78 1.93 0.00 0.00 0.00 0.00 0.00
Kanoite 0.75 1.59 1.68 1.59 1.60 0.00 0.00 4.46 4.26 4.46 4.65 4.84
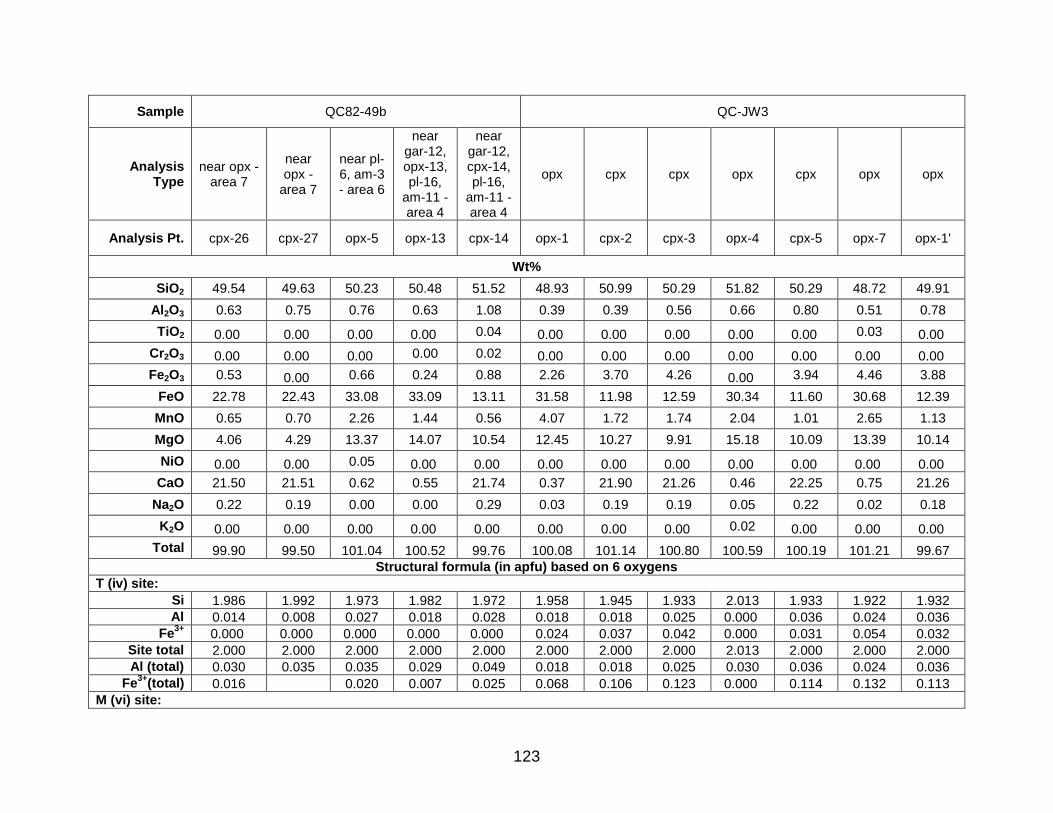
123
Sample QC82-49b QC-JW3
Analysis Type
near opx - area 7
near opx -
area 7
near pl-6, am-3 - area 6
near gar-12, opx-13, pl-16,
am-11 - area 4
near gar-12, cpx-14, pl-16,
am-11 - area 4
opx cpx cpx opx cpx opx opx
Analysis Pt. cpx-26 cpx-27 opx-5 opx-13 cpx-14 opx-1 cpx-2 cpx-3 opx-4 cpx-5 opx-7 opx-1'
Wt%
SiO2 49.54 49.63 50.23 50.48 51.52 48.93 50.99 50.29 51.82 50.29 48.72 49.91
Al2O3 0.63 0.75 0.76 0.63 1.08 0.39 0.39 0.56 0.66 0.80 0.51 0.78
TiO2 0.00 0.00 0.00 0.00 0.04 0.00 0.00 0.00 0.00 0.00 0.03 0.00
Cr2O3 0.00 0.00 0.00 0.00 0.02 0.00 0.00 0.00 0.00 0.00 0.00 0.00
Fe2O3 0.53 0.00 0.66 0.24 0.88 2.26 3.70 4.26 0.00 3.94 4.46 3.88
FeO 22.78 22.43 33.08 33.09 13.11 31.58 11.98 12.59 30.34 11.60 30.68 12.39
MnO 0.65 0.70 2.26 1.44 0.56 4.07 1.72 1.74 2.04 1.01 2.65 1.13
MgO 4.06 4.29 13.37 14.07 10.54 12.45 10.27 9.91 15.18 10.09 13.39 10.14
NiO 0.00 0.00 0.05 0.00 0.00 0.00 0.00 0.00 0.00 0.00 0.00 0.00
CaO 21.50 21.51 0.62 0.55 21.74 0.37 21.90 21.26 0.46 22.25 0.75 21.26
Na2O 0.22 0.19 0.00 0.00 0.29 0.03 0.19 0.19 0.05 0.22 0.02 0.18
K2O 0.00 0.00 0.00 0.00 0.00 0.00 0.00 0.00 0.02 0.00 0.00 0.00
Total 99.90 99.50 101.04 100.52 99.76 100.08 101.14 100.80 100.59 100.19 101.21 99.67
Structural formula (in apfu) based on 6 oxygens
T (iv) site:
Si 1.986 1.992 1.973 1.982 1.972 1.958 1.945 1.933 2.013 1.933 1.922 1.932
Al 0.014 0.008 0.027 0.018 0.028 0.018 0.018 0.025 0.000 0.036 0.024 0.036
Fe3+
0.000 0.000 0.000 0.000 0.000 0.024 0.037 0.042 0.000 0.031 0.054 0.032
Site total 2.000 2.000 2.000 2.000 2.000 2.000 2.000 2.000 2.013 2.000 2.000 2.000
Al (total) 0.030 0.035 0.035 0.029 0.049 0.018 0.018 0.025 0.030 0.036 0.024 0.036
Fe3+
(total) 0.016 0.020 0.007 0.025 0.068 0.106 0.123 0.000 0.114 0.132 0.113
M (vi) site:

124
Al 0.000 0.000 0.000 0.000 0.021 0.000 0.000 0.000 0.030 0.000 0.000 0.000
Ti 0.000 0.000 0.000 0.000 0.001 0.000 0.000 0.000 0.001 0.000 0.001 0.000
Fe3+
0.016 0.000 0.020 0.007 0.025 0.044 0.069 0.081 0.000 0.083 0.078 0.081
Fe2+
0.764 0.753 1.087 1.087 0.420 1.057 0.382 0.405 0.986 0.373 1.012 0.401
Mn2+
0.022 0.024 0.075 0.048 0.018 0.138 0.056 0.057 0.067 0.033 0.089 0.037
Mg 0.243 0.257 0.783 0.824 0.601 0.743 0.584 0.568 0.879 0.578 0.787 0.585
Ni 0.000 0.000 0.002 0.000 0.000 0.000 0.000 0.000 0.000 0.000 0.000 0.000
Ca 0.923 0.925 0.026 0.023 0.892 0.016 0.895 0.875 0.019 0.916 0.032 0.882
Na 0.017 0.015 0.000 0.000 0.021 0.002 0.014 0.014 0.004 0.016 0.002 0.014
K 0.000 0.000 0.000 0.000 0.000 0.000 0.000 0.000 0.001 0.000 0.000 0.000
Site total 2.000 2.000 2.000 2.000 2.000 2.000 2.000 2.000 1.987 2.000 2.000 2.000
Molecular percentages of major components
Diopside 21.39 22.67 1.09 1.00 49.82 0.66 50.62 47.32 0.92 52.31 1.43 48.80
Hedenbergite 67.31 66.49 1.51 1.33 34.78 0.94 33.14 33.72 1.03 33.73 1.83 33.45
Enstatite 1.44 1.51 34.28 37.89 5.12 29.88 4.44 5.34 40.41 3.20 34.67 5.34
Ferrosilite 4.52 4.43 52.83 53.15 3.58 52.46 2.91 3.80 49.12 2.07 50.37 3.66
Jadeite 0.12 1.48 0.00 0.00 0.00 0.00 0.00 0.00 0.32 0.00 0.00 0.00
Aegerine 1.59 0.00 0.00 0.00 2.14 0.00 1.43 1.45 0.00 1.67 0.16 1.37
Esseneite 0.00 0.00 0.00 0.00 0.40 0.00 1.79 2.59 0.00 3.68 0.00 3.62
Johannsenite 2.21 2.38 0.00 0.00 1.81 0.00 5.66 5.79 0.00 3.34 0.00 3.77
Kanoite 0.00 0.00 7.54 4.80 0.00 13.96 0.00 0.00 6.81 0.00 9.10 0.00
Sample QC-JW3
Analysis Type opx cpx opx opx circle 1 circle 1 circle 3 circle 3 cpx cpx core rim
Analysis Pt. opx-3' cpx-4' opx-5' opx-6' cpx-3 opx-4 opx-5 opx-8 cpx-1 cpx-2 opx-1 opx-1
Wt%
SiO2 48.34 49.79 48.84 48.83 51.68 50.04 49.90 49.60 51.03 51.36 49.93 50.07
Al2O3 0.45 0.72 0.48 0.40 0.72 0.58 0.58 0.64 0.65 0.64 0.48 0.50
TiO2 0.00 0.03 0.00 0.00 0.01 0.01 0.00 0.00 0.00 0.00 0.02 0.01
Cr2O3 0.00 0.00 0.00 0.00 0.01 0.00 0.00 0.02 0.00 0.00 0.01 0.00
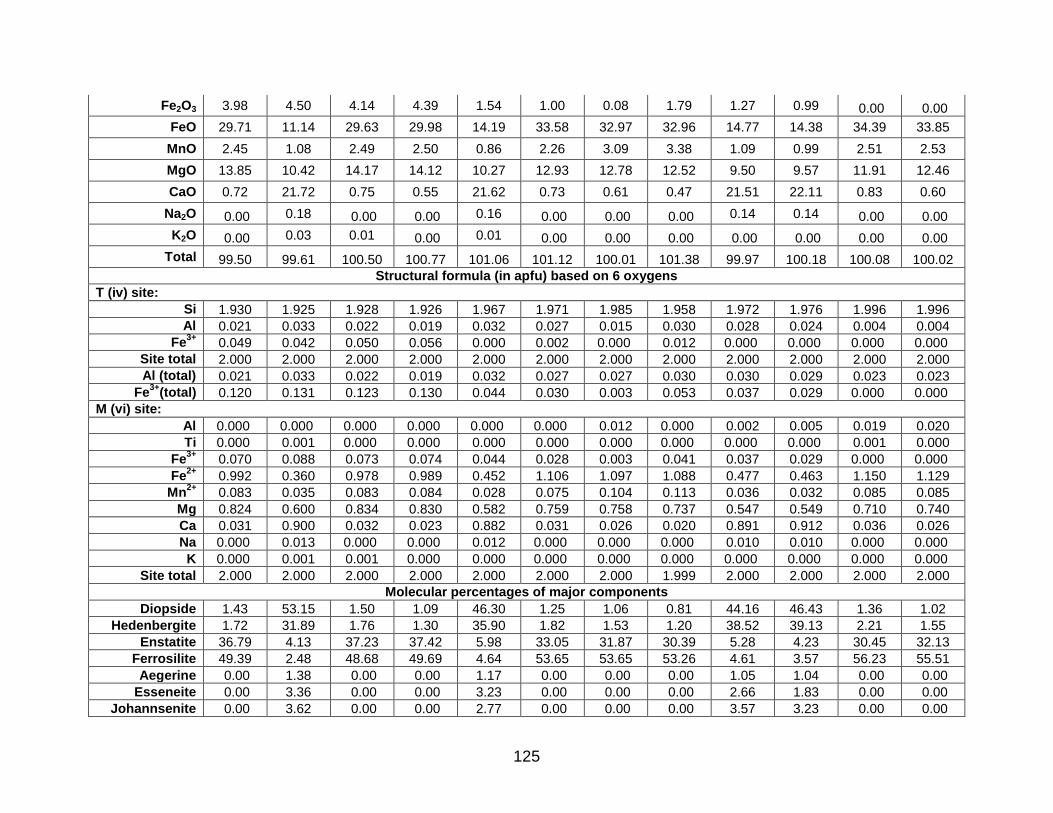
125
Fe2O3 3.98 4.50 4.14 4.39 1.54 1.00 0.08 1.79 1.27 0.99 0.00 0.00
FeO 29.71 11.14 29.63 29.98 14.19 33.58 32.97 32.96 14.77 14.38 34.39 33.85
MnO 2.45 1.08 2.49 2.50 0.86 2.26 3.09 3.38 1.09 0.99 2.51 2.53
MgO 13.85 10.42 14.17 14.12 10.27 12.93 12.78 12.52 9.50 9.57 11.91 12.46
CaO 0.72 21.72 0.75 0.55 21.62 0.73 0.61 0.47 21.51 22.11 0.83 0.60
Na2O 0.00 0.18 0.00 0.00 0.16 0.00 0.00 0.00 0.14 0.14 0.00 0.00
K2O 0.00 0.03 0.01 0.00 0.01 0.00 0.00 0.00 0.00 0.00 0.00 0.00
Total 99.50 99.61 100.50 100.77 101.06 101.12 100.01 101.38 99.97 100.18 100.08 100.02
Structural formula (in apfu) based on 6 oxygens
T (iv) site:
Si 1.930 1.925 1.928 1.926 1.967 1.971 1.985 1.958 1.972 1.976 1.996 1.996
Al 0.021 0.033 0.022 0.019 0.032 0.027 0.015 0.030 0.028 0.024 0.004 0.004
Fe3+
0.049 0.042 0.050 0.056 0.000 0.002 0.000 0.012 0.000 0.000 0.000 0.000
Site total 2.000 2.000 2.000 2.000 2.000 2.000 2.000 2.000 2.000 2.000 2.000 2.000
Al (total) 0.021 0.033 0.022 0.019 0.032 0.027 0.027 0.030 0.030 0.029 0.023 0.023
Fe3+
(total) 0.120 0.131 0.123 0.130 0.044 0.030 0.003 0.053 0.037 0.029 0.000 0.000
M (vi) site:
Al 0.000 0.000 0.000 0.000 0.000 0.000 0.012 0.000 0.002 0.005 0.019 0.020
Ti 0.000 0.001 0.000 0.000 0.000 0.000 0.000 0.000 0.000 0.000 0.001 0.000
Fe3+
0.070 0.088 0.073 0.074 0.044 0.028 0.003 0.041 0.037 0.029 0.000 0.000
Fe2+
0.992 0.360 0.978 0.989 0.452 1.106 1.097 1.088 0.477 0.463 1.150 1.129
Mn2+
0.083 0.035 0.083 0.084 0.028 0.075 0.104 0.113 0.036 0.032 0.085 0.085
Mg 0.824 0.600 0.834 0.830 0.582 0.759 0.758 0.737 0.547 0.549 0.710 0.740
Ca 0.031 0.900 0.032 0.023 0.882 0.031 0.026 0.020 0.891 0.912 0.036 0.026
Na 0.000 0.013 0.000 0.000 0.012 0.000 0.000 0.000 0.010 0.010 0.000 0.000
K 0.000 0.001 0.001 0.000 0.000 0.000 0.000 0.000 0.000 0.000 0.000 0.000
Site total 2.000 2.000 2.000 2.000 2.000 2.000 2.000 1.999 2.000 2.000 2.000 2.000
Molecular percentages of major components
Diopside 1.43 53.15 1.50 1.09 46.30 1.25 1.06 0.81 44.16 46.43 1.36 1.02
Hedenbergite 1.72 31.89 1.76 1.30 35.90 1.82 1.53 1.20 38.52 39.13 2.21 1.55
Enstatite 36.79 4.13 37.23 37.42 5.98 33.05 31.87 30.39 5.28 4.23 30.45 32.13
Ferrosilite 49.39 2.48 48.68 49.69 4.64 53.65 53.65 53.26 4.61 3.57 56.23 55.51
Aegerine 0.00 1.38 0.00 0.00 1.17 0.00 0.00 0.00 1.05 1.04 0.00 0.00
Esseneite 0.00 3.36 0.00 0.00 3.23 0.00 0.00 0.00 2.66 1.83 0.00 0.00
Johannsenite 0.00 3.62 0.00 0.00 2.77 0.00 0.00 0.00 3.57 3.23 0.00 0.00

126
Kanoite 8.49 0.00 8.54 8.59 0.00 7.55 10.40 11.36 0.00 0.00 8.54 8.58
Sample QC-JW3
Analysis Type core rim opx cpx cpx rim incl. in
grt cpx
in qz band
opx opx cpx
Analysis Pt. cpx-4 cpx-4 opx-5 cpx-6 cpx-7 cpx-8 cpx-9 cpx-10 opx-11 opx-12 opx-13 cpx-14
Wt%
SiO2 51.16 51.49 50.03 50.92 51.05 50.96 51.02 50.91 50.40 50.42 49.72 51.39
Al2O3 0.68 0.58 0.52 0.73 0.66 0.75 0.68 0.69 0.37 0.36 0.34 0.33
TiO2 0.00 0.00 0.00 0.00 0.00 0.00 0.03 0.00 0.02 0.00 0.00 0.00
Cr2O3 0.00 0.00 0.00 0.00 0.00 0.00 0.00 0.00 0.00 0.02 0.00 0.00
Fe2O3 0.62 0.69 0.00 1.24 0.66 1.03 0.75 1.02 0.00 0.00 0.00 0.59
FeO 15.41 13.93 34.02 15.05 14.70 15.08 16.12 15.88 32.88 33.42 33.27 14.99
MnO 1.11 0.93 2.38 1.08 1.01 1.11 1.18 1.13 3.46 3.41 3.38 1.23
MgO 9.04 9.76 12.39 9.25 9.53 9.22 9.30 9.23 12.40 12.18 11.80 9.43
CaO 21.65 22.36 0.60 21.55 21.64 21.58 20.64 20.77 0.72 0.73 0.70 21.70
Na2O 0.17 0.14 0.00 0.14 0.13 0.14 0.15 0.17 0.00 0.00 0.04 0.13
Total 99.84 99.88 99.96 99.95 99.39 99.87 99.88 99.80 100.25 100.54 99.25 99.79
Structural formula (in apfu) based on 6 oxygens
T (iv) site:
Si 1.982 1.982 1.996 1.971 1.980 1.973 1.978 1.976 2.005 2.004 2.004 1.989
Al 0.018 0.018 0.004 0.029 0.020 0.027 0.022 0.024 0.000 0.000 0.000 0.011
Site total 2.000 2.000 2.000 2.000 2.000 2.000 2.000 2.000 2.005 2.004 2.004 2.000
Al (total) 0.031 0.026 0.024 0.033 0.030 0.034 0.031 0.032 0.017 0.017 0.016 0.015
Fe3+
(total) 0.018 0.020 0.000 0.036 0.019 0.030 0.022 0.030 0.000 0.000 0.000 0.017
M (vi) site:
Al 0.013 0.008 0.021 0.004 0.010 0.007 0.009 0.007 0.017 0.017 0.016 0.004
Ti 0.000 0.000 0.001 0.000 0.000 0.000 0.001 0.000 0.001 0.000 0.000 0.000

127
Fe3+
0.018 0.020 0.000 0.036 0.019 0.030 0.022 0.030 0.000 0.000 0.000 0.017
Fe2+
0.499 0.449 1.135 0.487 0.477 0.488 0.523 0.515 1.094 1.111 1.122 0.485
Mn2+
0.036 0.030 0.080 0.035 0.033 0.036 0.039 0.037 0.117 0.115 0.115 0.040
Mg 0.522 0.560 0.737 0.534 0.551 0.532 0.538 0.534 0.735 0.722 0.709 0.544
Ca 0.899 0.922 0.026 0.894 0.899 0.895 0.857 0.864 0.031 0.031 0.030 0.900
Na 0.013 0.010 0.000 0.011 0.010 0.011 0.011 0.013 0.000 0.000 0.003 0.010
Site total 2.000 2.000 2.000 2.000 2.000 2.000 2.000 2.000 1.995 1.995 1.996 2.000
Molecular percentages of major components
Diopside 43.14 48.54 1.01 43.33 45.36 43.38 40.40 40.82 1.24 1.23 1.18 44.84
Hedenbergite 41.26 38.87 1.56 39.54 39.27 39.81 39.29 39.40 1.85 1.90 1.86 39.99
Enstatite 4.53 3.74 32.21 5.02 4.87 4.92 6.65 6.29 30.35 29.75 29.13 4.78
Ferrosilite 4.33 2.99 55.84 4.58 4.22 4.51 6.47 6.07 53.88 54.69 55.26 4.26
Jadeite 0.00 0.00 0.00 0.00 0.00 0.00 0.00 0.00 0.00 0.00 0.31 0.00
Aegerine 1.28 1.04 0.00 1.05 0.98 1.05 1.13 1.28 0.00 0.00 0.00 0.98
Esseneite 0.54 0.94 0.00 2.55 0.95 1.96 1.07 1.71 0.00 0.00 0.00 0.74
Johannsenite 3.64 3.03 0.00 3.54 3.32 3.64 3.88 3.71 0.00 0.00 0.00 4.03
Kanoite 0.00 0.00 8.08 0.00 0.00 0.00 0.00 0.00 11.75 11.55 11.60 0.00
Sample QC-JW3
Analysis Type cpx opx opx cpx opx cpx opx opx cpx
Analysis Pt. cpx-15 opx-16 opx-17 cpx-18 opx-19 cpx-20 opx-21 opx-22 cpx-23
Wt%
SiO2 51.27 50.25 50.18 51.37 50.06 51.34 49.77 49.81 51.11
Al2O3 0.35 0.29 0.27 0.33 0.27 0.43 0.37 0.44 0.58
TiO2 0.00 0.00 0.00 0.00 0.04 0.00 0.02 0.04 0.00
Cr2O3 0.00 0.00 0.03 0.00 0.01 0.00 0.01 0.02 0.00
Fe2O3 0.78 0.00 0.00 0.19 0.00 0.56 0.00 0.00 0.49
FeO 15.61 32.68 33.27 15.26 32.84 15.28 34.21 33.75 15.74
MnO 1.29 3.84 3.45 1.23 3.78 1.37 3.59 3.80 1.48

128
MgO 9.14 12.25 12.05 9.38 11.89 9.18 11.18 11.52 9.00
CaO 21.39 0.65 0.82 21.58 0.76 21.63 0.57 0.88 21.22
Na2O 0.15 0.00 0.00 0.12 0.00 0.14 0.00 0.02 0.14
Total 99.98 100.00 100.07 99.46 99.65 99.93 99.72 100.28 99.76
Structural formula (in apfu) based on 6 oxygens
T (iv) site:
Si 1.986 2.007 2.005 1.994 2.010 1.987 2.008 1.993 1.985
Al 0.014 0.000 0.000 0.006 0.000 0.013 0.000 0.007 0.015
Site total 2.000 2.007 2.005 2.000 2.010 2.000 2.008 2.000 2.000
Al (total) 0.016 0.014 0.013 0.015 0.013 0.020 0.018 0.021 0.027
Fe3+
(total) 0.023 0.000 0.000 0.006 0.000 0.016 0.000 0.000 0.014
M (vi) site:
Al 0.002 0.014 0.013 0.009 0.013 0.007 0.018 0.014 0.011
Ti 0.000 0.001 0.000 0.000 0.001 0.000 0.001 0.001 0.000
Fe3+
0.023 0.000 0.000 0.006 0.000 0.016 0.000 0.000 0.014
Fe2+
0.506 1.091 1.112 0.495 1.103 0.495 1.154 1.129 0.511
Mn2+
0.042 0.130 0.117 0.040 0.129 0.045 0.123 0.129 0.049
Mg 0.528 0.729 0.718 0.543 0.712 0.530 0.672 0.687 0.521
Ca 0.888 0.028 0.035 0.898 0.033 0.897 0.025 0.038 0.883
Na 0.011 0.000 0.000 0.009 0.000 0.011 0.000 0.002 0.011
Site total 2.000 1.993 1.994 2.000 1.990 2.000 1.992 1.999 2.000
Molecular percentages of major components
Diopside 42.48 1.12 1.39 44.51 1.29 43.42 0.91 1.43 41.35
Hedenbergite 40.70 1.68 2.15 40.61 2.00 40.53 1.57 2.35 40.56
Enstatite 5.15 29.45 29.40 4.88 28.59 4.78 27.08 27.06 5.38
Ferrosilite 4.93 53.86 54.64 4.46 54.35 4.46 57.10 55.08 5.28
Jadeite 0.00 0.00 0.00 0.34 0.00 0.00 0.00 0.00 0.00
Aegerine 1.13 0.00 0.00 0.57 0.00 1.05 0.00 0.00 1.05
Esseneite 1.15 0.00 0.00 0.00 0.00 0.58 0.00 0.00 0.38
Johannsenite 4.23 0.00 0.00 4.04 0.00 4.49 0.00 0.00 4.87
Kanoite 0.00 13.09 11.75 0.00 12.97 0.00 12.37 12.90 0.00

129
APPENDIX C: FELDSPAR EPMA DATA
Sample QC82-44
Analysis Pt. 7 8 9 10 11 12 13 14 15 19 20 21 22
Wt%
SiO2 55.54 57.35 56.74 57.04 57.29 55.62 56.62 56.57 57.57 57.30 57.30 57.66 56.84
Al2O3 28.00 27.67 27.26 27.30 26.99 25.76 28.85 28.00 27.60 27.26 27.49 27.80 27.40
FeO 0.17 0.22 0.13 0.38 0.68 0.09 0.08 0.07 0.05 0.12 0.11 0.39 0.06
MgO 0.00 0.02 0.00 0.00 0.00 0.01 0.00 0.00 0.00 0.00 0.00 0.00 0.02
CaO 9.79 9.22 9.54 9.80 9.03 11.58 10.64 10.06 9.57 9.03 9.31 9.44 9.30
BaO 0.05 0.09 0.13 0.15 0.08 0.08 0.09 0.11 0.07 0.12 0.12 0.08 0.10
Na2O 5.36 5.91 5.86 6.14 6.13 5.78 4.92 5.21 5.59 6.45 6.25 5.82 5.74
K2O 0.08 0.06 0.13 0.32 0.24 0.15 0.15 0.25 0.10 0.14 0.16 0.07 0.18
Total 98.99 100.54 99.79 101.13 100.44 99.07 101.35 100.27 100.55 100.42 100.74 101.26 99.64
Structural formula (in apfu) based on 8 oxygens
T (iv) site:
Si 2.518 2.556 2.553 2.544 2.565 2.543 2.508 2.532 2.562 2.562 2.554 2.554 2.556
Al 1.496 1.453 1.445 1.435 1.424 1.388 1.506 1.477 1.448 1.436 1.444 1.451 1.452
Site total 4.014 4.009 3.998 3.979 3.990 3.930 4.014 4.009 4.010 3.998 3.998 4.005 4.009
M site:
Fe2+
0.006 0.008 0.005 0.014 0.025 0.003 0.003 0.003 0.002 0.004 0.004 0.014 0.002
Mg
0.000 0.001 0.000 0.000 0.000 0.001 0.000 0.000 0.000 0.000 0.000 0.000 0.001
Ca 0.475 0.440 0.460 0.468 0.433 0.567 0.505 0.482 0.456 0.433 0.445 0.448 0.448
Ba 0.001 0.002 0.002 0.003 0.001 0.001 0.002 0.002 0.001 0.002 0.002 0.001 0.002
Na 0.471 0.511 0.511 0.531 0.532 0.512 0.423 0.452 0.482 0.559 0.540 0.500 0.501
K 0.005 0.003 0.007 0.018 0.014 0.009 0.008 0.014 0.006 0.008 0.009 0.004 0.010
Site total 0.952 0.956 0.981 1.020 0.981 1.090 0.938 0.951 0.946 1.002 0.996 0.953 0.961
Main feldspar components (mol %)
Albite 49.48 53.42 52.12 52.05 54.28 47.01 45.07 47.55 51.01 55.81 54.23 52.44 52.10
Anorthite 49.94 46.06 46.89 45.91 44.18 52.05 53.86 50.74 48.26 43.18 44.64 47.00 46.65

130
Orthoclase 0.49 0.36 0.76 1.78 1.40 0.80 0.90 1.50 0.60 0.80 0.91 0.41 1.07
Celsian 0.09 0.16 0.23 0.26 0.14 0.13 0.17 0.20 0.13 0.21 0.21 0.15 0.18
Sample QC82-44 QC82-49b
Analysis Type
hyal-area 4 pl-area 4
Analysis Pt. 23 24 25 26 27 1 2 3 4 5 6 7 8
Wt%
SiO2 57.48 56.71 55.67 56.07 56.77 61.43 61.33 61.23 60.97 61.33 47.72 47.70 47.76
Al2O3 27.00 27.06 27.82 26.94 26.92 19.45 19.61 20.06 19.76 19.65 32.91 32.90 32.79
FeO 0.09 0.33 0.09 0.04 0.07 0.03 0.05 0.02 0.04 0.03 0.08 0.06 0.12
MnO 0.00 0.00 0.00 0.00 0.00 0.00 0.01 0.02 0.00 0.00 0.01 0.00 0.00
MgO 0.00 0.01 0.00 0.01 0.00 0.01 0.00 0.00 0.01 0.01 0.00 0.00 0.00
CaO 9.19 9.00 10.14 9.12 9.05 0.09 0.11 0.45 0.17 0.13 16.42 16.41 16.41
BaO 0.20 0.07 0.10 0.11 0.05 5.55 5.67 5.68 5.71 5.63 0.02 0.00 0.00
SrO 0.00 0.00 0.00 0.00 0.00 0.03 0.11 0.12 0.09 0.11 0.20 0.11 0.15
Na2O 5.86 5.84 5.26 5.42 5.57 1.05 1.07 1.09 1.04 0.97 1.93 2.00 2.01
K2O 0.20 0.27 0.23 0.41 0.21 12.56 12.39 12.53 12.59 12.62 0.03 0.01 0.03
Total 100.02 99.29 99.31 98.12 98.64 100.21 100.33 101.19 100.37 100.48 99.32 99.20 99.26
Structural formula (in apfu) based on 8 oxygens
T (iv) site:
Si 2.576 2.562 2.520 2.561 2.574 2.915 2.908 2.885 2.896 2.906 2.203 2.203 2.206
Al 1.426 1.441 1.484 1.450 1.439 1.087 1.096 1.114 1.106 1.097 1.791 1.791 1.785
Site total 4.002 4.003 4.004 4.011 4.013 4.002 4.004 3.999 4.002 4.003 3.993 3.994 3.991
M site:
Fe2+
0.003 0.012 0.003 0.002 0.003 0.001 0.002 0.001 0.002 0.001 0.003 0.002 0.005
Mn 0.000 0.000 0.000 0.000 0.000 0.000 0.000 0.001 0.000 0.000 0.000 0.000 0.000
Mg
0.000 0.001 0.000 0.001 0.000 0.001 0.000 0.000 0.000 0.001 0.000 0.000 0.000

131
Ca 0.441 0.436 0.492 0.446 0.440 0.005 0.006 0.023 0.009 0.006 0.812 0.812 0.812
Ba 0.004 0.001 0.002 0.002 0.001 0.103 0.105 0.105 0.106 0.105 0.000 0.000 0.000
Sr 0.000 0.000 0.000 0.000 0.000 0.001 0.003 0.003 0.002 0.003 0.005 0.003 0.004
Na 0.509 0.512 0.462 0.480 0.490 0.097 0.098 0.099 0.096 0.089 0.173 0.179 0.180
K 0.011 0.016 0.013 0.024 0.012 0.761 0.749 0.753 0.763 0.763 0.002 0.001 0.002
Site total 0.965 0.964 0.968 0.952 0.942 0.966 0.961 0.983 0.976 0.966 0.992 0.995 0.997
Main feldspar components (mol %)
Albite 52.74 53.06 47.67 50.41 51.96 10.02 10.23 10.12 9.81 9.28 17.50 18.07 18.08
Anorthite 45.71 45.19 50.78 46.87 46.66 0.48 0.58 2.32 0.88 0.67 82.31 81.88 81.73
Orthoclase 1.18 1.61 1.37 2.51 1.29 78.81 78.20 76.86 78.39 79.19 0.16 0.05 0.20
Celsian 0.36 0.13 0.18 0.21 0.09 10.69 10.99 10.70 10.92 10.86 0.03 0.00 0.00
Sample QC82-49b
Analysis Type
pl-area 4 hyal-
area 4 pl-area 4
incl. in am-2
near opx-5, kfs-8 (area 6)
near opx-5, pl-6,7
(area 6)
near pl-16
(area 6)
near hyal-15 (area
6)
Analysis Pt. 9 10 11 12 13 14 15 pl-4 pl-6 pl-7 hyal-8 hyal-15 pl-16
Wt%
SiO2 47.86 48.11 48.03 62.21 52.47 48.59 48.39 46.90 46.24 46.21 58.55 60.06 47.69
Al2O3 32.72 32.54 32.38 19.00 29.58 32.06 32.45 32.82 33.05 33.03 20.71 19.73 32.27
FeO 0.05 0.09 0.09 0.02 0.04 0.07 0.13 0.69 0.31 0.34 0.32 0.02 0.04
MnO 0.01 0.00 0.00 0.00 0.00 0.01 0.02 0.01 0.03 0.03 0.01 0.00 0.00
MgO 0.00 0.00 0.00 0.01 0.01 0.00 0.00 0.02 0.00 0.00 0.00 0.00 0.00
CaO 16.44 16.30 16.33 0.16 13.17 15.86 16.15 16.92 17.33 17.42 1.06 0.47 16.56
BaO 0.05 0.00 0.04 3.79 0.14 0.04 0.00 0.02 0.02 0.00 6.81 5.60 0.02
SrO 0.15 0.07 0.06 0.09 0.09 0.07 0.11 0.00 0.00 0.00 0.00 0.00 0.00
Na2O 2.00 2.19 2.08 1.03 3.66 2.41 2.21 1.86 1.57 1.63 1.07 1.10 1.62

132
K2O 0.01 0.03 0.05 13.41 0.48 0.06 0.03 0.06 0.03 0.03 11.62 12.55 0.00
Total 99.29 99.33 99.06 99.72 99.65 99.17 99.49 99.30 98.57 98.69 100.14 99.53 98.22
Structural formula (in apfu) based on 8 oxygens
T (iv) site:
Si 2.210 2.219 2.221 2.940 2.394 2.243 2.228 2.176 2.159 2.157 2.818 2.881 2.221
Al 1.780 1.769 1.765 1.058 1.591 1.744 1.760 1.795 1.819 1.817 1.175 1.115 1.771
Site total 3.990 3.987 3.986 3.998 3.984 3.986 3.988 3.971 3.978 3.974 3.992 3.996 3.992
M site:
Fe2+
0.002 0.003 0.004 0.001 0.002 0.003 0.005 0.027 0.012 0.013 0.013 0.001 0.002
Mn 0.000 0.000 0.000 0.000 0.000 0.000 0.001 0.000 0.001 0.001 0.000 0.000 0.000
Mg
0.000 0.000 0.000 0.000 0.001 0.000 0.000 0.001 0.000 0.000 0.000 0.000 0.000
Ca 0.813 0.805 0.809 0.008 0.644 0.784 0.796 0.841 0.867 0.871 0.055 0.024 0.826
Ba 0.001 0.000 0.001 0.070 0.003 0.001 0.000 0.000 0.000 0.000 0.128 0.105 0.000
Sr 0.004 0.002 0.002 0.002 0.002 0.002 0.003 0.000 0.000 0.000 0.000 0.000 0.000
Na 0.179 0.196 0.187 0.095 0.323 0.216 0.197 0.167 0.142 0.148 0.100 0.102 0.146
K 0.001 0.002 0.003 0.808 0.028 0.003 0.002 0.004 0.001 0.002 0.714 0.768 0.000
Site total 0.997 1.004 1.001 0.984 1.000 1.006 0.998 1.013 1.011 1.021 0.996 0.999 0.973
Main feldspar components (mol %)
Albite 17.98 19.51 18.69 9.66 32.41 21.48 19.78 16.51 14.06 14.48 10.00 10.21 15.03
Anorthite 81.86 80.31 80.94 0.82 64.51 78.09 80.03 83.07 85.77 85.33 5.47 2.41 84.90
Orthoclase 0.07 0.18 0.30 82.37 2.82 0.35 0.18 0.37 0.15 0.20 71.64 76.86 0.02
Celsian 0.09 0.00 0.07 7.16 0.25 0.08 0.00 0.04 0.03 0.00 12.89 10.52 0.04

133
APPENDIX D: AMPHIBOLE EPMA DATA
Sample QC-IS
Analysis Type Traverse of matrix grain
Analysis Pt. 1 2 3 4 5 6 7 8 9 10 11 12 13
Wt%
SiO2 40.01 39.72 39.71 39.71 39.81 39.90 39.69 39.46 39.72 39.51 39.80 39.66 39.43
TiO2 0.15 0.12 0.12 0.12 0.12 0.12 0.11 0.10 0.11 0.12 0.09 0.12 0.12
Al2O3 12.07 11.97 12.06 11.75 11.77 11.72 11.73 11.71 11.70 11.70 11.68 11.66 11.64
Cr2O3 0.01 0.01 0.01 0.00 0.01 0.00 0.00 0.01 0.00 0.02 0.02 0.00 0.01
MnO 0.25 0.23 0.28 0.23 0.26 0.31 0.27 0.28 0.24 0.21 0.26 0.26 0.31
FeO 20.08 19.64 19.51 19.88 19.88 19.89 19.67 19.72 19.71 19.55 19.61 19.81 19.67
Fe2O3 4.97 5.66 6.33 5.70 5.46 5.59 6.20 5.90 5.89 5.99 6.47 5.75 5.53
NiO 0.05 0.00 0.01 0.00 0.03 0.01 0.01 0.00 0.01 0.01 0.00 0.02 0.02
MgO 5.50 5.71 5.67 5.68 5.71 5.73 5.75 5.69 5.79 5.76 5.79 5.66 5.69
CaO 11.48 11.30 11.47 11.52 11.53 11.59 11.50 11.59 11.58 11.42 11.58 11.44 11.52
Na2O 0.58 0.62 0.61 0.60 0.63 0.62 0.62 0.64 0.60 0.62 0.62 0.60 0.62
BaO 0.17 0.22 0.23 0.22 0.18 0.19 0.20 0.18 0.15 0.14 0.19 0.16 0.19
K2O 2.84 2.94 2.92 2.98 2.96 2.98 3.03 3.00 3.04 3.01 2.95 3.02 2.99
H2O (calc) 1.43 1.43 1.42 1.42 1.43 1.46 1.42 1.44 1.44 1.44 1.45 1.44 1.44
F 0.21 0.21 0.21 0.22 0.23 0.17 0.25 0.22 0.22 0.21 0.22 0.20 0.22
Cl 1.37 1.36 1.42 1.38 1.33 1.34 1.32 1.31 1.31 1.31 1.30 1.33 1.29
O=F,Cl (calc) -0.40 -0.39 -0.41 -0.40 -0.40 -0.37 -0.40 -0.39 -0.39 -0.39 -0.39 -0.38 -0.38
Total 100.75 100.74 101.55 101.01 100.93 101.24 101.38 100.85 101.11 100.62 101.64 100.75 100.30
Normalization procedure(s)
Si–Ca&Li=15 Si–Mg&Li=13
T site (ideally 8 apfu):
Si 6.259 6.221 6.180 6.217 6.230 6.229 6.194 6.192 6.208 6.204 6.192 6.224 6.216

134
Al 1.741 1.779 1.820 1.783 1.770 1.771 1.806 1.808 1.792 1.796 1.808 1.776 1.784
T subtotal 8.000 8.000 8.000 8.000 8.000 8.000 8.000 8.000 8.000 8.000 8.000 8.000 8.000
C site (ideally 5 apfu):
Ti 0.017 0.014 0.014 0.014 0.014 0.014 0.013 0.012 0.013 0.014 0.010 0.015 0.014
Al 0.483 0.429 0.392 0.386 0.401 0.385 0.352 0.357 0.364 0.369 0.334 0.381 0.379
Cr
0.001 0.001 0.001 0.000 0.001 0.000 0.000 0.002 0.000 0.002 0.002 0.000 0.002
Fe3+
0.585 0.667 0.740 0.672 0.642 0.658 0.730 0.697 0.694 0.707 0.758 0.678 0.657
Ni 0.006 0.000 0.001 0.000 0.004 0.002 0.002 0.000 0.001 0.001 0.000 0.003 0.002
Mn2+
0.000 0.000 0.000 0.000 0.003 0.013 0.000 0.014 0.004 0.000 0.002 0.000 0.016
Fe2+
2.626 2.556 2.537 2.602 2.603 2.596 2.566 2.588 2.575 2.560 2.551 2.600 2.593
Mg 1.283 1.333 1.315 1.326 1.332 1.333 1.338 1.331 1.349 1.348 1.343 1.324 1.337
C subtotal 5.001 5.000 5.000 5.000 5.000 5.001 5.001 5.001 5.000 5.001 5.000 5.001 5.000
B site (ideally 2 apfu):
Mn2+
0.033 0.031 0.037 0.031 0.031 0.028 0.036 0.024 0.028 0.028 0.032 0.035 0.025
Fe2+
0.002 0.018 0.004 0.001 0.000 0.000 0.000 0.000 0.000 0.009 0.000 0.001 0.000
Ca 1.924 1.895 1.913 1.933 1.933 1.939 1.923 1.949 1.939 1.921 1.930 1.924 1.946
Na 0.041 0.056 0.047 0.036 0.036 0.033 0.041 0.028 0.033 0.042 0.037 0.041 0.029
B subtotal 2.000 2.000 2.001 2.001 2.000 2.000 2.000 2.001 2.000 2.000 1.999 2.001 2.000
A site (from 0 to 1 apfu):
Na 0.134 0.133 0.136 0.147 0.155 0.154 0.146 0.166 0.148 0.146 0.148 0.141 0.159
Ba 0.007 0.009 0.010 0.009 0.008 0.008 0.008 0.007 0.006 0.006 0.008 0.007 0.008
K 0.566 0.586 0.579 0.596 0.591 0.592 0.604 0.600 0.606 0.604 0.586 0.604 0.601
A subtotal 0.707 0.728 0.725 0.752 0.754 0.754 0.758 0.773 0.760 0.756 0.742 0.752 0.768
W site (ideally 2 apfu):
OH 1.500 1.507 1.498 1.499 1.506 1.535 1.500 1.519 1.518 1.517 1.525 1.519 1.519
F 0.102 0.102 0.101 0.108 0.112 0.083 0.123 0.110 0.110 0.107 0.110 0.098 0.109
Cl 0.363 0.362 0.374 0.366 0.353 0.353 0.350 0.348 0.346 0.349 0.344 0.353 0.345
O 0.034 0.028 0.027 0.028 0.028 0.028 0.027 0.024 0.025 0.028 0.021 0.029 0.028
W subtotal 1.999 1.999 2.000 2.001 1.999 1.999 2.000 2.001 1.999 2.001 2.000 1.999 2.001
Sum T,C,B,A 15.708 15.728 15.726 15.753 15.754 15.755 15.759 15.775 15.760 15.757 15.741 15.754 15.768
Species potassic-hastingsite

135
Sample QC82-44 QC81-
1
Analysis Type Matrix Secon.
am
Analysis Pt. 28 29 30 31 32 33 34 35 36 37 38 39 am-4
Wt%
SiO2 43.66 43.09 43.53 44.22 42.70 43.60 43.84 42.57 43.36 43.84 43.32 43.02 52.96
TiO2 0.24 0.28 0.28 0.26 0.28 0.27 0.26 0.28 0.29 0.24 0.25 0.26 0.01
Al2O3 12.60 12.51 11.84 12.37 12.08 11.93 12.01 12.49 12.85 12.14 12.19 12.04 0.26
Cr2O3 0.01 0.01 0.01 0.01 0.03 0.01 0.05 0.01 0.03 0.03 0.02 0.02 0.00
MnO 0.26 0.33 0.34 0.30 0.31 0.28 0.28 0.31 0.32 0.31 0.31 0.31 0.24
FeO 12.95 11.87 14.39 13.04 13.03 12.23 13.39 11.60 12.23 12.12 11.34 11.38 27.66
Fe2O3 6.53 7.88 7.59 7.17 7.66 8.80 7.20 9.61 8.36 8.43 10.10 9.74 0.00
MgO 9.40 9.61 9.10 9.70 9.33 9.65 9.30 9.40 9.41 9.83 9.24 9.74 15.27
CaO 11.02 11.07 10.02 10.82 10.17 10.95 10.80 11.11 11.00 11.02 10.69 11.01 0.15
Na2O 1.07 1.01 1.01 0.88 0.95 0.98 0.97 1.00 0.97 1.08 1.15 1.03 0.01
K2O 0.64 0.73 0.79 0.67 0.82 0.73 0.72 0.75 0.72 0.72 0.67 0.71 0.00
H2O (calc) 1.94 1.92 1.91 1.94 1.92 1.93 1.93 1.91 1.92 1.93 1.93 1.93 2.01
F 0.00 0.00 0.00 0.00 0.00 0.00 0.00 0.00 0.00 0.00 0.00 0.00 0.01
Cl 0.10 0.13 0.11 0.09 0.09 0.08 0.10 0.13 0.13 0.10 0.10 0.08 0.00
O=F,Cl (calc) -0.02 -0.03 -0.02 -0.02 -0.02 -0.02 -0.02 -0.03 -0.03 -0.02 -0.02 -0.02 0.00
Total 100.39 100.41 100.90 101.45 99.34 101.43 100.82 101.14 101.57 101.76 101.29 101.25 98.58
Normalization procedure(s)
Si–Ca&Li=15 Si–Mg&Li=13
Si–Ca&Li=15 Si–Na=15
Si–Ca&Li=15 Si–Mg&Li
=13
Si–Ca&Li=15 Si–Na=15
Si–Ca&Li=15 Si–Mg&Li
=13
Si–Ca&Li=15 Si–Mg&Li
=13 Si–
Na=15
Si–Ca&Li=15 Si–Mg&Li
=13
Si–Ca&Li=15 Si–
Na=15
T site (ideally 8 apfu):
Si 6.459 6.384 6.464 6.474 6.417 6.410 6.482 6.292 6.358 6.413 6.374 6.339 7.979

136
Al 1.541 1.616 1.536 1.526 1.583 1.590 1.518 1.708 1.642 1.587 1.626 1.661 0.021
T subtotal 8.000 8.000 8.000 8.000 8.000 8.000 8.000 8.000 8.000 8.000 8.000 8.000 8.000
C site (ideally 5 apfu):
Ti 0.027 0.031 0.031 0.029 0.031 0.030 0.029 0.031 0.031 0.026 0.028 0.029 0.001
Al 0.656 0.568 0.536 0.608 0.557 0.477 0.575 0.467 0.579 0.506 0.488 0.431 0.025
Cr
0.001 0.001 0.001 0.002 0.003 0.002 0.006 0.001 0.003 0.004 0.002 0.002 0.000
Fe3+
0.726 0.879 0.848 0.791 0.865 0.974 0.800 1.068 0.923 0.928 1.119 1.081 0.000
Fe2+
1.517 1.398 1.569 1.455 1.453 1.401 1.540 1.361 1.405 1.392 1.337 1.319 1.544
Mg 2.073 2.122 2.014 2.116 2.090 2.116 2.050 2.072 2.058 2.144 2.026 2.139 3.430
C subtotal 5.000 4.999 4.999 5.001 4.999 5.000 5.000 5.000 4.999 5.000 5.000 5.001 5.000
B site (ideally 2 apfu):
Mn2+
0.033 0.041 0.043 0.037 0.040 0.034 0.034 0.039 0.040 0.038 0.038 0.039 0.031
Fe2+
0.085 0.072 0.218 0.141 0.185 0.102 0.116 0.073 0.094 0.089 0.058 0.083 1.941
Ca 1.747 1.757 1.594 1.697 1.638 1.725 1.711 1.759 1.728 1.727 1.685 1.738 0.024
Na 0.135 0.130 0.145 0.125 0.137 0.139 0.138 0.129 0.138 0.145 0.218 0.140 0.003
B subtotal 2.000 2.000 2.000 2.000 2.000 2.000 1.999 2.000 2.000 1.999 1.999 2.000 1.999
A site (from 0 to 1 apfu):
Na 0.172 0.160 0.146 0.125 0.138 0.140 0.140 0.159 0.139 0.161 0.109 0.153 0.000
K 0.121 0.138 0.150 0.125 0.157 0.136 0.135 0.141 0.135 0.134 0.126 0.134 0.000
A subtotal 0.293 0.298 0.296 0.250 0.295 0.276 0.275 0.300 0.274 0.295 0.235 0.287 0.000
W site (ideally 2 apfu):
OH 1.921 1.905 1.910 1.920 1.915 1.919 1.916 1.905 1.904 1.922 1.918 1.921 1.993
F 0.000 0.000 0.000 0.000 0.000 0.000 0.000 0.000 0.000 0.000 0.000 0.000 0.005
Cl 0.025 0.033 0.028 0.022 0.022 0.021 0.026 0.034 0.033 0.025 0.026 0.021 0.000
O 0.054 0.063 0.063 0.058 0.063 0.060 0.058 0.062 0.063 0.053 0.056 0.059 0.002
W subtotal 2.000 2.001 2.001 2.000 2.000 2.000 2.000 2.001 2.000 2.000 2.000 2.001 2.000
Sum T,C,B,A 15.293 15.297 15.295 15.251 15.294 15.276 15.274 15.300 15.273 15.294 15.234 15.288 14.999
Species magnesio-ferri-hornblende ferri-tschermakite
magnesio-ferri-
hornblende
ferri-tschermakite gruneri
te
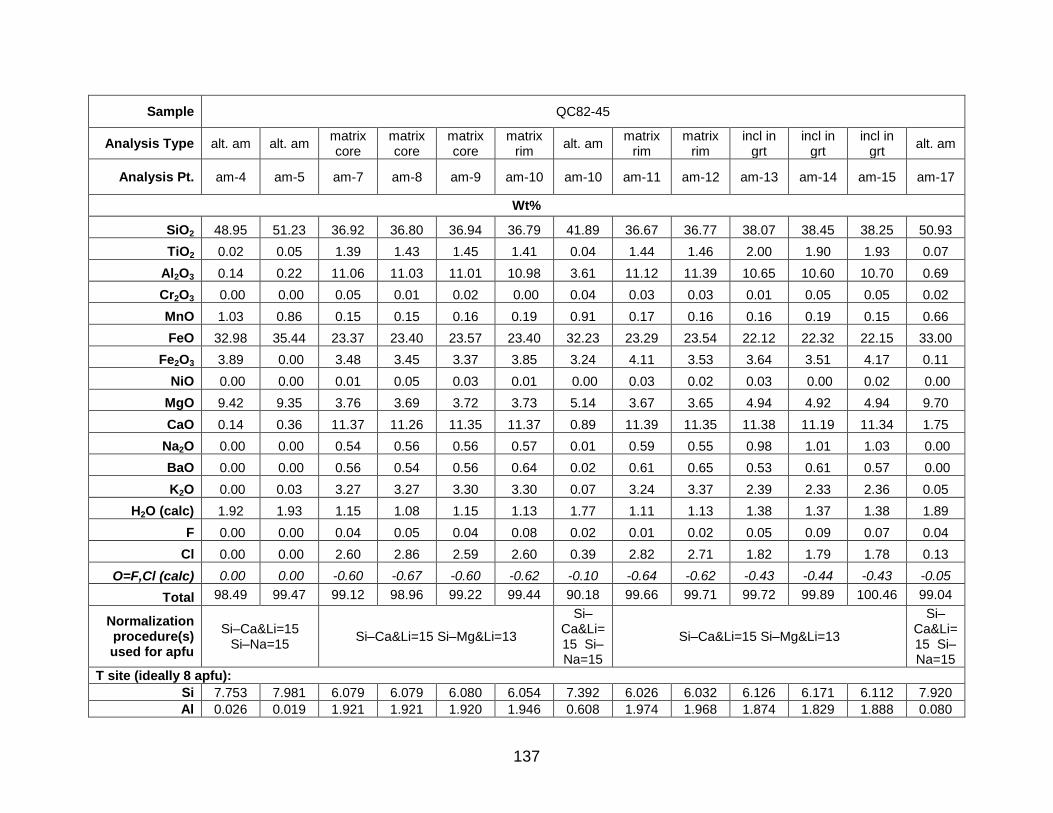
137
Sample QC82-45
Analysis Type alt. am alt. am matrix core
matrix core
matrix core
matrix rim
alt. am matrix
rim matrix
rim incl in
grt incl in
grt incl in
grt alt. am
Analysis Pt. am-4 am-5 am-7 am-8 am-9 am-10 am-10 am-11 am-12 am-13 am-14 am-15 am-17
Wt%
SiO2 48.95 51.23 36.92 36.80 36.94 36.79 41.89 36.67 36.77 38.07 38.45 38.25 50.93
TiO2 0.02 0.05 1.39 1.43 1.45 1.41 0.04 1.44 1.46 2.00 1.90 1.93 0.07
Al2O3 0.14 0.22 11.06 11.03 11.01 10.98 3.61 11.12 11.39 10.65 10.60 10.70 0.69
Cr2O3 0.00 0.00 0.05 0.01 0.02 0.00 0.04 0.03 0.03 0.01 0.05 0.05 0.02
MnO 1.03 0.86 0.15 0.15 0.16 0.19 0.91 0.17 0.16 0.16 0.19 0.15 0.66
FeO 32.98 35.44 23.37 23.40 23.57 23.40 32.23 23.29 23.54 22.12 22.32 22.15 33.00
Fe2O3 3.89 0.00 3.48 3.45 3.37 3.85 3.24 4.11 3.53 3.64 3.51 4.17 0.11
NiO 0.00 0.00 0.01 0.05 0.03 0.01 0.00 0.03 0.02 0.03 0.00 0.02 0.00
MgO 9.42 9.35 3.76 3.69 3.72 3.73 5.14 3.67 3.65 4.94 4.92 4.94 9.70
CaO 0.14 0.36 11.37 11.26 11.35 11.37 0.89 11.39 11.35 11.38 11.19 11.34 1.75
Na2O 0.00 0.00 0.54 0.56 0.56 0.57 0.01 0.59 0.55 0.98 1.01 1.03 0.00
BaO 0.00 0.00 0.56 0.54 0.56 0.64 0.02 0.61 0.65 0.53 0.61 0.57 0.00
K2O 0.00 0.03 3.27 3.27 3.30 3.30 0.07 3.24 3.37 2.39 2.33 2.36 0.05
H2O (calc) 1.92 1.93 1.15 1.08 1.15 1.13 1.77 1.11 1.13 1.38 1.37 1.38 1.89
F 0.00 0.00 0.04 0.05 0.04 0.08 0.02 0.01 0.02 0.05 0.09 0.07 0.04
Cl 0.00 0.00 2.60 2.86 2.59 2.60 0.39 2.82 2.71 1.82 1.79 1.78 0.13
O=F,Cl (calc) 0.00 0.00 -0.60 -0.67 -0.60 -0.62 -0.10 -0.64 -0.62 -0.43 -0.44 -0.43 -0.05
Total 98.49 99.47 99.12 98.96 99.22 99.44 90.18 99.66 99.71 99.72 99.89 100.46 99.04
Normalization procedure(s) used for apfu
Si–Ca&Li=15 Si–Na=15
Si–Ca&Li=15 Si–Mg&Li=13
Si–Ca&Li=15 Si–Na=15
Si–Ca&Li=15 Si–Mg&Li=13
Si–Ca&Li=15 Si–Na=15
T site (ideally 8 apfu):
Si 7.753 7.981 6.079 6.079 6.080 6.054 7.392 6.026 6.032 6.126 6.171 6.112 7.920
Al 0.026 0.019 1.921 1.921 1.920 1.946 0.608 1.974 1.968 1.874 1.829 1.888 0.080

138
T subtotal 7.999 8.000 8.000 8.000 8.000 8.000 8.000 8.000 8.000 8.000 8.000 8.000 8.000
C site (ideally 5 apfu):
Ti 0.000 0.006 0.172 0.178 0.180 0.175 0.005 0.178 0.180 0.242 0.229 0.232 0.008
Al 0.000 0.021 0.225 0.227 0.216 0.183 0.143 0.180 0.235 0.146 0.176 0.128 0.046
Cr
0.000 0.000 0.007 0.001 0.003 0.000 0.006 0.004 0.004 0.001 0.006 0.006 0.002
Fe3+
0.000 0.000 0.431 0.428 0.419 0.478 0.430 0.507 0.436 0.440 0.424 0.503 0.012
Ni 0.000 0.000 0.001 0.007 0.004 0.001 0.000 0.004 0.003 0.004 0.000 0.003 0.000
Mn2+
0.000 0.000 0.021 0.018 0.022 0.026 0.000 0.024 0.020 0.004 0.000 0.000 0.000
Fe2+
2.531 2.801 3.218 3.233 3.243 3.219 3.063 3.202 3.230 2.977 2.987 2.952 2.682
Mg 2.224 2.171 0.923 0.909 0.913 0.915 1.352 0.899 0.893 1.185 1.177 1.177 2.249
C subtotal 5.000 4.999 4.998 5.001 5.000 4.997 4.999 4.998 5.001 4.999 4.999 5.001 4.999
B site (ideally 2 apfu):
Mn2+
0.138 0.113 0.000 0.003 0.000 0.000 0.136 0.000 0.002 0.018 0.026 0.020 0.087
Fe2+
1.838 1.816 0.000 0.000 0.000 0.000 1.694 0.000 0.000 0.000 0.009 0.007 1.610
Ca 0.024 0.060 2.000 1.993 2.000 2.000 0.168 2.000 1.995 1.962 1.924 1.942 0.292
Na 0.000 0.000 0.000 0.004 0.000 0.000 0.002 0.000 0.003 0.020 0.040 0.031 0.011
B subtotal 2.000 1.989 2.000 2.000 2.000 2.000 2.000 2.000 2.000 2.000 1.999 2.000 2.000
A site (from 0 to 1 apfu):
Ca 0.000 0.000 0.006 0.000 0.002 0.005 0.000 0.005 0.000 0.000 0.000 0.000 0.000
Na 0.000 0.000 0.172 0.176 0.179 0.182 0.002 0.188 0.172 0.286 0.274 0.288 0.004
Ba 0.000 0.000 0.025 0.024 0.025 0.028 0.001 0.027 0.029 0.023 0.026 0.025 0.000
K 0.000 0.006 0.687 0.689 0.693 0.693 0.016 0.679 0.705 0.491 0.477 0.481 0.010
A subtotal 0.000 0.006 0.890 0.889 0.899 0.908 0.019 0.899 0.906 0.800 0.777 0.794 0.014
W site (ideally 2 apfu):
OH 2.000 2.000 1.253 1.173 1.256 1.233 1.872 1.209 1.236 1.478 1.467 1.482 1.946
F 0.000 0.000 0.021 0.026 0.021 0.042 0.011 0.005 0.010 0.025 0.046 0.035 0.020
Cl 0.000 0.000 0.726 0.801 0.723 0.725 0.117 0.786 0.754 0.497 0.487 0.482 0.034
W subtotal 2.000 2.000 2.000 2.000 2.000 2.000 2.000 2.000 2.000 2.000 2.000 1.999 2.000
Sum T,C,B,A 14.999 14.994 15.888 15.890 15.899 15.905 15.018 15.897 15.907 15.799 15.775 15.795 15.013
Species grunerite potassic-hastingsite gruneri
te potassic-hastingsite
grunerite

139
Sample QC82-45
Analysis Type alt. am matrix incl. in
gar incl. in
opx incl. in
opx incl. in
opx incl. in
opx incl. in
opx incl. in
opx matrix
by biot 45
incl. in opx
matrix
Analysis Pt. am-18 28 29 30 am-32 33 34 am-35 am-41 am-43 am-46 am-47 48
Wt%
SiO2 52.79 37.11 37.97 36.84 36.84 36.73 37.05 36.73 36.16 37.55 36.61 36.77 36.88
TiO2 0.05 1.40 1.84 1.53 1.53 1.37 1.70 1.44 1.29 1.53 1.29 1.35 1.34
Al2O3 0.28 11.38 10.86 11.94 11.94 12.05 11.90 11.85 11.75 12.08 11.70 11.49 11.59
Cr2O3 0.00 0.04 0.04 0.02 0.02 0.02 0.03 0.02 0.00 0.05 0.04 0.01 0.04
MnO 0.70 0.17 0.17 0.21 0.21 0.18 0.19 0.20 0.18 0.18 0.10 0.18 0.14
FeO 31.05 23.22 22.04 24.41 24.41 24.37 24.17 24.33 23.74 22.51 23.16 23.66 22.74
Fe2O3 0.00 4.52 4.12 4.02 4.02 4.26 4.48 3.93 4.69 3.54 4.51 4.28 4.57
NiO 0.04 0.00 0.00 0.00 0.00 0.00 0.00 0.00 0.00 0.00 0.00 0.00 0.00
MgO 12.02 3.83 4.96 3.19 3.19 2.97 3.27 3.12 3.18 4.18 3.67 3.49 3.97
CaO 0.20 11.50 11.62 11.48 11.48 11.41 11.54 11.43 11.42 11.47 11.48 11.59 11.60
Na2O 0.03 0.65 1.06 0.63 0.63 0.59 0.76 0.54 0.53 0.54 0.52 0.58 0.62
BaO 0.00 0.55 0.53 1.07 1.07 1.09 0.84 0.65 1.03 0.63 0.70 0.61 0.36
K2O 0.01 3.20 2.39 3.26 3.26 3.15 2.93 3.46 3.37 3.02 3.40 3.30 3.30
H2O (calc) 1.96 1.14 1.29 1.11 1.11 1.13 1.22 1.13 1.06 1.45 1.09 1.13 1.17
F 0.03 0.08 0.25 0.17 0.17 0.00 0.10 0.07 0.16 0.00 0.11 0.10 0.06
Cl 0.04 2.61 1.82 2.55 2.55 2.76 2.28 2.62 2.71 1.64 2.73 2.60 2.53
O=F,Cl (calc) -0.02 -0.62 -0.52 -0.65 -0.65 -0.62 -0.56 -0.62 -0.68 -0.37 -0.66 -0.63 -0.60
Total 99.18 100.77 100.44 101.78 101.78 101.46 101.90 100.91 100.59 100.01 100.45 100.51 100.31
Normalization procedure(s) used for apfu
Si–Ca&Li=15 Si–Na=15
Si–Ca&Li=15 Si–Mg&Li=13
T site (ideally 8 apfu):
Si 8.046 6.011 6.076 5.955 5.955 5.961 5.950 5.976 5.930 6.042 5.969 5.993 5.984
Al 0.000 1.989 1.924 2.045 2.045 2.039 2.050 2.024 2.070 1.958 2.031 2.007 2.016
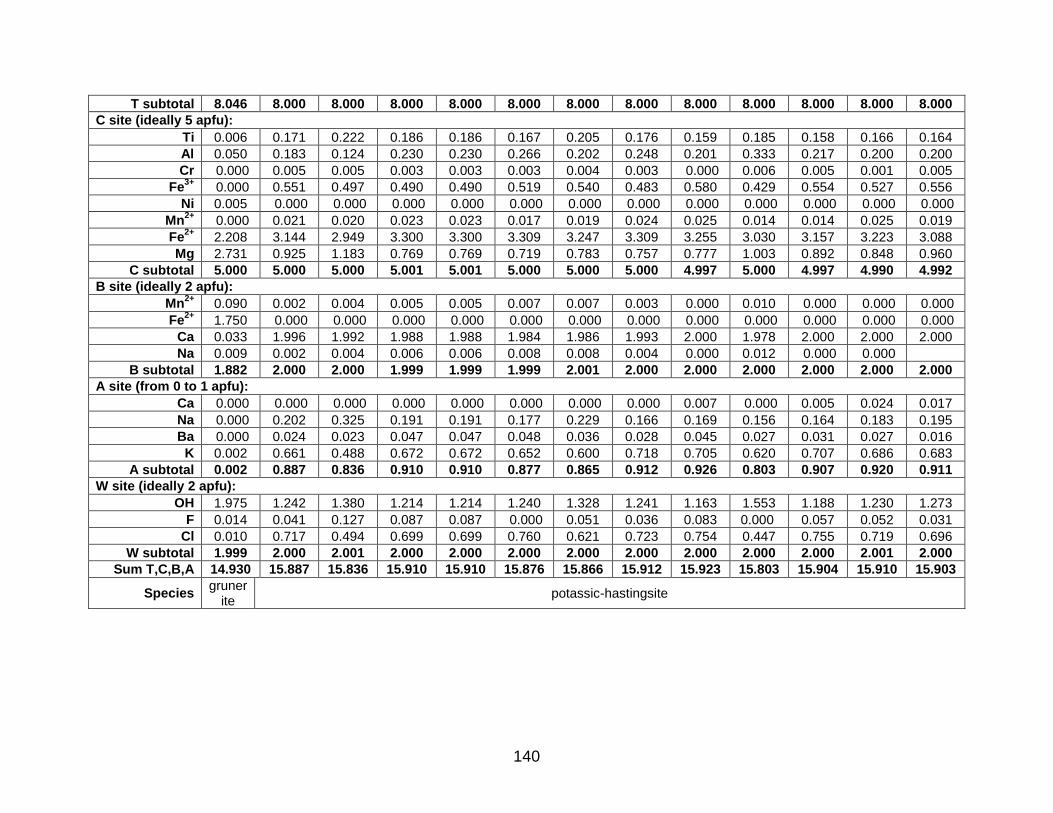
140
T subtotal 8.046 8.000 8.000 8.000 8.000 8.000 8.000 8.000 8.000 8.000 8.000 8.000 8.000
C site (ideally 5 apfu):
Ti 0.006 0.171 0.222 0.186 0.186 0.167 0.205 0.176 0.159 0.185 0.158 0.166 0.164
Al 0.050 0.183 0.124 0.230 0.230 0.266 0.202 0.248 0.201 0.333 0.217 0.200 0.200
Cr
0.000 0.005 0.005 0.003 0.003 0.003 0.004 0.003 0.000 0.006 0.005 0.001 0.005
Fe3+
0.000 0.551 0.497 0.490 0.490 0.519 0.540 0.483 0.580 0.429 0.554 0.527 0.556
Ni 0.005 0.000 0.000 0.000 0.000 0.000 0.000 0.000 0.000 0.000 0.000 0.000 0.000
Mn2+
0.000 0.021 0.020 0.023 0.023 0.017 0.019 0.024 0.025 0.014 0.014 0.025 0.019
Fe2+
2.208 3.144 2.949 3.300 3.300 3.309 3.247 3.309 3.255 3.030 3.157 3.223 3.088
Mg 2.731 0.925 1.183 0.769 0.769 0.719 0.783 0.757 0.777 1.003 0.892 0.848 0.960
C subtotal 5.000 5.000 5.000 5.001 5.001 5.000 5.000 5.000 4.997 5.000 4.997 4.990 4.992
B site (ideally 2 apfu):
Mn2+
0.090 0.002 0.004 0.005 0.005 0.007 0.007 0.003 0.000 0.010 0.000 0.000 0.000
Fe2+
1.750 0.000 0.000 0.000 0.000 0.000 0.000 0.000 0.000 0.000 0.000 0.000 0.000
Ca 0.033 1.996 1.992 1.988 1.988 1.984 1.986 1.993 2.000 1.978 2.000 2.000 2.000
Na 0.009 0.002 0.004 0.006 0.006 0.008 0.008 0.004 0.000 0.012 0.000 0.000
B subtotal 1.882 2.000 2.000 1.999 1.999 1.999 2.001 2.000 2.000 2.000 2.000 2.000 2.000
A site (from 0 to 1 apfu):
Ca 0.000 0.000 0.000 0.000 0.000 0.000 0.000 0.000 0.007 0.000 0.005 0.024 0.017
Na 0.000 0.202 0.325 0.191 0.191 0.177 0.229 0.166 0.169 0.156 0.164 0.183 0.195
Ba 0.000 0.024 0.023 0.047 0.047 0.048 0.036 0.028 0.045 0.027 0.031 0.027 0.016
K 0.002 0.661 0.488 0.672 0.672 0.652 0.600 0.718 0.705 0.620 0.707 0.686 0.683
A subtotal 0.002 0.887 0.836 0.910 0.910 0.877 0.865 0.912 0.926 0.803 0.907 0.920 0.911
W site (ideally 2 apfu):
OH 1.975 1.242 1.380 1.214 1.214 1.240 1.328 1.241 1.163 1.553 1.188 1.230 1.273
F 0.014 0.041 0.127 0.087 0.087 0.000 0.051 0.036 0.083 0.000 0.057 0.052 0.031
Cl 0.010 0.717 0.494 0.699 0.699 0.760 0.621 0.723 0.754 0.447 0.755 0.719 0.696
W subtotal 1.999 2.000 2.001 2.000 2.000 2.000 2.000 2.000 2.000 2.000 2.000 2.001 2.000
Sum T,C,B,A 14.930 15.887 15.836 15.910 15.910 15.876 15.866 15.912 15.923 15.803 15.904 15.910 15.903
Species gruner
ite potassic-hastingsite

141
Sample QC82-45 HP82-59
Analysis Type matrix matrix alt. am alt. am alt. am alt. am alt. am alt. am alt. am alt. am alt. am alt. am am
Analysis Pt. am-49 am-50 33 34 35 39 40 41 42 43 44 70 71
Wt%
SiO2 36.88 37.80 52.35 52.76 52.74 55.16 54.01 55.07 54.70 54.48 55.00 55.49 40.37
TiO2 1.34 1.44 0.00 0.00 0.04 0.03 0.03 0.02 0.05 0.06 0.06 0.07 0.52
Al2O3 11.59 11.27 0.63 0.56 0.66 0.46 0.67 0.58 0.54 0.59 0.42 0.60 14.27
Cr2O3 0.04 0.06 0.05 0.00 0.00 0.00 0.00 0.00 0.00 0.00 0.02 0.02 0.00
MnO 0.14 0.17 0.24 0.18 0.26 0.27 0.33 0.29 0.19 0.24 0.22 0.44 0.13
FeO 22.74 23.29 18.35 17.25 16.33 20.77 19.39 20.03 20.22 20.74 19.70 21.57 20.83
Fe2O3 4.57 4.18 3.24 3.04 4.31 0.50 0.42 0.00 0.00 0.00 0.00 0.00 4.67
MgO 3.97 4.11 12.66 12.21 12.72 12.11 11.87 11.81 11.37 11.44 12.18 13.14 4.95
CaO 11.60 11.76 10.43 12.33 12.17 11.68 12.13 11.47 11.25 11.65 12.25 8.23 11.48
Na2O 0.62 0.69 0.09 0.06 0.06 0.09 0.07 0.07 0.08 0.03 0.05 0.09 1.09
BaO 0.36 0.30 0.00 0.04 0.01 0.02 0.00 0.04 0.00 0.00 0.01 0.00 0.09
K2O 3.30 3.15 0.07 0.05 0.02 0.03 0.03 0.03 0.03 0.03 0.01 0.07 1.78
H2O (calc) 1.17 1.21 2.02 2.02 2.03 2.02 2.03 2.03 2.03 2.02 2.03 2.04 1.69
F 0.06 0.07 0.00 0.00 0.00 0.00 0.00 0.00 0.00 0.00 0.00 0.00 0.00
Cl 2.53 2.41 0.02 0.01 0.00 0.00 0.00 0.00 0.00 0.00 0.00 0.00 0.93
O=F,Cl (calc) -0.60 -0.57 0.00 0.00 0.00 0.00 0.00 0.00 0.00 0.00 0.00 0.00 -0.21
Total 100.31 101.34 100.14 100.51 101.34 103.13 100.97 101.43 100.47 101.27 101.95 101.78 102.59
Normalization procedure(s) used for apfu
Si–Ca&Li=15 Si–Mg&Li=13
Si–Ca&Li=15 Si–Na=15
Si–Ca&Li=15 Si–
Mg&Li=13
T site (ideally 8 apfu):
Si 5.984 6.055 7.755 7.776 7.700 7.928 7.913 8.007 8.033 7.970 7.963 8.020 6.131
Al 2.016 1.945 0.109 0.098 0.113 0.072 0.087 0.000 0.000 0.030 0.037 0.000 1.869

142
Ti 0.000 0.000 0.000 0.000 0.004 0.000 0.000 0.000 0.000 0.000 0.000 0.000 0.000
Fe3+
0.000 0.000 0.135 0.126 0.182 0.000 0.000 0.000 0.000 0.000 0.000 0.000 0.000
T subtotal 8.000 8.000 7.999 8.000 7.999 8.000 8.000 8.007 8.033 8.000 8.000 8.020 8.000
C site (ideally 5 apfu):
Ti 0.164 0.174 0.000 0.000 0.000 0.003 0.003 0.002 0.005 0.006 0.006 0.008 0.060
Al 0.200 0.182 0.000 0.000 0.000 0.006 0.029 0.099 0.094 0.072 0.035 0.102 0.685
Cr
0.005 0.008 0.006 0.000 0.000 0.000 0.000 0.000 0.000 0.000 0.002 0.003 0.000
Fe3+
0.556 0.505 0.225 0.212 0.291 0.053 0.045 0.000 0.000 0.000 0.000 0.000 0.533
Mn2+
0.019 0.023 0.000 0.000 0.000 0.000 0.000 0.000 0.000 0.000 0.000 0.000 0.000
Fe2+
3.088 3.119 1.973 2.105 1.940 2.343 2.330 2.339 2.412 2.427 2.328 2.056 2.602
Mg 0.960 0.981 2.796 2.683 2.769 2.595 2.593 2.560 2.489 2.495 2.629 2.831 1.121
C subtotal 4.992 4.992 5.000 5.000 5.000 5.000 5.000 5.000 5.000 5.000 5.000 5.000 5.001
B site (ideally 2 apfu):
Mn2+
0.000 0.000 0.030 0.022 0.032 0.033 0.041 0.035 0.024 0.029 0.027 0.054 0.017
Fe2+
0.000 0.000 0.301 0.021 0.055 0.155 0.046 0.097 0.072 0.111 0.058 0.551 0.045
Ca 2.000 2.000 1.656 1.947 1.904 1.799 1.904 1.787 1.770 1.826 1.900 1.274 1.868
Na 0.000 0.000 0.013 0.009 0.009 0.013 0.009 0.021 0.024 0.008 0.015 0.026 0.070
B subtotal 2.000 2.000 2.000 1.999 2.000 2.000 2.000 1.940 1.890 1.974 2.000 1.905 2.000
A site (from 0 to 1 apfu):
Ca 0.017 0.018 0.000 0.000 0.000 0.000 0.000 0.000 0.000 0.000 0.000 0.000 0.000
Na 0.195 0.214 0.013 0.009 0.009 0.013 0.009 0.000 0.000 0.000 0.000 0.000 0.250
Ba 0.016 0.013 0.000 0.001 0.000 0.001 0.000 0.001 0.000 0.000 0.000 0.000 0.004
K 0.683 0.644 0.014 0.009 0.003 0.005 0.006 0.005 0.006 0.006 0.002 0.013 0.345
A subtotal 0.911 0.889 0.027 0.019 0.012 0.019 0.015 0.006 0.006 0.006 0.002 0.013 0.599
W site (ideally 2 apfu):
OH 1.273 1.310 1.995 1.998 2.000 1.999 2.000 1.999 2.000 2.000 1.999 2.000 1.762
F 0.031 0.035 0.000 0.000 0.000 0.000 0.000 0.000 0.000 0.000 0.000 0.000 0.000
Cl 0.696 0.654 0.005 0.002 0.000 0.001 0.000 0.001 0.000 0.000 0.001 0.000 0.238
W subtotal 2.000 1.999 2.000 2.000 2.000 2.000 2.000 2.000 2.000 2.000 2.000 2.000 2.000
Sum T,C,B,A 15.903 15.881 15.026 15.018 15.011 15.019 15.015 14.953 14.929 14.980 15.002 14.938 15.600
Species potassic-
hastingsite actinolite
potassic-ferro-pargasi
te
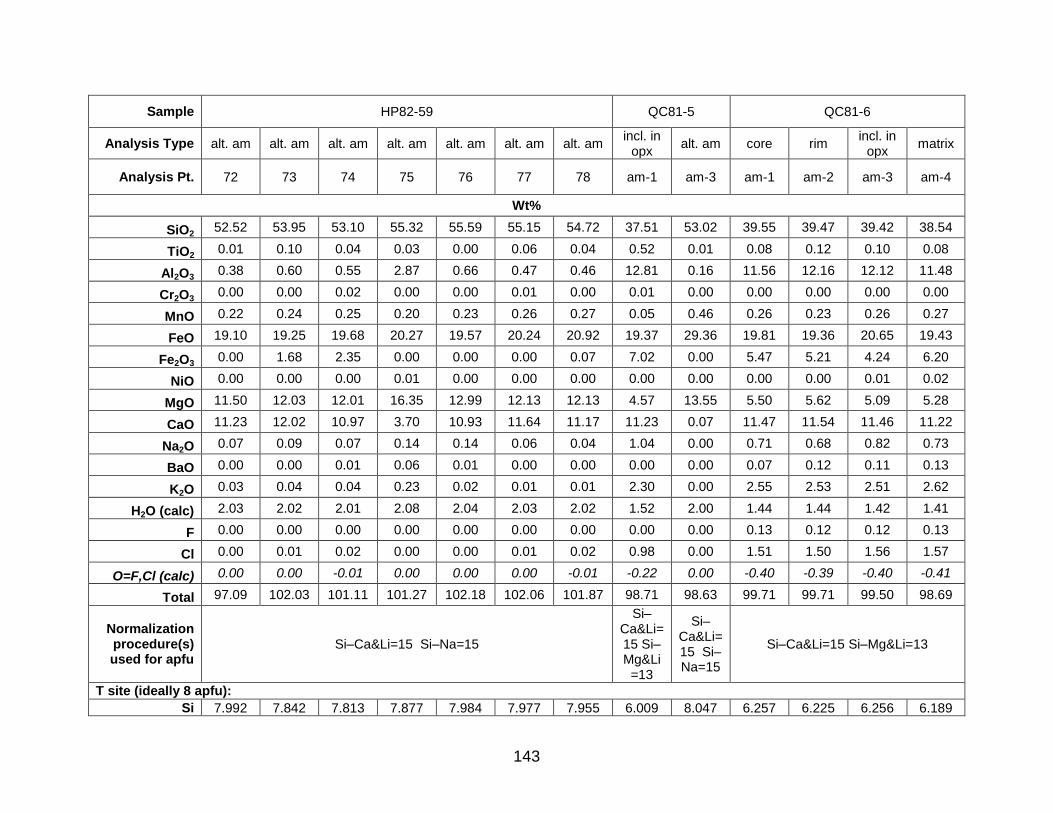
143
Sample HP82-59 QC81-5 QC81-6
Analysis Type alt. am alt. am alt. am alt. am alt. am alt. am alt. am incl. in
opx alt. am core rim
incl. in opx
matrix
Analysis Pt. 72 73 74 75 76 77 78 am-1 am-3 am-1 am-2 am-3 am-4
Wt%
SiO2 52.52 53.95 53.10 55.32 55.59 55.15 54.72 37.51 53.02 39.55 39.47 39.42 38.54
TiO2 0.01 0.10 0.04 0.03 0.00 0.06 0.04 0.52 0.01 0.08 0.12 0.10 0.08
Al2O3 0.38 0.60 0.55 2.87 0.66 0.47 0.46 12.81 0.16 11.56 12.16 12.12 11.48
Cr2O3 0.00 0.00 0.02 0.00 0.00 0.01 0.00 0.01 0.00 0.00 0.00 0.00 0.00
MnO 0.22 0.24 0.25 0.20 0.23 0.26 0.27 0.05 0.46 0.26 0.23 0.26 0.27
FeO 19.10 19.25 19.68 20.27 19.57 20.24 20.92 19.37 29.36 19.81 19.36 20.65 19.43
Fe2O3 0.00 1.68 2.35 0.00 0.00 0.00 0.07 7.02 0.00 5.47 5.21 4.24 6.20
NiO 0.00 0.00 0.00 0.01 0.00 0.00 0.00 0.00 0.00 0.00 0.00 0.01 0.02
MgO 11.50 12.03 12.01 16.35 12.99 12.13 12.13 4.57 13.55 5.50 5.62 5.09 5.28
CaO 11.23 12.02 10.97 3.70 10.93 11.64 11.17 11.23 0.07 11.47 11.54 11.46 11.22
Na2O 0.07 0.09 0.07 0.14 0.14 0.06 0.04 1.04 0.00 0.71 0.68 0.82 0.73
BaO 0.00 0.00 0.01 0.06 0.01 0.00 0.00 0.00 0.00 0.07 0.12 0.11 0.13
K2O 0.03 0.04 0.04 0.23 0.02 0.01 0.01 2.30 0.00 2.55 2.53 2.51 2.62
H2O (calc) 2.03 2.02 2.01 2.08 2.04 2.03 2.02 1.52 2.00 1.44 1.44 1.42 1.41
F 0.00 0.00 0.00 0.00 0.00 0.00 0.00 0.00 0.00 0.13 0.12 0.12 0.13
Cl 0.00 0.01 0.02 0.00 0.00 0.01 0.02 0.98 0.00 1.51 1.50 1.56 1.57
O=F,Cl (calc) 0.00 0.00 -0.01 0.00 0.00 0.00 -0.01 -0.22 0.00 -0.40 -0.39 -0.40 -0.41
Total 97.09 102.03 101.11 101.27 102.18 102.06 101.87 98.71 98.63 99.71 99.71 99.50 98.69
Normalization procedure(s) used for apfu
Si–Ca&Li=15 Si–Na=15
Si–Ca&Li=15 Si–Mg&Li
=13
Si–Ca&Li=15 Si–Na=15
Si–Ca&Li=15 Si–Mg&Li=13
T site (ideally 8 apfu):
Si 7.992 7.842 7.813 7.877 7.984 7.977 7.955 6.009 8.047 6.257 6.225 6.256 6.189

144
Al 0.008 0.103 0.096 0.123 0.016 0.023 0.045 1.991 0.000 1.743 1.775 1.744 1.811
Ti 0.000 0.010 0.005 0.000 0.000 0.000 0.000 0.000 0.000 0.000 0.000 0.000 0.000
Fe3+
0.000 0.045 0.087 0.000 0.000 0.000 0.000 0.000 0.000 0.000 0.000 0.000 0.000
T subtotal 8.000 8.000 8.001 8.000 8.000 8.000 8.000 8.000 8.047 8.000 8.000 8.000 8.000
C site (ideally 5 apfu):
Ti 0.001 0.000 0.000 0.004 0.000 0.007 0.005 0.063 0.001 0.010 0.014 0.012 0.010
Al 0.060 0.000 0.000 0.359 0.096 0.058 0.034 0.428 0.029 0.412 0.485 0.523 0.362
Cr
0.000 0.000 0.002 0.000 0.000 0.001 0.000 0.001 0.000 0.000 0.000 0.000 0.000
Fe3+
0.000 0.140 0.172 0.000 0.000 0.000 0.007 0.848 0.000 0.652 0.618 0.506 0.749
Ni 0.000 0.000 0.000 0.001 0.000 0.000 0.000 0.000 0.000 0.000 0.000 0.001 0.003
Mn2+
0.000 0.000 0.000 0.000 0.000 0.000 0.000 0.000 0.000 0.009 0.008 0.011 0.005
Fe2+
2.331 2.253 2.191 1.166 2.123 2.318 2.326 2.568 1.905 2.620 2.554 2.742 2.609
Mg 2.609 2.607 2.634 3.470 2.781 2.616 2.629 1.091 3.066 1.297 1.321 1.204 1.264
C subtotal 5.001 5.000 4.999 5.000 5.000 5.000 5.001 4.999 5.001 5.000 5.000 4.999 5.002
B site (ideally 2 apfu):
Mn2+
0.029 0.029 0.031 0.024 0.028 0.031 0.033 0.007 0.059 0.026 0.023 0.024 0.032
Fe2+
0.100 0.086 0.230 1.248 0.228 0.130 0.218 0.026 1.822 0.000 0.000 0.000 0.000
Ca 1.831 1.872 1.729 0.564 1.682 1.804 1.740 1.928 0.011 1.944 1.950 1.949 1.931
Na 0.021 0.013 0.010 0.038 0.039 0.017 0.009 0.040 0.000 0.030 0.027 0.028 0.037
B subtotal 1.981 2.000 2.000 1.874 1.977 1.982 2.000 2.001 1.892 2.000 2.000 2.001 2.000
A site (from 0 to 1 apfu):
Na 0.000 0.013 0.010 0.000 0.000 0.000 0.002 0.283 0.000 0.188 0.181 0.225 0.190
Ba 0.000 0.000 0.000 0.002 0.000 0.000 0.000 0.000 0.000 0.003 0.005 0.005 0.006
K 0.006 0.008 0.007 0.042 0.004 0.001 0.002 0.470 0.000 0.515 0.509 0.508 0.537
A subtotal 0.006 0.021 0.017 0.044 0.004 0.001 0.004 0.753 0.000 0.706 0.695 0.738 0.733
W site (ideally 2 apfu):
OH 1.999 1.997 1.994 2.000 2.000 1.999 1.994 1.608 1.998 1.511 1.511 1.496 1.487
F 0.000 0.000 0.000 0.000 0.000 0.000 0.000 0.000 0.000 0.065 0.060 0.060 0.066
Cl 0.001 0.003 0.006 0.000 0.000 0.001 0.006 0.266 0.000 0.405 0.401 0.420 0.427
O 0.000 0.000 0.000 0.000 0.000 0.000 0.000 0.126 0.002 0.019 0.029 0.024 0.019
W subtotal 2.000 2.000 2.000 2.000 2.000 2.000 2.000 2.000 2.000 2.000 2.001 2.000 1.999
Sum T,C,B,A 14.988 15.021 15.017 14.918 14.981 14.983 15.005 15.753 14.940 15.706 15.695 15.738 15.735
Species actinolite cummingtonit
e actinolite
potassic-
hastingsite
grunerite
potassic-hastingsite
potassic-ferro-pargasi
te
potassic-
hastingsite
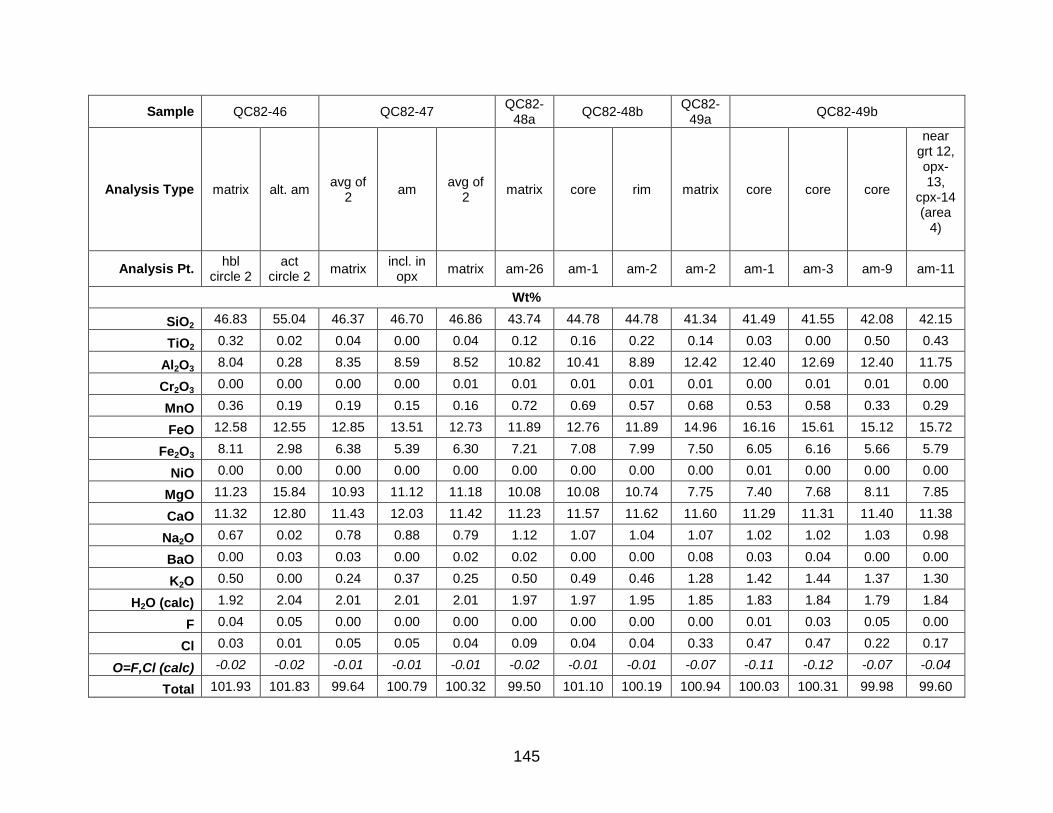
145
Sample QC82-46 QC82-47 QC82-
48a QC82-48b
QC82-49a
QC82-49b
Analysis Type matrix alt. am avg of
2 am
avg of 2
matrix core rim matrix core core core
near grt 12, opx-13,
cpx-14 (area
4)
Analysis Pt. hbl
circle 2 act
circle 2 matrix
incl. in opx
matrix am-26 am-1 am-2 am-2 am-1 am-3 am-9 am-11
Wt%
SiO2 46.83 55.04 46.37 46.70 46.86 43.74 44.78 44.78 41.34 41.49 41.55 42.08 42.15
TiO2 0.32 0.02 0.04 0.00 0.04 0.12 0.16 0.22 0.14 0.03 0.00 0.50 0.43
Al2O3 8.04 0.28 8.35 8.59 8.52 10.82 10.41 8.89 12.42 12.40 12.69 12.40 11.75
Cr2O3 0.00 0.00 0.00 0.00 0.01 0.01 0.01 0.01 0.01 0.00 0.01 0.01 0.00
MnO 0.36 0.19 0.19 0.15 0.16 0.72 0.69 0.57 0.68 0.53 0.58 0.33 0.29
FeO 12.58 12.55 12.85 13.51 12.73 11.89 12.76 11.89 14.96 16.16 15.61 15.12 15.72
Fe2O3 8.11 2.98 6.38 5.39 6.30 7.21 7.08 7.99 7.50 6.05 6.16 5.66 5.79
NiO 0.00 0.00 0.00 0.00 0.00 0.00 0.00 0.00 0.00 0.01 0.00 0.00 0.00
MgO 11.23 15.84 10.93 11.12 11.18 10.08 10.08 10.74 7.75 7.40 7.68 8.11 7.85
CaO 11.32 12.80 11.43 12.03 11.42 11.23 11.57 11.62 11.60 11.29 11.31 11.40 11.38
Na2O 0.67 0.02 0.78 0.88 0.79 1.12 1.07 1.04 1.07 1.02 1.02 1.03 0.98
BaO 0.00 0.03 0.03 0.00 0.02 0.02 0.00 0.00 0.08 0.03 0.04 0.00 0.00
K2O 0.50 0.00 0.24 0.37 0.25 0.50 0.49 0.46 1.28 1.42 1.44 1.37 1.30
H2O (calc) 1.92 2.04 2.01 2.01 2.01 1.97 1.97 1.95 1.85 1.83 1.84 1.79 1.84
F 0.04 0.05 0.00 0.00 0.00 0.00 0.00 0.00 0.00 0.01 0.03 0.05 0.00
Cl 0.03 0.01 0.05 0.05 0.04 0.09 0.04 0.04 0.33 0.47 0.47 0.22 0.17
O=F,Cl (calc) -0.02 -0.02 -0.01 -0.01 -0.01 -0.02 -0.01 -0.01 -0.07 -0.11 -0.12 -0.07 -0.04
Total 101.93 101.83 99.64 100.79 100.32 99.50 101.10 100.19 100.94 100.03 100.31 99.98 99.60

146
Normalization procedure(s) used for apfu
Si–Ca&Li=15 Si–Na=15
Si–Ca&Li=15 Si–Mg&Li=13
T site (ideally 8 apfu):
Si 6.820 7.816 6.876 6.857 6.884 6.538 6.597 6.659 6.249 6.330 6.307 6.370 6.420
Al 1.180 0.047 1.124 1.143 1.116 1.462 1.403 1.341 1.751 1.670 1.693 1.630 1.580
Ti 0.000 0.002 0.000 0.000 0.000 0.000 0.000 0.000 0.000 0.000 0.000 0.000 0.000
Fe3+
0.000 0.135 0.000 0.000 0.000 0.000 0.000 0.000 0.000 0.000 0.000 0.000 0.000
T subtotal 8.000 8.000 8.000 8.000 8.000 8.000 8.000 8.000 8.000 8.000 8.000 8.000 8.000
C site (ideally 5 apfu):
Ti 0.035 0.000 0.004 0.000 0.004 0.013 0.018 0.025 0.016 0.003 0.000 0.057 0.049
Al 0.200 0.000 0.336 0.343 0.360 0.444 0.405 0.217 0.461 0.560 0.577 0.582 0.530
Cr
0.000 0.000 0.000 0.000 0.001 0.001 0.001 0.001 0.001 0.000 0.001 0.001 0.000
Fe3+
0.888 0.184 0.712 0.595 0.697 0.810 0.785 0.895 0.852 0.694 0.704 0.645 0.664
Ni 0.000 0.000 0.000 0.000 0.000 0.000 0.000 0.000 0.000 0.000 0.000 0.000 0.000
Mn2+
0.000 0.000 0.000 0.000 0.000 0.000 0.005 0.003 0.031 0.000 0.000 0.000 0.000
Fe2+
1.439 1.463 1.532 1.628 1.489 1.485 1.572 1.478 1.892 2.058 1.980 1.885 1.974
Mg 2.438 3.353 2.416 2.434 2.449 2.246 2.214 2.381 1.746 1.683 1.738 1.829 1.782
C subtotal 5.000 5.000 5.000 5.000 5.000 4.999 5.000 5.000 4.999 4.999 5.000 4.999 4.999
B site (ideally 2 apfu):
Mn2+
0.044 0.023 0.024 0.019 0.020 0.091 0.081 0.069 0.056 0.068 0.075 0.042 0.037
Fe2+
0.094 0.027 0.062 0.031 0.075 0.003 0.000 0.000 0.000 0.004 0.000 0.028 0.028
Ca 1.766 1.948 1.816 1.892 1.798 1.799 1.826 1.851 1.879 1.846 1.839 1.848 1.857
Na 0.095 0.003 0.098 0.057 0.108 0.108 0.093 0.080 0.065 0.082 0.086 0.082 0.078
B subtotal 1.999 2.001 2.000 1.999 2.001 2.001 2.000 2.000 2.000 2.000 2.000 2.000 2.000
A site (from 0 to 1 apfu):
Na 0.094 0.003 0.126 0.193 0.117 0.217 0.213 0.220 0.248 0.219 0.215 0.219 0.210
Ba 0.000 0.001 0.001 0.000 0.001 0.001 0.000 0.000 0.003 0.001 0.002 0.000 0.000
K 0.093 0.000 0.045 0.069 0.047 0.095 0.092 0.087 0.247 0.276 0.279 0.265 0.253
A subtotal 0.187 0.004 0.172 0.262 0.165 0.313 0.305 0.307 0.498 0.496 0.496 0.484 0.463
W site (ideally 2 apfu):
OH 1.904 1.971 1.978 1.988 1.981 1.950 1.954 1.941 1.884 1.867 1.865 1.806 1.858
F 0.018 0.022 0.000 0.000 0.000 0.000 0.000 0.000 0.000 0.005 0.014 0.023 0.000
Cl 0.007 0.002 0.013 0.012 0.010 0.023 0.010 0.010 0.085 0.122 0.121 0.056 0.043
O 0.070 0.004 0.009 0.000 0.009 0.027 0.036 0.049 0.032 0.007 0.000 0.115 0.098
W subtotal 1.999 1.999 2.000 2.000 2.000 2.000 2.000 2.000 2.001 2.001 2.000 2.000 1.999
Sum T,C,B,A 15.186 15.005 15.172 15.261 15.166 15.313 15.305 15.307 15.497 15.495 15.496 15.483 15.462

147
Species
magnesio-ferri-
hornblende
actinolite
magnesio-ferri-hornblende hasting
site ferro-ferri-hornblende
Sample QC-JW QC81-45
Analysis Type matrix am am Alt. am matrix matrix matrix am incl. in
opx core rim core
Analysis Pt. am-7 am-1 am-2 am-2 am-3 am-4 am-6 am-3 am in opx
am-1 am-2 am-3
Wt%
SiO2 41.08 40.96 41.43 52.37 41.42 41.06 41.16 41.25 40.05 39.45 39.14 39.42
TiO2 0.00 0.04 0.02 0.00 0.00 0.01 0.03 0.01 0.08 0.08 0.05 0.10
Al2O3 12.62 12.12 12.25 1.45 11.58 12.09 12.61 11.94 12.14 11.50 11.54 11.54
Cr2O3 0.00 0.00 0.00 0.02 0.00 0.01 0.01 0.00 0.08 0.00 0.00 0.00
MnO 0.67 0.48 0.47 0.78 0.71 0.62 0.68 0.54 0.46 0.35 0.36 0.40
FeO 17.30 16.57 17.48 15.74 17.37 17.06 17.01 16.92 19.28 18.89 19.06 18.64
Fe2O3 6.34 6.30 5.35 3.02 6.64 6.91 6.89 6.57 6.55 6.74 6.08 6.47
NiO 0.00 0.00 0.00 0.04 0.00 0.06 0.01 0.01 0.00 0.01 0.01 0.03
MgO 6.40 6.90 6.71 12.95 6.32 6.36 6.40 6.81 5.49 5.74 5.53 5.91
CaO 11.29 11.55 11.63 11.57 10.94 10.92 11.36 11.43 11.46 11.46 11.39 11.38
Na2O 1.06 0.87 0.93 0.07 1.01 1.05 1.00 0.90 0.74 0.77 0.71 0.77
BaO 0.04 0.00 0.03 0.00 0.03 0.03 0.04 0.06 0.09 0.14 0.11 0.14
K2O 1.23 1.37 1.31 0.05 0.99 1.10 1.16 1.37 2.31 2.36 2.38 2.50
H2O (calc) 1.64 1.66 1.65 2.02 1.61 1.66 1.64 1.67 1.38 1.40 1.40 1.38
F 0.07 0.06 0.05 0.00 0.02 0.01 0.03 0.06 0.12 0.14 0.10 0.13
Cl 1.10 1.00 1.07 0.06 1.27 1.09 1.13 0.99 1.81 1.64 1.71 1.72

148
O=F,Cl (calc) -0.28 -0.25 -0.26 -0.01 -0.30 -0.25 -0.27 -0.25 -0.46 -0.43 -0.43 -0.44
Total 100.56 99.62 100.10 100.13 99.61 99.78 100.88 100.28 101.58 100.24 99.14
100.09
Normalization procedure(s) used for apfu
Si–Ca&Li=15 Si–Mg&Li=13
Si–Ca&Li=15 Si–Na=15
Si–Ca&Li=15 Si–Mg&Li=13
T site (ideally 8 apfu):
Si 6.294 6.317 6.361 7.702 6.407 6.336 6.283 6.333 6.212 6.209 6.229 6.212
Al 1.706 1.683 1.639 0.252 1.593 1.664 1.717 1.667 1.788 1.791 1.771 1.788
Fe3+
0.000 0.000 0.000 0.046 0.000 0.000 0.000 0.000 0.000 0.000 0.000 0.000
T subtotal 8.000 8.000 8.000 8.000 8.000 8.000 8.000 8.000 8.000 8.000 8.000 8.000
C site (ideally 5 apfu):
Ti 0.000 0.004 0.002 0.000 0.000 0.001 0.004 0.001 0.009 0.009 0.006 0.012
Al 0.573 0.520 0.579 0.000 0.519 0.535 0.552 0.493 0.431 0.343 0.394 0.355
Cr
0.000 0.000 0.000 0.002 0.000 0.001 0.001 0.000 0.010 0.000 0.000 0.000
Fe3+
0.731 0.731 0.617 0.287 0.773 0.801 0.790 0.761 0.763 0.800 0.727 0.767
Ni 0.000 0.000 0.000 0.005 0.000 0.007 0.002 0.002 0.000 0.001 0.001 0.004
Mn2+
0.018 0.020 0.020 0.000 0.006 0.000 0.021 0.014 0.016 0.015 0.022 0.017
Fe2+
2.216 2.139 2.246 1.867 2.247 2.193 2.173 2.172 2.501 2.485 2.538 2.456
Mg 1.462 1.586 1.536 2.838 1.456 1.462 1.457 1.557 1.269 1.347 1.312 1.388
C subtotal 5.000 5.000 5.000 4.999 5.001 5.000 5.000 5.000 4.999 5.000 5.000 4.999
B site (ideally 2 apfu):
Mn2+
0.068 0.042 0.040 0.097 0.088 0.081 0.066 0.056 0.044 0.031 0.027 0.036
Fe2+
0.000 0.000 0.000 0.070 0.000 0.010 0.000 0.000 0.000 0.000 0.000 0.000
Ca 1.853 1.909 1.913 1.823 1.812 1.806 1.858 1.880 1.904 1.933 1.942 1.921
Na 0.078 0.049 0.046 0.010 0.100 0.103 0.076 0.064 0.051 0.036 0.031 0.042
B subtotal 1.999 2.000 1.999 2.000 2.000 2.000 2.000 2.000 1.999 2.000 2.000 1.999
A site (from 0 to 1 apfu):
Na 0.237 0.210 0.230 0.010 0.204 0.211 0.221 0.204 0.171 0.199 0.188 0.193
Ba 0.002 0.000 0.001 0.000 0.001 0.001 0.002 0.002 0.004 0.006 0.005 0.006
K 0.240 0.270 0.256 0.009 0.195 0.217 0.225 0.269 0.457 0.474 0.483 0.503
A subtotal 0.479 0.480 0.487 0.019 0.400 0.429 0.448 0.475 0.632 0.679 0.676 0.702
W site (ideally 2 apfu):
OH 1.680 1.699 1.696 1.984 1.657 1.705 1.685 1.711 1.447 1.474 1.476 1.452
F 0.034 0.031 0.022 0.000 0.011 0.007 0.014 0.030 0.059 0.070 0.050 0.065
Cl 0.286 0.261 0.278 0.016 0.333 0.286 0.293 0.258 0.476 0.438 0.461 0.459

149
O 0.000 0.009 0.004 0.000 0.000 0.002 0.007 0.002 0.019 0.019 0.012 0.024
W subtotal 2.000 2.000 2.000 2.000 2.001 2.000 1.999 2.001 2.001 2.001 1.999 2.000
Sum T,C,B,A 15.478 15.480 15.486 15.018 15.401 15.429 15.448 15.475 15.630 15.679 15.676 15.700
Species ferro-ferri-hornblende actinolite ferro-ferri-hornblende potassic-hastingsite
Sample HR02-71
Analysis Type matrix alt. am matrix alt. am
Analysis Pt. am-1 am-2 am-1 am-2
Wt%
SiO2 43.82 51.82 45.57 52.89
TiO2 0.22 0.00 0.23 0.00
Al2O3 8.07 0.25 8.39 0.26
Cr2O3 0.05 0.00 0.05 0.00
MnO 0.52 2.82 0.54 2.87
FeO 17.49 32.25 18.59 32.91
Fe2O3 6.17 0.00 5.97 0.00
MgO 7.56 9.99 7.86 10.20
CaO 11.12 0.73 11.56 0.74
Na2O 0.88 0.06 0.91 0.06
BaO 0.03 0.04 0.03 0.04
K2O 0.76 0.00 0.79 0.00
H2O (calc) 1.89 1.94 1.94 1.94
Cl 0.10 0.02 0.11 0.02
O=F,Cl (calc) -0.02 0.00 -0.02 0.00
Total 98.66 99.92 102.52 101.93
Normalization Si–Ca&Li=15 Si– Si–Ca&Li=15 Si– Si–Ca&Li=15 Si– Si–Ca&Li=15 Si–

150
procedure(s) used for apfu
Mg&Li=13 Na=15 Mg&Li=13 Na=15
T site (ideally 8 apfu):
Si 6.778 7.989 6.779 7.989
Al 1.222 0.011 1.221 0.011
T subtotal 8.000 8.000 8.000 8.000
C site (ideally 5 apfu):
Ti 0.026 0.000 0.026 0.000
Al 0.249 0.035 0.250 0.035
Cr
0.006 0.000 0.006 0.000
Fe3+
0.719 0.000 0.667 0.000
Fe2+
2.257 2.669 2.309 2.668
Mg 1.743 2.296 1.743 2.297
C subtotal 5.000 5.000 5.001 5.000
B site (ideally 2 apfu):
Mn2+
0.068 0.368 0.068 0.367
Fe2+
0.005 1.489 0.005 1.489
Ca 1.843 0.121 1.843 0.120
Na 0.084 0.018 0.084 0.019
B subtotal 2.000 1.996 2.000 1.995
A site (from 0 to 1 apfu):
Na 0.180 0.000 0.179 0.000
Ba 0.001 0.002 0.001 0.001
K 0.150 0.000 0.150 0.000
A subtotal 0.331 0.002 0.330 0.001
W site (ideally 2 apfu):
OH 1.922 1.995 1.973 1.995
Cl 0.026 0.005 0.027 0.005
O 0.051 0.000 0.000 0.000
W subtotal 1.999 2.000 2.000 2.000
Sum T,C,B,A 15.331 14.998 15.331 14.996
Species ferro-ferri-
hornblende grunerite
ferro-ferri-hornblende
grunerite
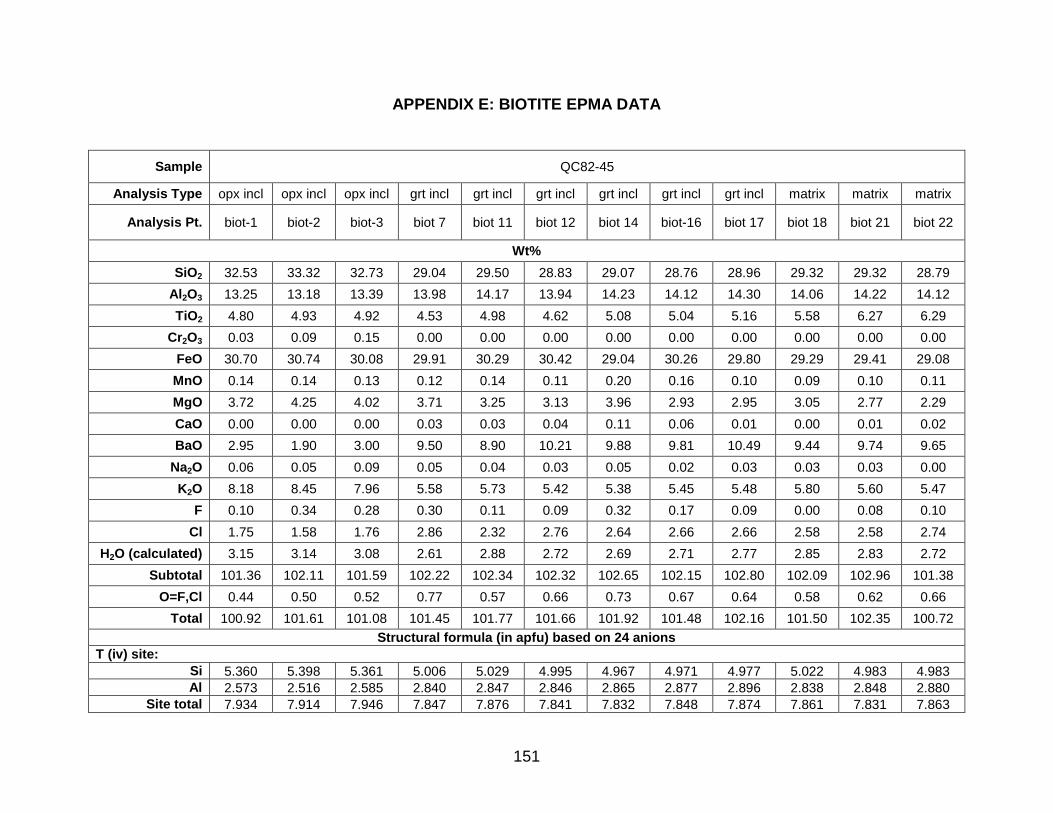
151
APPENDIX E: BIOTITE EPMA DATA
Sample QC82-45
Analysis Type opx incl opx incl opx incl grt incl grt incl grt incl grt incl grt incl grt incl matrix matrix matrix
Analysis Pt. biot-1 biot-2 biot-3 biot 7 biot 11 biot 12 biot 14 biot-16 biot 17 biot 18 biot 21 biot 22
Wt%
SiO2 32.53 33.32 32.73 29.04 29.50 28.83 29.07 28.76 28.96 29.32 29.32 28.79
Al2O3 13.25 13.18 13.39 13.98 14.17 13.94 14.23 14.12 14.30 14.06 14.22 14.12
TiO2 4.80 4.93 4.92 4.53 4.98 4.62 5.08 5.04 5.16 5.58 6.27 6.29
Cr2O3 0.03 0.09 0.15 0.00 0.00 0.00 0.00 0.00 0.00 0.00 0.00 0.00
FeO 30.70 30.74 30.08 29.91 30.29 30.42 29.04 30.26 29.80 29.29 29.41 29.08
MnO 0.14 0.14 0.13 0.12 0.14 0.11 0.20 0.16 0.10 0.09 0.10 0.11
MgO 3.72 4.25 4.02 3.71 3.25 3.13 3.96 2.93 2.95 3.05 2.77 2.29
CaO 0.00 0.00 0.00 0.03 0.03 0.04 0.11 0.06 0.01 0.00 0.01 0.02
BaO 2.95 1.90 3.00 9.50 8.90 10.21 9.88 9.81 10.49 9.44 9.74 9.65
Na2O 0.06 0.05 0.09 0.05 0.04 0.03 0.05 0.02 0.03 0.03 0.03 0.00
K2O 8.18 8.45 7.96 5.58 5.73 5.42 5.38 5.45 5.48 5.80 5.60 5.47
F 0.10 0.34 0.28 0.30 0.11 0.09 0.32 0.17 0.09 0.00 0.08 0.10
Cl 1.75 1.58 1.76 2.86 2.32 2.76 2.64 2.66 2.66 2.58 2.58 2.74
H2O (calculated) 3.15 3.14 3.08 2.61 2.88 2.72 2.69 2.71 2.77 2.85 2.83 2.72
Subtotal 101.36 102.11 101.59 102.22 102.34 102.32 102.65 102.15 102.80 102.09 102.96 101.38
O=F,Cl 0.44 0.50 0.52 0.77 0.57 0.66 0.73 0.67 0.64 0.58 0.62 0.66
Total 100.92 101.61 101.08 101.45 101.77 101.66 101.92 101.48 102.16 101.50 102.35 100.72
Structural formula (in apfu) based on 24 anions
T (iv) site:
Si 5.360 5.398 5.361 5.006 5.029 4.995 4.967 4.971 4.977 5.022 4.983 4.983
Al 2.573 2.516 2.585 2.840 2.847 2.846 2.865 2.877 2.896 2.838 2.848 2.880
Site total 7.934 7.914 7.946 7.847 7.876 7.841 7.832 7.848 7.874 7.861 7.831 7.863
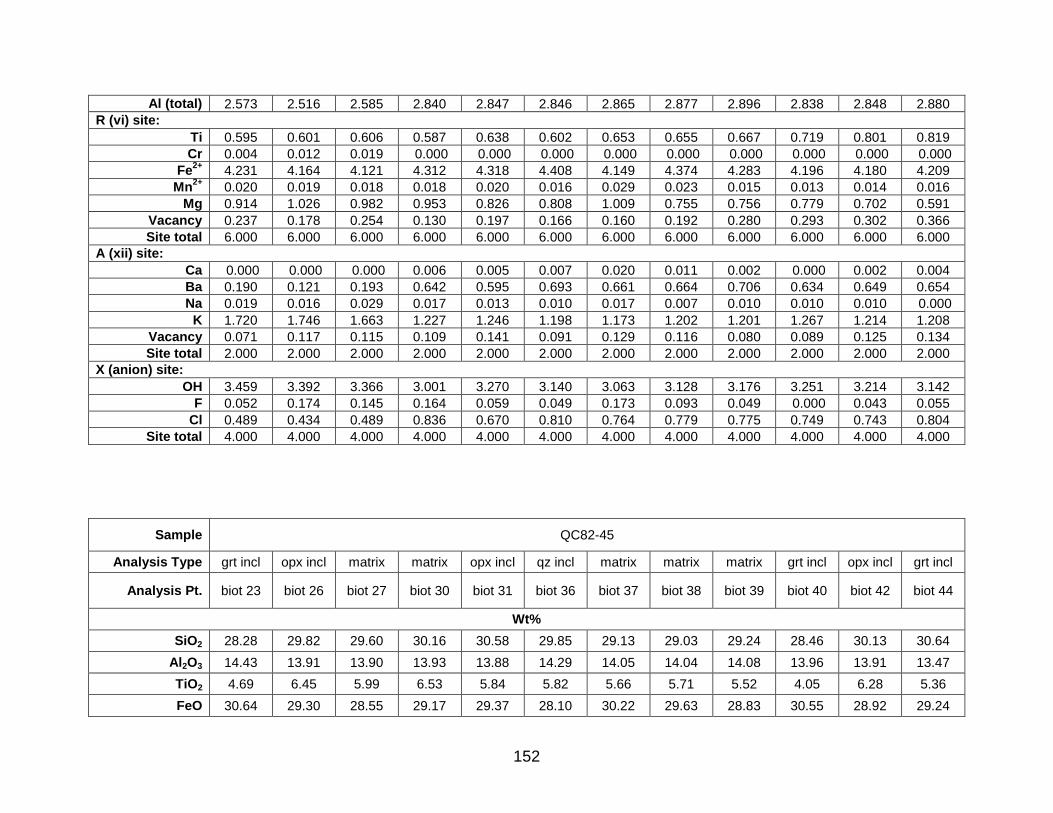
152
Al (total) 2.573 2.516 2.585 2.840 2.847 2.846 2.865 2.877 2.896 2.838 2.848 2.880
R (vi) site:
Ti 0.595 0.601 0.606 0.587 0.638 0.602 0.653 0.655 0.667 0.719 0.801 0.819
Cr 0.004 0.012 0.019 0.000 0.000 0.000 0.000 0.000 0.000 0.000 0.000 0.000
Fe2+
4.231 4.164 4.121 4.312 4.318 4.408 4.149 4.374 4.283 4.196 4.180 4.209
Mn2+
0.020 0.019 0.018 0.018 0.020 0.016 0.029 0.023 0.015 0.013 0.014 0.016
Mg 0.914 1.026 0.982 0.953 0.826 0.808 1.009 0.755 0.756 0.779 0.702 0.591
Vacancy 0.237 0.178 0.254 0.130 0.197 0.166 0.160 0.192 0.280 0.293 0.302 0.366
Site total 6.000 6.000 6.000 6.000 6.000 6.000 6.000 6.000 6.000 6.000 6.000 6.000
A (xii) site:
Ca 0.000 0.000 0.000 0.006 0.005 0.007 0.020 0.011 0.002 0.000 0.002 0.004
Ba 0.190 0.121 0.193 0.642 0.595 0.693 0.661 0.664 0.706 0.634 0.649 0.654
Na 0.019 0.016 0.029 0.017 0.013 0.010 0.017 0.007 0.010 0.010 0.010 0.000
K 1.720 1.746 1.663 1.227 1.246 1.198 1.173 1.202 1.201 1.267 1.214 1.208
Vacancy 0.071 0.117 0.115 0.109 0.141 0.091 0.129 0.116 0.080 0.089 0.125 0.134
Site total 2.000 2.000 2.000 2.000 2.000 2.000 2.000 2.000 2.000 2.000 2.000 2.000
X (anion) site:
OH 3.459 3.392 3.366 3.001 3.270 3.140 3.063 3.128 3.176 3.251 3.214 3.142
F 0.052 0.174 0.145 0.164 0.059 0.049 0.173 0.093 0.049 0.000 0.043 0.055
Cl 0.489 0.434 0.489 0.836 0.670 0.810 0.764 0.779 0.775 0.749 0.743 0.804
Site total 4.000 4.000 4.000 4.000 4.000 4.000 4.000 4.000 4.000 4.000 4.000 4.000
Sample QC82-45
Analysis Type grt incl opx incl matrix matrix opx incl qz incl matrix matrix matrix grt incl opx incl grt incl
Analysis Pt. biot 23 biot 26 biot 27 biot 30 biot 31 biot 36 biot 37 biot 38 biot 39 biot 40 biot 42 biot 44
Wt%
SiO2 28.28 29.82 29.60 30.16 30.58 29.85 29.13 29.03 29.24 28.46 30.13 30.64
Al2O3 14.43 13.91 13.90 13.93 13.88 14.29 14.05 14.04 14.08 13.96 13.91 13.47
TiO2 4.69 6.45 5.99 6.53 5.84 5.82 5.66 5.71 5.52 4.05 6.28 5.36
FeO 30.64 29.30 28.55 29.17 29.37 28.10 30.22 29.63 28.83 30.55 28.92 29.24

153
MnO 0.11 0.09 0.10 0.11 0.10 0.14 0.10 0.09 0.10 0.16 0.11 0.08
MgO 2.54 3.10 3.23 3.10 3.96 3.65 2.80 3.01 3.54 2.93 3.26 3.88
NiO 0.00 0.00 0.00 0.06 0.00 0.06 0.03 0.00 0.00 0.00 0.00 0.00
CaO 0.03 0.01 0.01 0.01 0.01 0.01 0.02 0.01 0.02 0.04 0.01 0.03
BaO 10.52 8.38 8.56 7.64 7.25 8.44 9.44 9.88 9.38 10.27 7.30 6.84
Na2O 0.04 0.04 0.07 0.05 0.05 0.05 0.03 0.05 0.04 0.03 0.03 0.03
K2O 5.10 6.58 6.29 6.81 6.93 6.18 6.07 5.93 5.98 5.63 6.85 7.15
F 0.00 0.00 0.08 0.16 0.07 0.17 0.19 0.09 0.12 0.06 0.00 0.12
Cl 2.85 2.58 2.59 2.54 2.26 1.98 2.51 2.49 2.52 3.39 2.25 2.10
H2O (calculated) 2.71 2.91 2.82 2.86 3.00 2.96 2.78 2.83 2.81 2.53 2.99 2.97
Subtotal 101.94 103.17 101.79 103.13 103.30 101.70 103.03 102.79 102.18 102.06 102.04 101.91
O=F,Cl 0.64 0.58 0.62 0.64 0.54 0.52 0.65 0.60 0.62 0.79 0.51 0.52
Total 101.30 102.58 101.17 102.49 102.76 101.19 102.39 102.19 101.56 101.27 101.53 101.39
Structural formula (in apfu) based on 24 anions
T (iv) site:
Si 4.935 5.021 5.048 5.053 5.083 5.046 4.976 4.969 4.998 4.992 5.071 5.155
Al 2.968 2.760 2.794 2.750 2.719 2.847 2.829 2.832 2.837 2.886 2.759 2.671
Site total 7.903 7.781 7.842 7.803 7.802 7.894 7.805 7.802 7.835 7.878 7.831 7.826
Al (total) 2.968 2.760 2.794 2.750 2.719 2.847 2.829 2.832 2.837 2.886 2.759 2.671
R (vi) site:
Ti 0.615 0.817 0.768 0.823 0.730 0.740 0.727 0.735 0.710 0.534 0.795 0.678
Fe2+
4.471 4.126 4.072 4.087 4.083 3.973 4.317 4.242 4.122 4.481 4.071 4.114
Mn2+
0.016 0.013 0.014 0.016 0.014 0.020 0.014 0.013 0.014 0.024 0.016 0.011
Mg 0.661 0.778 0.821 0.774 0.981 0.920 0.713 0.768 0.902 0.766 0.818 0.973
Ni 0.000 0.000 0.000 0.008 0.000 0.008 0.004 0.000 0.000 0.000 0.000 0.000
Vacancy 0.236 0.267 0.324 0.293 0.192 0.339 0.224 0.242 0.252 0.195 0.301 0.223
Site total 6.000 6.000 6.000 6.000 6.000 6.000 6.000 6.000 6.000 6.000 6.000 6.000
A (xii) site:
Ca 0.006 0.002 0.002 0.002 0.002 0.002 0.004 0.002 0.004 0.008 0.002 0.005
Ba 0.719 0.553 0.572 0.502 0.472 0.559 0.632 0.663 0.628 0.706 0.481 0.451
Na 0.014 0.013 0.023 0.016 0.016 0.016 0.010 0.017 0.013 0.010 0.010 0.010
K 1.135 1.413 1.368 1.455 1.470 1.333 1.323 1.295 1.304 1.260 1.471 1.535
Vacancy 0.126 0.019 0.035 0.025 0.040 0.090 0.032 0.024 0.051 0.017 0.036 0.000

154
Site total 2.000 2.000 2.000 2.000 2.000 2.000 2.000 2.000 2.000 2.000 2.000 2.001
X (anion) site:
OH 3.157 3.264 3.208 3.194 3.327 3.342 3.171 3.229 3.205 2.959 3.358 3.337
F 0.000 0.000 0.043 0.085 0.037 0.091 0.103 0.049 0.065 0.033 0.000 0.064
Cl 0.843 0.736 0.749 0.721 0.637 0.567 0.727 0.722 0.730 1.008 0.642 0.599
Site total 4.000 4.000 4.000 4.000 4.000 4.000 4.000 4.000 4.000 4.000 4.000 4.000
Sample QC82-45
Analysis Type by amph matrix opx incl opx incl opx incl matrix matrix matrix matrix matrix matrix
Analysis Pt. biot 45 biot 48 biot 1 biot 2 biot 3 biot 4 biot 5 biot 6 biot 19 biot 20 biot 21
Wt%
SiO2 30.15 30.14 29.80 29.69 29.94 29.98 29.88 29.72 29.84 29.75 29.52
Al2O3 13.68 13.79 13.31 13.24 13.36 13.40 13.42 13.37 13.63 13.66 13.72
TiO2 4.93 5.50 6.83 6.85 6.88 6.33 6.36 6.51 6.23 6.24 6.29
Cr2O3 0.00 0.00 0.00 0.00 0.00 0.01 0.04 0.01 0.07 0.11 0.12
FeO 29.71 29.16 29.15 29.08 29.00 29.18 29.44 29.21 28.45 28.26 28.48
MnO 0.08 0.05 0.08 0.12 0.09 0.07 0.07 0.07 0.08 0.06 0.07
MgO 3.25 3.59 2.96 2.90 2.87 2.95 3.02 2.95 3.21 3.17 3.13
NiO 0.00 0.00 0.03 0.02 0.04 0.04 0.05 0.02 0.06 0.03 0.00
CaO 0.04 0.01 0.00 0.00 0.00 0.00 0.00 0.02 0.00 0.00 0.00
BaO 7.61 7.73 8.40 8.20 8.46 8.59 8.60 8.54 8.49 8.55 8.66
Na2O 0.03 0.04 0.06 0.03 0.05 0.05 0.04 0.03 0.04 0.08 0.07
K2O 6.70 6.74 6.52 6.40 6.35 6.28 6.13 6.29 6.18 6.17 6.30
F 0.12 0.13 0.09 0.03 0.07 0.03 0.07 0.06 0.04 0.07 0.07
Cl 2.63 2.38 2.51 2.46 2.51 2.44 2.53 2.44 2.52 2.52 2.51
H2O (calculated) 2.79 2.88 2.86 2.88 2.87 2.90 2.86 2.87 2.86 2.84 2.84

155
Subtotal 101.72 102.14 102.60 101.90 102.49 102.25 102.51 102.11 101.70 101.51 101.78
O=F,Cl 0.64 0.59 0.60 0.57 0.60 0.56 0.60 0.58 0.59 0.60 0.60
Total 101.08 101.55 101.99 101.33 101.89 101.68 101.91 101.54 101.12 100.91 101.19
Structural formula (in apfu) based on 24 anions
T (iv) site:
Si 5.142 5.097 5.051 5.057 5.071 5.093 5.071 5.061 5.080 5.075 5.038
Al 2.750 2.749 2.659 2.658 2.667 2.683 2.684 2.683 2.735 2.746 2.759
Site total 7.892 7.846 7.710 7.714 7.737 7.776 7.755 7.744 7.815 7.822 7.797
Al (total) 2.750 2.749 2.659 2.658 2.667 2.683 2.684 2.683 2.735 2.746 2.759
R (vi) site:
Ti 0.632 0.699 0.871 0.877 0.876 0.809 0.812 0.834 0.798 0.801 0.807
Cr 0.000 0.000 0.000 0.000 0.000 0.001 0.005 0.001 0.009 0.015 0.016
Fe2+
4.238 4.124 4.132 4.142 4.107 4.146 4.178 4.160 4.050 4.032 4.064
Mn2+
0.012 0.007 0.011 0.017 0.013 0.010 0.010 0.010 0.012 0.009 0.010
Mg 0.826 0.905 0.748 0.736 0.725 0.747 0.764 0.749 0.815 0.806 0.796
Ni 0.000 0.000 0.004 0.003 0.005 0.005 0.007 0.003 0.008 0.004 0.000
Vacancy 0.292 0.264 0.234 0.224 0.273 0.281 0.224 0.243 0.308 0.334 0.306
Site total 6.000 6.000 6.000 6.000 6.000 6.000 6.000 6.000 6.000 6.000 6.000
A (xii) site:
Ca 0.007 0.002 0.000 0.000 0.000 0.000 0.000 0.004 0.000 0.000 0.000
Ba 0.509 0.512 0.558 0.547 0.561 0.572 0.572 0.570 0.566 0.572 0.579
Na 0.010 0.013 0.020 0.010 0.016 0.016 0.013 0.010 0.013 0.026 0.023
K 1.458 1.454 1.410 1.391 1.372 1.361 1.327 1.366 1.342 1.343 1.372
Vacancy 0.016 0.019 0.012 0.052 0.050 0.051 0.088 0.050 0.078 0.059 0.026
Site total 2.000 2.000 2.000 2.000 2.000 2.000 2.000 2.000 2.000 2.000 2.000
X (anion) site:
OH 3.175 3.248 3.231 3.274 3.242 3.281 3.235 3.263 3.251 3.234 3.236
F 0.065 0.070 0.048 0.016 0.037 0.016 0.038 0.032 0.022 0.038 0.038
Cl 0.760 0.682 0.721 0.710 0.720 0.703 0.728 0.704 0.727 0.729 0.726
Site total 4.000 4.000 4.000 4.000 4.000 4.000 4.000 4.000 4.000 4.000 4.000

156
Sample QC81-113 HP81-82 QC81-1 HR02-72
Analysis Type opx incl opx incl opx incl core rim matrix biot matrix
Analysis Pt. biot-1 biot-2 biot-3 biot-1 biot-2 biot-3 1 biot-2
Wt%
SiO2 32.98 33.28 33.37 35.24 35.29 35.11 33.51 34.84
Al2O3 15.05 15.05 15.11 14.34 14.25 13.93 15.56 15.19
TiO2 1.07 1.02 0.00 4.67 4.53 4.44 3.85 3.01
Cr2O3 0.02 0.02 0.02 0.10 0.04 0.03 0.01 0.01
FeO 27.18 27.14 27.14 24.21 24.29 23.62 24.38 23.52
MnO 0.13 0.13 0.13 0.02 0.04 0.05 0.07 0.05
MgO 6.56 6.66 6.76 8.72 8.41 8.56 7.58 8.49
NiO 0.03 0.02 0.00 0.00 0.02 0.01 0.00 0.00
CaO 0.05 0.03 0.03 0.00 0.00 0.00 0.01 0.01
BaO 2.83 2.90 2.78 0.00 0.00 0.00 0.00 0.64
Na2O 0.09 0.08 0.09 0.05 0.06 0.04 0.11 0.13
K2O 8.01 8.18 8.18 9.87 9.88 9.74 9.64 9.20
F 0.02 0.07 0.05 0.08 0.06 0.10 0.00 0.00
Cl 2.38 2.41 2.37 0.26 0.24 0.25 0.42 0.16
H2O (calculated) 3.02 3.01 2.99 3.78 3.78 3.72 3.66 3.77
Subtotal 99.42 100.00 99.02 101.34 100.89 99.60 98.80 99.02
O=F,Cl 0.55 0.57 0.56 0.09 0.08 0.10 0.09 0.04
Total 98.87 99.42 98.47 101.25 100.81 99.50 98.71 98.98
Structural formula (in apfu) based on 24 anions
T (iv) site:
Si 5.447 5.466 5.529 5.437 5.472 5.503 5.329 5.487
Al 2.553 2.534 2.471 2.563 2.528 2.497 2.671 2.513
Site total 8.000 8.000 8.000 8.000 8.000 8.000 8.000 8.000
Al (total) 2.930 2.913 2.950 2.608 2.604 2.573 2.916 2.819
R (vi) site:

157
Al 0.377 0.380 0.479 0.045 0.076 0.076 0.245 0.306
Ti 0.133 0.126 0.000 0.542 0.528 0.523 0.460 0.356
Cr 0.003 0.003 0.003 0.012 0.005 0.004 0.001 0.001
Fe2+
3.754 3.728 3.760 3.124 3.150 3.096 3.242 3.098
Mn2+
0.018 0.018 0.018 0.003 0.005 0.007 0.009 0.007
Mg 1.615 1.631 1.670 2.006 1.944 2.000 1.797 1.993
Ni 0.004 0.003 0.000 0.000 0.002 0.001 0.000 0.000
Vacancy 0.096 0.112 0.070 0.268 0.290 0.294 0.245 0.238
Site total 6.000 6.000 6.000 6.000 6.000 6.000 6.000 6.000
A (xii) site:
Ca 0.009 0.005 0.005 0.000 0.000 0.000 0.002 0.001
Ba 0.183 0.187 0.180 0.000 0.000 0.000 0.000 0.039
Na 0.029 0.025 0.029 0.015 0.018 0.012 0.034 0.041
K 1.688 1.714 1.729 1.943 1.954 1.947 1.956 1.848
Vacancy 0.091 0.069 0.056 0.042 0.028 0.040 0.009 0.071
Site total 2.000 2.000 2.000 2.000 2.000 2.000 2.000 2.000
X (anion) site:
OH 3.323 3.293 3.308 3.893 3.908 3.884 3.887 3.957
F 0.010 0.036 0.026 0.039 0.029 0.050 0.000 0.000
Cl 0.666 0.671 0.665 0.068 0.063 0.066 0.113 0.043
Site total 4.000 4.000 4.000 4.000 4.000 4.000 4.000 4.000

158
VITA
Nicholas Daigle was born and raised in Metairie, Louisiana and graduated from
Jesuit High School in 2009 before beginning his undergraduate career at Louisiana
State University. Initially accepted as an anthropology major, he fell in love with the
geosciences and decided to switch majors in his third semester after completing the first
two introductory courses. Three years later he graduated with a B.S. from LSU and
immediately began working on his M.S. degree in metamorphic petrology with Dr.
Darrell Henry.
During his time at LSU, Nick was a member of the Geological Society of America
(GSA), Mineralogical Society of America (MSA), LSU AAPG Student Chapter, Volunteer
LSU and International Student Volunteers (ISV). While acquiring his M.S., he held a
research assistantship position for which he served as the technician for the microprobe
at LSU. In his spare time, he enjoys long distance running and biking, volunteering,
eating, drinking and binge-watching Netflix.
Copyright © 2022 FDOKUMEN