A detailed next-to-leading order QCD analysis of deeply virtual Compton scattering observables
Upload
ltz-augustenbergCategory
view
0download
0
arX
iv:h
ep-e
x/05
0405
7v1
28
Apr
200
5
EPJ manuscript No.(will be inserted by the editor)
Deeply virtual and exclusive electroproduction of ω mesons
The CLAS collaborationL. Morand1, D. Dore1, M. Garcon1a, M. Guidal2, J.-M. Laget1,3, S. Morrow1,2, F. Sabatie1, E. Smith3,G. Adams31, P. Ambrozewicz11, M. Anghinolfi17, G. Asryan39, G. Audit1, H. Avakian3, H. Bagdasaryan29,39,J. Ball1, J.P. Ball4, N.A. Baltzell34, S. Barrow12, V. Batourine22, M. Battaglieri17, M. Bektasoglu29, M. Bellis31,N. Benmouna14, B.L. Berman14, A.S. Biselli6,31, S. Boiarinov3,20, B.E. Bonner32, S. Bouchigny2, R. Bradford6,D. Branford10, W.J. Briscoe14, W.K. Brooks3, S. Bultmann29, V.D. Burkert3, C. Butuceanu38, J.R. Calarco26,S.L. Careccia29, D.S. Carman28, A. Cazes34, S. Chen12, P.L. Cole3,18, D. Cords3, P. Corvisiero17, D. Crabb37,J.P. Cummings31, E. De Sanctis16, R. DeVita17, P.V. Degtyarenko3, H. Denizli30, L. Dennis12, A. Deur3,K.V. Dharmawardane29, K.S. Dhuga14, C. Djalali34, G.E. Dodge29, J. Donnelly15, D. Doughty3,8, M. Dugger4,S. Dytman30, O.P. Dzyubak34, H. Egiyan3,38, K.S. Egiyan39, L. Elouadrhiri3, P. Eugenio12, R. Fatemi37,G. Feldman14, R.G. Fersch38, R.J. Feuerbach3, H. Funsten38, G. Gavalian26, G.P. Gilfoyle33, K.L. Giovanetti21,F.-X. Girod1, J.T. Goetz5, C.I.O. Gordon15, R.W. Gothe34, K.A. Griffioen38, M. Guillo34, N. Guler29, L. Guo3,V. Gyurjyan3, C. Hadjidakis2, R.S. Hakobyan7, J. Hardie3,8, D. Heddle3, F.W. Hersman26, K. Hicks28, I. Hleiqawi28,M. Holtrop26, C.E. Hyde-Wright29, Y. Ilieva14, D.G. Ireland15, M.M. Ito3, D. Jenkins36, H.-S. Jo2, K. Joo3,9,H.G. Juengst14, J.D. Kellie15, M. Khandaker27, W. Kim22, A. Klein29, F.J. Klein7, A.V. Klimenko29, M. Kossov20,V. Kubarovski31, L.H. Kramer3,11, S.E. Kuhn29, J. Kuhn6,31, J. Lachniet6, J. Langheinrich34, D. Lawrence24,T. Lee26, Ji Li31, K. Livingston15, C. Marchand1, L.C. Maximon14, S. McAleer12, B. McKinnon15, J.W.C. McNabb6,B.A. Mecking3, S. Mehrabyan30, J.J. Melone15, M.D. Mestayer3, C.A. Meyer6, K. Mikhailov20, R. Minehart37,M. Mirazita16, R. Miskimen24, V. Mokeev25, J. Mueller30, G.S. Mutchler32, J. Napolitano31, R. Nasseripour11,S. Niccolai2,14, G. Niculescu21,28, I. Niculescu3,14,21, B.B. Niczyporuk3, R.A. Niyazov3,29 M. Nozar3, G.V. O’Rielly14,M. Osipenko17, A.I. Ostrovidov12 K. Park22, E. Pasyuk4, S.A. Philips14, N. Pivnyuk20, D. Pocanic37, O. Pogorelko20,E. Polli16, I. Popa14, S. Pozdniakov20, B.M. Preedom34, J.W. Price5, Y. Prok37, D. Protopopescu15,26, B.A. Raue3,11,G. Riccardi12, G. Ricco17, M. Ripani17, B.G. Ritchie4, F. Ronchetti16, G. Rosner15, P. Rossi16, P.D. Rubin33,C. Salgado27, J.P. Santoro3,36, V. Sapunenko3, R.A. Schumacher6, V.S. Serov20, Y.G. Sharabian3, J. Shaw24,A.V. Skabelin23, L.C. Smith37, D.I. Sober7, A. Stavinsky20, S. Stepanyan3,29, S.S. Stepanyan22, B.E. Stokes12,P. Stoler31, I.I. Strakovsky14, S. Strauch14, M. Taiuti17, D.J. Tedeschi34, U. Thoma3,13,19, A. Tkabladze28,L. Todor6,33, C. Tur34, M. Ungaro9,31, M.F. Vineyard33,35, A.V. Vlassov20, L.B. Weinstein29, D.P. Weygand3,M. Williams6, E. Wolin3, M.H. Wood34, A. Yegneswaran3, and L. Zana26
1 CEA-Saclay, Service de Physique Nucleaire, F91191 Gif-sur-Yvette, France2 Institut de Physique Nucleaire, F91406 Orsay, France3 Thomas Jefferson National Accelerator Facility, Newport News, Virginia 23606, USA4 Arizona State University, Tempe, Arizona 85287-1504, USA5 University of California at Los Angeles, Los Angeles, California 90095-1547, USA6 Carnegie Mellon University, Pittsburgh, Pennsylvania 15213, USA7 Catholic University of America, Washington, D.C. 20064, USA8 Christopher Newport University, Newport News, Virginia 23606, USA9 University of Connecticut, Storrs, Connecticut 06269, USA
10 Edinburgh University, Edinburgh EH9 3JZ, United Kingdom11 Florida International University, Miami, Florida 33199, USA12 Florida State University, Tallahassee, Florida 32306, USA13 Physikalisches Institut der Universitat Gießen, 35392 Gießen, Germany14 The George Washington University, Washington, DC 20052, USA15 University of Glasgow, Glasgow G12 8QQ, United Kingdom16 INFN, Laboratori Nazionali di Frascati, Frascati, Italy17 INFN, Sezione di Genova, 16146 Genova, Italy18 Idaho State University, Pocatello, Idaho 83209, USA19 Institute fur Strahlen und Kernphysik, Universitat Bonn, Germany20 Institute of Theoretical and Experimental Physics, Moscow, 117259, Russia21 James Madison University, Harrisonburg, Virginia 22807, USA
a Corresponding author: [email protected]
2
22 Kyungpook National University, Daegu 702-701, The Republic of Korea23 Massachusetts Institute of Technology, Cambridge, Massachusetts 02139-4307, USA24 University of Massachusetts, Amherst, Massachusetts 01003, USA25 Moscow State University, General Nuclear Physics Institute, 119899 Moscow, Russia26 University of New Hampshire, Durham, New Hampshire 03824-3568, USA27 Norfolk State University, Norfolk, Virginia 23504, USA28 Ohio University, Athens, Ohio 45701, USA29 Old Dominion University, Norfolk, Virginia 23529, USA30 University of Pittsburgh, Pittsburgh, Pennsylvania 15260, USA31 Rensselaer Polytechnic Institute, Troy, New York 12180-3590, USA32 Rice University, Houston, Texas 77005-1892, USA33 University of Richmond, Richmond, Virginia 23173, USA34 University of South Carolina, Columbia, South Carolina 29208, USA35 Union College, Schenectady, NY 12308, USA36 Virginia Polytechnic Institute and State University, Blacksburg, Virginia 24061-0435, USA37 University of Virginia, Charlottesville, Virginia 22901, USA38 College of William and Mary, Williamsburg, Virginia 23187-8795, USA39 Yerevan Physics Institute, 375036 Yerevan, Armenia
Received: date / Revised version: date
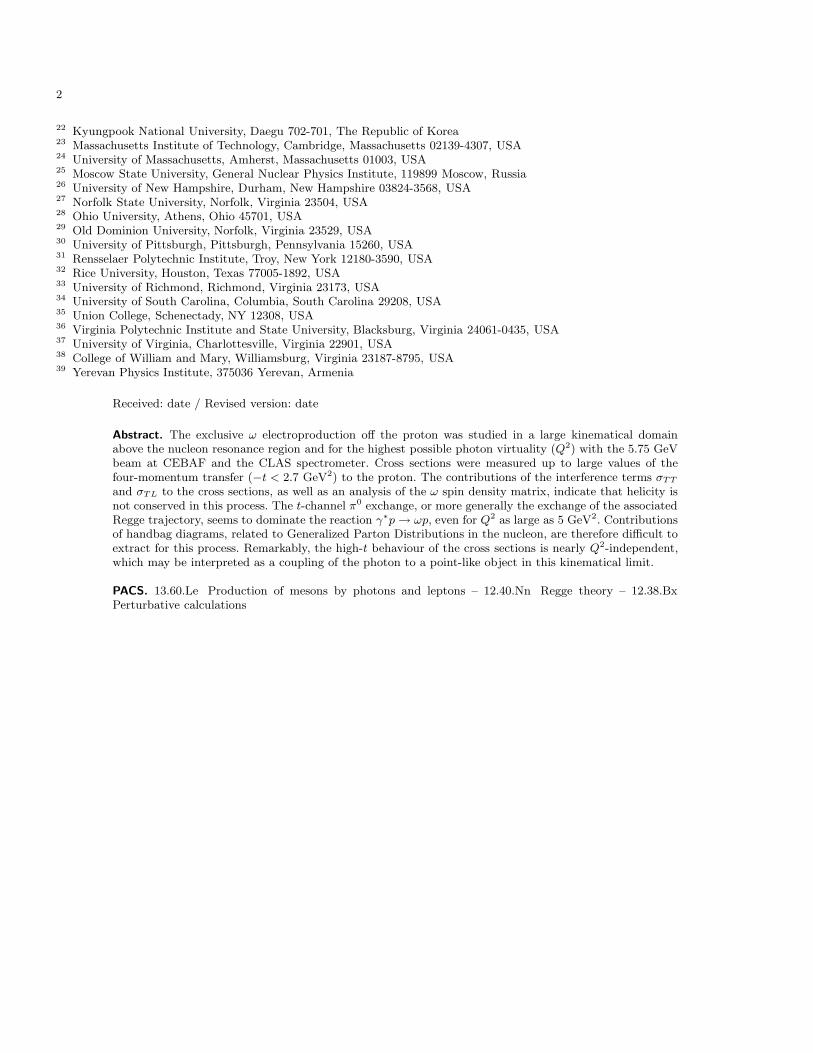
Abstract. The exclusive ω electroproduction off the proton was studied in a large kinematical domainabove the nucleon resonance region and for the highest possible photon virtuality (Q2) with the 5.75 GeVbeam at CEBAF and the CLAS spectrometer. Cross sections were measured up to large values of thefour-momentum transfer (−t < 2.7 GeV2) to the proton. The contributions of the interference terms σTT
and σTL to the cross sections, as well as an analysis of the ω spin density matrix, indicate that helicity isnot conserved in this process. The t-channel π0 exchange, or more generally the exchange of the associatedRegge trajectory, seems to dominate the reaction γ∗p → ωp, even for Q2 as large as 5 GeV2. Contributionsof handbag diagrams, related to Generalized Parton Distributions in the nucleon, are therefore difficult toextract for this process. Remarkably, the high-t behaviour of the cross sections is nearly Q2-independent,which may be interpreted as a coupling of the photon to a point-like object in this kinematical limit.
PACS. 13.60.Le Production of mesons by photons and leptons – 12.40.Nn Regge theory – 12.38.BxPerturbative calculations
2
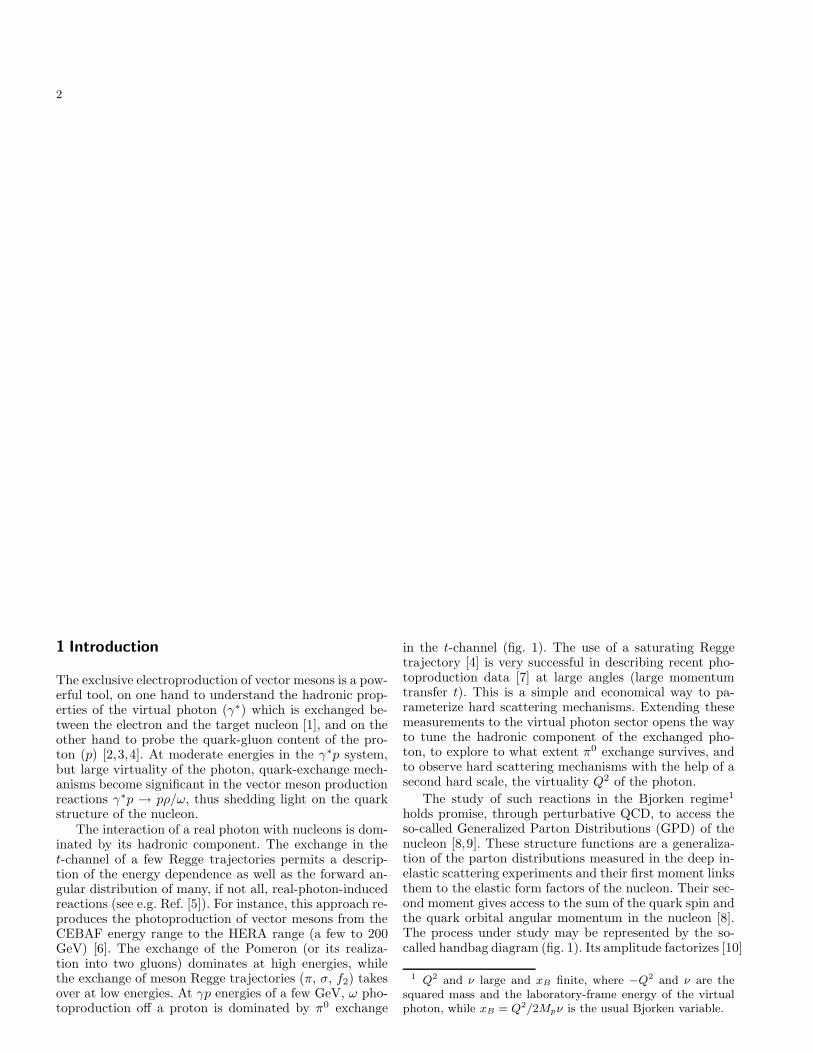
1 Introduction
The exclusive electroproduction of vector mesons is a pow-erful tool, on one hand to understand the hadronic prop-erties of the virtual photon (γ∗) which is exchanged be-tween the electron and the target nucleon [1], and on theother hand to probe the quark-gluon content of the pro-ton (p) [2,3,4]. At moderate energies in the γ∗p system,but large virtuality of the photon, quark-exchange mech-anisms become significant in the vector meson productionreactions γ∗p → pρ/ω, thus shedding light on the quarkstructure of the nucleon.
The interaction of a real photon with nucleons is dom-inated by its hadronic component. The exchange in thet-channel of a few Regge trajectories permits a descrip-tion of the energy dependence as well as the forward an-gular distribution of many, if not all, real-photon-inducedreactions (see e.g. Ref. [5]). For instance, this approach re-produces the photoproduction of vector mesons from theCEBAF energy range to the HERA range (a few to 200GeV) [6]. The exchange of the Pomeron (or its realiza-tion into two gluons) dominates at high energies, whilethe exchange of meson Regge trajectories (π, σ, f2) takesover at low energies. At γp energies of a few GeV, ω pho-toproduction off a proton is dominated by π0 exchange
in the t-channel (fig. 1). The use of a saturating Reggetrajectory [4] is very successful in describing recent pho-toproduction data [7] at large angles (large momentumtransfer t). This is a simple and economical way to pa-rameterize hard scattering mechanisms. Extending thesemeasurements to the virtual photon sector opens the wayto tune the hadronic component of the exchanged pho-ton, to explore to what extent π0 exchange survives, andto observe hard scattering mechanisms with the help of asecond hard scale, the virtuality Q2 of the photon.
The study of such reactions in the Bjorken regime1
holds promise, through perturbative QCD, to access theso-called Generalized Parton Distributions (GPD) of thenucleon [8,9]. These structure functions are a generaliza-tion of the parton distributions measured in the deep in-elastic scattering experiments and their first moment linksthem to the elastic form factors of the nucleon. Their sec-ond moment gives access to the sum of the quark spin andthe quark orbital angular momentum in the nucleon [8].The process under study may be represented by the so-called handbag diagram (fig. 1). Its amplitude factorizes [10]
1 Q2 and ν large and xB finite, where −Q2 and ν are thesquared mass and the laboratory-frame energy of the virtualphoton, while xB = Q2/2Mpν is the usual Bjorken variable.

3
p
∗ ρ, ω ...γ
p’
e’
x x’
t
e
p
Lfactorization
LL
GPD’s
ρ , ω ...∗γ
Fig. 1. Schematic representations of the t-channel exchange(left) and of the handbag diagram (right) for exclusive vectormeson electroproduction.
into a “hard” process where the virtual photon is ab-sorbed by a quark and a “soft” one containing the newinformation on the nucleon, the GPD (which are func-tions of x and x′, the momentum fraction carried by thequark in the initial and final states, and of t, the squaredfour-momentum transfer between the initial and final pro-tons). The factorization applies only to the transition,at small values of −t, between longitudinal photons (L)and helicity-0 mesons, which is dominant in the Bjorkenregime. Because of the necessary gluon exchange to pro-duce the meson in the hard process (see fig. 1), the domi-nance of the handbag contribution is expected to be reachedat a higher Q2 for meson production than for photon pro-duction (DVCS). Nevertheless, recent results on deeplyvirtual ρ production show a qualitative agreement withcalculations based on the handbag diagram [11,12]. Vectormeson production is an important complement to DVCS,since it singles out the quark helicity independent GPD Hand E which enter Ji’s sum rule [8] and allows, in princi-ple, for a flavor decomposition of these distributions (seee.g. Ref. [13]).
Apart from early, low statistics, muon production ex-periments at SLAC [14,15], the leptoproduction of ω mesonswas measured at DESY [16], for 0.3 < Q2 < 1.4 GeV2,W < 2.8 GeV (xB < 0.3), and then at Cornell [17], in awider kinematical range (0.7 < Q2 < 3 GeV2, W < 3.7GeV) but with larger integration bins. These two experi-ments yielded cross sections differing by a factor of about 2wherever they overlap (around Q2 ≃ 1 GeV2). The DESYexperiment also provided the only analysis so far, in elec-troproduction, of the ω spin density matrix elements, av-eraged over the whole kinematical range. This analysis in-dicated that, in contrast with ρ electroproduction, there islittle increase in the ratio R of longitudinal to transversecross sections (σL/σT ) when going from photoproductionto low Q2 electroproduction. More recently, ω electropro-duction was measured at ZEUS [18], at high Q2 and verylow xB , in a kinematical regime more sensitive to purelydiffractive phenomena and to gluons in the nucleon. Fi-nally, there is also unpublished data from HERMES [19].
The main goal of the present experiment was to reachthe highest achievable Q2 values in exclusive meson elec-troproduction in the valence quark region. In the specificcase of the ω production, it is to test which of the two de-scriptions — with hadronic or quark degrees of freedom,
Bx0 0.1 0.2 0.3 0.4 0.5 0.6 0.7 0.8
)2 (
GeV
2Q
0
1
2
3
4
5
6
7
DESY
Cornell
HE
RM
ES
ZE
US
JLab (this w
ork)
Fig. 2. (Color online) Kinematical range covered by this andprevious [16,17,18,19] ω electroproduction experiments. Thelines are indicative of the total coverage in Q2 and xB of pre-vious experiments.
more specifically t-channel Regge trajectory exchange orhandbag diagram — applies in the considered kinematicaldomain (see fig. 2). For this purpose, the reduced crosssections σγ∗p→ωp were measured in fine bins in Q2 andxB, as well as their distribution in t and φ (defined be-low). In addition, parameters related to the ω spin densitymatrix were extracted from the analysis of the angular dis-tribution of the ω decay products. If the vector meson isproduced with the same helicity as the virtual photon,s-channel helicity conservation (SCHC) is said to hold.From our results, the relevance of SCHC and of naturalparity exchange in the t-channel was explored in a model-independent way. These properties have been establishedempirically in the case of photo- and electroproduction ofthe ρ meson (see e.g. Ref. [20]), but may not be a generalfeature of all vector meson production channels.
This paper is based on the thesis work of Ref. [21],where additional details on the data analysis may be found.
2 Experimental procedure
We measured the process ep → epω, followed by the decayω → π+π−π0. The scattered electron and the recoil pro-ton were detected, together with at least one charged pionfrom the ω decay. At a given beam energy E, this processis described by ten independent kinematical variables. Inthe absence of polarization in the ep initial state, the ob-servables are independent of the electron azimuthal anglein the laboratory. Q2 and xB are chosen to describe theγ∗p initial state. The scattered electron energy E′ and,for ease of comparison with other data, the γ∗p center-of-mass energy W will be used as well. t is the squaredfour-momentum transfer from the γ∗ to the ω, and φ theangle between the electron (ee′γ∗) and hadronic (γ∗ωp)planes. Since t is negative and has a kinematical upperbound t0(Q
2, xB) corresponding to ω production in the di-rection of the γ∗, the variable t′ = t0 − t will also be used.The ω decay is described in the so-called helicity frame,

4
φ
x
hadronic
production plan
eVirtual photoproduction
θ
2
N
N
θ
θ∗
p
ω
electr
on scatt
ering plan
e
y
z
ω
γ∗ (Q )
(t)
(E)Laboratory frame
c.m. frame
Helicity frameω( at rest)
(E’)
e
e’
φ
Fig. 3. (Color online) Reference frames and relevant variablesused for the description of the reaction ep → epω, followed byω → π+π−π0.
where the ω is at rest and the z-axis is given by the ωdirection in the γ∗p center-of-mass system. In this helicityframe, the normal to the decay plane is characterized bythe angles θN and ϕN (fig. 3). Finally the distribution ofthe three pions within the decay plane is described by twoangles and a relative momentum. This latter distributionis known from the spin and parity of the ω meson [22]and is independent of the γ∗p → ωp reaction mechanism.The purpose of the present study is to characterize ascompletely as possible the distributions of cross sectionsaccording to the six variables Q2, xB, t, φ, cos θN and ϕN .
2.1 The experiment
The experiment was performed at the Thomas JeffersonNational Accelerator Facility (JLab). The CEBAF 5.754GeV electron beam was directed at a 5-cm long liquid-hydrogen target. The average beam intensity was 7 nA,resulting in an effective integrated luminosity of 28.5 fb−1
for the data taking period (October 2001 to January 2002).The target was positioned at the center of the CLAS spec-trometer. This spectrometer uses a toroidal magnetic fieldgenerated by six superconducting coils for the determina-tion of particle momenta. The field integral varied approx-imately from 2.2 to 0.5 Tm, in average over charges andmomenta of different particles, for scattered angles be-tween 14◦ and 90◦. All the spectrometer components arearranged in six identical sectors. Charged particle trajec-tories were detected in three successive packages of driftchambers (DC), the first one before the region of magneticfield (R1), the second one inside this region (R2), and thethird one after (R3). Threshold Cerenkov counters (CC)were used to discriminate pions from electrons. Scintilla-tors (SC) allowed for a precise determination of the par-ticle time-of-flight. Finally, a segmented electromagneticcalorimeter (EC) provided a measure of the electron en-ergy. This geometry and the event topology are illustrated
Fig. 4. (Color online) Schematic view of the CLAS spectrome-ter components (see text for description) and of typical particletracks, viewed in projection. The torus coils are not shown.
in fig. 4. A detailed description of the CLAS spectrometerand of its performance is given in Ref. [23].
The data acquisition was triggered by a coincidenceCC·EC corresponding to a minimal scattered electron en-ergy of about 0.575 GeV. The trigger rate was 1.5 kHz,with a data acquisition dead time of 6%. A total of 1.25×10⁹ events was recorded.
2.2 Particle identification
After calibration of all spectrometer subsystems, trackswere reconstructed from the DC information. The identi-fication of particles associated with each track proceededdifferently for electrons and hadrons.
Electrons were identified from the correlation betweenmomentum (from DC) and energy (from EC). In addi-tion pions were rejected from the electron sample by acut in the CC amplitude and imposing a condition onthe energy sharing between EC components compatiblewith the depth profile of an electromagnetic shower. Ge-ometrical fiducial cuts ensured that the track was insidea high efficiency region for both CC and EC. The effi-ciencies of the electron identification cuts (ηCC and ηEC)depended on the electron momentum and angle (or onQ2 and xB). ηEC was calculated from data samples usingvery selective CC cuts in order to unambiguously selectelectrons. ηCC was extracted from an extrapolation of theCC amplitude Poisson distribution into the low amplituderegion. These efficiencies varied respectively between 0.92and 0.99 (CC), and 0.86 to 0.96 (EC). At low electron en-ergies, a small contamination of pions remained, which didnot however satisfy the ω selection criteria to be describedbelow.
The relation between momentum (from DC) and ve-locity (from path length in DC and time-of-flight in SC)allowed for a clean identification of protons (p) and pi-ons (π+ and π−). However, for momenta larger than 2GeV/c, ambiguities arose between p and π+ identification,which led us to the discarding of events corresponding to
5
[epX] (GeV)XM0 0.2 0.4 0.6 0.8 1 1.2 1.4 1.6
)2X
] (G
eV+ π
[ep
2 XM
0
0.2
0.4
0.6
0.8
1
0
500
1000
1500
2000
2500
3000
3500
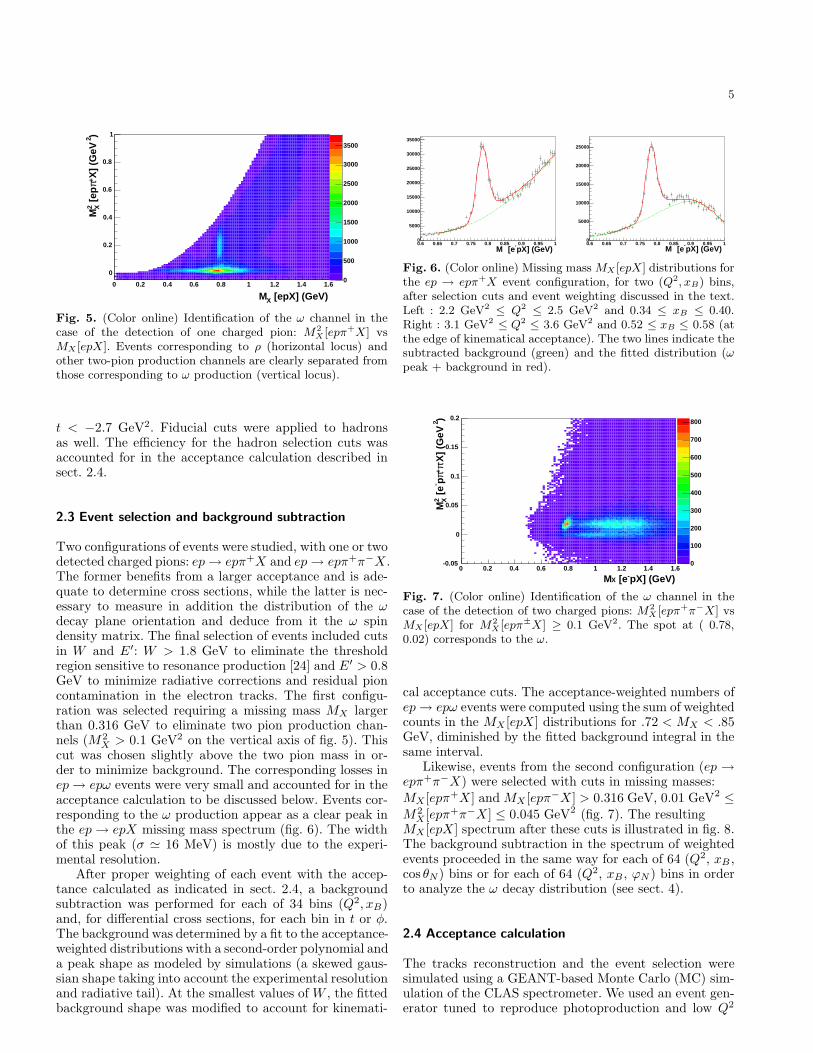
Fig. 5. (Color online) Identification of the ω channel in thecase of the detection of one charged pion: M2
X [epπ+X] vsMX [epX]. Events corresponding to ρ (horizontal locus) andother two-pion production channels are clearly separated fromthose corresponding to ω production (vertical locus).
t < −2.7 GeV2. Fiducial cuts were applied to hadronsas well. The efficiency for the hadron selection cuts wasaccounted for in the acceptance calculation described insect. 2.4.
2.3 Event selection and background subtraction
Two configurations of events were studied, with one or twodetected charged pions: ep → epπ+X and ep → epπ+π−X .The former benefits from a larger acceptance and is ade-quate to determine cross sections, while the latter is nec-essary to measure in addition the distribution of the ωdecay plane orientation and deduce from it the ω spindensity matrix. The final selection of events included cutsin W and E′: W > 1.8 GeV to eliminate the thresholdregion sensitive to resonance production [24] and E′ > 0.8GeV to minimize radiative corrections and residual pioncontamination in the electron tracks. The first configu-ration was selected requiring a missing mass MX largerthan 0.316 GeV to eliminate two pion production chan-nels (M2
X > 0.1 GeV2 on the vertical axis of fig. 5). Thiscut was chosen slightly above the two pion mass in or-der to minimize background. The corresponding losses inep → epω events were very small and accounted for in theacceptance calculation to be discussed below. Events cor-responding to the ω production appear as a clear peak inthe ep → epX missing mass spectrum (fig. 6). The widthof this peak (σ ≃ 16 MeV) is mostly due to the experi-mental resolution.
After proper weighting of each event with the accep-tance calculated as indicated in sect. 2.4, a backgroundsubtraction was performed for each of 34 bins (Q2, xB)and, for differential cross sections, for each bin in t or φ.The background was determined by a fit to the acceptance-weighted distributions with a second-order polynomial anda peak shape as modeled by simulations (a skewed gaus-sian shape taking into account the experimental resolutionand radiative tail). At the smallest values of W , the fittedbackground shape was modified to account for kinemati-
0.6 0.65 0.7 0.75 0.8 0.85 0.9 0.95 10
5000
10000
15000
20000
25000
30000
35000
pX] (GeV)- [eM0.6 0.65 0.7 0.75 0.8 0.85 0.9 0.95 10
5000
10000
15000
20000
25000
pX] (GeV)- [eM
Fig. 6. (Color online) Missing mass MX [epX] distributions forthe ep → epπ+X event configuration, for two (Q2, xB) bins,after selection cuts and event weighting discussed in the text.Left : 2.2 GeV2 ≤ Q2 ≤ 2.5 GeV2 and 0.34 ≤ xB ≤ 0.40.Right : 3.1 GeV2 ≤ Q2 ≤ 3.6 GeV2 and 0.52 ≤ xB ≤ 0.58 (atthe edge of kinematical acceptance). The two lines indicate thesubtracted background (green) and the fitted distribution (ωpeak + background in red).
pX] (GeV)- [eXM0 0.2 0.4 0.6 0.8 1 1.2 1.4 1.6
)2X
] (G
eV- π+ πp-
[e
2 XM
-0.05
0
0.05
0.1
0.15
0.2
0
100
200
300
400
500
600
700
800
Fig. 7. (Color online) Identification of the ω channel in thecase of the detection of two charged pions: M2
X [epπ+π−X] vsMX [epX] for M2
X [epπ±X] ≥ 0.1 GeV2. The spot at ( 0.78,0.02) corresponds to the ω.
cal acceptance cuts. The acceptance-weighted numbers ofep → epω events were computed using the sum of weightedcounts in the MX [epX ] distributions for .72 < MX < .85GeV, diminished by the fitted background integral in thesame interval.
Likewise, events from the second configuration (ep →epπ+π−X) were selected with cuts in missing masses:MX [epπ+X ] and MX [epπ−X ] > 0.316 GeV, 0.01 GeV2 ≤M2
X [epπ+π−X ] ≤ 0.045 GeV2 (fig. 7). The resultingMX [epX ] spectrum after these cuts is illustrated in fig. 8.The background subtraction in the spectrum of weightedevents proceeded in the same way for each of 64 (Q2, xB ,cos θN) bins or for each of 64 (Q2, xB , ϕN ) bins in orderto analyze the ω decay distribution (see sect. 4).
2.4 Acceptance calculation
The tracks reconstruction and the event selection weresimulated using a GEANT-based Monte Carlo (MC) sim-ulation of the CLAS spectrometer. We used an event gen-erator tuned to reproduce photoproduction and low Q2
6
[epX] (GeV)XM0 0.2 0.4 0.6 0.8 1 1.2 1.4 1.6 1.8 2
0
5000
10000
15000
20000
25000
30000
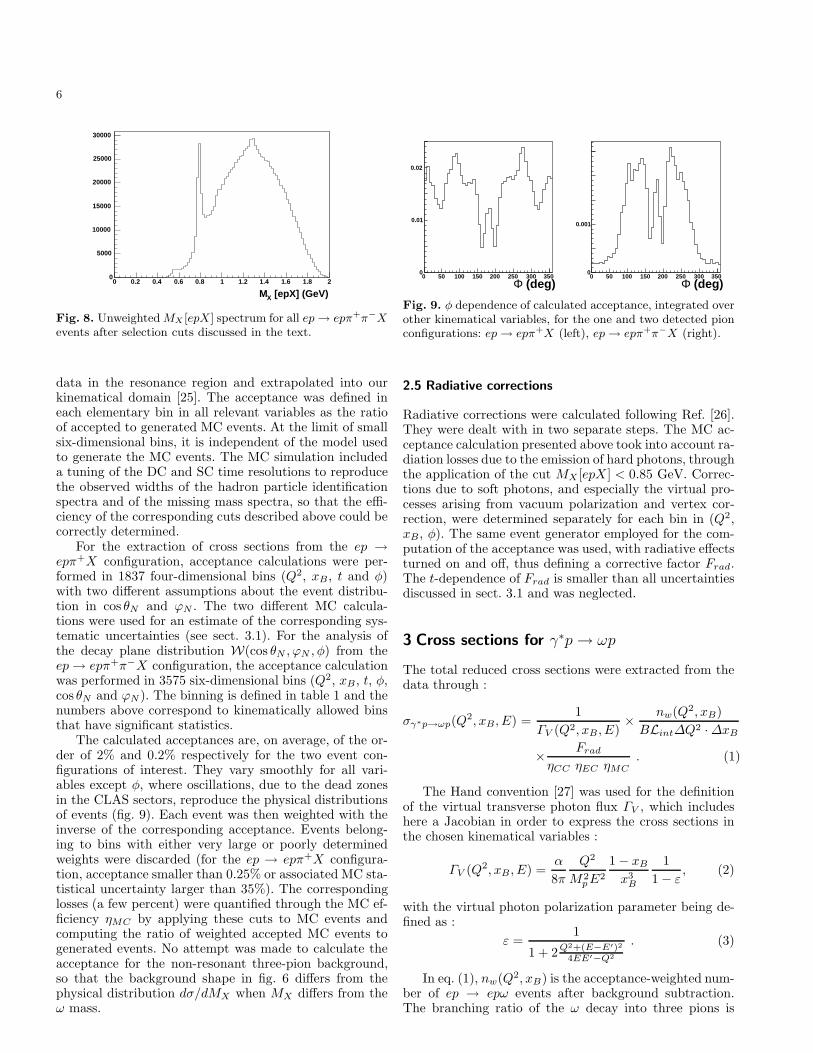
Fig. 8. Unweighted MX [epX] spectrum for all ep → epπ+π−Xevents after selection cuts discussed in the text.
data in the resonance region and extrapolated into ourkinematical domain [25]. The acceptance was defined ineach elementary bin in all relevant variables as the ratioof accepted to generated MC events. At the limit of smallsix-dimensional bins, it is independent of the model usedto generate the MC events. The MC simulation includeda tuning of the DC and SC time resolutions to reproducethe observed widths of the hadron particle identificationspectra and of the missing mass spectra, so that the effi-ciency of the corresponding cuts described above could becorrectly determined.
For the extraction of cross sections from the ep →epπ+X configuration, acceptance calculations were per-formed in 1837 four-dimensional bins (Q2, xB, t and φ)with two different assumptions about the event distribu-tion in cos θN and ϕN . The two different MC calcula-tions were used for an estimate of the corresponding sys-tematic uncertainties (see sect. 3.1). For the analysis ofthe decay plane distribution W(cos θN , ϕN , φ) from theep → epπ+π−X configuration, the acceptance calculationwas performed in 3575 six-dimensional bins (Q2, xB, t, φ,cos θN and ϕN ). The binning is defined in table 1 and thenumbers above correspond to kinematically allowed binsthat have significant statistics.
The calculated acceptances are, on average, of the or-der of 2% and 0.2% respectively for the two event con-figurations of interest. They vary smoothly for all vari-ables except φ, where oscillations, due to the dead zonesin the CLAS sectors, reproduce the physical distributionsof events (fig. 9). Each event was then weighted with theinverse of the corresponding acceptance. Events belong-ing to bins with either very large or poorly determinedweights were discarded (for the ep → epπ+X configura-tion, acceptance smaller than 0.25% or associated MC sta-tistical uncertainty larger than 35%). The correspondinglosses (a few percent) were quantified through the MC ef-ficiency ηMC by applying these cuts to MC events andcomputing the ratio of weighted accepted MC events togenerated events. No attempt was made to calculate theacceptance for the non-resonant three-pion background,so that the background shape in fig. 6 differs from thephysical distribution dσ/dMX when MX differs from theω mass.
0 50 100 150 200 250 300 3500
0.01
0.02
(deg)Φ0 50 100 150 200 250 300 350
0
0.001
(deg)Φ
Fig. 9. φ dependence of calculated acceptance, integrated overother kinematical variables, for the one and two detected pionconfigurations: ep → epπ+X (left), ep → epπ+π−X (right).
2.5 Radiative corrections
Radiative corrections were calculated following Ref. [26].They were dealt with in two separate steps. The MC ac-ceptance calculation presented above took into account ra-diation losses due to the emission of hard photons, throughthe application of the cut MX [epX ] < 0.85 GeV. Correc-tions due to soft photons, and especially the virtual pro-cesses arising from vacuum polarization and vertex cor-rection, were determined separately for each bin in (Q2,xB, φ). The same event generator employed for the com-putation of the acceptance was used, with radiative effectsturned on and off, thus defining a corrective factor Frad.The t-dependence of Frad is smaller than all uncertaintiesdiscussed in sect. 3.1 and was neglected.
3 Cross sections for γ∗p → ωp
The total reduced cross sections were extracted from thedata through :
σγ∗p→ωp(Q2, xB, E) =
1
ΓV (Q2, xB, E)×
nw(Q2, xB)
BLint∆Q2 · ∆xB
×Frad
ηCC ηEC ηMC. (1)
The Hand convention [27] was used for the definitionof the virtual transverse photon flux ΓV , which includeshere a Jacobian in order to express the cross sections inthe chosen kinematical variables :
ΓV (Q2, xB, E) =α
8π
Q2
M2p E2
1 − xB
x3B
1
1 − ε, (2)
with the virtual photon polarization parameter being de-fined as :
ε =1
1 + 2Q2+(E−E′)2
4EE′−Q2
. (3)
In eq. (1), nw(Q2, xB) is the acceptance-weighted num-ber of ep → epω events after background subtraction.The branching ratio of the ω decay into three pions is
7
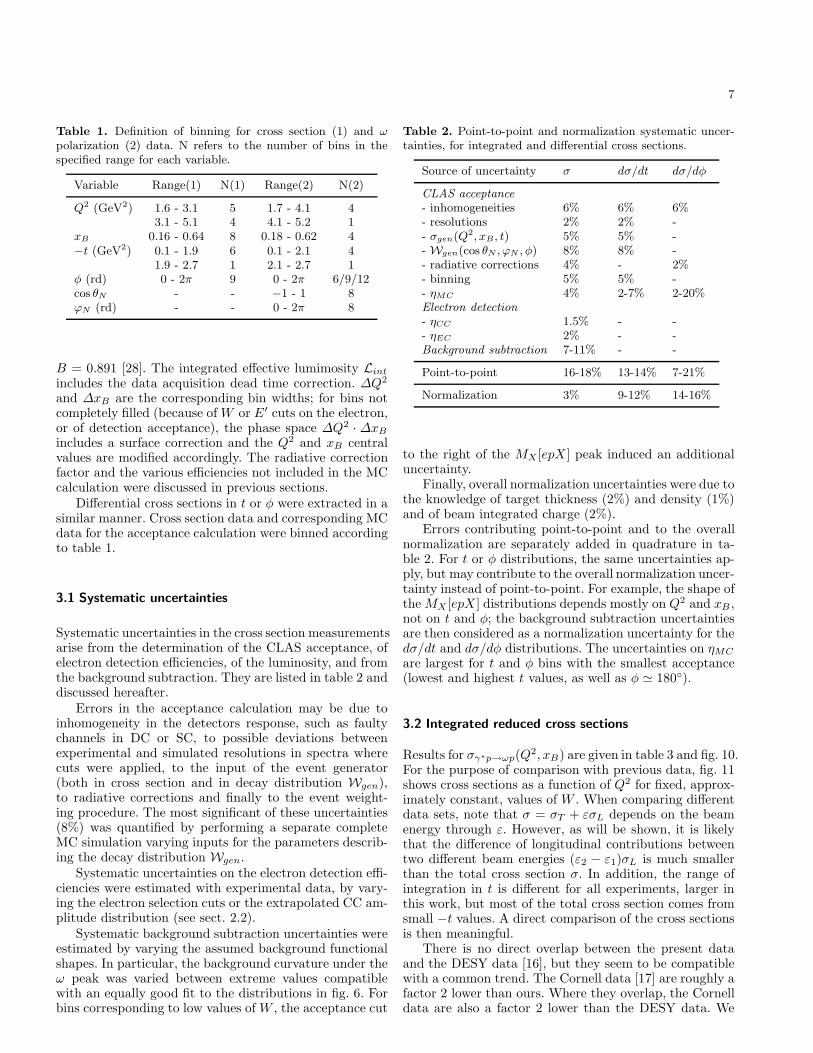
Table 1. Definition of binning for cross section (1) and ωpolarization (2) data. N refers to the number of bins in thespecified range for each variable.
Variable Range(1) N(1) Range(2) N(2)
Q2 (GeV2) 1.6 - 3.1 5 1.7 - 4.1 43.1 - 5.1 4 4.1 - 5.2 1
xB 0.16 - 0.64 8 0.18 - 0.62 4−t (GeV2) 0.1 - 1.9 6 0.1 - 2.1 4
1.9 - 2.7 1 2.1 - 2.7 1φ (rd) 0 - 2π 9 0 - 2π 6/9/12cos θN - - −1 - 1 8ϕN (rd) - - 0 - 2π 8
B = 0.891 [28]. The integrated effective lumimosity Lint
includes the data acquisition dead time correction. ∆Q2
and ∆xB are the corresponding bin widths; for bins notcompletely filled (because of W or E′ cuts on the electron,or of detection acceptance), the phase space ∆Q2 · ∆xB
includes a surface correction and the Q2 and xB centralvalues are modified accordingly. The radiative correctionfactor and the various efficiencies not included in the MCcalculation were discussed in previous sections.
Differential cross sections in t or φ were extracted in asimilar manner. Cross section data and corresponding MCdata for the acceptance calculation were binned accordingto table 1.
3.1 Systematic uncertainties
Systematic uncertainties in the cross section measurementsarise from the determination of the CLAS acceptance, ofelectron detection efficiencies, of the luminosity, and fromthe background subtraction. They are listed in table 2 anddiscussed hereafter.
Errors in the acceptance calculation may be due toinhomogeneity in the detectors response, such as faultychannels in DC or SC, to possible deviations betweenexperimental and simulated resolutions in spectra wherecuts were applied, to the input of the event generator(both in cross section and in decay distribution Wgen),to radiative corrections and finally to the event weight-ing procedure. The most significant of these uncertainties(8%) was quantified by performing a separate completeMC simulation varying inputs for the parameters describ-ing the decay distribution Wgen.
Systematic uncertainties on the electron detection effi-ciencies were estimated with experimental data, by vary-ing the electron selection cuts or the extrapolated CC am-plitude distribution (see sect. 2.2).
Systematic background subtraction uncertainties wereestimated by varying the assumed background functionalshapes. In particular, the background curvature under theω peak was varied between extreme values compatiblewith an equally good fit to the distributions in fig. 6. Forbins corresponding to low values of W , the acceptance cut
Table 2. Point-to-point and normalization systematic uncer-tainties, for integrated and differential cross sections.
Source of uncertainty σ dσ/dt dσ/dφ
CLAS acceptance
- inhomogeneities 6% 6% 6%- resolutions 2% 2% -- σgen(Q2, xB, t) 5% 5% -- Wgen(cos θN , ϕN , φ) 8% 8% -- radiative corrections 4% - 2%- binning 5% 5% -- ηMC 4% 2-7% 2-20%Electron detection
- ηCC 1.5% - -- ηEC 2% - -Background subtraction 7-11% - -
Point-to-point 16-18% 13-14% 7-21%
Normalization 3% 9-12% 14-16%
to the right of the MX [epX ] peak induced an additionaluncertainty.
Finally, overall normalization uncertainties were due tothe knowledge of target thickness (2%) and density (1%)and of beam integrated charge (2%).
Errors contributing point-to-point and to the overallnormalization are separately added in quadrature in ta-ble 2. For t or φ distributions, the same uncertainties ap-ply, but may contribute to the overall normalization uncer-tainty instead of point-to-point. For example, the shape ofthe MX [epX ] distributions depends mostly on Q2 and xB ,not on t and φ; the background subtraction uncertaintiesare then considered as a normalization uncertainty for thedσ/dt and dσ/dφ distributions. The uncertainties on ηMC
are largest for t and φ bins with the smallest acceptance(lowest and highest t values, as well as φ ≃ 180◦).
3.2 Integrated reduced cross sections
Results for σγ∗p→ωp(Q2, xB) are given in table 3 and fig. 10.
For the purpose of comparison with previous data, fig. 11shows cross sections as a function of Q2 for fixed, approx-imately constant, values of W . When comparing differentdata sets, note that σ = σT + εσL depends on the beamenergy through ε. However, as will be shown, it is likelythat the difference of longitudinal contributions betweentwo different beam energies (ε2 − ε1)σL is much smallerthan the total cross section σ. In addition, the range ofintegration in t is different for all experiments, larger inthis work, but most of the total cross section comes fromsmall −t values. A direct comparison of the cross sectionsis then meaningful.
There is no direct overlap between the present dataand the DESY data [16], but they seem to be compatiblewith a common trend. The Cornell data [17] are roughly afactor 2 lower than ours. Where they overlap, the Cornelldata are also a factor 2 lower than the DESY data. We
8
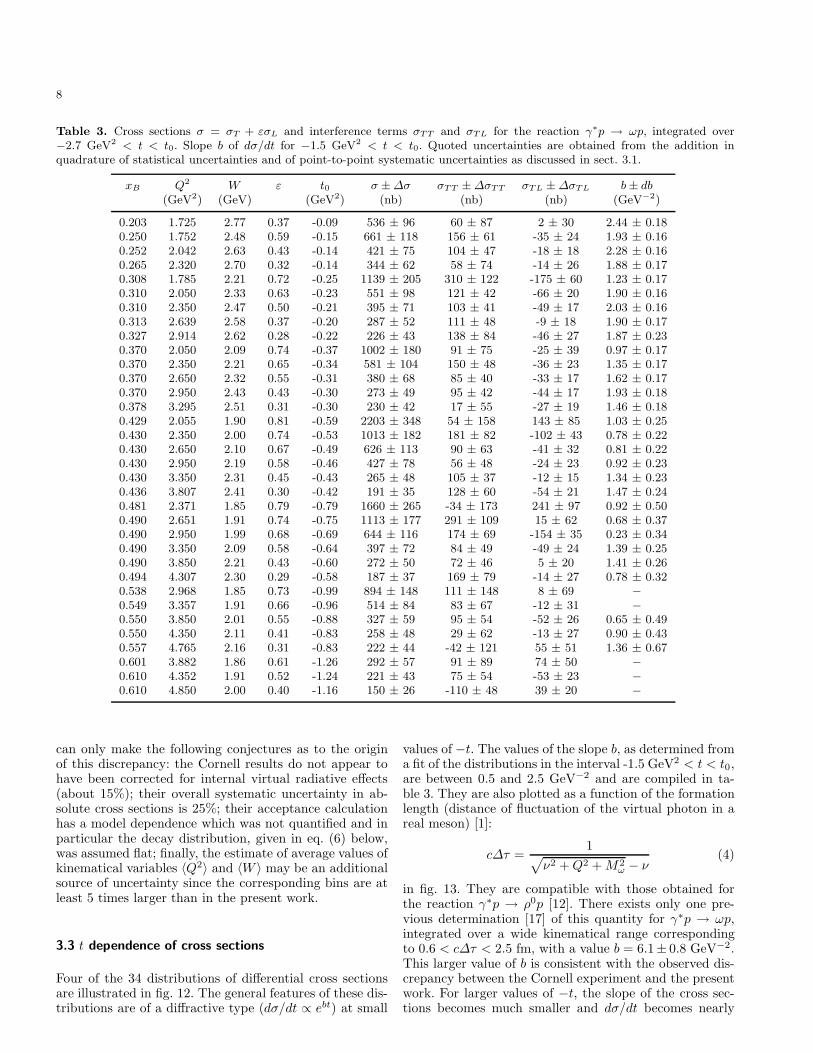
Table 3. Cross sections σ = σT + εσL and interference terms σTT and σTL for the reaction γ∗p → ωp, integrated over−2.7 GeV2 < t < t0. Slope b of dσ/dt for −1.5 GeV2 < t < t0. Quoted uncertainties are obtained from the addition inquadrature of statistical uncertainties and of point-to-point systematic uncertainties as discussed in sect. 3.1.
xB Q2 W ε t0 σ ± ∆σ σTT ± ∆σTT σTL ± ∆σTL b ± db(GeV2) (GeV) (GeV2) (nb) (nb) (nb) (GeV−2)
0.203 1.725 2.77 0.37 -0.09 536 ± 96 60 ± 87 2 ± 30 2.44 ± 0.180.250 1.752 2.48 0.59 -0.15 661 ± 118 156 ± 61 -35 ± 24 1.93 ± 0.160.252 2.042 2.63 0.43 -0.14 421 ± 75 104 ± 47 -18 ± 18 2.28 ± 0.160.265 2.320 2.70 0.32 -0.14 344 ± 62 58 ± 74 -14 ± 26 1.88 ± 0.170.308 1.785 2.21 0.72 -0.25 1139 ± 205 310 ± 122 -175 ± 60 1.23 ± 0.170.310 2.050 2.33 0.63 -0.23 551 ± 98 121 ± 42 -66 ± 20 1.90 ± 0.160.310 2.350 2.47 0.50 -0.21 395 ± 71 103 ± 41 -49 ± 17 2.03 ± 0.160.313 2.639 2.58 0.37 -0.20 287 ± 52 111 ± 48 -9 ± 18 1.90 ± 0.170.327 2.914 2.62 0.28 -0.22 226 ± 43 138 ± 84 -46 ± 27 1.87 ± 0.230.370 2.050 2.09 0.74 -0.37 1002 ± 180 91 ± 75 -25 ± 39 0.97 ± 0.170.370 2.350 2.21 0.65 -0.34 581 ± 104 150 ± 48 -36 ± 23 1.35 ± 0.170.370 2.650 2.32 0.55 -0.31 380 ± 68 85 ± 40 -33 ± 17 1.62 ± 0.170.370 2.950 2.43 0.43 -0.30 273 ± 49 95 ± 42 -44 ± 17 1.93 ± 0.180.378 3.295 2.51 0.31 -0.30 230 ± 42 17 ± 55 -27 ± 19 1.46 ± 0.180.429 2.055 1.90 0.81 -0.59 2203 ± 348 54 ± 158 143 ± 85 1.03 ± 0.250.430 2.350 2.00 0.74 -0.53 1013 ± 182 181 ± 82 -102 ± 43 0.78 ± 0.220.430 2.650 2.10 0.67 -0.49 626 ± 113 90 ± 63 -41 ± 32 0.81 ± 0.220.430 2.950 2.19 0.58 -0.46 427 ± 78 56 ± 48 -24 ± 23 0.92 ± 0.230.430 3.350 2.31 0.45 -0.43 265 ± 48 105 ± 37 -12 ± 15 1.34 ± 0.230.436 3.807 2.41 0.30 -0.42 191 ± 35 128 ± 60 -54 ± 21 1.47 ± 0.240.481 2.371 1.85 0.79 -0.79 1660 ± 265 -34 ± 173 241 ± 97 0.92 ± 0.500.490 2.651 1.91 0.74 -0.75 1113 ± 177 291 ± 109 15 ± 62 0.68 ± 0.370.490 2.950 1.99 0.68 -0.69 644 ± 116 174 ± 69 -154 ± 35 0.23 ± 0.340.490 3.350 2.09 0.58 -0.64 397 ± 72 84 ± 49 -49 ± 24 1.39 ± 0.250.490 3.850 2.21 0.43 -0.60 272 ± 50 72 ± 46 5 ± 20 1.41 ± 0.260.494 4.307 2.30 0.29 -0.58 187 ± 37 169 ± 79 -14 ± 27 0.78 ± 0.320.538 2.968 1.85 0.73 -0.99 894 ± 148 111 ± 148 8 ± 69 −0.549 3.357 1.91 0.66 -0.96 514 ± 84 83 ± 67 -12 ± 31 −0.550 3.850 2.01 0.55 -0.88 327 ± 59 95 ± 54 -52 ± 26 0.65 ± 0.490.550 4.350 2.11 0.41 -0.83 258 ± 48 29 ± 62 -13 ± 27 0.90 ± 0.430.557 4.765 2.16 0.31 -0.83 222 ± 44 -42 ± 121 55 ± 51 1.36 ± 0.670.601 3.882 1.86 0.61 -1.26 292 ± 57 91 ± 89 74 ± 50 −0.610 4.352 1.91 0.52 -1.24 221 ± 43 75 ± 54 -53 ± 23 −0.610 4.850 2.00 0.40 -1.16 150 ± 26 -110 ± 48 39 ± 20 −
can only make the following conjectures as to the originof this discrepancy: the Cornell results do not appear tohave been corrected for internal virtual radiative effects(about 15%); their overall systematic uncertainty in ab-solute cross sections is 25%; their acceptance calculationhas a model dependence which was not quantified and inparticular the decay distribution, given in eq. (6) below,was assumed flat; finally, the estimate of average values ofkinematical variables 〈Q2〉 and 〈W 〉 may be an additionalsource of uncertainty since the corresponding bins are atleast 5 times larger than in the present work.
3.3 t dependence of cross sections
Four of the 34 distributions of differential cross sectionsare illustrated in fig. 12. The general features of these dis-tributions are of a diffractive type (dσ/dt ∝ ebt) at small
values of −t. The values of the slope b, as determined froma fit of the distributions in the interval -1.5 GeV2 < t < t0,are between 0.5 and 2.5 GeV−2 and are compiled in ta-ble 3. They are also plotted as a function of the formationlength (distance of fluctuation of the virtual photon in areal meson) [1]:
c∆τ =1
√
ν2 + Q2 + M2ω − ν
(4)
in fig. 13. They are compatible with those obtained forthe reaction γ∗p → ρ0p [12]. There exists only one pre-vious determination [17] of this quantity for γ∗p → ωp,integrated over a wide kinematical range correspondingto 0.6 < c∆τ < 2.5 fm, with a value b = 6.1± 0.8 GeV−2.This larger value of b is consistent with the observed dis-crepancy between the Cornell experiment and the presentwork. For larger values of −t, the slope of the cross sec-tions becomes much smaller and dσ/dt becomes nearly
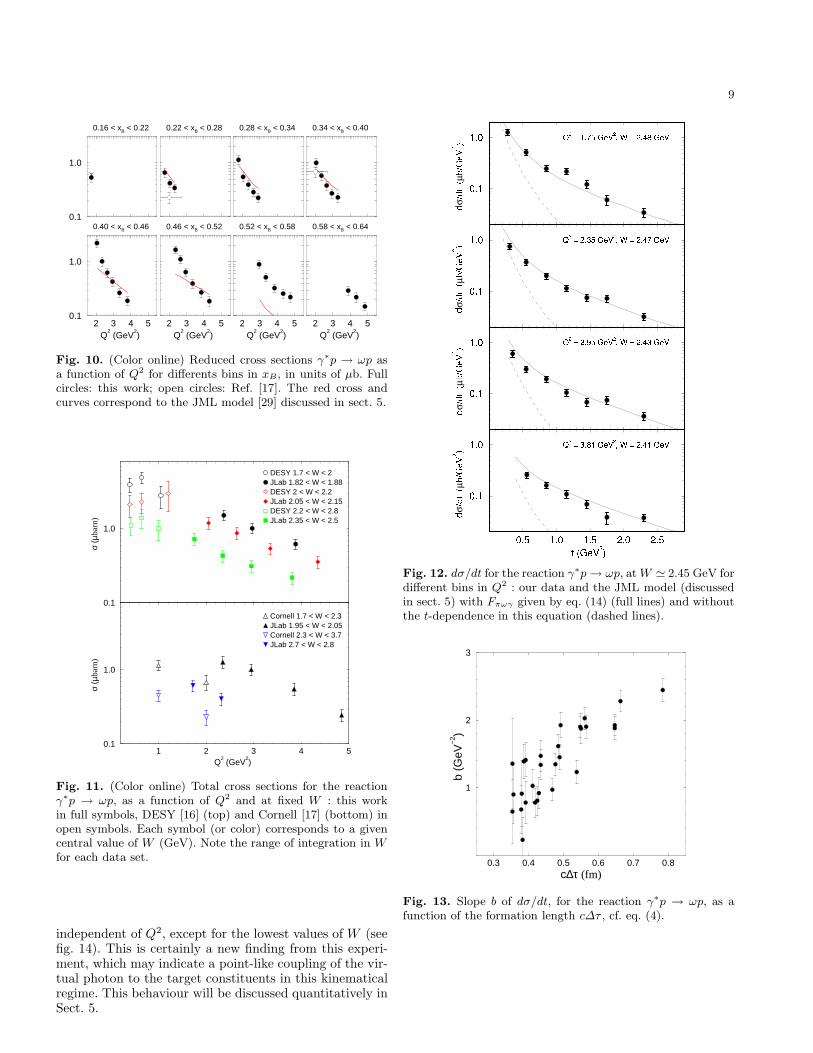
9
0.22 < xB < 0.28
0.1
1.0
0.16 < xB < 0.22 0.28 < xB < 0.34 0.34 < xB < 0.40
2 3 4 5Q
2 (GeV
2)
0.1
1.0
0.40 < xB < 0.46
2 3 4 5Q
2 (GeV
2)
0.46 < xB < 0.52
2 3 4 5Q
2 (GeV
2)
0.52 < xB < 0.58
2 3 4 5Q
2 (GeV
2)
0.58 < xB < 0.64
Fig. 10. (Color online) Reduced cross sections γ∗p → ωp asa function of Q2 for differents bins in xB, in units of µb. Fullcircles: this work; open circles: Ref. [17]. The red cross andcurves correspond to the JML model [29] discussed in sect. 5.
1 2 3 4 5Q
2 (GeV
2)
0.1
1.0
σ (µ
barn
)
Cornell 1.7 < W < 2.3JLab 1.95 < W < 2.05Cornell 2.3 < W < 3.7JLab 2.7 < W < 2.8
0.1
1.0
σ (µ
barn
)
DESY 1.7 < W < 2 JLab 1.82 < W < 1.88DESY 2 < W < 2.2JLab 2.05 < W < 2.15 DESY 2.2 < W < 2.8JLab 2.35 < W < 2.5
Fig. 11. (Color online) Total cross sections for the reactionγ∗p → ωp, as a function of Q2 and at fixed W : this workin full symbols, DESY [16] (top) and Cornell [17] (bottom) inopen symbols. Each symbol (or color) corresponds to a givencentral value of W (GeV). Note the range of integration in Wfor each data set.
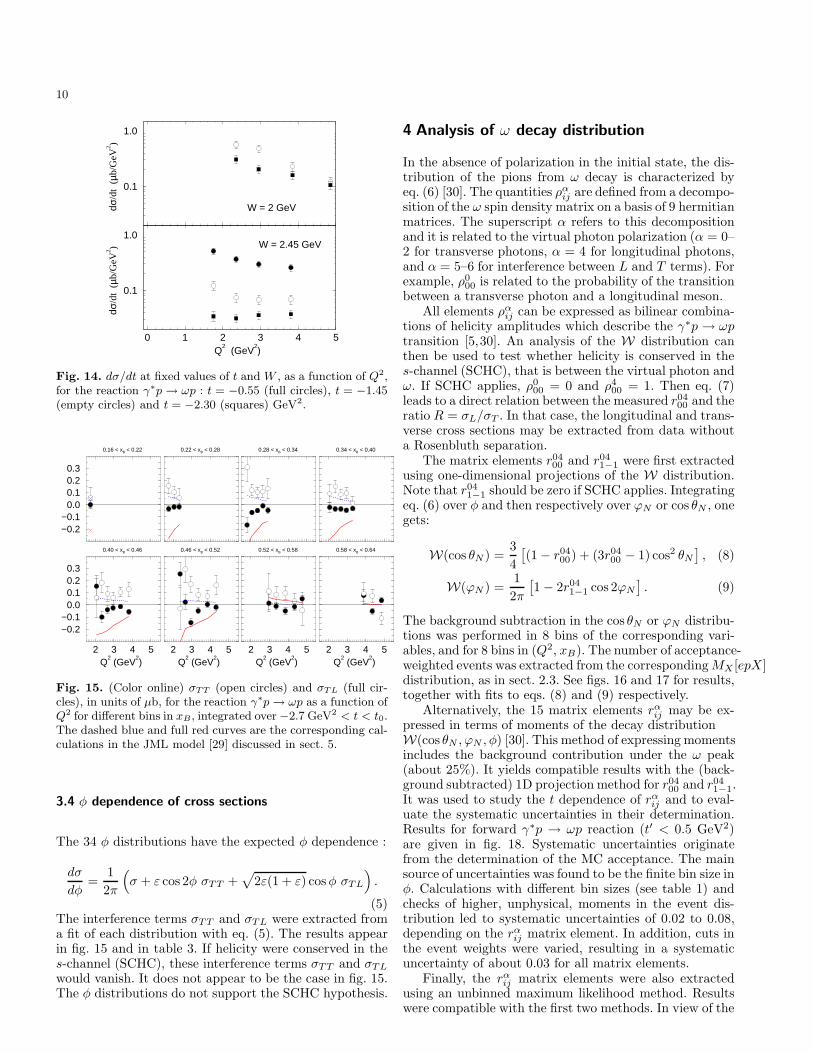
independent of Q2, except for the lowest values of W (seefig. 14). This is certainly a new finding from this experi-ment, which may indicate a point-like coupling of the vir-tual photon to the target constituents in this kinematicalregime. This behaviour will be discussed quantitatively inSect. 5.
Fig. 12. dσ/dt for the reaction γ∗p → ωp, at W ≃ 2.45 GeV fordifferent bins in Q2 : our data and the JML model (discussedin sect. 5) with Fπωγ given by eq. (14) (full lines) and withoutthe t-dependence in this equation (dashed lines).
0.3 0.4 0.5 0.6 0.7 0.8c∆τ (fm)
1
2
3
b (G
eV−
2 )
Fig. 13. Slope b of dσ/dt, for the reaction γ∗p → ωp, as afunction of the formation length c∆τ , cf. eq. (4).
10
0 1 2 3 4 5Q
2 (GeV
2)
0.1
1.0
dσ/d
t (µ
b/G
eV2 )
0.1
1.0
dσ/d
t (µ
b/G
eV2 )
W = 2.45 GeV
W = 2 GeV
Fig. 14. dσ/dt at fixed values of t and W , as a function of Q2,for the reaction γ∗p → ωp : t = −0.55 (full circles), t = −1.45(empty circles) and t = −2.30 (squares) GeV2.
0.22 < xB < 0.28
−0.2−0.1
0.00.10.20.3
0.16 < xB < 0.22 0.28 < xB < 0.34 0.34 < xB < 0.40
2 3 4 5Q
2 (GeV
2)
−0.2−0.1
0.00.10.20.3
0.40 < xB < 0.46
2 3 4 5Q
2 (GeV
2)
0.46 < xB < 0.52
2 3 4 5Q
2 (GeV
2)
0.52 < xB < 0.58
2 3 4 5Q
2 (GeV
2)
0.58 < xB < 0.64
Fig. 15. (Color online) σTT (open circles) and σTL (full cir-cles), in units of µb, for the reaction γ∗p → ωp as a function ofQ2 for different bins in xB, integrated over −2.7 GeV2 < t < t0.The dashed blue and full red curves are the corresponding cal-culations in the JML model [29] discussed in sect. 5.
3.4 φ dependence of cross sections
The 34 φ distributions have the expected φ dependence :
dσ
dφ=
1
2π
(
σ + ε cos 2φ σTT +√
2ε(1 + ε) cosφ σTL
)
.
(5)The interference terms σTT and σTL were extracted froma fit of each distribution with eq. (5). The results appearin fig. 15 and in table 3. If helicity were conserved in thes-channel (SCHC), these interference terms σTT and σTL
would vanish. It does not appear to be the case in fig. 15.The φ distributions do not support the SCHC hypothesis.
4 Analysis of ω decay distribution
In the absence of polarization in the initial state, the dis-tribution of the pions from ω decay is characterized byeq. (6) [30]. The quantities ρα
ij are defined from a decompo-sition of the ω spin density matrix on a basis of 9 hermitianmatrices. The superscript α refers to this decompositionand it is related to the virtual photon polarization (α = 0–2 for transverse photons, α = 4 for longitudinal photons,and α = 5–6 for interference between L and T terms). Forexample, ρ0
00 is related to the probability of the transitionbetween a transverse photon and a longitudinal meson.
All elements ραij can be expressed as bilinear combina-
tions of helicity amplitudes which describe the γ∗p → ωptransition [5,30]. An analysis of the W distribution canthen be used to test whether helicity is conserved in thes-channel (SCHC), that is between the virtual photon andω. If SCHC applies, ρ0
00 = 0 and ρ400 = 1. Then eq. (7)
leads to a direct relation between the measured r0400 and the
ratio R = σL/σT . In that case, the longitudinal and trans-verse cross sections may be extracted from data withouta Rosenbluth separation.
The matrix elements r0400 and r04
1−1 were first extractedusing one-dimensional projections of the W distribution.Note that r04
1−1 should be zero if SCHC applies. Integratingeq. (6) over φ and then respectively over ϕN or cos θN , onegets:
W(cos θN ) =3
4
[
(1 − r0400) + (3r04
00 − 1) cos2 θN
]
, (8)
W(ϕN ) =1
2π
[
1 − 2r041−1 cos 2ϕN
]
. (9)
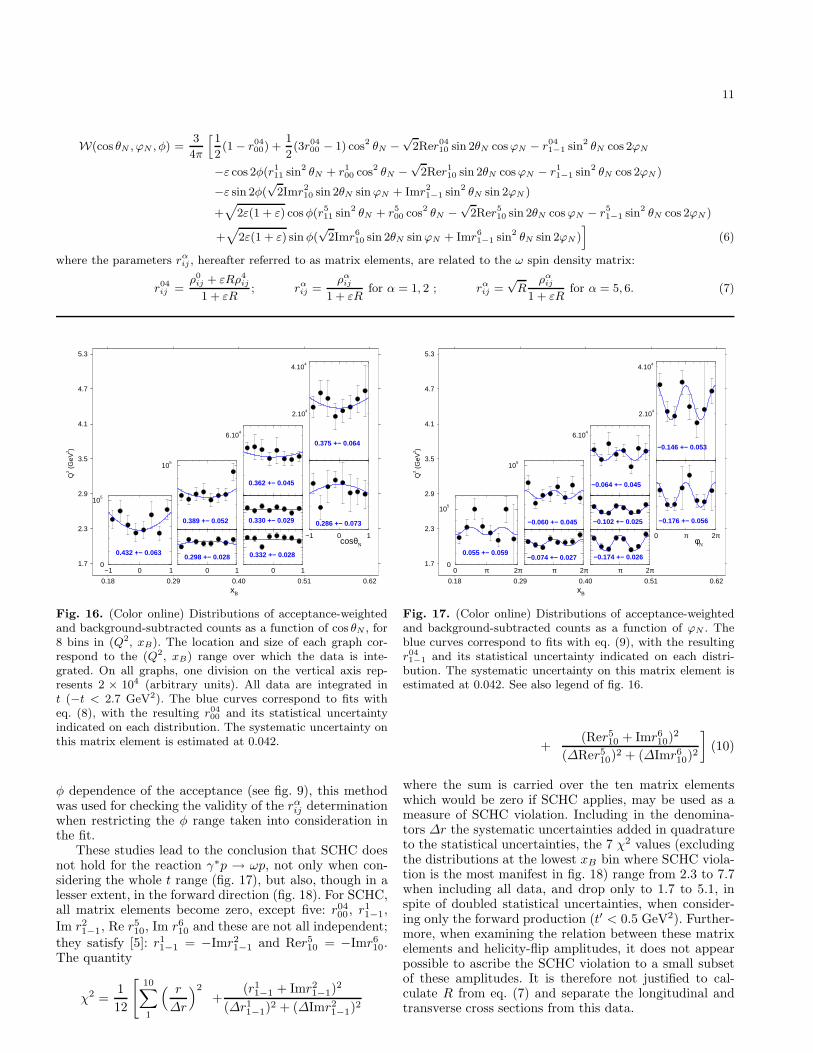
The background subtraction in the cos θN or ϕN distribu-tions was performed in 8 bins of the corresponding vari-ables, and for 8 bins in (Q2, xB). The number of acceptance-weighted events was extracted from the corresponding MX [epX ]distribution, as in sect. 2.3. See figs. 16 and 17 for results,together with fits to eqs. (8) and (9) respectively.
Alternatively, the 15 matrix elements rαij may be ex-
pressed in terms of moments of the decay distributionW(cos θN , ϕN , φ) [30]. This method of expressing momentsincludes the background contribution under the ω peak(about 25%). It yields compatible results with the (back-ground subtracted) 1D projection method for r04
00 and r041−1.
It was used to study the t dependence of rαij and to eval-
uate the systematic uncertainties in their determination.Results for forward γ∗p → ωp reaction (t′ < 0.5 GeV2)are given in fig. 18. Systematic uncertainties originatefrom the determination of the MC acceptance. The mainsource of uncertainties was found to be the finite bin size inφ. Calculations with different bin sizes (see table 1) andchecks of higher, unphysical, moments in the event dis-tribution led to systematic uncertainties of 0.02 to 0.08,depending on the rα
ij matrix element. In addition, cuts inthe event weights were varied, resulting in a systematicuncertainty of about 0.03 for all matrix elements.
Finally, the rαij matrix elements were also extracted
using an unbinned maximum likelihood method. Resultswere compatible with the first two methods. In view of the
11
W(cos θN , ϕN , φ) =3
4π
[
1
2(1 − r04
00) +1
2(3r04
00 − 1) cos2 θN −√
2Rer0410 sin 2θN cos ϕN − r04
1−1 sin2 θN cos 2ϕN
−ε cos 2φ(r111 sin2 θN + r1
00 cos2 θN −√
2Rer110 sin 2θN cos ϕN − r1
1−1 sin2 θN cos 2ϕN )
−ε sin 2φ(√
2Imr210 sin 2θN sin ϕN + Imr2
1−1 sin2 θN sin 2ϕN )
+√
2ε(1 + ε) cos φ(r511 sin2 θN + r5
00 cos2 θN −√
2Rer510 sin 2θN cos ϕN − r5
1−1 sin2 θN cos 2ϕN )
+√
2ε(1 + ε) sin φ(√
2Imr610 sin 2θN sin ϕN + Imr6
1−1 sin2 θN sin 2ϕN )]
(6)
where the parameters rαij , hereafter referred to as matrix elements, are related to the ω spin density matrix:
r04ij =
ρ0ij + εRρ4
ij
1 + εR; rα
ij =ρα
ij
1 + εRfor α = 1, 2 ; rα
ij =√
Rρα
ij
1 + εRfor α = 5, 6. (7)
−1 0 10
105
105
0 1 0 1
−1 0 1cosθN
0.18 0.29 0.40 0.51 0.62xB
1.7
2.3
2.9
3.5
4.1
4.7
5.3
Q2 (
GeV
2 )
0.432 +− 0.063
0.389 +− 0.052
6.104
4.104
2.104
0.298 +− 0.028
0.362 +− 0.045
0.330 +− 0.029
0.332 +− 0.028
0.375 +− 0.064
0.286 +− 0.073
Fig. 16. (Color online) Distributions of acceptance-weightedand background-subtracted counts as a function of cos θN , for8 bins in (Q2, xB). The location and size of each graph cor-respond to the (Q2, xB) range over which the data is inte-grated. On all graphs, one division on the vertical axis rep-resents 2 × 10⁴ (arbitrary units). All data are integrated int (−t < 2.7 GeV2). The blue curves correspond to fits witheq. (8), with the resulting r04
00 and its statistical uncertaintyindicated on each distribution. The systematic uncertainty onthis matrix element is estimated at 0.042.
φ dependence of the acceptance (see fig. 9), this methodwas used for checking the validity of the rα
ij determinationwhen restricting the φ range taken into consideration inthe fit.
These studies lead to the conclusion that SCHC doesnot hold for the reaction γ∗p → ωp, not only when con-sidering the whole t range (fig. 17), but also, though in alesser extent, in the forward direction (fig. 18). For SCHC,all matrix elements become zero, except five: r04
00 , r11−1,
Im r21−1, Re r5
10, Im r610 and these are not all independent;
they satisfy [5]: r11−1 = −Imr2
1−1 and Rer510 = −Imr6
10.The quantity
χ2 =1
12
[
10∑
1
( r
∆r
)2
+(r1
1−1 + Imr21−1)
2
(∆r11−1)
2 + (∆Imr21−1)
2
0 π 2π0
105
105
π 2π π 2π
0 π 2πφN
0.18 0.29 0.40 0.51 0.62xB
1.7
2.3
2.9
3.5
4.1
4.7
5.3
Q2 (
GeV
2 )
0.055 +− 0.059
−0.060 +− 0.045
6.104
4.104
2.104
−0.074 +− 0.027
−0.064 +− 0.045
−0.102 +− 0.025
−0.174 +− 0.026
−0.146 +− 0.053
−0.176 +− 0.056
Fig. 17. (Color online) Distributions of acceptance-weightedand background-subtracted counts as a function of ϕN . Theblue curves correspond to fits with eq. (9), with the resultingr041−1 and its statistical uncertainty indicated on each distri-
bution. The systematic uncertainty on this matrix element isestimated at 0.042. See also legend of fig. 16.
+(Rer5
10 + Imr610)
2
(∆Rer510)
2 + (∆Imr610)
2
]
(10)
where the sum is carried over the ten matrix elementswhich would be zero if SCHC applies, may be used as ameasure of SCHC violation. Including in the denomina-tors ∆r the systematic uncertainties added in quadratureto the statistical uncertainties, the 7 χ2 values (excludingthe distributions at the lowest xB bin where SCHC viola-tion is the most manifest in fig. 18) range from 2.3 to 7.7when including all data, and drop only to 1.7 to 5.1, inspite of doubled statistical uncertainties, when consider-ing only the forward production (t′ < 0.5 GeV2). Further-more, when examining the relation between these matrixelements and helicity-flip amplitudes, it does not appearpossible to ascribe the SCHC violation to a small subsetof these amplitudes. It is therefore not justified to cal-culate R from eq. (7) and separate the longitudinal andtransverse cross sections from this data.
12
−0.5
0.0
0.5
1.0
0.5
1.0
0.5
1.0
−0.5
0.0
0.0
0.5
1.0
0.18 0.29 0.40 0.51 0.62xB
1.7
2.3
2.9
3.5
4.1
4.7
5.3
Q2 (
GeV
2 )
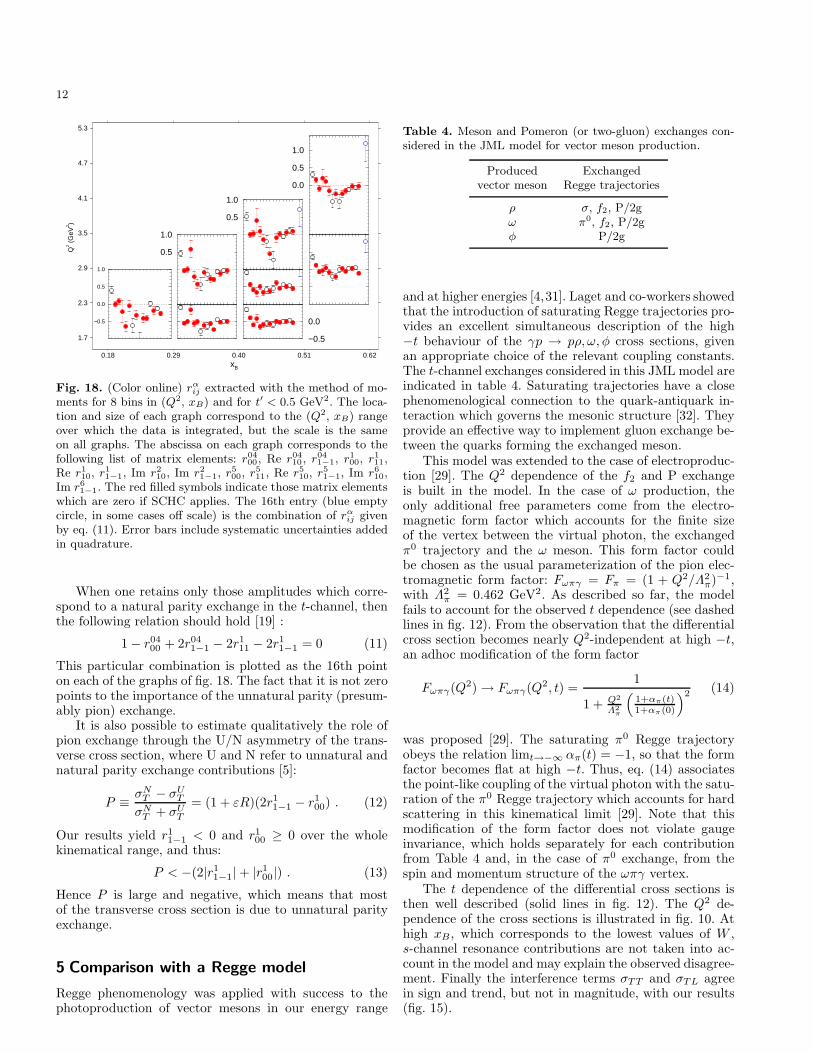
Fig. 18. (Color online) rαij extracted with the method of mo-
ments for 8 bins in (Q2, xB) and for t′ < 0.5 GeV2. The loca-tion and size of each graph correspond to the (Q2, xB) rangeover which the data is integrated, but the scale is the sameon all graphs. The abscissa on each graph corresponds to thefollowing list of matrix elements: r04
00, Re r0410 , r04
1−1, r100, r1
11,Re r1
10, r11−1, Im r2
10, Im r21−1, r5
00, r511, Re r5
10, r51−1, Im r6
10,Im r6
1−1. The red filled symbols indicate those matrix elementswhich are zero if SCHC applies. The 16th entry (blue emptycircle, in some cases off scale) is the combination of rα
ij givenby eq. (11). Error bars include systematic uncertainties addedin quadrature.
When one retains only those amplitudes which corre-spond to a natural parity exchange in the t-channel, thenthe following relation should hold [19] :
1 − r0400 + 2r04
1−1 − 2r111 − 2r1
1−1 = 0 (11)
This particular combination is plotted as the 16th pointon each of the graphs of fig. 18. The fact that it is not zeropoints to the importance of the unnatural parity (presum-ably pion) exchange.
It is also possible to estimate qualitatively the role ofpion exchange through the U/N asymmetry of the trans-verse cross section, where U and N refer to unnatural andnatural parity exchange contributions [5]:
P ≡σN
T − σUT
σNT + σU
T
= (1 + εR)(2r11−1 − r1
00) . (12)
Our results yield r11−1 < 0 and r1
00 ≥ 0 over the wholekinematical range, and thus:
P < −(2|r11−1| + |r1
00|) . (13)
Hence P is large and negative, which means that mostof the transverse cross section is due to unnatural parityexchange.
5 Comparison with a Regge model
Regge phenomenology was applied with success to thephotoproduction of vector mesons in our energy range
Table 4. Meson and Pomeron (or two-gluon) exchanges con-sidered in the JML model for vector meson production.
Produced Exchangedvector meson Regge trajectories
ρ σ, f2, P/2gω π0, f2, P/2gφ P/2g
and at higher energies [4,31]. Laget and co-workers showedthat the introduction of saturating Regge trajectories pro-vides an excellent simultaneous description of the high−t behaviour of the γp → pρ, ω, φ cross sections, givenan appropriate choice of the relevant coupling constants.The t-channel exchanges considered in this JML model areindicated in table 4. Saturating trajectories have a closephenomenological connection to the quark-antiquark in-teraction which governs the mesonic structure [32]. Theyprovide an effective way to implement gluon exchange be-tween the quarks forming the exchanged meson.
This model was extended to the case of electroproduc-tion [29]. The Q2 dependence of the f2 and P exchangeis built in the model. In the case of ω production, theonly additional free parameters come from the electro-magnetic form factor which accounts for the finite sizeof the vertex between the virtual photon, the exchangedπ0 trajectory and the ω meson. This form factor couldbe chosen as the usual parameterization of the pion elec-tromagnetic form factor: Fωπγ = Fπ = (1 + Q2/Λ2
π)−1,with Λ2
π = 0.462 GeV2. As described so far, the modelfails to account for the observed t dependence (see dashedlines in fig. 12). From the observation that the differentialcross section becomes nearly Q2-independent at high −t,an adhoc modification of the form factor
Fωπγ(Q2) → Fωπγ(Q2, t) =1
1 + Q2
Λ2π
(
1+απ(t)1+απ(0)
)2 (14)
was proposed [29]. The saturating π0 Regge trajectoryobeys the relation limt→−∞ απ(t) = −1, so that the formfactor becomes flat at high −t. Thus, eq. (14) associatesthe point-like coupling of the virtual photon with the satu-ration of the π0 Regge trajectory which accounts for hardscattering in this kinematical limit [29]. Note that thismodification of the form factor does not violate gaugeinvariance, which holds separately for each contributionfrom Table 4 and, in the case of π0 exchange, from thespin and momentum structure of the ωπγ vertex.
The t dependence of the differential cross sections isthen well described (solid lines in fig. 12). The Q2 de-pendence of the cross sections is illustrated in fig. 10. Athigh xB, which corresponds to the lowest values of W ,s-channel resonance contributions are not taken into ac-count in the model and may explain the observed disagree-ment. Finally the interference terms σTT and σTL agreein sign and trend, but not in magnitude, with our results(fig. 15).
13
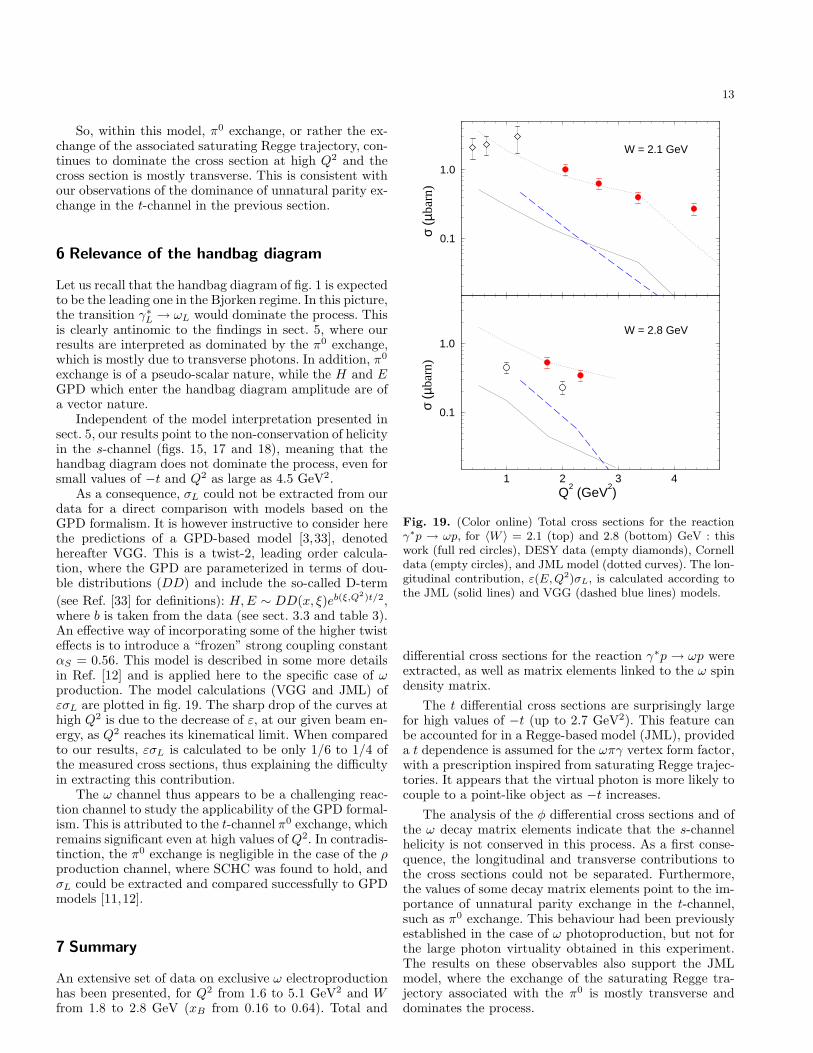
So, within this model, π0 exchange, or rather the ex-change of the associated saturating Regge trajectory, con-tinues to dominate the cross section at high Q2 and thecross section is mostly transverse. This is consistent withour observations of the dominance of unnatural parity ex-change in the t-channel in the previous section.
6 Relevance of the handbag diagram
Let us recall that the handbag diagram of fig. 1 is expectedto be the leading one in the Bjorken regime. In this picture,the transition γ∗
L → ωL would dominate the process. Thisis clearly antinomic to the findings in sect. 5, where ourresults are interpreted as dominated by the π0 exchange,which is mostly due to transverse photons. In addition, π0
exchange is of a pseudo-scalar nature, while the H and EGPD which enter the handbag diagram amplitude are ofa vector nature.
Independent of the model interpretation presented insect. 5, our results point to the non-conservation of helicityin the s-channel (figs. 15, 17 and 18), meaning that thehandbag diagram does not dominate the process, even forsmall values of −t and Q2 as large as 4.5 GeV2.
As a consequence, σL could not be extracted from ourdata for a direct comparison with models based on theGPD formalism. It is however instructive to consider herethe predictions of a GPD-based model [3,33], denotedhereafter VGG. This is a twist-2, leading order calcula-tion, where the GPD are parameterized in terms of dou-ble distributions (DD) and include the so-called D-term
(see Ref. [33] for definitions): H, E ∼ DD(x, ξ)eb(ξ,Q2)t/2,where b is taken from the data (see sect. 3.3 and table 3).An effective way of incorporating some of the higher twisteffects is to introduce a “frozen” strong coupling constantαS = 0.56. This model is described in some more detailsin Ref. [12] and is applied here to the specific case of ωproduction. The model calculations (VGG and JML) ofεσL are plotted in fig. 19. The sharp drop of the curves athigh Q2 is due to the decrease of ε, at our given beam en-ergy, as Q2 reaches its kinematical limit. When comparedto our results, εσL is calculated to be only 1/6 to 1/4 ofthe measured cross sections, thus explaining the difficultyin extracting this contribution.
The ω channel thus appears to be a challenging reac-tion channel to study the applicability of the GPD formal-ism. This is attributed to the t-channel π0 exchange, whichremains significant even at high values of Q2. In contradis-tinction, the π0 exchange is negligible in the case of the ρproduction channel, where SCHC was found to hold, andσL could be extracted and compared successfully to GPDmodels [11,12].
7 Summary
An extensive set of data on exclusive ω electroproductionhas been presented, for Q2 from 1.6 to 5.1 GeV2 and Wfrom 1.8 to 2.8 GeV (xB from 0.16 to 0.64). Total and
1 2 3 4Q
2 (GeV
2)
0.1
1.0
σ (µ
barn
)
0.1
1.0
σ (µ
barn
)
W = 2.1 GeV
W = 2.8 GeV
Fig. 19. (Color online) Total cross sections for the reactionγ∗p → ωp, for 〈W 〉 = 2.1 (top) and 2.8 (bottom) GeV : thiswork (full red circles), DESY data (empty diamonds), Cornelldata (empty circles), and JML model (dotted curves). The lon-gitudinal contribution, ε(E,Q2)σL, is calculated according tothe JML (solid lines) and VGG (dashed blue lines) models.
differential cross sections for the reaction γ∗p → ωp wereextracted, as well as matrix elements linked to the ω spindensity matrix.
The t differential cross sections are surprisingly largefor high values of −t (up to 2.7 GeV2). This feature canbe accounted for in a Regge-based model (JML), provideda t dependence is assumed for the ωπγ vertex form factor,with a prescription inspired from saturating Regge trajec-tories. It appears that the virtual photon is more likely tocouple to a point-like object as −t increases.
The analysis of the φ differential cross sections and ofthe ω decay matrix elements indicate that the s-channelhelicity is not conserved in this process. As a first conse-quence, the longitudinal and transverse contributions tothe cross sections could not be separated. Furthermore,the values of some decay matrix elements point to the im-portance of unnatural parity exchange in the t-channel,such as π0 exchange. This behaviour had been previouslyestablished in the case of ω photoproduction, but not forthe large photon virtuality obtained in this experiment.The results on these observables also support the JMLmodel, where the exchange of the saturating Regge tra-jectory associated with the π0 is mostly transverse anddominates the process.

14
Finally, the experiment demonstrated that exclusivevector meson electroproduction can be measured with highstatistics in a wide kinematical range. The limitations athigh Q2 were not due to the available luminosity of theCEBAF accelerator or to the characteristics of the CLASspectrometer, but to the present beam energy. With theplanned upgrade of the beam energy up to 12 GeV [34],such reactions will be measured to still higher values of Q2.In the specific case of the ω meson, as was shown in thispaper, this will be a necessary condition for the extrac-tion of a longitudinal contribution of the handbag type,related at low values of −t to generalized parton distribu-tions. More generally, this experiment opens a window onthe high Q2 and high −t behaviour of exclusive reactions,which needs further exploration.
We would like to acknowledge the outstanding efforts of thestaff of the Accelerator and the Physics Divisions at JLabthat made this experiment possible. This work was supportedin part by the Italian Istituto Nazionale di Fisica Nucleare,the French Centre National de la Recherche Scientifique, theFrench Commissariat a l’Energie Atomique, the U.S. Depart-ment of Energy and National Science Foundation, the EmmyNoether grant from the Deutsche Forschungs Gemeinschaftand the Korean Science and Engineering Foundation. The South-eastern Universities Research Association (SURA) operates theThomas Jefferson National Accelerator Facility for the UnitedStates Department of Energy under contract DE-AC05-84ER-40150.
References
1. T.H. Bauer et al., Rev. Mod. Phys. 50 (1978) 261.2. L.L. Frankfurt, G.A. Miller and M.I. Strikman, Ann. Rev.
Nucl. Sci. 44 (1994) 501.3. M. Vanderhaeghen, P.A.M. Guichon and M. Guidal, Phys.
Rev. D 56 (1997) 2982.4. F. Cano and J.-M. Laget, Phys. Rev. D 65 (2002) 074022.5. S. Donnachie, G. Dosch, P. Landshoff and O. Nachtmann,
Pomeron Physics and QCD (Cambridge University Press,New York, 2002).
6. J.-M. Laget, Phys. Lett. B489 (2000) 313.7. M. Battaglieri et al., Phys. Rev. Lett. 90 (2003) 022002.8. X. Ji, Phys. Rev. Lett. 78 (1997) 610; Phys. Rev. D 55
(1997) 7114; Annu. Rev. Nucl. Part. Sci. 54 (2004) 413.9. A.V. Belitsky and A.V. Radyushkin, Report JLAB-THY-
04-34 (2004), hep-ph/0504030.10. J.C. Collins, L. Frankfurt, and M. Strikman, Phys. Rev. D
56 (1997) 2982.11. A. Airapetian et al., Eur. Phys. J. C 17 (2000) 389.12. C. Hadjidakis et al., Phys. Lett. B 605 (2005) 256.13. M. Diehl, Phys. Rep. 388 (2003) 41.14. J. Ballam et al., Phys. Rev. D 10 (1974) 765.15. C. del Papa et al., Phys. Rev. D 19 (1979) 1303.16. P. Joos et al., Nucl. Phys. B122 (1977) 365.17. D.G. Cassel et al., Phys. Rev. D 24 (1981) 2787.18. J. Breitweig et al., Phys. Lett. B 487 (2000) 273.19. M. Tytgat, DESY-THESIS-2001-018 (2001).20. A.H. Rosenfeld and P. Soding, Properties of the fundamen-
tal interactions, in Proceedings 1971 Int. School of Subnu-
clear Physics, Erice, edited by A. Zichichi, Vol. 9C (EditriceCompositori, Bologna, 1973) p. 883.
21. L. Morand, These de doctorat, Universite Denis Diderot-Paris 7 (2003); Report DAPNIA-03-09-T.
22. M.L. Stevenson et al., Phys. Rev. 125 (1962) 687.23. B.A. Mecking et al., Nucl. Instr. and Meth. A503 (2003)
513.24. A separate CLAS experiment, under analysis, addresses
the low W and low Q2 ω electroproduction; see V. Burkertet al., AIP Conf. Proc. 549 (2002) 259.
25. P. Corvisiero et al., Nucl. Instr. and Meth. A346 (1994)433; and M. Battaglieri, private communication.
26. L.W. Mo and Y.S. Tsai, Rev. Mod. Phys. 41 (1969) 205.27. L.N. Hand, Phys. Rev. 129 (1963) 1834.28. Particle Data Group: S. Eidelman et al., Phys. Lett B592
(2004) 1.29. J.-M. Laget, Phys. Rev. D 70 (2004) 054023.30. K. Schilling and G. Wolf, Nucl. Phys. B61 (1973) 381.31. A. Sibirtsev, K. Tsushima and S. Krewald, Phys. Rev. C
67 (2003) 055201.32. M.N. Sergeenko, Z. Phys. C64 (1994) 315.33. K. Goeke, M.V. Polyakov and M. Vanderhaeghen, Prog.
Part. Nucl. Phys. 47 (2001) 401.34. Pre-conceptual design report for the science and ex-
perimental equipment for the 12 GeV upgrade of CE-
BAF, http://www.jlab.org/div dept/physics division/pCDR public/pCDR final
Copyright © 2022 FDOKUMEN