Middle cerebral artery flow velocity waveforms and fetal compromise
Upload
independentCategory
view
3download
0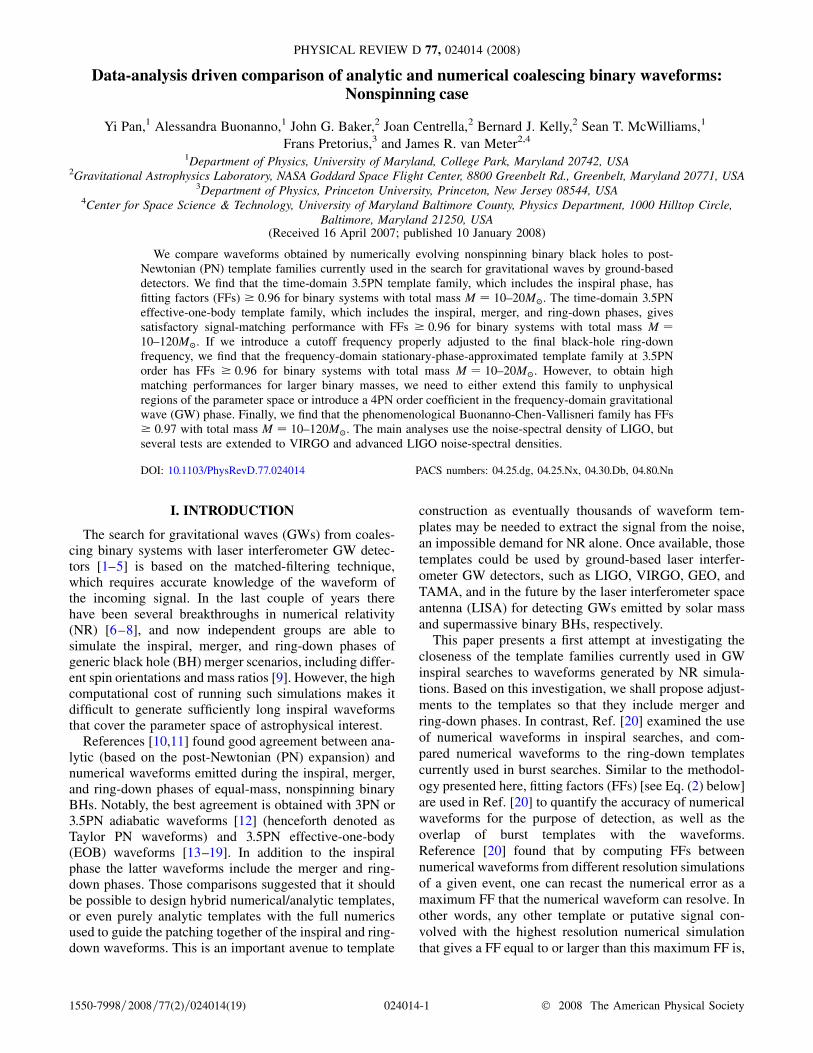
Data-analysis driven comparison of analytic and numerical coalescing binary waveforms:Nonspinning case
Yi Pan,1 Alessandra Buonanno,1 John G. Baker,2 Joan Centrella,2 Bernard J. Kelly,2 Sean T. McWilliams,1
Frans Pretorius,3 and James R. van Meter2,4
1Department of Physics, University of Maryland, College Park, Maryland 20742, USA2Gravitational Astrophysics Laboratory, NASA Goddard Space Flight Center, 8800 Greenbelt Rd., Greenbelt, Maryland 20771, USA
3Department of Physics, Princeton University, Princeton, New Jersey 08544, USA4Center for Space Science & Technology, University of Maryland Baltimore County, Physics Department, 1000 Hilltop Circle,
Baltimore, Maryland 21250, USA(Received 16 April 2007; published 10 January 2008)
We compare waveforms obtained by numerically evolving nonspinning binary black holes to post-Newtonian (PN) template families currently used in the search for gravitational waves by ground-baseddetectors. We find that the time-domain 3.5PN template family, which includes the inspiral phase, hasfitting factors (FFs) � 0:96 for binary systems with total mass M � 10–20M�. The time-domain 3.5PNeffective-one-body template family, which includes the inspiral, merger, and ring-down phases, givessatisfactory signal-matching performance with FFs � 0:96 for binary systems with total mass M �10–120M�. If we introduce a cutoff frequency properly adjusted to the final black-hole ring-downfrequency, we find that the frequency-domain stationary-phase-approximated template family at 3.5PNorder has FFs � 0:96 for binary systems with total mass M � 10–20M�. However, to obtain highmatching performances for larger binary masses, we need to either extend this family to unphysicalregions of the parameter space or introduce a 4PN order coefficient in the frequency-domain gravitationalwave (GW) phase. Finally, we find that the phenomenological Buonanno-Chen-Vallisneri family has FFs� 0:97 with total mass M � 10–120M�. The main analyses use the noise-spectral density of LIGO, butseveral tests are extended to VIRGO and advanced LIGO noise-spectral densities.
DOI: 10.1103/PhysRevD.77.024014 PACS numbers: 04.25.dg, 04.25.Nx, 04.30.Db, 04.80.Nn
I. INTRODUCTION
The search for gravitational waves (GWs) from coales-cing binary systems with laser interferometer GW detec-tors [1–5] is based on the matched-filtering technique,which requires accurate knowledge of the waveform ofthe incoming signal. In the last couple of years therehave been several breakthroughs in numerical relativity(NR) [6–8], and now independent groups are able tosimulate the inspiral, merger, and ring-down phases ofgeneric black hole (BH) merger scenarios, including differ-ent spin orientations and mass ratios [9]. However, the highcomputational cost of running such simulations makes itdifficult to generate sufficiently long inspiral waveformsthat cover the parameter space of astrophysical interest.
References [10,11] found good agreement between ana-lytic (based on the post-Newtonian (PN) expansion) andnumerical waveforms emitted during the inspiral, merger,and ring-down phases of equal-mass, nonspinning binaryBHs. Notably, the best agreement is obtained with 3PN or3.5PN adiabatic waveforms [12] (henceforth denoted asTaylor PN waveforms) and 3.5PN effective-one-body(EOB) waveforms [13–19]. In addition to the inspiralphase the latter waveforms include the merger and ring-down phases. Those comparisons suggested that it shouldbe possible to design hybrid numerical/analytic templates,or even purely analytic templates with the full numericsused to guide the patching together of the inspiral and ring-down waveforms. This is an important avenue to template
construction as eventually thousands of waveform tem-plates may be needed to extract the signal from the noise,an impossible demand for NR alone. Once available, thosetemplates could be used by ground-based laser interfer-ometer GW detectors, such as LIGO, VIRGO, GEO, andTAMA, and in the future by the laser interferometer spaceantenna (LISA) for detecting GWs emitted by solar massand supermassive binary BHs, respectively.
This paper presents a first attempt at investigating thecloseness of the template families currently used in GWinspiral searches to waveforms generated by NR simula-tions. Based on this investigation, we shall propose adjust-ments to the templates so that they include merger andring-down phases. In contrast, Ref. [20] examined the useof numerical waveforms in inspiral searches, and com-pared numerical waveforms to the ring-down templatescurrently used in burst searches. Similar to the methodol-ogy presented here, fitting factors (FFs) [see Eq. (2) below]are used in Ref. [20] to quantify the accuracy of numericalwaveforms for the purpose of detection, as well as theoverlap of burst templates with the waveforms.Reference [20] found that by computing FFs betweennumerical waveforms from different resolution simulationsof a given event, one can recast the numerical error as amaximum FF that the numerical waveform can resolve. Inother words, any other template or putative signal con-volved with the highest resolution numerical simulationthat gives a FF equal to or larger than this maximum FF is,
PHYSICAL REVIEW D 77, 024014 (2008)
1550-7998=2008=77(2)=024014(19) 024014-1 © 2008 The American Physical Society
for the purpose of detection, indistinguishable from thenumerical waveform. We will explore this aspect of theproblem briefly. The primary conclusions we will drawfrom the analysis do not crucially depend on the exactnessof the numerical waveforms. What counts here is that thetemplates can capture the dominant spectral characteristicsof the true waveform.
For our analysis we shall focus on two nonspinningequal-mass binary simulation waveforms which differ inlength, initial conditions, and the evolution codes used tocompute them: Cook-Pfeiffer quasiequilibrium initial databuilt on Refs. [21–25] evolved with Pretorius’ generalized-harmonic code [6], and Brandt-Brugmann puncture data[26] evolved using the Goddard group’s moving-puncturecode [8]. We also consider two nonspinning unequal-massbinary simulations with mass ratios m2=m1 � 1:5 andm2=m1 � 2 produced by the Goddard group.
The paper is organized as follows. In Sec. II we discussthe phase differences between PN inspiraling templates. InSec. III we build hybrid waveforms by stitching togetherPN and NR waveforms. We try to understand how manyNR cycles are needed to obtain good agreement betweenNR and PN waveforms, to offer a guide for how long PNwaveforms can be used as accurate templates. In Sec. IVwe compute the FFs between several PN-template familiesand NR waveforms. We first focus on low-mass binarysystems with total mass M � 10–30M�, then high-massbinary systems with total mass M � 30–120M�. Finally,Sec. V contains our main conclusions. In the appendix wecomment on how different representations of the energy-balance equations give GW frequencies closer to or fartherfrom the NR ones.
II. PHASE DIFFERENCES IN POST-NEWTONIANINSPIRALING MODELS
Starting from Ref. [27], which pointed out the impor-tance of predicting GW phasing with the highest possibleaccuracy when building GW templates, many subsequentstudies [14,18,19,28–32] (those references are restricted tothe nonspinning case) focused on this issue and thoroughlytested the accuracy of those templates, proposing improvedrepresentations of them. These questions were motivatedby the observation that comparable-mass binary systemswith total mass higher than 30M� merge in-band with thehighest signal-to-noise ratio (SNR) for LIGO detectors. Itfollows that the corresponding templates demand an im-proved analysis.
In the absence of NR results and under the urgency ofproviding templates to search for comparable-mass binaryBHs, the analytic PN community pushed PN calculationsto higher PN orders, notably 3.5PN order [12], and alsoproposed ways of resumming the PN expansion, either forconservative dynamics (the EOB approach [13,16,17]),radiation-reaction effects (the Pade resummation [19]),or both [14,18]. Those results lead to several con-
clusions: (i) 3PN terms improve the comparison betweenanalytic and (numerical) quasiequilibrium predictions[22,25,33,34]; (ii) Taylor expanded and resummed PNpredictions for equal-mass binary systems are much closerat 3.5PN order than at previous PN orders, indicating aconvergence between the different schemes [18,28,30];(iii) the two-body motion is quasicircular until the end ofa rather blurred plunge [14], (iv) the transition to ring-down can be described by an extremely short merger phase[14,18]. Today, with the NR results we are in a position tosharpen the above conclusions, and to start to assess thecloseness of analytic templates to numerical waveforms.
Henceforth, we restrict the analysis to the three time-domain physical template families which are closest to NRresults [10,11]: the adiabatic Taylor PN model (Tpn) [see,e.g., Eqs. (1), (10), and (11)–(13) in Ref. [35]] computed at3PN and 3.5PN order, and the nonadiabatic EOB model(Epn) [see e.g., Eqs. (3.41)–(3.44) in Ref. [14]] computedat 3.5PN order. We shall denote our models as Tpn(n) andEpn(n), n being the PN order. The Tpn model is obtainedby solving a particular representation of the balance equa-tion. In the appendix we briefly discuss how time-domainPN models based on different representations of theenergy-balance equation would compare with NR results.
The waveforms we use are always derived in the so-called restricted approximation which uses the amplitudeat Newtonian order and the phase at the highest PN orderavailable. They are computed by solving PN dynamicalequations providing the instantaneous frequency !�t� andphase ��t� � �0 �
Rtt0!�t0�dt0, thus
h�t� �A!�t�2=3 cos�2��t��; (1)
where t0 and�0 are the initial time and phase, respectively,and A is a constant amplitude, irrelevant to our discus-sion. The inclusion of higher-order PN corrections to theamplitude can be rather important for certain unequal-massbinary systems, and will be the subject of a future study.
When measuring the differences between waveforms weweight them by the power spectral-density (PSD) of thedetector, and compute the widely used fitting factor (FF)(i.e., the ambiguity function or normalized overlap), orequivalently the mismatch defined as 1-FF. Following thestandard formalism of matched-filtering [see, e.g.,Refs. [19,30,36]], we define the FF as the overlaphh1�t�; h2�t�i between the waveforms h1�t� and h2�t�:
hh1�t�;h2�t�i4ReZ 1
0
~h1�f�~h2�f�
Sh�f�df;
FF maxt0;�0;�i
hh1;h2�t0;�0;�i�i�����������������������������������������������������������������������
hh1;h1ihh2�t0;�0;�i�;h2�t0;�0;�
i�ip ;
(2)
where ~hi�f� is the Fourier transform of hi�t�, and Sh�f� isthe detector’s PSD. Thus, the FF is the normalized overlapbetween a target waveform h1�t� and a set of templatewaveforms h2�t0; �0; �i� maximized over the initial time
YI PAN et al. PHYSICAL REVIEW D 77, 024014 (2008)
024014-2
t0, initial phase�0, and other parameters �i. Sometimes weare interested in FFs that are optimized only over t0 and�0;we shall denote these as FF0. For data analysis purposes,the FF has more direct meaning than the phase evolution ofthe waveforms, since it takes into account the PSDs and isproportional to the SNR of the filtered signal. Since theevent rate is proportional to the cube of the SNR, and thusto the cube of the FF, a FF � 0:97 corresponds to a loss ofevent rates of�10%. A template waveform is considered asatisfactory representation of the target waveform whenthe FF is larger than 0.97.
When comparing two families of waveforms, the FF isoptimized over the initial phase of the template waveform,and we also need to specify the initial phase of the targetwaveform. Since there is no preferred initial phase of thetarget, two options are usually adopted: (i) the initial phasemaximizes the FF or (ii) it minimizes the FF. The resultingFFs are referred to as the best and minimax FFs [29]. AllFFs we present in this paper are minimax FFs. Althoughthe FF of two waveform families is generally asymmetricunder interchange of the template family [30], the best andthe minimax FF0s are symmetric (see Appendix B ofRef. [29] for details). Henceforth, when comparing twowaveform families using FF0, we do not need to specifywhich family is the target.
We shall consider three interferometric GW detectors:LIGO, advanced LIGO, and VIRGO. The latter two havebetter low-frequency sensitivity and broader bandwidth.For LIGO, we use the analytic fit to the LIGO designPSD given in Ref. [28]; for advanced LIGO we use thebroadband configuration PSD given in Ref. [37]; forVIRGO we use the PSD given in Ref. [28].
In Fig. 1, we show the FF0s as functions of the accumu-lated difference in the number of GW cycles betweenwaveforms generated with different inspiraling PN modelsand for binary systems with different component masses.We first generate two waveforms by evolving two PNmodels, say, ‘‘PN1’’ and ‘‘PN2’’ which start at the sameGW frequency fGW � 30 Hz and have the same initialphase. The two waveforms are terminated at the sameending frequency fGW � fend up to a maximum fend;max �
min�fend;PN1; fend;PN2
�, where fend;PN is the frequency atwhich the PN inspiraling model ends. (For Tpn modelsthis is the frequency at which the PN energy has a mini-mum; for Epn models it is the EOB light-ring frequency.)Then, we compute the difference in phase and number ofGW cycles accumulated until the ending frequency
�NGW �����
1
���PN1
�fend� ��PN2�fend��: (3)
By varying fend (up to fend;max) �NGW changes, though notnecessarily monotonically. Although there seems to be aloose correlation between the FF0s and �NGW, it is hard toquantify it as a one-to-one correspondence. For example, aphase difference of about half a GW cycle (�NGW ’ 0:5) is
usually thought to be significant. However, here we findrelatively high FF0s between 0.97 and >0:99, dependingon the masses of the binary and the specific PN model used.This happens because the FF between two waveforms isnot determined by the total phase difference accumulated,but rather by how the phase difference accumulates acrossthe detector’s most sensitive frequency band. The relationbetween FFs and phase differences is also blurred by themaximization over the initial time and phase: shifting thephase by half a cycle from the most sensitive band to a lesssensitive band can increase the matching significantly. Weconclude that with LIGO’s PSD, after maximizing only oninitial phase and time, Epn(3.5) and Tpn(3.5) templates areclose to each other for comparable-mass binary systemsM � 6–30M� with FF0 * 0:97, but they can be differentfor mass ratios m2=m1 ’ 0:3 with FF0 as low as ’ 0:8.Tpn(3) and Tpn(3.5) templates have FF0 * 0:97 for thebinary masses considered. Note that for m2=m1 � 1[ ’ 0:3] binary systems, Tpn(3.5) is closer to Epn(3.5)[Tpn(3)] than to Tpn(3) [Epn(3.5)]. Note also that whenmaximizing on binary masses the FFs can increase signifi-cantly, for instance, for a �15� 3�M� binary, the FF be-tween Tpn(3.5) and Epn(3.5) waveforms becomes >0:995,whereas FF0 ’ 0:8.
III. BUILDING AND COMPARING HYBRIDWAVEFORMS
Recent comparisons [10,11] between analytic and nu-merical inspiraling waveforms of nonspinning, equal-massbinary systems have shown that numerical waveforms arein good agreement with Epn(3.5), Tpn(3), and Tpn(3.5)
0 0.2 0.4 0.6 0.8 1.0 1.2NGW
0.95
0.96
0.97
0.98
0.99
1.00
Fitti
ng F
acto
r
Tpn(3.5) & Epn(3.5), (3+3)Tpn(3.5) & Epn(3.5), (15+3)Tpn(3.5) & Epn(3.5), (15+15)Tpn(3) & Tpn(3.5), (3+3)Tpn(3) & Tpn(3.5), (15+3)Tpn(3) & Tpn(3.5), (15+15)
∆
FIG. 1 (color online). We show FF0s between waveformsgenerated from the three PN models Tpn(3), Tpn(3.5), andEpn(3.5) versus �NGW [see Eq. (3)]. The FF0s are evaluatedwith LIGO’s PSD. Note that for Tpn(3.5) and Epn(3.5) and a�15� 3�M� binary, the lowest FF0 is 0.78 and the difference inthe number of GW cycles �NGW ’ 2. In the limit �NGW ! 0,the FF0 goes to unity.
DATA-ANALYSIS DRIVEN COMPARISON OF ANALYTIC . . . PHYSICAL REVIEW D 77, 024014 (2008)
024014-3
waveforms. Those results were assessed using eight and 16numerical inspiral GW cycles. Can we conclude from theseanalyses that Epn(3.5), Tpn(3.5), and Tpn(3) can safely beused to build a template bank for detecting inspiraling GWsignals? A way to address this question is to compute themismatch between hybrid waveforms built by attachingeither Epn or Tpn waveforms to the same numerical wave-form, and varying the time when the attachment is made.This is equivalent to varying the number of numerical GWcycles n in the hybrid template. The larger n the smaller themismatch, as we are using the same numerical segment inboth waveforms. For a desired maximum mismatch, say3%, we can then find the smallest number n of numericalcycles that is required in the hybrid waveform. This num-ber will, of course, depend on the binary mass and the PSDof each detector.
A. Hybrid waveforms
We build hybrid waveforms by connecting PN wave-forms to NR waveforms at a chosen point in the lateinspiral stage. As mentioned before, we use NR waveformsgenerated with Pretorius’ [10] code and the Goddardgroup’s [38] code. Pretorius’ waveform is from an equal-mass binary with total mass M, and equal, corotating spins(a � 0:06). The simulation lasts ’ 671M, and the wave-form has ’ 8 cycles before the formation of the commonapparent horizon. The Goddard waveform refers to anequal-mass nonspinning binary. The simulation lasts about’ 1516M, and the waveform has ’ 16 cycles beforemerger.
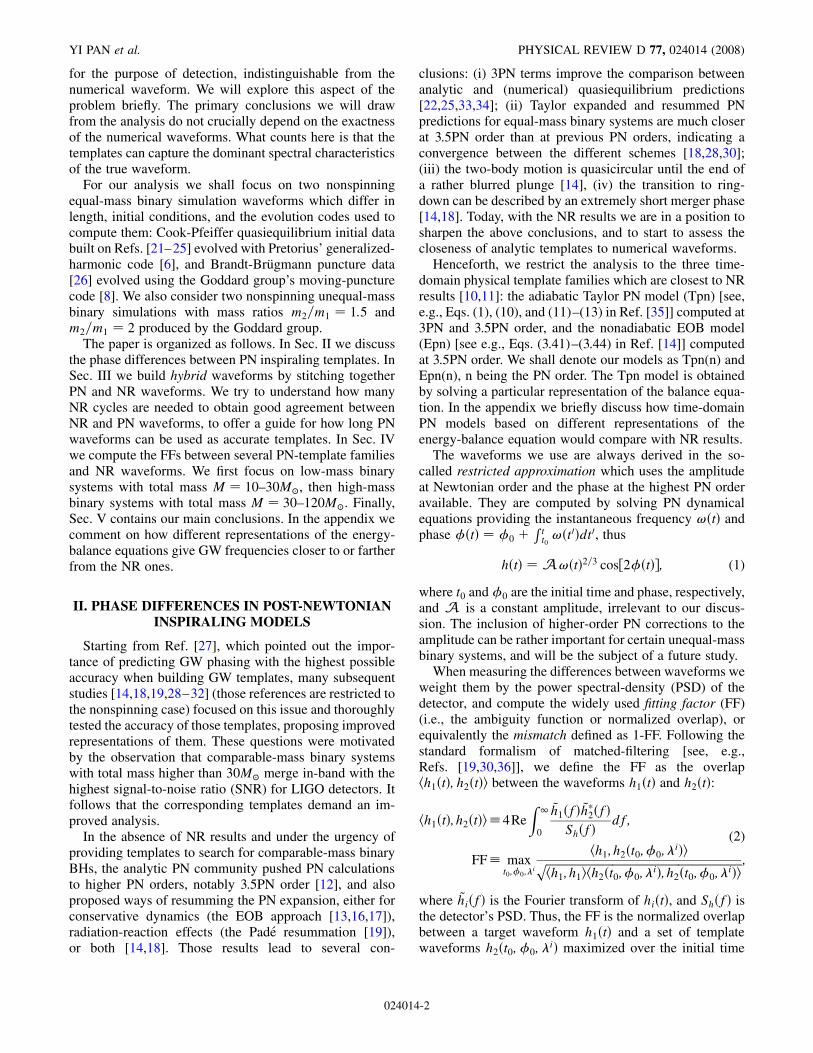
Since we will present results from these two waveformsit is useful to first compare them by computing the FF0.Although the binary parameters considered by Pretoriusand Goddard are slightly different, we expect the wave-forms, especially around the merger stage, to be fairlyclose. Comparisons between (shorter) waveforms com-puted with moving punctures and generalized-harmonicgauge were reported in Ref. [39], where the authors dis-cussed the different initial conditions, wave extractiontechniques, and compared the phase, amplitude, and fre-quency evolutions. Since the two simulations use differentinitial conditions and last for different amounts of time wecut the longer Goddard waveform at roughly the frequencywhere the Pretorius waveform starts. In this way we com-pare waveforms that have the same length between theinitial time and the time at which the wave amplitudereaches its maximum. In Fig. 2, we show the FF0 asfunction of the total binary mass. Despite differences inthe two simulations the FF0s are rather high. The wave-forms differ more significantly at lower frequencies.Indeed, as the total mass decreases the FF0s also decreaseas these early parts of the waveform contribute more to thesignal power given LIGO’s PSD.
Any waveform extracted from a numerical simulationwill inherit truncation errors, affecting both the wave-
form’s amplitude and phase [10,20,38]. To check whetherthose differences would change the results of the compari-sons between NR and PN waveforms, we plot in Fig. 2 theFF0s versus total binary mass between two Goddard wave-forms generated from a high and a medium-resolution run[38]. The FF0s are extremely high (> 0:995).
Based on the comparisons between high and medium-resolution waveforms, we can estimate the FFs betweenhigh-resolution and exact waveforms. If we have severalsimulations with different resolutions, specified by themesh-spacings xi, and xi are sufficiently small, we canassume that the waveforms hi are given by
hi � h0 � xni hd; (4)
where n is the convergence factor of the waveform, h0 isthe exact waveform generated from the infinite resolutionrun (x0 ! 0), and hd is the leading order truncation errorcontribution to the waveform and is independent of themesh spacing xi. We find that the mismatch between thewaveforms hi and hj, 1� FFij, scales as
1� FFij / �xni � xnj �
2: (5)
In the Goddard simulations, the high and medium-resolution runs have mesh-spacing ratio xh=xm � 5=6,and the waveform convergence rate is n � 4 [38]. TheFF between the high-resolution and exact waveforms hhand h0 is given by
FF 0h � 1� 0:87�1� FFhm�; (6)
where FFhm is the FF between the high and medium-resolution waveforms hh and hm. That is to say, the mis-
30 40 50 60 70 80 90 100Total mass of the binary ( )
0.980
0.985
0.990
0.995
1.000
FF0
Goddard high and medium resolutionsPretorius and Goddard waveforms
FIG. 2 (color online). FF0 between NR waveforms as a func-tion of the binary total mass M. The solid curve is generated forwaveforms from Pretorius and the Goddard group. The longerGoddard waveform is shortened such that both waveforms last’ 671M and contain ’ 8 cycles. The dashed curve is generatedfor waveforms from the high-resolution and medium-resolutionsimulations of the Goddard group. All FFs are evaluated usingLIGO’s PSD.
YI PAN et al. PHYSICAL REVIEW D 77, 024014 (2008)
024014-4
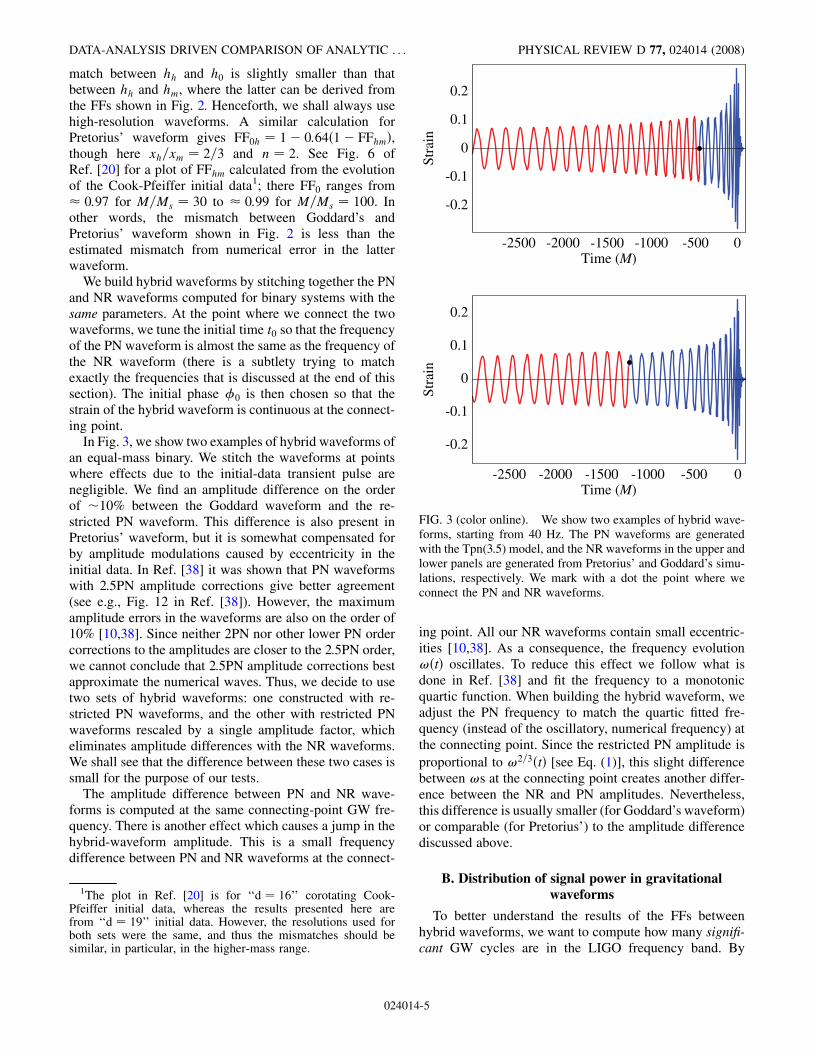
match between hh and h0 is slightly smaller than thatbetween hh and hm, where the latter can be derived fromthe FFs shown in Fig. 2. Henceforth, we shall always usehigh-resolution waveforms. A similar calculation forPretorius’ waveform gives FF0h � 1� 0:64�1� FFhm�,though here xh=xm � 2=3 and n � 2. See Fig. 6 ofRef. [20] for a plot of FFhm calculated from the evolutionof the Cook-Pfeiffer initial data1; there FF0 ranges from 0:97 for M=Ms � 30 to 0:99 for M=Ms � 100. Inother words, the mismatch between Goddard’s andPretorius’ waveform shown in Fig. 2 is less than theestimated mismatch from numerical error in the latterwaveform.
We build hybrid waveforms by stitching together the PNand NR waveforms computed for binary systems with thesame parameters. At the point where we connect the twowaveforms, we tune the initial time t0 so that the frequencyof the PN waveform is almost the same as the frequency ofthe NR waveform (there is a subtlety trying to matchexactly the frequencies that is discussed at the end of thissection). The initial phase �0 is then chosen so that thestrain of the hybrid waveform is continuous at the connect-ing point.
In Fig. 3, we show two examples of hybrid waveforms ofan equal-mass binary. We stitch the waveforms at pointswhere effects due to the initial-data transient pulse arenegligible. We find an amplitude difference on the orderof �10% between the Goddard waveform and the re-stricted PN waveform. This difference is also present inPretorius’ waveform, but it is somewhat compensated forby amplitude modulations caused by eccentricity in theinitial data. In Ref. [38] it was shown that PN waveformswith 2.5PN amplitude corrections give better agreement(see e.g., Fig. 12 in Ref. [38]). However, the maximumamplitude errors in the waveforms are also on the order of10% [10,38]. Since neither 2PN nor other lower PN ordercorrections to the amplitudes are closer to the 2.5PN order,we cannot conclude that 2.5PN amplitude corrections bestapproximate the numerical waves. Thus, we decide to usetwo sets of hybrid waveforms: one constructed with re-stricted PN waveforms, and the other with restricted PNwaveforms rescaled by a single amplitude factor, whicheliminates amplitude differences with the NR waveforms.We shall see that the difference between these two cases issmall for the purpose of our tests.
The amplitude difference between PN and NR wave-forms is computed at the same connecting-point GW fre-quency. There is another effect which causes a jump in thehybrid-waveform amplitude. This is a small frequencydifference between PN and NR waveforms at the connect-
ing point. All our NR waveforms contain small eccentric-ities [10,38]. As a consequence, the frequency evolution!�t� oscillates. To reduce this effect we follow what isdone in Ref. [38] and fit the frequency to a monotonicquartic function. When building the hybrid waveform, weadjust the PN frequency to match the quartic fitted fre-quency (instead of the oscillatory, numerical frequency) atthe connecting point. Since the restricted PN amplitude isproportional to !2=3�t� [see Eq. (1)], this slight differencebetween !s at the connecting point creates another differ-ence between the NR and PN amplitudes. Nevertheless,this difference is usually smaller (for Goddard’s waveform)or comparable (for Pretorius’) to the amplitude differencediscussed above.
B. Distribution of signal power in gravitationalwaveforms
To better understand the results of the FFs betweenhybrid waveforms, we want to compute how many signifi-cant GW cycles are in the LIGO frequency band. By
-500
-500-1000
-1000-1500
-1500-2000
-2000-2500
-2500
-0.2
-0.1
-0.2
-0.1
0Time (M)
0
0.1
0.2
Stra
in
0Time (M)
0
0.1
0.2
Stra
in
FIG. 3 (color online). We show two examples of hybrid wave-forms, starting from 40 Hz. The PN waveforms are generatedwith the Tpn(3.5) model, and the NR waveforms in the upper andlower panels are generated from Pretorius’ and Goddard’s simu-lations, respectively. We mark with a dot the point where weconnect the PN and NR waveforms.
1The plot in Ref. [20] is for ‘‘d � 16’’ corotating Cook-Pfeiffer initial data, whereas the results presented here arefrom ‘‘d � 19’’ initial data. However, the resolutions used forboth sets were the same, and thus the mismatches should besimilar, in particular, in the higher-mass range.
DATA-ANALYSIS DRIVEN COMPARISON OF ANALYTIC . . . PHYSICAL REVIEW D 77, 024014 (2008)
024014-5
significant GW cycles we mean the cycles that contributemost to the signal power, or to the SNR of the filteredsignal. Since GW frequencies are scaled by the total binarymass, the answer to this question depends on both the PSDand the total mass of a binary.
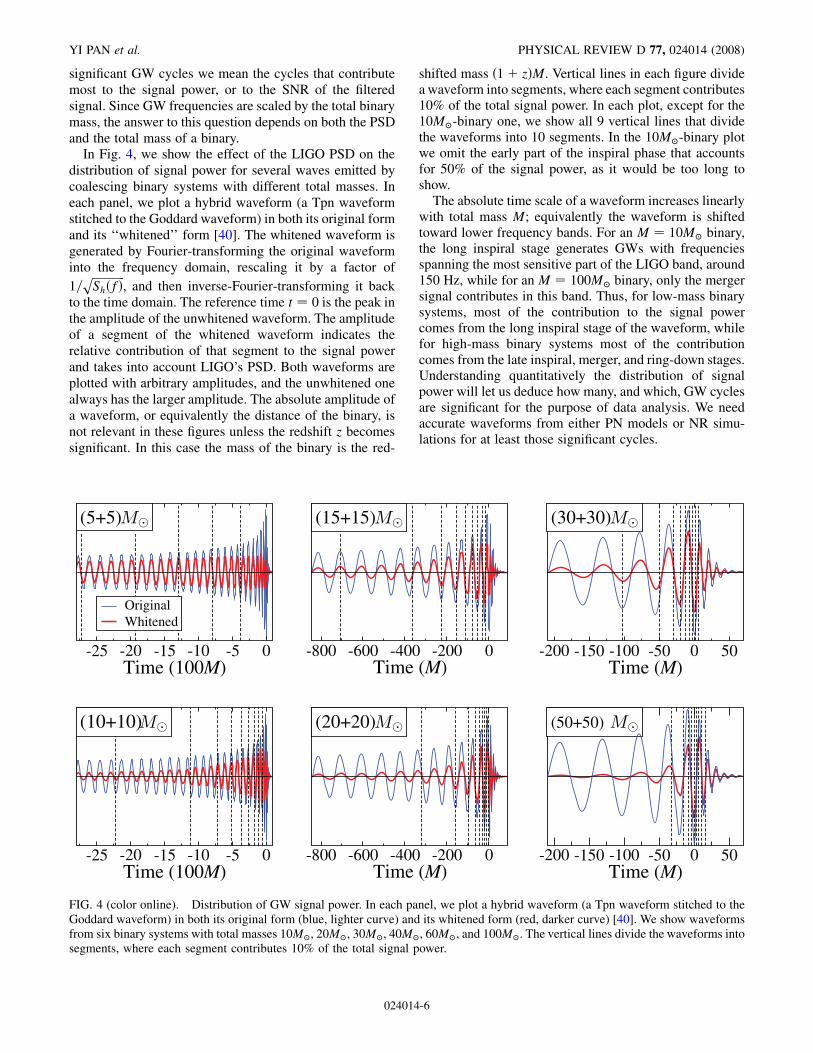
In Fig. 4, we show the effect of the LIGO PSD on thedistribution of signal power for several waves emitted bycoalescing binary systems with different total masses. Ineach panel, we plot a hybrid waveform (a Tpn waveformstitched to the Goddard waveform) in both its original formand its ‘‘whitened’’ form [40]. The whitened waveform isgenerated by Fourier-transforming the original waveforminto the frequency domain, rescaling it by a factor of1=
������������Sh�f�
p, and then inverse-Fourier-transforming it back
to the time domain. The reference time t � 0 is the peak inthe amplitude of the unwhitened waveform. The amplitudeof a segment of the whitened waveform indicates therelative contribution of that segment to the signal powerand takes into account LIGO’s PSD. Both waveforms areplotted with arbitrary amplitudes, and the unwhitened onealways has the larger amplitude. The absolute amplitude ofa waveform, or equivalently the distance of the binary, isnot relevant in these figures unless the redshift z becomessignificant. In this case the mass of the binary is the red-
shifted mass �1� z�M. Vertical lines in each figure dividea waveform into segments, where each segment contributes10% of the total signal power. In each plot, except for the10M�-binary one, we show all 9 vertical lines that dividethe waveforms into 10 segments. In the 10M�-binary plotwe omit the early part of the inspiral phase that accountsfor 50% of the signal power, as it would be too long toshow.
The absolute time scale of a waveform increases linearlywith total mass M; equivalently the waveform is shiftedtoward lower frequency bands. For an M � 10M� binary,the long inspiral stage generates GWs with frequenciesspanning the most sensitive part of the LIGO band, around150 Hz, while for an M � 100M� binary, only the mergersignal contributes in this band. Thus, for low-mass binarysystems, most of the contribution to the signal powercomes from the long inspiral stage of the waveform, whilefor high-mass binary systems most of the contributioncomes from the late inspiral, merger, and ring-down stages.Understanding quantitatively the distribution of signalpower will let us deduce how many, and which, GW cyclesare significant for the purpose of data analysis. We needaccurate waveforms from either PN models or NR simu-lations for at least those significant cycles.
-25 -20 -15 -10 -5 0Time (100M)
OriginalWhitened
-25 -20 -15 -10 -5 0Time (100M)
-800 -600 -400 -200 0Time (M)
-800 -600 -400 -200 0Time (M)
-200 -150 -100 -50 0 50Time (M)
-200 -150 -100 -50 0 50Time (M)
(10+10) (20+20)
(15+15) (30+30)
(50+50)
(5+5)
FIG. 4 (color online). Distribution of GW signal power. In each panel, we plot a hybrid waveform (a Tpn waveform stitched to theGoddard waveform) in both its original form (blue, lighter curve) and its whitened form (red, darker curve) [40]. We show waveformsfrom six binary systems with total masses 10M�, 20M�, 30M�, 40M�, 60M�, and 100M�. The vertical lines divide the waveforms intosegments, where each segment contributes 10% of the total signal power.
YI PAN et al. PHYSICAL REVIEW D 77, 024014 (2008)
024014-6

From Fig. 4 we conclude that:(i) For an M � 10M� binary, the last 25 inspiral cycles,
plus the merger and ring-down stages of the wave-form contribute only 50% of the signal power, andwe need 80 cycles (not shown in the figure) ofaccurate inspiral waveforms to recover 90% of thesignal power. For an M � 20M� binary, the last 23cycles, plus the merger and ring-down stages of thewaveform contribute >90% of the signal power, andcurrent NR simulations can produce waveforms ofsuch length;
(ii) For an M � 30M� binary, the last 11 inspiralcycles, plus the merger and ring-down stages ofthe waveform contribute >90% of the signal power,which means that, for binary systems with totalmasses higher than 30M�, current NR simulations,e.g., the 16 cycles obtained in Ref. [38], can providelong enough waveforms for a matched-filter searchof binary coalescence, as also found in Ref. [20];
(iii) For an M � 100M� binary, >90% of the signalpower comes from the last inspiral cycle, merger,and ring-down stages of the waveform, with twocycles dominating the signal power. It is thus pos-sible to identify this waveform as a ‘‘burst’’ signal.
Similar analyses can be also done for advanced LIGO andVIRGO.
C. Comparing hybrid waveforms
We shall now compute FF0s between hybrid waveforms.We fix the total mass of the equal-mass binary in eachcomparison, i.e., we do not optimize over mass parameters,but only on phase and time. We use the mismatch, definedas 1� FF0, to measure the difference between waveformsand we compute them for LIGO, advanced LIGO, andVIRGO. Note that by using FF0, we test the closeness
among hybrid waveforms that are generated from binarysystems with the same physical parameters; in other words,we test whether the waveforms are accurate enough for thepurpose of parameter estimation, rather than for the solepurpose of detecting GWs. In the language of Ref. [19] weare studying the faithfulness of the PN templates.2
Since at late inspiral stages PN waveforms are partlyreplaced by NR waveforms, differences between hybridwaveforms from two PN models are smaller than thosebetween pure PN waveforms. In general, the more NRcycles we use to generate hybrid waveforms, the less thedifference is expected to be between these hybrid wave-forms. This is evident in Figs. 5 and 6 where we showmismatches between hybrid waveforms for binary systemswith different total masses as a function of the number ofNR cycles n. Specifically, the mismatches are taken be-tween two hybrid waveforms generated from the same NRwaveform (from the Goddard group, taking the last ncycles, plus merger and ring-down) and two different PNwaveforms generated with the same masses.
The mismatches are lower for binary systems withhigher total masses, since most of their signal power isconcentrated in the late cycles close to merger (see Fig. 4).Comparing results between LIGO, advanced LIGO, andVIRGO, we see that for the same waveforms the mis-matches are lowest when evaluated with the LIGO PSD,and highest when evaluated with the VIRGO PSD. This isdue to the much broader bandwidth of VIRGO, especiallyat low frequency: the absolute sensitivity is not relevant;only the shape of the PSD matters. In VIRGO, the inspiralpart of a hybrid waveform has higher weighting in its
4 6 8 10 12 14Number of NR waveform cycles
0.0
0.5
1.0
1.5
Mis
mat
ch (
%)
Restricted PNRescaled PN
4 6 8 10 12 14Number of NR waveform cycles
0.0
1.0
2.0
3.0
4.0
Mis
mat
ch (
%)
Quartic-fit frequencyOscillatory frequency
10
20
40
30
40
30
20
10
FIG. 5 (color online). We show the mismatch between hybrid waveforms as a function of the number of NR waveform cycles used togenerate the hybrid waveforms. The LIGO PSD is used to evaluate the mismatches. In the left panel, we compare the Epn(3.5) andTpn(3.5) models. In the right panel, we compare the Tpn(3) and Tpn(3.5) models. From top to bottom, the four curves correspond tofour equal-mass binary systems, with total masses 10M�, 20M�, 30M�, and 40M�. The dots show mismatches taken between hybridwaveforms that are generated with different methods. In the left panel, we adjust the amplitude of restricted PN waveforms, such thatthey connect smoothly in amplitude to NR waveforms. In the right panel, to set the frequency of PN waveforms at the joining point, weuse the original orbital frequency, instead of the quartic fitted one. (See Sec. III A for the discussion on amplitude scaling andfrequency fitting).
2Following Ref. [19], faithful templates are templates thathave large overlaps, say * 96:5%, with the expected signalmaximizing only over the initial phase and time of arrival. Bycontrast when the maximization is done also on the binarymasses, the templates are called effectual.
DATA-ANALYSIS DRIVEN COMPARISON OF ANALYTIC . . . PHYSICAL REVIEW D 77, 024014 (2008)
024014-7
contribution to the signal power. As already observed at theend of Sec. II, we can see also that the difference betweenthe Epn(3.5) and Tpn(3.5) models is smaller than thatbetween the Tpn(3) and Tpn(3.5) models.
Figures 5 and 6 show good agreement among hybridwaveforms. In Sec. IV, as a further confirmation of whatwas found in Refs. [10,11], we shall see that PN waveformsfrom Tpn and Epn models have good agreement with theinspiral phase of the NR waveforms. Therefore, we arguethat hybrid waveforms are likely to have high accuracy. Infact, for the late evolution of a compact binary, where NRwaveforms are available, the PN waveforms are close tothe NR waveforms, while for the early evolution of thebinary, where we expect the PN approximations to workbetter, the PN waveforms (from Tpn and Epn models) areclose to each other. Based on these observations, we drawthe following conclusions for LIGO, advanced LIGO, andVIRGO data analysis:
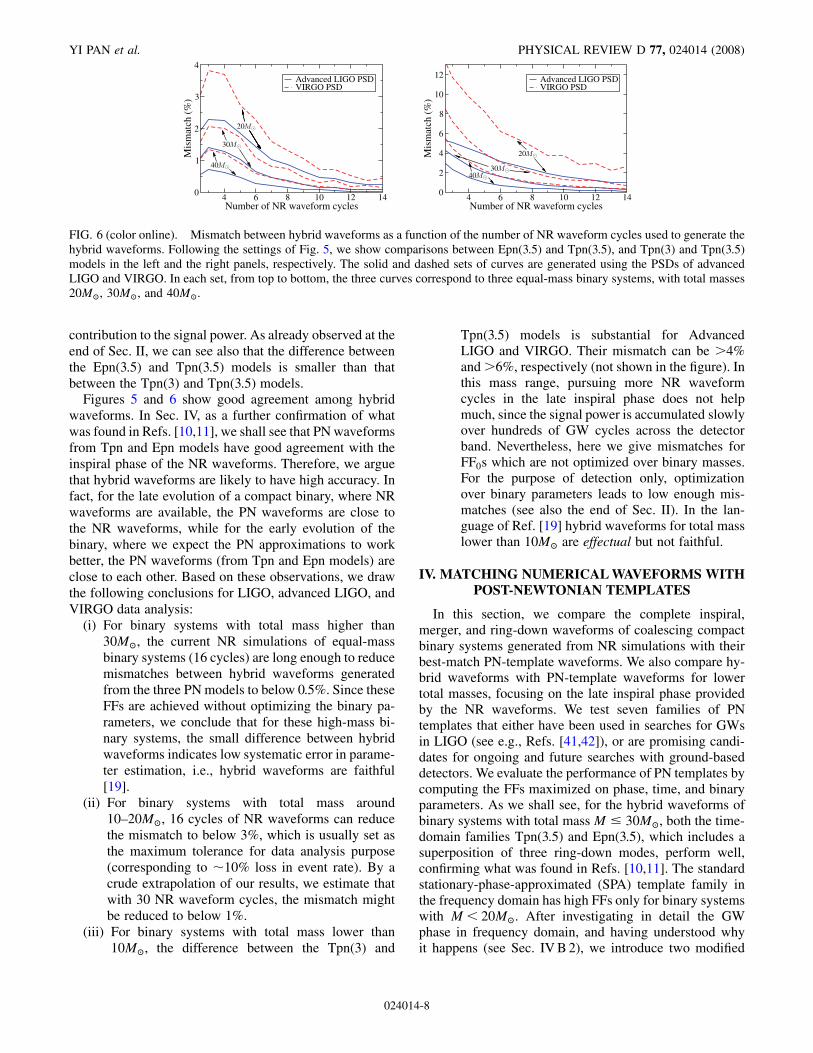
(i) For binary systems with total mass higher than30M�, the current NR simulations of equal-massbinary systems (16 cycles) are long enough to reducemismatches between hybrid waveforms generatedfrom the three PN models to below 0.5%. Since theseFFs are achieved without optimizing the binary pa-rameters, we conclude that for these high-mass bi-nary systems, the small difference between hybridwaveforms indicates low systematic error in parame-ter estimation, i.e., hybrid waveforms are faithful[19].
(ii) For binary systems with total mass around10–20M�, 16 cycles of NR waveforms can reducethe mismatch to below 3%, which is usually set asthe maximum tolerance for data analysis purpose(corresponding to �10% loss in event rate). By acrude extrapolation of our results, we estimate thatwith 30 NR waveform cycles, the mismatch mightbe reduced to below 1%.
(iii) For binary systems with total mass lower than10M�, the difference between the Tpn(3) and
Tpn(3.5) models is substantial for AdvancedLIGO and VIRGO. Their mismatch can be >4%and>6%, respectively (not shown in the figure). Inthis mass range, pursuing more NR waveformcycles in the late inspiral phase does not helpmuch, since the signal power is accumulated slowlyover hundreds of GW cycles across the detectorband. Nevertheless, here we give mismatches forFF0s which are not optimized over binary masses.For the purpose of detection only, optimizationover binary parameters leads to low enough mis-matches (see also the end of Sec. II). In the lan-guage of Ref. [19] hybrid waveforms for total masslower than 10M� are effectual but not faithful.
IV. MATCHING NUMERICAL WAVEFORMS WITHPOST-NEWTONIAN TEMPLATES
In this section, we compare the complete inspiral,merger, and ring-down waveforms of coalescing compactbinary systems generated from NR simulations with theirbest-match PN-template waveforms. We also compare hy-brid waveforms with PN-template waveforms for lowertotal masses, focusing on the late inspiral phase providedby the NR waveforms. We test seven families of PNtemplates that either have been used in searches for GWsin LIGO (see e.g., Refs. [41,42]), or are promising candi-dates for ongoing and future searches with ground-baseddetectors. We evaluate the performance of PN templates bycomputing the FFs maximized on phase, time, and binaryparameters. As we shall see, for the hybrid waveforms ofbinary systems with total mass M � 30M�, both the time-domain families Tpn(3.5) and Epn(3.5), which includes asuperposition of three ring-down modes, perform well,confirming what was found in Refs. [10,11]. The standardstationary-phase-approximated (SPA) template family inthe frequency domain has high FFs only for binary systemswith M< 20M�. After investigating in detail the GWphase in frequency domain, and having understood whyit happens (see Sec. IV B 2), we introduce two modified
4 6 8 10 12 14Number of NR waveform cycles
0
1
2
3
4
Mis
mat
ch (
%)
Advanced LIGO PSDVIRGO PSD
4 6 8 10 12 14Number of NR waveform cycles
0
2
4
6
8
10
12
Mis
mat
ch (
%)
Advanced LIGO PSDVIRGO PSD
20
30
4040
30
20
FIG. 6 (color online). Mismatch between hybrid waveforms as a function of the number of NR waveform cycles used to generate thehybrid waveforms. Following the settings of Fig. 5, we show comparisons between Epn(3.5) and Tpn(3.5), and Tpn(3) and Tpn(3.5)models in the left and the right panels, respectively. The solid and dashed sets of curves are generated using the PSDs of advancedLIGO and VIRGO. In each set, from top to bottom, the three curves correspond to three equal-mass binary systems, with total masses20M�, 30M�, and 40M�.
YI PAN et al. PHYSICAL REVIEW D 77, 024014 (2008)
024014-8
SPA template families (defined in Sec. IV B 2) for binarysystems with total mass M � 30M�. Overall, formasses M � 30M�, the Epn(3.5) template family in thetime domain and the two modified SPA template familiesin the frequency domain exhibit the best-matchperformances.
A. Numerical waveforms and post-Newtoniantemplates
For binary systems with total mass M � 30M�, the last8–16 cycles contribute more than 80%–90% of the signalpower, thus in this case we use only the NR waveforms. Bycontrast, for binary systems with total mass 10 � M �30M�, for which the merger and ring-down phases of thewaveforms contribute only �1%–10%, we use the hybridwaveforms, generated by stitching Tpn waveforms to theGoddard NR waveforms.
We want to emphasize that FFs computed for differenttarget numerical waveforms cannot directly be comparedwith each other. For instance, the Goddard waveform islonger than the Pretorius waveform, and the FFs are some-times slightly lower using the Goddard waveform. This is acompletely artificial effect, due to the fact that it is mucheasier to tune the template parameters and obtain a large FFwith a shorter target waveform than a longer one.
We consider seven PN-template families. The two time-domain families introduced in Sec. II are:
(i) Tpn(3.5) [30,35]: The inspiral Taylor model.(ii) Epn(3.5) [10,13,14,16,19]: The EOB model which
includes a superposition of three quasinormalmodes (QNMs) of the final BH. These are labeledby three integers �l; m; n� [43]: the least damped
QNM (2, 2, 0) and two overtones (2, 2, 1) and (2,2, 2). The ring-down waveform is given as:
hQNM�t� �X2
n�0
Ane��t�tend�=�22n
� cos�!22n�t� tend� ��n�; (7)
where !lmn and �lmn are the frequency and decaytime of the QNM �l;m; n�, determined by the massMf and spin af of the final BH. The quantities Anand�n in Eq. (7) are the amplitude and phase of theQNM �2; 2; n�. They are obtained by imposing thecontinuity of h� and h�, and their first and secondtime derivatives, at the time of matching tmatch.Besides the mass parameters, our Epn model con-tains three other physical parameters: �t, �M, and �J.The parameter �t takes into account possible differ-ences between the time tend at which the EOBmodels end and the time tmatch at which the match-ing to ring-down is done. More explicitly, we settmatch � �1� �t�tend, and if �t > 0, we extrapolatethe EOB evolution, and set an upper limit for the �tsearch where the extrapolation fails. The parameters�M and �J describe possible differences between thevalues of the mass Mend Eend and angular mo-mentum aend Jend=M2
end at the end of the EOBinspiral and the final BH mass and angular momen-tum. (The end of the EOB inspiral occurs around theEOB light-ring.) The differences are due to the factthat the system has yet to release energy and angularmomentum during the merger and ring-down phasebefore settling down to the stationary BH solution.If the total binary mass and angular momentum at
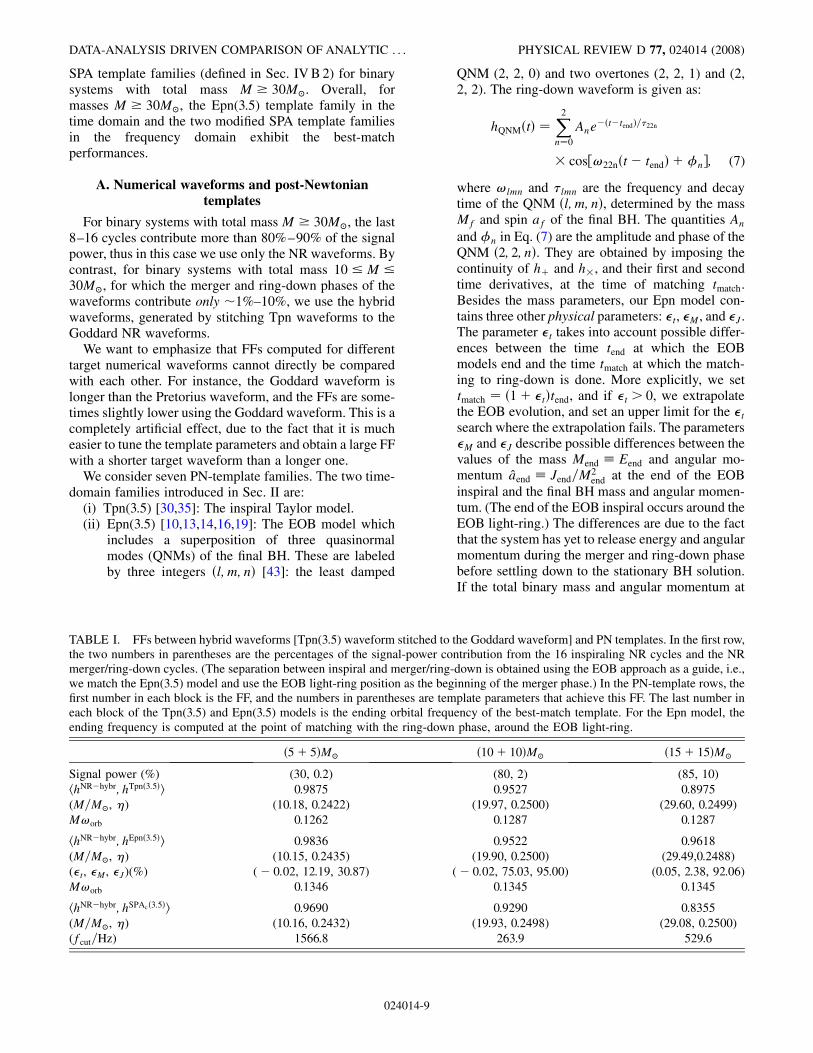
TABLE I. FFs between hybrid waveforms [Tpn(3.5) waveform stitched to the Goddard waveform] and PN templates. In the first row,the two numbers in parentheses are the percentages of the signal-power contribution from the 16 inspiraling NR cycles and the NRmerger/ring-down cycles. (The separation between inspiral and merger/ring-down is obtained using the EOB approach as a guide, i.e.,we match the Epn(3.5) model and use the EOB light-ring position as the beginning of the merger phase.) In the PN-template rows, thefirst number in each block is the FF, and the numbers in parentheses are template parameters that achieve this FF. The last number ineach block of the Tpn(3.5) and Epn(3.5) models is the ending orbital frequency of the best-match template. For the Epn model, theending frequency is computed at the point of matching with the ring-down phase, around the EOB light-ring.
�5� 5�M� �10� 10�M� �15� 15�M�
Signal power (%) (30, 0.2) (80, 2) (85, 10)hhNR�hybr; hTpn�3:5�i 0.9875 0.9527 0.8975(M=M�, �) (10.18, 0.2422) (19.97, 0.2500) (29.60, 0.2499)M!orb 0.1262 0.1287 0.1287
hhNR�hybr; hEpn�3:5�i 0.9836 0.9522 0.9618(M=M�, �) (10.15, 0.2435) (19.90, 0.2500) (29.49,0.2488)(�t, �M, �J)(%) (� 0:02, 12.19, 30.87) (� 0:02, 75.03, 95.00) (0.05, 2.38, 92.06)M!orb 0.1346 0.1345 0.1345
hhNR�hybr; hSPAc�3:5�i 0.9690 0.9290 0.8355(M=M�, �) (10.16, 0.2432) (19.93, 0.2498) (29.08, 0.2500)(fcut=Hz) 1566.8 263.9 529.6
DATA-ANALYSIS DRIVEN COMPARISON OF ANALYTIC . . . PHYSICAL REVIEW D 77, 024014 (2008)
024014-9
the end of the EOB inspiral areMend and Jend, we setthe total mass and angular momentum of the finalstationary BH to be Mf � �1� �M�Mend and Jf ��1� �J�Jend, and use af Jf=Mf to compute !lmn
and �lmn. We consider the current Epn model withthree parameters �t, �M, and �J, as a first attempt tobuild a physical EOB model for matching coher-ently the inspiral, merger, and ring-down phases.Since the �-parameters are related to physical quan-tities, e.g., the loss of energy during ring-down, theyare functions of the initial physical parameters ofthe binary, such as masses, spins, etc. In the nearfuture we expect to be able to fix the �-values by
comparing NR and (improved) EOB waveforms fora large range of binary parameters.
We also consider five frequency-domain models, inwhich two (modified SPA models) are introduced later inSec. IV B 2, and three are introduced here:
(i) SPAc�3:5� [32]: SPAc PN model with an appropriatecutoff frequency fcut [30,35];
(ii) BCV [30]: BCV model with an amplitude correc-tion term (1� �f2=3) and an appropriate cutofffrequency fcut.
(iii) BCVimpr [30]: Improved BCV model with an am-plitude correction term (1� �f1=2) and an appro-priate cutoff frequency fcut. We include this
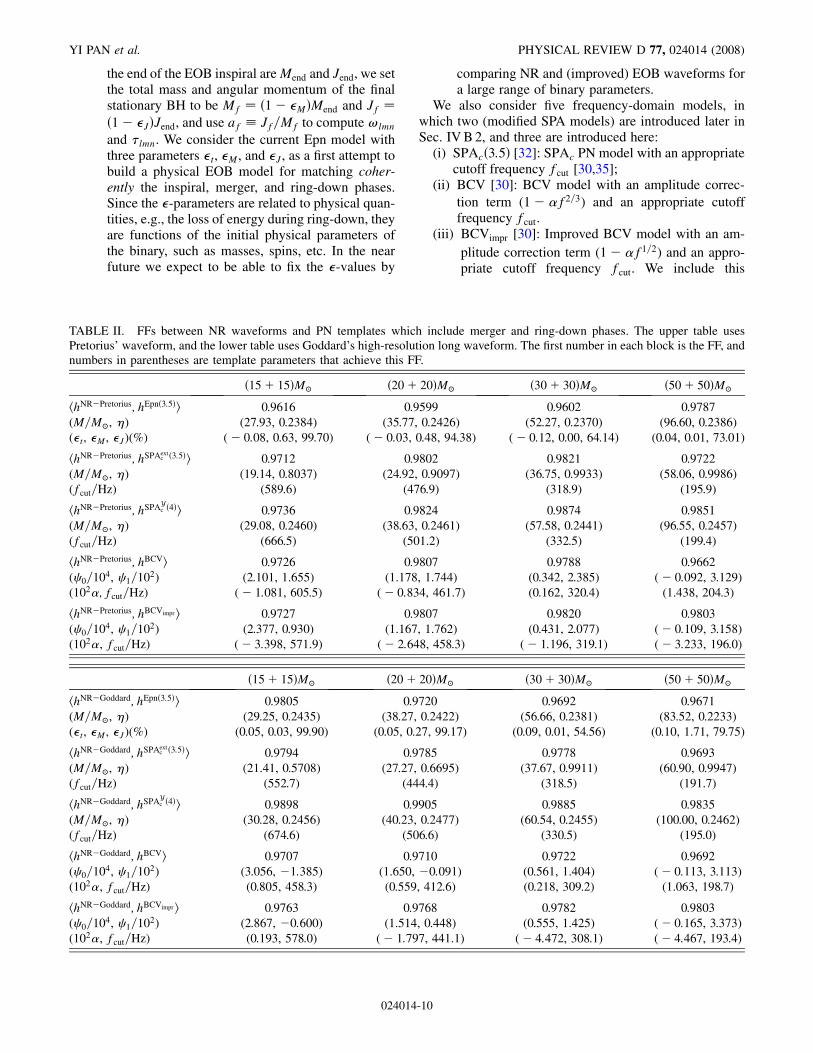
TABLE II. FFs between NR waveforms and PN templates which include merger and ring-down phases. The upper table usesPretorius’ waveform, and the lower table uses Goddard’s high-resolution long waveform. The first number in each block is the FF, andnumbers in parentheses are template parameters that achieve this FF.
�15� 15�M� �20� 20�M� �30� 30�M� �50� 50�M�
hhNR�Pretorius; hEpn�3:5�i 0.9616 0.9599 0.9602 0.9787(M=M�, �) (27.93, 0.2384) (35.77, 0.2426) (52.27, 0.2370) (96.60, 0.2386)(�t, �M, �J)(%) (� 0:08, 0.63, 99.70) (� 0:03, 0.48, 94.38) (� 0:12, 0.00, 64.14) (0.04, 0.01, 73.01)
hhNR�Pretorius; hSPAextc �3:5�i 0.9712 0.9802 0.9821 0.9722
(M=M�, �) (19.14, 0.8037) (24.92, 0.9097) (36.75, 0.9933) (58.06, 0.9986)(fcut=Hz) (589.6) (476.9) (318.9) (195.9)
hhNR�Pretorius; hSPAYc �4�i 0.9736 0.9824 0.9874 0.9851
(M=M�, �) (29.08, 0.2460) (38.63, 0.2461) (57.58, 0.2441) (96.55, 0.2457)(fcut=Hz) (666.5) (501.2) (332.5) (199.4)
hhNR�Pretorius; hBCVi 0.9726 0.9807 0.9788 0.9662( 0=104, 1=102) (2.101, 1.655) (1.178, 1.744) (0.342, 2.385) (� 0:092, 3.129)(102�; fcut=Hz) (� 1:081, 605.5) (� 0:834, 461.7) (0.162, 320.4) (1.438, 204.3)
hhNR�Pretorius; hBCVimpr i 0.9727 0.9807 0.9820 0.9803( 0=104, 1=102) (2.377, 0.930) (1.167, 1.762) (0.431, 2.077) (� 0:109, 3.158)(102�, fcut=Hz) (� 3:398, 571.9) (� 2:648, 458.3) (� 1:196, 319.1) (� 3:233, 196.0)
�15� 15�M� �20� 20�M� �30� 30�M� �50� 50�M�
hhNR�Goddard; hEpn�3:5�i 0.9805 0.9720 0.9692 0.9671(M=M�, �) (29.25, 0.2435) (38.27, 0.2422) (56.66, 0.2381) (83.52, 0.2233)(�t, �M, �J)(%) (0.05, 0.03, 99.90) (0.05, 0.27, 99.17) (0.09, 0.01, 54.56) (0.10, 1.71, 79.75)
hhNR�Goddard; hSPAextc �3:5�i 0.9794 0.9785 0.9778 0.9693
(M=M�, �) (21.41, 0.5708) (27.27, 0.6695) (37.67, 0.9911) (60.90, 0.9947)(fcut=Hz) (552.7) (444.4) (318.5) (191.7)
hhNR�Goddard; hSPAYc �4�i 0.9898 0.9905 0.9885 0.9835
(M=M�, �) (30.28, 0.2456) (40.23, 0.2477) (60.54, 0.2455) (100.00, 0.2462)(fcut=Hz) (674.6) (506.6) (330.5) (195.0)
hhNR�Goddard; hBCVi 0.9707 0.9710 0.9722 0.9692( 0=104, 1=102) (3.056, �1:385) (1.650, �0:091) (0.561, 1.404) (� 0:113, 3.113)(102�, fcut=Hz) (0.805, 458.3) (0.559, 412.6) (0.218, 309.2) (1.063, 198.7)
hhNR�Goddard; hBCVimpr i 0.9763 0.9768 0.9782 0.9803( 0=104, 1=102) (2.867, �0:600) (1.514, 0.448) (0.555, 1.425) (� 0:165, 3.373)(102�, fcut=Hz) (0.193, 578.0) (� 1:797, 441.1) (� 4:472, 308.1) (� 4:467, 193.4)
YI PAN et al. PHYSICAL REVIEW D 77, 024014 (2008)
024014-10
improved BCV model because Ref. [10] found adeviation of the Fourier-transform amplitude fromthe Newtonian prediction f�7=6 during the mergerand ring-down phases (see Fig. 22 of Ref. [10]).Here we shall assume n � �2=3 in the fn powerlaw to get the (1� �f1=2) form of the amplitudecorrection. While it was found [10] that the value ofn is close to �2=3 for the l � 2, m � 2 waveform,this value varies slightly if other multiple momentsare included and if binary systems with differentmass ratios are considered. Finally, the � parameteris expected to be negative, but in our actual searchit can take both positive and negative values.
B. Discussion of fitting-factor results
In Table I, we list the FFs for hybrid target waveformsand three PN-template families: Tpn(3.5), Epn(3.5), andSPAc�3:5�, together with the template parameters at whichthe best match is obtained. As shown in the first row, in thisrelatively low-mass range, i.e. 10M� <M< 30M�, themerger/ring-down phases of the waveforms contributeonly a small fraction of the total signal power, while thelast 16 inspiraling cycles of the NR waveform contribute asignificant fraction. Therefore, confirming recent claims byRefs. [10,11], we can conclude that the PN-template fam-ilies Tpn(3.5) and Epn(3.5) have good agreement with theinspiraling NR waveforms. The Tpn(3.5) model gives alow FF forM � 30M� because for these higher masses themerger/ring-down phases, which the Tpn model does notinclude, start contributing to the signal power. Note thatboth time-domain templates give fairly good estimates ofthe mass parameters. The SPAc�3:5� template family givesFFs that drop substantially when the total binary massincreases from 10M� to 30M�, indicating that this tem-plate family can only match the early, less relativisticinspiral phase of the hybrid waveforms. Nevertheless, itturns out that by slightly modifying the SPA waveform wecan match the NR waveforms with high FFs (seeSec. IV B 2).
In Table II, we list the FFs for full NR waveforms andfive PN-template families: Epn(3.5), SPAext
c �3:5�,SPAY
c �4�, BCV, and BCVimpr, together with the templateparameters at which the best match is obtained. TheSPAext
c �3:5� and SPAYc �4� families are modified versions
of the SPA family, defined in Sec. IV B 2.We shall investigate these results in more detail in the
following sections.
1. Effective-one-body template performances
The Epn model is the only available time-domain modelthat explicitly includes ring-down waveforms. It achieveshigh FFs � 0:96 for all target waveforms, confirming thenecessity of including ring-down modes and proving thatthe inclusion of three QNMs with three tuning parameters
�t, �M, and �J is sufficient for detection. As we see inTable II, the values of the tuning parameters �M and �J,where the FFs are achieved, are different from their physi-cal values. For reference, the Goddard numerical simula-tion predictsMf ’ 0:95M and af Jf=M2
f ’ 0:7 [38], andEpn(3.5) predicts Mend � 0:967 and aend Jend=M2
end �0:796, so the two tuning parameters should be �M ’ 1:75%and �J ’ 11%. In our search, e.g., forM � 30M�, �J tendsto be tuned to its lowest possible value and �t tends to takeits highest possible value, indicating that pushing the endof the Epn(3.5) inspiral to a later time gives higher FFs.
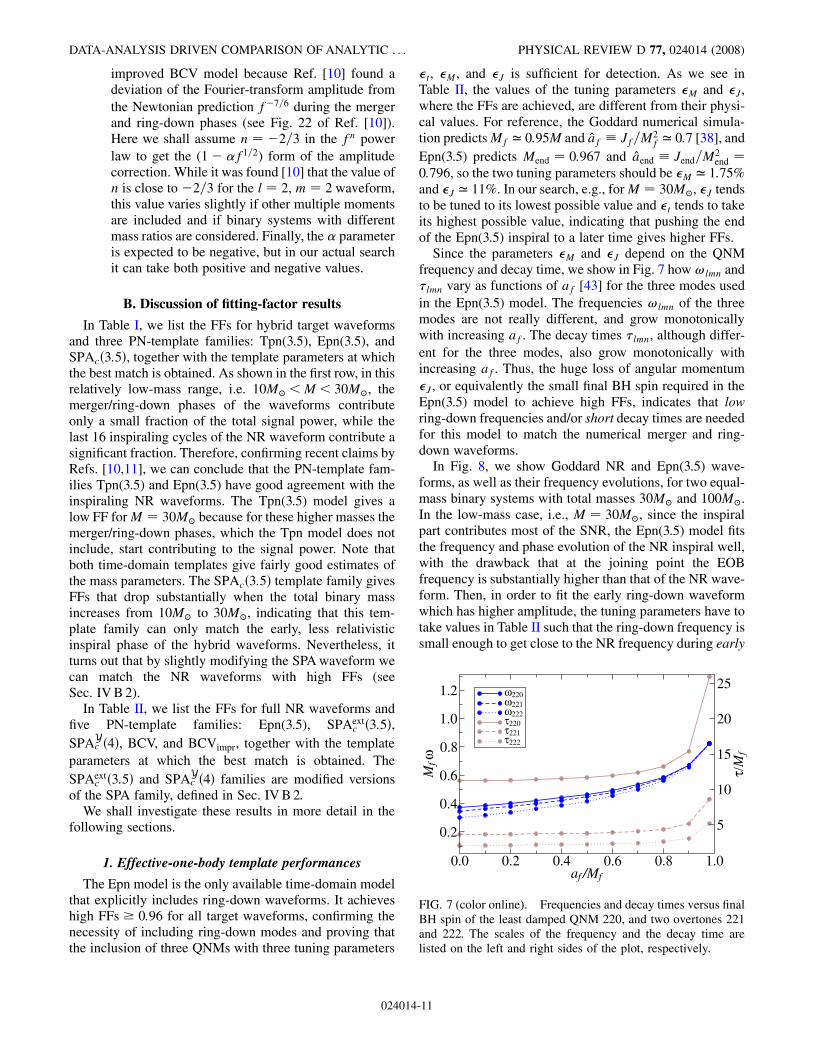
Since the parameters �M and �J depend on the QNMfrequency and decay time, we show in Fig. 7 how!lmn and�lmn vary as functions of af [43] for the three modes usedin the Epn(3.5) model. The frequencies !lmn of the threemodes are not really different, and grow monotonicallywith increasing af. The decay times �lmn, although differ-ent for the three modes, also grow monotonically withincreasing af. Thus, the huge loss of angular momentum�J, or equivalently the small final BH spin required in theEpn(3.5) model to achieve high FFs, indicates that lowring-down frequencies and/or short decay times are neededfor this model to match the numerical merger and ring-down waveforms.
In Fig. 8, we show Goddard NR and Epn(3.5) wave-forms, as well as their frequency evolutions, for two equal-mass binary systems with total masses 30M� and 100M�.In the low-mass case, i.e., M � 30M�, since the inspiralpart contributes most of the SNR, the Epn(3.5) model fitsthe frequency and phase evolution of the NR inspiral well,with the drawback that at the joining point the EOBfrequency is substantially higher than that of the NR wave-form. Then, in order to fit the early ring-down waveformwhich has higher amplitude, the tuning parameters have totake values in Table II such that the ring-down frequency issmall enough to get close to the NR frequency during early
0.0 0.2 0.4 0.6 0.8 1.0af /Mf
0.2
0.4
0.6
0.8
1.0
1.2
Mfω
5
10
15
20
25
τ/M
f
ω220ω221ω222τ220τ221τ222
FIG. 7 (color online). Frequencies and decay times versus finalBH spin of the least damped QNM 220, and two overtones 221and 222. The scales of the frequency and the decay time arelisted on the left and right sides of the plot, respectively.
DATA-ANALYSIS DRIVEN COMPARISON OF ANALYTIC . . . PHYSICAL REVIEW D 77, 024014 (2008)
024014-11

ring-down stage, as indicated in Fig. 8. The late ring-downwaveform does not contribute much to the SNR, and thus itis not too surprising that waveform optimizing the FF doesnot adequately represent this part of the NR waveform. Inthe higher-mass case, M � 100M�, the Epn(3.5) modelgives a much better, though not perfect, match to themerger and ring-down phases of the NR waveform, at theexpense of misrepresenting the early inspiral part. Again,this is not unexpected considering that in this mass rangethe merger and ring-down waveforms dominate the con-tribution to the SNR.
Comparing the two cases discussed above, we can seethat with the current procedure of matching the inspiral and
ring-down waveforms in the EOB approach it is not pos-sible to obtain a perfect match with the entire NR wave-form. However, due to the limited detector sensitivitybandwidth, the FFs are high enough for detection. Thelarge systematic error in estimating the physical parame-ters will be overcome by improving the EOB matchingprocedure during the inspiral part, and also by fixing the�-parameters to physical values obtained by comparisonwith numerical simulations.
Finally, in Figs. 9 and 10 we show the frequency-domainamplitude and phase of the NR and EOB waveforms. Quiteinterestingly, we notice that the inclusion of three ring-down modes reproduce rather well the bump in the NR
0.10 0.12 0.14 0.16 0.18Time (s)
-0.02
0.00
0.02
0.04
0.06
0.08
0.10
GW
fre
quen
cy (
1/M
)
NR frequency & waveformEpn frequency & waveform
(15+15)
0.40 0.45 0.50 0.55 0.60Time (s)
(50+50)
FIG. 8 (color online). Frequency evolution of waveforms from the Epn(3.5) model, and the NR simulations of the Goddard group. Inthe left and right panels, we show frequency evolutions for two equal-mass binary systems with total mass 30M� and 100M�. In eachpanel, there are two nearly monotonic curves and two oscillatory curves, where the former are frequency evolutions and the latter arebinary coalescence waveforms. The solid curves (blue) are from the NR simulations, while the dashed curves (red) are from theEpn(3.5) model. The vertical line in each plot shows the position where the three-QNM ring-down waveform is attached to the EOBwaveform.
100 200 500-20-10
0102030
Stra
in p
hase
NR phaseSPAc(3.5)SPAc
y(4)SPAc
ext(3.5)Epn(3.5)
M=30
100 200 500Frequency (Hz)
0.1
0.51
5
Stra
in a
mpl
itude
NR amplitudeSPAc
y(4)Epn(3.5)
FIG. 9 (color online). For M � 30M� equal-mass binary sys-tems, we compare the phase and amplitude of the frequency-domain waveforms from the SPAc models and NR simulation(Goddard group). We also show the amplitude of the waveformfrom the Epn(3.5) model.
50 100 200
-30
-20
-10
0
Stra
in p
hase
NR phaseSPAc(3.5)SPAc
y(4)SPAc
ext(3.5)Epn(3.5)
M=100
50 100 200Frequency (Hz)
0.1
0.51
5
Stra
in a
mpl
itude
NR amplitudeSPAc
y(4)Epn(3.5)
FIG. 10 (color online). For M � 100M� equal-mass binarysystems, we compare the phase and amplitude of thefrequency-domain waveforms from the SPAc models and NRsimulation (Goddard group). We also show the amplitude of thewaveform from the Epn(3.5) model.
YI PAN et al. PHYSICAL REVIEW D 77, 024014 (2008)
024014-12
frequency-domain amplitude. The EOB frequency-domainphase also matches the NR one very well.
2. Stationary-phase-approximated templateperformances
Figures 9 and 10 also show the frequency-domain phasesand amplitudes for the best-match SPAc�3:5� waveforms.We see that at high frequency the NR and SPAc�3:5� phasesrise with different slopes.3 Based on this observation weintroduce two modified SPA models:
(i) SPAextc �3:5�: SPAc PN model with unphysical values
of � and an appropriate cutoff frequency fcut. Therange of the symmetric mass ratio � �m1m2=�m1 �m2�
2 is extended from its physicalrange 0� 0:25 to the unphysical range 0� 1.
(ii) SPAYc �4�: SPAc PN model with an ad hoc 4PN order
term in the phase, and an appropriate cutoff fre-quency fcut. The phase of the SPA model is knownup to the 3.5PN order (see, e.g., Eq. (3.3) ofRef. [32]):
�f� � 2�ft0 ��0 ��4�
3
128�v5
XNk�0
�kvk;
(8)
where v � ��Mf�1=3. The PN coefficients �ks, k �0; . . . ; N, (with N � 7 at 3.5PN order) are given byEqs. (3.4a), (3.4h) of Ref. [32]. We add the follow-ing term at 4PN order:
�8 � Y logv; (9)
where Y is a parameter which we fix by imposinghigh matching performances with NR waveforms.Note that a constant term in �8 only adds a 4PNorder term that is linear in f, which can be absorbedinto the 2�ft0 term. Thus, to obtain a nontrivialeffect, we need to introduce a logarithmic term. Thecoefficient Y could in principle depend on �. Wedetermine Y by optimizing the FFs of equal andunequal masses. We find that in the equal-mass caseY does not depend significantly on the binary totalmass and is given by Y � 3923. The latter is alsoclose to the best-match value obtained for unequalmasses. More specifically, it is within 4.5% forbinary systems of mass ratio m2=m1 � 2. To furtherexplore the dependence of Y on �, we need a largersample of waveforms for unequal-mass binary sys-tems.4 As seen in Table II, the two modified SPActemplate families have FF> 0:97 (except for one
0.9693) for all target waveforms, even though noexplicit merger or ring-down phases are included inthe waveform. The SPAY
c �4� model provides also areally good estimation of parameters.
In Fig. 11 we plot Goddard NR and SPAYc �4� waveforms
for two equal-mass binary systems with total masses M �30M� and M � 100M�. We can clearly see tail-like ring-down waveforms at the end of the SPAY
c �4� waveforms,which result from the inverse Fourier transform offrequency-domain waveforms that have been cut at f �fcut. This well-known feature is called the Gibbs phenome-non. At first glance, it may appear surprising that the ofteninconvenient Gibbs phenomenon [40] can provide reason-able ring-down waveforms in the time domain. However,by looking at the spectra of these waveforms in the fre-quency domain (see the amplitudes in Figs. 9 and 10), wesee that the SPAY
c �4� cuts off at the frequency fcut (ob-tained from the optimized FF) where the NR spectra alsostart to drop. Thus, even though the frequency-domainSPAc waveforms are discontinuous, while the frequency-domain NR waveforms are continuous (being combina-tions of Lorentzians), the SPAc time-domain waveformscontain tails with frequencies and decay rates similar to theNR ring-down modes. We expect that the values of thecutoff frequency fcut at which the FFs are maximized arewell determined by the highest frequency of the NR wave-forms, i.e. by the frequency of the fundamental QNM. Inthe next section, we shall show quantitative results toconfirm this guess.
3. Buonanno-Chen-Vallisneri template performances
In Table II we see that the BCV and BCVimpr familiesgive almost the same FFs for relatively low-mass binarysystems (M � 30, 40M�), while the BCVimpr family givesslightly better FFs for higher-mass binary systems (M �60, 100M�). For higher-mass binary systems, we find thatthe � parameter takes negative values with reasonablemagnitude. This is because the amplitude of the NR wave-forms in the frequency domain deviates from the f�7=6
power law only near the merger, which lasts for about oneGW cycle. This merger cycle is important only when thetotal mass of the binary is high enough (see Fig. 4). [Seealso Ref. [45] where similar tests have been done.]
The BCVand BCVimpr template families give FFs nearly
as high as those given by the SPAYc �4� family, but the latter
has the advantage of being parametrized directly in termsof the physical binary parameters, and it gives fairly smallsystematic errors.
C. Frequency-domain templates for inspiral, merger,and ring-down
In this section, we extend our comparisons between theSPAc families and NR waveforms to higher total-massbinary systems (40M� to 120M�) and to unequal-mass
3By looking in detail at the PN terms in the SPAc�3:5� phase,we find that the difference in slope is largely due to thelogarithmic term at 2.5PN order.
4Note that the auxiliary phase introduced in Eq. (239) ofRef. [44] also gives rise to a term in the SPA phase of thekind f logv, except an order of magnitude smaller than Y.
DATA-ANALYSIS DRIVEN COMPARISON OF ANALYTIC . . . PHYSICAL REVIEW D 77, 024014 (2008)
024014-13
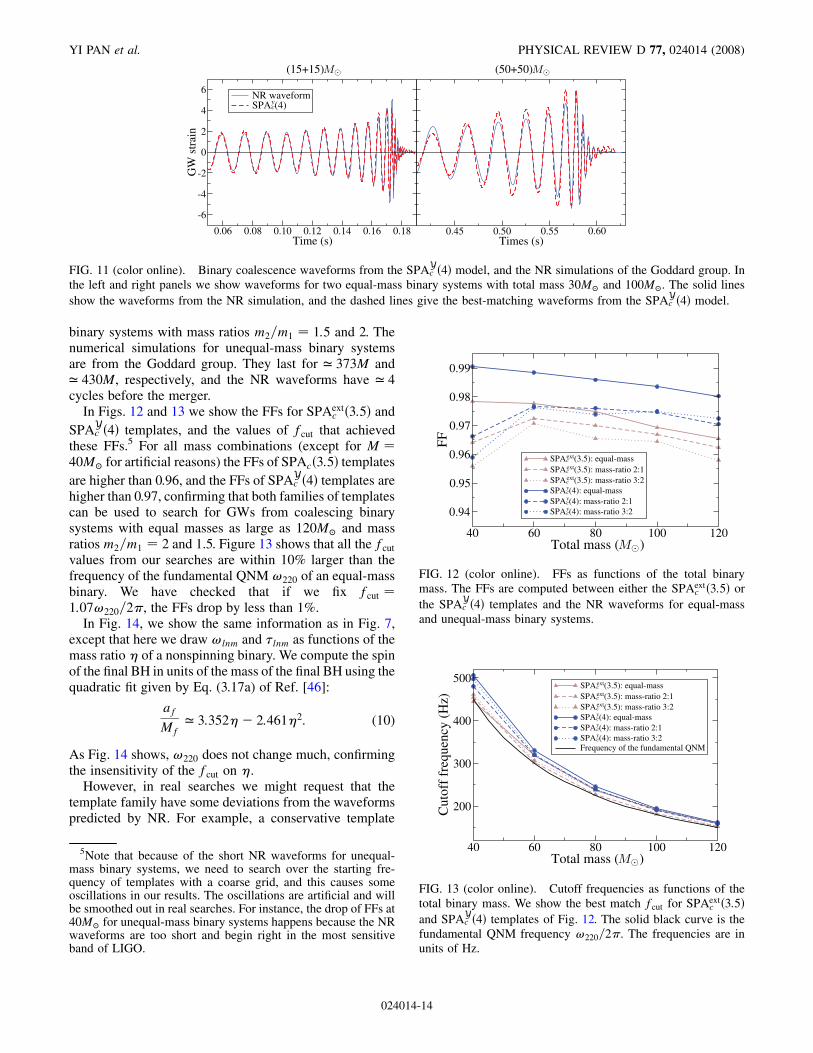
binary systems with mass ratios m2=m1 � 1:5 and 2. Thenumerical simulations for unequal-mass binary systemsare from the Goddard group. They last for ’ 373M and’ 430M, respectively, and the NR waveforms have ’ 4cycles before the merger.
In Figs. 12 and 13 we show the FFs for SPAextc �3:5� and
SPAYc �4� templates, and the values of fcut that achieved
these FFs.5 For all mass combinations (except for M �40M� for artificial reasons) the FFs of SPAc�3:5� templatesare higher than 0.96, and the FFs of SPAY
c �4� templates arehigher than 0.97, confirming that both families of templatescan be used to search for GWs from coalescing binarysystems with equal masses as large as 120M� and massratios m2=m1 � 2 and 1.5. Figure 13 shows that all the fcut
values from our searches are within 10% larger than thefrequency of the fundamental QNM!220 of an equal-massbinary. We have checked that if we fix fcut �1:07!220=2�, the FFs drop by less than 1%.
In Fig. 14, we show the same information as in Fig. 7,except that here we draw !lnm and �lnm as functions of themass ratio � of a nonspinning binary. We compute the spinof the final BH in units of the mass of the final BH using thequadratic fit given by Eq. (3.17a) of Ref. [46]:
afMf’ 3:352�� 2:461�2: (10)
As Fig. 14 shows, !220 does not change much, confirmingthe insensitivity of the fcut on �.
However, in real searches we might request that thetemplate family have some deviations from the waveformspredicted by NR. For example, a conservative template
0.06 0.08 0.10 0.12 0.14 0.16 0.18Time (s)
-6
-4
-2
0
2
4
6
GW
str
ain
NR waveformSPAc
y(4)
(15+15)
0.45 0.50 0.55 0.60Times (s)
(50+50)
FIG. 11 (color online). Binary coalescence waveforms from the SPAYc �4� model, and the NR simulations of the Goddard group. In
the left and right panels we show waveforms for two equal-mass binary systems with total mass 30M� and 100M�. The solid linesshow the waveforms from the NR simulation, and the dashed lines give the best-matching waveforms from the SPAY
c �4� model.
40 60 80 100 120Total mass ( )
0.94
0.95
0.96
0.97
0.98
0.99
FFSPAc
ext(3.5): equal-massSPAc
ext(3.5): mass-ratio 2:1SPAc
ext(3.5): mass-ratio 3:2SPAc
y(4): equal-massSPAc
y(4): mass-ratio 2:1SPAc
y(4): mass-ratio 3:2
FIG. 12 (color online). FFs as functions of the total binarymass. The FFs are computed between either the SPAext
c �3:5� orthe SPAY
c �4� templates and the NR waveforms for equal-massand unequal-mass binary systems.
40 60 80 100 120Total mass ( )
200
300
400
500
Cut
off
freq
uenc
y (H
z)
SPAcext(3.5): equal-mass
SPAcext(3.5): mass-ratio 2:1
SPAcext(3.5): mass-ratio 3:2
SPAcy(4): equal-mass
SPAcy(4): mass-ratio 2:1
SPAcy(4): mass-ratio 3:2
Frequency of the fundamental QNM
FIG. 13 (color online). Cutoff frequencies as functions of thetotal binary mass. We show the best match fcut for SPAext
c �3:5�and SPAY
c �4� templates of Fig. 12. The solid black curve is thefundamental QNM frequency !220=2�. The frequencies are inunits of Hz.
5Note that because of the short NR waveforms for unequal-mass binary systems, we need to search over the starting fre-quency of templates with a coarse grid, and this causes someoscillations in our results. The oscillations are artificial and willbe smoothed out in real searches. For instance, the drop of FFs at40M� for unequal-mass binary systems happens because the NRwaveforms are too short and begin right in the most sensitiveband of LIGO.
YI PAN et al. PHYSICAL REVIEW D 77, 024014 (2008)
024014-14
bank might cover a region of fcut ranging from theSchwarzschild innermost stable circular orbit (ISCO) fre-quency, or the innermost circular orbit (ICO) frequencydetermined by the 3PN conservative dynamics, up to avalue slightly higher than the frequency of the fundamentalQNM. The number of templates required to cover the fcut
dimension depends on the binary masses. We find that tocover the fcut dimension from the 3PN ICO frequency tothe fundamental QNM frequency with an SPAext
c �3:5� tem-plate bank, imposing a mismatch <0:03 between neigh-boring templates, we need only two (� 20) templates ifM � 30M� (M � 100M�) and � � 0:25. In the lattercase, the match between templates is more sensitive tofcut since most signal power comes from the last twocycles, sweeping through a large frequency range, rightin LIGO’s most sensitive band. The number of templatesdirectly affects the computational power needed, and thefalse-alarm rate. Further investigations are needed in orderto determine the most efficient way to search over the fcut
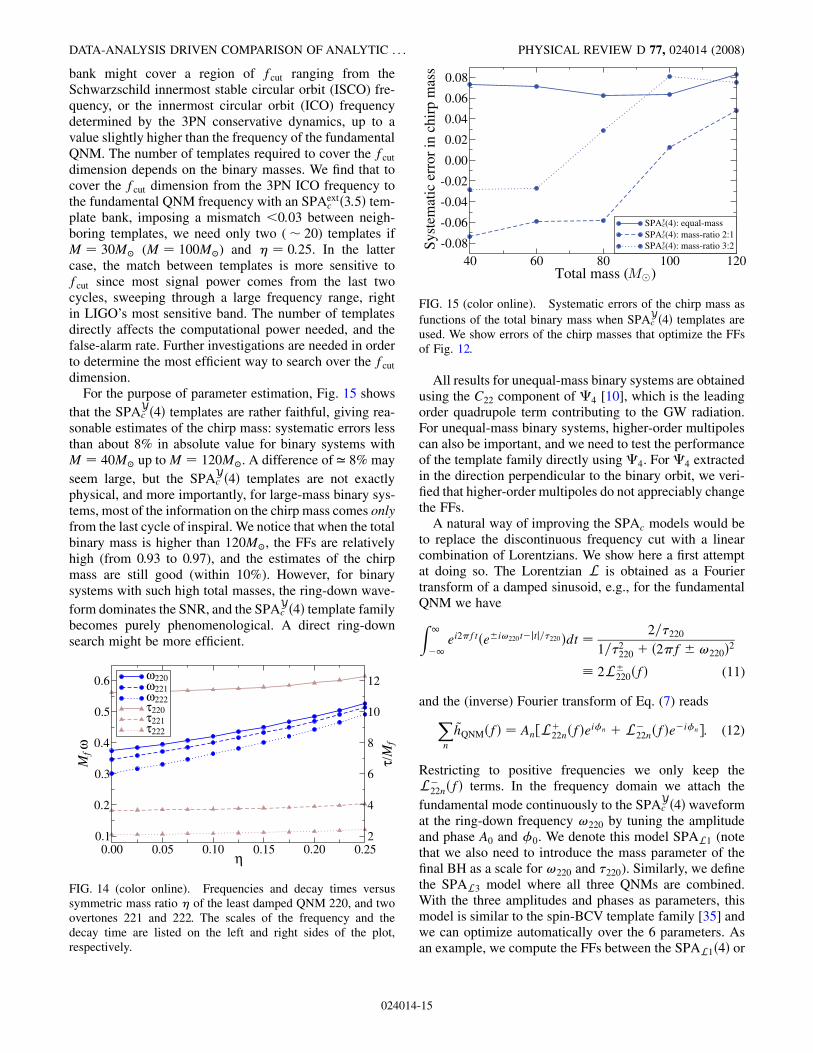
dimension.For the purpose of parameter estimation, Fig. 15 shows
that the SPAYc �4� templates are rather faithful, giving rea-
sonable estimates of the chirp mass: systematic errors lessthan about 8% in absolute value for binary systems withM � 40M� up to M � 120M�. A difference of ’ 8% mayseem large, but the SPAY
c �4� templates are not exactlyphysical, and more importantly, for large-mass binary sys-tems, most of the information on the chirp mass comes onlyfrom the last cycle of inspiral. We notice that when the totalbinary mass is higher than 120M�, the FFs are relativelyhigh (from 0.93 to 0.97), and the estimates of the chirpmass are still good (within 10%). However, for binarysystems with such high total masses, the ring-down wave-form dominates the SNR, and the SPAY
c �4� template familybecomes purely phenomenological. A direct ring-downsearch might be more efficient.
All results for unequal-mass binary systems are obtainedusing the C22 component of �4 [10], which is the leadingorder quadrupole term contributing to the GW radiation.For unequal-mass binary systems, higher-order multipolescan also be important, and we need to test the performanceof the template family directly using �4. For �4 extractedin the direction perpendicular to the binary orbit, we veri-fied that higher-order multipoles do not appreciably changethe FFs.
A natural way of improving the SPAc models would beto replace the discontinuous frequency cut with a linearcombination of Lorentzians. We show here a first attemptat doing so. The Lorentzian L is obtained as a Fouriertransform of a damped sinusoid, e.g., for the fundamentalQNM we have Z 1�1
ei2�ft�e�i!220t�jtj=�220�dt �2=�220
1=�2220 � �2�f�!220�
2
2L�220�f� (11)
and the (inverse) Fourier transform of Eq. (7) reads
Xn
~hQNM�f� � An�L�22n�f�e
i�n �L�22n�f�e�i�n�: (12)
Restricting to positive frequencies we only keep theL�22n�f� terms. In the frequency domain we attach thefundamental mode continuously to the SPAY
c �4�waveformat the ring-down frequency !220 by tuning the amplitudeand phase A0 and �0. We denote this model SPAL1 (notethat we also need to introduce the mass parameter of thefinal BH as a scale for !220 and �220). Similarly, we definethe SPAL3 model where all three QNMs are combined.With the three amplitudes and phases as parameters, thismodel is similar to the spin-BCV template family [35] andwe can optimize automatically over the 6 parameters. Asan example, we compute the FFs between the SPAL1�4� or
0.00 0.05 0.10 0.15 0.20 0.25η
0.1
0.2
0.3
0.4
0.5
0.6
Mfω
2
4
6
8
10
12
τ/M
f
ω220ω221ω222τ220τ221τ222
FIG. 14 (color online). Frequencies and decay times versussymmetric mass ratio � of the least damped QNM 220, and twoovertones 221 and 222. The scales of the frequency and thedecay time are listed on the left and right sides of the plot,respectively.
40 60 80 100 120Total mass ( )
-0.08
-0.06
-0.04
-0.02
0.00
0.02
0.04
0.06
0.08
Syst
emat
ic e
rror
in c
hirp
mas
s
SPAcy(4): equal-mass
SPAcy(4): mass-ratio 2:1
SPAcy(4): mass-ratio 3:2
FIG. 15 (color online). Systematic errors of the chirp mass asfunctions of the total binary mass when SPAY
c �4� templates areused. We show errors of the chirp masses that optimize the FFsof Fig. 12.
DATA-ANALYSIS DRIVEN COMPARISON OF ANALYTIC . . . PHYSICAL REVIEW D 77, 024014 (2008)
024014-15

SPAL3�4� and the NR waveform of an equal mass M �100M� binary. Using the LIGO PSD, we obtain 0.9703 and0.9817, respectively. Those FFs are comparable to the FFsobtained with the simpler SPAc model, shown in Fig. 12. Itis known that adding more parameters increases the FFsbut also increases the false-alarm probability. By furtherinvestigation and comparison with NR waveforms our goalis to express the phase and amplitude parameters of theLorentzian in terms of the physical binary parameters,relating them to the amplitudes and phases of the QNMsand the physics of the merger. Those parameters are some-what similar to the �-parameters introduced above for theEOB model when modeling the merger and ring-downphases.
We wish to emphasize that the results we presented inthis section are preliminary, in the sense that we consideredonly a few mass combinations and the NR waveforms ofunequal-mass binary systems are quite short. Nevertheless,these results are interesting enough to propose a systematicstudy of the efficiency of these template families throughMonte Carlo simulations in real data.
V. CONCLUSIONS
In this paper we compared NR and analytic waveformsemitted by nonspinning binary systems, trying to under-stand the performance of PN-template families developedduring the last ten years and currently used for the searchfor GWs with ground-based detectors, suggesting possibleimprovements.
We first computed FF0s (maximized only on time andphase) between PN-template families which best-matchNR waveforms [10,11], i.e., Tpn(3), Tpn(3.5), andEpn(3.5). We showed how the drop in FF0s is not simplydetermined by the accumulated phase difference betweenwaveforms, but also depends on the detector’s PSD and thebinary mass. Thus, waveforms which differ even by oneGW cycle can have FF0 � 0:97, depending on the binarymasses (see Fig. 1).
We then showed that the NR waveforms from the high-resolution and medium-resolution simulations of theGoddard group are close to each other (FF0 around 0.99,see Fig. 2). We also estimated that the FF0 between high-resolution and exact NR waveforms is even higher, basedon the numerical convergence rates of the Goddardsimulations.
Second, by stitching PN waveforms to NR waveformswe built hybrid waveforms, and computed FF0s (maxi-mized only on time and phase) between hybrid waveformsconstructed with different PN models, notably Tpn(3),Tpn(3.5), and Epn(3.5) models. We found that forLIGO’s detectors and equal-mass binary systems with totalmass M> 30M�, the last 11 GW cycles plus merger andring-down phases contribute >90% of the signal power.This information can be used to set the length of NRsimulations.
The FF0s between hybrid waveforms are summarized inFigs. 5 and 6. We found that for LIGO’s detectors andbinary systems with total mass higher than 10M�, thecurrent NR simulations for equal-mass binary systemsare long enough to reduce the differences between hybridwaveforms built with the PN models Tpn(3), Tpn(3.5), andEpn(3.5) to the level of <3% mismatch. For GW detectorswith broader bandwidth like advanced LIGO and VIRGO,longer NR simulations will be needed if the total binarymasses M< 10M�. With the current available length ofnumerical simulations, it is hard to estimate from the FFsbetween hybrid waveforms how long the simulationsshould be. Nevertheless, from our study of the distributionof signal power, we estimate that for M< 10M� binarysystems, at least �80 NR inspiraling cycles before mergerare needed.
Finally, we evaluated FFs (maximized on binary masses,initial time, and phase) between full NR (or hybrid wave-forms, depending on the total binary mass) and severaltime and frequency-domain PN-template families. Fortime-domain PN templates and binary masses 10M� <M< 20M�, for which the merger/ring-down phases donot contribute significantly to the total detector signalpower, we confirm results obtained in Refs. [10,11], nota-bly that Tpn(3.5) and Epn(3.5) models have high FFs withgood parameter estimation, i.e., they are faithful. We foundthat the frequency-domain SPA family has high FFs onlyfor binary systems with M< 20M�, for which most of thesignal power comes from the early stages of inspiral.Furthermore, we found that it is possible to improve theSPA family by either extending it to unphysical regions ofthe parameter space (as done with BCV templates) or byintroducing an ad hoc 4PN-order constant coefficient in thephase. Both modified SPA families achieve high FFs forhigh-mass binary systems with total masses 30M� <M<120M�.
For time-domain PN templates and binary masses M *
30M�, we found that if a superposition of ring-downmodes is attached to the inspiral waveform, as naturallydone in the EOB model, the FFs can increase from�0:8 to>0:9. We tested the current Epn(3.5) template familyobtained by attaching to the inspiral waveform threeQNMs [10] around the EOB light-ring. In order to properlytake into account the energy and angular-momentum re-leased during the merger/ring-down phases we introduced[10] two physical parameters, �M and �J, whose depen-dence on the binary masses and spins will be determinedby future comparisons between EOB and NR waveformscomputed for different mass ratios and spins. We foundhigh FFs * 0:96. Because of small differences betweenEOB and NR waveforms during the final cycles of theevolution, the best matches are reached at the cost of largesystematic error in the merger—ring-down binary parame-ters. Thus, the Epn(3.5) template family can be used fordetection, but for parameter estimation it needs to be
YI PAN et al. PHYSICAL REVIEW D 77, 024014 (2008)
024014-16
improved when matching to the ring-down, and also duringthe inspiral phase. The refinements can be achieved (i) byintroducing deviations from circular motion, (ii) addinghigher-order PN terms in the EOB dynamics, (iii) using inthe EOB radiation-reaction equations a GW energy fluxcloser than the NR flux, (iv) designing a better match toring-down modes, etc. The goal would be to achieve de-phasing between EOB and NR waveforms of less than afew percent in the comparable-mass case, as obtained inRef. [47] in the extreme mass-ratio limit. Indeed, withmore accurate numerical simulations, especially those us-ing spectral methods [48], it will be possible to improve theinspiraling templates by introducing higher-order PN termsin the analytic waveforms computed by direct comparisonwith NR waveforms.
Frequency-domain PN templates with an appropriatecutoff frequency fcut provide high FFs (> 0:97), even forlarge masses. This is due to oscillating tails (Gibbs phe-nomenon) produced when cutting the signal in the fre-quency domain. We tested the SPAext
c �3:5� and theSPAY
c �4� template families for total masses up to 120M�,and three mass ratios m2=m1 � 1, 1.5, and 2. We alwaysget FFs >0:96, even when using a fixed cutoff frequency,fcut � 1:07!220=2�. Because of its high efficiency, faith-fulness, i.e., low systematic error in parameter estimation,and simple implementation, the SPAY
c �4� template family(or variants of it which include Lorentzians) is, togetherwith the EOB model, a good candidate for searchingcoherently for GWs from binary systems with total massesup to 120M�.
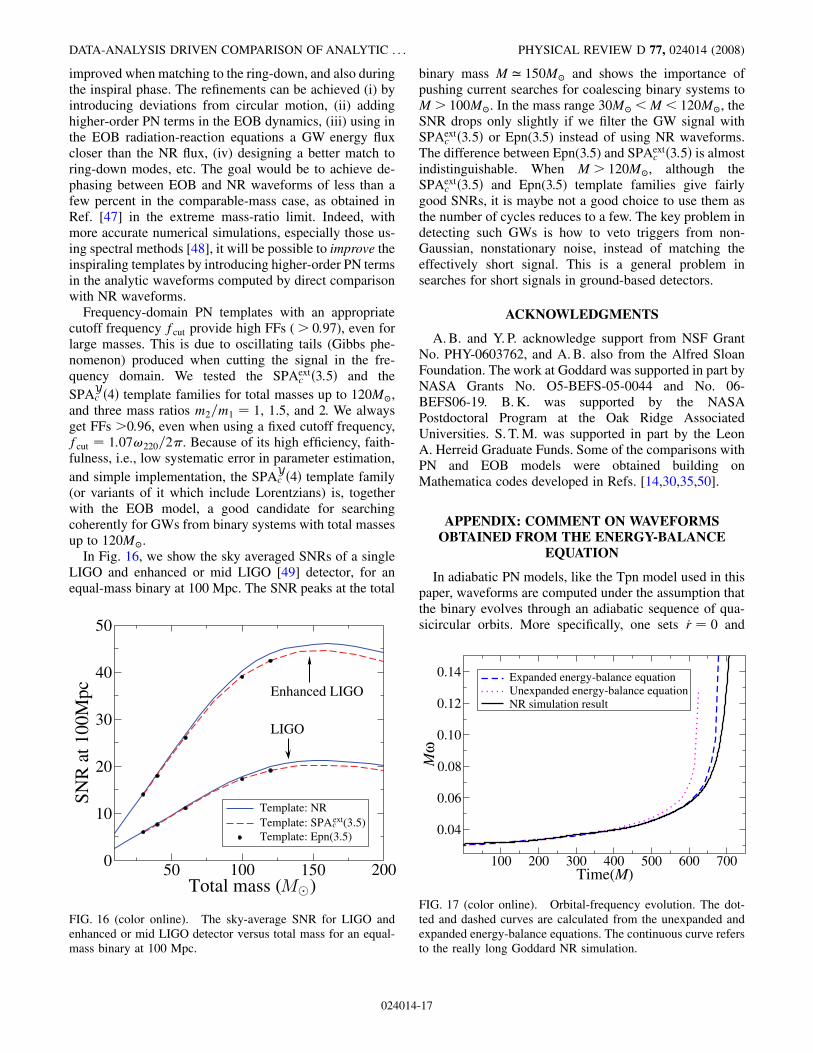
In Fig. 16, we show the sky averaged SNRs of a singleLIGO and enhanced or mid LIGO [49] detector, for anequal-mass binary at 100 Mpc. The SNR peaks at the total
binary mass M ’ 150M� and shows the importance ofpushing current searches for coalescing binary systems toM> 100M�. In the mass range 30M� <M< 120M�, theSNR drops only slightly if we filter the GW signal withSPAext
c �3:5� or Epn(3.5) instead of using NR waveforms.The difference between Epn(3.5) and SPAext
c �3:5� is almostindistinguishable. When M> 120M�, although theSPAext
c �3:5� and Epn(3.5) template families give fairlygood SNRs, it is maybe not a good choice to use them asthe number of cycles reduces to a few. The key problem indetecting such GWs is how to veto triggers from non-Gaussian, nonstationary noise, instead of matching theeffectively short signal. This is a general problem insearches for short signals in ground-based detectors.
ACKNOWLEDGMENTS
A. B. and Y. P. acknowledge support from NSF GrantNo. PHY-0603762, and A. B. also from the Alfred SloanFoundation. The work at Goddard was supported in part byNASA Grants No. O5-BEFS-05-0044 and No. 06-BEFS06-19. B. K. was supported by the NASAPostdoctoral Program at the Oak Ridge AssociatedUniversities. S. T. M. was supported in part by the LeonA. Herreid Graduate Funds. Some of the comparisons withPN and EOB models were obtained building onMathematica codes developed in Refs. [14,30,35,50].
APPENDIX: COMMENT ON WAVEFORMSOBTAINED FROM THE ENERGY-BALANCE
EQUATION
In adiabatic PN models, like the Tpn model used in thispaper, waveforms are computed under the assumption thatthe binary evolves through an adiabatic sequence of qua-sicircular orbits. More specifically, one sets _r � 0 and
Total mass ( )50 100 150 2000
10
20
30
40
50
SNR
at 1
00M
pc Enhanced LIGO
LIGO
Template: NRTemplate: SPAc
ext(3.5)Template: Epn(3.5)
FIG. 16 (color online). The sky-average SNR for LIGO andenhanced or mid LIGO detector versus total mass for an equal-mass binary at 100 Mpc.
100 200 300 400 500 600 700Time(M)
0.04
0.06
0.08
0.10
0.12
0.14
Mω
Expanded energy-balance equationUnexpanded energy-balance equationNR simulation result
FIG. 17 (color online). Orbital-frequency evolution. The dot-ted and dashed curves are calculated from the unexpanded andexpanded energy-balance equations. The continuous curve refersto the really long Goddard NR simulation.
DATA-ANALYSIS DRIVEN COMPARISON OF ANALYTIC . . . PHYSICAL REVIEW D 77, 024014 (2008)
024014-17

computes the orbital frequency ! from the energy-balanceequation dE�!�=dt � F �!�, where E�!� is the total en-ergy of the binary system and F �!� is the GW energy flux.Both E�!� and F �!� are computed for circular orbits andexpressed as a Taylor expansion in !. The adiabatic evo-lution ends in principle at the innermost circular orbit(ICO) [34], or minimum energy circular orbit (MECO)[35], where �dE=d!� � 0.
By rewriting the energy-balance equation, !�t� can beintegrated directly as
_!�t� �F �!�
dE�!�=d!: (A1)
The right-hand side of Eq. (A1) can be expressed as anexpansion in powers of !. The expanded version is widelyused in generating adiabatic PN waveforms [28,30,35,50],it is used to generate the so-called Tpn template family. Itturns out that Tpn(3) and Tpn(3.5) are quite close to the NR
inspiraling waveforms [10,11]. We wonder whether usingthe energy balance in the form of Eq. (A1), i.e., withoutexpanding it, might give PN waveforms closer to or fartherfrom NR waveforms. In principle the adiabatic sequence ofcircular orbits described by Eq. (A1) ends at the ICO, sothe adiabatic model should work better until the ICO andstart deviating (with ! going to infinity) from the exactresult beyond it.
In Fig. 17 we show the NR orbital frequency !�t�together with the PN orbital frequency obtained by solvingthe unexpanded and expanded form of the energy-balanceequation. The frequency evolution in these two cases israther different, with the orbital-frequency computed fromthe expanded energy-balance equation agreeing much bet-ter with the NR one. When many, extremely accurate, GWcycles from NR will be available, it will be worthwhile tocheck whether this result is still true.
[1] A. Abramovici et al., Science 256, 325 (1992); http://www.ligo.caltech.edu.
[2] H. Luck et al., Classical Quantum Gravity 14, 1471(1997); http://www.geo600.uni-hannover.de.
[3] M. Ando et al., Phys. Rev. Lett. 86, 3950 (2001); http://tamago.mtk.nao.ac.jp.
[4] B. Caron et al., Classical Quantum Gravity 14, 1461(1997); http://www.virgo.infn.it.
[5] http://www.lisa-science.org/resources/talks-articles/science/lisa_science_case.pdf.
[6] F. Pretorius, Phys. Rev. Lett. 95, 121101 (2005).[7] M. Campanelli, C. O. Lousto, P. Marronetti, and Y.
Zlochower, Phys. Rev. Lett. 96, 111101 (2006).[8] J. Baker, J. Centrella, D. Choi, M. Koppitz, and J. van
Meter, Phys. Rev. Lett. 96, 111102 (2006).[9] M. Campanelli, C. O. Lousto, and Y. Zlochower, Phys.
Rev. D 74, 041501 (2006); 74, 084023 (2006); , arXiv:gr-qc/0606079 [Phys. Rev. D (to be published)]; J. Gonzalez,U. Sperhake, B. Brugmann, M. Hannam, and S. Husa,Phys. Rev. Lett. 98, 091101 (2007); B. Szilagyi, D.Pollney, L. Rezzolla, J. Thornburg and J. Winicour,Classical Quantum Gravity 24, S275 (2007); F. Pretoriusand D. Khurana, Classical Quantum Gravity 24, S83(2007).
[10] A. Buonanno, G. Cook, and F. Pretorius, Phys. Rev. D 75,124018 (2007).
[11] J. Baker, J. van Meter, S. McWilliams, J. Centrella, and B.Kelly, arXiv:gr-qc/0612024 [Phys. Rev. Lett. (to be pub-lished)].
[12] P. Jaranowski and G. Schafer, Phys. Rev. D 57, 7274(1998); 63 029902(E) (2000); L. Blanchet and G. Faye,Phys. Rev. D 63, 062005 (2001); V. C. de Andrade, L.Blanchet, and G Faye, Classical Quantum Gravity 18, 753(2001); T. Damour, P. Jaranowski, and G. Schafer, Phys.Lett. B 513, 147 (2001); L. Blanchet, G. Faye, B. R. Iyer,
and B. Joguet, Phys. Rev. D 65, 061501(R) (2002); 71,129902 (2005); L. Blanchet and B. R. Iyer, ClassicalQuantum Gravity 20, 755 (2003); L. Blanchet, T.Damour, G. Esposito-Farese, and B. R. Iyer, Phys. Rev.Lett. 93, 091101 (2004).
[13] A. Buonanno and T. Damour, Phys. Rev. D 59, 084006(1999).
[14] A. Buonanno and T. Damour, Phys. Rev. D 62, 064015(2000).
[15] A. Buonanno and T. Damour, in Proceedings of the IXthMarcel Grossmann Meeting, Rome, 2000 (unpublished).
[16] T. Damour, P. Jaranowski, and G. Schafer, Phys. Rev. D62, 084011 (2000).
[17] T. Damour, Phys. Rev. D 64, 124013 (2001).[18] A. Buonanno, Y. Chen, and T. Damour, Phys. Rev. D 74,
104005 (2006).[19] T. Damour, B. R. Iyer, and B. S. Sathyaprakash, Phys. Rev.
D 57, 885 (1998).[20] T. Baumgarte, P. Brady, J. D. E. Creighton, L. Lehner,
F. Pretorius, and R. DeVoe, arXiv:gr-qc/0612100.[21] J. W. York, Jr., Phys. Rev. Lett. 82, 1350 (1999).[22] E. Gourgoulhon, P. Grandclement, and S. Bonazzola,
Phys. Rev. D 65, 044020 (2002).[23] P. Grandclement, E. Gourgoulhon, and S. Bonazzola,
Phys. Rev. D 65, 044021 (2002).[24] H. P. Pfeiffer, L. E. Kidder, M. S. Scheel, and S. A.
Teukolsky, Comput. Phys. Commun. 152, 253 (2003).[25] G. B. Cook and H. P. Pfeiffer, Phys. Rev. D 70, 104016
(2004); M. Caudill, G. B. Cook, J. D. Grigsby, and H.Pfeiffer, Phys. Rev. D 74, 064011 (2006).
[26] S. Brandt and B. Brugmann, Phys. Rev. Lett. 78, 3606(1997).
[27] C. Cutler et al., Phys. Rev. Lett. 70, 2984 (1993).[28] T. Damour, B. Iyer, and B. Sathyaprakash, Phys. Rev. D
63, 044023 (2001); 66, 027502 (2002).
YI PAN et al. PHYSICAL REVIEW D 77, 024014 (2008)
024014-18
[29] T. Damour, B. R. Iyer, and B. S. Sathyaprakash, Phys. Rev.D 67, 064028 (2003).
[30] A. Buonanno, Y. Chen, and M. Vallisneri, Phys. Rev. D 67,024016 (2003); 74, 029903(E) (2006).
[31] T. Damour, B. Iyer, P. Jaranowski, and B. Sathyaprakash,Phys. Rev. D 67, 064028 (2003).
[32] K. G. Arun, B. R. Iyer, B. S. Sathyaprakash, and P.Sundararajan, Phys. Rev. D 71, 084008 (2005); 72,069903(E) (2005).
[33] T. Damour, E. Gourgoulhon, and P. Grandclement, Phys.Rev. D 66, 024007 (2002); P. Grandclement, E.Gourgoulhon, and S. Bonazzola, Phys. Rev. D 65,044021 (2002).
[34] L. Blanchet, Phys. Rev. D 65, 124009 (2002).[35] A. Buonanno, Y. Chen, and M. Vallisneri, Phys. Rev. D 67,
104025 (2003); 74, 029904(E) (2006).[36] L. S. Finn, Phys. Rev. D 46, 5236 (1992); L. S. Finn and
D. F. Chernoff, Phys. Rev. D 47, 2198 (1993); E. E.Flanagan and S. A. Hughes, Phys. Rev. D 57, 4535 (1998).
[37] http://www.ligo.caltech.edu/advLIGO/scripts/ref_des.shtml.
[38] J. Baker, S. McWilliams, J. van Meter, J. Centrella, D.Choi, B. Kelly, and M. Koppitz, Phys. Rev. D 75, 124024(2007).
[39] J. Baker, M. Campanelli, F. Pretorius, and Y. Zlochower,Classical Quantum Gravity 24, S25 (2007).
[40] T. Damour, B. Iyer, and B. Sathyaprakash, Phys. Rev. D62, 084036 (2000).
[41] B. Abbott et al. (LIGO Scientific Collaboration), Phys.Rev. D 72, 082001 (2005).
[42] B. Abbott et al. (LIGO Scientific Collaboration), Phys.Rev. D 73, 062001 (2006).
[43] E. Berti, V. Cardoso, and C. Will, Phys. Rev. D 73, 064030(2006).
[44] L. Blanchet, Living Rev. Relativity 9, 4 (2006).[45] P. Ajith et al. (unpublished).[46] E. Berti, V. Cardoso, J. Gonzalez, U. Sperhake, M.
Hannam, S. Husa, and B. Brugmann, arXiv:gr-qc/0703053 [Phys. Rev. D (to be published)].
[47] A. Nagar, T. Damour, and A. Tartaglia, Classical QuantumGravity 24, S109 (2007); T. Damour and A. Nagar, inProceedings of the XIth Marcel Grossmann Meeting,Berlin, 2006 (unpublished).
[48] H. P. Pfeiffer, D. A. Brown, L. E. Kidder, L. Lindblom, G.Lovelace, and M. A. Scheel, Classical Quantum Gravity24, S59 (2007).
[49] http://www.ligo.caltech.edu/~rana/NoiseData/S6/DCnoise.txt.
[50] Y. Pan, A. Buonanno, Y. Chen, and M. Vallisneri, Phys.Rev. D 69, 104017 (2004).
DATA-ANALYSIS DRIVEN COMPARISON OF ANALYTIC . . . PHYSICAL REVIEW D 77, 024014 (2008)
024014-19
Copyright © 2022 FDOKUMEN