Expression of ferredoxin-dependent glutamate synthase in dark-grown pine seedlings
REGULAR ARTICLE
Competition for nitrogen between Pinus sylvestris andectomycorrhizal fungi generates potential for negativefeedback under elevated CO2
Odair Alberton Æ Thomas W. Kuyper ÆAntonie Gorissen
Received: 12 February 2007 / Accepted: 21 May 2007 / Published online: 21 June 2007
� Springer Science+Business Media B.V. 2007
Abstract We investigated fungal species-specific
responses of ectomycorrhizal (ECM) Scots pine
(Pinus sylvestris) seedlings on growth and nutrient
acquisition together with mycelial development under
ambient and elevated CO2. Each seedling was
associated with one of the following ECM species:
Hebeloma cylindrosporum, Laccaria bicolor, Suillus
bovinus, S. luteus, Piloderma croceum, Paxillus
involutus, Boletus badius, or non-mycorrhizal, under
ambient, and elevated CO2 (350 or 700 ml l�1 CO2);
each treatment contained six replicates. The trial
lasted 156 days. During the final 28 days, the
seedlings were labeled with 14CO2. We measured
hyphal length, plant biomass, 14C allocation, and
plant nitrogen and phosphorus concentration. Almost
all parameters were significantly affected by fungal
species and/or CO2. There were very few significant
interactions. Elevated CO2 decreased shoot-to-root
ratio, most strongly so in species with the largest
extraradical mycelium. Under elevated CO2, ECM
root growth increased significantly more than hyphal
growth. Extraradical hyphal length was significantly
negatively correlated with shoot biomass, shoot N
content, and total plant N uptake. Root dry weight was
significantly negatively correlated with root N and P
concentration. Fungal sink strength for N strongly
affected plant growth through N immobilization.
Mycorrhizal fungal-induced progressive nitrogen
limitation (PNL) has the potential to generate negative
feedback with plant growth under elevated CO2.
Keywords Carbon and nitrogen allocation �Ectomycorrhizal fungi � Elevated CO2 � Extraradical
hyphae � Mycocentric � N immobilization �Progressive nitrogen limitation � Pinus sylvestris
Introduction
Responses to elevated CO2 have often been studied
from the plant’s perspective (phytocentric approach)
and less often from the fungal perspective (myco-
centric approach) in which carbon and nutrient sink
strength of the fungus plays an important role (Fitter
et al. 2000; Staddon 2005). It has often been assumed
that plant and fungal responses are coordinated and of
the same magnitude, implying that elevated CO2
provides roughly similar benefits for both symbiotic
partners (Alberton et al. 2005; Reich et al. 2006)
Under such conditions positive feedbacks between
increased carbon availability and increased nutrient
availability are likely to occur, leading to sustained
Responsible Editor: Herbert Johannes Kronzucker
O. Alberton (&) � T. W. Kuyper
Department of Soil Quality, Wageningen University,
PO Box 47, 6700 AA Wageningen, The Netherlands
e-mail: [email protected]; [email protected]
A. Gorissen
IsoLife, PO Box 349, 6700 AH Wageningen,
The Netherlands
123
Plant Soil (2007) 296:159–172
DOI 10.1007/s11104-007-9306-5

increased productivity of the plant. However, Diaz
et al. (1993) hypothesized that an enhanced C flow to
the soil increases nutrient immobilization by (sapro-
trophic) microbiota and hence decreases plant nutrient
availability, which provides a negative feedback and
limits plant response to elevated CO2. Such microbi-
ally induced progressive nitrogen limitation (PNL)
potentially decreases plant response to rising atmo-
spheric CO2 (Luo et al. 2004; Hu et al. 2006).
Furthermore, a recent meta-analysis of mycorrhizal
plant and fungal responses to elevated CO2 suggested
that in ectomycorrhizal (ECM) symbioses, fungal
responses are larger than plant responses (Alberton
et al. 2005). On average, doubling atmospheric CO2
concentration led to an increase of 45% of the ECM
mycelium and 26% of the plant. As a consequence of
this differential response, competition between mycor-
rhizal plant and fungus for nutrients could increase.
The meta-analysis also indicated that different
fungal species derive similar benefits from elevated
CO2, but that fungal species identity matters very
much from the plant’s perspective. Plants associated
with individual fungal species also showed a signif-
icantly lower response to elevated CO2 than plants
that were colonized by a fungal assemblage. Alberton
et al. (2005) proposed two hypotheses to explain this
observation. Elevated CO2 could result in a shift in
the fungal assemblage toward species that have lower
nutrient-to-carbon demands (Fransson et al. 2001;
Parrent et al. 2006). The alternative hypothesis is that
research results are biased by selection of species that
perform well under the conditions normally encoun-
tered in experiments, but that are not sufficiently
representative for fungal assemblages in the field.
Research bias likely leads to overrepresentation of
ECM fungi that tend to be nutrient-limited rather than
carbon-limited, since ECM fungi contain higher
concentration of N than plant material (Colpaert
et al. 1996). Because the meta-analysis indicated that
fungal species identity was a major determinant of
the outcome of individual studies, Alberton et al.
(2005) also suggested argued choices in species
selection for experiments. Because only a limited
number of species have been investigated to date,
there is a clear need for testing ECM plant and fungal
responses to elevated CO2 by a number of different
fungal species, with different carbon and nutrient
economies, in one experiment (see also Fransson
et al. 2007).
This work aimed at investigating fungal species-
specific responses of ECM Scots pine seedlings under
controlled conditions at ambient and elevated CO2.
We hypothesized that (1) elevated CO2 will increase
carbon allocation to the fungus; (2) enhanced alloca-
tion will increase nutrient immobilization in fungal
tissue; (3) larger nutrient immobilization in fungal
tissue will show negative feedback to plant nutrient
content and ultimately plant biomass due PNL; (4)
under such conditions mycorrhizal associations may
constrain plant responses to elevated CO2; (5) these
effects will be strongest in species that produce the
largest amount of mycelium. In other words, this
study sought for evidence of nutrient competition and
hence PNL between ECM fungus and plant in order
to improve our understanding and predictive ability
of ECM functioning under elevated CO2.
Materials and methods
Plants, fungi, and substrate
Seeds of Scots pine (Pinus sylvestris), purchased
from PVM, Grubbenvorst, The Netherlands, were
soaked in demineralized water overnight, and then
surface-sterilized in a 30% H2O2-solution containing
a drop of Tween 20 during 30 min. The sterilized
seeds were germinated on sterile water agar media
containing 5 g l�1 of glucose. After 3 weeks, each
seedling was transferred to a Petri dish (Ø 14.5 cm),
filled with 50 g of a sterilized (1 h at 1108C) peat-
vermiculite mixture (2:5, w/w). The mixture con-
tained 29.9 mg kg�1 of available mineral N and
1.4 mg kg�1 of available P. The peat-vermiculite
mixture was moistened with 50 ml full-strength
modified Melin–Norkrans (MMN) solution (without
agar, glucose, and malt extract) at the start of the
experiment. MMN solution was used to ensure that
both mycorrhizal and non-mycorrhizal treatments
were solely limited by N (and not by P), and to
prevent a decrease in pH due the ammonium-N
uptake during the experiment (Kamminga-van Wijk
and Prins 1989). During the experiment we further-
more added five times 23 ml MMN. In total, 8.66 mg
of N and 28.48 mg of P were added to each Petri dish.
Each seedling was inoculated around the root system
with 12 plugs of actively growing mycelium of one of
160 Plant Soil (2007) 296:159–172
123

the following ECM species: Hebeloma cylindrospo-
rum (CBS 558.96, kindly provided by Centraalbureau
voor Schimmelcultures CBS, Utrecht, The Nether-
lands), Laccaria bicolor, Suillus bovinus, S. luteus,
Piloderma croceum (BL 97-01, kindly provided by R.
Finlay, SLU, Uppsala, Sweden), Paxillus involutus,
Boletus badius. A non-mycorrhizal treatment was
also included. The isolates of L. bicolor, S. bovinus,
S. luteus, P. involutus, and B. badius were isolated
from fruitbodies collected in the surroundings of
Harderwijk, The Netherlands, in 2004. The Petri
dishes were hermetically sealed with parafilm and
tape, covered with aluminum foil, but contained three
openings. The median opening allowed shoots to
grow out of the dish using lanoline for sealing, while
one lateral opening could be instantaneously opened
for water addition, after which it was closed again.
During the labeling, the third opening was connected
to a PVC tube (Ø 2 cm; length 15 cm) containing
three layers of soda-lime (carbosorb) separated by
cotton plugs to trap root and mycorrhizal respiration
and to permit the free exchange of oxygen. Approx-
imately 7.5 g of soda-lime were used in the lower
layer to capture respiration. The upper layer served as
a barrier to capture CO2 entering from atmosphere,
and the layer in between was used as a background.
Plant growth and experimental conditions
The seedlings were placed into four growth cham-
bers (two for each CO2 level) with a steady flow of
either 350 or 700 ml l�1 CO2. Temperatures were
maintained at 208C during the day (16 h, irradiation
250 mmol m�2 s�1) and at 168C during the night
(8 h), and relative humidity was kept around 70%.
The Petri dishes were randomized every 2 weeks
within each growth chamber. After 128 days, the
Petri dishes were transferred to the Experimental
Soil Plant Atmosphere System (ESPAS; Gorissen
et al. 1996). The seedlings were exposed to 14CO2
(specific radioactivity 0.35 ± 0.05 kBq mg�1 C)
supplied from a pressurized cylinder for an addi-
tional 28 days. The growth conditions (temperature,
relative humidity, and CO2 level) in the ESPAS
were equal to the growth chambers, except for the
photosynthetically active irradiation level, which
was increased to 360 mmol m�2 s�1 for the first
2 weeks and 460 mmol m�2 s�1 for the last
2 weeks.
Analyses
All seedlings were harvested 28 days after 14C-
labeling started. Plants were removed from Petri
dishes; shoots, roots, and the peat-vermiculite mix-
ture were separated and dried at 708C for 48 h. These
fractions were subsequently ground and analyzed for
total 14C content with a modified wet combustion
method (Dalal 1979). Plant material (30 mg) and
peat-vermiculite (0.5 g) were digested in duplicate in
5 ml of a 10% (w/v) solution of K2Cr2O7 in a mixture
of concentrated H2SO4 and H3PO4 (3:2, v/v) at 1608Cfor 2 h. The 14CO2 evolved was trapped in 10 ml of
0.5 M NaOH. The 14C was determined in 0.5 ml of
NaOH by liquid scintillation counting (Tri-Carb
2100TR; Packard Instrument Company, Meriden,
CT, USA) with 3 ml of Ultima Gold (Packard).
The soda-lime containing the respired 14CO2 was
transferred to bottles (0.5 l) and dissolved in 50 ml
excess 6 M HCl, injected through a septum in the lid.
The 14CO2 evolved was captured in 10 ml of 5 M
NaOH and analyzed by liquid scintillation counting
as described.
N and P concentrations in shoots and roots were
determined colorimetrically by automated flow anal-
ysis after digestion of samples with H2SO4–salicyclic
acid–H2O2 and selenium (Temminghoff and Houba
2004).
The total extraradical hyphal length in the peat-
vermiculite mixture was determined with the gridline
intersection method and fluorescent staining as out-
lined by Bloem and Vos (2004). We did not subtract
hyphal length as measured in the control treatments
from hyphal length as measured in the mycorrhizal
treatments.
Statistical analyses
The experiment consisted of two CO2 concentrations
(350 or 700 ml l�1 CO2), eight mycorrhizal treatments
(seven ECM species and a non-mycorrhizal control)
and six replicates for each treatment. A total of 96
seedlings were included (2 · 8 · 6). In the growth
chamber, all Petri dishes for treatment combinations
were completely randomized. In order to comply with
ANOVA assumptions for homogeneity (Levene’s
test), the following variables were log10 transformed
before analysis: extraradical hyphal length, root dry
weight, shoot-to-root dry weight ratio, 14C in shoots,
Plant Soil (2007) 296:159–172 161
123

14C in shoot-to-root ratio, net 14C uptake per unit
shoot mass, N concentration in shoots and roots, P
concentration in roots, N content in shoots, P content
in roots, and N uptake efficiency. ANOVA followed
by Tukey’s honestly significant difference (HSD)
post hoc test was performed using SPSS Version
12.0.1 for Windows (SPSS Inc., Chicago, IL, USA).
Considering the large number of parameters mea-
sured and calculated (26), a sequential Bonferroni
correction was applied to keep the P-value constant at
P < 0.05. Pearson pairwise correlation coefficients
were calculated and their significance determined in
two-tailed t-test as indicators of direction of relation-
ship between plant and fungal parameters.
Results
No differences were observed between the results
from both growth chambers for each CO2 level, and
they were therefore combined. The respiration mea-
surements showed very low and variable values (14C
trapped in respiration usually between 0.5 and 1% of14C in roots). We concluded that the carbosorb traps
were most likely leaky, because respiration data are
normally an order of magnitude larger (Gorissen et al.
1991; Andersen and Rygiewicz 1995). Therefore, no
data on below-ground respiration and below-ground
carbon use efficiency (Gorissen and Kuyper 2000) are
reported.
Almost all parameters were significantly affected
by CO2 and/or fungal species. There were very few
significant interactions (Table 1). The non-mycorrhi-
zal plants performed equally well or significantly
better than some mycorrhizal treatments. Omission of
the non-mycorrhizal control did in general not affect
the significance of the various parameters (data not
shown). The parameters will be discussed in the
following order: hyphal length, root, and shoot.
Hyphal length was significantly affected by fungal
species, but not by elevated CO2. Hyphal length
increased by 12% under elevated CO2, but the
increment was not significant (Table 1). Average
hyphal length (for both CO2 levels) ranged from 54
(S. bovinus) to 634 (H. cylindrosporum) m g�1
substrate (Table 2). Hyphal length in the non-
mycorrhizal treatment was on average 29 m g�1
substrate. Incorporation of 14C in the substrate (where
are roots and external mycelia) followed a fairly
similar pattern but showed more variability (higher
coefficient of variation). It was lowest in the non-
mycorrhizal control and in the treatment with
S. bovinus, and highest in the treatments with
H. cylindrosporum, L. bicolor, and P. croceum
(elevated CO2 only) (Table 3).
Root dry weight was significantly affected by CO2
level and fungal species, and not by the interaction
(Table 1). Under elevated CO2 root dry weight
increased on average by 52%. Root biomass was
highest in the treatment with P. croceum and lowest
in the treatments with H. cylindrosporum and L.
bicolor (Fig. 1). 14C incorporation in roots was also
significantly affected by CO2 level and fungal
species, and not by the interaction. Elevated CO2
increased 14C activity in roots by 87%. Plants
inoculated with H. cylindrosporum and L. bicolor
presented the lowest 14C activity (Table 3). Root dry
weight and 14C incorporation in roots were signifi-
cantly positively correlated (r = 0.73, P < 0.01). Root
N and P concentration were also significantly affected
by CO2 level and fungal species, and not by the
interaction. Elevated CO2 decreased root N concen-
tration on average by 14% and root P concentration
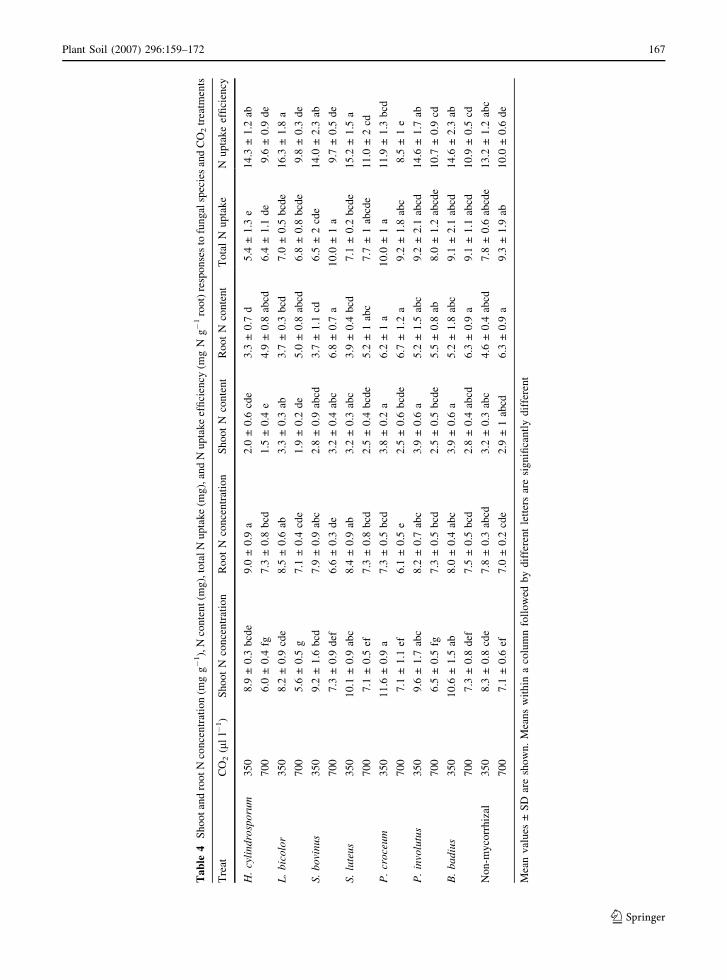
on average by 7%. Root N concentrations varied
between 6 and 9 mg g�1, and were lowest in the
treatment with P. croceum and highest in the
treatment with H. cylindrosporum (Table 4). Because
elevated CO2 increased root dry weight (52%), the
total amount of N and P in roots increased under
elevated CO2 by 32 and 41%, respectively. Again,
both CO2 level and fungal species, but not the
interaction, were significant. Root N content was
highest in the treatment with P. croceum and lowest
in the treatments with H. cylindrosporum and L.
bicolor (Table 4). Root dry weight was significantly
negatively correlated with shoot: root ratio
(r = �0.81; P < 0.001) and root N concentration
(r = �0.91; P < 0.001) (Fig. 2). N uptake efficiency
(mg N content g�1 non-mycorrhizal root dry weight
or ectomycorrhiza) was significantly affected by CO2
level and fungal species (Table 1). It ranged between
12 and 16 for ambient CO2, and 8 and 11 for elevated
CO2 (Table 4). N uptake efficiency was lower for
P. croceum than for the other mycorrhizal fungi and
non-mycorrhizal treatment.
Shoot dry weight was significantly affected by
fungus but not by elevated CO2 (Table 1). On
average shoot dry weight increased under elevated
162 Plant Soil (2007) 296:159–172
123
CO2 by 6%. Shoot dry weight was lowest in the
treatment with H. cylindrosporum (Table 2). 14C
incorporation in shoots followed the same pattern (it
increased under elevated CO2 by only 3%), and both
parameters were significantly correlated (r = 0.83;
P < 0.001). The activity of 14C in shoots in H.
cylindrosporum-colonized plants was lowest,
whereas the activity of 14C in shoots in S.
bovinus-colonized plants was highest (Table 3).
Shoot dry weight was significantly negatively cor-
related with hyphal length (r = �0.70; P < 0.01; log
scale to improve the homogeneity of variances;
Fig. 3a).
Shoot N concentration ranged between 8 and
12 mg g�1 under ambient CO2 and 6–7 mg g�1 under
elevated CO2 (Table 4). Under elevated CO2 shoot N
concentrations decreased on average by 29%. Shoot
N concentrations were highest in plants inoculated
with P. croceum, and lowest in non-mycorrhizal
plants and plants inoculated with H. cylindrosporum
and L. bicolor. P concentration in the shoots was
highest in plants colonized by H. cylindrosporum and
lowest in non-mycorrhizal plants and plants colo-
nized by L. bicolor and P. involutus. Because shoot
dry weight increased under elevated CO2 and N
concentration decreased, shoot N content decreased
by 24%. Shoot N was lowest in plants inoculated with
H. cylindrosporum. Shoot N content was significantly
negatively correlated with hyphal length (r = �0.57;
P < 0.02) (Fig. 3b).
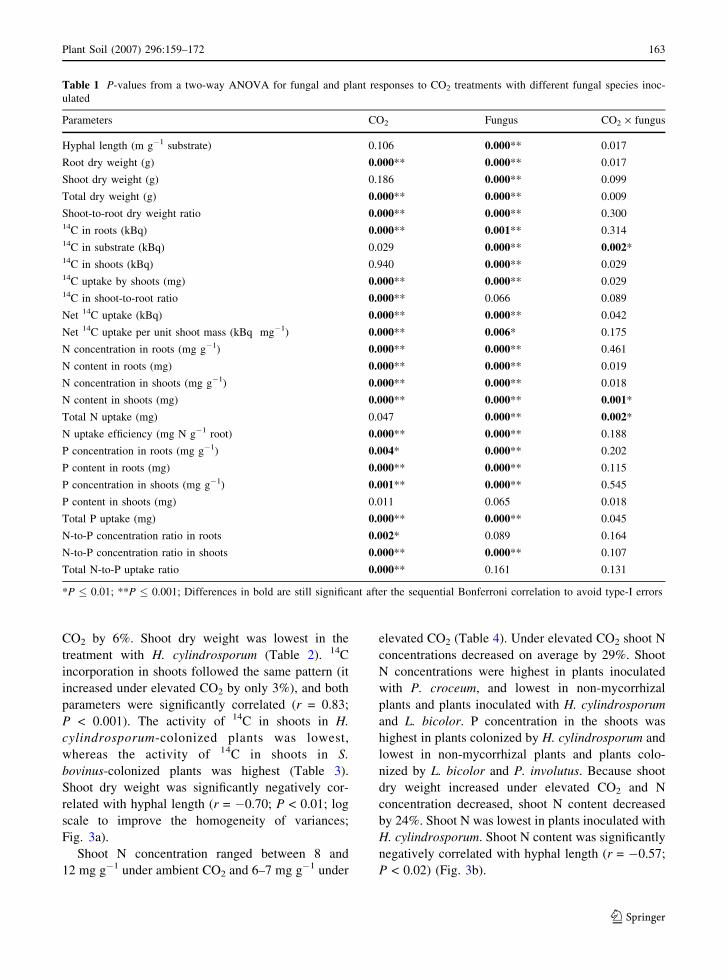
Table 1 P-values from a two-way ANOVA for fungal and plant responses to CO2 treatments with different fungal species inoc-
ulated
Parameters CO2 Fungus CO2 · fungus
Hyphal length (m g�1 substrate) 0.106 0.000** 0.017
Root dry weight (g) 0.000** 0.000** 0.017
Shoot dry weight (g) 0.186 0.000** 0.099
Total dry weight (g) 0.000** 0.000** 0.009
Shoot-to-root dry weight ratio 0.000** 0.000** 0.30014C in roots (kBq) 0.000** 0.001** 0.31414C in substrate (kBq) 0.029 0.000** 0.002*14C in shoots (kBq) 0.940 0.000** 0.02914C uptake by shoots (mg) 0.000** 0.000** 0.02914C in shoot-to-root ratio 0.000** 0.066 0.089
Net 14C uptake (kBq) 0.000** 0.000** 0.042
Net 14C uptake per unit shoot mass (kBq mg�1) 0.000** 0.006* 0.175
N concentration in roots (mg g�1) 0.000** 0.000** 0.461
N content in roots (mg) 0.000** 0.000** 0.019
N concentration in shoots (mg g�1) 0.000** 0.000** 0.018
N content in shoots (mg) 0.000** 0.000** 0.001*
Total N uptake (mg) 0.047 0.000** 0.002*
N uptake efficiency (mg N g�1 root) 0.000** 0.000** 0.188
P concentration in roots (mg g�1) 0.004* 0.000** 0.202
P content in roots (mg) 0.000** 0.000** 0.115
P concentration in shoots (mg g�1) 0.001** 0.000** 0.545
P content in shoots (mg) 0.011 0.065 0.018
Total P uptake (mg) 0.000** 0.000** 0.045
N-to-P concentration ratio in roots 0.002* 0.089 0.164
N-to-P concentration ratio in shoots 0.000** 0.000** 0.107
Total N-to-P uptake ratio 0.000** 0.161 0.131
*P � 0.01; **P � 0.001; Differences in bold are still significant after the sequential Bonferroni correlation to avoid type-I errors
Plant Soil (2007) 296:159–172 163
123

Total plant dry biomass increased by 33% under
elevated CO2 and once again presented significant
differences due to fungal species. Total plant biomass
was lowest in the treatment with H. cylindrosporum
and highest in the treatment with P. croceum
(Table 2). Elevated CO2 resulted in an average
increase of 14C incorporation by 46%, with signifi-
cant differences between species (Table 1). On
average, total N uptake increased by 8% under
elevated CO2. It was affected by fungal species and
by the interaction fungal species · CO2, but not by
CO2 (Table 1). Plants colonized by H. cylindrospo-
rum, L. bicolor, and S. luteus showed the lowest total
N uptake and plants colonized by P. croceum and B.
badius the highest (Table 4). Total N uptake was also
significantly negatively correlated with hyphal length
(r = �0.54; P < 0.05) (Fig. 3c). Under elevated CO2 P
uptake increased by 32%. Total P uptake was also
affected by fungal species, but not by the interaction.
Total P uptake was lower in plants colonized by
H. cylindrosporum, L. bicolor, and S. luteus than in
plants colonized by P. croceum (Table 5).
Shoot: root ratio was significantly affected by
elevated CO2 and fungal species and not by their
interaction. On average, elevated CO2 reduced shoot:
root ratio from 0.67 to 0.45, a decrease of 33%.
Shoot: root ratio was lowest in plants inoculated with
P. croceum. Shoot: root ratio and the ratio of 14C
incorporation in shoots and roots were significantly
correlated (r = 0.75; P < 0.001). The 14C in shoot:
root ratio decreased by 52% under elevated CO2. This
decrease, caused by an increased C allocation to the
roots compared to the shoots during the final 4 weeks
of the experiment, indicated increased sink strength
below-ground.
Discussion
In our experiment hyphal length of seven different
ECM fungal species did not significantly increase
under elevated CO2. The average increase of 12%
was much lower than the value of 34% of the general
ECM fungal response (i.e., mycelial dry weight,
mycelial area, hyphal length, etc.) reported by
Alberton et al. (2005). Our experiment did therefore
not provide complete support for our first hypothesis.
Plant performance (with regard to N) suggests an
explanation for the lack of a fungal response.
Mycorrhizal symbiosis often enhances plant
growth due to increased nutrient uptake compared
to non-mycorrhizal plants. However, in our experi-
ment the non-mycorrhizal plants performed equally
well or significantly better than in some mycorrhizal
Table 2 Extraradical hyphal length (m g�1 substrate) and seedling biomass (g) responses to fungal species and CO2 treatments
Fungal species CO2 (ml l�1) Hyphal length Root dry weight Shoot dry weight Total dry weight Shoot-to-root ratio
H. cylindrosporum 350 600 ± 270 a 0.37 ± 0.08 g 0.23 ± 0.07 c 0.60 ± 0.15 f 0.61 ± 0.1 abc
700 669 ± 468 a 0.67 ± 0.14 bcdef 0.26 ± 0.06 bc 0.93 ± 0.19 cdef 0.38 ± 0.05 cd
L. bicolor 350 224 ± 54 ab 0.43 ± 0.05 fg 0.41 ± 0.05 a 0.84 ± 0.05 def 0.97 ± 0.19 a
700 248 ± 63 ab 0.70 ± 0.09 abcde 0.34 ± 0.06 abc 1.04 ± 0.13 bcde 0.49 ± 0.06 bcd
S. bovinus 350 73 ± 31 cdef 0.47 ± 0.16 efg 0.30 ± 0.08 abc 0.78 ± 0.23 ef 0.68 ± 0.2 ab
700 35 ± 9 fg 1.03 ± 0.07 ab 0.44 ± 0.03 a 1.46 ± 0.07 a 0.43 ± 0.05 bcd
S. luteus 350 116 ± 51 bcde 0.47 ± 0.06 defg 0.32 ± 0.04 abc 0.78 ± 0.07 ef 0.68 ± 0.12 ab
700 111 ± 14 bcd 0.72 ± 0.21 abcd 0.35 ± 0.07 abc 1.08 ± 0.23 bcde 0.53 ± 0.22 bcd
P. croceum 350 143 ± 59 bcd 0.85 ± 0.14 abc 0.33 ± 0.04 abc 1.18 ± 0.1 abcd 0.41 ± 0.14 cd
700 180 ± 64 bc 1.09 ± 0.2 a 0.35 ± 0.07 abc 1.45 ± 0.24 a 0.33 ± 0.07 d
P. involutus 350 54 ± 24 def 0.64 ± 0.17 cdef 0.41 ± 0.08 a 1.05 ± 0.2 bcde 0.69 ± 0.22 ab
700 70 ± 23 cdef 0.76 ± 0.15 abc 0.39 ± 0.1 ab 1.15 ± 0.22 abcd 0.53 ± 0.11 bcd
B. badius 350 88 ± 57 cdef 0.65 ± 0.23 cdef 0.38 ± 0.06 abc 1.03 ± 0.21 bcde 0.65 ± 0.28 abc
700 119 ± 55 bcde 0.84 ± 0.09 abc 0.39 ± 0.09 ab 1.22 ± 0.16 abc 0.47 ± 0.1 bcd
Non-mycorrhizal 350 17 ± 8 g 0.59 ± 0.05 cdef 0.39 ± 0.05 ab 0.98 ± 0.08 bcde 0.65 ± 0.08 ab
700 40 ± 18 ef 0.92 ± 0.13 abc 0.41 ± 0.15 ab 1.33 ± 0.26 ab 0.44 ± 0.1 bcd
Mean values ± SD are shown. Means within a column followed by different letters are significantly different
164 Plant Soil (2007) 296:159–172
123
Ta
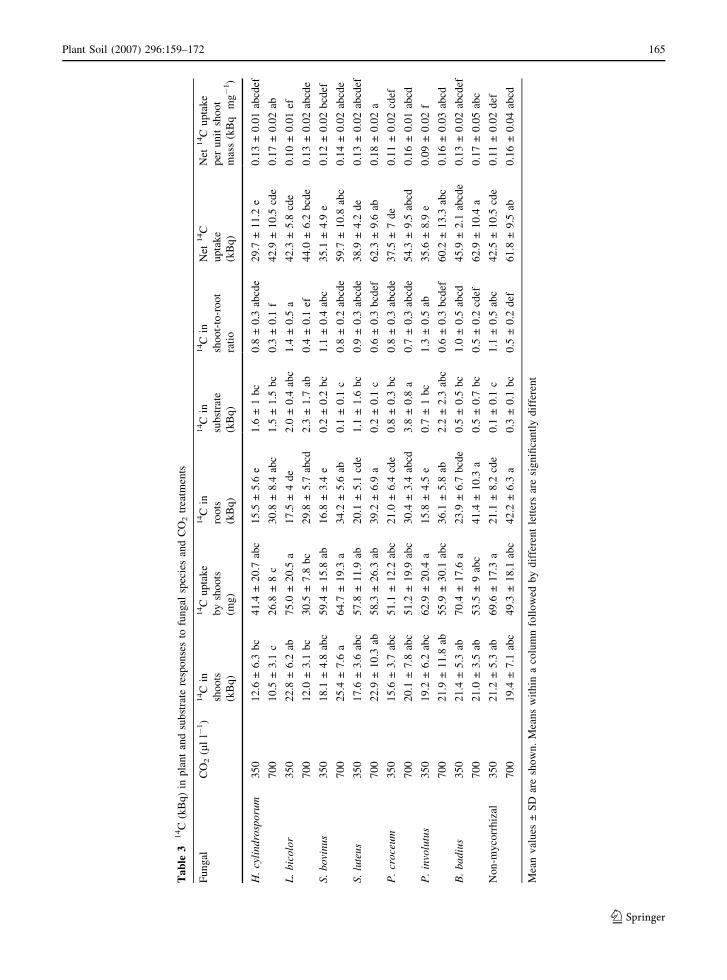
ble
314C
(kB
q)
inp
lan
tan
dsu
bst
rate
resp
on
ses
tofu
ng
alsp
ecie
san
dC
O2
trea
tmen
ts
Fu
ng
alC
O2
(ml
l�1)
14C
in
sho
ots
(kB
q)
14C
up
tak
e
by
sho
ots
(mg
)
14C
in
roo
ts
(kB
q)
14C
in
sub
stra
te
(kB
q)
14C
in
sho
ot-
to-r
oo
t
rati
o
Net
14C
up
tak
e
(kB
q)
Net
14C
up
tak
e
per
un
itsh
oo
t
mas
s(k
Bq
mg�
1)
H.
cyli
nd
rosp
oru
m3
50
12
.6±
6.3
bc
41
.4±
20
.7ab
c1
5.5
±5
.6e
1.6
±1
bc
0.8
±0
.3ab
cde
29
.7±
11
.2e
0.1
3±
0.0
1ab
cdef
70
01
0.5
±3
.1c
26
.8±
8c
30
.8±
8.4
abc
1.5
±1
.5b
c0
.3±
0.1
f4
2.9
±1
0.5
cde
0.1
7±
0.0
2ab
L.
bic
olo
r3
50
22
.8±
6.2
ab7
5.0
±2
0.5
a1
7.5
±4
de
2.0
±0
.4ab
c1
.4±
0.5
a4
2.3
±5
.8cd
e0
.10
±0
.01
ef
70
01
2.0
±3
.1b
c3
0.5
±7
.8b
c2
9.8
±5
.7ab
cd2
.3±
1.7
ab0
.4±
0.1
ef4
4.0
±6
.2b
cde
0.1
3±
0.0
2ab
cde
S.
bo
vin
us
35
01
8.1
±4
.8ab
c5
9.4
±1
5.8
ab1
6.8
±3
.4e
0.2
±0
.2b
c1
.1±
0.4
abc
35
.1±
4.9
e0
.12
±0
.02
bcd
ef
70
02
5.4
±7
.6a
64
.7±
19
.3a
34
.2±
5.6
ab0
.1±
0.1
c0
.8±
0.2
abcd
e5
9.7
±1
0.8
abc
0.1
4±
0.0
2ab
cde
S.
lute
us
35
01
7.6
±3
.6ab
c5
7.8
±1
1.9
ab2
0.1
±5
.1cd
e1
.1±
1.6
bc
0.9
±0
.3ab
cde
38
.9±
4.2
de
0.1
3±
0.0
2ab
cdef
70
02
2.9
±1
0.3
ab5
8.3
±2
6.3
ab3
9.2
±6
.9a
0.2
±0
.1c
0.6
±0
.3b
cdef
62
.3±
9.6
ab0
.18
±0
.02
a
P.
cro
ceu
m3
50
15
.6±
3.7
abc
51
.1±
12
.2ab
c2
1.0
±6
.4cd
e0
.8±
0.3
bc
0.8
±0
.3ab
cde
37
.5±
7d
e0
.11
±0
.02
cdef
70
02
0.1
±7
.8ab
c5
1.2
±1
9.9
abc
30
.4±
3.4
abcd
3.8
±0
.8a
0.7
±0
.3ab
cde
54
.3±
9.5
abcd
0.1
6±
0.0
1ab
cd
P.
invo
lutu
s3
50
19
.2±
6.2
abc
62
.9±
20
.4a
15
.8±
4.5
e0
.7±
1b
c1
.3±
0.5
ab3
5.6
±8
.9e
0.0
9±
0.0
2f
70
02
1.9
±1
1.8
ab5
5.9
±3
0.1
abc
36
.1±
5.8
ab2
.2±
2.3
abc
0.6
±0
.3b
cdef
60
.2±
13
.3ab
c0
.16
±0
.03
abcd
B.
ba
diu
s3
50
21
.4±
5.3
ab7
0.4
±1
7.6
a2
3.9
±6
.7b
cde
0.5
±0
.5b
c1
.0±
0.5
abcd
45
.9±
2.1
abcd
e0
.13
±0
.02
abcd
ef
70
02
1.0
±3
.5ab
53
.5±
9ab
c4
1.4
±1
0.3
a0
.5±
0.7
bc
0.5
±0
.2cd
ef6
2.9
±1
0.4
a0
.17
±0
.05
abc
No
n-m
yco
rrh
izal
35
02
1.2
±5
.3ab
69
.6±
17
.3a
21
.1±
8.2
cde
0.1
±0
.1c
1.1
±0
.5ab
c4
2.5
±1
0.5
cde
0.1
1±
0.0
2d
ef
70
01
9.4
±7
.1ab
c4
9.3
±1
8.1
abc
42
.2±
6.3
a0
.3±
0.1
bc
0.5
±0
.2d
ef6
1.8
±9
.5ab
0.1
6±
0.0
4ab
cd
Mea
nv
alu
es±
SD
are
sho
wn
.M
ean
sw
ith
ina
colu
mn
foll
ow
edb
yd
iffe
ren
tle
tter
sar
esi
gn
ifica
ntl
yd
iffe
ren
t
Plant Soil (2007) 296:159–172 165
123
treatments. Especially plants colonized by H. cylin-
drosporum showed a significantly lower growth
performance. Basically, two related hypotheses have
been forwarded to explain lower growth performance
of mycorrhizal plants compared to non-mycorrhizal
plants. The first hypothesis focuses on carbon costs
for the mycorrhizal fungus, while the second hypoth-
esis focuses on nutrient immobilization by the
mycorrhizal fungus.
Under the first hypothesis increased carbon avail-
ability (through higher rates of photosynthesis) would
decrease relative carbon costs to maintain the
mycorrhizal fungus. One corollary following from
that hypothesis would be that increased CO2 avail-
ability reduces carbon costs and hence decreases
growth reduction. In our experiment, the growth
performance of mycorrhizal plants was independent
of CO2 levels. Dry weight of mycorrhizal plants
(averaged over seven species) was 91% of that of
non-mycorrhizal plants at ambient CO2 levels and
90% at elevated CO2 levels. So, increased sink
strength for carbon in mycorrhizal plants does not
seem to be the cause of the growth reduction. In
addition, dry weight of mycorrhizal plants was
largely determined by intrinsic fungal properties,
notably the length of the extraradical mycelium,
because we found significantly negative correlations
between extraradical hyphal length and shoot weight
(Fig. 3a), shoot N content (Fig. 3b), and total N
uptake (Fig. 3c), indicating the importance of fungal
sink strength for N.
Several lines of evidence suggest that this growth
reduction of mycorrhizal plants was due to N
immobilization in the extraradical mycelium. An N
balance showed that under ambient CO2 76% of the
mineral N that was in or added to the system could be
accounted for in shoots and roots of non-mycorrhizal
plants, and that mycorrhizal colonization reduced that
to on average 67%. Under elevated CO2, 89% of N in
the system could be accounted for in shoots and roots
of non-mycorrhizal plants, and in ECM plants this
was on average 68%. Plants colonized by H. cylin-
drosporum, where a very high length of extraradical
mycelium was recorded, remained the smallest,
despite the high below-ground investment. Because
of the C compounds associated with the immobiliza-
tion of N, the extraradical mycelium of Hebeloma
species has been noted to be a large modifier of plant
photosynthesis and carbohydrate metabolism (Miller
et al. 1989; Rygiewicz and Andersen 1994; Marm-
eisse et al. 1999). Also in conditions of low P supply,
H. cylindrosporum associated with seedlings of Pinus
pinaster reduced plant growth due to P retention
(Conjeaud et al. 1996). When different kinds of N
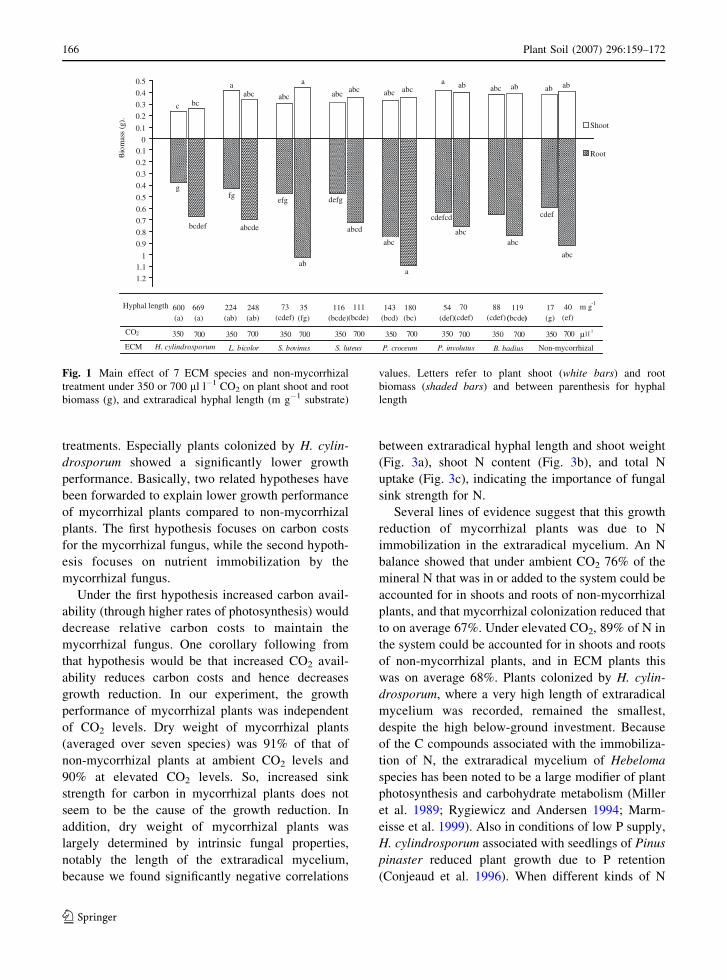
Fig. 1 Main effect of 7 ECM species and non-mycorrhizal
treatment under 350 or 700 ml l�1 CO2 on plant shoot and root
biomass (g), and extraradical hyphal length (m g�1 substrate)
values. Letters refer to plant shoot (white bars) and root
biomass (shaded bars) and between parenthesis for hyphal
length
166 Plant Soil (2007) 296:159–172
123
Ta
ble
4S
ho
ot
and
roo
tN
con
cen
trat
ion
(mg
g�
1),
Nco
nte
nt
(mg
),to
tal
Nu
pta
ke
(mg
),an
dN
up
tak
eef
fici
ency
(mg
Ng�
1ro
ot)
resp
on
ses
tofu
ng
alsp
ecie
san
dC
O2
trea
tmen
ts
Tre
atC
O2
(ml
l�1)
Sh
oo
tN
con
cen
trat
ion
Ro
ot
Nco
nce
ntr
atio
nS
ho
ot
Nco
nte
nt
Ro
ot
Nco
nte
nt
To
tal
Nu
pta
ke
Nu
pta
ke
effi
cien
cy
H.
cyli
nd
rosp
oru
m3
50
8.9
±0
.3b
cde
9.0
±0
.9a
2.0
±0
.6cd
e3
.3±
0.7
d5
.4±
1.3
e1
4.3
±1
.2ab
70
06
.0±
0.4
fg7
.3±
0.8
bcd
1.5
±0
.4e
4.9
±0
.8ab
cd6
.4±
1.1
de
9.6
±0
.9d
e
L.
bic
olo
r3
50
8.2
±0
.9cd
e8
.5±
0.6
ab3
.3±
0.3
ab3
.7±
0.3
bcd
7.0
±0
.5b
cde
16
.3±
1.8
a
70
05
.6±
0.5
g7
.1±
0.4
cde
1.9
±0
.2d
e5
.0±
0.8
abcd
6.8
±0
.8b
cde
9.8
±0
.3d
e
S.
bo
vin
us
35
09
.2±
1.6
bcd
7.9
±0
.9ab
c2
.8±
0.9
abcd
3.7
±1
.1cd
6.5
±2
cde
14
.0±
2.3
ab
70
07
.3±
0.9
def
6.6
±0
.3d
e3
.2±
0.4
abc
6.8
±0
.7a
10
.0±
1a
9.7
±0
.5d
e
S.
lute
us
35
01
0.1
±0
.9ab
c8
.4±
0.9
ab3
.2±
0.3
abc
3.9
±0
.4b
cd7
.1±
0.2
bcd
e1
5.2
±1
.5a
70
07
.1±
0.5
ef7
.3±
0.8
bcd
2.5
±0
.4b
cde
5.2
±1
abc
7.7
±1
abcd
e1
1.0
±2
cd
P.
cro
ceu
m3
50
11
.6±
0.9
a7
.3±
0.5
bcd
3.8
±0
.2a
6.2
±1
a1
0.0
±1
a1
1.9
±1
.3b
cd
70
07
.1±
1.1
ef6
.1±
0.5
e2
.5±
0.6
bcd
e6
.7±
1.2
a9
.2±
1.8
abc
8.5
±1
e
P.
invo
lutu
s3
50
9.6
±1
.7ab
c8
.2±
0.7
abc
3.9
±0
.6a
5.2
±1
.5ab
c9
.2±
2.1
abcd
14
.6±
1.7
ab
70
06
.5±
0.5
fg7
.3±
0.5
bcd
2.5
±0
.5b
cde
5.5
±0
.8ab
8.0
±1
.2ab
cde
10
.7±
0.9
cd
B.
ba
diu
s3
50
10
.6±
1.5
ab8
.0±
0.4
abc
3.9
±0
.6a
5.2
±1
.8ab
c9
.1±
2.1
abcd
14
.6±
2.3
ab
70
07
.3±
0.8
def
7.5
±0
.5b
cd2
.8±
0.4
abcd
6.3
±0
.9a
9.1
±1
.1ab
cd1
0.9
±0
.5cd
No
n-m
yco
rrh
izal
35
08
.3±
0.8
cde
7.8
±0
.3ab
cd3
.2±
0.3
abc
4.6
±0
.4ab
cd7
.8±
0.6
abcd
e1
3.2
±1
.2ab
c
70
07
.1±
0.6
ef7
.0±
0.2
cde
2.9
±1
abcd
6.3
±0
.9a
9.3
±1
.9ab
10
.0±
0.6
de
Mea
nv
alu
es±
SD
are
sho
wn
.M
ean
sw
ith
ina
colu
mn
foll
ow
edb
yd
iffe
ren
tle
tter
sar
esi
gn
ifica
ntl
yd
iffe
ren
t
Plant Soil (2007) 296:159–172 167
123

were supplied to the symbiosis P. pinaster—H.
cylindrosporum, decreased plant growth of the pine
was related to the C cost for fungal growth and N
assimilation, and the extraradical hyphae were con-
sidered as the main sink (Plassard et al. 2000).
Colpaert et al. (1992) demonstrated a negative
correlation between mycelial size and the growth of
P. sylvestris seedlings and in a subsequent study
Colpaert et al. (1996) suggested that growth reduction
of pine seedlings colonized by Scleroderma citrinum
was best explained by the N-drain.
While in a strict sense our second and third
hypothesis were not supported (because under ele-
vated CO2 there were no increases in the size of the
extraradical mycelium), the underlying mechanism of
mycorrhizal fungal-induced PNL (mycelial size
determines fungal N immobilization potential and
hence plant N concentration and content) was con-
firmed. While laboratory evidence for nutrient (N)
retention by ECM fungi resulting in reduced plant
growth was also provided by Nylund and Wallander
(1989), Dosskey et al. (1990, 1991), Colpaert and
Verstuyft (1999), and Fransson et al. (2005), the
question is relevant whether the same mechanism
could also occur under field conditions. Instances of
very strong N-limitation of ECM mycelial growth has
been reported from several boreal and arctic ecosys-
tems (Hendricks et al. 2006; Clemmensen et al. 2006;
Wallander 2006). There is also field evidence for N-
limitation of arbuscular mycorrhizal fungi (Treseder
and Allen 2002; Allen et al. 2005). It is therefore
likely that mycorrhizal fungal-induced PNL can also
occur under field conditions and will ultimately
constrain mycorrhizal plant responses to elevated
CO2 (Johnson 2006; Hu et al. 2006).
Further indirect evidence for mycorrhizal-fungal
induced PNL comes from N concentration. In our
system shoot and root N under ambient CO2 ranged
between 7 and 12 mg g�1, and under elevated CO2
between 6 and 7 mg g�1. Especially these latter
values are clearly below the deficiency limit of
10 mg g�1 as mentioned by Reuter et al. (1997) for
pines. Similar low plant N concentrations were also
observed in northern Finland in Scots pine and
Norway spruce (Picea abies) stands on very poor
soils (Helmisaari et al. 2007) with root N concentra-
tions between 5 and 8 mg g�1, indicating that this
degree of N-limitation also occurs in natural systems.
The high-N retention by mycorrhizal hyphae appar-
ently limits plant growth given the fact that the
non-mycorrhizal plants grew somewhat better than
the mycorrhizal plants. This confirms our fourth
0
1
2
3
4
5
6
7
8
9
0.3
conc
entr
atio
n in
roo
t (m
g g–1
)N
..
Ambient CO2
Elevated CO2
Root dry weight (g)
0.4 0.5 0.6 0.7 0.8 0.9 1.0 1.1
Fig. 2 Relation between root dry weight (g) and root N
concentration (mg g�1) under ambient (open circle) and
elevated (filled diamond) CO2 [n = 16, r = �0.908, and
P < 0.001]
0.00
0.05
0.10
0.15
0.200.25
0.30
0.35
0.40
0.45
0.50
1.2
)g(thgiew
yrdtoohS
.
ACO2
ECO2
Ambient CO2
Elevated CO2
0.0
0.5
1.0
1.5
2.0
2.5
3.0
3.5
4.0
4.5
)gm(
stoohsnitnetnoc
N...
…
Ambient CO2Elevated CO2
0
2
4
6
8
10
12
Log hyphal length (m g–1 substrate )
)gm(
ekatpuNlat oT
..
ACO2
ECO2
Ambient CO2
Elevated CO2
1.4 1.6 1.8 2.0 2.2 2.4 2.6 2.8 3.0
1.2 1.4 1.6 1.8 2.0 2.2 2.4 2.6 2.8 3.0
1.2 1.4 1.6 1.8 2.0 2.2 2.4 2.6 2.8 3.0
(a)
(b)
(c)
Fig. 3 Relation between hyphal length (log m g�1 substrate)
and a shoot dry weight (g), b N content in shoots (mg), and ctotal N uptake (mg) under ambient (open circle) and elevated
(filled diamond) CO2 [n = 16, r = �0.7, and P < 0.01 (a);
r = �0.572 and P < 0.02 (b); r = �0.54 and P < 0.05 (c)]
168 Plant Soil (2007) 296:159–172
123
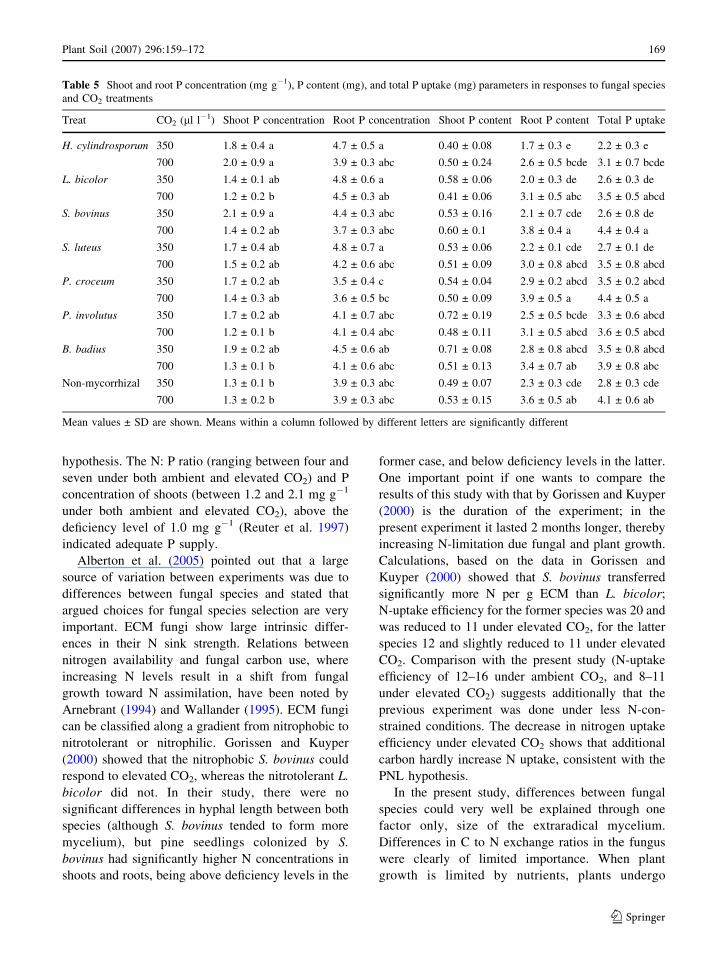
hypothesis. The N: P ratio (ranging between four and
seven under both ambient and elevated CO2) and P
concentration of shoots (between 1.2 and 2.1 mg g�1
under both ambient and elevated CO2), above the
deficiency level of 1.0 mg g�1 (Reuter et al. 1997)
indicated adequate P supply.
Alberton et al. (2005) pointed out that a large
source of variation between experiments was due to
differences between fungal species and stated that
argued choices for fungal species selection are very
important. ECM fungi show large intrinsic differ-
ences in their N sink strength. Relations between
nitrogen availability and fungal carbon use, where
increasing N levels result in a shift from fungal
growth toward N assimilation, have been noted by
Arnebrant (1994) and Wallander (1995). ECM fungi
can be classified along a gradient from nitrophobic to
nitrotolerant or nitrophilic. Gorissen and Kuyper
(2000) showed that the nitrophobic S. bovinus could
respond to elevated CO2, whereas the nitrotolerant L.
bicolor did not. In their study, there were no
significant differences in hyphal length between both
species (although S. bovinus tended to form more
mycelium), but pine seedlings colonized by S.
bovinus had significantly higher N concentrations in
shoots and roots, being above deficiency levels in the
former case, and below deficiency levels in the latter.
One important point if one wants to compare the
results of this study with that by Gorissen and Kuyper
(2000) is the duration of the experiment; in the
present experiment it lasted 2 months longer, thereby
increasing N-limitation due fungal and plant growth.
Calculations, based on the data in Gorissen and
Kuyper (2000) showed that S. bovinus transferred
significantly more N per g ECM than L. bicolor;
N-uptake efficiency for the former species was 20 and
was reduced to 11 under elevated CO2, for the latter
species 12 and slightly reduced to 11 under elevated
CO2. Comparison with the present study (N-uptake
efficiency of 12–16 under ambient CO2, and 8–11
under elevated CO2) suggests additionally that the
previous experiment was done under less N-con-
strained conditions. The decrease in nitrogen uptake
efficiency under elevated CO2 shows that additional
carbon hardly increase N uptake, consistent with the
PNL hypothesis.
In the present study, differences between fungal
species could very well be explained through one
factor only, size of the extraradical mycelium.
Differences in C to N exchange ratios in the fungus
were clearly of limited importance. When plant
growth is limited by nutrients, plants undergo
Table 5 Shoot and root P concentration (mg g�1), P content (mg), and total P uptake (mg) parameters in responses to fungal species
and CO2 treatments
Treat CO2 (ml l�1) Shoot P concentration Root P concentration Shoot P content Root P content Total P uptake
H. cylindrosporum 350 1.8 ± 0.4 a 4.7 ± 0.5 a 0.40 ± 0.08 1.7 ± 0.3 e 2.2 ± 0.3 e
700 2.0 ± 0.9 a 3.9 ± 0.3 abc 0.50 ± 0.24 2.6 ± 0.5 bcde 3.1 ± 0.7 bcde
L. bicolor 350 1.4 ± 0.1 ab 4.8 ± 0.6 a 0.58 ± 0.06 2.0 ± 0.3 de 2.6 ± 0.3 de
700 1.2 ± 0.2 b 4.5 ± 0.3 ab 0.41 ± 0.06 3.1 ± 0.5 abc 3.5 ± 0.5 abcd
S. bovinus 350 2.1 ± 0.9 a 4.4 ± 0.3 abc 0.53 ± 0.16 2.1 ± 0.7 cde 2.6 ± 0.8 de
700 1.4 ± 0.2 ab 3.7 ± 0.3 abc 0.60 ± 0.1 3.8 ± 0.4 a 4.4 ± 0.4 a
S. luteus 350 1.7 ± 0.4 ab 4.8 ± 0.7 a 0.53 ± 0.06 2.2 ± 0.1 cde 2.7 ± 0.1 de
700 1.5 ± 0.2 ab 4.2 ± 0.6 abc 0.51 ± 0.09 3.0 ± 0.8 abcd 3.5 ± 0.8 abcd
P. croceum 350 1.7 ± 0.2 ab 3.5 ± 0.4 c 0.54 ± 0.04 2.9 ± 0.2 abcd 3.5 ± 0.2 abcd
700 1.4 ± 0.3 ab 3.6 ± 0.5 bc 0.50 ± 0.09 3.9 ± 0.5 a 4.4 ± 0.5 a
P. involutus 350 1.7 ± 0.2 ab 4.1 ± 0.7 abc 0.72 ± 0.19 2.5 ± 0.5 bcde 3.3 ± 0.6 abcd
700 1.2 ± 0.1 b 4.1 ± 0.4 abc 0.48 ± 0.11 3.1 ± 0.5 abcd 3.6 ± 0.5 abcd
B. badius 350 1.9 ± 0.2 ab 4.5 ± 0.6 ab 0.71 ± 0.08 2.8 ± 0.8 abcd 3.5 ± 0.8 abcd
700 1.3 ± 0.1 b 4.1 ± 0.6 abc 0.51 ± 0.13 3.4 ± 0.7 ab 3.9 ± 0.8 abc
Non-mycorrhizal 350 1.3 ± 0.1 b 3.9 ± 0.3 abc 0.49 ± 0.07 2.3 ± 0.3 cde 2.8 ± 0.3 cde
700 1.3 ± 0.2 b 3.9 ± 0.3 abc 0.53 ± 0.15 3.6 ± 0.5 ab 4.1 ± 0.6 ab
Mean values ± SD are shown. Means within a column followed by different letters are significantly different
Plant Soil (2007) 296:159–172 169
123

morphological, and physiological modifications. By
changing the functional equilibrium between shoots
and roots, plants allocate more C to below-ground
structures for nutrient acquisition. If plants allocate
more biomass to the organs that are involved in the
acquisition of the resource that is currently most
limiting, one would predict that elevated CO2 would
decrease shoot: root ratio. Our data are consistent
with that prediction. Shoot: root ratios declined under
elevated CO2 from 0.67 to 0.45. A meta-analysis,
conducted by Poorter and Nagel (2000) showed that
under conditions of severe nutrient limitation, ele-
vated CO2 led to a decrease in shoot: root ratio. Our
experiments showed the largest reduction in shoot:
root ratio in plants that were colonized by those ECM
fungal species that had the largest extraradical
mycelium, lowest N concentration in needles under
elevated CO2 and lowest 14C incorporation in
needles, viz. L. bicolor and H. cylindrosporum. The
ultimate effect of this changed allocation of carbon
(and unavoidably of nitrogen!) would be that photo-
synthesis rates go down, in the end to levels where no
effect of elevated CO2 on shoot biomass or shoot 14C
incorporation was noted (Table 1). The observation
that fungal sink strength for N constrains plant
response to elevated CO2 supports our claim that the
size of the extraradical mycelium generates potential
for negative feedback through PNL (Hu et al. 2006).
The fact that mycelial length, and hence, mycelial
biomass did not increase significantly under elevated
CO2 (Table 1) could suggest that plants do have some
control over allocation of C to their fungal symbionts.
However, increases in the ECM root biomass likely
entails increases in fungal biomass on the roots as
well. From data by Hobbie and Colpaert (2003) we
calculated that fungi contributed 20% to the ECM
root mass of pine seedlings (18% under high N, 21%
under low N—average for S. luteus and T. terrestris).
Assuming that fungi also contribute 20% to the mass
of the ECM in our study, and converting hyphal
length into fungal biomass (treating mycelium as an
elongated cylinder with a diameter of 2.7 mm and a
hyphal density of 1.3 g cm�3 (Bloem and Vos 2004),
we calculate that the increased allocation below-
ground under elevated CO2 could increase ECM
fungal biomass with on average of 32% for most
species (64% for S. bovinus), remarkably close to the
34% of generalized fungal response in Alberton et al.
(2005).
Shoot dry weight increased with only 6% under
elevated CO2, and this was slightly less than the
increase in hyphal length (12%). However, both
changes were not significant. The increase in shoot
weight was also less than reported in Alberton et al.
(2005). The low above-ground plant response is
mainly due to the low N availability. The experi-
mental system (Petri dish) may not easily allow
extrapolation of results into the field. However, this
system, which achieves good control over humidity,
light availability, temperature, and CO2 level, has
been successfully applied in several previous inves-
tigations (Ineichen and Wiemken 1992; Ineichen
et al. 1995; Fransson et al. 2007).
In conclusion, fungal sink strength for N, together
with low N availability in a restricted growth medium
constrained plant growth especially with fungal
species with the largest mycelial size. In an exper-
iment where nutrients were not limiting, elevated
CO2 resulted both in a rapid positive response by
ECM fungi and in an increase in photosynthetic
performance by pine seedlings (Fransson et al. 2007).
In nutrient-constrained systems, elevated CO2 will
increase allocation belowground (to mycorrhizal
fungi and roots) and enhance nutrient immobilization
by mycorrhizal fungi. However, increased immobili-
zation lowers plant N concentration and hence
restricts the plant’s ability to respond to this elevated
CO2. Mycelial sink strength then generates negative
feedback to plant growth under elevated CO2, as
predicted by the PNL hypothesis. If ecosystems are
generally ‘saturated’ (O’Neill 1994) with respect to
ECM fungi, calculating the optimal mycelium size,
using modeling approaches, taking into consideration
soil properties and hyphal distribution in soil is an
important challenge.
Acknowledgments This study was funded by the C. T. de
Wit Graduate School for Production Ecology and Resource
Conservation (PE&RC) of Wageningen University and
Research Centre, The Netherlands. Constructive comments
by two anonymous reviewers on an earlier version of the
manuscript are gratefully acknowledged.
References
Alberton O, Kuyper TW, Gorissen A (2005) Taking myco-
centrism seriously: mycorrhizal fungal and plant re-
sponses to elevated CO2. New Phytol 167:859–868
170 Plant Soil (2007) 296:159–172
123

Allen MF, Klironomos JN, Treseder KK, Oechel WC (2005)
Responses of soil biota to elevated CO2 in a chaparral
ecosystem. Ecol Appl 15:1701–1711
Andersen CP, Rygiewicz PT (1995) Allocation of carbon in
mycorrhizal Pinus ponderosa seedlings exposed to ozone.
New Phytol 131:471–480
Arnebrant K (1994) Nitrogen amendments reduce the growth
of extramatrical ectomycorrhizal mycelium. Mycorrhiza
5:7–15
Bloem J, Vos A (2004) Fluorescent staining of microbes for
total direct counts. In: Kowalchuk GA, de Bruijn FJ, Head
IM, Akkermans AD, van Elsas JD (eds) Molecular
microbial ecology manual, 2nd edn, vol 402. Kluwer,
Dordrecht, pp 861–874
Clemmensen KE, Michelsen A, Jonasson S, Shaver GR (2006)
Increased ectomycorrhizal fungal abundance after
long-term fertilization and warming of two artic tundra
ecosystems. New Phytol 171:391–404
Colpaert JV, van Assche JA, Luijtens K (1992) The growth of
the extramatrical mycelium of ectomycorrhizal fungi and
the growth response of Pinus sylvestris L. New Phytol
120:127–135
Colpaert JV, van Laere A, van Assche JA (1996) Carbon and
nitrogen allocation in ectomycorrhizal and non-mycor-
rhizal Pinus sylvestris L. seedlings. Tree Physiol 16:787–
793
Colpaert JV, Verstuyft I (1999) The ingestad concept in
ectomycorrhizal research: possibilities and limitations.
Physiol Plant 105:233–238
Conjeaud C, Scheromm P, Mousain D (1996) Effects of
phosphorus and ectomycorrhiza on maritime pine (Pinuspinaster). New Phytol 133:345–351
Dalal RC (1979) Simple procedure for the determination of
total carbon and its radioactivity in soils and plant mate-
rials. Analyst 104:151–154
Dıaz S, Grime JP, Harris J, McPherson E (1993) Evidence of a
feedback mechanism limiting plant response to elevated
carbon dioxide. Nature 364:616–617
Dosskey MG, Boersma L, Linderman RG (1991) Role for the
photosynthate demand of ectomycorrhizas in the response
of Douglas fir seedlings to drying soil. New Phytol
117:327–334
Dosskey MG, Linderman RG, Boersma L (1990) Carbon-sink
stimulation of photosynthesis in Douglas fir seedlings by
some ectomycorrhizas. New Phytol 115:269–274
Fitter AH, Heinemeyer A, Staddon PL (2000) The impact of
elevated CO2 and global climate change on arbuscular
mycorrhizas: a mycocentric approach. New Phytol
147:179–187
Fransson PMA, Anderson IC, Alexander IJ (2007) Does carbon
partitioning in ectomycorrhizal pine seedlings under
elevated CO2 vary with fungal species? Plant Soil
291:323–333
Fransson PMA, Taylor AFS, Finlay RD (2001) Elevated
atmospheric CO2 alters root symbiont community struc-
ture in forest trees. New Phytol 152:431–442
Fransson PMA, Taylor AFS, Finlay RD (2005) Mycelial pro-
duction, spread and root colonisation by the ectomycor-
rhizal fungi Hebeloma crustuliniforme and Paxillusinvolutus under elevated atmospheric CO2. Mycorrhiza
15:25–31
Gorissen A, Joosten NN, Jansen AE (1991) Effects of ozone
and ammonium sulphate on carbon partitioning to
mycorrhizal roots of juvenile Douglas fir. New Phytol
119:243–250
Gorissen A, Kuikman PJ, van Ginkel JH, van de Beek H,
Jansen AG (1996) ESPAS—an advanced phytotron for
measuring carbon dynamics in a whole plant-soil system.
Plant Soil 179:81–87
Gorissen A, Kuyper TW (2000) Fungal species-specific
responses of ectomycorrhizal Scots pine (Pinus sylvestris)
to elevated [CO2]. New Phytol 146:163–168
Helmisaari HS, Derome J, Nojd P, Kukkola M (2007) Fine root
biomass in relation to site and stand characteristics in
Norway spruce and Scots pine stands. Tree Physiol (in
press)
Hendricks JJ, Mitchell RJ, Kuehn KA, Pecot SD, Sims SE
(2006) Measuring external mycelia production of ecto-
mycorrhizal fungi in the field: the soil matrix matters.
New Phytol 171:179–186
Hobbie EA, Colpaert JV (2003) Nitrogen availability and
colonization by mycorrhizal fungi correlate with
nitrogen isotope patterns in plants. New Phytol 157:
115–126
Hu S, Tu C, Chen X, Gruver JB (2006) Progressive N limita-
tion of plant response to elevated CO2: a microbiological
perspective. Plant Soil 289:47–58
Ineichen K, Wiemken V (1992) Changes in the fungus-specific,
soluble-carbohydrate pool during rapid and synchronous
ectomycorrhiza formation of Picea abies with Pisolithustinctorius. Mycorrhiza 2:1–7
Ineichen K, Wiemken V, Wiemken A (1995) Shoots, roots and
ectomycorrhiza formation of pine seedlings at elevated
atmospheric carbon dioxide. Plant Cell Environ 18:703–
707
Johnson DW (2006) Progressive N limitation in forests: review
and implications for long-term responses to elevated CO2.
Ecology 87:64–75
Kamminga-van Wijk C, Prins HBA (1989) The influence of pH
on ectomycorrhizal development of Pseudotsuga menzi-esii inoculated with Laccaria bicolor in hydroculture.
Agric Ecosyst Environ 28:213–217
Luo Y, Su B, Currie WS, Dukes JS, Finzi A, Hartwig U,
Hungate B, McMurtrie RS, Oren R, Parton WJ, Pataki
DE, Shaw R, Zak DR, Field CB (2004) Progressive
nitrogen limitation of ecosystem responses to rising
atmospheric carbon dioxide. BioScience 54:731–739
Marmeisse R, Gryta H, Jargeat P, Fraissinet-Tachet L, Gay G,
Debaud JC (1999) Hebeloma. In: Cairney JWG, Cham-
bers SM (eds) Ectomycorrhizal fungi: key genera in
profile. Springer, Berlin, pp 89–127
Miller SL, Durall DM, Rygiewicz PT (1989) Temporal allo-
cation of 14C to extramatrical hyphae of ectomycorrhizal
ponderosa pine seedlings. Tree Physiol 5:239–249
Nylund JE, Wallander H (1989) Effects of ectomycorrhiza on
host growth and carbon balance in a semi-hydroponic
cultivation system. New Phytol 112:389–398
O’Neill EG (1994) Responses of soil biota to elevated atmo-
spheric carbon dioxide. Plant Soil 165:55–65
Parrent JL, Morris WF, Vilgalys R (2006) CO2-enrichment and
nutrient availability alter ectomycorrhizal fungal com-
munities. Ecology 87:2278–2287
Plant Soil (2007) 296:159–172 171
123

Plassard C, Bonafos B, Touraine B (2000) Differential effects
of mineral and organic N sources, and of ectomycorrhizal
infection by Hebeloma cylindrosporum, on growth and N
utilization in Pinus pinaster. Plant Cell Environ 23:1195–
1205
Poorter H, Nagel O (2000) The role of biomass allocation in
the growth response of plants to different levels of light,
CO2, nutrients and water: a quantitative review. Aust J
Plant Physiol 27:595–607
Reich PB, Hungate BA, Luo Y (2006) Carbon-nitrogen inter-
actions in terrestrial ecosystems in response to rising
atmospheric carbon dioxide. Annu Rev Ecol Evol Syst
37:611–636
Reuter DJ, Robinson JB, Dutkiewicz C (1997) Plant analysis:
an interpretation manual. CSIRO, Collingwood, Australia
Rygiewicz PT, Andersen CP (1994) Mycorrhizae alter quality
and quantity of carbon allocated below ground. Nature
396:58–60
Staddon PL (2005) Mycorrhizal fungi and environmental
change: the need for a mycocentric approach. New Phytol
167:635–637
Temminghoff EJM, Houba VJG (eds) (2004) Digestion in
tubes with H2SO4 – salicylic acid – H2O2 and selenium.
In: Plant analysis procedures. 2nd ed. Kluwer Academic
Publishers, Dordrecht, pp 7–9
Treseder KK, Allen MF (2002) Direct nitrogen and phosphorus
limitation of arbuscular mycorrhizal fungi: a model and
field test. New Phytol 155:507–515
Wallander H (1995) A new hypothesis to explain allocation of
dry matter between mycorrhizal fungi and pine seedlings
in relation to nutrient supply. Plant Soil 168–169:243–248
Wallander H (2006) External mycorrhizal mycelia—the
importance of quantification in natural ecosystems. New
Phytol 171:240–242
172 Plant Soil (2007) 296:159–172
123
Copyright © 2022 FDOKUMEN