Dairy production in an urbanizing environment
133
kassel university press Marion Reichenbach Dairy production in an urbanizing environment A system approach in Bengaluru, India
-
Upload
khangminh22 -
Category
Documents
-
view
1 -
download
0
Transcript of Dairy production in an urbanizing environment
kasseluniversity
press
Marion Reichenbach
Dairy production in an urbanizing environmentA system approach in Bengaluru, India
Marion Reichenbach
Dairy production in an urbanizing environment
A system approach in Bengaluru, India
kasseluniversity
press
This work has been accepted by the Faculty of Organic Agricultural Sciences of the University of Kassel as a thesis for acquiring the academic degree of Doktorin der Agrarwissenschaften (Dr. agr.). Supervisor: Prof. Dr. Eva Schlecht, University of Kassel and Georg August University of Göttingen Co‐Supervisor: Prof. Dr. Sven König, Justus Liebig University Giessen Examiner: Prof. Dr. Bernhard Brümmer, Georg August University of Göttingen Examiner: Prof. Dr. Jürgen Hummel, Georg August University of Göttingen Defense day: 2. July 2020
This document – excluding quotations and otherwise identified parts – is licensed under the Creative Commons Attribution‐Share Alike 4.0 International License (CC BY‐SA 4.0: https://creativecommons.org/licenses/by‐sa/4.0/) https://orcid.org/0000‐0002‐8477‐0808 (Marion Reichenbach)
Bibliographic information published by Deutsche Nationalbibliothek The Deutsche Nationalbibliothek lists this publication in the Deutsche Nationalbibliografie; detailed bibliographic data is available in the Internet at http://dnb.dnb.de. Zugl.: Kassel, Univ., Diss. 2020 ISBN 978‐3‐7376‐0894‐7 DOI: https://doi.org/doi:10.17170/kobra‐202010221984 © 2020, kassel university press, Kassel https://kup.uni‐kassel.de Printed in Germany
III
To life, resilience and empowerment
IV
Contents List of figures .................................................................................................................... VII
List of tables ........................................................................................................................ X
Abbreviations ................................................................................................................... XIII
Acknowledgements ........................................................................................................ XIV
Summary ......................................................................................................................... XVI
Zusammenfassung ......................................................................................................... XIX
1 General Introduction ............................................................................................. 1
1.1 A framework to livestock production in an urbanizing environment .......................... 1
1.1.1 A system approach ........................................................................... 1
1.1.2 Urbanization and rural-urban linkages .............................................. 1
1.1.3 Social-ecological system and resilience............................................ 4
1.2 Livestock production systems in an urbanizing environment .................................... 6
1.2.1 Agricultural transition ........................................................................ 6
1.2.2 Market integration ............................................................................. 7
1.2.3 (Peri-)urban livestock production systems ........................................ 8
1.3 Dairy production in an urbanizing environment: the case study of Bengaluru, India . 9
1.3.1 The national context ......................................................................... 9
1.3.2 The city of Bengaluru...................................................................... 11
1.3.3 The dairy sector of Bengaluru ......................................................... 11
1.3.4 Study outline and research objectives ............................................ 13
2 Typology of dairy production systems and linkages in the rural-urban interface
of Bengaluru ........................................................................................................ 15
2.1 Introduction ........................................................................................................... 15
2.2 Materials and methods .......................................................................................... 17
2.2.1 Research area ................................................................................ 17
2.2.2 Sampling design ............................................................................. 18
2.2.1 Dairy production baseline survey .................................................... 20
2.2.2 Statistical analyses ......................................................................... 24
V
2.3 Results .................................................................................................................. 24
2.3.1 Predictors of dairy production systems ........................................... 24
2.3.2 Typology of dairy production systems ............................................. 25
2.3.3 Characteristics of dairy productions systems .................................. 27
2.4 Discussion ............................................................................................................. 35
2.5 Conclusions ........................................................................................................... 39
3 A system approach to feed conversion efficiency of dairy production in an
urbanizing environment ...................................................................................... 41
3.1 Introduction ........................................................................................................... 41
3.2 Materials and methods .......................................................................................... 42
3.2.1 Research area ................................................................................ 42
3.2.2 Dairy production systems and selected units .................................. 43
3.2.3 Data collection ................................................................................ 44
3.2.4 Statistical analyses ......................................................................... 47
3.3 Results .................................................................................................................. 48
3.3.1 Type of feedstuffs and seasonal contribution .................................. 48
3.3.2 Feeding intensity ............................................................................ 50
3.3.3 Energy and protein coverage .......................................................... 54
3.3.4 Milk offtake and feed conversion efficiency ..................................... 57
3.4 Discussion ............................................................................................................. 61
3.5 Conclusions ........................................................................................................... 64
4 A system approach to carbon footprint of dairy production in an urbanizing
environment ......................................................................................................... 65
4.1 Introduction ........................................................................................................... 65
4.2 Materials and methods .......................................................................................... 67
4.2.1 Research area and dairy production systems ................................. 67
4.2.2 Data collection ................................................................................ 68
4.2.3 GHG emissions, functional unit and allocation ................................ 69
4.2.4 Computation of greenhouse gas emissions .................................... 69
VI
4.3 Results .................................................................................................................. 71
4.3.1 Characteristics of dairy cattle .......................................................... 71
4.3.1 Feedstuffs and diet ......................................................................... 72
4.3.2 Methane emissions of Bengaluru’s dairy production systems ......... 76
4.3.3 Nitrous oxide emissions of Bengaluru’s dairy production systems .. 78
4.3.4 Carbon footprint of Bengaluru’s dairy production systems .............. 79
4.4 Discussion ............................................................................................................. 82
4.5 Conclusions ........................................................................................................... 87
5 General discussion ............................................................................................. 88
5.1 Methodological considerations .............................................................................. 88
5.1.1 The definition of urbanization .......................................................... 88
5.1.2 Dairy production baseline survey .................................................... 89
5.1.3 Quantification of feed conversion efficiency and carbon footprint ... 90
5.2 A critical perspective on Bengaluru’s dairy sector .................................................. 91
5.2.1 Agricultural transition ...................................................................... 91
5.2.2 Market integration ........................................................................... 94
5.3 Generalization of results and further research ....................................................... 98
5.4 Conclusions ......................................................................................................... 100
6 References ......................................................................................................... 101
VII
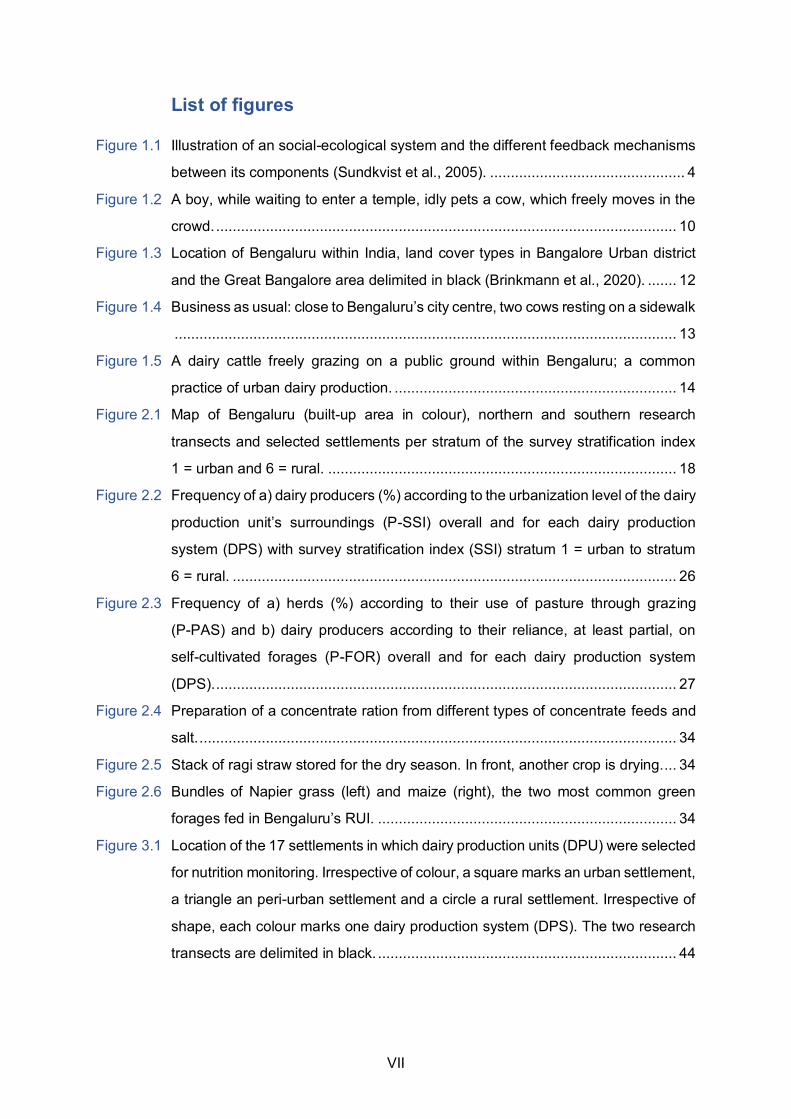
List of figures
Figure 1.1 Illustration of an social-ecological system and the different feedback mechanisms
between its components (Sundkvist et al., 2005). ............................................... 4
Figure 1.2 A boy, while waiting to enter a temple, idly pets a cow, which freely moves in the
crowd. ............................................................................................................... 10
Figure 1.3 Location of Bengaluru within India, land cover types in Bangalore Urban district
and the Great Bangalore area delimited in black (Brinkmann et al., 2020). ....... 12
Figure 1.4 Business as usual: close to Bengaluru’s city centre, two cows resting on a sidewalk
......................................................................................................................... 13
Figure 1.5 A dairy cattle freely grazing on a public ground within Bengaluru; a common
practice of urban dairy production. .................................................................... 14
Figure 2.1 Map of Bengaluru (built-up area in colour), northern and southern research
transects and selected settlements per stratum of the survey stratification index
1 = urban and 6 = rural. .................................................................................... 18
Figure 2.2 Frequency of a) dairy producers (%) according to the urbanization level of the dairy
production unit’s surroundings (P-SSI) overall and for each dairy production
system (DPS) with survey stratification index (SSI) stratum 1 = urban to stratum
6 = rural. ........................................................................................................... 26
Figure 2.3 Frequency of a) herds (%) according to their use of pasture through grazing
(P-PAS) and b) dairy producers according to their reliance, at least partial, on
self-cultivated forages (P-FOR) overall and for each dairy production system
(DPS). ............................................................................................................... 27
Figure 2.4 Preparation of a concentrate ration from different types of concentrate feeds and
salt. ................................................................................................................... 34
Figure 2.5 Stack of ragi straw stored for the dry season. In front, another crop is drying.... 34
Figure 2.6 Bundles of Napier grass (left) and maize (right), the two most common green
forages fed in Bengaluru’s RUI. ........................................................................ 34
Figure 3.1 Location of the 17 settlements in which dairy production units (DPU) were selected
for nutrition monitoring. Irrespective of colour, a square marks an urban settlement,
a triangle an peri-urban settlement and a circle a rural settlement. Irrespective of
shape, each colour marks one dairy production system (DPS). The two research
transects are delimited in black. ........................................................................ 44

VIII
Figure 3.2 Seasonal contribution (%) to total daily dry matter (DM) intake of lactating and dry
cows plus mature heifers per type of feedstuff and season in 28 dairy production
units located within the rural-urban interface of Bengaluru, India. ..................... 49
Figure 3.3 Example of organic wastes collected on markets by urban dairy producers to fed
their cattle (right) and a cow feeding on organic wastes in the shed (left). ......... 50
Figure 3.4 Share of lactating and dry cows plus mature heifers (LDH) per metabolizable
energy (ME) supply level (ratio between individual metabolizable energy intake
and requirement for maintenance, growth including pregnancy, milk production
and locomotion) for the four dairy production systems (DPS) of Bengaluru’s
rural-urban interface; adequate supply equals a ratio between 0.8-1.2, mild deficit
between 0.5 - < 0.8, severe deficit < 0.5, mild surplus between > 1.2 – 1.5, and
severe surplus > 1.5. ........................................................................................ 55
Figure 3.5 Intake-to-requirements ratio of metabolizable energy (ME) and crude protein (CP)
for heifers and cows of different physiological status (L0: lactating, not pregnant
cow; L1: lactating, pregnant cow; D1: dry, pregnant cow; H1: mature heifer). The
black line shows the median value for each group, the box the interquartile range,
the whiskers the first and third quartiles and the circles are outlier values. Boxplots
with different lowercase (ME coverage ratio) or capital (CP coverage ratio)
superscript letters significantly differ at P < 0.05. .............................................. 56
Figure 3.6 Share of lactating and dry cows plus mature heifers (LDH) per crude protein (CP)
supply level (ratio between individual crude protein intake and requirements for
maintenance, growth, including foetal growth, and milk production) for the four
dairy production systems (DPS) of Bengaluru’s rural-urban interface; adequate
supply equals a ratio between 0.8-1.2, mild deficit between 0.5 - < 0.8, severe
deficit < 0.5, mild surplus between > 1.2 – 1.5 and severe surplus > 1.5; * = 1%.
......................................................................................................................... 57
Figure 3.7 Daily milk offtake (MO; kg Energy-Corrected-Milk (ECM) per cow and day; left)
and feed conversion efficiency (FCE; kg ECM per kg dry matter intake (DMI); right)
for the four dairy production systems (DPS) of Bengaluru’s rural-urban interface.
Please note the different scaling of the y-axes. The black line shows the median
value for each group, the box the interquartile range, the whiskers the first and
third quartiles and the circles are outlier values. Boxplots with different lowercase
(MO) or capital (FCE) superscript letters differ significantly at P < 0.05 (n= 451).
......................................................................................................................... 58
IX
Figure 3.8 Refusals of green forage. Dairy producers often fed green forages as whole plants
(stem with leaves) or chopped by hand, which leads to selective feeding of the
most palatable parts and large amount of refusals. ........................................... 61
Figure 4.1 Methane (CH4) emissions per dairy production unit (DPU) and round due to a)
enteric fermentation (EF) and b) manure management system (MMS) in carbon
dioxide equivalents (kg CO2-eq) for each dairy production system (DPS) in
Bengaluru’s rural-urban interface. Please note the different scaling of the y-axes.
The black line shows the median value for each group, the box the interquartile
range, the whiskers the first and third quartiles and the circles are outlier values.
Boxplots with different lowercase (CH4 emissions EF) or uppercase (CH4
emissions MMS) superscript letters differ significantly at P < 0.05 (n= 192). ..... 76
Figure 4.2 Total nitrous oxide (N2O) emissions per dairy production unit (DPU) and round,
expressed as carbon dioxide equivalents (kg CO2-eq) for each dairy production
system (DPS) in Bengaluru’s rural-urban interface. The black line shows the
median value for each group, the box the interquartile range, the whiskers the first
and third quartiles and the circles are outlier values. Boxplots with different
lowercase superscript letters differ significantly at P < 0.05 (n= 192). DPU = dairy
production unit; MMS = manure management system. ..................................... 79
Figure 4.3 Carbon footprint per dairy production unit and round, expressed as ratio between
carbon dioxide equivalents (kg CO2-eq) and milk offtake (kg energy-corrected milk
(ECM)) for each dairy production system (DPS) in Bengaluru’s rural-urban
interface. The black line shows the median value for each group, the box the
interquartile range, the whiskers the first and third quartiles and the circles are
outlier values. Boxplots with different lowercase superscript letters differ
significantly at P < 0.05 (n= 189). ...................................................................... 80
Figure 5.1 A large herd by Bengaluru’s standards: seven cows and one heifer, kept by a joint
family. ............................................................................................................... 94
Figure 5.2 A smaller herd (two cows and two heifers), more typical of Bengaluru’s dairy
sector. ............................................................................................................... 95
Figure 5.3 Despite its 10 million inhabitants, not all of Bengaluru is built-up, as here 10 km
from the city centre, and offers public grounds suitable for pasture and forage
collection. .......................................................................................................... 97
X
List of tables
Table 2.1 Number (n) of selected settlements and completed dairy production baseline
surveys in the northern research transect (Nsect), in the southern research
transect (Ssect) and in additional locations (Add.) per survey stratification index
(SSI) stratum and urbanization level. ................................................................ 19
Table 2.2 Predictors and list of main variables collected in the dairy production baseline
survey from 337 dairy producers in Bengaluru’s rural-urban interface or calculated
from the answers. ............................................................................................. 21
Table 2.3 Importance ranking scores of expenses related to dairy production with 3 = first
expense, 2 = second expense, 1 = third expense and 0 = not an expense. ...... 28
Table 2.4 Feeding frequency (in % of DPU) for the most common forages and concentrate
feed utilised in Bengaluru’s dairy production systems (DPS), and their most
frequent origin (own production (Own prod.), bought (Bought), collected for free
from public grounds or as waste (Free) or collected on own ground but not
cultivated (Wild)). .............................................................................................. 33
Table 2.5 Daily milk production per dairy production unit (DPU) and per cow, share of milk
kept for HH consumption and use of marketing channels by the dairy producers
(DP). ................................................................................................................. 33
Table 3.1 Main characteristics of the four dairy production systems (DPS) within Bengaluru’s
rural-urban interface. ......................................................................................... 43
Table 3.2 Mean concentration of dry matter (DM), crude protein (CP), metabolizable energy
(ME), and digestible organic matter (DOM) per type of feedstuff (n feed samples
analysed = 321). ............................................................................................... 49
Table 3.3 Mean body weight, daily dry matter (DM), crude protein (CP) and metabolizable
energy (ME) intake of lactating and dry cows plus mature heifers on-farm and
overall (intake on-farm plus pasture) relative to metabolic weight (MW), and
pasture contribution to daily intake (% DM) in the four dairy production system
(DPS) of Bengaluru’s rural-urban interface (total individual nutrition records
collected from 28 dairy production units over one year = 641). ......................... 52
Table 3.4 Mean daily dry matter intake (DMI), metabolizable energy (ME) and crude protein
(CP) coverage ratio (intake over requirements) per dairy cattle, corrected milk
offtake (cMO; kg Energy-corrected milk (ECM) per 100 kg body weight (BW) and
per day) and feed conversion efficiency (FCE; kg of ECM per kg of DM intake) by
dairy production system (DPS) in Bengaluru’s rural-urban interface. ................ 52
XI
Table 3.5 Mean daily dry matter (DM), crude protein (CP) and metabolizable energy (ME)
intake on-farm and in total (intake on-farm plus pasture) per dairy cattle relative to
metabolic weight (MW), and pasture share (% DM), by genotype and physiological
status in Bengaluru’s rural-urban interface (total individual nutrition records
collected from 28 dairy production units over one year; n = 641 for genotype and
n = 616 for physiological status). ....................................................................... 53
Table 3.6 Mean metabolizable energy (ME) and crude protein (CP) coverage ratio (intake
over requirements) per dairy cattle by genotype and physiological status in
Bengaluru’s rural-urban interface (total individual nutrition records collected from
28 dairy production units and over one year). ................................................... 55
Table 3.7 Absolute number of LDH observations per metabolizable energy (ME; n = 481)
and crude protein (CP; n = 458) supply level, mean lactation number, absolute
number of LD observations per lactation number (n = 421), mean fat-to-protein
ratio of milk, absolute number of L observations per metabolic disorders levels
(n = 383) and mastitis level (453) per dairy production system (DPS) and overall.
......................................................................................................................... 59
Table 3.8 Summary of the outcomes from the stepwise regression with cow as random effect
and effect of additional fixed dairy production variables (n observation = 332). . 60
Table 3.9 Mean temperature-humidity index (THI) per season (n = 216). ......................... 60
Table 4.1 Average concentration of dry matter (DM), crude protein (CP) content, neutral
detergent fibre (NDF) content, acid detergent fibre (ADF) content, digestible
organic matter (DOM) and gross energy (GE) content per type of feedstuff
(n = number of feed samples). .......................................................................... 69
Table 4.2 Items computed, unit, equation number (#) in IPCC guidelines (2006) and
parameter values used to calculate methane (CH4) and nitrous oxide (N2O)
emissions. ......................................................................................................... 70
Table 4.3 Average length of dry period and lactation (in days), average protein content of
milk, annual milk offtake (kg energy-corrected-milk (ECM)) per cow and year, and
annual manure production per dairy production unit (DPU) and year, for each dairy
production system (DPS). ................................................................................. 72
Table 4.4 Average weight and number of records (n) per cattle category and per dairy
production system (DPS) with standard error of the mean (SEM; n total = 873),
and average daily weight gain per cattle category with standard error of the mean
(n total = 754). .................................................................................................. 73

XII
Table 4.5 Average number of dairy cattle (n) per DPU, average daily energy-corrected milk
(ECM) offtake per lactating cow, share of dry matter (DM) intake per type of
feedstuff and average total daily DM intake per cattle category and dairy
production system (DPS; n observations = 856). .............................................. 73
Table 4.6 Number of observations (n) and diet quality (weighted average of digestible
organic matter DOM, %) per dairy production system (DPS) and category of dairy
cattle with standard error of the mean (SEM). ................................................... 78
Table 4.7 Methane (CH4) and nitrous oxide (N2O) emissions per dairy production unit (DPU)
and round, contribution in CO2-equivalents to the total GHG emissions per DPU
and round, milk offtake (kg energy-corrected-milk (ECM)) per DPU and round and
carbon footprint for each dairy production system (DPS). ................................. 81
Table 4.8 Annual methane and nitrous oxide emissions in CO2-equivalents per dairy
production system (DPS) in Bengaluru’s rural-urban interface. ......................... 81

XIII
Abbreviations
ADF acid detergent fibre
BW body weight
C2O-eq carbon dioxide equivalents
CH4 methane
cMO milk offtake corrected to body weight
CP crude protein
D dry cow
DM dry matter
DMI dry matter intake
DOM digestible organic matter
DPS dairy production system(s)
DPU dairy production unit(s)
ECM energy-corrected-milk
EF enteric fermentation
FCE feed conversion efficiency
H mature heifer
L lactating cow
LDH productive dairy assets; incl. lactating and dry cows, plus mature
heifers
ME metabolizable energy
MMS manure management system
MO milk offtake
MW metabolic weight
N2O nitrous oxide
NDF neutral detergent fibre
P-FLOW, P-GEN cluster predictor related to breeding
P-FOR, P-PAS cluster predictor related to feeding
P-SSI cluster predictor related to urbanization level
RUI rural-urban interface
SES social-ecological system
SSI survey stratification index
THI temperature-humidity index
XIV
Acknowledgements
Close to the completion of a 4-year journey across three countries, I’m thankful to
the support, collaboration, friendship and love of many, which made it possible and worth it.
I would first and foremost like to thank my principal supervisor Prof. Dr. Eva
Schlecht for giving me the opportunity of this work four years ago and having been there every
step of the way. Her supervision, trust in my work but also my ideas, her numerous advices,
her patience and the fact she regularly supplied me with chocolates during my fieldwork in
India, never forgetting the human component of academia, kept me on the path. I also thank
Prof. Dr. Sven König for being co-supervisor of the FOR2432/1 A03 project and of this thesis.
Thank you Prof. Dr Brümmer and Prof. Dr. Hummel for accepting the role of examiners.
As part of the Research Unit FOR2432/1 Social-ecological systems in the Indian
Rural-Urban Interface: Functions, Scales, and Dynamics of Transition, this work was founded
by the German Research Foundation (DFG). In this context, I would like to thank Prof. Dr.
Bürkert for his interest in scooter races and my work, Dr. Bhatta and Dr. Malik at NIANP for
their collaboration, and the GKVK community for hosting me.
I’m forever indebted and grateful to my dear colleague Ana, which is not only the
best teammate I could have had, a fellow cow-enthusiate, co-owner of the Scowter,
concomitant of 18 months of field work in India but someone I can trust and count on. This
work owns a lot to the quality of our collaboration. You were there in the bad but also the best
moments of this 4-year journey.
I’m grateful to Beate for having wanted to marry me in her family a few days only
after we first met. You have been supporting colleague and a kind friend, making me feel at
home both in India and Germany. Yours and Madan’s advices and knowledge of India allowed
me to do the best of my fieldwork and stay in India.
I’m thankful to Mirka for her friendship, our (A03/C04) discussions, her delicious
cooking and guiding me when I don’t wear glasses. Thank you Johannes and my fellow
colleagues from FOR2432 and BangaDyn for our time together in India and Germany.
In Witzenhausen, I would like to thank all my colleagues, old, new or passing, but
especially my fellow AHTS doctoral colleagues - Asif and Jennifer - who made it worth it to go
to the office and take a coffee break. Thanks to Tobias, who have answered many of the
questions I was too lazy to figure out at my arrival in Germany and Sven for regularly bringing
XV
sweets to the office. Four years later, I’m still astonish and grateful for the hospitality of Ribana,
Markus and Lukas. In Göttingen, I would like to thank my flatmate Janina for our evenings on
the balcony. Coming back from India, they were precious to me.
India and Germany have been great countries of adoption but I’m especially
grateful to all my friends and family in Switzerland: although I was not often at home and
always in a hurry, your support and friendship was flawless. Special thanks to my fellow
doctoral friends – Annik, Adrien Bussy, Adrien Butty, and a late arrival, Alan – with whom it
was great to share the struggles of doctoral life. Special thanks to Margaux for always listening
and balancing science and art.
Je ne serai pas là non plus sans mes parents, que je remercie pour me permettre
de revenir à la maison et m’y faire sentir comme si je l’avais quittée hier. Un tendre merci à
mes soeurs, Nat, Nessa, Nino, Mario, Malika et Mum pour m’accueillir à bras ouverts lorsque
je rentre, mes grand-parents Myriam et Henri qui m’ont toujours encouragée dans mes études
et ma grand-mère Rose, un modèle d’indépendance.
Et sans oublier mon Joseph: à toutes nos aventures passées et futures, ici ou
ailleurs, tant qu’il y a plus de koala sur la route.
This work could not have existed without the collaboration of numerous dairy
producers and their families in and around Bengaluru. I’m grateful to all I have met and worked
with for allowing me to collect data but also repeatedly welcoming me in their everyday life.
Despite the cultural difficulties of Indian fieldwork, these were sunny days. At last, I’m grateful
to all the persons, who have shown interest in my work. It made it all worth it.

XVI
Summary
An urbanizing environment is typically dichotomized into agricultural
production-oriented rural areas versus consumption-oriented urban areas, between which the
flow of agricultural goods and services is a major linkage. Since agricultural producers and
consumers are parts of the same social-ecological system that is getting more complex but
also looser, the function of agricultural producers as a link between society and the
environment becomes crucial. India is currently one of the fastest urbanizing countries. Its
dairy sector supports the livelihood of about 70 million households and is the largest in the
world. Numerous decades-long pro-poor dairy development programmes were implemented
and boosted rural-urban linkages through milk flow. However, the current impacts of
urbanization on dairy production are neither assessed in terms of structural change in the dairy
sector, shifts in resources availability and use by dairy producers, nor in terms of the increasing
complexity of the social-ecological systems that centres around dairy producers.
The present study aims to provide deeper insights into the impacts of urbanization
on dairy production, taking the dairy sector of the Indian megacity of Bengaluru (10 million
inhabitants) as case study. Since the 1970s, Bengaluru is one of the fastest growing cities in
India and benefits from its own dairy development program, while (peri-)urban dairy production
is common. The present study first focusses on identifying and characterizing the dairy
production systems (DPS) that co-exist in the rural-urban interface of Bengaluru, while
highlighting potential linkages between its social-ecological components. In a second step, the
present study focusses on quantifying the impacts of distinct dairy production strategies in
terms of resources use efficiency, namely feed conversion efficiency, and global
environmental impact, namely the emission intensity of greenhouse gasses, in relation to the
spatial distribution of DPS across Bengaluru’s rural-urban interface.
To identify and characterize the DPS co-existing in Bengaluru’s rural-urban
interface, a dairy production baseline survey was conducted with 337 dairy producers across
six urbanization levels. Four DPS were identified through a two-step cluster analysis based
on five predictors: the urbanization level of the settlement, reliance on self-cultivated forages,
use of pasture, cattle in- and outflows within the herd and share of specialized dairy genotypes.
DPS-1 was ubiquitous and extensive, with cattle feeding not relying on self-cultivated forages
but rather on public grounds for pasture and forages collection, or market wastes, or both;
DSP-2 was rural and semi-intensive, with cattle feeding relying on both pasture and
self-cultivated forages, and a breeding management of specialized dairy genotypes. DPS-3
was the same as DPS-2 apart for their breeding management, which did not rely on
XVII
specialized dairy genotypes. DPS-4 was rural and intensive with a feeding management
relying on self-cultivated forages but not on pasture. Dairy producers in DPS-1 were typically
landless producers and used mostly informal marketing channels to sell their milk, while those
in DPS-2, DPS-3 and DPS-4 relied on dairy cooperatives for inputs and as marketing channel.
Overall, Bengaluru’s dairy sector had a well-established network of dairy cooperatives and
was characterized by small-scale family DPU with a homogenous socio-economic background
and similar production practices. Complex linkages between social-ecological components,
namely the dairy producers, their herd, their family, consumers of dairy products and the
ecosystem, in urban areas differ from peri-urban and rural ones.
In order to quantify resource use efficiency, i.e. feed conversion efficiency, of
Bengaluru’s DPS, 28 dairy production units (DPU), 7 per DPS, were selected and monitored
at 6-week intervals during one year: daily dry matter intake on-farm and at pasture, and energy
and nutrient requirements (for maintenance, growth, pregnancy, locomotion, milk production)
were collected for each cow. Daily dry matter intake (DMI) per kg of metabolic weight showed
distinctly different feeding intensities that were linked to the reliance on self-cultivated forages
or pasture or both. Coverage of the requirements of metabolizable energy and crude protein
were variable in DPS-1, while in DPS-2, DPS-3 and DPS-4, cows were mostly oversupplied.
Milk offtake differed between DPS and, corrected to body weight, was affected by DPS,
days-in-milk, DMI, genotype, coverage ratio for metabolizable energy, pregnancy and period
of data collection. The extensive DPS-1 had the best feed conversion efficiency (1.00 kg DMI
per kg energy-corrected-milk (ECM)), while feed conversion efficiency in DPS-2 (0.71 kg DMI
kg-1 ECM), DPS-3 (0.77 kg DMI kg-1 ECM) and DPS-4 (0.72 kg DMI kg-1 ECM) were crippled
by the oversupply of cows. The decoupling of crop and livestock production in DPS-1 might
however lead to environmental deterioration, especially in the case of urban dairy producers,
with limited manure management options.
In order to quantify the global environmental impact of Bengaluru’s DPS, i.e. their
emission intensity of greenhouse gasses expressed in terms of carbon dioxide equivalents
(CO2-eq), methane and nitrous oxide emissions due to enteric fermentation and manure
management system were computed from the previous dataset for six DPU per DPS. The
carbon footprint (CF) of milk differed according to the feeding intensity and strategy of each
DPS: CF was highest in DPS-3 (1.95 kg CO2-eq kg-1 ECM) and DPS-4 (1.52 kg CO2-eq kg-1
ECM). In opposition, CF was lowest in the extensive DPS-1 (0.91 kg CO2-eq kg-1 ECM) and
intermediate in DPS-2 (1.21 kg CO2-eq kg-1 ECM). Cradle-to-farm-gate emission intensity of

XVIII
Bengaluru’s dairy sector was estimated to be within the range of DPS with similar production
levels in other countries.
Overall, the present study highlighted that: i) a range of DPS coexists within
Bengaluru’s rural-urban interface, leading to different levels of production intensity, resource
use efficiency and global envrionmental impacts; ii) small-scale DPU can be efficient and
emission conservative, as they take advantage of local opportunities while dealing with the
local constaints of an urbanizing envrionement; iii) urbanization impacts on dairy production
are complex: urbanisation lead to changes in labour availability but not directly in (decreasing)
land availability for dairy production; it enhanced market integration of rural and peri-urban
dairy producers but not structural change in Bengaluru’s dairy sector; at last, it enhanced
increasingly more complex linkages between social-ecological components.
By improving understanding of agricultural transitions in the case of dairy
production in an urbanizing environment, the present study can support the implementation of
future dairy development programs by pointing to local constraints and opportunities and the
importance of several social-ecological components that should be considered in such
initiatives. The present study further paves the way for research on the impacts of urbanization
on milk and livestock production systems in developing and transition countries with a broad
system approach.
XIX
Zusammenfassung
Im Zuge der Urbanisierung werden Gebiete typischerweise in landwirtschaftlich
produktionsorientierte ländliche Gebiete versus konsumorientierte städtische Gebiete
unterteilt, zwischen denen der Fluss landwirtschaftlicher Güter und Dienstleistungen eine der
Hauptverbindungen darstellt. Landwirte und Konsumenten sind Teil eines gemeinsamen
sozial-ökologischen Systems, das immer komplexer, gleichzeitig aber auch lockerer wird. Die
Rolle der Landwirte als verbindendes Subjekt zwischen Gesellschaft und Umwelt gewinnt
dabei an Bedeutung. Indien ist derzeit eines der Länder mit der schnellsten
Urbanisierungsrate weltweit, und sein Milchsektor ist der weltweit größte – er stellt die
Lebensgrundlage von 70 Millionen Haushalten dar. Indien hat jahrzehntelang zahlreiche
Programme zur Entwicklung der Milchwirtschaft unterhalten und die Verbindung zwischen
städtischen und ländlichen Gebieten durch den Fluss von Milch(produkten) gefördert. Bisher
fehlen allerdings Untersuchungen zu den Auswirkungen der fortschreitenden Urbanisierung
auf den Strukturwandel im Milchsektors, Veränderungen in Ressourcenverfügbarkeit
und -nutzung durch die Milcherzeuger sowie auf die zunehmende Komplexität der
sozial-ökologischen Systeme in deren Zentrum die Milcherzeuger stehen.
Daher ist das Ziel der vorliegenden Dissertation, einen vertieften Einblick in die
Auswirkungen der Urbanisierung auf die Milchproduktion zu tätigen; dabei dient der
Milchsektor der indischen Megacity Bengaluru (10 Millionen Einwohner) als Fallstudie. Seit
den 1970er Jahren ist Bengaluru eine der am schnellsten wachsenden Städte Indiens und
profitiert von einem eigenen Entwicklungsprogramm für die Milchwirtschaft. Milchproduktion
ist in den (peri-)urbanen Siedlungsgebieten weit verbreitet. Zunächst identifiziert und
charakterisiert die vorliegende Arbeit die Milchproduktionssysteme (DPS) die in Bengaluru an
der Schnittstelle Stadt-Land koexistieren und zeigt bestehende und potentielle Verbindungen
zwischen den sozial-ökologischen Komponenten des Systems „Milch“ auf. Darauf aufbauend
werden die Auswirkungen unterschiedlicher Milchproduktionsstrategien auf die
Ressourcennutzungseffizienz quantifiziert, d.h. auf die Futterverwertungseffizienz und die
globalen Umweltwirkungen in Form von Treibhausgasemissionen. Dabei wird jeweils die
räumliche Verteilung der DPS entlang der Schnittstelle Stadt-Land berücksichtigt.
Zur Identifizierung und Charakterisierung von DPS die entlang der Schnittstelle
Stadt-Land von Bengaluru koexistieren wurden 337 Milcherzeuger detailliert zu ihrem
Produktionssystem befragt, dabei wurde räumlich zwischen sechs Urbanisierungsgraden
unterschieden. Anhand einer zweistufigen Clusteranalyse wurden vier DPS ermittelt, die sich
in den folgenden fünf Variablen unterschieden: der Urbanisierungsgrad ihres Viertels, die
XX
Eigenerzeugung von Futtermitteln, die Nutzung von (öffentlichen) Weiden, die Zu- und
Abgänge von Milchvieh innerhalb der Herde und der Anteil an milchbetonten Genotypen. Das
extensive System DPS-1 war entlang der gesamten in Stadt-Land Schnittstelle von Bengaluru
vertreten; hier wurden keine eigenen Futtermittel erzeugt sondern öffentliche Flächen als
Weiden und zum Ernten von Grünfutter genutzt; außerdem wurden Marktabfällen als
Futtermittel eingesetzt. Das halbintensive DPS-2 war in den ländlichen Regionen verankert;
seine Fütterungsstrategie beinhaltete den Anbau von Futtermitteln und Weidegang, die
Zuchtstrategie war auf milchbetonten Genotypen fokussiert. DPS-3 ähnelte DPS-2 hinsichtlich
Verortung und Fütterungsstrategie, war aber nicht auf die Haltung milchbetonten Genotypen
spezialisiert. Das intensive DPS-4 war ausschließlich in den ruralen Randbereichen der Stadt
angesiedelt, die Fütterungsstrategie beruhte auf dem eigenen Anbau von Futtermitteln aber
nicht auf Weidegang. Milcherzeuger aus DSP-1 waren meist landlos und nutzten informelle
Vermarktungskanäle, um ihre Milch zu verkaufen. Milcherzeuger aus DPS-2, DPS-3 und
DPS-4 verließen sich auf Molkereigenossenschaften für den Bezug von Inputs und zur
Vermarktung ihrer Milch. Insgesamt verfügt der Milchsektor von Bengaluru über ein gut
etabliertes Netzwerk von Molkereigenossenschaften und wird von kleinen Familienbetrieben
mit homogenem sozioökonomischem Hintergrund und ähnlichen Produktionspraktiken
charakterisiert. Die komplexen Verbindungen zwischen den sozial-ökologischen
Komponenten des Systems „Milch“, nämlich den Milcherzeugern, ihren Herden, ihren
Familien, den Verbrauchern und dem Ökosystem sind in den urbanen Gebieten anders
ausgeprägt als in den peri-urbanen und ländlichen Gebieten.
Um die Ressourcennutzungseffizienz und speziell die Futterverwertungseffizienz
zu quantifizieren wurden 28 Milchviehbetriebe ausgewählt (7 pro DPS). In Intervallen von
sechs Wochen wurden während eines Jahres die tägliche Trockenmasseaufnahme (TMA)
aller Kühe im Stall und auf der Weide sowie ihr Energie- und Proteinbedarf (für Erhaltung,
Wachstum, Trächtigkeit, Fortbewegung, Milchproduktion) erfasst. Der Verzehr von
Trockenmasse (TM) pro kg metabolischer Körpermasse zeigte deutliche Unterschiede in der
Fütterungsintensität, die mit dem eigenen Anbau von Futtermitteln, der Weidenutzung oder
beiden Faktoren zusammenhingen. Die Energie- und Rohproteinversorgung der Kühe
variierte stark in DPS-1, in DPS-2, DPS-3 und DPS-4 wurden die Kühe meistens überversorgt.
Die Milchleistung (korrigiert um den Einfluss des Körpergewichts) in den vier DPS war deutlich
unterschiedlich und wurde beeinflusst durch DPS (Management), Genotyp, Laktationstag,
Trächtigkeit, TMA, Energieversorgung und Zeitpunkt (Saison) der Datenerfassung. Im
extensiven DPS-1 wurde die beste Futterverwertungseffizienz ermittelt (1,00 kg TM pro kg
XXI
energiekorrigierte Milch (EKM)), während die Futterverwertungseffizienz in DPS-2 (0,71 kg
TM kg-1 EKM), DPS-3 (0,77 kg TM kg-1 EKM) und DPS-4 (0,72 kg TM kg-1 EKM) durch das
Futterüberangebot herabgesetzt wurde. Die fehlende Kopplung von Ackerbau und Tierhaltung
in DPS-1 kann jedoch zu Umweltverschmutzung beitragen, insbesondere bei urbanen
Milcherzeugern mit begrenzten Möglichkeiten für das Dungmanagement.
Um die Umweltwirkungen von Bengalurus DPS zu quantifizieren wurde die
Emissionsintensität von Treibhausgasen in Form von Kohlendioxid-Äquivalent (CO2-äq)
berechnet. Dazu wurden aus dem Fütterungsdatensatz der sechs Milchviehbetriebe pro DPS
die Methan- und Distickstoffoxid-Emissionen aufgrund von enterischer Fermentation und
Dungmanagement berechnet. Die CO2-Bilanz der Milcherzeugung unterschied sich je nach
Fütterungsintensität und Managementstrategie der DPS, wobei die höchsten Werte für DPS-3
(1,95 kg CO2-äq kg-1 EKM) und DPS-4 (1,52 kg CO2-äq kg-1 EKM) berechnet wurden. Im
Vergleich dazu war die Bilanz des extensiven DPS-1 (0,91 kg CO2-äq kg-1 EKM) am
niedrigsten und die des DPS-2 (1,21 kg CO2-äq kg-1 EKM) intermediär. Die aus diesen Daten
geschätzte „cradle-to-farm-gate“ Emissionsintensität des Milchsektors von Bengaluru war
damit vergleichbar mit dem von Systemen ähnlicher Produktionsniveaus in anderen Ländern.
Insgesamt zeigt die vorliegende Studie, dass i) entlang Bengalurus
ländlich-städtischer Schnittstelle eine Reihe von DPS koexistieren, die durch unterschiedliche
Niveaus der Ressourcennutzungseffizienz und der globalen Umweltwirkungen charakterisiert
sind; ii) kleinskalige DPU nicht systematisch ineffizient oder emissionsintensiv sind, da sie oft
lokale Ressourcen nutzen und gleichzeitig mit lokalen Einschränkungen zurechtkommen; iii)
die Verstädterung komplexe Auswirkungen hat: Veränderungen in der Verfügbarkeit von
Arbeitskräften, aber nicht direkt in (abnehmende) Verfügbarkeit von Land; verbesserte
Marktintegration von ländlichen and periurbanen Milcherzeugern aber kein Strukturwandel
des Milchsektors; zunehmend komplexere Verbindungen zwischen sozial-ökologischen
Komponenten. Durch ein vertieftes Verständnisses landwirtschaftlicher Transformations-
prozesse, in diesem Fall der Milchproduktion in einem sich schnell urbanisierenden Umfeld,
kann die vorliegende Studie die Umsetzung zukünftiger Milchentwicklungsprogramme
unterstützen, indem sie auf lokale Einschränkungen und Möglichkeiten sowie auf die
Bedeutung mehrerer sozial-ökologischer Komponenten hinweist, die alle bei solchen
Initiativen berücksichtigt werden sollten. Die vorliegende Studie eröffnet ausserdem neue
Perspektiven für weitergehende systemische Forschung zu Fragen der Auswirkungen von
Urbanisierung auf Milchviehhaltung und andere Tierhaltungssysteme in den sogenannten
Entwicklungs- und Schwellenländern.
General introduction
1
1 General Introduction
1.1 A framework to livestock production in an urbanizing environment
1.1.1 A system approach
A system approach starts with the identification and characterization of the system,
as knowledge is key to its improvement, repair, duplication or comparison (Ikerd, 1993;
Spedding, 1988). Spedding (1988; p. 18) defines a system as “a group of interacting
components, operating together for a common purpose, capable of reacting as a whole to
external stimuli: it is unaffected directly by its own outputs and has a specified boundary based
on the inclusion of all significant feedbacks”. Broadly speaking, livestock production systems
are thus systems, whose outputs are goods and services specifically provided by the rearing
of livestock, usually food provision (milk, meat, eggs), and are limited to farm-level
components. Their further characterization is however context-specific. Statistical
classification methods (see Dossa et al. (2011) for a review) are thus often used to highlight
naturally occurring clusters of data, which can be interpreted as specific livestock production
systems. In the context of an urbanizing environment, (peri)-urban livestock production
systems have been characterized through two-step cluster analysis (Dossa et al., 2011;
Roessler et al., 2016), which allows the simultaneous consideration of continuous and
categorical context-specific variables for clustering. A two-step cluster analysis thus potentially
reflects the complexity and specificities of local livestock production systems more accurately
than a cluster analysis considering only one type of context-specific variables. Yet, this
accuracy depends on the range of collected data, which is defined by expert knowledge and
previous studies, their focus and their quality.
1.1.2 Urbanization and rural-urban linkages
Urbanization stands for the settlement of a large human population at high density
(Millennium Ecosystem Assessment, 2005) and by extension, the rise of (mega)cities and
associated physical transformation such as the conversion of agricultural lands into industrial
or residential areas. Urban areas resulting from urbanization and rural areas are generally
dichotomized, spatially and on a sector basis: urban areas are consumption oriented areas
with no agricultural production by opposition to rural areas, which are production oriented with
low consumption level (Lerner and Eakin, 2011; Tacoli and Vorley, 2015). The flow of
agricultural goods and services from rural to urban areas is called a rural-urban linkage and
often overlooks other rural-urban linkages such as the flows of persons, financial capital,
General introduction
2
information or even waste (Tacoli, 2003; Termeer et al., 2019). Shifts from a rural to an urban
spatial distribution of population is a major trend of the 21st century and a demographic driver
of change for rural-urban linkages. Yet, the spatial and sectorial dichotomization of rural and
urban areas is fairly recent.
A (historical) perspective on urbanization and rural-urban linkages. The
Neolithic revolution started roughly 10’000 years ago in the Fertile Crescent (Middle East) and
was both a demographic revolution and the beginning of agriculture: by adopting
food-production practices and domesticating plants and later animals, humans in the Fertile
Crescent and in later agricultural homelands shifted from being hunter-gatherers to sedentary
farmers (Curry, 2013; Diamond and Bellwood, 2003; Steel, 2008). The adoption of new
technologies and sedentary lifestyle resulted in the first human settlements and, over
millennia, lead to the development of larger and more complex societies, and the emergence
of human civilizations (Steel, 2008). A prominent example of the coevolution of human
populations and agriculture is the emergence of a genetic mutation causing the persistence of
lactase in adulthood 7’500 years ago in central Europe (Curry, 2013). The ability to digest the
lactose naturally present in raw milk improved the nutritional status of the European
populations, which fostered population growth and the expansion of dairying (Curry, 2013). At
the historic starting point of human societies and agriculture, the spatial and sectorial
dichotomization of urban and rural areas was thus at most marginal and rural-urban linkages
inexistent.
Fast-forward to contemporary times, the spatial and sectorial dichotomization of
urban and rural areas is increasingly stronger and rural-urban linkages increasingly more
complex. Although the sustenance of a large city through cereal imports can be traced back
to Ancient Rome, the perishable nature of animal products such as milk required the
maintenance of livestock in (peri-)urban areas for many additional centuries (Steel, 2008) e.g.
in 1829, there were 71 cowsheds within London (Atkins, 1977). The moving of livestock out of
cities after the Industrial Revolution was the decisive step in the western spatial and sectorial
dichotomization of rural and urban and the emergence of agricultural flows as a rural-urban
linkage (Lerner and Eakin, 2011; Steel, 2008; Tacoli and Vorley, 2015). This spatial and
sectorial shift was again a result of technological advances in transport and food preservation,
from which contemporary western food regimes emerged (Butler, 2012; Lamine, 2015; Steel,
2008). Yet, contemporary western food regimes foster additional rural-urban linkages, e.g.,
financial links in the forms of monetary subsidies, or informative links in the form of production
or animal-welfare labels, and a growing importance of institutions shaping them (Lamine,
General introduction
3
2015; Termeer et al., 2019). The historical case of livestock intensification in the Netherlands
from 1870 to 2017 descried by Termeer et al. (2019) is an excellent yet rare case study on the
nature of rural-urban linkages and, in the background, of historical agricultural transitions in
an urbanizing environment. Historical cases of urban milk supply in London from circa 1790
to 1914 by Atkins (1977) and in Singapore in the 20th century by Wikkramatileke and Singh
(1969) are also worth mentioning.
In Western countries, growth rates of urban agglomerations already slowed down
and the bulk of urbanization until 2030 is expected to happen in West Africa and Asia (United
Nations, 2018a). Interestingly, research in urbanizing tropical countries on on-going
transformation of their agricultural sector and rural-urban linkages challenges the spatial and
sectorial dichotomization of urban and rural areas. Firstly, this is due to the context-dependent
definition of urbanization, e.g. when definition of an urban settlement depends on its population
size and spatial shape, which are relative to national context (Tacoli, 1998). This prompted
the use of the growth rate of urban areas rather than their absolute size by the United Nations
(2018a) to quantify urbanization. Yet, the definition of urban areas can also take into account
geographical features such as percentage of built-up areas (Hoffmann et al., 2017) or specific
infrastructures (Philippine National Statistics Office, 1992; Tingbé-Azalou, 1997), while some
definitions include a sectorial criteria (Philippine National Statistics Office, 1992) and others
don’t (Hoffmann et al., 2017; Tingbé-Azalou, 1997). Distinction between urbanization and
correlated characteristics should be however maintained; e.g., increased demand for
agricultural products and shift in diet preferences is often attributed to urbanization, yet
growing income seems to be the underlying reason, which blurs the spatial restriction of a
growing demand to urban areas only (Tacoli and Vorley, 2015). Finally, spatial rural and urban
dichotomization often rests on a monocentric and gradual approach to urbanization,
overlooking the provision of goods and services to rural populations by urban areas of different
size and accessibility (Tacoli, 2003). The sectorial dichotomization of rural and urban areas is
first challenged because of, on one hand, the existence of rural consumers, which does not fit
the definition of rural areas as solely production-oriented (Tacoli and Vorley, 2015). On the
other hand, urban areas are considered consumption oriented, which does not account for the
existence of (peri-)urban agricultural production systems. On top of these considerations,
complex rural-urban linkages across space and sector exist in the form of, e.g., urban dwellers
owning rural properties and sending remittances to rural areas, income-generating off-farm
activities of rural inhabitants in the cities, or rural dwellers’ daily or seasonally commuting to a
city (Krüger, 1998; Tacoli, 2003). Finally, the spatial and sectorial dichotomy between rural
General introduction
4
and urban areas is challenged by the existence of peri-urban areas, not so much as a transition
space from rural to urban but a mix of both, where sectorial interaction and linkages as flows
of material, people and wastes are the most intensive (Lerner and Eakin, 2011; Tacoli, 2003,
1998).
1.1.3 Social-ecological system and resilience
A (livestock) production system is mostly limited to the boundaries of the
production unit but the definition of a system by Spedding (1988) can be applied at a larger
scale to include social-ecological components outside the boundaries of the production unit
“capable of reacting as a whole” and “all significant feedbacks”. Social-ecological systems
(SES), which provide agricultural goods and services, are thus made of a network of different
socioeconomic actors - producers and their families, the consumers, intermediaries of the
value chains and institutions involved in the regulation of the value chain – and of ecological
components, such as the ecosystem, resource units and biological processes (Ostrom, 2007;
Termeer et al., 2019). Because they typically provide agricultural goods and services, they
exist across rural and urban areas with the flows of agricultural products across the rural-urban
interface constituting the predominant link between its central components: producers and
consumers. SES components are further connected by different flows of material, people,
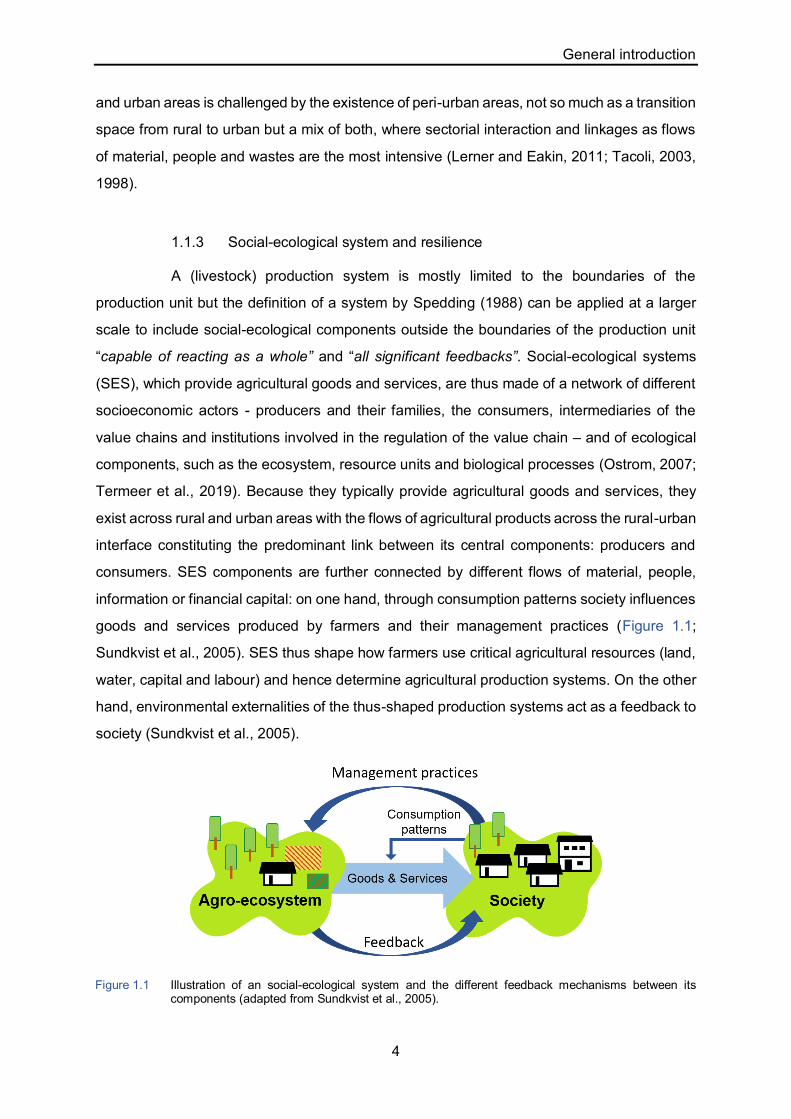
information or financial capital: on one hand, through consumption patterns society influences
goods and services produced by farmers and their management practices (Figure 1.1;
Sundkvist et al., 2005). SES thus shape how farmers use critical agricultural resources (land,
water, capital and labour) and hence determine agricultural production systems. On the other
hand, environmental externalities of the thus-shaped production systems act as a feedback to
society (Sundkvist et al., 2005).
Figure 1.1 Illustration of an social-ecological system and the different feedback mechanisms between its components (adapted from Sundkvist et al., 2005).
General introduction
5
The SES framework had been designed to improve the identification and
understanding of an outcome as results of complex interactions between social-ecological
components, such as unsustainable resource use (Ostrom, 2007). Cumming et al. (2014)
characterized SES preserving the local equilibrium between resources use and consumption
as “green-loop” and theorized that such equilibrium is maintained through tight feedbacks
between the SES components. By opposition, “red-loop” characterizes SES shifting toward
an unsustainable equilibrium as consumption outgrows local resources, which leads to
over-exploitation of local resources, expansion of the urban foodshed and outsourcing of
negative environmental externalities (Cumming et al., 2014; Kelly-Reif and Wing, 2016;
MacDonald et al., 2015).
A SES shifts from a “green-loop” to “red-loop” when the linkages between its
components loosen and the feedbacks between them weaken (Cumming et al., 2014;
Sundkvist et al., 2005; Termeer et al., 2019). Termeer et al. (2019) underline the importance
of human agency, namely the capacity of people to act voluntary and independently, as
component of efficient feedback mechanisms. When SES components are tightly linked,
socioeconomic actors of a SES feel concerned by the environmental issues generated by their
consumption and can decide to act on it, e.g. by changing their consumption patterns and
volumes or by calling for stricter environmental regulations. The role of institutions is however
increasingly crucial e.g. in the success of dairy cooperatives (Bijman, 2018) but especially to
compensate for unavoidable weakening of feedbacks (Termeer et al., 2019). Tight linkages
between SES components also provide resilience to SES; the latter is divided by Termeer et
al. (2019; p. 2) in three sub-capacities:
Robustness: “the capacity to maintain the same functions and desired levels of
outputs despite the occurrence of perturbations”
Adaptability: “the capacity to respond to shocks and stresses by adjusting internal
processes”
Transformability: “the capacity to create a fundamentally new system to capture
novel opportunities or respond to either severe anticipated/unanticipated shocks
or enduring stress that make the earlier system untenable”
General introduction
6
1.2 Livestock production systems in an urbanizing environment
1.2.1 Agricultural transition
Farming systems are characterized by their use of essential agricultural resources,
such as land and labour. Urbanization is a driver of change in farming systems as it induces
a transition in the use of essential agricultural resources, either because of a shift in the supply
side or in the demand side or both. At farm-level, the agricultural transition due to urbanization
results in distinct development trends of intensification versus extensification, or diversification
versus specialization.
Shift in the supply side. The most direct impact of urbanization is its physical
fallout, namely the decreased availability of agricultural land in and around urban areas as
arable land and pastures are converted into residential or industrial areas, and the agricultural
landscape gets fragmented (Satterthwaite et al., 2010). Urbanization also affects labour
availability since urban areas increase opportunity costs of family labour, especially of a
younger best-educated generation. Off-farm occupation of family labour can however create
new job opportunities for hired labour, which can benefit those whose access to resources is
too compromised to pursue an agricultural economic activity on their own (Satterthwaite et al.,
2010; Tacoli, 2003).
Shift in the demand side. Countries in the Global South see a massive
increase in consumer demand for animal products as they urbanize, which is termed “livestock
revolution” (Seré et al., 2008). Urbanization indirectly contributes to this increased demand as
not only the number of people involved in agriculture decrease (Satterthwaite et al., 2010) but
the (new) urban dwellers benefit of income increases which in turn foster a shift in consumption
patterns (Erler and Dittrich, 2017; Regmi and Dyck, 2001).
Intensification versus extensification. Because urbanization reduces land
and labour availability, farmers are implicitly pushed to produce as much goods as possible
with less inputs. As urbanization, rather than proximity to an urban area in itself, increases
market quality by easing access to production inputs, farmers are foremost given the
opportunity to improve their production through the intensified use of inputs such as
concentrate feed or modern animal and plant genetics (Duncan et al., 2013). Thus, the access
to essential agricultural resources is a determinant for the trend towards intensification of
production systems in an urbanizing environment (Zoomers and Kleinpenning, 1996).
Although trends of intensification and extensification can coexists within the same urbanized
space, as documented by Roessler et al. (2016), and subsistence often motivates extensive

General introduction
7
(peri-)urban production (Graefe et al., 2019), drivers of extensification in commercial-oriented
production in an urbanizing environment are not reviewed in-depth.
Diversification versus specialization. The incentive for family labour to
pursue off-farm economic activities drives occupational diversification (Bah et al., 2003).
However, the drive to intensify production also favours specialization of production by focusing
on only one product as efficiently as possible rather than providing a whole bundle of goods
and services.
1.2.2 Market integration
At sector-level, urbanization results in the development of the agricultural sector
from a subsistence-oriented production to a commercial agricultural sector; that is the
integration of farmers into formal value chains. Development of dairy production through
market integration is typically seen as an efficient way of improving livelihoods in rural areas
as it is not necessarily land intensive (Janssen and Swinnen, 2019; Wouters and van der Lee,
2010).
The role of dairy cooperatives. Dairy cooperatives are a bottom-up participative
approach to organize the supply side of milk and ease access to production inputs and
marketing channels (Wouters and van der Lee, 2010). Although a bottom-up approach,
institutional support is a key component of dairy cooperatives’ success on the long run
(Bijman, 2018). Typically, dairy cooperatives will focus on improving milk production through
easier access to concentrates feeds, genetically improved animals through artificial
insemination and extension services (Chagwiza et al., 2016; Wouters and van der Lee, 2010).
Dairy cooperatives also drive standardization and improvement of milk quality, which are
necessary prerequisites for dairy producers to enter into a formal value chain (Ikerd, 1993;
Tacoli and Vorley, 2015).
Market integration and resilience. Market integration of farmers challenges the
resilience of SES providing goods and services through the rearing of livestock due to four
processes that decrease the quality of linkages between producers and consumers:
distancing, homogenization, intensification and specialization (Sundkvist et al., 2005; Termeer
et al., 2019). According to Termeer et al. (2019), intensification leads to decoupling resources
uses from local ecosystems, while specialization decouples crop and livestock production.
Because of the dichotomization of rural and urban spaces, agricultural goods travel longer
distances and homogenization of production processes and products results in the loss of
local knowledge necessary to maintain a sustainable use of local resources.

General introduction
8
1.2.3 (Peri-)urban livestock production systems
As a rural activity taking place in urban areas, (peri-)urban agricultural production
presents a sectorial interaction that challenges the dichotomization of rural and urban areas
(Tacoli, 1998). (Peri-)urban dairy production it is fairly common in the Global South and has
been documented in Cairo, where adaptation strategies to urbanization were highlighted
(Daburon et al., 2017), in Ethiopia where it accommodates for religious specificities impacting
the local dairy sector (D'Haene et al., 2019; D'Haene and D’Haese, 2019), in Burkina Faso
where it lacks resources use efficiency (Schlecht et al., 2019), and in Mali (Amadou et al.,
2015), Burkina Faso and Ghana where specialisation and intensification trends are found
(Roessler et al., 2016).
Opportunities for (peri-)urban livestock production systems. (Peri-)urban
livestock production systems usually directly improve the livelihood of (peri-)urban producers
by providing food to the household (Graefe et al., 2019). (Peri-)urban producers are typically
also motivated by market opportunities and the viability of their activity depends of the
identification of a demand for their products (Graefe et al., 2019; Lapar et al., 2010).
(Peri-)urban livestock production systems can also be motivated by the preservation of the
cultural identity of the households (Lerner and Eakin, 2011; Tacoli, 1998). Furthermore,
inequalities in cities are often huge (Anand and Thampi, 2016) and (peri-)urban livestock
production systems are often informal and direct, supplying agricultural goods at low prices
for marginal urban inhabitants. By suppling highly perishable animal products, they also
compensate for poor transport and cooling infrastructures in the Global South (Lamine, 2015;
Prasad et al., 2019; Steel, 2008). Consumer preference for fresh products, trust in the direct
relationship with a producer as a guarantee of quality and local knowledge such as boiling raw
milk before consumption reinforce the market opportunities of (peri-)urban producers (Lapar
et al., 2010). (Peri-)urban areas also offer specific opportunities for producers such as novel
inputs – e.g., organic urban wastes to be used as livestock feeds – and direct marketing
channels, which can be financially more rewarding than in rural areas (Hemme and Otte,
2010).
Constraints for (peri-)urban livestock production systems. Constraints of
(peri-)urban agriculture are linked to the integration of livestock within the city (Steel, 2008),
the sanitary risks of the close proximity between humans and animals (Butler, 2012) but also
to the consumption of animal products from informal value chains (Tacoli and Vorley, 2015),
waste management (Butler, 2012), and the decoupling of crop and livestock production, which

General introduction
9
wastes nutrients and transforms cities into “nutrient sink” (Drechsel and Kunze, 2001; Prasad
et al., 2019).
1.3 Dairy production in an urbanizing environment: the case study of
Bengaluru, India
1.3.1 The national context
Urbanization. One person out of six on the planet currently lives in India. With
more than one billion inhabitants, it is the second most populous country in the world (World
Bank, 2018a). India classifies its administrative units as urban when they have an
administrative status as town (e.g., municipal corporation) or fulfil three criteria: a minimum
population of 5’000 people, less than 25% of the male population employed in the primary
sector and a high population density (minimum 400 people per km2; Government of India,
2011). In 2018, 34% of all Indian citizens lived in urban areas (World Bank, 2018b).
Dairy sector. The demographic scale of India is matched by the scale of its dairy
sector: India is the second largest producer of cattle milk worldwide (year 2018; FAOSTAT,
2019) but all dairy animals confounded, it is the largest dairy producer worldwide since 1996.
In 2019, India produced twice as much milk as the USA, who is the second dairy producer
worldwide (FAOSTAT, 2019). This massive production is largely due to India having the
largest buffalo herd and the second largest herd of cattle worldwide (FAOSTAT, 2019). Milk
and dairy products account for around two thirds of the Indian livestock sector’s value
(Mayberry et al., 2017; Ministry of Agriculture, 2014). Milk also has a high nutritional value as
a major source of animal protein in a country where 40% of the population is vegetarian
(Government of India, 2014). Yet, milk consumption per capita is low (145 g per capita and
day versus 227 g in Europe, year 2003; FAOSTAT, 2019).
Today’s dairy sector in India is built on the success of Operation Flood: launched
in the 1970s, Operation Flood was a large-scale and decades-long pro-poor dairy
development program, which successfully tackled the underdevelopment of dairy production
in rural areas. This was achieved by improving infrastructures, since dairy cooperatives
scaled-up milk extension services, processing and marketing, enabled rural production to
reach urban consumers, and reinforced rural-urban linkages (Cunningham, 2009). Between
1970 and 1996 and across 170 milksheds1 in 362 districts, Operation Flood tripled the
productivity per dairy animal, raised the number of dairy cooperatives from 1’600 to 70’000,
1Delimited geographical area supplying milk for a given city.
General introduction
10
doubled the income of landless farmers and ended the decades-long dependency of India on
milk imports (Cunningham, 2009).
Despite all infrastructural improvements introduced by Operation Flood,
smallholders with two to five cows still produce 80% of the national milk volume today
(Cunningham, 2009) and the productivity per dairy cattle is low. This low productivity is often
explained by poor feeding (poor diet quality, extensive pasture use, low use of concentrated
feeds, feed scarcity and seasonal variability; Mayberry et al., 2017), poor genetics (low
productivity of local dairy cattle; Ministry of Agriculture, 2014) and poor milking practices (short
lactations, long calving intervals; Duncan et al., 2013). Heat stress due to the tropical weather
of India can also partly explain low productivity of Bos taurus dairy cattle with otherwise high
genetic production potential (West, 2003).
The cow in the Indian society. The well-known sacred status of cows in India is
a thousand years old religious and national legacy, which lead to cow slaughter being legally
banned in almost all of today’s India. Old and unproductive dairy cows are often kept in cattle
shelters known locally as gaushala, which host about one seventh of the total Indian cattle
population. This practice also fuels the “sacred-cow controversy” in scientific literature on
externalities of such a large population of “useless” cattle (Kennedy et al., 2018). Cows provide
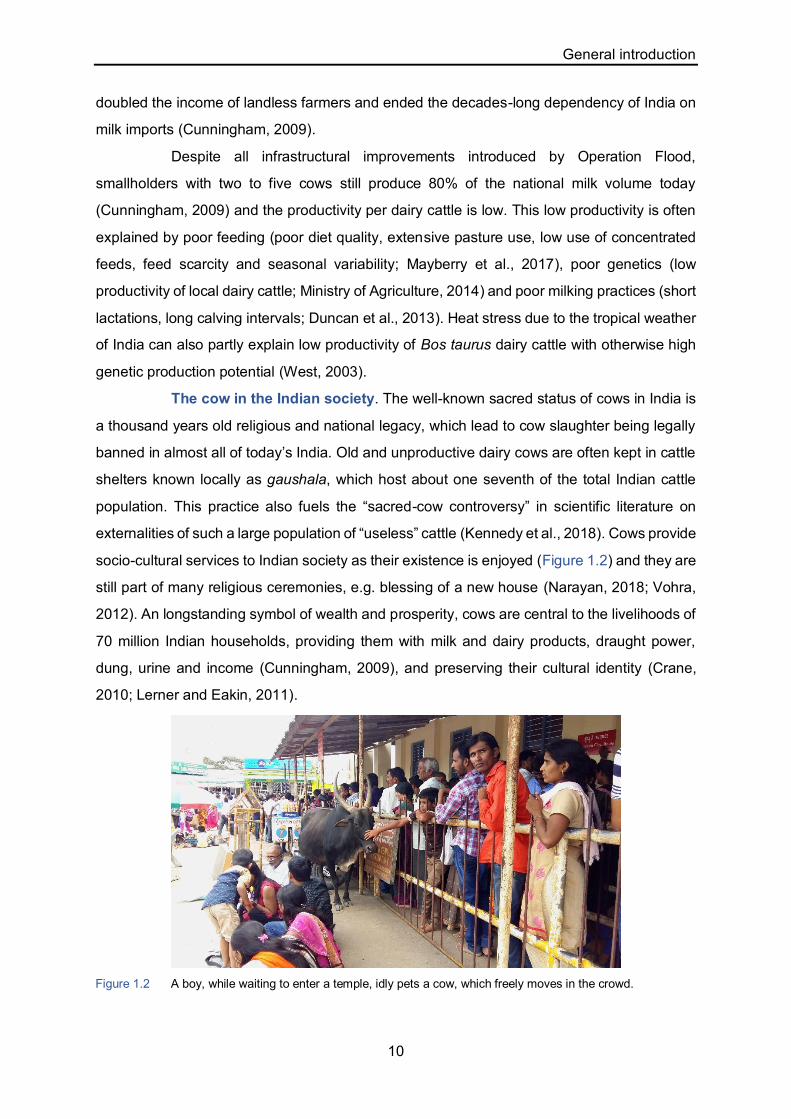
socio-cultural services to Indian society as their existence is enjoyed (Figure 1.2) and they are
still part of many religious ceremonies, e.g. blessing of a new house (Narayan, 2018; Vohra,
2012). An longstanding symbol of wealth and prosperity, cows are central to the livelihoods of
70 million Indian households, providing them with milk and dairy products, draught power,
dung, urine and income (Cunningham, 2009), and preserving their cultural identity (Crane,
2010; Lerner and Eakin, 2011).
Figure 1.2 A boy, while waiting to enter a temple, idly pets a cow, which freely moves in the crowd.
General introduction
11
1.3.2 The city of Bengaluru
Capital of the southern Indian state of Karnataka, Bengaluru, formerly Bangalore,
is located on the Deccan plateau at 920 meters above sea level. Its climate is hot semi-arid
(average maximum temperature 29.5°C, average minimum temperature 18.5°C, 948 mm of
annual rainfall; monthly average 2013-2017, weather station data of the University of
Agricultural Sciences Bangalore, GKVK campus). The dry season (March-May) is followed by
a monsoon season (June-October) and winter (November-February).
Formerly nicknamed “Garden City” because of its numerous trees, reputed for its
mild climate and numerous lakes, Bengaluru metropolitan area was estimated to be built-up
only at 23% to 24% in 2007 (Figure 1.3; Sudhira et al., 2007). Built-up areas in the Bangalore
Urban district however increased by 1’039% in 50 years (1965 to 2018; Brinkmann et al.,
2020). Since the 1970s, Bengaluru was one of the fastest growing cities in India, driven by an
(IT) industrial boom, which earned her the new nickname “Silicon Valley of India” (Sudhira et
al., 2007; Verma et al., 2017; World Bank, 2013). Its population growth was fuelled mostly by
migrants attracted by new economic opportunities (Sudhira et al., 2007) and led to more than
10 million citizens at present (Kumar et al., 2016). Being one of the largest urban
agglomerations in India today and a large metropolitan economy even by world standards
(Parilla et al., 2015), unplanned growth especially in peri-urban areas results in loss of
agricultural land, lakes and green spaces (Verma et al., 2017). Despite urbanization,
(peri-)urban agriculture in Bengaluru is not uncommon, motivated by the (original) population’s
quest for additional food and income sources (World Bank, 2013). Most (peri-)urban farmers
cultivate crops but dairy production within the city also exists (Prasad et al., 2019; World Bank,
2013).
1.3.3 The dairy sector of Bengaluru
Based on the model of Operation Flood, a Karnataka Dairy Development Project
was launched in 1974 and the resulting networks of dairy cooperatives and producers is now
known as the Karnataka Milk Federation (KMF), the second largest milk cooperative in India
(Alderman, 1987; Karnataka Milk Federation). Ten years after the launch of the Karnataka
Dairy Development Project differences between cooperatives’ members in Karnataka and
non-cooperative members were already reported by Alderman (1987): at the time, the average
herd size of cooperative members was 5.5 animals (approx. one quarter of male animals; milk
herd composed of 36% local cattle, 17% crossbreed cows and 47% buffaloes) versus a herd
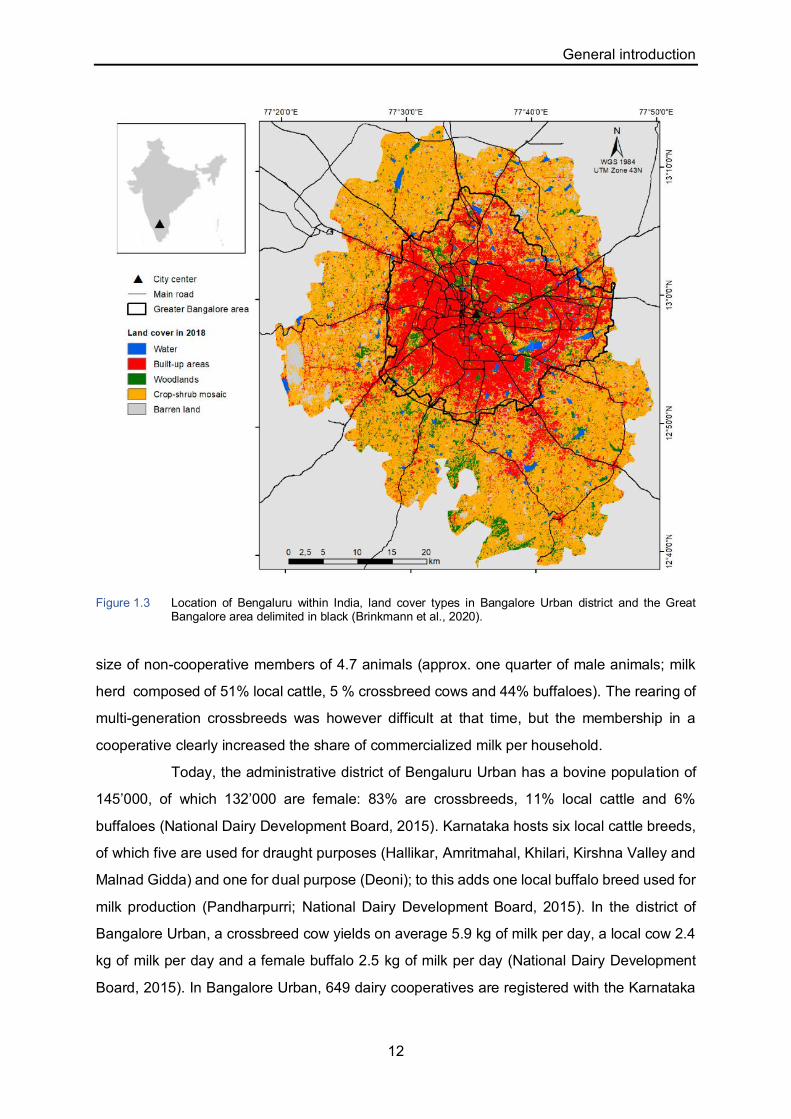
General introduction
12
size of non-cooperative members of 4.7 animals (approx. one quarter of male animals; milk
herd composed of 51% local cattle, 5 % crossbreed cows and 44% buffaloes). The rearing of
multi-generation crossbreeds was however difficult at that time, but the membership in a
cooperative clearly increased the share of commercialized milk per household.
Today, the administrative district of Bengaluru Urban has a bovine population of
145’000, of which 132’000 are female: 83% are crossbreeds, 11% local cattle and 6%
buffaloes (National Dairy Development Board, 2015). Karnataka hosts six local cattle breeds,
of which five are used for draught purposes (Hallikar, Amritmahal, Khilari, Kirshna Valley and
Malnad Gidda) and one for dual purpose (Deoni); to this adds one local buffalo breed used for
milk production (Pandharpurri; National Dairy Development Board, 2015). In the district of
Bangalore Urban, a crossbreed cow yields on average 5.9 kg of milk per day, a local cow 2.4
kg of milk per day and a female buffalo 2.5 kg of milk per day (National Dairy Development
Board, 2015). In Bangalore Urban, 649 dairy cooperatives are registered with the Karnataka
Figure 1.3 Location of Bengaluru within India, land cover types in Bangalore Urban district and the Great Bangalore area delimited in black (Brinkmann et al., 2020).
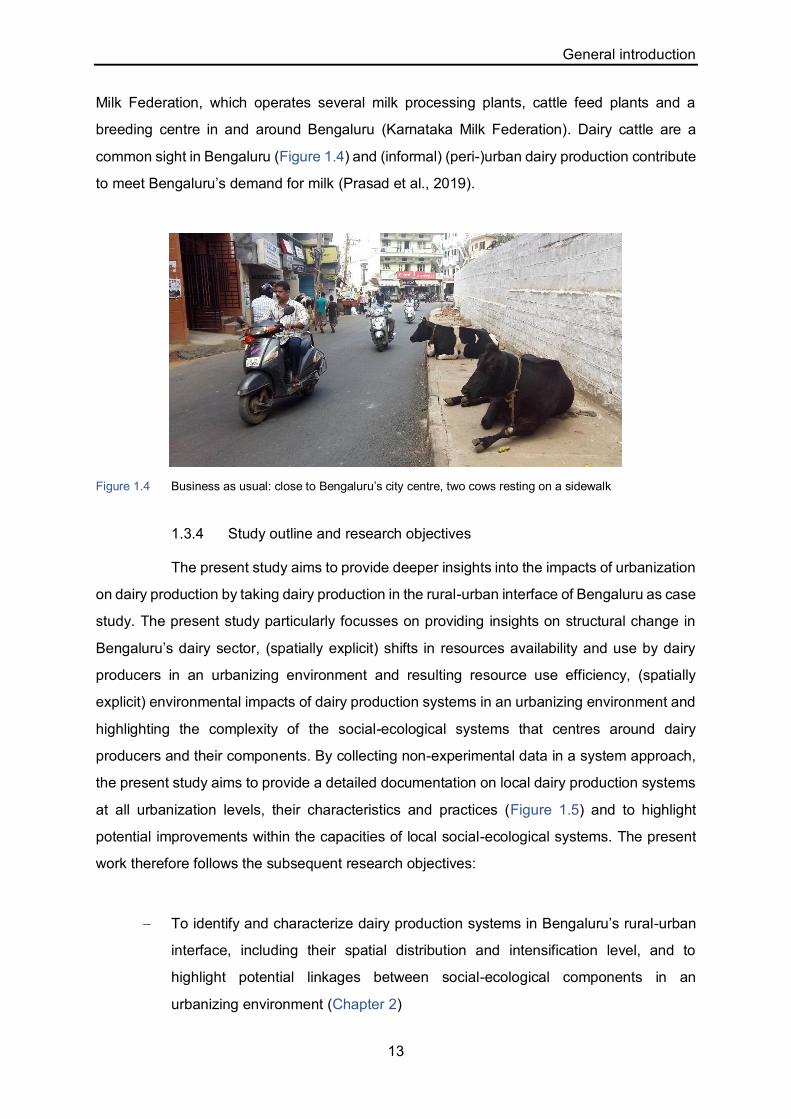
General introduction
13
Milk Federation, which operates several milk processing plants, cattle feed plants and a
breeding centre in and around Bengaluru (Karnataka Milk Federation). Dairy cattle are a
common sight in Bengaluru (Figure 1.4) and (informal) (peri-)urban dairy production contribute
to meet Bengaluru’s demand for milk (Prasad et al., 2019).
Figure 1.4 Business as usual: close to Bengaluru’s city centre, two cows resting on a sidewalk
1.3.4 Study outline and research objectives
The present study aims to provide deeper insights into the impacts of urbanization
on dairy production by taking dairy production in the rural-urban interface of Bengaluru as case
study. The present study particularly focusses on providing insights on structural change in
Bengaluru’s dairy sector, (spatially explicit) shifts in resources availability and use by dairy
producers in an urbanizing environment and resulting resource use efficiency, (spatially
explicit) environmental impacts of dairy production systems in an urbanizing environment and
highlighting the complexity of the social-ecological systems that centres around dairy
producers and their components. By collecting non-experimental data in a system approach,
the present study aims to provide a detailed documentation on local dairy production systems
at all urbanization levels, their characteristics and practices (Figure 1.5) and to highlight
potential improvements within the capacities of local social-ecological systems. The present
work therefore follows the subsequent research objectives:
To identify and characterize dairy production systems in Bengaluru’s rural-urban
interface, including their spatial distribution and intensification level, and to
highlight potential linkages between social-ecological components in an
urbanizing environment (Chapter 2)

General introduction
14
To quantify resource use efficiency, i.e. feed conversion efficiency, of Bengaluru’s
dairy production systems to challenge the hypothesis that urbanization leads to
intensification and efficient resource use (Chapter 3)
To quantify global environmental impact, i.e. greenhouse gas emissions due to
livestock, of Bengaluru’s dairy production systems to assess the impacts of local
differences in intensification level due to an urbanizing environment (Chapter 4)
At last, the methodological considerations, results and insights provided in
previous chapters are discussed in relation to agricultural transition at farm-level, market
integration of dairy producers and the SES framework (Chapter 5).
Figure 1.5 A dairy cattle freely grazing on a public ground within Bengaluru; a common practice of urban dairy production.

15
2 Typology of dairy production systems and linkages in the
rural-urban interface of Bengaluru
2.1 Introduction
As rural areas are taken over by rapidly expanding cities, the role of farmers as a
link between society and environment becomes crucial: the spatial flow of agricultural products
between rural producers and their urban consumers is a rural-urban linkage at the heart of
complex modern social-ecological systems (SES) extracting local resources (Cumming et al.,
2014; Francis et al., 2005; Tacoli, 2003). SES components are further linked by different flows
of material, people, information and financial capital: on one hand, through consumption
patterns, society influences the goods and services produced by farmers and their
management practices (Sundkvist et al., 2005). SES thus shape farmers’ use of critical
agricultural resources (land, water, capital and labour) and accordingly agricultural production
systems. On the other hand, environmental externalities of the thus-shaped agricultural
production systems act as a feedback to society (Sundkvist et al., 2005). SES are depicted as
“green-loop” when they maintain an equilibrium between local resource use and human
population size (Cumming et al., 2014), which is possible when the links between SES
components are tight and feedbacks effective (Sundkvist et al., 2005; Termeer et al., 2019).
By its nature and scope, urbanization increases disconnects and weakens feedbacks between
SES components through the processes of distancing, homogenization, intensification and
specialization (Cumming et al., 2014; Francis et al., 2005; Sundkvist et al., 2005; Termeer et
al., 2019). Urbanization first nurtures distancing by dichotomizing rural and urban worlds
spatially and on a sectoral basis, with the rural space dedicated to agricultural production and
the urban one to consumption (Lerner and Eakin, 2011; Tacoli, 2003). Spatial and sectoral
dichotomization between SES components leads to further “abstract” distancing:
i) psychological; that is the concerns of the consumer regarding social and ecological
consequences of their consumption decreases, especially regarding negative environmental
externalities (Francis et al., 2005); and ii) structural; that is intermediaries in the value chain
are multiplied as an increased spatial distance between production and consumption implies
an increased durability of primary agricultural products made possible only by processing, and
an increased in transport distances (Butler, 2012; Lamine, 2015; Sundkvist et al., 2005).
Secondly, urbanization nurtures homogenization of production systems and products as a
follow-up of distancing: homogenization guaranties quality and safety for the disconnected
consumers and economic efficiency for the intermediaries (Daburon et al., 2017; Prasad et

Chapter 2
16
al., 2019; Sundkvist et al., 2005). Third, urbanization nurtures agricultural intensification
through decreased availability of two critical agricultural resources: i) land, because of
conversion of agricultural land into built-up areas and the fragmentation of the agricultural
landscape; and ii) labour, as people, especially young, move to cities in search of better
economic opportunities (Satterthwaite et al., 2010; Tacoli, 2003). Urbanization additionally
nurtures agricultural intensification by easing farmers’ access to inputs and marketing
channels (Duncan et al., 2013). At last, urbanization nurtures agricultural specialization by
focusing on a single, main output, rather than on the total bundle of goods and services
provided by agroecosystems, and by assigning a monetary value to agricultural products,
pushing farmers to increase their economic efficiency (Butler, 2012; Prasad et al., 2019;
Sundkvist et al., 2005). Under the pressure of urbanization, disconnects between SES
components thus increase and feedbacks weaken, inducing a shift in SES toward
unsustainable use of local resources or “red-loop” conditions (Cumming et al., 2014).
Having the second largest population in the world (World Bank, 2018a), India is
also a rapidly urbanizing country with presently 34% of its population living in cities (United
Nations, 2019; World Bank, 2018b). With 40% of the population being vegetarian (Government
of India, 2014), milk is a vital source of animal protein but, despite being the largest milk
producer in the world since 1996 (FAOSTAT, 2019), daily milk consumption is low with 145 g
per capita (versus 227 g per capita in Europe, avg. year 2003; FAOSTAT, 2019). In the
1970s’, the Indian government launched a decades-long development programme called
Operation Flood that focused on dairy production as a vital rural-urban linkage (Cunningham,
2009). Operation Flood successfully scaled up rural milk production, marketing and
processing through dairy cooperatives and improved infrastructures, to supply urban areas
(Cunningham, 2009). Today’s Indian dairy sector rests on numerous rural but also (peri-)urban
smallholders, sometimes involved in informal marketing channels (Cunningham, 2009; Prasad
et al., 2019).
The urbanization level of an environment represents distinct sets of opportunities
and constraints for a farmer in terms of available resources and linking flows between
social-ecological components, shaping a variety of production systems. Distinct livestock
production systems coexisting within the same (peri-)urban space have been documented in
various major West African cities (Amadou et al., 2012; Dossa et al., 2015; Roessler et al.,
2016), ignoring however the livestock production systems at the rural periphery of the cities.
Taking dairy production in India as an example for production systems and SES linkages in
an urbanizing environment, the present study considers urban, peri-urban and rural areas in
Chapter 2
17
and around an emerging megacity to tackle the following research questions: i) do distinct
dairy production systems (DPS) coexist along a rural-urban interface (RUI)?; ii) how does the
spatial distribution of these DPS relate to urbanization level?; iii) which potential linkages
between social-ecological components of these DPS do exist in terms of flows of material,
people, information or financial capital along the RUI? To answer these questions, we focused
on the emerging megacity of Bengaluru in southern India and characterized the DPS
coexisting in its RUI based on surveys of over 300 dairy producers.
2.2 Materials and methods
2.2.1 Research area
Capital of the southern Indian state of Karnataka, Bengaluru has a hot semi-arid
climate (average maximum temperature 29.5°C, average minimum temperature 18.5°C, 948
mm of annual rainfall - monthly average 2013-2017, weather station data of the University of
Agricultural Sciences Bangalore). The dry season (March-May) is followed by a monsoon
season (June-October) and winter (November-February). Bengaluru’s urban agglomeration is
amongst the largest in India, driven since the 1970s by an unprecedent growth of population,
which is now more than 10 million (Kumar et al., 2016; Verma et al., 2017). The state of
Karnataka inaugurated its dairy development program as early as 1974, based on the model
of Operation Flood, setting up the Karnataka Milk Federation (KMF; Alderman, 1987). Two
research transects were established within Bengaluru’s RUI, following an urban to rural
gradient: the northern transect (Nsect) was a rectangular stripe of 5 km width and 40 km length
along a north-south axis, starting 10 km away from the city centre, in the northern part of
Bengaluru (Figure 2.1). The southern transect (Ssect) was a ca. 300 km2 polygon along a
south-west axis of 30 km length, starting 10 km away from the city centre, in the southern part
of Bengaluru. Each settlement (village, suburb or urban neighbourhood) within the two
transects was identified and assigned a survey stratification index (SSI) stratum. SSI went
from stratum 1 = urban to 6 = rural, based on build-up density of the settlement and its distance
to Bengaluru’s centre as proxy for its urbanization level (Hoffmann et al., 2017). Urbanization
levels were “urban” (strata 1 and 2), “peri-urban” (strata 3 and 4) and “rural” (strata 5 and 6;
Hoffmann et al., 2017).

Chapter 2
18
2.2.2 Sampling design
A two-step random selection process was used to survey a minimum of 300 dairy
producers across both transects: 30 settlements, 15 in Nsect and 15 in Ssect, were first drawn
at random proportionally to the transect’s prevalence of settlements per SSI stratum (Table
2.1; Hoffmann et al., 2017). In a second step, dairy producers were randomly selected per
settlement, based on the latest vaccination list for foot-and-mouth disease2. In two urban
settlements, the vaccination list was not available. Thus, the total number of dairy producers
was assessed by scouting the settlement on foot and talking to local inhabitants. As Ssect
was more urbanized than Nsect (Hoffmann et al., 2017) and to compensate for the lower
number of dairy producers in urban settlements (9 ± 7 dairy producers) than in peri-urban (45
± 37) and rural ones (55 ± 26, correlation coefficient SSI:total number of dairy producer per
settlement = 0.55, P < 0.05), i) the selection threshold (ST) of dairy producers per settlement
was set at 20% in Nsect and at 30% in Ssect; ii) two urban settlements were purposefully
added, one in Nsect (stratum 2, ST = 20%, 2 surveys), and one close to the city centre, thus
2Mandatory vaccination campaign done every 6 months, indicating the name of the cattle owner and number of vaccinated cattle (personal communication by local veterinarians).
Figure 2.1 Map of Bengaluru (built-up area in colour), northern and southern research transects and selected settlements per stratum of the survey stratification index 1 = urban and 6 = rural.
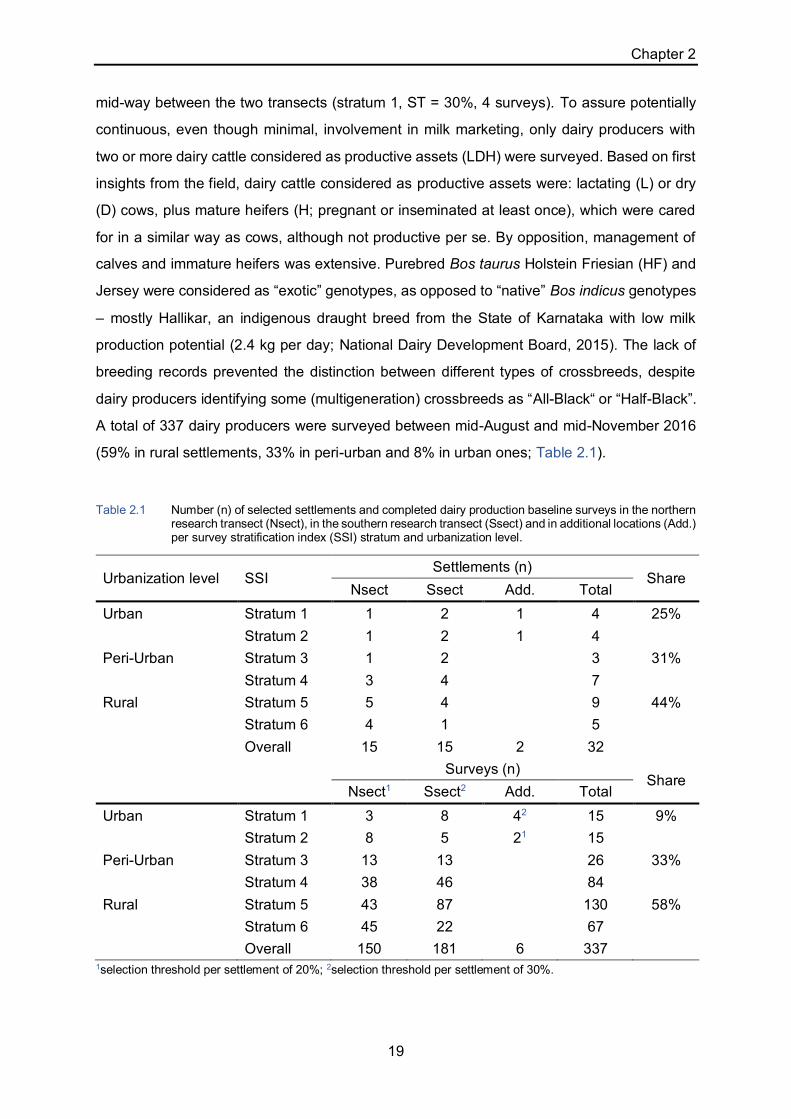
Chapter 2
19
mid-way between the two transects (stratum 1, ST = 30%, 4 surveys). To assure potentially
continuous, even though minimal, involvement in milk marketing, only dairy producers with
two or more dairy cattle considered as productive assets (LDH) were surveyed. Based on first
insights from the field, dairy cattle considered as productive assets were: lactating (L) or dry
(D) cows, plus mature heifers (H; pregnant or inseminated at least once), which were cared
for in a similar way as cows, although not productive per se. By opposition, management of
calves and immature heifers was extensive. Purebred Bos taurus Holstein Friesian (HF) and
Jersey were considered as “exotic” genotypes, as opposed to “native” Bos indicus genotypes
– mostly Hallikar, an indigenous draught breed from the State of Karnataka with low milk
production potential (2.4 kg per day; National Dairy Development Board, 2015). The lack of
breeding records prevented the distinction between different types of crossbreeds, despite
dairy producers identifying some (multigeneration) crossbreeds as “All-Black“ or “Half-Black”.
A total of 337 dairy producers were surveyed between mid-August and mid-November 2016
(59% in rural settlements, 33% in peri-urban and 8% in urban ones; Table 2.1).
Table 2.1 Number (n) of selected settlements and completed dairy production baseline surveys in the northern research transect (Nsect), in the southern research transect (Ssect) and in additional locations (Add.) per survey stratification index (SSI) stratum and urbanization level.
Urbanization level SSI Settlements (n)
Share Nsect Ssect Add. Total
Urban Stratum 1 1 2 1 4 25% Stratum 2 1 2 1 4
Peri-Urban Stratum 3 1 2 3 31% Stratum 4 3 4 7
Rural Stratum 5 5 4 9 44% Stratum 6 4 1 5
Overall 15 15 2 32
Surveys (n)
Share Nsect1 Ssect2 Add. Total
Urban Stratum 1 3 8 42 15 9% Stratum 2 8 5 21 15
Peri-Urban Stratum 3 13 13 26 33% Stratum 4 38 46 84
Rural Stratum 5 43 87 130 58% Stratum 6 45 22 67
Overall 150 181 6 337 1selection threshold per settlement of 20%; 2selection threshold per settlement of 30%.
Chapter 2
20
2.2.1 Dairy production baseline survey
The interview-based dairy production baseline survey and its procedures were
standardized during a pre-testing phase. All surveys were conducted in Kannada, the official
language of the state of Karnataka, face-to-face with the dairy producer himself/herself or an
adult member of his/her household (HH). Before starting the survey, the purpose and scope
of the survey was explained and only respondents giving oral consent to participate were
surveyed. Every survey was conducted by a team of two persons: one translator, familiar with
the questions and one researcher, filling out the survey sheets while checking for plausibility
and consistency of answers. One survey lasted for 28 minutes on average. Collected
quantitative and qualitative data addressed the socio-economic profile of the dairy producer,
dairy herd composition and management with focus on breeding, health care and feeding,
in- and output markets for dairy production and further agricultural activities following Dossa
et al. (2011) and Roessler et al. (2016; Table 2.2). Socio-economic classification of the HH
followed standards of the Market Research Society of India (2011; Table 2.2). Calculations of
HH labour force followed standards of the International Labour Organization (Table 2.2).
Calculations of tropical livestock unit (TLU) used conversion factors as cited in Dossa et al.
(2015; Table 2.2). Data were treated anonymously but the location of each dairy production
unit (DPU) was georeferenced with a wireless GPS logger (Holux M-241), with priority given
to the location of the cowshed if separated from the house of the dairy producer.
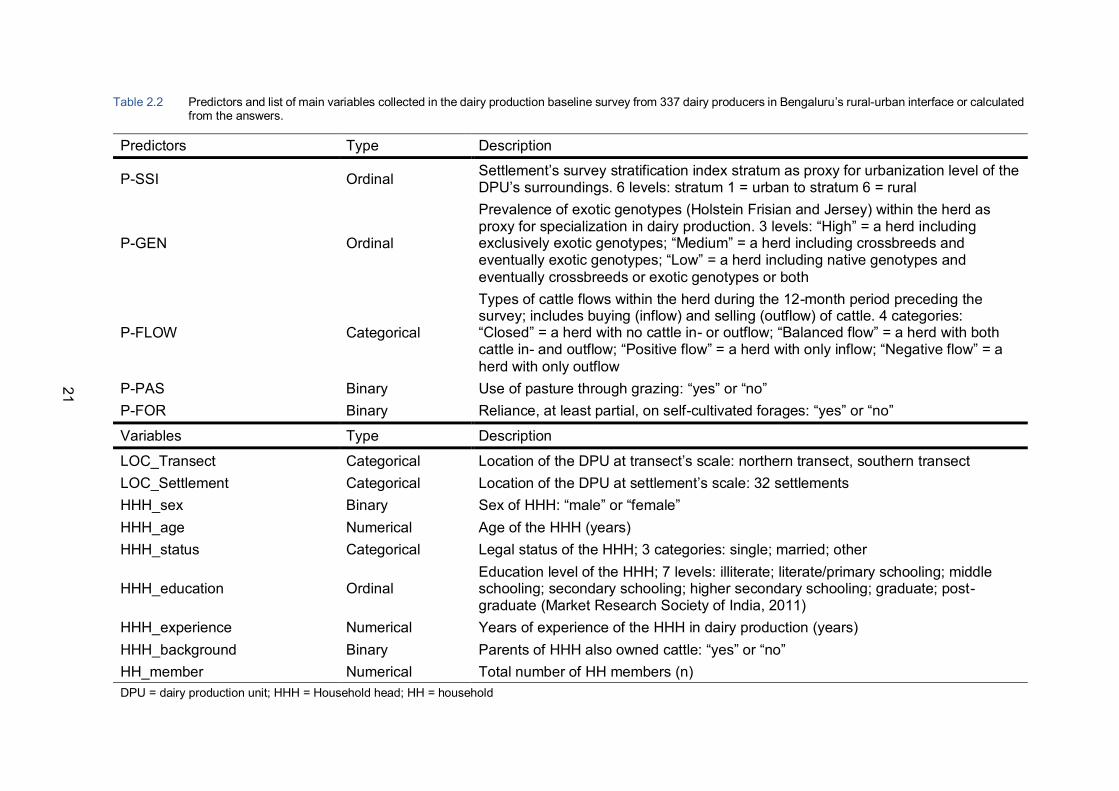
21
Table 2.2 Predictors and list of main variables collected in the dairy production baseline survey from 337 dairy producers in Bengaluru’s rural-urban interface or calculated from the answers.
Predictors Type Description
P-SSI Ordinal Settlement’s survey stratification index stratum as proxy for urbanization level of the DPU’s surroundings. 6 levels: stratum 1 = urban to stratum 6 = rural
P-GEN Ordinal
Prevalence of exotic genotypes (Holstein Frisian and Jersey) within the herd as proxy for specialization in dairy production. 3 levels: “High” = a herd including exclusively exotic genotypes; “Medium” = a herd including crossbreeds and eventually exotic genotypes; “Low” = a herd including native genotypes and eventually crossbreeds or exotic genotypes or both
P-FLOW Categorical
Types of cattle flows within the herd during the 12-month period preceding the survey; includes buying (inflow) and selling (outflow) of cattle. 4 categories: “Closed” = a herd with no cattle in- or outflow; “Balanced flow” = a herd with both cattle in- and outflow; “Positive flow” = a herd with only inflow; “Negative flow” = a herd with only outflow
P-PAS Binary Use of pasture through grazing: “yes” or “no” P-FOR Binary Reliance, at least partial, on self-cultivated forages: “yes” or “no”
Variables Type Description
LOC_Transect Categorical Location of the DPU at transect’s scale: northern transect, southern transect LOC_Settlement Categorical Location of the DPU at settlement’s scale: 32 settlements HHH_sex Binary Sex of HHH: “male” or “female” HHH_age Numerical Age of the HHH (years) HHH_status Categorical Legal status of the HHH; 3 categories: single; married; other
HHH_education Ordinal Education level of the HHH; 7 levels: illiterate; literate/primary schooling; middle schooling; secondary schooling; higher secondary schooling; graduate; post-graduate (Market Research Society of India, 2011)
HHH_experience Numerical Years of experience of the HHH in dairy production (years) HHH_background Binary Parents of HHH also owned cattle: “yes” or “no” HH_member Numerical Total number of HH members (n) DPU = dairy production unit; HHH = Household head; HH = household
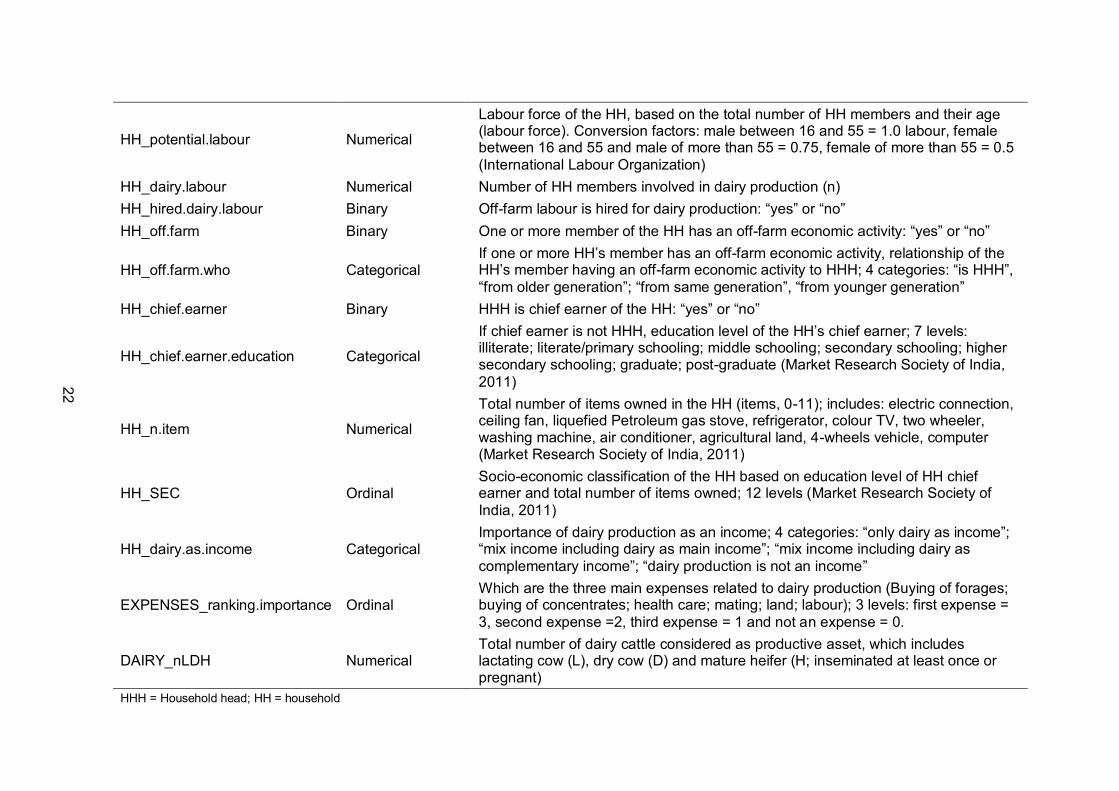
22
HH_potential.labour Numerical
Labour force of the HH, based on the total number of HH members and their age (labour force). Conversion factors: male between 16 and 55 = 1.0 labour, female between 16 and 55 and male of more than 55 = 0.75, female of more than 55 = 0.5 (International Labour Organization)
HH_dairy.labour Numerical Number of HH members involved in dairy production (n) HH_hired.dairy.labour Binary Off-farm labour is hired for dairy production: “yes” or “no” HH_off.farm Binary One or more member of the HH has an off-farm economic activity: “yes” or “no”
HH_off.farm.who Categorical If one or more HH’s member has an off-farm economic activity, relationship of the HH’s member having an off-farm economic activity to HHH; 4 categories: “is HHH”, “from older generation”; “from same generation”, “from younger generation”
HH_chief.earner Binary HHH is chief earner of the HH: “yes” or “no”
HH_chief.earner.education Categorical
If chief earner is not HHH, education level of the HH’s chief earner; 7 levels: illiterate; literate/primary schooling; middle schooling; secondary schooling; higher secondary schooling; graduate; post-graduate (Market Research Society of India, 2011)
HH_n.item Numerical
Total number of items owned in the HH (items, 0-11); includes: electric connection, ceiling fan, liquefied Petroleum gas stove, refrigerator, colour TV, two wheeler, washing machine, air conditioner, agricultural land, 4-wheels vehicle, computer (Market Research Society of India, 2011)
HH_SEC Ordinal Socio-economic classification of the HH based on education level of HH chief earner and total number of items owned; 12 levels (Market Research Society of India, 2011)
HH_dairy.as.income Categorical Importance of dairy production as an income; 4 categories: “only dairy as income”; “mix income including dairy as main income”; “mix income including dairy as complementary income”; “dairy production is not an income”
EXPENSES_ranking.importance Ordinal Which are the three main expenses related to dairy production (Buying of forages; buying of concentrates; health care; mating; land; labour); 3 levels: first expense = 3, second expense =2, third expense = 1 and not an expense = 0.
DAIRY_nLDH Numerical Total number of dairy cattle considered as productive asset, which includes lactating cow (L), dry cow (D) and mature heifer (H; inseminated at least once or pregnant)
HHH = Household head; HH = household
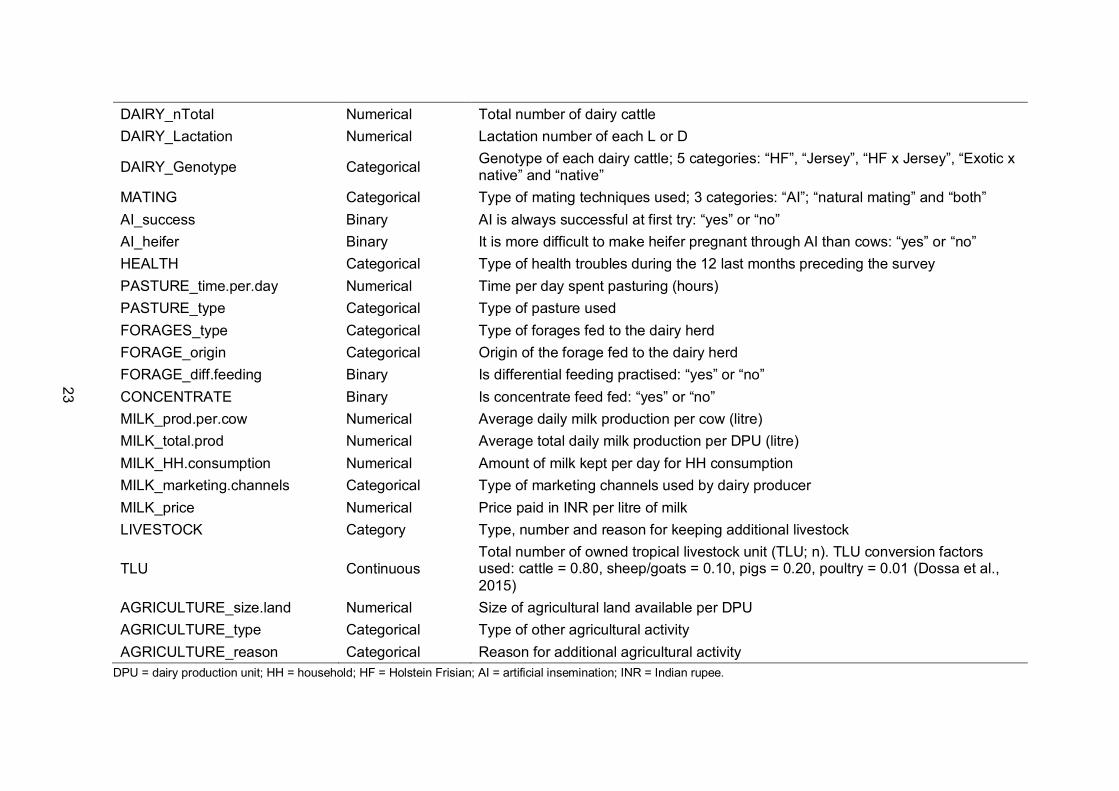
23
DAIRY_nTotal Numerical Total number of dairy cattle DAIRY_Lactation Numerical Lactation number of each L or D
DAIRY_Genotype Categorical Genotype of each dairy cattle; 5 categories: “HF”, “Jersey”, “HF x Jersey”, “Exotic x native” and “native”
MATING Categorical Type of mating techniques used; 3 categories: “AI”; “natural mating” and “both” AI_success Binary AI is always successful at first try: “yes” or “no” AI_heifer Binary It is more difficult to make heifer pregnant through AI than cows: “yes” or “no” HEALTH Categorical Type of health troubles during the 12 last months preceding the survey PASTURE_time.per.day Numerical Time per day spent pasturing (hours) PASTURE_type Categorical Type of pasture used FORAGES_type Categorical Type of forages fed to the dairy herd FORAGE_origin Categorical Origin of the forage fed to the dairy herd FORAGE_diff.feeding Binary Is differential feeding practised: “yes” or “no” CONCENTRATE Binary Is concentrate feed fed: “yes” or “no” MILK_prod.per.cow Numerical Average daily milk production per cow (litre) MILK_total.prod Numerical Average total daily milk production per DPU (litre) MILK_HH.consumption Numerical Amount of milk kept per day for HH consumption MILK_marketing.channels Categorical Type of marketing channels used by dairy producer MILK_price Numerical Price paid in INR per litre of milk LIVESTOCK Category Type, number and reason for keeping additional livestock
TLU Continuous Total number of owned tropical livestock unit (TLU; n). TLU conversion factors used: cattle = 0.80, sheep/goats = 0.10, pigs = 0.20, poultry = 0.01 (Dossa et al., 2015)
AGRICULTURE_size.land Numerical Size of agricultural land available per DPU AGRICULTURE_type Categorical Type of other agricultural activity AGRICULTURE_reason Categorical Reason for additional agricultural activity
DPU = dairy production unit; HH = household; HF = Holstein Frisian; AI = artificial insemination; INR = Indian rupee.
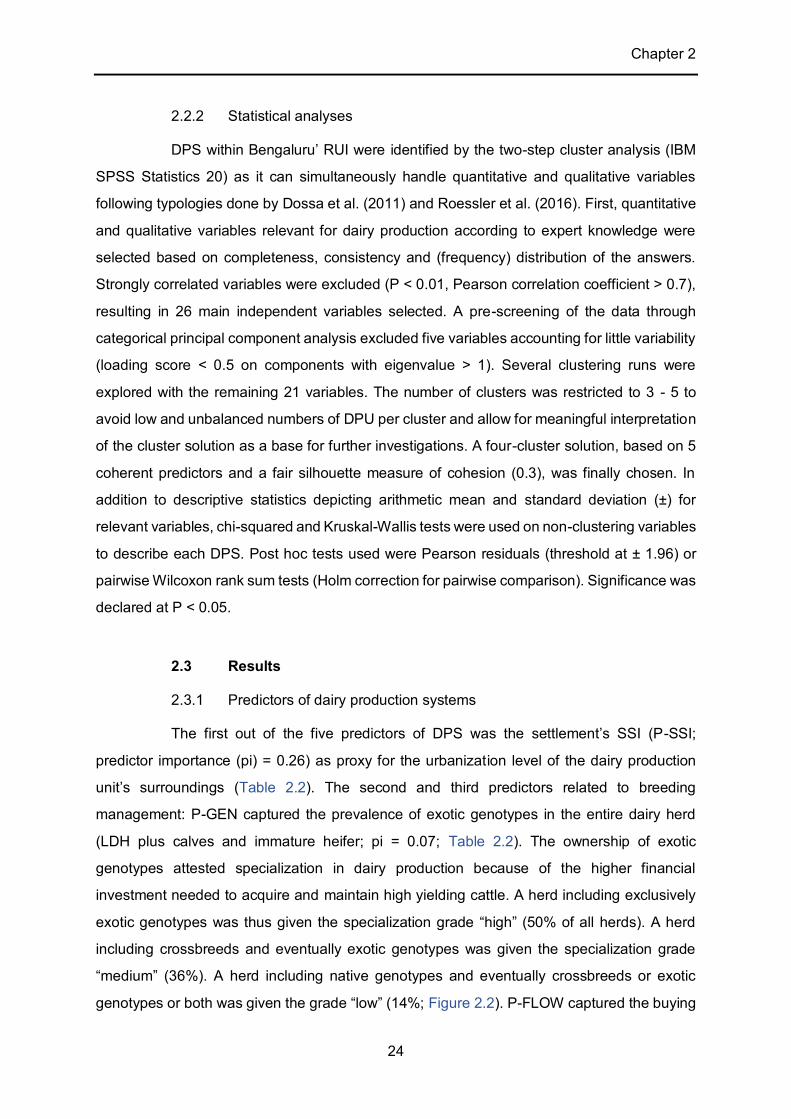
Chapter 2
24
2.2.2 Statistical analyses
DPS within Bengaluru’ RUI were identified by the two-step cluster analysis (IBM
SPSS Statistics 20) as it can simultaneously handle quantitative and qualitative variables
following typologies done by Dossa et al. (2011) and Roessler et al. (2016). First, quantitative
and qualitative variables relevant for dairy production according to expert knowledge were
selected based on completeness, consistency and (frequency) distribution of the answers.
Strongly correlated variables were excluded (P < 0.01, Pearson correlation coefficient > 0.7),
resulting in 26 main independent variables selected. A pre-screening of the data through
categorical principal component analysis excluded five variables accounting for little variability
(loading score < 0.5 on components with eigenvalue > 1). Several clustering runs were
explored with the remaining 21 variables. The number of clusters was restricted to 3 - 5 to
avoid low and unbalanced numbers of DPU per cluster and allow for meaningful interpretation
of the cluster solution as a base for further investigations. A four-cluster solution, based on 5
coherent predictors and a fair silhouette measure of cohesion (0.3), was finally chosen. In
addition to descriptive statistics depicting arithmetic mean and standard deviation (±) for
relevant variables, chi-squared and Kruskal-Wallis tests were used on non-clustering variables
to describe each DPS. Post hoc tests used were Pearson residuals (threshold at ± 1.96) or
pairwise Wilcoxon rank sum tests (Holm correction for pairwise comparison). Significance was
declared at P < 0.05.
2.3 Results
2.3.1 Predictors of dairy production systems
The first out of the five predictors of DPS was the settlement’s SSI (P-SSI;
predictor importance (pi) = 0.26) as proxy for the urbanization level of the dairy production
unit’s surroundings (Table 2.2). The second and third predictors related to breeding
management: P-GEN captured the prevalence of exotic genotypes in the entire dairy herd
(LDH plus calves and immature heifer; pi = 0.07; Table 2.2). The ownership of exotic
genotypes attested specialization in dairy production because of the higher financial
investment needed to acquire and maintain high yielding cattle. A herd including exclusively
exotic genotypes was thus given the specialization grade “high” (50% of all herds). A herd
including crossbreeds and eventually exotic genotypes was given the specialization grade
“medium” (36%). A herd including native genotypes and eventually crossbreeds or exotic
genotypes or both was given the grade “low” (14%; Figure 2.2). P-FLOW captured the buying

Chapter 2
25
(inflow) and selling (outflow) of cattle within the herd during the 12-month period preceding
the survey (pi = 0.51; Table 2.2). P-FLOW categorized each herd independently of the net
flow and type of cattle, as follows: a herd with no cattle in- or outflow was classified “closed”
(40% of all herds), a herd with both cattle in- and outflow had a “balanced flow” (17%), a
herd with only inflow had a “positive flow” (15%) and a herd with only outflow had a
“negative flow” (28%; Figure 2.2). The fourth and fifth predictors related to the feeding
management: P-PAS captured the use of pasture through grazing (pi = 0.90; Table 2.2): “no”
meant an absolute “absence of pasture” (25% of all herds), while “yes” meant “use of pasture”
(75%; Figure 2.3), independently of the regularity and length of daily pasturing, and ignoring
if the whole herd or only some cattle were sent to pasture or not. P-FOR captured the reliance,
at least partial, on self-cultivated forages (pi = 1.00; Table 2.2): “no” meant that the dairy
producer was not cultivating any forage (23% of all herds), while “yes” meant reliance on
self-cultivated forages (green, dry or crop residues; 77%; Figure 2.3). Thereby no distinction
was made between complete or partial reliance because i) the level of reliance on
self-cultivated forage varied with season as did overall diet composition, ii) the origin of a given
forage type could be multiple, and iii) crop use could be multiple.
2.3.2 Typology of dairy production systems
DPS-1: Extensive and ubiquitous. DPS-1 included 70 dairy producers (21%),
from across the whole RUI: 39% were urban, accounting for 27 out of the 30 urban dairy
producers surveyed overall (P < 0.5), 31% were peri-urban and 30% were rural (Figure 2.2).
The breeding management of DPS-1 mostly followed the overall trend of a dairy herd including
exotic genotypes and crossbreeds, and no selling or buying of cattle (Figure 2.2). The feeding
management of DPS-1 relied on the use of pasture (P < 0.05) but not on self-cultivated forages
(P < 0.05; Figure 2.3). DPS-1 was thus characterized as an extensive ubiquitous DPS.
DPS-2: Semi-intensive and rural with closed specialized herds. Being the
largest amongst the four clusters, DPS-2 included 120 dairy producers (35%) but none from
an urban settlement (P < 0.05; Figure 2.2). More than one dairy producer out of two kept
exclusively exotic genotypes (P < 0.05) in a closed herd (P < 0.05; Figure 2.2). The feeding
management of DPS-2 incorporated both the use of pasture (P < 0.05) and the reliance, at
least partial, on self-cultivated forages (P < 0.05; Figure 2.3). DPS-2 was thus characterized
as a semi-intensive rural DPS with closed specialized herds.
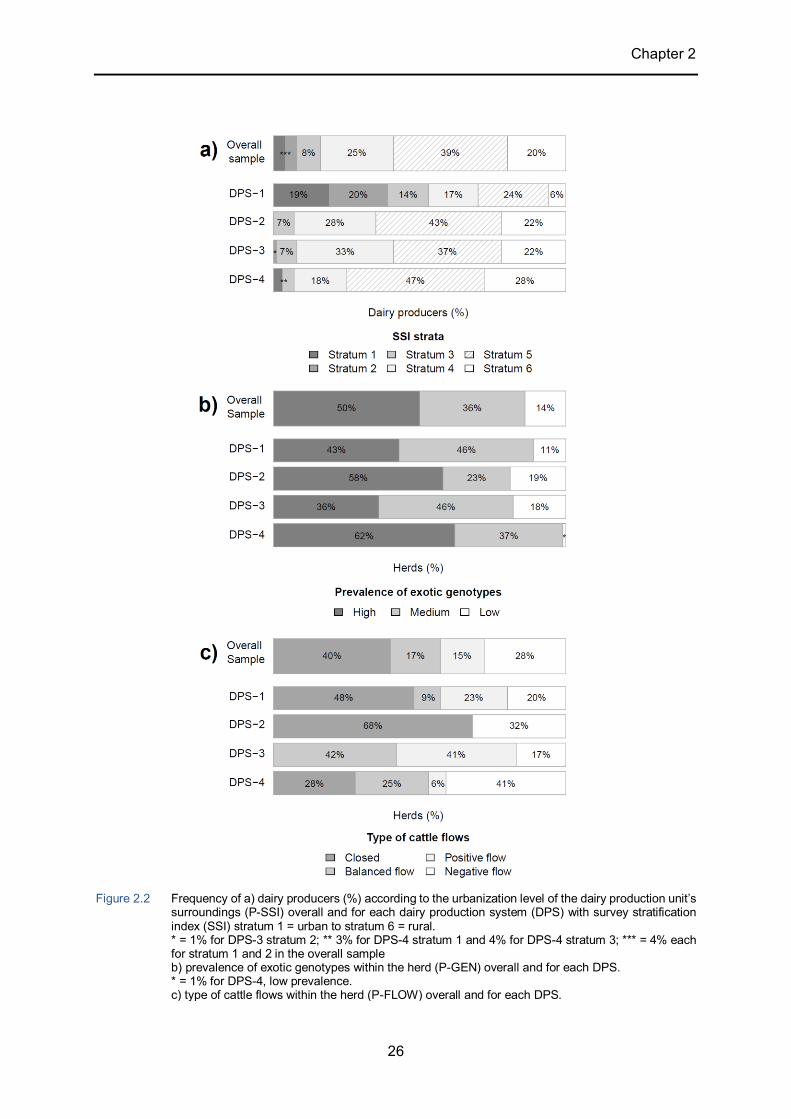
Chapter 2
26
Figure 2.2 Frequency of a) dairy producers (%) according to the urbanization level of the dairy production unit’s surroundings (P-SSI) overall and for each dairy production system (DPS) with survey stratification index (SSI) stratum 1 = urban to stratum 6 = rural. * = 1% for DPS-3 stratum 2; ** 3% for DPS-4 stratum 1 and 4% for DPS-4 stratum 3; *** = 4% each for stratum 1 and 2 in the overall sample b) prevalence of exotic genotypes within the herd (P-GEN) overall and for each DPS. * = 1% for DPS-4, low prevalence. c) type of cattle flows within the herd (P-FLOW) overall and for each DPS.

Chapter 2
27
DPS-3: Semi-intensive and rural with dynamic herds. DPS-3 included 76 dairy
producers (23%) of which 59% were rural (Figure 2.2). In contrast to DPS-2, dairy producers
in DPS-3 kept mostly exotic genotypes and crossbreeds (P < 0.05). Cattle flows were high
since all dairy producers either bought (42%; P < 0.05) or sold (17%) cattle, or had been
involved in both activities (41%) during the 12 months preceding the survey (P < 0.05; Figure
2.2). The feeding management of DPS-3 equated that of DPS-2 and incorporated use of
pasture (P < 0.5) as well as reliance, at least partial, on self-cultivated forages (P < 0.05;
Figure 2.3). DPS-3 was thus characterized as a semi-intensive rural DPS with dynamic herds.
DPS-4: Intensive and rural with specialized herds. DPS-4 included 71 dairy
producers (21%) of which 75% were rural (Figure 2.2). DPS-4 had the largest share of dairy
producers keeping only exotic genotypes (62%, and only 1% showing low specialisation of the
herd; P < 0.05) but also the largest share of herds with a negative flow (41%; P < 0.05; Figure
2.2). The feeding management of DPS-4 was the only one not relying on pasture (P < 0.05)
but only, at least partially, on self-cultivated forages (P < 0.05; Figure 2.3). DPS-4 was thus
characterized as an intensive rural DPS with specialized herds.
2.3.3 Characteristics of dairy productions systems
Additional spatial patterns. Despite P-SSI accounting for location within
Bengaluru’s RUI, DPS displayed additional spatial patterns: at the transects’ scale, DPS-4
was more common in the Nsect than in the Ssect (P < 0.05). Anecdotic data suggested that
the Nsect was drier than the Sect, potentially leading to less Nsect dairy producers sending
their cattle to pasture because of reduced biomass availability or higher risk of heat stress due
Figure 2.3 Frequency of a) herds (%) according to their use of pasture through grazing (P-PAS) and b) dairy producers according to their reliance, at least partial, on self-cultivated forages (P-FOR) overall and for each dairy production system (DPS).

Chapter 2
28
to the warmer environment or both. At the settlements’ scale, DPU of a same settlement were
often regrouped in the same DPS (P < 0.05) even in rural areas where more than one DPS
existed, showing that conditions even at settlement level impacted resources available to dairy
producers.
Socio-economic profile of dairy producers. The socio-economic profile of
Bengaluru’s DPU was homogenous across the four DPS and provided a clear picture of the
local dairy sector: in Bengaluru, dairy production was a family business, with the household
head (HHH) typically being a married man, 53 ± 13 years old, with not more than the
mandatory school education but 22 ± 14 years of experience in dairy production, whose
parents also had owned cattle (79% of HHH). He was chief earner of the HH (74%), which
included 4 ± 2 additional members, often spread across three generations. Labour force of the
HH amounted to 3.6 ± 1.6. Including the HHH, 3 ± 2 HH members were involved in dairy
production, but their amount of work varied. Only 4% of the DPU hired extra labour,
corroborated by a low importance ranking (0 ± 0.2) of labour as expenses related to dairy
production (Table 2.3). On 53% of the DPU, one or more HH members (1.4 ± 0.6; in 66% of
the cases a member of the younger generation) was involved in an off-farm economic activity.
66% of the HH classified as middle class, whereby the importance of dairy production as an
income source differed among DPS: whereas the majority of DPU in DPS-3 and DPS-4 had
mixed income sources with dairy production as the major (44% of DPU) or complementary
source (37%), in DPS-1 dairy production was the only income source of 36% of the DPU
(P < 0.05). In contrast, dairy production was an unimportant income source for 12% of DPU in
DPS-2 (P < 0.05).
Table 2.3 Importance ranking scores of expenses related to dairy production with 3 = first expense, 2 = second expense, 1 = third expense and 0 = not an expense.
DPS Importance ranking score
Concentrate feed Forages Health care Reproduction Land Labour
DPS-1 2.8 ± 0.6 1.5 ± 1.1a 0.5 ± 0.8 0.1 ± 0.5* 0 0 DPS-2 2.7 ± 0.9 0.8 ± 1.1b 0.7 ± 0.9 0.2 ± 0.6* 0 ± 0.3 0 DPS-3 2.7 ± 0.9 0.7 ± 1.0b 0.7 ± 1.0 0.1 ± 0.4* 0 ± 0.1 0 DPS-4 2.9 ± 0.5 0.8 ± 1.0b 0.5 ± 0.8 0 ± 0.1* 0 ± 0.2 0 ± 0.2
Values within a column with different subscript letters differs significantly (P < 0.05). *Significant analysis of variance but data is not enough to make statements about pairwise differences.
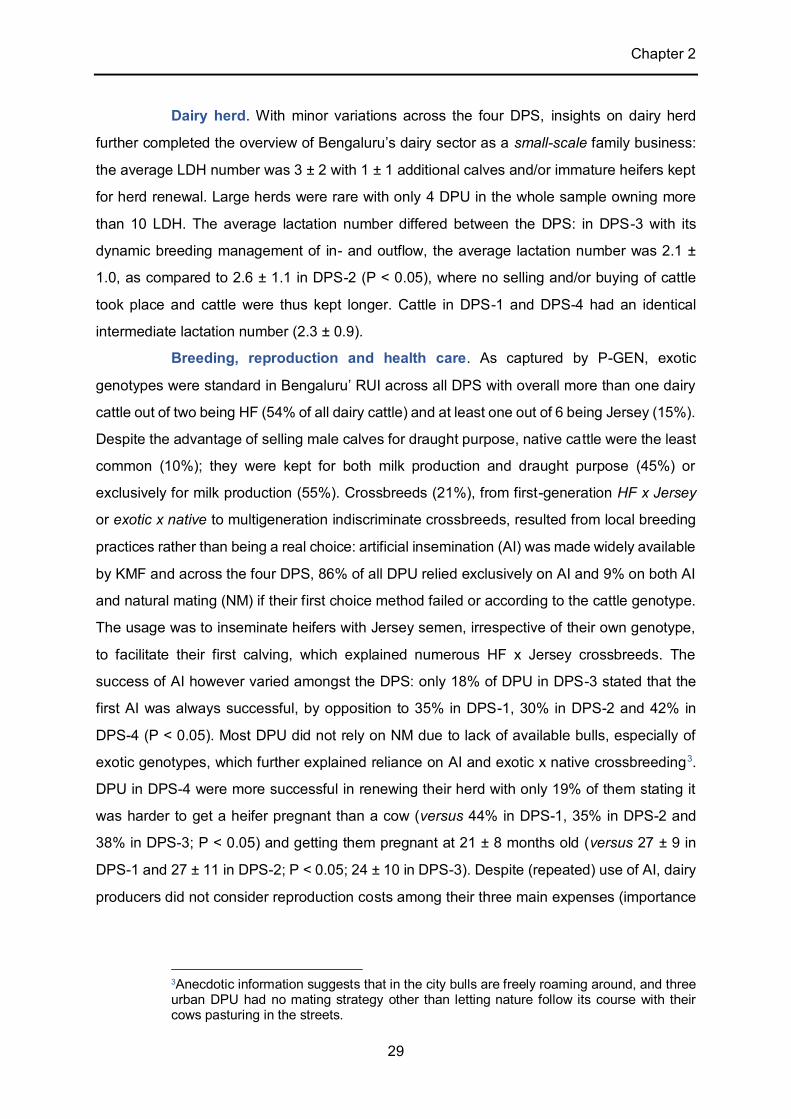
Chapter 2
29
Dairy herd. With minor variations across the four DPS, insights on dairy herd
further completed the overview of Bengaluru’s dairy sector as a small-scale family business:
the average LDH number was 3 ± 2 with 1 ± 1 additional calves and/or immature heifers kept
for herd renewal. Large herds were rare with only 4 DPU in the whole sample owning more
than 10 LDH. The average lactation number differed between the DPS: in DPS-3 with its
dynamic breeding management of in- and outflow, the average lactation number was 2.1 ±
1.0, as compared to 2.6 ± 1.1 in DPS-2 (P < 0.05), where no selling and/or buying of cattle
took place and cattle were thus kept longer. Cattle in DPS-1 and DPS-4 had an identical
intermediate lactation number (2.3 ± 0.9).
Breeding, reproduction and health care. As captured by P-GEN, exotic
genotypes were standard in Bengaluru’ RUI across all DPS with overall more than one dairy
cattle out of two being HF (54% of all dairy cattle) and at least one out of 6 being Jersey (15%).
Despite the advantage of selling male calves for draught purpose, native cattle were the least
common (10%); they were kept for both milk production and draught purpose (45%) or
exclusively for milk production (55%). Crossbreeds (21%), from first-generation HF x Jersey
or exotic x native to multigeneration indiscriminate crossbreeds, resulted from local breeding
practices rather than being a real choice: artificial insemination (AI) was made widely available
by KMF and across the four DPS, 86% of all DPU relied exclusively on AI and 9% on both AI
and natural mating (NM) if their first choice method failed or according to the cattle genotype.
The usage was to inseminate heifers with Jersey semen, irrespective of their own genotype,
to facilitate their first calving, which explained numerous HF x Jersey crossbreeds. The
success of AI however varied amongst the DPS: only 18% of DPU in DPS-3 stated that the
first AI was always successful, by opposition to 35% in DPS-1, 30% in DPS-2 and 42% in
DPS-4 (P < 0.05). Most DPU did not rely on NM due to lack of available bulls, especially of
exotic genotypes, which further explained reliance on AI and exotic x native crossbreeding3.
DPU in DPS-4 were more successful in renewing their herd with only 19% of them stating it
was harder to get a heifer pregnant than a cow (versus 44% in DPS-1, 35% in DPS-2 and
38% in DPS-3; P < 0.05) and getting them pregnant at 21 ± 8 months old (versus 27 ± 9 in
DPS-1 and 27 ± 11 in DPS-2; P < 0.05; 24 ± 10 in DPS-3). Despite (repeated) use of AI, dairy
producers did not consider reproduction costs among their three main expenses (importance
3Anecdotic information suggests that in the city bulls are freely roaming around, and three urban DPU had no mating strategy other than letting nature follow its course with their cows pasturing in the streets.
Chapter 2
30
ranking = 0.1 ± 0.5; Table 2.3) as they benefited from AI at a subsidised price through the
dairy cooperatives.
Health problems were irrespective of DPS too: one farmer out of four reported
mastitis in his herd during the last 12 months, even though the cows’ udder was washed before
milking on all farms. Moreover, 35% of the dairy producers reported additional health issues
such as fever (50% of additional health issues), foot-and-mouth disease (12%, despite
vaccination campaigns every 6 months4), physical wounds (11%) and fertility or calving issues
or both (11%). Hoof care was uncommon (5% of all DPU) as was the use of bedding material
(rubber mats) in the cowshed (7%). Because of the high costs engendered by a single health
problem, dairy producers considered health care among their three main expenses
(importance ranking = 0.6 ± 0.9; Table 2.3).
Nutrition. As captured by P-PAS, overall 3 DPU out of 4 made use of pasture:
typically, the whole dairy herd, apart from the calves, was sent to pasture once per day. In line
with their extensive feed management, pasturing lasted the longest with 6.6 ± 1.6 hours per
day in DPS-1 (P < 0.05), mostly on public grounds (80%; P < 0.05) or shared pasture (9%;
P < 0.05). In comparison, pasturing lasted 5.9 ± 1.3 hours in DPS-2 and 5.5 ± 1.5 in DPS-3
and the type of pasture used was more diverse: public grounds (DPS-2 = 49%; DPS-3 = 33%),
shared pasture (DPS-2 = 3%; DPS-3 = 0%), public grounds in addition to their own pasture
(DPS-2 = 28%; DPS-3 = 37%) or exclusively on their own pasture (DPS-2 = 20%; DPS-3 =
30%).
Nevertheless, no DPU relied solely on pasture and, as captured by P-FOR, 77%
of them also relied, at least partially, on self-cultivated forages. Most farmers stated that they
usually relied exclusively on their own production (DPS-2 = 60%, DPS-3 = 67%, DPS-4 = 68%)
but 43% nonetheless had to buy forages during the last 12 months because of forage
shortage. Only 9% of DPU sold forage during the last 12 months. Common cultivated green
forages were African tall maize (Zea mays; cultivated by 81% of DPU in DPS-2, DPS-3 and
DPS-4) and hybrid Napier grass (Pennisetum glaucum × P. purpureum; cultivated by 80%;
Table 2.4; Figure 2.6). Although not cultivating forages, 50% of the DPU in DPS-1 either
bought (86%) or got African tall maize for free (14%; agreement or exchange with a neighbour,
or collected from public grounds). 50% of the DPU in DPS-1 also either bought (79%) or got
hybrid Napier grass for free (21%). Consequently, expenditures for forages were frequently
mentioned as relevant in DPS-1 (importance ranking = 1.5 ± 1.1; DPS-1 versus DPS-2, DPS-
4Anecdotic information suggests that dairy producers did not systematically vaccinate pregnant cows or mature heifers by fear of affecting their pregnancy.
Chapter 2
31
3 and DPS-4; P < 0.05; Table 2.3). In addition to these common green forages, 39% of the
DPU in DPS-1, DPS-2 and DPS-3 fed their cattle with “wild grasses”: a mix of grasses naturally
available in the area, collected for free on their own non-cultivated land (e.g., from field
margins) or public grounds (e.g., lakes shores, including lakes in urban areas). Only 21% of
the dairy producers in DPS-4 fed wild grasses to their cattle (P < 0.05), once more in line with
their more intensive feeding management (Table 2.4). Across the four DPS, 83% of the
farmers relied on straw of finger millet (Eleusine coracanal, known locally as ragi) as forage
during the dry season (Figure 2.5), while rice straw feeding was uncommon (3%). Less
frequently used forages were fresh finger millet stems, sorghum (Sorghum bicolor) and, in
urban areas, organic waste from fruit and vegetable markets. As DPS-4 dairy producers did
not send their cattle to pasture, they fed them more often than the other dairy producers (4.6
± 2.1 times per day versus 2.5 ± 1.4 in DPS-1, DPS-2 and DPS-3; P < 0.05). Across DPS,
only 12% of all dairy producers practiced a differential feeding of forages based on
physiological status of LDH. Dairy producers in DPS-2, DPS-3 and DPS-4 usually chopped
forages offered to the dairy herd with a sickle (60%) while the use of a chaff cutter was rare
(10% in DPS-4; P < 0.05). A large range of concentrate feed was available on the surveyed
DPU, either as single element or as a mixture of wheat flour, with or without bran, corn flour,
dairy pellets, chickpea husks (Cicer arietinum, known as “Bengal gram”) and groundnut cake,
to which 85% of the farmers added salt or a commercial mineral supplement (Figure 2.4).
Although the dairy cooperatives provided some concentrate feed at a subsidised price,
concentrate feed was mentioned by all dairy producers as their main expense, with an average
importance ranking of 2.8 ± 0.8 (Table 2.3). Concentrate feed was fed twice a day, whereby
the amounts were adjusted to the individual animal’s physiological status. Feeding the HH’s
kitchen wastes to cattle was common for 86% of DPU in DPS-1, DPS-2 and DPS-3 but less
frequent in DPS-4 (69%; P < 0.05). No cattle had ad libitum access to water, and they were
mostly offered water in the shed (82% of all herds) or in addition had access to water during
pasture (river, pond, lake, 15%).
Milk production and marketing. Milk production per DPU and day was highest
in DPS-3 and DPS-4 and lowest in DPS-2 (P < 0.05), while DPS-1 was in-between (Table
2.5). As each DPU kept 2.1 ± 1.3 lactating cows (only 5 dairy units had 5 to maximum 9
lactating cows at once), average daily milk production per cow made the difference, with cows
in DPS-4 producing the highest amount of milk per day. Cows producing least were found in
DPS-1 and DPS-2 (P < 0.05), while cows in DPS-3 had an intermediary production (Table
2.5). Milking other than by hand, which was a time-consuming task and constrained by the
Chapter 2
32
dairy cooperative’s opening hours, was uncommon as only 9 DPU owned a milking machine.
Dairy producers could not estimate the average lactation length within their herd because they
usually stopped milking a cow when 7 months pregnant, irrespective of the duration of
lactation. Therefore, the duration of the lactation period depended on the time a cow needed
to become pregnant again, was strongly variable and, as usually more than one AI was
needed, rather long than short. Dairy producers in DPS-4 preferred to feed calves with milk
from a bucket (65%) instead of having it suckle the cow, whereas most dairy producers in the
other DPS allowed the calves to suckle the dam (avg. across DPS-1, DPS-2 and
DPS-3 = 62%; P < 0.05). In line with the different approaches, weaning occurred faster in
DPS-4 (3.6 ± 1.3 months) than in all other DPS (4.6 ± 2.6 months; P < 0.05).
DPU usually kept 1.2 ± 0.9 L of milk per day for their own consumption; since DPU
in DPS-2 had a low total daily milk production, they kept in proportion a share twice as high
as DPU from the other DPS (P < 0.05; Table 2.5). Since no DPU owned a cold storage facility
nor processed milk into dairy products to sell them, any milk not used for household
consumption was sold as raw milk. With the exception of 8% of DPU in DPS-2 who did not
sell any of the produced milk (P < 0.05; Table 2.5), all other DP marketed milk either through
dairy cooperatives linked to KMF or informal (direct) marketing channels, namely middlemen
(usually delivering in bulk to restaurants) or directly to the consumer (Table 2.5). Across the
rural DPS-2, DPS-3 and DPS-4, 83% of all DPU delivered their milk only to their dairy
cooperative; 10% delivered to their dairy cooperative and sold some litres directly to their
neighbours. In DPS-1 only 59% of DPU delivered exclusively to a dairy cooperative; since
many DPU were located in (peri-)urban areas, they had easier access to a larger number of
consumers: 14% sold their whole milk production through informal marketing channel(s)
(P < 0.05), and 23% sold part of the milk informally and relied on a cooperative for the
remaining milk (P < 0.05). The dairy cooperative network was very dense - for 95% of all DPU
delivering milk to a dairy cooperative, the collection centre was located within the same
settlement as the DPU. In addition to being able to easily deliver any quantity of milk twice
daily on foot, dairy producers benefited from a subsidy of four Indian rupees (INR) per litre of
milk in addition to an average milk price of 23 ± 1 INR per litre5, which was based on the milk
fat content. Informal milk marketing to middlemen and consumers yielded 31 ± 5 INR per litre6.
The higher price and the access to consumers were the main drivers for direct milk marketing,
while only four of the informal sellers claimed that they had no access to a dairy cooperative.
523 INR + 4 INR subsidy = 0.36 Euro per litre of milk, at the time of the survey. 60.42 Euro per litre of milk, at the time of the survey.
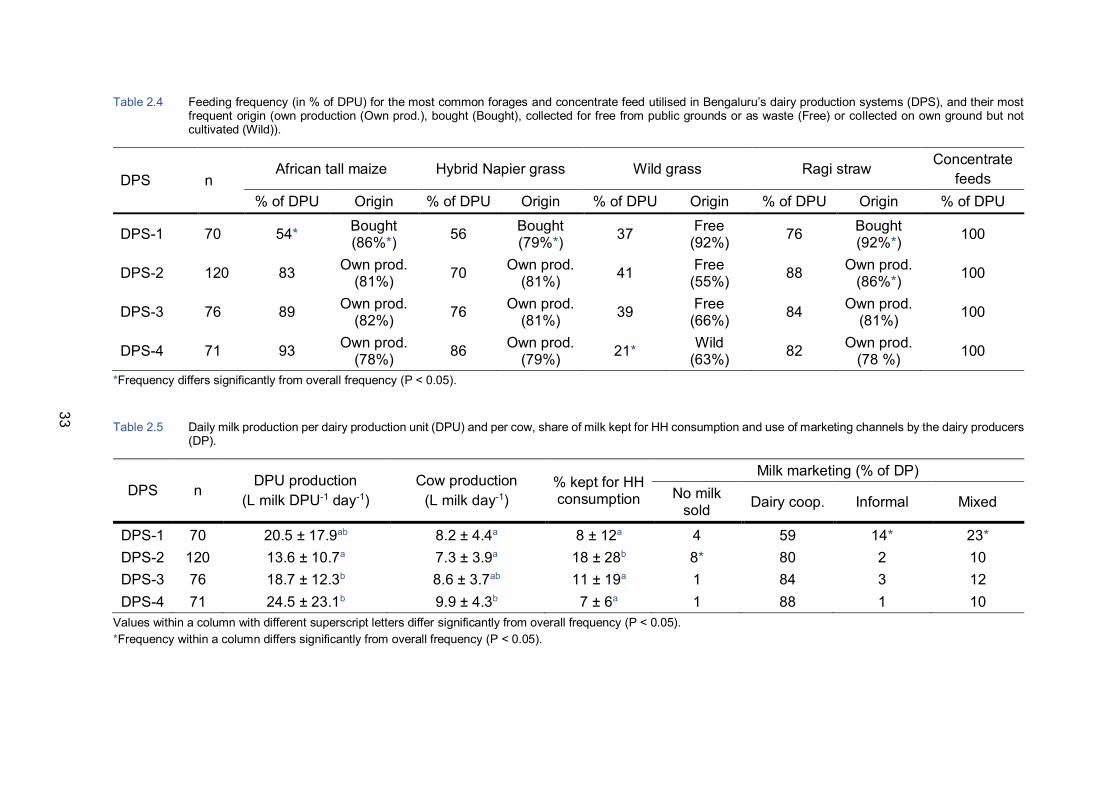
33
Table 2.4 Feeding frequency (in % of DPU) for the most common forages and concentrate feed utilised in Bengaluru’s dairy production systems (DPS), and their most frequent origin (own production (Own prod.), bought (Bought), collected for free from public grounds or as waste (Free) or collected on own ground but not cultivated (Wild)).
DPS n African tall maize Hybrid Napier grass Wild grass Ragi straw Concentrate
feeds % of DPU Origin % of DPU Origin % of DPU Origin % of DPU Origin % of DPU
DPS-1 70 54* Bought (86%*) 56 Bought
(79%*) 37 Free (92%) 76 Bought
(92%*) 100
DPS-2 120 83 Own prod. (81%) 70 Own prod.
(81%) 41 Free (55%) 88 Own prod.
(86%*) 100
DPS-3 76 89 Own prod. (82%) 76 Own prod.
(81%) 39 Free (66%) 84 Own prod.
(81%) 100
DPS-4 71 93 Own prod. (78%) 86 Own prod.
(79%) 21* Wild (63%) 82 Own prod.
(78 %) 100
*Frequency differs significantly from overall frequency (P < 0.05).
Table 2.5 Daily milk production per dairy production unit (DPU) and per cow, share of milk kept for HH consumption and use of marketing channels by the dairy producers (DP).
DPS n DPU production (L milk DPU-1 day-1)
Cow production (L milk day-1)
% kept for HH consumption
Milk marketing (% of DP) No milk
sold Dairy coop. Informal Mixed
DPS-1 70 20.5 ± 17.9ab 8.2 ± 4.4a 8 ± 12a 4 59 14* 23* DPS-2 120 13.6 ± 10.7a 7.3 ± 3.9a 18 ± 28b 8* 80 2 10 DPS-3 76 18.7 ± 12.3b 8.6 ± 3.7ab 11 ± 19a 1 84 3 12 DPS-4 71 24.5 ± 23.1b 9.9 ± 4.3b 7 ± 6a 1 88 1 10
Values within a column with different superscript letters differ significantly from overall frequency (P < 0.05). *Frequency within a column differs significantly from overall frequency (P < 0.05).
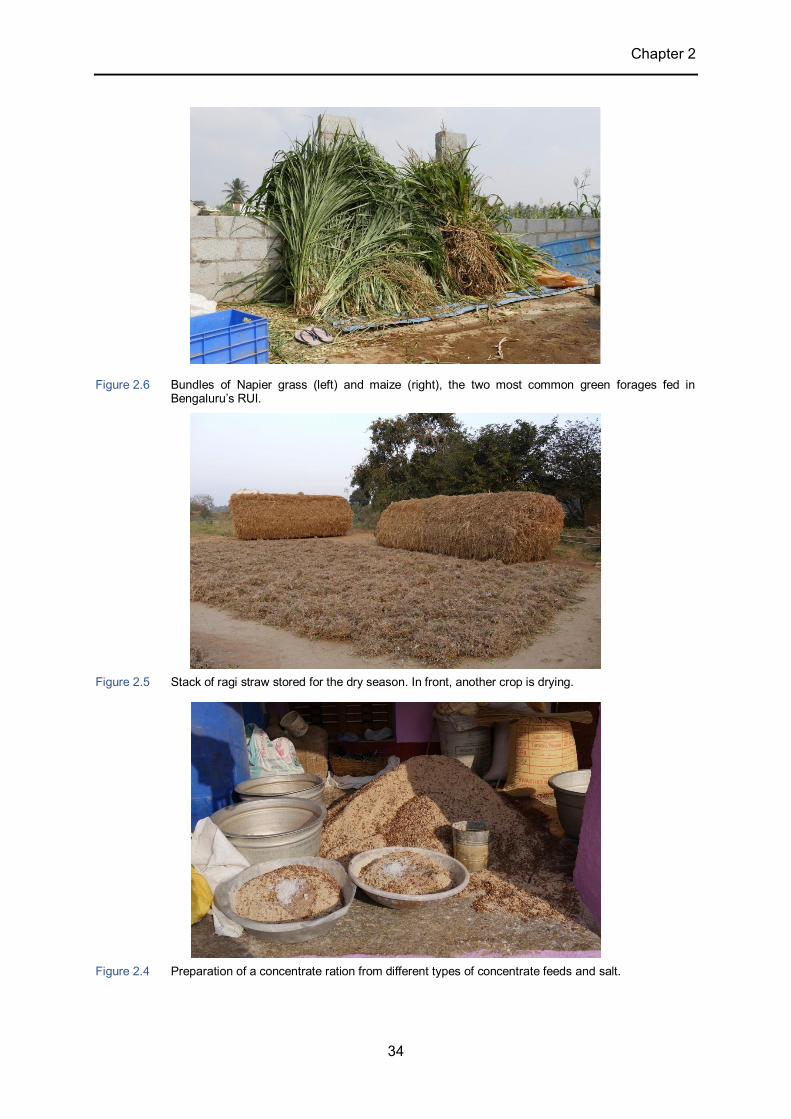
Chapter 2
34
Figure 2.6 Bundles of Napier grass (left) and maize (right), the two most common green forages fed in Bengaluru’s RUI.
Figure 2.5 Stack of ragi straw stored for the dry season. In front, another crop is drying.
Figure 2.4 Preparation of a concentrate ration from different types of concentrate feeds and salt.
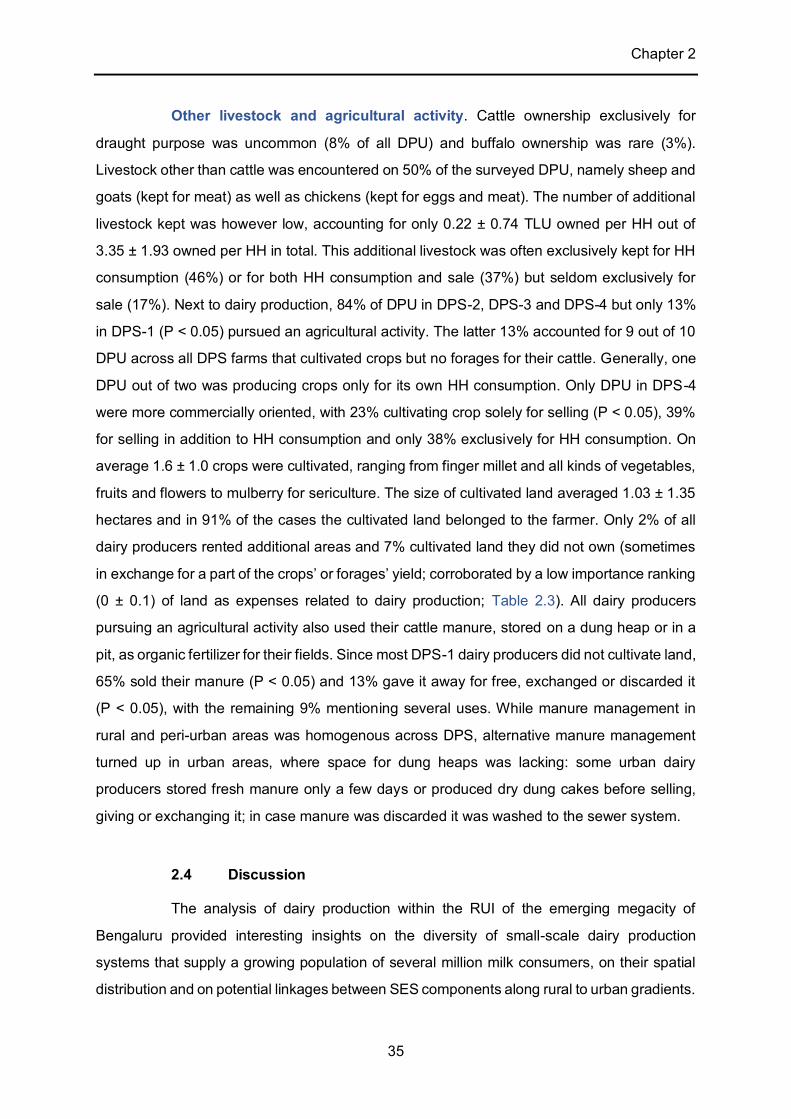
Chapter 2
35
Other livestock and agricultural activity. Cattle ownership exclusively for
draught purpose was uncommon (8% of all DPU) and buffalo ownership was rare (3%).
Livestock other than cattle was encountered on 50% of the surveyed DPU, namely sheep and
goats (kept for meat) as well as chickens (kept for eggs and meat). The number of additional
livestock kept was however low, accounting for only 0.22 ± 0.74 TLU owned per HH out of
3.35 ± 1.93 owned per HH in total. This additional livestock was often exclusively kept for HH
consumption (46%) or for both HH consumption and sale (37%) but seldom exclusively for
sale (17%). Next to dairy production, 84% of DPU in DPS-2, DPS-3 and DPS-4 but only 13%
in DPS-1 (P < 0.05) pursued an agricultural activity. The latter 13% accounted for 9 out of 10
DPU across all DPS farms that cultivated crops but no forages for their cattle. Generally, one
DPU out of two was producing crops only for its own HH consumption. Only DPU in DPS-4
were more commercially oriented, with 23% cultivating crop solely for selling (P < 0.05), 39%
for selling in addition to HH consumption and only 38% exclusively for HH consumption. On
average 1.6 ± 1.0 crops were cultivated, ranging from finger millet and all kinds of vegetables,
fruits and flowers to mulberry for sericulture. The size of cultivated land averaged 1.03 ± 1.35
hectares and in 91% of the cases the cultivated land belonged to the farmer. Only 2% of all
dairy producers rented additional areas and 7% cultivated land they did not own (sometimes
in exchange for a part of the crops’ or forages’ yield; corroborated by a low importance ranking
(0 ± 0.1) of land as expenses related to dairy production; Table 2.3). All dairy producers
pursuing an agricultural activity also used their cattle manure, stored on a dung heap or in a
pit, as organic fertilizer for their fields. Since most DPS-1 dairy producers did not cultivate land,
65% sold their manure (P < 0.05) and 13% gave it away for free, exchanged or discarded it
(P < 0.05), with the remaining 9% mentioning several uses. While manure management in
rural and peri-urban areas was homogenous across DPS, alternative manure management
turned up in urban areas, where space for dung heaps was lacking: some urban dairy
producers stored fresh manure only a few days or produced dry dung cakes before selling,
giving or exchanging it; in case manure was discarded it was washed to the sewer system.
2.4 Discussion
The analysis of dairy production within the RUI of the emerging megacity of
Bengaluru provided interesting insights on the diversity of small-scale dairy production
systems that supply a growing population of several million milk consumers, on their spatial
distribution and on potential linkages between SES components along rural to urban gradients.

Chapter 2
36
A first relevant point to discuss is Bengaluru’s dairy sector, especially its overall
homogeneity and its successful network of dairy cooperatives. In contrast to the immense
scale of Bengaluru as a city, its dairy sector relies on numerous small-scale family businesses
with a homogenous socio-economic profile. In India, 80% of dairy animals are kept in herds of
2 to 5 cows (Cunningham, 2009), a range in which Bengaluru’s average number of LDH per
HH (3.0 ± 1.5) fitted. Cattle and livestock ownership per HH was however lower than in West
African (peri-)urban areas (Amadou et al., 2012; Roessler et al., 2016), which can be related
to the high share of vegetarians in India and their focus on dairy products as source of animal
protein (Government of India, 2014). While higher numbers of TLU were reported for
peri-urban than for urban HH in Bobo Dioulasso, Burkina Faso (Dossa et al., 2015),
Bengaluru’s urban DPU owned more TLU than peri-urban or rural ones. The average daily
milk production per cow of 8.3 L was above the average of 5.9 L milk per day reported for the
district of Bengaluru Urban (National Dairy Development Board, 2015) but similar to milk yields
of exotic crossbreeds in a typical four-dairy-animal farm in Haryana state, northern India (7.5 L
milk per day; Hemme et al., 2003) or in Ouagadougou, capital of Burkina Faso (6.7 to 11.0 L
milk per day; Schlecht et al., 2019). Another Indian dairy production characteristic is the
reliance on family labour (Cunningham, 2009; Hemme et al., 2003) as seen in Bengaluru,
while in contrast, one out of three urban dairy producers in Ethiopia hired labour (D'Haene and
D’Haese, 2019). The trade-off between family labour and intensification of production is
documented for rural Ethiopia (Chagwiza et al., 2016) while in Nakuru, Kenya, dairy producers
trade-off family labour having an off-farm monetary activity for hired labour (Migose et al.,
2018). In Bengaluru, the number of LDH correlated positively but weakly to HH available
labour force (Pearson correlation coefficient = 0.11; P < 0.05). As new job opportunities are
available in the city, especially for a younger better-educated generation (Satterthwaite et al.,
2010), such a trade-off might partly explain the lower number of dairy producers in urban areas
as seen in Bengaluru and deserves more research, especially since farm persistence in and
adaptations to an urbanizing environment are linked to internal family dynamics (Inwood and
Sharp, 2012). Similarity in number of cattle owned and reliance on family labour was reflected
in the homogenous socio-economic profile of the DPU. The classification of most of
Bengaluru’s dairy producers as middle class (Market Research Society of India, 2011), to
which off-farm income certainly contributed, certified a good economic situation at the country
level as this scale is national. It might however not realistically reflect dairy producers’
economic power in comparison to other inhabitants of Bengaluru as consumption inequality is
generally more pronounced in urban areas (Anand and Thampi, 2016). Overall, Bengaluru’s

Chapter 2
37
dairy sector was not only homogenous for most of the production practices – herd
management, breeding, health care - but also well-established, thanks to its successful
network of dairy cooperatives linked to KMF: a milk collection centre existed in nearly all urban,
peri-urban and rural settlements, and provided dairy producers with inputs such as exotic
genotypes through AI, health check-ups, concentrate feed, and extension services to improve
their production. In rural Ethiopia, cows owned by members of a dairy cooperative yielded 8.3
L milk per day as compared to 4.3 L milk per day for non-members (Chagwiza et al., 2016).
For 95% of all DPU across the whole RUI, the dairy cooperatives served as the marketing
channel for all or a part of their milk production, thereby fulfilling their role in scaling-up milk
collection, processing and marketing to urban areas (Cunningham, 2009). Through its dairy
cooperative, Bengaluru nurtured the intensification of its dairy sector by easing access to new
inputs (exotic genotypes, concentrate feed; Chagwiza et al., 2016; Duncan et al., 2013).
A second relevant point to discuss is the existence of distinct DPS coexisting in
Bengaluru’s RUI and the predictors they are based on. Regarding the topic of urbanization,
the consideration of rural areas as one urbanization level shifted the focus from livestock
production systems in (peri-)urban areas (Amadou et al., 2012; Dossa et al., 2015; Roessler
et al., 2016) to livestock production systems in an urbanizing environment. Additionally, the
consideration of urbanization level as a predictor highlighted the spatial pattern of DPS across
Bengaluru’s RUI but also its relative importance in shaping them. On one hand, the
ubiquitousness of DPS-1 showed that a specific set of constraints versus opportunities in
resource availability for dairy producers, namely the non-cultivation of forages versus public
grounds available for pasture or forages collection or both, existed across urbanization levels.
Reliance of urban dairy farmers on public lands and organic market wastes is known from
India (Prasad et al., 2019). In Bobo Dioulasso, Burkina Faso, “landless” urban cattle
production systems relying on extensive pasturing on public grounds also exist, while
crop-livestock integration is maintained by other cattle production in (peri-)urban areas (Dossa
et al., 2015). Interestingly, the ubiquitousness of DPS-1 showed that reliance on public lands
was an extensification rather than intensification strategy pursued also by rural DPU, which
could be linked to issues of land accessibility (Bah et al., 2003) or family labour (Chagwiza et
al., 2016; Inwood and Sharp, 2012; Migose et al., 2018; Satterthwaite et al., 2010). On the
other hand, three DPS coexisted in rural areas, highlighting a diversity of production strategies
and specific set of constraints versus opportunities in resource availability for dairy producers
even at the same urbanization level. As improved animal nutrition and genetics are the most
effective steps to improve – and intensify – dairy production (Chagwiza et al., 2016; Mayberry
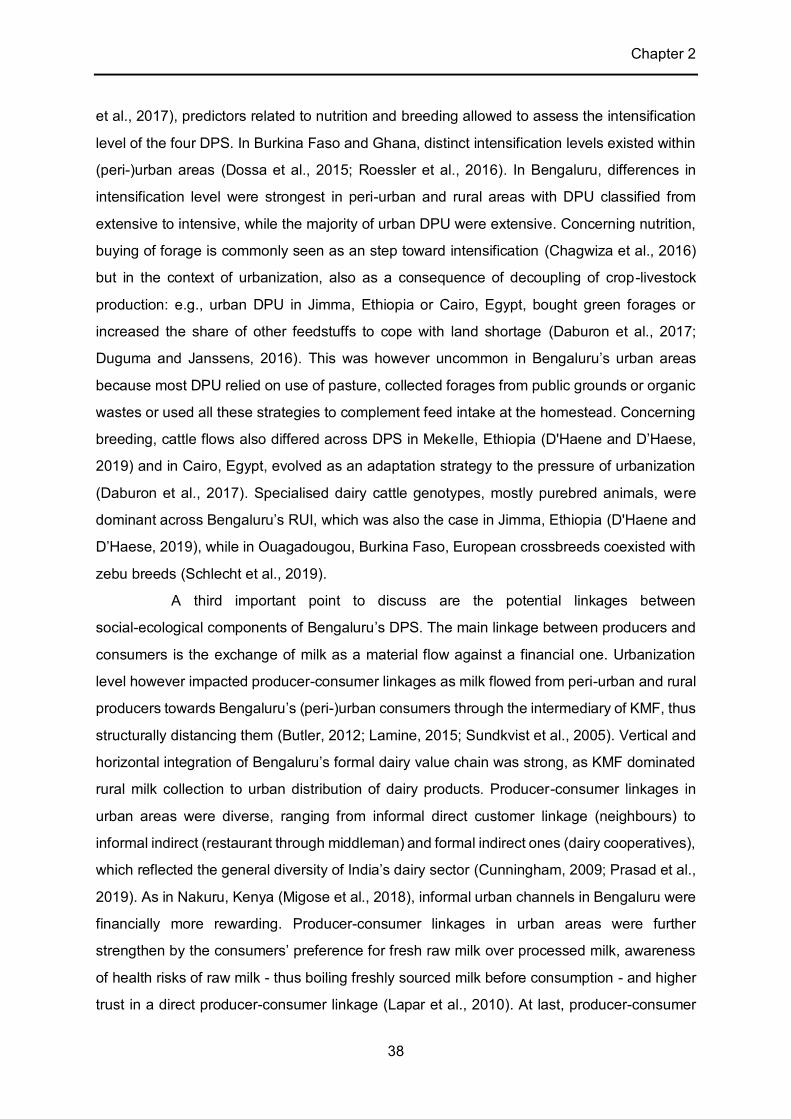
Chapter 2
38
et al., 2017), predictors related to nutrition and breeding allowed to assess the intensification
level of the four DPS. In Burkina Faso and Ghana, distinct intensification levels existed within
(peri-)urban areas (Dossa et al., 2015; Roessler et al., 2016). In Bengaluru, differences in
intensification level were strongest in peri-urban and rural areas with DPU classified from
extensive to intensive, while the majority of urban DPU were extensive. Concerning nutrition,
buying of forage is commonly seen as an step toward intensification (Chagwiza et al., 2016)
but in the context of urbanization, also as a consequence of decoupling of crop-livestock
production: e.g., urban DPU in Jimma, Ethiopia or Cairo, Egypt, bought green forages or
increased the share of other feedstuffs to cope with land shortage (Daburon et al., 2017;
Duguma and Janssens, 2016). This was however uncommon in Bengaluru’s urban areas
because most DPU relied on use of pasture, collected forages from public grounds or organic
wastes or used all these strategies to complement feed intake at the homestead. Concerning
breeding, cattle flows also differed across DPS in Mekelle, Ethiopia (D'Haene and D’Haese,
2019) and in Cairo, Egypt, evolved as an adaptation strategy to the pressure of urbanization
(Daburon et al., 2017). Specialised dairy cattle genotypes, mostly purebred animals, were
dominant across Bengaluru’s RUI, which was also the case in Jimma, Ethiopia (D'Haene and
D’Haese, 2019), while in Ouagadougou, Burkina Faso, European crossbreeds coexisted with
zebu breeds (Schlecht et al., 2019).
A third important point to discuss are the potential linkages between
social-ecological components of Bengaluru’s DPS. The main linkage between producers and
consumers is the exchange of milk as a material flow against a financial one. Urbanization
level however impacted producer-consumer linkages as milk flowed from peri-urban and rural
producers towards Bengaluru’s (peri-)urban consumers through the intermediary of KMF, thus
structurally distancing them (Butler, 2012; Lamine, 2015; Sundkvist et al., 2005). Vertical and
horizontal integration of Bengaluru’s formal dairy value chain was strong, as KMF dominated
rural milk collection to urban distribution of dairy products. Producer-consumer linkages in
urban areas were diverse, ranging from informal direct customer linkage (neighbours) to
informal indirect (restaurant through middleman) and formal indirect ones (dairy cooperatives),
which reflected the general diversity of India’s dairy sector (Cunningham, 2009; Prasad et al.,
2019). As in Nakuru, Kenya (Migose et al., 2018), informal urban channels in Bengaluru were
financially more rewarding. Producer-consumer linkages in urban areas were further
strengthen by the consumers’ preference for fresh raw milk over processed milk, awareness
of health risks of raw milk - thus boiling freshly sourced milk before consumption - and higher
trust in a direct producer-consumer linkage (Lapar et al., 2010). At last, producer-consumer
Chapter 2
39
linkages in urban areas were strengthened by the socio-cultural services provided by cows to
Bengaluru’s population: as a holy animal, their presence is enjoyed and they are still part of
many religious ceremonies e.g. blessing of a new house (Kennedy et al., 2018; Narayan,
2018). Urban milk collection points of the cooperatives were less easily accessible than rural
ones (not accessible by foot) and served as backup to sell milk leftovers, while the accessibility
to provided inputs (AI, veterinary care, concentrate feed) was more variable. Urban dairy
production in Bengaluru thus not only provided fresh milk for consumers but also an
opportunity for dairy farmers to continue their economic activity in a city that literally grew
around them, as seen in 19th century London (Atkins, 1977), while integrating themselves into
the urban landscape, benefitting from improved infrastructure (schools, hospitals) and
preserving their cultural identity (Lerner and Eakin, 2011). Cattle are however paying the price
of this urban integration as they are not well-adapted to urban husbandry conditions (Pinto et
al., 2020; Prasad et al., 2019), and are at risk of ingesting plastic waste on the many
uncontrolled waste dumps when foraging in the streets (Kennedy et al., 2018; Vohra, 2012).
The most important difference between rural and urban SES linkages at farm-level related to
manure and the decoupling of crop-livestock production in urban areas. Not only did Bengaluru
act as a nutrient sink (Drechsel et al., 2007) but the manure was sometimes washed away to
avoid neighbours’ complaints about bad odour and flies (Butler, 2012; Prasad et al., 2019),
potentially polluting Bengaluru’s water bodies (Prasad et al., 2019). The (negative)
environmental consequences of decoupling dairy production from agricultural land thus
represent the biggest weakening of SES linkages, as the feedback between the polluted
environment and the consumers is too weak, preventing the correction of dairy management
practices. Such gaps should be filled by institutions (Termeer et al., 2019). At landscape-level,
the extensive strategy of urban dairy producers trades off a social benefit - the integration of
dairy producers within Bengaluru – for a negative externality - manure mismanagement - and
poor husbandry conditions.
2.5 Conclusions
The case study of dairy production in the urbanizing environment of Bengaluru’s
rural-urban interface demonstrates that distinct dairy production systems coexist along a
rural-urban gradient. Addressing the urbanization level as a parameter reveals spatially
explicit trends of intensification as well as social-ecological linkages in the form of material,
information and financial flows. Despite rapidly progressing urbanization and a population of

Chapter 2
40
10 million, Bengaluru’s dairy sector relies on small-scale family dairy production units and a
strong network of dairy cooperatives connecting dairy producers in remote rural settlements
to the urban consumers, thereby sustaining dairy production and livelihood of the producers.
Distinct feeding and breeding practices result in several intensification levels across
Bengaluru’s rural-urban interface. Shifts in resources availability, especially labour, are
potential drivers of intensification but also of active extensification of market-oriented dairy
production in an urbanizing environment. Urbanization level itself leads to distinct
social-ecological linkages. Especially (inner)urban dairy production is exposed to a
challenging and highly land competitive environment but supported by tight linkages between
dairy producers and consumers via the provisioning of fresh milk and socio-cultural services
but at the cost of manure mismanagement and cow welfare.
41
3 A system approach to feed conversion efficiency of dairy
production in an urbanizing environment
3.1 Introduction
Efficient resource utilization, such as high dairy feed conversion efficiency (FCE),
is essential for sustainable agriculture (Romney et al., 1994). It is however challenged by two
demographic drivers of change: population growth and spatial distribution shift from rural areas
to urban ones, namely urbanization (Millennium Ecosystem Assessment, 2005). Urbanization
induces a transition in the utilization of essential agricultural resources, mainly land. Land is
affected by the physical fallout of urbanization, namely the conversion of arable lands and
pasture into residential or industrial areas, and the fragmentation of the agricultural landscape
(Satterthwaite et al., 2010). Urbanization also affects the demand for and supply of agricultural
goods and services: on one hand, the demand is increased and diet preferences shift (Erler
and Dittrich, 2017; Regmi and Dyck, 2001), which represents constraints but also market
opportunities for producers. On the other hand, the number of people directly involved in
agriculture, another essential agricultural resource, is decreasing (Satterthwaite et al., 2010).
Urbanization however enhances market quality for agricultural producers, namely the access
to inputs such as agrochemicals, compound feeds, veterinary services and modern plant and
animal genetics (Duncan et al., 2013). By decreasing the availability of essentials agricultural
resources but increasing access to production inputs and a larger output market, urbanization
is thus seen as a main driver of agricultural intensification. At last, urbanization shapes food
chains into unilateral resource flows from producers to consumers rather than as nutrient
cycles. Through food, cities massively import nutrients and accumulate them, thereby
becoming nutrient sinks (Drechsel et al., 2007), because the residues (waste and sewage)
are not brought back to fields as organic (residue) fertilizers (Drechsel and Kunze, 2001;
Prasad et al., 2019). Transition in resource utilization induced by an urbanizing environment
thus challenges the efficiency of agricultural systems.
In the 1970s, Indian dairy production already faced challenges related to
urbanization, whereby an increasing urban demand for dairy products was paralleled by poor
rural-urban linkages and underdeveloped rural areas with a vast untapped dairy development
potential (Cunningham, 2009; Duncan et al., 2013). Thus, India launched Operation Flood, a
decades-long development program focusing on dairy production to scale up milk production,
marketing and processing through dairy cooperatives and improve the livelihoods of numerous
rural smallholders (Cunningham, 2009; Mascarenhas, 1988). Today’s Indian dairy sector is
Chapter 3
42
the largest in the world, dominated by smallholders, partly informal (Cunningham, 2009;
FAOSTAT, 2019) and partly urban (Prasad et al., 2019), as testified by the presence of cattle
in urban areas, despite a continuously urbanizing India (United Nations, 2019) and the
constraints related to urban livestock production systems (Butler, 2012). The further
development of Indian (peri-)urban dairy production is yet open and plural: tropical (peri-)urban
livestock production systems show both dynamics of intensification and extensification
(Roessler et al., 2016), and distinct production strategies to take advantage of and deal with
the opportunities and constraints of urbanization (Daburon et al., 2017). They are, however,
often characterized by poor resource utilization (Amadou et al., 2015; Diogo et al., 2010;
Schlecht et al., 2019).
The increasing demand for milk in addition to its nature of high perishability and
daily availability and the fact that (peri-)urban agricultural systems continue to use increasingly
scarce and expensive spaces in West Africa and Asia (Graefe et al., 2019; Schlecht et al.,
2019) led to the following research question: within the rural-urban interface (RUI) of an
emerging Indian megacity, does urbanization lead to intensification or efficient resource
utilization, measured as FCE, or both in dairy production? Our case study was dairy production
in the RUI of Bengaluru, India, where feeding strategies, coverage of dairy cows’ nutritional
requirements, milk production and FCE were quantified at system-level during one year.
3.2 Materials and methods
3.2.1 Research area
Capital of the southern Indian state of Karnataka, Bengaluru is a megacity with
over 10 million inhabitants, which grew at an unprecedented rate during the last decades
(United Nations, 2018b; Verma et al., 2017). Its climate is hot semi-arid (average maximum
temperature 29.5°C, average minimum temperature 18.5°C, 948 mm of annual rainfall
(monthly average 2013-2017, weather station data, University of Agricultural Sciences
Bangalore, GKVK campus) with a dry season (March-May) followed by monsoon
(June-October) and winter (November-February). Along with Bengaluru’s emergence as a
megacity and multiple dairy development programs (Alderman, 1987; Nyholm et al., 1974),
the number of dairy cattle increased: from around 25’000 cattle in 1972 (Nyholm et al., 1974)
to 75’000 in 2012 (National Dairy Development Board, 2015). Two research transects were
established following an urban to rural gradient, north and south-west of Bengaluru (Hoffmann
et al., 2017). A survey stratification index based on build-up density of housing structures and
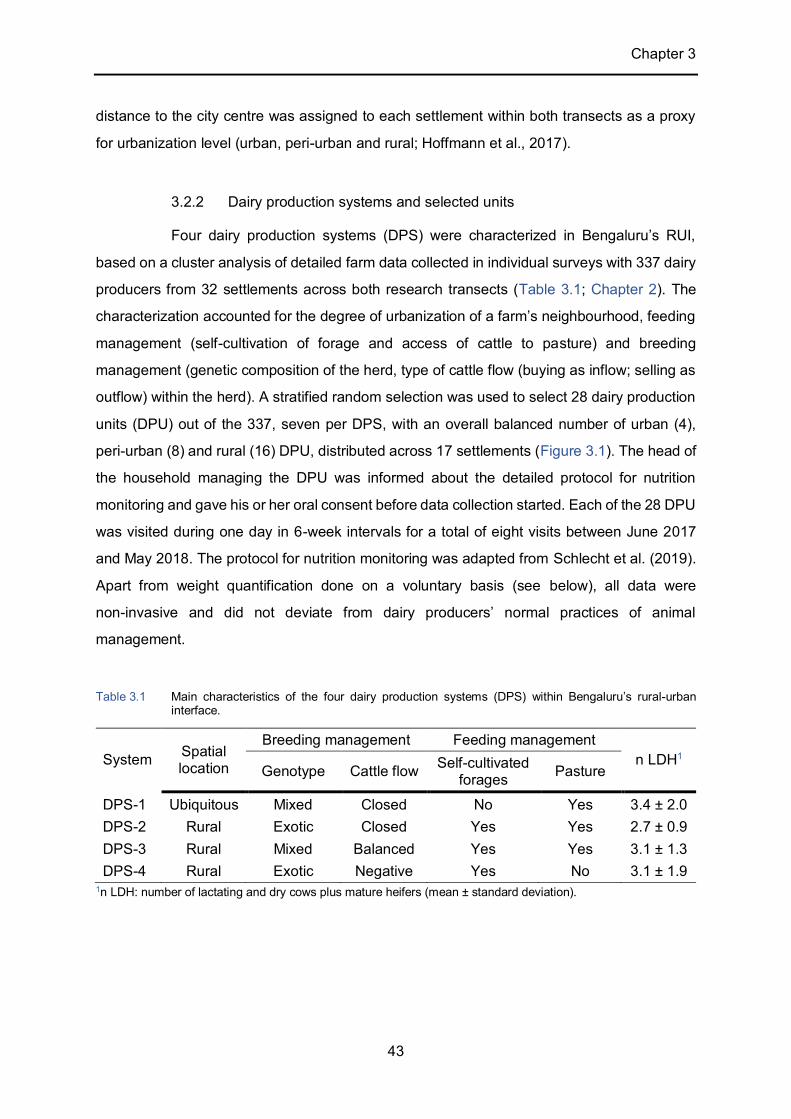
Chapter 3
43
distance to the city centre was assigned to each settlement within both transects as a proxy
for urbanization level (urban, peri-urban and rural; Hoffmann et al., 2017).
3.2.2 Dairy production systems and selected units
Four dairy production systems (DPS) were characterized in Bengaluru’s RUI,
based on a cluster analysis of detailed farm data collected in individual surveys with 337 dairy
producers from 32 settlements across both research transects (Table 3.1; Chapter 2). The
characterization accounted for the degree of urbanization of a farm’s neighbourhood, feeding
management (self-cultivation of forage and access of cattle to pasture) and breeding
management (genetic composition of the herd, type of cattle flow (buying as inflow; selling as
outflow) within the herd). A stratified random selection was used to select 28 dairy production
units (DPU) out of the 337, seven per DPS, with an overall balanced number of urban (4),
peri-urban (8) and rural (16) DPU, distributed across 17 settlements (Figure 3.1). The head of
the household managing the DPU was informed about the detailed protocol for nutrition
monitoring and gave his or her oral consent before data collection started. Each of the 28 DPU
was visited during one day in 6-week intervals for a total of eight visits between June 2017
and May 2018. The protocol for nutrition monitoring was adapted from Schlecht et al. (2019).
Apart from weight quantification done on a voluntary basis (see below), all data were
non-invasive and did not deviate from dairy producers’ normal practices of animal
management.
Table 3.1 Main characteristics of the four dairy production systems (DPS) within Bengaluru’s rural-urban interface.
System Spatial location
Breeding management Feeding management n LDH1
Genotype Cattle flow Self-cultivated forages Pasture
DPS-1 Ubiquitous Mixed Closed No Yes 3.4 ± 2.0 DPS-2 Rural Exotic Closed Yes Yes 2.7 ± 0.9 DPS-3 Rural Mixed Balanced Yes Yes 3.1 ± 1.3 DPS-4 Rural Exotic Negative Yes No 3.1 ± 1.9
1n LDH: number of lactating and dry cows plus mature heifers (mean ± standard deviation).
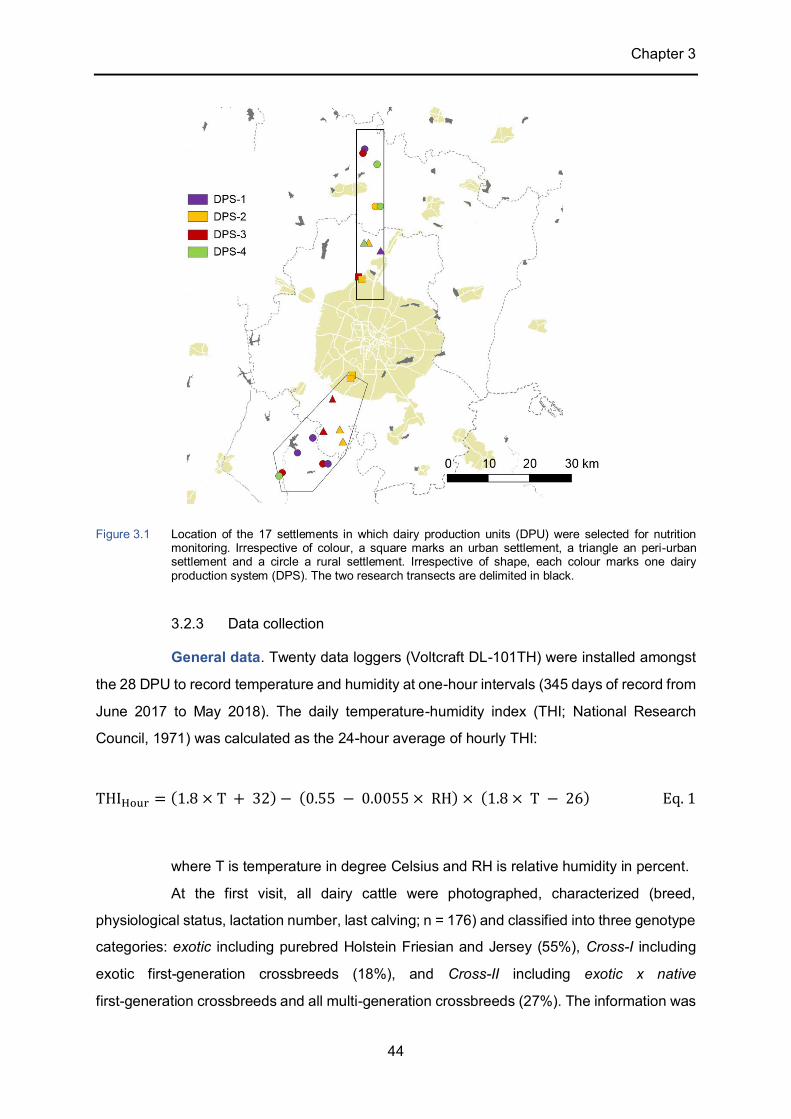
Chapter 3
44
3.2.3 Data collection
General data. Twenty data loggers (Voltcraft DL-101TH) were installed amongst
the 28 DPU to record temperature and humidity at one-hour intervals (345 days of record from
June 2017 to May 2018). The daily temperature-humidity index (THI; National Research
Council, 1971) was calculated as the 24-hour average of hourly THI:
THIHour = (1.8 × T + 32) − (0.55 − 0.0055 × RH) × (1.8 × T − 26) Eq. 1
where T is temperature in degree Celsius and RH is relative humidity in percent.
At the first visit, all dairy cattle were photographed, characterized (breed,
physiological status, lactation number, last calving; n = 176) and classified into three genotype
categories: exotic including purebred Holstein Friesian and Jersey (55%), Cross-I including
exotic first-generation crossbreeds (18%), and Cross-II including exotic x native
first-generation crossbreeds and all multi-generation crossbreeds (27%). The information was
Figure 3.1 Location of the 17 settlements in which dairy production units (DPU) were selected for nutrition monitoring. Irrespective of colour, a square marks an urban settlement, a triangle an peri-urban settlement and a circle a rural settlement. Irrespective of shape, each colour marks one dairy production system (DPS). The two research transects are delimited in black.
Chapter 3
45
amended at successive visits, with each new dairy cattle characterized likewise. Lactating (L)
or dry (D) cows plus mature heifers (H; pregnant or at least already inseminated once) were
considered as the productive dairy herd (LDH; n = 107). When relevant, the physiological
status of LDH was characterized with 1 = pregnant or (potentially) pregnant in the case of
heifers, and 0 = not pregnant, resulting into four categories: L0 (lactating cow, not pregnant),
L1 (lactating cow, pregnant), D1 (dry cow, pregnant) and H1 ((potentially) pregnant heifer).
Quantitative and qualitative determination of on-farm feed intake. At each
visit, at best each meal or otherwise a representative number of meals of each LDH were
quantified according to the 24-hour feeding pattern. Each offered feedstuff or mix (usually
concentrate feed, sometimes green forages) was characterized (type, self-cultivated or
bought) and weighed (Hanging scale PCE-HS 50N: 0.20-50.00 kg, accuracy ± 0.08 kg).
Afterwards, group or individual feed intake was quantified by re-weighing refusals wherever
relevant and possible. In some cases, refusals were mixed with excreta due to a lack of proper
feeding throughs or accumulated from more than one meal, which prevented their
quantification. Therefore, calculated daily feed intake values exceeding physiological dry
matter (DM) intake limits of an individual animal (Ulbrich et al., 2004) were excluded from the
analysis, resulting in 641 individual feeding records at LDH-level. Of individual feedstuffs and
mixes that were fed at each farm and visit, 321 representative samples were collected. Their
weight before and after air and oven drying (at 80°C for 24 hours; USB, Forced Convection
Oven 411-500420) was determined (Kern PCB 10000-1, 0.0-10.0 kg ± 0.1 kg; Denver
Instruments TP-124, 0.1 mg – 210 g, ± 0.0001 g); dry samples were ground to 0.5 mm particle
size (mixer grinder) and analysed for concentrations of DM (AOAC International, 2012; Method
934.01) and crude protein (CP; AOAC International, 2012; Method 955.01 (Kjeldahl); Gerhardt
protein analyser VAPODEST450). In-vitro digestible organic matter (DOM) content was
determined according to Menke et al. (1979). To assess the feedstuffs’ metabolizable energy
(ME) content, a DOM to ME regression (R2 = 0.9261) was established based on 93 selected
records from Close and Menke (1986) and Feedipedia.
Pasture intake and daily locomotion. The time cattle spent pasturing per day
was asked from the dairy producers. Manual observation of behaviour at pasture over
24-hours was done once in five DPU (two urban, one peri-urban, two rural) for one to two LDH
(n = 9 animal x day observation sets) to assess the time spent grazing as a fraction of the total
time spent on pasture: this was, on average, 42% of pasture time in urban areas and 77% in
peri-urban and rural areas. Daily feed intake on pasture was calculated with an intake rate of
8 g DM per kg metabolic weight (MW = body weight scaled to the power of 0.75; Ayantunde
Chapter 3
46
et al., 2002). The average quality of 32 samples of non-cultivated grasses (collected by dairy
producers for on-farm feeding from public spaces) was used to calculate nutrient intake from
pasture in peri-urban and rural settlements. A weighted average value (50:50) of the quality of
32 samples of non-cultivated grasses plus 3 samples of vegetable and fruit mixes was used
to calculate nutrient intake from pasture in urban settlements, where cows had additionally
access to household or market organic wastes dumped in the streets. On average 15% of the
daily time on pasture was spent on walking. The ME requirement for locomotion was set at
2.01 kJ per kg body weight (BW) and km (Menke and Huss, 1987) with a standard average
walking speed of 2.5 km per hour.
Milk offtake and quality. As direct consumption of milk by the calf was sometimes
allowed (24% of all milking records: from suckling to stimulate milk let-down to complete
feeding of the calf) but impossible to quantify, milk data per cow is referred to as milk offtake
(MO). Individual MO was quantified twice a day if possible. Else, individual MO in the morning
was estimated based on the recorded quantity of milk delivered to the dairy cooperative plus
the milk quantities used for family consumption, direct marketing and calf feeding, and the
afternoon share of production per L. A California mastitis test was done during afternoon
milking for each individual L. Degree of mastitis was categorized according to the number and
degree of infected teats with A = no mastitis, B = traces, C = mild mastitis and D = severe
mastitis. An individual milk sample was analysed for fat and protein content (Lactoscan Milk
Analyzer, Softrosys Technologies, Bengaluru, India) to assess the relevance of metabolic
disorders, with a fat-to-protein ratio below 1.0 indicating risk of acidosis and above 1.5 risk of
ketosis (Eicher, 2004). Daily energy corrected milk (ECM; 4% fat and 3.3% protein; Sjaunja et
al., 1990) was calculated as follows:
ECM = kg MO × (0.25 + 0.122 × Fat + 0.077 × Protein) Eq. 2
where MO is milk offtake in kg per day, Fat is fat percentage of the milk and Protein
is protein percentage of the milk.
The energy requirement for the synthesis of milk was set at 5.3 MJ ME per kg
ECM and the protein requirement at 85 g CP per kg ECM (Ulbrich et al., 2004).
Chapter 3
47
Maintenance, growth and gravidity requirements. A standard value of 480 kJ
ME and 3.7 g CP per kg MW and day was used to calculate the daily maintenance requirement
of ME and CP (Ulbrich et al., 2004). To quantify growth of individual dairy animals, including
foetal growth, a heart girth (HG) to BW regression (Vanvanhossou et al., 2018) was
established based on 569 weight records (Weighing Set EziWeigh 5, load bars MP600)
collected in November 2017 across the whole RUI and cattle of all categories of sex, age,
genotype and physiological status:
BW = −3.867 + 2.98 × log10(HG) Eq. 3
where BW is body weight in kg and HG is heart girth in cm, with a correlation
coefficient of the equation of R2 = 0.9846 (Grund, 2018).
Growth was calculated as the daily body weight gain or loss (Δ BW g per day) as
estimated from HG measurements at 6-week intervals. ME and CP requirements were set at
34.0 MJ ME and 380 g CP per kg Δ BW in the case of weight gain (Ulbrich et al., 2004),
whereas no requirements (and also no freed energy and protein) were factored in case of
weight losses.
3.2.4 Statistical analyses
Feed intake and feed conversion efficiency. Intake of DM, CP and ME on-farm
and on pasture were calculated per kilogram of MW. Values were compared between DPS,
genotypes and physiological status of LDH using Kruskal-Wallis test (Holm correction for
pairwise comparison) because normal distribution and homogeneity of variances were not
achieved (Shapiro-Wilk test, P < 0.05). Once total intake and ME and CP requirements for
maintenance, growth, locomotion and milk production were calculated, categorical supply
levels of ME and CP were defined as the ratio of intake to requirement and classified as
adequate supply (ratio = 0.8 - 1.2), mild deficit (0.5 - < 0.8), severe deficit (< 0.5), mild surplus
(> 1.2 – 1.5) and substantial surplus (> 1.5; Wassie et al., 2019). Kruskal-Wallis test was used
to assess differences in numerical ME and CP supply ratios between DPS, genotypes and
physiological status, whereas chi-squared test was used to determine differences in the
frequency of ME and CP supply levels between DPS, genotypes and physiological status. As
DPU within each DPS had similar feeding strategies, no DPU effect was considered in the
analyses of intake and FCE. Significance was declared at P < 0.05 for all analyses.
Chapter 3
48
Milk offtake. MO was compared between DPS using Kruskal-Wallis test. A
stepwise regression was used to investigate the relations between MO, corrected to 100 kg
BW (cMO; n = 332) and dairy production variables. Dairy production variables considered as
fixed effects were DPS, days-in-milk (DIM, numerical, intervall: 3-559), genotype category
(categorical, 3 levels), total daily DM intake (DMI), ME and CP coverage ratio (ME.cov and
CP.cov; continuous), metabolic disorders based on fat-to-protein ratio of the milk (categorical,
3 levels), pregnancy (Preg; yes, no), calf directly suckling milk (yes, no), mastitis (categorical,
4 levels), urbanization degree (urban, peri-urban, rural), round (R; categorical, 8 levels) and
THI (continuous). DPU (28) and cow (75) were considered as random effects. Dairy producers
often did not known the lactation number of cows they bought which resulted in a lot of missing
data. As a stepwise regression requires the exclusion of all incomplete observations, lactation
number was not considered in the final stepwise regression after prelimary stepwise
regressions did not find it a significant factor, to preserve a high number of observations.
3.3 Results
3.3.1 Type of feedstuffs and seasonal contribution
On-farm, dairy producers usually fed one to two green or dry feedstuffs per day to
their LDH cattle starting from after the morning milking until late in the night, with 2.7 ± 3.3
hours of pasture in-between (overall LDH average). The most important self-cultivated or
bought green forages (DM content from 10 to 76%; Table 3.2) were African tall maize (Zea
mays) and hybrid Napier grass (Pennisetum glaucum × P. purpureum). Most dairy producers
were also collecting a wide range of wild (non-cultivated) grasses from green spaces and, in
urban areas, also from the surroundings of lakes. Green forages were consistently the main
feedstuff fed, although their contribution decreased during winter and the dry season in
comparison to the monsoon time (Figure 3.2). Urban dairy producers (DPS-2) additionally
relied on organic wastes from markets (field bean pods, cabbage, banana peels, sugarcane
bagasse, amongst others) that they were getting at a low price or for free (20% contribution
over the year, inexistent in other DPS).
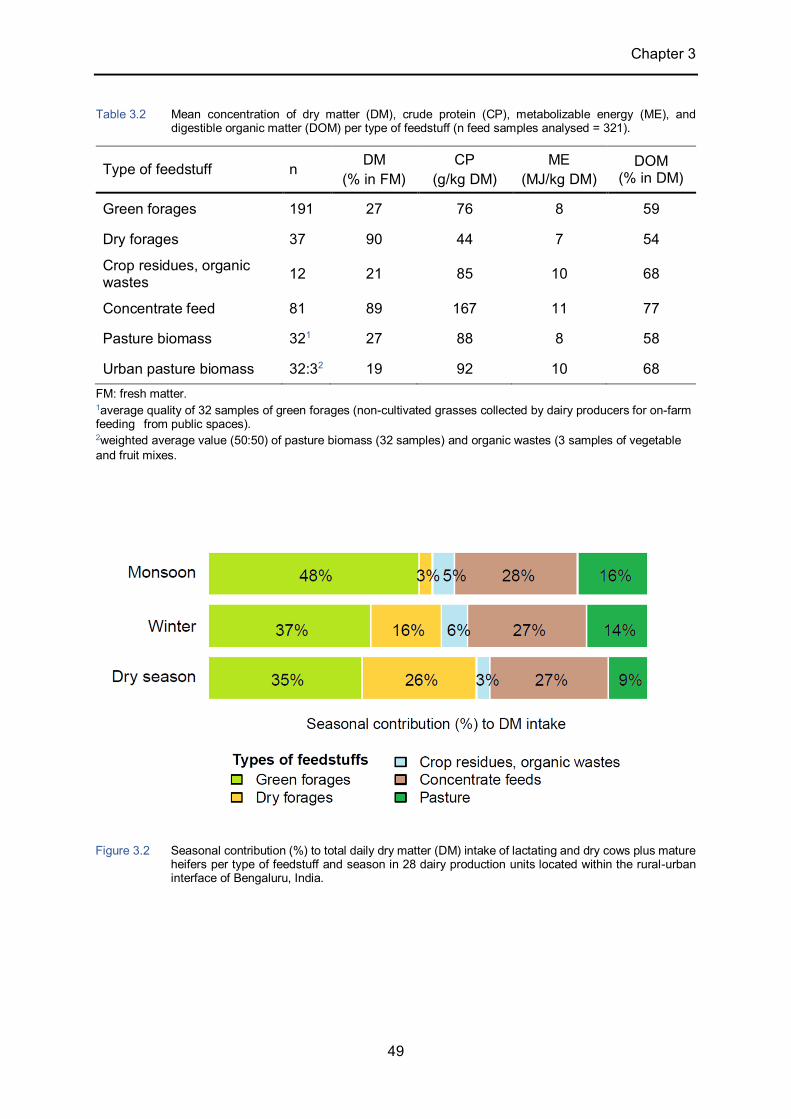
Chapter 3
49
Table 3.2 Mean concentration of dry matter (DM), crude protein (CP), metabolizable energy (ME), and digestible organic matter (DOM) per type of feedstuff (n feed samples analysed = 321).
Type of feedstuff n DM (% in FM)
CP (g/kg DM)
ME (MJ/kg DM)
DOM (% in DM)
Green forages 191 27 76 8 59
Dry forages 37 90 44 7 54
Crop residues, organic wastes 12 21 85 10 68
Concentrate feed 81 89 167 11 77
Pasture biomass 321 27 88 8 58
Urban pasture biomass 32:32 19 92 10 68 FM: fresh matter. 1average quality of 32 samples of green forages (non-cultivated grasses collected by dairy producers for on-farm feeding from public spaces). 2weighted average value (50:50) of pasture biomass (32 samples) and organic wastes (3 samples of vegetable and fruit mixes.
Figure 3.2 Seasonal contribution (%) to total daily dry matter (DM) intake of lactating and dry cows plus mature heifers per type of feedstuff and season in 28 dairy production units located within the rural-urban interface of Bengaluru, India.
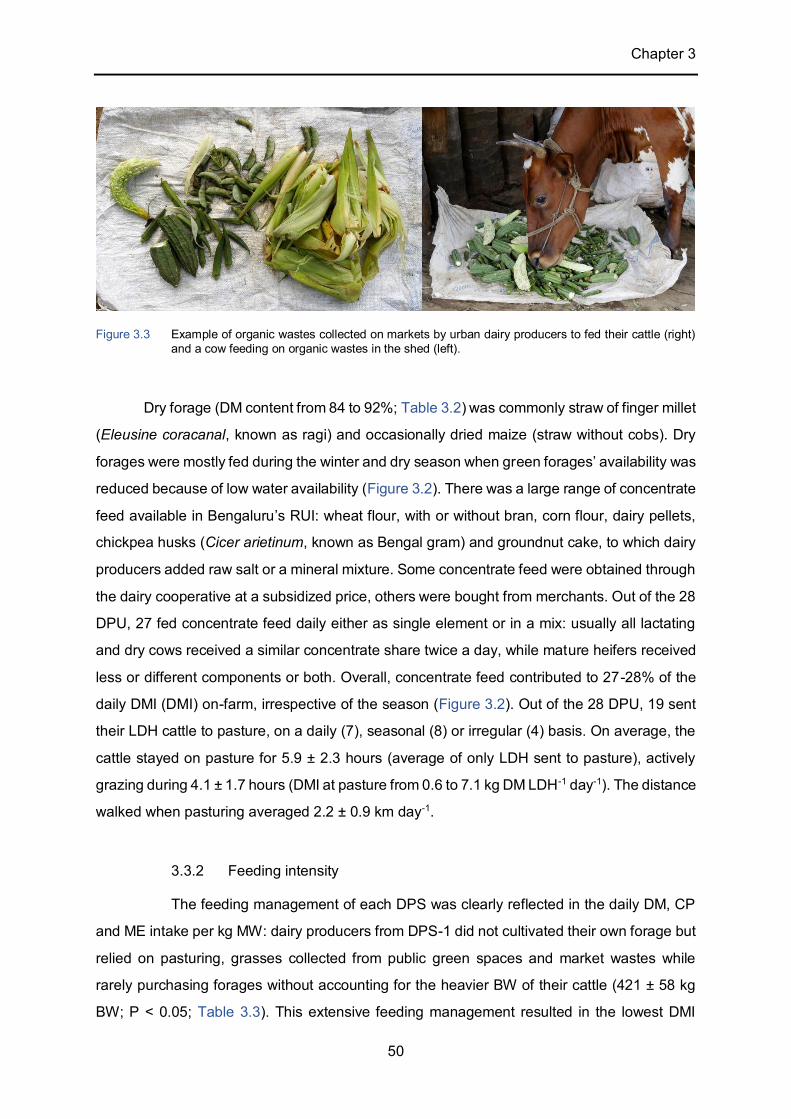
Chapter 3
50
Dry forage (DM content from 84 to 92%; Table 3.2) was commonly straw of finger millet
(Eleusine coracanal, known as ragi) and occasionally dried maize (straw without cobs). Dry
forages were mostly fed during the winter and dry season when green forages’ availability was
reduced because of low water availability (Figure 3.2). There was a large range of concentrate
feed available in Bengaluru’s RUI: wheat flour, with or without bran, corn flour, dairy pellets,
chickpea husks (Cicer arietinum, known as Bengal gram) and groundnut cake, to which dairy
producers added raw salt or a mineral mixture. Some concentrate feed were obtained through
the dairy cooperative at a subsidized price, others were bought from merchants. Out of the 28
DPU, 27 fed concentrate feed daily either as single element or in a mix: usually all lactating
and dry cows received a similar concentrate share twice a day, while mature heifers received
less or different components or both. Overall, concentrate feed contributed to 27-28% of the
daily DMI (DMI) on-farm, irrespective of the season (Figure 3.2). Out of the 28 DPU, 19 sent
their LDH cattle to pasture, on a daily (7), seasonal (8) or irregular (4) basis. On average, the
cattle stayed on pasture for 5.9 ± 2.3 hours (average of only LDH sent to pasture), actively
grazing during 4.1 ± 1.7 hours (DMI at pasture from 0.6 to 7.1 kg DM LDH-1 day-1). The distance
walked when pasturing averaged 2.2 ± 0.9 km day-1.
3.3.2 Feeding intensity
The feeding management of each DPS was clearly reflected in the daily DM, CP
and ME intake per kg MW: dairy producers from DPS-1 did not cultivated their own forage but
relied on pasturing, grasses collected from public green spaces and market wastes while
rarely purchasing forages without accounting for the heavier BW of their cattle (421 ± 58 kg
BW; P < 0.05; Table 3.3). This extensive feeding management resulted in the lowest DMI
Figure 3.3 Example of organic wastes collected on markets by urban dairy producers to fed their cattle (right) and a cow feeding on organic wastes in the shed (left).
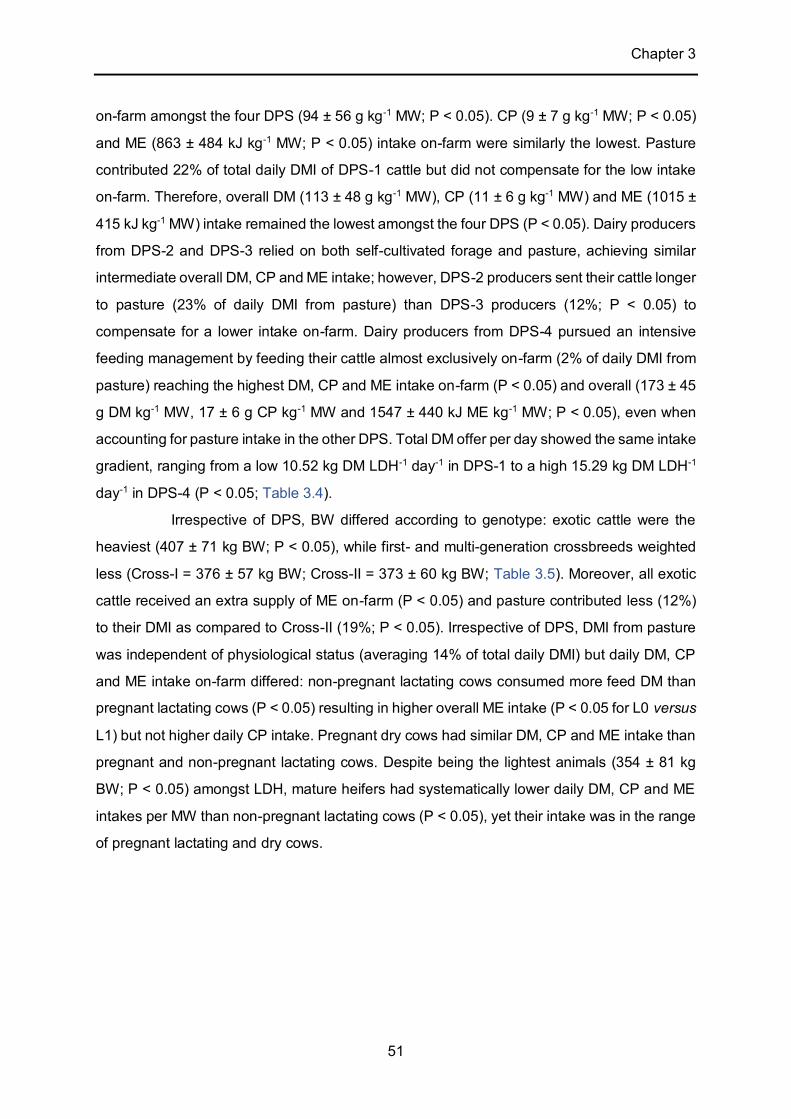
Chapter 3
51
on-farm amongst the four DPS (94 ± 56 g kg-1 MW; P < 0.05). CP (9 ± 7 g kg-1 MW; P < 0.05)
and ME (863 ± 484 kJ kg-1 MW; P < 0.05) intake on-farm were similarly the lowest. Pasture
contributed 22% of total daily DMI of DPS-1 cattle but did not compensate for the low intake
on-farm. Therefore, overall DM (113 ± 48 g kg-1 MW), CP (11 ± 6 g kg-1 MW) and ME (1015 ±
415 kJ kg-1 MW) intake remained the lowest amongst the four DPS (P < 0.05). Dairy producers
from DPS-2 and DPS-3 relied on both self-cultivated forage and pasture, achieving similar
intermediate overall DM, CP and ME intake; however, DPS-2 producers sent their cattle longer
to pasture (23% of daily DMI from pasture) than DPS-3 producers (12%; P < 0.05) to
compensate for a lower intake on-farm. Dairy producers from DPS-4 pursued an intensive
feeding management by feeding their cattle almost exclusively on-farm (2% of daily DMI from
pasture) reaching the highest DM, CP and ME intake on-farm (P < 0.05) and overall (173 ± 45
g DM kg-1 MW, 17 ± 6 g CP kg-1 MW and 1547 ± 440 kJ ME kg-1 MW; P < 0.05), even when
accounting for pasture intake in the other DPS. Total DM offer per day showed the same intake
gradient, ranging from a low 10.52 kg DM LDH-1 day-1 in DPS-1 to a high 15.29 kg DM LDH-1
day-1 in DPS-4 (P < 0.05; Table 3.4).
Irrespective of DPS, BW differed according to genotype: exotic cattle were the
heaviest (407 ± 71 kg BW; P < 0.05), while first- and multi-generation crossbreeds weighted
less (Cross-I = 376 ± 57 kg BW; Cross-II = 373 ± 60 kg BW; Table 3.5). Moreover, all exotic
cattle received an extra supply of ME on-farm (P < 0.05) and pasture contributed less (12%)
to their DMI as compared to Cross-II (19%; P < 0.05). Irrespective of DPS, DMI from pasture
was independent of physiological status (averaging 14% of total daily DMI) but daily DM, CP
and ME intake on-farm differed: non-pregnant lactating cows consumed more feed DM than
pregnant lactating cows (P < 0.05) resulting in higher overall ME intake (P < 0.05 for L0 versus
L1) but not higher daily CP intake. Pregnant dry cows had similar DM, CP and ME intake than
pregnant and non-pregnant lactating cows. Despite being the lightest animals (354 ± 81 kg
BW; P < 0.05) amongst LDH, mature heifers had systematically lower daily DM, CP and ME
intakes per MW than non-pregnant lactating cows (P < 0.05), yet their intake was in the range
of pregnant lactating and dry cows.
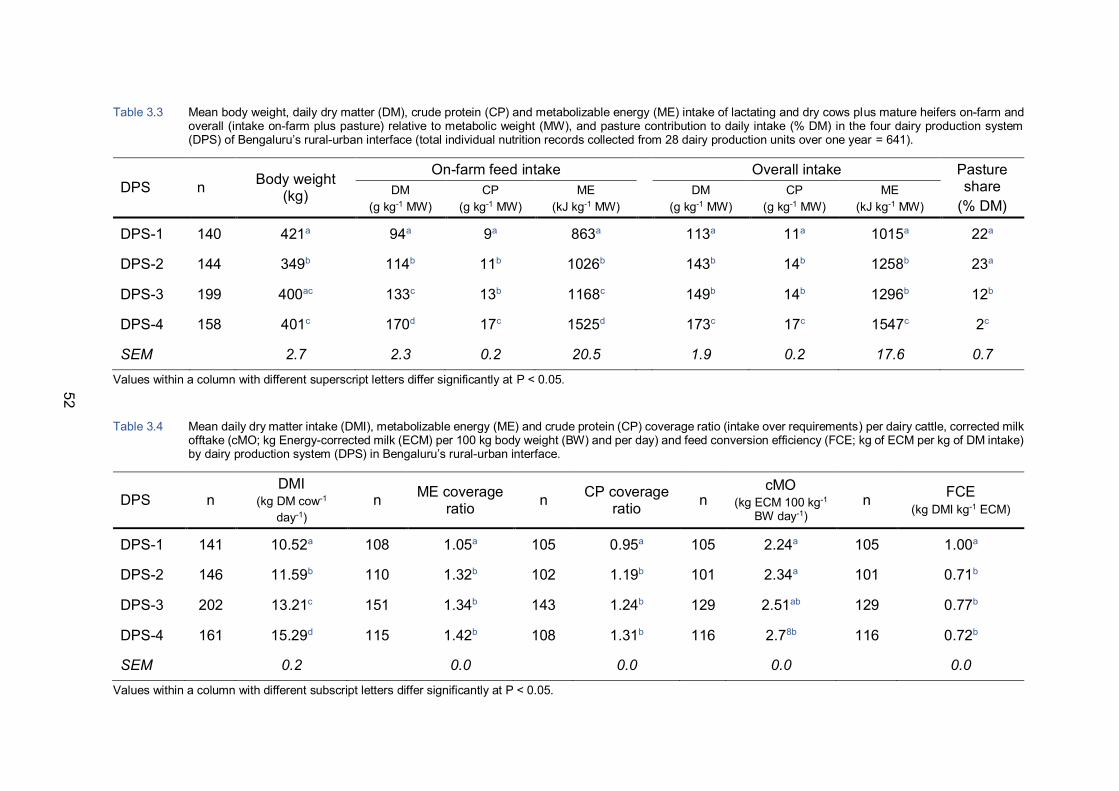
52
Table 3.3 Mean body weight, daily dry matter (DM), crude protein (CP) and metabolizable energy (ME) intake of lactating and dry cows plus mature heifers on-farm and overall (intake on-farm plus pasture) relative to metabolic weight (MW), and pasture contribution to daily intake (% DM) in the four dairy production system (DPS) of Bengaluru’s rural-urban interface (total individual nutrition records collected from 28 dairy production units over one year = 641).
DPS n Body weight (kg)
On-farm feed intake Overall intake Pasture share
(% DM) DM
(g kg-1 MW) CP
(g kg-1 MW) ME
(kJ kg-1 MW)
DM (g kg-1 MW)
CP (g kg-1 MW)
ME (kJ kg-1 MW)
DPS-1 140 421a 94a 9a 863a 113a 11a 1015a 22a
DPS-2 144 349b 114b 11b 1026b 143b 14b 1258b 23a
DPS-3 199 400ac 133c 13b 1168c 149b 14b 1296b 12b
DPS-4 158 401c 170d 17c 1525d 173c 17c 1547c 2c
SEM 2.7 2.3 0.2 20.5 1.9 0.2 17.6 0.7
Values within a column with different superscript letters differ significantly at P < 0.05.
Table 3.4 Mean daily dry matter intake (DMI), metabolizable energy (ME) and crude protein (CP) coverage ratio (intake over requirements) per dairy cattle, corrected milk offtake (cMO; kg Energy-corrected milk (ECM) per 100 kg body weight (BW) and per day) and feed conversion efficiency (FCE; kg of ECM per kg of DM intake) by dairy production system (DPS) in Bengaluru’s rural-urban interface.
DPS n DMI
(kg DM cow-1
day-1) n ME coverage
ratio n CP coverage ratio n
cMO (kg ECM 100 kg-1
BW day-1) n FCE
(kg DMI kg-1 ECM)
DPS-1 141 10.52a 108 1.05a 105 0.95a 105 2.24a 105 1.00a
DPS-2 146 11.59b 110 1.32b 102 1.19b 101 2.34a 101 0.71b
DPS-3 202 13.21c 151 1.34b 143 1.24b 129 2.51ab 129 0.77b
DPS-4 161 15.29d 115 1.42b 108 1.31b 116 2.78b 116 0.72b
SEM 0.2 0.0 0.0 0.0 0.0 Values within a column with different subscript letters differ significantly at P < 0.05.
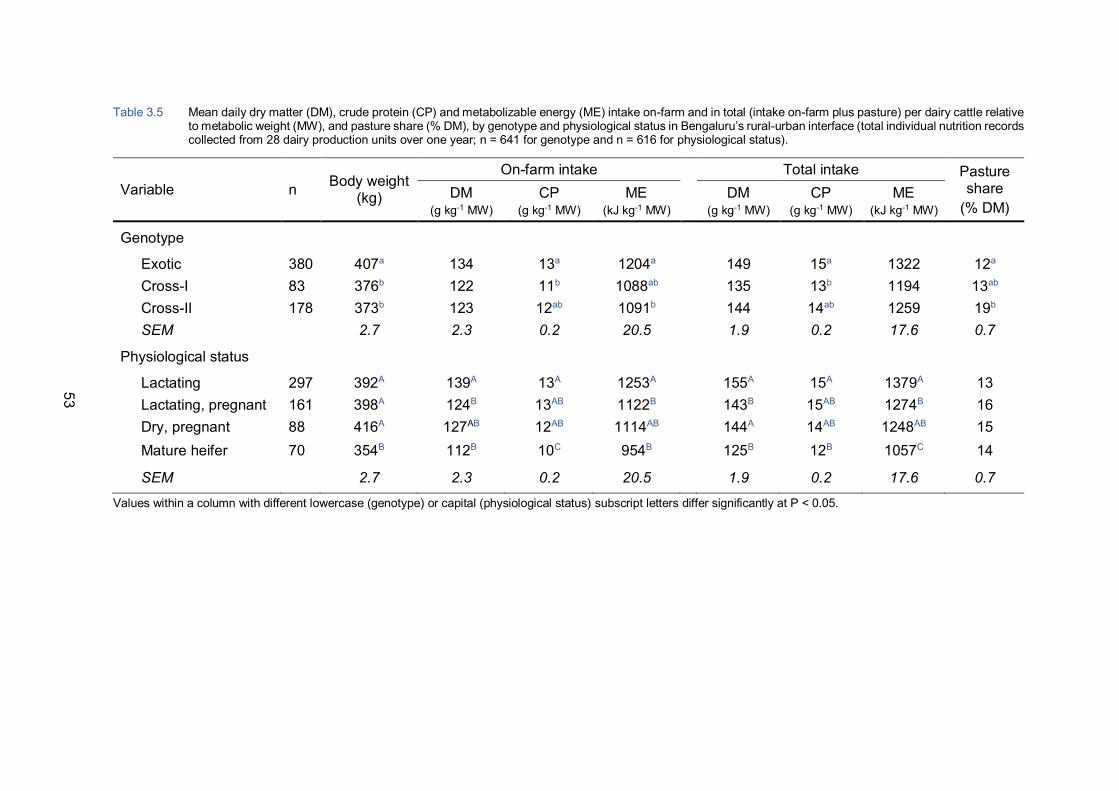
53
Table 3.5 Mean daily dry matter (DM), crude protein (CP) and metabolizable energy (ME) intake on-farm and in total (intake on-farm plus pasture) per dairy cattle relative to metabolic weight (MW), and pasture share (% DM), by genotype and physiological status in Bengaluru’s rural-urban interface (total individual nutrition records collected from 28 dairy production units over one year; n = 641 for genotype and n = 616 for physiological status).
Variable n Body weight (kg)
On-farm intake Total intake Pasture share
(% DM) DM
(g kg-1 MW) CP
(g kg-1 MW) ME
(kJ kg-1 MW) DM (g kg-1 MW)
CP (g kg-1 MW)
ME (kJ kg-1 MW)
Genotype
Exotic 380 407a 134 13a 1204a 149 15a 1322 12a Cross-I 83 376b 122 11b 1088ab 135 13b 1194 13ab Cross-II 178 373b 123 12ab 1091b 144 14ab 1259 19b SEM 2.7 2.3 0.2 20.5 1.9 0.2 17.6 0.7
Physiological status
Lactating 297 392A 139A 13A 1253A 155A 15A 1379A 13 Lactating, pregnant 161 398A 124B 13AB 1122B 143B 15AB 1274B 16 Dry, pregnant 88 416A 127AB 12AB 1114AB 144A 14AB 1248AB 15 Mature heifer 70 354B 112B 10C 954B 125B 12B 1057C 14
SEM 2.7 2.3 0.2 20.5 1.9 0.2 17.6 0.7 Values within a column with different lowercase (genotype) or capital (physiological status) subscript letters differ significantly at P < 0.05.
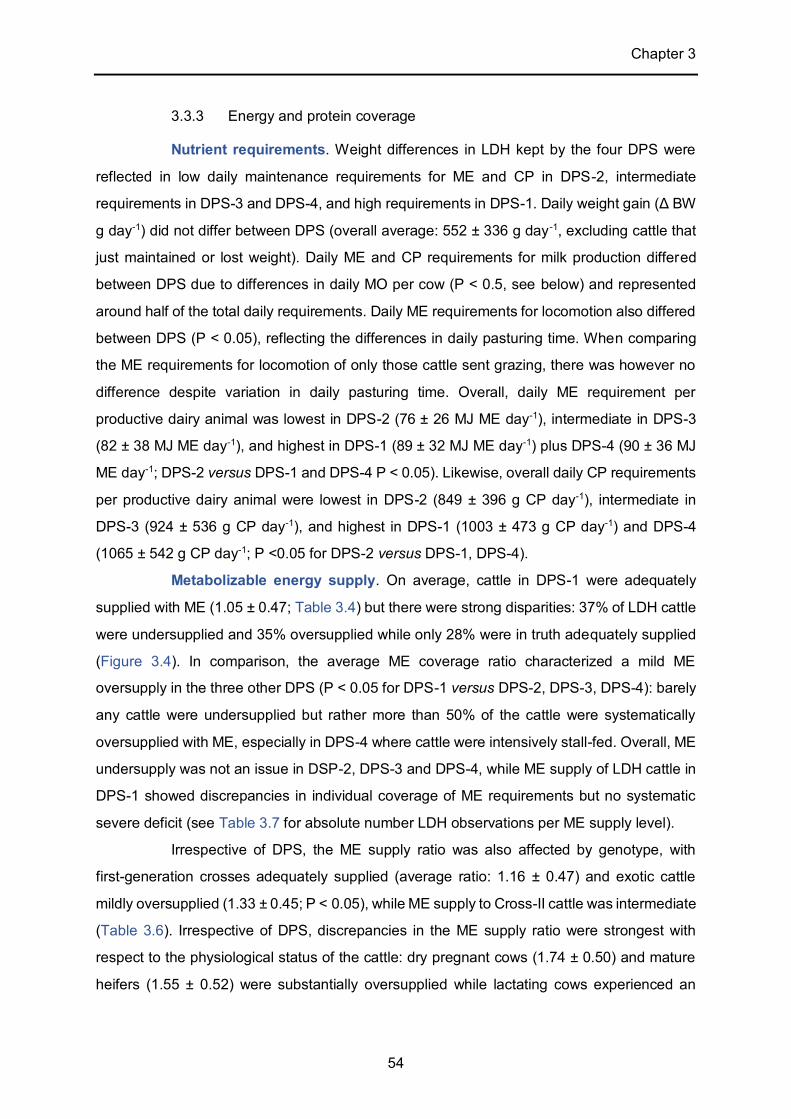
Chapter 3
54
3.3.3 Energy and protein coverage
Nutrient requirements. Weight differences in LDH kept by the four DPS were
reflected in low daily maintenance requirements for ME and CP in DPS-2, intermediate
requirements in DPS-3 and DPS-4, and high requirements in DPS-1. Daily weight gain (Δ BW
g day-1) did not differ between DPS (overall average: 552 ± 336 g day-1, excluding cattle that
just maintained or lost weight). Daily ME and CP requirements for milk production differed
between DPS due to differences in daily MO per cow (P < 0.5, see below) and represented
around half of the total daily requirements. Daily ME requirements for locomotion also differed
between DPS (P < 0.05), reflecting the differences in daily pasturing time. When comparing
the ME requirements for locomotion of only those cattle sent grazing, there was however no
difference despite variation in daily pasturing time. Overall, daily ME requirement per
productive dairy animal was lowest in DPS-2 (76 ± 26 MJ ME day-1), intermediate in DPS-3
(82 ± 38 MJ ME day-1), and highest in DPS-1 (89 ± 32 MJ ME day-1) plus DPS-4 (90 ± 36 MJ
ME day-1; DPS-2 versus DPS-1 and DPS-4 P < 0.05). Likewise, overall daily CP requirements
per productive dairy animal were lowest in DPS-2 (849 ± 396 g CP day-1), intermediate in
DPS-3 (924 ± 536 g CP day-1), and highest in DPS-1 (1003 ± 473 g CP day-1) and DPS-4
(1065 ± 542 g CP day-1; P <0.05 for DPS-2 versus DPS-1, DPS-4).
Metabolizable energy supply. On average, cattle in DPS-1 were adequately
supplied with ME (1.05 ± 0.47; Table 3.4) but there were strong disparities: 37% of LDH cattle
were undersupplied and 35% oversupplied while only 28% were in truth adequately supplied
(Figure 3.4). In comparison, the average ME coverage ratio characterized a mild ME
oversupply in the three other DPS (P < 0.05 for DPS-1 versus DPS-2, DPS-3, DPS-4): barely
any cattle were undersupplied but rather more than 50% of the cattle were systematically
oversupplied with ME, especially in DPS-4 where cattle were intensively stall-fed. Overall, ME
undersupply was not an issue in DSP-2, DPS-3 and DPS-4, while ME supply of LDH cattle in
DPS-1 showed discrepancies in individual coverage of ME requirements but no systematic
severe deficit (see Table 3.7 for absolute number LDH observations per ME supply level).
Irrespective of DPS, the ME supply ratio was also affected by genotype, with
first-generation crosses adequately supplied (average ratio: 1.16 ± 0.47) and exotic cattle
mildly oversupplied (1.33 ± 0.45; P < 0.05), while ME supply to Cross-II cattle was intermediate
(Table 3.6). Irrespective of DPS, discrepancies in the ME supply ratio were strongest with
respect to the physiological status of the cattle: dry pregnant cows (1.74 ± 0.50) and mature
heifers (1.55 ± 0.52) were substantially oversupplied while lactating cows experienced an
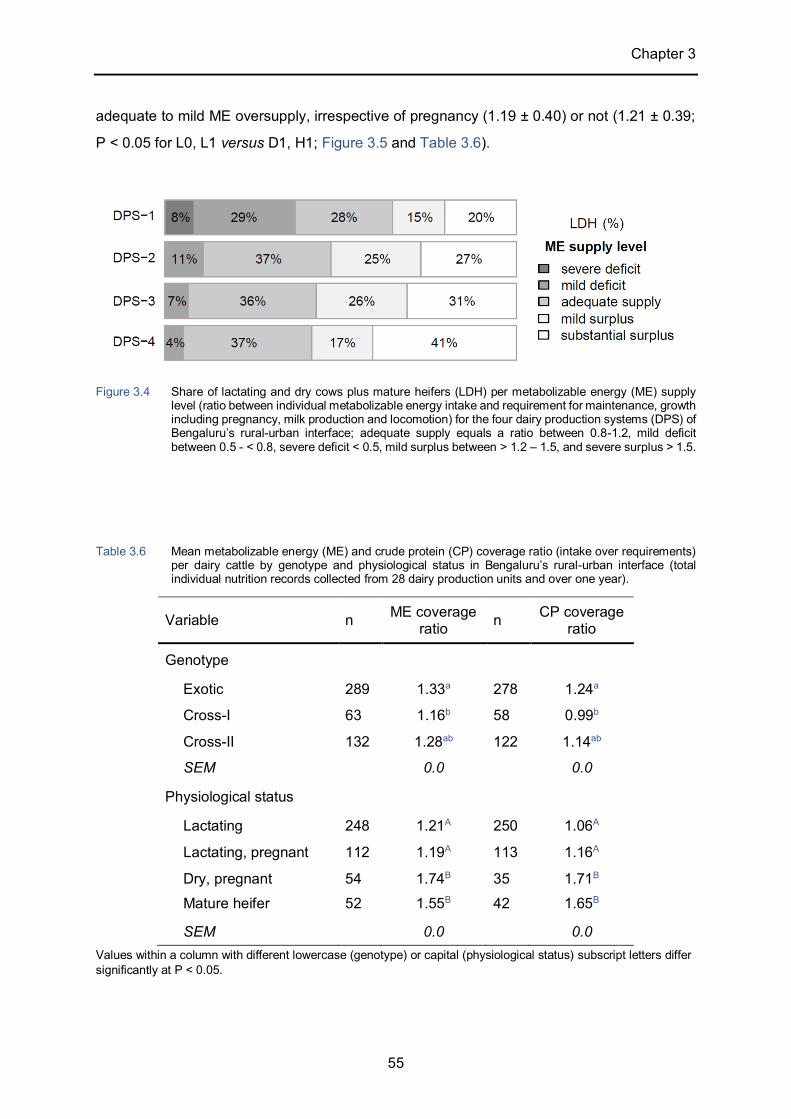
Chapter 3
55
adequate to mild ME oversupply, irrespective of pregnancy (1.19 ± 0.40) or not (1.21 ± 0.39;
P < 0.05 for L0, L1 versus D1, H1; Figure 3.5 and Table 3.6).
Figure 3.4 Share of lactating and dry cows plus mature heifers (LDH) per metabolizable energy (ME) supply
level (ratio between individual metabolizable energy intake and requirement for maintenance, growth including pregnancy, milk production and locomotion) for the four dairy production systems (DPS) of Bengaluru’s rural-urban interface; adequate supply equals a ratio between 0.8-1.2, mild deficit between 0.5 - < 0.8, severe deficit < 0.5, mild surplus between > 1.2 – 1.5, and severe surplus > 1.5.
Table 3.6 Mean metabolizable energy (ME) and crude protein (CP) coverage ratio (intake over requirements) per dairy cattle by genotype and physiological status in Bengaluru’s rural-urban interface (total individual nutrition records collected from 28 dairy production units and over one year).
Variable n ME coverage ratio n CP coverage
ratio
Genotype
Exotic 289 1.33a 278 1.24a
Cross-I 63 1.16b 58 0.99b
Cross-II 132 1.28ab 122 1.14ab
SEM 0.0 0.0
Physiological status
Lactating 248 1.21A 250 1.06A
Lactating, pregnant 112 1.19A 113 1.16A
Dry, pregnant 54 1.74B 35 1.71B Mature heifer 52 1.55B 42 1.65B
SEM 0.0 0.0 Values within a column with different lowercase (genotype) or capital (physiological status) subscript letters differ significantly at P < 0.05.
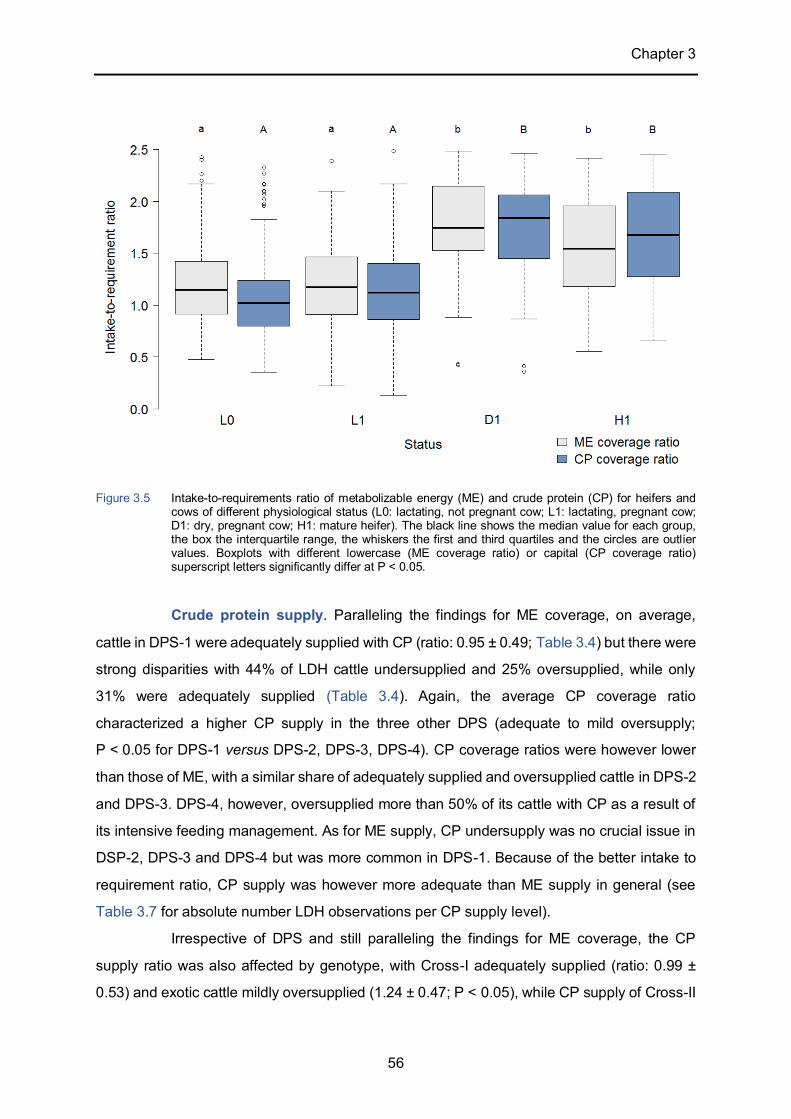
Chapter 3
56
Crude protein supply. Paralleling the findings for ME coverage, on average,
cattle in DPS-1 were adequately supplied with CP (ratio: 0.95 ± 0.49; Table 3.4) but there were
strong disparities with 44% of LDH cattle undersupplied and 25% oversupplied, while only
31% were adequately supplied (Table 3.4). Again, the average CP coverage ratio
characterized a higher CP supply in the three other DPS (adequate to mild oversupply;
P < 0.05 for DPS-1 versus DPS-2, DPS-3, DPS-4). CP coverage ratios were however lower
than those of ME, with a similar share of adequately supplied and oversupplied cattle in DPS-2
and DPS-3. DPS-4, however, oversupplied more than 50% of its cattle with CP as a result of
its intensive feeding management. As for ME supply, CP undersupply was no crucial issue in
DSP-2, DPS-3 and DPS-4 but was more common in DPS-1. Because of the better intake to
requirement ratio, CP supply was however more adequate than ME supply in general (see
Table 3.7 for absolute number LDH observations per CP supply level).
Irrespective of DPS and still paralleling the findings for ME coverage, the CP
supply ratio was also affected by genotype, with Cross-I adequately supplied (ratio: 0.99 ±
0.53) and exotic cattle mildly oversupplied (1.24 ± 0.47; P < 0.05), while CP supply of Cross-II
Figure 3.5 Intake-to-requirements ratio of metabolizable energy (ME) and crude protein (CP) for heifers and cows of different physiological status (L0: lactating, not pregnant cow; L1: lactating, pregnant cow; D1: dry, pregnant cow; H1: mature heifer). The black line shows the median value for each group, the box the interquartile range, the whiskers the first and third quartiles and the circles are outlier values. Boxplots with different lowercase (ME coverage ratio) or capital (CP coverage ratio) superscript letters significantly differ at P < 0.05.
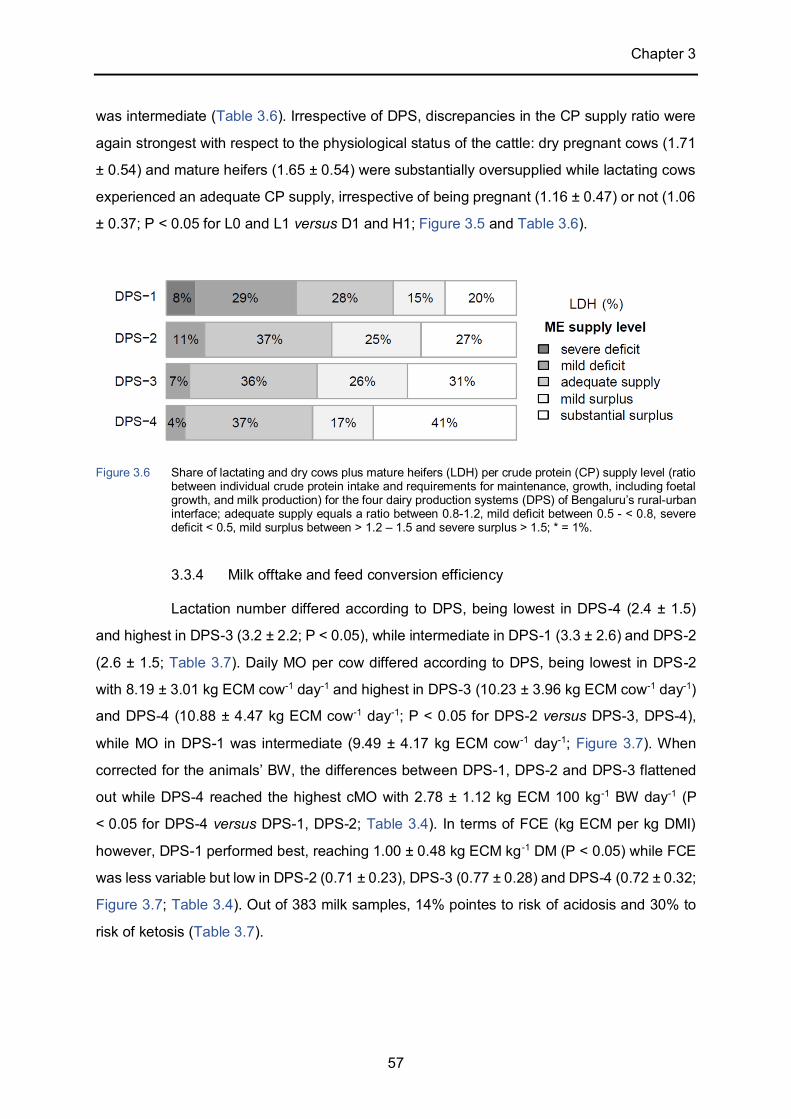
Chapter 3
57
was intermediate (Table 3.6). Irrespective of DPS, discrepancies in the CP supply ratio were
again strongest with respect to the physiological status of the cattle: dry pregnant cows (1.71
± 0.54) and mature heifers (1.65 ± 0.54) were substantially oversupplied while lactating cows
experienced an adequate CP supply, irrespective of being pregnant (1.16 ± 0.47) or not (1.06
± 0.37; P < 0.05 for L0 and L1 versus D1 and H1; Figure 3.5 and Table 3.6).
Figure 3.6 Share of lactating and dry cows plus mature heifers (LDH) per crude protein (CP) supply level (ratio
between individual crude protein intake and requirements for maintenance, growth, including foetal growth, and milk production) for the four dairy production systems (DPS) of Bengaluru’s rural-urban interface; adequate supply equals a ratio between 0.8-1.2, mild deficit between 0.5 - < 0.8, severe deficit < 0.5, mild surplus between > 1.2 – 1.5 and severe surplus > 1.5; * = 1%.
3.3.4 Milk offtake and feed conversion efficiency
Lactation number differed according to DPS, being lowest in DPS-4 (2.4 ± 1.5)
and highest in DPS-3 (3.2 ± 2.2; P < 0.05), while intermediate in DPS-1 (3.3 ± 2.6) and DPS-2
(2.6 ± 1.5; Table 3.7). Daily MO per cow differed according to DPS, being lowest in DPS-2
with 8.19 ± 3.01 kg ECM cow-1 day-1 and highest in DPS-3 (10.23 ± 3.96 kg ECM cow-1 day-1)
and DPS-4 (10.88 ± 4.47 kg ECM cow-1 day-1; P < 0.05 for DPS-2 versus DPS-3, DPS-4),
while MO in DPS-1 was intermediate (9.49 ± 4.17 kg ECM cow-1 day-1; Figure 3.7). When
corrected for the animals’ BW, the differences between DPS-1, DPS-2 and DPS-3 flattened
out while DPS-4 reached the highest cMO with 2.78 ± 1.12 kg ECM 100 kg-1 BW day-1 (P
< 0.05 for DPS-4 versus DPS-1, DPS-2; Table 3.4). In terms of FCE (kg ECM per kg DMI)
however, DPS-1 performed best, reaching 1.00 ± 0.48 kg ECM kg-1 DM (P < 0.05) while FCE
was less variable but low in DPS-2 (0.71 ± 0.23), DPS-3 (0.77 ± 0.28) and DPS-4 (0.72 ± 0.32;
Figure 3.7; Table 3.4). Out of 383 milk samples, 14% pointes to risk of acidosis and 30% to
risk of ketosis (Table 3.7).
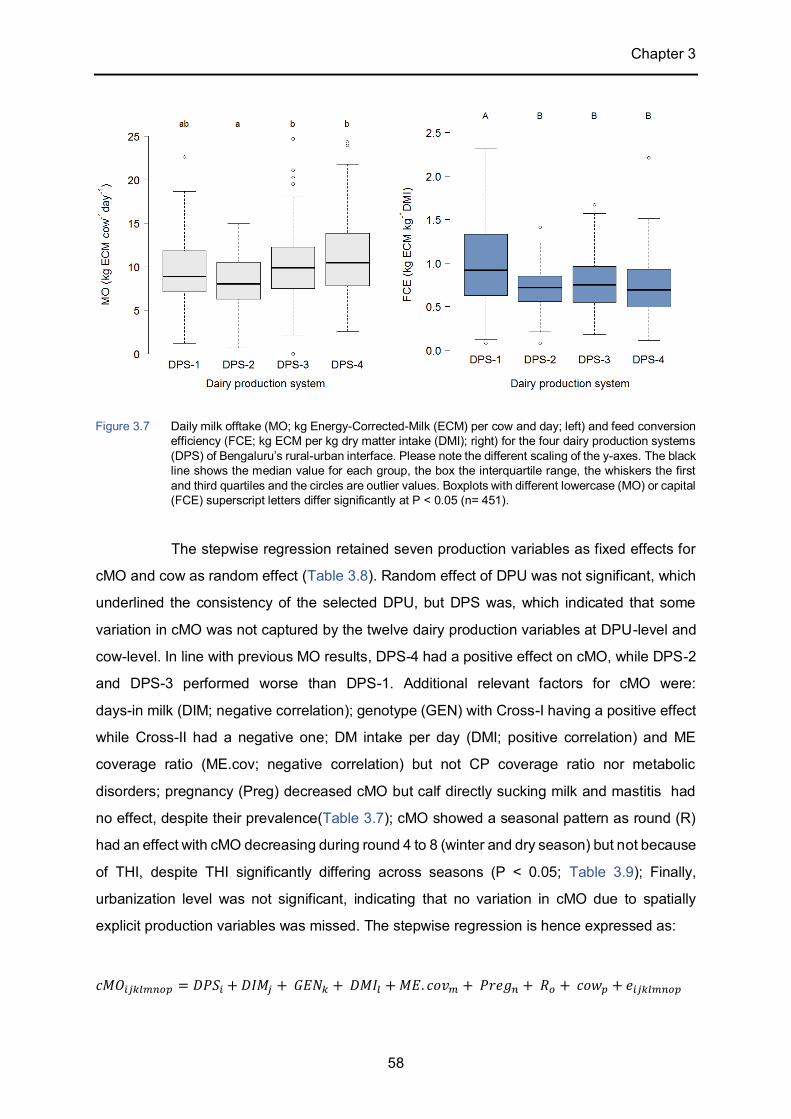
Chapter 3
58
The stepwise regression retained seven production variables as fixed effects for
cMO and cow as random effect (Table 3.8). Random effect of DPU was not significant, which
underlined the consistency of the selected DPU, but DPS was, which indicated that some
variation in cMO was not captured by the twelve dairy production variables at DPU-level and
cow-level. In line with previous MO results, DPS-4 had a positive effect on cMO, while DPS-2
and DPS-3 performed worse than DPS-1. Additional relevant factors for cMO were:
days-in milk (DIM; negative correlation); genotype (GEN) with Cross-I having a positive effect
while Cross-II had a negative one; DM intake per day (DMI; positive correlation) and ME
coverage ratio (ME.cov; negative correlation) but not CP coverage ratio nor metabolic
disorders; pregnancy (Preg) decreased cMO but calf directly sucking milk and mastitis had
no effect, despite their prevalence(Table 3.7); cMO showed a seasonal pattern as round (R)
had an effect with cMO decreasing during round 4 to 8 (winter and dry season) but not because
of THI, despite THI significantly differing across seasons (P < 0.05; Table 3.9); Finally,
urbanization level was not significant, indicating that no variation in cMO due to spatially
explicit production variables was missed. The stepwise regression is hence expressed as:
𝑐𝑀𝑂𝑖𝑗𝑘𝑙𝑚𝑛𝑜𝑝 = 𝐷𝑃𝑆𝑖 + 𝐷𝐼𝑀𝑗 + 𝐺𝐸𝑁𝑘 + 𝐷𝑀𝐼𝑙 + 𝑀𝐸. 𝑐𝑜𝑣𝑚 + 𝑃𝑟𝑒𝑔𝑛 + 𝑅𝑜 + 𝑐𝑜𝑤𝑝 + 𝑒𝑖𝑗𝑘𝑙𝑚𝑛𝑜𝑝
Figure 3.7 Daily milk offtake (MO; kg Energy-Corrected-Milk (ECM) per cow and day; left) and feed conversion efficiency (FCE; kg ECM per kg dry matter intake (DMI); right) for the four dairy production systems (DPS) of Bengaluru’s rural-urban interface. Please note the different scaling of the y-axes. The black line shows the median value for each group, the box the interquartile range, the whiskers the first and third quartiles and the circles are outlier values. Boxplots with different lowercase (MO) or capital (FCE) superscript letters differ significantly at P < 0.05 (n= 451).
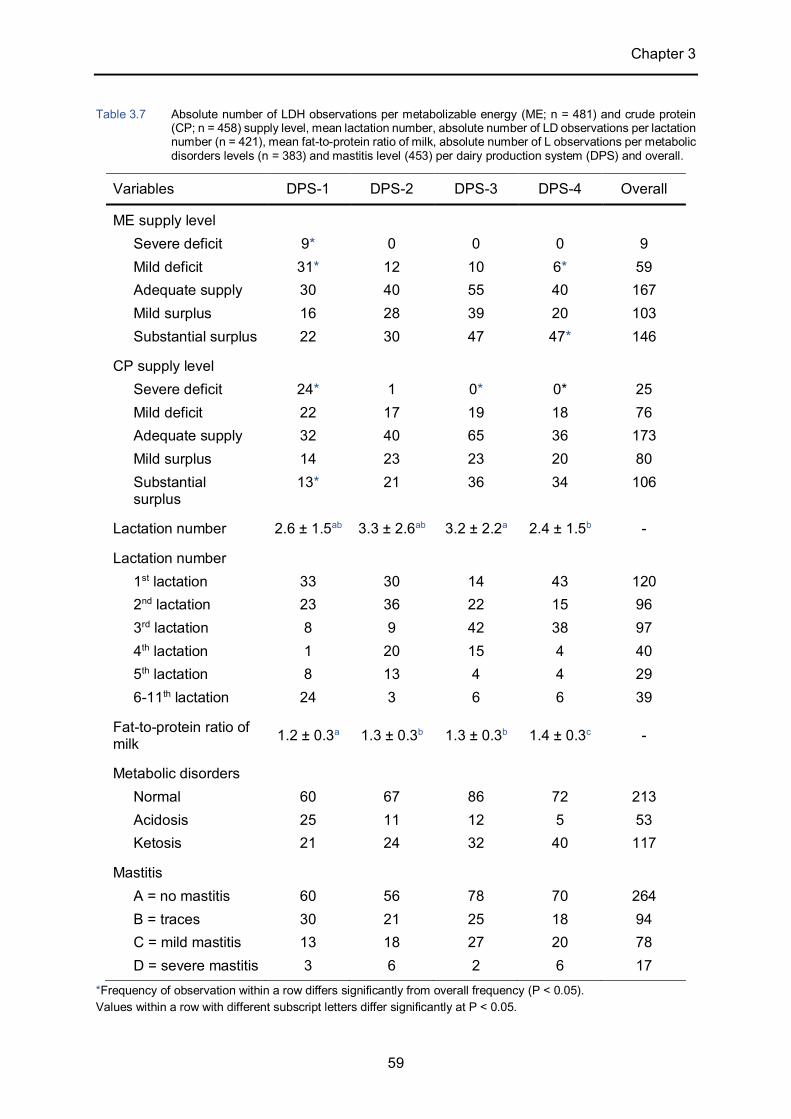
Chapter 3
59
Table 3.7 Absolute number of LDH observations per metabolizable energy (ME; n = 481) and crude protein (CP; n = 458) supply level, mean lactation number, absolute number of LD observations per lactation number (n = 421), mean fat-to-protein ratio of milk, absolute number of L observations per metabolic disorders levels (n = 383) and mastitis level (453) per dairy production system (DPS) and overall.
Variables DPS-1 DPS-2 DPS-3 DPS-4 Overall
ME supply level Severe deficit Mild deficit Adequate supply Mild surplus Substantial surplus
9*
31* 30 16 22
0
12 40 28 30
0
10 55 39 47
0 6* 40 20 47*
9
59 167 103 146
CP supply level Severe deficit Mild deficit Adequate supply Mild surplus Substantial surplus
24* 22 32 14 13*
1
17 40 23 21
0* 19 65 23 36
0* 18 36 20 34
25 76 173 80 106
Lactation number 2.6 ± 1.5ab 3.3 ± 2.6ab 3.2 ± 2.2a 2.4 ± 1.5b -
Lactation number 1st lactation 2nd lactation 3rd lactation 4th lactation 5th lactation 6-11th lactation
33 23 8 1 8
24
30 36 9
20 13 3
14 22 42 15 4 6
43 15 38 4 4 6
120 96 97 40 29 39
Fat-to-protein ratio of milk 1.2 ± 0.3a 1.3 ± 0.3b 1.3 ± 0.3b 1.4 ± 0.3c -
Metabolic disorders Normal Acidosis Ketosis
60 25 21
67 11 24
86 12 32
72 5
40
213 53 117
Mastitis A = no mastitis B = traces C = mild mastitis D = severe mastitis
60 30 13 3
56 21 18 6
78 25 27 2
70 18 20 6
264 94 78 17
*Frequency of observation within a row differs significantly from overall frequency (P < 0.05). Values within a row with different subscript letters differ significantly at P < 0.05.
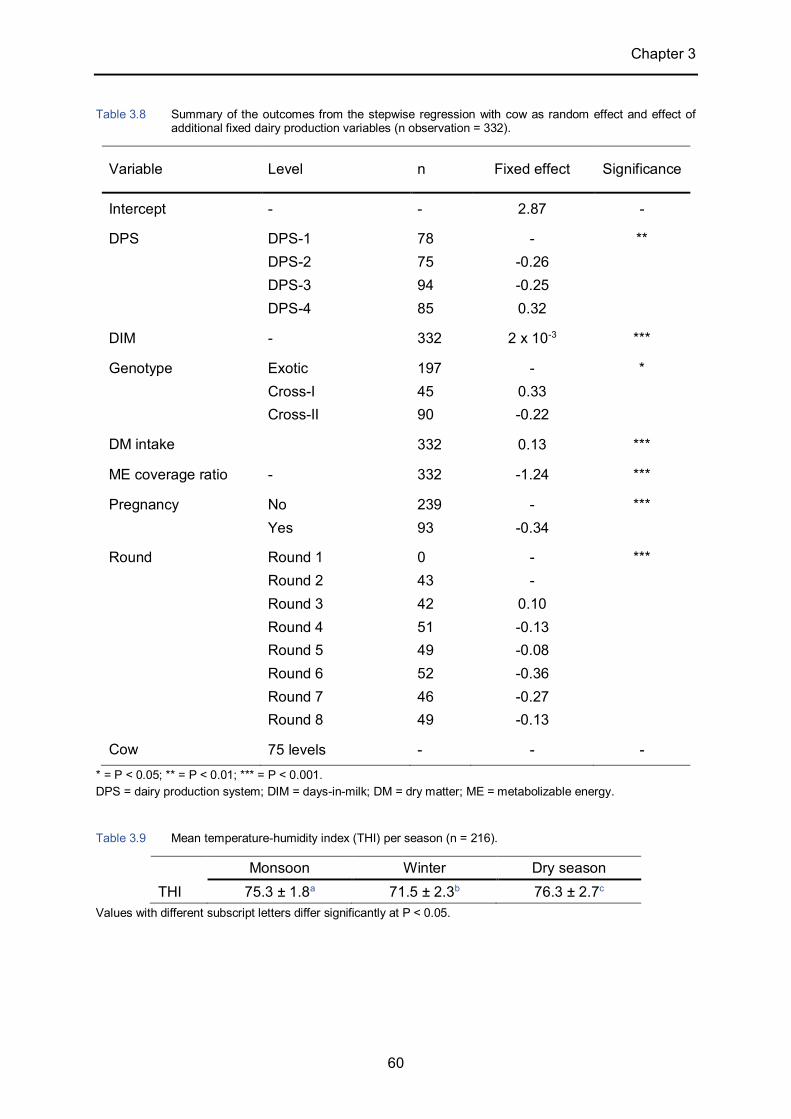
Chapter 3
60
Table 3.8 Summary of the outcomes from the stepwise regression with cow as random effect and effect of additional fixed dairy production variables (n observation = 332).
Variable Level n Fixed effect Significance
Intercept - - 2.87 -
DPS DPS-1 DPS-2 DPS-3 DPS-4
78 75 94 85
- -0.26 -0.25 0.32
**
DIM - 332 2 x 10⁻³ ***
Genotype Exotic Cross-I Cross-II
197 45 90
- 0.33 -0.22
*
DM intake 332 0.13 ***
ME coverage ratio - 332 -1.24 ***
Pregnancy
No Yes
239 93
- -0.34
***
Round Round 1 Round 2 Round 3 Round 4 Round 5 Round 6 Round 7 Round 8
0 43 42 51 49 52 46 49
- -
0.10 -0.13 -0.08 -0.36 -0.27 -0.13
***
Cow 75 levels - - - * = P < 0.05; ** = P < 0.01; *** = P < 0.001. DPS = dairy production system; DIM = days-in-milk; DM = dry matter; ME = metabolizable energy.
Table 3.9 Mean temperature-humidity index (THI) per season (n = 216).
Monsoon Winter Dry season THI 75.3 ± 1.8a 71.5 ± 2.3b 76.3 ± 2.7c
Values with different subscript letters differ significantly at P < 0.05.
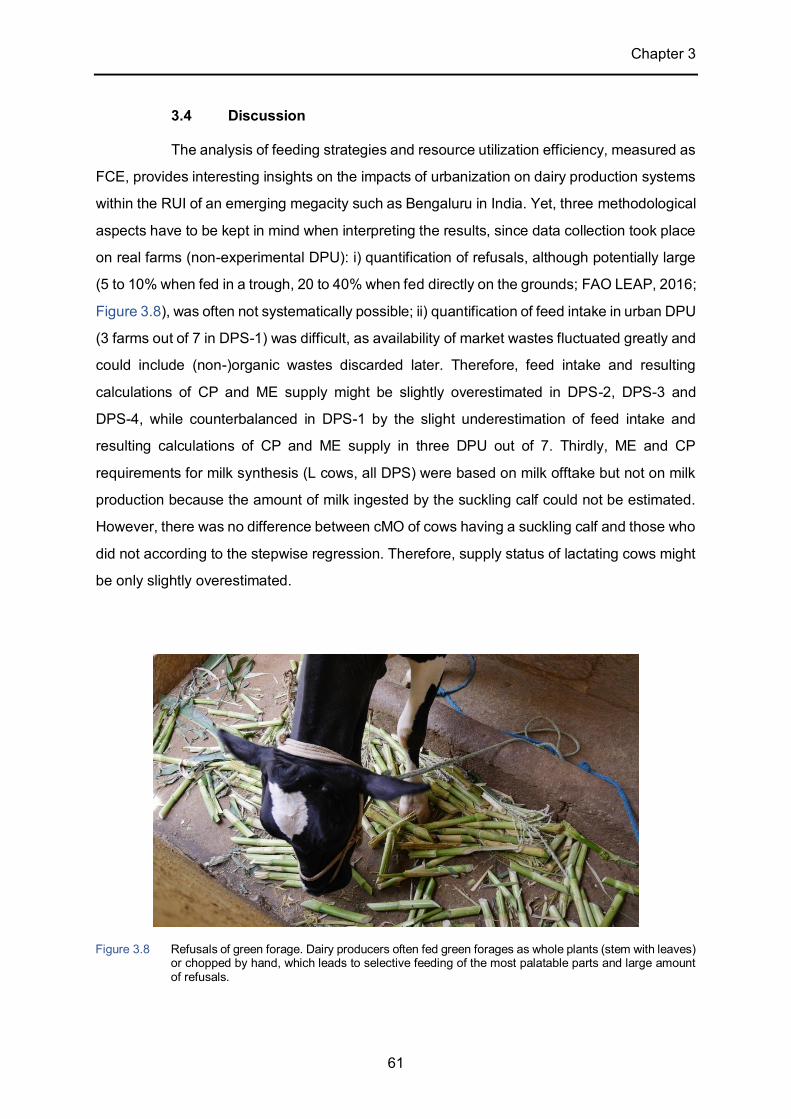
Chapter 3
61
3.4 Discussion
The analysis of feeding strategies and resource utilization efficiency, measured as
FCE, provides interesting insights on the impacts of urbanization on dairy production systems
within the RUI of an emerging megacity such as Bengaluru in India. Yet, three methodological
aspects have to be kept in mind when interpreting the results, since data collection took place
on real farms (non-experimental DPU): i) quantification of refusals, although potentially large
(5 to 10% when fed in a trough, 20 to 40% when fed directly on the grounds; FAO LEAP, 2016;
Figure 3.8), was often not systematically possible; ii) quantification of feed intake in urban DPU
(3 farms out of 7 in DPS-1) was difficult, as availability of market wastes fluctuated greatly and
could include (non-)organic wastes discarded later. Therefore, feed intake and resulting
calculations of CP and ME supply might be slightly overestimated in DPS-2, DPS-3 and
DPS-4, while counterbalanced in DPS-1 by the slight underestimation of feed intake and
resulting calculations of CP and ME supply in three DPU out of 7. Thirdly, ME and CP
requirements for milk synthesis (L cows, all DPS) were based on milk offtake but not on milk
production because the amount of milk ingested by the suckling calf could not be estimated.
However, there was no difference between cMO of cows having a suckling calf and those who
did not according to the stepwise regression. Therefore, supply status of lactating cows might
be only slightly overestimated.
Figure 3.8 Refusals of green forage. Dairy producers often fed green forages as whole plants (stem with leaves) or chopped by hand, which leads to selective feeding of the most palatable parts and large amount of refusals.

Chapter 3
62
The first insight from Bengaluru’s case study is that forage offer to dairy cows and
coverage of their nutritional requirements was not an issue according to the high intake and
coverage values, despite seasonal change in the availability and quality of feedstuff; this was
particularly the case when the management included at least partial reliance on self-cultivated
forage combined with access to pasture (DPS-2 and DPS-3) or even without pasturing
(DPS-4). Lack of own forage production (DPS-1) resulted in an extensive feeding
management with large differences in ME and CP coverage from one cow to another but did
not result in a systematic undersupply of cows. In comparison to intake values reported for
stall feeding plus grazing systems in Mali (Amadou et al., 2015) and Burkina Faso (Schlecht
et al., 2019), Bengaluru’s dairy cows were fed far better and had DM intake values similar to
cattle on intensive urban livestock farms in Niger (Diogo et al., 2010). High DM intake rates,
daily use of concentrate feed and high prevalence of exotic genotypes point to a well-
established dairy sector with respect to input supply (Duncan et al., 2013), market demand
and infrastructures: on one hand, because many Indians are vegetarians (Government of
India, 2014), milk and dairy products remain predominant diet components despite the general
shift towards meat consumption that is usually associated with urbanization (Erler and Dittrich,
2017; Regmi and Dyck, 2001). On the other hand, rural dairy producers (DPS-2, DPS-3 and
DPS-4) were well connected to Bengaluru’s urban (milk) market through the strong network
of settlement-based dairy cooperatives linked to the Karnataka Milk Federation (Cunningham,
2009), whereas urban dairy producers were often marketing some or all of their milk directly.
The second insight from Bengaluru’s case study is that milk production leaves
room for improvement. The average 10.9 kg MO per animal and day in Bengaluru’s most
intensive DPS is well above the reported milk yield of 5.9 kg per day for crossbred cattle in
Bengaluru Urban District (National Dairy Development Board, 2015). The present average MO
is however within the range of 6.7 to 11.0 kg milk offtake per day for European crossbred cows
in Burkina Faso (Schlecht et al., 2019), despite higher feed intakes, ME and CP supply levels
and prevalence of pure exotic genotypes in Bengaluru. Intensification of milk production relies
on optimal feeding and breeding decisions (Diogo et al., 2013; Duncan et al., 2013) plus
adequate health care. Concerning feeding, the low FCE of each of Bengaluru’s DPS was well
below the FCE range of large-scale dairy production in non-tropical countries: based on UK
feeding standards, Beever and Doyle (2007) estimated a FCE range of 1.46 to 1.70 kg ECM
kg-1 DM for a milk production range between 25 and 40 L day-1; Bava et al. (2014) reported an
FCE between 1.22 and 1.36 kg ECM kg-1 DM for a milk production range between 25 L day-1
and 29 L day-1 in three Italian DPS. The negative relationship between ME coverage ratios
Chapter 3
63
and cMO indicates potential for improvement through adjustment of the forage offer (Prasad
et al., 2019). Prevalence of metabolic disorders (44%) within the herds due to unbalanced
diets did not impacted cMO. Concerning animal genetics, native cattle produce on average
2.4 kg of milk per day (National Dairy Development Board, 2015), thus exotic x native
multi-generation crossbreeds have a lower production potential than exotic cattle or first-
generation exotic crossbreeds. Cross-I genotype was relevant for cMO, highlighting an F1
heterosis effect. Bengaluru’s average THI across all seasons (74.3) characterizes a mild heat
stress while the maximum recorded THI (82.5) characterizes severe heat stress (Moran,
2005). Despite the usual negative impact of heat stress on milk yield (West, 2003), THI could
not be linked to cMO. Nevertheless, mastitis prevalence (21%) did also not impact cMO,
despite being a major production disease. Yet mastitis needs to be tackled for animal welfare
reasons.
The third insight from Bengaluru’s case study is that distinct development
pathways and levels of resource utilization efficiency coexisted within its RUI. Distinct
pathways of intensification and extensification, coexisting within the same (peri-)urban areas,
were similarly assessed in West African cities (Roessler et al., 2016) and in Bengaluru. They
were distinguished by trade-offs at farm-level between land and (family) labour: on one hand,
the most intensive dairy producers within Bengaluru’s RUI (DPS-4) did not rely on pasture,
which represented additional labour to self-cultivate forages or financial capital to buy forages.
Semi-intensive dairy producers within Bengaluru’s RUI (DPS-2 and DPS-3) relied on pasture
thus allocating part of their labour to pasture rather than self-cultivation of forages, potentially
decreasing the physical burden of cattle maintenance. The larger share of DMI from pasture
in DPS-2 than in DPS-3 however yielded a lower MO. (Semi-)intensive feeding strategies
yielded only marginal MO increases in DPS-3 and DPS-4 and low FCE. The large share of
oversupplied cattle in DPS-2, DPS-3 and DPS-4 and dry pregnant cows and heifers in general,
also reflected inefficiency in resource utilization. Although balancing their dairy diets would
further reduce nutrient losses (Prasad et al., 2019), dairy producers self-cultivating forages
made efficient use of cow manure by using it on their fields, thus enabling nutrient cycling at
farm level. On the other hand, the most extensive dairy producers within Bengaluru’s RUI
(DPS-1) relied on pasture and green biomass growing on public grounds in rural areas or in
urban areas, organic wastes from markets and non-cultivated green biomass growing around
the numerous lakes of Bengaluru. This extensive feeding management was cheap and
minimized labour related to cattle maintenance, which allowed a potential additional off-farm
income-generating activity. Moreover, it yielded similar MO than (semi-)intensive feeding
Chapter 3
64
management (DPS-3 and DPS-4) and, by taking advantage of an abundant resource naturally
available within the whole RUI, with a minimum resource expenditure, yielded the best FCE
amongst the four DPS. At farm-level, the large difference in ME and CP coverage from one
cow to another however showed that extensive feeding should be matched by an adequate
knowledge of the cows’ requirements. At landscape-level, potential pollution of Bengaluru’s
water bodies due to manure being washed away and neglection of the nutrient cycle due to
the decoupling of crop and dairy production (Daburon et al., 2017; Prasad et al., 2019) showed
that in urban areas, extensive feeding should be matched by an adequate manure
management.
3.5 Conclusions
Bengaluru’s case study sheds light on dairy production within an urbanizing
environment leading to DPS with distinct feeding strategies, intensification levels and resource
utilization efficiency. Extensive resource utilization by dairy producers across Bengaluru’s RUI
lead to higher efficiency in the conversion of ingested feed into milk. By opposition, rural DPS
were (semi-)intensive, and if inputs within the dairy production unit increased, the inefficiency
due to the oversupply of their cattle increased as well, thus their feed conversion efficiency
dropped. To diminish inefficiencies in resources utilization, farmers should make better use of
the production potential of exotic genotypes and increase cattle welfare: i) differential feeding
at farm-level should be emphasized, especially regarding dry pregnant cows and mature heifer
as these seem to be systematically oversupplied; ii) diet imbalances between energy and
protein supply should be tackled; iii) husbandry conditions and hygiene practices should be
upgraded to provide more protection again heat stress and to reduce mastitis prevalence. On
the long term, for Bengaluru’s authorities to support its dairy producers, i) feasibility of small-
scale conservation of abundant green forage resources through drying or ensiling could be
studied to reduce variation in forage availability and increase dairy farmers’ resilience in
periods of low forage availability; ii) feasibility of coupling of urban “landless” DPU with
agricultural production elsewhere in Bengaluru’s RUI could be studied to assure a better
utilization of manure and preservation of the nutrient cycle.
65
4 A system approach to carbon footprint of dairy production
in an urbanizing environment
4.1 Introduction
Greenhouse gas (GHG) emissions are an urgent global environmental problem,
to which livestock supply chains contribute up to 15% (Gerber et al., 2013). Methane (CH4)
has a global warming potential 25 times bigger than carbon dioxide (CO2; IPCC, 2007) and
represents 44% of the sector’s emissions, mostly emitted as part of the ruminants’ digestive
process, namely enteric fermentation (EF; Gerber et al., 2013). The manure management
system (MMS) emits additional CH4 and nitrous oxide (N2O), which has a global warming
potential 298 times bigger than CO2 (IPCC, 2007). The global environmental impact of a
livestock supply chain is calculated as CO2 equivalents (CO2-eq) released per unit of its
output(s), mostly per kilogram milk or meat or both – in that case, one way to allocate the
emissions (Baldini et al., 2017) is based on economic value of each output, another way to
convert both products to edible protein e.g. in Gerber et al. (2011). Being the most common
domestic ruminant species in the world (FAOSTAT, 2019), cattle contribute most to the
sector’s emissions, despite cow milk having a lower emission intensity than beef and milk or
meat from small ruminants (Gerber et al., 2013). Yet, emission intensity of cow milk varies
strongly within and between dairy production systems because productivity and emission
intensity, especially of CH4 and N2O, are strongly correlated: as milk yield increases, emission
intensity decreases. Hence, an improvement of diet quality and to a lesser extent the genetic
makeup of the cows, achieve both productivity gains and emission reduction (Gerber et al.,
2011). The global environmental impact of low-yielding milk production systems (< 2000 kg of
milk per cow and year) is thus disproportionately high in comparison to the global
environmental impact of high-yielding milk production systems, but the formers systems have
more potential to mitigate CO2-eq emissions by improving productivity at cow and herd level
(Gerber et al., 2011; Gerber et al., 2013). Less productive dairy production systems (DPS) are
typically found in the Global South, which globally host a higher number of lactating cows than
developed countries, since the mostly small herds kept by a high share of the population
comprise cows of indigenous breeds with low production potential (FAO, 2020a, 2020b). Since
the 1990s, West Africa and Asia are rapidly urbanizing and in the Global South up to one third
of milk is now produced by (peri-)urban DPS (FAO, 2020b; UN, 2018a), such as in Burkina
Faso and Ghana (Dossa et al., 2015; Roessler et al., 2016), Ethiopia (D'Haene and D’Haese,
2019) or Egypt (Daburon et al., 2017). (Peri-)urban DPS alleviate the constraints of urban
Chapter 4
66
livestock husbandry (Butler, 2012) and of (peri-)urban areas where land is increasingly scarce
and expensive, by the daily provision of a highly perishable and nutritionally important product
(Schlecht et al., 2019). Coexisting (peri-)urban DPS in Ouagadougou, Burkina Faso, and in
Tamale, Ghana, showed distinct trends of both, intensification and extensification of milk
production (Roessler et al., 2016). Despite (peri-)urban DPS supplying primarily the demand
on local milk markets, the GHG they emit have a global environmental impact. To assess the
(global) environmental impact of dairy production systems, life cycle assessment (LCA) has
become the method of choice, as it can, among others, account for a system’s intensification
level (Bartl et al., 2011; Bava et al., 2014; Udo et al., 2016).
India is the second largest cow milk producer in the world since 1999, mostly
because it also has the second largest cattle population in the world (FAOSTAT, 2019). Its
dairy sector is dominated by smallholders: 80% of the dairy animals are kept in herds of 2 to
5 cows (Cunningham, 2009). Overall productivity is low: cows of the native breeds have a
minimum average annual milk yield of 649 litres and a maximum of 818 litres, while
crossbreeds between native and European cattle yield between 2190 litres (minimum
average) and 2670 litres (maximum average) of milk per year (Duncan et al., 2013). In rural
areas where dairy and crop production are coupled at farm level, manure is used on the fields
as organic fertilizer and farmers cultivate forages themselves with little mechanization (Prasad
et al., 2019). (Peri-)urban dairy production exists even in the biggest Indian cities (Delhi,
Mumbai, Bengaluru) and is typically “landless”: (peri-)urban dairy producers do not cultivate
land and rather than buying forages from rural areas they typically rely on locally available
feed resources: public grounds are used as pasture, green biomass naturally growing around
(peri-)urban lakes is harvested and fed on-farm and organic wastes from fruit and vegetable
markets are also used as feedstuffs (Prasad et al., 2019). Because of the decoupling of dairy
and crop production in (peri-)urban areas, however, manure management is problematic and
nutrients contained therein are wasted (Prasad et al., 2019). Yet, the proximity to the city
potentially improves market quality by easing the access of (peri-)urban dairy producers to
production inputs and output marketing channels, enabling an intensification of their dairy
production (Duncan et al., 2013).
Given that India has the largest dairy herd in the world, and hence, a massive
contribution to global GHG emissions, in view of the correlation between productivity at farm
level and emission intensity the following research question arises: does the emission intensity
of four Indian DPS that coexist within the same urbanizing environment differ according to
their intensification level and spatially explicit distribution? To answer this question, the
Chapter 4
67
emission intensity for each of the four previously identified DPS that coexist within Bengaluru’s
RUI (Chapter 2) was assessed as the carbon footprint (CF; all emissions calculated as
CO2-eq) of milk due to CH4 and N2O emissions from EF and MMS. Our dataset included 855
nutritional records from 147 dairy cattle, collected over one year, from four DPS previously
identified in the rural-urban interface (RUI) of Bengaluru, India.
4.2 Materials and methods
4.2.1 Research area and dairy production systems
Bengaluru is the capital of the Indian southern state of Karnataka and one of the
emerging megacities of these last decades: its population grew at a 4% annual rate in average
between 2000 and 2018 and is currently over 10 million (United Nations, 2018b). Bengaluru’s
climate is hot semi-arid with a dry season (March-May) followed by a monsoon season
(June-October) and winter (November-February). Monthly temperatures range between
18.5°C and 29.5°C and annual rainfall reaches 948 mm (average for 2013-2017, weather
station data of the University of Agricultural Sciences Bangalore, GKVK campus). The
administrative district of Bengaluru Urban has a bovine population of 145 000 heads (National
Dairy Development Board, 2015). To assess dairy production practices in relation to the
rapidly urbanizing environment, two research transects were established along a northern and
a southern urban to rural gradient (Hoffmann et al., 2017) and 337 dairy production units
(DPU) were surveyed. Four DPS (Table 3.1) were thus identified within Bengaluru’s RUI based
on three characteristics: i) a DPU’s spatial location within Bengaluru’s RUI as a proxy for the
urbanization level (urban, peri-urban, rural) of its surroundings; ii) a DPU’s feeding
management: reliance, at least partially, on self-cultivated forages or pasture or both; and iii)
a DPU’s breeding management: cattle inflow (bought) or outflow (sold) or both within the herd,
and genotypes kept. Exotic genotypes included Holstein Friesian (HF, 54% of all cattle in the
survey) and Jersey (15%) cattle by opposition to native genotypes (10%; mostly Bos indicus
Hallikar, a draught breed from the State of Karnataka producing 2.4 kg milk cow-1 day-1;
National Dairy Development Board, 2015). Crossbreeds (21%) ranged from exotic or
exotic x native first-generation to multi-generation crosses. Dairy cattle were categorized as
lactating cow, dry cow, heifer, young cattle (immature heifer) and calf (3-6 months old); a herd
typically included 3.0 ± 1.5 cows (lactating or dry) plus mature heifers (pregnant or inseminated
at least once) and 1.3 ± 1.2 non-productive dairy cattle (calves or immature heifers).

Chapter 4
68
4.2.2 Data collection
Per DPS, seven DPU were selected (Chapter 3) and visited eight times at a
6-week interval between June 2017 and May 2018, further referred to as round. The length of
each round was fixed across DPS but varied from one round to another: round 1 equalled 50
days, rounds 2 and 3 43 days, round 4 47 days, round 5 50 days, round 6 44 days, round 7
42 days, and round 8 46 days. Four DPU, one per DPS, were excluded because of incomplete
datasets. Data were collected at cow-level with a focus on the DPU’s feeding practices
following Schlecht et al. (2019). Variables quantified at each visit for all dairy cattle
included: 24-hour feedstuff offer (considered to equal daily feed intake at the farm, since
refusals were often difficult to quantify because of DPU’s feeding practices), pasture time,
quality of feedstuffs (concentrations of dry matter (DM), metabolizable energy (ME), digestible
organic matter (DOM), crude protein (CP), neutral detergent fibre (NDF) and acid detergent
fibre (ADF); 321 analysed feed samples (for analytical procedures see section 3.2.3, for quality
see Table 4.1), daily milk offtake (kg milk cow-1 day-1), fat and protein content of milk, and heart
girth of the animal (HG; in cm). Gross energy intake (GE) was calculated based on
metabolizable energy intake and DOM (Chapter 3; Hales, 2019). Intake at pasture was
estimated from eating time observed on pasture (Chapter 3) and an intake rate of 8 g DM per
kg metabolic weight (Ayantunde et al., 2002). DOM of pasture biomass was based on the
analysis of 32 samples of non-cultivated grasses (collected by dairy producers from public
spaces for on-farm feeding) plus, in urban areas where cows had also access to household
or market organic wastes dumped in the streets, 3 samples of vegetables and fruit mixes
(weighted average value 50:50). Excretion of faeces (further referred to as manure) was
calculated from the amount of DM ingested per day and DOM (kg manure cattle-1 day-1).
Individual body weight (BW), metabolic weight and daily weight gain (Δ kg BW day -1), were
calculated based on a HG to BW regression (kg BW = -3.867 + 2.98 × log10 (HG); 569 weight
records; R2 = 0.9846; Grund, 2018). The date of last calving was asked for each cow in round
1 or, if calving occurred later, during the round following calving, while the length of dry and
lactation period was calculated as an average for each DPS.
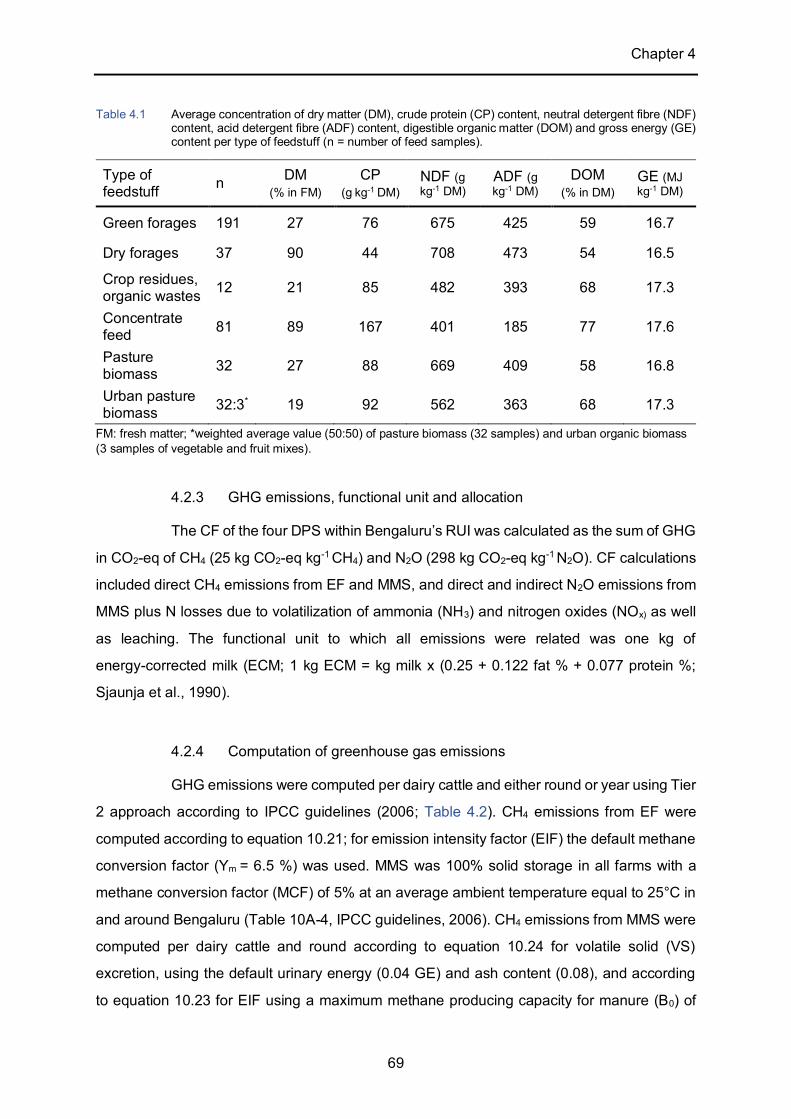
Chapter 4
69
Table 4.1 Average concentration of dry matter (DM), crude protein (CP) content, neutral detergent fibre (NDF) content, acid detergent fibre (ADF) content, digestible organic matter (DOM) and gross energy (GE) content per type of feedstuff (n = number of feed samples).
Type of feedstuff n DM
(% in FM) CP
(g kg-1 DM) NDF (g kg-1 DM)
ADF (g kg-1 DM)
DOM (% in DM)
GE (MJ kg-1 DM)
Green forages 191 27 76 675 425 59 16.7
Dry forages 37 90 44 708 473 54 16.5
Crop residues, organic wastes 12 21 85 482 393 68 17.3
Concentrate feed 81 89 167 401 185 77 17.6
Pasture biomass 32 27 88 669 409 58 16.8
Urban pasture biomass 32:3* 19 92 562 363 68 17.3
FM: fresh matter; *weighted average value (50:50) of pasture biomass (32 samples) and urban organic biomass (3 samples of vegetable and fruit mixes).
4.2.3 GHG emissions, functional unit and allocation
The CF of the four DPS within Bengaluru’s RUI was calculated as the sum of GHG
in CO2-eq of CH4 (25 kg CO2-eq kg-1 CH4) and N2O (298 kg CO2-eq kg-1 N2O). CF calculations
included direct CH4 emissions from EF and MMS, and direct and indirect N2O emissions from
MMS plus N losses due to volatilization of ammonia (NH3) and nitrogen oxides (NOx) as well
as leaching. The functional unit to which all emissions were related was one kg of
energy-corrected milk (ECM; 1 kg ECM = kg milk x (0.25 + 0.122 fat % + 0.077 protein %;
Sjaunja et al., 1990).
4.2.4 Computation of greenhouse gas emissions
GHG emissions were computed per dairy cattle and either round or year using Tier
2 approach according to IPCC guidelines (2006; Table 4.2). CH4 emissions from EF were
computed according to equation 10.21; for emission intensity factor (EIF) the default methane
conversion factor (Ym = 6.5 %) was used. MMS was 100% solid storage in all farms with a
methane conversion factor (MCF) of 5% at an average ambient temperature equal to 25°C in
and around Bengaluru (Table 10A-4, IPCC guidelines, 2006). CH4 emissions from MMS were
computed per dairy cattle and round according to equation 10.24 for volatile solid (VS)
excretion, using the default urinary energy (0.04 GE) and ash content (0.08), and according
to equation 10.23 for EIF using a maximum methane producing capacity for manure (B0) of

Chapter 4
70
0.13 (Table 10A-4, IPCC guidelines, 2006). The nitrogen consumption was computed
according to equation 10.32, N retention according to equation 10.33 and N excretion
according to equation 10.31. Direct N2O emissions from MMS were computed according to
equation 10.25. Indirect N losses from MMS due to volatilisation via NH3 and NOx were
computed according to equation 10.26, N losses due to leaching according to equation 10.28,
and indirect N2O emissions due to volatilisation or leaching of N according to equations 10.27
and 10.29. The default value (0.005 kg N2O-N kg-1 of N excreted; Table 10.21, IPCC
guidelines, 2006) was used for EIF of direct N2O emissions from solid storage MMS. The
default value (FracGasMS = 30%; Table 10.22, IPCC guidelines, 2006) was used for N
volatilisation from MMS via NH3 and NOx. The default value (Fracleach = 30%; Table 11.3, IPCC
guidelines, 2006) was used for N leaching from MMS during the rainy season. Because of the
limited number of DPU replicates per DPS, methane and nitrous oxide emissions, milk offtake
and CF were computed both per round and year. As round lengths were variable (see above),
this introduced variability within DPS but did neither prevent comparison between DPS as the
level of introduced variability was fixed across DPS, nor did it affect the calculated carbon
footprint as the latter is a ratio. Results per round are discussed in detail, while an average
result per year, irrespective of DPS, is used for comparison with other CF and whole LCA
studies.
Table 4.2 Items computed, unit, equation number (#) in IPCC guidelines (2006) and parameter values used to calculate methane (CH4) and nitrous oxide (N2O) emissions.
Item Unit IPCC Equation # Parameter value CH4 - Enteric fermentation Emission intensity factor kg CH4 head-1
round-1 10.21 Ym = 6.5%
CH4 - MMS Volatile solid excretion rate
kg VS day-1 10.24 Urinary energy
= 0.04 GE Ash = 0.08
Emission intensity factor kg CH4 head-1
round-1 10.23 Bo = 0.13
MCF = 5% MS = 100%
N consumption kg N head-1 round-1 10.32
N retention kg N head-1 round-1 10.33
N excretion kg N head-1 round-1 10.31
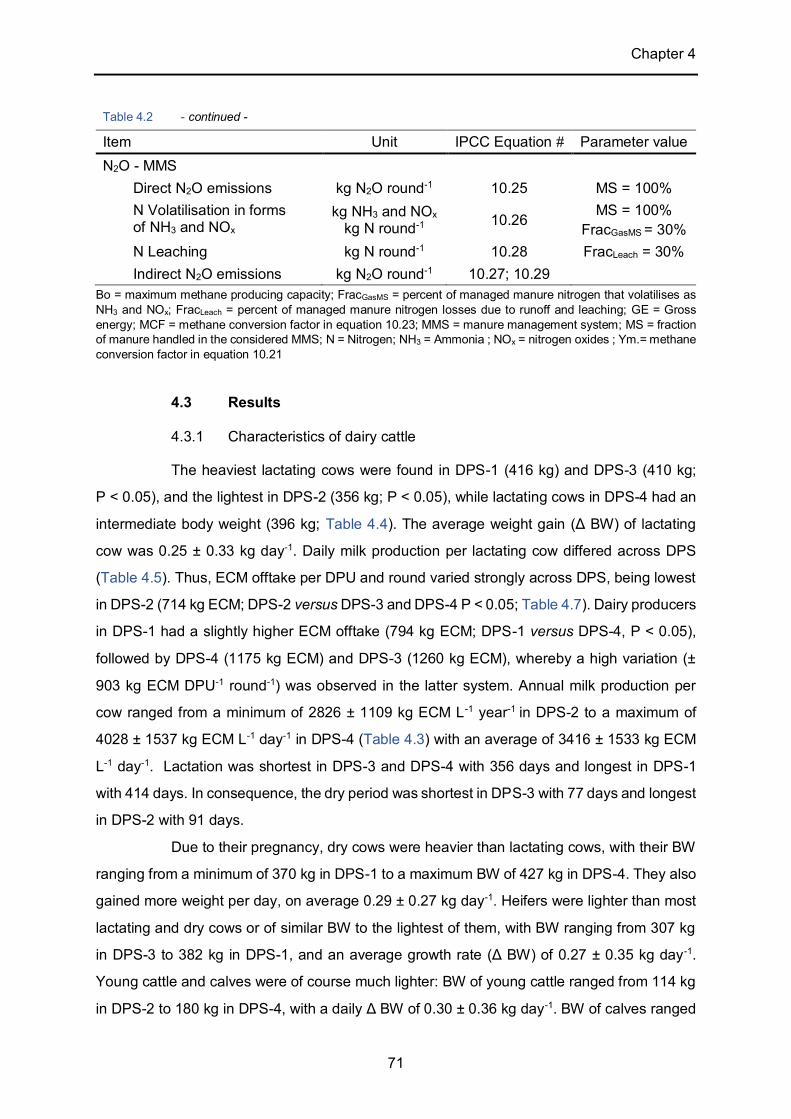
Chapter 4
71
Table 4.2 - continued - Item Unit IPCC Equation # Parameter value N2O - MMS Direct N2O emissions kg N2O round-1 10.25 MS = 100% N Volatilisation in forms of NH3 and NOx
kg NH3 and NOx kg N round-1 10.26 MS = 100%
FracGasMS = 30% N Leaching kg N round-1 10.28 FracLeach = 30% Indirect N2O emissions kg N2O round-1 10.27; 10.29
Bo = maximum methane producing capacity; FracGasMS = percent of managed manure nitrogen that volatilises as NH3 and NOx; FracLeach = percent of managed manure nitrogen losses due to runoff and leaching; GE = Gross energy; MCF = methane conversion factor in equation 10.23; MMS = manure management system; MS = fraction of manure handled in the considered MMS; N = Nitrogen; NH3 = Ammonia ; NOx = nitrogen oxides ; Ym.= methane conversion factor in equation 10.21
4.3 Results
4.3.1 Characteristics of dairy cattle
The heaviest lactating cows were found in DPS-1 (416 kg) and DPS-3 (410 kg;
P < 0.05), and the lightest in DPS-2 (356 kg; P < 0.05), while lactating cows in DPS-4 had an
intermediate body weight (396 kg; Table 4.4). The average weight gain (Δ BW) of lactating
cow was 0.25 ± 0.33 kg day-1. Daily milk production per lactating cow differed across DPS
(Table 4.5). Thus, ECM offtake per DPU and round varied strongly across DPS, being lowest
in DPS-2 (714 kg ECM; DPS-2 versus DPS-3 and DPS-4 P < 0.05; Table 4.7). Dairy producers
in DPS-1 had a slightly higher ECM offtake (794 kg ECM; DPS-1 versus DPS-4, P < 0.05),
followed by DPS-4 (1175 kg ECM) and DPS-3 (1260 kg ECM), whereby a high variation (±
903 kg ECM DPU-1 round-1) was observed in the latter system. Annual milk production per
cow ranged from a minimum of 2826 ± 1109 kg ECM L-1 year-1 in DPS-2 to a maximum of
4028 ± 1537 kg ECM L-1 day-1 in DPS-4 (Table 4.3) with an average of 3416 ± 1533 kg ECM
L-1 day-1. Lactation was shortest in DPS-3 and DPS-4 with 356 days and longest in DPS-1
with 414 days. In consequence, the dry period was shortest in DPS-3 with 77 days and longest
in DPS-2 with 91 days.
Due to their pregnancy, dry cows were heavier than lactating cows, with their BW
ranging from a minimum of 370 kg in DPS-1 to a maximum BW of 427 kg in DPS-4. They also
gained more weight per day, on average 0.29 ± 0.27 kg day-1. Heifers were lighter than most
lactating and dry cows or of similar BW to the lightest of them, with BW ranging from 307 kg
in DPS-3 to 382 kg in DPS-1, and an average growth rate (Δ BW) of 0.27 ± 0.35 kg day-1.
Young cattle and calves were of course much lighter: BW of young cattle ranged from 114 kg
in DPS-2 to 180 kg in DPS-4, with a daily Δ BW of 0.30 ± 0.36 kg day-1. BW of calves ranged
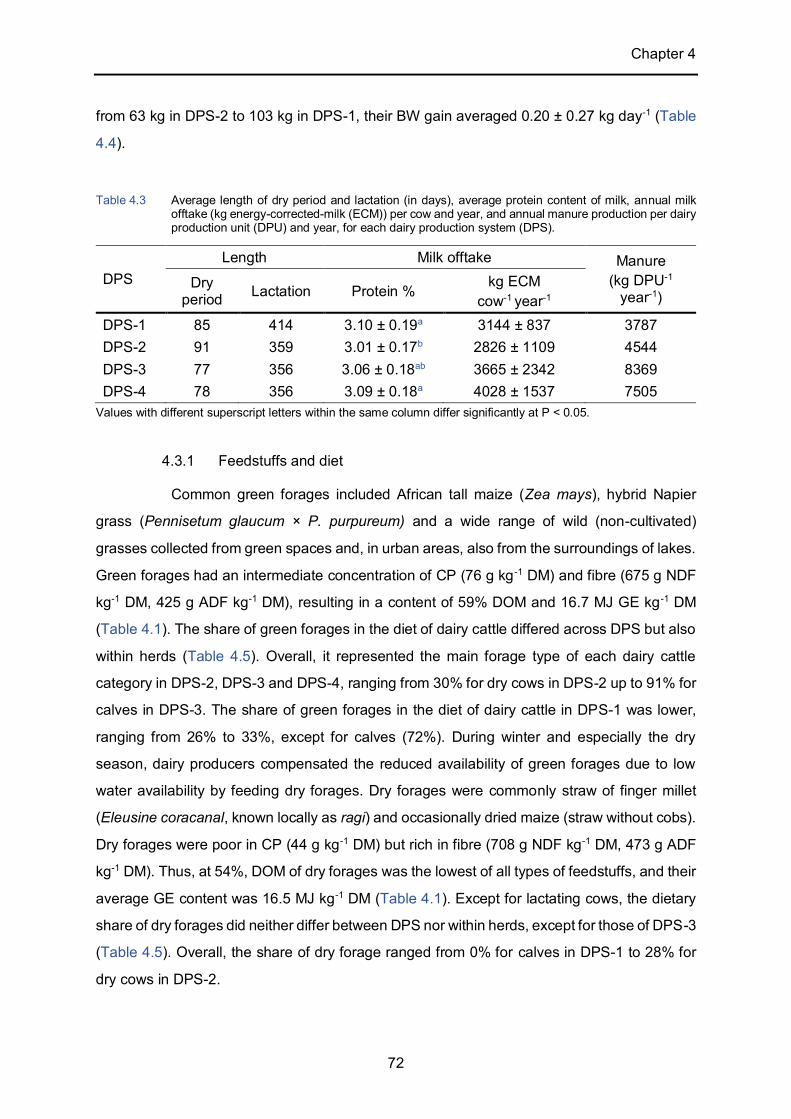
Chapter 4
72
from 63 kg in DPS-2 to 103 kg in DPS-1, their BW gain averaged 0.20 ± 0.27 kg day-1 (Table
4.4).
Table 4.3 Average length of dry period and lactation (in days), average protein content of milk, annual milk offtake (kg energy-corrected-milk (ECM)) per cow and year, and annual manure production per dairy production unit (DPU) and year, for each dairy production system (DPS).
DPS Length Milk offtake Manure
(kg DPU-1
year-1) Dry
period Lactation Protein % kg ECM cow-1 year-1
DPS-1 85 414 3.10 ± 0.19a 3144 ± 837 3787 DPS-2 91 359 3.01 ± 0.17b 2826 ± 1109 4544 DPS-3 77 356 3.06 ± 0.18ab 3665 ± 2342 8369 DPS-4 78 356 3.09 ± 0.18a 4028 ± 1537 7505
Values with different superscript letters within the same column differ significantly at P < 0.05.
4.3.1 Feedstuffs and diet
Common green forages included African tall maize (Zea mays), hybrid Napier
grass (Pennisetum glaucum × P. purpureum) and a wide range of wild (non-cultivated)
grasses collected from green spaces and, in urban areas, also from the surroundings of lakes.
Green forages had an intermediate concentration of CP (76 g kg -1 DM) and fibre (675 g NDF
kg-1 DM, 425 g ADF kg-1 DM), resulting in a content of 59% DOM and 16.7 MJ GE kg-1 DM
(Table 4.1). The share of green forages in the diet of dairy cattle differed across DPS but also
within herds (Table 4.5). Overall, it represented the main forage type of each dairy cattle
category in DPS-2, DPS-3 and DPS-4, ranging from 30% for dry cows in DPS-2 up to 91% for
calves in DPS-3. The share of green forages in the diet of dairy cattle in DPS-1 was lower,
ranging from 26% to 33%, except for calves (72%). During winter and especially the dry
season, dairy producers compensated the reduced availability of green forages due to low
water availability by feeding dry forages. Dry forages were commonly straw of finger millet
(Eleusine coracanal, known locally as ragi) and occasionally dried maize (straw without cobs).
Dry forages were poor in CP (44 g kg-1 DM) but rich in fibre (708 g NDF kg-1 DM, 473 g ADF
kg-1 DM). Thus, at 54%, DOM of dry forages was the lowest of all types of feedstuffs, and their
average GE content was 16.5 MJ kg-1 DM (Table 4.1). Except for lactating cows, the dietary
share of dry forages did neither differ between DPS nor within herds, except for those of DPS-3
(Table 4.5). Overall, the share of dry forage ranged from 0% for calves in DPS-1 to 28% for
dry cows in DPS-2.
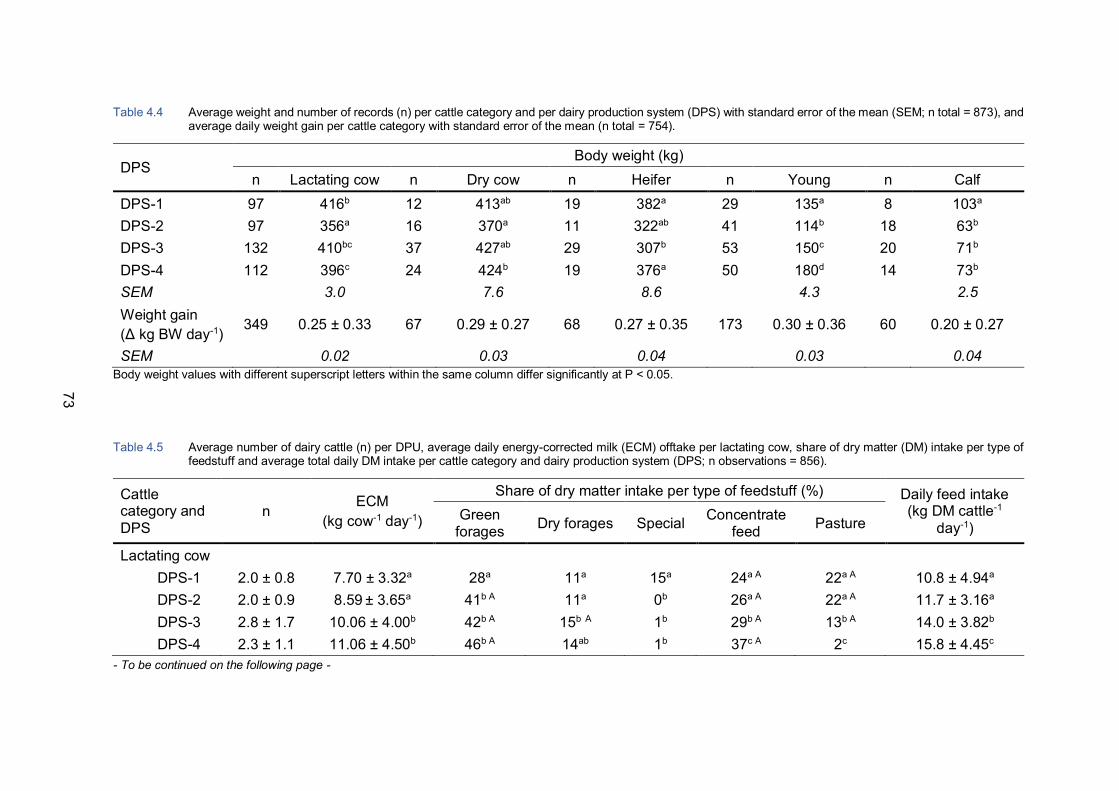
73
Table 4.4 Average weight and number of records (n) per cattle category and per dairy production system (DPS) with standard error of the mean (SEM; n total = 873), and average daily weight gain per cattle category with standard error of the mean (n total = 754).
DPS Body weight (kg)
n Lactating cow n Dry cow n Heifer n Young n Calf DPS-1 97 416b 12 413ab 19 382a 29 135a 8 103a DPS-2 97 356a 16 370a 11 322ab 41 114b 18 63b DPS-3 132 410bc 37 427ab 29 307b 53 150c 20 71b DPS-4 112 396c 24 424b 19 376a 50 180d 14 73b SEM 3.0 7.6 8.6 4.3 2.5 Weight gain (Δ kg BW day-1) 349 0.25 ± 0.33 67 0.29 ± 0.27 68 0.27 ± 0.35 173 0.30 ± 0.36 60 0.20 ± 0.27
SEM 0.02 0.03 0.04 0.03 0.04 Body weight values with different superscript letters within the same column differ significantly at P < 0.05.
Table 4.5 Average number of dairy cattle (n) per DPU, average daily energy-corrected milk (ECM) offtake per lactating cow, share of dry matter (DM) intake per type of
feedstuff and average total daily DM intake per cattle category and dairy production system (DPS; n observations = 856).
Cattle category and DPS
n ECM (kg cow-1 day-1)
Share of dry matter intake per type of feedstuff (%) Daily feed intake (kg DM cattle-1
day-1) Green
forages Dry forages Special Concentrate feed Pasture
Lactating cow DPS-1 2.0 ± 0.8 7.70 ± 3.32a 28a 11a 15a 24a A 22a A 10.8 ± 4.94a DPS-2 2.0 ± 0.9 8.59 ± 3.65a 41b A 11a 0b 26a A 22a A 11.7 ± 3.16a DPS-3 2.8 ± 1.7 10.06 ± 4.00b 42b A 15b A 1b 29b A 13b A 14.0 ± 3.82b DPS-4 2.3 ± 1.1 11.06 ± 4.50b 46b A 14ab 1b 37c A 2c 15.8 ± 4.45c
- To be continued on the following page -
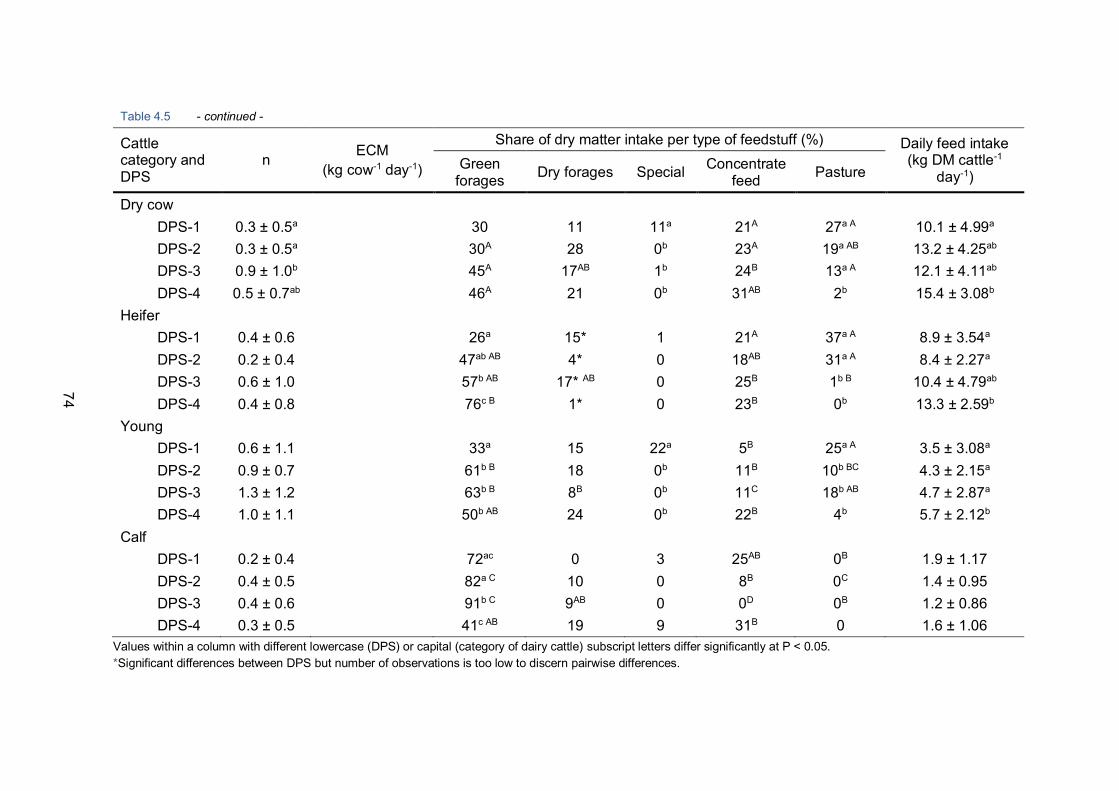
74
Table 4.5 - continued -
Cattle category and DPS
n ECM (kg cow-1 day-1)
Share of dry matter intake per type of feedstuff (%) Daily feed intake (kg DM cattle-1
day-1) Green
forages Dry forages Special Concentrate feed Pasture
Dry cow DPS-1 0.3 ± 0.5a 30 11 11a 21A 27a A 10.1 ± 4.99a DPS-2 0.3 ± 0.5a 30A 28 0b 23A 19a AB 13.2 ± 4.25ab DPS-3 0.9 ± 1.0b 45A 17AB 1b 24B 13a A 12.1 ± 4.11ab DPS-4 0.5 ± 0.7ab 46A 21 0b 31AB 2b 15.4 ± 3.08b Heifer DPS-1 0.4 ± 0.6 26a 15* 1 21A 37a A 8.9 ± 3.54a DPS-2 0.2 ± 0.4 47ab AB 4* 0 18AB 31a A 8.4 ± 2.27a DPS-3 0.6 ± 1.0 57b AB 17* AB 0 25B 1b B 10.4 ± 4.79ab DPS-4 0.4 ± 0.8 76c B 1* 0 23B 0b 13.3 ± 2.59b Young DPS-1 0.6 ± 1.1 33a 15 22a 5B 25a A 3.5 ± 3.08a DPS-2 0.9 ± 0.7 61b B 18 0b 11B 10b BC 4.3 ± 2.15a DPS-3 1.3 ± 1.2 63b B 8B 0b 11C 18b AB 4.7 ± 2.87a DPS-4 1.0 ± 1.1 50b AB 24 0b 22B 4b 5.7 ± 2.12b Calf DPS-1 0.2 ± 0.4 72ac 0 3 25AB 0B 1.9 ± 1.17 DPS-2 0.4 ± 0.5 82a C 10 0 8B 0C 1.4 ± 0.95 DPS-3 0.4 ± 0.6 91b C 9AB 0 0D 0B 1.2 ± 0.86 DPS-4 0.3 ± 0.5 41c AB 19 9 31B 0 1.6 ± 1.06
Values within a column with different lowercase (DPS) or capital (category of dairy cattle) subscript letters differ significantly at P < 0.05. *Significant differences between DPS but number of observations is too low to discern pairwise differences.
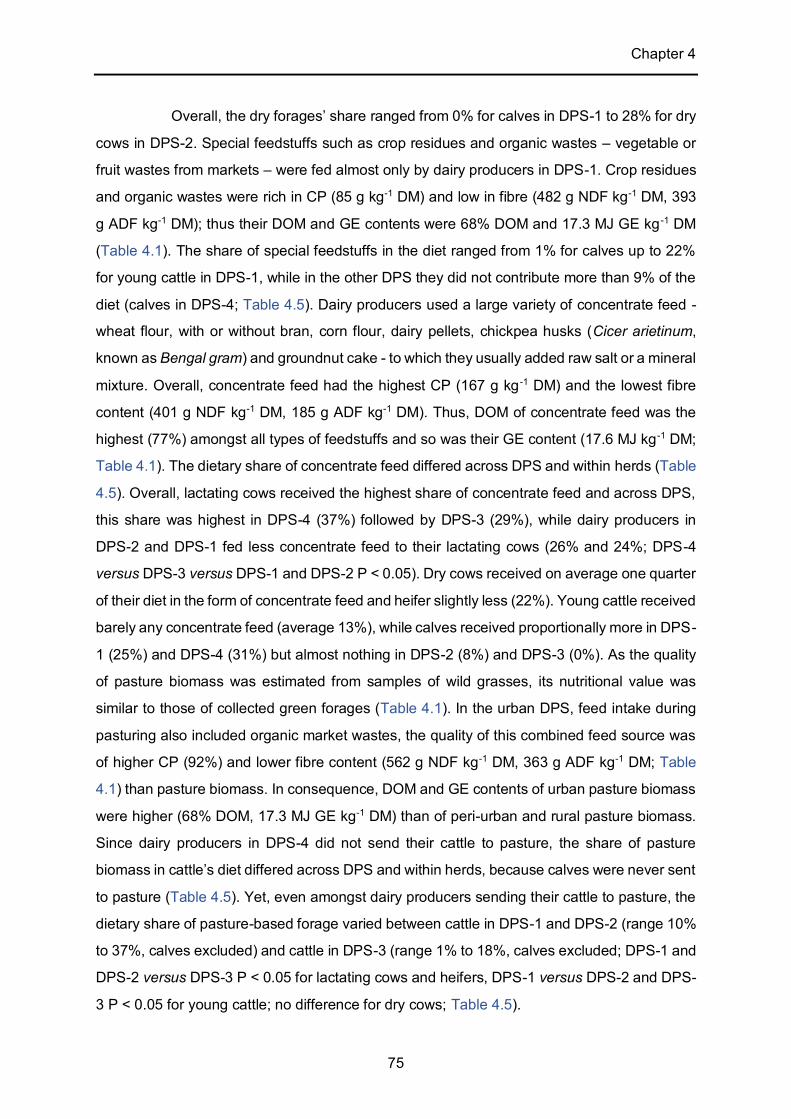
Chapter 4
75
Overall, the dry forages’ share ranged from 0% for calves in DPS-1 to 28% for dry
cows in DPS-2. Special feedstuffs such as crop residues and organic wastes – vegetable or
fruit wastes from markets – were fed almost only by dairy producers in DPS-1. Crop residues
and organic wastes were rich in CP (85 g kg-1 DM) and low in fibre (482 g NDF kg-1 DM, 393
g ADF kg-1 DM); thus their DOM and GE contents were 68% DOM and 17.3 MJ GE kg -1 DM
(Table 4.1). The share of special feedstuffs in the diet ranged from 1% for calves up to 22%
for young cattle in DPS-1, while in the other DPS they did not contribute more than 9% of the
diet (calves in DPS-4; Table 4.5). Dairy producers used a large variety of concentrate feed -
wheat flour, with or without bran, corn flour, dairy pellets, chickpea husks (Cicer arietinum,
known as Bengal gram) and groundnut cake - to which they usually added raw salt or a mineral
mixture. Overall, concentrate feed had the highest CP (167 g kg -1 DM) and the lowest fibre
content (401 g NDF kg-1 DM, 185 g ADF kg-1 DM). Thus, DOM of concentrate feed was the
highest (77%) amongst all types of feedstuffs and so was their GE content (17.6 MJ kg-1 DM;
Table 4.1). The dietary share of concentrate feed differed across DPS and within herds (Table
4.5). Overall, lactating cows received the highest share of concentrate feed and across DPS,
this share was highest in DPS-4 (37%) followed by DPS-3 (29%), while dairy producers in
DPS-2 and DPS-1 fed less concentrate feed to their lactating cows (26% and 24%; DPS-4
versus DPS-3 versus DPS-1 and DPS-2 P < 0.05). Dry cows received on average one quarter
of their diet in the form of concentrate feed and heifer slightly less (22%). Young cattle received
barely any concentrate feed (average 13%), while calves received proportionally more in DPS-
1 (25%) and DPS-4 (31%) but almost nothing in DPS-2 (8%) and DPS-3 (0%). As the quality
of pasture biomass was estimated from samples of wild grasses, its nutritional value was
similar to those of collected green forages (Table 4.1). In the urban DPS, feed intake during
pasturing also included organic market wastes, the quality of this combined feed source was
of higher CP (92%) and lower fibre content (562 g NDF kg-1 DM, 363 g ADF kg-1 DM; Table
4.1) than pasture biomass. In consequence, DOM and GE contents of urban pasture biomass
were higher (68% DOM, 17.3 MJ GE kg-1 DM) than of peri-urban and rural pasture biomass.
Since dairy producers in DPS-4 did not send their cattle to pasture, the share of pasture
biomass in cattle’s diet differed across DPS and within herds, because calves were never sent
to pasture (Table 4.5). Yet, even amongst dairy producers sending their cattle to pasture, the
dietary share of pasture-based forage varied between cattle in DPS-1 and DPS-2 (range 10%
to 37%, calves excluded) and cattle in DPS-3 (range 1% to 18%, calves excluded; DPS-1 and
DPS-2 versus DPS-3 P < 0.05 for lactating cows and heifers, DPS-1 versus DPS-2 and DPS-
3 P < 0.05 for young cattle; no difference for dry cows; Table 4.5).
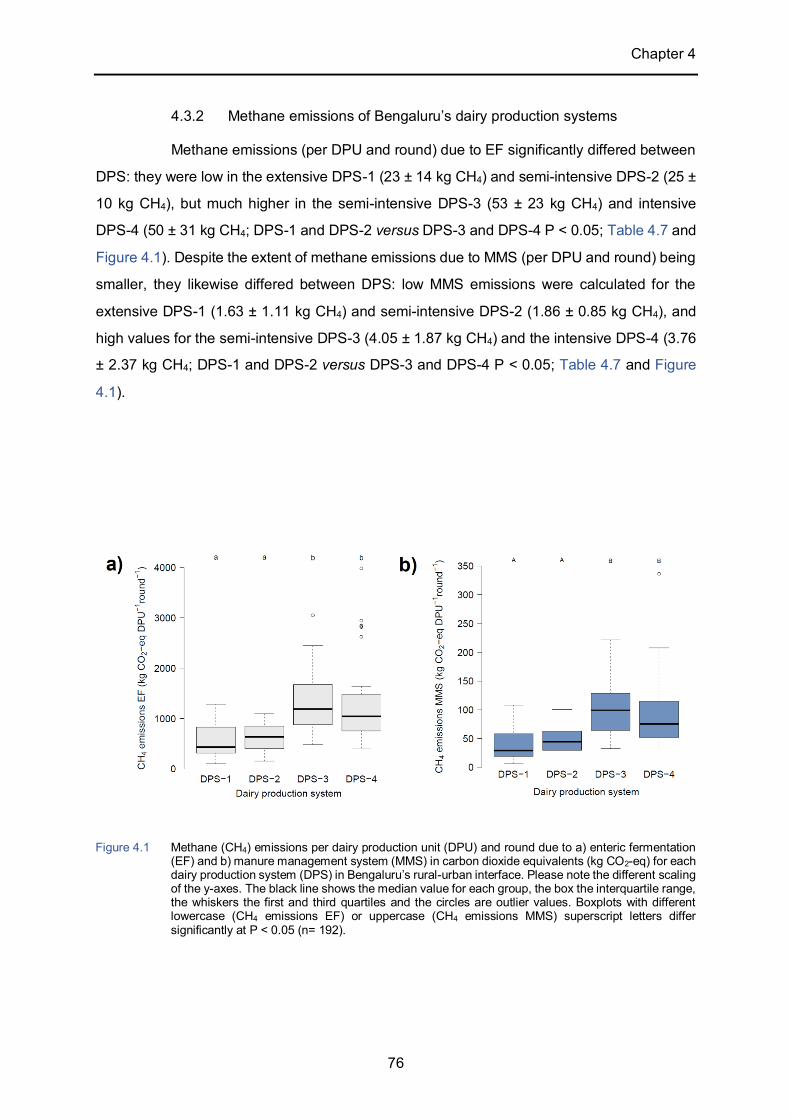
Chapter 4
76
4.3.2 Methane emissions of Bengaluru’s dairy production systems
Methane emissions (per DPU and round) due to EF significantly differed between
DPS: they were low in the extensive DPS-1 (23 ± 14 kg CH4) and semi-intensive DPS-2 (25 ±
10 kg CH4), but much higher in the semi-intensive DPS-3 (53 ± 23 kg CH4) and intensive
DPS-4 (50 ± 31 kg CH4; DPS-1 and DPS-2 versus DPS-3 and DPS-4 P < 0.05; Table 4.7 and
Figure 4.1). Despite the extent of methane emissions due to MMS (per DPU and round) being
smaller, they likewise differed between DPS: low MMS emissions were calculated for the
extensive DPS-1 (1.63 ± 1.11 kg CH4) and semi-intensive DPS-2 (1.86 ± 0.85 kg CH4), and
high values for the semi-intensive DPS-3 (4.05 ± 1.87 kg CH4) and the intensive DPS-4 (3.76
± 2.37 kg CH4; DPS-1 and DPS-2 versus DPS-3 and DPS-4 P < 0.05; Table 4.7 and Figure
4.1).
Figure 4.1 Methane (CH4) emissions per dairy production unit (DPU) and round due to a) enteric fermentation (EF) and b) manure management system (MMS) in carbon dioxide equivalents (kg CO2-eq) for each dairy production system (DPS) in Bengaluru’s rural-urban interface. Please note the different scaling of the y-axes. The black line shows the median value for each group, the box the interquartile range, the whiskers the first and third quartiles and the circles are outlier values. Boxplots with different lowercase (CH4 emissions EF) or uppercase (CH4 emissions MMS) superscript letters differ significantly at P < 0.05 (n= 192).
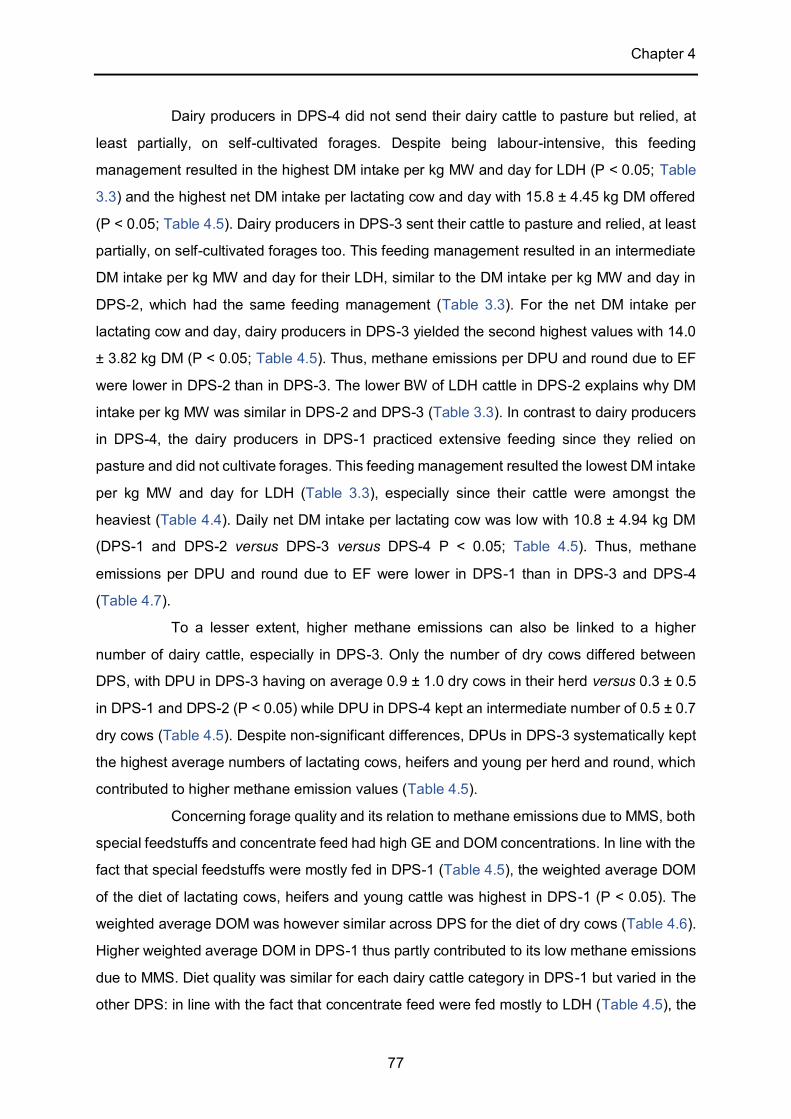
Chapter 4
77
Dairy producers in DPS-4 did not send their dairy cattle to pasture but relied, at
least partially, on self-cultivated forages. Despite being labour-intensive, this feeding
management resulted in the highest DM intake per kg MW and day for LDH (P < 0.05; Table
3.3) and the highest net DM intake per lactating cow and day with 15.8 ± 4.45 kg DM offered
(P < 0.05; Table 4.5). Dairy producers in DPS-3 sent their cattle to pasture and relied, at least
partially, on self-cultivated forages too. This feeding management resulted in an intermediate
DM intake per kg MW and day for their LDH, similar to the DM intake per kg MW and day in
DPS-2, which had the same feeding management (Table 3.3). For the net DM intake per
lactating cow and day, dairy producers in DPS-3 yielded the second highest values with 14.0
± 3.82 kg DM (P < 0.05; Table 4.5). Thus, methane emissions per DPU and round due to EF
were lower in DPS-2 than in DPS-3. The lower BW of LDH cattle in DPS-2 explains why DM
intake per kg MW was similar in DPS-2 and DPS-3 (Table 3.3). In contrast to dairy producers
in DPS-4, the dairy producers in DPS-1 practiced extensive feeding since they relied on
pasture and did not cultivate forages. This feeding management resulted the lowest DM intake
per kg MW and day for LDH (Table 3.3), especially since their cattle were amongst the
heaviest (Table 4.4). Daily net DM intake per lactating cow was low with 10.8 ± 4.94 kg DM
(DPS-1 and DPS-2 versus DPS-3 versus DPS-4 P < 0.05; Table 4.5). Thus, methane
emissions per DPU and round due to EF were lower in DPS-1 than in DPS-3 and DPS-4
(Table 4.7).
To a lesser extent, higher methane emissions can also be linked to a higher
number of dairy cattle, especially in DPS-3. Only the number of dry cows differed between
DPS, with DPU in DPS-3 having on average 0.9 ± 1.0 dry cows in their herd versus 0.3 ± 0.5
in DPS-1 and DPS-2 (P < 0.05) while DPU in DPS-4 kept an intermediate number of 0.5 ± 0.7
dry cows (Table 4.5). Despite non-significant differences, DPUs in DPS-3 systematically kept
the highest average numbers of lactating cows, heifers and young per herd and round, which
contributed to higher methane emission values (Table 4.5).
Concerning forage quality and its relation to methane emissions due to MMS, both
special feedstuffs and concentrate feed had high GE and DOM concentrations. In line with the
fact that special feedstuffs were mostly fed in DPS-1 (Table 4.5), the weighted average DOM
of the diet of lactating cows, heifers and young cattle was highest in DPS-1 (P < 0.05). The
weighted average DOM was however similar across DPS for the diet of dry cows (Table 4.6).
Higher weighted average DOM in DPS-1 thus partly contributed to its low methane emissions
due to MMS. Diet quality was similar for each dairy cattle category in DPS-1 but varied in the
other DPS: in line with the fact that concentrate feed were fed mostly to LDH (Table 4.5), the
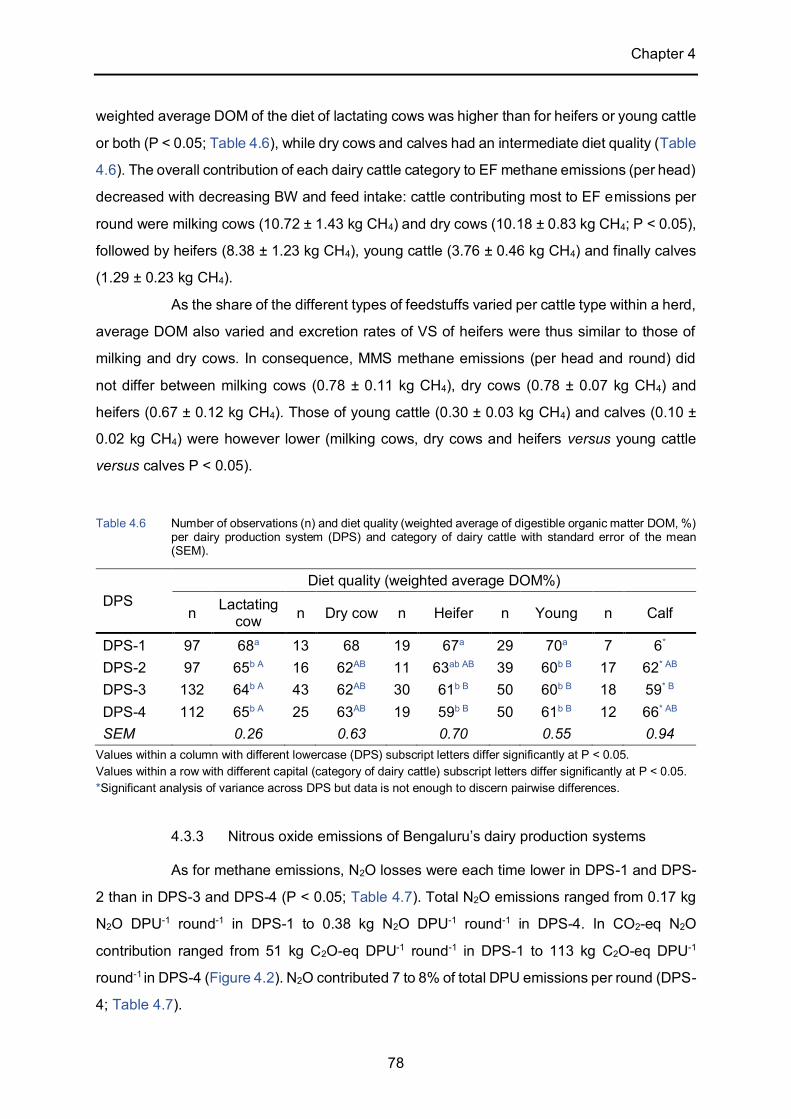
Chapter 4
78
weighted average DOM of the diet of lactating cows was higher than for heifers or young cattle
or both (P < 0.05; Table 4.6), while dry cows and calves had an intermediate diet quality (Table
4.6). The overall contribution of each dairy cattle category to EF methane emissions (per head)
decreased with decreasing BW and feed intake: cattle contributing most to EF emissions per
round were milking cows (10.72 ± 1.43 kg CH4) and dry cows (10.18 ± 0.83 kg CH4; P < 0.05),
followed by heifers (8.38 ± 1.23 kg CH4), young cattle (3.76 ± 0.46 kg CH4) and finally calves
(1.29 ± 0.23 kg CH4).
As the share of the different types of feedstuffs varied per cattle type within a herd,
average DOM also varied and excretion rates of VS of heifers were thus similar to those of
milking and dry cows. In consequence, MMS methane emissions (per head and round) did
not differ between milking cows (0.78 ± 0.11 kg CH4), dry cows (0.78 ± 0.07 kg CH4) and
heifers (0.67 ± 0.12 kg CH4). Those of young cattle (0.30 ± 0.03 kg CH4) and calves (0.10 ±
0.02 kg CH4) were however lower (milking cows, dry cows and heifers versus young cattle
versus calves P < 0.05).
Table 4.6 Number of observations (n) and diet quality (weighted average of digestible organic matter DOM, %) per dairy production system (DPS) and category of dairy cattle with standard error of the mean (SEM).
DPS Diet quality (weighted average DOM%)
n Lactating cow n Dry cow n Heifer n Young n Calf
DPS-1 97 68a 13 68 19 67a 29 70a 7 6* DPS-2 97 65b A 16 62AB 11 63ab AB 39 60b B 17 62* AB DPS-3 132 64b A 43 62AB 30 61b B 50 60b B 18 59* B DPS-4 112 65b A 25 63AB 19 59b B 50 61b B 12 66* AB SEM 0.26 0.63 0.70 0.55 0.94
Values within a column with different lowercase (DPS) subscript letters differ significantly at P < 0.05. Values within a row with different capital (category of dairy cattle) subscript letters differ significantly at P < 0.05. *Significant analysis of variance across DPS but data is not enough to discern pairwise differences.
4.3.3 Nitrous oxide emissions of Bengaluru’s dairy production systems
As for methane emissions, N2O losses were each time lower in DPS-1 and DPS-
2 than in DPS-3 and DPS-4 (P < 0.05; Table 4.7). Total N2O emissions ranged from 0.17 kg
N2O DPU-1 round-1 in DPS-1 to 0.38 kg N2O DPU-1 round-1 in DPS-4. In CO2-eq N2O
contribution ranged from 51 kg C2O-eq DPU-1 round-1 in DPS-1 to 113 kg C2O-eq DPU-1
round-1 in DPS-4 (Figure 4.2). N2O contributed 7 to 8% of total DPU emissions per round (DPS-
4; Table 4.7).
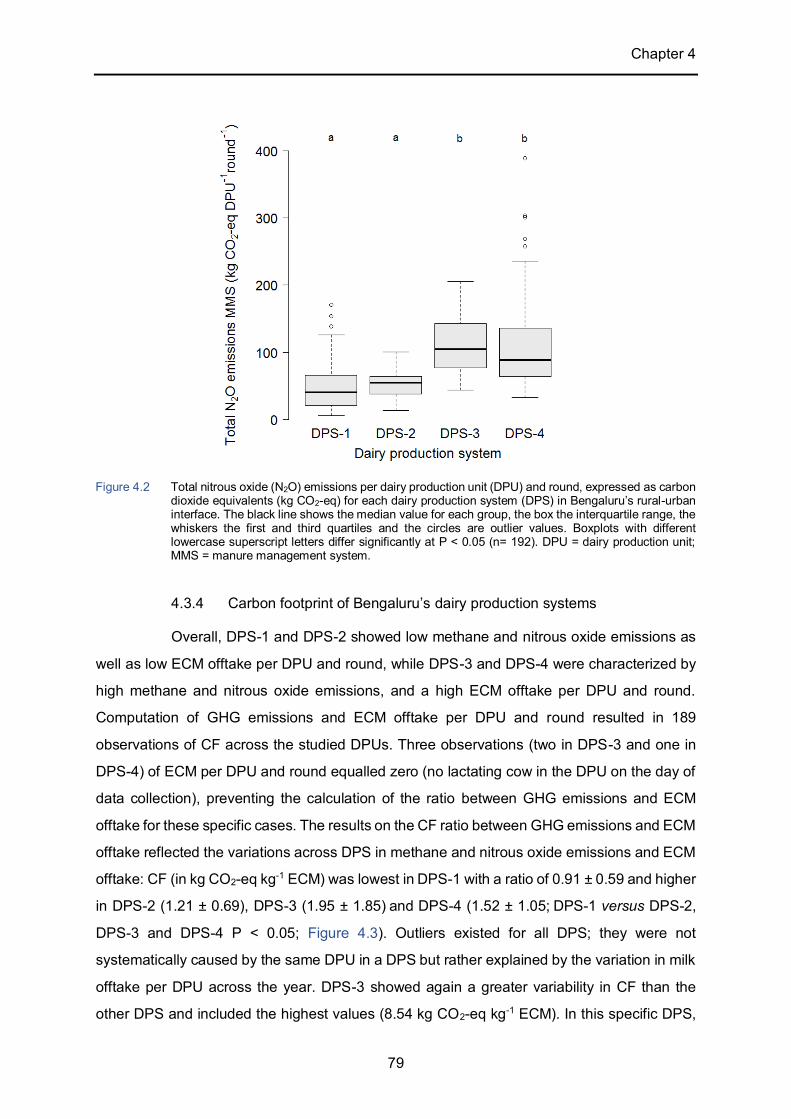
Chapter 4
79
4.3.4 Carbon footprint of Bengaluru’s dairy production systems
Overall, DPS-1 and DPS-2 showed low methane and nitrous oxide emissions as
well as low ECM offtake per DPU and round, while DPS-3 and DPS-4 were characterized by
high methane and nitrous oxide emissions, and a high ECM offtake per DPU and round.
Computation of GHG emissions and ECM offtake per DPU and round resulted in 189
observations of CF across the studied DPUs. Three observations (two in DPS-3 and one in
DPS-4) of ECM per DPU and round equalled zero (no lactating cow in the DPU on the day of
data collection), preventing the calculation of the ratio between GHG emissions and ECM
offtake for these specific cases. The results on the CF ratio between GHG emissions and ECM
offtake reflected the variations across DPS in methane and nitrous oxide emissions and ECM
offtake: CF (in kg CO2-eq kg-1 ECM) was lowest in DPS-1 with a ratio of 0.91 ± 0.59 and higher
in DPS-2 (1.21 ± 0.69), DPS-3 (1.95 ± 1.85) and DPS-4 (1.52 ± 1.05; DPS-1 versus DPS-2,
DPS-3 and DPS-4 P < 0.05; Figure 4.3). Outliers existed for all DPS; they were not
systematically caused by the same DPU in a DPS but rather explained by the variation in milk
offtake per DPU across the year. DPS-3 showed again a greater variability in CF than the
other DPS and included the highest values (8.54 kg CO2-eq kg-1 ECM). In this specific DPS,
Figure 4.2 Total nitrous oxide (N2O) emissions per dairy production unit (DPU) and round, expressed as carbon dioxide equivalents (kg CO2-eq) for each dairy production system (DPS) in Bengaluru’s rural-urban interface. The black line shows the median value for each group, the box the interquartile range, the whiskers the first and third quartiles and the circles are outlier values. Boxplots with different lowercase superscript letters differ significantly at P < 0.05 (n= 192). DPU = dairy production unit; MMS = manure management system.
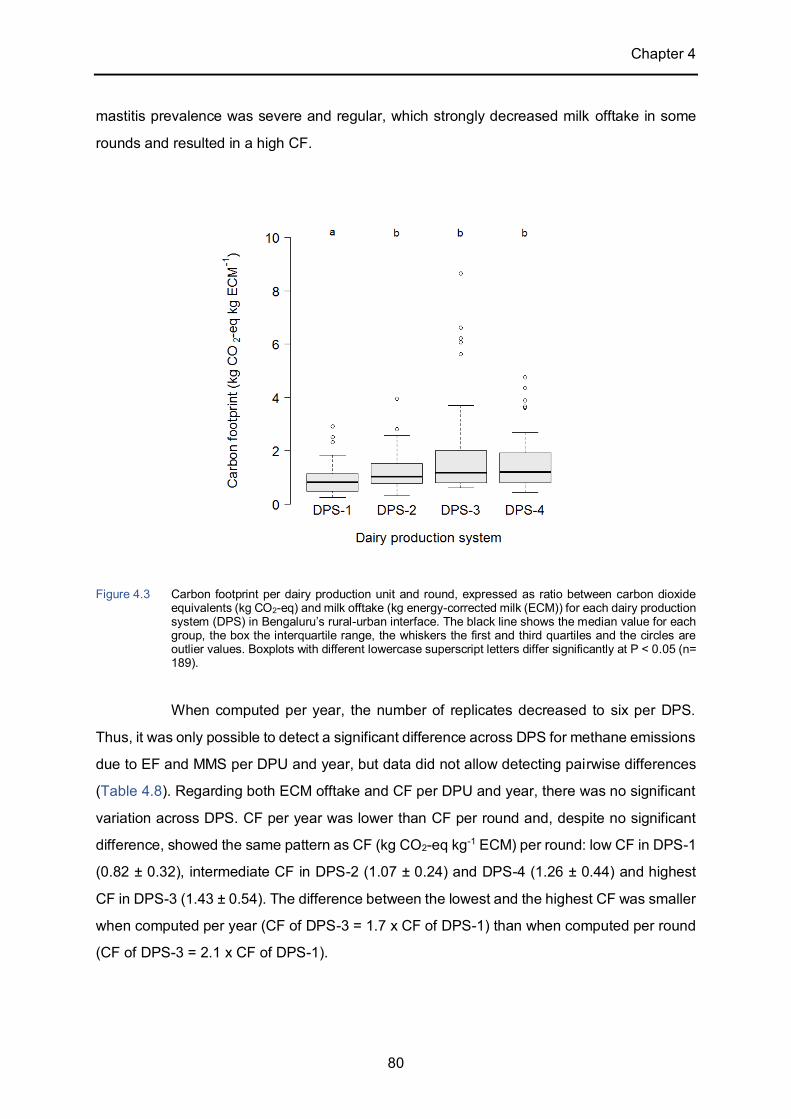
Chapter 4
80
mastitis prevalence was severe and regular, which strongly decreased milk offtake in some
rounds and resulted in a high CF.
Figure 4.3 Carbon footprint per dairy production unit and round, expressed as ratio between carbon dioxide equivalents (kg CO2-eq) and milk offtake (kg energy-corrected milk (ECM)) for each dairy production system (DPS) in Bengaluru’s rural-urban interface. The black line shows the median value for each group, the box the interquartile range, the whiskers the first and third quartiles and the circles are outlier values. Boxplots with different lowercase superscript letters differ significantly at P < 0.05 (n= 189).
When computed per year, the number of replicates decreased to six per DPS.
Thus, it was only possible to detect a significant difference across DPS for methane emissions
due to EF and MMS per DPU and year, but data did not allow detecting pairwise differences
(Table 4.8). Regarding both ECM offtake and CF per DPU and year, there was no significant
variation across DPS. CF per year was lower than CF per round and, despite no significant
difference, showed the same pattern as CF (kg CO2-eq kg-1 ECM) per round: low CF in DPS-1
(0.82 ± 0.32), intermediate CF in DPS-2 (1.07 ± 0.24) and DPS-4 (1.26 ± 0.44) and highest
CF in DPS-3 (1.43 ± 0.54). The difference between the lowest and the highest CF was smaller
when computed per year (CF of DPS-3 = 1.7 x CF of DPS-1) than when computed per round
(CF of DPS-3 = 2.1 x CF of DPS-1).
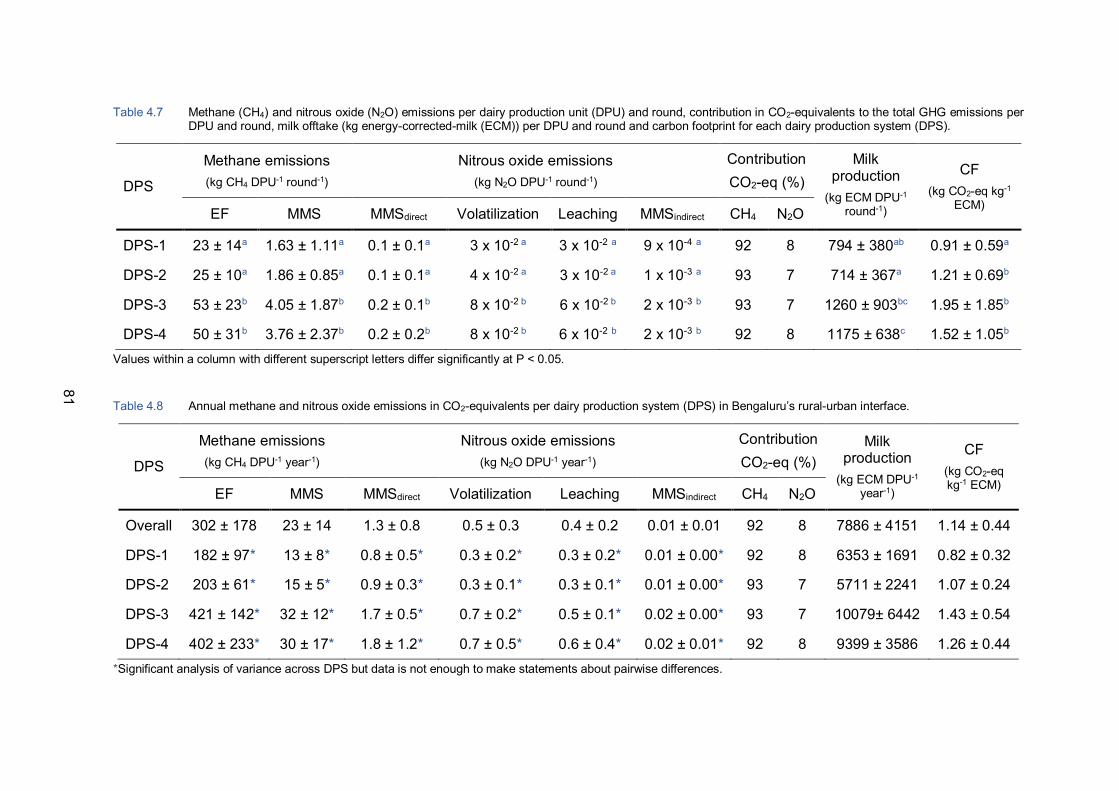
81
Table 4.7 Methane (CH4) and nitrous oxide (N2O) emissions per dairy production unit (DPU) and round, contribution in CO2-equivalents to the total GHG emissions per DPU and round, milk offtake (kg energy-corrected-milk (ECM)) per DPU and round and carbon footprint for each dairy production system (DPS).
DPS
Methane emissions (kg CH4 DPU-1 round-1)
Nitrous oxide emissions (kg N2O DPU-1 round-1)
Contribution CO2-eq (%)
Milk production
(kg ECM DPU-1 round-1)
CF (kg CO2-eq kg-1
ECM) EF MMS MMSdirect Volatilization Leaching MMSindirect CH4 N2O
DPS-1 23 ± 14a 1.63 ± 1.11a 0.1 ± 0.1a 3 x 10⁻² a 3 x 10⁻² a 9 x 10⁻⁴ a 92 8 794 ± 380ab 0.91 ± 0.59a
DPS-2 25 ± 10a 1.86 ± 0.85a 0.1 ± 0.1a 4 x 10⁻² a 3 x 10⁻² a 1 x 10⁻³ a 93 7 714 ± 367a 1.21 ± 0.69b
DPS-3 53 ± 23b 4.05 ± 1.87b 0.2 ± 0.1b 8 x 10⁻² b 6 x 10⁻² b 2 x 10⁻³ b 93 7 1260 ± 903bc 1.95 ± 1.85b
DPS-4 50 ± 31b 3.76 ± 2.37b 0.2 ± 0.2b 8 x 10⁻² b 6 x 10⁻² b 2 x 10⁻³ b 92 8 1175 ± 638c 1.52 ± 1.05b Values within a column with different superscript letters differ significantly at P < 0.05.
Table 4.8 Annual methane and nitrous oxide emissions in CO2-equivalents per dairy production system (DPS) in Bengaluru’s rural-urban interface.
DPS
Methane emissions (kg CH4 DPU-1 year-1)
Nitrous oxide emissions (kg N2O DPU-1 year-1)
Contribution CO2-eq (%)
Milk production
(kg ECM DPU-1 year-1)
CF (kg CO2-eq kg-1 ECM) EF MMS MMSdirect Volatilization Leaching MMSindirect CH4 N2O
Overall 302 ± 178 23 ± 14 1.3 ± 0.8 0.5 ± 0.3 0.4 ± 0.2 0.01 ± 0.01 92 8 7886 ± 4151 1.14 ± 0.44
DPS-1 182 ± 97* 13 ± 8* 0.8 ± 0.5* 0.3 ± 0.2* 0.3 ± 0.2* 0.01 ± 0.00* 92 8 6353 ± 1691 0.82 ± 0.32
DPS-2 203 ± 61* 15 ± 5* 0.9 ± 0.3* 0.3 ± 0.1* 0.3 ± 0.1* 0.01 ± 0.00* 93 7 5711 ± 2241 1.07 ± 0.24
DPS-3 421 ± 142* 32 ± 12* 1.7 ± 0.5* 0.7 ± 0.2* 0.5 ± 0.1* 0.02 ± 0.00* 93 7 10079± 6442 1.43 ± 0.54
DPS-4 402 ± 233* 30 ± 17* 1.8 ± 1.2* 0.7 ± 0.5* 0.6 ± 0.4* 0.02 ± 0.01* 92 8 9399 ± 3586 1.26 ± 0.44 *Significant analysis of variance across DPS but data is not enough to make statements about pairwise differences.

Chapter 4
82
4.4 Discussion
LCA is an important resource to assess and compare the global environmental
impact of dairy production systems across the world. LCA must however balance accuracy
and representativeness, which in particular applies to LCA of small-scale tropical DPS, where
inhomogeneous management practices across DPU and variability of inputs and outputs
within DPU is common. As in the present study data were computed per DPU, two
methodological constraints apply:
The first methodological constraint is that collection of sufficient data to correctly
estimate the CF of a small-scale tropical DPU is time intensive and, in a system’s approach,
limits the number of replicates. Weiler et al. (2014) included 20 farms in their LCA, which is
less than our sample size, but they did not distinguish between them. Cerri et al. (2016)
included 22 farms in their LCA and distinguished two groups based on the size of their herds.
As this research focused on the identification and characterization of distinct co-existing DPS
within Bengaluru’s RUI (Chapter 2), the system’s approach was retained for computing CF but
limited statistical power of the results as there were only six observations per DPS, one for
each DPU. By computing emissions per round, which was our original time frame, rather than
per year, the number of observations per farm increased from one to eight, i.e. 48 observations
per DPS, and allowed for conclusive analysis of variance and pairwise comparison. Yet, the
advantage of computing CF by round rather than year (increased number of observations per
DPS) was greater than the disadvantage (enhanced variation due to unequal round length).
Significant differences at round-level showed that even within a relatively small geographical
space and short time frame, distinct farm management practices resulted in distinctly different
CF. If the number of replicates per DPS had been higher, significant differences would also
have shown in CF computed per year. For comparison of the present data with other studies,
the yearly average CF across DPS of 1.17 kg CO2-eq kg-1 ECM will be used. The second
methodological constraint is that, since the values were computed per real non-experimental
DPU, the overall sample and its representativeness are small at the scale of India, which hosts
the largest dairy herd in the world and support the livelihood of 70 million dairy household
across a huge and diverse geographical region (Cunningham, 2009; FAOSTAT, 2019).
Nevertheless, the present sample is representative of distinct and co-existing DPS within the
RUI of an emerging Indian megacity, such as Bengaluru, Delhi or Mumbai. It shows that CF
of different DPS differ according to their intensification level and spatial distribution within a
relatively small geographical area such as the rural-urban interface of a megacity. To our
Chapter 4
83
knowledge, the CF of DPS in an urbanizing environment have not yet been documented
elsewhere.
Apart from these initial methodological considerations, the present study was
limited in one minor and one major aspect: regarding the minor limitation, a six-week interval
captures variation in nutrition management well enough but results in rough milk production
estimations for one round, especially in tropical smallholder dairy production units with few
replicates at cow-level, highly variable production and suckling calves, which results in milk
offtake value rather than true milk yield. In three instances CF per DPU and round could not
be computed because on the day of data collection, no cow was lactating. Thus, a milk offtake
equalling zero was computed for the round while in reality some milk might have been
produced during the duration of the round, which would have resulted in a high CF rather than
a missing observation. Hence, computation of CF for a short time frame, especially in the
context of smallholder dairy production, could be improved by modelling of representative
lactation curves (see Zezza et al. (2016) for a potential methodology). Regarding its major
limitation, the collected data focused on nutrition at cow-level. Thus, general data collected at
farm-level were insufficient to compute a cradle-to-farm-gate LCA and limited GHG
computations to CF caused by the farm’s dairy herd, namely methane emissions due to EF
and MMS, and nitrous oxide emissions due to MMS. Cerri et al. (2016) reported that emissions
from livestock accounted for 89 to 98% of the cradle-to-farm-gate GHG emissions of Brazilian
beef production units. In Peru, emissions from livestock accounted for respectively 74% and
82%, of cradle-to-farm-gate emissions in an intensive and extensive dairy production system
(Bartl et al., 2011). Bengaluru’ DPS share similarities with both DPS described by Bartl et al.
(2011) but are also different in a few aspects, which prevents direct comparison. Using their
computations as threshold values, however, it can roughly be estimated that the cradle-to-
farm-gate CF of an average DPU with EF and MMS emissions of 1.17 kg CO2-eq kg-1 ECM
ranges between 1.43 and 1.58 kg CO2-eq kg-1 ECM.
The quantification of the global environmental impact of Bengaluru’ DPS through
CF of milk provides interesting insights into the impacts of urbanization on dairy production
within the RUI of an emerging megacity: the first insight from Bengaluru’s case study is on the
variability of emissions and by extension, the accuracy of emission computations. When
computed per DPU and round, differences in round length partly explain variability of methane
emissions due to EF and MMS. Nevertheless, emission variability was higher in DPS-3 and
DPS-4 than in DPS-1 and DPS-2. DPS-3 and DPS-4 additionally had outliers, but not DPS-1
and DPS-2. The two biggest herds of the sample, but also one of the smallest herds, were
Chapter 4
84
found in DPS-3, contributing to emission variation within DPS when computed per DPU and
round. Likewise, the third biggest but also some of the smallest herds of the sample were kept
in DPS-4. Moreover, outliers in methane emissions due to EF in DPS-4 were not
systematically from the same farm, highlighting the variability of methane emissions within the
same DPU over one year. By extension, the variability in emissions also shows the sensitivity
of emission computations as relatively small seasonal changes in diet or number of dairy cattle
are accounted for. National emission intensities computed as per IPCC guidelines (2006) rest
on estimated daily DM intake based on national dairy cattle requirements and average diet
(quality). In view of the feeding inefficiencies quantified in Chapter 3 and the accuracy of
emission computation, the global environmental impact of Bengaluru’s DPS based on
estimated DM intake would potentially differ from present computations based on quantified
DM intake, including DM oversupply. This underlines once more the importance of detailed
assessments of local DPS, which take advantage of local opportunities while dealing with local
constraints.
The second insight from Bengaluru’s case study is that, as stated above, milk CF
of distinctly different DPS that co-exist within the same geographical space do differ according
to their intensification level. Intensification level of Bengaluru’s DPS is defined by their feeding
management (Chapter 2), namely reliance on self-cultivated forages or pasture use or both.
Intensification level of Bengaluru’s DPS is defined, yet to a lesser extent, by their breeding
management (Chapter 2), namely cattle in- and outflow within the herd and ownership of exotic
genotypes. Concerning breeding, crossbreeding of local genotypes with high-yielding exotic
genotypes is a common intensification strategy in tropical countries, which potentially
decreases emission intensity in virtue of the general relationship between (decreasing)
emission intensity and (increasing) productivity at cow-level as highlighted by Gerber et al.
(2011). In the case of smallholder beef production in central Java, Indonesia, the global
environmental impact of farms with crossbred animals was however similar to those with
unimproved cattle: the productivity gain due to crossbreeding was offset by the additional
emissions related to the additional feed resources needed to fatten the crossbreds (Widi et
al., 2015). In the context of Bengaluru, no clear relationship between breeding management
and emission intensity could be detected at farm-level, despite a higher share of dairy
producers keeping specialized (exotic or crossbred) dairy herds in DPS-2 and DPS-4 and a
positive F1 heterosis effect showing in cMO (Chapter 3). However, the in- and outflow strategy
for cattle used by DPS-3 might also have contributed to the large variation in emissions per
DPU and round. Concerning feeding, an effective strategy to mitigate emission intensity is

Chapter 4
85
high feed conversion efficiency (Hermansen and Kristensen, 2011). Keeping emission
intensity in mind, the feeding management in Bengaluru’s DPS can roughly be distinguish as
followings: feeding little of a good quality diet and using pasture (efficient; DPS-1), feeding
little of an average quality diet and using pasture (intermediate efficiency; DPS-2), or
oversupplying a diet of average quality (inefficient; DPS-3 and DPS-4). This resulted in the
lowest CF for the most extensive DPS, while (semi-)intensive ones (DPS-3 and DPS-4) had a
higher CF. However, Bengaluru’s extensive DPS-1 was extensive in its inputs of labour, land
and financial resources but relied on special feedstuff and concentrate feed, which were good
quality feedstuffs. Although energy and crude protein supply were variable, diet quality in
DPS-1 was thus high, and overall DPS-1 had the best feed conversion efficiency of the four
DPS. On the other hand, the (semi-)intensive strategies of DPS-3 and DPS-4 resulted in an
oversupply of their cattle with feed, and their milk CF was thus crippled by inefficiencies,
namely needless methane and nitrous oxide emissions. In DPS-2, the number of dairy cattle
per herd can also partially explain the higher methane emissions per DPU and round. In
opposition to the positive relationship between emission intensity and productivity highlighted
by Gerber et al. (2011), in Bengaluru, the relationship between emission intensity and
productivity was more complex due to the inefficiency of oversupplying cows in (semi-
)intensive systems and the presence of land and labour-extensive DPS with high diet quality.
In a tropical context, both Udo et al. (2016) and Bartl et al. (2011) documented a positive
relationship between emission intensity and productivity at national scale. Udo et al. (2016)
compared the cradle-to-farm-gate CF of three Kenyan DPS (free-grazing small-scale
extensive DPS (2.6 cows in average); zero-grazing small-scale extensive DPS (1.5 cows);
large intensive DPS (13.6 cows)). With all emissions allocated to milk, the small-scale
extensive free-grazing DPS had the highest emission intensity (2.57 kg CO2-eq kg-1 milk), the
small-scale extensive zero-grazing DPS an intermediate emission intensity (2.13 kg CO2-eq
kg-1 milk) and the large intensive DPS the lowest (1.3 kg CO2-eq kg-1 milk). Bartl et al. (2011)
compared an extensive Peruvian grazing system (4.2 cows, 2.57 kg milk per cow and day) to
an intensive one (5.3 cows, 19.54 kg milk per cow and day), in which cattle received maize
fodder and concentrate feed. The milk CF solely due to livestock was 4.8 higher in the
extensive system (11.25 kg CO2-eq kg-1 milk) than in the intensive one (2.35 kg CO2-eq kg-1
milk). In comparison to the CF computed for Bengaluru’s DPS, the CF of both Peruvian DPS
were higher. Outside of the tropics, Basset-Mens et al. (2009), however, reported a negative
relationship between emission intensity and productivity for New-Zealander low input grazing
DPS in comparison to more intensive DPS, which is similar to the findings in Bengaluru.
Chapter 4
86
Meanwhile, Bava et al. (2014) compared three distinct DPS coexisting within the same
geographical area (Northern Italy) but could not identify any intensification level performing
better than the others in terms of emission intensity. Regarding spatial patterns of emission
intensity, Woldegebriel et al. (2017) compared three DPS in the milkshed of Mekelle, Ethiopia.
This, to our knowledge, is the only study to include DPS at distinct urbanization levels,
although difference in CF is not addressed as an impact of urbanisation. The three DPS are:
large scale intensive DPS, semi-intensive (peri-)urban DPS and rural DPS. CF of large scale
intensive DPS was 1.60 kg CO2-eq kg-1 milk, of semi-intensive (peri-)urban DPS 1.27 kg CO2-
eq kg milk-1 and of rural DPS 0.45 kg CO2-eq kg-1 milk. In Bengaluru an inverse relationship
between emission intensity and urbanization level was found, since most rural and peri-urban
dairy producers were (semi-)intensive, while urban dairy producers were distinctly more
extensive and thus had a low CF. At last, despite distinctly different feeding management
strongly affecting CF of milk, MMS of manure collected on farm was identical (solid storage)
for all of Bengaluru’s DPS, although later use could differ. Nitrous oxide emissions overall
contributed 8% of dairy herds’ total GHG emissions in Bengaluru. The benefits and feasibility
of simple cost-extensive mitigation techniques such as covering heaps of solid manure with
ragi straw (Forabosco et al., 2017), which is a priori an abundant resource in Bengaluru’s RUI,
should be assessed.
The third insight from Bengaluru’s case study is how its dairy sector compares to
international production levels and emission intensities. Irrespective of DPS, an average DPU
in Bengaluru’s RUI emits 1.17 kg CO2-eq kg-1 ECM (cradle-to-farm-gate CF ca. 1.43 - 1.58 kg
CO2-eq kg-1 ECM). Annual milk offtake per cow in Bengaluru averaged 3416 ± 1533 kg ECM,
which is above the 2000 kg per cow threshold characterizing low-yielding production systems
with high emission intensity (Gerber et al., 2011; Gerber et al., 2013) and above the range
reported for Indian crossbreed cattle by Duncan et al. (2013) and Garg et al. (2016), which
underlines the high productivity of Bengaluru’s dairy sector at national scale. For DPU in
Western India, Garg et al. (2016) reported a lower feed conversion efficiency per cow (0.62
kg milk kg-1 DM) than determined for Bengaluru (between 0.71 kg ECM kg-1 DM in DPS-2 to
1.00 kg ECM kg-1 DM in DPS-1; Table 3.4) and a higher cradle-to-farm-gate CF (2.6 kg CO2-eq
per kg-1 milk). In Kenyan small-scale DPS, annual milk production per cow was lower than in
Bengaluru, with an average of 1649 kg in free-grazing and 1950 kg in zero-grazing cows (Udo
et al., 2016). In intensive large-scale systems, cows yielded 3296 kg milk year-1, which is
higher than the average annual milk production per cow in DPS-1 and DPS-2 but lower than
in DPS 3 and DPS-4. CF of milk reported by Udo et al. (2016) was slightly lower in the intensive
Chapter 4
87
large-scale Kenyan farms (1.3 kg CO2-eq kg-1 milk) than our estimate for Bengaluru, while
those of the extensive small-scale DPS (2.57 and 2.13 kg CO2-eq kg-1 milk) were higher.
Although Bava et al. (2014) did not report annual milk production per cow for northern Italian
DPS, cow productivity was high for all three intensification levels (ranging from 24.7 to 28.9
kg milk cow-1 day-1; in average 90 cows per DPU) in comparison to Bengaluru. Despite this,
the estimated cradle to farm-gate CF for Bengaluru’s average DPU overlapped with the higher
range of the Italian systems (0.90 to 1.56 of CO2-eq kg-1 milk), underlying that small-scale
tropical DPU can be equally emission-efficient to large-scale highly-productive DPU in
Western countries.
4.5 Conclusions
Bengaluru’s case study sheds light on dairy production within an urbanizing
environment leading to DPS with distinctly different environmental impact according to the
intensity level of their feeding management. In line with the previously assessed feed
conversion efficiency, Bengaluru’s extensive dairy farms had a lower CF of milk since their
feeding management was the most efficient. In opposition, (semi-)intensive production
systems oversupplied their cattle with feedstuffs and nutrients in relation to milk yield, which
crippled their CF. With millions of small-scale dairy producers in India and beyond, this study
highlights the importance of a judicious local assessment of system-specific GHG emissions
to assess their global environmental impact. Indeed, local production strategies are based on
a complex set of opportunities and constraints and local specificities such as the reliance on
organic wastes as feeds can positively contribute to more sustainable dairy production
systems. The local perspective therefore also challenges the definition of what is an extensive
or an intensive system, especially in terms of resources use efficiency and global
environmental impact.
88
5 General discussion
5.1 Methodological considerations
5.1.1 The definition of urbanization
A household survey is a cost-efficient method to collect a large number of data
provided the selection of a representative sample (Fraval et al., 2019). Our research area and
sampling process was established by the research unit FOR2432 and the SSI by Hoffmann et
al. (2017) was used as proxy for the urbanization level of each settlement. The SSI was a
practical approach to the complex definition of urbanization, which allowed for a
characterization of urbanization levels and for the subsequent household survey at the scale
of a megacity’s RUI. At transect level, the number of dairy producers in Nsect and Ssect was
balanced and the spatial pattern showed no bias despite different selection thresholds. At
settlement level, the number of dairy producers correlated to SSI and was used as a predictor
to reveal spatial patterns of Bengaluru’s DPS but did not show a bias in their selection. The
use of vaccination lists was a satisfactory way to randomly select dairy producers at settlement
level and could easily be matched with scouting the settlement on foot and talking to local
inhabitants in the few settlements where no such list existed.
In a developing country, another way to look at urbanization could have been
through the lens of market integration, namely the access to inputs and marketing channels,
and indirectly of road network. As dichotomized producers and consumers are linked through
the transport of agricultural goods (Butler, 2012; Lamine, 2015; Steel, 2008), the density and
quality of the road network can be an important predictor of market integration (Dudwick et al.,
2011; Tacoli, 2003; Thapa and Murayama, 2008) and indirectly of urbanization when defined
as market integration. An example is Lucknow, India, where a clear link between urbanization
level and road network has been established (Shukla and Jain, 2019). The quantification of
the density and quality of the road network is however a complex task and challenges a
monocentric approach to urbanization as it focuses on the accessibility of rural populations to
goods and services, often provided by urban areas of different size and accessibility (Tacoli,
2003). In the case of dairy production in Bengaluru’s RUI, the centred SSI approach to
urbanization, namely the use of the settlement’s distance to the city centre as one important
parameter of the index, was coherent, since the network of dairy cooperatives in Bengaluru’s
RUI was also centralized through KMF. When looking through the lens of market integration,
Bengaluru’s urban areas could have been defined as areas where dairy producers had market
access but were not integrated in formal value chains, while rural dairy producers were those
Chapter 5
89
who were integrated only through dairy cooperatives. Peri-urban areas are often theorised as
mixed spaces, where sectorial interaction and linkages are the most intensive (Lerner and
Eakin, 2011; Tacoli, 2003, 1998), but in our research they did not stand out as very different
from rural areas. Through the lens of market integration, peri-urban spaces could thus have
been defined as mixed spaces where dairy producers were integrated both through dairy
cooperatives and in a decentralized informal way, i.e. where the market integration was the
most intense and diverse. A fourth level of urbanization could have been defined as remote
rural areas, where dairy producers were not integrated in the market, with access neither to
inputs nor to consumers. In our sample, two settlements (Chikka Muddenahalli at the upper
border of Nsect and Muninagara close to the eastern border of Ssect) were rural and only had
access to a dairy cooperative in a close-by settlement. Low market integration showed in the
fact that dairy producers in both settlements tended to keep more native cattle (crossbreeds)
and more milk for HH consumption than in other settlements. When specifically categorized
as an urbanization level and selected in higher numbers, such remote rural settlement could
have offered an interesting contrast to settlements which were also rural but already impacted
by urbanization when considered through the lens of market integration, which challenges our
definition of rurality and the dichotomization of rural and urban areas when those are linked
with and impact each other. An approach to urbanization through the lens of market integration
in the context of Bengaluru’s RUI would have however been specific to dairy production; it
would have required a higher amount of preliminary work and led to a more fragmented
urbanization pattern.
5.1.2 Dairy production baseline survey
To be a cost-efficient method to collect a large number of data, a household survey
must also implement a robust collection protocol to guarantee data quality, namely credibility
(observations lie within a plausible range) and consistency (observations are accurate;
typically assessed over repeated rounds of data collection; Fraval et al., 2019). Characteristics
of our dairy production baseline protocol and survey such as beforehand training of
enumerators, shortness and generality of questions, and completion of each survey by a team
of one enumerator and one researcher guaranteed a minimum quality. When possible, to ease
the understanding between the dairy producer, the enumerator and the researcher, we asked
to see the cattle, thus checking some baseline information regarding the herd against the
“truth” (Fraval et al., 2019). The homogeneity of the collected data across all surveys speaks
Chapter 5
90
for a high credibility. With only one round of data collection however, data consistency could
not be assed and when dubious, which was mitigated by stepping back in the level of detail:
e.g., the characterization of the cattle genotype by the dairy producer was not very reliant
within and across herds as cattle were sometimes multi-generation crossbreeds without
genetic records or as dairy producers often mentioned the genotype of the cow without
accounting for the one of the bull, an inaccuracy often noticed when we asked to see the cattle.
Thus, inconsistency in genotype characterization was mitigated by using broad genotype
classes. The broad approach of our dairy production baseline survey also proved useful in
retrospective regarding e.g. pasturing and reliance on self-cultivated forages: first, because
those parameters were later quantified in detail, making more consistent data automatically
available. Second, because the detailed quantification of those parameters also showed their
variably within farms without calling into question the consistency of the baseline data as they
were broader; for example, only a part of the herd was going to pasture or cattle from a same
herd spent different amounts of time on pasture across seasons. This also underlines the
complementarity of both a large qualitative and small quantitative data collection to form a
coherent overall database.
5.1.3 Quantification of feed conversion efficiency and carbon footprint
Specific methodological considerations regarding the quantification of feed
conversion efficiency (Chapter 3) and carbon footprint (Chapter 4) have already been
highlighted in the respective chapters. Overall, the monitoring of dairy cattle nutrition for one
year and across 28 DPU was labour and time intensive. The number of observations for
carbon footprint calculations was thus limited since data are usually computed at farm-level.
This limitation was partly mitigated by computing them at farm-level per monitoring round
rather than for the whole year. As CF is a ratio, comparison between DPS based on emission
intensity per round was not a problem, although the average yearly CF was used for
international comparisons as per IPCC guidelines (2006). The number of observations was
not a problem for feed conversion efficiency calculation since data were computed at
cow-level. Both quantifications showed significant differences between DPS, highlighting the
diversity of DPS coexisting within a same rural-urban interface and the importance of regional
assessments. Our detailed monitoring of dairy cattle nutrition in the context of urbanizing India
on non-experimental farms added valuable insights to our baseline dairy production survey

Chapter 5
91
and proved to be a coherent work and a robust base for further research on Indian dairy
production systems in an urbanizing environment.
5.2 A critical perspective on Bengaluru’s dairy sector
Our research showed the coexistence of four DPS within Bengaluru’s RUI with
distinct dairy production strategies, which resulted in differences in intensification level, feed
conversion efficiency and carbon footprint. While each research chapter provides interesting
insights on the impacts of urbanization on DPS within Bengaluru’s RUI, altogether they also
provide interesting insights on agricultural transition in and commercialization of the dairy
sector of an emerging megacity in India.
5.2.1 Agricultural transition
Shift in the supply side. Urbanization created a shift in the supply side of
Bengaluru’s dairy sector, namely the production of milk, by affecting the availability of land
and labour. Concerning land, land holding per agricultural HH in and around Bengaluru is
typically small (85% own less than 2 ha; World Bank, Urban Development and Resilience Unit,
2013). Although labour-intensive, Indian dairy production has a development potential that is
not overly land-intensive (Janssen and Swinnen, 2019). Bengaluru’s “landless” dairy
producers (DPS-1) decreased the use of private land to a maximum by not cultivating forages
or even not owning land at all, showing the independence of dairy production from the
availability of land as a private resource to an unexpected extend: on one hand, because some
dairy producers were indeed completely independent from land, even public spaces. On the
other hand, because rural - and not only urban or peri-urban - dairy producers also adopted
this land-extensive production strategy, while elsewhere access to resources such as land is
critical to rural livelihoods (Bah et al., 2003) and the most direct impact of urbanization is the
decrease of land availability in (peri-)urban areas (Satterthwaite et al., 2010). In Cairo, Egypt,
“landless” (peri-)urban DPS are also reported by Daburon et al. (2017) but they are completely
indoors as dairy animals are not allowed to pasture in the streets. “Landless” dairy producers
were however a minority among Bengaluru’s dairy producers (21%) underlining that such
extensive production strategy evolved from a specific set of constraints and opportunities.
Most of Bengaluru’s dairy producers had a land-based approach to dairy
production and despite urbanization, their activity was not constrained by land availability in
the immediate future: land owned by dairy HH was typically inherited, which guaranteed land

Chapter 5
92
ownership despite rising land prices (Sudhira et al., 2007). However, decreasing land
availability potentially increases opportunity costs of not selling the land, especially around
major transport axes between Bengaluru and neighbouring smaller cities, and in peri-urban
areas (Shukla and Jain, 2019; Sudhira et al., 2007; Verma et al., 2017). Additionally,
decreased land availability is a potential constraint for low-income HH without inherited land,
who would like to start (semi-)intensive dairy production (Bah et al., 2003), or dairy HH, who
would like to expand their (semi-)intensive dairy production to a larger scale.
Concerning labour, as previously highlighted (Chapter 2), available family labour
and dairy production were closely linked. Irrespective of DPS, Bengaluru’s urban dairy
producers had significantly larger herds than those in rural and peri-urban areas; having
access to plenty of feed resources, their labour disinvestment in forages cultivation was
potentially traded-off for the maintenance of a larger herd or an off-farm activity or both. The
socio-economic data collected point at urbanization potentially already impacting availability
of family labour by increasing financial and physical opportunity costs of on-farm labour,
especially of the younger, better educated generation (Satterthwaite et al., 2010). In contrast
to Nakuru, Kenya, family labour in Bengaluru was not traded-off for hired labour (Migose et
al., 2018). This might be due to non-attractive working conditions for day-labourers or low
availability of hired labour, as resources access was sufficient for rural labour to have their
own activity (Bah et al., 2003; Satterthwaite et al., 2010; Tacoli, 2003). Thus, as already
underlined (Chapter 2), financial and physical attractiveness of off-farm jobs in Bengaluru
might partly explain the lower number of dairy producers in urban areas and challenges the
long-term persistence of dairy production in and around Bengaluru (Inwood and Sharp, 2012).
Shift in the demand side. Despite not being the focus of our research, no data
from the supply side indicated that the demand for milk was problematic: dairy producers
strived for higher milk offtake per cow, dairy cooperatives bought all available milk and informal
marketing channels were financially rewarding. With an ever growing population (Kumar et al.,
2016), strong socio-cultural norms regarding vegetarian diets and status of the cow
(Cunningham, 2009; Kennedy et al., 2018) as well as preference of raw fresh milk (Lapar et
al., 2010), the demand for milk in Bengaluru is huge. Lapar et al. (2010) additionally reported
that in the state of Assam, India, urban consumers readily spent money on high-value dairy
products. Urbanization is usually associated with a shift in diet preferences (Regmi and Dyck,
2001). In the case of Bengaluru, Erler and Dittrich (2017) reported a complex coexistence of
on-going food transitions, including a return to the traditional diet, in which dairy has a central
part. The decades-long existence of a large dairying community in 20 th century urban
Chapter 5
93
Singapore largely linked to and supplying Singapore’s Indian community is a good example of
how strong the demand for milk in the Indian society is (Wikkramatileke and Singh, 1969).
Intensification versus extensification. At farm-level, production inputs are
easily available through dairy cooperatives, especially concentrate feed and exotic genotypes.
The use of inputs and strive for higher daily milk offtake was common in all DPS and indicated
an overall intensification trend in Bengaluru’s dairy sector (Alderman, 1987; Cunningham,
2009; Hemme et al., 2003). Intensification lead to higher MO per cow and day but DPU were
crippled by inefficiencies especially due to the oversupply of LDH with feed in (semi-)intensive
DPS and of dry cows and heifers in general. Thus, despite Bengaluru’s dairy sector starting
to intensify, there is a real need to fine-tune the use of production inputs toward efficiency and
to bring about a substantial increase in MO. Moreover, this intensification trend has a limited
range: dairy producers made use of easily available inputs but did not make consequent long-
term investments into the welfare of their cattle, the scaling-up of their dairy production or the
persistence of their DPU. Financial capital investment was limited to rare production (e.g.,
buying a chaff cutter) or husbandry (rubber matt) improvements, both potentially subsidised
through dairy cooperatives, whereas no investment aimed at increasing herd size, e.g. by
hiring labour or mechanize the laborious tasks (e.g., milking machine).
Diversification versus specialization. A trend toward production specialization
was seen at farm-level given the focus on dairy production as a market-oriented activity:
ownership of additional livestock was low in comparison to (peri-)urban HH in West Africa
(Amadou et al., 2015; Roessler et al., 2016). The trend toward specialization in dairy
production can be linked to the high share of vegetarians in India (Government of India, 2014)
and their focus on dairy products as source of animal protein, as a typical
consumer-to-producer feedback on produced goods and services (Sundkvist et al., 2005).
Three quarters of the dairy producers coupled dairy production and crop production, but crop
cultivation was mostly for HH consumption or for both HH consumption and sale, and seldom
exclusively for sale. A trend toward occupation and income diversification was however seen
at HH level with half of all HH having one or more HH members, especially of the younger
generation, working off-farm and most HH having a mixed income. At Bengaluru’s RUI scale,
there was thus a potentially stronger trend toward diversification as off-farm opportunities gain
in attractivity, which could affect the persistency of smallholder dairy production as it is linked
to internal HH dynamics (Inwood and Sharp, 2012).

Chapter 5
94
5.2.2 Market integration
As described by Lobao and Meyer (2001), US farming saw a major agricultural
transition in the 20th century when family-farming became no more viable and agriculture an
industry. The structure of the US dairy sector hence changed from numerous family DPU to
less numerous and much larger DPU. This shift has not yet happened in Bengaluru’s RUI as
dairy production is still a family-business, which can (partly) sustain a family. In contrast to the
US, the urbanization of Bengaluru’s RUI seems to pull people out of dairy production
(opportunity cost of selling land; attractivity of off-farm employment) rather than pushing them
out.
When looking at our results, however, one might ask whether there is any
commercial dairy production in Bengaluru’s RUI. Regarding large-scale commercial DPU,
insights gained from one purposefully conducted baseline dairy production survey on large
scale commercial buffalo DPU (50+ buffalo) located close to a rural settlement but not included
in the analysis showed that such large-scale commercial farming does exist but might not be
settlement-based and have its own formal marketing channel(s) (in this case direct delivery to
an ice-cream processing plant) rather than relying on a dairy cooperative. Within our sample,
larger herds were often kept by joint families (more than one sibling and their families living in
a common household), giving them access to more family labour and financial capital (Figure
5.1). The structure of the Indian dairy sector at national level (smallholders with two to five
cows still produce 80% of the national milk volume; Cunningham, 2009; Figure 5.2) confirms
that the number of large DPU is marginal and not representative at the scale of Bengaluru’s
RUI.
Figure 5.1 A large herd by Bengaluru’s standards: seven cows and one heifer, kept by a joint family.
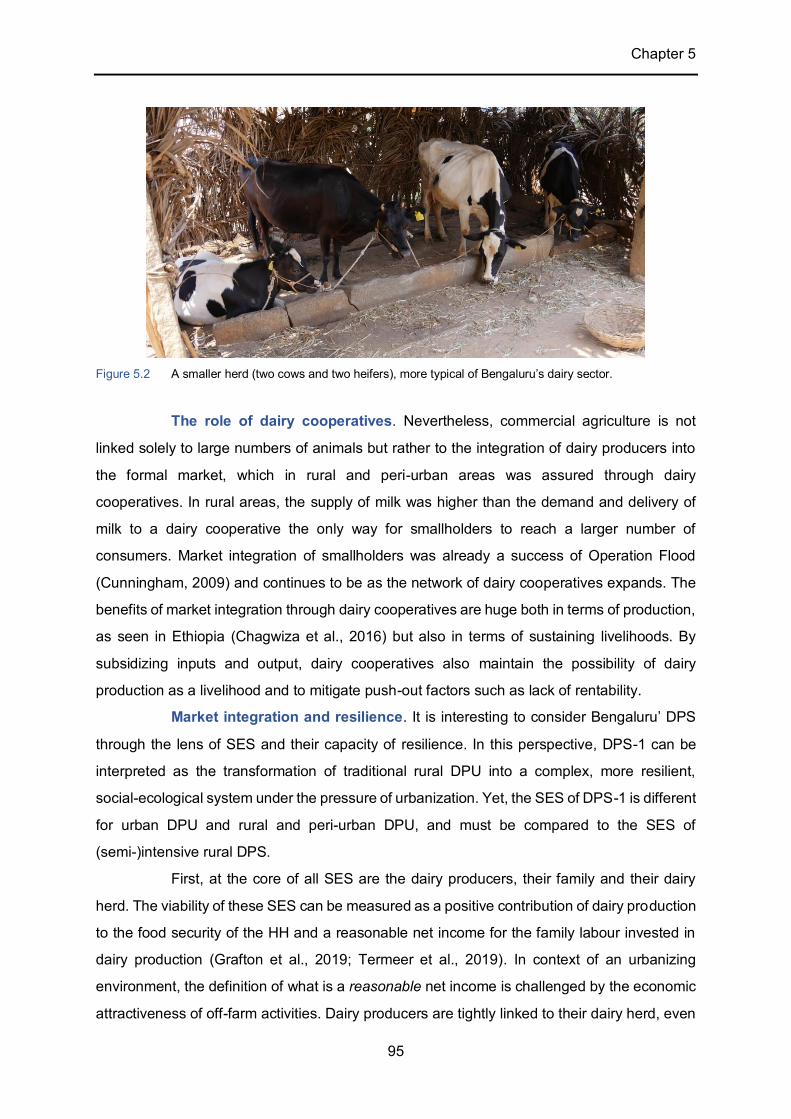
Chapter 5
95
Figure 5.2 A smaller herd (two cows and two heifers), more typical of Bengaluru’s dairy sector.
The role of dairy cooperatives. Nevertheless, commercial agriculture is not
linked solely to large numbers of animals but rather to the integration of dairy producers into
the formal market, which in rural and peri-urban areas was assured through dairy
cooperatives. In rural areas, the supply of milk was higher than the demand and delivery of
milk to a dairy cooperative the only way for smallholders to reach a larger number of
consumers. Market integration of smallholders was already a success of Operation Flood
(Cunningham, 2009) and continues to be as the network of dairy cooperatives expands. The
benefits of market integration through dairy cooperatives are huge both in terms of production,
as seen in Ethiopia (Chagwiza et al., 2016) but also in terms of sustaining livelihoods. By
subsidizing inputs and output, dairy cooperatives also maintain the possibility of dairy
production as a livelihood and to mitigate push-out factors such as lack of rentability.
Market integration and resilience. It is interesting to consider Bengaluru’ DPS
through the lens of SES and their capacity of resilience. In this perspective, DPS-1 can be
interpreted as the transformation of traditional rural DPU into a complex, more resilient,
social-ecological system under the pressure of urbanization. Yet, the SES of DPS-1 is different
for urban DPU and rural and peri-urban DPU, and must be compared to the SES of
(semi-)intensive rural DPS.
First, at the core of all SES are the dairy producers, their family and their dairy
herd. The viability of these SES can be measured as a positive contribution of dairy production
to the food security of the HH and a reasonable net income for the family labour invested in
dairy production (Grafton et al., 2019; Termeer et al., 2019). In context of an urbanizing
environment, the definition of what is a reasonable net income is challenged by the economic
attractiveness of off-farm activities. Dairy producers are tightly linked to their dairy herd, even
Chapter 5
96
spatially, as cows are often kept under the same roof even in urban areas, as also reported
for Cairo, Egypt (Daburon et al., 2017). In exchange for daily labour investment, cows provide
milk to the dairy producers, which contributes to HH food security, income, but also
employment and the preservation of their socio-cultural identity (Lerner and Eakin, 2011;
Tacoli, 1998). Consumers constitute a secondary core of these SES, linked to dairy producers
by a strong (daily) flow of agricultural goods, mainly (raw fresh) milk but in urban areas also
socio-cultural services, in exchange for a financial flow. In the background of these SES are
the city, the ecosystem and the institutions related to Bengaluru’s dairy sector, namely KMF
and the dairy cooperatives.
The characteristic of the urban SES is that it allows the integration of dairy producers
within the city through their activity, where they and their families can benefit from good
infrastructure (schools and hospital) while pursuing their economic activity and preserving their
cultural identity. The city provides the dairy producers with a large pool of directly reachable
consumers, public grounds for pasturing and forage collection (Figure 5.3), and additional
forage sources in form of organic wastes. In turn the city benefits from the recycling of
(feedable) organic waste through cows and the daily provision of a high-value but perishable
product. All these linkages and multiplies services between the SES components constitute a
robust SES with a tight feedback loop between consumers and dairy producers that
consumers trust (Lapar et al., 2010). Market integration usually means that producers become
susceptible to price volatility of in- and outputs. Yet, the extensive management in DPS-1
greatly reduces the susceptibility of dairy producers to price volatility as they spent limited
financial capital on inputs and the demand for milk is unlimited and financially rewarding.
Especially extensive urban dairy producers are very adaptive as they feed their cows from a
large range of feedstuff and take advantage of unconventional feed sources such as market
wastes. Moreover, if their output varies or they don’t sell all their milk to their direct customers,
they can fall back on a dairy cooperative to sell their production. The sub-capacity of resilience,
transformability, can easily be seen from the nature of this extensive DPS, especially its urban
DPU, which transformed their dairy farm in response to the urbanization of their immediate
environment without losing their socio-cultural identity. It is important to highlight that the urban
dairy producers were neither newcomers to the city of Bengaluru nor new dairy producers.
Rather, the city came to them at an exponential speed, engulfing their farm within a few
decades, as seen in 19th century London (Atkins, 1977).
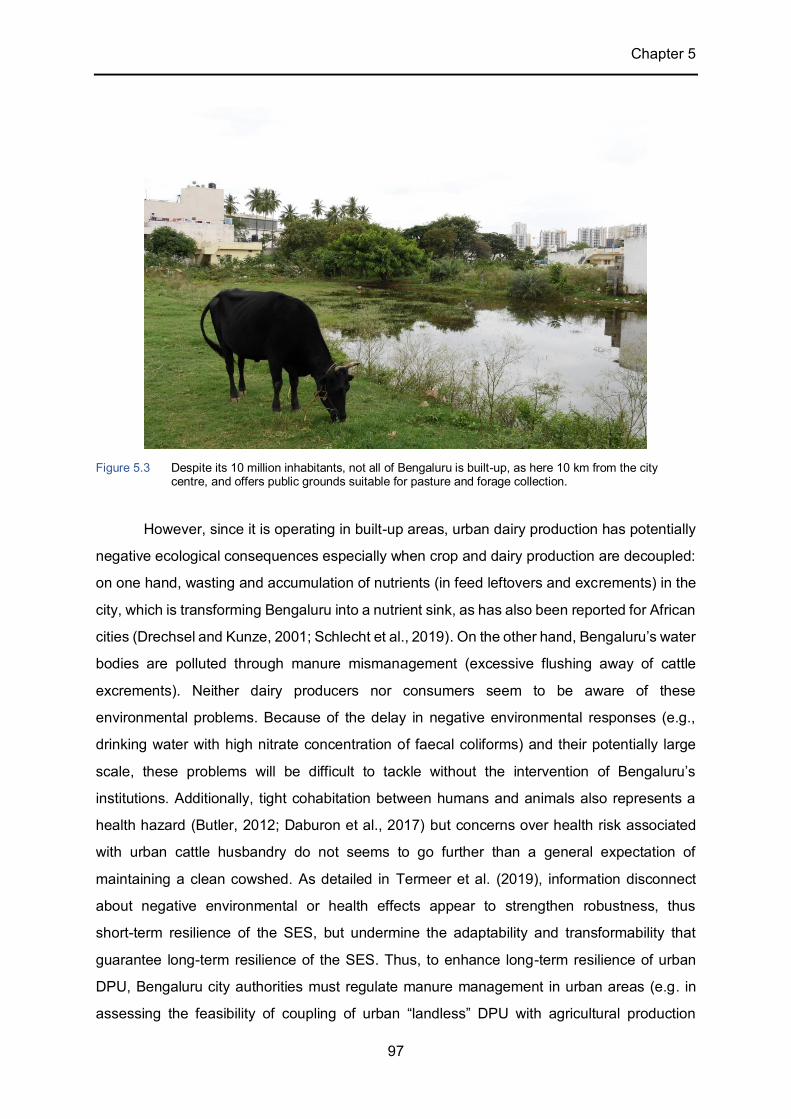
Chapter 5
97
Figure 5.3 Despite its 10 million inhabitants, not all of Bengaluru is built-up, as here 10 km from the city
centre, and offers public grounds suitable for pasture and forage collection.
However, since it is operating in built-up areas, urban dairy production has potentially
negative ecological consequences especially when crop and dairy production are decoupled:
on one hand, wasting and accumulation of nutrients (in feed leftovers and excrements) in the
city, which is transforming Bengaluru into a nutrient sink, as has also been reported for African
cities (Drechsel and Kunze, 2001; Schlecht et al., 2019). On the other hand, Bengaluru’s water
bodies are polluted through manure mismanagement (excessive flushing away of cattle
excrements). Neither dairy producers nor consumers seem to be aware of these
environmental problems. Because of the delay in negative environmental responses (e.g.,
drinking water with high nitrate concentration of faecal coliforms) and their potentially large
scale, these problems will be difficult to tackle without the intervention of Bengaluru’s
institutions. Additionally, tight cohabitation between humans and animals also represents a
health hazard (Butler, 2012; Daburon et al., 2017) but concerns over health risk associated
with urban cattle husbandry do not seems to go further than a general expectation of
maintaining a clean cowshed. As detailed in Termeer et al. (2019), information disconnect
about negative environmental or health effects appear to strengthen robustness, thus
short-term resilience of the SES, but undermine the adaptability and transformability that
guarantee long-term resilience of the SES. Thus, to enhance long-term resilience of urban
DPU, Bengaluru city authorities must regulate manure management in urban areas (e.g. in
assessing the feasibility of coupling of urban “landless” DPU with agricultural production

Chapter 5
98
elsewhere in Bengaluru’s RUI as suggested in Chapter 3) and implement standards for urban
cattle husbandry and eventually subsidize necessary improvements. Additionally, the
involvement of Bengaluru city authorities in urban dairy production and establishment of
standards would allow the recognition of urban dairy production and potentially improve the
livelihood of urban dairy producers and their families.
In contrast, (semi-)intensive rural DPU completely relied on dairy cooperatives for their
inputs and for the commercialization of their output. Market integration through dairy
cooperatives is a successful approach to improvement of rural livelihood, enhancing
participation of small-scale dairy producers in the development of dairy production
(Cunningham, 2009; Wouters and van der Lee, 2010). Rural DPU however typically suffer
from the traditional spatial and sectorial dichotomization of rural and urban areas, which could
potentially lead to overexploitation of local resources: land and water to produce crops,
vegetables and fodder for cattle, which are mostly exported as nutrients and virtual water to
the city, thus potentially decreasing soil fertility and local water resources. This red-loop trap
may develop as urban demand continues to increase; it might entail environmental injustice
between urban consumers and rural (dairy) producers as only the latter will have to bear
negative environmental consequences (poor soils, overexploited ecosystem), whereas the
only advantage of their proximity to the city is the financial reward of their economic activity.
5.3 Generalization of results and further research
Despite the specific context of India, our research provided insights into livestock
production systems in an urbanizing environment that can be generalised: the socio-cultural
importance of the cow is indeed strong and must be accounted for in the analysis of the Indian
dairy sector. Importance for the livelihood and multiple values, including socio-cultural, of cows
and livestock in general, are however not limited to India and have been reported from other
countries in the Global South such as Kenya (Weiler et al., 2014), even if expressed in less
obvious ways. Irrespective of the attribution of socio-cultural values to livestock, demand for
milk is affected by socio-cultural behaviours such as fasting practices of Orthodox Christians
in Ethiopia (D'Haene et al., 2019). Operation Flood shaped today’s Indian dairy sector and the
role of dairy cooperatives as tool of market integration is another aspect of our research that
is also found e.g. in Ethiopia (Chagwiza et al., 2016) and offers an interesting development
perspective to urbanization hotspots where formal market integration is lacking, as e.g. in
Cairo, Egypt (Daburon et al., 2017).

Chapter 5
99
This research, especially its limitations, thus constitutes a solid basis for further
research on the impact of urbanization on livestock production systems in India and other
urbanization hotspots in the Global South. To further understand the current impacts of
urbanization on livestock production systems but also predict and support further development
of livestock production systems, the following aspects should be researched:
Because Inwood and Sharp (2012) showed that family farms with a heir in perspective
will develop strategies to persist in an urbanizing environment, future research on livestock
production systems in an urbanizing environment should focus on internal family dynamics,
namely the availability of family labour, the possibility to hire labour and the link between labour
input and productivity at herd level. In addition to gain a detailed understanding of processes
at farm-level, future research should also focus on identifying the SES in which livestock
production units are embedded, because the frameworks of SES and resilience through
social-ecological linkages casts a new understanding on system transformation at sector level
in an urbanizing environment. From this perspective, the linkages and feedbacks between
producers and consumers are of major importance. Thus, future research should focus on
analysing production and consumption as two sides of the same problem, e.g. unsustainable
resource use or health risk as with the One Health framework, rather than depicting them as
distinct fields of research.
Since the present study analysed the current status of Bengaluru’s dairy sector, it
provides few insights on how it might further evolve. One way to overcome this limitation would
be collecting data on HH previously involved in dairy production and their reasons for stopping
their activity, thus increasing the understanding of the constraints and opportunities that
urbanization offers, especially regarding access to essential agricultural resources.
Anticipating the future developments of Bengaluru’s dairy sector is important for institutions
and policy makers to reasonably shape the processes while supporting its diversity, but also
because ongoing urbanization processes in West Africa and Asia offer a unique opportunity
to rethink food systems and rural-urban linkages. Should production and consumption be
dichotomized on a spatial and sectorial basis? How to foster fair and good quality rural-urban
linkages? Which place do peri-urban spaces occupy in the food supply strategy of emerging
megacities? Do extensive but highly adaptable production systems have a future in an
urbanizing environment, as they rely on locally available resources, opportunities and
constraints? Should small-scale family farming be preserved rather than transformed into
large-scale commercial production? And is small-scale family-farming versus large-scale
commercial production even mutually exclusive?

Chapter 5
100
5.4 Conclusions
This study showed that the impacts of urbanization on livestock production
systems are complex and need to be studied to overcome simplistic assumptions on the
mechanisms of urbanization, notably those of dichotomizing rural and urban areas on a spatial
and sectorial basis and especially in the Global South. Understanding and quantifying on-farm
mechanisms and transitions are important but only embedding them in their larger social-
ecological context and understanding the links between social-ecological components will
allow building sustainable and resilient food systems in an urbanizing environment.
In western countries, urbanization has led to spatial and sectorial dichotomization
of rural and urban areas and the shift from family agriculture to large scale commercial
agro-enterprises. In the rapidly urbanizing areas of West Africa and Asia, however,
urbanization might lead to different outcomes. Africa and Asia are faced with the complex task
of reinforcing their agriculture in a sustainable and resilient way to respond to the growing
demand for agricultural commodities but also to the growing threat of climate change, while
keeping the numerous smallholders currently active in agriculture at the centre of their
development strategies. By improving understanding of agricultural transitions in the case of
dairy production in an urbanizing environment, the present study can support the
implementation of future dairy development programs by pointing to local constraints and
opportunities and the importance of several social-ecological components that should all be
considered in such initiatives.
101
6 References
Alderman, H. Cooperative dairy development in Karnataka, India: An assessment. Vol. 64. Intl Food Policy Res Inst, 1987.
Amadou, H., Dossa, L.H., Lompo, D.J.-P., Abdulkadir, A., Schlecht, E., 2012. A comparison between urban livestock production strategies in Burkina Faso, Mali and Nigeria in West Africa. Tropical animal health and production 44 (7), 1631–1642. https://doi.org/10.1007/s11250-012-0118-0.
Amadou, H., Konaté, L., Nantoumé, H., Buerkert, A., Schlecht, E., 2015. Nutrient use efficiency in peri-urban dairy cattle and sheep holdings in southern Mali. Nutrient Cycling in Agroecosystems 102 (1), 65–78. https://doi.org/10.1007/s10705-014-9666-1.
Anand, I., Thampi, A., 2016. Recent Trends in Wealth Inequality in India. Economic & Political Weekly 51 (50).
Atkins, P.J., 1977. London’s Intra-Urban Milk Supply, circa 1790-1914. Transactions of the Institute of British Geographers, 383–399.
Ayantunde, A.A., Fernández-Rivera, S., Hiernaux P.H., van Keulen, H., Udo, H.M., 2002. Day and night grazing by cattle in the Sahel. Journal of Range Management, 144–149.
https://doi.org/10.2307/4003350 Bah, M., Cissé, S., Diyamett, B., Diallo, G., Lerise, F., Okali, D., Okpara, E., Olawoye, J.,
Tacoli, C., 2003. Changing rural–urban linkages in Mali, Nigeria and Tanzania. Environment & Urbanization 15 (1).
Baldini, C., Gardoni, D., Guarino, M., 2017. A critical review of the recent evolution of Life Cycle Assessment applied to milk production. Journal of Cleaner Production 140, 421–435. https://doi.org/10.1016/j.jclepro.2016.06.078.
Bartl, K., Gómez, C.A., Nemecek, T., 2011. Life cycle assessment of milk produced in two smallholder dairy systems in the highlands and the coast of Peru. Journal of Cleaner Production 19 (13), 1494–1505.
https://doi.org/10.1016/j.jclepro.2011.04.010. Basset-Mens, C., Ledgard, S., Boyes, M., 2009. Eco-efficiency of intensification scenarios for
milk production in New Zealand. Ecological Economics 68 (6), 1615–1625. https://doi.org/10.1016/j.ecolecon.2007.11.017.
Bava, L., Sandrucci, A., Zucali, M., Guerci, M., Tamburini, A., 2014. How can farming intensification affect the environmental impact of milk production? Journal of Dairy Science 97 (7), 4579–4593. https://doi.org/10.3168/jds.2013-7530.
Beever, D.E., Doyle, P.T., 2007. Feed conversion efficiency as a key determinant of dairy herd performance: a review. Aust. J. Exp. Agric. 47 (6), 645.
https://doi.org/10.1071/EA06048. Bijman, J., 2018. Exploring the Sustainability of the Cooperative Model in Dairy: The Case of
the Netherlands. Sustainability 10 (7), 2498. https://doi.org/10.3390/su10072498. Brinkmann, K., Hoffmann, E., Buerkert, A., 2020. Spatial and Temporal Dynamics of Urban
Wetlands in an Indian Megacity over the Past 50 Years. Remote Sensing 12 (4), 662. https://doi.org/10.3390/rs12040662.
102
Butler, W., 2012. Welcoming animals back to the city: Navigating the tensions of urban livestock through municipal ordinances. JAFSCD, 193–215.
https://doi.org/10.5304/jafscd.2012.022.003. Cerri, C.C., Moreira, C.S., Alves, P.A., Raucci, G.S., Almeida Castigioni, B. de, Mello, F.F.C.,
Cerri, D.G.P., Cerri, C.E.P., 2016. Assessing the carbon footprint of beef cattle in Brazil: a case study with 22 farms in the State of Mato Grosso. Journal of Cleaner Production 112, 2593–2600. https://doi.org/10.1016/j.jclepro.2015.10.072.
Chagwiza, C., Muradian, R., Ruben, R., 2016. Cooperative membership and dairy performance among smallholders in Ethiopia. Food Policy 59, 165–173. https://doi.org/10.1016/j.foodpol.2016.01.008.
Close, W., Menke, K.H., 1986. Selected topics in animal nutrition: A manual prepared for the 3rd Hohenheim course on animal nutrition in the tropics and semi-tropics. Feldafing.
Crane, T.A., 2010. Of Models and Meanings: Cultural Resilience in Social-Ecological Systems. Ecology and Society 15 (4). https://doi.org/10.5751/ES-03683-150419.
Cumming, G.S., Buerkert, A., Hoffmann, E.M., Schlecht, E., Cramon-Taubadel, S. von, Tscharntke, T., 2014. Implications of agricultural transitions and urbanization for ecosystem services. Nature 515 (7525), 50–57.
https://doi.org/10.1038/nature13945. Cunningham, K., 2009. Rural and urban linkages: Operation Flood’s role in India’s dairy
development. IFPRI Discussion Paper 00924, International Food Policy Research Institute, 48 pp.
Curry, A., 2013. Archaeology: The milk revolution. Nature News 500, 7460, 20-22 Daburon, A., Alary, V., Ali, A., El Sorougy, M., Tourrand, J.F., 2017. Urban Farms Under
Pressure: Cairo’s Dairy Producers, Egypt., in: Soulard, C.-T., Perrin, C., Valette, É. (Eds.), Toward sustainable relations between agriculture and the city. Springer, Cham, Switzerland.
D'Haene, E., D’Haese, M., 2019. Milk in the city: profiles and development paths for urban dairy holders in Ethiopia. Development Southern Africa 17 (3), 1–17. https://doi.org/10.1080/0376835X.2019.1689099.
D'Haene, E., Desiere, S., D'Haese, M., Verbeke, W., Schoors, K., 2019. Religion, Food Choices, and Demand Seasonality: Evidence from the Ethiopian Milk Market. Foods (Basel, Switzerland) 8 (5).
https://doi.org/10.3390/foods8050167 Diamond, J., Bellwood, P., 2003. Farmers and Their Languages: The First Expansions.
Science 300, 597–603. https://doi.org/10.1126/science.1078208 Diogo, R.V.C., Buerkert, A., Schlecht, E., 2010. Resource use efficiency in urban and peri-
urban sheep, goat and cattle enterprises. Animal 4 (10), 1725–1738. https://doi.org/10.1017/S1751731110000790.
Diogo, R.V.C., Schlecht, E., Buerkert, A., Rufino, M.C., van Wijk, M.T., 2013. Increasing nutrient use efficiency through improved feeding and manure management in urban and peri-urban livestock units of a West African city: A scenario analysis. Agricultural systems 114, 64–72. https://doi.org/10.1016/j.agsy.2012.09.001.

103
Dossa, L.H., Abdulkadir, A., Amadou, H., Sangare, S., Schlecht, E., 2011. Exploring the diversity of urban and peri-urban agricultural systems in Sudano-Sahelian West Africa: An attempt towards a regional typology. Landscape and Urban Planning 102 (3), 197–206. https://doi.org/10.1016/j.landurbplan.2011.04.005.
Dossa, L.H., Sangaré, M., Buerkert, A., Schlecht, E., 2015. Intra-urban and peri-urban differences in cattle farming systems of Burkina Faso. Land Use Policy 48, 401–411. https://doi.org/10.1016/j.landusepol.2015.06.031.
Drechsel, P., Graefe, S., Fink, M., 2007. Rural-urban food, nutrient and virtual water flows in selected West African cities. Research report / IWMI, Colombo, 29 pp.
https://cgspace.cgiar.org/handle/10568/39902 Drechsel, P., Kunze, D., 2001. Waste composting for urban and peri-urban agriculture: Closing
the rural-urban nutrient cycle in Sub-Saharan Africa. CABI Pub, Columbo, Sri Lanka, International Water Management Institute, Wallingford.
Dudwick, N., Hull, K., Katayama, R., Shilpi, F., Simler, K., 2011. From Farm to Firm: Rural-Urban Transition in Developing Countries. The International Bank for Reconstruction and Development, Washington DC, 256 pp.
https://doi.org/10.1596/978-0-8213-8623-1. Duguma, B., Janssens, G.P.J., 2016. Assessment of feed resources, feeding practices and
coping strategies to feed scarcity by smallholder urban dairy producers in Jimma town, Ethiopia. SpringerPlus 5 (1), 717. https://doi.org/10.1186/s40064-016-2417-9.
Duncan, A.J., Teufel, N., Mekonnen, K., Singh, V.K., Bitew, A., Gebremedhin, B., 2013. Dairy intensification in developing countries: effects of market quality on farm-level feeding and breeding practices. Animal 7 (12), 2054–2062.
https://doi.org/10.1017/S1751731113001602. Eicher, R., 2004. Evaluation of the metabolic and nutritional situation in dairy herds: Diagnostic
use of milk components. Medecin veterinaire du Québec 34, 36–37. Erler, M., Dittrich, C., 2017. Nahrungs- und Ernährungsverhalten urbaner Mittelschichten in
Bangalore. Geographische Rundschau 12, 26–32. FAOSTAT, 2019. Live animals & livestock primary datasets. Food and Agricultural
Organization of the United Nations. Statistics division. http://www.fao.org/faostat/en/#data/QL/visualize (accessed 10th November 2019). Feedipedia. Animal feed resources information system: Nutritional tables.
https://www.feedipedia.org/ (accessed 2nd September 2019). Food and Agricultural Organization of the United Nations, 2020a. Dairy animals - Cattle.
http://www.fao.org/dairy-production-products/production/dairy-animals/cattle/en/ (accessed 4 March 2020).
Food and Agricultural Organization of the United Nations, 2020b. Production systems. http://www.fao.org/dairy-production-products/production/production-systems/en/ (accessed 4 March 2020).
Food and Agricultural Organization of the United Nations (FAO), Livestock Environmental Assessment and Performance Partnership, 2016. Environmental performance of large ruminant supply chains: Guidelines for assessment. (Version 1), Rome, Italy, 232 pp.
104
Forabosco, F., Chitchyan, Z., Mantovani, R., 2017. Methane, nitrous oxide emissions and mitigation strategies for livestock in developing countries: A review. South African Journal of Animal Science 47 (3), 268. https://doi.org/10.4314/sajas.v47i3.3.
Francis, C., Lieblein, G., Steinsholt, H., Breland, T.A., Helenius, J., Sriskandarajah, N., Salomonsson, L., 2005. Food Systems and Environment: Building Positive Rural-Urban Linkages. Human Ecology Review, 60–71.
https://www.jstor.org/stable/24707501 Fraval, S., Hammond, J., Wichern, J., Oosting, S.J., de Boer, I. J. M., Teufel, N., Lannerstad,
M., Waha, K., Pagella, T., Rosenstock, T.S., Giller, K.E., Herrero, M., Harris, D., van Wijk, M.T., 2019. Making the most of imperfect farm household data: a critical evaluation of standard information collected in farm household surveys. Experimental Agriculture 55 (2), 230–250. https://doi.org/10.1017/S0014479718000388.
Garg, M.R., Phondba, B.T., Sherasia, P.L., Makkar, H.P.S., 2016. Carbon footprint of milk production under smallholder dairying in Anand district of Western India: a cradle-to-farm gate life cycle assessment. Animal Production Science 56 (3), 423. https://doi.org/10.1071/AN15464.
Gerber, P.J., Steinfeld, H., Henderson, B., Mottet, A., Opio, C., Dijkman, J., Falcucci, A., Tempio, G., 2013. Tackling climate change through livestock: A global assessment of emissions and mitigation opportunities. Food and Agriculture Organization of the United Nations (FAO), Rome.
Gerber, P.J., Vellinga, T., Opio, C., Steinfeld, H., 2011. Productivity gains and greenhouse gas intensity in dairy systems. Livestock Science 139, 100–108.
https://doi.org/10.1016/j.livsci.2011.03.012 Government of India, 2011. Census of India 2011: META DATA. Government of India, Ministry
of home Affairs, Office of the Registrar General & Census Commissioner, India. http://censusindia.gov.in/2011census/HLO/Metadata_Census_2011.pdf (accessed 12 March 2020).
Government of India, 2014. Sample Registration system: Baseline survey 2014. Government of India, Ministry of home Affairs, Office of the Registrar General & Census Commissioner, India, 89 pp. http://www.censusindia.gov.in/vital_statistics/
BASELINE%20TABLES08082016.pdf (accessed 14th November 2019). Graefe, S., Buerkert, A., Schlecht, E., 2019. Trends and gaps in scholarly literature on urban
and peri-urban agriculture. Nutrient Cycling in Agroecosystems 115 (2), 143–158. https://doi.org/10.1007/s10705-019-10018-z.
Grafton, R.Q., Doyen, L., Béné, C., Borgomeo, E., Brooks, K., Chu, L., Cumming, G.S., Dixon, J., Dovers, S., Garrick, D., Helfgott, A., Jiang, Q., Katic, P., Kompas, T., Little, L.R., Matthews, N., Ringler, C., Squires, D., Steinshamn, S.I., Villasante, S., Wheeler, S., Williams, J., Wyrwoll, P.R., 2019. Realizing resilience for decision-making. Nature Sustainability 2 (10), 907–913.
https://doi.org/10.1038/s41893-019-0376-1. Grund, J.-N., 2018. Biometric characteristics of dairy cattle in Karnataka. Master’s thesis.
Göttingen. Hales, K.E., 2019. Relationships between digestible energy and metabolizable energy in
current feedlot diets. Translational Animal Science 3 (3), 945–952.
105
https://doi.org/10.1093/tas/txz073. Hemme, T., Garcia, O., Saha, A., 2003. A Review of Milk Production in India with Particular
Emphasis on Small-Scale Producers. Pro-poor Livestock Policy Initiative Hemme, T., Otte, J. (Eds.), 2010. Status and prospects for smallholder milk production: A
global perspective. Food and Agriculture Organization of the United Nations, Rome, 181 pp.
Hermansen, J.E., Kristensen, T., 2011. Management options to reduce the carbon footprint of livestock products. Animal Frontiers 1 (1), 33–39. https://doi.org/10.2527/af.2011-0008.
Hoffmann, E., Jose, M., Nölke, N., Möckel, T., 2017. Construction and Use of a Simple Index of Urbanisation in the Rural–Urban Interface of Bangalore, India. Sustainability 9 (11), 2146. https://doi.org/10.3390/su9112146.
Ikerd, J.E., 1993. The need for a system approach to sustainable agriculture. Agriculture, Ecosystems & Environment 46 (1-4), 147–160. https://doi.org/10.1016/0167-8809(93)90020-P.
International Labour Organization. Labour force conversion factors: Cited in: Roessler et al. (2016). Emerging Development Pathways of Urban Livestock Production in Rapidly Growing West Africa Cities. Sustainability 8 (11), 1199.
Inwood, S.M., Sharp, J.S., 2012. Farm persistence and adaptation at the rural–urban interface: Succession and farm adjustment. Journal of Rural Studies 28 (1), 107–117. https://doi.org/10.1016/j.jrurstud.2011.07.005.
IPCC guidelines (Ed.), 2006. 2006 IPCC guidelines for national greenhouse gas inventories. Institute for Global Environmental Strategies, Hayama, Japan, 1 online resource (5 volumes).
Janssen, E., Swinnen, J., 2019. Technology adoption and value chains in developing countries: Evidence from dairy in India. Food Policy 83, 327–336. https://doi.org/10.1016/j.foodpol.2017.08.005.
Karnataka Milk Federation. Karnataka Milk Federation: About us. https://www.kmfnandini.coop/about-us (accessed 12th March 2020). Kelly-Reif, K., Wing, S., 2016. Urban-rural exploitation: An underappreciated dimension of
environmental injustice. Journal of Rural Studies 47, 350-358 https://doi.org/10.1016/j.jrurstud.2016.03.010 Kennedy, U., Sharma, A., Phillips, C.J.C., 2018. The Sheltering of Unwanted Cattle,
Experiences in India and Implications for Cattle Industries Elsewhere. Animals 8 (5). https://doi.org/10.3390/ani8050064.
Krüger, F., 1998. Taking advantage of rural assets as a coping strategy for the urban poor: the case of ruralurban interrelations in Botswana. Environment and Urbanization 10 (1), 119–134. https://doi.org/10.1177/095624789801000102.
Kumar, P., Geneletti, D., Nagendra, H., 2016. Spatial assessment of climate change vulnerability at city scale: A study in Bangalore, India. Land Use Policy 58, 514–532. https://doi.org/10.1016/j.landusepol.2016.08.018.
Lamine, C., 2015. Sustainability and Resilience in Agrifood Systems: Reconnecting Agriculture, Food and the Environment. Sociologica Ruralis 55 (1), 41–61. https://doi.org/10.1111/soru.12061.
106
Lapar, M.L.A., Choubey, M., Patwari, P., Kumar, A., Baltenweck, I., Jabbar, M.A., Staal, S., 2010. Consumer preferences for attributes of raw and powdered milk in Assam, Northeast India, in: Jabbar, M.A., Baker, D., Fadiga, M.L. (Eds.), Demand for livestock products in developing countries with a focus on quality and safety attributes: Evidence from case studies. ILRI (International Livestock Research Institute, Addis Ababa, Ethiopia.
Lerner, A.M., Eakin, H., 2011. An obsolete dichotomy? Rethinking the rural–urban interface in terms of food security and production in the global south. The Geographical journal 177 (4), 311–320. https://doi.org/10.1111/j.1475-4959.2010.00394.x.
Lobao, L., Meyer, K., 2001. The Great Agricultural Transition: Crisis, Change, and Social Consequences of Twentieth Century US Farming. Annual Review of Sociology
https://doi.org/10.1146/annurev.soc.27.1.103 MacDonald, G.K., Brauman, K.A., Sun, S., Carlson, K.M., Cassidy, E.S., Gerber, J.S., West,
P.C., 2015. Rethinking Agricultural Trade Relationships in an Era of Globalization. BioScience 65 (3), 275–289. https://doi.org/10.1093/biosci/biu225
Market Research Society of India, 2011. Socio-Economic Classification-2011: The New SEC system, Mumbai, 38 pp. Available at
https://mruc.net/uploads/posts/b17695616c422ec8d9dadafc1c3eec26.pdf Mascarenhas, R.C., 1988. A strategy for rural development: Dairy cooperatives in India. Sage,
New Delhi, London. Mayberry, D., Ash, A., Di Prestwidge, Godde, C.M., Henderson, B., Duncan, A., Blummel, M.,
Ramana Reddy, Y., Herrero, M., 2017. Yield gap analyses to estimate attainable bovine milk yields and evaluate options to increase production in Ethiopia and India. Agricultural systems 155, 43–51.
https://doi.org/10.1016/j.agsy.2017.04.007. Menke, K.H., Huss, K.H., 1987. Tierernährung un Futtermittelkunde: Richtzahlen für die
praktische Fütterung. Stuttgart. Menke, K.H., Raab, L., Salewski, A., Steingass, H., Fritz, D., Schneider, W., 1979. The
estimation of the digestibility and metabolizable energy content of ruminant feedingstuffs from the gas production when they are incubated with rumen liquor in vitro. The Journal of Agricultural Science 93 (1), 217-222.
Migose, S.A., Bebe, B.O., Boer, I.J.M. de, Oosting, S.J., 2018. Influence of distance to urban markets on smallholder dairy farming systems in Kenya. Tropical animal health and production 50 (7), 1417–1426. https://doi.org/10.1007/s11250-018-1575-x.
Millennium Ecosystem Assessment, 2005. Ecosystems and human well-being: Synthesis. Island Press, Washington DC, x, 137.
Ministry of Agriculture, 2014. Basic Animal Husbandry and Fisheries Statistics. Ministry of Agriculture Department of Animal Husbandry, Dairying and Fisheries, Krishi Bhawan, New Delhi, India.
Moran, J., 2005. Tropical dairy farming: Feeding management for small holder dairy farmers in the humid tropics. Landlinks, Oxford, xv, 295 s.
Narayan, S., 2018. The cows of Bangalore: And how I came to own one. Simon & Schuster India, New Delhi, 281 pp.

107
National Dairy Development Board, 2015. Dairying in Karnataka: A statistical profile 2015, Anand, Gujarat, India, 136 pp.
National Research Council, 1971. A Guide to Environmental Research on Animals. National Academies Sciences, Washington DC.
Nyholm, K., Schaumburg-Muller, H., Westergaad, K., 1974. Socio-economic aspects of dairy development: Report from the Bangalore milkshed area. Economic and Political Weekly Vol. 9, No. 52, A127-A136.
Ostrom, E., 2007. A diagnostic approach for going beyond panaceas. PNAS 104 (39), 15181–15187. https://doi.org/10.1073/pnas.0702288104
Parilla, J., Trujillo, J.L., Berube, A., Ran, T., 2015. Global metro monitor an uncertain recovery 2014. Metropolitan policy program.
Philippine National Statistics Office, 1992. Census of Population and Housing: Report No. 3: Socio-economic and Demographic Characteristics, Manila.
Pinto, A., Yin, T., Reichenbach, M., Bhatta, R., Schlecht, E., König, S., 2020. Phenotypic Dairy Cattle Trait Expressions in Dependency of Social-Ecological Characteristics along Rural-Urban Gradients. In Sustainability 12 (21), p. 9021. DOI: 10.3390/su12219021.
Prasad, C.S., Anandan, S., Gowda, N.K.S., Schlecht, E., Buerkert, A., 2019. Managing nutrient flows in Indian urban and peri-urban livestock systems. Nutrient Cycling in Agroecosystems 115 (2), 159–172. https://doi.org/10.1007/s10705-018-9964-0.
Regmi, A., Dyck, J., 2001. Effects of urbanization on global food demand, in: Changing structure of global food consumption and trade, WRS-01-1, pp. 23–30.
https://doi.org/10.1177/0956247809359644 Roessler, R., Mpouam, S., Muchemwa, T., Schlecht, E., 2016. Emerging Development
Pathways of Urban Livestock Production in Rapidly Growing West Africa Cities. Sustainability 8 (11), 1199. https://doi.org/10.3390/su8111199.
Romney, D.L., Thorne, P.J., Thomas, D., 1994. Some animal-related factors influencing the cycling of nitrogen in mixed farming systems in sub-Saharan Africa. Agriculture, Ecosystems & Environment 49 (2), 163–172. https://doi.org/10.1016/0167-8809(94)90006-X.
Satterthwaite, D., McGranahan, G., Tacoli, C., 2010. Urbanization and its implications for food and farming. Philosophical transactions of the Royal Society of London. Series B, Biological sciences 365 (1554), 2809–2820.
https://doi.org/10.1098/rstb.2010.0136. Schlecht, E., Plagemann, J., Mpouam, S.E., Sanon, H.O., Sangaré, M., Roessler, R., 2019.
Input and output of nutrients and energy in urban and peri-urban livestock holdings of Ouagadougou, Burkina Faso. Nutrient Cycling in Agroecosystems 115 (2), 201–230. https://doi.org/10.1007/s10705-019-09996-x.
Seré, C., van der Zijpp, A., Persley, G., Rege, E., 2008. Dynamics of livestock production systems, drivers of change and prospects for animal genetic resources. Animal Genetic Resources 42, 3-24
https://doi.org/10.1017/S1014233900002510
108
Shukla, A., Jain, K., 2019. Critical analysis of rural-urban transitions and transformations in Lucknow city, India. Remote Sensing Applications: Society and Environment 13, 445–456. https://doi.org/10.1016/j.rsase.2019.01.001.
Sjaunja, L.O., Baevre, L., Junkkarinen, L., Pedersen, J., Setäla J. (Eds.), 1990. A Nordic proposal for an energy corrected milk (ECM) formula: 27th Session International Committee for Recording and Productivity of Milk Animals, Paris, France.
Spedding, C.R.W., 1988. An Introduction to Agricultural Systems. Springer Netherlands, Dordrecht.
Steel, C., 2008. Hungry city: How food shapes our lives. Vintage Books, London, 383 pp. Sudhira, H.S., Ramachandra, T.V., Subrahmanya, M.B., 2007. City profile: Bangalore. Cities
24 (5), 379–390. https://doi.org/10.1016/j.cities.2007.04.003. Sundkvist, Å., Milestad, R., Jansson, A., 2005. On the importance of tightening feedback loops
for sustainable development of food systems. Food Policy 30 (2), 224–239. https://doi.org/10.1016/j.foodpol.2005.02.003.
Tacoli, C., 1998. Rural-urban interactions: a guide to the literature. Environment and Urbanization 10, 147–166. https://doi.org/10.1177/095624789801000105
Tacoli, C., 2003. The links between urban and rural development. Environment and Urbanization 15, 3–12. https://doi.org/10.1177/095624780301500111
Tacoli, C., Vorley, B., 2015. Reframing the debate on urbanisation, rural transformation and food security. IIED Briefing. International Institure for Environment and Development, 4 pp.
Termeer, C.J.A.M., Feindt, P.H., Karpouzoglou, T., Poppe, K.J., Hofstede, G.J., Kramer, K., Ge, L., Mathijs, E., Meuwissen, M.P.M., 2019. Institutions and the resilience of biobased production systems: the historical case of livestock intensification in the Netherlands. E&S 24 (4). https://doi.org/10.5751/ES-11206-240415.
Thapa, R.B., Murayama, Y., 2008. Land evaluation for peri-urban agriculture using analytical hierarchical process and geographic information system techniques: A case study of Hanoi. Land Use Policy 25 (2), 225–239.
https://doi.org/10.1016/j.landusepol.2007.06.004. Tingbé-Azalou, A., 1997. Cultural dimensions of rural-urban relations in Benin, in: Baker, J.
(Ed.), Rural-Urban Dynamics in Francophone Africa. Uppsala, pp. 79–89. Udo, H., Weiler, V., Modupeore, O., Viets, T., Oosting, S., 2016. Intensification to Reduce the
Carbon Footprint of Smallholder Milk Production: Fact or Fiction? Outlook on Agriculture 45 (1), 33–38. https://doi.org/10.5367/oa.2016.0229.
Ulbrich, M., Hoffmann, M., Drochner, W., 2004. Fütterung und Tiergesundheit. Ulmer, Stuttgart, 416 str.
United Nations, 2018a. Map: Growth rate of urban agglomerations by size class. United Nations, Department of Economic and Social Affairs Population Division. https://population.un.org/wup/Maps/ (accessed 5th March 2020).
United Nations, 2018b. The World’s Cities in 2018: Data Booklet. United Nations, Department of Economic and Social Affairs, Population Division, 34 pp.
United Nations, 2019. World urbanization prospects: The 2018 revision. United Nations, Department of Economic and Social Affairs, Population Division, New York, xix, 103.
109
Vanvanhossou, S.F.U., Diogo, R.V.C., Dossa, L.H., 2018. Estimation of live bodyweight from linear body measurements and body condition score in the West African Savannah Shorthorn cattle in North-West Benin. Cogent Food & Agriculture 4 (1), 135. https://doi.org/10.1080/23311932.2018.1549767.
Verma, S., Chatterjee, A., Mandal, N.R., 2017. Analysing Urban Sprawl and Shifting of Urban Growth Centre of Bengaluru City, India Using Shannon’s Entropy Method. Journal of Settlements and Spatial Planning 8 (2), 89–98.
https://doi.org/10.24193/JSSP.2017.2.02. Vohra, K., 2012. The Plastic Cow. Karuna Society for Animals and Nature. Wassie, S.E., Ali, A.I.M., Korir, D., Butterbach-Bahl, K., Goopy, J., Merbold, L., Schlecht, E.,
Dickhoefer, U., 2019. Effects of feed intake level on efficiency of microbial protein synthesis and nitrogen balance in Boran steers consuming tropical poor-quality forage. Archives of animal nutrition 73 (2), 140–157.
https://doi.org/10.1080/1745039X.2019.1572343. Weiler, V., Udo, H.M.J., Viets, T., Crane, T.A., Boer, I.J.M. de, 2014. Handling multi-
functionality of livestock in a life cycle assessment: the case of smallholder dairying in Kenya. Current Opinion in Environmental Sustainability 8, 29–38. https://doi.org/10.1016/j.cosust.2014.07.009.
West, J.W., 2003. Effects of heat-stress on production in dairy cattle. Journal of Dairy Science 86 (6), 2131–2144. https://doi.org/10.3168/jds.S0022-0302(03)73803-X.
Widi, T.S.M., Udo, H.M.J., Oldenbroek, K., Budisatria, I.G.S., Baliarti, E., Viets, T.C., van der Zijpp, A.J., 2015. Is cross-breeding of cattle beneficial for the environment? The case of mixed farming systems in Central Java, Indonesia. Animal Genetic Resources 57, 1–13. https://doi.org/10.1017/S2078633615000259.
Wikkramatileke, R., Singh, K., 1969. Tradition and change in an indian dairying community in singapore. Annals of the Association of American Geographers 60 (4), 717–742.
https://doi.org/10.1111/j.1467-8306.1970.tb00755.x Woldegebriel, D., Udo, H., Viets, T., van der Harst, E., Potting, J., 2017. Environmental impact
of milk production across an intensification gradient in Ethiopia. Livestock Science 206, 28–36. https://doi.org/10.1016/j.livsci.2017.10.005.
World Bank, 2018a. World Development Indicators: "Population, total". https://data.worldbank.org/indicator/SP.POP.TOTL (accessed 2 February 2020).
World Bank, 2018b. World Development Indicators: "Urban population". https://data.worldbank.org/indicator/SP.URB.TOTL.IN.ZS (accessed 2 February 2020).
World Bank, Urban Development and Resilience Unit, 2013. Urban Agriculture: Findings from Four City Case Studies. Urban Development Series Knowledge Papers, 104 pp.
Wouters, A.P., van der Lee, J., 2010. Inclusion of small-scale milk producers in modern dairy value chains. Wageningen UR, [Wageningen], 11 pp.
Zezza, A., Federighi, G., Kalilou, A.A., Hiernaux, P., 2016. Milking the data: Measuring milk off-take in extensive livestock systems. Experimental evidence from Niger. Food Policy 59, 174–186. https://doi.org/10.1016/j.foodpol.2016.01.005.

110
Zoomers, A.E.B., Kleinpenning, J.A.N., 1996. Livelihood and urban-rural relations in central Paraguay. Tijdschrift voor economische en sociale geografie 87 (2), 161–174. https://doi.org/10.1111/j.1467-9663.1998.tb01546.

9 783737 608947
ISBN 978-3-7376-0894-7
Did you ever see a cow in the middle of the street?
In Bengaluru, India, it is a common sight despite Bengaluru being one of the fastest urbanizing city in the world, with now over 10 million inhabitants. In short, the present work aims to explain how and why a cow in the middle of the street is a common sight in Bengaluru.
In full, the present work aims to provide deeper insights into the impacts of urbanization on dairy production, taking the dairy sector of the emerging megacity of Bengaluru as case study. The present work first focusses on identifying and characterizing the dairy production systems that co-exist in the rural-urban interface of Bengaluru, while highlighting potential linkages between its social-ecological components. In a second step, the present work focusses on quantifying the impacts of distinct dairy production strate-gies in terms of resources use efficiency, namely feed conversion efficiency, and global environmental impact, namely emission intensity of greenhouse gasses, in relation to the spatial distribution of Bengaluru’s dairy production systems across its rural-urban interface.