
D. Mohanadas Thesis (Commerce 2014).pdf - Bharathidasan ...
264
Ph.D., Thesis Submitted to the Bharathidasan University for the Award of the Degree of Doctor of Philosophy in Commerce By D. MOHANADAS (Ref No. 025705) Assistant Professor, Department of Commerce, Sindhi College, Chennai – 77. Under the Supervision of Dr. M. RENGASAMY, Ph.D., Associated Professor and Head (Rtd.), PG and Research Department of Commerce, Poompuhar College (Autonomous), Melaiyur – 609107. BHARTHIDASAN UNIVERSITY TIRUCHIRAPPALLI – 620024 JULY – 2014
-
Upload
khangminh22 -
Category
Documents
-
view
0 -
download
0
Transcript of D. Mohanadas Thesis (Commerce 2014).pdf - Bharathidasan ...

Ph.D., Thesis Submitted to the Bharathidasan University
for the Award of the Degree of Doctor of Philosophy in Commerce
By
D. MOHANADAS
(Ref No. 025705)
Assistant Professor,
Department of Commerce,
Sindhi College, Chennai – 77.
Under the Supervision of
Dr. M. RENGASAMY, Ph.D.,
Associated Professor and Head (Rtd.),
PG and Research Department of Commerce,
Poompuhar College (Autonomous), Melaiyur – 609107.
BHARTHIDASAN UNIVERSITY TIRUCHIRAPPALLI – 620024
JULY – 2014
2
DDrr.. MM.. RREENNGGAASSAAMMYY,, M.Com., M.Phil., Ph.D., M.Ed.,DCPA.,
Research Supervisor, Associate Professor and Head (Rtd.), PG and Research Department of Commerce, Poompuhar College, (Autonomous),
Melaiyur – 608 107, Sirkali Taluk, Nagapattinam District, Tamilnadu, India.
Date:
CCeerrttiiffiiccaattee
This is to certify that the thesis entitled
“PERFORMANCE OF UTI MUTUAL FUND WITH
REFERENCE TO ITS SELECTED SCHEMES – A STUDY” is
a bonafide record of research work done by
Mr.D.Mohanadas, Part-Time Research Scholar, PG and
Research Department of Commerce, Poompuhar College
(Autonomous), Melaiyur, under my guidance for the award
of the degree of Doctor of Philosophy and that this thesis
has not previously formed the basis for the award of any
degree, diploma, fellowship, associateship or any other
similar title to the candidate.
This is also to certify that the thesis represents the
independent work of the candidate.
Candidate Supervisor

3
DECLARATION
I hereby declare that the thesis entitled,
“Performance of UTI Mutual Fund with Reference to Its
Selected Schemes – A Study”, submitted for the degree of
Doctor of Philosophy in Commerce is the result of my
original and independent research work carried out under
the guidance of Dr.M.RENGASAMY, Associate Professor
and Head (Retired), PG and Research Department of
Commerce, Poompuhar College (Autonomous), Melaiyur,
and it has not been submitted for the award of any
degree, diploma, associateship for fellowship of any
university or institution.
Place: Signature of the candidate
Date: [D. Mohanadas]

4
ACKNOWLEDGEMENT
First I would like to thank the Lord God, the Almighty for his
abundant benevolence and blessing and his grace has guided me up to this
level in my academic and research endeavours.
It is a pride and privilege to record my heartfelt and deep sense of
gratitude to my research guide, Dr. M. RENGASAMY, M.Com., M.Phil., Ph.D., M.Ed.,
Associate Professor Head (Rtd.), PG and Research Department of
Commerce, Poomphuhar College, Malaiyur, for his punctilious guidance,
continuous encouragement, valuable suggestions scientific freedom which
have helped me to proceed confidently and complete the study successfully
my Ph.D Research work. His approach, vision, hard work , honest and
guidance in research enabled me to gain a lot. This thesis is largely a result
of his diligent and meticulous approach to each and every step of my work.
I express my sincere thanks to Doctoral Committee Members,
Dr. PM. Meera Mohiadeen, Head of the Department of Commerce, Jamal
Mohammed Collage, Trichy, for providing me valuable suggestions to make
this study.
I am very much thankful to Dr. A. Panneerselvam Principal, and
Dr. G. Rajendran, Head of the Department of Commerce, Poompuhar
College (Autonomous) Melaiyur for their advice, direction and inspiration.
I convey my heartfull thanks to Dr. G. Shanmugasundaram,
Professor, Department Commerce, Pondicherry University for his advices
and encouragement.
My sincere thanks are also due to the members of the staff,
Department of Commerce for their encouragement.
My everlasting thanks are due to the Bharadhidasan University,
Tiruchirappalli, for permitting me to undertake this research work.
I am very much grateful to the officials of the TNIA, AMFI, UTI,
ICICI, Reliance, and HDFC Mutual funds for their full support while
gathering information.

5
I wish to thank to Dr. K. Sathyanarayana, Principal, Sindhi College,
Chennai-77, for his suggestions and kind co-operation which enable me to
complete my research work successfully.
I express my thankfulness to Mr. S. Sudharsan Assistant Professor,
Sindhi College, Chennai-77, for his help, pleasing words of encouragement
and who offered valuable suggestions.
I record my gratitude to Mr.R. Muthuraman, Mr.V. Sivaprakasam,
and Mr. A. Sairam, Faculty members of the Department of Corporate
Secretaryship, Sindhi college, for their timely help and co-operation which
enabled me to complete my research work successfully.
No words on earth can be enough to express my gratefulness to my
beloved parents, wife, my Children and members of my family who
helped me at every stage of this work.
I express my deep sense of gratitude to my beloved friends
Dr. V. Kannan and Mr. M. Dhamodharan, Assistant Professor, who have
provided accommodation facilities and for their support enabled me to
complete it successfully.
Also my special thanks to Bala-Sara computers, OP, Main Road
for their neat typing and execution of this research work.
[D.Mohanadas]

6
CONTENTS
CHAPTER
NO.
TITLE PAGE
NO.
Certificate i
Declaration ii
Acknowledgement iii
List of Tables vi
List of Graph x
List of Schedule xi
List of Abbreviations xii
I RESEARCH DESIGN 1
II REVIEW OF LITERATURE 43
III AWARENESS AND THE PERCEPTIONS 73
IV SCHEMES AND PERFORMANCE 126
V PERFORMANCE OF FUND MANAGERS 175
VI PERFORMANCE OF UTI AND PRIVATE
SECTOR MUTUAL FUND SCHEMES
185
VII FINDINGS, SUGGESTIONS AND
CONCLUSION
205
BIBLIOGRAPHY 222
APPENDIX
7
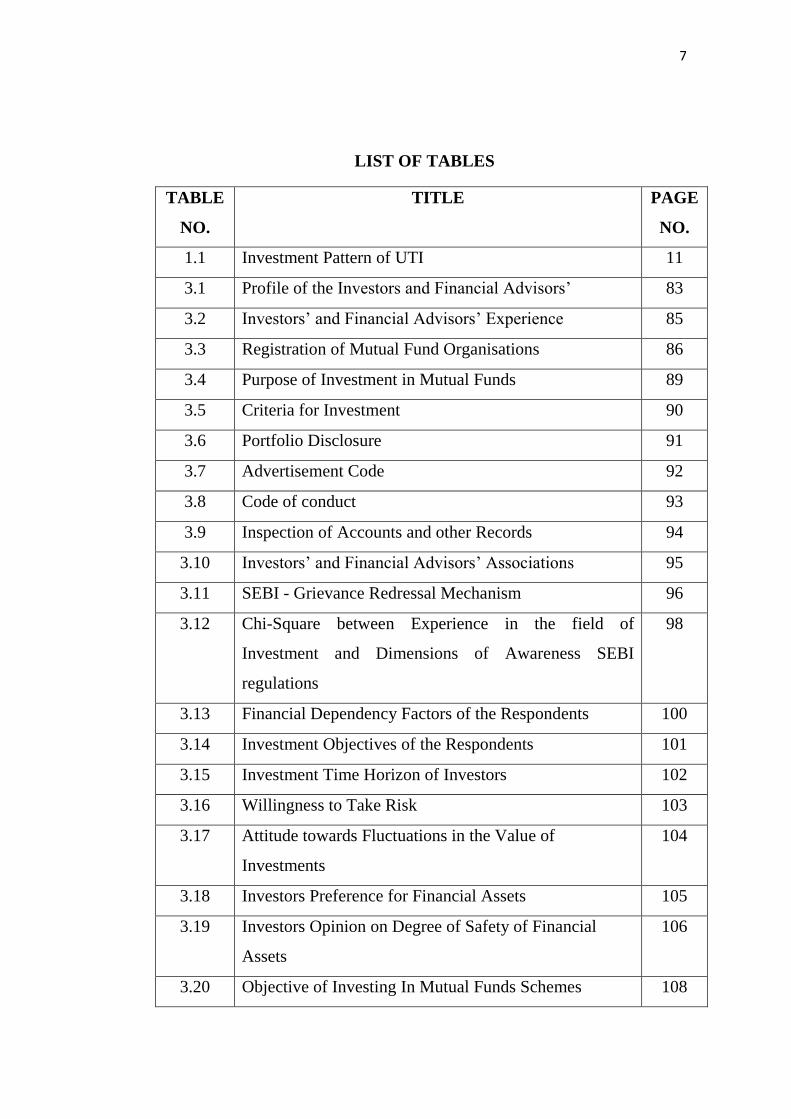
LIST OF TABLES
TABLE
NO.
TITLE PAGE
NO.
1.1 Investment Pattern of UTI 11
3.1 Profile of the Investors and Financial Advisors‟ 83
3.2 Investors‟ and Financial Advisors‟ Experience 85
3.3 Registration of Mutual Fund Organisations 86
3.4 Purpose of Investment in Mutual Funds 89
3.5 Criteria for Investment 90
3.6 Portfolio Disclosure 91
3.7 Advertisement Code 92
3.8 Code of conduct 93
3.9 Inspection of Accounts and other Records 94
3.10 Investors‟ and Financial Advisors‟ Associations 95
3.11 SEBI - Grievance Redressal Mechanism 96
3.12 Chi-Square between Experience in the field of
Investment and Dimensions of Awareness SEBI
regulations
98
3.13 Financial Dependency Factors of the Respondents 100
3.14 Investment Objectives of the Respondents 101
3.15 Investment Time Horizon of Investors 102
3.16 Willingness to Take Risk 103
3.17 Attitude towards Fluctuations in the Value of
Investments
104
3.18 Investors Preference for Financial Assets 105
3.19 Investors Opinion on Degree of Safety of Financial
Assets
106
3.20 Objective of Investing In Mutual Funds Schemes 108
8
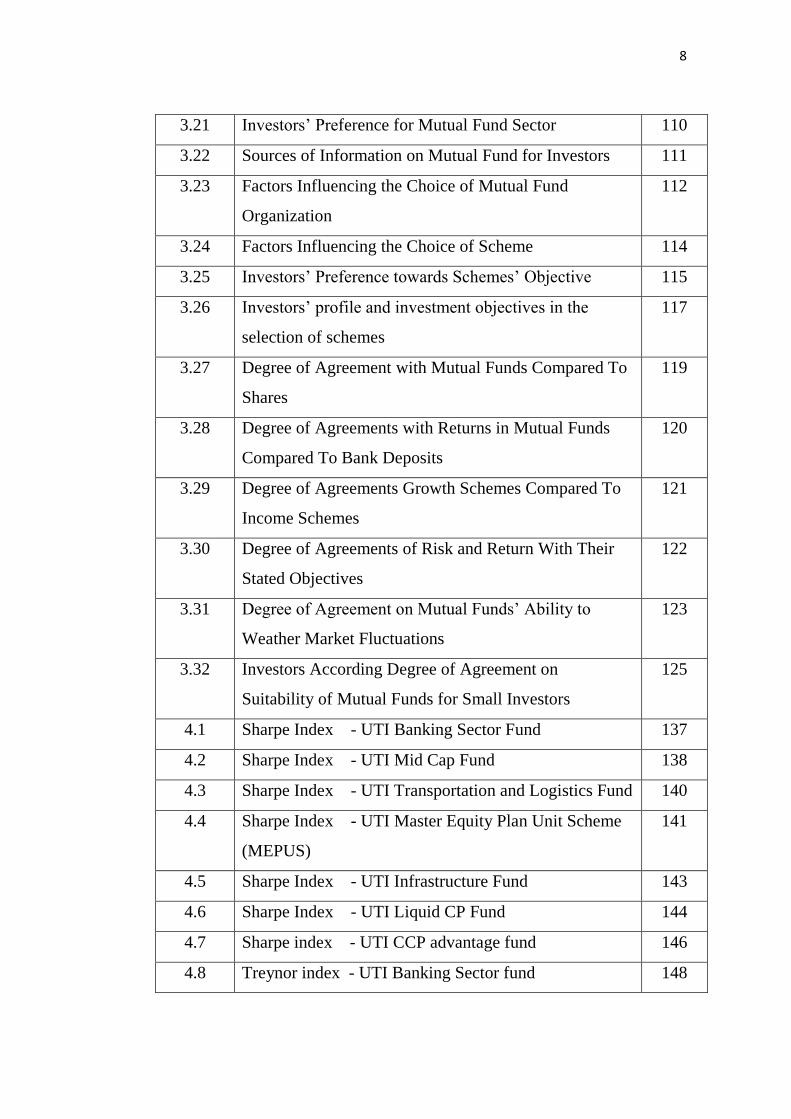
3.21 Investors‟ Preference for Mutual Fund Sector 110
3.22 Sources of Information on Mutual Fund for Investors 111
3.23 Factors Influencing the Choice of Mutual Fund
Organization
112
3.24 Factors Influencing the Choice of Scheme 114
3.25 Investors‟ Preference towards Schemes‟ Objective 115
3.26 Investors‟ profile and investment objectives in the
selection of schemes
117
3.27 Degree of Agreement with Mutual Funds Compared To
Shares
119
3.28 Degree of Agreements with Returns in Mutual Funds
Compared To Bank Deposits
120
3.29 Degree of Agreements Growth Schemes Compared To
Income Schemes
121
3.30 Degree of Agreements of Risk and Return With Their
Stated Objectives
122
3.31 Degree of Agreement on Mutual Funds‟ Ability to
Weather Market Fluctuations
123
3.32 Investors According Degree of Agreement on
Suitability of Mutual Funds for Small Investors
125
4.1 Sharpe Index - UTI Banking Sector Fund 137
4.2 Sharpe Index - UTI Mid Cap Fund 138
4.3 Sharpe Index - UTI Transportation and Logistics Fund 140
4.4 Sharpe Index - UTI Master Equity Plan Unit Scheme
(MEPUS)
141
4.5 Sharpe Index - UTI Infrastructure Fund 143
4.6 Sharpe Index - UTI Liquid CP Fund 144
4.7 Sharpe index - UTI CCP advantage fund 146
4.8 Treynor index - UTI Banking Sector fund 148
9
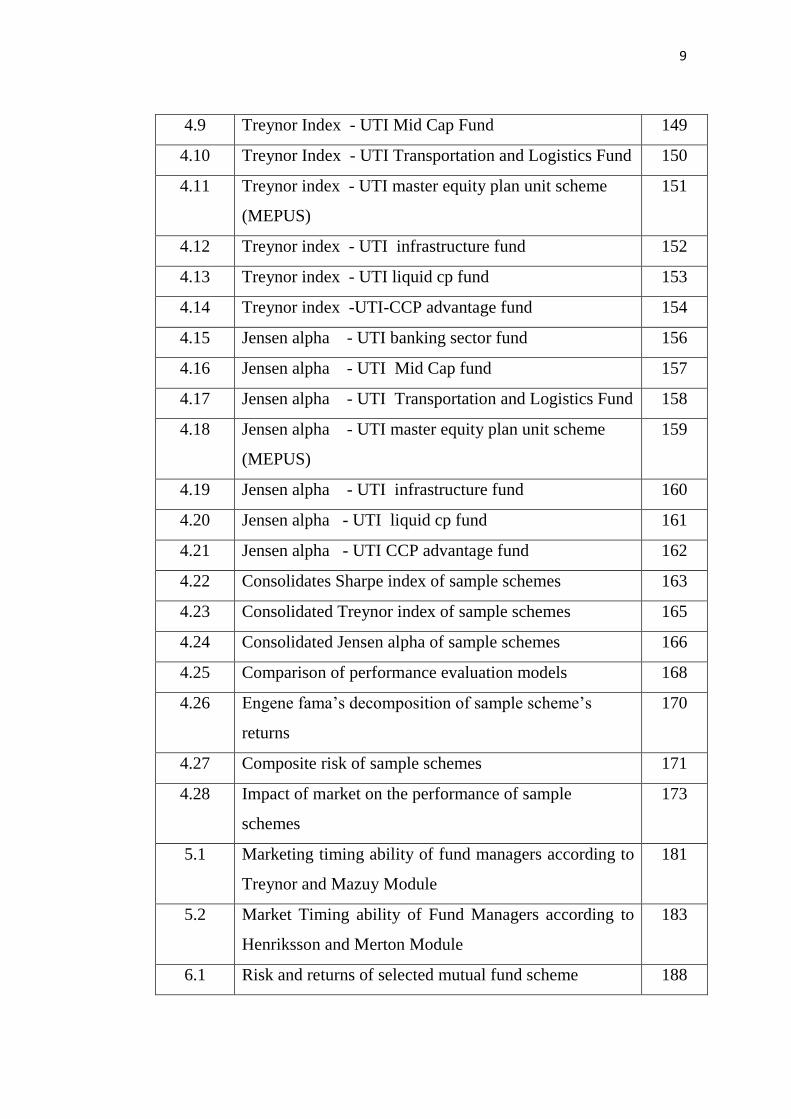
4.9 Treynor Index - UTI Mid Cap Fund 149
4.10 Treynor Index - UTI Transportation and Logistics Fund 150
4.11 Treynor index - UTI master equity plan unit scheme
(MEPUS)
151
4.12 Treynor index - UTI infrastructure fund 152
4.13 Treynor index - UTI liquid cp fund 153
4.14 Treynor index -UTI-CCP advantage fund 154
4.15 Jensen alpha - UTI banking sector fund 156
4.16 Jensen alpha - UTI Mid Cap fund 157
4.17 Jensen alpha - UTI Transportation and Logistics Fund 158
4.18 Jensen alpha - UTI master equity plan unit scheme
(MEPUS)
159
4.19 Jensen alpha - UTI infrastructure fund 160
4.20 Jensen alpha - UTI liquid cp fund 161
4.21 Jensen alpha - UTI CCP advantage fund 162
4.22 Consolidates Sharpe index of sample schemes 163
4.23 Consolidated Treynor index of sample schemes 165
4.24 Consolidated Jensen alpha of sample schemes 166
4.25 Comparison of performance evaluation models 168
4.26 Engene fama‟s decomposition of sample scheme‟s
returns
170
4.27 Composite risk of sample schemes 171
4.28 Impact of market on the performance of sample
schemes
173
5.1 Marketing timing ability of fund managers according to
Treynor and Mazuy Module
181
5.2 Market Timing ability of Fund Managers according to
Henriksson and Merton Module
183
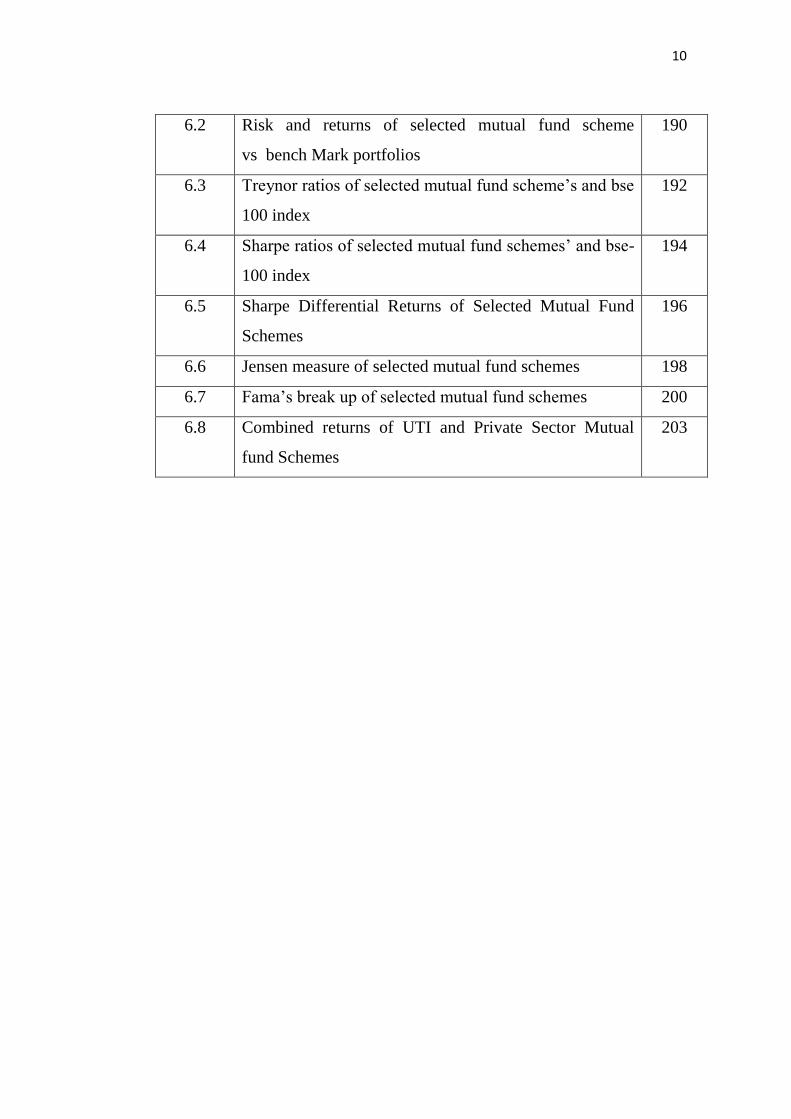
6.1 Risk and returns of selected mutual fund scheme 188
10
6.2 Risk and returns of selected mutual fund scheme
vs bench Mark portfolios
190
6.3 Treynor ratios of selected mutual fund scheme‟s and bse
100 index
192
6.4 Sharpe ratios of selected mutual fund schemes‟ and bse-
100 index
194
6.5 Sharpe Differential Returns of Selected Mutual Fund
Schemes
196
6.6 Jensen measure of selected mutual fund schemes 198
6.7 Fama‟s break up of selected mutual fund schemes 200
6.8 Combined returns of UTI and Private Sector Mutual
fund Schemes
203
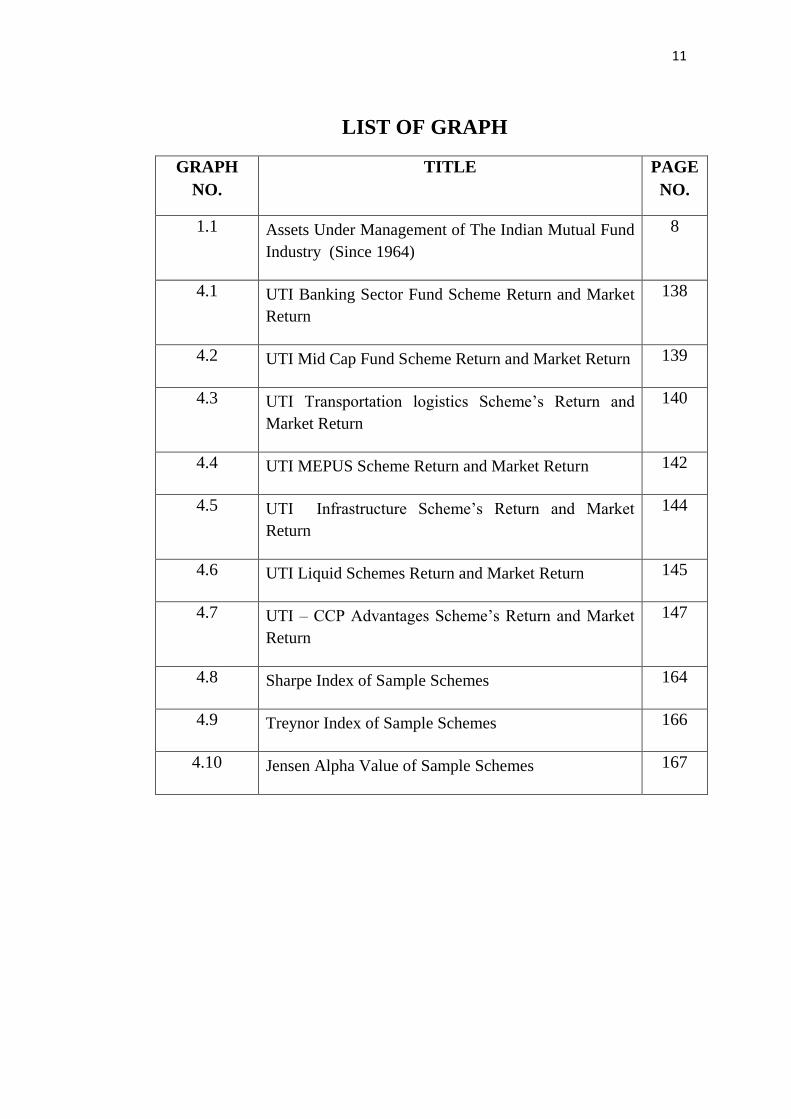
11
LIST OF GRAPH
GRAPH
NO.
TITLE PAGE
NO.
1.1 Assets Under Management of The Indian Mutual Fund
Industry (Since 1964)
8
4.1 UTI Banking Sector Fund Scheme Return and Market
Return
138
4.2 UTI Mid Cap Fund Scheme Return and Market Return 139
4.3 UTI Transportation logistics Scheme‟s Return and
Market Return
140
4.4 UTI MEPUS Scheme Return and Market Return 142
4.5 UTI Infrastructure Scheme‟s Return and Market
Return
144
4.6 UTI Liquid Schemes Return and Market Return 145
4.7 UTI – CCP Advantages Scheme‟s Return and Market
Return
147
4.8 Sharpe Index of Sample Schemes 164
4.9 Treynor Index of Sample Schemes 166
4.10 Jensen Alpha Value of Sample Schemes 167

12
LIST OF SCHEDULE
SCHDULE
NO.
TITLE PAGE
NO.
4.1 Various schemes offered by UTI Mutual Fund
(Since 2004)
131
6.1 Mutual Fund Schemes selected for Comparative
Performance
186
13
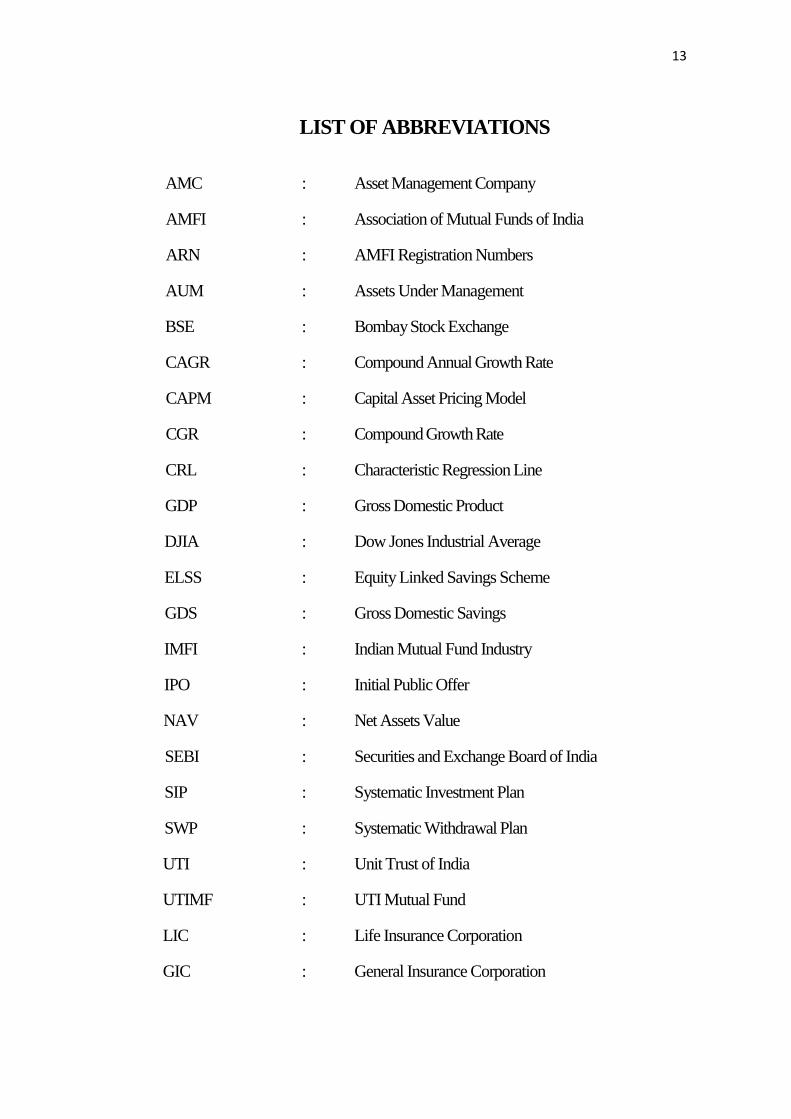
LIST OF ABBREVIATIONS
AMC : Asset Management Company
AMFI : Association of Mutual Funds of India
ARN : AMFI Registration Numbers
AUM : Assets Under Management
BSE : Bombay Stock Exchange
CAGR : Compound Annual Growth Rate
CAPM : Capital Asset Pricing Model
CGR : Compound Growth Rate
CRL : Characteristic Regression Line
GDP : Gross Domestic Product
DJIA : Dow Jones Industrial Average
ELSS : Equity Linked Savings Scheme
GDS : Gross Domestic Savings
IMFI : Indian Mutual Fund Industry
IPO : Initial Public Offer
NAV : Net Assets Value
SEBI : Securities and Exchange Board of India
SIP : Systematic Investment Plan
SWP : Systematic Withdrawal Plan
UTI : Unit Trust of India
UTIMF : UTI Mutual Fund
LIC : Life Insurance Corporation
GIC : General Insurance Corporation
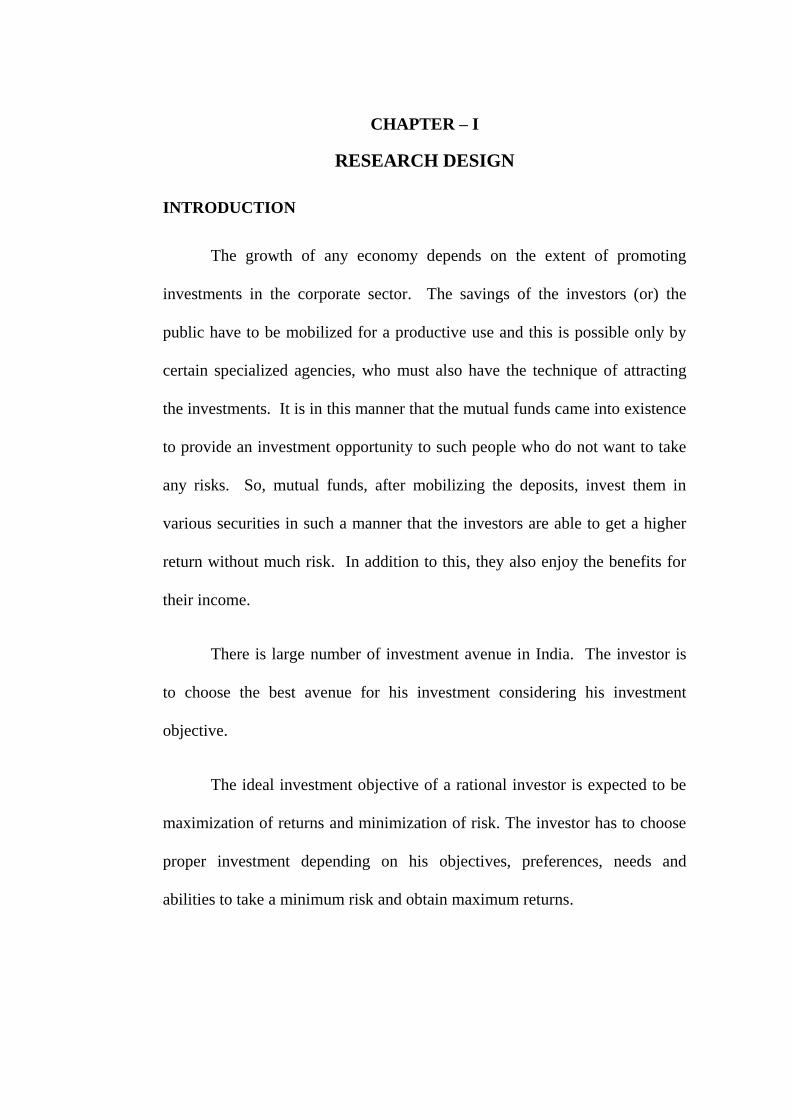
CHAPTER – I
RESEARCH DESIGN
INTRODUCTION
The growth of any economy depends on the extent of promoting
investments in the corporate sector. The savings of the investors (or) the
public have to be mobilized for a productive use and this is possible only by
certain specialized agencies, who must also have the technique of attracting
the investments. It is in this manner that the mutual funds came into existence
to provide an investment opportunity to such people who do not want to take
any risks. So, mutual funds, after mobilizing the deposits, invest them in
various securities in such a manner that the investors are able to get a higher
return without much risk. In addition to this, they also enjoy the benefits for
their income.
There is large number of investment avenue in India. The investor is
to choose the best avenue for his investment considering his investment
objective.
The ideal investment objective of a rational investor is expected to be
maximization of returns and minimization of risk. The investor has to choose
proper investment depending on his objectives, preferences, needs and
abilities to take a minimum risk and obtain maximum returns.

2
Concept of Mutual Fund
SEBI (Mutual Funds) Regulations 1993 define Mutual fund as “a fund
established in the form of a trust by a sponsor to raise monies by the trustee
through the sale of units to the public under one or more schemes for investing
in securities in accordance with these regulations”1.
A mutual fund is a company that invests, may of its money, in public
traded securities, stocks and bond of business corporations. A mutual fund
obtains its capital by issuing and selling its schemes to investors, typically
small individual investors, who are company‟s shareholders2.
MUTUAL FUND INDUSTRY IN THE WORLD
At the very dawn of commercial history, Egyptians and Phoenicians
were selling shares in vessels and caravans in order to spread the risk of these
perilous ventures. The idea of pooling money dates back to 1822, when
groups of people in Belgium established a company to finance investments in
national industries under the name of „Societe Generale de Belgique‟
incorporating the concept of risk sharing3. The institution acquired securities
from a wide range of companies and practiced the concept of mutual fund for
risk diversification. The word „mutual‟ denoted something to be done
collectively by a group of people with the common objective of having mutual
faith and understanding among themselves. „Fund‟ was used in monetary
terms, to collect some money from the members for a common objective like
earning profits with joint efforts.
1 Jayadev, M. Investment policy and performance of Mutual funds, Kanishka Publishers
Distributors, New Delhi, 2004, p.44. 2 Grolieten Academic Encyclopedia. P.687.1983.
3 Mestholioma Resource centre, the Free Encyclopedia, p.698, 2004.
3
Mutual fund in America is basically the concept of Unit Trust of
Britain. In U.S.A. mutual funds have come a long way since March 21, 1924
when the first fund, „Massachusetts Investment Trust‟ was organised by the
professors of Harvard University and offered shares to the public in 1926. But
it was Sherman L Adams, the father of modern mutual fund, along with
Charles Learoyd and Ashton Carr established a modest portfolio of 45
common stocks worth USD 50,0004.
The enactment of Securities Act of 1933, Investment Company Act of
1940 and Investment Advisors Act of 1940, led to the revival of mutual funds
in U.S.A. The value of securities owned by U.S.A. funds in 1950 was 2.5
billion USD. So, the accepting houses started rapidly to build up their skills
and knowledge to deal with enlarged capital.
The Mutual fund industry in Japan dates back to 1937. But an
investment trust modeled on the unit trusts of U.K. was established only in
l941. Investment trusts in Japan were set up under the Securities Investment
Law of 1951 with the three important characteristics namely contractual
nature, open-end and flexibility5.
Prior to 1960s, the U.S.A. provident fund professional investment
authorities were abhorrent of investing in equities as they are of in India
today. In 1980s, because of high mutual fund returns, employees individual
retirement accounts (IRA) enmasse shifted to equity option for their
retirement fund. In stark contrast, Japan saw a 60 percent decline in Nikkei
from 40,000 to 16,000 as a consequence of Japanese retail investors‟ aversion
to equities. With the increasing inflation and interest rates during 1990s, the
4Sudhkar A a nd Sasikumar K, “Globalisation of Mutual Fund Industry: Challenges and
Implications” , Southern Economist, Vol 42, Nov 15, 2004, p22. 5Benjamin Graham and David L. David, “Security Analysis”: The classic edition, 1951, Principle
and Techniques, Books, pp. 698.

4
individual and institutional investors became extremely sensitive to the true
value of money. The shift started towards non-intermediation, resulting in the
growth of mutual funds.
Retail investments in US mutual funds were low because of the
flatness of the market since 1966 till 1982. The value of securities owned by
U.S.A. fund houses increased from $ 60 billion in 1960 to more than $100
billion in 1983. Since the beginning of 1990, investors have poured over half a
trillion dollars into stock and bond mutual funds. In 1990, U.S.A. mutual fund
industry consisted of 2,362 mutual funds with 39,614 thousands of investors
holding $ 570.8 billions of assets. American investors embraced mutual funds
with a fervor that even the most optimistic fund executives could not have
predicted. By the end of 1994 in U.S.A., mutual funds had become the second
largest financial institution, after the banking sector, holding assets worth
$2161.4 billion. In 1995, U.K. equity income category had the highest number
of account holders (11,86,365)6.
The popularity of mutual funds among retail investors was further
driven by changes in retirement fund investment norms where employees at
large were allowed to choose asset allocation between equities and debt. In
December 1995, the European community issued a directive to coordinate
laws, regulations and the administrative provisions relating to mutual funds
and was popularly known as Undertakings for Collective Investment in
Transferable Securities. The directive established a common regulatory
scheme for investment policies, public disclosure, structure of organisation,
and regulations to encourage the growth of mutual funds all over the world,
6 Fredman, Albert J, et.al , “How Mutual funds Work”, Prentice Hall of India Private Limited,
New Delhi, 1997, p 293.

5
which led the momentum in many countries in the Asia-Pacific region with a
big bang, including Hong Kong, Thailand, Singapore and Korea.
The mutual fund in its present structure is a Twentieth Century
phenomenon. Globally there were thousands of funds offering varied schemes
with different investment objectives and options. Mutual funds emerged as the
most important investment vehicle for household investments in U.S.A. with
the basic objective of allowing small investors to partake in the capital market
by investing in a wide portfolio of stocks so as to reduce risk. At the end of
first quarter of 2013, the assets of worldwide mutual funds stood at $ 27.86
trillion while the assets of equity funds contributed for 41 percent. The asset
share of bond fund was 26 percent, and the asset share of balanced, and mixed
funds was 12 percent, money market fund assets represented 17 percent, and
others four percent of the world wide total7.
MUTUAL FUND INDUSTRY IN INDIA
The mutual fund industry in India started in 1963 with the formation of
Unit Trust of India, at the initiative of Government of India and Reserve Bank
of India. The history of mutual funds in India can be broadly divided into four
distinct phases.
First Phase (1964-87)
Unit Trust of India (UTI) was established on 1963 by an Act of
Parliament. It was set up by the Reserve Bank of India and functioned under
the Regulatory and administrative control of the Reserve Bank of India. In
1978 UTI was de-linked from the RBI and the Industrial Development Bank
of India (IDBI) took over the regulatory and administrative control in place of
RBI. The first scheme launched by UTI was Unit Scheme 1964. At the end
of 1988 UTI had Rs. 6,700 crores of assets under management.
7 Tripathy, Naliniprava, Financial Instruments and Services, Prentice Hall of India Private Ltd.,
New Delhi, 2013, pp. 51-52.

6
Second Phase (1987-1993)
1987 marked the entry of non-UTI, public sector mutual funds set up
by public sector banks and Life Insurance Corporation of India (LIC) and
General Insurance Corporation of India (GIC). SBI Mutual Fund was the first
non-UTI Mutual Fund established in June 1987 followed by Canbank Mutual
Fund (December, 1987), Punjab National Bank Mutual Fund (August, 1989),
Indian Bank Mutual Fund (November 1989), Bank of India (June, 1990),
Bank of Baroda Mutual Fund (October, 1992). LIC established its mutual
fund in June 1989 while GIC had set up its mutual fund in December, 1990.
At the end of 1993, the mutual fund industry had assets under management of
Rs. 47, 004 crores.
Third Phase (1993-2003)
With the entry of private sector funds in 1993, a new era started in the
Indian mutual fund industry, giving the Indian investors a wider choice of
fund families. Also, 1993 was the year in which the first Mutual Fund
Regulations came into being, under which all mutual funds, except UTI, were
to be registered and governed. The erstwhile Kothari Pioneer (now merged
with Franklin Templeton) was the first private sector mutual fund registered in
July, 1993.
The 1993 SEBI (Mutual Fund) Regulations were substituted by a more
comprehensive and revised Mutual Fund Regulations in 1996. The industry
now functions under the SEBI (Mutual Fund Regulations 1996.
The number of mutual fund houses went on increasing, with many
foreign mutual funds setting up funds in India and also the industry has
witnessed several mergers and acquisitions. As at the end of January 2003,
there were 33 mutual funds with total assets of Rs. 1,21,805 crores. The Unit
Trust of India with Rs. 44, 541 crores of assets under management was way
ahead of other mutual funds.
7
Fourth Phase (Since February 2003)
In February 2003, following the repeal of the Unit Trust of India Act
1963 UTI was bifurcated into two separate entities. One is the Specified
Undertaking of the Unit Trust of India with assets under management of
Rs.29, 835 crores as at the end of January 2003, representing broadly, the
assets of Unit Scheme (US)-64, assured return and certain other schemes. The
Specified Undertaking of Unit Trust of India, functioning under an
administrator and under the rules framed by Government of India, does not
come under the purview of the Mutual Fund Regulations.
The second is the UTI Mutual Fund, sponsored by SBI, PNB, BOB,
and LIC. It is registered with SEBI and functions under the Mutual Fund
Regulations. With the bifurcation of the erstwhile UTI which had in March
2000 more than Rs. 76,000 crores of assets under management and with the
setting up of a UTI Mutual Fund, conforming to the SEBI Mutual Fund
Regulations, and with recent mergers taking place among different private
sector funds, the mutual fund industry has entered its current phase of
consolidation and growth.
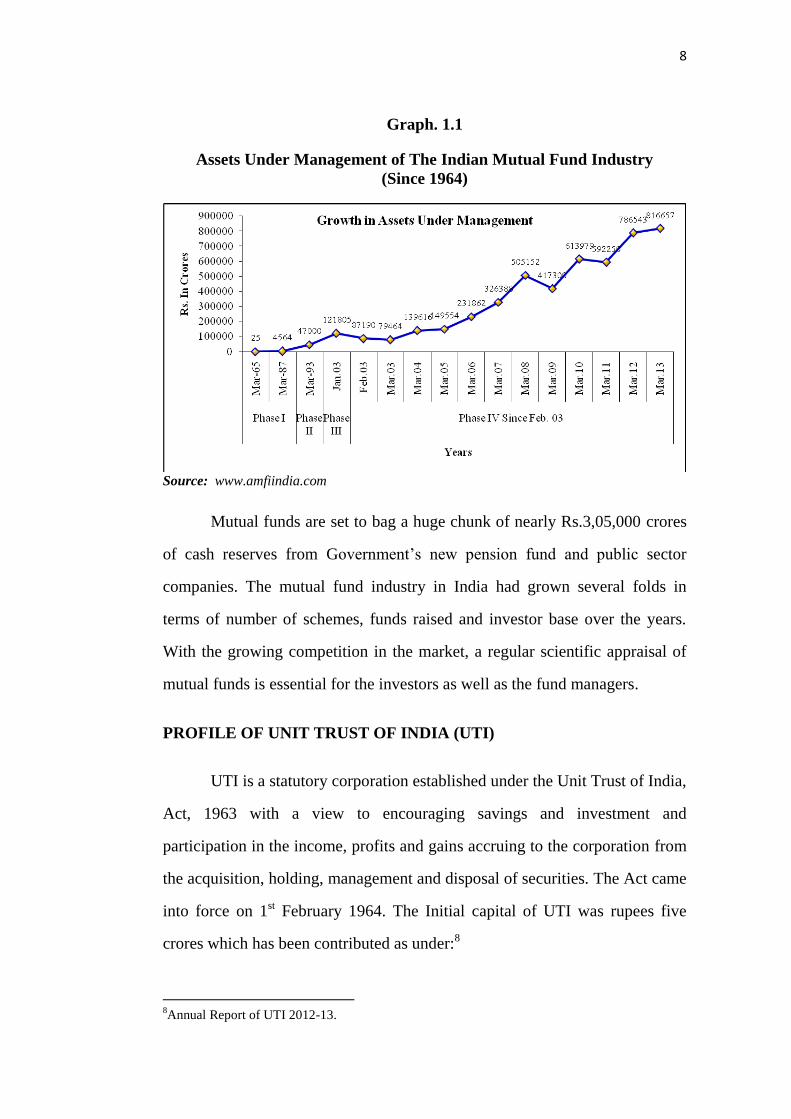
In India, mutual funds as vehicles of mobilization and channels of
funds towards the securities market, as exposed in the graph indicates
improvement in total net assets from Rs.25 crores, by the end of 1964-65 to
Rs.47,734 crores as on March 31, 1993, and touched Rs.2,31,862 crores as on
March 31, 2006 as shown in the graph 1.4. The industry held total net assets
worth Rs.8,16,657 crores as on March 31, 2013 through 1294 schemes.
8
Graph. 1.1
Assets Under Management of The Indian Mutual Fund Industry
(Since 1964)
Source: www.amfiindia.com
Mutual funds are set to bag a huge chunk of nearly Rs.3,05,000 crores
of cash reserves from Government‟s new pension fund and public sector
companies. The mutual fund industry in India had grown several folds in
terms of number of schemes, funds raised and investor base over the years.
With the growing competition in the market, a regular scientific appraisal of
mutual funds is essential for the investors as well as the fund managers.
PROFILE OF UNIT TRUST OF INDIA (UTI)
UTI is a statutory corporation established under the Unit Trust of India,
Act, 1963 with a view to encouraging savings and investment and
participation in the income, profits and gains accruing to the corporation from
the acquisition, holding, management and disposal of securities. The Act came
into force on 1st February 1964. The Initial capital of UTI was rupees five
crores which has been contributed as under:8
8Annual Report of UTI 2012-13.

9
i. Reserve Bank of India Rs. 2.50 crores
ii. Life Insurance Corporation of India Rs. 0.75 crores
iii. State Bank of India and its Subsidiary Banks Rs. 0.75 crores
iv. Schedule Banks and notified financial
institutions
Rs. 1.00 crores
Total Rs. 5.00 crores
The contribution of initial capital of the UTI as per Sec(2) of the UTI
Act, 1963 by its original owners. The initial capital forms part of Unit
Scheme-64 and the subscribers hold units in that schemes. In 1975, the UTI
Act was amended and by virtue of the amendment, the Industrials
Development Bank of India (IDBI) took over the rights and responsibilities of
RBI under the Act and the share of the initial held by RBI was transferred to
and vested in IDBI.
The general superintendence, direction and management of the affairs
and business of UTI rests in a Board of Trustees which exercised all powers
and does all acts and functions which may be exercised by UTI. The
composition of the Board of Trustees is as follows.
The Chairman to be appointed by the Central Government in
Consultation with Industrial Development Bank of India (IDBI, the Leader in
the Indian Capital Market). One trustee to be nominated by RBI. Four
trustees to be nominated by IDBI of whom not less than three persons having
special knowledge of/or experience in commerce, industry, banking, finance
or investment. One trustee each to be nominated by LIC and SBI. Two
trustees to be elected by other contributing institutions viz., scheduled banks
and their subsidiary banks and notified financial institutions. An executive
trustee to be appointed by IDBI, provided that such an appointment may not
10
necessary if the chairman is whole time. The board meets not less than six
times in a year and at least once in two months.
Executive Committee of UTI
The UTI operates through an executive committee structure. The
committee is given powers subject to such general and or special directions as
the Board may feel fit, from time to time. It has the power to deal with any
matter with the competence of UTI. The Executive Committee consists of the
Chairman of the Board and two other trustees nominated by IDBI. The
executive committee usually meets once in a month.
The day to day business operations of UTI are looked after by the full
time Chairman. He is assisted by a team of Executive Directors and Chief
General Managers. Presently eight Executive Directors and twelve Chief
General Managers are involved in the business9.
UTI has a three-tier organizational set up with a corporate office, Four
Zonal Offices and Fifty Four Branch offices. It has about 6.71 crores unit
holding accounts under 46 domestic schemes having investible funds at
market value as on 31st December 2013 of Rs.700.57 billion10. In addition, it
has six off shore funds and four venture capital funds. Its management
expenses amount to about one percent of the investible funds.
There is an Audit Committee consisting of five trustees, which reviews
the systems and control and interacts with the internal and external auditors.
In addition to the Board and committee, there are a number of committees
constituted by the executives of the UTI.
9 UTI Annual Report, 2012.
10 www.Amfi.com.
11
A first-tier audit committee reviews the reports of all sections and
department of UTI and initiates necessary corrective action. An investment
valuation committee reviews the systems and practice the valuation of
securities. Primary market investment committee handles primary market
proposals. Property management committee appraises proposals approved by
building committee and an internal committee for settlement dues.
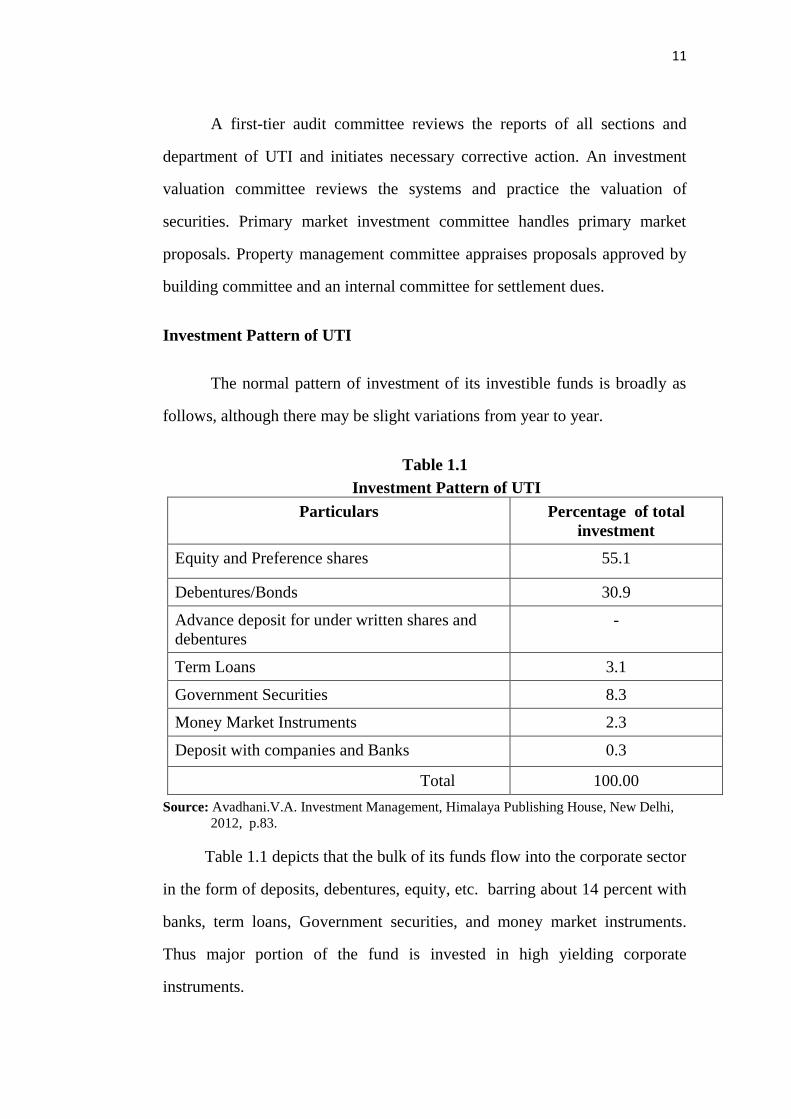
Investment Pattern of UTI
The normal pattern of investment of its investible funds is broadly as
follows, although there may be slight variations from year to year.
Table 1.1
Investment Pattern of UTI
Particulars Percentage of total
investment
Equity and Preference shares 55.1
Debentures/Bonds 30.9
Advance deposit for under written shares and
debentures
-
Term Loans 3.1
Government Securities 8.3
Money Market Instruments 2.3
Deposit with companies and Banks 0.3
Total 100.00
Source: Avadhani.V.A. Investment Management, Himalaya Publishing House, New Delhi,
2012, p.83.
Table 1.1 depicts that the bulk of its funds flow into the corporate sector
in the form of deposits, debentures, equity, etc. barring about 14 percent with
banks, term loans, Government securities, and money market instruments.
Thus major portion of the fund is invested in high yielding corporate
instruments.
12
Objectives of UTI
Its main objectives are to mobilize savings, particularly from the low
and middle income groups, to channelize these savings into productive
investment and to provide an assured income to savers. It provides the savers
with expert investment services, portfolio management and assured income.
Borrowing Power
There may be occasions for the trust to buy in bulk the shares and
debentures of many industrial concerns and institutions. When the resources
are found to be inadequate to meet its requirements, the UTI is authorized to
borrow from the Reserve Bank of India, or the Government or any other
authority.
Power to make schemes
Under sec.21(1) of the Unit Trust of India Act, 1963, the Board of
Trustees has been authorized to offer various schemes to the public for the
purpose of providing facilities for participation in the income, profits and
gains arising out of the acquisition, holding, management or disposal of
securities by the UTI.
Network of UTI
The core strength of UTI has been to build a large number of small
investors who have remained with UTI for long years. In all, as on 31st March,
2013 UTI has 76 schemes in operation with above 6.71 crores unit holding
accounts. UTI is well entrenched among investors and savers in each and
every district of the country. UTI has wide marketing network of 54 branches,
292 main branches, 190 collection centres 53 franchise offices and over
13
90,000 agents11. UTI has a well-knit distribution network to attract and
provide sufficient service to unit holders in all parts of the country. They are
committed to strengthen their marketing network and make give it a total
investment trusts to quicken and better the investor‟s services.
UTI Mutual Fund has a track record of managing a variety of schemes
catering to the needs of every class of citizens. It has a nationwide network
consisting of 146 UTI Financial Centres (UFCs) and UTI International offices
in London, Dubai, Bahrain and Singapore.
Reliability
UTI Mutual Fund (UTIMF) has consistently reset and upgraded
transparency standards. All the branches, UFCs and registrar offices are
connected on a robust IT network to ensure cost-effective quick and efficient
service. All these have evolved UTIMF to position as a dynamic, responsive,
restructured, efficient and transparent entity, fully compliant with SEBI
regulations.
STATEMENT OF THE PROBLEM
India has become the world‟s fourth largest economy besides U.S.A.,
China, and Japan12. Although the Indian capital market witnessed some
significant changes during the eighties, both the primary and the secondary
segments continued to suffer from some serious deficiencies. Many unhealthy
practices prevailed in the primary market to attract retail investors. High
pricing of new issues, difficulties in analyzing the prospects of a company,
under pricing of shares in the market after listing have discouraged and
11
www. Utimf.com. 12
Sudhakar A and Sasikumar K, “Globalization of Mutual Fund Industry: Challenges and
Implications”, Southern Economist, Vol. 42, Nov. 15, 2004, p.22.

14
aroused hesitation among many investors to enter into the stock market. The
secondary market had become highly volatile and technical for small
investors.
Markets for equity shares, real estate, derivatives and other assets have
become highly dynamic. Unprecedented global and national events have
brought in substantial changes in the securities market. Capital market, being
the major supplier of corporate finance, ought to grow in a healthy manner to
pump in more and more money. Investment in corporate securities demands
investors to understand the complexities of market, to keep track of market
movements and to make scientific investment decisions. The growing
popularity of mutual funds prove that it is an ideal investment vehicle for
small investors having limited information and knowledge to enter the today‟s
complex and modern capital market. Out of the household investors in
Mutual Fund, Bond, Debentures, IPO, Secondary Market, and Derivative
market, household investors in Mutual Fund stands first by holding
0.51 million followed by house holding investors in Bonds 0.16 billion,
Debentures 0.08 million, IPO 0.10 million, Secondary market 0.025 million,
and derivative 0.04 million13. The domestic mutual fund industry has grown
by 50 percent particularly through Systematic Investment Plan (SIP) from
retail participants. But, there is still a long way to go as only five percent of
the households are investing in mutual fund schemes.
Liberalization of economic policies, metamorphic changes in the
Indian Financial System, brought out increase in the share of household
savings, changes in investment attitude and preferences. It was estimated that,
the Gross Domestic Savings for 2007-08 to 2012-13 ranges from 33.4 percent
13
How House holds save and invest, National council of Applied Economic Research Report,
July 2011, p.29. Sponsored by SEBI.
15
to 34.7 percent, under the growth scenarios of seven to nine percent
respectively, against 27.1 percent in 2004-05. Household sector‟s financial
savings for 2011-12 to 2014-15 is expected to be in the range of 33.7 percent
to 37.7 percent, with household financial and physical savings projected in the
range of 11.3 percent to 11.4 percent and 12.9 percent to 13 percent
respectively14. As the household sector‟s share in financial assets is expected
to go much higher in the country‟s savings, it is of utmost importance to show
a right path to individual investors. With an emphasis on increase in domestic
savings and improvement in deployment of investible funds into the market,
the need and scope for mutual fund operations have increased and is expected
to increase tremendously in future. Mutual funds seek to serve those
individuals, who have the inclination to invest but lack the background,
expertise and sufficient resources to diversify their investment among various
sectors.
UTI is considered a leader in the mutual funds scenario, being the first
to have been established in India and is also the largest and a providing wide
range of products patronized by investors, both individual and institutional
large way. The product life cycle of these schemes has not been studied
properly. But during the later nineties, UTI faces severe challenges with it unit
schemes US-64 due to mismanagement. The problems of US-64 that has snow
balled has been hogging all the head lines in all dailies during nineties.
With the entry of private sector mutual funds offer with attractive
schemes, UTI confronted competition from several fronts. As a results, shares
of UTI investment in the industry is gradually decreasing as the private sector
14
Srinivasan G (2011), “Household, corporate savings seen rising on income growth”, The Hindu
Business Line: Economy, May 27, 2011. p 6.
16
mutual funds capture a substantial portion of total resource mobilization in the
industry.
In view of the above problem of UTI, the cabinet approved and passed
to repeal the UTI Act, 1963 and the SEBI Act. This paves the way for recast
of the UTI and overhaul of market watch dog and SEBI hence organizational
structure.
The setting up of a UTI mutual fund conforming to the SEBI mutual
fund regulations, led the UTI Mutual Fund to merge lot of existing schemes
into new schemes which have been effected since March 2003.
However, mutual fund have emerged as an important segment of
financial market in India, leading to merger and acquisitions in UTI Mutual
fund schemes. The present work is concentrated on, after the mergers and
acquisition undertaken by UTI Mutual Fund, the performance of its schemes
over a period of operations under the SEBI mutual fund regulated
environments. Specifically, the researcher attempts to bring out performance
of selected schemes where investors invest in terms of huge value of funds
involved in the UTI mutual fund. It would be of useful to the investors.
OBJECTIVES OF THE STUDY
The study is carried out with the following objectives;
1. To study the role of SEBI in regulating Mutual Funds and thereby to
know the investors‟ and financial advisors‟ awareness on regulation
and perception about Mutual Funds.
2. To know the various schemes offered by the UTI Mutual Fund and to
evaluate the performance of selected schemes on the basis of return

17
and risk by using Sharpe, Treynor, Jensen and Fama‟s measures of
portfolio evaluation.
3. To know the performance of the selected schemes by UTI Mutual
Fund based on market timing abilities of the fund managers by using
Treynor and Mazuy and Henriksson and Merton models.
4. To know the comparative performance of selected schemes of UTI
Mutual Fund and selected schemes of private sectors‟ mutual fund
through Sharpe, Treynor, Jensen and Fama‟s measures of portfolio
evaluation.
HYPOTHESIS OF THE STUDY
Based on the above objectives suitable hypothesis are framed for
analysis and are tested.
1. There is no significant relationship between investors and financial
advisors experience in the field of investment and awareness of SEBI
regulations on Mutual funds.
2. There is no significant difference among the performance evaluation
measures as used Sharpe, Treynor and Jensen.
3. The fund managers are not a successful market timers as suggested by
Treynor and Mazuy and Henricksson and Merton.
4. There is no significant difference between the performance of UTI
Mutual Fund and private sector mutual fund schemes.
18
METHODOLOGY
The present research is both descriptive and analytical in nature. It
focuses on mutual fund investors, financial advisors and performance of
selected schemes.
Investors‟ and Financial advisors‟ awareness on regulation and
perception about mutual fund study considered Chennai city. Performance of
selected Schemes and comparative performance are measured at all India
level. The researcher adopted proportionate stratified sampling technique for
selecting investors and financial advisors. The technique is suitable for
yielding a representative sample from homogenous Mutual Fund Investors
Population.
SAMPLING
1. Investors
In India, the estimates of savers households, in region wise, in
Northern Region stands first (10.20 million), followed by Western Region
(8.93 million), Southern region (5.75 million), Eastern Region (5.28 million),
Central Region (2.70 million), and North-Eastern region (0.66 million). But
the estimates of investor households respectively are: 1.42 million,
4.84 million, 5.88 million, 2.62 million, 0.14 million, and 1.42 million15. A
careful look at the figures shows that the maximum of saver households in
Southern Region invest their savings. Hence, for the purpose of the present
study southern region is preferred by the researcher.
There are two types of investors in mutual funds. The first one is
direct investors who invest in the mutual fund and deal their shares in the
15
Ibid, p.14.

19
stock market directly. The second one is indirect investors who invest in the
mutual fund through Investors Associations formed themselves and their share
in the stock market through associations. It is tedious to locate all the investors
and after all they are located there may be a chance of non-response that at
presently they are not dealing with mutual funds. In order to avoid such
problems the registered investors with the investors association is preferred
for the study. In southern region, there are three Investors‟ Association,
recognized by SEBI. Tamil Nadu possess the largest number of associations
in Southern Region16. Hence, once again the selection of sample is confined
to Tamilnadu. Tamilnadu Investors Association located at Chennai has 710
registered members, Kovai Investors‟ Association, located at Coimbatore has
360 registered members, and Coimbatore District Consumer Protection
Council, Coimbatore, has 296 registered members17. As the Tamilnadu
Investors Association has the largest registered members, the sampling is once
again confined to registered members in Tamilnadu Investors Association.
Out of the 710 registered members in Tamilnadu Investors Association
predominantly 675 (95 percent) of them are residing in Chennai and the
remaining members belong to other areas. So, as per the predominance and
feasibility of the study, samples are drawn only from Chennai, divided into
three areas (Northern, Southern and Central). So as to avoid
non-representative sampling and statistical errors in sampling. 350 number of
sampling investors is taken by proportionate stratified sampling method using
proportionate ratio among three areas of Chennai to collect desired data for
the study.
16
List of Investors‟ Association recognized by SEBI as on December, 2013. 17
Ibid.
20
2. Financial Advisors
Similarly, large number of financial advisors are working under
various assets management companies registered with Association of Mutual
Funds in India (AMFI). As per the registration number holder, 795 holders
are located in Chennai, which is the highest AMFI Registration Numbers
(ARN) holders compared to other areas of Tamil Nadu. Hence, the financial
advisors in Chennai are considered for data collection in the study. Again
based on the strength of the financial advisors in three areas of Chennai. So as
to avoid non-representative sampling and statistical errors in sampling 150
sample financial advisors are selected by the proportionate sampling method
using proportionate ratio to collect information for the study.
As per the requirement for the study sample size adopted by the
researcher, both the investors (350) and financial advisors (150) is totally 500.
In particular as per the need of the study the investors has been given
appropriate weight because it is more important for the study to identify the
perception of mutual funds among investors in wide range by using diverse
variables.
3. Selection of Samples Schemes
To evaluate the performance of selected schemes of UTI mutual fund,
the schemes introduced after February, 2003, the year in which the UTI
mutual fund registered with SEBI mutual fund regulations, 1996 was
implemented uniform regulations, are taken into consideration. Totally, there
are 51 schemes introduced by UTI mutual funds till March 2014, the period
which is considered as worth for analysis. Out of the 51 schemes, only seven
schemes are long term schemes considered for analysis, because, only long
21
term period analysis will give fruitful result and can be the basis for
forecasting the future.
Out of the 51 schemes the close ended schemes are merely five (10
percent) and the remaining 46 (90 percent) are open ended schemes. The life
of close ended schemes ranges from five to seven years and are considered not
fit for the analysis pertaining to long period (10 years). Hence they are
excluded for analysis. Only the schemes the life of which is not less than ten
years and that too are open ended, are selected for the study. This period is
generally considered to be sufficient enough to cover all upswings and down
swings of markets.
Open ended mutual fund schemes (46) comprises of Equity Growth
schemes 22 (43 percent), Debt Growth schemes 23 (45 percent) and Balanced
schemes one (Two percent). Out of 22 Equity Growth Schemes, 12 schemes
are young introduced in 2009-10 and after. Out of the remaining 10 schemes,
five (23 percent) schemes are in short-term maturity period (quarterly, half
yearly and annually), Remaining five equity growth open ended schemes are
long term in nature and are selected for the study. Out of the 23 (45 percent)
Debt Growth schemes, 21 (91 percent) schemes are young introduced in
2009-10 and after, and hence the rest Two Debt Schemes (9 percent) are
selected for the study. Balanced scheme (one) is not considered for the study
because it is not actively traded in the mutual fund industry.
The entire seven short listed schemes were initially open-end schemes.
Thus the sampling frame for the purpose of the study constitutes:
22
UTI Banking Sector Fund (Equity)
UTI Mid Cap Fund (Equity)
UTI Master Equity Plan Unit Scheme (Equity)
UTI Transportation and Logistics(Equity)
UTI Infrastructure Fund (Equity)
UTI Liquid Fund Cash Plan (Debt)
UTI CCP Advantage Fund (Debt)
In order to compare the performance of mutual fund schemes of the
UTI with the schemes introduced by the other private mutual funds, only the
dominating mutual fund industry, namely; ICICI, HDFC and Reliance are
taken into consideration. In consonance with the schemes introduced by the
UTI, seven schemes in each of the three industries were chosen, and totally 21
schemes were chosen for comparative analysis.
PERIOD OF STUDY
As the study is confined to the performance of UTI Mutual Fund with
the reference to its selected schemes, the period of study is from
April 2004 to March 2014.
SOURCES OF DATA
The study is blend of both primary and secondary data.
Primary Data: The researcher collected primary source of data from
investors and financial advisors by using questionnaire.
Secondary Data: The secondary data were collected from different reports,
Net Assets value, resale prices and repurchases prices announced by the
institution and published widely from time to time. The secondary data were
also collected from the published documents of UTI, HDFC, ICICI, and
23
Reliance Mutual Funds. To identify the performance of selected schemes, the
data are collected from the records of Centre for Monitoring Indian Economy
(CMIE), reports of SEBI and Credit Rating and Information Services of India
Ltd., (CRISIL). The Economic Times, The Business Time, and Association
of Mutual Fund Industry (AMFI) Newsletters and websites of respective
mutual funds were also used to collect the secondary data.
TOOLS FOR DATA COLLECTION
The researcher used well structured questionnaire as a tool for
collecting primary data from investors. In order to find out the applicability
and validity of the tool a well prepared questionnaire was tested with five
sample respondents. Based on the pretesting the researcher added and edited
some questions on those heads.
TOOLS OF ANALYSIS
The data collected from various sources have been analyzed by using
different technique as under.
1. Basic statistical technique like simple averages, percentages and
graphs.
2. Statistical formulae like standard deviation, alpha and beta to find the
intensity of risk.
3. The information collected by secondary source was analysed using
simple and sophisticated techniques as follows: (a) Compound Annual
Growth Rate (CAGR), (b) Compound Growth Rate (CGR), (c) Rank
Correlation, (d) Kendalls Coefficient of Concordace and (e) Binomial
Test.
4. (a) Rate of return (b) Sharp ratio (c) Treynor Ratio (d) Jensen
Differential Return, (g) Treynor and Mazuy Module, (h) Henriksson
24
and Merton Module and (i) Rank Order Scoring were used to measure
the financial performance of various sample mutual fund schemes.
5. Chi-square test has been employed to test the significance of
differences of opinions and perceptions of investors.
6. Correlation analysis, t-test and Z-test have been used to know the
degree of relation and significance between inter dependent variables
like different investment avenues and others.
TECHNIQUES OF ANALYSIS
In analyzing the risk-return relationship the Capital Asset Pricing
Model (CAPM) is used. The CAPM uses the concept of beta to link risk
with return. Beta as a measure of systematic risk shows how the Net
Asset Value (NAV) of a growth scheme responds to changes in market
performance. Using the beta concept the CAPM helps to define the required
return on a security. The equation for calculating the expected return based on
CAPM is as follows:
Ri = Rf + Rm-Rf)
Ri = Expected return
Rf = Risk-free return
= Measure of systematic risk
Rm = Market return
NAV values on every Monday of the sample schemes for the
period of (April 2004 to March 2014) ten years were used based on the data
available.
Portfolio Return refers to the yield from the selected growth
schemes with growth option. Portfolio returns (Rp) are calculated on the basis

25
of changes in the NAV on a weekly basis. Average of such weekly returns
(ARp) is calculated on a yearly basis and for the entire period of study as
follows:
1t
1ttp
NAV
NAVNAV R
Where t = Total period.
Market Return is calculated on the basis of the changes in the BSE
100 Index on a weekly basis (Rm) and the averages of such weekly
returns (ARm) are arrived at for every year and for the total period of study.
BSE 100 index is used as a benchmark for the selected growth schemes as it is
widely considered as a market proxy or benchmark for the purpose of
academic, research by practicing fund managers. BSE 100 index is a
broad based index, consisting of 100 actively traded equity shares
representing more than 70 percent of the total market capitalization in
Mumbai Stock Exchange. The market return is calculated as follows:
1-t
1-tt
IndexMarket
IndexMarket IndexMarket = Rm
Risk-free return (Rf) is the return available from zero risk investment
avenues like treasury bills and bank deposits. The current RBI bank rate of
9.00 percent is assumed as the risk-free rate of return and is related with
the most commonly preferred investment avenue namely bank deposits.
Risk is the uncertainty and variability of returns / capital appreciation
or loss of both. Total risk is measured with the help of standard deviation of
both scheme and market returns. The total risk of an investment consists of
two components: Diversifiable and non-diversifiable risk.
26
Diversifiable (Unsystematic) risk represents that portion of an
investment‟s risk that can be eliminated by holding enough number of
varied types of securities. Unsystematic risk is that portion of total risk
calculated as follows:
Unsystematic Risk = ( p2) – ( 2 - m
2)
p Standard Deviation of the Scheme
m Standard Deviation of the Market
Non-diversifiable (Systematic) risk is that part of total variability
in returns caused by factors due to economic, social and political
causes. Systematic risk is unavoidable. Each security possesses its own
level of systematic risk, which is measured using beta coefficient.
Systematic 2 x 2
Beta reflects how volatile the return from an investment in response to
market swings. It measures the impact of the market forces on return
expected from funds. Beta is calculated by relating portfolio return with
market return using regression analysis. Beta values greater than one depicts
high sensitivity of scheme‟s returns against market being aggressive. Beta
values less than one indicates defensive nature of the scheme. The regression
slope coefficient from the Characteristic Regression Line (CRL) measures the
systematic risk of an asset. The CAPM is applied to compute the beta value
from the following formula:
Ri = + Rm+e
Co-variance reflects the degree to which the market and scheme
returns vary. A positive covariance means that the market and scheme
27
returns move in the same direction whereas a negative covariance implies
that the return moves in the opposite direction. Covariance is calculated using
the formula:
C.V = (( p/ pX ) x 100)
pX is the mean return of the scheme
Coefficient of Correlation (r) measures the nature and the extent
of relationship between stock market index return and the scheme‟s return for
a particular period. The co-movement of schemes performance with that of
market index is studied with the help of a simple linear regression analysis
using the following formula:
22 yx x
xy =r
)X(X X
)Y(Y X
Coefficient of Determination (R2) is the square of the correlation
co-efficient and indicates the degree of diversification. It gives the percentage
variation in the scheme‟s return as explained by the variation in the market‟s
return. A low R2 indicates that scheme has further scope for diversification
and a high R2 indicates that the scheme is well diversified.
Compound Annual Growth Rate (CAGR) calculates the growth in
variables (number of funds, funds mobilized, assets under management,
number of schemes) on a yearly basis.
CAGR = [((P1 / P0) (1/n)– 1) × 100]

28
P1, P0, n are the variable in the current period, base period and the
number of years.
Compound Growth Rate (CGR) calculates the growth in variables
for the entire period of study. CGR is a superior measure of calculating
compounded return than simple return with the following formula:
CGR = [(Pn/ P0) (1/n)– 1) × 100]
Rank Correlation is used when information is sufficient to rank the
data. The rank correlation coefficient is a measure of correlation that
exists between two sets of ranks. It is a measure of association that is based on
the ranks of the observations and not on the numerical values of the data as
calculated using the following formula:
1)N(N
D61 R
2
2
R denotes coefficient of rank correlation
D refers to the difference of rank between the paired items in two
series.
Kendall’s Coefficient of Concordance is a non-parametric measure
of relationship determining the degree of association among several (k) sets of
ranking of N objects.
N)(N(1/12)k
)Rj(R W
32
2
j
k is the number of sets of rankings
N is the number of objects ranked
Rj is the sum of ranks assigned by all the k judges

29
(1/12) k2 (N3 – N) is the maximum possible sum of the squared
deviations.
Chi-square test is a non-parametric test explaining whether or not two
attributes are associated or not, using the following formula:
ij
2
ijij2
E
)E(O χ
Oij is the observed frequency of the cell in ith row and jth column
Eij is the expected frequency of the cell in ith row and jth column.
Z Test is used to verify the extent of relationship between the market
and the scheme using the correlation coefficient with the help of the formula:
nxr-1
r test Z
2
Student’s T-test is applied for the two populations when (sample)
mean and (Sample) variance is unknown. It is a measure of significance of
the difference between the mean of combined return of UTI and Private sector
mutual fund scheme using the following formula:
2
2
2
1
2
1
21
n
S
n
SS
XX t
Binomial Test of Significance is used to test the probability
model to make inference about population proportion from observations
satisfying the Bernoulli trials using Z test. The proportion of investors
agreeing with the specific attitude statements has been tested using the

30
following formula to identify the attitude towards mutual fund industry in
India and the extent of distribution of investors accepting with the specific
attitude statements:
(pxq)/n
Px/n= Z
x is the number of respondents agreeing
p, q and n is the proportion of acceptance, non acceptance and number
of Bernouls trails.
Sharpe Index (St) measures the risk premium of the portfolio with
reference to the total amount of risk. The index St measures the slope of the
line emanating from risk-free rate outward the portfolio. The larger the St, the
better the portfolio has performed. St is the reward to variability of the
scheme‟s total risk and is a summary measure of scheme‟s performance
adjusted for risk.
pt
fpt
tσ
RAR S
St = Sharpe Index
ARpt = Average return on portfolio „t‟
Rf = Risk-free rate of return
pt = Risk involved in portfolio „t‟ returns
Treynor Index (Tt) sums up the risk and return of a portfolio in a
single number. The index measures the slope of the line emanating outward
31
from the risk-free rate to the portfolio under consideration. Treynor index is a
reward to volatility of the portfolio. The characteristic line relates the market
return to a specific portfolio return without any direct adjustment for risk.
This line can be fitted through a least square regression involving a single
market portfolio. To use Treynor‟s measure first the Characteristics
Regression Line (CRL) of portfolios are fixed by estimating the following
equation:
Rp = ap + bp Rm + ep
Rp Return on portfolio „p‟
ap Intercept coefficient for portfolio
bp Portfolio‟s beta coefficient
Rm Return on market index
ep Random error term for portfolio „p‟
p
fp
tβ
RAR T
Jensen constructed a measure of absolute performance on a
risk-adjusted basis while Sharpe and Treynor models provided measures
for ranking the relative performance of various portfolios on a risk-
adjusted basis. Equilibrium average return on a portfolio is the benchmark.
Equilibrium average return is the return of the market portfolio for a given
systematic risk calculated with the following formula:
EARp = Rf + (Rm - Rf) Bp
EARp is the equilibrium average return of the portfolio „p‟ indicating
superior / inferior. Performance of the portfolio‟s alpha ( ) Jensen‟s Alpha is
the intercept of the CRL. If alpha is positive, the portfolio has performed
better and if it is negative, scheme performance is not up to the

32
benchmark. In a well-diversified portfolio, the average value of alpha of all
stocks turns out to be zero.
Eugene Fama’s Decomposition Of Total Returns Eugene Fama
provides an analytical framework, which enables for a detailed analysis of
scheme performance popularly known as Fama‟s Decomposition of Total
Return. The total return on a portfolio comprises risk-free return (Rf) and
excess return.
The excess return arises from different factors such as risk accepted
and stock selection. The excess return can be decomposed into two
components, namely risk premium (reward for bearing risk) and for stock
selectivity (return from stock selection).
Each portfolio will have both systematic risk and unsystematic risk.
Hence risk premium can be decomposed into two components namely,
return for bearing systematic risk (market risk) and return for bearing
unsystematic risk.
Return for Systematic Risk (R1) = p(Rm - Rf)
Return for Unsystematic Risk (R2) = [( p/ m) - p] × (Rm- Rf)
The return from pure stock selectivity (R3) is the difference between
the actual return and the sum of the other three components. The return for
pure (net) selectivity is the additional return obtained by a portfolio
manager for his superior stock selection ability over and above the return
mandated by the total risk of the portfolio.
33
Fama‟s net selectivity = Rp – [Rf + ( p/ m) × ( Rm– Rf)]
Hence, the total return on a fund can be decomposed into four
components:
Total return on Portfolio = Risk-Free return (Rf) + Return for
bearing Systematic risk (R1) + Return for bearing Unsystematic risk (R2)
+ Return from pure Stock Selectivity (R3).
Sharpe’s Differential Return measures the ability of fund managers
in both security selection and diversifying portfolio. The difference
between the expected return and actual return of the portfolio are called
differential returns. If a portfolio is well diversified, the two measures
(Jensen and Sharpe) indicates same quantum of differential return. In
case the portfolio is not fully diversified, the Sharpe Differential Return would
be small in magnitude than Jensen‟s alpha. The difference can be interpreted
as a decline in performance resulting from lack of diversification. Sharpe‟s
Differential returns are computed by applying the following equation to
measure the incremental returns earned by the mutual fund manager for a
given level of total risk using the formula:
SDR = Ri {Rf + (Rm – Rf) p/ m}
Treynor and Mazuy Module
Treynor and Mazuy module was developed by Treynor and Mazuy
(1966). They suggested that in order to detect the market timing abilities of

34
fund managers should add a squared term to the simple linear relationship
module which are given as under:
(Rpt-Rft) = (Rmt – Rft) + (Rmt – Rft)2 + eit
Where,
Rpt is the return on fund P in period t,
Rmt is the return on the market index in period t,
Rft is the return on risk less asset in period t,
Eit is the residual return in period t,
and are constant.
The rational behind the equation is that if a fund manager is not
engaged in market timing and concentrate at the stock selection, the average
beta of the fund should be constant. In that case fund return would be
straight-line linear relationship against market return. However, if the fund
manager changes the cash position of the fund and beta position of the fund on
time, but not successes in properly assessing the direction of the market, then
plotting would still show a linear relationship.
Henriksson and Merton Module
Henriksson and Merton (1981) developed a statistical framework for
both parametric and non-parametric tests of market timing ability of fund
managers. Henriksson and Merton module the fund beta would take only two
values- a large value of the market is expected to do well if market return is
greater than risk free return (Rm>Rf) and small value of the market not
expected to do well if market return is less than risk free return
(Rm<Rf).Therefore, such relationship can be estimated by the following
equation:

35
(Rpt – Rft ) = (Rmt – Rft) + + eit
Where
Rpt is the return on fund period t.
Rmt is the return on the market index in period t,
Rft is the return on the risk less asset in period t.
Eit is the residual return in period t
t = max (0, Rmt – Rft)
and are constants
Hence, the beta of the funds is β in an up markets and (β-γ) in down
market. Thus, under this module, γ indicates the difference between the two
betas and a positive and significant value of γ would indicate market timing
ability of the fund manager.
Rank Order Scoring
In the case of analysis using ranks, the total scores are obtained by way
of multiplying the frequency with the weights assigned for each rank.
The highest weight is assigned for the first rank and the weights are reduced
by one for each successive rank.
Degree of Safety
The highest weight has been assigned for the highest degree of
safety. The weights are reduced by one for each successive degree of safety
thereby assigning the lowest weight (one) for the lowest degree of safety.
Degree of Satisfaction
The highest weight has been assigned for the fully satisfied and the
weight one is assigned for the not satisfied state of opinion by way of
reducing weight by one degree for each successive degree of satisfaction.
36
Degree of Importance
The highest weight has been assigned for very important and the
weight one is assigned for not at all important as reduced by one point of
weight for each successive degree of importance.
Degree of Agreement
The highest weight of five points was assigned for strongly
agreeing and the lowest weight of one point was assigned for strongly
disagreeing statement. For each successive degree of agreement one point of
differentiation was assigned. Total scores are arrived by way of multiplying
the frequencies with their respective weights. Average scores are calculated
by way of dividing the total score by the total number of observations in each
case.
SCOPE OF THE STUDY
The present study is confined to study the perception and awareness
level of investors and financial advisors in the Mutual fund market and SEBI
mutual fund regulations. This will root to understand the investment process
and strategies followed by UTI Mutual Fund and private sector mutual fund
industries. Performance evaluation is restricted to seven growth schemes
launched during the study period and the industry brought under the regulated
environment by passing the SEBI (Mutual Funds) Regulations 1996.
Performance in terms of NAV of growth schemes with growth option alone is
studied from the angle of risk and return in comparison with the benchmark
(BSE 100) index of April 2004 to March 2014. Comparison of UTI mutual
fund and private sector selected schemes is done to know the financial
performance only and other aspects have not been considered.

37
LIMITATIONS OF THE STUDY
1. The study is confined only to the Mutual Fund Industry in India. Therefore
it has not focused on the mutual funds of other countries.
2. The sample size in the case of mutual fund investors and financial advisors
has been restricted to the limits of Chennai areas as it is highly difficult to
identify them in other areas because they are wide spread population. So
the research confined the sample with AMFI and Tamil Nadu Investors
Association records.
3. Brokerage commission, entry load, exit load and taxes are not considered
for performance evaluation because they are not practiced for all the
schemes.
4. Only the open-ended mutual fund (Seven short listed) schemes have been
included for measuring the financial performance as these are actively
traded in the Mutual Fund industry.
5. Though the techniques used for analyzing the data are traditional, these
were more appropriate as many researchers in India are following at
present.
DEFINITIONS OF CONCEPTS
Asset Management Company (AMC) means a company formed and
registered under the companies Act, 1956 (1 of 1956) and approved as such by
the SEBI under sub-regulation (2) of regulation 21; the company which
handles the day to day operations and investment decisions of a mutual fund
trust18.
18
SEBI Mutual Funds Regulation, 1996, pp.6-8.
38
Sponsor means any person who, acting alone or in combination with
another body corporate, establishes a mutual fund19.
Custodian means a person who has been granted a certificate of
registration to carry on the business of custodian of securities under the SEBI
Regulations, 1996. Legal custodian is who looks after all the monies invested
in a unit trust or mutual fund20.
Trustees means the board of trustees or a trustee company who hold
the property of the mutual fund in trust for the benefit of the unit holders21.
Mutual fund scheme refers to the IMFI products launched
representing a category with specific objective and varied options. A scheme
can belong to open or close - end type of operation. The objective of the
scheme can relate to any category like income, growth, balanced money
market and equity linked saving scheme22.
Portpolio means a collection of securities owned by an individual or
an institution (such as a mutual fund) that may include stocks, bonds and
many market securities23.
Units means the share of holding of an investor in a mutual fund
scheme. Each unit represents one undivided share in the assets of a scheme24.
Unit holders means a person holding unit in a schemes of a mutual
fund25.
19
Ibid, p.37. 20
Ibid 21
Ibid 22
Ibid 23
NCAER Survey, 2011, Glossary, p.107 24
Ibid p.38 25
Ibid

39
Growth Schemes Invest primarily in shares and also might hold
fixed-income securities in a smaller proportion26.
Growth option of a mutual fund schemes is an option for long term
growth of resources mobilized as it invest primarily in shares with significant
growth potential. Dividend is not paid to the investors but ploughed back into
the fund increasing the NAV of the units27.
Net Asset Value (NAV) is the value of a fund‟s asset less the value of
its liabilities per unit.
Fund Manager the person(s) responsible for implementing a fund's
investing strategy and managing its portfolio trading activities. A fund can be
managed by one person, by two people as co-managers and by a team of three
or more people. Fund managers are paid a fee for their work, which is a
percentage of the fund's average assets under management28.
Investors: An investor is a person who allocates capital with the
expectation of a financial return. This definition makes no distinction
between those in the primary and secondary markets. That is, someone who
provides a business with capital and someone who buys a stock are both
investors. Since those in the secondary market are considered investors,
speculators are also investors29.
26
Ibid, p.39 27
Ibid 28
www. investopedia.com 29
From Wikipedia, the free encyclopedia.
40
Financial Advisors A financial advisor (or advisor) is a professional
who renders financial services to clients. According to the U.S. Financial
Industry Regulatory Authority (FINRA), terms such as financial
adviser and financial planner are general terms or job titles used by investment
professionals and do not denote any specific designations. FINRA describes
the main groups of investment professionals who may use the term financial
advisor to be: brokers, investment advisors30.
Market Timing Ability: The act of attempting to predict the future
direction of the market, typically through the use of technical indicators or
economic data. The practice of switching among mutual fund asset classes in
an attempt to profit from the changes in their market outlook31.
Stock Selection: Stock selection criteria are methods for selecting a
stock(s) for investment. The stock investment or position can be "long" (to
benefit from a stock price increase) or "short" (to benefit from a decrease in a
stock's price), depending on the investor's expectation of how the stock price
is going to move. The stock selection criteria may include systematic stock
picking methods that utilize computer software and/or data32.
30
Ibid, p.40. 31
Ibid. 32
Ibid.
41
CHAPTER SCHEMES
The present study is broadly divided into seven chapters:
1. The first chapter „Research Design‟ being this chapter dealt with
the Introduction, mutual funds concepts, worldwide mutual funds,
mutual fund in India and an overview of the UTI mutual fund,
statement of the problem, objectives, methodology, analysis of
data, scope and limitation of the study.
2. The second chapter „Review of Literature‟ presents the previous
research works relating to the present study in a nutshell. It also
explains how the present study differs from the earlier studies.
3. The third chapter „Awareness and Perceptions‟ consists of
Awareness on SEBI Mutual Fund Regulations, Perceptions of
investors on the mutual fund industry, Investors preference on the
mutual fund industry, and Attitude of Investors towards mutual
fund industry.
4. The fourth chapter „Schemes and Performance‟ presents the
schemes offered by the UTI Mutual Fund, performance of return
and risk of selected schemes analysis using by Sharpe Index,
Treynor index, Jensen Alpha, and Sharpe Differential Return,
Composite risk-return Analysis, Comparative performance
evaluation of Sharpe, Treynor and Jensen Alpha model. Eugene
Fama‟s Decomposition of performance, Risk analysis, and
Relationship between the scheme and market.
42
5. The fifth chapter „Performance of Fund Managers‟ deals with the
estimation of market timing ability of fund managers. It is
analysed by using Treynor and Mazuy module, and Henriksson and
Merton module.
6. The sixth chapter „Performance of UTI Mutual Fund and Private
Sector Mutual Fund Schemes‟ presents the comparative analysis of
the performance of the selected schemes of UTI mutual fund with
that the private sector mutual funds by using of risk and returns vs.
Bench Mark, portfolios, Treynor Ratio, Sharpe Ratio and BSE 100
Index, Sharpe Differential Returns, Jensen measure, and Fama‟s
break up of selected schemes.
7. The seventh chapter „Findings, Suggestions and Conclusion‟
consists of Summary of findings, conclusion, and valuable
suggestions for improving the performance of mutual fund industry
and it includes the scope for further research in the study area.

43
CHAPTER – II
REVIEW OF LITERATURE
The present chapter attempts to review some of the important studies
on investment performance in the mutual fund industry. Studies made both in
India and abroad are reviewed.
FOREIGN STUDIES
Friend, et al., (1962)33 made an extensive and systematic study of 152
mutual funds and found that mutual fund schemes earned an average annual
return of 12.4 percent, while their composite benchmark earned a return of
12.6 percent. Their alpha was negative with 20 basis points. Overall results
did not suggest widespread inefficiency in the industry. Comparison of fund
returns with turnover and expense categories did not reveal a strong
relationship.
Irwin, Brown, FE (1965)34 analyzed issues relating to investment
policy, portfolio turnover rate, performance of mutual funds and its impact on
the stock markets. The schoolwork identified that mutual funds had a
significant impact on the price movement in the stock market. They concludes
that, on an average, funds did not perform better than the composite markets
and there was no persistent relationship between portfolio turnover and fund
performance.
33
Friend et. al, “A Study of Mutual Funds” U.S. Securities and Exchange Commission, USA,
(1962). 34
Irwin, Brown, FE, et al., “A Study of Mutual Funds: Investment Policy and Investment
Company Performance” reprinted in Hsiu-Kwangwer and Alan Jzakon (Ed.) Elements of
Investments, New York: Holt, Renchart and Winston, (1965), pp.371-385.

44
Treynor (1965)35 used „characteristic line‟ for relating expected rate of
return of a fund to the rate of return of a suitable market average. He coined a
fund performance measure taking investment risk into account. Further, to
deal with a portfolio, „portfolio-possibility line‟ was used to relate expected
return to the portfolio owner‟s risk preference.
Sharpe, William F (1966)36 evaluated 34 open-end mutual funds for
the period 1944-63 and developed a composite measure of return and risk.
Regarding to variability ratio for each scheme was significantly less than
Down Jones Industrial Average (DJIA) and ranged from 0.43 to 0.78. Expense
ratio was inversely related with the fund performance, as correlation
coefficient was 0.0505. The results depicted that good performance was
associated with low expense ratio and not with the size. Sample schemes
showed consistency in risk measure.
Treynor and Mazuy (1966)37 evaluated the performance of 57 fund
managers in terms of their market timing abilities and found that, fund
managers had not successfully outguessed the market. The results suggested
that, investors were completely dependent on fluctuations in the market.
Improvement in the rates of return was due to the fund managers‟ ability to
identify under-priced industries and companies.
Jensen (1968)38 evaluated the ability of 115 fund managers in
selecting securities during the period 1945-66. Analysis of net returns
35 Treynor Jack L, “How to Rate Management of Investment Funds”, Harvard Business Review,
Vol. 43(1), (1965), pp. 63-75. 36
Sharpe, William F “Mutual Fund Performance”, The Journal of Business, Vol. 39(1), (1966),
pp.119-138. 37
Treynor and Mazuy , “Can Mutual Funds Outguess The Markets” Harvard Business Review,
Vol. 44, (1966), pp.131-136. 38
Jensen Michael C, “The Performance Of Mutual Funds In The Period 1945-1964”, Journal of
Finance, Vol. 23, (1968), pp.389-416.
45
indicated that, 39 funds had above average returns, while 76 funds yielded
abnormally poor returns. Using gross returns, 48 funds showed above average
results and 67 funds below average results. He developed a composite
portfolio evaluation technique concerning risk-adjusted returns. Jensen
concluded that, there was very little evidence that funds were able to perform
significantly better than expected as fund managers were not able to forecast
securities price movements.
Smith and Tito (1969)39 examined the inter-relationships between the
three widely used composite measures of investment performance and
suggested a fourth alternative, identifying some aspects of differentiation in
the process. While ranking the funds on the basis of ex-post performance,
alternative measures produced little differences. However, conclusions
differed widely when performance were compared with the market. In view of
this, they suggested modified Jensen‟s measure based on estimating equation
and slope coefficient.
Friend, Blume and Crockett (1970)40 compared the performance of
86 funds with random portfolios. The study concluded that, mutual funds
performed badly in terms of total risk. Funds with higher turnover
outperformed the market. The size of the fund did not have any impact on
their performance.
Carlson (1970)41 examined mutual funds emphasizing the effect of
market series Standard and Poor 500 (S&P 500), New York Stock Exchange
39
Smith and Tito , “Risk-Return Measures of Post-Portfolio Performance” Journal of Financial
and Quantitative Analysis, Vol. 4, (1969), pp.449-471. 40
Friend, Blume, Crockett, Mutual Funds and Other Institutional Investors – A new perspective,
Mc Graw Hill Book Company, New York, (1970). 41
Carlson, “Aggregate Performance Of Mutual Funds, 1948-1967”, Journal of Financial and
Quantitaive Analysis,Vol.5,(1970),pp.1-32
46
(NYSE) composite, DJIA) during the period 1948-67. All fund groups
outperformed DJIA but for a few which had gross returns better than that of
S&P 500 or NYSE composite. Though there was consistency in risk and
return, there was no consistency between risk-adjusted performance measures
over the time period. Carlson‟s analysis of performance exposed relationship
between cash inflows into funds and not with the size or expense ratio.
Arditti (1971)42 found that Sharpe‟s conclusion got altered when
annual rate of return was introduced as a third dimension. He found that,
contrary to Sharpe‟s findings the average fund performance could no longer
be judged inferior to the performance of Doun Jones Industrial Average
(DJIA). Fund managers opted higher risk for better annual returns.
Williamson (1972)43 compared ranks of 180 funds between 1961-65
and 1966-70. There was no correlation between the rankings of the two
periods. The investment abilities of most of the fund managers were identical.
He highlighted the growing prominence of volatility in the measurement of
investment risk.
Fama (1972)44 developed methods to distinguish observed return due
to the ability to pick up the best securities at a given level of risk from that of
predictions of price movements in the market. He introduced a multi-period
model allowing evaluation on a period-by-period and on a cumulative basis.
He branded that, return on a portfolio constitutes return for security selection
and return for bearing risk. His contributions combined the concepts from
42
Arditti, “Another Look at Mutual Fund Performance”, Journal of Financial and Quantitative
Analysis,Vol.3,(1971),pp.909-912. 43
Williamson, “Measurement and Forecasting of Mutual Fund Performance: Choosing an
Investment Strategy”, Financial Analysts Journal, Vol. 28, (1972), pp.78-84. 44
Fama, “Components of Investment Performance”, Journal of Finance, Vol. 27, (1972), pp.551-
567.

47
modern theories of portfolio selection and capital market equilibrium with
more traditional concepts of good portfolio management.
Klemosky (1973)45 analysed investment performance of 40 funds
based on quarterly returns during the period 1966-71. He acknowledged that,
biases in Sharpe, Treynor, and Jensen‟s measures, could be removed by using
mean absolute deviation and semi-standard deviation as risk surrogates
compared to the composite measures derived from the CAPM.
McDonald and John (1974)46examined 123 mutual funds and
identified the existence of positive relationship between objectives and risk.
The study identified the existence of positive relationship between return and
risk. The relationship between objective and risk-adjusted performance
indicated that, more aggressive funds experienced better results.
Gupta (1974)47 evaluated the performance of mutual fund industry for
the period 1962-71 using Sharpe, Treynor, and Jensen models. All the funds
covered under the study outperformed the market irrespective of the choice of
market index. The results indicated that all the three models provided identical
results. All the mutual fund subgroups outperformed the market using DJIA
while income and balanced groups under performed S&P 500. Return per unit
of risk varied with the level of volatility assumed and he concluded that, funds
with higher volatility exhibited superior performance.
45
Klemosky, “The Bias in Composite Performance Measures”, Journal of Financial Quantitative
Analysis, Vol. 8, (1973), pp.505-514. 46
McDonald and John, “Objectives And Performance Of Mutual Funds, 1960-69”, Journal of
Financial and Quantitative Analysis, Vol. 9, (1974), pp.311-333. 47
Gupta, “The Mutual Fund Industry and Its Comparative Performance”, Journal of Financial
and Quantitative Analysis, Vol. 6, (1974), pp.894.

48
Klemosky (1977)48 examined performance consistency of 158 fund
managers for the period 1968-75. The ranking of performance showed better
consistency between four-year periods and relatively lower consistency
between adjacent two-year periods.
Ippolito’s (1989)49 studied load charges and expenses of funds.
Results and conclusions were relevant and consistent with the theory of
efficiency of informed investors. He estimated that risk-adjusted return for the
mutual fund industry was greater than zero and attributed positive alpha
before load charges and identified that fund performance was not related to
expenses and turnover as predicted by efficiency arguments.
Rich Fortin and Stuart Michelson (1995)50 studied 1,326 load funds
and 1,161 no load funds and identified that, no-load funds had lower expense
ratio and so was suitable for six years and load funds had higher expense ratio
and so had fifteen years of average holding period. No-load funds offered
superior results in nineteen out of twenty-four schemes. He concluded that, a
mutual fund investor had to remain invested in a particular fund for very long
periods to recover the initial front-end charge and achieve investment results
similar to that of no-load funds.
Baur, Sundaram and Smith (1995)51 outlined the pricing
fundamentals of open-end and close-end funds, and described the transaction
cost of buying and selling funds. The U.S.A.‟s experience of mutual funds
48
Klemosky, “How Consistently Do Managers Manage”, Journal of Portfolio Management,
Vol. 3, (1977), pp.11-15. 49
Ippolito R, “Efficiency with Costly Information: A Study of Mutual Fund Performance”,
Quarterly Journal of Economics, Vol. 104, (1989), pp.1-23. 50
Rich Fortin, and Stuart Michelson, “Are load Mutual Funds Worth the Price?” Journal Of
Investing, Vol. 4(3) , (Fall 1995), pp. 89-94. 51
Baur, Sundaram and Smith, “Mutual Funds: The US Experience”, Finance India, Vol.
9(4),(1995),pp.945-957.
49
described how these institutions could change a country‟s capital market and
individual investment patterns. The study disclosed that the continuous
redemption privilege of open-end funds had vulnerable consequences in the
pricing of each type of fund, the assets held by each type of fund and the
manner in which the transaction and management fees were collected.
Conrad S Ciccotello and C Terry Grant’s (1996)52 study identified a
negative correlation between asset size of the fund and the expense ratio. The
results of the study brought out that, larger funds had lower expense ratios due
to economies of scale. Equity funds had spent heavily to acquire information
for trading decision and were consistent with the theory of information
pricing. The high beta, high expenses and high turnover in the aggressive
growth group than in long-term growth funds and income funds suggested
higher costs being associated with obtaining and using corporate information
in emerging and volatile market.
Grubber (1996)53 attempted to study the puzzle relating to the fast
growth of mutual funds inspite of inferior performance of actively managed
portfolios. The study revealed that, mutual funds had negative performance
compared to the market and provided evidence of persistence of under
performance. Sophisticated clientele withdrew money from mutual funds
during the period of poor performance, where as mutual funds found money
from disadvantaged clientele leading to the faster growth of funds.
52
Conrad S Ciccotello and C Terry Grant, “Information Pricing: The Evidence from Equity
Mutual Funds”, The Financial Review, Vol. 31(2), (1996), pp.365-380. 53
Grubber, “The Persistence Of Risk-Adjusted Mutual Fund Performance”, Journal of
Business,Vol.2,(1996),pp.133-157.
50
Dellva, Wilfred L and Olson, Gerard T (1998)54 studied 568 mutual
funds without survivorship bias. The results indicate that, informational
competency of funds increased the efficiency, reduced expenses and provided
for higher risk-adjusted returns. Redemption fees had positive and significant
impact on expenses. International funds had higher expense ratios.
Khorana, Ajay and Nelling, Edward (1998)55 using multinomial
probe model identified that, funds with higher ratings had higher risk
diversification, larger asset base, lower portfolio turnover, managers with
longer tenures, lower front load and expense ratios. Persistence in fund
performance was statistically significant during short time horizons.
Morningstar‟s mutual fund ratings were based on historic risk and reward. The
ratings provided useful information while selecting mutual funds. Funds in the
top 10 percent of risk-adjusted scores had five star rating; next 22.55 percent
received four star rating; middle 35 percent were assigned three stars, and the
last two categories represented the next 22.5 percent and 10 percent. High
rated funds performed substantially better than low rated funds after the issue
of ratings.
Fernando, Chitru S et., al. (1999)56 analysed share price related to
marketability of funds, observed that splitting did not exhibit any superior
performance nor any change in the risk characteristics of funds but enhance
the marketability of fund‟s shares due to positive response from small
investors.
54
Dellva, Wilfred L.and Olson, Gerard T. “The Relationship Between Mutual Fund Fees And
Expenses And Their Effects On Performance”, The Financial Review, Vol. 33(1), (Feb
1998),pp.85-104. 55
Khorana, Ajay and Nelling, Edward “The Determinants And Predictive Ability Of Mutual Fund
Ratings”, Journal Of Investing, Vol. 7(3), Fall (1998), pp 61-66. 56
Fernando, Chitru S et.al, “Is Share Price Related To Marketability? Evidence from Mutual Fund
Share Splits”, Journal of The Financial Management Association, Vol. 28(3), Autumn (1999)
pp.54-67.
51
Statman, Meir (2000)57 emphasizes that, socially responsible
investing has to be taken as a tool by the corporations. He further identified
that, socially responsible stocks out performed while socially responsible
mutual funds under performed the S & P 500 Index during 1990-98.
Maria Do Ceu Cortez and Florinda Silva (2002)58 analyzed the
implications of conditioning information variables on a sample of Portuguese
stock funds. He identified that unconditional Jensen‟s alpha ensured superior
performance till incorporation of public information variables. Alpha was not
statistically different from zero while beta was related to public information
variables.
Jow-Ran Chang (2003)59 developed a new performance measure to
evaluate fund managers hedging ability. According to the new measure, the
study found that the sample of 65 U.S Mutual Funds manager were an average
credited with positive security selection and negative market timing ability.
Nicolas P.B Bollen and Jeffrey A. Busse (2004)60 examined the issue
of determination in mutual fund performance emphasing short measurement
period and found no evidence of ability.
George J. Jiang, Tong Yao (2007)61 implemented new measures of
market timing based on mutual fund holdings. The authors found that actively
57
Statman, Meir “Socially Responsible Mutual Funds”, Journal Of Financial Analysts Vol. 56 (3)
(May / June 2000), pp. 30-38. 58
Maria Do Ceu Cortez & Florinda Silva, “Conditioning Information on Portfolio Performance
Evaluation: A Reexamination of Performance Persistence in the Portuguese Mutual Fund
Market”, Finance India, Vol. XVI (4), (December 2002), pp. 1393-1408. 59
Jown-Ran Chang (2003) “Performance measure to evaluate fund manager hedging ability”.
Revised Quantitative Finance and Accounting. Vol. 1, Issue 2003, pp.415-433. 60
Nicolas P.B., Bollen and Jefferey A. Busse (2004). “Another look at Mutual Fund
Tournaments”, Journal of Finance and Qualitative Analysis, 36(1), March, 2011, pp. 53-73. 61
George J. Jaing, Tong Yao (2007), “A Study of selectivity abilities of fund manager, Quarterly
Journal of Economics, May, 2007, p. 403-456.

52
managed U.S domestic equity funds had positive timing ability in their study
period.
The literature survey of foreign studies revealed that mutual fund
managers were not able to offer higher returns due to their inability in stock
selection and market timing. For short periods fund managers were able to
offer superior returns.
INDIAN STUDIES
S.G. Shah (1979)62 studied the UTI‟s improved efficiency enabled the
unit holders, to get the dividend warrants promptly and it is a tremendous
improvement over the previous years. This improvement may be due to the
functioning of its computer center. Another improvement is the accepting of
cheques and the beneficent of giving special price. The researcher further
added that the UTI has done a lot to improve the performance and
productivity of its staff. The study has concluded with a suggestion that the
return to investor must be larger than the capital gains by way of purchasing
the units in the month of July and selling the same in May, in which the books
are closed.
Gupta Ramesh (1989)63 evaluated fund performance in India
comparing the returns earned by schemes of similar risk and similar
constraints. An explicit risk-return relationship was developed to make
comparison across funds with different risk levels. His study decomposed
total return into return from investors risk, return from managers‟ risk and
target risk. Mutual fund return due to selectivity was decomposed into return
62
Shah, S.G. Unit Trust of India Improved performance Commerce. Vol.18.No.80 August 25,
1979, 383. 63
Gupta, Ramesh “Mutual Funds”, The Management Accountant, Vol. 24(5), (May 1989), pp.320-
322.

53
due to selection of securities and timing of investment in a particular class of
securities.
Vidhyashankar S (1990)64 identified a shift from bank or company
deposits to mutual funds due to its superiority by way of ensuring a healthy
and orderly development of capital market with adequate investor protection
through SEBI interference. The study identified that mutual funds in the
Indian capital market have a bright future as one of the predominant
instruments of savings by the end of the century.
Lee and Rahman (1990)65 empirically examined market timings and
selectivity performance of UTI mutual funds by using simple regression
technique to separate stock selection ability from market timing ability. The
inputs to the model were return earned on market portfolio. The results
indicated some evidence of micro and macro forecasting ability of fund
managers.
Bansal L K (1991)66 identified that mutual fund like other financial
institutions is a potential intermediary between the prospective investor and
the capital market. Mutual fund, as an investment agency was preferred since
1985-86 due to the benefits of liquidity, safety and reasonable appreciation
assured by the industry. The schemes with assured returns showed tremendous
progress. Majority of the funds floated by commercial banks gave an
impression that the responsibility of funds laid with the respective banks and
their investment was secured.
64
Vidhyashankar S, “Mutual Funds: Emerging Trends In India”, Chartered Secretary, Vol. 20(8),
(August 1990), pp.639-640. 65
Lee, Chnag – Few and Rehman Shafigur, Market-Timing, Selectivity and Mutual fund
performance. An empirical investigation, Journal of Business, 21 (1990), pp 261 -278. 66
Bansal L K, “Challenges For Mutual Funds In India”, Chartered Secretary, Vol. 21(10),
(October 1991), pp. 825-26.
54
Barua and Varma (1991)67 made a maiden attempt to evaluate the
master share scheme of UTI using the data for 1987 – 90. They came to the
conclusion that the master share scheme has out performed the market in
terms of NAV, Further they commented that the master scheme benefited
large scale investors rather than small scale investors, which is not consistent
with the objectives of UTI.
Sarkar A K (1991)68 critically examined mutual fund evaluation
methodology and pointed out that Sharpe and Treynor performance measures
ranked mutual funds alike inspite of their differences in terms of risk. The
Sharpe and Treynor index could be used to rank performance of portfolios
with different risk levels.
Shukla (1991)69 evaluated the master share of the UTI and Canshare of
Canbank mutual fund using the data for the period between 1989 -1991 and
concluded that Master share and Canshare have outperformed the market.
Batra and Bhatia (1992)70 appreciated the performance of various
funds in terms of return and funds mobilized. UTI, LIC and SBI Mutual Fund
are in the capital market for many years declaring dividends ranging from 11
percent to 16 percent. The performance of Canbank Mutual Fund, Indian
Bank Mutual Fund and PNB Mutual Fund were highly commendable. The
performance of many schemes was equally good compared to industrial
securities.
67
Barua, S.K. and J.R. Varma, Master Share A bonanza for large investors, „Vikalpa‟, January –
March 1991. pp 29- 34. 68
Sarkar A K, “Mutual Funds in India - Emerging Trends”, The Management Accountant, Vol. 26
(3), (March 1991), pp.171-174. 69
Shukla. S, Performance evaluation of mastershare, can share and Index port folio; UTI-ICM
Research 1991 unpublished. 70
Batra and Bhatia, “Indian Mutual Funds: A study of Public sector” , paper presented, UTI
Institute of Capital Market, Mumbai, (1992).
55
Gupta L C (1992)71 attempted a household survey of investors with
the objective of identifying investors‟ preferences for mutual funds so as to
help policy makers and mutual funds in designing mutual fund products and in
shaping the mutual fund industry.
Gangadhar V (1992)72 identified mutual funds as the prime vehicle
for mobilization of household sectors‟ savings as it ensures the triple benefits
of steady return, capital appreciation and low risk. He identified that open-end
funds were very popular in India due to its size, economies of operations and
for its liquidity. Investors opted for mutual funds with the expectation of
higher return for a given risk, greater convenience and liquidity.
Sahu R K (1992)73 identified mutual funds as a suitable investment
vehicle to strengthen capital market, as the total assets were around Rs.30,000
crores while the total resources in equity was less than 15 percent of market
capitalization.
Venugopalan S (1992)74 opined that India (15 million) ranks third in
the World next to U.S.A. (50 million) and Japan (25 million) in terms of
number of shareholders ensuring the spread of equity cult. However, many
investors face hardships in the share market due to lack of professional advice,
inability to minimize risk, limited resources and information.
71
Gupta L C, Mutual Funds and Asset Preference, Society for Capital Market Research and
Development, New Delhi, First Edition (1992). 72
Gangadhar V, “The Changing Pattern of Mutual Funds in India”, The Management Accountant,
Vol. 27 (12), (December 1992), pp. 924-28. 73
Sahu R K, “A Critical Review of the Mutual Fund Regulations”, Chartered Secretary, Vol.
22(12), (December 1992), pp. 1076-1078. 74
Venugopalan S, “Mutual Funds”, Chartered Secretary, Vol. XXII (8), (August 1992), pp.691-
694.

56
Anagol (1992)75 identified the urgent need for a comprehensive
selfregulatory regime for mutual funds in India, in the context of divergence
in its size, constitution, regulation among funds and sweeping deregulation
and liberalization in the financial sector.
Shashikant Uma (1993)76 critically examined the rationale and
relevance of mutual fund operations in Indian Money Markets. She pointed
out that in money market mutual funds with low-risk and low return offered
conservative investors a reliable investment avenue for short-term investment.
Ansari (1993)77 stressed the need for mutual funds to bring in
innovative schemes suitable to the varied needs of the small savers in order to
become predominant financial service institution in the country.
Sahu R K and Panda J (1993)78 identified that, the savings of the
Indian public in mutual funds was five to six percent of total financial savings,
11 to 12 percent of bank deposits and less than 15 percent of equity market
capitalization. The study suggested that, mutual funds should develop suitable
strategies keeping in view the savings potentials, growth prospects of
investment outlets, national policies and priorities.
Saha Asish and Rama Murthy Y Sree (1993-94)79 identified that
return, liquidity, safety and capital appreciation played a predominant role in
the preference of the schemes by investors. The preference of the households
75
Angol, “Role of Self Regulatory Organisation in Mutual Fund Industry in India”, Chartered
Financial Analyst, Vol.7(1), 1992, p11. 76
Shashikant, Uma “Accounting Policy and Practices of Mutual Funds: The Need for
Standardization”, Prajan, Vol. XXIV (2), (1993), pp. 91-102. 77
Ansari, “Mutual Funds in India: Emerging Trends”, The Chartered Accountant, Vol. 42(2),
(August 1993), pp.88-93. 78
Sahu R K and Panda J, “The Role And Future Of Mutual Funds In India”, Management
Account,(February 1993)pp.91-3. 79
Saha Asish and Rama Murthy Y Sree, “Managing Mutual Funds: Some Critical Issues”,
Journal of Social and Management Science, Vol. XXII (1), (1993-94), pp.25-35.
57
towards shares and debentures was seven percent by 1989-90. Mutual funds
being an alternative way for direct purchase of stocks should be managed
effectively adopting investment analysis, valuation models, and portfolio
management techniques. The study suggested that, fund managers could adopt
portfolio selection techniques to make more informed judgments rather than
making investments on an intuition basis.
Vaid, Seema (1994)80 study revealed that the mutual fund industry
showed a continuous growth in savings mobilization and the number of unit
holders during the period 1987 to 1992. 58.40 percent of resources mobilized
by the industry were through income schemes. UTI accounted for 83.90
percent of industry mobilization. Pure growth schemes displayed a sound
investment pattern with 81.80 percent of portfolios in equity scrips and had
identified that semi-urban and rural areas were not adequately tapped by the
mutual funds inspite of satisfactory returns. Offshore funds showed best
performance during 1985-86.
Shukla and Singh (1994)81 attempted to identify whether
professionally qualified portfolio managers professional education brought out
superior performance. They found that equity mutual funds managed by
professionally qualified managers were riskier but better diversified than the
others. Though the performance differences were not statistically significant,
the three professionally qualified fund managers reviewed outperformed
others.
80
Vaid, Seema, “Mutual Fund Operations In India”, Rishi Publications, Varnasi, (1994). 81
Shukla and Singh , “Are CFA Charter Holders Better Equity Fund Managers”, Chartered
Financial Analysts, Vol. 2, (1994), pp.68-74.
58
Shome (1994)82 based on growth schemes, examined the performance
of the mutual fund industry between April 1993 to March 1994 with BSE
SENSEX as market surrogate. The study revealed that, in the case of 10
schemes, the average rate of return on mutual funds were marginally lower
than the market return while the standard deviation was higher than the
market. The analysis also provide that, performance of a fund was not closely
associated with its size.
Shah Ajay and Thomas Susan (1994)83 studied the performance of
11 mutual fund schemes on the basis of market prices. Weekly returns
computed for these schemes since their launch of the scheme to April 1994
were evaluated using Jensen and Sharpe measures. They concluded that,
except UGS 2000 scheme of UTI, none of the sample schemes earned
superior returns than the market due to very high risk and inadequate
diversification.
K.V. Roa and K. Venkateshwaralu (1994)84 made a good attempt on
„Market Timing Abilities of Fund Managers‟ – A case study of Unit Trust of
India. Evaluating the market timing abilities of UTI fund managers, all the
listed schemes of UTI under the close – ended category have been taken into
consideration. They used tools to find out the risk and return as well as for
exhibiting the market timing abilities. Of the nine schemes studied, two
schemes, viz., Master share is very small (0.03) and that of Grand Master
shows negative (-0.05). So, it is clear that fund managers of listed schemes of
UTI are less concerned about forecasting the market and making necessary
82
Shome, “A Study Of Performance Of Indian Mutual Funds”, unpublished thesis, Jhansi
University, (1994). 83
Shah Ajay and Thomas Susan, “Performance Evaluation of Professional Portfolio Management
In India”, paper presented, CMIE, (10 April 1994). 84
Rao K.V. and Venkateswaraju, Performance Evaluation of mutual funds. A case study of UTI
1994,p.8.1-8.24.
59
adjustments in the portfolios. Finally they concluded the absence of market
timing abilities could be observed even today and that it was the right time for
UTI to emerge as a professionally managed institution as against an institution
that has been continuously supported by the government.
Jaideep and Sudip Majumdar (1994)85 evaluated the performance of
five growth oriented schemes of UTI for the period February 1991 to August
1993. They have used CAMP and Jensen measures to evaluate the
performances. They concluded that the selected mutual fund schemes have
not offered superior returns+ during the study period than the market in
general.
Kale and Uma (1995)86 conducted a study on the performance of 77
schemes managed by eight mutual funds. The study revealed that, growth
schemes yielded 47 percent Compound Annual Growth Rate (CAGR),
tax-planning schemes 30 percent CAGR followed by balanced schemes with
28 percent CAGR and income schemes with 18 percent CAGR.
The Delhi-based Value Research India Pvt. Ltd (1996)87 conducted a
survey covering the bearish phase of Indian stock markets from 30th June 1994
to 31st December 1995. The survey examined 83 mutual fund schemes. The
study revealed that, 15 schemes provided negative returns, of which, 13 were
growth schemes. Returns from income schemes and income-cum-growth
schemes were more than 20 percent. From the point of risk-adjusted monthly
returns, of the 53 growth schemes, 28 (52.8 percent) could beat the index even
in a bear phase.
85
Jaideepand Sudhipta manjumdar, “Performance evaluation of mutual funds in India” NMIS
management review vol. vi.No:2 July –Dec – 1994 pp. 64 – 78. 86
Kale and Uma, “A Study On The Evaluation Of The Performance Of Mutual Funds In India”,
National Insurance Academy, Pune, India (1995). 87
Value Research India Pvt. Ltd, “Mutual Fund” Delhi, India. (1996).
60
Tripathy, Nalini Prava (1996)88 identified that the Indian capital
market expanded tremendously as a result of economic reforms, globalization
and privatization. Household sector accounted for about 80 percent of
country‟s savings and only about one-third of such savings were available for
the corporate sector. The study suggested that, mutual funds should build
investors confidence through schemes meeting the diversified needs of
investors, speedy disposal of information, improved transparency in operation,
better customer service and assured benefits of professionalism.
Yadav R A and Mishra, Biswadeep (1996)89 evaluated 14 close end
schemes over the period of April 1992 to March 1995 with BSE National
Index as benchmark. Their analysis indicated that, 57 percent of sample
schemes had a mean return higher than that of the market. Schemes performed
well in terms of diversification and total variability of returns but failed to
provide adequate risk-premium per unit of systematic risk. 57 percent had
positive alpha signifying superior performance in terms of timing ability of
fund managers. Fund managers of growth schemes adopted a conservative
investment policy and maintained a low portfolio beta to restrict losses in a
rapidly falling stock market.
Jayadev M (1996)90 studied the performance of UTI Mastergain 1991
and SBI Magnum Express from 1992-94 with 13 percent return offered by
Post Office Monthly Income Deposits as risk-free return. Mastergain earned
an average return of 2.89 percent as against market earnings of 2.84 percent.
Volatility of Magnum Express was high compared to Mastergain. Master gain
88
Tripathy, Nalini Prava, “Mutual Fund In India: A Financial Service in Capital Market”,
Finance India, Vol. X (1), (March 1996), pp. 85-91. 89
Yadav R A and Mishra, Biswadeep “Performance Evaluation of Mutual Funds: An empirical
analysis”, MDI Management Journal, Vol. 9(2), (July 1996), pp.117-125. 90
Jayadev M, “Mutual Fund Performance: An Analysis of Monthly Returns”, Finance India, Vol.
X (1) (March 1996), pp. 73-84.
61
had a superior performance over its benchmark (Economic Times Ordinary
Share Price Index) by taking greater risk than the market. Mastergain
indicated lesser degree of diversification of the portfolio with lower R2 value
and very high unique risk. Magnum Express portfolio was well diversified
with higher R2 value along with lower unique risk and total risk. Both the
funds did not earn superior returns because of lack of selectivity on the part of
the fund managers indicating that, the funds did not offer the advantages of
professionalism to the investors.
Sahadevan S and Thiripalraju M (1997)91 stated that, mutual funds
provided opportunity for the middle and lower income groups to acquire
shares. The savings of household sector constituted more than 75 percent of
the GDS along with a shift in the preference from physical assets to financial
assets and also identified that, savings pattern of households shifted from bank
deposits to shares, debentures, and mutual funds.
Krishnamurthi S (1997)92 identified mutual funds as an ideal
investment vehicle for small and medium investors with limited resources, to
reap the benefits of investing in blue chip shares through firm allotment in
primary market, avoid dud shares, access to price sensitive information and
spread risk along with the benefits of professional fund management.
Gupta and Sehgal (1998)93 evaluated performance of 80 mutual fund
schemes over four years (1992-96). The study tested the proposition relating
to fund diversification, consistency of performance, parameter of performance
and risk-return relationship. The study noticed the existence of inadequate
91
Sahadevan S and Thiripalraju M, Mutual Funds: Data, Interpretation and Analysis, Prentice
Hall of India Private Limited, New Delhi, (1997). 92
Krishnamurthi S, “Genesis of Mutual Funds in India”, Vision Books, New Delhi, (1997). 93
Gupta O P and Sehgal, Sanjay, “Investment Performance of Mutual Funds: The Indian
Experience”, paper presented in Second UTI-ICM Capital Markets Conference, December 23-
24, (1998), Vasi, Bombay.
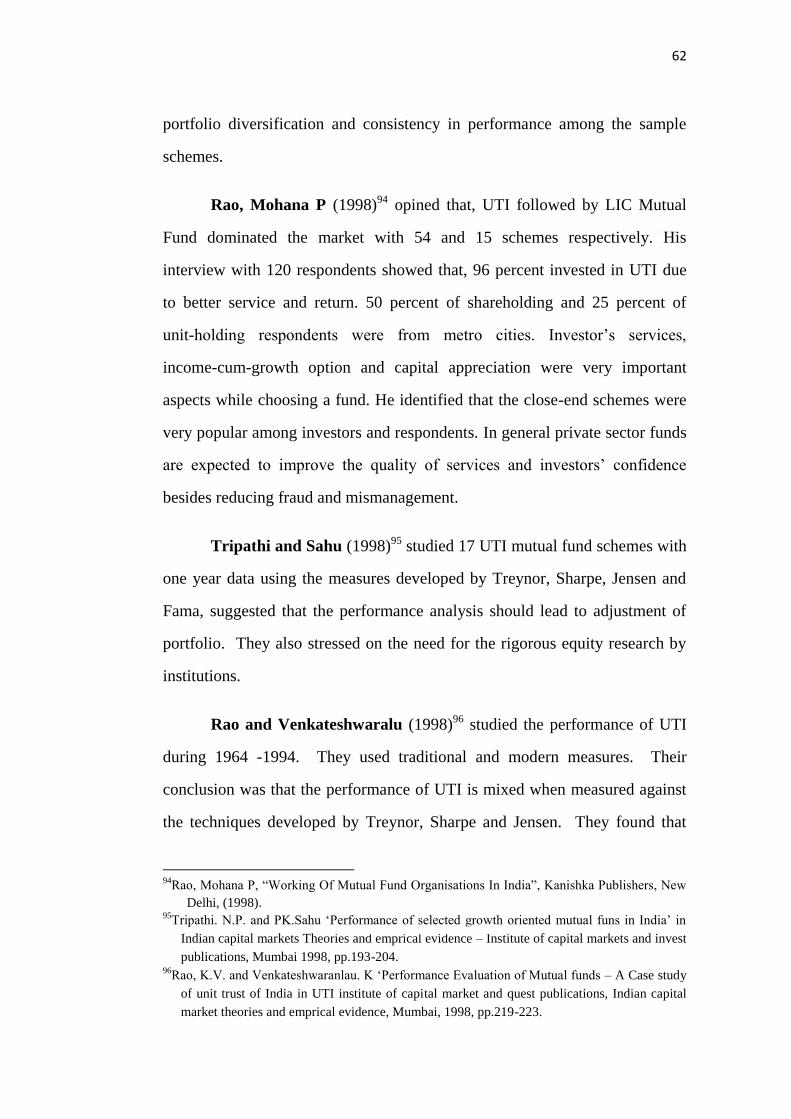
62
portfolio diversification and consistency in performance among the sample
schemes.
Rao, Mohana P (1998)94 opined that, UTI followed by LIC Mutual
Fund dominated the market with 54 and 15 schemes respectively. His
interview with 120 respondents showed that, 96 percent invested in UTI due
to better service and return. 50 percent of shareholding and 25 percent of
unit-holding respondents were from metro cities. Investor‟s services,
income-cum-growth option and capital appreciation were very important
aspects while choosing a fund. He identified that the close-end schemes were
very popular among investors and respondents. In general private sector funds
are expected to improve the quality of services and investors‟ confidence
besides reducing fraud and mismanagement.
Tripathi and Sahu (1998)95 studied 17 UTI mutual fund schemes with
one year data using the measures developed by Treynor, Sharpe, Jensen and
Fama, suggested that the performance analysis should lead to adjustment of
portfolio. They also stressed on the need for the rigorous equity research by
institutions.
Rao and Venkateshwaralu (1998)96 studied the performance of UTI
during 1964 -1994. They used traditional and modern measures. Their
conclusion was that the performance of UTI is mixed when measured against
the techniques developed by Treynor, Sharpe and Jensen. They found that
94
Rao, Mohana P, “Working Of Mutual Fund Organisations In India”, Kanishka Publishers, New
Delhi, (1998). 95
Tripathi. N.P. and PK.Sahu „Performance of selected growth oriented mutual funs in India‟ in
Indian capital markets Theories and emprical evidence – Institute of capital markets and invest
publications, Mumbai 1998, pp.193-204. 96
Rao, K.V. and Venkateshwaranlau. K „Performance Evaluation of Mutual funds – A Case study
of unit trust of India in UTI institute of capital market and quest publications, Indian capital
market theories and emprical evidence, Mumbai, 1998, pp.219-223.
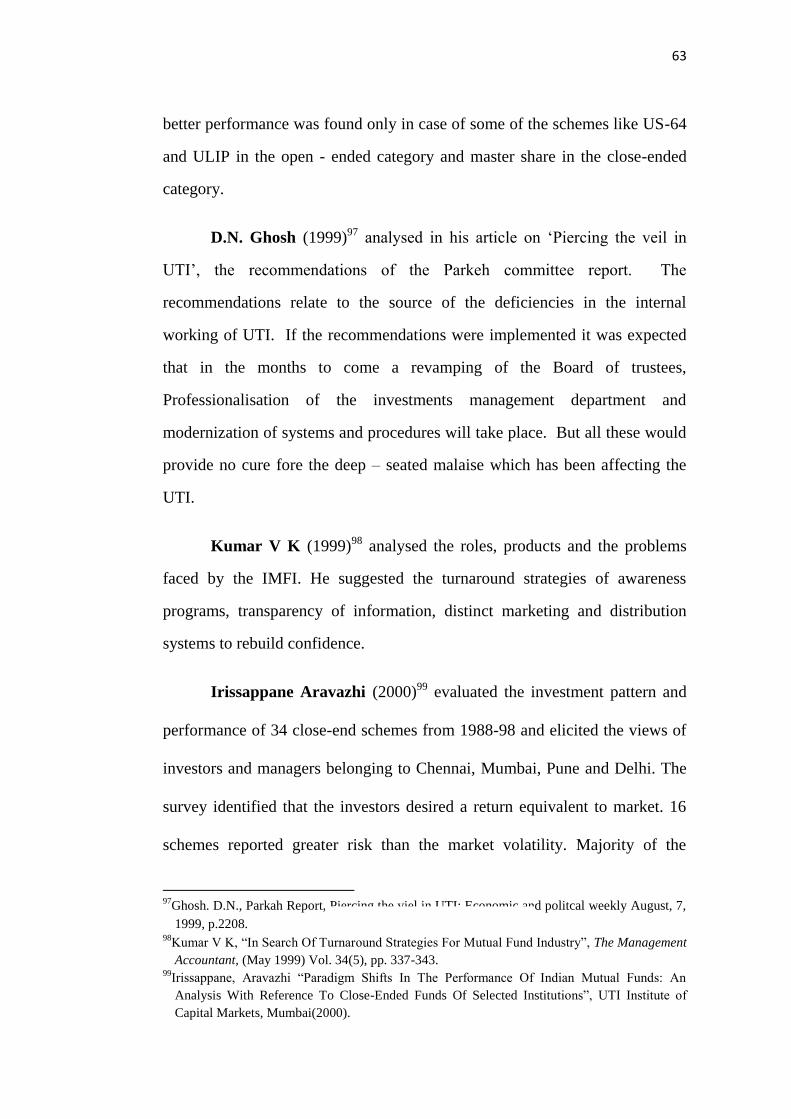
63
better performance was found only in case of some of the schemes like US-64
and ULIP in the open - ended category and master share in the close-ended
category.
D.N. Ghosh (1999)97 analysed in his article on „Piercing the veil in
UTI‟, the recommendations of the Parkeh committee report. The
recommendations relate to the source of the deficiencies in the internal
working of UTI. If the recommendations were implemented it was expected
that in the months to come a revamping of the Board of trustees,
Professionalisation of the investments management department and
modernization of systems and procedures will take place. But all these would
provide no cure fore the deep – seated malaise which has been affecting the
UTI.
Kumar V K (1999)98 analysed the roles, products and the problems
faced by the IMFI. He suggested the turnaround strategies of awareness
programs, transparency of information, distinct marketing and distribution
systems to rebuild confidence.
Irissappane Aravazhi (2000)99 evaluated the investment pattern and
performance of 34 close-end schemes from 1988-98 and elicited the views of
investors and managers belonging to Chennai, Mumbai, Pune and Delhi. The
survey identified that the investors desired a return equivalent to market. 16
schemes reported greater risk than the market volatility. Majority of the
97
Ghosh. D.N., Parkah Report, Piercing the viel in UTI: Economic and politcal weekly August, 7,
1999, p.2208. 98
Kumar V K, “In Search Of Turnaround Strategies For Mutual Fund Industry”, The Management
Accountant, (May 1999) Vol. 34(5), pp. 337-343. 99
Irissappane, Aravazhi “Paradigm Shifts In The Performance Of Indian Mutual Funds: An
Analysis With Reference To Close-Ended Funds Of Selected Institutions”, UTI Institute of
Capital Markets, Mumbai(2000).

64
schemes had a lower beta. Negative values in the case of Treynor and Sharpe
index among many schemes indicated the mockery of the market. He further
identified that the fund managers of 26 schemes had missed the chance of
gaining from scheduling with response to changes in the market.
Gupta Amitabh (2000)100 identified that the IMFI had come a long
way since its inception in 1964. The transformation in the previous decade
was the outcome of policy initiatives taken by the Government of India to
break the monolithic structure of the industry in 1987 by permitting public
sector banks and insurance sectors to enter the market.
Agrawal, Ashok Motilal (2000)101 opined that mutual funds had made
a remarkable progress during 1987-95. The cumulative investible funds of the
mutual funds industry recorded a skyrocketing growth since 1987 and reached
Rs.8,059 crores by December 31, 1995 from Rs.4,564 crores during 1986-87.
Ramesh Chander (2000)102 examined 34 mutual fund schemes with
reference to the three fund characteristics with 91-days treasury bills rated as
risk-free investment from January 1994 to December 1997. Returns based on
NAV of many sample schemes were superior and highly volatile compared to
BSE SENSEX. Open-end schemes outperformed close-end schemes in term
of return. Income funds outsmarted growth and balanced funds. Banks and
100
Gupta Amitabh, “Investment Performance of Indian Mutual Funds: An Empirical Study”,
Finance India, Vol. XIV (3), (September 2000), pp. 833-866. 101
Agrawal, Ashok Motilal, “Mutual Funds- Emerging Trends and Prospects”, Finance India,
Vol. XIV (4), (December 2000) pp.1271-1275. 102
Ramesh Chander “Performance Appraisal of Mutual Funds in India”, Finance India, Vol.
XIV(4) (December 2000), pp.1256-1261.
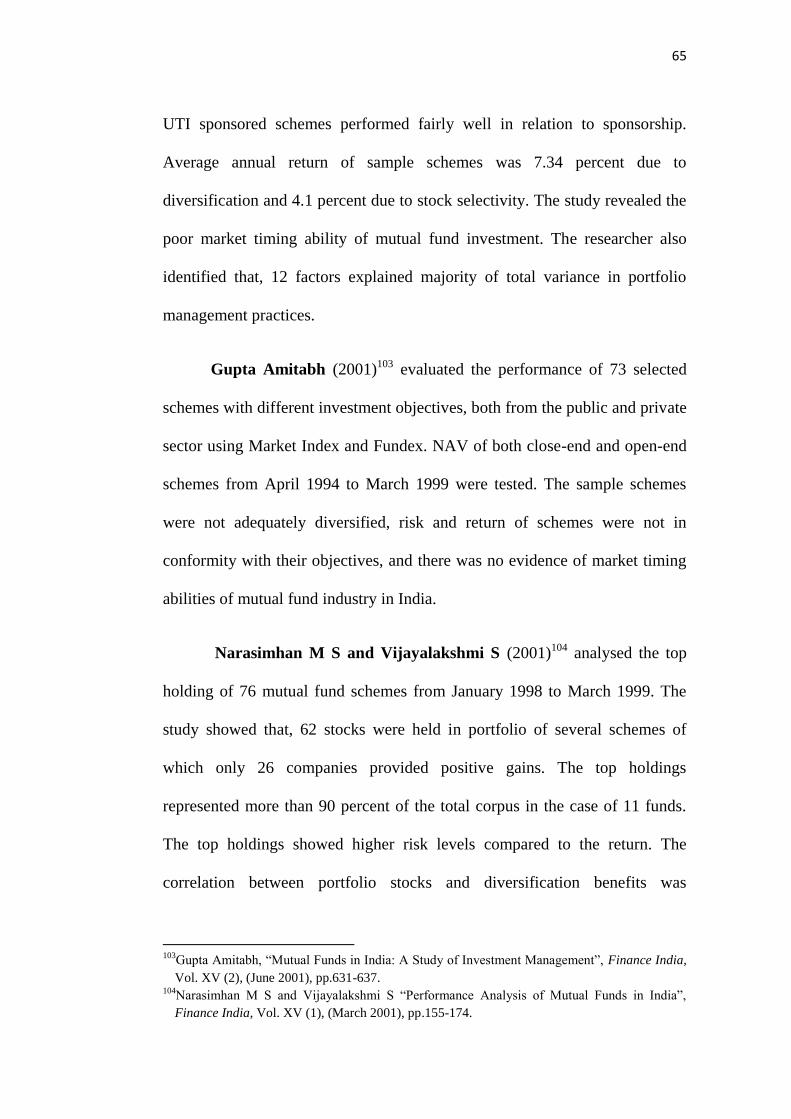
65
UTI sponsored schemes performed fairly well in relation to sponsorship.
Average annual return of sample schemes was 7.34 percent due to
diversification and 4.1 percent due to stock selectivity. The study revealed the
poor market timing ability of mutual fund investment. The researcher also
identified that, 12 factors explained majority of total variance in portfolio
management practices.
Gupta Amitabh (2001)103 evaluated the performance of 73 selected
schemes with different investment objectives, both from the public and private
sector using Market Index and Fundex. NAV of both close-end and open-end
schemes from April 1994 to March 1999 were tested. The sample schemes
were not adequately diversified, risk and return of schemes were not in
conformity with their objectives, and there was no evidence of market timing
abilities of mutual fund industry in India.
Narasimhan M S and Vijayalakshmi S (2001)104 analysed the top
holding of 76 mutual fund schemes from January 1998 to March 1999. The
study showed that, 62 stocks were held in portfolio of several schemes of
which only 26 companies provided positive gains. The top holdings
represented more than 90 percent of the total corpus in the case of 11 funds.
The top holdings showed higher risk levels compared to the return. The
correlation between portfolio stocks and diversification benefits was
103
Gupta Amitabh, “Mutual Funds in India: A Study of Investment Management”, Finance India,
Vol. XV (2), (June 2001), pp.631-637. 104
Narasimhan M S and Vijayalakshmi S “Performance Analysis of Mutual Funds in India”,
Finance India, Vol. XV (1), (March 2001), pp.155-174.

66
significant at one percent level for 30 pairs and at five percent level for 53
pairs.
Roshni Jayam (2002)105 study brought out that equities had a good
chance of appreciation in future. The researcher was of the view that,
investors should correctly judge their investment objective and risk appraisal
before picking schemes. Diversified equity funds were typically safer than
others and index funds were the best when market movements were not
certain. The researcher suggested Systematic Withdrawal Plan (SWP) when
growth option was more suitable for investors in need of regular cash inflows.
Bansal Manish (2003)106 survey of 2,819 respondents revealed that,
the unit holders‟ loyalty seemed to have become a myth as investors were
looking for performance. Unit-holders spread their holdings over two or more
funds with an urge to diversify increasing competitive mutual fund
environment.
Singh, Jaspal and Subhash Chander (2003)107 identified that past
record and growth prospects influenced the choice of scheme. Investors in
mutual funds expected repurchase facility, prompt service and adequate
information. Return, portfolio selection and NAV were important criteria‟s for
mutual fund appraisal. The ANOVA results indicated that, occupational status
105
Roshni Jayam, “Debt Be Not Proud, Equity‟s Back”, Business Today, (April 2002) pp. 42-45. 106
Bansal, Manish “Mutual Funds: Eight Steps to nirvana”, Chartered Financial Analyst, Vol.
9(12), (December 2003), pp. 34-40. 107
Singh, Jaspal and Subhash Chander, “What Drives the Investors towards Mutual Funds: An
Empirical Analysis”, The ICFAI Journal Of Applied Finance, Vol. 9(8), (November 2003),
pp.38-46.

67
and age had insignificant influence on the choice of scheme. Salaried and
retired categories had priority for past record and safety in their mutual fund
investment decisions.
Saha, Tapas Rajan (2003)108 identified that Prudential ICICI
Balanced Fund, Zurich(I) Equity Fund were the best among the equity funds
while Pioneer ITI Treasury scheme was the best among debt schemes. He
concluded that, the efficiency of the fund managers was the key in the success
of mutual funds and so the AMCs had to ensure more professional outlook for
better results.
Satish D (2004)109 opined that investors from seven major cities in
India had a preference for mutual funds compared to banking and insurance
products. Investors expected moderate return and accepted moderate risk. 60
percent of investors preferred growth schemes. The image of AMC acted as a
major factor in the choice of schemes. Investors had the same level of
confidence towards shares and mutual funds.
Sharath Jutur (2004)110 studied 58 schemes during the bearish period
(September 1998 to April 2002). He identified that the risk was low for 37
schemes, below average risk for 11 and of average risk for 10 schemes.
Risk-return analysis revealed that, average mutual funds were found to be
108
Saha, Tapas Rajan “Indian Mutual Fund Management”, Management Accountant, (October
2003), Vol. 38(10), pp.765-771. 109
Sathis D, “Investors Perceptions: A Survey by MARCH Marketing Consultancy & Research”,
Chartered Financial Analyst, Vol. 10(7), (July 2004) pp. 35-36. 110
Sharath Jutur, “Evaluating Indian Mutual Funds”, Chartered Financial Analyst, (July 2004).
p.83.

68
with low unsystematic and high total risk. The return was positive in the case
of 46 schemes, with 30 schemes yielding above five percent. 32 schemes had
positive Treynor ratio, 30 schemes had positive Sharpe ratio, 35 schemes had
positive Jensen measure due to the bearish market with low CAPM returns.
Elango’s (2004)111 analytical results indicate that, private funds had a
high positive association between the past and current year NAV compared to
public sector. The private sector schemes outperformed public sector in terms
of NAV range value, innovative products and in deployment of funds. Public
sector funds showed low volatility as against greater variability for private
sector indicating low consistency. Student „t‟ test indicated the existence of a
high significant difference between the mean NAV of private sector funds and
public sector with a high statistical significance of 5.95.
Venkateshwarlu M (2004)112 had analysed investors from the twin
cities of Hyderabad and Secunderabad. Investors preferred to invest in
open-end schemes with growth objectives. Chi-squared value revealed that,
the size of income class is independent of preference pattern, and dependent
on the choice of fund floating institution. Reasonable returns and long-term
strategy adopted by the scheme were the criteria of scheme selection.
Investors perceived that too many restrictions led to the average performance
of mutual funds in India.
111
Elango R, “Which fund yields more returns?” The Management Accountant, Vol. 39(4),
(2004), p283-290. 112
Venkateshwarlu M (2004), “Investors‟ Perceptions of Mutual Funds”, Southern Economist,
(January 15, 2004), pp.14-16.

69
Sondhi H J and Jain P K (2005)113 examined 17 public and 19 private
sector mutual fund equity schemes. The mean and median returns for the
aggregate period (1993-2002) were lower than the returns on 364 days
treasury bills, and higher than the BSE 100 index. Alliance Equity fund was
the top performer and Canbonus and LIC Dhanvikas(I) were the worst
performers. They hypothesized that majority of the sample schemes earned
returns better than the market. Private equity schemes had superior
performance due to its popularity; fund management practices,
well-researched stock selection and timing skills. More than three-fourth of
public sector schemes were unable to achieve better returns in spite of higher
investor confidence associated with high safety. The funds did not show
consistency in performance.
Muthappan P K and Damodharan E (2006)114 evaluated 40 schemes
for the period April 1995 to March 2000. The study identified that majority of
the schemes earned returns higher than the market but lower than 91 days
Treasury bill rate. The average risk of the schemes was higher than the
market. 15 schemes had an above average monthly return. Growth schemes
earned average monthly return. The risk and return of the schemes were not
always in conformity with their stated investment objectives. The sample
schemes were not adequately diversified, as the average unique risk was 7.45
percent with an average diversification of 35.01 percent. 23 schemes
113
Sondhi HJ and Jain PK “Financial Management of private and Public equity mutual in India:
An Analysis of protitability – July 2005. The ICFAI Journal of Applied Finance, 2005, pp.14-
27. 114
Muthappan P K & Damodharan E , “Risk-Adjusted Performance Evaluation of Indian Mutual
Funds Schemes”, Finance India, Vol. XX(3), (September 2006), pp.965-983.
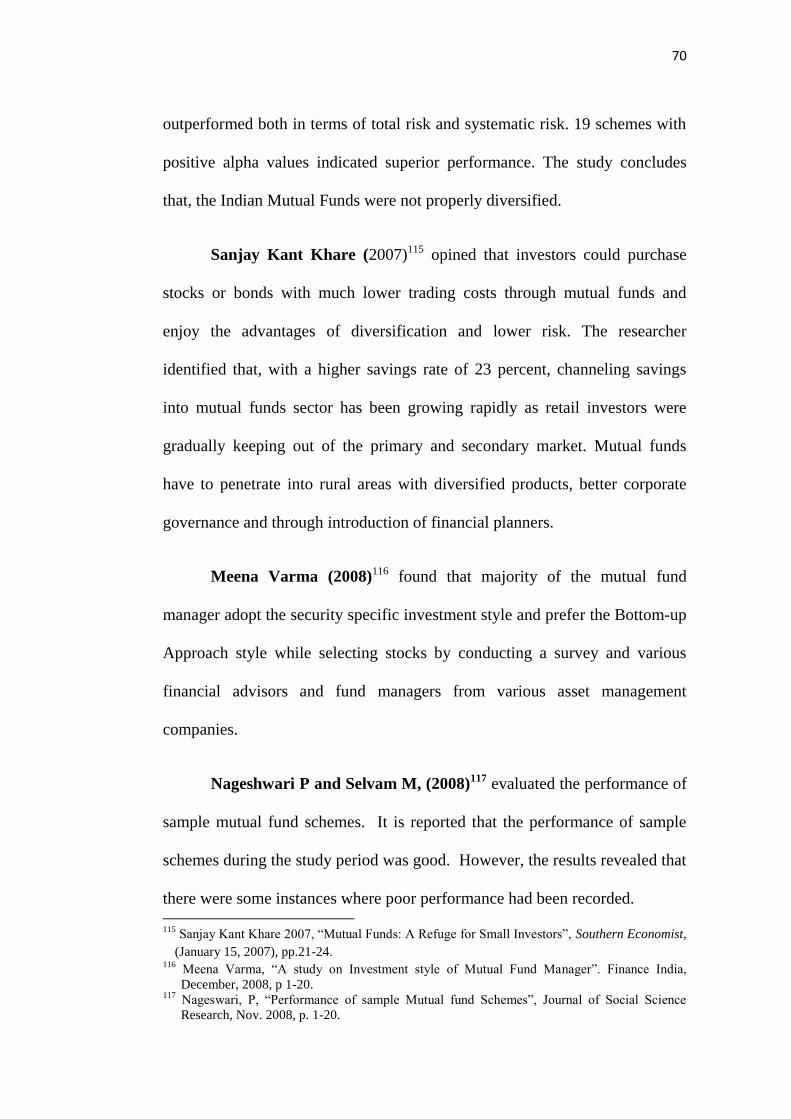
70
outperformed both in terms of total risk and systematic risk. 19 schemes with
positive alpha values indicated superior performance. The study concludes
that, the Indian Mutual Funds were not properly diversified.
Sanjay Kant Khare (2007)115 opined that investors could purchase
stocks or bonds with much lower trading costs through mutual funds and
enjoy the advantages of diversification and lower risk. The researcher
identified that, with a higher savings rate of 23 percent, channeling savings
into mutual funds sector has been growing rapidly as retail investors were
gradually keeping out of the primary and secondary market. Mutual funds
have to penetrate into rural areas with diversified products, better corporate
governance and through introduction of financial planners.
Meena Varma (2008)116 found that majority of the mutual fund
manager adopt the security specific investment style and prefer the Bottom-up
Approach style while selecting stocks by conducting a survey and various
financial advisors and fund managers from various asset management
companies.
Nageshwari P and Selvam M, (2008)117 evaluated the performance of
sample mutual fund schemes. It is reported that the performance of sample
schemes during the study period was good. However, the results revealed that
there were some instances where poor performance had been recorded. 115
Sanjay Kant Khare 2007, “Mutual Funds: A Refuge for Small Investors”, Southern Economist,
(January 15, 2007), pp.21-24. 116
Meena Varma, “A study on Investment style of Mutual Fund Manager”. Finance India,
December, 2008, p 1-20. 117
Nageswari, P, “Performance of sample Mutual fund Schemes”, Journal of Social Science
Research, Nov. 2008, p. 1-20.

71
Bhuvaneshwari P, (2011)118 examined “post performance Analysis of
Mutual Fund schemes merger” explained how the technological development
and globalization have vastly contributed to the popularity of merger and
acquisition in Indian Mutual Fund Industry. The study examined the post
performance of mutual fund schemes merger.
The present work is based on the review of foreign and Indian studies
relating to mutual funds. The review of foreign studies ensures that, mutual
funds have a significant impact on the price movement in the stock market,
the average return from the schemes were below that of their benchmark, all
the three models provided identical results, good performance were associated
with low expense ratio and not with the size.
The aforementioned Indian studies indicate that the evaluation of
mutual funds has been a matter of concern in India for the researchers,
academicians, fund managers and financial analysts to a greater extent after
1985. The reviews bring to light the importance of mutual funds in the Indian
financial scenario; highlight the need for adequate investor protection, single
regulatory authority, higher return for a given risk as per investors‟
expectation, greater convenience and liquidity, and the expectations that
mutual funds should act as a catalytic agent of economic growth and foster
investors‟ interest.
118
Bhuvaneshwari, “A study a post performance analysis of mutual fund schemes manager”, The
Journal of Financial and Quantitative Analysis, Sep. 2011, p.345-368.
72
From the above it can be said that the performance of mutual fund in
India, generally UTI as well as other than UTI mutual fund are capturing the
attention of several scholars. They have investigated the performance of
mutual fund, performance of fund manager and regulation on mutual fund
separately. Their investigated were for short period only. The present study
has been undertaken to cover all three aspect collectively and that too after the
split down of UTI into two parts under the new regulation by the SEBI
(Securities Exchange Board of India).
73
CHAPTER - III
AWARENESS AND THE PERCEPTIONS
Before Securities and Exchange Board of India (SEBI) came into
existence the capital market was partly regulated by Controller of Capital
Issues and partly by Department of Company Affairs. SEBI was established as
an administrative body in April 1988, and was given a statutory status under
Section 3 of Securities and Exchange Board of India Act, 1992 on 30th
January 1992, to regulate capital market.
Mutual Funds are to be established in the form of Trust under Indian
Trust Act, and are to be operated by Asset Management Company (AMC).
Mutual Funds dealing exclusively with Money Market Instruments are to be
regulated by Reserve Bank of India (RBI). Mutual Funds dealing primarily
with capital market and also partly in Money Market Instruments are to be
regulated by SEBI. All schemes floated by Mutual Funds are to be registered
with SEBI.
Regulatory Initiatives
After the UTI debacle, the SEBI has taken several measures to
develop a comprehensive regulatory framework for mutual funds in
consultation with the Association of Mutual Funds in India (AMFI).
Regulatory guidelines relating to insider trading, late trading, switching
assets, minimum number of investors for each scheme and marketing of
mutual funds have now been issued to protect small investors. The SEBI
has also closely monitoring investment decisions in unlisted securities and
mergers between schemes and fund houses.
“As far as insider trading by the fund managers on their
personal accounts is concerned, SEBI has issued regulations that trustees

74
furnish a certificate to it stating that they have satisfied themselves and that
there have been no instances of insider trading by any of the trustees,
directors or key personal of the asset management companies.
About the switching-off assets by distributors and intermediaries
to earn commission, SEBI has issued letters to AMC to check such
irregularities.
To restrict the large investors and institutions using buying at todays
closing price after the trading had closed, SEBI has now stipulated uniform
cut-off timings for all transaction request to control late trading. Time
stamping has been made mandatory to avoid the occurrence of such
incidents119.
To serve the small and retail investors from the institutional investors,
SEBI has stipulated that mutual fund schemes should have minimum 20
investors and no single investors should account for 25 per cent corpus of the
scheme.
To control the high expense ratio of Indian mutual funds, SEBI
has fixed the expenses ratio of 2.5 per cent for equity and 2.25 per cent in the
debt schemes. The SEBI has also clearly notified that service tax expenses
should be included in the total expense ratio limit.
Before going in for any merger, mutual fund should inform the
investors and SEBI about possible post merger implications120.
119
Amit Singh Sisodia and Ravi Babu Adusumalli, “Mutual Fund Regulations- Facilitating
growth”, Chartered Financial Analyst, MF Special-2005, p.42. 120
Kurian AP, “AMFIs decade long Existence”,Chartered Financial Analyst. MF Special-
2005, p.52.
75
The AMFI is also doing its level best for the growth of the
industry doing research to find the standards interacting with the
regulators like SEBI, as the voice of the industry and doing investor
education by conducting online test. It also recognized the need to establish
a minimum level of risk management system conforming to international
standards.
On September , 2012 SEBI came out with new guidelines for the use
of derivatives related to hedging, portfolio rebalancing, use of index
futures and options and position limit for each of the scheme.
SEBI REGULATIONS ON MUTUAL FUNDS
Securities and Exchange Board of India had issued a set of regulations
and code of conduct as SEBI (Mutual Fund) Regulations, 1996 on 9th
December 1996 for the smooth conduct and regulation of mutual funds.
Recently, SEBI has issued updated regulations as SEBI (Mutual fund)
Regulations 2011 on 07th Jan 2012 covering all amendments up to December
2011. These guidelines lay down certain criteria for Registration, Constitution
and Management of Mutual Fund, Rights and Obligation of Trustee,
Constitution and Management of Assets Management Company, Restriction
of business activities of AMC and its obligations, Schemes of Mutual Funds,
Investment objectives, Criteria for investment, Disclosure, Investments
valuation norms, Advertisement code, Code of conduct and Accounts and
Other documents.
Registration of Mutual Funds
An application for registration of a mutual fund shall be made to the
Board in Form A by the sponsor. Every application for registration under

76
regulation (3) shall be accompanied by non-refundable application fee as
specified in the Second Schedule. An application, which is not complete in all
respects shall be liable to be rejected. The Board may require the sponsor to
furnish such further information or clarification as may be required by it.
Constitution and Management of Mutual Fund
A Mutual Fund shall be constituted in the form of a trust and the
instrument of trust shall be in the form of a deed, duly registered under the
provision of the Indian Registration Act, 1908 (16 of 1908), executed by the
sponsor in favour of the trustees named in such an instrument. The trust deed
shall contain such clauses as are mentioned in the Third Schedule and such
other clauses which are necessary for safeguarding the interests of the unit
holders.
Rights and Obligations of the Trustees
The trustees and the asset management company shall, with the prior
approval of Board, enter into an investment management agreement. The
investment management agreement shall contain such clauses as are
mentioned in the fourth schedule and such other clauses as are necessary for
the purpose of making investments. The trustees shall have a right to obtained
from the assets management company such information as is considered
necessary by the trustees. The trustees shall be accountable for and be the
custodian of the funds and property of the respective schemes and shall hold
the same in trust for the benefits of the unit holders in accordance with the
regulations and the provision of trust deed.
77
Constitution and Management of Asset Management Company and
Custodian
The application for the approval of the asset management company
shall be made in Form D. The provision of regulations applicable to confirm
to the requirements, furnishing information and consideration of application
shall, so far as may be, apply to the application made under sub-regulation (1)
as they to the application for registration of a mutual fund. The sponsor or if
so authorized by the trust deed, the trustee, shall appoint an asset management
company, which has been approved by the Board under sub-regulation (2) of
regulation 21. The appointment of an asset management company can be
terminated by majority of the trustees or by seventy-five percent of the unit
holders of the scheme. Any change in the appointment of the asset
management company shall be subject to prior approval of the Board and the
unit holders.
Restrictions on Business Activities of the AMC
The Asset Management Company shall not act as a trustee of any
mutual fund, and not undertake any other business activities except activities
in the nature of (portfolio management services) management and advisory
services to off-shore funds, pension funds, provident funds, venture capital
funds, management of insurance funds, financial consultancy and exchange of
research on commercial basis, if any, of such activities which are in conflict
with the activities of mutual fund, provided that the AMC may itself or
through its subsidiaries undertake such activities if it satisfies the Board that
the key personnel of the assets management company, the systems, back
office band and securities accounts are segregated activity-wise and there exist
system to prohibit access to inside information/various activities.
78
Schemes of Mutual Fund
No scheme shall be launched by the asset management company unless
such schemes is approved by the trustees and a copy of the offer document has
been filed with the Board. The mutual fund shall pay the minimum filing fee
specified in the Second Schedule to the Board while filing the offer document
under sub-regulation (1). Schemes of mutual fund include procedure for
launching, disclosure of offer document, nomination, advertisement,
misleading statements, repurchase of close ended schemes, offering period,
allotment of units, refund of money, units certificates, transfer of units,
guaranteed returns and winding up.
Investment Objective
Subject to other provision of these regulations, a mutual fund may
invest money collected under any of its schemes only in: (a) securities,
(b) money market instruments, (c) privately placed debentures,
(d) securitised debt instruments, which are either asset backed or mortgage
backed securities, (e) gold related instruments, and (f) real estate assets as
defined in clause (a) of regulation 49A.
Criteria for Investment
The Mutual Fund Regulations lay down certain investment criteria that
the mutual funds need to observe. There are certain restrictions on the
investments made by a mutual fund. A mutual fund schemes shall not invest
more than 15 percent of its NAV in debt instruments issued by a single issuer
which are rated not below investment grade by a credit rating agency
authorized to carry out such activity under the Act. Such investment limit may
be extended to 20 percent of the NAV of the scheme with the prior approval
79
of the Board of Trustees and the asset management company. No mutual fund,
under all its schemes, should own more than ten percent of any company‟s
paid up capital carrying voting rights. Transfers of investments from one
scheme to another schemes in the same mutual fund shall only be allowed.
The initial issue expenses in respect of any scheme may not exceed six
percent of the funds raised under that scheme.
Disclosure of Portfolio
The trustees shall be bound to make such disclosures to the unit
holders as are essential in order to keep them informed about any information
which may have an adverse bearing on their investments.
Investment Valuation Norms
Mutual fund shall value its investments according to the following
valuation norms.
Net assets value of a schemes is determined by dividing the net assets
of the schemes by the number of outstanding units on the valuation date. The
traded securities shall be valued at the last quoted closing price on the stock
exchange. When the securities are traded in more than one recognized stock
exchange, the securities shall be valued at the last quoted closing price on the
stock exchange where the security is principally traded. It would be left to the
AMC to select the appropriate stock exchange, but the reasons for the
selection should be recorded in writing. There should, however, be no
objection for all scripts being valued at the price quoted on the stock exchange
where a majority, in value of the investments, are principally traded. When a
security is not traded on any stock exchange for a period of thirty days prior to
the valuation date, the script must be treated as a „non-traded‟ script.
80
Code of Conduct
Mutual funds schemes should not be organized, operated, managed or
the portfolio of securities selected, in the interest of sponsors, directors of
assets management companies, members of Board of trustees or directors of
trustee company, associated persons, in the interest of special class of unit
holders, other than in the interest of all classes of the scheme. Trustees and
assets management companies must ensure the dissemination to all unit
holders, of adequate, accurate, explicit and timely information fairly presented
in a simple language about the investment policies, investment objectives,
financial position, and general affairs of the schemes. Trustees and asset
management companies should avoid excessive concentration of business
with broking firms, affiliates and also excessive holding of units in a schemes
among a few investors.
Advertisement Code
An advertisement shall be truthful, fair and clear and shall not contain
a statement, promise or forecast which is in the nature of misleading. An
advertisement shall be considered to be misleading if it contains;
(a) misleading statements, (b) inaccurate portrayal of a past performance, and
(e) statements promising the benefits of owning units.
The advertisement shall not be so designed in content and format or in
print to be likely to be misunderstood, or likely to disguise the significance of
any statement. Advertisement shall not contain statements which directly or
by implication or by omission may mislead the investor. The sale literature
may contain only information, the substance of which is included in the fund‟s
current advertisement in accordance with the code.
81
Accounts and Other Documents
All mutual funds shall be required to get their accounts audited in
terms of a provision to that effect in their trust deeds. The Auditor‟s Report
shall form a part of the annual report. It should accompany the abridged
Balanced Sheet and Revenue Account. The auditors shall report to the Board
of Trustees and not to the unit holders.
AWARENESS CAMPAIGN ON SECURITIES MARKET
SEBI believes that „An Educated Investor is a Protected Investor.‟ A
comprehensive Securities Market Awareness Campaign was launched on
January 17, 2003. The campaign includes workshops, audio-visual clippings,
distribution of educative materials in English, Hindi and local languages, a
dedicated investor website with inventory of booklets/pamphlets/Frequently
Asked Questions(FAQ‟s) and periodic advertisements in All India Radio
(AIR) and print media. Till March 2013, 3217 workshops were conducted
covering around 493 cities/towns in India. 73 awareness workshop were
conducted in Chennai by Tamilnadu investors association recognized by
SEBI121.
RECOGNITION OF INVESTORS ASSOCIATIONS
SEBI recognizes investors associations, extends financial support for
conducting investor education programmes, and also addresses various issues
raised by them to protect the interest of the investors. SEBI has so far
recognized 26 Investors‟ Associations122.
121
Awareness workshop conducted by investors association recognized by SEBI as on
December, 2013. 122
Source: www. SEBI.com Name and Contact Information of Investors‟ Associations
recognized by SEBI as on December, 2013.
82
AWARENESS ON SEBI (MUTUAL FUNDS) REGULATIONS
Awareness is knowledge or perception of a situation or fact. Investors
Awareness is a term used in investor relations, by public companies and
similar bodies, to describe how well their investors and the investment market
in general know their business. Its significance is that investor are expected to
base their investment decisions on awareness and knowledge, and a lack of
these may lead to a low profile amongst its peers in the market to the
detriment of the business123.
Awareness of regulations considered for the analysis: Registration of
Mutual fund, Purpose of investment in mutual funds, Criteria for Investment,
Portfolio Disclosure, Advertisement Code, Prescribed Code of Conduct
Frequency of Inspection of Accounts and others Records, Investors and
Financial Advisors Associations, SEBI – Grievance Redressal Mechanism,
The awareness level of the respondents on SEBI (Mutual Fund) regulations
were tested by using statistical tools for adding relevance to the study.
Before analyzing the awareness and perceptions to investors and
financial advisors on SEBI regulations, an attempt is made to explain their
Profile and experience so as to make the study clear.
Profile of the Investors and Financial Advisors
Demographic features, educational status and income level of investors
may have their own effect on investment. For example persons who earn
more may invest their savings and highly educated may invest in risk free
investment.
123
“Tool used to score how well companies Manage Investor Awareness”, retrieved from
http://en. Wikipedia.org.

83
Table 3.1
Profile of the Investors and Financial Advisors
Profile Investors
(Percent)
Financial Advisors
(Percent)
Age Below 25 years
26 – 35 years
36 – 45 years
45 years & Above
26 (7)
58 (17)
209 (60)
57 (16)
15 (10)
40 (27)
65 (43)
30 (20)
Gender Male
Female
217 (62)
133 (38)
100 (67)
50 (33)
Educational
Qualification
Upto Higher Secondary
Undergraduate
Post – Graduate
44 (13)
56 (16)
250 (71)
0 (0)
24 (16)
126 (84)
Income
(Per Month)
Below 15,000
15001 – 25000
Above 25000
20 (6)
40 (11)
290 (83)
03 (2)
14 (9)
133 (89)
Savings
Save
Don‟t Save
310 (89)
40 (11)
140 (93)
10 (7)
Occupation Business
Agriculture
Professional
Employed
Others (Retired )
130 (37)
00 (0)
105 (30)
100 (29)
15 (4)
15 (10)
00 (0)
109 (73)
20 (13)
6 (4)
Marital Status Married
Unmarried
280 (80)
70 (20)
129 (86)
21 (14)
Source: Primary data
Table 3.1 depicts, young investors and financial advisors in the age
groups of 36 to 45 years have more involvement in the investment industry. It
is because of their curiosity, courage and faith in investment industry. The age
level describes the experience also. Participation of male in both investors and
financial advisors is higher than the female, because of their high involvement
in social participation and thereby gaining high knowledge on investment.

84
Post-graduate holders are highly involved in both investors and
financial advisor followed by graduate and higher secondary holders. It
depicts the direct relationship between the educational qualification and
participation in investment activities. Regarding income, those who earn more
than Rs.25000/- per month ranks first. It is because they are able to save a part
of their income and deposit the same in investment and vice versa. Similarly
those who have the habit of savings are able to invest large amount and those
are not invest a megre amount.
Monthly income of respondents shown above Rs. 25000 have earned
large number of investors and financial advisors and rest of the respondents
have earned below Rs. 25000. It is because, higher income group people
involve to invest surplus money to overcome the family commitments. Lower
income group also invested money with hardness of family commitments It is
the reason to say the respondents are least numbered.
Business people are largest investors, followed by professionals
employed persons, and others. As per the table investment in mutual funds by
agriculturist is nil. It shows that they are unaware of mutual funds. As the
income of business people is commendable and they are also interested to
increase their earning through investment business, their portion of investment
is higher than the others.
Involvement of professionals ranks first in financial advisory function
followed by employed persons, business people and others. It is because the
professionals in the particular field knows the dos and donts. That is why the
role of investment professionals is dominating one in the investment advisory
field.
The participation of married people is higher than the unmarried one
both in investors and in financial advisors. Because of their necessity to
increase their family income, the role of married people is higher than the
unmarried people.

85
Table 3.2
Investors’ and Financial Advisors’ Experience
S.No. Experience Investors
(Percent)
Financial Advisors
(Percent)
1 Less than 5 years 73 (21) 27 (18)
2 6 – 10 years 88 (25) 30 (20)
3 11-15 years 124 (35) 60 (40)
4 16-20 years 37 (11) 18 (12)
5 Above 20 years 28 (8) 15 (10)
Total 350 (100) 150 (100)
Source: Primary data
Table 3.2 explains the experience in the field of Investment,
35 percent of investors having 11-15 years of experience are the highest.
Purely eight percent of the investors and ten percent of the financial advisors
having above 20 years of experience are lowest. In the light of the Table it is
revealed that most of them are having 11-15 years of experience as investors
and financial advisors. It is because of their investment „confidence level
increase‟ based on increasing experience earned income upto some of years.
Regarding above 20 years experience respondents as well as investors and
financial advisors are least number. Because of gathering more information on
their investment decreases in the confidence level based on more expectation
of markets, movements of the markets poorly performance, more experienced
people turn aside from the usual course of investment.
Registration of Mutual Fund
Awareness of investors and financial advisors on registration of mutual
funds consider for analysis are: 1) Application procedure, 2) Eligibility
criteria, 3) Considerations of application, 4) Grant of certificate of
registration, and 5)Terms and condition of registration.
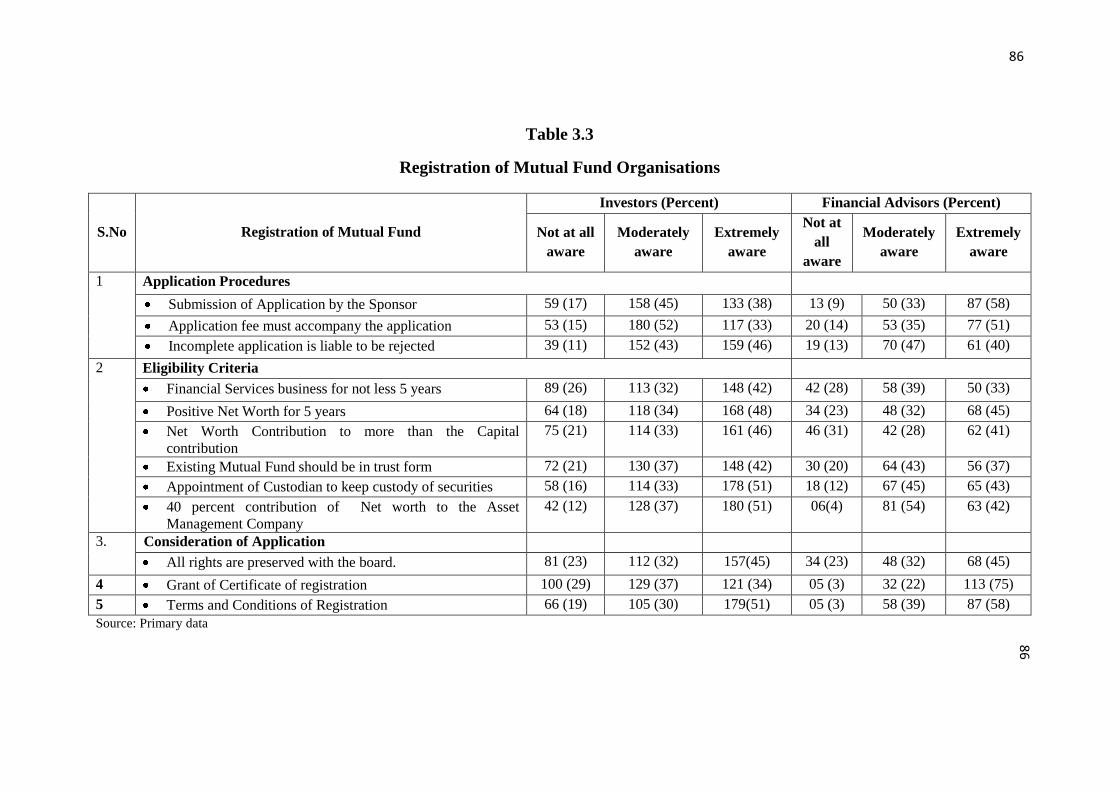
86
Table 3.3
Registration of Mutual Fund Organisations
S.No Registration of Mutual Fund
Investors (Percent) Financial Advisors (Percent)
Not at all
aware
Moderately
aware
Extremely
aware
Not at
all
aware
Moderately
aware
Extremely
aware
1 Application Procedures
Submission of Application by the Sponsor 59 (17) 158 (45) 133 (38) 13 (9) 50 (33) 87 (58)
Application fee must accompany the application 53 (15) 180 (52) 117 (33) 20 (14) 53 (35) 77 (51)
Incomplete application is liable to be rejected 39 (11) 152 (43) 159 (46) 19 (13) 70 (47) 61 (40)
2 Eligibility Criteria
Financial Services business for not less 5 years 89 (26) 113 (32) 148 (42) 42 (28) 58 (39) 50 (33)
Positive Net Worth for 5 years 64 (18) 118 (34) 168 (48) 34 (23) 48 (32) 68 (45)
Net Worth Contribution to more than the Capital
contribution
75 (21) 114 (33) 161 (46) 46 (31) 42 (28) 62 (41)
Existing Mutual Fund should be in trust form 72 (21) 130 (37) 148 (42) 30 (20) 64 (43) 56 (37)
Appointment of Custodian to keep custody of securities 58 (16) 114 (33) 178 (51) 18 (12) 67 (45) 65 (43)
40 percent contribution of Net worth to the Asset
Management Company
42 (12) 128 (37) 180 (51) 06(4) 81 (54) 63 (42)
3. Consideration of Application
All rights are preserved with the board. 81 (23) 112 (32) 157(45) 34 (23) 48 (32) 68 (45)
4 Grant of Certificate of registration 100 (29) 129 (37) 121 (34) 05 (3) 32 (22) 113 (75)
5 Terms and Conditions of Registration 66 (19) 105 (30) 179(51) 05 (3) 58 (39) 87 (58)
Source: Primary data
86

87
Table 3.3 explains the awareness on registration of mutual fund
investment as per SEBI regulations.
Application Procedures: 45 percent of investors are moderately
aware and 58 percent of the financial advisors are extremely aware about the
submission of application by the sponsor according to SEBI regulations.
Nearly 52 percent of the investors and 51 percent of the financial advisors are
extremely aware that the application fee must accompany the application.
More than 40 percent respondents have an understanding that the incomplete
application is liable to be rejected as per the SEBI regulations. It is because,
they are educated and know information regarding application procedure
through attending investors education awareness programmes conducted by
SEBI.
Eligibility Criteria: Nearly 42 percent of the respondents are
extremely aware about the eligibility conditions of financial services business
for a period of not less than 5 years and just 39 percent of the financial
advisors are moderately aware about the same. Almost 48 percent of the
investors and 45 percent of the financial advisors are extremely aware about
the eligibility conditions of having positive net worth in all the preceding five
years. 46 percent of the investors and 41 percent of the financial advisors are
extremely aware about the net worth, in the immediately preceding year, is
more than the capital contribution of the sponsor in the AMC.
Merely 42 percent of the investors and 37 percent of the financial
advisors are extremely aware that the existing mutual fund should be in trust
form during registration. In particular the appointment of custodian in order to
keep custody of the securities or other assets of the mutual fund held in terms
88
of these SEBI regulations is also criteria accepted by more than 50 percent of
the investors and financial advisors.
51 percent of the investors and 42 percent of financial advisors are
extremely aware that the sponsor must contribute at least 40 percent to the net
worth of the AMC. Regarding eligibility criteria large number of respondents
are extremely aware about them. It is because of their more involvement in
studying periodical reports related to financial services, positive net worth ,
net worth contribution and appointment of custodian, etc.
Consideration of Application: 45 percent of investors and 45 percent
by financial advisors are extremely aware that the board preserve the right to
decide on the application. Grant of certificate of registration is provided to the
applicant on paying the registration fee is moderately known to almost 75
percent of the financial advisors. More than half of the investors
(51 percent) and financial advisors (58 percent) are extremely aware about the
terms and conditions of the registration under the SEBI Mutual Fund
Amendment regulations, from time to time. It could be inferred respondents‟
aware about the registration of mutual fund procedures with the help of SEBI
awareness workshop.
Purpose of Investment in Mutual Funds
Mutual funds are primarily intended to be a vehicle for investors to
participate in the market. Investors wish to make investment in mutual funds
for the purpose of wealth creation, good retirement life, tax saving, emergency
needs and accumulation of wealth. They are considered for analysis.
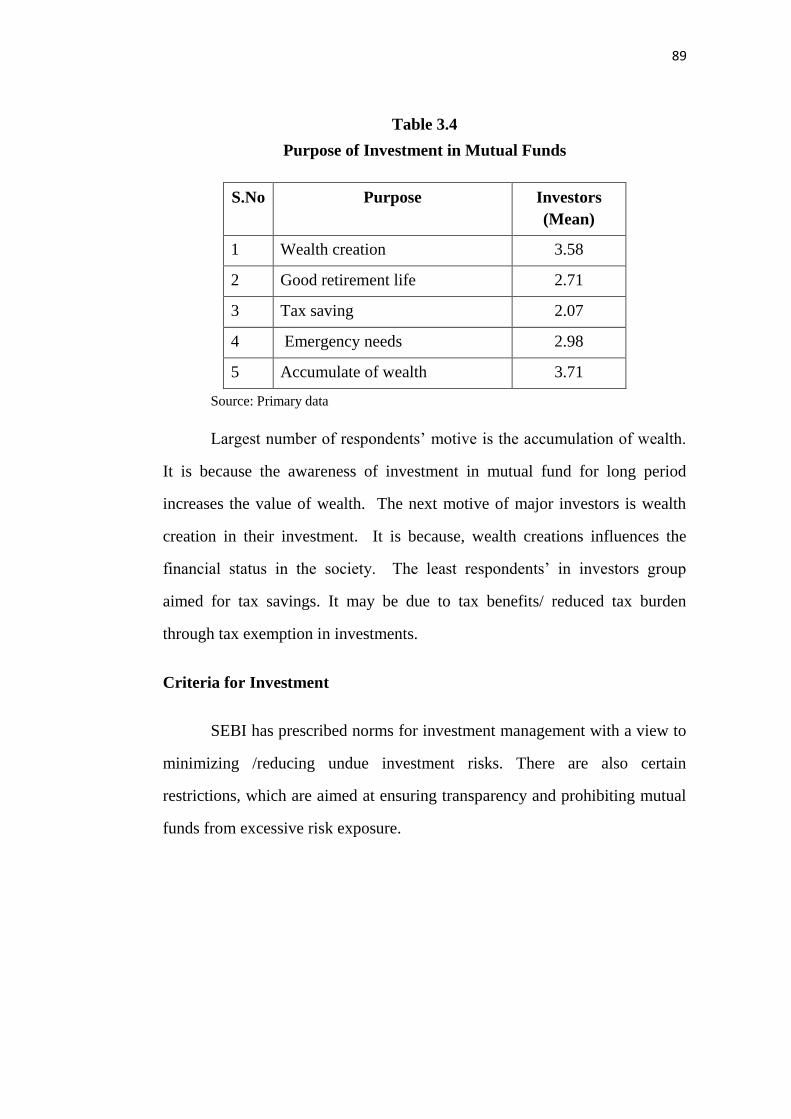
89
Table 3.4
Purpose of Investment in Mutual Funds
S.No Purpose Investors
(Mean)
1 Wealth creation 3.58
2 Good retirement life 2.71
3 Tax saving 2.07
4 Emergency needs 2.98
5 Accumulate of wealth 3.71
Source: Primary data
Largest number of respondents‟ motive is the accumulation of wealth.
It is because the awareness of investment in mutual fund for long period
increases the value of wealth. The next motive of major investors is wealth
creation in their investment. It is because, wealth creations influences the
financial status in the society. The least respondents‟ in investors group
aimed for tax savings. It may be due to tax benefits/ reduced tax burden
through tax exemption in investments.
Criteria for Investment
SEBI has prescribed norms for investment management with a view to
minimizing /reducing undue investment risks. There are also certain
restrictions, which are aimed at ensuring transparency and prohibiting mutual
funds from excessive risk exposure.
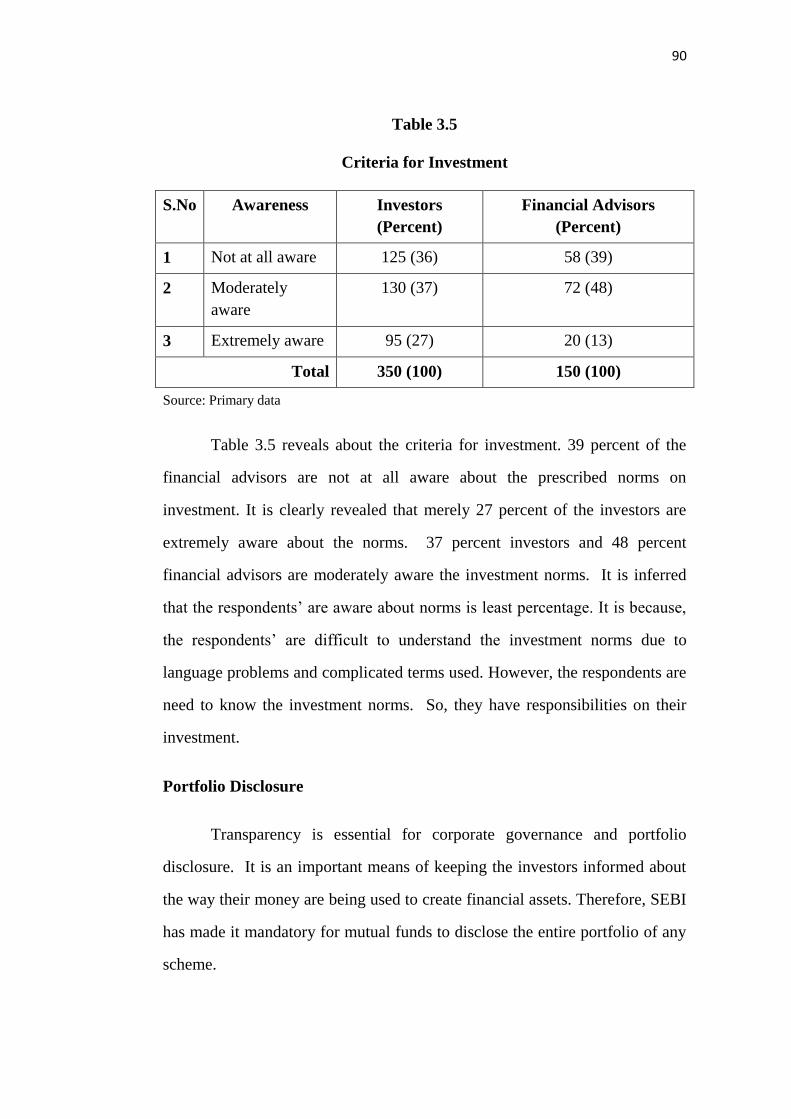
90
Table 3.5
Criteria for Investment
S.No Awareness Investors
(Percent)
Financial Advisors
(Percent)
1 Not at all aware 125 (36) 58 (39)
2 Moderately
aware
130 (37) 72 (48)
3 Extremely aware 95 (27) 20 (13)
Total 350 (100) 150 (100)
Source: Primary data
Table 3.5 reveals about the criteria for investment. 39 percent of the
financial advisors are not at all aware about the prescribed norms on
investment. It is clearly revealed that merely 27 percent of the investors are
extremely aware about the norms. 37 percent investors and 48 percent
financial advisors are moderately aware the investment norms. It is inferred
that the respondents‟ are aware about norms is least percentage. It is because,
the respondents‟ are difficult to understand the investment norms due to
language problems and complicated terms used. However, the respondents are
need to know the investment norms. So, they have responsibilities on their
investment.
Portfolio Disclosure
Transparency is essential for corporate governance and portfolio
disclosure. It is an important means of keeping the investors informed about
the way their money are being used to create financial assets. Therefore, SEBI
has made it mandatory for mutual funds to disclose the entire portfolio of any
scheme.
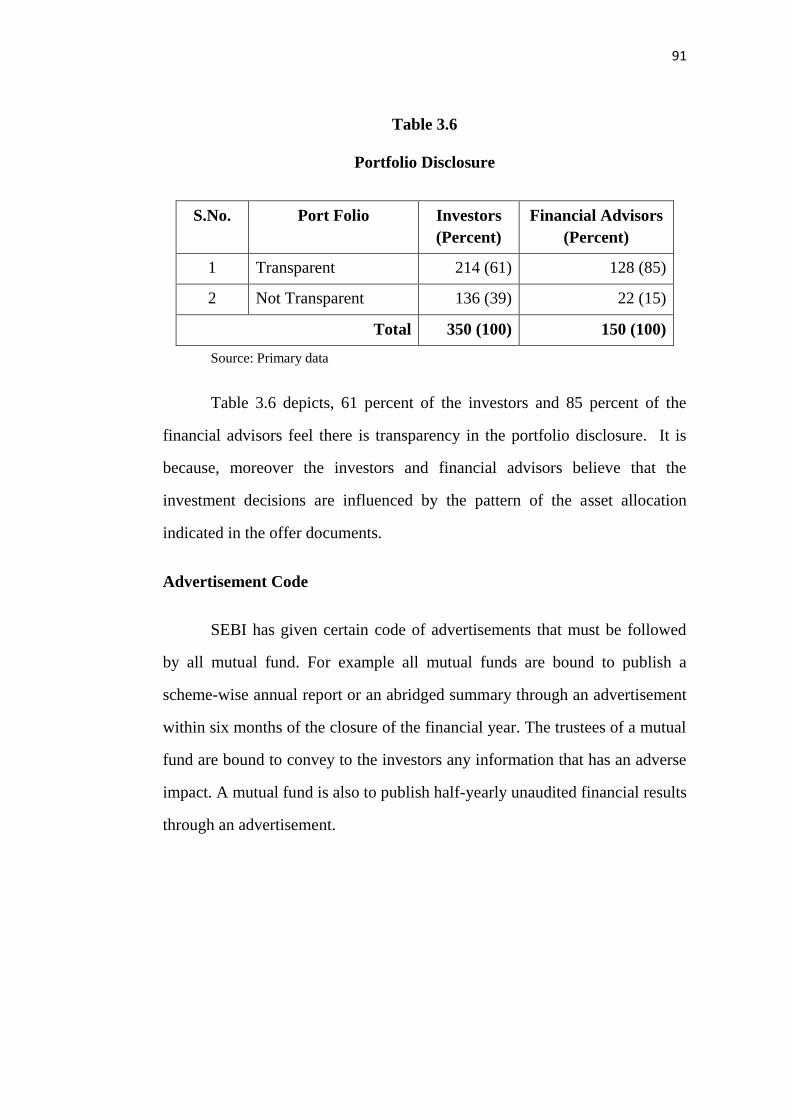
91
Table 3.6
Portfolio Disclosure
S.No. Port Folio Investors
(Percent)
Financial Advisors
(Percent)
1 Transparent 214 (61) 128 (85)
2 Not Transparent 136 (39) 22 (15)
Total 350 (100) 150 (100)
Source: Primary data
Table 3.6 depicts, 61 percent of the investors and 85 percent of the
financial advisors feel there is transparency in the portfolio disclosure. It is
because, moreover the investors and financial advisors believe that the
investment decisions are influenced by the pattern of the asset allocation
indicated in the offer documents.
Advertisement Code
SEBI has given certain code of advertisements that must be followed
by all mutual fund. For example all mutual funds are bound to publish a
scheme-wise annual report or an abridged summary through an advertisement
within six months of the closure of the financial year. The trustees of a mutual
fund are bound to convey to the investors any information that has an adverse
impact. A mutual fund is also to publish half-yearly unaudited financial results
through an advertisement.

92
Table 3.7
Advertisement Code
S.No Awareness Investors (Percent) Financial Advisors
(Percent)
1 Not at all aware 134 (38) 58 (39)
2 Moderately aware 124 (35) 48 (32)
3 Extremely aware 92 (26) 44 (29)
Total 350 (100) 150 (100)
Source: Primary data
Table 3.7 shows the awareness level about the advertisement code.
Awareness level of investors and financial advisors is low. It is because,
mutual fund advertisement given by media communication is speedy. Within
few seconds there are hundreds of words spoken in advertisement, which are
not easy to understand and memorize by the viewers.
Moderately aware respondents are followed by extremely aware due to
the studying of periodical reports and magazine relating to mutual fund
organizations.
Code of conduct
The awareness among the investors and financial advisors on
prescribed code of conduct for the trustee and Asset Management Company
according the fifth schedule of the SEBI (Mutual Fund) Regulations, 1996, is
given in Table 3.8.

93
Table 3.8
Code of conduct
S.No Codes
Investors
(Percent)
Financial Advisors
(Percent)
Aware Not Aware Aware Not Aware
1 Avoiding excessive concentration of Business 250 (71) 100(29) 133(87) 17(11)
2 Avoids the conflicts of interest in managing the schemes 199 (57) 151(43) 110 (73) 40(27)
3 The interest of all unit holders paramount in all matters 315 (90) 35(10) 143 (95) 07(5)
4 Not using any unethical means to sell or induce any investor 133 (38) 217(62) 122 (81) 28(19)
5 High standards of service and exercise independent professional
judgment
203 (58) 147(42) 144(96) 6(4)
6 Maintaining High standards of integrity and fairness in all their
dealings and in the conduct of business.
340 (97) 10(3) 150 (100) 0 (0)
7 AMC shall not make any exaggerated statement on Investment
services
320 (91) 30(9) 126 (84) 24(16)
Source: Primary data
93
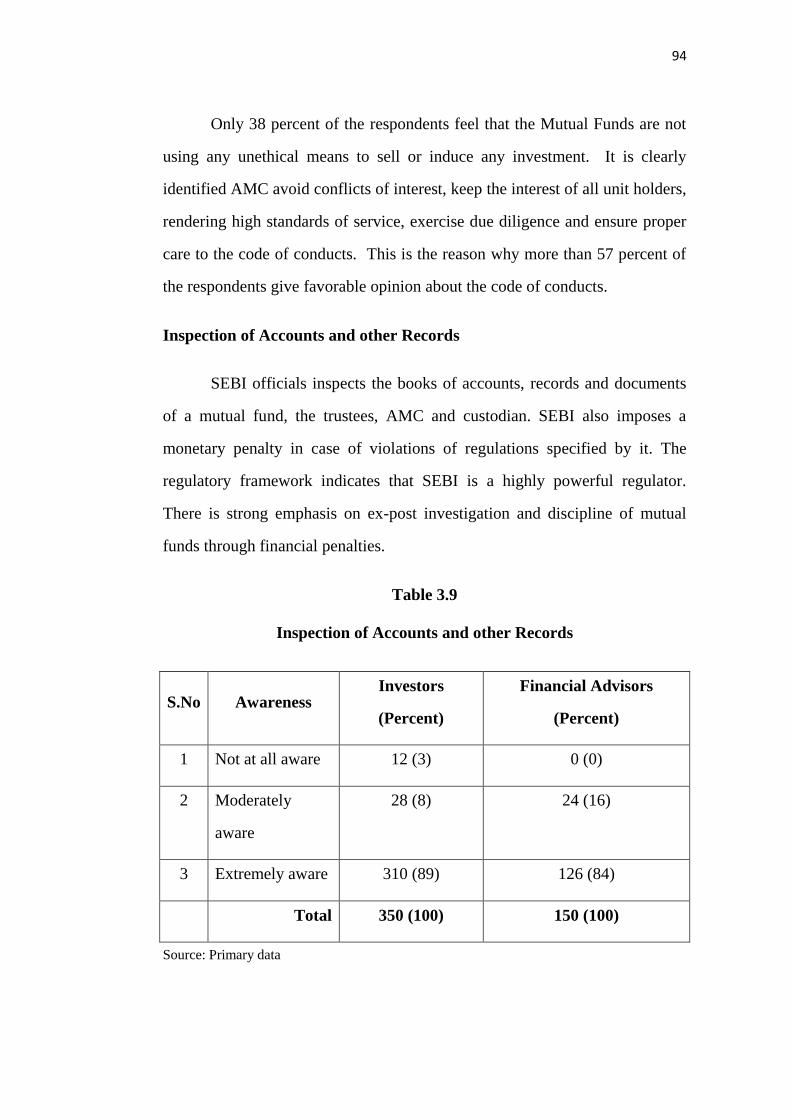
94
Only 38 percent of the respondents feel that the Mutual Funds are not
using any unethical means to sell or induce any investment. It is clearly
identified AMC avoid conflicts of interest, keep the interest of all unit holders,
rendering high standards of service, exercise due diligence and ensure proper
care to the code of conducts. This is the reason why more than 57 percent of
the respondents give favorable opinion about the code of conducts.
Inspection of Accounts and other Records
SEBI officials inspects the books of accounts, records and documents
of a mutual fund, the trustees, AMC and custodian. SEBI also imposes a
monetary penalty in case of violations of regulations specified by it. The
regulatory framework indicates that SEBI is a highly powerful regulator.
There is strong emphasis on ex-post investigation and discipline of mutual
funds through financial penalties.
Table 3.9
Inspection of Accounts and other Records
S.No Awareness Investors
(Percent)
Financial Advisors
(Percent)
1 Not at all aware 12 (3) 0 (0)
2 Moderately
aware
28 (8) 24 (16)
3 Extremely aware 310 (89) 126 (84)
Total 350 (100) 150 (100)
Source: Primary data
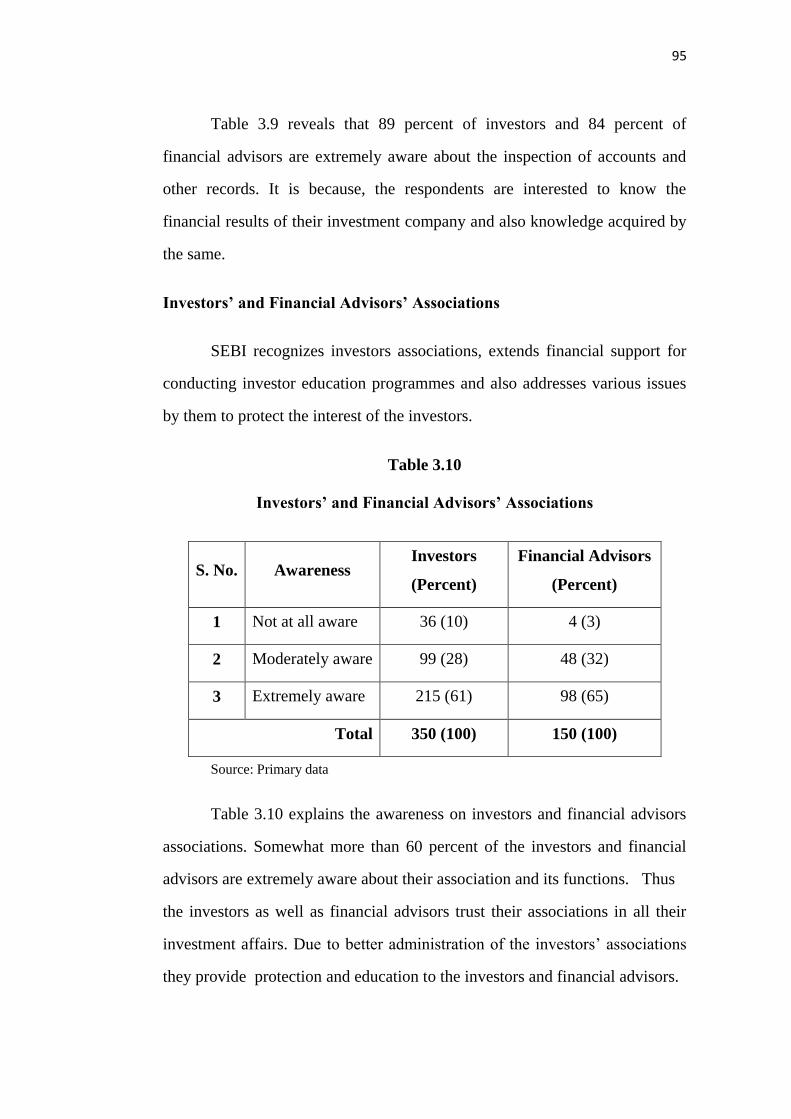
95
Table 3.9 reveals that 89 percent of investors and 84 percent of
financial advisors are extremely aware about the inspection of accounts and
other records. It is because, the respondents are interested to know the
financial results of their investment company and also knowledge acquired by
the same.
Investors’ and Financial Advisors’ Associations
SEBI recognizes investors associations, extends financial support for
conducting investor education programmes and also addresses various issues
by them to protect the interest of the investors.
Table 3.10
Investors’ and Financial Advisors’ Associations
S. No. Awareness Investors
(Percent)
Financial Advisors
(Percent)
1 Not at all aware 36 (10) 4 (3)
2 Moderately aware 99 (28) 48 (32)
3 Extremely aware 215 (61) 98 (65)
Total 350 (100) 150 (100)
Source: Primary data
Table 3.10 explains the awareness on investors and financial advisors
associations. Somewhat more than 60 percent of the investors and financial
advisors are extremely aware about their association and its functions. Thus
the investors as well as financial advisors trust their associations in all their
investment affairs. Due to better administration of the investors‟ associations
they provide protection and education to the investors and financial advisors.
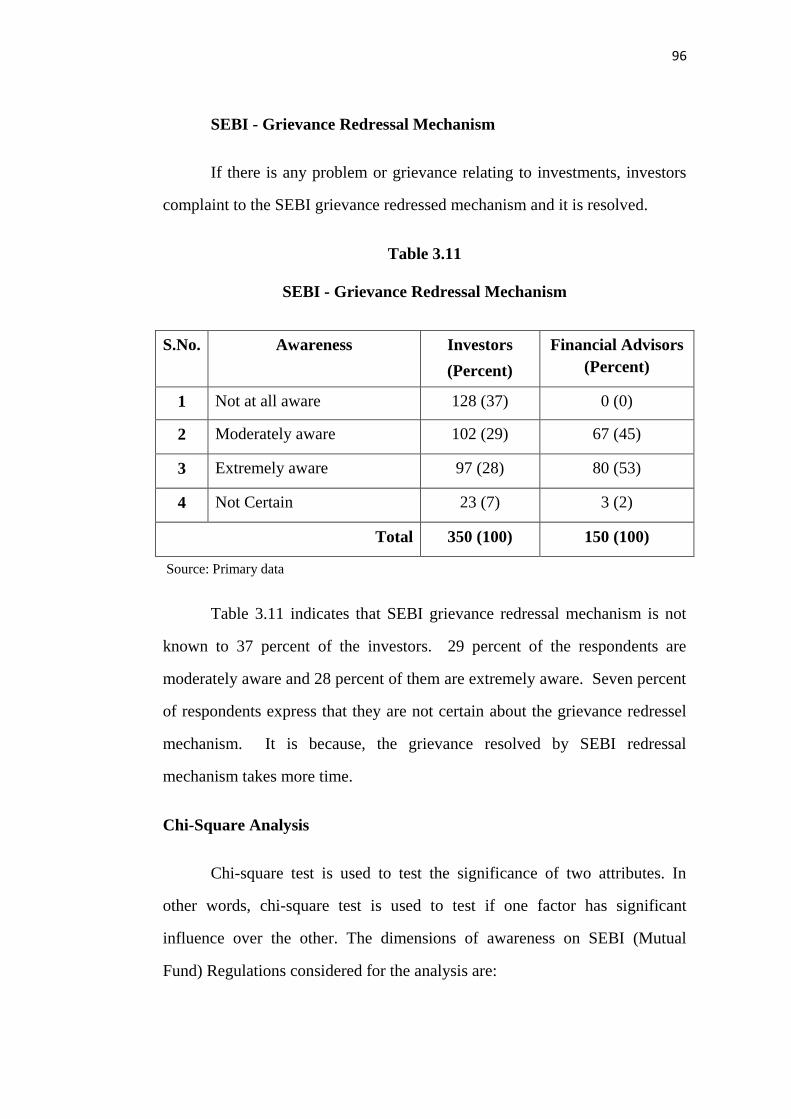
96
SEBI - Grievance Redressal Mechanism
If there is any problem or grievance relating to investments, investors
complaint to the SEBI grievance redressed mechanism and it is resolved.
Table 3.11
SEBI - Grievance Redressal Mechanism
S.No. Awareness Investors
(Percent)
Financial Advisors
(Percent)
1 Not at all aware 128 (37) 0 (0)
2 Moderately aware 102 (29) 67 (45)
3 Extremely aware 97 (28) 80 (53)
4 Not Certain 23 (7) 3 (2)
Total 350 (100) 150 (100)
Source: Primary data
Table 3.11 indicates that SEBI grievance redressal mechanism is not
known to 37 percent of the investors. 29 percent of the respondents are
moderately aware and 28 percent of them are extremely aware. Seven percent
of respondents express that they are not certain about the grievance redressel
mechanism. It is because, the grievance resolved by SEBI redressal
mechanism takes more time.
Chi-Square Analysis
Chi-square test is used to test the significance of two attributes. In
other words, chi-square test is used to test if one factor has significant
influence over the other. The dimensions of awareness on SEBI (Mutual
Fund) Regulations considered for the analysis are:
97
1. Registration of Mutual fund
2. SEBI – Grievance Redressal Mechanism
3. Investors and Financial Advisors Associations
4. Port Folio Disclosure
5. Advertisement Code
6. Criteria for Investment
7. Frequency of Inspection of accounts and other records, and
8. Prescribed Code of Conduct
All the tests are carried out at five percent level of significance. The
chi-square test is applied between the investors‟ and financial advisors‟
experience in the field of Investment and the dimensions of awareness on
SEBI (Mutual Fund) Regulations and the result is given in the following
Table with suitable hypothesis and interpretation.
Ho: 1 There is no significant relationship between Investors and
Financial Advisors Experience in the field of Investment and Awareness on
SEBI regulations on Mutual Fund.

98
Table 3.12
Chi-Square between Experience in the field of Investment and Dimensions of Awareness on SEBI regulations
S.No Dimensions of Awareness Chi-square value Table Value Significant / Not Significant
1. Registration of Mutual fund 9.12 5.99 Significant
2. SEBI – Grievance Redressal Mechanism 9.33 3.56 Significant
3. Investors /Financial Advisors Associations 3.66 5.00 Not Significant
4. Port Folio Disclosure 7.31 6.44 Significant
5. Advertisement Code 3.99 5.60 Significant
6. Criteria for Investment 3.89 5.04 Significant
7. Frequency of Inspection of Accounts and other records 6.99 5.49 Significant
8. Prescribed Code of Conduct 5.76 6.33 Significant
Source: Primary Data
98

99
Table 3.12 shows that the hypothesis is accepted. In other words,
highly experienced investors and financial advisors aware the SEBI
regulations on Mutual Fund. The Chi-square analysis reveals that the
knowledge in various dimensions of the awareness is totally related with the
level of experience. The awareness of regulations are difficult to understand,
but at the same time the professionals have experience gain knowledge in their
field.
PERCEPTION OF INVESTORS ON THE MUTUAL FUND
INDUSTRY IN INDIA
Perception is the process by which a person selects, organize and
interprets information124. As per this concept perception has three
components. (1) Selection, (2) Organisation and (3) Interpretation. The
process of selection highly influenced by the receipt of information. Some
information is ignored or quickly forgetten because of the difficulty of
retaining large amounts of information. Some information reaches to
consciousness while other information does not. The information reaches the
consciousness, if it relates to needs and wishes of the person. If the
information is too large it may distort selective process. Similarly if the
information does not coincide with the present beliefs and attitudes, definitely
it will distort the selection process.
Perceptions are learned. People develop their perception through
experience and acquiring knowledge. A person‟s attitudes‟ are learned
predisposition towards something. It may be favourable or unfavorable. The
attitude is also shaped by past and present experience. A favourable attitude is
the result of belief that a person has. A belief is a state of mind in which trust
124
Charles Futrell, ABC‟s of Selling, RICHARD. IRWIN, INC, Homewood, Illinosis 60430,
1996, pp.61. ALL INDIA TRAVELER BOOK SELLER, DELHI – 110051.
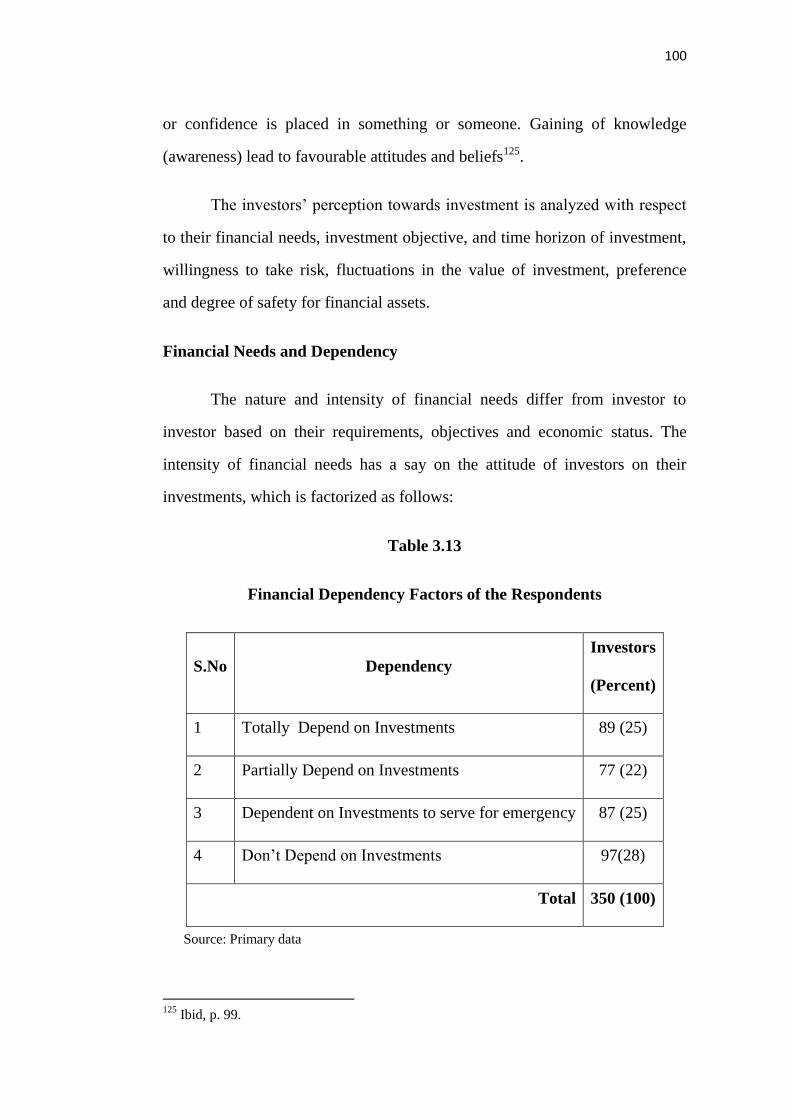
100
or confidence is placed in something or someone. Gaining of knowledge
(awareness) lead to favourable attitudes and beliefs125.
The investors‟ perception towards investment is analyzed with respect
to their financial needs, investment objective, and time horizon of investment,
willingness to take risk, fluctuations in the value of investment, preference
and degree of safety for financial assets.
Financial Needs and Dependency
The nature and intensity of financial needs differ from investor to
investor based on their requirements, objectives and economic status. The
intensity of financial needs has a say on the attitude of investors on their
investments, which is factorized as follows:
Table 3.13
Financial Dependency Factors of the Respondents
S.No Dependency
Investors
(Percent)
1 Totally Depend on Investments 89 (25)
2 Partially Depend on Investments 77 (22)
3 Dependent on Investments to serve for emergency 87 (25)
4 Don‟t Depend on Investments 97(28)
Total 350 (100)
Source: Primary data
125
Ibid, p. 99.

101
The Table 3.13 shows that 28 percent of the investors are not
depending on their investments. It shows that earning income through
investment is the secondary factor to them. Their basic source of income is
other than the investment may be business, employment, or profession. Only
25 percent of the investors mainly depends for their income from their
investment. Perhaps they may not have other source of income or their hard
earned money might have been invested in mutual funds on the hope that it is
dependable one.
Investment Objectives of Investors
People have many motives for investing. The choice of investment and
the constituents of portfolio are based on their motives. The investment
objectives of investors can be categorized into five options.
Table 3.14
Investment Objectives of the Respondents
S.No Objectives
Investors
(%)
1 Capital Preservation and Satisfactory Current Income 96 (27)
2 First priority for Income and second priority for Growth 60 (17)
3 Balanced preference for income and growth 74 (21)
4 Basically growth oriented but intends to play it somewhat safe. 62 (18)
5 Maximize growth, as income is not critical 58 (16)
Total 350 (100)
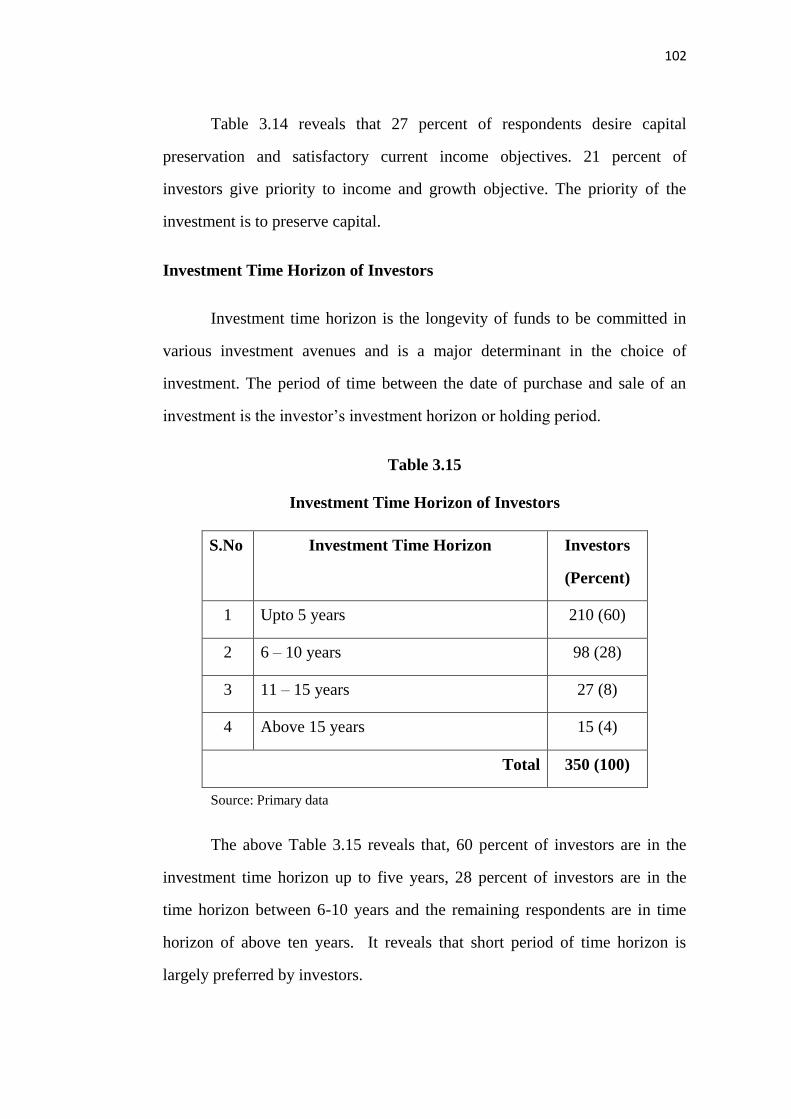
102
Table 3.14 reveals that 27 percent of respondents desire capital
preservation and satisfactory current income objectives. 21 percent of
investors give priority to income and growth objective. The priority of the
investment is to preserve capital.
Investment Time Horizon of Investors
Investment time horizon is the longevity of funds to be committed in
various investment avenues and is a major determinant in the choice of
investment. The period of time between the date of purchase and sale of an
investment is the investor‟s investment horizon or holding period.
Table 3.15
Investment Time Horizon of Investors
S.No Investment Time Horizon Investors
(Percent)
1 Upto 5 years 210 (60)
2 6 – 10 years 98 (28)
3 11 – 15 years 27 (8)
4 Above 15 years 15 (4)
Total 350 (100)
Source: Primary data
The above Table 3.15 reveals that, 60 percent of investors are in the
investment time horizon up to five years, 28 percent of investors are in the
time horizon between 6-10 years and the remaining respondents are in time
horizon of above ten years. It reveals that short period of time horizon is
largely preferred by investors.
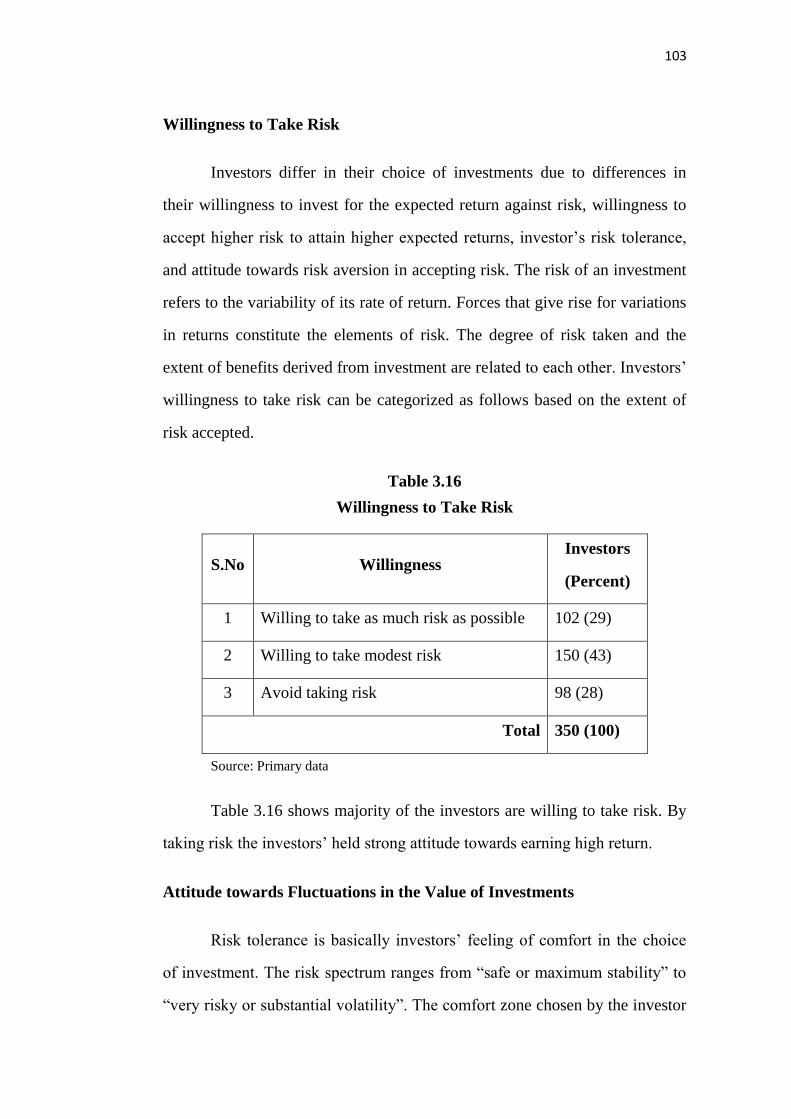
103
Willingness to Take Risk
Investors differ in their choice of investments due to differences in
their willingness to invest for the expected return against risk, willingness to
accept higher risk to attain higher expected returns, investor‟s risk tolerance,
and attitude towards risk aversion in accepting risk. The risk of an investment
refers to the variability of its rate of return. Forces that give rise for variations
in returns constitute the elements of risk. The degree of risk taken and the
extent of benefits derived from investment are related to each other. Investors‟
willingness to take risk can be categorized as follows based on the extent of
risk accepted.
Table 3.16
Willingness to Take Risk
S.No Willingness Investors
(Percent)
1 Willing to take as much risk as possible 102 (29)
2 Willing to take modest risk 150 (43)
3 Avoid taking risk 98 (28)
Total 350 (100)
Source: Primary data
Table 3.16 shows majority of the investors are willing to take risk. By
taking risk the investors‟ held strong attitude towards earning high return.
Attitude towards Fluctuations in the Value of Investments
Risk tolerance is basically investors‟ feeling of comfort in the choice
of investment. The risk spectrum ranges from “safe or maximum stability” to
“very risky or substantial volatility”. The comfort zone chosen by the investor
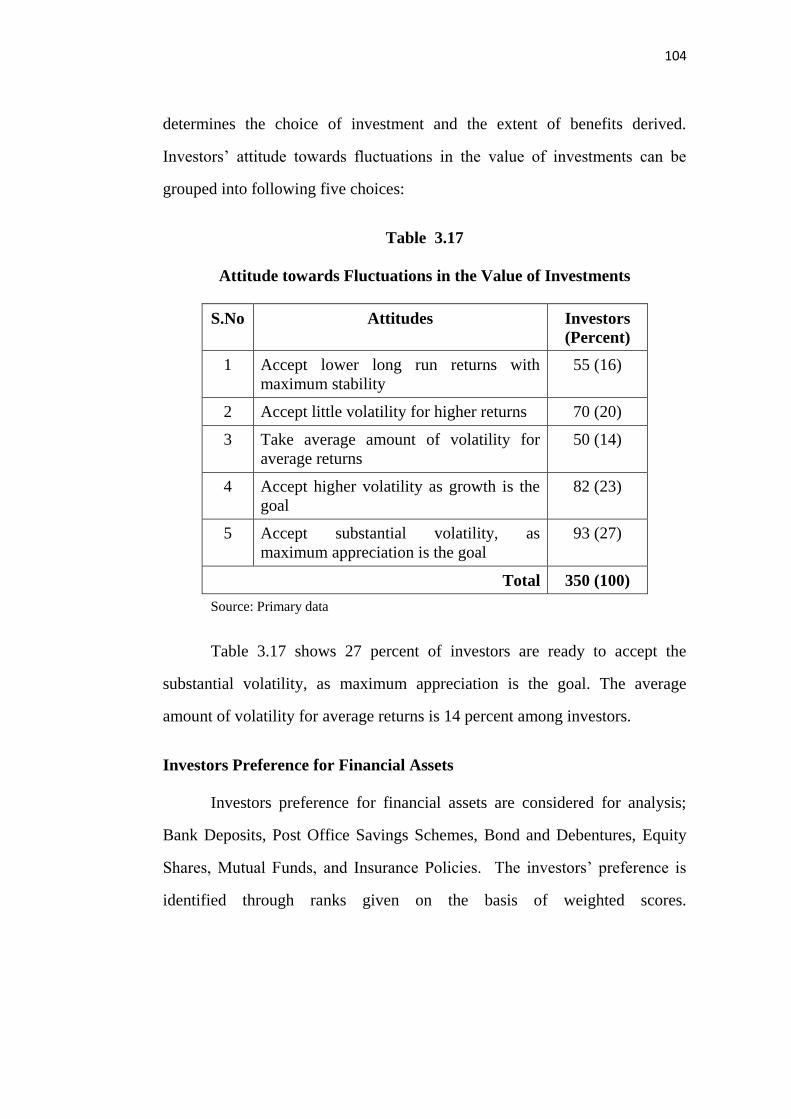
104
determines the choice of investment and the extent of benefits derived.
Investors‟ attitude towards fluctuations in the value of investments can be
grouped into following five choices:
Table 3.17
Attitude towards Fluctuations in the Value of Investments
S.No Attitudes Investors
(Percent)
1 Accept lower long run returns with
maximum stability
55 (16)
2 Accept little volatility for higher returns 70 (20)
3 Take average amount of volatility for
average returns
50 (14)
4 Accept higher volatility as growth is the
goal
82 (23)
5 Accept substantial volatility, as
maximum appreciation is the goal
93 (27)
Total 350 (100)
Source: Primary data
Table 3.17 shows 27 percent of investors are ready to accept the
substantial volatility, as maximum appreciation is the goal. The average
amount of volatility for average returns is 14 percent among investors.
Investors Preference for Financial Assets
Investors preference for financial assets are considered for analysis;
Bank Deposits, Post Office Savings Schemes, Bond and Debentures, Equity
Shares, Mutual Funds, and Insurance Policies. The investors‟ preference is
identified through ranks given on the basis of weighted scores.

105
Table 3.18
Investors Preference for Financial Assets
Financial Assets Order of Preference Total
Score
Average
Score
Rank
Rank I Rank II Rank III Rank IV Rank V Rank VI
Bank Deposits 130 83 36 38 33 26 1507 4.3 I
Post Office Savings
Schemes
83 92 47 39 38 34 1373 3.9 II
Bonds and Debentures 24 39 64 73 116 106 1142 3.3 III
Equity Shares 56 36 78 48 43 53 1111 3.1 V
Mutual Funds 33 45 67 110 35 45 1136 3.2 IV
Insurance Policies 24 55 58 42 85 86 1033 2.9 VI
Source: Primary data
105
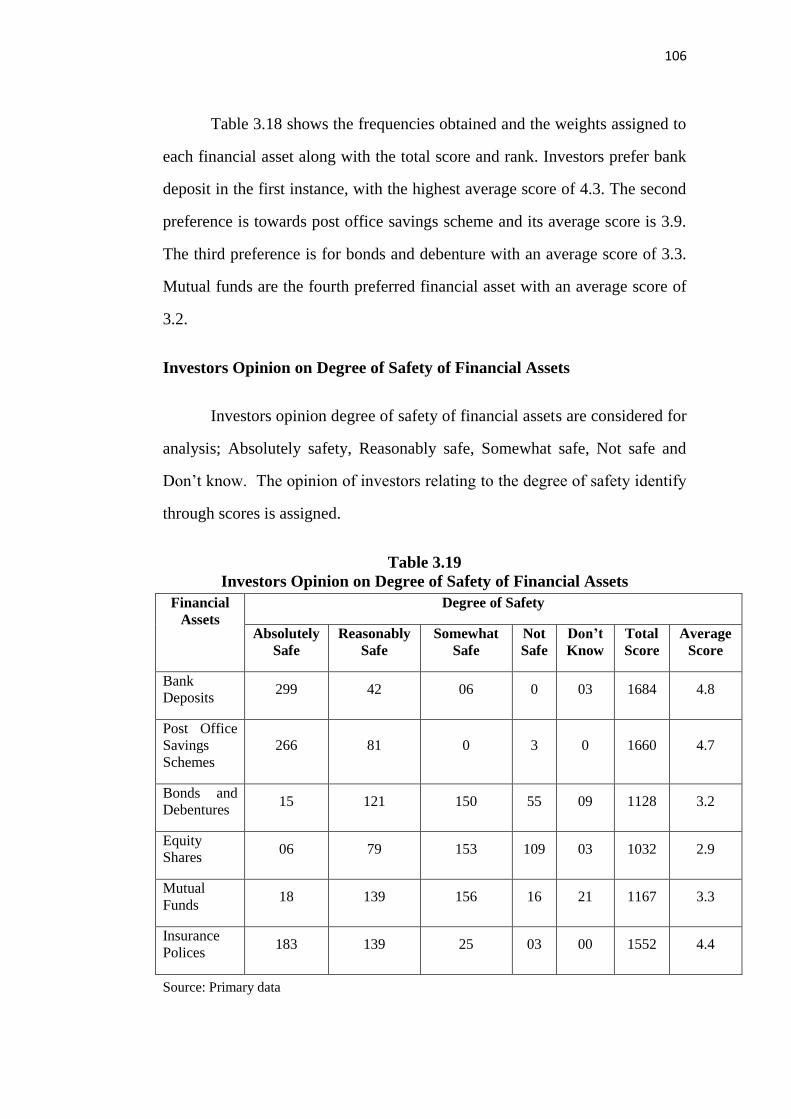
106
Table 3.18 shows the frequencies obtained and the weights assigned to
each financial asset along with the total score and rank. Investors prefer bank
deposit in the first instance, with the highest average score of 4.3. The second
preference is towards post office savings scheme and its average score is 3.9.
The third preference is for bonds and debenture with an average score of 3.3.
Mutual funds are the fourth preferred financial asset with an average score of
3.2.
Investors Opinion on Degree of Safety of Financial Assets
Investors opinion degree of safety of financial assets are considered for
analysis; Absolutely safety, Reasonably safe, Somewhat safe, Not safe and
Don‟t know. The opinion of investors relating to the degree of safety identify
through scores is assigned.
Table 3.19
Investors Opinion on Degree of Safety of Financial Assets
Financial
Assets
Degree of Safety
Absolutely
Safe
Reasonably
Safe
Somewhat
Safe
Not
Safe
Don’t
Know
Total
Score
Average
Score
Bank
Deposits 299 42 06 0 03 1684 4.8
Post Office
Savings
Schemes
266 81 0 3 0 1660 4.7
Bonds and
Debentures 15 121 150 55 09 1128 3.2
Equity
Shares 06 79 153 109 03 1032 2.9
Mutual
Funds 18 139 156 16 21 1167 3.3
Insurance
Polices 183 139 25 03 00 1552 4.4
Source: Primary data
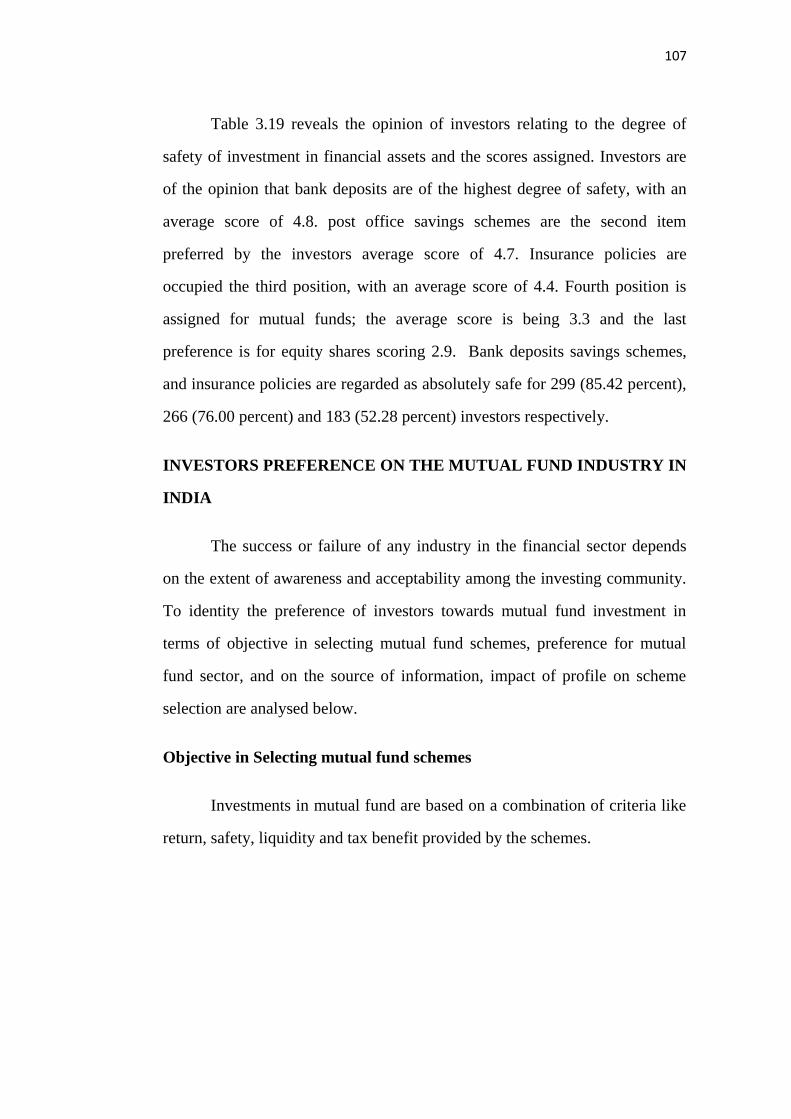
107
Table 3.19 reveals the opinion of investors relating to the degree of
safety of investment in financial assets and the scores assigned. Investors are
of the opinion that bank deposits are of the highest degree of safety, with an
average score of 4.8. post office savings schemes are the second item
preferred by the investors average score of 4.7. Insurance policies are
occupied the third position, with an average score of 4.4. Fourth position is
assigned for mutual funds; the average score is being 3.3 and the last
preference is for equity shares scoring 2.9. Bank deposits savings schemes,
and insurance policies are regarded as absolutely safe for 299 (85.42 percent),
266 (76.00 percent) and 183 (52.28 percent) investors respectively.
INVESTORS PREFERENCE ON THE MUTUAL FUND INDUSTRY IN
INDIA
The success or failure of any industry in the financial sector depends
on the extent of awareness and acceptability among the investing community.
To identity the preference of investors towards mutual fund investment in
terms of objective in selecting mutual fund schemes, preference for mutual
fund sector, and on the source of information, impact of profile on scheme
selection are analysed below.
Objective in Selecting mutual fund schemes
Investments in mutual fund are based on a combination of criteria like
return, safety, liquidity and tax benefit provided by the schemes.

108
Table 3.20
Objective of Investing In Mutual Funds Schemes
Objective Specification Investors (Percent)
Return Regular Income 153 (44)
Growth 107(31)
Both 90 (25)
Stability Safety 180 (51)
Speculation 65 (19)
Both 105(30)
Marketability High Liquidity 102 (29)
High Profitability 128 (37)
Both 120 (34)
Tax Benefit Tax Savings 121 (35)
Non- Tax Savings 51 (15)
Both 178 (50)
The table 3.20 reveals that investment based on the return, under the
specification of regular income and growth schemes is higher. Because, these
schemes provide periodical return and fixed income growth to a minimum
period. The return boost the confidence of investors. Under the objective of
stability investors prefer mutual funds mainly for the purpose of safety and
then speculation. It clearly shows that investors who invest in mutual fund
schemes expect safety of investment in the market. On the other hand
speculation is also considered by investors to get an insight into market
possibilities. Under the objective of marketability, investors prefer mutual
funds mainly for high profitability and then for high liquidity. Because,
marketability of schemes ensures the performance track record along with the

109
investors expectations. From the tax benefit point of view, investors prefer
mainly for the tax savings. It is because, they enjoy the privillage of tax
benefits.
Preference for Mutual Fund
Many Mutual Fund organization are there to meet the objectives of
investors. However investors prefer only certain organization on their own.
Based on the some criteria, they invest their money in specified mutual fund.
Mutual funds are normally run by banks, specified institutions. Indian joint
venture firms, foreign joint venture firms, and private concerns. In India,
major banks doing mutual fund operations are: SBI, Bank of Baroda, Canara
Bank, Panjab National Bank, etc., The mutual fund operations carried by
specified institutions are: UTI, LIC, GIC, etc., Indian Joint venture firms
doing mutual operations are: Birla, HDFC, Sundaram, and ICICI. Foreign
Joint venture firms doing mutual fund operations in India are: HSBC, Franklin
India, ING Vysya, and Templeton. Private concerns doing mutual fund
operations are; JM Mutual fund, Reliance, Sahara, Tata, Kotak, and Chola
Mutual Fund.

110
Table 3.21
Investors’ Preference for Mutual Fund Sector
Mutual
Fund
Sector
Order of Preference
Total
Score
Average
Score Rank Rank
I
Rank
II
Rank
III
Rank
IV
Rank
V
Banks
Sponsored 40 73 132 54 51 1047 3.0 II
Institutions
Sponsored 54 70 66 73 87 981 2.80 IV
Private
Indian
Concerns
40 63 97 98 52 991 2.83 III
Indian
Joint
Venture
75 141 52 40 42 1257 3.4 I
Foreign
Joint
Venture
61 45 54 81 109 918 2.6 V
Source: Primary data
The table 3.21 reveals that the investors prefer first Indian joint venture
followed by banks, Indian private concerns, sponsored Indian institutions, and
foreign joint venture firms. It is inferred Indian join ventures firms has
emerged as the most important constituent of mutual fund industry in India in
the current century. The market share of Indian Joint venture is under
remarkable growth. Banks sponsored mutual fund is providing minimum
assured return to the investors. So, the respondents‟ given second preference.
Source of Information on Mutual Fund for Investors
Source of information to the investors may also have its impact on
their attitude towards investment.
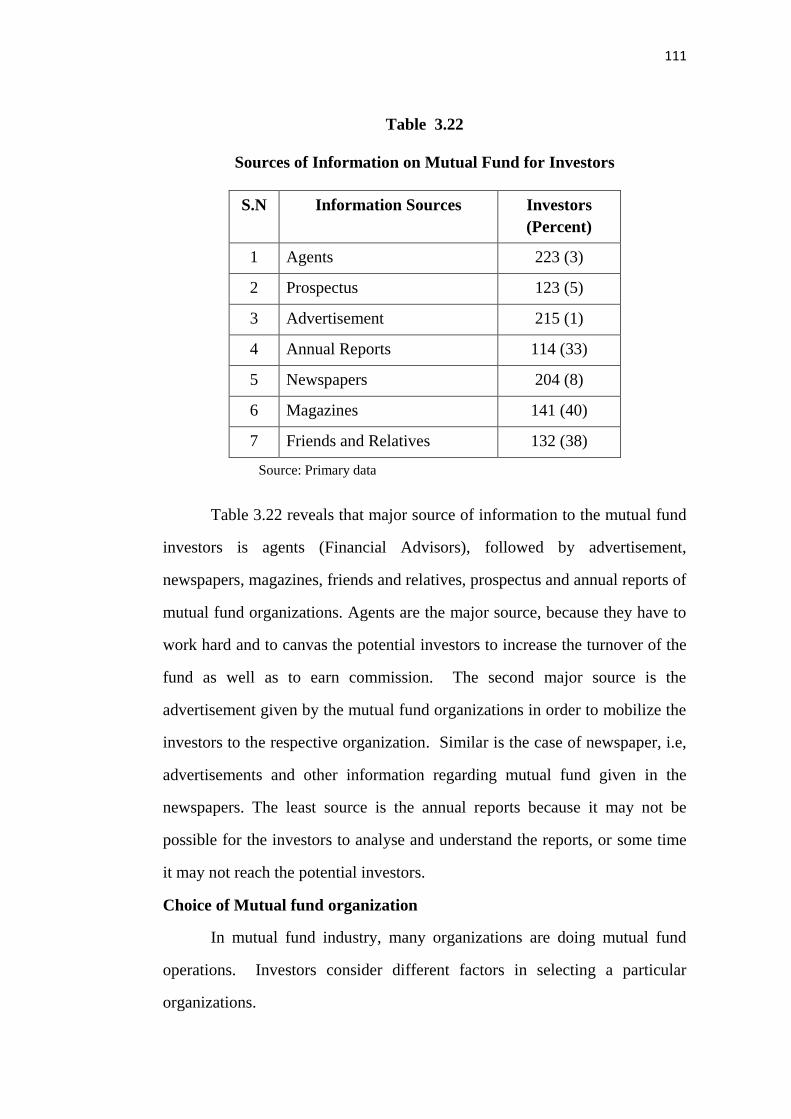
111
Table 3.22
Sources of Information on Mutual Fund for Investors
S.N Information Sources Investors
(Percent)
1 Agents 223 (3)
2 Prospectus 123 (5)
3 Advertisement 215 (1)
4 Annual Reports 114 (33)
5 Newspapers 204 (8)
6 Magazines 141 (40)
7 Friends and Relatives 132 (38)
Source: Primary data
Table 3.22 reveals that major source of information to the mutual fund
investors is agents (Financial Advisors), followed by advertisement,
newspapers, magazines, friends and relatives, prospectus and annual reports of
mutual fund organizations. Agents are the major source, because they have to
work hard and to canvas the potential investors to increase the turnover of the
fund as well as to earn commission. The second major source is the
advertisement given by the mutual fund organizations in order to mobilize the
investors to the respective organization. Similar is the case of newspaper, i.e,
advertisements and other information regarding mutual fund given in the
newspapers. The least source is the annual reports because it may not be
possible for the investors to analyse and understand the reports, or some time
it may not reach the potential investors.
Choice of Mutual fund organization
In mutual fund industry, many organizations are doing mutual fund
operations. Investors consider different factors in selecting a particular
organizations.

112
Table 3.23
Factors Influencing the Choice of Mutual Fund Organization
Factors
Degree of Importance Total
Score
Average
Score Very
Important Important Unimportant
Not
Important
Goodwill 229 92 21 18 1252 3.5
Volume of Business 118 148 73 21 1083 3.0
Sector Represented 79 184 73 24 1038 2.9
Investor Services 139 158 45 18 1138 3.2
Past Performance 134 117 91 18 1087 3.0
Infrastructure 72 170 100 18 1016 2.8
Suggestions from friends, relatives etc 42 118 151 49 873 2.4
Background Experience 89 163 84 24 1037 2.9
Investment Philosophy
and Methodology
78 186 75 21 1041 2.9
Source: Primary data
112
113
Table 3.23 shows the factors affecting the choice of mutual fund
organization. Goodwill was the most influential factor in the selection of the
mutual fund with an average score of 3.5. Second important factor was
investor services with an average score of 3.2 followed by past performance
with an average score of 3.0. It could be inferred that the mutual fund
organization have earned reputed name among the investors. So, they prefer
goodwill as the first choice of selecting of mutual funds investments.
Similarly, mutual fund organization provides basic information on schemes
launched to investors, assists them in filling up application forms, submission
of application forms, and answering schemes related to queries investors may
have related to schemes. The investors services average score occupies second
position. Before selecting the mutual fund by investors, they must evaluate the
past performance track records of the mutual funds schemes. When result
indicates better return, investors act favouring towards that Mutual Funds.
Choice of scheme
After selecting a particular organization, the investor used to invest his
money in a particular scheme available in that organization. Each mutual fund
organization offers many schemes to the investors. It is imperative on the part
of investors to select a particular schemes or schemes for their investment. In
selecting a particular scheme, the investors consider different factors.

114
Table 3.24
Factors Influencing the Choice of Scheme
Factors Influencing Choice Of Mutual
Fund Scheme
Degree of Importance Total
Score
Average
Score Very
Important Important Unimportant
Not
Important
Capital Appreciation 239 97 0 24 1271 3.5
Objective of the Fund 135 171 33 21 1140 3.2
Return on Investment 136 175 31 18 1149 3.2
Tax Benefit 76 197 69 18 1051 2.9
Liquidity 112 157 73 18 1083 3.0
Safety 142 167 33 18 1153 3.2
Loan facility 39 85 187 49 834 2.3
Convenience of Reinvestment 60 130 130 40 930 2.6
Fund managers Background 101 147 88 24 1045 2.9
Early Bird incentive 42 78 201 39 843 2.3
Source: Primary data
114

115
Table 3.24 reveals that, the most important factor affecting the choice
of mutual fund scheme is capital appreciation with an average score of 3.5
followed by fund objective, return on investment and safety with an average
score of 3.2 each
Scheme Galore
The Indian Mutual Fund Industry offers a wide variety of schemes.
Based on the investment policy, the schemes can be broadly classified as
presented in the Table 3.28.
In India there are 1294 live schemes126. Though the investors have
some criteria in selecting a particular scheme, they are put in vague in
choosing a particular scheme. For the purpose of understanding and also make
it easy to the investors, generally, all the schemes are classified into six groups
(given in table) based on the objective of each schemes. The investors‟
preference for each groups are presented in the Table, 3.28.
Table 3.25
Investors’ Preference towards Schemes’ Objective
Objectives
Preference for Scheme Objective Total
Score
Average
Score
Rank Rank
I
Rank
II
Rank
III
Rank
IV
Rank
V
Rank
VI
Growth 136 99 64 6 12 33 1644 4.7 I
Income 123 97 44 33 24 29 1575 4.5 II
Balanced 21 57 63 57 24 128 1010 2.8 V
ELSS 33 21 57 63 15 161 1082 3.0 III
Money
Market 5 54 57 61 128 45 1012 2.9 IV
Gilt 2 7 9 13 143 176 584 1.6 VI
Source: Primary data
126
Assets under management of the Indian mutual fund industry as on March 31, 2013.
(www. amfiindia.com)

116
Table 3.25 reveals that the investors prefer first growth schemes with
an average score of 4.7. Second preference is for income schemes with an
average score of 4.5. Third rating is for equity linked savings schemes with an
average score of 3.0. It is because, growth schemes aim to provide capital
appreciation in the long period. The income schemes also provide regular and
steady income to investors, and capital appreciation in such schemes limited.
That is why it is highly preferred next to growth schemes.
Investors Profile and Objective of Selecting Mutual Fund Schemes
Though objectives of mutual fund investment have their main role in
selecting a particular schemes, the profile characters also have their influence
in mutual fund investment. Hence an attempt is made to find out the influence
of both profile characters and objectives of investment in Mutual Fund and is
tested using chi-square test at five percent level of significance with the
following hypothesis.
Ho: 1-1 Profile of investors does not have any significant impact on the
criteria of selecting mutual fund schemes.

117
Table 3.26
Investors’ profile and investment objectives in the selection of schemes
Profile
Investment Objectives
Return Stability Marketability Tax Benefit
Age 59.87 * 22.94* 28.82* 15.48*
Sex 2.75 7.28* 5.07 8.60*
Occupation 30.87* 29.95* 29.45* 22.03*
Educational
Qualification 9.18 6.55 45.21* 57.44*
Marital Status 5.01 13.28* 0.18 3.23
Monthly Income 46.39* 56.32* 20.79* 17.30*
Monthly Savings 23.50* 23.49* 47.08* 21.51*
* Significant at 5 percent level.
Table 3.26 reveals that the hypothesis is rejected (significant) in 21
cases and accepted (insignificant) in seven cases. It could be concluded that,
age, occupation, monthly income and monthly savings have significant
influence on the selection of schemes based on the criteria of return, safety,
liquidity and tax benefit. Sex has a significant influence on the selection of
schemes based on safety and tax benefits. Educational qualification has
significant influence on the selection of mutual fund schemes based on the
criteria of liquidity and tax benefit. Marital Status has a significant influence
on the choice of mutual fund scheme based on the criterion of safety of
investment alone.
118
ATTITUDE OF INVESTORS TOWARDS MUTUAL FUND INDUSTRY
An attitude is a subjective measure of how one or more persons feel
about an event, person, or object. Marketers attempt to measure attitude of
consumers to determine the products they may buy. Likewise, analysts
measure investors‟ attitude to estimate future market movements127. Thus,
attitude implies the readiness to act one way rather than another.
The specific attitude of investors towards various aspect of Indian
Mutual fund industry is analysed on the basis of risk, return from bank
deposits, growth, relationship between risk and return with the objectives
weathering away the fluctuation in market, and suitability to small investors.
Attitude statements
To study the attitude of investors relating to various aspects of mutual
funds the following specific attitude statements are framed. The investors
degree of agreement on five point scaling is collected and reduced to two
point scaling to identify the impact on attitude towards acceptance of mutual
funds.
Statement I: Investing in funds is less risky compared to shares.
The attitude of the investors towards the statement “Investing in funds
are less risky compared to shares” is tested applying binomial test to the
distribution of investors according to their degree of agreement. The null
hypothesis formulated is “investing in mutual funds is less risky compared to
shares is 50 percent”. It is tested at five percent level of significance as shown
in the Table 3.27.
127
Farlex, Financial Dictionary, © 2012 Wikipedia encyclopedia.

119
Table 3.27
Degree of Agreement with Mutual Funds Compared To Shares
S.N Degrees Number of
Respondents
Degree of
Agreement
on Two
Points Scale
Respondents
Numbers percentage
1 Strongly
Agree
123
Agree
271
85.49
2 Agree 148
3 Neutral 33
4 Disagree 24
Disagree
46
14.51 5 Strongly
Disagree
22
Table 3.27 shows that, 271 investors (85.49 percent) agree with the
mutual funds comparing to share. Applying the binomial test of significance,
the calculated Z value is 12.97 and it is greater than the Table value 1.96.
Hence, it can be inferred that, the null hypothesis is rejected. Thus more than
50 percent of the sample respondents highly favour investment in mutual
funds in comparison to investment in shares.
Statement II: Investments in mutual funds fetch higher returns than
deposits in banks
The attitude of investors towards investing in mutual funds is much
better in terms of returns than depositing in banks is tested at five percent
level of significance. The null hypothesis is, “the proportion of investors
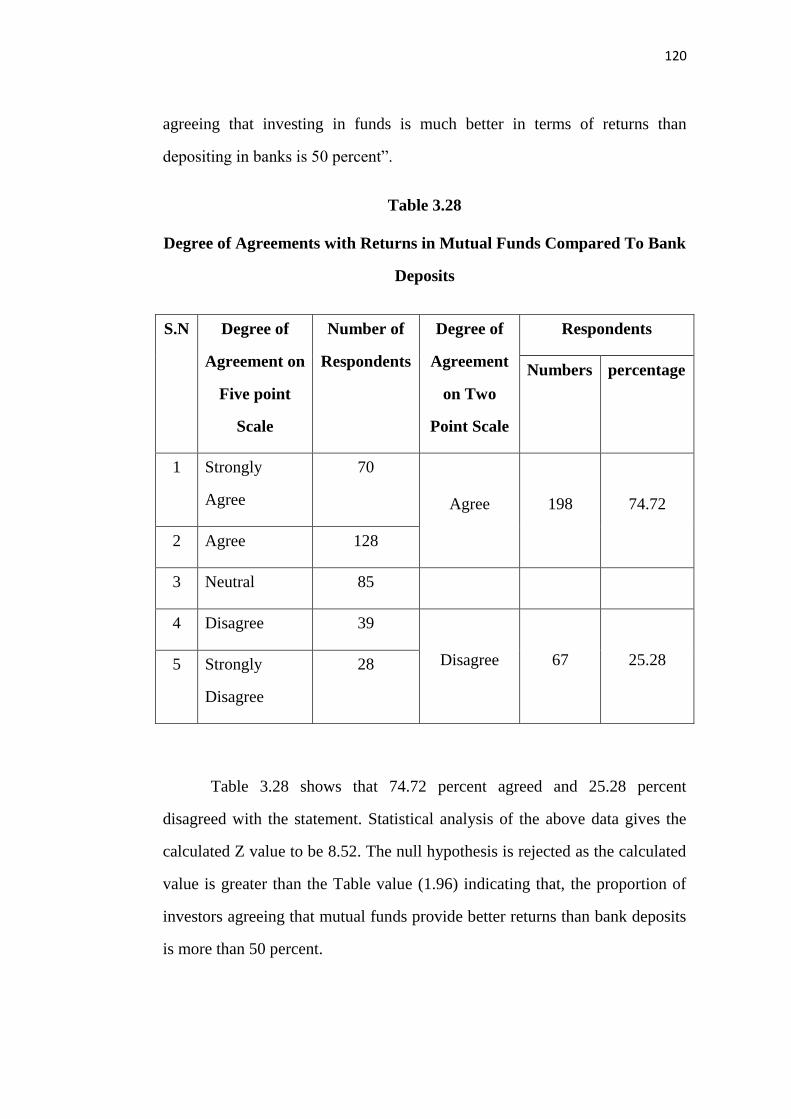
120
agreeing that investing in funds is much better in terms of returns than
depositing in banks is 50 percent”.
Table 3.28
Degree of Agreements with Returns in Mutual Funds Compared To Bank
Deposits
S.N Degree of
Agreement on
Five point
Scale
Number of
Respondents
Degree of
Agreement
on Two
Point Scale
Respondents
Numbers percentage
1 Strongly
Agree
70
Agree 198 74.72
2 Agree 128
3 Neutral 85
4 Disagree 39
Disagree 67 25.28 5 Strongly
Disagree
28
Table 3.28 shows that 74.72 percent agreed and 25.28 percent
disagreed with the statement. Statistical analysis of the above data gives the
calculated Z value to be 8.52. The null hypothesis is rejected as the calculated
value is greater than the Table value (1.96) indicating that, the proportion of
investors agreeing that mutual funds provide better returns than bank deposits
is more than 50 percent.
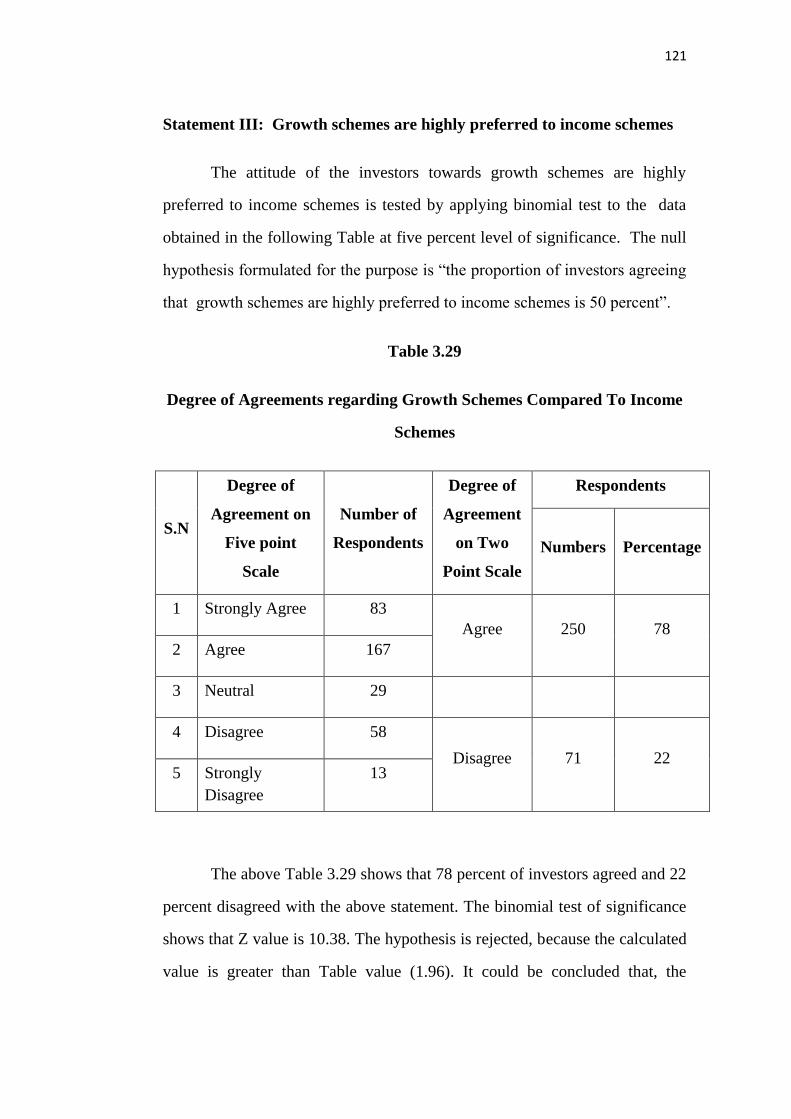
121
Statement III: Growth schemes are highly preferred to income schemes
The attitude of the investors towards growth schemes are highly
preferred to income schemes is tested by applying binomial test to the data
obtained in the following Table at five percent level of significance. The null
hypothesis formulated for the purpose is “the proportion of investors agreeing
that growth schemes are highly preferred to income schemes is 50 percent”.
Table 3.29
Degree of Agreements regarding Growth Schemes Compared To Income
Schemes
S.N
Degree of
Agreement on
Five point
Scale
Number of
Respondents
Degree of
Agreement
on Two
Point Scale
Respondents
Numbers Percentage
1 Strongly Agree 83
Agree 250 78
2 Agree 167
3 Neutral 29
4 Disagree 58
Disagree 71 22 5 Strongly
Disagree
13
The above Table 3.29 shows that 78 percent of investors agreed and 22
percent disagreed with the above statement. The binomial test of significance
shows that Z value is 10.38. The hypothesis is rejected, because the calculated
value is greater than Table value (1.96). It could be concluded that, the
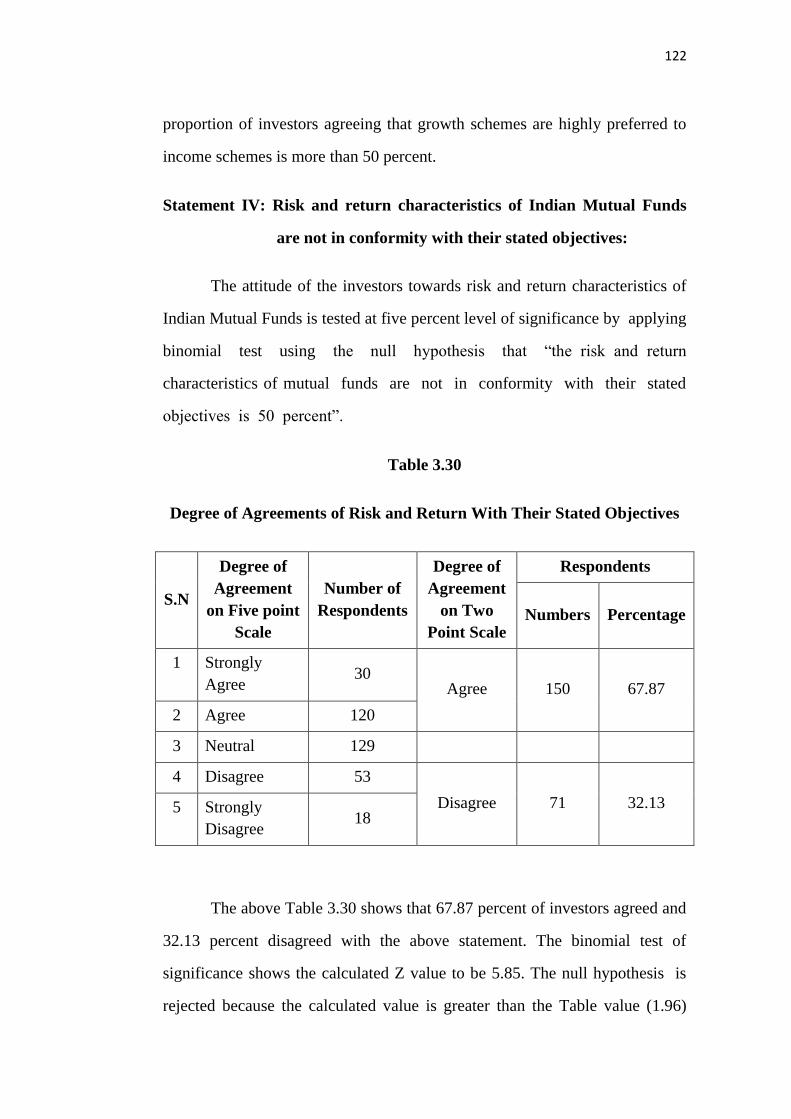
122
proportion of investors agreeing that growth schemes are highly preferred to
income schemes is more than 50 percent.
Statement IV: Risk and return characteristics of Indian Mutual Funds
are not in conformity with their stated objectives:
The attitude of the investors towards risk and return characteristics of
Indian Mutual Funds is tested at five percent level of significance by applying
binomial test using the null hypothesis that “the risk and return
characteristics of mutual funds are not in conformity with their stated
objectives is 50 percent”.
Table 3.30
Degree of Agreements of Risk and Return With Their Stated Objectives
S.N
Degree of
Agreement
on Five point
Scale
Number of
Respondents
Degree of
Agreement
on Two
Point Scale
Respondents
Numbers Percentage
1 Strongly
Agree 30
Agree 150 67.87
2 Agree 120
3 Neutral 129
4 Disagree 53
Disagree 71 32.13 5 Strongly
Disagree 18
The above Table 3.30 shows that 67.87 percent of investors agreed and
32.13 percent disagreed with the above statement. The binomial test of
significance shows the calculated Z value to be 5.85. The null hypothesis is
rejected because the calculated value is greater than the Table value (1.96)
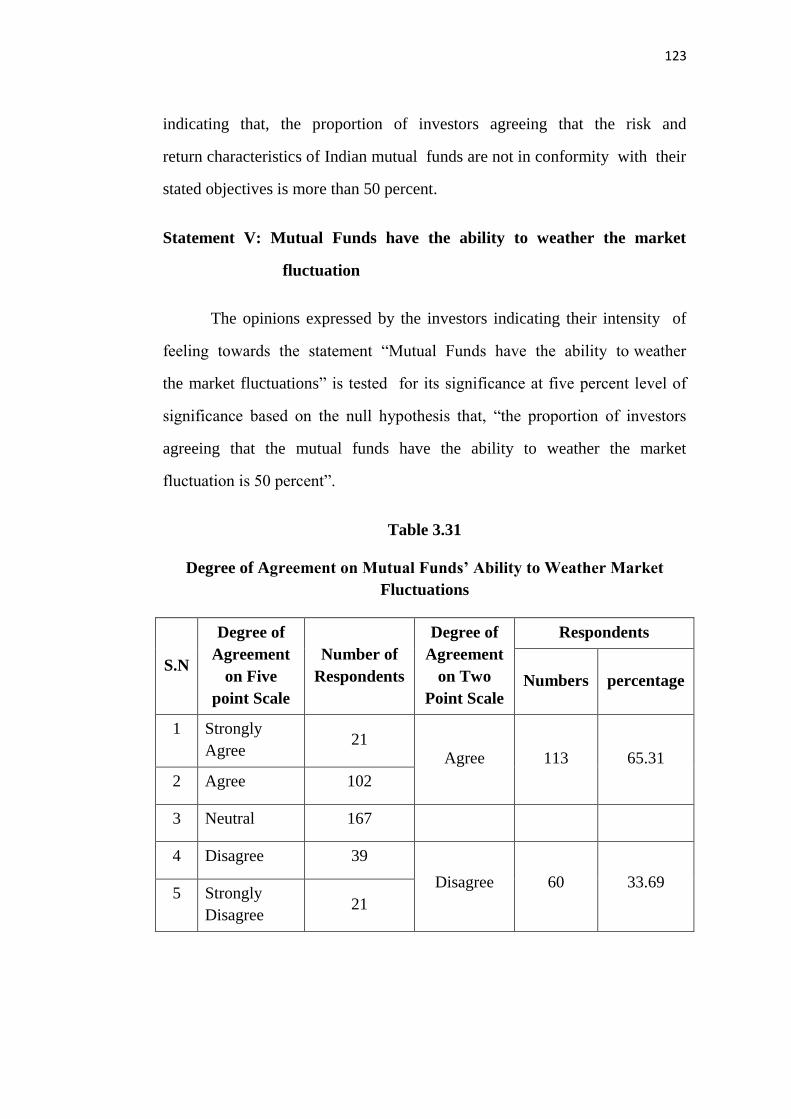
123
indicating that, the proportion of investors agreeing that the risk and
return characteristics of Indian mutual funds are not in conformity with their
stated objectives is more than 50 percent.
Statement V: Mutual Funds have the ability to weather the market
fluctuation
The opinions expressed by the investors indicating their intensity of
feeling towards the statement “Mutual Funds have the ability to weather
the market fluctuations” is tested for its significance at five percent level of
significance based on the null hypothesis that, “the proportion of investors
agreeing that the mutual funds have the ability to weather the market
fluctuation is 50 percent”.
Table 3.31
Degree of Agreement on Mutual Funds’ Ability to Weather Market
Fluctuations
S.N
Degree of
Agreement
on Five
point Scale
Number of
Respondents
Degree of
Agreement
on Two
Point Scale
Respondents
Numbers percentage
1 Strongly
Agree 21
Agree 113 65.31
2 Agree 102
3 Neutral 167
4 Disagree 39
Disagree 60 33.69 5 Strongly
Disagree 21
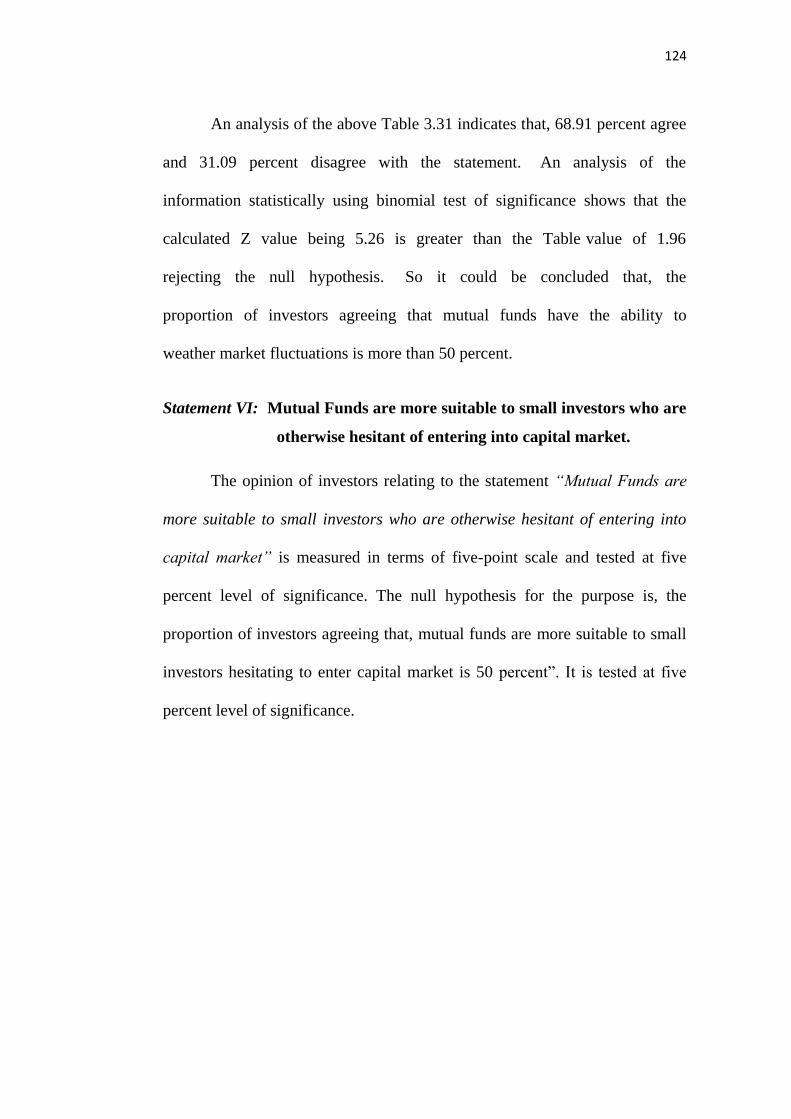
124
An analysis of the above Table 3.31 indicates that, 68.91 percent agree
and 31.09 percent disagree with the statement. An analysis of the
information statistically using binomial test of significance shows that the
calculated Z value being 5.26 is greater than the Table value of 1.96
rejecting the null hypothesis. So it could be concluded that, the
proportion of investors agreeing that mutual funds have the ability to
weather market fluctuations is more than 50 percent.
Statement VI: Mutual Funds are more suitable to small investors who are
otherwise hesitant of entering into capital market.
The opinion of investors relating to the statement “Mutual Funds are
more suitable to small investors who are otherwise hesitant of entering into
capital market” is measured in terms of five-point scale and tested at five
percent level of significance. The null hypothesis for the purpose is, the
proportion of investors agreeing that, mutual funds are more suitable to small
investors hesitating to enter capital market is 50 percent”. It is tested at five
percent level of significance.
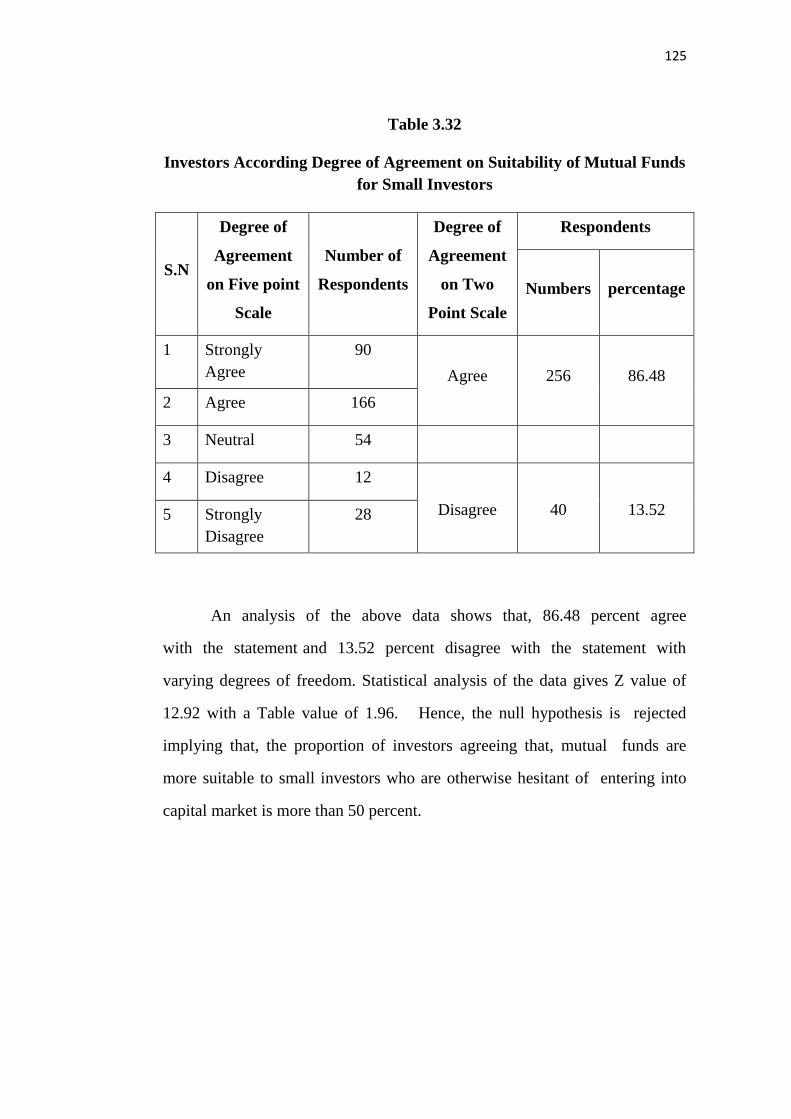
125
Table 3.32
Investors According Degree of Agreement on Suitability of Mutual Funds
for Small Investors
S.N
Degree of
Agreement
on Five point
Scale
Number of
Respondents
Degree of
Agreement
on Two
Point Scale
Respondents
Numbers percentage
1 Strongly
Agree
90
Agree
256
86.48
2 Agree 166
3 Neutral 54
4 Disagree 12
Disagree
40
13.52 5 Strongly
Disagree
28
An analysis of the above data shows that, 86.48 percent agree
with the statement and 13.52 percent disagree with the statement with
varying degrees of freedom. Statistical analysis of the data gives Z value of
12.92 with a Table value of 1.96. Hence, the null hypothesis is rejected
implying that, the proportion of investors agreeing that, mutual funds are
more suitable to small investors who are otherwise hesitant of entering into
capital market is more than 50 percent.
126
CHAPTER – IV
SCHEMES AND PERFORMANCE
Schemes offered by the Mutual Funds are classified as 1) Schemes
According to maturity period, and 2) Schemes According to investment
objective.
BASED ON MATURITY PERIOD
Again it is classified into open-ended schemes and close-ended
schemes.
(i) Open-Ended Schemes
Open-ended scheme is one that available for subscription and
repurchase on continuous basis. These schemes do not have fixed maturity
period. Investors can conveniently buy and sell units at Net Assets value
(NAV) related prices, which are declared on a daily basis. The key feature of
open-ended scheme is liquidity.
(ii) Close-Ended Schemes
Close-ended scheme has a stipulated maturity period from five to
seven years. The fund is open for subscription only during a specific period at
the time of launch of the scheme. Investors can invest in the scheme at the
time of the initial public issue and thereafter they can buy or sell the units of
the scheme on the stock exchanges where the units are listed. In order to
provide an exit route to the investors, some close-ended funds give an option
of selling back the units to the mutual fund through periodic repurchase at
NAV related prices. SEBI regulations stipulate that at least one of the two exit
routes is provided to the investors i.e., either repurchase facility or through
listing on stock exchanges. These mutual fund schemes disclose NAV
generally on weekly basis.

127
BASED ON INVESTMENT OBJECTIVES
Schemes according to investment objective can also be classified as
growth schemes, income schemes, or balanced schemes. Such schemes may
be open ended or close-ended schemes as described earlier. Such schemes
may be classified mainly as follows:
(i) Equity/Growth Oriented Schemes
The aim of growth funds is to provide capital appreciation over the
medium to long-term. Such schemes normally invest a major part of their
corpus in equities. Such funds have comparatively high risks. These schemes
provide different options to the investors like dividend option, capital
appreciation, etc. and the investors may choose an option depending on their
preferences. The investors must indicate the option in the application form.
The mutual funds also allow the investors to change the options at a later date.
Growth schemes are good for investors having a long-term out look seeking
appreciation over a period of time.
(ii) Income/ Debt Oriented Schemes
Income funds is to provide regular and steady income to investors.
Such schemes generally invest in fixed income securities such as bonds,
corporate debentures, Government securities and money market instrument.
This type of funds is less risky compared to equity schemes. The NAV of the
scheme is affected because of change in interest rate in the country. If the
interest rates fall, NAVs of such schemes are likely to increase in the short run
and vice-versa. However, long-term investors may not bother about these
fluctuations.
128
(ii) Balanced Fund
The aim of balanced fund is to provide both growth and regular
income. The funds of such schemes are invested both in equities and fixed
income securities in the proportion indicated in their offer documents. These
are appropriate for investors looking for moderate growth. They generally
invest 40-60 percent in equity and the balance in debt instruments. These
funds are also affected because of fluctuations in share prices in the stock
markets. However, NAVs of such funds are likely to be less volatile compared
to pure equity funds.
(iv)Money Market Fund
These funds are also income funds and their aim is to provide easy
liquidity, preservation of capital and moderate income. These schemes invest
exclusively in safer short-term instruments such as treasury bills, certificates
of deposit, commercial paper and inter-bank call money, government
securities, etc. Returns on these schemes fluctuate much less compared to
other funds. These funds are appropriate for corporate and individual investors
as a means to part their surplus funds for short periods.
(v) Gilt Fund
These funds invest exclusively in government securities. Government
securities have no default risk. NAVs of these schemes also fluctuate due to
change in interest rates and other economic factor as is the case with income
or debt oriented schemes.
129
(vi) Index Fund
Index Funds replicate the portfolio of a particular index such as the
BSE Sensitive index, S&P NSE 50 index, (Nifty), etc. These schemes invest
in the securities in the same weightage comprising of an index. NAVs of such
schemes would rise or fall in accordance with the rise or fall in the index,
though not exactly by the same percentage due to some factors known as
“tracking error” in technical terms. Necessary disclosures in this regard are
made in the offer document of the mutual fund scheme.
(vii) Other Schemes
Tax Saving Schemes
These schemes offer tax rebates to the investors under tax laws as
prescribed from time to time. This is made possible because the Government
offers tax incentives for investment in specified avenues. For example, Equity
Linked Savings Schemes (ELSS) and Pension Schemes. The details of such
tax saving schemes are provided in the relevant offer documents.
Special Schemes
This category includes index schemes that attempt to replicate the
performance of a particular index such as the sensex or the NSE 50, or
industry specific schemes (which invest in specific industries) or sectoral
schemes (which invest exclusively in segments such „IX Group shares or
initial public offerings).
130
Sectoral Fund
The scheme is meant for investment in a particular sector or segment.
SCHEMES OFFERED BY THE UTI MUTUAL FUND
UTI Mutual Fund came into existence on 1st February 2004. Bank of
Baroda (BOB) Punjab National Bank (PNB), State Bank of India (SBI) and
Life Insurance Corporation of India (LIC) are the sponsors of the UTI Mutual
Fund. UTI Mutual Fund is managed by UTI Asset Management Company
Limited (UTI AMC) which incorporated on 14, November 2002. UTI AMC is
a registered portfolio manager under the SEBI Regulations 1993 (Portfolio
Managers) for undertaking portfolio management services and also acts as the
Manager and Marketer to offshore funds.
The fund has a track record of managing a variety of schemes catering
to the needs of every class of citizenry. Following are the living schemes.
Dead schemes are omitted.

131
Schedule-4.1
Various schemes offered by UTI Mutual Fund (Since 2004)
Sl.
No Schemes name Type of scheme Nature of scheme
Option of
scheme
Scheme
inception date
1. UTI Banking Sector Fund Open-ended Equity Growth 9/3/2004
2. UTI Mid Cap Fund Open-ended Equity Growth 9/4/2004
3. UTI Transportation and Logistics Open-ended Equity Growth 9/3/2004
4. UTI India Lifestyle Fund Open-ended Equity Growth 24/8/2007
5. UTI Leadership Equity Fund Open-ended Equity Growth 20/2/2008
6. UTI Contra Fund Open-ended Equity Growth 22/3/2009
7. UTI Long Term Advantage Fund Series II Open-ended Equity tax savings Growth 31/3/2008
8. UTI CCP Advantage Fund Open-ended Debt Growth 19/01/2004
9. UTI Master Equity Plan Unit Scheme Open-ended Equity Growth 31/3/2004
10. UTI Long Term Advantage Fund Close-ended Equity Growth 30/3/2007
11. UTI Opportunities Fund Open-ended Equity tax savings Growth 20/7/2007
12. UTI Wealth Builder Fund Series - II Open-ended Equity Growth 17/12/2008
13. UTI Infrastructure Fund Open-ended Equity Growth 09/03/2004
14. UTI Dividend Yield Fund Open-ended Equity Growth 23/05/2009
15. UTI MIS-Advantage Fund Open-ended Debt Growth 16/12/2008
16. UTI Dynamic Bond Fund Open-ended Equity Growth 23/06/2010
17. UTI Short Term Income Fund Institutional Open-ended Debt Growth 18/09/2007
18. UTI Gilt Advantage Fund Long Term PF Plan Close-ended Gilt Growth 29/09/2006
13
1
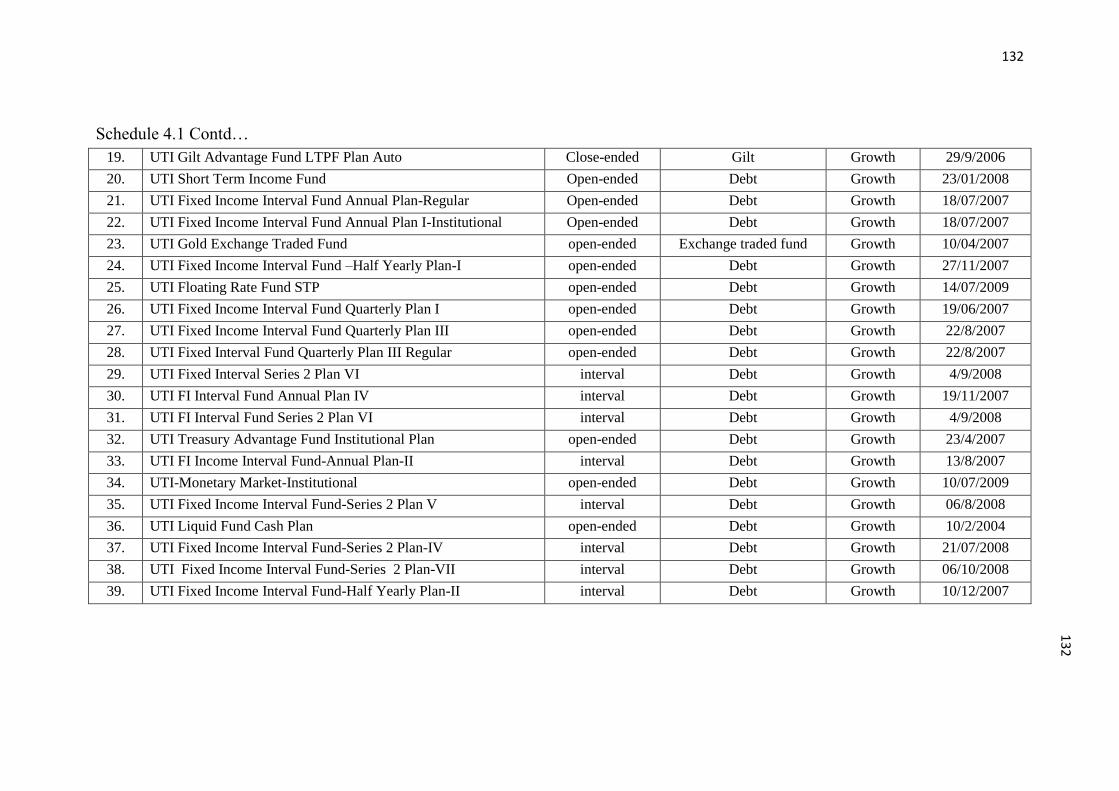
132
Schedule 4.1 Contd…
19. UTI Gilt Advantage Fund LTPF Plan Auto Close-ended Gilt Growth 29/9/2006
20. UTI Short Term Income Fund Open-ended Debt Growth 23/01/2008
21. UTI Fixed Income Interval Fund Annual Plan-Regular Open-ended Debt Growth 18/07/2007
22. UTI Fixed Income Interval Fund Annual Plan I-Institutional Open-ended Debt Growth 18/07/2007
23. UTI Gold Exchange Traded Fund open-ended Exchange traded fund Growth 10/04/2007
24. UTI Fixed Income Interval Fund –Half Yearly Plan-I open-ended Debt Growth 27/11/2007
25. UTI Floating Rate Fund STP open-ended Debt Growth 14/07/2009
26. UTI Fixed Income Interval Fund Quarterly Plan I open-ended Debt Growth 19/06/2007
27. UTI Fixed Income Interval Fund Quarterly Plan III open-ended Debt Growth 22/8/2007
28. UTI Fixed Interval Fund Quarterly Plan III Regular open-ended Debt Growth 22/8/2007
29. UTI Fixed Interval Series 2 Plan VI interval Debt Growth 4/9/2008
30. UTI FI Interval Fund Annual Plan IV interval Debt Growth 19/11/2007
31. UTI FI Interval Fund Series 2 Plan VI interval Debt Growth 4/9/2008
32. UTI Treasury Advantage Fund Institutional Plan open-ended Debt Growth 23/4/2007
33. UTI FI Income Interval Fund-Annual Plan-II interval Debt Growth 13/8/2007
34. UTI-Monetary Market-Institutional open-ended Debt Growth 10/07/2009
35. UTI Fixed Income Interval Fund-Series 2 Plan V interval Debt Growth 06/8/2008
36. UTI Liquid Fund Cash Plan open-ended Debt Growth 10/2/2004
37. UTI Fixed Income Interval Fund-Series 2 Plan-IV interval Debt Growth 21/07/2008
38. UTI Fixed Income Interval Fund-Series 2 Plan-VII interval Debt Growth 06/10/2008
39. UTI Fixed Income Interval Fund-Half Yearly Plan-II interval Debt Growth 10/12/2007
132

133
Schedule 4.1 Contd…
40. UTI Fixed Income Interval Fund- Regular Annual Plan-II interval Debt Growth 1308/2007
41. UTI Fixed Income Interval Fund-Monthly Plan II Regular interval Debt Growth 05/12/2007
42. UTI Fixed Income Interval Fund-Series 2 Qtly Interval Plan V interval Debt Growth 06/08/2008
43. UTI Fixed Income Interval Fund-Annual Plan III interval Debt Growth 24/9/2007
44. UTI Fixed Income Interval Fund-Monthly Plan I interval Debt Growth 12/9/2007
45. UTI Fixed Income Interval Fund-Monthly Plan I Regular interval Debt Growth 10/7/2007
46. UTI Fixed Income Interval Fund-Series-2 Plan IV interval Debt Growth 27/7/2005
47. UTI Floating Rate Fund- Short Term Plan open-ended Debt Growth 29/8/2007
48. UTI Fixed Income Interval-Fund Annual Plan III interval Debt Growth 24/9/07
49. UTI g-sec. Short Term Plan open-ended Gilt Growth 24/11/08
50. UTI Spread Fund Close-ended Equity Growth 29/6/06
51. UTI Wealth Builder Fund Close-ended Equity Growth 19/11/08
Source :www.utimf.com
133
134
PERFORMANCE OF SELECTED SCHEMES
The returns from out of mutual fund schemes and their sufficiency,
was found to be the major expectation of the investors. Hence the
performance efficiency of schemes would be based on the returns on the
schemes. In this chapter an attempt is made to evaluate the performance of
schemes, making use of different tools mentioned in the first chapter.
RETURN
People who have money to invest and looking for professional help are
more interested in better return on investment. The return from an investment
is constructed as the realisable cash flow earned by its owner during a given
period of time. It is expressed as a percentage on the beginning period value
of the investment. This value of rate of return is the generally accepted
criteria for determining the efficiency of performance of the investment. In
assessing performance the rate of return data is used as the basis. Data on
returns were obtained across schemes in order to analyse the performance by
schemes. The returns are computed on the basis of month end NAVs
announced by mutual funds.
For each of the schemes selected the returns have been computed by
taking end NAVs for the study period.
RISK
Risk is defined as the degree of variations in the portfolio returns.
Standard deviation is a statistical measure, which quantifies dispersion in
return. This measure is used widely for quantifying risk. The smaller the
deviation, the smaller is spread in the distribution and consequently, lower the
135
risk of the investment. The variance about the mean value, or standard
deviation of the returns may not be completely in accordance with one‟s
interpretation of the term risk. In other words, there are many ways by which
risk may be measured. But Sharpe (1966)128 pointed out that, this “is generally
highly correlated with familiar measures and thus provides an adequate
surrogate”. So the standard deviation of the monthly return is taken as a
measure of risk.
As equity based schemes are comparatively riskier; investors expect
return in relation to the risk involved. Hence, a better way to assess the
portfolio is to consider return per unit of risk. To measure the risk, two
appropriate quantitative risk surrogates that can be used are: standard
deviation of rate of return and beta coefficient of the portfolio.
Markowitz‟s portfolio theory paved the way for a new direction to the
risk-return analysis of portfolios. The CAPM developed by Sharpe (1964) and
John Linter (1969) laid the foundation stone for the growth of capital market.
Treynor (1965) and Jensen (1968) made remarkable contribution by
developing models to evaluate portfolios. Fama made a valuable contribution
to decompose return into various components. An empirical review of NAV
of the selected growth schemes bequeaths a better understanding of the mutual
fund schemes performance. The present part of the research work is an
attempt to study the second objectives to ascertain whether the selected
128 William Sharpe. F. “Mutual Fund Perforamne”, Journal of Business XXXIX, part-2 (Jan,
1996), pp. 119-38.

136
mutual funds performed well through their selective buying and selling of
securities rather than by random picking up, whether the selected portfolios
performed better than the market, how capable are the portfolio managers in
predicting market movements.
Many research works followed the methodology of Treynor, Sharpe
and Jensen. On the same lines, based on the background of the previous
studies reviewed, the researcher has attempted to make a close assessment of
the mutual funds in the interest of the investing public. The present part of the
research work relates to the appraisal of the seven schemes, using Sharpe
Reward to Variability, Treynor Reward to Volatility, Jensen Alpha, and
Eugene Fama Decomposed Total Return for the period of ten financial years
from April 2004 to March 2014 under the regulated environment.
SHARPE INDEX
Sharpe Index (St) is based on the scheme‟s total risk and is a summary
measure of scheme‟s performance adjusted for risk.
St = [(Return from the Portfolio – Risk-free Rate of Return) ÷ Total
Risk of Portfolio]

137
Table 4.1
Sharpe Index – UTI Banking Sector Fund
Year Return Market
Return Risk
Sharpe
Index
Market
Sharpe
Index
2004-05
2005-06
2006-07
2007-08
2008-09
2009-10
2010-11
2011-12
2012-13
2013-14
0.0048
0.0144
(-)0.0084
(-)0.0002
(-)0.0010
0.0101
0.0040
0.0095
0.0083
0.0101
(-)0.0001
0.0125
(-)0.0092
0.0009
(-)0.0039
0.0132
0.0074
0.0092
0.0194
0.0124
0.0836
0.0663
0.1026
0.0422
0.0205
0.0317
0.0488
0.0316
0.0413
0.0442
(-) 0.6634
(-)0.6732
(-)0.6669
(-)1.4245
(-)2.9814
(-)1.5748
(-) 1.3473
(-) 2.3222
(-)1.7341
(-)1.6324
(-)0.4273
(-)0.8495
(-)1.2713
(-)1.3567
(-)2.7173
(-)1.1327
(-)1.2738
(-) 2.1318
(-) 1.6732
(-) 1.7135
Average 0.0052 0.0061 0.0512 (-)0.9508 (-)1.4695
The Table 4.1 presents the calculations of Sharpe‟s Index for UTI
Banking sector fund scheme during the period of study. The return from the
scheme ranges from (-) 0.0084 to 0.0144 and is better than the market return
except in three years (2006-07, 2007-08, 2008-09). Scheme‟s risk ranges from
0.0205 to 0.1026.
Sharpe index of the scheme shows negative values in all the years. It is
the result of poor performance due to redemption pressure of investment,
world wide recession fall of corporate profits and competition with buyount
secondary markets.

138
Graph 4.1
UTI Banking Sector Fund Scheme Return and Market Return
Graph 4.1 displays the relationship between scheme return and
market return and ensures that market outperformed the scheme from
2008-09 onwards. However, the scheme‟s average return (0.0052) and
Sharpe index (-0.9508) is better than the market in comparison to risk.
Table 4.2
Sharpe Index - UTI Mid Cap Fund
Year Return Market
Return Risk
Sharpe
Index
Market
Sharpe
Index
2004-05
2005-06
2006-07
2007-08
2008-09
2009-10
2010-11
2011-12
2012-13
2013-14
0.0144
0.0063
(-)0.0054
0.0038
0.0006
0.0183
0.0043
0.0131
0.0173
0.0048
(-) 0.0001
0.0125
(-)0.0092
0.0009
(-)0.0039
0.0132
0.0074
0.0092
0.0104
0.0124
0.0476
0.0870
0.0445
0.0434
0.0233
0.0395
0.0403
0.0230
0.0584
0.0343
(-) 1.0250
(-)0.6175
(-)1.4673
(-)1.3216
(-)2.5581
(-)1.0843
(-)1.3483
(-)2.1248
(-)1.4301
(-)2.4831
(-) 1.4273
(-)0.8495
(-)1.2713
(-)1.3567
(-)2.7173
(-)1.1327
(-)1.2738
(-)2.1318
(-)1.6732
(-)1.7135
Average 0.0073 0.0061 0.0441 (-)1.1392 (-)1.4695
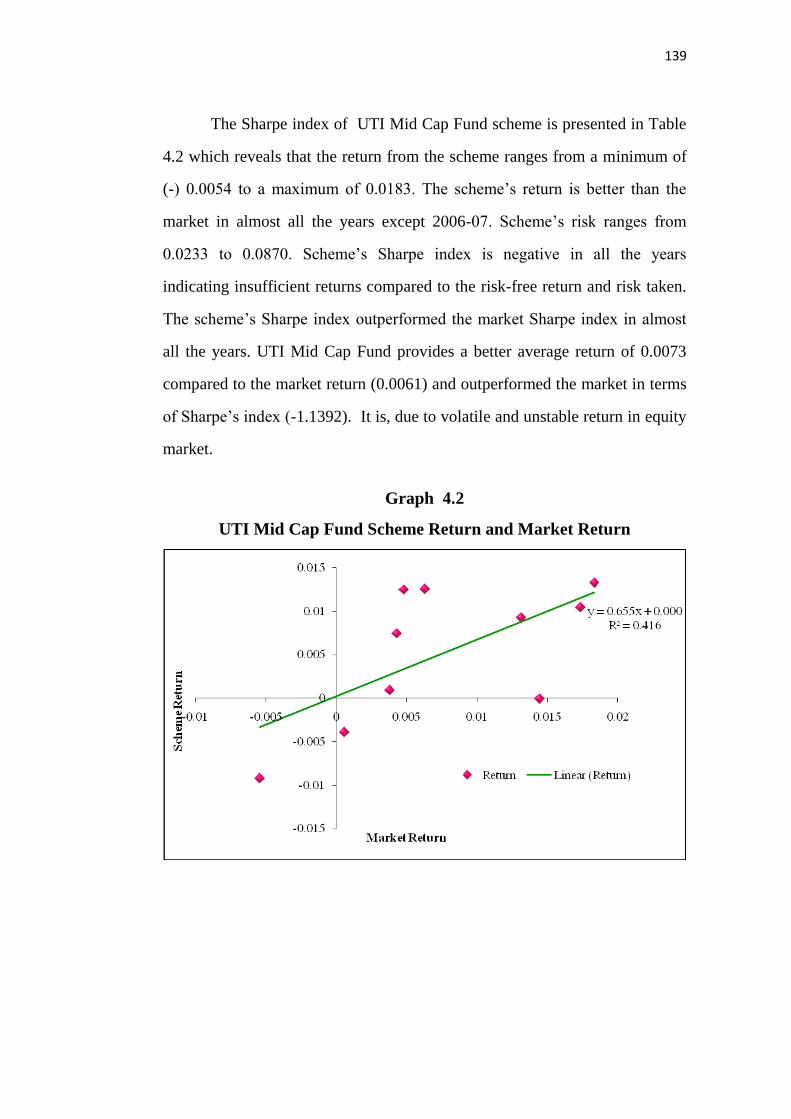
139
The Sharpe index of UTI Mid Cap Fund scheme is presented in Table
4.2 which reveals that the return from the scheme ranges from a minimum of
(-) 0.0054 to a maximum of 0.0183. The scheme‟s return is better than the
market in almost all the years except 2006-07. Scheme‟s risk ranges from
0.0233 to 0.0870. Scheme‟s Sharpe index is negative in all the years
indicating insufficient returns compared to the risk-free return and risk taken.
The scheme‟s Sharpe index outperformed the market Sharpe index in almost
all the years. UTI Mid Cap Fund provides a better average return of 0.0073
compared to the market return (0.0061) and outperformed the market in terms
of Sharpe‟s index (-1.1392). It is, due to volatile and unstable return in equity
market.
Graph 4.2
UTI Mid Cap Fund Scheme Return and Market Return
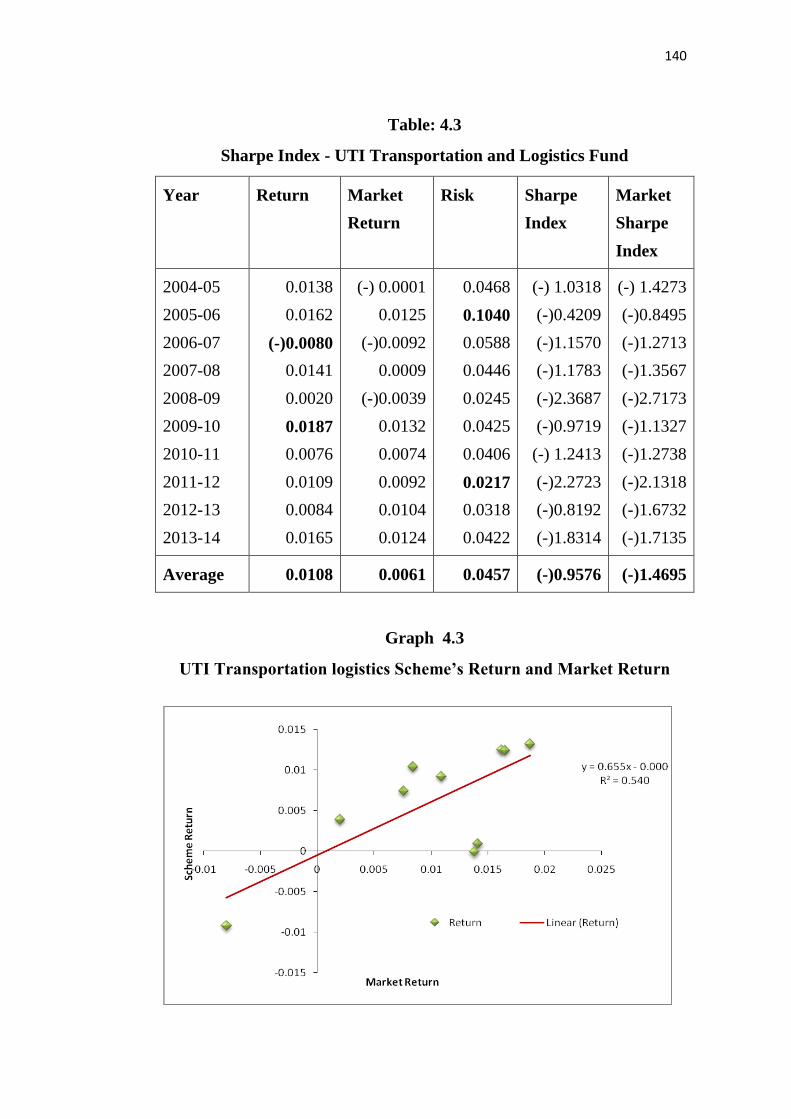
140
Table: 4.3
Sharpe Index - UTI Transportation and Logistics Fund
Year Return Market
Return
Risk Sharpe
Index
Market
Sharpe
Index
2004-05
2005-06
2006-07
2007-08
2008-09
2009-10
2010-11
2011-12
2012-13
2013-14
0.0138
0.0162
(-)0.0080
0.0141
0.0020
0.0187
0.0076
0.0109
0.0084
0.0165
(-) 0.0001
0.0125
(-)0.0092
0.0009
(-)0.0039
0.0132
0.0074
0.0092
0.0104
0.0124
0.0468
0.1040
0.0588
0.0446
0.0245
0.0425
0.0406
0.0217
0.0318
0.0422
(-) 1.0318
(-)0.4209
(-)1.1570
(-)1.1783
(-)2.3687
(-)0.9719
(-) 1.2413
(-)2.2723
(-)0.8192
(-)1.8314
(-) 1.4273
(-)0.8495
(-)1.2713
(-)1.3567
(-)2.7173
(-)1.1327
(-)1.2738
(-)2.1318
(-)1.6732
(-)1.7135
Average 0.0108 0.0061 0.0457 (-)0.9576 (-)1.4695
Graph 4.3
UTI Transportation logistics Scheme’s Return and Market Return

141
The Table 4.3 shows that the return on UTI Transportation and
Logistics Fund return ranges from (-) 0.0080 to 0.0187 and is better than the
market in all the years covered under the study. The risk covered by the
scheme ranges from 0.0217 to 0.1040.
The Sharpe index of the scheme showed negative returns in all the
years indicating inadequate returns compared to the total risk and risk-free
return. The scheme‟s Sharpe index is better than the market Sharpe index in
almost all the years indicating outperformance compared to market.
On an overall, UTI Transportation and Logistics Fund performance in
terms of average return (0.0108) and Sharpe index (-0.9576) is good
compared to the market. From the analysis it is evident that interest rate is
constant for several years due to earned high return of schemes.
Table 4.4
Sharpe Index – UTI Master Equity Plan Unit Scheme (MEPUS)
Year Return Market
Return Risk
Sharpe
Index
Market
Sharpe
Index
2004-05
2005-06
2006-07
2007-08
2008-09
2009-10
2010-11
2011-12
2012-13
2013-14
0.0128
0.0036
(-)0.0047
0.0016
(-)0.0010
0.0172
0.0069
0.0097
0.0110
0.0131
(-) 0.0001
0.0125
(-)0.0092
0.0009
(-)0.0039
0.0132
0.0074
0.0092
0.0104
0.0124
0.0899
0.0445
0.0319
0.0233
0.0234
0.0375
0.0387
0.0243
0.0584
0.0712
(-) 0.5182
(-)1.2850
(-)2.0250
(-)2.4955
(-)2.6111
(-)1.1782
(-) 1.3020
(-) 2.0592
(-) 2.4951
(-) 2.9021
(-) 1.4273
(-)0.8495
(-)1.2713
(-)1.3567
(-)2.7173
(-)1.1327
(-)1.2738
(-)2.1318
(-)1.6732
(-)1.7135
Average 0.0070 0.0061 0.0443 (-)1.2169 (-)1.4695

142
Table 4.4 shows the calculations on Sharpe‟s index. As per the Table
the return on UTI MEPUS ranges from (-) 0.0047 to 0.0172. Scheme‟s return
is better than the market in almost all the years except in 2006-07 and
2008-09. It is supported by graph 4.4, which shows the scheme‟s risk is the
lowest in the year 2007-08 (0.0233) and highest (0.0899) in the year 2004-05.
Sharpe index is negative for the scheme and for the market in all the
years indicating insufficient returns in relation to the risk-free return and risk
involved.
It is concluded that UTI MEPUS Scheme outperformed the market in
terms of average return (0.0070). Sharpe index (-1.2169) is also higher than
Sharpe market index indicating better performance. It is because, the UTI
Mutual Fund shifted its assets from one instrument to another to get the
benefit from the financial and capital market during the study period.
Graph 4.4
UTI MEPUS Scheme Return and Market Return
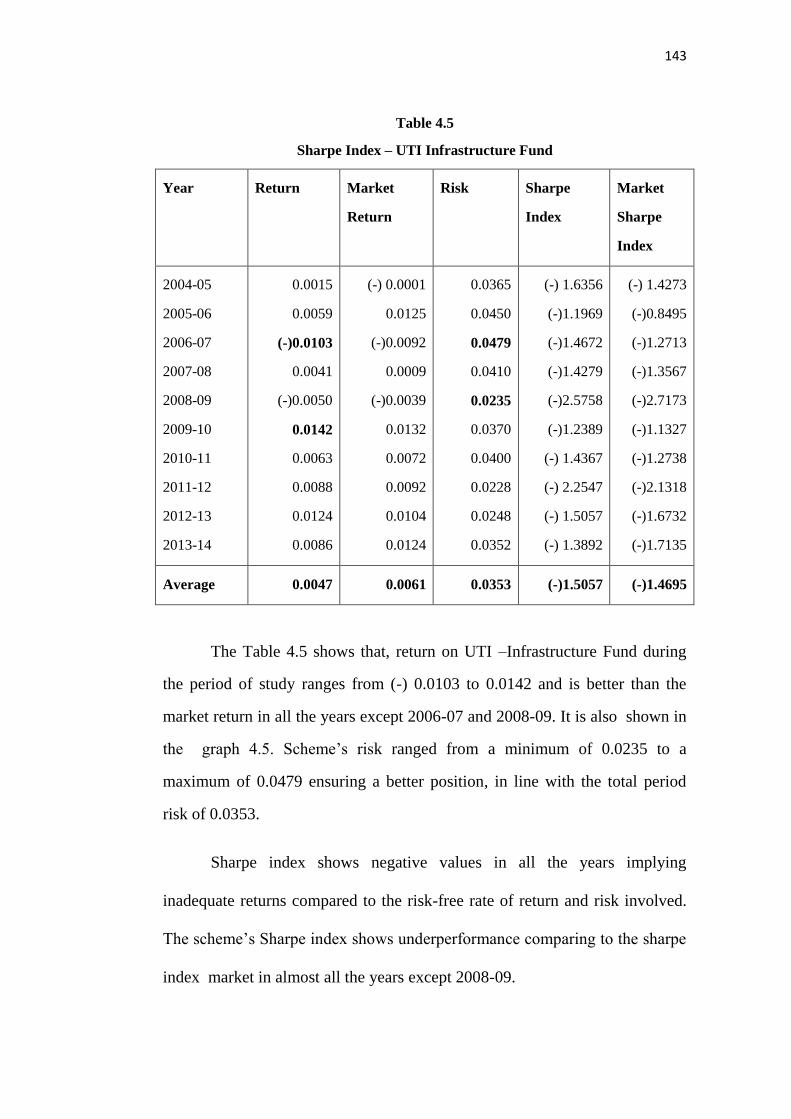
143
Table 4.5
Sharpe Index – UTI Infrastructure Fund
Year Return Market
Return
Risk Sharpe
Index
Market
Sharpe
Index
2004-05
2005-06
2006-07
2007-08
2008-09
2009-10
2010-11
2011-12
2012-13
2013-14
0.0015
0.0059
(-)0.0103
0.0041
(-)0.0050
0.0142
0.0063
0.0088
0.0124
0.0086
(-) 0.0001
0.0125
(-)0.0092
0.0009
(-)0.0039
0.0132
0.0072
0.0092
0.0104
0.0124
0.0365
0.0450
0.0479
0.0410
0.0235
0.0370
0.0400
0.0228
0.0248
0.0352
(-) 1.6356
(-)1.1969
(-)1.4672
(-)1.4279
(-)2.5758
(-)1.2389
(-) 1.4367
(-) 2.2547
(-) 1.5057
(-) 1.3892
(-) 1.4273
(-)0.8495
(-)1.2713
(-)1.3567
(-)2.7173
(-)1.1327
(-)1.2738
(-)2.1318
(-)1.6732
(-)1.7135
Average 0.0047 0.0061 0.0353 (-)1.5057 (-)1.4695
The Table 4.5 shows that, return on UTI –Infrastructure Fund during
the period of study ranges from (-) 0.0103 to 0.0142 and is better than the
market return in all the years except 2006-07 and 2008-09. It is also shown in
the graph 4.5. Scheme‟s risk ranged from a minimum of 0.0235 to a
maximum of 0.0479 ensuring a better position, in line with the total period
risk of 0.0353.
Sharpe index shows negative values in all the years implying
inadequate returns compared to the risk-free rate of return and risk involved.
The scheme‟s Sharpe index shows underperformance comparing to the sharpe
index market in almost all the years except 2008-09.
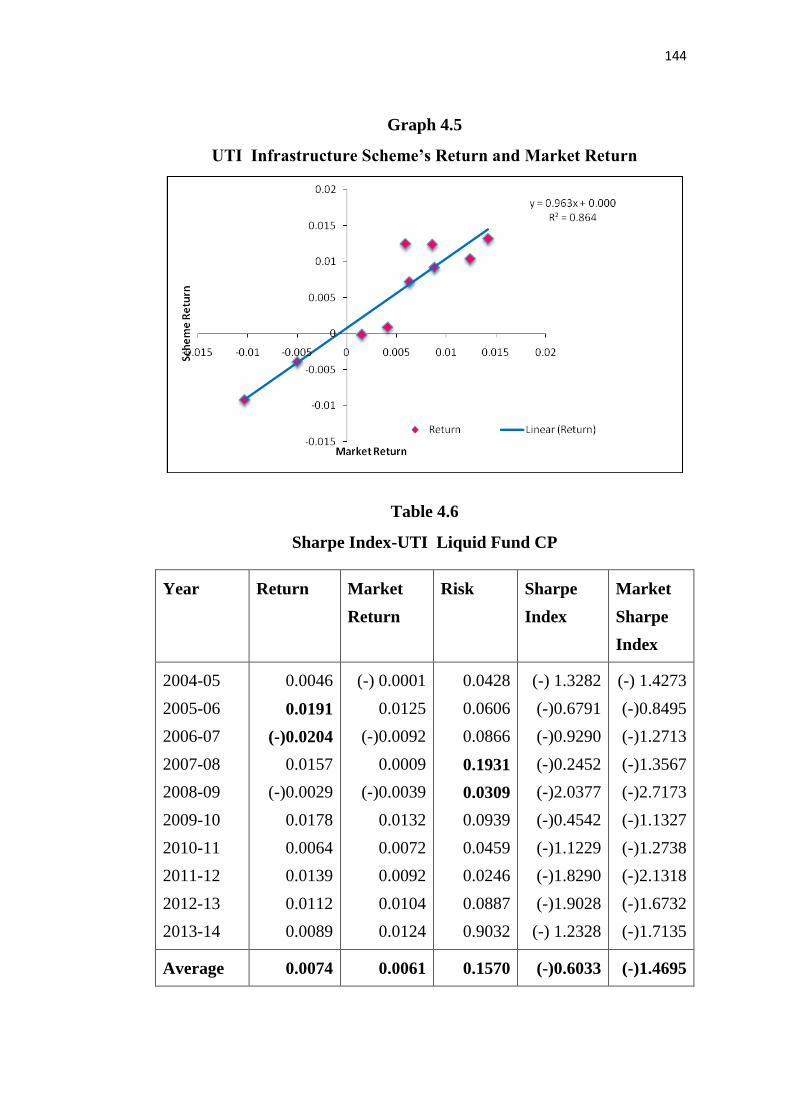
144
Graph 4.5
UTI Infrastructure Scheme’s Return and Market Return
Table 4.6
Sharpe Index-UTI Liquid Fund CP
Year Return Market
Return
Risk Sharpe
Index
Market
Sharpe
Index
2004-05
2005-06
2006-07
2007-08
2008-09
2009-10
2010-11
2011-12
2012-13
2013-14
0.0046
0.0191
(-)0.0204
0.0157
(-)0.0029
0.0178
0.0064
0.0139
0.0112
0.0089
(-) 0.0001
0.0125
(-)0.0092
0.0009
(-)0.0039
0.0132
0.0072
0.0092
0.0104
0.0124
0.0428
0.0606
0.0866
0.1931
0.0309
0.0939
0.0459
0.0246
0.0887
0.9032
(-) 1.3282
(-)0.6791
(-)0.9290
(-)0.2452
(-)2.0377
(-)0.4542
(-)1.1229
(-)1.8290
(-)1.9028
(-) 1.2328
(-) 1.4273
(-)0.8495
(-)1.2713
(-)1.3567
(-)2.7173
(-)1.1327
(-)1.2738
(-)2.1318
(-)1.6732
(-)1.7135
Average 0.0074 0.0061 0.1570 (-)0.6033 (-)1.4695

145
Table 4.6 depicts that, the return on UTI Liquid Fund CP scheme
ranges from (-) 0.0204 to 0.0191 during the period of study with an
average return of 0.0074. It is also shown in the Graph 4.6. Scheme‟s
return is better than the market return in almost all the years except in the
years 2006-07 and 2008-09. Scheme‟s risk ranges from 0.0309 to 0.1931.
The performance of the scheme in terms of risk and return as
measured by Sharpe Index shows negative values during the entire period
of study implying that the returns are not sufficient to cover the risk free
return and risk involved. UTI Liquid Fund CP outperforms the market in
all the ten years studied in terms of Sharpe index.
The overall Sharpe index of the scheme (-0.6033) is less than the
market Sharpe index (-1.4695) which shows that the scheme outperforms
the market.
Graph 4.6
UTI Liquid Schemes Return and Market Return

146
Table 4.7
Sharpe Index - UTI CCP Advantage Fund
Year Return Market
Return Risk
Sharpe
Index
Market
Sharpe
Index
2004-05
2005-06
2006-07
2007-08
2008-09
2009-10
2010-11
2011-12
2012-13
2013-14
0.0061
0.0084
(-)0.0104
0.0021
(-)0.0013
0.0142
0.0058
(-)0.0010
0.0131
0.0091
(-) 0.0001
0.0125
(-)0.0092
0.0009
(-)0.0039
0.0132
0.0072
0.0092
0.0104
0.0124
0.0461
0.0482
0.0667
0.0401
0.0211
0.0367
0.0411
0.0836
0.0512
0.6703
(-) 1.3217
(-)1.0488
(-)1.0559
(-)1.4505
(-)2.9243
(-)1.2787
(-)1.3198
(-)0.7293
(-)1.7287
(-)1.1982
(-) 1.4273
(-)0.8495
(-)1.2713
(-)1.3567
(-)2.7173
(-)1.1327
(-)1.2738
(-)2.1318
(-)1.6732
(-)1.7135
Average 0.0038 0.0061 0.1105 (-)1.1317 (-)1.4695
The above Table reveals that, the return from UTI CCP Advantage
scheme ranges from (-) 0.0104 to 0.0142. It is also displayed in the Graph
4.7.Scheme‟s return is better than the market only in seven years (excluding
2006-07, 2008-09 and 2011-12). Scheme‟s risk ranges from 0.0211 to 0.667
with an overall risk of 0.1105.
Scheme‟s Sharpe index shows negative values in all the years implying
inadequate returns compared to the risk-free return and risk covered.
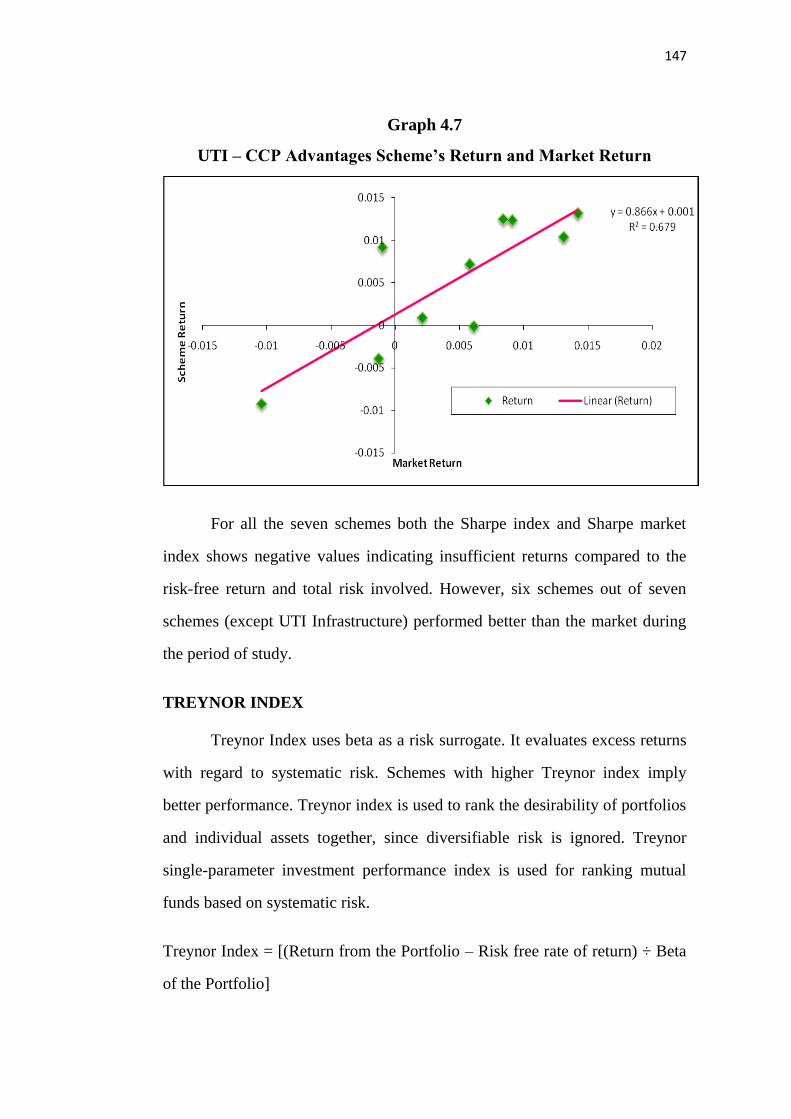
147
Graph 4.7
UTI – CCP Advantages Scheme’s Return and Market Return
For all the seven schemes both the Sharpe index and Sharpe market
index shows negative values indicating insufficient returns compared to the
risk-free return and total risk involved. However, six schemes out of seven
schemes (except UTI Infrastructure) performed better than the market during
the period of study.
TREYNOR INDEX
Treynor Index uses beta as a risk surrogate. It evaluates excess returns
with regard to systematic risk. Schemes with higher Treynor index imply
better performance. Treynor index is used to rank the desirability of portfolios
and individual assets together, since diversifiable risk is ignored. Treynor
single-parameter investment performance index is used for ranking mutual
funds based on systematic risk.
Treynor Index = [(Return from the Portfolio – Risk free rate of return) ÷ Beta
of the Portfolio]
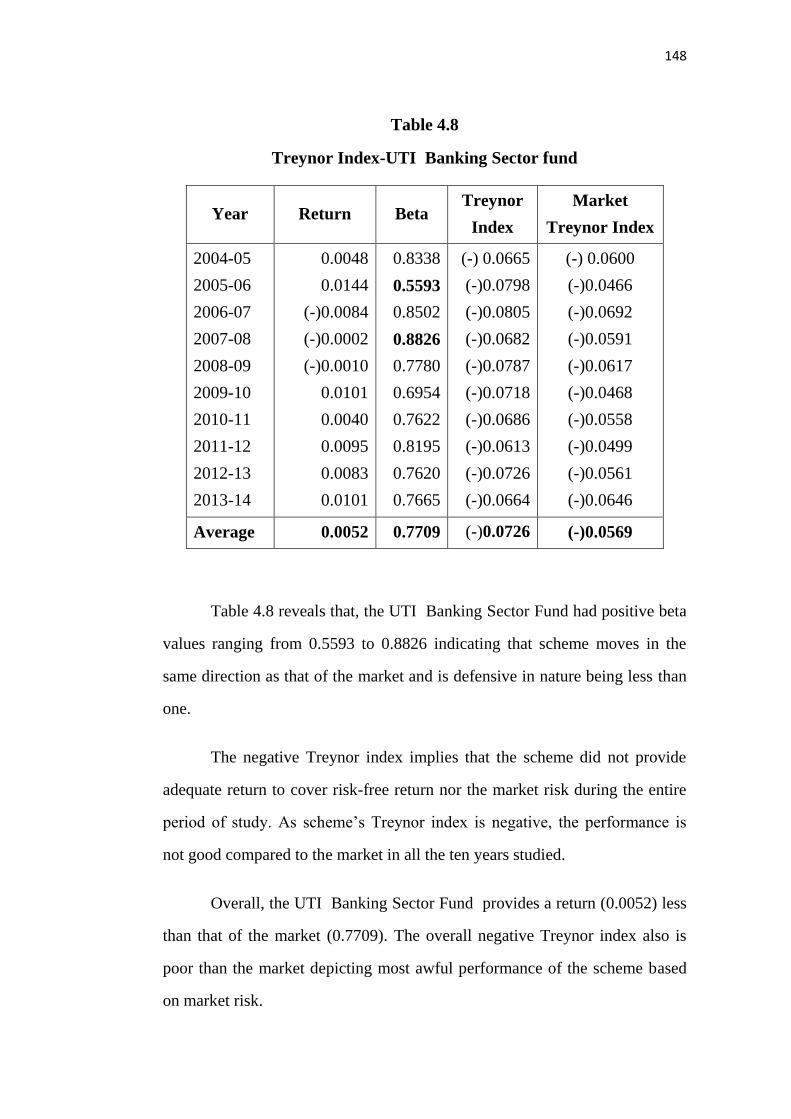
148
Table 4.8
Treynor Index-UTI Banking Sector fund
Year Return Beta Treynor
Index
Market
Treynor Index
2004-05
2005-06
2006-07
2007-08
2008-09
2009-10
2010-11
2011-12
2012-13
2013-14
0.0048
0.0144
(-)0.0084
(-)0.0002
(-)0.0010
0.0101
0.0040
0.0095
0.0083
0.0101
0.8338
0.5593
0.8502
0.8826
0.7780
0.6954
0.7622
0.8195
0.7620
0.7665
(-) 0.0665
(-)0.0798
(-)0.0805
(-)0.0682
(-)0.0787
(-)0.0718
(-)0.0686
(-)0.0613
(-)0.0726
(-)0.0664
(-) 0.0600
(-)0.0466
(-)0.0692
(-)0.0591
(-)0.0617
(-)0.0468
(-)0.0558
(-)0.0499
(-)0.0561
(-)0.0646
Average 0.0052 0.7709 (-)0.0726 (-)0.0569
Table 4.8 reveals that, the UTI Banking Sector Fund had positive beta
values ranging from 0.5593 to 0.8826 indicating that scheme moves in the
same direction as that of the market and is defensive in nature being less than
one.
The negative Treynor index implies that the scheme did not provide
adequate return to cover risk-free return nor the market risk during the entire
period of study. As scheme‟s Treynor index is negative, the performance is
not good compared to the market in all the ten years studied.
Overall, the UTI Banking Sector Fund provides a return (0.0052) less
than that of the market (0.7709). The overall negative Treynor index also is
poor than the market depicting most awful performance of the scheme based
on market risk.

149
Table 4.9
Treynor Index-UTI MID Cap Fund
Year Return Beta Treynor
Index
Market
Treynor
Index
2004-05
2005-06
2006-07
2007-08
2008-09
2009-10
2010-11
2011-12
2012-13
2013-14
0.0144
0.0063
(-)0.0054
0.0038
0.0006
0.0183
0.0043
0.0131
0.0173
0.0048
0.9566
0.6544
0.7292
0.9304
0.9331
0.9034
0.9100
0.9344
0.8242
0.9012
(-) 0.0510
(-)0.0821
(-)0.0895
(-)0.0617
(-)0.0640
(-)0.0474
(-)0.0613
(-)0.0524
(-)0.0656
(-)0.6034
(-) 0.0600
(-)0.0466
(-)0.0692
(-)0.0591
(-)0.0617
(-)0.0468
(-)0.0558
(-)0.0499
(-)0.0561
(-)0.0646
Average 0.0073 0.8676 (-)0.0656 (-)0.0569
Table 4.9 shows that, the UTI Mid Cap Fund positive beta values
ranges from a minimum of 0.6544 to a maximum of 0.9566 indicating
performance of the scheme is in the same direction as that of the market.
However, the scheme‟s beta values being less than one in all the years indicate
its defensive nature.
The negative Treynor index for all the years indicate that the scheme
did not provide adequate return to cover risk-free return and for the market
risk undertaken by the unit-holders. The negative Treynor index being less
than the market in only one year (2004-05) indicates poor performance of the
scheme based on beta risk during the study period.

150
Table 4.10
Treynor Index-UTI Transportation and Logistics Fund
Year Return Beta Treynor
Index
Market
Treynor
Index
2004-05
2005-06
2006-07
2007-08
2008-09
2009-10
2010-11
2011-12
2012-13
2013-14
0.0138
0.0162
(-)0.0080
0.0141
0.0020
0.0187
0.0076
0.0109
0.0084
0.0165
0.7221
0.7817
0.7822
0.8532
0.8514
0.7956
0.8556
0.6528
0.7981
0.7718
(-) 0.0669
(-)0.0560
(-)0.0869
(-)0.0616
(-)0.0681
(-)0.0520
(-)0.0589
(-)0.0754
(-)0.0645
(-)0.0658
(-) 0.0600
(-)0.0466
(-)0.0692
(-)0.0591
(-)0.0617
(-)0.0468
(-)0.0558
(-)0.0499
(-)0.0561
(-)0.0646
Average 0.0108 0.7954 (-)0.0645 (-)0.0569
The UTI Transportation and Logistics Fund positive beta values as
depicted in the Table 4.10 with an overall value of 0.7954 demonstrate that
scheme and the market moves in the same direction. The beta values ranging
from 0.7221 to 0.8556 are an indication of high sensitivity of the scheme for
the market movement. The scheme did not provide enough returns to cover
the risk-free return and for the market risk involved as reflected in the
negative Treynor index.
The negative Treynor index of UTI Transportation and Logistics Fund
being more than the market in all the years studied establishes that the market
performance is better than that of the scheme.

151
Table 4.11
Treynor Index-UTI Master Equity Plan Unit Scheme (MEPUS)
Year Return Beta Treynor
Index
Market
Treynor
Index
2004-05
2005-06
2006-07
2007-08
2008-09
2009-10
2010-11
2011-12
2012-13
2013-14
0.0128
0.0036
(-)0.0047
0.0016
(-)0.0010
0.0172
0.0069
0.0097
0.0110
0.0131
0.7454
0.3946
0.4501
0.4273
0.5032
0.6230
0.8305
0.8451
0.5605
0.6320
(-) 0.0625
(-)0.1450
(-)0.1437
(-)0.1362
(-)0.1213
(-)0.0709
(-)0.0607
(-)0.0592
(-)0.0964
(-)0.6709
(-) 0.0600
(-)0.0466
(-)0.0692
(-)0.0591
(-)0.0617
(-)0.0468
(-)0.0558
(-)0.0499
(-)0.0561
(-)0.0646
Average 0.0070 0.5676 (-)0.0964 (-)0.0569
Table 4.11 shows the UTI MEPUS positive beta values ranging from
0.3946 to 0.8451 reveals that the performance of the scheme and that of the
market are in the same direction. The lower beta values in all the years
indicate the defensive nature of the scheme.
The negative Treynor index in all the years signify that the scheme did
not provide adequate returns to cover the market risk involved and the
risk-free return. The negative Treynor‟s index being more than that of market
in all the years signify under performance of the scheme compared to the
market
The overall Treynor index of UTI MEPUS being more than that of the
market indicates that the scheme‟s performance is disgraceful.
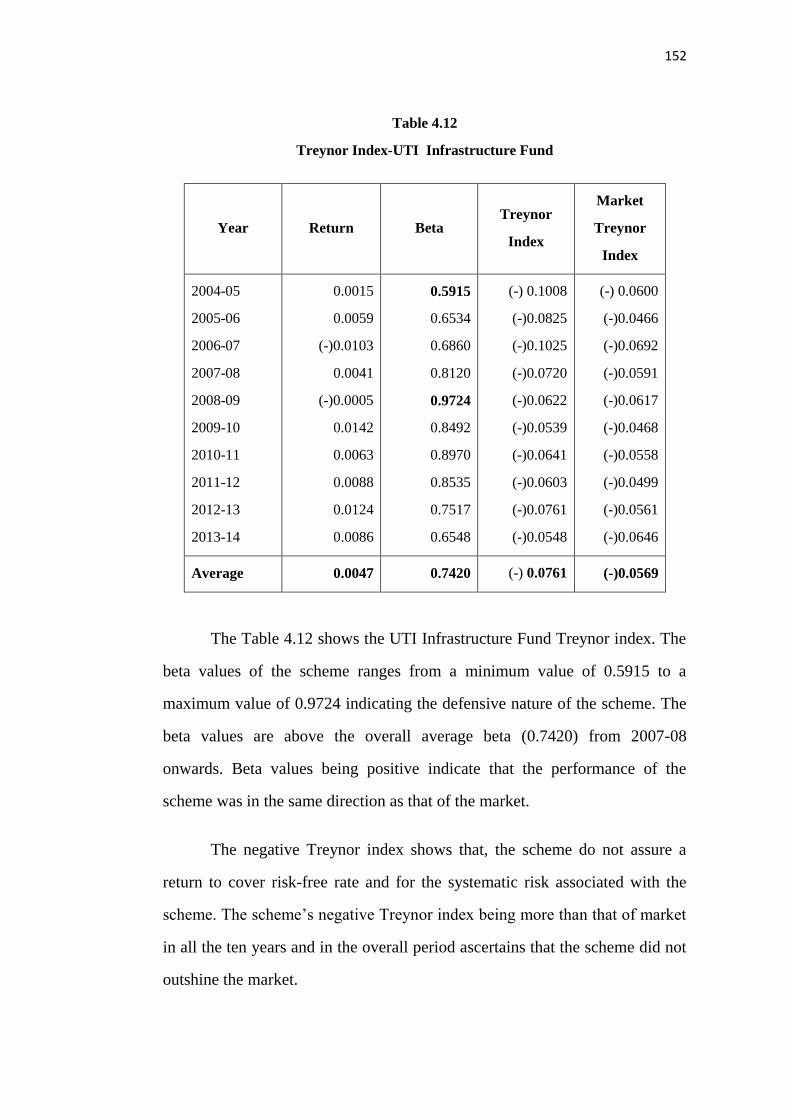
152
Table 4.12
Treynor Index-UTI Infrastructure Fund
Year Return Beta Treynor
Index
Market
Treynor
Index
2004-05
2005-06
2006-07
2007-08
2008-09
2009-10
2010-11
2011-12
2012-13
2013-14
0.0015
0.0059
(-)0.0103
0.0041
(-)0.0005
0.0142
0.0063
0.0088
0.0124
0.0086
0.5915
0.6534
0.6860
0.8120
0.9724
0.8492
0.8970
0.8535
0.7517
0.6548
(-) 0.1008
(-)0.0825
(-)0.1025
(-)0.0720
(-)0.0622
(-)0.0539
(-)0.0641
(-)0.0603
(-)0.0761
(-)0.0548
(-) 0.0600
(-)0.0466
(-)0.0692
(-)0.0591
(-)0.0617
(-)0.0468
(-)0.0558
(-)0.0499
(-)0.0561
(-)0.0646
Average 0.0047 0.7420 (-) 0.0761 (-)0.0569
The Table 4.12 shows the UTI Infrastructure Fund Treynor index. The
beta values of the scheme ranges from a minimum value of 0.5915 to a
maximum value of 0.9724 indicating the defensive nature of the scheme. The
beta values are above the overall average beta (0.7420) from 2007-08
onwards. Beta values being positive indicate that the performance of the
scheme was in the same direction as that of the market.
The negative Treynor index shows that, the scheme do not assure a
return to cover risk-free rate and for the systematic risk associated with the
scheme. The scheme‟s negative Treynor index being more than that of market
in all the ten years and in the overall period ascertains that the scheme did not
outshine the market.
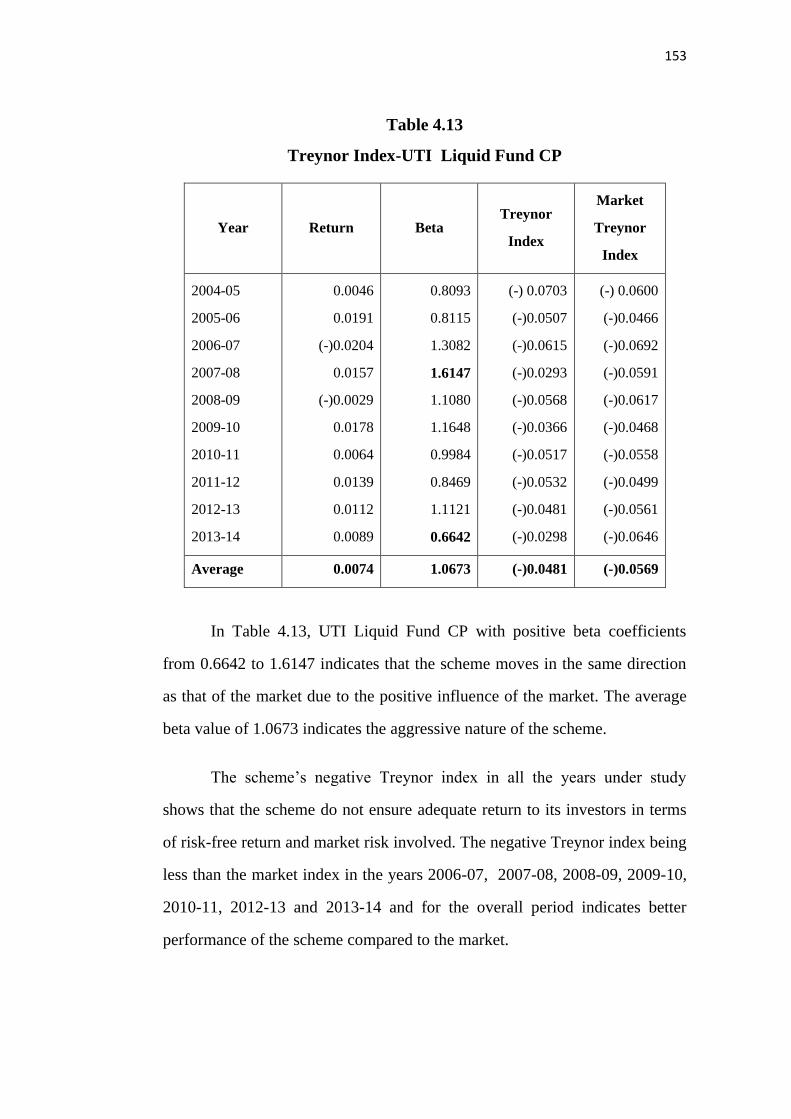
153
Table 4.13
Treynor Index-UTI Liquid Fund CP
Year Return Beta Treynor
Index
Market
Treynor
Index
2004-05
2005-06
2006-07
2007-08
2008-09
2009-10
2010-11
2011-12
2012-13
2013-14
0.0046
0.0191
(-)0.0204
0.0157
(-)0.0029
0.0178
0.0064
0.0139
0.0112
0.0089
0.8093
0.8115
1.3082
1.6147
1.1080
1.1648
0.9984
0.8469
1.1121
0.6642
(-) 0.0703
(-)0.0507
(-)0.0615
(-)0.0293
(-)0.0568
(-)0.0366
(-)0.0517
(-)0.0532
(-)0.0481
(-)0.0298
(-) 0.0600
(-)0.0466
(-)0.0692
(-)0.0591
(-)0.0617
(-)0.0468
(-)0.0558
(-)0.0499
(-)0.0561
(-)0.0646
Average 0.0074 1.0673 (-)0.0481 (-)0.0569
In Table 4.13, UTI Liquid Fund CP with positive beta coefficients
from 0.6642 to 1.6147 indicates that the scheme moves in the same direction
as that of the market due to the positive influence of the market. The average
beta value of 1.0673 indicates the aggressive nature of the scheme.
The scheme‟s negative Treynor index in all the years under study
shows that the scheme do not ensure adequate return to its investors in terms
of risk-free return and market risk involved. The negative Treynor index being
less than the market index in the years 2006-07, 2007-08, 2008-09, 2009-10,
2010-11, 2012-13 and 2013-14 and for the overall period indicates better
performance of the scheme compared to the market.
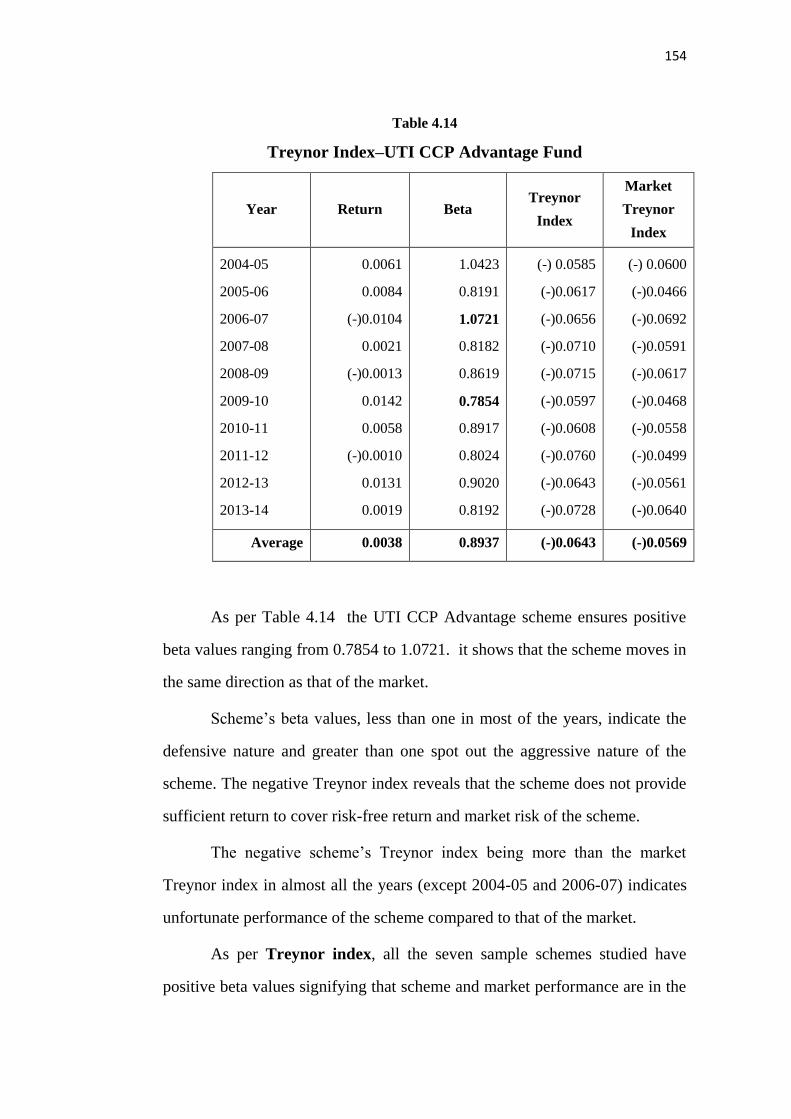
154
Table 4.14
Treynor Index–UTI CCP Advantage Fund
Year Return Beta Treynor
Index
Market
Treynor
Index
2004-05
2005-06
2006-07
2007-08
2008-09
2009-10
2010-11
2011-12
2012-13
2013-14
0.0061
0.0084
(-)0.0104
0.0021
(-)0.0013
0.0142
0.0058
(-)0.0010
0.0131
0.0019
1.0423
0.8191
1.0721
0.8182
0.8619
0.7854
0.8917
0.8024
0.9020
0.8192
(-) 0.0585
(-)0.0617
(-)0.0656
(-)0.0710
(-)0.0715
(-)0.0597
(-)0.0608
(-)0.0760
(-)0.0643
(-)0.0728
(-) 0.0600
(-)0.0466
(-)0.0692
(-)0.0591
(-)0.0617
(-)0.0468
(-)0.0558
(-)0.0499
(-)0.0561
(-)0.0640
Average 0.0038 0.8937 (-)0.0643 (-)0.0569
As per Table 4.14 the UTI CCP Advantage scheme ensures positive
beta values ranging from 0.7854 to 1.0721. it shows that the scheme moves in
the same direction as that of the market.
Scheme‟s beta values, less than one in most of the years, indicate the
defensive nature and greater than one spot out the aggressive nature of the
scheme. The negative Treynor index reveals that the scheme does not provide
sufficient return to cover risk-free return and market risk of the scheme.
The negative scheme‟s Treynor index being more than the market
Treynor index in almost all the years (except 2004-05 and 2006-07) indicates
unfortunate performance of the scheme compared to that of the market.
As per Treynor index, all the seven sample schemes studied have
positive beta values signifying that scheme and market performance are in the
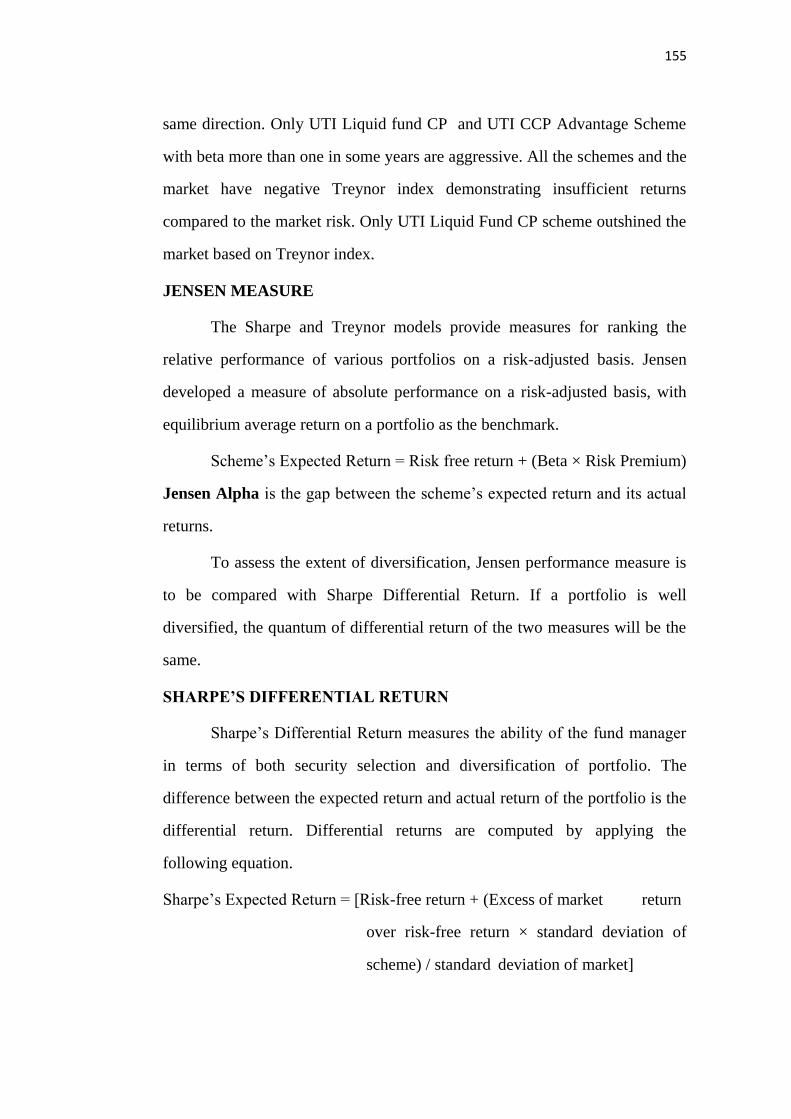
155
same direction. Only UTI Liquid fund CP and UTI CCP Advantage Scheme
with beta more than one in some years are aggressive. All the schemes and the
market have negative Treynor index demonstrating insufficient returns
compared to the market risk. Only UTI Liquid Fund CP scheme outshined the
market based on Treynor index.
JENSEN MEASURE
The Sharpe and Treynor models provide measures for ranking the
relative performance of various portfolios on a risk-adjusted basis. Jensen
developed a measure of absolute performance on a risk-adjusted basis, with
equilibrium average return on a portfolio as the benchmark.
Scheme‟s Expected Return = Risk free return + (Beta × Risk Premium)
Jensen Alpha is the gap between the scheme‟s expected return and its actual
returns.
To assess the extent of diversification, Jensen performance measure is
to be compared with Sharpe Differential Return. If a portfolio is well
diversified, the quantum of differential return of the two measures will be the
same.
SHARPE’S DIFFERENTIAL RETURN
Sharpe‟s Differential Return measures the ability of the fund manager
in terms of both security selection and diversification of portfolio. The
difference between the expected return and actual return of the portfolio is the
differential return. Differential returns are computed by applying the
following equation.
Sharpe‟s Expected Return = [Risk-free return + (Excess of market return
over risk-free return × standard deviation of
scheme) / standard deviation of market]
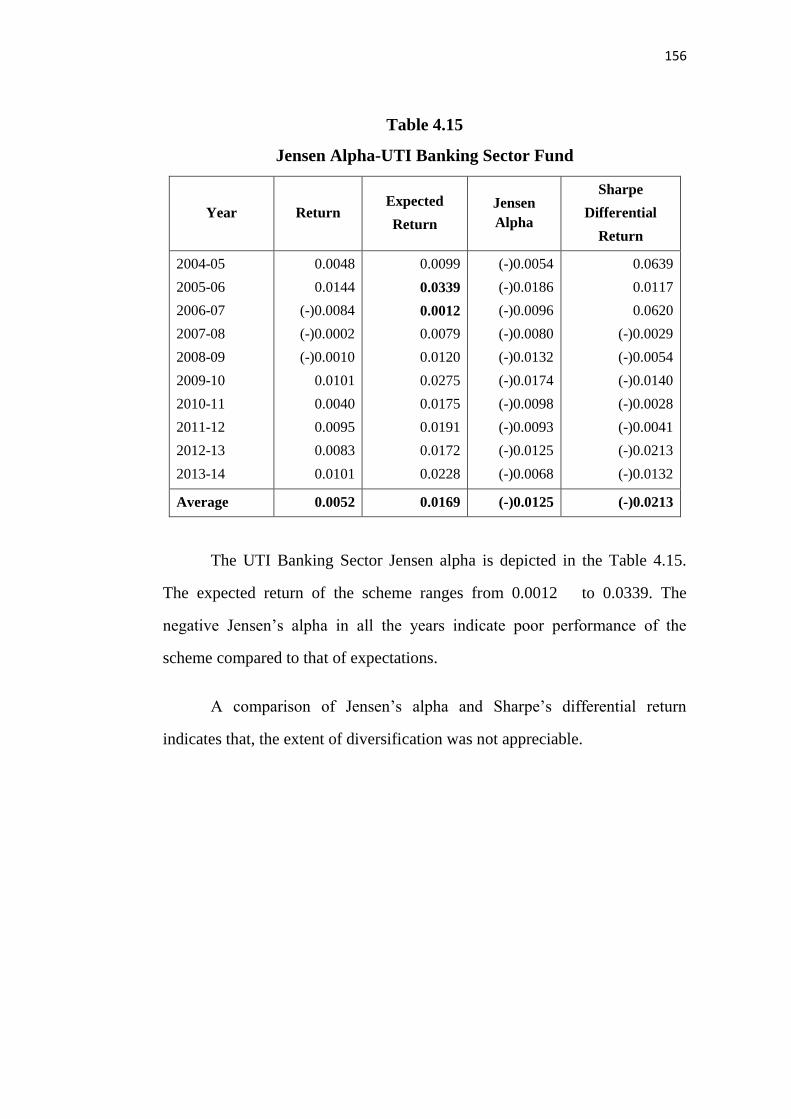
156
Table 4.15
Jensen Alpha-UTI Banking Sector Fund
Year Return Expected
Return
Jensen
Alpha
Sharpe
Differential
Return
2004-05
2005-06
2006-07
2007-08
2008-09
2009-10
2010-11
2011-12
2012-13
2013-14
0.0048
0.0144
(-)0.0084
(-)0.0002
(-)0.0010
0.0101
0.0040
0.0095
0.0083
0.0101
0.0099
0.0339
0.0012
0.0079
0.0120
0.0275
0.0175
0.0191
0.0172
0.0228
(-)0.0054
(-)0.0186
(-)0.0096
(-)0.0080
(-)0.0132
(-)0.0174
(-)0.0098
(-)0.0093
(-)0.0125
(-)0.0068
0.0639
0.0117
0.0620
(-)0.0029
(-)0.0054
(-)0.0140
(-)0.0028
(-)0.0041
(-)0.0213
(-)0.0132
Average 0.0052 0.0169 (-)0.0125 (-)0.0213
The UTI Banking Sector Jensen alpha is depicted in the Table 4.15.
The expected return of the scheme ranges from 0.0012 to 0.0339. The
negative Jensen‟s alpha in all the years indicate poor performance of the
scheme compared to that of expectations.
A comparison of Jensen‟s alpha and Sharpe‟s differential return
indicates that, the extent of diversification was not appreciable.
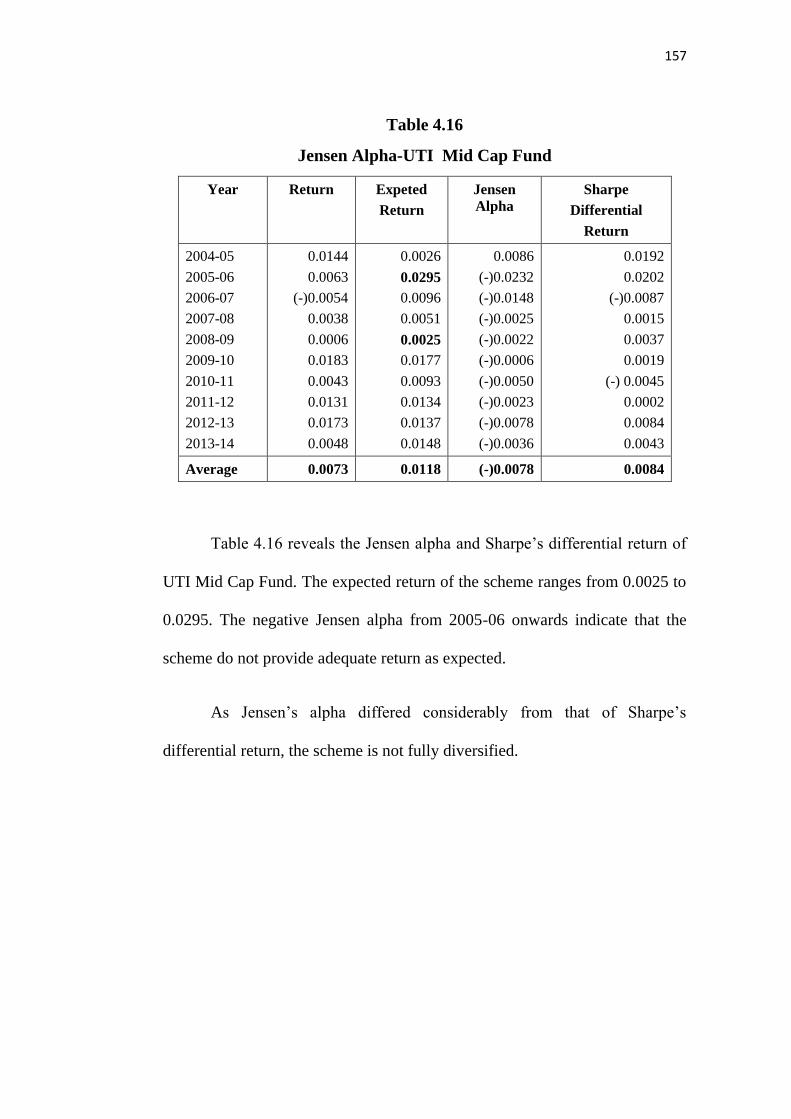
157
Table 4.16
Jensen Alpha-UTI Mid Cap Fund
Year Return Expeted
Return
Jensen
Alpha
Sharpe
Differential
Return
2004-05
2005-06
2006-07
2007-08
2008-09
2009-10
2010-11
2011-12
2012-13
2013-14
0.0144
0.0063
(-)0.0054
0.0038
0.0006
0.0183
0.0043
0.0131
0.0173
0.0048
0.0026
0.0295
0.0096
0.0051
0.0025
0.0177
0.0093
0.0134
0.0137
0.0148
0.0086
(-)0.0232
(-)0.0148
(-)0.0025
(-)0.0022
(-)0.0006
(-)0.0050
(-)0.0023
(-)0.0078
(-)0.0036
0.0192
0.0202
(-)0.0087
0.0015
0.0037
0.0019
(-) 0.0045
0.0002
0.0084
0.0043
Average 0.0073 0.0118 (-)0.0078 0.0084
Table 4.16 reveals the Jensen alpha and Sharpe‟s differential return of
UTI Mid Cap Fund. The expected return of the scheme ranges from 0.0025 to
0.0295. The negative Jensen alpha from 2005-06 onwards indicate that the
scheme do not provide adequate return as expected.
As Jensen‟s alpha differed considerably from that of Sharpe‟s
differential return, the scheme is not fully diversified.

158
Table 4.17
Jensen Alpha – UTI Transportation and Logistics Fund
Year Return Expeted
Return
Jensen
Alpha
Sharpe
Differential
Return
2004-05
2005-06
2006-07
2007-08
2008-09
2009-10
2010-11
2011-12
2012-13
2013-14
0.0138
0.0162
(-)0.0080
0.0141
0.0020
0.0187
0.0076
0.0109
0.0084
0.0165
0.0166
0.0236
0.0059
0.0096
0.0075
0.0228
0.0123
0.0274
0.0152
0.0242
(-) 0.0049
(-)0.0073
(-)0.0139
(-)0.0022
(-)0.0055
(-)0.0041
(-)0.0027
(-)0.0167
(-)0.0066
(-)0.0134
0.0185
0.0446
0.0067
0.0080
0.0085
0.0068
0.0013
(-)0.0030
0.0193
0.0152
Average 0.0108 0.0165 (-)0.0066 0.0193
Table 4.17 shows the UTI Transportation and Logistics Fund Jensen
alpha. The expected return of the scheme ranges from 0.0059 to 0.0274.
The negative Jensen‟s alpha in all the years indicate that the scheme
provided poor returns than expected.
The difference in Jensen‟s alpha and differential Sharpe‟s returns of
the scheme shows that the scheme‟s portfolio is not fully diversified.

159
Table 4.18
Jensen Alpha – UTI Master Equity Plan Unit Scheme (MEPUS)
Year Return Expected
Return
Jensen
Alpha
Sharpe
Differential
Return
2004-05
2005-06
2006-07
2007-08
2008-09
2009-10
2010-11
2011-12
2012-13
2013-14
0.0128
0.0036
(-)0.0047
0.0016
(-)0.0010
0.0172
0.0069
0.0099
0.0110
0.0131
0.0152
0.0416
0.0289
0.0348
0.0290
0.0308
0.0137
0.0179
0.0285
0.0142
(-) 0.0018
(-)0.0388
(-)0.0335
(-)0.0330
(-)0.0300
(-)0.0150
(-)0.0041
(-)0.0079
(-)0.0226
(-)0.0132
0.0817
(-)0.0194
(-)0.0241
(-)0.0266
0.0025
(-)0.0017
(-)0.0011
0.0018
0.0045
0.0028
Average 0.0070 0.0254 (-)0.0226 0.0045
The UTI MEPUS Jensen alpha is depicted in the Table 4.18. The
expected return ranges from 0.0137 to 0.0416. The negative Jensen alpha in
all the years indicates that the returns provided by the scheme are less than the
expected.
A comparison of the Jensen‟s alpha with Sharpe‟s differential return
shows that the scheme is not well-diversified.
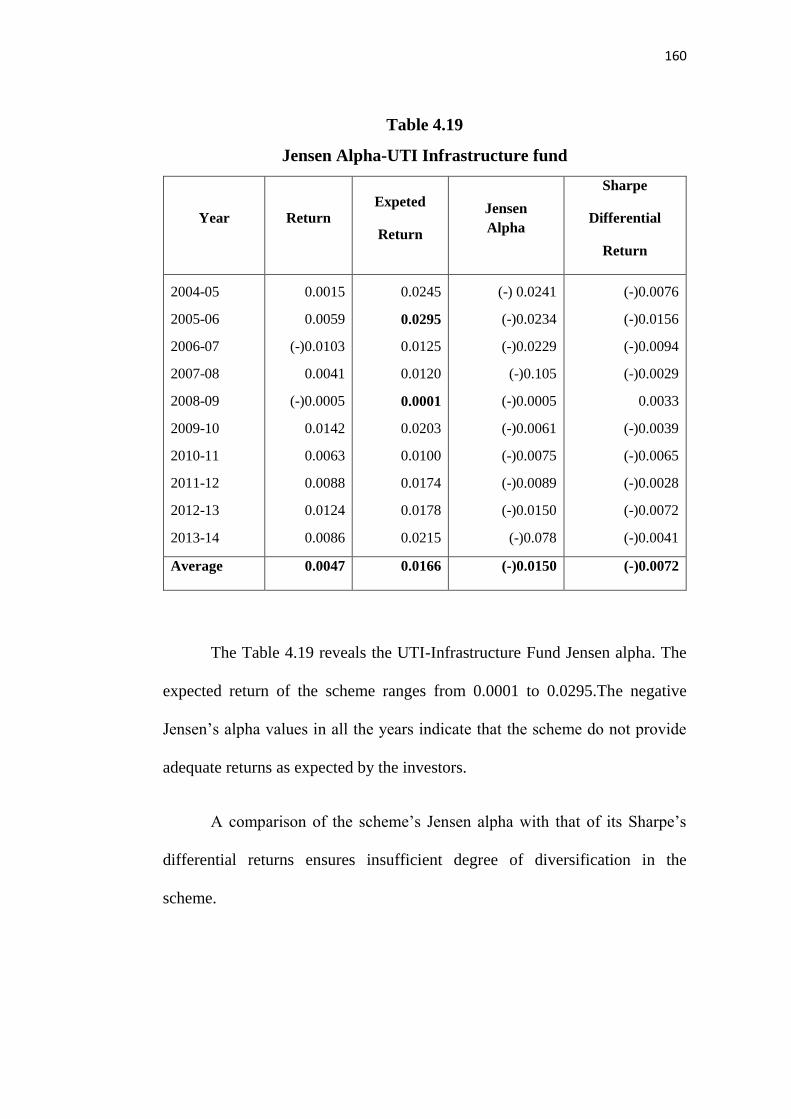
160
Table 4.19
Jensen Alpha-UTI Infrastructure fund
Year Return Expeted
Return
Jensen
Alpha
Sharpe
Differential
Return
2004-05
2005-06
2006-07
2007-08
2008-09
2009-10
2010-11
2011-12
2012-13
2013-14
0.0015
0.0059
(-)0.0103
0.0041
(-)0.0005
0.0142
0.0063
0.0088
0.0124
0.0086
0.0245
0.0295
0.0125
0.0120
0.0001
0.0203
0.0100
0.0174
0.0178
0.0215
(-) 0.0241
(-)0.0234
(-)0.0229
(-)0.105
(-)0.0005
(-)0.0061
(-)0.0075
(-)0.0089
(-)0.0150
(-)0.078
(-)0.0076
(-)0.0156
(-)0.0094
(-)0.0029
0.0033
(-)0.0039
(-)0.0065
(-)0.0028
(-)0.0072
(-)0.0041
Average 0.0047 0.0166 (-)0.0150 (-)0.0072
The Table 4.19 reveals the UTI-Infrastructure Fund Jensen alpha. The
expected return of the scheme ranges from 0.0001 to 0.0295.The negative
Jensen‟s alpha values in all the years indicate that the scheme do not provide
adequate returns as expected by the investors.
A comparison of the scheme‟s Jensen alpha with that of its Sharpe‟s
differential returns ensures insufficient degree of diversification in the
scheme.
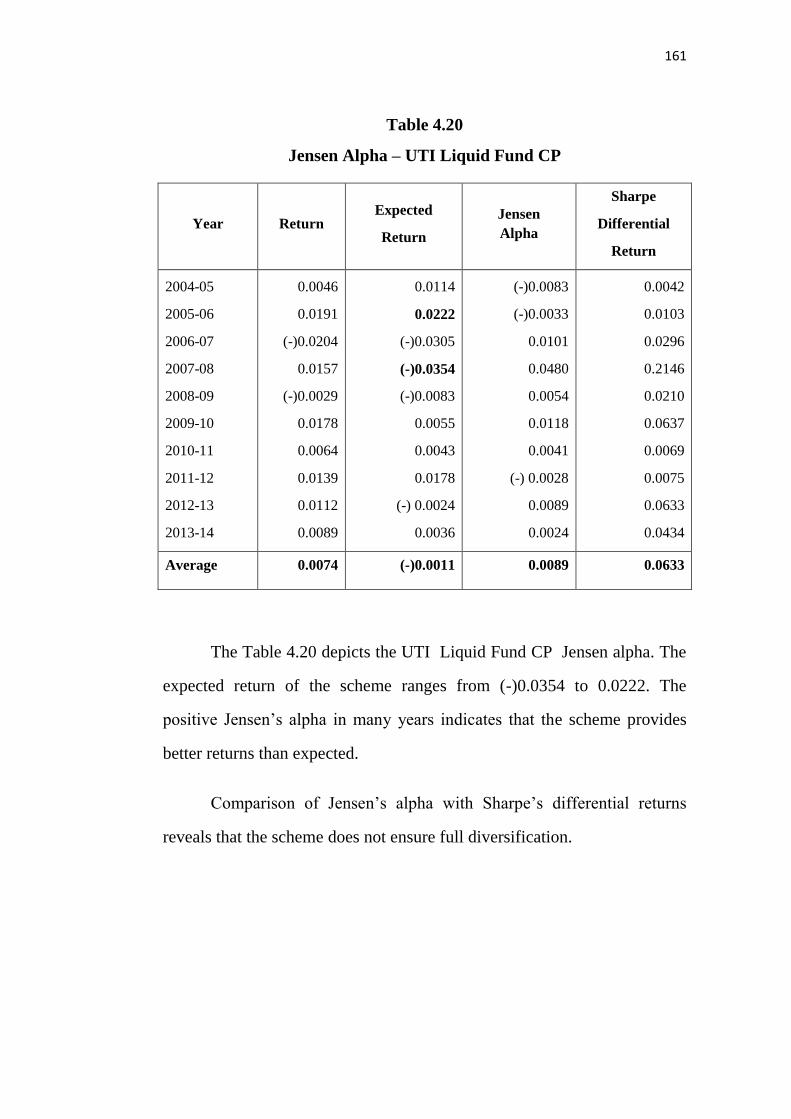
161
Table 4.20
Jensen Alpha – UTI Liquid Fund CP
Year Return Expected
Return
Jensen
Alpha
Sharpe
Differential
Return
2004-05
2005-06
2006-07
2007-08
2008-09
2009-10
2010-11
2011-12
2012-13
2013-14
0.0046
0.0191
(-)0.0204
0.0157
(-)0.0029
0.0178
0.0064
0.0139
0.0112
0.0089
0.0114
0.0222
(-)0.0305
(-)0.0354
(-)0.0083
0.0055
0.0043
0.0178
(-) 0.0024
0.0036
(-)0.0083
(-)0.0033
0.0101
0.0480
0.0054
0.0118
0.0041
(-) 0.0028
0.0089
0.0024
0.0042
0.0103
0.0296
0.2146
0.0210
0.0637
0.0069
0.0075
0.0633
0.0434
Average 0.0074 (-)0.0011 0.0089 0.0633
The Table 4.20 depicts the UTI Liquid Fund CP Jensen alpha. The
expected return of the scheme ranges from (-)0.0354 to 0.0222. The
positive Jensen‟s alpha in many years indicates that the scheme provides
better returns than expected.
Comparison of Jensen‟s alpha with Sharpe‟s differential returns
reveals that the scheme does not ensure full diversification.
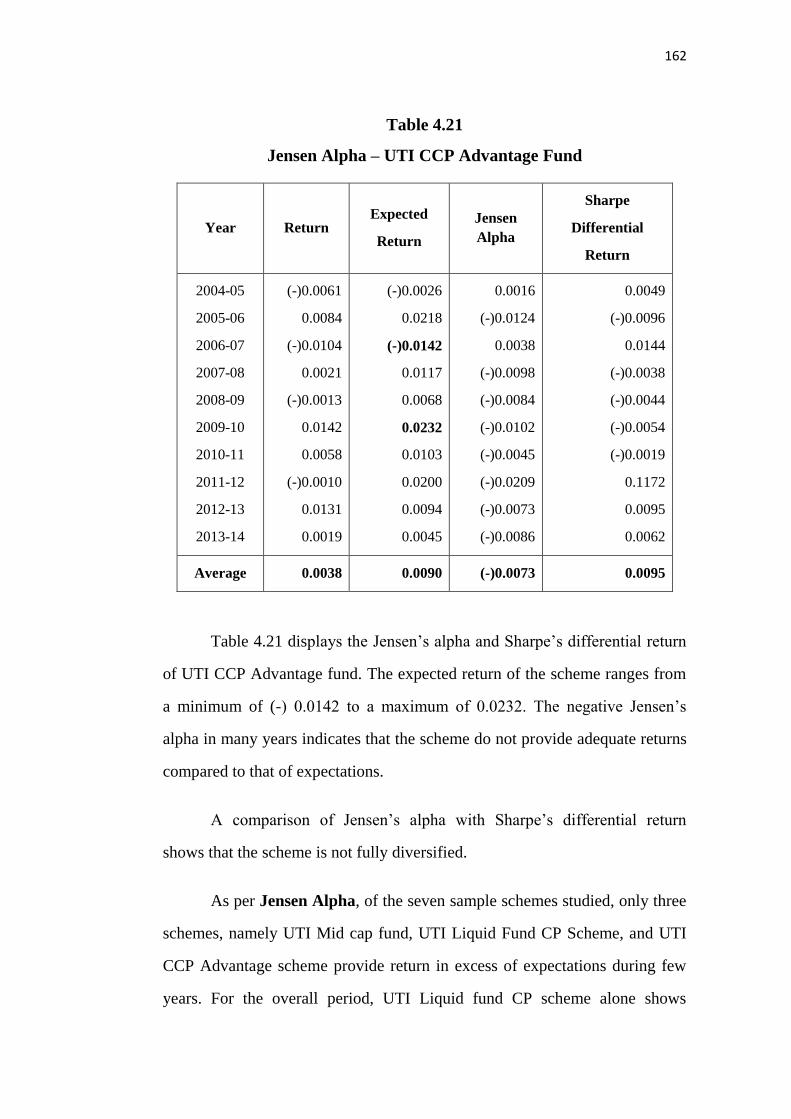
162
Table 4.21
Jensen Alpha – UTI CCP Advantage Fund
Year Return Expected
Return
Jensen
Alpha
Sharpe
Differential
Return
2004-05
2005-06
2006-07
2007-08
2008-09
2009-10
2010-11
2011-12
2012-13
2013-14
(-)0.0061
0.0084
(-)0.0104
0.0021
(-)0.0013
0.0142
0.0058
(-)0.0010
0.0131
0.0019
(-)0.0026
0.0218
(-)0.0142
0.0117
0.0068
0.0232
0.0103
0.0200
0.0094
0.0045
0.0016
(-)0.0124
0.0038
(-)0.0098
(-)0.0084
(-)0.0102
(-)0.0045
(-)0.0209
(-)0.0073
(-)0.0086
0.0049
(-)0.0096
0.0144
(-)0.0038
(-)0.0044
(-)0.0054
(-)0.0019
0.1172
0.0095
0.0062
Average 0.0038 0.0090 (-)0.0073 0.0095
Table 4.21 displays the Jensen‟s alpha and Sharpe‟s differential return
of UTI CCP Advantage fund. The expected return of the scheme ranges from
a minimum of (-) 0.0142 to a maximum of 0.0232. The negative Jensen‟s
alpha in many years indicates that the scheme do not provide adequate returns
compared to that of expectations.
A comparison of Jensen‟s alpha with Sharpe‟s differential return
shows that the scheme is not fully diversified.
As per Jensen Alpha, of the seven sample schemes studied, only three
schemes, namely UTI Mid cap fund, UTI Liquid Fund CP Scheme, and UTI
CCP Advantage scheme provide return in excess of expectations during few
years. For the overall period, UTI Liquid fund CP scheme alone shows

163
positive Jensen alpha. However, all the schemes are not well diversified
indicated by the differences in Jensen alpha and Sharpe‟s differential returns.
COMPOSITE RISK–RETURN ANALYSIS
A composite risk-return analysis of sample schemes during the ten year
period of study and their ranking based on Sharpe, Treynor and Jensen
measures is of utmost importance to identify the scheme that perform well in
terms of actual return, total risk, systematic risk and return in excess of
expectations based on market conditions.
Table 4.22
Consolidates Sharpe Index of Sample Schemes
Mutual fund
Scheme Return Risk
Risk
Premium
Sharpe
Index Rank
UTI Banking sector fund
UTI Mid cap Fund
UTI Transportation and Logistics
Fund
UTI MEPUS Fund
UTI Infrastructure Fund
UTI Liquid Fund CP
UTI CCP Advantage Fund
0.0052
0.0073
0.0108
0.0070
0.0047
0.0074
0.0038
0.0512
0.0441
0.0457
0.0443
0.0353
0.1570
0.1105
(-)0.0553
(-)0.0541
(-)0.0514
(-)0.0540
(-)0.0572
(-)0.0535
(-)0.0580
(-)0.9508
(-)1.1392
(-)0.9576
(-)1.2169
(-)1.5057
(-)0.6033
(-)1.1317
II
V
III
VI
VII
I
IV
The Table 4.22 presents the return, risk, risk premium and sharpe index
of the seven sample schemes for the ten years. The return from UTI
Transportation and logistics scheme (0.0108) is the highest and the UTI CCP
advantage scheme (0.0038) is the lowest. The risk of UTI infrastructure is
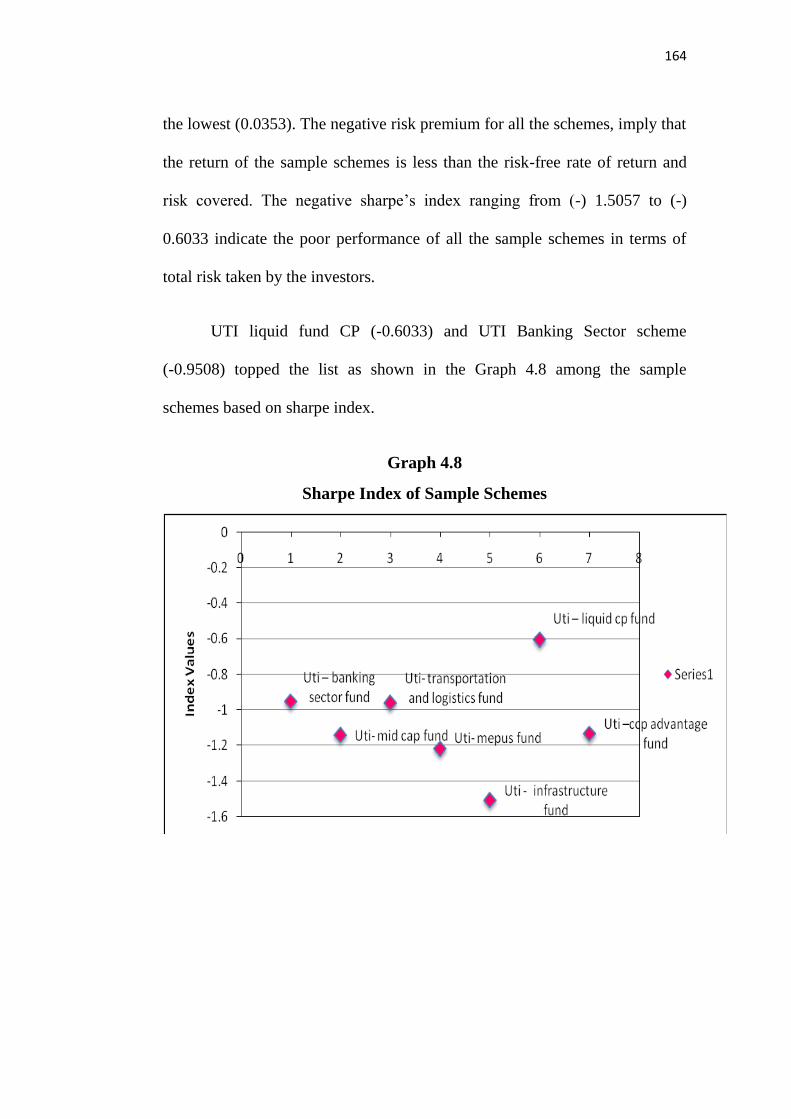
164
the lowest (0.0353). The negative risk premium for all the schemes, imply that
the return of the sample schemes is less than the risk-free rate of return and
risk covered. The negative sharpe‟s index ranging from (-) 1.5057 to (-)
0.6033 indicate the poor performance of all the sample schemes in terms of
total risk taken by the investors.
UTI liquid fund CP (-0.6033) and UTI Banking Sector scheme
(-0.9508) topped the list as shown in the Graph 4.8 among the sample
schemes based on sharpe index.
Graph 4.8
Sharpe Index of Sample Schemes

165
Table 4.23
Consolidated Treynor Index of Sample Schemes
Mutual fund
Scheme Return
Risk
(Beta)
Risk
Premium
Treynor
Index Rank
UTI Banking Sector Fund 0.0052 0.7709 (-0.0553 (-)0.0726 V
UTI Mid Cap Scheme 0.073 0.8676 (-)0.0541 (-)0.0656 IV
UTI Transportation and Logistics
Scheme 0.0108 0.7954 (-)0.0514 (-)0.0645 III
UTI MEPUS Scheme 0.0070 0.5676 (-)0.0540 (-)0.0964 VII
UTI Infrastructure Fund 0.0047 0.7420 (-)0.0572 (-)0.0761 VI
UTI Liquid Fund CP 0.0074 1.0673 (-)0.0535 (-)0.0481 I
UTI CCP Advantage Fund 0.0038 0.8937 (-)0.0580 (-)0.0643 II
The Table 4.23 reveals the return, beta, risk premium and Treynor
index for the ten years of all the sample schemes. The beta value is the lowest
for UTI MEPUS Scheme (0.5676) and the highest in the case of UTI Liquid
fund CP (1.0673).
UTI Liquid fund CP with the beta value more than one indicates its
aggressive nature while all other sample schemes are defensive in nature with
beta values less than one. The negative Treynor index for all the schemes
ranging from (-)0.0964 to (–)0.0481 indicates that the sample schemes provide
insufficient returns compared to the risk free return and the market risk
involved.

166
Graph 4.9 shows that UTI Liquid CP Scheme (-0.0481) and UTICCP
Advantage Scheme (-0.0643) topped the list among the sample schemes based
on Treynor Index.
Graph 4.9
Treynor Index of Sample Schemes
Table 4.24
Consolidated Jensen Alpha of Sample Schemes
Mutual fund
Scheme
Return
Expected
Return
Jensen
Alpha
Sharpe’s
Differenti
al
Return
Rank
UTI Banking Sector Fund 0.0052 0.0169 (-) 0.0125 (-)0.0213 V
UTI Mid Cap Scheme 0.0073 0.0118 (-)0.0078 0.0084 IV
UTI Transportation and
Logistics Scheme 0.0108 0.0165 (-)0.0066 0.0193 II
UTI MEPUS Scheme 0.0070 0.0254 (-)0.0226 0.0045 VII
UTI Infrastructure
Fund 0.0047 0.0166 (-)0.0150 (-)0.0072 VI
UTI Liquid fund CP 0.0074 (-)0.0011 0.0089 0.0633 I
UTI CCP Advantage Fund 0.0038 0.0090 (-)0.0073 0.0095 III
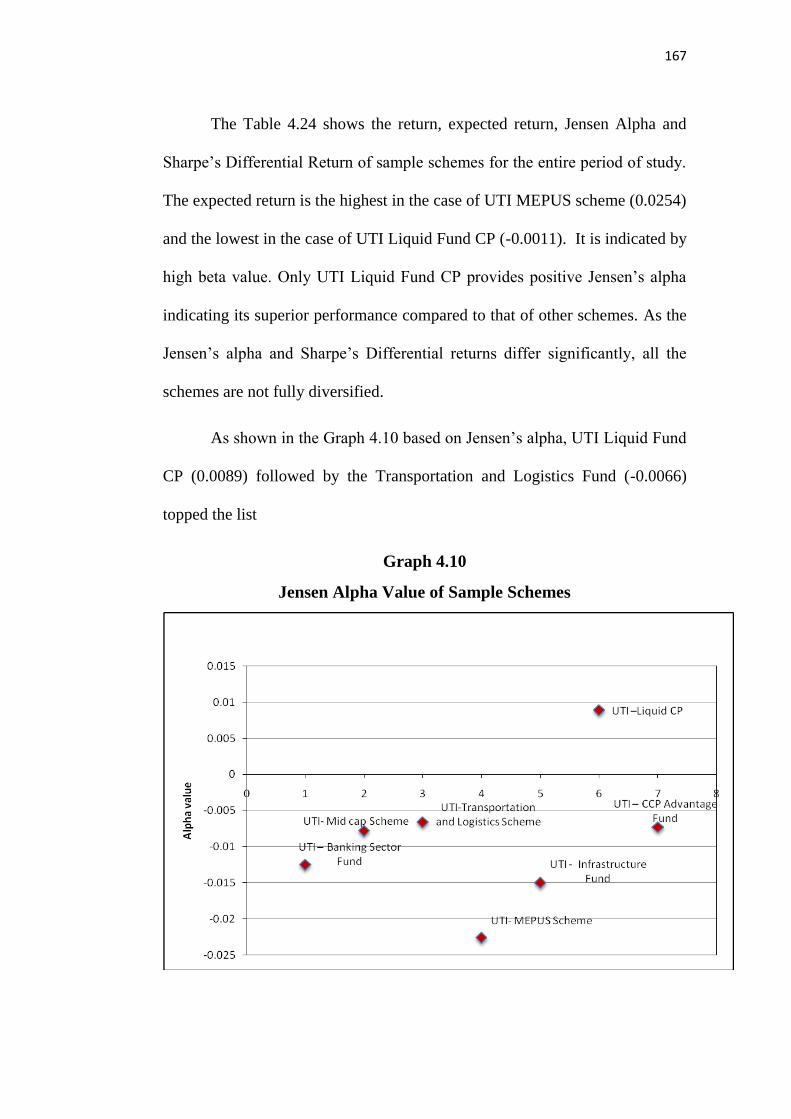
167
The Table 4.24 shows the return, expected return, Jensen Alpha and
Sharpe‟s Differential Return of sample schemes for the entire period of study.
The expected return is the highest in the case of UTI MEPUS scheme (0.0254)
and the lowest in the case of UTI Liquid Fund CP (-0.0011). It is indicated by
high beta value. Only UTI Liquid Fund CP provides positive Jensen‟s alpha
indicating its superior performance compared to that of other schemes. As the
Jensen‟s alpha and Sharpe‟s Differential returns differ significantly, all the
schemes are not fully diversified.
As shown in the Graph 4.10 based on Jensen‟s alpha, UTI Liquid Fund
CP (0.0089) followed by the Transportation and Logistics Fund (-0.0066)
topped the list
Graph 4.10
Jensen Alpha Value of Sample Schemes
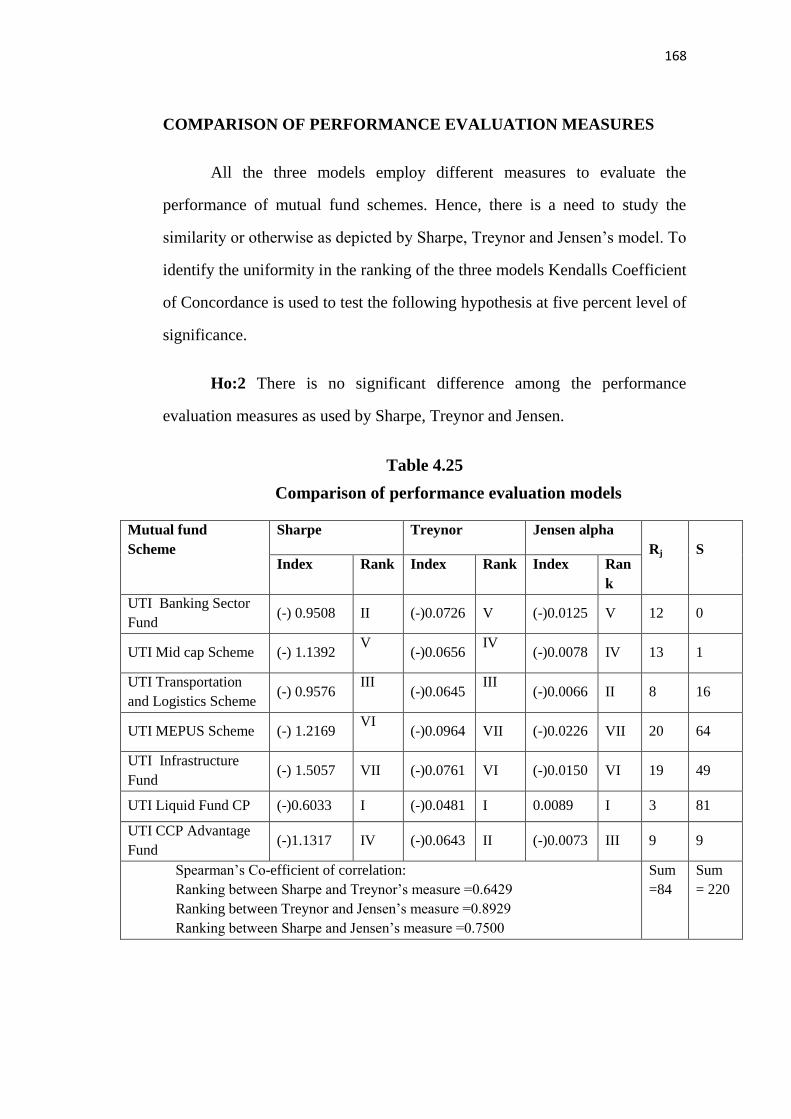
168
COMPARISON OF PERFORMANCE EVALUATION MEASURES
All the three models employ different measures to evaluate the
performance of mutual fund schemes. Hence, there is a need to study the
similarity or otherwise as depicted by Sharpe, Treynor and Jensen‟s model. To
identify the uniformity in the ranking of the three models Kendalls Coefficient
of Concordance is used to test the following hypothesis at five percent level of
significance.
Ho:2 There is no significant difference among the performance
evaluation measures as used by Sharpe, Treynor and Jensen.
Table 4.25
Comparison of performance evaluation models
Mutual fund
Scheme
Sharpe Treynor Jensen alpha
Rj
S Index Rank Index Rank Index Ran
k
UTI Banking Sector
Fund (-) 0.9508 II (-)0.0726 V (-)0.0125 V 12 0
UTI Mid cap Scheme (-) 1.1392 V
(-)0.0656
IV
(-)0.0078 IV 13 1
UTI Transportation
and Logistics Scheme (-) 0.9576
III
(-)0.0645
III
(-)0.0066 II 8 16
UTI MEPUS Scheme (-) 1.2169 VI
(-)0.0964 VII (-)0.0226 VII 20 64
UTI Infrastructure
Fund (-) 1.5057 VII (-)0.0761 VI (-)0.0150 VI 19 49
UTI Liquid Fund CP (-)0.6033 I (-)0.0481 I 0.0089 I 3 81
UTI CCP Advantage
Fund (-)1.1317 IV (-)0.0643 II (-)0.0073 III 9 9
Spearman‟s Co-efficient of correlation:
Ranking between Sharpe and Treynor‟s measure =0.6429
Ranking between Treynor and Jensen‟s measure =0.8929
Ranking between Sharpe and Jensen‟s measure =0.7500
Sum
=84
Sum
= 220
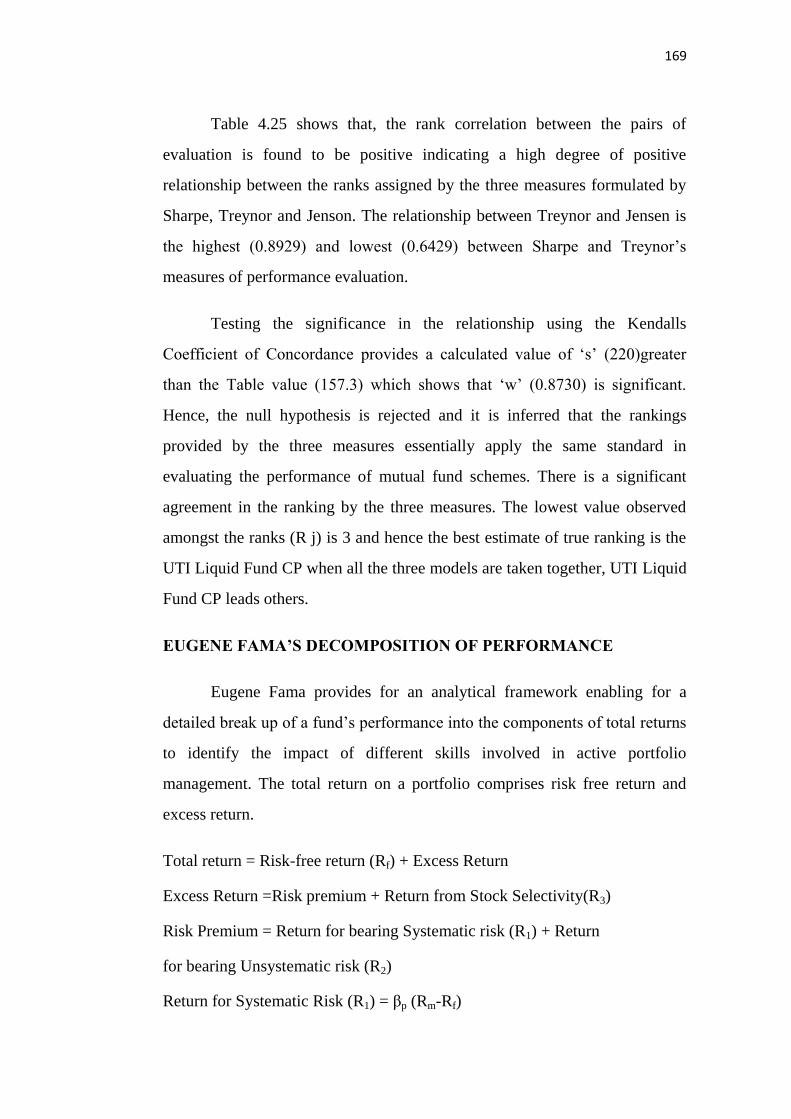
169
Table 4.25 shows that, the rank correlation between the pairs of
evaluation is found to be positive indicating a high degree of positive
relationship between the ranks assigned by the three measures formulated by
Sharpe, Treynor and Jenson. The relationship between Treynor and Jensen is
the highest (0.8929) and lowest (0.6429) between Sharpe and Treynor‟s
measures of performance evaluation.
Testing the significance in the relationship using the Kendalls
Coefficient of Concordance provides a calculated value of „s‟ (220)greater
than the Table value (157.3) which shows that „w‟ (0.8730) is significant.
Hence, the null hypothesis is rejected and it is inferred that the rankings
provided by the three measures essentially apply the same standard in
evaluating the performance of mutual fund schemes. There is a significant
agreement in the ranking by the three measures. The lowest value observed
amongst the ranks (R j) is 3 and hence the best estimate of true ranking is the
UTI Liquid Fund CP when all the three models are taken together, UTI Liquid
Fund CP leads others.
EUGENE FAMA’S DECOMPOSITION OF PERFORMANCE
Eugene Fama provides for an analytical framework enabling for a
detailed break up of a fund‟s performance into the components of total returns
to identify the impact of different skills involved in active portfolio
management. The total return on a portfolio comprises risk free return and
excess return.
Total return = Risk-free return (Rf) + Excess Return
Excess Return =Risk premium + Return from Stock Selectivity(R3)
Risk Premium = Return for bearing Systematic risk (R1) + Return
for bearing Unsystematic risk (R2)
Return for Systematic Risk (R1) = βp (Rm-Rf)

170
Return for Unsystematic Risk (R2) = [(σp / σm ) - βp ] * ( Rm – Rf)
Return from pure Stock Selectivity (R3) = Rp- (Rf+ R1+ R2)
Table 4.26
Engene Fama’s Decomposition of sample scheme’s returns
Mutual fund
Scheme Return
Return for
systematic
risk
Return for
unsystematic
risk
Return
For pure
Selectivity
UTI Banking Sector
Fund
0.0052 (-)0.0428 (-)0.0338 0.0213
UTI Mid cap Scheme 0.0073 (-)0.0463 (-)0.0163 0.0084
UTI Transportation and
Logistics Scheme
0.0108 (-)0.0448 (-)0.0234 0.0193
UTI MEPUS Scheme 0.0070 (-)0.0315 (-)0.0835 0.0045
UTI Infrastructure
Fund
0.0047 (-)0.0422 (-)0.0079 (-)0.0072
UTI Liquid Fund CP 0.0074 (-)0.0624 (-)0.0544 0.0633
UTI CCP Advantage
Fund
0.0038 (-)0.0506 (-)0.0168 0.0095
Table 4.26 shows the Eugene Fames‟ Decomposition of total returns.
The negative values of return on systematic and unsystematic risk imply that
the market return is less than the risk-free return during the period of study
and so do not cover any of the risk involved. The negative return on
systematic risk is the highest in the case of UTI-MEPUS scheme (-0.0315)
and lowest in the case of UTI-Liquid Fund CP (-0.0624).
The negative return on unsystematic risk is the highest in the case of
UTI –Infrastructure Scheme (-)0.0079 and the lowest in the case of
UTI-MEPUS (-)0.0835. The return from stock selectivity is positive

171
(Infrastructure scheme) implying that the sample schemes earned superior
return due to stock selectivity.UTI –Liquid CP scheme provides the highest
net superior returns (0.0633) due to selectivity skills assuming higher risk.
RISK ANALYSIS
An analysis of the scheme‟s risk in comparison with that of the
benchmark index risk is of paramount importance to identify the schemes
which are riskier than the market and the impact of the market on the mutual
fund scheme. Sharpe considers the total variance explained by the market
index in terms of systematic risk and the unexplained otherwise residual
variance in terms of unsystematic risk. The risk components are calculated as
follows:
Total Variance Explained by Index = r2×σp2
Total Variance not explained by Index = (1- r2) ×σp2
Table 4.27
Composite risk of sample schemes
Mutual fund
Scheme
Components of risk Total
Variance Explained
Variance
Unexplained
Variance
UTI Banking Sector Fund
UTI Mid cap Scheme
UTI Transportation and Logistics
Scheme
UTI MEPUS Scheme
UTI Infrastructure Fund
UTI Liquid Fund CP
UTI CCP Advantage Fund
0.0011
0.0013
0.0012
0.0006
0.0010
0.0023
0.0015
0.0023
0.0010
0.0017
0.0014
0.0004
0.0056
0.0011
0.0034
0.0023
0.0029
0.0020
0.0014
0.0079
0.0026

172
The Table 4.27 explains the components of risk. The explained
variance by market index is the lowest in the case of UTI MEPUS Scheme
(0.0006) it is the highest in and the case of UTI Liquid Fund CP (0.0023). The
unexplained variance by market index is the highest for UTI Liquid, Fund CP
(0.0056) and lowest in the case of UTI Infrastructure Scheme (0.0004).
UTI Liquid Fund CP shows high explained and high unexplained
variance during the period of study.
RELATIONSHIP BETWEEN THE SCHEME AND MARKET
The risk involved in individual securities is measured by standard
deviation. The interactive risk or covariance between the scheme and the
market rate of return helps to identify whether the two rates of returns move in
the same direction or inversely related based on the positive or negative
covariance. If the covariance is zero it implies that the scheme is independent
of the market.
The coefficient of correlation helps to identify the similarity or
otherwise in the behavior of schemes and market rate of return. The scheme
could reduce risk by way of investing in negative or low covariance providing
security so as to reduce risk by diversification. Lower the correlation, better
the diversification of portfolio. The coefficient of determination (R2) provides
the percentage of variance of the scheme that is explained by the variation of
return on the market. To test the relationship between the market index return
and scheme return, the following null hypothesis is formulated and tested at
five percent level of significance using Chi-square test of significance.
Ho:2-1 Index returns and scheme returns are not significantly related.
173
Table 4.28
Impact of market on the performance of sample schemes
Mutual fund
Scheme
Co-
variance
Correlation Co-efficient
Of
Determination
Calculated
Z value
UTI Banking Sector
Fund
0.0014 0.5584 0.3118 13.70*
UTI Mid cap
Scheme
0.0015 0.7400 0.5476 22.39*
UTI Transportation
and Logistics
Scheme
0.0014
0.6330
0.4007
14.64*
UTI MEPUS
Scheme
0.0010 0.5379 0.2893 12.98*
UTI Infrastructure
Fund
0.0014
0.8430
0.7107
31.89*
UTI Liquid CP 0.0020 0.5342 0.2854 12.86*
UTI CCP Advantage
Fund
0.0016 0.7504 0.5631 23.10*
*Significant at five percent level
The interactive risk as measured by covariance between the market and
the scheme‟s are positive for all the schemes covered under the study. It
indicates that the sample schemes moves in the same direction as that of the
market. The highest covariance is in the case of UTI Liquid Fund CP (0.0020)
and the lowest is in the case of UTI MEPUS Scheme (0.0010).
UTI Infrastructure scheme has the highest 71.07 percent of variance of
the scheme‟s return explained by the variation of return on the market index
while UTI Liquid Fund CP Scheme has the lowest 28.54percent explained by
the variation in the market return.
The calculated Z Value is greater than the Table value (1.96) for all the
schemes covered under the study. Hence, it is concluded that the hypothesis is
174
rejected, i.e., market return has a significant impact on all the sample mutual
fund scheme‟s returns.
During the ten years of study period, the sample schemes outperformed
the market in terms of average returns in many years. But all the sample
schemes and the market do not provide adequate return to cover risk-free
return and total risk of the scheme. Schemes in general perform better than the
market. Except UTI Liquid Fund CP, the other sample schemes did not
ensure expected returns.
The performance of the sample schemes are in the same direction as
that of the market as evident from the positive beta values. Only UTI Liquid
Fund CP and UTI CCP Advantage Scheme are aggressive with high beta
values. All the sample schemes are not well diversified as depicted by the
differences in the Jensen alpha and Sharpe‟s Differential return. All the three
risk-adjusted performance measures by Sharpe, Treynor and Jensen Models
depicted poor performance of the sample schemes and ensured significant
agreement in their ranking. Of the seven sample schemes studied, UTI Liquid
Fund CP Scheme topped the list in the case of all the three portfolio
performance evaluation models.
175
CHAPTER –V
PERFORMANCE OF FUND MANAGERS
Market timing refers to the dynamic allocation of capital among broad
classes of investments, often restricted to equities and short-term government
debt. The successful market times increases the portfolio weight on equities
prior to a rise in the market, and decreases the weight on equities prior to a fall
in the market. A mutual fund manager‟s ability to shift a fund‟s allocation is
constrained to varying degrees by the investment objectives of the fund, as
established in the fund‟s “Statement of Additional Information”. A manager
constrained to holding equities might then time the market by adjusting the
correlation between a portfolio‟s return and the market return as the market
rises and falls. Fund managers may expect more evidence of market timing
and other dynamic strategies among hedge fund managers than mutual fund
managers.
The performance of fund can be measured in terms of stock selection
ability and market timing abilities. Stock selection refers to micro forecasting
ability to identify under or overvalued securities. It is possible through
applying stock selection technique to achieve superior returns by timing
market correctly. Market timing refers to the timely rebalancing of the
portfolio, switching-off funds among the various assets, classes and taking
advantages of market.
Factors Considered by the Fund Managers for Diversification of Funds
Many factors can cause the price of a stock to raise or fall. News about
a company‟s earnings mainly influence the price of stock. Mutual fund
manager consider market timing to be sensible in certain situation of market.
The ability of fund manager depends on the final performance of the funds. It

176
is the strategy of making buy or sell decision on financial assets by attempting
to predict future market price movements. The prediction may be based on an
outlook of market or economic conditions resulting from technical or
fundamental analysis. This is an investment strategy based on the outlook for
an aggregate market, rather than for mutual funds.
The economy is a complex system that contain many factors, even at
times of significant market optimism or pessimism to predetermine the
maximum or minimum of future prices with any precision. So, they consider
the following factors which influence the stock prices before diversification of
funds.
1. Company news and performance
News releases on: earnings and profits and future estimated earnings,
announcement of dividends, introduction of a new product (or) a product
recall, securing a new large contract, anticipated takeover or merger, a change
of management and accounting errors or scandals.
2. Industry performance
Often, the stock price of the companies in the same industry will move
in tandem with each other. This is because market conditions generally affect
the companies in the same industry and in the same way. But sometimes, the
stock price of a company will benefit from a piece of bad news for its
competitors if the companies are competing for the same market.

177
3. Investor Sentiment
Investors‟ sentiments or confidence can cause the market to go up or
down, which can cause stock price to rise or fall. The general direction that
the stock market takes can affect the value of a stock.
i. Bull market
A strong market where stock price are rising and investors confidence
is growing. It‟s often tied to economic recovery or an economic boom, as well
as investor optimism.
ii. Bear market
A weak market where stock prices are falling and investors confidence
is fading. It often happens when an economy is in recession and
unemployment is high, with rising prices.
4. Economic factors
(i) Interest rates
The RBI can raise or lower interest rates to stabilize the Indian
economy. This is known as monitory policy. If a company borrows money to
expand and improve its business, higher interest rates will affect the cost of its
debt. This can reduce company profits and the dividends it pays shareholders.
As a result, its share price may drop. And, in times of higher interest rates
investment that pay interest tend to be more attractive to investors than stocks.
(ii) Economic outlook
If it looks like the economy is going to expand, stock prices may rise.
Investors may buy more stocks thinking they will see future profits and higher

178
stock prices. If the economic outlook is uncertain investors may reduce their
buying or selling.
(iii) Inflation
Inflation means higher consumer prices. This often slows sales and
reduce profits. Higher prices will also often lead to higher interest rates. For
example RBI may rise interest rates to slow down inflation. These changes
will tend to bring down prices. Commodities however, may do better with
inflation, so, their prices may rise.
(iv) Deflation
Falling prices tend mean lower profits for companies and decreased
economics activity. Stock prices may go down, and investors may start
selling their shares and move to fixed-income investments like bonds. Interest
may be lowered to encourage people to borrow more. The goal is increased
spending and economic activity.
(v) Economic and Political Shocks
Changes around the world can affect both the economic and political
policies. The stock price is influenced by the political disturbance inside the
country. Uncertainty in political conditions, revolution or outbreak of war
have a quick effect on stock values. An act of terrorism can also lead to a
downturn in economic activity and a fall in stock prices.
(vi) Changes in economics policy
If a new government comes into power, it may decide to make new
policies. Sometimes these changes can be seen a good for business, and
179
sometimes not. They may lead to changes in inflation and interest rates, which
in turn may affect stock prices.
(vii) Trade activities
Stock exchange is greatly influenced by the slumps and booms. When
trade activities are fast in the boom period, the prices of the securities tend the
increase. In case of depression, the prices of the shares tend to fall due to low
production.
(viii) Value of the Indian Rupees
Many Indian companies sell products to buyers in other countries. If
the value of Indian rupee rises, their customer will have to spend more to buy
Indian goods. This can drive down sales, which in turn can lead to lower
stock prices. When the price of the Indian rupee falls, it make it cheaper for
others to buy Indian products. This can make stock prices rise.
Portfolio is done by balancing the bond and equity composition of the
mutual fund. In a passive sense, it involves a shift in the allocation between
debt securities and equity securities. This basically means, when the market is
unfavorable or in the down trend, the fund managers should shift their
positions from equity to debt securities and when the market is favorable or up
trend, it would be beneficial to liquidate debt and commit to equity. A fund
manager should be efficient enough to foresee these changes in the market or
in other words, enter into transactions in the market at the most appropriate
time. This is referred to as the timing ability of the fund Manager. A number
of studies, as in Chapter II has established some evidences that mutual fund
portfolios do not in fact maintain a constant risk posture over time and
180
conclude that attempts at market timing may well be a dimension of fund
manager‟s decision process.
In this chapter an attempt is made to evaluate the market timing
abilities of the fund managers in UTI Mutual Fund selected schemes during
the study period. For the purpose the models developed and fasted by experts.
Treynor and Mazuy, and Henriksson and Merton are used.
ESTIMATION OF MARKET TIMING MODULES
Treynor and Mazuy (TM) Module
Treynor and Mazuy (1966) developed a model to analyse the timing
ability of mutual funds. Their procedure is to fit a quadratic curve to the
performance data. The equation traces the curvature of the relationship
between the fund returns and the market returns.
Their equation is
(Rpt-Rft) = (Rmt – Rft) + (Rmt – Rft)2 + eit
According to Treynor and Mazuy the constant (Gamma) is the
measure of the fund timing ability. If the value is positive it indicates that
market timing ability exists. If there is no market timing (gamma) is
negative.
Standard regression techniques have been used for estimating the
parameters of two modules. To evaluate the market timing ability of fund
managers, according to Henriksson and Merton module, it must be pointed
out that sample schemes utilized two stages for estimating beta value, one for
up market and down market and second by using dummy variable.
Ho: 3 The fund managers are not a successful market timers suggested
by Treynor and Mazuy and Henricksson and Merton.
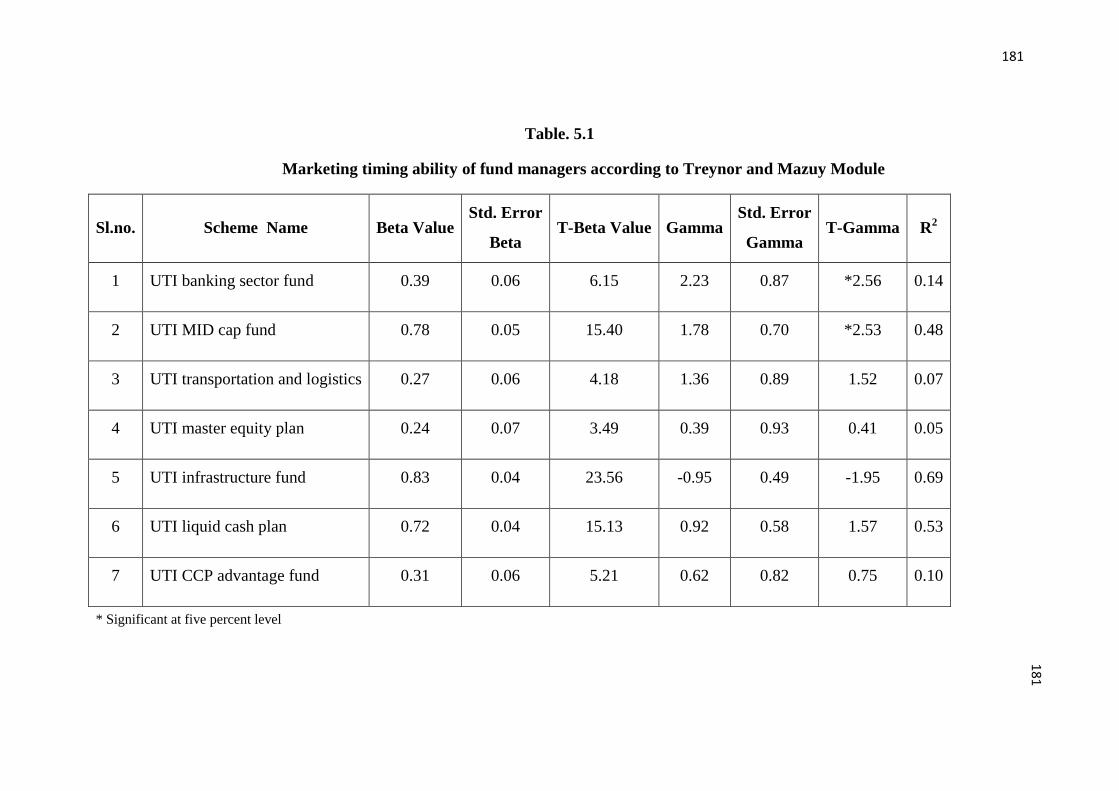
181
Table. 5.1
Marketing timing ability of fund managers according to Treynor and Mazuy Module
Sl.no. Scheme Name Beta Value Std. Error
Beta T-Beta Value Gamma
Std. Error
Gamma T-Gamma R2
1 UTI banking sector fund 0.39 0.06 6.15 2.23 0.87 *2.56 0.14
2 UTI MID cap fund 0.78 0.05 15.40 1.78 0.70 *2.53 0.48
3 UTI transportation and logistics 0.27 0.06 4.18 1.36 0.89 1.52 0.07
4 UTI master equity plan 0.24 0.07 3.49 0.39 0.93 0.41 0.05
5 UTI infrastructure fund 0.83 0.04 23.56 -0.95 0.49 -1.95 0.69
6 UTI liquid cash plan 0.72 0.04 15.13 0.92 0.58 1.57 0.53
7 UTI CCP advantage fund 0.31 0.06 5.21 0.62 0.82 0.75 0.10
* Significant at five percent level
181
182
Table 5.1 provides the analysis of market timing ability of fund
managers according to Treynor and Mazuy Module. As discussed in the
Treynor and mazuy module gamma is the measure of testing market timing
ability of the fund manager. If the t-value of gamma is positively significant at
five percent statistical level the fund manager is timing the market in right
direction successfully. On the other hand, if t-value of gamma is negatively
significant at five percent statistical level then fund manager is timing the
market but in wrong direction. Out of seven schemes, fund managers are able
in timing the market correctly in right direction for six schemes (86 percent).
Schemes with timing the market correctly are: UTI Banking Sector Fund, UTI
Mid Cap Fund, UTI Transportation and logistics, UTI Master equity, UTI
liquid fund cash and UTI CCP Advantage Fund. Out of total schemes 80
percent are open-ended equity schemes and 20 are percent open ended debt
schemes. All the selected schemes are growth option schemes. Thus, the
result of Treynor and Mazuy module is reasonable. In the case of one sample
scheme (UTI infrastructure equity) fund manager are timing the market in the
wrong direction. So, the result of Treynor and Mazuy module is unable to
achieve the hypothesis that Indian fund managers show different market
timing abilities.
Henriksson and Merton (HM) Module
Henriksson and Merton (1981) suggested a slightly different module
for testing market timing ability. The test enables the separation of the gains
of market timing skills from the gains of micro stock selection skills.
Their equation is:
(Rpt – Rft ) = (Rmt – Rft) + + eit
(gamma) is the measure of the funds timing ability and is negative if
there is no market timing. If it is positive it means that market timing ability
exists.

183
Table 5.2
Market Timing ability of Fund Managers according to Henriksson and Merton Module
Sl.No. Scheme Name Beta up
market
Std. Error
Beta
t-beta
Up
y=B-1
-B2
Std. Error
Gamma
t-gamma R2
1 UTI Banking Sector 0.54 0.12 4.64 0.33 0.19 1.71 0.13
2 UTI Mid Cap Fund 0.87 0.09 9.28 0.21 0.16 1.31 0.47
3 UTI Transportation and
logistics
0.42 0.12 3.58 0.32 0.20 1.63 0.07
4 UTI Master Equity Plan 0.24 0.12 1.95 0.01 0.21 0.07 0.05
5 UTI Infrastructure Fund 0.72 0.06 11.18 (-)0.22 0.11 -2.08* 0.69
6 UTI Liquid Fund Cash plan 0.78 0.08 9.97 0.12 0.13 0.91 0.53
7 UTI CCP Advantage Fund 0.34 0.11 3.15 (-)0.07 0.18 (-)0.38 0.10
* Significant at five percent level
183
184
Table 5.2 presents the analysis of market-timing ability of fund
managers according to Henriksson and Merton module. Gamma is the
measure of testing market timing ability of the fund managers in Henriksson
and Merton module also. If the t-value of gamma is positively significant at
five percent statistical level then the fund manager is timing the market in the
right direction successfully. If the t-value of gamma is not significant at five
percent statistical level then fund manager is unable in timing the market. The
table 5.2 indicates that out of total schemes, 71.42 percent schemes are under
right direction of timing the market, and 28.58 percent schemes are not under
timing the market. Name of the schemes under right direction of timing ability
are: UTI Banking Sector (1.71), UTI Mid Cap Fund (1.31) UTI
Transportation logistics (1.63), UTI Master equity Plan (0.07), and UTI
Liquid Fund (0.91). For UTI infrastructure fund and UTI CCP Advantage
fund (both are open ended debt scheme), t-value of gamma is negative in the
market. Because, fund managers of these schemes are not efficiently timing
the market.

185
CHAPTER – VI
PERFORMANCE OF UTI AND PRIVATE SECTOR
MUTUAL FUND SCHEMES
Mutual Fund Industry in India with about 35 players is one of the most
preferred investment avenues in India. However, with a plethora of schemes
to choose from, the retail investor faces problems in selecting funds. Factors
such as investment strategy and management style are qualitative, but the
funds‟ financial performance is an indicator too. Therefore, there is a need to
assess the past performance of different mutual fund schemes. The major
objective of this chapter is to evaluate the comparative performance of
selected schemes of UTI mutual funds with those of private sectors, through
various standard measures.
For the purpose of comparison three leading mutual funds in the
private sector, namely: HDFC, ICICI and Reliance are chosen by the
researcher. The schemes selected from the private sector are akin to the seven
samples chosen from the UTI. They are listed in the following schedule.

186
Schedule 6.1
Mutual Fund Schemes selected for Comparative Performance
S.No Schemes
Sample period No. of
observations
From To
I. UTI Mutual Fund
1. UTI Banking sector April 2004 March 2014 120
2. UTI Mid cap fund April 2004 March 2014 120
3. UTI Transportation and logistics fund April 2004 March 2014 120
4. UTI Master equity plan unit scheme April 2004 March 2014 120
5. UTI Infrastructure fund April 2004 March 2014 120
6. UTI Liquid fund CP April 2004 March 2014 120
7. UTI CCP advantage fund April 2004 March 2014 120
II. HDFC Mutual Fund
8. HDFC capital building fund April 2004 March 2014 120
9. HDFC core and satelite fund April 2004 March 2014 120
10. HDFC equity fund April 2004 March 2014 120
11. HDFC long term equity fund April 2004 March 2014 120
12. HDFC top 200 fund April 2004 March 2014 120
13. HDFC index fund April 2004 March 2014 120
14. HDFC high interest April 2004 March 2014 120
III. ICICI Mutual Fund
15. ICICI growth April 2004 March 2014 120
16. ICICI dynamic plan April 2004 March 2014 120
17. ICICI industries fund April 2004 March 2014 120
18. ICICI top 100 fund April 2004 March 2014 120
19. ICICI top 200 fund April 2004 March 2014 120
20. ICICI liquid fund April 2004 March 2014 120
21. ICICI balanced fund April 2004 March 2014 120
IV Reliance Mutual Fund
22. Reliance growth fund April 2004 March 2014 120
23. Reliance income fund April 2004 March 2014 120
24. Reliance floating rate fund April 2004 March 2014 120
25. Reliance vision fund April 2004 March 2014 120
26. Reliance banking fund April 2004 March 2014 120
27. Reliance equity fund April 2004 March 2014 120
28. Reliance regular saving April 2004 March 2014 120
187
Performance Evaluation Measures
The following six measures are used to evaluate and compare
performance of the UTI Mutual Fund and Private Mutual Fund Schemes. (1)
Risk and Return (2) Treynor ratio (3) Sharpe ratio (4) Jensen differential
return measure (5) Sharpe differential returns (6)Fama‟s components of
investment performance. The above mentioned measurements measure the
schemes under various perception by using empirical analysis.
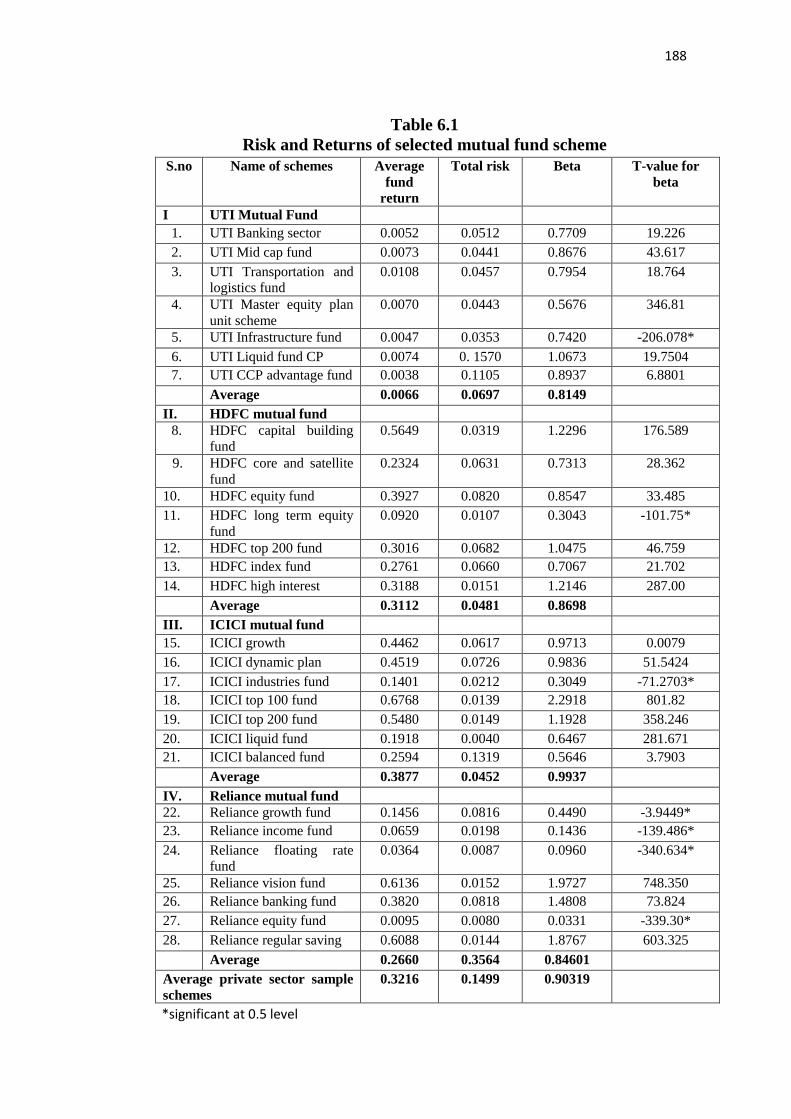
188
Table 6.1
Risk and Returns of selected mutual fund scheme
S.no Name of schemes Average
fund
return
Total risk Beta T-value for
beta
I UTI Mutual Fund
1. UTI Banking sector 0.0052 0.0512 0.7709 19.226
2. UTI Mid cap fund 0.0073 0.0441 0.8676 43.617
3. UTI Transportation and
logistics fund
0.0108 0.0457 0.7954 18.764
4. UTI Master equity plan
unit scheme
0.0070 0.0443 0.5676 346.81
5. UTI Infrastructure fund 0.0047 0.0353 0.7420 -206.078*
6. UTI Liquid fund CP 0.0074 0. 1570 1.0673 19.7504
7. UTI CCP advantage fund 0.0038 0.1105 0.8937 6.8801
Average 0.0066 0.0697 0.8149
II. HDFC mutual fund
8. HDFC capital building
fund
0.5649 0.0319 1.2296 176.589
9. HDFC core and satellite
fund
0.2324 0.0631 0.7313 28.362
10. HDFC equity fund 0.3927 0.0820 0.8547 33.485
11. HDFC long term equity
fund
0.0920 0.0107 0.3043 -101.75*
12. HDFC top 200 fund 0.3016 0.0682 1.0475 46.759
13. HDFC index fund 0.2761 0.0660 0.7067 21.702
14. HDFC high interest 0.3188 0.0151 1.2146 287.00
Average 0.3112 0.0481 0.8698
III. ICICI mutual fund
15. ICICI growth 0.4462 0.0617 0.9713 0.0079
16. ICICI dynamic plan 0.4519 0.0726 0.9836 51.5424
17. ICICI industries fund 0.1401 0.0212 0.3049 -71.2703*
18. ICICI top 100 fund 0.6768 0.0139 2.2918 801.82
19. ICICI top 200 fund 0.5480 0.0149 1.1928 358.246
20. ICICI liquid fund 0.1918 0.0040 0.6467 281.671
21. ICICI balanced fund 0.2594 0.1319 0.5646 3.7903
Average 0.3877 0.0452 0.9937
IV. Reliance mutual fund
22. Reliance growth fund 0.1456 0.0816 0.4490 -3.9449*
23. Reliance income fund 0.0659 0.0198 0.1436 -139.486*
24. Reliance floating rate
fund
0.0364 0.0087 0.0960 -340.634*
25. Reliance vision fund 0.6136 0.0152 1.9727 748.350
26. Reliance banking fund 0.3820 0.0818 1.4808 73.824
27. Reliance equity fund 0.0095 0.0080 0.0331 -339.30*
28. Reliance regular saving 0.6088 0.0144 1.8767 603.325
Average 0.2660 0.3564 0.84601
Average private sector sample
schemes
0.3216 0.1499 0.90319
*significant at 0.5 level

189
The table 6.1 reflects that the UTI Mutual Fund sample schemes
have earned an average return of 0.0066 per month but have taken an
average total risk of 0.0697.
Among the UTI Mutual Fund schemes, Transportation and Logistics
schemes have earned higher average fund returns of 0.0108 with total risk of
0.0457. Private sector Mutual Fund sample schemes, on the other hand, have
earned higher average return of 0.3216 per month by taking an average total
risk of 0.1499 which is more than that of UTI Mutual Fund. Four schemes
from private sector, namely; HDFC Capital Building Fund, ICICI Top 100
fund, Reliance Vision Fund and Reliance Regular Saving Fund have earned
higher returns with lower total risk.
As far as market risk is concerned average beta of the UTI
Mutual Fund sample schemes is 0.8149 at an average returns of 0.0066. On
the other hand, private sectors have earned 0.9039 per month at an average
return of 0.3216. And the beta for UTI Mutual Fund sample schemes varies
from minimum of 0.5676 (UTI Master Equity Plan Unit Scheme) to the
maximum of 1.0673 (UTI Liquid Fund Schemes). On the other hand beta
of the private sector varies from 0.0331 for Reliance Equity Fund to the
maximum of 2.2918 to ICICI Top 100 fund.
Three schemes from UTI Mutual Fund, i.e., UTI Transportation and
Logistics Fund, UTI Liquid Capital Fund, and UTI Mid Cap Fund have earned
good returns with higher market risk than the average returns of UTI Mutual
Fund. Some of the schemes from private sector like ICICI Top 100 fund,
ICICI Top 200 fund, ICICI Growth, ICICI Dynamic Plan, Reliance Vision
Fund, Reliance Regular Saving Fund and HDFC Capital Building Fund,
HDFC Equity Fund have also earned good returns with the higher average
market risk. Thus, private sector schemes earn higher average returns than the
UTI Mutual Fund Schemes.

190
Table 6.2
Risk and Returns of selected mutual fund scheme
Vs Bench Mark portfolios
S.No Name of schemes Average
fund return Average
risk
Bench mark return
Average Market risk
Risk free rate of returns
I. UTI Mutual Fund
1. UTI banking sector 0.0052 0.0581 0.0061 0.0981 0.7012
2. UTI mid cap fund 0.0073 0.0475 0.0061 0.0760 0.7012
3. UTI transportation and logistics fund
0.0108 0.0537 0.0061 0.9393 0.7012
4. UTI master equity plan unit scheme
0.0070 0.0444 0.0061 0.7952 0.7012
5. UTI infrastructure fund 0.0047 0.0380 0.0061 0.6754 0.7012
6. UTI liquid fund CP 0.0074 0.0887 0.0061 0.0981 0.7012
7. UTI CCP advantage fund 0.0038 0.0512 0.0061 0.7604 0.7012
8. Average 0.0066 0.0545 0.0061 0.4918 0.7012
II. HDFC Mutual Fund
9. HDFC capital building fund 0.5649 0.0319 0.4594 0.0755 0.7012
10. HDFC core and satelite fund 0.2324 0.0631 0.3178 0.0751 0.7012
11. HDFC equity fund 0.3927 0.0820 0.4594 0.0755 0.7012
12. HDFC long term equity fund 0.0920 0.0107 0.3025 0.0726 0.7012
13. HDFC top 200 fund 0.3016 0.0682 0.2879 0.0713 0.7012
14. HDFC index fund 0.2761 0.0660 0.3907 0.0753 0.7012
15. HDFC high interest 0.3188 0.0151 0.2625 0.0748 0.7012
Average 0.3112 0.0481 0.3543 0.0743 0.7012
III. ICICI Mutual Fund
16. ICICI growth 0.4462 0.0617 0.4594 0.0755 0.7012
17. ICICI dynamic plan 0.4519 0.0726 0.4594 0.0755 0.7012
18. ICICI industries fund 0.1401 0.0212 0.4594 0.0755 0.7012
19. ICICI top 100 fund 0.6768 0.0139 0.2953 0.7475 0.7012
20. ICICI top 200 fund 0.5480 0.0149 0.4594 0.0755 0.7012
21. ICICI liquid fund 0.1918 0.0040 0.2967 0.0712 0.7012
22. ICICI balanced fund 0.2594 0.1319 0.4594 0.0755 0.7012
Average 0.3877 0.0457 0.4127 0.1709 0.7012
IV. Reliance Mutual Fund
23. Reliance growth fund 0.1456 0.0816 0.3243 0.0760 0.7012
24. Reliance income fund 0.0659 0.0198 0.4594 0.0755 0.7012
25. Reliance floating rate fund 0.0364 0.0087 0.3799 0.0726 0.7012
26. Reliance vision fund 0.6136 0.0152 0.3110 0.0694 0.7012
27. Reliance banking fund 0.3820 0.0818 0.2580 0.0751 0.7012
28. Reliance equity fund 0.0095 0.0080 0.2879 0.0713 0.7012
29. Reliance regular saving 0.6088 0.0144 0.3243 0.0760 0.7012
Average 0.2660 0.0327 0.3350 0.0737 0.7012
Average private sector sample schemes
0.3216 0.0422 0.3673 0.1063 0.7012

191
Table 6.2 shows risk and returns of the sample mutual fund schemes
vs. benchmark portfolios, i.e., BSE-100 National Index and 91 days T-bills for
the corresponding periods. The benchmark returns of BSE-100 is 0.3673 for
the corresponding period. The benchmark return of 91 days T-bills is 0.7012
for the corresponding period. UTI sample mutual fund schemes have earned
an average return of 0.0066 per month during the period. It is more than the
average market return 0.0061 and less than the risk free rate of return 0.7012.
Thus, it is clear that the UTI Mutual Fund schemes have earned lower returns
by taking the higher risk than the market.
Private sector mutual funds secure an average return of 0.3216 per
month, which is less than the average benchmark returns of BSE- 100 Index
0.3673 and 91 days T-bills 0.7012. On the other hand, average total risk of
sample private sector (0.0422) is also lower than the average market risk
0.1063. Sample schemes of ICICI have earned highest average returns of
0.3877 per month than the average returns of selected sample schemes at a
total risk of 0.0457.
47 percent of the private sector sample schemes (10) earned greater
than the average returns of sample schemes and the balance 53 percent have
earned less than the average sample. 18 percent of the sample private
sector schemes (four) have crossed the returns of benchmark portfolios
(BSE-100 and 91 Days T-bills) by taking an average total risk of 0.0422.
The sample schemes which earned highest returns are HDFC Capital Building
Fund, ICICI Top 100, ICICI Top 200 fund, Reliance Vision Fund and
Reliance Regular Savings Fund.
From the above analysis it is evident that by comparing the risk
and returns of the sample schemes with the risk and returns of
benchmark portfolios, UTI mutual fund schemes have earned lower returns
with higher total risk than the private sector sample mutual fund schemes.
During the study period UTI mutual fund admits a stiff competition with other
public and private sectors mutual funds. Due to volatile stock market and the
opening up of many private sectors income schemes, the schemes of private
sector are moving better in the market than the UTI mutual fund schemes.
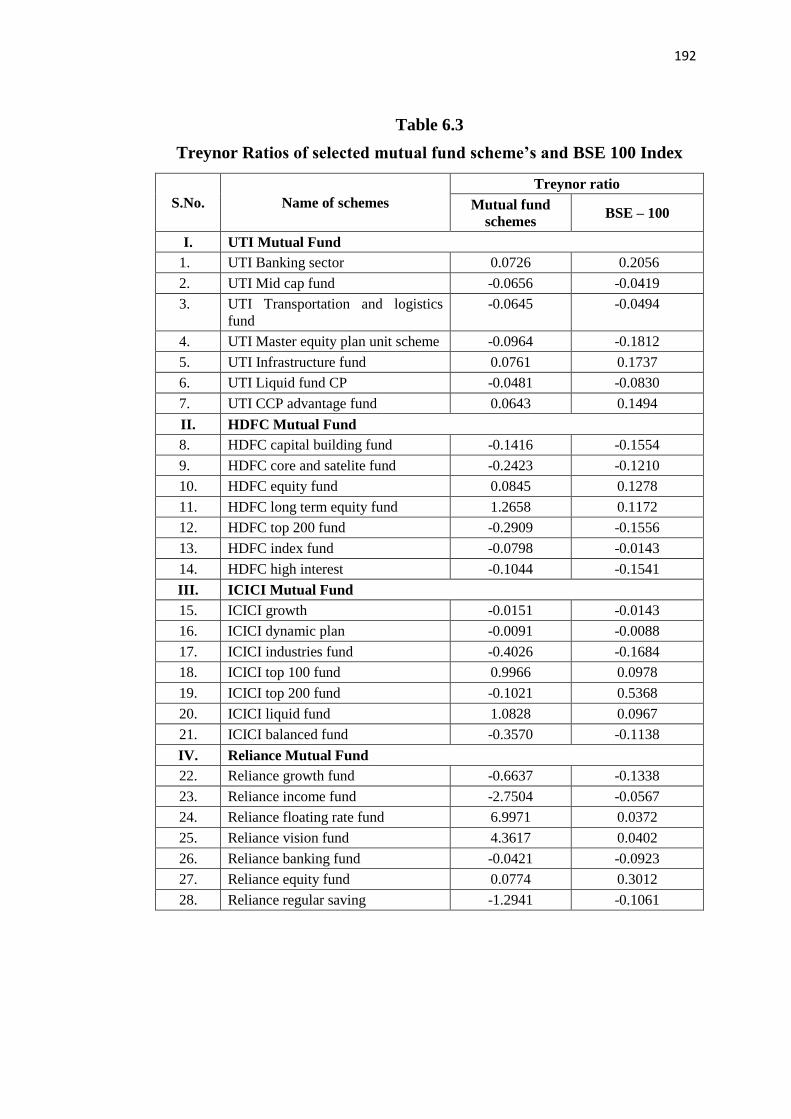
192
Table 6.3
Treynor Ratios of selected mutual fund scheme’s and BSE 100 Index
S.No. Name of schemes
Treynor ratio
Mutual fund
schemes BSE – 100
I. UTI Mutual Fund
1. UTI Banking sector 0.0726 0.2056
2. UTI Mid cap fund -0.0656 -0.0419
3. UTI Transportation and logistics
fund
-0.0645 -0.0494
4. UTI Master equity plan unit scheme -0.0964 -0.1812
5. UTI Infrastructure fund 0.0761 0.1737
6. UTI Liquid fund CP -0.0481 -0.0830
7. UTI CCP advantage fund 0.0643 0.1494
II. HDFC Mutual Fund
8. HDFC capital building fund -0.1416 -0.1554
9. HDFC core and satelite fund -0.2423 -0.1210
10. HDFC equity fund 0.0845 0.1278
11. HDFC long term equity fund 1.2658 0.1172
12. HDFC top 200 fund -0.2909 -0.1556
13. HDFC index fund -0.0798 -0.0143
14. HDFC high interest -0.1044 -0.1541
III. ICICI Mutual Fund
15. ICICI growth -0.0151 -0.0143
16. ICICI dynamic plan -0.0091 -0.0088
17. ICICI industries fund -0.4026 -0.1684
18. ICICI top 100 fund 0.9966 0.0978
19. ICICI top 200 fund -0.1021 0.5368
20. ICICI liquid fund 1.0828 0.0967
21. ICICI balanced fund -0.3570 -0.1138
IV. Reliance Mutual Fund
22. Reliance growth fund -0.6637 -0.1338
23. Reliance income fund -2.7504 -0.0567
24. Reliance floating rate fund 6.9971 0.0372
25. Reliance vision fund 4.3617 0.0402
26. Reliance banking fund -0.0421 -0.0923
27. Reliance equity fund 0.0774 0.3012
28. Reliance regular saving -1.2941 -0.1061

193
Table 6.3 gives results pertaining to Treynor ratio for the sample
schemes as well as for the benchmark portfolios. Out of the seven UTI Mutual
Fund sample schemes, four schemes (57 percent) i.e., UTI Mid Cap Fund, UTI
Transportation and Logistics, UTI Master Equity and UTI Liquid fund CP,
have generated negative ratio. It is more than the benchmark in terms of
volatility. Though UTI banking sector, UTI infrastructure fund and UTI CCP
advantage fund have generated positive ratio, it is less than the benchmark
during the period.
On the other hand, out of the 21 private sector sample schemes, 14
schemes (67 percent) have generated negative ratio, it is more than the
benchmark in terms of volatility. HDFC Equity Fund, HDFC LT fund, ICICI
Top 100, ICICI Liquid fund, Reliance Floating Rate Fund, Reliance Vision, and
Reliance Equity Fund though revealed positive ratios they are not matched
with benchmark portfolio ratios.
From the above it is evident that by comparing the Treynor ratios
of sample schemes with the Treynor ratios of benchmarks in terms of
volatility, Private Sector Mutual Fund sample schemes performed well.

194
Table 6.4
Sharpe Ratios of selected mutual fund schemes’ and BSE-100 Index
S.No. Name of scheme
Sharpe Ratio
Mutual fund
Schemes
BSE-100
I. UTI Mutual Fund
1. UTI banking sector -0.9508 -3.1148
2. UTI mid cap fund -1.1392 -3.1148
3. UTI transportation and logistics fund -0.9576 -7.7811
4. UTI master equity plan unit scheme -1.2169 -0.5949
5. UTI infrastructure fund -1.5057 -3.1148
6. UTI liquid fund CP -0.6033 -2.4465
7. UTI CCP advantage fund 1.1317 0.5949
II. HDFC Mutual Fund
8. HDFC capital building fund -0.8324 -0.0203
9. HDFC core and satelite fund -3.3698 -1.6958
10. HDFC equity fund 3.2514 0.0203
11. HDFC long term equity fund -6.9704 -2.4048
12. HDFC top 200 fund -2.1734 -2.2702
13. HDFC index fund -2.5952 -0.7561
14. HDFC high interest -8.3822 -2.4465
III. ICICI Mutual Fund
15. ICICI growth -0.2386 -0.0203
16. ICICI dynamic plan -0.1244 -0.0286
17. ICICI industries fund -3.2514 -0.0203
18. ICICI top 100 fund -6.1276 -0.0203
19. ICICI top 200 fund 16.7962 2.9439
20. ICICI liquid fund 14.5188 1.1851
21. ICICI balanced fund -1.5275 -0.0203
IV. Reliance Mutual Fund
22. Reliance growth fund -3.6486 -1.5687
23. Reliance income fund -19.9457 -1.9456
24. Reliance floating rate fund -510.265 -2.2882
25. Reliance vision fund 8.0388 -1.0363
26. Reliance banking fund -0.7620 -2.4815
27. Reliance equity fund 10.0117 1.0203
28. Reliance regular saving -1.02570 -2.1851
195
Table 6.4 presents results related to Sharpe ratio for the sample mutual
fund schemes and for the benchmark portfolio, i.e., BSE-100. Out of the seven
UTI mutual fund sample schemes, one (14 percent) scheme, i.e., UTI CCP
Advantage fund has outperformed the benchmark ratio, in terms of total risk.
On the other hand out of the 21 private sector sample schemes
four (19 percent) schemes have outperformed the benchmark ratio. They are
one scheme from HDFC (HDFC Equity) two from ICICI (ICICI TOP 200 fund
and ICIC liquid fund) and one from Reliance mutual fund (Reliance Equity
Fund). It is evident that, by comparing the Sharpe ratios of sample
schemes with the Sharpe ratios of benchmark portfolios, private sectors
mutual fund sample schemes have performed well in terms of total risk.
And among the private sector, sample schemes related to ICICI Top 200 fund,
ICICI Liquid fund and Reliance equity fund performed better than the other
schemes.
Comparison of Treynor and Sharpe ratios:
By comparing the Treynor and Sharpe ratios of sample mutual fund
schemes with the ratios of benchmark portfolios, it is concluded that the
private sector mutual fund sample schemes have performed well in terms of
both the total risk and systematic risk compared with UTI mutual fund schemes.

196
Table 6.5
Sharpe Differential Returns of Selected Mutual Fund Schemes
S.N
o. Name of Scheme
Expected
returns
Average
fund
returns
Differential
Returns
I. UTI Mutual Fund
1. UTI Banking sector 0.0169 0.0052 -0.0213
2. UTI Mid cap fund 0.0118 0.0073 0.0084
3. UTI Transportation and logistics fund 0.0165 0.0108 0.0193
4. UTI Master equity plan unit scheme 0.0254 0.0070 0.0045
5. UTI Infrastructure fund 0.0166 0.0047 -0.0072
6. UTI Liquid fund CP -0.0011 0.0074 0.0633
7. UTI CCP advantage fund 0.0090 0.0038 0.0095
Average 0.0136 0.0066 0.0129
II. HDFC Mutual Fund
8. HDFC capital building fund 0.4603 0.5649 0.1046
9. HDFC core and satelite fund 0.3381 0.2324 -0.1056
10. HDFC equity fund 0.4593 0.3927 -0.0665
11. HDFC long term equity fund 0.4515 0.9206 -0.3594
12. HDFC top 200 fund 0.2950 0.3016 0.0660
13. HDFC index fund 0.3977 0.2761 -0.1216
14. HDFC high interest -0.0898 0.3188 0.4087
Average 0.3303 0.4296 -0.0105
III. ICICI mutual fund
15. ICICI growth 0.4597 0.4462 -0.0134
16. ICICI dynamic plan 0.4595 0.4519 -0.0075
17. ICICI industries fund 0.4605 0.1401 -0.3204
18. ICICI top 100 fund 0.4151 0.6768 0.2616
19. ICICI top 200 fund 0.4606 0.5480 0.5480
20. ICICI liquid fund 0.4434 0.1918 -0.2515
21. ICICI balanced fund 0.4602 0.1373 -0.0160
Average 0.4513 0.3703 -0.0160
IV. Reliance Mutual Fund
22. Reliance growth fund 0.3155 0.1456 -0.1699
23. Reliance income fund 0.4605 0.0349 -0.4255
24. Reliance floating rate fund 0.4605 0.0659 -0.3946
25. Reliance vision fund 0.4280 0.6136 0.1856
26. Reliance banking fund 0.2413 0.3820 0.1407
27. Reliance equity fund 0.4317 0.0095 -0.4222
28. Reliance regular saving 0.4210 0.6088 0.1877
Average 0.3941 0.2658 -0.1063
Average private sector sample schemes 0.3919 0.3552 -0.1228

197
Table 6.5 shows Sharpe differential returns of the sample mutual fund
schemes. Of the seven UTI mutual fund sample schemes, five schemes
(71 percent), i.e., UTI Mid Cap, UTI Transportation, UTI MEPUS, UTI
Liquid fund CP, and UTI CCP Advantage reflect positive differential returns,
thereby indicating superior performance. The remaining two schemes
(29 percent) shows negative differential returns indicating that they are not
able to generate returns commensurate with the risk they assured.
On the other hand, out of the 21 private sector sample schemes, eight
schemes (38 percent) reflect positive differential returns, thereby indicating
superior performance. It is quite surprising that out of the seven sample
schemes related to the category of HDFC mutual fund three schemes reflect
positive differential returns by showing superior performance than the UTI
mutual fund. And the top performers in the private sector are ICICI TOP 200
fund, and HDFC high interest fund.
From the above it is clear that as far as Sharpe differential returns is
concerned UTI mutual fund sample schemes have superior performance in
security selection and diversifying the portfolio, than Private sector mutual
fund.

198
Table 6.6
Jensen measure of selected mutual fund schemes
S.no Name of the mutual fund
scheme
Average
fund
return
Equilibrium
return
Alpha
value
T-value for
alpha
I UTI Mutual Fund
1. UTI Banking sector 0.0052 0.3391 -0.0125 -20.5557
2. UTI Mid cap fund 0.0073 0.2722 -0.0078 -10.0031
3. UTI Transportation and logistics 0.0108 0.3369 0.0066 18.9724 *
4. UTI Master equity plan unit 0.0070 0.4739 -0.0226 -823.860
5. UTI Infrastructure fund 0.0047 0.3221 -0.0150 -683.502
6. UTI Liquid fund CP 0.0074 0.4390 0.0089 452.889*
7. UTI CCP advantage fund 0.0038 0.3371 -0.0073 -33.8994
Average 0.0066 0.3676 0.0054
II HDFC Mutual Fund
8. HDFC capital building fund 0.5649 0.4590 0.1058 -22.8126
9. HDFC core and satelite fund 0.2324 0.3520 -0.1196 -39.2305
10. HDFC equity fund 0.3927 0.4596 0.8524 180.2144*
11. HDFC long term equity fund 0.0920 0.4241 -0.3320 -302.120
12. HDFC top 200 fund 0.3016 0.2802 0.0214 16.25175*
13. HDFC index fund 0.2761 0.4073 -0.1312 -34.7785
14. HDFC high interest 0.3188 0.2231 0.0956 -41.8983
Average 0.3112 0.3722 0.0841
III. ICICI Mutual Fund
15. ICICI growth 0.4462 0.4596 -0.0132 -26.7774
16. ICICI dynamic plan 0.4519 0.4596 -0.0075 -22.1431
17. ICICI industries fund 0.1401 0.4605 -0.3204 -190.1417
18. ICICI top 100 fund 0.6768 0.1050 0.5717 166.3248*
19. ICICI top 200 fund 0.5480 0.4591 0.0889 -57.4451
20. ICICI liquid fund 0.1918 0.3516 -0.1597 -690.5393
21. ICICI balanced fund 0.2594 0.4601 -0.2007 -23.5334
Average 0.3240 0.3928 -0.0058
IV Reliance Mutual Fund
22. Reliance growth fund 0.1456 0.3901 -0.2444 -34.3891
23. Reliance income fund 0.0659 0.4607 -.39447 -232.79
24. Reliance floating rate fund 0.3647 0.3829 0.3464 -460.77
25. Reliance vision fund 0.6136 0.1652 0.4484 126.234*
26. Reliance banking fund 0.3820 0.1683 0.2136 1.03070*
27. Reliance equity fund 0.0095 0.4446 -0.4351 -461.563
28. Reliance regular saving 0.6088 0.2197 0.3890 71.8244*
Average 0.2660 0.0031 0.0031
Average private sector sample
scheme
0.3004 0.2560 0.0310
* Significance at 0.5% level
199
Table 6.6 presents results of Jensen measure of the sample mutual fund
schemes. Of the total seven UTI mutual fund sample schemes alpha value
for only two schemes (28 percent) i.e., UTI Transportation and logistic fund,
and UTI Liquid Fund CP, are positive, thereby indicating superior
performance. In other words these schemes have generated returns in excess of
equilibrium returns. The results also indicate that alpha value for the above
two schemes is statistically significant at 0.5 level, thereby indicating that
these scheme only generate above normal returns.
On the other hand, out of the 21 private sector sample schemes, six
schemes (29 percent) have generated returns in excess of equilibrium
returns by indicating superior performance. Out of them two schemes are under
the HDFC mutual fund i.e., (HDFC Equity Fund and HDFC TOP 200), one
from ICICI mutual fund (ICICI TOP 100 fund), and three from Reliance mutual
fund (Reliance vision fund, Reliance Banking fund and Reliance regular
savings). The results also indicate that the alpha value for all the six schemes
are statistically significant at 0.5 level, thereby implying that these schemes
generate above normal returns.
From the above analysis it is evident that in terms of Jensen measure,
private sector sample schemes, particularly Reliance mutual funds and ICICI
mutual fund, have performed better than the UTI mutual fund sample schemes.
Among the UTI mutual funds sample schemes UTI Liquid fund CP performed
well.
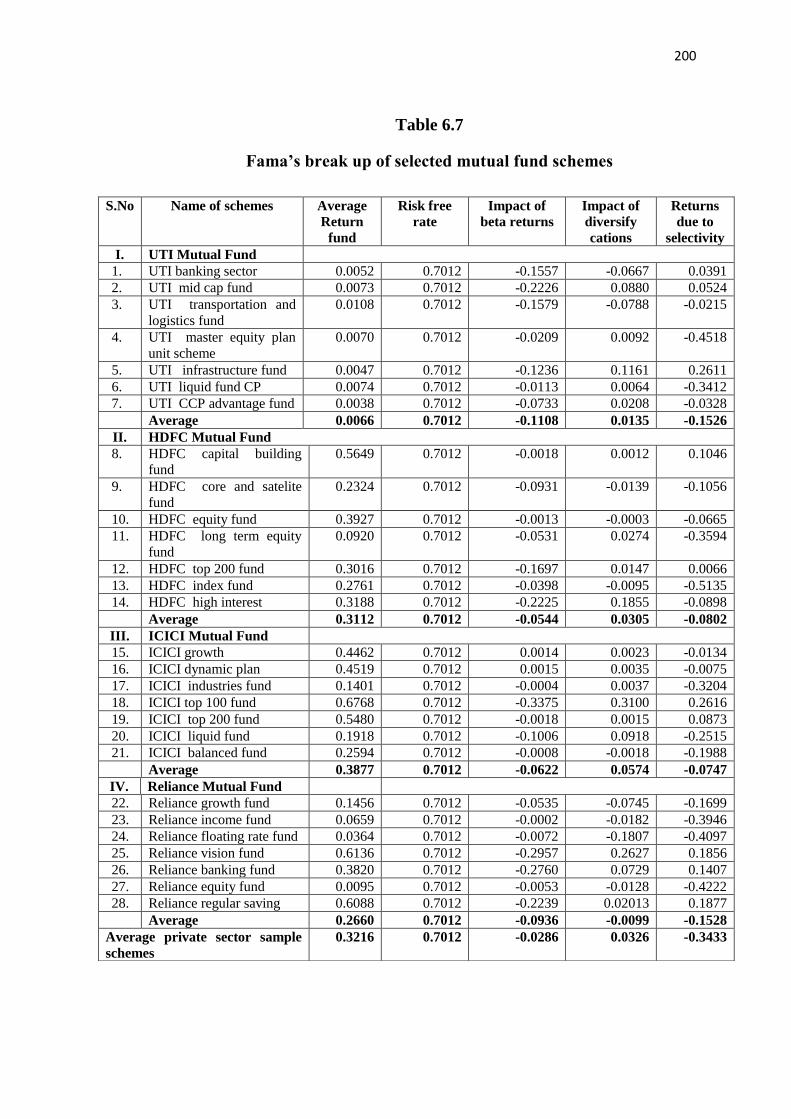
200
Table 6.7
Fama’s break up of selected mutual fund schemes
S.No Name of schemes Average
Return
fund
Risk free
rate
Impact of
beta returns
Impact of
diversify
cations
Returns
due to
selectivity
I. UTI Mutual Fund
1. UTI banking sector 0.0052 0.7012 -0.1557 -0.0667 0.0391
2. UTI mid cap fund 0.0073 0.7012 -0.2226 0.0880 0.0524
3. UTI transportation and
logistics fund
0.0108 0.7012 -0.1579 -0.0788 -0.0215
4. UTI master equity plan
unit scheme
0.0070 0.7012 -0.0209 0.0092 -0.4518
5. UTI infrastructure fund 0.0047 0.7012 -0.1236 0.1161 0.2611
6. UTI liquid fund CP 0.0074 0.7012 -0.0113 0.0064 -0.3412
7. UTI CCP advantage fund 0.0038 0.7012 -0.0733 0.0208 -0.0328
Average 0.0066 0.7012 -0.1108 0.0135 -0.1526
II. HDFC Mutual Fund
8. HDFC capital building
fund
0.5649 0.7012 -0.0018 0.0012 0.1046
9. HDFC core and satelite
fund
0.2324 0.7012 -0.0931 -0.0139 -0.1056
10. HDFC equity fund 0.3927 0.7012 -0.0013 -0.0003 -0.0665
11. HDFC long term equity
fund
0.0920 0.7012 -0.0531 0.0274 -0.3594
12. HDFC top 200 fund 0.3016 0.7012 -0.1697 0.0147 0.0066
13. HDFC index fund 0.2761 0.7012 -0.0398 -0.0095 -0.5135
14. HDFC high interest 0.3188 0.7012 -0.2225 0.1855 -0.0898
Average 0.3112 0.7012 -0.0544 0.0305 -0.0802
III. ICICI Mutual Fund
15. ICICI growth 0.4462 0.7012 0.0014 0.0023 -0.0134
16. ICICI dynamic plan 0.4519 0.7012 0.0015 0.0035 -0.0075
17. ICICI industries fund 0.1401 0.7012 -0.0004 0.0037 -0.3204
18. ICICI top 100 fund 0.6768 0.7012 -0.3375 0.3100 0.2616
19. ICICI top 200 fund 0.5480 0.7012 -0.0018 0.0015 0.0873
20. ICICI liquid fund 0.1918 0.7012 -0.1006 0.0918 -0.2515
21. ICICI balanced fund 0.2594 0.7012 -0.0008 -0.0018 -0.1988
Average 0.3877 0.7012 -0.0622 0.0574 -0.0747
IV. Reliance Mutual Fund
22. Reliance growth fund 0.1456 0.7012 -0.0535 -0.0745 -0.1699
23. Reliance income fund 0.0659 0.7012 -0.0002 -0.0182 -0.3946
24. Reliance floating rate fund 0.0364 0.7012 -0.0072 -0.1807 -0.4097
25. Reliance vision fund 0.6136 0.7012 -0.2957 0.2627 0.1856
26. Reliance banking fund 0.3820 0.7012 -0.2760 0.0729 0.1407
27. Reliance equity fund 0.0095 0.7012 -0.0053 -0.0128 -0.4222
28. Reliance regular saving 0.6088 0.7012 -0.2239 0.02013 0.1877
Average 0.2660 0.7012 -0.0936 -0.0099 -0.1528
Average private sector sample
schemes
0.3216 0.7012 -0.0286 0.0326 -0.3433
201
Table 6.7 reveals Fama‟s break-up of the sample mutual fund schemes.
UTI mutual fund sample schemes return (0.0066) are below the risk free rate
of return (0.7012). The private sector sample schemes return (0.3216) are also
below the risk free rate of return.
Impact of systematic risk:
On account of risk bearing activity of the fund managers, most
of the schemes suffered with negative performance. Except two schemes,
namely; ICICI Growth and ICICI Dynamic plan, all other schemes are in
negative performance. However, the average negative performance in the
case of private sector sample schemes (-0.0286) is less than the average
negative performance of sample UTI mutual fund schemes (-0.1108).
Impact of diversification:
Analysis of fund managers‟ performance on diversification reveals
that; out of the seven UTI mutual fund sample schemes, five schemes
(71 percent) revealed positive returns, and out of 21 private sector
sample schemes, 13 schemes (62 percent) revealed positive returns. And
the average positive returns of UTI mutual fund sample schemes (0.0135)
is less than the average positive returns (0.0326) of private sector for their
diversification activities.
Returns due to Selectivity
The residual performance on selectivity is attributed to net selectivity
and it will be equal to (or less than) that on selectivity. A positive net

202
selectivity will indicate superior performance. Out of the seven UTI mutual
fund schemes, three schemes i.e., UTI Banking sector and UTI mid cap
fund and UTI infrastructure fund show positive performance. Out of 21
private sector sample schemes, seven schemes, (33 percent) possess superior
stock selection ability i.e., positive performance.
From the above it is clear that the returns due to diversification
and net selectivity in the case of private sector is higher than the UTI mutual
fund. Among the private sector, sample schemes related to Reliance mutual
fund revealed better returns than the other categories due to diversification
and net selectivity .
Combined Returns of UTI and Private Sector Mutual Fund Schemes
The UTI and Private sector mutual funds companies‟ combined returns
are compared with the help of t-test to know which sector so as to help the
investors fund provide more return in future. On the basis of the average
return, the researcher applied t-test with the following suitable hypothesis
framed and tested for the result.
Ho: 4 There is no significant difference between the performance of UTI
mutual fund and private sector mutual fund schemes.

203
Table 6.8
Combined returns of UTI and Private Sector Mutual Fund Schemes
Returns UTI Mutual Fund
(X1 – Mean) (X1–Mean)2
Private Sector Mutual
fund
(X1–Mean)
(X2 – Mean)2
Average return 0.66 54.61 30.04 1.63
Average Market return 0.61 55.35 36.73 63.52
Expected return 1.36 44.75 39.19 108.73
Sharpe differential return 1.29 45.69 12.28 271.59
Equilibrium return 0.36 59.13 25.60 9.98
X1 = 40.25
Mean = 8.05 (X1-mean)2 =259
X2 = 143.84
Mean = 28.75
( X2-mean)2 =455
203
204
The result of the test shows that the calculated t-value is 1.95 greater
than tabulated value 1.86. The difference is significant. Hence, it is concluded
that the null hypothesis is rejected at five percent level significance. The return
of private sector is greater than the return of UTI mutual fund. X2 value of
private sector (455) is more than the UTI mutual fund (259). That the private
sector mutual fund shows very impressive growth in comparison to UTI mutual
fund.
205
CHAPTER – VII
FINDINGS, SUGGESTIONS AND CONCLUSION
The followings are the major findings of the study.
AWARENESS
1. Young investors (60 percent) and financial advisors (43 percent) in the age
groups of 36 to 45 years have more involvement in the investment
industry. It is because of their curiosity, courage and faith in investment.
2. Participation of male in both investors (62 percent) and financial advisors
(67 percent) is higher than the female because of their involvement in
social participation and thereby gaining high knowledge on investment.
3. Post-graduate holders are highly involved in both investors and financial
advisor followed by graduate and higher secondary holders. It depicts the
direct relationship between the educational qualification and participation
in investment activities.
4. Regarding income, those who earn more than Rs.25000/- per month ranks
first. It is because they are able to save a part of their income and deposit
the same in investment and vice versa.
5. Business people are largest investors, followed by professionals, employed
persons, and others. Investment in mutual funds by agriculturist is nil. It
shows that they are unaware of mutual funds. As the income of business
people is commendable and they are also interested to increase their
earning through investment business, their portion of investment is higher
than the others‟.

206
6. Involvement of professionals ranks first in financial advisory function
followed by employed persons, business people and others. It is because
the professionals in the particular field knows the dos and donts. That is
why the role of investment professionals is dominating one in the
investment advisory field.
7. The participation of married people is higher than the unmarried one both
in investors and in financial advisors. Because of their necessity to increase
their family income, the role of married people is higher than the
unmarried people.
8. Most of the investors and financial advisors are having 11-15 years of
experience. It shows their high level of confidence in investing in mutual
fund.
9. 45 percent of investors are moderately aware and 58 percent of the
financial advisors are extremely aware about the submission of application
by the Sponsor according to SEBI regulations.
10. 52 percent of the investors and 51 percent of the financial advisors are
extremely aware that the application fee must accompany the application.
11. 46 percent of investors and 40 percent of financial advisors have an
understanding that the incomplete application is liable for rejection as per
the SEBI regulations. It is because, they are educated and know
information regarding application procedure through attending investor
education awareness programmes conducted by investors association
recognized for the purpose by SEBI.
12. 42 percent of the respondents are extremely aware that the eligibility
conditions in financial services business is a period of not less than five

207
years and 39 percent of the financial advisors are moderately aware about
the same.
13. 48 percent of the investors and 45 percent of the financial advisors are
extremely aware about the eligibility conditions of having positive net
worth in all the preceding five years.
14. 46 percent of the investors and 41 percent of the financial advisors are
extremely aware about the net worth, in the immediately proceeding year,
is more than the capital contribution of the sponsor in the AMC.
15. 42 percent of the investors and 37 percent of the financial advisors are
aware that the existing mutual fund should be in trust form during
registration. 51 percent of the investors and 42 percent of financial advisors
are extremely aware that, sponsor must contribute at least 40 percent to the
net worth of the AMC.
16. 45 percent of investors and 45 percent financial advisors are extremely
aware that the board preserve the right to decide on the application.
17. „Grant of certificate of registration is provided to the applicant on paying
the registration fee‟ is moderately known to 75 percent of the financial
advisors.
18. 51 percent of investors and 58 percent of financial advisors are extremely
aware about the terms and conditions of the registration under the SEBI
Mutual Fund (Amendment) regulations, from time to time.
19. Largest number of respondents‟ (3.7 highest mean value) motive is the
accumulation of wealth. It is because, the awareness of investment in
mutual fund for long period increases the value of wealth.

208
20. 37 percent of investors and 48 percent of financial advisors are moderately
aware the investment norms. It is because, the respondents are difficult to
understand the investment norms due to language problems, and
complicated term used in the prospectus.
21. Regarding portfolio disclosure, 61 percent of the investors and 85 percent
of the financial advisors feel there is transparency in the portfolio
disclosure. It is because, the respondents believe that the investment
decisions are influenced by the pattern of the asset allocation indicated in
the offer documents.
22. Regarding the advertisement code, the awareness level of investors and
financial advisors are low (26 percent of investors and 29 percent of
financial advisors). It is because, mutual fund advertisement given by
media communication is speedy. Within few seconds there are hundreds of
words spoken in advertisement, which are not easy to understand and
memorize by the viewers.
23. Only 38 percent of the respondents feel that the mutual funds are not using
any unethical means to sell or induce any investment. The others lack of
awareness regarding this point.
24. 57 percent of the investors accept that the SEBI regulations avoid the
conflicts of interest in the management of mutual fund schemes.
25. 89 percent of investors and 84 percent of financial advisors are extremely
aware about the inspection of accounts and other records. It is because, the
respondents are interested to know the audited financial results of their
investment company, and because of the knowledge acquired by them.
209
26. 60 percent of the investors and financial advisors are extremely aware
about the investors‟ association and its functions. Thus the investors as
well as financial advisors have faith on investors association regarding the
investment affairs of their deposits.
27. Only 28 percent of investors are extremely aware about SEBI grievance
redress mechanism. It is because, grievance redressal mechanism by SEBI
takes more time.
28. The chi-square analysis reveals that the knowledge in various dimension of
the awareness is totally related with the level of experience. The
awareness of regulation are difficult to understand but at the same time the
professionals having experience gain knowledge in the field.
PERCEPTIONS
29. 28 percent of the investors perceive that they are not depending on their
investments. 25 percent of sample respondents perceive they are mainly
depending upon their investment in mutual funds. Another 25 percent of
investors perceive that their investment in mutual fund is only for
emergency purpose.
30. 27 percent (highest percentage) of investors perceive their investment in
mutual fund is preserved one and fetches satisfactory current income.
31. 60 percent of investors, and in the investment time horizon up to five years,
and 28 percent of investors are in the time horizon between 6-10 years. It
reveals that short period of time horizon is largely preferred by investors.
32. 43 percent the investors (highest percentage) are willing to take risk. It
shows their strong attitude towards earning high return.

210
33. 27 percent of the investors (highest percentage) perceives and accept the
goal of investment of mutual fund is the maximum appreciation of
investment. Others are interested in earning stable income or higher return
in short period.
34. Investors prefer bank deposit in the first instance, with the highest average
score of 4.3. Mutual funds are the fourth preferred financial asset with an
average score of 3.2.
35. Return on investment point of view, 44 percent preferred funds providing
regular income. From stability point of view, 51 percent chose schemes
assuring safety of investment. From the angle of marketability of schemes,
37 percent preferred mutual funds ensuring high profitability. From the tax
benefit point of view, 50 percent of investors invested in schemes with or
without tax savings.
36. Investors prefer first for private sector Indian joint venture mutual funds,
with an average score of 3.4. Second preference is for bank sponsored
mutual funds, with an average score of 3.0. Third ranking is for private
sector Indian mutual funds (2.83) and the fourth ranking is for institutions
sponsored mutual funds (2.80).
37. Main source of information for mutual funds is from agents (63 percent of
investors) followed by advertisements (61 percent) and newspapers (58
percent).
38. Goodwill is the most influencing factor in the selection of the mutual fund
with an average score of 3.5. Second important factor is investor services
to investors with an average score of 3.2 followed by past performance
with an average score of 3.0.
211
39. The most important factor affecting the choice of mutual fund scheme is
capital appreciation with an average score of 3.5 followed by fund
objective, return on investment and safety with an average score of 3.2
each
40. Investors prefer first for growth schemes with an average score of 4.7.
Second preference is for income schemes with an average score of 4.5.
Third rating is for equity linked savings schemes with an average score of
3.0.
41. Age, occupation, monthly income and monthly savings are significant
influence on the selection of schemes based on the criteria of return, safety,
liquidity and tax benefit.
42. 271 investors (85.49 percent) agree that the mutual funds is better than
share. Applying the binomial test of significance, the calculated Z value is
12.97 and it is greater than the Table value 1.96. it shows that the
proportion of investors agreeing that „investing in mutual funds is less
risky compared to shares‟.
43. 74.72 percent of investors agree that mutual funds provide better returns
than bank deposits. It is proved by the table 3.28.
44. 78 percent of investors agree that the growth schemes are highly preferred
to income schemes. It is proved by the table 3.29.
45. 67.87 percent of investors agree that the risk and return characteristics of
Indian mutual funds are not in conformity with their stated objectives. It is
proved by the Table 3.30
212
46. 65.31 percent of investors agree that mutual funds have the ability to
weather market fluctuations. It is proved by the Table 3.31
47. 86.48 percent of investors agree that mutual funds are more suitable to
small investors who are otherwise hesitant of entering into capital market.
It is proved by the table 3.32.
PERFORMANCE BASED ON RISK AND RETURN:
Sharpe Index
48. UTI Mid cap scheme provides better return (0.0073) than the market return
(0.0061) and scheme sharpe index is (-1.1392). It shows UTI, Mid cap
scheme performance is good.
49. The overall return (0.0108), scheme risk (0.0457), and sharpe index of UTI
transportation and logistic scheme is (-0.9576), greater than the market
sharpe index (-1.4695). it shows its outperformance compared to market
performance.
50. Comparing the average risk with the average return of the UTI MEPUS, its
performance is poor. It is also indicated by the negative Sharpe index of
UTI MEPUS (Table 4.4).
51. The average return of the UTI Infrastructure scheme (0.047) is less than the
average risk (0.0353). It shows its under performance is compared to the
average market return (0.0061).
52. Average Sharpe index of the UTI Liquid Fund CP scheme (-0.6033) is less
than the average market Sharpe index (-1.4695). It shows out performance
of the scheme.

213
53. The performance of UTI CCP advantage scheme is poor. It is indicated by
its average return 0.0038 which is lower than its average market return
(0.0061). But its average Sharpe index -1.1317 is higher than the average
market Sharpe index (-1.4695) indicating out performance.
54. As per Sharpe index among the seven schemes, UTI Liquid Fund CP
outperformed the market in all the ten years while UTI infrastructure
scheme underperformed the market (-1.5057) during the study period
(Table 4.22).
Treyner Index
55. The average beta value of UTI Banking Sector Fund (0.7709), UTI Mid
Cap Fund (0.8676), UTI Transportation and Logistics (0.7954), UTI
MEPUS (0.5676) and UTI Infrastructure (0.7420), is less than one. It
shows they are defensive nature compared to the market. Where as the
average beta value of UTI Liquid Fund CP (1.0673) is it indicates its
aggressive nature.
56. The average Treynor Index, all the seven schemes studied are negative. As
per the average Treynor Index, the performance of UTI Liquid Fund CP is
better than its market performance (Table 4.13).
Jensen Alpha
57. UTI Liquid Fund CP scheme (0.0089) show positive Jensen Alpha during
the period of study. UTI Banking sector fund (-0.0125), UTI Mid Cap
fund (-0.0078), UTI Transportation and Logistics fund (-0.0066), UTI
MEPUS (-0.0226), UTI Infrastructure fund (-0.0150), and UTI CCP
Advantage (-0.0073) Scheme show negative Jensen alpha in all the years.

214
Composite Risk – Return Analysis
58. Return from UTI Transport and Logistics fund (0.0108) is the highest
among the seven schemes studied. The beta value is the lowest for UTI
MEPUS (0.5676), and highest for UTI Liquid Fund CP (1.0673). The
average risk of UTI Infrastructure is the lowest (0.0353) and it is the
highest (0.1570) for UTI Liquid Fund CP.
59. Based on Sharpe Index, the performance of UTI Liquid Fund CP
(-0.6033) is highest and it is followed by UTI Banking sector (-0.9508) and
others.
60. On the basis of Treynor Index, the performance of UTI Liquid Fund CP (-
0.0481) and UTI CCP Advantages fund (-0.0643) topped the list due to
their aggressive nature.
61. only the return of UTI liquid Fund CP (0.0089) is greater than its expected
return and its proved by the positive Jensen alpha (Table 4.24).
Comparison performance evaluation measures
62. The relationship between Treynor and Jensen measure is the highest
(0.8929) and it is the lowest (0.6429) between Sharpe and Treynor models
of performance evaluation. The Kendalls Coefficient of Concordance
revealed the existence of a significant agreement in the ranking assigned by
the three models. All the three measures on the whole assigned first rank to
UTI Liquid Fund CP scheme in terms of performance based on total risk
and systematic risk.

215
Eugene Fama’s Decomposition of Total Returns
63. The return on systematic risk is the highest in the case of
UTI MEPUS Scheme (-0.0315) and the lowest in the case of UTI Liquid
Fund CP(-0.0624). The return on unsystematic risk is the highest in the
case of UTI Infrastructure Fund (-0.0079) and the lowest in the case of
UTI MEPUS Scheme (-0.0835).
64. The UTI Liquid Fund CP scheme (0.0633) provides the highest net
superior returns due to selectivity skills assuming highest risk.
65. UTI Liquid Fund CP Scheme (0.0023) shows highest explained and high
unexplained risk (0.0056) during the period of study while explained
variance is lowest in the case of UTI MEPUS Scheme (0.006) and
unexplained variance is lowest in the case of UTI Infrastructure scheme
(0.0004).
Impact of Market Return of Sample Schemes
66. The highest covariance is in the case of UTI liquid fund CP scheme
(0.0020) and it is the lowest in the case of UTI MEPUS schemes (0.0010).
The Z test revealed the existence of a significant impact of market returns
on the performance of all the sample schemes with a high degree of
positive correlation.
216
PERFORMANCE OF SCHEMES BASED ON MARKET TIMING
ABILITY OF FUND MANAGERS
Treynor and Mazuy Module (TM)
67. 86 percent of schemes have timing the market and 14 percent of schemes
are unable to timing the market. Out of seven schemes, the fund managers
of six schemes are able in timing the market correctly in right direction.
68. Schemes which timing the market correctly are: UTI Banking Sector Fund,
UTI Mid Cap Fund, UTI Transportation and Logistics, UTI Master Equity,
UTI Liquid Fund CP, and UTI CCP Advantage fund.
Henriksson and Merton Module (HM)
69. 71.42 percent of schemes timing the market and 28.58 Percent of schemes
are unable to timing the market. The t-value of gamma for UTI
infrastructure fund and UTI CCP advantage fund is negative in the market.
COMPARATIVE PERFORMANCE OF UTI AND PRIVATE SECTOR
SCHEMES
Risk and returns
70. When comparing the average risk and average returns, Private sector
sample schemes have earned higher average returns (0.3216) than the
average of risk 0.1499, and the market risk (beta) 0.90319 is more than the
UTI mutual fund schemes.
71. Among the UTI Mutual Fund sample schemes, schemes related to UTI
Transportation and Logistics have earned higher average returns of 0.0108
than the average risk of 0.0457.

217
72. Schemes from private sector like ICICI Top 100 fund (0.6768), ICICI Top
200 (0.5480), Reliance vision fund (0.6126), Reliance regular savings fund
(0.6088) and HDFC capital building fund (0.5649), have earned average
higher returns than the average market risks.
Risk and returns vs. Benchmark portfolio
73. Sample schemes of ICICI have earned highest average return of 0.3877
with an average risk of 0.0457 per month. the average returns of selected
sample schemes is 0.3216 with an average risk of 0.0422.
74. 47 percent of the private sector schemes (10) earned greater than the
average return of sample schemes and the balance 53 percent earned less
than the average return of sample schemes.
75. 18 percent of the private sector sample schemes (four) have crossed the
return of benchmark portfolio (BSE-100) and 91 day T-bills by taking an
average risk of 0.0422.
76. By comparing the average risk and average returns of sample schemes with
the average risk and average returns of benchmark portfolios, private sector
sample schemes have earned higher returns than the UTI mutual fund
schemes.
Treynor ratios and BSE-100 index
77. 57 percent of UTI mutual funds schemes (four) and 67 percent of private
sectors schemes (14) have generated negative Treynor ratio. It is more
than the benchmark in terms of volatility (systematic risk).
78. Comparing the Treynor ratios of sample schemes with the Treynor ratios of
(BSE-100) benchmark index in terms of volatility (systematic risk), private

218
sector mutual fund sample schemes performed better than the UTI mutual
fund schemes.
79. Private sector sample schemes; HDFC Equity fund, HDFC LT fund, ICICI
Top 100, ICICI Liquid fund, Reliance vision, Reliance floating rate fund
and Reliance Equity fund though revealed positive Treynor ratios, they are
not matched to the benchmark portfolio ratios.
Sharpe ratios and BSE-100 index
80. Out of the seven UTI mutual fund sample schemes, one (14 percent), UTI
CCP advantages fund have out performed the benchmark ratio, in terms of
total risk.
81. By comparing the Sharpe ratios of sample schemes with the Sharpe ratios
of benchmark portfolios, Private sector mutual fund sample schemes have
performed better in terms of total risk than the UTI mutual funds.
82. 19 percent of private sector schemes (four) have outperformed the
benchmark ratio. Such sample schemes are; HDFC Equity fund, ICICI
Top 200 fund, ICICI Liquid fund, and Reliance Equity fund.
Sharpe differential returns
83. 71 percent of UTI (five) and 38 percent of private sector schemes (eight)
reflect positive differential returns, thereby indicating superior
performance.
84. By comparing the Sharpe differential returns, UTI mutual fund sample
schemes have superior performance in security selection and diversifying
the portfolio than the private sector mutual fund schemes.
219
Jensen measure
85. 28 percent of UTI (two) and 29 percent of privates sector (six) schemes
have generated return in excess of equilibrium return by indicating superior
performance.
86. In respect of alpha values of Jensen measure, private sector sample
schemes, particularly Reliance mutual fund and ICICI Mutual fund, have
performed better than the UTI Mutual Fund sample schemes. Among the
UTI mutual funds sample schemes UTI liquid Fund CP performed well.
Fama’s break up
87. Fama‟s breakup of sample schemes reveals that the private sector sample
schemes, particularly Reliance mutual fund, have performed well in respect
of all the components namely, compensation for systematic risk,
compensation for inadequate diversification and net superior returns due to
selectivity of fund managers.
SUGGESTIONS
1. The mutual fund companies may concentrate on semi-urban and rural
areas for mobilizing the funds. And they should consider the possibility
of selling mutual fund products through post offices.
2. UTI mutual fund, in order to face the competition with the private sector
mutual funds, have to study the exact cause for decline in the returns,
there by initiate proper remedial measure within their control.
3. The mutual fund advertisement given by media communication is
speedy. It is not easy to understand and memorize by the viewers. The
advertisement by mutual fund companies should be easy for
understanding by the viewers.

220
4. The policy makers and governing bodies may abolish the schemes
giving poor performance. Because people like to invest in schemes with
assured return.
5. The offer documents should be simple and free of technicalities, so that
a lay investors can easily understand them.
CONCLUSION
In India, innumerable public and private sector mutual fund schemes are
available to common investors which generally perplex them to pick the best
out of them. This study provides some insights on mutual fund performance so
as to assist the common investors in taking the rational investment decisions for
allocating their resources in correct mutual fund. The study conclude with the
help of data analysed that the private sector mutual funds have performed better
and given good return to the investors. But, the UTI mutual fund earned
insufficient returns, which is lead to affect the investors confidence level on
UTI mutual fund. The private sectors mutual funds more efficient allocators of
investors resources than UTI mutual funds. So, the UTI mutual fund have to
maintain investors confidence in mutual funds, they should be provide adequate
return, timely information, speed, quality of services, and transparency to the
investors. The UTI mutual fund should formulate the strategies in a way that
helps in fulfilling the investors‟ expectations. Generally, the main task before
mutual fund is to convert the potential investors into the reality investors. New
and more innovative schemes should be launched from time to time so, that
investors‟ confidence should be maintained. All this will lead to the overall
growth and development of mutual fund industry under the regulated
environment.

221
SCOPE FOR FURTHER RESEARCH
The scope for further research is given below.
1. Comparative analysis of similar Mutual Fund Schemes in different
sector.
2. Analysis may Effect of economic factors on mutual fund schemes.
3. Analysis of entry and exit load of Mutual Funds schemes.
4. The study can also be undertaken regarding the investors‟ perceptions of
risk disclosure practices of mutual fund companies.
5. Study may also be taken up on the working of association of mutual
funds in India.

222
BIBLIOGRAPHY
BOOKS
1. Agarwal, Peensh Ranjan Mutual Funds - A Comprehensive Approach
to Mutual Funds, Orient Law House, New Delhi (1996).
2. Avadhani VA, Investment Management, Himalaya Publishing House,
Mumbai (2008).
3. Bhatt R S, Unit Trust of India and Mutual Funds, UTI Institute of
Capital Market, Navi Mumbai, (1996).
4. Fredman, Albert J and Wiles, Russ How Mutual Funds Work,
Prentice Hall of India Private Limited, New Delhi, (1997).
5. Friend et. al, "A Study of Mutual Funds" U.S. Securities and
Exchange Commission, USA, (1962).
6. Friend, Blume, Crockett, Mutual Funds and Other Institutional
Investors - A new perspective, Me Graw Hill Book Company, New
York, (1970).
7. Fuller, Russell J and James L Farrell, Modern Investments & Security
Analysis, Me Graw Hill International, New York, (1987).
8. Gupta L C and Utpal K Choudhury, How Good Are Mutual Funds,
Society for Capital Market Research and Development, New Delhi,
First Edition, (2001).
9. Gupta L C, India's Financial Markets & Institutions, Society for
Capital Market Research and Development, New Delhi (1999).
10. Gupta L C, Mutual Funds and Asset Preference, Society for Capital
Market Research and Development, New Delhi, First Edition
(1992).
11. Gupta, Amitabh, Mutual Funds in India: A Study of Investment
Management, Anmol Publications Pvt Ltd, New Delhi, First Edition
(2002).
12. Invin, Brown, FE, et al., "A Study of Mutual Funds: Investment
Policy and Investment Company Performance" reprinted in Hsiu-
kwangwer and Alan Jzakon (Ed.) Elements of Investments, New
York: Holt, Renchart and Winston, (1965), pp.371-385.

223
13. Jayadev, Investment Policy & Performance of Mutual Funds,
Kanishka Publishers & Distributors, New Delhi, (1998).
14. Krishnamurthi S, "Genesis of Mutual Funds in India", Vision Books,
New Delhi, (1997).
15. Kulshreshtha C M, Mastering Mutual Funds - Opportunities & Risk
Management for the Individual Investor, Vision Books, New Delhi,
(1994).
16. Laderman, Jeffrey M.Business Week's Guide to Mutual Funds,
Business Week, Me Graw Hill Inc, New York, (1994).
17. Rajeshwer (Editor), Mutual Fund Series, UTI-A saga of Crises and
Bailouts, The Institute of Chartered Financial Analysts of India,
Hyderabad, (2001).
18. Randall, Carter Nonstop winning on the stock market - Insights and
Wisdom from a Wall Street Pro, Vision Books, New Delhi, Second
Edition, (1993).
19. Rao, Mohana P, "Working Of Mutual Fund Organisations In India",
Kanishka Publishers, New Delhi, (1998).
20. Sadhak.H. Mutual Funds in India- Marketing, strategies &
Investment Practices, Response Books, New Delhi, (1997).
21. Sahadevan S and Thiripalraju M, Mutual Funds: Data, Interpretation
and Analysis, Prentice Hall of India Private Limited, New Delhi,
(1997).
22. Saroja (Editor), Emerging Trends in the Capital Market in India,
Global Business Press, New Delhi, (1991).
23. Shashikant Uma (Editor), Mutual Funds in India: Challenges,
opportunities and Strategic Perspectives, (1996).
24. Singh H K, Meera Singh, Mutual Funds and Indian Capital Market:
Performance and Profitability, Kanishka Publishers, New Delhi,
First Edition, (2001).
25. Taylor, John U.Building Wealth with Mutual Funds, Windsor Books,
New York, (1993).

224
26. Thomas, Susan (Editor), Fund Management in India: Challenges and
Opportunities, Tata McGraw-Hill Publishing Company Limited,
New Delhi, (1999).
27. Tripathy, Nalini Prava, Financial Instruments and Services, Prentice
Hall of India Private Limited, New Delhi, 2004.
28. Turan M S and Bodla B S, Performance Appraisal of Mutual Funds,
Excel Books, New Delhi, First Edition, (2001).
29. Tushar Waghmare, The future of fund Management in India 1997,
Tata McGraw-Hill Publishing Company Limited, New Delhi,
(1998).
30. Vaid, Seema, "Mutual Fund Operations In India", Rishi Publications,
Varnasi, (1994).
31. Verma J C, Bharats 'Guide to Mutual Funds & Investments
Portfolio- Law & Procedure, Bharat Publishing House, New
Delhi, (1992).
JOURNALS
32. Aabhas Pandya, "Have Mutual Funds passed the Test?", ICFAI
Reader, Vol. 111:6, (June 2001), pp.50-51.
33. Agrawal G D, "Mutual Funds and Investors' Interest", The Journal
For Corporate Professionals Vol. XXII (1), (January 1992), pp. 23-
24.
34. Agrawal, Ashok Motilal, "Mutual Funds- Emerging Trends and
Prospects", Finance India, Vol. XIV (4), (December 2000)
pp.1271-1275. :
35. Anagol Malati, "Role Of Self-Regulatory Organisation In Mutual
Fund Industry In India", Chartered Financial Analyst, Vol. 7(1),
(1992). P 11.
36. Ang, James S etal "Mutual Fund Managers' Efforts and
Performance", Journal Of Investing, Vol. 7(4), (Winter 1998), pp.
68-74.
37. Ansari, "Mutual Funds in India: Emerging Trends", The Chartered
Accountant, Vol. 42(2), (August 1993), pp.88-93.
225
38. Arditti, "Another Look at Mutual Fund Performance", Journal of
Financial and Quantitative Analysis, Vol. 3, (1971), pp. 909-912.
39. Arunajatesan S & Balaji S, "Mutual Funds: Bid for orderly growth",
THE HINDU Survey of Indian Industry (2003), pp. 93-94.
40. Ashutosh Joshi and Vandana, "MFs corner Rs 1 trn assets in 9
months", Business Standard: Money & Markets Section II, June
8,2007 p.l.
41. Ashutosh Joshi, "MFs to get rich with inflows from PSUs", Business
Standard: Money & Markets, Section II, May 18, 2007, p.l.
42. Atmaramani K N, "Mutual Funds: The Best Avenue for Investment",
Chartered Secretary, Vol. XXXI (1), (January 2001) pp. 9-11.
43. Baks Klaas P et al, "Should Investors avoid all Actively Managed
Mutual Funds? A study in Bayesian Performance Evaluation"
Journal of Finance, Vol. LVI (1) (February 2001), pp. 45-83.
44. Balaji lyer S and Kumar Bhaskar R "Investor's Psychology: A study
of Investor Behaviour in the Indian Capital Market", Finance India,
Vol. XVI (4), (December 2002), pp.l357-1375.
45. Balzer, Leslie A "Snail Trails: Measuring Fund Manager Risk /
Return Performance over time", Journal Of Investing, Spring
(1995), Vol. 4(1), pp.8-17.
46. Banerjee, Arindam "Mutual Funds: Wealth Creation through
Systematic Investment Plans", ICFAI Portfolio Organiser, (April
2006) pp.53-58.
47. Bansal L K and Gupta R K, "Mutual Funds: A case study of Master
Share of Unit Trust of India", The Indian Journal Of Commerce
Vol. XLV (II), (June 1992), pp.89-96.
48. Bansal L K, "Challenges For Mutual Funds In India", Chartered
Secretary, Vol. 21(10), (October 1991), pp. 825-26.
49. Bansal L K, "Mutual Fund Investors Taken for Granted by AMCs",
Chartered Secretary, (April, 1996) pp. 114-5.
226
50. Bansal, Manish "Mutual Funds: Eight Steps to nirvana", Chartered
Financial Analyst, Vol. 9(12), (December 2003), pp. 34-40.
51. Baur, Sundaram and Smith, "Mutual Funds: The US Experience",
Finance India, Vol. 9(4), (1995), pp.945-957.
52. Bergstresser, Daniel and Poterba, James "Do after-tax returns affect
mutual fund inflows?" Journal Of Financial Economics, Vol.
63(1), (January 2002), pp. 381-414.
53. Bhatia, Dilip "Mutual Fund Valuation Norms - A Review",
Chartered Secretary, Vol. XXX(12), (December 2000), pp. 1531-
34.
54. Bhayani, Sanjay J & Patidar, Vishal G "An Empirical Analysis of
Performance Evaluation of Mutual Fund Schemes in India", ICFAI
Reader, (April 2006), pp. 15-24.
55. Bollen, Nicolas P B and Busse, Jeffrey A "On the Timing Ability of
Mutual Fund Managers", Journal Of Finance, Vol. LVI (3), (June
2001), pp. 1075-1094.
56. Bose, Suchismita & Coondoo, Dipankor "The Indian Bond Market:
Part II", ICRA Bulletin: Money & Finance, Vol. 10, (July-Sep
1999), pp.51-60.
57. Brown, Stephen J and Goetzmanh, William N "Mutual Fund Styles",
Journal Of Financial Economics, Vol. 43 (3) (March 1997), pp.
373-399.
58. Busse, Jeffrey A "Volatility Timings in Mutual Funds: Evidence from
Daily Returns", The Review OfFinanacial Studies, Vol. 12(5),
(Winter 1999) pp. 1009-1041.
59. Capon, Andrew "Bond Funds", Institutional Investor, (June 2001),
Vol. XXVI (6), pp.51-55.
60. Carhart, Mark M et.al, "Mutual Fund Survivorship", The Review Of
Finanacial Studies,Vol. 15(5) (Winter 2002), pp. 1439-1463.
61. Carlson, "Aggregate Performance Of Mutual Funds, 1948-1967",
Journal of Financial and Quantitative Analysis, Vol. 5, (1970), pp.
1-32.
227
62. Chan, Louis K C et. al, "On Mutual Fund Investment Styles", The
Review Of Financial Studies, Vol. 15(5) (Winter 2002), pp. 1407-
1435.
63. Chandel Kulbhushan & Verma O P, "Managing Mutual Fund
Investments in the Era of Change", The ICFAI Journal Of Applied
Finance, Vol. 11(9) (October 2005), pp.56-67.
64. Chander, Subhash & Singh, Jaspal (June 2004) "Performance of
Mutual Funds in India - An Empirical Evidence", The ICFAI
Journal Of Applied Finance, (June 2004)pp.45-63.
65. Chander, Subhash "An Appraisal of Mutual Funds in India", Journal
Of Accounting & Finance, Vol. 17(1), (October 2002-March 2003),
pp.39-45.
66. Chander, Subhash and Mahajan, Mukesh "Perceptions of Investors
towards Mutual Funds: An Empirical Investigation", The Indian
Journal Of Commerce, Vol. XLV (H-171), (June 1992), pp. 117-
124.
67. Christopher, Avery & Judith, Chevalier, "Identifying Investor
Sentiment from Price Paths: The Case of Football Betting",
Journal of Business, Vol. 72(4), (October 1999), pp. 493-521.
68. Collins, Patrick J "Monitoring Passively Managed Mutual Funds",
Journal Of Investing, Vol. 8(4), (Winter 1999), pp.49-60.
69. Conrad S Ciccotello and C Terry Grant, "Information Pricing: The
Evidence from Equity Mutual Funds", The Financial Review, Vol.
31(2), (May 1996), pp.365-380.
70. Cornell, Bradford, "Asymmetric information and Portfolio
Performance Measurement" Journal of Financial Economics,
Vol 3, (1979): 381-390.
71. Dave S A., "Mutual Funds- Growth and Development", The Journal
Of The Indian Institute Of Bankers, Vol. 63(1), (January-March
1992), pp. 13-15.
72. Davis, James L "Mutual Fund Performance and Manager Style",
Journal of Financial Analysts, Vol. 57 (1), (January / February
2001) pp. 19-27.
73. Deli, Daniel N "Mutual Fund Advisory Contracts: An Empirical
Investigation", Journal Of Finance Vol. LVII (1) (February 2002)
pp. 109-131.
228
74. Deli, Daniel N and Varma, Raj "Closed-end versus open-end: the
choice of organizational form", Journal Of Corporate Finance, Vol.
8(1), (January 2002), pp.1-26.
75. Deli, Daniel N and Varma, Raj "Contracting in the investment
management industry: evidence from mutual funds", Journal of
Financial Economics, Vol. 63 (1) (January 2002), pp. 79-98.
76. Dellva, Wilfred L.and Olson, Gerard T. "The Relationship Between
Mutual Fund Fees And Expenses And Their Effects On
Performance", The Financial Review, Vol. 33(1), (Feb 1998),
pp.85-104.
77. Dhar, Satyajit "Mutual Funds in India- a Close Look", Finance India,
Vol. VIII (3) (September 1994), pp. 675-679.
78. Edelen, Roger M and Warner, Jerold B "Aggregate price effects of
institutional trading: a study of Mutual Fund flow and market
returns", Journal Of Financial Economics, Vol. 59(2), (January
2001), pp. 195-220.
79. Elango R, "Which fund yields more returns?" The Management
Accountant, Vol. 39(4), (2004), p283.
80. Fama, "Components of Investment Performance", Journal of
Finance, Vol. 27, (1972),pp.551-567.
81. Fernando, Chitru S etal, "Is Share Price Related To Marketability?
Evidence from Mutual Fund Share Splits", Journal of The
Financial Management Association, Vol. 28(3), Autumn (1999)
pp.54-67.
82. Frye, Melissa B "The Performance of Bank-Managed Mutual
Funds", The Journal Of Financial Research, Vol. XXIV(3), (Fall
2001), pp.419-442.
83. Ganesan S, Raja J, "Mutual Funds, the Millennium Strategy", The
Journal of The All India Management Association, Vol. 39(10),
(October 2000), pp.42-47.
84. Gangadhar V, "The Changing Pattern of Mutual Funds in India", The
Management Accountant, Vol. 27 (12), (December 1992), pp. 924-
28.
229
85. Gottsman Laura and Kessler, Jon "Smart Screened Investments:
Environmentally Screened Equity Funds that Perform Like
Conventional Funds", Journal Of Investing, Vol. 7(3), Fall (1998),
pp. 15-24.
86. Grinblatt, Mark and Matti Keloharju, "The Investment behaviour and
performance of various investor types: A study of Finland's unique
data set", Journal Of Financial Economics, Vol. 55(1), (January
2000), pp.43-67.
87. Grinblatt, Mark and Titman, Sheridan "The Persistence of Mutual
Fund Performance", Journal Of Finance Vol. XLVII (5)
(December 1992) pp. 1977-1984.
88. Grubber, "The Persistence Of Risk-Adjusted Mutual Fund
Performance", Journal of Business, Vol. 2, (1996), pp. 133-157.
89. Gruber, "Another Puzzle: The Growth in Actively Managed Mutual
Funds", Journal Of Finance Vol. LI (3), (July 1996) pp. 783-809.
90. Gupta G P, "Prospects for Mutual Fund Industry", The Prime
Directory, pp. 0-13-0-16.
91. Gupta O P and Sehgal, Sanjay, "Investment Performance of Mutual
Funds: The Indian Experience", paper presented in Second UTI-
ICM Capital Markets Conference, December 23-24, (1998), Vasi,
Bombay.
92. Gupta, "The Mutual Fund Industry and Its Comparative
Performance", Journal of Financial and Quantitative Analysis, Vol.
6, (1974), pp.894.
93. Gupta, Amitabh, "Investment Performance of Indian Mutual Funds:
An Empirical Study", Finance India, Vol. XIV (3), (September
2000), pp. 833-866.
94. Gupta, Amitabh, "Mutual Funds in India: A Study of Investment
Management", Finance India, Vol. XV (2), (June 2001), pp.631-63
7.
95. Gupta, Ramesh "Mutual Funds", The Management Accountant, Vol.
24(5), (May 1989),pp.320-322.

230
96. Guy, James R F "The Performance of British Investment Trust
Industry" Journal of Finance, 33(1978): 443-455.
97. Indro, Daniel C., Christine X Jiang, Michael Y Hu, Wayne Y Lee,
"Mutual Fund Performance: A Question of Style", Journal Of
Investing, Summer (1998), Vol. 7(2),pp.46-53.
98. Ippolito R, "Efficiency with Costly Information: A Study of Mutual
Fund Performance", Quarterly Journal of Economics, Vol. 104,
(1989), pp. 1-23.
99. Jain, Abhinav "Indian Mutual Industry: On a Consolidation Spree",
Chartered Financial Analyst, Vol. 9(5), (May 2003) pp. 65-67.
100. Jain, Amit "Mutual Funds- Trends and Features", Chartered
Secretary, Vol. XXX (12) (December 2000), pp. 1528-30.
101. Jaiswal OCR, "Money Market Mutual Fund - A Short-term
Financial Instrument", Chartered Accountant, Vol. 42(7), (January
1994), pp.582- 584.
102. Jayadev M, "Mutual Fund Performance: An Analysis of Monthly
Returns", Finance India, Vol. X (1) (March 1996), pp. 73-84.
103. Jensen Michael C, "The Performance Of Mutual Funds In The
Period 1945-1964", Journal of Finance, Vol. 23, (1968), pp.389-
416.
104. Jhamb, Mahendra "Mutual Funds Dominate Market Capital",
YOJANA, Vol. 35(12), (July 15, 1991). pp.8-10.
105. John M R Chalmers, Roger M Edelen and Gregory B Kadlec, "On
the Perils of Financial Intermediaries Setting Security Prices: The
Mutual Fund Wild Card Option", Journal of Finance Vol. LVI (6)
(December 2001), pp.2209-2235.
106. Kale and Uma, "A Study On The Evaluation Of The Performance
Of Mutual Funds In India", National Insurance Academy, Pune,
India (1995).
107. Kami H Doshi, "Mutual Funds - Few aspects", Chartered
Accountant, Vol. 25(10), (October 1993), pp.823-20.

231
108. Keim, Donald B "An analysis of mutual fund design: the case of
investing in small-cap stocks", Journal of Financial Economics,
Vol. 51, (1999), pp. 173-194.
109. Khan S H "India's Capital Markets: Challenges & Opportunities" ,
The Prime Directory,l998 Praxis Consulting & Information
Services Pvt. Ltd, New Delhi, Fifth Edition (1998) pp. 0-9 to 0-12 .
110. Khare, Sanjay Kant, "Mutual Funds: A Refuge for Small
Investors", Southern Economist, (January 15, 2007), pp.21-24.
111. Khatri Prem, "Surviving the Bulls and Bears of the Market with
Mutual Funds", Chartered Secretary, Vol. XXX (12), (December
2000), pp. 1523.
112. Khorana, Ajay and Nelling, Edward "The Determinants And
Predictive Ability Of Mutual Fund Ratings", Journal Of Investing,
Vol. 7(3), Fall (1998), pp 61-66.
113. King, Alfred M. "Warning Use of EBITDA May be Dangerous to
your career", ICFAI Reader, Vol. Ill: 11, (Nov, 2001) pp.49-51.
114. Kishore N K "mutual FUNDS Investments are subject to Market
Risks", ICFAI Portfolio Organiser, (October 2005), pp.53-
115. Klemosky, "How Consistently Do Managers Manage", Journal of
Portfolio Management, Vol. 3, (1977), pp.11-15.
116. Klemosky, "The Bias in Composite Performance Measures",
Journal of Financial and Quantitative Analysis, Vol. 8, (1973),
pp.505-514.
117. Kon, Stanley J and Jen, Frank C "Estimation of time varying
Systematic Risk and Performance for Mutual Fund Portfolios An
Application of switching Regression", The Journal of Finance.
3(457-475).
118. Kothari S P and Jerold B Warner, "Evaluating Mutual Fund
Performance", Journal of Finance, Vol. LVI (5) (October 2001),
pp. 1985-2009.
119. Kothari, Dheer "Mutual Funds", Journal on Banking and Finance,
Vol. XIV (1), (January 2001), pp. 28-29.

232
120. Krishnan, Aarati "Mutual Funds: Changing investor Mix", THE
HINDU Survey of Indian Industry" ( 2006), pp. 5-58.
121. Kumar V K, "In Search Of Turnaround Strategies For Mutual Fund
Industry", The Management Accountant, (May 1999) Vol. 34(5),
pp. 337-343.
122. Kumar, Dhirendra "Mutual Funds in Y2K: Year of Ladders and
Snakes", ICFAI Reader, Vol. Ill: 3, (February 2001), pp.42-45.
123. Lal C & Sharma Seema, "Mutual Funds: How To Keep Them On
Right Track", YOJANA, Vol. 35(23) (December 31,1991), pp. 18-
19.
124. Lal C and Sharma Seema, "Mutual Fund-A Buoyant Financial
Instrument", Finance India, Vol. VI (4) (December 1992), pp.811-
18.
125. Lamba, Asjeet S "How isolated is the Indian Stock Market -
Empirical Research Findings?" Journal Of Financial Management
And Analysis, Vol. 12(1) (Jan-June 1999) pp. 35-46.
126. Levy, Robert A "Measurement of Investment Performance", The
Journal of Financial and Quantitative Analysis, 3(1968):35-57.
127. Lockwood Larry J, "Macroeconomic Forces and Mutual Fund
Betas", The Financial Review, Vol. 31 (4), (November 1996),
pp.747-763.
128. Lofthouse, Stephen "Closed- End Fund and Investment Trust
Discounts", Journal •Of Investing, Vol. 8(1), (Springl999), pp.27-
33.
129. Madhavakumar K, "Mutual Funds: UTI bid to retain Lead", THE
HINDU Survey of Indian Industry (2006), pp.93-94.
130. Malkiel, Burton G, "The valuation of Closed-End Investment
Company Shares" Journal of Finance, 3(1977): 847-859.
131. Maria Do Ceu Cortez & Florinda Silva, "Conditioning Information
on Portfolio Performance Evaluation: A Reexamination of
Performance Persistence in the Portuguese Mutual Fund Market",
Finance India, Vol. XVI (4), (December 2002), pp. 1393-1408.
233
132. Mathew, James "Mutual Funds in India: A Study", Southern
Economist, Vol. 39(7) (August 1,2000), pp.3-5.
133. Mathur S B, "Nidhis and Mutual Benefit Fund Societies:
Consolidated Norms For Functioning", Chartered Secretary, Vol.
XXX (1), (January 2000), pp. 13-14.
134. Mayya M R, "Few Thoughts on the Functioning of Mutual Funds",
Chartered Secretary, Vol. XXX (12), (December 2000), pp.1515-
17.
135. McDonald and John, "Objectives And Performance Of Mutual
Funds, 1960-69", Journal of Financial and Quantitative Analysis,
Vol. 9, (1974), pp.311-333.
136. McDonald, lan "How Cisco Killed Everything", ICFAI Reader,
Vol. 111:4 (April 2001) pp.36-37.
137. Mehta, Rajan "Indian Mutual Fund Industry: Challenging Issues",
Chartered Financial Analyst, Vol. IX, (December, 2003) pp. 32-33.
138. Meyer, "Further Applications of Stochastic Dominance to Mutual
Fund Performance", Journal of Financial and Quantitative
Analysis, Vol 12(1977) 917-924.
139. Michele La Plante, Michele La "Influences and Trends in Mutual
Fund Expense Ratios", The Journal Of Financial Research, Vol.
XXIV(l), (Spring 2001), pp.45-63.
140. Mike K P et al., "An Empirical Study of volatility in seven
southeast Asian Stock markets using ARV models", Journal Of
Business Finance And Accounting, Vol. 24(2), (March 1997),
pp.261-275.
141. Mishra, Biswadeep "Selectivity and Timing Skills of Mutual Funds
in India: An Empirical Analysis", The ICFAI Journal Of Applied
Finance, Vol. 8(5), (September 2002), pp.5-14.
142. Mulraj J, "Mutual Funds: The Accountability issue", Chartered
Financial Analyst, Vol. 9(1), (January 2003), pp. 52-53.
143. Muthappan P K & Damodharan E , "Risk-Adjusted Performance
Evaluation of Indian Mutual Funds Schemes", Finance India, Vol.
XX(3), (September 2006), pp.965-983.

234
144. Narasimhan M S and Vijayalakshmi S "Performance Analysis of
Mutual Funds in India", Finance India, Vol. XV (1), (March 2001),
pp.155-174.
145. Nayak, Mahesh "The great Mutual Fund Boom", Business Today,
(November 6, 2005) pp.112-118.
146. Nayak, Satyendra S "Mutual Funds: A more efficient vehicle of
creation of wealth", The Journal Of The Indian Institute Of
Bankers, Vol. 65(3), (July-September 1994), pp. 124-132,149-
152,106-110,118-119,180-181.
147. Niamatullah, "Mutual Funds: Still Coming of Age", Chartered
Secretary, Vol. XXX (12) (December 2000), pp. 1536-37.
148. Nigam, Divya "Mutual Funds: A Prospering reality", ICFAI
Portfolio Organiser, (February 2006), pp. 45-49.
149. O'Neal, Edward S "How Many Mutual Funds Constitute a
Diversified Mutual
150. Fund Portfolio?" Journal of Financial Analysts Vol. 53(2),
(March/April 1997), pp. 37-46.
151. Panda, Tapan K and Tripathy, Nalini Prava "Customer Orientation
in Designing Mutual Fund Products", The ICFAIJournal Of Applied
Finance, Vol. 7(4), (Sep 2001) pp.20-28.
152. Pandey Ajay, "Assured Returns Schemes by Mutual Funds: An
appraisal of Regulatory Issues", The Journal Of Business
Perspective, Vol. 4(1), (January -June 2000) pp.29-34.
153. Parthasarathy R, "Arrows of Time: From the Blackholes to Nirvana
Point", Southern Economist, Vol. 40(20), (February 15,2002),
pp.24.
154. Pastor, Lubos and Stambaugh, Robert F "Investing in equity
Mutual Funds", Journal Of Financial Economics, Vol. 63 (1),
(January 2002), pp. 351-380.
155. Pastor, Lubos and Stambaugh, Robert F, "Mutual Fund
Performance and seemingly unrelated assets", Journal Of Financial
Economics, Vol. 63 (1), (January 2002), pp. 315-349.

235
156. Paul J M, Klumpes and Michael McCrae, "Evaluating the Financial
Performance of Pension Funds: An Individual Investor's
Perspective", Journal Of Business Finance And Accounting, Vol.
26(3 & 4), (April/May 1999), pp.261-279.
157. Philpot, James etal, "Active Management, fund size, and bond
mutual fund returns", The Financial Review, Vol. 33(2), (May
1998), pp.115-126.
158. Prashant Shah, "Mutual Funds: A Win-win Option", ICFAI
Portfolio Organiser, (April 2006), pp.46-53.
159. Prem C Jain & Joanna Shuang Wu, "Truth in Mutual Fund
Advertising: Evidence on Future Performance and Fund Flows",
Journal Of Finance Vol. LV( 2), (April 2000), pp.937-957.
160. Pu Liu, Fazal 3: Seyyed and Stanley D. Smith, "The Independent
Impact of Credit Rating Changes- The Case of Moody's Rating
Refinement on Yield Premiums", Journal Of Business Finance And
Accounting, Vol. 26( 3 & 4), (April/ May, 1999), pp. 337-359.
161. Rajagopalan T, "On Ethical Funds", Chartered Secretary, Vol.
XXX (12), (December 2000), pp. 1524.
162. Rajarajan, "Determinants of Portfolio choice of Individual
Investors", The Indian Economic Journal, Vol. 50(1), (July-
Sep2002-03), pp.81-84.
163. Raman T P, "Mutual Funds: Focus on Retail Investor", THE
HINDU Survey of Indian Industry (2003), pp. 75-76.
164. Ramesh Chander "Performance Appraisal of Mutual Funds in
India", Finance India, Vol. XIV(4) (December 2000), pp.1256-
1261.
165. Ramesh Chander, "An Evaluation of Portfolio Performance
Components Across Fund Characteristics", Finance India, Vol.
XVI (4), (December 2002), pp. 1377-1391.
166. Ramesh Gupta, "Mutual Funds-The Case For Assured Returns",
Chartered Accountant, Vol. 47(9), (March 1999), pp. 64 - 66.
167. Ramesh Kumar, "Indian Capital Market: Emerging Role of Mutual
Funds", Vol. 44(15& 16), (Dec 1 &15, 2005) pp. 11-13.
168. Ramola K S, "Mutual Fund And The Indian Capital Market",
YOJANA, Vol. 36(11), (June 30,1992), pp. 11-12.
236
169. Rao, Chandra Sekhara & Krishnan, Radha "Does Indian Mutual
Funds Industry Pose A Revolutionary Shift?" FACTS FOR YOU
Vol. 26(4), (January 2006), pp.25-33.
170. Ravi O N, "Law of Nomination and Mutual Funds", Chartered
Secretary, Vol. XXX (12) (December 2000), pp. 1535-1537.
171. Reddy Vivek, "Mutual Funds: Future perfect", Chartered Financial
Analyst, Vol. 15(5), (January, 2000) pp. 27.
172. Reddy Y V, "Reviving confidence in the Indian Economy", RBI
Bulletin, Vol. LV(10) (October 2001), pp.1085-1100.
173. Resia Beegam S, "Private Sector Mutual Funds Gaining
Prominence in India", Southern Economist, Vol. 44 (18), (January
15, 2006) pp. 23-25.
174. Rich Fortin, and Stuart Michelson, "Are load Mutual Funds Worth
the Price?", Journal Of Investing, Vol. 4(3) , (Fall 1995), pp. 89-94.
175. Rich Fortin, and Stuart Michelson, "Mutual Fund Trading Costs",
Journal Of Investing, Vol. 7(1), (Spring 1998), pp. 66-70.
176. Roshni Jayakar, "Life After Death for the Mutual fund", Business
Today, (December 7,1998).
177. Roshni Jay am, "Debt Be Not Proud, Equity's Back", Business
Today, (April 2002) pp. 42-45.
178. Roy, Bijan "Mutual Fund Performance Measurement: a Closer
Look", ICFAI Portfolio Organiser, (2006) p. 51.
179. Roy, Bijan and Saikat Sovan Deb, "Conditional Alpha and
Performance Persistence for Indian Mutual Funds: Empirical
Evidence", The ICFAI Journal Of Applied Finance, Vol. 10(1),
(January 2004), pp.30-43.
180. Rustagi, Hemant "Mutual Funds: Key lessons learnt from the last
decade", The Prime Directory, (2001), pp.0-23 to 0-25 2001, 8th
edition.
181. Saha Asish and Rama Murthy Y Sree, "Managing Mutual Funds:
Some Critical Issues", Journal of Social and Management Science,
Vol. XXII (1), (1993-94), pp.25-35.

237
182. Saha, Tapas Rajan "Indian Mutual Fund Management",
Managment Accountant, (October 2003), Vol. 38(10), pp.765-771.
183. Saha, Tapas Rajan, "Indian mutual fund management", The
Management Accountant, Vol. 38(10) (October 2003) pp.765-771.
184. Sahoo M S, "Trading of Units of Mutual Funds on Stock
Exchanges", Chartered Secretary. Vol. XXXII(3) (March 2002),
pp. 342- 44.
185. Sahu M and Jena R K, "Emerging Scenario of Mutual Funds and
Investors Perception in India", The Indian Journal Of Commerce,
Vol. XLV (IV-173) (December 1992), pp. 77-85.
186. Sahu R K and Panda J, "The Role And Future Of Mutual Funds In
India", Management Accountant (February 1993) pp. 91-3.
187. Sahu R K, "A Critical Review of the Mutual Fund Regulations",
Chartered Secretary, Vol. 22(12), (December 1992), pp. 1076-
1078.
188. Sahu R K, Panda, J "The Role And Future Of Mutual Funds In
India", The Management Accountant, Vol. 28(2), (February 1993)
pp.91-93.
189. Salam Abdus and Kulsum, Umma "Savings Behaviour in India: An
Empirical Study", The Indian Economic Journal, Vol. 50(1), (July-
Sep2002-03), pp.77-80.
190. Sandip K Bhatt, "Some Reflection of financial Services of Mutual
Fund Company's", Journal of Palghat Management Association,
Vol. XIX (4), (January - March 2004), pp. 4-5.
191. Sanghvi, R Ajit "Mutual Funds", Chartered Accountant, Vol.
32(12), (June 1984), pp.816-819.
192. Santini, Donald L and Aber, Jack W "Investor Response to Mutual
Fund Policy Variables", The Financial Review, Vol. 31(4),
(November 1996), pp.765-781.
193. Sarkar A K, "Mutual Funds in India - Emerging Trends", The
Management Accountant, Vol. 26 (3), (March 1991), pp. 171 -174.
238
194. Sarkar A K, "Performance evaluation of mutual funds", The
Management Accountant, Vol. 26(9), (September) 1991, pp.691-
693.
195. Sarkar A K, "Should we invest in mutual funds", The Management
Accountant, Vol. 27(10), (October 1992), pp.738-740.
196. Sathis D, "Investors Perceptions: A Survey by MARCH Marketing
Consultancy & Research", Chartered Financial Analyst, Vol.
10(7), (July 2004) pp. 35-36.
197. Shah Ajay and Thomas Susan, "Performance Evaluation of
Professional Portfolio Management In India", paper presented,
CMIE, (10 April 1994).
198. Shanbag A N, "In the wonderland of Investment: How To Wound
an Economy", Chartered Secretary, Vol. XXIX (9), (September
1999), pp. 969-970.
199. Shankar A "Mutual Funds: Branding as a growth tool", THE
HINDU Survey of Indian Industry (2006), pp. 108-113.
200. Sharath Jutur, "Evaluating Indian Mutual Funds", Chartered
Financial Analyst, (July 2004). p.83.
201. Sharpe, William F "Mutual Fund Performance", The Journal of
Business, Vol. 39(1), (1966), pp.119-138.
202. Shashikant, Uma "Accounting Policy and Practices of Mutual
Funds: The Need for Standardization", Prajan, Vol. XXIV (2),
(1993), pp. 91-102.
203. Shukla and Singh , "Are CFA Charter Holders Better Equity Fund
Managers", Chartered Financial Analysts, Vol. 2, (1994), pp.68-
74.
204. Singh, Jaspal and Subhash Chander, "What Drives the Investors
towards Mutual Funds: An Empirical Analysis", The 1CFAI
Journal Of Applied Finance, Vol. 9(8), (November 2003), pp.38-
46.
205. Singh, Surinder Pal "Mutual Fund Investing Programme: Survival
and Success", Chartered Secretary, Vol. XXX (12) (December
2000), pp. 1525-27.
239
206. Smith and Tito, "Risk-Return Measures of Post-Portfolio
Performance" Journal of Financial and Quantitative Analysis, Vol.
4, (1969), pp.449-471.
207. Smith, Charles "No Yen for Funds", Institutional Investor,
(October 2000), Vol. XXV(10),pp.69-74.
208. Sondhi H J and Jain P K, "Financial Management Of Private And
Public Equity Mutual Funds In India: An Analysis Of
Profitability", (July 2005), The ICFAI Journal of Applied Finance,
(2005), pp. 14-27.
209. Srinivasan G (2007), "Household, corporate savings seen rising on
income growth", The Hindu Business Line: Economy, May
27,2007. p 6.
210. Srinivasan, Ajay "Mutual Funds: The New Era", Chartered
Secretary, Vol. XXIX (9), (September 1999), pp. 968-970,
211. Statman, Meir "Socially Responsible Mutual Funds", Journal Of
Financial Analysts Vol. 56 (3) (May / June 2000), pp. 30-38.
212. Sudhakar A and Sasi Kumar K, "Globalisation of Mutual Fund
Industry: Challenges & Implications", Southern Economist,
(November 15, 2004), pp.22-25.
213. Sudhkar A & Sasikumar K, "Performance Evaluation of Mutual
Funds: A Case Study", Southern Economist, Vol. 44 (13),
(November 1,2005), pp. 19-23.
214. Thiripalraju M, "Do Shareholders Benefit by Rights and bonus
Issues of Mutual Funds?" Journal of Social And Management
Science, Vol. XXIII (3), (1994-95) pp.353-362.
215. Thomson, Rex "The Information Contents of Discounts and
Premiums on Closed-end Fund Shares", Journal of Financial
Economics, 2-31(1978): 151-185.
216. Treynor and Mazuy , "Can Mutual Funds Outguess The Markets"
Harvard Business Review, Vol. 44, (1966), pp.131-136.
217. Treynor, "How to Rate Management of Investment Funds",
Harvard Business Review, Vol. 43(1), (1965), pp. 63-75.
240
218. Tripathy, Nalini Prava, "Mutual Fund In India: A Financial Service
in Capital Market", Finance India, Vol. X (1), (March 1996), pp.
85-91.
219. Trivedi Rohit H and Savalia Jignasa R, "Money going to mutual
funds in a bi way", Facts For You, (August 2006), pp. 38-40.
220. Value Research India Pvt. Ltd, "Mutual Fund" Delhi, India. (1996).
221. Venkateshwarlu M (2004), "Investors' Perceptions of Mutual
Funds", Southe Economist, (January 15, 2004), pp.14-16.
222. Venugopalan S, "Mutual Funds and Company Law", The Journal
For Corporate Professionals, Vol. XXII (11), (November 1992),
pp. 1003- 4.
223. Venugopalan S, "Mutual Funds", Chartered Secretary, Vol. XXII
(8), (August 1992),pp.691-694.
224. Vidhyashankar S, "Mutual Funds: Emerging Trends In India",
Chartered Secretary, Vol. 20(8), (August 1990), pp.639-640.
225. Vijay C, "Mutual Funds an Overview", Journal On Banking And
Finance, Vol. XVII(4), (April 2004), pp,24 -27.
226. Weimin Liu, Norman Strong and Xinzhong Xu, "The Profitability
of Momentum Investing", Journal Of Business Finance And
Accounting, Vol. 26(9 & 10), (November / December 1999), pp.
1043-1087.
227. Wenchi G Kao, Louis T W Cheng, Kam C Chan, "International
mutual fund selectivity and market timing during up and down
market conditions", The Financial Review, Vol. 33(2), (May 1998),
pp. 127-144.
228. Wendy Cooper, "Fund Management: They let the bull get away",
Institutional Investor, Vol. XXIII (2), (February 1998), pp. 16-17.
229. William B Braden, "Modeling Mutual Funds Using Linear
Regression", Journal Of Investing, Vol. 5(4), (Winter 1995), pp.36-
43.
241
230. William N Goetzmann, Zoran Ivkovic, K.Geert Rouwenhorst, "Day
Trading International Mutual Funds: Evidence and Policy
Solutions", Journal of Financial and Quantitative Analysis, Vol.
36(3), (September 2001), pp.287-309.
231. William Reichenstein, "Bond Fund Returns and Expenses: A Study
of Bond Market Efficiency" Journal of Investing, Vol. 8(4),
(Winter 1999), pp.8-14.
232. Williamson, "Measurement and Forecasting of Mutual Fund
Performance: Choosing an Investment Strategy", Financial
Analysts Journal, Vol. 28, (1972), pp.78-84.
233. Yadav R A and Mishra, Biswadeep "Investment Pattern of
household sector in financial assets: An empirical investigation",
MDl Management Journal, Vol. 9(1), (January 1996), pp.65 -75.
234. Yadav R A and Mishra, Biswadeep "Performance Evaluation of
Mutual Funds-. An empirical analysis", MDl Management Journal,
Vol. 9(2), (July 1996), pp.117-125.
235. Yassir A. Pitalwalla, "Mutual Funds", Journal On Banking And
Finance, Vol. XIV (2), (February 2001), pp.32-33.
UNPUBLISHED SOURCES
236. Irissappane, Aravazhi "Paradigm Shifts In The Performance Of
Indian Mutual Funds: An Analysis With Reference To Close-Ended
Funds Of Selected Institutions", UTI Institute of Capital Markets,
Mumbai (2000).
237. Shakunthala Mani P, "Performance of Mutual Funds in India- A
Study of Selected Mutual Funds in India", Department of
Commerce, Bharathiar University (2001).
238. Shome, "A Study Of Performance Of Indian Mutual Funds",
unpublished thesis, Jhansi University, (1994).
239. Venkatapathi Raju D "Mutual Funds: Perceptions of Urban and
Rural Investors in West Godavari District of Andhra Pradesh",
Andhra University, Visakhapatnam, (1999).
WEB SITES
www.amfiindia.com
www.sebi.org.in
www.mutualfundsindia.com
242
QUESTIONNAIRE
AWARENESS ON SEBI (MF) REGULATIONS AND PERCEPTIONS ABOUT
MUTUAL FUNDS INDUSTRY
(STRICTLY CONFIDENTIAL)
Researcher: Research Supervisor:
D. MOHANADAS Dr. M. RENGASAMY
Associate Professor and Head
PG and Research Dept. of Commerce
Poompuhar College, (Autonomous)
Melaiyur, Sirkali Taluk-609107
Nagapattinam Dist., Tamilnadu.
Note: 1) Information supplied will be used for research purpose only and treated as strictly
confidential.
2) If any question is not applicable to the respondent make a cross ( ) against the question
number, in the tick ( ) for „yes in the relevant box.
A. AWARENESS ON SEBI (MF) REGULATIONS:
Investors / Financial Advisors: Mr._______________
1. Profile of Investors and Financial Advisors.
Profile of Investors and financial advisor.
1. Name (optional)
:
2. Age : Below 25 years 26-35 years

243
36-45 years above 45 years
3. Sex : : Male Female
4. Occupation : Business
Professional
Agriculture
Employed
5. Education : Upto Higher Secondary
Postgraduate
Undergraduate
Others_____
6. Marital Status : Married Unmarried
7. Monthly Income
Below Rs.15000
Above 25000
Rs.15001-25000
8. Monthly Savings : Save Don‟t save
2. How many years of experience in the field of investment? (please one relevant box)
(i)Less than 5 years (ii) 6 – 10 years
(iii) 11 – 15 years (iv) 16 – 20 years
(v) Above 20 years
3. State yours awareness level on SEBI mutual fund regulations on mutual fund.
S.
No
Registration of Mutual
Fund
Investors Financial Advisors
Not at all
aware
Moderately
aware
Extremely
aware
Not at
all
aware
Moderately
aware
Extremely
aware
I. Application Procedures
Submission of
Application by the
Sponsor
Application fee to
accompany the
application
Incomplete application is
liable to be rejected
Eligibility Criteria

244
II. Financial Services
business for not less 5
years
Positive Net Worth for 5
years
Net Worth Contribution
to more than the Capital
contribution
Existing Mutual Fund
should be in trust form
Appointment of
Custodian to keep
custody of securities
40 percent contribution
of Net worth of the
Asset Management
Company
III. Consideration of Application
All rights are preserved
with the board.
IV. Grant of Certificate of
registration
V. Terms and Conditions of
Registration
4. How would you feel about effect of SEBI regulations on mutual fund market players?
(i ) effect having control (ii) effect not having control
5. State performance of SEBI regulation on mutual fund.
(i) performance proactive (ii) performance Neutral
(iii) performance passive
6. Do you know about familiarity to security market.
(i) Familiar (ii) Unfamiliar
7. Do you know SEBI – Grievance Redressal mechanism.
(i) Not at all (ii) moderately

245
(iii) Very much (iv) Not certain/Not applicable
8. Are you know about investors and financial advisor association?
(i)Not at all aware (ii) Moderately aware
(iii)Extremely aware
9. What do you feel about transparency in investment decisions by SEBI regulations?
(i ) Transparent (ii) Not transparent
10. What do you feel about portfolio disclosure in investment decisions by SEBI (MF) regulation?
(i ) Transparent (ii) Not transparent
11. Are you know about awareness of advertisement of Mutual fund?
(i)Not at all aware (ii) Moderately aware
(iii)Extremely aware
12. Are you know about prescribed norms on investment of SEBI (MF) regulation?
(i)Not at all aware (ii) Moderately aware
(iii)Extremely aware
13. Do you know the frequency of inspection and penalties of SEBI?
(i)Twice in a year (ii) Once in a year
14. Are you know about awareness on prescribed code of conduct of MF regulations?
(i) Avoiding excessive concentration of business
(ii) To avoid the conflicts of investment in managing the schemes
(iii) The interest of all unit holders paramount in all matters
(iv) Not to use any unethical means to sell (or) induce any investor
(v) High standards of service and exercise independent professional judgement
(vi) Maintaining high standards of integrity and fairness in all their dealings and in the conduct of
their business
(vii) AMC shall not to make any exaggerated statement on investment services
15. What is the purpose of investment in mutual funds?
(i) Wealth creation (ii) good retirement life
(iii) Tax savings (iv) Emergency needs
(v) To accumulate fund

246
B. PERCEPTIONS OF INVESTORS:
I. Attitude towards Investment [Investors only]
16. How would you describe your financial needs (Please one statement)
Factor 1 - Depend totally on investments.
Factor 2 - Depend on investments for income and emergency needs.
Factor 3 - Depend somewhat on investments for income and emergency needs.
Factor 4 - Depend on investments to serve only on an emergency.
Factor 5 - Devote investments to long - term savings.
Factor 6 - Don't Depend on investments.
17. What is your investment objective (Please one statement)
Option 1- Capital preservation and satisfactory current income.
Option 2 - First priority for Income and second priority for Growth.
Option 3 - Balanced preference for income and growth.
Option 4 - Basically growth oriented but intends to play it somewhat safe. Option 5 -
Maximize growth, as income is not critical.
18. What is your investment time horizon'? When do you think you will need or want to tab into
your portfolio?
In 5 years 6-10 years 11-15 years Above 15 years
19. Give your -willingness to take risk? (Please one statement)
Category 1 - Willing to take as much risk as possible.
Category 2 - Willing to take modest risk.
Category 3 - Avoid taking risk.0

247
20. What is your attitude towards fluctuation in the value of your portfolio? (Pleaseone statement)
Choice 1 - Accept lower long run returns with maximum stability.
Choice 2 - Accept little volatility for higher returns.
Choice 3 - Take average amount of volatility for average returns.
Choice 4 - Accept higher volatility as growth is the goal.
Choice 5 - Accept substantial volatility, as maximum appreciation is the goal.
21. What is your experience in the field of investments?
Less than 5 years 6-10 years 11-15 years
16-20 years Above 20 years
22. What is your percentage of investment held by you in the following investment avenues? Give your
order of preference (Rank 1,2,3,...)
Financial Assets Percentage Preference (Rank)
Bank Deposits ____ ____
P.O. Saving Schemes ____ ____
Bonds and Debentures ____ ____
Equity Shares ____ ____
Mutual Funds ____ ____
Insurance Policies ____ ____
Others________________
(please specify)
23. Please For each financial asset to indicate your degree of safety. Absolutely safe Reasonably safe
Somewhat safe
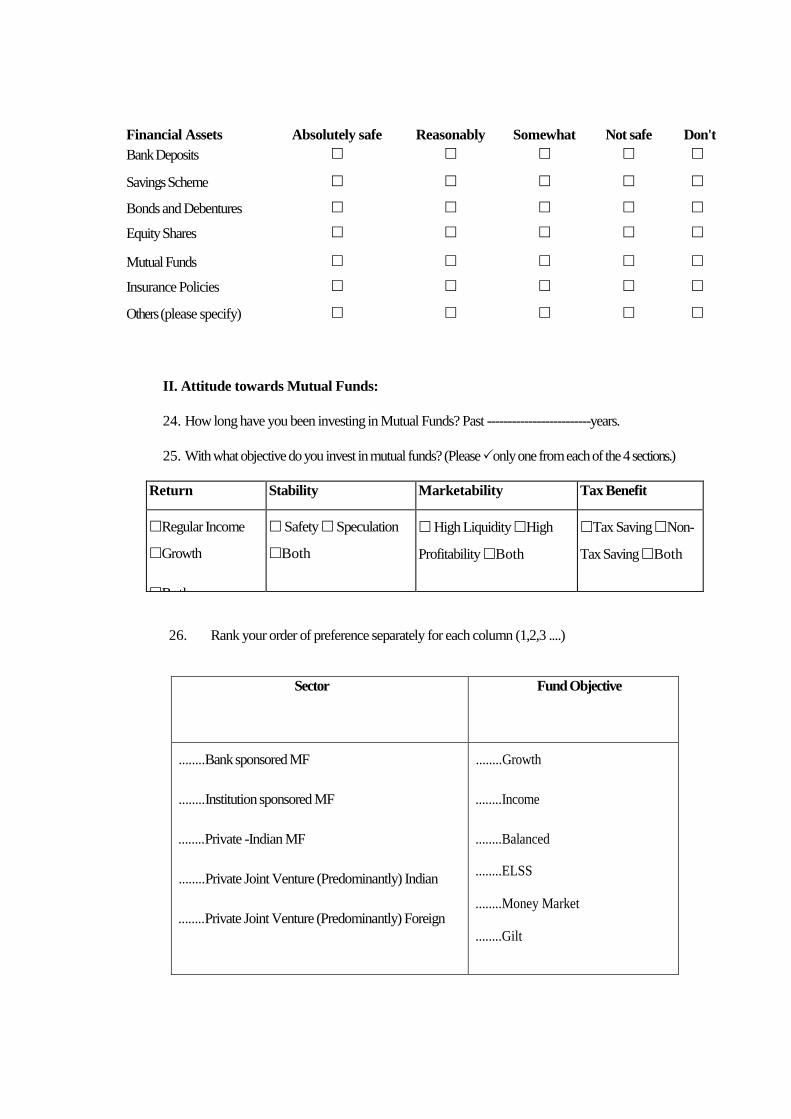
II. Attitude towards Mutual Funds:
24. How long have you been investing in Mutual Funds? Past -------------------------years.
25. With what objective do you invest in mutual funds? (Please only one from each of the 4 sections.)
Return
Stability
Marketability
Tax Benefit
Regular Income
Growth
Both
Safety Speculation
Both
High Liquidity High
Profitability Both
Tax Saving Non-
Tax Saving Both
26. Rank your order of preference separately for each column (1,2,3 ....)
Sector
Fund Objective
........Bank sponsored MF
........Institution sponsored MF
........Private -Indian MF
........Private Joint Venture (Predominantly) Indian
........Private Joint Venture (Predominantly) Foreign
........Growth
........Income
........Balanced
........ELSS
........Money Market
........Gilt
Financial Assets
Absolutely safe
Reasonably safe
Somewhat safe
Reasonably
safe
Somewhat
safe
Not safe
know
Don't
Bank Deposits
Savings Scheme
Bonds and Debentures
Equity Shares
Mutual Funds
Insurance Policies
Others (please specify)

249
27. What factors determine the success of a mutual fund (Please your degree of
importance).
Factors Very Important Important Not Important Not at all
Important
Quality of service
Suitability of product
Research
Risk orientation
No: of investor service center
28. What are the sources of information about Mutual Funds? ( Please the sources)
Brokers/ agents Prospectus Advertisement
Annual Reports
Newspapers Magazines Friends and Relatives Others______
(
Please specify) 29.What are the benefits of investing in mutual funds? (Please benefits you
enjoy)
Portfolio diversification Tax Shelter Lower cost Liquidity of
investment
Assured allotment High Yielding Convenience Quality of service
Innovation in Schemes Profitability Transferability Repurchase
Facility
Capital appreciation Loan Facility Professional Management
Wide investment opportunities Transparency in operation
Others_________ (please specify).
30. To what extent the following factors are important in your choice of mutual fund
organization. (Please for each factor indicating your importance).
Factors
Very Important Important
Not Important
Not at al

250
Goodwill
Volume of business
Sector represented
Investor services
Past performance
Infrastructure
Suggestions(friends, relatives etc)
Background Experience
Investment Philosophy &
Methodology
Others_________________
(Please specify)
31. To what extent the following factors are important in the choice of a mutual fund scheme?
( Please for each factor)
Factors
Very Important Important
Not Important
Not at al
Capital Appreciation
Objective of the fund
Return on Investment
Tax benefit
Liquidity
Safety
Loan facility
Convenience of reinvestment
Fund Managers Background
Early Bird Incentive
Others_________
(Please specify)

251
32 .Give your degree of satisfaction Fully Satisfied Moderately Satisfied Not Satisfied
a. Mutual Fund Industry performance
b. Investment opportunities in M F industry
c. Services to Investors by Mutual Funds
33. Please your degree of agreement relating to mutual fund.
Strongly
Agree
Agree Neutral Disagree Strongly
Disagree
a. Investing in
funds are less risky
compared to shares.
b. Mutual Funds are
more suitable to
small investors who are otherwise
hesitant of entering into capital market.
c. Mutual
funds have the ability to weather the market fluctuations.
d. Risk and
return characteristics of Indian MFs are not in conformity with
their stated objectives.
e. Investing in funds is much better in terms of returns than
depositing money in banks.
f. Growth schemes are highly preferred to income schemes.