Metabolic and Nutritional Profile of Obese Adolescents With Nonalcoholic Fatty Liver Disease

CYP2E1-Dependent and Leptin-Mediated Hepatic CD57Expression on CD8+ve T Cells aid Progression of Environment-Linked Nonalcoholic Steatohepatitis
Ratanesh Kumar Seth1, Suvarthi Das1, Ashutosh Kumar2, Anindya Chanda1, Maria B.Kadiiska2, Gregory Michelotti3, Jose Manautou4, Anna Mae Diehl3, and SaurabhChatterjee1,*
1Environmental Health and Disease Laboratory, Department of Environmental Health Sciences,Arnold School of Public Health, University of South Carolina, Columbia SC 292082Free Radical Metabolism Group, Laboratory of Toxicology and Pharmacology, National Instituteof Environmental Health Sciences, Research Triangle Park, NC 277093Division of Gastroenterology, Duke University, Durham NC 277074Dept. of Pharmaceutical Sciences, University of Connecticut, Storrs, CT 06269-3092
AbstractEnvironmental toxins induce a novel CYP2E1/leptin signaling axis in liver. This in turn activates apoorly characterized innate immune response that contributes to nonalcoholic steatohepatitis(NASH) progression. To identify the relevant subsets of T-lymphocytes in CYP2E1-dependent,environment-linked NASH, we utilized a model of diet induced obese (DIO) mice that arechronically exposed to bromodichloromethane. Mice deficient in CYP2E1, leptin (ob/ob mice), orboth T and B cells (Pfp/Rag2 double knockout (KO) mice) were used to delineate the role of eachof these factors in metabolic oxidative stress-induced T cell activation. Results revealed thatelevated levels of lipid peroxidation, tyrosyl radical formation, mitochondrial tyrosine nitrationand hepatic leptin as a consequence of metabolic oxidative stress caused increased levels ofhepatic CD57, a marker of peripheral blood lymphocytes including NKT cells. CD8+CD57+cytotoxic T cells but not CD4+CD57+ cells were significantly decreased in mice lacking CYP2E1and leptin. There was a significant increase in the levels of T cell cytokines IL-2, IL-1β, IFN-γ inbromodichloromethane exposed DIO mice but not in mice that lacked CYP2E1, leptin or T and Bcells. Apoptosis as evidenced by TUNEL assay and levels of cleaved caspase-3 was significantlylower in leptin and Pfp/Rag2 KO mice and highly correlated with protection from NASH. The
© 2013 Elsevier Inc. All rights reserved.1Author for correspondence:Dr. Saurabh Chatterjee, Ph.D. Environmental Health and Disease Laboratory, Department ofEnvironmental Health Sciences, University of South Carolina, Columbia 29208 USA. [email protected]; Tel: 803-777-8120;Fax: 803-777-3391.
Publisher's Disclaimer: This is a PDF file of an unedited manuscript that has been accepted for publication. As a service to ourcustomers we are providing this early version of the manuscript. The manuscript will undergo copyediting, typesetting, and review ofthe resulting proof before it is published in its final citable form. Please note that during the production process errors may bediscovered which could affect the content, and all legal disclaimers that apply to the journal pertain.
Authorship: R.S. designed, performed experiments and statistical analysis of data. S.D. and, A.K. performed experiments. S.Danalyzed data. A.C. performed experiments and analyzed microscopic images; M.B.K, G.M. and A.D. analyzed data and editedmanuscript. S.C designed and performed experiment, analyzed data, wrote and edited manuscript.
“This article may be the work product of an employee or group of employees of the National Institute of Environmental HealthSciences (NIEHS), National Institutes of Health (NIH), however, the statements, opinions or conclusions contained therein do notnecessarily represent the statements, opinions or conclusions of NIEHS, NIH or the United States government.”
Conflict of interest: The authors declare no conflict of interest.
NIH Public AccessAuthor ManuscriptToxicol Appl Pharmacol. Author manuscript; available in PMC 2015 January 01.
Published in final edited form as:Toxicol Appl Pharmacol. 2014 January 1; 274(1): . doi:10.1016/j.taap.2013.10.029.
NIH
-PA Author Manuscript
NIH
-PA Author Manuscript
NIH
-PA Author Manuscript

results described above suggest that higher levels of oxidative stress-induced leptin mediatedCD8+CD57+ T cells play an important role in the development of NASH. It also provides a novelinsight of immune dysregulation and may be a key biomarker in NASH.
Keywordsbromodichloromethane; lipid peroxidation; fibrosis; apoptosis; CD3; P53; caspase-3; TUNEL;IL-2; OB/OB mice
IntroductionIncidences of nonalcoholic steatohepatitis (NASH), a hepatic manifestation of metabolicsyndrome and inflammation have increased in the last decade (1). This correlates with therise in obesity to alarming proportions not only in the western world, but in developingcountries like India, Brazil and China (2–4). Many laboratories in the past including ourlaboratory have hypothesized the involvement of environmental toxicants as a probablecause for NASH (5, 6). Recent published reports from our laboratory indicate theinvolvement of carbon tetrachloride and disinfection byproducts of drinking waterbromodichloromethane (BDCM) and their free radical metabolism are possible factors forthe progression of NASH (6–9). The metabolic oxidative stress generated from the exposureof these compounds, hasten the progression from steatosis to a more aggressiveinflammatory pathophysiology associated with NASH development (6). Similarly it hasbeen shown that CYP2E1 is the principle isoform among CYP450 enzymes in the liver thataid in NASH progression either through its generation of reactive oxygen species or byproducing free radical metabolites of environmental toxins (6, 10). Coupled with CYP2E1,our laboratory has also shown the involvement of pattern recognition receptors followingCYP2E1 activation that lead to innate immune activation (7). CYP2E1 induced metabolismof environmental toxins has also been shown to increase both circulating and hepatic leptinlevels (8, 9). Leptin was found to activate Kupffer cells and innate immune mechanisms thatcontribute to NASH progression (8).
Though innate immune activation and TH1 cytokines have been found to escalate NASHprogression several research reports also stress upon the involvement of hepatic T cells inthe progression of NASH (11–14). Liver mononuclear cells, especially the CD4+ve,CD8+ve, NK and NKT cells are abundant in the liver and certain cells like NKT cells aredeemed to be part of innate immune system. Distinct role of T cell subsets especially thecytotoxic T cells have been elucidated but there are scarce reports about their directinvolvement in NASH progression (15). Though the involvement of T cell subsets in thefibrogenic process was discovered 25 years back, the literature remains scant in establishingthe roles of T cells in NASH progression. This may be due to the paradox that several T cellcytokines like IFN-γ and IL-10 has been found to be aiding in resolution of fibrogenesisrather than accelerating it (15, 16). Especially striking are observations that CD8+ cytotoxicT lymphocytes contribute to the hepatic fibrogenesis. A role of CD8+ T cells as inducers ofhepatic fibrosis was confirmed in a study in a CCl4 model of hepatic fibrosis (15, 17). Betaglucosyl ceramide administration significantly reduced fibrosis and was associated with analtered distribution of CD8+ve lymphocytes and modulation of cytokine expression (17).The complex interplay between lymphocyte populations and expression of TH2 cytokineslike IL-10 and IL-4 was recently underscored in a study where Copaxone, an immunemodulator employed for the treatment of multiple sclerosis, was used in a toxic model offibrogenesis (18). Copaxone had significant effects on the fibrogenesis pattern where it wasassociated with decreased CD8+ cells and serum IL-4 levels while NK cells, CD4(+)CD25(+) FoxP3(+) cells and serum IL-10 levels were increased (18). Interestingly, the
Seth et al. Page 2
Toxicol Appl Pharmacol. Author manuscript; available in PMC 2015 January 01.
NIH
-PA Author Manuscript
NIH
-PA Author Manuscript
NIH
-PA Author Manuscript

profibrogenic role of CD8+ T cells had already been hypothesized in a murine model ofgraft-versus-host disease several years before, on the basis that these cells were found as themain responsible of fibrosis (19).
The role of CD8+ Lymphocytes was also described in alcoholic liver disease. In alcoholiccirrhosis, significant reductions of CD4+ T cells correlated with severity of liver cirrhosis(20). Along these lines, a decreased CD4+ cells and a corresponding increase in CD8+ Tcells were reported in chronic hepatitis C model (21). More importantly, a recent reportsuggested that hepatic stellate cells physically interact with lymphocytes in vivo (22). Theactivated state of hepatic stellate cells was upregulated by CD8+ T lymphocytes and in vitroexperiments indicated that lymphocytes undergo phagocytosis within HSCs, a processprevented by integrin receptor blockade or irradiation of HSC. Thus, a direct pathwayresponsible for modulation of fibrogenesis by lymphocytes, and specifically CD8+ T cells,could be the end result of this important study (22).
Although there are studies indicating the role of CD8+ T cells in hepatic fibrosis, expressionof other parallel markers on the CD8+ T cells and their role in hepatic fibrosis has neverbeen studied especially those that will help in the progression of NASH. CD8+ T cells thatexpress CD28 markers have been found in many chronic diseases including patients ofalcoholism and other conditions where repeated antigenic stimulations are involved (23). Itis established that upon chronic antigenic stimulation CD8+ CD28+ T cells rapidly lose theirCD28 expression and become apoptotic (24). Strikingly the cells that enter a phase ofsenescence have higher expressions of CD57 on the CD8+ T cells (24). Together with theCD8+ and CD57+ expression these cells undergo rapid apoptosis and have short telomerelength (23, 24). The presence of the CD8+CD57+ cells have been documented in non-viralinfections, transplantation cases, chronic alcoholism and chronic pulmonary diseases thathave immunosuppression as a major event(23–28). Chronic alcoholics with or without liverdisease have very stable expressions of CD8+ CD57+ cells with the hepatocyte injury-associated antigenic exposure as a cause for the existence of these cells (27). Interestinglythe study reports that the likely cause could be the chronic antigenic exposure resulting fromacetaldehyde protein adducts (27, 29). It may be recalled that in free radical metabolism oftoxins that aid in development of NASH, lipid peroxidation products also form adducts onproteins that can result in chronic antigenic stimulation (6, 9).
Another important mediator of hepatic fibrogenesis is the adipokine leptin which has beenshown to activate the hepatic stellate cells and promote fibrogenesis (6, 30, 31). Importantlyleptin also has a significant role in T cell proliferation (32). In a study published by Matiolliet al. it was found that in immature dendritic cells, leptin upregulates interleukin-12p70production on CD40 stimulation and increases their capacity to stimulate activation ofautologous CD8(+) T cells (33).
Thus in the light of the existing literature we hypothesized that upon metabolic oxidativestress, which is common following activation of CYP2E1 in a rodent model of environment-linked NASH, CD57+ expression in T cells play a crucial role in progression of thefibrogenesis. The hepatic fibrogenic mechanisms are mediated by leptin, an adipokine that iselevated following CYP2E1 activation and toxin exposure. We show that there is a hugeincrease in CD57 expression (70–90 fold) in the liver of mice exposed to BDCM and isdown regulated in mice that lack T,B and NK cells. Further, mice with spontaneousknockout of leptin (OB/OB) have significant decrease in CD57 expression. Also importantis the observation that CD57 was found mostly in CD8+ T cells and lack of T,B or NK cellshad significantly reduced apoptosis, fibrogenesis and NASH progression.
Seth et al. Page 3
Toxicol Appl Pharmacol. Author manuscript; available in PMC 2015 January 01.
NIH
-PA Author Manuscript
NIH
-PA Author Manuscript
NIH
-PA Author Manuscript

Materials and MethodsMouse model
Pathogen-free, custom, diet-induced obese (DIO) adult male mouse with a C57BL/6Jbackground (Jackson Laboratories, Bar Harbor, Maine) was used as the model for toxin-induced non-alcoholic steatohepatitis (NASH). They were fed with a high fat diet (60%kcal) from 6 weeks to 16 weeks. All experiments were conducted at the completion of 16-weeks. The animals were housed one in each cage before any experimental use. Mice(C57BL/6J background) with CYP2E1 gene deletion (129/Sv-Cyp2e1tm1Gonz/J, JacksonLaboratories) and mice (C57BL/6NTac background) with Pfp/Rag2 dual gene deletion(B6.129S6-Rag2tm1FwaPrf1tm1Clrk N12, Taconic Farms Inc., Hudson, New York) were fedwith high fat diet and treated identically to DIO mice. The four different kinds of mice thatwere used for experiments were: (i) diet-induced obese mouse (DIO), (ii) diet-induced obesemouse exposed to bromodichloromethane (DIO+BDCM), (iii) diet-induced obese mousewith CYP2E1 gene deletion and exposed to BDCM (CYP2E1 KO), (iv) diet-induced obesemouse with Pfp/Rag2 dual gene deletion and exposed to BDCM (Pfp/Rag2 dKO). Mice hadad libitum access to food and water and were housed in a temperature-controlled room at23–24°C with a 12-hour light/dark cycle. All animals were treated in strict accordance withthe NIH Guide for the Humane Care and Use of Laboratory Animals, and the experimentswere approved by the institutional review board both at NIEHS and the University of SouthCarolina at Columbia, USA.
Induction of liver injury in miceDIO mice or high-fat-fed gene-specific knockout mice at 16 weeks were administeredbromodichloromethane (BDCM) obtained from Sigma Aldrich, St Louis, MO, at 1.0 mmole/kg, diluted in olive oil. The diluted BDCM were administered two doses per week for fourweeks through the intra-peritoneal route. DIO mice treated with olive oil (diluent of BDCM)were used as vehicle-treated control. After completion of the treatment, mice of all studygroups were sacrificed for liver tissue and serum for the further experiments.
ImmunohistochemistryFormalin-fixed, paraffin-embedded liver tissue from all the mouse groups were cut into 5µm thick tissue sections. Each section was deparaffinized using standard protocol. Briefly,sections were incubated with xylene twice for 3 min, washed with xylene:ethanol (1:1) for 3min and rehydrated through a series of ethanol (twice with 100 %, 95%, 70%, 50%), twicewith distilled water and finally rinsed twice with phosphate buffered saline (PBS) (Sigma-Aldrich). Epitope retrieval of deparaffinized sections was carried out using epitope retrievalsolution and steamer (IHC-world, Woodstock, MD) following manufacturer’s protocol. Theprimary antibodies were (i) anti-4-hydroxynonenal, (ii) anti-3-nitrotyrosine, (iii) anti-CD57,(iv) anti-α-SMA and (v) anti-TGF-β. Primary antibodies were purchased from AbCam Inc.(Massachussetts, USA), and used in 1:250 dilutions. Antigen specificimmunohistochemistry (IHC) were performed using Vectastain Elite ABC kit (VectorLaboratories, Inc. Burlingame, CA) following manufacturer’s protocols.3,3’Diaminobenzedine (DAB) (Sigma-Aldrich) were used as a chromogen substrate.Sections were counter-stained by Mayer’s hematoxylin (Sigma-Aldrich). Washing with PBS(Sigma-Aldrich) was performed thrice between the steps. Sections were mounted in Simpomount (GBI Labs, Mukilteo, WA) and observed under 20× oil objective.
Mitochondrial Nitrotyrosine assayMitochondrial protein extract was prepared using Mitochondrial Isolation kit (AbCam Inc.Massachussetts, USA) and following manufacturer’s protocol. Standard ELISA was
Seth et al. Page 4
Toxicol Appl Pharmacol. Author manuscript; available in PMC 2015 January 01.
NIH
-PA Author Manuscript
NIH
-PA Author Manuscript
NIH
-PA Author Manuscript

performed to estimate the mitochondrial 3-nitrotyrosine. Briefly, high binding, round bottom96-well ELISA plates were coated with 5µg/well of mitochondrial proteins and incubated at4°C overnight. The wells were blocked with 5% non-fat milk in PBST for 1 h at RT. Afterwashing with PBST anti-3-nitrotyrosine antibody (1:1000) were incubated for 2 h at RT.The plates were washed and incubated with species-specific anti-IgG conjugated with biotin(1:5000) for 1 h at RT. The plates were washed with PBST and incubated with streptavidin/HRP solution for 1 h at RT. Finally, plates were washed and developed withchemiluminescent ELISA substrate. Total luminescence was recorded using SynergyHT
microplate reader (BioTek, Winooski, VT).
Quantitative Real Time Polymerase Chain Reaction (qRTPCR)Gene expression levels in tissue samples were measured by two step qRTPCR. Total RNAwas extracted from liver tissue by homogenization in TRIzol reagent (Invitrogen, Carlsbad,CA) according to the manufacturer’s instructions and purified with the use of RNeasy minikit columns (Qiagen, Valencia, CA). Purified RNA (1µg) was converted to cDNA usingiScript cDNA synthesis kit (Bio-rad, Hercules, CA) following the manufacturer's standardprotocol. qRTPCR was performed with the gene specific primers using SsoAdvancedSYBRGreen supermix (Bio-rad) and CFX96 thermal cycler (Bio-rad). Threshold Cycle (Ct) valuesfor the selected genes were normalized against 18sRNA (internal control) values in the samesample. Each reaction was carried out in triplicates for each gene and for each tissue sample.DIO mouse liver sample was used as the control for comparison with all other liver samplesin the toxin-induced NASH group. The relative fold change was calculated by the 2−ΔΔCt
method. The sequences for the primers used for Real time PCR are provided below in 5’ to3’ orientation:
Gene Primer sequence
CD57 Sense: GGGTCATCTCTGGGTCATCCAntisense: TGCCCCTCTGAAGAACCAAC
CD3 Sense: GGAACAAATGTTGCTTGTCTGGAntisense: TCTTGGCAAACAGCAGTCGTA
CD4 Sense: CACACACCTGTGCAAGAAGCAntisense: GCGTCTTCCCTTGAGTGACA
CD8 Sense: GCCCTTCTGCTGTCCTTGATAntisense: TAGTTGTAGCTTCCTGGCGG
CD28 Sense: ATGTACCCTCCGCCTTACCTAntisense: CCACTGTCACTAGCAAGCCA
IL-2 Sense: GTGCTCCTTGTCAACAGCGAntisense: GGGGAGTTTCAGGTTCCTGTA
IL-1β Sense: CCTCGGCCAAGACAGGTCGCAntisense: TGCCCATCAGAGGCAAGGAGGA
IFN-γ Sense: TGCGGGGTTGTATCTGGGGGTAntisense: GCGCTGGCCCGGAGTGTAGA
FasL Sense: GCAGCAGCCCATGAATTACCAntisense: AGATGAAGTGGCACTGCTGTCTAC
Bcl-2 Sense: TCTTTGAGTTCGGTGGGGTCAntisense: GCCCAGACTCATTCAACCAGA
Casp3 Sense: AGCTGGACTGTGGCATTGAGAntisense: CCACGACCCGTCCTTTGAAT
p53 Sense: CACGTACTCTCCTCCCCTCAATAntisense: AACTGCACAGGGCACGTCTT
Seth et al. Page 5
Toxicol Appl Pharmacol. Author manuscript; available in PMC 2015 January 01.
NIH
-PA Author Manuscript
NIH
-PA Author Manuscript
NIH
-PA Author Manuscript

Gene Primer sequence
Leptin Sense: GAGACCCCTGTGTCGGTTCAntisense: CTGCGTGTGTGAAATGTCATTG
Immuno-fluorescence microscopyParaffin-embedded liver tissue from all the mouse groups were cut into 5 µm thick sections.Each section was deparaffinized using standard protocol. Epitope retrieval of deparaffinizedsections was carried out using epitope retrieval solution and steamer (IHC-world,Woodstock, MD) following manufacturer’s protocol. The primary antibodies (i) anti-CD3,(ii) anti-CD8, and (iii) anti-CD57 were purchased from AbCam Inc. (Massachussetts, USA),and used in 1:250 dilutions. Species-specific anti-IgG secondary antibody conjugated withAlexa Fluor 488 or with Alexa Fluor 633 (Invitrogen, California, USA) were used together.Sections were mounted in ProLong gold antifade reagent with DAPI. Images were takenunder 20×/40× oil objectives using Olympus BX51 microscope.
Western blotting30 mg of tissue from each liver sample was homogenized in 100 µl of RIPA buffer (SigmaAldrich) with protease inhibitor (1×) (Pierce, Rockford, IL) using dounce homogenizer. Thehomogenate was centrifuged, the supernatant was diluted 1:5 and used for SDS PAGE andsubjected to western blotting. Novex (Invitrogen, California, USA) 4–12% bis-tris gradientgel was used for SDS PAGE. Proteins were transferred to nitrocellulose membrane (i) usingprecut nitrocellulose/filter paper sandwiches (Bio-Rad Laboratories Inc., California, USA)and Trans – Blot Turbo transfer system (Bio-Rad) in case of low molecular weight proteins;and (ii) using wet transfer module from Invitrogen in case of high molecular weightproteins. 5% non-fat milk solution was used for blocking. Primary antibodies againstcaspase-3 and leptin (obtained from AbCam Inc.), FasL, p53 and Bcl2 (obtained fromSantacruz Biotech) were used at recommended dilutions; and compatible HRP-conjugatedsecondary antibodies (from AbCam) were used. Pierce ECL Western Blotting substrate(Thermo Fisher Scientific Inc., Rockford, IL) was used as the chemiluminescent substrate.The blot was developed using BioMax MS Films and cassettes (with intensifying screen,Kodak). The images were subjected to densitometry analysis using LabImage 2006Professional 1D gel analysis software from KAPLEAN Bioimaging Solutions, Liepzig,Germany.
TUNEL assayFormalin-fixed, paraffin-embedded liver tissue from all the mouse groups were cut into 5µm thick tissue sections. Each section was deparaffinized using the following protocol.Briefly, sections were incubated at 57°C for 5 min, with xylene twice for 3 min, rehydratedthrough a series of ethanol (twice with 100 %, 95%, 70%, 50%), twice with distilled waterand finally rinsed twice with phosphate buffered saline (PBS) (Sigma-Aldrich). TUNELstaining to determine the number of apoptotic nuclei was done using TACS.XL Blue Labelkit from Trevigen Inc., Gaithersburg, MD, following manufacturer’s protocol. Nuclear FastRed (Trevigen Inc.) was used as counterstain. All stained sections were mounted usingtoluene-based mounting medium (Trevigen Inc.) and imaged under 20× magnification.
Quantification of hepatic collagen contentMacro- and micro-vescicular collagen content in liver tissue was evaluated usingmorphometric analysis of Sirius red–stained liver sections. Each liver section (5 µm thick,paraffin-embedded) was deparaffinized and stained with Picro-Sirius red staining kit (IHC
Seth et al. Page 6
Toxicol Appl Pharmacol. Author manuscript; available in PMC 2015 January 01.
NIH
-PA Author Manuscript
NIH
-PA Author Manuscript
NIH
-PA Author Manuscript

World) and counterstained with Weigert's hematoxylin as per manufacturer’s protocol.Collagen staining was quantitated in sections from all mice (magnification 10×; three fieldsfrom each section).
Statistical AnalysesAll in vivo experiments were repeated three times with 3 mice per group (N=3; data fromeach group of three mice were pooled). All in vitro experiments were repeated three times,and the statistical analysis was carried out by analysis of variance (ANOVA) followed bythe Bonferroni posthoc correction for intergroup comparisons. Quantitative data fromWestern blots as depicted by the relative intensity of the bands were analyzed by performinga student’s t test. P<0.05 was considered statistically significant.
ResultsCYP2E1 dependent metabolic oxidative stress following high fat diet feeding andenvironmental toxin exposure results in lipid peroxidation, tyrosyl radical formation andmitochondrial tyrosine nitration
Metabolic oxidative stress either from high fat diet alone, or through a second hit fromenvironmental toxins, metabolized by CYP2E1, causes progression from steatosis toNASH(6, 34). To investigate the nature of metabolic oxidative stress following BDCMexposure in mice that were fed with a high fat diet, lipid peroxidation as measured by 4-hydroxynonenal (4-HNE) adducts in the liver were analyzed. Results indicated that DIOmice exposed to BDCM (DIO+BDCM) livers showed significantly increased 4-HNEadducts as compared to DIO mice and mice that had a deletion of the CYP2E1 gene, fedwith a high fat diet and exposed to BDCM (CYP2E1 KO) (Fig. 1A and 1C) (P<0.05).CYP2E1 metabolism of BDCM causes protein radical formation and it has been found thatthe radical formation happens mostly at the tyrosine moiety. To identify the extent andnature of the tyrosyl radical formation, 3-nitrotyrosine immunoreactivity was assessed inDIO, DIO+BDCM and CYP2E1 KO groups. Results showed that 3-nitrotyrosineimmunoreactivity was significantly increased in DIO+BDCM group as compared to bothDIO and CYP2E1 KO group (Fig. 1B and 1D)(P<0.05). Metabolic oxidative stress is alsoassociated with mitochondrial generation of reactive oxygen species that disrupt normalfunctioning of the mitochondria (35). To assess the mitochondrial generation of proteinradicals, tyrosine nitration, which can be a direct consequence of tyrosyl radical formationwas analyzed by isolating mitochondrial counterpart from the livers of exposed groups.Results showed that mitochondrial 3-nitrotyrosine immunoreactivity as measured by a directELISA was significantly higher in DIO+BDCM group as compared to DIO and CYP2E1KO groups (Fig. 1E)(P<0.05).
Metabolic oxidative stress in progressive NASH causes T cell expression of CD57 that isCYP2E1 dependent
It has been reported that by controlling and modulating oxidative stress in the extracellularmilieu might influence T cell signaling and activation (36). Further toxins can influencelipid peroxidation which in turn can give rise to T cell proliferation, especially 4-HNEadducts (37). To elucidate the T cell activation process in response to oxidative stress inDIO+BDCM, mRNA expressions of T cell markers and IL-2 expression was assessed.Results showed that CD57 (80 fold when compared to DIO mice) and pan T cell markerCD3 (20–25 fold) were significantly increased in DIO+BDCM group as compared to DIO,CYP2E1KO and Pfp/Rag2 gene deleted mice co exposed to high fat diet and BDCM (Pfp/Rag2 dKO) (Fig. 2A)(P<0.05). To explore the nature of T cells that were activated followingmetabolic oxidative stress, mRNA expressions of CD4, CD8 and CD28 mRNA expressionswere assessed. Results showed that CD8 rather than CD4 mRNA was significantly
Seth et al. Page 7
Toxicol Appl Pharmacol. Author manuscript; available in PMC 2015 January 01.
NIH
-PA Author Manuscript
NIH
-PA Author Manuscript
NIH
-PA Author Manuscript

expressed in DIO+BDCM group as compared to CYP2E1KO and Pfp/Rag2 dKO (Fig. 2A)(P<0.05). CD28 and CD4 mRNA expressions were only increased marginally in DIO+BDCM group. IL-2 which is a T cell cytokine and is the principle cytokine required for theT cell proliferation process was significantly elevated in DIO+BDCM group when comparedto CYP2E1KO and Pfp/Rag2 dKO groups (Fig. 2A)(P<0.05). Since mRNA expression ofCD57, a marker expressed on a subclass of T cells that have a prominent role in T cellsenescence, aging and apoptosis, we measured the CD57 protein and localization of thismarker in the liver. Results showed that CD57 immunoreactivity as assessed byimmunohistochemistry in liver slices, was high in DIO+BDCM group and the localizationwas markedly increased in Zone 3 and portal areas, when compared to CYP2E1KO and Pfp/Rag2 dKO groups (Fig. 2B). To explore the cell type for the expression of CD57, whichcarried immense significance in its role in the progression of NASH and its fibrotic pattern,and since the double knockout mice model (Pfp/Rag2) does not contain T, B and NK cells, itwas essential for us to use co-localization analysis as a tool to analyze the cell type thatcontained the CD57 expression. Immuno-fluorescence revealed that CD3 and CD57containing cells colocalized (Fig. 2C, viii) while there was a mismatch in localization ofCD57/NK1.1 and CD57/CD22 cells (data not shown). CD3/CD57 colocalization wasdecreased in mice either containing a deletion of the CYP2E1 gene or the Pfp/Rag2 gene,suggesting that (a) the metabolic oxidative stress was responsible for the CD3 basedexpression of CD57 and (b) T cells were primarily responsible for increased expression ofCD57 (Fig. 2C). Published literature indicates the important role of CD8+ve cytotoxic Tcells that co-express CD57, in aging, apoptosis and many chronic diseases, mainly arisingfrom successive antigenic stimulation (23, 24). Also there are prominent roles of thissubclass of T cells in pulmonary fibrosis and in chronic alcoholic drinkers (27). To find theT cell subsets, mainly CD8+ve cytotoxic T cells that are primarily expressing the CD57molecule, fluorescence imaging were performed at both low and high magnifications.Results indicated that CD8+ve T cells colocalized with CD57 molecules in DIO+BDCMgroup while no such colocalization was observed in CYP2E1KO or Pfp/Rag2 dKO groups(Fig. 2D), suggesting that the metabolic oxidative stress caused an increase inCD8+veCD57+ve T cells following exposure to high fat diet and BDCM.
CD8+veCD57+ve T cells produces pro-apoptotic cytokines, activate hepatic apoptosis, aprocess that is dependent on the presence of CYP2E1
Both T cell cytokines IL-1β and IFN-γ are reported to play major roles in the cellularapoptosis process, either through direct T cell mediated effects or through theinflammosome activation (38, 39). Since CD8+veCD57+ve cells are also reported toproduce increased amounts of IL-1β and IFN-γ and FasL (CD95L) plays a major role in Tcell mediated apoptosis, we estimated the mRNA expression of these mediators (24, 40, 41).Results showed that there was a significant increase in the mRNA levels of IL-1 β, IFN-γand FasL in the DIO+BDCM group as compared to CYP2E1KO and Pfp/Rag2 dKO groups(Fig. 3A)(P<0.05). To elucidate the effector downstream actions of CD8+ve CD57+ve Tcells in NASH pathogenesis, apoptosis mechanisms of liver tissue was analyzed. mRNAanalysis of Bcl-2, an important regulator of mitochondrial pathway of apoptosis, caspase-3,the terminal caspase and p53, a critical transcription factor for apoptosis, was performed.Results showed that Bcl-2 and p53 mRNA expressions were significantly elevated in DIO+BDCM group when compared to DIO, CYP2E1KO and Pfp/Rag2 dKO mice (Fig. 3B)(P<0.05). However there was no change in the levels of caspase-3 (Fig. 3B). Since theactivation of terminal caspase (caspase-3) is brought about by the cleavage of caspase-3 intosmall peptides of low molecular weight, we performed western blot analysis of bothcaspase-3 and its cleaved isoforms. Results showed that DIO+BDCM group had both thelarger and the smaller subunits of cleaved caspase-3 while DIO and Pfp/Rag2 dKO mice didnot have the cleaved caspase-3 bands (Fig. 3C). CYP2E1 gene deleted mice that were co-
Seth et al. Page 8
Toxicol Appl Pharmacol. Author manuscript; available in PMC 2015 January 01.
NIH
-PA Author Manuscript
NIH
-PA Author Manuscript
NIH
-PA Author Manuscript

exposed to high fat diet and BDCM only had a larger cleaved subunit but the smallercleaved subunit was inconspicuous (Fig. 3C and 3D). To estimate the morphological basis ofapoptosis, TUNEL assay for liver slices from DIO, DIO+BDCM and the correspondinggene deleted livers were performed. Results showed that there was a significant increase inthe TUNEL positive cells in the DIO+BDCM group (89%) as compared to DIO (48%) orCYP2E1 KO (12%) or Pfp/Rag2 dKO (10%) mice (Fig. 3E and 3F)(P<0.05), suggesting thatCD8+veCD57+cells might be responsible for apoptosis. Western Blot analysis of apoptoticproteins revealed that FasL, p53 and Bcl2 were increased in DIO+BDCM group whiledecreased in CYP2E1 KO and Pfp/Rag2 dKO groups respectively (Fig 3G).
Metabolic Oxidative stress-induced Leptin mediates CD57 expression on CD8+ve T cellsand facilitates activation of this CD8+veCD57+ve phenotype in the liver of BDCM-treatedDIO mice
CYP2E1 reductive metabolism is associated with increased leptin production in the liver andis found in increased concentration in circulation, higher than leptin resistant conditions ofobesity (8). We have shown before that following CYP2E1 reductive metabolism of CCl4and BDCM, higher leptin concentrations are induced in the liver (9). Leptin mRNAexpression were significantly high in DIO+BDCM group as compared to DIO group alone(Fig. 4A)(P<0.05). Leptin protein levels as estimated by western blot analysis was alsosignificantly higher in DIO+BDCM group when compared to DIO group alone (Fig. 4B).Our earlier results showed that metabolic oxidative stress significantly up-regulated CD57protein on CD8+ve T cells accompanied by higher CD3 and CD8 T cells. To explorewhether the increased T cell expression of CD57 was modulated by leptin, OB/OB mice thatare spontaneous knockouts of leptin were used. Results showed that CD57, CD28, CD3,CD8 and IL2 mRNA expressions were significantly decreased in OB/OB mice coexposedwith high fat diet and BDCM (Leptin KO) when compared to DIO+BDCM group (Fig. 4C)(P<0.05). The T cell cytokines (IFN-γ and IL-1β) and FasL which have a role in fibrogenesisand apoptosis and have been shown to be released following activation of CD8+veCD57+veT cell phenotypes were significantly decreased in the Leptin KO mice when compared toDIO+BDCM group (Fig. 4D)(P<0.05). CD57 protein levels as estimated by the CD57immunoreactivity in liver slices was significantly decreased in Leptin KO mice whencompared to DIO+BDCM (Fig. 4E and 4F)(P<0.05). CD8+veCD57+ve colocalization wasanalyzed using fluorescence microscopy and results showed that leptin knockout mice haddecreased colocalization events as compared to DIO+BDCM group (Fig. 4G) suggestingthat leptin strongly mediates CD57 expression on CD8 Tcells and plays a role in theiractivation process. To prove that leptin mediation of the activation of CD8+veCD57+vephenotype T cells contributed to NASH pathogenesis and apoptosis, liver slices from DIO+BDCM, Leptin KO and Pfp/Rag2 dKO mice-treated with high fat diet and BDCM wereanalyzed for fibrogenesis indicators α-SMA, TGF-β and collagen deposition (Picrosirius redstaining). Results showed that α-SMA and TGF-β were significantly decreased in bothLeptin KO and Pfp/Rag2 dKO groups as compared to DIO+BDCM group (Fig. 5A and 5B)(P<0.05). Picrosirius red staining for collagen was also decreased in Leptin KO and Pfp/Rag2 dKO mice suggesting leptin-mediated CD8+CD57+ve T cell subsets might bemodulated by the presence of leptin (Fig. 5C). Further to show that leptin also mediates theapoptotic process in the liver, a function which is associated with CD8+veCD57+ve T cellsin chronic disease, TUNEL assay, mRNA expression analysis of apoptotic proteins andmeasurement of active caspase-3 were performed. Results showed that Leptin KO mice hadsignificantly decreased TUNEL positive cells (Fig. 5D and 5E), Bcl-2 and p53 mRNAexpressions as compared to DIO+BDCM group (Fig. 5F) (P<0.05). Results also showed thatLeptin KO mice had significantly decreased active caspase-3 subunits as compared to DIO+BDCM group suggesting that leptin mediated the apoptotic effects of theCD8+veCD57+ve T cells (Fig. 5G)(band quantification not shown)(P<0.05). Further a
Seth et al. Page 9
Toxicol Appl Pharmacol. Author manuscript; available in PMC 2015 January 01.
NIH
-PA Author Manuscript
NIH
-PA Author Manuscript
NIH
-PA Author Manuscript

detailed graphical representation of the proposed pathway of CD8+veCD57+ve T cell role inNASH pathogenesis is shown in Fig.6.
DiscussionOur study shows for the first time that CD57 expression on CD8+ve cells are increasedfollowing metabolic oxidative stress during NASH progression and this increasedexpression correlate well with increased hepatic apoptosis followed by development ofNASH. We are not aware of any reports that indicate the involvement of CD57 in NASHprogression and the novel finding that mostly CD8+ve cells carry the increased expressionof CD57 augurs well for a new and unique pathway for the involvement of T cells in NASHPathogenesis. Further, our studies also show that the increased CD57 levels and expressionare mediated by leptin, which has a simultaneous role in the inflammatory pathways inNASH and the fibrogenesis that follows.
Our discovery of CD57+ve CD8+ve cells in rodent liver is in stark contrast to earlier reportswhere studies show that there are no CD8+ve CD57+ve T cells in rodents (42, 43). This maybe due to an organ specific compartmentalization of these T cell subsets which were notobserved earlier.
Our results are also significant in the findings that show that the CD57 expression wasmetabolic oxidative stress driven and was highly dependent on CYP2E1, a xenobioticenzyme present in higher concentrations in the liver parenchymal cells. Few research reportsshow that controlling and modulating oxidative stress in the extra cellular milieu mayinfluence T cell signaling and activation (36). T cells that undergo successive cell divisionsas might happen initially during NASH progression may be subject to proliferative stressand/or oxidative stress as in the case here and reach replicative senescence (23). It isimportant to consider at this point that CD57 expression has been found to increase onCD8+ve T cells in cases of repeated antigenic stimulation with a progressive loss of CD28(23). The consequence of a metabolic oxidative stress mediated higher population of CD57expressing CD8+ve T cells, with a simultaneous drop in CD28 can be two fold. The rise inCD57 expression can pave way for higher cytokine production and also more apoptosis asseen in our studies. Though our studies do not confirm whether the same T cells undergoapoptosis but there is a definite correlation between higher CD57 expression and hepaticapoptosis in our studies. The results are in agreement with another study in alcoholicdrinkers that showed cell death in hepatic parenchyma following a stable expansion ofCD8+ve CD57+ve cells (27). We used Pfp/Rag2 dKO mice to establish the role of livermononuclear cells, especially B cells, T cells and NK cells which might have the expressionof CD57. The results showed that CD57 expression was significantly decreased in thesemice accompanied by decreased T cell cytokines IL-1β, IL-2, IFN-γ and CD95L (FasL).Interestingly there are contrasting reports about the involvement of IFN-γ in fibrosis, wherethe role of IFN-γ in causing liver fibrosis is skewed (11). There are many in vivo and in vitrostudies that report the proinflammatory actions of IFN-γ and work towards resolution offibrosis but studies that involve choline deficient and ethionine supplemented diets showedIFN-γ administration increased progenitor cell proliferation, caused increased inflammationand fibrosis (44–46). In our studies where we see an increased IFN-γ release in the livermight be a consequence of higher expression of CD57+ve cells on CD8+ve cytotoxic Tlymphocytes that are a consequence of the higher metabolic oxidative stress in this model.The higher IFN-γ production in these cells is supported by another study which foundincreased production of this cytokine that correlated well with higher number of CD8+vehighCD28-veCD57+ subpopulation (47). Our studies further showed that there was also asignificant reduction of liver apoptosis in these mice. However, at this point the use of Pfp/Rag2 dKO mice restricted us from inferring conclusively that the CD57 expression was
Seth et al. Page 10
Toxicol Appl Pharmacol. Author manuscript; available in PMC 2015 January 01.
NIH
-PA Author Manuscript
NIH
-PA Author Manuscript
NIH
-PA Author Manuscript

specifically more in CD8+ve cytotoxic T cells since we did not use mice that werespecifically deficient in CD8+ T lymphocytes. To prove that the CD8+ve cells were mainlyexpressing higher CD57+ve cells, fluroscence microscopy was used. Using dual dyelabeling and colocalization analysis it was revealed that CD57 expression was mainly inCD8+ve cells. Future studies are planned to elucidate more concerted roles of CD8+veCD57+ve cells in an in vitro culture system using isolated liver specific mononuclear cellsco-exposed to the environmental toxin and adipokine leptin. Following our observation thatCD8+ve T cells had higher expression of CD57 and they might play a role in thefibrogenesis during NASH progression and since a role of CD8+ve cells in inducingfibrogenesis in a toxin model of liver fibrosis have been reported earlier (15), we exploredthe role of leptin-CD8 - axis in mediating the higher expression of CD57 on CD8+ve cells. Itis reported that CD8+ve cells can up-regulate the activated state of hepatic stellate cells andso does leptin, which has a direct role in activating hepatic stellate cells (22, 48). Adipokineleptin is a 16kd protein with established roles in stellate cell activation, Kupffer cellactivation, proinflammatory cytokine production and fibrogenesis in NASH (49). Leptinalso has a significant role in T cell proliferation including activation of CD8+ve T cells (32).A study by Mattioli B et al found that leptin up-regulates interleukin-12p70 production onCD40 stimulation and, more importantly, increases their capacity to stimulate activation ofautologous CD8(+) T cells (33). Metabolic oxidative stress following environmental toxinexposures like CCl4 and BDCM caused increased levels of serum and hepatic leptin (8, 9).In the present study we also show increased leptin mRNA and protein in DIO+BDCMgroup, data that is consistent with our previous published reports. High leptin in our modelof NASH, coupled with increased metabolic oxidative stress might lead to higher expressionof CD57. This is also supported by the fact that OB/OB mice have less CD57 expression.Further, our observations show that OB/OB mice administered BDCM had significantlydecreased CD57 expression on CD8+ve cells, decreased T cell cytokine levels and reducedapoptosis. The same mice were also protected from liver fibrosis and NASH progression.However the set of data that is shown does not directly outline the mechanisms of leptininduced CD57 expression on CD+ve T cells, nor does it clearly show how downstreamleptin signaling might increase CD57 expression of CD8+ve cells. Future research can bedirected towards exploring the mechanisms of leptin in immunosuppression and T cellsenescence in NASH.
Taken together, the present study identifies for the first time that CD57 protein is increasedin NASH progression and is primarily expressed on CD8+ve T cells. Further the metabolicoxidative stress dependent CD57 expression contributes to T cell cytokine increase,apoptosis and fibrogenesis in NASH, a process that is mediated by adipokine leptin (Fig. 6).This novel discovery of a more than 70–80 fold increase in CD57 in NASH livers makesthis molecule to be an ideal biomarker for NASH pathogenesis.
AcknowledgmentsThe authors gratefully acknowledge the technical services of Benny Davidson at the IRF, University of SouthCarolina, School of Medicine. We also thank Dr David C. Volz for use of the BX51 fluorescence microscope, theInstrumentation resource facility (IRF) at the University of South Carolina School of Medicine for equipment usageand consulting services. This work has been supported by NIH pathway to Independence Award(4R00ES019875-02 to Saurabh Chatterjee), NIH R01(R01DK053792 to Anna Mae Diehl) and the IntramuralResearch Program of the National Institutes of Health and the National Institute of Environmental Health Sciences.
References1. Nascimbeni F, Pais R, Bellentani S, Day CP, Ratziu V, Loria P, et al. From NAFLD in clinical
practice to answers from guidelines. J Hepatol. 2013 Epub 2013/06/12. PubMed PMID: 23751754.
Seth et al. Page 11
Toxicol Appl Pharmacol. Author manuscript; available in PMC 2015 January 01.
NIH
-PA Author Manuscript
NIH
-PA Author Manuscript
NIH
-PA Author Manuscript

2. Fan JG. Epidemiology of alcoholic and nonalcoholic fatty liver disease in China. Journal ofgastroenterology and hepatology. 2013; 28(Suppl 1):11–17. Epub 2013/07/24. PubMed PMID:23855290. [PubMed: 23855290]
3. Fan JG, Farrell GC. Epidemiology of non-alcoholic fatty liver disease in China. J Hepatol. 2009;50(1):204–210. Epub 2008/11/19. PubMed PMID: 19014878. [PubMed: 19014878]
4. Fan JG, Peng YD. Metabolic syndrome and non-alcoholic fatty liver disease: Asian definitions andAsian studies. Hepatobiliary & pancreatic diseases international : HBPD INT. 2007; 6(6):572–578.Epub 2007/12/19. PubMed PMID: 18086620. [PubMed: 18086620]
5. Wahlang B, Beier JI, Clair HB, Bellis-Jones HJ, Falkner KC, McClain CJ, et al. Toxicant-associatedsteatohepatitis. Toxicologic pathology. 2013; 41(2):343–360. Epub 2012/12/25. PubMed PMID:23262638. [PubMed: 23262638]
6. Seth RK, Kumar A, Das S, Kadiiska MB, Michelotti G, Diehl AM, et al. Environmental toxin-linked nonalcoholic steatohepatitis and hepatic metabolic reprogramming in obese mice.Toxicological sciences : an official journal of the Society of Toxicology. 2013 Epub 2013/05/04.PubMed PMID: 23640861.
7. Chatterjee S, Rana R, Corbett J, Kadiiska MB, Goldstein J, Mason RP. P2×7 receptor-NADPHoxidase axis mediates protein radical formation and Kupffer cell activation in carbon tetrachloride-mediated steatohepatitis in obese mice. Free Radic Biol Med. 2012; 52(9):1666–1679. Epub2012/02/22. PubMed PMID: 22343416; PubMed Central PMCID: PMCPMC3341527. [PubMed:22343416]
8. Chatterjee S, Ganini D, Tokar EJ, Kumar A, Das S, Corbett J, et al. Leptin is key to peroxynitrite-mediated oxidative stress and Kupffer cell activation in experimental nonalcoholic steatohepatitis. JHepatol. 2012 Epub 2012/12/05. PubMed PMID: 23207144.
9. Das S, Kumar A, Seth RK, Tokar EJ, Kadiiska MB, Waalkes MP, et al. Proinflammatory adipokineleptin mediates disinfection byproduct bromodichloromethane-induced early steatohepatitic injuryin obesity. Toxicology and applied pharmacology. 2013 Epub 2013/02/27. PubMed PMID:23438451.
10. Abdelmegeed MA, Banerjee A, Yoo SH, Jang S, Gonzalez FJ, Song BJ. Critical role ofcytochrome P450 2E1 (CYP2E1) in the development of high fat-induced nonalcoholicsteatohepatitis. J Hepatol. 2012; 57(4):860–866. Epub 2012/06/07. PubMed PMID: 22668639;PubMed Central PMCID: PMCPMC3445664. [PubMed: 22668639]
11. Marra F, Aleffi S, Galastri S, Provenzano A. Mononuclear cells in liver fibrosis. Seminars inimmunopathology. 2009; 31(3):345–358. Epub 2009/06/18. PubMed PMID: 19533130. [PubMed:19533130]
12. Smedsrod B, De Bleser PJ, Braet F, Lovisetti P, Vanderkerken K, Wisse E, et al. Cell biology ofliver endothelial and Kupffer cells. Gut. 1994; 35(11):1509–1516. Epub 1994/11/01. PubMedPMID: 7828963; PubMed Central PMCID: PMCPMC1375602. [PubMed: 7828963]
13. Imamura M, Ogawa T, Sasaguri Y, Chayama K, Ueno H. Suppression of macrophage infiltrationinhibits activation of hepatic stellate cells and liver fibrogenesis in rats. Gastroenterology. 2005;128(1):138–146. Epub 2005/01/06. PubMed PMID: 15633130. [PubMed: 15633130]
14. Casini A, Ricci OE, Paoletti F, Surrenti C. Immune mechanisms for hepatic fibrogenesis. T-lymphocyte-mediated stimulation of fibroblast collagen production in chronic active hepatitis.Liver. 1985; 5(3):134–141. Epub 1985/06/01. PubMed PMID: 3876501. [PubMed: 3876501]
15. Safadi R, Ohta M, Alvarez CE, Fiel MI, Bansal M, Mehal WZ, et al. Immune stimulation ofhepatic fibrogenesis by CD8 cells and attenuation by transgenic interleukin-10 from hepatocytes.Gastroenterology. 2004; 127(3):870–882. Epub 2004/09/14. PubMed PMID: 15362042. [PubMed:15362042]
16. Shi Z, Wakil AE, Rockey DC. Strain-specific differences in mouse hepatic wound healing aremediated by divergent T helper cytokine responses. Proceedings of the National Academy ofSciences of the United States of America. 1997; 94(20):10663–10668. Epub 1997/10/06. PubMedPMID: 9380692; PubMed Central PMCID: PMCPMC23440. [PubMed: 9380692]
17. Safadi R, Zigmond E, Pappo O, Shalev Z, Ilan Y. Amelioration of hepatic fibrosis via beta-glucosylceramide-mediated immune modulation is associated with altered CD8 and NKTlymphocyte distribution. International immunology. 2007; 19(8):1021–1029. Epub 2007/08/19.PubMed PMID: 17698563. [PubMed: 17698563]
Seth et al. Page 12
Toxicol Appl Pharmacol. Author manuscript; available in PMC 2015 January 01.
NIH
-PA Author Manuscript
NIH
-PA Author Manuscript
NIH
-PA Author Manuscript

18. Horani A, Muhanna N, Pappo O, Melhem A, Alvarez CE, Doron S, et al. Beneficial effect ofglatiramer acetate (Copaxone) on immune modulation of experimental hepatic fibrosis. Americanjournal of physiology Gastrointestinal and liver physiology. 2007; 292(2):G628–G638. Epub2006/10/14. PubMed PMID: 17038628. [PubMed: 17038628]
19. Inada S, Suzuki K, Kimura T, Hayashi A, Narita T, Yui R, et al. Concentric fibrosis and cellularinfiltration around bile ducts induced by graft-versus-host reaction in mice: a role of CD8+ cells.Autoimmunity. 1995; 22(3):163–171. Epub 1995/01/01. PubMed PMID: 8734570. [PubMed:8734570]
20. Lombardo L, Capaldi A, Poccardi G, Vineis P. Peripheral blood CD3 and CD4 T-lymphocytereduction correlates with severity of liver cirrhosis. International journal of clinical & laboratoryresearch. 1995; 25(3):153–156. Epub 1995/01/01. PubMed PMID: 8562979. [PubMed: 8562979]
21. Panasiuk A, Prokopowicz D, Zak J, Wysocka J. Peripheral blood T, B, and NK cells in relation tohistological hepatitis activity and fibrosis stage in chronic hepatitis C. Hepato-gastroenterology.2003; 50(49):178–182. Epub 2003/03/13. PubMed PMID: 12630018. [PubMed: 12630018]
22. Muhanna N, Doron S, Wald O, Horani A, Eid A, Pappo O, et al. Activation of hepatic stellate cellsafter phagocytosis of lymphocytes: A novel pathway of fibrogenesis. Hepatology. 2008; 48(3):963–977. Epub 2008/08/30. PubMed PMID: 18726940; PubMed Central PMCID:PMCPMC2880478. [PubMed: 18726940]
23. Strioga M, Pasukoniene V, Characiejus D. CD8+ CD28− and CD8+ CD57+ T cells and their rolein health and disease. Immunology. 2011; 134(1):17–32. Epub 2011/06/30. PubMed PMID:21711350; PubMed Central PMCID: PMCPMC3173691. [PubMed: 21711350]
24. Brenchley JM, Karandikar NJ, Betts MR, Ambrozak DR, Hill BJ, Crotty LE, et al. Expression ofCD57 defines replicative senescence and antigen-induced apoptotic death of CD8+ T cells. Blood.2003; 101(7):2711–2720. Epub 2002/11/16. PubMed PMID: 12433688. [PubMed: 12433688]
25. Sada-Ovalle I, Torre-Bouscoulet L, Valdez-Vazquez R, Martinez-Cairo S, Zenteno E, Lascurain R.Characterization of a cytotoxic CD57+ T cell subset from patients with pulmonary tuberculosis.Clinical immunology (Orlando, Fla). 2006; 121(3):314–323. Epub 2006/10/13. PubMed PMID:17035093.
26. Frassanito MA, Silvestris F, Cafforio P, Dammacco F. CD8+/CD57 cells and apoptosis suppressT-cell functions in multiple myeloma. British journal of haematology. 1998; 100(3):469–477.Epub 1998/03/21. PubMed PMID: 9504628. [PubMed: 9504628]
27. Song K, Coleman RA, Alber C, Ballas ZK, Waldschmidt TJ, Mortari F, et al. TH1 cytokineresponse of CD57+ T-cell subsets in healthy controls and patients with alcoholic liver disease.Alcohol (Fayetteville, NY). 2001; 24(3):155–167. Epub 2001/09/15. PubMed PMID: 11557301.
28. Sharma G, Hanania NA, Shim YM. The aging immune system and its relationship to thedevelopment of chronic obstructive pulmonary disease. Proceedings of the American ThoracicSociety. 2009; 6(7):573–580. Epub 2009/11/26. PubMed PMID: 19934352. [PubMed: 19934352]
29. Arosa FA. CD8+CD28− T cells: certainties and uncertainties of a prevalent human T-cell subset.Immunology and cell biology. 2002; 80(1):1–13. Epub 2002/03/01. PubMed PMID: 11869357.[PubMed: 11869357]
30. Ikejima K, Takei Y, Honda H, Hirose M, Yoshikawa M, Zhang YJ, et al. Leptin receptor-mediatedsignaling regulates hepatic fibrogenesis and remodeling of extracellular matrix in the rat.Gastroenterology. 2002; 122(5):1399–1410. Epub 2002/05/02. PubMed PMID: 11984526.[PubMed: 11984526]
31. Wang J, Leclercq I, Brymora JM, Xu N, Ramezani-Moghadam M, London RM, et al. Kupffer cellsmediate leptin-induced liver fibrosis. Gastroenterology. 2009; 137(2):713–723. Epub 2009/04/21.PubMed PMID: 19375424; PubMed Central PMCID: PMCPMC2757122. [PubMed: 19375424]
32. Matarese G, Moschos S, Mantzoros CS. Leptin in immunology. J Immunol. 2005; 174(6):3137–3142. Epub 2005/03/08. PubMed PMID: 15749839. [PubMed: 15749839]
33. Mattioli B, Straface E, Matarrese P, Quaranta MG, Giordani L, Malorni W, et al. Leptin as animmunological adjuvant: enhanced migratory and CD8+ T cell stimulatory capacity of humandendritic cells exposed to leptin. FASEB journal : official publication of the Federation ofAmerican Societies for Experimental Biology. 2008; 22(6):2012–2022. Epub 2008/01/26. PubMedPMID: 18218920. [PubMed: 18218920]
Seth et al. Page 13
Toxicol Appl Pharmacol. Author manuscript; available in PMC 2015 January 01.
NIH
-PA Author Manuscript
NIH
-PA Author Manuscript
NIH
-PA Author Manuscript

34. Mendelson KG, Contois LR, Tevosian SG, Davis RJ, Paulson KE. Independent regulation of JNK/p38 mitogen-activated protein kinases by metabolic oxidative stress in the liver. Proceedings of theNational Academy of Sciences of the United States of America. 1996; 93(23):12908–12913. Epub1996/11/12. PubMed PMID: 8917518; PubMed Central PMCID: PMCPMC24019. [PubMed:8917518]
35. Morris EM, Rector RS, Thyfault JP, Ibdah JA. Mitochondria and redox signaling in steatohepatitis.Antioxid Redox Signal. 2011; 15(2):485–504. Epub 2010/12/07. PubMed PMID: 21128703;PubMed Central PMCID: PMCPMC3118705. [PubMed: 21128703]
36. Larbi A, Kempf J, Pawelec G. Oxidative stress modulation and T cell activation. Experimentalgerontology. 2007; 42(9):852–858. Epub 2007/07/03. PubMed PMID: 17604927. [PubMed:17604927]
37. Wang G, Konig R, Ansari GA, Khan MF. Lipid peroxidation-derived aldehyde-protein adductscontribute to trichloroethene-mediated autoimmunity via activation of CD4+ T cells. Free RadicBiol Med. 2008; 44(7):1475–1482. Epub 2008/02/13. PubMed PMID: 18267128; PubMed CentralPMCID: PMCPMC2440665. [PubMed: 18267128]
38. Chawla-Sarkar M, Lindner DJ, Liu YF, Williams BR, Sen GC, Silverman RH, et al. Apoptosis andinterferons: role of interferon-stimulated genes as mediators of apoptosis. Apoptosis : aninternational journal on programmed cell death. 2003; 8(3):237–249. Epub 2003/05/27. PubMedPMID: 12766484. [PubMed: 12766484]
39. Csak T, Ganz M, Pespisa J, Kodys K, Dolganiuc A, Szabo G. Fatty acid and endotoxin activateinflammasomes in mouse hepatocytes that release danger signals to stimulate immune cells.Hepatology. 2011; 54(1):133–144. Epub 2011/04/14. PubMed PMID: 21488066. [PubMed:21488066]
40. Borthwick NJ, Lowdell M, Salmon M, Akbar AN. Loss of CD28 expression on CD8(+) T cells isinduced by IL-2 receptor gamma chain signalling cytokines and type I IFN, and increasessusceptibility to activation-induced apoptosis. International immunology. 2000; 12(7):1005–1013.Epub 2000/07/06. PubMed PMID: 10882412. [PubMed: 10882412]
41. Wood KL, Twigg HL 3rd, Doseff AI. Dysregulation of CD8+ lymphocyte apoptosis, chronicdisease, and immune regulation. Frontiers in bioscience : a journal and virtual library. 2009;14:3771–3781. Epub 2009/03/11. PubMed PMID: 19273309; PubMed Central PMCID:PMCPMC2740383.
42. Vallejo AN. CD28 extinction in human T cells: altered functions and the program of T-cellsenescence. Immunological reviews. 2005; 205:158–169. Epub 2005/05/11. PubMed PMID:15882352. [PubMed: 15882352]
43. Weng NP, Akbar AN, Goronzy J. CD28(−) T cells: their role in the age-associated decline ofimmune function. Trends in immunology. 2009; 30(7):306–312. Epub 2009/06/23. PubMedPMID: 19540809; PubMed Central PMCID: PMCPMC2801888. [PubMed: 19540809]
44. Czaja MJ, Weiner FR, Takahashi S, Giambrone MA, van der Meide PH, Schellekens H, et al.Gamma-interferon treatment inhibits collagen deposition in murine schistosomiasis. Hepatology.1989; 10(5):795–800. Epub 1989/11/01. PubMed PMID: 2509321. [PubMed: 2509321]
45. Baroni GS, D'Ambrosio L, Curto P, Casini A, Mancini R, Jezequel AM, et al. Interferon gammadecreases hepatic stellate cell activation and extracellular matrix deposition in rat liver fibrosis.Hepatology. 1996; 23(5):1189–1199. Epub 1996/05/01. PubMed PMID: 8621153. [PubMed:8621153]
46. Knight B, Lim R, Yeoh GC, Olynyk JK. Interferon-gamma exacerbates liver damage, the hepaticprogenitor cell response and fibrosis in a mouse model of chronic liver injury. J Hepatol. 2007;47(6):826–833. Epub 2007/10/10. PubMed PMID: 17923165. [PubMed: 17923165]
47. Bandres E, Merino J, Vazquez B, Inoges S, Moreno C, Subira ML, et al. The increase of IFN-gamma production through aging correlates with the expanded CD8(+high)CD28(−)CD57(+)subpopulation. Clinical immunology (Orlando, Fla). 2000; 96(3):230–235. Epub 2000/08/31.PubMed PMID: 10964541.
48. Saxena NK, Titus MA, Ding X, Floyd J, Srinivasan S, Sitaraman SV, et al. Leptin as a novelprofibrogenic cytokine in hepatic stellate cells: mitogenesis and inhibition of apoptosis mediatedby extracellular regulated kinase (Erk) and Akt phosphorylation. FASEB journal : officialpublication of the Federation of American Societies for Experimental Biology. 2004; 18(13):
Seth et al. Page 14
Toxicol Appl Pharmacol. Author manuscript; available in PMC 2015 January 01.
NIH
-PA Author Manuscript
NIH
-PA Author Manuscript
NIH
-PA Author Manuscript

1612–1614. Epub 2004/08/21. PubMed PMID: 15319373; PubMed Central PMCID:PMCPMC2924993. [PubMed: 15319373]
49. Kamada Y, Takehara T, Hayashi N. Adipocytokines and liver disease. Journal of gastroenterology.2008; 43(11):811–822. Epub 2008/11/18. PubMed PMID: 19012034. [PubMed: 19012034]
Seth et al. Page 15
Toxicol Appl Pharmacol. Author manuscript; available in PMC 2015 January 01.
NIH
-PA Author Manuscript
NIH
-PA Author Manuscript
NIH
-PA Author Manuscript

Highlights
1. Metabolic oxidative stress caused increased levels of hepatic CD57, a marker ofperipheral blood lymphocytes including NKT cells.
2. CD8+CD57+ cytotoxic T cells but not CD4+CD57+ cells were significantlydecreased in mice lacking CYP2E1 and leptin.
3. There was a significant increase in the levels of T cell cytokines IL-2, IL-1β,IFN-γ in bromodichloromethane exposed DIO mice but not in mice that lackedCYP2E1, leptin or T and B cells.
4. Apoptosis as evidenced by TUNEL assay and levels of cleaved caspase-3 wassignificantly lower in leptin and Pfp/Rag2 KO mice and highly correlated withprotection from NASH.
5. Leptin mediated CD8+CD57+ T cells play an important role in the developmentof NASH and also provides a novel insight of immune dysregulation and maybe a key biomarker in NASH.
Seth et al. Page 16
Toxicol Appl Pharmacol. Author manuscript; available in PMC 2015 January 01.
NIH
-PA Author Manuscript
NIH
-PA Author Manuscript
NIH
-PA Author Manuscript

Fig.1.A(i)–(iii). 4-Hydroxynonenal (4-HNE, a marker for lipid peroxidation) immunoreactivity asshown by immunohistochemistry in liver slices from diet-induced obese mouse (DIO), diet-induced obese mouse exposed to bromodichloromethane (DIO+BDCM), and diet-inducedobese mouse with CYP2E1 gene deletion and exposed to bromodichloromethane (CYP2E1KO) respectively. Images were taken in 20×. B (i)–(iii). 3-Nitrotyrosine (3NTyr, a markerfor protein nitrosylation) immunoreactivity as shown by immunohistochemistry in liverslices from DIO, DIO+BDCM and CYP2E1 KO groups respectively. Images were taken in20×. C. Percentage of 4-HNE positive immunoreactive cells (obtained by morphometrydone on images from three separate microscopic fields) in DIO, DIO+BDCM and CYP2E1
Seth et al. Page 17
Toxicol Appl Pharmacol. Author manuscript; available in PMC 2015 January 01.
NIH
-PA Author Manuscript
NIH
-PA Author Manuscript
NIH
-PA Author Manuscript
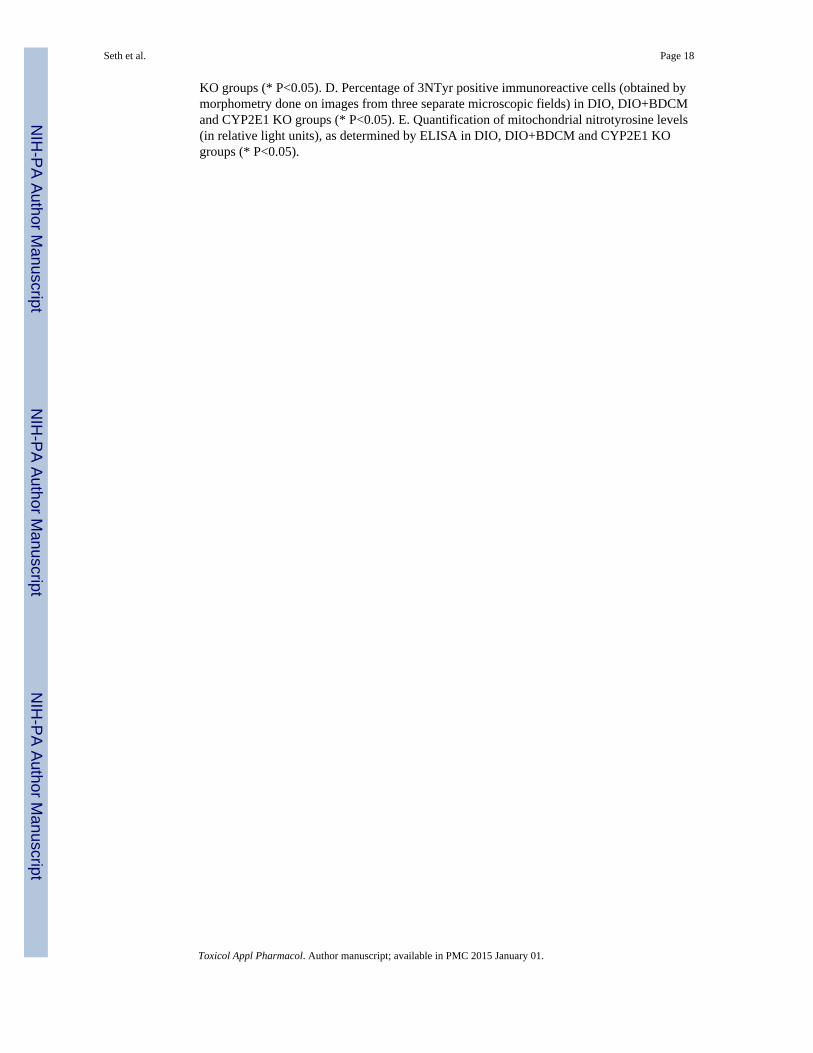
KO groups (* P<0.05). D. Percentage of 3NTyr positive immunoreactive cells (obtained bymorphometry done on images from three separate microscopic fields) in DIO, DIO+BDCMand CYP2E1 KO groups (* P<0.05). E. Quantification of mitochondrial nitrotyrosine levels(in relative light units), as determined by ELISA in DIO, DIO+BDCM and CYP2E1 KOgroups (* P<0.05).
Seth et al. Page 18
Toxicol Appl Pharmacol. Author manuscript; available in PMC 2015 January 01.
NIH
-PA Author Manuscript
NIH
-PA Author Manuscript
NIH
-PA Author Manuscript

Seth et al. Page 19
Toxicol Appl Pharmacol. Author manuscript; available in PMC 2015 January 01.
NIH
-PA Author Manuscript
NIH
-PA Author Manuscript
NIH
-PA Author Manuscript

Seth et al. Page 20
Toxicol Appl Pharmacol. Author manuscript; available in PMC 2015 January 01.
NIH
-PA Author Manuscript
NIH
-PA Author Manuscript
NIH
-PA Author Manuscript

Fig.2.A. mRNA expressions of CD57, CD3, CD4, CD8, CD28 and IL-2 from liver homogenatesof diet-induced obese mouse (DIO), diet-induced obese mouse exposed tobromodichloromethane (DIO+BDCM), diet-induced obese mouse with CYP2E1 genedeletion and exposed to bromodichloromethane (CYP2E1 KO), and diet-induced obesemouse with Pfp/Rag2 dual gene deletion and exposed to bromodichloromethane (Pfp/Rag2dKO). mRNA expressions had been assessed by quantitative real-time PCR (qRTPCR) andexpressions in DIO+BDCM, CYP2E1 KO and Pfp/Rag2 dKO groups were normalizedagainst mRNA expression in DIO group (* P<0.05). B (i)–(iv). CD57 immunoreactivity asshown by immunohistochemistry in liver slices from DIO, DIO+BDCM, CYP2E1 KO andPfp/Rag2 dKO groups respectively. Images were taken in 20×. C. Immunofluorescenceimages for co-localization of CD57 (red) and CD3 (green) from liver sections of DIO [(i)–(iv)], DIO+BDCM [(v)–(viii)], CYP2E1 KO [(ix)–(xii)] and Pfp/Rag2 dKO [(xiii)–(xvi)]groups. The images in the overlay panel on the extreme right depict co-localizations ofCD57 and CD3 as revealed by the yellow regions. The localizations of CD3 and CD57 are
Seth et al. Page 21
Toxicol Appl Pharmacol. Author manuscript; available in PMC 2015 January 01.
NIH
-PA Author Manuscript
NIH
-PA Author Manuscript
NIH
-PA Author Manuscript

shown by blue and yellow arrows respectively. Images were taken in 40× magnification. D.Immunofluorescence laser scanning images for co-localization of CD57 (red) and CD8(green) from liver sections of DIO [(i)–(iv)], DIO+BDCM [(v)–(viii)], CYP2E1 KO [(ix)–(xii)] and Pfp/Rag2 dKO [(xiii)–(xvi)] groups. The images in the overlay panel on theextreme right depict co-localizations of CD57 and CD8 as revealed by the yellow regions.Images were taken in 40× magnification. The localizations of CD8 and CD57 are shown bypink and yellow arrows respectively.
Seth et al. Page 22
Toxicol Appl Pharmacol. Author manuscript; available in PMC 2015 January 01.
NIH
-PA Author Manuscript
NIH
-PA Author Manuscript
NIH
-PA Author Manuscript

Fig.3.A. mRNA expressions of IL-1β, IFN-γ and FasL from liver homogenates of dietinducedobese mouse (DIO), diet-induced obese mouse exposed to bromodichloromethane (DIO+BDCM), diet-induced obese mouse with CYP2E1 gene deletion and exposed tobromodichloromethane (CYP2E1 KO), and diet-induced obese mouse with Pfp/Rag2 dualgene deletion and exposed to bromodichloromethane (Pfp/Rag2 dKO). mRNA expressionshad been assessed by quantitative real-time PCR (qRTPCR) and expressions in DIO+BDCM, CYP2E1 KO and Pfp/Rag2 dKO groups were normalized against mRNAexpression in DIO group (* P<0.05). B. mRNA expressions of Bcl-2, Caspase-3 (Casp-3)and P53 from liver homogenates of DIO, DIO+BDCM, CYP2E1 KO and Pfp/Rag2 dKO
Seth et al. Page 23
Toxicol Appl Pharmacol. Author manuscript; available in PMC 2015 January 01.
NIH
-PA Author Manuscript
NIH
-PA Author Manuscript
NIH
-PA Author Manuscript

groups. mRNA expressions had been assessed by qRTPCR and expressions in DIO+BDCM,CYP2E1 KO and Pfp/Rag2 dKO groups were normalized against mRNA expression in DIOgroup (* P<0.05). C. Western Blot analysis of pro-caspase-3 and active-caspase-3 (large andsmall subunits) protein expression levels in liver homogenates from DIO, DIO+BDCM,CYP2E1 KO and Pfp/Rag2 dKO groups. The corresponding β-actin levels are shown in thelower panel. D. Band quantification analysis (arbitrary units) of active-caspase-3 (ratio to β-actin) from DIO, DIO+BDCM, CYP2E1 KO and Pfp/Rag2 dKO groups (bands shown infig. 3C). E (i)–(iv). Number of apoptotic nuclei as shown by TUNEL staining in liver slicesfrom DIO, DIO+BDCM, CYP2E1 KO and Pfp/Rag2 dKO groups respectively. Number ofTUNEL positive cells identified by their blue-stained nuclei as against the nuclear fast redstained nuclei correspond to the number of apoptotic events. Images were taken in 20×magnification. F. Percentage of TUNEL positive cells (obtained by morphometry done onimages from three separate microscopic fields) in DIO, DIO+BDCM, CYP2E1 KO and Pfp/Rag2 dKO groups (* P<0.05). Western blot analysis of apoptotic protein FasL, p53 and Bcl2(From top down) from liver homogenates.
Seth et al. Page 24
Toxicol Appl Pharmacol. Author manuscript; available in PMC 2015 January 01.
NIH
-PA Author Manuscript
NIH
-PA Author Manuscript
NIH
-PA Author Manuscript

Seth et al. Page 25
Toxicol Appl Pharmacol. Author manuscript; available in PMC 2015 January 01.
NIH
-PA Author Manuscript
NIH
-PA Author Manuscript
NIH
-PA Author Manuscript

Fig.4.A. mRNA expression of leptin from liver homogenates of diet-induced obese mouse (DIO),diet-induced obese mouse exposed to bromodichloromethane (DIO+BDCM) and diet-induced obese mouse with leptin gene deletion and exposed to bromodichloromethane(Leptin KO). mRNA expressions had been assessed by quantitative real-time PCR(qRTPCR) and expressions in DIO+BDCM and Leptin KO groups were normalized againstmRNA expression in DIO group (* P<0.05). B. Western Blot analysis of leptin proteinexpression levels in liver homogenates from DIO, DIO+BDCM and Leptin KO groups. Thecorresponding β-actin levels are shown in the lower panel. C. mRNA expressions of CD57,CD28, CD4, CD8, CD3 and IL-2 from liver homogenates of DIO+BDCM and Leptin KOgroups. mRNA expressions had been assessed by qRTPCR and expressions in DIO+BDCMand Leptin KO groups were normalized against mRNA expression in DIO group (* P<0.05).D. mRNA expressions of IFN-γ, IL-1β and FasL from liver homogenates of DIO+BDCMand Leptin KO groups. mRNA expressions had been assessed by qRTPCR and expressionsin DIO+BDCM and Leptin KO groups were normalized against mRNA expression in DIOgroup (* P<0.05). E (i)–(ii). CD57 immunoreactivity as shown by immunohistochemistry inliver slices from DIO+BDCM and Leptin KO groups respectively. Images were taken in 20×magnification. F. Percentage of CD57 positive immunoreactive cells (obtained bymorphometry done on images from three separate microscopic fields) in DIO+BDCM andLeptin KO groups compared to DIO group (* P<0.05). G. Immunofluorescence images forco-localization of CD57 (red) and CD8 (green) from liver sections of DIO+BDCM [(i)–(iv)]and Leptin KO[(v)–(viii)] groups. The images in the overlay panel on the extreme rightdepict co-localizations of CD57 and CD8 as revealed by the yellow regions. Images weretaken in 40× magnification. The localizations of CD8 and CD57 are shown by pink andyellow arrows respectively.
Seth et al. Page 26
Toxicol Appl Pharmacol. Author manuscript; available in PMC 2015 January 01.
NIH
-PA Author Manuscript
NIH
-PA Author Manuscript
NIH
-PA Author Manuscript

Fig.5.A (i)–(iii). α-Smooth muscle actin (α-SMA) immunoreactivity as shown byimmunohistochemistry in liver slices from diet-induced obese mouse exposed tobromodichloromethane (DIO+BDCM), diet-induced obese mouse with leptin gene deletionand exposed to bromodichloromethane (Leptin KO) and diet-induced obese mouse with Pfp/Rag2 dual gene deletion and exposed to bromodichloromethane (Pfp/Rag2 dKO)respectively. (iv)–(vi) TGF-β immunoreactivity as shown by immunohistochemistry in liverslices from DIO+BDCM, Leptin KO and Pfp/Rag2 dKO groups respectively. All imageswere taken in 20× magnification. B. Percentage of α-SMA positive and TGF-β positiveimmunoreactive cells (obtained by morphometry done on images from three separate
Seth et al. Page 27
Toxicol Appl Pharmacol. Author manuscript; available in PMC 2015 January 01.
NIH
-PA Author Manuscript
NIH
-PA Author Manuscript
NIH
-PA Author Manuscript

microscopic fields in each case) in DIO+BDCM, Leptin KO and Pfp/Rag2 dKO groupscompared to DIO group (* P<0.05). C (i)–(iii). Macro- and micro-vescicular collagendeposition as shown by Picrosirius red staining in liver slices from DIO+BDCM, Leptin KOand Pfp/Rag2 dKO groups respectively. Images were taken in 10× magnification. D (i)–(ii).Number of apoptotic nuclei as shown by TUNEL staining in liver slices from DIO+BDCMand Leptin KO groups respectively. Number of TUNEL positive cells identified by theirblue-stained nuclei as against the nuclear fast red stained nuclei correspond to the number ofapoptotic events. Images were taken in 20× magnification. E. Percentage of TUNEL positivecells (obtained by morphometry done on images from three separate microscopic fields) inDIO+BDCM and Leptin KO groups (* P<0.05). F. mRNA expressions of Bcl-2, Caspase-3(Casp-3) and P53 from liver homogenates of DIO+BDCM and Leptin KO groups. mRNAexpressions had been assessed by quantitative real-time PCR (qRTPCR) and expressions inDIO+BDCM and Leptin KO groups were normalized against mRNA expression in DIOgroup (* P<0.05). G. Western Blot analysis of pro-caspase-3 and active-caspase-3 (large andsmall subunits) protein expression levels in liver homogenates from DIO+BDCM and LeptinKO groups. The corresponding β-actin levels are shown in the lower panel.
Seth et al. Page 28
Toxicol Appl Pharmacol. Author manuscript; available in PMC 2015 January 01.
NIH
-PA Author Manuscript
NIH
-PA Author Manuscript
NIH
-PA Author Manuscript

Fig.6.Graphical representation of the role of CD8+veCD57+ve T cells in NASH pathogenesis.Metabolic oxidative stress mediated by the xenobiotic enzyme CYP2E1 increases hepaticleptin levels. Leptin causes an increased expression of CD57 on CD8+ve T cells andmediates release of proinflammatory cytokines with a concomitant increase of apoptosis inthe liver. Inflammatory T cell signals causes increased fibrosis and contributes to NASHprogression.
Seth et al. Page 29
Toxicol Appl Pharmacol. Author manuscript; available in PMC 2015 January 01.
NIH
-PA Author Manuscript
NIH
-PA Author Manuscript
NIH
-PA Author Manuscript
Copyright © 2022 FDOKUMEN