Cyclic plastic deformation and damage in 304LN stainles ssteel
10
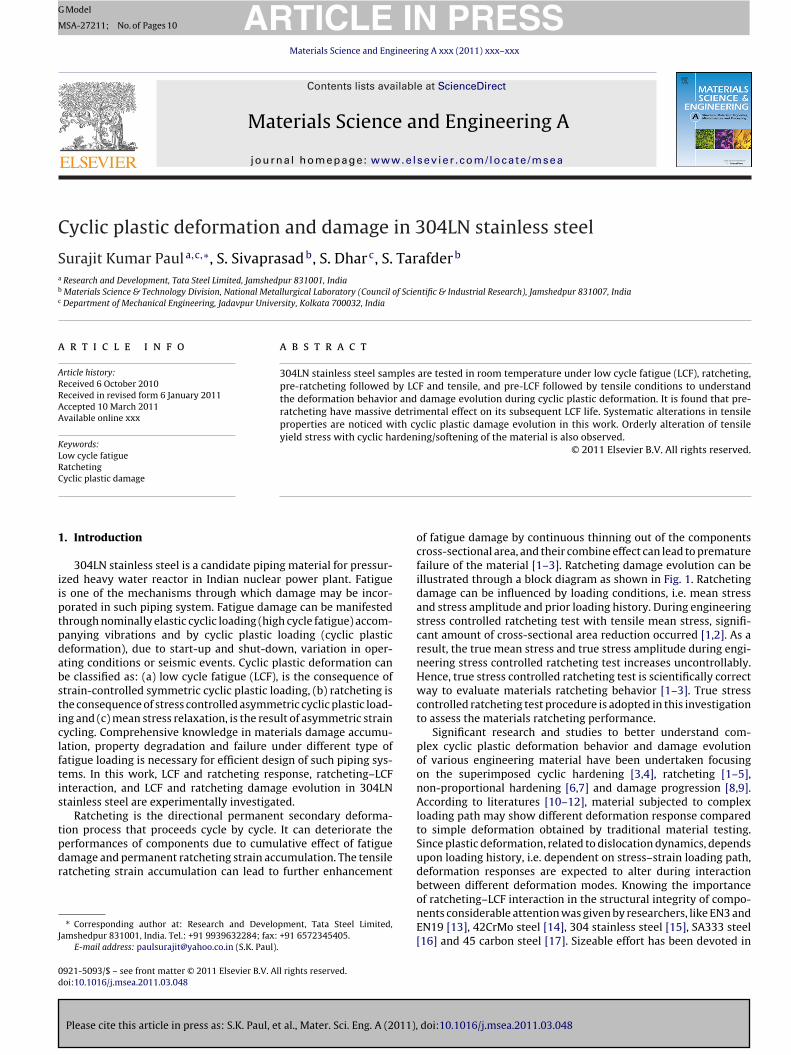
Please cite this article in press as: S.K. Paul, et al., Mater. Sci. Eng. A (2011), doi:10.1016/j.msea.2011.03.048 ARTICLE IN PRESS G Model MSA-27211; No. of Pages 10 Materials Science and Engineering A xxx (2011) xxx–xxx Contents lists available at ScienceDirect Materials Science and Engineering A journal homepage: www.elsevier.com/locate/msea Cyclic plastic deformation and damage in 304LN stainless steel Surajit Kumar Paul a,c,∗ , S. Sivaprasad b , S. Dhar c , S. Tarafder b a Research and Development, Tata Steel Limited, Jamshedpur 831001, India b Materials Science & Technology Division, National Metallurgical Laboratory (Council of Scientific & Industrial Research), Jamshedpur 831007, India c Department of Mechanical Engineering, Jadavpur University, Kolkata 700032, India article info Article history: Received 6 October 2010 Received in revised form 6 January 2011 Accepted 10 March 2011 Available online xxx Keywords: Low cycle fatigue Ratcheting Cyclic plastic damage abstract 304LN stainless steel samples are tested in room temperature under low cycle fatigue (LCF), ratcheting, pre-ratcheting followed by LCF and tensile, and pre-LCF followed by tensile conditions to understand the deformation behavior and damage evolution during cyclic plastic deformation. It is found that pre- ratcheting have massive detrimental effect on its subsequent LCF life. Systematic alterations in tensile properties are noticed with cyclic plastic damage evolution in this work. Orderly alteration of tensile yield stress with cyclic hardening/softening of the material is also observed. © 2011 Elsevier B.V. All rights reserved. 1. Introduction 304LN stainless steel is a candidate piping material for pressur- ized heavy water reactor in Indian nuclear power plant. Fatigue is one of the mechanisms through which damage may be incor- porated in such piping system. Fatigue damage can be manifested through nominally elastic cyclic loading (high cycle fatigue) accom- panying vibrations and by cyclic plastic loading (cyclic plastic deformation), due to start-up and shut-down, variation in oper- ating conditions or seismic events. Cyclic plastic deformation can be classified as: (a) low cycle fatigue (LCF), is the consequence of strain-controlled symmetric cyclic plastic loading, (b) ratcheting is the consequence of stress controlled asymmetric cyclic plastic load- ing and (c) mean stress relaxation, is the result of asymmetric strain cycling. Comprehensive knowledge in materials damage accumu- lation, property degradation and failure under different type of fatigue loading is necessary for efficient design of such piping sys- tems. In this work, LCF and ratcheting response, ratcheting–LCF interaction, and LCF and ratcheting damage evolution in 304LN stainless steel are experimentally investigated. Ratcheting is the directional permanent secondary deforma- tion process that proceeds cycle by cycle. It can deteriorate the performances of components due to cumulative effect of fatigue damage and permanent ratcheting strain accumulation. The tensile ratcheting strain accumulation can lead to further enhancement ∗ Corresponding author at: Research and Development, Tata Steel Limited, Jamshedpur 831001, India. Tel.: +91 9939632284; fax: +91 6572345405. E-mail address: [email protected] (S.K. Paul). of fatigue damage by continuous thinning out of the components cross-sectional area, and their combine effect can lead to premature failure of the material [1–3]. Ratcheting damage evolution can be illustrated through a block diagram as shown in Fig. 1. Ratcheting damage can be influenced by loading conditions, i.e. mean stress and stress amplitude and prior loading history. During engineering stress controlled ratcheting test with tensile mean stress, signifi- cant amount of cross-sectional area reduction occurred [1,2]. As a result, the true mean stress and true stress amplitude during engi- neering stress controlled ratcheting test increases uncontrollably. Hence, true stress controlled ratcheting test is scientifically correct way to evaluate materials ratcheting behavior [1–3]. True stress controlled ratcheting test procedure is adopted in this investigation to assess the materials ratcheting performance. Significant research and studies to better understand com- plex cyclic plastic deformation behavior and damage evolution of various engineering material have been undertaken focusing on the superimposed cyclic hardening [3,4], ratcheting [1–5], non-proportional hardening [6,7] and damage progression [8,9]. According to literatures [10–12], material subjected to complex loading path may show different deformation response compared to simple deformation obtained by traditional material testing. Since plastic deformation, related to dislocation dynamics, depends upon loading history, i.e. dependent on stress–strain loading path, deformation responses are expected to alter during interaction between different deformation modes. Knowing the importance of ratcheting–LCF interaction in the structural integrity of compo- nents considerable attention was given by researchers, like EN3 and EN19 [13], 42CrMo steel [14], 304 stainless steel [15], SA333 steel [16] and 45 carbon steel [17]. Sizeable effort has been devoted in 0921-5093/$ – see front matter © 2011 Elsevier B.V. All rights reserved. doi:10.1016/j.msea.2011.03.048
Transcript of Cyclic plastic deformation and damage in 304LN stainles ssteel
G
M
C
Sa
b
c
a
ARRAA
KLRC
1
iiptpdabsticlftis
tpdr
J
0d
ARTICLE IN PRESSModel
SA-27211; No. of Pages 10
Materials Science and Engineering A xxx (2011) xxx–xxx
Contents lists available at ScienceDirect
Materials Science and Engineering A
journa l homepage: www.e lsev ier .com/ locate /msea
yclic plastic deformation and damage in 304LN stainless steel
urajit Kumar Paula,c,∗, S. Sivaprasadb, S. Dharc, S. Tarafderb
Research and Development, Tata Steel Limited, Jamshedpur 831001, IndiaMaterials Science & Technology Division, National Metallurgical Laboratory (Council of Scientific & Industrial Research), Jamshedpur 831007, IndiaDepartment of Mechanical Engineering, Jadavpur University, Kolkata 700032, India
r t i c l e i n f o
rticle history:eceived 6 October 2010
a b s t r a c t
304LN stainless steel samples are tested in room temperature under low cycle fatigue (LCF), ratcheting,pre-ratcheting followed by LCF and tensile, and pre-LCF followed by tensile conditions to understand
eceived in revised form 6 January 2011ccepted 10 March 2011vailable online xxx
eywords:ow cycle fatigueatcheting
the deformation behavior and damage evolution during cyclic plastic deformation. It is found that pre-ratcheting have massive detrimental effect on its subsequent LCF life. Systematic alterations in tensileproperties are noticed with cyclic plastic damage evolution in this work. Orderly alteration of tensileyield stress with cyclic hardening/softening of the material is also observed.
© 2011 Elsevier B.V. All rights reserved.
yclic plastic damage
. Introduction
304LN stainless steel is a candidate piping material for pressur-zed heavy water reactor in Indian nuclear power plant. Fatigues one of the mechanisms through which damage may be incor-orated in such piping system. Fatigue damage can be manifestedhrough nominally elastic cyclic loading (high cycle fatigue) accom-anying vibrations and by cyclic plastic loading (cyclic plasticeformation), due to start-up and shut-down, variation in oper-ting conditions or seismic events. Cyclic plastic deformation cane classified as: (a) low cycle fatigue (LCF), is the consequence oftrain-controlled symmetric cyclic plastic loading, (b) ratcheting ishe consequence of stress controlled asymmetric cyclic plastic load-ng and (c) mean stress relaxation, is the result of asymmetric strainycling. Comprehensive knowledge in materials damage accumu-ation, property degradation and failure under different type ofatigue loading is necessary for efficient design of such piping sys-ems. In this work, LCF and ratcheting response, ratcheting–LCFnteraction, and LCF and ratcheting damage evolution in 304LNtainless steel are experimentally investigated.
Ratcheting is the directional permanent secondary deforma-
Please cite this article in press as: S.K. Paul, et al., Mater. Sci. Eng. A (2011),
ion process that proceeds cycle by cycle. It can deteriorate theerformances of components due to cumulative effect of fatigueamage and permanent ratcheting strain accumulation. The tensileatcheting strain accumulation can lead to further enhancement
∗ Corresponding author at: Research and Development, Tata Steel Limited,amshedpur 831001, India. Tel.: +91 9939632284; fax: +91 6572345405.
E-mail address: [email protected] (S.K. Paul).
921-5093/$ – see front matter © 2011 Elsevier B.V. All rights reserved.oi:10.1016/j.msea.2011.03.048
of fatigue damage by continuous thinning out of the componentscross-sectional area, and their combine effect can lead to prematurefailure of the material [1–3]. Ratcheting damage evolution can beillustrated through a block diagram as shown in Fig. 1. Ratchetingdamage can be influenced by loading conditions, i.e. mean stressand stress amplitude and prior loading history. During engineeringstress controlled ratcheting test with tensile mean stress, signifi-cant amount of cross-sectional area reduction occurred [1,2]. As aresult, the true mean stress and true stress amplitude during engi-neering stress controlled ratcheting test increases uncontrollably.Hence, true stress controlled ratcheting test is scientifically correctway to evaluate materials ratcheting behavior [1–3]. True stresscontrolled ratcheting test procedure is adopted in this investigationto assess the materials ratcheting performance.
Significant research and studies to better understand com-plex cyclic plastic deformation behavior and damage evolutionof various engineering material have been undertaken focusingon the superimposed cyclic hardening [3,4], ratcheting [1–5],non-proportional hardening [6,7] and damage progression [8,9].According to literatures [10–12], material subjected to complexloading path may show different deformation response comparedto simple deformation obtained by traditional material testing.Since plastic deformation, related to dislocation dynamics, dependsupon loading history, i.e. dependent on stress–strain loading path,deformation responses are expected to alter during interaction
doi:10.1016/j.msea.2011.03.048
between different deformation modes. Knowing the importanceof ratcheting–LCF interaction in the structural integrity of compo-nents considerable attention was given by researchers, like EN3 andEN19 [13], 42CrMo steel [14], 304 stainless steel [15], SA333 steel[16] and 45 carbon steel [17]. Sizeable effort has been devoted in

ARTICLE IN PRESSG Model
MSA-27211; No. of Pages 10
2 S.K. Paul et al. / Materials Science and Engineering A xxx (2011) xxx–xxx
Asymmetric stress cycling
(amplitude and mean stress)
Prior loading history Material
Early failure of material
Fatigue damage Directional strain
accumulation
Ratcheting
Fig. 1. Schematic representation of ratcheting.
1 10 100 1000 10000 100000
250
300
350
400
450
500
550
600Strain amplitude, %
0.2
0.5
0.7
1.0
1.2
1.4
1.6
1.8
2.0
Str
ess
amp
litu
de,
MP
a
to
pmsaastgap
Ta
0 2 4 6 8 10 12 14 16 18 20 22
-400
-200
0
200
400
600
800Mean stress 120 MPa
Stress amplitude 420 MPa
1500 3600500501-3
Tru
e st
ress
, M
Pa
True strain, %
-15.0 -12.5 -10.0 -7.5 -5.0 -2.5 0.0
-600
-400
-200
0
200
400
Mean stress -60 MPa
Stress amplitude 420 MPa
400 200 100600820 50 1-5
Tru
e st
ress
, M
Pa
a
b
by restricting the dislocation movement, and that can be hap-
TT
Number of cycles
Fig. 2. Cyclic stress response curve.
his investigation to study the ratcheting–LCF interaction responsef 304LN stainless steel.
Cyclic plastic damage evolution can be described as three-stagerocess, (i) Micro-structural damage progression by dislocationultiplication, interaction and cell formation [18]. For 304LN
tainless steel, plastic straining sometime can lead to damagedvancement by phase transformation (austenite to martensite)lso [19]. (ii) Microscopic crack nucleation on the surface of thepecimen by surface relief [20]. (iii) Growth of this micro-crackhrough interaction with microstructure, followed by macro-crackrowth and fracture [21,22]. In this work, an effort has been initi-ted to measure cyclic plastic damage progression by mechanical
Please cite this article in press as: S.K. Paul, et al., Mater. Sci. Eng. A (2011),
roperty assessment through tensile test.Fracture is final outcome of the entire deformation processes.
herefore, material deformation histories are expected to leaven impression on the fracture surface. Material can be fractured
able 1ensile properties.
Material Yield stress (MPa) Ultimate tensile s
AISI 304LN stainless steel 353 671
True strain, %
Fig. 3. Ratcheting, showing selected cycles: (a) 120 MPa mean stress and 420 MPastress amplitude, (b) −60 MPa mean stress and 420 MPa stress amplitude.
by ductile or brittle or combination of two in monotonic loadingcondition. Ductile fracture micromechanism involves nucleation,growth, and coalescence of microvoids, which initiate predom-inantly at second phase particles, precipitates, and inclusions[23,24], whereas brittle fracture involves the formation of cleav-age along specific favorable crystallographic planes and directions[25]. In ductile materials, voids grow under the influence of hydro-static stress associated with a favorable amount of plastic strain[25,26]. For brittle materials, cleavage is preferred when plasticflow is restricted [26]. The fracture surface morphology dependsupon test conditions (test temperature and strain rate) [27,28],material states (microstructure, phase transformation and disloca-tion dynamics) [29,30], mechanical properties of material [30–32].
Plastic flow is significantly controlled by dislocation move-ment [33] within the material. Strengthening in material may arise
doi:10.1016/j.msea.2011.03.048
pened in several ways such as dislocation–dislocation interaction,dislocation–particle interaction, etc. [34]. Dislocation pile up isresponsible for local strain field creation and which controls ini-tiation and growth of voids. Since, cyclic plastic deformation alters
tress (MPa) Uniform elongation (%) Total elongation (%)
52.8 69.62
Please cite this article in press as: S.K. Paul, et al., Mater. Sci. Eng. A (2011), doi:10.1016/j.msea.2011.03.048
ARTICLE IN PRESSG Model
MSA-27211; No. of Pages 10
S.K. Paul et al. / Materials Science and Engineering A xxx (2011) xxx–xxx 3
0 2500 5000 7500 10000 12500 15000
0
5
10
15
20
25
Mean stress 120 MPa
Stress amplitude
420 MPa
360 MPa
300 MPa
Tru
e ra
tchet
ing s
trai
n, %
Number of cycles
0 1000 2000 3000 4000 5000 6000 7000
-15
-10
-5
0
5
10
15
20
25 304LN stainless steel
Stress amplitude 420 MPa
Mean stress
180 MPa
120 MPa
60 MPa
0 MPa
-60 MPa
Rat
chet
ing s
trai
n, %
Number of cycles
a
b
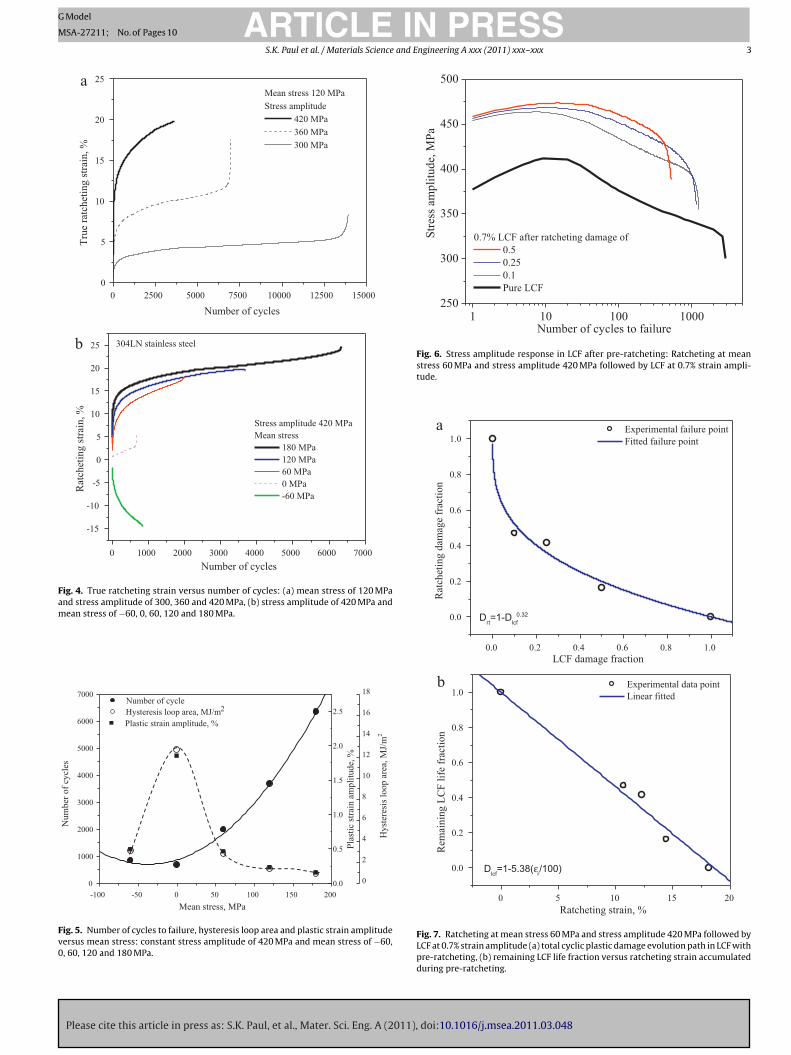
Fig. 4. True ratcheting strain versus number of cycles: (a) mean stress of 120 MPaand stress amplitude of 300, 360 and 420 MPa, (b) stress amplitude of 420 MPa andmean stress of −60, 0, 60, 120 and 180 MPa.
-100 -50 0 50 100 150 200
0
1000
2000
3000
4000
5000
6000
7000 Number of cycle
Pla
stic
str
ain a
mpli
tude,
%
Hyst
eres
is l
oop a
rea,
MJ/
m2
Num
ber
of
cycl
es
Mean stress, MPa
0
2
4
6
8
10
12
14
16
18
Hysteresis loop area, MJ/m2
0.0
0.5
1.0
1.5
2.0
2.5
Plastic strain amplitude, %
Fig. 5. Number of cycles to failure, hysteresis loop area and plastic strain amplitudeversus mean stress: constant stress amplitude of 420 MPa and mean stress of −60,0, 60, 120 and 180 MPa.
1 10 100 1000250
300
350
400
450
500
0.7% LCF after ratcheting damage of
0.5
0.25
0.1
Pure LCF
Str
ess
amp
litu
de,
MP
a
Number of cycles to failure
Fig. 6. Stress amplitude response in LCF after pre-ratcheting: Ratcheting at meanstress 60 MPa and stress amplitude 420 MPa followed by LCF at 0.7% strain ampli-tude.
0.0 0.2 0.4 0.6 0.8 1.0
0.0
0.2
0.4
0.6
0.8
1.0
Drt=1-D
lcf
0.32
Experimental failure point
Fitted failure pointR
atch
etin
g d
amag
e fr
acti
on
LCF damage fraction
0 5 10 15 20
0.0
0.2
0.4
0.6
0.8
1.0
Dlcf=1-5.38(
r/100)ε
Experimental data point
Linear fitted
Rem
ainin
g L
CF
lif
e fr
acti
on
Ratcheting strain, %
a
b
Fig. 7. Ratcheting at mean stress 60 MPa and stress amplitude 420 MPa followed byLCF at 0.7% strain amplitude (a) total cyclic plastic damage evolution path in LCF withpre-ratcheting, (b) remaining LCF life fraction versus ratcheting strain accumulatedduring pre-ratcheting.
ARTICLE IN PRESSG Model
MSA-27211; No. of Pages 10
4 S.K. Paul et al. / Materials Science and Engineering A xxx (2011) xxx–xxx
0 10 20 30 40 50 60 70 80
0
100
200
300
400
500
600
700
800
LCF at strain amplitude 1.0%
followed by tensile
pure tensile
15 cy LCF
200 cy LCF
510 cy LCF
800 cy LCF
Str
ess,
MP
a
Strain, %
0 100 200 300 400 500 600 700 800 900 1000 1100
340
360
380
400
420
440
460
Stress amplitude
Tensile yield stress
Str
ess,
MP
a
Number of cycles
b
c
a
80706050403020100
0
100
200
300
400
500
600
700
800
304LN stainless steel
LCF at strain amplitude 1.0%
followed by tensile
pure tensile
15 cy LCF
200 cy LCF
510 cy LCF
800 cy LCF
Str
ess,
MP
a
Strain, %
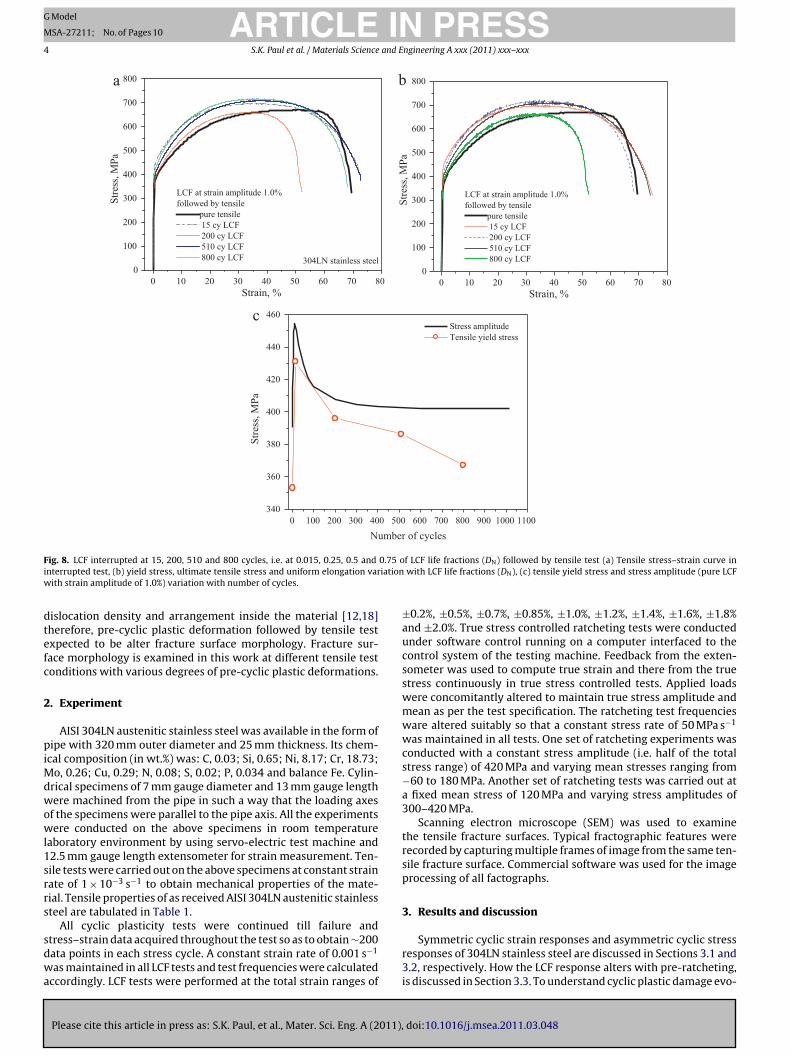
F 0.75 oi iationw
dtefc
2
piMdwowl1srrs
sdwa
ig. 8. LCF interrupted at 15, 200, 510 and 800 cycles, i.e. at 0.015, 0.25, 0.5 andnterrupted test, (b) yield stress, ultimate tensile stress and uniform elongation var
ith strain amplitude of 1.0%) variation with number of cycles.
islocation density and arrangement inside the material [12,18]herefore, pre-cyclic plastic deformation followed by tensile testxpected to be alter fracture surface morphology. Fracture sur-ace morphology is examined in this work at different tensile testonditions with various degrees of pre-cyclic plastic deformations.
. Experiment
AISI 304LN austenitic stainless steel was available in the form ofipe with 320 mm outer diameter and 25 mm thickness. Its chem-
cal composition (in wt.%) was: C, 0.03; Si, 0.65; Ni, 8.17; Cr, 18.73;o, 0.26; Cu, 0.29; N, 0.08; S, 0.02; P, 0.034 and balance Fe. Cylin-
rical specimens of 7 mm gauge diameter and 13 mm gauge lengthere machined from the pipe in such a way that the loading axes
f the specimens were parallel to the pipe axis. All the experimentsere conducted on the above specimens in room temperature
aboratory environment by using servo-electric test machine and2.5 mm gauge length extensometer for strain measurement. Ten-ile tests were carried out on the above specimens at constant strainate of 1 × 10⁻³ s−1 to obtain mechanical properties of the mate-ial. Tensile properties of as received AISI 304LN austenitic stainlessteel are tabulated in Table 1.
Please cite this article in press as: S.K. Paul, et al., Mater. Sci. Eng. A (2011),
All cyclic plasticity tests were continued till failure andtress–strain data acquired throughout the test so as to obtain ∼200ata points in each stress cycle. A constant strain rate of 0.001 s−1
as maintained in all LCF tests and test frequencies were calculatedccordingly. LCF tests were performed at the total strain ranges of
f LCF life fractions (DN) followed by tensile test (a) Tensile stress–strain curve inwith LCF life fractions (DN), (c) tensile yield stress and stress amplitude (pure LCF
±0.2%, ±0.5%, ±0.7%, ±0.85%, ±1.0%, ±1.2%, ±1.4%, ±1.6%, ±1.8%and ±2.0%. True stress controlled ratcheting tests were conductedunder software control running on a computer interfaced to thecontrol system of the testing machine. Feedback from the exten-someter was used to compute true strain and there from the truestress continuously in true stress controlled tests. Applied loadswere concomitantly altered to maintain true stress amplitude andmean as per the test specification. The ratcheting test frequenciesware altered suitably so that a constant stress rate of 50 MPa s−1
was maintained in all tests. One set of ratcheting experiments wasconducted with a constant stress amplitude (i.e. half of the totalstress range) of 420 MPa and varying mean stresses ranging from−60 to 180 MPa. Another set of ratcheting tests was carried out ata fixed mean stress of 120 MPa and varying stress amplitudes of300–420 MPa.
Scanning electron microscope (SEM) was used to examinethe tensile fracture surfaces. Typical fractographic features wererecorded by capturing multiple frames of image from the same ten-sile fracture surface. Commercial software was used for the imageprocessing of all factographs.
3. Results and discussion
doi:10.1016/j.msea.2011.03.048
Symmetric cyclic strain responses and asymmetric cyclic stressresponses of 304LN stainless steel are discussed in Sections 3.1 and3.2, respectively. How the LCF response alters with pre-ratcheting,is discussed in Section 3.3. To understand cyclic plastic damage evo-
ARTICLE IN PRESSG Model
MSA-27211; No. of Pages 10
S.K. Paul et al. / Materials Science and Engineering A xxx (2011) xxx–xxx 5
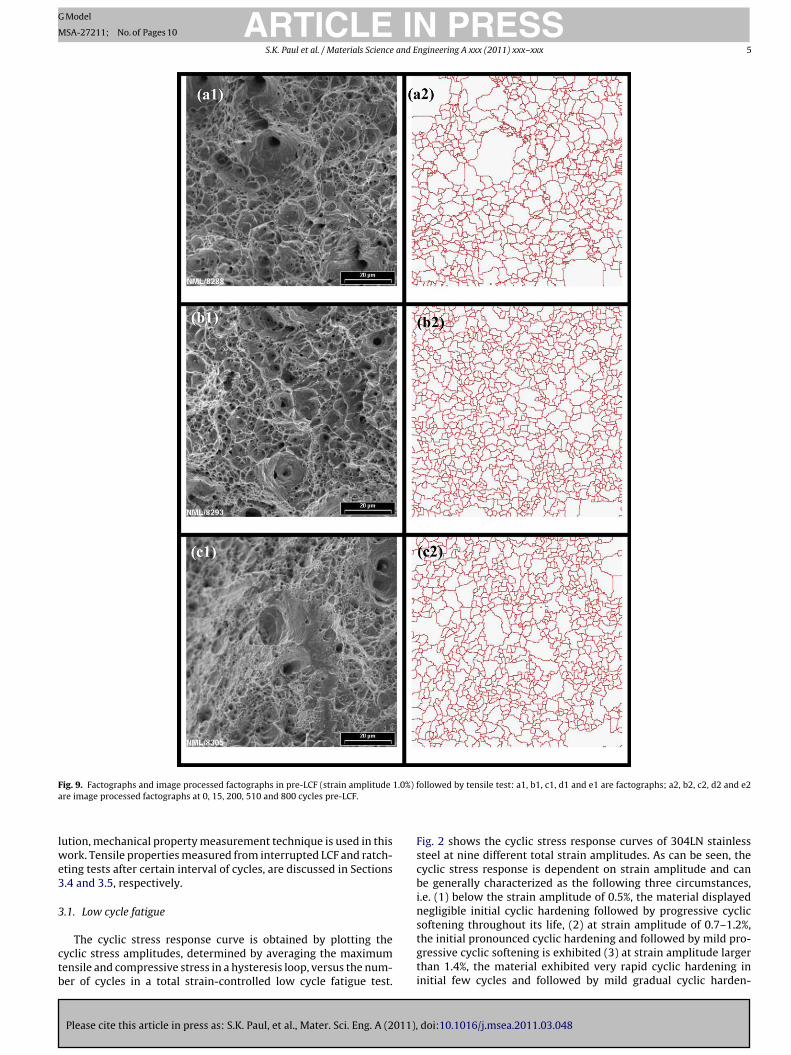
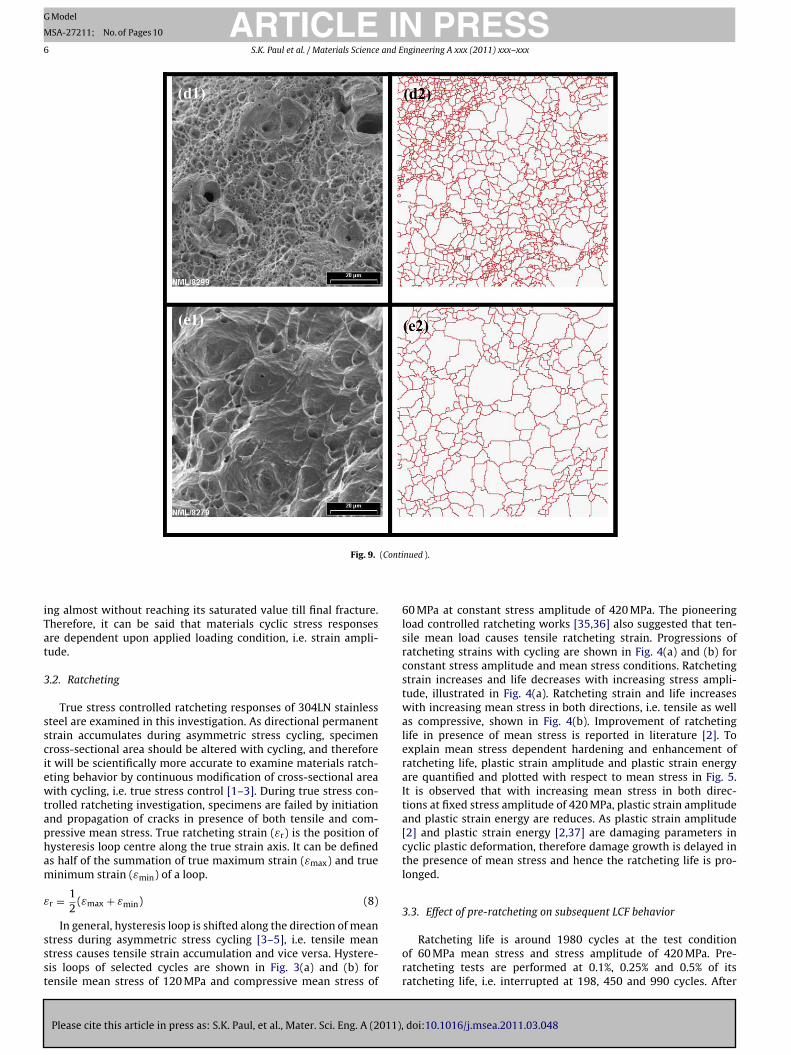
F 1.0%) fa
lwe3
3
ctb
ig. 9. Factographs and image processed factographs in pre-LCF (strain amplitudere image processed factographs at 0, 15, 200, 510 and 800 cycles pre-LCF.
ution, mechanical property measurement technique is used in thisork. Tensile properties measured from interrupted LCF and ratch-
ting tests after certain interval of cycles, are discussed in Sections.4 and 3.5, respectively.
.1. Low cycle fatigue
Please cite this article in press as: S.K. Paul, et al., Mater. Sci. Eng. A (2011),
The cyclic stress response curve is obtained by plotting theyclic stress amplitudes, determined by averaging the maximumensile and compressive stress in a hysteresis loop, versus the num-er of cycles in a total strain-controlled low cycle fatigue test.
ollowed by tensile test: a1, b1, c1, d1 and e1 are factographs; a2, b2, c2, d2 and e2
Fig. 2 shows the cyclic stress response curves of 304LN stainlesssteel at nine different total strain amplitudes. As can be seen, thecyclic stress response is dependent on strain amplitude and canbe generally characterized as the following three circumstances,i.e. (1) below the strain amplitude of 0.5%, the material displayednegligible initial cyclic hardening followed by progressive cyclic
doi:10.1016/j.msea.2011.03.048
softening throughout its life, (2) at strain amplitude of 0.7–1.2%,the initial pronounced cyclic hardening and followed by mild pro-gressive cyclic softening is exhibited (3) at strain amplitude largerthan 1.4%, the material exhibited very rapid cyclic hardening ininitial few cycles and followed by mild gradual cyclic harden-
ARTICLE IN PRESSG Model
MSA-27211; No. of Pages 10
6 S.K. Paul et al. / Materials Science and Engineering A xxx (2011) xxx–xxx
(Conti
iTat
3
ssciewtapham
ε
ssst
Fig. 9.
ng almost without reaching its saturated value till final fracture.herefore, it can be said that materials cyclic stress responsesre dependent upon applied loading condition, i.e. strain ampli-ude.
.2. Ratcheting
True stress controlled ratcheting responses of 304LN stainlessteel are examined in this investigation. As directional permanenttrain accumulates during asymmetric stress cycling, specimenross-sectional area should be altered with cycling, and thereforet will be scientifically more accurate to examine materials ratch-ting behavior by continuous modification of cross-sectional areaith cycling, i.e. true stress control [1–3]. During true stress con-
rolled ratcheting investigation, specimens are failed by initiationnd propagation of cracks in presence of both tensile and com-ressive mean stress. True ratcheting strain (εr) is the position ofysteresis loop centre along the true strain axis. It can be defineds half of the summation of true maximum strain (εmax) and trueinimum strain (εmin) of a loop.
r = 12
(εmax + εmin) (8)
Please cite this article in press as: S.K. Paul, et al., Mater. Sci. Eng. A (2011),
In general, hysteresis loop is shifted along the direction of meantress during asymmetric stress cycling [3–5], i.e. tensile meantress causes tensile strain accumulation and vice versa. Hystere-is loops of selected cycles are shown in Fig. 3(a) and (b) forensile mean stress of 120 MPa and compressive mean stress of
nued ).
60 MPa at constant stress amplitude of 420 MPa. The pioneeringload controlled ratcheting works [35,36] also suggested that ten-sile mean load causes tensile ratcheting strain. Progressions ofratcheting strains with cycling are shown in Fig. 4(a) and (b) forconstant stress amplitude and mean stress conditions. Ratchetingstrain increases and life decreases with increasing stress ampli-tude, illustrated in Fig. 4(a). Ratcheting strain and life increaseswith increasing mean stress in both directions, i.e. tensile as wellas compressive, shown in Fig. 4(b). Improvement of ratchetinglife in presence of mean stress is reported in literature [2]. Toexplain mean stress dependent hardening and enhancement ofratcheting life, plastic strain amplitude and plastic strain energyare quantified and plotted with respect to mean stress in Fig. 5.It is observed that with increasing mean stress in both direc-tions at fixed stress amplitude of 420 MPa, plastic strain amplitudeand plastic strain energy are reduces. As plastic strain amplitude[2] and plastic strain energy [2,37] are damaging parameters incyclic plastic deformation, therefore damage growth is delayed inthe presence of mean stress and hence the ratcheting life is pro-longed.
3.3. Effect of pre-ratcheting on subsequent LCF behavior
doi:10.1016/j.msea.2011.03.048
Ratcheting life is around 1980 cycles at the test conditionof 60 MPa mean stress and stress amplitude of 420 MPa. Pre-ratcheting tests are performed at 0.1%, 0.25% and 0.5% of itsratcheting life, i.e. interrupted at 198, 450 and 990 cycles. After

IN PRESSG
M
and Engineering A xxx (2011) xxx–xxx 7
ptsseadiprgitRaeonaFtaesiawiids
3
afostdTfttRt[edist
aamtsfbrcca
0 100 200 300 400 500 600 700 800 900
5
10
15
20
25
301.0% LCF followed by tensile
Aver
age
dim
ple
siz
e, µ
m2
Number of cycles
0 100 200 300 400 500 600 700 800 900
200
400
600
800
1000
1200
1400
1600
1800
20001.0% LCF followed by tensile
Dim
ple
nu
mber
in 1
04µ
m2
Number of cycles
a
b
Fig. 10. Interrupted LCF tests (strain amplitude 1.0%) at 0, 15, 200, 510 and 800
ARTICLEModel
SA-27211; No. of Pages 10
S.K. Paul et al. / Materials Science
re-ratcheting, LCF tests are conducted with 0.7% strain ampli-ude. Reason behind choosing 0.7% strain amplitude is that averagetress amplitude in LCF is close to the ratcheting stress amplitude,o that other effect in cyclic plastic deformation (i.e. strain rangeffect, loading dependent cyclic hardening/softening, etc.) can bevoided. Stress amplitude response in LCF with pre-ratchetingeformation histories are illustrated in Fig. 6. Stress amplitudes
n all pre-ratcheting conditions are positioned far above thanure LCF, and that indicates materials get hardened during pre-atcheting conditions. After prominent initial cyclic hardening,radual cyclic softening is noticed in pure LCF condition, whereasnitial cyclic hardening followed by gradual cyclic softening isrimming down and perceiving mild with rising pre-ratcheting.atcheting damage fraction is the ratio of pre-ratcheting cyclesnd the number of cycles to failure in corresponding pure ratch-ting condition. LCF damage fraction can be defined by the ratiof number of cycles to failure in pre-ratcheting samples andumber of cycles to failure in pure LCF condition. LCF dam-ge fraction versus ratcheting damage fraction is portrayed inig. 7(a). If, LCF damage fraction versus ratcheting damage frac-ion plot follow a linear curve with 135◦ inclined to horizontalxis, i.e. addition of their damage fraction is equal to one (Min-rs damage law), then it can be said that pre-ratcheting have noignificant influence on its subsequent LCF life. Since, the curves concave in nature, it can be said that pre-ratcheting have
significant detrimental effect on its subsequent LCF life andhich is arose from directional strain accumulation as discussed
n Fig. 1. The accumulated ratcheting strain during pre-ratchetings plotted against remaining LCF life fraction, i.e. subsequent LCFamage fraction in Fig. 7(b) and it follows a linear relation-hip.
.4. Effect of pre-LCF on subsequent tensile behavior
Pre-LCF experiments with 1.0% strain amplitude are interruptedt 15, 200, 510 and 800 cycles, i.e. 0.015, 0.2, 0.5 and 0.78 of LCF liferactions (DN). LCF life fractions (DN) can be determined by the ratiof current number of cycles and number of cycles to failure (for 1.0%train amplitude is 1017). Those pre-LCF damaged specimens arehen used for tensile test. Tensile stress–strain curve with differentegrees of LCF damaged materials are characterized in Fig. 8(a).ensile properties like yield stress, ultimate tensile stress and uni-orm elongation are determined and plotted in Fig. 8(b). Ultimateensile stress increases and uniform elongation reduces with DN upo 0.5, and in DN = 0.78 ultimate tensile stress decreased further.eduction in load bearing capacity of the material at DN = 0.78 ishought to be caused by initiation of micro defect, i.e. tiny crack21,22]. Therefore, with LCF damage progression, tensile uniformlongation reduces from the begging, of course in the first half ofamage progression reduction in uniform elongation is high and
n the latter half of reduction is gradual; whereas, ultimate tensiletress, i.e. load bearing capacity of the material starts lessening inhe latter half of damage progression.
The comparison between materials cyclic hardening/softeningnd change in tensile yield stress is shown in Fig. 8(c). Stressmplitude versus number of cycle plot shows that during LCFaterial cyclically hardened in few initial cycles, i.e. stress ampli-
ude increases and afterward progressively cyclically soften, i.e.tress amplitude decreases. The tensile yield stress determinedrom interrupted LCF tests are varied in a similar fashion with num-
Please cite this article in press as: S.K. Paul, et al., Mater. Sci. Eng. A (2011),
er of cycles as depicted in Fig. 8(c). In 800th cycle, i.e. 78% of LCF life,eduction of yield stress and ultimate tensile stress is thought to beaused by initiation of micro defect. Therefore, it can be stated thathange in tensile yield stress is taking place with cyclic hardeningnd softening of the material.
cycles followed by tensile test (a) average dimple size (/�m2) versus number ofcycles, (b) dimple number in 104 �m2 area versus number of cycles.
Factographs of as received and interrupted-LCF sample’s ten-sile fracture surfaces are shown in Fig. 9. Dimple size and numberare quantified from above mentioned tensile factographs and illus-trated in Fig. 10(a) and (b). Average dimple size increases anddimple number decreases with number of cycles in interrupted-LCFfollowed by tensile test, i.e. LCF damage.
Void nucleation occurs where inclusions, precipitates and othersecond phase particles present and also simultaneously inhomoge-neous deformation takes place [38]. LCF cycling results dislocationmultiplication and their networks formation, i.e. tangle, cell, byforward and backward movement of dislocations [12,39]. Thesedislocation networks appears during LCF restrict unidirectionaldislocation movement during subsequent tensile test, and as aconsequence generation of dislocations pileup. Therefore, disloca-tions pileup sites are not necessarily all inclusions during pre-LCFdamaged tensile deformation. Dislocations pileup sites aroundinclusions, i.e. void nucleation sites decreases due to interferenceof other dislocation pileup sites breed by pre-LCF dislocation net-work evolution activity. The stress at the tip of a pileup can leadto nucleation of void where inclusions, precipitates and other sec-ond phase particles present. As void nucleation sites are become
doi:10.1016/j.msea.2011.03.048
less during pre-LCF damaged tensile deformation so, dimple num-ber is also less and size is large, because there is a scope for voidgrowth.
ARTICLE IN PRESSG Model
MSA-27211; No. of Pages 10
8 S.K. Paul et al. / Materials Science and Engineering A xxx (2011) xxx–xxx
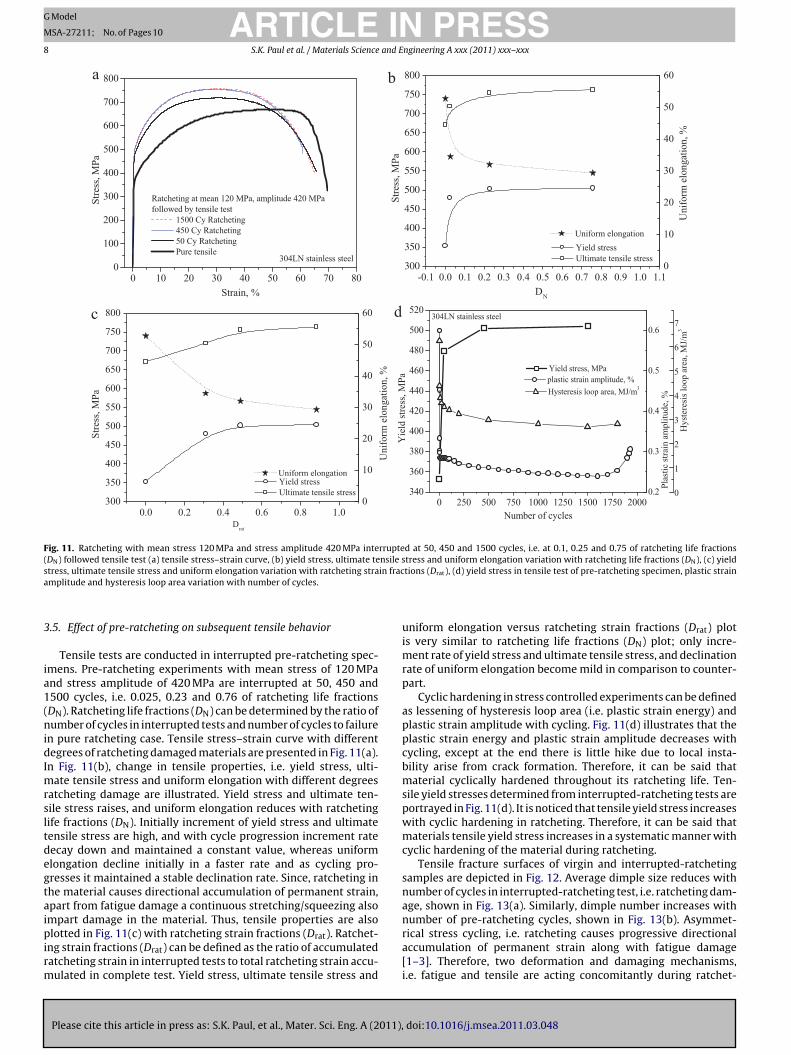
Fig. 11. Ratcheting with mean stress 120 MPa and stress amplitude 420 MPa interrupted at 50, 450 and 1500 cycles, i.e. at 0.1, 0.25 and 0.75 of ratcheting life fractions( nsile ss in fraca
3
ia1(nidImrsltdegtaipirm
DN) followed tensile test (a) tensile stress–strain curve, (b) yield stress, ultimate tetress, ultimate tensile stress and uniform elongation variation with ratcheting stramplitude and hysteresis loop area variation with number of cycles.
.5. Effect of pre-ratcheting on subsequent tensile behavior
Tensile tests are conducted in interrupted pre-ratcheting spec-mens. Pre-ratcheting experiments with mean stress of 120 MPand stress amplitude of 420 MPa are interrupted at 50, 450 and500 cycles, i.e. 0.025, 0.23 and 0.76 of ratcheting life fractionsDN). Ratcheting life fractions (DN) can be determined by the ratio ofumber of cycles in interrupted tests and number of cycles to failure
n pure ratcheting case. Tensile stress–strain curve with differentegrees of ratcheting damaged materials are presented in Fig. 11(a).
n Fig. 11(b), change in tensile properties, i.e. yield stress, ulti-ate tensile stress and uniform elongation with different degrees
atcheting damage are illustrated. Yield stress and ultimate ten-ile stress raises, and uniform elongation reduces with ratchetingife fractions (DN). Initially increment of yield stress and ultimateensile stress are high, and with cycle progression increment rateecay down and maintained a constant value, whereas uniformlongation decline initially in a faster rate and as cycling pro-resses it maintained a stable declination rate. Since, ratcheting inhe material causes directional accumulation of permanent strain,part from fatigue damage a continuous stretching/squeezing also
Please cite this article in press as: S.K. Paul, et al., Mater. Sci. Eng. A (2011),
mpart damage in the material. Thus, tensile properties are alsolotted in Fig. 11(c) with ratcheting strain fractions (Drat). Ratchet-
ng strain fractions (Drat) can be defined as the ratio of accumulatedatcheting strain in interrupted tests to total ratcheting strain accu-ulated in complete test. Yield stress, ultimate tensile stress and
tress and uniform elongation variation with ratcheting life fractions (DN), (c) yieldtions (Drat), (d) yield stress in tensile test of pre-ratcheting specimen, plastic strain
uniform elongation versus ratcheting strain fractions (Drat) plotis very similar to ratcheting life fractions (DN) plot; only incre-ment rate of yield stress and ultimate tensile stress, and declinationrate of uniform elongation become mild in comparison to counter-part.
Cyclic hardening in stress controlled experiments can be definedas lessening of hysteresis loop area (i.e. plastic strain energy) andplastic strain amplitude with cycling. Fig. 11(d) illustrates that theplastic strain energy and plastic strain amplitude decreases withcycling, except at the end there is little hike due to local insta-bility arise from crack formation. Therefore, it can be said thatmaterial cyclically hardened throughout its ratcheting life. Ten-sile yield stresses determined from interrupted-ratcheting tests areportrayed in Fig. 11(d). It is noticed that tensile yield stress increaseswith cyclic hardening in ratcheting. Therefore, it can be said thatmaterials tensile yield stress increases in a systematic manner withcyclic hardening of the material during ratcheting.
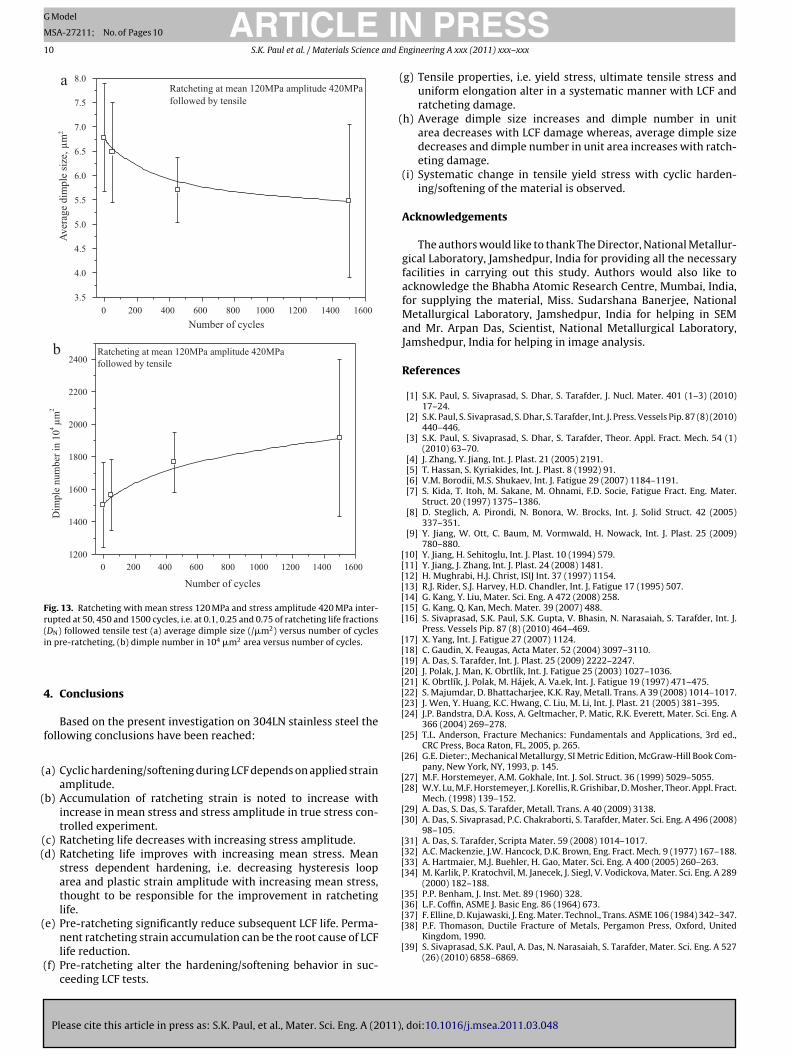
Tensile fracture surfaces of virgin and interrupted-ratchetingsamples are depicted in Fig. 12. Average dimple size reduces withnumber of cycles in interrupted-ratcheting test, i.e. ratcheting dam-age, shown in Fig. 13(a). Similarly, dimple number increases with
doi:10.1016/j.msea.2011.03.048
number of pre-ratcheting cycles, shown in Fig. 13(b). Asymmet-rical stress cycling, i.e. ratcheting causes progressive directionalaccumulation of permanent strain along with fatigue damage[1–3]. Therefore, two deformation and damaging mechanisms,i.e. fatigue and tensile are acting concomitantly during ratchet-
ARTICLE IN PRESSG Model
MSA-27211; No. of Pages 10
S.K. Paul et al. / Materials Science and Engineering A xxx (2011) xxx–xxx 9
F ss 120f 00 cyc
ibidv
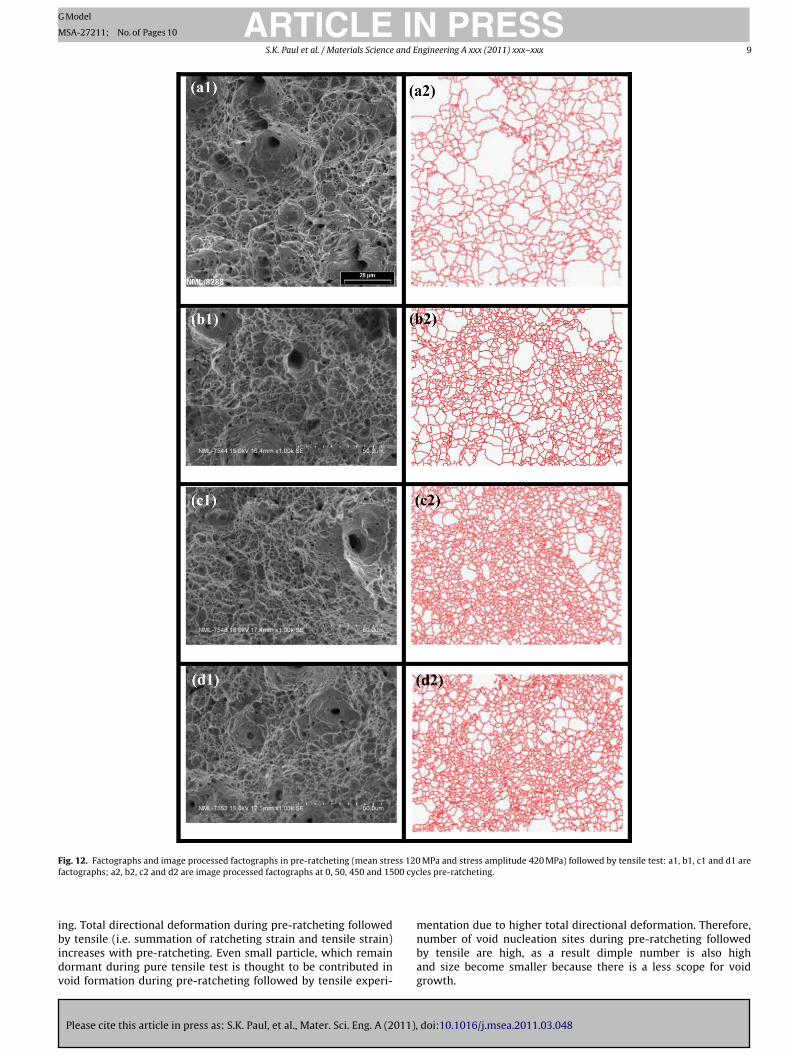
ig. 12. Factographs and image processed factographs in pre-ratcheting (mean streactographs; a2, b2, c2 and d2 are image processed factographs at 0, 50, 450 and 15
Please cite this article in press as: S.K. Paul, et al., Mater. Sci. Eng. A (2011),
ng. Total directional deformation during pre-ratcheting followedy tensile (i.e. summation of ratcheting strain and tensile strain)
ncreases with pre-ratcheting. Even small particle, which remainormant during pure tensile test is thought to be contributed inoid formation during pre-ratcheting followed by tensile experi-
MPa and stress amplitude 420 MPa) followed by tensile test: a1, b1, c1 and d1 areles pre-ratcheting.
doi:10.1016/j.msea.2011.03.048
mentation due to higher total directional deformation. Therefore,number of void nucleation sites during pre-ratcheting followedby tensile are high, as a result dimple number is also highand size become smaller because there is a less scope for voidgrowth.
ARTICLE ING Model
MSA-27211; No. of Pages 10
10 S.K. Paul et al. / Materials Science and E
0 200 400 600 800 1000 1200 1400 1600
3.5
4.0
4.5
5.0
5.5
6.0
6.5
7.0
7.5
8.0
Av
erag
e d
imp
le s
ize,
µm
2
Ratcheting at mean 120MPa amplitude 420MPa
followed by tensile
Number of cycles
0 200 400 600 800 1000 1200 1400 1600
1200
1400
1600
1800
2000
2200
2400Ratcheting at mean 120MPa amplitude 420MPa
followed by tensile
Dim
ple
num
ber
in 1
04 µ
m2
Number of cycles
a
b
Fig. 13. Ratcheting with mean stress 120 MPa and stress amplitude 420 MPa inter-rupted at 50, 450 and 1500 cycles, i.e. at 0.1, 0.25 and 0.75 of ratcheting life fractions(i
4
f
(
(
((
(
(
(
(
[[[[[[[
[[[[[[[[
[
[
[[
[[
[[[[
[[36] L.F. Coffin, ASME J. Basic Eng. 86 (1964) 673.[37] F. Elline, D. Kujawaski, J. Eng. Mater. Technol., Trans. ASME 106 (1984) 342–347.[38] P.F. Thomason, Ductile Fracture of Metals, Pergamon Press, Oxford, United
DN) followed tensile test (a) average dimple size (/�m2) versus number of cyclesn pre-ratcheting, (b) dimple number in 104 �m2 area versus number of cycles.
. Conclusions
Based on the present investigation on 304LN stainless steel theollowing conclusions have been reached:
a) Cyclic hardening/softening during LCF depends on applied strainamplitude.
b) Accumulation of ratcheting strain is noted to increase withincrease in mean stress and stress amplitude in true stress con-trolled experiment.
c) Ratcheting life decreases with increasing stress amplitude.d) Ratcheting life improves with increasing mean stress. Mean
stress dependent hardening, i.e. decreasing hysteresis looparea and plastic strain amplitude with increasing mean stress,thought to be responsible for the improvement in ratchetinglife.
e) Pre-ratcheting significantly reduce subsequent LCF life. Perma-
Please cite this article in press as: S.K. Paul, et al., Mater. Sci. Eng. A (2011),
nent ratcheting strain accumulation can be the root cause of LCFlife reduction.
f) Pre-ratcheting alter the hardening/softening behavior in suc-ceeding LCF tests.
[
PRESSngineering A xxx (2011) xxx–xxx
g) Tensile properties, i.e. yield stress, ultimate tensile stress anduniform elongation alter in a systematic manner with LCF andratcheting damage.
h) Average dimple size increases and dimple number in unitarea decreases with LCF damage whereas, average dimple sizedecreases and dimple number in unit area increases with ratch-eting damage.
(i) Systematic change in tensile yield stress with cyclic harden-ing/softening of the material is observed.
Acknowledgements
The authors would like to thank The Director, National Metallur-gical Laboratory, Jamshedpur, India for providing all the necessaryfacilities in carrying out this study. Authors would also like toacknowledge the Bhabha Atomic Research Centre, Mumbai, India,for supplying the material, Miss. Sudarshana Banerjee, NationalMetallurgical Laboratory, Jamshedpur, India for helping in SEMand Mr. Arpan Das, Scientist, National Metallurgical Laboratory,Jamshedpur, India for helping in image analysis.
References
[1] S.K. Paul, S. Sivaprasad, S. Dhar, S. Tarafder, J. Nucl. Mater. 401 (1–3) (2010)17–24.
[2] S.K. Paul, S. Sivaprasad, S. Dhar, S. Tarafder, Int. J. Press. Vessels Pip. 87 (8) (2010)440–446.
[3] S.K. Paul, S. Sivaprasad, S. Dhar, S. Tarafder, Theor. Appl. Fract. Mech. 54 (1)(2010) 63–70.
[4] J. Zhang, Y. Jiang, Int. J. Plast. 21 (2005) 2191.[5] T. Hassan, S. Kyriakides, Int. J. Plast. 8 (1992) 91.[6] V.M. Borodii, M.S. Shukaev, Int. J. Fatigue 29 (2007) 1184–1191.[7] S. Kida, T. Itoh, M. Sakane, M. Ohnami, F.D. Socie, Fatigue Fract. Eng. Mater.
Struct. 20 (1997) 1375–1386.[8] D. Steglich, A. Pirondi, N. Bonora, W. Brocks, Int. J. Solid Struct. 42 (2005)
337–351.[9] Y. Jiang, W. Ott, C. Baum, M. Vormwald, H. Nowack, Int. J. Plast. 25 (2009)
780–880.10] Y. Jiang, H. Sehitoglu, Int. J. Plast. 10 (1994) 579.11] Y. Jiang, J. Zhang, Int. J. Plast. 24 (2008) 1481.12] H. Mughrabi, H.J. Christ, ISIJ Int. 37 (1997) 1154.13] R.J. Rider, S.J. Harvey, H.D. Chandler, Int. J. Fatigue 17 (1995) 507.14] G. Kang, Y. Liu, Mater. Sci. Eng. A 472 (2008) 258.15] G. Kang, Q. Kan, Mech. Mater. 39 (2007) 488.16] S. Sivaprasad, S.K. Paul, S.K. Gupta, V. Bhasin, N. Narasaiah, S. Tarafder, Int. J.
Press. Vessels Pip. 87 (8) (2010) 464–469.17] X. Yang, Int. J. Fatigue 27 (2007) 1124.18] C. Gaudin, X. Feaugas, Acta Mater. 52 (2004) 3097–3110.19] A. Das, S. Tarafder, Int. J. Plast. 25 (2009) 2222–2247.20] J. Polak, J. Man, K. Obrtlík, Int. J. Fatigue 25 (2003) 1027–1036.21] K. Obrtlík, J. Polak, M. Hájek, A. Va.ek, Int. J. Fatigue 19 (1997) 471–475.22] S. Majumdar, D. Bhattacharjee, K.K. Ray, Metall. Trans. A 39 (2008) 1014–1017.23] J. Wen, Y. Huang, K.C. Hwang, C. Liu, M. Li, Int. J. Plast. 21 (2005) 381–395.24] J.P. Bandstra, D.A. Koss, A. Geltmacher, P. Matic, R.K. Everett, Mater. Sci. Eng. A
366 (2004) 269–278.25] T.L. Anderson, Fracture Mechanics: Fundamentals and Applications, 3rd ed.,
CRC Press, Boca Raton, FL, 2005, p. 265.26] G.E. Dieter:, Mechanical Metallurgy, SI Metric Edition, McGraw-Hill Book Com-
pany, New York, NY, 1993, p. 145.27] M.F. Horstemeyer, A.M. Gokhale, Int. J. Sol. Struct. 36 (1999) 5029–5055.28] W.Y. Lu, M.F. Horstemeyer, J. Korellis, R. Grishibar, D. Mosher, Theor. Appl. Fract.
Mech. (1998) 139–152.29] A. Das, S. Das, S. Tarafder, Metall. Trans. A 40 (2009) 3138.30] A. Das, S. Sivaprasad, P.C. Chakraborti, S. Tarafder, Mater. Sci. Eng. A 496 (2008)
98–105.31] A. Das, S. Tarafder, Scripta Mater. 59 (2008) 1014–1017.32] A.C. Mackenzie, J.W. Hancock, D.K. Brown, Eng. Fract. Mech. 9 (1977) 167–188.33] A. Hartmaier, M.J. Buehler, H. Gao, Mater. Sci. Eng. A 400 (2005) 260–263.34] M. Karlik, P. Kratochvil, M. Janecek, J. Siegl, V. Vodickova, Mater. Sci. Eng. A 289
(2000) 182–188.35] P.P. Benham, J. Inst. Met. 89 (1960) 328.
doi:10.1016/j.msea.2011.03.048
Kingdom, 1990.39] S. Sivaprasad, S.K. Paul, A. Das, N. Narasaiah, S. Tarafder, Mater. Sci. Eng. A 527
(26) (2010) 6858–6869.