Cu-Zn-Ag-In) deposit and its Devonian host - LU|ZONE|UL ...
517
Geological, fluid-chemical and petrochronological studies of the East Kemptville Sn(-Cu-Zn-Ag-In) deposit and its Devonian host batholith (Nova Scotia, Canada). by Luke Bickerton A thesis submitted in partial fulfillment of the requirements for the degree of Doctor of Philosophy (PhD) in Mineral Deposits and Precambrian Geology The Faculty of Graduate Studies Laurentian University Sudbury, Ontario, Canada © Luke Bickerton, 2021
-
Upload
khangminh22 -
Category
Documents
-
view
0 -
download
0
Transcript of Cu-Zn-Ag-In) deposit and its Devonian host - LU|ZONE|UL ...
Geological, fluid-chemical and petrochronological studies of the East Kemptville
Sn(-Cu-Zn-Ag-In) deposit and its Devonian host batholith (Nova Scotia, Canada).
by
Luke Bickerton
A thesis submitted in partial fulfillment
of the requirements for the degree of
Doctor of Philosophy (PhD) in
Mineral Deposits and Precambrian Geology
The Faculty of Graduate Studies
Laurentian University
Sudbury, Ontario, Canada
© Luke Bickerton, 2021

ii
THESIS DEFENCE COMMITTEE/COMITÉ DE SOUTENANCE DE THÈSE
Laurentian Université/Université Laurentienne
Faculty of Graduate Studies/Faculté des études supérieures
Title of Thesis
Titre de la thèse Geological, fluid-chemical and petrochronological studies of the East
Kemptville Sn(-Cu-Zn-Ag-In) deposit and its Devonian host batholith (Nova
Scotia, Canada)
Name of Candidate
Nom du candidat Bickerton, Luke
Degree
Diplôme Doctor orf Philosophy
Department/Program Date of Defence
Département/Programme Mineral Deposits and Precambrian Geology Date de la soutenance July 21, 2021
APPROVED/APPROUVÉ
Thesis Examiners/Examinateurs de thèse:
Dr. Daniel Kontak
(Co-Supervisor/Co-directeur(trice) de thèse)
Dr. Iain Samson
(Co-Supervisor/Co-directeur(trice) de thèse)
Approved for the Faculty of Graduate Studies
Approuvé pour la Faculté des études supérieures
Tammy Eger, PhD
Vice-President Research (Office of Graduate Studies)
Dr. Reimer Seltmann Vice-rectrice à la recherche (Bureau des études supérieures)
(External Examiner/Examinateur externe) Laurentian University / Université Laurentienne
Dr. Allan Galley
(Internal Examiner/Examinateur interne)
ACCESSIBILITY CLAUSE AND PERMISSION TO USE
I, Luke Bickerton, hereby grant to Laurentian University and/or its agents the non-exclusive license to archive and make
accessible my thesis, dissertation, or project report in whole or in part in all forms of media, now or for the duration of my
copyright ownership. I retain all other ownership rights to the copyright of the thesis, dissertation or project report. I also
reserve the right to use in future works (such as articles or books) all or part of this thesis, dissertation, or project report. I
further agree that permission for copying of this thesis in any manner, in whole or in part, for scholarly purposes may be
granted by the professor or professors who supervised my thesis work or, in their absence, by the Head of the Department in
which my thesis work was done. It is understood that any copying or publication or use of this thesis or parts thereof for
financial gain shall not be allowed without my written permission. It is also understood that this copy is being made available
in this form by the authority of the copyright owner solely for the purpose of private study and research and may not be copied
or reproduced except as permitted by the copyright laws without written authority from the copyright owner.
iii
Abstract
Primary tin ores form in magmatic-hydrothermal systems related to highly-evolved granites
enriched in lithophile elements (e.g., Li, Cs, Rb, U). Causative magmas are sourced from melting
(or contamination by) enriched crust, or from melting hydrothermally-altered mantle. These
granites form in large, multi-phase complexes (batholiths) and concentrate tin through fractional
crystallization. The latter increases volatiles (H2O, F) in residual melts that are emplaced at
shallow crustal depths, and thus the hydrothermal component to Sn-systems. Volatiles exsolve
into aqueous fluids that contain soluble Sn2+. These fluids typically separate into highly-saline
brines and vapours, and precipitate ore (SnO2) via oxidation of the Sn2+. The fluids focus along
fractures in the crust and their accumulation is dependent on fluid- versus lithostatic pressures.
The northern Appalachian evolution included incremental emplacement of numerous batholiths
and tin occurrences. The largest of these is the South Mountain Batholith (SMB) in Nova Scotia,
which was emplaced deep in the crust; although is host to multiple evolved granites, the SMB
contains only one significant tin deposit at East Kemptville (EK). To establish the depositional
setting of EK at a greater crustal depth, this thesis analyses its geology and fluid chemistry as
well as stable (O) and radiogenic (Re-Os, U-Pb, Lu-Hf) isotopes for both EK mineralization and
the zircon minerals that represent the SMB. The study addresses the absence of other significant
tin deposits in the SMB by evaluating the source of metal endowment.
Due to its deep emplacement, the fluids at EK show no evidence of phase separation, yet
abundant evidence of pressure-cycling. The latter allowed for replenishment of ore fluids during
deposit formation; whereas initial tin formed via fluid-rock exchange, later ores formed from

iv
mixing with foreign fluids. This segmented hydrothermal evolution at EK is reflected by a
range of mineralization ages.
The zircon ages and chemistry indicate: 1) the SMB formed over 15-20 m.y. from altered mantle
melts that underwent contamination by host rocks; and 2) the EK host is temporally and
isotopically distinct from the SMB, and likely evolved from a lower crust-derived melt. The
distinct source suggests other tin occurrences in the region share a similar origin.
Keywords
tin; granite; greisen; magmatic-hydrothermal; fluid inclusion; mineralization; zircon
petrochronology; U-Pb geochronology; O isotope; Lu-Hf isotope; South Mountain Batholith;
East Kemptville

v
Statement of co-authorship
This thesis consists of three separate manuscripts prepared for publication in peer-
reviewed journals. Chapters two, three and four have been co-authored by the candidate and
additional collaborators. Chapter two is intended for submission in Economic Geology or Ore
Geology Reviews in Fall 2021. Chapter three is intended for submission to Economic Geology in
Fall 2021. Chapter four is intended for submission Canadian Journal of Earth Sciences in
Summer 2021.
The thesis was designed by Dr. Daniel Kontak, Dr. Iain Samson, Dr. Brendan Murphy
and the candidate, as part of a Collaborative Research and Development (CRD) grant between
the Natural Sciences and Engineering Research Council (NSERC) of Canada and Avalon
Advanced Materials Inc. Financial and/or logistical support provided by strategic industry and
government supporters (Chapter two – Avalon Advanced Materials Inc., NSERC; Chapter three
– Avalon Advanced Materials Inc., NSERC; Chapter four –NSERC, Natural Resources Canada).
All fieldwork, sample collection, sample preparation, petrography, and interpretation of
analytical results were completed by the candidate with guidance by Drs. Daniel Kontak, Iain
Samson, and Brendan Murphy. Dr. Daniel Kontak provided additional petrographic,
geochemical, and microthermometric data he produced for the Nova Scotia Department of
Natural Resources. Avalon Advanced Materials, Inc. provided access to drill core, the East
Kemptville mine open-pit, drill logs, as well as geochemical and assay data. All chapters were
edited by Drs. Kontak and Samson. Additional collaboration, technical support, expertise and
constructive criticism was provided by co-authors listed herein.
Chapter two is co-authored by Daniel Kontak, Iain Samson, Brendan Murphy, Robert
Creaser, Christopher Holm-Denoma. Fieldwork, sample selection and sample preparation were

vi
completed by the candidate. The isotopic analytical work in this chapter was conducted by Drs.
Creaser (Re-Os molybdenite) and Holm-Denoma (U-Pb cassiterite). Financial and logistical
support for sample collection was coordinated by Bill Mercer and provided by Avalon Advanced
Materials Inc. and NSERC.
Chapter three is co-authored by Daniel Kontak, Iain Samson, Zoltán Zajacz, Mitchell
Kerr, and Mostafa Fayek. Fieldwork, sample selection and sample preparation were completed
by the candidate. Fluid inclusion geochemical and laser Raman analytical work was performed
by the candidate, with supervision by Drs. Zajacz, and Kerr, respectively. The O isotopic
analytical work on quartz in this chapter was conducted by Dr. Fayek. Financial and logistical
support for sample collection and analysis was coordinated by Bill Mercer and provided by
Avalon Advanced Materials Inc. and NSERC.
Chapter four is co-authored by Daniel Kontak, Brendan Murphy, Dawn Kellett, Iain
Samson, Jeffrey Marsh, Greg Dunning, and Richard Stern. Fieldwork, sample selection and
sample preparation were completed by the candidate. The isotopic analytical work in this chapter
was conducted by: the candidate for U-Pb zircon (SHRIMP-II), with supervision by Dr. Kellett,
and U-Pb, Lu-Hf (including trace element) zircon, with supervision by Dr. Marsh; Dr. Dunning
for U-Pb zircon (CA-ID-TIMS, including sample preparation); and Dr. Stern for O in zircon
(SIMS, including sample preparation). Financial and logistical support for fieldwork, sample
preparation, and analysis was provided by NSERC and National Resources Canada.
All manuscripts were edited by Drs. Daniel Kontak and Iain Samson (coauthors). Chapter
four was also edited by Drs. Brendan Murphy and Dawn Kellett (coauthors).
vii
Acknowledgments
I would like thank my supervisors Daniel Kontak, Iain Samson, and Brendan Murphy for their
mentorship, patience, and support throughout this project. Their thoughtful input and guidance
have helped me develop into a well-rounded geoscientist. Their feedback and reviews of the
project content have significantly improved the quality of the manuscripts in this thesis and have
made me a better researcher. I would like to thank Dr. Alan Galley for acting as my internal
examiner and Dr. Reimar Seltmann for acting as external examiner to provide thoughtful
feedback and improve this thesis.
This project was funded through a Collaborative Research and Development grant between the
Natural Sciences and Engineering Research Council (NSERC) of Canada and Avalon Advanced
Materials Inc. I would like to recognize the support from Avalon Advanced Materials Inc. for
getting me into the East Kemptville deposit to complete sample collection and field observations.
Specifically, I would like to thank Bill Mercer for making this project possible.
Having completed my PhD partially based out of Saint Mary’s University in Halifax, NS, I
would like to warmly thank the SMU faculty and staff that have provided advice and technical
support, including Jacob Hanley, Mitch Kerr, Fergus Tweedale, and Tara Inman.
Where I am today is largely a result of the encouragement and support of my family and close
friends. I would like to thank my parents for their support throughout my academic career. I am
grateful to both of you for everything.
viii
Table of Contents
Abstract .............................................................................................................................. iii
Statement of co-authorship ................................................................................................. v
Acknowledgments............................................................................................................. vii
Table of Contents ............................................................................................................. viii
List of Tables ................................................................................................................... xiii
List of Figures ................................................................................................................... xv
List of Electronic Appendices ........................................................................................... xx
Chapter 1 ............................................................................................................................. 1
Introduction to thesis........................................................................................................... 1
1.1 Background ............................................................................................................. 1
1.2 Research Problems .................................................................................................. 5
1.3 Thesis objectives ..................................................................................................... 8
1.4 Structure of thesis ................................................................................................. 10
1.5 Statement of original contributions ....................................................................... 11
1.6 References ............................................................................................................. 13
Chapter 2 ........................................................................................................................... 20
Petrochronological constraints on the generation and assembly of the Late Devonian
peraluminous South Mountain Batholith, Nova Scotia, Canada with implications for
metallogenic inheritance. ............................................................................................. 20
2.1 Abstract ................................................................................................................. 20
2.2 Introduction ............................................................................................................ 21
2.3 Regional Geology .................................................................................................. 26
2.4 The South Mountain Batholith ............................................................................... 29
2.4.1 Stage 1 Plutons ............................................................................................. 30
ix
2.4.2 Stage 2 Plutons ............................................................................................. 32
2.5 Analytical Techniques ............................................................................................ 35
2.5.1 Mineral Separation and Sample Preparation................................................ 35
2.5.2 U-Pb Geochronology ................................................................................... 37
2.5.3 Lu-Hf Isotopic Compositional Determination by LA-MC-ICP-MS ........... 40
2.5.4 Oxygen Stable Isotope Determinations by SIMS ........................................ 42
2.6 Results .................................................................................................................... 44
2.6.1 Zircon Characterization ............................................................................... 44
2.6.2 U-Pb Age Determinations: Preamble ........................................................... 45
2.6.3 U-Pb Age Determinations Results ............................................................... 47
2.6.4 Zircon Trace- and Rare Earth Element Compositions ................................. 51
2.6.5 Oxygen Stable Isotopic Composition of Zircon .......................................... 58
2.6.6 Hf Isotopic Composition of Zircon .............................................................. 59
2.7 Discussion ............................................................................................................. 63
2.7.1 Zircon chemistry and implications for magma evolution ............................ 63
2.7.2 Isotopic constraints on SMB magma source ................................................ 69
2.7.3 Construction and evolution of the South Mountain Batholith ..................... 77
2.7.4 Implications for the tectonic setting of SMB emplacement ......................... 82
2.7.5 Metallogenic implications ............................................................................ 87
2.8 Conclusions ........................................................................................................... 89
2.9 Acknowledgements ................................................................................................ 92
2.10 References ............................................................................................................ 92
Chapter 3 ......................................................................................................................... 185
The East Kemptville Mesothermal Greisen-Hosted Sn-Zn-Cu-Ag-In Deposit, Nova
Scotia, Canada: One ore body with two deposits .................................................. 185
x
3.1 Abstract ............................................................................................................... 185
3.2 Introduction .......................................................................................................... 187
3.3 Geologic Setting and Related Mineralization ...................................................... 190
3.3.1 Regional geology ....................................................................................... 190
3.3.2 Geology of the Meguma terrane ................................................................ 190
3.3.3 Geology and mineralization of the SW Meguma terrane .......................... 193
3.3.4 The SW Nova Scotia Sn base-metal domain ............................................. 195
3.4 The East Kemptville tin deposit ........................................................................... 197
3.4.1 Discovery and previous studies ................................................................. 198
3.4.2 Host rocks .................................................................................................. 199
3.4.3 Alteration ................................................................................................... 203
3.4.4 Mineralization ............................................................................................ 207
3.4.5 Structure ..................................................................................................... 213
3.5 Lithogeochemistry ............................................................................................... 216
3.5.1 Major element chemistry – Unmineralized rocks ...................................... 217
3.5.2 Trace element chemistry ............................................................................ 218
3.5.3 Rare-earth element (REE) chemistry ......................................................... 219
3.5.4 Major element chemistry – Mineralized rocks .......................................... 220
3.6 Geochronology ..................................................................................................... 221
3.6.1 Re-Os molybdenite dating ......................................................................... 221
3.6.2 In situ U-Pb cassiterite dating .................................................................... 223
3.7 Discussion ............................................................................................................ 225
3.7.1 Nature of the EKL and its role in deposit formation ................................. 225
3.7.2 Geological features and implications on ore zone formation .................... 229
3.7.3 Structural evolution of the deposit ............................................................. 238
xi
3.7.4 Implications of whole-rock lithogeochemistry for the EKL ...................... 241
3.7.5 Implications of geochronology for magmatic and hydrothermal events in the
East Kemptville deposit area .................................................................. 248
3.7.6 An updated model for the East Kemptville Sn deposit .............................. 252
3.7.7 Source of Sn ............................................................................................... 256
3.8 Conclusions .......................................................................................................... 258
3.9 Acknowledgments ................................................................................................ 261
3.10 References .......................................................................................................... 261
Chapter 4 ......................................................................................................................... 346
Geochemical constraints of ore-forming fluids in a mesothermal Sn-Zn-Cu-Ag-In
deposit, East Kemptville, Nova Scotia (Canada) ................................................... 346
4.1 Abstract ................................................................................................................ 346
4.2 Introduction .......................................................................................................... 347
4.3 Geological Setting ................................................................................................ 352
4.3.1Regional and Local Geological Setting ...................................................... 352
4.3.2 Davis Lake Pluton and East Kemptville Deposit ....................................... 354
4.3.3 East Kemptville Mineralization and Paragenesis ...................................... 356
4.4 Methods ................................................................................................................ 357
4.4.1 Petrography ................................................................................................ 357
4.4.2 Microthermometry ..................................................................................... 357
4.4.3 Evaporate mound analysis ......................................................................... 359
4.4.4 Confocal Laser Raman Microspectroscopy ............................................... 359
4.4.5 LA-ICP-MS analysis .................................................................................. 360
4.4.6 O isotopes................................................................................................... 362
4.5 Results .................................................................................................................. 363
4.5.1 Fluid inclusion petrography and types ....................................................... 363
xii
4.5.2 Features of inclusions and microthermometric data .................................. 365
4.5.3 Evaporate mound analysis ......................................................................... 368
4.5.4 LA-ICP-MS analysis .................................................................................. 370
4.5.5 Confocal Laser Raman Microspectroscopy ............................................... 371
4.5.6 O isotopes................................................................................................... 372
4.6 Discussion ............................................................................................................ 374
4.6.1 PT conditions during paragenetic evolution .............................................. 375
4.6.2 Fluid chemistry .......................................................................................... 382
4.6.3 Implications of δ18O data ........................................................................... 389
4.6.4 Implications of anomalous salinity in East Kemptville Fluid Types ......... 395
4.6.5 Cassiterite precipitation at the EKD .......................................................... 400
4.7 Conclusions .......................................................................................................... 405
4.8 Acknowledgements .............................................................................................. 407
4.9 References ........................................................................................................... 407
Chapter 5 ......................................................................................................................... 490
5.1 Conclusions .......................................................................................................... 490
5.2 Future Work ......................................................................................................... 493
xiii
List of Tables
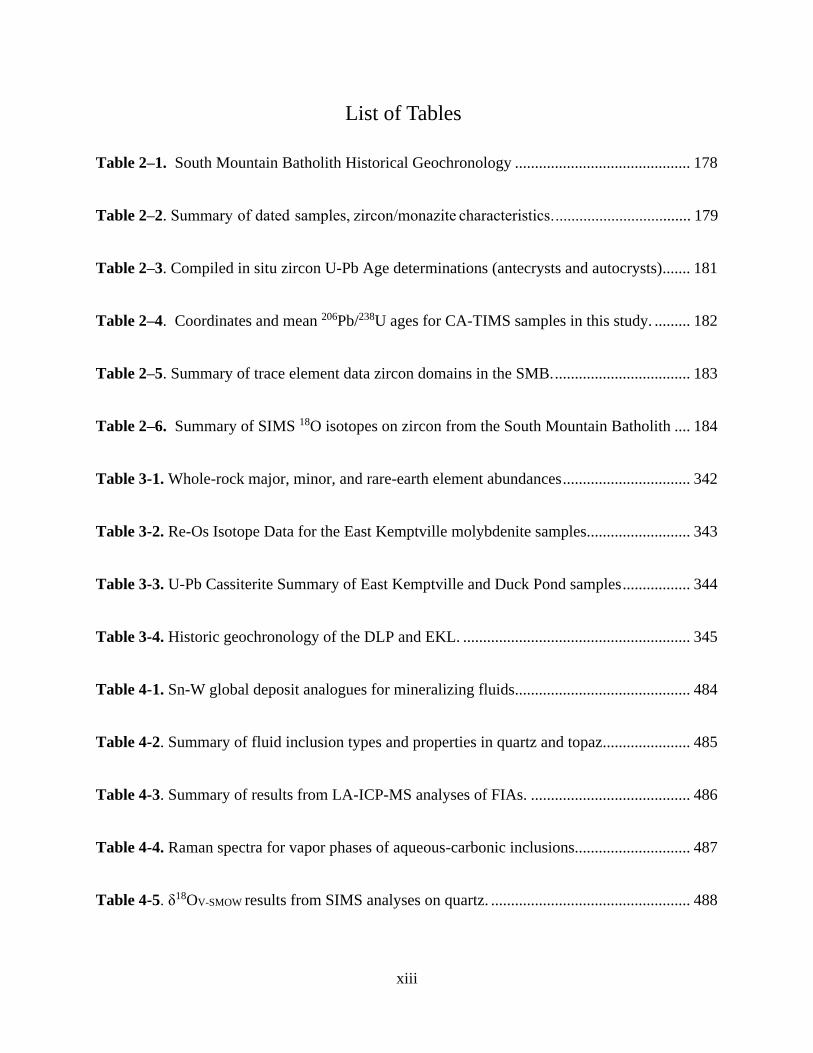
Table 2–1. South Mountain Batholith Historical Geochronology ............................................ 178
Table 2–2. Summary of dated samples, zircon/monazite characteristics . .................................. 179
Table 2–3. Compiled in situ zircon U-Pb Age determinations (antecrysts and autocrysts) ....... 181
Table 2–4. Coordinates and mean 206Pb/238U ages for CA-TIMS samples in this study. ......... 182
Table 2–5. Summary of trace element data zircon domains in the SMB. .................................. 183
Table 2–6. Summary of SIMS 18O isotopes on zircon from the South Mountain Batholith .... 184
Table 3-1. Whole-rock major, minor, and rare-earth element abundances ................................ 342
Table 3-2. Re-Os Isotope Data for the East Kemptville molybdenite samples. ......................... 343
Table 3-3. U-Pb Cassiterite Summary of East Kemptville and Duck Pond samples ................. 344
Table 3-4. Historic geochronology of the DLP and EKL. ......................................................... 345
Table 4-1. Sn-W global deposit analogues for mineralizing fluids ............................................ 484
Table 4-2. Summary of fluid inclusion types and properties in quartz and topaz ...................... 485
Table 4-3. Summary of results from LA-ICP-MS analyses of FIAs. ........................................ 486
Table 4-4. Raman spectra for vapor phases of aqueous-carbonic inclusions. ............................ 487
Table 4-5. δ18OV-SMOW results from SIMS analyses on quartz. .................................................. 488

xiv
Table 4-6. δ18OV-SMOW results from TIMS analysis................................................................... 489
xv
List of Figures
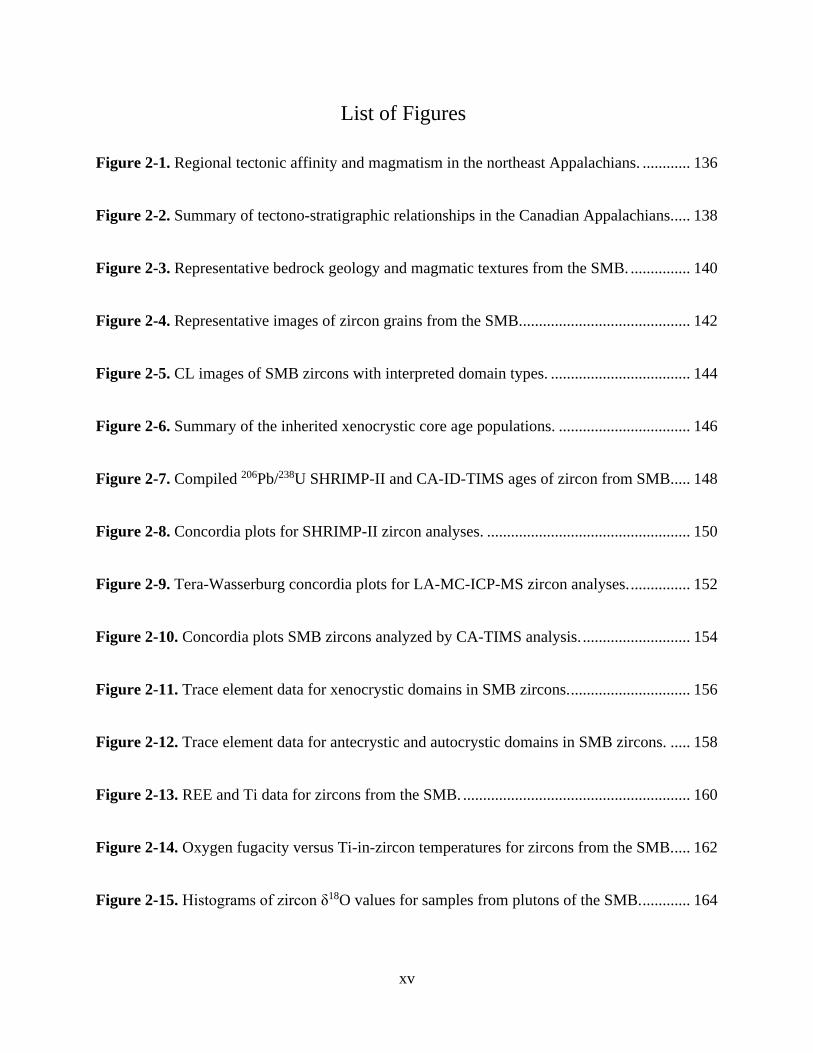
Figure 2-1. Regional tectonic affinity and magmatism in the northeast Appalachians. ............ 136
Figure 2-2. Summary of tectono-stratigraphic relationships in the Canadian Appalachians. .... 138
Figure 2-3. Representative bedrock geology and magmatic textures from the SMB. ............... 140
Figure 2-4. Representative images of zircon grains from the SMB. .......................................... 142
Figure 2-5. CL images of SMB zircons with interpreted domain types. ................................... 144
Figure 2-6. Summary of the inherited xenocrystic core age populations. ................................. 146
Figure 2-7. Compiled 206Pb/238U SHRIMP-II and CA-ID-TIMS ages of zircon from SMB. .... 148
Figure 2-8. Concordia plots for SHRIMP-II zircon analyses. ................................................... 150
Figure 2-9. Tera-Wasserburg concordia plots for LA-MC-ICP-MS zircon analyses. ............... 152
Figure 2-10. Concordia plots SMB zircons analyzed by CA-TIMS analysis. ........................... 154
Figure 2-11. Trace element data for xenocrystic domains in SMB zircons. .............................. 156
Figure 2-12. Trace element data for antecrystic and autocrystic domains in SMB zircons. ..... 158
Figure 2-13. REE and Ti data for zircons from the SMB. ......................................................... 160
Figure 2-14. Oxygen fugacity versus Ti-in-zircon temperatures for zircons from the SMB. .... 162
Figure 2-15. Histograms of zircon δ18O values for samples from plutons of the SMB. ............ 164
xvi
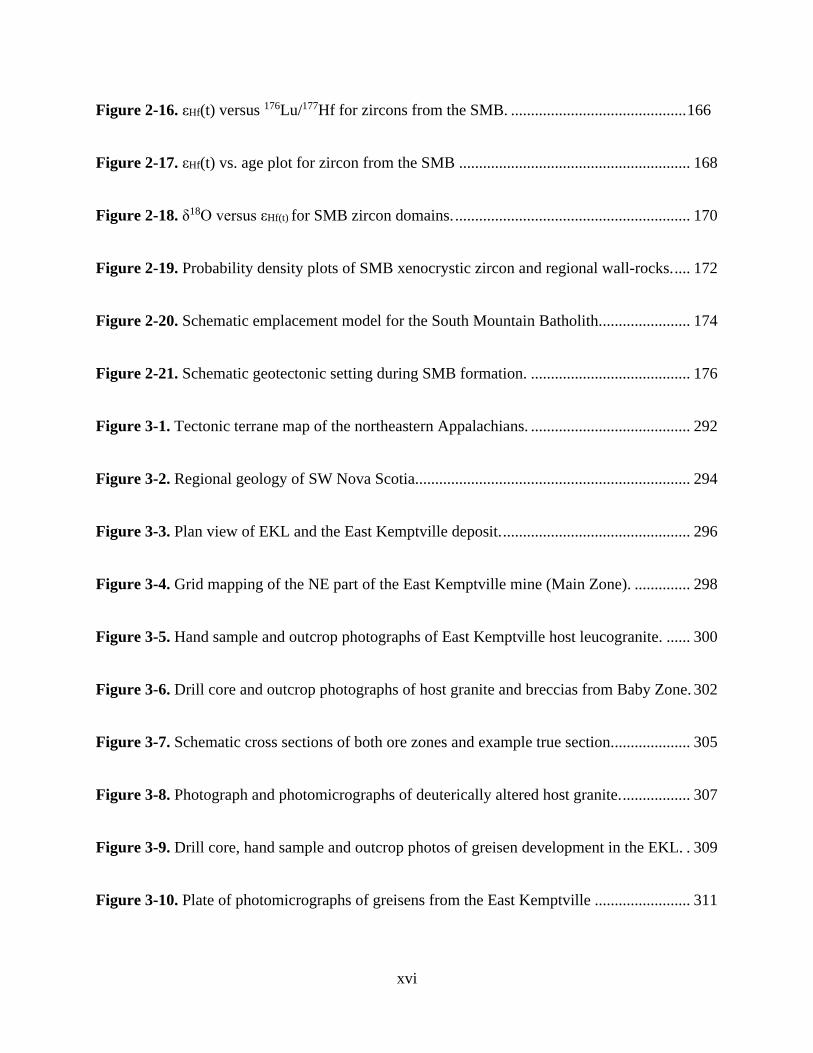
Figure 2-16. εHf(t) versus 176Lu/177Hf for zircons from the SMB. ............................................ 166
Figure 2-17. εHf(t) vs. age plot for zircon from the SMB .......................................................... 168
Figure 2-18. δ18O versus εHf(t) for SMB zircon domains. ........................................................... 170
Figure 2-19. Probability density plots of SMB xenocrystic zircon and regional wall-rocks. .... 172
Figure 2-20. Schematic emplacement model for the South Mountain Batholith. ...................... 174
Figure 2-21. Schematic geotectonic setting during SMB formation. ........................................ 176
Figure 3-1. Tectonic terrane map of the northeastern Appalachians. ........................................ 292
Figure 3-2. Regional geology of SW Nova Scotia. .................................................................... 294
Figure 3-3. Plan view of EKL and the East Kemptville deposit. ............................................... 296
Figure 3-4. Grid mapping of the NE part of the East Kemptville mine (Main Zone). .............. 298
Figure 3-5. Hand sample and outcrop photographs of East Kemptville host leucogranite. ...... 300
Figure 3-6. Drill core and outcrop photographs of host granite and breccias from Baby Zone. 302
Figure 3-7. Schematic cross sections of both ore zones and example true section. ................... 305
Figure 3-8. Photograph and photomicrographs of deuterically altered host granite. ................. 307
Figure 3-9. Drill core, hand sample and outcrop photos of greisen development in the EKL. . 309
Figure 3-10. Plate of photomicrographs of greisens from the East Kemptville ........................ 311
xvii
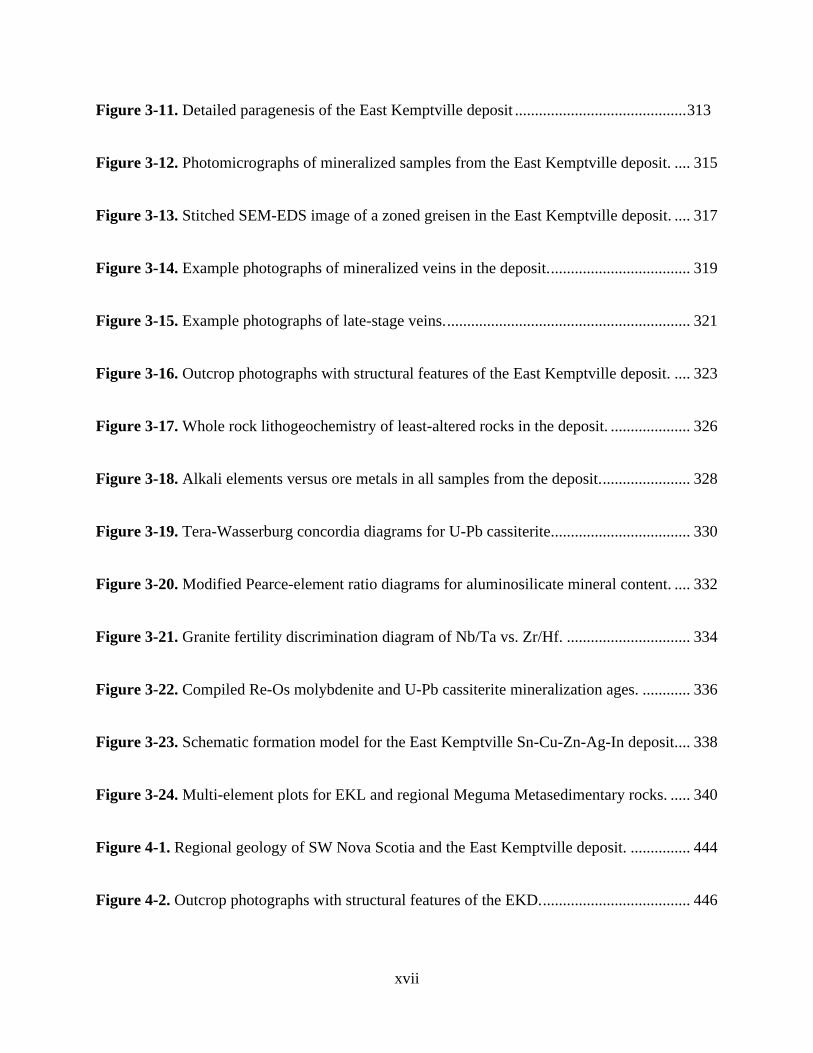
Figure 3-11. Detailed paragenesis of the East Kemptville deposit ........................................... 313
Figure 3-12. Photomicrographs of mineralized samples from the East Kemptville deposit. .... 315
Figure 3-13. Stitched SEM-EDS image of a zoned greisen in the East Kemptville deposit. .... 317
Figure 3-14. Example photographs of mineralized veins in the deposit. ................................... 319
Figure 3-15. Example photographs of late-stage veins. ............................................................. 321
Figure 3-16. Outcrop photographs with structural features of the East Kemptville deposit. .... 323
Figure 3-17. Whole rock lithogeochemistry of least-altered rocks in the deposit. .................... 326
Figure 3-18. Alkali elements versus ore metals in all samples from the deposit. ...................... 328
Figure 3-19. Tera-Wasserburg concordia diagrams for U-Pb cassiterite. .................................. 330
Figure 3-20. Modified Pearce-element ratio diagrams for aluminosilicate mineral content. .... 332
Figure 3-21. Granite fertility discrimination diagram of Nb/Ta vs. Zr/Hf. ............................... 334
Figure 3-22. Compiled Re-Os molybdenite and U-Pb cassiterite mineralization ages. ............ 336
Figure 3-23. Schematic formation model for the East Kemptville Sn-Cu-Zn-Ag-In deposit. ... 338
Figure 3-24. Multi-element plots for EKL and regional Meguma Metasedimentary rocks. ..... 340
Figure 4-1. Regional geology of SW Nova Scotia and the East Kemptville deposit. ............... 444
Figure 4-2. Outcrop photographs with structural features of the EKD. ..................................... 446
xviii
Figure 4-3. Summary paragenesis of the East Kemptville deposit ........................................... 448
Figure 4-4. Hand sample photographs of mineralization at East Kempville. ............................ 450
Figure 4-5. Images of quartz thick-sections with a range of fluid inclusion content. ................ 452
Figure 4-6. H2O-[Fe,Mn]Cl2-NaCl phase diagram with FIA microthermometric data. ............ 454
Figure 4-7. SEM images of induced decrepitate salt mounds. ................................................... 456
Figure 4-8. Example methodology for LA-ICP-MS analysis of fluid inclusions. ..................... 458
Figure 4-9. Photomicrographs of fluid inclusions hosted by the deposit. .................................. 460
Figure 4-10. Homogenization temperatures and salinities of East Kemptville FIAs. ............... 462
Figure 4-11. Relative and absolute element concentrations of evaporate mounds. ................... 464
Figure 4-12. Trace element concentration of FIAs determined by LA-ICP-MS analysis. ........ 466
Figure 4-13. Raman spectra (at 22°C) for aqueous carbonic fluid inclusions. .......................... 468
Figure 4-14. Comparative plots of δ18O for quartz through the paragenesis. ............................ 470
Figure 4-15. Th(total) histograms, P–T plots and calculated isochores for each fluid type. ..... 472
Figure 4-16. Th(halite) versus Th(liquid) for East Kemptville fluids and global analogues. .... 474
Figure 4-17. Schematic evolution of fluid inclusion entrapment through paragenesis. ............ 476
Figure 4-18. Ore metals relative to primary elements in the fluids through the paragenesis. ... 478
xix
Figure 4-19. K/Rb versus various metals for fluid types through the paragenesis. .................. 480
Figure 4-20. Temperature versus δ18O(quartz) through the deposit paragenesis. ......................... 482
xx
List of Electronic Appendices
Chapter 2
Table EA 2-1: SHRIMP-II zircon data (U-Pb)
Table EA 2-2: CA-ID-TIMS zircon and monazite data (U-Pb)
Table EA 2-3: LA-MC-ICP-MS zircon data (U-Pb, trace elements)
Table EA 2-2: O isotope zircon SIMS data
Table EA 2-3: LA-MC-ICP-MS zircon data (Lu-Hf)
Chapter 3
Table EA 3-1: Compilation of geochronologic data from SW Nova Scotia
Table EA 3-2: Compiled whole rock lithogeochemistry from the East Kemptville deposit
Table EA 3-3: U-Pb cassiterite geochronology LA-ICP-MS data
Chapter 4
Table EA 4-1: Microthermometric data on fluid inclusions
Table EA 4-2: Fluid inclusion evaporate mound SEM-EDS analytical results
xxi
Table EA 4-3: LA-ICP-MS analytical results from fluid inclusions
1
Chapter 1
Introduction to thesis
1.1 Background
Granitoid related ore deposits concentrate a range of elements that is more diverse than any other
magmatic related deposits and occur in three broad categories (cf. Černý et al., 2005):
disseminated magmatic mineralization (Zr, Nb, REE, Y, U, Li, Sn, Cu, Au, W, and Ta); late
magmatic-associated pegmatites (Li, REE, Rb, Cs, Be, Sn, and Ta); and magmatic-hydrothermal
mineralization associated with veins, breccias, and greisens in and around intruding granites (Sn,
W, Cu, and Mo). These latter deposits are additionally an important source of critical metals
(e.g., Li, B, Be, In, Ge and Ga), which are defined as elements that are essential in industrial and
high-technology applications and where global supply is limited or vulnerable. The increasing
demand for refined Sn and critical metals (for use in solder, chemicals, tinplate, lead acid
batteries, and copper alloys) necessitates further constraints on genetic factors controlling tin
precipitation in various granitoid intrusive settings that will better the approach of exploration
and extraction.
Three topics relevant to Sn mineralization are addressed in this thesis: (1) the lithogeochemical
and structural controls over mineralization style in geologic settings that are atypical of known
2
tin districts globally; (2) the chemical evolution of hydrothermal fluids through pressure-
temperature conditions that mineralization occurs; and (3) the character of the source and timing
of emplacement for magmatism enriched in granophile elements that localize mineralized centres
and define metallotects.
Cassiterite (SnO2) is the predominant tin ore mineral and greisen deposits are the predominant
style of tin deposit. Worldwide, cassiterite forms in greisens that typically evolve by interaction
of orthomagmatic fluids and host rock under high temperatures (200-500oC; e.g., Naumov, 2011)
and in high-level settings (i.e., <1 kbar). The host granites are typically highly fractionated,
relatively K rich, metaluminous to peraluminous, part of the ilmenite series of granitoids (i.e.,
magmas with low oxygen fugacity values (fO2); e.g., Ishihara, 1981; Blevin and Chappell, 1992;
Linnen et al., 1996), and enriched in Sn, F, and other incompatible elements. The high degree of
fractionation in the ore-forming melts is facilitated by volatiles that depolymerize the magma
(e.g., F, Li, P, B; e.g., Pichavant et al., 1987; Černý, 1991; London, 1992; Raimbault et al., 1995)
and the resultant orthomagmatic fluids are rich in ligands such as Cl, F, OH-, and H2S.
Ore precipitation is initiated by significant changes in the physicochemical conditions of
mineralizing fluids in greisenized host rocks. These changes cause destabilization of metal
complexes in solution and the controlling variables include: temperature, pressure, pH
(neutralization), and/or fO2. The physicochemical variables are influenced by either a mixing
process between hot metal-bearing fluids and cold, unmineralized external fluids (fluid-fluid
3
interaction, e.g., Mole Granite, Australia; Heinrich et al., 1999), or by either a redox or chemical
reaction between a mineralizing fluid with host rocks (e.g., Fe and Ca in wall-rock reacting to
W-bearing fluids forming wolframite and scheelite, Panasqueria, Portugal; Lecumberri-Sanchez
et al., 2017).
To constrain the controls on ore deposition in primary tin deposits, studies that focus on the
analysis of fluid inclusions are conducted. A compilation of determinations from tin greisens in
these studies have generally found mineralizing fluids to be acidic and two-phase aqueous-
carbonic with a highly variable gas content; with average compositions of volatile components to
be, in decreasing abundance, CO2, CH4, N2, and H2S (e.g., Naumov, 2011; Bodnar et al., 2014).
This range of volatiles is compatible with a metamorphic origin (i.e., metasedimentary),
however, the typical salinity of mineralizing fluids in tin deposits suggests the presence of
magmatic hypersaline brines (cf. Audétat et al., 2000). Likewise, stable isotopic signatures of
mineralizing fluids in these deposits are variable, having recorded fluid equilibration with
various rocks in their respective hydrothermal systems (e.g., Kelly and Rye, 1979; Sun and
Eadington, 1987; Wilkinson et al., 1995; Vallance et al., 2001); reflective of heterogeneous
fluid/rock interaction.
Mineralizing fluids that form greisens in Sn-W systems typically focus along permeable
structures or within lithologic units that allow fluid migration (cf. Lehmann, 2020); thus, greisens
essentially represent post-magmatic metasomatism of host rocks. They occur as lenses that are
4
subparallel to intrusive contacts along granitic cupulas or along fracture sets that act as fluid-
pathways; ore concentrates at the intersects of these two, where maximum fluid-rock interaction
is available (e.g., Pirajno, 2012; Lehmann, 2020). Host rock permeability, however, is a dynamic
parameter that evolves over time and is influenced by geologic processes such as: deformation,
fracturing, fluid overpressure, dissolution/precipitation, and/or hydrothermal alteration.
The global distribution of granitoid-related tin deposits suggests these systems mainly form in
late-orogenic tectonic settings (cf. Jébrak and Marcoux, 2008). The spatio-temporal distribution
of tin deposits that are exploited today is dominantly in late Paleozoic rocks of the Hercynian
orogeny (e.g., the Iberian province, the English Cornwall, the Armorican, Central and Bohemian
massifs; Štemprok, 1981; Romer and Kroner, 2016) and Mesozoic to Cenozoic rocks of the
Cimmerian orogeny (e.g., the Southeast Asian Tin Belt; Schwartz et al., 1995; Hou and Zhang,
2014). In each setting, the granites that form these deposits typically have partial generation
and/or contamination from aluminous crustal rocks (i.e., metapelite continental crust) that are
thickened at the loci of melting during orogenic activity (Clark et al., 2011; Romer and Kroner,
2016). Additionally, the pre-concentration of metals in each region is both suggested to be a
result of recycling lithophile element-enriched crustal rocks (e.g., Romer and Kroner, 2016),
and/or a result of mantle input; via magma mixing or metasomatism by mantle-derived fluids
(e.g., Walshe et al., 2011; Simons et al., 2016).
5
In the northern Appalachians, granitic magmatism is a key feature that is associated with a
variety of base- and critical-metal mineralized centres (e.g., Cu, W-Mo, Sn, Sb, and Ta; c.f. van
Staal, 2007) that span both time (ca. 410 to 360 Ma) and space (from Atlantic Canada to eastern
Quebec). A number of these mineralized centres are past producers of global significance; e.g.,
Mt. Pleasant, New Brunswick (W-Mo); Lake George, New Brunswick (Sb); Gaspé Cu, Québec
(Cu); and East Kemptville, Nova Scotia (Sn). Although these deposits collectively define a
granophile element enriched metallotect, East Kemptville represents the only significant Sn
mineralized centre that has been discovered in the region. The regional geology in southern Nova
Scotia, where the East Kemptville Sn-Cu-Zn-Ag(-In) deposit is located, is similar to that found
in the metallotects noted above; i.e., dominated by metasedimentary rocks and metaluminous to
peraluminous granitoid intrusions emplaced syn- to post-tectonically (van Staal, 2007; Kellett et
al., in press). Emplacement of peraluminous granites related to the East Kemptville deposit was
accompanied by lesser dioritic, gabbroic, and lamprophryric magmatism, indicative of some co-
spatial mantle input at this time (e.g., Clarke et al., 1997).
1.2 Research Problems
The characteristics of the East Kemptville deposit both overlap and depart from those of other
analogous deposits. The local geology is dominated by the Meguma Supergroup and the South
Mountain Batholith (SMB); in which the deposit is hosted by one of the most fractionated
phases, the East Kemptville leucogranite (EKL). The EKL has a geochemical signature like
6
some fractionated granites, but a REE depletion (e.g., LaN <5) and an anomalous enrichment in
F, Li, and Rb (e.g., Kontak, 1990). The EKL is related to a northeast-trending, sub-vertical
brittle-ductile shear zone. Zoned and massive greisens are hosted along this shear zone and
within a step-over feature along the same structural corridor (e.g., Halter et al., 1996). The
deposit comprises two main ore zones along the corridor with contrasting character; thus,
understanding the constraints on the structural evolution of the two ore zones is critical to better
defining the extent and geometry of the deposit as well as the exploration for additional
mineralized zones. Furthermore, the age of mineralization remains poorly constrained at East
Kemptville, compared to other mineralized centres in the SMB; Re-Os molybdenite ages at ca.
371 ± 3 Ma, ca. 5 Ma younger than the batholith, have been reported in the central SMB (Selby
and Creaser, 2004), but remain unexplained in a regional context. A single Re-Os age of 376 ± 3
Ma (Kontak et al., 2003) for a pegmatite (pre-greisen) sample in one of the ore zones at East
Kemptville provides a maximum age for mineralization, although it is much older than a Pb-Pb
isochron age of 366 ± 4 Ma obtained for the greisens in the deposit (Kontak and Chatterjee,
1992). Thus, the age of mineralization at East Kemptville needs refining based on both ore zones
and interpretation compared to other mineralized centres in the SMB and rest of the metallotect.
The depth of deposit formation that is indicated by a majority of fluid inclusions through the
paragenesis (ca. 3-4 kbars) is unusually high for such systems (e.g., Sinclair, 2007), in addition
to contrasting with the low pressures that are indicated by hydrothermal collapse breccias that

7
dominate one of the ore zones at East Kemptville. Several fluid inclusion studies have provided a
basis for understanding the pressure-temperature evolution of the hydrothermal system (i.e.,
Richardson, 1988; Richardson et al., 1989; Kontak, 1993), and these studies also used isotopic
analysis (O, S, Sr) to understand the geochemical evolution of hydrothermal fluids in the deposit.
These studies have suggested the East Kemptville hydrothermal evolution involved an
orthomagmatic fluid, element exchange with the metasedimentary wall-rocks, and input from
meteoric fluids. However, to adequately define the chemical composition of hydrothermal fluids
in the deposit, the use of LA-ICP-MS analysis of well-defined individual fluid inclusion
assemblages is required.
The sources of enrichment proposed for causative magmas associated with tin deposits include
melting of heterogeneous mantle and either anatexis of, or contamination by, Sn-enriched
supracrustal material. Typically, such magmas form incrementally as voluminous composite
batholiths that host multiple deposits (described above). The SMB is a composite intrusion and,
despite the considerable number of petrological studies that were conducted on it, there is a
paucity of precise U-Pb geochronologic constraints on its emplacement. Thus, to interpret
sources for the SMB and mineralized centres in the complex, defining the age range (i.e.,
duration of construction) by U-Pb zircon analysis and the chemical composition of the zircons
from the various intrusive phases is required.
8
1.3 Thesis objectives
The primary objective of this thesis is to better understand tin deposit formation in a
metasedimentary rock-hosted mesothermal intrusive setting, and to improve the understanding of
geologic and metallogenic controls on mineralization in these settings. The following specific
research questions will be addressed herein:
1) What are the geochemical and structural controls to the East Kemptville tin deposit, and why
are there two ore zones of contrasting lithologic character?
a. Is the host leucogranite at East Kemptville the source for metals in the deposit or was
metal enrichment brought by hydrothermal alteration and sourced elsewhere?
b. What is the influence of the East Kemptville shear zone on localization of
mineralization and what are the implications on delineation of the ore resource?
c. Is there a genetic or timing difference in the mineralization between the two ore
zones at East Kemptville?
2) What is the character and evolution of mineralizing fluids that formed the East Kemptville
deposit, and what inferences can be made about their origin(s)?
a. What is the isotopic character of the entire mineral paragenesis in both ore zones at
East Kemptville, and what does this imply about fluid source(s)?

9
b. What is the temporal fractionation of metals across the fluid evolution, from early-
stage cassiterite-greisens to later-stage base-metal sulfides, and what implications
does this have on the infiltration of fluids with different chemistry than the original
mineralizing fluid?
c. When in the paragenesis is C and other volatile species introduced to the ore system
and what is the impact on ore deposition?
3) What is the genetic link between the SMB and Sn mineralization at East Kemptville as well
as lithophile element enriched centres across the Canadian Appalachian metallotect?
a. When did emplacement of granites with which the East Kemptville mineralization is
spatially associated happen, and what was the duration of this magmatic event?
b. Is there a significant difference in age between the less-evolved phases of the SMB
and the more-evolved, lithophile element enriched plutons of the SMB?
c. How do we differentiate the petrochemical nature of the relatively barren SW part of
the SMB from its mineralized counterpart?
d. Can in situ zircon trace element chemistry and isotopic signature resolve the
magmatic evolution of the SMB and where in this evolution does metal enrichment
occur? What are the implications on metal enrichment in the metallotect as a whole?
10
1.4 Structure of thesis
This dissertation is presented as five chapters. Chapters two to four are written as standalone
manuscripts intended for publication in peer-reviewed scientific journals. Therefore, there is
some repetition in the introduction and geological background sections of these chapters.
Chapter two is written as a manuscript entitled “Petrochronological constraints on the
generation and assembly of the Late Devonian peraluminous South Mountain Batholith,
Nova Scotia, Canada with implications for metallogenic inheritance.” This manuscript has
been written for submission to the Canadian Journal of Earth Sciences (anticipated submission in
July, 2021). This manuscript describes the use of both zircon geochronology and in situ zircon
petrochronology as tools to adequately constrain the emplacement history of peraluminous
batholiths and to indicate the fertility or metallogenic potential for lithophile element enrichment
in such intrusive complexes. This study focusses on the South Mountain Batholith, which hosts
the East Kemptville Sn-Zn-Cu-Ag-In deposit.
Chapter three is a manuscript entitled “The East Kemptville Mesothermal Greisen-Hosted Sn-
Zn-Cu-Ag-In Deposit, Nova Scotia, Canada: One ore body with two deposits.”. This
manuscript is intended for submission to Economic Geology or Ore Geology Reviews
(anticipated submission in September, 2021) and presents a detailed geologic setting of the East
11
Kemptville deposit and mineralization in southwest Nova Scotia by magmatic-hydrothermal
fluids. Evidence for a structural control in the main ore zone of the deposit is provided through a
detailed structural analysis and alteration mapping, whereas evidence for a change in
mineralization style and timing elsewhere in the deposit is provided with both U-Pb cassiterite
and Re-Os molybdenite geochronology as well as detailed petrographic analyses.
Chapter four is a manuscript entitled “Geochemical constraints of ore-forming fluids in a
mesothermal Sn-Zn-Cu-Ag-In deposit, East Kemptville, Nova Scotia (Canada).”. This
manuscript is intended for submission to Economic Geology (anticipated submission in
September, 2021). This manuscript investigates the hydrothermal evolution of greisen-forming
fluids in the East Kemptville deposit of southwest Nova Scotia, Canada. This study provides
evidence for tin mineralization through a weakly efficient fluid reduction and pH change
mechanism via interaction of moderately saline magmatic fluid with granitic host rock and later
more efficient tin precipitation via solubility changes in a moderately saline magmatic fluid that
results from instantaneous pressure changes along a host shear zone and interaction with reduced
meteoric CO2-bearing fluids.
1.5 Statement of original contributions
The following is a summary of original contributions presented by the candidate in this study:
12
1. A revised interpretation of distinct alteration stages at the East Kemptville Sn-Zn-Cu-Ag-
In deposit, in association with periodic activation along the host shear zone and induced
permeability in the host EKL by hydrothermal circulation.
2. A detailed characterization of the contrasting geologic characteristics from the two ore
zones (Baby and Main) that comprise the East Kemptville deposit, and a resultant
interpretation of the deposit petrogenesis.
3. A new interpretation of mineralization age at East Kemptville, both of cassiterite (U-Pb)
and of molybdenite at various stages through the paragenesis (Re-Os), and the
significance in a regional context.
4. Detailed, integrated fluid inclusion investigation through the paragenesis at East
Kemptville; a follow-up to previous works by Dr. Daniel Kontak. This includes a
description of evaporate mound analyses and chemical composition, as well as carbonic
volatile content identification in fluids interpreted to be syn- to post-mineralization.
5. The first description of in situ O isotopic character of quartz at various stages through the
East Kemptville paragenesis to complement bulk O isotopic work done previously.
6. A comprehensive interpretation of U-Pb crystallization ages for the various zircon types
that occur in the multiple intrusive phases which make up the South Mountain Batholith
(SMB).
13
7. A description of trace element and isotopic (O, Lu-Hf) signature for the various zircon
types and ages from each major SMB plutonic phase.
8. A new interpretation of source(s) of Sn enrichment in the Canadian Appalachian Sn-W
metallotect.
1.6 References
Audétat, A., Gunther, D., and Heinrich, C.A., 2000. Causes for large scale metal zonation around
mineralized plutons: fluid inclusion LA-ICP-MS evidence from the Mole Granite,
Australia. Economic Geology, 95: 1563–1581.
Blevin, P. L., and Chappell, B. W., 1992. The role of magma sources, oxidation states and
fractionation in determining the granite metallogeny of eastern Australia. Transactions of
the Royal Society of Edinburgh: Earth Sciences, 83(1-2): 305–316.
Bodnar, R.J., Lecumberri-Sanchez, P., Moncada, D., and Steele-MacInnis, M., 2014. Fluid
Inclusions in Hydrothermal Ore Deposits. In: Treatise on Geochemistry, Second Edition,
H. D. Holland and K. K. Turekian (eds.), 13: 119–142.
Černý, P., Blevin, P.L., Cuney, M., London, D., 2005. Granite related ore deposits. Economic
Geology 100th Anniversary Volume: 337–370.
14
Clark, C., Fitzsimmons, I.C.W., and Healy, D., 2011. How does the continental crust get really
hot? Elements, 7: 235–240.
Clarke, D.B., MacDonald, M.A., and Tate, M.C., 1997. Late Devonian mafic-felsic magmatism
in the Meguma Zone, Nova Scotia. In: The nature of magmatism in the Appalachian
Orogen, A.K. Sinha, J.B. Whalen, J.P. Hogan (eds.), Geological Society America
Memoir 191: 107–127.
Halter, W.E., Williams-Jones, A.E., and Kontak, D.J., 1996. The role of greisenization in
cassiterite precipitation at the East Kemptville tin deposit, Nova Scotia. Economic
Geology, 91: 368–385.
Heinrich, C.A., Gunther, D., Audétat, A., Ulrich, T., and Frischknecht, R., 1999. Metal
fractionation between magmatic brine and vapor, determined by microanalysis of fluid
inclusions. Geology, 27(8): 755–758.
Hou, Z., and Zhang, H., 2015. Geodynamics and metallogeny of the eastern Tethyan
metallogenic domain. Ore Geology Reviews, 70: 346–384.
Ishihara, S., 1981. The granitoid series and mineralization. Economic Geology 75th Anniversary
Volume, 458–484.
Jébrak M., and Marcoux E., 2008. Geology of Mineral Resources. Géologie Québec. 685p.
Kellett, D.A., Piette-Lauzière, N., Mohammadi, N., Bickerton, L, Kontak, D., Rogers, .N and
Larson, K., in press, Spatio-temporal distribution of Devonian post-accretionary
15
granitoids in the Canadian Appalachians: implications for tectonic controls on intrusion-
related mineralization; in Targeted Geoscience Initiative 5: Contributions to the
understanding and exploration of porphyry deposits, (ed.) A. Plouffe and E. Schetselaar:
Geological Survey of Canada, Bulletin 616, p. xxx-xxx.
Kelly, W. C. and Rye, R. O., 1979. Geologic, fluid inclusion and stable isotope studies of the
tin–tungsten deposits of Panasqueira, Portugal. Economic Geology, 74: 1721–1822.
Kontak, D.J., 1990. The East Kemptville topaz-muscovite leucogranite, Nova Scotia. Geological
setting and whole rock geochemistry. Canadian Mineralogist, 28: 787–825.
Kontak, D.J., 1993. Geological, geochemical, and isotopic studies of the East Kemptville Sn-
(Zn-Cu-Ag) deposit, Yarmouth County, Nova Scotia, Canada: 8th Quadrennial IAGOD
Symposium, Ottawa, Canada, Proceedings: 383–409.
Kontak, D.J. and Chatterjee, A.K., 1992. The East Kemptville tin deposit, Yarmouth County,
Nova Scotia. A Pb isotope study of the leucogranite and mineralized greisens: Evidence
for a 366 Ma metallogenic event. Canadian Journal of Earth Sciences, 29: 1180–1196.
Kontak, D.J., Dunning, G., and Creaser, R., 2003. U/Pb and Re/Os dating of the South Mountain
and Musquodobit batholiths, Nova Scotia: evidence for protracted magmatic-
hydrothermal events. Joint Meeting Northeastern Section Geological Society of America-
Atlantic Geoscience Society, Program with Abstracts.
16
Lecumberri-Sanchez, P., Vieira, R., Heinrich, C.A., Pinto, F., Wälle, M., 2017. Fluid-rock
interaction is decisive for the formation of tungsten deposits. Geology, 45: 579–582.
Lehmann, B., 2020. Formation of tin ore deposits: A reassessment. Lithos, 14pp.
Linnen, R.L., Pichavant, M., Holtz, F., 1996. The combined effects of fO2 and melt composition
on SnO2 solubility and tin diffusivity in haplogranitic melts. Geochim. Cosmochim.
Acta, 60: 4965–4976.
London, D., 1992. Phosphorus in S-type magmas: the P2O5 content of feldspars from
peraluminous granites, pegmatites, and rhyolites. American Mineralogist, 77(1-2): 126–
145.
Naumov, V.B., Dorofeev, V.A., Mironova, O.F., 2011. Physicochemical parameters of the
formation of hydrothermal deposits: a fluid inclusion study. I. Tin and tungsten deposits.
Geochemistry International, 49: 1002–1021.
Pichavant, M., Boher, M., Stenger, J.-F., Aissa, M., and Charoy, B., 1987. Relations de phase des
granites de Beauvoir à 1 et 3 kbar en conditions de saturation en H2O: Géologie de la
France, no. 2–3: 77–86.
Pirajno, F., 2012. Hydrothermal mineral deposits: principles and fundamental concepts for the
exploration geologist. Springer Science & Business Media.
17
Raimbault, L., Cuney, M., Azencott, C., Duthou, J.L., and Joron, J.L., 1995. Geochemical
evidence for a multistage magmatic genesis of Ta-Sn-Li mineralization in the granite at
Beauvoir, French Massif Central. Economic Geology, 90(3): 548–576.
Richardson, J.M., 1988. Field and alteration relationships of alteration and greisen-hosted
mineralization at the East Kemptville tin deposit, Davis Lake monzogranite, southwest
Nova Scotia, Canada. In: Granite related mineral deposits, R.P. Taylor, and D.F. Strong,
D.F. (eds). Canadian Institute of Mining and Metallurgy, Special volume 39: 265–279.
Richardson J.M., Blenkinsopp, J., and Bell, K., 1989. Extreme enrichment in strontium initial
ratios in ore-related fluids. Contributions Mineralogy and Petrology, 104: 516–529.
Romer, R.L., and Kroner, U., 2016. Phanerozoic tin and tungsten mineralization—Tectonic
controls on the distribution of enriched protoliths and heat sources for crustal melting.
Gondwana Research, 31: 60–95.
Selby, D., and Creaser, R.A., 2004. Macroscale NTIMS and microscale LA-MC-ICP-MS Re-Os
isotopic analysis of molybdenite: Testing spatial restrictions for reliable Re-Os age
determinations, and implications for the decoupling of Re and Os within molybdenite.
Geochimica Cosmochimica Acta, 68: 3897–3908.
Schwartz, M.O., Rajah, S.S., Askury, A.K., Putthapiban, P., and Djaswadi, S., 1995. The
Southeast Asian tin belt. Earth-Science Reviews, 38: 95–293.
18
Simons, B., Shail, R.K., and Andersen, J.C., 2016. The petrogenesis of the Early Permian
Variscan granites of the Cornubian Batholith: lower plate post-collisional peraluminous
magmatism in the Rhenohercynian Zone of SW England. Lithos, 260: 76–94.
Sinclair, D., 2007. Porphyry Deposits. In: Mineral Deposits of Canada, W.D. Goodfellow (ed),
Geological Association of Canada, Special Publication 5: 223–244.
Štemprok, M., 1981. Tin and tungsten deposits of the west-central European Variscides.
Proceedings of the fifth quadrennieal IAGOD Symposium.
Sun, S. S. and Eadington, P.J., 1987. Oxygen isotope evidence for the mixing of magmatic and
meteoric waters during tin mineralization in the Mole Granite, New South Wales,
Australia. Economic Geology, 82(1): 43–52.
Vallance, J., Cathelineau, M., Marignac, C., Boiron, M. C., Fourcade, S., Martineau, F., and
Fabre, C., 2001. Microfracturing and fluid mixing in granites: W–(Sn) ore deposition at
Vaulry (NW French Massif Central). Tectonophysics, 336(1-4): 43–61.
van Staal, C.R., 2007. Pre-Carboniferous tectonic evolution and metallogeny of the Canadian
Appalachians. In: Mineral Deposits of Canada, W.D. Goodfellow (ed), Geological
Association of Canada, Special Publication 5: 793–818.
Walshe, J.L., Solomon, M., Whitford, D.J., Sun, S.S., and Foden, J.D., 2011. The role of the
mantle in the genesis of tin deposits and tin provinces of Eastern Australia. Economic
Geology, 106(2): 297–305.

19
Wilkinson, J.J., Jenkin, G.R.T., Fallick, A.E., and Foster, R.P., 1995. Oxygen and hydrogen
isotopic evolution of Variscan crustal fluids, south Cornwall, UK. Chemical Geology,
123(1-4): 239–254.
20
Chapter 2
Petrochronological constraints on the generation and assembly
of the Late Devonian peraluminous South Mountain Batholith,
Nova Scotia, Canada with implications for metallogenic
inheritance.
2.1 Abstract
Magmas associated with Sn-W deposits include those sourced from melts of metasomatized
mantle and either anatexis of, or contamination by, enriched supracrustal sequences. The South
Mountain Batholith (SMB; Nova Scotia, Canada) is the largest intrusive complex in the
Appalachians and hosts one significant Sn deposit at East Kemptville (EK) within the Davis
Lake Pluton (DLP). Here we present isotopes and petrochronology of SMB zircon to constrain
the magma and metal sources. CA-ID-TIMS zircon dates from the SMB indicate a temporal
transition from granodiorite (378.7 ± 1.2 to 375.4 ± 0.8 Ma) to leucogranite (375.4 to 371.8 ± 0.8
Ma). Furthermore, in situ SHRIMP, LA-MC-ICP-MS, and SIMS analyses of distinct zircon
domains reveal: 1) autocryst δ18O values between +7.3 and +9.1‰ (V-SMOW); 2) antecryst
crystallization ages ca. 3–15 Ma older than SMB emplacement; 3) isotopes, REE signatures, and
derived fO2 values are similar in antecrysts and autocrysts; 4) abundant xenocrysts (~420 Ma to
2.2 Ga); and 5) the εHf signature in autocrysts from the 371.8 ± 0.8 Ma DLP is higher (+1.74 to
+4.38) than those from the rest of the SMB (-2.99 to +1.68). Collectively the data suggest that
the construction of the SMB occurred from 390-370 Ma with abundant contamination of the
21
primary magma which δ18O and εHf zircon values suggest was sourced in the mantle source, and
the DLP represents a temporally and petrogenetically distinct magmatic phase. Thus the EK
deposit and similar polymetallic occurrences in the region likely sourced their Sn from lower
crustal melts distinct from the mantle-derived melts that influenced the rest of the SMB.
2.2 Introduction
The processes responsible for the construction of large granitoid batholiths are of first order
importance to understanding the formation and evolution of the continental crust and related
mineral deposits. Granophile-type Sn-W deposits and associated polymetallic base-metal (e.g.
Cu, Zn, Sb, In) mineralization are commonly hosted in peraluminous, relatively reduced
intrusions (e.g., Ishihara, 1981; Blevin and Chappell, 1992; Linnen et al., 1996; Černý et al.,
2005) enriched in fluxing components that lower solidus temperatures thereby facilitating
extensive fractionation (e.g., B, P, F, Li; Pichavant et al., 1987; Černý, 1991; London, 1992;
Raimbault et al., 1995; Černý et al., 2005). A vast amount of field, geochronological,
geophysical, and geochemical evidence (e.g., Brown, 1994; Petford et al., 2000; Vigneresse,
2004) suggests the composite granitoid batholiths that host such deposits are the end products of
crustal-scale magmatic plumbing systems in which plutons are assembled by incremental
emplacement of relatively small magma batches (e.g., Petford et al., 1993; Paterson and Vernon,
1995; Cruden, 1998; Brown and McClelland, 2000). Comprehensive geochronological,
geochemical and isotopic studies can determine the processes responsible for both compositional
22
diversity and metallogenic inheritance of these granitoid batholiths by documenting the longevity
of magmatism, as well as source and contaminating influences on magma composition.
Zircon and monazite are robust and ubiquitous minerals in granitoid rocks which preserve
their U-Pb isotopic composition over a wide range of temperatures (e.g., Cherniak and Watson,
2003). Application of U-Pb geochronology to these minerals in a variety of granitoid batholiths
suggest the duration of batholith construction typically ranges from ~104 to 106 years (e.g.,
Brown and Fletcher, 1999; Coleman et al., 2004; Schaltegger et al., 2009; Memeti et al., 2010;
Schoene et al., 2012; Broderick et al., 2015; Samperton et al., 2015; Miles and Woodcock, 2018).
However, integration of U-Pb zircon geochronology with intra-grain textural observations, as
provided via cathodoluminescence (CL), is required to fully constrain the timescales involved in
batholith construction. Detailed CL studies of growth patterns in zircon (e.g., Corfu et al., 2003;
Harley et al., 2007; Erdmann et al., 2013) document discrete domains that commonly record the
dynamic and temporal evolution of a magma plumbing system (e.g., Barboni et al., 2015; Miles
and Woodcock, 2018). These domains include (cf. Miller et al., 2007): 1) inherited xenocrystic,
representing host rock contamination or source rock; 2) inherited antecrystic, reflecting early
magma gestation prior to batholith construction; 3) autocrystic, i.e., formed within a crystallizing
melt during emplacement; or 4) formed by partial replacement involving post-magma
emplacement metamorphic (e.g., Hoskin and Black, 2000) and/or hydrothermal zircon growth
(cf. Schaltegger, 2007).

23
Complex growth zoning patterns in zircon potentially record the dynamic and temporal evolution
of a magma plumbing system (e.g., Barboni et al., 2015; Miles and Woodcock, 2018) and
necessitate a multi-method approach to dating zircon growth. Chemical abrasion isotope dilution
thermal ionization mass spectrometry (CA-ID-TIMS) is the most precise method available for
dating zircon, but importantly, analytical methods that utilize chemical abrasion but do not
account for complex growth zones or inherited components could yield erroneous ages (i.e., not
reflecting times of crystallization) as the HF-leaching procedure does not simply dissolve the
outermost zircon layers but rather burrows into grains in unpredictable, asymmetric ways
(Mattinson, 2011). Zircon textural or geochemical information obtained prior to chemical
abrasion may not be connected to the age that is eventually measured (cf. Schoene and Baxter,
2017).
To document the origin, evolution and emplacement of magmas that construct a
batholith, it is paramount that the ages of different domains in zircon (and relevant monazite) be
determined, and this requires an integrated approach to achieve both high spatial- and age-
precision data. Chemical abrasion isotope dilution thermal ionization mass spectrometry (CA-
ID-TIMS) is the most precise method available for dating zircon (e.g., Mattinson, 2005; Crowley
et al., 2007). However, such studies rarely consider complex domains or the presence of robust
inherited components which could yield erroneous ages (i.e., not reflective of crystallization age)
due to the unpredictable, asymmetric dissolution of damaged parts of the zircon during the HF
leaching procedure (Mattinson, 2011). The use of an ion beam sputtering sensitive high-
24
resolution ion microprobe (SHRIMP) can provide analyses in an essentially non-destructive
manner, albeit with difficulty in measuring Pb/U measurements with less than 1% accuracy, and
can identify zircon grains with a prolonged or episodic magmatic history by targeting discrete
domains identified by CL images.
Previous studies characterizing the construction of the composite South Mountain Batholith
(SMB) of southern Nova Scotia, Canada, the largest intrusion in the Appalachian orogen, have
concentrated on its petrologic evolution by examining field, geochemical, and geophysical
evidence (e.g., Benn et al., 1999; Culshaw and Bhatnagar, 2001; MacDonald, 2001; Clarke et al.,
2004, 2009). However, a comprehensive study using robust geochronology to constrain the
absolute time and duration of emplacement (i.e., longevity) has not been done, thereby inhibiting
our understanding of processes such as melt generation and subsequent batholith emplacement,
construction, and its related metallogeny. Previously published U-Pb geochronological data
constrained the crystallization of its less evolved phases to ca. 385 Ma and more evolved phases
to ca. 370 Ma (Keppie et al., 1993), which implies a ~15 m.y. emplacement window; this is at
least an order of magnitude longer than the range in ages typical of batholith emplacement (e.g.,
Petford et al., 2000; Coleman et al., 2004; Glazner et al., 2004). This study presents new in-situ
SHRIMP U-Pb dates that distinguish and constrain the ages of antecrystic and xenocrystic
domains (e.g., Samperton et al., 2015; Schaltegger and Davies, 2017; Smith et al., 2019), and
CA-ID-TIMS dates from autocrysts which yield the precise time of crystallization of the most
pristine magmatic zircon and monazite autocrysts (e.g., Parrish and Noble, 2003; Mattinson,

25
2005). In addition to the above methods, U-Pb dating by laser-ablation multi-collector
inductively coupled plasma mass spectrometry (LA-MC-ICP-MS) was completed to correlate
chemical measurements to each domain type.
To understand the processes of melt generation, magmatic evolution, and related metallogeny of
the South Mountain Batholith (SMB) in southern Nova Scotia, Canada, we adopt the
aforementioned approach to constrain the U-Pb crystallization ages of zircon for each of the
main intrusive phases of this composite batholith. The results constrain, for the first time, the age
and duration of SMB emplacement, which has implications for the larger-scale regional tectono-
magmatic evolution as well as the spatial and temporal relationships between magmatism and
granophile mineralization (e.g., Sn, W, and U). Furthermore, the integration of precise CA-ID-
TIMS dating with in situ dating using SHRIMP and LA-MC-ICP-MS provides the bases to
distinguish ages of xenocrystic, antecrystic, autocrystic, and post-emplacement (i.e., sub-solidus)
zircon growth. To address the petrogenesis of the SMB and its metallogenic implications, the
zircon dating was complemented with in situ isotopic (Lu-Hf and δ18O) and geochemical (trace
and rare earth elements [REE]) analyses using LA-ICP-MS and secondary ion-mass
spectrometry (SIMS). Collectively, these data allow for a detailed temporal reconstruction of the
SMB, and constrain the sources of the magma and its contamination, as well as the tectonic
setting and metallogenic potential for the SMB.
26
2.3 Regional Geology
The SMB lies within the Meguma terrane of southern mainland Nova Scotia (Fig. 2–1), which is
predominantly underlain by Ediacaran–Early Ordovician metasedimentary rocks of the Meguma
Supergroup and abundant peraluminous granitoid intrusive rocks, including the SMB and smaller
satellite plutons (White, 2010). The Meguma Supergroup is subdivided into the Goldenville and
Halifax groups, which collectively consist of interbedded metasandstone, metasiltstone, and slate
that are unconformably overlain by metasedimentary and metavolcanic rocks of the Silurian-
Devonian Rockville Notch Group, including ca. 440 Ma volcanic rocks of the White Rock
Formation (White, 2010).
The Meguma terrane is the most outboard of several Gondwana-derived terranes that accreted to
the eastern Laurentian margin during the Paleozoic (i.e., Ganderia, Avalonia and Meguma, Fig.
2–1A; Bird and Dewey, 1970; Murphy and Nance, 1989; van Staal, 1994; Waldron et al., 1998,
2015). Lithostratigraphic and detrital zircon data suggest the Meguma Supergroup was
predominantly derived from the West African craton along the northern margin of Gondwana
(White et al., 2006; 2018; Waldron et al., 2009; White and Barr, 2010). The Meguma terrane
underwent prolonged deformation from the late Early Devonian (410–395 Ma), as recorded by
40Ar/39Ar muscovite and Re-Os in vein-hosted arsenopyrite throughout the terrane (e.g., Muecke
et al., 1988; Kontak et al., 1998; Hicks et al., 1999; Morelli et al., 2005), through to the Early
Carboniferous (375–350 Ma), as recorded by U-Pb zircon crystallization ages of deformed
27
granite and 40Ar/39Ar muscovite along discrete shear zones in the terrane (e.g., Keppie and
Dallmeyer, 1987; Archibald et al., 2018). The latter deformation is localized to major structures
in the Meguma terrane and is synchronous with metamorphism recorded central New England,
attributed to a “Neo-Acadian” orogeny (Robinson et al., 1998). Early Devonian-Early
Carboniferous tectonothermal events in the Meguma terrane are widely attributed to the
Neoacadian orogeny (van Staal, 2007; van Staal et al., 2009, in press; Waldron et al., 2009;
White et al., 2007, 2018) and reflect dextral transpression of the Meguma terrane along the
eastern composite Laurentian margin (e.g., Keppie et al., 1991; Murphy and Keppie, 2005;
Murphy et al., 2011; Fig. 2–2). The Avalon terrane, which had accreted to Laurentia during the
earlier Acadian orogeny (~421–417 Ma), is thought to have underthrust the converging Meguma
terrane during this time interval (e.g., van Staal et al., 2009; Fig. 2–2).
A variety of geochronological studies, summarized in Table 2–1, have broadly constrained the
age of the SMB and the spatially affiliated intrusions to the Late Devonian (~385–370 Ma), and
occurrences of younger granitic plutons in the southwest part of the Meguma terrane to ca. 360
Ma (e.g., Wedgeport and Clayton Hill granites). The former include numerous relatively small
mafic intrusive rocks that range in composition from tonalite and diorite (e.g., the Bog Island
Lake, BG in Fig. 2–1A; Giles and Chatterjee, 1987) to lamprophyre (e.g., the Pope’s Harbour
dykes, PH in Fig. 2–1A; Owen et al., 1988). Intermediate to felsic plutons of similar age to the
SMB are also exposed along the periphery of the SMB (e.g., Kinsar, Shelburne, Port Mouton,
Barrington Passage, and Wedgeport plutons; Fig. 2–1A); the intermediate phases are interpreted

28
to have formed through hybridization of mafic-intermediate and felsic magmas (e.g., Tate and
Clarke, 1997; Tate et al., 1997).
The younger ca. 360 Ma granitic magmatism in the southwest part of the Meguma terrane is
pene-contemporaneous with Neoacadian deformation (e.g., Culshaw and Reynolds, 1997;
Culshaw and Lee, 2006) and as well as basin-fill molasse deposits of the late Famennian Horton
Group (Martel et al., 1993). The Horton Group is the oldest stratigraphic unit to be deposited on
the Avalon-Meguma terrane boundary. It unconformably overlies the Meguma Supergroup along
the northern margin of the Meguma terrane where it also onlaps the SMB; and has a clast
inventory that indicates provenance from the Meguma Supergroup, the Rockville Notch Group,
and the SMB (Murphy, 2000). Thus, at least the northern part of the SMB was exhumed by ca.
355 Ma.
The SMB is the largest of granitoid plutons and published data suggest it is ~5 to 10 Ma older
than the less voluminous, basic- to intermediate intrusions and dike rocks (e.g., Weekend dikes;
Owen et al., 1988; Kempster et al., 1989) that occur around its periphery and the periphery of
other similar-aged intrusions, such as the Musquodoboit Batholith (e.g., MacDonald et al., 1992;
Clarke et al., 1993; Kontak and Reynolds, 1994; Keppie and Krogh, 1999; MacLean et al., 2003;
Fig. 2–1 and Table 2–1). Field observations combined with gravity, seismic and aeromagnetic
studies have indicated that basement faults controlled the emplacement of these intrusions and
29
were important conduits for the later focusing of hydrothermal fluids (e.g., Keen et al., 1991;
Horne et al., 1992; Kontak, 1994; Benn et al., 1997; MacDonald, 2001).
2.4 The South Mountain Batholith
The SMB of southwest Nova Scotia is a composite intrusive complex dominated by granodiorite
to monzogranite (Clarke et al., 1988, 1993, 1997; MacDonald et al., 1992; McDonald, 2001) and
with a surface exposure of over 7300 km2 it is the largest batholith in the Appalachian orogen.
The SMB has a bulk composition that is peraluminous, as indicated by the presence of corundum
in the normative mineralogy, and is high in P2O5 and MgO (e.g., McKenzie and Clarke, 1975;
Clarke et al., 2005). A number of studies along its northeastern and southeastern margins
constrain emplacement pressure to ca. 3.5 kbar (e.g., Halter and Williams-Jones, 1999; Carruzzo
et al., 2000; Kontak et al., 2002a; Hilchie and Jamieson, 2008, 2014; Kontak and Keyser, 2011).
The conventional interpretation is that the SMB was generated via partial melting of unexposed
basement rocks beneath the Meguma Supergroup to produce its general peraluminous nature
(Clarke et al., 1988); the SMB was subsequently modified due to combined assimilation
fractional crystallization processes (AFC; Clarke et al., 2004), the former involving Meguma
metasedimentary rocks (e.g., MacDonald et al., 1992; Clarke et al., 1997; Clarke and Carruzzo,
2007; Shellnutt and Dostal, 2012; MacDonald and Clarke, 2017).
30
Detailed mapping of the SMB, done for the first time in the mid-late 1980s and summarized in
MacDonald (2001), defined its composite nature, which was interpreted to reflect two distinct
magmatic stages: an early granodiorite that forms a border phase to the batholith and is referred
to as stage 1, and later more evolved phases of monzogranitic composition, consisting of at least
five plutons and referred to as stage 2 (Fig. 2–1B). From west to east, these latter intrusions
include the Davis Lake (DLP), West Dalhousie (WDP), East Dalhousie (EDP), New Ross (NRP)
and Halifax (HP). The multi-phase SMB hosts numerous polymetallic (Sn, W, Mo, Cu, Zn, U,
Ta, Nb) occurrences hosted in the more-evolved plutons (MacDonald, 2001); however, the only
significant economic deposit to date is the East Kemptville greisen-type Sn-(Zn-Cu-Ag-In)
deposit, which is hosted in an evolved muscovite-topaz leucogranite phase of the DLP
(Richardson, 1988; Kontak, 1990; Halter et al., 1996; Kontak et al., 2002a; Bickerton et al.,
submitted).
In this study, the SMB was sampled for U-Pb geochronology at spatially representative locations
in the outer granodiorite as well as in each of the evolved plutons, to complement and refine
previous geochronology of both the SMB and its peripheral plutons (compiled in Table 2–1).
Sample locations are shown in Fig. 2–1B, with precise coordinates in Table 2–2.
2.4.1 Stage 1 Plutons
The majority of the SMB is a biotite-muscovite granodiorite that locally transitions to leucocratic
phases and melanocratic segregations. These rocks typically contain fabrics, such as aligned
31
megacrysts and preferred orientations of schlieren and xenoliths, which reflect magmatic flow
(e.g., Fig. 2–3A, B, C). Along its margins, the granodiorite typically contains abundant, variably-
sized and corroded xenoliths of the immediate wall-rock unit (i.e., lithologies of the host
Meguma terrane; e.g., Fig. 2–3C).
In many stage 1 plutons, primary cordierite (e.g., Fig. 2–3D), andalusite, topaz, almandine-rich
garnet, and tourmaline occur locally (e.g., Clarke et al., 2005; Erdmann et al., 2009; Clarke,
2010; Lackey et al., 2011). The cordierite and garnet, both high in aluminum content, are thought
to represent peritectic phases that crystallized during partial melting of pelitic xenoliths under
fluid-absent conditions (cf. MacDonald and Clarke, 2017) and preservation of such partially
melted xenoliths is common (e.g., Fig. 2–3E, F).
Five samples were collected from different locations in these early-stage intrusive phases (Fig.
2–1B, Table 2–2) for detailed U-Pb geochronology analysis. Of these, two samples were dating
using CA-ID-TIMS (16BIC-073 and 15SMB-ORIG), three were dated via SHRIMP (16BIC-
074, 16BIC-080, and 16BIC-075), and three duplicate samples were dating via LA-MC-ICP-MS
(16BIC-073, 16BIC-074B, and 16BIC-075). Sample 15SMB-ORIG was collected from a 1.5 km
deep drill hole made by the Nova Scotia Department of Natural Resources as part of a study on
compositional variability with depth in the SMB (Chatterjee and Dostal, 2003).
32
2.4.2 Stage 2 Plutons
The poorly exposed WDP, the smallest of the more evolved plutons, is located along the west-
northwestern margin of the SMB where a number of small leucomonzogranite to leucogranite
bodies are mapped (Fig. 2–1B). Two samples of muscovite-biotite monzogranite were collected
from this phase: 16BIC-083 is from the community of West Springhill near the western
periphery of the SMB; here the unit is a leucocratic phase that is exposed outside of its
previously mapped contact and is located adjacent to an inferred along-strike projection of the
Chebogue Point shear zone (CPSZ, White and Barr 2010; Fig. 2–1B); 19BIC-086 comes from
near the community of West Dalhousie in the central part of a muscovite-biotite monzogranite
intrusion. 16BIC-083 and 16BIC-083B, from the same outcrop, were used for SHRIMP and LA-
MC-ICP-MS analysis, respectively, whereas 19BIC-086 underwent CA-ID-TIMS analysis
(Table 2–2).
The EDP is a poorly exposed leucomonzogranite along the NE-trending East Kemptville–East
Dalhousie shear zone (EKEDSZ, Fig. 2–1B). It is similar to the WDP and NRP (see below) in
terms of the range of textures and compositions. Two samples were collected from this unit (Fig.
2–1B), one for SHRIMP analysis (16BIC-084) and the other for CA-ID-TIMS analysis (16BIC-
076; Table 2–2). Duplicates of each were analyzed by LA-MC-ICP-MS.
The NRP leucogranite, which occurs in the New Ross area, is the third largest pluton of the SMB
in terms of area and thus it is not 32urprising that it defines the most pronounced negative

33
Bouger gravity anomaly in the SMB; this anomaly has been modeled to suggest a deep root zone
extending to a depth of 10-20 km (Garland, 1953; Clarke and Chatterjee, 1988). The
geochemical signature of this pluton indicates it is one of the most fractionated phases in the
SMB (MacDonald, 2001) and it is characterized by a variety of polymetallic mineralization (i.e.,
Sn, W, U, Mo, Cu, Mn) that relates to areas of pegmatite-, greisen- and quartz veining (O’Reilly
et al., 1982; Carruzzo et al., 2000).
Four samples collected from the NRP were used for SHRIMP (16BIC-081 and 16BIC-082) and
CA-ID-TIMS analysis (16BIC-077 and 19BIC-087; Table 2–2). Duplicates of 16BIC-077,
16BIC-081, and 16-BIC-082 were also analyzed by LA-MC-ICP-MS. Sample 16BIC-081 is a
monzogranite representative of the central part of the NRP, whereas 16BIC-082 and 19BIC-087
are leucomonzogranites from outside of the mapped pluton (off its southeastern tip on the
Aspotogan Peninsula), although interpreted here to represent a late phase of the NRP (Fig. 2–
1B). Sample 19BIC-087 was collected to follow up the anomalously young age determined from
SHRIMP analysis on sample 16BIC-082 in the same area (see results below). Sample 16BIC-077
is a leucomonzogranite from a section along the inferred NE projection of the Rossignol shear
zone (RSZ; Fig. 2–1B) located to the southwest.
The HP, a complexly zoned intrusion of granodiorite to leucomonzogranite, is the most easterly
pluton of the SMB and considered to be one of its more-evolved phases (MacDonald and Horne,
1988). It is well exposed along an extensive coastal section.

34
Three samples were collected from the HP: two for SHRIMP (16BIC-079 and 16-BIC-085) and
one for CA-ID-TIMS (16BIC-078; Table 2–2) analysis. Each of the three sample locations were
used to collect additional samples for LA-MC-ICP-MS analysis. Sample 16BIC-079 is a
muscovite-biotite monzogranite from the periphery of the pluton, 16BIC-085, from its
southwestern margin, and 16BIC-078, from its interior (Fig. 2–1B) are both leucomonzogranite.
The DLP, at the most southwestern extent of the SMB, is one of its most evolved phases. It is
poorly exposed, but abundant subcrops may occur northeast of the community of East
Kemptville. Representative drilling across the pluton indicates the DLP as zoned from an early
biotite granodiorite to a highly fractionated muscovite leucogranite with the latter enriched in Li,
U, F, Ta, and Sn (Dostal and Chatterjee, 1995).
Two leucogranite samples from the DLP (16BIC-072 and 16BIC-071; Fig. 2–1B) were collected
northeast of East Kemptville for SHRIMP and CA-ID-TIMS analysis, respectively, whereas
duplicates of each were used for LA-MC-ICP-MS analysis (Table 2–2). Sample 16BIC-072 is
from subcrop in the interior of the DLP, proximal to the inferred southwestern projection of the
Tobeatic shear zone (TSZ; Giles, 1985), whereas sample 16BIC-071 is from an outcrop at the
southwestern edge of the pluton proximal the southwestern projection of the EKEDSZ (Horne et
al., 1988; 2006; Fig. 2–1B).
35
2.5 Analytical Techniques
2.5.1 Mineral Separation and Sample Preparation
Zircon were separated from samples for either U-Pb dating, δ18O analysis or combined trace
element and Hf isotopic analysis. Specific sample preparation protocols are specific to each of
the procedures and laboratories used.
2.5.1.1 Sensitive High-Resolution Ion Microprobe (SHRIMP) Analysis
The zircon grains from ten ~10 kg rock samples were separated using conventional methods of
crushing followed by gravity and electric-pulse disaggregation at Overburden Drilling
Management in Ottawa, Ontario (Averill and Huneault, 2006; Cabri et al., 2008). Zircon grains
in the concentrates, which range from greater than 10,000 grains in the less-evolved granodiorite
samples to approximately 5000 grains in the more-evolved leucocratic samples, were hand-
picked and mounted in epoxy resin together with the zircon reference materials Temora-2
(primary; Black et al., 2004), z6266 (Stern and Amelin, 2003), and z9910 (unpublished internal
laboratory standard). The accepted 206Pb/238U age of z9910 is 441.2 ± 0.4 Ma, based on 5 ID-TIMS
fractions (B. Davis and V. McNicoll, unpublished data with reported TIMS long-term average age
of 440.7 ± 7 Ma). The grain mount was subsequently polished to reveal approximate zircon
midsections. The internal features of zircon grains (i.e., zoning, internal domains, and alteration)
were characterized via cathodoluminescence (CL) and backscattered electron (BSE) imaging
36
utilizing a Cambridge Instruments scanning electron microscope (SEM) at the Geological Survey
of Canada, Ottawa; representative BSE and CL images are available in the Electronic Appendix
Table EA 2-1. All reported errors are at 2 sigma and include the external long-term
reproducibility of the 9910 reference zircon (constant external error of 0.59%, 95% conf.).
2.5.1.2 Chemical Abrasion Isotope Dilution Thermal Ionization Mass Spectrometry
(CA-ID-TIMS) Analysis
Samples were processed using standard techniques of crushing and concentration of a heavy
mineral separate by density and magnetic techniques followed by hand-picking to select zircon
and monazite fractions from each sample. Some monazite and zircon grains are physically
abraded to remove visible alteration (cf. Krogh, 1982), as indicated by ‘Abr’ in Table EA 2-2
(Electronic Appendix), whereas euhedral gem-quality zircon and monazite are not abraded. The
morphology and internal texture of zircon were examined prior to U–Pb age determination. The
overall morphology of zircon was characterized by transmitted light using a standard
petrographic microscope and the internal textures were observed using a (FEI Quanta 400) SEM
and a CL detector at Memorial University (e.g., Fig. 2–4A, B, C).
37
2.5.1.3 Secondary Ion-Mass Spectrometry (SIMS) Oxygen Stable Isotopes Analysis
and Laser Ablation Multi Collector-Inductively Coupled Plasma-Mass
Spectrometry (LA-MC-ICP-MS)
Approximately 20 to 30 zircon grains were separated from each of the fifteen igneous rock
samples that were also used for U-Pb geochronology and O and Hf analysis, in addition to
further in situ analysis for U-Pb dating trace-element chemistry. Mount preparation was carried
out at the Canadian Centre for Isotopic Microanalysis (CCIM), University of Alberta where
zircon grains were epoxy-embedded and polished to their mid-sections using diamond grits. The
prepared 25 mm SIMS mount (M1560B) was coated with 25 nm of high-purity Au prior to
imaging on an SEM utilizing a Zeiss EVO MA15 instrument equipped with a high-sensitivity,
broadband CL and BSE detectors. Beam conditions in this study were 15 kV and 3–5 nA sample
current. Another 100 nm of Au was subsequently deposited on the mount prior to SIMS analysis.
2.5.2 U-Pb Geochronology
2.5.2.1 SHRIMP U-Pb Analysis
In situ U-Pb isotopic analyses of zircon were carried out using the SHRIMP in the J.C. Roddick
Ion Microprobe Laboratory at the Geological Survey of Canada in Ottawa. Abundances of U and
Pb isotopes are measured in situ in individual zircons by SHRIMP, generating an approximately
38
17 x 20 μm elliptical spot, 1 to 5 μm deep, on the target. Precise locations of analyses in this
study were selected after evaluating the internal structure of the grains revealed in the BSE and
CL imagery (e.g., Fig. 2–4D to F). Standard operating techniques for the SHRIMP employed in
this study are described in Stern (1997). All reported errors are at 2 sigma and include the
external long-term reproducibility of secondary standard 9910 reference zircon (constant external
error of 0.59%, 95% confidence). The TIMS age for standard z9910 is 441 Ma during our
analytical session, z9910 calibrated against primary standard 10493 Temora yielded 440.70 ±
0.70 Ma (n = 42, MSWD = 1.4).
In SHRIMP analysis, spot selection is based on growth zones within the zircon (see Table EA 2-
1, Electronic Appendix). Results from spots placed on domains interpreted as antecrystic or
metamict/overgrowth are shown in Table EA 2-1; these analyses typically yield dates that
overlap or are slightly older than the dominant autocrystic zircon age population. Xenocrystic
cores have CL and BSE responses distinct from zircon rims and the mantles to cores. In addition
to the contrasts in CL and BSE responses, xenocrystic cores typically yield ages significantly
older than the rest of the zircon U-Pb SHRIMP analyses.
2.5.2.2 CA-ID-TIMS U-Pb Analysis
Analytical work was carried out in the radiogenic isotope facility at Memorial University of
Newfoundland. In CA-ID-TIMS analysis, zircon and monazite grains are selected for analysis
according to criteria of morphology and clarity. The analytical methods for these analyses were
39
carried out as reported by Sánchez-García et al. (2008). High-quality zircon and monazite grains
with no visible inherited core are removed from epoxy mounts and chemically abraded (cf.
Mattinson, 2005) to minimize or eliminate Pb-loss. All zircons are washed in dilute nitric acid,
then distilled water prior to dissolution. The ion exchange chemistry followed a miniaturized
version of that described by Krogh (1973). Lead and U isotopic ratios are measured by thermal
ionization mass spectrometry, and results are calculated using ISOPLOT (Ludwig, 2003) for
weighted average 206Pb/238U ages, or Davis (1982) for linear regressions (Table EA 2-2,
Electronic Appendix). Uncertainties on all ages are reported at the 95% confidence interval.
2.5.2.3 LA-MC-ICP-MS U-Pb and Trace Element Analysis
Trace-element and U-Pb data on zircon were collected simultaneously by using a Photon
Machines Analyte G2 193-nm excimer laser ablation system (λ = 193 nm) coupled to a Thermo
Neptune Plus with Jet Interface ICP-mass spectrometer at the Mineral Exploration Research
Centre Isotope Geochemistry Lab (MERC-IGL), Laurentian University. In situ analytical
techniques were employed following McFarlane (2016). In this study, a laser spot diameter of 40
µm, a low energy density of 2 J/cm2 and 7 Hz pulse frequency ensured conditions that minimize
isotopic fractionation. Each analysis included a background acquisition of approximately 30 s
and a signal acquisition of 10 s. The instrument mass bias was controlled through 40
measurements of the 91500 reference zircon (CA-ID-TIMS 207Pb/206Pb age of 1065 ± 1 Ma;
Wiedenbeck et al., 1995) during the course of the analyses, which yielded a mean 207Pb/206Pb age
40
of 1063.5 ± 6.6 Ma (MSWD = 1.5; Table EA 2-3b, Electronic Appendix). Secondary reference
zircon crystals were repeatedly analyzed to assess the accuracy of the mass bias correction: 10
analyses of Plesovice (337.1 ± 0.37 Ma; Sláma et al., 2008) yielded an average 206Pb/238U age of
338.1 ± 3.0 Ma (MSWD = 4.4; Electronic Appendix Fig. EA 2-3b) and 10 analyses of reference
material Temora2 (416.8 ± 1.3 Ma; Black et al., 2004) yielded a mean 206Pb/238U age of 418.5 ±
3.2 Ma (MSWD = 2.4; Electronic Appendix Fig. EA 2-3e). No common Pb correction was
applied to results. Trace-element concentrations are quantified by normalizing to SRM610 glass
reference material and using stoichiometric Si as an internal standard. Titanium concentrations
are normalized to zircon reference materials 91500, GJ1, AUSZ7-5, and AUSZ7-1
(Szymanowski et al., 2018) and, in this study, resulted in an average correction factor of 1.2 (2s
= 0.06; Table EA 2-3, Electronic Appendix). Downhole U-Pb fractionation and instrumental
mass bias were corrected by matrix-matched normalization using the GJ-1 reference zircon. Data
reduction was performed using the VizualAge data reduction package (Petrus and Kamber,
2012) in Iolite v. 3.32 (Paton et al., 2011). All sample and reference material data are provided in
Table EA 2-3 (Electronic Appendix). A summary of in situ zircon U-Pb isotope data is shown in
Table 2–3 and a summary of trace-element data in Table 2–5.
2.5.3 Lu-Hf Isotopic Compositional Determination by LA-MC-ICP-MS
The Lu-Hf isotopes in zircon were acquired by employing LA-MC-ICP-MS at the MERC-IGL in
Sudbury, Ontario, Canada. The spot selection for 176Hf/177Hf isotope ratio analysis was based on
41
domains that yielded U–Pb, trace element, and (wherever possible) O-isotope results. The Lu-Hf
analyses are performed using a Photon Machines Analyte G2 193-nm laser ablation system
coupled to a Thermo Neptune Plus with Jet Interface ICP-mass spectrometer. For one Hf isotope
analysis, a zircon is ablated for 60 seconds using a spot diameter of 40 µm, an energy density of
6 J/cm2 and a repetition rate of 7 Hz. The first 30 s of each analysis is used to determine
instrumental background count, and is followed by 60 s of laser ablation sampling. The thermo
Neptune Plus MC-ICP-MS has a fixed detector array of 9 Faraday cups that simultaneously
analysed masses 171Yb, 173Yb, 174Yb, 175Lu, 176Hf, 176Yb, 176Lu, 177Hf, 178Hf, and 179Hf. Hafnium
isotope data baselines are automatically subtracted from the sample data by the Neptune software
and the data are further corrected for mass bias and isobaric interferences of 176Yb and 176Lu on
176Hf; 176Yb/173Yb = 1.35272, 176Lu/175Lu = 0.02655, and 179Hf/177Hf = 0.7325 ratios are used,
assuming exponential mass fractionation law of Russell et al. (1978).
For this study, a primary reference material of Plesovice standard zircon (176Hf/177Hf = 0.282482;
Sláma et al., 2008) was analysed to check the accuracy and external reproducibility of the
method, which yielded 176Hf/177Hf of 0.282482 (n = 43). Secondary reference materials of
standard zircon included 91500 (176Hf/177Hf = 0.282306; Wiedenbeck et al., 1995), R33
(176Hf/177Hf = 0.282755; Kemp et al. 2017), Temora2 (176Hf/177Hf = 0.282680; Woodhead and
Hergt, 2005), and MUN1/3 (176Hf/177Hf = 0.282140; Fisher et al., 2011); these were also
analysed to check the accuracy and external reproducibility of the method and yielded average
176Hf/177Hf values of 0.282303 (n = 10), 0.282749 (n = 10), 0.282658 (n = 10), and 0.282129 (n
42
= 10), respectively. The reference material results agree with the LA-MC-ICP-MS long-term
average of reference zircons at the MERC-IGL. Initial ratios are calculated via a 176Lu decay
constant value of ~1.86 × 10⁻¹¹ year-1 (Scherer et al., 2001), as well as chondritic uniform
reservoir (CHUR) ratios of 0.282785 for (176Hf/177Hf)CHUR and 0.0336 for (176Lu/177Hf)CHUR
(Bouvier et al., 2008). All Hf isotope analytical results are provided in the Electronic Appendix
Table EA 2-5. The results quoted in the text are given with their corresponding 2σ errors, unless
stated otherwise.
2.5.4 Oxygen Stable Isotope Determinations by SIMS
Oxygen isotopes (18O, 16O) in zircon are analyzed using a Cameca IMS 1280 multicollector ion
microprobe. In this study, a 133Cs+ primary beam was operated with impact energy of 20 keV and
beam current of ~ 2.0 nA. The ~10 µm diameter probe was rastered (20 x 20 µm) for 30 s prior
to acquisition, and then 3 x 3 µm during analysis. A normal incidence electron gun is utilized for
charge compensation. Negative secondary ions are extracted through 10 kV into the secondary
(Transfer) column. Transfer conditions for this study included a 122 µm entrance slit, a 5 x 5 mm
pre-ESA (field) aperture, and 100x (MA80) sample magnification at the field aperture,
transmitting all regions of the sputtered area; no energy filtering was employed. The mass/charge
separated oxygen ions are detected simultaneously in Faraday cups L’2 (16O-) and H’2 (18O-) at
mass resolutions (m/∆m at 10 %) of 1950 and 2250, respectively. Secondary ion count rates for
16O- and 18O- are typically ~2 x 10⁹ and 4 x 10⁶ counts/s utilizing 1010 Ω and 1011 Ω amplifier
43
circuits, respectively. Faraday cup baselines are measured at the start of each analytical session.
For this study, a single analysis took 240 s, including pre-analysis rastering, automated
secondary ion tuning, and 75 s of continuous peak counting.
Instrumental mass fractionation (IMF) was monitored in this study by repeated analysis of the
zircon primary reference material S0081 (δ18OVSMOW = +4.87‰; R. Stern, unpublished laser
fluorination data, University of Oregon), once after every four unknowns. A secondary zircon
reference material, TEM2 (δ18OVSMOW = +8.2‰; Black et al., 2004) was also analysed after
every 12 unknowns. The 18O/16O data set for S0081 was processed collectively for single
analytical sessions, yielding a standard deviation of 0.09‰ (this followed correction for
systematic within-session drift of 0.15‰). The individual spot uncertainties in δ18OVSMOW for the
unknowns had a median of ± 0.21‰ at 95% confidence, which included errors relating to within-
spot counting statistics, between-spot (geometric) effects, and correction for instrumental mass
fractionation. Results for multiple spots on multiple grains of the secondary reference material
(TEM2) yielded a weighted mean δ18OVSMOW = +8.22‰ (MSWD = 0.78; n = 34, σ = 0.09‰),
consistent with the reference value. All sample and reference material data are provided in Table
EA 2-4 (Electronic Appendix) and a summary of zircon O isotope data is shown in Table 2–6.
44
2.6 Results
2.6.1 Zircon Characterization
The zircons used for this study are considered representative of the entire population found in the
SMB since they were extracted from a wide range of SMB lithologies. In general, they range
from 25 to 500 μm in length and have external morphologies that include irregular stubby and
partially resorbed, regular elongate prismatic, and the most dominant which is equant prismatic.
The zircons analyzed herein contain four types of internal domains identified by texture, zoning,
CL response, and chemistry (i.e., trace elements and crystallization age). These domain types
include: xenocrysts (inherited), antecrysts (inherited), autocrysts, and post-emplacement or
metamict growth domains, as summarized in Figure 2–5. Xenocrystic zircon form cores that are
mantled by well-zoned magmatic zircon; the former domains are typically rounded or irregular
in shape with zonation patterns that range from convoluted to unzoned (e.g., Fig. 5A). If the
growth zones are narrow, mineral dissolution (i.e., CA-ID-TIMS) or in situ analysis (i.e., LA-
ICP-MS or SHRIMP) could necessarily or inadvertently sample multiple growth zones resulting
in a mixed age with little geological significance (cf. Mundil et al., 2001; Miller et al., 2007). To
avoid these latter problems, zircon selection for CA-ID-TIMS analysis targeted the least
damaged and most homogenous crystals, whereas homogeneous portions of grains from both
interior (cores or mantles to cores) and exterior (rims) were selected for in situ analysis.
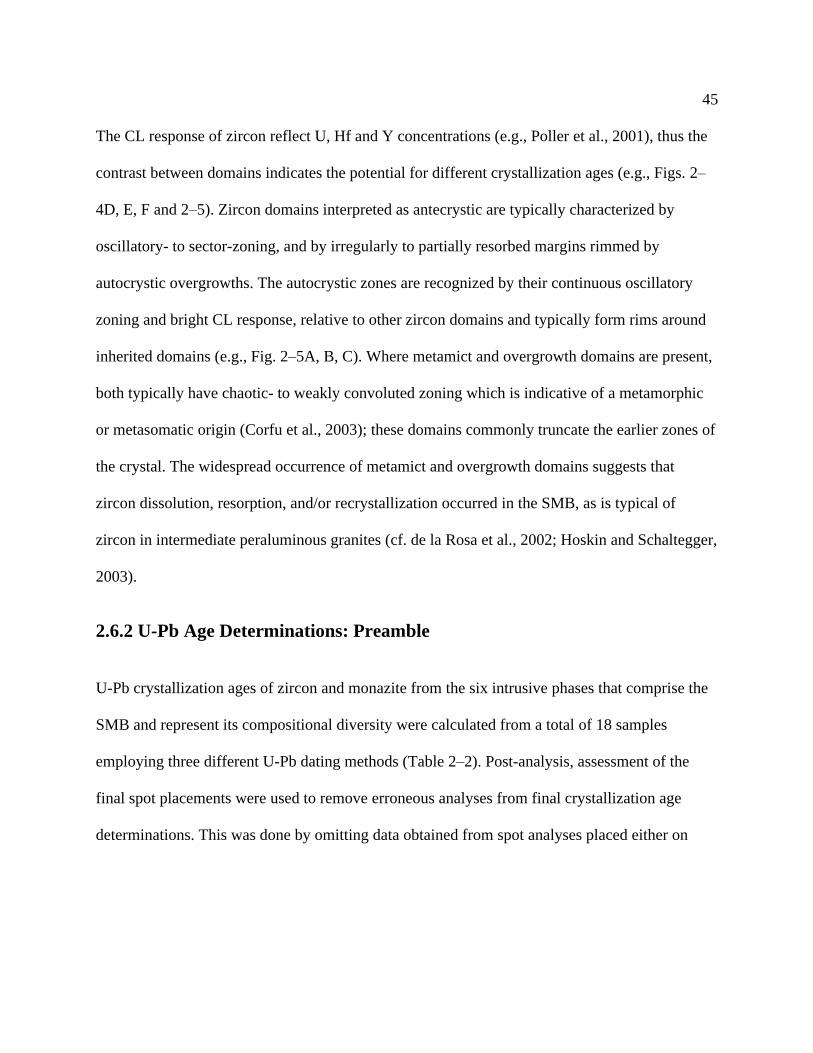
45
The CL response of zircon reflect U, Hf and Y concentrations (e.g., Poller et al., 2001), thus the
contrast between domains indicates the potential for different crystallization ages (e.g., Figs. 2–
4D, E, F and 2–5). Zircon domains interpreted as antecrystic are typically characterized by
oscillatory- to sector-zoning, and by irregularly to partially resorbed margins rimmed by
autocrystic overgrowths. The autocrystic zones are recognized by their continuous oscillatory
zoning and bright CL response, relative to other zircon domains and typically form rims around
inherited domains (e.g., Fig. 2–5A, B, C). Where metamict and overgrowth domains are present,
both typically have chaotic- to weakly convoluted zoning which is indicative of a metamorphic
or metasomatic origin (Corfu et al., 2003); these domains commonly truncate the earlier zones of
the crystal. The widespread occurrence of metamict and overgrowth domains suggests that
zircon dissolution, resorption, and/or recrystallization occurred in the SMB, as is typical of
zircon in intermediate peraluminous granites (cf. de la Rosa et al., 2002; Hoskin and Schaltegger,
2003).
2.6.2 U-Pb Age Determinations: Preamble
U-Pb crystallization ages of zircon and monazite from the six intrusive phases that comprise the
SMB and represent its compositional diversity were calculated from a total of 18 samples
employing three different U-Pb dating methods (Table 2–2). Post-analysis, assessment of the
final spot placements were used to remove erroneous analyses from final crystallization age
determinations. This was done by omitting data obtained from spot analyses placed either on
46
significantly damaged parts of the crystal or clearly overlapping different growth domains. The
geological significance of weighted mean 206Pb/238U ages, concordia ages, and individual
crystallization ages are discussed in the context of the internal crystal structure (i.e., zonation,
morphology, domain classification), zircon geochemical and isotopic characteristics, as well as
field relationships among phases of the SMB and regional structures. The resultant full data sets
are presented in Electronic Appendices Tables EA 2-1 (SHRIMP zircon analyses, including
erroneous analyses), EA 2-2 (CA-ID-TIMS zircon and monazite analyses), and EA 2-3 (LA-MC-
ICP-MS zircon analyses).
The spots analysed by LA-MC-ICPMS were wider and deeper than the SHRIMP spots, and thus
results are typically relatively discordant. For concordant data, the age interpretations are based
on the weighted mean average 206Pb/238U ages; these data are presented in the text, with
corresponding 2σ error, unless stated otherwise. For data that were determined to be discordant,
the age interpretations were calculated from concordia intercepts of simple Pb-loss lines or
common Pb-mixing lines, where possible. The full data tables U-Pb zircon and monazite
geochronology results from samples collected from each major phase of the SMB are provided in
the Electronic Appendices.
47
2.6.3 U-Pb Age Determinations Results
2.6.3.1 SHRIMP and LA-ICP-MS data
Zircon crystallization, its subsequent resorption and/or recrystallization, and alteration can each
play a role in the final ages yielded by a single grain. The SHRIMP and LA-MC-ICP-MS spot
analysis on zircon thus targeted distinct autocrystic, antecrystic, xenocrystic, and late
replacement domains (cf. Miller et al., 2007), as initially characterized texturally. Post-analysis,
assessment of the final spot placements was used to remove erroneous data from final
crystallization age determinations. Data omitted include spot analyses placed either on
significantly damaged crystal domains or those overlapping different growth domains. Analytical
spots placed on xenocrystic cores are further subdivided by their respective zircon crystallization
age groupings. The in-situ zircon U-Pb results are herein presented in the context of domain
types characterized above. In keeping with the sequential development of the zircon domains, the
data are presented from oldest to youngest, thus xenocryst, antecryst, autocryst and metasomatic
overgrowth/recrystallized.
The spots analysed by LA-MC-ICP-MS yielded crystallization ages (not corrected to common
Pb) that are consistent with, though less concordant than, the 204Pb-corrected 206Pb/238U ages
from equivalent SHRIMP spots (see below). Thus, the interpretation of LA-MC-ICP-MS data
relies on the trace element and Lu-Hf results. For data with error ellipses that overlap concordia,
48
age interpretations are based on the weighted mean average 206Pb/238U ages; these data are
presented below with the corresponding 2σ error.
The xenocrystic zircon domains collectively yield age populations that can be divided into three
sub-groups based on distinct peaks in probability density space (Fig. 2–6): 1) ~400 to 470 Ma; 2)
~480 to 670 Ma; and 3) >700 Ma. Low density clusters also occur at ~700 to 850 Ma, ca. 1.5 Ga,
and ~1.9 to 2.2 Ga. The 207Pb/206Pb chronometer is applied to data that yielded ages >850 Ma,
thus included in the comparison, for a more robust measure of concordance in older zircon
population, shifted from the typical 1.5 Ga cut-off (Spencer et al., 2016) to accommodate zircon
with the ~1.5 Ga age spectra. The xenocrystic zircon ages are similar to the detrital zircon
populations documented in the upper part of Meguma Supergroup stratigraphy and overlying
Silurian-Devonian rocks (i.e., Halifax Group, upper Goldenville Group, White Rock and
Torbrook formations; summary in Waldron et al., 2009). The ~540 to 770 Ma zircon population
is also shared by clastic sedimentary units of the adjacent Avalon terrane (cf. Barr et al., 2012;
Henderson et al., 2016). A small anomalous xenocryst population also occurs at ~1.5 Ga (6
analyses across 4 samples; Fig. 2–6).
A majority of antecryst domains form mantles around xenocrysts and are characterized by abrupt
changes in zonation or morphology based on CL and backscattered electron images (e.g., Fig. 2–
5A, B). These data typically record crystallization ages ~3 to 15 m.y. older than their respective
autocrystic domains (Table 2–3; Figs. 2–7, 2–8 and 2–9). Furthermore, the antecryst zircon
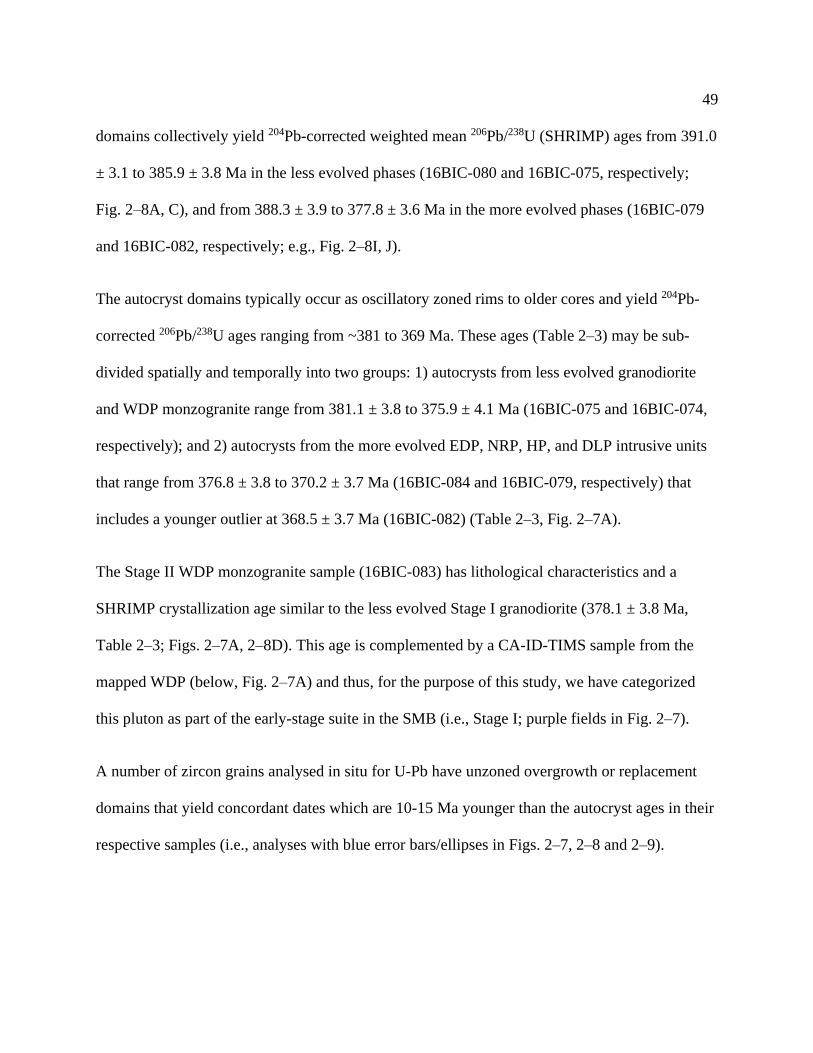
49
domains collectively yield 204Pb-corrected weighted mean 206Pb/238U (SHRIMP) ages from 391.0
± 3.1 to 385.9 ± 3.8 Ma in the less evolved phases (16BIC-080 and 16BIC-075, respectively;
Fig. 2–8A, C), and from 388.3 ± 3.9 to 377.8 ± 3.6 Ma in the more evolved phases (16BIC-079
and 16BIC-082, respectively; e.g., Fig. 2–8I, J).
The autocryst domains typically occur as oscillatory zoned rims to older cores and yield 204Pb-
corrected 206Pb/238U ages ranging from ~381 to 369 Ma. These ages (Table 2–3) may be sub-
divided spatially and temporally into two groups: 1) autocrysts from less evolved granodiorite
and WDP monzogranite range from 381.1 ± 3.8 to 375.9 ± 4.1 Ma (16BIC-075 and 16BIC-074,
respectively); and 2) autocrysts from the more evolved EDP, NRP, HP, and DLP intrusive units
that range from 376.8 ± 3.8 to 370.2 ± 3.7 Ma (16BIC-084 and 16BIC-079, respectively) that
includes a younger outlier at 368.5 ± 3.7 Ma (16BIC-082) (Table 2–3, Fig. 2–7A).
The Stage II WDP monzogranite sample (16BIC-083) has lithological characteristics and a
SHRIMP crystallization age similar to the less evolved Stage I granodiorite (378.1 ± 3.8 Ma,
Table 2–3; Figs. 2–7A, 2–8D). This age is complemented by a CA-ID-TIMS sample from the
mapped WDP (below, Fig. 2–7A) and thus, for the purpose of this study, we have categorized
this pluton as part of the early-stage suite in the SMB (i.e., Stage I; purple fields in Fig. 2–7).
A number of zircon grains analysed in situ for U-Pb have unzoned overgrowth or replacement
domains that yield concordant dates which are 10-15 Ma younger than the autocryst ages in their
respective samples (i.e., analyses with blue error bars/ellipses in Figs. 2–7, 2–8 and 2–9).
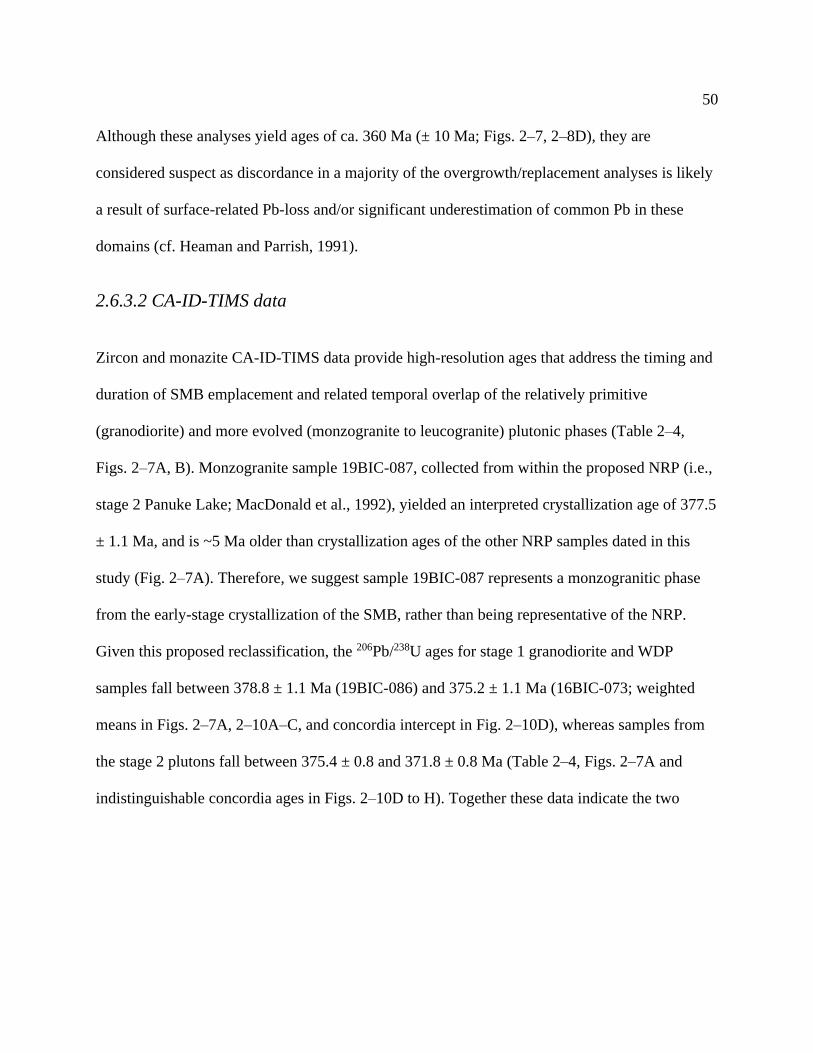
50
Although these analyses yield ages of ca. 360 Ma (± 10 Ma; Figs. 2–7, 2–8D), they are
considered suspect as discordance in a majority of the overgrowth/replacement analyses is likely
a result of surface-related Pb-loss and/or significant underestimation of common Pb in these
domains (cf. Heaman and Parrish, 1991).
2.6.3.2 CA-ID-TIMS data
Zircon and monazite CA-ID-TIMS data provide high-resolution ages that address the timing and
duration of SMB emplacement and related temporal overlap of the relatively primitive
(granodiorite) and more evolved (monzogranite to leucogranite) plutonic phases (Table 2–4,
Figs. 2–7A, B). Monzogranite sample 19BIC-087, collected from within the proposed NRP (i.e.,
stage 2 Panuke Lake; MacDonald et al., 1992), yielded an interpreted crystallization age of 377.5
± 1.1 Ma, and is ~5 Ma older than crystallization ages of the other NRP samples dated in this
study (Fig. 2–7A). Therefore, we suggest sample 19BIC-087 represents a monzogranitic phase
from the early-stage crystallization of the SMB, rather than being representative of the NRP.
Given this proposed reclassification, the 206Pb/238U ages for stage 1 granodiorite and WDP
samples fall between 378.8 ± 1.1 Ma (19BIC-086) and 375.2 ± 1.1 Ma (16BIC-073; weighted
means in Figs. 2–7A, 2–10A–C, and concordia intercept in Fig. 2–10D), whereas samples from
the stage 2 plutons fall between 375.4 ± 0.8 and 371.8 ± 0.8 Ma (Table 2–4, Figs. 2–7A and
indistinguishable concordia ages in Figs. 2–10D to H). Together these data indicate the two

51
stages slightly overlap temporally and that final crystallization of the entire batholith was
prolonged for ~8 m.y.
Notably, the muscovite leucogranite sample from the DLP (16BIC-071), which is an important
phase of the SMB given that it hosts the East Kemptville Sn deposit, has zircon and monazite
that yielded a discordia upper intercept age of 374 +17/-12 Ma. To resolve the latter in regard to
the large associated error, the same sample was analyzed by LA-MC-ICP-MS which yielded a
weighted mean 206Pb/238U age of 373.3 ± 2.2 Ma (Table 2–3, Fig. 2–7B and a similar Discordia
intercept age in Fig. 2–9O), which is considered its time of crystallization. The DLP, therefore, is
likely representative of the more evolved SMB phases defined by the other CA-ID-TIMS results.
2.6.4 Zircon Trace- and Rare Earth Element Compositions
The trace-element concentrations in the different zircon domains representative of each of the
main plutons in the SMB are summarized in Table 2–5 and Figures 2–11 to 2–13 with the
complete dataset available in Table EA 2-3 (Electronic Appendix). For the autocrystic and
antecrystic domains, the element concentrations or ratios either vary from linear or curvilinear
discrimination pathways and show a variance in age, or show no apparent trend; notably, the
number of outliers significantly increases in the most discordant fifth of the data (final
discordance >67%). Zircon domains with U-Pb ages partially reset by post-emplacement
processes are nonetheless interpreted to have consistent trace-element composition up to a 67%
final discordance cut-off, and the petrochemical data herein is presented in this context.

52
For the xenocrysts, the Hf contents are again uniform and in fact similar to that in the SMB
magmatic zircon phases, whereas Th/U shows systematically low values in the ~470 – 400 Ma
age population (i.e., <0.3; Fig. 2–11A) and higher and more variable values in the rest of the
xenocrysts with no discernable age trend (Fig. 2–11B, C). Zircon domains for a majority of the
antecrysts and autocrysts have a consistent range of Hf concentration regardless of their U-Pb
age (Fig. 2–12), whereas the Th/U values, which typically increase with fractionation (cf.
Kirkland et al., 2015), are highest in the autocyrsts (Fig. 2–12).
SMB zircon display typical chondrite-normalized REE patterns for zircon with the heavy REE
(HREE) being more enriched (i.e., >3 or 4 orders of magnitude) relative to the light REE (LREE;
Table 2–5). The enrichment of HREE relative to middle REE (MREE; i.e., [Yb/Gd]N) also
generally decreases with higher Th/U (Fig. 2–13A). Figure 2–13B presents the Ce-in zircon
anomalies (Ce/Ce*) in magmatic zircon domains against their respective (Yb/Gd)N values, for
which there is no apparent trend. The range of negative Eu anomalies (Eu/Eu*) for all zircon
domains from each phase of the SMB overlap, although the range narrows to slightly lower
values with younger ages (Fig. 2–13C; Table 2–5).
For in situ zircon analysis, crystallization temperatures for each spot were determined using the
Ti-in-zircon geothermometer of Ferry and Watson (2007) at fixed external activities of SiO2 and
TiO2. For the purpose of this study, the activity of SiO2 and TiO2 were assumed to be 1 and 0.5,
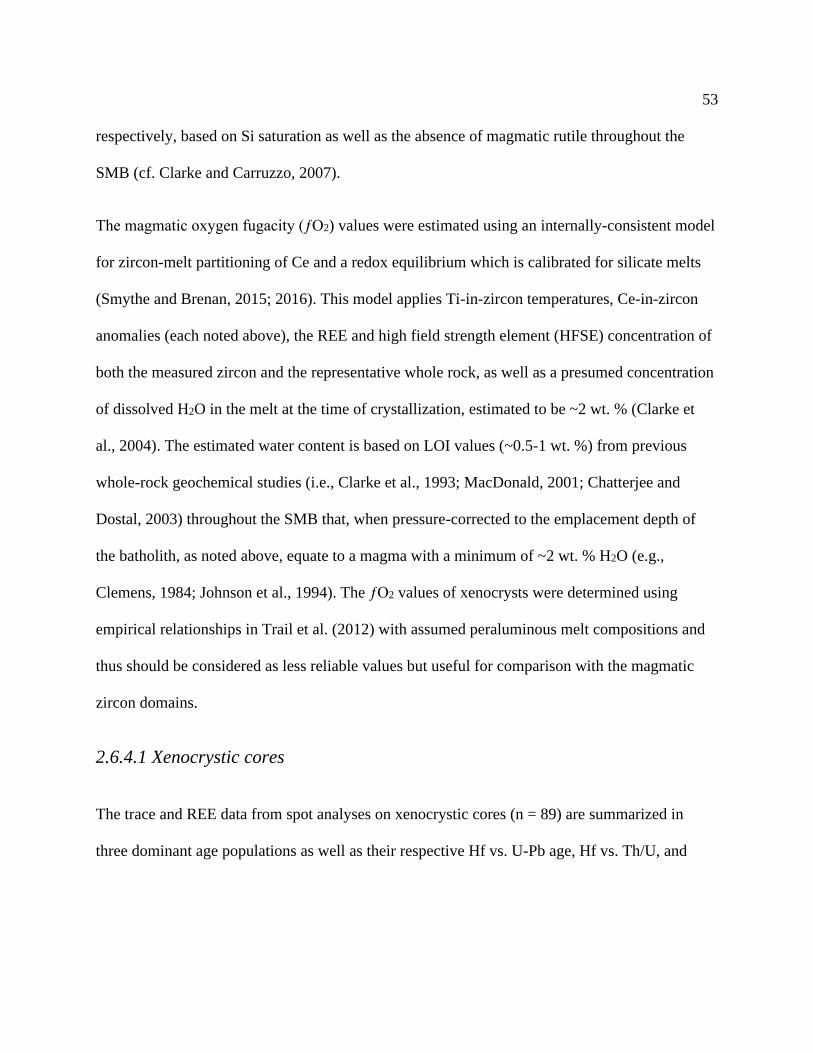
53
respectively, based on Si saturation as well as the absence of magmatic rutile throughout the
SMB (cf. Clarke and Carruzzo, 2007).
The magmatic oxygen fugacity (ƒO2) values were estimated using an internally-consistent model
for zircon-melt partitioning of Ce and a redox equilibrium which is calibrated for silicate melts
(Smythe and Brenan, 2015; 2016). This model applies Ti-in-zircon temperatures, Ce-in-zircon
anomalies (each noted above), the REE and high field strength element (HFSE) concentration of
both the measured zircon and the representative whole rock, as well as a presumed concentration
of dissolved H2O in the melt at the time of crystallization, estimated to be ~2 wt. % (Clarke et
al., 2004). The estimated water content is based on LOI values (~0.5-1 wt. %) from previous
whole-rock geochemical studies (i.e., Clarke et al., 1993; MacDonald, 2001; Chatterjee and
Dostal, 2003) throughout the SMB that, when pressure-corrected to the emplacement depth of
the batholith, as noted above, equate to a magma with a minimum of ~2 wt. % H2O (e.g.,
Clemens, 1984; Johnson et al., 1994). The ƒO2 values of xenocrysts were determined using
empirical relationships in Trail et al. (2012) with assumed peraluminous melt compositions and
thus should be considered as less reliable values but useful for comparison with the magmatic
zircon domains.
2.6.4.1 Xenocrystic cores
The trace and REE data from spot analyses on xenocrystic cores (n = 89) are summarized in
three dominant age populations as well as their respective Hf vs. U-Pb age, Hf vs. Th/U, and
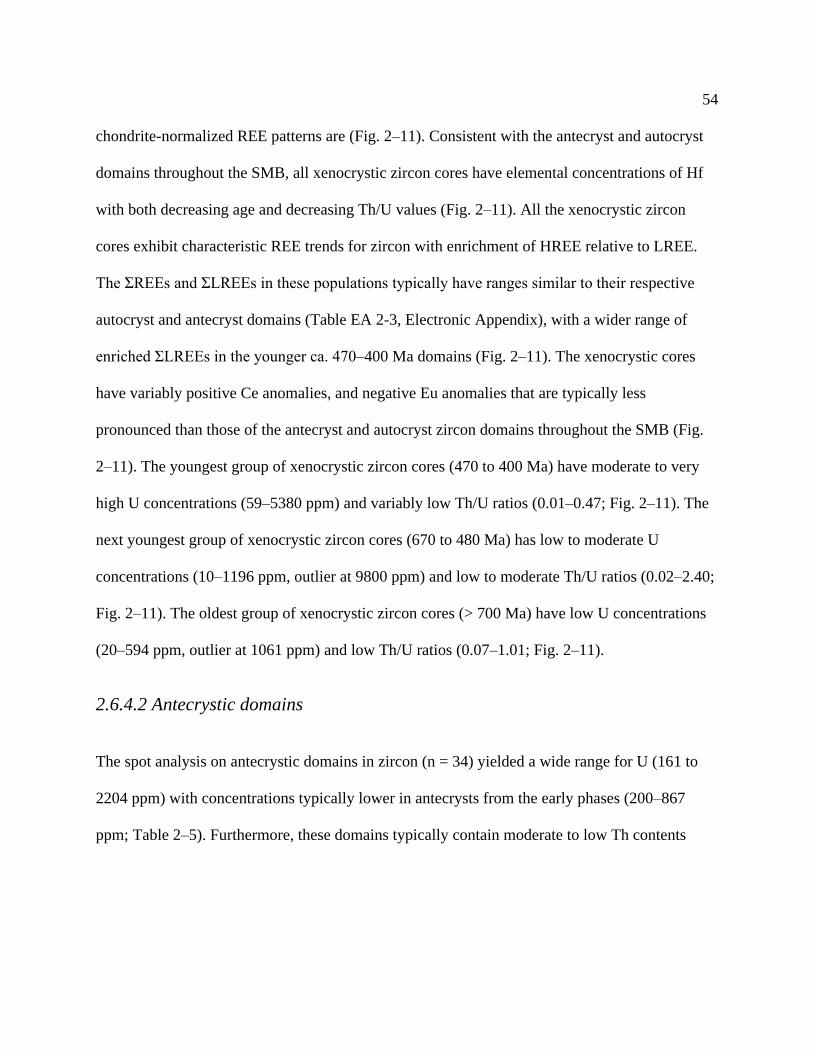
54
chondrite-normalized REE patterns are (Fig. 2–11). Consistent with the antecryst and autocryst
domains throughout the SMB, all xenocrystic zircon cores have elemental concentrations of Hf
with both decreasing age and decreasing Th/U values (Fig. 2–11). All the xenocrystic zircon
cores exhibit characteristic REE trends for zircon with enrichment of HREE relative to LREE.
The ΣREEs and ΣLREEs in these populations typically have ranges similar to their respective
autocryst and antecryst domains (Table EA 2-3, Electronic Appendix), with a wider range of
enriched ΣLREEs in the younger ca. 470–400 Ma domains (Fig. 2–11). The xenocrystic cores
have variably positive Ce anomalies, and negative Eu anomalies that are typically less
pronounced than those of the antecryst and autocryst zircon domains throughout the SMB (Fig.
2–11). The youngest group of xenocrystic zircon cores (470 to 400 Ma) have moderate to very
high U concentrations (59–5380 ppm) and variably low Th/U ratios (0.01–0.47; Fig. 2–11). The
next youngest group of xenocrystic zircon cores (670 to 480 Ma) has low to moderate U
concentrations (10–1196 ppm, outlier at 9800 ppm) and low to moderate Th/U ratios (0.02–2.40;
Fig. 2–11). The oldest group of xenocrystic zircon cores (> 700 Ma) have low U concentrations
(20–594 ppm, outlier at 1061 ppm) and low Th/U ratios (0.07–1.01; Fig. 2–11).
2.6.4.2 Antecrystic domains
The spot analysis on antecrystic domains in zircon (n = 34) yielded a wide range for U (161 to
2204 ppm) with concentrations typically lower in antecrysts from the early phases (200–867
ppm; Table 2–5). Furthermore, these domains typically contain moderate to low Th contents
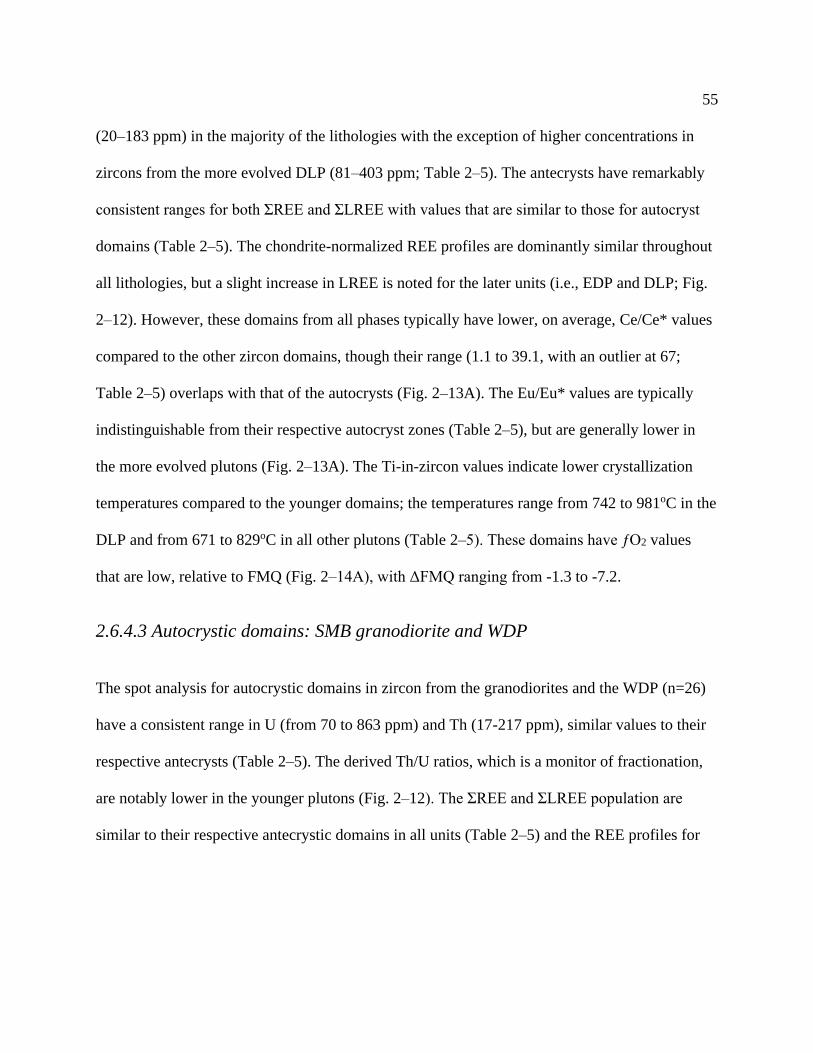
55
(20–183 ppm) in the majority of the lithologies with the exception of higher concentrations in
zircons from the more evolved DLP (81–403 ppm; Table 2–5). The antecrysts have remarkably
consistent ranges for both ΣREE and ΣLREE with values that are similar to those for autocryst
domains (Table 2–5). The chondrite-normalized REE profiles are dominantly similar throughout
all lithologies, but a slight increase in LREE is noted for the later units (i.e., EDP and DLP; Fig.
2–12). However, these domains from all phases typically have lower, on average, Ce/Ce* values
compared to the other zircon domains, though their range (1.1 to 39.1, with an outlier at 67;
Table 2–5) overlaps with that of the autocrysts (Fig. 2–13A). The Eu/Eu* values are typically
indistinguishable from their respective autocryst zones (Table 2–5), but are generally lower in
the more evolved plutons (Fig. 2–13A). The Ti-in-zircon values indicate lower crystallization
temperatures compared to the younger domains; the temperatures range from 742 to 981oC in the
DLP and from 671 to 829oC in all other plutons (Table 2–5). These domains have ƒO2 values
that are low, relative to FMQ (Fig. 2–14A), with ΔFMQ ranging from -1.3 to -7.2.
2.6.4.3 Autocrystic domains: SMB granodiorite and WDP
The spot analysis for autocrystic domains in zircon from the granodiorites and the WDP (n=26)
have a consistent range in U (from 70 to 863 ppm) and Th (17-217 ppm), similar values to their
respective antecrysts (Table 2–5). The derived Th/U ratios, which is a monitor of fractionation,
are notably lower in the younger plutons (Fig. 2–12). The ΣREE and ΣLREE population are
similar to their respective antecrystic domains in all units (Table 2–5) and the REE profiles for

56
these domains are normal for zircon. The Ce/Ce* values are moderately positive (2.1–53.6;
Table 2–5) and the Eu/Eu* values are low to overlapping those of the autocrystic domains in the
more evolved units (Fig. 2–13A). The Ti-in-zircon values for the early units indicate a wide
range of crystallization temperatures (669 to 874oC) which overlap those of autocrysts from the
rest of the batholith but are somewhat higher than for some of their respective antecrystic
domains (Fig. 2–13D). These domains in the early phases have ƒO2 values that are similar to
those of their respective antecrysts, with ΔFMQ ranging from -1.6 to -6.8 (Fig. 2–14B), and are
consistent with the values in autocrysts from later phases (Table 2–5).
2.6.4.4 Autocrystic domains: SMB evolved phases (EDP, NRP, HP, DLP)
The spot analysis on autocrystic domains in zircon from more evolved phases (i.e., the EDP,
NRP, HP, and DLP; n = 50) have a wide range in U concentrations (119 to 2617 ppm) that is, in
general, similar to the values in their respective antecrystic domains and to those of autocryst
populations from each of the more evolved phases. Notably, however, autocrysts in the EDP
have a narrow range of U values (163–452 ppm; Table 2–5). These domains in the more evolved
phases, apart from the DLP, contain moderate to low Th contents (18–268 ppm), whereas in the
DLP they have a wider range of higher Th values (66–442 ppm; Table 2–5) that are similar to
their respective antecrystic populations. The Th/U ratios for these domains in the more evolved
phases are lower in the younger phases (Fig. 2–12). The ΣREE, including ΣLREE, in these
populations have ranges similar to their respective antecryst domains as well as the autocrysts
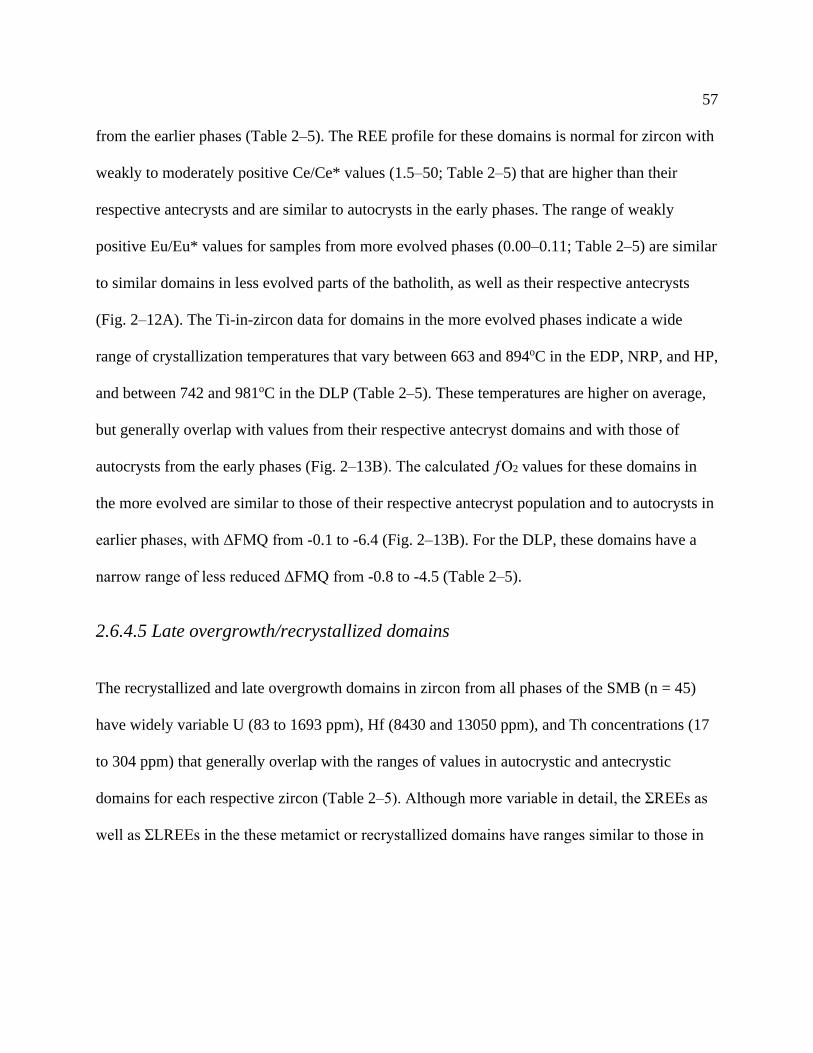
57
from the earlier phases (Table 2–5). The REE profile for these domains is normal for zircon with
weakly to moderately positive Ce/Ce* values (1.5–50; Table 2–5) that are higher than their
respective antecrysts and are similar to autocrysts in the early phases. The range of weakly
positive Eu/Eu* values for samples from more evolved phases (0.00–0.11; Table 2–5) are similar
to similar domains in less evolved parts of the batholith, as well as their respective antecrysts
(Fig. 2–12A). The Ti-in-zircon data for domains in the more evolved phases indicate a wide
range of crystallization temperatures that vary between 663 and 894oC in the EDP, NRP, and HP,
and between 742 and 981oC in the DLP (Table 2–5). These temperatures are higher on average,
but generally overlap with values from their respective antecryst domains and with those of
autocrysts from the early phases (Fig. 2–13B). The calculated ƒO2 values for these domains in
the more evolved are similar to those of their respective antecryst population and to autocrysts in
earlier phases, with ΔFMQ from -0.1 to -6.4 (Fig. 2–13B). For the DLP, these domains have a
narrow range of less reduced ΔFMQ from -0.8 to -4.5 (Table 2–5).
2.6.4.5 Late overgrowth/recrystallized domains
The recrystallized and late overgrowth domains in zircon from all phases of the SMB (n = 45)
have widely variable U (83 to 1693 ppm), Hf (8430 and 13050 ppm), and Th concentrations (17
to 304 ppm) that generally overlap with the ranges of values in autocrystic and antecrystic
domains for each respective zircon (Table 2–5). Although more variable in detail, the ΣREEs as
well as ΣLREEs in the these metamict or recrystallized domains have ranges similar to those in
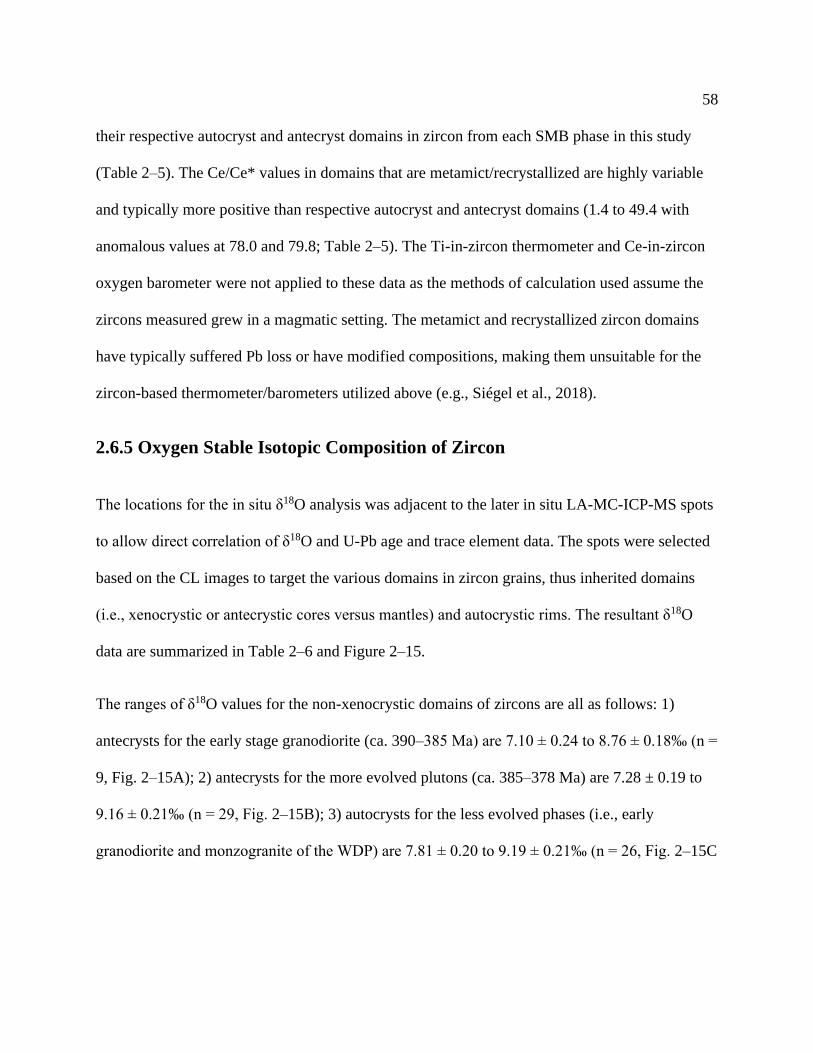
58
their respective autocryst and antecryst domains in zircon from each SMB phase in this study
(Table 2–5). The Ce/Ce* values in domains that are metamict/recrystallized are highly variable
and typically more positive than respective autocryst and antecryst domains (1.4 to 49.4 with
anomalous values at 78.0 and 79.8; Table 2–5). The Ti-in-zircon thermometer and Ce-in-zircon
oxygen barometer were not applied to these data as the methods of calculation used assume the
zircons measured grew in a magmatic setting. The metamict and recrystallized zircon domains
have typically suffered Pb loss or have modified compositions, making them unsuitable for the
zircon-based thermometer/barometers utilized above (e.g., Siégel et al., 2018).
2.6.5 Oxygen Stable Isotopic Composition of Zircon
The locations for the in situ δ18O analysis was adjacent to the later in situ LA-MC-ICP-MS spots
to allow direct correlation of δ18O and U-Pb age and trace element data. The spots were selected
based on the CL images to target the various domains in zircon grains, thus inherited domains
(i.e., xenocrystic or antecrystic cores versus mantles) and autocrystic rims. The resultant δ18O
data are summarized in Table 2–6 and Figure 2–15.
The ranges of δ18O values for the non-xenocrystic domains of zircons are all as follows: 1)
antecrysts for the early stage granodiorite (ca. 390–385 Ma) are 7.10 ± 0.24 to 8.76 ± 0.18‰ (n =
9, Fig. 2–15A); 2) antecrysts for the more evolved plutons (ca. 385–378 Ma) are 7.28 ± 0.19 to
9.16 ± 0.21‰ (n = 29, Fig. 2–15B); 3) autocrysts for the less evolved phases (i.e., early
granodiorite and monzogranite of the WDP) are 7.81 ± 0.20 to 9.19 ± 0.21‰ (n = 26, Fig. 2–15C

59
and Table 2–6) and overlap with the higher values in their respective ca. 390–385 Ma antecryst
populations; 4) autocrysts from the more evolved phases, excluding the DLP (i.e., EDP, NRP,
and HP) are between 8.26 ± 0.23 and 9.13 ± 0.23‰ and are similar to that in the less evolved
autocrysts (n = 36; Table 2–6 and Fig. 2–15D); 5) autocrysts in the DLP display two sub-
populations (Fig. 2–15E), lower values that range between 7.31 ± 0.28 and 7.95 ± 0.26‰ (n = 7)
and are less than equivalent to zircon domains in the rest of the SMB, and a higher range of
values between 8.10 ± 0.25 and 8.88 ± 0.15‰ (n = 12; Table 2–6) that are indistinguishable from
the autocrysts throughout the SMB; 6) metamict and recrystallized domains from across the
SMB have values from 7.68 ± 0.23 to 9.18 ± 0.24‰ and thus are somewhat similar to the
different magmatic domains (n = 26; Fig. 2–15F).
The xenocrystic cores for zircon grains from throughout the SMB record the most variability in
δ18O values (Fig. 2–15G). The δ18O values also weakly correlate with age as follows: 1) for ages
from ~400 to 470 Ma, they vary from 7.71 ± 0.16 to 9.44 ± 0.20‰ with an average 8.68 ±
0.21‰ (n = 12); 2) for ages from ~480 to 670 Ma, they vary from 4.31 ± 0.27 to 11.38 ± 0.24‰
(n = 38); and 3) for ages >700 Ma, they vary from 3.45 ± 0.18 to 9.92 ± 0.18‰ (n = 12; Table 2–
6).
2.6.6 Hf Isotopic Composition of Zircon
Hafnium isotope analyses were obtained on zircon domains previously dated and analyzed for
trace elements with the same instrument, as noted previously. A total of 377 analyses on 321
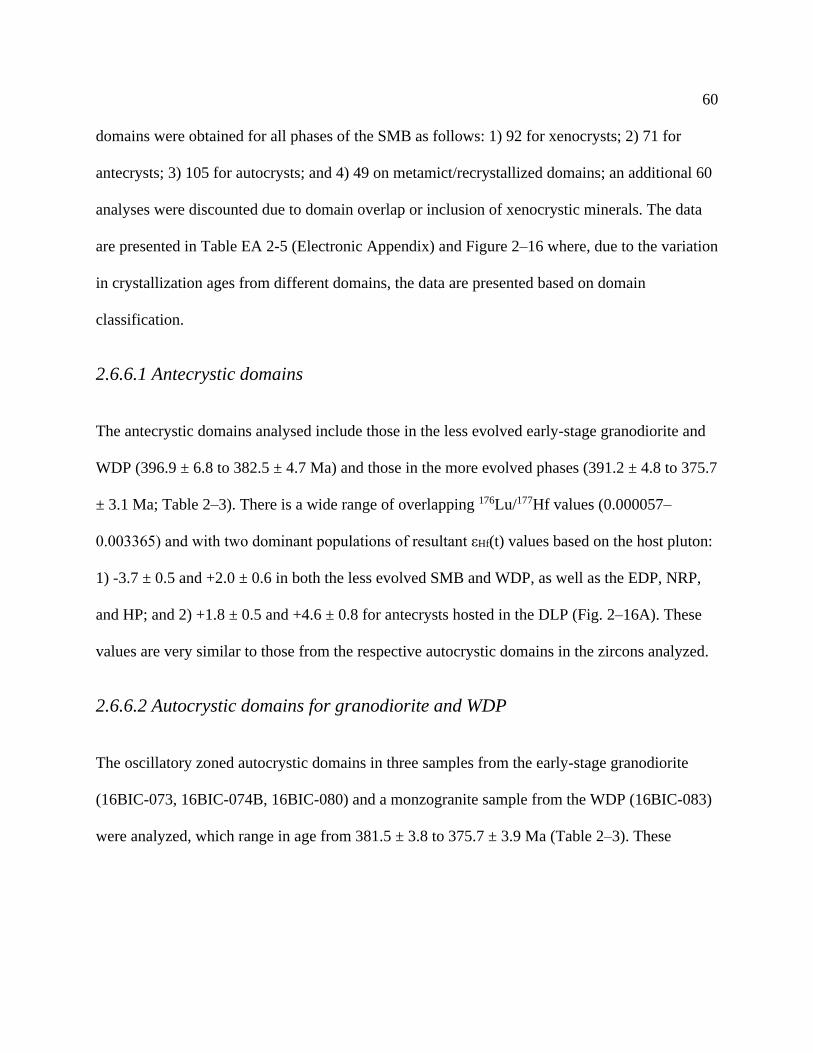
60
domains were obtained for all phases of the SMB as follows: 1) 92 for xenocrysts; 2) 71 for
antecrysts; 3) 105 for autocrysts; and 4) 49 on metamict/recrystallized domains; an additional 60
analyses were discounted due to domain overlap or inclusion of xenocrystic minerals. The data
are presented in Table EA 2-5 (Electronic Appendix) and Figure 2–16 where, due to the variation
in crystallization ages from different domains, the data are presented based on domain
classification.
2.6.6.1 Antecrystic domains
The antecrystic domains analysed include those in the less evolved early-stage granodiorite and
WDP (396.9 ± 6.8 to 382.5 ± 4.7 Ma) and those in the more evolved phases (391.2 ± 4.8 to 375.7
± 3.1 Ma; Table 2–3). There is a wide range of overlapping 176Lu/177Hf values (0.000057–
0.003365) and with two dominant populations of resultant εHf(t) values based on the host pluton:
1) -3.7 ± 0.5 and +2.0 ± 0.6 in both the less evolved SMB and WDP, as well as the EDP, NRP,
and HP; and 2) +1.8 ± 0.5 and +4.6 ± 0.8 for antecrysts hosted in the DLP (Fig. 2–16A). These
values are very similar to those from the respective autocrystic domains in the zircons analyzed.
2.6.6.2 Autocrystic domains for granodiorite and WDP
The oscillatory zoned autocrystic domains in three samples from the early-stage granodiorite
(16BIC-073, 16BIC-074B, 16BIC-080) and a monzogranite sample from the WDP (16BIC-083)
were analyzed, which range in age from 381.5 ± 3.8 to 375.7 ± 3.9 Ma (Table 2–3). These
61
domains have a wide range of overlapping 176Lu/177Hf values (0.000514–0.003190; n = 28,
excluding an outlier value at 0.00517) and similar resultant εHf(t) values of -3.1 ± 0.6 to +1.9 ±
1.7 (Fig. 2–16B). The εHf(t) values are similar to those determined from their respective
antecrysts.
2.6.6.3 Autocryst domains for evolved phases (EDP, NRP, HP, DLP)
The oscillatory zoned autocrystic domains in samples collected from the evolved phases of the
SMB included two samples from the EDP (16BIC-076 and 16BIC-084), three from the NRP
(16BIC-077, 16BIC-081 and 16BIC-082), three from the HP (16BIC-078, 16BIC-079 and
16BIC-085), and two from the DLP leucogranite (16BIC-071 and 16BIC-072). These domains,
which range from 377.3 ± 3.8 to 368.2 ± 3.5 Ma (Table 2–3) and yielded the following data: 1)
early-stage granodiorite and monzogranite have overlapping 176Lu/177Hf values (0.000368–
0.003403) with two dominant populations of resultant εHf(t) values based on the host pluton: 1) -
3.1 ± 0.6 and +1.4 ± 0.7 in autocrysts from the EDP, NRP, and HP (n = 51 and an outlier at -4.6
± 0.7); and 2) +0.9 ± 0.6 and +4.4 ± 0.7 in autocrysts from the DLP (n = 22; Fig. 2–16B). The
εHf(t) subpopulations are similar to those characterized in the respective antecrystic domains
from each pluton.
62
2.6.6.4 Metamict/recrystallized domains
The interpreted metamict and recrystallized domains throughout the SMB that were analyzed (n
= 43) are interpreted to represent post-emplacement growth zones for which their ages range
from 371.5 ± 3.2 to 334.3 ± 4.2 Ma (Table EA 2-5, Electronic Appendix). These domains have
176Lu/177Hf in the range 0.000269–0.002710 and resultant εHf(t) values between -6.0 and 4.0 (n =
42, excluding an outlier at -17.7; Fig. 2–16C).
2.6.6.5 Xenocrystic cores
Analysis of xenocrystic cores, presumably inherited from wall-rock lithologies, throughout the
SMB have 176Lu/177Hf ratios that vary with respect to their ages (Fig. 2–16D). A total of 19 spots
of ~400 to 470 Ma have 176Lu/177Hf in the range 0.000381–0.002954 (median = 0.001470) and
εHf(t) between -5.5 and 5.6 (median = 0.17, n = 18; excluding an outlier value at -9.8). A total of
46 spots on cores between ~480 to 670 Ma have 176Lu/177Hf in the range 0.000308–0.003126
(median = 0.001088) and εHf(t) between -19.0 and +9.4 (median = -0.16, n = 45; excluding an
outlier value at -35.9). A total of 16 spots on cores older than 700 Ma have a smaller range of
176Lu/177Hf from 0.000286–0.002840 (average mean = 0.00092 ± 0.00063) and a wide range of
εHf(t) between -22.8 and 10.9 (median = 0.30, n = 14; excluding two outlier data at 34.7 and
37.9).
63
2.7 Discussion
The U-Pb zircon and monazite geochronological data presented herein constrain the absolute age
and duration of SMB emplacement. In addition, the trace-element chemistry and complementary
Lu-Hf and oxygen-isotopic analyses for various zircon domain types (i.e., autocrystic,
antecrystic, xenocrystic) provide insights into the source reservoirs, temperatures and redox
conditions of the magma. These data, when combined with field relationships and petrographic
observations, lead to models for the construction and evolution of the SMB, its metallogenic
affiliation, and for the tectonic setting into which it was emplaced.
2.7.1 Zircon chemistry and implications for magma evolution
Trace-element and REE data from temporally-constrained magmatic zircon domains document
intra-grain and inter-pluton variability that provide insights into magma evolution in the crustal-
scale SMB plumbing system. The trace-element geochemistry can also distinguish zircon
crystallized during progressive magma fractionation in crustal melts and/or in melts that were
influenced by mixing or contamination (e.g., Claiborne et al., 2010; Wotzlaw et al., 2013; Marsh
and Stockli, 2015; Buret et al., 2016). In the SMB, magmatic zircon geochemistry shows
evidence of both magma fractionation, as exemplified by the increasing (Yb/Gd)N with
decreasing Th/U (e.g., Claiborne et al., 2010; Buret et al., 2016), and contamination/mixing of
64
different rock types, as exemplified by wide ranges in Th/U, Ce/Ce*, and Eu/Eu* (e.g.,
Belousova et al., 2002; Fig. 2–13) throughout the evolution of the SMB.
The chemical signature of the SMB xenocrysts has two dominant populations, distinguished by
age. The younger population (i.e., 470–400 Ma) typically has lower Th/U values, negative
Eu/Eu*, HREE enrichment, lacks a significant positive Ce anomaly (and calculated lower ƒO2
values), and exhibits a wide range of LREE enrichment relative to chondrite (Fig. 2–12A).
Collectively, these data suggest a metamorphic origin for these domains (e.g., Rubatto, 2002)
that do not overlap with detrital ages from the Meguma Supergroup. The youngest of these
xenocrysts (i.e., at ca. 400 Ma) do, however, overlap in age and Th/U signature to a population
of zircon from granulite xenoliths in the Pope’s Harbour dike (Fig. 2–1A), which are thought to
be metamorphic and representative of Avalonian lower crust that had underthrust Meguma rocks
by ca. 380 Ma (Shellnutt et al., 2019); the latter time constraint being prior to construction of the
SMB. In contrast to a metamorphic signature of the younger population, the older population of
SMB xenocrysts (i.e., >470 Ma) have a wide range of trace-element features that include a
moderate Th/U values, HREE enrichment, moderately negative Eu/Eu* values, and strongly
positive Ce/Ce* values (and calculated higher ƒO2 values; Fig. 2–12B, C). The latter data
suggest crystallization from felsic magmas (e.g., Hinton and Upton, 1991; Hoskin and Ireland,
2000) and collectively likely represent a detrital provenance.
65
In situ analysis of magmatic zircon domains shows no systematic trend of either Hf
concentration or relative REE content with age and, with the exception of the DLP, only a weak
decrease in Th/U with decreasing age (Fig. 2–12). Although Th/U values have been used to
monitor fractionation in granites (cf. Kirkland et al., 2015), the relatively flat profiles for SMB
zircons suggest that this ratio may not be as effective in composite magmatic complexes with
extensive contamination. However, this ratio can be used to generally identify discrete magma
pulses in the SMB. In addition to similar Th/U in the SMB magmatic zircon domains, relatively
homogeneous Hf and REE compositions suggest that: 1) melts that crystallized both domain
types (autocrystic and antecrystic) were sourced from a similarly equilibrated chemical reservoir;
and/or 2) progressive crystallization within the SMB magmas did not cause systematic
compositional changes in the zircon crystallized from them.
The SMB samples with anomalously young zircon domains (i.e., ca. 360 Ma “late
overgrowth/recrystallization” domains in samples 16BIC-071, -072, -076, -080, -083 and -084;
Figs. 2–7A, –B, 2–8, and 2–9) are located either within or along the strike-trace of regional shear
zones through the SMB (Fig. 2–1B). Relative to their respective autocryst domains and the rest
of the SMB, the trace element signature of these zircons typically includes a range of
overlapping but, on average, higher LREE values and larger positive Ce anomalies (Ce/Ce*;
Table 2–5). The latter part of this signature is a typical response to greater oxygen partial
pressure in the magmatic-hydrothermal setting post-SMB emplacement, and has been ascribed to
66
hydrothermal zircon in magmatic-hydrothermal transitional settings for Sn-hosting granites
elsewhere (i.e., Mole Granite, Australia, Pettke et al., 2005; Schaltegger, 2007).
Titanium-in-zircon thermometry provides reliable estimates of silicic melt temperatures at the
time of zircon crystallization (Ferry and Watson, 2007). Application of this technique on data
from a majority of SMB zircon domains suggests crystallization occurred in low- to moderate-
temperature magmas; between ~675 and 825oC for the antecrysts (Figs. 2–14A and Table 2–5)
and between ~700 and 900oC for the autocrysts (Fig. 2–14B and Table 2–5), hence they broadly
overlap. Abundant xenocrysts and partially resorbed antecrystic zircons in granites are typical of
low-temperature peraluminous melts (e.g., Miller et al., 2003) and the combination of these
textural observations and Ti-in-zircon measurements from the peraluminous SMB support this
characterization. The antecryst and autocryst crystallization temperatures of most of the SMB
intrusive phases are similar; however, the DLP at the SW end of the SMB exhibits a wider range
for zircon crystallization temperatures of ~750 to 1000oC. The latter data indicate a high
temperature for some of the zircon and is in conflict with the general idea that highly evolved
magmas typically crystallize at lower temperatures than their less evolved equivalents (cf. F-
bearing melts in Černý et al., 2005). The higher crystallization temperatures for zircon from the
more evolved DLP suggest different processes may have influenced the melt temperature, such
as melting of a dehydrated crustal melt source or a source melt reservoir that was thermally
reheated by mafic intrusions (Huber et al., 2009).
67
The derived oxygen fugacity (ƒO2) values, as determined using the Ce-in-zircon method (Trail et
al., 2012 for the xenocrysts; Smythe and Brenan, 2015, 2016, for the antecrysts and autocrysts),
were used to constrain the redox conditions for zircon domains throughout the SMB. The values,
which dominantly overlap for the two magmatic zircon domain types, range from 0.1 to 7 log
units below the FMQ buffer (Fig. 2–14A, B) and indicate that each magma batch that
constructed the SMB was strongly reduced. The younger xenocryst population (i.e., ~470–400
Ma) also overlaps with these values, however a majority of the older xenocrysts (i.e., >470 Ma)
have a wider range of ƒO2 values (-9.5 to +12.4 ΔFMQ); a majority of which are markedly less
reduced than the magmatic zircon domains (Fig. 2–14C). The strongly reduced signature of SMB
magmas is similar to abyssal spinel peridotites, such as those recorded in xenoliths from the
lherzolite massifs in northern Morocco and southern Spain (maroon field in Fig. 2–14A); these
xenoliths are thought to represent the variably metasomatized lithospheric mantle beneath this
region (Woodland et al., 1992, 2006; Frets et al., 2014).
The reduced nature of melts that constructed the SMB is ascribed, at least in part, to interaction
with the carbonaceous host Meguma Supergroup (e.g., White, 2010); which has been shown to
be a contaminant in the SMB magmas from both field (Clarke and Chatterjee, 1988; MacDonald
and Horne, 1988; MacDonald, 2001) and petrographic observations (Erdmann et al., 2007;
Clarke and Carruzzo, 2007; Clarke et al., 2009), as a well as by modelling of its whole-rock
chemistry (Clarke et al., 2004) and isotopic features (Clarke and Halliday, 1980; Longstaffe et
al., 1980; Poulson et al., 1991). These features are common in many other peraluminous
68
granitoid suites (e.g., Sierra Nevada batholith in southwest USA, Lackey et al., 2006; the
Lachlan Fold Belt in southeast Australia, Clemens, 2003; Sierra Norte-Ambargasta batholith in
western Argentina, Iannizzotto et al., 2013; the French Massif Central, France et al., 2016; the
Nanling Range in southeast China, Zhang et al., 2017), many of which are host to Sn-W deposits
(e.g., Taylor, 1979; Černý et al., 2005; Lehmann, 2020). The variation in redox conditions
recorded by xenocrysts in the SMB (Fig. 2–14C), however, suggests the contaminant which
sourced these younger xenocrysts was the primary factor in reducing the SMB melts.
Antecrysts and autocrysts hosted by the less evolved granodiorite and the WDP have average fO2
values that are, on average, lower but dominantly overlap with equivalent zircon domain types in
the more evolved NRP, HP, EDP, and DLP (Fig. 2–14A, B; Table 2–5). The autocryst fO2 values
for zircon in the more evolved SMB plutons are similar to those determined by Chavez (2019),
who used the same Ce-in-zircon calibration, and determined ΔFMQ values of 1.05 to -5.23 for
the HP and NRP (calculated assuming ~5 wt. % H2O in the melt). The autocrysts in the DLP,
however, have fO2 values and Ti-in-zircon crystallization temperatures that are generally higher
than those in the rest of the SMB implying the melt which formed the DLP was less reduced and
hotter compared to melts that formed the rest of the SMB. The higher ΔFMQ values in the DLP
autocrysts relative to the rest of the SMB suggest that during the evolution of the magmatic
plumbing system involved interaction with a less reduced magma at depth and/or the melt which
formed the DLP had less interaction with reducing contaminants, which is further addressed
below.
69
The typical oxidized I-type magmas in the northern Appalachians are represented by the blue
field in Figure 2–14B (Magaguadavic Granite suite of southern New Brunswick) have fO2 values
2 to 7 log units higher than those recorded by zircon in a majority of the SMB, although values
from fractionated I-type granites (i.e., Mount Pleasant, New Brunswick) do overlap with much of
the SMB data (Yang and Lentz, 2005). Examples of strongly contaminated and reduced I-type
intrusions (grey field in Fig. 2–14B; Ague and Brimhall, 1988) also have similar values to the
zircon in the more evolved parts of the SMB; this field also partially overlaps with zircon from
the DLP. The DLP, however, has zircon values consistent with a less contaminated magma
compared to the rest of the SMB data.
2.7.2 Isotopic constraints on SMB magma source
2.7.2.1 Implications of the δ18O zircon data
The δ18O values of zircon constrain sources of contamination in a crystallizing melt, with the
following assumptions (cf. Roberts et al., 2013): 1) for mantle-derived melts, zircon has a δ18O
value of +5.3 ± 0.3‰ (Valley et al., 1998); 2) values >6.5‰ are attributed to melting or
assimilation of sedimentary and/or altered volcanic rocks; and 3) values <5‰ are attributed to
melting of hydrothermally altered material (Valley et al., 2005). There is evidence, however, of
δ18O heterogeneity in the mantle reservoir such that mantle-derived melts may become enriched
in 18O by up to +2‰ compared to typical mantle values due to metasomatism by 18O-enriched
70
fluids, likely derived from dehydration of subducted sediments (e.g., Eiler et al., 2005; Auer et
al., 2009; Johnson et al., 2009; Roberts et al., 2013). The SMB δ18Ozircon data (Fig. 2–15)
generally indicate the following with respect to contamination and melt source signature: 1) a
slight increase for average values from antecrystic to autocrystic domains of about 1‰ that
reflects partial contamination of the melt (cf. Taylor and Sheppard, 1986); 2) the values for
magmatic domains exceed by several units per mil those of primitive mantle-derived melts (see
above); and 3) the overgrowth/recrystallized domains of ca. 360 Ma have higher values due to
interaction with fluids of variable signatures (i.e., equilibrated with wall rocks or surficial fluids),
as has been proposed by previous studies (e.g., Carruzzo et al., 2004; Kontak and Kyser, 2011).
The δ18O signatures for both autocrystic and antecrystic zircon in a majority of the SMB (i.e.,
excluding the DLP) range between +7.8 and +9.2‰ (outliers at +7.1 and +7.3‰; Fig. 2–15D, E),
whereas the late overgrowth/recrystallized domains extend to higher values. The narrow range of
δ18O zircon values (± ≤1.4‰) indicates the SMB magma was isotopically homogeneous, thus
either derived from a similar source (with a relatively uniform δ18O) or shared a common source
with similar degrees of contamination across the batholith. Importantly, when the δ18Ozircon data
are corrected for approximately +1‰ fractionation of 18O between zircon and melt (ΔWR-zircon;
Valley et al., 1994), the derived melt values range between ~8.8 and 10.2‰, and therefore
overlap with the range of whole-rock data for the batholith (9 to 13‰, compiled in Kontak et al.,
2002b). The higher values in zircon are a well-known phenomenon in cooling intrusive bodies
(e.g., Taylor and Sheppard, 1986), and are attributed in the SMB to the role of late-stage
71
interaction of crystallized igneous rocks with cooling orthomagmatic fluids and/or fluids
equilibrated with the Meguma metasedimentary rocks (as summarized in Carruzzo et al., (2004)
and Kontak and Kyser (2011)). The lower melt δ18O values are thus likely representative of the
primary δ18O signature for the SMB.
To assess contamination in the SMB by Meguma metasedimentary rocks, as suggested by Clarke
et al. (2004), the δ18Ozircon data are compared to whole-rock values in the latter, which range from
+10.1 to +13.3‰ (Fig. 2–15; Longstaffe et al., 1980). Using a mean value of 11‰ for the
hypothesized contaminant, mass balance indicates that for initial melt δ18O values of 7, 8 and
9‰ (i.e., zircon values of 6, 7, and 8‰, respectively), approximately 50, 30 and 0%
contamination (respectively) is required. For comparison, Clarke et al. (2004) suggested, based
on major element and Sr and Nd isotopic data, that up to 30% contamination by Meguma
metasedimentary rocks may have occurred, with a possible role of Avalonian-equivalent rocks
(note, however, that Shellnut and Dostal (2012) suggest <20% contamination). The δ18Ozircon
values are consistent with this interpretation, however the uniform signature across the SMB and
its lithologies indicate the source contamination must have occurred early in the magmatic
evolution. The latter is therefore in conflict with the model of Clarke et al. (2004), which
attributes some of the observed chemical variation in the SMB to late heterogeneous
contamination.
72
The δ18O values from both antecrystic and autocrystic zircon of the DLP are significantly lower
than those found in the rest of the SMB and are also characterized by a large range (from +7.3 to
+8.9‰, Table 2–6). In addition, two subpopulations are prominent for the autocryst values of
+7.3 to +7.7‰ and +8.1 to +8.9‰ (Fig. 2–15E). Given the data are from a single sample and the
range is greater that that expected from analytical variability (i.e., ± 0.21 ‰) and δ18O values in
zircon are not affected by magma fractionation (cf. Bindeman and Valley, 2002), it is likely that
these values reflect the influence of a contaminant, such as the Meguma host rocks.
2.7.2.2 Lu-Hf and εHf data
In addition to the O isotopic data, the Lu-Hf isotopic signature and derived εHf values for zircon
domains can be used to determine the influence of different isotopic melt reservoirs on magmas.
For example, a wide variation in εHf in a given zircon domain is typically attributed to source
heterogeneity and/or open system processes (e.g., crustal assimilation) during magma evolution
(e.g., Kemp et al., 2007; Appleby et al., 2010; Gagnevin et al., 2011; Wang et al., 2013; Ge et al.,
2015). Furthermore, an evolving magmatic complex may source melts from an isotopically
heterogeneous reservoir; thus isolated magma batches may contain a juvenile εHf signature with
respect to the rest of the complex, such as documented for zircon from the DLP compared to the
rest of the SMB. However, as the εHf signatures of both antecrysts and autocrysts match the
majority of the xenocryst data, open system processes are likely restricted to the early stages of
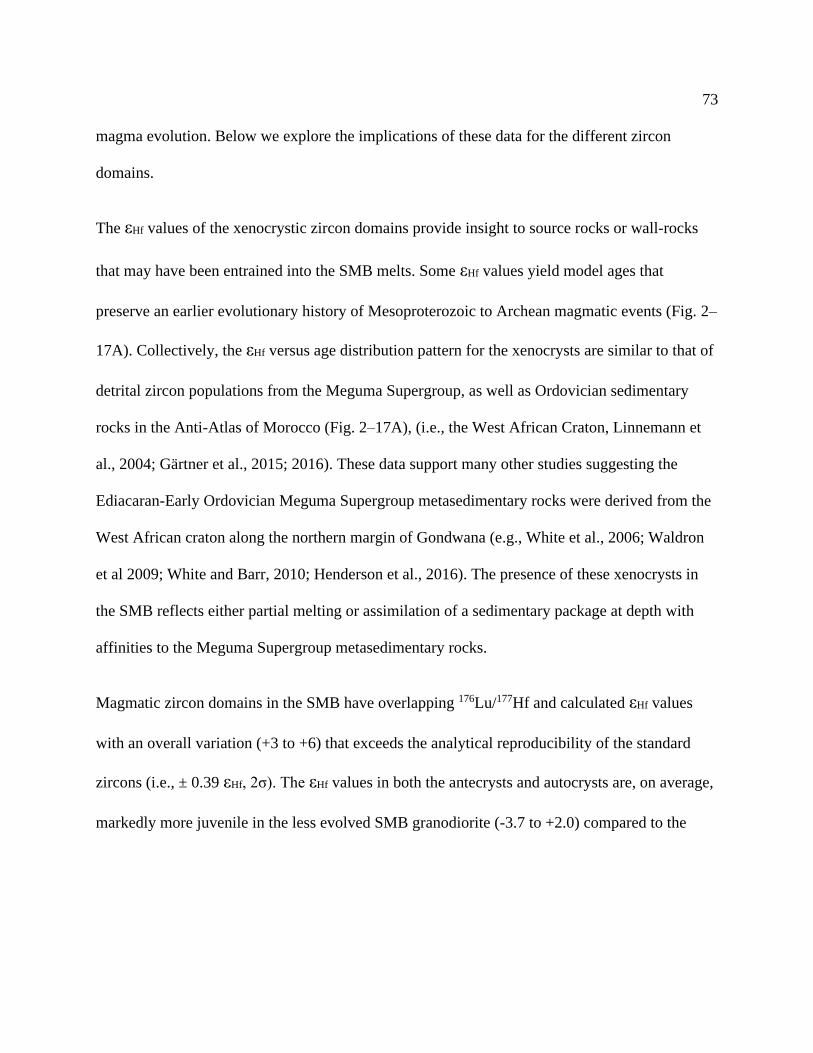
73
magma evolution. Below we explore the implications of these data for the different zircon
domains.
The εHf values of the xenocrystic zircon domains provide insight to source rocks or wall-rocks
that may have been entrained into the SMB melts. Some εHf values yield model ages that
preserve an earlier evolutionary history of Mesoproterozoic to Archean magmatic events (Fig. 2–
17A). Collectively, the εHf versus age distribution pattern for the xenocrysts are similar to that of
detrital zircon populations from the Meguma Supergroup, as well as Ordovician sedimentary
rocks in the Anti-Atlas of Morocco (Fig. 2–17A), (i.e., the West African Craton, Linnemann et
al., 2004; Gärtner et al., 2015; 2016). These data support many other studies suggesting the
Ediacaran-Early Ordovician Meguma Supergroup metasedimentary rocks were derived from the
West African craton along the northern margin of Gondwana (e.g., White et al., 2006; Waldron
et al 2009; White and Barr, 2010; Henderson et al., 2016). The presence of these xenocrysts in
the SMB reflects either partial melting or assimilation of a sedimentary package at depth with
affinities to the Meguma Supergroup metasedimentary rocks.
Magmatic zircon domains in the SMB have overlapping 176Lu/177Hf and calculated εHf values
with an overall variation (+3 to +6) that exceeds the analytical reproducibility of the standard
zircons (i.e., ± 0.39 εHf, 2σ). The εHf values in both the antecrysts and autocrysts are, on average,
markedly more juvenile in the less evolved SMB granodiorite (-3.7 to +2.0) compared to the
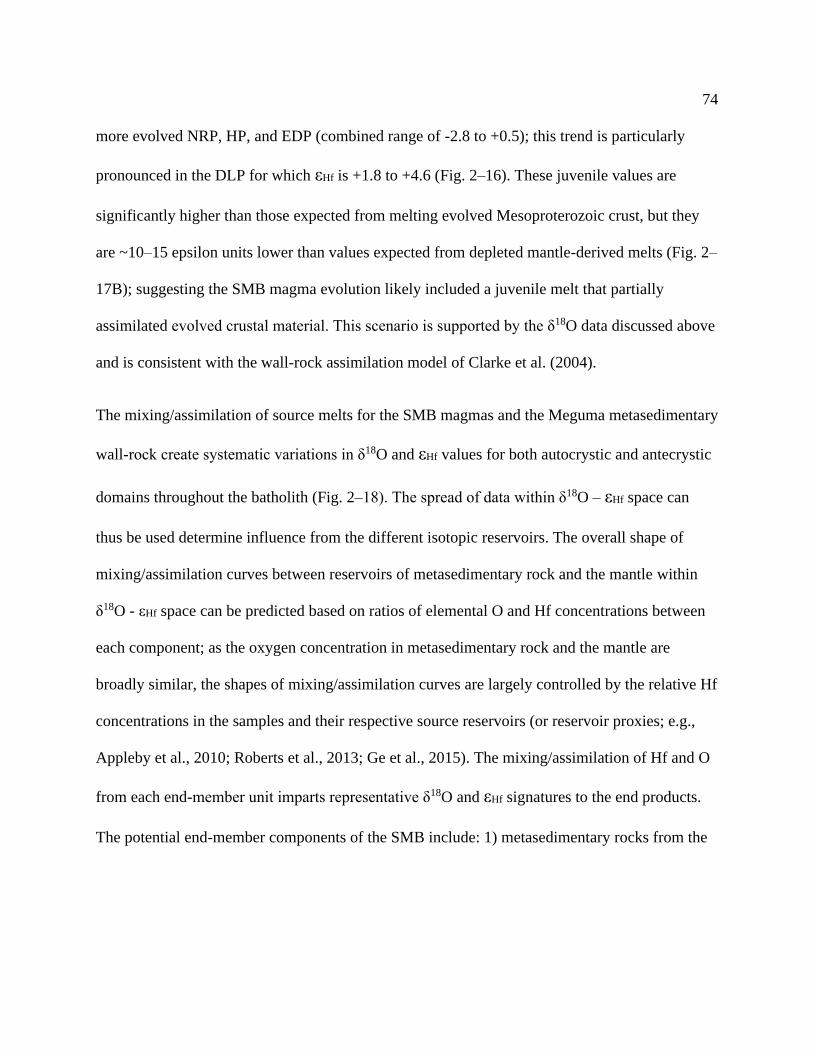
74
more evolved NRP, HP, and EDP (combined range of -2.8 to +0.5); this trend is particularly
pronounced in the DLP for which εHf is +1.8 to +4.6 (Fig. 2–16). These juvenile values are
significantly higher than those expected from melting evolved Mesoproterozoic crust, but they
are ~10–15 epsilon units lower than values expected from depleted mantle-derived melts (Fig. 2–
17B); suggesting the SMB magma evolution likely included a juvenile melt that partially
assimilated evolved crustal material. This scenario is supported by the δ18O data discussed above
and is consistent with the wall-rock assimilation model of Clarke et al. (2004).
The mixing/assimilation of source melts for the SMB magmas and the Meguma metasedimentary
wall-rock create systematic variations in δ18O and εHf values for both autocrystic and antecrystic
domains throughout the batholith (Fig. 2–18). The spread of data within δ18O – εHf space can
thus be used determine influence from the different isotopic reservoirs. The overall shape of
mixing/assimilation curves between reservoirs of metasedimentary rock and the mantle within
δ18O - εHf space can be predicted based on ratios of elemental O and Hf concentrations between
each component; as the oxygen concentration in metasedimentary rock and the mantle are
broadly similar, the shapes of mixing/assimilation curves are largely controlled by the relative Hf
concentrations in the samples and their respective source reservoirs (or reservoir proxies; e.g.,
Appleby et al., 2010; Roberts et al., 2013; Ge et al., 2015). The mixing/assimilation of Hf and O
from each end-member unit imparts representative δ18O and εHf signatures to the end products.
The potential end-member components of the SMB include: 1) metasedimentary rocks from the
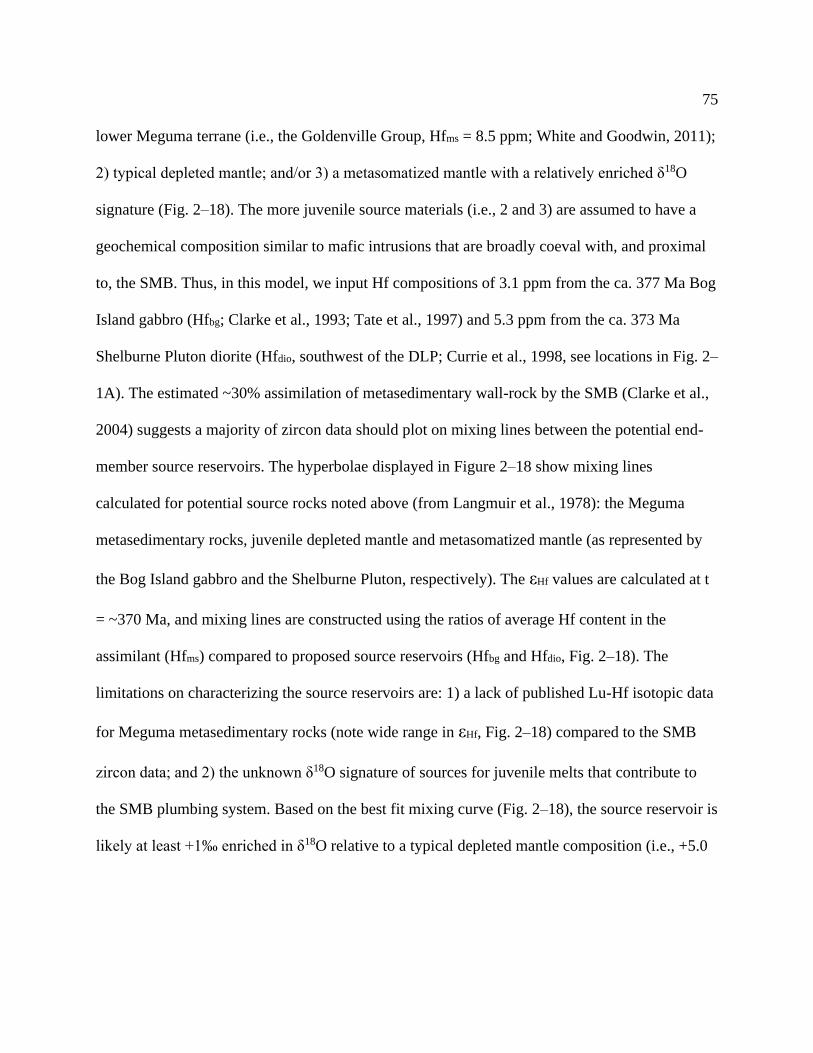
75
lower Meguma terrane (i.e., the Goldenville Group, Hfms = 8.5 ppm; White and Goodwin, 2011);
2) typical depleted mantle; and/or 3) a metasomatized mantle with a relatively enriched δ18O
signature (Fig. 2–18). The more juvenile source materials (i.e., 2 and 3) are assumed to have a
geochemical composition similar to mafic intrusions that are broadly coeval with, and proximal
to, the SMB. Thus, in this model, we input Hf compositions of 3.1 ppm from the ca. 377 Ma Bog
Island gabbro (Hfbg; Clarke et al., 1993; Tate et al., 1997) and 5.3 ppm from the ca. 373 Ma
Shelburne Pluton diorite (Hfdio, southwest of the DLP; Currie et al., 1998, see locations in Fig. 2–
1A). The estimated ~30% assimilation of metasedimentary wall-rock by the SMB (Clarke et al.,
2004) suggests a majority of zircon data should plot on mixing lines between the potential end-
member source reservoirs. The hyperbolae displayed in Figure 2–18 show mixing lines
calculated for potential source rocks noted above (from Langmuir et al., 1978): the Meguma
metasedimentary rocks, juvenile depleted mantle and metasomatized mantle (as represented by
the Bog Island gabbro and the Shelburne Pluton, respectively). The εHf values are calculated at t
= ~370 Ma, and mixing lines are constructed using the ratios of average Hf content in the
assimilant (Hfms) compared to proposed source reservoirs (Hfbg and Hfdio, Fig. 2–18). The
limitations on characterizing the source reservoirs are: 1) a lack of published Lu-Hf isotopic data
for Meguma metasedimentary rocks (note wide range in εHf, Fig. 2–18) compared to the SMB
zircon data; and 2) the unknown δ18O signature of sources for juvenile melts that contribute to
the SMB plumbing system. Based on the best fit mixing curve (Fig. 2–18), the source reservoir is
likely at least +1‰ enriched in δ18O relative to a typical depleted mantle composition (i.e., +5.0
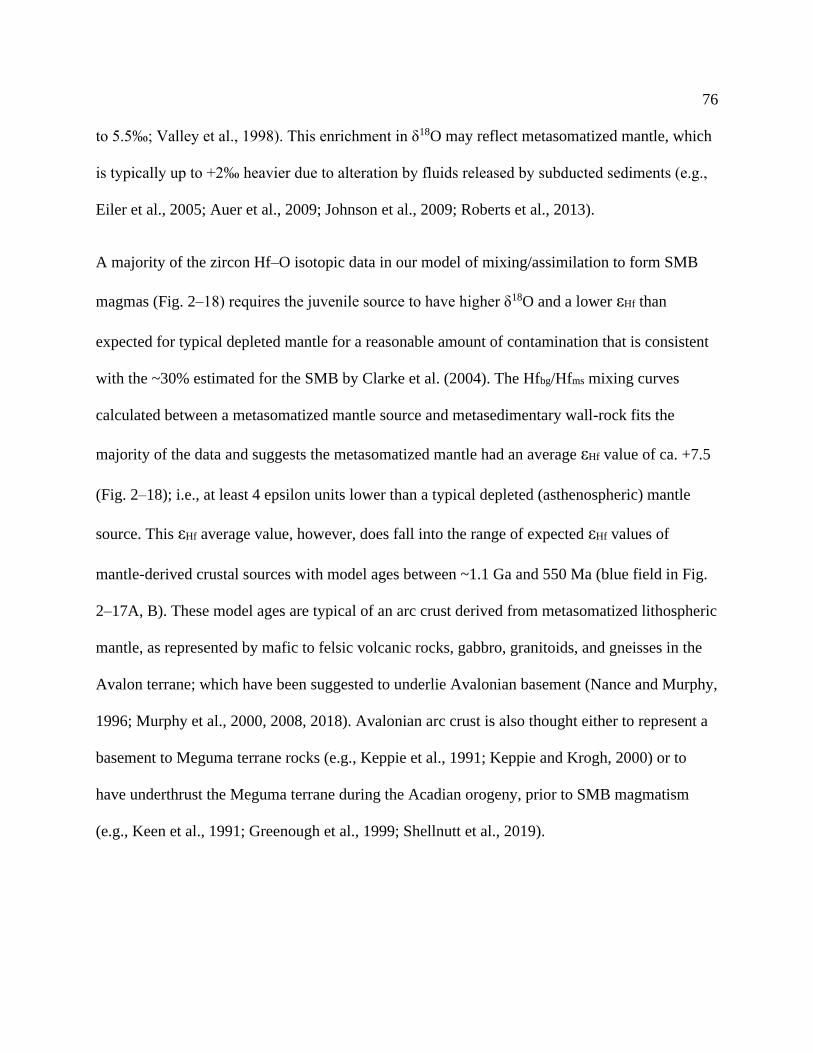
76
to 5.5‰; Valley et al., 1998). This enrichment in δ18O may reflect metasomatized mantle, which
is typically up to +2‰ heavier due to alteration by fluids released by subducted sediments (e.g.,
Eiler et al., 2005; Auer et al., 2009; Johnson et al., 2009; Roberts et al., 2013).
A majority of the zircon Hf–O isotopic data in our model of mixing/assimilation to form SMB
magmas (Fig. 2–18) requires the juvenile source to have higher δ18O and a lower εHf than
expected for typical depleted mantle for a reasonable amount of contamination that is consistent
with the ~30% estimated for the SMB by Clarke et al. (2004). The Hfbg/Hfms mixing curves
calculated between a metasomatized mantle source and metasedimentary wall-rock fits the
majority of the data and suggests the metasomatized mantle had an average εHf value of ca. +7.5
(Fig. 2–18); i.e., at least 4 epsilon units lower than a typical depleted (asthenospheric) mantle
source. This εHf average value, however, does fall into the range of expected εHf values of
mantle-derived crustal sources with model ages between ~1.1 Ga and 550 Ma (blue field in Fig.
2–17A, B). These model ages are typical of an arc crust derived from metasomatized lithospheric
mantle, as represented by mafic to felsic volcanic rocks, gabbro, granitoids, and gneisses in the
Avalon terrane; which have been suggested to underlie Avalonian basement (Nance and Murphy,
1996; Murphy et al., 2000, 2008, 2018). Avalonian arc crust is also thought either to represent a
basement to Meguma terrane rocks (e.g., Keppie et al., 1991; Keppie and Krogh, 2000) or to
have underthrust the Meguma terrane during the Acadian orogeny, prior to SMB magmatism
(e.g., Keen et al., 1991; Greenough et al., 1999; Shellnutt et al., 2019).
77
2.7.3 Construction and evolution of the South Mountain Batholith
The new U-Pb zircon and monazite data presented herein constrain the intrusive history of the
main plutonic phases that comprise the composite SMB; together these data imply a protracted
magmatic evolution prior to its final emplacement. The CA-ID-TIMS analysis of high-quality
oscillatory-zoned zircon crystals document the final emplacement of the SMB: 378.7 ± 0.6 to
375.6 ± 0.5 Ma for the less evolved plutons versus 375.4 ± 0.8 to 371.8 ± 0.8 Ma for the more
evolved plutons (Figs. 2–7A and 2–10). This range in crystallization ages, together with similar
age determinations via in situ methods (i.e., SHRIMP and LA-MC-ICP-MS), collectively outline
approximately 8 m.y. of continuous magmatism. The emplacement time-frame of the SMB is
typical of mid- to upper-crustal batholiths constructed by incremental injection of magma
batches over a relatively short duration (e.g., Brown and McClelland, 2000; Coleman et al.,
2004; Broderick et al., 2015; Samperton et al., 2015; Schaltegger et al., 2019).
The age population distribution and isotopic characteristics of xenocrystic zircon in the SMB
suggest a magmatic plumbing system that likely assimilated a variety of sources (Figs. 2–19A
and 2–20, insets). The age distribution of the xenocrysts is similar to that of detrital zircons in the
Silurian-Devonian Rockville Notch Group (cf. White et al., 2018) as well as the lower Paleozoic
Goldenville Group (cf. Waldron et al., 2009), which underlie much of the Meguma terrane (Fig.
2–19B and C, respectively). The youngest concordant dates in xenocrystic zircon cores (24
analyses) are between ~400 and 500 Ma, with the highest density at ca. 433 Ma (Fig. 2–19A).
78
This population closely matches the Upper Ordovician–Lower Silurian felsic volcanic rocks of
the White Rock Formation (e.g., MacDonald et al., 2002) and their intrusive equivalent (e.g., the
439 +4/−3 Ma Brenton Pluton; Keppie et al., 2018), and zircon in granulite xenoliths from the
ca. 370 Ma Pope’s Harbour dyke located to the northeast of the SMB (Owen et al., 1988;
Shellnutt et al., 2019; Figs. 2–1A and 2–19D). The Brenton Pluton and lamprophyre dykes on
the shores of the eastern Meguma terrane, which includes Pope’s Harbour, carry xenocrysts and
granulite xenoliths, respectively, that are interpreted to represent lower crustal material (Owen et
al., 1988; Eberz et al., 1991; Greenough et al., 1999; Keppie et al., 2018; Shellnutt et al., 2019;
Fig. 2–20). The granulite xenoliths carry detrital zircon that have ages (i.e., ~420 Ma, ~660 Ma,
and minor groups at ~1100 and ~2200 Ma) indicative of an Avalonia provenance with protolith
depositional ages interpreted as ~420 Ma (cf. Shellnutt et al. 2019). This interpretation is
consistent with the distribution of δ18O, εHf, and 176Lu/177Hf values in xenocrysts from the SMB
(Figs. 2–15G and 2–16D, respectively), which also suggest derivation from a variety of sources –
from the lithospheric mantle to evolved Mesoproterozoic and Archean-aged crust.
The age and chemistry of antecrystic and autocrystic zircon domains typically record incremental
stages of a magma generation and evolution, including the role of magma-mixing and host-rock
assimilation (e.g., Hoskin and Schaltegger, 2003). The local preservation of antecrystic zircon
domains suggest the SMB formed from multiple injections into a crystal mush that did not
undergo complete crystal-resorption of the earlier zircon phases (cf. Miller et al., 2007; Miles
and Woodcock, 2018). Our study identifies antecrysts that are, on average, between ~3 to 15
79
m.y. older than those of autocryst populations from the same samples. The resorption textures
observed in the antecrysts suggest their crystallization in an early crystal mush that oscillated
between zircon-saturation and undersaturation as it was repeatedly injected by new melt, as has
been suggested for other magmatic settings (e.g., de la Rosa et al., 2002; Zeck and Williams,
2002; Bachmann and Bergantz, 2006).
The antecrysts have trace element chemical characteristics that are apparently indistinguishable
from younger autocryst domains (i.e., wide range of Hf, Ce/Ce*, and Eu/Eu*, bivariant spread of
Th/U and Yb/Gd values). The Ti-in-zircon geothermometer indicates crystallization temperatures
for antecrysts are between 670–830oC in most of the SMB plutons, which compares to 740–
980oC for the DLP (Table 2–5). These temperatures are, on average, lower than those calculated
for their respective autocryst domains, although the ranges overlap (660–895oC in most of the
SMB and 727 and 1008oC in the DLP; Table 2–5). The antecrysts are interpreted, therefore, to
represent early magmas that likely crystallized in melt-rich roots in the lower crust ~3 to 15 m.y.
before the construction of the SMB (Fig. 2–20). The trace-element similarities between
antecrysts and autocrysts suggest the magmas that the antecrysts crystallized from may have
been early, but they are part of the SMB plumbing system.
In contrast with zircon from the rest of the SMB, zircons in the DLP typically have higher εHf
values (Fig. 2–16B) and a subpopulation of lower δ18O values. Both of these differences suggest
an additional contribution from a more juvenile source compared to the rest of the SMB. The Hf-

80
O isotopic data for the zircons in the DLP are consistent with an assimilation-fractionation
mixing model suggesting melts were derived from a metasomatized mantle-like source that
subsequently underwent contamination by Meguma metasedimentary rock (Fig. 2–18). In
contrast with the assimilation-fractionation mixing models from most of the SMB, mixing
models that fit the DLP data used a melt reservoir proxy with a Hf concentration similar to the
Shelburne Pluton diorite located ~20 km southwest of the DLP (Fig. 2–1A). Transitional from
the diorite mass, the ca. 373 Ma Shelburne Pluton contains felsic phases that are compositionally
similar to the SMB (Currie et al., 1998); the interpreted hybridization and mingling of
peraluminous granitoid and metaluminous gabbroic to dioritic phases indicates mantle-derived
magma played a significant role in the origin and emplacement of the Shelburne Pluton. We
suggest, therefore, that the DLP shares isotopic characteristics with this and possibly other
younger plutons with a juvenile source component in southwest Nova Scotia (e.g., Port Mouton
Pluton, Fallon et al., 2001; Wedgeport Pluton, MacLean et al., 2003; Clayton Hill Pluton, Kontak
et al., 2013), and formed from melts that were derived from a metasomatized mantle-like source
and thus distinct from the sources for the rest of the SMB (Fig. 2–18).
Within ~10 Ma of the SMB emplacement, rapid differential uplift and unroofing is recorded in
the Meguma terrane relative to the Avalon terrane by ca. 360 Ma (Fig. 2–2; e.g., Keppie, 1979;
Keppie and Dallmeyer, 1995; Murphy, 2000) and indicates exhumation and ultimately exposure
of the northern SMB from initial depths of ~10-12 km (e.g., Hilchie and Jamieson, 2008; Kontak
and Kyser, 2011). Dextral transpressional movement along the Meguma-Avalonia terrane
81
boundary and related shear zones through the Meguma terrane (e.g., Fig. 2–1B, 2–20B) is
recorded by dynamically recrystallized muscovite and biotite with 40Ar/39Ar plateau ages
between 360 and 370 Ma (Keppie and Dallmeyer, 1987). These crustal faults (Fig. 2–1B) were
thus active as transtensional pathways during and after SMB emplacement, and likely controlled
incremental melt addition during SMB emplacement (i.e., repetition of Fig. 2–20A to B), prior to
accommodating differential uplift and exhumation of the batholith. A Cenozoic analogue may be
the Red River shear zone in SE Asia, where exhumation of high-grade metamorphic rocks and
syn-kinematic granitoids occurred by transpression along ductile shear zones (Leloup et al.,
2001).
The youngest U-Pb zircon ages recorded are metamict/recrystallized and unzoned overgrowth
domains which yield dates around 360 Ma. This age is correlative with: 1) exhumation of the
SMB, as constrained by the deposition of the late Famennian-Early Tournaisian Horton Group
which locally onlaps the SMB and other ca. 375 Ma granites (e.g., Kelly pluton in eastern
Meguma terrane; Archibald et al., 2018); 2) widespread fluid flux, as recorded by dating of new
mineral growth and partial resetting of others (e.g., Ravenhurst et al., 1987; Culshaw and
Reynolds, 1997; Hicks et al., 1999; Keppie et al., 2002; Reynolds et al., 2004; Keppie and
Dallmeyer, 2005; Archibald et al., 2018); and 3) localized magmatism in the southwest Meguma
terrane, such as the Wedgeport and Clayton Hill plutons (MacLean et al., 2003; Kontak et al.,
2013). Thus, these young zircon domains may be a local expression of regional magmatic-
hydrothermal activity that has generated and mobilized fluids that have penetrated the SMB. The
82
geochemistry, O and Lu-Hf isotopic signatures of these domains indicate that the fluid
composition reflects a juvenile source that partially equilibrated with the SMB host-rock as well
as Meguma metasedimentary wall-rock (Table 2–5; Figs. 2–15F and 2–16C).
Taken together, the U-Pb ages and Hf-O isotopic compositions of zircon suggest the SMB
formed in four main stages: 1) melts were derived from a depleted mantle source beginning at ca.
390-385 Ma (Fig. 2–20A), as recorded by zircon antecrysts, and continued until ca. 375 Ma, as
recorded by autocrysts in the less evolved parts of the SMB (Fig. 2–7A, –B); 2) these melts
assimilated up to ~30% Meguma metasedimentary material; 3) between ca. 375 and 371 Ma,
magma production continued (Fig. 2–20B) with related extensive fractionation that coincided
with emplacement of the more evolved plutons within the SMB (i.e., HP, NRP, EDP); and 4) at
ca. 371 Ma final emplacement of the SMB occurred with a change in the locus of magmatism to
its southwestern part with the formation of the DLP. The latter was generated from a
metasomatized mantle-like source similar in isotopic composition to that of typical Avalonian
crust (Fig. 2–18).
2.7.4 Implications for the tectonic setting of SMB emplacement
The new geochronological data presented here indicate the SMB magmas were generated over a
protracted interval that spans the duration of regional deformation and metamorphism associated
with the Acadian and Neoacadian orogenic events. These events are commonly interpreted to
reflect the accretion of the Avalon and Meguma terranes (respectively) to the eastern Laurentian
83
margin, between ca. 420 and 365 Ma (e.g. van Staal 2007; van Staal et al., 2009, 2021; Fig. 2–
21). Subsequent (late Devonian) rapid uplift of the Meguma terrane relative to Avalonia and
other inboard terranes (i.e., Ganderia), resulted in exposure of the SMB by ca. 360 Ma (Fig. 2–2;
Keppie and Dallmeyer, 1995; Murphy, 2000; Archibald et al., 2018).
Our data provide the following additional constraints related to the SMB magmatism in the
Meguma terrane: 1) overlapping crystallization ages for the antecrysts and autocrysts indicate
melt generation and magmatic conditions were more prolonged (~10–15 m.y.) than previously
realized; 2) the onset of magmatism at ca. 395 Ma occurred during ductile deformation of the
host rock, as documented by 40Ar/39Ar data from both the Meguma Supergroup and White Rock
Formation (e.g., Muecke et al., 1988; Kontak et al., 1998; Hicks et al., 1999; Reynolds et al.,
2012); 3) δ18O and εHf values in zircon from less evolved parts of the SMB (i.e., ~379 to 376 Ma)
are consistent with melts that were both sourced from a metasomatized mantle, consistent with
regional models of subduction beneath the Meguma terrane (e.g., van Staal et al., 2021), and
significantly (~30%) contaminated by Meguma metasedimentary rocks; and 4) zircons in the
DLP (i.e., at 373.4 ± 3.7 Ma) have chemical and isotopic signatures implying this stage in the
SMB evolution produced higher (ca. 727 to 1008oC) temperature melts derived from lower
Avalonian crust.
Our data indicate that the onset of magmatism at ca. 395 Ma was coeval with late stages of
regional deformation in the Meguma terrane (i.e., ~415–390 Ma) associated with dextral
84
transpression between the Avalon and Meguma terranes. The early melts that crystallized a
majority of the antecrysts in the SMB have isotopic signatures consistent with a sub-lithospheric
mantle source beneath either the Meguma or Avalonia terranes (e.g., Fig. 2–21B). Between 385
and 375 Ma, antecryst zircon crystallization ages record an interval of sustained magmatism
coeval with regional deformation and metamorphism which are interpreted to reflect continued
dextral transpression during Neoacadian orogenic events (cf. van Staal and Barr, 2012; Fig. 2–
21C).
Sustained magmatic temperatures as recorded by zircon has been attributed elsewhere to
internal (radioactive) heat production of overthickened crust (e.g., Lucazeau and Vasseur, 1989;
Cuney et al., 1990; Jamieson et al., 1998). Although the Meguma crust was overthickened and
the lower crust was likely dehydrated, as indicated by P-T conditions derived for granulite-facies
rocks preserved as xenoliths in the Pope’s Harbour dike (Owen et al., 1988; Eberz et al., 1991),
heating from thermal relaxation (e.g. England and Thompson, 1984; Gaudemer et al., 1988) of
such a crust is typically expected to produce ~5 weight per cent melt over 40 m.y. after
thickening (e.g., Thompson and Connolly, 1995). Modelling of water-fluxed lower crust melting
processes (~8 kbar), however, show that addition of ~4.5 wt. % water into a mafic dioritic crust
at 900°C can generate ~40% melt, and at 750 °C will produce ~30% tonalitic to trondhjemitic
melts (Collins et al., 2020). Thus, the addition of water is important for generation of large
volumes of melt in an anhydrous lower crust (Castro, 2020). For a majority of the SMB magmas,
melt derivation from a metasomatized mantle indicates direct infiltration of water from oblique
85
subduction processes (down-going Rheic oceanic slab) along the Laurentian margin at the onset
of SMB magmatism (i.e., ca. 395 Ma; Fig. 2–21B). Although no direct evidence of subduction
during this time interval is preserved in the current level of exposure, the widespread regional
magmatism of this age in the northern Appalachians is interpreted to represent subduction
processes followed by slab-breakoff and mantle upwelling (e.g., van Staal et al., 2009, 2021;
Wilson et al., 2017; Kellett et al., in press).
The terminal stages of SMB emplacement occurred between ~375 and 370 Ma, and
crystallized the most evolved plutons (i.e., Stage II of MacDonald, 2001), including the DLP
which hosts the most isotopically juvenile zircons in the batholith. The DLP zircons have
combined Lu-Hf and O isotopic signatures suggesting the DLP parental melts were sourced from
an intermediate crustal component that likely formed from water-bearing, metasomatized
mantle-derived magmas (i.e., a pre-existing fractionated mafic underplate, Castro 2020, and
references therein). A candidate for the intermediate crustal component is that of the Avalonian
lower crust, which would have underthrust the Meguma terrane during convergence between
these terranes (~380-375 Ma; Fig. 2–21C).
Accretion of the Avalonia-Meguma terranes along the Laurentian margin is interpreted
here to have resulted in break-off of a subducted slab of Rheic oceanic lithosphere by ca. 371 Ma
(Fig. 2–21C). The sinking of this orphaned slab would initially subject the underthrust Avalonian
sub-continental lithospheric mantle to melting from an upwelling asthenosphere (Fig. 2–21D).
86
This process is consistent with the juvenile isotopic signature and higher average crystallization
temperatures in DLP zircon compared to zircons in older SMB plutons. Additionally,
asthenospheric upwelling would result in thinning of the lithosphere beneath the
Avalonia/Meguma terrane boundaries and thus re-activation of deep crustal faults, allowing for
significant differential uplift between these terranes along the Laurentian margin (Fig. 2–21D).
The data presented here suggest the emplacement of most of the SMB occurred between
378-372 Ma, i.e. ca. 15-20 Ma after magmatism commenced, suggesting the delayed onset of
favourable conditions for melt ascent into the upper crust. We suggest that the progressive
downward development of fault conduits, as a result of terrane convergence between Meguma
and Avalonia (i.e., during the Neoacadian), penetrated to the zone of magma generation and
prompted the magma ascent. The evidence for such deep-seated structures that controlled magma
ascent has been suggested in field observations (i.e., outline of the SMB external contacts,
internal faults/shear zones and jointing) that mirror those in the Meguma Supergroup, and studies
on the gravity, seismic and aeromagnetic signature of the SMB that indicate the SMB roots
follow penetrative structures traced as deep as the Moho (e.g., Keen et al., 1991; Horne et al.,
1992; Benn et al., 1997; MacDonald, 2001). Therefore, the evolution of the SMB magmatic
plumbing system likely involved a change from a ductile lower crustal infrastructure, where
early melts were generated and gestated, to a brittle upper crustal regime. This change coincided
with the accretion of the Meguma terrane to Avalonia and the Laurentian margin. The latter
87
structural reactivation in a brittle regime not only facilitated magma ascent but also the
preferential emplacement of granitoid magmas into releasing bends along the structures.
2.7.5 Metallogenic implications
A variety of Cu, W-Mo, Sn, Sb and Ta mineralized centres associated with Devonian-
Carboniferous granitic magmatism occur in different tectonic terranes in the northern
Appalachians (van Staal, 2007; Kellett et al., in press; Fig. 2–1A). Mineralization associated with
the SMB varies in character and includes polymetallic (Sn, W, Mo, Cu, Ta, Nb, Zn) occurrences,
typically in the more-evolved plutons; however, the only significant Sn deposit that contains
economic concentrations of metals is the Sn-Zn-Cu-Ag-In East Kemptville deposit near the
southwest contact of the ca. 370 Ma DLP (Fig. 2–1A). Between ~370 and 355 Ma mafic- to
intermediate magmatism is associated with numerous sites of Sn-polymetallic occurrences along
shear zones through the southwest margin of the DLP (e.g., Clarke et al., 1997). These mineral
occurrence have collectively been referred to as a Sn-Ag domain (Chatterjee and Strong, 1985;
Kontak, 1990; MacDonald, 2001).
Typically, Sn ore-forming magmas have low oxygen fugacities with Sn in its reduced state (i.e.,
Sn2+), thereby inhibiting substitution into ferromagnesian minerals resulting in Sn enrichment in
fractionated magmas (Ishihara, 1981; Blevin and Chappell, 1992; Linnen et al., 1996); globally,
these magmas have typically been emplaced into or adjacent to graphite-bearing as well as Sn-
and/or W-enriched pelitic rocks (cf. Romer and Kroner, 2015). The contamination of the SMB
88
by graphite-bearing metasedimentary rocks in the southwestern part of the batholith, as
documented above, would have resulted in reduced magmas and therefore allowed for Sn
enrichment during fractionation. Although the SMB magmas were strongly reduced, the
presence of this signature in antecrysts, autocrysts (Fig. 2–14A, B), and the youngest xenocrysts
(representative of crustal material beneath the Meguma Supergroup) suggests the source melts
were reduced, implying the potential for protracted Sn enrichment during fractionation. The
contrasting oxidized fO2 signatures from xenocrysts typical of the Meguma Supergroup detrital
population (Fig. 2–14C) indicate the melts became less reduced as they assimilated wall-rock
material. Other parts of the SMB are equally as contaminated as the DLP, yet do not contain
significant Sn mineralization. Additionally, metasedimentary rocks in the southwest part of the
Meguma terrane are depleted in B, Sn, and Ta with respect to the rest of the terrane (Chapter 3);
indicating localized contamination would not result in enriched Sn for this part of the SMB.
Whereas the bulk of the SMB is intermediate to felsic and does not contain significant
concentration of Sn-polymetallic occurrences, intrusions in the Sn-Ag domain southwest of the
DLP either: 1) overlap in age with the SMB but show evidence of a more juvenile source melt;
or 2) are ca. 10 m.y. younger than the SMB but mafic to intermediate with A-type characteristics
(see Kontak et al., 2013, for a summary). Therefore, the data suggest that metal occurrences in
the southwestern part of the terrane does not reflect contamination in the SMB by locally Sn-
enriched crustal wall-rock (e.g., Romer and Kroner, 2015); rather, magmatism in the area (i.e.,
89
DLP and later intrusives of the Sn-Ag domain) were likely derived from a metal-enriched melt
source (i.e., metasomatized mantle), different from that which sourced of earlier SMB magmas.
Regionally, in addition to the East Kemptville deposit, the northern Appalachians host the Mount
Pleasant W-Mo deposit (associated with the ca. 368 Ma Mount Douglas Granite; e.g.,
Mohammadi et al., 2020) and the Ackley Sn-W-Mo deposit (hosted by the ca. 372 Ma Ackley
Granite; e.g., Kontak et al., 1988; Kellett et al., 2014); both hosted by intrusive complexes
interpreted to straddle the Avalonia-Ganderia boundary.
The induced melting of a sub-Avalonian metasomatized mantle by ca. 370 Ma (Fig. 2–21D) by
asthenospheric upwelling as discussed above likely occurred beneath both the Avalonian-
Meguma and Avalonian-Ganderia terrane boundaries. This interpretation suggests that across the
Canadian Appalachians, Sn-W deposits associated with ~370-360 Ma magmatic-hydrothermal
activity (Fig. 2–1A) originated by melting a common Sn-enriched source that is represented by
sub-continental lithospheric mantle or lower crust to the Avalon terrane (Fig. 2–21D).
2.8 Conclusions
Comprehensive U-Pb zircon dating from representative samples of the 7300 km2 composite
peraluminous SMB has yielded a range in ages from various CL-defined zircon domain types.
The CA-TIMS autocryst zircon dates from the SMB indicate the batholith was constructed in a
magmatic system that was long-lived, but crystallized in two main intrusive events: 1) early

90
phases of granodiorite to monzogranite that crystallized between 378.7 ± 0.6 Ma and 375.6 ± 0.5
Ma, which includes a more evolved leucomonzogranite pluton (i.e., WDP) that previously was
considered to be part of a later stage event; and 2) the less voluminous but highly fractionated
DLP, EDP, NRP, and HP that crystallized between 375.4 ± 0.8 Ma and 371.8 ± 0.8 Ma.
Together, these intrusive phases record approximately 8 m.y. of overlapping magmatic activity.
SHRIMP and LA-MC-ICP-MS dating of abundant xenocrystic zircon cores document a varied
age population (~400 Ma to 2.2 Ga) that is very similar to that of the detrital zircon population in
Meguma terrane metasedimentary rocks, including a younger group of dates (i.e., ~470-400 Ma)
not present in the upper crust, but characteristic of granulite xenoliths in lamprophyre dykes,
interpreted to represent the current basement underlying the Meguma terrane of interpreted
Avalon affinity.
The 8 m.y. emplacement window is defined by autocrysts, although in situ SHRIMP and LA-
MC-ICP-MS analyses of antecrysts record multiple crystallization events that are ca. 3–15 Ma
older than the autocryst ages (dominantly between ~390 and 380 Ma). The antecryst ages
represent crystallization from early melts in the lower crust that were subsequently resorbed
and/or entrained into the SMB magmatic plumbing system. In situ SIMS and LA-MC-ICP-MS
analyses for both antecrystic and autocrystic zircon domains in most plutons, with the exception
of the DLP, document similar δ18O, REE and εHf signatures, as well as derived fO2 values that
91
make up the SMB. These similarities are a record of the extensive contamination in the SMB by
metasedimentary rocks of the Meguma terrane.
The DLP has an εHf signature in zircon autocrysts (+1.74 to +4.38) that is higher than those in the
rest of the SMB (-2.99 to +1.68). Relative to the rest of the SMB, these zircon also have, on
average, higher calculated Ti-in-zircon crystallization temperatures, a population of lower δ18O
values, and overlapping fO2 values. Combined, these data suggest the DLP underwent less
contamination by upper crustal rocks and/or was derived from a melt source more juvenile than
that of the SMB, with characteristics of a metasomatized mantle. The latter feature is important
in assessing metallic (Sn, W, Mo, Cu, Ta, Nb, Zn) fertility in the northern Appalachians as the
DLP and surrounding post SMB-emplacement granitoids are associated with such mineral
occurrences, unlike the rest of the SMB. Throughout the accretionary Appalachian orogen,
similar aged sub-economic deposits occur associated with mantle-derived fractionated
magmatism; suggesting metal endowment is related to the melt generation stage of these
intrusions.
The tectonic setting during the SMB formation initially (i.e., ~395 Ma) was coeval with dextral
transpressional accretion of the Meguma terrane to Avalonia, as evidenced by regional
deformation in the upper crust through the Meguma terrane at ~415–390 Ma (e.g., Murphy et al.,
2011). Subsequent evolution of the setting is documented by contamination of the SMB,
whereby early antecrysts and rare xenocrysts that reflect a source component consistent with a
92
sub-lithospheric mantle consistent with the root zone to Avalonia, that suggests westward over-
thrusting of Meguma terrane between 385 and 375 Ma. The sustained magmatic conditions
recorded in zircon from the SMB is attributed to regional deformation and metamorphism in the
Meguma terrane during the Neoacadian orogenic event.
2.9 Acknowledgements
This project was partially funded from NSERC CRD grants to DJK and IMS as well as Natural
Resources Canada as part of the Targeted Geoscience Initiative program of the Geological
Survey of Canada (DAK). The authors acknowledge Dr. Isabelle Coutand for assistance with
sample preparation and would like to thank Dr. James Brenan, Fergus Tweedale, and the late Dr.
Trevor McHattie for thoughtful discussions that aided geological interpretation. We would like
to thank Nicole Rayner for assistance with SHRIMP analysis.
2.10 References
Ague, J.J., and Brimhall, G.H., 1988, Magmatic arc asymmetry and distribution of anomalous
plutonic belts in the batholiths of California: Effects of assimilation, crustal thickness,
and depth of crystallization: Geological Society of America Bulletin, v. 100, no. 6, p.
912-927.
93
Annen, C., Blundy, J.D., Leuthold, J., Sparks, R.S.J., 2015, Construction and evolution of
igneous bodies: towards an integrated perspective of crustal magmatism: Lithos, v. 230,
p. 206–221.
Archibald, D.B., and Murphy, J.B., 2021, A slab failure origin for the Donegal composite
batholith, Ireland as indicated by trace-element geochemistry: Geological Society,
London, Special Publications, v. 503, no. 1, p. 347-370.
Archibald, D.B., Murphy, J.B., Reddy, S.M., Jourdan, F., Gillespie, J., and Glorie, S., 2018,
Post-accretionary exhumation of the Meguma terrane relative to the Avalon terrane in the
Canadian Appalachians: Tectonophysics, v. 747, p.343-356.
Auer, S., Bindeman, I., Wallace, P., Ponomareva, V. and Portnyagin, M., 2009, The origin of
hydrous, high-δ18 O voluminous volcanism: diverse oxygen isotope values and high
magmatic water contents within the volcanic record of Klyuchevskoy volcano,
Kamchatka, Russia. Contributions to Mineralogy and Petrology, v. 157, no. 2, p. 209.
Averill, S.A., and Huneault. R., 2006, Overburden Drilling Management Ltd: Exploring heavy
minerals: EXPLORE, Newsletter of the Association of Applied Geochemists, v. 133, p.
1-5.
Bachmann, O., and Bergantz, G.W., 2006, Gas percolation in upper-crustal silicic crystal mushes
as a mechanism for upward heat advection and rejuvenation of near-solidus magma
bodies: Journal of Volcanology and Geothermal research, v. 149, p. 85-102.
94
Barboni, M., Annen, C., and Schoene, B., 2015, Evaluating the construction and evolution of
upper crustal magma reservoirs with coupled U/Pb zircon geochronology and thermal
modeling: A case study from the Mt. Capanne pluton (Elba, Italy): Earth and Planetary
Science Letters, v. 432, p. 436–448.
Barr, S.M., Hamilton, M.A., Samson, S.D., Satkoski, A.M., White, C.E., 2012, Provenance
variations in northern Appalachian Avalonia based on detrital zircon age patterns in
Ediacaran and Cambrian sedimentary rocks, New Brunswick and Nova Scotia, Canada:
Canadian Journal of Earth Sciences, v. 49, p. 533–546.
Beckman, V., Möller, C., Söderlund, U. and Andersson, J., 2017, Zircon growth during
progressive recrystallization of gabbro to garnet amphibolite, Eastern Segment,
Sveconorwegian orogen: Journal of Petrology, v. 58, p. 167-187.
Benn, K, Horne, R.J. Kontak, D.J., Pignotta, G.S., and Evans, N.G., 1997, Syn-Acadian
emplacement model for the South Mountain Batholith, Meguma Terrane, Nova Scotia:
Magnetic fabric and structural analyses: Geological Society of Americia Bulletin, v. 109,
p. 1279-1293.
Benn, K., Roest, W.R., Rochette, P., Evans, N.G., and Pignotta, G.S., 1999, Geophysical and
structural signatures of syntectonic batholith construction: the South Mountain Batholith,
Meguma Terrane, Nova Scotia: Geophysical Journal International, v. 136, p.144-158.
95
Bird, J.M., and Dewey, J.F., 1970, Lithosphere platecontinental margin tectonics and the
evolution of the Appalachian Orogen: Geological Society of America Bulletin, v. 81, p.
1031–1060.
Black, L. P., Kamo, S. L., Allen, C. M., Davis, D., Aleinikoff, J. N., Valley, J. W., Mundil, R.,
Campbell, I. H., Korsch, R. J., Williams, I. S., and Foudoulis, C., 2004. Improved
206Pb/238U microprobe geochronology by the monitoring of a trace-element-related matrix
effect; SHRIMP, ID-TIMS, ELA-ICP-MS and oxygen isotope documentation for a series
of zircon standards: Chemical Geology, v. 205, p. 115-140.
Blevin, P.L. and Chappell, B.W., 1992, The role of magma sources, oxidation states and
fractionation in determining the granite metallogeny of eastern Australia: Transactions of
the Royal Society of Edinburgh: Earth Sciences, v. 83, p.305-316.
Bouvier, A., Vervoort, J.D. and Patchett, P.J., 2008, The Lu–Hf and Sm–Nd isotopic
composition of CHUR: constraints from unequilibrated chondrites and implications for
the bulk composition of terrestrial planets: Earth and Planetary Science Letters, v. 273,
p.48-57.
Broderick, C., Wotzlaw, J., Frick, D., Gerndez, A., Ulianov, A., Gunther, D., Schaltegger, U.,
2015, Linking the thermal evolution and emplacement history of an upper crustal pluton
to its lower-crustal roots using zircon geochronology and geochemistry (southern
96
Adamello batholith, N. Italy): Contributions to Mineralogy and Petrology, v. 170, p. 1–
17.
Brown, E.H., and McClelland, W.C., 2000, Pluton emplacement by sheeting and vertical
ballooning in part of the southeast Coast Plutonic Complex, British Columbia: Geological
Society of America Bulliten, v. 112, p. 708-719.
Brown, M., 1994, The generation, segregation, ascent and emplacement of granite magma: the
migmatite-to-crustally-derived granite connection in thickened orogens: Earth-Science
Reviews, v. 36, p. 83-130.
Brown, S.J.A., Fletcher, I.R., 1999, SHRIMP U-Pb dating of the preeruption growth history of
zircons from the 340 ka Whakamaru Ignimbrite, New Zealand; evidence for N250 k.y.
magma residence times: Geology, v. 27, p. 1035–1038.
Buret, Y., Von Quadt, A., Heinrich, C., Selby, D., Wälle, M., and Peytcheva, I., 2016, From a
long-lived upper-crustal magma chamber to rapid porphyry copper emplacement:
Reading the geochemistry of zircon crystals at Bajo de la Alumbrera (NW Argentina):
Earth and Planetary Science Letters, v. 450, p. 120-131.
Cabri, L.J., Rudashevsky, N.S., Rudashevsky, V.N. and Oberthür, T., 2008, Electric-Pulse
Disaggregation (EPD), Hydroseparation (HS) and their use in combination for mineral
processing and advanced characterization of ores. in Canadian Mineral Processors 40th
Annual Meeting, Proceedings, v. 14, p. 211-235.
97
Carruzzo, S., Kontak, D.J., and Clarke, D.B., 2000, Granite-hosted mineral deposits of the New
Ross area, South Mountain Batholith, Nova Scotia, Canada: P, T and X constraints of
fluids using fluid inclusion thermometry and decrepitate analysis: Transactions of the
Royal Society of Edinburgh: Earth Sciences, v. 91, p. 303–319.
Černý, P., 1991, Rare-element granitic pegmatites. Part II: Regional to global environments and
petrogenesis: Geoscience Canada.
Černý, P., Blevin, P. L., Cuney, M., and London, D., 2005, Granite related ore deposits:
Economic Geology 100th Anniversary Volume, p. 337–370.
Chatterjee, A.K.,, Strong, D.F., 1985, Geochemical characteristics of the polymetallic tin
domain, southwestern Nova Scotia, Canada. in Taylor, R.P., and Strong, D.F., eds.,
Granite-Related Mineral Deposits: Geology, Petrogenesis and Tectonic Setting: Canadian
Institute of Mining and Metallurgy, Extended Abstract, p. 4l-52.
Chatterjee A.K., Cormier, R.F., 1991, A Rb-Sr geochronological study of the Davis Lake pluton,
South Mountain batholith, southern Nova Scotia: evidence for a 374Ma time of
emplacement. Mines and Minerals Branch Report of activities, part A. Nova Scotia
Department of Natural Resources Report.
Chatterjee, A., and Dostal, J., 2003, Deep drill hole in the Devonian South Mountain batholith,
Nova Scotia: a potential for hidden mineral deposits within the batholith: Atlantic
Geology, v. 38, p.1-10.

98
Chavez, J., 2019, Redox state of the South Mountain Batholith: A reconnaissance study using
zircon geochemistry: unpublished B.Sc. Thesis, Dalhousie University, Halifax, Canada,
53 pp.
Cherniak, D.J. and Watson, E.B., 2003, Diffusion in zircon: Reviews in mineralogy and
geochemistry, v. 53, p.113-143.
Claiborne, L.L., Miller, C.F. and Wooden, J.L., 2010, Trace element composition of igneous
zircon: a thermal and compositional record of the accumulation and evolution of a large
silicic batholith, Spirit Mountain, Nevada: Contributions to Mineralogy and Petrology, v.
160, p.511-531.
Clarke, D.B., 2010, The Meguma Lithotectonic Terrane. in Clarke, D.B., ed., Eurogranites 2010
Field Excursion Guidebook, Nova Scotia: Atlantic Geoscience Society, Special
Publication, v. 37, p. 5-31.
Clarke, D.B., and Carruzzo, S, 2007, Assimilation of country-rock ilmenite and rutile in the
South Mountain Batholith, Nova Scotia, Canada: Canadian Mineralogist, v. 45, p. 31-42.
Clarke, D.B., and Chatterjee, A.K., 1988, Physical and chemical processes in the South
Mountain Batholith. in Taylor, R.P., and Strong, D.F., eds., Recent advances in the
geology of granite-related mineral deposits: Special Volume - Canadian Institute of
Mining and Metallurgy, v. 39, p. 223-233.
99
Clarke, D.B., and Halliday, A.N., 1980, Strontium isotope geology of the South Mountain
batholith, Nova Scotia: Geochimica et Cosmochimica Acta, v. 44, p. 1045–1058.
Clarke, D.B., Halliday, A.N. and Hamilton, P.J., 1988, Neodymium and strontium isotopic
constraints on the origin of the peraluminous granitoids of the South Mountain Batholith,
Nova Scotia, Canada: Chemical Geology: Isotope Geoscience section, v. 73, p.15-24.
Clarke, D.B., MacDonald, M.A., Reynolds, P.H., Longstaffe, F.J., 1993, Leucogranites from the
Eastern Part of the South Mountain Batholith, Nova Scotia: Journal of Petrology, v. 34, p.
653–679.
Clarke. D.B., MacDonald, M.A., and Tate, M.C., 1997, Late Devonian mafic-felsic magmatism
in the Meguma Zone, Nova Scotia. in Sinha, A.K., Whalen, J.B., Hogan, J.P., eds., The
nature of magmatism in the Appalachian Orogen: Geological Society America Memoir,
v. 191, p. 107–127.
Clarke, D. B., Fallon, R., and Heaman, L.M., 2000, Interaction among upper crustal, lower
crustal, and mantle materials in the Port Mouton pluton, Meguma Lithotectonic Zone,
southwest Nova Scotia: Canadian Journal of Earth Sciences, v. 37, p. 579-600.
Clarke, D.B., MacDonald, M.A., and Erdmann, S., 2004, Chemical variation in Al2O3-CaO-
Na2O-K2O space: controls on the peraluminosity of the South Mountain Batholith:
Canadian Journal of Earth Sciences, v. 41, p. 785-798.

100
Clarke, D.B., Dorais, M., Barbarin, B., Barker, D., Cesare, B., Clarke, G., El Baghdadi, M.,
Erdmann, S., Förster, H.J., Gaeta, M. and Gottesmann, B., 2005, Occurrence and origin
of andalusite in peraluminous felsic igneous rocks: Journal of Petrology, v. 46, p.441-
472.
Clarke, D.B., Erdmann, S., Samson, H. and Jamieson, R.A., 2009, Contamination of the South
Mountain Batholith by sulfides from the country rocks: The Canadian Mineralogist, v.
47, p.1159-1176.
Clemens, J.D., 1984, Water contents of silicic to intermediate magmas: Lithos, v. 17, p. 273-287.
Clemens, J., 2003, S-type granitic magmas—petrogenetic issues, models and evidence: Earth-
Science Reviews, v. 61, p. 1–18.
Coleman, D.S., Gray, W., Glazner, A.F., 2004, Rethinking the emplacement and evolution of
zoned plutons: Geochronologic evidence for incremental assembly of the Tuolumne
Intrusive Suite, California: Geology, v. 32, p. 433–436.
Corfu, F., Hanchar, J., Hoskin, P.W.O., and Kinny, P., 2003, Atlas of zircon textures: Reviews in
Mineralogy and Geochemistry, v. 53.
Courtney-Davies, L., Ciobanu, C.L., Verdugo-Ihl, M.R., Slattery, A., Cook, N.J., Dmitrijeva, M.,
Keyser, W., Wade, B.P., Domnick, U.I., Ehrig, K. and Xu, J., 2019, Zircon at the
Nanoscale Records Metasomatic Processes Leading to Large Magmatic–Hydrothermal
Ore Systems: Minerals, v. 9, p. 364.
101
Culshaw, N., and Reynolds, P., 1997, 40Ar/39Ar age of shear zones in the southwest Meguma
Zone between Yarmouth and Meteghan, Nova Scotia: Canadian Journal of Earth
Sciences, v. 34, p. 848-853.
Culshaw, N. and Lee, S.K., 2006, The Acadian fold belt in the Meguma Terrane, Nova Scotia:
Cross sections, fold mechanisms, and tectonic implications: Tectonics, v. 25, 16p.
Culshaw, N., and Bhatnagar, P., 2001, The interplay of regional structure and emplacement
mechanisms at the contact of the South Mountain Batholith, Nova Scotia: floor-down or
wall-up?: Canadian Journal of Earth Sciences, v. 38, p.1285-1299.
Cuney, M., 1990, Structural and magmatic control of late-Hercynian uranium concentrations; the
la Crouzille district (Haute-Vienne Department, France). Controles magmatiques et
structuraux de la metallogenese uranifere tardi-hercynienne; exemple du district de la
Crouzille (Haute-Vienne): Chronique de la Recherche Miniere (France), v. 58, p. 499.
Currie, K.L., Whalen, J.B., Davis, W.J., Longstaffe, F.J., and Cousens, B.L., 1998, Geochemical
evolution of peraluminous plutons in southern Nova Scotia, Canada—a pegmatite-poor
suite: Lithos, v. 44, p. 117-140.
Cruden, A.R., 1998, On the emplacement of tabular granites: Journal of the Geological Society
of London, v. 155, p. 853-862.
Davis, D.W., 1982, Optimum linear regression and error estimation applied to U-Pb data:
Canadian Journal of Earth Sciences, v. 19, p. 2141-2149.
102
de la Rosa, J.D., Jenner, G.A. and Castro, A., 2002, A study of inherited zircons in granitoid
rocks from the South Portuguese and Ossa-Morena Zones, Iberian Massif: support for the
exotic origin of the South Portuguese Zone: Tectonophysics, v. 352, p. 245-256.
Dostal, J., and Chatterjee, A.K., 1995, Origin of topaz-bearing and related peraluminous granites
of the Late Devonian Davis Lake pluton, Nova Scotia, Canada: crystal versus fluid
fractionation: Chemical Geology, v. 123, p.67-88.
Eberz, G.W., Clarke, D.B., Chatterjee, A.K., and Giles, P.S., 1991, Chemical and isotopic
composition of the lower crust beneath the Meguma lithotectonic zone, Nova Scotia:
evidence from granulite facies xenoliths: Contributions to Mineralogy and Petrology, v.
109, p. 69–88.
Eiler, J.M., Carr, M.J., Reagan, M. and Stolper, E., 2005, Oxygen isotope constraints on the
sources of Central American arc lavas: Geochemistry, Geophysics, Geosystems, v. 6.
England, P.C. and Thompson, A.B., 1984, Pressure—temperature—time paths of regional
metamorphism I. Heat transfer during the evolution of regions of thickened continental
crust: Journal of Petrology, v. 25, p.894-928.
Erdmann, S., London, D., Morgan, G.G.B., and Clarke, D.B., 2007, The contamination of
granitic magma by sedimentary country-rock material: an experimental study: Canadian
Mineralogist, v. 45, p. 43-61.
103
Erdmann, S., Jamieson, R.A., and MacDonald, M.A., 2009, Evaluating the Origin of Garnet,
Cordierite, and Biotite in Granitic Rocks: a Case Study from the South Mountain
Batholith, Nova Scotia: Journal of Petrology, v. 50, p. 1477–1503.
Erdmann, S., Wodicka, N., Jackson, S.E., and Corrigan, D., 2013, Zircon textures and
composition: refractory recorders of magmatic volatile evolution?: Contributions to
Mineralogy and Petrology, v. 165, p.45-71.
Fallon, R. P., Reynolds, P. H., and Clarke, D.B., 2001, A comparative 40Ar/39Ar conventional
and laserprobe study of muscovite from the Port Mouton pluton, southwest Nova Scotia:
Canadian Journal of Earth Sciences, v. 38, p. 347-357.
Farina, F., Stevens, G., Villaros, A., 2012. Multi-batch, incremental assembly of a dynamic
magma chamber: the case of the Peninsula pluton granite (Cape Granite Suite, South
Africa): Contributions to Mineralogy and Petrology, v. 106, p.193–216.
Ferry, J.M., and Watson, E.B., 2007, New thermodynamic models and revised calibrations for
the Ti-in-zircon and Zr-in-rutile thermometers: Contributions to Mineralogy and
Petrology, v. 154, p. 429–437.
Fisher, C.M., Hanchar, J.M., Samson, S.D., Dhuime, B., Blichert-Toft, J., Vervoort, J.D. and
Lam, R., 2011, Synthetic zircon doped with hafnium and rare earth elements: A reference
material for in situ hafnium isotope analysis: Chemical Geology, v. 286, p. 32-47.

104
France, L., Demacon, M., Gurenko, A.A. and Briot, D., 2016, Oxygen isotopes reveal crustal
contamination and a large, still partially molten magma chamber in Chaîne des Puys
(French Massif Central): Lithos, v. 260, p. 328-338.
Frets, E.C., Tommasi, A., Garrido, C.J., Vauchez, A., Mainprice, D., Targuisti, K. and Amri, I.,
2014, The Beni Bousera peridotite (Rif Belt, Morocco): an oblique-slip low-angle shear
zone thinning the subcontinental mantle lithosphere: Journal of Petrology, v. 55, p. 283-
313.
Gaudemer, Y., Jaupart, C. and Tapponnier, P., 1988, Thermal control on post-orogenic extension
in collision belts: Earth and Planetary Science Letters, v. 89, p.48-62.
Garland, G.D., 1953, Gravity measurements in the Maritime Provinces. Ottawa, Publ. Dom.
Obs., v. 16, p. 185-275.
Gärtner, A., Villeneuve, M., Linnemann, U., Gerdes, A., Youbi, N., Guillou, O. and Rjimati,
E.C., 2016, History of the west African Neoproterozoic ocean: key to the geotectonic
history of circum-Atlantic peri-Gondwana (Adrar Souttouf massif, Moroccan Sahara):
Gondwana Research, v. 29, p. 220-233.
Geisler, T., Schaltegger, U. and Tomaschek, F., 2007, Re-equilibration of zircon in aqueous
fluids and melts: Elements, v. 3, p. 43-50.
Giles, P.S., 1985, A major post-Visean sinistral shear zone – new perspectives on Devonian and
Carboniferous rocks of southern Nova Scotia. in Chatterjee, A.K. and Clarke, D.B., eds.,
105
Guide to the granites and mineral deposits of southwestern Nova Scotia: Nova Scotia
Department of Mines and Energy, v. 85, p. 233-248.
Giles, P.S. and Chatterjee, A.K., 1987, Evolution of the Liscomb Complex and its relevance to
metallogeny in the Eastern Meguma Terrane: Nova Scotia Department of Mines, Report,
v. 87, p.1.
Glazner, A.F., Bartley, J.M., Coleman, D.S., Gray, W., and Taylor, R.Z., 2004, Are plutons
assembled over millions of years by amalgamation from small magma chambers?: GSA
Today, v. 14, p. 4.
Greenough, J.D., Krogh, T.E., Kamo, S.L., Owen, J.V. and Ruffman, A., 1999, Precise U-Pb
dating of Meguma basement xenoliths: new evidence for Avalonian underthrusting:
Canadian Journal of Earth Sciences, v. 36, p. 15-22.
Griffin, W.L., Pearson, N.J., Belousova, E., Jackson, S.V., Van Achterbergh, E., O’Reilly, S.Y.,
and Shee, S.R., 2000, The Hf isotope composition of cratonic mantle: LAM-MC-ICPMS
analysis of zircon megacrysts in kimberlites: Geochimica et cosmochimica acta, v. 64, p.
133-147.
Griffin, W.L., Wang, X., Jackson, S.E., Pearson, N.J., O'Reilly, S.Y., Xu, X. and Zhou, X., 2002,
Zircon chemistry and magma mixing, SE China: in-situ analysis of Hf isotopes, Tonglu
and Pingtan igneous complexes: Lithos, v. 61, p. 237-269.
106
Haggerty, S.E., 1978,. The redox state of planetary basalts: Geophysical Research Letters, v. 5,
p. 443-446.
Halter W.E., and Williams-Jones, A.E., 1999, Application of topaz muscovite F-OH exchange as
a geothermometer: Economic Geology, v. 94, p. 1249–1258.
Halter, W.E., Williams-Jones, A.E. and Kontak, D.J., 1996, The role of greisenization in
cassiterite precipitation at the East Kemptville tin deposit, Nova Scotia: Economic
Geology, v. 91, p. 368-385.
Harley, S.L., Kelly, N.M. and Moller, A., 2007, Zircon behaviour and the thermal histories of
mountain chains: Elements, v. 3, p. 25-30.
Harper, C.L., 1988, On the nature of time in the cosmological perspective. Unpublished Ph.D.
Thesis, Oxford University, 508 pp.
Heaman, L., and Parrish, R., 1991, U-Pb Geochronology of accessory minerals, in Heaman, L.,
and Ludden, J. N., eds., Applications of Radiogenic Isotope Systems to Problems to
Geology: Short Course Handbook: Mineralogical Association of Canada, p. 59–100.
Hibbard, J.P., van Staal, C.R., Rankin, D., and Williams, H., 2006, Geology, Lithotectonic Map
of the Appalachian Orogen, Canada–United States of America: Geological Survey of
Canada, Map 2096A, scale 1:1 500 000.
107
Hicks, R.J., Jamieson, R.A. and Reynolds, P.H., 1999, Detrital and metamorphic 40Ar/39Ar ages
from muscovite and whole-rock samples, Meguma Supergroup, southern Nova Scotia:
Canadian Journal of Earth Sciences, v. 36, p. 23-32.
Hilchie L, Jamieson, R.A., 2008, Graphite thermometry in the Halifax contact aureole: Atlantic
Geology, v. 44, p. 16–17.
Hilchie, L.J., and Jamieson, R.A., 2014. Graphite thermometry in a low-pressure contact aureole,
Halifax, Nova Scotia: Lithos, v. 208, p. 21-33.
Hinton, R.W. and Upton, B.G.J., 1991, The chemistry of zircon: variations within and between
large crystals from syenite and alkali basalt xenoliths: Geochimica et Cosmochimica
Acta, v. 55, p. 3287-3302.
Horne, R.J., MacDonald, M.A., Corey, M.C., and Ham, L.J., 1992, Structure and emplacement
of the South Mountain Batholith, soutlwestern Nova Scotia: Atlantic Geology, v. 28, p.
29-50.
Horne, R.J., Corey, M.C., Ham, L.J. and MacDonald, M.A., 1988, Primary and secondary
structural features in the eastern portion of the South Mountain Batholith, southwestern
Nova Scotia: Implications for regional stress orientations during intrusion: Maritime
Sediments and Atlantic Geology, v. 24, p. 71-82.
Horne, R.J., King, M.S. Kontak, D.J., O’Reilly, G.A., and Black, D., 2006, The Kemptville shear
zone: Regional shear related to emplacement and mineralization. in MacDonald, D.R.,
108
ed., Mines and Minerals Branch Report of Activities 2005: Nova Scotia Department of
Natural Resources, Report 2006-1, p. 19-37.
Hoskin, P.W.O. and Black, L.P., 2000, Metamorphic zircon formation by solid‐state
recrystallization of protolith igneous zircon: Journal of metamorphic Geology, v. 18, p.
423-439.
Hoskin, P.W. and Ireland, T.R., 2000, Rare earth element chemistry of zircon and its use as a
provenance indicator: Geology, v. 28, p. 627-630.
Hoskin, P.W. and Schaltegger, U., 2003, The composition of zircon and igneous and
metamorphic petrogenesis: Reviews in mineralogy and geochemistry, v. 53, p. 27-62.
Huber, C., Bachmann, O. and Manga, M., 2009, Homogenization processes in silicic magma
chambers by stirring and mushification (latent heat buffering): Earth and Planetary
Science Letters, v. 283, p. 38-47.
Iannizzotto, N.F., Rapela, C.W., Baldo, E.G.A., Galindo, C., Fanning, C.M., Pankhurst, R.J.,
2013, The Sierra Norte-Ambargasta batholith: late Ediacaran-early Cambrian magmatism
associated with Pampean transpressional tectonics: Journal of South American Earth
Science, v. 42, p. 127–143.
Ishihara, S., 1981, The granitoid series and mineralization. in Skinner, B.J., ed., Economic
Geology, 75th anniversary volume: New Haven, Connecticut: Economic Geology
Publishing Co., p. 458-484.
109
Jamieson, R.A., Beaumont, C., Fullsack, P., and Lee, B., 1998, Barrovian regional
metamorphism: Where’s the heat?: Geological Society, London, Special Publications, v.
138, p. 23-51.
Johnson, M.C., Anderson Jr., A. T., Rutherford, M.J., 1994, Pre-eruptive volatile contents of
magmas, in Carroll, Michael R., and John R. Holloway, eds., Volatiles in magmas:
Reviews in Mineralogy, v. 30, p. 281–330.
Johnson, E.R., Wallace, P.J., Delgado Granados, H., Manea, V.C., Kent, A.J., Bindeman, I.N.
and Donegan, C.S., 2009. Subduction-related volatile recycling and magma generation
beneath Central Mexico: insights from melt inclusions, oxygen isotopes and geodynamic
models. Journal of Petrology, v. 50, p. 1729-1764.
Keen, C.E., Kay, W.A., Keppie, D., Marillier, F., Pe-Piper, G., and Waldron, J.W.F., 1991, Deep
seismic reflection data from the Bay of Fundy and Gulf of Maine: tectonic implications
for the northern Appalachians: Canadian Journal of Earth Sciences, v. 28, p. 1096-1111.
Kellett, D.A., Rogers, N., McNicoll, V., Kerr, A. and van Staal, C., 2014, New age data refine
extent and duration of Paleozoic and Neoproterozoic plutonism at Ganderia–Avalonia
boundary, Newfoundland: Canadian Journal of Earth Sciences, v. 51, p. 943-972.
Kellett, D.A., Piette-Lauzière, N., Mohammadi, N., Bickerton, L, Kontak, D., Rogers, .N and
Larson, K., in press, Spatio-temporal distribution of Devonian post-accretionary
granitoids in the Canadian Appalachians: implications for tectonic controls on intrusion-
110
related mineralization; in Targeted Geoscience Initiative 5: Contributions to the
understanding and exploration of porphyry deposits, (ed.) A. Plouffe and E. Schetselaar:
Geological Survey of Canada, Bulletin 616, p. xxx-xxx.
Kellett, D. A., Rogers, N., McNicoll, V., Kerr, A., and van Staal, C., 2014, New age data refine
extent and duration of Paleozoic and Neoproterozoic plutonism at Ganderia–Avalonia
boundary, Newfoundland: Canadian Journal of Earth Sciences, v. 51, p. 943–972.
Kemp, A.I., Vervoort, J.D., Bjorkman, K.E. and Iaccheri, L.M., 2017, Hafnium Isotope
Characteristics of Palaeoarchaean Zircon OG 1/OGC from the Owens Gully Diorite,
Pilbara Craton, Western Australia: Geostandards and Geoanalytical Research, v. 41, p.
659-673.
Kempster, R.M.F., Clarke, D.B., Reynolds, P.H., and Chatterjee, A.K., 1989, Late Devonian
lamprophyric dykes in the Meguma Zone of Nova Scotia: Canadian Journal of Earth
Sciences, v. 26, p. 611-613.
Keppie, J.D., 1979, Geological map of the province of Nova Scotia geophysical edition: Nova
Scotia Department of Mines and Energy, Halifax, N.S., scale 1 : 500 000.
Keppie, J.D., and Dallmeyer, R.D., 1987, Dating transcurrent terrane accretion: an example from
the Meguma and Avalon composite terranes in the northern Appalachians: Tectonics, v.
6, p. 831-847.
111
Keppie, J.D., and Dallmeyer, R.D., 1995, Late Paleozoic collision, delamination, short-lived
magmatism, and rapid denudation in the Meguma Terrane (Nova Scotia, Canada):
constraints from 40Ar/39Ar isotopic data: Canadian Journal of Earth Sciences, v. 32, p.
644-659.
Keppie, J.D., and Krogh, T.E., 1999, U-Pb geochronology of Devonian granites in the Meguma
terrane of Nova Scotia, Canada: evidence for hotspot melting of a Neoproterozoic source.
Journal of Geology, v. 107, p. 555–568.
Keppie, J.D. and Krogh, T.E., 2000, 440 Ma igneous activity in the Meguma Terrane, Nova
Scotia, Canada; part of the Appalachian overstep sequence?: American Journal of
Science, v. 300, p. 528-538.
Keppie, J. D., Currie, K. L., Murphy, J. B., Pickerill, R. K., Fyffe, L.R., and St. Julien, P., 1985,
Appalachian geotraverse (Canadian Mainland): Geological Association of Canada
Excursion 1.
Keppie, J. D., Nance, R. D., Murphy, J. B., and Dostal, J., 1991, Northern Appalachians: Avalon
and Meguma terranes. in The West African orogens and circum-Atlantic correlatives, p.
315-333.
Keppie, J.D., Dallmeyer, R.D., Krogh, T.E., and Aftalion, M., 1993, Dating mineralization using
several isotopic methods: an example from the South Mountain Batholith, Nova Scotia,
Canada: Chemical Geology, v. 103, p. 251–270.
112
Keppie, D.F., Keppie, J.D. and Murphy, J.B., 2002, Saddle reef auriferous veins in a conical fold
termination (Oldham anticline, Meguma terrane, Nova Scotia, Canada): reconciliation of
structural and age data: Canadian Journal of Earth Sciences, v. 39, p. 53-63.
Keppie, J.D., Shellnutt, J.G., Dostal, J. and Keppie, D.F., 2018, An autochthonous Avalonian
basement source for the latest Ordovician Brenton Pluton in the Meguma terrane of Nova
Scotia: U–Pb–Hf isotopic constraints and paleogeographic implications: International
Journal of Earth Sciences, v. 107, p. 955-969.
Kerr, A., and McNicoll, V., 2012, New U–Pb geochronological constraints from mineralized
granites in southern Newfoundland, in Current Research: Newfoundland Department of
Natural Resources, Geological Survey, Report 12-1, p. 21–38.
Kirkland, C.L., Smithies, R.H., Taylor, R.J.M., Evans, N., and McDonald, B., 2015, Zircon Th/U
ratios in magmatic environs: Lithos, v. 212, p. 397-414.
Kontak, D.J., 1990. The East Kemptville topaz-muscovite leucogranite, Nova Scotia. I.
Geological setting and whole rock geochemistry: Canadian Mineralogist, v. 28, p. 787–
825.
Kontak, D.J., 1994, Geological and geochemical studies of alteration processes in a fluorine-rich
environment: the East Kemptville Sn-(Zn-Cu-Ag) deposit, Yarmouth County, Nova
Scotia, Canada. In Lentz, D.R., ed., Alteration and Alteration Processes associated with
113
Ore-forming Systems: Geological Association of Canada, Short Course Notes, v. 11, p.
261-314.
Kontak, D.J., and Chatterjee, A.K., 1992, The East Kemptville tin deposit, Yarmouth County,
Nova Scotia. A Pb isotope study of the leucogranite and mineralized greisens: Evidence
for a 366 Ma metallogenic event: Canadian Journal of Earth Sciences, v. 29, p. 1180-
1196.
Kontak, D.J. and Cormier, R.F., 1991, Geochronological evidence for multiple tectono-thermal
overprinting events in the East Kemptville muscovite-topaz leucogranite, Yarmouth
County, Nova Scotia, Canada: Canadian Journal of Earth Science, v. 28, p. 209-224.
Kontak, D.J. and Kyser, T.K., 2011, Fingerprinting multiple fluid reservoirs in a 380 Ma
Intrusion-Related Gold (IRG) setting, Nova Scotia, Canada: Implications for the nature
and origin of IRG deposits: Mineralium Deposita, v. 46, p. 337-363.
Kontak, D.J. and Reynolds, P.H., 1994, 40Ar/39Ar dating of metamorphic and igneous rocks of
the Liscomb Complex, Meguma Terrane, southern Nova Scotia, Canada: Canadian
Journal of Earth Sciences, v. 31, p. 1643-1653.
Kontak, D.J., Tuach, J., Strong, D.F., Archibald, D.A., and Farrar, E., 1988, Plutonic and
hydrothermal events in the Ackley Granite, southeast Newfoundland, as indicated by
total-fusion 40Ar/39Ar geochronology: Canadian Journal of Earth Sciences, v. 25, p.
1151-1160.
114
Kontak, D.J., Horne, R.J., Sandeman, H., Archibald, D., and Lee, J. K., 1998, 40Ar/39Ar dating
of ribbon-textured veins and wall-rock material from Meguma lode gold deposits, Nova
Scotia: implications for timing and duration of vein formation in slate-belt hosted vein
gold deposits: Canadian Journal of Earth Sciences, v. 35, p. 746-761.
Kontak, D.J., Horne, R.J., Ansdell, K., and Archibald, D.A., 1999, Carboniferous barite-fluorite
mineralization in the Late Devonian Kinsac Pluton, southern Nova Scotia: Atlantic
Geology, v. 35.
Kontak, D.J., Dostal, J., Ansdell, K., Halter, W., Martin, R.F, and Williams-Jones, A.E., 2002a,
The nature and origin of pegmatite in a fluorine-rich leucogranite, East Kemptville, Nova
Scotia: Transactions of the Royal Society of Edinburgh: Earth Sciences, v. 92, p. 173-
200.
Kontak, D.J., Dostal, J., Kyser, K. and Archibald, D.A., 2002b, A petrological, geochemical,
isotopic and fluid inclusion study of 370 Ma pegmatite-aplite sheets, Peggy’s Cove, Nova
Scotia, Canada: Canadian Mineralogist, v. 40, p. 1249-1286.
Kontak D.J., Ham L.J., Dunning G., 2004, U-Pb dating of the Musquodoboit Batholith, southern
Nova Scotia: evidence for a protracted magmatic-hydrothermal event: Atlantic Geology,
v. 40, p. 207–216.
Kontak, D.J., Horne, R.J., Creaser, R.A., Petrus, J.A., and Archibald, D. 2013. A petrological
and geochronological study of a 360 Ma metallogenic event in Maritime Canada with
115
implications for lithophile-metal mineralization in the Canadian Appalachians: Canadian
Journal of Earth Sciences, v. 50, p. 1147–1163.
Krogh, T.E., 1973, A low-contamination method for hydrothermal decomposition of zircon and
extraction of U and Pb for isotopic age determinations: Geochim. Cosmochim. Acta, v.
37, p. 485-494.
Krogh, T.E., 1982, Improved accuracy of U-Pb zircon ages by the creation of more concordant
systems using an air abrasion technique: Geochim. Cosmochim Acta, v. 46, p. 637 -649.
Krogh, T.E. and Keppie, J.D., 1990, Age of detrital zircon and titanite in the Meguma Group,
southern Nova Scotia, Canada: clues to the origin of the Meguma Terrane:
Tectonophysics, v. 177, p. 307-323.
Lackey, J.S., Valley, J.W., and Hinke, H.J., 2006, Deciphering the source and contamination
history of peraluminous magmas using δ18O of accessory-minerals: examples from
garnet-bearing plutons of the Sierra Nevada batholith: Contributions to Mineralogy and
Petrology, v. 151, p. 20-44.
Lackey, J., Erdmann, S., Hark, J., Nowak, R., Murray, K., Clarke, D, and Valley, J., 2011,
Tracing garnet origins in granitoid rocks by oxygen isotope analysis: examples from the
South Mountain Batholith, Nova Scotia: The Canadian Mineralogist, v. 49, p. 417-439.
116
Langmuir, C.H., Vocke Jr, R.D., Hanson, G.N. and Hart, S.R., 1978, A general mixing equation
with applications to Icelandic basalts: Earth and Planetary Science Letters, v. 37, p. 380-
392.
Lehmann, B., 2020, Formation of tin ore deposits: A reassessment: Lithos.
Linnen, R.L., Pichavant, M. and Holtz, F., 1996, The combined effects of fO2 and melt
composition on SnO2 solubility and tin diffusivity in haplogranitic melts: Geochimica et
Cosmochimica Acta, v. 60, p. 4965-4976.
London, D., 1992, Phosphorus in S-type magmas: the P2O5 content of feldspars from
peraluminous granites, pegmatites, and rhyolites: American Mineralogist, v. 77, p. 126-
145.
Longstaffe, F.J., Smith, T.E., and Muehlenbachs, K., 1980, Oxygen isotope evidence for the
genesis of Upper Paleozoic granitoids from southwestern Nova Scotia: Canadian Journal
of Earth Sciences, v. 17, p. 132-141.
Lucazeau, F., and Vasseur, G., 1989, Heat flow density data from France and surrounding
margins: Tectonophysics, v. 164, p. 251-258.
Ludwig, K.R., 2003, User’s Manual for Isoplot 3.00; Berkeley Geochronology Center, Special
Publication 4.
117
MacDonald, L.A., Barr, S.M., White, C.E. and Ketchum, J.W., 2002, Petrology, age, and
tectonic setting of the White Rock Formation, Meguma terrane, Nova Scotia: evidence
for Silurian continental rifting: Canadian Journal of Earth Sciences, v. 39, p. 259-277.
MacDonald, M.A., 2001, Geology of the South Mountain Batholith, southwestern Nova Scotia:
Nova Scotia Department of Natural Resources Open File Report ME2001-2.
MacDonald, M.A. and Clarke, D.B., 2017, Occurrence, origin, and significance of melagranites
in the South Mountain Batholith, Nova Scotia: Canadian Journal of Earth Sciences, v. 54,
p. 693-713.
MacDonald, M.A. and Horne, R. J., 1988. Petrology of the zoned, peraluminous Halifax pluton,
south-central Nova Scotia: Maritime Sediments and Atlantic Geology, v. 24, p. 33-46
MacDonald, M.A., Horne, R.J., Corey, M.C., and Ham, L.J., 1992, An overview of recent
bedrock mapping and follow-up petrological studies of the South Mountain Batholith,
southwestern Nova Scotia, Canada: Atlantic Geology, v. 28, p. 7-28.
MacLean, N.J., Barr, S.M., White, C.E. and Ketchum, J.W., 2003, New U-Pb (zircon) age and
geochemistry of the Wedgeport Pluton, Meguma terrane, Nova Scotia.
Martel, A.T., McGregor, D.C. and Utting, J., 1993. Stratigraphic significance of Upper Devonian
and Lower Carboniferous miospores from the type area of the Horton Group, Nova
Scotia. Canadian Journal of Earth Sciences, v. 30, p. 1091-1098.
118
MacHattie, T.G., White, C.E., Beresford V.P., and Reid, M.G., 2013, The Eastern Cobequid
Highlands: Redefined Geology and Related Economic Potential: Part 2. Open File
Illustration 2013-017.
Marsh, J.H. and Stockli, D.F., 2015, Zircon U–Pb and trace element zoning characteristics in an
anatectic granulite domain: Insights from LASS-ICP-MS depth profiling: Lithos, v. 239,
p. 170-185.
Mattinson, J.M., 2005, Zircon U–Pb chemical abrasion (“CA-TIMS”) method: Combined
annealing and multi-step partial dissolution analysis for improved precision and accuracy
of zircon ages: Chemical Geology, v. 220, p. 47–66.
Mattinson, J.M., 2011, Extending the Krogh legacy: development of the CATIMS method for
zircon U–Pb geochronology: Canadian Journal of Earth Sciences, v. 48, p. 95–105.
McDonough, W.F. and Sun, S.S., 1995, The composition of the Earth. Chemical geology, 120, p.
223-253.
McFarlane, C.R.M., 2016, Allanite U-Pb geochronology by 193 nm LA ICPMS using NIST610
glass for external calibration: Chemical Geology, v. 438, p. 91–102.
McKenzie, C.B., and Clarke, D.B., 1975, Petrology of the South Mountain Batholith, Nova
Scotia: Canadian Journal of Earth Sciences, v. 12, p. 1209-1218.
McLeod, M.J., Johnson, S.C., Krogh, T.E., 2003, Archived U–Pb (zircon) dates from southern
New Brunswick: Atlantic Geology, v. 39, p. 209–225.

119
McNicoll, V.J., Squires, G.C., Wardle, R.J., Dunning, G.R. and O’Brien, B.H., 2006, U–Pb
geochronological evidence for Devonian deformation and gold mineralization in the
eastern Dunnage Zone, Newfoundland, in Current Research: Government of
Newfoundland and Labrador, Department of Natural Resources, Geological Survey,
Report 06-1, p. 45–60.
Memeti, V., Paterson, S., Matzel, J., Mundil, R., Okaya, D., 2010, Magmatic lobes as
“snapshots” of magma chamber growth and evolution in large, composite batholiths: an
example from the Tuolumne intrusion, Sierra Nevada, California: Geological Society of
America Bulletin, v. 122, p. 1912–1931.
Miles, A.J., Woodcock, N.H., 2018, A combined geochronological approach to investigating
long lived granite magmatism, the Shap granite, UK: Lithos, v. 304–307, p. 245-257.
Miller, C.F., McDowell, S.M. and Mapes, R.W., 2003, Hot and cold granites? Implications of
zircon saturation temperatures and preservation of inheritance: Geology, v. 31: p. 529-
532.
Miller, J.S., Matzel, J.E.P., Miller, C.F., Burgess, S.D., and Miller, R.B., 2007, Zircon growth
and recycling during the assembly of large, composite arc plutons: Journal of
Volcanology and Geothermal Research, v. 167, p. 282–299.

120
Mohammadi, N., McFarlane, C.R., Lentz, D.R., and Thorne, K.G., 2020, Timing of magmatic
crystallization and Sn–W–Mo greisen vein formation within the Mount Douglas Granite,
New Brunswick, Canada: Canadian Journal of Earth Sciences, v. 57, p. 814–839.
Morelli, R.M., Creaser, R.A., Selby, D., Kontak, D.J., and Horne, R.J., 2005, Rhenium-osmium
geochronology of arsenopyrite in Meguma Group gold deposits, Meguma terrane, Nova
Scotia, Canada: Evidence for multiple gold-mineralizing events: Economic Geology, v.
100, p. 1229-1242.
Muecke, G.K., Elias, P., and Reynolds, P.H., 1988, Hercynian/Alleghanian overprinting of an
Acadian terrane: 40Ar/39Ar studies in the Meguma zone, Nova Scotia, Canada. Chemical
Geology: Isotope Geoscience section, v. 73, p. 153-167.
Murphy, J.B., 2000, Tectonic influence on sedimentation along the southern flank of the late
Paleozoic Magdalen basin in the Canadian Appalachians: Geochemical and isotopic
constraints on the Horton Group in the St. Marys basin, Nova Scotia: Geological Society
of America Bulletin, v. 112, p. 997-1011.
Murphy, J.B., and Nance, R.D., 1989, Model for the evolution of the Avalonian-Cadomian belt:
Geology, v. 17, p. 735-738.
Murphy, J.B. and Keppie, J.D., 2005, The Acadian orogeny in the northern Appalachians:
International Geology Review, v. 47, p. 663-687.
121
Murphy, J.B. and Hamilton, M.A., 2000, Orogenesis and basin development: U-Pb detrital
zircon age constraints on evolution of the Late Paleozoic St. Marys Basin, central
mainland Nova Scotia: The Journal of Geology, v. 108, p. 53-71.
Murphy, J.B., Dostal, J. and Keppie, J.D., 2008, Neoproterozoic–Early Devonian magmatism in
the Antigonish Highlands, Avalon terrane, Nova Scotia: tracking the evolution of the
mantle and crustal sources during the evolution of the Rheic Ocean: Tectonophysics, v.
461, p. 181-201.
Murphy, J.B., Waldron, J.W., Kontak, D.J., Pe-Piper, G. and Piper, D.J., 2011, Minas Fault
Zone: Late Paleozoic history of an intra-continental orogenic transform fault in the
Canadian Appalachians: Journal of Structural Geology, v. 33, p. 312-328.
Murphy, J.B., Shellnutt, J.G. and Collins, W.J., 2018, Late Neoproterozoic to Carboniferous
genesis of A-type magmas in Avalonia of northern Nova Scotia: repeated partial melting
of anhydrous lower crust in contrasting tectonic environments: International Journal of
Earth Sciences, v. 107, p. 587-599.
Mundil, R., Metcalfe, I., Ludwig, K.R., Renne, P.R., Oberli, F. and Nicoll, R.S., 2001, Timing of
the Permian–Triassic biotic crisis: implications from new zircon U/Pb age data (and their
limitations): Earth and Planetary Science Letters, v. 187, p. 131-145.
Nance, R.D., and Murphy, J.B., 1996, Basement isotopic signatures and Neoproterozoic
paleogeography of Avalonian –Cadomian and related terranes in the circum-North
122
Atlantic, in Nance, R.D., Thompson, M.D., eds., Avalonian and Related Peri-Gondwanan
Terranes of the Circum-North Atlantic: Geological Society of America Special Paper, v.
304, p. 333–346.
O’Reilly, G.A., Farley, E.J., and Charest, M.H., 1982, Metasomatic–hydrothermal mineral
deposits of the New Ross– Mahone Bay area, Nova Scotia: Nova Scotia Department of
Mines and Energy, Paper 82-2.
Owen, J.V., Greenough, J.D., Hy, C., Ruffman, A., 1988, Xenoliths in a mafic dyke at Popes
Harbour, Nova Scotia: implications for the basement to the Meguma Group: Canadian
Journal of Earth Sciences, v. 25, p. 1464–1471.
Parrish, R.R., Noble, S.R., 2003, Zircon U-Th-Pb Geochronology by Isotope Dilution -- Thermal
Ionization Mass Spectrometry (ID-TIMS): Reviews in Mineralogy and Geochemistry, v.
53, p. 183–213.
Paterson, S.R., and Vernon, R.H., 1995, Bursting the bubble of ballooning plutons: a return to
nested diapirs emplaced by multiple processes: Geological Society of America Bulletin,
v. 107, p. 1356-1380.
Paton, C., Hellstrom, J., Paul, B., Woodhead, J. and Hergt, J., 2011, Iolite: Freeware for the
visualisation and processing of mass spectrometric data: Journal of Analytical Atomic
Spectrometry, v. 26, p. 2508-2518.

123
Petford, N., Kerr, R.C. and Lister, J.R., 1993, Dike transport of granitoid magmas: Geology, v.
21, p. 845-848.
Petford, N., Cruden, A.R., McCaffrey, K.J.W., and Vigneresse, J.-L., 2000, Granite magma
formation, transport and emplacement in the Earth’s crust: Nature, v. 408, p. 669–673.
Petrus, J.A. and Kamber, B.S., 2012, VizualAge: A novel approach to laser ablation ICP‐MS U‐
Pb geochronology data reduction: Geostandards and Geoanalytical Research, v. 36, p.
247-270.
Pettke, T., Audétat, A., Schaltegger, U., and Heinrich, C.A., 2005, Magmatic-to-hydrothermal
crystallization in the W–Sn mineralized Mole Granite (NSW, Australia): Part II:
Evolving zircon and thorite trace element chemistry: Chemical Geology, v. 220, p. 191-
213.
Pichavant, M., 1987, The Macusani glasses, SE Peru: evidence of chemical fractionation in
peraluminous magmas. Magmatic Process: Physicochemical Principles: Geochem. Soc.
Spec. Publ., 1, p. 359-373.
Pietranik, A.B., Hawkesworth, C.J., Storey, C.D., Kemp, A.I.S., Sircombe, K.N., Whitehouse,
M.J., and Bleeker, W., 2008, Episodic, mafic crust formation from 4.5 to 2.8 Ga: New
evidence from detrital zircons, Slave craton, Canada: Geology, v. 36, p. 875-878.
124
Poller, U., Huth, J., Hoppe, P. and Williams, I.S., 2001, REE, U, Th, and Hf distribution in
zircon from western Carpathian Variscan granitoids: a combined cathodoluminescence
and ion microprobe study: American Journal of Science, v. 301, p. 858-867.
Poulson, S.R., Kubilius, W.P., and Ohmoto, H., 1991, Geochemical behavior of sulfur in
granitoids during intrusion of the South Mountain Batholith, Nova Scotia, Canada:
Geochimica et Cosmochimica Acta, v. 55, p. 3809-3830.
Raimbault, L., Cuney, M., Azencott, C., Duthou, J.L. and Joron, J.L., 1995, Geochemical
evidence for a multistage magmatic genesis of Ta-Sn-Li mineralization in the granite at
Beauvoir, French Massif Central: Economic Geology, v. 90, p. 548-576.
Reynolds, P.H., Zentilli, M. and Muecke, G.K., 1981, K–Ar and 40Ar/39Ar geochronology of
granitoid rocks from southern Nova Scotia: its bearing on the geological evolution of the
Meguma Zone of the Appalachians: Canadian Journal of Earth Sciences, v. 18, p. 386-
394.
Richards, J.P., 2003, Tectono-magmatic precursors for porphyry Cu-(Mo-Au) deposit formation:
Economic geology, v. 98, p. 1515-1533.
Richardson, J.M., 1988, Field and alteration relationships of alteration and greisen-hosted
mineralization at the East Kemptville tin deposit, Davis Lake monzogranite, southwest
Nova Scotia, Canada, in Taylor, R.P., and Strong, D.F., eds., Granite related mineral
deposits: Canadian Institute of Mining and Metallurgy, Special, v. 39, p. 265-279.
125
Richardson J.M., Bell, K., Blenkinsopp, J., and Watkinson, D., 1989. Rb-Sr age and geochemical
distinctions between the Carboniferous tin-bearing Davis Lake complex and the
Devonian South Mountain batholith, Meguma Terrane, Nova Scotia: Canadian Journal of
Earth Sciences, v. 26, p. 2044-2061.
Roberts, N.M., Slagstad, T., Parrish, R.R., Norry, M.J., Marker, M. and Horstwood, M.S., 2013,
Sedimentary recycling in arc magmas: geochemical and U–Pb–Hf–O constraints on the
Mesoproterozoic Suldal Arc, SW Norway: Contributions to Mineralogy and Petrology, v.
165, p. 507-523.
Robinson, P., Tucker, R.D., Bradley, D., Berry, H.N., and Osberg, P.H., 1998, Paleozoic orogens
in New England, USA: Geologiska Foreningens Stockholm Forhandlingar, v. 120, p.
119-148.
Romer, R.L. and Kroner, U., 2015, Sediment and weathering control on the distribution of
Paleozoic magmatic tin–tungsten mineralization. Mineralium Deposita, v. 50, p. 327-338.
Rubatto, D., 2002, Zircon trace element geochemistry: partitioning with garnet and the link
between U–Pb ages and metamorphism: Chemical geology, v. 184, p. 123-138.
Rubatto, D. and Hermann, J., 2007. Zircon behaviour in deeply subducted rocks. Elements, 3(1),
pp.31-35.
126
Russell, W.A., Papanastassiou, D.A., and Tombrello, T.A., 1978, Ca isotope fractionation on the
Earth and other solar system materials: Geochimica et Cosmochimica Acta, v. 42, p.
1075-1090.
Samperton, K.M., Schoene, B., Cottle, J.M., Keller, C.B., Crowley, J.L., Schmitz, M.D., 2015.
Magma emplacement, differentiation and cooling in the middle crust: integrated zircon
geochronolical-geochemical constraints from the Bergell Intrusion, Central Alps:
Chemical Geology, v. 417, p. 322–340.
Sánchez-García, T., Quesada, C., Bellido, F., Dunning, G.R., G.R., and González del Tánago, J.,
2008, Two-step magma flooding of the upper crust during rifting: the early Paleozoic of
the Ossa Morena Zone (SW Iberia): Tectonophysics, v. 461, p. 72–90.
Schaltegger, U., 2007, Hydrothermal zircon: Elements, v. 3, p. 51-79.
Schaltegger, U. and Davies, J.H., 2017, Petrochronology of zircon and baddeleyite in igneous
rocks: Reconstructing magmatic processes at high temporal resolution: Reviews in
Mineralogy and Geochemistry, v. 83, p. 297-328.
Schaltegger, U., Brack, P., Ovtcharova, M., Peytcheva, I., Schoene, B., Stracke, A., Marocchi,
M., Bargossi, G.M., 2009, Zircon and titanite recording 1.5million years of magma
accretion, crystallisation and initial cooling in a composite pluton (southern Adamello
batholith, northern Italy): Earth and Planetary Science Letters, v. 286, p. 208–218.
127
Schaltegger, U., Nowak, A., Ulianov, A., Fisher, C. M., Gerdes, A., Spikings, R., Whitehouse,
M. J., Bindeman, I., Hanchar, J. M., Duff, J., Vervoort, J. D., Sheldrake, T., Caricchi, L.,
Brack, P. Müntener, O., 2019, Zircon Petrochronology and 40Ar/39Ar
Thermochronology of the Adamello Intrusive Suite, N. Italy: Monitoring the Growth and
Decay of an Incrementally Assembled Magmatic System: Journal of Petrology, v. 60, p.
701–722.
Scherer, E., Münker, C. and Mezger, K., 2001, Calibration of the lutetium-hafnium clock:
Science, v. 293, p. 683-687.
Schoene, B., and Baxter, E.F., 2017, Petrochronology and TIMS: Reviews in Mineralogy and
Geochemistry, v. 83, p. 231-260.
Schoene, B., Schaltegger, U., Brack, P., Latkoczy, C., Stracke, A., Gunther, D., 2012, Rates of
magma differentiation and emplacement in a ballooning pluton recorded by U-Pb TIMS-
TEA, Adamello batholith, Italy: Earth and Planetary Science Letters, v. 355, p. 162–173.
Selby, D., and Creaser, R., 2004, Macro-scale NTIMS and micro-scale LA-MCICP-MS Re-Os
isotopic analysis of molybdenite: Testing spatial restrictions for reliable Re-Os age
determinations, and implications for the decoupling of Re and Os within molybdenite:
Geochimica et Cosmochimica Acta, v. 68, p. 3897–3912.
128
Shellnutt, J.G., and Dostal, J., 2012, An evaluation of crustal assimilation within the Late
Devonian South Mountain Batholith, SW Nova Scotia: Geological Magazine, v. 149, p.
353-365.
Shellnutt, J.G., Owen, J.V., Yeh, M.W., Dostal, J., and Nguyen, D.T., 2019, Long-lived
association between Avalonia and the Meguma terrane deduced from zircon
geochronology of metasedimentary granulites: Scientific reports, v. 9, p. 1-11.
Siegél, C., Bryan, S.E., Allen, C.M. and Gust, D.A., 2018, Use and abuse of zircon-based
thermometers: a critical review and a recommended approach to identify antecrystic
zircons: Earth-Science Reviews, v. 176, p. 87-116.
Sláma, J., Košler, J., Condon, D.J., Crowley, J.L., Gerdes, A., Hanchar, J.M., Horstwood, M.S.,
Morris, G.A., Nasdala, L., Norberg, N. and Schaltegger, U., 2008, Plešovice zircon—a
new natural reference material for U–Pb and Hf isotopic microanalysis: Chemical
Geology, v. 249, p. 1-35.
Smith, W.D., Darling, J.R., Bullen, D.S., Lasalle, S., Pereira, I., Moreira, H., Allen, C.J. and
Tapster, S., 2019, Zircon perspectives on the age and origin of evolved S-type granites
from the Cornubian Batholith, Southwest England: Lithos, v. 336, p. 14-26.
Smythe, D.J. and Brenan, J.M., 2015, Cerium oxidation state in silicate melts: Combined fO2,
temperature and compositional effects: Geochimica et Cosmochimica Acta, v. 170, p.
173-187.
129
Smythe, D.J. and Brenan, J.M., 2016, Magmatic oxygen fugacity estimated using zircon-melt
partitioning of cerium: Earth and Planetary Science Letters, v. 453, p. 260-266.
Stern, R.A., 1997, A SHRIMP II Ion Microprobe at the Geological Survey of Canada:
Geoscience Canada, v. 23, p. 73–76.
Stern, R.A., and Amelin, Y., 2003, Assessment of errors in SIMS zircon U–Pb geochronology
using a natural zircon standard and NIST SRM 610 glass: Chemical Geology, v. 197, p.
111-142.
Szymanowski, D., Fehr, M.A., Guillong, M., Coble, M.A., Wotzlaw, J.F., Nasdala, L., Ellis,
B.S., Bachmann, O. and Schönbächler, M., 2018, Isotope-dilution anchoring of zircon
reference materials for accurate Ti-in-zircon thermometry: Chemical Geology, v. 481, p.
146-154.
Tate, M.C. and Clarke, D.B., 1997, Compositional diversity among Late Devonian peraluminous
granitoid intrusions in the Meguma Zone of Nova Scotia, Canada: Lithos, v. 39, p. 179 –
194.
Tate, M.C., Clarke, D.B. and Heaman, L.M., 1997, Progressive hybridisation between Late
Devonian mafic-intermediate and felsic magmas in the Meguma Zone of Nova Scotia,
Canada: Contributions to Mineralogy and Petrology, v. 126, p. 401-415.
Taylor, R.G., 1979, Geology of Tin Deposits. Elsevier, Amsterdam: 543pp.

130
Thompson, A.B. and Connolly, J.A., 1995, Melting of the continental crust: some thermal and
petrological constraints on anatexis in continental collision zones and other tectonic
settings: Journal of Geophysical Research: Solid Earth, v. 100, p. 15565-15579.
Trail, D., Watson, E.B. and Tailby, N.D., 2012, Ce and Eu anomalies in zircon as proxies for the
oxidation state of magmas: Geochimica et Cosmochimica Acta, v. 97, p. 70-87.
Valley, J.W., 2003, Oxygen isotopes in zircon. Reviews in mineralogy and geochemistry, v. 53,
p. 343-385.
Valley, J.W., Chiarenzelli, J.R., and McLelland, J.M., 1994, Oxygen isotope geochemistry of
zircon: Earth and Planetary Science Letters, v. 126, p. 187 – 206.
Valley, J.W., Kinny, P.D., Schulze, D.J. and Spicuzza, M.J., 1998, Zircon megacrysts from
kimberlite: oxygen isotope variability among mantle melts: Contributions to mineralogy
and petrology, v. 133, p. 1-11.
Valley, J.W., Lackey, J.S., Cavosie, A.J., Clechenko, C.C., Spicuzza, M.J., Basei, M.A.S.,
Bindeman, I.N., Ferreira, V.P., Sial, A.N., King, E.M. and Peck, W.H., 2005, 4.4 billion
years of crustal maturation: oxygen isotope ratios of magmatic zircon. Contributions to
Mineralogy and Petrology, v. 150, p. 561-580.
van Staal, C.R., 1994, The Brunswick subduction complex in the Canadian Appalachians: record
of the Late Ordovician to Late Silurian collision between Laurentia and the Gander
margin of Avalon: Tectonics, v. 13, p. 946-962.

131
van Staal, C.R., 2007, Pre-Carboniferous tectonic evolution and metallogeny of the Canadian
Appalachians, in Mineral Deposits of Canada, Goodfellow, W.D., ed.: Geological
Association of Canada, Special Publication 5, p. 793–818.
van Staal, C.R., and Barr, S.M., 2012, Lithospheric architecture and tectonic evolution of the
Canadian Appalachians and associated Atlantic margin: Geological Association of
Canada, Special Paper, v. 49, p. 41-95.
van Staal, C. R., Whalen, J. B., Valverde-Vaquero, P., Zagorevski, A., and Rogers, N, 2009, Pre-
Carboniferous, episodic accretion-related, orogenesis along the Laurentian margin of the
northern Appalachians. Geological Society, London, Special Publications, v. 327, p. 271-
316.
van Staal, C.R., Barr, S.M., Waldron, J.W.F., Schofield, D.I., Zagorevski, A., and White, C.E.,
2021, Provenance and Paleozoic tectonic evolution of Ganderia and its relationships with
Avalonia and Megumia in the Appalachian-Caledonide orogen: Gondwana Research (in
press).
Vigneresse, J. L., 2004, A new paradigm for granite generation. Transactions of the Royal
Society of Edinburgh: Earth Sciences, v. 95, p. 11-22.
Vigneresse, J.L., and Tikoff, B., 1999, Strain partitioning during partial melting and crystallizing
felsic magmas: Tectonophysics, v. 312, p. 117–132.
132
Waldron, J.W.F., Anderson, S., Cawood, P., Goodwin, L.B., Hall, J., Jamieson, R.A., Palmer, S.
E., Stockmal, G.S., and Williams, P.F., 1998, Evolution of the Appalachian Laurentian
margin: Lithoprobe results in western Newfoundland: Canadian Journal of Earth
Sciences, v. 35, p. 1271–1287.
Waldron, J.W., White, C.E., Barr, S.M., Simonetti, A. and Heaman, L.M., 2009, Provenance of
the Meguma terrane, Nova Scotia: rifted margin of early Paleozoic Gondwana: Canadian
Journal of Earth Sciences, v. 46, p. 1-8.
Waldron, J.W.F., Barr, S.M., Park, A.F., White, C.E., and Hibbard, J., 2015, Late Paleozoic
strike-slip faults in Maritime Canada and their role in the reconfiguration of the northern
Appalachian orogen: Tectonics, v. 34, p. 1661–1684.
Wiedenbeck, M.A.P.C., Alle, P., Corfu, F., Griffin, W.L., Meier, M., Oberli, F.V., Quadt, A.V.,
Roddick, J.C. and Spiegel, W., 1995, Three natural zircon standards for U‐Th‐Pb, Lu‐Hf,
trace element and REE analyses: Geostandards newsletter, v. 19, p. 1-23.
White, C.E., 2010, Stratigraphy of the Lower Paleozoic Goldenville and Halifax groups in
southwestern Nova Scotia: Atlantic Geology, v. 46, p. 136-154.
White, C.E., and Barr, S.M., 2010, Lithochemistry of the Lower Paleozoic Goldenville and
Halifax groups, southwestern Nova Scotia, Canada: Implications for stratigraphy,
provenance, and tectonic setting of the Meguma terrane, in Tollo, R.P., Bartholomew,
M.J., Hibbard, J.P., and Karabinos, P.M., eds., From Rodinia to Pangea: The
133
Lithotectonic Record of the Appalachian Region: Geological Society of America Memoir
206, p. 347–366.
White, C.E., Barr, S.M. and Toole, R.M., 2006, New insights on the origin of the Meguma
Group in southwestern Nova Scotia, Canada: Nova Scotia Department of Natural
Resources, Mineral Resource Branch, Open File Illustration, ME, 2.
White, C.E., Barr, S.M., Horne, R.J., and Hamilton, M.A., 2007, The Neoacadian orogeny in the
Meguma terrane, Nova Scotia, Canada, in 42st Annual Meeting Geological Society of
America, Northeastern Section, March 12-14, 2007, Abstracts with Programs 2007, v. 39,
p. 69.
White, C. E., Barr, S. M., and Linnemann, U., 2018, U–Pb (zircon) ages and provenance of the
White Rock Formation of the Rockville Notch Group, Meguma terrane, Nova Scotia,
Canada: evidence for the “Sardian gap” and West African origin: Canadian Journal of
Earth Sciences, v. 55, p. 589-603.
Woodhead, J.D. and Hergt, J.M., 2005, A preliminary appraisal of seven natural zircon reference
materials for in situ Hf isotope determination: Geostandards and Geoanalytical Research,
v. 29, p. 183-195.
Woodland, A.B., Kornprobst, J., and Wood, B.J., 1992. Oxygen thermobarometry of orogenic
lherzolite massifs: Journal of Petrology, v. 33, p. 203-230.
134
Woodland, A.B., Kornprobst, J., and Tabit, A., 2006, Ferric iron in orogenic lherzolite massifs
and controls of oxygen fugacity in the upper mantle: Lithos, v. 89, p. 222-241.
Wotzlaw, J.F., Schaltegger, U., Frick, D.A., Dungan, M.A., Gerdes, A. and Günther, D., 2013,
Tracking the evolution of large-volume silicic magma reservoirs from assembly to
supereruption, Geology, v. 41, p. 867-870.
Yang, X.M. and Lentz, D.R., 2005, Chemical composition of rock-forming minerals in gold-
related granitoid intrusions, southwestern New Brunswick, Canada: implications for
crystallization conditions, volatile exsolution, and fluorine-chlorine activity:
Contributions to Mineralogy and Petrology, v. 150, p. 287-305.
Zeck, H.P. and Williams, I.S., 2002, Inherited and Magmatic Zircon from Neogene Hoyazo
Cordierite Dacite, SE Spain—Anatectic Source Rock Provenance and Magmatic
Evolution, in Memoriam Professor Chris Powell,† 2001.07. 21: Journal of Petrology, v.
43, p. 1089-1104.
Zhang, W., 2015, Petrological and Metallogenic Studies of the Nashwaak Granite and Felsic
Dykes Associated with the Sisson Book W-Mo-(Cu) Deposit, West-Central New
Brunswick, Canada: Ph.D. Thesis, University of New Brunswick, Fredericton, NB,
Canada.

135
Zhang, Y., Yang, J.H., Chen, J.Y., Wang, H. and Xiang, Y.X., 2017, Petrogenesis of Jurassic
tungsten-bearing granites in the Nanling Range, South China: Evidence from whole-rock
geochemistry and zircon U–Pb and Hf–O isotopes: Lithos, v. 278, p. 166-180.
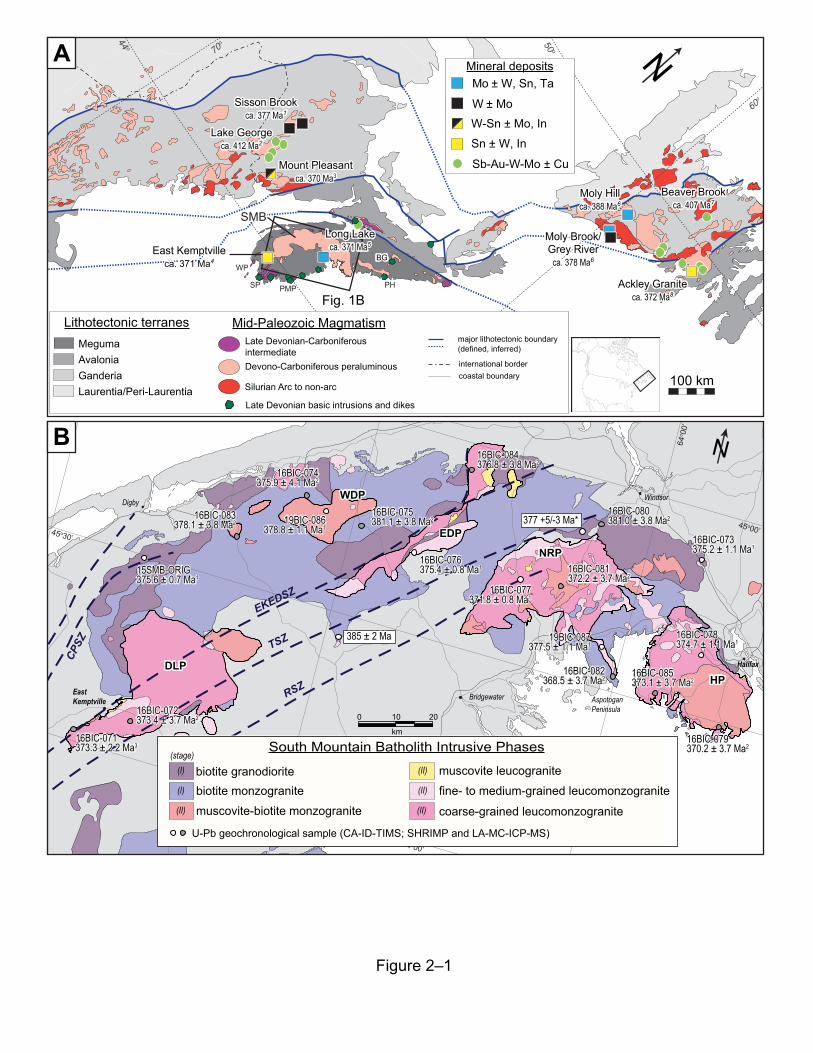
Figure 2–1
45o00’45o30’
44 o00’
65o 00
’
64o 00
’
N
DLP
WDP
EDP
NRP
HP
EKEDSZ
TSZ
RSZ
CPSZ
DLP
WDP
EDP
NRP
HP
15SMB-ORIG375.6 ± 0.7 Ma1
16BIC-071373.3 ± 2.2 Ma3
16BIC-072373.4 ± 3.7 Ma2
16BIC-083378.1 ± 3.8 Ma2
16BIC-074375.9 ± 4.1 Ma2
19BIC-086378.8 ± 1.1 Ma1
16BIC-075381.1 ± 3.8 Ma2
16BIC-076375.4 ± 0.8 Ma1
16BIC-084376.8 ± 3.8 Ma2
16BIC-077371.8 ± 0.8 Ma1
16BIC-081372.2 ± 3.7 Ma2
16BIC-080381.0 ± 3.8 Ma2
16BIC-073375.2 ± 1.1 Ma1
19BIC-087377.5 ± 1.1 Ma1
16BIC-082368.5 ± 3.7 Ma2
16BIC-078374.7 ± 1.1 Ma1
16BIC-085373.1 ± 3.7 Ma2
16BIC-079370.2 ± 3.7 Ma2
385 ± 2 Ma
377 +5/-3 Ma*
Halifax
Windsor
Bridgewater
Liverpool
EastKemptville
Digby
AspotoganPeninsula
fine- to medium-grained leucomonzogranitemuscovite leucogranite biotite granodiorite
muscovite-biotite monzogranitebiotite monzogranite
coarse-grained leucomonzogranite
U-Pb geochronological sample (CA-ID-TIMS; SHRIMP and LA-MC-ICP-MS)
South Mountain Batholith Intrusive Phases
0 10
km
20
B
(stage)(I)
(I)
(II)
(II)
(II)
(II)
100 km
N50 o
60o
70o
44 o
East Kemptvilleca. 371 Ma4
SMBSMB
Mount Pleasantca. 370 Ma3
Moly Brook/Grey River
ca. 378 Ma6
Moly Hillca. 388 Ma6
Lake Georgeca. 412 Ma2
Ackley Graniteca. 372 Ma8
Beaver Brookca. 407 Ma7
Long Lakeca. 371 Ma5
Sisson Brookca. 377 Ma1
East Kemptvilleca. 371 Ma4
Mount Pleasantca. 370 Ma3
Moly Brook/Grey River
ca. 378 Ma6
Moly Hillca. 388 Ma6
Lake Georgeca. 412 Ma2
Ackley Graniteca. 372 Ma8
Beaver Brookca. 407 Ma7
Long Lakeca. 371 Ma5
Sisson Brookca. 377 Ma1
MegumaAvaloniaGanderiaLaurentia/Peri-Laurentia
Lithotectonic terranes Mid-Paleozoic Magmatism
Silurian Arc to non-arc
Late Devonian-Carboniferous intermediateDevono-Carboniferous peraluminous
Late Devonian basic intrusions and dikes
Sb-Au-W-Mo ± Cu
W ± Mo
Mo ± W, Sn, Ta
W-Sn ± Mo, InSn ± W, In
Mineral deposits
international bordercoastal boundary
major lithotectonic boundary (defined, inferred)
Fig. 1B
A
PH
BG
PMP
WP
SP
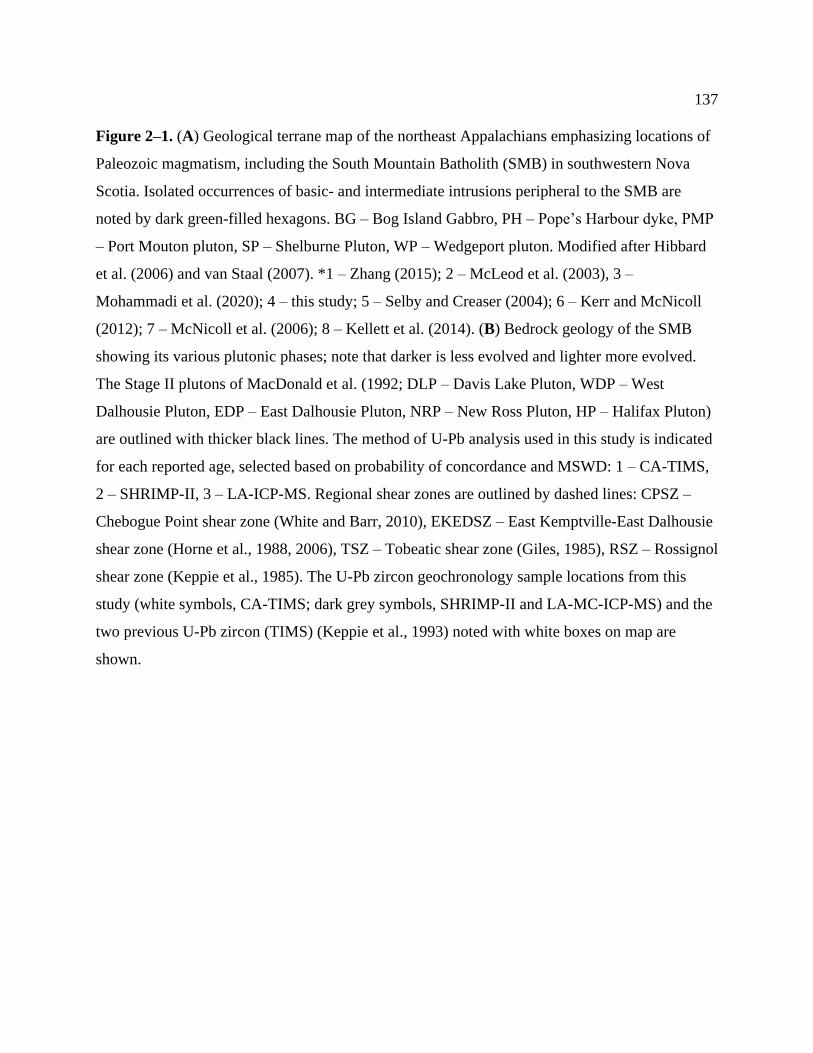
137
Figure 2–1. (A) Geological terrane map of the northeast Appalachians emphasizing locations of
Paleozoic magmatism, including the South Mountain Batholith (SMB) in southwestern Nova
Scotia. Isolated occurrences of basic- and intermediate intrusions peripheral to the SMB are
noted by dark green-filled hexagons. BG – Bog Island Gabbro, PH – Pope’s Harbour dyke, PMP
– Port Mouton pluton, SP – Shelburne Pluton, WP – Wedgeport pluton. Modified after Hibbard
et al. (2006) and van Staal (2007). *1 – Zhang (2015); 2 – McLeod et al. (2003), 3 –
Mohammadi et al. (2020); 4 – this study; 5 – Selby and Creaser (2004); 6 – Kerr and McNicoll
(2012); 7 – McNicoll et al. (2006); 8 – Kellett et al. (2014). (B) Bedrock geology of the SMB
showing its various plutonic phases; note that darker is less evolved and lighter more evolved.
The Stage II plutons of MacDonald et al. (1992; DLP – Davis Lake Pluton, WDP – West
Dalhousie Pluton, EDP – East Dalhousie Pluton, NRP – New Ross Pluton, HP – Halifax Pluton)
are outlined with thicker black lines. The method of U-Pb analysis used in this study is indicated
for each reported age, selected based on probability of concordance and MSWD: 1 – CA-TIMS,
2 – SHRIMP-II, 3 – LA-ICP-MS. Regional shear zones are outlined by dashed lines: CPSZ –
Chebogue Point shear zone (White and Barr, 2010), EKEDSZ – East Kemptville-East Dalhousie
shear zone (Horne et al., 1988, 2006), TSZ – Tobeatic shear zone (Giles, 1985), RSZ – Rossignol
shear zone (Keppie et al., 1985). The U-Pb zircon geochronology sample locations from this
study (white symbols, CA-TIMS; dark grey symbols, SHRIMP-II and LA-MC-ICP-MS) and the
two previous U-Pb zircon (TIMS) (Keppie et al., 1993) noted with white boxes on map are
shown.
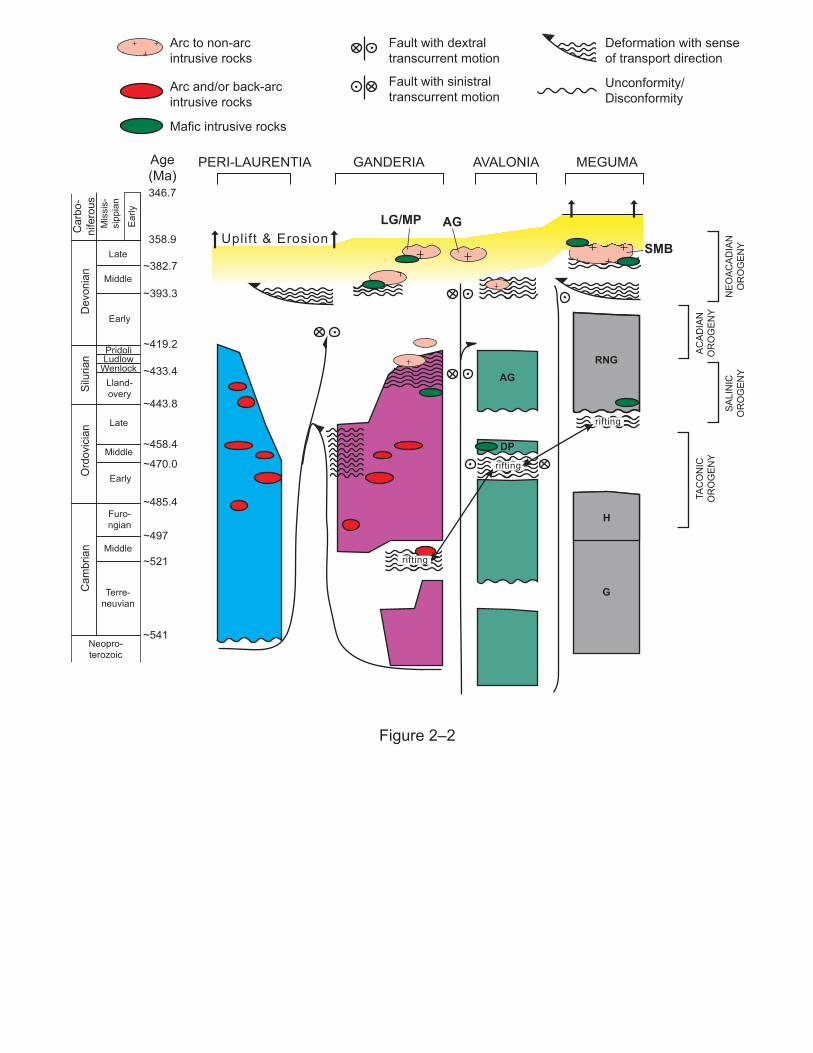
Figure 2–2
~382.7
358.9
346.7
~393.3
~419.2
~433.4
~443.8
~458.4
~470.0
~485.4
~497
~521
~541
Age(Ma)
PERI-LAURENTIA GANDERIA AVALONIA MEGUMA
Dev
onia
nC
arbo
-ni
fero
usSi
luria
nO
rdov
icia
nC
ambr
ian
Late
Mis
sis-
sipp
ian
Middle
Early
PridoliLudlow
WenlockLland-overy
Late
Middle
Early
Furo-ngian
Middle
Terre-neuvian
Neopro-terozoic
NEO
ACAD
IAN
OR
OG
ENY
ACAD
IAN
OR
OG
ENY
SALI
NIC
OR
OG
ENY
TAC
ON
ICO
RO
GEN
Y
Fault with dextraltranscurrent motion
Fault with sinistraltranscurrent motion
Arc to non-arc intrusive rocks
Arc and/or back-arcintrusive rocks
Mafic intrusive rocks
Deformation with senseof transport direction
Unconformity/Disconformity
SMB
RNG
H
G
Ear
ly
rifting
rifting
rifting
AG
DP
Uplift & ErosionLG/MP AG
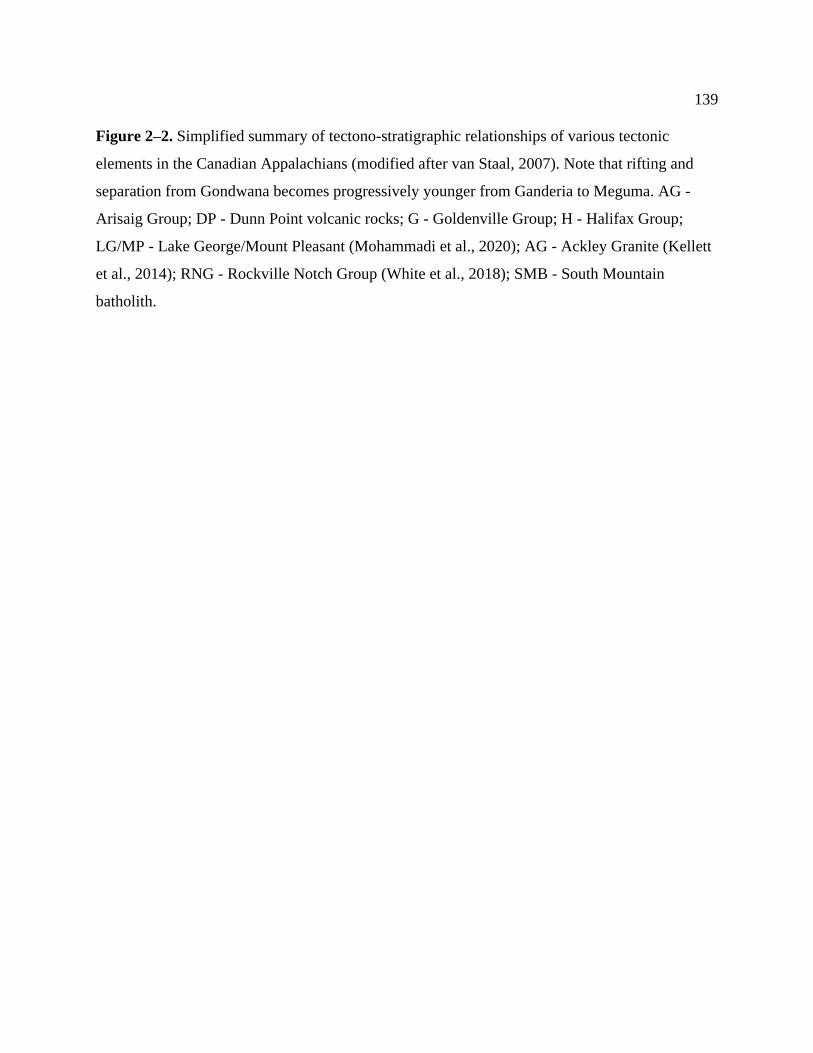
139
Figure 2–2. Simplified summary of tectono-stratigraphic relationships of various tectonic
elements in the Canadian Appalachians (modified after van Staal, 2007). Note that rifting and
separation from Gondwana becomes progressively younger from Ganderia to Meguma. AG -
Arisaig Group; DP - Dunn Point volcanic rocks; G - Goldenville Group; H - Halifax Group;
LG/MP - Lake George/Mount Pleasant (Mohammadi et al., 2020); AG - Ackley Granite (Kellett
et al., 2014); RNG - Rockville Notch Group (White et al., 2018); SMB - South Mountain
batholith.
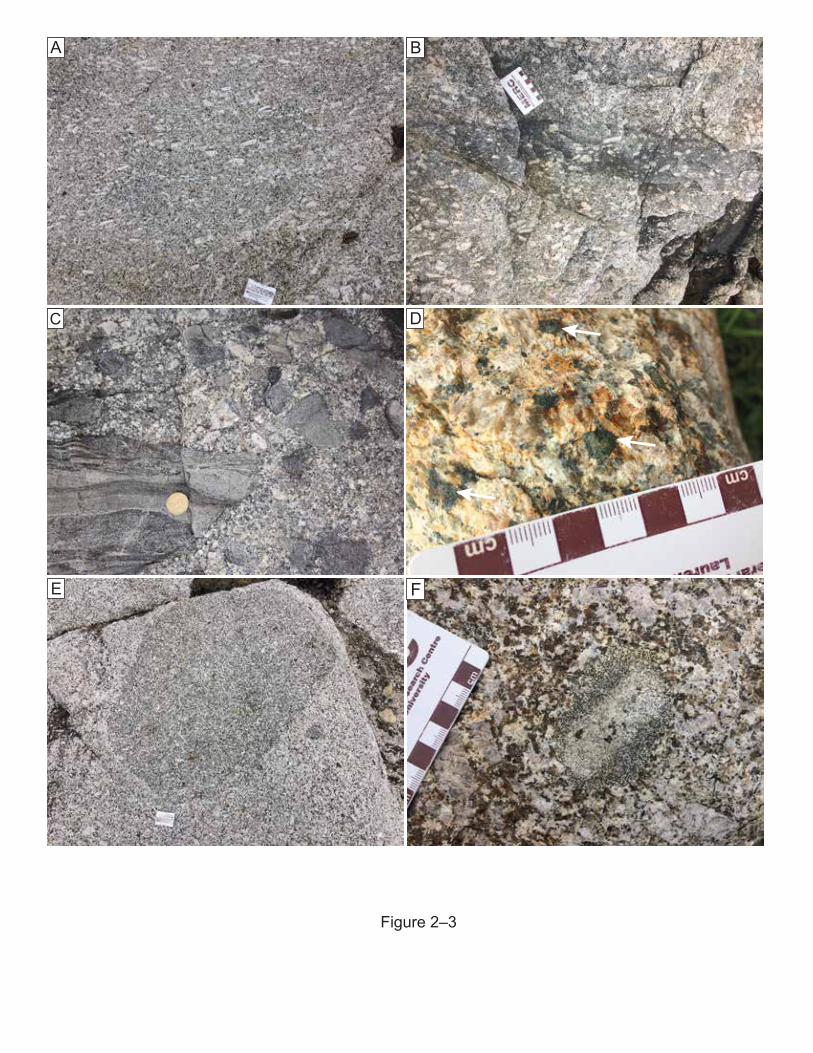
Figure 2–3
A B
C D
E F
141
Figure 2–3. Representative examples of bedrock geology and magmatic textures from the South
Mountain Batholith (SMB). (A) Halifax Pluton (Sambro area) showing a massive medium-
grained K-feldspar megacrystic monzogranite with partial alignment of feldspars. (B) Halifax
Pluton (Prospect area) showing massive medium-grained, K-feldspar megacrystic biotite
leucomonzogranite with alignment of feldspar megacrysts and hosting a melanocratic (biotite-
rich) enclave. Note presence of K-feldspar megacrysts in both phases. (C) Outcrop of stage 1
medium- to coarse-grained biotite granodiorite containing multiple xenoliths of Meguma
metasedimentary rock with variable size and shape/resorption. From the eastern SMB in the Mt.
Uniacke area (photo courtesy of F. Tweedale). (D) Halifax Pluton (Duncan’s Cove area) coarse-
grained cordierite (arrows) muscovite-leucomonzogranite. (E) Halifax Pluton (Prospect area)
showing melanocratic enclave in massive medium-grained biotite monzogranite. (F)
Melanocratic enclave with growth of K-feldspar megacryst in a medium-grained biotite-
granodiorite from the western SMB (Milford area).
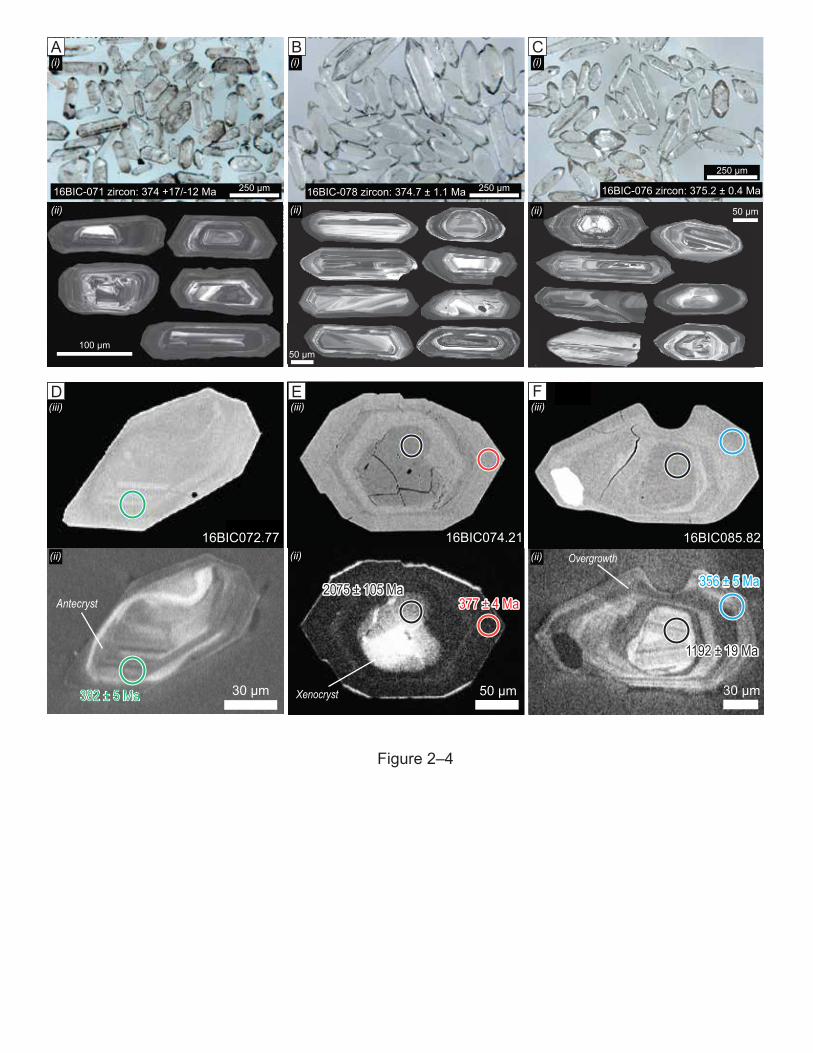
30 µm
16BIC085.82Overgrowth
356 ± 5 Ma356 ± 5 Ma
1192 ± 19 Ma1192 ± 19 Ma
16BIC074.21
50 µmXenocryst
377 ± 4 Ma377 ± 4 Ma2075 ± 105 Ma2075 ± 105 Ma
16BIC072.77
30 µm
Antecryst
382 ± 5 Ma382 ± 5 Ma
16BIC-076 zircon: 375.2 ± 0.4 Ma
50 µm
250 µm
16BIC-078 zircon: 374.7 ± 1.1 Ma 250 µm
50 µm
16BIC-071 zircon: 374 +17/-12 Ma 250 µm
100 µm
Figure 2–4
A B C
E FD
(i)
(ii)
(i)
(ii)
(i)
(ii)
(iii)
(ii)
(iii)
(ii)
(iii)
(ii)
143
Figure 2–4. Representative images of zircon grains from the South Mountain Batholith dated by
CA-TIMS and SHRIMP-II as seen using transmitted light (i; A-C), cathodoluminescence (ii; CL;
D-F), and backscatter electrons (iii; BSE; E-G). Analytical spot locations are indicated and CA-
TIMS ages labelled, where applicable in the BSE images (see text for discussion). Labels beside
the circles show the U-Pb age determinations (note that 206Pb/238U ages are reported for ages <
ca. 800 Ma and 207Pb/206Pb ages are reported for ages >ca. 800 Ma). The different age domains
for the in situ SHRIMP ages are indicated as follows: 1) black circle xenocryst; 2) green circle
antecryst; 3) red circle autocryst; and 4) blue circle younger overgrowth. Sample numbers are
noted in the upper portion of each pair of images.

100um
Xenocryst (ca. 560 Ma)(Th/U ~ 0.68)
Antecryst (ca. 390 Ma)(Th/U ~ 0.15)
Autocryst (375 - 380 Ma)(Th/U ~ 0.27)
Metamict / overgrowth (ca. 360 Ma)(Th/U ~ 0.25)
100 μm
A B C
Figure 2–5
coremantle
rim

145
Figure 2-5. Cathodoluminescence images and interpreted domains for zircons from the South
Mountain Batholith showing textural complexities and isotopic differences in each grain. The
criteria of morphology, zoning, and resorption with respect to the structure of a grain (i.e., rim,
mantle, and core) were used to identify domains of inherited xenocrystic cores (e.g., grey domain
in A), antecrystic mantles to cores and inner grains (e.g., green domains in A and B), autocrystic
crystallization (red domains in A-C), and anomalously young zircon metamict zone
replacement/overgrowth domains (e.g., blue domains in B and C). The domain classification was
complemented using the respective U-Pb ages and Th/U ratios from analysis.
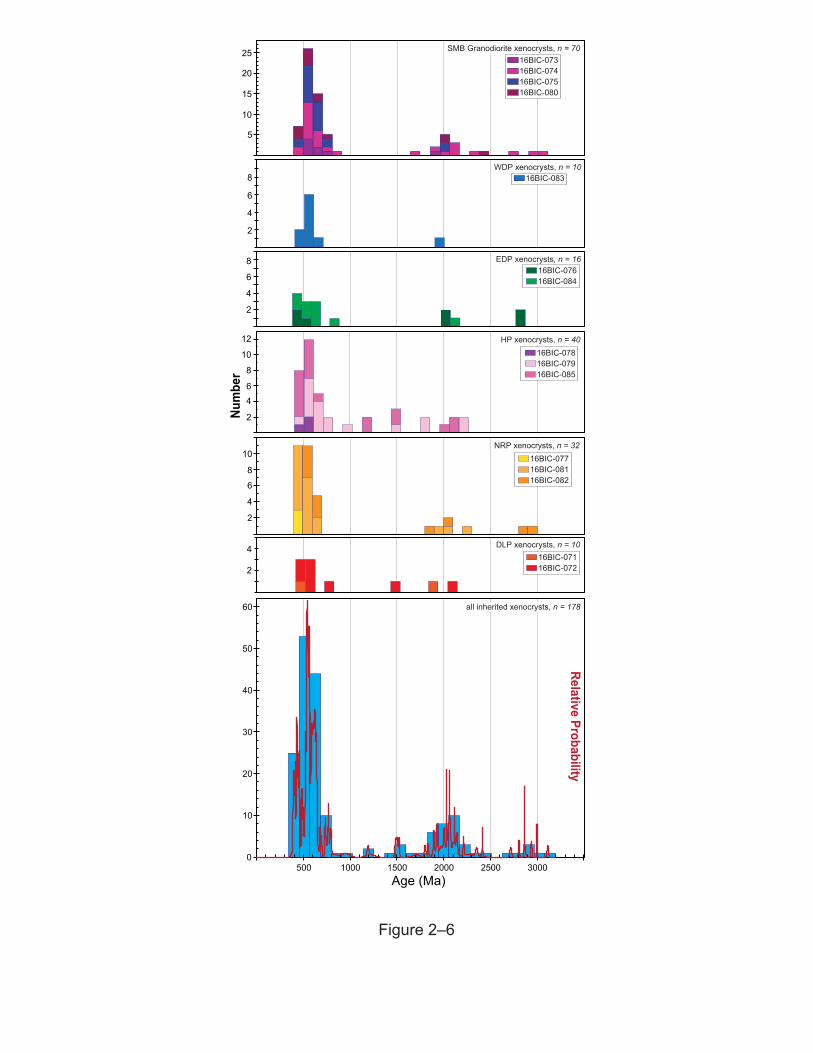
Num
ber
0
10
20
30
40
50
60
500 1000 1500 2000 2500 3000Age (Ma)
Relative Probability
all inherited xenocrysts, n = 178
6
4
8
2
16BIC-07616BIC-084
EDP xenocrysts, n = 16
5
10
15
20
2516BIC-07316BIC-07416BIC-07516BIC-080
SMB Granodiorite xenocrysts, n = 70
16BIC-083
6
4
8
2
WDP xenocrysts, n = 10
6
4
8
10
2
16BIC-07716BIC-08116BIC-082
NRP xenocrysts, n = 32
64
8
10
2
1216BIC-07816BIC-07916BIC-085
HP xenocrysts, n = 40
4
216BIC-07116BIC-072
DLP xenocrysts, n = 10
Figure 2–6
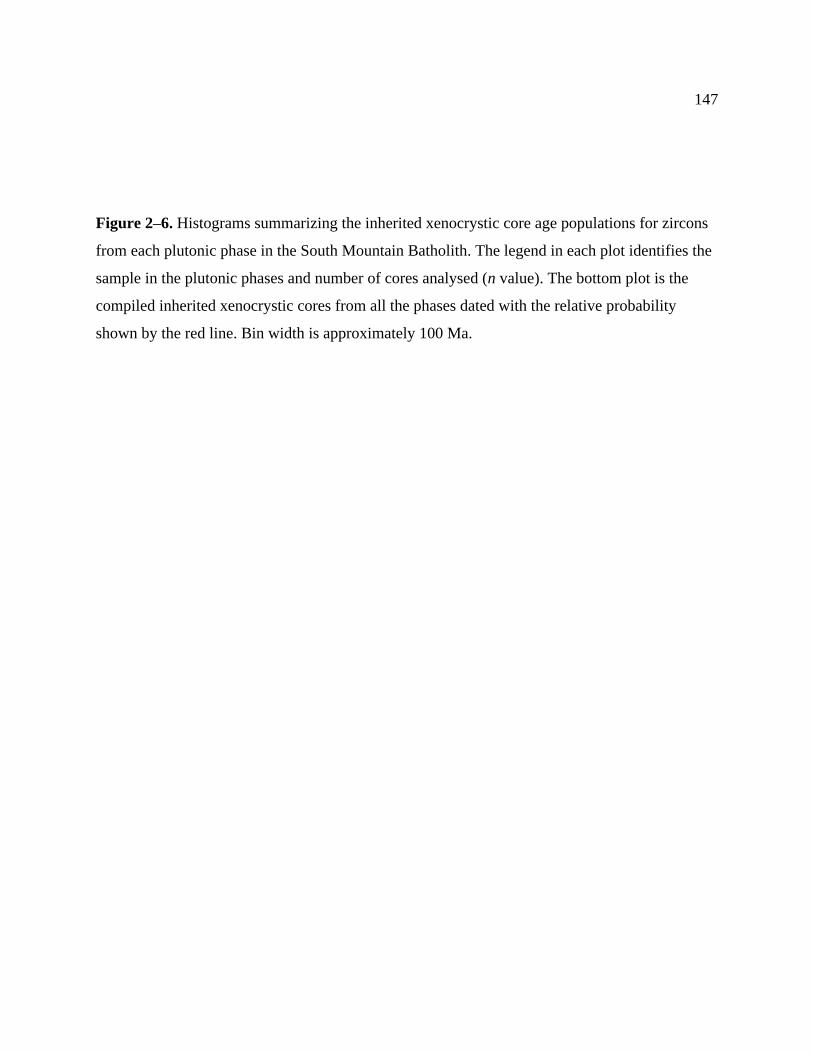
147
Figure 2–6. Histograms summarizing the inherited xenocrystic core age populations for zircons
from each plutonic phase in the South Mountain Batholith. The legend in each plot identifies the
sample in the plutonic phases and number of cores analysed (n value). The bottom plot is the
compiled inherited xenocrystic cores from all the phases dated with the relative probability
shown by the red line. Bin width is approximately 100 Ma.
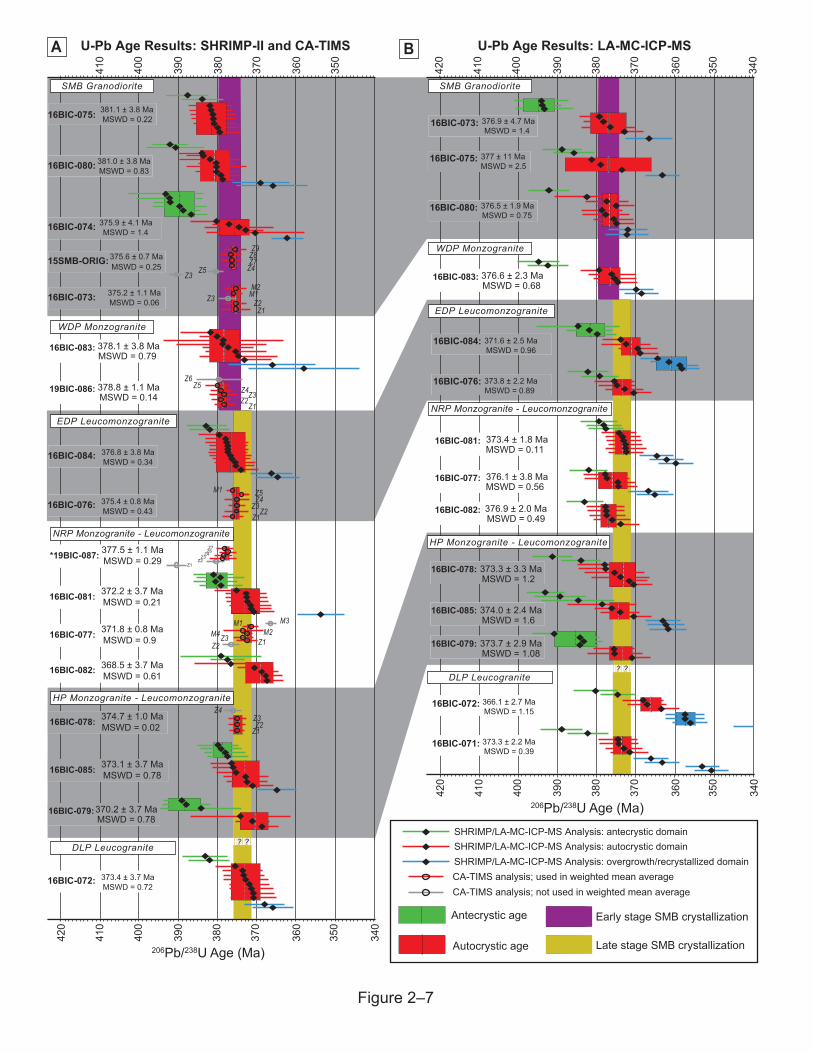
? ?
420
410
400
390
380
370
360
350
340
420
410
400
390
380
370
360
350
340
206Pb/238U Age (Ma)
376.9 ± 4.7 Ma16BIC-073:MSWD = 1.4
377 ± 11 Ma16BIC-075:MSWD = 2.5
SMB Granodiorite
376.5 ± 1.9 Ma16BIC-080:MSWD = 0.75
16BIC-083: 376.6 ± 2.3 MaMSWD = 0.68
WDP Monzogranite
373.8 ± 2.2 Ma16BIC-076:MSWD = 0.89
371.6 ± 2.5 Ma16BIC-084:MSWD = 0.96
EDP Leucomonzogranite
16BIC-078: 373.3 ± 3.3 MaMSWD = 1.2
16BIC-079: 373.7 ± 2.9 MaMSWD = 1.08
16BIC-085: 374.0 ± 2.4 MaMSWD = 1.6
HP Monzogranite - Leucomonzogranite
16BIC-077: 376.1 ± 3.8 MaMSWD = 0.56
16BIC-081: 373.4 ± 1.8 MaMSWD = 0.11
16BIC-082: 376.9 ± 2.0 MaMSWD = 0.49
NRP Monzogranite - Leucomonzogranite
373.3 ± 2.2 Ma16BIC-071:MSWD = 0.39
366.1 ± 2.7 Ma16BIC-072:MSWD = 1.15
DLP Leucogranite
420
410
400
390
380
370
360
350
340
410
400
390
380
370
360
350
? ?
206Pb/238U Age (Ma)
SMB Granodiorite
16BIC-073:Z1
Z2Z3 M1M2
375.2 ± 1.1 MaMSWD = 0.06
Z3Z4Z5Z7Z8Z9
15SMB-ORIG:375.6 ± 0.7 MaMSWD = 0.25
16BIC-080: 381.0 ± 3.8 MaMSWD = 0.83
16BIC-075: 381.1 ± 3.8 MaMSWD = 0.22
16BIC-074: 375.9 ± 4.1 MaMSWD = 1.4
WDP Monzogranite
Z1Z2
Z3Z4Z5Z6
19BIC-086: 378.8 ± 1.1 MaMSWD = 0.14
16BIC-083: 378.1 ± 3.8 MaMSWD = 0.79
Z1Z2
Z3Z4Z5M1
16BIC-076: 375.4 ± 0.8 MaMSWD = 0.43
16BIC-084: 376.8 ± 3.8 MaMSWD = 0.34
EDP Leucomonzogranite
Z1Z2
Z3Z4
16BIC-078: 374.7 ± 1.0 MaMSWD = 0.02
16BIC-085: 373.1 ± 3.7 MaMSWD = 0.78
16BIC-079:370.2 ± 3.7 MaMSWD = 0.78
HP Monzogranite - Leucomonzogranite
Z1Z2Z3
M1M2
M3M416BIC-077: 371.8 ± 0.8 Ma
MSWD = 0.9
16BIC-082: 368.5 ± 3.7 MaMSWD = 0.61
16BIC-081: 372.2 ± 3.7 MaMSWD = 0.21
*19BIC-087: 377.5 ± 1.1 MaMSWD = 0.29 Z1
Z2Z3
Z4Z6Z7
NRP Monzogranite - Leucomonzogranite
16BIC-072: 373.4 ± 3.7 MaMSWD = 0.72
DLP Leucogranite
A
Figure 2–7
B
SHRIMP/LA-MC-ICP-MS Analysis: antecrystic domainSHRIMP/LA-MC-ICP-MS Analysis: autocrystic domainSHRIMP/LA-MC-ICP-MS Analysis: overgrowth/recrystallized domainCA-TIMS analysis; used in weighted mean averageCA-TIMS analysis; not used in weighted mean average
Antecrystic age Early stage SMB crystallization
Autocrystic age Late stage SMB crystallization
U-Pb Age Results: SHRIMP-II and CA-TIMS U-Pb Age Results: LA-MC-ICP-MS

149
Figure 2–7. A) Compilation of 206Pb/238U age determinations of zircon from all units of the
South Mountain Batholith (SMB) by SHRIMP-II and CA-ID-TIMS techniques. B) Compilation
of 206Pb/238U age determinations of zircon from all units of the SMB by LA-MC-ICP-MS
technique. The weighted mean average 206Pb/238U ages of each sample is highlighted in
background of each spot/grain analysis. Grain analyses coloured grey were not included in the
weighted mean due to discordance and spot analyses that are discordant or overlapping zircon
domains are omitted from this figure. Zircon domain affinity is interpreted from zircon
morphology, zonation, and isotopic signature in all U-Pb chronometers. The crystallization age
ranges of early and late-stage granitoids are interpreted from CA-TIMS analyses; these fields are
duplicated onto the field of LA-MC-ICP-MS analyses. Note the late stage crystallization field is
projected to the DLP results, despite there being no concordant CA-TIMS analysis from this
pluton, and overlaps with the autocrystic SHRIMP-II age; the late stage crystallization field,
however, is older than the interpreted LA-MC-ICP-MS interpreted age from the same sample.
207Pb/235U0.400.40 0.44
0.058
0.060
206Pb238U
360
370
380
390
360
370
380
390
400400
376.8 ± 3.8 MaMSWD = 0.34
Probability = 0.97n = 11
375
370
380
206Pb/238U (Ma)
EDP Leucomonzogranite: 16BIC-084
0.057
0.058
0.40 0.44
373.1 ± 3.7 MaMSWD = 0.78
Probability = 0.64n = 10
360
370
380
360
370
380
HP Leucomonzogranite: 16BIC-085
207Pb/235U
206Pb238U
370
380
206Pb/238U (Ma)
0.056
0.058
0.40 0.42 0.44
340
350
360
370
380
390
340
350
360
370
380
390
378.1 ± 3.8 MaMSWD = 0.79
Probability = 0.60n = 8
207Pb/235U
206Pb238U
WDP Monzogranite: 16BIC-083
370
390
206Pb/238U (Ma)
0.058
0.060
0.40 0.44 0.48
DLP Leucogranite: 16BIC-072
373.4 ± 3.7 MaMSWD = 0.72
Probability = 0.70n = 10360
370
380
390
360
370
380
390
207Pb/235U
206Pb238U
370
380
206Pb/238U (Ma)
0.058
0.057
0.38 0.44
360
370
380
350
360
370
380
350
372.2 ± 3.7 MaMSWD = 0.21
Probability = 0.97n = 7
207Pb/235U
206Pb238U
NRP Monzogranite: 16BIC-081
375
370
206Pb/238U (Ma)
360
370
380
390
360
370
380
390
0.060
0.062
0.40 0.44 0.48 207Pb/235U
370.2 ± 3.7 MaMSWD = 0.59
Probability = 0.56n = 3
206Pb238U
206Pb238U
380
370
206Pb/238U (Ma)
HP Monzogranite: 16BIC-079
0.060
0.059
0.062
368.5 ± 3.7 MaMSWD = 0.61
Probability = 0.65n = 5
0.36 0.44340
350
360
370
380
390
340
350
360
370
380
390
207Pb/235U
206Pb238U
NRP Monzogranite: 16BIC-082
360
375
206Pb/238U (Ma)
Stage 1 Granodiorite: 16BIC-074
0.059
0.061
0.40 0.44 0.48 207Pb/235U
375.9 ± 4.1 MaMSWD = 1.4
Probability = 0.24n = 5
360
370
380
390
400
360
370
380
390
400
206Pb238U
370
390
206Pb/238U (Ma)
207Pb/235U
0.065
0.061
0.063
0.40 0.44 0.48
206Pb238U
Stage 1 Granodiorite: 16BIC-075
360
370
380
390
400
360
370
380
390
400
375
380
385
206Pb/238U (Ma) 381.1 ± 3.8 MaMSWD = 0.22
Probability = 0.97n = 7
380
390
206Pb/238U (Ma)
0.059
0.061
0.063
0.36 0.40 0.44
381.0 ± 3.8 MaMSWD = 0.83
Probability = 0.56n = 8
360
370
380
390
360
370
380
390
Stage 1 Granodiorite: 16BIC-080
207Pb/235U
206Pb238U
Figure 2–8
370
380
Spot analysis error ellipses (2σ); antecrystic, autocrystic, metamict/overgrowth
Insets of 206Pb/238U autocryst ages; ages in Ma, box heights are 2σ Line of Concordia; ages in Ma
Concordia diagrams for SHRIMP analyses on SMB Samples
Age calculation text boxes(weighted average 206Pb/238U age)
J
IHG
FED
CBA

151
Figure 2–8. Concordia plots for select zircon grains from plutons in the South Mountain
Batholith analyzed by SHRIMP-II. Coloured lead-loss lines are through age data from Table EA
2-1 (Electronic Appendix), with colour representing respective interpretation, described in the
legend. The intercept age of Pb-loss lines to the concordia are noted in sharp cornered boxes and
concordia ages are noted in rounded corner boxes; note that ages were calculated from equations
in Isoplot 3 (Ludwig 2003). Decay constant errors included are 2σ and errors of autocrystic ages
are adjusted to minimum 1% of final age. The MSWD and probability of concordance are also
noted in each box.
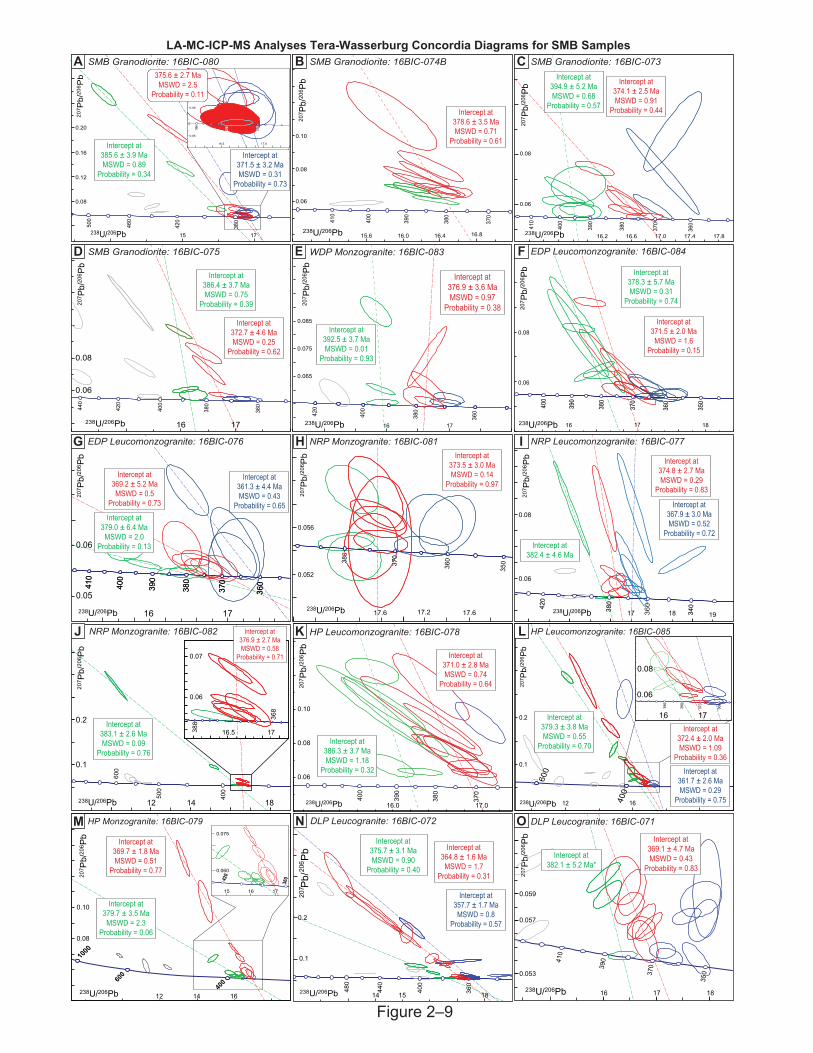
0.1
0.2
14 15 18
Intercept at364.8 ± 1.6 MaMSWD = 1.7
Probability = 0.31
Intercept at375.7 ± 3.1 MaMSWD = 0.90
Probability = 0.40
Intercept at357.7 ± 1.7 MaMSWD = 0.8
Probability = 0.57
238U/206Pb
207 Pb
/206 Pb
DLP Leucogranite: 16BIC-072
0.053
0.057
0.059
16 17 18238U/206Pb
207 P
b/20
6 Pb
DLP Leucogranite: 16BIC-071
Intercept at369.1 ± 4.7 MaMSWD = 0.43
Probability = 0.83Intercept at
382.1 ± 5.2 Ma*
0.06
0.08
16.2 16.6 17.0 17.4 17.8238U/206Pb
207 P
b/20
6 Pb
SMB Granodiorite: 16BIC-073
Intercept at374.1 ± 2.5 MaMSWD = 0.91
Probability = 0.44
Intercept at394.9 ± 5.2 MaMSWD = 0.68
Probability = 0.57
0.06
0.08
0.10
15.6 16.0 16.4 16.8238U/206Pb
207 P
b/20
6 Pb
SMB Granodiorite: 16BIC-074B
Intercept at378.6 ± 3.5 MaMSWD = 0.71
Probability = 0.61
Intercept at372.7 ± 4.6 MaMSWD = 0.25
Probability = 0.62
Intercept at386.4 ± 3.7 MaMSWD = 0.75
Probability = 0.39
0.06
0.08
16 17238U/206Pb
207 P
b/20
6 Pb
SMB Granodiorite: 16BIC-075
0.06
0.08
17 18 19360
360
Intercept at374.8 ± 2.7 MaMSWD = 0.29
Probability = 0.83
Intercept at382.4 ± 4.6 Ma
Intercept at367.9 ± 3.0 MaMSWD = 0.52
Probability = 0.72
238U/206Pb
207 P
b/20
6 Pb
NRP Leucomonzogranite: 16BIC-077
0.06
0.08
0.10
16.0 17.0238U/206Pb
207 P
b/20
6 Pb
HP Leucomonzogranite: 16BIC-078
Intercept at371.0 ± 2.8 MaMSWD = 0.74
Probability = 0.64
Intercept at386.3 ± 3.7 MaMSWD = 1.18
Probability = 0.32
0.060
0.075
16 1715
420
360
0.10
0.08
1000
600
400
238U/206Pb
207 P
b/20
6 Pb
14 1612
HP Monzogranite: 16BIC-079
Intercept at369.7 ± 1.8 MaMSWD = 0.51
Probability = 0.77
Intercept at379.7 ± 3.5 MaMSWD = 2.3
Probability = 0.06
0.08
0.12
0.16
0.20
15 17238U/206Pb
207 P
b/20
6 Pb
0.05
0.06
0.07
16.5 17.0Intercept at385.6 ± 3.9 MaMSWD = 0.89
Probability = 0.34
375.6 ± 2.7 MaMSWD = 2.5
Probability = 0.11
Intercept at371.5 ± 3.2 MaMSWD = 0.31
Probability = 0.73
SMB Granodiorite: 16BIC-080
17.2 17.617.6
Intercept at373.5 ± 3.0 MaMSWD = 0.14
Probability = 0.97
238U/206Pb
NRP Monzogranite: 16BIC-081
207 P
b/20
6 Pb
0.052
0.056
0.1
0.2
12 14 18238U/206Pb
207 P
b/20
6 Pb
NRP Monzogranite: 16BIC-082
Intercept at383.1 ± 2.6 MaMSWD = 0.09
Probability = 0.76
0.06
0.07
16.5 17
Intercept at376.9 ± 2.7 MaMSWD = 0.58
Probability = 0.71
0.065
0.075
0.085
16 17238U/206Pb
207 P
b/20
6 Pb
WDP Monzogranite: 16BIC-083
Intercept at376.9 ± 3.6 MaMSWD = 0.97
Probability = 0.38
Intercept at392.5 ± 3.7 MaMSWD = 0.01
Probability = 0.93
0.06
0.08
16 17 18
Intercept at371.5 ± 2.0 MaMSWD = 1.6
Probability = 0.15
238U/206Pb
207 P
b/20
6 Pb
EDP Leucomonzogranite: 16BIC-084
Intercept at378.3 ± 5.7 MaMSWD = 0.31
Probability = 0.74
0.1
0.2
12 16
600
800
400
238U/206Pb
207 P
b/20
6 Pb
0.06
0.08
16 17
HP Leucomonzogranite: 16BIC-085
Intercept at372.4 ± 2.0 MaMSWD = 1.09
Probability = 0.36
Intercept at379.3 ± 3.8 MaMSWD = 0.55
Probability = 0.70
Intercept at361.7 ± 2.6 MaMSWD = 0.29
Probability = 0.75
0.05
0.06
16 17
Intercept at369.2 ± 5.2 MaMSWD = 0.5
Probability = 0.73
Intercept at379.0 ± 6.4 MaMSWD = 2.0
Probability = 0.13
Intercept at361.3 ± 4.4 MaMSWD = 0.43
Probability = 0.65
410
390
380
370
36040
0
410
390
380
370
36040
0
238U/206Pb
207 P
b/20
6 Pb
EDP Leucomonzogranite: 16BIC-076
Figure 2–9
ONM
KJ
IHG
FED
CBA
L
LA-MC-ICP-MS Analyses Tera-Wasserburg Concordia Diagrams for SMB Samples

153
Figure 2–9. Tera-Wasserburg concordia plots for select zircon grains from plutons in the South
Mountain Batholith analyzed by LA-MC-ICP-MS. Coloured Pb-loss lines are through age data
from Table EA 2-3 (Electronic Appendix) with colours representing respective interpretation;
note the same legend as in Figure 2–8. Ages were calculated from equations in Isoplot 3 (Ludwig
2003).
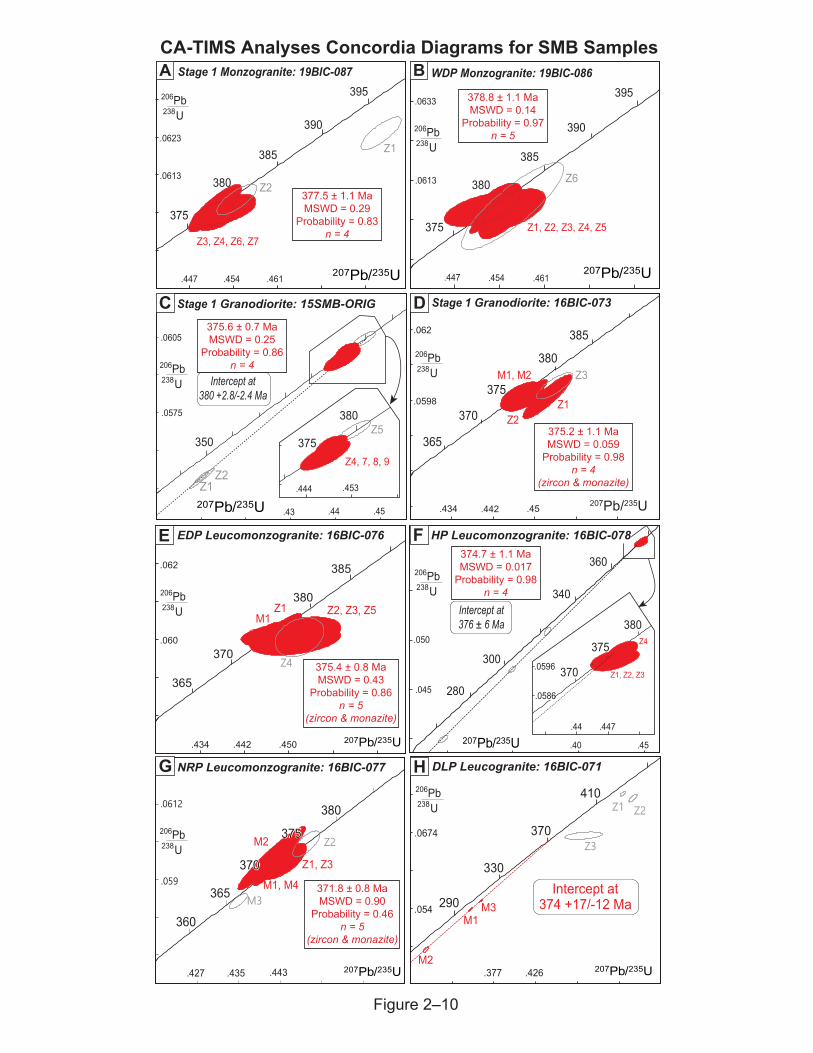
.40 .45
.050
280
300
340
360
.045
207Pb/235U.44 .447
.0596
.0586
370
375
380
Z1, Z2, Z3
Z4
HP Leucomonzogranite: 16BIC-078
206Pb238U
Intercept at376 ± 6 Ma
374.7 ± 1.1 MaMSWD = 0.017
Probability = 0.98n = 4
.427 .435 .443
.059
.0612
207Pb/235U
Z1, Z3
M1, M4M3
Z2M2
NRP Leucomonzogranite: 16BIC-077
360
365
370
375
380
360
365
370
375
380206Pb238U
371.8 ± 0.8 MaMSWD = 0.90
Probability = 0.46n = 5
(zircon & monazite)
.447 .454 .461
.0613
.0633
375
380
385
390
395
Z1, Z2, Z3, Z4, Z5
Z6
WDP Monzogranite: 19BIC-086
207Pb/235U
206Pb238U
378.8 ± 1.1 MaMSWD = 0.14
Probability = 0.97n = 5
.434 .442 .45
.0598
.062
365
370
375
380
385
Z1Z2
Z3M1, M2
Stage 1 Granodiorite: 16BIC-073
207Pb/235U
206Pb238U
375.2 ± 1.1 MaMSWD = 0.059
Probability = 0.98n = 4
(zircon & monazite)
.377 .426
.054
.0674
290
330
370
410Z1 Z2
Z3
M1
M2
M3
207Pb/235U
Intercept at374 +17/-12 Ma
DLP Leucogranite: 16BIC-071
206Pb238U
.434 .442 .450
.060
.062
365
370
380
385
Z2, Z3, Z5M1
207Pb/235U
Z4
EDP Leucomonzogranite: 16BIC-076
206Pb238U
375.4 ± 0.8 MaMSWD = 0.43
Probability = 0.86n = 5
(zircon & monazite)
Z1
.447 .454 .461
.0613
.0623
375
380
385
390
395
Z1
Z2
Z3, Z4, Z6, Z7
207Pb/235U
Stage 1 Monzogranite: 19BIC-087
206Pb238U
377.5 ± 1.1 MaMSWD = 0.29
Probability = 0.83n = 4
.43 .44 .45
.0575
.0605
350
Z1Z2
.435
.444 .453
.0628
207Pb235 U
206Pb238 U
370
375
380
Z4, 7, 8, 9
Z5
Stage 1 Granodiorite: 15SMB-ORIG
Intercept at380 +2.8/-2.4 Ma
207Pb/235U
206Pb238U
375.6 ± 0.7 MaMSWD = 0.25
Probability = 0.86n = 4
HG
FE
DC
BA
Figure 2–10
CA-TIMS Analyses Concordia Diagrams for SMB Samples
155
Figure 2–10. Concordia plots for select zircon grains from plutons in the South Mountain
Batholith analyzed by CA-TIMS analysis. Error ellipses highlighted in red are those used in the
weighted mean 206Pb/238U crystallization ages (Table EA 2-2, Electronic Appendix) and those in
grey are not used in the age calculations. Concordia and intercept ages are noted in each plot,
legend the same as in Figure 2–8. Ages were calculated from equations in Isoplot 3 (Ludwig
2003).
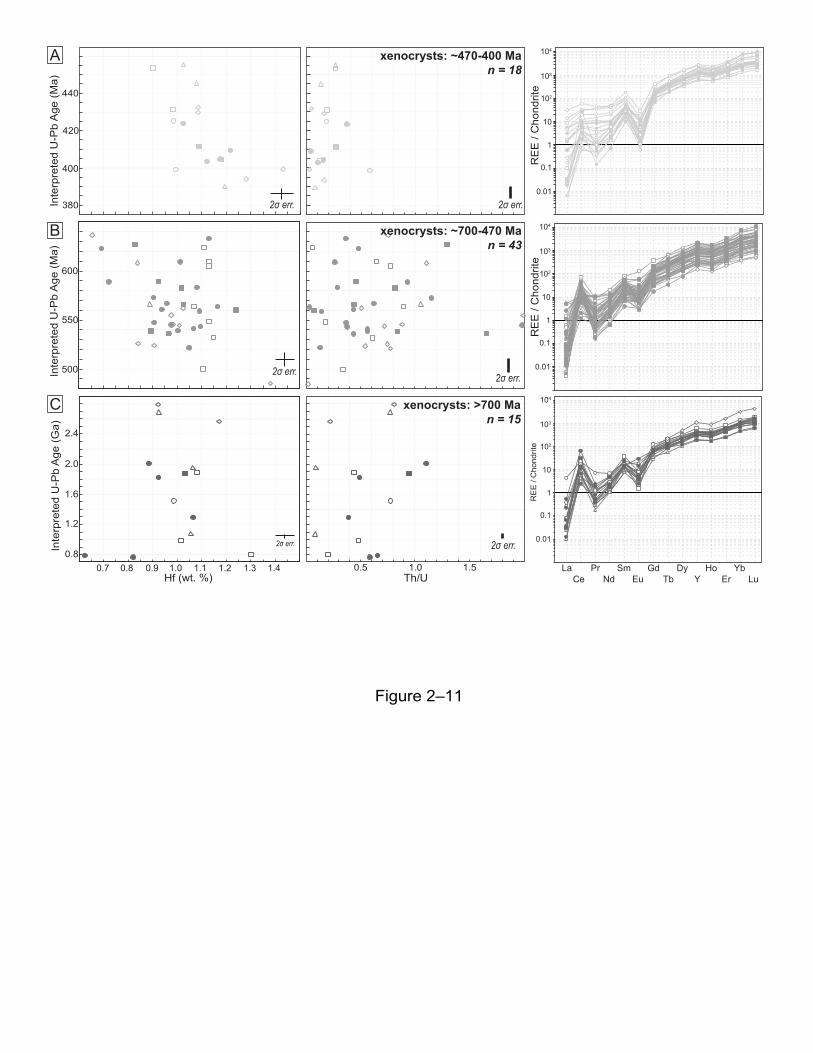
2σ err. 2σ err.
1.00.90.80.7 1.1 1.2 1.4Hf (wt. %)
1.3
Inte
rpre
ted
U-P
b A
ge (G
a)
0.8
1.2
1.6
2.0
2.4
Th/U1.0 1.50.5
Figure 2–11
2σ err. 2σ err.
0.1
0.01
1
10
103
104
RE
E /
Cho
ndrit
e 102
CePrLa
NdSm
EuGd
TbDy
YHo
ErYb
Lu
Inte
rpre
ted
U-P
b A
ge (M
a)
500
550
600
0.1
0.01
1
10
103
104
RE
E /
Cho
ndrit
e
102
380
400
420
440
Inte
rpre
ted
U-P
b A
ge (M
a)
2σ err. 2σ err.
0.1
0.01
1
10
103
104
RE
E /
Cho
ndrit
e
102
xenocrysts: ~470-400 Man = 18
xenocrysts: ~700-470 Man = 43
xenocrysts: >700 Man = 15
A
B
C
157
Figure 2–11. Trace element data for xenocrystic domains in zircons from all phases of the South
Mountain Batholith subdivided based on U-Pb ages. On the left are plots of Hf concentration
(left) and Th/U ratio (right) versus zircon U-Pb age, whereas on the right are chondrite-
normalized rare-earth element plots (normalizing values after McDonough and Sun, 1995). Note
the data shown only include those with <67% discordance in the U-Pb analysis. The age
subdivisions, as determined from LA-MC-ICP-MS and SHRIMP-II analyses (Tables EA 2-1 and
EA 2-3), and number of spots presented are denoted in top middle of each diagram.

1.00.90.8 1.1 1.2 1.4Hf (wt. %)
1.3
206 P
b/23
8 U A
ge (M
a)
370
380
390
400
Th/U0.4 0.5 0.60.1 0.2 0.3
0.1
0.01
1
10
103
104
REE
/ C
hond
rite
102
LaCe
PrNd
SmEu
GdTb
DyY
HoEr
YbLu
2σ err.
2σ err.
0.1
0.01
1
10
103
104
RE
E /
Cho
ndrit
e
102
206 P
b/23
8 U A
ge (M
a)
370
380
390
400
2σ err. 2σ err.
0.1
1
10
103
104
RE
E /
Cho
ndrit
e
102
0.01
206 P
b/23
8 U A
ge (M
a)
370
380
390
400
2σ err. 2σ err.
0.1
0.01
1
10
103
104
RE
E /
Cho
ndrit
e
102
field of stage 1 & WDPantecryst domainsantecryst domains
206 P
b/23
8 U A
ge (M
a)
370
380
390
400
2σ err. 2σ err.
0.1
0.01
1
10
103
104
RE
E /
Cho
ndrit
e
102
field of autocrystsantecryst domains
206 P
b/23
8 U A
ge (M
a)
370
380
390
400
2σ err. 2σ err.
West Dalhousie Pluton (WDP)stage 1 granodiorite (SMB)Halifax Pluton (HP)
East Dalhousie Pluton (EDP)New Ross Pluton (NRP)Davis Lake Pluton (DLP)
Host Plutonantecrystic
autocrystic
Zircon Domain
E
A
B
C
D
Figure 2–12
stage 1 granodiorite & WDP
New Ross Pluton (antecrysts: n = 6)(autocrysts: n = 16)
Halifax Pluton (antecrysts: n = 12)(autocrysts: n = 16)
East Dalhousie Pluton (antecrysts: n = 7)(autocrysts: n = 11)
Davis Lake Pluton (antecrysts: n = 6)(autocrysts: n = 11)
(antecrysts: n = 12)(autocrysts: n = 28)
159
Figure 2–12. Trace element data for antecrystic and autocrystic domains in zircons from early
and late-stage phases of the South Mountain Batholith. On the left are plots of Hf concentration
(left) and Th/U ratio (right) versus zircon U-Pb age, whereas on the right are chondrite-
normalized rare-earth element plots (normalizing values after McDonough and Sun, 1995). The
plutonic affiliation and number of spot analyses presented are denoted in top left corner of each
diagram. Note the data shown only include those with <67% discordance in the U-Pb analysis.
Data displayed are for: 1) the less evolved plutons that includes the granodiorites and also the
West Dalhousie pluton (WDP); and 2) the more evolved phases that includes the New Ross
Pluton (NRP), the Halifax Pluton (HP), the East Dalhousie pluton (EDP), and the Davis Lake
Pluton (DLP).
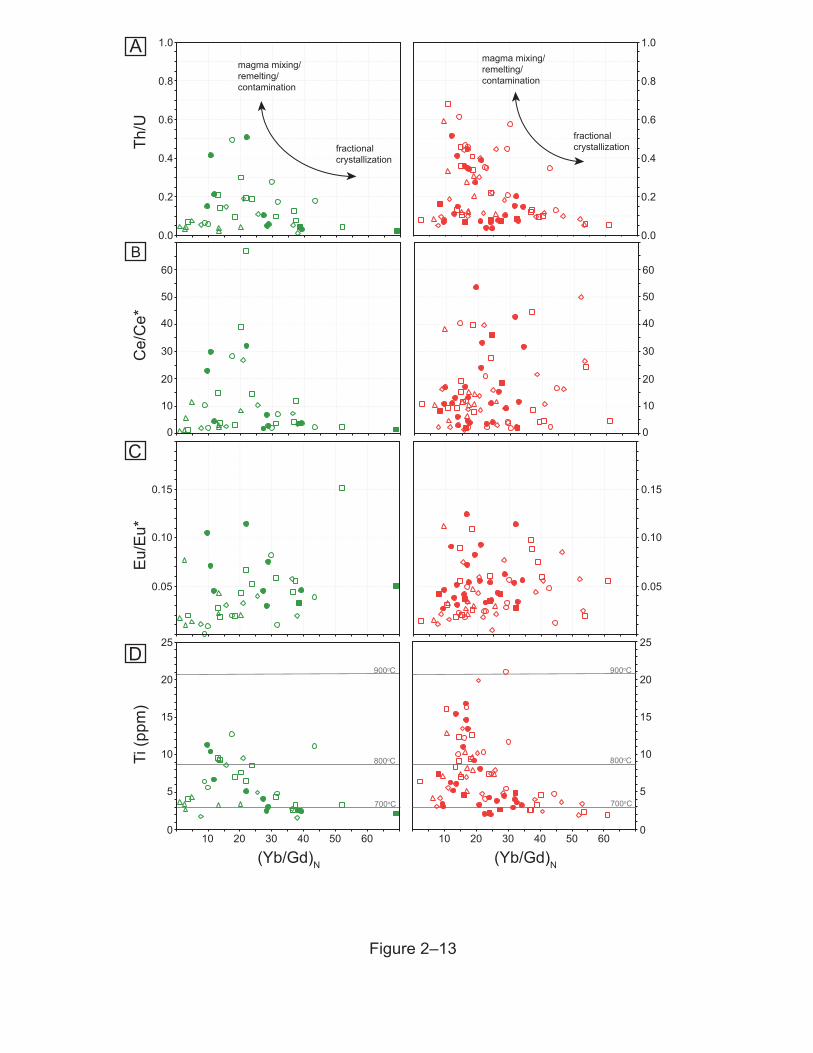
40
50
60
30
20
10
0
Ce/
Ce*
0.15
0.10
0.05
Eu/E
u*
700oC
800oC
900oC
10
15
20
25
5
0
Ti (p
pm)
20 30 40 50 6010
(Yb/Gd)N
0.8
1.0
0.6
0.4
0.2
0.0
40
50
60
30
20
10
0
0.15
0.10
0.05
700oC
800oC
900oC
20 30 40 50 6010
(Yb/Gd)N
10
15
20
25
5
0
Th/U
0.8
1.0
0.6
0.4
0.2
0.0
magma mixing/remelting/contamination
fractional crystallization
magma mixing/remelting/contamination
fractional crystallization
Figure 2–13
A
B
C
D
161
Figure 2–13. Rare-earth element and Ti data for antecrystic (left) and autocrystic (right) domains
in zircons from across the South Mountain Batholith. Plots show the Yb/Gd ratio normalized to
chondrite ([Yb/Gd]N) versus: A) Th/U (including indicated fractionation and
mixing/contamination pathways based on trace-element chemistry; e.g., Claiborne et al., 2010;
Buret et al., 2016); B) Ce anomalies (Ce/Ce*); C) Eu anomalies (Eu/Eu*= 2EuN/(SmN+GdN),
Ce/Ce*= 2CeN/(LaN+PrN); and D) Ti concentration (note the average 2σ error for all data = 1.7
ppm) as well as the Ti-in-zircon temperatures (from Ferry and Watson, 2007). Legend for all
data is same as Figure 2–12. Note the data displayed are those with <67% discordance from U-
Pb analysis.

Figure 2–14
West Dalhousie Pluton
SMB Granodiorte
New Ross Pluton
Halifax Pluton
East Dalhousie Pluton
Davis Lake Pluton
Host PlutonZircon domain interpretation
autocrystic
~470-400 Ma~700-470 Ma>700 Ma
antecrystic
xenocrysts
fayalite-magnetite-quartz (FMQ)
wustite-magnetite (WM)
Redox Buffers
Mount Pleasant fractionated I-type granites
strongly contaminated I-type granites
Normal I-Type granites
peridotites of Beni Bousera (Morocco) and Ronda (Spain)
Regional granitoids (Yang and Lentz, 2005)
Orogenic lherzolite massifs (Woodland et al., 1992; 2006)
Reference fields
FMQ
WM
-25
-20Log
fO2
-15
-10
-5
-30700 800
T (oC)900 1000
FMQ
WM
700 800T (oC)
900 1000
WDP and SMBNRP
HPEDPDLP
WDP and SMBNRP
HPEDPDLPA B
C
FMQ
WM
-25
-20
Log
fO2
-15
-10
-5
0
-30700 800
T (oC)900 1000
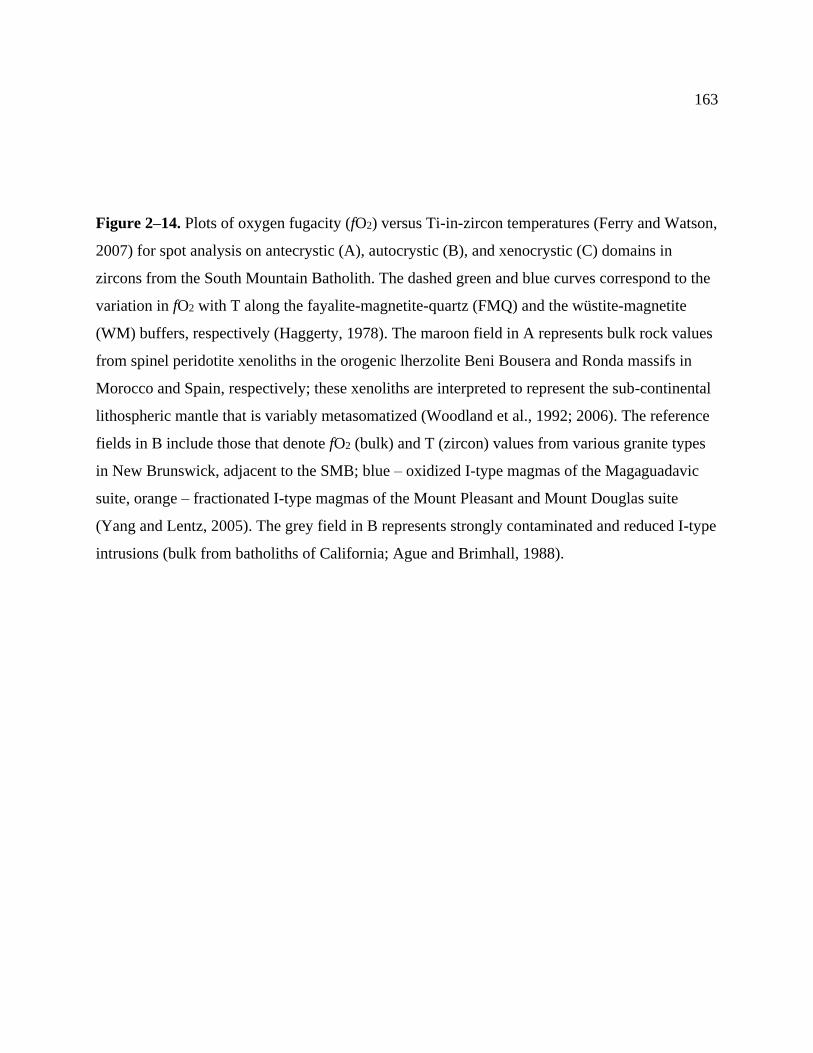
163
Figure 2–14. Plots of oxygen fugacity (fO2) versus Ti-in-zircon temperatures (Ferry and Watson,
2007) for spot analysis on antecrystic (A), autocrystic (B), and xenocrystic (C) domains in
zircons from the South Mountain Batholith. The dashed green and blue curves correspond to the
variation in fO2 with T along the fayalite-magnetite-quartz (FMQ) and the wüstite-magnetite
(WM) buffers, respectively (Haggerty, 1978). The maroon field in A represents bulk rock values
from spinel peridotite xenoliths in the orogenic lherzolite Beni Bousera and Ronda massifs in
Morocco and Spain, respectively; these xenoliths are interpreted to represent the sub-continental
lithospheric mantle that is variably metasomatized (Woodland et al., 1992; 2006). The reference
fields in B include those that denote fO2 (bulk) and T (zircon) values from various granite types
in New Brunswick, adjacent to the SMB; blue – oxidized I-type magmas of the Magaguadavic
suite, orange – fractionated I-type magmas of the Mount Pleasant and Mount Douglas suite
(Yang and Lentz, 2005). The grey field in B represents strongly contaminated and reduced I-type
intrusions (bulk from batholiths of California; Ague and Brimhall, 1988).
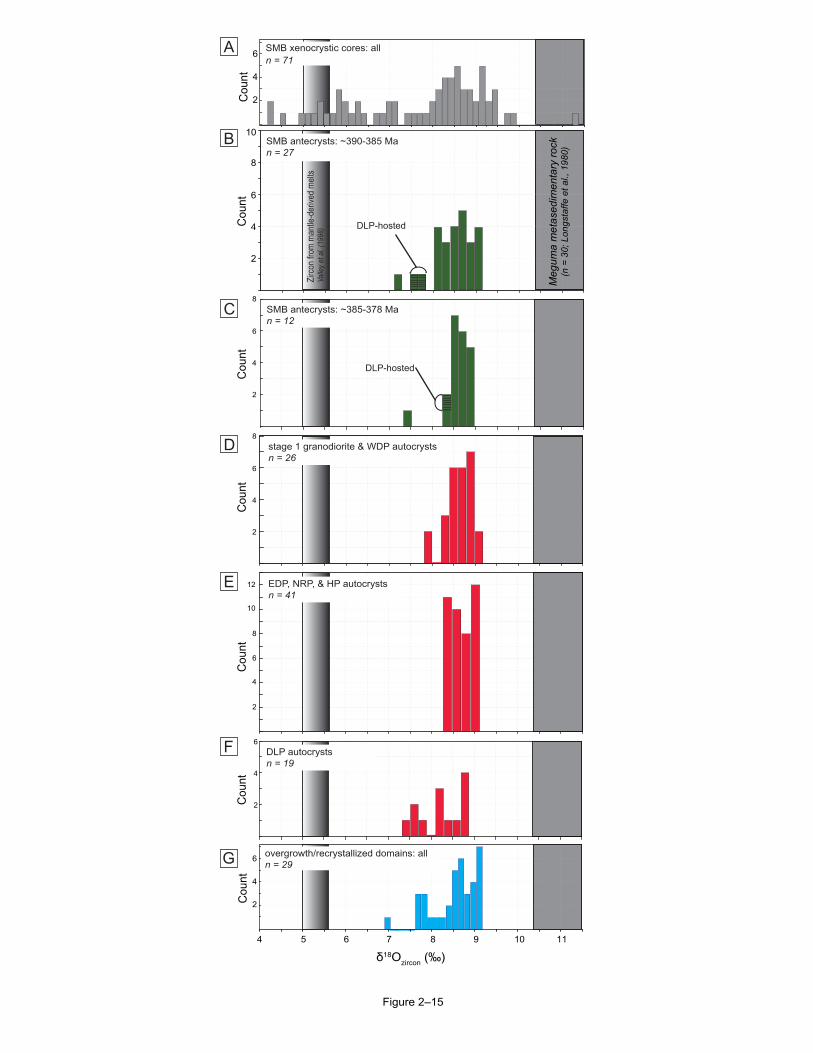
Figure 2–15
δ18Ozircon (‰)
Meg
uma
met
ased
imen
tary
rock
(n =
30;
Lon
gsta
ffe e
t al.,
198
0)
SMB antecrysts: ~385-378 Man = 12
6
8
2
4 DLP-hosted
Zirco
n fro
m ma
ntle-
deriv
ed m
elts
Valle
y et a
l. (19
98)
SMB antecrysts: ~390-385 Man = 27
6
8
2
4
10
DLP-hosted
stage 1 granodiorite & WDP autocrystsn = 26
6
8
2
4
EDP, NRP, & HP autocrysts n = 41
6
8
2
4
10
12
DLP autocrysts n = 19
6
2
4
Cou
ntC
ount
Cou
ntC
ount
Cou
nt
overgrowth/recrystallized domains: alln = 29
2
4
6
Cou
nt
6
4
2
SMB xenocrystic cores: alln = 71
Cou
nt
4 5 6 7 8 9 10 11
A
B
D
C
E
G
F
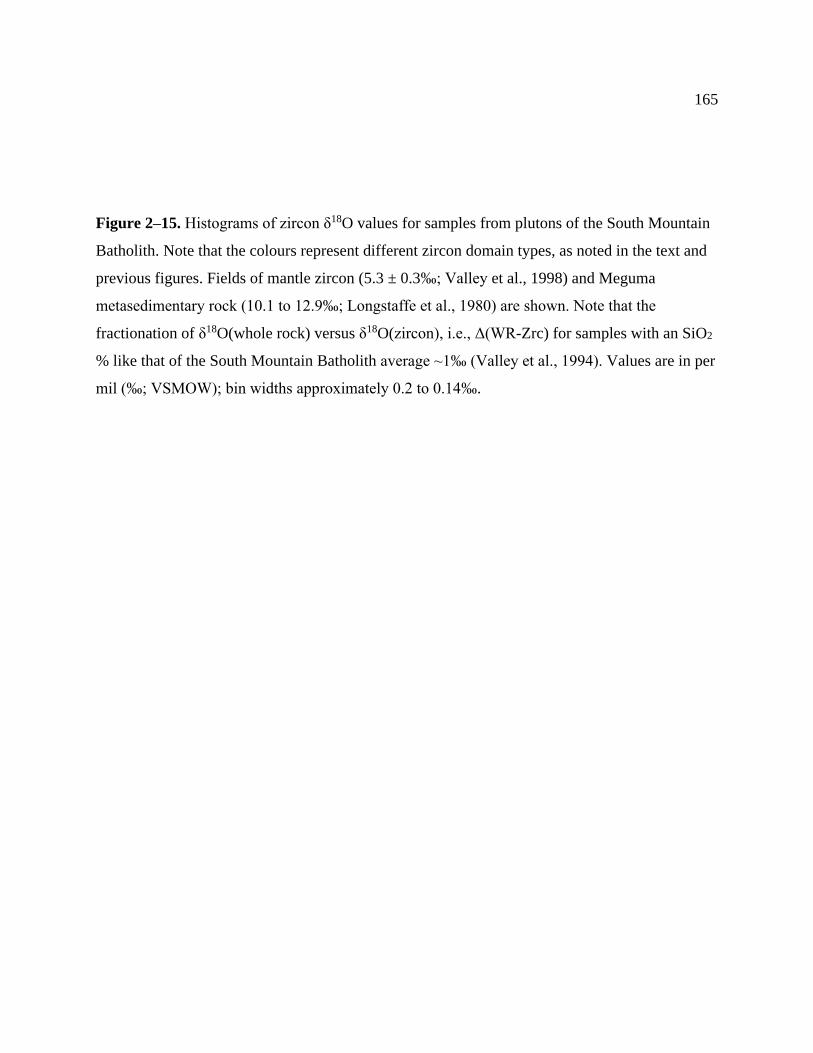
165
Figure 2–15. Histograms of zircon δ18O values for samples from plutons of the South Mountain
Batholith. Note that the colours represent different zircon domain types, as noted in the text and
previous figures. Fields of mantle zircon (5.3 ± 0.3‰; Valley et al., 1998) and Meguma
metasedimentary rock (10.1 to 12.9‰; Longstaffe et al., 1980) are shown. Note that the
fractionation of δ18O(whole rock) versus δ18O(zircon), i.e., Δ(WR-Zrc) for samples with an SiO2
% like that of the South Mountain Batholith average ~1‰ (Valley et al., 1994). Values are in per
mil (‰; VSMOW); bin widths approximately 0.2 to 0.14‰.
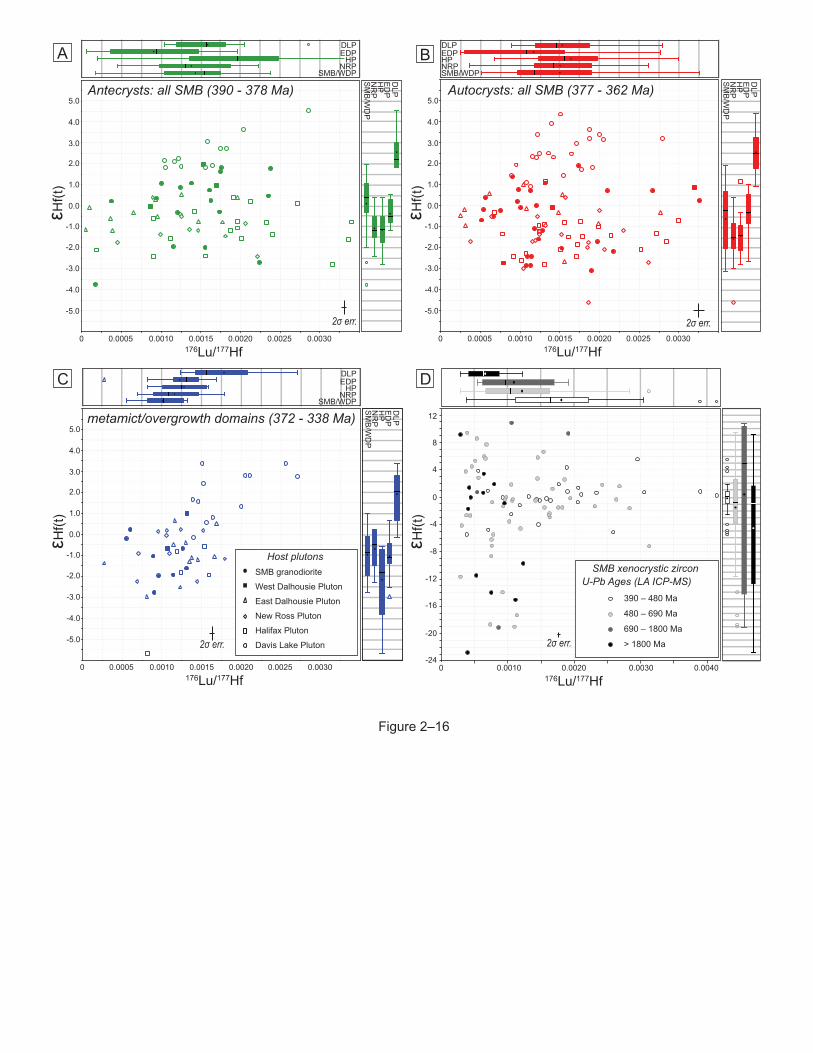
εHf(t
)
176Lu/177Hf0 0.0005 0.0010 0.0015 0.0020 0.0025 0.0030
-5.0
-4.0
-3.0
-2.0
-1.0
0.0
1.0
2.0
3.0
4.0
5.0Antecrysts: all SMB (390 - 378 Ma)
SMB/WDPNRP
HPEDPDLP
SMB/W
DP
NR
PH
PED
PD
LP
2σ err.
εHf(t
)
176Lu/177Hf0 0.0010 0.0020 0.0030 0.0040
-24
-20
-16
-12
-8
-4
0
4
8
12
U-Pb Ages (LA ICP-MS)SMB xenocrystic zircon
> 1800 Ma
690 – 1800 Ma
480 – 690 Ma
390 – 480 Ma
Figure 2–16
A B
DC
εHf(t
)
176Lu/177Hf0 0.0005 0.0010 0.0015 0.0020 0.0025 0.0030
-5.0
-4.0
-3.0
-2.0
-1.0
0.0
1.0
2.0
3.0
4.0
5.0Autocrysts: all SMB (377 - 362 Ma)
2σ err.
SMB/WDPNRPHPEDPDLP
SMB/W
DP
NR
PH
PED
PD
LPεH
f(t)
176Lu/177Hf0 0.0005 0.0010 0.0015 0.0020 0.0025 0.0030
-5.0
-4.0
-3.0
-2.0
-1.0
0.0
1.0
2.0
3.0
4.0
5.0metamict/overgrowth domains (372 - 338 Ma)
SMB/WDPNRP
HPEDPDLP
SMB/W
DP
NR
PH
PED
PD
LP
Host plutons
Davis Lake Pluton
New Ross PlutonHalifax Pluton
East Dalhousie PlutonWest Dalhousie PlutonSMB granodiorite
2σ err. 2σ err.
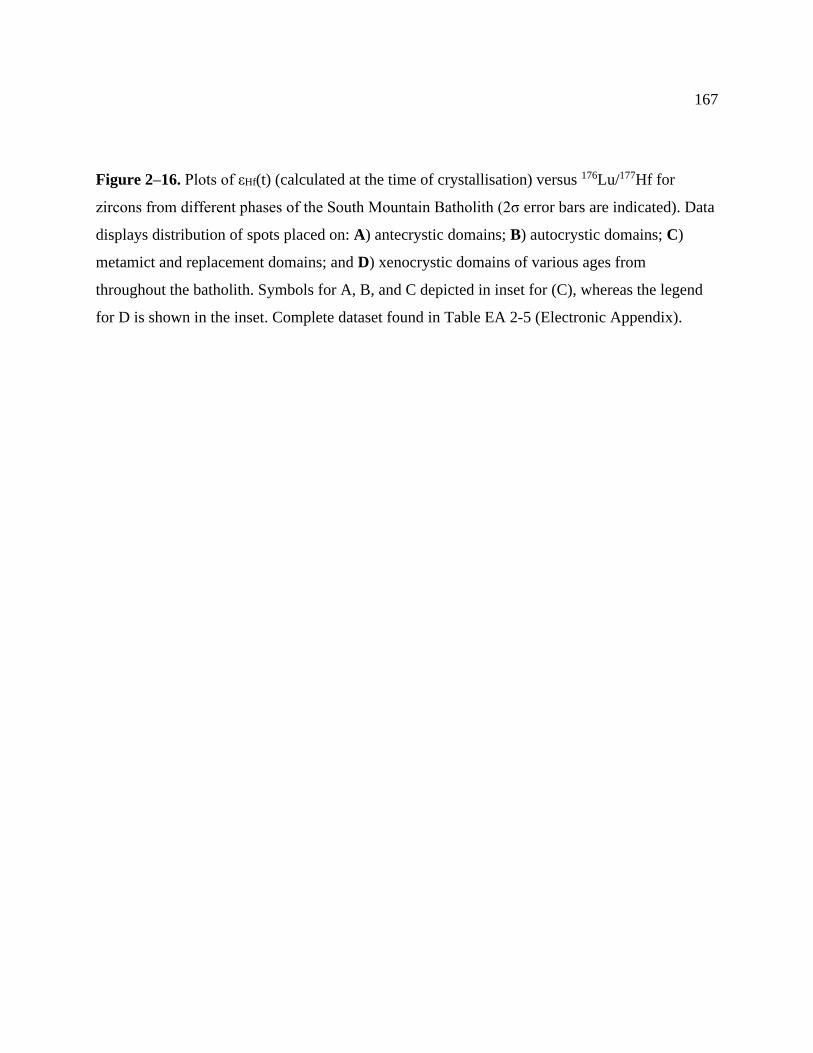
167
Figure 2–16. Plots of εHf(t) (calculated at the time of crystallisation) versus 176Lu/177Hf for
zircons from different phases of the South Mountain Batholith (2σ error bars are indicated). Data
displays distribution of spots placed on: A) antecrystic domains; B) autocrystic domains; C)
metamict and replacement domains; and D) xenocrystic domains of various ages from
throughout the batholith. Symbols for A, B, and C depicted in inset for (C), whereas the legend
for D is shown in the inset. Complete dataset found in Table EA 2-5 (Electronic Appendix).

Compiled Hf data from West African Craton (Anti-Atlas; Gärtner et al., 2016)
(176Lu/177Hf = 0.022)Average arc crustal evolution
Figure 2–17
Interpreted Age (Ma)
εHf
CHUR
DM
350 370 390 410 430 450
10
15
5
0
-5
Avalon crust
Paleoproterozoic Crust
CHUR
DM
Archean Crust
Mesoproterozoic Crust
Mesoproterozoic CrustAvalon crust
West African Craton
Interpreted Age (Ma)0 300 600 900 1200 1500 1800 2100 2400 2700
εHf
20
30
10
0
-10
-20
-30
A
B

169
Figure 2–17. A) εHf(t) vs. age plot for autocrystic and antecrystic zircon domains as well as
analyses of inherited xenocrystic cores from the SMB. For reference, the evolutionary arrays for
Archaean, Paleoproterozoic, and Mesoproterozoic crust with average upper crustal 176Lu/177Hf
values of 0.015 (Griffin et al., 2002) are shown as well as the evolutionary array for a more
mafic crust (176Lu/177Hf = 0.022; Pietranik et al., 2008) representative of the Avalon terrane (TDM
constraints derived from εNd values and growth lines in Nance and Murphy, 1996). Grey fields
represent εHf(t) data for detrital zircon from the West African craton (Gärtner et al., 2016). Note
the most radiogenic Hf isotopic compositions of the ca. 375 Ma granitoids plot above the 1.6–2.5
Ga and older crustal evolution arrays that contain xenocrystic data, indicating potential mixing
between melted Meguma crust and more juvenile material. The εHf(t) data were calculated using
the decay constant of 1.867 × 10⁻¹¹ year−1 (Scherer et al., 2001), and the CHUR parameters of
Bouvier et al. (2008). B) Closer view of εHf(t) ratios versus concordant U–Pb zircon age for
autocrystic and antecrystic zircon domain analyses in this study. Note the higher εHf(t) values in
the zircon from the DLP. DM—depleted mantle; depleted mantle curve from Griffin et al.
(2000).
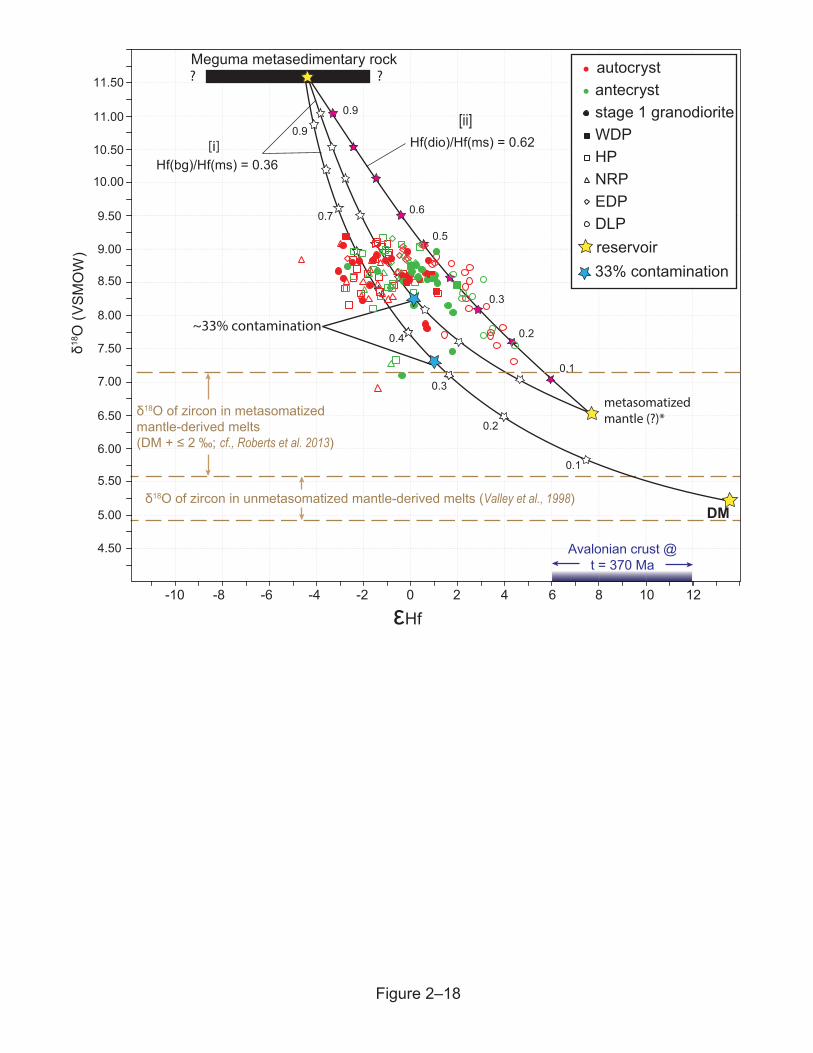
Meguma metasedimentary rock
δ18O of zircon in unmetasomatized mantle-derived melts (Valley et al., 1998)
? ?
Hf(bg)/Hf(ms) = 0.36[i]
DM
δ18O
(VSM
OW
)
metasomatizedmantle (?)*
0.1
0.2
0.3
0.4
0.7
0.9
~33% contamination
Hf(dio)/Hf(ms) = 0.62[ii]
4.50
5.00
5.50
6.00
6.50
7.00
7.50
8.00
8.50
9.00
9.50
10.00
10.50
11.00
11.50
-10 -8 -6 -4 -2 0 2 4 6 8 10 12
0.6
0.9
0.1
0.2
0.3
0.5
εHf
autocrystantecryst
DLPreservoir33% contamination
EDPNRPHPWDPstage 1 granodiorite
Figure 2–18
δ18O of zircon in metasomatized mantle-derived melts (DM + ≤ 2 ‰; cf., Roberts et al. 2013)
Avalonian crust @t = 370 Ma
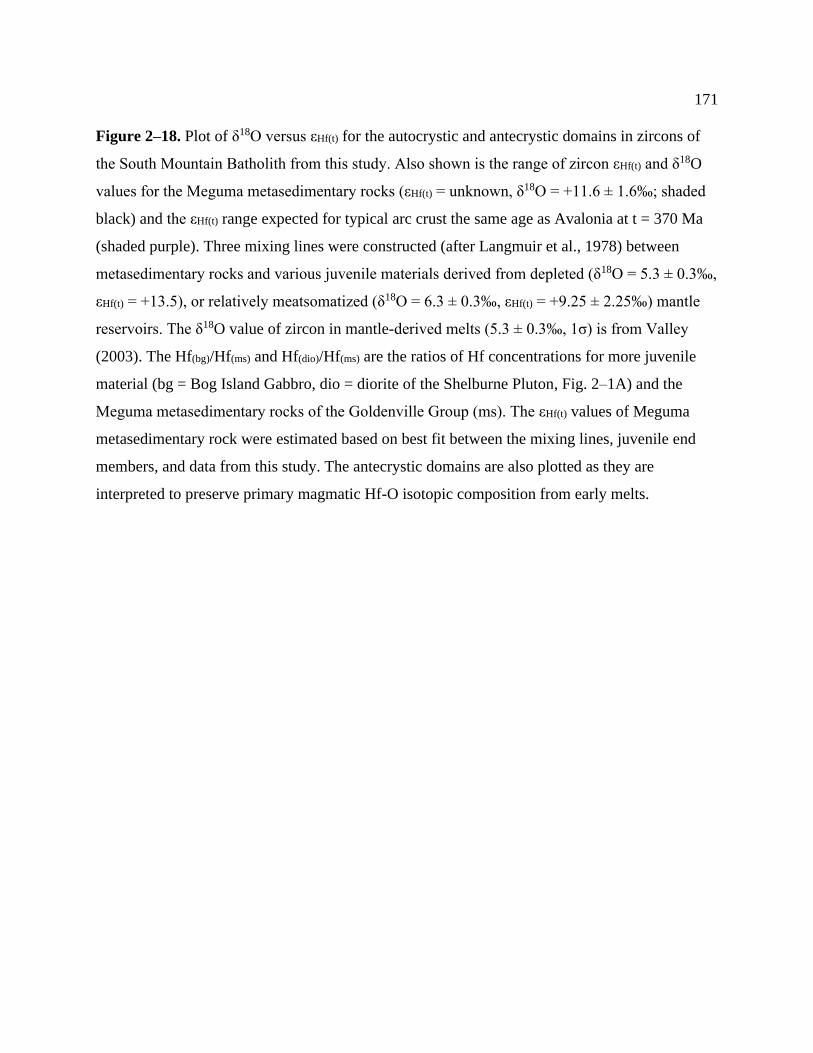
171
Figure 2–18. Plot of δ18O versus εHf(t) for the autocrystic and antecrystic domains in zircons of
the South Mountain Batholith from this study. Also shown is the range of zircon εHf(t) and δ18O
values for the Meguma metasedimentary rocks (εHf(t) = unknown, δ18O = +11.6 ± 1.6‰; shaded
black) and the εHf(t) range expected for typical arc crust the same age as Avalonia at t = 370 Ma
(shaded purple). Three mixing lines were constructed (after Langmuir et al., 1978) between
metasedimentary rocks and various juvenile materials derived from depleted (δ18O = 5.3 ± 0.3‰,
εHf(t) = +13.5), or relatively meatsomatized (δ18O = 6.3 ± 0.3‰, εHf(t) = +9.25 ± 2.25‰) mantle
reservoirs. The δ18O value of zircon in mantle-derived melts (5.3 ± 0.3‰, 1σ) is from Valley
(2003). The Hf(bg)/Hf(ms) and Hf(dio)/Hf(ms) are the ratios of Hf concentrations for more juvenile
material (bg = Bog Island Gabbro, dio = diorite of the Shelburne Pluton, Fig. 2–1A) and the
Meguma metasedimentary rocks of the Goldenville Group (ms). The εHf(t) values of Meguma
metasedimentary rock were estimated based on best fit between the mixing lines, juvenile end
members, and data from this study. The antecrystic domains are also plotted as they are
interpreted to preserve primary magmatic Hf-O isotopic composition from early melts.
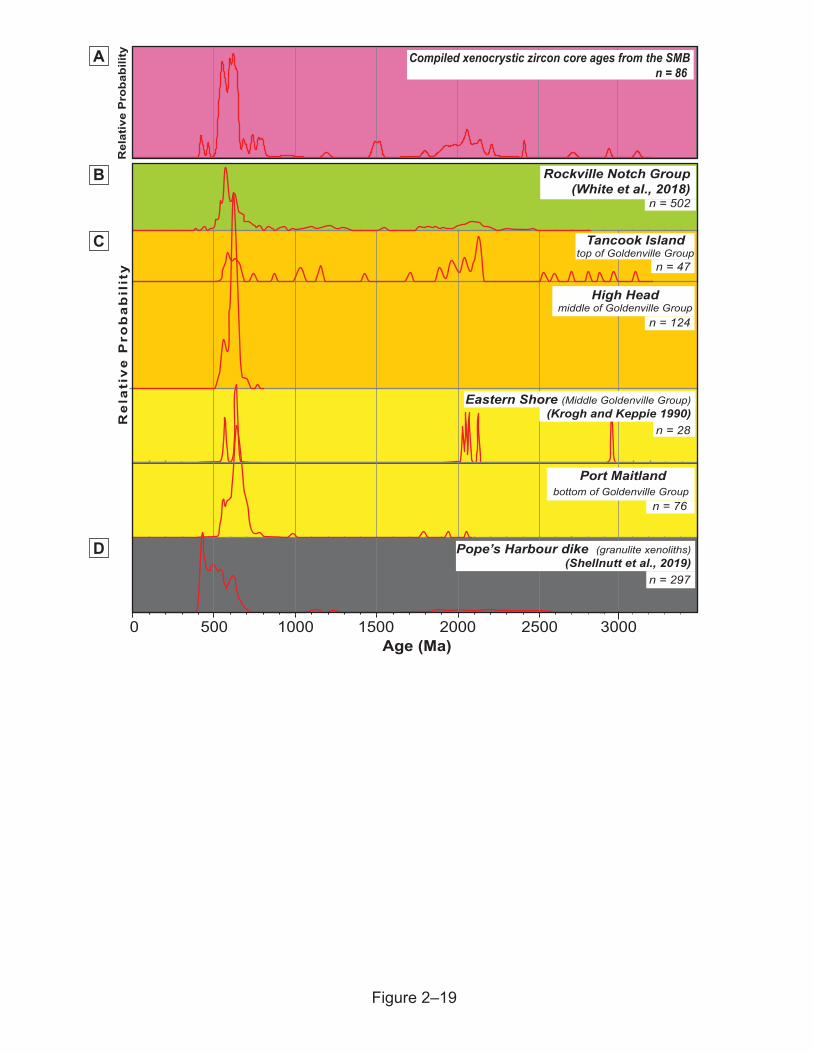
Figure 2–19
Rockville Notch Group(White et al., 2018)
Tancook Islandtop of Goldenville Group
High Headmiddle of Goldenville Group
ytilib
ab
orP
evit
ale
R
0 500 1000 1500Age (Ma)
2000 2500 3000
Port Maitlandbottom of Goldenville Group
n = 76
Eastern Shore (Middle Goldenville Group)(Krogh and Keppie 1990)
n = 28
Pope’s Harbour dike (granulite xenoliths)(Shellnutt et al., 2019)
n = 297
n = 124
n = 47
n = 502
Compiled xenocrystic zircon core ages from the SMBn = 86
ytilibaborP evitale
R
A
B
C
D
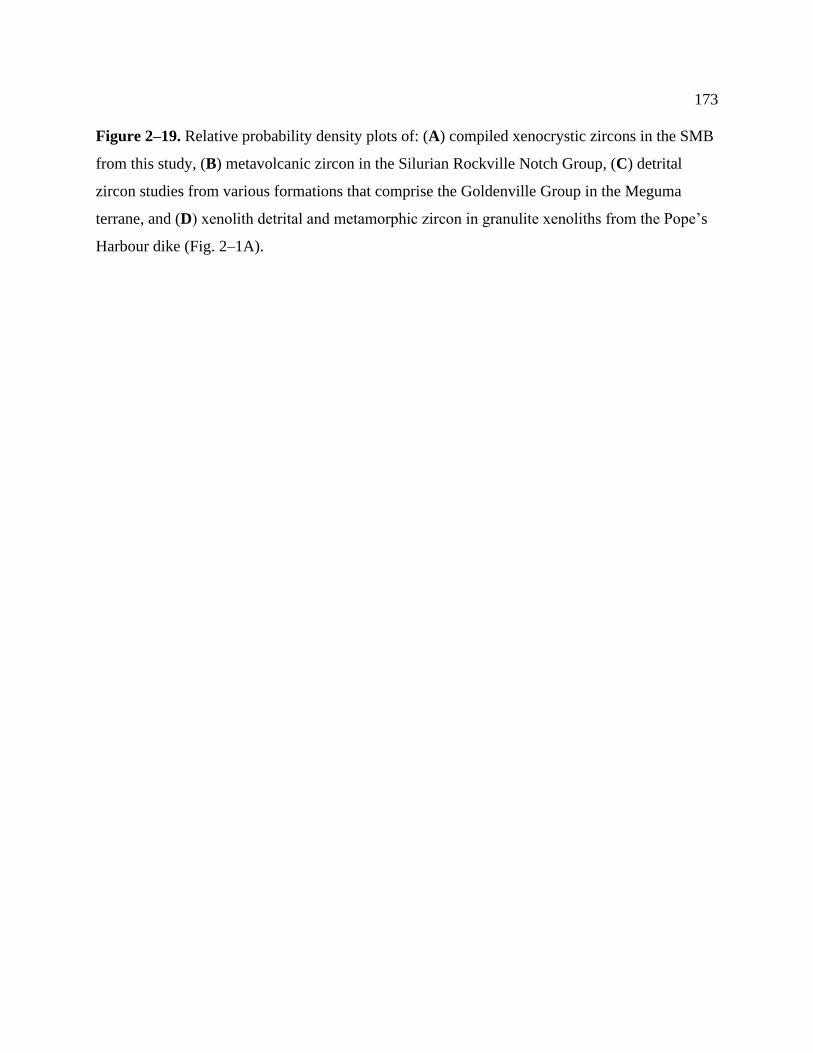
173
Figure 2–19. Relative probability density plots of: (A) compiled xenocrystic zircons in the SMB
from this study, (B) metavolcanic zircon in the Silurian Rockville Notch Group, (C) detrital
zircon studies from various formations that comprise the Goldenville Group in the Meguma
terrane, and (D) xenolith detrital and metamorphic zircon in granulite xenoliths from the Pope’s
Harbour dike (Fig. 2–1A).
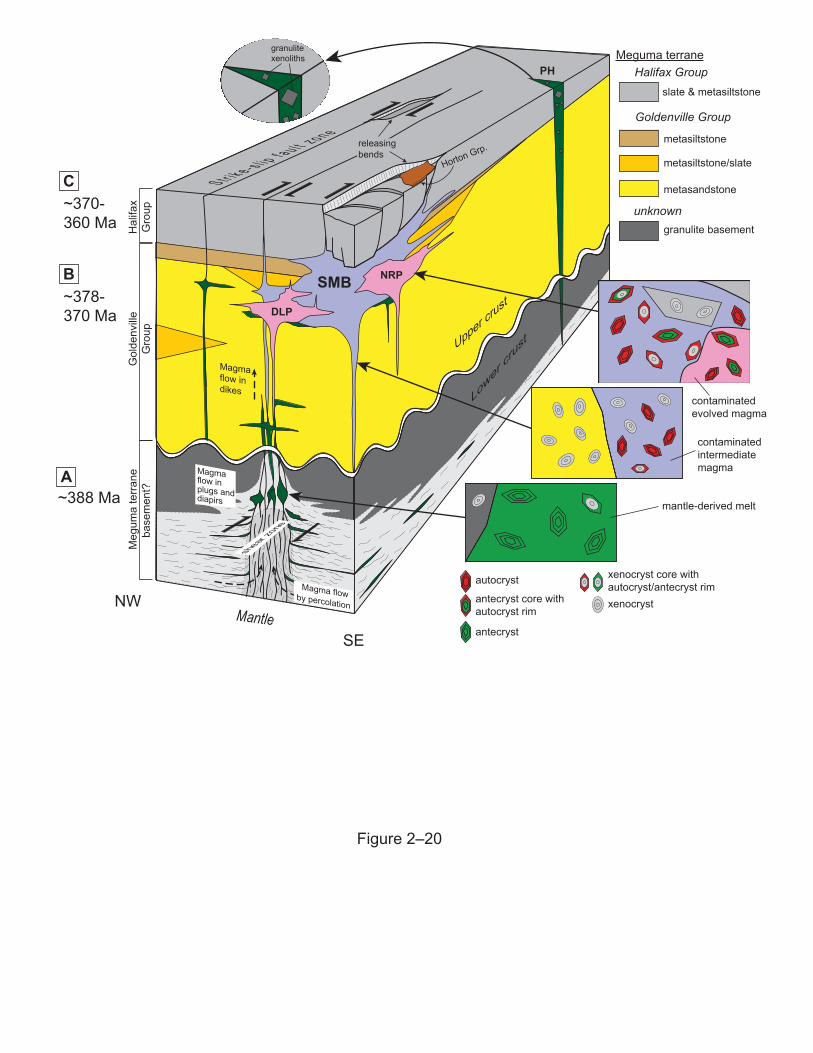
Mantle
Gol
denv
illeG
roup
Meg
uma
terra
neba
sem
ent?
Hal
ifax
Gro
up
NW
SE
~378-370 Ma
~388 Ma
metasiltstone
metasiltstone/slate
metasandstone
Magma flowby percolation
S t r i k e - s l i p f a u l t z o n e
Upper crust
Lower
cru
st
Magma flow indikes
Magma flow inplugs anddiapirs
SMB
PH
DLP
NRP
autocryst
antecryst core withautocryst rim
antecryst
xenocryst
xenocryst core withautocryst/antecryst rim
slate & metasiltstone
granulite basement
Goldenville Group
Halifax GroupMeguma terrane
unknown
Figure 2–20
mantle-derived melt
contaminatedintermediate magma
contaminatedevolved magma
A
B
~370-360 Ma
C
granulitexenoliths
releasingbends
Horton Grp.
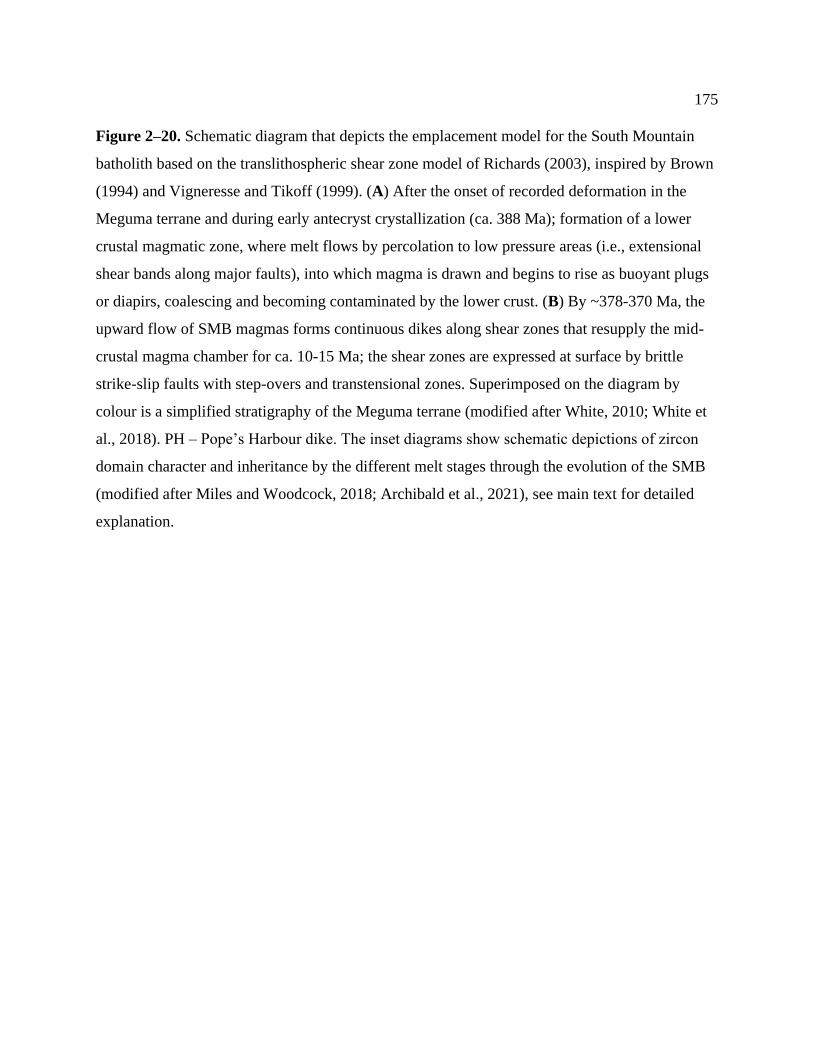
175
Figure 2–20. Schematic diagram that depicts the emplacement model for the South Mountain
batholith based on the translithospheric shear zone model of Richards (2003), inspired by Brown
(1994) and Vigneresse and Tikoff (1999). (A) After the onset of recorded deformation in the
Meguma terrane and during early antecryst crystallization (ca. 388 Ma); formation of a lower
crustal magmatic zone, where melt flows by percolation to low pressure areas (i.e., extensional
shear bands along major faults), into which magma is drawn and begins to rise as buoyant plugs
or diapirs, coalescing and becoming contaminated by the lower crust. (B) By ~378-370 Ma, the
upward flow of SMB magmas forms continuous dikes along shear zones that resupply the mid-
crustal magma chamber for ca. 10-15 Ma; the shear zones are expressed at surface by brittle
strike-slip faults with step-overs and transtensional zones. Superimposed on the diagram by
colour is a simplified stratigraphy of the Meguma terrane (modified after White, 2010; White et
al., 2018). PH – Pope’s Harbour dike. The inset diagrams show schematic depictions of zircon
domain character and inheritance by the different melt stages through the evolution of the SMB
(modified after Miles and Woodcock, 2018; Archibald et al., 2021), see main text for detailed
explanation.
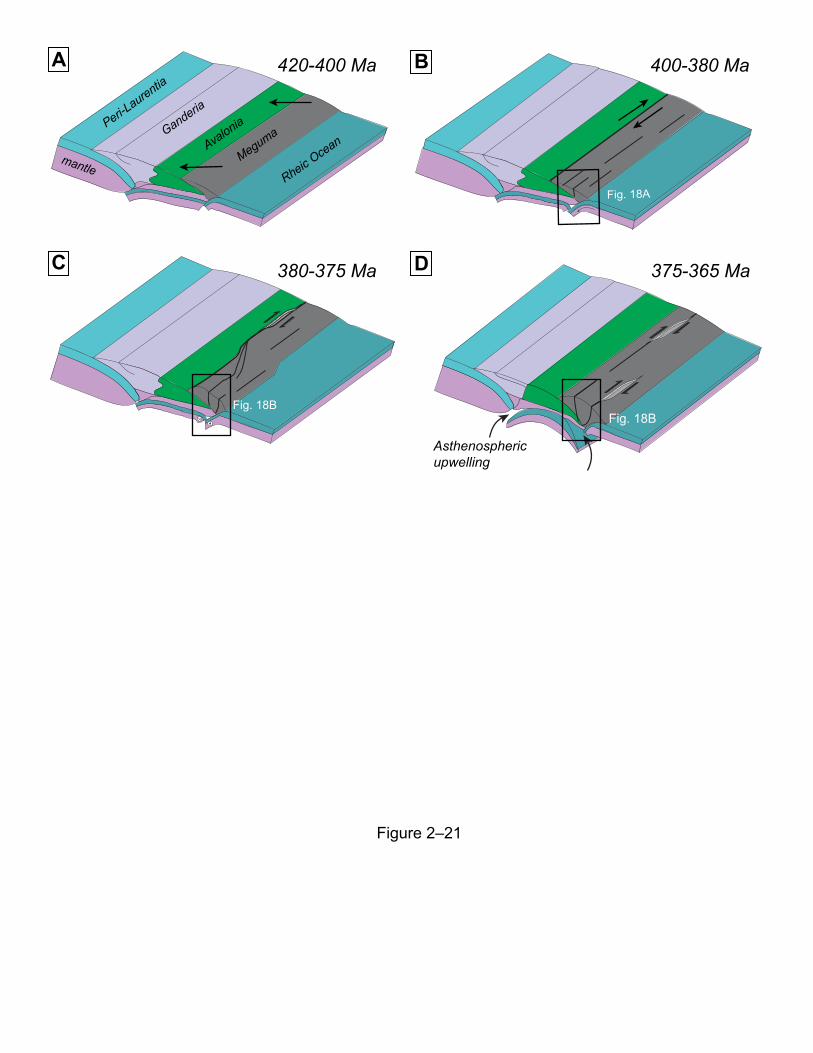
A 420-400 Ma
Peri-Laurentia
Ganderia
Avalonia
Meguma
Rheic Ocean
mantle
Figure 2–21
B 400-380 Ma
Fig. 18A
C 380-375 Ma
Fig. 18B
D 375-365 Ma
Asthenosphericupwelling
Fig. 18B
177
Figure 2–21. Schematic simplified geotectonic setting outboard of the Laurentian margin
depicting the juxtaposed Ganderia-Avalonia-Meguma terranes prior to and during the
emplacement window of the South Mountain Batholith and associated magmatism, modified
after van Staal et al. (2021): A) ~420–400 Ma; B) ~400–380 Ma; C) ~380–375 Ma; and D) 375–
365 Ma.
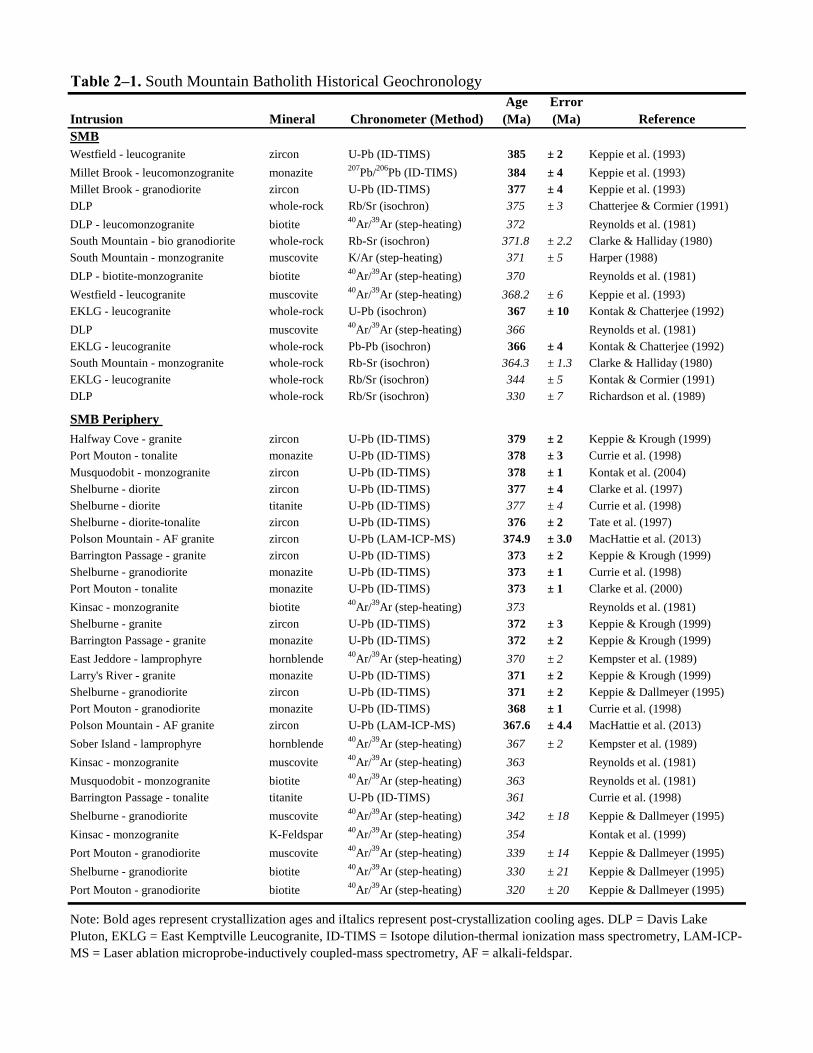
Age Error
Intrusion Mineral (Ma) (Ma) Reference
SMB
Westfield - leucogranite zircon U-Pb (ID-TIMS) 385 ± 2 Keppie et al. (1993)
Millet Brook - leucomonzogranite monazite207
Pb/206
Pb (ID-TIMS) 384 ± 4 Keppie et al. (1993)
Millet Brook - granodiorite zircon U-Pb (ID-TIMS) 377 ± 4 Keppie et al. (1993)
DLP whole-rock Rb/Sr (isochron) 375 ± 3 Chatterjee & Cormier (1991)
DLP - leucomonzogranite biotite40
Ar/39
Ar (step-heating) 372 Reynolds et al. (1981)
South Mountain - bio granodiorite whole-rock Rb-Sr (isochron) 371.8 ± 2.2 Clarke & Halliday (1980)
South Mountain - monzogranite muscovite K/Ar (step-heating) 371 ± 5 Harper (1988)
DLP - biotite-monzogranite biotite40
Ar/39
Ar (step-heating) 370 Reynolds et al. (1981)
Westfield - leucogranite muscovite40
Ar/39
Ar (step-heating) 368.2 ± 6 Keppie et al. (1993)
EKLG - leucogranite whole-rock U-Pb (isochron) 367 ± 10 Kontak & Chatterjee (1992)
DLP muscovite40
Ar/39
Ar (step-heating) 366 Reynolds et al. (1981)
EKLG - leucogranite whole-rock Pb-Pb (isochron) 366 ± 4 Kontak & Chatterjee (1992)
South Mountain - monzogranite whole-rock Rb-Sr (isochron) 364.3 ± 1.3 Clarke & Halliday (1980)
EKLG - leucogranite whole-rock Rb/Sr (isochron) 344 ± 5 Kontak & Cormier (1991)
DLP whole-rock Rb/Sr (isochron) 330 ± 7 Richardson et al. (1989)
SMB Periphery
Halfway Cove - granite zircon U-Pb (ID-TIMS) 379 ± 2 Keppie & Krough (1999)
Port Mouton - tonalite monazite U-Pb (ID-TIMS) 378 ± 3 Currie et al. (1998)
Musquodobit - monzogranite zircon U-Pb (ID-TIMS) 378 ± 1 Kontak et al. (2004)
Shelburne - diorite zircon U-Pb (ID-TIMS) 377 ± 4 Clarke et al. (1997)
Shelburne - diorite titanite U-Pb (ID-TIMS) 377 ± 4 Currie et al. (1998)
Shelburne - diorite-tonalite zircon U-Pb (ID-TIMS) 376 ± 2 Tate et al. (1997)
Polson Mountain - AF granite zircon U-Pb (LAM-ICP-MS) 374.9 ± 3.0 MacHattie et al. (2013)
Barrington Passage - granite zircon U-Pb (ID-TIMS) 373 ± 2 Keppie & Krough (1999)
Shelburne - granodiorite monazite U-Pb (ID-TIMS) 373 ± 1 Currie et al. (1998)
Port Mouton - tonalite monazite U-Pb (ID-TIMS) 373 ± 1 Clarke et al. (2000)
Kinsac - monzogranite biotite40
Ar/39
Ar (step-heating) 373 Reynolds et al. (1981)
Shelburne - granite zircon U-Pb (ID-TIMS) 372 ± 3 Keppie & Krough (1999)
Barrington Passage - granite monazite U-Pb (ID-TIMS) 372 ± 2 Keppie & Krough (1999)
East Jeddore - lamprophyre hornblende40
Ar/39
Ar (step-heating) 370 ± 2 Kempster et al. (1989)
Larry's River - granite monazite U-Pb (ID-TIMS) 371 ± 2 Keppie & Krough (1999)
Shelburne - granodiorite zircon U-Pb (ID-TIMS) 371 ± 2 Keppie & Dallmeyer (1995)
Port Mouton - granodiorite monazite U-Pb (ID-TIMS) 368 ± 1 Currie et al. (1998)
Polson Mountain - AF granite zircon U-Pb (LAM-ICP-MS) 367.6 ± 4.4 MacHattie et al. (2013)
Sober Island - lamprophyre hornblende40
Ar/39
Ar (step-heating) 367 ± 2 Kempster et al. (1989)
Kinsac - monzogranite muscovite40
Ar/39
Ar (step-heating) 363 Reynolds et al. (1981)
Musquodobit - monzogranite biotite40
Ar/39
Ar (step-heating) 363 Reynolds et al. (1981)
Barrington Passage - tonalite titanite U-Pb (ID-TIMS) 361 Currie et al. (1998)
Shelburne - granodiorite muscovite40
Ar/39
Ar (step-heating) 342 ± 18 Keppie & Dallmeyer (1995)
Kinsac - monzogranite K-Feldspar40
Ar/39
Ar (step-heating) 354 Kontak et al. (1999)
Port Mouton - granodiorite muscovite40
Ar/39
Ar (step-heating) 339 ± 14 Keppie & Dallmeyer (1995)
Shelburne - granodiorite biotite40
Ar/39
Ar (step-heating) 330 ± 21 Keppie & Dallmeyer (1995)
Port Mouton - granodiorite biotite40
Ar/39
Ar (step-heating) 320 ± 20 Keppie & Dallmeyer (1995)
Table 2–1. South Mountain Batholith Historical Geochronology
Chronometer (Method)
Note: Bold ages represent crystallization ages and iItalics represent post-crystallization cooling ages. DLP = Davis Lake
Pluton, EKLG = East Kemptville Leucogranite, ID-TIMS = Isotope dilution-thermal ionization mass spectrometry, LAM-ICP-
MS = Laser ablation microprobe-inductively coupled-mass spectrometry, AF = alkali-feldspar.
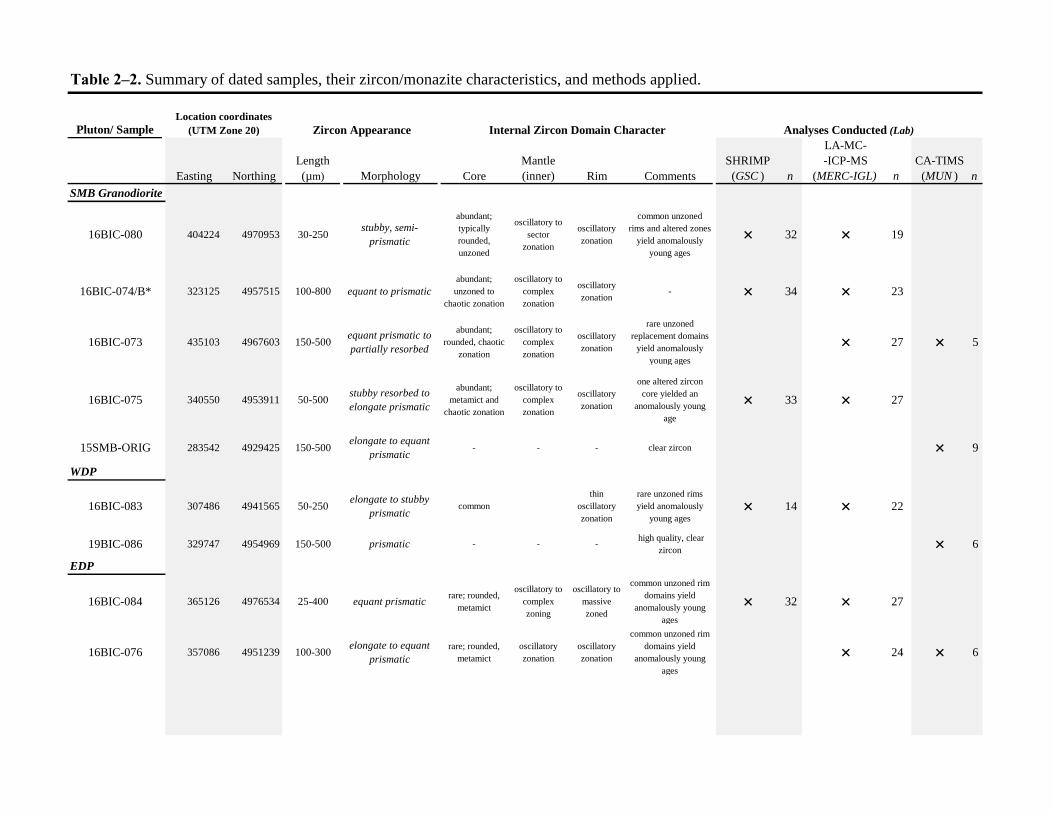
Table 2–2. Summary of dated samples, their zircon/monazite characteristics, and methods applied.
Pluton/ Sample
Easting Northing
Length
(µm) Morphology Core
Mantle
(inner) Rim Comments
SHRIMP
(GSC ) n
LA-MC-
-ICP-MS
(MERC-IGL) n
CA-TIMS
(MUN ) n
SMB Granodiorite
16BIC-080 404224 4970953 30-250stubby, semi-
prismatic
abundant;
typically
rounded,
unzoned
oscillatory to
sector
zonation
oscillatory
zonation
common unzoned
rims and altered zones
yield anomalously
young ages
× 32 × 19
16BIC-074/B* 323125 4957515 100-800 equant to prismatic
abundant;
unzoned to
chaotic zonation
oscillatory to
complex
zonation
oscillatory
zonation- × 34 × 23
16BIC-073 435103 4967603 150-500equant prismatic to
partially resorbed
abundant;
rounded, chaotic
zonation
oscillatory to
complex
zonation
oscillatory
zonation
rare unzoned
replacement domains
yield anomalously
young ages
× 27 × 5
16BIC-075 340550 4953911 50-500stubby resorbed to
elongate prismatic
abundant;
metamict and
chaotic zonation
oscillatory to
complex
zonation
oscillatory
zonation
one altered zircon
core yielded an
anomalously young
age
× 33 × 27
15SMB-ORIG 283542 4929425 150-500elongate to equant
prismatic- - - clear zircon × 9
WDP
16BIC-083 307486 4941565 50-250elongate to stubby
prismatic common
thin
oscillatory
zonation
rare unzoned rims
yield anomalously
young ages× 14 × 22
19BIC-086 329747 4954969 150-500 prismatic - - - high quality, clear
zircon × 6
EDP
16BIC-084 365126 4976534 25-400 equant prismaticrare; rounded,
metamict
oscillatory to
complex
zoning
oscillatory to
massive
zoned
common unzoned rim
domains yield
anomalously young
ages
× 32 × 27
16BIC-076 357086 4951239 100-300elongate to equant
prismatic
rare; rounded,
metamict
oscillatory
zonation
oscillatory
zonation
common unzoned rim
domains yield
anomalously young
ages
× 24 × 6
Internal Zircon Domain Character Analyses Conducted (Lab)
Location coordinates
(UTM Zone 20) Zircon Appearance
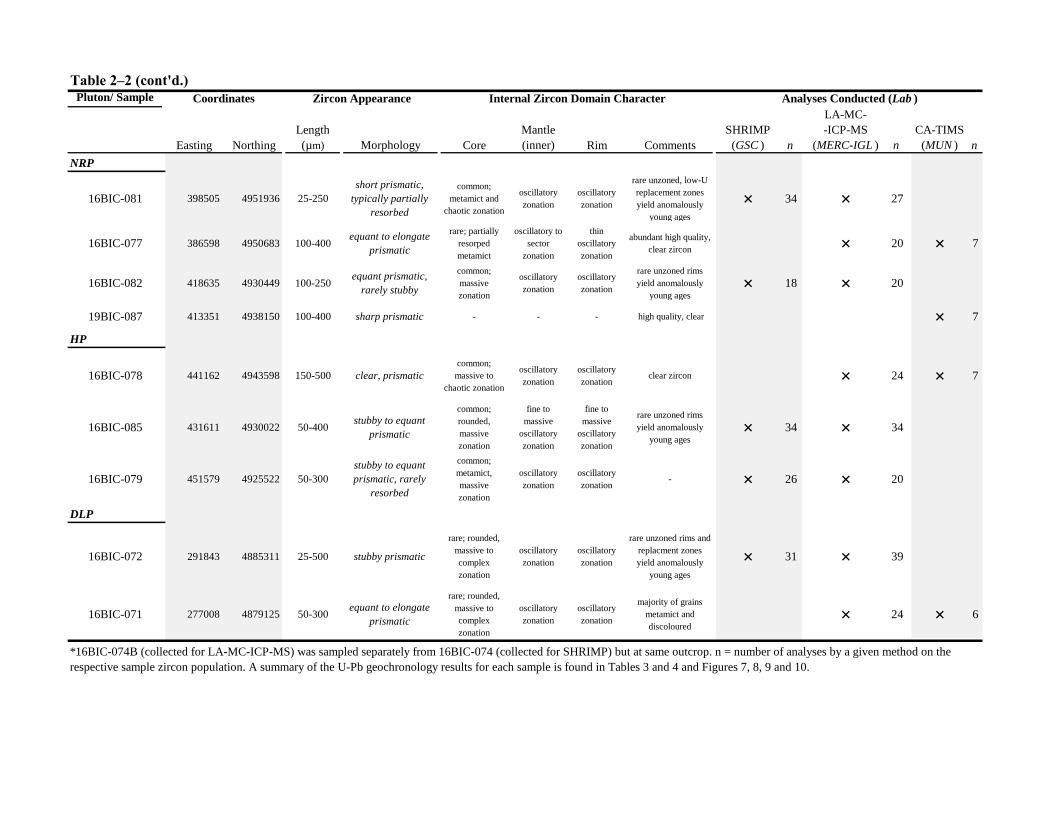
Table 2–2 (cont'd.)Pluton/ Sample
Easting Northing
Length
(µm) Morphology Core
Mantle
(inner) Rim Comments
SHRIMP
(GSC ) n
LA-MC-
-ICP-MS
(MERC-IGL ) n
CA-TIMS
(MUN ) n
NRP
16BIC-081 398505 4951936 25-250
short prismatic,
typically partially
resorbed
common;
metamict and
chaotic zonation
oscillatory
zonation
oscillatory
zonation
rare unzoned, low-U
replacement zones
yield anomalously
young ages
× 34 × 27
16BIC-077 386598 4950683 100-400equant to elongate
prismatic
rare; partially
resorped
metamict
oscillatory to
sector
zonation
thin
oscillatory
zonation
abundant high quality,
clear zircon × 20 × 7
16BIC-082 418635 4930449 100-250equant prismatic,
rarely stubby
common;
massive
zonation
oscillatory
zonation
oscillatory
zonation
rare unzoned rims
yield anomalously
young ages× 18 × 20
19BIC-087 413351 4938150 100-400 sharp prismatic - - - high quality, clear × 7
HP
16BIC-078 441162 4943598 150-500 clear, prismatic
common;
massive to
chaotic zonation
oscillatory
zonation
oscillatory
zonationclear zircon × 24 × 7
16BIC-085 431611 4930022 50-400stubby to equant
prismatic
common;
rounded,
massive
zonation
fine to
massive
oscillatory
zonation
fine to
massive
oscillatory
zonation
rare unzoned rims
yield anomalously
young ages× 34 × 34
16BIC-079 451579 4925522 50-300
stubby to equant
prismatic, rarely
resorbed
common;
metamict,
massive
zonation
oscillatory
zonation
oscillatory
zonation- × 26 × 20
DLP
16BIC-072 291843 4885311 25-500 stubby prismatic
rare; rounded,
massive to
complex
zonation
oscillatory
zonation
oscillatory
zonation
rare unzoned rims and
replacment zones
yield anomalously
young ages
× 31 × 39
16BIC-071 277008 4879125 50-300equant to elongate
prismatic
rare; rounded,
massive to
complex
zonation
oscillatory
zonation
oscillatory
zonation
majority of grains
metamict and
discoloured × 24 × 6
*16BIC-074B (collected for LA-MC-ICP-MS) was sampled separately from 16BIC-074 (collected for SHRIMP) but at same outcrop. n = number of analyses by a given method on the
respective sample zircon population. A summary of the U-Pb geochronology results for each sample is found in Tables 3 and 4 and Figures 7, 8, 9 and 10.
Coordinates Zircon Appearance Internal Zircon Domain Character Analyses Conducted (Lab )
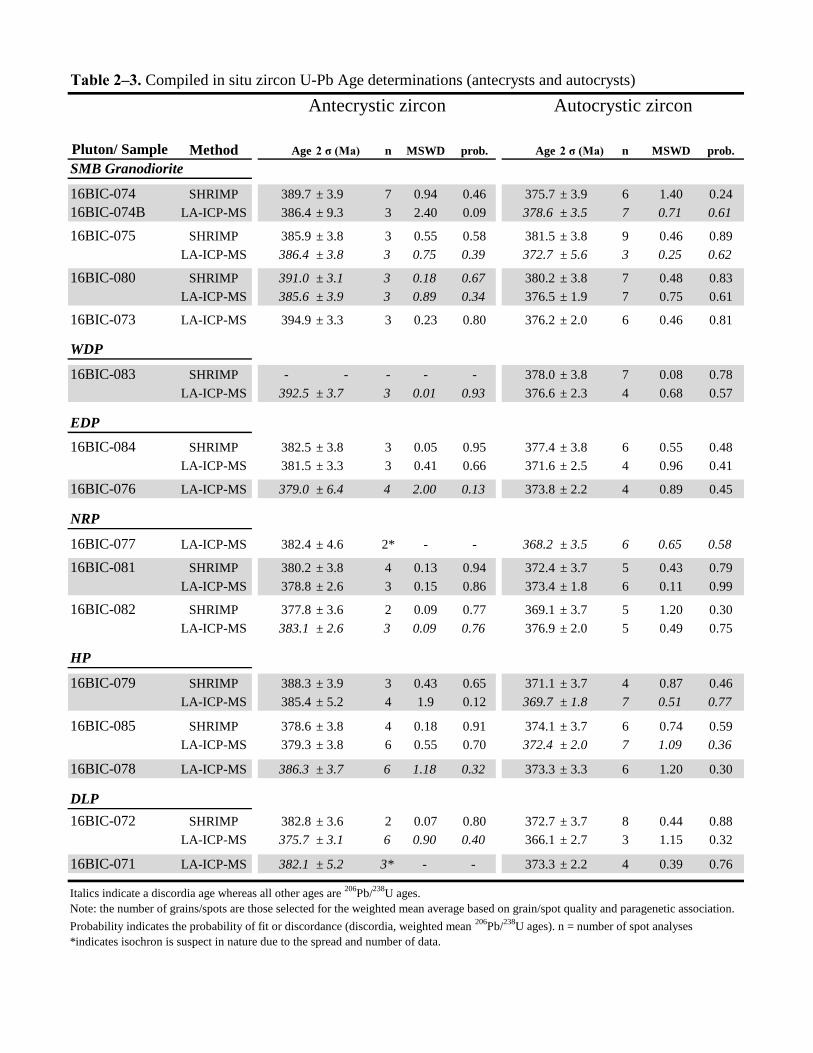
Table 2–3. Compiled in situ zircon U-Pb Age determinations (antecrysts and autocrysts)
Pluton/ Sample Method Age 2 σ (Ma) n MSWD prob. Age 2 σ (Ma) n MSWD prob.
SMB Granodiorite
16BIC-074 SHRIMP 389.7 ± 3.9 7 0.94 0.46 375.7 ± 3.9 6 1.40 0.24
16BIC-074B LA-ICP-MS 386.4 ± 9.3 3 2.40 0.09 378.6 ± 3.5 7 0.71 0.61
16BIC-075 SHRIMP 385.9 ± 3.8 3 0.55 0.58 381.5 ± 3.8 9 0.46 0.89
LA-ICP-MS 386.4 ± 3.8 3 0.75 0.39 372.7 ± 5.6 3 0.25 0.62
16BIC-080 SHRIMP 391.0 ± 3.1 3 0.18 0.67 380.2 ± 3.8 7 0.48 0.83
LA-ICP-MS 385.6 ± 3.9 3 0.89 0.34 376.5 ± 1.9 7 0.75 0.61
16BIC-073 LA-ICP-MS 394.9 ± 3.3 3 0.23 0.80 376.2 ± 2.0 6 0.46 0.81
WDP
16BIC-083 SHRIMP - - - - - 378.0 ± 3.8 7 0.08 0.78
LA-ICP-MS 392.5 ± 3.7 3 0.01 0.93 376.6 ± 2.3 4 0.68 0.57
EDP
16BIC-084 SHRIMP 382.5 ± 3.8 3 0.05 0.95 377.4 ± 3.8 6 0.55 0.48
LA-ICP-MS 381.5 ± 3.3 3 0.41 0.66 371.6 ± 2.5 4 0.96 0.41
16BIC-076 LA-ICP-MS 379.0 ± 6.4 4 2.00 0.13 373.8 ± 2.2 4 0.89 0.45
NRP
16BIC-077 LA-ICP-MS 382.4 ± 4.6 2* - - 368.2 ± 3.5 6 0.65 0.58
16BIC-081 SHRIMP 380.2 ± 3.8 4 0.13 0.94 372.4 ± 3.7 5 0.43 0.79
LA-ICP-MS 378.8 ± 2.6 3 0.15 0.86 373.4 ± 1.8 6 0.11 0.99
16BIC-082 SHRIMP 377.8 ± 3.6 2 0.09 0.77 369.1 ± 3.7 5 1.20 0.30
LA-ICP-MS 383.1 ± 2.6 3 0.09 0.76 376.9 ± 2.0 5 0.49 0.75
HP
16BIC-079 SHRIMP 388.3 ± 3.9 3 0.43 0.65 371.1 ± 3.7 4 0.87 0.46
LA-ICP-MS 385.4 ± 5.2 4 1.9 0.12 369.7 ± 1.8 7 0.51 0.77
16BIC-085 SHRIMP 378.6 ± 3.8 4 0.18 0.91 374.1 ± 3.7 6 0.74 0.59
LA-ICP-MS 379.3 ± 3.8 6 0.55 0.70 372.4 ± 2.0 7 1.09 0.36
16BIC-078 LA-ICP-MS 386.3 ± 3.7 6 1.18 0.32 373.3 ± 3.3 6 1.20 0.30
DLP
16BIC-072 SHRIMP 382.8 ± 3.6 2 0.07 0.80 372.7 ± 3.7 8 0.44 0.88
LA-ICP-MS 375.7 ± 3.1 6 0.90 0.40 366.1 ± 2.7 3 1.15 0.32
16BIC-071 LA-ICP-MS 382.1 ± 5.2 3* - - 373.3 ± 2.2 4 0.39 0.76
Antecrystic zircon Autocrystic zircon
Italics indicate a discordia age whereas all other ages are 206
Pb/238
U ages.
Note: the number of grains/spots are those selected for the weighted mean average based on grain/spot quality and paragenetic association.
Probability indicates the probability of fit or discordance (discordia, weighted mean 206
Pb/238
U ages). n = number of spot analyses
*indicates isochron is suspect in nature due to the spread and number of data.
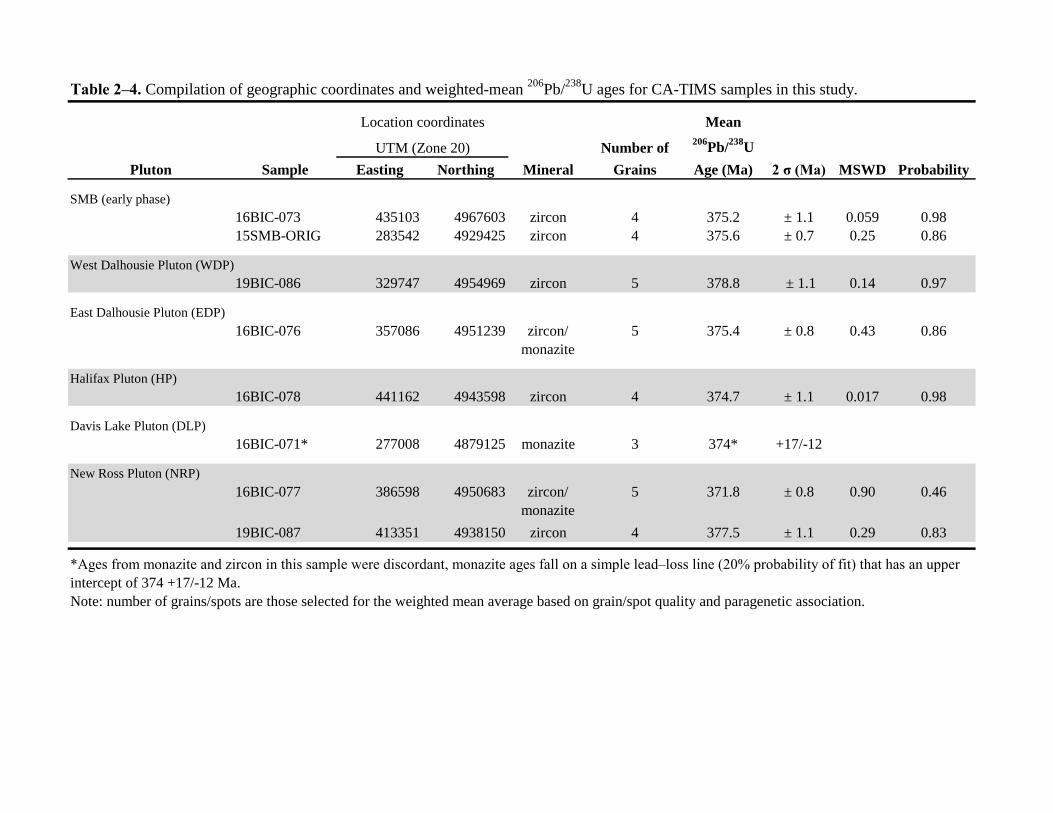
Mean
Number of206
Pb/238
U
Pluton Sample Easting Northing Mineral Grains Age (Ma) 2 σ (Ma) MSWD Probability
SMB (early phase)
16BIC-073 435103 4967603 zircon 4 375.2 ± 1.1 0.059 0.98
15SMB-ORIG 283542 4929425 zircon 4 375.6 ± 0.7 0.25 0.86
West Dalhousie Pluton (WDP)
19BIC-086 329747 4954969 zircon 5 378.8 ± 1.1 0.14 0.97
East Dalhousie Pluton (EDP)
16BIC-076 357086 4951239 zircon/
monazite
5 375.4 ± 0.8 0.43 0.86
Halifax Pluton (HP)
16BIC-078 441162 4943598 zircon 4 374.7 ± 1.1 0.017 0.98
Davis Lake Pluton (DLP)
16BIC-071* 277008 4879125 monazite 3 374* +17/-12
New Ross Pluton (NRP)
16BIC-077 386598 4950683 zircon/
monazite
5 371.8 ± 0.8 0.90 0.46
19BIC-087 413351 4938150 zircon 4 377.5 ± 1.1 0.29 0.83
Location coordinates
UTM (Zone 20)
Table 2–4. Compilation of geographic coordinates and weighted-mean 206
Pb/238
U ages for CA-TIMS samples in this study.
*Ages from monazite and zircon in this sample were discordant, monazite ages fall on a simple lead–loss line (20% probability of fit) that has an upper
intercept of 374 +17/-12 Ma.
Note: number of grains/spots are those selected for the weighted mean average based on grain/spot quality and paragenetic association.
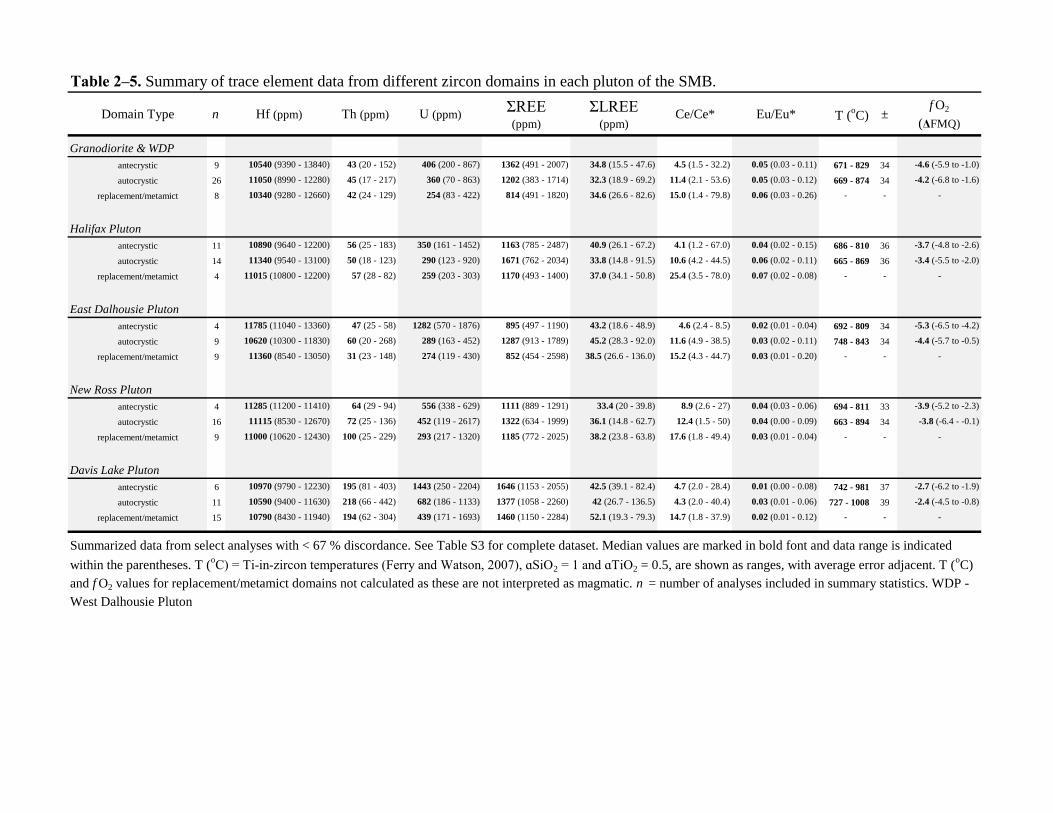
Table 2–5. Summary of trace element data from different zircon domains in each pluton of the SMB.
Domain Type n Hf (ppm) Th (ppm) U (ppm)ΣREE(ppm)
ΣLREE(ppm)
Ce/Ce* Eu/Eu* T (oC) ±
f O2
(ΔFMQ)
Granodiorite & WDP
antecrystic 9 10540 (9390 - 13840) 43 (20 - 152) 406 (200 - 867) 1362 (491 - 2007) 34.8 (15.5 - 47.6) 4.5 (1.5 - 32.2) 0.05 (0.03 - 0.11) 671 - 829 34 -4.6 (-5.9 to -1.0)
autocrystic 26 11050 (8990 - 12280) 45 (17 - 217) 360 (70 - 863) 1202 (383 - 1714) 32.3 (18.9 - 69.2) 11.4 (2.1 - 53.6) 0.05 (0.03 - 0.12) 669 - 874 34 -4.2 (-6.8 to -1.6)
replacement/metamict 8 10340 (9280 - 12660) 42 (24 - 129) 254 (83 - 422) 814 (491 - 1820) 34.6 (26.6 - 82.6) 15.0 (1.4 - 79.8) 0.06 (0.03 - 0.26) - - -
Halifax Pluton
antecrystic 11 10890 (9640 - 12200) 56 (25 - 183) 350 (161 - 1452) 1163 (785 - 2487) 40.9 (26.1 - 67.2) 4.1 (1.2 - 67.0) 0.04 (0.02 - 0.15) 686 - 810 36 -3.7 (-4.8 to -2.6)
autocrystic 14 11340 (9540 - 13100) 50 (18 - 123) 290 (123 - 920) 1671 (762 - 2034) 33.8 (14.8 - 91.5) 10.6 (4.2 - 44.5) 0.06 (0.02 - 0.11) 665 - 869 36 -3.4 (-5.5 to -2.0)
replacement/metamict 4 11015 (10800 - 12200) 57 (28 - 82) 259 (203 - 303) 1170 (493 - 1400) 37.0 (34.1 - 50.8) 25.4 (3.5 - 78.0) 0.07 (0.02 - 0.08) - - -
East Dalhousie Pluton
antecrystic 4 11785 (11040 - 13360) 47 (25 - 58) 1282 (570 - 1876) 895 (497 - 1190) 43.2 (18.6 - 48.9) 4.6 (2.4 - 8.5) 0.02 (0.01 - 0.04) 692 - 809 34 -5.3 (-6.5 to -4.2)
autocrystic 9 10620 (10300 - 11830) 60 (20 - 268) 289 (163 - 452) 1287 (913 - 1789) 45.2 (28.3 - 92.0) 11.6 (4.9 - 38.5) 0.03 (0.02 - 0.11) 748 - 843 34 -4.4 (-5.7 to -0.5)
replacement/metamict 9 11360 (8540 - 13050) 31 (23 - 148) 274 (119 - 430) 852 (454 - 2598) 38.5 (26.6 - 136.0) 15.2 (4.3 - 44.7) 0.03 (0.01 - 0.20) - - -
New Ross Pluton
antecrystic 4 11285 (11200 - 11410) 64 (29 - 94) 556 (338 - 629) 1111 (889 - 1291) 33.4 (20 - 39.8) 8.9 (2.6 - 27) 0.04 (0.03 - 0.06) 694 - 811 33 -3.9 (-5.2 to -2.3)
autocrystic 16 11115 (8530 - 12670) 72 (25 - 136) 452 (119 - 2617) 1322 (634 - 1999) 36.1 (14.8 - 62.7) 12.4 (1.5 - 50) 0.04 (0.00 - 0.09) 663 - 894 34 -3.8 (-6.4 - -0.1)
replacement/metamict 9 11000 (10620 - 12430) 100 (25 - 229) 293 (217 - 1320) 1185 (772 - 2025) 38.2 (23.8 - 63.8) 17.6 (1.8 - 49.4) 0.03 (0.01 - 0.04) - - -
Davis Lake Pluton
antecrystic 6 10970 (9790 - 12230) 195 (81 - 403) 1443 (250 - 2204) 1646 (1153 - 2055) 42.5 (39.1 - 82.4) 4.7 (2.0 - 28.4) 0.01 (0.00 - 0.08) 742 - 981 37 -2.7 (-6.2 to -1.9)
autocrystic 11 10590 (9400 - 11630) 218 (66 - 442) 682 (186 - 1133) 1377 (1058 - 2260) 42 (26.7 - 136.5) 4.3 (2.0 - 40.4) 0.03 (0.01 - 0.06) 727 - 1008 39 -2.4 (-4.5 to -0.8)
replacement/metamict 15 10790 (8430 - 11940) 194 (62 - 304) 439 (171 - 1693) 1460 (1150 - 2284) 52.1 (19.3 - 79.3) 14.7 (1.8 - 37.9) 0.02 (0.01 - 0.12) - - -
Summarized data from select analyses with < 67 % discordance. See Table S3 for complete dataset. Median values are marked in bold font and data range is indicated
within the parentheses. T (oC) = Ti-in-zircon temperatures (Ferry and Watson, 2007), ɑSiO2 = 1 and ɑTiO2 = 0.5, are shown as ranges, with average error adjacent. T (
oC)
and f O2 values for replacement/metamict domains not calculated as these are not interpreted as magmatic. n = number of analyses included in summary statistics. WDP -
West Dalhousie Pluton
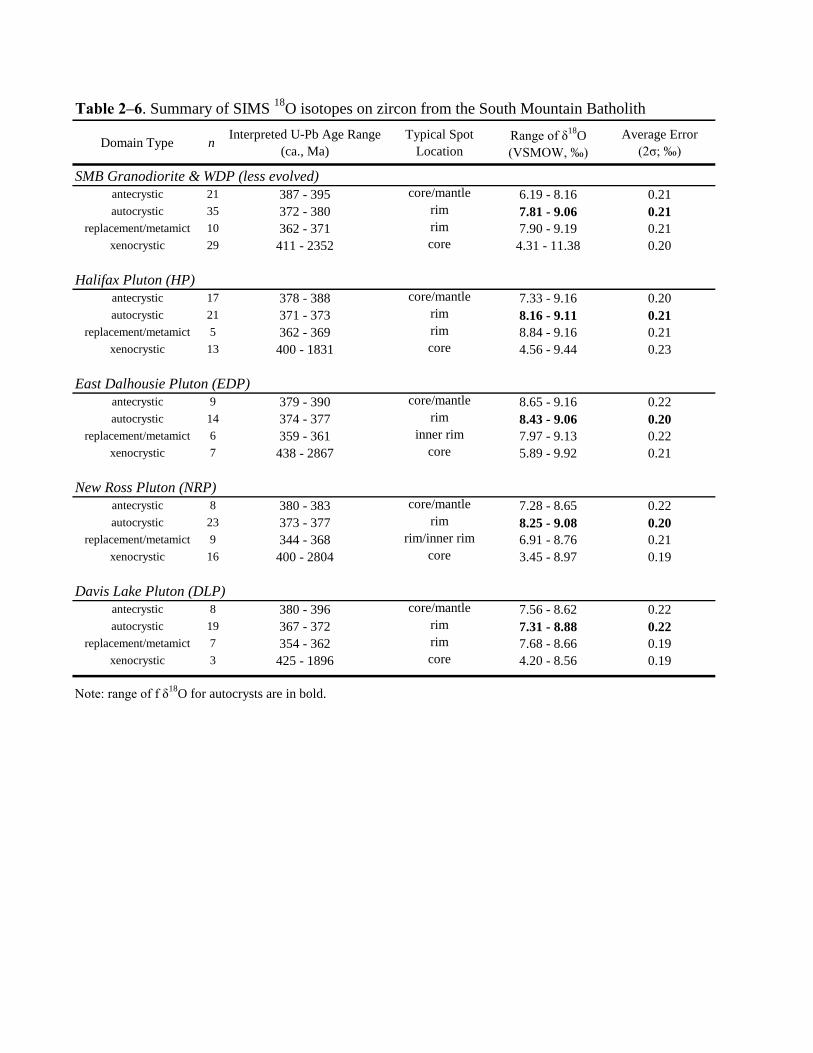
Table 2–6. Summary of SIMS 18
O isotopes on zircon from the South Mountain Batholith
Domain Type nInterpreted U-Pb Age Range
(ca., Ma)
Typical Spot
Location
Range of δ18
O
(VSMOW, ‰)
Average Error
(2σ; ‰)
SMB Granodiorite & WDP (less evolved)
antecrystic 21 387 - 395 core/mantle 6.19 - 8.16 0.21
autocrystic 35 372 - 380 rim 7.81 - 9.06 0.21
replacement/metamict 10 362 - 371 rim 7.90 - 9.19 0.21
xenocrystic 29 411 - 2352 core 4.31 - 11.38 0.20
Halifax Pluton (HP)
antecrystic 17 378 - 388 core/mantle 7.33 - 9.16 0.20
autocrystic 21 371 - 373 rim 8.16 - 9.11 0.21
replacement/metamict 5 362 - 369 rim 8.84 - 9.16 0.21
xenocrystic 13 400 - 1831 core 4.56 - 9.44 0.23
East Dalhousie Pluton (EDP)
antecrystic 9 379 - 390 core/mantle 8.65 - 9.16 0.22
autocrystic 14 374 - 377 rim 8.43 - 9.06 0.20
replacement/metamict 6 359 - 361 inner rim 7.97 - 9.13 0.22
xenocrystic 7 438 - 2867 core 5.89 - 9.92 0.21
New Ross Pluton (NRP)
antecrystic 8 380 - 383 core/mantle 7.28 - 8.65 0.22
autocrystic 23 373 - 377 rim 8.25 - 9.08 0.20
replacement/metamict 9 344 - 368 rim/inner rim 6.91 - 8.76 0.21
xenocrystic 16 400 - 2804 core 3.45 - 8.97 0.19
Davis Lake Pluton (DLP)
antecrystic 8 380 - 396 core/mantle 7.56 - 8.62 0.22
autocrystic 19 367 - 372 rim 7.31 - 8.88 0.22
replacement/metamict 7 354 - 362 rim 7.68 - 8.66 0.19
xenocrystic 3 425 - 1896 core 4.20 - 8.56 0.19
Note: range of f δ18
O for autocrysts are in bold.
185
Chapter 3
The East Kemptville Mesothermal Greisen-Hosted Sn-Zn-Cu-Ag-In
Deposit, Nova Scotia, Canada: One ore body with two deposits
3.1 Abstract
The East Kemptville Sn(-Cu-Zn-Ag-In) deposit (Nova Scotia, Canada), with two greisen-style
ore zones with contrasting geologic character, comprises the most significant Sn deposit in the
northern Appalachian Sn–W metallotect. Its mesothermal setting (~3.5 kbars) is unusual for
greisen-style deposits in general, and is one of numerous regional Sn-polymetallic occurrences in
the area which also includes the proximal Duck Pond skarn-style deposit. The host East
Kemptville Leucogranite (EKL) is part of the Davis Lake Pluton, and at the southwestern end of
a ca. 375-380 Ma composite peraluminous South Mountain Batholith (SMB).
In the deposit area, zoned and massive greisens overprint the deuteric altered, topaz-rich EKL.
The latter is characterized locally by layered pegmatites, stockscheiders, miaroles, and USTs
which rarely contain magmatic cassiterite; these features attest to the volatile- and Sn-rich nature
of the EKL when emplaced. The two ore zones, the Baby and Main, are localized in fractured
EKL related to a long-lived, NE-trending regional fault zone. However, whereas the Baby Zone
is characterized by massive greisens and magmatic-hydrothermal breccias, the Main Zone has
abundant zoned greisens proximal the fault zone.

186
Geochemically, the EKL is strongly peraluminous (ASI = 1.40) and enriched in P, Li, Rb, Cs,
Sn, W, and U relative to the SMB along with differing Nb/Ta and Zr/Hf values. Notable
differences between the ore zones include higher P2O5 concentrations, U/Th ratios, and tetrad
effect (TE1,3 of 1.39 versus 1.15) in the Main Zone, and higher Y and REE in the Baby Zone.
The geochemical differences suggest accessory-mineral fractionation between the two zones, but
differing progenitor magmas cannot be excluded.
Mineralization ages (U-Pb cassiterite, Re-Os molybdenite) define three general ages: 1) Main
Zone cassiterite ranges from 376 to 365.4 Ma (369.4 ± 4.5 Ma) and vein molybdenite is 370.2 ±
1.6 Ma; 2) two Main Zone vein molybdenites record ages of 359.4 ± 1.8 Ma and 354.9 ± 2.0 Ma;
and 3) Baby Zone molybdenite at 343.7 ± 1.7 Ma is associated with a magmatic breccia and is
similar in age to cassiterite from the nearby Duck Pond deposit of 347 ± 12 Ma. These ages are
consistent with other mineralization in the region indicating that two distinct magmatic-
hydrothermal systems existed.
These data confirm a magmatic-hydrothermal origin for the East Kemptville deposit which we
relate to a deeper, more evolved equivalent to the host rock EKL. The nature of the ore zones
reflects the high confining pressure and overall structural controls of the setting. The latter
features also account for the telescoped nature of mineralization and lack of a distinct vertical
zoning to the Sn(-Cu-Zn-Ag-In) mineralization.

187
3.2 Introduction
Magmatic-hydrothermal deposits with primary enrichment in Sn and W ± polymetallic base-
metals (e.g., Cu, Zn, In) occur in a variety of styles (i.e., greisens, veins, skarns, porphyry,
pegmatites). These deposits have long been noted to be hosted in, or proximal to highly
fractionated, peraluminous felsic intrusions (e.g., Taylor, 1979; Heinrich, 1990; Černý et al.,
2005; Lehmann, 2020). Globally they define metallogenic districts (e.g., Schuiling, 1967; Kelly
and Turneaure, 1970; Schwartz et al., 1995) wherein mineralization typically occurs with
magmatism regionally hosted in Sn- and/or W-enriched graphitic metasiltstones and slates, as
suggested for the Appalachian Sn-W metallotect (Romer and Kroner, 2015, 2016). Such
sedimentary rocks are the wall-rocks to the Sn mineralized leucogranite at East Kemptville,
Nova Scotia (e.g., Kontak and Dostal, 1992; White, 2010a; White and Barr, 2010). The Sn-W
endowment in these global metallotects has been attributed to two divergent processes: 1) the
mantle, which is the source of the melts that subsequently fractionate ore elements into economic
concentrations (e.g., Schuiling, 1967; Sillitoe, 1975); and 2) enriched clastic sedimentary
sequences (e.g., metaturbidies) that either contribute Sn and W via crust-derived partial melts
that may be the progenitors to these deposits (Sato, 2012; Romer and Kroner, 2015, 2016), or by
extensive crustal contamination to mantle-derived melts and subsequent fractionation (e.g.,
Blevin and Chappell, 1992, 1995).
188
The northern Appalachian region hosts a variety of base- and rare-metal mineralized centres that
include Cu, Sn, W-Mo, Sb and Ta that are associated with widespread granitic magmatism (e.g.,
van Staal, 2007; Sinclair et al., 2011; Fig. 3–1). These deposits range in age from ca. 410 to 360
Ma and have a spatial distribution which spans across a large area of eastern Canada (Fig. 3–1).
The style of mineralization ranges from shallow porphyry and epithermal-hosted systems with
association greisen-, vein-, and breccia-hosted mineralization (e.g., Ackley greisen Sn deposit;
Mt. Pleasant greisen, vein and breccia W-Sn deposit; Lake George vein-hosted Sb deposit;
Gaspé porphyry Cu-Mo). In contrast to these granite-associated deposits is the mesothermal Sn
greisen and base-metal vein system of East Kemptville (Nova Scotia; Richardson et al., 1982;
Kontak, 1990a; Halter et al., 1995a), which records a depth of formation (i.e., ca. 3.5 kbars) that
is deeper than most Sn settings (Taylor 1979; Černý et al., 2005). Another anomalous feature for
this area compared to other Sn districts is that there has only been a single primary Sn producer
of Sn, this being the East Kemptville Sn-Cu-Zn-Ag-In deposit. Mined from 1985 to 1992, and
the most significant primary Sn deposit in North America, the deposit had historical reserves of
56 Mt at 0.17% Sn (Richardson et al., 1982) with an in-ground measured and indicated resource
of 22.97 Mt at 0.15% Sn (using a 0.1% Sn cut-off grade; Gowans et al., 2018).
Previous studies at East Kemptville (Richardson, 1988; Kontak, 1990a, b, 1991, 1994; Halter et
al., 1996, 1998; Kontak et al. 2001) noted a number of characteristics that differentiate it from
typical greisen-style Sn deposits: 1) it formed under greater than typical pressures (i.e., ca. 3.5
189
kbars as opposed to <1 kbar; Halter et al., 1996; Kontak et al., 2001); 2) the host batholith is not
uniformly enriched in Sn with typical contents <5–10 ppm (MacDonald, 2001; cf. Lehmann,
1990); and 3) other sites of significant Sn mineralization are apparently absent in the host South
Mountain Batholith (SMB) intrusive complex (Fig. 3–1).
The aim of the present contribution, which forms part of a broader fluid-chemical study of the
greisen and vein mineralization and a petrochronology study of the host SMB, is to provide an
update on the geology and petrology of this important Sn deposit setting which has not been
reexamined for nearly three decades. The work presented here has also benefited from 2014-
2015 drilling of the deposit area which has provided information for part of the deposit that was
not previously available. Herein we assess and discuss the nature of alteration and related
mineralization, structural features of the ore zones, lithogeochemistry of the intrusive host rocks,
and the absolute age of the mineralization through Re-Os and in situ U-Pb dating of molybdenite
and cassiterite, respectively. Previous studies have shown that the East Kemptville deposit is
hosted by two discrete ore zones, characterized by: 1) high-tonnage, low-grade Sn in
discontinuous fracture-controlled greisens (Main Zone); and 2) low-tonnage, higher-grade
massive greisens that transition upwards to a pipe-shaped igneous-hydrothermal breccia body
(Baby Zone). The results of the current study provide the basis to better define the ore zones and
for reconstructing the deposit and thus to compare it with more typical greisen-style Sn systems
and identify local controls on mineralization.
190
3.3 Geologic Setting and Related Mineralization
3.3.1 Regional geology
The northern Appalachians of Atlantic Canada are underlain by several tectonic terranes (peri-
Laurentia, Ganderia, Avalonia, and Meguma; Fig. 3–1) that accreted to the evolving continental
margin during consecutive Paleozoic orogenic events: the Taconic, Salinic, Acadian, and
Neoacadian (van Staal et al., 2009, and references therein). The youngest of these orogenic
events, the Neoacadian, is attributed to the accretion of the Meguma terrane which forms the
most outboard of the terranes. This later deformation was, importantly, accompanied by
widespread and abundant ca. 385-360 Ma meta- to peraluminous magmatism and associated
mineralization across the accreted terranes (Fig. 3–1; e.g., van Staal, 2007). These accretionary
events were followed by a later, more intense and restricted regional deformation at ca. 300 Ma
(Muecke et al., 1988; Culshaw and Reynolds, 1997) associated with the terminal continent-
continent collision (Alleghanian orogeny) between Gondwana and Laurentia (e.g., Keppie, 1993;
Hibbard et al., 2010). In the context of this study, this later deformation is significant as it
overprints the mineralized East Kemptville area.
3.3.2 Geology of the Meguma terrane
The Meguma terrane is dominated by a thick (>12 km) sequence of Ediacaran to Lower
Ordovician clastic metaturbiditic rocks (the Meguma Supergroup) that formed along the rifted
191
western margin of Gondwana (White, 2010b; White and Barr, 2010; White et al., 2012) into
which was emplaced voluminous felsic magmas. The Meguma sedimentary rocks are sub-
divided into two major packages - the metasandstone-dominated Goldenville Group and the
overlying metasiltstone/slate-dominated Halifax Group (e.g., White, 2010b). The transition
between these two groups is historically referred to as the Goldenville-Halifax Transition zone
(GHTZ), which is characterized by alternating facies of sandy and slaty metaturbidites through a
thickness of ~1 km in the SW part of the terrane (Waldron, 1992). Notably, the GHTZ contains
elevated concentrations of Mn, C, Ba and trace metals (Pb, Zn, Cu, Mo, W, Au) relative to the
rest of the Meguma metasedimentary rocks (Zentilli et al., 1986; Sangster, 1990) and rarely
localizes Sn-W and base-metal (Zn-Pb) mineralization (Sangster, 1990). Along the northwestern
margin of the Meguma terrane, the Halifax Group is disconformably overlain by Silurian-
Devonian bimodal metavolcanic to metasedimentary rocks of the Rockville Notch Group (White,
2010a; White and Barr, 2017).
All of the above stratigraphy was regionally deformed and variably metamorphosed (greenschist,
but locally amphibolite facies) during the Early- to Late Devonian Neoacadian orogenic event
(ca. 405–365 Ma; Dallmeyer and Keppie, 1987; Hicks et al., 1999; Culshaw and Lee, 2006), and
intruded by syntectonic meta- to peraluminous felsic bodies; the largest of these bodies is the
voluminous (7300 km2) SMB (Benn et al., 1997, 1999; Clarke et al., 1997, 2004). The composite
SMB has been divided into two intrusive suites which, based on textural and mineralogical
192
characteristics, are referred to as stage I and II (Fig. 3–1) that correspond to early granodiorite to
monzogranite and later monzogranite to leucogranite, respectively (MacDonald, 2001). The
emplacement ages of these suites overlap at ~383 to 375 Ma for stage I and ~379 to 370 Ma for
stage II (Bickerton et al., 2018). The SMB is therefore similar in age to the nearby Musquodoboit
Batholith of 377.5 ± 0.6 Ma (Kontak et al., 2004), as well as mafic- to hybridized intermediate
satellite intrusions to the SMB (Figs. 3–1 and 3–2). The pressures of emplacement of the SMB
and Musquodoboit batholith are estimated at ~3 to 3.5 kbars based on muscovite
thermobarometry and graphite thermometry (Massonne et al., 2010; Hilchie and Jamieson,
2014).
The Neoacadian deformation is related at least in part to the dextral transpressive motion of the
Meguma terrane against Avalonia along a terrane-bounding fault system (Fig. 3–1; Murphy et al.
2011). The younger limit for the Neoacadian deformation and associated granitic magmatism in
the terrane is provided by the unconformably overlying late Famennian Horton Group which is
located along the northern margin of the Meguma terrane. This unit contains clasts of granitic
material and onlaps the northern part of the SMB with a depositional age of ~355 Ma, providing
a minimum exhumation age for the SMB in this area (Martel et al., 1993; Murphy, 2000). Fault
systems active during the Neoacadian that occur within the Meguma terrane and are manifested
as wide, brittle-ductile fault zones (e.g., the East Kemptville-East Dalhousie, EKEDSZ, and the
Tobeatic Shear Zone) that record Ar–Ar tectonothermal ages between 370 and 300 Ma (e.g.,
193
Kontak et al., 1995, and references therein; Fig. 3–2). Full details on historic geochronology in
the SW part of the Meguma terrane are provided in Table EA 3-1 (Electronic Appendix).. The
prolonged activity along these fault zones accommodates the rapid exhumation of the SMB, as
well as subsequent Carboniferous deformation related to the docking of Gondwana (Africa)
outboard of the Meguma terrane (Moran et al. 2007; Waldron et al. 2015). These regional NE-
trending fault zones are also interpreted to have been active during granite intrusion and thus
strongly influenced localization of the SMB, as well as its genetically hosted Sn-W-Cu-Mo and
U-Mn mineralization (e.g., Horne et al., 1992; Benn et al., 1997).
Mineralization associated with the SMB varies in character and includes polymetallic (Sn, W,
Mo, Mn, Cu, Ta, Nb, Zn) occurrences in the more-evolved plutons, the styles of which include
greisens (e.g., East Kemptville deposit), veins (e.g., New Ross Mn Mines; Millet Brook U
deposit), granite-pegmatite (e.g., Long Lake Mo in the New Ross Pluton; Carruzzo et al., 2000),
and peribatholithic (e.g., Duck Pond Sn deposit; Pitre and Richardson, 1989). However, the only
significant deposit of economic note is the greisen-style East Kemptville (Sn-Zn-Cu-Ag-In) at
the SW margin of the SMB (Figs. 3–1 and 3–2).
3.3.3 Geology and mineralization of the SW Meguma terrane
Key aspects of the geology of the SW part of the Meguma terrane are the the SMB, plutonic
rocks peripheral to the SMB, and the metasedimentary rocks of the Meguma Supergroup, as well
as mixed volcanic and sedimentary rocks of the Silurian-Devonian White Rock Formation. All of
194
these units are folded and faulted along NE-trending fold axes and faults. Here, the basal
Goldenville Group, which dominates the area, consists of metasandstone and metasiltstone, the
latter of which transitions through the calcareous and sulfidic GHTZ into the overlying shale-rich
Halifax Group (e.g., White, 2010b). Notably, the GHTZ occurs locally along the EKEDSZ and
hosts several Sn(-Cu-Zn-Ag) sites of mineralization WSW of East Kemptville, which are further
described below.
The SMB in this area is dominated by an evolved stage II intrusion, the Davis Lake Pluton (DLP;
Dostal et al., 2004; Fig. 3–2). The zoned DLP is dominated by coarse-grained biotite-muscovite
monzogranite and leucomonzogranite with a minor, but important elongate body of topaz-
muscovite leucogranite at its SW margin, the East Kemptville leucogranite (EKL), which hosts
the East Kemptville deposit (Figs. 3–2 and 3–3A). The northern, less-evolved part of the DLP is
monzogranite that contains orthoclase, zoned oligoclase (An5-35), biotite, and minor muscovite
in contrast to the SW part that is dominated by highly differentiated leucomonzogranite with
abundant muscovite, albite (An0–5), topaz (5-8 modal %), and minor biotite (Kontak, 1990a;
Dostal and Chatterjee, 1995). Geochemical zoning of the DLP is defined by incompatible trace
elements (e.g., Rb, Li, U, Ta, Sn) and variation in both elemental (e.g., K/Rb, Nb/Ta, La/Sm) and
isotopic (i.e., 206Pb/204Pb, 87Sr/86Sr) ratios which is interpreted to reflect fluid-mediated
fractionation (Dostal et al., 2004, and references therein). Other ca. 360 Ma intrusions that are
present south and west of the DLP host minor Sn-W-Mo-Cu-Zn mineralization and are small
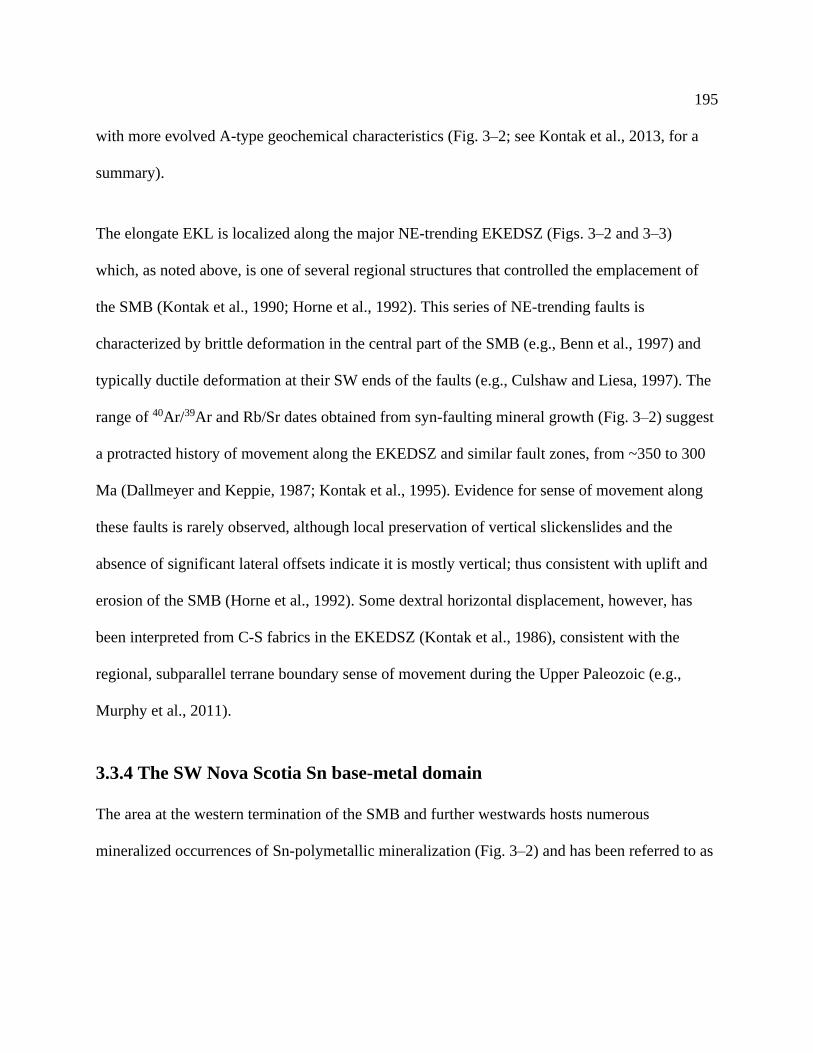
195
with more evolved A-type geochemical characteristics (Fig. 3–2; see Kontak et al., 2013, for a
summary).
The elongate EKL is localized along the major NE-trending EKEDSZ (Figs. 3–2 and 3–3)
which, as noted above, is one of several regional structures that controlled the emplacement of
the SMB (Kontak et al., 1990; Horne et al., 1992). This series of NE-trending faults is
characterized by brittle deformation in the central part of the SMB (e.g., Benn et al., 1997) and
typically ductile deformation at their SW ends of the faults (e.g., Culshaw and Liesa, 1997). The
range of 40Ar/39Ar and Rb/Sr dates obtained from syn-faulting mineral growth (Fig. 3–2) suggest
a protracted history of movement along the EKEDSZ and similar fault zones, from ~350 to 300
Ma (Dallmeyer and Keppie, 1987; Kontak et al., 1995). Evidence for sense of movement along
these faults is rarely observed, although local preservation of vertical slickenslides and the
absence of significant lateral offsets indicate it is mostly vertical; thus consistent with uplift and
erosion of the SMB (Horne et al., 1992). Some dextral horizontal displacement, however, has
been interpreted from C-S fabrics in the EKEDSZ (Kontak et al., 1986), consistent with the
regional, subparallel terrane boundary sense of movement during the Upper Paleozoic (e.g.,
Murphy et al., 2011).
3.3.4 The SW Nova Scotia Sn base-metal domain
The area at the western termination of the SMB and further westwards hosts numerous
mineralized occurrences of Sn-polymetallic mineralization (Fig. 3–2) and has been referred to as
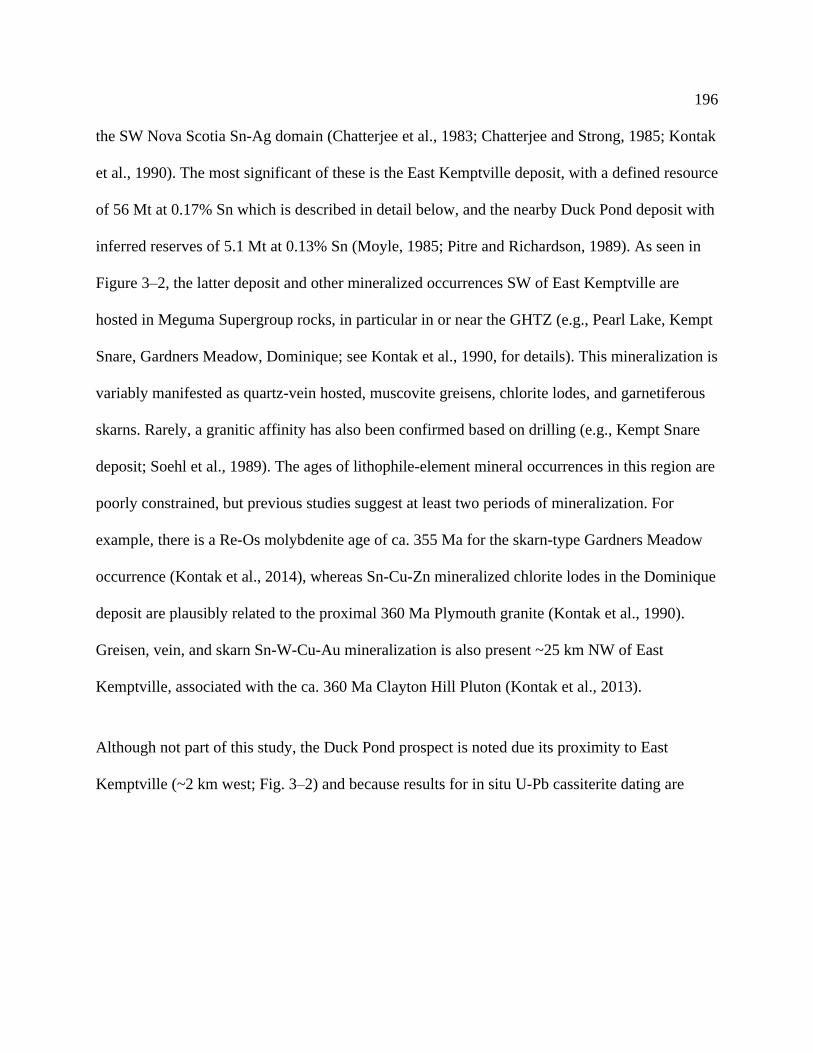
196
the SW Nova Scotia Sn-Ag domain (Chatterjee et al., 1983; Chatterjee and Strong, 1985; Kontak
et al., 1990). The most significant of these is the East Kemptville deposit, with a defined resource
of 56 Mt at 0.17% Sn which is described in detail below, and the nearby Duck Pond deposit with
inferred reserves of 5.1 Mt at 0.13% Sn (Moyle, 1985; Pitre and Richardson, 1989). As seen in
Figure 3–2, the latter deposit and other mineralized occurrences SW of East Kemptville are
hosted in Meguma Supergroup rocks, in particular in or near the GHTZ (e.g., Pearl Lake, Kempt
Snare, Gardners Meadow, Dominique; see Kontak et al., 1990, for details). This mineralization is
variably manifested as quartz-vein hosted, muscovite greisens, chlorite lodes, and garnetiferous
skarns. Rarely, a granitic affinity has also been confirmed based on drilling (e.g., Kempt Snare
deposit; Soehl et al., 1989). The ages of lithophile-element mineral occurrences in this region are
poorly constrained, but previous studies suggest at least two periods of mineralization. For
example, there is a Re-Os molybdenite age of ca. 355 Ma for the skarn-type Gardners Meadow
occurrence (Kontak et al., 2014), whereas Sn-Cu-Zn mineralized chlorite lodes in the Dominique
deposit are plausibly related to the proximal 360 Ma Plymouth granite (Kontak et al., 1990).
Greisen, vein, and skarn Sn-W-Cu-Au mineralization is also present ~25 km NW of East
Kemptville, associated with the ca. 360 Ma Clayton Hill Pluton (Kontak et al., 2013).
Although not part of this study, the Duck Pond prospect is noted due its proximity to East
Kemptville (~2 km west; Fig. 3–2) and because results for in situ U-Pb cassiterite dating are

197
provided below. This setting is a vein- and strata-bound Sn prospect hosted by interbedded meta-
wacke and meta-argillite of the GHTZ (Pitre and Richardson, 1989; Kontak et al., 1990).
3.4 The East Kemptville tin deposit
In contrast to the other Sn base-metal occurrences in SW Nova Scotia, the East Kemptville
greisen-type Sn-Zn-Cu-Ag-In deposit is wholly contained within the evolved EKL (Fig. 3–3A;
Richardson et al., 1982; Richardson, 1988; Kontak, 1990a, 1991), an elongate body that intrudes
the Goldenville Group along the EKEDSZ (Fig. 3–3B). The deposit has a surface expression of
<1 km2 and the host leucogranite displays variable alteration from least altered to intensely
greisenized with veined zones that generally align parallel to a NE trending penetrative fabric
(Fig. 3–3C, D, and inset). Rare pegmatitic dikes associated with the EKL also occur in the
adjacent wall-rocks and typically align parallel to the prominent NE fabric. The two main ore
zones, the Baby and Main, both contain ore-grade greisens that are preferentially concentrated
along the main NE-trending, sub-vertical fault zone which has a poorly documented kinematic
evolution.
Collectively, the deposit and host EKL record a protracted history of magmatic, hydrothermal,
and tectonic events that are here described using both previous work (lithogeochemistry; Rb-Sr,
Ar-Ar, and Pb-Pb geochronology) and new data collected from recent diamond drilling, surface
grid mapping (Fig. 3–3C), petrography, microanalysis (scanning-electron microprobe back-
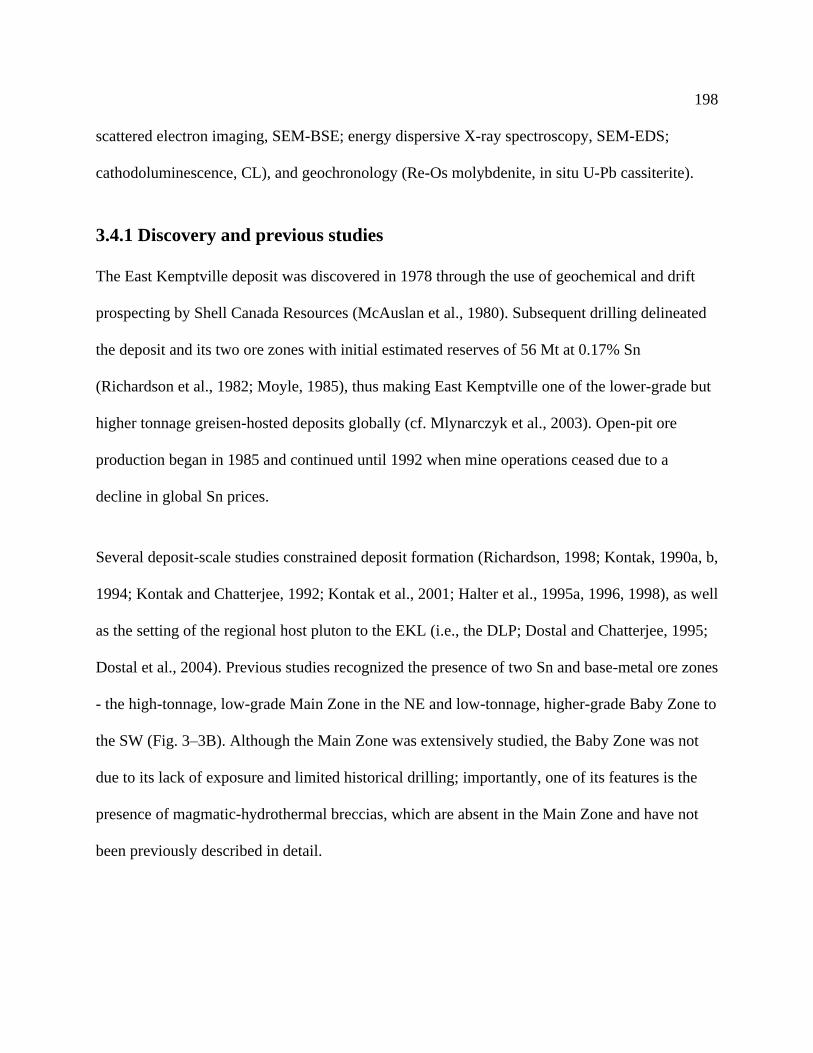
198
scattered electron imaging, SEM-BSE; energy dispersive X-ray spectroscopy, SEM-EDS;
cathodoluminescence, CL), and geochronology (Re-Os molybdenite, in situ U-Pb cassiterite).
3.4.1 Discovery and previous studies
The East Kemptville deposit was discovered in 1978 through the use of geochemical and drift
prospecting by Shell Canada Resources (McAuslan et al., 1980). Subsequent drilling delineated
the deposit and its two ore zones with initial estimated reserves of 56 Mt at 0.17% Sn
(Richardson et al., 1982; Moyle, 1985), thus making East Kemptville one of the lower-grade but
higher tonnage greisen-hosted deposits globally (cf. Mlynarczyk et al., 2003). Open-pit ore
production began in 1985 and continued until 1992 when mine operations ceased due to a
decline in global Sn prices.
Several deposit-scale studies constrained deposit formation (Richardson, 1998; Kontak, 1990a, b,
1994; Kontak and Chatterjee, 1992; Kontak et al., 2001; Halter et al., 1995a, 1996, 1998), as well
as the setting of the regional host pluton to the EKL (i.e., the DLP; Dostal and Chatterjee, 1995;
Dostal et al., 2004). Previous studies recognized the presence of two Sn and base-metal ore zones
- the high-tonnage, low-grade Main Zone in the NE and low-tonnage, higher-grade Baby Zone to
the SW (Fig. 3–3B). Although the Main Zone was extensively studied, the Baby Zone was not
due to its lack of exposure and limited historical drilling; importantly, one of its features is the
presence of magmatic-hydrothermal breccias, which are absent in the Main Zone and have not
been previously described in detail.

199
3.4.2 Host rocks
The deposit area is underlain by two lithologies, the EKL and metasandstones (Fig. 3–3B). The
character of the host EKL in both the Baby and Main ore zones varies from a muscovite (± rare
biotite) leucogranite to a topaz-muscovite leucogranite. Where least altered, the EKL is
dominantly a medium-grained, seriate- to equigranular-textured leucomonzogranite, but rarely
aphanite facies of unknown extent are present (Fig. 3–5Ai and Aii, respectively) along with later
fine-grained felsic dike rocks that manifest thin (<5 mm) silica borders (i.e., pressure quench
features; Fig. 3–5B). The country rock is dominantly fine-grained, grey to black metapsammites
and metapelites that show variable amounts of alteration, veining and localized Sn- and Cu-Zn
mineralization (Kontak and Dostal, 1992). Proximal to the intrusive contacts (≤50 m), the wall-
rock is hornfelsed and characterized by poikiolitic cordierite and rarely by garnet (1–5 mm),
whereas within the EKL there is grain size reduction and local stockscheiders (Fig. 3–5C),
banded aplite-pegmatites (<1 m) with UST features (i.e., well-developed quartz layers in aplite,
Fig. 3–5D, E; cf. Kirwin, 2005), and thin cassiterite-bearing micro-pegmatites and miaroles (Fig.
3–5F and G, respectively) occur. In addition to the UST features, minor occurrences of
interconnected granitic-veins are seen throughout the Main Zone (e.g., Fig. 3–5H) that resemble
the fluid-saturation textures described by Candela and Blevin (1995). The least-altered EKL has
a primary mineralogy and approximate modes (after Kontak, 1990a) of quartz (37%), albite
(30%), K-feldspar (19%), muscovite (8%), and topaz (5%). Trace amounts (<0.5 modal %) of
secondary dark mica (variable amounts of Mg- and Fe-rich lepidolite as well as Li-rich biotite;
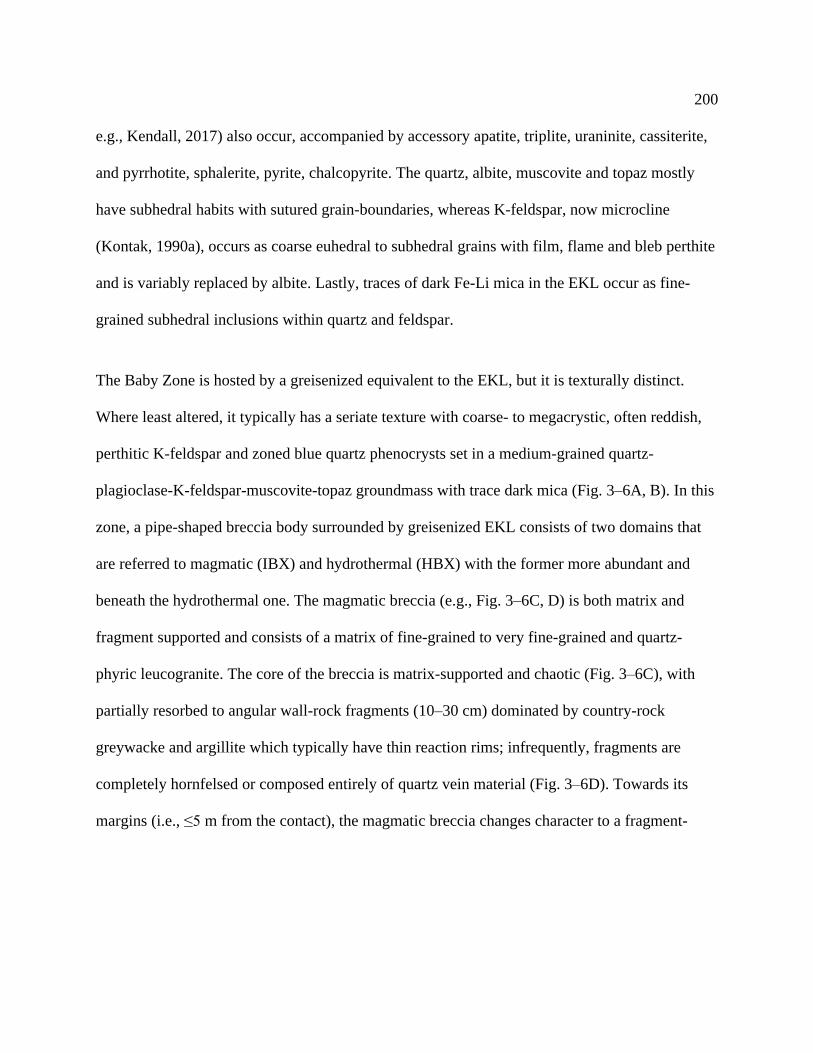
200
e.g., Kendall, 2017) also occur, accompanied by accessory apatite, triplite, uraninite, cassiterite,
and pyrrhotite, sphalerite, pyrite, chalcopyrite. The quartz, albite, muscovite and topaz mostly
have subhedral habits with sutured grain-boundaries, whereas K-feldspar, now microcline
(Kontak, 1990a), occurs as coarse euhedral to subhedral grains with film, flame and bleb perthite
and is variably replaced by albite. Lastly, traces of dark Fe-Li mica in the EKL occur as fine-
grained subhedral inclusions within quartz and feldspar.
The Baby Zone is hosted by a greisenized equivalent to the EKL, but it is texturally distinct.
Where least altered, it typically has a seriate texture with coarse- to megacrystic, often reddish,
perthitic K-feldspar and zoned blue quartz phenocrysts set in a medium-grained quartz-
plagioclase-K-feldspar-muscovite-topaz groundmass with trace dark mica (Fig. 3–6A, B). In this
zone, a pipe-shaped breccia body surrounded by greisenized EKL consists of two domains that
are referred to magmatic (IBX) and hydrothermal (HBX) with the former more abundant and
beneath the hydrothermal one. The magmatic breccia (e.g., Fig. 3–6C, D) is both matrix and
fragment supported and consists of a matrix of fine-grained to very fine-grained and quartz-
phyric leucogranite. The core of the breccia is matrix-supported and chaotic (Fig. 3–6C), with
partially resorbed to angular wall-rock fragments (10–30 cm) dominated by country-rock
greywacke and argillite which typically have thin reaction rims; infrequently, fragments are
completely hornfelsed or composed entirely of quartz vein material (Fig. 3–6D). Towards its
margins (i.e., ≤5 m from the contact), the magmatic breccia changes character to a fragment-
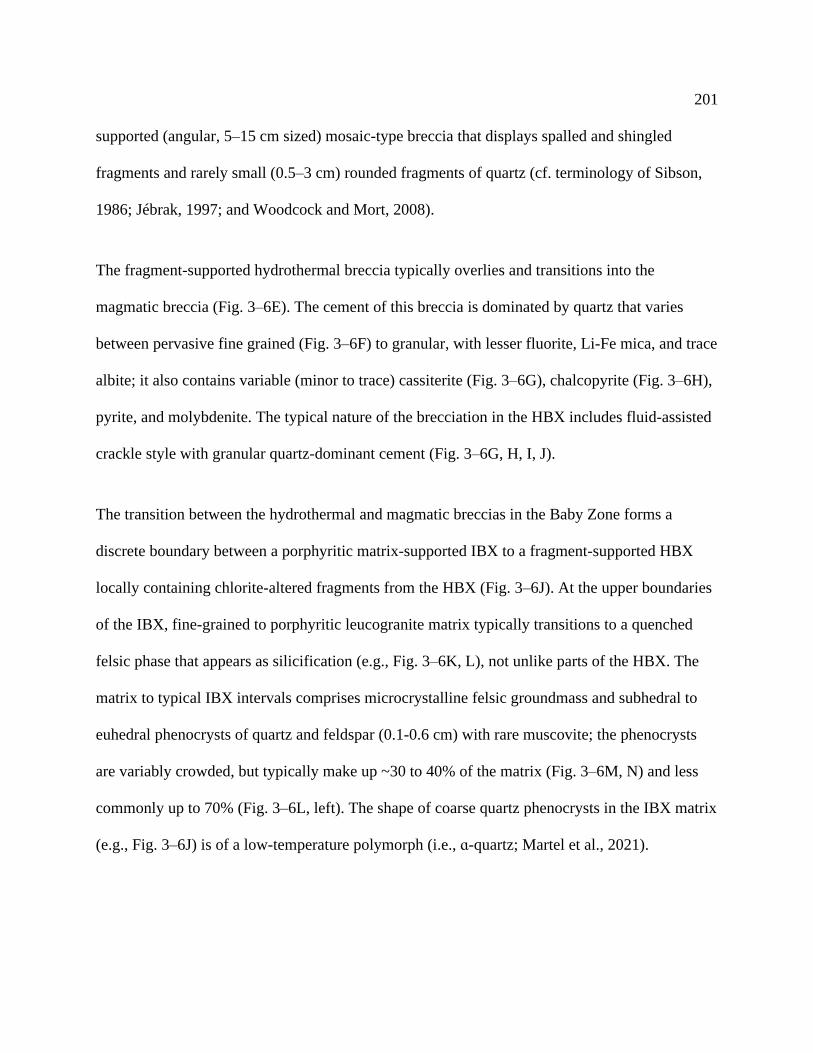
201
supported (angular, 5–15 cm sized) mosaic-type breccia that displays spalled and shingled
fragments and rarely small (0.5–3 cm) rounded fragments of quartz (cf. terminology of Sibson,
1986; Jébrak, 1997; and Woodcock and Mort, 2008).
The fragment-supported hydrothermal breccia typically overlies and transitions into the
magmatic breccia (Fig. 3–6E). The cement of this breccia is dominated by quartz that varies
between pervasive fine grained (Fig. 3–6F) to granular, with lesser fluorite, Li-Fe mica, and trace
albite; it also contains variable (minor to trace) cassiterite (Fig. 3–6G), chalcopyrite (Fig. 3–6H),
pyrite, and molybdenite. The typical nature of the brecciation in the HBX includes fluid-assisted
crackle style with granular quartz-dominant cement (Fig. 3–6G, H, I, J).
The transition between the hydrothermal and magmatic breccias in the Baby Zone forms a
discrete boundary between a porphyritic matrix-supported IBX to a fragment-supported HBX
locally containing chlorite-altered fragments from the HBX (Fig. 3–6J). At the upper boundaries
of the IBX, fine-grained to porphyritic leucogranite matrix typically transitions to a quenched
felsic phase that appears as silicification (e.g., Fig. 3–6K, L), not unlike parts of the HBX. The
matrix to typical IBX intervals comprises microcrystalline felsic groundmass and subhedral to
euhedral phenocrysts of quartz and feldspar (0.1-0.6 cm) with rare muscovite; the phenocrysts
are variably crowded, but typically make up ~30 to 40% of the matrix (Fig. 3–6M, N) and less
commonly up to 70% (Fig. 3–6L, left). The shape of coarse quartz phenocrysts in the IBX matrix
(e.g., Fig. 3–6J) is of a low-temperature polymorph (i.e., ɑ-quartz; Martel et al., 2021).
202
Importantly to timing of events, the IBX post-dates mineralization as it has traces of mineralized
fragments, both of veined and greisenized wall-rock and fragments of quartz ± sulfide material
(Fig. 3–6D, E, M, N) as well as, very rarely, fragments of fine-grained EKL (Fig. 3–6M, O). The
upper part of the IBX contains evidence of fluid exsolution features seen as the thin intergrowth
of Fe-Li mica and quartz, in sequence, from the edges of wall-rock fragments into the IBX
matrix (e.g., Fig. 3–6O). Additionally, thin (<3 cm) fine-grained dikes extend from the IBX
matrix and contain rare molybdenite (Fig. 3–6P).
The Baby and Main zones both contain the same suite of ore elements (Sn, Zn, Cu, Ag, In) and
each is centered along discrete fault domains that are part of the regional EKEDSZ (Figs. 3–2
and 3–3). The host lithologies and their relationships to the individual ore zones differ, despite
their close proximity (Figs. 3–4, 3–7A, B). The greisens in the Main Zone are subvertical, 25–30
m wide zones hosted in or proximal the EKEDSZ (Fig. 3–7A), and are locally found beneath
shallowly-dipping intrusive contacts between the EKL and the country-rocks. Greisen
development and Sn-grade in the Baby Zone is also related to vertical structures as well as more
pervasive patches in the EKL beneath and adjacent to the IBX, or less commonly within the
HBX (Fig. 3–7B). Notably, greisens are not typically associated with the magmatic breccia
through the center of the Baby Zone but the hydrothermal breccias do contain tin mineralization.
203
3.4.3 Alteration
The textures and mineralogy of the EKL reflect pervasive metasomatism. The degree of
alteration in parts of the EKL distal to the ore-bearing greisens is weaker than the metasomatism
typically documented in granitoids hosting ore in other Sn-provinces; e.g., microclinization in
the Erzgebirge (Štemprok, 1987) or albitization in the Australian tin fields (Witt, 1988; Charoy
and Pollard, 1989). The alteration described below includes the background or deuteric type in
the EKL most distal from greisens followed by the more proximal massive- and zoned-style
greisens.
3.4.3.1 Background (deuteric) alteration
The least-altered EKL is a light buff to pinkish leucogranite (Fig. 3–5A) with sub- to euhedral
primary phases of K-feldspar, plagioclase, quartz, muscovite, and topaz. In both of the ore zones,
a pervasive background alteration is characterized by development of a grey-to green
discolouration that distorts primary textures (Fig. 3–8A). This stage of alteration, identified
petrographically and with SEM-EDS analysis, relates to sericitization of the K-feldspar,
albitization of Ca-plagioclase, and replacement of primary muscovite by a secondary muscovite.
Changes to the major silicate phases include: 1) formation of variably perthitic K-feldspar along
with its partial sericitization (Fig. 3–8B) along with inversion to microcline, the latter of which
relates to fluid-rock interaction and/or subsequent deformation processes (Kontak, 1990a;
Kontak et al., 1996). Importantly, the following features are observed: 1) cassiterite forming with
204
sericite where fractures traverse K-feldspar; 2) secondary muscovite that replaces and is
texturally and chemically distinct (less Fe-rich) from earlier primary type along its grain
boundaries and cleavage with rare sulfide inclusions, based BSE imagery (Fig. 3–8C, D); 3) a
chemically distinct type of biotite comprising a clear variety with relatively low FeO (~1-4 wt.
%) that is replaced by a dark-brown pitted variety with higher FeO content (~8-12 wt. %;
Kontak, 1994); and 4) albite characterized by disseminated, small euhedral fluorapatite crystals
readily seen in CL images (Fig. 3–8E, F). This alteration general preserves the overall texture of
the EKL, as seen in the CL images, but in detail there is, particularly in the feldspars,
development of pitted textures via coupled dissolution precipitation (CDP; Putnis, 2002, 2009).
The pitted domains are characterized by the formation of fine-grained secondary phases,
including oxides (Nb, Ta, Sn), sulfides (Fe, Cu, Pb, Zn), phosphates, and silicates (Fig. 3–8C).
3.4.3.2 Zoned and massive greisens
The types of greisens and their development have been described extensively in the past (Kontak
et al., 1986; Richardson, 1988; Kontak, 1990a, b, 1994; Halter et al., 1995a, 1996, 1998). The
greisen zones have a strong NE-SW striking, steeply-dipping preferred orientation, as noted by
others and confirmed here (Figs. 3–3 and 3–4), and are interpreted to be a product of fluid-rock
interaction with a progression of overprinting mineralogical stages due to sequential mineral
reactions that progressed via CDP. The spatial transition between deuteric alteration and
greisenization of precursor EKL is recognizable as discrete boundaries between a light buff

205
colored and a darker grey-green (or rust colour in oxidized outcrops), respectively (Fig. 3–9A, B,
C). The type of greisens observed relates to whether a complete zoned greisen has formed (Fig.
3–9C, D), if only a part of such a greisen is observed, or if only the more distal zones (i.e.,
incipient stages) of the zoned greisen are developed. Whereas the latter reflects a lower
fluid:rock ratio process, the cores to zoned greisens (i.e., topaz-rich; Fig. 3–9E, left) represent
much higher fluid:rock ratios (Halter et al., 1995a, 1996).
The zoned greisens vary in thickness (cm to ≤1 m) from their mineralized cores to least altered
EKL (Fig. 3–9C). They typically have, from the rim to core, dominant mineral assemblages (in
order of abundance) of: 1) quartz, albite (after K-feldspar and Ca-rich plagioclase), muscovite,
and minor magmatic topaz with trace cassiterite, pyrite; 2) quartz, mica (sericite, Fe-Li mica),
and minor magmatic topaz with weak cassiterite, pyrite, chalcopyrite; 3) quartz, hydrothermal
topaz, mica (sericite, Fe-Li mica) greisen with interstitial sulfides and disseminated cassiterite; 4)
hydrothermal topaz and quartz; and 5) a core of coarse cassiterite and interstitial sulfides with
trace Fe-Li mica (Fig. 3–9C, D, E). Locally, individual zones can be thicker (>30 cm) and thus
appear massive/homogeneous (e.g., rare dominant topaz(-quartz) greisens, Fig. 3–9F).
Importantly, cassiterite in these latter zones is texturally late, as compared to that in distal zones
it tends to be coarser and more euhedral and lines pores created during alteration (e.g., Kontak,
1994; Halter et al., 1996). The noted sequence represents the progressive alteration of the host

206
EKL with the following sequential transformations: K-feldspar to albite (1), albite to sericite (2),
and sericite to hydrothermal topaz (3, 4; Halter et al., 1996).
Unlike the zoned greisens, the massive greisens are fine- to medium-grained, typically texturally
homogeneous, and range in colour from green-grey to dark grey or black (e.g., Fig. 3–9G, H).
The C content in dark greisens, which can be up to 0.15 wt. % (Kontak, 1994), in part causes
variation of grey scale (i.e., light to dark) in massive greisens, whereas C in zoned greisens
concentrates along greisen cores. The massive greisens are steeply dipping and vary in size (i.e.,
<1–20 m) with the widest likely representative of coalesced zones of more narrowly altered
EKL. In the Baby Zone, massive greisens are wider and have generally steeply dipping
geometries, and are found proximal to fault planes crossing the deposit and intrusive contacts
(Fig. 3–7B). Individually, the mineral assemblages of the massive greisens can vary such that,
for example, quartz-muscovite-(Fe-Li)mica, quartz-topaz-(Fe-Li)mica (Fig. 3–9G), quartz-(Fe-
Li)mica (Fig. 3–9H). An excellent example of massive greisen formation at a broad scale is seen
in upper 100 m of a deep drill hole (EK-90-1), studied in detail by Halter et al. (1995), where
intervals of quartz-topaz greisen graded into mixed quartz-topaz and quartz-topaz-sericite
greisen.
In detail, greisens with massive character are homogeneous and fine-grained with respect to
typical EKL, and have irregular sutured crystal grain-boundaries as well as abundant
interconnected dissolution cavities infilled by late mineralization and overprinting networks of
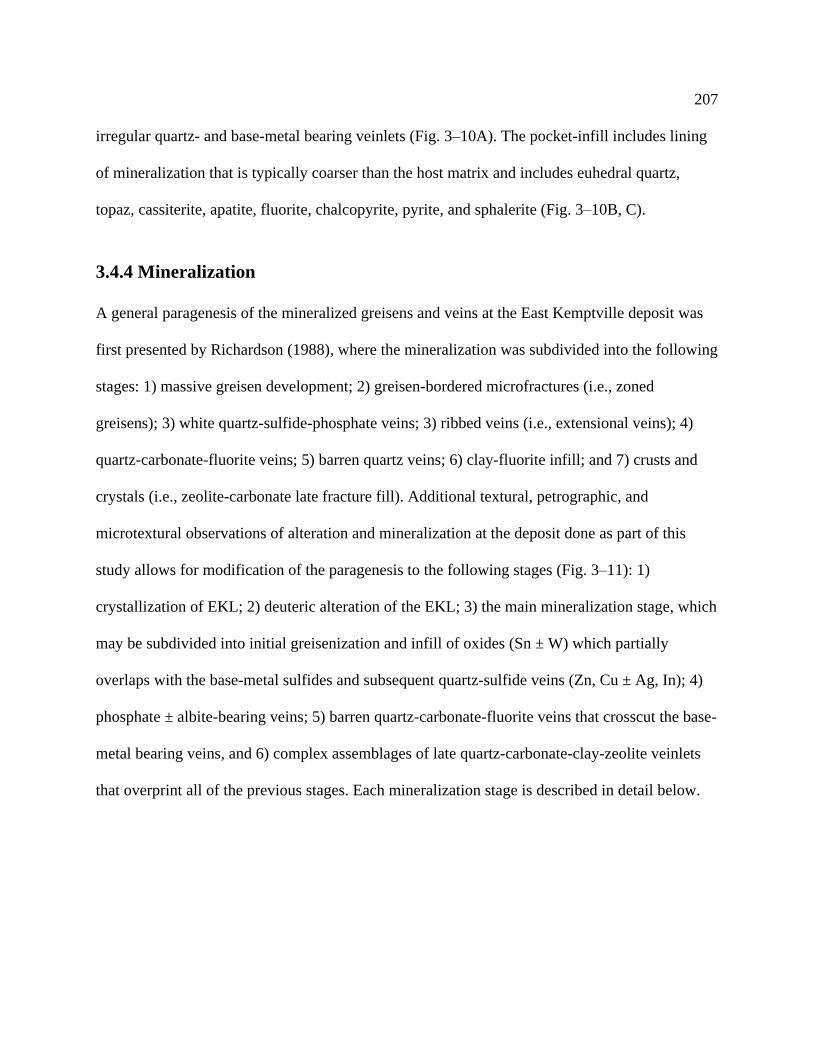
207
irregular quartz- and base-metal bearing veinlets (Fig. 3–10A). The pocket-infill includes lining
of mineralization that is typically coarser than the host matrix and includes euhedral quartz,
topaz, cassiterite, apatite, fluorite, chalcopyrite, pyrite, and sphalerite (Fig. 3–10B, C).
3.4.4 Mineralization
A general paragenesis of the mineralized greisens and veins at the East Kemptville deposit was
first presented by Richardson (1988), where the mineralization was subdivided into the following
stages: 1) massive greisen development; 2) greisen-bordered microfractures (i.e., zoned
greisens); 3) white quartz-sulfide-phosphate veins; 3) ribbed veins (i.e., extensional veins); 4)
quartz-carbonate-fluorite veins; 5) barren quartz veins; 6) clay-fluorite infill; and 7) crusts and
crystals (i.e., zeolite-carbonate late fracture fill). Additional textural, petrographic, and
microtextural observations of alteration and mineralization at the deposit done as part of this
study allows for modification of the paragenesis to the following stages (Fig. 3–11): 1)
crystallization of EKL; 2) deuteric alteration of the EKL; 3) the main mineralization stage, which
may be subdivided into initial greisenization and infill of oxides (Sn ± W) which partially
overlaps with the base-metal sulfides and subsequent quartz-sulfide veins (Zn, Cu ± Ag, In); 4)
phosphate ± albite-bearing veins; 5) barren quartz-carbonate-fluorite veins that crosscut the base-
metal bearing veins, and 6) complex assemblages of late quartz-carbonate-clay-zeolite veinlets
that overprint all of the previous stages. Each mineralization stage is described in detail below.
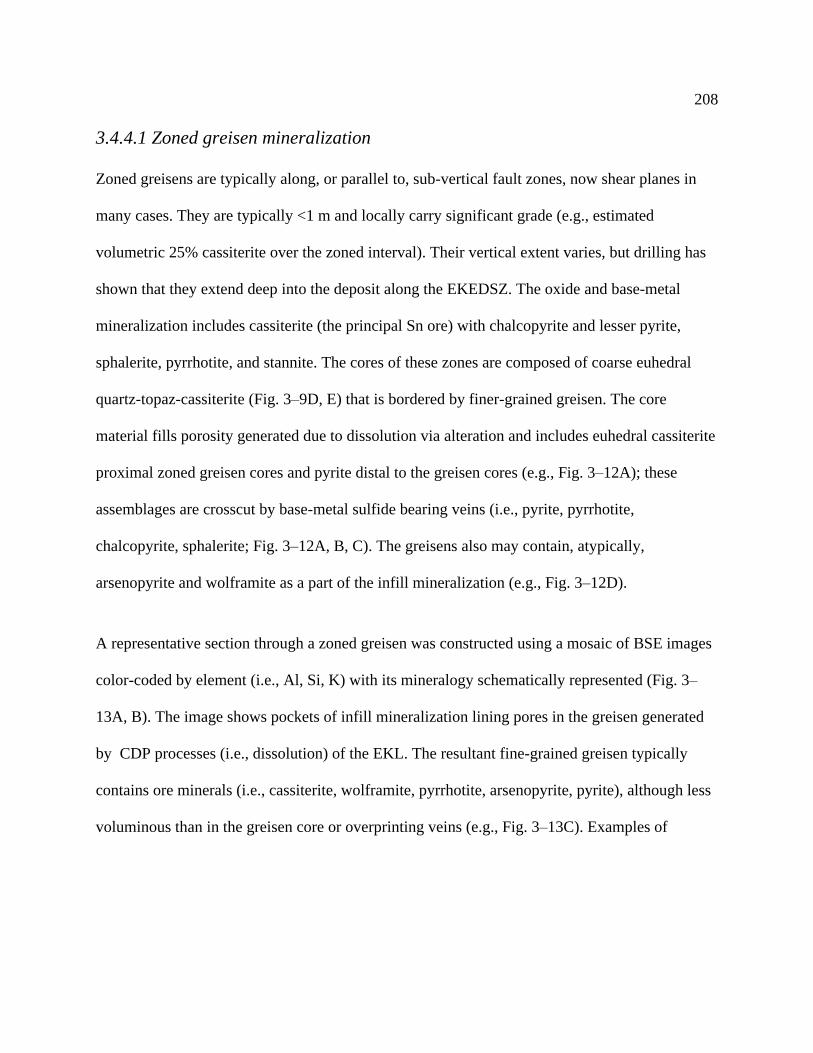
208
3.4.4.1 Zoned greisen mineralization
Zoned greisens are typically along, or parallel to, sub-vertical fault zones, now shear planes in
many cases. They are typically <1 m and locally carry significant grade (e.g., estimated
volumetric 25% cassiterite over the zoned interval). Their vertical extent varies, but drilling has
shown that they extend deep into the deposit along the EKEDSZ. The oxide and base-metal
mineralization includes cassiterite (the principal Sn ore) with chalcopyrite and lesser pyrite,
sphalerite, pyrrhotite, and stannite. The cores of these zones are composed of coarse euhedral
quartz-topaz-cassiterite (Fig. 3–9D, E) that is bordered by finer-grained greisen. The core
material fills porosity generated due to dissolution via alteration and includes euhedral cassiterite
proximal zoned greisen cores and pyrite distal to the greisen cores (e.g., Fig. 3–12A); these
assemblages are crosscut by base-metal sulfide bearing veins (i.e., pyrite, pyrrhotite,
chalcopyrite, sphalerite; Fig. 3–12A, B, C). The greisens also may contain, atypically,
arsenopyrite and wolframite as a part of the infill mineralization (e.g., Fig. 3–12D).
A representative section through a zoned greisen was constructed using a mosaic of BSE images
color-coded by element (i.e., Al, Si, K) with its mineralogy schematically represented (Fig. 3–
13A, B). The image shows pockets of infill mineralization lining pores in the greisen generated
by CDP processes (i.e., dissolution) of the EKL. The resultant fine-grained greisen typically
contains ore minerals (i.e., cassiterite, wolframite, pyrrhotite, arsenopyrite, pyrite), although less
voluminous than in the greisen core or overprinting veins (e.g., Fig. 3–13C). Examples of
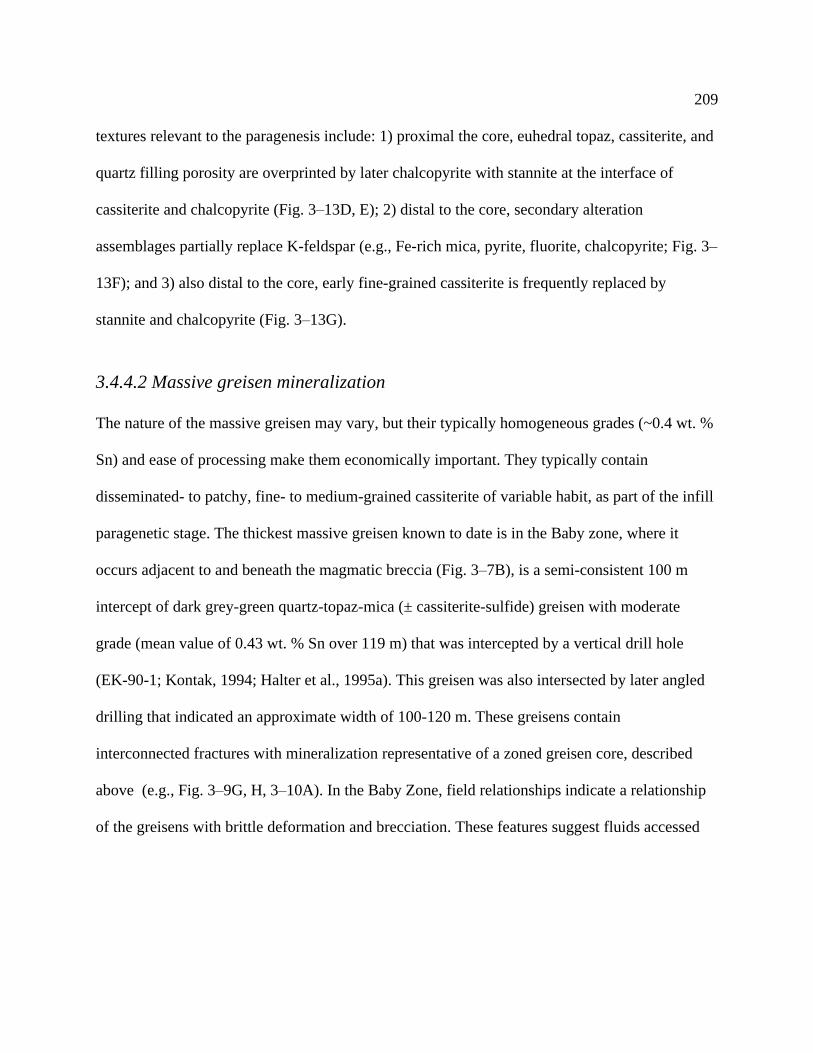
209
textures relevant to the paragenesis include: 1) proximal the core, euhedral topaz, cassiterite, and
quartz filling porosity are overprinted by later chalcopyrite with stannite at the interface of
cassiterite and chalcopyrite (Fig. 3–13D, E); 2) distal to the core, secondary alteration
assemblages partially replace K-feldspar (e.g., Fe-rich mica, pyrite, fluorite, chalcopyrite; Fig. 3–
13F); and 3) also distal to the core, early fine-grained cassiterite is frequently replaced by
stannite and chalcopyrite (Fig. 3–13G).
3.4.4.2 Massive greisen mineralization
The nature of the massive greisen may vary, but their typically homogeneous grades (~0.4 wt. %
Sn) and ease of processing make them economically important. They typically contain
disseminated- to patchy, fine- to medium-grained cassiterite of variable habit, as part of the infill
paragenetic stage. The thickest massive greisen known to date is in the Baby zone, where it
occurs adjacent to and beneath the magmatic breccia (Fig. 3–7B), is a semi-consistent 100 m
intercept of dark grey-green quartz-topaz-mica (± cassiterite-sulfide) greisen with moderate
grade (mean value of 0.43 wt. % Sn over 119 m) that was intercepted by a vertical drill hole
(EK-90-1; Kontak, 1994; Halter et al., 1995a). This greisen was also intersected by later angled
drilling that indicated an approximate width of 100-120 m. These greisens contain
interconnected fractures with mineralization representative of a zoned greisen core, described
above (e.g., Fig. 3–9G, H, 3–10A). In the Baby Zone, field relationships indicate a relationship
of the greisens with brittle deformation and brecciation. These features suggest fluids accessed
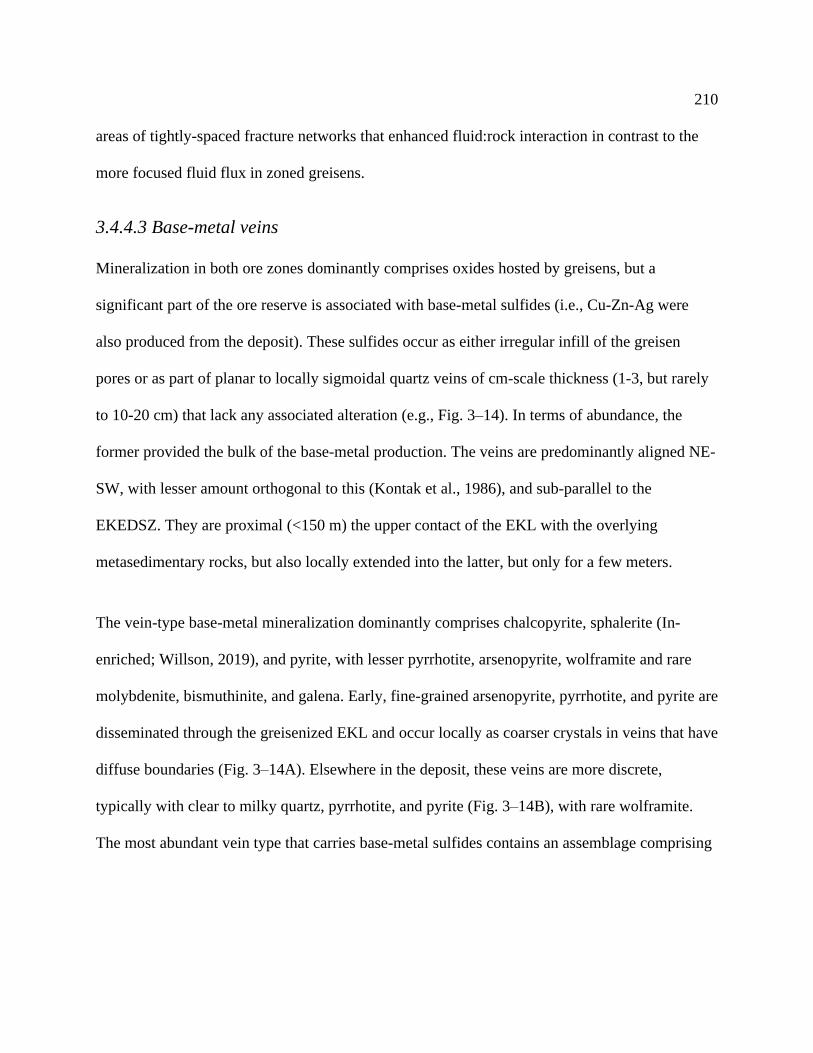
210
areas of tightly-spaced fracture networks that enhanced fluid:rock interaction in contrast to the
more focused fluid flux in zoned greisens.
3.4.4.3 Base-metal veins
Mineralization in both ore zones dominantly comprises oxides hosted by greisens, but a
significant part of the ore reserve is associated with base-metal sulfides (i.e., Cu-Zn-Ag were
also produced from the deposit). These sulfides occur as either irregular infill of the greisen
pores or as part of planar to locally sigmoidal quartz veins of cm-scale thickness (1-3, but rarely
to 10-20 cm) that lack any associated alteration (e.g., Fig. 3–14). In terms of abundance, the
former provided the bulk of the base-metal production. The veins are predominantly aligned NE-
SW, with lesser amount orthogonal to this (Kontak et al., 1986), and sub-parallel to the
EKEDSZ. They are proximal (<150 m) the upper contact of the EKL with the overlying
metasedimentary rocks, but also locally extended into the latter, but only for a few meters.
The vein-type base-metal mineralization dominantly comprises chalcopyrite, sphalerite (In-
enriched; Willson, 2019), and pyrite, with lesser pyrrhotite, arsenopyrite, wolframite and rare
molybdenite, bismuthinite, and galena. Early, fine-grained arsenopyrite, pyrrhotite, and pyrite are
disseminated through the greisenized EKL and occur locally as coarser crystals in veins that have
diffuse boundaries (Fig. 3–14A). Elsewhere in the deposit, these veins are more discrete,
typically with clear to milky quartz, pyrrhotite, and pyrite (Fig. 3–14B), with rare wolframite.
The most abundant vein type that carries base-metal sulfides contains an assemblage comprising

211
quartz-pyrite-pyrrhotite-chalcopyrite-sphalerite ± molybdenite, siderite that is pervasive through
the deposit (Fig. 3–14C–F). This dominant vein assemblage typically has variable proportions of
sphalerite and chalcopyrite, with chalcopyrite being more abundant where veins crosscut
metasedimentary host rock (Fig. 3–14C) and some heavily greisenized EKL (Fig. 3–14D);
sphalerite was more abundant where veins crosscut less altered EKL (Fig. 3–14E). The veins
crosscut zoned greisens at any angle(e.g., Fig. 3–14F). Molybdenite rarely occurs, either in
mineralized pegmatites or as accessory-minerals in mineralized veins through the paragenesis
that include: 1) coarse grains in veins with no apparent affinity to greisenization and ore
mineralization (Fig. 3–14G); 2) coarse grains intergrown with euhedral wolframite hosted in a
Main Zone granular quartz vein (Fig. 3–14H); and 3) fine grains in late quartz-dominant veins
overprinting ore mineralization in the Main Zone (Fig. 3–14I).
3.4.4.4 Phosphate-bearing veins
A generation of quartz-dominant and phosphate ± albite-bearing veins crosscut, and hence post-
date, the greisen and base-metal stages. They typically occur as discontinuous, ladder to en-
echelon, 1 cm-wide extensional veins with syntaxial, locally fibrous, infill growth (e.g., Fig. 3–
15A). This vein generation contains bands of clear quartz and sub- to euhedral albite with
phosphate minerals in some examples (Fig. 3–15A, B). The phosphate minerals include
fluoroapatite, hydroxylapatite, triplite and less commonly vivianite (e.g., Fig. 3–15C, D) as well
as rare childrenite, phosphophyllite, and mcauslanite (cf. ribbed veins of Richardson, 1988).
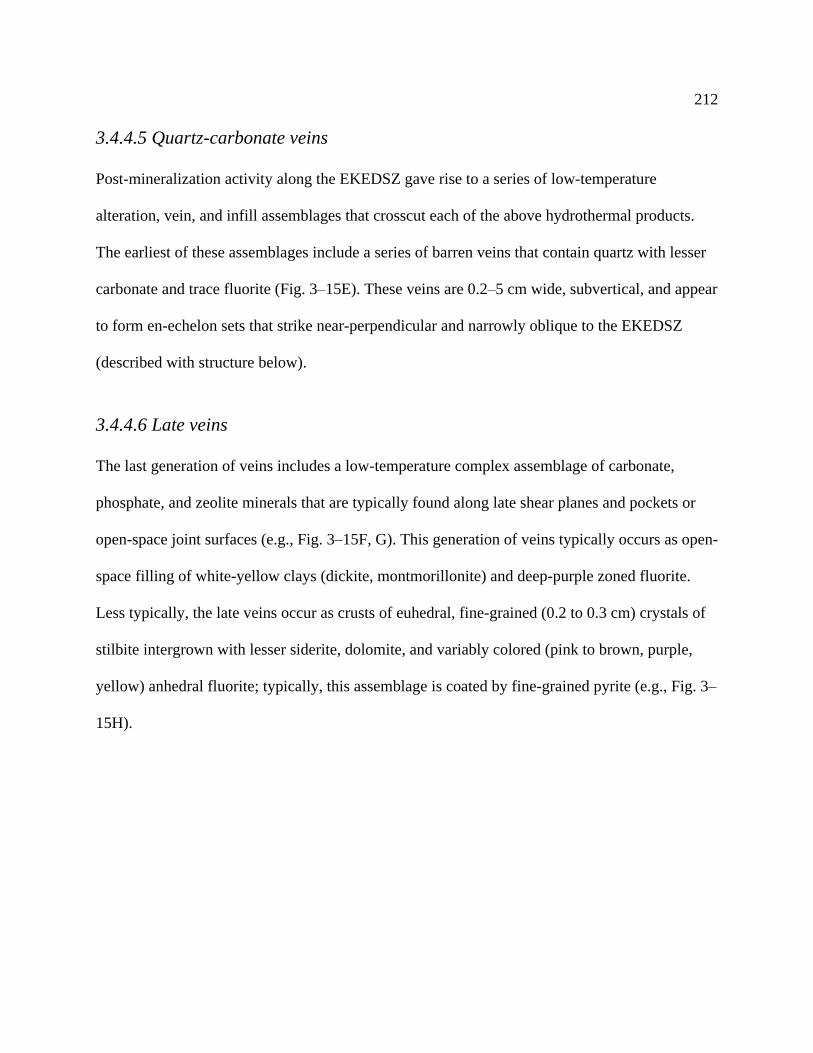
212
3.4.4.5 Quartz-carbonate veins
Post-mineralization activity along the EKEDSZ gave rise to a series of low-temperature
alteration, vein, and infill assemblages that crosscut each of the above hydrothermal products.
The earliest of these assemblages include a series of barren veins that contain quartz with lesser
carbonate and trace fluorite (Fig. 3–15E). These veins are 0.2–5 cm wide, subvertical, and appear
to form en-echelon sets that strike near-perpendicular and narrowly oblique to the EKEDSZ
(described with structure below).
3.4.4.6 Late veins
The last generation of veins includes a low-temperature complex assemblage of carbonate,
phosphate, and zeolite minerals that are typically found along late shear planes and pockets or
open-space joint surfaces (e.g., Fig. 3–15F, G). This generation of veins typically occurs as open-
space filling of white-yellow clays (dickite, montmorillonite) and deep-purple zoned fluorite.
Less typically, the late veins occur as crusts of euhedral, fine-grained (0.2 to 0.3 cm) crystals of
stilbite intergrown with lesser siderite, dolomite, and variably colored (pink to brown, purple,
yellow) anhedral fluorite; typically, this assemblage is coated by fine-grained pyrite (e.g., Fig. 3–
15H).
213
3.4.5 Structure
The deposit area is characterized by a NE-trending, sub-vertical penetrative fabric (Fig. 3–16H)
related to deformation associated with the EKEDSZ and is heterogeneously developed as micro-
shear planes throughout the deposit area (Kontak et al., 1986; Kontak and Cormier, 1991;
Kontak, 1994). The latter structure is characterized by multiple, semi-ductile faults having
similar strike (ca. 045o) and dip (sub-vertical) orientations that penetrates the EKL and the meta-
wacke country rocks. The above foliation is subparallel to the EKL intrusive contact at
approximately 045/75o (Fig. 3–3A). Discrete shear planes (0.1–2 m), identified in drill core
through the deposit and recorded in drill logs, were confirmed from surface observations and
categorized for interpolation in 3-D space. Two examples of major faults through the deposit
include: 1) a well-defined ~40 m-wide shear zone that crosscuts the Main Zone and the SE part
of the Baby Zone, and which truncates breccia in the latter; and 2) a ~20 m-wide shear zone
approximately 120 m SE of the aforementioned fault that is characterized by a strong penetrative
foliation along multiple thin shear planes through the Main Zone (e.g., Fig. 3–3B, C).
The delineation of brittle and ductile structural domains in both the Baby and Main zones was
completed by compiling historic descriptions of structure in drill logs. These results defined
contrasting structural domains between the ore zones such that the terminology used in drill logs
from the Baby Zone dominantly refers to brittle deformation whereas those from the Main Zone
suggest ductile deformation. This distinction was confirmed with outcrop observations in the
214
northern part of the deposit (Figs. 3–3 and 3–16C, D, I) and is also consistent with observations
of earlier workers noted above.
At surface, a vertical normal offset is visible in the Main Zone along the contact between the
EKL and its country rock which created an inlier of metasedimentary rocks referred to
historically as the keel zone (e.g., Richardson et al., 1982; Fig. 3–16A, B). The NW contact of
this feature is demarcated by a 15 cm-wide mylonitized zone that overprints an original brittle
fault, oriented at 046o/84oW (Richardson et al., 1990a; Fig. 16C), whereas in the SE there is an
intrusive contact between the sedimentary rocks and chilled EKL. The original brittle structural
feature is parallel to most zoned greisens in the Main Zone (e.g., Fig. 3–16E, F, G). The latter
feature also contains quartz-albite-sphalerite fibre veins (Fig. 3–16D) that indicate late ore fluid
infiltration synchronous to vertical slip, with a NW side-up sense of movement. This is
significant as this structure has also regionally been noted to host well-developed greisen and Sn
mineralization (see Fig. 3–2; Richardson et al., 1982; Halter et al., 1995a).
The zoned greisens are dominantly recognized as NE-trending, steep brittle features locally
overprinted by shear planes. The brittle features were the preferred conduits for greisenizing
fluids, based on numerous structural measurements across the Main Zone (Richardson et al.,
1982; Kontak et al., 1986; Kontak 1994; Figs. 3–3C inset, 3–4, and 3–16G). The time of their
formation is best seen in areas of least deformed rocks where vertically-oriented greisens are
noted to cut conjugate cooling joints in the EKL (Fig. 3–16E). The greisens and unmineralized
215
EKL are further deformed by a penetrative sub-vertical foliation (Fig. 3–16H) that is aligned
parallel to the greisen development. The above mentioned features are also cut by later brittle
features that include a variably spaced (2–15 cm) shallow SE-dipping cleavage (Fig. 3–16F, I)
and the fracturing of quartz-topaz rich greisen cores and infilled by fluorite and pyrite (e.g., Figs.
3–9E, 3–13A).
In contrast to the brittle features, post-greisen ductile deformation through the deposit is
predominantly recorded by normal to dextral shear-sense manifested as kinematic indicators, for
example: 1) stretched quartz grains that form sigmoid-shaped porphyroclasts and strong
alignment of muscovite, with localized C-C’ fabric (Fig. 3–16J); 2) post-mineralization
deformation and segmentation of both greisen and vein mineralogy (i.e., cassiterite-topaz and
quartz-sulfides, Fig. 3–16K); 3) syn-kinematic quartz vein development along fault planes with
slickenslide development indicative of normal movement (Fig. 3–16L); 4) thin shear planes that
offset greisens and aplitic dikes (e.g., Fig. 3–16M); 5) en-echelon shear vein sets containing
barren quartz±carbonate (noted above, Fig. 3–16N); 6) minor extensional quartz-phosphate-
albite-fluorite veins with syntaxial fiber-textures (e.g., Fig. 3–16O); and 7) late shear planes that
are locally filled with assemblages of chlorite and graphite (e.g., Fig. 3–16P). Petrographically,
the EKL proximal shear planes through the deposit (<20 m) contain brittle-ductile fabrics, such
as quartz with undulose extinction and irregular subgrains, feldspar with bent twinned lamellae,
216
and kinking of micas. However, the degree of stain in the EKL varies considerably with a
continuum from relatively undeformed to discrete zones with intense shearing (Kontak, 1990a).
3.5 Lithogeochemistry
To determine the compositional evolution of the EKL with respect to the DLP and document the
petrogenetic relationship between the host rocks to the two ore zones, whole-rock
lithogeochemical data from previous studies (Kontak, 1990a; Richardson et al., 1990a;
MacDonald, 2001) are combined with newer analyses of drill core (courtesy of Avalon
Advanced Materials Inc. drill programs in 2014 and 2015; Table EA 3-2, Electronic Appendix)
and outcrop samples from this study (Table 3–1). For archived samples, analytical details are
provided in the cited papers, whereas analyses for the latter two sample suites were done by ALS
Laboratory Group Ltd. (Canada) using the lithium borate fusion inductively coupled plasma-
atomic emission spectroscopy (ICP-AES; method ME-ICP06) for major elements, solution
inductively coupled plasma-mass spectrometry (ICP-MS; method ME-MS81) for trace elements,
and four-acid digestion (method ME-4ACD81) for volatile trace elements.
Out of the final dataset, the least-altered samples from the EKL and DLP were selected for use
by filtering the compiled dataset in the order of: 1) excluding any samples that were logged as
greisens (i.e., altered) or to have moderate vein density; 2) excluding samples with a high
aluminum saturation index (ASI, apatite-corrected; Zen, 1986) that would suggest alteration (i.e.,
217
values >1.55); and 3) only including samples in the lowest quartile of Sn concentrations (<200
ppm). Samples deemed to record the effects of greisenization were returned to the dataset and
used to assess the nature of metasomatism in the context of mineralization.
These data are shown for selected elements and ratios in Figure 3–17 and 3–18, where they are
compared also to other petrologically relevant data: the average S-type granite of the Lachland
Fold Belt, Australia (Chappell and White, 1992) and the volatile- and metal-rich Macusani glass
of Peru (Pichavant et al., 1987).
3.5.1 Major element chemistry – Unmineralized rocks
The geochemical database for the least altered, relatively unmineralized intrusive rocks (i.e., Sn
< 200 ppm) is filtered spatially and lithologically to compare the petrogenetic signatures. Major
element concentrations (Fig. 3–17A) are similar for all EKL samples, but with subtle differences
compared to the DLP (data from Dostal and Chatterjee, 1995). Similarities between the two
intrusive suites include SiO2 (71–79 wt. % in EKL versus 68.5–77 wt. % in the DLP), Al2O3
(12–20 wt. % in both), and ∑Fe (1.0–2.8 wt. % FeO* in EKL and 1.1–4.2 wt. % in DLP). In
contrast, differences between EKL and the DLP include relative depletion of TiO2 (0.01-0.1 wt.
% versus 0.03-0.75 wt. %) and MgO (0.01-0.23 versus 0.7-1.9 wt. %). The ASI values for the
DLP in the filtered dataset average 1.01 ± 0.24, which compares to the EKL (both Main and
Baby zones overlap) average of 1.40 ± 0.07. Although the major element contents for the EKL
from the two ore zones are similar, some differences are noted: the less mineralized host granite
218
in the Baby Zone is enriched in SiO2 and shows a wider range in wt. % Al2O3, whereas similar
rocks in the Main Zone have a higher values and a wider range for wt. % P2O5, from 0.09 to 1.18
wt. % (average = 0.46 ± 0.08) versus 0.11 to 0.21 wt. % (average = 0.16 ± 0.03) in the Baby
Zone.
3.5.2 Trace element chemistry
The trace element data for least altered, relatively unmineralized EKL samples proximal to both
ore zones compare to the specialized granites of Tischendorf (1978) with: enrichment in Sn, W,
Cs, P, Ta, Rb, and U; similar Th, K, and Nb; and depletion in Sr, Ti, and Zr (e.g., Fig. 3–17B).
These relative concentrations are also much more enriched in the lithophile elements (i.e., Li, Cs,
Rb) compared to the typical S-type intrusive rocks (e.g., Rb shown here; Chappell and White,
1992). These latter relative elemental concentrations are, however, similar to that of the
Macusani glass with comparably complementary depletions in Ba and Sr relative to specialized
granites of Tischendorf (1978).
Selected trace elements for the EKL and DLP suites are plotted versus SiO2 in Figure 3–17A and
the overall ranges and average values for trace- and rare-earth (REE) elements relative to
primitive mantle (McDonough and Sun, 1995) are summarized in spidergram plots in Figure 3–
17B. Relative to the DLP, the data for the EKL show enrichment in (range in ppm) Li (330–
1230), Rb (325–1230), U (9–36), Ga (22–76), Nb (8–185), and Cs (9–48), in addition to the ore
elements (range, median in ppm): Sn (5–197, 96), Cu (1–10000, 72), W (0.4–152, 14), and Zn
219
(29–5030, 320). Although the EKL is highly evolved relative to the DLP, there is variable
depletion of (range, median in ppm; Fig. 3–17B) Sr (9–196, 36), Ba (2–233, 9), and Zr (22–51,
31). Trace-element abundances are similar for the EKL in the two ore zones with the exception
of Th and Nd, which are lower in the Main Zone samples. In EKL for both ore zones and the
DLP, trace element ratios display subtle differences in terms of fractionation trends. With
increasing SiO2, the DLP shows an increase in U/Th and a decrease in Zr/Y with Baby Zone
samples overlapping with the most evolved parts of the DLP (Fig. 3–17A). In contrast, the Main
Zone samples have distinctly higher U/Th and Zr/Y (Fig. 3–17A). Such chemical differences for
the EKL between the Main and Baby zones was also noted by Halter et al. (1995).
3.5.3 Rare-earth element (REE) chemistry
The REE concentrations for EKL and DLP samples normalized to chondritic values
(McDonough and Sun, 1995) are shown in Figure 3–17C. The EKL samples generally have
lower ∑REE than the DLP, whereas those from the Baby Zone (average ƩREE = 30 ppm) have
higher overall abundances than the Main Zone (average ƩREE = 12 ppm); this same observation
was also noted by Halter et al. (1995). For the EKL suites, each is slightly enriched in LREE
relative to HREE, with the Baby Zone having flatter profiles than the Main Zone. The average
(Lu/La)N values are 0.51 for the DLP, 0.47 for the Main Zone, and 0.89 for the Baby Zone (Fig.
3–17C). The EKL samples also exhibit a subtle depletion from LREE to MREE ([La/Sm]N =
1.21–1.26), have significant negative Eu anomalies (i.e., Eu/Eu* <1), but with a narrower range
220
for the Baby Zone (0.02–0.53) than the Main Zone (0.02-0.91), and variable positive Ce
anomalies (Ce/Ce* = 0.39–4.30). On average, the EKL from the two ore zones have contrasting
HREE profiles, with a slight depletion from MREE to HREE in the Main Zone ([Gd/Lu]N =
1.31) and a slight enrichment in the Baby Zone ([Gd/Lu]N = 0.81; Fig. 3–17C). This is reflected
by the overall higher and much greater spread in REEs of the Baby Zone relative to the Main
Zone, including a range of values noted in the felsic matrix to magmatic breccias of the Baby
Zone (Fig. 3–17D).
The EKL samples from both ore zones show a lanthanide tetrad effect that is typical of highly
fractionated, peraluminous F-rich melts (cf. Masuda and Akagi, 1990). The degree of the tetrad
effect (TE1,3) may be calculated using the first and third tetrad, and Irber (1999) has proposed
that a well-developed tetrad effect in REE bulk-rock data (i.e., TE1,3 > 1.10) is exclusively
related to highly evolved and altered granites containing late-stage minerals such as albite, Li-
mica, tourmaline, topaz, and/or fluorite. The calculated values of the tetrad effect in the EKL ore
zones average 1.39 in the Main Zone and 1.15 in the Baby Zone.
3.5.4 Major element chemistry – Mineralized rocks
The variation of major element chemistry in mineralized rocks from both suites of granites (i.e.,
the DLP and both ore zones in the EKL) is compared to total ore metal content in Figure 3–18
(with Sn-only in the inset of Fig. 3–18A). For comparison, these data are also plotted with the
average S-type granite from the Lachlan fold Belt (Chappell and White, 1992), as well as the
221
bulk average ore sample (with a cut-off at 0.05 wt. % Sn) from the deposit, calculated from
Table EA 3-2 to have ∑[Sn + Zn + Cu] = 6200 ppm (Fig. 3–18A). It should be noted that the for
the drill-core samples, core lengths were generally 1 m and were in many cases mixture of EKL
and variably greisenized EKL with, in rare cases, zoned greisens with high-grade Sn.
Overall, the data show little change in the total alkalis with increasing metal concentrations until
a slight decrease at ca. 1000 ppm (Fig 3–18A), which is also reflected by the fact that the alkali
ratio remains close to unity (Fig. 3–18B, C). Further increase in metal content is seen to be
reflected first with an increase in Na2O (Fig. 3–18B) and the K2O, which relates to formation of
albite followed by sericite in greisens (Halter et al., 1995a, 1996). For the low-grade and less
mineralized samples, there are similar alkali contents to the DLP suite (Fig. 3–18A). The erratic
correlation of metal content with Al2O3 likely is a reflection of well poorly sericite alteration
zones and well mineralized quartz-topaz zones, both of which have enriched Al2O3 (Fig. 3–18D).
Lastly, for the highest grade samples, there is marked enrichment in SiO2 which relates to the
formation of quartz ± topaz greisen zones (Fig. 3–18E).
3.6 Geochronology
3.6.1 Re-Os molybdenite dating
Four molybdenite-bearing samples were used to obtain Re-Os dates to constrain the age of
mineralization and to compare with a previous Re-Os molybdenite age (see below) for
222
molybdenite hosted in a pegmatite from the Baby Zone (initially reported by Kontak et al.,
2003). Samples used include three from the Main Zone and one from the Baby Zone: 1) a fine-
grained molybdenite from the edge of a micro-dike from the Baby Zone (EKAV-15-15; Fig. 3–
6P); 2) coarse molybdenite in a granular quartz vein (EKDJK-18-01; Fig. 3–14G) from the Main
zone; 3) coarse molybdenite intergrown with coarse, euhedral wolframite in a granular quartz
vein (EKDJK-18-02; Fig. 3–14H) from the Main Zone; and 4) coarse molybdenite in a quartz
vein from the Main Zone (EKAV-15-17; Fig. 3–14I).
Samples were prepared and analyzed at the University of Alberta Radiogenic Isotope Facility.
They were first coarsely crushed and milled, and all the molybdenite removed using magnetic
and gravity concentration methods. The molybdenite was then crushed and homogenized to a
100-300 mg aliquot used for isotopic analysis. As the material used was not overly coarse, only
one aliquot was analyzed for each samplesince decoupling of Re and Os was not considered an
issue for these samples (cf. Selby and Creaser, 2004). The isotopic abundances of Re and Os
were determined using isotope dilution mass spectrometry using Carius tube, solvent extraction,
and chromatographic techniques. Complete analytical procedures and error calculations are
given in Selby et al. (2007).
Details of the samples, results of Re-Os analysis, and calculated model ages for all molybdenite
samples, including the pegmatite sample first presented by Kontak et al. (2003), are summarized
in Table 3–2 and later in Figure 3–22. The data for the latter sample (EK-95-11-3) yielded an age

223
of 376.2 ± 3.3 Ma and is provided here, as it has not been formerly published. For the other four
samples, the Re-Os ages are: 370.2 ± 1.6 (EKDJK-18-01); 359.4 ± 1.8 (EKDJK-18-02); 354.9 ±
2.0 Ma (EKAV-15-17); and 343.7 ± 1.7 Ma (EK-AV-15-15; Fig. 3–22).
3.6.2 In situ U-Pb cassiterite dating
Representative samples of cassiterite were used for in situ U-Pb geochronology via LA-ICP-MS
at the U.S. Geological Survey, Southwest Isotope Research Laboratory, Denver, CO. Details of
the samples and analytical results are given in Table EA 3-3 (Electronic Appendix). A summary
of the U-Pb data and Terra-Wasserberg plots with calculated ages for the samples are given in
Table 3–3 and Figure 3–19.
The samples used comprised six samples from the East Kemptville deposit and one from the
Duck Pond deposit (Fig. 3–2). For those from East Kemptville, four samples were of coarse-
grained cassiterite from the cores of zoned greisens in the Main zone (e.g., Fig. 3–9D; samples
EKDJK-87-2, 8, 10, EKDJK-89-11), a coarse-grained cassiterite lining a miarole in microgranite
in the Main Zone (Fig. 3–5F, G; EKDJK-2016), and a sample of disseminated cassiterite in
massive topaz greisen from the top of the Baby Zone (e.g., Fig. 3–9G; EKDJK-90-1). The Duck
Pond prospect sample contained coarse cassiterite grains hosted in a lens of manganiferous meta-
pelite within the GHTZ (Fig. 3–19F inset; DP-20-224.9).
224
The cassiterite, either in polished thin section or grains mounted in epoxy, was first imaged using
cathodoluminescence (CL) and backscatter electron (BSE) techniques to assess zonation and
irregularities (e.g., inclusions) within grains. Details of the analytical methods employed follow
those in Neymark et al. (2018) whereby a Teledyne Photon Machines Excite-Analyte™ 193 nm
excimer laser coupled to a Nu Instruments Attom™ high-resolution sector field ICPMS were
used to acquire U-Th-Pb data. Similar to the Neymark et al. (2018) study, the following
conditions were used: 1) system was optimized using NIST 610 glass prior to analysis; 2)
ablation was in the raster mode to achieve maximum signal intensity; and 3) optimal peak shapes
at masses 208 and 238 were used with low inter-element fractionation monitored by Th/U
(typically ~0.9–1.0). The laser ablation spot sizes used on cassiterite varied between 85 μm, 115
μm and 135 μm, depending on crystal size and/or signal intensity of the unknown (i.e., larger
spot sizes used for cassiterite with lower U concentration), and pits are shallow (~10 μm) after 40
s of ablation at 5 Hz repetition rate. As with Newmark et al. (2018), the data are normalized to
cassiterite internal standards to correct for matrix effects related to using the NIST 610 standard.
For Main zone samples, the results follow: 1) the miarolitic hosted cassiterite (EKDJK-2016)
yielded an age of 370.6 ± 7.8 (n = 30, MSWD of 1.70); and 2) for the zoned greisen samples,
ages are 367 ± 12 (EKDJK-87-2, n = 30, MSWD = 2.8), 368.6 ± 8.9 (EKDJK-87-8, n = 60,
MSWD = 8.1), 365.4 ± 4.3 Ma (EKDJK-87-10, n = 30, MSWD =2.5), and 367.5 ± 9.4 (EKDJK-
89-11, n = 60, MSWD = 8.8). The single sample from the Baby zone remains to be analyzed and
225
results will be reported at a later date. Lastly, the Duck Pond prospect samples yielded an age of
347 ± 12 Ma (DP-20-224.9, n = 60, MSWD = 2.3).
3.7 Discussion
The up-to-date geological, petrological, and geochronological (Re-Os molybdenite, U-Pb
cassiterite) information on the East Kemptville deposit allows us to fully assess the two ore
zones and the relationship among alteration, mineralization, and structure, in addition to the
geochemical signatures of the igneous and hydrothermal stages, and the absolute time(s) of
mineralization. Below we discuss: 1) the nature of the EKL and its role in deposit formation; 2)
the geologic character and differences between the two ore zones and the implications for
reconstructing the evolution of the deposit; 3) the structural aspects of the deposit; 4)
implications of the whole-rock lithogeochemistry; 5) dating (U-Pb cassiterite, Re-Os
molybdenite) of magmatic and hydrothermal events in each ore zone and its implications for
deposit formation and exploration; 6) an updated model for the formation of the deposit; and 7)
aspects of potential Sn endowment.
3.7.1 Nature of the EKL and its role in deposit formation
Field, petrographic, and petrologic evidence presented indicate the EKL crystallized from a
highly-differentiated volatile-rich (i.e., F, H2O) melt with trace element concentrations
comparable to the specialized granites of Tischendorf (1978). The EKL has enrichment in

226
lithophile elements and select metals (Sn, Zn) that is similar to F-rich melts, such as those
represented by the Peruvian Macusani glass (Fig. 3–17A; Pichavant et al., 1987) or Beauvoir
Granite (cf. Cuney et al., 1992). Although situated at the SW edge of the DLP and similar in age
(discussed below), the EKL lacks both field-relationships and clear geochemical trends that
suggest derivation from the DLP. This contrast has been suggested by Kontak (1990a) to
represent a discontinuity in the fractionation that is resolved by a common melt source residing
at depth, rather than locally. The transport of fractionated magmas away from their source has
also been proposed for the Cornubian plutons, where exposed differentiated intrusions are distal
(i.e., above) to the source batholith (cf. Chappell and Hine, 2006).
Features such as stockscheider pegmatites proximal to the EKL intrusive contacts that transition
to layered aplite-pegmatite with USTs, as well as cassiterite-bearing miaroles and micro-
pegmatites are evidence for metal and volatile enrichment of late-stage melts and commensurate
volatile saturation in the terminal fractionation stages of the EKL. These late fluids caused the
abundant and pervasive deuteric alteration in the EKL (Kontak, 1990a, 1991) that is
characterized by: 1) widespread pitting of feldspars, due to CDP (Putnis, 2002; Parsons et al.,
2005); 2) formation of variably perthitic K-feldspar; 3) replacement of primary muscovite by a
Fe-poor type (Fig. 3–8D), and abundant secondary phases (i.e., triplite, cassiterite, Nb-Ta oxides,
ferberite; Kontak, 1991); and 4) pervasive formation of secondary disseminated apatite in
albitized plagioclase (Fig. 3–8E). Also relevant in this regard is the association of low-grade Sn
227
and base-metal mineralization with sericitized feldspar (Fig. 3–13A, F, G). The latter feature,
along with the presence of magmatic cassiterite in the EKL miaroles and pegmatites (e.g., Fig.
3–5F, G), suggests that the earliest fluid event recorded in the deposit setting was stanniferous.
Thus, the anomalous Sn-enrichment documented in the least altered rocks that pre-date greisen
formation and characterize the EKL (Fig. 3–17A) is to be expected and has been independently
demonstrated by others (cf. Fig. 45A of Stanley, 2020).
Greisens in the deposit are interpreted to overprint deuteric alteration and follow brittle fractures
parallel to the EKEDSZ that are observed to truncate cooling joints in the EKL (e.g., Fig. 3–
16E). Importantly, therefore, greisens developed after the cooling of the host leucogranite and
indicates that the cassiterite seen in pegmatites and miaroles are distinct from that hosted in the
greisens. This complements earlier interpretation of an evolving melt source at depth (Kontak,
1990a; Halter et al., 1995a; Kontak et al., 2001) and thereby implicating a potential petrogenetic
connection between the EKL and DLP.
The presence of magmatically-derived cassiterite, as locally observed in pegmatites, indicates the
EKL fractionated to an extent that it saturated in cassiterite; typical Sn concentrations of the least
altered EKL are ~0.06 wt. % (Fig. 3–3D). However, for the EKL to source all the Sn localized in
the deposit, one would expect abundant cassiterite to have formed in pegmatites and the granite
itself through the deposit prior to greisen formation, which is not observed. A limitation to the
formation of such widespread stanniferous pegmatites, similar for example to the Nong Sua tin
228
pegmatites of Thailand described by Linnen et al (1992), is the depth of emplacement estimated
at 3.5 kbars (Halter et al., 1996; Kontak et al., 2001). Granite-derived abyssal pegmatites that
form under such pressures are typically sparse, poorly mineralized, and rarely economic (cf.
Černý and Ecrit, 2005).
The alteration distal to ore-bearing greisens is generally weaker in the EKL than the well-
documented occurrence of microclinization and albitization in host granitoids from other Sn-
provinces of similar character (e.g., Taylor, 1979; Pollard, 1983; Černý et al., 2005). Whereas the
primary mineralogy of least altered EKL away from zoned greisens is uniform and granitic, as
previously noted (Kontak, 1990a), we do note however the rare and localized occurrence of
albitites: 1) as part of the regional DLP ca. 5 km SE of the deposit area where albite-quartz-
biotite-magnetite breccia hosts cassiterite mineralization (Richardson et al., 1990b); and 2) at 510
m depth of the deep hole (EK-90-1) in the Baby Zone where 5 m of albitite was intersected
(Halter et al., 1995a, 1995b). Thus, the generally uniform nature of the EKL contrasts with
typical assemblages of Li-F granites in the Erzgebirge Mountains that include massive pervasive
albitization which precedes Li-rich Sn-W greisenization (e.g., Krásno, Cínovec; cf. Štemprok,
2005); proximal greisen development in the Krásno area (from Jarchovský, 2006) that includes
quartz (20-30%), albite (30-50%), zinnwaldite (10-15%), and topaz (3-8%), and those in the
Podlesí granite (Breiter, 2002) that includes less albite content (17-19%) and higher K-feldspar
(35-40%), both twinned (microcline) and perthitic varieties. The formation of these assemblages

229
in apical parts of granites in the Erzgebirge are interpreted to precede greisen formation and
relate to subsolidus alteration (e.g., Dolejš, and Štemprok, 2001), thus similar in their
paragenesis to the generally weaker deuteric alteration in the EKL. Thus, the absence of
significant massive, pervasive albitization and microclinization through much of the EKL
proximal greisens is interpreted as evidence for a differentiated melt at depth to have sourced the
fluid budget necessary for significant greisenization in the deposit, rather than the late stage
EKL-sourced fluids. Notably, however, the presence of deuteric alteration and noted Sn
mineralization in miaroles and pegmatites does not exclude the EKL from contributing a
relatively minor component of Sn to the deposit.
The occurrences of topaz-bearing leucogranites in the SMB is not restricted to the EKL.
Although these similar leucogranites contain far less topaz (trace to 0.7% versus up to 8% in the
EKL; Kontak, 1990a), they are found in the New Ross and East Dalhousie plutons (MacDonald
et al., 1992; Clarke et al., 1993). Despite the petrogenetic similarities to the EKL, these
leucogranites do not contain significant tin mineralization, but instead host greisen-style
prospects with other metal associations (e.g., Long Lake Mo-W, Fig. 3–1; MacDonald, 2001).
3.7.2 Geological features and implications on ore zone formation
The geological features and textural differences between the Baby and Main ore zones provide
evidence of geologic setting and timing of mineralization in each zone. Of note is these
differences may in part reflect sampling bias since a deep diamond drill hole (EK-90-1 drilled to
230
about 1 km; Kontak, 1994; Halter et al., 1995a) accessed the very least altered parts of the Baby
Zone, whereas sampling of the Main Zone was at or the near-surface. Thus, least- altered Main
Zone samples may not be as representative as the equivalent from the Baby Zone.
The primary lithological difference between both ore zones is the presence of magmatic and
hydrothermal breccias in the Baby Zone. The fragment inventory of these breccias is dominated
by Meguma metasedimentary wall-rocks. Whereas these wall-rock sourced fragments in the
HBX are relatively uniform in their composition and texture, those in the IBX are variably
altered and locally hornfelsed which suggests incorporation after an earlier magmatic
(±hydrothermal) event. Additionally, the IBX very rarely contains sub-angular fragments of fine-
grained altered leucogranite similar to the EKL, and fragments of hydrothermally brecciated
material; together these observations suggest the magmatic brecciation occurred after
emplacement of the host EKL and HBX. The imbalance in these breccia fragment types (i.e.,
wall-rock versus host rock (i.e., EKL)) indicates the brecciation was dominantly implosive (i.e.,
collapsing) in nature and due to the confining pressures at the depth of emplacement (i.e., 3.5
kbars; Halter et al., 1996; Kontak et al., 2001). Alternatively, the morphology of the EKL roof
zone prior to brecciation may have included a down-faulted fenster of wall-rocks in the EKL,
similar to the keel zone noted by Richardson et al. (1982) in the northeastern part of the Main
Zone, that was dominantly affected by localized brecciation.
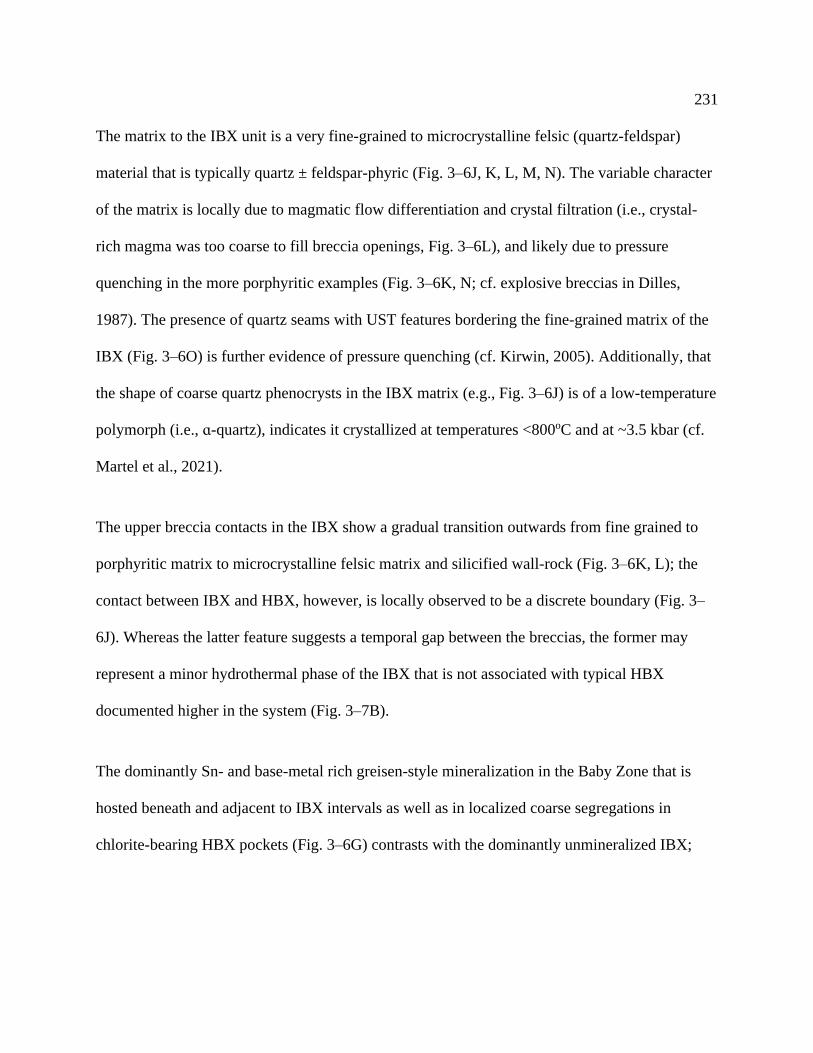
231
The matrix to the IBX unit is a very fine-grained to microcrystalline felsic (quartz-feldspar)
material that is typically quartz ± feldspar-phyric (Fig. 3–6J, K, L, M, N). The variable character
of the matrix is locally due to magmatic flow differentiation and crystal filtration (i.e., crystal-
rich magma was too coarse to fill breccia openings, Fig. 3–6L), and likely due to pressure
quenching in the more porphyritic examples (Fig. 3–6K, N; cf. explosive breccias in Dilles,
1987). The presence of quartz seams with UST features bordering the fine-grained matrix of the
IBX (Fig. 3–6O) is further evidence of pressure quenching (cf. Kirwin, 2005). Additionally, that
the shape of coarse quartz phenocrysts in the IBX matrix (e.g., Fig. 3–6J) is of a low-temperature
polymorph (i.e., ɑ-quartz), indicates it crystallized at temperatures <800oC and at ~3.5 kbar (cf.
Martel et al., 2021).
The upper breccia contacts in the IBX show a gradual transition outwards from fine grained to
porphyritic matrix to microcrystalline felsic matrix and silicified wall-rock (Fig. 3–6K, L); the
contact between IBX and HBX, however, is locally observed to be a discrete boundary (Fig. 3–
6J). Whereas the latter feature suggests a temporal gap between the breccias, the former may
represent a minor hydrothermal phase of the IBX that is not associated with typical HBX
documented higher in the system (Fig. 3–7B).
The dominantly Sn- and base-metal rich greisen-style mineralization in the Baby Zone that is
hosted beneath and adjacent to IBX intervals as well as in localized coarse segregations in
chlorite-bearing HBX pockets (Fig. 3–6G) contrasts with the dominantly unmineralized IBX;
232
mineralization in the IBX is restricted to crosscutting sulfide-bearing veins and molybdenite
localized to the edges of magmatic breccia zones (Fig. 3–6P). Fluid exsolution and USTs in the
IBX show no evidence of cassiterite which is in contrast to the minor cassiterite contained in
pegmatites of the northern Main Zone (Fig. 3–7A).
The magmatic fluid exsolution textures and pressure quenched dike rocks in both ore zones
suggest cycling of fluid pressure in a volatile saturated magma (e.g., Kirkham and Sinclair, 1988;
Lowenstern and Sinclair, 1996) occurred in both settings, likely at different times (i.e., formation
of the EKL and during mineralization events). Similar features are common in rare-metal
evolved and mineralized felsic intrusions (e.g., Podlesí stock, Czech Republic; Breiter et al.,
1997, 2005). Furthermore, the characteristic magmatic to hydrothermal breccias of the Baby
Zone also suggest cycling of fluid pressure from an evolved magmatic body, not unlike what is
recorded by porphyry systems (e.g., Seedorff et al., 2005; Sillitoe, 2010). Evidence for
movement along the EKEDSZ synchronous with ore formation indicates this structure played a
role in forming these features as the deposit evolved, which is discussed below.
3.7.2.1 Implications of mineral paragenesis for deposit formation
The derived mineral paragenesis (Fig. 3–11) for the deposit includes an early primary magmatic
assemblage overprinted by a variety of later hydrothermal stages: alteration assemblages, greisen
formation, and a variety of crosscutting veins. Mineralization occurred after the deuteric
233
alteration of EKL, as noted by the presence of early magmatic cassiterite in pegmatites and
miaroles and weakly disseminated in the altered EKL; economic grades were reached by the
additional infill and base-metal vein mineralization stages. The latest stages of mineralization,
although precipitated from F- and P-bearing fluids, are likely a result of a fault-controlled
overprint of the deposit. Thus an early volatile-rich magma related to extreme fractionation of
the EKL locally formed primary cassiterite in pegmatites which was synchronous with, or
succeeded by, an early weakly mineralized deuteric alteration stage that preceded the the
structurally-controlled greisen event localized to sub-vertical faults that parallel the EKEDSZ.
The early deuteric alteration features are typical of deuteric alteration in granites, both barren and
mineralized, due to decomposition of mica and feldspar into a diversity of secondary phases
(e.g., Lee et al., 1995; Eliasson and Petersson, 1996; Ishihara et al., 2008; Petersson et al., 2014).
Early alteration of feldspars by CDP processes (e.g., Lee et al., 1995; Putnis, 2002; Parsons et al.,
2005), in particular, results in irregular, porous textures relative to primary feldspars and a
change in composition to a mosaic of sub-grains; these features are weakly pervasive through the
deposit (e.g., Fig. 3–8), but are not as extensive as those documented in host granitoids from
other Sn-provinces, as noted above. The former is attributed to lower fluid:rock ratios whereas
the latter reflects much higher ratios due to a protracted and sustained fluid flux.
Mineralogical changes associated with the main ore stage is restricted to zones of greisenization
where variable degrees of CDP modified the EKL. This process is best recorded in zoned
234
greisens where coarse topaz-cassiterite (e.g., Fig. 3–9C, D) was deposited in greisen cores as a
result of CDP with higher fluid:rock ratios relative to alteration distal from the cores. In the areas
distal to greisen cores, relict cassiterite formed from earlier magmatic crystallization or deuteric
alteration is partially to wholly replaced by stannite and chalcopyrite (Fig. 3–13G). The latter
replacement of cassiterite (i.e., distal to greisen cores) suggests greisenizing fluids that have been
buffered by host rock composition distal to greisen cores dissolved the cassiterite and
precipitated sulfides. Alternatively, the texture represents an advancing alteration front whereby
earlier precipitated early cassiterite (Halter et al., 1998) was overprinted by later fluxing of base-
metal-bearing fluids.
Five main generations of veins are noted in the deposit – these crosscut the greisens and
generally each has a different infill mineralogy with earlier stages containing base-metal sulfides
(see above and Fig 11). The base-metal sulfides crosscut and rim early cassiterite, and thus post-
date Sn mineralization. Samples in the deposit with greater base-metal bearing vein density are
represented by the relative increase in SiO2 with higher grades (Fig. 3–18E), reflecting additional
quartz content. The veins, regardless of their type or relative age, notably lack alteration haloes,
indicating mineralizing fluids at this stage of the paragenesis had equilibrated with their EKL
host. This is further supported by the apparent correlation between host rock lithogeochemistry
and vein mineralogy; for example, later veins that crosscut greisens precipitate fluorite-albite
whereas the same interpreted vein generation typically includes phosphate infill where
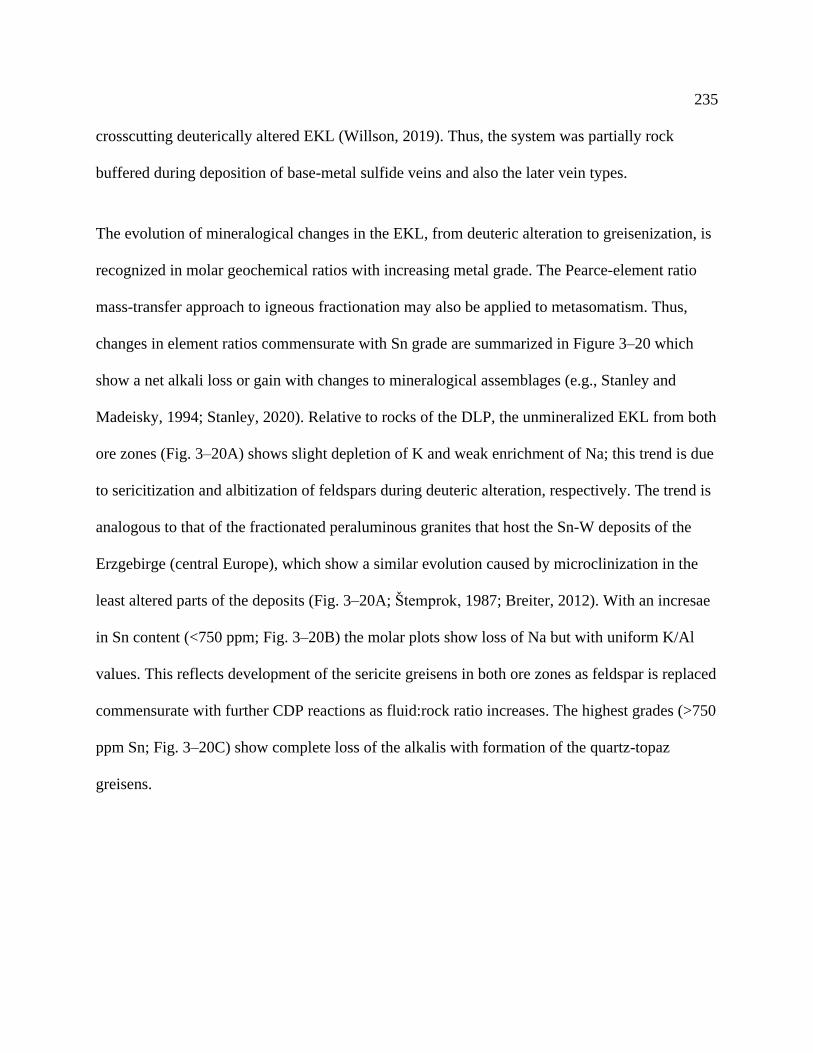
235
crosscutting deuterically altered EKL (Willson, 2019). Thus, the system was partially rock
buffered during deposition of base-metal sulfide veins and also the later vein types.
The evolution of mineralogical changes in the EKL, from deuteric alteration to greisenization, is
recognized in molar geochemical ratios with increasing metal grade. The Pearce-element ratio
mass-transfer approach to igneous fractionation may also be applied to metasomatism. Thus,
changes in element ratios commensurate with Sn grade are summarized in Figure 3–20 which
show a net alkali loss or gain with changes to mineralogical assemblages (e.g., Stanley and
Madeisky, 1994; Stanley, 2020). Relative to rocks of the DLP, the unmineralized EKL from both
ore zones (Fig. 3–20A) shows slight depletion of K and weak enrichment of Na; this trend is due
to sericitization and albitization of feldspars during deuteric alteration, respectively. The trend is
analogous to that of the fractionated peraluminous granites that host the Sn-W deposits of the
Erzgebirge (central Europe), which show a similar evolution caused by microclinization in the
least altered parts of the deposits (Fig. 3–20A; Štemprok, 1987; Breiter, 2012). With an incresae
in Sn content (<750 ppm; Fig. 3–20B) the molar plots show loss of Na but with uniform K/Al
values. This reflects development of the sericite greisens in both ore zones as feldspar is replaced
commensurate with further CDP reactions as fluid:rock ratio increases. The highest grades (>750
ppm Sn; Fig. 3–20C) show complete loss of the alkalis with formation of the quartz-topaz
greisens.
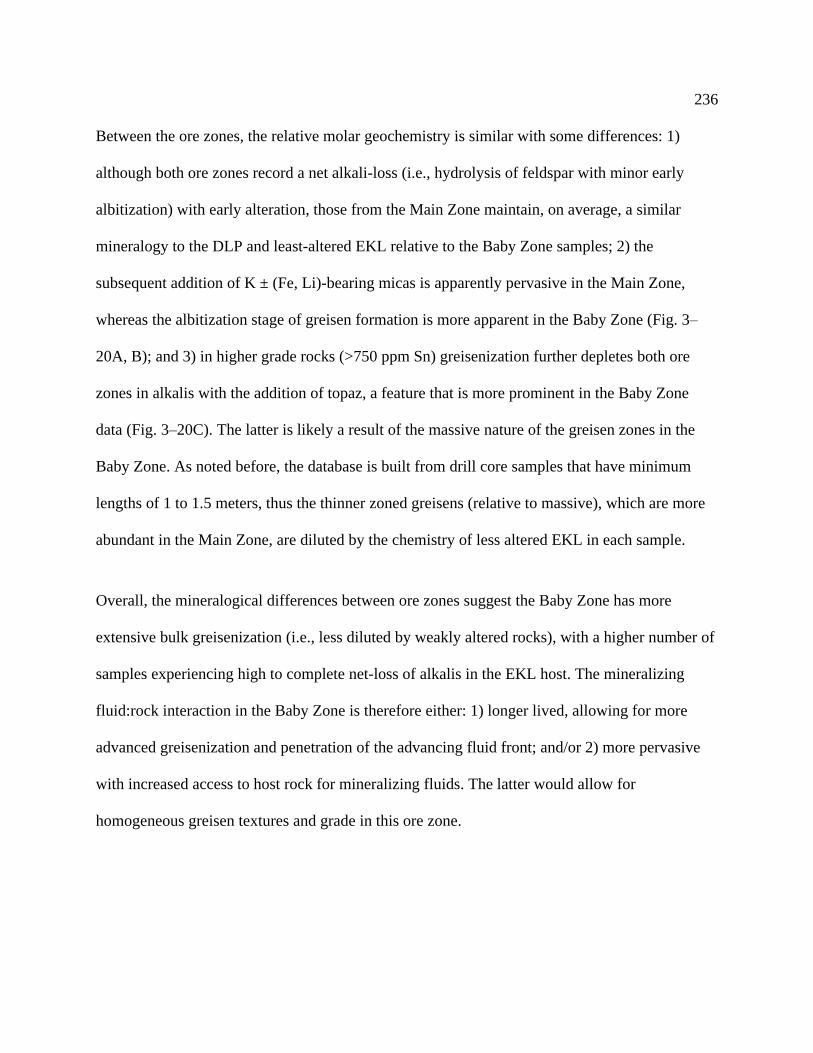
236
Between the ore zones, the relative molar geochemistry is similar with some differences: 1)
although both ore zones record a net alkali-loss (i.e., hydrolysis of feldspar with minor early
albitization) with early alteration, those from the Main Zone maintain, on average, a similar
mineralogy to the DLP and least-altered EKL relative to the Baby Zone samples; 2) the
subsequent addition of K ± (Fe, Li)-bearing micas is apparently pervasive in the Main Zone,
whereas the albitization stage of greisen formation is more apparent in the Baby Zone (Fig. 3–
20A, B); and 3) in higher grade rocks (>750 ppm Sn) greisenization further depletes both ore
zones in alkalis with the addition of topaz, a feature that is more prominent in the Baby Zone
data (Fig. 3–20C). The latter is likely a result of the massive nature of the greisen zones in the
Baby Zone. As noted before, the database is built from drill core samples that have minimum
lengths of 1 to 1.5 meters, thus the thinner zoned greisens (relative to massive), which are more
abundant in the Main Zone, are diluted by the chemistry of less altered EKL in each sample.
Overall, the mineralogical differences between ore zones suggest the Baby Zone has more
extensive bulk greisenization (i.e., less diluted by weakly altered rocks), with a higher number of
samples experiencing high to complete net-loss of alkalis in the EKL host. The mineralizing
fluid:rock interaction in the Baby Zone is therefore either: 1) longer lived, allowing for more
advanced greisenization and penetration of the advancing fluid front; and/or 2) more pervasive
with increased access to host rock for mineralizing fluids. The latter would allow for
homogeneous greisen textures and grade in this ore zone.
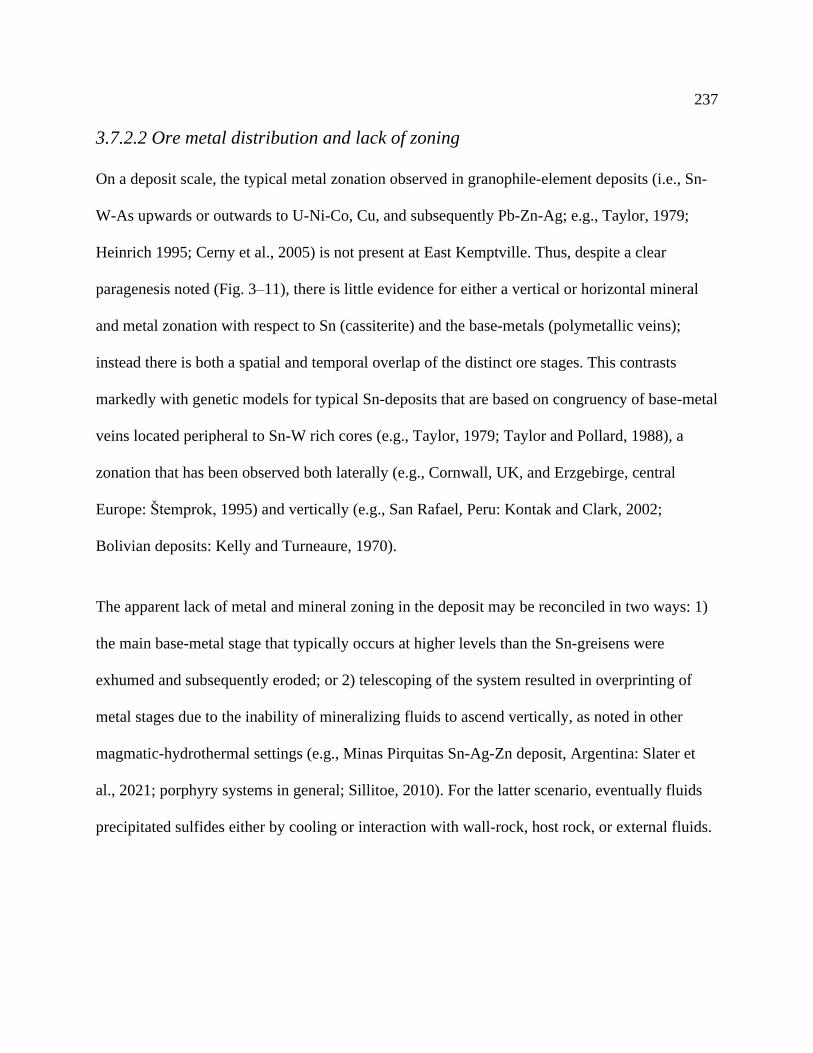
237
3.7.2.2 Ore metal distribution and lack of zoning
On a deposit scale, the typical metal zonation observed in granophile-element deposits (i.e., Sn-
W-As upwards or outwards to U-Ni-Co, Cu, and subsequently Pb-Zn-Ag; e.g., Taylor, 1979;
Heinrich 1995; Cerny et al., 2005) is not present at East Kemptville. Thus, despite a clear
paragenesis noted (Fig. 3–11), there is little evidence for either a vertical or horizontal mineral
and metal zonation with respect to Sn (cassiterite) and the base-metals (polymetallic veins);
instead there is both a spatial and temporal overlap of the distinct ore stages. This contrasts
markedly with genetic models for typical Sn-deposits that are based on congruency of base-metal
veins located peripheral to Sn-W rich cores (e.g., Taylor, 1979; Taylor and Pollard, 1988), a
zonation that has been observed both laterally (e.g., Cornwall, UK, and Erzgebirge, central
Europe: Štemprok, 1995) and vertically (e.g., San Rafael, Peru: Kontak and Clark, 2002;
Bolivian deposits: Kelly and Turneaure, 1970).
The apparent lack of metal and mineral zoning in the deposit may be reconciled in two ways: 1)
the main base-metal stage that typically occurs at higher levels than the Sn-greisens were
exhumed and subsequently eroded; or 2) telescoping of the system resulted in overprinting of
metal stages due to the inability of mineralizing fluids to ascend vertically, as noted in other
magmatic-hydrothermal settings (e.g., Minas Pirquitas Sn-Ag-Zn deposit, Argentina: Slater et
al., 2021; porphyry systems in general; Sillitoe, 2010). For the latter scenario, eventually fluids
precipitated sulfides either by cooling or interaction with wall-rock, host rock, or external fluids.
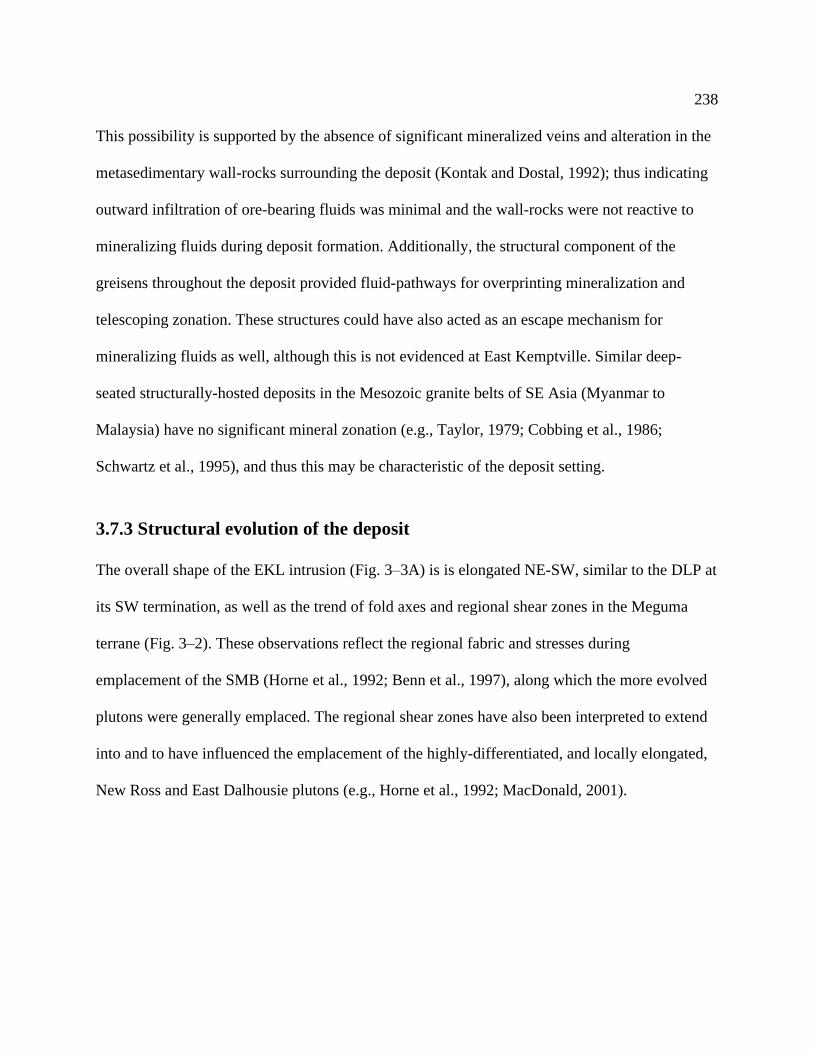
238
This possibility is supported by the absence of significant mineralized veins and alteration in the
metasedimentary wall-rocks surrounding the deposit (Kontak and Dostal, 1992); thus indicating
outward infiltration of ore-bearing fluids was minimal and the wall-rocks were not reactive to
mineralizing fluids during deposit formation. Additionally, the structural component of the
greisens throughout the deposit provided fluid-pathways for overprinting mineralization and
telescoping zonation. These structures could have also acted as an escape mechanism for
mineralizing fluids as well, although this is not evidenced at East Kemptville. Similar deep-
seated structurally-hosted deposits in the Mesozoic granite belts of SE Asia (Myanmar to
Malaysia) have no significant mineral zonation (e.g., Taylor, 1979; Cobbing et al., 1986;
Schwartz et al., 1995), and thus this may be characteristic of the deposit setting.
3.7.3 Structural evolution of the deposit
The overall shape of the EKL intrusion (Fig. 3–3A) is is elongated NE-SW, similar to the DLP at
its SW termination, as well as the trend of fold axes and regional shear zones in the Meguma
terrane (Fig. 3–2). These observations reflect the regional fabric and stresses during
emplacement of the SMB (Horne et al., 1992; Benn et al., 1997), along which the more evolved
plutons were generally emplaced. The regional shear zones have also been interpreted to extend
into and to have influenced the emplacement of the highly-differentiated, and locally elongated,
New Ross and East Dalhousie plutons (e.g., Horne et al., 1992; MacDonald, 2001).

239
Primary features in the EKL that formed during its terminal stage of evolution, that is from the
most fractionated and volatile enriched melts, include pegmatites and pegmatite-aplite dikes that
typically occur near its roof zone (i.e., stockscheiders) and generally aligned parallel to its
intrusive contact. The latter distribution reflects fluid saturation at the latest stages of melt
crystallization (i.e., 2nd boiling; Burnham, 1979). Additionally, rare micro-pegmatite dikes in the
adjacent wall-rocks typically align parallel to the prominent NE fabric through the EKL (Fig. 3–
3, inset). Kontak et al. (2001) also noted the similar alignment of the coarse pyramidal-shaped
quartz in such pegmatites in the deposit. Thus the EKEDSZ and the dominant strain regime that
localized this fault/shear structure likely existed prior to emplacement of the EKL. The latter was
responsible for the formation of the keel feature in the Main Zone whereby metasedimentary
wall-rocks were juxtaposed against the EKL. Lastly, the stockscheider pegmatites noted in the
roof zone proximal these faults become more elongated and rotated parallel to the fault contacts
(Fig. 3–5C) suggesting their possible re-orientation during the latest stage of EKL formation.
The NE-trends and steep dips of structures associated with the EKEDSZ is recorded in the
deposit area by fracture planes that define zoned greisens (Fig. 3–16G) and sub-parallel
mineralized veins. The NE-orientation of mineralization is further evidenced by alignment of
higher Sn grades in the historic blast hole database (Fig. 3D) and the general trend of heavier
alteration in the deposit area (Fig. 3–4). This is also the preferred orientation of shear planes and
a penetrative foliation proximal the main faults (e.g., Fig. 3–16C, H, J); notably, the ductile

240
deformation is observed to locally overprint greisen development (Fig. 3–16K) and influence
vein development (e.g., fibrous quartz-albite veins, Fig. 3–16O). Thus, the deposit setting was
one dominated by NE-trending fractures and brittle features during the main mineralization
stages and subsequently experienced ductile deformation, localized to shear planes through the
deposit that record similar orientations.
The compilation of deformation textures recorded in historic drill logs and relogging in this study
is combined with outcrop observations to define the brittle and ductile features in the Baby and
Main zones. The Main Zone contains abundant ductile deformation features, such as shears,
which are likely reactivated fractures with strain partitioned into alteration zones closely related
to Sn grade. In contrast, the Baby Zone dominantly displays brittle deformation, as seen in
breccias, and higher grades occur along irregular and densely spaced fracture networks. This
apparent contrast in deformation style between the ore zones suggests variable strain partitioning
in rocks between the ore zones. This may be explained by mineralogy with the Baby Zone
having more quartz and topaz and the Main Zone more sericite (e.g., Fig. 3–20), thereby
behaving in a more brittle fashion to movement along the EKEDSZ.
Both ore zones required the formation of brittle features (fractures) for the fluxing of fluids to
generate and localize greisen formation. Such fluid-rock interaction is enhanced and continually
renewed in settings with protracted movement along such features (i.e., long-lived deformation).
The brittle fractures that accommodate greisen formation at East Kemptville were subject to
241
reactivation and an increase in metamorphic grade as evidenced by ductile deformation in
greisenized rocks along the EKEDSZ (Fig. 3–16K). The latter (ductile) conditions may focus
additional fluid flow along shear planes during creep (cf. Micklethwaite et al., 2010), however
the former (brittle) would have produced damage zones in step-overs along the EKEDSZ, best
exemplified by abundant fracture networks in the Baby Zone (cf. Kim et al., 2004). This
mechanism for brittle feature development also accommodates offset in flanking strike-slip
faults, and may be subject to co-seismic negative fluid pressures as well as implosive brecciation
(Sibson, 1986). Such conditions have been proposed for brittle features and the incursion of
meteoric fluids into deeper settings of altered rock subject to ductile conditions, for example: the
Martha Hill lode Au-Ag vein system (North Island, New Zealand; Spörli and Cargill, 2011); and
the Tuolumne Intrusive Complex (Sierra Nevada, USA; Hartman et al., 2018). Therefore,
protracted deformation along the EKEDSZ in the deposit setting created the contrast in character
of the ore due to a step-over near the Baby Zone. Importantly, this mechanism also accounts for
introduction of mineralizing fluids from outside the system.
3.7.4 Implications of whole-rock lithogeochemistry for the EKL
Chemical similarities of the EKL to the specialized granites of Tischendorf (1978) and Taylor
(1979) includes enrichment in ‘granophile elements’ (Sn, W, As, U, Na, P, Li, and F; i.e., in part
the BELIP suite of Strong, 1981) and negative anomalies in Ba, Sr, Nb, and Ti (Fig. 3–17B).
Relative to typical peraluminous S-type granites from the Lachlan Fold Belt (Chappell and
242
White, 1992; Fig. 3–17A), the DLP and EKL (to a greater extent) have enrichment and depletion
in the elements noted above, in addition to their overall higher SiO2 contents. The latter feature
likely reflects the volatile content in the EKL melt (i.e., F, B, H2O), which depressed the solidus
temperature of felsic melts and extended fractional crystallization (e.g., Manning and Pichavant,
1988; London, 1997). This process appears to be more prevalent in samples from the Baby Zone
based on element enrichments (Fig. 3–17A, C, D). Additionally, the volatile content allows for
Na and Al enrichment in the residual melt and crystallization of more albitic plagioclase due to a
shifting of the cotectic (Manning, 1981; London et al., 1989).
The Zr/Hf ratio has been used as a geochemical indicator for fractionation as Hf is more
incompatible relative to Zr (e.g., Zaraisky et al., 2009). In a similar fashion, Nb/Ta may be used
as an indicator of fractionation or magmatic-hydrothermal processes; i.e., the solubility of Nb
and Ta, with minor fractionation of Nb over Ta, is greatly enhanced in reduced, F-rich fluids
such as suggested for the DLP (Dostal and Chatterjee, 2000). Thus, the low Nb/Ta ratio that
exists in the EKL is likely due to interaction with sub-solidus fluids which may be sourced
externally rather than fractionation of the host, a process recorded elsewhere in highly-
fractionated and mineralized peraluminous granites (Zaraisky et al., 2010). The Nb/Ta versus
Zr/Hf plot (Fig. 3–20) shows the degree of fractionation for peraluminous granitoids and the
mineralization affinity (modified from Ballouard et al., 2016). The least-altered EKL samples
have low Nb/Ta and Zr/Hf, and cluster in the field of rare metal-mineralized granites; alongside
243
the Li-mica granites and greisens from the Erzgebirge area. This suggests these samples are
either highly fractionated with respect to granites hosting other Sn-deposits, or have undergone
pervasive interaction with F-rich magmatic-hydrothermal fluids. As the EKL is no more
fractionated than other Sn-bearing granites, metasomatic processes are more likely for the low
Nb/Ta and Zr/Hf in the EKL due to its F-saturated nature (based on the presence of primary
topaz; Kontak, 1990a) and evidence of late-stage volatile saturation (i.e., presence of pegmatites,
stockscheiders, and miaroles noted above). The zoning observed in the DLP, from coarse-
grained biotite-muscovite monzogranite to fine-grained leucomonzogranite, has been interpreted
to reflect magmatic differentiation late in its evolution (Dostal and Chatterjee, 1995; Dostal et
al., 2004). However, the Nb/Ta and Zr/Hf ratios in the DLP represent a spread of data between
barren granites and Sn-W-(U) granites, with no apparent fractionation vector to the EKL samples
from this study. This is in contrast with the spatial fractionation vector interpreted by Dostal and
Chatterjee (2000) based on various elemental enrichments and depletions relative to decreased
Nb/Ta values proximal the EKL. The latter may reflect alteration brought about by fluids
transported along the EKEDSZ, as even the least altered EKL samples do have significant
depletion in Nb/Ta values. The Zr/Hf values, however, are distinct from the rest of the DLP
samples. Thus, either the EKL evolved separately or differently from the DLP fractionation
process, or was sourced from a more highly-differentiated phase which may or may not be
related to the DLP and is not exposed at surface.
244
The concentrations of the majority of major and trace elements in the least-altered EKL from
both ore zones are similar with few exceptions. The latter includes markedly higher P2O5 and
U/Th ratios in the Main Zone, with lower Y and HREE concentrations relative to the Baby Zone
(Fig. 3–17A). These differences represent a contrast between the host granites in each ore zone
that is similar to that recorded between mineralized granites in the Erzgebirge district of central
Europe. The latter comprise: 1) a strongly peraluminous ca. 330–320 Ma granites enriched in P,
F, Rb, Li, U, Sn, W, Nb, Ta, and depleted in HREEs; and 2) a weakly peraluminous 325–295
Ma granite with depletion in P and increased F, Li, Be, Sn, W, Nb, Ta, Th, Y, and HREEs
(Breiter, 2012). Notably, a significant convex tetrad effect is present in the EKL from both ore
zones, the magnitude of which varies between an average TE1,3 of 1.39 in the Main Zone and
1.15 in the Baby Zone (Iber, 1999; Fig. 3–17C). The tetrad effect itself is indicative of the
extreme fractionation in the EKL-forming melts, and has been proposed as evidence for
elemental mobility during late stage magmatic-hydrothermal interaction and deuteric alteration
(e.g., Bau, 1996; Jahn et al., 2001; Dostal et al., 2015; Zoheir et al., 2020). However, the tetrad
effect has also been proposed as a result of fractionation of monazite and xenotime in F-rich
melts which have reduced viscosities and therefore facilitate the settling or escape of late crystal
phases (Duc-Tin and Keppler, 2015). Thus the contrast of tetrad effects between the ore zones
may reflect fractionation of these accessory phases in the Main Zone relative to the Baby Zone.
245
In addition to influencing the tetrad effect, crystallization of each of apatite
(Ca5[PO4]3[F,Cl,OH]), monazite ([Ce, LREE]PO4) and xenotime ([Y, HREE]PO4) would
sequester much of the P and REEs in the EKL. Furthermore, relative to each other, monazite and
xenotime crystallize in sequence and typically concentrate Th and U + Y, respectively (e.g.,
Voncken, 2016). The spatial heterogeneity in these elements between ore zones (Fig. 3–17D)
suggests that EKL rocks in the Baby Zone contain, overall, a greater amount of accessory-
minerals, in agreement with the documented difference in tetrad effect magnitude. The Main
Zone samples that do contain higher REEs are also typically characterized by monazite (±
apatite) relative to the xenotime, suggesting this part of the deposit crystallized prior to the
related melt in the Baby Zone that carries more xenotime. Although the geochemical differences
between ore zones can apparently be resolved by relative abundances of accessory phases, this
interpretation cannot be fully assessed without thorough petrography, which should also account
for the abundant apatite inclusions in the deuterically altered EKL samples from both ore zones
(e.g., Fig. 3–8E, F).
The differences between EKL samples in both ore zones also cannot be classified as separate
intrusive events by field observations, as at present no discrete contacts between granites in each
ore zone are recognized. The geochemical differences are, however, not inconsistent with other
features identified distal to potential contacts; namely field setting and textures (i.e., equigranular
medium-grained muscovite-topaz-leucogranite in the Main Zone versus seriate textured biotite-
246
muscovite leucogranite with coarse, zoned blueish quartz in the Baby Zone; Figs. 3–5A and 3–
6B, respectively). From a mineralization standpoint, both the Baby and Main zones contain
typical ore elements (i.e., Sn, Cu, Zn, Ag, In, Bi, W) that are coupled with FeO concentration and
are restricted to greisenized host rock. However, as discussed above and despite the geochemical
and spatial differences, mineralization in the two ore zones is interpreted to be structurally
controlled (i.e., hosted by fractures formed by the EKEDSZ). Therefore, although the
leucogranites of the Main and Baby zones may represent different magma pulses with slightly
different chemical attributes, as suggested by others (e.g., Halter et al., 1995a; Stanley, 2020),
this evolution may not have significant influence on mineralization in the deposit.
3.7.4.1 Geochemical evolution of greisens and related mineralization
The relationship between greisen development and Sn and base-metal grades is assessed using
the lithogeochemical data for variably mineralized rocks in the deposit (Figs. 3–18 and 3–20). To
be noted, the trends in these plots are partially influenced by the fact that the analyzed material
was 1 m core lengths which had mixed proportions of variably altered EKL and greisens. We
note, however, that similar plots presented in earlier studies (Kontak, 1994; Kontak et al., 2001)
using smaller selected material for EKL and greisens produced similar trends noted in Figure 3–
18A.
As seen in Figure 3–18A, there is a general trend of decreasing Na2O and K2O as ore grade
increases (i.e., ∑[Sn + Zn + Cu] as well as ∑Sn; Fig. 3–18A). As discussed above, deuteric

247
alteration resulted in early albitization of plagioclase and sericitization of K-feldspar, and
greisenization further sericitized the EKL (Fig. 3–20A, B). These processes are reflected in the
subtle addition of Na2+ and remobilization (but conservation) of K+ with increasing grades as
high as ~0.05 wt. % Sn and ~4000 ppm ∑[Sn + Zn + Cu]; i.e., similar to the bulk average ore
sample from the deposit (e.g., Fig. 3–18B, C). The metal enrichment associated with roughly
constant ∑(Na2O + K2O) in the EKL is thus tied to the presence of cassiterite formation related
to several plausible processes: 1) magmatic, as seen in micro-pegmatites and miaroles (Fig. 3–
5F, G); 2) deuteric, as seen associated with altered feldspars (Fig. 3–13G); and/or 3) incipient
development of greisens (e.g., Heinrich, 1990). The treatment of the same dataset by Stanley
(2020) also showed the presence of elevated Sn in least altered EKL (see his Fig. 45A) and thus
evidence for an early Sn event.
The relatively constant alkali content versus metal values for increasing grade to the bulk ore
sample from the deposit (Fig. 3–18A) suggests the original resource of 56 Mt at 0.17% Sn
(Richardson et al., 1982; Moyle, 1985) had similar major element concentrations to the least
altered DLP and EKL, in stark contrast with rocks with only remotely higher grades. This
indicates that the deposit resource represents significant dilution of altered, yet barren to low-
grade EKL material and is a factor to be considered for mineral processing in the deposit.
A decrease in alkali element concentrations (Fig. 3–18A) is recorded in rocks with grades similar
to higher than that of the bulk average ore sample, as noted above. This inflection represents the
248
addition of SiO2 and Al2O3 with greisens and significant veins (Figs. 3–18A, D, E; 3–20B, C).
Samples with coarser cassiterite and dominant quartz-topaz assemblages were subject to high
fluid:rock interaction during deposit formation. This stage thus involved CDP of the EKL with
commensurate generation of voids and infill by (i.e., addition of) coarse-grained ore mineralogy.
Notably, the decrease in alkalis is more apparent in data from the Baby Zone relative to the Main
Zone (Fig. 3–18A, inset); this likely reflects the massive versus zoned greisen style and length of
sample intervals, as noted above. In addition to greisen cores, earlier cassiterite (i.e., magmatic
and/or deuteric) is overprinted by later mineralizing fluids, as evidenced from the rimming of
early cassiterite by stannite and chalcopyrite (e.g., Fig. 3–13A, F, G). The later mineralizing
event is evident in higher grade samples that exhibit relatively static K2O and Al2O3 content with
higher metal content relative to the least altered samples (Fig. 3–18D). Samples that show
complete loss of alkalis and extreme enrichment in SiO2 (i.e., up to ~88 wt. %; Fig. 3–18E)
represent samples of bulk to high-density veining, or hydrothermal brecciation in the Baby Zone,
that dominantly contain base-metal ore elements.
3.7.5 Implications of geochronology for magmatic and hydrothermal events in
the East Kemptville deposit area
Together with the numerous previous attempts to date the host rock and ore events in the deposit
setting (Table 3–4), the present study provides further constraints on the ore-stage event via
dating of molybdenite and cassiterite, methods that were not available to earlier workers and
249
both of which are not easily reset. The timing of the earliest magmatic stage of the ore system,
that is the crystallization of the DLP, is constrained by (Fig. 3–22): 1) a 372.8 ± 3.0 Ma U-Pb
zircon age (Bickerton et al., 2018); 2) a 375 ± 3 Ma Rb-Sr whole rock isochron (Chatterjee and
Cormier, 1991); 3) a 378 ± 3.6 Ma Pb-Pb isochron age for K-feldspars (Dostal and Chatterjee,
1995), although this has a large MSWD value of 6.4 incorporated into the error; and 4) a ca. 375
Ma Ar-Ar biotite age (corrected for updated decay constant; Reynolds et al., 1981). For the EKL,
the best estimate of its formation is provided by a Pb-Pb isochron plot for whole rock and
minerals (muscovite, K-feldspar) of 367 ± 13 Ma that incorporate an MSWD = 15.8 (Kontak and
Chatterjee, 1992). The latter study also provided the best previous age constraint on greisen
formation based on a Pb-Pb age of 366 ± 4.5 Ma.
The new ages for magmatic activity at the deposit, based on Re-Os molybdenite and U-Pb
cassiterite ages, are represented by a Re-Os molybdenite age of 376 ± 3 Ma for a pegmatite from
the Baby Zone and U-Pb cassiterite age of 370.6 ± 7.6 Ma from the Main Zone. These ages
overlap with earlier data for the DLP and EKL and thus, importantly, the new data indicate the
earliest onset of mineralization in the system was synchronous with magmatic events recorded in
the DLP and EKL.
The Re-Os molybdenite and U-Pb cassiterite ages for the mineralized greisens and veins indicate
a large range for hydrothermal activity, albeit of three general ages (Fig. 3–22). The older results
for hydrothermal events overlap with the aforementioned U-Pb age for magmatic cassiterite and
250
the Pb-Pb age for the greisen noted above. In contrast to the cassiterite ages, however, the Re-Os
molybdenite ages for vein material may indicate three distinct hydrothermal events that overlap
with both the early cassiterite ages and the Duck Pond cassiterite age, and potentially outline a
hydrothermal event between these two. Thus, these results can be interpreted in at least three
different ways: 1) a protracted magmatic-hydrothermal event spanning some 30 Ma; 2) several
distinct episodic magmatic-hydrothermal systems; and/or 3) variably resetting of the samples.
Each of these is considered below.
Evidence for a protracted magmatic-hydrothermal event is not without precedent, as the Cornish
Sn-polymetallic system is documented to span ca. 30 Ma based on multiple studies (Darbyshire
and Shepherd, 1985; Chen et al., 1993; Smith et al., 2019; Moscati and Neymark, 2020). In
comparison, although the longevity of magmatism for the SMB is extensive, i.e., constrained by
U-Pb zircon ages to ca. 15 Ma (see summary in Bickerton et al., 2018), the dating of similar
hydrothermal events in the SMB by Re-Os molybdenite and Ar-Ar micas in the New Ross area
give restricted ages at ca. 371 Ma (Carruzzo et al., 2000; Selby and Creaser, 2004). Thus, this
scenario is discarded. As for episodic events, we note a younger magmatic-hydrothermal event at
ca. 360 Ma is well documented in the SW Nova Scotia Sn domain (Fig. 3–2, Table EA 3-1), as
noted above. In this scenario, the Duck Pond deposit and the younger ca. 359-355 Ma Re-Os
molybdenite ages may indicate a younger event. However, the extent of this event in the East
Kemptville deposit setting remains relatively untested in this regard, but do note the pending U-
251
Pb dating of cassiterite in the Baby Zone where the youngest Re-O age of 343.7 Ma was
obtained (see Fig. 3–22). A relevant aspect of the Baby Zone is the presence of the late breccia
bodies which are barren. Thus, it might also be considered that this event has acted to mobilize
earlier molybdenite and thus overprint the system.
Lastly, the presence of widespread deformation related to the ca. 300 Ma Alleghanian orogenesis
in this part of the Meguma terrane (e.g., Muecke et al., 1988; Culshaw and Liesa, 1997; Culshaw
and Reynolds, 1997) wholly or partially reset Rb-Sr and Ar-Ar chronometers in the deposit area
(see Kontak and Cormier, 1991; Kontak et al., 1995). Although the Re-Os system is generally
considered to be robust based on dating overprinted mineralized settings (e.g., Stein et al., 2001;
Selby et al., 2007), fine-grained molybdenite is known to sometimes give aberrant results as
reflected by younger apparent ages (our unpublished data). Thus, given the highly anomalous
age of 343.7 Ma for the Baby Zone sample and its fine grained texture (Fig. 3–6P) relative to the
coarse molybdenite used from each of the other samples dated, this possibility cannot be ruled
out.
The implications of the geochronology summarized above combined with earlier studies clearly
indicate the presence of at least two distinct magmatic-hydrothermal events in the study area;
informally referred to as the East Kemptville and Duck Pond events. Whereas the former appears
to be constrained to the SW termination of the SMB, the latter event represents the contiguous
252
development of Sn mineralization in the area which is relevant in the context of both
metallogeny and future exploration for additional economic Sn deposits.
3.7.6 An updated model for the East Kemptville Sn deposit
The evidence presented herein indicates the East Kemptville deposit setting evolved from the
initial emplacement of the EKL which was followed by the greisen stage that hosts Sn
mineralization through several overprinting vein types, both mineralized and barren. Absolute
age dating indicates magmatism commenced at ca. 375 Ma and that hydrothermal activity
continued for perhaps 10 Ma, or longer if maximum errors are considered. New work relevant to
deposit formation is absolute age dating, integration of structural data, recognition of breccias in
the Baby Zone and an extensive modern lithogeochemical database. These data and observations
provide the basis for a modified model for deposit formation (cf. Halter et al., 1995).
The F-rich melt which gave rise to the EKL was sourced from a highly evolved magma, likely
petrogenetically related at source to the zoned DLP, although some geochemical data indicate
aspects of this need to be further assessed (e.g., Hf/Zr versus Nb/Ta). Field observations reveal
mineralogical and textural features (e.g., stockschieders, layered aplite/pegmatite, USTs,
miaroles; Fig. 3–5) that the magma was volatile-saturated upon emplacement. Fluid release that
resulted from magma solidification caused the pervasive deuteric alteration of the host (Kontak,
1990a). Also of importance is evidence for the stanniferous nature of this magma, based on the
presence of magmatic cassiterite (i.e., in pegmatites and miaroles; Fig. 3–5F, G). Thus, the EKL
253
likely represents the cupola of a larger progenitor Sn-and base-metal-rich magma that gave rise
to the deposit due to its continued fractionation at deeper levels and exploitation of the EKEDSZ
(Fig. 3–23A) which facilitated fluid transport to the ore environment, as suggested earlier (Halter
et al., 1995).
An important part of the deposit formation is the preferred alignment of the EKL with the
EKEDSZ (Figs. 3–2 inset and 3–3A), a feature that is part of a larger structural control to all
phases of the SMB, but in particular the later evolved intrusions (Horne et al., 1992). Along with
the early greisen development, pegmatites are also aligned with the structural grain, as is the
orientation of contained coarse quartz crystals; thus indicates a strong structural control to the ore
system from its inception.
A protracted history of activation along the EKEDSZ faults includes movement subsequent to
emplacement of the EKL. This included a normal component which juxtaposed Meguma
metasedimentary rocks and the EKL (i.e., the keel zone in Richardson et al., 1982; Fig. 3–16A,
B). Movement along this structure is inferred to have developed NE-striking and steeply dipping
fractures through the deposit area. These latter features localized negative fluid pressure and
were exploited as flow conduits by upward migrating greisenizing fluids likely sourced from the
same reservoir as for the EKL (see Fig. 3–23A). The importance of this structure for Sn
mineralization is evidenced from the contoured Sn grades in the rock proximal the EKEDSZ
(Figs. 3–3D, 3–4).
254
There is no evidence that the East Kemptville greisenizing fluids escaped the system, as an
extensive vein system in the wall-rocks is lacking (Kontak and Dostal, 1992) which suggests
such fluids were likely entrapped due to sufficient confining pressures outside the ore zones.
This prevented metal- and mineral zonation in the deposit area to form, as is common in these
deposit settings globally. However, in the latter case, as noted above, the deposits former at
shallower crustal levels where confining pressures and related deviatoric stresses were much
different.
Whereas greisen development is dominantly restricted to fault-parallel fractures in the Main
Zone, the character of greisens in the Baby Zone indicate there was a more interconnected and
extensive fracture networks; similar to the brittle features expected from a step-over zone along a
regional shear zone (i.e., the EKEDSZ; cf. Kim et al., 2004). The current spatial distribution of
the two ore zones supports the latter setting, as the dominant shear planes recognized in the Baby
Zone are offset from the expected NE-SW projection from their documented location in the Main
Zone (Figs. 3–3, 3–23A). If the Baby Zone cassiterite is younger (i.e., similar in age to the Duck
Pond at ca. 345 Ma), such a change in stress conditions is expected over time.
Cassiterite precipitation in the zoned greisens is attributed to orthomagmatic fluids that
underwent a decrease in fO2, coupled with an increase in pH during alteration of the EKL (Halter
et al., 1996). The multiple-pass fluid flow model of Halter et al. (1998), modeled after that of
Heinrich (1990), involved prolonged fluid-rock interaction that led to zoned greisen formation
255
along fracture planes. This model also explains formation of the massive greisens whereby fluids
accessed areas with greater density of fractures, hence a pervasive greisenization could occur.
Additionally, the hydrothermal breccias (HBX) that are locally mineralized in the Baby Zone
suggest mineralizing fluid were less restricted to the EKL than in the Main Zone, and infiltrated
the down-dropped block of metasedimentary rocks through brecciating fluid pathways (e.g., Fig.
3–23B).
Although no cassiterite from the Baby Zone was dated, if the HBX unit formed synchronously
with mineralization in the Main Zone, the U-Pb cassiterite and Re-Os molybdenite from this
stage of the paragenesis indicate an age between ca. 370 and 360 Ma (Fig. 3–22). The high-
grade, but low-tonnage of the Baby zone, therefore, reflects a localized zone of greater
permeability for mineralizing fluids that brecciated the wall-rock sometime between EKL
emplacement at ca. 370 Ma and the precipitation of mineralized veins in the Main Zone at ca.
360 Ma.
Subsequent to the main mineralizing event, the Baby Zone step-over is further exploited by a
magmatic breccia (IBX) that follows the EKEDSZ, overprints the main greisen event and HBX
formation, and is dominantly barren of Sn and base-metals (Fig. 3–23C). The timing of this event
is weakly constrained by Re-Os molybdenite to ca. 345 Ma (Fig. 3–22); thus of similar age to the
Duck Pond event. Ductile deformation along the EKEDSZ is subsequently recorded by each of
the above stages, particularly along fractures parallel to the EKEDSZ in the Main Zone,
256
indicating the regional structure was re-activated with significant strain at this time. This is
further evidenced by the widespread resetting of Rb-Sr and Ar-Ar chronometers in the
southwestern Meguma terrane, including in the EKL (Kontak and Cormier, 1991; Kontak et al.,
1995), which is attributed to tectonothermal activity rarely reported in the eastern part of the
terrane. The latter is likely due to the rapid differential uplift recorded by the Horton Group
which onlaps the exhumed northern part of the SMB by ~355 Ma (Martel et al., 1993; Murphy,
2000; Archibald et al., 2018). Thus the southwestern end of the SMB likely remained at depth
and was subject to a series of tectonothermal events between 370 and 310 Ma (e.g., Kontak et al.,
1995, and references therein) along major shear zones such as the EKEDSZ which in part relate
to the Alleghanian orogeny (Culshaw and Liesa, 1997; Culshaw and Reynolds, 1997).
3.7.7 Source of Sn
The source of metals (e.g., Sn, W) in progenitor magmas hosting or related to rare-metal
mineralization has long been debated (e.g., Schuiling, 1967; Schneider and Lehmann, 1977;
Romer and Kroner, 2015, 2016; Jiang et al., 2018; Neymark et al., 2021). The genesis of Sn-W
deposits in the northern Appalachians has recently been suggested to represent magma
contamination by metal-enriched protolith(s), whereby the melts eventually fractionate to form
LCT-type pegmatites and evolved felsic magmas with associated Sn ± W magmatic-
hydrothermal fluids (e.g., Romer and Kroner, 2015, 2016); this model is similar to the proposed
origin for Sn-enrichment in the Erzgebirge Mountains. The SMB hosts the East Kemptville
257
deposit in the most fractionated part of one of its stage 2 intrusions, the DLP (Kontak, 1990a;
Dostal and Chatterjee, 1995; Dostal et al., 2004). The SMB, based on its 87Sr/86Sr and
143Nd/144Nd isotopic signatures and a major element chemistry, has been interpreted to have
assimilated up to ~30% Meguma metasedimentary country-rock (Clarke et al., 2004), although
more recent work suggests a maximum of 10–20% (Shellnutt and Dostal, 2012). Thus, we assess
the chemistry of the metasedimentary country rocks as a potential source of metals for the SMB
by comparing their whole-rock lithogeochemical signature in the SW part of the Meguma terrane
against that of the DLP and the EKL in both the Main and Baby zones.
The trace-element contents of the relevant sedimentary and igneous rocks are shown normalized
to the upper continental crust in Figure 3–24. In Figure 3–24A, the data for the Meguma
metasedimentary rocks proximal and distal to the deposit area (labelled as “Proximal DLP” and
“Distal to DLP”, respectively), whereas Figure 3–24B shows values for the least-altered EKL
from both ore zones as well as the DLP. The Meguma metasedimentary rocks proximal to the
deposit have a signature that is similar to that of the upper-continental crust, with enrichment of
Mo and W. Although the EKL in both ore zones and the DLP are enriched in Sn and Ta relative
to upper continental crust (Fig. 3–24B), the surrounding wall-rocks regionally show anomalous
depletions in these elements. Metasedimentary rocks distal to the deposit are also enriched in Mo
and W, however, they have an enrichment in Sn relative to the deposit proximal samples (Fig. 3–
24A). Thus, given the wall-rock chemistry and the absence of Sn mineralization through the rest
258
of the SMB, local metal endowment by contamination of Sn-enriched metasedimentary rocks is
not reasonable for the DLP. In addition and also relevant to the contamination model, we note
that the EKL is not anomalous in its δ18O values compared to the SMB (Kontak, 1990a; Kontak
et al., 2001), as the contaminant model would imply with assimilation of Meguma sedimentary
rocks with much higher δ18O signatures (e.g., Longstaffe et al., 1980).
3.8 Conclusions
Alteration at the East Kemptville deposit occurred in distinct mineralogical stages after
emplacement of the EKL with a spatial and temporal overlap: 1) deuteric alteration through the
deposit area represented by weak pervasive partial replacement of calcic plagioclase and K-
feldspar by albite, sericite, and apatite precipitation, the latter of which occurs in the pore space
created by albitization; 2) strong to intense sericitization and muscovite ± Fe-Li mica formation
that is localized to zones proximal brittle fractures through the deposit and represent the early
stages of greisen formation, as proposed by Halter et al. (1996); and 3) complete replacement of
the host EKL by quartz and topaz with lesser muscovite and ore mineralization that represent
well developed greisens (e.g., zoned greisen cores). Chemically, the evolution of each alteration
stage above is recognized by distribution of Pearce element ratios for alkali elements and Al in
the deposit; they reflect a subtle increase in Na during deuteric event (1), a relative increase in Al
and K during initial greisen formation (2), and a steep drop in alkali element content with
relative increases in Al in the final stages of greisen formation (3).

259
The two dominant character types of greisens in the deposit (i.e., massive and zoned) likely
reflect the variation in fluid:rock interaction through the deposit: 1) the wide intervals of massive
greisens have uniform texture and grade due to pervasive greisen formation in zones with a high
density of brittle fractures, allowing for interconnected fluid flow during CDP processes; and 2)
zoned greisens which display typical cores of coarse quartz-topaz-cassiterite that transition to
outer zones of sericitized EKL represent multiple pass fluid flow along NE-trending vertical
brittle fractures, these fractures are parallel to the regional EKEDSZ and acted as critical
transport conduits for the mineralizing fluids in the deposit area. Notably, the higher density
brittle fracture patterns (and thus massive greisens) are interpreted to favor the Baby Zone due to
its localization in a step-over transtensional zone along the EKEDSZ, whereas the Main Zone
represents dominantly transpressional fracture development.
The absence of metal zonation typical to granophile-element deposits at East Kemptville (i.e., no
vertical or horizontal mineral and metal zonation) is reconciled by telescoping of a system where
mineralizing fluids were unable to escape the host EKL due to significant lithostatic pressures
that allowed for wall-rocks to act as an impermeable cap during deposit formation. Although no
metal or mineral zonation is observed, there is a parity between ore zones in the typical grades,
historically, due to the dominant character type of greisens: high-grade samples in the Main
Zone are restricted to the cores of zoned greisens, and thus are diluted in bulk sampling by a
gangue mineralogy with alkali content similar to weakly altered EKL; and 2) high-grade samples
260
in the Baby Zone, however, are typically part of more homogeneous massive greisens with fine-
grained cassiterite and quartz-topaz gangue mineralogy through the rock that is sampled.
The age of early greisen-related mineralization at the East Kemptville deposit is associated with
U-Pb cassiterite at 370 ± 4 Ma and Re-Os molybdenite at 371 ± 2.0 Ma. This age is ca. 5–10 Ma
younger than the interpreted crystallization of the host EKL, determined from molybdenite in a
pegmatite at the East Kemptville deposit to be 376.2 ± 3.3 Ma, and ≥ 10 Ma older than younger
mineralization associated with veins that crosscut the deposit as part of reactivation along the
EKEDSZ corridor; i.e., Re-Os molybdenite in veinlets at 354.9 ± 2.0 Ma and 343.7 ± 1.7 Ma.
In a regional context, the East Kemptville deposit is similar in age to other Sn-deposits in the
northern Appalachians. These mineralized centers are associated with intrusions of similar
composition to that of the EKL, however, East Kemptville differs in that is formed in a
mesothermal setting and is hosted by country rocks of the Meguma terrane; at the most outboard
lithotectonic entity in the northern Appalachians. The latter has been proposed as a source of Sn
via contamination in melts that formed the SMB, and thus led to enrichment in the East
Kemptville deposit (Romer and Kroner, 2015, 2016). However, the distinct host terranes to other
Sn deposits in the region with various host lithologies, in addition a relative depletion of Sn in
metasedimentary rock proximal the mineralized EKL with respect to similar host rocks for the
unmineralized parts of the SMB, is evidence to the contrary. To resolve a potential Sn-source
and mode of ore deposition at East Kemptville, further investigation into the petrogenesis of the
261
host Davis Lake Pluton and SMB, as well as of the hydrothermal evolution of the deposit is
warranted to place East Kemptville history relative to the rest of the metallotect.
3.9 Acknowledgments
Funding for this project was provided by Avalon Advanced Materials, Inc. and by the National
Science and Engineering Research Council of Canada (NSERC) as part of a collaborative
research and development (CRD) grant to I.M. Samson, D.J. Kontak, and J.B. Murphy. Thanks
to Cliff Stanley and Jason Willson for and valuable discussion, the latter of whom also provided
assistance in the field. Many thanks to the staff at Laurentian University and Saint Mary’s
University for support during this study. We thank Bill Mercer (Avalon Advanced Materials,
Inc.) for providing unpublished geochemical data from the East Kemptville deposit area. We also
like to thank Chris White for assistance in compiling lithogeochemical data from the region.
3.10 References
Archibald, D.B., Murphy, J.B., Reddy, S.M., Jourdan, F., Gillespie, J., and Glorie, S., 2018,
Post-accretionary exhumation of the Meguma terrane relative to the Avalon terrane in the
Canadian Appalachians: Tectonophysics, v. 747, p. 343–356.
262
Ballouard, C., Poujol, M., Boulvais, P., Branquet, Y., Tartèse, R. and Vigneresse, J.L., 2016, Nb-
Ta fractionation in peraluminous granites: A marker of the magmatic-hydrothermal
transition: Geology, v. 44, p. 231–234.
Bau, M., 1996, Controls on the fractionation of isovalent trace elements in magmatic and
aqueous systems: evidence from Y/Ho, Zr/Hf, and lanthanide tetrad effect: Contributions
to Mineralogy and Petrology, v. 123, p. 323–333.
Benn, K, Horne, R.J. Kontak, D.J., Pignotta, G.S., and Evans, N.G., 1997, Syn-Acadian
emplacement model for the South Mountain Batholith, Meguma Terrane, Nova Scotia:
Magnetic fabric and structural analyses: Geological Society of Americia Bulletin, v. 109,
p. 1279–1293.
Benn, K., Roest, W.R., Rochette, P., Evans, N.G., and Pignotta, G.S., 1999, Geophysical and
structural signatures of syntectonic batholith construction: the South Mountain Batholith,
Meguma Terrane, Nova Scotia: Geophysics Journal International, v. 136, p. 144–158.
Bickerton, L., Kontak, D.J., Samson, I.M., Murphy, J.B., and Kellett, D.A., 2018, U-Pb
geochronology of the South Mountain Batholith, Nova Scotia, in Rogers, N., ed.,
Targeted Geoscience Initiative: 2017 report of activities, volume 1: Geological Survey of
Canada, Open File 8358, p. 51–55.

263
Blevin, P.L. and Chappell, B.W., 1992, The role of magma sources, oxidation states and
fractionation in determining the granite metallogeny of eastern Australia: Transactions of
the Royal Society of Edinburgh: Earth Sciences, v. 83, p. 305–316.
Blevin, P.L. and Chappell, B.W., 1995, Chemistry, origin, and evolution of mineralized granites
in the Lachlan fold belt, Australia; the metallogeny of I-and S-type granites: Economic
Geology, v. 90, p. 1604–1619.
Burnham, C.W., 1979, Magmas and hydrothermal fluids, in Barnes, H.L., ed., Geochemistry of
hydrothermal ore deposits: John Wiley and Sons, New York, p. 7l–136.
Breiter, K., 2002, From explosive breccia to unidirectional solidification textures: magmatic
evolution of a phosphorus-and fluorine-rich granite system (Podlesí, Krušné hory Mts.,
Czech Republic): Bulletin Czech Geological Survey, v. 77, p. 67–92.
Breiter, K., Frýda, J., Seltmann, R., and Thomas, R., 1997, Mineralogical evidence for two
magmatic stages in the evolution of an extremely fractionated P-rich rare-metal granite:
the Podlesí stock, Krušné hory, Czech Republic: Journal of Petrology, v. 38, p. 1723–
1739.
Breiter, K., Müller, A., Leichmann, J. and Gabašová, A., 2005, Textural and chemical evolution
of a fractionated granitic system: the Podlesí stock, Czech Republic: Lithos, v. 80, p.
323–345.
264
Breiter, K., 2012, Nearly contemporaneous evolution of the A-and S-type fractionated granites in
the Krušné hory/Erzgebirge Mts., Central Europe: Lithos, v. 151, p. 105–121.
Candela, P.A., and Blevin, P.L., 1995, Do some miarolitic granites preserve evidence of
magmatic volatile phase permeability?: Economic Geology, v. 90, p. 2310–2316.
Carruzzo S., Kontak D.J., and Clarke D. B., 2000, Granite-hosted mineral deposits of the New
Ross area, South Mountain, Nova Scotia, Canada: P, T and X constraints of fluids using
fluid inclusion thermometry and decrepitate analysis: Transactions of the Royal Society
Edinburgh Earth Science, v. 91, p. 303–319.
Černý, P., and Ercit, T.S., 2005, The classification of granitic pegmatites revisited: The Canadian
Mineralogist, v. 43, p. 2005–2026.
Černý, P., Blevin, P.L., Cuney, M., London, D., 2005, Granite related ore deposits: Economic
Geology 100th Anniversary Volume, p. 337–370.
Chappell, B.W. and White, A.J.R., 1992, I- and S-type granites in the Lachlan Fold Belt.
Transactions of the Royal Society of Edinburgh: Earth Sciences, v. 83, p. 1–26.
Chappell, B.W., and Hine, R., 2006, The Cornubian Batholith: an example of magmatic
fractionation on a crustal scale: Resource Geology, v. 56, p. 203–244.
Charoy, B., and Pollard, P.J., 1989, Albite-Rich, Silica-Depleted Metasomatic Rocks at
Emuford, Northeast Queensland: Mineralogical, Geochemical, and Fluid Inclusion
265
Constraints on Hydrothermal Evolution and Tin Mineralization: Economic Geology, v.
84, p. 1850–1874.
Chatterjee, A.K., and Cormier, R.F., 1991, A Rb-Sr geochronological study of the Davis Lake
pluton, South Mountain batholith, southern Nova Scotia: evidence of a 374 Ma time of
emplacement, in MacDonald, D.R., ed., Nova Scotia Department of Mines and Energy:
Report 91-A, 19p.
Chatterjee, A.K., and Strong, D.F., 1985, Geochemical characteristics of the polymetallic tin
domain, southwestern Nova Scotia, Canada [ext. abs.]: in Taylor, R.P. and Strong, D.F.,
eds., Granite-Related Mineral Deposits: Geology, Petrogenesis and Tectonic Setting:
Canadian Institute of Mining and Metallurgy, Extended Abstracts, p. 41–52.
Chatterjee, A.K., Strong, D.F., and Muecke, G.K., 1983, A multivariate approach to geochemical
distinction between tin-specialized and uranium-specialized granites of southern Nova
Scotia: Canadian Journal of Earth Sciences, v. 20, p. 420–430.
Chen, Y., Clark, A.H., Farrar, E., Wasteneys, H., Hodgson, M.J. and Bromley, A.V., 1993,
Diachronous and independent histories of plutonism and mineralization in the Cornubian
Batholith, southwest England: Journal of the Geological Society, v. 150, p. 1183–1191.
Clarke, D.B., MacDonald, M.A., Reynolds, P.H., and Longstaffe, F.J., 1993, Leucogranites from
the eastern part of the South Mountain Batholith, Nova Scotia: Journal of Petrology, v.
34, p. 653–679.
266
Clarke. D.B., MacDonald, M.A., and Tate, M.C., 1997, Late Devonian mafic-felsic magmatism
in the Meguma Zone, Nova Scotia, in Sinha, A.K., Whalen, J.B., Hogan, J.P., eds., The
nature of magmatism in the Appalachian Orogen: Geological Society America Memoir,
v. 191, p. 107–127.
Clarke, D.B., MacDonald, M.A., and Erdmann, S., 2004, Chemical variation in Al2O3–CaO–
Na2O–K2O space: controls on the peraluminosity of the South Mountain Batholith:
Canadian Journal of Earth Sciences, v. 41, p. 785–798.
Cobbing, E.J., Mallick, D.I.J., Pitfield, P.E.J., and Teoh, L.H., 1986, The granites of the
Southeast Asian tin belt: Journal of the Geological Society of London, v. 143, p. 537–
550.
Culshaw, N., and Liesa, M., 1997, Alleghanian reactivation of the Acadian fold belt, Meguma
Zone, southwest Nova Scotia: Canadian Journal of Earth Sciences, v. 34, p. 833–847.
Culshaw, N., and Reynolds, P., 1997, 40Ar/39Ar age of shear zones in the southwest Meguma
Zone between Yarmouth and Meteghan, Nova Scotia: Canadian Journal of Earth
Sciences, v. 34, p. 848–853.
Culshaw, N., and Lee, S.K., 2006, The Acadian fold belt in the Meguma Terrane, Nova Scotia:
Cross sections, fold mechanisms, and tectonic implications: Tectonics, v. 25, 16p.
267
Cuney, M., Marignac, C., and Weisbrod, A., 1992, The Beauvoir Topaz-Lepidolite Albite
Granite (Massif Central, France): The Disseminated Magmatic Sn-Li-Ta-Nb-Be
Mineralization. Economic Geology, v. 87, p. 1766–1794.
Dallmeyer, R.D., and Keppie, J. D., 1987, Polyphase Late Paleozoic tectonothermal evolution of
the southwestern Meguma Terrane, Nova Scotia: evidence from 40Ar/39Ar mineral ages:
Canadian Journal of Earth Sciences, v. 24, p. 1242–1254.
Darbyshire, D.P.F., and Shepherd, T.J., 1985, Chronology of granite magmatism and associated
mineralization, SW England: Journal of the Geological Society, v. 142, p. 1159–1177.
Dilles, J.H., 1987, Petrology of the Yerington Batholith, Nevada; evidence for evolution of
porphyry copper ore fluids: Economic Geology, v. 82, p. 1750–1789.
Dolejš, D., and Štemprok, M., 2001, Magmatic and hydrothermal evolution of Li-F granites:
Cínovec and Krásno intrusions, Krušné hory batholith, Czech Republic: Bulletin Czech
Geological Survey, v. 76, p. 77–99.
Dostal, J., and Chatterjee, A. K., 1995, Origin of topaz-bearing and related peraluminous granites
of late Devonian Davis Lake pluton, Nova Scotia, Canada: Chemical Geology, v. 123, p.
67–88.
Dostal, J., and Chatterjee, A.K., 2000, Contrasting behaviour of Nb/Ta and Zr/Hf ratios in a
peraluminous granitic pluton (Nova Scotia, Canada): Chemical Geology, v. 163, p. 207–
218.
268
Dostal, J., Chatterjee, A.K., and Kontak, D.J., 2004, Chemical and isotopic (Pb, Sr) zonation in a
peraluminous granite pluton: role of fluid fractionation: Contributions to Mineralogy and
Petrology, v. 147, p. 74–90.
Dostal, J., Kontak, D.J., Gerel, O., Shellnut, J.G., Fayek, M., 2015, Cretaceous ongonites (topaz-
bearing albite-rich microleucogranites) from Ongon Khairkhan, Central Mongolia:
Products of extreme magmatic fractionation and pervasive metasomatic fluid:rock
interaction: Lithos, v. 236–237, p. 173–189.
Duc-Tin, Q., and Keppler, H., 2015, Monazite and xenotime solubility in granitic melts and the
origin of the lanthanide tetrad effect: Contributions to Mineralogy and Petrology, v. 169,
p. 1–26.
Eliasson, T., and Petersson, J., 1996, Deuteric accessory phases in the Bohus granite, SW
Sweden. GFF, v. 118, p. 12–13.
Halter, W.E., Williams-Jones, A.E., and Kontak, D.J., 1995a, Origin and Evolution of the
Greisenizing Fluid at the East Kemptville Tin Deposit, Nova Scotia, Canada: Economic
Geology, v. 93, p. 1026–1051.
Halter, W.E., Williams-Jones, A.E., and Kontak, D.J., 1995b, REE mobility during albitite
formation at the East Kemptville tin deposit, Nova Scotia, in MacDonald, D.R., ed.,
Mines and Minerals Branch Report of Activities 1994: Nova Scotia Department of
Natural Resources, Report 95-1, p. 91-97.
269
Halter, W.E., Williams-Jones, A.E., and Kontak, D.J., 1996, The role of greisenization in
cassiterite precipitation at the East Kemptville tin deposit, Nova Scotia: Economic
Geology, v. 91, p. 368–385.
Halter W.E., Williams-Jones A.E., and Kontak D.J., 1998, Origin and evolution of the greisening
fluid at the East Kemptville tin deposit, Nova Scotia, Canada: Economic Geology, 93,
1026–1051.
Hartman, S.M., Paterson, S.R., Holk, G.J. and Kirkpatrick, J.D., 2018, Structural and
hydrothermal evolution of a strike-slip shear zone during a ductile-brittle transition,
Sierra Nevada, CA: Journal of Structural Geology, v. 113, p. 134–154.
Heinrich, C.A., 1990, The chemistry of hydrothermal tin (-tungsten) ore deposition: Economic
Geology, v. 85, p. 457–481.
Heinrich C.A., 1995, Geochemical evolution and hydrothermal mineral deposition in Sn (-W-
base-metalbase-metal) and other granite-related ore systems: Some conclusions from
Australian examples: Short Course Handbook, Mineralogical Association of Canada,
v. 23, p. 203–220.
Hibbard, J.P., van Staal, C.R., and Rankin, D.W., 2010, Comparative analysis of the geological
evolution of the northern and southern Appalachian orogen: Late Ordovician–Permian, in
Tollo, R.P., Bartholomew, M.J., Hibbard, J.P., and Karabinos, P.M., eds., From Rodinia
270
to Pangea: The Lithotectonic Record of the Appalachian Region: Geological Society of
America Memoir, v. 206, p. 51–69.
Hicks, R.J., Jamieson, R.A. and Reynolds, P.H., 1999, Detrital and metamorphic 40Ar/39Ar ages
from muscovite and whole-rock samples, Meguma Supergroup, southern Nova Scotia:
Canadian Journal of Earth Sciences, v. 36, p. 23–32.
Hilchie, L.J., and Jamieson, R.A., 2014, Graphite thermometry in a low-pressure contact aureole,
Halifax, Nova Scotia: Lithos, v. 208, p. 21–33.
Horne, R.J., MacDonald, M.A., Corey, M.C., and Ham, L.J., 1992, Structure and emplacement
of the South Mountain Batholith, southwestern Nova Scotia: Atlantic Geology, v. 28, p.
29–50.
Irber, W., 1999, The lanthanide tetrad effect and its correlation with K/Rb, Eu/Eu*, Sr/Eu, Y/Ho,
and Zr/Hf of evolving peraluminous granite suites. Geochimica Cosmochimica Acta, v.
63, p. 489–508.
Ishihara, S., Hua, R., Hoshino, M., and Murakami, H., 2008, REE abundance and REE minerals
in granitic rocks in the Nanling Range, Jianxi Province, Southern China, and generation
of REE-rich weathered crust deposits: Resource Geology, v. 58, p. 355–372.
Jahn, B.M., Wu, F., Capdevila, R., Martineau, F., Zhao, Z. and Wang, Y., 2001, Highly evolved
juvenile granites with tetrad REE patterns: the Woduhe and Baerzhe granites from the
Great Xing'an Mountains in NE China: Lithos, v. 59, p. 171–198.
271
Jarchovský, T., 2006, The nature and genesis of greisen stocks at Krásno, Slavkovský les area–
Western Bohemia, Czech Republic: Journal of the Czech Geological Society, v. 51, p.
201–216.
Jébrak, M., 1997, Hydrothermal breccias in vein-type ore deposits: A review of mechanisms,
morphology and size distribution: Ore Geology Reviews, v. 12, p. 111–134.
Jiang, W., Li, H., Evans, N.J., Wu, J. and Cao, J., 2018, Metal Sources of World-Class
Polymetallic W–Sn Skarns in the Nanling Range, South China: Granites versus
Sedimentary Rocks?: Minerals, v. 8, p. 265.
Kelly, W.C., and Turneaure, F.S., 1970, Mineralogy, paragenesis and geothermometry of the tin
and tungsten deposits of the Eastern Andes, Bolivia: Economic Geology, v. 65, p. 609–
680.
Kendall, T.G., 2017, An investigation of infrared spectral features related to the presence of
lithium in micas, East Kemptville tin deposit, Nova Scotia: BSc thesis, Saint Mary’s
University: 53p.
Keppie, J.D., 1993, Synthesis of Palaeozoic deformational events and terrane accretion in the
Canadian Appalachians: Geologische Rundschau, v. 82, p. 381–431.
Kerr, A., and McNicoll, V., 2012, New U–Pb geochronological constraints from mineralized
granites in southern Newfoundland, in Current Research: Newfoundland Department of
Natural Resources, Geological Survey, Report 12-1, p. 21–38.
272
Kim, Y.-S., Peacock, D.C.P., and Sanderson, D.J., 2004, Fault damage zones: Journal of
Structural Geology, v. 26, p. 503–517.
Kirkham, R.V., and Sinclair, W.D., 1988, Comb quartz layers in felsic intrusions and their
relationship to porphyry deposits, in Taylor, R.P. and Strong, D.F., eds., Recent advances
in the geology of granite-related mineral deposits: Canadian Institute of Mining and
Metallurgy Special Volume 39, p. 50–71.
Kirwin, D.J., 2005, Unidirectional solidification textures associated with intrusion-related
Mongolian mineral deposits, in Seltmann, R., Gerel, O., and Kirwin, D.J., eds.,
Geodynamics and Metallogeny of Mongolia with a Special Emphasis on Copper and
Gold Deposits: International Association on the Genesis of Ore Deposits, Guidebook
Series 11, CERCAMS/NHM London, p. 63–84.
Kontak, D.J., 1990a, The East Kemptville topaz-muscovite leucogranite, Nova Scotia. I.
Geological setting and whole rock geochemistry: Canadian Mineralogist, v. 28, p. 787–
825.
Kontak, D.J., 1990b, A sulfur isotopic study of main-stage tin and base-metalbase-metal
mineralization at the East Kemptville tin deposit, Yarmouth County, Nova Scotia,
Canada: evidence for magmatic origin of metals and sulfur: Economic Geology, v. 85, p.
399–407.
273
Kontak, D.J., 1991, The East Kemptville topaz-muscovite leucogranite, Nova Scotia: U. Mineral
chemistry: Canadian Mineralogist, v. 29, p. 37–60.
Kontak, D.J., 1994, Geological and geochemical studies of alteration processes in a fluorine-rich
environment: the East Kemptville Sn-(Zn-Cu-Ag) deposit, Yarmouth County, Nova
Scotia, Canada, in Lentz, D.R., ed., Alteration and Alteration Processes associated with
Ore-forming Systems: Geological Association of Canada, Short Course Notes, v. 11, p.
261–314.
Kontak, D.J., and Chatterjee, A.K., 1992, The East Kemptville tin deposit, Yarmouth County,
Nova Scotia: a Pb-isotope study of the leucogranite and mineralized greisens- evidence
for a 366 Ma metallogenic event, Canadian Journal of Earth Science, v. 29, p. 1180–
1196.
Kontak, D.J., and Clark, A.H., 2002, Genesis of the giant, bonanza San Rafael lode tin deposit,
Peru: origin and significance of pervasive alteration: Economic Geology, v. 97, p. 1741–
1777.
Kontak, D.J., and Cormier, R.F., 1991, Geochronological evidence for multiple tectono-thermal
overprinting events in the East Kemptville muscovite-topaz leucogranite, Yarmouth
County, Nova Scotia, Canada: Canadian Journal of Earth Science, v. 28, p. 209–224.
274
Kontak, D.J., and Dostal, J., 1992, The East Kemptville tin deposit, Yarmouth County,
southwestern Nova Scotia: a lithogeochemical study of the wallrock metasedimentary
rocks: Atlantic Geology, v. 28, p. 63–83.
Kontak, D.J., Mulja, T., and Hingston, R., 1986, The East Kemptville Sn deposit: preliminary
results from recent mapping, in Bates, J.L., and MacDonald, D.R., eds., Tenth annual
open house and review of activities: Nova Scotia Department of Mines and Energy,
Information Series 12, p. 97–103.
Kontak, D.J., Tuach, J., Strong, D.F., Archibald, D.A., and Farrar, E., 1988, Plutonic and
hydrothermal events in the Ackley Granite, southeast Newfoundland, as indicated by
total-fusion 40Ar/39Ar geochronology: Canadian Journal of Earth Sciences, v. 25, p.
1151-1160.
Kontak, D.J., O'Reilly, G.A., and Chatterjee, A.K., 1990, The southwest Nova Scotia tin domain,
Yarmouth County, Nova Scotia: implications for tin metallogeny in the Meguma Terrane,
Nova Scotia, in MacDonald, D.R., ed., Mines and Minerals Branch Report of Activities
for 1989, Part B: Nova Scotia Department of Mines and Energy, Report 90-1, p. 13–32.
Kontak, D.J., Farrar, E., McBride, S.M., and Martin, R.F., 1995, Mineral chemistry and
40Ar/39Ar dating of muscovite from the East Kemptville leucogranite, southern Nova
Scotia: evidence for localised resetting of 40Ar/39Ar systematics in a shear zone: Canadian
Mineralogist, v. 33, p. 1237–1253.
275
Kontak, D.J., Martin, R.F. and Richard, L., 1996, Patterns of phosphorus enrichment in alkali
feldspar, South Mountain batholith, Nova Scotia, Canada: European Journal of
Mineralogy, v. 8, p. 805-824.
Kontak, D.J., Dostal, J., Ansdell, K., Halter, W., Martin, R.F, and Williams-Jones, A.E., 2001,
The nature and origin of pegmatite in a fluorine-rich leucogranite, East Kemptville, Nova
Scotia: Transactions of the Royal Society of Edinburgh: Earth Sciences, v. 92, p. 173–
200.
Kontak, D.J., Dunning, G., and Creaser, R., 2003, U/Pb and Re/Os dating of the South Mountain
and Musquodoboit batholiths, Nova Scotia: evidence for protracted magmatic-
hydrothermal events: Joint Meeting Northeastern Section Geological Society of America-
Atlantic Geoscience Society, Program with Abstracts.
Kontak, D.J., Ham, L.J. and Dunning, G., 2004, U-Pb dating of the Musquodoboit Batholith,
southern Nova Scotia: evidence for a protracted magmatic-hydrothermal event in a
Devonian intrusion: Atlantic Geology, v. 40, p. 207–216.
Kontak, D.J., Horne, R.J., Bertrand, A., and Creaser, R., 2012, Post 380 Ma granophile
mineralization in southwest Nova Scotia, Canada: Evidence from the Clayton Hill and
Gardners Meadow mineralized centres: Atlantic Geology, v. 48, p. 34–35.
Kontak, D.J., Horne, R.J., Creaser, R.A., Petrus, J.A., and Archibald, D., 2013, A petrological
and geochronological study of a 360 Ma metallogenic event in Maritime Canada with

276
implications for lithophile-metal mineralization in the Canadian Appalachians: Canadian
Journal of Earth Sciences, v. 50, p. 1147–1163.
Kontak, D.J., Alimohammadi, M., and Watts, K., 2014, The Gardners Meadow Sn-Zn-Cu
showing of southwest Nova Scotia: A small but not insignificant ca. 360 Ma metallogenic
event: Atlantic Geoscience Society Abstracts: 40th Annual Colloquium & Annual
General Meeting 2014.
Lee, M.R., Waldron, K.A., and Parsons, I., 1995, Exsolution and alteration microtextures in
alkali feldspar phenocrysts from the Shap granite. Mineralogical Magazine, v. 59, p. 63–
78.
Lehmann, B., 2020, Formation of tin ore deposits: A reassessment: Lithos, 105756.
Linnen, R.L., Williams-Jones, A.E., and Martin, R.F., 1992, Evidence of magmatic cassiterite
mineralisation at the Nong Sua aplite pegmatite complex, Thailand: Canadian
Mineralogist, v. 30, p. 739-61.
London, D., 1997, Estimating abundances of volatile and other mobile components in evolved
silicic melts through mineral–melt equilibria: Journal of Petrology, v. 38, p. 1691–1706.
London, D., Morgan, C.B., Hervig, R.I., 1989, Vapour-undersaturated experiments with
Macusani glass+ H2O at 200 MPa, and their internal differentiation of granitic
pegmatites: Contributions to Mineralogy and Petrology, v. 102, p. 1–17.

277
Longstaffe, F.J., Smith, T.E. and Muehlenbachs, K., 1980, Oxygen isotope evidence for the
genesis of Upper Paleozoic granitoids from southwestern Nova Scotia: Canadian Journal
of Earth Sciences, v. 17, p. 132–141.
Lowenstern, J.B., and Sinclair, W.D., 1996, Exsolved magmatic fluid and its role in the
formation of comb-layered quartz at the Cretaceous Logtung W- Mo deposit, Yukon
Territory, Canada: Transactions of the Royal Society of Edinburgh: Earth Sciences, v. 87,
p. 291–303.
MacDonald, M.A., Horne, R.J., Corey, M.C., and Ham, L.J., 1992, An overview of recent
bedrock mapping and follow-up petrological studies of the South Mountain batholith,
southwestern Nova Scotia, Canada: Atlantic Geology, v. 28, p. 7–28.
MacDonald, M.A., 2001, Geology of the South Mountain Batholith, southwestern Nova Scotia:
Nova Scotia Department of Natural Resources Open File Report ME2001-2.
Manning, D.A.C., 1981, The effect of fluorine on liquidus phase relationships in the system Qz–
Ab–Or with excess water at 1 kbar: Contributions to Mineralogy and Petrology, v. 76, p.
206–215.
Manning, D.A.C., Pichavant, M., 1988, Volatiles and their bearing on the behavior of metals in
granitic systems, in Taylor, R.P., and Strong, D.F., eds., Recent Advances in the Geology
of Granite-Related Mineral Deposits: Canadian Institute of Mining and Metallurgy,
Special Volume 39, p. 13–24.

278
Mark, G., 1998, Albitite formation by selective pervasive sodic alteration of tonalite plutons in
the Cloncurry district, Queensland: Australian Journal of Earth Sciences, v. 45, p. 765–
774.
Martel, A.T., McGregor, D.C. and Utting, J., 1993, Stratigraphic significance of Upper Devonian
and Lower Carboniferous miospores from the type area of the Horton Group, Nova
Scotia: Canadian Journal of Earth Sciences, v. 30, p. 1091–1098.
Martel, C., Pichavant, M., Di Carlo, I., Champallier, R., Wille, G., Castro, J.M., Devineau, K.,
Davydova, V.O. and Kushnir, A.R., 2021, Experimental Constraints on the
Crystallization of Silica Phases in Silicic Magmas: Journal of Petrology, v. 62, p. 1–18.
Massonne, H.J., Clarke, D.B., and MacDonald, M.A., 2010, Intrusion level of the Musquodoboit
Batholith in Nova Scotia, Canada–a case study: Zeitschrift für Geologische
Wissenschaften, v. 38, p. 181–194.
Masuda, A., and Akagi, T., 1990, Lanthanide tetrad effect observed in leucogranites from China:
Geochemical Journal, v. 23, p. 245–253.
McAuslan, D.A., Dickie, G.B., Sarkar, P., Sinclair, P.E., and Wilson, B.H., 1980, The history of
discovery and the description of the East Kemptville tin deposit southwest Nova Scotia:
Canadian Institute of Mining and Metallurgy, v. 73, p. 78–79.
McDonough, W.F., and Sun, S.S., 1995, The composition of the Earth: Chemical geology, v.
120, p. 223–253.
279
McNicoll, V.J., Squires, G.C., Wardle, R.J., Dunning, G.R. and O’Brien, B.H., 2006, U–Pb
geochronological evidence for Devonian deformation and gold mineralization in the
eastern Dunnage Zone, Newfoundland, in Current Research: Government of
Newfoundland and Labrador, Department of Natural Resources, Geological Survey,
Report 06-1, p. 45–60.
Micklethwaite, S., Sheldon, H.A., and Baker, T., 2010, Active fault and shear processes and their
implications for mineral deposit formation and discovery: Journal of Structural Geology,
v. 32, p. 151–165.
Moran, P.C., Barr, S.M., White, C.E., and Hamilton, M.A., 2007, Petrology, age, and tectonic
setting of the Seal Island pluton, offshore southwestern Nova Scotia: Canadian Journal of
Earth Sciences, v. 44, p. 1467–1478.
Morrissy, C.J., and Ruitenberg, A.A., 1980, Geology of the Lake George antimony deposit,
southern New Brunswick: Canadian Institute of Mining and Metallurgy Bulletin, v. 73.
Moscati, R.J. and Neymark, L.A., 2020, U–Pb geochronology of tin deposits associated with the
Cornubian Batholith of southwest England: Direct dating of cassiterite by in situ LA-
ICPMS: Mineralium Deposita, v. 55, p. 1–20.
Moyle, J.E., 1985, East Kemptville tin project, in Chatterjee, A.K., and Clarke, D.B., eds., Guide
to the Granites and Mineral Deposits of Southwestern Nova Scotia: Nova Scotia
Department of Mines and Energy, v. 85, p. 199–200.

280
Muecke, G.K., Elias, P., and Reynolds, P.H., 1988, Hercynian/Alleghanian overprinting of an
Acadian terrane: 40Ar/39Ar studies in the Meguma zone, Nova Scotia, Canada: Chemical
Geology: Isotope Geoscience section, v. 73, p. 153–167.
Murphy, J.B., 2000, Tectonic influence on sedimentation along the southern flank of the late
Paleozoic Magdalen basin in the Canadian Appalachians: Geochemical and isotopic
constraints on the Horton Group in the St. Mary’s basin, Nova Scotia: Geological Society
of America Bulletin, v. 112, p. 997–1011.
Murphy, J.B., Waldron, J.W., Kontak, D.J., Pe-Piper, G. and Piper, D.J., 2011, Minas Fault
Zone: Late Paleozoic history of an intra-continental orogenic transform fault in the
Canadian Appalachians: Journal of Structural Geology, v. 33, p. 312-328.
Neymark, L.A., Holm-Denoma, C.S., Moscati, R.J., 2018, In situ LA-ICPMS U–Pb dating of
cassiterite without a known-age matrix-matched reference material: Examples from
worldwide tin deposits spanning the Proterozoic to the Tertiary: Chemical Geology, v.
483, p. 410–425.
Neymark, L.A., Holm-Denoma, C.S., Larin, A.M., Moscati, R.J. and Plotkina, Y.V., 2021, LA-
ICPMS U-Pb dating reveals cassiterite inheritance in the Yazov granite, Eastern Siberia:
Implications for tin mineralization: Mineralium Deposita, p. 1–18.
O'Reilly, G.A., Demont, G.J., Poole, J.C., and Fisher, B.E., compilers, 2016, DP ME 2, Version
11: Nova Scotia Mineral Occurrence Database. Digital product accessed March 2018.
281
Parsons, I., Thompson, P., Lee, M.R., and Cayzer, N., 2005, Alkali feldspar microtextures as
provenance indicators in siliciclastic rocks and their role in feldspar dissolution during
transport and diagenesis: Journal of Sedimentary Research, v. 75, p. 921–942.
Petersson, J., Fallick, A.E., Broman, C., and Eliasson, T., 2014, Imprints of multiple fluid
regimes on episyenites in the Bohus granite, Sweden: Lithos, v. 196, p. 99–114.
Pichavant, M., Boher, M., Stenger, J.-F., Aissa, M., and Charoy, B., 1987, Relations de phase des
granites de Beauvoir à 1 et 3 kbar en conditions de saturation en H2O: Géologie de la
France, no. 2–3: p. 77–86.
Pitre, C.V., and Richardson, J.M., 1989, Paragenesis of veins of the Duck Pond tin prospect,
Meguma Group, East Kemptville, Nova Scotia: Canadian Journal of Earth Sciences, v.
26, p. 2032–2043.
Pollard, P.J., 1983, Magmatic and post-magmatic processes in the formation of rocks associated
with rare-element deposits: Transactions Institute Mining and Metallurgy, v. 2B, p. l-9.
Putnis, A., 2002, Mineral replacement reactions: from macroscopic observations to microscopic
mechanisms: Mineralogical Magazine, v. 66, p. 689–708.
Putnis, A., 2009, Mineral replacement reactions: Reviews in mineralogy and geochemistry, v.
70, p. 87–124.
Reynolds, P.H., Zentilli, M., and Muecke, G.K., 1981, K-Ar and 40Ar/39Ar geochronology of
granitoid rocks from southern Nova Scotia: its bearing on the geological evolution of the
282
Meguma Zone of the Appalachians: Canadian Journal of Earth Sciences, v. 18, p. 386–
394.
Richardson, J.M., 1988, Field and alteration relationships of alteration and greisen-hosted
mineralization at the East Kemptville tin deposit, Davis Lake monzogranite, southwest
Nova Scotia, Canada, in Taylor, R.P., and Strong, D.F., eds., Granite related mineral
deposits: Canadian Institute of Mining and Metallurgy, Special, v. 39, 265–279.
Richardson, J.M.G., Spooner, E.T.C., and McAuslan, D.A., 1982, The East Kemptville tin
deposit, Nova Scotia: an example of a large tonnage, low grade, greisen-hosted deposit in
the endocontact zone of a granite batholith: Geological Survey of Canada Current
Research, p. 27-32.
Richardson, J.M., Bell, K., Blenkinsopp, J., and Watkinson, D., 1989, Rb-Sr age and
geochemical distinctions between the Carboniferous tin-bearing Davis Lake complex and
the Devonian South Mountain batholith, Meguma Terrane, Nova Scotia: Canadian
Journal of Earth Sciences, v. 26: p. 2044–2061.
Richardson, J. M., Bell, K., Watkinson, D. H., and Blenkinsop, J., 1990a, Genesis and fluid
evolution of the East Kemptville greisen-hosted tin mine, southwestern Nova Scotia,
Canada, in Stein, H. J., and Hannah, J. L., eds., Ore-bearing granite systems; Pedogenesis
and mineralizing processes: Geological Society of America Special Paper 246.
283
Richardson, J.M., Kontak, D.J., Chatterjee, A.K., Boyle, D.R., Cormier, R.F., and Pitre, C.V.,
1990b, The East Kemptville polymetallic tin domain, in Boyle, D.R., Mineral Deposits of
New Brunswick and Nova Scotia (Field Trip 2): 8th IAGOD Symposium, Geological
Survey of Canada Open File 2157, p. 88–132.
Romer, R.L., Kroner, U., 2015, Sediment and weathering control on the distribution of Paleozoic
magmatic tin–tungsten mineralization: Mineralium Deposita, v. 50, p. 327–338.
Romer, R.L., Kroner, U., 2016, Phanerozoic tin and tungsten mineralization—Tectonic controls
on the distribution of enriched protoliths and heat sources for crustal melting: Gondwana
Research, v. 31, p. 60–95.
Rudnick R.L., and Gao S., 2003, Composition of the Continental Crust, in Rudnick, R.L., ed.,
Treatise on Geochemistry vol 3. Elsevier, Amsterdam, p. 1–64.
Sandeman, H.A.I., Peddle, C., and Newman, R., 2018, Beaver Brook Antimony Mine revisited:
An update on operations and new structural and geological observations, Current
Research, Government of Newfoundland and Labrador: Department of Natural
Resources, Geological Survey, Report, v. 18, p. 123–152.
Sangster, A.L., ed., 1990. Mineral Deposit Studies in Nova Scotia (No. 8). Energy, Mines and
Resources Canada.

284
Sato, K., 2012, Sedimentary Crust and Metallogeny of Granitoid Affinity: Implications from the
Geotectonic Histories of the Circum‐Japan Sea Region, Central Andes and Southeastern
Australia: Resource Geology, v. 62, p. 329–351.
Schneider, H.J., and Lehmann, B., 1977, Contribution to a new genetical concept on the Bolivian
tin province, in, Time-and strata-bound ore deposits, Springer, Berlin, Heidelberg, p.
153–168.
Schuiling, R.D., 1967, Tin belts on the continents around the Atlantic ocean: Economic Geology,
v. 62, p. 540–550.
Schwartz, M.O., Rajah, S.S., Askury, A.K., Putthapiban, P., and Djaswadi, S., 1995, The
Southeast Asian tin belt: Earth-Science Reviews, v. 38, p. 95–293.
Seedorff, E., Dilles, J.H., Proffett, J.M., Jr., Einaudi, M.T., Zurcher, L., Stavast, W.J.A., Johnson,
D.A., and Barton, M.D., 2005, Porphyry deposits: Characteristics and origin of hypogene
features: Economic Geology 100th Anniversary Volume, p. 251–298.
Selby, D., and Creaser, R.A. 2004, Macroscale NTIMS and microscale LA-MC-ICP-MS Re-Os
isotopic analysis of molybdenite: Testing spatial restrictions for reliable Re-Os age
determinations, and implications for the decoupling of Re and Os within molybdenite:
Geochimica Cosmochimica Acta, v. 68, p. 3897–3908.
Selby, D., Creaser, R.A., Stein, H.J., Markey, R.J. and Hannah, J.L., 2007, Assessment of the
187Re decay constant by cross calibration of Re–Os molybdenite and U–Pb zircon

285
chronometers in magmatic ore systems: Geochimica et Cosmochimica Acta, v. 71, p.
1999–2013.
Shellnutt, J.G., and Dostal, J., 2012, An evaluation of crustal assimilation within the late
Devonian South Mountain Batholith, SW Nova Scotia: Geological Magazine, v. 149, p .
353–365.
Sibson, R.H., 1986, Brecciation processes in fault zones: Inferences from Earthquake rupturing:
Pure and Applied Geophysics, v. 124, p. 159–175.
Sillitoe, R.H., 2010, Porphyry copper systems: Economic Geology, v. 105, p. 3–41.
Sillitoe, R.H., Halls, C. and Grant, J.N., 1975, Porphyry tin deposits in Bolivia: Economic
Geology, v. 70, p. 913–927.
Sinclair, W.D., Gonevchuk, G.A., Korostelev, P.G., Semenyak, B.I., Rodionov, S., Seltmann, R.,
Štemprok, M., 2011, World Distribution of Tin and Tungsten Deposits: Geological
Survey of Canada, Open File 5482, scale 1: 35 000 000.
Slater, E., Kontak, D.J., and McDonald, A., 2021, Origin of a Miocene multi-stage epithermal
Ag-Zn-Pb-Sn deposit: The Cortaderas breccia body, Pirquitas Mine, NW Argentina:
Mineralium Deposita, v. 56, p. 381–406.
Smith, W.D., Darling, J.R., Bullen, D.S., Lasalle, S., Pereira, I., Moreira, H., Allen, C.J. and
Tapster, S., 2019, Zircon perspectives on the age and origin of evolved S-type granites
from the Cornubian Batholith, Southwest England: Lithos, v. 336, p. 14–26.
286
Smoliar, M.I., Walker, R.J., and Morgan, J.W., 1996, Re-Os ages of group IIA, IIIA, IVA, and
IVB iron meteorites: Science, v. 271, p. 1099–1102.
Soehl, T.P, O'Reilly, G.A., Clarke, D.B., and Reynolds, P.H., 1989, The Graphite-Bearing
Kempt Snare Lake Greisenised Leucogranite Cupola, Yarmouth County Nova Scotia:
Nova Scotia Department of Mines and Energy, Report of Activities 89-1 Part B, p. 51-69.
Spörli, K.B. and Cargill, H., 2011, Structural evolution of a world-class epithermal orebody: The
Martha Hill deposit, Waihi, New Zealand: Economic Geology, v. 106, p. 975–998.
Stanley, C.R., 2020, Molar element ratio analysis of lithogeochemical data: a toolbox for use in
mineral exploration and mining: Geochemistry: Exploration, Environment, Analysis, v.
20, p. 233–256.
Stanley, C.R., and Madeisky, H.E., 1994, Lithogeochemical exploration for hydrothermal ore
deposits using Pearce element ratio analysis, in Lentz, D.R., ed., Alteration and
Alteration Processes associated with Ore-forming Systems: Geological Association of
Canada, Short Course Notes, v. 11, p. 193–211.
Stein, H.J., Markey, R.J., Morgan, J.W., Hannah, J.L., and Scherstén, A., 2001, The remarkable
Re–Os chronometer in molybdenite: how and why it works: Terra Nova, v. 13, p. 479–
486.
Štemprok, M., 1987, Greisenization (a review): Geologische Rundschau, v. 76, p. 169–175.
287
Štemprok, M., 1995, A comparison of the Krušné Hory-Erzgebirge (Czech Republic–Germany)
and Cornish (UK) granites and their related mineralizations, in Proc Ussher Soc, v. 8, p.
347–356.
Štemprok, M., Pivec, E. and Langrová, A., 2005, The petrogenesis of a wolframite-bearing
greisen in the Vykmanov granite stock, Western Krušné hory pluton (Czech Republic):
Bulletin of Geosciences, v. 80, p. 163–184.
Strong, D.F., 1981, Ore deposit models-5. A model for granophile mineral deposits: Geoscience
Canada, v. 8, p. 155–161.
Taylor, R.G., 1979, Geology of Tin Deposits: Elsevier, Amsterdam.
Taylor, R.G., and Pollard, P., 1988, Pervasive hydrothermal alteration in tin-bearing granites and
implications for the evolution of ore-bearing magmatic fluids, in Taylor, R.P. and Strong,
D.F., eds., Recent Advances in the Geology of Granite-Related Mineral Deposits:
Canadian Institute of Mining and Metallurgy, Special Volume 39, p. 86–95.
Taylor, S.R. and McLennan, S.M., 1981, The composition and evolution of the continental crust:
rare earth element evidence from sedimentary rocks: Philosophical Transactions of the
Royal Society of London. Series A, Mathematical and Physical Sciences, v. 301, p. 381–
399.
Thorne, K.G., Fyffe, L.R., and Creaser, R.A., 2013, Re-Os geochronological constraints on the
W–Mo mineralizing event in the Mount Pleasant Caldera Complex: implications for the

288
timing of subvolcanic magmatism and caldera development: Atlantic Geology, v. 49, p.
131–150.
Tischendorf, G., 1978, Geochemical and petrographic characteristics of silicic magmatic rocks
associated with rare element mineralization, in Štemprok, M., Burnol, L., and
Tischendorf, G., Metallization associated with acid magmatism, v. 2: Geological Survey
of Czechoslovakia, Prague, p. 41–96.
van Staal, C.R., 2007. Pre-Carboniferous tectonic evolution and metallogeny of the Canadian
Appalachians, in Goodfellow, W.D., ed., Mineral Deposits of Canada: Geological
Association of Canada, Special Publication, v. 5, p. 793–818.
van Staal, C.R., Whalen, J.B., Valverde-Vaquero, P., Zagorevski, A., and Rogers, N., 2009, Pre-
Carboniferous, episodic accretion-related, orogenesis along the Laurentian margin of the
northern Appalachians: Geological Society, London, Special Publications, v. 327, p. 271–
316.
Voncken, J.H.L., 2016, The rare earth elements: an introduction. Delft University of Technology,
Delft. Springer International Publishing: Imprint: Springer, 127p.
Waldron, J.W., 1992, The Goldenville–Halifax transition, Mahone Bay, Nova Scotia: relative
sea-level rise in the Meguma source terrane: Canadian Journal of Earth Sciences, v. 29, p.
1091–1105.
289
Waldron, J.W.F., Barr, S.M., Park, A.F., White, C.E., and Hibbard, J., 2015, Late Paleozoic
strike-slip faults in Maritime Canada and their role in the reconfiguration of the northern
Appalachian orogen: Tectonics, v. 34, p. 1661–1684.
White, C.E., 2010a, Compilation of geochemical and petrographic data from the western and
southern parts of the Goldenville and Halifax Groups, Nova Scotia: Halifax, Nova Scotia
Department of Natural Resources: Mineral Resources Branch Open-File Report ME
2010-1, 9 p.
White, C.E., 2010b, Stratigraphy of the Lower Paleozoic Goldenville and Halifax groups in
southwestern Nova Scotia, Atlantic Geology, v. 46, p. 136–154.
White, C.E., and Barr, S.M., 2010, Lithochemistry of the Lower Paleozoic Goldenville and
Halifax groups, southwestern Nova Scotia, Canada: Implications for stratigraphy,
provenance, and tectonic setting of the Meguma terrane, in Tollo, R.P., Bartholomew,
M.J., Hibbard, J.P., and Karabinos, P.M., eds., From Rodinia to Pangea: The
Lithotectonic Record of the Appalachian Region: Geological Society of America
Memoir, v. 206, p. 347–366.
White, C.E., and Barr, S.M., 2017, Stratigraphy and depositional setting of the Silurian–
Devonian Rockville Notch Group, Meguma terrane, Nova Scotia, Canada: Atlantic
Geology, v. 53, p. 337–365.
290
White, C.E., Palacios, T., Jensen, S., and Barr, S.M., 2012, Cambrian–Ordovician acritarchs in
the Meguma terrane, Nova Scotia, Canada: resolution of Early Paleozoic stratigraphy and
implications for paleogeography: Geological Society of America Bulletin, v. 124, p.
1773–1792.
Willson, J., 2019, Character and genesis of Indium mineralization, East Kemptville, Nova Scotia:
MSc Thesis, University of Windsor, Windsor, Ontario, Canada, 111p.
Witt, W.K., 1988, Evolution of High-Temperature Hydrothermal Fluids Associated with
Greisenization and Feldspathic Alteration of a Tin-Mineralized Granite, Northeast
Queensland: Economic Geology, v. 83, p. 310–334.
Woodcock, N.H., and Mort, K., 2008, Classification of fault breccias and related fault rocks:
Geological Magazine, v. 145, p. 435–440.
Zaraisky, G.P., Aksyuk, A.M., Devyatova, V.N., Udoratina, O.V., and Chevychelov, V.Y., 2009,
The Zr/Hf ratio as a fractionation indicator of rare-metal granites: Petrology, v. 17, p. 25–
45.
Zaraisky, G.P., Korzhinskaya, V., and Kotova, N., 2010, Experimental studies of Ta2O5 and
columbite–tantalite solubility in fluoride solutions from 300 to 550°C and 50 to 100 MPa:
Mineralogy and Petrology, v. 99, p. 287–300.
Zen, E.A., 1986, Aluminum enrichment in silicate melts by fractional crystallization: some
mineralogic and petrographic constraints: Journal of Petrology, v. 27, p. 1095–1117.

291
Zentilli, M., and Reynolds, P.H., 1985, 40Ar/39Ar dating of micas from the East Kemptville tin
deposit, Yarmouth County, Nova Scotia: Canadian Journal of Earth Sciences, v. 22, p.
1546–1548.
Zentilli, M., Graves, M. C., Mulja, T., and MacInnis, I., 1986, Geochemical characterization of
the Goldenville-Halifax transition of the Meguma Group of Nova Scotia: preliminary
report, in Current research, part A. Geological Survey of Canada, Paper 86-lA, p. 423–
428.
Zhang, W., 2015, Petrological and Metallogenic Studies of the Nashwaak Granite and Felsic
Dykes Associated with the Sisson Book W-Mo-(Cu) Deposit, West-Central New
Brunswick, Canada: Ph.D. Thesis, University of New Brunswick, Fredericton, NB,
Canada.
Zoheir, B., Lehmann, B., Emam, A., Radwan, A., Zhang, R., Bain, W.M., Steele-MacInnis, M.
and Nolte, N., 2020, Extreme fractionation and magmatic–hydrothermal transition in the
formation of the Abu Dabbab rare-metal granite, Eastern Desert, Egypt: Lithos, v. 352,
105329.
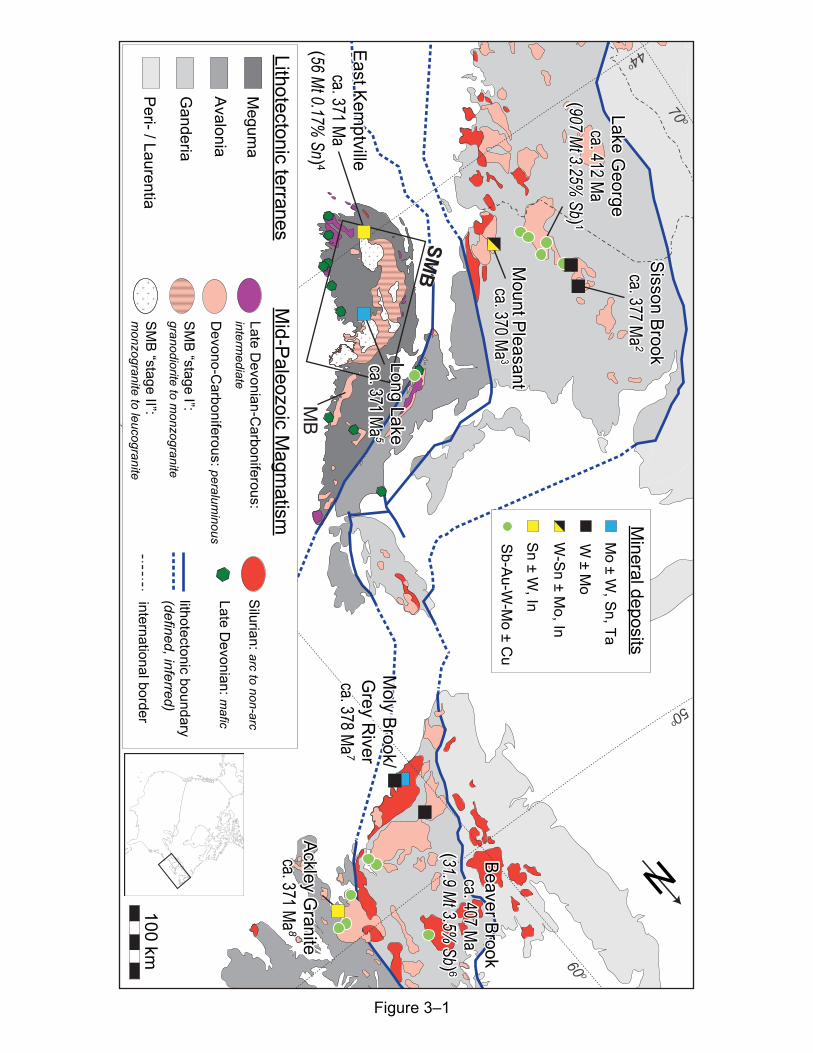
Figure 3–1
100 km
N
50o
60 o
70 o
44o
SMB
SMB
East Kemptville
ca. 371 Ma(56 Mt 0.17%
Sn) 4
East Kemptville
ca. 371 Ma(56 Mt 0.17%
Sn) 4
Mount Pleasantca. 370 Ma
3M
ount Pleasantca. 370 Ma
3
Lake George
ca. 412 Ma(907 Mt 3.25%
Sb) 1
Lake George
ca. 412 Ma(907 Mt 3.25%
Sb) 1
Beaver Brookca. 407 Ma
(31.9 Mt 3.5% Sb) 6
Beaver Brookca. 407 Ma
(31.9 Mt 3.5% Sb) 6
Moly Brook/
Grey R
iverca. 378 Ma
6
Ackley Granite
ca. 372 Ma8
Long Lakeca. 371 Ma
5M
oly Brook/G
rey River
ca. 378 Ma7
Ackley Granite
ca. 371 Ma8
Long Lakeca. 371 Ma
5
Sisson Brookca. 377 Ma
2Sisson Brook
ca. 377 Ma2
MB
Sb-Au-W-M
o ± Cu
W ± M
o M
o ± W, Sn, Ta
W-Sn ± M
o, In
Sn ± W, In
Mineral deposits
Megum
a
Avalonia
Ganderia
Peri- / Laurentia
Lithotectonic terranesM
id-Paleozoic Magm
atismSilurian: arc to non-arc
Late Devonian-C
arboniferous: interm
ediate
Devono-C
arboniferous: peraluminous
SMB “stage II”:
monzogranite to leucogranite
SMB “stage I”:
granodiorite to monzogranite
Late Devonian: m
afic
international border
lithotectonic boundary (defined, inferred)
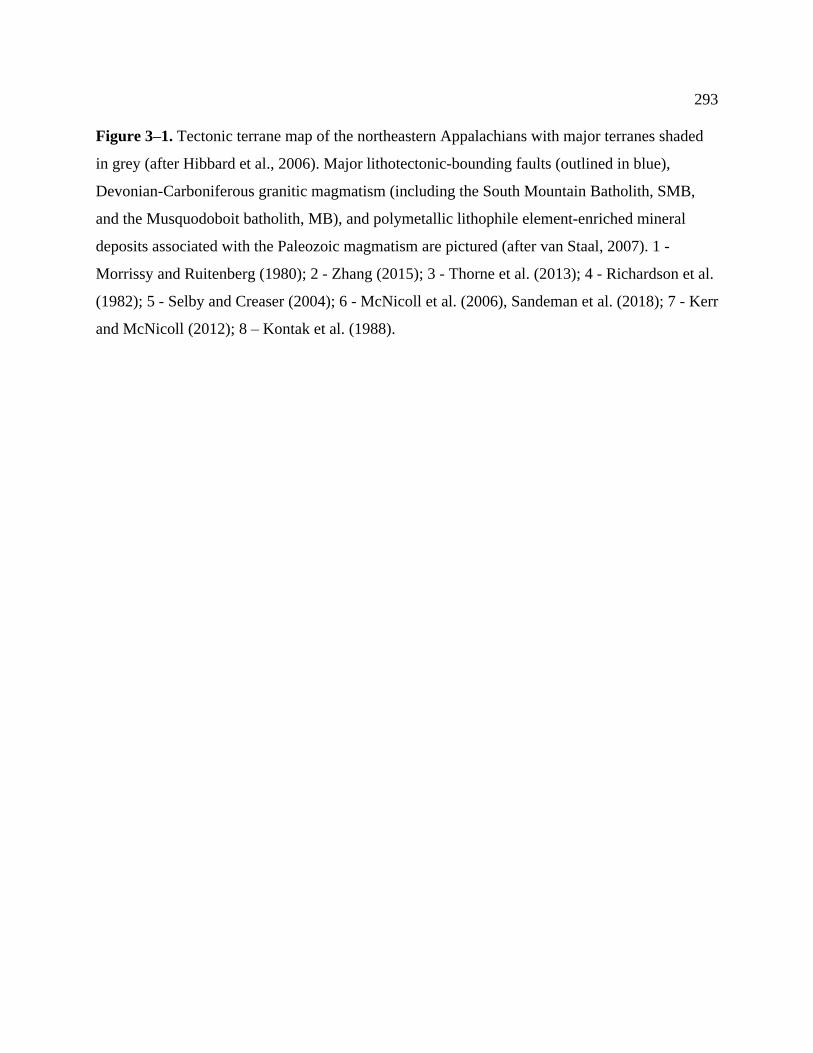
293
Figure 3–1. Tectonic terrane map of the northeastern Appalachians with major terranes shaded
in grey (after Hibbard et al., 2006). Major lithotectonic-bounding faults (outlined in blue),
Devonian-Carboniferous granitic magmatism (including the South Mountain Batholith, SMB,
and the Musquodoboit batholith, MB), and polymetallic lithophile element-enriched mineral
deposits associated with the Paleozoic magmatism are pictured (after van Staal, 2007). 1 -
Morrissy and Ruitenberg (1980); 2 - Zhang (2015); 3 - Thorne et al. (2013); 4 - Richardson et al.
(1982); 5 - Selby and Creaser (2004); 6 - McNicoll et al. (2006), Sandeman et al. (2018); 7 - Kerr
and McNicoll (2012); 8 – Kontak et al. (1988).
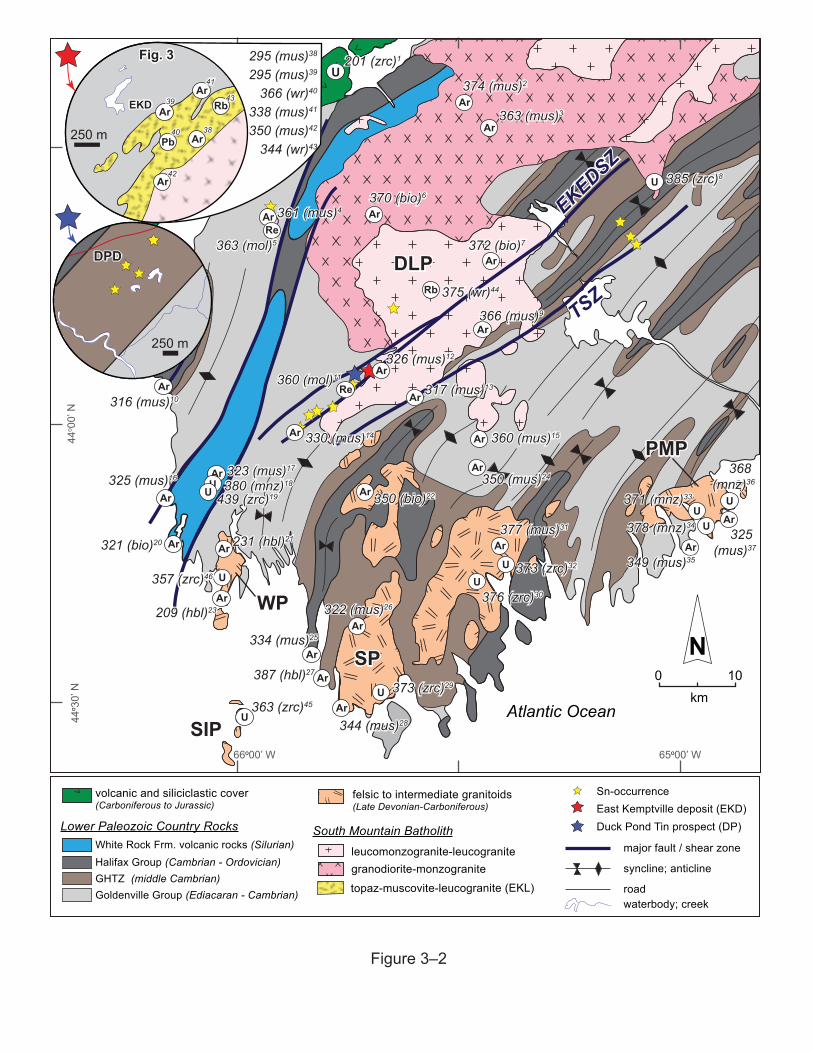
South Mountain BatholithLower Paleozoic Country Rocks
volcanic and siliciclastic cover(Carboniferous to Jurassic)
felsic to intermediate granitoids (Late Devonian-Carboniferous)
granodiorite-monzogranite
Sn-occurrence
leucomonzogranite-leucograniteHalifax Group (Cambrian - Ordovician)GHTZ (middle Cambrian)Goldenville Group (Ediacaran - Cambrian)
White Rock Frm. volcanic rocks (Silurian)
syncline; anticline
roadwaterbody; creek
major fault / shear zone
East Kemptville deposit (EKD)Duck Pond Tin prospect (DP)
topaz-muscovite-leucogranite (EKL)
km100
65o00’ W
Atlantic Ocean
66o00’ W
44o 0
0’ N
44o 3
0’ N
N
DLP
SP
WP
PMP
DLP
SP
WP
PMP
SIP
TSZ
EKEDSZ
TSZ
EKEDSZ250 m
250 m
DPDDPD
EKDEKD
Fig. 3Fig. 3
Ar
ArAr
Ar
Ar
Ar
Ar
ArU
U
Re
Ar
Ar
Ar
Ar
ArU
UU
Ar
Ar
UU
UAr
Ar
Ar
Ar
Pb
U
Ar
Ar
UAr
Ar
Ar
Re
Ar
Ar
Ar
Ar
Ar
Rb
Rb
U
U
316 (mus)10
316 (mus)16
316 (bio)20
323 (mus)17
380 (mnz)18
439 (zrc)19
231 (hbl)21
209 (hbl)23
350 (bio)22
322 (mus)26
334 (mus)25
344 (mus)28
387 (hbl)27
373 (zrc)29
376 (zrc)30
373 (zrc)32
377 (mus)31
360 (mus)15
371 (mnz)33
378 (mnz)34
368 (mnz)36
325 (mus)37
349 (mus)35
317 (mus)13
326 (mus)12
363 (mol)5
361 (mus)4370 (bio)6
385 (zrc)8
350 (mus)24
374 (mus)2
201 (zrc)1
360 (mol)11
330 (mus)14
363 (mus)3
372 (bio)7
366 (mus)9
38
39
40
41
316 (mus)10
325 (mus)16
321 (bio)20
323 (mus)17
380 (mnz)18
439 (zrc)19
231 (hbl)21
209 (hbl)23
350 (bio)22
322 (mus)26
334 (mus)25
344 (mus)28
387 (hbl)27
373 (zrc)29
376 (zrc)30
373 (zrc)32
377 (mus)31
360 (mus)15
371 (mnz)33
378 (mnz)34
368 (mnz)36
325 (mus)37
349 (mus)35
317 (mus)13
326 (mus)12
366 (wr)40
363 (mol)5
361 (mus)4370 (bio)6
385 (zrc)8
350 (mus)24
374 (mus)2
201 (zrc)1
338 (mus)41
295 (mus)39
295 (mus)38
360 (mol)11
330 (mus)14
363 (mus)3
372 (bio)7
366 (mus)9
38
39
40
41
4242
350 (mus)42
344 (wr)43
4343
375 (wr)44375 (wr)44
363 (zrc)45
357 (zrc)46357 (zrc)46
Figure 3–2

295
Figure 3–2. Regional geology of SW Nova Scotia, Canada (modified after White, 2010a),
displaying the Davis Lake pluton (DLP), the distribution of SMB satellite intermediate plutons,
metasedimentary rocks of the Meguma terrane, and historic geochronological data in the area.
References and details for plotted geochronological data are listed in Table EA 3-1 (Electronic
Appendix). Insets: overviews of the East Kemptville deposit (EKD; located at the SW edge of
the Davis Lake Pluton) and the Duck Pond prospect (DP; located ~2 km WSW of the EKD).
Hybridized intermediate granitoid intrusions coeval with the SMB (WP – Wedgeport Pluton, SP
– Sandwich Point Pluton, SIP – Seal Island Pluton, PMP – Point Mouton Pluton), regional fold
axes, and Sn mineral occurrences (O’Reilly et al., 2016) in this part of the province are also
shown. Major shear zones: TSZ – Tobeatic Shear Zone, and EKEDSZ – East Kemptville East
Dalhousie Shear Zone. Note the variability in Ar-Ar ages, the relatively constrained U-Pb ages in
the SMB (ca. 385 Ma) and the spatially associated felsic to intermediate granitoids (ca. 375 Ma
in the SP, 370 Ma in the PMP, and 360 Ma in the WP).
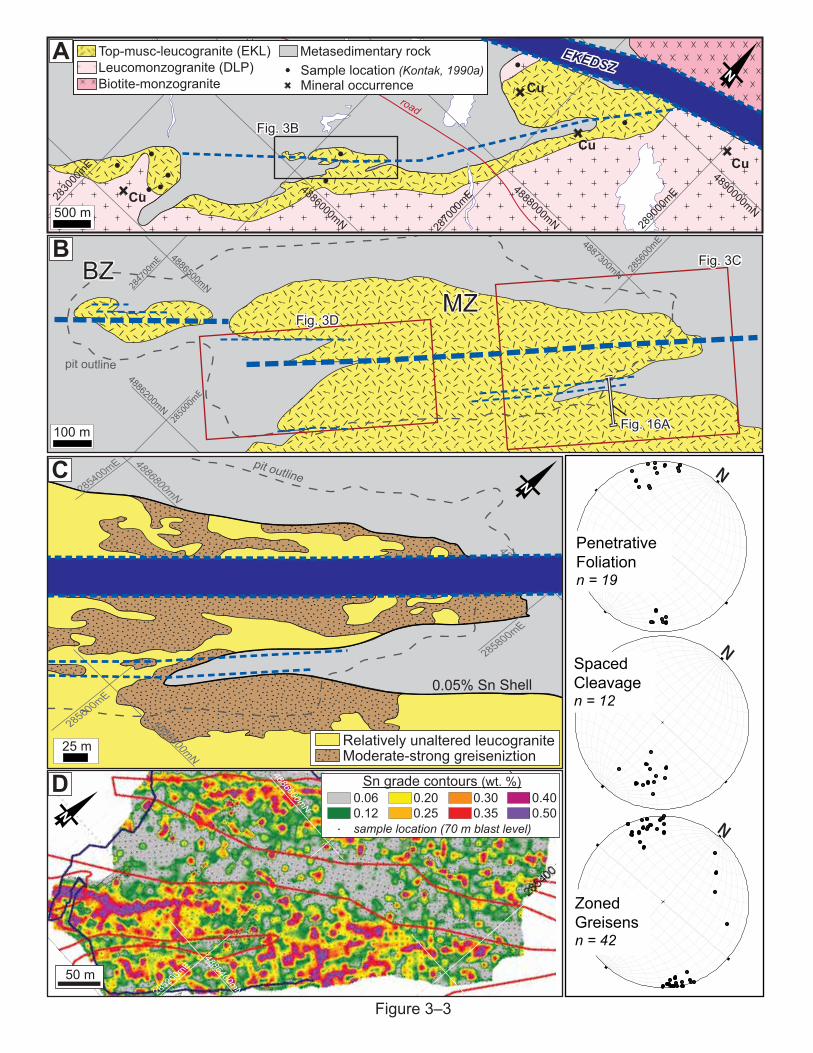
Figure 3–3
25 m Relatively unaltered leucograniteModerate-strong greiseniztion
4887000mN
4886800mN
285600mE
285800mE
285400mE
4886600mN
0.05% Sn Shell
pit outline N
N
N
N
Zoned Greisensn = 42
PenetrativeFoliationn = 19
SpacedCleavagen = 12
C
4886200mN
285000mE
4886500mN284700mE
4887300mN 2856
00mE
pit outline
MZMZBZBZ Fig. 3CFig. 3CB
100 m
Fig. 3DFig. 3D
Cu
CuCu
Cu
SnSn
Cu
4886000mN
2830
00mE
4888000mN
4890000mN
2870
00mE
2890
00mE
road
Top-musc-leucogranite (EKL)Leucomonzogranite (DLP)Biotite-monzogranite
Metasedimentary rockSample location (Kontak, 1990a)Mineral occurrence
N
Fig. 3BFig. 3B
500 m
A
Fig. 16AFig. 16A
EKEDSZEKEDSZ
285200mE
4886400mN
4886600mN
50 m
D Sn grade contours (wt. %)0.060.12sample location (70 m blast level)
0.200.25
0.300.35
0.400.50N
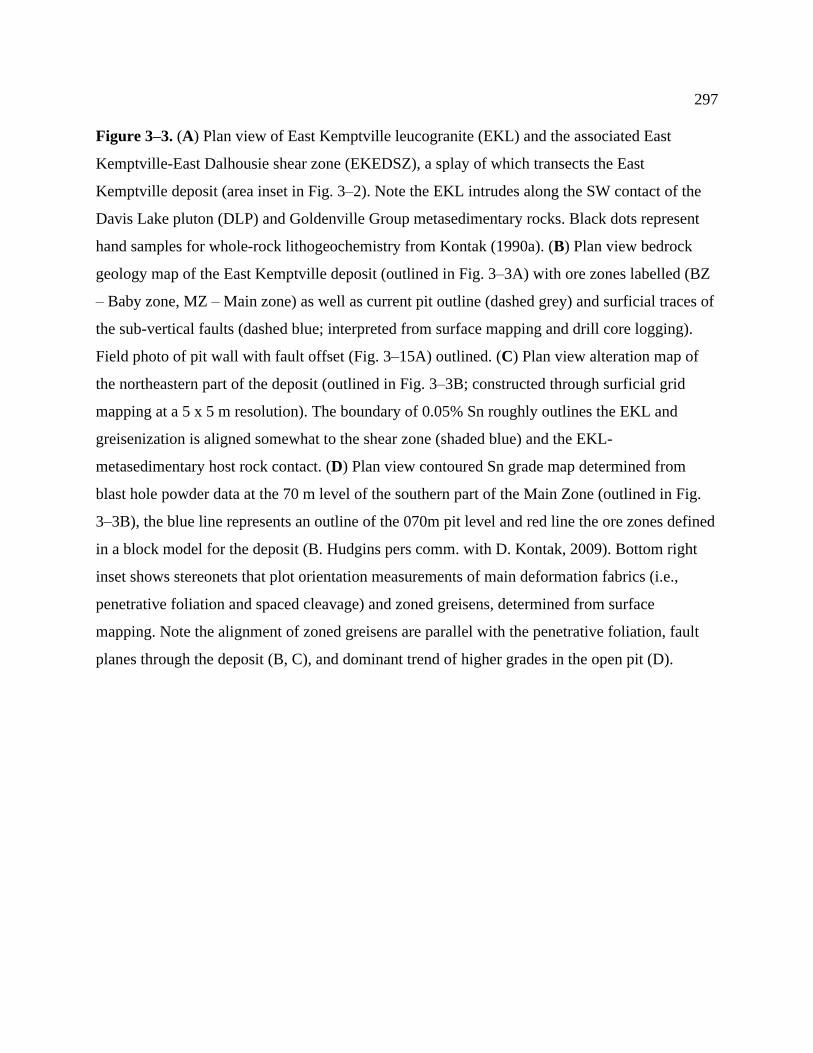
297
Figure 3–3. (A) Plan view of East Kemptville leucogranite (EKL) and the associated East
Kemptville-East Dalhousie shear zone (EKEDSZ), a splay of which transects the East
Kemptville deposit (area inset in Fig. 3–2). Note the EKL intrudes along the SW contact of the
Davis Lake pluton (DLP) and Goldenville Group metasedimentary rocks. Black dots represent
hand samples for whole-rock lithogeochemistry from Kontak (1990a). (B) Plan view bedrock
geology map of the East Kemptville deposit (outlined in Fig. 3–3A) with ore zones labelled (BZ
– Baby zone, MZ – Main zone) as well as current pit outline (dashed grey) and surficial traces of
the sub-vertical faults (dashed blue; interpreted from surface mapping and drill core logging).
Field photo of pit wall with fault offset (Fig. 3–15A) outlined. (C) Plan view alteration map of
the northeastern part of the deposit (outlined in Fig. 3–3B; constructed through surficial grid
mapping at a 5 x 5 m resolution). The boundary of 0.05% Sn roughly outlines the EKL and
greisenization is aligned somewhat to the shear zone (shaded blue) and the EKL-
metasedimentary host rock contact. (D) Plan view contoured Sn grade map determined from
blast hole powder data at the 70 m level of the southern part of the Main Zone (outlined in Fig.
3–3B), the blue line represents an outline of the 070m pit level and red line the ore zones defined
in a block model for the deposit (B. Hudgins pers comm. with D. Kontak, 2009). Bottom right
inset shows stereonets that plot orientation measurements of main deformation fabrics (i.e.,
penetrative foliation and spaced cleavage) and zoned greisens, determined from surface
mapping. Note the alignment of zoned greisens are parallel with the penetrative foliation, fault
planes through the deposit (B, C), and dominant trend of higher grades in the open pit (D).

15-028
15-029
15-02615-027
15-025
285650 285700 285750 285800 285850 285900
4886
900
4886
950
4887
000
4887
050
meters
10 200
FOLI
ATIO
N INTE
NSITY
ALTERAT
ION IN
TENSIT
Y
N
Extent of 2016 Mapping
East Kemptville Mine (NE): Geology
Leucogranite (outcrop, inferred)
Metasedimentary rock (outcrop, inferred)
Contour (0.5 m)
Drillhole (collar, trace)Greisen
Alterationweak: minor mica alterationmoderate: feldspars replacedstrong: primary textures overprintedintense: qtz-tpz greisen
Foliationunfoliatedmoderate: cleavage developedstrong: penetrative fabricintense: mylonitic
100 m
N
MZMZ
BZBZ
Fig. 7B
Fig. 7A
Figure 3–4
299
Figure 3–4. Outcrop mapping in the NE part of the East Kemptville mine; data measurements
were taken on a 3 x 3 m grid basis, and intensity of alteration and foliation were measured to
create contours for increased greisenization and deformation (bottom-right insets; criteria for
intensity shown in legend). Compilation of structural measurements shown in stereonet inset of
Figure 3–3. Inset to top left shows aerial photograph (taken June 15, 2018; courtesy of Avalon
Advanced Materials Inc.) of East Kemptville mine with: ore zones labelled (flooded open-pits);
surficial expression of interpreted cross-sections shown in Figure 3–7A, B; and the area of
bedrock mapping (red box).
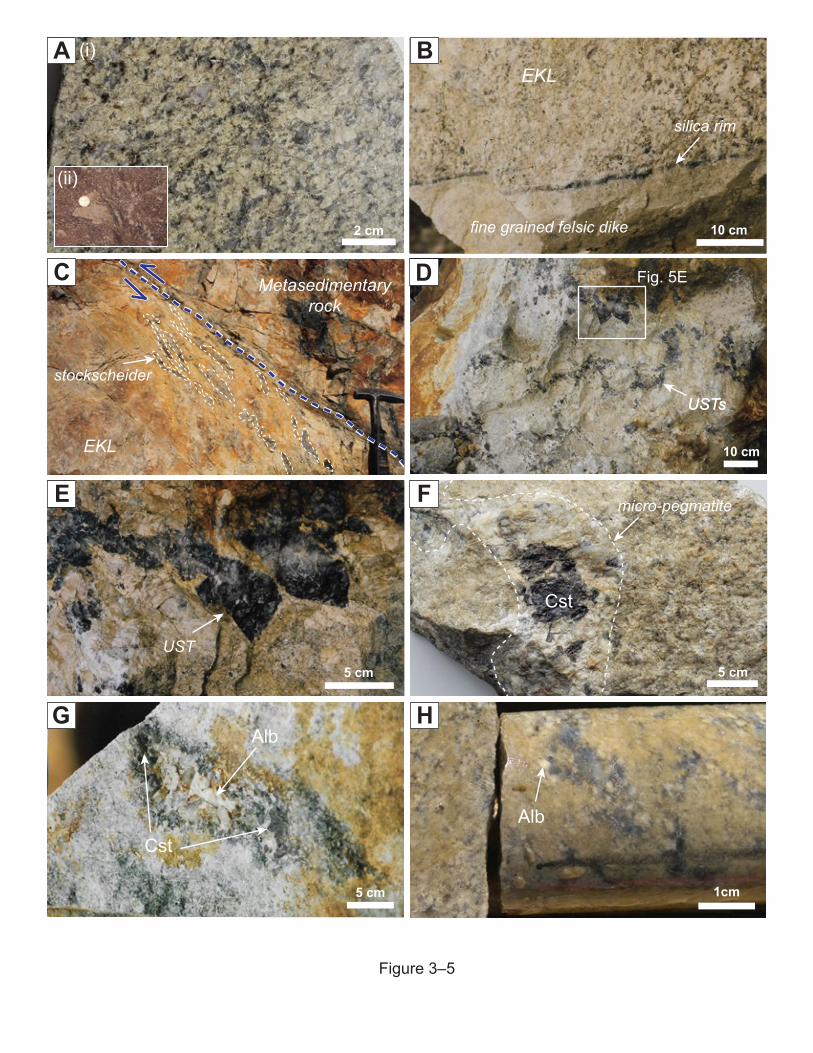
EKL
Metasedimentaryrock
stockscheider
10 cm
Fig. 5E
USTs
5 cm
UST
5 cm
Cst
Alb
1cm
Alb
10 cm
silica rim
fine grained felsic dike
EKL
micro-pegmatite
5 cm
USTs
Cst
Figure 3–5
2 cm
A (i)
(ii)
C D
E
G H
F
B
301
Figure 3–5. (A) Hand sample of light buff medium-grained (i), and an inset of fine-grained (ii),
equigranular East Kemptville muscovite-topaz-leucogranite (EKL). (B) Fine grained quenched
felsic dike in EKL with a thin layer of fine grained silica that is the result of fluid exsolution by
depressurization. (C) Outcrop photo of sheared contact (dashed blue) between host
metasedimentary rock and EKL, note the presence of coarse stockscheider quartz-pegmatites
(outlined) that become less amorphous and more elongated parallel to fault towards the contact.
(D-E) Outcrop example of unidirectional solidification textures (USTs) of elongated quartz
(arrow in E) indicating localized fluid saturation in the EKL. (F) Thin pegmatite in the EKL
(outlined, arrow) with coarse cassiterite (Cst). (G) Hand sample with miarole rimmed by coarse
albite (Alb) and containing primary cassiterite. (H) Hand sample of granitic rock with
interconnected granitic-veins. Granitic-veins rimmed by albite and filled with quartz ±
muscovite.
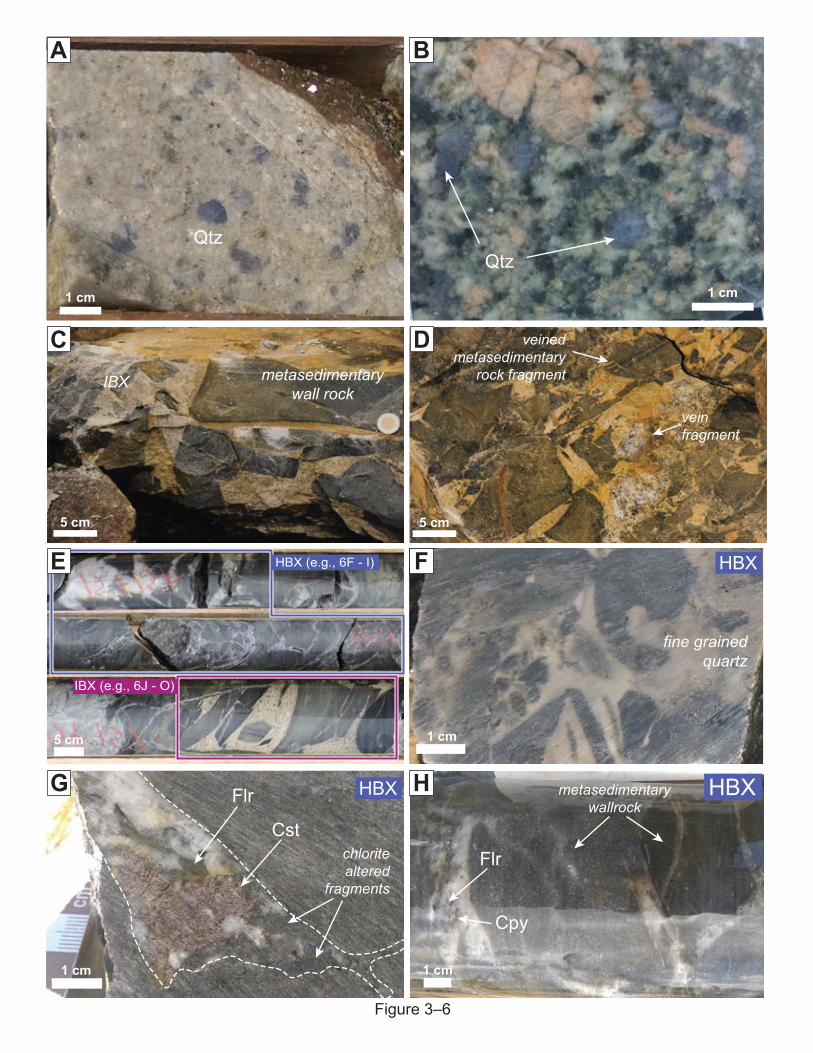
1 cm
Qtz
1 cm
Qtz
5 cm
veinedmetasedimentary
rock fragment
veinfragment
5 cm
metasedimentarywall rock
IBX
5 cm
HBX (e.g., 6F - I)
IBX (e.g., 6J - O)
1 cm
HBX
Cpy
Flr
metasedimentarywallrock
1 cm
HBX
Cstchloritealtered
fragments
Flr
1 cm1 cm
fine grainedquartz
HBXE
A
Figure 3–6
B
C D
F
G H
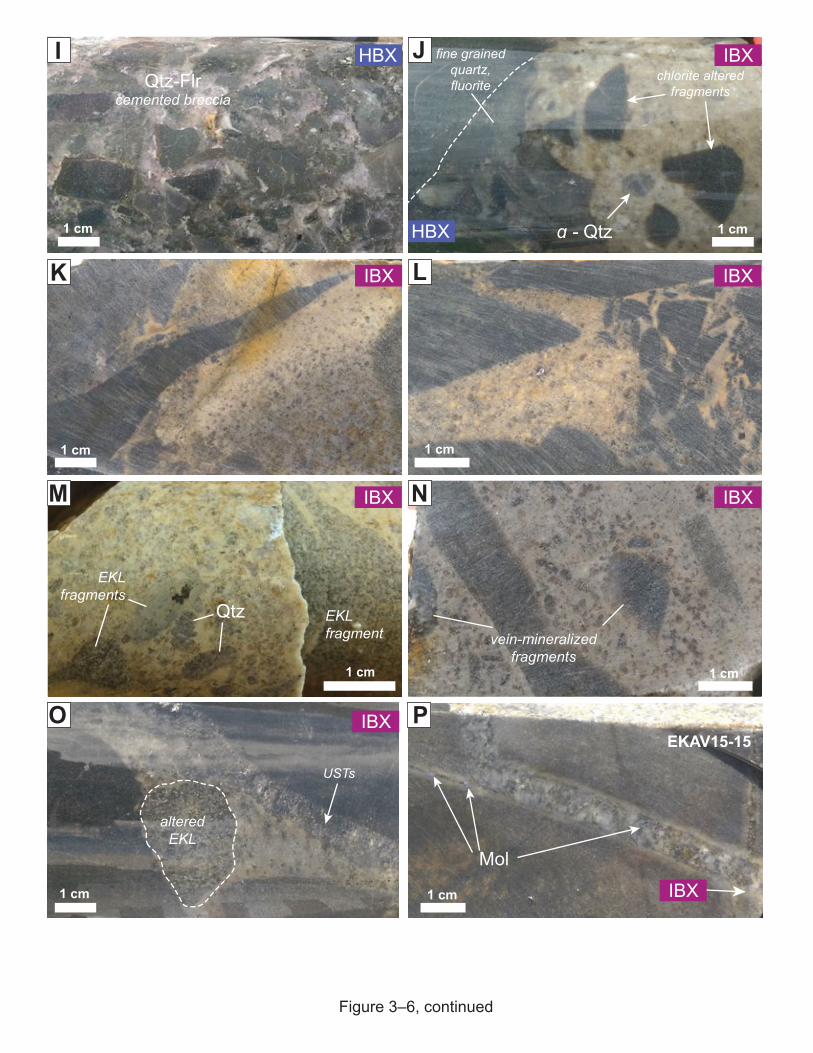
quartz
1 cm
vein-mineralizedfragments
IBX
1 cm
EKLfragments
EKLfragment
IBX
Qtz
Qtz-Flrcemented breccia
1 cm
HBX
1 cm
IBX
1 cm
IBX
1 cmHBX ɑ - Qtz
chlorite alteredfragments
fine grainedquartz,fluorite
IBX
1 cm
USTs
IBX
alteredEKL
1 cm
MolIBX
EKAV15-15
J
M
Figure 3–6, continued
K L
N
O P
I
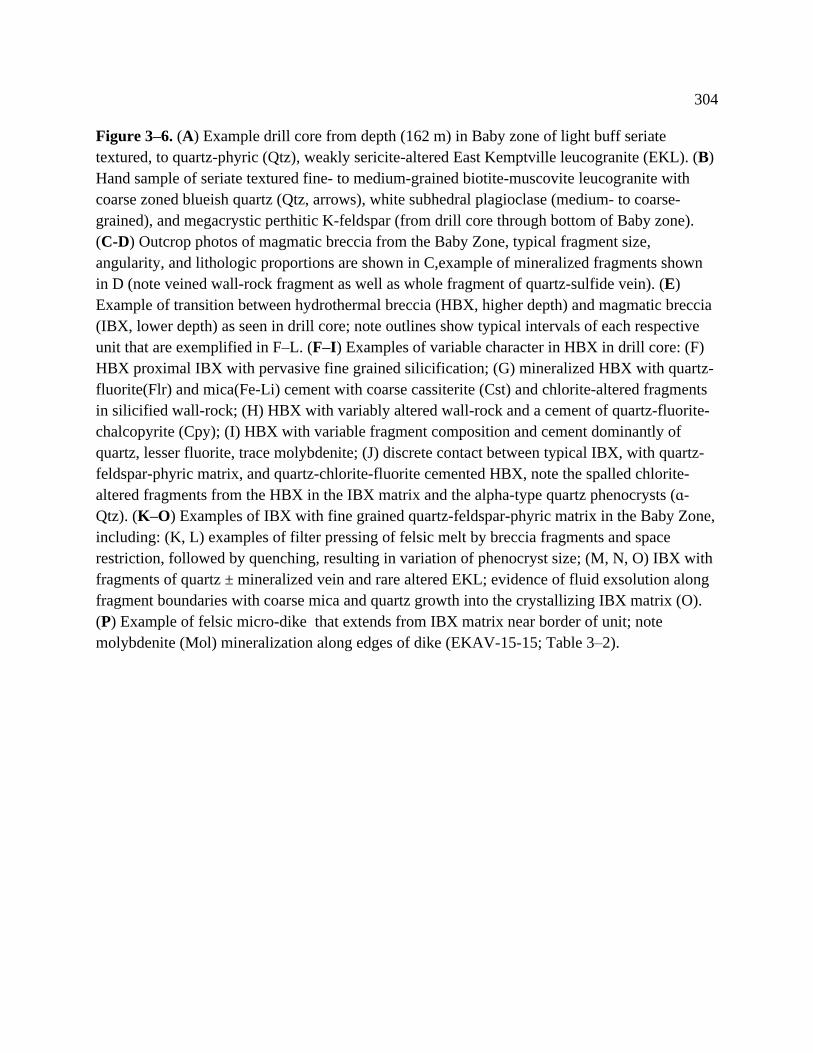
304
Figure 3–6. (A) Example drill core from depth (162 m) in Baby zone of light buff seriate
textured, to quartz-phyric (Qtz), weakly sericite-altered East Kemptville leucogranite (EKL). (B)
Hand sample of seriate textured fine- to medium-grained biotite-muscovite leucogranite with
coarse zoned blueish quartz (Qtz, arrows), white subhedral plagioclase (medium- to coarse-
grained), and megacrystic perthitic K-feldspar (from drill core through bottom of Baby zone).
(C-D) Outcrop photos of magmatic breccia from the Baby Zone, typical fragment size,
angularity, and lithologic proportions are shown in C,example of mineralized fragments shown
in D (note veined wall-rock fragment as well as whole fragment of quartz-sulfide vein). (E)
Example of transition between hydrothermal breccia (HBX, higher depth) and magmatic breccia
(IBX, lower depth) as seen in drill core; note outlines show typical intervals of each respective
unit that are exemplified in F–L. (F–I) Examples of variable character in HBX in drill core: (F)
HBX proximal IBX with pervasive fine grained silicification; (G) mineralized HBX with quartz-
fluorite(Flr) and mica(Fe-Li) cement with coarse cassiterite (Cst) and chlorite-altered fragments
in silicified wall-rock; (H) HBX with variably altered wall-rock and a cement of quartz-fluorite-
chalcopyrite (Cpy); (I) HBX with variable fragment composition and cement dominantly of
quartz, lesser fluorite, trace molybdenite; (J) discrete contact between typical IBX, with quartz-
feldspar-phyric matrix, and quartz-chlorite-fluorite cemented HBX, note the spalled chlorite-
altered fragments from the HBX in the IBX matrix and the alpha-type quartz phenocrysts (ɑ-
Qtz). (K–O) Examples of IBX with fine grained quartz-feldspar-phyric matrix in the Baby Zone,
including: (K, L) examples of filter pressing of felsic melt by breccia fragments and space
restriction, followed by quenching, resulting in variation of phenocryst size; (M, N, O) IBX with
fragments of quartz ± mineralized vein and rare altered EKL; evidence of fluid exsolution along
fragment boundaries with coarse mica and quartz growth into the crystallizing IBX matrix (O).
(P) Example of felsic micro-dike that extends from IBX matrix near border of unit; note
molybdenite (Mol) mineralization along edges of dike (EKAV-15-15; Table 3–2).
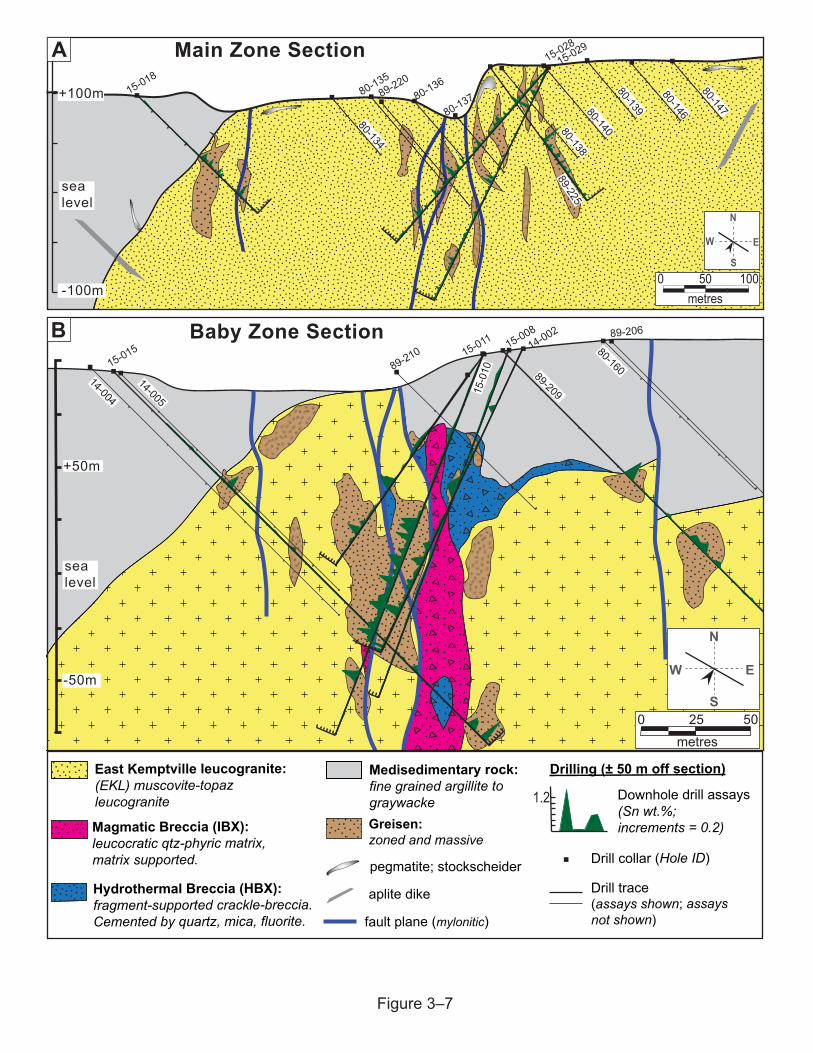
Figure 3–7
Baby Zone Section
metres0 25 50
sealevel
-50m
+50m
W E
S
N
14-004
14-005
89-209
80-160
89-20614-002
15-0
10
15-008
15-011
89-21015-015
Magmatic Breccia (IBX): leucocratic qtz-phyric matrix, matrix supported.
Hydrothermal Breccia (HBX): fragment-supported crackle-breccia.Cemented by quartz, mica, fluorite.
East Kemptville leucogranite:(EKL) muscovite-topaz leucogranite
Medisedimentary rock: fine grained argillite to graywacke
fault plane (mylonitic)
Downhole drill assays (Sn wt.%; increments = 0.2)
1.2
Greisen: zoned and massive
pegmatite; stockscheider
aplite dike
Drill collar (Hole ID)
Drill trace (assays shown; assays not shown)
Drilling (± 50 m off section)
metres500 100
W E
S
N
Main Zone Section
sealevel
+100m
-100m
15-01880-135
80-136
80-13789-220
80-139
15-02815-029
80-140
80-146
80-147
80-134
89-22580-138
A
B
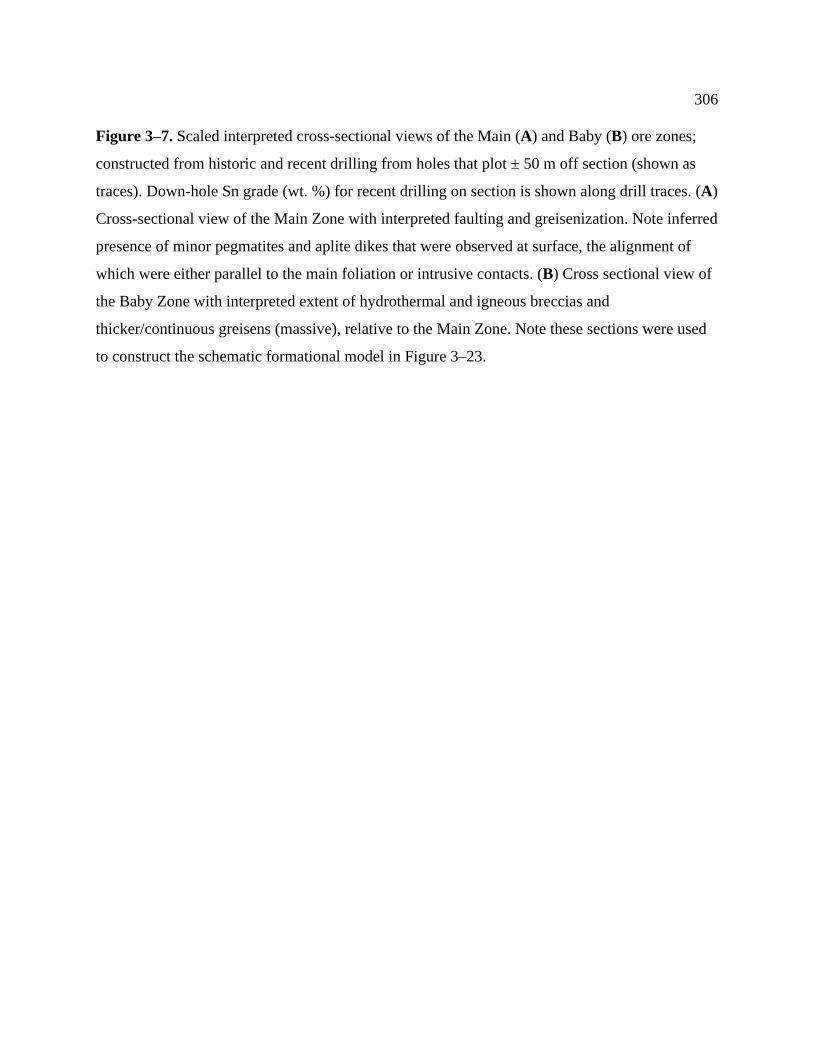
306
Figure 3–7. Scaled interpreted cross-sectional views of the Main (A) and Baby (B) ore zones;
constructed from historic and recent drilling from holes that plot ± 50 m off section (shown as
traces). Down-hole Sn grade (wt. %) for recent drilling on section is shown along drill traces. (A)
Cross-sectional view of the Main Zone with interpreted faulting and greisenization. Note inferred
presence of minor pegmatites and aplite dikes that were observed at surface, the alignment of
which were either parallel to the main foliation or intrusive contacts. (B) Cross sectional view of
the Baby Zone with interpreted extent of hydrothermal and igneous breccias and
thicker/continuous greisens (massive), relative to the Main Zone. Note these sections were used
to construct the schematic formational model in Figure 3–23.

1 cmPlg
Mus
Ksp
Mus
Ksp
Mus
0.5 mm
0.5 mm0.5 mm
Alb
KspAlb
Muss/p
Alb
KspAlb
Muss/p 0.2 mm0.2 mm
Musp
Muss
0.25 mm
AlbAlb
AlbAlb
AlbAlb
KspKsp
1 mm
QtzQtz AlbAlb
KspKsp
Figure 3–8
A B
C D
E F
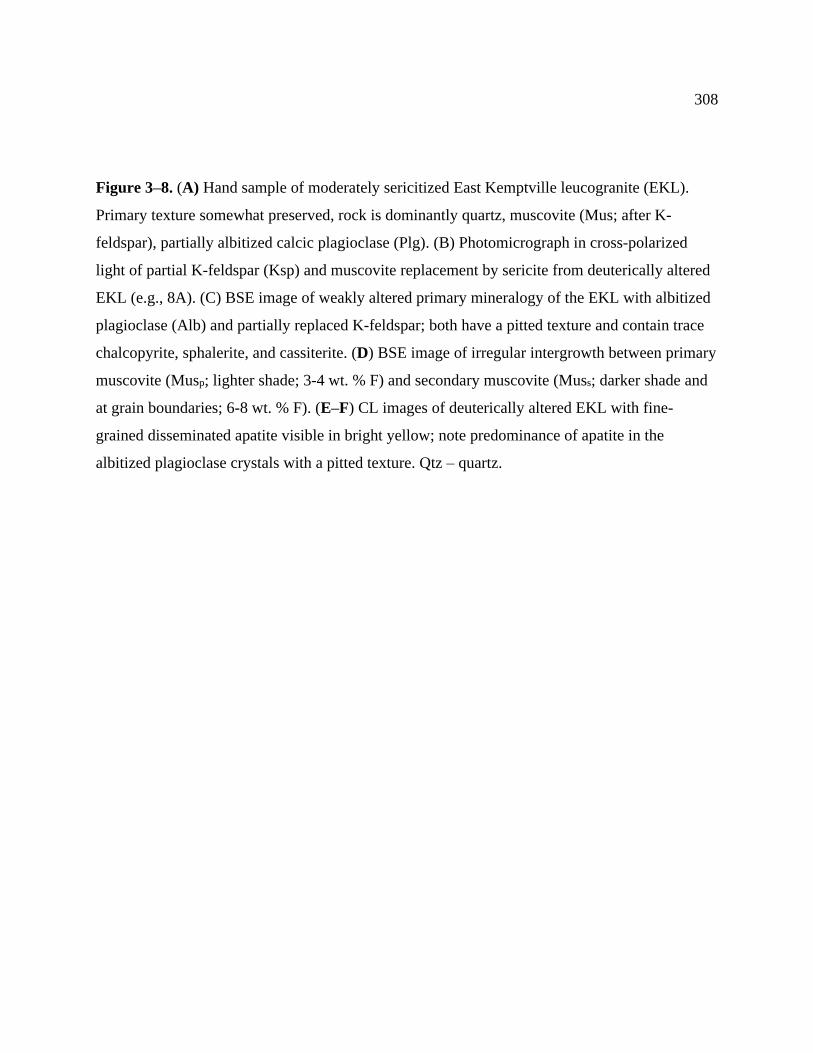
308
Figure 3–8. (A) Hand sample of moderately sericitized East Kemptville leucogranite (EKL).
Primary texture somewhat preserved, rock is dominantly quartz, muscovite (Mus; after K-
feldspar), partially albitized calcic plagioclase (Plg). (B) Photomicrograph in cross-polarized
light of partial K-feldspar (Ksp) and muscovite replacement by sericite from deuterically altered
EKL (e.g., 8A). (C) BSE image of weakly altered primary mineralogy of the EKL with albitized
plagioclase (Alb) and partially replaced K-feldspar; both have a pitted texture and contain trace
chalcopyrite, sphalerite, and cassiterite. (D) BSE image of irregular intergrowth between primary
muscovite (Musp; lighter shade; 3-4 wt. % F) and secondary muscovite (Muss; darker shade and
at grain boundaries; 6-8 wt. % F). (E–F) CL images of deuterically altered EKL with fine-
grained disseminated apatite visible in bright yellow; note predominance of apatite in the
albitized plagioclase crystals with a pitted texture. Qtz – quartz.
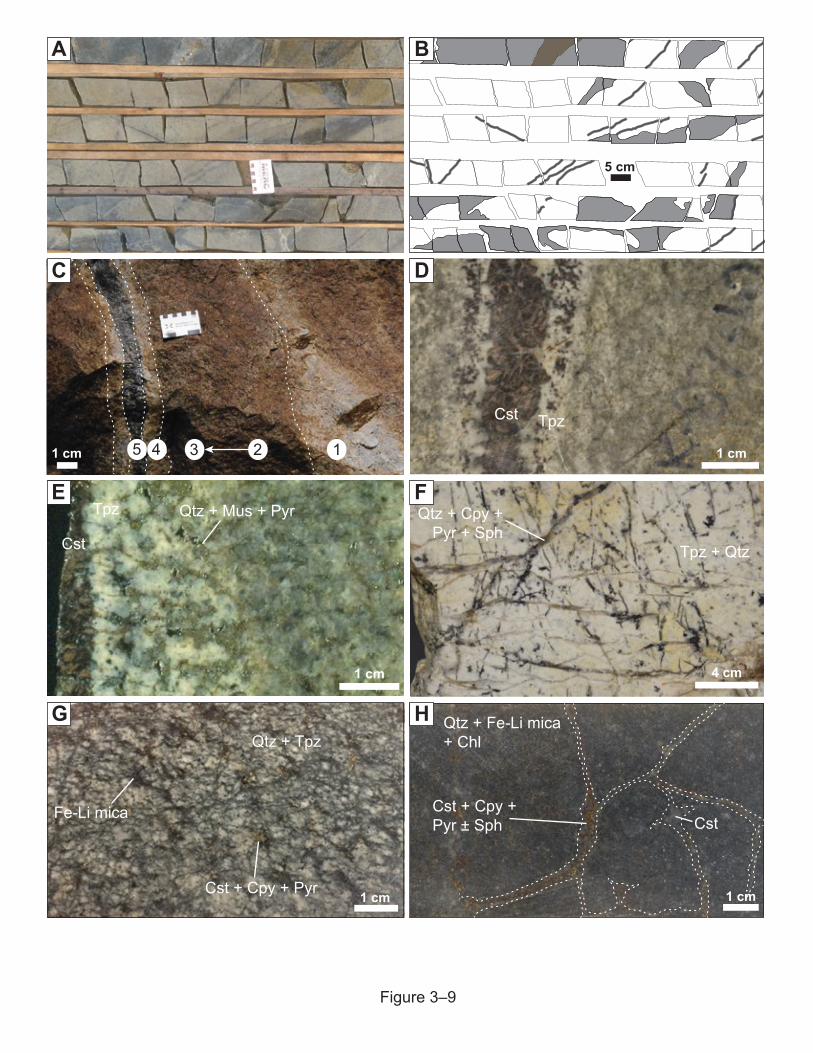
1 cm
Qtz + Tpz
Cst + Cpy + Pyr
Fe-Li mica
145 231 cm
5 cm5 cm
Qtz + Cpy +Pyr + Sph
Tpz + Qtz
4 cm
1 cm
Cst Tpz
1 cm
Cst + Cpy +Pyr ± Sph Cst
Qtz + Fe-Li mica+ Chl
1 cm
Cst
Tpz Qtz + Mus + Pyr
Figure 3–9
A B
C D
E F
G H
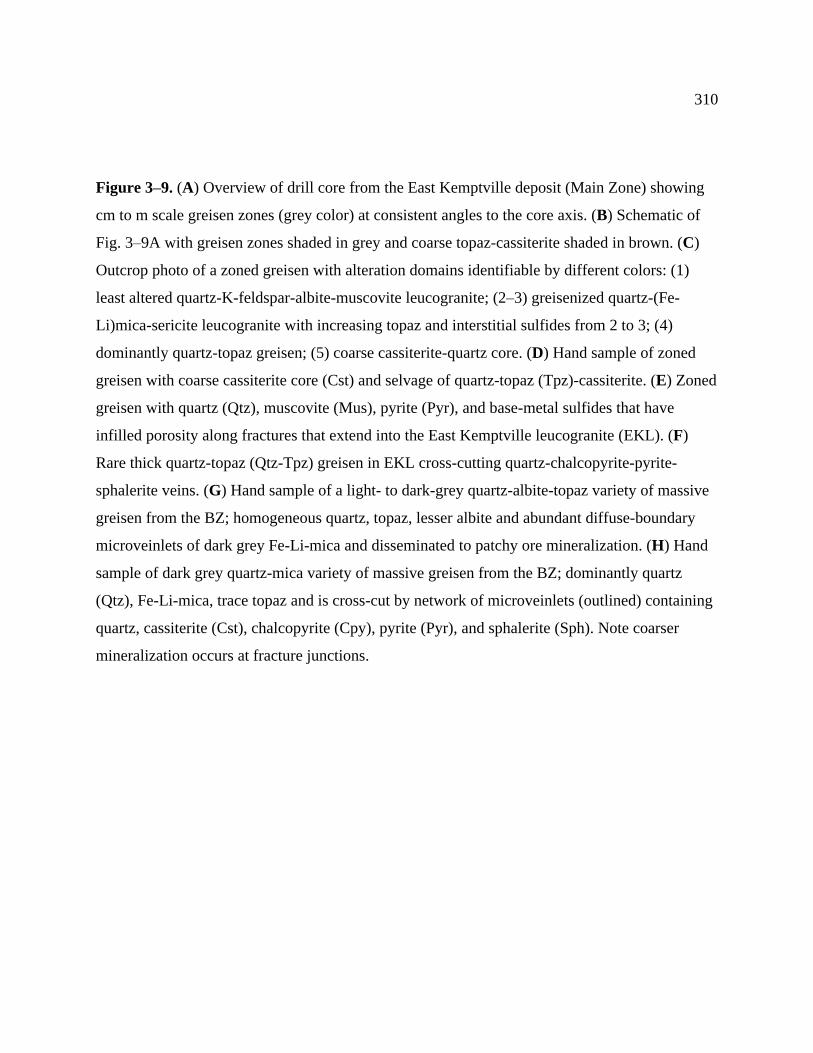
310
Figure 3–9. (A) Overview of drill core from the East Kemptville deposit (Main Zone) showing
cm to m scale greisen zones (grey color) at consistent angles to the core axis. (B) Schematic of
Fig. 3–9A with greisen zones shaded in grey and coarse topaz-cassiterite shaded in brown. (C)
Outcrop photo of a zoned greisen with alteration domains identifiable by different colors: (1)
least altered quartz-K-feldspar-albite-muscovite leucogranite; (2–3) greisenized quartz-(Fe-
Li)mica-sericite leucogranite with increasing topaz and interstitial sulfides from 2 to 3; (4)
dominantly quartz-topaz greisen; (5) coarse cassiterite-quartz core. (D) Hand sample of zoned
greisen with coarse cassiterite core (Cst) and selvage of quartz-topaz (Tpz)-cassiterite. (E) Zoned
greisen with quartz (Qtz), muscovite (Mus), pyrite (Pyr), and base-metal sulfides that have
infilled porosity along fractures that extend into the East Kemptville leucogranite (EKL). (F)
Rare thick quartz-topaz (Qtz-Tpz) greisen in EKL cross-cutting quartz-chalcopyrite-pyrite-
sphalerite veins. (G) Hand sample of a light- to dark-grey quartz-albite-topaz variety of massive
greisen from the BZ; homogeneous quartz, topaz, lesser albite and abundant diffuse-boundary
microveinlets of dark grey Fe-Li-mica and disseminated to patchy ore mineralization. (H) Hand
sample of dark grey quartz-mica variety of massive greisen from the BZ; dominantly quartz
(Qtz), Fe-Li-mica, trace topaz and is cross-cut by network of microveinlets (outlined) containing
quartz, cassiterite (Cst), chalcopyrite (Cpy), pyrite (Pyr), and sphalerite (Sph). Note coarser
mineralization occurs at fracture junctions.
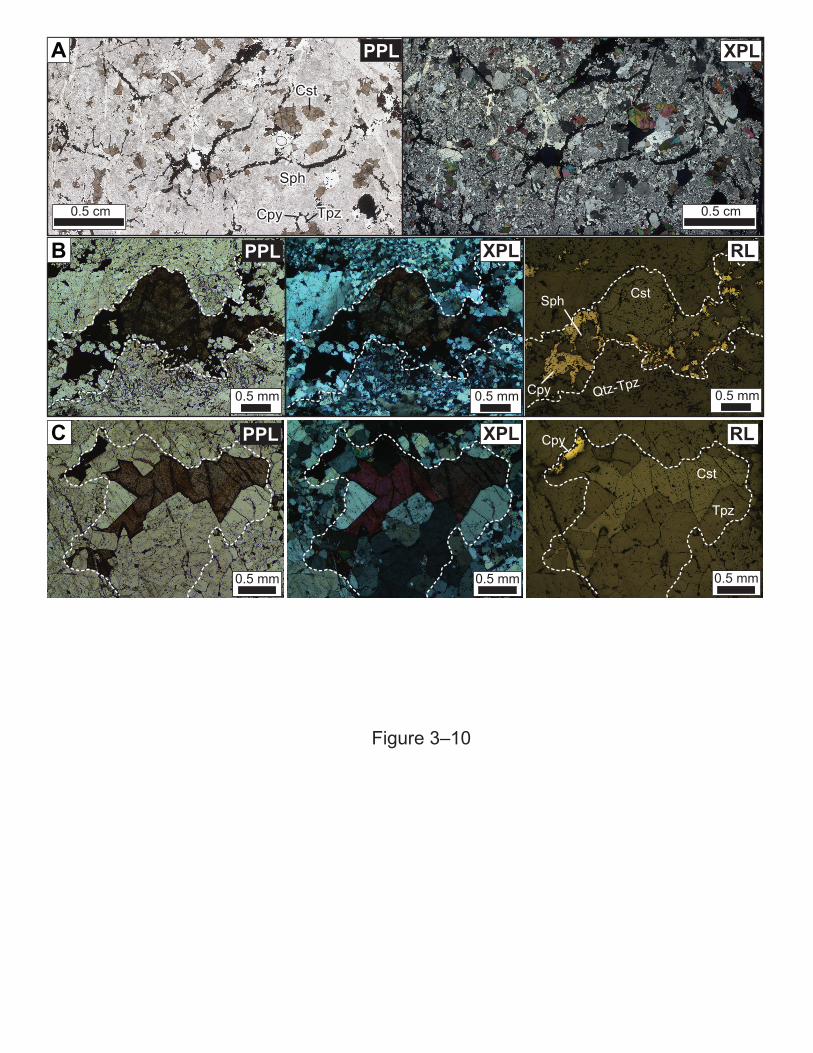
PPL XPL
Cpy
Sph
Cst
TpzCpy
Sph
Cst
Tpz
Cst
Tpz
CpyXPLPPL RL
Cpy
Sph Cst
Qtz-Tpz
PPL XPL RL
0.5 mm
0.5 cm0.5 cm
0.5 mm 0.5 mm
0.5 mm0.5 mm 0.5 mm
A
C
B
Figure 3–10
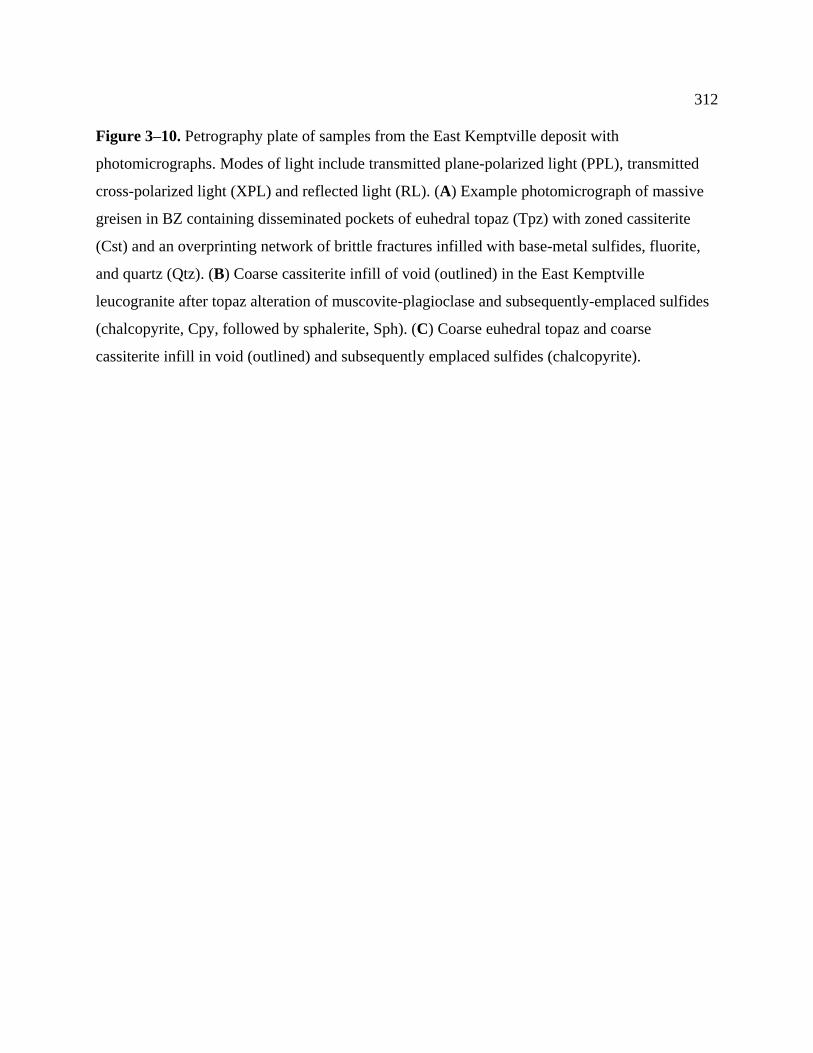
312
Figure 3–10. Petrography plate of samples from the East Kemptville deposit with
photomicrographs. Modes of light include transmitted plane-polarized light (PPL), transmitted
cross-polarized light (XPL) and reflected light (RL). (A) Example photomicrograph of massive
greisen in BZ containing disseminated pockets of euhedral topaz (Tpz) with zoned cassiterite
(Cst) and an overprinting network of brittle fractures infilled with base-metal sulfides, fluorite,
and quartz (Qtz). (B) Coarse cassiterite infill of void (outlined) in the East Kemptville
leucogranite after topaz alteration of muscovite-plagioclase and subsequently-emplaced sulfides
(chalcopyrite, Cpy, followed by sphalerite, Sph). (C) Coarse euhedral topaz and coarse
cassiterite infill in void (outlined) and subsequently emplaced sulfides (chalcopyrite).
Stilbite
IIICassiterite
Wolframite
IIII IIMolybdenite
Arsenopyrite I II
Pyrrhotite
Chalcopyrite
Sphalerite
Stannite
Galena
Bismuthinite
III IIIIIPyrite
Oligoclase (An10-30)
Albite (An0-10)I II
I IITopaz
BiotiteI IIMuscovite
Chlorite
Li-Fe mica
Microcline
I II III IV VQuartz
Apatite I II III
Dickite
Dolomite
Childrenite
I II III IVFluorite
Siderite I II
Triplite
Vivianite
Montmorillinite
MineralsEKL
CrystallizationDeuteric
AlterationMain Stage Mineralization
Sulfide veinsSulfide infillOxide infillPhosphate
veinsLate
veins/alterationGreisenization
Figure 3 – 11
314
Figure 3–11. Detailed paragenesis of the East Kemptville leucogranite (EKL) and the
mineralization of the East Kemptville Sn-Cu-Zn-Ag-In deposit; modified after Kontak, 1990.
Main paragenetic stages are divided into cross-cutting relationships and textures observed in
petrographic analyses throughout the deposit. The main-stage mineralization is subdivided into
four stages but this can be observed as two temporally equivalent stages that follow the incipient
greisen alteration (greisen infill and base-metal sulfide veins) that result in different grades.
Multiple generations of one mineral type across the paragenesis are denoted with roman
numerals.
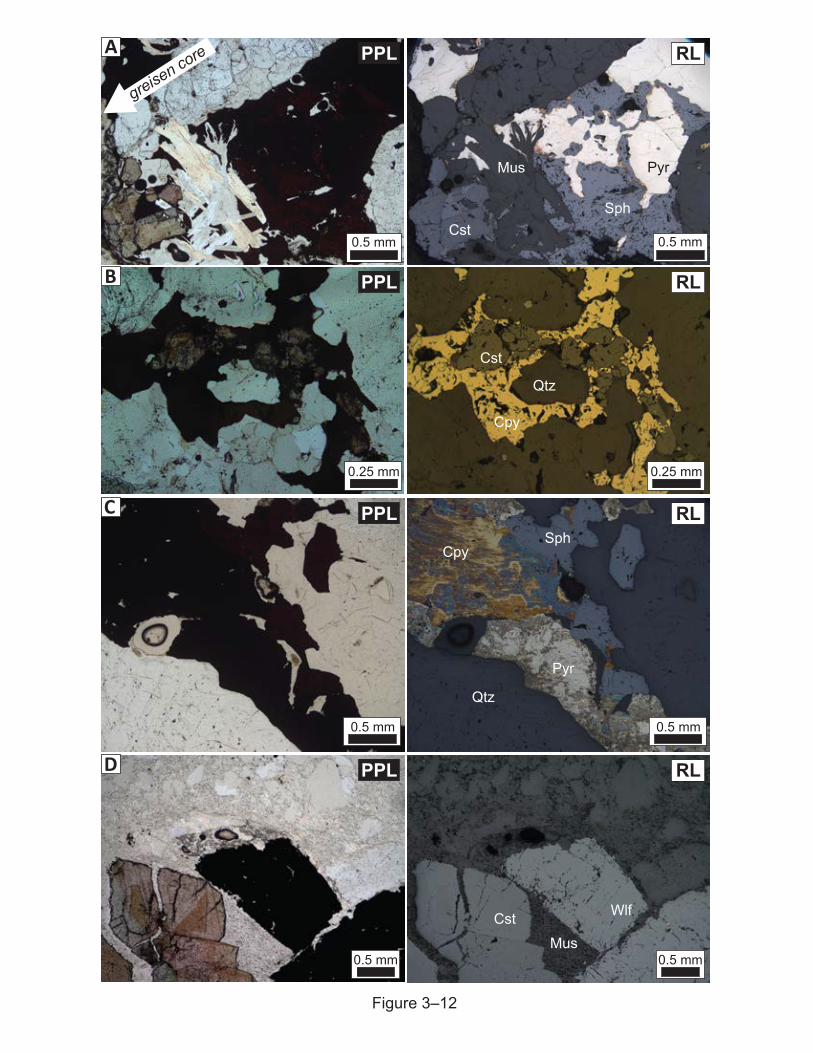
0.5 mm
WlfCstMus
0.5 mm
PPL RL
0.25 mm0.25 mm
Cst
Cpy
Qtz
PPL RL
0.5 mm 0.5 mm
Pyr
Cpy
Qtz
SphPPL RL
SphCst
PyrMus
0.5 mm 0.5 mm
greisen core PPL RL
Figure 3–12
D
C
B
A

316
Figure 3–12. Photomicrographs of mineralized samples from the East Kemptville deposit.
Modes of light include transmitted plane-polarized light (PPL, left) and reflected light (RL,
right). (A) Thick vein with infill of quartz, pyrite (Pyr), sphalerite (Sph), and chalcopyrite, with
rafts of muscovite (Mus) and cassiterite (Cst). (B) Irregular porosity infill by chalcopyrite (Cpy)
with rafts of embayed quartz (Qtz) and partially digested cassiterite. (C) Coarse cassiterite
(bottom left) and muscovite (Mus) crosscut by vein with sphalerite (Sph)-pyrite (Pyr) infill. (D)
Coarse cassiterite and wolframite (Wlf) mineralization precipitated alongside quartz-sericite
greisen proximal to contact with metasedimentary host rock.
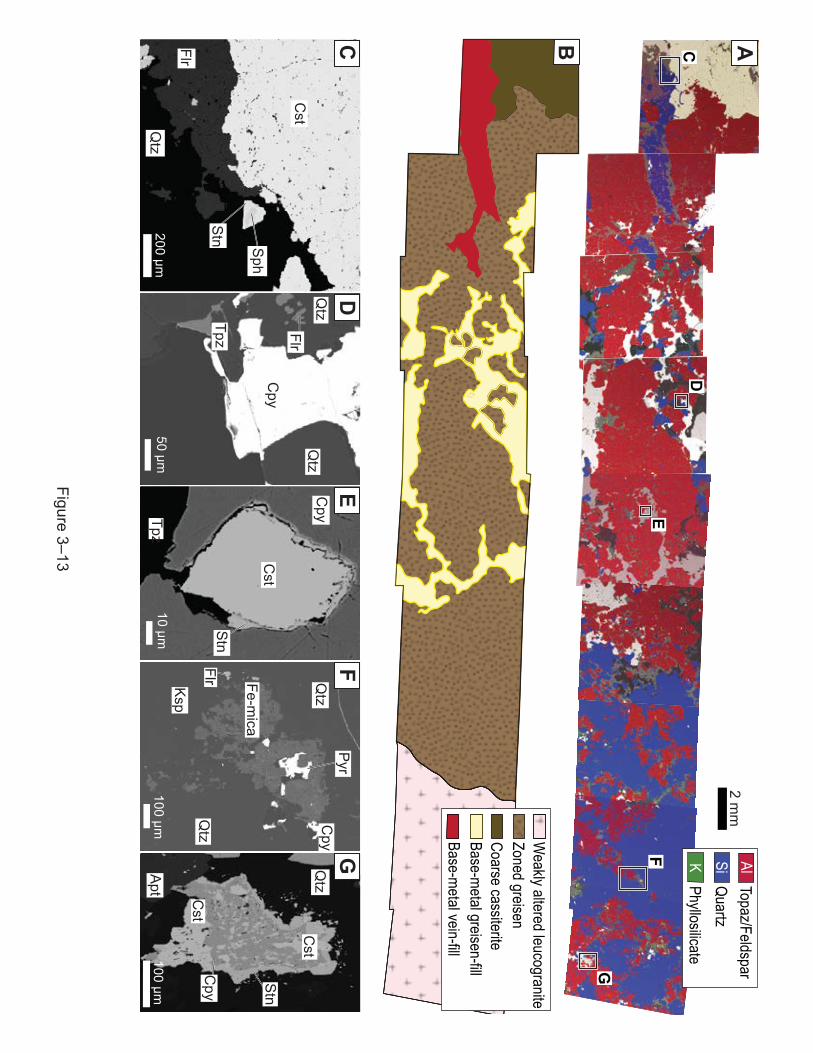
CD
EF
G
2 mm
Topaz/FeldsparAlSiK
QuartzPhyllosilicate
100 µm
Qtz
Cst
Cpy
Stn
Cst
Apt100 µm
Sph
Stn
Qtz
Cst
Flr
200 µm50 µm
Qtz
Qtz
FlrC
py
Tpz
Tpz
Cpy
Cst
Stn
10 µm
Qtz
Flr
Cpy
PyrQ
tz
Fe-mica
Ksp
Weakly altered leucogranite
Zoned greisenCoarse cassiteriteBase-m
etal greisen-fill Base-m
etal vein-fill
CD
EF
G
B A
Figure 3–13
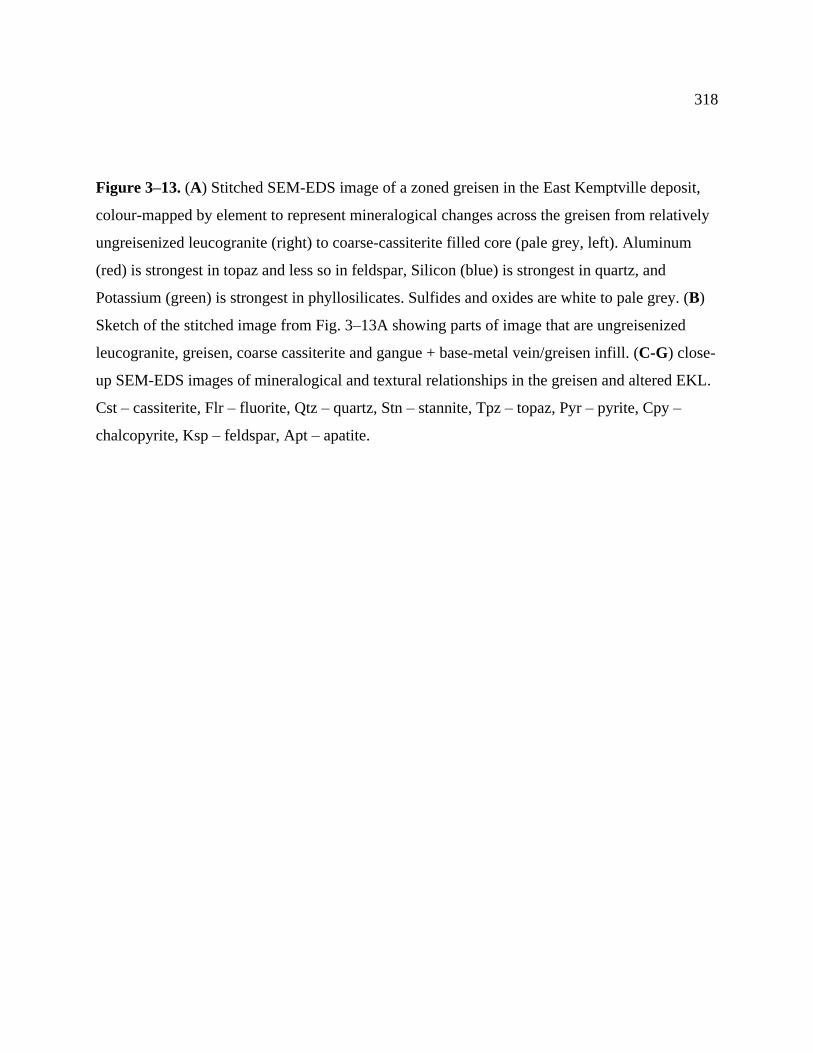
318
Figure 3–13. (A) Stitched SEM-EDS image of a zoned greisen in the East Kemptville deposit,
colour-mapped by element to represent mineralogical changes across the greisen from relatively
ungreisenized leucogranite (right) to coarse-cassiterite filled core (pale grey, left). Aluminum
(red) is strongest in topaz and less so in feldspar, Silicon (blue) is strongest in quartz, and
Potassium (green) is strongest in phyllosilicates. Sulfides and oxides are white to pale grey. (B)
Sketch of the stitched image from Fig. 3–13A showing parts of image that are ungreisenized
leucogranite, greisen, coarse cassiterite and gangue + base-metal vein/greisen infill. (C-G) close-
up SEM-EDS images of mineralogical and textural relationships in the greisen and altered EKL.
Cst – cassiterite, Flr – fluorite, Qtz – quartz, Stn – stannite, Tpz – topaz, Pyr – pyrite, Cpy –
chalcopyrite, Ksp – feldspar, Apt – apatite.
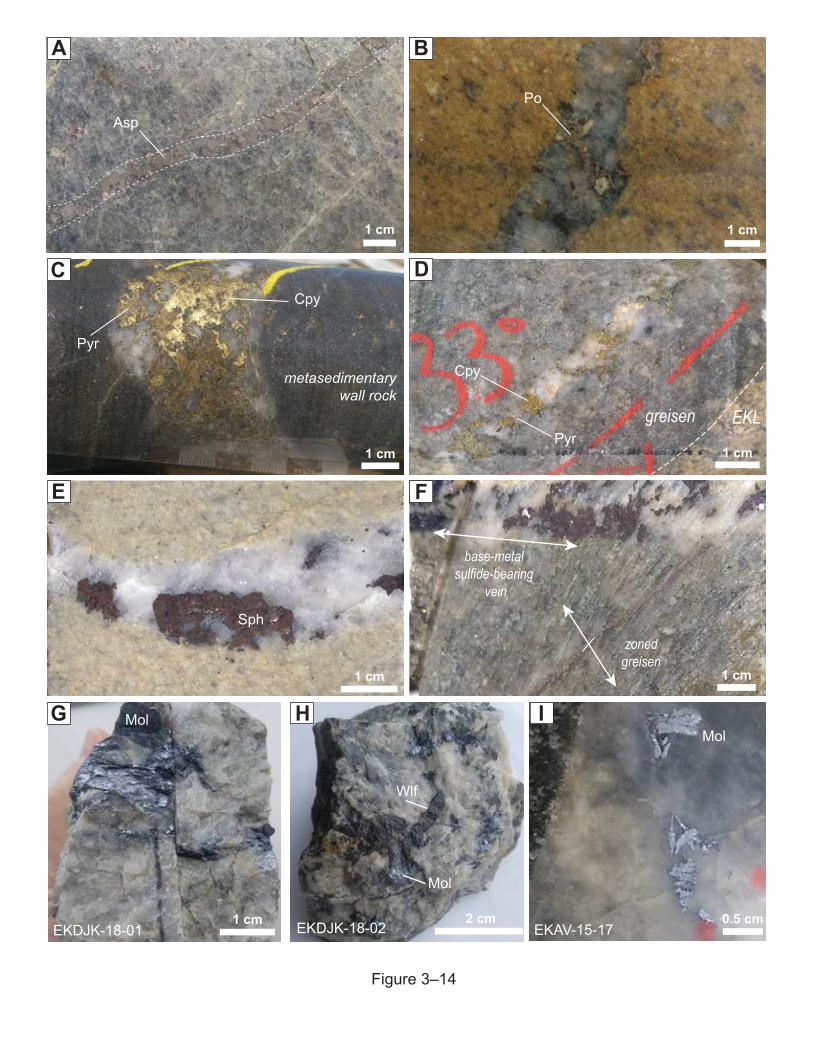
1 cm
Sph
1 cm
Asp
1 cm
Po
1 cm
Cpy
greisen EKLPyr
1 cm
zonedgreisen
base-metalsulfide-bearing
vein
2 cm
Mol
Wlf
EKDJK-18-021 cm
Mol
EKDJK-18-01
Cpy
Pyr
metasedimentarywall rock
1 cm
EKAV-15-170.5 cm
Mol
Figure 3–14
A B
C D
FE
H IG
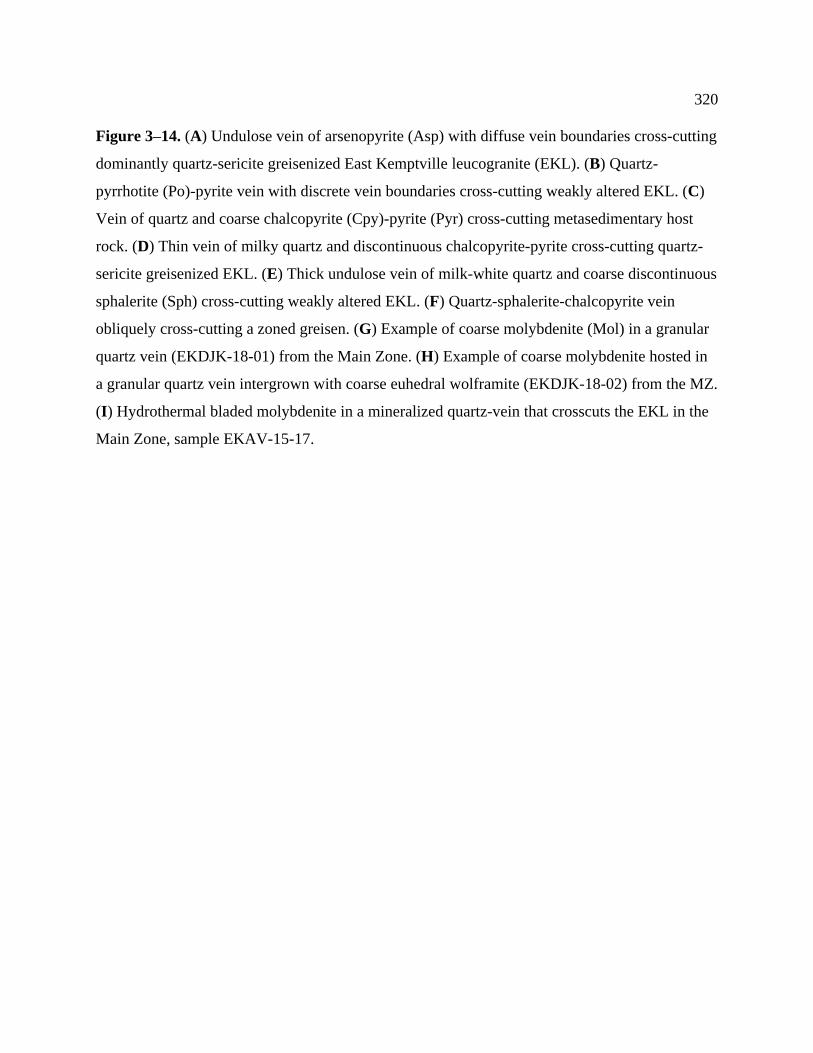
320
Figure 3–14. (A) Undulose vein of arsenopyrite (Asp) with diffuse vein boundaries cross-cutting
dominantly quartz-sericite greisenized East Kemptville leucogranite (EKL). (B) Quartz-
pyrrhotite (Po)-pyrite vein with discrete vein boundaries cross-cutting weakly altered EKL. (C)
Vein of quartz and coarse chalcopyrite (Cpy)-pyrite (Pyr) cross-cutting metasedimentary host
rock. (D) Thin vein of milky quartz and discontinuous chalcopyrite-pyrite cross-cutting quartz-
sericite greisenized EKL. (E) Thick undulose vein of milk-white quartz and coarse discontinuous
sphalerite (Sph) cross-cutting weakly altered EKL. (F) Quartz-sphalerite-chalcopyrite vein
obliquely cross-cutting a zoned greisen. (G) Example of coarse molybdenite (Mol) in a granular
quartz vein (EKDJK-18-01) from the Main Zone. (H) Example of coarse molybdenite hosted in
a granular quartz vein intergrown with coarse euhedral wolframite (EKDJK-18-02) from the MZ.
(I) Hydrothermal bladed molybdenite in a mineralized quartz-vein that crosscuts the EKL in the
Main Zone, sample EKAV-15-17.
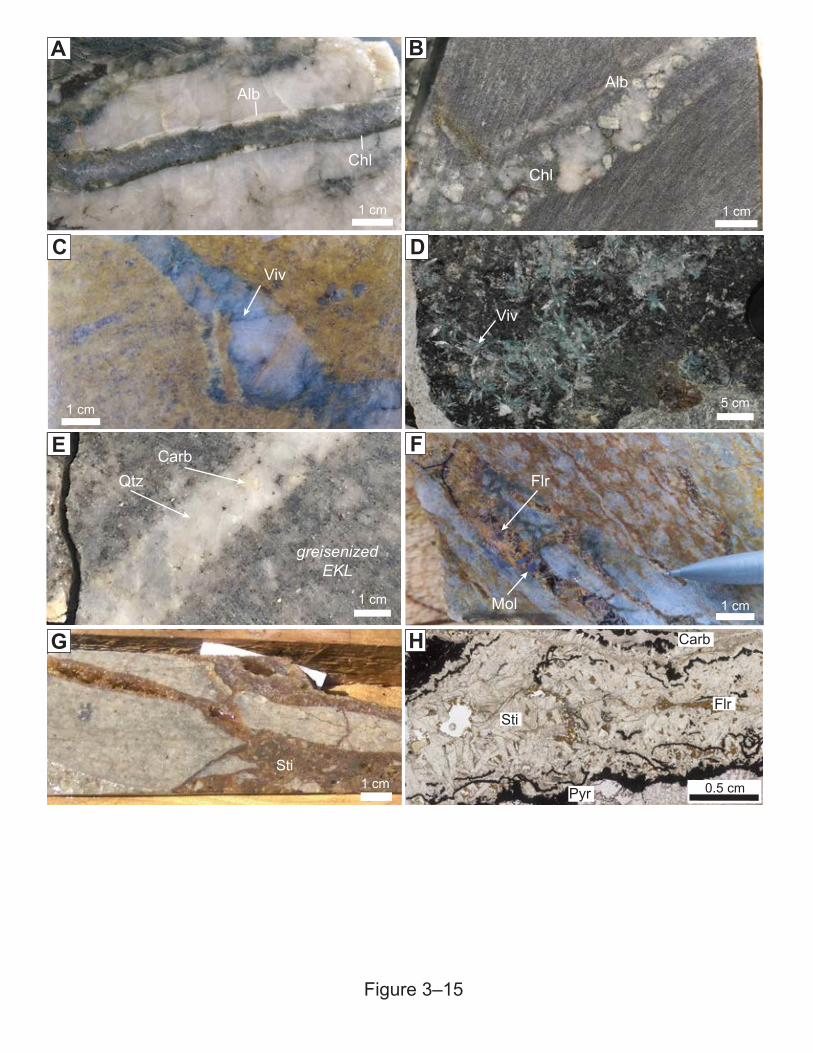
1 cm
Alb
Chl
1 cm
Alb
Chl
1 cm
1 cmMol
Flr
1 cm
Viv
0.5 cm
FlrSti
Pyr
Carb
Sti
5 cm
Viv
1 cm
QtzCarb
greisenizedEKL
Figure 3–15
E
DC
BA
F
G H
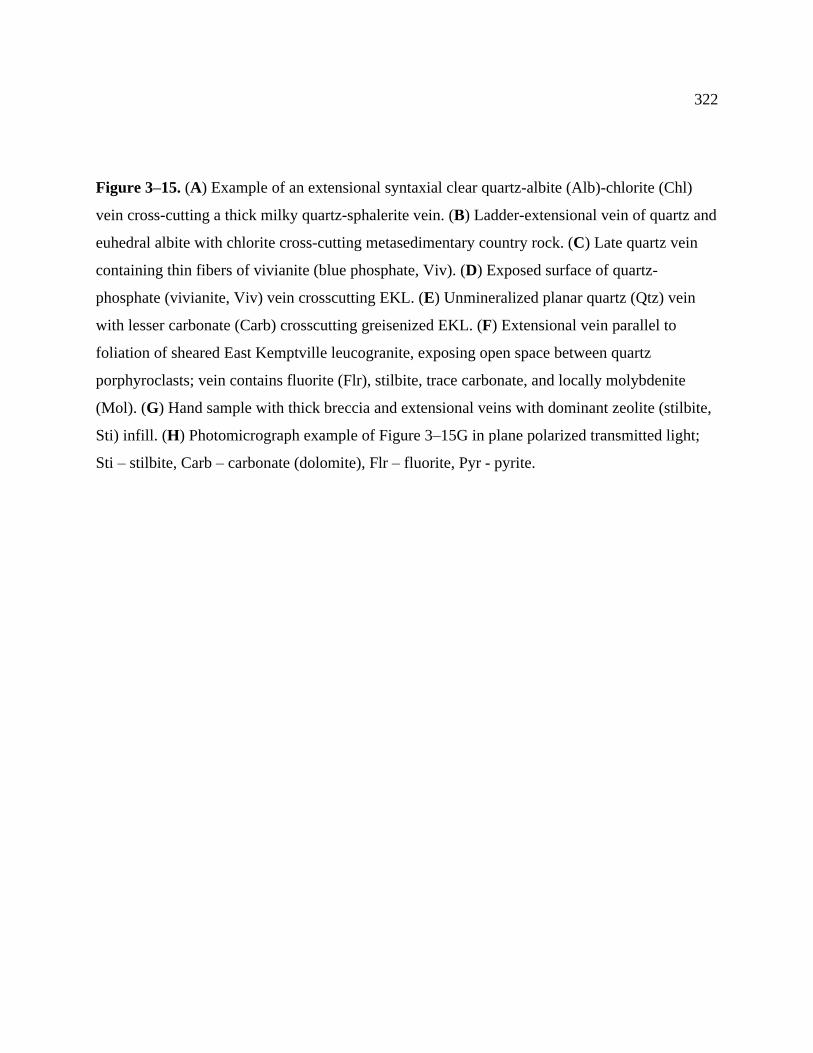
322
Figure 3–15. (A) Example of an extensional syntaxial clear quartz-albite (Alb)-chlorite (Chl)
vein cross-cutting a thick milky quartz-sphalerite vein. (B) Ladder-extensional vein of quartz and
euhedral albite with chlorite cross-cutting metasedimentary country rock. (C) Late quartz vein
containing thin fibers of vivianite (blue phosphate, Viv). (D) Exposed surface of quartz-
phosphate (vivianite, Viv) vein crosscutting EKL. (E) Unmineralized planar quartz (Qtz) vein
with lesser carbonate (Carb) crosscutting greisenized EKL. (F) Extensional vein parallel to
foliation of sheared East Kemptville leucogranite, exposing open space between quartz
porphyroclasts; vein contains fluorite (Flr), stilbite, trace carbonate, and locally molybdenite
(Mol). (G) Hand sample with thick breccia and extensional veins with dominant zeolite (stilbite,
Sti) infill. (H) Photomicrograph example of Figure 3–15G in plane polarized transmitted light;
Sti – stilbite, Carb – carbonate (dolomite), Flr – fluorite, Pyr - pyrite.
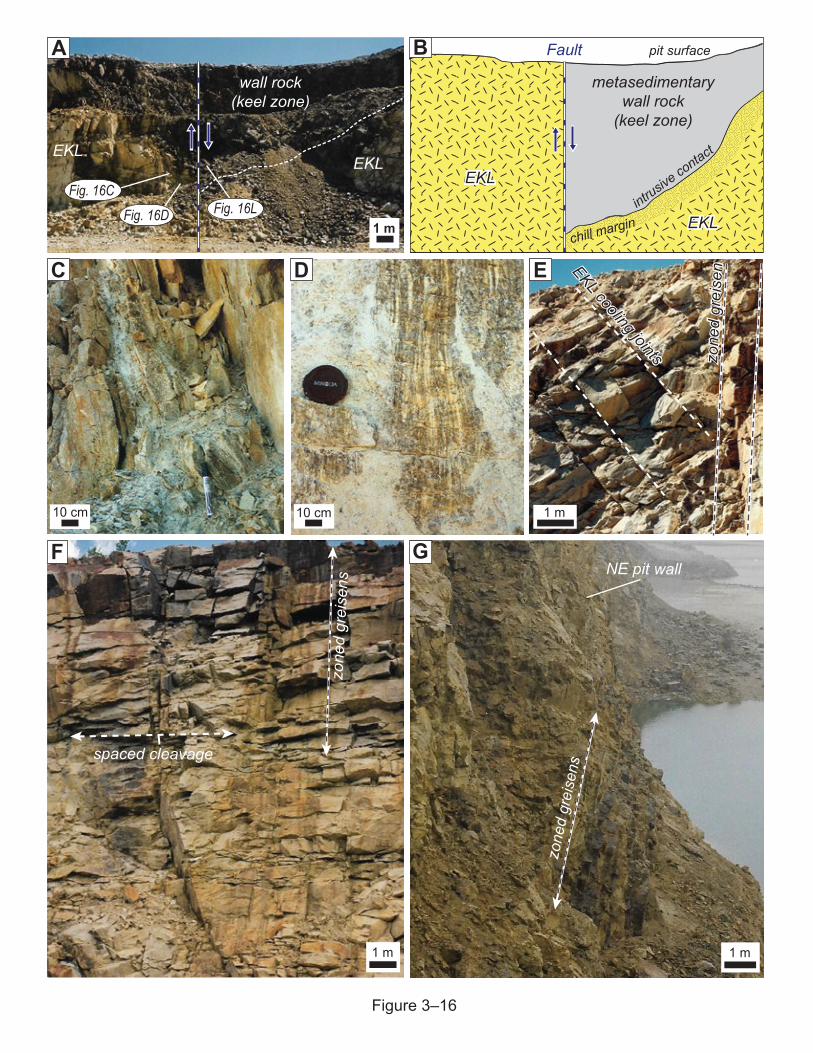
1 m
pit surface
metasedimentarywall rock
(keel zone)
intrusiv
e contact
chill margin
Fault
EKL
EKL
EKL
EKL1 mFig. 16D
Fig. 16C
EKLEKL
wall rock(keel zone)
Fig. 16L
10 cm 10 cm 1 m
1 m
NE pit wall
1 m
zone
d gr
eise
ns
spaced cleavage
zone
d gr
eise
nzo
ned
grei
senEKL cooling joints
EKL cooling joints
zone
d gr
eise
ns
Figure 3–16
A B
C D E
F G
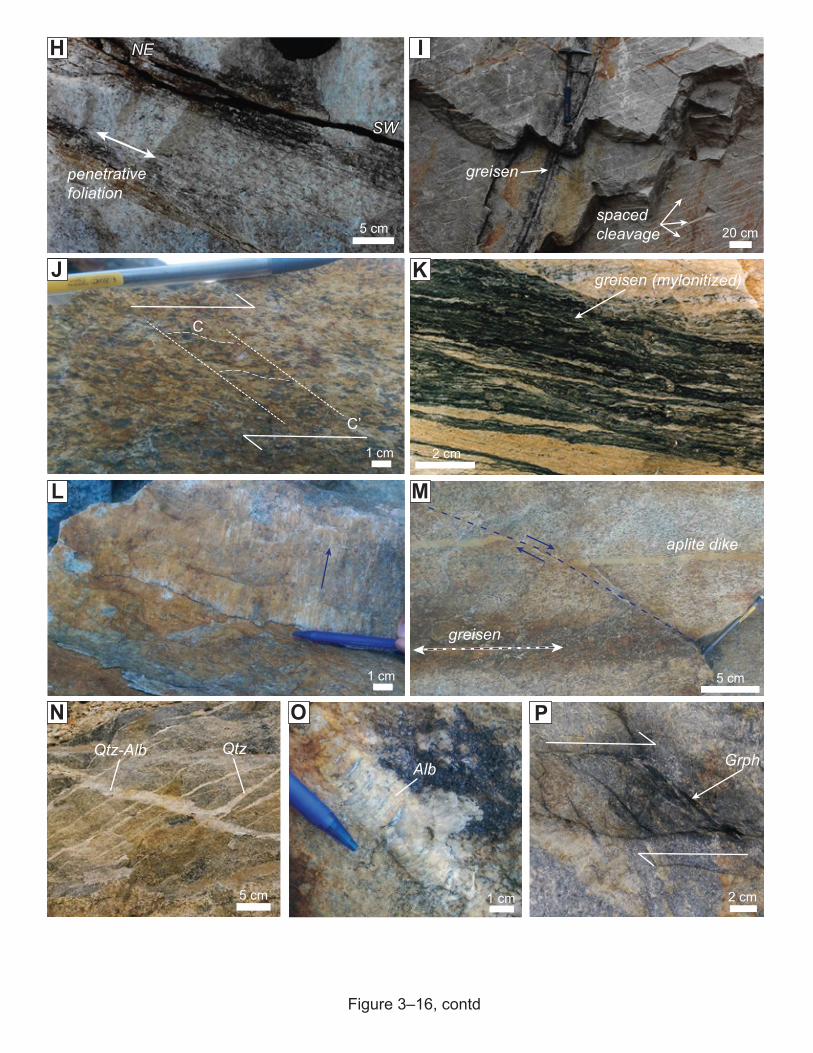
20 cmspaced cleavage
greisen
NENE
SWSW
penetrative foliation
5 cm
C’
C
1 cm 2 cm
greisen (mylonitized)
2 cm5 cm 1 cm
1 cm 5 cm
J K
H I
P
L M
N O
greisen
aplite dike
GrphAlbQtz-Alb
Figure 3–16, contd
Qtz
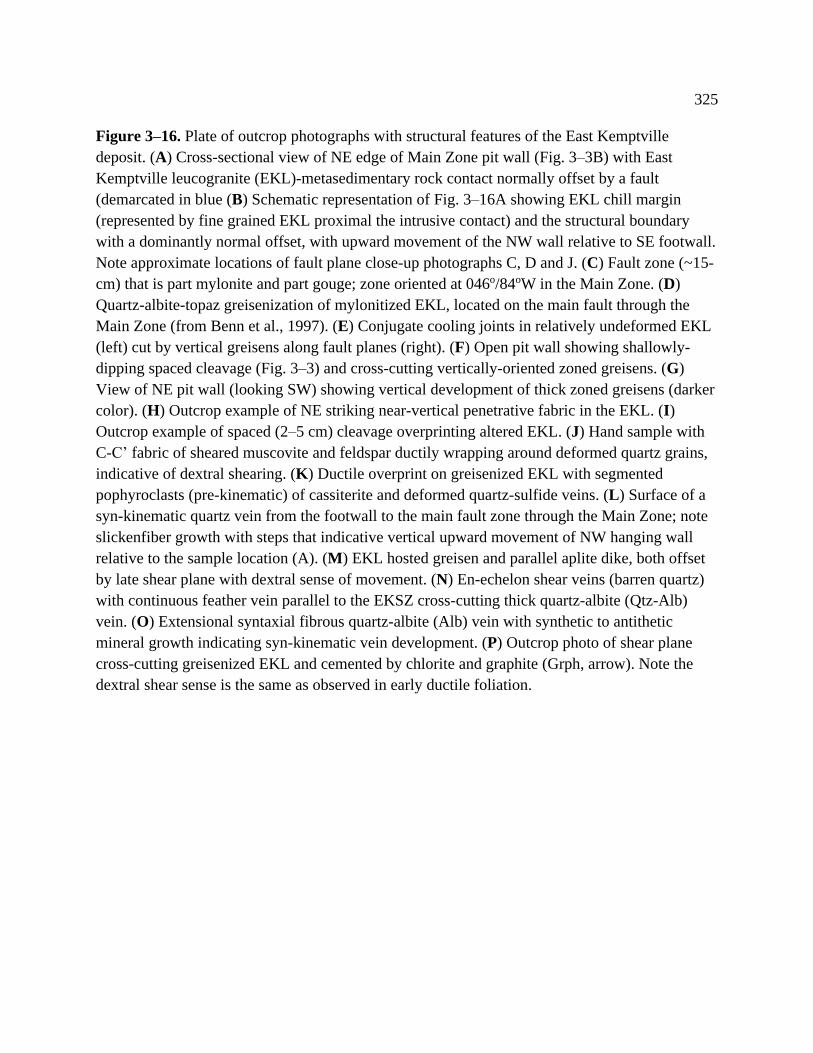
325
Figure 3–16. Plate of outcrop photographs with structural features of the East Kemptville
deposit. (A) Cross-sectional view of NE edge of Main Zone pit wall (Fig. 3–3B) with East
Kemptville leucogranite (EKL)-metasedimentary rock contact normally offset by a fault
(demarcated in blue (B) Schematic representation of Fig. 3–16A showing EKL chill margin
(represented by fine grained EKL proximal the intrusive contact) and the structural boundary
with a dominantly normal offset, with upward movement of the NW wall relative to SE footwall.
Note approximate locations of fault plane close-up photographs C, D and J. (C) Fault zone (~15-
cm) that is part mylonite and part gouge; zone oriented at 046o/84oW in the Main Zone. (D)
Quartz-albite-topaz greisenization of mylonitized EKL, located on the main fault through the
Main Zone (from Benn et al., 1997). (E) Conjugate cooling joints in relatively undeformed EKL
(left) cut by vertical greisens along fault planes (right). (F) Open pit wall showing shallowly-
dipping spaced cleavage (Fig. 3–3) and cross-cutting vertically-oriented zoned greisens. (G)
View of NE pit wall (looking SW) showing vertical development of thick zoned greisens (darker
color). (H) Outcrop example of NE striking near-vertical penetrative fabric in the EKL. (I)
Outcrop example of spaced (2–5 cm) cleavage overprinting altered EKL. (J) Hand sample with
C-C’ fabric of sheared muscovite and feldspar ductily wrapping around deformed quartz grains,
indicative of dextral shearing. (K) Ductile overprint on greisenized EKL with segmented
pophyroclasts (pre-kinematic) of cassiterite and deformed quartz-sulfide veins. (L) Surface of a
syn-kinematic quartz vein from the footwall to the main fault zone through the Main Zone; note
slickenfiber growth with steps that indicative vertical upward movement of NW hanging wall
relative to the sample location (A). (M) EKL hosted greisen and parallel aplite dike, both offset
by late shear plane with dextral sense of movement. (N) En-echelon shear veins (barren quartz)
with continuous feather vein parallel to the EKSZ cross-cutting thick quartz-albite (Qtz-Alb)
vein. (O) Extensional syntaxial fibrous quartz-albite (Alb) vein with synthetic to antithetic
mineral growth indicating syn-kinematic vein development. (P) Outcrop photo of shear plane
cross-cutting greisenized EKL and cemented by chlorite and graphite (Grph, arrow). Note the
dextral shear sense is the same as observed in early ductile foliation.
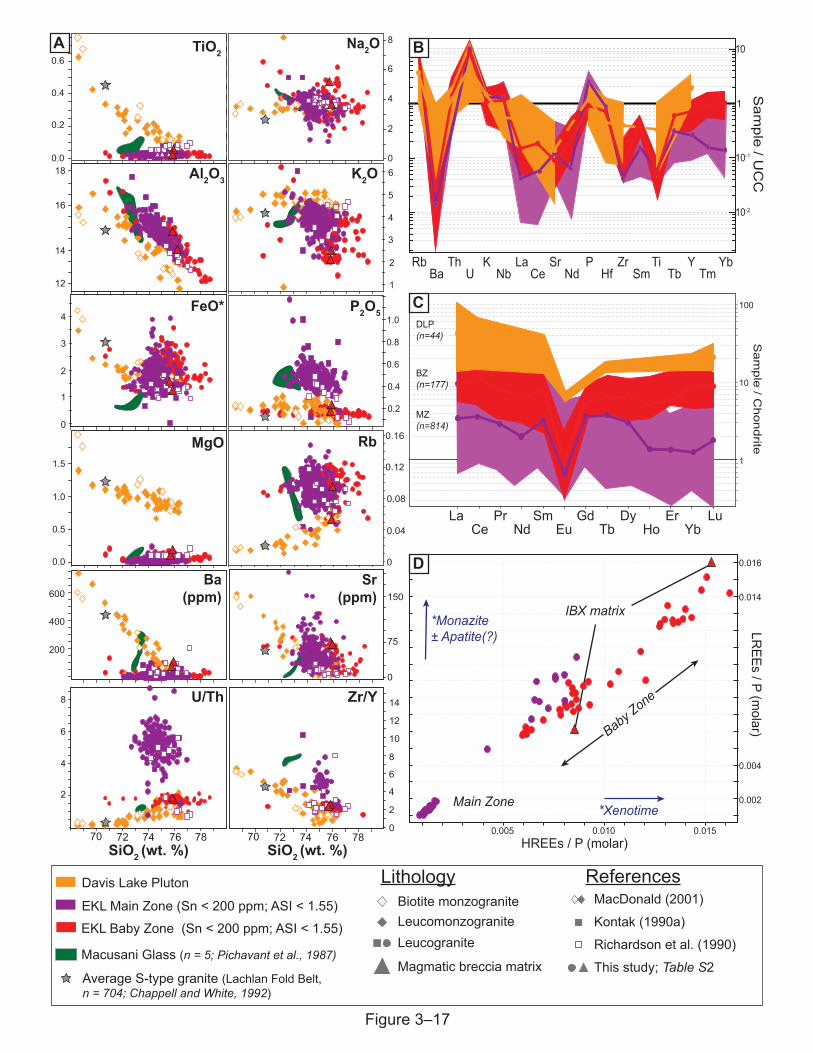
LithologyBiotite monzograniteLeucomonzograniteLeucogranite
Magmatic breccia matrix
Davis Lake Pluton
EKL Main Zone (Sn < 200 ppm; ASI < 1.55)EKL Baby Zone (Sn < 200 ppm; ASI < 1.55)
References
Average S-type granite (Lachlan Fold Belt, n = 704; Chappell and White, 1992)
Macusani Glass (n = 5; Pichavant et al., 1987)
MacDonald (2001)
This study; Table S2
Richardson et al. (1990)
Kontak (1990a)
0.8
1.0
0.6
0.4
0.2
6
8
4
2
0
0.08
0.04
0
0.12
0.16
150
75
0
0.6
0.4
0.2
0.0
TiO2
16
18
14
12
4
2
1
0
3
FeO*
Al2O3
1.0
0.5
0.0
1.5
MgO
400
200
600Ba
(ppm)
7270 74 76
U/Th
6
8
4
2
SiO2 (wt. %) 78
4
5
3
2
1
6
Na2O
K2O
P2O5
14
12
10
0
6
8
4
2
Zr/Y
7270 74 76SiO2 (wt. %)
78
Rb
Sr(ppm)
100
10
1
LaCe
PrNd
SmEu
GdTb
DyHo
ErYb
Lu
MZ(n=814)
BZ(n=177)
DLP(n=44) S
ample / C
hondriteS
ample / U
CC
10-1
10-2
1
10
RbBa
ThU Nb
K LaCe
Sr PNd
ZrHf Sm
TiTb
YTm
Yb
A
C
Figure 3–17
0.005 0.010 0.015HREEs / P (molar)
0.002
0.004
0.014
0.016
LREEs / P (m
olar)
IBX matrix
Main Zone
Baby Zone
*Xenotime
*Monazite± Apatite(?)
B
D
327
Figure 3–17. (A) Scatter plots of major and trace element concentrations as well as ratios in the
less altered granitic rocks from various parts of the Davis Lake Pluton (DLP) and from the East
Kemptville leucogranite (EKL) at the deposit (i.e., Baby and Main zones). The grey star depicts
average values for S-Type granites (from Chappell and White, 1992) and the field of samples
from the F-rich Macusani glass of Peru is shown in green (Pichavant et al., 1987). Note, number
of samples shown in Fig. 3–17C. (B) Multi-element plot normalized to average upper continental
crust (Taylor and McLennan, 1995) with least altered samples from both ore zones and the DLP
plotted; fields for each suite are shown as different colors and averages (means) are shown as
lines for each field. (C) Spider-diagram with average rare-earth element (REE) concentrations
normalized to chondrite (McDonough and Sun, 1995) for each of the aforementioned suites of
least altered granitic rocks; note the sample bias as the number of samples and suite of elements
analyzed is greater and broader for rocks of the Baby and Main zones relative to historic analyses
of the DLP. (D) Plot of molar light (L) REEs versus heavy (H) REEs, each normalized to P,
showing the discrimination between ore zones in the least altered EKL samples; included is the
felsic matrix to the magmatic breccias of the Baby Zone (IBX). Note that increases to molar
HREEs versus LREEs (with P normalized) suggests an increase in xenotime versus monazite and
apatite content.

K 2O /
Na 2O
100
10
1
0.1
3.90 - 8.173.50 - 3.902.80 - 3.49 0.00 - 2.79
Na2O (wt. %)
4.50 - 11.484.00 - 4.493.60 - 3.990.00 - 3.59
K2O (wt. %)
K2O
(wt.
%)
10
1
0.1
100 1000 10000Sn + Cu + Zn (ppm)
15.21 - 35.4814.91 - 15.2014.62 - 14.910.00 - 14.62
Al2O3 (wt. %)
100 1000 10000Sn + Cu + Zn (ppm)
76.70 - 87.9775.40 - 76.6974.70 - 75.390.00 - 74.69SiO2 (wt. %)
Sn + Cu + Zn (ppm)
Na 2O
+ K
2O (w
t. %
)
100 200 1000 100000.01
0.1
1
10
G R E I S E N I Z AT I O N
magma crystallization & deuteric alteration
Average S-type granite (n = 704) from Lachlan Fold Belt (Chappell and White 1992)
Bulk average ore sample (cut-off = 0.05 % Sn)
Figure 3–18
Sn (ppm)
Na 2O
+ K
2O (w
t. %
)
10 100 1000 10000
0.1
1
10
IBX matrix(Baby Zone)
A
B C
D E
DLP: n = 43 samplesBaby Zone: n = 596 samplesMain Zone: n = 1246 samples
329
Figure 3–18. (A) Scatter plot showing Na2O + K2O content versus ore-element content (Sn + Cu
+ Zn; Sn-only in inset) in DLP and East Kemptville leucogranite (EKL; entire sample suite,
legend same as Fig. 3–17); logarithmic scale. Note that the concentration of Na2O+K2O of the
bulk average ore sample in the deposit is near equal to that of the less altered (moderate Na2O +
K2O concentration) granitic rocks, and the reduction of Na2O+K2O content (suggestive of
greisen development) is related to an inflection near the bulk average. (B–E) Log-log plots
showing the ratio of K2O / Na2O (B, C) or K2O (D, E) versus ore-element content (Sn + Cu +
Zn) in the EKL and Davis Lake Pluton samples (entire sample suite, legend same as Fig. 3–17),
multiple major element changes are shown by point sizes in each plot and the inferred alteration
represented is shown in parentheses: (B) Na2O enrichment (albitization); (C) K2O enrichment
(sericitization); (D) Al2O3 enrichment (topaz-greisenization); (E) SiO2 enrichment
(greisenization and hydrothermal veining).
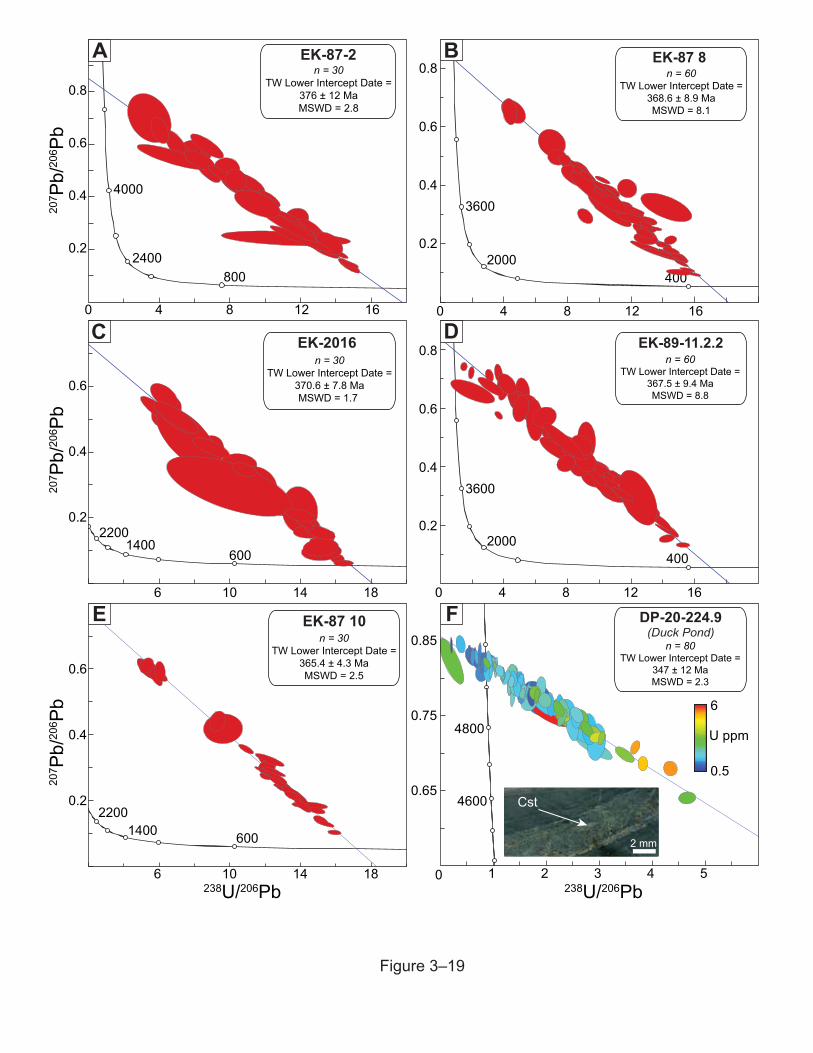
0.2
0.4
0.6
0.8
0 4 8 12 16
207 P
b/20
6 Pb
8002400
4000
n = 30TW Lower Intercept Date =
376 ± 12 MaMSWD = 2.8
EK-87-2
6001400
2200
EK-2016
6 10 14 18
0.2
0.4
0.6
207 P
b/20
6 Pb
n = 30TW Lower Intercept Date =
370.6 ± 7.8 MaMSWD = 1.7
0.2
0.4
0.6
6 10 14 18
60014002200
EK-87 10
238U/206Pb
207 P
b/20
6 Pb
n = 30TW Lower Intercept Date =
365.4 ± 4.3 MaMSWD = 2.5
4002000
3600
0.2
0.4
0.6
0.8
0 4 8 12 16
EK-87 8n = 60
TW Lower Intercept Date =368.6 ± 8.9 MaMSWD = 8.1
0.2
0.4
0.6
0.8
0
0
4 8 12 16
4002000
3600
EK-89-11.2.2n = 60
TW Lower Intercept Date =367.5 ± 9.4 MaMSWD = 8.8
0.65
0.75
0.85
1 2 3 4 5
4600
4800
DP-20-224.9(Duck Pond)
238U/206Pb
U ppm
0.5
6
n = 80TW Lower Intercept Date =
347 ± 12 MaMSWD = 2.3
Figure 3–19
Cst
2 mm
A B
C D
E F
331
Figure 3–19. Tera-Wasserburg concordia diagrams for cassiterite samples from the East
Kemptville deposit (A-E) and Duck Pond deposit (F) with an inset of dated material (cassiterite-
bearing lens of greisen in metapelite. Data point error ellipses are 2σ.

Plg+
Ksp
Ksp-Bt
AlbTpz,
Chl
Ca-, Na-smectite
K/Al
(mol
ar)
0.00.10.20.30.40.50.60.70.80.91.0
Musc(± Fe, Li)
0.0
0.2
0.4
0.6
0.8
1.0
K/Al (molar)
Plg+
Ksp
Ksp-Bt
Alb
Tpz,
Chl
Ca-, Na-smectite
0.00.10.20.30.40.50.60.70.80.91.0
K/Al
(mol
ar)
Plg+
Ksp
Ksp-Bt
Alb
Tpz,
Chl
0.0
0.2
0.4
0.6
0.8
1.0
K/Al (molar)Pl
g+Ks
p
Ksp-Bt
Alb
Tpz,
Chl
0.2 0.4 0.6 0.8 1.00.0
0.2
0.4
0.6
0.8
1.0
(2Ca + Na + K)/Al (molar)
K/Al (molar)Pl
g+Ks
p
Ksp-Bt
Alb
Tpz,
Chl
0.00.10.20.30.40.50.60.70.80.91.0
(2Ca + Na + K)/Al (molar)0.2 0.4 0.6 0.8 1.0
K/Al
(mol
ar)
Plg+
Ksp
Ksp-Bt
Alb
Tpz,
Chl
Sn <200 ppm (n = 386) (n = 187)
Sn <750 ppm (n = 859)
+ Musc (± Fe, Li)+ Ab- Ksp- Plg
+ Musc (± Fe, Li)+ Ab+Tpz- Ksp- Plg
+ Tpz- Ksp- Alb
+ Tpz+ Chl- Ksp- Alb
Main Zone (MZ) Baby Zone (BZ)
Sn >750 ppm (n = 385)
Musc(± Fe, Li)
Musc(± Fe, Li)
Musc(± Fe, Li)
Musc(± Fe, Li)
Musc(± Fe, Li)
(n = 250)
(n = 345)
field of variable sericite composition:muscovite and smectite withvariable Fe and Li substitution
Davis Lake Pluton (from MacDonald, 2001)
Erzgebirge granites (from Breiter, 2012)
Figure 3–20
B
A
C
alkali loss
albitization
alkali loss
albitization
greisenizationgreisenization
greisenizationgreisenization
333
Figure 3–20. Modified Pearce-element ratio diagram depicting aluminosilicate mineral content
(after Stanley and Madeisky, 1994) with population density clouds (red = dense sample data,
blue = sparse sample data) of granitic rocks from the two ore zones in the deposit (Main Zone on
left and Baby Zone on right) based on Sn-content tertials: (A) 0–205 ppm, (B) 0–739 ppm, (C)
all assays. The grey field in each plot represents the population of the less-evolved Davis Lake
Pluton (DLP) samples. Note the dashed black line in the plots of mineralized samples showing
the evolution in net change of alkalis and mineral assemblages for higher grade rocks; elements
added and removed from the deposit along these paths are shown in the inset to each plot. Ksp–
K-feldspar, Bt–biotite, Tpz–topaz, Chl–chlorite, Mus– muscovite, Alb–albite, Plg–plagioclase.
The shaded red triangle represents a field of variable mica content in sericite; between muscovite
and smectite and including varying degrees of Fe and Li substitution into the K+ site for
muscovite (represented along the [Tpz,Chl]–Mus tie-line).
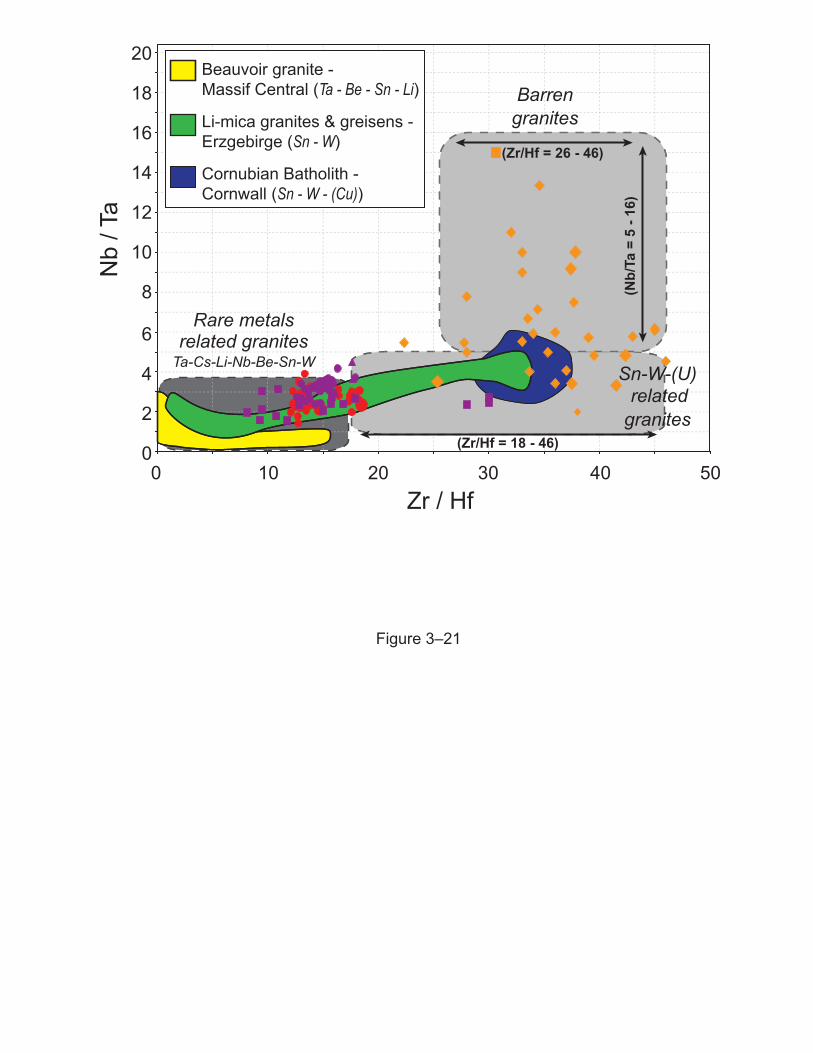
Figure 3–21
Nb
/ Ta
Zr / Hf0 10 20 30 40 50
0
2
4
6
8
10
12
14
16
18
20
(Zr/Hf = 26 - 46)
(Zr/Hf = 18 - 46)
(Nb/
Ta =
5 -
16)
Rare metalsrelated granites
Ta-Cs-Li-Nb-Be-Sn-W
Barrengranites
Sn-W-(U)related
granites
Beauvoir granite - Massif Central (Ta - Be - Sn - Li)
Li-mica granites & greisens - Erzgebirge (Sn - W)
Cornubian Batholith - Cornwall (Sn - W - (Cu))

335
Figure 3–21. Plot of whole rock Nb/Ta versus Zr/Hf showing least altered East Kemptville
leucogranite (EKL) sample data (legend same as previous geochemical figures) with fields of
granite fertility for lithophile element mineralization between i) rare metal-related mineralization
(Ta-Cs-Li-Nb-Be-Sn-W), ii) Sn-W-U related mineralization, and iii) barren granites; fields for
leucogranite data from other global Sn-bearing deposits are also shown, the legend for which is
depicted in the plot inset (modified from Ballouard et al., 2016). Note, a majority of Davis Lake
Pluton samples plot within the ‘barren granite’ field, whereas a majority of the EKL samples
(from both ore zones) plot within the ‘rare metal-related granite’ field and most closely related to
the Li-mica granites and greisens of the Erzgebirge region.
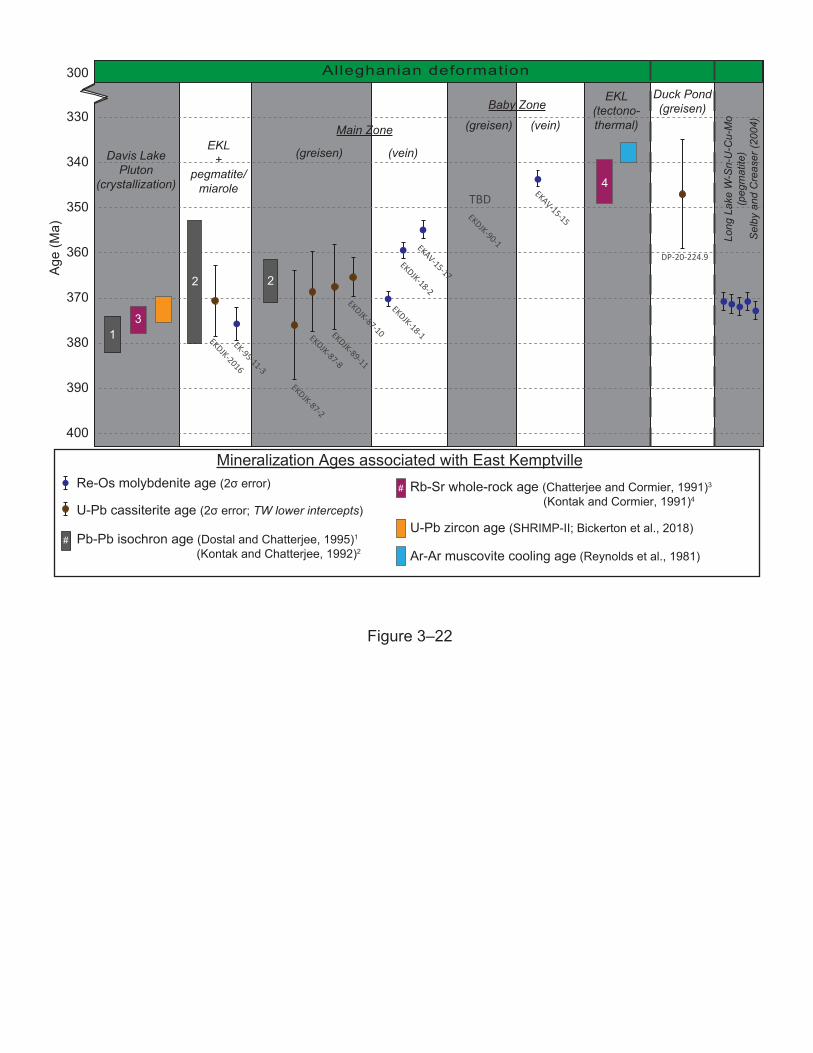
Alleghanian deformation
330
300
340
350
360
370
380
390
400
Age
(Ma)
EK-95-11-3
EKDJK-2016
EKDJK-87-2
EKDJK-87-8
EKDJK-89-11
EKDJK-87-10
2
DP-20-224.9
Re-Os molybdenite age (2σ error)
U-Pb cassiterite age (2σ error; TW lower intercepts)
Rb-Sr whole-rock age (Chatterjee and Cormier, 1991)3
(Kontak and Cormier, 1991)4#
U-Pb zircon age (SHRIMP-II; Bickerton et al., 2018)Pb-Pb isochron age (Dostal and Chatterjee, 1995)1
(Kontak and Chatterjee, 1992)2 Ar-Ar muscovite cooling age (Reynolds et al., 1981)
Mineralization Ages associated with East Kemptville
#
13
Davis LakePluton
(crystallization)
(greisen)EKL+
pegmatite/miarole
EKAV-15-17
EKDJK-18-1
EKDJK-18-2
(vein)
EKAV-15-15
(vein)
Duck Pond(greisen)
(greisen)
EKDJK-90-1
TBD
Long
Lak
e W
-Sn-
U-C
u-M
o(p
egm
atite
)S
elby
and
Cre
aser
(200
4)
Figure 3–22
EKL(tectono-thermal)
4
2
Baby Zone
Main Zone
337
Figure 3–22. Comparison plot showing compiled Re-Os molybdenite and U-Pb cassiterite
mineralization ages from this study. Also shown are previous geochronology (Rb-Sr whole rock,
Ar-Ar muscovite, U-Pb zircon) of the East Kemptville deposit and Duck Pond prospect as well
as associated intrusions. Also shown is the Re-Os molybdenite ages from the Long Lake deposit
in the New Ross Pluton, within the South Mountain Batholith (Selby and Creaser, 2004).
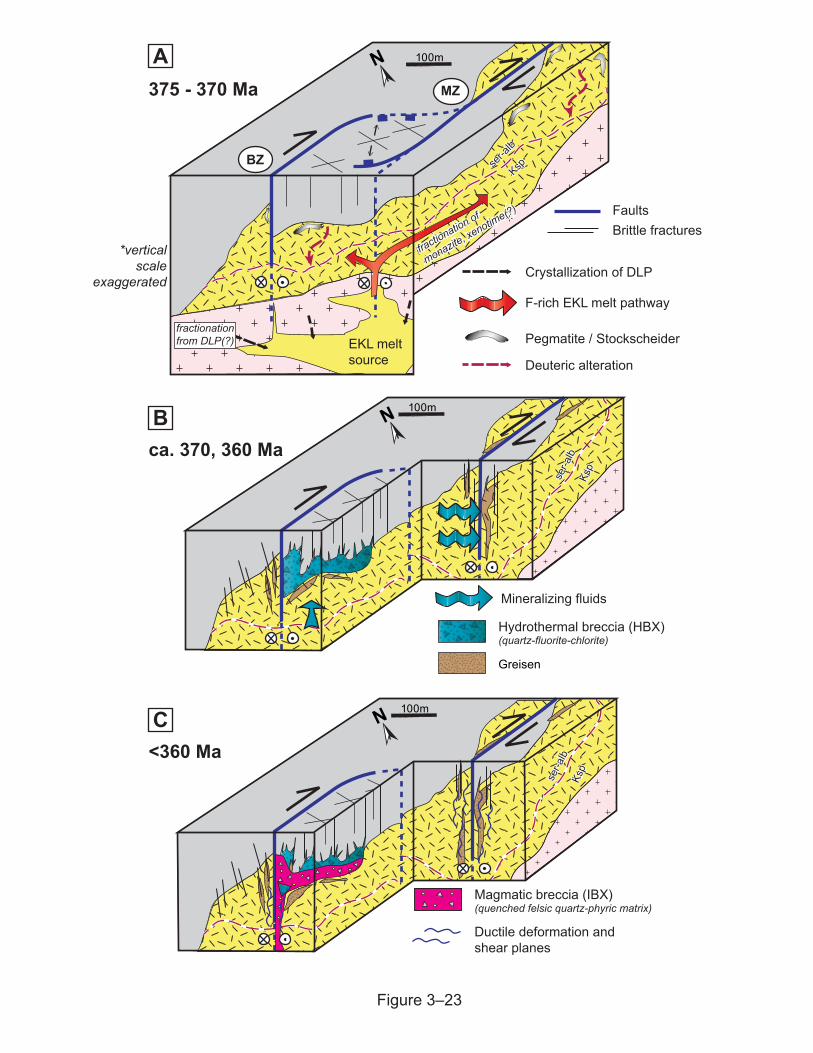
ser-a
lbKs
p
ser-a
lbKs
p
100mN
ser-a
lbKs
p
ser-a
lbKs
p
100mN
ser-a
lb
Kspser-a
lb
Ksp
N
fractionation of
monazite, xenotime(?)
fractionation of
monazite, xenotime(?)
100mA
Magmatic breccia (IBX)(quenched felsic quartz-phyric matrix)
Ductile deformation and shear planes
BZ
375 - 370 Ma
Bca. 370, 360 Ma
C<360 Ma
MZ
Figure 3–23
EKL melt source
fractionationfrom DLP(?)
*verticalscale
exaggeratedF-rich EKL melt pathway
Crystallization of DLP
Deuteric alteration
Brittle fracturesFaults
Pegmatite / Stockscheider
Mineralizing fluids
Hydrothermal breccia (HBX) (quartz-fluorite-chlorite)
Greisen
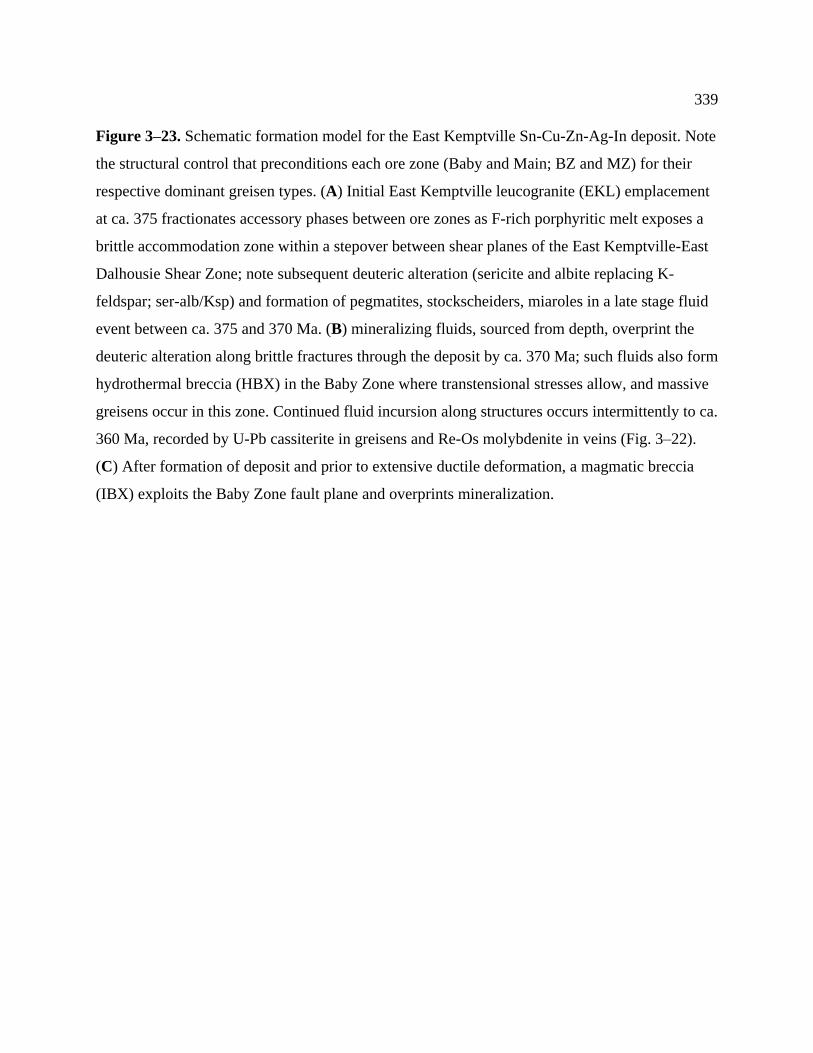
339
Figure 3–23. Schematic formation model for the East Kemptville Sn-Cu-Zn-Ag-In deposit. Note
the structural control that preconditions each ore zone (Baby and Main; BZ and MZ) for their
respective dominant greisen types. (A) Initial East Kemptville leucogranite (EKL) emplacement
at ca. 375 fractionates accessory phases between ore zones as F-rich porphyritic melt exposes a
brittle accommodation zone within a stepover between shear planes of the East Kemptville-East
Dalhousie Shear Zone; note subsequent deuteric alteration (sericite and albite replacing K-
feldspar; ser-alb/Ksp) and formation of pegmatites, stockscheiders, miaroles in a late stage fluid
event between ca. 375 and 370 Ma. (B) mineralizing fluids, sourced from depth, overprint the
deuteric alteration along brittle fractures through the deposit by ca. 370 Ma; such fluids also form
hydrothermal breccia (HBX) in the Baby Zone where transtensional stresses allow, and massive
greisens occur in this zone. Continued fluid incursion along structures occurs intermittently to ca.
360 Ma, recorded by U-Pb cassiterite in greisens and Re-Os molybdenite in veins (Fig. 3–22).
(C) After formation of deposit and prior to extensive ductile deformation, a magmatic breccia
(IBX) exploits the Baby Zone fault plane and overprints mineralization.
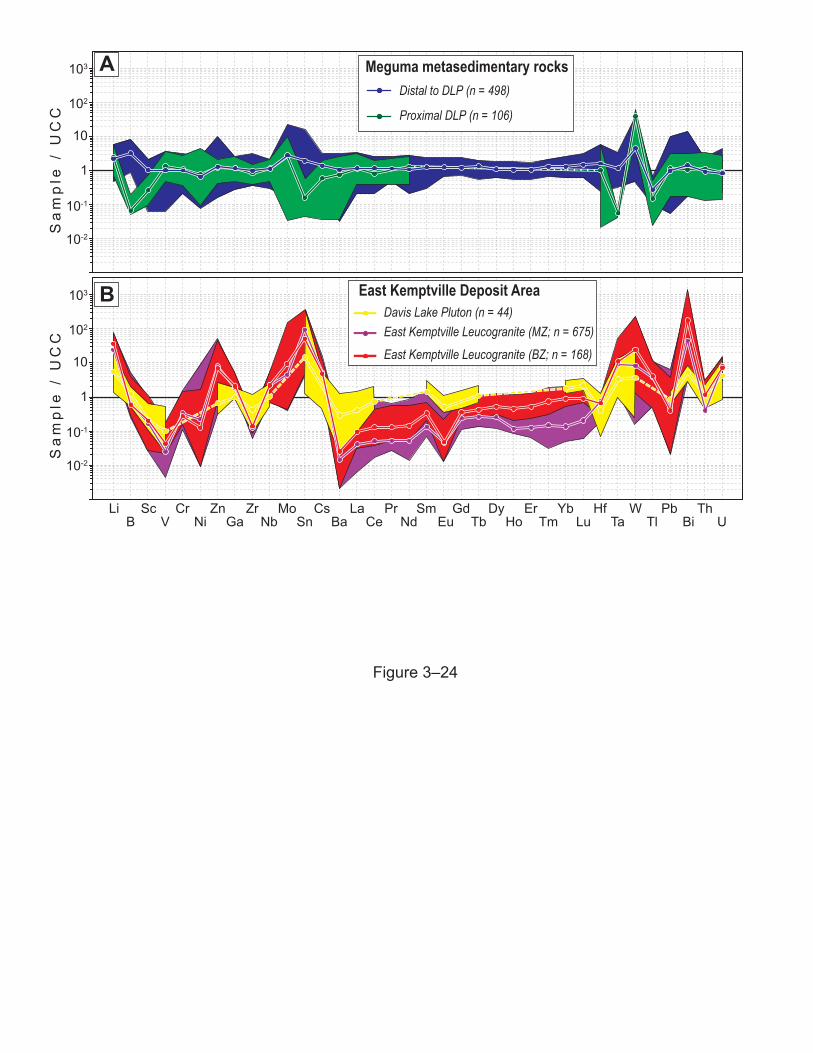
Sa
mp
le /
UC
C
LiB V
Sc CrNi Ga
Zn ZrNb Sn
Mo CsBa Ce
La PrNd Eu
SmTb
Gd DyHo Tm
Er YbLu Ta
HfTl
W PbBi U
Th
103
102
10
1
10-1
10-2
103
102
10
1
10-1
10-2
Sa
mp
le /
UC
C
Davis Lake Pluton (n = 44)East Kemptville Leucogranite (MZ; n = 675)
East Kemptville Leucogranite (BZ; n = 168)
East Kemptville Deposit Area
Figure 3–24
ADistal to DLP (n = 498)
Proximal DLP (n = 106)
Meguma metasedimentary rocks
B
341
Figure 3–24. Multi-element plots normalized to upper continental crust (UCC; Rudnick and
Gao, 2003) of (A) metasedimentary rocks of the Meguma terrane from southwest Nova Scotia,
divided into western and southern portions of the region (White, 2010b) and (B) least-altered
leucogranites of the Davis Lake Pluton and mineralization-associated East Kemptville
Leucogranite, divided into the two ore zones of Baby (BZ) and Main (MZ). Note the fields
represent all data and the lines represent average composition (mean). SW NS = southwest Nova
Scotia (Fig. 3–2).
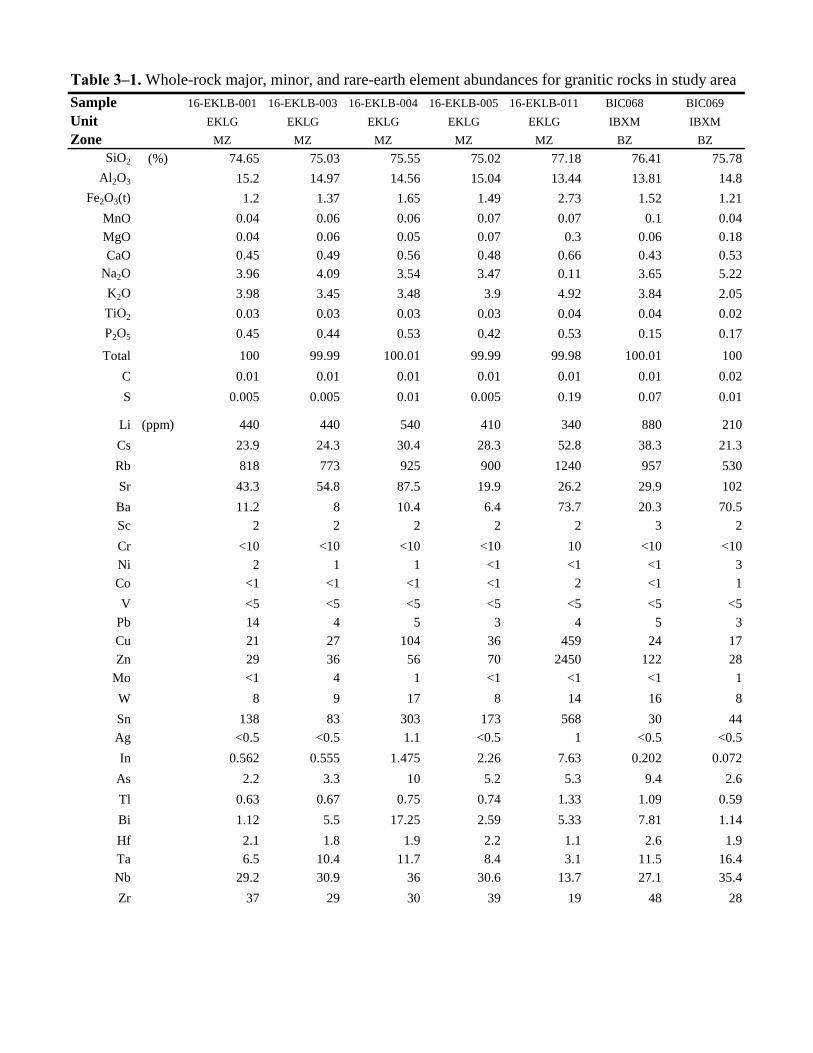
Table 3–1. Whole-rock major, minor, and rare-earth element abundances for granitic rocks in study area
Sample 16-EKLB-001 16-EKLB-003 16-EKLB-004 16-EKLB-005 16-EKLB-011 BIC068 BIC069
Unit EKLG EKLG EKLG EKLG EKLG IBXM IBXM
Zone MZ MZ MZ MZ MZ BZ BZ
SiO2 (%) 74.65 75.03 75.55 75.02 77.18 76.41 75.78
Al2O3 15.2 14.97 14.56 15.04 13.44 13.81 14.8
Fe2O3(t) 1.2 1.37 1.65 1.49 2.73 1.52 1.21
MnO 0.04 0.06 0.06 0.07 0.07 0.1 0.04
MgO 0.04 0.06 0.05 0.07 0.3 0.06 0.18
CaO 0.45 0.49 0.56 0.48 0.66 0.43 0.53
Na2O 3.96 4.09 3.54 3.47 0.11 3.65 5.22
K2O 3.98 3.45 3.48 3.9 4.92 3.84 2.05
TiO2 0.03 0.03 0.03 0.03 0.04 0.04 0.02
P2O5 0.45 0.44 0.53 0.42 0.53 0.15 0.17
Total 100 99.99 100.01 99.99 99.98 100.01 100
C 0.01 0.01 0.01 0.01 0.01 0.01 0.02
S 0.005 0.005 0.01 0.005 0.19 0.07 0.01
Li (ppm) 440 440 540 410 340 880 210
Cs 23.9 24.3 30.4 28.3 52.8 38.3 21.3
Rb 818 773 925 900 1240 957 530
Sr 43.3 54.8 87.5 19.9 26.2 29.9 102
Ba 11.2 8 10.4 6.4 73.7 20.3 70.5
Sc 2 2 2 2 2 3 2
Cr <10 <10 <10 <10 10 <10 <10
Ni 2 1 1 <1 <1 <1 3
Co <1 <1 <1 <1 2 <1 1
V <5 <5 <5 <5 <5 <5 <5
Pb 14 4 5 3 4 5 3
Cu 21 27 104 36 459 24 17
Zn 29 36 56 70 2450 122 28
Mo <1 4 1 <1 <1 <1 1
W 8 9 17 8 14 16 8
Sn 138 83 303 173 568 30 44
Ag <0.5 <0.5 1.1 <0.5 1 <0.5 <0.5
In 0.562 0.555 1.475 2.26 7.63 0.202 0.072
As 2.2 3.3 10 5.2 5.3 9.4 2.6
Tl 0.63 0.67 0.75 0.74 1.33 1.09 0.59
Bi 1.12 5.5 17.25 2.59 5.33 7.81 1.14
Hf 2.1 1.8 1.9 2.2 1.1 2.6 1.9
Ta 6.5 10.4 11.7 8.4 3.1 11.5 16.4
Nb 29.2 30.9 36 30.6 13.7 27.1 35.4
Zr 37 29 30 39 19 48 28
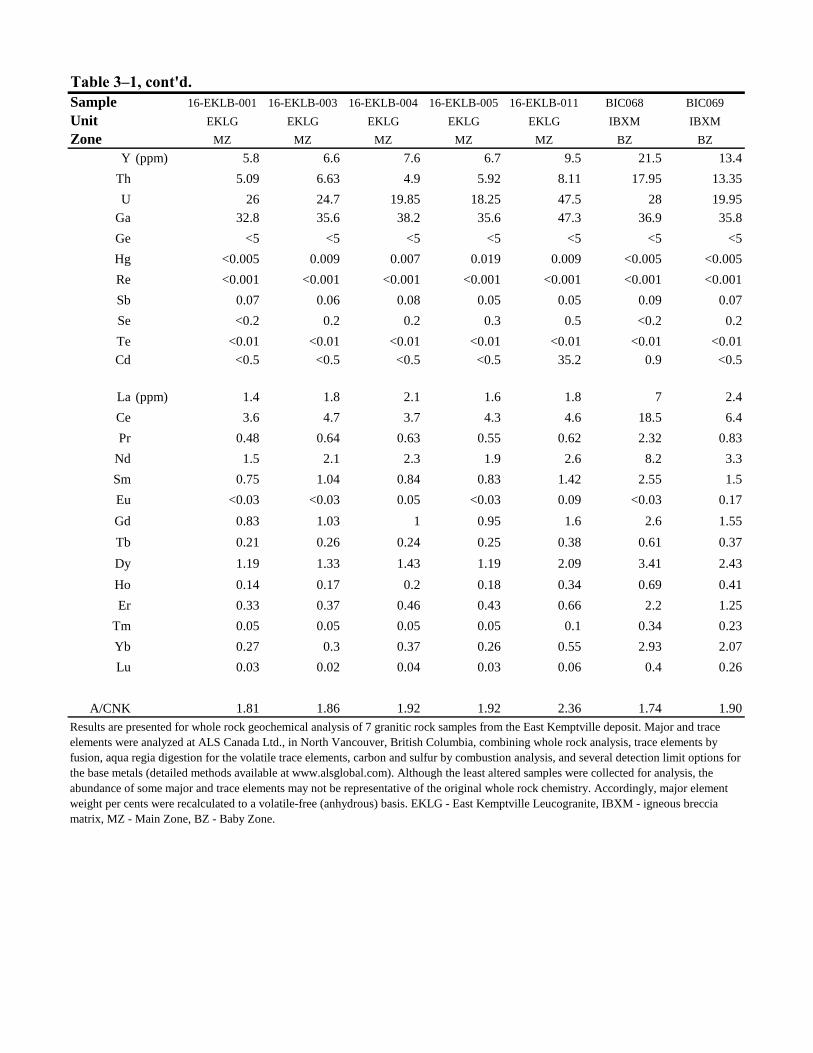
Table 3–1, cont'd.
Sample 16-EKLB-001 16-EKLB-003 16-EKLB-004 16-EKLB-005 16-EKLB-011 BIC068 BIC069
Unit EKLG EKLG EKLG EKLG EKLG IBXM IBXM
Zone MZ MZ MZ MZ MZ BZ BZ
Y (ppm) 5.8 6.6 7.6 6.7 9.5 21.5 13.4
Th 5.09 6.63 4.9 5.92 8.11 17.95 13.35
U 26 24.7 19.85 18.25 47.5 28 19.95
Ga 32.8 35.6 38.2 35.6 47.3 36.9 35.8
Ge <5 <5 <5 <5 <5 <5 <5
Hg <0.005 0.009 0.007 0.019 0.009 <0.005 <0.005
Re <0.001 <0.001 <0.001 <0.001 <0.001 <0.001 <0.001
Sb 0.07 0.06 0.08 0.05 0.05 0.09 0.07
Se <0.2 0.2 0.2 0.3 0.5 <0.2 0.2
Te <0.01 <0.01 <0.01 <0.01 <0.01 <0.01 <0.01
Cd <0.5 <0.5 <0.5 <0.5 35.2 0.9 <0.5
La (ppm) 1.4 1.8 2.1 1.6 1.8 7 2.4
Ce 3.6 4.7 3.7 4.3 4.6 18.5 6.4
Pr 0.48 0.64 0.63 0.55 0.62 2.32 0.83
Nd 1.5 2.1 2.3 1.9 2.6 8.2 3.3
Sm 0.75 1.04 0.84 0.83 1.42 2.55 1.5
Eu <0.03 <0.03 0.05 <0.03 0.09 <0.03 0.17
Gd 0.83 1.03 1 0.95 1.6 2.6 1.55
Tb 0.21 0.26 0.24 0.25 0.38 0.61 0.37
Dy 1.19 1.33 1.43 1.19 2.09 3.41 2.43
Ho 0.14 0.17 0.2 0.18 0.34 0.69 0.41
Er 0.33 0.37 0.46 0.43 0.66 2.2 1.25
Tm 0.05 0.05 0.05 0.05 0.1 0.34 0.23
Yb 0.27 0.3 0.37 0.26 0.55 2.93 2.07
Lu 0.03 0.02 0.04 0.03 0.06 0.4 0.26
A/CNK 1.81 1.86 1.92 1.92 2.36 1.74 1.90
Results are presented for whole rock geochemical analysis of 7 granitic rock samples from the East Kemptville deposit. Major and trace
elements were analyzed at ALS Canada Ltd., in North Vancouver, British Columbia, combining whole rock analysis, trace elements by
fusion, aqua regia digestion for the volatile trace elements, carbon and sulfur by combustion analysis, and several detection limit options for
the base metals (detailed methods available at www.alsglobal.com). Although the least altered samples were collected for analysis, the
abundance of some major and trace elements may not be representative of the original whole rock chemistry. Accordingly, major element
weight per cents were recalculated to a volatile-free (anhydrous) basis. EKLG - East Kemptville Leucogranite, IBXM - igneous breccia
matrix, MZ - Main Zone, BZ - Baby Zone.

Sample no.
Mineralization
type Zone
Total Re
(ppm)
187Re
(ppb)
187Os
(ppb)
Re-Os Age
(Ma)1
EK-95-11-3 pegmatite Baby 0.2375 0.1493 0.9385 376.2 ± 3.3
EKAV-15-15 border of IBX Baby 0.1193 74.97 0.4310 343.7 ± 1.7
EKAV-15-17 vein Main 0.03860 24.29 0.1440 354.9 ± 2.0
EKDJK-18-01 vein Main 1.741 1095 6.800 370.2 ± 1.6
EKDJK-18-02 vein Main 0.06500 41.00 0.1000 359.4 ± 1.8
Ages calculated using the decay constant λ187
Re = 1.666 x 10⁻¹¹
y-1
(Smoliar et al. 1996); 12σ
Table 3–2. Re-Os Isotope Data for the East Kemptville molybdenite samples

Table 3–3. U-Pb Cassiterite Summary of East Kemptville and Duck Pond samples
Sample no. Mineralization type Zone Age (Ma) error (2σ) n MSWD
EKDJK-87-2 zoned greisen Main zone 376 ± 12 30 2.8
EKDJK-2016 miarole Main zone 370.6 ± 7.8 30 1.7
EKDJK-87-8 zoned greisen Main zone 368.6 ± 8.9 60 8.1
EKDJK-89-11 zoned greisen Main zone 367.5 ± 9.4 60 8.8
EKDJK-87-10 zoned greisen Main zone 365.4 ± 4.3 30 2.5
DP-20-224.9 greisen Duck Pond 347 ± 12 80 2.3
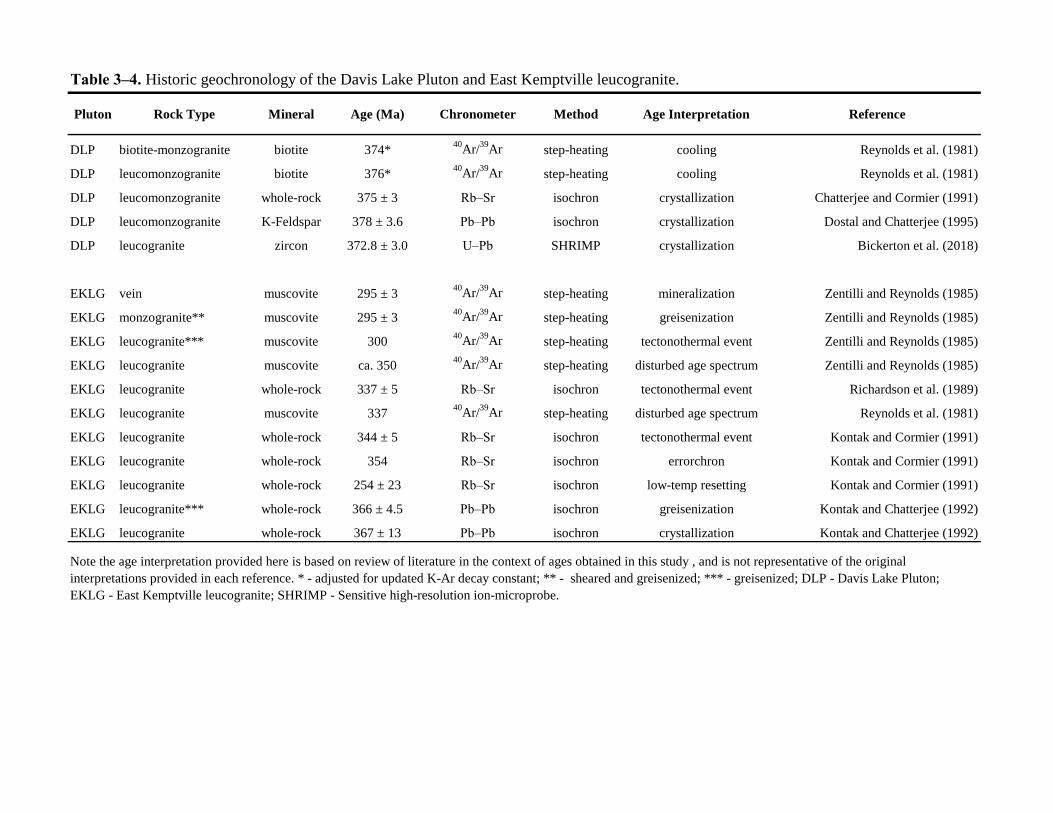
Table 3–4. Historic geochronology of the Davis Lake Pluton and East Kemptville leucogranite.
Pluton Rock Type Mineral Age (Ma) Chronometer Method Age Interpretation Reference
DLP biotite-monzogranite biotite 374*40
Ar/39
Ar step-heating cooling Reynolds et al. (1981)
DLP leucomonzogranite biotite 376*40
Ar/39
Ar step-heating cooling Reynolds et al. (1981)
DLP leucomonzogranite whole-rock 375 ± 3 Rb–Sr isochron crystallization Chatterjee and Cormier (1991)
DLP leucomonzogranite K-Feldspar 378 ± 3.6 Pb–Pb isochron crystallization Dostal and Chatterjee (1995)
DLP leucogranite zircon 372.8 ± 3.0 U–Pb SHRIMP crystallization Bickerton et al. (2018)
EKLG vein muscovite 295 ± 340
Ar/39
Ar step-heating mineralization Zentilli and Reynolds (1985)
EKLG monzogranite** muscovite 295 ± 340
Ar/39
Ar step-heating greisenization Zentilli and Reynolds (1985)
EKLG leucogranite*** muscovite 30040
Ar/39
Ar step-heating tectonothermal event Zentilli and Reynolds (1985)
EKLG leucogranite muscovite ca. 35040
Ar/39
Ar step-heating disturbed age spectrum Zentilli and Reynolds (1985)
EKLG leucogranite whole-rock 337 ± 5 Rb–Sr isochron tectonothermal event Richardson et al. (1989)
EKLG leucogranite muscovite 33740
Ar/39
Ar step-heating disturbed age spectrum Reynolds et al. (1981)
EKLG leucogranite whole-rock 344 ± 5 Rb–Sr isochron tectonothermal event Kontak and Cormier (1991)
EKLG leucogranite whole-rock 354 Rb–Sr isochron errorchron Kontak and Cormier (1991)
EKLG leucogranite whole-rock 254 ± 23 Rb–Sr isochron low-temp resetting Kontak and Cormier (1991)
EKLG leucogranite*** whole-rock 366 ± 4.5 Pb–Pb isochron greisenization Kontak and Chatterjee (1992)
EKLG leucogranite whole-rock 367 ± 13 Pb–Pb isochron crystallization Kontak and Chatterjee (1992)
Note the age interpretation provided here is based on review of literature in the context of ages obtained in this study , and is not representative of the original
interpretations provided in each reference. * - adjusted for updated K-Ar decay constant; ** - sheared and greisenized; *** - greisenized; DLP - Davis Lake Pluton;
EKLG - East Kemptville leucogranite; SHRIMP - Sensitive high-resolution ion-microprobe.
346
Chapter 4
Geochemical constraints of ore-forming fluids in a
mesothermal Sn-Zn-Cu-Ag-In deposit, East Kemptville, Nova
Scotia (Canada)
4.1 Abstract
The ca. 375 Ma Davis Lake Pluton in southwest Nova Scotia, Canada, hosts the greisen- and
vein-type Sn-Cu-Zn-Ag-In East Kemptville deposit in a topaz-muscovite leucogranite. The pre-
to syn-mineral pressure-temperature-compositional evolution of fluid is assessed by analysis of
fluid inclusion assemblages (FIAs), their key characteristics include: 1) no petrographic evidence
for fluid unmixing; 2) pervasive decrepitate textures result in primary FIAs being less common
than those of indeterminate origin; 3) ore fluid types comprise, in order of appearance through
the paragenesis, early liquid-vapor-halite (L–V–H ± solids; 29-38 wt% NaCl equiv.), a L–V type
(24-29 wt% NaCl equiv.), and a L–V ± CO2 type (10-23 wt% NaCl equiv.); 4) greisen and vein-
hosted FIAs yield homogenization temperatures indicating a wide range of trapping pressures
(i.e., 0.5-3.5 kbar) over a temperature range of 450–300oC; 5) evaporate mound analysis notes
Na–K–Fe–Mn ± Ca salts from early fluids and Na–K salt dominant mounds late in the
paragenesis; 6) LA-ICP-MS analysis of early fluid types are weakly enriched in Sn (13-196
ppm), Cu (7-147 ppm), Fe (0.9-1.7 wt. %), In (0.5-2 ppm), and S (0.3-1.2 wt. %); and 7)
δ18Oquartz signatures through the paragenesis are similar, and indicate variable mixing between
fluids, with initial δ18OH2O values of 9.3–7.1‰ and values as low as ~2.8‰ by the late vein

347
stages. The results indicate two main mineralization stages; the first under mesothermal
pressures between 450 and 400oC by magmatic fluids, and the second between 400 and 300oC
under a range of pressures while the system was diluted by external fluids. A magmatic fluid
source and fluid-rock exchange is suggested for the enrichment and precipitation in of early
greisen-style ore, whereas fluid-fluid mixing is the precipitation mechanism of late coarse
cassiterite and mineralized veins.
4.2 Introduction
Magmatic-hydrothermal tin mineralization is recognized globally to have dominantly formed in
settings within and proximal to highly differentiated felsic granites; involving the saturation and
exsolution of aqueous fluids from residual granitic melts, and partitioning Sn into the mobile
fluid phase (e.g., Kelly and Turneaure, 1970; Taylor, 1979; Charoy, 1986; Heinrich, 1990; Černý
et al., 2005; Lehmann, 2020). These deposits typically form in high-level settings (i.e., <2 km
depth) with a variety of styles, including: vein-type (stockwork, sheeted, massive lode); breccia;
disseminated; skarn; pegmatite; and greisen (e.g., Sillitoe et al., 1975; Taylor, 1979; Černý et al.,
2005; Kesler and Wilkinson, 2013). Less common are deposits localized to deeper settings (i.e.,
~2 kbar; Table 4–1) that are associated with rare-metal pegmatites, such as Greenbushes,
Australia (Partington et al., 1995) and Kamativi, Zimbabwe (Rijks and van der Veen, 1972),
where mineralization is associated with late-stage metasomatic events of controversial origin
(i.e., magmatic versus hydrothermal). The formation of these deposits requires: 1) Sn enrichment
348
in a magmatic reservoir, typically by extensive fractional crystallization and differentiation; 2)
ore-bearing fluid transport, typically by focusing magmatic fluids into structural traps; and 3)
precipitation of dissolved Sn by fluid-rock interaction, cooling, boiling or dilution by fluid
mixing (e.g., Heinrich, 1990; Audétat et al., 2000; Korges et al., 2018; Schmidt, 2018).
Stanniferous greisen-style deposits are the product of acid feldspar-destructive hydrothermal
alteration resulting in coarse-grained quartz-muscovite ± tourmaline ± fluorite/topaz ± cassiterite
rock (Lehmann, 2020), whereas vein-style Sn mineralization typically has variable size,
morphology, and mineralogy, with the following major features (cf. Pollard and Taylor, 1986): i)
a spatial relationship with the apices of host granites or overlying wall-rocks; (ii) formation of
subparallel, sheeted vein systems; (iii) a diversity of mineral phases with zonal characteristics;
and (iv) a general tendency for fluid evolution to progress from high-temperature, high-salinity
fluids to later, lower temperature and lower salinity fluids (e.g., Kelly and Turneaure, 1970;
Eadington, 1983; Kontak and Clark, 2002).
Cassiterite (SnO2) is the most economically important mineral in tin deposits. Cassiterite
formation in granite-related hydrothermal veins is evidence for exsolution of magmatic aqueous
fluids and thus highlights the role aqueous fluids play in the formation of these deposits. Fluid
inclusion studies on cassiterite and paragenetically related quartz indicate typical formational
conditions to be high-level (i.e., <1 kbar) with temperatures of 300–500°C and bimodal fluid
salinity due to fluid unmixing, thus similar to what is found for porphyry Cu-Mo systems (from

349
~1 to >50 wt% NaCl equiv.; cf. Bodnar et al., 2014). In addition to the pressure-temperature (PT)
setting during ore deposition, fluid inclusions are also used to quantify fluid chemistry and
isotopic signature to understand fluid evolution and metal transport in many ore deposits: e.g.,
Cu-Mo (e.g., Heinrich et al., 1999; Ulrich et al., 2002; Williams-Jones and Heinrich, 2005);
orogenic gold (e.g., Garofalo et al., 2014; Morales et al., 2016; Fusswinkel et al., 2017; Kerr et
al., 2018; Tuba et al. 2019); and Sn-W (e.g., Audétat et al., 2000; Müller et al., 2001; Graupner et
al., 2005; Harlaux et al., 2017).
The mechanism of cassiterite precipitation and the conditions required to yield economic
concentrations may be better understood through fluid inclusion analysis. The various
mineralization styles for these deposits require favorable conditions that include, but are likely
not limited to, the oxidation and/or neutralization of an acidic ore-bearing fluid (Heinrich, 1990).
To obtain equilibrium, these reactions are typically balanced with the reduction and/or hydrolysis
of an externally-sourced fluid or host-rock/wall-rock components. Changes to the chemistry of
the mineralizing fluid thus reflects chemical changes to the host rock and may be quantified by
direct trace-element microanalysis of fluid inclusions hosted through a deposit paragenesis (e.g.,
Audétat et al., 1998; Heinrich et al., 1993). A similar approach that is relatively simple and
efficient is the semi-quantitative analysis of evaporate mounds from induced decrepitation of
fluid inclusions (e.g., Eadington, 1974; Haynes et al., 1988; Halter et al., 1998; Kontak, 2004).
Integration of the latter data with standard thermometric measurements to determine relative
350
proportions of cation and anion of fluid inclusions may be used to quickly ascertain the major
element composition of fluids and thus the stage of fluid evolution.
The East Kemptville Sn-Zn-Cu-Ag-In deposit (EKD) in southern Nova Scotia, Canada, is a low-
grade, moderate-tonnage deposit with initial reserves of ca. 58 Mt at 0.17 % Sn (Richardson et
al., 1982). This has since been updated by Avalon Advanced Materials Inc. following the
historical (1985-1992) production to a remaining in-ground measured and indicated resource of
22.97 Mt at 0.15% Sn (for a 0.1% Sn cut-off grade; Gowans et al., 2018); this resource still
remains the largest primary Sn deposit in North America. It is hosted by a topaz muscovite
leucogranite with mineralization in massive and zoned topaz-muscovite greisens. Previous
studies on the host leucogranite, mineral paragenesis and fluid-chemical attributes (e.g.,
Richardson et al., 1982, 1988, 1989; Kontak, 1990a, b, 1993, 1994; Halter et al., 1996, 1998;
Kontak et al., 2001) have established the EKD as a magmatic-hydrothermal system, much like
other Sn settings globally. However, in notable contrast to global analogues of this deposit type,
the EKD has features more typical of a mesothermal setting, such as emplacement depth of the
host leucogranite, the strong structural control of the greisens, and the PT conditions inferred
from fluid inclusion assemblages (FIAs) throughout the ore stages. Previous work has also
highlighted the unusually saline nature of mineralizing fluids (i.e., 25–40 wt% NaCl equiv.) that
shows no evidence for fluid unmixing; hence another atypical feature compared to other Sn
settings (e.g., Bodnar et al., 2014).

351
The greisen-related ore mineralization at the EKD is interpreted to result from oxidation and/or
acid neutralization and increasing pH associated with the fluid-rock interaction that accompanied
alteration along greisen fronts (Halter et al., 1996, 1998). The coarse-cassiterite coring to zoned
greisens (e.g., Kontak, 1994), however, suggests localized differences in ore depositional style
later in the deposit evolution. As ore deposition in many Sn systems involves fluids sourced from
both a hydrous magma source and external to the generative magma (e.g., Heinrich, 1995), this
study aims to identify and differentiate such influences and to quantify fluid-rock and fluid-fluid
interaction in the context of hydrothermal processes that initiate ore deposition. To evaluate such
conditions in any deposit setting, essential features need to be constrained, which in this study
are: 1) the paragenetic stages in which metal concentration occur (i.e., greisen formation in the
EKD; Chapter 3); 2) the PT characteristics of ore fluids relative to the host leucogranite; 3) the
chemical characteristics of fluid types and notable changes through the deposit evolution (i.e.,
gains and losses of elements due to alteration and mineralization); and 4) the O isotopic signature
of mineralizing fluids to determine whether mineralization was produced by fluids sourced from
exsolution in the host leucogranite, or a deeper reservoir, or surrounding meteoric hydrothermal
convection cells.
To assess the above constraints, the PT and chemistry (PTX) of fluids hosted by mineralized
rocks in well-defined paragenetic stages were determined by integrating fluid inclusion and
stable isotope studies. The fluids were characterized via fluid inclusion microthermometry,
evaporate mound analysis, laser Raman mircospectroscopy (LRM), in situ laser ablation
352
inductively coupled mass spectrometry (LA ICP-MS) of FIAs, as well as δ18O using isotope-
ratio mass spectrometry (IRMS) and in situ secondary ion mass spectrometry (SIMS) on quartz
from throughout the paragenesis.
4.3 Geological Setting
4.3.1Regional and Local Geological Setting
The EKD is hosted by the ca. 375 Ma South Mountain Batholith (SMB) located in the Meguma
terrane (Nova Scotia, Canada), which is the most outboard lithotectonic terrane in the
Appalachian orogen (Fig. 4–1) and comprises a Lower Paleozoic stratigraphy dominated by the
metasedimentary rocks of the Meguma Supergroup. These rocks include Cambrian-Ordovician
metasandstones of the Goldenville Group and overlying slates and metasiltstones of the Halifax
Group. The Meguma terrane also comprises less extensive late Ordovician–Devonian
metasedimentary and rift-related metavolcanic rocks of the White Rock Formation, that lie
unconformably on the Meguma Supergroup (Fig. 4–1). The SMB is but one of several Late
Devonian felsic- to mafic intrusions that intrude these metasedimentary rocks. In the southwest
part of the terrane, these include hybridized granitoids of similar age to the SMB (e.g.,
Shelburne, Port Mouton, Barrington Passage plutons) or up to ca. 10 Ma younger (e.g., Seal
Island, Wedgeport, Clayton Hill plutons; Chapter 3, and references therein).
353
Neoacadian deformation of the Paleozoic stratigraphy is seen as northeast-trending, shallowly-
plunging open- to closed folds and related faults (Fig. 4–1A; Keppie and Dallmeyer, 1987;
Culshaw and Lee, 2006; van Staal, 2007). Timing of the regional deformation is constrained
from 40Ar/39Ar ages for whole-rock and neomorphic muscovite at 410 to 380 Ma (Reynolds et
al., 1987; Hicks et al., 1999; Kontak et al., 1998). More localized deformation of Alleghanian
age (ca. 300 Ma) is localized to the southwestern part of the Meguma terrane (Muecke et al.,
1988; Culshaw and Liesa, 1997) and overprints the EKD (Kontak et al., 1995).
The meta- to peraluminous SMB, which is the largest intrusion in the Appalachian orogen (ca.
7300 km2), hosts a variety of lithophile-element mineralization occurrences (e.g., Sn, W, U, Ta,
Nb; MacDonald, 2001). It is a composite granitoid intrusive complex with two plutonic stages
distinguished based on textural and mineralogical characteristics: an early stage I dominated by
biotite granodiorite to monzogranite, and a more evolved stage II of biotite-muscovite
monzogranite to leucogranite (Fig. 4–1; MacDonald 2001). The SMB and other Late Devonian
intrusions were emplaced syn- to post-tectonically (e.g., Horne et al., 1992; Benn et al., 1997,
1999) during the waning stages of the Neoacadian orogeny. The thermal aureole around the
SMB constrains its emplacement to ca. 3.5 kbar (~12 km depth in a normal geostatic gradient;
e.g., Raeside and Mahoney, 1996; Hilchie and Jamieson, 2008, 2014), which is supported by
several fluid inclusion studies on magmatic-hydrothermal settings (Kontak et al., 2001; Carruzzo
et al., 2000; Kontak and Kyser, 2011 and references therein).
354
Following regional deformation and emplacement of the SMB and associated intrusions, the
Meguma terrane experienced rapid uplift and erosion by ca. 360 Ma, as recorded by the clast
content and presence of Tournaisian fossils in the overlying Horton Group (Martel et al., 1993;
Murphy, 2000). Archibald et al. (2018) suggest uplift rates in the eastern Meguma terrane of 0.06
to 0.08 cm yr−1 and an associated regional geothermal gradient in the northern Meguma terrane
of between 39.5 °C km−1 and 67.8 °C km−1.
4.3.2 Davis Lake Pluton and East Kemptville Deposit
The Davis Lake Pluton, located in the southwestern part of the SMB, is a later stage II pluton in
the batholith and the only one to host significant mineralization in the EKD. It is zoned from an
early coarse-grained biotite to biotite-muscovite monzogranite to more evolved
leucomonzogranite (Dostal and Chatterjee, 1995, 2000). In addition to the EKD, several Sn-Cu-
Zn-Ag occurrences occur along the southwestern edge of the Davis Lake Pluton and further
westwards; hosted both within the pluton and the adjacent metasedimentary rocks (Fig. 4–1A).
The greisen mineralization of the EKD is hosted in the <1 km2 East Kemptville muscovite-topaz
leucogranite which is the most evolved part of the Davis Lake Pluton.
The southwestern termination of the Davis Lake Pluton is bound by two regional shear zones;
the NE-trending East Kemptville shear zone at its furthest west extent (EKSZ; Horne et al.,
1992; Kontak and Chatterjee, 1992; Figs. 4–1A to D, 4–2A, B), and the Tobeatic Shear Zone at
its eastern edge (Giles, 1985). Both these shear zones contain extensive hydrothermal
355
mineralization that is deformed in a brittle-ductile strain regime: the Flintstone Rock silica-clay
deposit formed dominantly by meteoric-dominant fluids in the latter (Kontak and Kyser, 2000);
and the greisen-hosted EKD, formed dominantly by magmatic fluids in the former.
The EKD shows evidence of greisens that form pre- to syn-kinematically, with preferred
alignment along the penetrative fabric through the deposit area (e.g., Fig. 4–2C). Deformation of
the EKD continued episodically after ore deposition, as evidenced by post-greisenization
structural features which include deformed greisen mineralization (e.g., Fig. 4–2D, E), post-
mineralization shear planes that are locally cemented by assemblages of chlorite and graphite
(e.g., Fig. 4–2F), en echelon shear veins of late, barren quartz (e.g., Fig. 4–2G), and extensional
second-generation veins (e.g., quartz-phosphate-albite-fluorite, Fig. 4–2H; Chapter 3). The
deposit area also records deformation and thermal overprinting related to the ca. 300 Ma
Alleghanian deformation (Kontak and Cormier, 1991; Kontak et al., 1995).
The deposit has two ore zones, the Baby (Fig. 4–1C) and Main (Fig. 4–1D). Although both zones
are enriched in similar elements (Sn, Zn, Cu, Ag, In) and centered on the EKSZ, their
lithological characteristics and contact-relationships differ. In the Main zone, mineralization is
wholly within the host East Kemptville leucogranite (EKL) with greisens most intensely
developed at shallowly-dipping intrusive contacts or along shear planes in the 25–30 m wide
EKSZ. In contrast, the Baby Zone is hosted by a pervasively greisenized leucograniteseated
beneath a pipe-shaped magmatic-hydrothermal breccia body. Most of the Baby Zone breccia
356
comprises a collapse breccia, characterized by angular fragments of hornfelsed country-rock
greywacke and argillite with thin reaction rims.
4.3.3 East Kemptville Mineralization and Paragenesis
The simplified paragenesis for the EKD (Fig. 4–3) is subdivided into several stages recognized at
the macro- and microscopic scale (Richardson et al., 1990; Kontak, 1990b): 1) emplacement of
the EKL, which includes crystallization of cassiterite-bearing pegmatites and miaroles (Fig. 4–
4A) in the Main Zone, and deuteric alteration; 2) quartz-topaz (± cassiterite) greisens, the first of
the two main ore stages, which involved partial replacement of the host leucogranite (i.e., K-
feldspar → albite → muscovite → topaz) and precipitation of early cassiterite (Fig. 4–4B to F);
3) a second hydrothermal ore stage with quartz-sulfide veins and late-stage sulfides, restricted to
within the EKL and related breccias, occluding porosity in earlier greisens. These veins evolved
from quartz + Cu-sulfide (chalcopyrite dominant) with lesser Sn (± W) oxide (Fig. 4–4D, E) to
quartz + Zn-sulfide (sphalerite dominant; Fig. 4–4F) with lesser accessory sulfides, phosphates
(e.g., aplite, triplite), and fluorite (Fig. 4–4G); 4) barren veins of quartz + carbonate ± albite,
fluorite, chlorite, and phosphates (Fig. 4–4H); and 5) veins with complex assemblages of
carbonate, phosphate, and zeolites that are typically found coating shear planes, pockets, or joint
surfaces. A minor but notable presence of graphite is in syn-kinematic veins throughout the
EKSZ and within greisens parallel to the shear zone (e.g., Kontak, 1990b; Chapter 3); graphite
occurs intergrown with sulfides or as fine-grained, disseminated masses (noted to result in the
357
dark grey greisen colour) and assays have indicated maximum amounts of 0.15 wt. % organic
carbon (Kontak, 1994).
4.4 Methods
4.4.1 Petrography
Petrographic analysis of fluid inclusions was completed at the Fluid Inclusion Laboratory,
Harquail School of Earth Sciences, Laurentian University (Sudbury, Ontario) using samples
collected from drill-core and during the active mining phase. Twenty-six quartz- and topaz-
bearing samples (Fig. 4–5) that collectively span the paragenesis were cut into polished thick
sections (100-150 µm) and observed using an Olympus BX-51 research microscope equipped
with a Qimaging MicroPublisher 5.0 RTV camera.
4.4.2 Microthermometry
Microthermometric measurements were performed in the aforementioned laboratory on a
Linkam TMS600 heating-freezing stage coupled to an Olympus BX-51 research microscope.
Calibration of the stage was done using synthetic fluid inclusions with measurements of the triple
points for pure CO2 (Tm[CO2] at –56.6oC) and pure water (Tm[Ice] at 0oC), in addition to the
critical point of pure water at 374oC. Total uncertainties for the microthermometric

358
measurements at a heating rate of 1oC/min, based on reproducibility of standards, range from ±
0.2oC for Tm[CO2] and Tm[Ice] and ± 2–3oC for high temperature runs.
Measurements of changes in the fluid inclusions were made for a total of 56 FIAs and included:
dissolution of halite (Tm[Halite]), total homogenization temperature (Th[LV→L]), freezing
temperature (Tf), first ice-melting temperature (Te), final ice-melting temperature (Tm(ice)), and
melting of hydrohalite (Tm(HH)) for aqueous inclusions, and for aqueous-carbonic inclusions
CO2 melting (Tm(CO2)) and homogenization (Th(CO2); LV→V), clathrate melting (Tm(Clath),
and the total homogenization (Th(total)). Salinities were calculated depending on the nature of
the chemistry of the inclusions: 1) for complex multi-component systems (i.e., H2O-NaCl ± KCl
± FeCl2 ± MnCl2 ± CaCl2) microthermometric data were plotted on a ternary eutectic diagram
(e.g., Lecumberri-Sanchez et al., 2015; Fig. 4–6); 2) for halite-bearing type 1 and 4b inclusions,
microthermometric data were plotted on a binary H2O-NaCl eutectic diagram (e.g., Bodnar,
2003); 3) for simple two-phase type 2 inclusions, refined salinities were calculated from
microthermometric data (i.e., Tm(ice) or Tm(HH) based on the equations of Bodnar (2003),
Steele-MacInnis et al. (2012), and Lecumberri-Sanchez et al. (2015); and 4) for aqueous-
carbonic inclusions in which CO2 clathrates were noted, in all cases as Th(CO2) > Tm(Clath), the
measured volumetric proportion of the carbonic phase at Th(CO2) was input into the algorithms
of Steele-MacInnis (2018) to calculate salinity (wt. % NaCl equiv.), molar volumes (cc/mol), and
iosochores.
359
4.4.3 Evaporate mound analysis
Evaporate salt mounds were analyzed following the method of Kontak (2004) with results
complementing earlier studies (Kontak, 2004; Kontak et al., 2001). Fluid inclusion-rich quartz
chips from 26 previously studied fluid inclusion sections spanning the paragenetic stages were
used. These quartz chips were heated in a Linkham stage at 50oC/min to induce decrepitation,
which typically occurred between 350 and 500oC. Quartz chips were subsequently removed,
placed on double-sided carbon tape adhered to a glass slide, and carbon coated. The salt mounds
(Fig. 4–7) were imaged using a JEOL 6400 scanning electron microscope (SEM) coupled to an
INCA Energy Dispersive Spectrometer (EDS) in the MicroAnalytical Centre (MAC) at
Laurentian University. Operating conditions were: 20 kV accelerating voltage, 1.00 nA beam
current, spot (<5 µm) or rastering mode depending mound size, and 5-40 s counting time. The
use of rastering mode on larger mounds was to address the issue of elemental fractionation
during mound formation (Kontak, 2004). The results were normalized to 100% after excluding
Si and O which relates to interference from the quartz substrate, in particular for the smaller
mounds.
4.4.4 Confocal Laser Raman Microspectroscopy
LRM was performed on aqueous-carbonic fluid inclusions in five polished wafer samples at
Saint Mary ’s University (Halifax, Nova Scotia, Canada). Analysis was done using a Horiba
360
Jobin-Yvon LabRam HR confocal Raman microscope equipped with a 100 mW 532-nm (green)
Nd-YAG diode laser that was used for excitation, an 800-mm spectrograph, and a Synapse 1024
× 256-pixel charged-coupled device (CCD) detector. Measurements were made in confocal mode
by focusing the laser beam through the optical path of an Olympus microscope using a 100x
short path length objective. Instrumental conditions used for identification of fluid inclusion-
hosted volatile phases, determination of the fermi diad spacing (between the SS-FD and 2v2-FD
Raman shift values of CO2), and spectrum collection were the same as those detailed in Kerr et
al. (2018). Determination of the presence and relative abundances (mol %) of volatile species
(e.g., H2O, CO2, CH4, N2) was done using the empirical quantification parameters and
methodologies summarized by Wopenka and Pasteris (1986, 1987), Dubessy et al. (1989), Burke
(2001), Beeskow et al. (2005), and Frezzotti et al. (2012). Wavelength-dependent relative Raman
scattering cross sections for each gas species were determined from Table 2 of Burke (2001, and
references therein). Instrumental efficiency factors for CO2 and CH4 were calculated from 7
reference material samples to be 0.83 ± 0.14 and 0.96 ± 0.19, respectively. Due to a lack of N2
and H2S standards, instrumental efficiency factors for these species are assumed to be unity;
thus, quantification of these species yields maximum possible mol % concentrations.
4.4.5 LA-ICP-MS analysis
Major- and trace-element compositions of fluid inclusions were determined using LA ICP-MS at
the Department of Earth Sciences, University of Toronto (Ontario, Canada) following the
361
protocols detailed in Heinrich et al. (2003) and Pettke (2006). The instrument used was an NWR
193 UC laser ablation system coupled to an Agilent 7900 inductively-coupled plasma quadruple
mass spectrometer. Flow rates used for a He carrier gas and an Ar plasma gas were 1.0 and 0.87
L/min, respectively, and tuning of the ICP-MS was done by monitoring mass-21/mass-42,
ThO/Th, and U/Th ratios in order to maintain a ThO production rate of <0.3 % and U/Th ~ 1.
Dwell times were set to 10 ms for all masses measured, except for Sn (40 ms) and In (20 ms).
Entire fluid inclusions, hosted by quartz or topaz, from a total of 16 samples (and over 32 FIAs)
across the mineral paragenesis, were pre-targeted and drilled out using a beam width set such
that ablation pit diameters were ~5–10 mm larger than the inclusion ablated (Fig. 4–8A, B) and
the resultant signals gave counts per second of combined background, host mineral, and
inclusion (Fig. 4–8C). Data are reduced to mass concentrations (in ppm) using an internal
standard based on wt% NaCl equiv., as determined from microthermometry. The elements used
to calibrate the host mineral signature throughout each analysis were Si and Al in quartz and
topaz, respectively. Trace-element quantification of fluid inclusions was performed using the
SILLS software (Guillong et al., 2008). Analyte sensitivities were calibrated for drift correction
by using the reference standard NIST610 that was ablated 2 times at the beginning and 2 times at
the end of each block of inclusions (50 analyses).
Quartz and/or topaz crystallized throughout the paragenesis at East Kemptville and
previous studies noted similar microthermometric properties of primary- to indeterminate-type
fluid inclusions in each of these phases, as well as spatially-associated cassiterite (e.g., Kontak,
362
1994; Halter et al., 1998; Kontak et al., 2001). For this reason, inclusions hosted by quartz and
topaz were subjected to LA-ICP-MS (and LRM) to fully characterize the chemistry of fluids
responsible for precipitation of all spatially-associated phases.
4.4.6 O isotopes
Various generations of quartz from across the deposit paragenesis (host leucogranite, greisens,
veins, breccia) were selected for oxygen isotopic analysis to characterize the δ18OH2O of pre- syn-
and post-mineralizing fluids. Complementary determination of δ18O was done on high-quality
quartz separates using conventional IRMS whereas in situ δ18O was done by measuring mounted
grains (25 per puck) using SIMS.
The SIMS analysis was done using a CAMECA 7f ion microprobe with a 3 nA cesium (Cs+)
primary beam accelerated (to 10 kV) onto the sample surface with a sputtering diameter of
approximately 20 µm. The instrument operated with a 300 V offset, –9 kV secondary
accelerating voltage, and a mass resolving power of 347 m/Δm. Grains of University of
Wisconsin rose quartz (UWQ-1) with a δ18O value of 12.3 ± 0.1‰ (Kelly et al., 2007) were used
as the quartz standard for oxygen-isotope analysis. The SIMS results from the standard were
compared to accepted isotopic compositions to calculate correction factors applied to the
unknowns measured during the same analytical session (e.g., Holliger and Cathelineau, 1988). A
detailed description on sample preparation, operating conditions, and method of correction for
instrumental mass fractionation and matrix effects is found in Fayek et al. (2002). Values are
363
reported using the δ notation relative to V-SMOW (Vienna standard mean ocean water);
replicate analyses were reproducible to ≤1.2‰.
For quartz separates, oxygen isotopic analysis was done at the Department of Geological
Sciences, University Saskatchewan, Saskatoon (Canada). Quartz was dissolved using the BrF5
technique (Clayton and Mayeda, 1963) and stable isotope measurements measured using VG
model 602C stable isotope mass spectrometer. As above, values are reported using the δ notation
relative to V-SMOW and replicate δ18O analyses were reproducible to ± 0.2‰ based on replicate
analyses of laboratory standards. Further details are provided in Kontak and Kerrich (1995).
4.5 Results
4.5.1 Fluid inclusion petrography and types
Quartz in the host EKL and various phases of the greisens and veins, such as quartz, topaz,
cassiterite, sphalerite, apatite, carbonate, and fluorite, are typically inundated with fluid
inclusions (Figs. 4–5 and 4–9A). Although each mineral contains abundant fluid inclusions,
those in relatively undeformed quartz and topaz are typically most suited for microthermometric
analysis due to their size (>5 µm; Fig. 4–9) and that either one or both of these mineral phases
occur in each stage of the paragenesis (Fig. 4–3); thus, FIAs in quartz and topaz formed the focus
of this study. The fluid inclusion types, as seen at room temperature (i.e., ~20-25oC), are
described below and the features of the inclusions are summarized in Table 4–2, with

364
representative examples in Figure 4–9. The FIAs were characterized using: 1) types and
proportion of phases; 2) shapes and size of inclusions; and 3) compositional data determined
from microthermometry, mound analysis, and LRM. Classification of inclusions in terms of their
time of entrapment (i.e., primary, secondary, pseudosecondary, indeterminate) follow the
protocols of Goldstein and Reynolds (1994) and Bodnar (2003).
Five inclusion types are recognized: (i) type 1: three- or four-phase, hypersaline aqueous
inclusions with halite(H) ± another solid (S) with 15–25% vapor phase (at 20 oC); (ii) type 2:
two- or three-phase aqueous and moderately saline inclusions (L-V ± H) with 20–40% vapor
phase; (iii) type 3: two- or three-phase aqueous-carbonic inclusions (i.e., LH2O-VCO2 or LH2O-
LCO2-VCO2) of lower salinity with 30–50% vapor phase; (iv) type 4a: two-phase aqueous
inclusions of lower salinity with 15–30% vapor phase; and (v) type 4b: three-phase moderately
saline aqueous inclusions with 15–30% vapor phase. The 4a and 4b FIA types are dominantly
recognized and distinguished from type 2 through their morphology and secondary origin; they
occur exclusively along trails parallel to deformation planes in pre- and syn-mineralization
quartz and topaz (Figs. 4–5A, D, 9F).
Of the five fluid inclusion types identified, types 1 to 3 are either of primary or of indeterminate
origin, whereas types 4a and 4b are exclusively of secondary origin. The primary types define
growth zones (Figs. 4–5C and 4–8B), whereas the indeterminate occur as generally large
inclusions (>10% of crystal diameter) forming isolated groups in three-dimensional (3D), non-
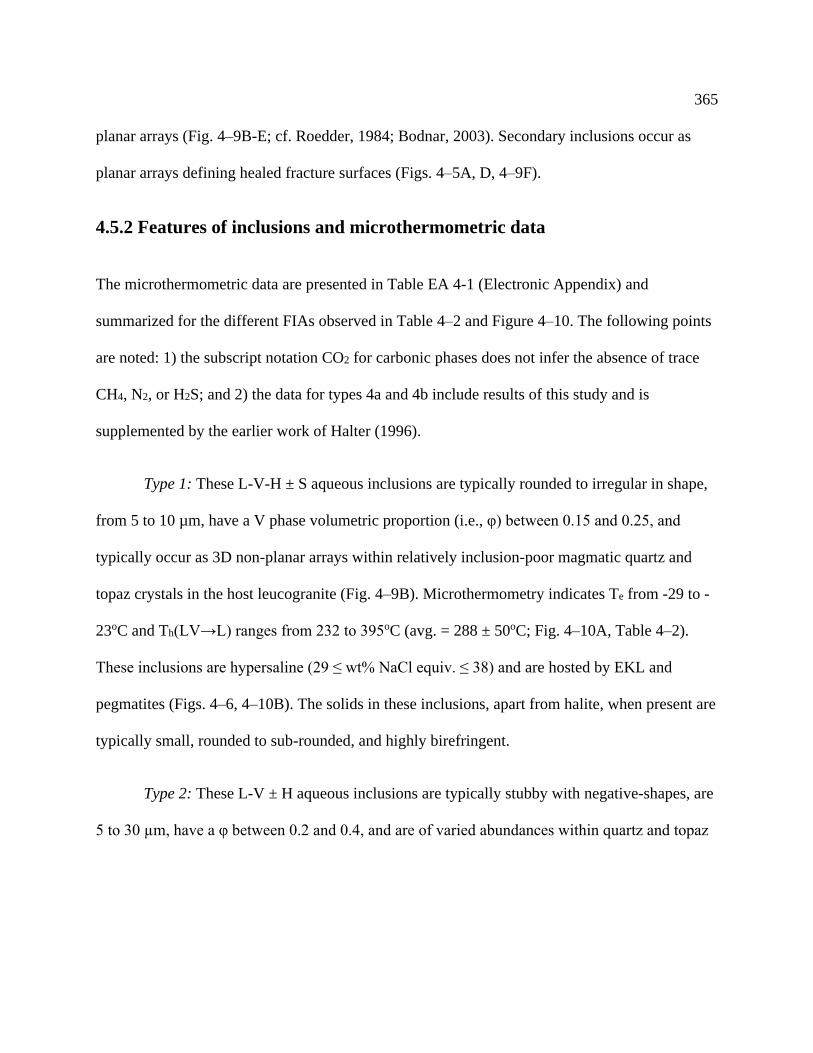
365
planar arrays (Fig. 4–9B-E; cf. Roedder, 1984; Bodnar, 2003). Secondary inclusions occur as
planar arrays defining healed fracture surfaces (Figs. 4–5A, D, 4–9F).
4.5.2 Features of inclusions and microthermometric data
The microthermometric data are presented in Table EA 4-1 (Electronic Appendix) and
summarized for the different FIAs observed in Table 4–2 and Figure 4–10. The following points
are noted: 1) the subscript notation CO2 for carbonic phases does not infer the absence of trace
CH4, N2, or H2S; and 2) the data for types 4a and 4b include results of this study and is
supplemented by the earlier work of Halter (1996).
Type 1: These L-V-H ± S aqueous inclusions are typically rounded to irregular in shape,
from 5 to 10 µm, have a V phase volumetric proportion (i.e., φ) between 0.15 and 0.25, and
typically occur as 3D non-planar arrays within relatively inclusion-poor magmatic quartz and
topaz crystals in the host leucogranite (Fig. 4–9B). Microthermometry indicates Te from -29 to -
23oC and Th(LV→L) ranges from 232 to 395oC (avg. = 288 ± 50oC; Fig. 4–10A, Table 4–2).
These inclusions are hypersaline (29 ≤ wt% NaCl equiv. ≤ 38) and are hosted by EKL and
pegmatites (Figs. 4–6, 4–10B). The solids in these inclusions, apart from halite, when present are
typically small, rounded to sub-rounded, and highly birefringent.
Type 2: These L-V ± H aqueous inclusions are typically stubby with negative-shapes, are
5 to 30 µm, have a φ between 0.2 and 0.4, and are of varied abundances within quartz and topaz
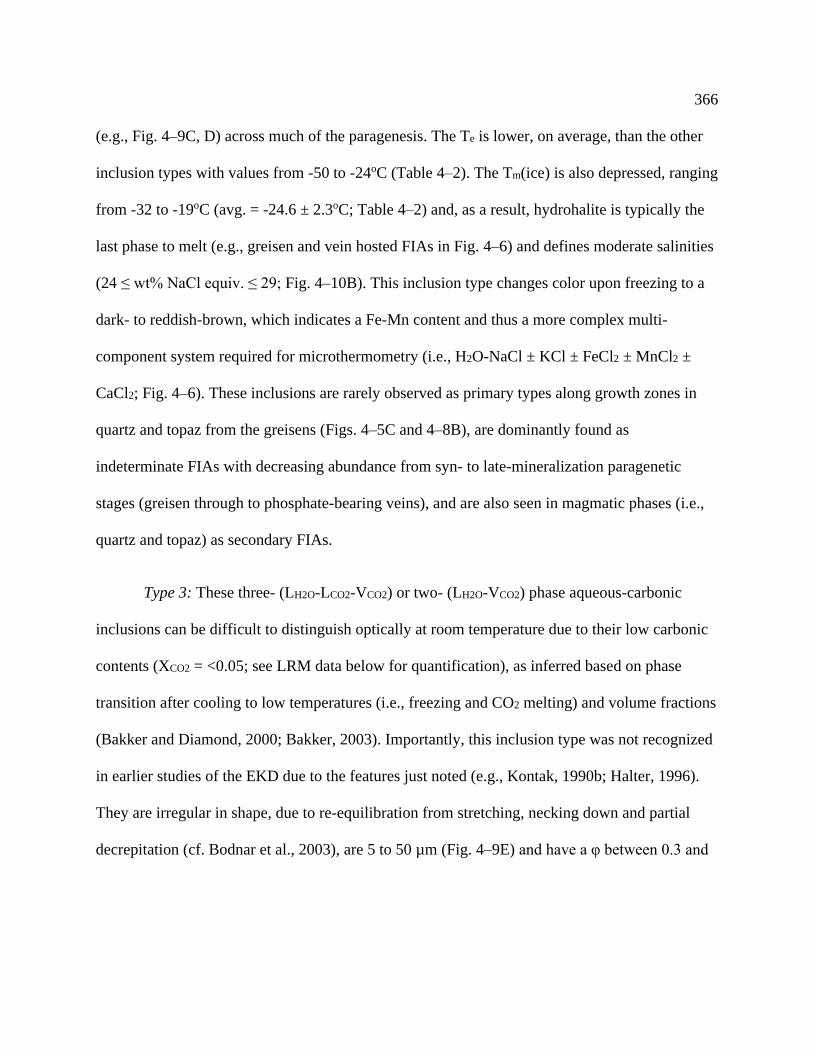
366
(e.g., Fig. 4–9C, D) across much of the paragenesis. The Te is lower, on average, than the other
inclusion types with values from -50 to -24oC (Table 4–2). The Tm(ice) is also depressed, ranging
from -32 to -19oC (avg. = -24.6 ± 2.3oC; Table 4–2) and, as a result, hydrohalite is typically the
last phase to melt (e.g., greisen and vein hosted FIAs in Fig. 4–6) and defines moderate salinities
(24 ≤ wt% NaCl equiv. ≤ 29; Fig. 4–10B). This inclusion type changes color upon freezing to a
dark- to reddish-brown, which indicates a Fe-Mn content and thus a more complex multi-
component system required for microthermometry (i.e., H2O-NaCl ± KCl ± FeCl2 ± MnCl2 ±
CaCl2; Fig. 4–6). These inclusions are rarely observed as primary types along growth zones in
quartz and topaz from the greisens (Figs. 4–5C and 4–8B), are dominantly found as
indeterminate FIAs with decreasing abundance from syn- to late-mineralization paragenetic
stages (greisen through to phosphate-bearing veins), and are also seen in magmatic phases (i.e.,
quartz and topaz) as secondary FIAs.
Type 3: These three- (LH2O-LCO2-VCO2) or two- (LH2O-VCO2) phase aqueous-carbonic
inclusions can be difficult to distinguish optically at room temperature due to their low carbonic
contents (XCO2 = <0.05; see LRM data below for quantification), as inferred based on phase
transition after cooling to low temperatures (i.e., freezing and CO2 melting) and volume fractions
(Bakker and Diamond, 2000; Bakker, 2003). Importantly, this inclusion type was not recognized
in earlier studies of the EKD due to the features just noted (e.g., Kontak, 1990b; Halter, 1996).
They are irregular in shape, due to re-equilibration from stretching, necking down and partial
decrepitation (cf. Bodnar et al., 2003), are 5 to 50 µm (Fig. 4–9E) and have a φ between 0.3 and
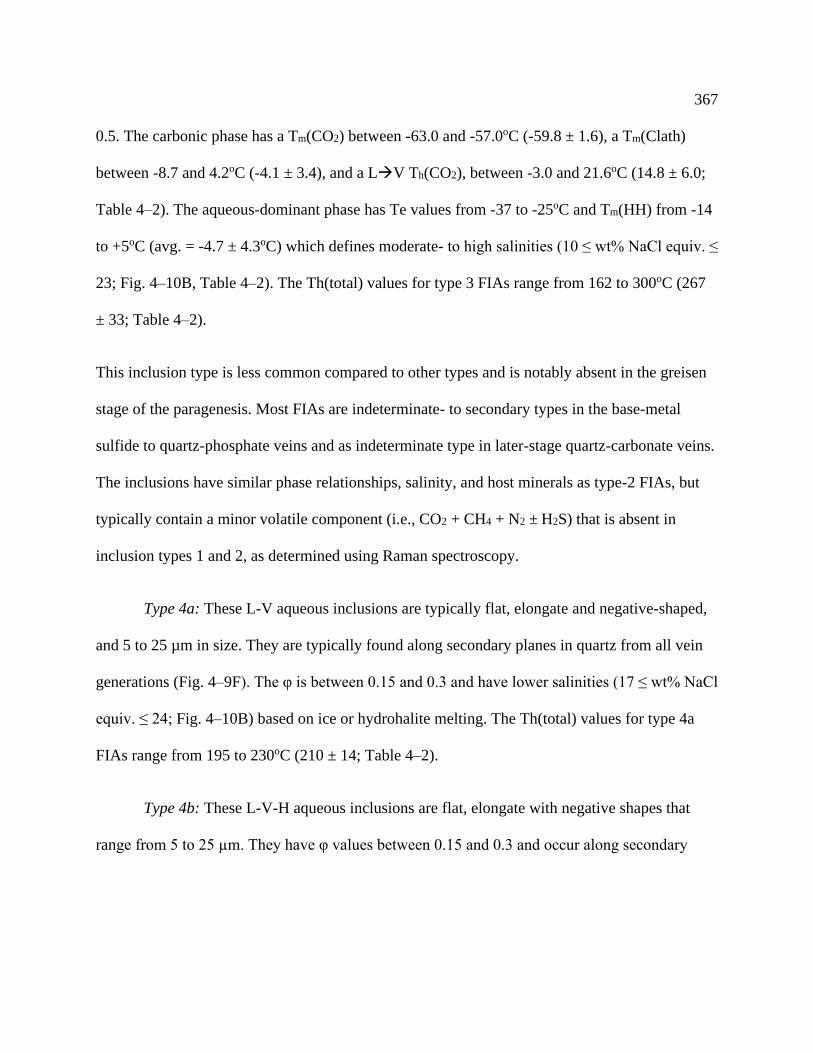
367
0.5. The carbonic phase has a Tm(CO2) between -63.0 and -57.0oC (-59.8 ± 1.6), a Tm(Clath)
between -8.7 and 4.2oC (-4.1 ± 3.4), and a L→V Th(CO2), between -3.0 and 21.6oC (14.8 ± 6.0;
Table 4–2). The aqueous-dominant phase has Te values from -37 to -25oC and Tm(HH) from -14
to +5oC (avg. = -4.7 ± 4.3oC) which defines moderate- to high salinities (10 ≤ wt% NaCl equiv. ≤
23; Fig. 4–10B, Table 4–2). The Th(total) values for type 3 FIAs range from 162 to 300oC (267
± 33; Table 4–2).
This inclusion type is less common compared to other types and is notably absent in the greisen
stage of the paragenesis. Most FIAs are indeterminate- to secondary types in the base-metal
sulfide to quartz-phosphate veins and as indeterminate type in later-stage quartz-carbonate veins.
The inclusions have similar phase relationships, salinity, and host minerals as type-2 FIAs, but
typically contain a minor volatile component (i.e., CO2 + CH4 + N2 ± H2S) that is absent in
inclusion types 1 and 2, as determined using Raman spectroscopy.
Type 4a: These L-V aqueous inclusions are typically flat, elongate and negative-shaped,
and 5 to 25 µm in size. They are typically found along secondary planes in quartz from all vein
generations (Fig. 4–9F). The φ is between 0.15 and 0.3 and have lower salinities (17 ≤ wt% NaCl
equiv. ≤ 24; Fig. 4–10B) based on ice or hydrohalite melting. The Th(total) values for type 4a
FIAs range from 195 to 230oC (210 ± 14; Table 4–2).
Type 4b: These L-V-H aqueous inclusions are flat, elongate with negative shapes that
range from 5 to 25 µm. They have φ values between 0.15 and 0.3 and occur along secondary
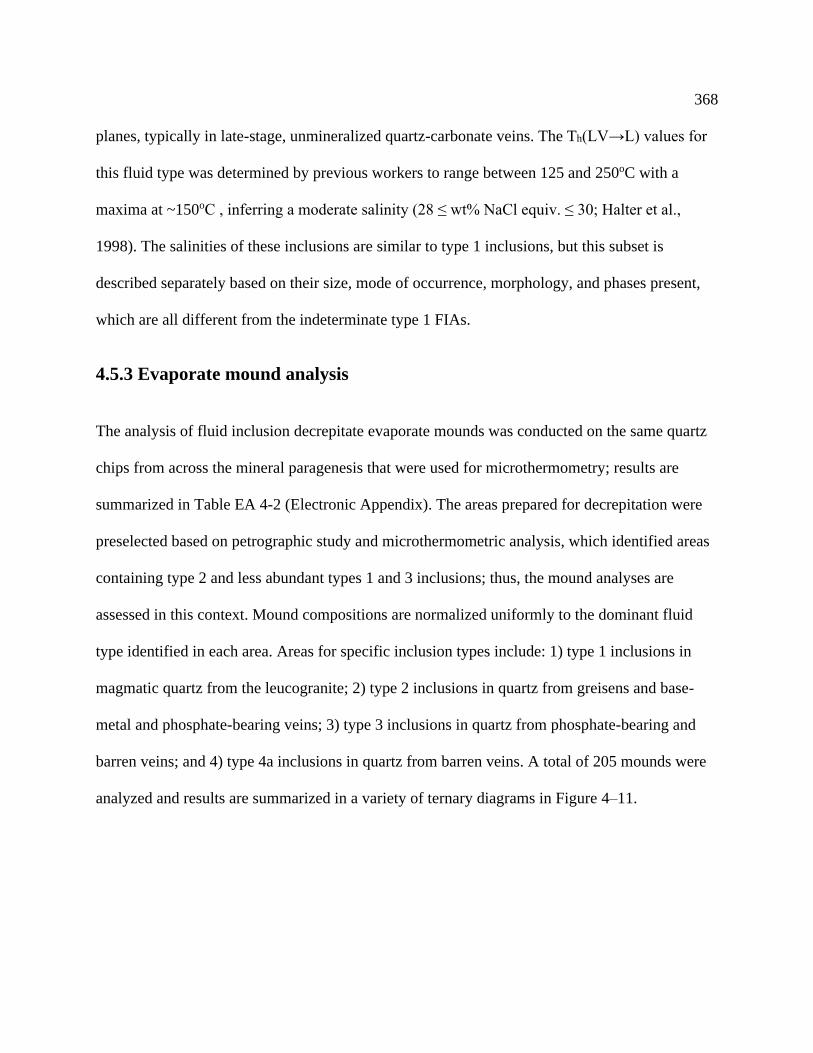
368
planes, typically in late-stage, unmineralized quartz-carbonate veins. The Th(LV→L) values for
this fluid type was determined by previous workers to range between 125 and 250oC with a
maxima at ~150oC , inferring a moderate salinity (28 ≤ wt% NaCl equiv. ≤ 30; Halter et al.,
1998). The salinities of these inclusions are similar to type 1 inclusions, but this subset is
described separately based on their size, mode of occurrence, morphology, and phases present,
which are all different from the indeterminate type 1 FIAs.
4.5.3 Evaporate mound analysis
The analysis of fluid inclusion decrepitate evaporate mounds was conducted on the same quartz
chips from across the mineral paragenesis that were used for microthermometry; results are
summarized in Table EA 4-2 (Electronic Appendix). The areas prepared for decrepitation were
preselected based on petrographic study and microthermometric analysis, which identified areas
containing type 2 and less abundant types 1 and 3 inclusions; thus, the mound analyses are
assessed in this context. Mound compositions are normalized uniformly to the dominant fluid
type identified in each area. Areas for specific inclusion types include: 1) type 1 inclusions in
magmatic quartz from the leucogranite; 2) type 2 inclusions in quartz from greisens and base-
metal and phosphate-bearing veins; 3) type 3 inclusions in quartz from phosphate-bearing and
barren veins; and 4) type 4a inclusions in quartz from barren veins. A total of 205 mounds were
analyzed and results are summarized in a variety of ternary diagrams in Figure 4–11.
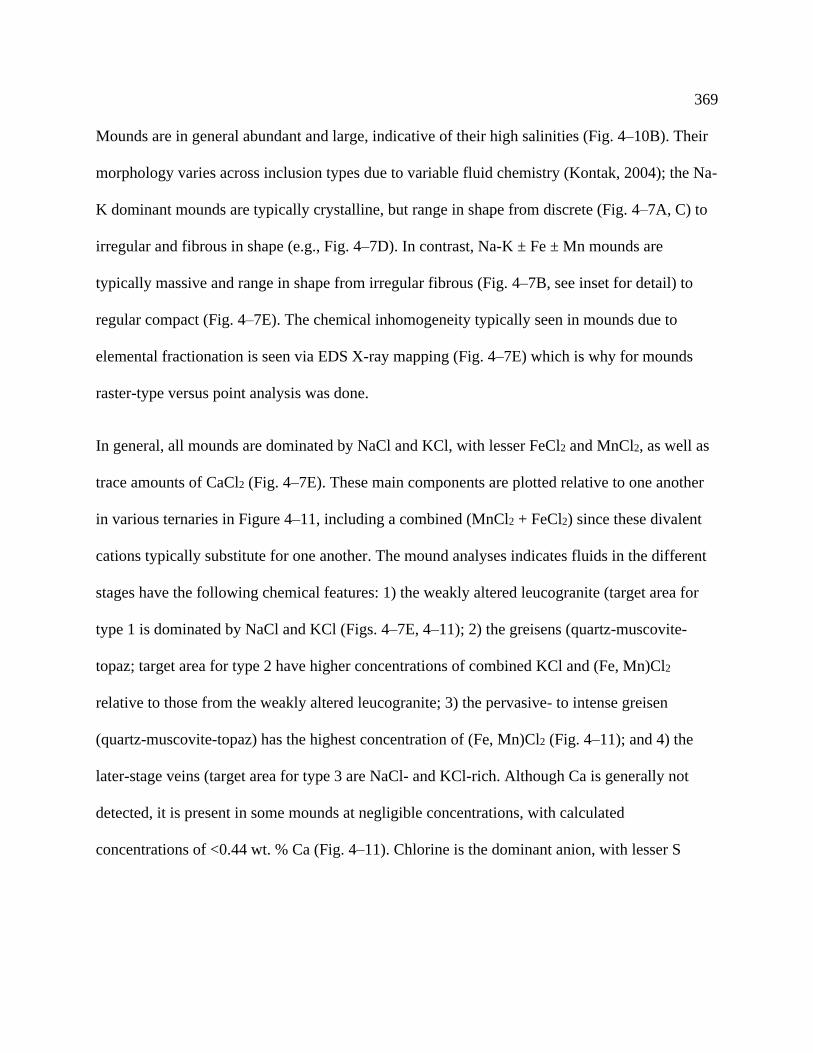
369
Mounds are in general abundant and large, indicative of their high salinities (Fig. 4–10B). Their
morphology varies across inclusion types due to variable fluid chemistry (Kontak, 2004); the Na-
K dominant mounds are typically crystalline, but range in shape from discrete (Fig. 4–7A, C) to
irregular and fibrous in shape (e.g., Fig. 4–7D). In contrast, Na-K ± Fe ± Mn mounds are
typically massive and range in shape from irregular fibrous (Fig. 4–7B, see inset for detail) to
regular compact (Fig. 4–7E). The chemical inhomogeneity typically seen in mounds due to
elemental fractionation is seen via EDS X-ray mapping (Fig. 4–7E) which is why for mounds
raster-type versus point analysis was done.
In general, all mounds are dominated by NaCl and KCl, with lesser FeCl2 and MnCl2, as well as
trace amounts of CaCl2 (Fig. 4–7E). These main components are plotted relative to one another
in various ternaries in Figure 4–11, including a combined (MnCl2 + FeCl2) since these divalent
cations typically substitute for one another. The mound analyses indicates fluids in the different
stages have the following chemical features: 1) the weakly altered leucogranite (target area for
type 1 is dominated by NaCl and KCl (Figs. 4–7E, 4–11); 2) the greisens (quartz-muscovite-
topaz; target area for type 2 have higher concentrations of combined KCl and (Fe, Mn)Cl2
relative to those from the weakly altered leucogranite; 3) the pervasive- to intense greisen
(quartz-muscovite-topaz) has the highest concentration of (Fe, Mn)Cl2 (Fig. 4–11); and 4) the
later-stage veins (target area for type 3 are NaCl- and KCl-rich. Although Ca is generally not
detected, it is present in some mounds at negligible concentrations, with calculated
concentrations of <0.44 wt. % Ca (Fig. 4–11). Chlorine is the dominant anion, with lesser S
370
(≤2.5 wt. %; Figs. 4–7E and 4–11), and there is a notable absence of F apart from trace amounts
in the mounds that contain Ca. The latter is significant given the abundance of F in mounds
elsewhere in the SMB, but only where there is substantive Ca is present (Kontak and Kyser,
2011; Tweedale, 2019).
4.5.4 LA-ICP-MS analysis
The LA-ICP-MS analysis of each fluid inclusion type is summarized as ranges, means and
medians in Table 4–3 and selected elements are shown in Figure 4–12A; detailed results are
found in Table EA 4-3 (Electronic Appendix). A total of 129 fluid inclusions from 29 FIAs were
analyzed. A representative ablation profile for a topaz-hosted fluid inclusion in Figure 4–8C
shows how the host is used to track and correct for its elemental contribution to the chemistry of
inclusions.
The data show a wide range of element concentrations for each inclusion type, the values of
which vary slightly between each paragenetic stage. Thus, fluid types are depicted in Figure 4–
12 based on their paragenetic stage, but the data are compiled by fluid type for the entire deposit
in Table 4–3. Overall, the elemental concentrations fall in the range (in ppm) of 10s to 100s of
thousands for Na and K, 1000s for Ca, S, Fe, Mn, Zn, Cs, and Rb, 10s to 100s for Li, Sn, Cu and
As, <10s for W and <10 for Ga and In.
371
The range of element concentrations for each inclusion type is consistent in each paragenetic
stage, with the exception of some major (i.e., Fe and Mn) and ore (i.e., Sn, Cu., Zn) elements.
The concentrations of some elements with overall higher concentration in the fluid (i.e., Mn, Fe,
and Zn) show a U-shaped pattern across the paragenesis, thus from higher concentration in type-
1 FIAs in quartz of the weakly altered host leucogranite, decreasing in type-2 FIAs in quartz
from greisenized leucogranite and quartz-sulfide bearing veins, and returning to higher
concentrations in type-4 FIAs (although lower than the values in type 1 fluids) from quartz in
barren veins (top plot in Fig. 4–12A). A similar pattern is recognized for many of the ore-related
trace elements (i.e., Sn, Cu, As, W, In), apart from the concentrations measured in quartz-hosted
type-3 FIAs from sulfide-bearing veins, which have higher concentrations than in type 2
inclusions from the same veins or in type 3 inclusions from phosphate-bearing veins (Fig. 4–
12A, bottom plot). Type-2 FIAs from the greisen-infill stage of the paragenesis have anomalous
concentrations of some elements relative to the patterns described above; these anomalies
include lower S and Ga, as well as higher Li concentrations (Fig. 4–12A).
4.5.5 Confocal Laser Raman Microspectroscopy
The carbonic phase in quartz-hosted type 3 FIAs, first identified using microthermometry, was
further evaluated and quantified using LRM. The results are summarized in Table 4–4 and
representative spectra are shown in Figure 4–13. The analysis verified two of the main
characteristics identified in fluid types from petrography and microthermometry: 1) fluid types 1
372
and 2 have no identifiable carbonic component; and 2) the CO2-bearing phase in type 3
inclusions has variable trace amounts of N2, H2S, and CH4. The average CO2 density of type 3
inclusions in the greisen fill and quartz-sulfide veins is significantly higher (0.42 ± 0.26 g/cc)
than similar inclusions in the quartz-carbonate veins (0.02 ± 0.13 g/cc). The concentration of
CH4 is relatively consistent through the paragenesis (<0.1 mol. %), but increases significantly in
the later barren quartz-carbonate veins (<0.75 mol. % CH4). Furthermore, both N2 and H2S
increase in relative concentration from the early greisen-fill and quartz-sulfide vein stage (<0.05
mol. % N2 and no detected mol. % H2S) to the later stage barren quartz ± carbonate veins (<0.14
mol. % N2 and <0.01 mol. % H2S; Table 4–4, Fig. 4–13B, D). The increase in S is consistent
with the results from LA-ICP-MS analysis.
4.5.6 O isotopes
The results for in situ SIMS δ18Oquartz analysis are presented in Table 4–5 and Figure 4–14, where
data are arranged in the context of paragenesis, with the TIMS δ18O analysis on bulk mineral
separates (i..e, quartz, cassiterite, albite) presented in Table 4–6. In situ quartz analysis provides
insight to potential variation that may be averaged due to bulk sampling, and this method was
used in part to assess the intermittent excursions in δ18OH2O during the mineral paragenesis; as
has been documented in other magmatic hydrothermal settings such as porphyry Cu (e.g., Allan
and Yardley, 2007; Fekete et al., 2016) and orogenic gold (e.g., Kerr et al., 2018; McDivitt et al.,
2021).
373
The in situ SIMS δ18Oquartz data are mostly for Main Zone samples, the exceptions being two
massive greisens and samples of igneous and hydrothermal breccia from the Baby Zone (Table
4–5). There is a wide overall range of δ18O values, but little variation for individual quartz grains
such that results fall within the error for an analytical session (i.e., 1.2‰).
For the Main Zone, magmatic quartz in the weak- to moderately altered leucogranite has average
values of +9.5 and +10.3‰, respectively (Fig. 4–14), and a combined mean of +9.8‰. In
contrast, hydrothermal quartz from the massive greisens shows a change to lower δ18O values
that range from +7.4 to 8.4‰, with a mean of +8.0‰. Quartz from greisen infill and base-metal
bearing veins are similar in their population percentiles with 50% of the data ranging between
+8.9 and +9.9‰ and +8.2 and +10.0‰, respectively (Fig. 4–14). Quartz from late-stage
phosphate-bearing veins also fall within the latter range, as two samples yielded values of +8.5
and +8.8‰ (Table 4–5).
For the Baby Zone samples, the δ18O values of quartz phenocrysts in the matrix of the igneous
breccia range from +7.5 to +9.1‰ (mean of +8.5‰; Fig. 4–14). Quartz from the cement of the
hydrothermal breccia yielded a wider range of δ18O values from +7.5 to +11.7‰ (mean of
+9.5‰; Fig. 4–14). The late-stage barren veins that crosscut the EKL and associated breccias
have the highest average δ18O values measured, with a range of +11.6 to +12.1‰ (Table 4–5)
and a mean of +11.8‰ (Fig. 4–14).

374
The results from bulk δ18O analysis are for samples from the Main Zone only and include
material from the early greisen Sn, quartz-sulfide, and the late barren quartz-sulfate paragenetic
stages (Table 4–6). Two quartz samples in the early greisen Sn stage had similar δ18O values of
11.5 and 11.2‰, whereas two cassiterite samples from this stage have δ18O values of 5.2 and
4.2‰. For the quartz-sulfide stage, δ18O values for nine quartz samples range from 13 to 10.2‰
with an average of 10.8‰, but if the one anomalous sample at 13‰ is removed, the average is
10.6 ± 0.4‰. For the late barren quartz-sulfate stage veins, the four quartz samples have δ18O
values of 10.9 to 9.9‰ and two albites from this stage have δ18O values of 8.8 and 8.1‰.
4.6 Discussion
The anomalous mesothermal-type character of the EKD, as evaluated based on its geological
setting and nature of the greisen and veins (see Chapter 3 and references therein), has been
further investigated here via the PTX of the hydrothermal fluids. The latter was done by
characterizing the chemistry of fluid inclusions preserved through the mineral paragenesis from
late in the evolution of the host leucogranite through to greisen formation, later greisen-fill and
subsequent formation of various vein generations. The PTX controls on the hydrothermal
evolution are therefore discussed in the following context: 1) the PT characteristics of the fluids
over a range of emplacement conditions consistent with both the host leucogranite and shallower
settings that typify Sn deposits; and 2) the fluid chemistry through the paragenesis as it relates to
changes in element concentrations due to alteration (i.e., fluid:rock interaction) and
375
mineralization. These results provide the evidence to address the source of the mineralizing fluid,
primary metal concentrations, and depositional processes relevant to formation of the EKD.
4.6.1 PT conditions during paragenetic evolution
Abundant previous work constrained the confining pressure of the SMB and the PT evolution of
the EKD mineralized system. For the former, a variety of petrological, isotopic, and fluid
inclusion studies at various settings proximal to the SMB intrusive contact constrain its
emplacement at 3 to 4 kbar (i.e., the mesozonal regime at 10 ± 5 km depth; Raeside and
Mahoney, 1996; Halter and Williams-Jones, 1999; Carruzzo et al., 2000; Hilchie and Jamieson,
2008, 2014; Kontak and Kyser, 2011); this is also supported by work at the age-equivalent
Musquodoboit Batholith (Kontak et al., 1999, 2004). These data are used to constrain the purple
box across Figure 4–15. For the EKD, previous workers provide important PT constraints: 1)
pegmatite-hosted fluid inclusions constrain PT to 2.5–3.5 kbar and 550–600oC (Kontak et al.,
2001; pink field in Fig. 4–15); 2) δ18Oquartz-cassiterite geothermometry constrains greisen formation
to 450–480oC (Halter et al., 1998; Kontak et al., 2001); 3) F-OH exchange between topaz and
muscovite constrains greisen formation to 400–450oC (Halter and Williams-Jones, 1999; brown
field in Fig. 4–15); and 4) fluid inclusions and δ34Ssulfide geothermometry constrain veins to 250–
325oC and 300–400oC (Kontak, 1990a; Willson, 2019; red field in Fig. 4–15). Additionally, the
upper limit constraining temperature of mineralization is assumed to be the solidus for late-stage
F-rich melts (Fig. 4–15), such as the EKL.
376
Previous work on the saline (ca. 40 wt% NaCl equiv.) quartz-hosted fluid inclusions in the EKL,
as well as pegmatites and miarolitic cavities, are noted to have homogenization by halite
dissolution (Tm[Halite]) that is ≤100oC above the Th(LV→L) values (shaded fields of Fig. 4–
16A). This suggests, if using a 20-25 bar/oC slope for the isochores (cf. Bodnar, 1994), a
minimum pressure estimate of 2.5 kbar during entrapment for these fluids (Kontak et al., 2001).
Additionally, entrapment pressures determined in this study for each fluid type, with respect to
the mineralization temperature constraints, range from 3.5 to as low as 0.25–1 kbar (i.e., from
lithostatic to hydrostatic conditions at 5-10 km depth). Thus, hypersaline fluids presumed to have
originated due to exsolution from a magma were trapped at pressures less than those interpreted
to be recorded by the SMB contact aureole (i.e., 3.2 to 3.8 kbar; Raeside and Mahoney, 1996),
and subsequent fluid incursion record highly variable PT conditions through the paragenesis.
The previously determined constraints are further refined in this study based on the new
microthermometric data (Th(total), uncorrected for pressure Table EA 4-1; Electronic Appendix),
and the resultant isochores for the each fluid type categorized by their host mineralization stage
in the deposit paragenesis (Fig. 4–15). The Tm[Halite] values for type 1 fluids typically occur at
temperatures similar to those of the Th(LV→L) values, with the exception of a number of FIAs
with Th(LV→L) values that are ca. 100–150oC higher than the Tm[Halite] (Fig. 4–16A). In
contrast to the typical Tm[Halite] and Th(LV→L) value relationship, the FIAs we note with
Th(LV→L) values higher than Tm[Halite] are more similar to quartz-hosted fluids in the granite
from the same study (Fig. 4–16). Thus, the higher Th(LV→L) values suggests type 1 fluids may

377
represent different PT conditions based on whether trapped in pegmatitic or altered EKL.
Furthermore, the different PT conditions is recognized in isochores for the majority of type-1
FIAs, which intersect the emplacement pressure for the SMB (i.e., ca. 3.5 kbar; e.g., Hilchie and
Jamieson, 2014) at two separate temperature windows that correspond to constraints listed
above: greater than 550oC, intersecting the solidus for F-rich melts and similar to the calculated
equilibration temperatures between magmatic fluids and pegmatites (Fig. 4–15); and between
450 and 480oC, overlapping the interpreted greisen mineralization temperature.
The Th(total) values for type 2 inclusions show a bimodal distribution that is dependent on the
host mineralization stage (Fig. 4–15, center); somewhat lower values where hosted by quartz-
muscovite-topaz greisens (250–313°C) relative to a higher range of values in quartz-sulfide and
quartz-phosphate veins (280–359°C; Fig 4–16B; Table EA 4-1, Electronic Appendix). The
resultant isochores from type 2 fluids overlap with topaz greisen fluid-inclusion data from
previous workers (i.e., yellow field of Fig. 4–15; Kontak et al., 2001). The isochores of greisen-
hosted type 2 fluids (green in Fig. 4–15, center) roughly intersect the overlapping SMB
emplacement pressures and constraints on EKD cassiterite formation (i.e., 400–480oC; Halter et
al., 1996; Halter and Williams Jones, 1999; Kontak et al., 2001). The higher homogenization
temperatures in type 2 inclusions from quartz-sulfide to quartz-phosphate veins, however, reflect
entrapment at PT conditions different from those recorded in greisens. This suggests either an
increase in temperature (at consistent pressure) or a decrease in pressure (with or without a
decrease in temperature; green to red isochores, Fig. 4–15). The latter is more likely given the
378
localization of the EKD along a shear zone that was active during mineralization (cf. Chapter 3).
The higher homogenization temperatures in vein-hosted type 2 inclusions is also consistent with
lower temperature estimates from sulfur geothermometry in Kontak (1990a; i.e., 300–400oC) and
the higher temperature estimates from sulfur geothermometry in Willson (2019; i.e., 250–
325oC). To overlap each of these ranges, the temperature of formation for the main vein
mineralization stage is herein interpreted to be between 300 and 400oC (red fields in Fig. 4–15).
The homogenization temperatures for types 1 and 2 inclusions are typically higher than those of
aqueous-carbonic type 3 inclusions which display a wide range of Th(total) (i.e., 162–300°C;
Table 4–2). The respective fluid isochores, however, are calculated using measured volumetric
proportion of the carbonic phase, Tm[Clath] where present, and Th[CO2] (Fig. 4–15, right). The
latter two measurements are generally consistent in type 3 fluids, whether hosted by quartz
sulfide/phosphate veins or in late-stage unmineralized veins. The slopes of isochores from type 3
inclusions suggest entrapment pressures lower than those interpreted from SMB emplacement (≤
2.5 kbar) and, as such, these fluids record either an increase in temperature from <400 to 400–
600oC (at low pressures), or a decrease in pressure at the same temperature range (i.e., 300 to
400oC; red field in Fig. 4–15). Entrapment of type 2 fluids was therefore likely repeated in the
later mineralization stages of the paragenesis, and the variable fluid pressure along the EKSZ
suggests pressure fluctuation was responsible for the range of PT signatures in these fluids.
379
All of the mineralization-associated fluids (types 1, 2 and 3) described above have higher
homogenization temperatures and salinities than those recorded in the type-4 FIAs (125 to
285°C), hosted by the overprinting quartz-carbonate vein assemblage. Although this study did
not conduct extensive microthermometry on this fluid type, the PT conditions are interpreted to
be low temperature and low pressure with respect to the rest of the EKD inclusions.
The pressure variation during entrapment of types 2 and 3 fluids is best explained by
hydrofracturing and mechanical slip due to sub-vertical movement on the EKSZ during
mineralization. The EKSZ is a major structure that controlled the emplacement of parts of the
SMB and the activity of which is also considered to have been synchronous to formation of the
associated ore systems (Horne et al., 1992; MacDonald, 2001); in particular the EKD (Halter et
al., 1996). We suggest, therefore, that the EKSZ experienced sudden pressure changes from
lithostatic to near-hydrostatic (i.e., ΔP ≤ 3 kbar; Fig. 4–15) during the emplacement of the SMB.
Porosity that is generated from greisenization as well as mechanical slip would infill with
mineralization through the paragenesis, thus building the effective pressure in the deposit back to
lithostatic conditions, until the cycle repeats with recurring slip along the EKSZ (see Fig. 4–17).
The coupling of fluid infiltration and mineral precipitation with movement along the EKSZ is
evidenced by: 1) the presence of quartz-albite-pyrite-sphalerite fiber veins on the EDSZ (Fig. 4–
2H); and 2) late-stage echelon shear veins and extensional quartz-phosphate-albite-fluorite veins
(Fig. 4–2G). This repetition is similar to that of the cyclical fault valve model (Sibson, 1990,
1992), and has been recorded in other types of hydrothermal ore settings: e.g., orogenic Au (e.g.,
380
Sibson et al., 1988; Taylor et al., 2021) and porphyry Cu (e.g., Redmond et al., 2004; Monecke et
al., 2018). Importantly, the cyclical fault valve process that has been attributed with unmixing in
CO2-bearing fluids in greenstone-hosted mesothermal quartz-vein Au deposits (e.g., Sibson et
al., 1988; Boullier and Robert, 1992; Micklethwaite et al., 2010). The pressure change recorded
by inclusions for each seismic event may also depend on distance from the major fault zone (e.g.,
Sibson, 1994). For example, in the centers of high-pressure systems, the trapping pressures for
fluid inclusions in single vein samples have ranged from 1 to 3.5 kbar (shear zone-related veins
of the central Pyrenees; Henderson and McCaig, 1996). This may explain the range of pressures,
between lithostatic and near-hydrostatic conditions, that are recorded by inclusions of the EKD.
Cyclical fluid pressure changes are also well documented in porphyry Cu deposits and these
settings can provide insight to processes that formed the EKD. In such settings, the exsolved
magmatic fluids maintain or exceed lithostatic fluid pressure values near the apex of a
mineralizing intrusion (Fournier, 1999; Cox, 2005); thereby producing early, high-temperature
steeply-dipping veins or, in some cases, magmatic-hydrothermal breccias (Sillitoe, 1985). The
associated hydrofracturing in these settings allow for rapid drops in pressure, toward hydrostatic
levels (Seedorf et al., 2008, and references therein). Notably, the fluctuating fluid pressure and
hydrothermal activity in porphyry Cu systems has been attributed to seismic release (e.g.,
Richards, 2018) as well as to 1st and 2nd boiling of magmatic fluids (Burnham, 1979); the latter
of which is identified in fluid inclusion types and is recognized as the primary cause for ore
precipitation (e.g., Redmond et al., 2004). Pressure fluctuations in porphyry settings have also
381
been attributed to repeated boiling of new mineralizing fluids, resulting in inclusions with
variable phase proportions and homogenization behaviors through a relatively static temperature
window (e.g., El Teniente, Chile; Klemm et al., 2007).
Further evidence for fluctuating pressure during the paragenesis is observed at a microscopic
scale by the presence of decrepitated and re-equilibrated fluid inclusions (e.g., Fig. 4–5). That
inclusions can change shape owing to ΔPfluid has been demonstrated for some time based on both
natural (e.g., Pécher, 1989; Boullier, 1999; Vityk et al., 1994) and experimental (e.g., Pécher,
1981; Sterner and Bodnar, 1988; Vityk and Bodnar, 1995; Diamond et al., 2010). Such textures
are common in samples from the EKD and this strongly supports the re-equilibration of
inclusions during transient changes in ΔPfluid. These textures are mostly restricted to larger
inclusions and, combined with their shapes, this suggests formation when Pinternal>Pconfining (cf.
Sterner and Bodnar, 1989); therefore, decrepitation was likely initiated when Plithostatic changed to
Phydrostatic. Although such textures have rarely been integrated into fluid inclusion studies they are
in fact widespread in a variety of ore deposit settings (Kontak and Tuba, 2017), as recent studies
have shown (e.g., Zoheir et al., 2019; Sun et al., 2020; Tsuruoka et al., 2021). In the EKD, the
fluid inclusion textures are commensurate with the structural setting and suggest an important
role for ΔPfluid in the deposit evolution.
382
4.6.2 Fluid chemistry
The geochemical changes through various stages of the paragenesis have previously been
characterized through whole-rock lithogeochemistry and chemistry of the hydrothermal minerals
(Halter et al., 1996; Kontak et al., 2001). In addition, inferences of fluid chemistry were made
from evaporate mound and leachate analyses (Halter et al., 1995; Kontak et al. 2001) which
showed the earliest fluids, as represented in the EKL and pegmatites, and those involved in
greisen formation were saline and dominated by NaCl with lower abundances (i.e., < 6.5 wt. %)
of Fe, Mn, and K. In this study, a more comprehensive characterization of fluid chemistry
through the entire paragenesis was done via microthermometry, evaporate mound, and in situ
LA-ICP-MS analysis, and LRM of inclusions. As a caveat to this discussion, we note that the
spatial association of ore minerals with quartz and/or topaz hosting the fluid inclusions does not
unequivocally indicate growth of these phases from the same mineralizing fluid, as generally
inferred in most studies; the work of Campbell and Panter (1990) and Wilkinson (2001), among
others, illustrate this point. Furthermore, we again note that the measured FIAs were dominantly
of indeterminate origin, but where present primary FIAs were also measured.
4.6.2.1 Implications of Evaporate Mound Analysis
The majority of inclusions through the mineralized stages of the paragenesis have low eutectic
(Te) and Tm[ice] values (i.e., -23 to -50oC and -19 to -32oC, respectively; Table 4–2) that indicate
383
the presence of divalent cations, in addition to Na and K (Steele-MacInnis et al., 2016). The dark
brown to reddish-brown color of inclusions induced during freezing, as well as the presence of
hydrohalite as the last phase to melt, confirm the presence of these cations, in particular Fe and
Mn (Fig. 4–6), with subordinate Ca. These observations are complemented by similar findings
using evaporate mounds and, with more select samples, LA-ICP-MS analyses (Figs. 4–11 and 4–
12, respectively). Although these datasets are dominantly in agreement with each other, the latter
data do suggest more Fe and Mn in hypersaline type 1 fluids than do the mound analysis. This
observation may relate in part to precipitation efficiency of Fe and Mn salts relative to Na and K
salts in mounds, as such details relating to mounds have yet to be studied in detail. The majority
of data for the hypersaline type 1 inclusions, however, suggest that any non-halite solid phase is
likely a Fe-K-Mn chloride and/or hydrate; similar, for example, to those identified in fluid
inclusions from the Mount Pleasant Sn (-W-Mo-In) deposit (New Brunswick, Canada; Elmi
Assadzadeh et al., 2016). The elevated Fe and Mn contents from both mound and LA-ICP-MS
analysis (Figs. 4–11 and 4–12, respectively) support the presence of such phases.
The EKD contains abundant topaz indicating significant addition of F to the system, however the
chemistry of evaporate mounds indicate fluid inclusion chemistry through the paragenesis
contains no detectable F content (Table EA 4-2; Electronic Appendix). The LA-ICP-MS analysis
did not measure F in the samples; whereby the high ionization potential of F precludes its
detection, and electron microprobe measurements of F are limited to solid substrates with
relatively high abundances (detection limits of 100 s ppm for F; see discussion in Hanley and
384
Koga, 2018). The absence of detectable F in the evaporate mound data, however, is an important
observation as F has been documented in similar studies elsewhere in the SMB to be an
important anion in the magmatic fluids (e.g., Kontak and Kyser, 2011; Tweedale et al., 2014,
Tweedale, 2019). This may be related to the absence of Ca measured in fluid inclusions of the
EKD, as Ca is needed to couple with F during mound formation, otherwise it is likely volatized
prior to analysis. The comparative SMB settings noted above, where F is found to be enriched in
mound analysis, show a strong association of F with Ca (Kontak and Kyser, 2011; Tweedale,
2019). The abundance of secondary apatite in the EKD (see Chapter 3) may account for Ca
depletion in fluid inclusions; apatite is the likely sink for any Ca liberated from primary
plagioclase by albitization. Therefore, Ca is not present in the fluid inclusions whereas F is likely
present, but as HF and thus lost during evaporate mound formation.
4.6.2.2 Implications of Confocal Laser Raman Microanalysis
The LRM analysis verified the carbonic phase as dominantly CO2-bearing with variable amounts
of N2, H2S, and CH4. Through the paragenesis, carbonic phases have a higher CO2 density where
hosted by greisen infill and quartz-sulfide veins relative to those in later quartz-carbonate veins
(Table 4–4). Although these fluids have similar salinity, this density change indicates variable
pressure recorded during trapping of these inclusions. The relative difference of CO2 density
suggests the aqueous-carbonic inclusions in the greisen fill and quartz-sulfide veins were trapped
at significantly higher pressures than those trapped in late stage quartz-carbonate veins.
385
The significant increase in CH4 concentration is coupled with decreased density in carbonic
phases of type 3 fluids, as noted between ore mineralization and late unmineralized veins; this
change is similar for both N2 and H2S (Table 4–4). The heterogeneity of carbonic phases in type
3 fluid inclusions suggests their formation may be related to effervescence (phase separation); a
process attributed to decreasing pressures during hydraulic fracturing. The intermittent changes
to pressure in the EKD, as discussed above, explain repeated effervescence and the separation of
N2–CH4 from CO2 in varying proportions through the paragenesis (Table 4–4). The absence of
H2S in ore mineralization stages, however, is likely due to its uptake in precipitated sulfides.
The changes in CH4 concentration are likely due to variable pressure; a process that has been
recorded by previous studies which note relatively high CH4 concentrations subsequent to a
transition from lithostatic to hydrostatic conditions (e.g., Caumon et al., 2014). However, CH4
concentrations may also increase as a result of cassiterite precipitation from CO2-bearing fluids,
where the oxidation of Sn(II)aq to Sn(IV) is coupled with a simultaneous reduction of CO2 to CH4
(e.g., Schmidt, 2018). For the latter process to be prevalent, we would expect high CH4
concentrations in aqueous-carbonic fluid types through the cassiterite mineralization stages;
although evidence for this process is not pervasive in the EKD, it is present in a single example
from type 3 inclusions from the greisen infill of EK-86-122A (Table 4–4).
386
4.6.2.3 Implications of LA-ICP-MS analysis
There are several aspects of the ore fluid chemistry that need to be accounted for, such as the
decrease in concentration of many elements part-way through the paragenesis and the subsequent
enrichment to levels similar to the initial stages (i.e., U-shaped pattern observed in Fig. 4–12A).
The depletion of Mn, Fe, Zn, and S in mineralization stages may reflect co-precipitation of the
relevant mineral phases that contain or substitute these elements (e.g., pyrite, chalcopyrite,
sphalerite). The enrichment in relative concentrations of Mn, Fe, Zn, and S part-way through the
paragenesis (Fig. 4–12A) suggests a replenishment of the initial ore-forming fluids prior to
continued mineralization.
The relatively flat patterns of other elements (i.e., K, Cs, Rb, Li) through the paragenesis is due
to the mobilization of these elements from the host rocks, coupled with accommodation into
alteration products at each stage in the paragenesis, for example: K+ released from hydrolosis of
K-feldspar in the EKL is readily incorporated into muscovite alteration and subsequent greisen
mica mineralogy; whereas Cs maintains high concentrations (~2000 ppm; Fig. 4–14A), which
reflect a highly-fractionated magmatic exsolution source (cf. Audétat et al., 2008), due to it being
largely a nonprecipitating element through the paragenesis. Subtle variation from the flat pattern
of Rb and Li concentrations include two notable changes at different stages: 1) a decrease from
type 1 to type 2 fluids, perhaps the result of dilution by an external fluid, and 2) a minor increase
recorded by inclusions from the late greisen infill stages (Fig. 4–14A). The latter change in these
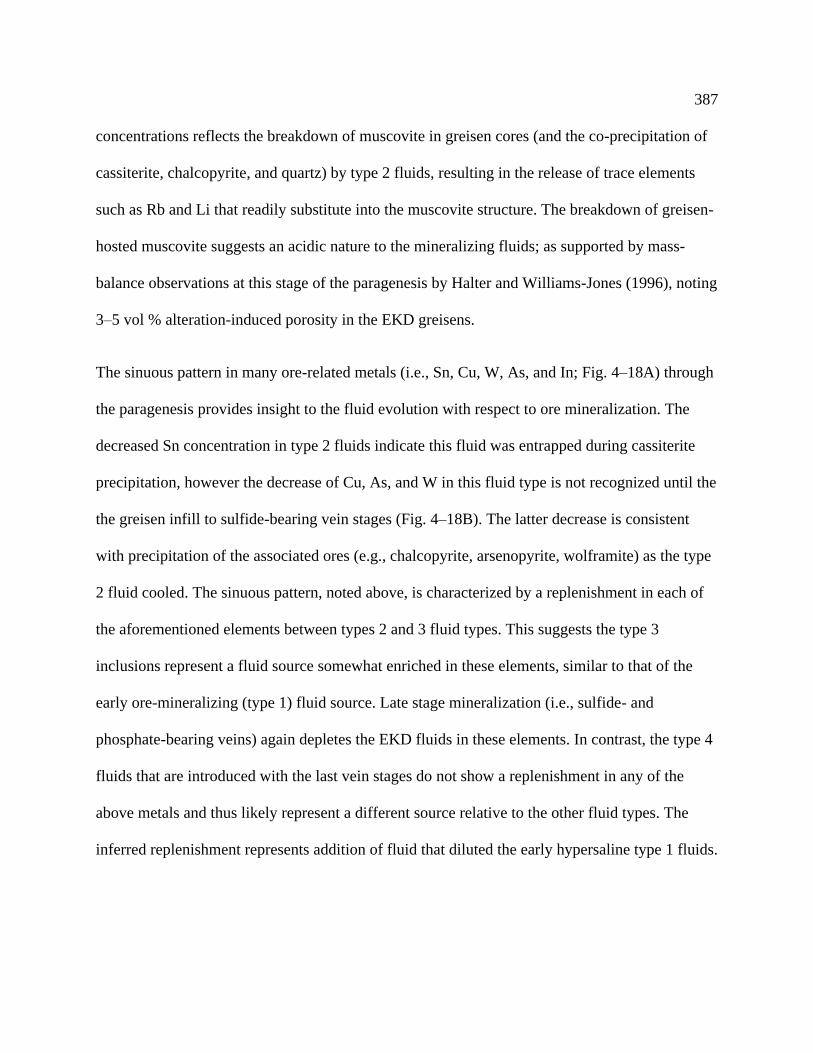
387
concentrations reflects the breakdown of muscovite in greisen cores (and the co-precipitation of
cassiterite, chalcopyrite, and quartz) by type 2 fluids, resulting in the release of trace elements
such as Rb and Li that readily substitute into the muscovite structure. The breakdown of greisen-
hosted muscovite suggests an acidic nature to the mineralizing fluids; as supported by mass-
balance observations at this stage of the paragenesis by Halter and Williams-Jones (1996), noting
3–5 vol % alteration-induced porosity in the EKD greisens.
The sinuous pattern in many ore-related metals (i.e., Sn, Cu, W, As, and In; Fig. 4–18A) through
the paragenesis provides insight to the fluid evolution with respect to ore mineralization. The
decreased Sn concentration in type 2 fluids indicate this fluid was entrapped during cassiterite
precipitation, however the decrease of Cu, As, and W in this fluid type is not recognized until the
the greisen infill to sulfide-bearing vein stages (Fig. 4–18B). The latter decrease is consistent
with precipitation of the associated ores (e.g., chalcopyrite, arsenopyrite, wolframite) as the type
2 fluid cooled. The sinuous pattern, noted above, is characterized by a replenishment in each of
the aforementioned elements between types 2 and 3 fluid types. This suggests the type 3
inclusions represent a fluid source somewhat enriched in these elements, similar to that of the
early ore-mineralizing (type 1) fluid source. Late stage mineralization (i.e., sulfide- and
phosphate-bearing veins) again depletes the EKD fluids in these elements. In contrast, the type 4
fluids that are introduced with the last vein stages do not show a replenishment in any of the
above metals and thus likely represent a different source relative to the other fluid types. The
inferred replenishment represents addition of fluid that diluted the early hypersaline type 1 fluids.
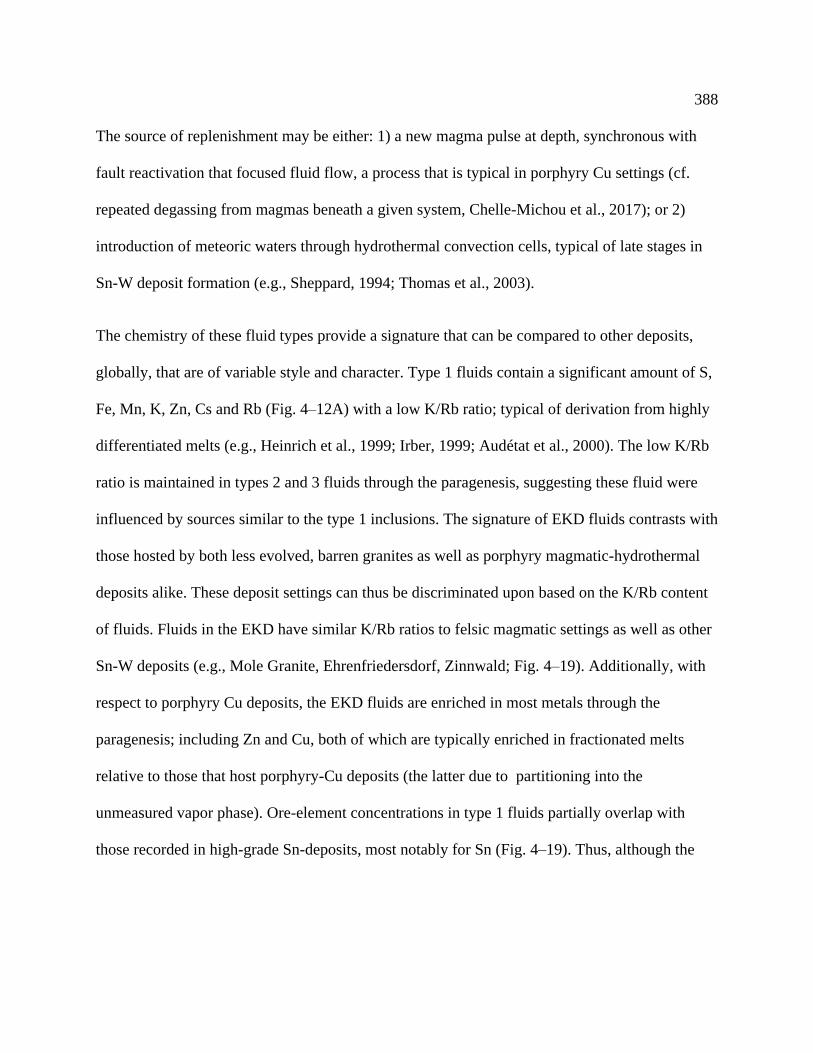
388
The source of replenishment may be either: 1) a new magma pulse at depth, synchronous with
fault reactivation that focused fluid flow, a process that is typical in porphyry Cu settings (cf.
repeated degassing from magmas beneath a given system, Chelle-Michou et al., 2017); or 2)
introduction of meteoric waters through hydrothermal convection cells, typical of late stages in
Sn-W deposit formation (e.g., Sheppard, 1994; Thomas et al., 2003).
The chemistry of these fluid types provide a signature that can be compared to other deposits,
globally, that are of variable style and character. Type 1 fluids contain a significant amount of S,
Fe, Mn, K, Zn, Cs and Rb (Fig. 4–12A) with a low K/Rb ratio; typical of derivation from highly
differentiated melts (e.g., Heinrich et al., 1999; Irber, 1999; Audétat et al., 2000). The low K/Rb
ratio is maintained in types 2 and 3 fluids through the paragenesis, suggesting these fluid were
influenced by sources similar to the type 1 inclusions. The signature of EKD fluids contrasts with
those hosted by both less evolved, barren granites as well as porphyry magmatic-hydrothermal
deposits alike. These deposit settings can thus be discriminated upon based on the K/Rb content
of fluids. Fluids in the EKD have similar K/Rb ratios to felsic magmatic settings as well as other
Sn-W deposits (e.g., Mole Granite, Ehrenfriedersdorf, Zinnwald; Fig. 4–19). Additionally, with
respect to porphyry Cu deposits, the EKD fluids are enriched in most metals through the
paragenesis; including Zn and Cu, both of which are typically enriched in fractionated melts
relative to those that host porphyry-Cu deposits (the latter due to partitioning into the
unmeasured vapor phase). Ore-element concentrations in type 1 fluids partially overlap with
those recorded in high-grade Sn-deposits, most notably for Sn (Fig. 4–19). Thus, although the
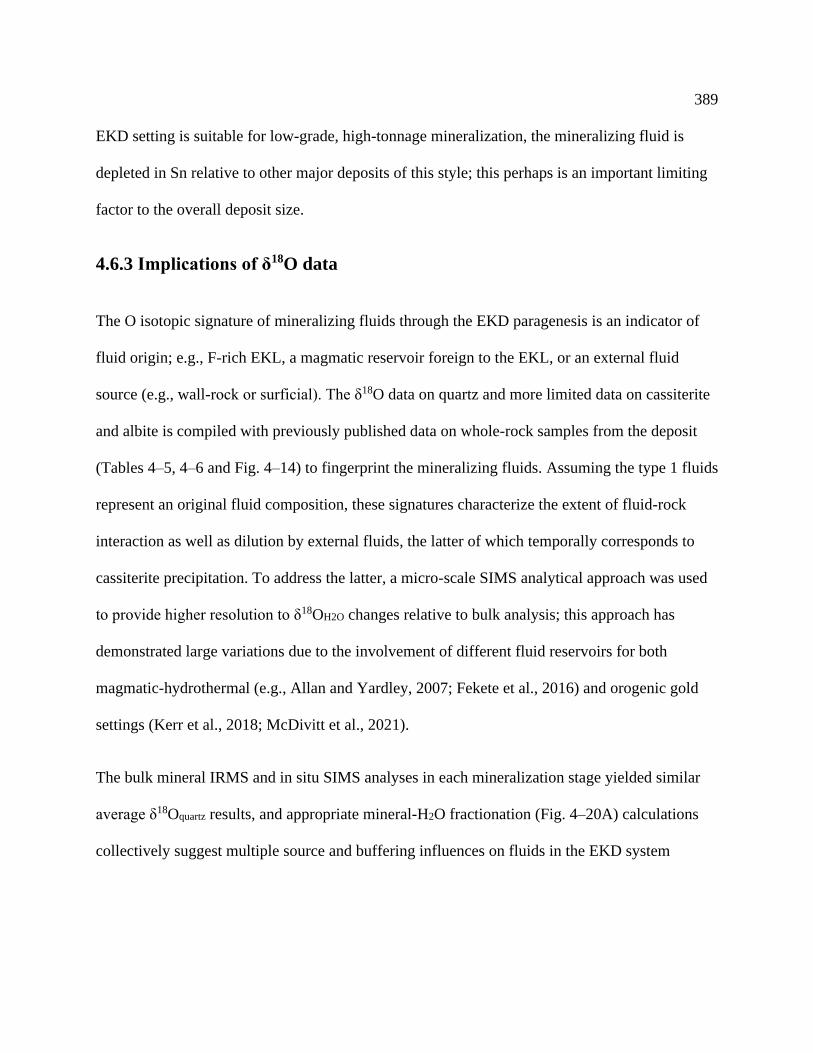
389
EKD setting is suitable for low-grade, high-tonnage mineralization, the mineralizing fluid is
depleted in Sn relative to other major deposits of this style; this perhaps is an important limiting
factor to the overall deposit size.
4.6.3 Implications of δ18O data
The O isotopic signature of mineralizing fluids through the EKD paragenesis is an indicator of
fluid origin; e.g., F-rich EKL, a magmatic reservoir foreign to the EKL, or an external fluid
source (e.g., wall-rock or surficial). The δ18O data on quartz and more limited data on cassiterite
and albite is compiled with previously published data on whole-rock samples from the deposit
(Tables 4–5, 4–6 and Fig. 4–14) to fingerprint the mineralizing fluids. Assuming the type 1 fluids
represent an original fluid composition, these signatures characterize the extent of fluid-rock
interaction as well as dilution by external fluids, the latter of which temporally corresponds to
cassiterite precipitation. To address the latter, a micro-scale SIMS analytical approach was used
to provide higher resolution to δ18OH2O changes relative to bulk analysis; this approach has
demonstrated large variations due to the involvement of different fluid reservoirs for both
magmatic-hydrothermal (e.g., Allan and Yardley, 2007; Fekete et al., 2016) and orogenic gold
settings (Kerr et al., 2018; McDivitt et al., 2021).
The bulk mineral IRMS and in situ SIMS analyses in each mineralization stage yielded similar
average δ18Oquartz results, and appropriate mineral-H2O fractionation (Fig. 4–20A) calculations
collectively suggest multiple source and buffering influences on fluids in the EKD system

390
(summarized in Fig. 4–20B). To evaluate these influences, the δ18Oquartz data is compared with
relevant published δ18O whole-rock data, shown in Figure 4–20B, for: 1) Meguma metapelitic
country rocks (Longstaffe et al., 1980); 2) leucogranites of the SMB (Longstaffe et al., 1980;
Poulson et al., 1991; Clarke et al., 1993); 3) the host EKL (Kontak, 1990b); and 4) intermediate
plutons peripheral to the DLP (Longstaffe et al., 1980). These ranges were also compared with
δ18Oquartz values from pegmatites equivalent to the SMB leucogranites (Kontak et al., 2002; Fig.
4–20B).
The early stages of alteration in the EKD involved interaction between the host rock and a fluid
of magmatic origin (pink box in Fig. 4–20A), the isotopic evolution of which is shown by the red
trajectory in Figure 4–20B (cf. Sheppard, 1986). The data show that δ18OH2O values in
equilibrium with EKL quartz (i.e., the earliest mineralizing fluid; 5– 8.9‰, Table 4–5) are
consistent with those from EKL whole rock samples (~+8.6‰; Kontak, 1990b) and data from
pegmatite K-feldspars (8.6–11.2‰; Kontak et al., 2001). Importantly, the higher values from the
above range are consistent with: 1) calculated δ18OH2O values of 89‰ for magmatic water based
on the δ18Ozircon for the Davis Lake Pluton (see Chapter 3), using the Δzircon-H2O fractionation of
Krylov et al. (2002); 2) the range of previously published δ18O values (excluding outliers > 4‰)
from the SMB, both in whole-rock (9.5–13‰; Longstaffe et al., 1980; Kontak et al., 1988; 1991;
2002) and quartz (8.9–13.9‰; Kontak et al., 1991; Poulson et al., 1991); 3) the range of δ18OH2O
values determined in host rocks to mineralized greisens elsewhere in the SMB, i.e., the New
Ross area (7.6–10.6‰; Carruzzo et al., 2004); and 4) the range of δ18O whole rock values
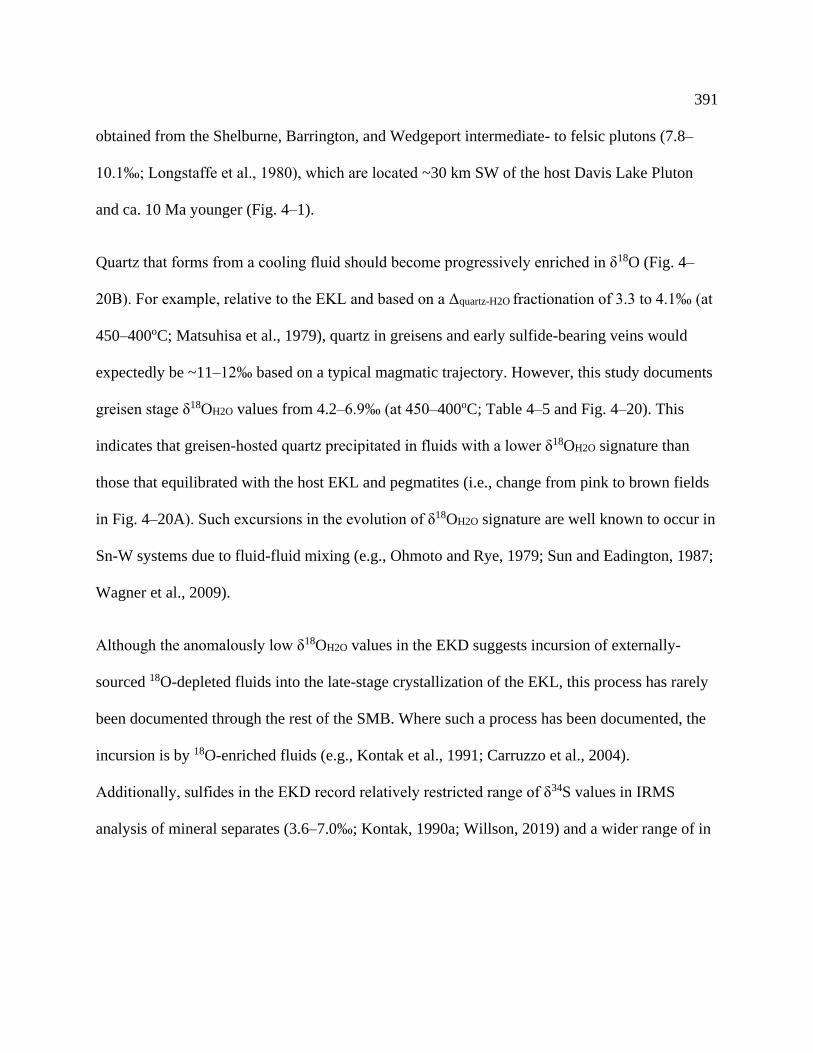
391
obtained from the Shelburne, Barrington, and Wedgeport intermediate- to felsic plutons (7.8–
10.1‰; Longstaffe et al., 1980), which are located ~30 km SW of the host Davis Lake Pluton
and ca. 10 Ma younger (Fig. 4–1).
Quartz that forms from a cooling fluid should become progressively enriched in δ18O (Fig. 4–
20B). For example, relative to the EKL and based on a Δquartz-H2O fractionation of 3.3 to 4.1‰ (at
450–400oC; Matsuhisa et al., 1979), quartz in greisens and early sulfide-bearing veins would
expectedly be ~11–12‰ based on a typical magmatic trajectory. However, this study documents
greisen stage δ18OH2O values from 4.2–6.9‰ (at 450–400oC; Table 4–5 and Fig. 4–20). This
indicates that greisen-hosted quartz precipitated in fluids with a lower δ18OH2O signature than
those that equilibrated with the host EKL and pegmatites (i.e., change from pink to brown fields
in Fig. 4–20A). Such excursions in the evolution of δ18OH2O signature are well known to occur in
Sn-W systems due to fluid-fluid mixing (e.g., Ohmoto and Rye, 1979; Sun and Eadington, 1987;
Wagner et al., 2009).
Although the anomalously low δ18OH2O values in the EKD suggests incursion of externally-
sourced 18O-depleted fluids into the late-stage crystallization of the EKL, this process has rarely
been documented through the rest of the SMB. Where such a process has been documented, the
incursion is by 18O-enriched fluids (e.g., Kontak et al., 1991; Carruzzo et al., 2004).
Additionally, sulfides in the EKD record relatively restricted range of δ34S values in IRMS
analysis of mineral separates (3.6–7.0‰; Kontak, 1990a; Willson, 2019) and a wider range of in

392
situ analysis (i.e., SIMS), ranging from 0.7–6.7‰ in greisen-hosted sulfides and 2.9–9.8‰ in
sulfide-bearing veins (Willson, 2019). The lower δ34S values are consistent with H2S-dominated
ore fluids and reflecting a homogeneous magmatic source for sulfur (i.e., no significant change
in the H2S/SO4 ratio of the fluid). Thus, the above δ18OH2O signature evolution in the EKD
indicates the main mineralizing stages (i.e., after incipient greisenization) involved mixing an
initially primitive magmatic fluid with another δ18O-depleted fluid that shows little equilibration
with the surrounding wall-rocks (e.g., Fig. 4–20B).
Infill mineralization to greisens have a range of δ18Oquartz values that is similar to those recorded
in sulfide-bearing veins and the interpreted formational temperatures of subsequent
mineralization stages (300–350oC; red field in Fig. 4–15) and yield equilibrium δ18OH2O values
between 0.6 and 6.7‰ (red field in Fig. 4–20A). These values suggest quartz in these stages
precipitated from a fluid with a depleted δ18OH2O signature relative to the earlier mineralization
stages, and likely represent either less mixing with the original magmatic fluid or a cooler, more
evolved equivalent to the externally-sourced fluid (noted above) with less rock buffering (e.g.,
green trajectory in Fig. 4–20B). This pattern continues into The late mineralized veins (i.e.,
quartz-albite-apatite) have δ18Oquartz signatures (8.5–8.8‰; Table 4–5 and Fig. 4–14) consistent
with an evolution from a fluid with a depleted δ18OH2O signature. The data from the late
mineralized vein stage yields δ18OH2O values between +2 and 5‰ (assuming similar temperatures
to the sulfide-bearing vein stage, red field in Fig. 4–20A). Lastly, overprinting quartz-carbonate
vein have δ18Oquartz signatures from 11.6 to 12.1‰, suggesting enrichment in 18O and

393
equilibration with metasedimentary rocks of the Meguma terrane (Fig. 4–20B); based on
corresponding whole rock δ18O data (i.e., 8.6‰, Table 4–5; Kontak, 1990b) the calculated
equilibration temperatures yield a range of δ18OH2O values between 0 and +2‰ (hatched field in
Fig. 4–20A), indicative of a meteoric origin.
The implications from limited δ18O data on cassiterite and albite are consistent with those from
the associated quartz discussed above. For cassiterite, the two samples have δ18OH2O values (i.e.,
8.0 and 9.3‰ at 400-450°C; Table 4–6) that overlap with associated quartz δ18O values. Similar
cassiterite data are reported by Halter et al. (1996), with enriched δ18O relative to cassiterite in
the EKL pegmatites (i.e., 2.8‰; Kontak et al., 2001). The two albite δ18O data and their
corresponding δ18Oquartz values (from a phosphate bearing- and a late barren vein) provide
δ18OH2O and formational temperature information for the representative paragenetic stages. In
regards to the latter, the Δquartz-albite fractionation indicates formation temperature of 382 and
258°C for the phosphate-bearing and barren veins, respectively, using appropriate equations
(Matsuhisa et al., 1979; O’Neil and Taylor, 1967). Incorporating these calculated temperatures
results in low δ18OH2O values of 5.4 and 1.7‰ for the quartz-albite pairs in phosphate-bearing
and unmineralized veins, respectively; these values are in agreement with the ranges derived
from 18O in quartz (above) for their respective paragenetic stage.
The δ18O signatures at each stage of the paragenesis, as described above, indicate variable
amounts of mixing of at least three discrete fluids (Fig. 4–20B). This first is a magmatic fluid
394
that initially interacted with the host EKL, causing early alteration and greisen formation. The
second fluid mixed with the rock-buffered system and had a depleted δ18OH2O signature; the
amount of rock buffering and influence from the first fluid likely decreased through the
paragenesis (i.e., from early and late greisenization to sulfide-bearing veins). The δ18Oquartz
values of Meguma metasedimentary rocks are high (10.1–12.9‰, grey field in Fig. 4–20B;
Longstaffe et al., 1980), and thus we would expect quartzprecipitated from wall-rock
equilibrated fluids to have a heavier 18O signature than indicated by the fluid-mixing model (Fig.
4–20B). The heavy signature, however, has not been observed in other SMB ore systems where
such interaction has occurred; the depression of δ18O values is rather recorded in muscovite and
K-feldspar (see discussion in Carruzzo et al., 2004, and Kontak and Kyser, 2011). The Carruzzo
et al. (2004) study estimated meteoric water equilibrated with Meguma metasedimentary rocks at
ca. 380 Ma to have a δ18OH2O of -6 ± 2‰ and a δDH2O of -38 ± 16‰. Thus, although the origin of
the fluid is somewhat enigmatic, partial equilibration with Meguma metasedimentary rocks
would explain the 18O depletion; further research on the δDH2O values of the EKD fluids is
required to quantify the influence of meteoric waters. Importantly, such a fluid has been noted as
critical in the formation of the SMB-hosted Flintstone Rock silica-clay deposit, located ~20 km
south of the EKD (Fig. 4–1A) along the western end of the Tobeatic Shear Zone (Kontak and
Kyser, 2001); thus, a similar structural setting to that of the EKD. The third discrete fluid is
attributed with forming the latest stage quartz-carbonate veins and presents a dramatic excursion
in the δ18Oquartz signature to higher values, suggesting this stage of the paragenesis involved
395
incursion of a fluid that, if formed at low temperatures, was more equilibrated with Meguma
metasedimentary rock (i.e., low δ18OH2O).
4.6.4 Implications of anomalous salinity in East Kemptville Fluid Types
The development of highly evolved, fractionated systems typically results in enrichment of B
and/or F, in addition to many other incompatible elements (e.g., the BeBLiP group of Strong,
1981; Černý et al., 2005 and references therein). The incompatible element content may stay
enriched in a melt to temperatures as low as 500oC under upper crustal pressures (e.g., Manning
and Pichavant, 1983; London et al., 1989, 1993; 1999; Morgan and London, 1999; Thomas et al.,
2000; Sirbescu and Nabelek, 2003). At low pressure, fluids that exsolve from such magmas
typically have low salinities, between 5 and 15 wt% NaCl equiv., based on many studies of
natural samples (e.g., Cline and Bodnar, 1991; Williams-Jones and Heinrich, 2005; Audétat et
al., 2008; Bodnar et al., 2014) as well as experiments (Iveson et al., 2019; Webster et al., 2020).
The microthermometric properties (i.e., Th and salinities) of these exsolved fluids are consistent
through different magmatic-hydrothermal settings, both for Sn ± W style and porphyry Cu and/or
Mo style deposits (Bodnar et al., 2014). In these settings, the primary fluid type with low salinity
has been credited with transporting significant metal content prior to separating into a brine and
vapor (unmixing) at shallow depths and precipitating ore mineralization (e.g., Redmond et al.,
2004). For the resultant brines, a decrease in salinity and Th from early to late in the deposit
396
paragenesis relates to cooling of the magmatic-derived fluids as well as the likely dilution from
external fluid sources, such as meteoric waters (e.g., Audétat et al., 2000).
In contrast to the low salinity primary fluids that are recognized as early paragenetic fluids in Sn,
W, Cu, and Mo deposits noted above, the type 1 inclusions found in the weakly altered EKL,
inferred to be orthomagmatic in origin (see above), are hypersaline (29 to 38 wt% NaCl equiv.;
Table 4–2, Fig. 4–16B). These inclusions, however, do not coexist with V-rich fluid inclusion
types. The absence of V-rich fluid inclusions for the extensive suite of samples through the
complete paragenesis in the Main Zone (i.e., granite, pegmatites, greisens and different vein
types) is notable as a lack of evidence for phase separation; an important process for many
magmatic-hydrothermal systems (Williams-Jones and Heinrich, 2005; Richards, 2011; Bodnar et
al., 2014). This absence therefore highlights an unusual aspect of the EKD ore fluid relative to
other magmatic-hydrothermal systems: the high to moderate-salinity character of fluids that has
not been produced through fluid unmixing.
Subsequent to trapping of hypersaline type 1 inclusions, the fluid characteristics through the
EKD ore mineralization stages (i.e., types 2 and 3 fluids) decrease in salinity and average Th
values; a similar trend to what is described in magmatic-hydrothermal settings elsewhere, as
noted above. The end of ore mineralization at the EKD, trapped fluids that record a decrease in
salinity, from 29–38 to 10–23 wt% NaCl equiv., indicating a 2–3-fold dilution of the magmatic
saline type 1 fluids that results in the type 3 fluid. This change is consistent with the difference

397
between calculated δ18OH2O values for fluids that are interpreted to mineralized early greisens
and late barren veins at 6.3–7.6 and 2.2–4.0‰, respectively (Table 4–5, Fig. 4–20). The shift in
salinity and fluid isotope composition towards values of meteoric water indicates the diluting
fluid is of meteoric origin; although the somewhat elevated 18O values for these fluids, relative to
a meteoric fluid, suggests a modest modification by isotope exchange with silicate rocks at high
temperatures (i.e., > 300 oC, as indicated by fluid inclusions at the terminal mineralization
stages). Alternatively, the diluting fluid may represent a mixture of meteoric water with low-
salinity magmatic vapor that had previously condensed into this low salinity liquid (e.g., Audétat
et al., 2008). This process may explain the chemical composition of low-salinity end-stage fluids
that are typified in the EKD by enrichment of select ore elements (see discussion on sinuious
pattern above, Fig. 4–12A) that are preferentially transported by magmatic vapor (e.g., S, Cu,
As; cf. Fekete et al., 2016)
The derived isochores presented above suggest the hypersaline type 1 EKD fluids originated due
to exsolution via combined 1st and 2nd boiling processes (e.g., Burnham, 1979), from a highly-
evolved F-rich melt under relatively high pressures (Fig. 4–15); i.e., PT conditions similar to
those recorded by the SMB and the associated EKL. Thermodynamic modelling on such melts
by Webster and Holloway (1988) suggest an decreased capacity of Cl dissolution with higher
pressures (i.e. up to ~2-2.2 kbar); however, without degassing at depth, crystallization of silicate
minerals results in residual melts with excess Cl (up to 0.5 wt. % Cl after ~ 80 wt. %
crystallization of the melt). Additionally, decreasing temperature and fractionation at depth of
398
magmas with high halogen/H2O ratios, such as the EKL, exsolve a hydrosaline liquid (i.e., brine)
with progressively decreasing salinity (Dolejš and Zajacz, 2018). As Cl partitions strongly into a
fluid phase, any aqueous fluids derived from a magma under these conditions will thus be Cl-rich
(i.e., from 0.3 to 11 wt. %) and highly saline (Webster and Halloway, 1990; Iveson et al., 2019;
Webster et al., 2020). Although the SMB emplacement conditions indicate higher pressures (ca.
3.5 kbar) than these experiments, the high salinities and Cl concentrations measured in early type
1 fluids (i.e., 1.8 to 10.6 wt. % Cl; Table EA 4-3, Electronic Appendix) are similar to those
predicted by the Webster et al. (2020) models.
The enrichment of Cl in peraluminous granitic melts has important consequences for partitioning
of some ore metals, trace elements and the major elements (i.e., Na, K and Fe) into the fluid
(e.g., Webster, 2004); this enrichment also, therefore, influences the subsequent efficiency of ore
metal dissolution, transport, and deposition. The solubility of many ore metals is strongly
enhanced by the presence of Cl in hydrothermal fluids (e.g., Heinrich et al., 1992; Hedenquist
and Lowenstern, 1994; Candela and Piccoli, 1995; Seward and Barnes, 1997). Furthermore, if
first boiling is the more dominant mechanism of fluid exsolution, a Cl-enriched melt will do so at
greater relative pressures (i.e., at greater depths) than a felsic magma that exsolves an H2O-rich
fluid (Webster and Rebbert, 1998). Consequently, Cl-enriched magmas need not ascend to near-
surface depths to form magmatic-hydrothermal deposits.
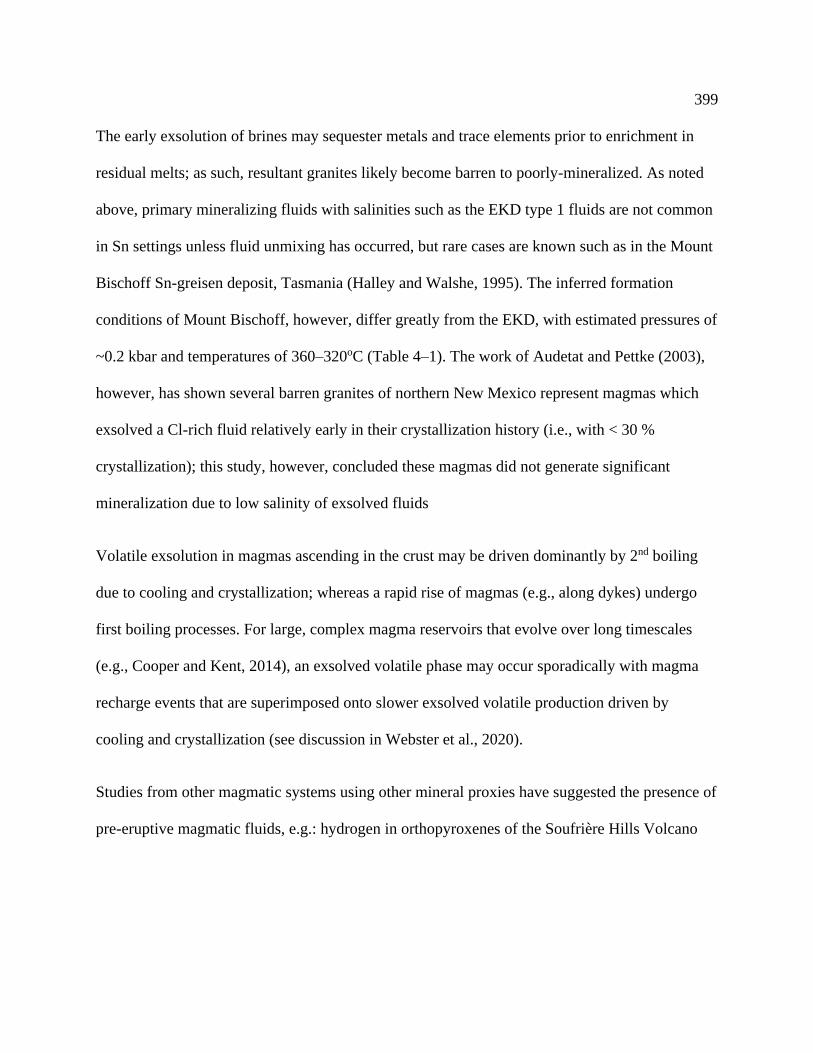
399
The early exsolution of brines may sequester metals and trace elements prior to enrichment in
residual melts; as such, resultant granites likely become barren to poorly-mineralized. As noted
above, primary mineralizing fluids with salinities such as the EKD type 1 fluids are not common
in Sn settings unless fluid unmixing has occurred, but rare cases are known such as in the Mount
Bischoff Sn-greisen deposit, Tasmania (Halley and Walshe, 1995). The inferred formation
conditions of Mount Bischoff, however, differ greatly from the EKD, with estimated pressures of
~0.2 kbar and temperatures of 360–320oC (Table 4–1). The work of Audetat and Pettke (2003),
however, has shown several barren granites of northern New Mexico represent magmas which
exsolved a Cl-rich fluid relatively early in their crystallization history (i.e., with < 30 %
crystallization); this study, however, concluded these magmas did not generate significant
mineralization due to low salinity of exsolved fluids
Volatile exsolution in magmas ascending in the crust may be driven dominantly by 2nd boiling
due to cooling and crystallization; whereas a rapid rise of magmas (e.g., along dykes) undergo
first boiling processes. For large, complex magma reservoirs that evolve over long timescales
(e.g., Cooper and Kent, 2014), an exsolved volatile phase may occur sporadically with magma
recharge events that are superimposed onto slower exsolved volatile production driven by
cooling and crystallization (see discussion in Webster et al., 2020).
Studies from other magmatic systems using other mineral proxies have suggested the presence of
pre-eruptive magmatic fluids, e.g.: hydrogen in orthopyroxenes of the Soufrière Hills Volcano

400
suggest volatile-saturated magma storage at depths of up to ~12 km (Edmonds et al., 2016); An-
rich plagioclase xenocrysts in Al-rich melts and experimental phase-equilibria infer water-rich
parental andesites beneath St. Kitts that crystallise over a pressure range from 1.5 to 6.0 kbar
(Melekhova et al., 2017); Webster (2004) draws similarities between the volatile contents of melt
inclusions from the potassic, alkaline magmas of Mt. Somma-Vesuvius (with high Cl/H2O ratios)
to those of the F-rich alkaline magmas associated with orthomagmatic gold–tellurium deposits of
Cripple Creek, Colorado, where the veined ores are associated with fluid inclusions of CO2-
bearing brines containing up to 40 wt% NaCl equiv. (Thompson et al., 1985); Kamenetsky et al.
1999 document the occurrence of coexisting silicate melt, salt melt, and hypersaline fluids
trapped as inclusions in clinopyroxene from the ore-bearing Balut dike at the Dinkidi Cu-Au
porphyry deposit, Philippines. These naturally occurring examples provide evidence for chlorine-
rich brines to exsolve under higher pressures, and highlight the significant potential for
magmatic-hydrothermal ore deposition in such settings.
4.6.5 Cassiterite precipitation at the EKD
The EKD is defined by greisen-hosted cassiterite mineralization localized along the EKSZ,
which extends regionally to define a trend of Sn-occurrences. This pattern indicates Sn-bearing
ore fluids used the EKSZ as a conduit and the deposit formed as an open-system. The interpreted
replenishment of fluid through the paragenesis (Fig. 4–18A) is consistent with open-system
behavior and is also reflected by the fluctuating PT conditions recorded by the inclusions;
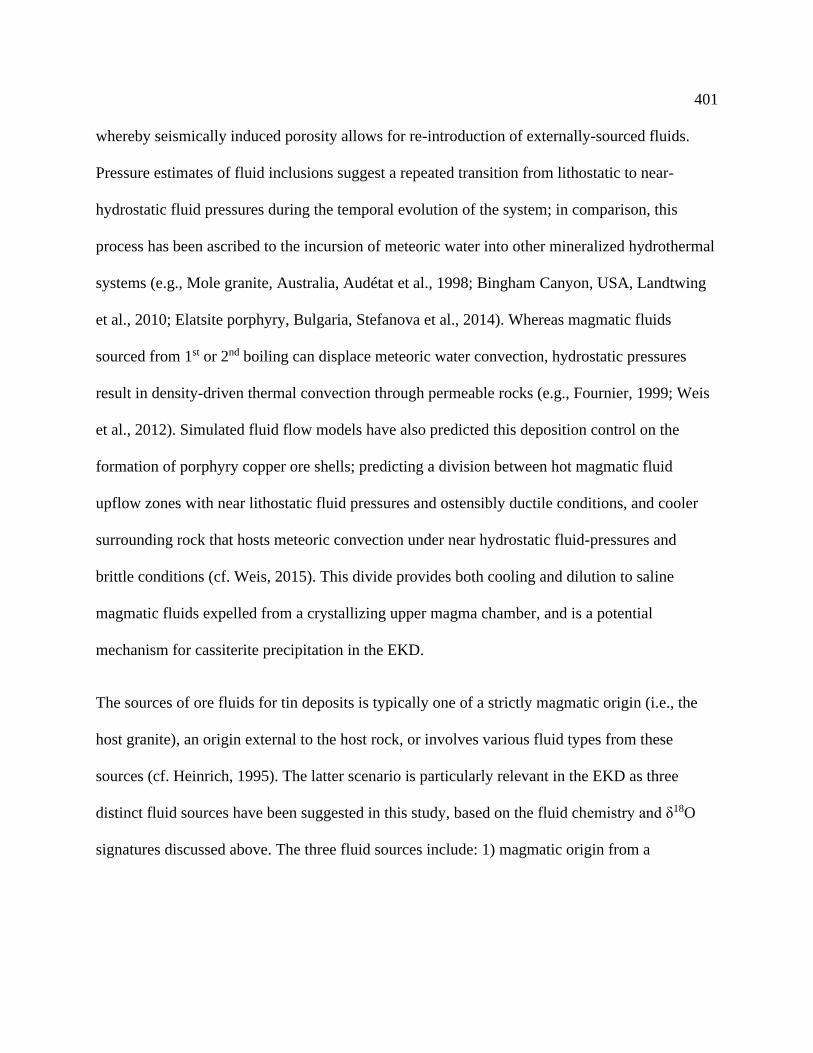
401
whereby seismically induced porosity allows for re-introduction of externally-sourced fluids.
Pressure estimates of fluid inclusions suggest a repeated transition from lithostatic to near-
hydrostatic fluid pressures during the temporal evolution of the system; in comparison, this
process has been ascribed to the incursion of meteoric water into other mineralized hydrothermal
systems (e.g., Mole granite, Australia, Audétat et al., 1998; Bingham Canyon, USA, Landtwing
et al., 2010; Elatsite porphyry, Bulgaria, Stefanova et al., 2014). Whereas magmatic fluids
sourced from 1st or 2nd boiling can displace meteoric water convection, hydrostatic pressures
result in density-driven thermal convection through permeable rocks (e.g., Fournier, 1999; Weis
et al., 2012). Simulated fluid flow models have also predicted this deposition control on the
formation of porphyry copper ore shells; predicting a division between hot magmatic fluid
upflow zones with near lithostatic fluid pressures and ostensibly ductile conditions, and cooler
surrounding rock that hosts meteoric convection under near hydrostatic fluid-pressures and
brittle conditions (cf. Weis, 2015). This divide provides both cooling and dilution to saline
magmatic fluids expelled from a crystallizing upper magma chamber, and is a potential
mechanism for cassiterite precipitation in the EKD.
The sources of ore fluids for tin deposits is typically one of a strictly magmatic origin (i.e., the
host granite), an origin external to the host rock, or involves various fluid types from these
sources (cf. Heinrich, 1995). The latter scenario is particularly relevant in the EKD as three
distinct fluid sources have been suggested in this study, based on the fluid chemistry and δ18O
signatures discussed above. The three fluid sources include: 1) magmatic origin from a
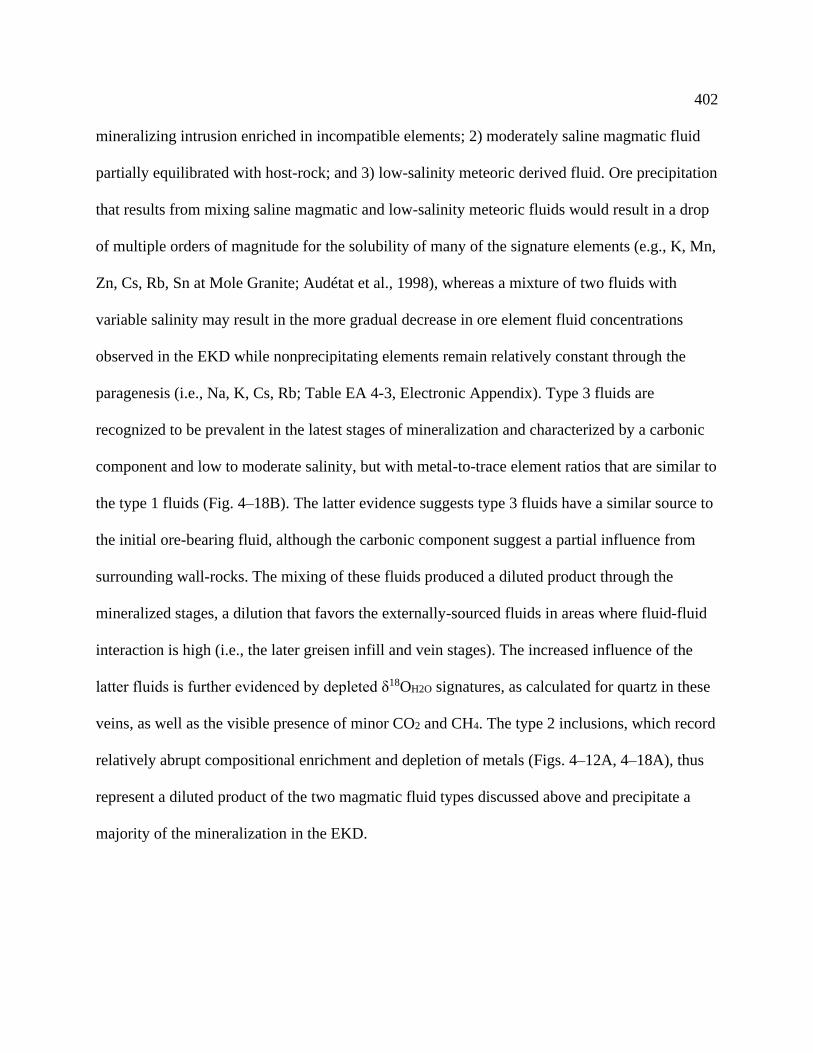
402
mineralizing intrusion enriched in incompatible elements; 2) moderately saline magmatic fluid
partially equilibrated with host-rock; and 3) low-salinity meteoric derived fluid. Ore precipitation
that results from mixing saline magmatic and low-salinity meteoric fluids would result in a drop
of multiple orders of magnitude for the solubility of many of the signature elements (e.g., K, Mn,
Zn, Cs, Rb, Sn at Mole Granite; Audétat et al., 1998), whereas a mixture of two fluids with
variable salinity may result in the more gradual decrease in ore element fluid concentrations
observed in the EKD while nonprecipitating elements remain relatively constant through the
paragenesis (i.e., Na, K, Cs, Rb; Table EA 4-3, Electronic Appendix). Type 3 fluids are
recognized to be prevalent in the latest stages of mineralization and characterized by a carbonic
component and low to moderate salinity, but with metal-to-trace element ratios that are similar to
the type 1 fluids (Fig. 4–18B). The latter evidence suggests type 3 fluids have a similar source to
the initial ore-bearing fluid, although the carbonic component suggest a partial influence from
surrounding wall-rocks. The mixing of these fluids produced a diluted product through the
mineralized stages, a dilution that favors the externally-sourced fluids in areas where fluid-fluid
interaction is high (i.e., the later greisen infill and vein stages). The increased influence of the
latter fluids is further evidenced by depleted δ18OH2O signatures, as calculated for quartz in these
veins, as well as the visible presence of minor CO2 and CH4. The type 2 inclusions, which record
relatively abrupt compositional enrichment and depletion of metals (Figs. 4–12A, 4–18A), thus
represent a diluted product of the two magmatic fluid types discussed above and precipitate a
majority of the mineralization in the EKD.

403
Cassiterite precipitation in areas of high fluid-fluid interaction may occur through the oxidation
of Sn(II)aq in the original magmatic fluid by partially-equilibrated, CO2-bearing externally
sourced magmatic fluids. Oxidation of Sn(II)aq is marked by the increase of CH4 concentration in
carbonic phases from type 3 fluids through the paragenesis. This process is evidenced by the
presence of CH4 in one sample from greisen infill and suggests this process may be responsible
for cassiterite precipitation in the oxide-ore mineralization stages. The variation of CH4 and CO2
concentrations in type 3 fluids may also reflect buffering by graphite (e.g., Burnham and
Ohmoto, 1980; Kreulen, 1987), a mineral present in syn-kinematic veins throughout the EKSZ
and within greisens parallel to the shear zone (e.g., Kontak, 1990b; Chapter 3). The presence of
graphite and variation in carbonic specices complement the interpretation of incipient greisens
and early cassiterite precipitation due to fluid-rock interaction (i.e., pH change; Halter et al.,
1996, 1998), and later coarse cassiterite precipitating due to episodic dilution by a CO2-bearing
foreign fluid.
Previous workers have established that cassiterite precipitation in the EKD that was required to
form economic Sn grades (i.e., up to 2 wt. %) in part resulted from a pH increase in ore fluids,
brought on by fluid-rock interaction (i.e., hydrolysis; Halter et al., 1996, 1998); however, the
coarse-grained character to late greisen infill (i.e., zoned greisen cores) suggest late greisen-infill
mineralization is responsible for the highest Sn grades (> 2 wt. % Sn; e.g., Chapter 3) with a
fluid-dominant precipitation mechanism. The Halter et al. (1996, 1998) studies note changes in
mineral (e.g., replacement of muscovite by topaz) and fluid compositions across zoned greisens
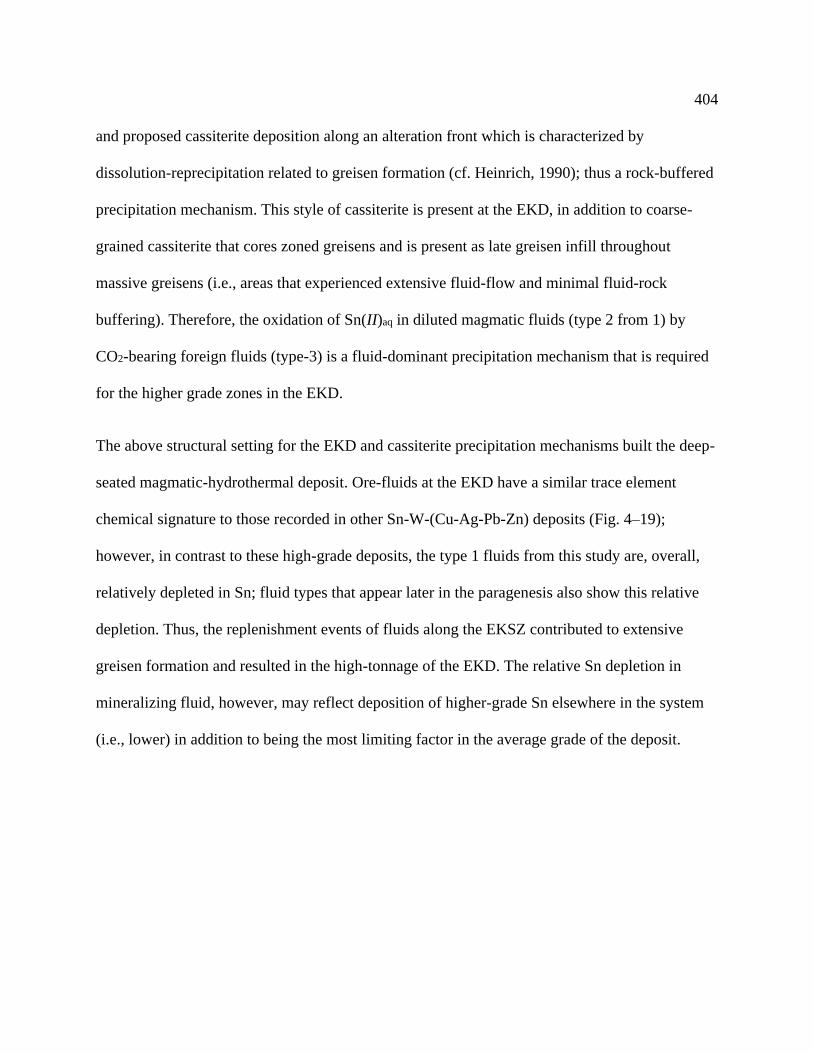
404
and proposed cassiterite deposition along an alteration front which is characterized by
dissolution-reprecipitation related to greisen formation (cf. Heinrich, 1990); thus a rock-buffered
precipitation mechanism. This style of cassiterite is present at the EKD, in addition to coarse-
grained cassiterite that cores zoned greisens and is present as late greisen infill throughout
massive greisens (i.e., areas that experienced extensive fluid-flow and minimal fluid-rock
buffering). Therefore, the oxidation of Sn(II)aq in diluted magmatic fluids (type 2 from 1) by
CO2-bearing foreign fluids (type-3) is a fluid-dominant precipitation mechanism that is required
for the higher grade zones in the EKD.
The above structural setting for the EKD and cassiterite precipitation mechanisms built the deep-
seated magmatic-hydrothermal deposit. Ore-fluids at the EKD have a similar trace element
chemical signature to those recorded in other Sn-W-(Cu-Ag-Pb-Zn) deposits (Fig. 4–19);
however, in contrast to these high-grade deposits, the type 1 fluids from this study are, overall,
relatively depleted in Sn; fluid types that appear later in the paragenesis also show this relative
depletion. Thus, the replenishment events of fluids along the EKSZ contributed to extensive
greisen formation and resulted in the high-tonnage of the EKD. The relative Sn depletion in
mineralizing fluid, however, may reflect deposition of higher-grade Sn elsewhere in the system
(i.e., lower) in addition to being the most limiting factor in the average grade of the deposit.
405
4.7 Conclusions
The PTX characteristics of mineralizing fluids in the EKD were determined through fluid
inclusion and stable isotope analysis to assess fluid sources, controls on mineralization, and
deposit evolution in a regional context. The absence of evidence for fluid immiscibility and
anomalously saline magmatic fluids are the result of deep emplacement for the highly
fractionated and F-rich host EKL, or similar intrusion at depth; whereby crystallization forced
exsolution of a Cl-enriched aqueous fluid with a trace element chemistry that is roughly similar
to fluids from higher-grade Sn deposits globally.
The Cl-rich type 1 fluids in the EKD formed through combined 1st and 2nd boiling from a highly-
evolved F-rich melt under relatively high pressures; fluid-rock interaction resulted in
precipitation of cassiterite as early greisen-style ore. Abundant decrepitate textures and large
ranges in PT isochores for quartz-hosted fluid inclusions through the rest of the mineral
paragenesis indicates pressure cycling subsequently controlled fluid flow in the ore system
through hydro-fracturing. The interpreted depth of formation for the SMB and localization of the
EKD along the long-lived EKSZ support the conditions interpreted from the fluid inclusion
evidence. Strike-slip and dip-slip movement along the EKSZ focused externally-sourced fluids
and provided a corridor of fluid incursion into the EKD setting and propagated greisen formation
in the host rock. The greisen formation involved high fluid-rock interaction and cassiterite
precipitation that resulted from an increasing pH in mineralizing fluids. The permeability

406
generated in these greisens were subsequently infilled with late coarse cassiterite mineralization
and quartz-sulfide assemblages that fill veins throughout the deposit. This latter ore is deposited
with a low fluid-rock interaction and increasing influence of externally-sourced metal-enriched
fluids that have partially equilibrated with surrounding wall-rocks.
The relatively sinuous pattern of ore metals and U-shaped pattern of select trace elements
through the paragenesis suggest that, despite the distinct sources of types 1 and 3 fluids, both are
somewhat enriched in trace lithophile elements and thus likely magmatic in origin. That they
represent two distinct fluid reservoirs suggests that fluid exsolution from a new magma
replenished the ore system, a typical process in most porphyry Cu deposits but rarely recorded in
Sn-W deposits.
The type 2 fluids are a product of mixing between ore element-enricehd types 1 and 3 fluids. The
resultant fluid is lower in salinity and depleted in elements that precipitated minerals during the
dilution event. The permeability generated through alteration of the host rock allowed for
extensive and efficient mixing by foreign fluids which utilized the EKSZ during seismic events;
temporarily shifting the lithostatic fluid pressures to near hydrostatic conditions and causing
incursion of the externally sourced fluids. The minor CO2 component in type 3 fluids that is not
recognized in any of the earlier fluid types and depleted δ18O signature of quartz in the late
mineralization stages suggests the late fluid had a partial equilibration with the surrounding
carbonaceous Meguma metasedimentary rock.
407
4.8 Acknowledgements
Thanks to Avalon Advanced Materials Inc. and Bill Mercer for their support and contribution to
this research. Special thanks to Dr. Jacob Hanley and the Saint Mary’s University Earth Sciences
Department, Halifax, NS, for their support on this project.
4.9 References
Allan, M.M., and Yardley, B.W., 2007, Tracking meteoric infiltration into a magmatic-
hydrothermal system: A cathodoluminescence, oxygen isotope and trace element study of
quartz from Mt. Leyshon, Australia: Chemical Geology, v. 240, p. 343–360.
Audétat, A., and Pettke, T., 2003, The magmatic-hydrothermal evolution of two barren granites:
A melt and fluid inclusion study of the Rito del Medio and Canada Pinabete plutons in
northern New Mexico (USA): Geochimica et Cosmochimica Acta, v. 67, p. 97–121.
Audétat, A., Günther, D., and Heinrich, C.A., 1998, Formation of a magmatic-hydrothermal ore
deposit: Insights with LA-ICP-MS analysis of fluid inclusions: Science, v. 279, p. 2091–
2094.
Audétat, A. Günther, D., and Heinrich, C.A., 2000, Causes for large scale metal zonation around
mineralized plutons: fluid inclusion LA-ICP-MS evidence from the Mole Granite,
Australia: Economic Geology, v. 95, p. 1563–1581.
408
Audétat, A., Pettke, T., Heinrich, C. A., and Bodnar, R.J., 2008, The composition of magmatic-
hydrothermal fluids in barren and mineralized intrusions: Economic Geology, v. 103, p.
877–908.
Archibald, D.B., Murphy, J.B., Reddy, S.M., Jourdan, F., Gillespie, J., and Glorie, S., 2018,
Post-accretionary exhumation of the Meguma terrane relative to the Avalon terrane in the
Canadian Appalachians: Tectonophysics, v. 747, p. 343–356.
Artiaga, D., Torres, B., Torró, L., Tauler, E., Melgarejo, J.C., and Arce, O.R., 2013, The Viloco
Sn-W-Mo-As deposits, Bolivia: geology and mineralogy [ext. abs.]: 12th SGA Biennial
Meeting “Mineral deposit research for a high-tech world”, Uppsala, Sweden, Extended
Abstracts, p. 1327–1330.
Bakker, R.J., 1999, Adaption of Bowers and Helgeson (1983) equation of state to isochore and
fugacity coefficient calculation in the H2O-CO2-CH4-N2-NaCl fluid system: Chemical
Geology, v. 154, p. 225–236.
Bakker, R.J., 2003, Package FLUIDS 1. Computer programs for analysis of fluid inclusion data
and for modelling bulk fluid properties: Chemical Geology, v. 194, p. 3–23.
Bakker, R.J., and Diamond, L.W., 2000, Determination of the composition and molar volume of
H2O-CO2 fluid inclusions by microthermometry: Geochimica et Cosmochimica Acta, v.
64, p. 1753–1764.
409
Beaudoin, G., and Therrien, P., 2004, The web stable isotope fractionation calculator, in De
Groot, P.A., ed., Handbook of stable isotope analytical techniques, Volume-I: Elsevier, p.
1045–1047.
Beeskow, B., Rankin, A.H., Murphy, P.J., and Treloar, P.J., 2005, Mixed CH4–CO2 fluid
inclusions in quartz from the South Wales Coalfield as suitable natural calibration
standards for microthermometry and Raman spectroscopy: Chemical Geology, v. 223, p.
3–15.
Benn, K, Horne, R.J. Kontak, D.J., Pignotta, G.S., and Evans, N.G., 1997, Syn-Acadian
emplacement model for the South Mountain Batholith, Meguma Terrane, Nova Scotia:
Magnetic fabric and structural analyses: Geological Society of Americia Bulletin, v. 109,
p. 1279–1293.
Benn, K., Roest, W.R., Rochette, P., Evans, N.G., and Pignotta, G.S., 1999, Geophysical and
structural signatures of syntectonic batholith construction: the South Mountain Batholith,
Meguma Terrane, Nova Scotia: Geophysical Journal International, v. 136, p.144-158.
Bettencourt, J.S., Leite Jr, W.B., Goraieb, C.L., Sparrenberger, I., Bello, R.M., and Payolla, B.L.,
2005, Sn-polymetallic greisen-type deposits associated with late-stage rapakivi granites,
Brazil: fluid inclusion and stable isotope characteristics: Lithos, v. 80, 363–386.
Bickerton, L., Kontak, D.J., Samson, I.M., Murphy, J.B., and Kellett, D.A., 2018, U–Pb
geochronology of the South Mountain Batholith, Nova Scotia, in Rogers, N., ed.,
410
Targeted Geoscience Initiative: 2017 report of activities, volume 1, Geological Survey of
Canada, Open File 8358, 2018, p. 51–55.
Bodnar, R.J., 1994, Synthetic fluid inclusions: XII. The system H2O–NaCl. Experimental
determination of the halite liquidus and isochores for a 40 wt% NaCl solution:
Geochimica et Cosmochimica Acta, v. 58, p. 1053–1063.
Bodnar, R.J., 2003, Introduction to aqueous-electrolyte fluid inclusions, in I.M. Samson, A.
Anderson, and D. Marshall, eds., Fluid Inclusions: Analysis and Interpretation:
Mineralogical Association of Canada Short Course, v. 32, p. 81–99.
Bodnar, R.J., Lecumberri-Sanchez, P., Moncada, D., and Steele-MacInnis, M., 2014, Fluid
Inclusions in Hydrothermal Ore Deposits, in H.D. Holland and K.K. Turekian, eds.,
Treatise on Geochemistry, Second Edition, v. 13, p. 119–142.
Boullier, A.-M., 1999, Fluid inclusions: tectonic indicators: Journal of Structural Geology, v. 21,
p. 1229–1235.
Boullier, A.-M., and Robert, F., 1992, Palaeoseismic events recorded in Archaean gold-quartz
vein networks, Val d’Or, Abitibi, Quebec, Canada: Journal of Structural Geology, v. 14,
p. 161–179.
Boullier, A.-M., Charoy, B., and Pollard, P.J., 1994, Fluctuation in porosity and fluid pressure
during hydrothermal events: textural evidence in the Emuford District, Australia: Journal
of Structural Geology, v. 16, p. 1417–1429.
411
Burnham, C.W., 1979, Magmas and hydrothermal fluids, in Barnes, H.L., ed., Geochemistry of
hydrothermal ore deposits: John Wiley and Sons, New York, p. 7l–136.
Burnham, C.W., and Ohmoto, H., 1980, Late-stage processes of felsic magmatism: Min. Geol.
Spec. Issue 8, p. 1–11.
Burke, E.A., 2001, Raman microspectrometry of fluid inclusions: Lithos, v. 55, p. 139–158.
Campbell, A.R., and Panter, K.S., 1990, Comparison of fluid inclusions in coexisting
(cogenetic?) wolframite, cassiterite, and quartz from St. Michael’s Mount and Cligga
Head, Cornwall, England: Geochimica et Cosmochimica Acta, v. 54, p. 673–681.
Candela, P.A., Piccoli, P.M., 1995, Model ore–metal partitioning from melts into vapor and
vapor/brine mixtures, in Thompson, J.F.H., ed., Magmas, Fluids, and Ore Deposits, vol.
23: Mineralogical Society of Canada, Nepean, Ontario, Canada, p. 101–127
Candela, P.A., 1995, Model ore-metal partitioning from melts into vapor and vapor/brine
mixtures: Mineralogical Association of Canada Short Course, p. 101–122.
Carruzzo, S., Kontak, D.J., and Clarke, D.B., 2000, Granite-hosted mineral deposits of the New
Ross area, South Mountain Batholith, Nova Scotia, Canada: P, T and X constraints of
fluids using fluid inclusion thermometry and decrepitate analysis: Transactions of the
Royal Society of Edinburgh: Earth Sciences, v. 91, p. 303–319.
Carruzzo, S., Kontak, D.J., Clarke, D.B., and Kyser, T.K., 2004, An integrated fluid–mineral
stable-isotope study of the granite-hosted mineral deposits of the New Ross area, south

412
mountain batholith, Nova Scotia, Canada: evidence for multiple reservoirs: The Canadian
Mineralogist, v. 42, p. 1425–1441.
Caumon, M.C., Robert, P., Laverret, E., Tarantola, A., Randi, A., Pironon, J., Dubessy, J., and
Girard, J.P., 2014, Determination of methane content in NaCl–H2O fluid inclusions by
Raman spectroscopy. Calibration and application to the external part of the Central Alps
(Switzerland): Chemical Geology, v. 378, p. 52–61.
Černý, P., Blevin, P.L., Cuney, M., and London, D., 2005, Granite related ore deposits:
Economic Geology 100th Anniversary Volume, p. 337–370.
Chelle-Michou, C., Rottier, B., Caricchi, L., and Simpson, G., 2017, Tempo of magma degassing
and the genesis of porphyry copper deposits: Scientific reports, v. 7, p. 1–12.
Clarke, D.B., Chatterjee, A.K., and Giles, P.S., 1993, Petrochemistry, tectonic history, and Sr-Nd
systematics of the Liscomb Complex, Meguma Lithotectonic Zone, Nova Scotia:
Canadian Journal of Earth Sciences, v. 30, p. 449–464.
Clayton, R.N., and Mayeda, T.K., 1963, The use of bromine pentafluoride in the extraction of
oxygen from oxides and silicates for isotopic analysis: Geochimica et cosmochimica acta,
v. 27, p. 43–52.
Cline, J.S., and Bodnar, R.J., 1991, Can economic porphyry copper mineralization be generated
by a typical calc-alkaline melt?: Journal of Geophysical Research, v. 96, p. 8113–8126.
413
Collins, P.L.F., 1981, The geology and genesis of the Cleveland tin deposit, western Tasmania;
fluid inclusion and stable isotope studies: Economic Geology, v. 76, p. 365–392.
Cooper, K.M., and Kent, A.J., 2014, Rapid remobilization of magmatic crystals kept in cold
storage: Nature, v. 506, p. 480–483.
Cox, S.F., 2005, Coupling between deformation, fluid pressures, and fluid flow in ore-producing
hydrothermal systems at depth in the crust: Economic Geology 100th Anniversary
Volume, p. 39–75.
Culshaw, N., and Lee, S.K., 2006, The Acadian fold belt in the Meguma Terrane, Nova Scotia:
Cross sections, fold mechanisms, and tectonic implications: Tectonics, v. 25.
Culshaw, N., and Liesa, M., 1997, Alleghanian reactivation of the Acadian fold belt, Meguma
Zone, southwest Nova Scotia: Canadian Journal of Earth Sciences, v. 34, p. 833–847.
Cuney, M., Marignac, C., and Weisbrod, A., 1992, The Beauvoir Topaz-Lepidolite Albite
Granite (Massif Central, France): The Disseminated Magmatic Sn-Li-Ta-Nb-Be
Mineralization: Economic Geology, v. 87, p. 1766–1794.
Darling, R.S., 1991, An extended equation to calculate NaCl contents from final clathrate
melting temperatures in H2O-CO2-NaCl fluid inclusions: Implications for PT isochore
location: Geochimica et Cosmochimica Acta, v. 55, p. 3869–3871.
414
Desanois, L., Lüders, V., Niedermann, S., and Trumbull, R.B., 2019, Formation of epithermal
Sn-Ag-(Zn) vein-type mineralization at the Pirquitas deposit, NW Argentina: fluid
inclusion and noble gas isotopic constraints: Chemical Geology, v. 508, p. 78–91.
Diamond, L.W., Tarantola, A., Stünitz, H., 2010, Modification of fluid inclusions in quartz by
deviatoric stress. II: experimentally induced changes in inclusion volume and
composition: Contributions to Mineralogy and Petrology, v. 160, p. 845–864.
Dolejš, D., and Zajacz, Z., 2018, Halogens in silicic magmas and their hydrothermal systems, in
Harlov, D.E., and Aranovich, L., eds., The Role of Halogens in Terrestrial and
Extraterrestrial Geochemical Processes: Springer, p. 431–543.
Dostal, J., and Chatterjee, A.K., 1995, Origin of topaz-bearing and related peraluminous granites
of late Devonian Davis Lake pluton, Nova Scotia, Canada: Chemical Geology, v. 123, p.
67–88.
Dostal, J., and Chatterjee, A. K., 2000, Contrasting behaviour of Nb/Ta and Zr/Hf ratios in a
peraluminous granitic pluton (Nova Scotia, Canada): Chemical Geology, v. 163, p. 207–
218.
Dubessy, J., Poty, B., and Ramboz, C., 1989, Advances in COHNS fluid geochemistry based on
micro-Raman spectrometric analysis of fluid inclusions: European journal of
Mineralogy, v. 1, p. 517–534.
415
Eadington, P.J., 1974, Microprobe analysis of the non-volatile constituents of fluid inclusions:
Neues Jahrb Mineral., Monatsh, p. 518–525.
Eadington, P.J., 1983, A fluid inclusion investigation of ore formation in a tin-mineralized
granite, New England, New South Wales: Economic Geology, v. 78, p. 1204–1221.
Elmi Assadzadeh, G., Samson, I.M., and Gagnon, J.E., 2016, Identification of Fluid Inclusion
Solid Phases Using A Focused Ion Beam Scanning Electron Microscope With Energy
Dispersive Spectroscopy: Implications For Interpreting Microthermometric Data and
Composition of Fluids In SN (-W-Mo) Deposits: The Canadian Mineralogist, v. 54, 737–
754.
Fall, A., Tattitch, B., and Bodnar, R.J., 2011, Combined microthermometric and Raman
spectroscopic technique to determine the salinity of H2O–CO2–NaCl fluid inclusions
based on clathrate melting: Geochimica et Cosmochimica Acta, v. 75, p. 951–964.
Fayek, M., Harrison, T. M., Ewing, R. C., Grove, M., and Coath, C. D., 2002, O and Pb isotopic
analyses of uranium minerals by ion microprobe and U-Pb ages from the Cigar Lake
deposit: Chemical Geology, v. 185, p. 205–225.
Fekete, S., Weis, P., Driesner, T., Bouvier, A.-S., Baumgartner, L., and Heinrich, C.A., 2016,
Contrasting hydrological processes of meteoric water incursion during magmatic–
hydrothermal ore deposition: An oxygen isotope study by ion microprobe: Earth and
Planetary Science Letters, v. 451, p. 263–271.
416
Fournier, R.O., 1999, Hydrothermal processes related to movement of fluid from plastic into
brittle rock in the magmatic-epithermal environment: Economic Geology, v. 94, p. 1193–
1211.
Frezzotti, M.L., Tecce, F. and Casagli, A., 2012, Raman spectroscopy for fluid inclusion
analysis: Journal of Geochemical Exploration, v. 112, p. 1–20.
Fusswinkel, T., Wagner, T. and Sakellaris, G., 2017, Fluid evolution of the Neoarchean Pampalo
orogenic gold deposit (E Finland): Constraints from LA-ICPMS fluid inclusion
microanalysis: Chemical Geology, v. 450, p. 96–121.
Garofalo, P.S., Fricker, M.B., Günther, D., Bersani, D., and Lottici, P.P., 2014, Physical-
chemical properties and metal budget of Au-transporting hydrothermal fluids in orogenic
deposits: Geological Society, London, Special Publications, v. 402, p. 71–102.
Giles, P.S., 1985, A major post-Visean sinistral shear zone – new perspectives on Devonian and
Carboniferous rocks of southern Nova Scotia, in A.K. Chatterjee and D.B. Clarke, eds.,
Guide to the granites and mineral deposits of southwestern Nova Scotia: Nova Scotia
Department of Mines and Energy, Paper 85-3, p. 233–248.
Goldstein, R.H., and Reynolds, T.J., 1994, Systematics of fluid inclusions in diagenetic minerals.
Short Course 31, Society of Economic Paleontologists and Mineralogists, Tulsa, 199 p.
417
Gowans, R., Jacobs, C., Anderson, D., Spooner, J., Mercer, W., Hains, D.H., Smith, R., 2018,
The East Kemptville Tin Production and Site Remediation Project Preliminary Economic
Assessment Nova Scotia, Canada: NI-43-101 Technical Report, 296 pp.
Graupner, T., Brätz, H., and Klemd, R., 2005, LA-ICP-MS micro-analysis of fluid inclusions in
quartz using a commercial Merchantek 266 nm Nd: YAG laser: a pilot study: European
Journal of Mineralogy, v. 17, p. 93–102.
Guillong M., Meier D. L., Allan M. M., Heinrich C. A., and Yardley, B.W.D., 2008, Appendix
A6: SILLS: a Matlab-based program for the reduction of Laser Ablation ICP–MS data of
homogeneous materials and inclusions: Short Course, Mineral. Association of Canada, v.
40, p. 328–333.
Halley, S.W., and Walshe, J.L., 1995, A re-examination of the Mount Bischoff cassiterite sulfide
skarn, western Tasmania: Economic Geology, v. 90, p. 1676–1693.
Halter, W.E., 1996, Physiochemical controls of greisen formation and cassiterite deposition at
the East Kemptville Tin deposit, Nova Scotia: PhD Thesis, McGill University, 317pp.
Halter, W.E., and Williams-Jones, A.E., 1999, Application of topaz muscovite F-OH exchange
as a geothermometer: Economic Geology, v. 94, p. 1249–1258.
Halter, W.E., Williams-Jones, A.E., and Kontak, D.J., 1996, The role of greisenization in
cassiterite precipitation at the East Kemptville tin deposit, Nova Scotia: Economic
Geology, v. 91, p. 368–385.
418
Halter, W.E., Williams-Jones, A.E. and Kontak, D.J., 1998, Modeling fluid–rock interaction
during greisenization at the East Kemptville tin deposit: implications for mineralization:
Chemical Geology, v. 150, p. 1–17.
Hanley, J.J., and Koga, K.T., 2018, Halogens in terrestrial and cosmic geochemical systems:
abundances, geochemical behaviors, and analytical methods, in The role of halogens in
terrestrial and extraterrestrial geochemical processes: Springer, Cham, p. 21–121.
Hanus, D., 1982, The Colquiri tin deposit: a contribution to its genesis, in, Ore Genesis:
Springer, Berlin, Heidelberg, p. 308–318.
Harlaux, M., Mercadier, J., Bonzi, W.M.E., Kremer, V., Marignac, C., and Cuney, M., 2017,
Geochemical signature of magmatic-hydrothermal fluids exsolved from the Beauvoir
rare-metal granite (Massif Central, France): Insights from LA-ICPMS analysis of primary
fluid inclusions: Geofluids, 2017.
Haynes, F.M., Sterner, S.M., and Bodnar, R.J., 1988, Synthetic fluid inclusions in natural quartz.
IV. Chemical analyses of fluid inclusions by SEM/EDA: evaluation and method:
Geochimica et Cosmochimica Acta, v. 52, p. 969–977.
Hedenquist, J.W., and Lowenstern, J.B., 1994, The role of magmas in the formation of
hydrothermal ore deposits: Nature, v. 370, p. 519–527.
Heinrich, C.A., 1990, The chemistry of hydrothermal tin (-tungsten) ore deposition: Economic
Geology, v. 85, p. 457–481.
419
Heinrich, C.A., 1995, Geochemical evolution and hydrothermal mineral deposition in Sn (-W-
base-metal) and other granite-related ore systems: Some conclusions from Australian
examples: Short Course Handbook, Mineralogical Association of Canada, v. 23, p. 203–
220.
Heinrich, C.A., Ryan, C.G., Mernagh, T.P., and Eadington, P.J., 1992, Segregation of ore metals
between magmatic brine and vapor; a fluid inclusion study using PIXE microanalysis:
Economic Geology, v. 87, p. 1566–1583.
Heinrich, C.A., Gunther, D., Audétat, A., Ulrich, T., and Frischknecht, R., 1999, Metal
fractionation between magmatic brine and vapor, determined by microanalysis of fluid
inclusions: Geology, v. 27, p. 755–758.
Heinrich, C.A., Pettke, T., Halter, W.E., Aigner-Torres, M., Audétat, A., Günther, D.,
Hattendorf, B., Bleiner, D., Guillong, M. and Horn, I., 2003, Quantitative multi-element
analysis of minerals, fluid and melt inclusions by laser-ablation inductively-coupled-
plasma mass-spectrometry: Geochimica et Cosmochimica Acta, v. 67, p. 3473–3497.
Henderson, I.H.C., and McCaig, A.M., 1996, Fluid pressure and salinity variations in shear zone-
related veins, central Pyrenees, France: Implications for the fault-valve model.
Tectonophysics, v. 262, p. 321–348.
420
Hicks, R.J., Jamieson, R.A., and Reynolds, P.H., 1999, Detrital and metamorphic 40Ar/39Ar ages
from muscovite and whole-rock samples, Meguma Supergroup, southern Nova Scotia:
Canadian Journal of Earth Sciences, v. 36, p. 23–32.
Hilchie, L., and Jamieson, R.A., 2008, Graphite thermometry in the Halifax contact aureole:
Atlantic Geology, v. 44, p. 16–17.
Hilchie, L.J., and Jamieson, R.A., 2014, Graphite thermometry in a low-pressure contact aureole,
Halifax, Nova Scotia: Lithos, v. 208, p. 21–33.
Holliger, P., and Cathelineau, M., 1988, In situ U-Pb age determination by secondary ion mass
spectrometry: Chemical Geology, v. 70, 173pp.
Horne, R.J., MacDonald, M.A., Corey, M.C., and Ham, L.J., 1992, Structure and emplacement
of the South Mountain Batholith, southwestern Nova Scotia: Atlantic Geology, v. 28, p.
29–50.
Horne, R.J., King, M.S. Kontak, D.J., O’Reilly, G.A., and Black, D., 2006, The Kemptville
shear zone: Regional shear related to emplacement and mineralization, in MacDonald,
D.R., ed., Mines and Minerals Branch Report of Activities 2005: Nova Scotia
Department of Natural Resources, Report 2006-1, p. 19–37.
Irber, W., 1999. The lanthanide tetrad effect and its correlation with K/Rb, Eu/Eu∗, Sr/Eu, Y/Ho,
and Zr/Hf of evolving peraluminous granite suites: Geochimica et Cosmochimica Acta,
v. 63, p. 489–508.

421
Iveson, A.A., Webster, J.D., Rowe, M.C., and Neill, O.K., 2019, Fluid-melt trace-element
partitioning behaviour between evolved melts and aqueous fluids: Experimental
constraints on the magmatic-hydrothermal transport of metals: Chemical Geology, v.
516, p. 18–41.
Jackson, N.J., Willis-Richards, J., Manning, M., and Satns, M., 1989, Evolution of the Cornubian
ore field: Part II. Ore deposits and mineralizing processes: Economic Geology, v. 84, p.
1101–1133.
Kelly, J.L., Fu, B., Kita, N.T., and Valley, J.W., 2007, Optically continuous silcrete quartz
cements of the St. Peter Sandstone: High precision oxygen isotope analysis by ion
microprobe: Geochimica et Cosmochimica Acta, v. 71, p. 3812–3832.
Kelly, W.C., and Rye, R.O., 1979, Geologic, fluid inclusion and stable isotope studies of the tin–
tungsten deposits of Panasqueira, Portugal: Economic Geology, 74, p. 1721–1822.
Kelly, W.C., and Turneaure, F.S., 1970, Mineralogy, paragenesis and geothermometry of the tin
and tungsten deposits of the Eastern Andes, Bolivia: Economic Geology, v. 65, p. 609–
680.
Keppie, J.D., and Dallmeyer, R.D., 1987, Dating transcurrent terrane accretion: an example from
the Meguma and Avalon composite terranes in the northern Appalachians: Tectonics, v.
6, p. 831–847.
422
Kerr, M.J., Hanley, J.J., Kontak, D.J., Morrison, G.G., Petrus, J., and Fayek, M., 2018, Evidence
of upgrading of gold tenor in an orogenic quartz-carbonate vein system by late magmatic-
hydrothermal fluids at the Madrid Deposit, Hope Bay Greenstone Belt, Nunavut, Canada:
Geochimica et Cosmochimica Acta, v. 241, p. 180–218.
Kesler, S.E., and Wilkinson, B.H., 2015, Tectonic-diffusion estimates of global mineral
resources: extending the method: granitic tin deposits: Geological Society, London,
Special Publications, v. 393, p. 277–290.
Klemm, L.M., Pettke, T., Heinrich, C.A. and Campos, E., 2007, Hydrothermal evolution of the
El Teniente deposit, Chile: Porphyry Cu-Mo ore deposition from low-salinity magmatic
fluids: Economic Geology, v. 102, p. 1021–1045.
Kobayashi, S., Kado, S., Oishi, T., Ohshima, S., Kagawa, T., Nagae, Y., Yamamoto, S.,
Mizuuchi, T., Nagasaki, K., Okada, H. and Minami, T., 2012, Density fluctuation
measurements using beam emission spectroscopy on Heliotron J: Review of Scientific
Instruments, v. 83, p.10D535.
Kontak, D.J., 1990a, A sulfur isotopic study of main-stage tin and base-metal mineralization at
the East Kemptville tin deposit, Yarmouth County, Nova Scotia, Canada: evidence for
magmatic origin of metals and sulfur: Economic Geology, v. 85, p. 399–407.
423
Kontak, D.J., 1990b, The East Kemptville topaz-muscovite leucogranite, Nova Scotia. I.
Geological setting and whole rock geochemistry: Canadian Mineralogist, v. 28, p. 787–
825.
Kontak, D.J., 1993, Geological, geochemical and isotopic studies of the East Kemptville Sn-(Zn-
Cu-Ag) deposit, Yarmouth County, Nova Scotia, Canada: Proceedings of the Eighth
Quadrennial IAGOD Symposium E. Schweizerbart'sche Verlagsbuchhandlung, Stuttgart,
Germany, p. 383–409.
Kontak, D.J., 1994, Geological and geochemical studies of alteration processes in a fluorine-rich
environment: The East Kemptville Sn-(Zn-Cu-Ag) deposit, Yarmouth County, Nova
Scotia, Canada, in Lentz, D.R., ed., Alteration and Alteration Processes associated with
Ore-forming Systems: Geological Association of Canada, Short Course Notes, v. 11, p.
261–314.
Kontak, D.J., 2004, Analysis of evaporate mounds as a complement to fluid-inclusion
thermometric data: Case studies from granitic environments in Nova Scotia and Peru:
The Canadian Mineralogist, v. 42, p. 1315–1329.
Kontak, D.J., and Cormier, R.F., 1991, Geochronological evidence for multiple tectono-thermal
overprinting events in the East Kemptville muscovite-topaz leucogranite, Yarmouth
County, Nova Scotia, Canada: Canadian Journal of Earth Science, v. 28, p. 209–224.
424
Kontak, D.J., and Chatterjee, A.K., 1992, The East Kemptville tin deposit, Yarmouth County,
Nova Scotia. A Pb isotope study of the leucogranite and mineralized greisens: Evidence
for a 366 Ma metallogenic event: Canadian Journal of Earth Sciences, v. 29, p. 1180–
1196.
Kontak, D.J., and Clark, A.H., 2002, Genesis of the giant, bonanza San Rafael lode tin deposit,
Peru: origin and significance of pervasive alteration: Economic Geology, v. 97, p. 1741–
1777.
Kontak, D.J., and Kerrich, R., 1995, Geological and geochemical studies of a metaturbidite
hosted lode gold deposit: The Beaver Dam deposit, Nova Scotia: II: Isotopic Studies:
Economic Geology, v. 90, p. 885–901.
Kontak, D.J., and Kyser, T.K., 2001, Preliminary fluid inclusion and oxygen isotope studies of
the Flintstone Rock (NTS 21N04) silica-clay deposit, Yarmouth County, Nova Scotia, in
MacDonald, D.R., ed., Minerals and Energy Branch, Report of Activities: Nova Scotia
Department of Natural Resources 2000, Report ME 2001-1, p. 37-48.
Kontak, D.J., and Kyser, T.K., 2011, Fingerprinting multiple fluid reservoirs in a 380 Ma
Intrusion-Related Gold (IRG) setting, Nova Scotia, Canada: Implications for the nature
and origin of IRG deposits, Mineralium Deposita, v. 46, p. 337–363.
Kontak, D.J., Strong, D.F., and Kerrich, R., 1988, Crystal-melt±fluid phase equilibria versus
late-stage fluid-rock interaction in granitoid rocks of the South Mountain Batholith, Nova
425
Scotia: whole rock geochemistry and oxygen isotope evidence: Atlantic Geology, v. 24,
p. 97–110.
Kontak, D.J., Kerrich, R., and Strong, D.F., 1991, The role of fluids in the late-stage evolution of
the South Mountain Batholith, Nova Scotia: further geochemical and oxygen isotopic
studies: Atlantic Geology, v. 27, p. 29–47.
Kontak, D.J., Farrar, E., McBride, S.M., and Martin, R.F., 1995, Mineral chemistry and
40Ar/39Ar dating of muscovite from the East Kemptville leucogranite, southern Nova
Scotia: evidence for localised resetting of 40Ar/39Ar systematics in a shear zone: Canadian
Mineralogist, v. 33, p. 1237–1253.
Kontak, D.J., Home, R.J., Sandeman, H., Archibald, D., and Lee, K.W., 1998, 40Ar/39Ar dating
of ribbon-textured veins and wall-rock material from Meguma lode gold deposits, Nova
Scotia: implications for timing and duration of vein formation in slate-belt hosted vein
gold deposits: Canadian Journal of Earth Sciences, v. 35, p. 746-761.
Kontak, D.J., Ansdell, K., and Archibald, D.A., 1999, New constraints on the age and origin of
the Dunbrack Pb-Cu-Zn-Ag deposit, Musquodoboit Batholith, southern Nova Scotia:
Atlantic Geology, v. 35, p. 19-42.
Kontak, D.J., Dostal, J., Ansdell, K., Halter, W., Martin, R.F, and Williams-Jones, A.E., 2001,
The nature and origin of pegmatite in a fluorine-rich leucogranite, East Kemptville, Nova

426
Scotia: Transactions of the Royal Society of Edinburgh: Earth Sciences, v. 92, p. 173–
200.
Kontak, D.J, Ham. L.J., and Dunning, G., 2004, U/Pb dating of the Musquodoboit Batholith,
southern Nova Scotia: evidence for a protracted magmatic-hydrothermal event in a
Devonian intrusion: Atlantic Geology, v. 40, p. 207–216.
Kontak, D.J. and Tuba, G., 2017, How can fluid inclusion studies better constrain orogenic gold
deposit models: case studies from the Superior Province and Meguma terrane, Canada
[ext. abs.]: Society for Geology Applied to Mineral Deposits (SGA) Biennial Meeting,
14th, Quebec City, Canada, Extended Abstracts, p. 55–58.
Korges, M., Weis, P., Lüders, V., and Laurent, O., 2018, Depressurization and boiling of a single
magmatic fluid as a mechanism for tin-tungsten deposit formation: Geology, v. 46, p.75–
78.
Kreulen, R., 1987, Thermodynamic calculations of the C–O–H system applied to fluid
inclusiuons: Are fluid inclusions unbiased samples of ancient fluids?: Chemical Geology,
v. 61, p. 59–64.
Krylov, D.P., Zagnitko, V.N., Hoernes, S., Lugovaja, I.P., and Hoffbauer, R., 2002, Oxygen
isotope fractionation between zircon and water: experimental determination and
comparison with quartz-zircon calibrations: European Journal of Mineralogy, v. 14, p.
849–853.
427
Landtwing, M.R., Pettke, T., Halter, W.E., Heinrich, C.A., Redmond, P.B., Einaudi, M.T., and
Kunze, K., 2005, Copper deposition during quartz dissolution by cooling magmatic–
hydrothermal fluids: the Bingham porphyry: Earth and Planetary Science Letters, v. 235,
p. 229–243.
Lecumberri-Sanchez, P., Steele-MacInnis, M., and Bodnar, R.J. 2015. Synthetic fluid inclusions
XIX. Experimental determination of the vapor-saturated liquidus of the system H2O–
NaCl–FeCl2: Geochimica et Cosmochimica Acta, v. 148, p. 34–49.
Lehmann, B., 2020, Formation of tin ore deposits: A reassessment: Lithos, 105756.
London D., Morgan G.B.VI, and Hervig, R.L., 1989, Vapor-undersaturated experiments in the
system macusanite-H2O at 200 MPa, and the internal differentiation of granitic
pegmatites: Contributions to Mineralogy and Petrology, v. 102, p. 1–17.
London, D., Morgan, G.B., VI, Babb, H.A., and Loomis, J.L., 1993, Behavior and effects of
phosphorus in the system Na2O–K2O–Al2O3–SiO2–P2O5–H2O at 200 MPa (H2O):
Contrib. Mineral. Petrol., v. 113, p. 450–465.
London, D., Wolf, M.B., Morgan, G.B., and Garrido, M.G., 1999, Experimental silicate–
phosphate equilibria in peraluminous granitic magmas, with a case study of the
Alburquerque batholith at Tres Arroyos, Badajoz, Spain: Journal of Petrology, v. 40, p.
215–240.
428
Longstaffe, F.J., Smith, T.E., and Muehlenbachs, K., 1980, Oxygen isotope evidence for the
genesis of Upper Paleozoic granitoids from southwestern Nova Scotia: Canadian Journal
of Earth Sciences, v. 17, p. 132–141.
MacDonald, M.A., Horne, R.J., Corey, M.C., and Ham, L.J., 1992, An overview of recent
bedrock mapping and follow-up petrological studies of the South Mountain batholith,
southwestern Nova Scotia, Canada: Atlantic Geology, v. 28, p. 7–28.
MacDonald, M.A., 2001, Geology of the South Mountain Batholith, southwestern Nova Scotia.
Nova Scotia Department of Natural Resources, Open File Report ME2001-2.
MacLean, N. J., Barr, S. M., White, C. E., and Ketchum, J. W. F., 2004. New U-Pb (zircon) age
and geochemistry of the Wedgeport pluton, Meguma terrane, Nova Scotia: Atlantic
Geology, v. 39, p. 239–253.
Manning, D.A.C., and Pichavant, M., 1983, The role of fluorine and boron in the generation of
granitic melts [ext. abs.]: High grade metamorphism, migmatites and melting: Meeting of
the Geochemical Group of the Mineralogical Society, Extended Abstracts, p. 94–109.
Martel, A.T., McGregor, D.C., and Utting, J., 1993, Stratigraphic significance of Upper
Devonian and Lower Carboniferous miospores from the type area of the Horton Group,
Nova Scotia: Canadian Journal of Earth Sciences, v. 30, p. 1091–1098.
429
Matsuhisa, Y., Goldsmith, J. R., and Clayton, R.N., 1979, Oxygen isotopic fractionation in the
system quartz-albite-anorthite-water: Geochimica et Cosmochimica Acta, v. 43, p. 1131–
1140.
McDivitt, J.A., Kontak, D.J., Lafrance, B., Petrus, J.A., and Fayek, M., 2021, A trace metal,
stable isotope (H, O, S), and geochronological (U-Pb titanite) characterization of
hybridized gold orebodies in the Missanabie-Renabie district, Wawa subprovince
(Canada): Mineralium Deposita, v. 56, p. 1-22.
Micklethwaite, S., Sheldon, H. A., and Baker, T., 2010, Active fault and shear processes and
their implications for mineral deposit formation and discovery: Journal of Structural
Geology, v. 32, p. 151–165.
Monecke, T., Monecke, J., Reynolds, T.J., Tsuruoka, S., Bennett, M.M., Skewes, W.B. and
Palin, R.M., 2018, Quartz solubility in the H2O-NaCl system: A framework for
understanding vein formation in porphyry copper deposits: Economic Geology, v. 113, p.
1007–1046.
Morales, M.J., e Silva, R.C.F., Lobato, L.M., Gomes, S.D., Gomes, C.C. and Banks, D.A., 2016,
Metal source and fluid–rock interaction in the Archean BIF-hosted Lamego gold
mineralization: Microthermometric and LA-ICP-MS analyses of fluid inclusions in
quartz veins, Rio das Velhas greenstone belt, Brazil: Ore Geology Reviews, v. 72, p.
510–531.
430
Morgan, G.B., VI, and London, D., 1999, Crystallization of the Little Three layered pegmatite-
aplite dike, Ramona district, California: Contributions to Mineralogy and Petrology , v.
136, p. 310–330.
Muecke, G.K., Elias, P., and Reynolds, P. H., 1988, Hercynian/Alleghanian overprinting of an
Acadian terrane: 40Ar/39Ar studies in the Meguma zone, Nova Scotia, Canada: Chemical
Geology (Isotope Geoscience Section), v. 73, p. 153–167.
Müller, B., Frischknecht, R., Seward, T. M., Heinrich, C. A., and Camargo Gallegos, W., 2001,
A fluid inclusion reconnaissance study of the Huanuni tin deposit (Bolivia), using LA-
ICP-MS micro-analysis: Mineralium Deposita, v. 36, p. 680–688.
Murphy, J.B., 2000, Tectonic influence on sedimentation along the southern flank of the late
Paleozoic Magdalen basin in the Canadian Appalachians: Geochemical and isotopic
constraints on the Horton Group in the St. Marys basin, Nova Scotia: Geological Society
of America Bulletin, v. 112, p. 997–1011.
O'Neil, J.R., and Taylor, H.P.Jr., 1967. The oxygen isotope and cation exchange chemistry of
feldspars: American Mineralogist, v. 52, p. 1414–1437.
Ohmoto, H., Rye, R.O., 1979, Isotopes of sulfur and carbon, in, Barnes, H.L., ed., Geochemistry
of Hydrothermal Ore Deposits: Wiley, New York, p. 509–567.
431
Partington, G.A., McNaughton, N.J., and Williams, I.S., 1995, A review of the geology,
mineralization, and geochronology of the Greenbushes pegmatite, Western Australia:
Economic Geology, v. 90, p. 616-635.
Pécher, A., 1981, Experimental decrepitation and reequilibration of fluid inclusions in synthetic
quartz: Tectonophysics, v. 78, p. 567–584.
Pécher, A., 1989, The metamorphism in the central Himalaya: Journal of Metamorphic Geology,
v. 7, p. 31–41.
Pettke, T., 2006, In-situ Laser-Ablation-ICP-MS chemical analysis of melt inclusion and
prospects for constraining subduction zone magmas, in Webster, J.D., ed., Melt
inclusions in plutonic rocks: Mineralogical Association of Canada, Montreal, Short
Course Series, v. 36, p. 51–80.
Pollard, P.J., and Taylor, R.G., 1986, Progressive evolution of alteration and tin mineralization;
controls by interstitial permeability and fracture-related tapping of magmatic fluid
reservoirs in tin granites: Economic Geology, v. 81, p. 1795–1800.
Poulson, S.R., Kubilius, W.P., and Ohmoto, H., 1991, Geochemical behavior of sulfur in
granitoids during intrusion of the South Mountain Batholith, Nova Scotia, Canada:
Geochimica et Cosmochimica Acta, v. 55, p. 3809–3830.

432
Raeside, R.P. and Mahoney, K.M., 1996, The contact metamorphic aureole of the South
Mountain Batholith, southern Nova Scotia [ext. abs.]: Geological Association of Canada
– Mineralogical Association of Canada, Program Abstracts, 21.
Redmond, P.B., Einaudi, M.T., Inan, E.E., Landtwing, M.R. and Heinrich, C.A., 2004, Copper
deposition by fluid cooling in intrusion-centered systems: New insights from the
Bingham porphyry ore deposit, Utah: Geology, v. 32, p. 217–220.
Reynolds, P.H., Elias, P., Muecke, G.K., and Grist, A.M., 1987, Thermal history of the
southwestern Meguma Zone, Nova Scotia, from an 40Ar/39Ar and fission track dating
study of intrusive rocks: Canadian Journal of Earth Sciences, v. 24, p. 1952–1965.
Richards, J.P., 2011, High Sr/Y arc magmas and porphyry Cu±Mo±Au deposits: just add water:
Economic Geology, v. 106, p. 1075–1081.
Richards, J.P., 2018, A shake-up in the porphyry world?: Economic Geology, v. 113, p. 1225–
1233.
Richardson, J.M., Spooner, E.T.C., and McAuslan, D.A., 1982, the East Kemptville tin deposit.
Nova Scotia; An example of large tonnage, low grade greisen-hosted tin mineralization:
Canada Geological Survey Paper 82-IB, p. 27–32.
Richardson, J.M., Blenkinsop, J., and Bell, K., 1988. Extreme variations (0.729-0.828) in initial
87Sr/86Sr ratios in magmato-hydrothermal fluids derived from the East Kemptville greisen
tin deposit, Nova Scotia, Canada: Chemical Geology, v. 70, p. 136.
433
Richardson, J. M Bell, K., Blenkinsop, J., and Watkinson, D.H., 1989, Geochemical distinctions
between the Carboniferous tin-bearing Davis Lake complex and the Devonian South
Mountain batholith, Meguma Terrane, N.S., Canada: Canadian Journal of Earth Sciences,
v. 26, p. 2044–2061.
Richardson, J. M., Bell, K., Watkinson, D. H., and Blenkinsop, J., 1990, Genesis and fluid
evolution of the East Kemptville greisen hosted tin mine, southwestern Nova Scotia,
Canada, in Stein, H.J., and Hannah, J.L., eds., Ore-bearing Granite Systems; Petrogenesis
and Mineralizing Processes: Geological Society of American Special Paper 246, p. 181–
203.
Rickers, K., Thomas, R. and Heinrich, W., 2006, The behavior of trace elements during the
chemical evolution of the H2O-, B-, and F-rich granite–pegmatite–hydrothermal system
at Ehrenfriedersdorf, Germany: a SXRF study of melt and fluid inclusions: Mineralium
Deposita, v. 41, p. 229–245.
Rijks, H.R.P., and Van Der Veen, A.H., 1972, The geology of the tin-bearing pegmatites in the
eastern part of the Kamativi district, Rhodesia: Mineralium Deposita, v. 7, p. 383–395.
Roedder, E., 1984. Fluid inclusions: Mineralogical Society of America. Reviews in Mineralogy,
v. 12, 644p.
434
Rosso, K.M., and Bodnar, R.J., 1995, Microthermometric and Raman spectroscopic detection
limits of CO2 in fluid inclusions and the Raman spectroscopic characterization of CO2:
Geochimica et Cosmochimica Acta, v. 59, p. 3961–3975.
Rusk, B.G., Reed, M.H., Dilles, J.H., Klemm, L.M. and Heinrich, C.A., 2004, Compositions of
magmatic hydrothermal fluids determined by LA-ICP-MS of fluid inclusions from the
porphyry copper–molybdenum deposit at Butte, MT: Chemical Geology, v. 210, p. 173–
199.
Samson, I.M., 1990, Fluid evolution and mineralization in a subvolcanic granite stock; the
Mount Pleasant W-Mo-Sn deposits, New Brunswick, Canada: Economic Geology, v. 85,
p. 145–163.
Schmidt, C., 2018, Formation of hydrothermal tin deposits: Raman spectroscopic evidence for an
important role of aqueous Sn (IV) species: Geochimica et Cosmochimica Acta, v. 220, p.
499–511.
Schwartz, M.O., and Surjono, 1990, Greisenization and albitization at the Tikus tin-tungsten
deposit, Belitung, Indonesia: Economic Geology, v. 85, p. 691–713.
Seedorff, E., Barton, M.D., Stavast, W.J., and Maher, D.J., 2008, Root zones of porphyry
systems: Extending the porphyry model to depth: Economic Geology, v. 103, p. 939–956.

435
Seward, T.M., and Barnes, H.L., 1997, Metal transport by hydrothermal ore fluids, in Barnes,
H.L., ed., Geochemistry of hydrothermal ore deposits, 3rd ed.: New York, Wiley, p. 435–
486.
Sillitoe, R.H., 1985, Ore breccias in volcanoplutonic arcs: Economic Geology, v. 80, p. 1467–
1514.
Sheppard, S.M., 1986, Characterization and isotopic variations in natural waters, in Valley, J.W.,
Taylor, H.P., and O’Neil, eds., Stable isotopes in high temperature geological processes:
Reviews in Mineralogy, v. 16, p. 165–184.
Sheppard, S.M.F., 1994, Stable Isotope and Fluid Inclusion Evidence for the Origin and
Evolution of Hercynian Mineralizing Fluids, in Seltmann, R., Kampf, H., and Moller, P.,
eds., Metallogeny of Collisional Orogens: Proc. IAGOD Erzgebirge Meeting, Geyer,
June 4–6, 1993, Czech Geological Survey, Prague, p. 49–60.
Sibson, R. H., 1990, Conditions for fault-valve behaviour, in Knipe, R.J., and Rutter, E.H., eds.,
Deformation Mechanisms, Rheology and Tectonics: Geological Society, London, Special
Publications, v. 54, p. 15–28.
Sibson, R.H., 1992, Implications of fault-valve behaviour for rupture nucleation and recurrence:
Tectonophysics, v. 211, p. 283–293.
436
Sibson, R. H., 1994, Crustal stress, faulting and fluid flow, in Parnell, J., ed., Geofluids: Origin,
Migration and Evolution of Fluids in Sedimentary Basins: Geological Society Special
Publication, v. 78, p. 69–84.
Sibson, R.H., Robert, F., and Poulsen, K.H., 1988, High-angle reverse faults, fluid pressure
cycling and mesothermal gold-quartz deposits: Geology, v. 16, p. 551–555.
Sirbescu, M.L.C., and Nabelek, P.I., 2003, Crustal melts below 400 C: Geology, v. 31, p. 685–
688.
Soloviev, S.G., Kryazhev, S.G., and Dvurechenskaya, S.S., 2017, Geology, mineralization,
stable isotope, and fluid inclusion characteristics of the Vostok-2 reduced W-Cu skarn
and Au-W-Bi-As stockwork deposit, Sikhote-Alin, Russia: Ore Geology Reviews, v. 86,
p. 338–365.
Steele-MacInnis, M., 2018, Fluid inclusions in the system H2O-NaCl-CO2: An algorithm to
determine composition, density and isochore: Chemical Geology, v. 498, p. 31–44.
Steele-MacInnis, M., Lecumberri-Sanchez, P., and Bodnar, R. J., 2012, HOKIEFLINCS-H2O-
NACL: A Microsoft Excel spreadsheet for interpreting microthermometric data from
fluid inclusions based on the PVTX properties of H2O-NaCl: Comput. Geosci., v. 49, p.
334–337.

437
Steele-MacInnis, M., Ridley, J., Lecumberri-Sanchez, P., Schlegel, T.U. and Heinrich, C.A.,
2016, Application of low-temperature microthermometric data for interpreting
multicomponent fluid inclusion compositions: Earth-Science Reviews, v. 159, p. 14–35.
Sterner, S.M., Bodnar, R.J., 1989, Synthetic fluid inclusions—VII. Re-equilibration of fluid
inclusions in quartz during laboratory-simulated metamorphic burial and uplift: Journal
of Metamorphic Geology, v. 7, p. 243–260.
Strong, D. F., 1981, Ore deposit models — 5. A model for granophile mineral deposits. -
Geoscience Canada,8, 155–161.
Sugaki, A., 1985, Geological study on the ore deposits in the La Paz district, Bolivia. Sci. Rept.
Tohoku Univ., Ser. III, v. 16, p. 131–198.
Sun, S., and Eadington, P.J., 1987, Oxygen isotope evidence for the mixing of magmatic and
meteoric waters during tin mineralization in the Mole Granite, New South Wales,
Australia: Economic Geology, v. 82, p. 43–52
Sun, M., Monecke, T., Reynolds, T.J., and Yang, Z., 2020, Understanding the evolution of
magmatic-hydrothermal systems based on microtextural relationships, fluid inclusion
petrography, and quartz solubility constraints: insights into the formation of the Yulong
Cu-Mo porphyry deposit, eastern Tibetan Plateau, China: Mineralium Deposita, p. 1–20.
Taylor Jr, H.P., 1978, Oxygen and hydrogen isotope studies of plutonic granitic rocks. Earth and
Planetary Science Letters, v. 38, p. 177–210.
438
Taylor, R.D., Monecke, T., Reynolds, T.J. and Monecke, J., 2021, Paragenesis of an Orogenic
Gold Deposit: New Insights on Mineralizing Processes at the Grass Valley District,
California: Economic Geology, v. 116, p. 323–356.
Taylor, R.G., 1979, Geology of Tin Deposits: Elsevier, Amsterdam, 543pp.
Thomas, R., Webster, J.D. and Heinrich, W., 2000, Melt inclusions in pegmatite quartz:
complete miscibility between silicate melts and hydrous fluids at low pressure:
Contributions to Mineralogy and Petrology, v. 139, p. 394–401.
Thomas, R., Förster, H. J., and Heinrich, W., 2003, The behaviour of boron in a peraluminous
granite-pegmatite system and associated hydrothermal solutions: a melt and fluid-
inclusion study: Contributions to Mineralogy and Petrology, v. 144, p. 457–472.
Tsuruoka, S., Monecke, T. and Reynolds, T.J., 2021. Evolution of the Magmatic-Hydrothermal
System at the Santa Rita Porphyry Cu Deposit, New Mexico, USA: Importance of
Intermediate-Density Fluids in Ore Formation. Economic Geology, in press.
Tuba, G., Kontak, D.J., Zajacz, Z. and Petrus, J.A., 2019, Bulk microanalysis of assemblages of
small fluid inclusions by LA-ICP-MS: Methodology and application to orogenic gold
systems: Chemical Geology, v. 529, p.119-326.
Tuttle, O.F., and Bowen, N.L., 1958, Origin of Granite in the Light of Experimental Studies in
the System: NaAlSi3O8 (No. 74): Geological Society of America.
439
Tweedale, F.M., 2019, Bulk Compositional Analysis of Quartz–hosted Fluid Inclusions from the
South Mountain Batholith, Nova Scotia. MSc Thesis, Saint Mary’s University, 279pp.
Tweedale, F., Hanley, J., Kontak, D.J., Rogers, N., 2014, Using evaporate mound chemistry of
fluid inclusions to assess the metal fertility and fluid:rock interaction in a large
peraluminous batholith: A case study of the mineralized (Sn-W-U-Cu-Zn-Ag) South
Mountain Batholith, Nova Scotia [ext. abs.]: 12th Pan-American Current Research on
Fluid Inclusions Conference, Denver. CO, Canada Program with Abstracts, p. 54–55.
Ulrich, T., Günther, D. and Heinrich, C.A., 1999, Gold concentrations of magmatic brines and
the metal budget of porphyry copper deposits: Nature, v. 399, p. 676–679.
Ulrich, T., Günther, D., and Heinrich, C.A., 2002, The evolution of a porphyry Cu-Au deposit,
based on LA-ICP-MS analysis of fluid inclusions: Bajo de la Alumbrera, Argentina:
Economic Geology, v. 97, p. 1889–1920.
van Staal, C.R., 2007, Pre-Carboniferous tectonic evolution and metallogeny of the Canadian
Appalachians, in Goodfellow, W.D., ed., Mineral Deposits of Canada: Geological
Association of Canada Special Publication, v. 5, p. 793–818.
Vityk, M.O., Bodnar, R.J., 1995, Textural evolution of synthetic fluid inclusions in quartz during
reequilibration, with applications to tectonic reconstruction: Contributions to Mineralogy
and Petrology, v. 121, p. 309–323.
440
Vityk, M.O., Bodnar, R.J., Schmidt, C.S., 1994, Fluid inclusions as tectonothermobarometcrs:
relation between pressure-temperature history and reequilibration morphology during
crustal thickening: Geology, v. 22, pp. 731–734.
Wagner, T., Mlynarczyk, M.S., Williams-Jones, A.E. and Boyce, A.J., 2009, Stable isotope
constraints on ore formation at the San Rafael tin-copper deposit, Southeast Peru:
Economic Geology, v. 104, p. 223–248.
Wang X., Chou I. M., Hu W., Burruss R. C., Sun Q., and Song Y., 2011, Raman spectroscopic
measurements of CO2 density: Experimental calibration with high-pressure optical cell
(HPOC) and fused silica capillary capsule (FSCC) with application to fluid inclusion
observations: Geochimica et Cosmochimica Acta, v. 75, p. 4080–4093.
Webster, J.D., 1997, Chloride Solubility in Felsic Melts and the Role of Chloride in Magmatic
Degassing: Journal of Petrology, v. 38, p. 1793–1807.
Webster, J.D., 2004, The exsolution of magmatic hydrosaline chloride liquids: Chemical
Geology, v. 210, p. 33–48.
Webster, J.D., and Holloway, J.R., 1990, Partitioning of F and Cl between magmatic—
hydrothermal fluids and highly evolved granitic magmas. Ore-Bearing Granite Systems:
Petrogenesis and Mineralizing Processes: Geological Society of America Special Paper
246, 21p.
441
Webster, J.D. and Rebbert, C.R., 1998, Experimental investigation of H2O and Cl− solubilities in
F-enriched silicate liquids; implications for volatile saturation of topaz rhyolite magmas:
Contributions to Mineralogy and Petrology, v. 132, p. 198–207.
Webster, J.D., Iveson, A.A., Rowe, M.C., and Webster, P.M., 2020, Chlorine and felsic magma
evolution: Modeling the behavior of an under-appreciated volatile component:
Geochimica et Cosmochimica Acta, v. 271, p. 248–288.
Weis, P., 2015, The dynamic interplay between saline fluid flow and rock permeability in
magmatic‐hydrothermal systems: Geofluids, v. 15, p. 350–371.
White, C.E., 2010, Stratigraphy of the Lower Paleozoic Goldenville and Halifax groups in
southwestern Nova Scotia: Atlantic Geology, v. 46, p. 136–154.
White, C. E., and Barr, S. M., 2010, Lithochemistry of the Lower Paleozoic Goldenville and
Halifax groups, southwestern Nova Scotia, Canada: Implications for stratigraphy,
provenance, and tectonic setting of the Meguma terrane, in Tollo, R.P., Bartholomew,
M.J., Hibbard, J.P., and Karabinos, P.M., eds., From Rodinia to Pangea: The
Lithotectonic Record of the Appalachian Region: Geological Society of America Memoir
206, p. 347–366.
Wilkinson, J.J., 2001, Fluid inclusions in hydrothermal ore deposits, Lithos, v. 55, p. 229–272.
442
Williams-Jones, A.E. and Heinrich, C.A., 2005, 100th Anniversary special paper: vapor transport
of metals and the formation of magmatic-hydrothermal ore deposits: Economic Geology,
v. 100, p. 1287–1312.
Willson, J., 2019, Character and genesis of Indium mineralization, East Kemptville, Nova Scotia.
MSc Thesis, University of Windsor, 111pp.
Wopenka, B. and Pasteris, J., 1986, Limitations to Quantitative Analysis of Fluid Inclusions in
Geological Samples by Laser Raman Microprobe Spectroscopy: Applied Spectroscopy,
v. 40, p. 144–151.
Wopenka, B., and J. Pasteris, J., 1987, Raman intensities and detection limits of geochemically
relevant gas mixtures for a laser Raman microprobe: Analytical Chemistry, v. 59, p.
2165–2170.
Wright, J. H. and Kwak, T.A.P., 1989, Tin-bearing greisens of mount Bischoff, northwestern
Tasmania, Australia. Economic Geology, v. 84, p. 551–574.
Yamamoto, J., and Kagi, H., 2006, Extended micro-Raman densimeter for CO2 applicable to
mantle-originated fluid inclusions: Chemistry Letters, v. 35, p. 610–611.
Yamamoto, J., Kagi, H., Kaneoka, I., Lai, Y., Prikhod’ko, V. S., and Arai, S., 2002, Fossil
pressures of fluid inclusions in mantle xenoliths exhibiting rheology of mantle minerals:
implications for the geobarometry of mantle minerals using micro-Raman spectroscopy:
Earth and Planetary Science Letters, v. 198, p. 511–519.
443
Zajacz, Z., Hanley, J.J., Heinrich, C.A., Halter, W.E., and Guillong, M., 2009, Diffusive
reequilibration of quartz-hosted silicate melt and fluid inclusions: Are all metal
concentrations unmodified?: Geochimica et Cosmochimica Acta, v. 73, p. 3013–3027.
Zoheir, B., Steele-MacInnis, M. and Garbe-Schönberg, D., 2019, Orogenic gold formation in an
evolving, decompressing hydrothermal system: Genesis of the Samut gold deposit,
Eastern Desert, Egypt: Ore Geology Reviews, v. 105, p. 236–257.
Zhao, Z.F., and Zheng, Y.F., 2003, Calculation of oxygen isotope fractionation in magmatic
rocks, Chemical Geology, v. 193, p. 59–80.
Zheng, Y.F., 1993, Calculation of oxygen isotope fractionation in hydroxyl-bearing silicates.
Earth and Planetary Science Letters, v. 120, p. 247–263.
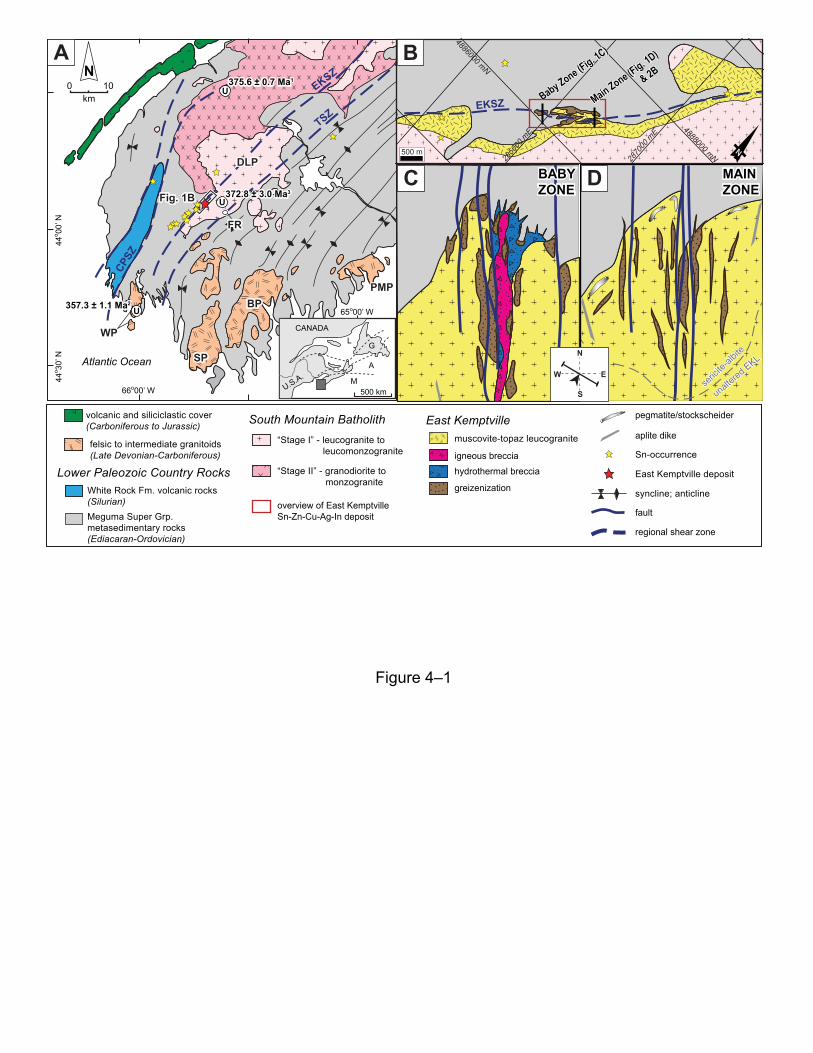
EKSZ
TSZCP
SZ
km100
65o00’ W
Atlantic Ocean
66o00’ W
44o 00
’ N44
o 30’ N
NU
375.6 ± 0.7 Ma1375.6 ± 0.7 Ma1
U357.3 ± 1.1 Ma2357.3 ± 1.1 Ma2
U372.8 ± 3.0 Ma3372.8 ± 3.0 Ma3Fig. 1BFig. 1B
DLP
WP
DLP
WP
FRFR
SPSP
BPBPPMOPMP
500 km
CANADA
U.S.A.
L G
A
M seric
ite-al
bite
seric
ite-al
bite
unaltered EKL
unaltered EKL
MAINZONEMAINZONE
BABYZONEBABYZONE
W E
S
N
4886000 mN
2850
00 m
E 4888000 mN2870
00 m
E
EKSZ
N
Baby Zone (Fig. 1C)
Main Zone (Fig. 1D)
& 2B
Baby Zone (Fig. 1C)
Main Zone (Fig. 1D)
& 2B
Lower Paleozoic Country Rocks
volcanic and siliciclastic cover(Carboniferous to Jurassic)
felsic to intermediate granitoids (Late Devonian-Carboniferous)
Meguma Super Grp. metasedimentary rocks(Ediacaran-Ordovician)
White Rock Fm. volcanic rocks (Silurian)
syncline; anticline
East Kemptville deposit
Sn-occurrence
pegmatite/stockscheider
aplite dike
fault
regional shear zone
East Kemptville
greizenization
hydrothermal brecciaigneous breccia
muscovite-topaz leucogranite
South Mountain Batholith
“Stage II” - granodiorite to monzogranite
“Stage I” - leucogranite to leucomonzogranite
overview of East KemptvilleSn-Zn-Cu-Ag-In deposit
A
Figure 4–1
B
C D500 m

445
Figure 4–1. (A) Regional geology of SW Nova Scotia, Canada (modified after MacDonald et al.,
1992; White, 2010) showing the location of the East Kemptville deposit, hosted a muscovite-
topaz leucogranite (Fig. 4–1B) in the western part of the Davis Lake pluton (DLP), which is
dominantly a biotite monzogranite and part of the composite South Mountain Batholith. U-Pb
(zircon) ages displayed (1 – Bickerton et al., submitted; 2 – MacLean et al., 2004; 3 – Bickerton
et al., 2018) and regional shear zones are outlined (CPSZ – Chebogue Point shear zone, White
and Barr 2010; EKSZ – East Kemptville shear zone, Horne et al. 2006; TSZ – Tobeatic shear
zone, Giles 1985). WP – Wedgeport Pluton; SP – Shelburne Pluton; BP – Barrington Passage
Pluton; PMP – Port Mouton Pluton; FR – Flintstone Rock Silica-Clay deposit. Note the Sn
mineralization occurrences in this part of the SMB. (B) Plan view of the East Kemptville deposit
area showing the extent of the F-rich EKL and EKSZ-hosted deposit. (C & D) Schematic cross-
sections of the two main ore zones in the East Kemptville deposit which show markedly different
lithological characteristics, the southwestern Baby zone and the northeastern Main zone. Note
the presence of the magmatic and hydrothermal breccia bodies that are restricted to the Baby
zone.
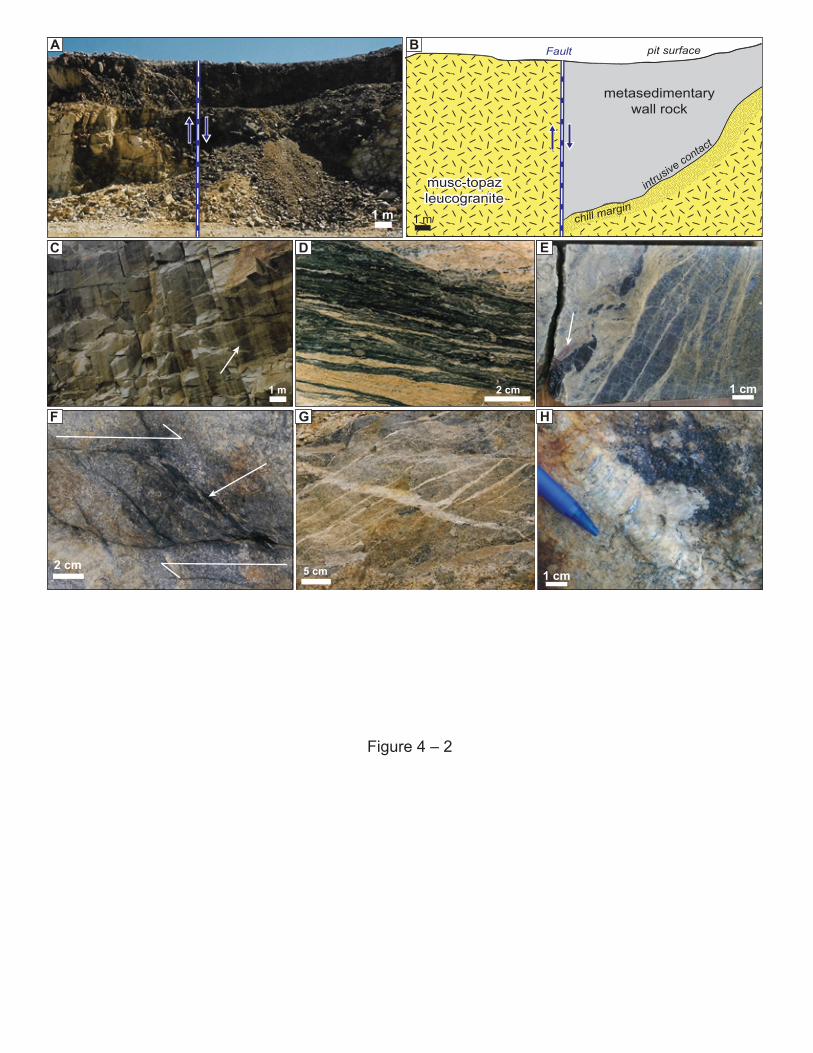
2 cm1 m
2 cm
1 m
pit surface
metasedimentarywall rock
musc-topazleucogranitemusc-topazleucogranite
intrusiv
e contact
chill margin
Fault
1 m1 m
1 cm
1 cm5 cm
A
C
B
D
Figure 4 – 2
E
F G H
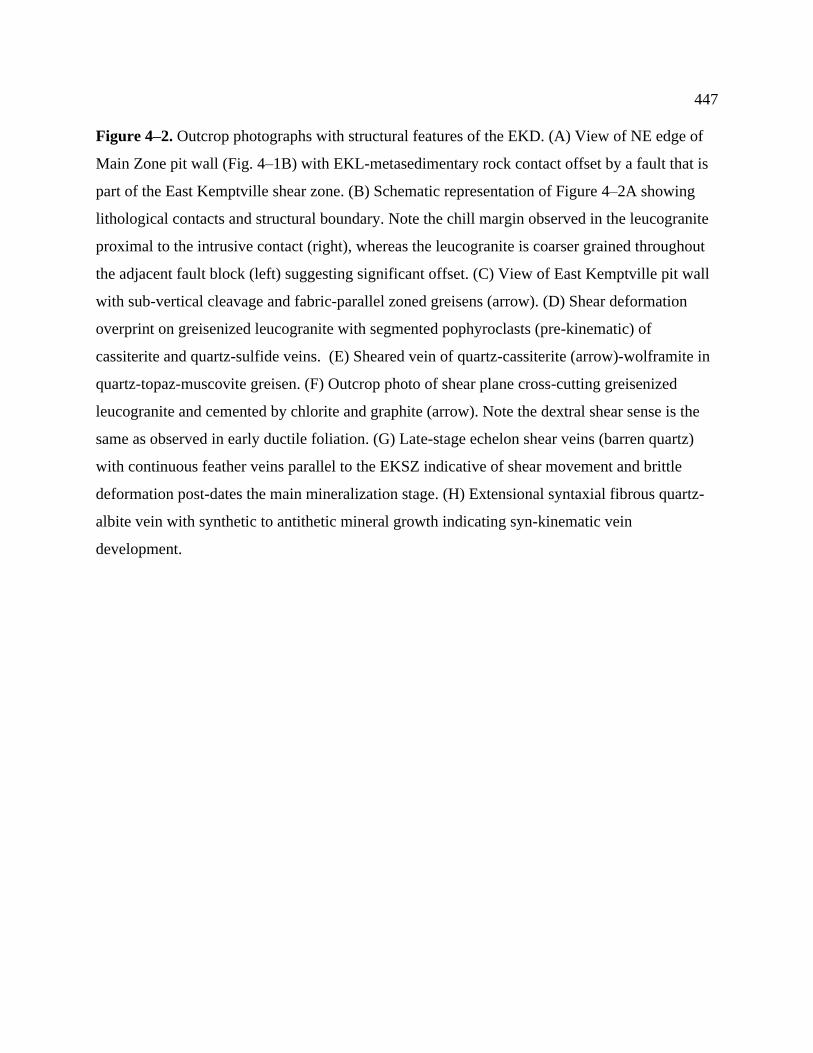
447
Figure 4–2. Outcrop photographs with structural features of the EKD. (A) View of NE edge of
Main Zone pit wall (Fig. 4–1B) with EKL-metasedimentary rock contact offset by a fault that is
part of the East Kemptville shear zone. (B) Schematic representation of Figure 4–2A showing
lithological contacts and structural boundary. Note the chill margin observed in the leucogranite
proximal to the intrusive contact (right), whereas the leucogranite is coarser grained throughout
the adjacent fault block (left) suggesting significant offset. (C) View of East Kemptville pit wall
with sub-vertical cleavage and fabric-parallel zoned greisens (arrow). (D) Shear deformation
overprint on greisenized leucogranite with segmented pophyroclasts (pre-kinematic) of
cassiterite and quartz-sulfide veins. (E) Sheared vein of quartz-cassiterite (arrow)-wolframite in
quartz-topaz-muscovite greisen. (F) Outcrop photo of shear plane cross-cutting greisenized
leucogranite and cemented by chlorite and graphite (arrow). Note the dextral shear sense is the
same as observed in early ductile foliation. (G) Late-stage echelon shear veins (barren quartz)
with continuous feather veins parallel to the EKSZ indicative of shear movement and brittle
deformation post-dates the main mineralization stage. (H) Extensional syntaxial fibrous quartz-
albite vein with synthetic to antithetic mineral growth indicating syn-kinematic vein
development.
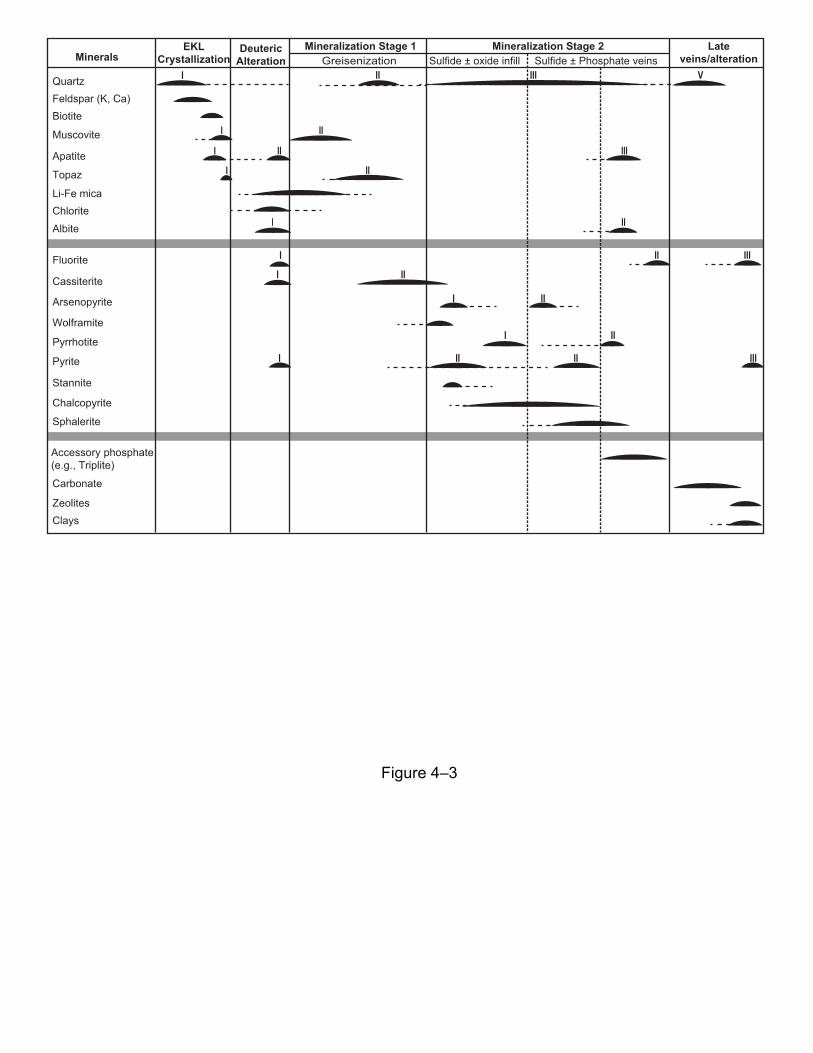
Figure 4–3
Zeolites
IIICassiterite
Wolframite
Arsenopyrite I II
Pyrrhotite
Chalcopyrite
Sphalerite
Stannite
III IIIIIPyrite
Albite I II
I IITopaz
BiotiteI IIMuscovite
ChloriteLi-Fe mica
Feldspar (K, Ca)
I II III VQuartz
Apatite I II III
Clays
Carbonate
I II IIIFluorite
Accessory phosphate(e.g., Triplite)
III
MineralsEKL
CrystallizationDeuteric
AlterationMineralization Stage 1 Mineralization Stage 2
Sulfide ± Phosphate veinsSulfide ± oxide infillLate
veins/alterationGreisenization
449
Figure 4–3. Summary paragenesis of the East Kemptville leucogranite (EKL) and the associated
alteration as well as mineralization of the East Kemptville Sn-Cu-Zn-Ag-In deposit. Main
paragenetic stages are divided into cross-cutting relationships and textures observed in
petrographic analyses throughout the deposit. Note the main stage hydrothermal ore precipitation
mineralization is divided into two stages and the latter stage is subdivided into three temporally
equivalent to continuous mineralization events that follow greisen alteration (greisen infill to
base-metal sulfide and quartz-sulfide-phosphate veins). Multiple generations of one mineral type
across the paragenesis are denoted with roman numerals.
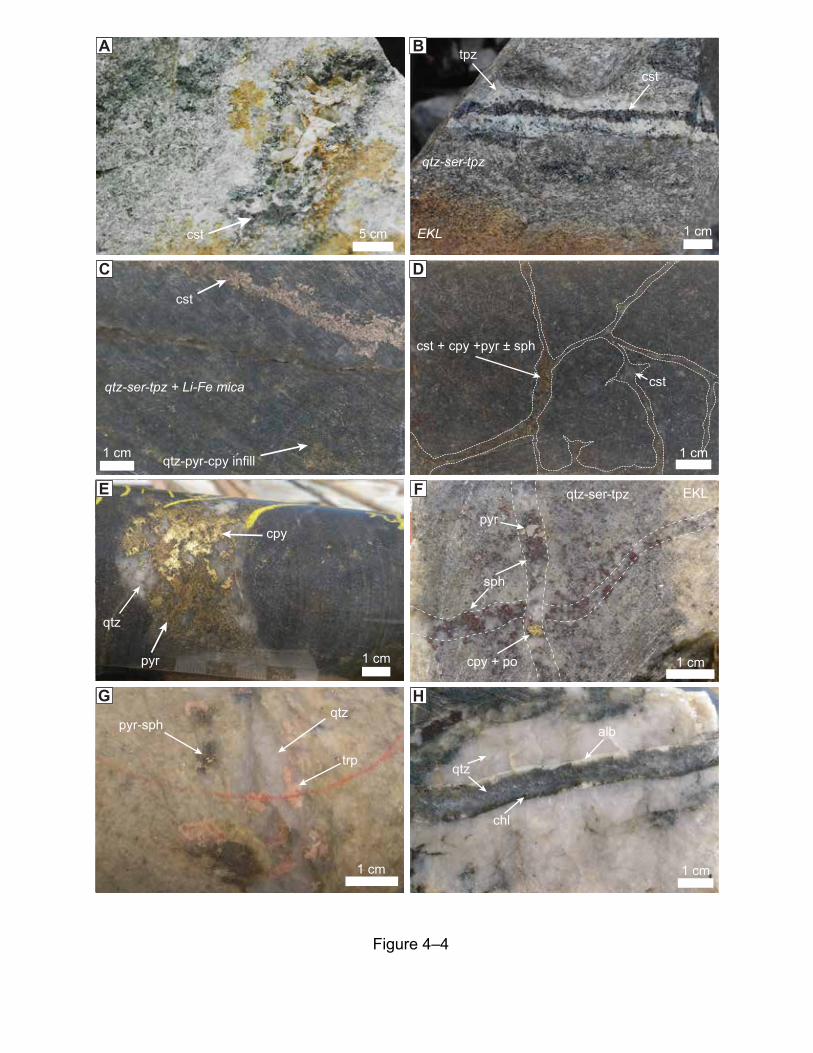
Figure 4–4
1 cm
alb
chl
qtz
1 cm
trp
qtzpyr-sph
1 cm
cst
qtz-ser-tpz + Li-Fe mica
qtz-pyr-cpy infill
1 cm
cpy
sph
1 cm
qtz-ser-tpz EKL
sph
cpy + po
pyr
1 cm
cpy
qtz
pyr
1 cm
cst + cpy +pyr ± sph
cst
1 cm
csttpz
qtz-ser-tpz
EKL5 cmcst
A B
C D
E F
G H
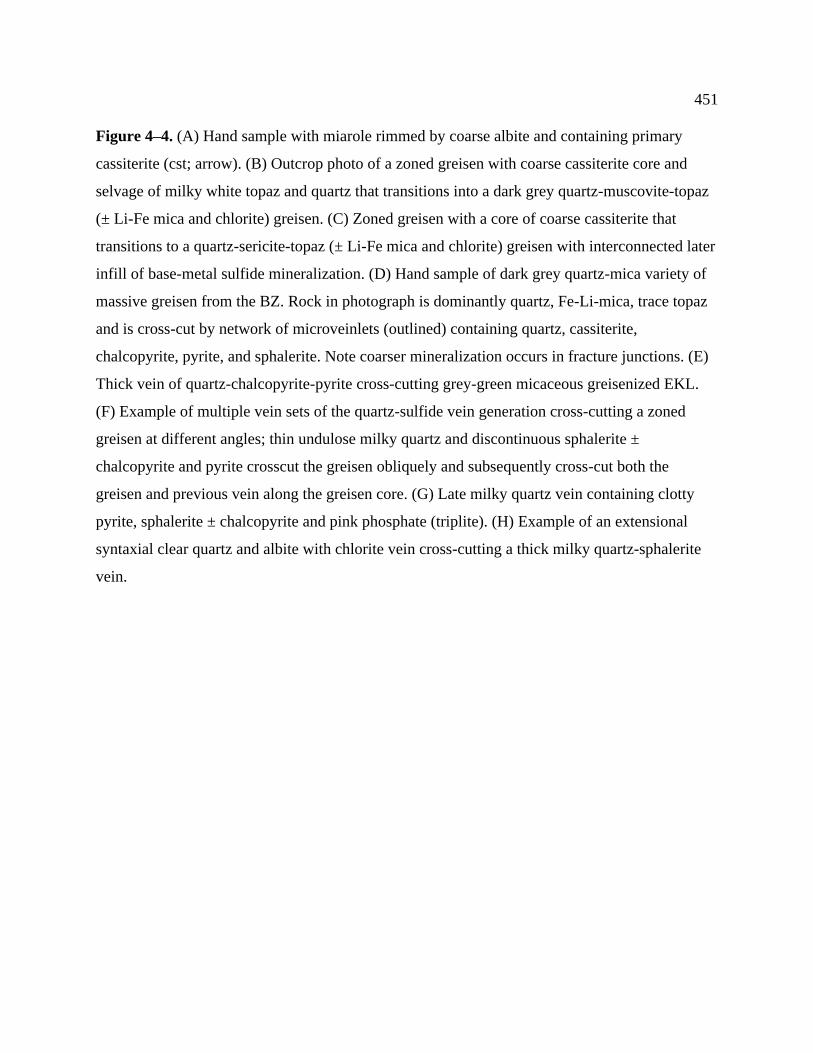
451
Figure 4–4. (A) Hand sample with miarole rimmed by coarse albite and containing primary
cassiterite (cst; arrow). (B) Outcrop photo of a zoned greisen with coarse cassiterite core and
selvage of milky white topaz and quartz that transitions into a dark grey quartz-muscovite-topaz
(± Li-Fe mica and chlorite) greisen. (C) Zoned greisen with a core of coarse cassiterite that
transitions to a quartz-sericite-topaz (± Li-Fe mica and chlorite) greisen with interconnected later
infill of base-metal sulfide mineralization. (D) Hand sample of dark grey quartz-mica variety of
massive greisen from the BZ. Rock in photograph is dominantly quartz, Fe-Li-mica, trace topaz
and is cross-cut by network of microveinlets (outlined) containing quartz, cassiterite,
chalcopyrite, pyrite, and sphalerite. Note coarser mineralization occurs in fracture junctions. (E)
Thick vein of quartz-chalcopyrite-pyrite cross-cutting grey-green micaceous greisenized EKL.
(F) Example of multiple vein sets of the quartz-sulfide vein generation cross-cutting a zoned
greisen at different angles; thin undulose milky quartz and discontinuous sphalerite ±
chalcopyrite and pyrite crosscut the greisen obliquely and subsequently cross-cut both the
greisen and previous vein along the greisen core. (G) Late milky quartz vein containing clotty
pyrite, sphalerite ± chalcopyrite and pink phosphate (triplite). (H) Example of an extensional
syntaxial clear quartz and albite with chlorite vein cross-cutting a thick milky quartz-sphalerite
vein.
Figure 4–5
50 µm
necked
500 µm
secondary inclusion
trails
400 µm
decrepitates
qtz10 mm
primary FIAs
C
indeterminateFIA
1 mm qtz (ii)
sph - cpy qtz (iii)
qtz (i)
1 mmqtz
secondary FIA
decrepitates
secondary FIA
FE
D
BA
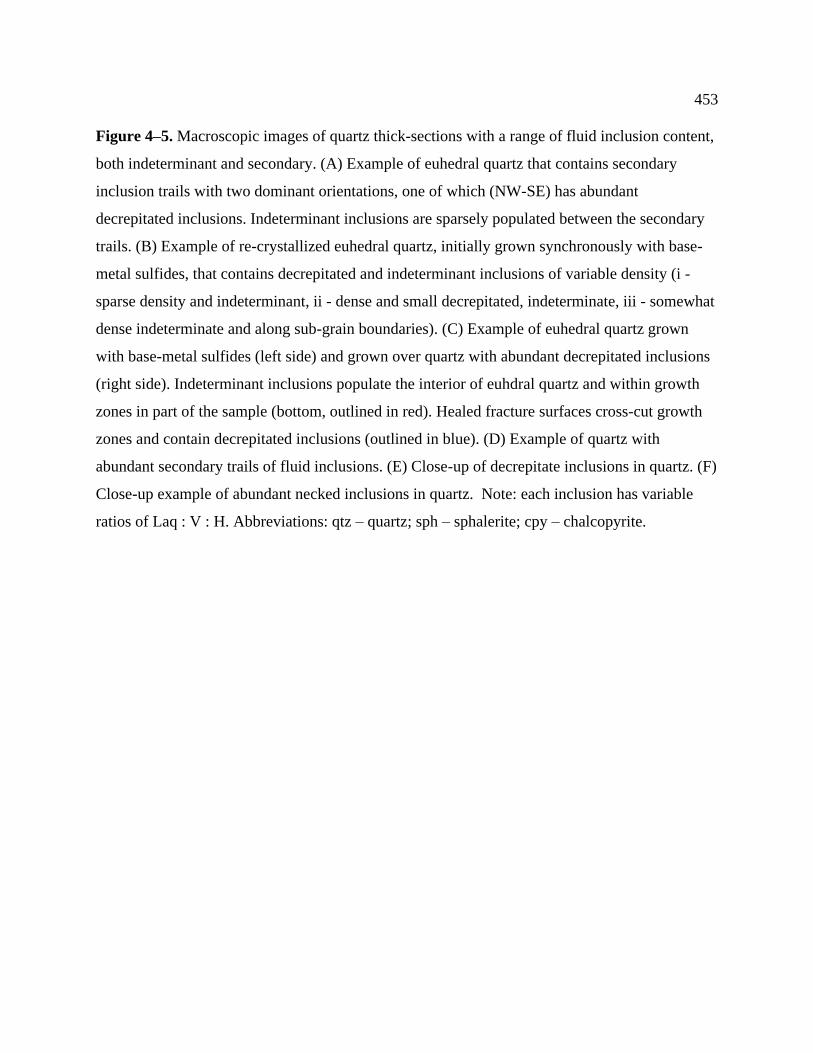
453
Figure 4–5. Macroscopic images of quartz thick-sections with a range of fluid inclusion content,
both indeterminant and secondary. (A) Example of euhedral quartz that contains secondary
inclusion trails with two dominant orientations, one of which (NW-SE) has abundant
decrepitated inclusions. Indeterminant inclusions are sparsely populated between the secondary
trails. (B) Example of re-crystallized euhedral quartz, initially grown synchronously with base-
metal sulfides, that contains decrepitated and indeterminant inclusions of variable density (i -
sparse density and indeterminant, ii - dense and small decrepitated, indeterminate, iii - somewhat
dense indeterminate and along sub-grain boundaries). (C) Example of euhedral quartz grown
with base-metal sulfides (left side) and grown over quartz with abundant decrepitated inclusions
(right side). Indeterminant inclusions populate the interior of euhdral quartz and within growth
zones in part of the sample (bottom, outlined in red). Healed fracture surfaces cross-cut growth
zones and contain decrepitated inclusions (outlined in blue). (D) Example of quartz with
abundant secondary trails of fluid inclusions. (E) Close-up of decrepitate inclusions in quartz. (F)
Close-up example of abundant necked inclusions in quartz. Note: each inclusion has variable
ratios of Laq : V : H. Abbreviations: qtz – quartz; sph – sphalerite; cpy – chalcopyrite.
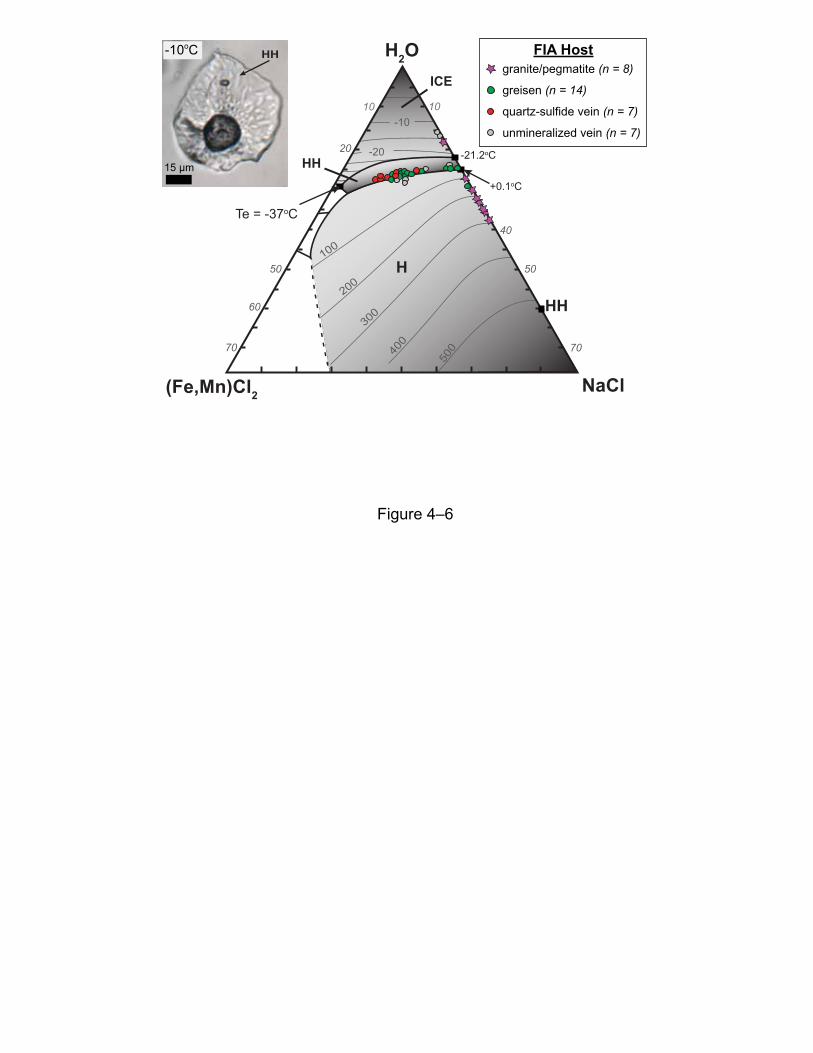
-10oC
15 µm
HH
Figure 4–6
greisen (n = 14)
quartz-sulfide vein (n = 7)
granite/pegmatite (n = 8)
unmineralized vein (n = 7)
FIA Host
(Fe,Mn)Cl2 NaCl
H2OICE
HH
H
-21.2oC
+0.1oC
-20
-10
100
200
300
400
500
50
1010
50
HH
Te = -37oC
60
70 70
40
20

455
Figure 4–6. Ternary phase diagram (H2O-[Fe,Mn]Cl2-NaCl; modified after Lecumberri-Sanchez
et al., 2015) with temperature-solubility contours and microthermometric data points of East
Kemptville FIAs. Each data point represents a quartz-hosted FIA and the legend divides the FIAs
into which paragenetic phase the quartz was associated with (n infers number of FIAs plotted for
each host). Inset shows an example of hydrohalite phase in a fluid inclusion at –10oC during
heating-freezing microthermometric analysis. HH – hydrohalite, H – halite. Note: The salinity of
halite-bearing L-V-H ± Solid(s) FIAs, typically hosted by quartz in the granite/pegmatite
paragenetic stage, was determined through temperature of homogenization through halite
dissolution; thus, the data plot along the H2O-NaCl binary and not influenced by divalent cation-
content (Fe2+, Mn2+) in the fluid.
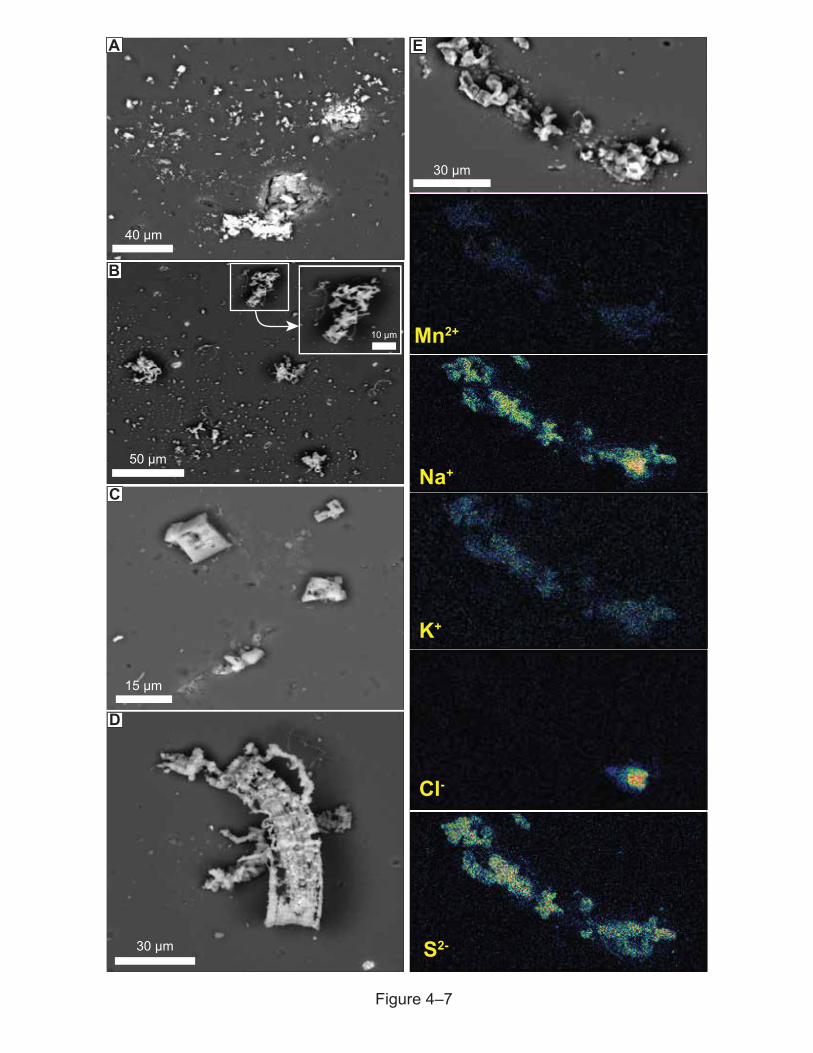
40 µm
50 µm
10 µm
15 µm
30 µm
30 µm
Na+
Mn2+
K+
S2-
Cl-
Figure 4–7
B
A
D
C
E

457
Figure 4–7. (A-D) Scanning Electron Microscopy (SEM) images of induced decrepitate salt
mounds with variable morphology on the surface of quartz wafers: (A) Fine clustered Na-K
bearing mounds from FIA in unmineralized vein. (B) Fibrous Na-K ± Fe, Mn bearing massive
mounds from FIA in quartz-sulfide vein. (C) Euhedral Na-K salt mounds on quartz of base-
metal-mineralized vein. (D) Mound of homogeneous fibrous NaCl spotted with fine KCl salts
from quartz in a weakly greisenized EKL. (E) Example of fluid inclusion evaporate mound
mapped by energy-dispersive X-ray spectroscopy (EDS). Salt mounds containing S(x-) as the
dominant anion, with homogeneous weak Mn+, K+, and Na+ content and a single locality of
NaCl, from quartz in a mineralized greisen sample; note the top frame is an SEM image of the
mound which was mapped by the element in each image beneath.

Figure 4–8
polished wafer surface
Mn55
Zn66
Si29
K39
Na23
Al27
Time (s)
coun
ts
0 20 40 60 80 100 120101
102
103
104
105
106
107
inclusion hit
primary FIA
secondary FIA
laser ablationpits
1 mm
A B C
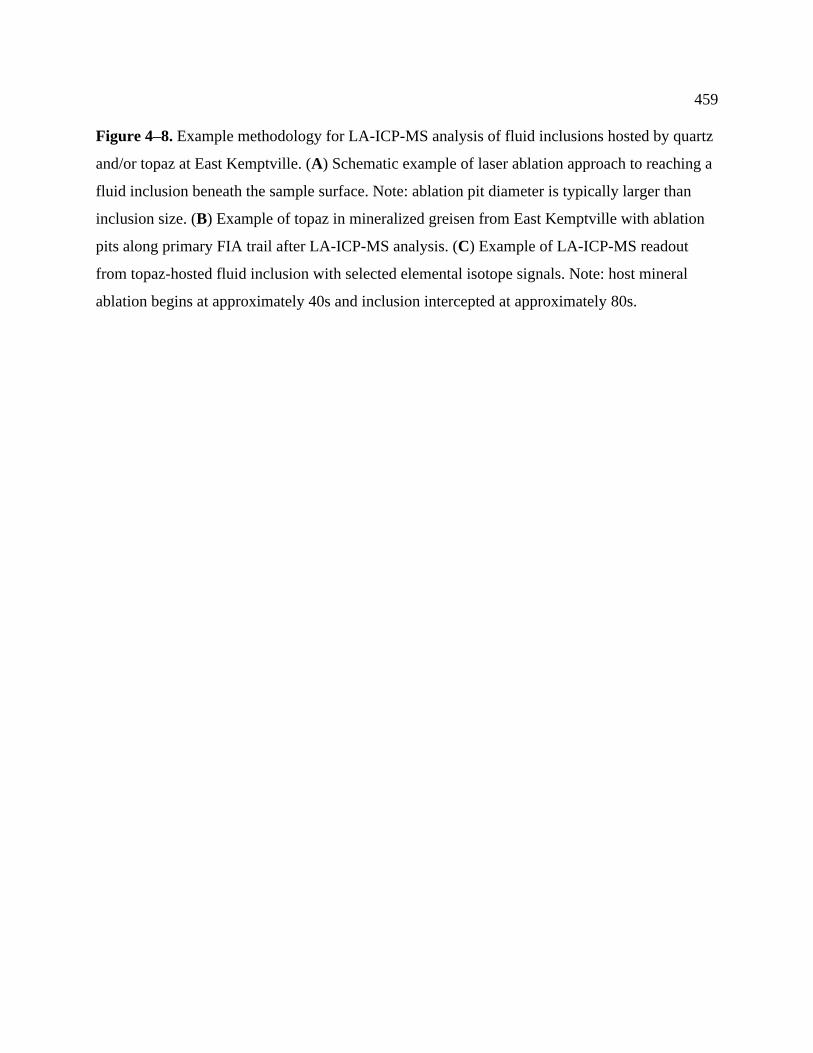
459
Figure 4–8. Example methodology for LA-ICP-MS analysis of fluid inclusions hosted by quartz
and/or topaz at East Kemptville. (A) Schematic example of laser ablation approach to reaching a
fluid inclusion beneath the sample surface. Note: ablation pit diameter is typically larger than
inclusion size. (B) Example of topaz in mineralized greisen from East Kemptville with ablation
pits along primary FIA trail after LA-ICP-MS analysis. (C) Example of LA-ICP-MS readout
from topaz-hosted fluid inclusion with selected elemental isotope signals. Note: host mineral
ablation begins at approximately 40s and inclusion intercepted at approximately 80s.
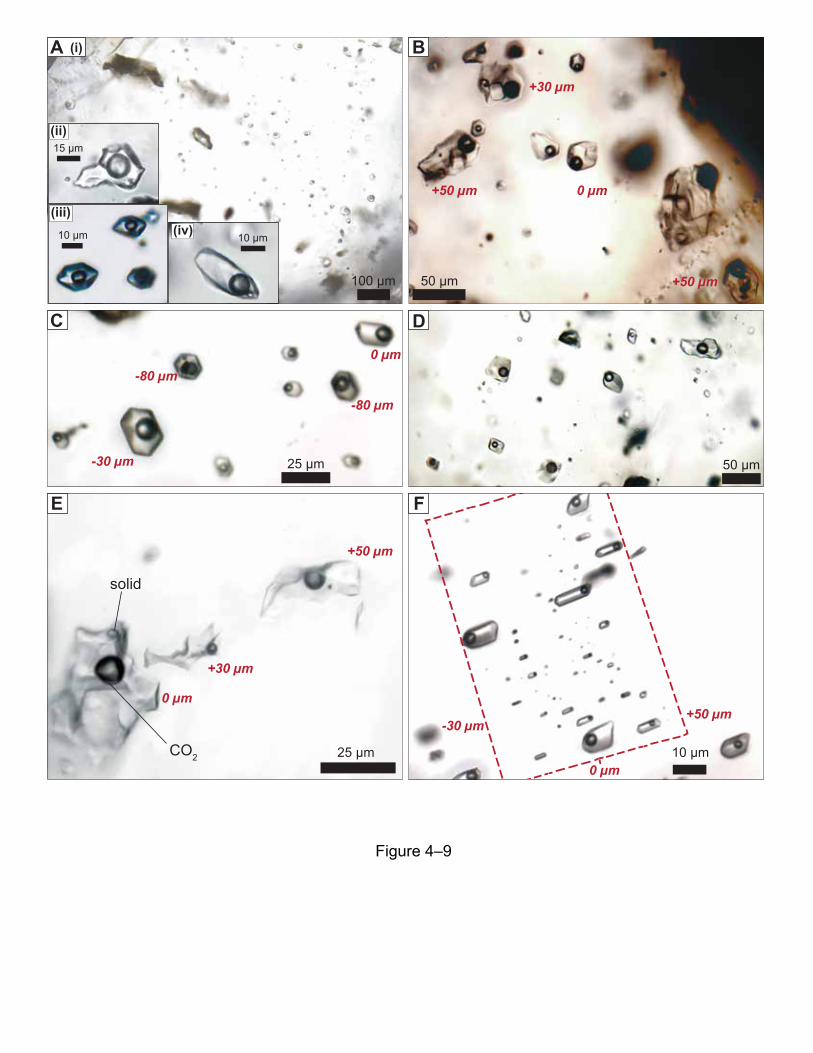
10 µm
+50 µm-30 µm
0 µm25 µm
+50 µm
+30 µm
0 µm
CO2
solid
50 µm25 µm-30 µm
-80 µm
0 µm-80 µm
50 µm +50 µm
+50 µm
+30 µm
0 µm
15 μm
10 μm10 μm
100 μm
Figure 4–9
A B
C D
E F
(i)
(ii)
(iv)(iii)
461
Figure 4–9. Photomicrographs of various fluid inclusion types hosted by quartz and topaz in the
East Kemptville deposit. Inclusions not in plane of focus have been included, with relative
position to the photomicrographic plane captioned. (A) [i] Laq-V +/- solid indeterminate and
secondary FIAs in quartz at 22oC. [ii - iv] close-ups of Laq-V+/-s inclusions from slightly
immature (ii) to mature negative crystal shape (iii). (B) Indeterminant 3 to 4-phase (Laq-V-H-
solid(s)) FIA with somewhat immature shape and variable sizes that range from 5 to 50 µm in
core of a quartz crystal within weakly altered EKL at 22oC. (C) Indeterminant Laq-V negative-
crystal shaped inclusions in mineralized greisen quartz fill at 22oC. (D) Indeterminant Laq-V
moderately mature inclusions in quartz of base-metal-sulfide vein at 22oC. (E) Close up of
indeterminant and immature LCarb-VCarb-Laq-solid FIA hosted by topaz of mineralized greisen at
20oC. (F) Secondary plane of mature Laq-V FIA hosted by quartz in a base-metal-sulfide vein at
22oC.

400
350
300
250
200
160
Hom
ogen
izat
ion
tem
pera
ture
(o C)
1 2 3 4 5 6 7 8 9 10 11 12 13 14 15 16 17 18 19 20 21 22 23 24 25FIA #
40.0
35.0
30.0
25.0
20.0
15.0
10.0
Salin
ity (w
t% N
aCl e
quiv
.)
1 2 3 4 5 6 7 8 9 10 11 12 13 14 15 16 17 18 19 20 21 22 23 24 25
FIA #
(3)
(5)
(5)
(5)
(5)
(6)
(3)
(5)
(6)
(17)
(13)(6)
(8)(5) (8)
(7)(5)
(4)
(5)
(4)
(6)
(5)
(3) (4)
(5)
Figure 4–10
Type 1 Type 2 Type 3 Type 4
EARLY LATE
A
B
Type 4 (2)Type 3 (6)Type 2 (11)Type 1 (6) East Kemptville leucogranite quartz
quartz - sulfide ± phosphate veins
late stage unmineralized veinslate stage unmineralized veins
FIA Type (# of FIAs) Latest Paragenetic Stage
463
Figure 4–10. (A) Homogenization temperatures of fluid inclusion types 1 through 4, represented
by FIAs hosted in quartz from each stage of the paragenesis at the East Kemptville deposit,
plotted as a function of relative age. (b) Salinities of fluid inclusions inclusion types 1 through 4,
hosted in quartz from each stage of the paragenesis, shown in Figure 4–10A, plotted as a
function of relative age. Each box represent an individual FIA analyzed and the number of
inclusions is denoted above the boxes in Figure 4–10A; the box ends constrain the middle 50 %
of data for the groups of analyses, whiskers represent maximum and minimum values in each
dataset, solid line in box represents the data median and solid circle box represents data mean for
each dataset (summarized in Table EA 4-1, Electronic Appendix).
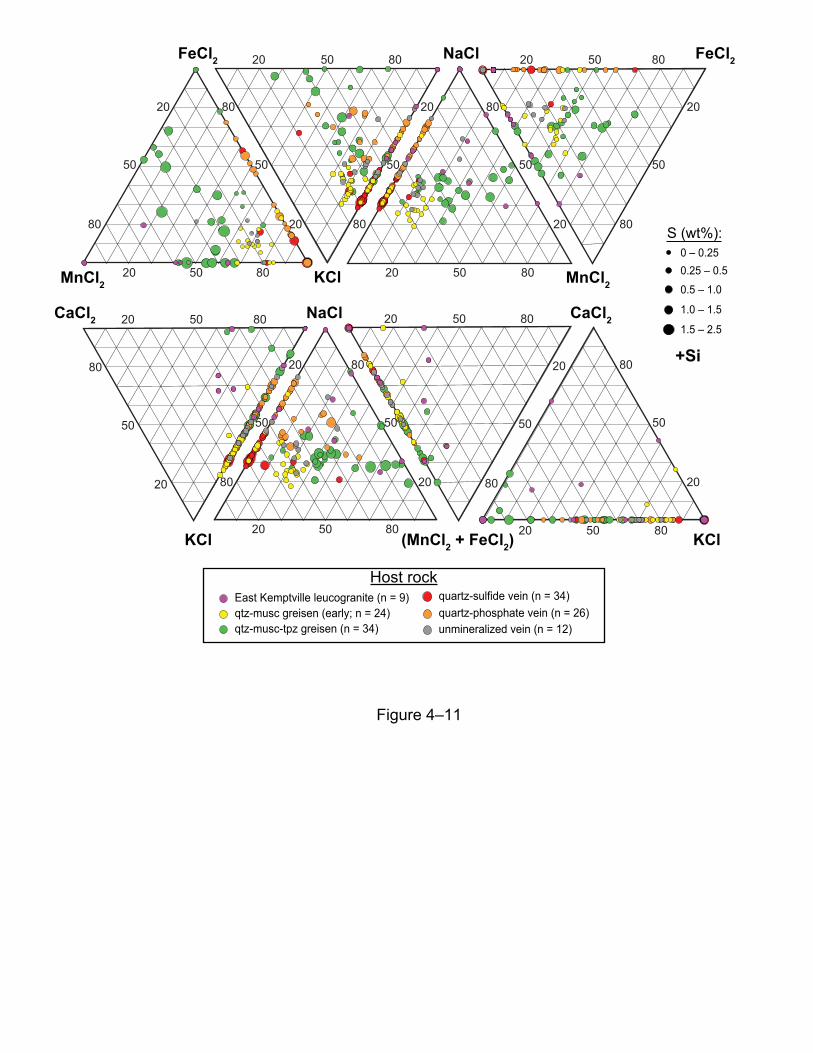
50 50 50
20
80 20
80 20
80
80
50 50
20 80
20
20 2050 5080 80
808050 5020 20
50 50 50
20
80 20
80 20
80
80
5050
20
80
20
2020 5050 8080
808050 5020 20
Figure 4–11
Host rockEast Kemptville leucogranite (n = 9)qtz-musc greisen (early; n = 24)qtz-musc-tpz greisen (n = 34)
quartz-sulfide vein (n = 34)
unmineralized vein (n = 12)quartz-phosphate vein (n = 26)
KCl (MnCl2 + FeCl2) KCl
CaCl2 CaCl2NaCl
FeCl2 FeCl2NaCl
KClMnCl2 MnCl2
S (wt%):0 – 0.250.25 – 0.50.5 – 1.0
1.0 – 1.5
1.5 – 2.5
+Si
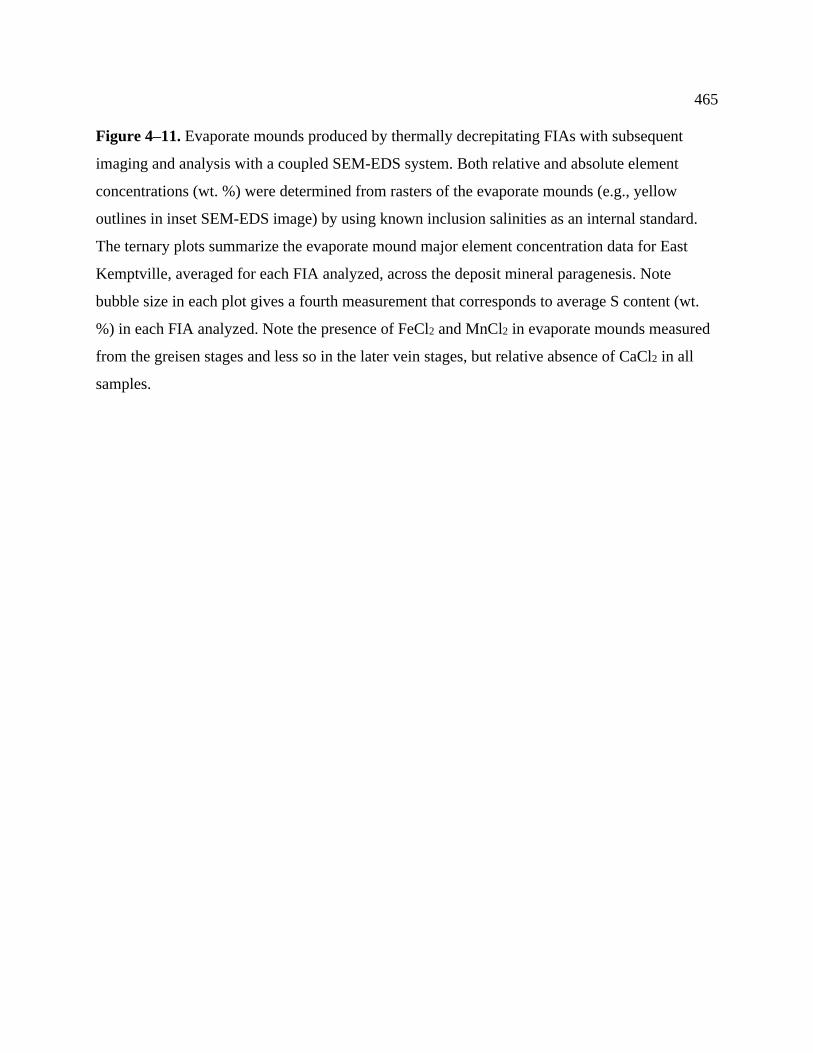
465
Figure 4–11. Evaporate mounds produced by thermally decrepitating FIAs with subsequent
imaging and analysis with a coupled SEM-EDS system. Both relative and absolute element
concentrations (wt. %) were determined from rasters of the evaporate mounds (e.g., yellow
outlines in inset SEM-EDS image) by using known inclusion salinities as an internal standard.
The ternary plots summarize the evaporate mound major element concentration data for East
Kemptville, averaged for each FIA analyzed, across the deposit mineral paragenesis. Note
bubble size in each plot gives a fourth measurement that corresponds to average S content (wt.
%) in each FIA analyzed. Note the presence of FeCl2 and MnCl2 in evaporate mounds measured
from the greisen stages and less so in the later vein stages, but relative absence of CaCl2 in all
samples.
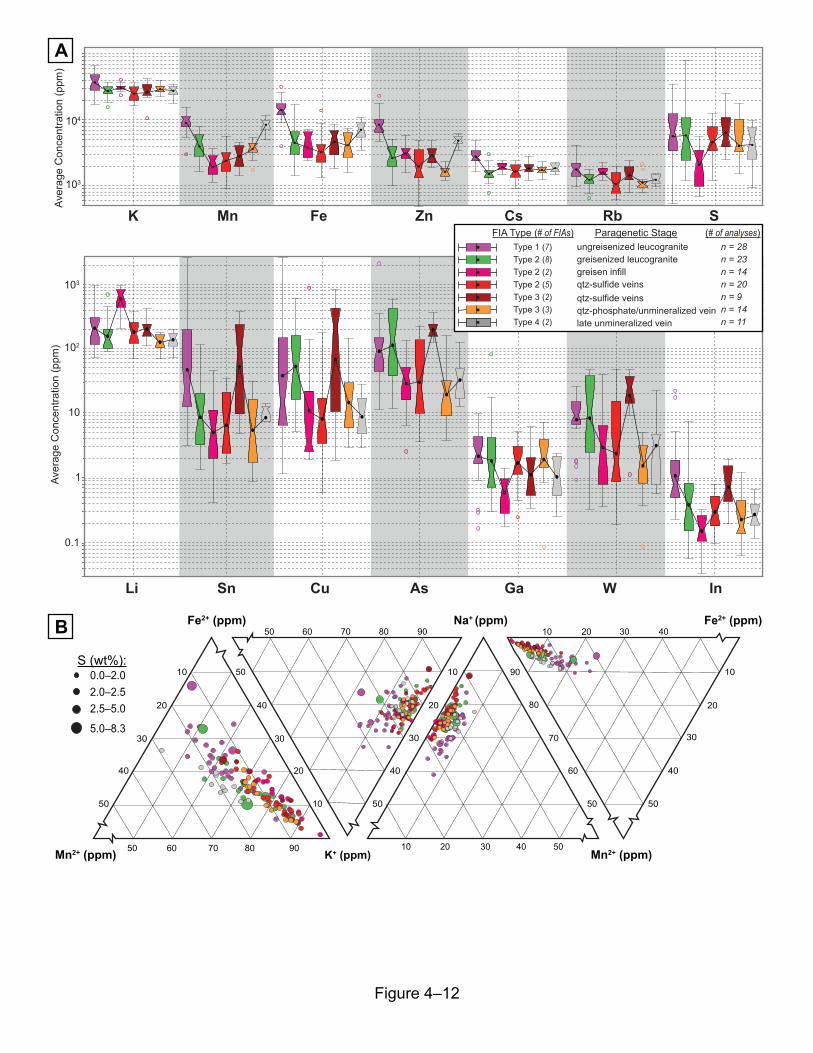
104
103
102
103
10
1
0.1
Aver
age
Con
cent
ratio
n (p
pm)
Aver
age
Con
cent
ratio
n (p
pm)
Figure 4–12
B
A
Type 3 (3)Type 3 (2)Type 2 (5)Type 2 (2)Type 2 (8)Type 1 (7) n = 28
n = 23n = 14n = 20n = 9n = 14n = 11
ungreisenized leucogranite greisenized leucogranite greisen infillqtz-sulfide veinsqtz-sulfide veinsqtz-phosphate/unmineralized vein late unmineralized vein
FIA Type (# of FIAs) Paragenetic Stage (# of analyses)
Type 4 (2)
Mn2+ (ppm)
20
50
40
30
Fe2+ (ppm)20 4010 30
10
20
50
30
40
K+ (ppm)
50 908060 70
10
20
50
30
40
Mn2+ (ppm)
Fe2+ (ppm)
50 80 9060 70
20
50
30
40
10
10
3010 20 40 50
Na+ (ppm)
60
90
70
80
50
S (wt%):0.0–2.02.0–2.52.5–5.0
5.0–8.3
K Mn Fe Zn Cs Rb S
Li Sn Cu As Ga W In
467
Figure 4–12. (A) Average trace element concentration (ppm, logarithmic scale) of quartz- and
topaz-hosted fluid inclusion assemblages; determined by LA-ICP-MS analysis and presented as
box plots for the selected elements with highest recognizable concentration (excluding Na and
Cl). Boxes represent the FIA types analyzed from quartz and/or topaz in each paragenetic stage
(see legend inset). Each upper box end (Q3) and lower box end (Q1) constrain the middle 50 %
of data for the groups of analyses, whiskers represent maximum and minimum values in each
dataset, indent in box represents the data median and solid circle represents data mean for each
dataset (summarized in Table 4–3). Outliers represent data points that are further than 1.5*(Q3-
Q1) away from the box for each dataset. The detailed results are found in Table EA 4-3
(Electronic Appendix). (B) Ternary plots summarizing relative elemental concentrations from
LA-ICP-MS analyses of various fluid types, legend in Figure 4–12A applies to this data. Note
bubble size in each plot gives a fourth measurement that corresponds to average S content (wt.
%) in each FIA analyzed.

Quartz Host
H2O(~25 wt. % NaCl eq)
Raman shift (cm-1)
Inte
nsity
(cou
nts)
0
1000
3000
2000
4000
800 1600 2400 3200
H2O
Liquid Phase CO2
2v2-FDSS-FD
Quartz Host
N2
CH4
H2O
Raman shift (cm-1)
0
2000
6000
4000
8000
13000
800 1200 1600 2000 2400 2800 36003200
Vapour Phase
5 µm
18oC
Laq
VCO2–CH4–N2
Raman shift (cm-1)
Inte
nsity
(cou
nts)
CO2
2v2-FDSS-FD
Quartz Host
N2
CH4
H2O
0
400
800
1200
16002600
800 1200 2000 28001600 2400 3200 3600
10 µm
VCO2–CH4–N2
Laq
20oC
Raman shift (cm-1)
Inte
nsity
(cou
nts)
0
1000
2000
3000
4000
5000
13000
25 µmLaq
VCO2–CH4–N2–H2S
LCO2
0oC
CO2
2v2-FD
SS-FD
Quartz Host
N2
CH4
H2OH2S
800 1200 1600 2000 2400 2800 36003200
CO2
2v2-FD1388
SS-FD1370
Quartz Host
N2
CH4
H2O
Raman shift (cm-1)
0
500
1500
1000
2000
31000
800 1200 1600 2000 2400 2800 36003200
H2S
H2O
Quartz HostCO2(aq)
Raman shift (cm-1)
Inte
nsity
(cou
nts)
0
100
300
200
400
500
600
700
800
700 800 900 1000 1100 1200 1300 1400
B(OH)30
877
1277SS-FD
13852v2-FD
5 µm
Laq–CO2(aq)–B(OH)3
VCO2–CH4–N2–H2S-1oCLiquid Phase Vapour Phase
A
Figure 4–13
B
C
D
base-metal sulfide mineralized vein
unmineralizedquartz vein
base-metal sulfide mineralized vein
unmineralizedquartz-carbonate vein
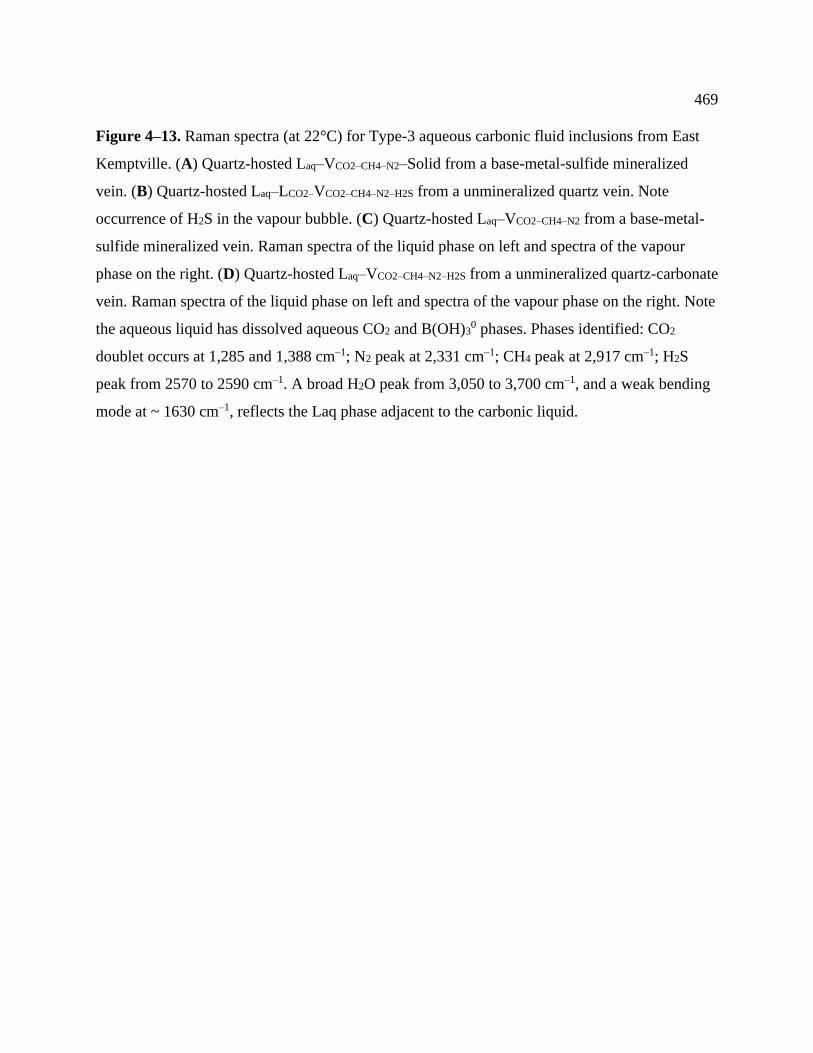
469
Figure 4–13. Raman spectra (at 22°C) for Type-3 aqueous carbonic fluid inclusions from East
Kemptville. (A) Quartz-hosted Laq–VCO2–CH4–N2–Solid from a base-metal-sulfide mineralized
vein. (B) Quartz-hosted Laq–LCO2–VCO2–CH4–N2–H2S from a unmineralized quartz vein. Note
occurrence of H2S in the vapour bubble. (C) Quartz-hosted Laq–VCO2–CH4–N2 from a base-metal-
sulfide mineralized vein. Raman spectra of the liquid phase on left and spectra of the vapour
phase on the right. (D) Quartz-hosted Laq–VCO2–CH4–N2–H2S from a unmineralized quartz-carbonate
vein. Raman spectra of the liquid phase on left and spectra of the vapour phase on the right. Note
the aqueous liquid has dissolved aqueous CO2 and B(OH)30 phases. Phases identified: CO2
doublet occurs at 1,285 and 1,388 cm–1; N2 peak at 2,331 cm–1; CH4 peak at 2,917 cm–1; H2S
peak from 2570 to 2590 cm–1. A broad H2O peak from 3,050 to 3,700 cm–1, and a weak bending
mode at ~ 1630 cm–1, reflects the Laq phase adjacent to the carbonic liquid.

weakly altered EKLaltered EKL (qtz-musc)
massive greisen (qtz-musc-top)EKL pegmatite (Kontak et al., 2001)
zoned greisen infill
qtz-asp veinqtz-sph vein
qtz-cpy-sph vein
qtz-apt-alb vein
matrix to IBX
cement to HBX
qtz-carbonate vein
Quartz paragenetic affilitation
Figure 4–14
EKL
greisens
breccias
main stageveins
late veins
δ18O (‰) quartz 7.0 8.0 9.0 10.0 11.0 12.0
6
2
2
4
48
2
2
22
2
9**
2**
4**
6**
**
** 2
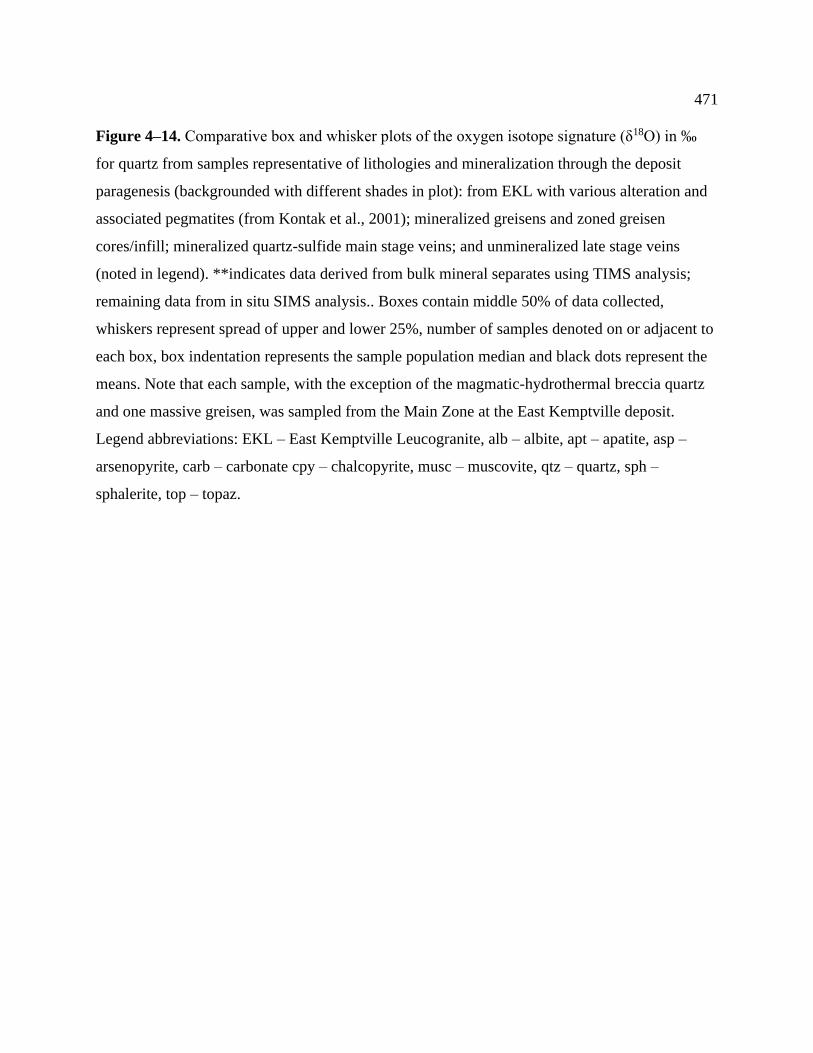
471
Figure 4–14. Comparative box and whisker plots of the oxygen isotope signature (δ18O) in ‰
for quartz from samples representative of lithologies and mineralization through the deposit
paragenesis (backgrounded with different shades in plot): from EKL with various alteration and
associated pegmatites (from Kontak et al., 2001); mineralized greisens and zoned greisen
cores/infill; mineralized quartz-sulfide main stage veins; and unmineralized late stage veins
(noted in legend). **indicates data derived from bulk mineral separates using TIMS analysis;
remaining data from in situ SIMS analysis.. Boxes contain middle 50% of data collected,
whiskers represent spread of upper and lower 25%, number of samples denoted on or adjacent to
each box, box indentation represents the sample population median and black dots represent the
means. Note that each sample, with the exception of the magmatic-hydrothermal breccia quartz
and one massive greisen, was sampled from the Main Zone at the East Kemptville deposit.
Legend abbreviations: EKL – East Kemptville Leucogranite, alb – albite, apt – apatite, asp –
arsenopyrite, carb – carbonate cpy – chalcopyrite, musc – muscovite, qtz – quartz, sph –
sphalerite, top – topaz.
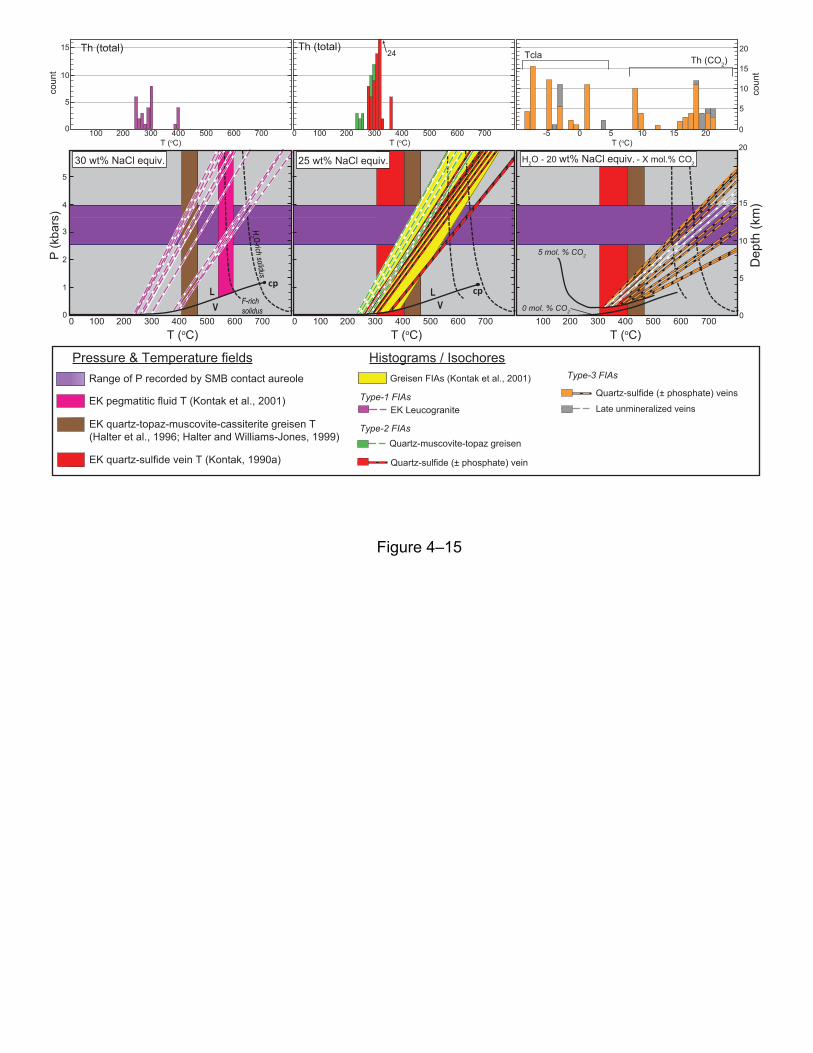
Figure 4–15
Greisen FIAs (Kontak et al., 2001)
EK pegmatitic fluid T (Kontak et al., 2001)
Range of P recorded by SMB contact aureole
EK quartz-topaz-muscovite-cassiterite greisen T (Halter et al., 1996; Halter and Williams-Jones, 1999)
EK quartz-sulfide vein T (Kontak, 1990a)
P (k
bars
)
Dep
th (k
m)
2
1
4
3
5
0
5
10
15
20
0
Pressure & Temperature fields Histograms / Isochores
EK LeucograniteType-1 FIAs
T (oC)100 200 300 400 500 600 700
H2O - 20 wt% NaCl equiv. - X mol.% CO2
5 mol. % CO2
0 mol. % CO2
T (oC)0 100 200 300 400 500 600 700
25 wt% NaCl equiv.
LV
cp
T (oC)0 100 200 300 400 500 600 700
cpLV
H2 O-rich solidus
30 wt% NaCl equiv.
cou
nt
5
0
10
15
coun
t
Th (total) 24Th (total)
T (oC)T (oC)
5
10
15
20Tcla Th (CO2)
0T (oC)
-5 0 5 10 20150 100 200 300 400 500 600 700100 200 300 400 500 600 700
F-rich solidus
Quartz-muscovite-topaz greisen
Quartz-sulfide (± phosphate) vein
Type-2 FIAs
Quartz-sulfide (± phosphate) veinsLate unmineralized veins
Type-3 FIAs
473
Figure 4–15. Histograms (above) with counts of Th(total) values, for aqueous fluid inclusions,
and Tcla + Th(CO2) values, for aqueous carbonic inclusions, from individual fluid inclusions of
respective P–T plots (below). Isochores on the P–T plots calculated from Th(total) values (points
on LV-curve) for type-1 FIAs in quartz of weakly altered EKL (left), from hydrothermal quartz-
hosted type-2 FIAs in greisens and base-metal-sulfide veins (center), as well as type-3 FIAs
hosted in base-metal-sulfide bearing veins and unmineralized late carbonate-bearing veins
(right). Isochores for aqueous FIAs calculated using ISOC (Bakker, 2003) and aqueous-carbonic
FIAs calculated using algorithm from Steele-MacInnis (2018). A field of calculated isochores
from a previous study of FIAs in topaz-greisens is shaded in grey (Kontak et al. 2001) and the
estimated mineralization temperature range (ca. 300–400oC) is shaded in red. Calculated
cassiterite-quartz thermometry from East Kemptville pegmatites is shown (Kontak et al. 2001) in
addition to the estimated emplacement P from the SMB (after Kontak and Kyser 2011). Note: the
solvi are plotted for H2O-saturated (Tuttle and Bowen 1958) and F-rich haplogranites (Cuney et
al. 1992). The H2O-NaCl-CO2 solvi are calculated using algorithm from Steele-MacInnis (2018).

Th(Hal) = Th(LV)
300
200
100200 300 400
Th(H
alite
)
Th(Liquid)
35 wt. %
38 wt. %
42 wt. %
granitepegmatitecavity
Fields from Kontak et al. (2001):~2000 individual fluid inclusions or fluid inclusion assemblages from 72 tin–tungsten deposits
Fields from Bodnar et al. (2014):
greisen base-metal mineralized veinphosphate-bearing vein
graniteFrom this study:
Figure 4–16
30
20
10
60
50
40
100 200 300 400 500
Salin
ity (w
t. %
NaC
l eq.
)
Th(Total)
A B
475
Figure 4–16. (A) Thermometric data of halite dissolution versus total homogenization
temperatures for quartz-hosted fluid inclusions from this study and Kontak et al. (2001). Fluid
inclusions hosted by quartz in leucogranite, greisenized leucogranite, pegmatites, and miaroles of
the East Kemptville deposit. (B) Thermometric data of total homogenization temperatures and
salinity for quartz-hosted fluid inclusions from various paragenetic stages in this study over top
of fields representing fluid inclusions from 72 Sn-W deposits, compiled by Bodnar et al. (2014).
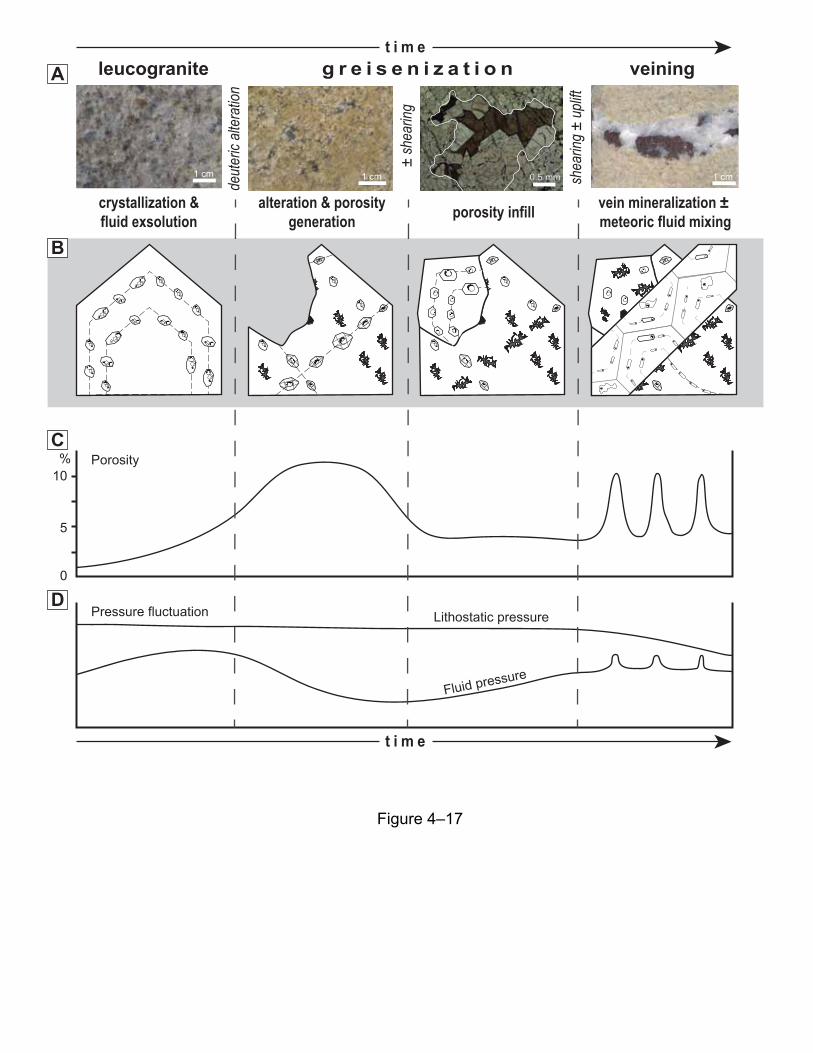
1 cm1 cm 0.5 mm0.5 mm 1 cm
5
10
0
% Porosity
Pressure fluctuation Lithostatic pressure
Fluid pressure
Figure 4–17
A
B
C
D
leucogranite g r e i s e n i z a t i o n
deut
eric
alter
ation
± sh
earin
g
shea
ring
± up
lift
crystallization &fluid exsolution
alteration & porositygeneration porosity infill vein mineralization ±
meteoric fluid mixing
veiningt i m e
t i m e
477
Figure 4–17. (A) Example hand samples and photomicrograph of resultant alteration and
mineralization brought about by hydrothermal processes during the paragenetic stages of the East
Kemptville deposit formation. (B) Schematic crystal growth and fluid inclusion entrapment,
from types1 to 4, through the paragenesis. Note the formation of decrepitates and secondary
inclusion trails with each stage of deformation as well as mineral dissolution and subsequent
formation. (C) Schematic plot of interpreted porosity in the EKL during deposit formation as a
result of alteration and deformation (modified after Boullier et al., 1994). Note the gradual
increase and decrease in porosity during the main mineralization stage that resulted from
greisenization (mineral dissolution) and greisen infill. Porosity scale determined by percent of
rock now filled by veining and greisen mineralization (sulfides, fluorides and oxides; cf. Halter
et al., 1996). The late stage veining infilled voids formed during brittle deformation (relatively
instantaneous increases in porosity). (D) Schematic plot of the interpreted relative pressure
fluctuation (both fluid and lithostatic pressure) felt at East Kemptville through the paragenesis
(modified after Boullier et al., 1994). Although mineral dissolution during greisenization reduces
fluid pressure, the later vein stages indicate fluctuation of fluid pressure in the deposit,
suggesting a decrease in lithostatic pressure by this point in the hydrothermal evolution.

Figure 4–18
Th(total)
10-1
10-2
10-3
10-4
10-5
10-6
Zn
Cs
AsSnCu
W
In
[met
al] /
(Na+
K+Fe
+Mn)
A
B
400 - 230 360 - 220 300 - 160 230 - 200
10-1
10-2
Σ(m
etal
s) /
(Na+
K+Fe
+Mn)
Type 1 Type 2 Type 3 Type 4(a/b)
dilution andprecipitation
replenishment
precip.
precip.
replenishment
29
24 14
20
9
14
11
479
Figure 4–18. The evolution of individual (A; mean values) and sum of (B) ore metals relative to
the sum of primary elements in the fluids (Na + K + Mn + Fe) through the paragenesis, with the
range of homogenisation temperatures recorded from each fluid type. Number of inclusions
analyzed noted beneath boxes, each upper box end and lower box end constrain the middle 50 %
of data for the groups of analyses, whiskers represent maximum and minimum values in each
dataset, indent in box represents the data median and solid circle represents data mean for each
dataset. Paragenetic stage legend is the same as in Figure 4–14. In (B), Cs is plotted as an
elements not involved in precipitation processes, as such it shows a constant ratio through the
fluid evolution. Ore metals, however, show a sinuous trend through the paragenesis that suggest
dilution and/or mixing between trapping of new fluid types, and a notable replenishment of
metal-bearing type 2 fluid between the greisen formation and greisen infill stages.
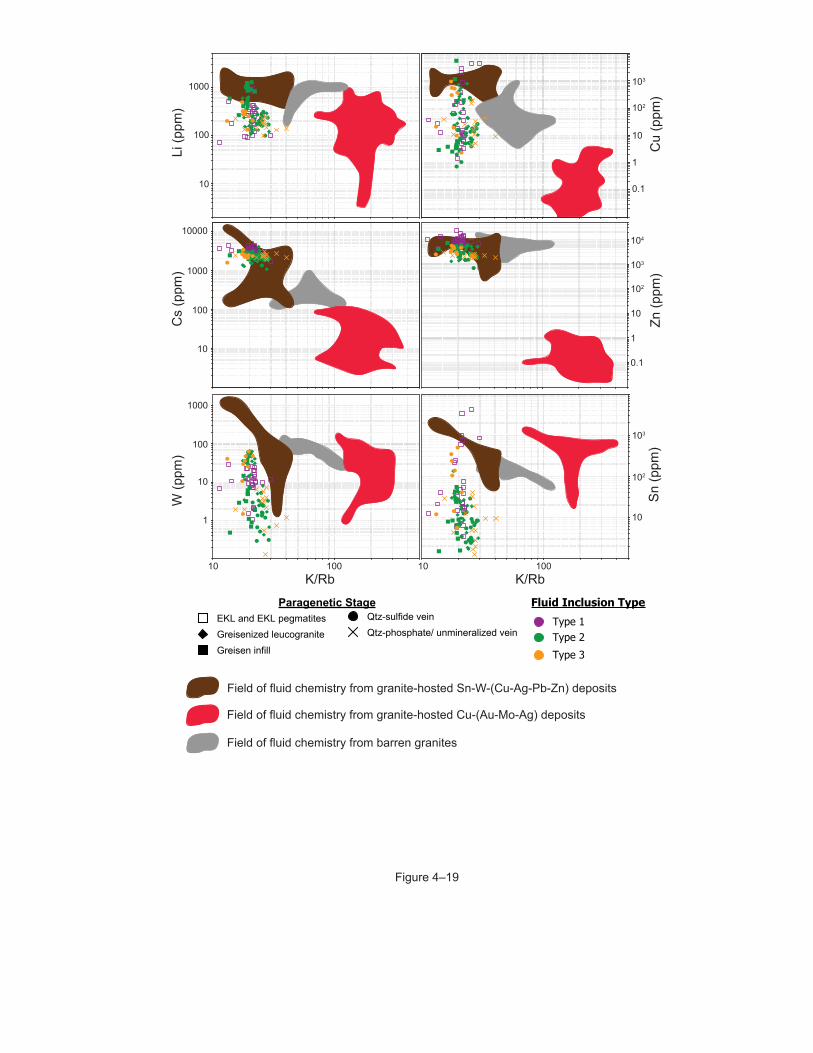
Li (p
pm)
10
100
1000
Cs
(ppm
)
10
100
1000
10000
W (p
pm)
10
1
100
1000
10 100
Zn (p
pm)
0.1
10
103
1
102
104
Sn (p
pm)
10
102
103
10 100
Cu
(ppm
)
0.1
10
103
1
102
K/Rb K/Rb
Field of fluid chemistry from granite-hosted Sn-W-(Cu-Ag-Pb-Zn) deposits
Field of fluid chemistry from granite-hosted Cu-(Au-Mo-Ag) deposits
Field of fluid chemistry from barren granites
Qtz-phosphate/ unmineralized veinQtz-sulfide vein
Greisen infillGreisenized leucograniteEKL and EKL pegmatites
Paragenetic Stage Fluid Inclusion Type
Type 3Type 2Type 1
Figure 4–19
481
Figure 4–19. Discriminatory fluid chemistry plots of K/Rb versus various metals for fluid types
from the East Kemptville deposit, through the paragenesis. Fields of fluid chemistry (brines)
from other styles of mineral deposit are shown, compiled from previous studies: Sn-W-(Cu-Ag-
Pb-Zn) field includes fluids from Mole Granite (Audétat et al. 2000), Ehrenfriedersdorf (Rickers
et al. 2006; Zajacz et al., 2008), Zinnwald (Heinrich et al. 1999); Cu-(Au-Mo-Ag) field includes
fluids from Bajo de la Alumbrera (Ulrich et al. 2002), Grasberg (Ulrich et al. 1999), Bingham
(Landtwing et al. 2005; Heinrich et al., 1999), Butte (Rusk et al. 2004); and the barren granite
field includes fluids from Baveno, Mt. Malosa, Cuasso al Monte (Zajacz et al., 2008), and Rito
del Medio (Audétat and Pettke, 2003).
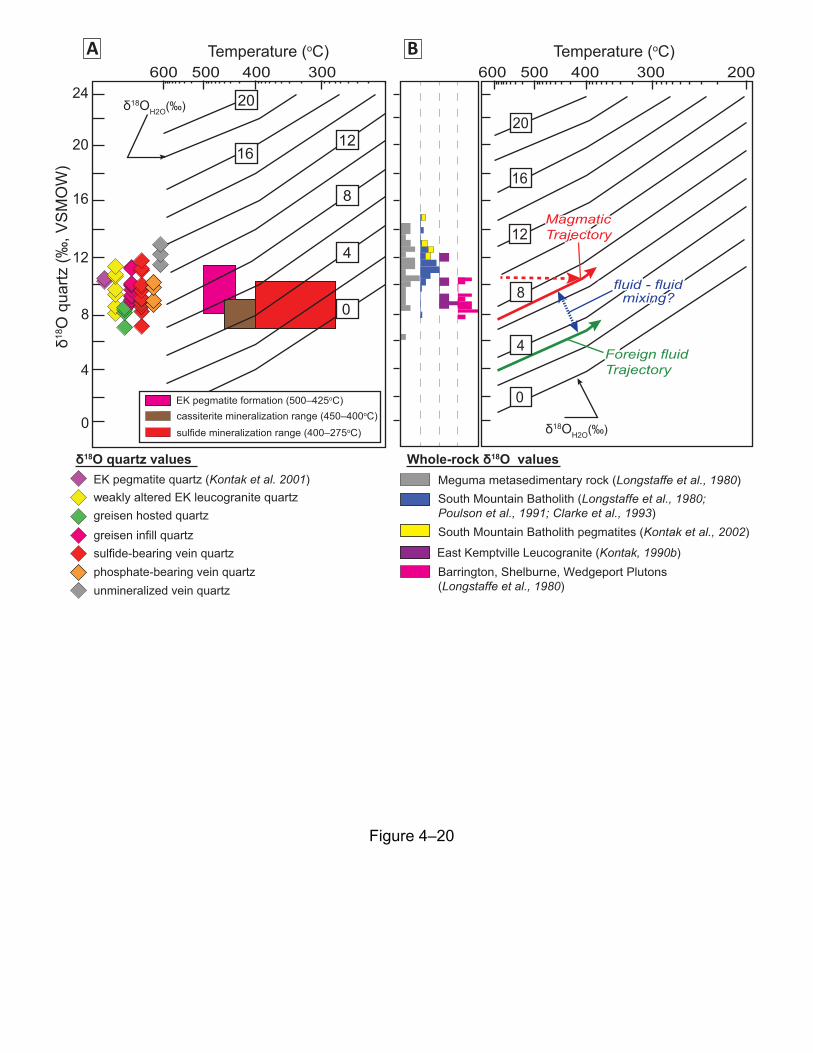
24
20
16
12
8
4
0
20
1612
8
4
0
δ18OH2O(‰)
weakly altered EK leucogranite quartzEK pegmatite quartz (Kontak et al. 2001)
greisen hosted quartzgreisen infill quartzsulfide-bearing vein quartzphosphate-bearing vein quartzunmineralized vein quartz
Meguma metasedimentary rock (Longstaffe et al., 1980)South Mountain Batholith (Longstaffe et al., 1980;Poulson et al., 1991; Clarke et al., 1993)South Mountain Batholith pegmatites (Kontak et al., 2002)
Barrington, Shelburne, Wedgeport Plutons (Longstaffe et al., 1980)
East Kemptville Leucogranite (Kontak, 1990b)
Figure 4–20
600 500 400 300Temperature (oC)
600 500 400 300 200δ1
8 O q
uartz
(‰, V
SMO
W)
20
16
12
0
mixingfluid - fluid
mixing?fluid - fluid
Magmatic TrajectoryMagmatic Trajectory
MeteoricTrajectoryForeign fluidTrajectory
8
4
BA Temperature (oC)
δ18OH2O(‰)
Whole-rock δ18O values δ18O quartz values
cassiterite mineralization range (450–400oC) sulfide mineralization range (400–275oC)
EK pegmatite formation (500–425oC)
483
Figure 4–20. Plots of Temperature (°C) versus δ18O(quartz) contoured for isopleths of δ18OH2O.
The fractionation equation of Matsuhisa et al. (1979) used to construct the diagrams. (A)
δ18O(quartz) values through the East Kemptville deposit paragenesis are plotted along the left
axis, whereas the fields represent ranges of δ18O(quartz) correlated with temperature of
formation for i) pegmatites at East Kemptville (pink), ii) greisens (brown), and iii) sulfide- to
phosphate-bearing veins (red); see text for detail. (B) Fractionation trends for magmatic water
(red) and a foreign (blue) water, based on an initial δ18O (quartz) value of +7‰ and +3‰,
respectively. The expected trend of contamination between these fluids is displayed in blue. Note
that the δ18O(quartz) values from mineralized rocks at East Kemptville are lower than is capable
of the fractionation trend that the magmatic water follows; thus mixing with a foreign fluid is
likely to have occurred. Left of the plot is relative probability histograms of δ18O(whole rock)
values for various intrusive units associated with the EKD as well as δ18O(quartz) values from
pegmatites elsewhere in the SMB.

Table 4–1. Sn-W Global deposit analogues for mineralizing fluids
P
(kbars)
T
(oC)
ThTOT
(oC)
Salinity
(wt% NaCl
equiv.)
Colquiri Bolivian Tin Belt early Mesozoic Sn-Pb-Zn Veins metasedimentary rock 0.66 300 - 400 191 – 383 1.2 – 6.4Hanus, 1982;
Sugaki, 1985
Panasqueira Portugal 340 – 260 W-Sn-Cu Veinsmonzogranite /
metasedimentary rock0.15 – 0.03 230 – 360 255 – 320 6 – 9 Kelly and Rye, 1979
Mount
Pleasant
New Brunswick,
CanadaLate Devonian W-Mo-Sn Veins granite porphyry 0.75 – 0.25 450 – 600 92 – 353 < 10 Samson, 1990
Pirquitas Bolivian Tin Belt 15 – 9 Sn-Ag-Zn Veins metasedimentary rock > 0.15 < 400 217 – 370 0 – 10.6 Desanois et al., 2019
Huanuni Bolivian Tin Belt Miocene Sn Veins metasedimentary rock – – 364 – 385 3 – 11.1 Müller et al., 2001
Cleveland W Tasmania Late Devonian Sn - Cu Veinsgranite /
graywacke-argillite1.4 – 0.3 480 – 500 300 – 380 7 – 14 Collins, 1981
San Rafael Bolivian Tin Belt 22.7 – 21.9 ± 0.5 Sn-Cu Veinsmonzogranite /
metasedimentary rock0.62 – 0.15 < 500 215 – 420 0 – 20
Kontak and Clark,
2002
Viloco Bolivian Tin Belt 26.2 ± 0.2 Sn-W-Mo-As Veinscordierite-granodiorite /
metapelite – – 256 – 494 16.9 – 26
Artiaga et al., 2013;
Sugaki, 1985
Yankee LodeMole Granite,
E AustraliaPermian-Triassic Sn - W Veins
leucogranite /
siltstone & mudstones0.25 422 – 528 350 – 420 20 – 40 Eadington, 1983
TikusBelitung,
Indonesia195 ± 12 Sn-W Greisen
granite /
metasedimentary rock2.0 – 0.7 – 200 – 340 0.8 – 7
Schwartz and Surjono,
1990
Oriente Novo Itu, Brazil – Sn-W-Ta-Nb Greisen zinnwaldite-granite 2.4 – 1.0 250 – 370 250 – 370 0.4 – 13.8Bettencourt et al.,
2005
CorreasRondonia,
Brazil619 ± 11 Sn-W-Zn-Cu Greisen topaz-muscovite-granite 2.0 – 1.3 300 – 440 300 – 360 0 – 19
Bettencourt et al.,
2005
South Crofty Cornwall, UK 300 – 270 Sn-W-Cu-Zn Greisenperaluminous granite /
metasedimentary rock1.5 – 1.0 200 – 500 300 – 450 10 – 30 Jackson et al., 1989
Mount Bischoff W Tasmania Late Devonian Sn GreisenAdamellite /
shale-sandstone0.2 320 – 360 280 – 365 30 - 36 / c. 12
Wright and Kwak,
1989;
Halley and Walshe,
1995
Chorukh-DaironTien Shan,
Central Asia319 – 315 W-Cu-Mo Skarn
monzogranite /
metasedimentary rock1.1 – 0.7 400 – 500 320 – 400 30-38 / 15-22
Soloviev and
Kryazhev, 2017
Ore Deposit
Region/
Metallotect
Associated
LithologyAge (Ma)
Note: Deposits sorted by a) mineralization style and b) salinity of main Sn-mineralizing fluids. Formation conditions are those decribed for the primary Sn-mineralizing event in each deposit.
Abbreviations: P = Pressure; T = Temperature; ThTOT = Total homogenization temperature.
ReferenceStyle
Primary
Mineralization
Formation Conditions Sn-Mineralizing Fluid
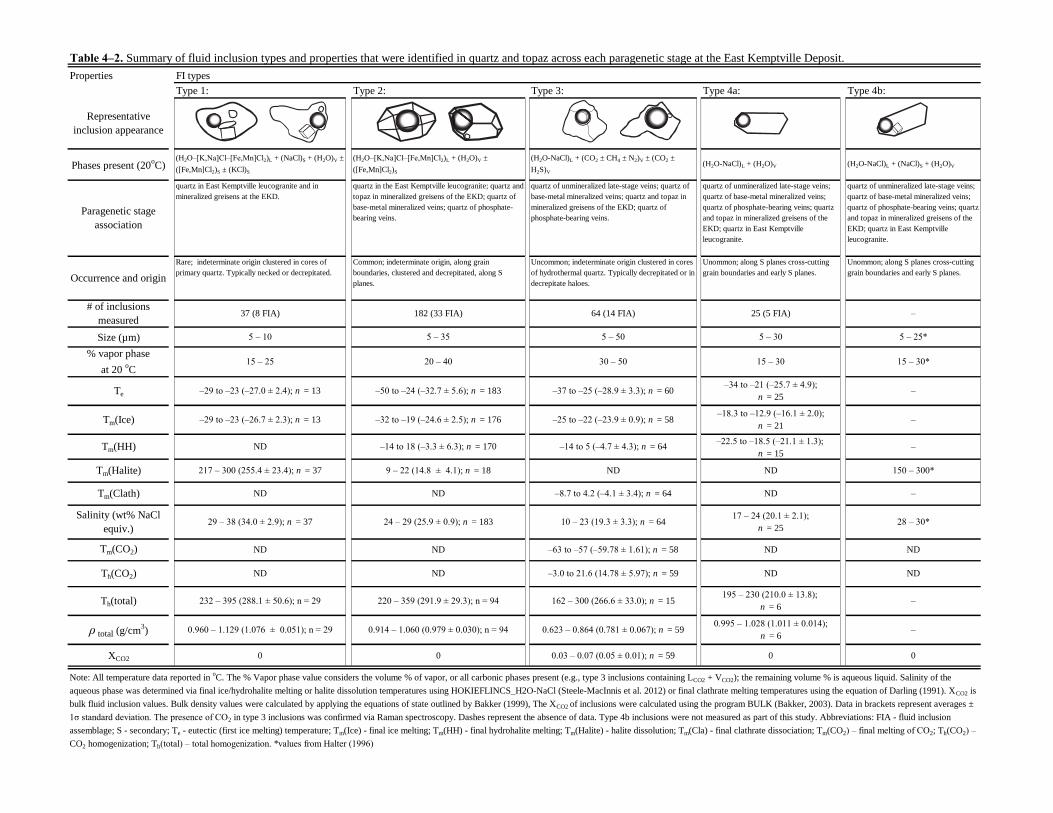
Table 4–2. Summary of fluid inclusion types and properties that were identified in quartz and topaz across each paragenetic stage at the East Kemptville Deposit.
Properties FI types
Type 1: Type 2: Type 3: Type 4a: Type 4b:
Size (µm)
Te
Tm(Ice)
Tm(HH)
Tm(Halite)
Tm(Clath)
Th(CO2)
Th(total)
ρ total (g/cm3)
XCO2
–29 to –23 (–27.0 ± 2.4); n = 13 –50 to –24 (–32.7 ± 5.6); n = 183 –37 to –25 (–28.9 ± 3.3); n = 60–34 to –21 (–25.7 ± 4.9);
n = 25–
–18.3 to –12.9 (–16.1 ± 2.0);
n = 21
–22.5 to –18.5 (–21.1 ± 1.3);
n = 15
–
ND
–
150 – 300*
0
–
ND
17 – 24 (20.1 ± 2.1);
n = 25
–
0
0.995 – 1.028 (1.011 ± 0.014);
n = 6
ND
28 – 30*
ND
ND ND
–195 – 230 (210.0 ± 13.8);
n = 6
quartz of unmineralized late-stage veins;
quartz of base-metal mineralized veins;
quartz of phosphate-bearing veins; quartz
and topaz in mineralized greisens of the
EKD; quartz in East Kemptville
leucogranite.
quartz of unmineralized late-stage veins;
quartz of base-metal mineralized veins;
quartz of phosphate-bearing veins; quartz
and topaz in mineralized greisens of the
EKD; quartz in East Kemptville
leucogranite.
(H2O-NaCl)L + (H2O)V (H2O-NaCl)L + (NaCl)S + (H2O)V
quartz of unmineralized late-stage veins; quartz of
base-metal mineralized veins; quartz and topaz in
mineralized greisens of the EKD; quartz of
phosphate-bearing veins.
0.03 – 0.07 (0.05 ± 0.01); n = 5900
162 – 300 (266.6 ± 33.0); n = 15220 – 359 (291.9 ± 29.3); n = 94232 – 395 (288.1 ± 50.6); n = 29
0.623 – 0.864 (0.781 ± 0.067); n = 590.914 – 1.060 (0.979 ± 0.030); n = 940.960 – 1.129 (1.076 ± 0.051); n = 29
–63 to –57 (–59.78 ± 1.61); n = 58NDND
–3.0 to 21.6 (14.78 ± 5.97); n = 59NDND
10 – 23 (19.3 ± 3.3); n = 6424 – 29 (25.9 ± 0.9); n = 18329 – 38 (34.0 ± 2.9); n = 37
–25 to –22 (–23.9 ± 0.9); n = 58–32 to –19 (–24.6 ± 2.5); n = 176–29 to –23 (–26.7 ± 2.3); n = 13
–8.7 to 4.2 (–4.1 ± 3.4); n = 64NDND
ND –14 to 5 (–4.7 ± 4.3); n = 64–14 to 18 (–3.3 ± 6.3); n = 170
217 – 300 (255.4 ± 23.4); n = 37 9 – 22 (14.8 ± 4.1); n = 18 ND
5 – 355 – 10
30 – 5020 – 4015 – 25
5 – 30 5 – 25*
15 – 30 15 – 30*
64 (14 FIA)
5 – 50
37 (8 FIA)
Unommon; along S planes cross-cutting
grain boundaries and early S planes.
Unommon; along S planes cross-cutting
grain boundaries and early S planes.
25 (5 FIA) –
Uncommon; indeterminate origin clustered in cores
of hydrothermal quartz. Typically decrepitated or in
decrepitate haloes.
Common; indeterminate origin, along grain
boundaries, clustered and decrepitated, along S
planes.
Salinity (wt% NaCl
equiv.)
Tm(CO2)
Note: All temperature data reported in oC. The % Vapor phase value considers the volume % of vapor, or all carbonic phases present (e.g., type 3 inclusions containing LCO2 + VCO2); the remaining volume % is aqueous liquid. Salinity of the
aqueous phase was determined via final ice/hydrohalite melting or halite dissolution temperatures using HOKIEFLINCS_H2O-NaCl (Steele-MacInnis et al. 2012) or final clathrate melting temperatures using the equation of Darling (1991). XCO2 is
bulk fluid inclusion values. Bulk density values were calculated by applying the equations of state outlined by Bakker (1999), The XCO2 of inclusions were calculated using the program BULK (Bakker, 2003). Data in brackets represent averages ±
1σ standard deviation. The presence of CO2 in type 3 inclusions was confirmed via Raman spectroscopy. Dashes represent the absence of data. Type 4b inclusions were not measured as part of this study. Abbreviations: FIA - fluid inclusion
assemblage; S - secondary; Te - eutectic (first ice melting) temperature; Tm(Ice) - final ice melting; Tm(HH) - final hydrohalite melting; Tm(Halite) - halite dissolution; Tm(Cla) - final clathrate dissociation; Tm(CO2) – final melting of CO2; Th(CO2) –
CO2 homogenization; Th(total) – total homogenization. *values from Halter (1996)
Representative
inclusion appearance
Phases present (20oC)
Paragenetic stage
association
Occurrence and origin
# of inclusions
measured
% vapor phase
at 20 oC
(H2O–[K,Na]Cl–[Fe,Mn]Cl2)L + (H2O)V ±
([Fe,Mn]Cl2)S
(H2O-NaCl)L + (CO2 ± CH4 ± N2)V ± (CO2 ±
H2S)V
quartz in the East Kemptville leucogranite; quartz and
topaz in mineralized greisens of the EKD; quartz of
base-metal mineralized veins; quartz of phosphate-
bearing veins.
(H2O–[K,Na]Cl–[Fe,Mn]Cl2)L + (NaCl)S + (H2O)V ±
([Fe,Mn]Cl2)S ± (KCl)S
quartz in East Kemptville leucogranite and in
mineralized greisens at the EKD.
Rare; indeterminate origin clustered in cores of
primary quartz. Typically necked or decrepitated.
182 (33 FIA)
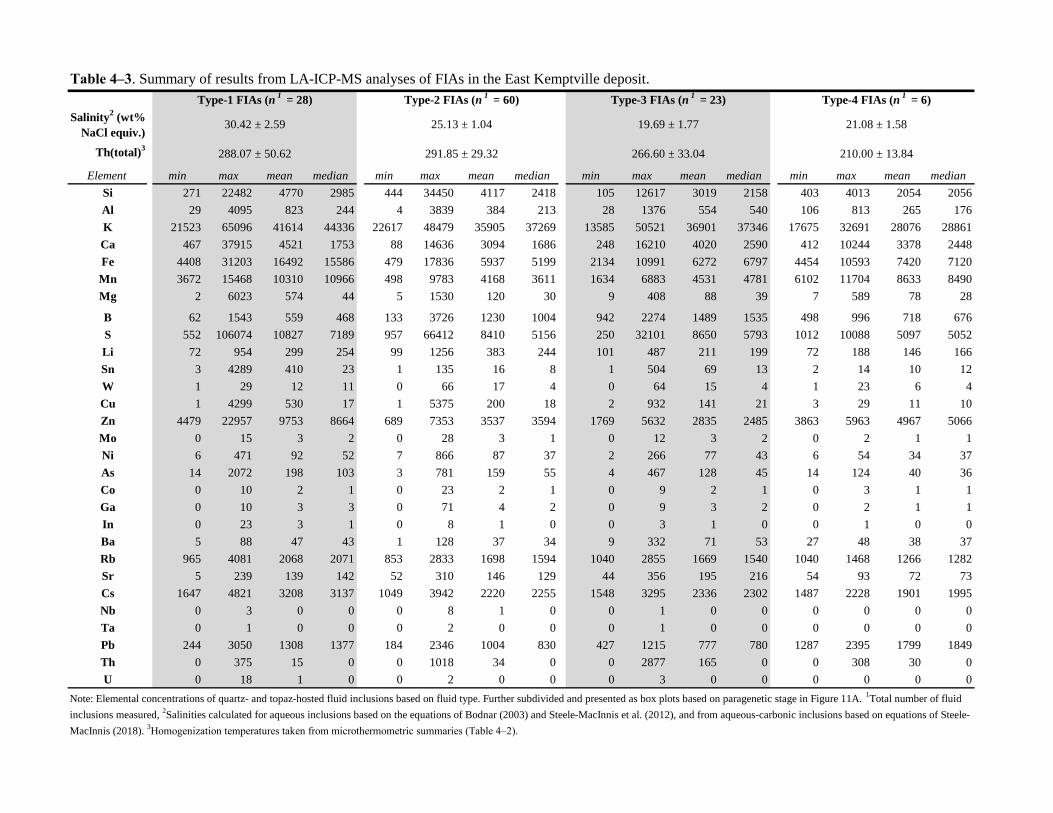
Table 4–3. Summary of results from LA-ICP-MS analyses of FIAs in the East Kemptville deposit.
Salinity2 (wt%
NaCl equiv.)
Th(total)3
Element min max mean median min max mean median min max mean median min max mean median
Si 271 22482 4770 2985 444 34450 4117 2418 105 12617 3019 2158 403 4013 2054 2056
Al 29 4095 823 244 4 3839 384 213 28 1376 554 540 106 813 265 176
K 21523 65096 41614 44336 22617 48479 35905 37269 13585 50521 36901 37346 17675 32691 28076 28861
Ca 467 37915 4521 1753 88 14636 3094 1686 248 16210 4020 2590 412 10244 3378 2448
Fe 4408 31203 16492 15586 479 17836 5937 5199 2134 10991 6272 6797 4454 10593 7420 7120
Mn 3672 15468 10310 10966 498 9783 4168 3611 1634 6883 4531 4781 6102 11704 8633 8490
Mg 2 6023 574 44 5 1530 120 30 9 408 88 39 7 589 78 28
B 62 1543 559 468 133 3726 1230 1004 942 2274 1489 1535 498 996 718 676
S 552 106074 10827 7189 957 66412 8410 5156 250 32101 8650 5793 1012 10088 5097 5052
Li 72 954 299 254 99 1256 383 244 101 487 211 199 72 188 146 166
Sn 3 4289 410 23 1 135 16 8 1 504 69 13 2 14 10 12
W 1 29 12 11 0 66 17 4 0 64 15 4 1 23 6 4
Cu 1 4299 530 17 1 5375 200 18 2 932 141 21 3 29 11 10
Zn 4479 22957 9753 8664 689 7353 3537 3594 1769 5632 2835 2485 3863 5963 4967 5066
Mo 0 15 3 2 0 28 3 1 0 12 3 2 0 2 1 1
Ni 6 471 92 52 7 866 87 37 2 266 77 43 6 54 34 37
As 14 2072 198 103 3 781 159 55 4 467 128 45 14 124 40 36
Co 0 10 2 1 0 23 2 1 0 9 2 1 0 3 1 1
Ga 0 10 3 3 0 71 4 2 0 9 3 2 0 2 1 1
In 0 23 3 1 0 8 1 0 0 3 1 0 0 1 0 0
Ba 5 88 47 43 1 128 37 34 9 332 71 53 27 48 38 37
Rb 965 4081 2068 2071 853 2833 1698 1594 1040 2855 1669 1540 1040 1468 1266 1282
Sr 5 239 139 142 52 310 146 129 44 356 195 216 54 93 72 73
Cs 1647 4821 3208 3137 1049 3942 2220 2255 1548 3295 2336 2302 1487 2228 1901 1995
Nb 0 3 0 0 0 8 1 0 0 1 0 0 0 0 0 0
Ta 0 1 0 0 0 2 0 0 0 1 0 0 0 0 0 0
Pb 244 3050 1308 1377 184 2346 1004 830 427 1215 777 780 1287 2395 1799 1849
Th 0 375 15 0 0 1018 34 0 0 2877 165 0 0 308 30 0
U 0 18 1 0 0 2 0 0 0 3 0 0 0 0 0 0
288.07 ± 50.62 291.85 ± 29.32 266.60 ± 33.04 210.00 ± 13.84
Note: Elemental concentrations of quartz- and topaz-hosted fluid inclusions based on fluid type. Further subdivided and presented as box plots based on paragenetic stage in Figure 11A. 1Total number of fluid
inclusions measured, 2Salinities calculated for aqueous inclusions based on the equations of Bodnar (2003) and Steele-MacInnis et al. (2012), and from aqueous-carbonic inclusions based on equations of Steele-
MacInnis (2018). 3Homogenization temperatures taken from microthermometric summaries (Table 4–2).
Type-3 FIAs (n1
= 23) Type-4 FIAs (n1
= 6)Type-1 FIAs (n1
= 28) Type-2 FIAs (n1
= 60)
30.42 ± 2.59 25.13 ± 1.04 19.69 ± 1.77 21.08 ± 1.58
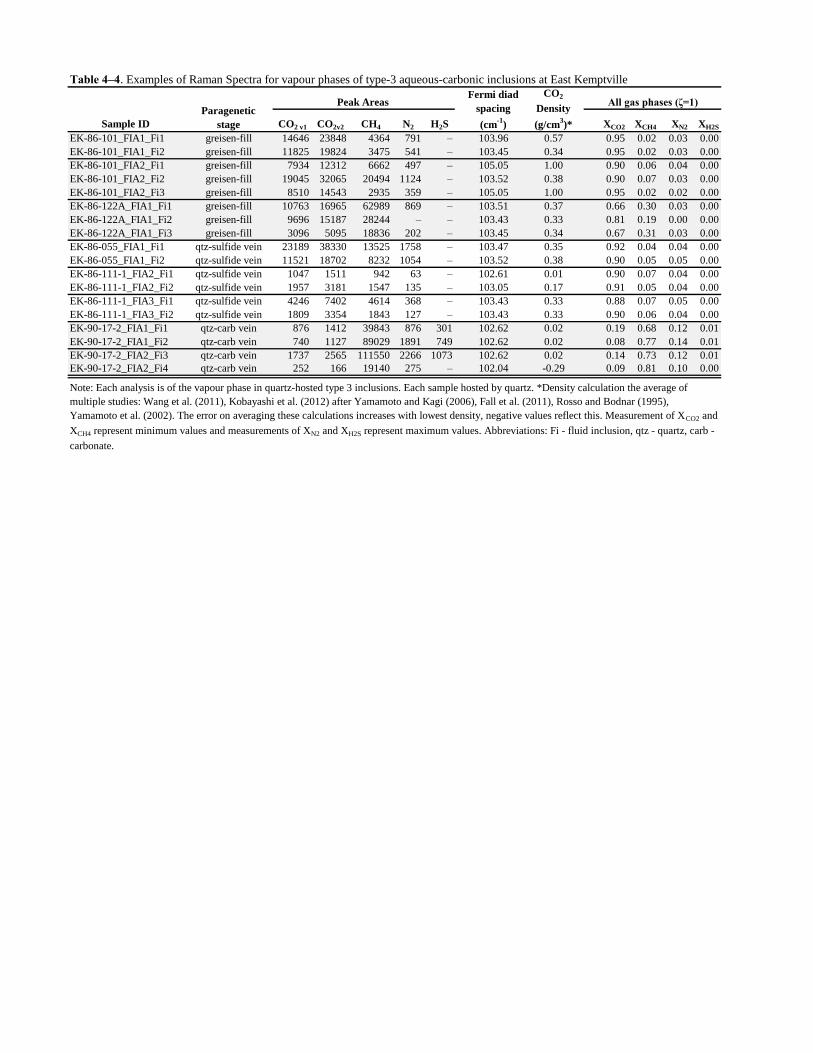
Sample ID CO2 v1 CO2v2 CH4 N2 H2S XCO2 XCH4 XN2 XH2S
EK-86-101_FIA1_Fi1 greisen-fill 14646 23848 4364 791 – 103.96 0.57 0.95 0.02 0.03 0.00
EK-86-101_FIA1_Fi2 greisen-fill 11825 19824 3475 541 – 103.45 0.34 0.95 0.02 0.03 0.00
EK-86-101_FIA2_Fi1 greisen-fill 7934 12312 6662 497 – 105.05 1.00 0.90 0.06 0.04 0.00
EK-86-101_FIA2_Fi2 greisen-fill 19045 32065 20494 1124 – 103.52 0.38 0.90 0.07 0.03 0.00
EK-86-101_FIA2_Fi3 greisen-fill 8510 14543 2935 359 – 105.05 1.00 0.95 0.02 0.02 0.00
EK-86-122A_FIA1_Fi1 greisen-fill 10763 16965 62989 869 – 103.51 0.37 0.66 0.30 0.03 0.00
EK-86-122A_FIA1_Fi2 greisen-fill 9696 15187 28244 – – 103.43 0.33 0.81 0.19 0.00 0.00
EK-86-122A_FIA1_Fi3 greisen-fill 3096 5095 18836 202 – 103.45 0.34 0.67 0.31 0.03 0.00
EK-86-055_FIA1_Fi1 qtz-sulfide vein 23189 38330 13525 1758 – 103.47 0.35 0.92 0.04 0.04 0.00
EK-86-055_FIA1_Fi2 qtz-sulfide vein 11521 18702 8232 1054 – 103.52 0.38 0.90 0.05 0.05 0.00
EK-86-111-1_FIA2_Fi1 qtz-sulfide vein 1047 1511 942 63 – 102.61 0.01 0.90 0.07 0.04 0.00
EK-86-111-1_FIA2_Fi2 qtz-sulfide vein 1957 3181 1547 135 – 103.05 0.17 0.91 0.05 0.04 0.00
EK-86-111-1_FIA3_Fi1 qtz-sulfide vein 4246 7402 4614 368 – 103.43 0.33 0.88 0.07 0.05 0.00
EK-86-111-1_FIA3_Fi2 qtz-sulfide vein 1809 3354 1843 127 – 103.43 0.33 0.90 0.06 0.04 0.00
EK-90-17-2_FIA1_Fi1 qtz-carb vein 876 1412 39843 876 301 102.62 0.02 0.19 0.68 0.12 0.01
EK-90-17-2_FIA1_Fi2 qtz-carb vein 740 1127 89029 1891 749 102.62 0.02 0.08 0.77 0.14 0.01
EK-90-17-2_FIA2_Fi3 qtz-carb vein 1737 2565 111550 2266 1073 102.62 0.02 0.14 0.73 0.12 0.01
EK-90-17-2_FIA2_Fi4 qtz-carb vein 252 166 19140 275 – 102.04 -0.29 0.09 0.81 0.10 0.00
Paragenetic
stage
Note: Each analysis is of the vapour phase in quartz-hosted type 3 inclusions. Each sample hosted by quartz. *Density calculation the average of
multiple studies: Wang et al. (2011), Kobayashi et al. (2012) after Yamamoto and Kagi (2006), Fall et al. (2011), Rosso and Bodnar (1995),
Yamamoto et al. (2002). The error on averaging these calculations increases with lowest density, negative values reflect this. Measurement of XCO2 and
XCH4 represent minimum values and measurements of XN2 and XH2S represent maximum values. Abbreviations: Fi - fluid inclusion, qtz - quartz, carb -
carbonate.
Table 4–4. Examples of Raman Spectra for vapour phases of type-3 aqueous-carbonic inclusions at East Kemptville
All gas phases (ζ=1)Fermi diad
spacing
(cm-1
)
Average
CO2
Density
(g/cm3)*
Peak Areas

Table 4–5. δ18
OV-SMOW Results from SIMS analyses on quartz in the East Kemptville Deposit.
Sample Spot Host Lithology Comments
Main Zone
BIC070 EK-1-1 in situ qtz w/ ksp 9.4 450-500 6.3 - 7.1
EK-1-2 8.4 5.3 - 6.1
EK-86-071 EK-3-1 in situ qtz w/ alb 11.2 450-500 8.1 - 8.9
EK-3-2 8.1 5.0 - 5.8
EK-86-023B EK-4-1 Altered EKL 10.7 8.6 385** 6.3
EK-4-2 9.8 511** 7.6
EK-86-1084 EK-12-1 Massive greisen 8.3 400-450 4.2 - 5.2
EK-12-2 7.4 3.3 - 4.3
BIC038 EK-7-1 Zoned greisen 9.9 400-450 5.8 - 6.8
EK-7-2 9.4 5.3 - 6.3
EK-86-159 EK-9-1 Zoned greisen 9.4 400-450 5.3 - 6.3
EK-9-2 10.0 5.9 - 6.9
EK-86-170 EK-10-1 Zoned greisen 9.7 400-450 5.6 - 6.6
EK-10-2 9.1 5.0 - 6.0
EK-86-110 EK-15-1 Zoned greisen 8.8 400-450 4.7 - 5.7
EK-15-2 8.5 4.4 - 5.4
EK-86-112 EK-13-1 Qtz-cpy-sph vein 9.7 300-350 2.8 - 4.4
EK-13-2 7.5 0.6 - 2.2
EK-86-155 EK-14-1 Qtz-cpy-sph vein 10.0 300-350 3.1 - 4.7
EK-14-2 9.1 2.2 - 3.8
EK-86-106 EK-16-1 Qtz-cpy-sph vein 8.3 300-350 1.4 - 3.0
EK-16-2 12.0 5.1 - 6.7
EK-93-22 EK-18-1 Qtz-aspy vein 10.0 300-350 3.1 - 4.7
EK-18-2 8.1 1.2 - 2.8
EK-87-4 EK-20-1 Qtz-apt-alb vein 8.5 300-350 1.6 - 3.2
EK-20-2 8.8 1.9 - 3.5
EK-86-23C EK-2-1 Qtz vein 12.1 8.6 229** 2.2
EK-2-2 11.6 281** 4.0Baby Zone
BIC032 EK-11-1 Massive greisen 8.1 400-450 4.0 - 5.0
EK-11-2 8.4 4.3 - 5.3
BIC003 EK-5-1 Matrix to IBX 9.1 400-450 5.0 - 6.0
EK-5-2 8.8 4.7 - 5.7
BIC026 EK-6-1 Cement to HBX 7.5 400-450 3.4 - 4.4
EK-6-2 11.7 7.6 - 8.6
δ18
O (‰)
H2OT (oC)
δ18
O (‰)
WR*
δ18
O (‰)
quartz
qtz; cross-cuts EKL
qtz; cross-cuts wall
rock
qtz; cross-cuts
greisenized EKL
qtz; qtz-top-cst
greisen fill
in situ qtz w/ ser-
sulfides
qtz; cross-cuts
greisenized EKL
qtz; cross-cuts
greisenized EKL
qtz; coarse qtz-cst-wlf
infill
qtz; qtz-top-cst
greisen fill
qtz; qtz-top-cst
greisen fill
qtz; fragment-
supported HBX
euhedral qtz
phenocryst
Note: Spot-to-spot reproducibility on the quartz standard = 0.6–0.9 ‰. Each analyses has a 1σ error of 1.2 ‰. Multpile
analyses for each sample represent spots across the respective quartz grain. *Whole-rock values of same EKL sample from
Kontak et al. (1990b). **Calculated temperature of formation from Matsuhisa et al. (1979; quartz<=>H2O) and Zhao and
Zheng (2003; granite<=>H2O) using Alpha-Delta software (Beaudoin and Therrien 2004). All other temperatures are assumed
based on constraints by previous workers (described in text). δ18
O (‰)H2O values derived from Matsuhisa et al. (1979;
quartz<=>H2O) using Alpha-Delta software (Beaudoin and Therrien 2004). Abbreviations: SIMS - secondary ion mass
spectrometry; WR - Whole Rock; EKL - East Kemptville Leucogranite; IBX - igneous breccia of the East Kemptville Baby
Zone (Chapter 3); HBX - hydrothermal breccia of the East Kemptville Baby Zone; qtz - quartz; ksp - potassium feldspar; alb -
albite; ser - sericite; cpy - chalcopyrite; sph - sphalerite; cst - cassiterite; wlf - wolframite; aspy - arsenopyrite; apt - apatite.
Weakly altered EKL
Weakly altered EKL
in situ qtz w/ ser-
sulfides
in situ qtz w/ alb-ser
late; cross-cuts EKL
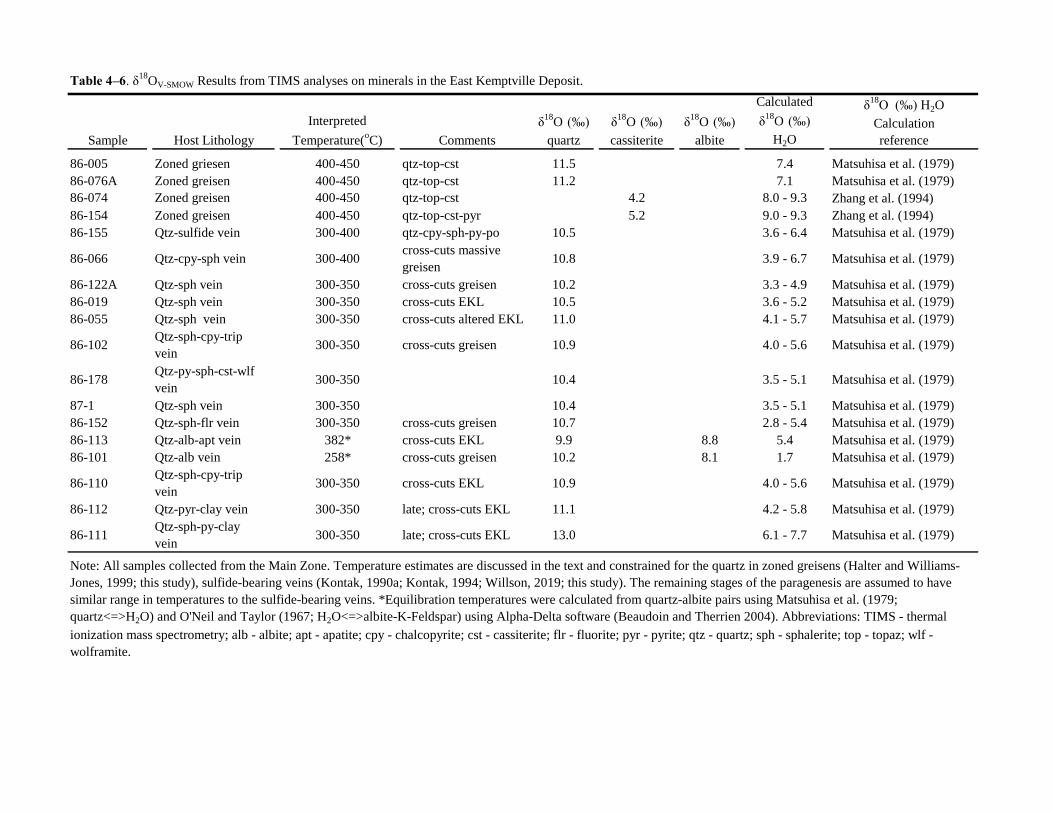
Table 4–6. δ18
OV-SMOW Results from TIMS analyses on minerals in the East Kemptville Deposit.
86-005 Zoned griesen 400-450 qtz-top-cst 11.5 7.4 Matsuhisa et al. (1979)
86-076A Zoned greisen 400-450 qtz-top-cst 11.2 7.1 Matsuhisa et al. (1979)
86-074 Zoned greisen 400-450 qtz-top-cst 4.2 8.0 - 9.3 Zhang et al. (1994)
86-154 Zoned greisen 400-450 qtz-top-cst-pyr 5.2 9.0 - 9.3 Zhang et al. (1994)
86-155 Qtz-sulfide vein 300-400 qtz-cpy-sph-py-po 10.5 3.6 - 6.4 Matsuhisa et al. (1979)
86-066 Qtz-cpy-sph vein 300-400cross-cuts massive
greisen10.8 3.9 - 6.7 Matsuhisa et al. (1979)
86-122A Qtz-sph vein 300-350 cross-cuts greisen 10.2 3.3 - 4.9 Matsuhisa et al. (1979)
86-019 Qtz-sph vein 300-350 cross-cuts EKL 10.5 3.6 - 5.2 Matsuhisa et al. (1979)
86-055 Qtz-sph vein 300-350 cross-cuts altered EKL 11.0 4.1 - 5.7 Matsuhisa et al. (1979)
86-102Qtz-sph-cpy-trip
vein300-350 cross-cuts greisen 10.9 4.0 - 5.6 Matsuhisa et al. (1979)
86-178Qtz-py-sph-cst-wlf
vein300-350 10.4 3.5 - 5.1 Matsuhisa et al. (1979)
87-1 Qtz-sph vein 300-350 10.4 3.5 - 5.1 Matsuhisa et al. (1979)
86-152 Qtz-sph-flr vein 300-350 cross-cuts greisen 10.7 2.8 - 5.4 Matsuhisa et al. (1979)
86-113 Qtz-alb-apt vein 382* cross-cuts EKL 9.9 8.8 5.4 Matsuhisa et al. (1979)
86-101 Qtz-alb vein 258* cross-cuts greisen 10.2 8.1 1.7 Matsuhisa et al. (1979)
86-110Qtz-sph-cpy-trip
vein300-350 cross-cuts EKL 10.9 4.0 - 5.6 Matsuhisa et al. (1979)
86-112 Qtz-pyr-clay vein 300-350 late; cross-cuts EKL 11.1 4.2 - 5.8 Matsuhisa et al. (1979)
86-111Qtz-sph-py-clay
vein300-350 late; cross-cuts EKL 13.0 6.1 - 7.7 Matsuhisa et al. (1979)
δ18
O (‰) H2O
Calculation
reference
Note: All samples collected from the Main Zone. Temperature estimates are discussed in the text and constrained for the quartz in zoned greisens (Halter and Williams-
Jones, 1999; this study), sulfide-bearing veins (Kontak, 1990a; Kontak, 1994; Willson, 2019; this study). The remaining stages of the paragenesis are assumed to have
similar range in temperatures to the sulfide-bearing veins. *Equilibration temperatures were calculated from quartz-albite pairs using Matsuhisa et al. (1979;
quartz<=>H2O) and O'Neil and Taylor (1967; H2O<=>albite-K-Feldspar) using Alpha-Delta software (Beaudoin and Therrien 2004). Abbreviations: TIMS - thermal
ionization mass spectrometry; alb - albite; apt - apatite; cpy - chalcopyrite; cst - cassiterite; flr - fluorite; pyr - pyrite; qtz - quartz; sph - sphalerite; top - topaz; wlf -
wolframite.
δ18
O (‰)
quartz
δ18
O (‰)
cassiterite
δ18
O (‰)
albite
Interpreted
Temperature(oC) CommentsSample Host Lithology
Calculated
δ18
O (‰)
H2O

490
Chapter 5
5.1 Conclusions
This thesis documents and characterizes tin mineralization in a mesothermal intrusive setting,
providing an interpretation on the conditions needed to form such deposits. The thesis also
characterizes a magmatic evolution and emplacement history of the host batholith and, based on
this, the implications for tin fertility in this part of the Canadian Appalachian Sn-W metallotect.
In summary, the thesis provides the following:
• Chapter 2 presents a new understanding of the emplacement history for the large
peraluminous South Mountain Batholith and its genetic link to tin mineralized centres in the
Canadian Appalachians. Evidence from comprehensive U-Pb zircon dating across the batholith
indicates it was constructed from a long-lived magmatic system (~8 Myr of overlapping
magmatic activity), but crystallized in two main intrusive events: 1) a bulk of the less evolved
granodiorite phases between 378.7 ± 0.6 and 375.6 ± 0.5 Ma, and 2) the more highly fractionated
phases between 375.4 ± 0.8 and 371.8 ± 0.8 Ma. The zircon in the batholith record multiple
crystallization events that preceded final emplacement by a margin of error that often overlaps
with the crystallization age interpretation; these ages (dominantly between ~380 and 390 Ma)
represent crystallization of early partial melts. These early crystallization ages indicate a
prolonged history of heating and melt underplating in this region. A majority of the SMB
evolved from a melt derived from a metasomatized mantle that underwent significant
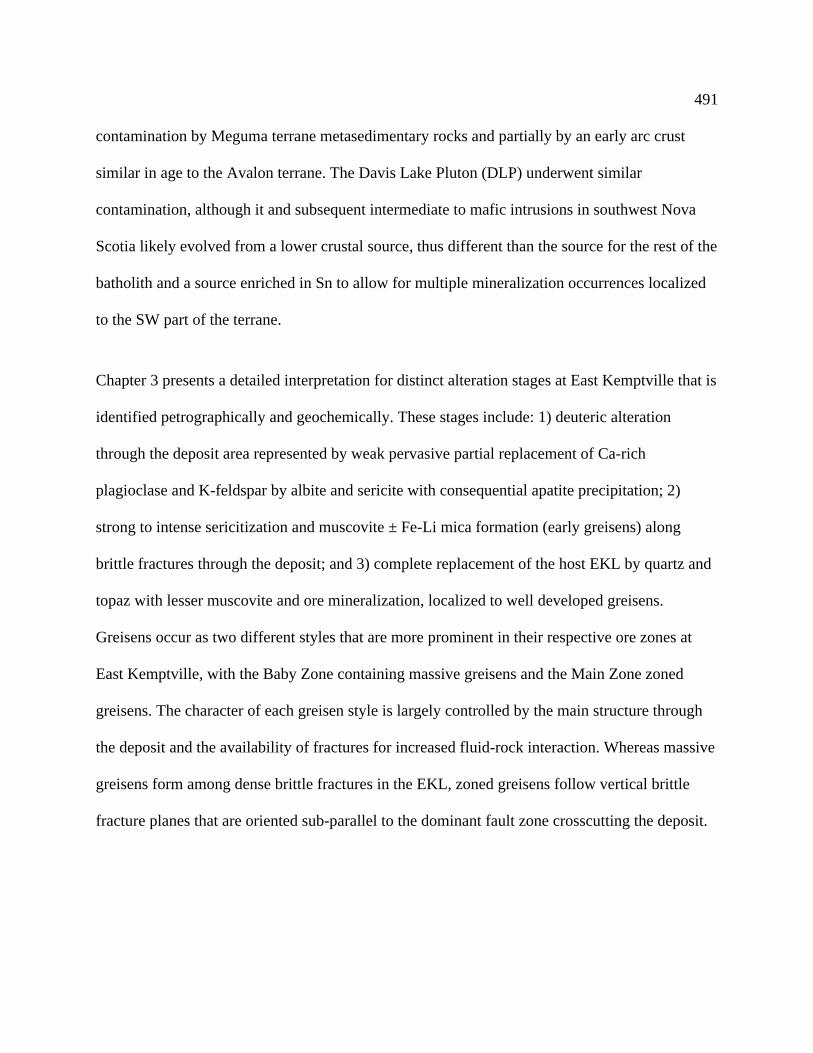
491
contamination by Meguma terrane metasedimentary rocks and partially by an early arc crust
similar in age to the Avalon terrane. The Davis Lake Pluton (DLP) underwent similar
contamination, although it and subsequent intermediate to mafic intrusions in southwest Nova
Scotia likely evolved from a lower crustal source, thus different than the source for the rest of the
batholith and a source enriched in Sn to allow for multiple mineralization occurrences localized
to the SW part of the terrane.
Chapter 3 presents a detailed interpretation for distinct alteration stages at East Kemptville that is
identified petrographically and geochemically. These stages include: 1) deuteric alteration
through the deposit area represented by weak pervasive partial replacement of Ca-rich
plagioclase and K-feldspar by albite and sericite with consequential apatite precipitation; 2)
strong to intense sericitization and muscovite ± Fe-Li mica formation (early greisens) along
brittle fractures through the deposit; and 3) complete replacement of the host EKL by quartz and
topaz with lesser muscovite and ore mineralization, localized to well developed greisens.
Greisens occur as two different styles that are more prominent in their respective ore zones at
East Kemptville, with the Baby Zone containing massive greisens and the Main Zone zoned
greisens. The character of each greisen style is largely controlled by the main structure through
the deposit and the availability of fractures for increased fluid-rock interaction. Whereas massive
greisens form among dense brittle fractures in the EKL, zoned greisens follow vertical brittle
fracture planes that are oriented sub-parallel to the dominant fault zone crosscutting the deposit.
492
The contrast between these mineralization styles may be the result of a step-over along the above
fault zone that localized extensive brittle features to accommodate strain in the Baby Zone area
and thus acted as a preferred conduit for higher fluid flux in this area. Given the mesothermal
conditions at the time of formation, however, the ore fluids were still constrained by overlying
lithostatic pressures, and thus either escaped laterally, without reacting to wall-rocks, or
accumulated in the EKL ore zones. New interpreted mineralization ages at East Kemptville
define three general ages, the earliest of which includes: previously interpreted crystallization of
the host EKL, determined from pegmatite molybdenite at ca. 376 Ma; U-Pb cassiterite at 370 ± 4
Ma and Re-Os molybdenite at 371 ± 2.0 Ma from greisens and veins, respectively, in the Main
Zone; and ≥ 10 Ma younger mineralization that is associated with crosscutting veins introduced
along the deposit-hosting fault zone; i.e., Re-Os molybdenite in veinlets at 354.9 ± 2.0 Ma and
343.7 ± 1.7 Ma. The latter of these ages is similar to the 347 ± 12 Ma obtained for cassiterite
from the nearby metasedimentary rock-hosted Duck Pond skarn-style deposit. Although a
reliable U-Pb cassiterite age has yet to be obtained from the Baby Zone, the spectrum of younger
ages associated with veins suggest many features of the Baby Zone were not temporally
equivalent to the Main Zone, and thus the contrast in character between the ore zones may be the
result of continued magmatic-hydrothermal activity along the host fault zone and mineralization
synchronous with fault propagation between the main over-stepping fault zones through the
deposit.
493
• Chapter 4 presents abundant fluid inclusion evidence of repetitive changes to pressure
during the formation of the East Kemptville deposit through its paragenesis; indicative of
continued mechanical fracturing as the hydrothermal system cooled. The early, anomalously
saline orthomagmatic fluids present at East Kemptville are interpreted to be the result of
exsolution of Cl-enriched aqueous fluids at depth for the highly fractionated and F-rich host
leucogranite. The in situ δ18Oquartz values from mineralized greisens in this study and the
interpreted range of precipitation temperatures suggest mixing and equilibration between fluids
exsolved from the host rock leucogranite and externally derived magmatic fluids, both enriched
in ore elements. Fluid-rock interaction at East Kemptville is interpreted to transition from rock-
dominant in the early mineralization stages to fluid-dominant in the main mineralization stage
(i.e., during coarse cassiterite and base-metal sulfide precipitation). Paragenetically late fluids in
the mineralizing system show evidence of a minor CO2 component that is not recognized in any
fluid type associated to paragenetic stages prior to veining; these reduced fluids were derived
from an external magmatic source, likely at depth, and were partially equilibrated to surrounding
wall-rocks. The resultant precipitation of late coarse cassiterite and base-metal sulfide
mineralization occurred in greisen cores, vugs, and tensional veins at East Kemptville.
5.2 Future Work
In Chapter 2, evidence for structural controls on the two ore zones in the East Kemptville deposit
suggest the East Kemptville–East Dalhousie Shear Zone (EKEDSZ) was the primary corridor for

494
mineralizing fluids and that releasing bends along this shear zone host the highest grade
mineralization. Therefore, future work should be aimed at the trace of this fault zone and the
identification of similar step-over features that host abundant fracturing necessary for hosting
greisen formation. This identification is crucial for further Sn-Zn-Cu-Ag-In exploration.
Additionally, the geochemistry of the least altered East Kemptville leucogranite (EKL) samples
in the deposit suggest a fractionation vector between the DLP and the host rocks to the deposit is
missing; this interpretation contrasts with previous interpretations on the geochemistry of the
DLP, which used Nb/Ta as a fractionation vector. A review of the DLP would benefit from
additional sampling with a spatial respect to the EKEDSZ to evaluate the relative influence of
alteration and fractional crystallization oof the DLP trace element chemistry along this structural
corridor. Lastly, this study is awaiting results from U-Pb cassiterite age-dating in the Baby Zone
greisens as evidence for the potential temporal contrast between the two ore zones.
Chapter 3 presented evidence for physiochemical changes in mineralizing fluids through the East
Kemptville deposit paragenesis. This study, however, was unable to identify measurable fluid
inclusion assemblages in the Baby Zone of the deposit, and thus the work was constrained to
greisens and veins from the Main Zone. Future work should therefore be aimed at identifying
and characterizing fluid inclusion assemblages from the Baby Zone, where possible; given the
brecciation present in the ore zone, the presence of phase separation (boiling) in fluid inclusions
should be tested. The presence of graphite in the EKEDSZ as well as a CO2 volatile presence in
495
later stage fluids warrants a genetic investigation of the carbonic component in mineralizing
fluids through C isotope analysis.
Chapter 4 presented evidence for a younger, more juvenile signature for zircon from the DLP
that hosts the East Kemptville mineralization, deposited along a regional shear zone that is
interpreted to control the emplacement of the SMB. A follow up study on the SMB should focus
on the leucogranite phases that intrude along the regional shear zones to further constrain the
timing of the most evolved plutonic phases that are associated with mineralization. To further
investigate the juvenile signature to these later magmas that has been indicated by this study, and
evaluate contamination relative to the rest of the SMB, an investigation into melt inclusions
within zircon of the SMB would be beneficial to the understanding of the early magmatic
evolution.