CT-SPECT fusion for analysis of radiolabeled antibodies: Applications in gastrointestinal and lung...
16
h’ucL Med. Biol. Vol. 18, No. I, pp. 2742, 1991 Inf. J. Radiat. Appl. Instrum. Parr B Printed in Great Britain. All rights reserved 0883-2897/91 $3.00 + 0.00 Copyright 0 1991 Pergamon Press plc CT-SPECT Fusion for Analysis of Radiolabeled Antibodies: Applications in Gastrointestinal and Lung Carcinoma ELISSA L. KRAMER’* and MARILYN E. NOZ’ ‘Memorial Sloan-Kettering Cancer Center, 1275 York Avenue, New York, NY 10021 and 2New York University Medical Center/Bellevue Hospital Center, 560 First Avenue, New York, NY 10016, U.S.A. Fusing or image registration improves the information obtained by correlating images from various imaging modalities. We “fused” radiolabeled antibody SPECT with CT in patients with color&al or lung cancer. We identified corresponding landmarks on cross-sectional images and used standard graphics algorithms for untilting to match planes of reconstruction and for two-dimensional warping or transformation of images or regions of interest. Fusing localizes activity on SPECT to specific anatomic structures and decreases SPECT false positives and CT false negatives. In the evaluation of the cancer patient, radiolabeled antibody imaging can provide unique information which is unavailable through any other imaging modality currently in use; i.e. the presence of an abnormal concentration of tumor-associated antigen may be demonstrated. With the development of new chelation techniques and more specific and higher affinity antibodies, radiolabeled antibody imaging has improved tremendously from detection rates of approx. 40% in the late 1970s (Mach et al., 1980) to rates of 80% or more in recent reports (Siccardi et al., 1989). The addition of single photon emission tom- ography or SPECT has increased the sensitivity (Berche et al., 1982; Kramer et al., 1988). The quality of this information is hampered in several respects, however. First, as our clinical experi- ence with imaging radiolabeled antibodies grows, we have learned that persistence of blood pool activity may obscure an abnormal concentration of radio- labeled antibody or that blood pool-containing struc- tures may be confused with abnormal accumulations of radiolabeled antibody. Although the antigens against which these antibodies are directed occur in greater concentration in tumor, they may have some expression in normal tissues leading to non-specific localization. Also, depending on the chemistry of the radiolabeling and the size of the antibody or antibody fragment labeled, there will be non-tumor concen- *All correspondence should be addressed to: Elissa L. Kramer, M.D., Division of Nuclear Medicine, Rm HW 215, NYU Medical Center, 560 First Avenue, New York, NY 10016, U.S.A. tration of radiolabel. Many of these non-specific localizations can be identified as such, but on oc- casion, they may not be easily distinguishable from abnormal tumor accumulation. Second, radiolabeled antibody images frequently lack anatomic landmarks so that identification of the structure in which the abnormal accumulation is localized may be difficult and/or inaccurate. This may be particularly important in staging of tumors or in providing the surgical oncologist with a “road map” for surgical treatment planning and/or exploration. Although SPECT may enhance our ability to local- ize a focus of abnormal accumulation in cross- section, normal activity containing structures may be more difficult to identify. There is loss of other landmark information on SPECT which we usually integrate into our interpretation of images. As a result, it is often more difficult to determine the structure with which the suspicious activity is associated. In contrast, structural imaging modalities such as CT or MRI provide exquisite anatomic detail and can localize abnormal masses or enlargement of lymph nodes in many instances. For these modalities, difficulties in interpretation occur where enlargement of nodes or abnormal bulk of tissue may not rep- resent tumor. For instance, in lung cancer enlarged mediastinal lymph nodes may represent hyperplasia or metastatic involvement. In other instances, the normal anatomy may be variable, e.g. bowel loops in the pelvis or, particularly in the postsurgical patient, where the disruption of the normal anatomy may make detection of recurrence difficult. 27
Transcript of CT-SPECT fusion for analysis of radiolabeled antibodies: Applications in gastrointestinal and lung...

h’ucL Med. Biol. Vol. 18, No. I, pp. 2742, 1991 Inf. J. Radiat. Appl. Instrum. Parr B Printed in Great Britain. All rights reserved
0883-2897/91 $3.00 + 0.00 Copyright 0 1991 Pergamon Press plc
CT-SPECT Fusion for Analysis of
Radiolabeled Antibodies: Applications in
Gastrointestinal and Lung Carcinoma
ELISSA L. KRAMER’* and MARILYN E. NOZ’
‘Memorial Sloan-Kettering Cancer Center, 1275 York Avenue, New York, NY 10021 and 2New York University Medical Center/Bellevue Hospital Center, 560 First Avenue, New York,
NY 10016, U.S.A.
Fusing or image registration improves the information obtained by correlating images from various imaging modalities. We “fused” radiolabeled antibody SPECT with CT in patients with color&al or lung cancer. We identified corresponding landmarks on cross-sectional images and used standard graphics algorithms for untilting to match planes of reconstruction and for two-dimensional warping or transformation of images or regions of interest. Fusing localizes activity on SPECT to specific anatomic structures and decreases SPECT false positives and CT false negatives.
In the evaluation of the cancer patient, radiolabeled antibody imaging can provide unique information which is unavailable through any other imaging modality currently in use; i.e. the presence of an abnormal concentration of tumor-associated antigen may be demonstrated. With the development of new chelation techniques and more specific and higher affinity antibodies, radiolabeled antibody imaging has improved tremendously from detection rates of approx. 40% in the late 1970s (Mach et al., 1980) to rates of 80% or more in recent reports (Siccardi et al., 1989). The addition of single photon emission tom- ography or SPECT has increased the sensitivity (Berche et al., 1982; Kramer et al., 1988).
The quality of this information is hampered in several respects, however. First, as our clinical experi- ence with imaging radiolabeled antibodies grows, we have learned that persistence of blood pool activity may obscure an abnormal concentration of radio- labeled antibody or that blood pool-containing struc- tures may be confused with abnormal accumulations of radiolabeled antibody. Although the antigens against which these antibodies are directed occur in greater concentration in tumor, they may have some expression in normal tissues leading to non-specific localization. Also, depending on the chemistry of the radiolabeling and the size of the antibody or antibody fragment labeled, there will be non-tumor concen-
*All correspondence should be addressed to: Elissa L. Kramer, M.D., Division of Nuclear Medicine, Rm HW 215, NYU Medical Center, 560 First Avenue, New York, NY 10016, U.S.A.
tration of radiolabel. Many of these non-specific localizations can be identified as such, but on oc- casion, they may not be easily distinguishable from abnormal tumor accumulation.
Second, radiolabeled antibody images frequently lack anatomic landmarks so that identification of the structure in which the abnormal accumulation is localized may be difficult and/or inaccurate. This may be particularly important in staging of tumors or in providing the surgical oncologist with a “road map” for surgical treatment planning and/or exploration.
Although SPECT may enhance our ability to local- ize a focus of abnormal accumulation in cross- section, normal activity containing structures may be more difficult to identify. There is loss of other landmark information on SPECT which we usually integrate into our interpretation of images. As a result, it is often more difficult to determine the structure with which the suspicious activity is associated.
In contrast, structural imaging modalities such as CT or MRI provide exquisite anatomic detail and can localize abnormal masses or enlargement of lymph nodes in many instances. For these modalities, difficulties in interpretation occur where enlargement of nodes or abnormal bulk of tissue may not rep- resent tumor. For instance, in lung cancer enlarged mediastinal lymph nodes may represent hyperplasia or metastatic involvement. In other instances, the normal anatomy may be variable, e.g. bowel loops in the pelvis or, particularly in the postsurgical patient, where the disruption of the normal anatomy may make detection of recurrence difficult.
27

28 ELISSA L. KRAMER and MARILYN E. Noz
Comparison of functional and structural cross- sectional images can enhance the information pro- vided by both types of modalities. Image registration or “fusing”, i.e. precise matching of the data from different imaging modalities, has been used for im- proved understanding and analysis of brain imaging in the past both for quantitative analysis (Farkas et al., 1984; Wolkin et al., 1985) and for radiation treatment planning (Schad et al., 1987). It has also been employed in the chest and abdomen for analysis of 67Ga, “‘-leukocyte, and 99mTc-labeled red blood cell imaging (Kaplan and Swayne, 1988). More recently, we have used image “fusing” to analyze radiolabeled anti-CEA antibodies in patients with colorectal carci- noma (Kramer et al., 1989). Fusion can help define the precise anatomic location of an accumulation of radioactivity, can help define the metabolically active portion of a tumor, localize an occult site of pathology, and provide a more accurate means of drawing regions of interest for quantitative or semi- quantitative analysis. In addition to image analysis for diagnosis, this technique may have some apph- cation in the better definition of boundaries on functional images (PET or SPECT) which suffer from poorer spatial resolution than CT or MRI. It may also be that this technique will be helpful in deter- mining more accurate algorithms for attenuation correction of SPECT images if the CT images can be superimposed to give more detailed information about the body configuration (Rusinek, 1989a).
Technical Considerations
In order to fuse two images, the data from the different imaging modalities must be matched as accurately as possible. At the outset this requires the capability of handling images acquired from various modalities using equipment made by different com- mercial companies. File structures of the image sets under consideration may vary markedly. Software and hardware used for this task must be able to convert and then handle data in a consistent and optimized fashion. In our laboratories, we have em- ployed “qsh” which is an image display and handling toolkit composed of several software modules. These software modules which have been created and vali- dated over the past 10 years have been described in detail elsewhere (Noz and Maguire, 1988).
The handling of the image format has been a central concern of qsh. The format of images is a very important consideration, because each device that needs to manipulate them must know the file format. Additionally, it would be convenient if the file format chosen could also act as a database for the data associated with the image, e.g. the amount of radio- activity administered or patient demographics. qsh has been developed with both of these issues in mind.
*UNIX is a trademark of AT&T Technologies. tVMS is a trademark of Digital Equipment Corporation.
Furthermore, the image format used with qsh images can be easily adapted to any standard format which is adopted in the future. An adaptation of the AAPM standard image format (Baxter et al., 1982) was used for the image file structure and the University of North Carolina vsh (visual shell) (Zimmerman et al., 1982) was used as a model for developing the image analysis software. qsh, then, is a hardware indepen- dent system, written in C and running under UNIX* and VMSt which routinely handles the standardiz- ation of image data across modalities as well as across manufacturers’ diverse formats (Maguire and Noz, 1989).
The image file format associated with qsh provides a header file as text in the form of sets of standard key-value pairs for the non-pixel data and a second (separate) file composed of the N-dimensional array of numeric values (image data) which comprise the actual pixel values. This header information (the key-value pairs) are stored as ASCII character strings.
Two routines, ImagePutValue and ImageGetValue are the only routines necessary to use the key-value pairs. Thus a server or other process can read values from a header file, answer requests for values, up- dates values, add new key-value pairs and update image header files. This provides facilities similar to environment variables with the added capability of updating these values and sharing them between separate processes.
When images which are obtained at different times or from contrasting modalities (such as PET and CT) are to be viewed side by side, it is useful to have the ability to give each image its own background and saturation values as well as color scale. This is important for comparative studies where regions of interest are drawn on images of one modality and overlaid on images of another modality, or for recog- nition of features difficult to visualize in one modality which are clearly visible on images obtained from a different modality.
To accomplish this we must choose between more complex hardware (with assignment of regions to different video look-up tables) and more extensive processing of the image. One present image pro- cessing method for handling this is the adaptive histogram equalization technique (Pizer ef al., 1986). Although this requires substantial processing of the image before display, the time required for this processing can be reduced by limiting the equaliza- tion to a number of regions of the image, or by building special purpose hardware.
The alternative to extensive image processing is to use more complex frame buffers (hardware) which provide separate video look-up tables for different locations on the display. The fact that color tables can be independently adjusted (using the same or different color scale) allows the display of several different features on one screen. If the frame buffer has sufficient capacity, the entire image data set could

CT-SPECT fusion of radiolabeled antibodies 29
be resident in memory at once. In this situation, it would be possible to have multiple window widths and levels displayed in different locations on the screen and would require less processing on the part of the host computer. Several frame buffer manufacturers offer this feature.
Once the images are available, we must account for the differences in the geometry of the two images. To begin with the differences in the center-to-center interslice distance of the two different image sets must be considered. One approach has been to try to match slice thickness of the various image sets as closely as possible. We have taken two simple approaches to this: one has been to tailor the CT or MRI slice acquisition so that the thickness matches the SPECT slice thickness or a multiple thereof. The other is to choose the two slices which represent the same dis- tance from a fiduciary marker or anatomic landmark. Slices must also be matched for size within the plane of reconstruction. The dimensions of the pixel matrices of the two images must be the same. Typi- cally SPECT images are acquired in a 64 x 64 or 128 x 128 matrix and CT and MRI images are acquired generally in a 256 x 256 or 512 x 512 matrix. In practice we have interpolated all our images to a matrix size of 128 x 128 for subsequent matching. The difference in the size represented by a pixel in one image compared to the other is compensated for through the “warping” algorithm (described below) which allows translation, rotation, scale and skew.
Once the matrix dimensions match and the trans- axial level corresponds, corresponding landmarks must be identified on each image. This can be done using several different methods. Three major approaches to image registration include: (a) analyti- cal with respect to structure; (b) analytical with respect to surfaces; and (c) procedural. Two other approaches, while analytical in nature, introduce data external to the studies. One of these is the use of an anatomic atlas and the other is the use of external markers, which is an approach we have used. It should be noted that these approaches are not mutually exclusive and may be used in conjunction with each other.
One of the solutions for the problem of structure identification is to determine translate, rotate and scale transformations using Fourier analysis methods. One group has approached the problem by using a 2-D global tacking algorithm based on phase corre- lation Fourier methods (DeCastro and Morandi, 1987).
Another solution uses a cross-correlation employ- ing Fourier invariance properties and logarithmic transforms to decouple the variables. While this eliminates the iterative nature of the algorithm and reduces the computational expense, as with the first method, the images must be preprocessed (Apicella et al., 1991).
Identification (of structure) which involves trans- late, rotate, scale and skew can be implemented also
with a polynomial based warping algorithm. These techniques have been applied to correlate serial thal- lium heart scans (Singh et al., 1979). The coefficients for the polynomial transformation are obtained using linear regression analysis of a set of cross-correlated landmarks using Gauss-Jordan matrix inversion. Recently, a linear and non-linear polynomial warp using interactively specified 3-D landmarks has been proposed for correlating CT and MR and PET (Schiers et al., 1989). Promising results were obtained with rigid objects (an artificial fixed geometry scene and a cadaver), but when non-linear distortion is present, problems with oscillation occur unless enough landmarks are specified in a well distributed manner over the 3-D surface.
Surface identification is another method which has been used to register images. There are three major approaches to surface identification: the least squares search technique; eigenvalue decomposition; and moment matching techniques. The first approach (Chen et al., 1985; Pelizzari and Chen, 1987; Chen et al., 1988; Pelizzari et al., 1989; Levin et al., 1988, 1989) uses a search technique to minimize “mismatch” between the surfaces, i.e. the sum of squares of distances from points on surface A to nearest points on surface B. The second approach finds the principal axes, as these depend only on the shape and represent orthogonal axes about which the moments of inertia are minimum. The techniques involve the eigenvalue decomposition of scatter matrices (second order mo- ments) applied to the threshold version of the original images (Faber and Stokely, 1988) or to the surface data (Moshfeghi, 1988; Toennies et al., 1989). In the third approach surface fitting is accomplished by moment matching techniques (Gamboa-Aldeco et al., 1986). All of the above approaches to surface match- ing work well on structures with bony outlines such as the head, but are less successful with structures composed of soft tissues such as in the abdomen. Their application to parts of the body other than the head is limited since the presence of well-defined contours is necessary. We have instituted a surface matching routine for head SPECT but not yet for body because of these limitations (Rusinek et al., 1989b). We reconstructed a volume of the CT or MR data in three dimensions. External markers on the SPECT projec- tion data are then matched to these reconstructions by rotating, translating, and tilting the reconstructed volume. Then the CT and/or MR slices are pre-pro- jetted as indicted by the above manipulations. These slices now form a mask for the reconstruction within which the radionuclide activity and the attenuation medium are assumed to be contained.
The procedural approach to image registration is based on accurate and reproducible positioning of the body part at the time of the study acquisitions. This has been used to register head scans by means of a stereotactic frame to the head. In each case, a head holder specifically molded to the subject head is used (Fox et al., 1985; Bergstrom et al., 1981; Evans et al.,
30 ELISSA L. KRAMER and MARILYN E. Noz
1988; Marrett et al., 1989). Mismatch between two studies may be a problem for researchers using this approach exclusively (Maguire et aI., 1986).
Another method to register images is based on an anatomic atlas (Bohm et al., 1983; Bajcsy et al., 1983; Bohm and Greitz, 1988; Dann, 1989). Anatomic atlases are currently available only for the brain, but projects are underway for other parts of the body. The atlas can be transformed to fit images such as those obtained from CT. Once the anatomic struc- tures are well-defined, it should be possible to overlay the CT image onto the functional image. However, the calculation of the atlas to CT transformation cannot be accomplished without some difficulties. Since each subject has a variant of the normal position and size of structures, the structures delin- eated in a CT slice are unlikely to match the struc- tures defined by the atlas. Hence, some registration method, such as elastic transformation (Bajcsy and Broit, 1982) must almost always be employed. The definition of this transformation, however, depends on our ability to find the edge of the structure. Unfortunately, when functional images such as PET or SPECT are used, edge finding techniques may fail due to the poor quantum statistics in the image. For analysis of radionuclide images, the structures must first be located unambiguously on the CT or on the MR image and then these must be correlated with the radionuclide image.
To overcome this difficulty, one group of re- searchers (Evans et al., 1988; Marrett et al., 1989) has defined an atlas of regions of interest (ROIs) drawn at specific levels in the brain using data acquired from MR scans of normal subjects. These ROIs are then reshaped to fit the patient anatomy as defined on MRI. The PET and MR patient .scans are then aligned using fiducial markers and the ROIs are overlaid on the PET scan. This technique has not yet been used in the body.
The analytical method fuses functional and struc- tural scans by placing external flexible markers at key positions in the radiation field. For SPECT appli- cations, markers composed of a lower energy radio- nuclide are placed on the patient at key anatomic positions which are easily recognizable on structural images such as along the canthomeatal line, or the iliac crests, the tip of the xyphoid or umbilicus. This method, which has been used successfully for external narrow beam radiotherapy planning in primary brain tumors (Schad et al., 1987), is preferred by the researchers in Linz, Austria (Deisenhammer et al., 1987) and in Montreal (Evans et al., 1988; Marrett et al., 1989). This is also the method we have em- ployed both for brain image registration and for registration of images from the abdomen and chest for analysis of radiolabeled antibody images (Kramer et al., 1989, 1990). The external marker method is flexible and adaptable to all body locations.
Our method has been a combination of this ana- lytical method, choosing pairs of points correspond-
ing between the two images and a polynomial warping algorithm. The major steps involved are oblique projection, identification of landmarks, and warping.
To render the images co-planar an oblique recon- struction (Foley and Van Dam, 1982) or tilt algor- ithm is employed to obtain an oblique slice of the CT and/or MRI image which most closely aligns with the PET or SPECT image (Rhodes et al., 1980). A transaxial slice is displayed and the levels for sagittal and coronal reconstruction, which form the (x, J) coordinate of the pivot point, are chosen on this slice (Fig. 1). The sagittal and coronal view are then reconstructed and displayed. A cursor on the coronal view (along with its coordinates) is displayed and moved through the coronal view for the purpose of obtaining the z coordinate of the pivot point. A line on the coronal view at this z level is rotated until the desired tilt is obtained in the X-Z plane. Then a line on the sagittal view at the correct z height, is rotated until the tilt in the y-z plane is selected. The values of the pivot point and angles are stored in the image header file. The oblique reconstruction then is performed.
Landmarks are chosen on the reference image and on the image to be registered. Each landmark from the reference image is cross-correlated with the corre- sponding landmark from the other image. A frame buffer used as a raster display is employed for viewing images simultaneously thus aiding the comparison of the relative positions of features on each image and the measurement of their respective coordinates. Usually between 10 and 20 pairs of landmarks are chosen (Hall, 1979).
These point pairs (or landmarks) may correspond to external markers placed on identifiable and repro- ducible external anatomical landmarks. For instance, for SPECT studies of “‘In-labeled monoclonal anti- body SPECT, “Co markers have been used. For MRI, Vitamin E capsules are useful for this pur- pose. Depending on the distribution of radiopharma- ceutical, other anatomic landmarks depicted in both images may be used to match corresponding points. In the “lIn-labeled monoclonal antibody studies where some activity accumulated in the skeleton, we found that we could use skeletal landmarks such as the sacral promontory or the posterior aspect of the sacroiliac joint as a landmark on both the SPECT image and on the CT of the pelvis. Yet another type of landmark which we have found useful is edge or surface matching. Very often on the SPECT study either the scatter will help depict the body edge or one can use the edge of the functioning organ as the functional image landmark. When matching cerebral perfusion SPECT slices with CT or MRI, the edge of the functioning cortex can be used. Identifiable characteristics of the surface are used for landmarks. In matching SPECT of the thorax after adminis- tration of ggmTc-labeled antibody the edge of the scatter on the image which corresponds to body
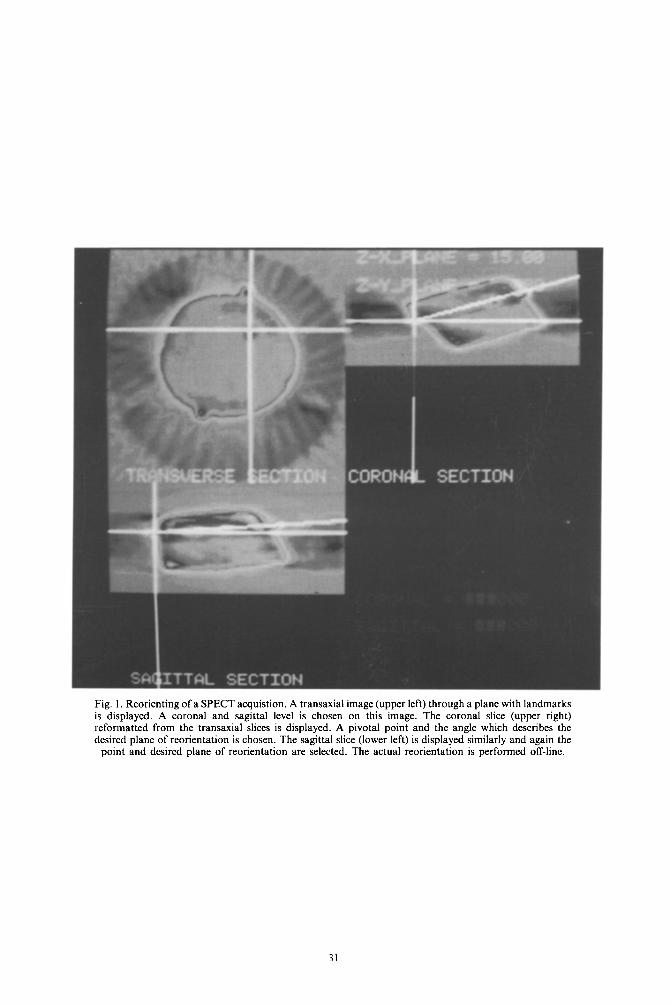
Fig. 1. Reorienting of a SPECT acquistion. A transaxial image (upper left) through a plane with landmarks is displayed. A coronal and sagittal level is chosen on this image. The coronal slice (upper right) reformatted from the transaxial slices is displayed. A pivotal point and the angle which describes the desired plane of reorientation is chosen. The sagittal slice (lower left) is displayed similarly and again the
point and desired plane of reorientation are selected. The actual reorientation is performed off-line.

Fig.
2.
Jas
zcza
k ph
anto
m:
(a)
orig
inal
tr
ansa
xial
im
ages
at
th
e le
vel
of
the
sphe
res
obta
ined
of
th
e ph
anto
m
fille
d w
ith
Pgm
Tc]
pert
echn
etat
e on
SP
EC
T
in
the
%“T
c w
indo
w
(bot
tom
le
ft)
and
in
the
57C
o w
indo
w
(bot
tom
ri
ght)
. T
he
orig
inal
M
RI
scan
of
th
e ph
anto
m
fille
d w
ith
iodi
nate
d co
ntra
st
is d
ispl
ayed
in
the
up
per
left
an
d th
e or
igin
al
CT
is
dis
play
ed
uppe
r ri
ght.
(b)
Aft
er
war
ping
of
th
e M
RI,
th
e di
ffer
ence
s in
tr
ansl
atio
n,
skew
an
d ro
tatio
n be
twee
n th
e SP
EC
T
and
the
MR
I ha
ve
been
el
imin
ated
. N
ote
the
diff
eren
ce
in
the
posi
tion
of
the
sphe
res
on
the
war
ped
imag
e.

Fig.
3.
A
64-y
ear-
old
man
w
ith
a hi
stor
y of
co
lore
ctal
ca
rcin
oma
and
a ne
wly
el
evat
ed
seru
m
CE
A.
The
pa
tient
un
derw
ent
abdo
min
al
CT
i.v
. an
d or
al
cont
rast
. T
hen
afte
r in
fusi
on
of
1 m
g of
“‘
In-l
abel
ed
ZC
E02
5 an
ti-C
EA
an
tibod
y (1
85
MB
q)
com
bine
d w
ith
40 m
g of
un
labe
led
antib
ody,
SP
EC
T
imag
es
wer
e ob
tain
ed.
Tw
o fo
ci
of
activ
ity
wer
e su
spic
ious
on
SP
EC
T.
(a)
In
the
pelv
is
a fo
cus
was
no
ted
to
the
left
of
m
idlin
e.
CT
at
th
is
leve
l w
as
unre
mar
kabl
e an
d co
nsis
tent
w
ith
unde
rfill
ed
loop
s of
sm
all
bow
el.
CT
-SPE
CT
fu
sing
pl
aced
th
is
focu
s ov
er
a so
ft
tissu
e de
nsity
on
C
T
(reg
ion
of
inte
rest
).
At
surg
ery
a sm
all
bow
el
met
astis
w
as
foun
d.
(b)
At
the
leve
l of
th
e po
rtal
ve
in
a se
cond
fo
cus
was
su
spic
ious
. C
T
show
ed
som
e de
nsity
be
twee
n th
e in
feri
or
vena
ca
va
and
the
port
al
vein
. C
T-S
PEC
T
fusi
ng
show
ed
that
th
e in
crea
sed
upta
ke
corr
espo
nded
to
th
e in
feri
or
vena
ca
va.
At
surg
ical
ex
plor
atio
n,
ther
e w
as
no
tum
or
in
this
ar
ea.

Fig. 4. A 46-year-old man with a history of partial hepatectomy for metastases from colorectal carcinoma and newly elevated CEA. The CT scan was felt to be normal except for post-surgical changes. SPECT obtained after administration of 185 MBq (5 mCi) of “‘In-labeled Cl 10 anti-CEA antibody showed two abnormal foci of activity in the liver. CT-SPECT fusing was performed by digitizing a tracing of the liver since digital data on the CT was not available. (a) A region of interest was traced on the CT around the edge of the liver to assess the adequacy of the warping. (b) The anterior liver focus corresponded to the anterior aspect of the liver on CT (circle). This may have been obscured by beam hardening artifact from the rib. (c) A second focus in the right lateral aspect of the liver was found on fusing to correspond to an area in the liver just inferior to the surgical clips (circle). Tumors were found in these locations at
surgery.
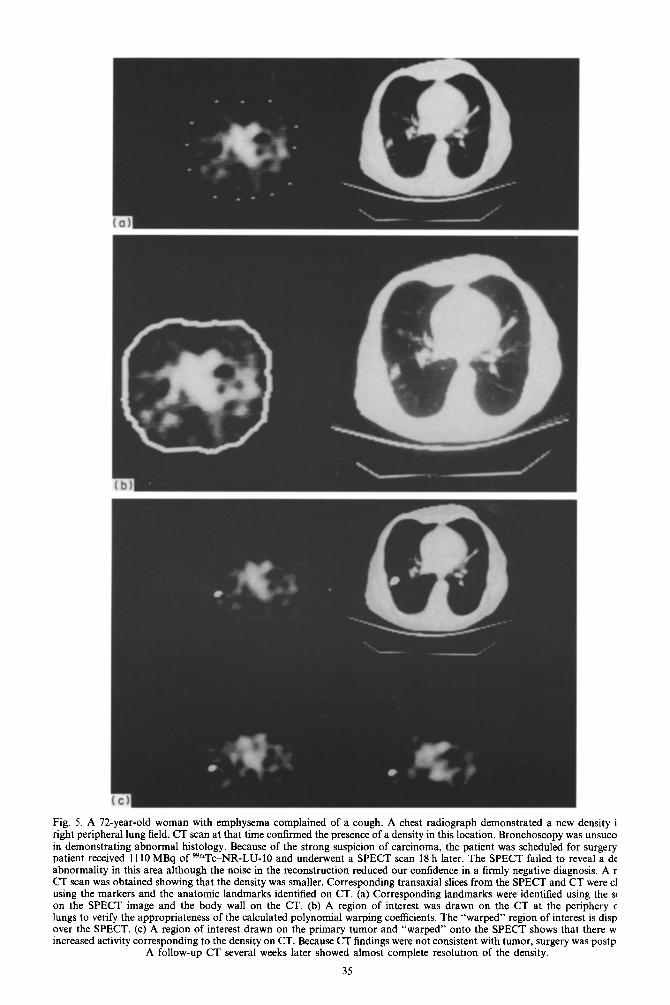
Fig. 5. A 72-year-old woman with emphysema complained of a cough. A chest radiograph demonstrated a new density i right peripheral lung field. CT scan at that time confirmed the presence of a density in this location. Bronchoscopy was unsucc~ in demonstrating abnormal histology. Because of the strong suspicion of carcinoma, the patient was scheduled for surgery patient received 1110 MBq of 99”Tc-NR-LU-10 and underwent a SPECT scan 18 h later. The SPECT failed to reveal a de abnormality in this area although the noise in the reconstruction reduced our confidence in a firmly negative diagnosis, A r CT scan was obtained showing that the density was smaller. Corresponding transaxial slices from the SPECT and CT were cl using the markers and the anatomic landmarks identified on CT. (a) Corresponding landmarks were identified using the SC on the SPECT image and the body wall on the CT. (b) A region of interest was drawn on the CT at the periphery E lungs to verify the appropriateness of the calculated polynomial warping coefficients. The “warped” region of interest is disp over the SPECT. (c) A region of interest drawn on the primary tumor and “warped” onto the SPECT shows that there w increased activity corresponding to the density on CT. Because CT findings were not consistent with tumor, surgery was postp
A follow-up CT several weeks later showed almost complete resolution of the density.
35
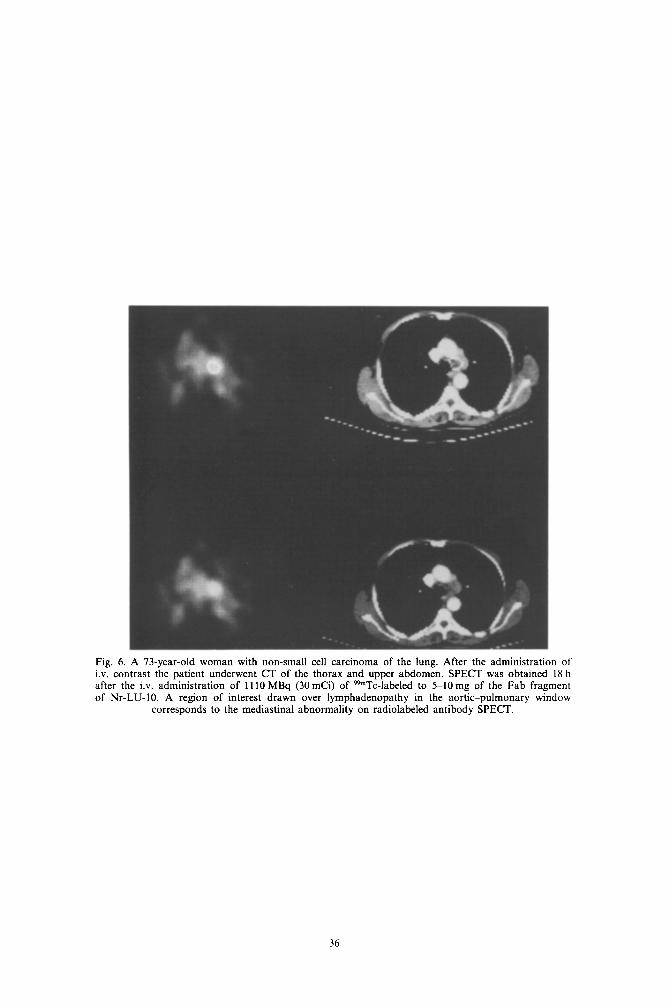
Fig. 6. A 73-year-old woman with non-small cell carcinoma of the lung. After the administration of i.v. contrast the patient underwent CT of the thorax and upper abdomen. SPECT was obtained 18 h after the i.v. administration of 1110 MBq (30 mCi) of WmTc-labeled to 5-10mg of the Fab fragment of Nr-LU-IO. A region of interest drawn over lymphadenopathy in the aortic-pulmonary window
corresponds to the mediastinal abnormality on radiolabeled antibody SPECT.
36

CT-SPECT fusion of radiolabeled antibodies 37
surface is matched with the body surface shown on the CT. Similarly, the configuration (edge) of the liver on the SPECT study of an “‘In-labeled antibody scan could be matched with the liver edge on the CT scan. The shape of the respective edges provides landmarks which can be matched.
At the end of this procedure, sets of coordinate pairs (x,, y,; ui, vi) which relate the respective locations of the anatomical landmarks in the two images are produced. To refine the choice of land- marks, the coordinates on the image to be registered are adjusted using cross-correlation. Letting a,, and b , + k,,+, designate the pixels of the window and the search areas respectively, the cross-correlation co- efficient function is defined as:
n n
R(k, I) = ,F,,g, ‘,jbj+kj+l
(i i u; i f: b;+k,j+,)“2’ (‘) ,=,,=I i=lj=l
Once corresponding points, edges or surfaces are identified an algorithm is applied which describes the relationship between the corresponding sites. Our approach to this has been to use a polynomial warping algorithm (Maguire et al., 1986).
The alteration achieved by the application of the algorithm may be perfomed on either the images them- selves or on a region of interest which describes an outline of a structure on the CT or MRI or a concen- tration of radioactivity on the SPECT. We have more recently used the latter approach. When altering the images, we perform “warping” of the structural image rather than the SPECT since warping may compro- mise the integrity of the pixel value and we are interested in preserving the SPECT data. In order to proceed with the warping, the coefficients for a poly- nomial transform are calculated by linear regression applied to the cross-correlated landmarks. Following Frei’s algorithm (Singh et al., 1979; Hall, 1979), polynomials are formed in the following manner:
y=b,+b,u+b,v+b,uu+b,u*+b,u*+... (2)
The polynomial coefficients are determined using a linear regression technique which employs a least squares fit on the set of chosen landmarks (Eadie et al., 1971; Ostle and Mensing, 1975). Either three or six terms in each polynomial can be used.
The Gauss-Jordan inversion algorithm is then employed to obtain the eigenvalues of the matrix of coefficients (Pizer and Wallace, 1983).
These eigenvalues are then used together with a resamphng technique to determine the new coordi- nates for each pixel in the image to be moved. To accomplish this transformation, a 4 pixel area is used to estimate the fraction of the original pixels to be moved to the new pixel. Contributions from one or more original pixels are summed to give a total activity in that pixel. Currently, the “area” of the
pixel to be included is divided proportionately; a gaussian point spread function, where the distance is proportional to the weighted distance might also be used. A worst case match occurs when two images are mismatched by 11/4. When an ROI is transformed, the vertices of the polygon are recomputed from equation (2).
Validation studies have been performed in our laboratory using a standard Jaszczak phantom. For the SPECT acquisition, the phantom was filled wtih 925 MBq (25 mCi) of [99mTc]pertechnetate with a ring of 5.55MBq (15OpCi) iz31 pills fixed circumferen- tially around the phantom at the level of the spheres. The acquisition was performed with 128 angles in a 64 x 64 matrix and using two simultaneous energy windows. A 4% width energy window was centered at 159 keV and a 20% window was centered at 140 keV.
The phantom was filled with iodinated contrast material for CT acquisition and with water for the MRI acquisition. For the MRI vitamin E capsules were placed circumferentially around the phantom at the level of the spheres. The CT scan performed on a GE 9800 scanner yielded transaxial slices 10 mm thick with an interslice distance of 12 mm. The MRI was performed on a Phillips gyroscan (0.5 T) yielding transaxial slices with an interslice distance of 12 mm. Slices from all three modalities were transferred offline to a Sun 3/180 computer. All four image sets, the %“Tc-SPECT, the iz31-SPECT, the CT, and the MRI, were displayed simultaneously and slices which best represented the mid cut through the spheres were chosen (Fig. 2a). A series of 9 points was defined on the SPECT, CT and MRI slice which represented corresponding landmarks in the images. Regions of interest drawn around spheres shown on the CT were interpolated using the array of equations defined by the relationship of the corresponding points on the SPECT and then on the MRI. The correctness of the positioning of the interpolated regions of interest on the SPECT and MRI were used to assess the appro- priateness of the identification of the landmarks. The CT and MRI slices were then interpolated and rotated using the 2-D warping algorithm. Superimpo- sition of the altered slices showed correspondence of the resulting images within l-2 pixels (or approx. 3-6mm). Given the spatial resolution of SPECT (which is about 1.2 cm at FWHM on conventional rotating y cameras) this level of accuracy is sufficient to permit confident analysis of images (Fig. 2b).
A second SPECT acquisition was obtained with the same phantom using the same acquisition par- ameters. For this acquisition, however, the phantom was tilted approx. IO” out of the original transaxial plane. A slice from the resulting transaxial recon- struction with included some of the spheres was displayed. The software for correction of tilt was applied to reorient the slices in the x-z (coronal) and y-z (sagittal) planes. In a similar fashion to the original phantom acquisition, nine landmarks were

38 ELISSA L. KRAMER and MARILYN E. Noz
chosen on the resulting untilted SPECT slice which corresponded to the landmarks chosen on the CT. The degree of image registration was determined by the use of interpolated regions of interest. Again the two images were matched within 2 pixels (6mm). However, with the tilting of the images, some geo- metric distortion of the image occurs.
Clinical Applications
We have now used CTjSPECT fusing of radio- labeled monoclonal antibody SPECT images with CT in both the abdomen and chest. Our initial experi- ence involved patients with colorectal carcinoma, primary or recurrent, who had received “‘In-ZCE025 (Hybritech, Inc., San Diego, Calif.), a murine IgG, specific for carcinoembryonic antigen, as part of a Phase III trial. We processed SPECT and CT on 8 patients in this study. Five patients were studied prior to resection of a primary colerectal carcinoma; 1 with an elevated serum CEA but no known primary, and 2 with suspected recurrence of colorectal carcinoma. After informed consent was obtained, patients re- ceived 1 mg of DTPA-conjugated ZCE025 labeled with 5 mCi of “‘In-ZCE025 and 40 mg of unlabeled, non-conjugated ZCE025. SPECT images were ac- quired at 72 or 96 h after injection and again at 6 or 7 days after injection. For studies of the abdomen and pelvis, 57Co line markers were placed at the umbilicus, 3 cm caudad to the umbilicus and at the anterior superior iliac spines with the ends of the line sources just the promontory of the spines. 128 projections for 12 s a view over a 360” interval were acquired into a 64 x 64 pixel matrix. Acquisitions were performed with dual energy windows yielding two sets of projec- tions: a 4% window centered 122 keV for the markers and one with two 15% windows centered at 173 and 247 keV for the antibody images. Each resulting set of projections was reconstructed in its entire volume providing 64 contiguous slices in each reconstructed image set. Each slice was approx. 6.2 mm thick. Pixel size was 6.2 x 6.2mm.
CT scans in these patients were obtained from the diaphragm to the anus after the administration of oral and i.v. contrast. Iodinated iv. contrast material (45 g) was delivered by power injector and dynamic sequential scanning of the abdomen (or, in one case, thorax) was performed. Slices of IOmm thickness were acquired at 12mm intervals into a 512 x 512 matrix. The 12mm interval was chosen to match a multiple of the SPECT slice thickness. The standard pixel size for the CT was 0.94 x 0.94mm, but this standard size could be modified by a target magnification factor yielding pixels of 0.94-0.63 mm.
Both the SPECT and CT slices were tranferred offline where SPECT (antibody), SPECT (markers), and CT slices were interpolated to a 128 x 128 matrix. To better match the pixel sizes, bilinear interpolation was then performed on the CT. We chose to alter the CT because our interest in this
instance was primarily in the interpretation and evaluation of pixel values in the radiolabeled anti- body SPECT. The slices with identifiable landmarks were chosen for SPECT (either the level of the markers or with clearly identifiable anatomy). CT slices at corresponding levels were chosen. SPECT slices were merged 2 to 1 to provide slices comparable in thickness in the CT.
SPECT and CT slice pairs were displayed side- by-side on the same monitor using two color scales appropriate to the optimal display of each modality. Corresponding points on each slice were identified. For instance, on the slice through the anterior superior iliac spines, a point which represented the skin over the prominence of each spine was identified on the CT and at the marker on the SPECT marker view. Since the marker and antibody SPECT slices are matched in terms of positioning, the coordinates from the marker slice were comparable for the anti- body SPECT slice. These point pairs were used to adjust the position of the CT slice, i.e. translate the CT within the transaxial plane of the slices so that the slice pairs matched. Differences in translation of x and y positions were thus reduced as well as differ- ences in within-plane rotation. This modification of the CT slice was performed using a linear regression. The appropriateness of the shift of the CT was confirmed by superimposing marker views on the CT and further checked by matching identifiable anat- omy such as the iliac vessels in the pelvis.
We then performed correction for the differences in “tilt”, i.e. differences in the x-z (coronal) or y-z (sagittal) orientation. For the coronal section usually the anterior superior iliac spines were used. For y-z tilt, a point anteriorly usually the umbilicus and a point posteriorly, usually the sacral promontory or posterior aspect of the sacroiliac joint, were selected. Because there are so many degrees of freedom of rotation and tilt in the abdomen and pelvis and because the degree of rotation or tilt may differ between the abdomen and pelvis at any one examin- ation session, correction for tilt and rotation must be recalculated for transaxial levels distant from the level used for the correction.
In addition to superimposition of the marker views, a program was used to interactively draw regions of interest simultaneously on the matched slices permitting delineation of boundaries, structures of interest, and accumulations of radioactivity which might have potential significance. In general, regions were drawn on the CT to determine what the relative concentration of activity of radiolabel in that structure might be. However, when the nature of a focus of activity was unclear or when the correspond- ing structure could not be identified with certainty, the region was generated using the SPECT slice (Fig. 3).
Our results in this group of antibody studies (Table 1) (Kramer et al., 1989) suggest certain im- portant applications and clinical situations in which

CT-SPECT fusion of radiolabeled antibodies
Table I. Results of fusing of CT with “‘In-ZCE025 monoclonal antibodv in oatients with adenocarcinoma
39
No. of lesions No. of patients CT-SPECT fusing results
+ MoAb/ - CT 9 7 S/9 lesions localized anatomically; I FP MoAb MoAb/ + CT 3 3 3 Fn MoAbs + MoAb/ + CT 6 6 Activity localized to normal structure in I lesion
CT-SPECT or MRI-SPECT fusing may be import- ant. First, in evaluation of the patient who has undergone surgery in which the surgical site may be difficult to evaluate because of scarring, fibrosis, or postoperative inflammatory changes, the determi- nation of recurrence may be difficult to make on the CT scan alone. For at least one of our patients in this series, CT-SPECT fusing showed that the abnormal focus of activity corresponded to a recurrence at the site of previous resection. We have since anecdotally found this helpful in a patient with suspected metastatic colon carcinoma where previous wedge resection of hepatic metastases, surgical clips, and possibly rib artifact made the liver difficult to evalu- ate on CT (Fig. 4). The patient received 185 MBq (5 mCi) of “‘In-labeled Cl10 (1 mg) an anti-CEA IgG, antibody (Abbott Laboratories, Chicago, Ill., U.S.A.). The scans showed abnormal foci in the liver. CT-SPECT fusing was used to localize the lesions, one anteriorly and one just inferior to the site of the previous wedge resection. At re-exploration, metastatic lesions corresponding to these sites were found.
Another setting in which we have found CT-SPECT fusion to be helpful is that in which normal anatomy is variable and may obscure abnor- mal masses. This occurs most frequently in the pelvis where bowel loops may be underfilled with oral contrast even in the most cooperative patient. Be- cause of the variability in the appearance of the small bowel, masses in the bowel or mesentery or even in more fixed anatomy such as lymph nodes may be obscured or difficult to identify as abnormal (Fig. 3). CT-SPECT fusing helped identify the location of the mass on CT in one patient with a metastases to the small bowel.
Uncertainty about the interpretation of the radio- labeled antibody scan is another circumstance in which CT-SPECT fusing has been useful. This may become a less important application as we become more experienced with a particular radiolabeled anti- body. However, each radiolabel, chelate, and anti- body have unique characteristics which may cause slight variations in their in uivo behavior. Moreover, the coexistence of other conditions in patients may influence the appearance of a radio- labeled antibody scan. For instance, in one of our patients, the liver appeared unusually heterogeneous on the “‘In-ZCE025 study. The CT-SPECT fusing helped determine that the irregularity on antibody scan was not related to tumor.
CT-SPECT fusing can be helpful particularly in differentiating residual blood pool activity from ab- normal antibody accumulation. We have found this
useful in the abdomen, especially in the region of the great vessels and in the mediastinum. In cross-section, in the abdomen on the “‘In-ZCE025 antibody scans the amount of blood pool activity varied among patients even at similar time points after injection. This makes the distinction between blood pool con- taining structures and abnormal foci more difficult especially in cross-section when the 3-D configuration of the structure is not obvious. For example, in one of our patients, a focus was seen in the right upper quadrant on SPECT in the region of the portal vein inferior vena cava, right adrenal (Fig. 3). The inten- sity of the focus led us to suspect an abnormal accumulation possibly in a lymph node in that area. Examination of the CT revealed a suggestion of increased soft tissue density between the inferior vena cava and the portal vein. CT-SPECT fusing in this case showed that the suspicious focus corresponded to the inferior vena cava blood pool activity. Indeed at surgery, no tumor was found at this site.
Analysis of Radiolabeled Antibody Studies in Non-small Cell Lung Cancer
The contribution of CT-SPECT fusing to the evaluation of the mediastinum is seen in our experi- ence with 99mTc-NR-LU10 (NeoRx Corporation, Seattle, Wash., U.S.A.), a Fab fragment of a murine monoclonal antibody which is specific for a 40 kDa glycoprotein expressed on many adenocarcinomas. We have studied patients with non-small cell lung carcinoma prior to thoracotomy or staging medi- astinoscopy as part of a Phase II-III study under an IND sponsored by NeoRx Corporation (Seattle, Wash.). Once informed consent was obtained accord- ing to the institutional review board guidelines, the patients received approx. 30 mCi of 99mTc labeled to 10-15 mg of antibody. Patients underwent planar and SPECT imaging approx. 17-20 h later. SPECT imaging of the thorax was performed using a large field-of-view rotating y camera fitted with a low energy, general purpose collimator. Two 57Co point source markers were placed on the patient: one at the sternal notch and one at the tip of the xiphoid. Two sets of 128 projections were acquired simultaneously at 20 s per view using two separate energy windows, a 4% window centered at 122 keV and a 15% window centered at 140 keV. Both sets of projections were reconstructed in their entire volume yielding 64 corre- sponding slices. These image sets were transferred to a MicroVax II interfaced to a Lexidata terminal for further processing with qs’sh image registration soft- ware running under the VMS operating system. CT slices (IO mm thick) of the chest and upper abdomen
40 ELWA L. KRAMER and MARILYN E. Noz
acquired at 10 mm intervals on a GE 9800 CT scan- ner after the administration of i.v. contrast were also transferred to the MicroVax II. The marker views were used to identify the slices which represented the level of the sternal notch and the xiphoid. These levels were matched with the appropriate CT slice and distances for other corresponding slices calculated based on the thickness of the CT slices and the SPECT slices (N 6 mm). SPECT slices with suspected abnormalities or CT slices with findings of interest, e.g. possible adenopathy are selected for fusing. CT-SPECT fusing has been performed in 5 cases.
For the chest, because there are fewer degrees of motion possible, matching of slices has required only in-plane adjustment. For these cases we have chosen to adjust regions of interest rather than the images themselves. For the SPECT, the body edge defined by scatter can be used to place landmarks (Fig. 5). The shape of the body edge can be matched to the shape of the body edge which is plainly depicted on the CT. Corresponding points are marked on each image. Again, the correctness of the matching is determined by outlining clearly delineated structures on CT with an irregular region of interest. This region is then interpolated using the polynomial warping algorithm defined by the landmarks and displayed on the SPECT slice. The correlation of the functional (SPECT) and structural image (CT) may then be made using several regions of interest generated in the same manner.
In our analysis of the 99mTc-NR-LU-10 images, CT-SPECT fusing has been helpful initially in under- standing the normal appearance of the images. This antibody cross-reacts with normal thyroid tissue so that all patients show considerable uptake in the thyroid. Because of the intensity of uptake, the lower neck/superior mediastinum may be somewhat more difficult to evaluate on SPECT. CT-SPECT fusing has helped to elucidate the nature of questionable foci of uptake on antibody scans in this region in one case.
Images at the level of the cardiac blood pool demonstrate the intensity of normal blood pool. CT-SPECT fusing has helped distinguish normal blood pool from areas which may represent lymphadenopathy. In the future, regions generated on “fused” images might be used to compare the intensity of uptake in hilar and mediastinal structures to that in clear-cut blood pool containing structures, to help determine if the radiolabeled antibody con- centration in the structure in question represents its increased blood pool or an abnormal concentration of antigen. This was helpful in the one false negative case which we encountered.
Fusing of antibody SPECT and CT may play an important role in evaluating mediastinal adenopathy. Three of our five patients demonstrated lymph- adenopathy on CT. In two, fusing was helpful in localizing the abnormal accumulation of radiolabeled antibody to specific sites, e.g. aorto-pulmonary window. In the third, a false negative study,
CT-SPECT confirmed the absence of accumulation in sites found at surgery to be tumor. Because the location of abnormal lymph nodes in the media- stinum is so critical in staging of non-small cell lung cancer, CT-SPECT fusing may aid in anatomic local- ization abnormal lymph node accumulation (Fig. 6).
Beyond providing a means of accelerating the “learning curve” for this radiolabeled antibody, CT-SPECT fusing may help to elucidate the relation- ship of pulmonary nodules and radiolabeled antibody uptake. Two contrasting cases demonstrate this. In one, a patient with emphysema and a peripheral irregular density in the right lung on CT, the antibody scan was negative. SPECT images showed diffuse irregular activity throughout the lungs. This irregu- larity together with the nature of the noise generated in the SPECT reconstruction made analysis of the SPECT by itself uncertain. CT-SPECT fusing con- firmed the absence of increased radiolabeled antibody in the region of the density. A follow-up CT has shown marked resolution of this density which is consistent with an inflammatory process rather than a tumor (Fig. 5).
In a second patient with a right apical density which was somewhat ill-defined on chest radiograph and irregular on CT, there appeared to be slight resolution over a period of 4 weeks. Pleural thicken- ing and chronic changes were also present in apex. The temporal change in the setting of evidence of old inflammatory disease suggested again that this might be inflammatory rather than tumor. The patient underwent a 99mTc-NR-LU-I0 scan which showed prominent accumulation in the right lung apex. CT-SPECT fusing confirmed that this uptake corre- sponded to the suspicious density on CT.
Future Applications of CT/SPECT Fusing in Radiolabeled Antibody Imaging
As SPECT reconstruction algorithms and attenu- ation correction methods become more rigorous, SPECT will begin to yield more quantitative infor- mation. CT/MRI-SPECT fusing may have multiple roles in the utilization of this information. First, we have already begun in the brain to use the fusing of 3-D MRI reconstructions with SPECT to determine soft tissue boundaries for more accurate attenuation correction (Rusinek, 1989a). By constraining the volume of the reconstruction to the patient body, the reconstruction involves a smaller volume than the entire field of view, making the use of a more computationally-demanding iterative reconstruction algorithm practical. The delineation of the body edge by the alignment of the SPECT study with the MRI also permits more accurate scatter correction (Rusinek et al., 1989a).
In the future, fusing of radiolabeled antibody studies with CT and MRI may become useful for semi-quantitative or quantitative analysis. For SPECT this application is dependent on the use of
CT-SPECT fusion of radiolabeled antibodies 41
more computationally demanding reconstruction al- gorithms which better account for attenuation correc- tion and provide more accurate measurements of activity concentrations. For antibody studies labeled with positron emitters, more accurately quantitative data is available on a more routine basis. In both situations region of interest delineation of fused images, or, alternatively, interpolation of regions of interest using the fusing algorithms will help accurate placement of regions and more accurate region description. Not only will this advance our under- standing of in uivo distribution of radiolabeled antibody, but it also has implications for using SPECT to estimate dosimetry in radioimmuno- therapy (Denardo et al., 1985).
Acknowledgements-We would like to thank Hovanes Kalaigian and Dr Homer Macapinlac for their help in processing the images from the lung cancer project. We also very much appreciate the help of Martha Helmers and Toni Jalandoni in preparing the figures for this manuscript.
References Apicella, A.; Nagel, J.; Duara, R. Fast multimodality image
matching. IEEE Trans. Med. Imag. 1991; in press. Bajcsy, R.; Broit, C. Matching of deformed images. IEEE
Proc. Sixth Int. Conf: on Paffern Recognition, 1982: 351-353.
Bajcsy, R.; Lieberson, R.; Reivich, M. A computerized system for the elastic matching of deformed radiographic images to idealized atlas images. J. Compuf. Assisf. Tomogr. 7: 618625; 1983.
Baxter, B. S.; Hitchner, L. E.; Maguire, G. Q. Jr. A Sfandard Format for Digital Image Exchange. New York: Am. Inst. of Phys.; 1982: I-11.
Berche, C.; Mach, J. P.; Lumbroso, J. D. et al. Tomoscintig- raphy for detecting gastrointestinal and medullary thy- roid cancers: First clinical results using radiolabeled monoclonal antibodies against carcinoembryonic antigen. Br. Med. J. 285: 1447-1451: 1982.
Bergstrom, M.; Bethius, B. J.; Eriksson, L. et al. Heat fixation device for reproducible position alignment in transmission CT and positron emission tomography. J. Comput. Assist. Tomogr. 5: 136141; 1981.
Bohm, C.; Greitz, T. The construction of a functional brain atlas-elimination of bias from anatomical variations at PET by reforming 3-D into a standardized anatomy. Visualization of Brain Functions, Proc. Wenner-Gren Center Inf. Symp. 9-11 June 1988.
Bohm, C.; Greitz, T.; Kingsley, D. et al. Adjustable com- puterized stereotaxic brain atlas for transmission and emission tomography. Am. J. Neuroradiol. 4: 731-733; 1983.
Chen, G. T. Y.; Kessler, M.; Pitluck, S. Structure Transfer Between Sets of Three-dimensional Medical Imaging Data. Dallas, Tex.; 1985: 171-177.
Chen, C. T.; Pelizzari, C. A.; Chen, G. T. Y. et al. Image analysis of PET data with the aid of CT and MR Images In: Viergever CNdGaMA, editor. In Information Process- ing in Medical Imaging. New York: Plenum Press; 1988: 601-611.
Dann, R.; Hoford, J.; Kovacic, S.; Reivich, M.; Bajcsy, R. Evaluation of elastic matching system for anatomic (CT, MR) and functional (PET) cerebral images. J. Compuf. Assisf. Tomogr. 13: 60361 I; 1989.
DeCastro, E.; Morandi, C. Registration of translated and rotated images using finite fourier transformation. PAMI 9: 700-703; 1987.
Deisenhammer, E.; Hoell, K.; Luft, C. et al. Analysis of distribution of ‘*jIMP and P9mT~ HMPAO with early and late SPECT in cerebrovascular disease. J. Nucl. Med. 28: 591; 1987.
Denardo, G. L; Raventos, A.; Hines, H. H.; Scheibe, P. 0.; Macey, D. J.; Hays, M. T.; Denardo, S. J. Reauirements for a treatment planning system for radioimmunotherapy. Int. J. Radiat. Oncol. Biol. Phvs. 11: 335-348: 1985.
Eadie, W. T.; Drijard, D.; James, F. E. ef al.‘Stafistical Methods in Experimental Physics. New York: North Holland; 1971: 121-124.
Evans, A. C.; Beil, C.; Marrett, S. et al. Anatomical- functional correlation using an adjustable MRI-based region of interest atlas with positron emission tomog- raphy. J. Cereb. Blood Flow Mefab. 8: 513-530; 1988.
Faber, T. L.; Stokely, E. M. Orientation of 3-D structures in medical images. PAMI 10: 626633; 1988.
Farkas, T.; Wolf, A. P.; Jaeger, J. et al. Regional brain glucose metabolism in the study of chronic schizophrenia. Arch. Gen. Psych. 41: 293-300; 1984.
Foley, J. D.; Van Dam, A. Fundamentals of Interactive Computer Graphics. Reading, Mass.: Addison Wesley; 1982: 664 pp.
Fox, P. T.; Perlmutter, J. S.; Raichle, M. E. A stereotactic method of anatomical localization for positron emission tomography. J. Comput. Assisf. Tomogr. 9: 141-153; 1985.
Gamboa-Aldeco, A.; Fellingham, L. L.; Chen, G. T. Y. Correlation of 3D surfaces from multiple modalities in medical imaging. Proc. SPIE. 1986: 467473.
Hall, E. L. Computer Image Processing and Recognifion. New York: Academic Press; 1979: 186189, 468-554.
Kaplan, I. L.; Swayne, L. C. Composite SPECT-CT images: technique and potential applications in chest and abdominal imaging. Am. J. Roentgenol. 152: 865-866; 1988.
Kramer, E. L.; Sanger, J. J.; Walsh, C. et 01. Contribution of SPECT to imaging of gstrointestinal adenocarcinoma with 11 Iln labeled anti-CEA monoclonal antibody. Am. J. Roenfgenol. 151: 697-703; 1988.
Kramer, E. L.; Noz, M. E.; Sanger, J. J. et al. CT-SPECT fusion to correlate radiolabeled monoclonal antibody uptake with abdominal CT findings. Radiology 172: 861-865; 1989.
Kramer, E. L.; Reddy, D.; Noz, M. E. et al. “Fusion” of CT and radiolabeled antibody (AB) SPECT to improve mediastinal staging of patients with lung cancer. 37fh Annual Meeting of the Society of Nuclear Medicine. Washington, D.C.: 1990.
Levin, D. N.; Pelizzari, C. A.; Chen, G. T. Y. el al. Retrospective geometric correlation of MR, CT and PET images. Radiology 169: 817-823; 1988.
Levin, D. N.; Hu, X.; Tan, K. K. et al. The brain: integrated three-dimensional display of MR and PET images. Radiology 172: 783-789; 1989.
Mach. J. P.: Carrel. 8: Forni. M. et al. Tumour localisation ,. of radiolabelled antibodies against carcinoembryonic antigen in patients with carcinoma. N. Engl. J. Med. 303: 5-10; 1980.
Maguire, G. Q. Jr; Noz, M. E. Image formats: five years after the AAPM standard format for digital image inter- change. Med. Phys. 16: 818-823; 1989.
Maguire, G. Q. Jr; Noz, M. E.; Lee, E. ef al. Correlation methods for tomographic images using two and three dimensional techniques In: Barcharach, S. L. editor. Information Processing in Medical Imaging. Dordrecht, The Netherlands: Martinus Nijhoff; 1986: 266279.
Marrett, S.; Evans, A. C.; Collins, L. ef al. A volume of interest (VOI) atlas for the analysis of neurophysical image data. Proc. SPIE 1092: 467477; 1989.
Moshfeghi, M. Registration of 3D medical images from multiple modalities using landmarks or Surfaces. Briarcliff Manor, N.Y.; Philips Laboratories: 1988.
42 ELISSA L. KRAMER and MARILYN E. Noz
Noz, M. E.; Maguire, G. Q. Jr. QSH: a minimal but highly portable image display and handling toolkit. Compu?. Meth. Prog. Biomed. 27: 229-240; 1988.
Ostle, B.; Mensing, R. W. Statistics in Research, 3rd edn. Ames, Iowa: The Iowa State University Press; 1975: 165-236.
Pelizzari, C. A.; Chen G. T. Y. Registration of multiple diagnostic imaging using surface fitting In: al. IADBe, editor. The Use of Computers in Radiation Therapy. Amsterdam, The Netherlands: Elsevier Science; 1987.
Pehzzari, C. A.; Chen, G. T. Y.; Spelbring, D. R. et a/. Accurate three-dimensional registration of CT, PET and/or MR images of the brain. J. Comput. Assist. Tomogr. 13: 20-26; 1989.
Pizer, S. H.; Wallace, V. L. To Compute Numerically. Boston, Mass.: Little, Brown &Company; 1983: 182-204.
Pizer, S. M.; Koenderlink, J. J.; Lifshitz, L. M. et al. An image description for object definition, based on extremal regions in the stack. In: Bacharach S. L., editor. Information Processing in Medical Imaging. Dordrecht, The Netherlands: Martinus Nijhoff; 1986: 24-38.
Rhodes, M. L.; Glenn, W. V.; Azzawi, Y. M. Extracting oblique planes from serial CT sections. J. Comput. Assist. Tomogr. 4: 649657; 1980.
Rusinek, H.; Kramer, E.; Noz, M. E. et al. Constraining SPECT reconstruction to body volume determined from CT or MR scans. J. Nucl. Med. 30: 835; 1989a.
Rusinek, H.; Mourino, M. R.; Firooznia, H. et al. Volumetric rendering of MR images. Radiology 171: 2699272; 1989b.
Schad, L. R.; Boesecke, R.; Schlegel, W. (‘I ul. Three dimensional image correlation of CT. MR. and PET studies in radiotherapy treatment planning of brain tu- mors. J. Comput. Assist. Tomogr. ll(6): 9488954: 1987.
Schiers, C.; Tiede, U.; Ho, K. H. Interactive 3D registration of image volumes from different sources In: Lemke. M. L. R.; Jaffee, C. C.; Felix, R. editors. CAR ‘89-Computer Assisted Rediology. Berlin, F.R.G.: Springer-Verlag: 1989: 666670.
Siccardi, A. G.; Buraggi, G. L.: Callegaro. L. et a/. Immunoscintigraphy of adenocarcinomas by means of radiolabeled F(ab’)Z fragments of an anti-carcinoembry- onic antigen monoclonal antibody: a multicenter study. Cancer Res. 49(11): 309553103: 1989.
Singh, M.; Frei, W.; Shibita, T. er al. A digital technique for accurate change detection in nuclear medicine images- with application to myocardial perfusion studies using thallium 201. IEEE NS 26: 565-575: 1979.
Toennies, K. D.; Herman, G. T.: Udupa, J. K. Surface registration for the segmentation of implanted bone grafts. In: Lemke, M. L. R.; Jaffee, C. C.; Felix, R. editors. CAR ‘89-ComputerAssisted Radiology. Berlin, F.R.G.: Springer-Verlag; 1989: 382-386.
Wolkin, A.; Jaeger, J.; Brodie, J. D. et a/. Persistent cerebral metabolic abnormalities in schizophrenia as determined by PET. Am. J. Psych. 142: 5644571: 1985.
Zimmerman, J.; Entenman, G.; Fitzpatrick. M. et a/. Shell Reference Manual, Version 2. Chapel Hill. N.C.: Department of Computer Science, University of North Carolina; 1982: l-30.