Cross-cultural structural equivalence of RIASEC models and measures
20
Journal of Counseling Psychology Copyright 1996 by the American Psychological Association, Inc. 1996, Vol. 43, No. 3, 310-329 0022-0167/96/$3.00 Cross-Cultural Structural Equivalence of RIASEC Models and Measures James Rounds and Terence J. Tracey University of Illinois at Urbana-Champaign A structural meta-analysis was conducted to evaluate the fit of J. L. Holland's (1985a) circular order model, I. Gati's (1982) three-group partition, and an alternative three-class partition on vocational interest correlation matrices drawn from the cross-cultural literature. The randomization test of hypothesized order relations (L. Hubert & P. Arabie, 1987) was used to evaluate the model fit for 20 U.S. ethnic matrices, 76 international matrices (representing 18 countries), and a U.S. benchmark sample of 73 matrices. The cross-culture structural equivalence of Holland's circular order model was not supported. Both Gati's partition and the alternative partition fit the U.S. benchmark and international samples equally well. None of the 3 models were found to be an adequate representation of the structure of vocational interests for U.S. ethnic samples. There is an expanding interest in the problems of applying models and measures generated on one population to an- other, especially when this generalization involves applica- tions across cultures (Ben-Porath, 1990; Eysenck, 1986; Hesketh & Rounds, 1995; Hui & Triandis, 1985; Irvine & Carroll, 1980; Lonner, 1990; Lonner & Ibrahim, 1989; Malpass & Poortinga, 1986; Van de Vijver & Poortinga, 1991; Watkins, 1989). Researchers have frequently studied cultural differences, for example, in work values (Hofstede, 1980a), job satisfaction (Griffeth & Horn, 1987), work centrality (MOW International Research Team, 1987), and managerial attitudes (Haire, Ghiselli, & Porter, 1966) by comparing group means on measures across cultures. Such practices can be highly questionable given the possible different underlying meaning ascribed by each culture to the methods and items, leading to possible differences in the structural properties of the measures. Without equivalent structures, mean score comparisons across cultures are pointless: The differences or similarities are essentially un- interpretable. The purpose of our study was to examine the cross-culture equivalence of Holland's (1985a) model of vocational interests. Our study involved both cross-ethnic (U.S. cultural groups) and international comparisons. Holland's Model of Vocational Interests Not since E. K. Strong's (1943) pioneering interest mea- surement research has one approach, that of J. L. Holland James Rounds and Terence J. Tracey, Department of Educa- tional Psychology, University of Illinois at Urbana-Champaign. This article has benefited from the comments and suggestions of Lawrence Hubert. We thank John L. Holland, Bernard Tttreau, Elchanan I. Meir, Beryl Hesketh, Stanley H. Cramer, Rent V. Dawis, William E. Sedlacek, Nadya A. Fouad, L. Suzanne Dancer, Thomas F. Harrington, Gregory J. Boyle, and Sar B. Khan for sending RIASEC correlation matrices and manuals. Correspondence concerning this article should be addressed to James Rounds, 210 Education, University of Illinois at Urbana- Champaign, 1310 South Sixth Street, Champaign, Illinois 61820. Electronic mail may be sent via Internet to [email protected]. (1959, 1966, 1973, 1985a), had such a vast influence on how psychologists conceptualize and assess vocational in- terests. Simply put, Holland asserted that there are six personality types: realistic (R), investigative (I), artistic (A), social (S), enterprising (E), and conventional (C), referred to collectively as RIASEC; and that structural relations among the types are best represented by a circular order of R-I-A- S-E-C (often called the hexagonal model). Holland's struc- tural hypothesis specifies that types that are more proximate are more similar than types that are more distant. As doc- umented by Borgen (1986), the impact of Holland's pro- posal has had far-reaching effects on vocational interest assessment. With the merger of Holland's and Strong's systems (Campbell & Holland, 1972), for example, the Strong Interest Inventory (Hansen & Campbell, 1985) has developed scales to assess the RIASEC types and has used Holland's model to organize assessment results and inter- pretation. New interest inventories such as the Career Decision-Making Interest Survey (Harrington & O'Shea, 1993) and Career Assessment Inventory (Johansson, 1986) are also based on Holland's RIASEC model. Major voca- tional assessment programs including the American College Testing Program (1988) and the United States Employment Service (U.S. Department of Labor, 1979) have either ex- plicit scales to assess RIASEC types or methods to convert interest scale scores to Holland's system. Procedures have even been suggested to link Kuder's General Interest Sur- vey scales (Kuder, 1988), Jackson's factor-derived General Occupational Themes (Jackson, 1986), and scales built on Roe's theoretical model (Lunneborg, 1981; Meir & Ben- Yehuda, 1976) to Holland's RIASEC types. With such widespread acceptance of Holland's RIASEC model in the United States, it is not surprising that research- ers and practitioners have adopted his model and measures internationally. Holland and Gottfredson (1992) reported that the Strong Interest Inventory (SII) has been translated into 17 languages, and the Vocational Preference Inventory (VPI; Holland, 1985b) and Self-Directed Search (SDS; Hol- land, 1985c) have been translated into 20 languages. Test publishers in the United States have recently begun to 310
Transcript of Cross-cultural structural equivalence of RIASEC models and measures

Journal of Counseling Psychology Copyright 1996 by the American Psychological Association, Inc. 1996, Vol. 43, No. 3, 310-329 0022-0167/96/$3.00
Cross-Cultural Structural Equivalence of RIASEC Models and Measures
J a m e s Rounds and Te rence J. T r acey University of Illinois at Urbana-Champaign
A structural meta-analysis was conducted to evaluate the fit of J. L. Holland's (1985a) circular order model, I. Gati's (1982) three-group partition, and an alternative three-class partition on vocational interest correlation matrices drawn from the cross-cultural literature. The randomization test of hypothesized order relations (L. Hubert & P. Arabie, 1987) was used to evaluate the model fit for 20 U.S. ethnic matrices, 76 international matrices (representing 18 countries), and a U.S. benchmark sample of 73 matrices. The cross-culture structural equivalence of Holland's circular order model was not supported. Both Gati's partition and the alternative partition fit the U.S. benchmark and international samples equally well. None of the 3 models were found to be an adequate representation of the structure of vocational interests for U.S. ethnic samples.
There is an expanding interest in the problems of applying models and measures generated on one population to an- other, especially when this generalization involves applica- tions across cultures (Ben-Porath, 1990; Eysenck, 1986; Hesketh & Rounds, 1995; Hui & Triandis, 1985; Irvine & Carroll, 1980; Lonner, 1990; Lonner & Ibrahim, 1989; Malpass & Poortinga, 1986; Van de Vijver & Poortinga, 1991; Watkins, 1989). Researchers have frequently studied cultural differences, for example, in work values (Hofstede, 1980a), job satisfaction (Griffeth & Horn, 1987), work centrality (MOW International Research Team, 1987), and managerial attitudes (Haire, Ghiselli, & Porter, 1966) by comparing group means on measures across cultures. Such practices can be highly questionable given the possible different underlying meaning ascribed by each culture to the methods and items, leading to possible differences in the structural properties of the measures. Without equivalent structures, mean score comparisons across cultures are pointless: The differences or similarities are essentially un- interpretable. The purpose of our study was to examine the cross-culture equivalence of Holland's (1985a) model of vocational interests. Our study involved both cross-ethnic (U.S. cultural groups) and international comparisons.
Hol land ' s Model of Vocational Interests
Not since E. K. Strong's (1943) pioneering interest mea- surement research has one approach, that of J. L. Holland
James Rounds and Terence J. Tracey, Department of Educa- tional Psychology, University of Illinois at Urbana-Champaign.
This article has benefited from the comments and suggestions of Lawrence Hubert. We thank John L. Holland, Bernard Tttreau, Elchanan I. Meir, Beryl Hesketh, Stanley H. Cramer, Rent V. Dawis, William E. Sedlacek, Nadya A. Fouad, L. Suzanne Dancer, Thomas F. Harrington, Gregory J. Boyle, and Sar B. Khan for sending RIASEC correlation matrices and manuals.
Correspondence concerning this article should be addressed to James Rounds, 210 Education, University of Illinois at Urbana- Champaign, 1310 South Sixth Street, Champaign, Illinois 61820. Electronic mail may be sent via Internet to [email protected].
(1959, 1966, 1973, 1985a), had such a vast influence on how psychologists conceptualize and assess vocational in- terests. Simply put, Holland asserted that there are six personality types: realistic (R), investigative (I), artistic (A), social (S), enterprising (E), and conventional (C), referred to collectively as RIASEC; and that structural relations among the types are best represented by a circular order of R-I-A- S-E-C (often called the hexagonal model). Holland's struc- tural hypothesis specifies that types that are more proximate are more similar than types that are more distant. As doc- umented by Borgen (1986), the impact of Holland's pro- posal has had far-reaching effects on vocational interest assessment. With the merger of Holland's and Strong's systems (Campbell & Holland, 1972), for example, the Strong Interest Inventory (Hansen & Campbell, 1985) has developed scales to assess the RIASEC types and has used Holland's model to organize assessment results and inter- pretation. New interest inventories such as the Career Decision-Making Interest Survey (Harrington & O'Shea, 1993) and Career Assessment Inventory (Johansson, 1986) are also based on Holland's RIASEC model. Major voca- tional assessment programs including the American College Testing Program (1988) and the United States Employment Service (U.S. Department of Labor, 1979) have either ex- plicit scales to assess RIASEC types or methods to convert interest scale scores to Holland's system. Procedures have even been suggested to link Kuder's General Interest Sur- vey scales (Kuder, 1988), Jackson's factor-derived General Occupational Themes (Jackson, 1986), and scales built on Roe's theoretical model (Lunneborg, 1981; Meir & Ben- Yehuda, 1976) to Holland's RIASEC types.
With such widespread acceptance of Holland's RIASEC model in the United States, it is not surprising that research- ers and practitioners have adopted his model and measures internationally. Holland and Gottfredson (1992) reported that the Strong Interest Inventory (SII) has been translated into 17 languages, and the Vocational Preference Inventory (VPI; Holland, 1985b) and Self-Directed Search (SDS; Hol- land, 1985c) have been translated into 20 languages. Test publishers in the United States have recently begun to
310

CROSS-CULTURAL STUDY OF RIASEC MODELS 311
market Spanish-language translations for many of the major RIASEC inventories, such as the Career Decision-Making Interest Survey, Strong Interest Inventory, and Self- Directed Search. The book entitled Holland in Australia (Lokan & Taylor, 1986) presents a series of studies inves- tigating the applicability of Holland's theory and measures to Australia and New Zealand. Instead of translating or adapting U.S. RIASEC inventories, researchers in Australia (Athanasou, 1986a), France (Dupont, 1979), and Canada (T6treau & Trahan, 1986, 1989, 1992) have developed new measures based on Holland's RIASEC model.
A practical objective of cross-cultural adoption of U.S. RIASEC measures is to provide useful assessment proce- dures for other cultures. Because RIASEC measures in the United States have certainly been useful for career educa- tion, vocational guidance, and placement purposes, it is assumed that similar uses can be found for these measures in different cultures. From a theoretical perspective, how- ever, the focus shifts to appraising the generality and uni- versality of RIASEC personality types: The objective is to evaluate the extent to which constructs developed to char- acterize personality in one culture can be applied across many diverse cultures. Ben-Porath (1990), for example, discussed cross-cultural research as an investigation of con- struct validity wherein one attempts to ascertain whether the interpretations associated with an inventory developed in the United States can validly be used in another culture. For both objectives, cross-cultural structural equivalence of the constructs must be established (e.g., see Buss & Royce, 1975; Butcher & Pancheri, 1976; Cattell, 1973; Irvine & Carroll, 1980) before a measure developed in one culture can be used for counseling and research purposes in a second culture and before meaningful cross-cultural com- parisons can be made. If it can be shown that a RIASEC structure is invariant across diverse cultures, then the plau- sibility that Holland's types represent universal entities is strengthened.
Reviews of cross-culture studies of Holland's model have usually concluded that the relations among RIASEC types have maintained their circular structure across international and U.S. ethnic samples. Hansen (1987), for example, said that "Generally, the structure of interests of international and cross-ethnic populations seem to correspond to Hol- land' s model almost as well as does the structure of interests of Whites" (p. 173). Likewise, Holland (1985a), summariz- ing the literature on his hexagonal model, stated that "the ordering (RIASEC) of types or occupational categories is similar even when the data, sexes, and cultures vary" (p. 119). Harrington and O'Shea (1993), discussing the re- search on their RIASEC scales for the revised Career Decision-Making System, also concluded that the evidence provides cross-cultural support for Holland's structural assertions.
Nevertheless, as evident in a special issue of the Journal of Vocational Behavior (Tinsley, 1992) devoted primarily to a cross-national and cross-ethnic study of the structure of RIASEC types, Holland's, Hansen's, and Harrington and O'Shea's conclusions may be premature. Commentators (Chartrand, 1992; Dawis, 1992; Subich, 1992), with few
exceptions (e.g., Holland and Gottfredson, 1992), reacting to Fouad and Dancer's (1992) study of engineering students and professional engineers from Mexico and Swanson's (1992) study of African Americans, believe that the cross- cultural literature has yet to support the universality of Holland's RIASEC structure. Even Hansen (1992) has be- come more cautious, concluding that "the construct of in- terests appears to have a broad pattern of structural similar- ity across cultures in concert with specific sample differences that reflect the individual differences of cul- tures" (p. 188).
The goal of this article was to evaluate the cross-cultural structural equivalence of RIASEC personality types across U.S. ethnic groups and samples from different countries. Holland's RIASEC measures have a distinct advantage over many other measures of personality used in cross-cultural research: There exist several explicit structural models to account for the relations among scales. Without a structural model to guide cross-cultural comparisons, it becomes dif- ficult if not impossible to evaluate the fit of data structures across cultures and to generalize structural findings. In our article we evaluated the relative validity of three models-- Holland's circular order, Gati's three-group partition ([R, I], [A, S], [E, C]), and an alternative three-class partition ([R, I], [A], [S, E, C])--to account for RIASEC relations. Both Gati's model and the alternative model represent the relations among RIASEC types as discrete clusters.
RIASEC Models
Two forms of Holland's structural hypothesis have been proposed (Rounds, Tracey, & Hubert, 1992; Tracey & Rounds, 1993): the circular order model and the circumplex model. In our study, only Holland's order model was eval- uated because it generates order predictions that can be compared directly with the predictions generated by Gati's model and an alternative partition model. In addition, the circumplex model is a more restrictive form of the circular order model. If the circular order model does not fit the data, then by definition neither would the circumplex model.
The circular order model is derived from Holland's cal- culus hypothesis (often referred to as the hexagon) that the interpoint distances for the RIASEC types are "inversely proportional to the theoretical relationships between them" (Holland, 1973, 1985a, p. 5); that is, adjacent types are most related, alternate types have an intermediate relationship, and opposite types are least related. It follows that the circular order hypothesis predicts that the correlations among pairs of adjacent RIASEC types (RI, IA, AS, SE, EC, and CR) are greater than the correlations among pairs of alternate types (RA, IS, AE, SC, ER, and CI) and correla- tions among pairs of opposite types (RS, IE, and AS) and that the correlations among pairs of altemate types are greater than the correlations among pairs of opposite types (RS, IE, and AS).
Holland's circular order model has not gone unchal- lenged. Gati (1979, 1982, 1991) has claimed that Holland's circular order structure does not adequately account for the

312 ROUNDS AND TRACEY
relations among RIASEC types and that a single three- group partition ([R, I], [A, S], [E, C]) shows a better fit to RIASEC data. As shown in Figure 1, Gati 's discrete repre- sentation predicts that the correlations between RIASEC types belonging to the same category (e.g., R and I) are greater than the correlations between pairs of RIASEC types outside of the category (e.g., R and A).
With respect to the fit of Holland's circular order model to U.S. samples, three quantitative reviews (Prediger, 1982; Rounds, 1995; Trapnell, 1989) have reported that Holland's model shows a good fit to RIASEC relations generated on U.S. samples. Gati (1991), however, has concluded that the relations among RIASEC types across 9 data sets were better represented by his three-group partition than Hol- land's model. In response to Gati (1991), Tracey and Rounds (1993) conducted a structural meta-analysis and found that Holland's model when compared with Gati's model had a better model-data fit across 77 U.S. RIASEC matrices. Although Gati 's model cannot be ruled out as a reasonable representation of RIASEC data, the evidence appears to show that Holland's model best represents U.S. RIASEC data variation.
A fundamental problem with both Gati 's model and Hol- land's circular order model is the proposed magnitude of the relation between A and S. Holland's circular order model views A and S as having as strong a relation as all other adjacent types. Gati views A and S as one of the three central clusters. Several researchers, however, have noted the discontinuity between the A and other Holland types (e.g., Fouad & Dancer, 1992; Swanson, 1992). Even Gati (1991, p. 317) has suggested that the AS cluster may not be the best depiction of the RIASEC types. To attempt to better account for the problematic pairing of A and S, we propose a single-partition three-category model that is similar to Gati's model, but with the exception that the A type exists as its own category and the S type is added to the EC category. Our creation of an SEC category makes sense on both empirical and theoretical grounds: (a) An uncon- strained cluster analysis of 104 RIASEC matrices (Tracey & Rounds, 1993) produced a SEC cluster across two-, three-, and four-cluster solutions; and (b) the E type is linked to the S type through involvement with people and the E and C
R
FI F F C I R I A S E C
Gati's Three-Group Partition
R I A S E C
S Alternative Three-Class Partition Holland's Circular-Order
Figure 1. Representations of three models of RIASEC person- ality types. R = realistic, I = investigative, A = artistic, S = social, E = enterprising, C = conventional.
types are linked through business activity (Holland, 1985a). These conjectures lead to the discrete structure shown in Figure 1, labeled the alternative three-class partition, ([R, I], [A], IS, E, C]). We sought to examine the validity of each of these three structural representations, Holland's circular order, Gati 's three-cluster partition, and our alternative three-class partition across a variety of cultures by using a structural meta-analysis.
Need for Structural Meta-Analysis
We believe that past reviews of the literature on structural equivalence of RIASEC types across samples are question- able. First, reviewers of the cross-cultural research have based their conclusions on a few selected structural studies, leaving many potential sources of data unexamined. Hansen (1987), for example, drew her conclusions on eight studies. Holland's (1985a) review, although not portrayed as ex- haustive, cites seven studies. Because these reviews are primarily narrative, we feel that they do not make full use of the data that are available. Thus, we have taken a more quantitative approach which, in comparison, focuses first on locating RIASEC matrices. In this manner, the variety and number of studies under review can be greatly expanded, and the model-data fit of the matrices can be determined.
Second, the primary studies on which reviewers have drawn their conclusions have been beset by methodological problems. Cross-cultural studies have used in most cases inexact and inappropriate methods to test Holland's pre- cisely defined structures. Methods used to evaluate the cross-culture invariance of Holland's RIASEC model have widely varied. The most common method is to calculate the correlations among the six types on a sample from another country and then to visually compare the resulting correla- tion matrix with a correlation matrix developed on U.S. respondents (e.g., Erlianto, 1982; Ferreira, 198911990; Har- rington & O'Shea, 1993; Lokan, 1988; Mercurius-Fraser, 1980; Naylor & Mount, 1986). Another method is to apply a spatial analysis technique such as multidimensional scal- ing or factor analysis to the correlation matrix and, again, visually compare Holland's hypothesized RIASEC circle with the resulting spatial representation (e.g., Athanasou, 1986a; Meir & Ben-Yehuda, 1976; Peiser, 1984; Taylor, Kelso, Pretty, & Power, 1980). Methods that rely on visual inspection are woefully inexact.
When more exact methods have been used, researchers have typically misspecified Holland's order model and ap- plied incorrect statistical tests. A method that explicitly evaluates Holland's circular order hypothesis is to compare the predicted order relations with the actual magnitude of the correlations among the types. Studies (e.g., Carroll, 1986; Gati, 1982, 1991; Salleh, 1984/1985; Tuck & Keel- ing, 1986) that have applied a statistical test to the ordered relations have used a binominal test, incorrectly assuming that the ordered relations are independent. These problems are not unique to cross-cultural research. Research on the U.S. samples evaluating Holland's structure have also been shown to have similar problems and issues (Rounds,

CROSS-CULTURAL STUDY OF RIASEC MODELS 313
Tracey, & Hubert , 1992): It seems that many of the con- ceptual and methodo log ica l p rob lems have been expor ted a long with H o l l a n d ' s models and measures.
Tracey and Rounds (1993) have argued for a quant i ta t ive integrat ion o f covar ia t ion results (e.g., R I A S E C correlat ion matr ices) that can more precisely and systemat ical ly eval- uate f indings across a var ie ty o f data sources than can the tradit ional narrat ive r ev iew procedures . The purpose o f this art icle was to conduct a structural meta-analys is to evaluate the fit o f H o l l a n d ' s and Gat i ' s mode ls and the al ternat ive three-class part i t ion on R I A S E C matr ices drawn f rom the cross-cul tural l i t e ra tu re - -U.S , ethnic samples and interna- t ional samples.
In our study we analyzed 72 U.S. matr ices to generate a benchmark for cross-cul tural compar isons . These U.S. benchmark matr ices have prev ious ly been used to evaluate Ga t i ' s (1991) and Pred iger ' s (1982) structural assertions (see studies by Tracey & Rounds, 1993; Rounds & Tracey, 1993).
M e t h o d
Sample
The sampling unit is a RIASEC correlation matrix. We began by identifying measures of Holland's RIASEC types. In most studies of the cross-cultural applicability of the RIASEC model, research- ers use adaptations or translations of Holland's Vocational Pref- erence Inventory and Self-Directed Search or scales (e.g., General Occupational Theme scales of the Strong Interest Inventory) that have been explicitly constructed to assess the six types. Occasion- ally, authors have constructed a RIASEC measure guided by Holland's theory. In such cases, a measure was considered a RIASEC measure if the following criteria were met: (a) an au- thor's claim that the six scales were developed to assess Holland's RIASEC personality types; and (b) empirical evidence that sup- ports the inference that the RIASEC scales under consideration are measuring Holland's types. The latter information was principally drawn from correlational studies of the presumed RIASEC form with the Vocational Preference Inventory and Self-Directed Search, Holland's benchmark measures of the RIASEC personality types.
When authors reported RIASEC matrices separately for female and male participants, these matrices were used instead of a matrix based on a combined-sex sample. Coding matrices by sex of the sample allowed for an additional evaluation of sex differences in the structure of RIASEC types. When a study had two matrices based on the same sample, that is, the same subject sample com- pleted two different RIASEC inventories, both of the RIASEC matrices were included, allowing possible comparisons between measures on the same sample.
Search Procedures
The search for RIASEC matrices built upon Tracey and Rounds (1993), who identified 104 RIASEC matrices of which 26 matrices were based on samples outside the United States and 4 matrices were based on U.S. ethnic samples. Tracey and Round's literature search concentrated on the period of 1970 to 1989, and their methodology involved the following: (a) a search for relevant references in bibliographies of current and former editions of test
manuals (Vocational Preference Inventory, Self-Directed Search, Strong Interest Inventory, Career Decision-Making System, Amer- ican College Testing Program), annual reviews in the Journal of Vocational Behavior (1976-1989), and Making Vocational Choic- es: A Theory of Vocational Personalities and Work Environments (Holland, 1973, 1985a); and (b) an article-by-article search of the 1970-1989 issues of Journal of Vocational Behavior, Journal of Counseling Psychology, Measurement and Evaluation in Counsel- ing and Development, Journal of Applied Psychology, Vocational Guidance Quarterly, Educational and Psychological Measure- ment, and Journal of Occupational Psychology. With the excep- tion of several dissertations cited in published sources, no system- atic effort was made to locate matrices in unpublished sources.
We expanded our literature search by concentrating on non-U.S. and U.S. ethnic data sets. The coverage was increased to 1992, and unpublished sources and sources relevant to cross-cultural studies were searched. The journals cited here, including the annual re- views in the Journal of Vocational Behavior, were searched for the years 1989-1992. The search was widened to include (a) an article-by-article search of the 1970-1992 issues of Australian Journal of Psychology, Australian Psychologist, Le Travail Hu- main, New Zealand Journal of Educational Studies, Applied Psy- chology: An International Review, International Journal for the Advancement of Counselling, International Journal of Psychology, Journal of Cross-Cultural Psychology, Hispanic Journal of Be- havioral Sciences, Journal of American Indian Education, and Journal of Multicultural Counseling and Development; (b) ERIC and Dissertation Abstracts International data bases from 1970 to 1992; (c) bibliographies of Holland's theory (Holland & Gottfred- son, 1990) and the Strong Interest Inventory (Center for Interest Measurement Research, 1988); (d) reviews of the research litera- ture on career development of Hispanics (Arbona, 1990) and on the validity of the Strong Interest Inventory with African American samples (Carter & Swanson, 1990). The reference lists of studies examining RIASEC structural properties were also inspected for relevant articles. When a relevant study based on a dissertation did not report a RIASEC matrix, we obtained the dissertation. In total, we obtained and examined 44 dissertations. In the case of cross- cultural studies on RIASEC measures that did not report matrices, we wrote to the authors and requested the matrices.
Cross-Cultural RIASEC Matrices
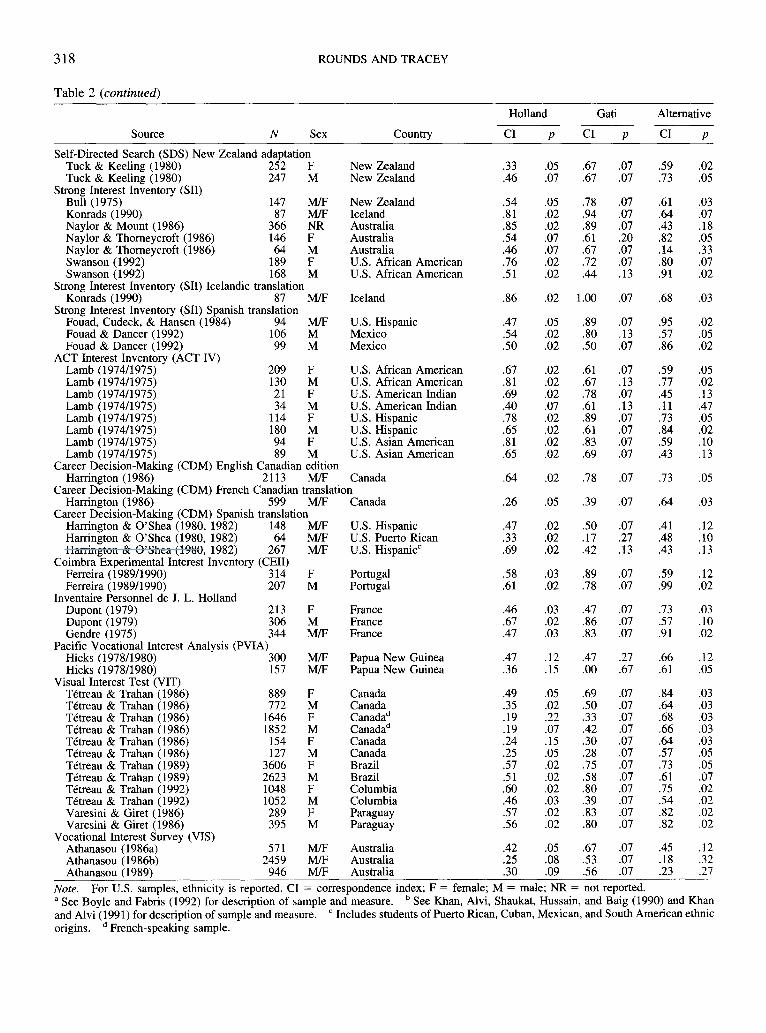
We located 96 cross-cultural RIASEC matrices, of which 26 came from Tracey and Rounds (1993). These 96 RIASEC matrices were found in 15 published articles, 11 dissertations, 8 test man- uals, 1 book, and 8 unpublished sources (i.e., technical reports, conference papers, and personal communications). The 96 RIA- SEC matrices came from 19 countries: Australia (n = 24), Brazil (n = 2), Canada (n = 10), Colombia (n = 2), France (n = 3), Guyana (n = 8), Iceland (n = 2), Indonesia (n = 1), Israel (n = 3), Japan (n = 2), Malaysia (n = 2), Mexico (n = 2), New Zealand (n = 3), Pakistan (n = 2), Papua New Guinea (n = 2), Paraguay (n = 2), Portugal (n = 2), Taiwan (n = 4), and the United States (n = 20). The U.S. matrices came from four ethnic groups: African American (n = 10), American Indian (n = 2), Asian American (n = 2), and Hispanic (n = 2). The surprising number of matrices from Australia is due to the Australian Council for Educational Research and their efforts to study the applicability of Holland's theory in Australia (Lokan & Taylor, 1986). Especially notable are countries not represented. Missing are matrices from Africa, Eastern Europe, and the former Soviet Union. Table 2 in the Results section provides a listing and description of the 96 RIASEC samples.

314 ROUNDS AND TRACEY
Measures developed by Holland, Vocational Preference Inven- tory (VPI) and Self-Directed Search (SDS) and adaptations and translations of these inventories, account for 50 matrices, approx- imately one half of the total. The remaining matrices come from the Visual Interest Test (n = 12), Strong Interest Inventory (n = 11), ACT Interest Inventory (n = 8), Career Decision-Making Interest Survey (n = 5), Inventaire Personnel de J. L. Holland (n = 3), Vocational Interest Survey (n = 3), Coimbra Experimental Interest Inventory (n -- 2), and Pacific Vocational Interest Anal- ysis (n = 2). The sample sizes for these matrices ranged from 21 to 3,606, with 73 of the matrices based on sample sizes greater than 100 respondents and 33 matrices based on samples greater than 300 respondents. The total sample size for the 96 matrices is 39,557 respondents. Classification of the matrix sample by sex showed that 33 matrices are based on female samples, 38 matrices are based on male samples, 23 matrices are based on mixed-sex samples, and for 2 matrices sex of the sample was not reported. With a few exceptions, most of the samples were taken from high school and postsecondary schools.
We located four studies that used two RIASEC measures on the same sample (i.e., the same subject sample completed two RIA- S EC measures): the VPI and SDS in Bingham' s (1977/1978) study of employed adult African Americans and Mercurius-Fraser's (1980) study of Guyanese students and employed adults, VPI and SII in Naylor and Mount's (1986) study of Australian adults, and SII and the SII Icelandic translation in Konrads' (1990) study of bilingual students. Unless otherwise noted, when comparisons were made within the total set of matrices, the model fit indices were averaged across the two matrices for each of these four samples.
Cross-Cultural Categories of RIASEC Measures
Depending on the country and sample studied, researchers used four forms of RIASEC measures for non-U.S, samples: (a) U.S. RIASEC measures, (b) adaptation of U.S. RIASEC inventories, (c) theory-constructed RIASEC measures, and (d) translated U.S. RIASEC measures. The majority of the RIASEC matrices (n = 39) were based on English-language U.S. RIASEC inventories. When the samples studied were fluent in English (Australia, Can- ada, Guyana, New Zealand, and Pakistan), researchers took several different approaches to exporting U.S. inventories. The most con- venient but the most problematic approach was to use the U.S. RIASEC edition without adapting the items to the new culture. For example, Mercurius-Fraser (1980) used the VPI and the SDS in Guyana and reported that "it was found necessary to explain some of the job descriptions to them" (p. 60). A second approach was to change or revise the U.S. RIASEC items when the items did not exist in the new culture. Revising RIASEC measures is particularly important when occupational smacture of a country differs from the United States. Usually, authors replaced inappropriate items with items with the same Holland RIASEC code. Of the 39 English-language cross-national matrices, 23 were based on U.S. inventories and 16 were based on adaptations of U.S. RIASEC inventories.
A third category exported Holland's U.S. theory by developing a new RIASEC measure that is more appropriate for the different culture. Four examples were found: (a) Vocational Interest Survey constructed to assess Holland's RIASEC types in Australia; (b) Coimbra Experimental Interest Inventory (CEIl; Ferreira, 1989/ 1990), a Portuguese language measure; (c) Visual Interest Test (VIT; T~treau & Trahan, 1986, 1989, 1992) with instructions in English, French, Portuguese, and Spanish; and (d) Inventaire Per- sonnel de J. L. Holland (Dupont, 1979), a French-language RIA-
SEC measure that Holland and Gottfredson (1990) described as a "forerunner of the SDS" (p. 3). These theory-driven inventories accounted for 22 matrices.
The fourth category includes matrices (n = 15) based on U.S. inventories translated into other languages. Holland and Gottfred- son (1992) reported that the VPI or SDS have been translated into 20 languages and the SVIB, SCII, or SII have been translated into 17 languages. We were only able to locate RIASEC matrices for a small number of language translations. Matrices were identified for the (a) VPI Japanese translation; (b) SDS Chinese, Hebrew, and Malay translations; (c) SII Icelandic and Spanish translations; and (d) CDM Interest Survey French and Spanish translations.
In comparison, matrices (n = 20) representing ethnic samples in the United States were usually based on U.S. English RIASEC inventories, the exception being RIASEC inventories translated into Spanish for use with Hispanic samples. Four of the 20 matri- ces were based on Spanish translations.
U.S. Benchmark RIASEC Matrices
The model-data fit values generated on U.S. RIASEC matrices were used as benchmarks to evaluate the structural equivalence of RIASEC models across cultures. The U.S. RIASEC matrices came from a structural meta-analysis (Tracey & Rounds, 1993) that identified 77 matrices (see Rounds & Tracey, 1993, for a more detailed description of the RIASEC sample). Because 4 of the 77 RIASEC matrices were generated only on U.S. ethnic respondents, we removed these matrices, yielding a total of 73 U.S. benchmark matrices.
Across the 73 U.S. RIASEC matrices, the number of subjects varied from 84 to 2,621; 71 matrices are based on samples greater than 100 subjects, 50 matrices are based on samples greater than 300 subjects, and the total subject sample size is 41,149. The matrices are equally divided between male (n = 31) and female (n = 31) samples with 11 based on mixed-sex samples. In most cases, the ethnic composition of the RIASEC samples was not reported. An exception, for example, is the tenth grade, male and female UNIACT samples (American College Testing Program, 1988). The students were randomly selected from a 1983 national norm group, a probability sample that closely approximates the 1980 U.S. Census demographic characteristics (e.g., sex, school affiliation, region of country, socioeconomic status, and racial- ethnic distribution). Nevertheless, it cannot be assumed that each of the 73 samples included a representative sample of individuals from various ethnic groups in the United States.
The matrices came from well-established RIASEC measures. Approximately 42% of the 73 U.S. matrices were from measures developed by Holland: Vocational Preference Inventory (VPI; Holland, 1985b; n = 22) and Self-Directed Search (SDS; Holland, 1985c; n = 11). The remaining matrices came from the Strong Interest Inventory General Occupational Theme scales (SII; Han- sen & Campbell, 1985; n = 17), American College Testing in- cluding the ACT Vocational Interest Profile (VIP; American Col- lege Testing Program, 1977; n = 6), ACT Interest Inventory (ACT IV; Hanson, 1974; n = 2), the Unisex Edition of the ACT Interest Inventory (UNIACT; American College Testing Program, 1988; n = 10), Career Assessment Inventory (CAI; Johansson, 1986; n = 4), and Career Decision-Making Interest scales (CDM; Har- rington & O'Shea, 1982; n = 1).
Model Predictions
Most of the structural evaluations of Holland's and Gati's mod- els have been based on an incomplete specification of the nuinber

CROSS-CULTURAL STUDY OF RIASEC MODELS 315
and types of order predictions, making it important to specify the exact order prediction generated by these models (Rounds et al., 1992; Tracey & Rounds, 1993). The order predictions made by each model are presented in Table 1. The rows and columns of Table 1 represent the 15 possible relations of 6 Holland types (e.g., RI represents the correlation between realistic type and investiga- tive type). In other words, the intercorrelation of the RIASEC types yields 15 unique correlations or 15 measures of correspon- dence between distinct pairs of RIASEC codes. As shown in Table 1, the 15 × 15 matrix based on the comparison of the magnitude of pairs of correlations yields a total of 105 possible unique predictions in either the upper or lower triangle of the matrix. The cells in Table 1, therefore, represent the structural hypotheses drawn from Holland's theory, Gati's theory, and the proposed
alternative model. Holland's model, for example, generates the predictions that the correlation between R and A (see row RA) should be less than the correlation between R and I (see column RI), the RA correlation should be greater than the RS correlation, and so on. Inspection of the predictions in Table 1 shows that Holland's circular order model yields 72 order predictions, Gati's three-group partition model generates 36 order predictions, and the alternative partition model yields 44 order predictions.
A number of conclusions can be drawn from the comparisons of the three RIASEC order models shown in Table 1. An obvious but important conclusion is that Holland's model is more fully spec- ified because it makes order predictions for all possible pairs of correlations with the exception of the 33 adjacent, alternate, and opposite pairs. The two partition models make much fewer order
Table 1 Order Predictions of the Holland Circular Order, Gati Three-Group Partition, and the Alternative Partition Models Regarding the Relative Magnitude of Correlations in a Correlation Matrix
Three-Group
RI RA RS RE RC IA IS IE IC AS AE AC SE SC EC
RI - - g > g > g > g > g > g > g > g > g? g > g > g > g > g? - - h > h > h > h? h? h > h > h > h? h > h > h? h > h? - - a > a > a > a > a > a > a > a > a > a > a > a? a? a?
RA g< - - g? g? g? g? g? g? g? g< g? g? g? g? g< h< - - h> h? h< h< h? h> h? h< h? h> h< h? h< a< - - a? a? a? a? a? a? a? a? a? a? a< a< a<
RS g< g? - - g? g? g? g? g? g? g< g? g? g? g? g< h< h< - - h< h< h< h< h? h< h< h< h? h< h< h< a< a? - - a? a? a? a? a? a? a? a? a? a< a< a<
RE g< g? g? - - g? g? g? g? g? g< g? g? g? g? g< h< h? h> - - h< h< h? h> h? h< h? h> h< h? h< a< a? a? - - a? a? a? a? a? a? a? a? a< a< a<
RC g< g? g? g? - - g? g? g? g? g< g? g? g? g? g< h? h> h> h> - - h? h> h> h> h? h> h> h? h> h? a< a? a? a? - - a? a? a? a? a? a? a? a< a< a<
IA g< g? g? g? g? - - g? g? g? g< g? g? g? g? g< h? h> h> h> h? - - h> h> h> h? h> h> h? h> h? a< a? a? a? a? - - a? a? a? a? a? a? a< a< a<
IS g< g? g? g? g? g? - - g? g? g< g? g? g? g? g< h< h? h> h? h< h< - - h> h? h< h? h> h< h? h< a< a? a? a? a? a? - - a? a? a? a? a? a< a< a<
IE g< g? g? g? g? g? g? - - g? g< g? g? g? g? g< h< h< h? h< h< h< h< - - h< h< h< h? h< h< h< a< a? a? a? a? a? a? - - a? a? a? a? a< a< a<
IC g< g? g? g? g? g? g? g? - - g< g? g? g? g? g< h< h? h> h? h< h< h? h> - - h< h? h> h< h? h< a< a? a? a? a? a? a? a? - - a? a? a? a< a< a<
AS g? g> g> g> g> g> g> g> g> - - g> g> g> g> g? h? h> h> h> h? h? h> h> h> - - h> h> h? h> h? a< a? a? a? a? a? a? a? a? - - a? a? a< a< a<
AE g< g? g? g? g? g? g? g? g? g< - - g? g? g? g< h< h? h> h? h< h< h? h> h? h< - - h> h< h? h< a< a? a? a? a? a? a? a? a? a? - - a? a< a< a<
AC g< g? g? g? g? g? g? g? g? g< g? - - g? g? g< h< h< h? h< h< h< h< h? h< h< h< - - h< h< h< a< a? a? a? a? a? a? a? a? a? a? - - a< a< a<
SE g< g? g? g? g? g? g? g? g? g< g? g? - - g? g< h? h> h> h> h? h? h> h> h> h? h> h> - - h> h? a? a> a> a> a> a> a> a> a> a> a> a> - - a? a?
SC g< g? g? g? g? g? g? g? g? g< g? g? g? _ g< h< h? h> h? h< h< h? h> h? h< h? h> h< - - h< a? a> a> a> a> a> a> a> a> a> a> a> a? - - a?
EC g? g> g> g> g> g> g> g> g> g? g> g> g> g> _ h? h> h> h> h? h? h> h> h> h? h> h> h? h> - - a? a> a> a> a> a> a> a> a> a> a> a> a? a? - -
Note. Read the row value first so that > means row value greater than column value, g = Gati predictions, h = Holland predictions, a = alternative predictions, ? = no prediction made.

316 ROUNDS AND TRACEY
predictions than Holland, with Gati and alternative partition leav- ing 69 and 61 possible predictions unspecified, respectively. Sec- ond, the partition models do not offer a completely competitive structure to Holland's order model. Gati's model has no strict order prediction that is contrary to Holland's order predictions (Hubert & Arabic, 1987). Inspection of Table 1 shows that 27 of 36 (75%) order predictions made by Gati are identical to Holland's predic- tions. For the remaining nine comparisons made by Gati, Hol- land's order hypothesis is silent (no predictions are made). The alternative model, however, provides a slightly more competitive structure to Holland's model: It has 27 of 44 (61%) order predic- tions that are identical to Holland's predictions and three order predictions (i.e., IA, AS, and EC < SC) that are diametrically opposite to the same predictions made by Holland. For the remain- ing 14 comparisons generated by the alternative partition, Hol- land's order model makes no predictions. Finally, the two partition models are the most competitive models. Gati's partition and the alternative partition have 20 identical order predictions, approxi- mately one half of their respective total order predictions in com- mon. Two order predictions are diametrically opposite (i.e., AS vs. SE and SC). The remaining 14 and 22 order predictions of Gati and alternative model, respectively, are noncompetitive with one model generating predictions and the other model making no predictions.
Analysis
A randomization test of hypothesized order relations (Hubert & Arabie, 1987) was used to evaluate the model fit for the 96 RIASEC matrices. The randomization test is designed to examine the order relations in proximity data (e.g., RIASEC correlations), making it appropriate for order predictions generated by Holland's circular order model, Gati's three-group partition, and the alterna- tive partition model.
Hubert and Arabie (1987) criticized the use of the binomial test, a commonly used method (e.g., Gati, 1979, 1982; Rounds, Davi- son, & Dawis, 1979; Wakefield & Doughtie, 1973), to evaluate Holland's and Gati's order models. They showed that when the binomial statistic is applied to a RIASEC correlation matrix, it is based on an incorrect assumption that the order predictions among correlations are independent. As a more appropriate method and a method to deal directly with dependencies among the predictions in a correlation matrix, they proposed the randomization test of hypothesized order relations. In the randomization test, the fit of the hypothesized set of order predictions to the original RIASEC correlation matrix is compared with the fit attainable from all possible rearrangements (called relabeling) of the columns and rows of the original correlation matrix. The comparison of the observed number of confirmed predictions for the original corre- lation matrix to the distribution of confirmed predictions generated by the relabeling strategy yields an exact probability (i.e., a p value) of obtaining a result as or more extreme than that observed under the null conjecture that the objects can be relabeled at random. The application of the randomization test to RIASEC data is explained and demonstrated in Rounds et al. (1992), and Tracey and Rounds (1993).
Besides providing a method for determining the distribution of confirmed predictions under a random relabeling conjecture, Hu- bert and Arabie (1987) also proposed a correspondence index as an indicator of relative model-data fit within a correlation matrix. The correspondence index is the difference between the propor- tions of agreements and disagreements, that is, the number of order predictions met (agreements) minus the number of violations of the order predictions (disagreements), each divided by the total
number of order predictions made. The correspondence index has several nice properties: It is a normalized descriptive statistic indicating the degree to which the ordered predictions are satisfied; it varies from - 1 to 1, with 0 indicating its expected value under the null conjecture of random relabeling. The correspondence index also provides a simple interpretable indicator of model-data fit. For example, a correspondence index value of .50 would indicate that three fourths of the predictions were met (.75 agree- ments minus .25 disagreements). The correspondence index was used as a means of comparing the three order models: Holland's circular order, Gati's three-group partition, and the alternative three-class partition.
Resu l t s and D i s c u s s i o n
Global Model Tests
Hubert and Arabie ' s (1987) randomization test was ap- plied to each of the 96 cross-cultural matrices to evaluate the extent that Holland's , Gat i ' s , and the alternative model ' s order relations were manifested in the RIASEC data. Pre- sented in Table 2 are the exact p values generated by the randomization test and the correspondence index values for each of the three order-models across the 96 cross-cultural RIASEC matrices. The frequency distributions of the exact p values for each of the order models are shown in Figure 2. Across the 96 cross-cultural matrices, Hol land 's circular order model had 55 (57%) matrices that achieved a p value less than the traditional value of .05. The alternative three- class partition fared slightly better with 60 (62%) matrices, achieving a p value of less than .05. None of the p values for Gat i ' s model on the cross-cultural data were less than .05. Because Gati proposed so few order predictions compared with the total number possible (36 versus 105), the p value would never reach the .05 level. In fact, the smallest achiev- able p value for Gat i ' s 36 confirmed order predictions is .07.
For comparison purposes, the randomization test was conducted on the U.S. benchmark matrices for the three models. As shown in Figure 2, the randomization test results for Hol land 's order model are unequivocal with 70 (98%) of the p values less than .05, indicating that a random reorder- ing of the RIASEC types can be rejected (at this level) for 70 of the 73 matrices. For the alternative model, 42 (58%) of the p values were less than .05. When the cross-cultural randomization test results were compared with the U.S. benchmark results, Hol land 's circular order model poorly accounted for the cross-cultural RIASEC relations and the alternative model fit equally well across the two data sets.
The means and standard deviations of the correspondence index for Hol land 's circular order model, Gat i ' s partition, and the alternative partition are presented in Table 3. The analysis of variance comparing the correspondence index values for each of the three models across cross-cultural groups (U.S. benchmark, U.S. ethnic, and international sam- ples) were significant only for Hol land 's circular order model. Neither Gat i ' s partition nor the alternative partition were found to differ across the cross-cultural groups. Post hoc Scheff6 t tests conducted on the correspondence index values for the circular order model indicated that the overall significant results were attributable to the better fit for the

CROSS-CULTURAL STUDY OF RIASEC MODELS
Table 2 Source, Sample Characteristics, and Randomization Test Results for the Cross-Cultural Matrices (N = 96)by
317
Inventory
Holland Gati
Source N Sex Country CI p CI p
Alternative
CI p
Vocational Preference Inventory (VPI) Athanasou (1982) 116 F Australia .83 .02 .61 .13 Athanasou (1982) 129 M Australia .60 .02 .86 .07 Bingham (1977/1978) 93 F U.S. African American .61 .02 .31 .13 Carroll (1986) 74 F Australia .50 .05 .36 .20 Carroll (1986) 75 M Australia .36 .07 .67 .07 Droz (1990) 60 F U.S. African American .15 .23 .11 .53 Droz (1990) 60 M U.S. African American -.01 .48 .06 .47 Mercurius-Fraser (1980) 444 F Guyana .28 .13 .67 .07 Mercurius-Fraser (1980) 387 M Guyana .21 .23 .61 .13 Mercurius-Fraser (1980) 144 F Guyana .36 .03 .39 .20 Mercurius-Fraser (1980) 156 M Guyana .17 .25 .19 .33 Naylor & Mount (1986) 366 NR Australia .86 .02 .89 .07 Salas (1986) 117 M Australia .76 .02 .61 .13 Trapnell (1989) 113 M/F Canada .71 .02 .94 .07 Wakefield, Yom, Doughtie,
Chang, & Alston (1975) 115 M/F U.S. African American .49 .07 .28 .33 Vocational Preference Inventory (VPI) Australian adaptations
Athanasou, O'Gorman, & Meyer (1981, 1986) 101 M Australia .56
Athanasou, O'Gorman, & Meyer (1981, 1986) 99 M/F Australia .61
Carroll (1986) 98 F Australia .60 Carroll (1986) 97 M Australia .26 Carroll (1986) 44 F Australia .39 Carroll (1986) 56 M Australia .17 Docking & Thornton (1980) 411 M/F Australia .47 Taylor et al. (1980) 406 F Australia .50 Taylor et al. (1980) 501 M Australia .58
Vocational Preference Inventory (VPI) Japanese translation Koyo Shokugyo Sogo
Kenkyujo (1985) 1528 F Japan .72 Koyo Shokugyo Sogo
Kenkyujo (1985) 2371 M Japan ,65 Self-Directed Search (SDS)
Bingham (1977/1978) 93 F U.S. African American .43 Boyle (1992) a 401 M Australia .32 Erlianto (1982) 146 M Indonesia .58 Fitzsimmons & Melnychuk
(1979) 200 M/F Canada .47 Mercurius-Fraser (1980) 444 F Guyana .35 Mercurius-Fraser (1980) 387 M Guyana .30 Mercurius-Fraser (1980) 144 F Guyana .44 Mercurius-Fraser (1980) 156 M Guyana .25 Sedlacek (1992) 298 M/F U.S. African American .42
Self-Directed Search (SDS) Australian adaptation Lokan (1988) 920 F Australia .58 Lokan (1988) 849 M Australia .22
Self-Directed Search (SDS) Chinese translation Jin (1986/1987) 228 F Taiwan .47 Jin (1986/1987) 247 M Taiwan .32 Jin (1986/1987) 205 F Taiwan .57 Jin (1986/1987) 182 M Taiwan .40
Self-Directed Search (SDS) Hebrew translation Meir (1992) 160 M/F Israel .75 Meir & Ben-Yehuda (1976) 217 M/F Israel .50 Peiser (1984) 870 M Israel .78
Self-Directed Search (SDS) Malay translation Salleh (1984/1985) 86 F Malaysia .36 Salleh (1984/1985) 80 M Malaysia .50
Self-Directed Search (SDS) Pakistan adaptation (English) Khan (1992) b 133 F Pakistan .46 Khan (1992) b 243 M Pakistan .53
.57 .05
.91 .02
.25 .27
.32 .25
.36 .15
.64 .05
.73 .03
.91 .02
.86 .02
.86 .02
.52 .07
.45 .18
.95 .02
.54 .07
.20 .27
.02 .94 .07 .95 .02
.03 .72 .07 .50 .08
.03 .61 .13 .82 .07
.07 .42 .13 .61 .05
.10 .58 .20 .11 .38
.33 .50 .27 .48 .13
.07 .28 .40 .73 .03
.03 .78 .07 .34 .23
.02 .53 .07 .66 .07
.02 .75 .07
.02 .80 .07
.07 .44 .20
.02 .33 .20
.02 .72 .07
.07 .89 .07
.05 .69 .07
.13 .67 .07
.07 .72 .07 ,05 .42 .07 ,05 .83 .07
.02 .75 .07 ,05 .28 .13
.05 .36 .20
.08 .64 .07
.02 .83 .07
.08 .72 .13
.03 .94 .07
.03 .99 .07
.02 .89 .07
.05 .61 .07
.02 .58 .07
.03 .61 .07
.02 .83 .07
.82 .03
.66 .03
.41 .17
.54 .05
.59 .05
.82 .05
.68 .03
.77 .02
.68 .05
.61 .03
.95 .02
.64 .03
.59 .03
.68 .03
.89 .02
.93 .02
.95 .02
.20 .37
.54 .10
.95 .02
.27 .25
.48 .10
.91 .02 1.00 .02
(table continues)
318
Table 2 (continued)
ROUNDS AND TRACEY
Source N Sex Country
Holland Gati Alternative
CI p CI p CI p
Self-Directed Search (SDS) New Zealand adaptation Tuck & Keeling (1980) 252 F New Zealand Tuck & Keeling (1980) 247 M New Zealand
Strong Interest Inventory (SII) Bull (1975) 147 M/F New Zealand Konrads (1990) 87 M/F Iceland Naylor & Mount (1986) 366 NR Australia Naylor & Thorneycroft (1986) 146 F Australia Naylor & Thorneycroft (1986) 64 M Australia Swanson (1992) 189 F U.S. African American Swanson (1992) 168 M U.S. African American
Strong Interest Inventory (SII) Icelandic translation Konrads (1990) 87
Strong Interest Inventory (SII) Spanish translation M/F Iceland
Fouad, Cudeck, & Hansen (1984) 94 M/F U.S. Hispanic Fouad & Dancer (1992) 106 M Mexico Fouad & Dancer (1992) 99 M Mexico
ACT Interest Inventory (ACT IV) Lamb (1974/1975) 209 F U.S. African American Lamb (1974/1975) 130 M U.S. African American Lamb (1974/1975) 21 F U.S. American Indian Lamb (1974/1975) 34 M U.S. American Indian Lamb (1974/1975) 114 F U.S. Hispanic Lamb (1974/1975) 180 M U.S. Hispanic Lamb (1974/1975) 94 F U.S. Asian American Lamb (1974/1975) 89 M U.S. Asian American
Career Decision-Making (CDM) English Canadian edition Harrington (1986) 2113 M/F Canada
Career Decision-Making (CDM) French Canadian translation Harrington (1986) 599 M/F
Career Decision-Making (CDM) Spanish transition
.33 .05 .67 .07 .59 .02
.46 .07 .67 .07 .73 .05
.54 .05 .78 .07 .61 .03
.81 .02 .94 .07 .64 .07
.85 .02 .89 .07 .43 .18
.54 .07 .61 .20 .82 .05
.46 .07 .67 .07 .14 .33
.76 .02 .72 .07 .80 .07
.51 .02 .44 .13 .91 .02
.86 .02 1.00 .07 .68 .03
.47 .05 .89 .07 .95 .02
.54 .02 .80 .13 .57 .05
.50 .02 .50 .07 .86 .02
.67 .02 .61 .07 .59 .05
.81 .02 .67 .13 .77 .02
.69 .02 .78 .07 .45 .13
.40 .07 .61 .13 .11 .47
.78 .02 .89 .07 .73 .05
.65 .02 .61 .07 .84 .02
.81 .02 .83 .07 .59 .10
.65 .02 .69 .07 .43 .13
.64 .02 .78 .07 .73 .05
Canada .26 .05 .39 .07 .64 .03
Harrington & O'Shea (1980, 1982) 148 M/F U.S. Hispanic Harrington & O'Shea (1980, 1982) 64 M/F U.S. Puerto Rican Harrington & O'Shea (1980, 1982) 267 M/F U.S. Hispanic °
Coimbra Experimental Interest Inventory (CEII) Ferreira (1989/1990) 314 F Portugal Ferreira (1989/1990) 207 M Portugal
Inventaire Personnel de J. L. Holland Dupont (1979) 213 F France Dupont (1979) 306 M France Gendre (1975) 344 M/F France
Pacific Vocational Interest Analysis (PVIA) 300 M/F Papua New Guinea
Papua New Guinea
.47 .02 .50 .07 .41 .12
.33 .02 .17 .27 .48 .10
.69 .02 .42 .13 .43 .13
.58 .03 .89 .07 .59 .12
.61 .02 .78 .07 .99 .02
.46 .03 .47 .07 .73 .03
.67 .02 .86 .07 .57 .10
.47 .03 .83 .07 .91 .02
Hicks (1978/1980) Hicks (1978/1980) 157 M/F
Visual Interest Test (VIT) Tttreau & Trahan (1986) 889 F Canada Tttreau & Trahan (1986) 772 M Canada Tttreau & Trahan (1986) 1646 F Canada d Tttreau & Trahan (1986) 1852 M Canada d Tttreau & Trahan (1986) 154 F Canada Tttreau & Trahan (1986) 127 M Canada Tttreau & Trahan (1989) 3606 F Brazil Tttreau & Trahan (1989) 2623 M Brazil Tttreau & Trahan (1992) 1048 F Columbia Tttreau & Trahan (1992) 1052 M Columbia Varesini & Giret (1986) 289 F Paraguay Varesini & Giret (1986) 395 M Paraguay
Vocational Interest Survey (VIS) Athanasou (1986a) 571 M/F Athanasou (1986b) 2459 M/F Athanasou (1989) 946 M/F
.47 .12 .47 .27 .66 .12
.36 .15 .00 .67 .61 .05
.49 .05 .69 .07 .84 .03
.35 .02 .50 .07 .64 .03
.19 .22 .33 .07 .68 .03
.19 .07 .42 .07 .66 .03
.24 .15 .30 .07 .64 .03
.25 .05 .28 .07 .57 .05
.57 .02 .75 .07 .73 .05
.51 .02 .58 .07 .61 .07
.60 .02 .80 .07 .75 .02
.46 .03 .39 .07 .54 .02
.57 .02 .83 .07 .82 .02
.56 .02 .80 .07 .82 .02
Australia .42 .05 .67 .07 .45 .12 Australia .25 .08 .53 .07 .18 .32 Australia .30 .09 .56 .07 .23 .27
Note. For U.S. samples, ethnicity is reported. CI = correspondence index; F = female; M = male; NR = not reported. a See Boyle and Fabris (1992) for description of sample and measure, b See Khan, Alvi, Shaukat, Hussain, and Baig (1990) and Khan and Alvi (1991) for description of sample and measure, c Includes students of Puerto Rican, Cuban, Mexican, and South American ethnic origins, d French-speaking sample.

CROSS-CULTURAL STUDY OF RIASEC MODELS 319
70-
60-
50. O
48-
O" 30. I I
20"
10.
Cross-Cultural Matr ices
- - - ~ Gat i 3 G r o u p Part i t ion - - H o l l a n d C i r cu la r O r d e r . . . . A l te rna t i ve 3 C lass Par t i t ion
i
, \
.o'5 .1'o .,'s .2'o .215 .do .3's .4'0 .4~ .~'o 5'~ .do .8~ p-value
70~
60-
50- O t-- 4 0 - ID --'1
~" 30- U -
20-
10-
Figure 2.
U. S. Benchmark Matrices
\ I
\ I
\ I
d~ 1'0 1'5 ~0.2~ a'0 a's 4b 4~ go s~ 6'0 8~ p-value
Frequency distribution of the exact p values of H o l -
land's circular order, Gati's three-group partition, and the altema- five three-class partition models for 96 cross-cultural matrices (top) and for 73 U.S. benchmark matrices (bottom).
U.S. benchmark samples when compared with the interna- tional samples and the U.S. ethnic samples. The fit of the U.S. ethnic matrices was not significantly different from that of the international matrices.
Given that none of the three models fit U.S. ethnic sam- pies, we explored whether the specific model predictions can be viewed as random or are systematic (and occur more frequently for certain predictions than for others). The pre- dictions for the three models were examined for the total sample of ethnic matrices (N = 20) and separately for the African American matrices (n = 10). This analysis revealed that no predictions were more disconfirmed than others and no clear patterns of disconfirmation were found for specific models. These findings suggest that instances of disconfir- mation are due to sampling or measurement error rather than other factors in the fit of particular aspects of the three order models to the U.S. ethnic samples.
Effect sizes were calculated to determine the magnitude of the significant mean differences for Holland's order model. The effect sizes were calculated by subtracting the mean correspondence index for the U.S. benchmark sample from the mean correspondence index for the cross-cultural samples (separately for the U.S. ethnic samples and the international samples) and then dividing by the standard deviation of the correspondence index for the U.S. bench-
mark sample. The effect sizes were strikingly large: -1 .14 standard deviation units for the U.S. ethnic sample and - 1.57 standard deviation units for the international sample. The - 1.57 effect size, for example, indicates that the upper half of cases for the international sample were exceeded by 94% of the U.S. benchmark samples. It is clear that Hol- land's circular order model shows a poor fit to both the U.S. ethnic samples and international samples.
One possible explanation for the large difference in fit between the international samples and the U.S. benchmark samples for Holland's model is that model fit is moderated by how well the cross-cultural inventories assess Holland's RIASEC types. Recall that researchers used four assessment methods when studying Holland's model and measures in another country: (a) original U.S. RIASEC inventory, (b) adaptation of U.S. RIASEC inventory, (c) translation of U.S. RIASEC inventory, and (d) theory-constructed RIA- SEC inventory. Revising and adapting the items of a U.S. RIASEC inventory appears important to adequately repre- sent interests in different countries and culture groups. We expected, therefore, that the model fit should be better for inventories that were tailored (i.e., adaptations and transla- tions) to represent RIASEC interest domains of different
Table 3 Means and Standard Deviations of the Correspondence Index for the RIASEC Models by Cross-Cultural Group, Sex, Inventory, and Cross-Cultural Assessment Method
Holland Gati Alternative
Variable n M SD M SD M SD
All samples Total 96 .50 .19 .62 .22 .64 .22 Cross-cultural
group U.S. ethnic 20 .54 .22 .54 .26 .58 .25 International 76 .48 .18 .64 .20 .65 .21 U.S. benchmark 73 .70 .14 .66 .19 .65 .24 F(2, 166) 32.75** 2.76 1.09
Sex Male 38 .45 .19 .59 .20 .68 .22 Female 33 .51 .17 .62 .19 .64 .21 F(1, 69) 1.97 0.24 0.56
Inventory VPI 22 .50 .23 .56 .27 .62 .24 SDS 24 .45 .14 .67 .19 .68 .22 SII 10 .64 .19 .73 .17 .68 .25 VIT 12 .42 .16 .56 .21 .69 .10 F(3, 64) 3.35* 2.16 0.40
International Assessment
method U.S. edition Adaptation Translation Theory-
constructed F(3, 67)
samples only
18 .51 .17 .65 .19 .64 .22 16 .46 .15 .62 .19 .65 .23 15 .52 .18 .69 .20 .66 .25
22 .44 .15 .61 .20 .65 .19 1.04 0.56 0.03
Note. VPI = Vocational Preference Inventory; SDS = Self- Directed Search; SII = Strong Interest Inventory; VIT = Visual Interest Test. *p < .05. **p < .01.

320 ROUNDS AND TRACEY
cultures. Unexpectedly, as reported in Table 3, there were no significant differences in the fit of any of the models as a function of the types of cross-cultural RIASEC inventories.
Comparative model tests were conducted on the total matrix sample and then separately on the international ma- trices and the U.S. ethnic matrices. Repeated measures multivariate analyses of variance and post hoc paired t test comparisons of the correspondence indices across the three RIASEC models are presented in Table 4. For the total set of 96 RIASEC matrices, Holland's order model yielded significantly lower correspondence indices than either Gati 's or the alternative partition models. There was no difference in correspondence index values between Gati 's model and the alternative model. A similar pattern of rela- tive model fit was found when only the international matri- ces were examined; Gati 's and the alternative models were equal in fit and superior to Holland's circular order model. There were no differences in the fit of the three models for the U.S. ethnic samples: Each model fit equally well.
We evaluated the generalizability of the three models across the variables of sex and RIASEC measure. Sex differences in the structure of RIASEC types and differ- ences in the fit of RIASEC measures have been extensively studied on U.S. samples with mixed results (e.g., Gati, 1991; Tracey & Rounds, 1993). There were no significant differences between female and male participants with re- spect to the correspondence index values for each model as reported in Table 3. However, there were differences across the models. As shown in Table 4, the circular order model fit the RIASEC matrices less well than the two partition models for both male and female participants. A sex differ- ence, however, existed only in the relative fit of the two partition models. For the male participants, the alternative model fit the data better than Gati 's model, whereas for female participants, both models fit the data equally well. It
appears appropriate for male participants to separate A and S as is done in the alternative model, whereas for female participants, the placement of S does not seem to make a difference.
In comparing the fit of each model across RIASEC mea- sures, where there were an adequate number of matrices to enable statistical testing (i.e., Vocational Preference Inven- tory [VPI], Self-Directed Search [SDS], Strong Interest Inventory [SII], and Visual Interest Test [VIT]), differences were found only with respect to Holland's circular order model. As presented in Table 3, the SII had a better fit than the other RIASEC inventories. In examining the relative fit of the models within measure (see Table 4), there were significant differences found for the SDS and VIT but not for the SII and the VPI. The SDS and VIT poorly repre- sented the circular order model because the fit of Holland' s model was significantly poorer than the fit of the two partition models to the SDS and VIT matrices. The RIASEC inventory that yielded the best representation of each of the three models was the SII. That the SII has the best fit and the SDS has the worst fit mirrors recent results from analyses of U.S. RIASEC matrices (Rounds & Tracey, 1993).
Model Tests by Country
In the preceding analyses, the international sample repre- sented an aggregation of 76 matrices across 18 countries (excluding the U.S. ethnic sample). Grouping the matrices for the 18 countries together and conducting model com- parisons yielded answers to global questions about the uni- versality of RIASEC structures. Analyses on the interna- tional sample, a collection of 18 countries, however, raise several issues. First, the international sample analyses did not take into account the number of matrices per country. Of the 18 countries, 3 countries (Australia, n = 24; Canada n =
Table 4 Summary of the Results of the Repeated Measures MANOVAs and Paired t Tests Comparing the Correspondence Indices of RIASEC Models
Holland Holland vs. Gati vs. vs. Gaff Alternative Alternative Repeated measures
Group df t t t df F
Total 95 -6.66** -4.90** -0.64 2, 94 25.88** Cross-cultural
U.S. ethnic 19 -0.29 -0.56 -0.73 2, 18 .77 International 75 -8.28** -5.63** -0.44 2, 74 40.60**
Sex Male 35 -5.97** -5.70** -2.11" 2, 35 26.15"* Female 29 -3.61"* -2.84** -0.58 2, 31 7.44**
Inventory VPI 21 - 1.38 - 1.69 -0.91 2, 20 1.60 SDS 23 -7.29** -4.48** -0.25 2, 22 28.02** SII 9 - 1.57 -0.33 0.43 2, 22 1.10 VIT 11 -4.90** -7.01"* -3.27** 2, 10 26.66**
Note. MANOVAs = multivariate analyses of variance; VPI = Vocational Preference Inventory; SDS = Self-Directed Search; SII = Strong Interest Inventory; VIT = Visual Interest Test. *p < .05. **p < .01.

CROSS-CULTURAL STUDY OF RIASEC MODELS 321
10; and Guyana, n = 8) contributed over half of the 76 matrices, leaving open the possibility that several countries could bias the model comparison results. If a differential relation of model fit to country exist, an aggregate of international fit indexes without taking into account the number of matrices per country could lead to under- or overestimates of model fit. Second, and more important, aggregation leaves unexamined a central question of how well individual countries fit RIASEC structures.
We examined the potential biasing effect of aggregating the international fit indexes across country by using the mean correspondence index by country for the international sample (n = 18) and conducting a reanalysis, similar to the global model tests. The mean correspondence index for each country resulted in an equal weighting of the countries rather than countries being weighted by the number of samples.
We began the reanalysis by comparing the correspon- dence index values across three cross-cultural categories (U.S. benchmark, U.S. ethnic, and international) for each of the three models (Holland, Gati, and alternative). As found earlier, results were significant only for Holland's circular
order model, F(2, 108) = 15.73, p < .01. Post hoc Scheff6 t tests indicated that the U.S. benchmark samples fit signif- icantly better when compared with the international samples and the U.S. ethnic samples. We then conducted compari- sons of the correspondence indices across the three RIASEC models using repeated measures multivariate analyses of variance and post hoc paired t tests. Once again, the results were similar to the analyses using the aggregate interna- tional sample: Gati 's and the alternative models were equal in fit and superior to Holland's circular order model. It appears that the previous findings based on an aggregate international sample are fairly robust.
Figure 3 displays the mean correspondence values for 18 countries, the U.S. ethnic sample, and the U.S. benchmark sample by RIASEC model. The 18 countries and the U.S. ethnic sample in Figure 3 are ordered from left to right according to the size of the correspondence index for Hol- land's model. Several conclusions can be drawn from in- specting Figure 3. The circular order model when compared with the two partition models across the 18 countries shows a consistently poorer model fit. Only in the case of Iceland does the mean fit value of the circular order model exceed
1.0
.9
X .8
C: .7
O .6 c"
"O .5 c- O .4 O .
.3
.1
Japan Portugal Paraguay Brazil Colombia Australia New Malaysia Canada US Zealand Benchmark
Country Figure 3. Mean correspondence index values for 18 countries, the U.S. ethnic sample, and the U.S. benchmark sample by RIASEC model.

322 ROUNDS AND TRACEY
the mean fit values of the two partition models. When Gati's model and the alternative model are compared, neither partition model seems to show a superior model fit across the 18 countries. In general, the global analyses and the examination of the model fit by individual country yield similar conclusions.
The second question of how well individual countries fit RIASEC structures was evaluated by comparing the mean correspondence value of each country with the mean corre- spondence value for the U.S. benchmark sample. A 99% confidence interval was calculated for the correspondence index value of the U.S. benchmark sample for each RIA- SEC model. The lower bound 99% confidence interval for Holland's model is .66, Gati's model is .60, and the alter- native model is .58. For Holland's model, the mean corre- spondence values of Iceland, Japan, and Israel exceeded the lower bound confidence interval of the U.S. benchmark, demonstrating an acceptable fit for only 3 of the 19 cross- cultural groups. Comparing the mean correspondence val- ues for Gati's model showed that all cross-cultural groups except Canada, Guyana, New Guinea, and the U.S. ethnic sample showed a good model fit. For the alternative model, Australia, Israel, Malaysia, and the U.S. ethnic sample did not exceed the lower bound confidence interval of the U.S. benchmark. Across the three RIASEC models, only the U.S. ethnic sample when compared with the U.S. benchmark did not show an adequate fit to at least one of the models.
RIASEC in Australia
The majority of RIASEC matrices (n = 24) came from 12 separate research studies in Australia. We expected that Australian RIASEC matrices would fit Holland's circular order model as well as the U.S. benchmark matrices because both countries are English-speaking, Western nations and the occupational structure seems to be similar between the two countries. Nevertheless, the U.S. benchmark had a significantly better fit than the Australian sample, F(1, 95) = 30.12, p < .01. Of the 24 Australian matrices shown in Table 2, only 4 matrices (see studies by Athanasou, 1982; Naylor & Mount, 1986; Salas, 1986) exceeded the 99% confidence interval lower bound estimate for the U.S. benchmark sample. It is surprising that these 4 matrices were based on U.S. editions of the VPI and SII inventories rather than U.S. inventories that had been adapted for use in Australia.
One study, Lokan's (1988) adaptation of the Self- Directed Search, yielded matrices for male and female par- ticipants that in themselves could stand as Australian bench- marks. The 1977 American edition of the SDS was used as the basis for the Australian edition. The adaptation of the SDS involved expert review of the items and extensive item analyses. The SDS matrices presented in the manual were based on the normative sample, a random sample of 920 female and 849 male students enrolled in Year 9 to Year 11 in Australian secondary schools. Lokan compared the cor- relation matrices of the Australian edition with the correla- tion matrices of the 1977 and 1985 American editions,
reporting that the pattern of correlations supported Hol- land's model for the Australian and American editions.
We arrived at a somewhat different conclusion based on the analysis of Lokan's matrices shown in Table 2. The correspondence index for male participants is .22 and for female participants is .58, clearly indicating sex differences favoring female participants in the fit to Holland's model and that the Australian adaptation of the SDS, at least for male participants, does not fit Holland's model. In fact, as shown in Table 2, Lokan's Australian male sample had the poorest fit among 22 SDS cross-cultural samples and Lo- kan's female sample had a fairly good fit.
RIASEC in Canada
A completely unexpected finding was that the total set of Canadian matrices (n = 10) showed a significantly poorer model fit when compared with the U.S. benchmark matri- ces, F(1, 81 )= 43.92, p < .01. Only Trapnell's (1989) RIASEC matrix based on a U.S. edition of the VPI had a correspondence index of .71 that exceeded the 99% lower bound confidence interval of the U.S. benchmark. The rel- atively poor fit (M = .38) for the Canadian sample is due to six matrices (M = .29) based on the Visual Interest Test (VIT; T6treau & Trahan, 1986). The VIT is composed of 15 color slides for each Holland RIASEC type, showing work- ers performing occupational tasks. Directions and response formats (i.e., 5-point scale from dislike very much to like very much) are available in English, French, Portuguese, and Spanish. It is surprising that the VIT has shown a relatively better fit when used outside of Canada; across six matrices (see Table 2) based on male and female samples from Brazil, Colombia, and Paraguay, the mean correspon- dence index is .55.
The use of RIASEC inventories in Canada does present one case to compare the structural equivalence of English- language and French-language inventories. Harrington (1986) has developed a French and English Canadian edi- tion of the Career Decision-Making Inventory. As reported in Table 2, the correspondence indexes for the English and French editions were .64 and .26, respectively, suggesting that the English edition fit Holland's model better.
RIASEC in Guyana
Mercurius-Fraser's (1980) dissertation is frequently cited (e.g., Hansen, 1987; Holland, 1985a) as providing strong support for the cross-cultural applicability of Holland's measures and model. Her study is important principally because of the sampling and assessment methodology ap- plied to Guyana, an economically underdeveloped country and a multicultural society of African and East Indian descent. The VPI and SDS were administered to 831 sec- ondary students (ages 15-18) and 300 employed workers (ages 18-47); the workers were drawn from 12 occupations to represent the RIASEC types (2 occupations per type). A representative sample of Guyanese secondary students was obtained by using random sampling procedures applied to

CROSS-CULTURAL STUDY OF RIASEC MODELS 323
the secondary school level (27 schools randomly selected from educational districts) and then to the student level (random selection of students within schools). Mercurius- Fraser visually inspected the RIASEC correlation matrices and concluded that "Compared to the correlations given in the hexagonal model, correlations for this study were closer to the model than were Holland's" (p. 103).
We found, however, that the correspondence indexes were uniformly low, ranging from. 17 to .44, across the VPI and SDS (see Table 2). The mean correspondence index for the VPI is .26 and for the SDS is .34, across the four Guyanese samples, indicating a similar fit for the RIASEC inventories but also suggesting that Holland's model may not fit the Guyanese data. We further examined the fit of the Holland's circular order model to Mercurius-Fraser's (1980) male and female student samples by using nonmetric multidimensional scaling analysis (MDS; Kruskal & Wish, 1978). When applied to a RIASEC correlation matrix, MDS yields a spatial representation showing the similarity among RIASEC types. MDS has been often suggested (Fitzgerald & Hubert, 1987; Rounds & Zevon, 1983) as a method to evaluate Holland circular order structure.
MDS as implemented in SYSTAT (Wilkinson, 1989) was applied to the RIASEC matrices. A variety of different random starting configurations were used to minimize the possibility of obtaining an incomplete solution attributable to a local minimum. Figure 4 shows the two-dimensional solutions for the VPI and SDS, separately for the male and female student samples. For each solution, Holland's circu- lar arrangement of R-I-A-S-E-C types was not found. It should be noted that the SDS, male student matrix (see Figure 4, upper left RIASEC representation) yielded a de- generate solution, suggesting that a discrete (cluster) model may better represent the RIASEC relations. Our findings suggest that, contrary to received opinion, Holland's model does not fit the vocational preferences of Guyanese students.
RIASEC in the United States
It is surprising that the total set of 20 U.S. ethnic matrices, although fitting each RIASEC model equally well, showed a poor fit to all three models. For Holland' s order model, the
• R
•1
C E
S • A I
• R
BE
mS
mA
•C
SDS Male Students SDS Female Students Students
BE
i S • C
mR
HI mS
•A
nC
E
VPI Male Students VPI Female Students
Figure 4. Four multidimensional scaling solutions for the Self-Directed Search (SDS) and Vo- cational Preference Inventory (VPI) on male (n = 387) and female (n = 444) Guyanese samples. Data from Mercurius-Fraser (1980). R = realistic, I = investigative, A = artistic, S = social, E = enterprising, C = conventional.

324 ROUNDS AND TRACEY
large variability in fit among the ethnic samples is due to the two matrices drawn from Droz's (1990) dissertation. As shown in Table 2, Droz's matrices, based on a tenth to twelfth grade sample of African American male (correspon- dence index = - .01) and female students (correspondence index = .15), had the poorest fit across the total matrix sample (N = 96). Excluding Droz's matrices from the total set of ethnic matrices, however, still does not explain the overall poor fit of Holland's model.
The fit of Holland's model to each of the 20 matrices showed that 7 matrices had a good model fit when com- pared with the U.S. benchmark confidence interval. Five of these 7 matrices were based on the American College Test- ing Interest Inventory IV (ACT IV; Hanson, 1974), an inventory that has been shown to have desirable RIASEC structural properties (Rounds & Tracey, 1993). As shown in Table 2, with the exception of the American Indian male sample, the 8 ethnic matrices for the ACT IV (Lamb, 1974/1975), based on national norm samples, had the best fit among the 20 ethnic matrices. The partition models also fit the ACT IV data well. Apparently, the ACT IV results are an exception to the overall model fit data for the ethnic samples. It is unclear, however, how representative the ACT samples are of the four ethnic groups or whether these results can be attributed solely to the item characteristics of the ACT IV.
Finally, we calculated the mean correspondence indexes by ethnic group (excluding Droz's samples) for Holland's order model: African American (M = .59; n = 8), Hispanic (M = .57; n = 6), American Indian (M = .55; n = 2), and Asian American (M = .73; n = 2). The breakdown by ethnic group showed small variability among the groups, with only the Asian American sample clearly fitting Hol- land's model.
Variability Among Cross-Cultural Groups
When cross-cultural differences are identified, it is com- monly suggested that researchers should attempt to specify variables that account for the differences among cultures (Poortinga & Malpass, 1986; Poortinga & Van de Vijver, 1987; Sechrest, 1977). From this perspective (see Segall, 1984), culture is viewed as merely a label for a set of conditions (e.g., separate contextual variables) rather than an explanatory concept itself. We examined the covariation of the fit of each model with an index of economic devel- opment and Hofstede's (1980a) cultural values of individualism-collectivism and masculinity-femininity. Economic development is related to a nation's occupational structure, especially the distribution of kinds of occupations (Hall, 1975). Because Holland's RIASEC model and mea- sures are based on the U.S. occupational structure, we expected that more developed countries would show a better fit to the RIASEC models than the less developed countries.
Hofstede (1980a) identified four values (i.e., power dis- tance, individualism-collectivism, masculinity-femininity, and uncertainty avoidance) that reflect broad underlying dimensions of culture. These cultural dimensions are based
on results from factor analyses of questionnaire items from 40 countries. Two of the four values--individualism- collectivism and masculinity-femininity--may influence the development of vocational preferences in a country through the structure of choice and opportunity. Individualism-collectivism describes the relationship be- tween the individual and the social system. One conse- quence of highly individualistic countries on society is that belief is placed in individual decisions; in highly collectiv- istic countries, belief is placed on group decisions (Hof- stede, 1980b). Masculinity-femininity is the degree of mas- culinity of a society's dominant values--values such as assertiveness, money, and things--versus feminine values of caring for others and the quality of life. A consequence of high-masculinity countries on society is that sex roles are clearly differentiated (Hofstede, 1980a, 1980b). We ex- pected that countries with high collectivism and masculinity values would place constraints on the pattem of vocational preferences, leading to poorer model fits than countries with high individualism and femininity values.
Economic development was assessed with the gross do- mestic product per capita (GDPPC) for each of the 19 countries (as estimated by Orr, 1992). Hofstede (1980a) has calculated mean index values for the dimensions of individualism-collectivism and masculinity-femininity on 40 countries. We were able to match only 13 of the 19 countries with Hofstede's data base. The U.S. benchmark correspondence value was used rather than the mean corre- spondence value for the U.S. ethnic samples because the benchmark estimate was thought to be the best representa- tion of RIASEC model-data fit in the United States. The correlations of GDPPC and masculinity-femininity with the correspondence index across countries were nonsignificant for all three models. Individualism-collectivism, however, was significantly related to the fit only for the alternative partition model (Holland's model, r = .03, p > .05; Gati 's model, r = - . 14, p > .05; and alternative model, r -- - .63 , p < .05). Countries with more individualistic values fit the alternative partition model better than countries with more collective values.
Summary and Implicat ions
A startling finding was that regardless of the level of analysis, the cross-culture structural equivalence of Hol- land's circular order model was not supported. The global tests on the international sample and U.S. ethnic sample and the tests by country consistently showed a poor model fit. The model fit differences for the international sample com- pared with the U.S. benchmark were so large that 94% of the U.S. benchmark samples had a better fit than the inter- national samples. A similar fit difference was found for the comparison between the U.S. ethnic sample and the U.S. benchmark. The lack of fit for Holland's model generalized across 15 of 18 countries and cross-cultural assessment methods. The poor fit for Canada and Australia was espe- cially unexpected given that both countries have economies and occupational structures similar to the United States. For

CROSS-CULTURAL STUDY OF RIASEC MODELS 325
the total sample of cross-culture matrices, a poor fit was found for both male and female participants. Finally, Hol- land's model-fit differences among countries were not ex- plained by potential moderator variables--per capita gross national product and Hofstede's (1980a) cultural values of individualism-collectivism and masculinity-femininity.
The internal relations among the RIASEC types, repre- sented by a circle, are the cornerstone for Holland's (1985a) behavioral description of each personality type; the meaning of each personality type is derived from the nomological network of relations among all types. Because Holland's structure differed significantly across countries, it is possi- ble that the meaning and interpretations and the external correlates of the RIASEC types may also have changed in other countries. It is unclear from our results what specific interpretations associated with the RIASEC scales devel- oped in the United States can validly accompany their use in another country. Nevertheless, the structural results consti- tute a particularly strong warning that knowledge accumu- lated on RIASEC inventories in the United States cannot simply be applied to other countries.
The structure of Holland's RIASEC types has implica- tions not only for vocational theory but also for career counseling practices. A common use of the measures of Holland's types is to help individuals learn about their vocational interests and to assist individuals in matching their interests with occupations. That the interpretations of the RIASEC scales developed in the United States may not be applicable to other countries certainly calls into question the use of U.S. based RIASEC inventories in counseling practice in other countries. It is clear that test developers and counselors should not rely on interpretations developed on U.S. populations because Holland interpretations may not be applicable cross-culturally.
Gati's partition and the alternative partition achieved the best fit to the data. Both models represented the interna- tional samples and U.S. benchmark samples equally well, yielded similar fit to the data across RIASEC measures, and, most important, showed a better fit to the international samples than Holland's model. For the alternative partition, we were able to account for one third of the variability of the fit difference across 13 countries with Hofstede's (1980a) cultural value of individualism-collectivism.
Several differences in fit for Gati's model and the alter- native model were identified, but none of these differences present a compelling reason to recommend in general one partition model over the other. Across the 18 countries in the international sample, both models fit equally well for 12 countries. That leaves 6 countries in which a differential model fit was found. Gati's partition showed a relatively poor fit for Canada, Guyana, and Papua New Guinea and the alternative partition had a relatively poor fit for Austra- lia, Israel, and Malaysia. Thus, only in the case of a poor model fit to a specific country, for example, Gati's model in Canada, would one model (in this example, the alternative partition) be preferred over the other. An argument, how- ever, can be made that Gati's partition because it has un- dergone considerable research (see Gati, 1991, for a sum- mary), provides a better case than the alternative partition
for use in cross-cultural research and practice. On the other hand, the alternative partition may be the preferred model: It makes more predictions and therefore is a more fully specified model (accounts for more RIASEC relations) than Gati's partition.
The three order models fit the U.S. ethnic samples equally well, although the fit was poor for each model when com- pared with the U.S. benchmark. When ethnic groups were examined, results showed an equally poor fit to Holland's model for African American, Hispanic, and American In- dian samples. However, an adequate fit was identified for all three models on a subset of ethnic matrices based on ACT IV, suggesting that model fit may be moderated by sampling procedure or RIASEC inventory. Larger and more representative ethnic samples on a variety of RIASEC in- ventories need to be evaluated before we can conclude with certainty that available RIASEC models do not fit U.S. ethnic samples. Until more research is produced, the current results point to a lack of support for all three order models.
Although methodological reasons need to be ruled out first, several other, deeper explanations should be consid- ered for the results in the U.S. ethnic groups: culture and social factors. Many researchers writing on issues of career assessment with racial and ethnic minorities (see Walsh, 1994) have suggested that the responses to the items on vocational inventories are influenced by culture. Neverthe- less, researchers have only begun to explore questions of the extent to which culture influences (and how) the develop- ment of vocational preferences (Betz, 1992; Hackett & Watlons, 1995). Another explanatory framework for our results lies with the idea that structural characteristics of the society such as discrimination and poverty (Fitzgerald & Betz, 1994) have shaped vocational preferences by limiting access to opportunities in the educational and occupational environment. Ryan, Tracey, and Rounds (1996) evaluated the relations of gender and SES to the RIASEC structure with an African American sample and, contrary to expec- tations, found that low-SES African American students fit the circular model better than high-SES African American students or a White student sample. Both of these explana- t ions-cul ture and social factors--merit further research and discussion.
The failure of Holland's circular model and the success of the partition models suggests that less specified models that place a weak set of conditions on the RIASEC relations better generalize across nations. Holland's model is more fully specified than the partition models, with order predic- tions for 72 of the possible 105 total predictions that can be made among all pairs of RIASEC correlations. The partition models make many fewer predictions: 36 for Gati's model and 44 for the alternative model. Furthermore, the order predictions derived from the partition models have consid- erable overlap with Holland's order predictions. Our struc- tural results suggest that a subset of order predictions is invariant across countries. Identifying specific order predic- tions that show cross-cultural invariance, however, would take many more samples than are presently available.
We urge caution in interpreting these results because the number of samples and the sample sizes are small for the

326 ROUNDS AND TRACEY
U.S. ethnic groups and the countries that formed the inter- national sample. American Indians and Asian Americans, for example, were represented by only two samples, each drawn from the same source (i.e., American College Testing norm sample). It is puzzling, given the number of interest inventories sold every year (estimates vary from 4 to 6 million) and the centrality of vocational interests to career counseling, that few representative ethnic samples were available for study. In a similar vein, many countries are represented by only two samples (male and female) from a single study, raising not only issues of sample adequacy but also method dependency. We suggest, therefore, that the model fit results be considered as (a) a counterpoint to previous conclusions (e.g., Hansen, 1987; Holland, 1985a) that Holland's circular model generalizes across cultures; and (b) a caveat to test authors, publishers, and users that the knowledge developed on Holland's model using U.S. ma- jority samples may not be applicable to cross-cultural groups. Although the results failed to support Holland's model, two discrete models, based on partitioning the RIA- SEC types, were found to be invariant across the majority of countries studied and deserve increased attention in research investigating the cross-cultural structure of vocational interests.
References
American College Testing Program. (1977). Handbook for the ACT Career Planning Program. Iowa City, IA: Author.
American College Testing Program. (1988). Interim psychometric handbook for the 3rd edition ACT Career Planning Program. Iowa City, IA: Author.
Arbona, C. (1990). Career counseling research and Hispanics: A review of the literature. Counseling Psychologist, 18, 300-323.
Athanasou, J. A. (1982, February). Factor analysis of male and female responses on the vocational interest scales of the Voca- tional Preference Inventory. Paper presented at the Australian Council for Educational Research, Melbourne, Victoria, Austra- lia.
Athanasou, J. A. (1986a). A Vocational Interest Survey: Six ex- perimental scales for the measurement of Holland's vocational types. In J. L. Lokan & K. F. Taylor (Eds.), Holland in Australia (pp. 139-148). Melbourne: Australian Council for Educational Research.
Athanasou, J. A. (1986b). An outline of the development of the Vocational Interest Survey and preliminary technical data. (Re- port No. ISBN 0-7305-2116). Darlinghurst, Australia: New South Wales Department of Industrial Relations and Employ- ment, Human Resources Division. (ERIC Document Reproduc- tion Service No. ED 280 863).
Athanasou, J.A. (1989). Self-reports of vocational interests: In- strumentation and validity. Australian Psychologist, 24, 61-69.
Athanasou, J. A., O'Gorman, J., & Meyer, E. (1981). Factorial validity of the vocational interest scales of the Holland Voca- tional Preference Inventory for Australian high school students.
- Educational and Psychological Measurement, 41, 523-527. Athanasou, J. A., O'Gorman, J., & Meyer, E. (1986). Two com-
parisons of the Holland and Eysenck personality typologies among Australian high school students. In J. L. Lokan & K. F. Taylor (Eds.), Holland in Australia (pp. 52-60). Melbourne: Australian Council for Educational Research.
Ben-Porath, Y. S. (1990). Cross-cultural assessment of personal-
ity: The case for replicatory factor analysis. In J. N. Butcher & C.D. Spielberger (Eds.), Advances in personality assessment (Vol. 8, pp. 27-48). Hillsdale, NJ: Erlbaum.
Betz, N. E. (1992). Career assessment: A review of critical issues. In S. D. Brown & R. W. Lent (Eds.), Handbook of counseling psychology (2nd ed., pp. 453-484). New York: Wiley.
Bingham, R. P. (1978). The concurrent validity of two measures operationalizing Holland's theory using a sample of college degreed Black women (Doctoral dissertation, Ohio State Uni- versity, 1977). Dissertation Abstracts International, 38, 3849B.
Borgen, F. H. (1986). New approaches to the assessment of inter- ests. In W. B. Walsh & S. H. Osipow (Eds.), Advances in voca- tional psychology: Vol. 1. The assessment of interests (pp. 83- 125). Hillsdale, NJ: Erlbaum.
Boyle, G.J. (1992). [Self-Directed Search RIASEC correlation matrix for 401 apprentice plumbers]. Unpublished raw data.
Boyle, G. J., & Fabris, S. (1992). LISREL analyses of the RIASEC model: Confirmatory and congeneric factor analysis of Hol- land's Self-Directed Search. Personality and Individual Differ- ences, 13, 1077-1084.
Bull, P.E. (1975). Structure of occupational interests in New Zealand and America on Holland's typology. Journal of Coun- seling Psychology, 22, 554-556.
Buss, A. R., & Royce, J. R. (1975). Detecting cross-cultural com- monalities and differences: Intergroup factor analysis. Psycho- logical Bulletin, 82, 128-136.
Butcher, J.N., & Pancheri, P. (1976). A handbook of cross- national MMPI research. Minneapolis, MN: University of Min- nesota Press.
Campbell, D. P., & Holland, J. L. (1972). A merger in vocational interest research: Applying Holland's theory to Strong's data. Journal of Vocational Behavior, 2, 353-376.
Carroll, J.A. (1986). Revision of Holland's VPI for use with Brisbane metropolitan high school students. In J. L. Lokan & K. F. Taylor (Eds.), Holland in Australia (pp. 149-161). Mel- bourne: Australian Council for Educational Research.
Carter, R. T., & Swanson, J. L. (1990). The validity of the Strong Interest Inventory with Black Americans: A review of the liter- ature. Journal of Vocational Behavior, 36, 195-209.
Cattell, R. B. (1973). Personality and mood by questionnaire. San Francisco: Jossey-Bass.
Center of Interest Measurement Research. (1988). A bibliography for the Strong Vocational Interest Blank (SVIB) Strong- Campbell Interest Inventory (SCII). Minneapolis: Department of Psychology, University of Minnesota.
Chartrand, J. M. (1992). Research and application using Holland's typology: Reactions from a scientist-practitioner perspective. Journal of Vocational Behavior, 40, 194-200.
Dawis, R.V. (1992). The structure(s) of occupations: Beyond RIASEC. Journal of Vocational Behavior, 40, 171-178.
Docking, R. A., & Thornton, J. A. (1980). Vocational preference, anxiety, and educational self-theory of high school students. Paper presented at the annual meeting of the American Educa- tional Research Association, Boston, MA, (ERIC Document Reproduction Service No. ED 185 328).
Droz, E. (1990). Race and gender variables and the structure of vocational interests: A reexamination of the Holland model (Doctoral dissertation, State University of New York at Buffalo, 1990). Dissertation Abstracts International, 51, 742A.
Dupont, J.B. (1979). lnventaire Personnel de J.L. Holland. Issy-les-Moulineaux, France: Editions Scientifiques et Psy- chologiques.
Erlianto, W.S. (1982). A study of vocational choices of male Indonesian college students as related to personality pattern.

CROSS-CULTURAL STUDY OF RIASEC MODELS 327
Dissertation Abstracts International, 43, 1834A. (University Microfilms No. DA8225386).
Eysenck, H. J. (1986). Cross-cultural comparisons: The validity of assessment indices of factor comparisons. Journal of Cross- Cultural Psychology, 17, 506-515.
Ferreira, J. A. G. (1990). The development and validation of a vocational interest inventory and its relationship to personality characteristics (Doctoral dissertation, University of Iowa, 1989). Dissertation Abstracts International, 51, 414A.
Fitzgerald, L.F., & Betz, N.E. (1994). Career development in cultural context: The role of gender, race, class, and sexual orientation. In M. L. Savikas & R. W. Lent (Eds.), Convergence in career development theories: Implications for science and practice (pp. 103-117). Palo Alto, CA: CPP Books.
Fitzgerald, L. F., & Hubert, L.J. (1987). Multidimensional scal- ing: Some possibilities for counseling psychology. Journal of Counseling Psychology, 34, 469-480.
Fitzsimmons, G., & Melnychuk, D. (1979). The concurrent valid- ity of the Canadian Occupational Interest Inventory and the Self-Directed Search. Canadian Counsellor, 13, 219-224.
Fouad, N.A., Cudeck, R., & Hansen, J.C. (1984). Convergent validity of the Spanish and English forms of the Strong- Campbell Interest Inventory for bilingual Hispanic high school students. Journal of Counseling Psychology, 31, 339-348.
Fouad, N. A., & Dancer, L. S. (1992). Cross-cultural structure of vocational interests. Journal of Vocational Behavior, 40, 129- 143.
Gaff, I. (1979). A hierarchical model for the structure of vocational interests. Journal of Vocational Behavior, 15, 90-106.
Gaff, I. (1982). Testing models for the structure of vocational interests. Journal of Vocational Behavior, 21, 164-182,
Gati, I. (1991). The structure of vocational interests. Psychological Bulletin, 109, 309-332.
Gendre, F. (1975). Etude des relations entre l'inventaire personnel de J. L. Holland et l'adjective check-list de H. Gough [The study of the relationship between the personnel inventory by J. L. Holland and Adjective Check List by H. Gough]. Travail Hu- main, 38, 265-267.
Griffeth, R. W., &Hom, P.W. (1987). Some multivariate com- parisons of multinational managers. Multivariate Behavioral Research, 22, 173-191.
Hackett, G., & Watkins, C.E., Jr. (1995). Research in career assessment: Abilities, interests, decision making, and career development. In W. B. Walsh & S. H. Osipow (Eds.), Handbook of vocational psychology: Theory, research, and practice (2nd ed., pp. 181-215). Mahwah, NJ: Erlbaum.
Haire, M., Ghiselli, E.E., & Porter, L.W. (1966). Managerial thinking: An international study. New York: Wiley.
Hall, R. H. (1975). Occupations and the social structure (2nd ed.). Englewood Cliffs, NJ: Prentice Hall.
Hansen, J. C. (1987). Cross-cultural research on vocational inter- ests. Measurement and Evaluation in Counseling and Develop- ment, 19, 163-176.
Hansen, J. C. (1992). Does enough evidence exist to modify Hol- land's theory to accommodate the individual differences of diverse populations? Journal of Vocational Behavior, 40, 188- 193.
Hansen, J. C., & Campbell, D. P. (1985). Manual for the Strong Interest Inventory (4th ed.). Palo Alto, CA: Consulting Psychol- ogists Press.
Hanson, G.R. (1974). Assessing the career interests of college youth: Summary of research and applications (ACT Research Report No. 67). Iowa City, IA: American College Testing Pro- gram.
Harrington, T.F. (1986). The construct validity of the Career Decision-Making System cross-culturally. International Journal for the Advancement of Counselling, 9, 331-339.
Harrington, T.F., & O'Shea, A.J. (1980). Applicability of the Holland (1973) model of vocational development with Spanish- speaking clients. Journal of Counseling Psychology, 27, 246- 251.
Harrington, T. F., & O'Shea, A. J. (1982). The Harrington-O'Shea Career Decision-Making System manual. Circle Pines, MN: American Guidance Service.
Harrington, T.F., & O'Shea, A.T. (1993). The Harrington- O'Shea Career Decision-Making System Revised manual. Circle Pines, MN: American Guidance Service.
Hesketh, B., & Rounds, J. (1995). International cross-cultural approaches to career development. In W.B. Walsh & S.H. Osipow, Handbook of vocational psychology: Theory, research, and practice (2nd ed., pp. 367-390). Mahwah, NJ: Erlbaum.
Hicks, R.E. (1980). The assessment of vocational interests of literate indigenes of Papua New Guinea (Doctoral dissertation, University of South Africa, 1978). Dissertation Abstracts Inter- national, 40, 4410A.
Hofstede, G. (1980a). Culture's consequences: International dif- ferences in work-related values. Beverly Hills, CA: Sage.
Hofstede, G. (1980b). Motivation, leadership, and organization: Do American theories apply abroad? Organizational Dynamics, 9, 42-63.
Holland, J. L. (1959). A theory of vocational choice. Journal of Counseling Psychology, 6, 35-45.
Holland, J.L. (1966). The psychology of vocational choice. Waltham, MA: Blaisdell.
Holland, J.L. (1973). Making vocational choices: A theory of careers. Englewood Cliffs, NJ: Prentice Hall.
Holland, J. L. (1985a). Making of vocational choices: A theory of vocational personalities and work environments (2nd ed.). Englewood Cliffs, NJ: Prentice Hall.
Holland, J.L. (1985b). Manual for the Vocational Preference Inventory. Odessa, FL: Psychological Assessment Resources.
Holland, J.L. (1985c). The Self-Directed Search: Professional manual. Odessa, FL: Psychological Assessment Resources.
Holland, J. L., & Gottfredson, G. D. (1990). An annotated bibli- ography for Holland's theory of vocational personalities and work environments. Baltimore, MD: Johns Hopkins University.
Holland, J. L., & Gottfredson, G. D. (1992). Studies of the hexa- gon model: An evaluation (or, the perils of stalking the perfect hexagon). Journal of Vocational Behavior, 40, 158-170.
Hubert, L., &Arabie, P. (1987). Evaluating order hypotheses within proximity matrices. Psychological Bulletin, 102, 172- 178.
Hui, C.H., & Triandis, H.C. (1985). Measurement in cross- cultural psychology: A review and comparison of strategies. Journal of Cross-Cultural Psychology, 16, 131-152.
Irvine, S.H., & Carroll, W.K. (1980). Testing and assessment across cultures: Issues in methodology and theory. In H.C. Triandis & J. W. Berry (Eds.), Handbook of cross-cultural psy- chology: Vol. 2. Methodology (pp. 181-244). Boston: Allyn & Bacon.
Jackson, D. N. (1986). Career Directions Inventory manual. Port Huron, MI: Research Psychologists Press.
Jin, S. (1987). The factorial structure of the Holland typology in Chinese high school students: Sex differences (Doctoral disser- tation, University of Illinois at Urbana-Champalgn, 1986). Dis- sertation Abstracts International, 47, 2512A.
Johansson, C.B. (1986). Career Assessment Inventory: The en- hanced version. Minneapolis, MN: National Computer Systems.

328 ROUNDS AND TRACEY
Khan, S.B. (1992). [Self-Directed Search RIASEC correlation matrix for 133 female and 243 male Pakistani college students]. Unpublished raw data.
Khan, S.B., & Alvi, S.A. (1991). The structure of Holland's typology: A study in a non-western culture. Journal of Cross- Cultural Psychology, 22, 283-292.
Khan, S. B., Alvi, S. A., Shaukat, N., Hussain, M. A., & Baig, T. (1990). A study of the validity of Holland's theory in a non- western culture. Journal of Vocational Behavior, 36, 132-146.
Konrads, S. (1990). Cross-cultural cross-validation of the lawyer and engineer scales for linguistically equivalent forms of the Strong-Campbell Interest Inventory (Doctoral dissertation, Uni- versity of Minnesota, 1990). Dissertation Abstracts Interna- tional 51, 2669B.
Koyo Shokugyo Sogo Kenkyujo [Employment and Vocational Research Institute]. (1985). VPI Shokugyo Kyomi Kensa Tebiki [Vocational Preference Inventory (VPI) manual]. Tokyo: Nihon Bunka Kagakusha.
Kruskal, J.B., & Wish, M. (1978). Multidimensional scaling. Beverly Hills, CA: Sage.
Kuder, F. (1988). Kuder E General Interest Survey, general man- ual. Chicago: SRA/Pergamon Press.
Lamb, R. R. (1975). Concurrent validity of the American College Testing Interest Inventory for minority group members (Doctor- al dissertation, University of Iowa, 1974). Dissertation Abstracts International, 35, 4161A.
Lokan, J. (1988). The Self-Directed Search professional manual (Australian supplement). Hawthorn: Australian Council for Ed- ucational Research.
Lokan, J. J., & Taylor, K. F. (Eds.). (1986). Holland in Australia: A vocational choice theory in research and practice. Melbourne: Australian Council for Educational Research.
Lonner, W. J. (1990). An overview of cross-cultural testing and assessment. In R. W. Brislin (Ed.), Applied cross-cultural psy- chology (Vol. 14, pp. 56-76). Newbury Park, CA: Sage.
Lonner, W. J., & Ibrahim, F. (1989). Assessment in cross-cultural counseling. In P. Pedersen, J. G. Draguns, W. J. Lonner, & J. E. Trimble (Eds.), Cross-cultural counseling (3rd ed., pp. 299- 333). Honolulu: University of Hawaii Press.
Lunneborg, P. W. (1981). Vocational Interest Inventory (VII) man - ual. Los Angeles: Western Psychological Services.
Malpass, R. S., & Poortinga, Y. H. (1986). Strategies for design and analysis. In W. J. Lonner & J. W. Berry (Eds.), Field meth- ods in cross-cultural research (Vol. 8, pp. 47-83). Newbury Park, CA: Sage.
Meir, E.I. (1992). [Self-Directed Search (Hebrew translation) RIASEC correlation matrix]. Unpublished raw data.
Meir, E. I., & Ben-Yehuda, A. (1976). Inventories based on Roe and Holland yield similar results. Journal of Vocational Behav- ior, 8, 269-274.
Mercurius-Fraser, E.P. (1980). Personality types and vocational choice: A test of Holland's theory with samples of Guyanese students and employed persons. Dissertation Abstracts Interna- tional 41, 600A. (University Microfilms No. 8018353).
MOW International Research Team. (1987). The meaning of work- ing. London: Academic Press.
Naylor, F. D., & Mount, T. J. (1986). Issues in the generality of Holland's hexagonal model. In J.L. Lokan & K.F. Taylor (Eds.), Holland in Australia (pp. 19-25). Melbourne, Australia: Australian Council for Educational Research.
Naylor, F.D., & Thorneycroft, P.W. (1986). The relations be- tween Holland's and Eysenck's types: A further perspective. In J. L. Lokan & K.F. Taylor (Eds.), Holland in Australia (pp.
61-67). Melbourne: Australian Council for Educational Re- search.
Orr, B. (1992). The global economy in the 90s. New York: New York University Press.
Peiser, C. (1984). The use of Holland's typology and interest inventory in Israel. Journal of Social Psychology, 123, 169-178.
Poortinga, Y.H., & Malpass, R.S. (1986). Making inferences from cross-cultural data. In W. J. Lonner & J. W. Berry (Eds.), Field methods in cross-cultural research (Vol. 8, pp. 17-46). Newbury Park, CA: Sage.
Poortinga, Y.H., & Van de Vijver, F. J. R. (1987). Explaining cross-cultural differences. Journal of Cross-Cultural Psychol- ogy, 18, 259-282.
Prediger, D. J. (1982). Dimensions underlying Holland's hexagon: Missing link between interests and occupations? Journal of Vocational Behavior, 21, 259-287.
Rounds, J.B. (1995). Vocational interests: Evaluating structural hypotheses. In D. Lubinski & R.V. Dawis (Eds.), Assessing individual differences in human behavior: New concepts, meth- ods, and findings (pp. 177-232). Palo Alto, CA: Consulting Psychologists Press.
Rounds, J., & Tracey, T. J. (1993). Prediger's dimensional repre- sentation of Holland's RIASEC circumplex. Journal of Applied Psychology, 78, 875-890.
Rounds, J., Tracey, T. J., & Hubert, L. 0992). Methods for eval- uating vocational interest structural hypotheses. Journal of Vo- cational Behavior, 40, 239-259.
Rounds, J. B., Jr., Davison, M. L., & Dawis, R. V. (1979). The fit between Strong--Campbell Interest Inventory General Occupa- tional Themes and Holland's hexagonal model. Journal of Vo- cational Behavior, 15, 303-315.
Rounds, J. B., Jr., & Zevon, M. A. (1983). Multidimensional scal- ing research in vocational psychology. Applied Psychological Measurement, 7, 491-510.
Ryan, J. M., Tracey, T. J. G., & Rounds, J. (1996). Generalizabil- ity of Holland's structure of vocational interests across ethnicity, gender, and socioeconomic status. Journal of Counseling Psy- chology, 43, 330-337.
Salas, R. G. (1986). Investigations of a more realistic approach to measuring vocational interests in a selection setting. In J.L. Lokan & K.F. Taylor (Eds.), Holland in Australia (pp. 161- 167). Melbourne: Australian Council for Educational Research.
Salleh, A. H. M. (1985). An investigation of the reliability, valid- ity, and translation of Holland's Self-Directed Search for utili- zation by a Malaysian population (Doctoral dissertation, West- ern Michigan University, 1984). Dissertation Abstracts International, 46, 77A.
Sechrest, L. (1977). On the need for experimentation in cross- cultural research. In L. L. Alder (Ed.), Annals of the New York Academy of Sciences: Issues in cross-cultural research (Vol. 285, pp. 104-118). New York: New York Academy of Sciences.
Sedlacek, W.E. (1992). [Self-Directed Search RIASEC correla- tion matrix for 298 African American college freshman]. Un- published raw data.
Segall, M. H. (1984). More than we need to know about culture, but are afraid not to ask. Journal of Cross-Cultural Psychology, 15, 153-162.
Strong, E. K., Jr. (1943). Vocational interests of men and women. Stanford, CA: Stanford University Press.
Subich, L. M. (1992). Holland's theory: "Pushing the envelope." Journal of Vocational Behavior, 40, 201-206.
Swanson, J.L. (1992). The structure of vocational interests for African-American college students. Journal of Vocational Be- havior, 40, 129-143.

CROSS-CULTURAL STUDY OF RIASEC MODELS 329
Taylor, K.F., Kelso, G. I., Pretty, H.I., & Power, P. G. (1980). Some cultural and sex differences in responses to the VPI: An Australian-American comparison (Melbourne Psychology Re- ports, No. 65). Melbourne, Victoria, Australia: University of Melboume, Department of Psychology.
Trtreau, B., & Trahan, M. (1986). Test Visuel d'lnt~r~ts T~treau- Trahan, manuel d'Usage (2e 6dition) [Trtreau-Trahan Visual Interest Test, user manual]. Montrral, Quebec, Canada: Secorp.
Trtreau, B., & Trahan, M. (1989). Teste Visual de lnteresses T~treau-Trahan, Manual para uso do test [Trtreau-Trahan Vi- sual Tests of Interests, user manual for the test]. Montrral, Quebec, Canada: Secorp.
T6treau, B., & Trahan, M. (1992). Test Visual e Inventario Verbal de Intereses Profesionales (TVI-1VIP), manual de usa [Visual Test and Verbal Inventory of Professional Interests, use manual] (edici6n castellana). Montrral, Quebec, Canada: Secorp.
Tinsley, H. E. A. (Ed.). (1992). Special issue on Holland's theory. Journal of Vocational Behavior, 40(2).
Tracey, T.J., & Rounds, J. (1993). Evaluating Holland's and Gati's vocational interest models: A structural meta-analysis. Psychological Bulletin, 113, 229-246.
Trapnell, P. D. (1989). Structural validity in the measurement of Holland's vocational typology: A measure of Holland's types scaled to an explicit circumplex model. Unpublished master's thesis, University of British Columbia, Vancouver, Canada.
Tuck, B. F., & Keeling, B. (1980). Sex and cultural differences in the factorial structure of the Self-Directed Search. Journal of Vocational Behavior, 16, 105-114.
Tuck, B. F., & Keeling, B. (1986). Sex and cultural differences in the factorial structure of the Self-Directed Search. In J. L. Lokan & K. F. Taylor (Eds.), Holland in Australia (pp. 11-18). Mel- bourne, Victoria: Australian Council for Educational Research.
U.S. Department of Labor. (1979). Guide for occupational explo- ration. Washington, DC: U.S. Government Printing Office.
Van de Vijver, F. J. R., & Poortinga, Y. H. (1991). Testing across cultures. In R. K. Hambleton & J. N. Zaal (Eds.), Advances in educational and psychological testing: Theory and applications (pp. 277-309). Dordrecht, The Netherlands: Kluwer.
Varesini, M.I., & Giret, R.C. (1986). Test no verbal para la medicion de los intereses profesionales y vocacionales: "T.V.LT.T." T~treau-Trahan ]Nonverbal test for the measure- ment of professional and vocational interests: Trtreau-Trahan T.V.I.T.T.]. Asuncion, Paraguay: National University of Asun- cion, Department of Psychology.
Wakefield, J. A., & Doughtie, E. B. (1973). The geometric rela- tionship between Holland's personality typology and the Voca- tional Preference Inventory. Journal of Counseling Psychology, 20, 513-518.
Wakefield, J. A., Jr., Yom, B. L., Doughtie, E. B., Chang, W. C., & Alston, H.L. (1975). The geometric relationship between Holland's personality typology and the Vocational Preference Inventory for Blacks. Journal of Counseling Psychology, 22, 58-60.
Walsh, W.B. (Ed.). (1994). Special feature: Career assessment with racial and ethnic minorities. Journal of Career Assessment, 2 (3).
Watldns, D. (1989). The role of confirmatory factor analysis in cross-cultural research. International Journal of Psychology, 24, 685-701.
Wilkinson, L. (1989). SYSTAT: The system for statistics. Evanston, IL: SYSTAS.
Received November 27, 1995 Revision received February 22, 1996
Accepted February 27, 1996
Low Publication Prices for APA Members and Affiliates
Kee pin g you u p-t o-da te . All APA Fellows, Members, Associates, and Student Affiliates receive--as part of their annual dues--subscriptions to theAmerican Psychologist andAPA Monitor. High School Teacher and International Affiliates receive subscriptions to theAPA Monitor, and they may subscribe to the American Psychologist at a significantly reduced rate. In addition, all Members and Student Affiliates are eligible for savings of up to 60% (plus a journal credit) on all other APA journals, as well as significant discounts on subscriptions from cooperating societies and publishers (e. g., the American Association for Counseling and Development, Academic Press, and Human Sciences Press).
Essential resources. APA members and affiliates receive special rates for purchases of APA books, including the Publication Manual o f the American PsychologicalAssociation, and on dozens of new topical books each year.
Other benefits of membership. Membership in APA also provides eligibility for competitive insurance plans, continuing education programs, reduced APA convention fees, and specialty divisions.
M o re i n fo rm at ion. Write to American Psychological Association, Membership Services, 750 First Street, NE, Washington, DC 20002-4242.