Delta Sensorless Vector Control Compact ... - Delta Electronics
Upload
independentCategory
view
0download
0
Available online at www.sciencedirect.com
1877–0428 © 2011 Published by Elsevier Ltd. Selection and/or peer-review under responsibility of The 2nd International Geography Symposium-Mediterranean Environmentdoi:10.1016/j.sbspro.2011.05.180
Procedia Social and Behavioral Sciences 19 (2011) 641–650
The 2nd International Geography Symposium GEOMED2010
Creation of GIS digital land resources database of the Nile delta, Egypt, for optimal soil management
Abd-Alla Gada*, R. Alib
aNational Authority for remote sensing and space Sciences, Cair, P.Box 1564 Alf Masken, Cairo, Egypt bSoils and Water Use Dept. National Research Centre, Tahreer Street, Dokki, Giza, Egypt
Abstract
The National development plans mainly aim to conserve the arable lands in the Nile Valley and Delta, in addition to the Oases and desert fringes. Moreover, increasing land productivity is an important National goal for controlling the gap between food production and consumption. Therefore, providing accurate and integrated information about land resources is a must, especially with the accelerated progress of information technology. Such information would be the base for planning, decision making and research needs. Various available information and database systems were employed (e.g. ArcGIS, ERDAS IMAGINE and ENVI). Data of previous soil survey activities were the bases for the created GIS digital database. Soils survey maps (SCALE 1: 100,000), were prepared as GIS ready maps. Other thematic information layers were imported to the GIS model representing the networks of irrigation and drainage, roads, railways and utilities, each layer includes different categories. Urban settlements were updated using recent ETM+ and SPOT satellite images. An intensive field investigation was performed in the study region, with the purpose of representing the soil units and collecting ground control points and soil samples for laboratory analyses. The created digital land resources database was used to figure the distribution of soil units and to evaluate and map land capabilities on the bases of FAO, 1985 [1]. It was found that the Entisols soil order characterize most of the alluvial soils of Nile Delta, while Aridisols cover a limited area. The soil orders Entisols and Aridisols were found dominating the western desert fringes of the Delta. The results showed that 41.16% of the Delta soils are classified as highly capable, corresponding with Vertic Torrifluvents soil sub-great group. The moderately capable soils, which correspond to Typic Torrifluvents sub-great groups, exhibit 8.00% of the Delta. The low capable soils, corresponding to sub-great groups Aquic Torrifluvents, Typic Haplocalcids and Typic Quartizipsamments represent 17.59% of the Delta located mainly around its northern lakes. The very low capable soils dominate the soils of lacustrine and desert deposits, representing 35.25% of the Delta. It could be pointed out that achieving such detailed digital land resources database for local administrations is a great step towards the implementation of sustainable development and management programs. It is characterized by its comprehensiveness, geographical accuracy and updatability. In the current Era of distinctive progress in information technology, such data can be handled, enhanced and exchanged by different users and authorities. The most striking findings noticed was the urban encroachment on the account of most fertile soils; hence shrinkage in areas of high agricultural capabilities. On the other hand, urbanization doesn’t extend largely to low capable land. It was also noticed that a common unbalance between irrigation and drainage system networks is often and may lead to progress of salinization and land degradation.
© 2011 Published by Elsevier Ltd. Selection and/or peer-review under responsibility of Recep Efe and
Munir Ozturk
Keywords: GIS, Remote sensing, Land resources, databases, Nile Delta, Egypt
* Corresponding author. +/2012/3568182 - Fax: +/202/6225833 E-mail address: [email protected]
© 2011 Published by Elsevier Ltd. Selection and/or peer-review under responsibility of The 2nd International Geography Symposium-Mediterranean Environment

642 Abd-Alla Gad and R. Ali / Procedia Social and Behavioral Sciences 19 (2011) 641–650
( )
1. Introduction
The rapid increase of Egyptian population rate, cause a shortage in the per capita share of natural resources. Raising land productivity, in addition to desert land reclamation are major aims of sustainable agriculture development plans. However, realizing these purposes requires availability of accurate documented data for integrated natural resources. Techniques of remote sensing and Geographical Information Systems (GIS) provide suitable means for inventory monitoring and documentation of natural resources, as they are characterized by satisfactory resolution and multi-spectrality. Also, distribution of the natural resources and detection of their changes are accessible by multi-temporal space data nature. The current article is derived from the activities of the Project "Preparation of land resources data base for agricultural usage", which was housed in the National Authority for Remote Sensing and Space Sciences (NARSS) , and was funded by the Academy of Scientific Research and Technology (ASRT) aimed at documenting the Egyptian thematic maps. It is the first attempt in Egypt to prepare a digital geographic information land resources database for the Nile alluvial soils and the desert fringes. The author acknowledges the support of ASRT and NARSS research staff.
2. Materials used
The soil maps of Egypt [2] are the main materials collected and converted to the digital format. The collected soil maps cover the arable land, the fringes between the alluvial Nile Delta and the Desert fringes. The collected maps consist of a number of 12 map sheets at scale of 1: 100,000 in analogue format, covering the whole of Nile Delta region. Topographic maps at scale 1: 50,000 covering the whole course of Nile Delta, produced by the Egyptian General Survey Authority (EGSA) were converted to a digital format.
Satellite ETM images of 2004, covering the whole territory of Egypt amount 64 scenes. A number of seven scenes, covering the Nile Delta, were collected and processed to be included in the GIS land resources database and be used in thematic mapping processes. The recent SPOT images of 2006 were obtained from NARSS receiving station, and processed for updating different thematic maps and detecting changes in land use land cover.
The Shuttle Radar Topographic Mission (SRTM) images of 30 pixel size resolution, in addition to driven Digital Elevation Module (DEM) for the study area and its surrounding were consulted to represent the area landscape [3] and [4].
3. Methodologies
3.1. Coding the Soil Units:
In order to input the soil maps in the geographic information database, it was necessary to codify the mapping units. It was found that the number of soil sub-great groups identified in the soil map of Egypt [2] amount to 20. These units belong to three soil orders (i.e. Entisoil, Vertisols and Aridisols), classified down to the level of sub - great group, according to USDA [5]. Coding the soil units ought to be indicative to the soil taxonomy, properties, as well as the landscape.
3.2. Satellite images processing
Pre-processing activities were performed, to reduce some undesired variations/noises and to enhance other desired features. It commonly comprises a series of sequential operations, including radiometric correction or normalization, image registration, geometric correction, masking and image enhancement (e.g., for clouds, water, irrelevant features). Geometric rectification of the imagery was applied using ERDAS IMAGIN. This becomes especially important when scene to scene comparisons of individual pixels in applications such as change detection are being sought [6]. Image enhancement techniques (e.g. contrast stretching, Gray-level threshold, Level slicing, and spatial stretch) were tested to improve the visual interpretability of the used images by increasing the apparent distinction between the features.
3.3. Building GIS database
The digitizing specification of maps was defined according to the available themes. A number of 12 thematic layers, in addition to the geographic grid layer, were defined to be included in the geographic database. Each theme was subdivided into sub-themes, which were coded for the purpose of GIS modeling. The different digital maps were corrected from different errors and edge-matched after the geo-referencing processes. Edge matching, as a spatial adjustment process that aligns features in adjacent map sheets, was

Abd-Alla Gad and R. Ali / Procedia Social and Behavioral Sciences 19 (2011) 641–650 643
( )
performed according to Tomlin, 1990. This process was applied on the soil maps (scale 1: 100,000) and all derived thematic maps of scale 1: 50,000. The descriptive thematic data relted to all layers were attached as additional attribute tables. The attribute tables attachments were elaborated without affecting the spatial context of the map neither the previously stored attribute, nor the recent ones [7].
3.4. Spatial adjustments
It was noticed, after edge matching, that there is a kind of deviation (constant in many places in its direction and magnitude) between the produced maps and the well registered topographic ones as well as the satellite images of the study area. It was possible to attribute the deviation to two reasons; lack of coordinate system in some original map sheets and the rubber-sheeting accompanied the edge-matching task [8]. In order to overcome this problem another spatial adjustment (transformation) has been performed. Well registered topographic maps and accurately georeferenced satellite images have been used to perform the transformation process. The transformation tools of ArcGIS systems were found to be very effective in performing the spatial adjustment of the soil maps [9] and [10].
3.5. Compilation of laboratory analysis results
A number of 42 soil profiles, representing the different soil units of the studied regions were morphologically described according to FAO [11]. A number of 130 disturbed soil samples were collected for laboratory analysis, following the laboratory methods manual [12]. The results of these analyses have been compiled in the database and then incorporated into the attribute tables of the digital GIS soil maps [13] and [14].
4. Results and discussions
4.1. Land resources database of the Nile Delta
4.1.1. Soil resources Figure (1) shows the produced soil map of the Nile Delta region, and table (1) demonstrates the
distribution of different soil units. The soils were reclassified according to USDA 2006. It is clear that the Vertic Torrifluvents is the major sub great group in the alluvial Nile Delta, covering 12940.3 km2, representing 41.2% of the total area. These soils were represented by the profiles (6, 10, 12, 15, 17, 20, 28 and 39). Patches of sub-great groups Typic Torrifluvents are included in the alluvial soils, as represented by profiles no. 16, 13, 18, 29, 27 and 38. The sub-great group Typic Quartizpsamments (profiles 2, 5, 11, 19, 22 and 42) dominates the eastern and western desert fringes, covering an area of 4082 km2 (12.9% of total area) in addition to an area of 375.2 km2 interfered with the Typic Torriorthents sub-great group (profile no. 41).
The Typic Torripsamments / Typic Torriorthents sub-great groups association exists in an area of 399.1 km2, representing 1.3% of total area, adjacent to the previous one. The profiles 21, 23 and 40 are representing the Typic Torriorthent and Typic Torripsamments sub-great group respectively.
Fig. 1. Soil map of the Nile Delta region

644 Abd-Alla Gad and R. Ali / Procedia Social and Behavioral Sciences 19 (2011) 641–650
The sub-great groups Typic Torrifluvents, Typic Torriorthents and Typic Torripsamments exhibit significant coverage in delta borders, as their areas are 2514.9, 2390.9 km2 and 1385.0 km2 representing frequencies of 8%, 7.6% and 4.4% respectively. The sub-great groups Typic Aquisalids (profiles no.1, 4, 8, 26), Typic Haplosalids (profiles no.3, 9, and 37) and Aquic Torrifluvents (profiles no.7) occur in the northern Delta region influenced by the northern Delta lakes. They cover areas of 1928.8, 166.9 and 437.9, representing 6.1%, 0.5% and 1.4% of the total Nile Delta area respectively.
Minor areas of Typic Haplocalcids (profiles no. 31, 32), Typic Haplogypsids (profiles no 32, 25), Typic Petrogypsids (profiles no. 24) and Typic Calcigypsids (profiles no. 35) are distributed in the eastern and western Delta regions covering areas of 1012.6, 10007.5, 145.9 and 4.1 km2 representing 3.2%, 3.2%, 0.5% and 0.01% respectively.
Limited Hill and Rockland (site description no. 36) areas exist in the southern Delta region, covering areas of 1223.2 and 1426.9 km2 respectively.
Table (1) Areas and frequency of soil Sub great groups of the Nile Delta region
Type (Sub great group) Area (Km2) %
Aquic Torrifluvents 437.94 1.39
Typic Aquisalids 1928.75 6.13
Typic Calcigypsids 4.09 0.01
Typic Haplocalcids 1012.60 3.22
Typic Haplogypsids 1007.53 3.20
Typic Haplosalids 166.91 0.53
Typic Petrogypsids 145.85 0.46
Typic Quartizipsamments 4082.00 12.98
Typic Quartizipsamments/ Typic Torriorthents 375.18 1.19
Typic Torripsamments/Typic Torriorthents 399.06 1.27
Typic Torrifluvents 2514.98 8.00
Typic Torriorthents 2390.99 7.60
Typic Torripsamments 1385.04 4.41
Vertic Torrifluvents 12940.34 41.16
Hilland 1223.24 3.89
Rock land 1426.88 4.54
Total 28791.26 100.00
Concerning the soil taxonomy, three soil orders can be discussed here, as the Nile Delta soils can only be classified under one of these orders (i.e. Vertisols, Aridisols and Entisols).
- Soil order “Vertisols” The soils classified under the Vertisols order are those soils, which have a layer of 25 cm or more with an
upper boundary (within 100 cm of the mineral soil surface) has either slickensides or wedge-shaped aggregates. They are characterized by a weighted average of 30 percent or more clay in the fine-earth fraction. The cracks, characterizing such soils, open and close periodically.
These characteristics couldn't be generalized on the Nile Delta alluvial soils mainly due to irrigation. Vertisols however could be found in small un-mappable patches under the used scale (1: 100,000). The soil map sheets of the Nile Delta, produced through the project of “Soil Map of Egypt” [2] showed that the majority of the soils are classified under the order “Vertisols”. However, revising the required characteristics of this soil order, on basis of USDA [15] revealed that these soils can generally be classified under the sub-great group Vertic Torrifluvents, which will be explained in details under the Entisols soil order.
- Soil order “Aridisols” These soils are characterized by an aridic soil moisture regime, in addition to an ochric or anthropic
epipidon. They must also include particulat diagnostic horizonz, as shown in USDA [15]. Three sub-orders (Fig. 2) were found under this soil order (i.e. Calcids, Gypsids and Salids). Table (2) summarizes the areas of different great groups included in those suborders. Concerning the Calcids sub-order, only Haplocalcids soil great group, under which Typic Haplocalcids sub-great group is found, covering an area of 1012.6 km2 representing 23.7% of the Nile Delta’s Aridisols. The Haplocalcids are Calsids soils that have no petrocaclic horizon, where the Typic Haplocalcids includes soils having no lithic, ustic, vertic, aquic, duric, sodic properties.
Three great groups are found belonging to Gypsids sub-order (i.e. Calcigypsids, Petrogypsids and Haplogypsids). The Calcigypsids great group soils exhibits an area of 4.1 km2 representing 0.1% of Nile
Abd-Alla Gad and R. Ali / Procedia Social and Behavioral Sciences 19 (2011) 641–650 645
Delta’s Aridisols. The Petrogypsids great group covers an area of 145.85 representing 3.42% of Nile Delta Aridisols. The Haplogypsids great group exhibit an area of 166.91 km2 representing 3.91% of Nile Delta Aridisols. Concerning the Salids sub-order soils, two great groups are found in the north of the Nile Delta region under this sub-order (i.e. Aquisalids and Haploisalids). The Aquisalids cover an area of 1928.75 km2 representing 45.22% of Aridisols of the Nile Delta region. The Haplosalids exhibit an area of 166.91 km2 representing 3.91% of Nile Delta Aridisols. Only Typic sub-great groups of the previous great groups are found with the Nile Delta soils.
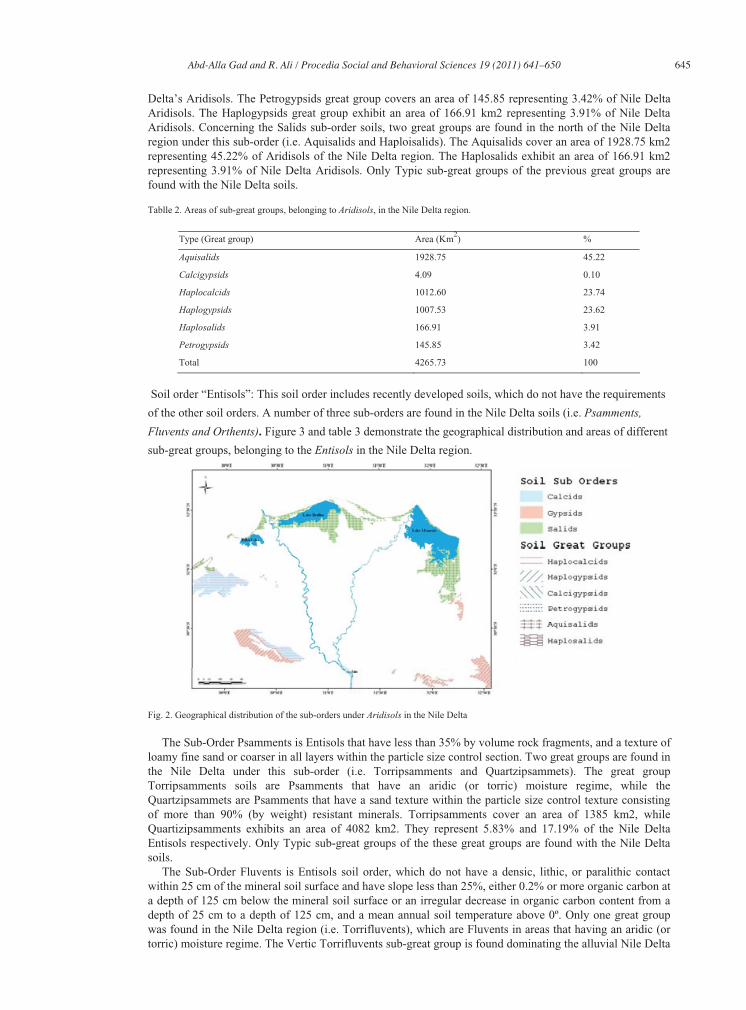
Tablle 2. Areas of sub-great groups, belonging to Aridisols, in the Nile Delta region.
Type (Great group) Area (Km2) %
Aquisalids 1928.75 45.22
Calcigypsids 4.09 0.10
Haplocalcids 1012.60 23.74
Haplogypsids 1007.53 23.62
Haplosalids 166.91 3.91
Petrogypsids 145.85 3.42
Total 4265.73 100
Soil order “Entisols”: This soil order includes recently developed soils, which do not have the requirements
of the other soil orders. A number of three sub-orders are found in the Nile Delta soils (i.e. Psamments,
Fluvents and Orthents). Figure 3 and table 3 demonstrate the geographical distribution and areas of different
sub-great groups, belonging to the Entisols in the Nile Delta region.
Fig. 2. Geographical distribution of the sub-orders under Aridisols in the Nile Delta
The Sub-Order Psamments is Entisols that have less than 35% by volume rock fragments, and a texture of loamy fine sand or coarser in all layers within the particle size control section. Two great groups are found in the Nile Delta under this sub-order (i.e. Torripsamments and Quartzipsammets). The great group Torripsamments soils are Psamments that have an aridic (or torric) moisture regime, while the Quartzipsammets are Psamments that have a sand texture within the particle size control texture consisting of more than 90% (by weight) resistant minerals. Torripsamments cover an area of 1385 km2, while Quartizipsamments exhibits an area of 4082 km2. They represent 5.83% and 17.19% of the Nile Delta Entisols respectively. Only Typic sub-great groups of the these great groups are found with the Nile Delta soils.
The Sub-Order Fluvents is Entisols soil order, which do not have a densic, lithic, or paralithic contact within 25 cm of the mineral soil surface and have slope less than 25%, either 0.2% or more organic carbon at a depth of 125 cm below the mineral soil surface or an irregular decrease in organic carbon content from a depth of 25 cm to a depth of 125 cm, and a mean annual soil temperature above 0º. Only one great group was found in the Nile Delta region (i.e. Torrifluvents), which are Fluvents in areas that having an aridic (or torric) moisture regime. The Vertic Torrifluvents sub-great group is found dominating the alluvial Nile Delta
646 Abd-Alla Gad and R. Ali / Procedia Social and Behavioral Sciences 19 (2011) 641–650
soils. Torriluvents soils cover an area of 15893.26 km2 representing 66.92% of the Nile Delta Entisols. These soils are characterized by cracks within 125 cm of the soil surface that are 5mm or more wide through a thickness of 30 cm or more for some time in most normal years, slickensides or wedge shaped aggregates in a layer 15 cm or more thick that has its upper boundary within 125 cm of the soil surface. It also has a linear extensibility or 6.0 cm or more between the soil surface and either a depth of 100 cm or a densic, lithic, or paralithic contact, which ever is shallower. The Aquic torrifluvents sub-great group includes other Torrifluvents that have in one or more horizons, within 100 cm of the soil surface, both redox depletions with chroma of 2 or less and aquic conditions for some time in normal years (or artificial drainage). Also, Typic Torrifluvents sub-great group is found interfered with the previous one. These soils are referred as other Torrifluvents, do not have the requirements of the other Torrifuvents sub-great group.
The sub-order Orthents is other Entisols that do not have the requirements of Aquents, Arents, Psamments and Fluvents. Only the sub-great group Torrioethents is found exhibiting an area of 2390.99 km2 representing 10.07% of the Nile Delta Entisols. The existent sub great groups Typic Torriorthents is identified as other torriorthents, which do not have the requirements of other Torriorthents, sub great groups.
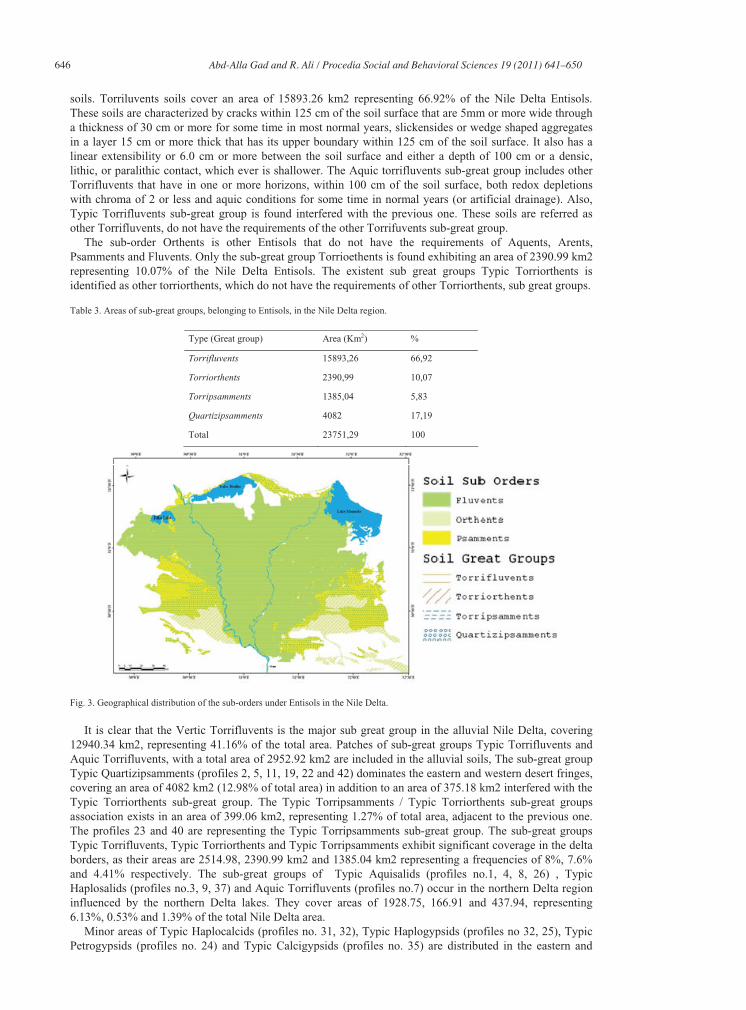
Table 3. Areas of sub-great groups, belonging to Entisols, in the Nile Delta region.
Type (Great group) Area (Km2) %
Torrifluvents 15893,26 66,92
Torriorthents 2390,99 10,07
Torripsamments 1385,04 5,83
Quartizipsamments 4082 17,19
Total 23751,29 100
Fig. 3. Geographical distribution of the sub-orders under Entisols in the Nile Delta.
It is clear that the Vertic Torrifluvents is the major sub great group in the alluvial Nile Delta, covering 12940.34 km2, representing 41.16% of the total area. Patches of sub-great groups Typic Torrifluvents and Aquic Torrifluvents, with a total area of 2952.92 km2 are included in the alluvial soils, The sub-great group Typic Quartizipsamments (profiles 2, 5, 11, 19, 22 and 42) dominates the eastern and western desert fringes, covering an area of 4082 km2 (12.98% of total area) in addition to an area of 375.18 km2 interfered with the Typic Torriorthents sub-great group. The Typic Torripsamments / Typic Torriorthents sub-great groups association exists in an area of 399.06 km2, representing 1.27% of total area, adjacent to the previous one. The profiles 23 and 40 are representing the Typic Torripsamments sub-great group. The sub-great groups Typic Torrifluvents, Typic Torriorthents and Typic Torripsamments exhibit significant coverage in the delta borders, as their areas are 2514.98, 2390.99 km2 and 1385.04 km2 representing a frequencies of 8%, 7.6% and 4.41% respectively. The sub-great groups of Typic Aquisalids (profiles no.1, 4, 8, 26) , Typic Haplosalids (profiles no.3, 9, 37) and Aquic Torrifluvents (profiles no.7) occur in the northern Delta region influenced by the northern Delta lakes. They cover areas of 1928.75, 166.91 and 437.94, representing 6.13%, 0.53% and 1.39% of the total Nile Delta area.
Minor areas of Typic Haplocalcids (profiles no. 31, 32), Typic Haplogypsids (profiles no 32, 25), Typic Petrogypsids (profiles no. 24) and Typic Calcigypsids (profiles no. 35) are distributed in the eastern and
Abd-Alla Gad and R. Ali / Procedia Social and Behavioral Sciences 19 (2011) 641–650 647
( )
western Delta regions covering areas of 1012.60, 1007.53, 145.85 and 4.09 km2 representing 3.22%, 3.20%, 0.46% and 0.1% respectively.
Limited Hill land and Rockland (site description no. 36) areas exist in the southern Delta region, covering areas of 1223.24 and 1426.88 km2 respectively
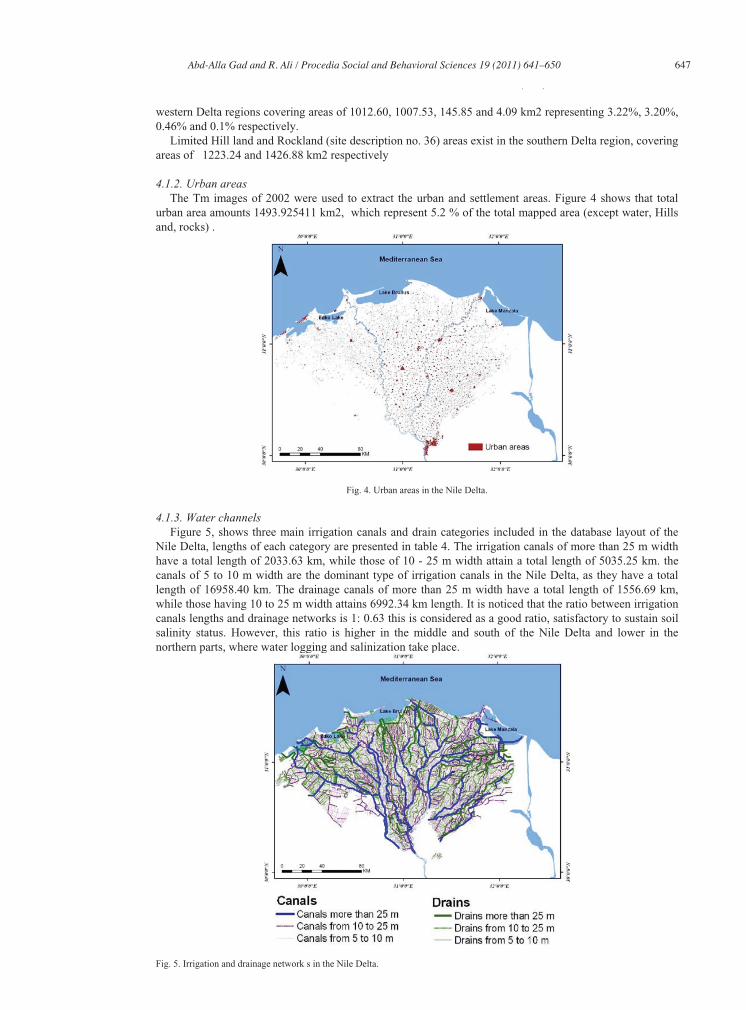
4.1.2. Urban areas The Tm images of 2002 were used to extract the urban and settlement areas. Figure 4 shows that total
urban area amounts 1493.925411 km2, which represent 5.2 % of the total mapped area (except water, Hills and, rocks) .
Fig. 4. Urban areas in the Nile Delta.
4.1.3. Water channels Figure 5, shows three main irrigation canals and drain categories included in the database layout of the
Nile Delta, lengths of each category are presented in table 4. The irrigation canals of more than 25 m width have a total length of 2033.63 km, while those of 10 - 25 m width attain a total length of 5035.25 km. the canals of 5 to 10 m width are the dominant type of irrigation canals in the Nile Delta, as they have a total length of 16958.40 km. The drainage canals of more than 25 m width have a total length of 1556.69 km, while those having 10 to 25 m width attains 6992.34 km length. It is noticed that the ratio between irrigation canals lengths and drainage networks is 1: 0.63 this is considered as a good ratio, satisfactory to sustain soil salinity status. However, this ratio is higher in the middle and south of the Nile Delta and lower in the northern parts, where water logging and salinization take place.
Fig. 5. Irrigation and drainage network s in the Nile Delta.
648 Abd-Alla Gad and R. Ali / Procedia Social and Behavioral Sciences 19 (2011) 641–650
Table 4. Canal Witdh and Length (km).
Canal Width Length (km) Irrigation
Canals more than 25 m 2033,633
Canals from 10 to 25 m 5035,25
Canals from 5 to 10 m 16958,4
Total 24027,28
Drainage
Drains more than 25 m 1556,691
Drains from 10 to 25 m 6992,338
Drains from 5 to 10 m 6563,665
Total 15112,69
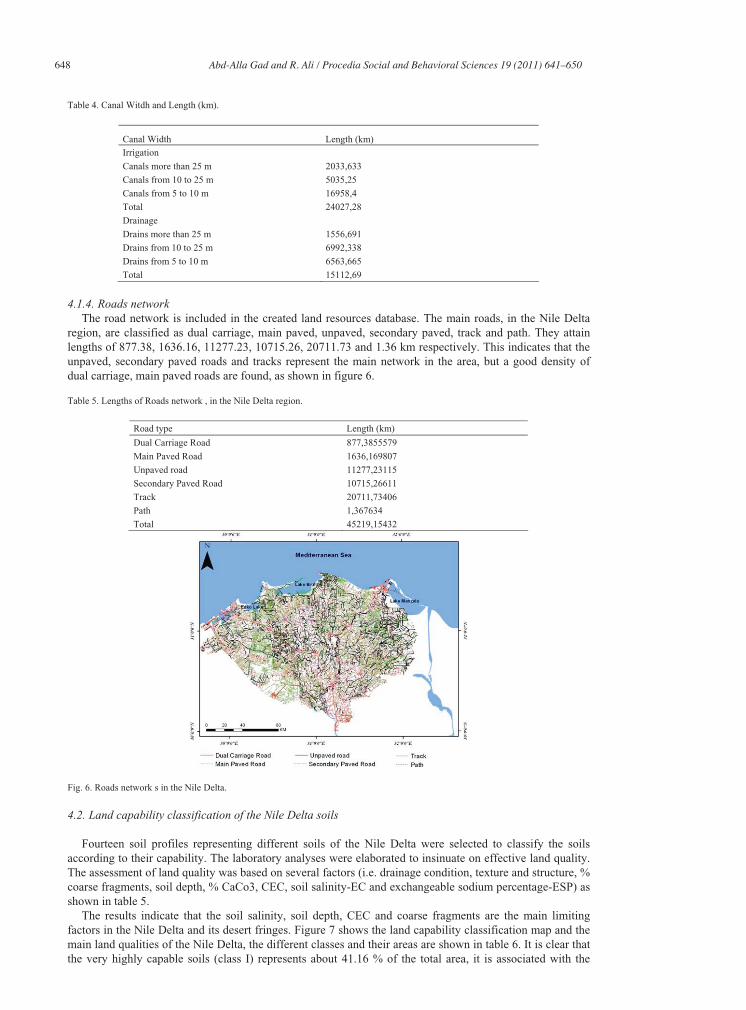
4.1.4. Roads network The road network is included in the created land resources database. The main roads, in the Nile Delta
region, are classified as dual carriage, main paved, unpaved, secondary paved, track and path. They attain lengths of 877.38, 1636.16, 11277.23, 10715.26, 20711.73 and 1.36 km respectively. This indicates that the unpaved, secondary paved roads and tracks represent the main network in the area, but a good density of dual carriage, main paved roads are found, as shown in figure 6.
Table 5. Lengths of Roads network , in the Nile Delta region.
Road type Length (km)
Dual Carriage Road 877,3855579
Main Paved Road 1636,169807
Unpaved road 11277,23115
Secondary Paved Road 10715,26611
Track 20711,73406
Path 1,367634
Total 45219,15432
Fig. 6. Roads network s in the Nile Delta.
4.2. Land capability classification of the Nile Delta soils
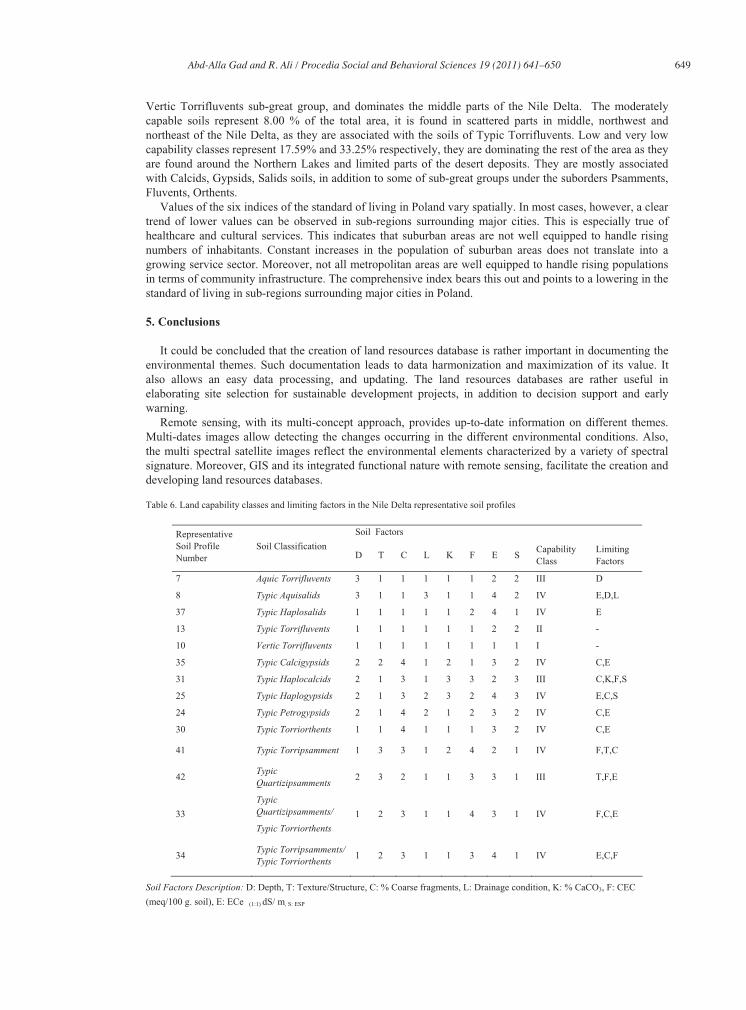
Fourteen soil profiles representing different soils of the Nile Delta were selected to classify the soils according to their capability. The laboratory analyses were elaborated to insinuate on effective land quality. The assessment of land quality was based on several factors (i.e. drainage condition, texture and structure, % coarse fragments, soil depth, % CaCo3, CEC, soil salinity-EC and exchangeable sodium percentage-ESP) as shown in table 5.
The results indicate that the soil salinity, soil depth, CEC and coarse fragments are the main limiting factors in the Nile Delta and its desert fringes. Figure 7 shows the land capability classification map and the main land qualities of the Nile Delta, the different classes and their areas are shown in table 6. It is clear that the very highly capable soils (class I) represents about 41.16 % of the total area, it is associated with the
Abd-Alla Gad and R. Ali / Procedia Social and Behavioral Sciences 19 (2011) 641–650 649
Vertic Torrifluvents sub-great group, and dominates the middle parts of the Nile Delta. The moderately capable soils represent 8.00 % of the total area, it is found in scattered parts in middle, northwest and northeast of the Nile Delta, as they are associated with the soils of Typic Torrifluvents. Low and very low capability classes represent 17.59% and 33.25% respectively, they are dominating the rest of the area as they are found around the Northern Lakes and limited parts of the desert deposits. They are mostly associated with Calcids, Gypsids, Salids soils, in addition to some of sub-great groups under the suborders Psamments, Fluvents, Orthents.
Values of the six indices of the standard of living in Poland vary spatially. In most cases, however, a clear trend of lower values can be observed in sub-regions surrounding major cities. This is especially true of healthcare and cultural services. This indicates that suburban areas are not well equipped to handle rising numbers of inhabitants. Constant increases in the population of suburban areas does not translate into a growing service sector. Moreover, not all metropolitan areas are well equipped to handle rising populations in terms of community infrastructure. The comprehensive index bears this out and points to a lowering in the standard of living in sub-regions surrounding major cities in Poland.
5. Conclusions
It could be concluded that the creation of land resources database is rather important in documenting the environmental themes. Such documentation leads to data harmonization and maximization of its value. It also allows an easy data processing, and updating. The land resources databases are rather useful in elaborating site selection for sustainable development projects, in addition to decision support and early warning.
Remote sensing, with its multi-concept approach, provides up-to-date information on different themes. Multi-dates images allow detecting the changes occurring in the different environmental conditions. Also, the multi spectral satellite images reflect the environmental elements characterized by a variety of spectral signature. Moreover, GIS and its integrated functional nature with remote sensing, facilitate the creation and developing land resources databases.
Table 6. Land capability classes and limiting factors in the Nile Delta representative soil profiles
Soil Factors RepresentativeSoil Profile Number
Soil Classification D T C L K F E S
CapabilityClass
Limiting Factors
7 Aquic Torrifluvents 3 1 1 1 1 1 2 2 III D
8 Typic Aquisalids 3 1 1 3 1 1 4 2 IV E,D,L
37 Typic Haplosalids 1 1 1 1 1 2 4 1 IV E
13 Typic Torrifluvents 1 1 1 1 1 1 2 2 II -
10 Vertic Torrifluvents 1 1 1 1 1 1 1 1 I -
35 Typic Calcigypsids 2 2 4 1 2 1 3 2 IV C,E
31 Typic Haplocalcids 2 1 3 1 3 3 2 3 III C,K,F,S
25 Typic Haplogypsids 2 1 3 2 3 2 4 3 IV E,C,S
24 Typic Petrogypsids 2 1 4 2 1 2 3 2 IV C,E
30 Typic Torriorthents 1 1 4 1 1 1 3 2 IV C,E
41 Typic Torripsamment 1 3 3 1 2 4 2 1 IV F,T,C
42TypicQuartizipsamments
2 3 2 1 1 3 3 1 III T,F,E
TypicQuartizipsamments/ 33
Typic Torriorthents
1 2 3 1 1 4 3 1 IV F,C,E
34Typic Torripsamments/ Typic Torriorthents
1 2 3 1 1 3 4 1 IV E,C,F
Soil Factors Description: D: Depth, T: Texture/Structure, C: % Coarse fragments, L: Drainage condition, K: % CaCO3, F: CEC
(meq/100 g. soil), E: ECe (1:1) dS/ m, S: ESP

650 Abd-Alla Gad and R. Ali / Procedia Social and Behavioral Sciences 19 (2011) 641–650
Fig. 7. Land capability classification map of the Nile Delta region.
The Nile Delta of Egypt is characterized by a variety of soil types, in addition to supportive fresh surface water resources balanced with irrigation network, urban settlements, infra structure and human occupation. However, the study showed a frequency of settlements in most fertile and capable soils. Urban expansion and management of soil productivity, in addition to salt balance are major issues to be followed for sustainability; digital land resource database will serve these objectives.
References
[1] FAO (1985). " Land evaluation for irrigated agriculture" soils bulletin 55, FAO, Rome. [2] ASRT, (1982). “Soil map of Egypr, final report” Academy of scientific research and technology (ASRT), 1982, Cairo Egypt. [3] Dobos, E. Norman, B. Bruee, W. Luca, M. Chris, J. and Erika, M., 2002. "The Use of DEM and Satellite Images for Regional Scale
Soil Database"17th World Congress of Soil Science (WCSS), 14-21 August 2002, Bangkok, Thailand. [4] NCSA (2005). "Extracting topographic features from shuttle radar topography mission (SRTM) Images" Technical Report, alg. 05-
002, July 18, 2005, National Center for Supercomputing Applications (NCSA), 605 East Springfield Avenue, Champaign, IL 61820
[5] Soil survey staff (1975). "Soil munssel color charts" USDA soil conserve Washington, D. C. [6] ERDAS, 1999 Practical excercises, University of Leicester, UK, 1999. [7] Bonham-Carter, G.F. (1994). Geographic Information Systems for Geoscientists: Modelling with GIS. Geological Survey of
Canada, Love Printing Service Ltd, Ontario, Canada. [8] Boullie, F. (1978). Structuring cartographic data and spatial processes with the hypergraph-based data structure. In: First
International Advanced study symposium on Topological Data Structures for Geographic Information Systems (ed. G. Dutton) Vol. 5. Laboratory for Computer Graphics and Spatial Analysis, Harvard.
[9] Burrough, P.A. (1986). Principals of geographic Information Systems for land resources assessment. Clarendon, Oxford. [10 ] Tomlin, C. D. (1990). Geographic Information Systems and Cartographic Modeling. Prentice Hall, Englewood Cliffs, N.J. [11] FAO (2006) FAO. "Guidelines for soil description" Fourth edition, FAO, Rome, ISBN 92-5-1055211 [12] USDA, (2004). "Soil Survey Laboratory Methods Manual" Soil Survey Investigation Report No. 42 Version 4.0 November 2004. [13] Nguyen Quec Dinh (2001). Cave database development, spatial analysis and 3D visualization with GIS – Case study in Son La
(Vietnam).VUB, Master dissertation (unpubl.). [14] Pavasovic, k. (1993). Land suitability models. Workshop on Geographical Information Systems in Integrated Coastal
Management, Alexandria, Egypt. Siderius, w., 1989. "Selected Readings in Land Evaluation Part I Rating of Soils Derived Land Qualities" lecture notes, ITC, Enschade,
the Netherlands. [15] USDA (2006). "Keys to Soil Taxonomy" United State Department of Agriculture, Natural Resources Conservation Service
(NRCS) tenth edition, 2006.
Copyright © 2022 FDOKUMEN