cpt-based axial capacity design method for driven piles in
44
1 1 2 3 4 CPT-BASED AXIAL CAPACITY DESIGN METHOD FOR DRIVEN PILES IN 5 CLAY 6 7 8 9 by 10 11 Barry M. Lehane 1 , Zhongqiang Liu 2 , Eduardo J. Bittar 3 , Farrokh Nadim 2 , Suzanne Lacasse 2 , 12 Nezam Bozorgzadeh 2 , Richard Jardine 4 , Jean-Christophe Ballard 5 , Pasquale Carotenuto 2 , 13 Kenneth Gavin 6 , Robert B. Gilbert 7 , Jens Bergan-Haavik 8 , Philippe Jeanjean 9 and Neil 14 Morgan 10 15 16 17 18 19 20 1 Corresponding author, School of Engineering, The University of Western Australia, 6009, 21 Australia. Email: [email protected] 22 2 Norwegian Geotechnical Institute, Oslo, Norway 23 3 University of Western Australia 24 4 Imperial College London 25 5 Fugro, London, UK 26 6 Delft University of Technology 27 7 Univ. of Texas at Austin, Austin, USA 28 8 DNV⋅GL AS, Høvik, Norway 29 9 BP America Inc., Houston, USA 30 10 Lloyd’s Register EMEA, Aberdeen, UK 31 32 Submitted to ASCE JGGE for review
-
Upload
khangminh22 -
Category
Documents
-
view
4 -
download
0
Transcript of cpt-based axial capacity design method for driven piles in

1
1
2
3
4
CPT-BASED AXIAL CAPACITY DESIGN METHOD FOR DRIVEN PILES IN 5 CLAY 6
7
8
9
by 10
11
Barry M. Lehane1, Zhongqiang Liu2, Eduardo J. Bittar3 , Farrokh Nadim2, Suzanne Lacasse2, 12
Nezam Bozorgzadeh2, Richard Jardine4, Jean-Christophe Ballard5, Pasquale Carotenuto2, 13
Kenneth Gavin6, Robert B. Gilbert7, Jens Bergan-Haavik8, Philippe Jeanjean9 and Neil 14
Morgan10 15
16
17
18
19
20
1Corresponding author, School of Engineering, The University of Western Australia, 6009, 21
Australia. Email: [email protected] 22 2Norwegian Geotechnical Institute, Oslo, Norway 23 3University of Western Australia 24 4Imperial College London 25 5Fugro, London, UK 26 6Delft University of Technology 27 7Univ. of Texas at Austin, Austin, USA 28 8DNV⋅GL AS, Høvik, Norway 29 9BP America Inc., Houston, USA 30 10Lloyd’s Register EMEA, Aberdeen, UK 31
32
Submitted to ASCE JGGE for review
2
Abstract 33
There are clear advantages in the establishment of reliable, direct CPT-based methods for 34
assessment of the axial capacity of driven piles. These advantages motivated the formation of 35
a Joint Industry Project (JIP) under the management of the Norwegian Geotechnical Institute 36
(NGI), which initially led to the creation of a "Unified" database of high-quality pile load tests 37
in sand and clay. The Unified database has the general consensus of representatives in the 38
profession and personnel in multiple companies from the offshore energy sector. This paper 39
presents a component of the research from the second phase of the JIP, which had the objective 40
of developing a new CPT-based method for driven piles in clay to "unify" several CPT-based 41
methods that are in use today. A rational basis for the CPT-based formulation is first described, 42
using trends from instrumented pile tests, that facilitates an understanding of the approach and 43
illustrates its empirical nature and limitations. The Unified database is used to calibrate the 44
formulation and this is subsequently shown to lead to good predictions for an independent 45
database of pile load tests and for measured distributions of shaft friction. 46
47
48
49
3
Introduction 50
Estimates of the axial capacity of driven piles in clay depend primarily on the assessment of 51
shaft friction (τf), which typically represents a major proportion of the axial capacity. The alpha 52
(α) design method proposed by API (2011) is currently the most common approach used to 53
assess τf and assumes that τf varies directly with the triaxial compression unconsolidated 54
undrained (UU) shear strength of the clay (suUU) via an α factor (or ‘adhesion’ factor). The α 55
value is expressed as an empirical function of the undrained strength ratio (suUU/σ'v0) which has 56
been determined from a best-fit to capacities measured in a database of pile load tests 57
(Randolph & Murphy 1985). Application of α approaches usually requires drilling and 58
sampling boreholes and subsequent undrained strength tests on a representative number of 59
nominally undisturbed samples. The cost of such an investigation coupled with the discrete 60
nature of sampling and the well-known variability in su data due to sampling disturbance and 61
other effects prompted the investigation into a new cone penetration test (CPT) based method 62
presented in this paper. 63
Relationships between shaft friction and the CPT measured and corrected cone end resistances 64
(qc and qt) for driven piles in clay have been proposed for many years e.g. Bustamante & 65
Gianeselli (1982), Almeida et al. (1996), Lehane et al. (2000, 2013), Eslami & Fellenius (1997) 66
and Niazi & Mayne (2016). This paper builds upon this earlier research and presents a new 67
CPT-based method that is calibrated using a new database of pile load tests that was compiled 68
by a team of experts working for a large Joint Industry Project (JIP) (Lehane et al. 2017). The 69
sand and the clay pile test databases compiled for this JIP are referred to as “Unified” databases 70
as they comprise the most reliable pile tests from a number of databases and were reviewed in 71
depth to ensure that they had general consensus of the profession. The creation of the sand 72
database has already led to the development of a new CPT-based method for driven piles in 73
sand (Lehane et al. 2020) that has replaced the previously recommended earth pressure design 74
4
approach in the draft version of the next edition of ISO 19901-4, planned for publication in 75
2021. 76
This paper first presents an analysis of results from instrumented pile test data and numerical 77
research that provide a rational basis for CPT-based formulations for axial pile capacity in clay 78
and facilitate an understanding of the limitations of these formulations. The ability of a range 79
of formulations to predict the capacities of piles in the “Unified” database is then examined to 80
establish a final set of recommended equations for shaft friction and end bearing. The reliability 81
of these equations is assessed by comparing their predictions for the capacities of piles in a 82
separate “Test” database that was compiled for this study and with distributions of shaft 83
frictions measured on well instrumented test piles. 84
Basis for formulation for shaft friction 85
General trends indicated by instrumented closed-ended piles 86
The stress changes that take place during the three stages in the life of a driven pile (i.e. 87
installation, equalization and load testing) ultimately control the magnitude of the shaft friction 88
that can be developed when a pile is in service. These changes are illustrated for the case of a 89
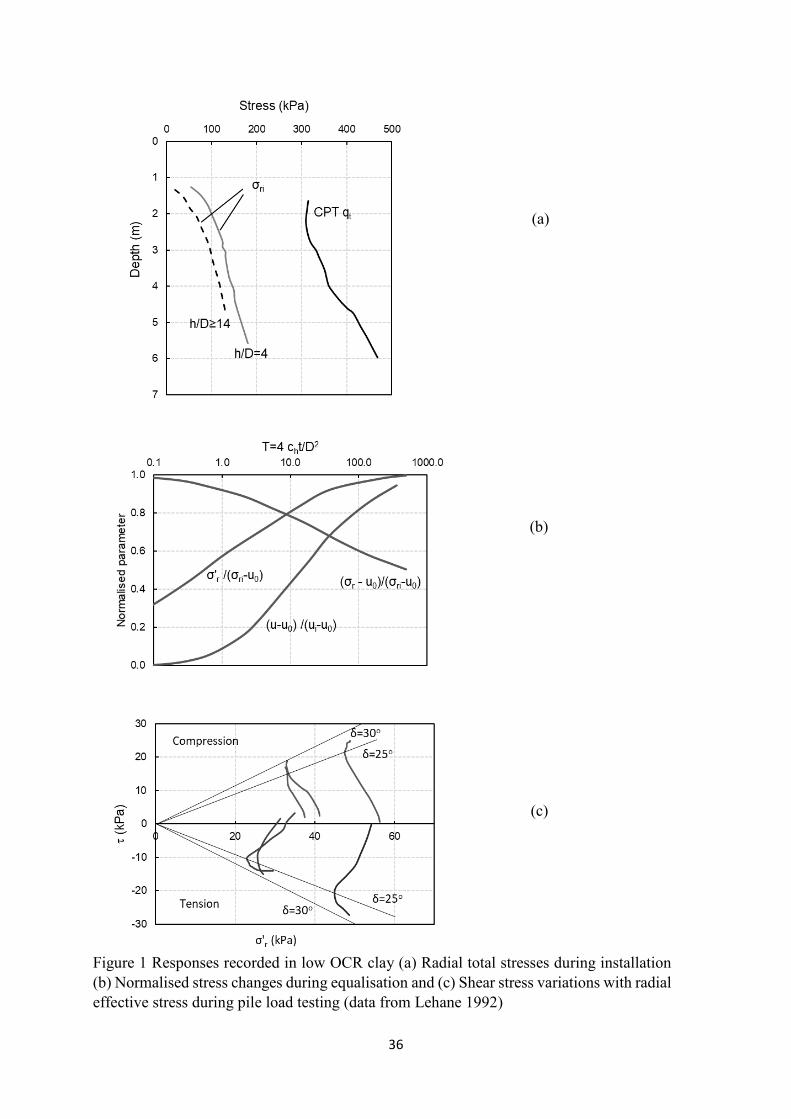
lightly overconsolidated clay on Figure 1, which plots average data measured at the shaft of a 90
jacked 6m long, 102mm diameter pile in Bothkennar clay (Lehane & Jardine 1994a). The 91
trends shown in Figure 1 are typical of data measured in other instrumented pile tests reported 92
by Azzouz & Morrison (1988), NGI (1988a,b) and Coop & Wroth (1989). The subscripts i and 93
c used in the following refer to installation and following equalization (consolidation) 94
respectively. 95
Figure 1a shows that radial stresses measured at any given depth during installation (σri) are 96
smaller than, but proportional to, the CPT qt resistances. These σri data also vary with the 97

5
distance of the radial stress sensor above the tip (h) and, in any given soil horizon, are about 98
40% of the qt value at 4 pile diameters from the tip (h/D=4) and about 30% of qt at h/D ≥14. 99
Installation excess pore pressure ratios (Δui/σ'v0) at this site varied from about 3 at h/D=1.5 to 100
about 2.1 at h/D ≥ 16. After the pile reached the required embedment, as shown on Figure 1b, 101
excess pore pressures dissipated, radial total stresses (σr) reduced and radial effective stresses 102
increased (σ'r) over several days to reach final fully equalized radial effective stress of σ'rc. It is 103
seen, for this example, that σ'rc is about 3 times the radial effective stress acting on the shaft 104
shortly after installation (σ'ri). During load testing after full equalization, Figure 1c shows that 105
radial effective stresses reduce to values at peak shear stresses (σ'rf) that are about 20% less 106
than σ'rc. The maximum shaft friction (τf) is controlled, through Coulomb’s friction law, by the 107
radial effective stress at failure, σ'rf, and the average clay-pile interface friction angle (δ) of 29o; 108
this δ value is closely comparable to angles measured in ring interface shear tests on 109
Bothkennar clay using a rough steel interface; see Lehane & Jardine (1992). 110
These stages in the life of a pile can be written in terms of radial total stresses (σr) normalized 111
by the corrected cone resistance (qt) using the following stress coefficients, where u0 is the 112
hydrostatic or ambient pore pressure: 113
Si = (σri -u0)/qt (1) 114
Sc = (σrc -u0)/qt = σ'rc/qt (2) 115
The loading coefficient is the ratio of the radial effective stress at peak shear stress (σ'rf) to the 116
equalized radial effective stress (σ'rc): 117
fL = σ'rf/σ'rc (3) 118
Jardine et al. (2005), and many others, have confirmed the validity of Coulomb’s friction law 119
at the loading rates adopted in typical static load tests. Assuming Coulomb’s friction law, 120
Equations (1) to (3) then lead to the following expression for shaft friction (τf), which gives τf 121
6
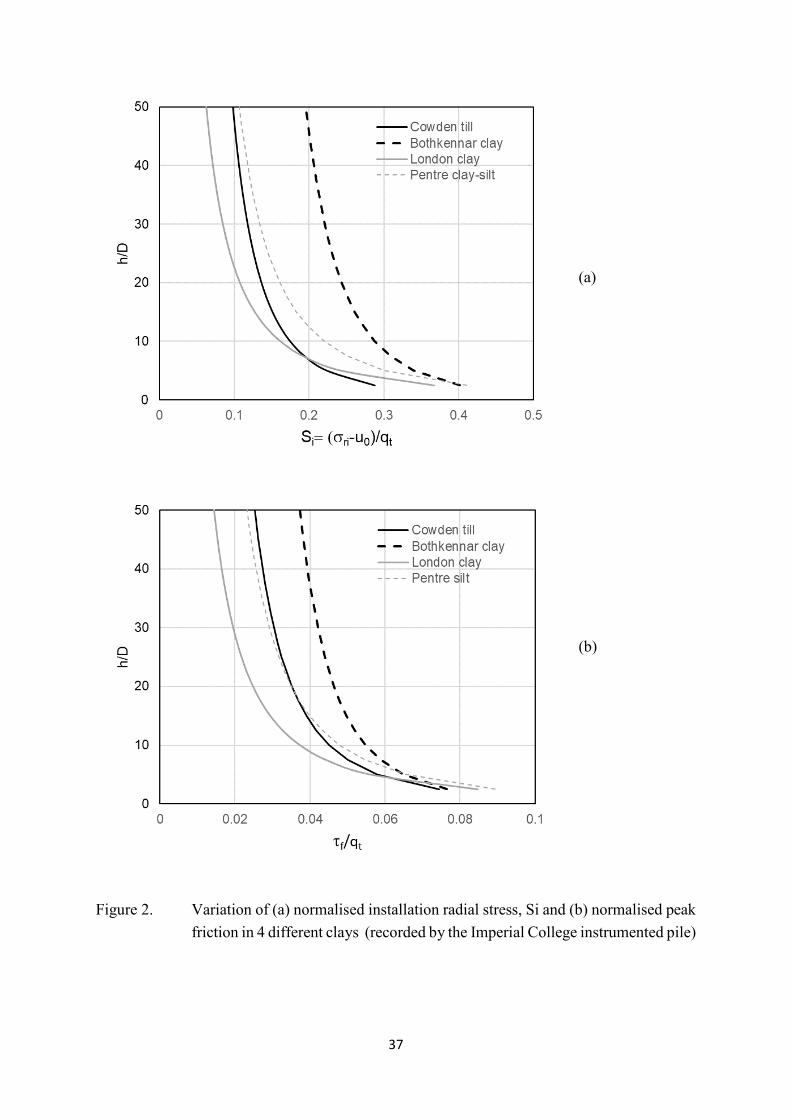
as a direct function of the corrected cone resistance qt, the three stress coefficients and the 122
interface friction angle (δ): 123
τf = σ'rf tan δ = qt Si (Sc/Si) fL tan δ (4) 124
The relationship between τf and qt given in equation (4) is examined first using data recorded 125
for the Imperial College instrumented pile in London clay, Cowden till, Bothkennar clay and 126
Pentre clayey silt (Bond & Jardine 1991, Lehane & Jardine 1994a,b and Jardine et al. 2005). 127
These experiments showed that the Si measurements at each site could be closely represented 128
as a unique function of the normalized distance above the pile tip (h/D) with the following 129
format, where A and c are fitting parameters: 130
Si = A (h/D)-c (5) 131
Mean recorded variations of Si with h/D are plotted on Figure 2a, where considerable 132
differences between the trends in each clay are apparent. The best-fit average values of A and 133
c corresponding to these trend lines are provided in Table 1 and indicate a significant 134
dependence of ‘c’ on clay type. The mean overconsolidation ratio (OCR) and plasticity index 135
(Ip) at these sites are also provided in Table 1. 136
The corresponding trends of normalized shaft friction, τf/qt, are plotted on Figure 2b and were 137
derived using Equation (4) and the mean A, c, Sc/Si, fL and δ values listed in Table 1, which 138
were determined from the Imperial College experiments. These average coefficients did not 139
indicate a systematic dependence on depth or pile length at the respective sites. It is evident 140
that the spread of τf/qt variations with h/D is lower than that of Si in Figure 2a and τf/qt ratios, 141
at a fixed h/D, typically vary by less than 25% from the mean trend of the four clays. 142
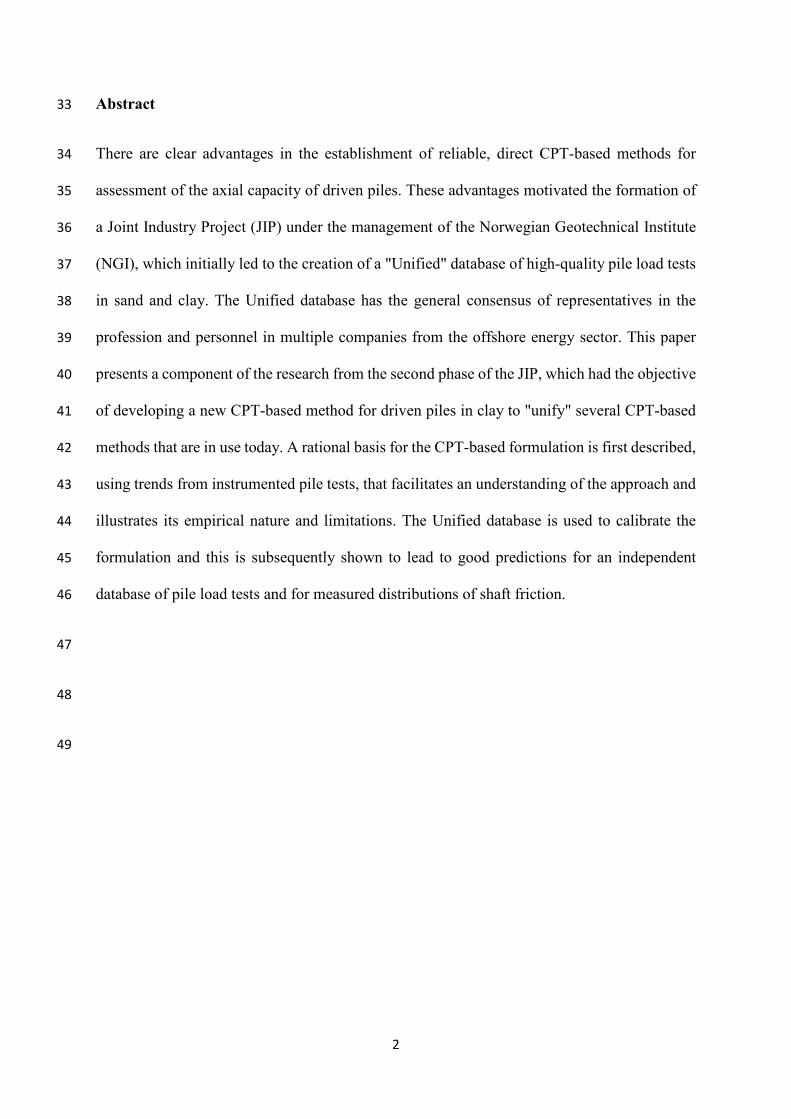
Further instrumented pile test data are shown on Figure 3 to allow a comparison of results 143
obtained in three lightly overconsolidated clays, namely Onsøy, Lierstranda and Bothkennar 144
7
clays. The test results in both Onsøy and Lierstranda clays, which are reported in NGI (1988a), 145
NGI (1988b) and Karlsrud et al. (1993), were obtained using eight 219mm diameter piles 146
driven to final penetrations of between 15m and 35m. Each pile was equipped with a pair of 147
radial stress sensors located at three levels, 5m apart. The CPT qt profiles at Bothkennar and 148
Onsøy varied approximately linearly with depth with a gradient of 40 kPa/m while qt values at 149
Lierstranda also varied linearly with depth but with a gradient of about 50 kPa/m. 150
Best-fit A and c coefficients derived from the measured Si data are also listed in Table 1 and 151
although these differ in magnitude, it is evident from the variations of Si with h/D shown on 152
Figure 3a that a broadly comparable Si relationship with h/D exists for these three low OCR 153
clays. However, as seen in Figures 3b and 3c, values of Sc/Si and fL are not similar with much 154
lower values of these parameters being recorded in the Lierstranda clay. 155
Numerical analyses performed using the Strain Path Method (SPM) and the MIT-E3 156
constitutive model reported by Whittle & Baligh (1988), Azzouz et al. (1990), and others, have 157
shown that clay sensitivity (St) and overconsolidation ratio (OCR) have a dominant effect on 158
the relaxation of total stresses during pore pressure equalization and hence the Sc/Si ratio. These 159
analyses are supported by the measured ratios given in Table 1, which indicates Sc/Si values 160
between 0.8 and 1.0 in the high OCR Cowden till and London clay and between 0.15 and 0.43 161
in the three low OCR clays considered. Of particular note, is the much lower Sc/Si value in 162
Lierstranda clay. The CPT friction ratio data indicate that the Lierstranda clay has a sensitivity 163
(St) of about 9 compared with St values of 3.5 and 6.0 for Bothkennar and Onsøy clays 164
respectively. The CPT data for the Lierstranda clay plot close to or within Zone 1 of the soil 165
behavior type (SBT) chart (Robertson 2009) denoting a sensitive clay while the Bothkennar 166
and Onsøy clays classify as typical silty clays within Zone 3. 167

8
As seen in Table 1, the average fL value for Lierstranda clay is also lower than for less sensitive 168
clays, indicating that greater reductions in radial effective stress (σ'r) occur during static load 169
tests in this material. Greater reductions in σ'r also occurred during undrained direct simple 170
shear (DSS) tests on intact samples of Lierstranda clay compared with Onsøy and Bothkennar 171
clays but these reductions were not as marked as those measured in the pile tests. 172
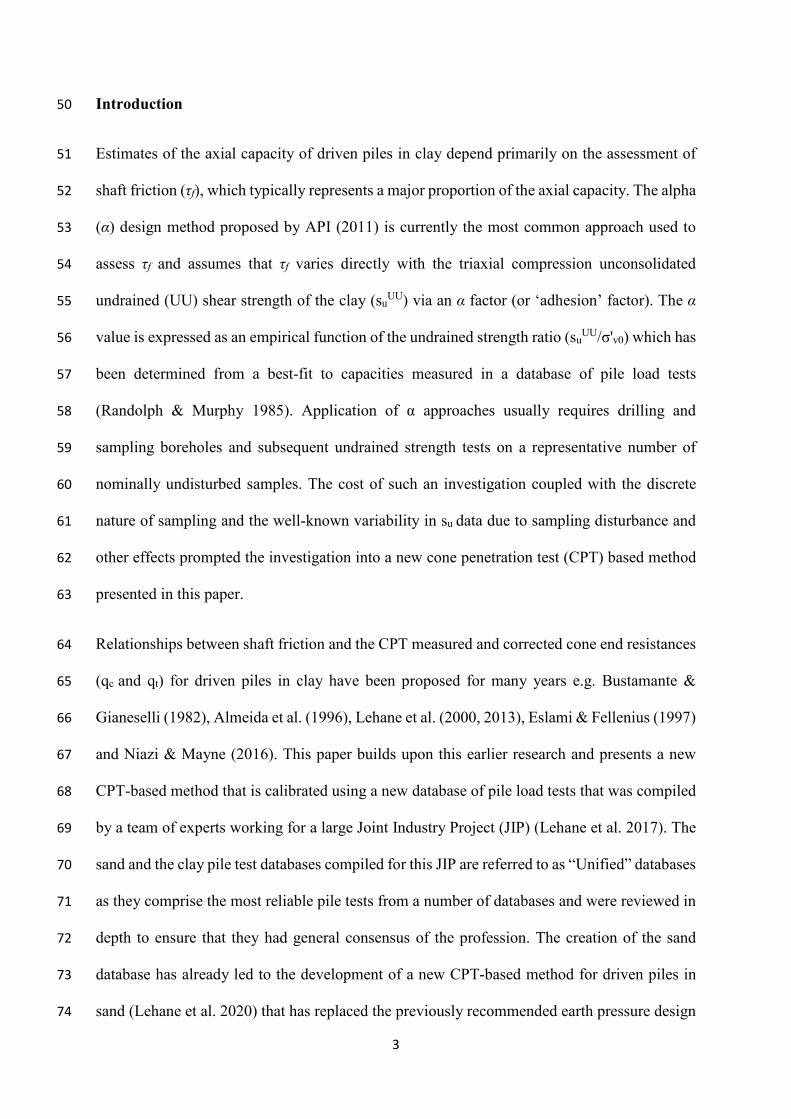
The compounding effect of low Sc/Si and fL ratios lead to very low τf/qt ratios in Lierstranda 173
clay, even though its Si and δ values are comparable with the other low OCR clays. Such low 174
ratios are apparent on Figure 4 which plots all variations of τf/qt with h/D determined using 175
equation (4) and the average coefficients in all clays (Table 1). The variations of τf/qt with h/D 176
are broadly similar, apart from in Lierstranda clay, and can be generally represented to within 177
20% by the following mean trend line, which is also shown on the figure : 178
τf = 0.08 qt (h/D)-0.3 h/D >0 (6) 179
The Lierstranda test data can be represented using the same format if a ‘sensitivity factor’, Fst, 180
is applied to equation (6) i.e. 181
τf = 0.08 Fst qt (h/D)-0.3 h/D >0 (7) 182
where Fst =0.3 in Lierstranda clay (which is in Zone 1 of the SBT chart) and unity in ‘typical’ 183
clays (i.e. in Zones 2, 3 and 4 of the SBT chart). 184
Equation (7), which was derived solely from instrumented pile tests, provides an indication of 185
a potential formulation for a CPT-based method for closed-ended piles. However, when 186
seeking a best-fit formulation to the Unified database of pile load tests, it is important to 187
recognize that the similarity of the relationship for the soils with Fst=1.0 arises because of 188
compensating effects in equation (4) of the parameters given in Table 1. 189
9
The dependence of τf on h/D in equation (7) is consistent with considerations of ‘length effects’ 190
dating back to reduction of the adhesion factor (α) with L/D proposed by Semple et al. (1984) 191
and Kolk & van der Velde (1996). Effects of progressive failure for long piles (e.g. Kraft 1981) 192
come in addition to the h/D dependence in equation (7), which has been predicted numerically 193
(but to a lesser extent) using the strain path method (SPM) with the MIT-E3 soil model (Whittle 194
1991). The effect of clay sensitivity, which emerges from the same SPM/MIT-E3 analyses, 195
was employed explicitly in formulations for τf involving OCR proposed by Lehane et al. (1994) 196
and Jardine et al. (2005). 197
Open-ended piles 198
The lower levels of soil displacement associated with the installation of open-ended piles 199
compared to closed-ended piles might be expected to lead to lower shaft friction, as is the case 200
for piles in sand (e.g. Gavin & Lehane 2003). However, empirical correlations such as proposed 201
by Bustamante & Gianeselli (1982) and Karlsrud et al. (2005) suggest that there is no 202
dependence on the plugging condition in low OCR clays but that friction in stiff or high OCR 203
clays can be lower for open-ended piles. Miller & Lutenegger (1997) also measured lower 204
frictions for open-ended piles in high OCR clay and observed lower frictions at lower degrees 205
of plugging during installation, where plugging was described by the plug length ratio (PLR). 206
Therefore, following a similar logic to that adopted for development of the CPT-based method 207
for piles in sand using the Unified database (Lehane et al. 2020), effects of soil displacement 208
can be examined in an extension of equation (5) by assuming that the normalized installation 209
total stress (Si) depends on h/D (as for a closed ended pile) and the effective area ratio (Are): 210
Si = A Areb (h/D)-c (8) 211
10
where b is a fitting parameter and Are represents the relative degree of displacement compared 212
to a closed-ended pile and is defined as a function of internal pile diameter (Di) and PLR: 213
Are = 1 –PLR (Di/D)2 = (Deq/D)2 (9a) 214
𝑃𝑃𝑃𝑃𝑃𝑃 = tanh �0.3 � 𝐷𝐷𝑖𝑖𝑑𝑑𝐶𝐶𝐶𝐶𝐶𝐶
�0.5� ; 𝑑𝑑𝐶𝐶𝐶𝐶𝐶𝐶 = 35.7𝑚𝑚𝑚𝑚 (9b) 215
PLR can be estimated from the equation (9b) which is based on available plugging data for 216
piles in clay (Lehane et al. 2017) and is zero for closed-ended piles. The level of partial 217
plugging of a pipe pile can also be described by the term Deq, which is the diameter of an 218
equivalent closed-ended pile leading to the same level of soil displacement. 219
Equation (8) is consistent with lateral stress data recorded in low OCR clay by Doherty & 220
Gavin (2011) during installation of (one of the very few) instrumented pipe piles in clay. The 221
same set of experiments showed that the values of Sc/Si, fL and δ were independent of the pile 222
end condition. The potential effects on Si of the clay OCR, referred to above, are not considered 223
explicitly in the assessment of best-fit formulations due to the shortage of related information. 224
The pile design method proposed by Jardine & Chow (1996) employs the term D* to reflect 225
the lower level of displacement induced during installation of a pipe pile, where : 226
D* = (D2 - Di2)0.5 for an open-ended pile 227
D* = D for a closed-ended pile (10) 228
The value of D* is equal to Deq when PLR=1 and the corresponding expression to equation (8) 229
is: 230
Si = A (h/D*)-c (11) 231
11
The format of equation (11) is consistent with numerical analyses performed by Chin (1986) 232
who predicted similar strain fields around closed and (non-plugging) open-ended piles when 233
distances from the pile are normalized by D*. Xu et al. (2006) also show that the lateral stresses 234
generated during installation of 1.02m diameter pipe piles and a 250mm square precast (closed-235
ended) pile have the same relationship with qt and h/D*. Equation (11) was therefore also 236
examined in the calibration of the database as it represents a useful simplification of equation 237
(8), noting that the approximate nature of the equation for PLR. 238
239
Loading direction coefficient, fD 240
The loading direction coefficient, fD, is defined as the ratio of the ultimate shaft friction 241
developed in tension to that in compression. This coefficient is best assessed by comparing 242
values of τf developed in first-time compression and tension load tests on identical piles. Such 243
comparisons indicated fD values of unity for piles in Kinnegar clay (McCabe and Lehane 2006), 244
Bothkennar clay (Lehane & Jardine 1994a), London clay (Bond & Jardine 1991), Haga clay 245
(Karlsrud and Haugen 1984) and Merville clay (Benzaria et al. 2012). However fD values 246
measured in Cowden till (Lehane and Jardine 1994b) and Pentre clayey-silt (Chow 1997) were 247
0.8 and 1.1 respectively. On this basis, a best estimate fD value of unity is adopted, although 248
the optimization studies considered below also investigated other fD values. 249
Basis for formulation for end bearing 250
The end bearing of compression piles in clay usually represents a small fraction of the total 251
capacity. This low relative contribution is reflected by the scarcity of research into the end 252
bearing of driven piles in clay, particularly pipe piles. API (2011) recommends taking the lesser 253
of the internal friction (calculated using the same formulation for external friction) and the 254
12
plugged end-bearing assumed to equal 9su; this relationship equates to 0.75qt for a typical CPT 255
cone factor of 12, when relating cone resistance to undrained shear strength in triaxial 256
compression. The plugged end bearing is almost always less than the calculated internal friction 257
for typical piles with L/D > 5 and therefore the database analysis did not consider internal 258
friction explicitly. 259
The few reliable cases that measured end bearing of closed-ended piles in clay indicate an end 260
bearing at a pile movement of 10% of the pile diameter (qb0.1) of about 80% of corrected cone 261
resistance at the pile tip level (qt). This proportion of qt is similar to that proposed by Jardine 262
& Chow (1996) and comparable to recommendations of API (2011) and Van Dijk & Kolk 263
(2011). 264
Doherty and Gavin (2011) present a unique set of measurements involving a twin-walled 265
instrumented pile that enabled separation of the average stress at the base of the plug and the 266
stress on the annulus during pile installation. All installation data recorded can be represented 267
by the following equation, where Are is given by equation (9): 268
qb0.1 = [0.2 + 0.6 Are] qt (12) 269
Equation (12) implies that the undrained end bearing capacity of a large offshore pile is 270
approximately 0.2qt (as Are approaches zero) and is 0.8qt for closed-ended piles. However, the 271
capacities of piles in the unified database were measured in static load tests on relatively small 272
diameter piles. Many of these pipe piles exhibited partial plugging during installation and also 273
had a greater potential for drainage during the tests compared to closed-ended piles. Jardine et 274
al. (2005) and Frank (2017) recommend qb0.1/qt ratios for these smaller piles under load testing 275
conditions of 0.4 and 0.35 respectively 276
13
On the basis of the foregoing, the following equations were considered to provide a reasonable 277
estimate of the end bearing mobilized by the database piles in static load tests (noting that the 278
mean contribution to compression capacity of end bearing of the database piles evaluated using 279
these expressions was less than 15%): 280
qb0.1 = 0.8 qt (closed-ended pile) (13a) 281
qb0.1 = 0.4 qt (open-ended pile) (13b) 282
The Unified database 283
A full description of the “Unified” database in clay is provided in Lehane et al. (2017). A total 284
of 300 pile load tests was examined but only 49 tests with CPT data were selected based on 285
stringent selection criteria explained in Lehane et al. (2017). These criteria included: (i) piles 286
had to be driven with a minimum diameter of 200mm and length of 5m, (ii) more than 75% of 287
the shaft friction was provided by clay layers, (iii) good quality CPT data were available close 288
to the pile test, (iv) the degree of consolidation prior to load testing was in excess of 80% and 289
only first-time tests were considered, (v) load-displacement data were provided for each test 290
pile up to a pile head displacement of D/10 and (vi) the loading rate was slow with ultimate 291
capacity typically attained a number of hours after the test start. A “Test” database was 292
compiled for the present study and followed these key criteria apart from allowing jacked piles 293
and piles with smaller diameters and shorter lengths. 294
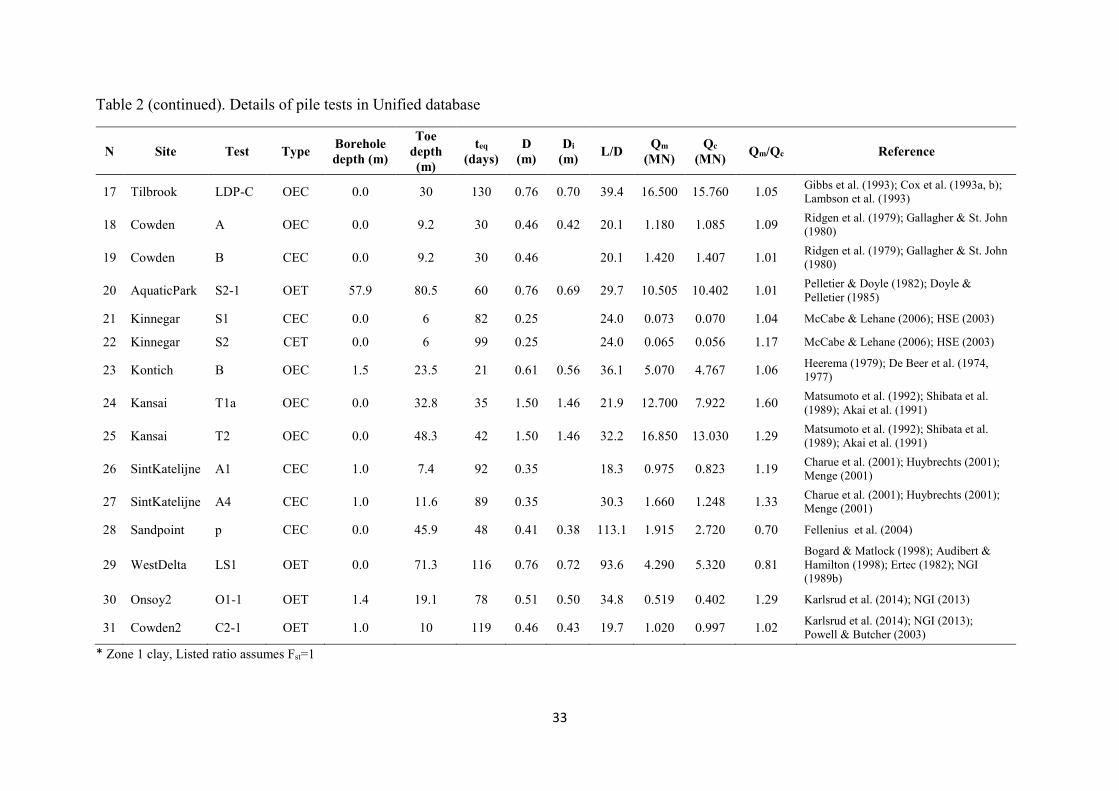
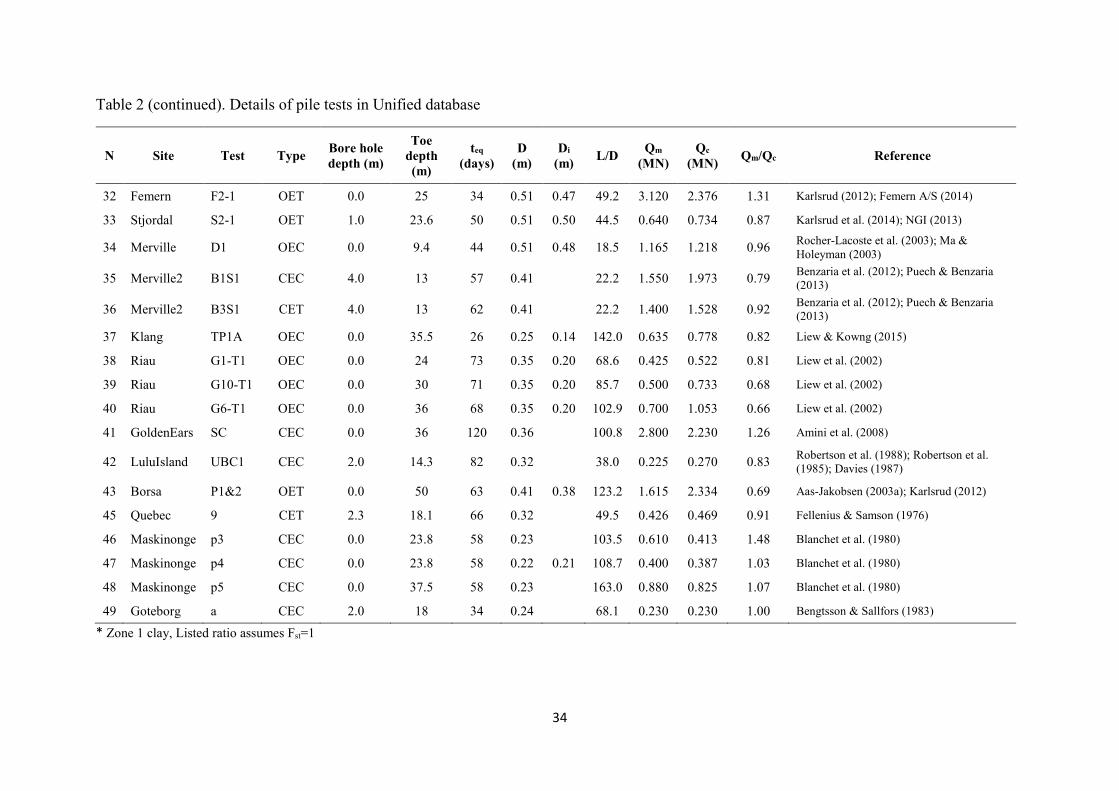
The pile load tests in the Unified and Test databases are listed in Tables 2 and 3 respectively. 295
The tables include details relating to the pile configurations, end conditions, loading direction 296
and measured axial capacity. The mean pile diameter of 450mm in the Unified database is 297
significantly smaller than full scale offshore piles. However laboratory and centrifuge studies 298
(e.g. Potts & Martins 1982, Li & Lehane 2011) have indicated that, unlike piles in sand, scale 299

14
effects due to the diameter dependence of dilation at the shaft interface do not apply in clays. 300
The database piles were load tested at periods after pile driving ranging from 21 to 130 days at 301
stages when their degrees of excess pore pressure dissipation were assessed as being generally 302
greater than 80% (see Lehane et al. 2017) 303
The measured pile capacity (Qm) was taken as the load at a pile head displacement of 10% of 304
the pile diameter (Q0.1D) or the maximum measured load if this occurred at a lower 305
displacement. The quoted values of Qm are those arising from the resistance provided by the 306
soil and exclude any contribution to resistance from the weight of piles or soil plugs. The unit 307
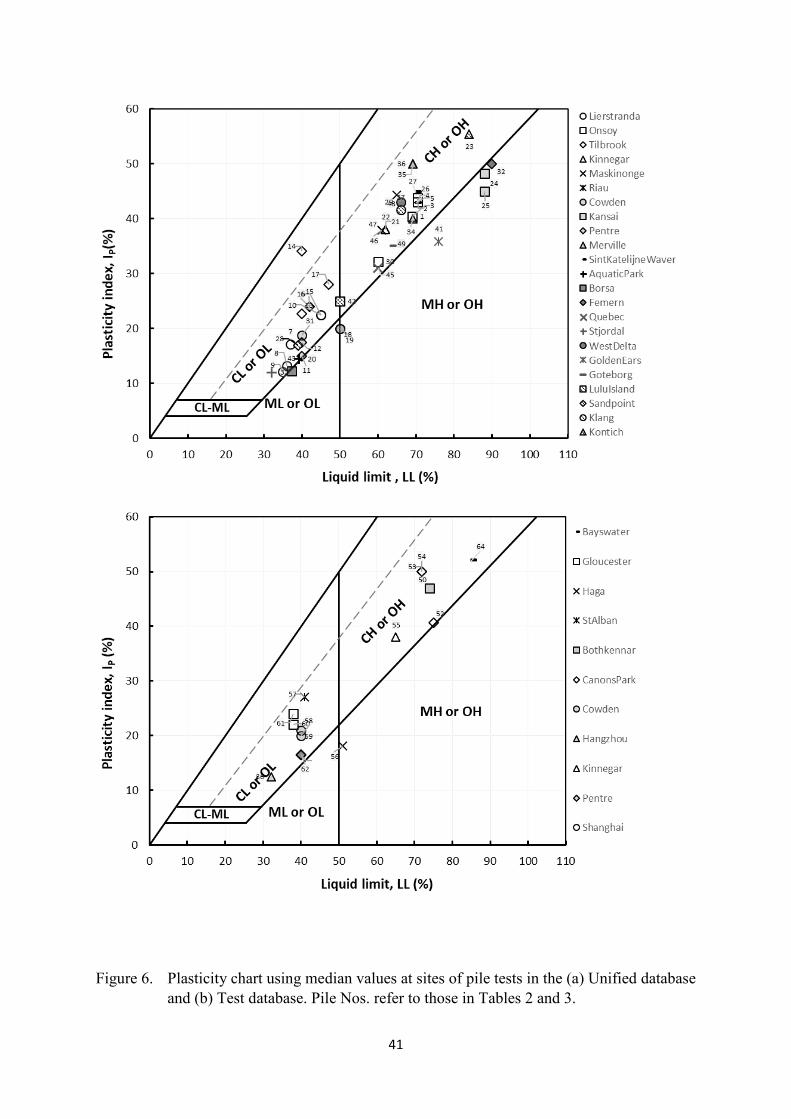
shaft capacities assessed from the database test piles assumed that peak frictions (τf) operated 308
over the entire pile shaft at the point of overall shaft failure and the formulations for τf calibrated 309
from these test data are therefore conservative in cases where the test piles experienced 310
significant progressive softening. The base pressure mobilized is lower than the actual qb0.1 311
value in cases when Qm is greater than Q0.1D. However this effect, as observed in the Unified 312
database, is negligible as the base resistance typically represented only about 10% of a 313
compression pile capacity and gains in base resistance between the displacement at maximum 314
load (typically 5% of the diameter for the cases with Qm >Q0.1D) and 0.1D are low. 315
The soil properties in both the Unified and Test databases are summarized by presenting the 316
median values in clay strata of the CPT consistency index (Ic), CPT friction ratio (Fr) and 317
plasticity index (Ip) along the embedded lengths of the piles. Median values are employed as 318
they provide more representative measures when there is significant layering at a given test 319
site. These are plotted on the soil behavior type (SBT) chart on Figure 5 and on the plasticity 320
chart on Figure 6. Figure 5 shows that the majority of the 31 clay sites fall within Zone 3 (silty 321
clay to clay) and Zone 4 (clayey silt to silty clay) and are either lightly overconsolidated with 322
normalized cone resistances (Qtn) of 5 ± 3 or have high OCRs with Qtn =35 ± 10. Two clays 323
(Pentre and West Delta) lie in Zone 2 (organic soils and clay) while four soils, namely 324
15
Lierstranda, Sandpoint, Borsa and Aquatic Park clays lie close to or within Zone 1 (sensitive 325
clays). 326
Figure 6 shows that the database comprises a large and uniform spread in Ip and liquid limit 327
values, where all soils plot above (or just below) the A-line. It is interesting that, while the four 328
clays classified in Zone 1 are of low plasticity (Ip <20%), the Pentre clay with a comparably 329
low plasticity index (Ip=16%) plots in Zone 2 and has a measured sensitivity (St) of only of 1.5 330
(Chow 1997). 331
Optimization analyses 332
The instrumented pile test records showed that the dominant parameters controlling local shaft 333
friction (τf) are the CPT resistance (qt) and the length effect, as described by the h/D term. 334
Initial calculations showed that use of the distance ‘h’ rather that the normalized value (h/D) 335
provided less satisfactory fits to the data. Additional terms were also examined using the 336
following two formats and assuming that the dependence of these terms could be represented 337
as power functions: 338
τf = f (qta, σ'vb, (h/D)-c, Are
d, Fre, Ic
f, Ipg, fD, Fst) (14) 339
τf = f (qta, σ'vb, (h/D*)-c, Fr
e, Icf, Ip
g, fD, Fst) (15) 340
Parameters a, b, c, d, e, f and g are fitting parameters and a minimum h/D* or h/D value was 341
nominally taken equal to 1.0. Capacities were calculated for various combinations of these 342
parameters using equation (13) to determine the base resistance of compression piles and 343
assuming initially that τf could be represented as a product of the power functions. Equations 344
(14) and (15) were used for calculation of τf in clay strata with Ic >2.5, while, in keeping with 345
its recommendations, the new ISO 19901-4 CPT sand method (Lehane et al. 2020) was applied 346
directly in sand and silty sand layers with Ic < 2.05. In (occasional) silt layers in the database 347
16
with Ic in the range between 2.05 and 2.5, the sand method was employed using the equivalent 348
clean sand qt value (qt,sand), derived using the following relationship which is equivalent to the 349
proposal of Robertson & Wride (1998) but adapted to a simplified format and modified to give 350
a correction factor of unity at Ic = 2.05: 351
qt,sand = [3.93 Ic2 - 14.78 Ic + 14.78] qt for 2.05 < Ic < 2.5 (16) 352
A spreadsheet-based optimization scheme was set up using the generalized reduced gradient 353
approach (Baker 2011) to determine the combination of fitting parameters that minimized the 354
coefficient of variation of the ratios of measured to calculated capacities (Qm/Qc) and gave an 355
average Qm/Qc ratio of unity for all 49 piles in the Unified database. The spreadsheet results 356
were verified independently using a Python code that used the Sequential Least Squares 357
Programming (SLSQP) algorithm. 358
A variety of different constraints were applied to the variables to ensure that (i) the local 359
minimum determined was a feasible solution, (ii) differences between calculated distributions 360
of τf and those reported in available case histories were small (e.g. Figure 7) and (iii) the 361
expression for τf was consistent with trends indicated in instrumented pile tests (Figure 4). 362
Preliminary analyses examined trends of Qm/Qc values with respect to individual terms in 363
equations (14) and (15) as well combinations of these terms (e.g. Figure 8). These analyses 364
confirmed the general versatility of using power functions in assessing the relative impact of 365
the terms and combinations of these terms. 366
Each Qm/Qc value was weighted following a procedure described in Lehane et al. (2017) to 367
deduce a weighted coefficient of variation (CoVw) for Qm/Qc ratios. Lower weightings were 368
applied to multiple piles at the same site and the weightings also varied with the quality ratings 369
assigned to each test pile by the team of experts responsible for compiling the database (Lehane 370
17
et al. 2017). Despite these procedures, the results of the analyses showed negligible differences 371
between the statistics for weighted and unweighted coefficients of variation. 372
The analyses revealed the following key findings: 373
(i) The lowest CoVw values were deduced when the exponent for qt was unity and the 374
exponent for σ'v (see Equations 14 and 15) was close to zero. Consequently, unlike the α 375
design method such as that recommended in API (2011), the analyses did not indicate a 376
dependence of τf on qt/σ'v, which varies approximately with the undrained strength ratio 377
and OCR. This characteristic is in keeping with the trends inferred from the instrumented 378
pile tests on Figure 4. 379
(ii) For any combination of the fitting parameters, Qm/Qc ratios determined in three of the 380
Zone 1 clays (and in particular the Lierstranda clay) were significantly over-predicted 381
when Fst was assumed equal to unity. Consequently, optimization focused on pile tests in 382
clays outside of Zone 1 and then re-visited the tests in Zone 1 to deduce recommendations 383
for Fst. 384
(iii) Inclusion of the Fr and Ic terms in the formulation had no beneficial effect on the 385
goodness-of-fit with the pile load tests in the Unified database i.e. optimized ‘e’ and ‘f’ 386
parameters were effectively zero and the same best-estimate formulation was applicable 387
to clays in Zones 2, 3 and 4 of the SBT chart. 388
(iv) The optimized exponent to Ip was close to zero indicating no effect of plasticity index on 389
the best fit τf formulation. This finding contrasts with the strong dependence on Ip 390
incorporated in the α method of Karlsrud et al. (2005). 391
(v) The minimum CoVw values achieved using the function forms in equations (14) and (15) 392
were identical and therefore equation (15), which uses the h/D* term, was adopted for 393
simplicity. It is noted that equation (15) reduces to equation (14) if the exponent, d, of 394
18
the effective ratio (Are) equals '-c/2'. The statistical analyses predicted d values that were 395
close to -c/2 hence justifying use of equation (15). 396
(vi) Similar CoVw values were obtained when fD was varied between 0.85 and 1.15 indicating 397
that fD can be set equal to unity in line with the average parameter deduced from field 398
tests discussed above. 399
(vii) CoVw values showed marginal differences for ‘c’ varying between 0.15 and 0.3 (where 400
c is the exponent for h/D*). A ‘c’ value of 0.25 was selected as it provided a slightly 401
improved fit to the ultimate shear stress profiles recorded on test piles, especially large 402
diameter pipe piles. 403
The initial, convenient assumption that the contribution of Fr, Ic and Ip to τf could be represented 404
in the optimization analysis as the product of power functions of these terms was warranted 405
because of the absence of any individual or combined contribution to the best-fit formulation. 406
Consideration of the product of the qt and σ'v terms enabled an indirect check on the influence 407
of undrained strength ratio while the inclusion in the formulation of the product of qt with h/D 408
or h/D* terms is consistent with the trend shown on Figure 4. Therefore, despite the wide-409
ranging investigation into potentially influential factors, the statistical analyses indicated that 410
the following simple correlation for peak friction in tension and compression provided a best 411
fit to the Unified database: 412
τf = 0.07 Fst qt Max[1, (h/D*)]-0.25 413
where Fst = 1 for clays in Zones 2, 3 and 4 414
Fst = 0.5 ± 0.2 for Zone 1 clays (17) 415
It is encouraging that Equation (17) is almost identical to Equation (7) which was deduced 416
independently from instrumented pile test data. Equation (17) has a mean Qm/Qc ratio of unity 417

19
for the Unified database pile load tests with a CoVw of Qm/Qc of 0.19 for piles in Zones 2, 3 418
and 4. This coefficient of variation is significantly lower than a typical value of 0.3 for existing 419
clay prediction methods, including the API (2011) α method (Lehane et al. 2017; Liu et al. 420
2019; Dithinde et al. 2011; Paikowsky et al. 2004). The best-fit Fst values were 0.3 in 421
Lierstranda clay, 0.7 in Borsa and Sandpoint clays and 1.0 in Aquatic Park clays. It is therefore 422
evident that the analyses did not lead to a unique Fst value for Zone 1 clays and, as such, there 423
is additional uncertainty related to use of the proposed Fst value of 0.5 for these clays. 424
Consequently, pile capacities in Zone 1 soils need to be assessed with particular care and ideally 425
rely on local experience and pile testing. In this regard, it is important to note that the 426
measurement of CPT friction sleeve stress is prone to error and may lead to mis-classification 427
of the soil type. Additional investigations to assist in a material’s classification are 428
recommended if the CPT data plot close to the Zone 1 boundary. 429
The peak shear stress profiles calculated using equation (17) are compared on Figure 7 with 430
profiles measured by three of the larger diameter pipe piles in the Unified database. It is seen 431
that the profile for the very long pile in the soft clay at West Delta is well predicted while 432
predictions in the low OCR clay at Onsoy and high OCR clay at Tilbrook provide less precise 433
matches to the measured distributions. While such differences may be partly attributed to errors 434
in the friction inferred from measured axial load distributions and due to difficulties in 435
separating end bearing and external friction for the compression pile at Tilbrook, the 436
comparisons serve to highlight the approximate and empirical nature of equation (17). 437
The optimization analyses included a constraint to minimize the bias of Qm/Qc with respect to 438
additional pile and soil parameters. To examine such bias, these ratios are plotted for the 439
Unified database on Figure 8 against the pile diameter, pile slenderness ratio (L//D), the median 440
friction ratio (Fr) and the median plasticity index (Ip). Best fit regression lines for each set of 441
data indicate no clear dependence of Qm/Qc on L/D, Fr and Ip. The slight apparent trend seen 442
20
on Figure 8a to overestimate pile capacity (i.e. Qm/Qc >1) as the diameter increases arises 443
because of the two 1.5m diameter piles at Kansai (Matsumoto et al. 1992). These piles were 444
driven into a clay deposit that included significant sand layers and, as such, their weighting to 445
the overall statistics was relatively low in the analyses. 446
Equation (17) provides an expression for peak shaft friction. Load transfer analyses using t-z 447
springs that include the post-peak softening ‘branches’ recommended by API (2011) or take 448
account of other site-specific softening data should be conducted to calculate the capacity of 449
long slender piles which may develop progressive failure. Such analyses were performed for 450
the Unified database piles using the t-z curves documented in API (2011) and the average 451
recommended softening coefficient of 0.8. The analyses had little effect on the evaluated Qm/Qc 452
ratios for piles with L/D <50 but gave an increase in these ratios to values in excess of 0.75 for 453
all piles with L/D>50 i.e. potential non-conservatism is reduced. 454
The shaft capacity of piles increases after consolidation is completed in a process referred to 455
as ageing (e.g. Doherty & Gavin 2013). Equation (17) does not incorporate an ageing 456
enhancement factor and provides a means of estimating shaft friction when the degree of excess 457
pore pressure dissipation after driving is more than 80%. According to Teh & Houlsby (1991) 458
and Randolph (2003), in a typical clay, achieving this level of dissipation at the shaft of a 2m 459
diameter offshore pipe pile with a wall thickness of 40mm may take 6 months or longer while 460
80% dissipation for a 250mm square precast concrete pile would generally be complete in 3 to 461
4 weeks. It should also be noted that the development of dilative local shaft effective stress 462
paths and other effects at low levels of equalization may compensate partially for low radial 463
effective stresses with a consequence that partially equalized shaft frictions are often higher 464
than anticipated from the degree of pore pressure dissipation e.g. Lehane & Jardine (1994a), 465
Basu et al. (2013), Bittar et al. (2022). 466

21
The Test database, summarized in Table 3, was used to obtain an independent check of the 467
best-fit formulation (equation 17) and involved an additional 8 clay types (all lying in Zones 3 468
and 4 on the SBT chart). Even though these piles were generally smaller in diameter and shorter 469
than those in the Unified database, it was found that Equation (17) predicted the capacity 470
relatively well with an average Qm/Qc value of 1.09 (i.e. slightly conservative in terms of 471
predicted capacity) and a coefficient of variation for Qm/Qc of 0.22. Bias charts for the 472
predictions of the Test database are provided on Figure 9 and demonstrate no obvious 473
dependence of Qm/Qc on D, L/D or Ip but do display a tendency for Qm/Qc to reduce slightly 474
with Fr. However, this trend was not evident from analysis of the Unified database, which 475
comprises about 3 times more tests. 476
The statistics for the Test database are consistent with those of the Unified database and provide 477
additional evidence in support of the general applicability of Equation (17). It is of note that 478
the outlier Qm/Qc values in the Test database occurred for the piles in Bothkennar and London 479
clay and averaged 1.5 and 0.67 respectively. These relatively large deviations from the average, 480
which are also evident on Figure 4, partially reflect the relatively high δ value of 29o in 481
Bothkennar clay and relatively low δ value of 13o in London clay and suggest that 482
improvements of predictive performance in future correlations may be achieved if δ values are 483
measured and documented reliably for new test piles. The variability of Qm/Qc on Figures 8 484
and 9 is a simple consequence of the limitations of the CPT-based formulation and the 485
variability in the pile load test results. 486
487
Conclusions 488
This paper presents the development of a new CPT based method for assessment of the axial 489
capacity of driven piles in clay. Equation (12) provides the expression deduced for the ultimate 490
22
end bearing capacity (defined at a displacement of 10% of the pile diameter) while the 491
expression for the peak local shaft friction is given in Equation (17); these equations are valid 492
for soil falling within zones 2, 3 and 4 of soil behavior chart and are applicable at slow rates of 493
loading (typical of static load tests) after equalization of excess pore pressures. The equations 494
are consistent with findings from field research and numerical analyses and were calibrated 495
using the Unified database of pile load tests published in Lehane et al. (2017). The method is 496
a significant improvement on popular existing methods and shown to provide good predictions 497
for both the Unified database and an additional Test database that was compiled to enable an 498
independent check of the method. Measured ultimate shaft friction distributions are also seen 499
to be reasonably well estimated. While providing generally good predictions for the particular 500
database used for its calibration, its empirical formulation is recognized and designers should 501
exercise due caution with the approach, especially when considering sensitive clays. 502
Data availability statement 503
All data and models used during the study appear in the submitted article. 504
Acknowledgements 505
The authors gratefully acknowledge the funding and support provided under a Joint Industry 506
Project (JIP) funded by Aramco, Equinor, Lundin, Ørsted, ONGC, BP, Total, ExxonMobil, 507
EnBW, EDF and SSER. The significant contribution of Dr. Jit Kheng Lim to the database 508
compilation is also highly appreciated as are the technical contributions of the JIP steering 509
committee members to the development of the method. 510
23
Notation 511
The following symbols and abbreviations are used in this paper: 512
Are effective area ratio (Ratio of soil displaced by pipe pile to displacement by 513 closed-ended pile) 514
c exponent to h/D and h/D* 515
CoV coefficient of variation 516
CoVw weighted coefficient of variation 517
CPT Cone Penetration Test 518
dCPT diameter of a standard cone penetrometer 519
D pile diameter 520
Deq diameter of an equivalent closed-ended pile that induces the sane soil 521 displacement during installation as a pipe pile 522
Di inner pile diameter (of pipe pile) 523
D* Deq value for full coring pipe pile or D for closed-ended pile 524
fD load direction coefficient for shaft friction 525
fL loading coefficient (σ'rf/ σ'rc) 526
Fst sensitivity coefficient 527
Fr CPT friction ratio 528
h height of given point on shaft above the pile base 529
Ic CPT soil consistency index 530
Ip plasticity index 531
JIP joint industry project 532
L pile length 533
OCR overconsolidation ratio 534
PLR plug length ratio (=plug length divided by embedded pile length) 535
qb0.1 end bearing stress at a pile base displacement of D/10 536
qc cone resistance 537
qt cone resistance corrected for pore pressure at filter 538
qt,sand qt measured at drained rate of penetration in silt 539
Qtn normalized cone resistance (see Robertson 2009) 540
Qc Calculated pile capacity 541
24
Qm measured pile capacity =load at 10% of the pile head displacement (Q0.1D) or 542 the maximum measured load if this occurred at a lower displacement 543
suUU triaxial compression unconsolidated undrained (UU) shear strength 544
SBT soil behavior type 545
SPM strain path method 546
teq time between installation and load testing 547
u0 ambient (hydrostatic) pore pressure 548
α adhesion factor (τf / suUU) 549
δ clay-pile interface friction angle 550
μ Mean value of Qm/Qc 551
Δui excess pore pressure at pile shaft during installation 552
σrc,σ'rc radial total and effective stress after equalisation of pore pressure 553
σri, σ'ri, radial total and effective stress operating during installation 554
σ'rf radial effective stress at peak shear stress in load test 555
σ'v0 in-situ vertical effective stress 556
τf peak shear stress 557
558
559

25
References 560
Almeida, M.S., Danziger, F.A., and Lunne, T. (1996). Use of the piezocone test to predict the 561
axial capacity of driven and jacked piles in clay. Canadian Geotechnical J., 33(1): 23-41. 562
API. (2011). ANSI/API RP 2GEO: Geotechnical and Foundation Design Considerations. ISO 563
19901-4:2003 (Modified), Petroleum and natural gas industries-Specific requirements for 564
offshore structures, Part 4-Geotechnical and foundation design considerations. 1st edition. 565
Washington, DC: API Publishing Services. 566
Azzouz, A.S., Baligh, M.M. and Whittle, A.J. (1990). Shaft Resistance of Piles in Clay. Journal 567
of Geotechnical Engineering, 116(2): 205–221. 568
Azzouz, A.S., and Morrison, M.J. (1988). Field Measurements on Model Pile in Two Clay 569
Deposits. J. Geotechnical Engineering, ASCE, 114(1): 104–121. 570
Baker K.R. (2011). Optimization modelling with spreadsheets. Wiley Online library. 571
Basu, P., Prezzi, M., Salgado, R. and Chakraborty T. (2014). Shaft resistance and setup factors 572
for piles jacked in clay. J. Geotech. & Geoenv. Engrg, ASCE, 140 (3), 57-73. 573
Benzaria, O., Puech, A. and Kouby, A. Le. (2012). Cyclic axial load tests on driven piles in 574
overconsolidated clay. Offshore Site Investigation and Geotechnics 2012: Integrated 575
Technologies - Present and Future, OSIG 2012: 307–314. 576
Bittar, E., Huang, B., Lehane, B.M. and Watson, P (2022). Pile ageing to support life extension 577
of offshore platforms. Proc 20th Int. Conf. Soil Mech. Geotech. Engrg, Sydney (in press) 578
Bond, A.J. (1989). Behaviour of displacement piles in overconsolidated clays. PhD thesis, 579
Imperial College London (University of London). 580
Bond, A.J. and Jardine R.J. (1991). Effects of installing displacement piles in high OCR clay. 581
Geotechnique, 41(3), 341-363. 582
Bustamante, M. and Gianeselli, L. (1982). Pile Bearing Capacity Prediction by Means of Static 583
Penetrometer CPT. Proceedings of the Second European Symposium on Penetration Testing: 584

26
493–500. 585
Chin, C.T. (1986). Open-ended pile penetration in saturated clays. PhD thesis, Massachusetts 586
Institute of Technology, Boston, MA. 587
Chow, F. (1997). Investigations into the behaviour of displacement piles for offshore 588
foundations. PhD thesis, Imperial College London (University of London). 589
Coop, M.R. and Wroth, C.P. (1989). Field studies of an instrumented model pile in clay. 590
Geotechnique, 39(4): 679–696. 591
Van Dijk, B.F.J. and Kolk, H.J. (2011). CPT-based design method for axial capacity of offshore 592
piles in clays. In Proc. of the Int. Symposium on Frontiers in Offshore Geotechnics II. Edited 593
by S. Gourvenec and D. White. Taylor & Francis Group, London. pp. 555–560. 594
Doherty, P. and Gavin, K. (2011). Shaft Capacity of Open-Ended Piles in Clay. J. Geotech. & 595
Geoenv. Engrg, 137(11): 1090–1102. 596
Doherty, P. and Gavin, K. (2013). Pile Aging in cohesive soils. J. Geotech. & Geoenv. Engrg., 597
ASCE, 139(9):1620-1624. 598
Dithinde, M., Phoon K.K., De Wet M. and Retief J.V. (2011). Characterization of Model 599
Uncertainty in the Static Pile Design Formula. J. Geotech. & Geoenv. Engrg, ASCE, 137 600
(1), 70-85. 601
Eslami, A. and Fellenius, B.H. 1997. Pile capacity by direct CPT and CPTu methods applied 602
to 102 case histories. Canadian Geotechnical J., 34(6): 886–904. 603
Frank, R. 2017. Some aspects of research and practice for pile design in France. Innovative 604
Infrastructure Solutions, 2(1): 1–15. Springer International Publishing. 605
Gavin, K.G. and Lehane, B.M. (2003). Shaft friction for open-ended piles in sand. Canadian 606
Geotechnical J., 40(1), 36-45. 607
ISO 19901-4. Petroleum and natural gas industries- Specific requirements for offshore 608
structures, Part 4: Geotechnical and foundation design considerations. International 609
27
Standards Organisation; 1996 edition to be updated to 2021 edition. 610
Jardine, R., and Chow, F. 1996. New design methods for offshore piles. Marine Technology 611
Directorate, London, UK. 612
Jardine, R., Chow, F., Overy, R. and Standing, J. (2005). ICP Design Methods for Driven Piles 613
in Sands and Clays. Thomas Telford London. 614
Karlsrud, K., Clausen, C.J.F. and Aas, P.M. (2005). Bearing capacity of driven piles in clay, 615
the NGI approach. Proc. Int. Symp. on Frontiers Offshore Geotechnics, Perth. pp. 775–782. 616
Karlsrud, K. and Haugen, T. (1985). Axial static capacity of steel model piles in over-617
consolidated clay. Proc., 11th Int. Conf. on Soil Mechanics and Foundation Engineering, 618
Vol. 3, Balkema, Rotterdam, Netherlands, 1401–1406. 619
Karlsrud, K., Kalsnes, B. and Nowacki, F. (1993). Response of piles in soft clay and silt 620
deposits to static and cyclic axial loading based on recent instrumented pile load tests. In 621
Offshore Site Investigation and Foundation Behaviour. Springer. pp. 549–583. 622
Kolk, H. and van der Velde, E. (1996). A Reliable Method to Determine Friction Capacity of 623
Piles Driven into Clays. In Proc. Offshore Technology Conference (OTC), Houston, Texas, 624
Pub No. 413532. 625
Lehane, B.M. (1992). Experimental investigations of pile behaviour using instrumented field 626
piles. PhD thesis, Imperial College London (University of London). 627
Lehane B.M. and Jardine R.J. (1992). On the residual strength of Bothkennar clay. 628
Geotechnique, 42(2), 363-368. 629
Lehane, B.M., Liu, Z., Bittar, E., Nadim, F., Lacasse, S., Jardine, R., Carotenuto, P., Rattley, 630
M., Jeanjean, P., Gavin, K., Gilbert, R., Bergan-haavik, J. and Morgan, N. (2020). A new 631
CPT-based axial pile capacity design method for driven piles in sand. Proc. 5th Int. Symp. 632
Frontiers Offshore Geotechnics, ISFOG-21, Paper No. 3457. DFI publications, New Jersey. 633
Lehane B.M., Chow F.C., McCabe B.M. and Jardine R.J. (2000). Relationships between shaft 634

28
capacity of driven piles and CPT end resistance. Geotech. Engrg., ICE, 143, 93-101. 635
Lehane, B.M. and Jardine, R.J. (1994a). Displacement-pile behaviour in a soft marine clay. 636
Canadian Geotechnical J., 31(2):181-191. 637
Lehane, B.M. and Jardine, R.J. (1994b). Displacement pile behaviour in glacial clay. Canadian 638
Geotechnical J., 31(1): 79-90. 639
Lehane, B.M., Jardine, R.J., Bond, A.J. and Chow, F.C. (1994). The development of shaft 640
resistance on displacement piles in clay. In International conference on soil mechanics and 641
foundation engineering. pp. 473–476. 642
Lehane, B.M., Li, Y. and Williams, R. (2013). Shaft Capacity of Displacement Piles in Clay 643
Using the Cone Penetration Test. J. Geotech. & Geoenv. Engrg., ASCE, 139(2):253-266. 644
Lehane, B.M., Lim, J.K., Carotenuto, P., Nadim, F., Lacasse, S., Jardine, R.J. and van Dijk, 645
B.F.J. (2017). Characteristics of Unified Databases for Driven piles. Proc. 8th International 646
Conf. Offshore investigation and Geotechnics: Smarter solutions for offshore developments, 647
Society for Underwater Technology, 1, 162-194. 648
Li Y. and Lehane B.M. (2012). Insights gained from instrumented centrifuge displacement 649
piles in Kaolin. Int. Journal of Geotechnical Engineering, 6, 157-161.Liu, Z., Nadim, F., 650
Lacasse, S., Lehane, B.M. and Choi, Y.J. (2019). Method uncertainty for five axial pile 651
capacity design methods. In Offshore Technology Conference (OTC 2019), 6-9 May 2019, 652
Houston, #OTC-29514-MS. 653
Matsumoto, T., Sekiguchi, H., Shibata, T. and Fuse, Y. (1992). Performance of steel pipe piles 654
driven in Pleistocene clays. In International conference on the application of stress-wave 655
theory to piles. pp. 293–298. 656
McCabe, B.A. and Lehane, B.M. (2006). Behavior of axially loaded pile groups driven in 657
clayey silt. J. Geotech. and Geoenv. Engrg, ASCE, 132(3): 401–410. 658
Miller, G.A. and Lutenegger, A.J. (1997). Influence of pile plugging on skin friction in 659
29
overconsolidated clay. J. Geotechnical Engineering, ASCE, 123(6): 525–533. 660
Niazi, F.S. and Mayne, P.W. (2016). CPTu-based enhanced UniCone method for pile capacity. 661
Engineering Geology, 212: 21–34. Elsevier B.V. 662
Norwegian Geotechnical Institute (NGI). (1988a). Summary, interpretation and analysis of the 663
pile load tests at the Lierstranda test site. NGI Rep. 52523-26, Oslo, Norway. 664
Norwegian Geotechnical Institute (NGI). (1988b). Summary, interpretation and analysis of the 665
pile load tests at the Onsoy test site. NGI Rep.52523-23, Oslo, Norway. 666
Potts, D.M. and Martins J.P. (1982). The shaft resistance of axially loaded piles in clay. 667
Géotechnique 32(4): 269-386. 668
Paikowsky S.G., Birgisson B., McVay M., Nguyen T., Kuo C., Baecher G., Ayyub B., 669
Stenerssen K., O’Malley K, Chernauskas L., O’Neill M. (2004). Load and resistance factor, 670
Design (LFRD) for deep foundations. NCHRP Report 507, Transport Research Board, 671
Washington D.C. 672
Randolph, MF. (2003). Science and empiricism in pile foundation design. Géotechnique 673
53(10): 847-876. 674
Randolph, M. F., and Murphy, B. S. (1985). Shaft capacity of driven piles in clay. Proc., 675
Offshore Technology Conf., Offshore Technology Conference, Houston. 676
Robertson, P.K. 2009. Interpretation of cone penetration tests - A unified approach. Canadian 677
Geotechnical J., 46(11):1337-1355. 678
Robertson, P.K., and Wride, C.E. (1998). Evaluating cyclic liquefaction potential using the 679
cone penetration test. Canadian Geotechnical Journal, 35(3):442-459. 680
Semple, R.M., Rigden, W.J., Randolph, M.F. and Murphy, B.S. (1984). Shaft capacity of 681
driven pipe piles in clay. Proc. Symp. On Codes and Standards, ASCE National Conv., San 682
Francisco. pp. 59–79. 683
Shanghai Xian Dai Architectural Design Co Ltd. (2008). The research on single piles bearing 684

30
capacity methods in Shanghai. Shanghai Construction and Transportation Commission 685
Marketing Dept Report 2007-02, Dec 2008. 686
Teh, CI and Houlsby, GT. (1991). An analytical study of the cone penetration test in clay. 687
Géotechnique 41(1): 17-34.Whittle, A.J. and Baligh, M.M. (1988). A Model for Predicting 688
the Performance of TLP Piles in Clays. Final Report Phase III to sponsors, Dept. of Civil 689
Engineering, Massachusetts Institute of Technology. 690
Whittle, A.J. (1991). Predictions of instrumented pile behaviour at the Bothkennar site. Report 691
for Dept. of Civil Engineering, Imperial College London (summarised in Lehane 1992). 692
Xu, X., Liu, H. and Lehane, B.M. (2006). Pipe pile installation effects in soft clay. Proceedings 693
of the Institution of Civil Engineers: Geotechnical Engineering, ICE, 159(4):285-296. 694

31
695
696
Table 1 Coefficients measured in instrumented pile tests 697
698
699
Definitions of coefficients are provided in Equations (1), (2), (3) and (5) 700
701
702
703
704
705
706
707
708
709
710
711 712 713
Clay
OCR Ip (%) A c Sc/Si fL δ (degs) Cowden till 10 21 0.40 0.36 0.80 0.80 22 London Clay 30 50 0.65 0.59 1.00 1.00 13 Bothkennar clay 1.7 47 0.50 0.24 0.43 0.80 29 Pentre silt 1.8 16 0.62 0.45 0.65 0.92 20 Onsoy Clay 1.3 43 0.40 0.15 0.32 0.81 24 Lierstranda clay 1.2 16 0.48 0.28 0.15 0.60 26.5

32
Table 2. Details of pile tests in Unified database
N Site Test Type Borehole depth (m)
Toe depth (m)
teq (days)
D (m)
Di (m) L/D Qm
(MN) Qc
(MN) Qm/Qc Reference
1 Onsoy A1-02 CET 5.0 15 26 0.22 45.7 0.091 0.122 0.74 Karlsrud et al. (1993b); NGI (1988b)
2 Onsoy A3-02 CET 20.0 30 54 0.22 45.7 0.224 0.251 0.89 Karlsrud et al. (1993b); NGI (1988b)
3 Onsoy B1-02 OET 5.0 15 81 0.81 0.79 12.3 0.427 0.430 0.99 Karlsrud et al. (1993b); NGI (1988b)
4 Onsoy C1-02 CET 5.0 35 50 0.22 137.0 0.407 0.504 0.81 Karlsrud et al. (1993b); NGI (1988b)
5 Onsoy C2-02 CET 5.0 35 51 0.22 137.0 0.487 0.504 0.97 Karlsrud et al. (1993b); NGI (1988b)
6 Lierstranda A7-02 CET 5.0 15 29 0.22 45.7 0.069 0.197 0.35 Karlsrud et al. (1993b); NGI (1988a)
7 Lierstranda A8-02 CET 12.5 22.5 32 0.22 45.7 0.077 0.241 0.32 Karlsrud et al. (1993b); NGI (1988a)
8 Lierstranda A9-02 CET 20.0 30 31 0.22 45.7 0.100 0.293 0.34 Karlsrud et al. (1993b); NGI (1988a)
9 Lierstranda A10-02 CET 27.5 37.5 30 0.22 45.7 0.074 0.305 0.24 Karlsrud et al. (1993b); NGI (1988a)
10 Lierstranda B2-02 OET 5.0 15 52 0.81 0.79 12.3 0.260 0.693 0.38 Karlsrud et al. (1993b); NGI (1988a)
11 Pentre A6-02a CET 25.0 32.5 32 0.22 34.2 0.351 0.374 0.94 Karlsrud et al. (1993a, b); NGI (1988c); Lambson et al. (1993)
12 Pentre LDP OEC 15.0 55 44 0.76 0.73 52.5 6.320 5.536 1.14 Gibbs et al. (1993); Cox et al. (1993a, b); Lambson et al. (1993)
13 Tilbrook A1 CET 3.0 12.9 61 0.22 45.2 1.246 1.275 0.98 Karlsrud et al. (1993a); NGI (1989c); Lambson et al. (1993)
14 Tilbrook B1 CET 17.5 25.6 59 0.22 37.0 1.741 1.873 0.93 Karlsrud et al. (1993a); NGI (1989c); Lambson et al. (1993)
15 Tilbrook C1 CET 3.0 17.5 59 0.22 66.2 2.045 2.495 0.82 Karlsrud et al. (1993a); NGI (1989c); Lambson et al. (1993)
16 Tilbrook D1 OET 3.0 17.5 73 0.27 0.24 53.1 2.039 2.738 0.74 Karlsrud et al. (1993a); NGI (1989c); Lambson et al. (1993)
* Zone 1 clay, Listed ratio assumes Fst=1
33
Table 2 (continued). Details of pile tests in Unified database
N Site Test Type Borehole depth (m)
Toe depth (m)
teq (days)
D (m)
Di (m) L/D Qm
(MN) Qc
(MN) Qm/Qc Reference
17 Tilbrook LDP-C OEC 0.0 30 130 0.76 0.70 39.4 16.500 15.760 1.05 Gibbs et al. (1993); Cox et al. (1993a, b); Lambson et al. (1993)
18 Cowden A OEC 0.0 9.2 30 0.46 0.42 20.1 1.180 1.085 1.09 Ridgen et al. (1979); Gallagher & St. John (1980)
19 Cowden B CEC 0.0 9.2 30 0.46 20.1 1.420 1.407 1.01 Ridgen et al. (1979); Gallagher & St. John (1980)
20 AquaticPark S2-1 OET 57.9 80.5 60 0.76 0.69 29.7 10.505 10.402 1.01 Pelletier & Doyle (1982); Doyle & Pelletier (1985)
21 Kinnegar S1 CEC 0.0 6 82 0.25 24.0 0.073 0.070 1.04 McCabe & Lehane (2006); HSE (2003)
22 Kinnegar S2 CET 0.0 6 99 0.25 24.0 0.065 0.056 1.17 McCabe & Lehane (2006); HSE (2003)
23 Kontich B OEC 1.5 23.5 21 0.61 0.56 36.1 5.070 4.767 1.06 Heerema (1979); De Beer et al. (1974, 1977)
24 Kansai T1a OEC 0.0 32.8 35 1.50 1.46 21.9 12.700 7.922 1.60 Matsumoto et al. (1992); Shibata et al. (1989); Akai et al. (1991)
25 Kansai T2 OEC 0.0 48.3 42 1.50 1.46 32.2 16.850 13.030 1.29 Matsumoto et al. (1992); Shibata et al. (1989); Akai et al. (1991)
26 SintKatelijne A1 CEC 1.0 7.4 92 0.35 18.3 0.975 0.823 1.19 Charue et al. (2001); Huybrechts (2001); Menge (2001)
27 SintKatelijne A4 CEC 1.0 11.6 89 0.35 30.3 1.660 1.248 1.33 Charue et al. (2001); Huybrechts (2001); Menge (2001)
28 Sandpoint p CEC 0.0 45.9 48 0.41 0.38 113.1 1.915 2.720 0.70 Fellenius et al. (2004)
29 WestDelta LS1 OET 0.0 71.3 116 0.76 0.72 93.6 4.290 5.320 0.81 Bogard & Matlock (1998); Audibert & Hamilton (1998); Ertec (1982); NGI (1989b)
30 Onsoy2 O1-1 OET 1.4 19.1 78 0.51 0.50 34.8 0.519 0.402 1.29 Karlsrud et al. (2014); NGI (2013)
31 Cowden2 C2-1 OET 1.0 10 119 0.46 0.43 19.7 1.020 0.997 1.02 Karlsrud et al. (2014); NGI (2013); Powell & Butcher (2003)
* Zone 1 clay, Listed ratio assumes Fst=1
34
Table 2 (continued). Details of pile tests in Unified database
N Site Test Type Bore hole depth (m)
Toe depth (m)
teq (days)
D (m)
Di (m) L/D Qm
(MN) Qc
(MN) Qm/Qc Reference
32 Femern F2-1 OET 0.0 25 34 0.51 0.47 49.2 3.120 2.376 1.31 Karlsrud (2012); Femern A/S (2014)
33 Stjordal S2-1 OET 1.0 23.6 50 0.51 0.50 44.5 0.640 0.734 0.87 Karlsrud et al. (2014); NGI (2013)
34 Merville D1 OEC 0.0 9.4 44 0.51 0.48 18.5 1.165 1.218 0.96 Rocher-Lacoste et al. (2003); Ma & Holeyman (2003)
35 Merville2 B1S1 CEC 4.0 13 57 0.41 22.2 1.550 1.973 0.79 Benzaria et al. (2012); Puech & Benzaria (2013)
36 Merville2 B3S1 CET 4.0 13 62 0.41 22.2 1.400 1.528 0.92 Benzaria et al. (2012); Puech & Benzaria (2013)
37 Klang TP1A OEC 0.0 35.5 26 0.25 0.14 142.0 0.635 0.778 0.82 Liew & Kowng (2015)
38 Riau G1-T1 OEC 0.0 24 73 0.35 0.20 68.6 0.425 0.522 0.81 Liew et al. (2002)
39 Riau G10-T1 OEC 0.0 30 71 0.35 0.20 85.7 0.500 0.733 0.68 Liew et al. (2002)
40 Riau G6-T1 OEC 0.0 36 68 0.35 0.20 102.9 0.700 1.053 0.66 Liew et al. (2002)
41 GoldenEars SC CEC 0.0 36 120 0.36 100.8 2.800 2.230 1.26 Amini et al. (2008)
42 LuluIsland UBC1 CEC 2.0 14.3 82 0.32 38.0 0.225 0.270 0.83 Robertson et al. (1988); Robertson et al. (1985); Davies (1987)
43 Borsa P1&2 OET 0.0 50 63 0.41 0.38 123.2 1.615 2.334 0.69 Aas-Jakobsen (2003a); Karlsrud (2012)
45 Quebec 9 CET 2.3 18.1 66 0.32 49.5 0.426 0.469 0.91 Fellenius & Samson (1976)
46 Maskinonge p3 CEC 0.0 23.8 58 0.23 103.5 0.610 0.413 1.48 Blanchet et al. (1980)
47 Maskinonge p4 CEC 0.0 23.8 58 0.22 0.21 108.7 0.400 0.387 1.03 Blanchet et al. (1980)
48 Maskinonge p5 CEC 0.0 37.5 58 0.23 163.0 0.880 0.825 1.07 Blanchet et al. (1980)
49 Goteborg a CEC 2.0 18 34 0.24 68.1 0.230 0.230 1.00 Bengtsson & Sallfors (1983)
* Zone 1 clay, Listed ratio assumes Fst=1
35
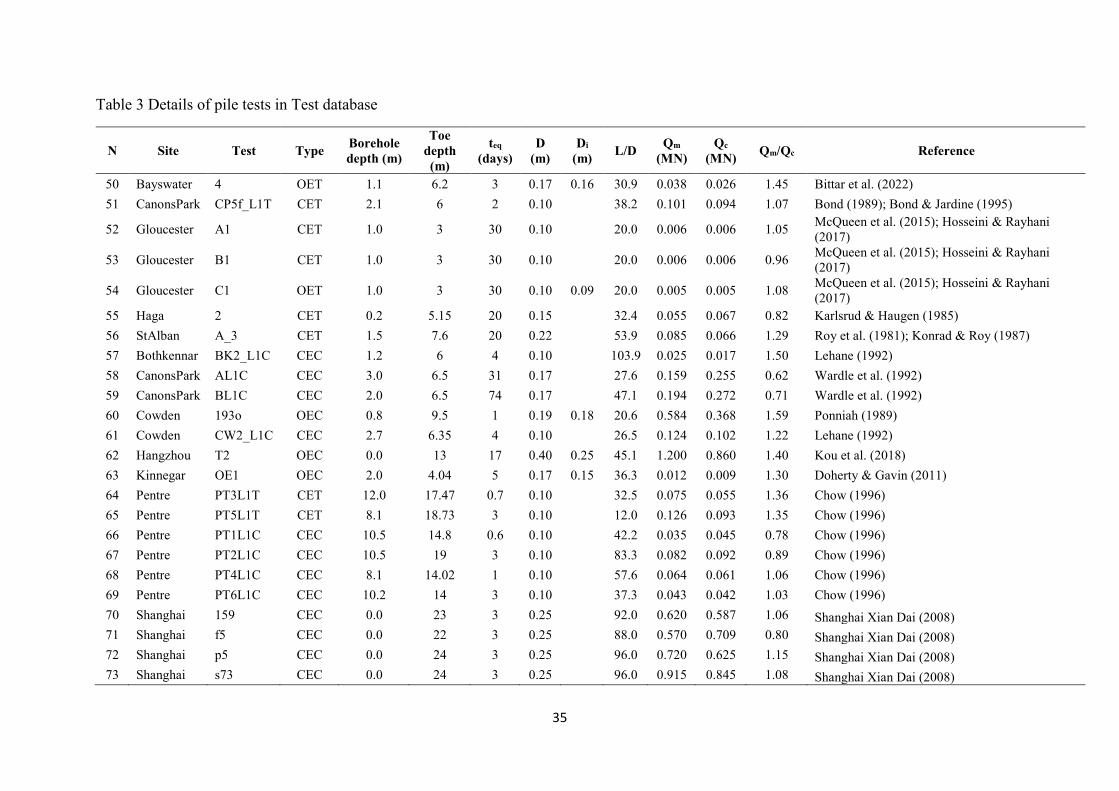
Table 3 Details of pile tests in Test database
N Site Test Type Borehole depth (m)
Toe depth (m)
teq (days)
D (m)
Di (m) L/D Qm
(MN) Qc
(MN) Qm/Qc Reference
50 Bayswater 4 OET 1.1 6.2 3 0.17 0.16 30.9 0.038 0.026 1.45 Bittar et al. (2022) 51 CanonsPark CP5f_L1T CET 2.1 6 2 0.10 38.2 0.101 0.094 1.07 Bond (1989); Bond & Jardine (1995)
52 Gloucester A1 CET 1.0 3 30 0.10 20.0 0.006 0.006 1.05 McQueen et al. (2015); Hosseini & Rayhani (2017)
53 Gloucester B1 CET 1.0 3 30 0.10 20.0 0.006 0.006 0.96 McQueen et al. (2015); Hosseini & Rayhani (2017)
54 Gloucester C1 OET 1.0 3 30 0.10 0.09 20.0 0.005 0.005 1.08 McQueen et al. (2015); Hosseini & Rayhani (2017)
55 Haga 2 CET 0.2 5.15 20 0.15 32.4 0.055 0.067 0.82 Karlsrud & Haugen (1985) 56 StAlban A_3 CET 1.5 7.6 20 0.22 53.9 0.085 0.066 1.29 Roy et al. (1981); Konrad & Roy (1987) 57 Bothkennar BK2_L1C CEC 1.2 6 4 0.10 103.9 0.025 0.017 1.50 Lehane (1992) 58 CanonsPark AL1C CEC 3.0 6.5 31 0.17 27.6 0.159 0.255 0.62 Wardle et al. (1992) 59 CanonsPark BL1C CEC 2.0 6.5 74 0.17 47.1 0.194 0.272 0.71 Wardle et al. (1992) 60 Cowden 193o OEC 0.8 9.5 1 0.19 0.18 20.6 0.584 0.368 1.59 Ponniah (1989) 61 Cowden CW2_L1C CEC 2.7 6.35 4 0.10 26.5 0.124 0.102 1.22 Lehane (1992) 62 Hangzhou T2 OEC 0.0 13 17 0.40 0.25 45.1 1.200 0.860 1.40 Kou et al. (2018) 63 Kinnegar OE1 OEC 2.0 4.04 5 0.17 0.15 36.3 0.012 0.009 1.30 Doherty & Gavin (2011) 64 Pentre PT3L1T CET 12.0 17.47 0.7 0.10 32.5 0.075 0.055 1.36 Chow (1996) 65 Pentre PT5L1T CET 8.1 18.73 3 0.10 12.0 0.126 0.093 1.35 Chow (1996) 66 Pentre PT1L1C CEC 10.5 14.8 0.6 0.10 42.2 0.035 0.045 0.78 Chow (1996) 67 Pentre PT2L1C CEC 10.5 19 3 0.10 83.3 0.082 0.092 0.89 Chow (1996) 68 Pentre PT4L1C CEC 8.1 14.02 1 0.10 57.6 0.064 0.061 1.06 Chow (1996) 69 Pentre PT6L1C CEC 10.2 14 3 0.10 37.3 0.043 0.042 1.03 Chow (1996) 70 Shanghai 159 CEC 0.0 23 3 0.25 92.0 0.620 0.587 1.06 Shanghai Xian Dai (2008) 71 Shanghai f5 CEC 0.0 22 3 0.25 88.0 0.570 0.709 0.80 Shanghai Xian Dai (2008) 72 Shanghai p5 CEC 0.0 24 3 0.25 96.0 0.720 0.625 1.15 Shanghai Xian Dai (2008) 73 Shanghai s73 CEC 0.0 24 3 0.25 96.0 0.915 0.845 1.08 Shanghai Xian Dai (2008)
36
(a)
(b)
(c)
Figure 1 Responses recorded in low OCR clay (a) Radial total stresses during installation (b) Normalised stress changes during equalisation and (c) Shear stress variations with radial effective stress during pile load testing (data from Lehane 1992)
37
Figure 2. Variation of (a) normalised installation radial stress, Si and (b) normalised peak friction in 4 different clays (recorded by the Imperial College instrumented pile)
(a)
(b)

38
Figure 3 Stress coefficients recorded in Onsøy, Lierstranda and Bothkennar clays (data from NGI 1988a, 1999b and Lehane & Jardine 1994a)
(a)
(b)
(c)

39
Figure 4. Average variations of τf/qt ratios with h/D inferred from instrumented data in six clays

40
Figure 5. Soil behaviour type (SBT) chart using median values at sites of pile tests in the (a) Unified database and (b) Test database. Pile Nos. refer to those in Tables 2 and 3.
(a)
(b)
41
Figure 6. Plasticity chart using median values at sites of pile tests in the (a) Unified database and (b) Test database. Pile Nos. refer to those in Tables 2 and 3.

42
Figure 7. Comparison of measured and calculated ultimate shaft friction profiles for three test piles in the Unified database

43
Figure 8. Variations of ratio Qm/Qc with D, L/D, Ip and Fr for Unified database (determined using Equation 17)
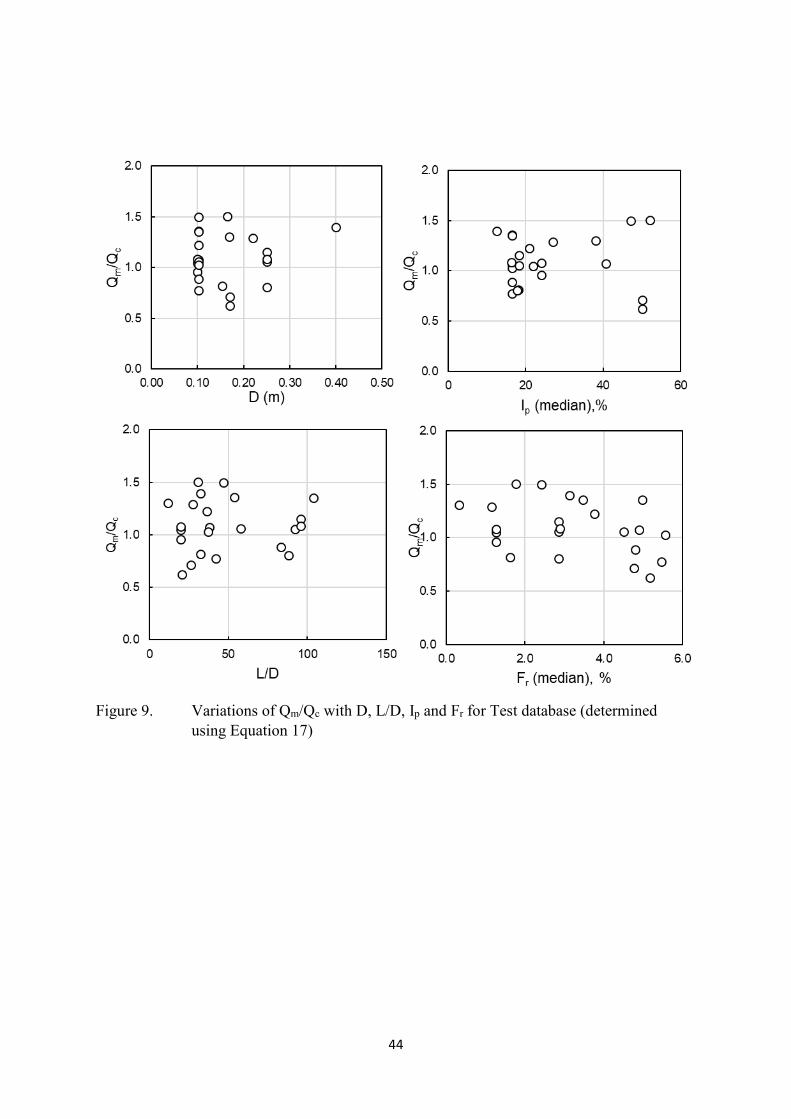
44
Figure 9. Variations of Qm/Qc with D, L/D, Ip and Fr for Test database (determined using Equation 17)