Reliability-based pile design in sandy soils by CPT measurements
12
PLEASE SCROLL DOWN FOR ARTICLE This article was downloaded by: [Giovanna] On: 2 March 2010 Access details: Access Details: [subscription number 919571663] Publisher Taylor & Francis Informa Ltd Registered in England and Wales Registered Number: 1072954 Registered office: Mortimer House, 37- 41 Mortimer Street, London W1T 3JH, UK Georisk: Assessment and Management of Risk for Engineered Systems and Geohazards Publication details, including instructions for authors and subscription information: http://www.informaworld.com/smpp/title~content=t744347545 Reliability-based pile design in sandy soils by CPT measurements C. Cherubini a ; G. Vessia a a Technical University of Bari, Department of Civil and Environmental Engineering, Bari Online publication date: 01 March 2010 To cite this Article Cherubini, C. and Vessia, G.(2010) 'Reliability-based pile design in sandy soils by CPT measurements', Georisk: Assessment and Management of Risk for Engineered Systems and Geohazards, 4: 1, 2 — 12 To link to this Article: DOI: 10.1080/17499510902798156 URL: http://dx.doi.org/10.1080/17499510902798156 Full terms and conditions of use: http://www.informaworld.com/terms-and-conditions-of-access.pdf This article may be used for research, teaching and private study purposes. Any substantial or systematic reproduction, re-distribution, re-selling, loan or sub-licensing, systematic supply or distribution in any form to anyone is expressly forbidden. The publisher does not give any warranty express or implied or make any representation that the contents will be complete or accurate or up to date. The accuracy of any instructions, formulae and drug doses should be independently verified with primary sources. The publisher shall not be liable for any loss, actions, claims, proceedings, demand or costs or damages whatsoever or howsoever caused arising directly or indirectly in connection with or arising out of the use of this material.
Transcript of Reliability-based pile design in sandy soils by CPT measurements

PLEASE SCROLL DOWN FOR ARTICLE
This article was downloaded by: [Giovanna]On: 2 March 2010Access details: Access Details: [subscription number 919571663]Publisher Taylor & FrancisInforma Ltd Registered in England and Wales Registered Number: 1072954 Registered office: Mortimer House, 37-41 Mortimer Street, London W1T 3JH, UK
Georisk: Assessment and Management of Risk for Engineered Systems andGeohazardsPublication details, including instructions for authors and subscription information:http://www.informaworld.com/smpp/title~content=t744347545
Reliability-based pile design in sandy soils by CPT measurementsC. Cherubini a; G. Vessia a
a Technical University of Bari, Department of Civil and Environmental Engineering, Bari
Online publication date: 01 March 2010
To cite this Article Cherubini, C. and Vessia, G.(2010) 'Reliability-based pile design in sandy soils by CPT measurements',Georisk: Assessment and Management of Risk for Engineered Systems and Geohazards, 4: 1, 2 — 12To link to this Article: DOI: 10.1080/17499510902798156URL: http://dx.doi.org/10.1080/17499510902798156
Full terms and conditions of use: http://www.informaworld.com/terms-and-conditions-of-access.pdf
This article may be used for research, teaching and private study purposes. Any substantial orsystematic reproduction, re-distribution, re-selling, loan or sub-licensing, systematic supply ordistribution in any form to anyone is expressly forbidden.
The publisher does not give any warranty express or implied or make any representation that the contentswill be complete or accurate or up to date. The accuracy of any instructions, formulae and drug dosesshould be independently verified with primary sources. The publisher shall not be liable for any loss,actions, claims, proceedings, demand or costs or damages whatsoever or howsoever caused arising directlyor indirectly in connection with or arising out of the use of this material.

Reliability-based pile design in sandy soils by CPT measurements
C. Cherubini and G. Vessia*
Technical University of Bari, Department of Civil and Environmental Engineering, Via Orabona, 4 -70125 Bari
(Received 12 May 2008; final version received 3 February 2009)
Field tests, such as static cone penetration tests (CPT), are widely used in granular soil characterisation because
they are largely correlated by empirical charts and graphics to the main physical and mechanical soil properties(i.e. DR, f, lithology etc.), although the uncertainties concerning such estimations are taken into account.Whereas those formulations are widely accepted by literature and used in practice, they are not discussed in terms
of reliability level of the pile bearing capacity. In this paper, Bustamante and Gianeselli’s formulation has beenadopted as a direct method for estimating pile bearing capacity from qc profile at Scanzano Jonico site. As far asthe reliability-based design of limit pile resistance is concerned, the statistical properties of the design variables are
based on the variability study carried out on such sand. Results are discussed with respect to the advantages inusage of direct instead of indirect methods for pile design in sand.
Keywords: CPT; reliability-based design; variability; uncertainty; Bustamante and Gianeselli’s method.
Introduction
Field tests are commonly used to characterisecohesionless soils. Over the years equipment forcone penetration tests has been developed and theusage of measurements from this type of test has beenintroduced in direct and indirect methods for founda-tion design especially for deep foundations.According to indirect designing methods, several
correlations are provided between qc measurementsand sand mechanical parameters as DR (Baldi et al.1986), f’ (Robertson and Campanella 1983, Kulhawyand Mayne 1990), overconsolidation ratio (OCR)(Mayne 2001) and lateral stress coefficient K0(Mayne 2005). Such correlations can introduce alarge amount of model errors which can result inunreliable pile design.On the contrary, direct methods estimate side and
tip resistance of piles from qc and fs profiles. Suchmethods have been widely applied and compared toeach other by researchers such as Briaud (1988),Robertson et al. (1988) and Eslami and Fellenius(1997), among others.However, up to now, comparisons between direct
and indirect methods are not available in terms ofreliability level of each prediction.Indirect and direct pile design methods are there-
fore applied in this paper at the Scanzano Jonico site.The study employs a reliability-based design approachand takes into account model errors in empirical
correlations and design formulations, measurement
uncertainties in cone penetration tests (CPTs) and the
natural soil variability, in order to assess and discuss
the differences in the reliability levels of direct and
indirect methods.
CPT for pile designing
Themain approaches for the application of cone data to
pile design available are indirect and direct methods.
Indirect CPT methods employ theoretical formulations
of failure mechanisms where soil parameters, such as
friction angle, relative density, and coefficient of lateral
earth pressure are used. Such methods introduce sig-
nificant uncertainties owing to the calculation of inter-
mediate parameters and to the introduction of empirical
factors whose uncertainty is hard to be quantified.On the other hand, direct CPTmethods assume the
measured cone resistance as the unit pile tip resistance.
Commonly, direct methods in sand link the tip and
shaft resistance to the cone tip resistance by Schmert-
mann and Nottingham’s method (Schmertmann 1978,
Nottingham 1975), the European method (DeRuiter
and Berigen 1979), the French method (Bustamante
andGianeselli 1982) andMeyerhofmethod (Meyerhof
1983). Such approaches use qc irregular profiles which
are commonly averaged according to the engineer
judgement rather than by means of data mining
techniques.
*Corresponding author. Email: [email protected]
GeoriskVol. 4, No. 1, March 2010, 2�12
ISSN 1749-9518 print/ISSN 1749-9526 online
# 2010 Taylor & Francis
DOI: 10.1080/17499510902798156
http://www.informaworld.com
Downloaded By: [Giovanna] At: 19:49 2 March 2010
From CPTs to soil parameters
The following expression is commonly used for theultimate bearing capacity Qtot of a pile with length Land diameter d, whenever design is carried out insandy soils:
Qtot�pdL �fs�pd2
4�q0tip: (1)
where fs is the unit side friction resistance and q’tip isthe net unit tip-bearing resistance. Several formula-tions can be used to derive fs and q’tip fromlaboratory tests. Those adopted in this paper areillustrated below.First, the evaluation of the side friction has to be
addressed. For the pile design in sandy soil theprinciple of sliding friction is considered. A generalexpression for side friction is
fs�s0htanff: (2)
where s’h is the horizontal effective stress and ff isthe soil-foundation interface friction angle. Research-ers have used laboratory tests to correlate tanff withthe ratio between ff and the effective friction angle ofthe soil, f’. Table 1 gives typical values of ff/f’.Moreover, it is well known that the ratio between
the horizontal and vertical effective stresses is definedas the coefficient of lateral earth pressure, K
K�s0h
s0v
(3)
Deep foundation construction causes significantchanges in the surrounding soil behaviour, thus thecoefficient of lateral earth pressure is generally notequal to the coefficient of lateral earth pressure in theground before construction, K0. The ratio K/K0depends on many factors as summarised by Coduto(2001). Kulhawy et al. (1983) suggested the K/K0ratios as shown in Table 2. Combining Equation (2)and Equation (3), the following equation for the sidefriction is obtained
fs�K0s0
v
�K
K0
��ff
f0
�(4)
In Equation (4) K0 and f’ shall be estimated.The commonest method of assessing K0 is by
empirical correlations with other soil properties.Among others the following by Mayne and Kulhawy(1982), based on laboratory tests performed on 170soils, from clay to gravel, has been used
K0�(1�sinf0)OCRsinf0: (5)
where f’ is the effective friction angle, OCR is theoverconsolidation ratio, which is related to therelative density DR according to Mayne (2001):
OCR��
0:192 � (qc=pa)0:22
(1� sinf0) � (s0v0=pa)
0:31
�� 1
sinf0�0:27
�
: (6)
where qc is the cone tip resistance from CPTs. Finally,Kulhawy and Mayne (1990) derived from 702 cali-bration chamber tests conducted on 26 clean quartzto siliceous sand, an expression for f’, that is qt is thestress-normalised cone tip stress according to Equa-tion (8)
qt�
qc
pa�s0v0
pa
�0:5 : (8)
where pa�100kPa.Second, the unit tip bearing capacity shall be
determined. To this end, the formula suggested byKulhawy et al. (1983) may be used
q0tip�dgNg�s0vtNq: (9)
where d is the pile diameter; g is the unit weight of soilimmediately beneath pile tip; Ng and Nq are thebearing capacity factors and s’vt is the verticaleffective stress at the pile tip elevation. In the caseof piles, the bearing capacity factors depend on both
Table 1. Approximateff/f’ values for the interface betweendeep foundations and soil (Adapted from Kulhawy et al.
1983, Kulhawy 1991).
Foundation type ff/f’
Rough concrete 1.0Smooth concrete (i.e. precast pile) 0.8�1.0Drilled shaft built using dry method or withtemporary casing and good constructiontechniques
1.0
Drilled shaft built with slurry method (highervalues correspond to more careful constructionmethods)
0.8�1.0
Table 2. Approximate ratio of the coefficient of lateral
earth pressure after and before construction (Adapted fromKulhawy et al. 1983, Kulhawy 1991).
Pile type and method of construction K/K0
Pile-small displacement, driven 0.7�1.2Drilled shaft-built using dry method withminimal sidewall disturbance and promptconcreting
0.9�1.0
Drilled shaft-slurry construction with goodworkmanship
0.9�1.0
Drilled shaft-slurry construction with poor
workmanship
0.6�0.7
Drilled shaft-casing method below water table 0.7�0.9
Georisk 3
Downloaded By: [Giovanna] At: 19:49 2 March 2010
shear strength and compressibility because any of thethree modes of failure (general, local or punchingshear) could govern. According to Vesic (1977), thebearing capacity factors Ng and Nq are computed asfollows
Ng�0:6(Nq�1)tanf0
Nq�(1� 2K0)Ns
2
Ns�3
3� sinf0 e(90�f0)p
180 tan2�45�
f0
2
�I
4sinf0
3(1�sinf0)r
Ir�E
2(1� n)(s0vttanf
0): (10)
where Ir is the rigidity index which defines thecompressibility effects; E is the modulus of theelasticity of soil in vicinity of tip; n is Poisson’s ratioof soil in vicinity of tip; Ns is a bearing capacityfactor and K0 is the coefficient of lateral earthpressure at rest.As far as E estimation is concerned, Schmertmann
(1978) and Robertson and Campanella (1989) devel-oped empirical correlations between E and themeasured cone resistance qc from cone resistancetests, summarised in Table 3 for sandy soils.
From CPTs to pile bearing capacity
When CPTs are performed it could be easier andfaster to use directly qc and fs profiles for estimating asingle pile bearing capacity. As a matter of fact, manyauthors proposed direct methods calibrated on fullscale pile loading tests. Among others, one of themost extensive experimental efforts has been pro-vided by Bustamante and Gianeselli (1982), whoproposed a direct method based on the interpretationof a series of 197 full-scale static pile loading tests.They investigated 48 sites containing soils made
up of different soils as clay, silt, sand, gravel,weathered rock but also mud, peat, more or lessweathered chalk and marl. The method relies on qcmeasurement from which values of both unit sideresistance qs and unit tip resistance qt of a pile can bedrawn, according to the following expression
Qtot�qt �At�qs �As
�qca �kc �pd2
4�pd �
1
a gL
0
qc(z) �dz: (11)
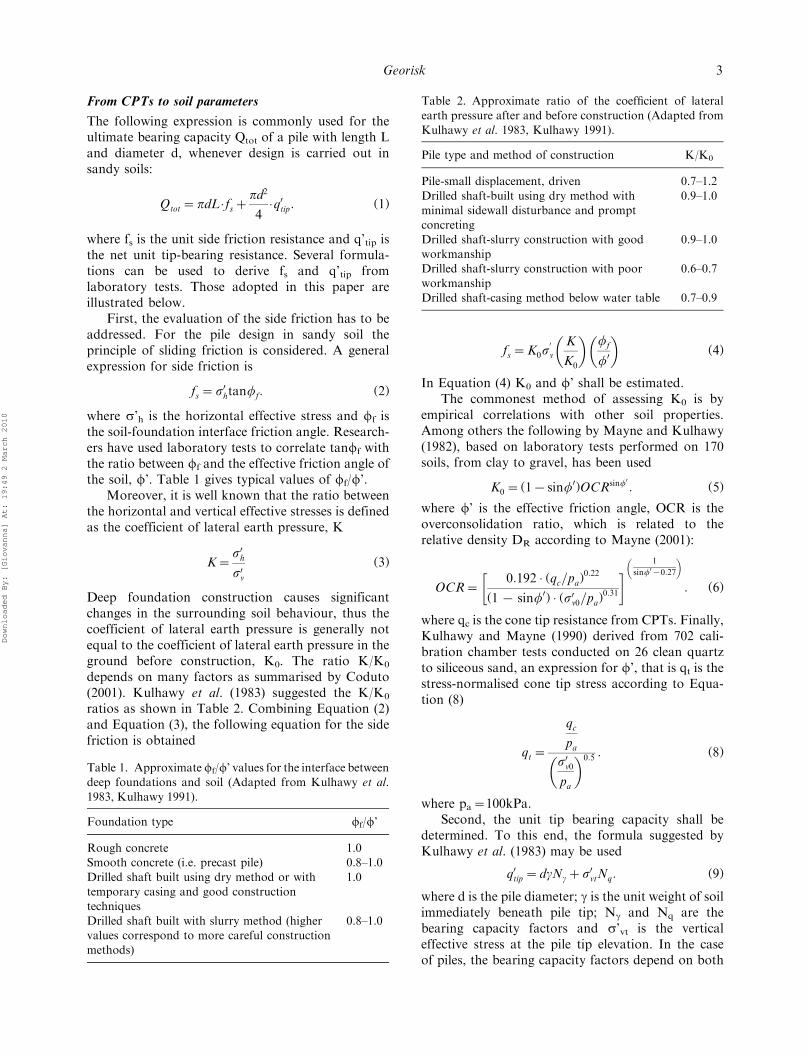
where qca is the equivalent cone resistance at the levelof pile tip (kN/m2), kc is the penetrometer bearingcapacity factor, d is the pile diameter (m), q(z) is thecone resistance along the pile length (kN/m2), alpha isa coefficient.As far as the calculation of qca is concerned, the
steps are here summarised:
1. the curve of the cone resistance qc is smooth-ened to q’c so as to reduce the local irregula-rities of the raw curve;
2. starting from the smoothed curve, qca iscalculated and corresponds to the mean valueof q’c between the values �a and �a, wherea�1.5 D measured with respect to the tip ofthe pile (Figure 1);
3. finally q’ca is calculated after eliminating thevalues higher than 1.3qca under the pile pointand lower than 0.7qca over the pile point.
The bearing capacity factor kc is provided by thesame authors, derived from full-scale loading tests(Table 4). These values depend on the nature of thesoil and on different pile placement techniques. Theyare divided into two groups:
Table 3. E values from CPT results (After Schmertmann
1978, Robertson and Campanella 1989).
Soil type E/qc
Normally consolidated silty or clayey sand 1.5Overconsolidated silty or clayey sand 3
Figure 1. Evaluation of q’ca according to Bustamante’ andGianeselli’s method. (After Bustamante and Gianeselli,1982).
4 C. Cherubini and G. Vessia
Downloaded By: [Giovanna] At: 19:49 2 March 2010

. Group I: Plain bored piles; mud bored piles;
Micropiles grouted under low pressure (Type
I); cased bored piles; hollow auger bored piles;
piers; barrettes.. Group II: Cast screwed piles; driven precast
piles; prestressed tubular piles; driven cast piles;
Micropiles or small diameter piles grouted
under high pressure, with diameter dB25 cm
(Type II); driven grouted piles (low pressure
grouting); driven metal piles; driven rammed
piles; jacked concrete piles; high-pressure
grouted piles of large diameter (see Table 4).
The limit unit skin friction qs is calculated by
dividing the cone resistance qc corresponding to the
given level by a coefficient a, which takes into accountthe nature of the soil and the pile production and
placement methods. As a matter of fact, the research-
ers define three categories of piles:
. Category I:A) Plain bored piles; mud bored piles; hollow
auger bored piles; cast screwed piles; type I
Micropiles; piers; barrettes.B) Cased bored piles (concrete or metal shaft);
driven cast piles.. Category II:A) Driven precast piles; prestressed tubular
piles; jacked concrete piles.
B) Driven metal piles; jacked metal piles.. Category III:A) Driven grouted piles; driven rammed piles.B) High pressure grouted piles with diametergreater than 25cm; Type II Micropiles.
C) After that, they suggest a values, as Table 5shows, according to the nature of the soil andthe category of piles. Moreover, Bustamanteand Gianeselli provide the maximum valuesof qs according to the preceding parameters.As can be noted from Table 5, only qsmaximum values are provided for pilesbelonging to Category III.
Reliability analysis in geotechnical design
With respect to geotechnical design activity, four
uncertainty factors can be distinguished (Honjo
2004):
. Physical uncertainty, known as aleatory,which is related to the spatial fluctuation ofsoil properties owing to natural and contin-uous processes of deposition, diagenesis anderosion of soil and rock deposits.
. Statistical uncertainty, called also epistemic. Itrelates to the number of experimental samplesfrom both laboratory and field tests and to thevolume sampled with respect to the soilvolume connected with the construction. Italso concerns measurement errors affectingexperimental procedures.
. Model uncertainty, which belongs to theepistemic uncertainties. It refers to the approx-imations introduced by both theoretical andempirical formulations used for the geotechni-cal designing. Moreover, such uncertainty isintroduced by correlations between measured
indexes and mechanical design variables.. Gross errors which are commonly disregarded.
Reviewing several variability analyses, Phoon and
Kulhawy (1999a) quantified in terms of coefficients
Table 4. Values of bearing capacity factors kc for the
calculation of limit tip resistance (Adapted after Bustamanteand Gianeselli 1982).
Factors kc
Nature of soil qc(105Pa) Group I Group II
Silt and loose sand 550 0.4 0.5
Moderately compactsand and gravel
50}120 0.4 0.5
Compact to very
compact sand andgravel
�120 0.3 0.4
Table 5. Values of coefficient a and maximum values for unit limit skin friction qs.
Coefficient a Maximum value of qs(105Pa)
Category Category
Nature of soil qc (105Pa) I(A) I(B) II(A) II(B) I(A) I(B) II(A) II(B) III(A) III(B)
Silt and loose sand 550 60 150 60 120 0.35 0.35 0.35 0.35 0.8 �Moderately compact
sand and gravel
50}120 100 200 100 200 0.8 0.35 0.8 0.8 1.2 ]2
Compact to verycompact sand and gravel
�120 150 300 150 200 1.2 0.8 1.2 1.2 1.5 ]2
Georisk 5
Downloaded By: [Giovanna] At: 19:49 2 March 2010
of variation, the contribution of different sources ofuncertainties on soil mechanical properties from fieldand laboratory tests. Accordingly they proposed anadditive variability model (Phoon and Kulhawy1999b) in which the total uncertainty is derived asfollows
CoV2(RP)�G2(L) �CoV2v(Pm)�CoV2m(Pm)
�CoV2M(Mt): (12)
in which CoV(RP) is the total coefficient of variationof the design variable/resistance; CoVv(Pm) is thecoefficient of variation of the inherent variability ofmeasured properties; G2(L) is the variance reductionfunction (related to spatial measurements) whichdepends on the length of the construction alongwhich the measurements are averaged, that is L;CoVm(Pm) is the coefficient of variation of measure-ment uncertainty of the measured property andCoVM(Mt) is the coefficient of variation of trans-formation model uncertainty.As far as measurement errors are concerned,
estimation of mechanical cone testing errors is carriedout by Kulhawy and Trautmann (1996) as is shown inTable 6.In the case of qc measured by mechanical device,
the uncertainty owing to equipment and procedure,according to the additive coefficient of variationmodel leads to CoVm(Pm), equals to 7%. This resultcomes from the expression
CoV2(qcmis)�ffiffiffiffiffiffiffiffiffiffiffiffiffiffiffiffiffiffiffiffiffiffiffiffiffiffiffiffiffiffiffiffiffiffiffiffiffiffiffiffiffiffiffiffiffiffiffiffiCoV2eqp(qc)�CoV2prc(qc)
q: (13)
where CoVeqp and CoVprc values are shown in Table6. This value shall be summed up to the inherentvariability of qc, for the case under study.
Hence, the point in the total resulting variability
of the estimated pile bearing capacity from CPTs is
the quantification of model uncertainty. It is clear
that it differs from direct to indirect methods. As a
matter of fact, in direct methods only the design
model uncertainty shall be taken into account,
whereas both correlation model and design model
uncertainties shall be considered when indirect
methods are employed. For instance, in order to
apply the additive variability model in Equation (13)
for the estimation of internal friction angle standard
deviation (sf’) the inherent variability of qc addedup to its measurement uncertainty � equal to the 7%of qc mean value � shall be propagated according toKulhawy’s and Mayne’s formulation (Equation (8)).
Then, the total f’ standard deviation for the firstlayer of the studied sand is equal to 3.38 whereas forthe second layer is 1.18. Such values, as the othersderived according to the same procedure, can be
used to estimate the reliability of the bearing
capacity of piles installed in Scanzano Jonico sand.
At this end direct and indirect design methods from
CPT measurements are employed. The inherent
variability study on such sand has been developed
by Vessia and Cherubini (2007) and here is briefly
reported.
Table 6. Estimated coefficients of variation for mechanical
cone testing MCPT (After Kulhawy and Trautmann 1996).
CoVeqp CoVprc CoVrnd
Test qc fs qc fs qc fs
MCPT 0.05 0.05 0.10 0.15 0.10 0.15
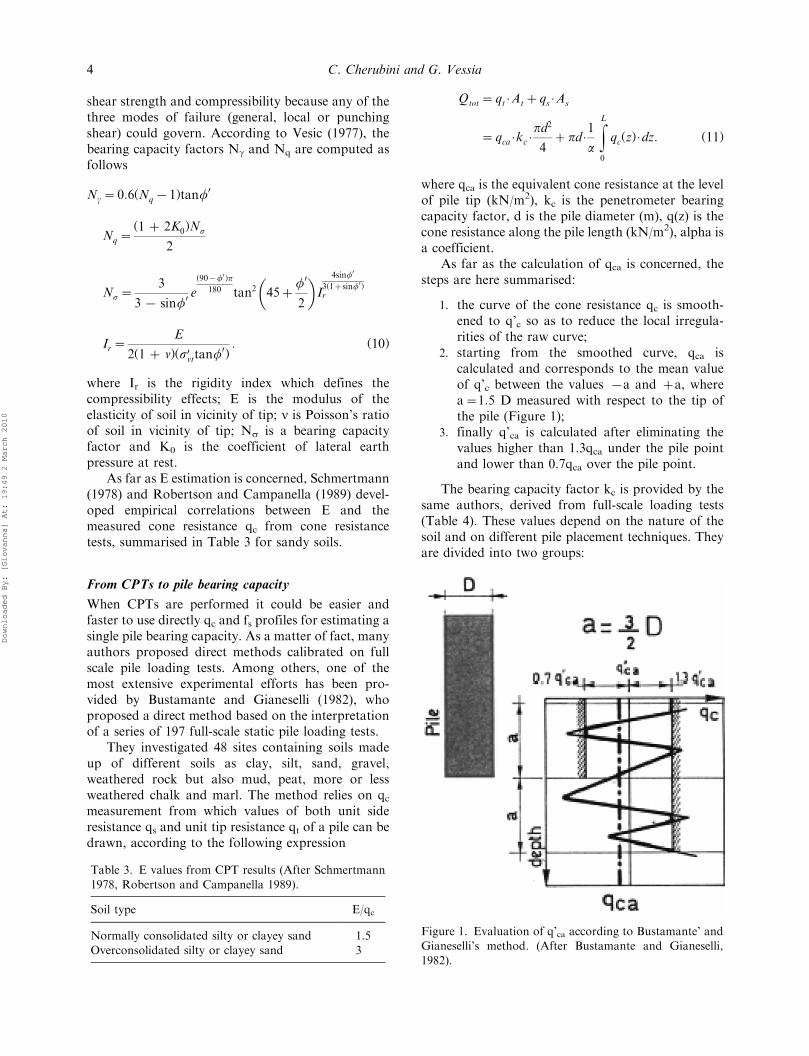
Figure 2. Location of studied area.
6 C. Cherubini and G. Vessia
Downloaded By: [Giovanna] At: 19:49 2 March 2010

Pile design in sand by reliability approach: the case
studied
The site under study is Scanzano Jonico town whichis set along the Ionian coast in Basilicata region(Figure 2). Cherubini and Lupo (2002) studiedphysical and mechanical properties of these sandmixtures by means of laboratory and field tests. Theirmain features are summarised in Table 7.At this site two types of sand mixtures have been
detected (Figure 3): the upper one has a greater claycontent while the lower one has a greater silt content.In order to recognise the interface between the twostrata, two CPTs are analysed by means of intraclasscorrelation coefficient RI, and the interface has beenfound at 7 m depth (Figure 4).Moreover, qc profiles have been studied in terms
of spatial variability in order to carry out a reliability-based design of pile foundations. Table 8 showsresults of qc profile variability structure derivedfrom the most representative CPT log. The mostcommonly used techniques of setting piles, in thisarea, are bored concrete piles because of the highdensity of these sand mixtures. However, in thefollowing both driven and bored piles are taken intoaccount for deriving general results from the relia-bility analysis undertaken. Such different techniquesare here taken into account by means of differentvalues of constants which are used in direct (Equation(11)) and indirect (Equation (4)) methods. Accord-ingly, these constants are assumed as random vari-
ables characterised by rectangular distribution whichmeans that there is the same probability that eachconstant assumes different values according to theinstallation technique used for the pile.The two design methods investigated are: (1) the
Bustamante and Gianeselli method (1982) whichdirectly uses qc measurements according to Equation(11); (2) the indirect method that employs empiricalcorrelations between qc and mechanical properties ofsandy soils according to Equations (1) to (10).The reliability analysis has been performed by
means of the COMREL program (1996) where first-order reliability method is employed for calculatingthe reliability index b. In this study, b measures thereliability level of the pile bearing capacity accordingto direct and indirect methods. Tables 9 and 10(a)and (b) report the values of mechanical variables usedin this study for the two sandy layers. The choice of acommercial code such as COMREL is due to the highnumber of random variables which needs an efficientcomputational effort.Eight combinations of pile geometry, according to
the most common dimensions used in ScanzanoJonico current design, have been investigated: twodiameters (40 and 60 cm) and four lengths (7, 8 10and 12 m). The choice of such length values is due tothe presence of the boundary of layers with differentmechanical resistances at 7 m; thus the tip contribu-tion to the bearing capacity of pile is referred to thesame soil � the second layer � provided that the most
Table 7. Main features of sand in Scanzano Jonico site.
Soil type Unit weight [kN/m3] Mean value of Relative density [%] Mean value of friction angle [8]
Sand mixtures (0}7 m) 18 60 32Sand mixtures (7}14 m) 19 85 39
(a)
0.6
2.6
4.6
6.6
8.6
10.6
12.6
14.6
0 5 10 15 20 25
qc (MPa)
Dep
th (
m)
(b)
0.6
2.6
4.6
6.6
8.6
10.6
12.6
14.6
0.00 0.10 0.20 0.30 0.40 0.50 0.60
fs (MPa)
Dep
th (
m)
Figure 3. Measurement profiles for five cone penetration tests: (a) tip resistance qc; (b) sleeve friction.
Georisk 7
Downloaded By: [Giovanna] At: 19:49 2 March 2010

important differences between direct and indirectmethod involve the evaluation of the pile tip resis-tance.Mean values and variances of mechanical variables
are derived from the variability study presented byVessia and Cherubini (2007). Here, load variability isneglected because the paper focuses on differences inpile resistance estimation carried out by differentmodels that shall be affected by load variability inthe same way.Variances have been reduced by means of the
variance reduction function G2, according to Babuand Shastry (2004)
G2�dL
�1�exp
��L
d
��;L
d�0 (14)
where L is the pile length (7, 8, 10 and 12 m,respectively) and d is the scale of fluctuation of qcrecorded along L.As a matter of fact Vanmarcke (1977) suggested
reducing the variance of soil properties as the sizeof the averaging length or volume connected withthe construction increases. These result from the
circumstance that the larger the length (or the
volume) on which the property is averaged, the
higher the fluctuation of soil property tends to be
cancelled in the spatial averaging.Results from reliability analyses are plotted in
Figure 5(a) and (b), where reliability index values
obtained from Bustamante and Gianeselli’s method
(called direct method), dotted lines, and the indirect
method (Equations (1) to (10)), solid lines, are
compared for the case of d�0.4 m (Figure 5(a))
and of d�0.6 m (Figure 5(a)). At first, it is worth
noticing that for the cases of 8, 10 and 12 m lengths,
the direct method for a fixed load value is always
much more reliable � about one unit of b in average �than the corresponding indirect method. Their trends
are almost linear and almost parallel each other.
Moreover when b varies between 3.5 to 5.5 (such bvalues correspond to the ones suggested by Eurocode
for structures of reliability class 2) the difference in
pile bearing capacity between direct and indirect
method is quite constant and about 100 kN. On the
contrary, results from 7 m pile lengths show higher bvalues for the indirect method than the direct method.
Figure 4. Intraclass coefficient ratio RI related to qc and fs profiles along depth (after Cherubini and Lupo 2002).
Table 8. Results from inherent variability study on qc log in Scanzano Jonico sands.
Sand layer Mean trend along depth [MPa] Standard deviation [MPa] Scale of fluctuation [m]
Layer 1 (0}7 m) 0.14 �z�1.38 1 1.3
Layer 2 (7}14 m) 0.83 �z�0.033 1.3 0.5
8 C. Cherubini and G. Vessia
Downloaded By: [Giovanna] At: 19:49 2 March 2010

Table 9. Mean values (/m); total standard deviation value as the summation of inherent variability and measurementuncertainty, square root of variance reduction function value (G) of mechanical properties of the upper sand layer (up to 7 m)used in the reliability-based pile design.a)
Variable /m /s Distribution type G
Friction angle f’(8) 32 3.3 Normal �Lateral earth pressure at rest K0 0.5 0.04 Normal �Overconsolidation ratio OCR 1.0 0.03 Normal �Unit weight (kN/m3) 18 � Constant �Poisson’s ratio n 0.2 � Constant �Cone tip stress: qc (MPa) Lpile�7 m 1.9 0.55 Lognormal 0.42
b)
Variable Min value Max value Distribution type
K/K0(Indirect method) 0.6 1.2 Rectangularff/f’(Indirect method) 0.8 1.0 Rectangular
a (direct method) 60 150 Rectangular
Table 10. Mean values (/m); total standard deviation value as the summation of inherent variability and measurementuncertainty, square root of variance reduction function value (G) of mechanical properties of the lower sand layer (beneath7m) used in the reliability-based pile design.a)
Variable /m /s Distribution type G
Friction angle f’(8) 39 1.1 Normal
Lateral earth pressure at rest K0 0.4 0.02Overconsolidation ratio OCR 1.1 0.02 Normal �Unit weight (kN/m3) 19 � Constant �Poisson’s ratio n 0.2 � Constant �Bearing capacity factor Ng 17 2.5 Normal �Bearing capacity factor Nq 35 4.4 Normal �
Unit side friction fp:Lpile� 8 m 3.5 1.16 0.71
Lpile�10 m 3.5 0.78 Lognormal 0.41Lpile�12 m 3.5 0.67 0.32
Equivalent cone resistance q’ca (MPa):Lpile� 7 m; D�0.4}0.6 m 6.0 1.1 1.0Lpile� 8 m; D�0.4}0.6 m 10.0 2.0 Lognormal 1.0
Lpile�10 m; D�0.4}0.6 m 11.0 2.1 1.0Lpile�12 m; D�0.4}0.6 m 12.2 2.15 1.0
b)
Variable Min value Max value Distribution type
K/K0 (indirect method) 0.6 1.2 Rectangularff/f’(indirect method) 0.8 1.00 Rectangularkc (direct method) 0.3 0.5 Rectangular
a (direct method) 100 200 Rectangular
Georisk 9
Downloaded By: [Giovanna] At: 19:49 2 March 2010

Such results are easy to interpret: it shall be reminded
that the boundary of the two layers is at 7 m, thus the
indirect method considers for the tip resistance only
the contribution of the second layer whereas the
direct method averages contribution from the two
layers. Accordingly, whenever the mechanical proper-
ties of the first layer are lower than the second then
the direct method from a deterministic standpoint
gives a lower tip resistance than the indirect one. In
this case the indirect method is less conservative than
the direct one that, from the authors’ standpoint, uses
a more realistic approach to evaluate the tip resis-
tance. Nonetheless such a result can be magnified by
the uncertainties and variability. As Figure 5(a) and
(b) show, for d�0.4 m and 0.6 m the difference in
b values between direct and indirect methods for pilelength of 7 m is kept lower than 1 unit whereas in
all the other cases the difference is kept about 1 unit
of b.
Furthermore, when b varies from 3.5 to 5.5 the
difference in bearing capacity for the two methods
decreases as b value increases and it varies from
50 kN to 15 kN independently from the pile diameter.The most important result, according to the
authors, can be found when focusing on two pairs
of trends: the direct method for L�8 m versus the
indirect method for L�10 m and the direct method
for L�10 m versus the indirect method for L�12 m. It can be seen that the reliability-based design
gives almost the same reliability to different pile
lengths: this means that the increase in bearing
capacity of a longer pile can be reduced by the
combination of the variability and measurement
uncertainty of variables and the errors induced by
the design model. Moreover, in the range of 3.5 to
5.5 for b values, the trend pairs cross at differentpoints so that the longer pile has a lower reliability
index than the shorter calculated by the direct
Figure 5. (a) and (b). Trends of reliability index values vs. pile loads. Solid lines correspond to indirect method results; dotted
lines relate to direct method results.
10 C. Cherubini and G. Vessia
Downloaded By: [Giovanna] At: 19:49 2 March 2010

method. The same behaviour characterises piles of0.4 m and 0.6 m diameter.
Conclusions
The study carried out is based on the fieldcharacterisation of sandy deposits in the South ofItaly at Scanzano Jonico site. This sand is alsostudied in terms of inherent variability structure inVessia and Cherubini (2007). On such basis thepaper deals with the reliability-based design of pilebearing capacity by means of cone tip stress fromCPTs. Two types of methods for pile design arecompared: the direct, which derives pile bearingcapacity from cone tip stress, and the indirectwhich uses soil mechanical properties drawn fromempirical correlations to qc measurements. Drivenand bored installation techniques are taken intoaccount.Results shown allow to make two relevant con-
siderations about the pile design in sandy soils. Atfirst, the cases of piles analysed have pointed out thatfor each b value, the direct method gives higher pilebearing capacity values than the indirect one butthe case where the length of pile corresponds to theboundary between two different layers.This could mean that whenever stratified soil is
considered the method used for evaluating the pilebearing capacity shall be chosen with care.Moreover, in two cases, the reliability of longer
piles can be the same of a shorter pile as it is sensitive tothe uncertainty introduced by the design method usedand themeasurement uncertainty and the variability ofrandom mechanical variable considered.Such results show the advantages of reliability-
based design with respect to the traditional determi-nistic approach in order to make a cheaper and morerational pile design.
References
Baldi, G., Bellotti, R., Ghionna, V., Jamiolkowski, M. and
Pasqualini, E., 1986. Interpretation of CPT’s andCPTU’s; 2nd part: drained penetration of sands.Proceedings of the 4th International Geotechnical Semi-
nar, Singapore, 143�156.Briaud, J.L., 1988. Evaluation of cone penetration test
methods using 98 pile load tests. Proceedings of the
International Symposium on Penetration Testing,ISOPT-1, Orlando. Vol. 2. Rotterdam: Balkema,687�697.
Bustamante, M. and Gianeselli L., 1982. Pile bearingcapacity prediction by means of static penetrometerCPT. Proceedings of the Second European symposiumon Penetration Testing, Amsterdam, 493�500.
Cherubini, C. and Lupo, M., 2002. Geomechanical proper-
ties of sandy soil near Scanzano Jonico (Basilicata,Italy). Journal of Geotechnical and Geological Engineer-
ing, 20, 317�392.Coduto, D.P., 2001. Foundation design: Principles and
practice. 2nd ed. New Jersey: Pearson Prentice Hall.
COMREL, 1996. A Structural Reliability Analysis Pro-gram: Theoretical Manual. Munich: RCP GmbH.
DeRuiter, J. and Beringen, F.I., 1979. Pile foundation for
large North Sea structures. Marine Geotechnology, 3(3), 267�314.
Eslami, A. and Fellenius, B.H., 1997. Pile capacity by direct
CPT and CPTU methods applied to 102 case histories.Canadian Geotechnical Journal, 34, 886�904.
Honjo, Y., 2004. Reliability based design of geotechnicalstructures. Proceedings of the International Workshopon Risk Assessment in Site Characterization and
Geotechnical Design. Bangalore, India, 1�7.Kulhawy, F.H., 1991. Drilled shaft foundations. In:
Hsai-Yang Fang Ed. Foundation engineering handbook2nd ed. New York: Van Nostrand Reinhold, Chapter14.
Kulhawy, F.H. and Mayne, P.W., 1990. Manual onestimating soil properties for foundation design.
Report EPRI EL-6800, Electric Power Research In-stitute, Palo Alto, 306.
Kulhawy, F.K. and Trautmann, C.H., 1996. Estimation of
in-situ test uncertainty. Uncertainty in the geologicenvironment: from theory to practice, ASCE Geotech-
nical Special Publication No. 58. C.D. Shackleford,P.P. Nelson and M.J.S. Roth, editors.. Madison, WI,USA, 269�286.
Kulhawy, F. H., Trautmann, C.H., Beech, J.F., O’Rourke,T.D., McGuire, W., Wood, W.A. and Capano, C.,
1983. Transmission line structure foundations foruplift-compression loading. Report No. EL-2870.Palo Alto: Electric Power Research Institute.
Mayne, P.W., 2001. Stress�strain�strength�flow parametersfrom enhanced in-situ tests. Proceedings of the Inter-
national Conference on In-Situ Measurement of SoilProperties and Case Histories, Bali, Indonesia, 27�48.
Mayne, P.W., 2005. Integrated ground behaviour: in-situ &
lab tests. Deformation Characteristics of Geomaterials,Vol. 2,.London: Taylor & Francis, 155�177.
Mayne, P.W. and Kulhawy, F. H., 1982. K0-OCR Rela-tionships in Soil. Journal of the Geotechnical Engineer-ing Division, ASCE, 108 (GT6), 851�872.
Meyerhof, G.G., 1983. Scale effects of pile capacity. Journalof the Geotechnical Engineering Division, ASCE, 108
(GT3), 195�228.Nottingham, L.C., 1975. Use of quasi-static friction cone
penetrometer data to estimate capacity of displacement
piles. PhD Thesis. Department of Civil Engineering,University of Florida, Ginesville.
Phoon, K. K. and Kulhawy, F. H., 1999a. Characterization
of geotechnical variability. Canadian GeotechnicalJournal, 36 (4), 612�624.
Phoon, K. K. and Kulhawy, F. H., 1999b. Evaluation ofgeotechnical property variability. Canadian Geotechni-cal Journal, 36 (4), 625�639.
Georisk 11
Downloaded By: [Giovanna] At: 19:49 2 March 2010

Robertson, P.K. and Campanella, R.G., 1983. Interpreta-
tion of cone penetration tests. Part I: Sand. CanadianGeotechnical Journal, 20 (4), 734�745.
Robertson, P.K. and Campanella, R.G., 1989. Guidelinesfor Geotechnical Design Using the Cone Penetrometer
Test and CPT with Pore Pressure Measurement. 4th ed.,Columbia: Hogentogler & Co.
Robertson, P.K., Campanella, R.G., Davies, M.G. and Sy,
A., 1988. Axial capacity of driven piles in detail soilsusing CPT. Proceedings of International Symposium onPenetration Testing, ISOPT-1, Orlando. Vol. 2.
Rotterdam: Balkema, 919�928.Schmertmann, J.H., 1978. Guidelines for Cone Penetration
Test: Performance and Design. Report FHWA-TS-78-
209. Washington DC: Federal Highway Administra-tion.
Sivakumar Babu, G.L. and Shastry, S., 2004. Reli-ability based geotechnical designs. Proceedings of the
International Workshop on Risk Assessment in Site
Characterization and Geotechnical Design. Bangalore:
India, 110�123.Vesic, A.S., 1977. Design of Pile Foundations. National
Cooperative Highway Research Program, Synthesis of
Highway Practice #42. Washington: Transportation
Research Board, National Research Council.Vanmarcke, E.H., 1977. Probabilistic modelling of soil
profiles. Journal of the Geotechnical Engineering
Division, 103, 1227�1246.Vessia, G. and Cherubini, C., 2007. Penetration test
measures for mechanical characterization of sandy
deposits at Scanzano Jonico: geostatistical methods
for variability interpretation. Proceedings of the First
International Symposium on Geotechnical Safety and
Risk (ISGSR 2007). Tongji University. 18�19 October.Shanghai.
12 C. Cherubini and G. Vessia
Downloaded By: [Giovanna] At: 19:49 2 March 2010