Course material on smart solutions for the interconnection of ...
434
This project has received funding from the European Union’s Horizon 2020 research and innovation programme under grant agreement No 692426 EUROPEAN UNION HORIZON 2020 RESEARCH & INNOVATION PROGRAMME D2.3 Course material on smart solutions for the interconnection of transportation networks Ref. Ares(2016)6222325 - 01/11/2016
-
Upload
khangminh22 -
Category
Documents
-
view
0 -
download
0
Transcript of Course material on smart solutions for the interconnection of ...
This project has received funding from the European Union’s Horizon 2020 research and innovation programme under grant agreement No 692426
EUROPEAN UNION
HORIZON 2020 RESEARCH & INNOVATION PROGRAMME
D2.3
Course material on smart solutions for the interconnection of transportation networks
Ref. Ares(2016)6222325 - 01/11/2016
Deliverable D2.3
www.alliance-project.eu 1
DOCUMENT CONTROL SHEET
Project no. 692426 Acronym ALLIANCE
Project Title Enhancing excellence and innovation capacity in sustainable transport interchanges
Work Package 2 Title Educational/training program
Deliverable no. 2.3
Title Course material on smart solutions for the interconnection of transportation networks
Date of preparation of this version
31-Oct-2016
Status (F: Final, D: Draft, RD: Revised Draft)
F
Issue Date 31-Oct-2016
Dissemination Level
Public
Future reference ALLIANCE Deliverable D2.3, 2016. Course material on smart solutions for the interconnection of transportation networks.
Author(s) Eftihia Nathanail, Giannis Adamos, Lambros Mitropoulos, Ioannis Karakikes (UTH), Oliver Meier, Olaf Poenicke, Henning Strubelt, David Weigert, Kay Matzner, Evelyn Fischer (Fraunhofer), Irina Yatskiv (Jackiva) (TTI)
Co-author(s) -
Responsible Organisation UTH
WP Leader UTH
Internal Reviewer(s) Igor Kabashkin, TTI
Project Officer Agnes Hegyvarine Nagy
ALLIANCE Beneficiaries
TRANSPORT AND TELECOMMUNICATION INSTITUTE – TTI Latvia
PANEPISTIMIO THESSALIAS – UTH Greece
FRAUNHOFER GESELLSCHAFT ZUR FORDERUNG DER ANGEWANDTEN FORSCHUNG EV – Fraunhofer
Germany
Deliverable D2.3
www.alliance-project.eu 2
TABLE OF CONTENTS
1 INTRODUCTION ...................................................................................................... 6
1.1 Background ...................................................................................................................................... 6
1.2 Deliverable scope and structure .................................................................................................... 7
2 SUSTAINABLE TRANSPORT INTERCHANGE PROGRAM ................................... 8
2.1 Overview ........................................................................................................................................... 8
2.2 STIP courses .................................................................................................................................... 8
3 COURSE MATERIAL DEVELOPMENT ................................................................. 10
3.1 Metadata ......................................................................................................................................... 10
3.2 Lectures .......................................................................................................................................... 54
4 REFERENCES ....................................................................................................... 54
LIST OF TABLES
Table 2.1: STIP courses ........................................................................................................................... 9
Table 3.1: Course C0 .............................................................................................................................. 11
Table 3.2: Course C1 .............................................................................................................................. 14
Table 3.3: Course C2 .............................................................................................................................. 17
Table 3.4: Course C3 .............................................................................................................................. 20
Table 3.5: Course C4 .............................................................................................................................. 23
Table 3.6: Course C5 .............................................................................................................................. 26
Table 3.7: Course C6 .............................................................................................................................. 29
Table 3.8: Course C7 .............................................................................................................................. 33
Table 3.9: Course C8 .............................................................................................................................. 36
Table 3.10: Course C9 ............................................................................................................................ 39
Table 3.11: Course C10 .......................................................................................................................... 42
Table 3.12: Course C11 .......................................................................................................................... 45

Deliverable D2.3
www.alliance-project.eu 3
Table 3.13: Course C12a ........................................................................................................................ 48
Table 3.14: Course C12b ........................................................................................................................ 51
Deliverable D2.3
www.alliance-project.eu 4
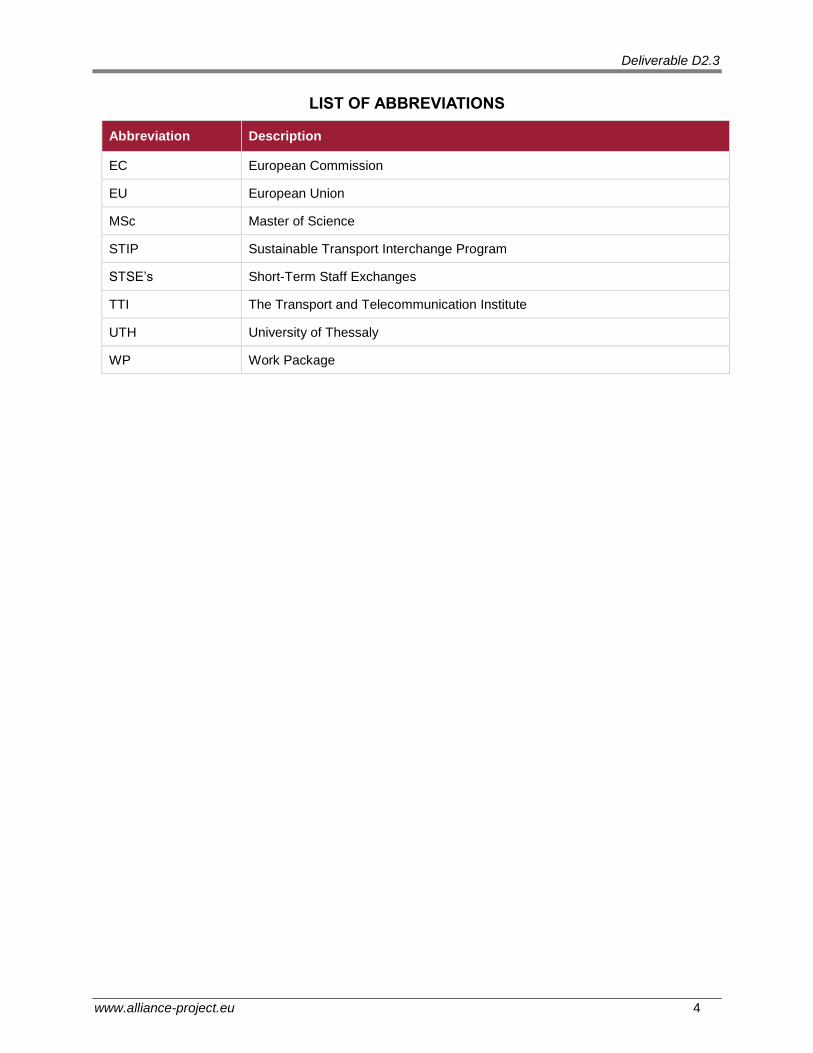
LIST OF ABBREVIATIONS
Abbreviation Description
EC European Commission
EU European Union
MSc Master of Science
STIP Sustainable Transport Interchange Program
STSE’s Short-Term Staff Exchanges
TTI The Transport and Telecommunication Institute
UTH University of Thessaly
WP Work Package

Deliverable D2.3
www.alliance-project.eu 5
Abstract
This deliverable includes the first version of the ALLIANCE course material on smart solutions for the interconnection of transportation networks. The material is expected to be updated in two specific milestones of the project thus, after the realization of each of the two summer schools.
Deliverable D2.3
www.alliance-project.eu 6
1 Introduction
1.1 Background
ALLIANCE aims at developing advanced research and higher education institution in the field of smart interconnecting sustainable transport networks in Latvia, by linking the Transport and Telecommunication Institute – TTI with two internationally recognized research entities – University of Thessaly – UTH, Greece and Fraunhofer Institute for Factory Operation and Automation – Fraunhofer, Germany. Close collaboration of TTI with UTH and Fraunhofer will enable the achievement of the goals through the following activities:
• Organization of young researchers’ seminars. • Organization of workshops. • Organization of summer schools for trainers and young researchers. • Development of educational programme for graduate and post-graduate students. • Development of training programme for trainers and practitioners. • Provision of grants for participation as authors of peer reviewed publications in
conferences. • Facilitation of Short-Term Staff Exchanges (STSE’s) with the aim of international
collaboration, mainly publications. • Establishment of a guidance strategy for preparing scientific publications. • Creation of an educational forum as on-line tool for distance learning and knowledge
sharing.
The overall methodology of the project is built around the analysis of the needs of Latvia and the surrounding region of the Baltic sea (Lithuania, Estonia, Poland) on knowledge gain about intermodal transport networks and the development of the tools to attain this knowledge, providing at the same time excellence and innovation capacity. The analysis to be conducted during the first stages of the project relies on the overarching relations among policy makers, industry and education/research.
Structured around three main pillars: 1) Organizational/governance, 2) operational/services, and 3) Service quality/customer satisfaction, ALLIANCE will deliver a coherent educational/training program, addressed to enhancing the knowledge of current and future researchers and professionals offering their services in Latvia and the wider region. The expected impacts on the overall research and innovation potential of TTI and Latvian research community will be of high importance and TTI will benefit from ALLIANCE by:
• Improving its knowledge in methodologies for preparing, writing and publishing scientific papers.
• Strengthening its research capacity. • Establishing international research teams in specific areas of interest. • Generating new innovative ideas for future research work through the project’s activities. • Setting up the fundamentals for the young generation of researchers. • Being integrated in a number of existing international transport research networks. • Being incorporated in the European research system of transport and logistics.
In addition, the cooperation of TTI with UTH and Fraunhofer will induce benefits into several domains of everyday life at regional, national and international scope. New bases will be established concerning knowledge transfer procedures, education and interdepartmental collaboration amongst research institutes. The innovative organizational framework, which will be structured for this purpose during the project, is expected to constitute a best practice application with tangible and well estimated progress results, which will be disseminated and communicated
Deliverable D2.3
www.alliance-project.eu 7
through social events to the research community and to the respective business sector as well. Lastly, an important benefit will be the configuration of an integrated framework pertaining to the knowledge transfer techniques and the generic upgrading of the educational system with use of networking, staff exchange, webinars and other knowledge transfer methods and techniques based on a well-structured and well-tried schedule.
1.2 Deliverable scope and structure
This document is the third deliverable of WP2 (Work Package 2) and its scope is to provide the first version of the ALLIANCE course material on smart solutions for the interconnection of transportation networks.
Following the introductory chapter, the subsequent sections of this deliverable include: Chapter 2, presents an overview of the “Sustainable Transport Interchange Program – STIP”, and Chapter 3 the courses’ metadata and the first version of the material, developed for the program.
Deliverable D2.3
www.alliance-project.eu 8
2 Sustainable Transport Interchange Program
2.1 Overview
The Transport and Telecommunication Institute – TTI with two internationally recognized research entities – University of Thessaly – UTH, Greece and Fraunhofer Institute for Factory Operation and Automation – Fraunhofer, Germany develop an advanced research and higher education program in the field of smart interconnecting sustainable transport networks in Latvia. The program, entitled “Sustainable Transport Interchange Program – STIP”, captures the needs of interconnecting transportation networks and the current and emerging research, educational and training requirements in Latvia and the region.
STIP aims to strengthen the scientific and technological capacity of Latvia and build the grounds for a common understanding of the basic principles that affect sustainable intermodality. While this program is developed for graduates students who attend either program at TTI “Transport Economics and Management” and “Transport and Logistics” it may be attended by other PhD students who did not graduate from these master programs.
The educational objectives of the program are (ALLIANCE, 2016a):
1. For graduates to develop essential skills on transportation intermodality and establish the engineering profile that is needed to address issues in society, environment, and economy.
2. For graduates to advance their careers to a higher position of responsibility by acquiring professional judgement and critical thinking of every day transport related problems.
3. For PhD students to become familiar with methods and tools that are prerequisites to fulfil their program and have not covered in previous earned degrees or are required in the development of their thesis.
2.2 STIP courses
The two-level gap analysis, conducted previously in WP2 and documented in Deliverable D2.1 (ALLIANCE, 2016b), converted practice related requirements for passenger and freight interchanges (Gap analysis I) into educational gaps and requirements for passenger and freight transport interchanges (Gap analysis II).The requirements per thematic area, i.e. governance, smart solutions and decision-making, were linked with an educational area. Twenty educational areas were determined, based on the Gap analysis II requirements, and the existing research, educational and training programs offered at research and educational institutes at European level (ALLIANCE, 2016a):
1. Building business models for passenger transport interchanges
2. Development and implementation of sustainability and transport policies in the EU region
3. Development and implementation of freight transport policies in the EU region
4. Public Private Partnerships in transport: Theory and schemes
5. Building business models for freight transport interchanges
6. Sustainable passenger transportation planning
7. Sustainable freight transportation planning
8. Operation and management of urban public transport systems
9. Operation and management of urban freight transport systems
10. Multimodal transport optimization for passenger transport (General and case studies)
11. Multimodal transport optimization for freight transport (General and case studies)
Deliverable D2.3
www.alliance-project.eu 9
12. Information systems for passenger intermodal terminals
13. Integrated ticketing and time table coordination
14. Design and safety principles of transport terminal infrastructure
15. Passenger terminal design
16. Urban freight terminals design
17. Information technologies for intermodal freight transport
18. Smart transhipment and alternative transport fuels
19. Risk assessment analysis, behavioral modeling, social cost benefit analysis and multi-stakeholder multi-criteria assessment
20. Innovative data collection methods to support decision making.
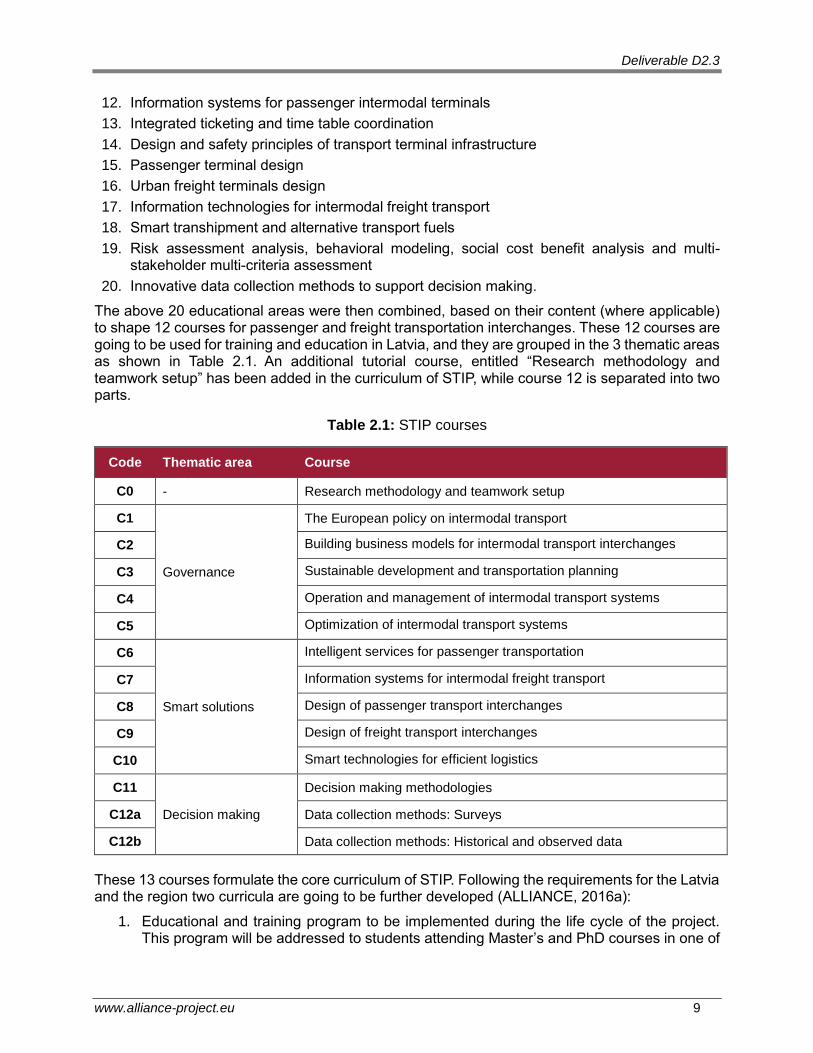
The above 20 educational areas were then combined, based on their content (where applicable) to shape 12 courses for passenger and freight transportation interchanges. These 12 courses are going to be used for training and education in Latvia, and they are grouped in the 3 thematic areas as shown in Table 2.1. An additional tutorial course, entitled “Research methodology and teamwork setup” has been added in the curriculum of STIP, while course 12 is separated into two parts.
Table 2.1: STIP courses
Code Thematic area Course
C0 - Research methodology and teamwork setup
C1
Governance
The European policy on intermodal transport
C2 Building business models for intermodal transport interchanges
C3 Sustainable development and transportation planning
C4 Operation and management of intermodal transport systems
C5 Optimization of intermodal transport systems
C6
Smart solutions
Intelligent services for passenger transportation
C7 Information systems for intermodal freight transport
C8 Design of passenger transport interchanges
C9 Design of freight transport interchanges
C10 Smart technologies for efficient logistics
C11
Decision making
Decision making methodologies
C12a Data collection methods: Surveys
C12b Data collection methods: Historical and observed data
These 13 courses formulate the core curriculum of STIP. Following the requirements for the Latvia and the region two curricula are going to be further developed (ALLIANCE, 2016a):
1. Educational and training program to be implemented during the life cycle of the project. This program will be addressed to students attending Master’s and PhD courses in one of
Deliverable D2.3
www.alliance-project.eu 10
the two programs offered at TTI, on “Transport Economics and Management” and “Transport and Logistics”.
2. Long-life-educational (LLE) program, addressed to University graduates who practice their profession in the transport industry, thus work for an authority, SME, or other organization (Trans-logistics Educational forum).
3 Course material development
3.1 Metadata
The responsible lecturer has prepared the course metadata, which include the following information:
• Analytic description, e.g. title, thematic area, responsible institute, lecturer, aim, learning outcomes, prerequisites, language, hours, key words, syllabus, bibliography, teaching methods, evaluation methods, license, number of topics
• Lecture content • A short description of how each teaching method will be applied.
The metadata of the 13 courses are analytically presented from Table 3.1 to Table 3.14.
Deliverable D2.3
www.alliance-project.eu 11
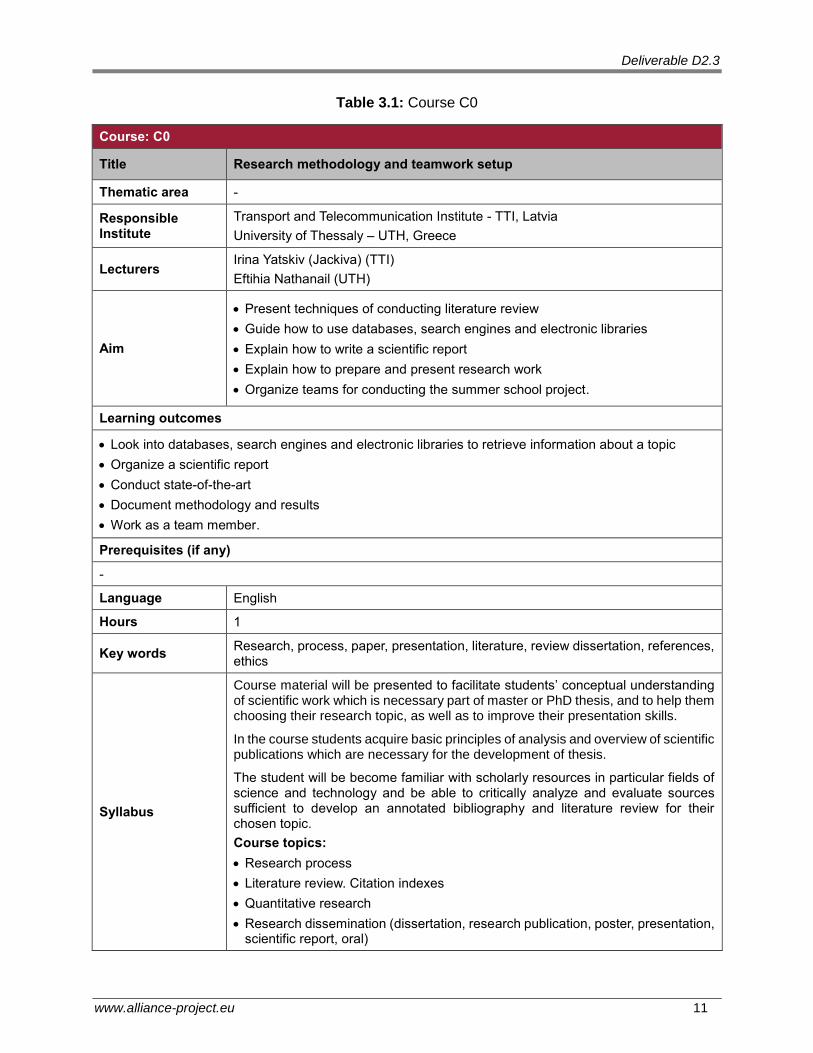
Table 3.1: Course C0
Course: C0
Title Research methodology and teamwork setup
Thematic area -
Responsible Institute
Transport and Telecommunication Institute - TTI, Latvia
University of Thessaly – UTH, Greece
Lecturers Irina Yatskiv (Jackiva) (TTI)
Eftihia Nathanail (UTH)
Aim
Present techniques of conducting literature review
Guide how to use databases, search engines and electronic libraries
Explain how to write a scientific report
Explain how to prepare and present research work
Organize teams for conducting the summer school project.
Learning outcomes
Look into databases, search engines and electronic libraries to retrieve information about a topic
Organize a scientific report
Conduct state-of-the-art
Document methodology and results
Work as a team member.
Prerequisites (if any)
-
Language English
Hours 1
Key words Research, process, paper, presentation, literature, review dissertation, references, ethics
Syllabus
Course material will be presented to facilitate students’ conceptual understanding of scientific work which is necessary part of master or PhD thesis, and to help them choosing their research topic, as well as to improve their presentation skills.
In the course students acquire basic principles of analysis and overview of scientific publications which are necessary for the development of thesis.
The student will be become familiar with scholarly resources in particular fields of science and technology and be able to critically analyze and evaluate sources sufficient to develop an annotated bibliography and literature review for their chosen topic.
Course topics:
Research process
Literature review. Citation indexes
Quantitative research
Research dissemination (dissertation, research publication, poster, presentation, scientific report, oral)
Deliverable D2.3
www.alliance-project.eu 12
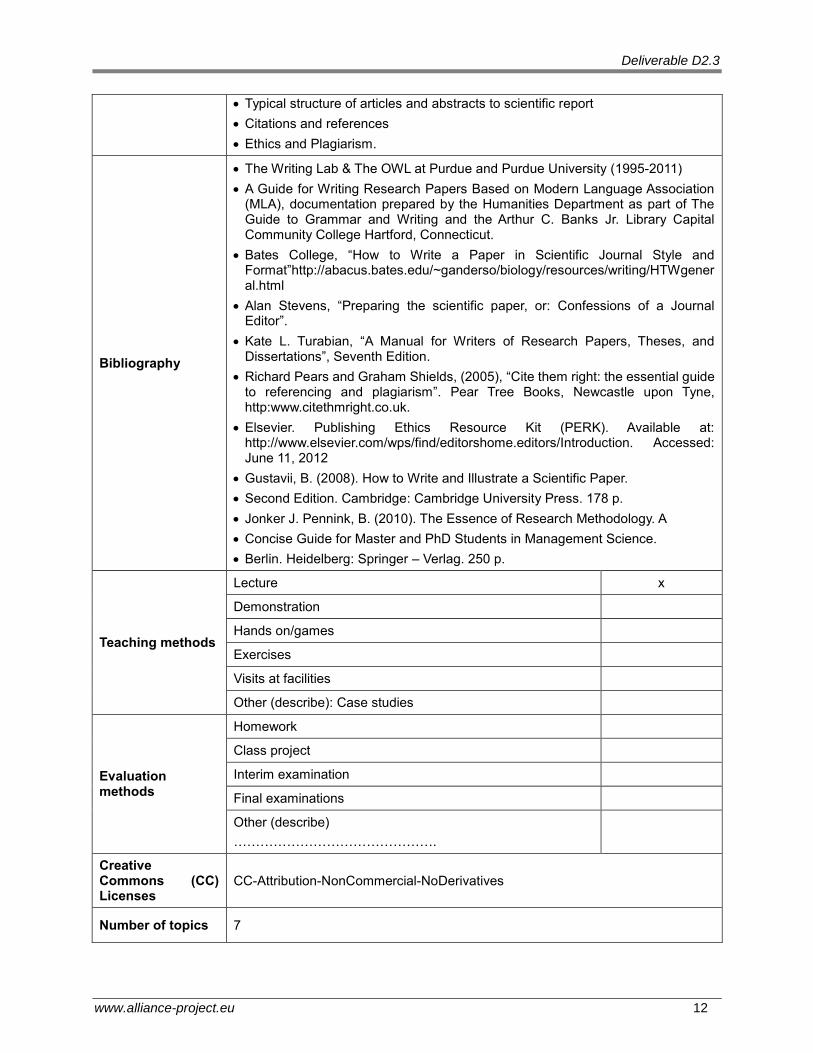
Typical structure of articles and abstracts to scientific report
Citations and references
Ethics and Plagiarism.
Bibliography
The Writing Lab & The OWL at Purdue and Purdue University (1995-2011)
A Guide for Writing Research Papers Based on Modern Language Association (MLA), documentation prepared by the Humanities Department as part of The Guide to Grammar and Writing and the Arthur C. Banks Jr. Library Capital Community College Hartford, Connecticut.
Bates College, “How to Write a Paper in Scientific Journal Style and Format”http://abacus.bates.edu/~ganderso/biology/resources/writing/HTWgeneral.html
Alan Stevens, “Preparing the scientific paper, or: Confessions of a Journal Editor”.
Kate L. Turabian, “A Manual for Writers of Research Papers, Theses, and Dissertations”, Seventh Edition.
Richard Pears and Graham Shields, (2005), “Cite them right: the essential guide to referencing and plagiarism”. Pear Tree Books, Newcastle upon Tyne, http:www.citethmright.co.uk.
Elsevier. Publishing Ethics Resource Kit (PERK). Available at: http://www.elsevier.com/wps/find/editorshome.editors/Introduction. Accessed: June 11, 2012
Gustavii, B. (2008). How to Write and Illustrate a Scientific Paper.
Second Edition. Cambridge: Cambridge University Press. 178 p.
Jonker J. Pennink, B. (2010). The Essence of Research Methodology. A
Concise Guide for Master and PhD Students in Management Science.
Berlin. Heidelberg: Springer – Verlag. 250 p.
Teaching methods
Lecture x
Demonstration
Hands on/games
Exercises
Visits at facilities
Other (describe): Case studies
Evaluation methods
Homework
Class project
Interim examination
Final examinations
Other (describe)
……………………………………….
Creative Commons (CC) Licenses
CC-Attribution-NonCommercial-NoDerivatives
Number of topics 7

Deliverable D2.3
www.alliance-project.eu 13
Lecture content
1 Research process
2 Work with the literature and international scientific citation system. Citation indexes
3 Quantitative research
4 Types of research dissemination
5 Typical structure of articles and abstracts to scientific report
6 Citations and references
7 Ethics and Plagiarism
8 Suggested literature
Deliverable D2.3
www.alliance-project.eu 14
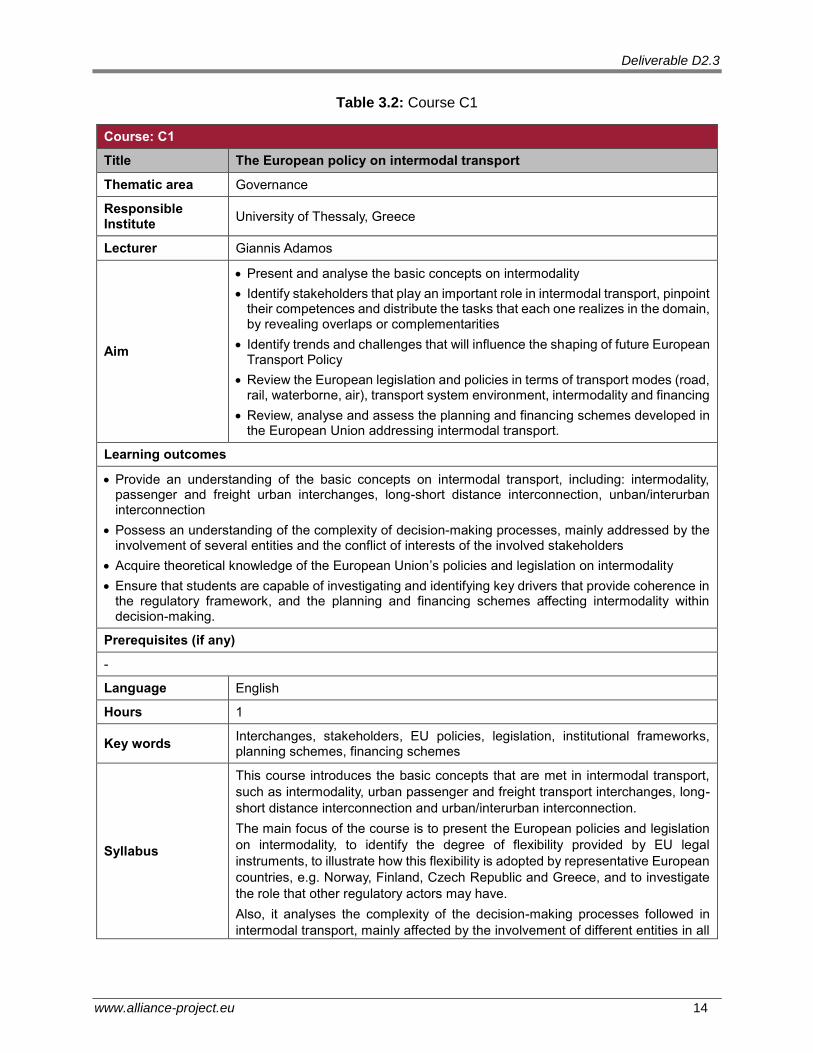
Table 3.2: Course C1
Course: C1
Title The European policy on intermodal transport
Thematic area Governance
Responsible Institute
University of Thessaly, Greece
Lecturer Giannis Adamos
Aim
Present and analyse the basic concepts on intermodality
Identify stakeholders that play an important role in intermodal transport, pinpoint their competences and distribute the tasks that each one realizes in the domain, by revealing overlaps or complementarities
Identify trends and challenges that will influence the shaping of future European Transport Policy
Review the European legislation and policies in terms of transport modes (road, rail, waterborne, air), transport system environment, intermodality and financing
Review, analyse and assess the planning and financing schemes developed in the European Union addressing intermodal transport.
Learning outcomes
Provide an understanding of the basic concepts on intermodal transport, including: intermodality, passenger and freight urban interchanges, long-short distance interconnection, unban/interurban interconnection
Possess an understanding of the complexity of decision-making processes, mainly addressed by the involvement of several entities and the conflict of interests of the involved stakeholders
Acquire theoretical knowledge of the European Union’s policies and legislation on intermodality
Ensure that students are capable of investigating and identifying key drivers that provide coherence in the regulatory framework, and the planning and financing schemes affecting intermodality within decision-making.
Prerequisites (if any)
-
Language English
Hours 1
Key words Interchanges, stakeholders, EU policies, legislation, institutional frameworks, planning schemes, financing schemes
Syllabus
This course introduces the basic concepts that are met in intermodal transport,
such as intermodality, urban passenger and freight transport interchanges, long-
short distance interconnection and urban/interurban interconnection.
The main focus of the course is to present the European policies and legislation
on intermodality, to identify the degree of flexibility provided by EU legal
instruments, to illustrate how this flexibility is adopted by representative European
countries, e.g. Norway, Finland, Czech Republic and Greece, and to investigate
the role that other regulatory actors may have.
Also, it analyses the complexity of the decision-making processes followed in
intermodal transport, mainly affected by the involvement of different entities in all
Deliverable D2.3
www.alliance-project.eu 15
stages and the absence of a strict hierarchical flow chart of responsibilities,
resulting to complicated procedures.
Course topics:
Basic concepts
Transportation in an era of change
Future changes in European Transport Policy
Obstacles and problems
Decision-making framework
Actors and interrelations
European institutional and legal framework
Planning and financing schemes
Applications.
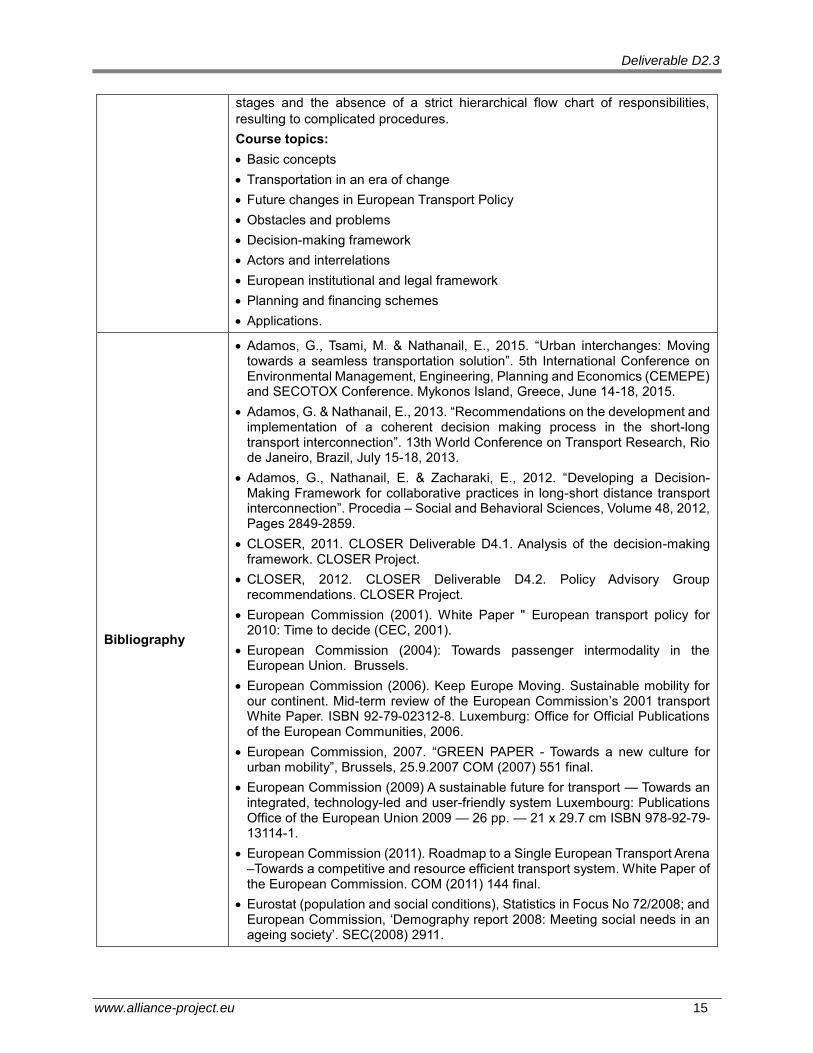
Bibliography
Adamos, G., Tsami, M. & Nathanail, E., 2015. “Urban interchanges: Moving towards a seamless transportation solution”. 5th International Conference on Environmental Management, Engineering, Planning and Economics (CEMEPE) and SECOTOX Conference. Mykonos Island, Greece, June 14-18, 2015.
Adamos, G. & Nathanail, E., 2013. “Recommendations on the development and implementation of a coherent decision making process in the short-long transport interconnection”. 13th World Conference on Transport Research, Rio de Janeiro, Brazil, July 15-18, 2013.
Adamos, G., Nathanail, E. & Zacharaki, E., 2012. “Developing a Decision-Making Framework for collaborative practices in long-short distance transport interconnection”. Procedia – Social and Behavioral Sciences, Volume 48, 2012, Pages 2849-2859.
CLOSER, 2011. CLOSER Deliverable D4.1. Analysis of the decision-making framework. CLOSER Project.
CLOSER, 2012. CLOSER Deliverable D4.2. Policy Advisory Group recommendations. CLOSER Project.
European Commission (2001). White Paper " European transport policy for 2010: Time to decide (CEC, 2001).
European Commission (2004): Towards passenger intermodality in the European Union. Brussels.
European Commission (2006). Keep Europe Moving. Sustainable mobility for our continent. Mid-term review of the European Commission’s 2001 transport White Paper. ISBN 92-79-02312-8. Luxemburg: Office for Official Publications of the European Communities, 2006.
European Commission, 2007. “GREEN PAPER - Towards a new culture for urban mobility”, Brussels, 25.9.2007 COM (2007) 551 final.
European Commission (2009) A sustainable future for transport — Towards an integrated, technology-led and user-friendly system Luxembourg: Publications Office of the European Union 2009 — 26 pp. — 21 x 29.7 cm ISBN 978-92-79-13114-1.
European Commission (2011). Roadmap to a Single European Transport Arena –Towards a competitive and resource efficient transport system. White Paper of the European Commission. COM (2011) 144 final.
Eurostat (population and social conditions), Statistics in Focus No 72/2008; and European Commission, ‘Demography report 2008: Meeting social needs in an ageing society’. SEC(2008) 2911.
Deliverable D2.3
www.alliance-project.eu 16
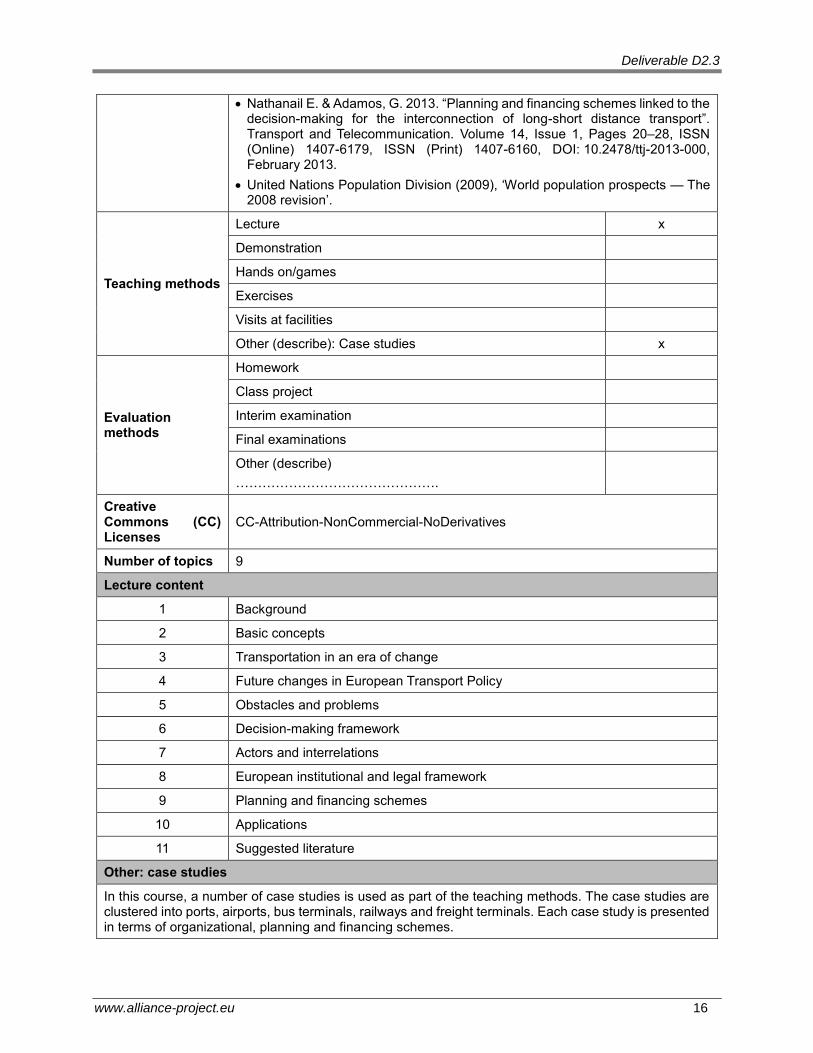
Nathanail E. & Adamos, G. 2013. “Planning and financing schemes linked to the decision-making for the interconnection of long-short distance transport”. Transport and Telecommunication. Volume 14, Issue 1, Pages 20–28, ISSN (Online) 1407-6179, ISSN (Print) 1407-6160, DOI: 10.2478/ttj-2013-000, February 2013.
United Nations Population Division (2009), ‘World population prospects — The 2008 revision’.
Teaching methods
Lecture x
Demonstration
Hands on/games
Exercises
Visits at facilities
Other (describe): Case studies x
Evaluation methods
Homework
Class project
Interim examination
Final examinations
Other (describe)
……………………………………….
Creative Commons (CC) Licenses
CC-Attribution-NonCommercial-NoDerivatives
Number of topics 9
Lecture content
1 Background
2 Basic concepts
3 Transportation in an era of change
4 Future changes in European Transport Policy
5 Obstacles and problems
6 Decision-making framework
7 Actors and interrelations
8 European institutional and legal framework
9 Planning and financing schemes
10 Applications
11 Suggested literature
Other: case studies
In this course, a number of case studies is used as part of the teaching methods. The case studies are clustered into ports, airports, bus terminals, railways and freight terminals. Each case study is presented in terms of organizational, planning and financing schemes.

Deliverable D2.3
www.alliance-project.eu 17
Table 3.3: Course C2
Course: C2
Title Business models for intermodal transport interchanges
Thematic area Governance
Responsible Institute
Otto-von-Guericke-University Magdeburg, Germany
Lecturer Dr.-Ing. Henning Strubelt
Aim
Get introduced to the development and evaluation of business models
Get enabled to analyze the options for and limitations to logistics implementation concepts concerning intermodal transport aspects
Develop a thorough understanding of the physical and monetary aspects and processes of material flow technology in intermodal transport networks.
Learning outcomes
Acquire basic knowledge of intermodal transport interchanges and business models
Acquire knowledge about the processual importance of intermodal transport interchanges in efficient supply chains
Develop skills for logistical evaluations required for the selection of intermodal transport concepts and to assess economic conditions of service and functionality
Enable the analysis and definition of complex intermodal transport networks.
Prerequisites (if any)
-
Language English
Hours 2
Key words Logistics, business models, intermodal interchanges, modal split, transport modes
Syllabus
The course is composed of two parts, a lecture style introduction to the topic of business models in intermodal transport, in particular intermodal interchanges and an exercise section.
The lecture includes the topics of creation and analysis of business models, an introduction to intermodal transport chains, possible transport mode interchanges and their relevant business models and the fundamental principles of technological means and infrastructure in logistics. Further it gives a summary of recent research findings and current applications of intermodal transport.
The exercise section is divided into two parts itself. The first part is the assessment of intermodal transport modes, to understand their specific advantages and disadvantages from a technological, economic, and ecological point of view. The second part of the exercise section involves a case study with the objective of deepening the understanding of application fields and assessing intermodal technologies. This is facilitated by the discussion of possibilities and their pros and cons. Further the aspects of sustainability and costs are evaluated and a business model for the participants’ preferred variant is to be developed. The first exercise section is done individually, while the second is intended to be done in small groups.
The course will conclude with a presentation of the developed business models and preferred intermodal transport solutions for the discussed case. This is
Deliverable D2.3
www.alliance-project.eu 18
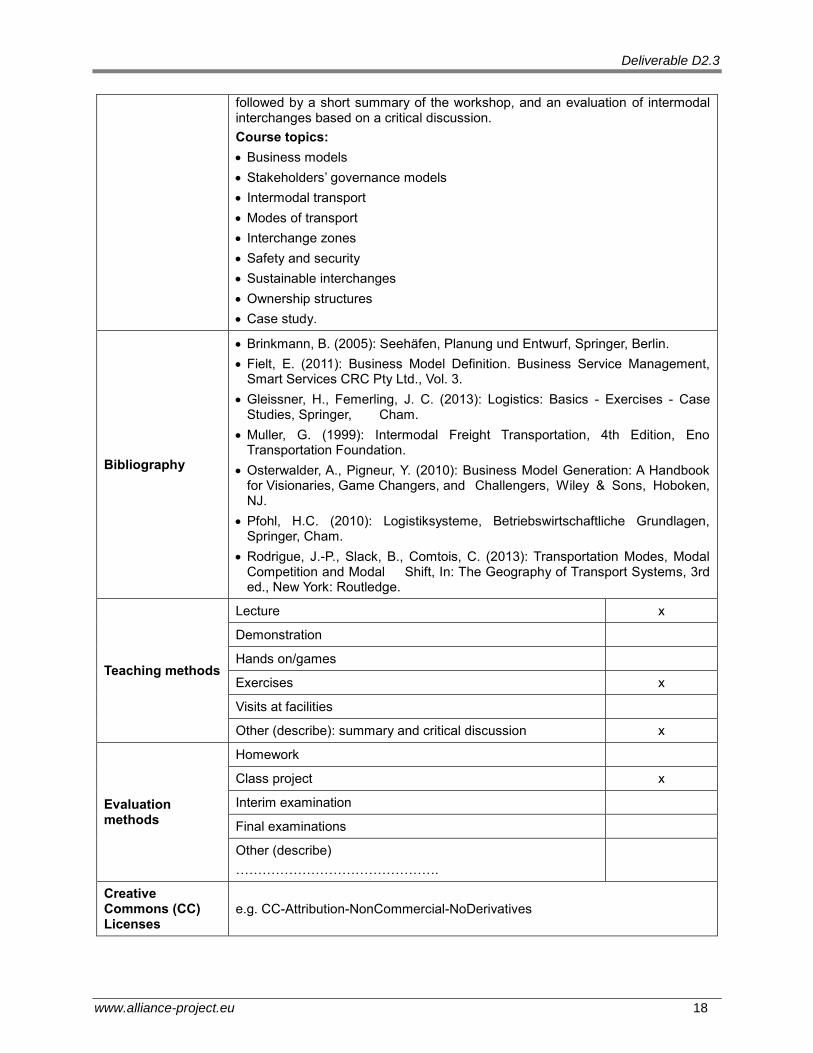
followed by a short summary of the workshop, and an evaluation of intermodal interchanges based on a critical discussion.
Course topics:
Business models
Stakeholders’ governance models
Intermodal transport
Modes of transport
Interchange zones
Safety and security
Sustainable interchanges
Ownership structures
Case study.
Bibliography
Brinkmann, B. (2005): Seehäfen, Planung und Entwurf, Springer, Berlin.
Fielt, E. (2011): Business Model Definition. Business Service Management, Smart Services CRC Pty Ltd., Vol. 3.
Gleissner, H., Femerling, J. C. (2013): Logistics: Basics - Exercises - Case Studies, Springer, Cham.
Muller, G. (1999): Intermodal Freight Transportation, 4th Edition, Eno Transportation Foundation.
Osterwalder, A., Pigneur, Y. (2010): Business Model Generation: A Handbook for Visionaries, Game Changers, and Challengers, Wiley & Sons, Hoboken, NJ.
Pfohl, H.C. (2010): Logistiksysteme, Betriebswirtschaftliche Grundlagen, Springer, Cham.
Rodrigue, J.-P., Slack, B., Comtois, C. (2013): Transportation Modes, Modal Competition and Modal Shift, In: The Geography of Transport Systems, 3rd ed., New York: Routledge.
Teaching methods
Lecture x
Demonstration
Hands on/games
Exercises x
Visits at facilities
Other (describe): summary and critical discussion x
Evaluation methods
Homework
Class project x
Interim examination
Final examinations
Other (describe)
……………………………………….
Creative Commons (CC) Licenses
e.g. CC-Attribution-NonCommercial-NoDerivatives
Deliverable D2.3
www.alliance-project.eu 19
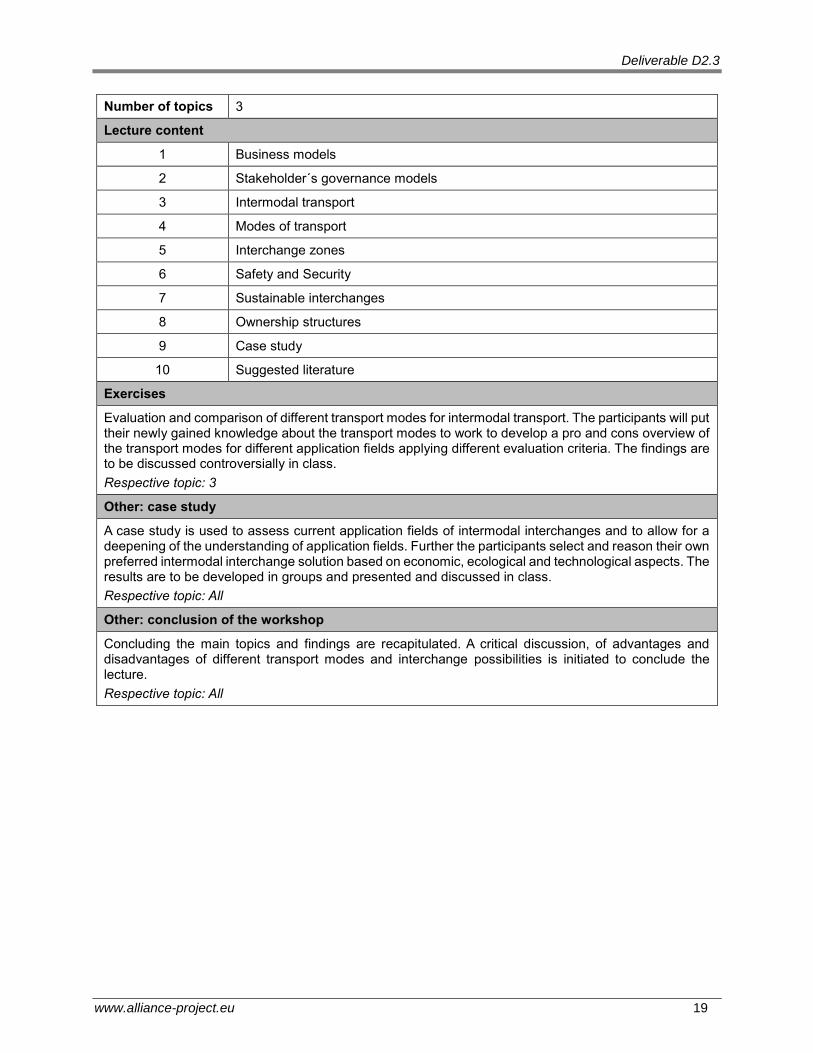
Number of topics 3
Lecture content
1 Business models
2 Stakeholder´s governance models
3 Intermodal transport
4 Modes of transport
5 Interchange zones
6 Safety and Security
7 Sustainable interchanges
8 Ownership structures
9 Case study
10 Suggested literature
Exercises
Evaluation and comparison of different transport modes for intermodal transport. The participants will put their newly gained knowledge about the transport modes to work to develop a pro and cons overview of the transport modes for different application fields applying different evaluation criteria. The findings are to be discussed controversially in class.
Respective topic: 3
Other: case study
A case study is used to assess current application fields of intermodal interchanges and to allow for a deepening of the understanding of application fields. Further the participants select and reason their own preferred intermodal interchange solution based on economic, ecological and technological aspects. The results are to be developed in groups and presented and discussed in class.
Respective topic: All
Other: conclusion of the workshop
Concluding the main topics and findings are recapitulated. A critical discussion, of advantages and disadvantages of different transport modes and interchange possibilities is initiated to conclude the lecture.
Respective topic: All
Deliverable D2.3
www.alliance-project.eu 20
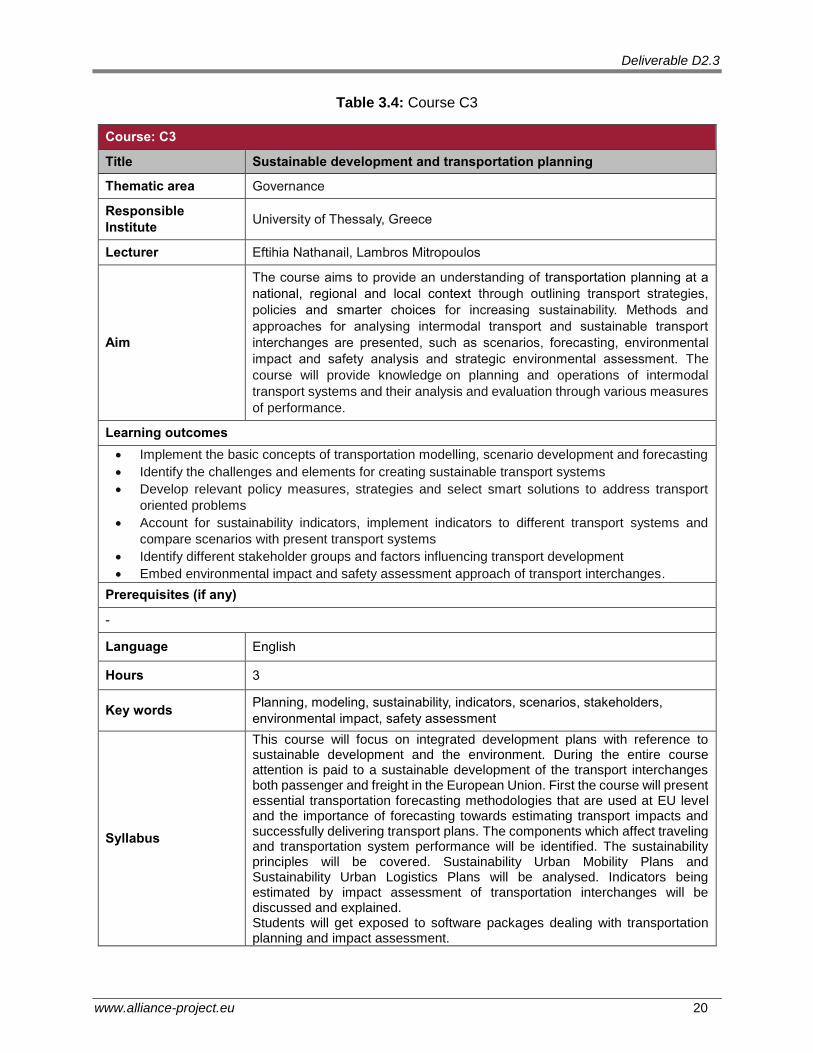
Table 3.4: Course C3
Course: C3
Title Sustainable development and transportation planning
Thematic area Governance
Responsible
Institute University of Thessaly, Greece
Lecturer Eftihia Nathanail, Lambros Mitropoulos
Aim
The course aims to provide an understanding of transportation planning at a
national, regional and local context through outlining transport strategies,
policies and smarter choices for increasing sustainability. Methods and
approaches for analysing intermodal transport and sustainable transport
interchanges are presented, such as scenarios, forecasting, environmental
impact and safety analysis and strategic environmental assessment. The
course will provide knowledge on planning and operations of intermodal
transport systems and their analysis and evaluation through various measures
of performance.
Learning outcomes
Implement the basic concepts of transportation modelling, scenario development and forecasting
Identify the challenges and elements for creating sustainable transport systems
Develop relevant policy measures, strategies and select smart solutions to address transport
oriented problems
Account for sustainability indicators, implement indicators to different transport systems and
compare scenarios with present transport systems
Identify different stakeholder groups and factors influencing transport development
Embed environmental impact and safety assessment approach of transport interchanges.
Prerequisites (if any)
-
Language English
Hours 3
Key words Planning, modeling, sustainability, indicators, scenarios, stakeholders,
environmental impact, safety assessment
Syllabus
This course will focus on integrated development plans with reference to sustainable development and the environment. During the entire course attention is paid to a sustainable development of the transport interchanges both passenger and freight in the European Union. First the course will present essential transportation forecasting methodologies that are used at EU level and the importance of forecasting towards estimating transport impacts and successfully delivering transport plans. The components which affect traveling and transportation system performance will be identified. The sustainability principles will be covered. Sustainability Urban Mobility Plans and Sustainability Urban Logistics Plans will be analysed. Indicators being estimated by impact assessment of transportation interchanges will be discussed and explained. Students will get exposed to software packages dealing with transportation planning and impact assessment.
Deliverable D2.3
www.alliance-project.eu 21
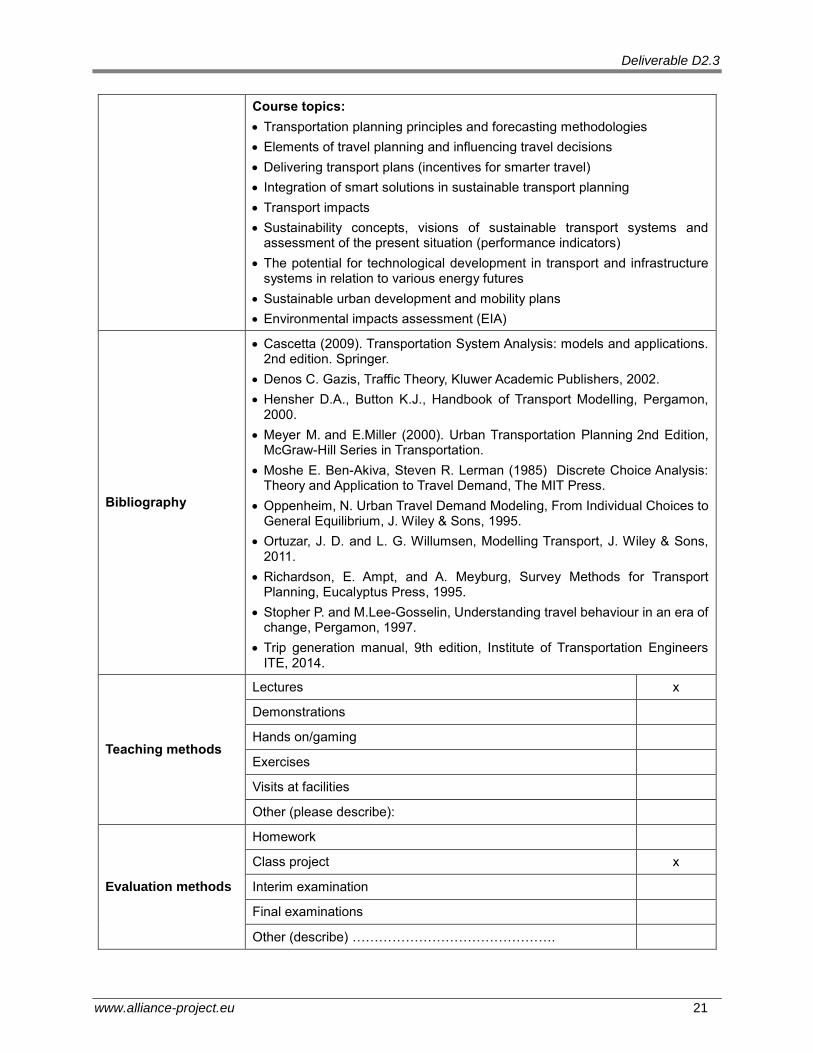
Course topics:
Transportation planning principles and forecasting methodologies
Elements of travel planning and influencing travel decisions
Delivering transport plans (incentives for smarter travel)
Integration of smart solutions in sustainable transport planning
Transport impacts
Sustainability concepts, visions of sustainable transport systems and assessment of the present situation (performance indicators)
The potential for technological development in transport and infrastructure systems in relation to various energy futures
Sustainable urban development and mobility plans
Environmental impacts assessment (EIA)
Bibliography
Cascetta (2009). Transportation System Analysis: models and applications. 2nd edition. Springer.
Denos C. Gazis, Traffic Theory, Kluwer Academic Publishers, 2002.
Hensher D.A., Button K.J., Handbook of Transport Modelling, Pergamon, 2000.
Meyer M. and E.Miller (2000). Urban Transportation Planning 2nd Edition, McGraw-Hill Series in Transportation.
Moshe E. Ben-Akiva, Steven R. Lerman (1985) Discrete Choice Analysis: Theory and Application to Travel Demand, The MIT Press.
Oppenheim, N. Urban Travel Demand Modeling, From Individual Choices to General Equilibrium, J. Wiley & Sons, 1995.
Ortuzar, J. D. and L. G. Willumsen, Modelling Transport, J. Wiley & Sons, 2011.
Richardson, E. Ampt, and A. Meyburg, Survey Methods for Transport Planning, Eucalyptus Press, 1995.
Stopher P. and M.Lee-Gosselin, Understanding travel behaviour in an era of change, Pergamon, 1997.
Trip generation manual, 9th edition, Institute of Transportation Engineers ITE, 2014.
Teaching methods
Lectures x
Demonstrations
Hands on/gaming
Exercises
Visits at facilities
Other (please describe):
Evaluation methods
Homework
Class project x
Interim examination
Final examinations
Other (describe) ……………………………………….
Deliverable D2.3
www.alliance-project.eu 22
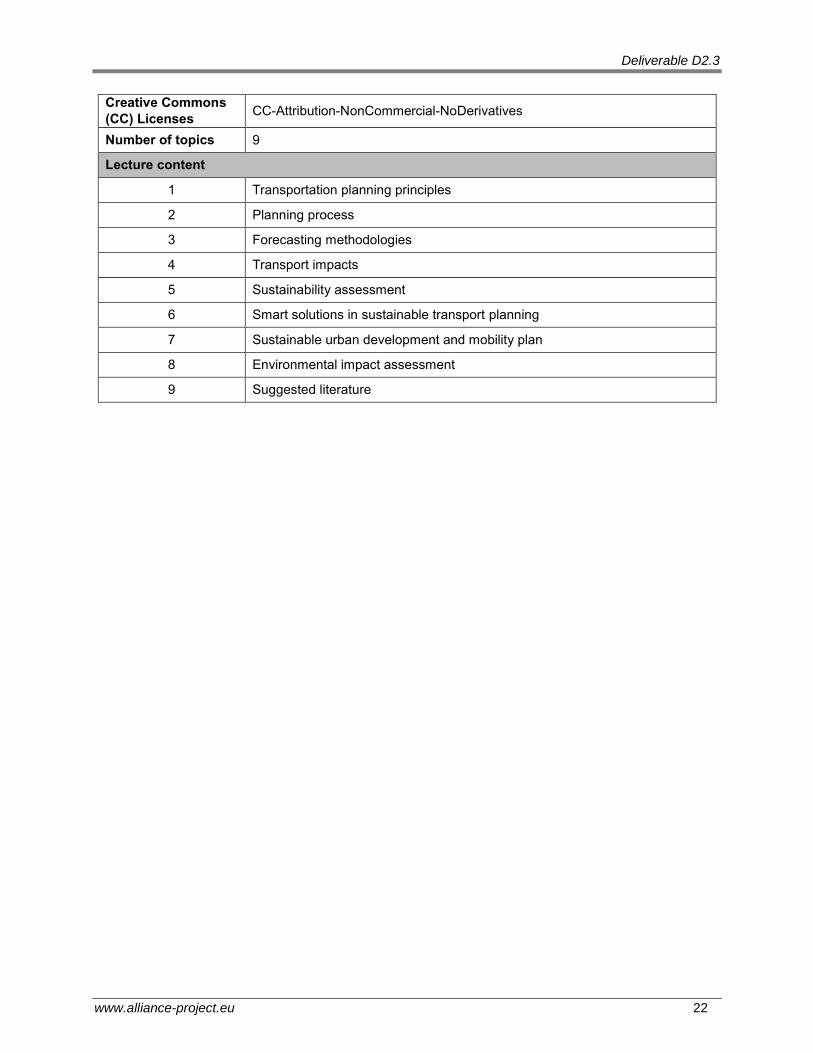
Creative Commons
(CC) Licenses CC-Attribution-NonCommercial-NoDerivatives
Number of topics 9
Lecture content
1 Transportation planning principles
2 Planning process
3 Forecasting methodologies
4 Transport impacts
5 Sustainability assessment
6 Smart solutions in sustainable transport planning
7 Sustainable urban development and mobility plan
8 Environmental impact assessment
9 Suggested literature
Deliverable D2.3
www.alliance-project.eu 23
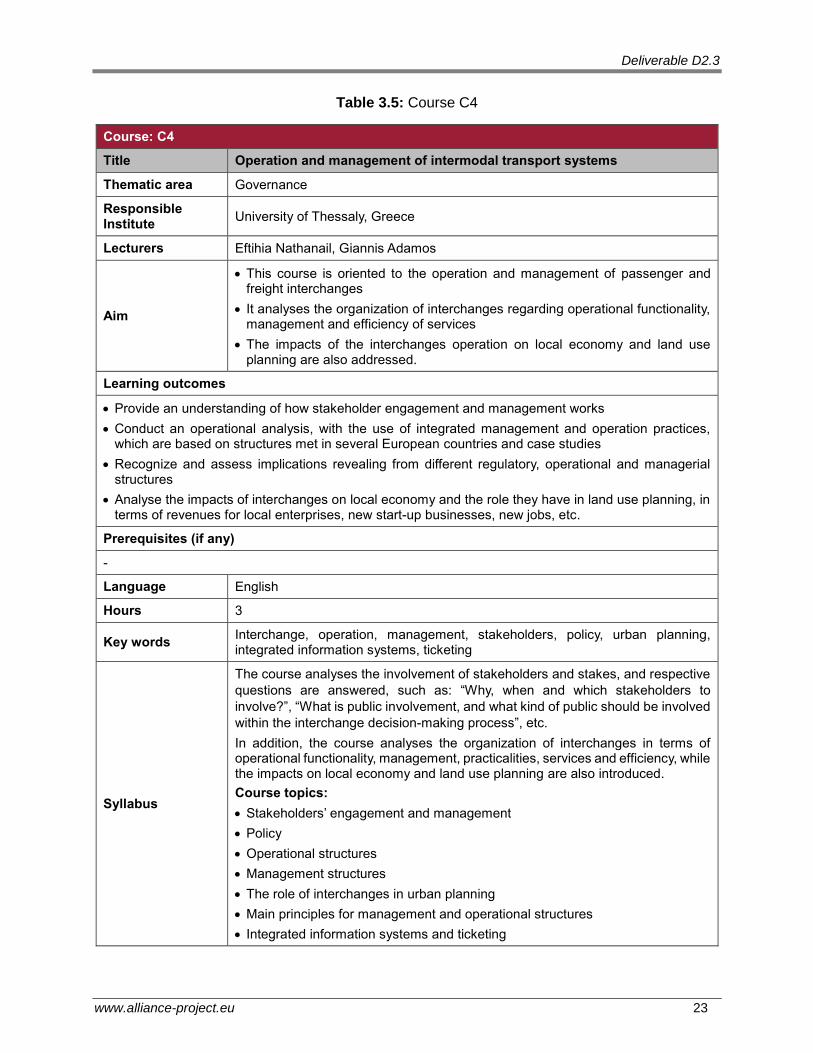
Table 3.5: Course C4
Course: C4
Title Operation and management of intermodal transport systems
Thematic area Governance
Responsible Institute
University of Thessaly, Greece
Lecturers Eftihia Nathanail, Giannis Adamos
Aim
This course is oriented to the operation and management of passenger and freight interchanges
It analyses the organization of interchanges regarding operational functionality, management and efficiency of services
The impacts of the interchanges operation on local economy and land use planning are also addressed.
Learning outcomes
Provide an understanding of how stakeholder engagement and management works
Conduct an operational analysis, with the use of integrated management and operation practices, which are based on structures met in several European countries and case studies
Recognize and assess implications revealing from different regulatory, operational and managerial structures
Analyse the impacts of interchanges on local economy and the role they have in land use planning, in terms of revenues for local enterprises, new start-up businesses, new jobs, etc.
Prerequisites (if any)
-
Language English
Hours 3
Key words Interchange, operation, management, stakeholders, policy, urban planning, integrated information systems, ticketing
Syllabus
The course analyses the involvement of stakeholders and stakes, and respective
questions are answered, such as: “Why, when and which stakeholders to
involve?”, “What is public involvement, and what kind of public should be involved
within the interchange decision-making process”, etc.
In addition, the course analyses the organization of interchanges in terms of operational functionality, management, practicalities, services and efficiency, while the impacts on local economy and land use planning are also introduced.
Course topics:
Stakeholders’ engagement and management
Policy
Operational structures
Management structures
The role of interchanges in urban planning
Main principles for management and operational structures
Integrated information systems and ticketing
Deliverable D2.3
www.alliance-project.eu 24
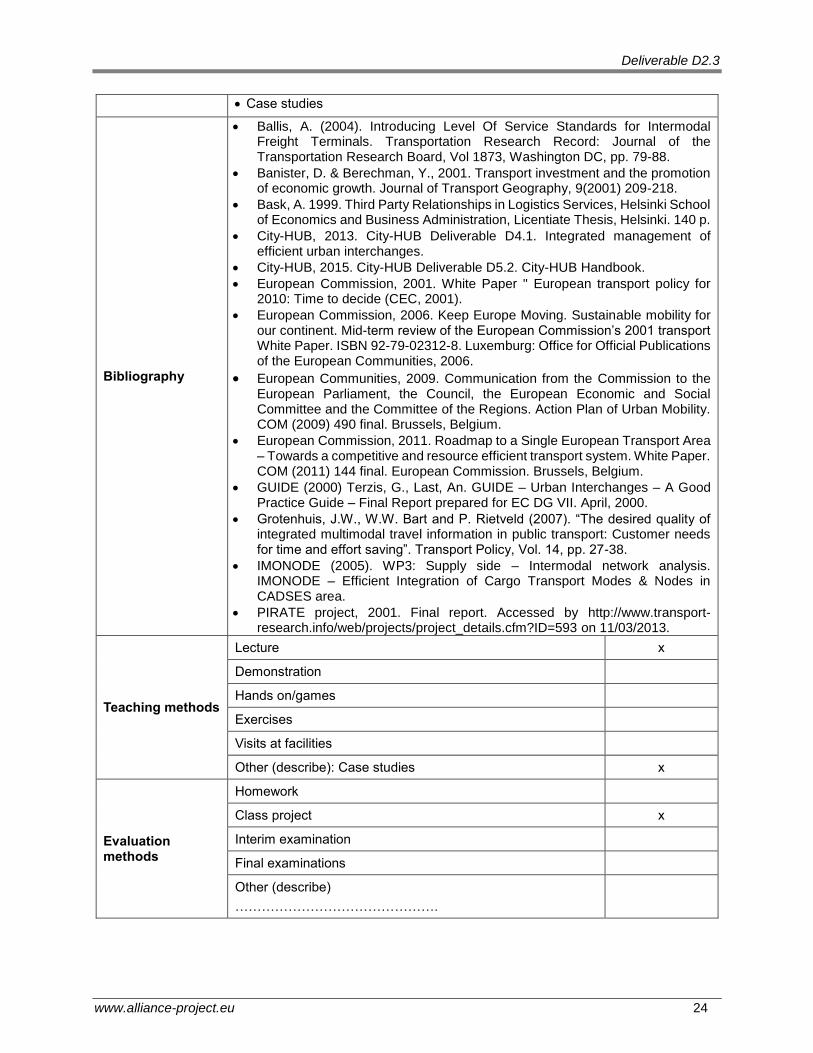
Case studies
Bibliography
Ballis, A. (2004). Introducing Level Of Service Standards for Intermodal Freight Terminals. Transportation Research Record: Journal of the Transportation Research Board, Vol 1873, Washington DC, pp. 79-88.
Banister, D. & Berechman, Y., 2001. Transport investment and the promotion of economic growth. Journal of Transport Geography, 9(2001) 209-218.
Bask, A. 1999. Third Party Relationships in Logistics Services, Helsinki School of Economics and Business Administration, Licentiate Thesis, Helsinki. 140 p.
City-HUB, 2013. City-HUB Deliverable D4.1. Integrated management of efficient urban interchanges.
City-HUB, 2015. City-HUB Deliverable D5.2. City-HUB Handbook.
European Commission, 2001. White Paper " European transport policy for 2010: Time to decide (CEC, 2001).
European Commission, 2006. Keep Europe Moving. Sustainable mobility for our continent. Mid-term review of the European Commission’s 2001 transport White Paper. ISBN 92-79-02312-8. Luxemburg: Office for Official Publications of the European Communities, 2006.
European Communities, 2009. Communication from the Commission to the European Parliament, the Council, the European Economic and Social Committee and the Committee of the Regions. Action Plan of Urban Mobility. COM (2009) 490 final. Brussels, Belgium.
European Commission, 2011. Roadmap to a Single European Transport Area – Towards a competitive and resource efficient transport system. White Paper. COM (2011) 144 final. European Commission. Brussels, Belgium.
GUIDE (2000) Terzis, G., Last, An. GUIDE – Urban Interchanges – A Good Practice Guide – Final Report prepared for EC DG VII. April, 2000.
Grotenhuis, J.W., W.W. Bart and P. Rietveld (2007). “The desired quality of integrated multimodal travel information in public transport: Customer needs for time and effort saving”. Transport Policy, Vol. 14, pp. 27-38.
IMONODE (2005). WP3: Supply side – Intermodal network analysis. IMONODE – Efficient Integration of Cargo Transport Modes & Nodes in CADSES area.
PIRATE project, 2001. Final report. Accessed by http://www.transport-research.info/web/projects/project_details.cfm?ID=593 on 11/03/2013.
Teaching methods
Lecture x
Demonstration
Hands on/games
Exercises
Visits at facilities
Other (describe): Case studies x
Evaluation methods
Homework
Class project x
Interim examination
Final examinations
Other (describe)
……………………………………….
Deliverable D2.3
www.alliance-project.eu 25
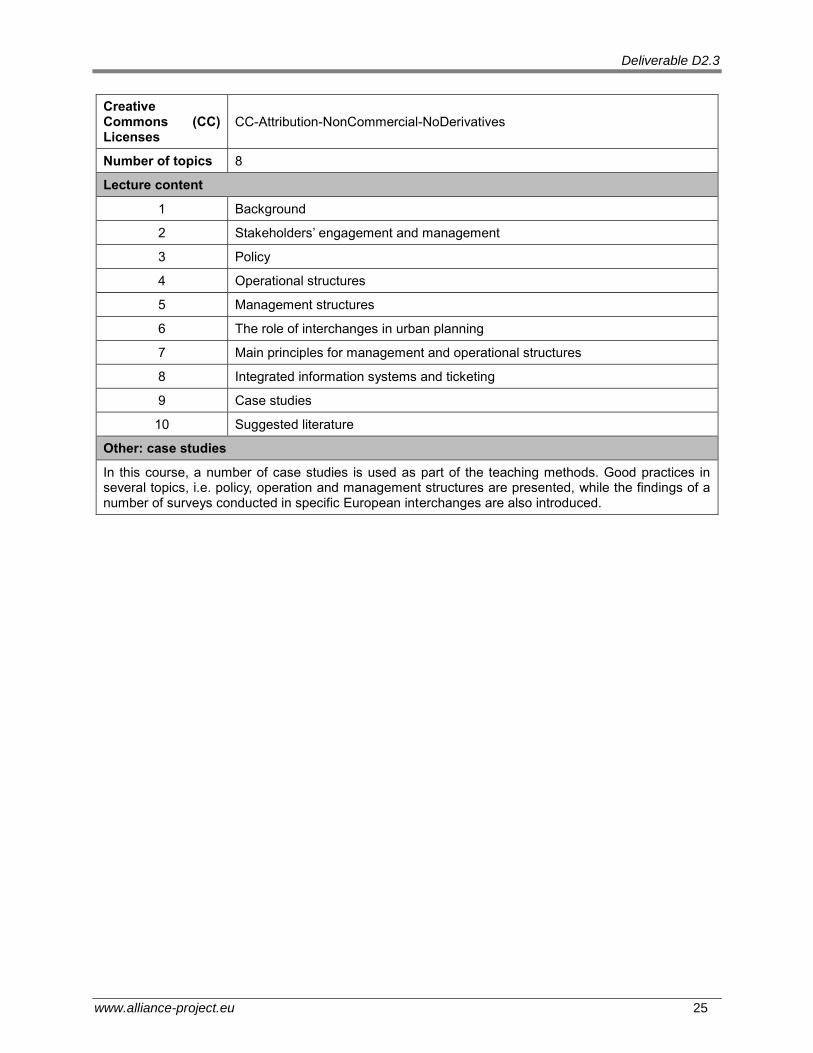
Creative Commons (CC) Licenses
CC-Attribution-NonCommercial-NoDerivatives
Number of topics 8
Lecture content
1 Background
2 Stakeholders’ engagement and management
3 Policy
4 Operational structures
5 Management structures
6 The role of interchanges in urban planning
7 Main principles for management and operational structures
8 Integrated information systems and ticketing
9 Case studies
10 Suggested literature
Other: case studies
In this course, a number of case studies is used as part of the teaching methods. Good practices in several topics, i.e. policy, operation and management structures are presented, while the findings of a number of surveys conducted in specific European interchanges are also introduced.

Deliverable D2.3
www.alliance-project.eu 26
Table 3.6: Course C5
Course: C5
Title Optimization of intermodal transport systems
Thematic area Governance
Responsible Institute
University of Thessaly, Greece
Lecturer Eftihia Nathanail
Aim The aim of this course is to introduce students with the principle of optimization, and the mathematical models that are built to facilitate decisions, in the context of reaching the optimum taking into account applying restrictions.
Learning outcomes
Identifying variables and relationships that govern in an optimization problem
Develop mathematical formulations that take into account the optimization of the objective function, safeguarding the satisfaction of constraints and limitations
Use computer programs that solve optimization problems.
Prerequisites (if any)
-
Language English
Hours 3
Key words Optimization, mathematical formulations, linear programming technique, integer lineal programming technique, SITATION
Syllabus
The course identifies the components that formulate a problem and the decision variables that need to be estimated for its solution. Firstly, it introduces the student to the network structure of the problem, and the conversion in mathematical terms of the decision variables and the constraints that apply.
It presents the concept of linear programming, and the alternative ways to formulate an optimization problem, depending on the variables to be defined by the analyst.
The linear programming technique is explained in depth and presented through the solution of examples. A more specific category of linear programming, integer linear programming is also studied. In this case, the variables may only obtain integer values, which restricts the number of possible solutions.
Finally, the transportation problem is described and solved, as well as other specific applications that deal with vehicle routing, resource allocation and facility location.
Course topics:
Background
Rules
Basic concepts
Techniques
Software and applications
Suggested literature.
Deliverable D2.3
www.alliance-project.eu 27
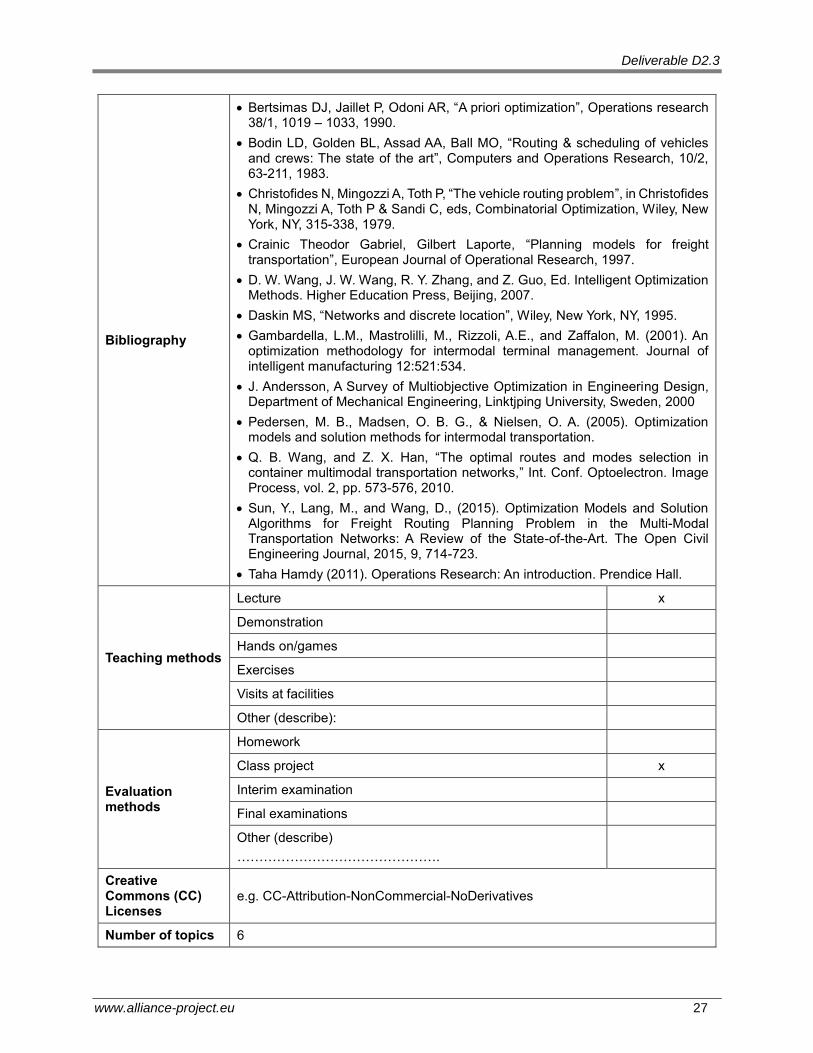
Bibliography
Bertsimas DJ, Jaillet P, Odoni AR, “A priori optimization”, Operations research 38/1, 1019 – 1033, 1990.
Bodin LD, Golden BL, Assad AA, Ball MO, “Routing & scheduling of vehicles and crews: The state of the art”, Computers and Operations Research, 10/2, 63-211, 1983.
Christofides N, Mingozzi A, Toth P, “The vehicle routing problem”, in Christofides N, Mingozzi A, Toth P & Sandi C, eds, Combinatorial Optimization, Wiley, New York, NY, 315-338, 1979.
Crainic Theodor Gabriel, Gilbert Laporte, “Planning models for freight transportation”, European Journal of Operational Research, 1997.
D. W. Wang, J. W. Wang, R. Y. Zhang, and Z. Guo, Ed. Intelligent Optimization Methods. Higher Education Press, Beijing, 2007.
Daskin MS, “Networks and discrete location”, Wiley, New York, NY, 1995.
Gambardella, L.M., Mastrolilli, M., Rizzoli, A.E., and Zaffalon, M. (2001). An optimization methodology for intermodal terminal management. Journal of intelligent manufacturing 12:521:534.
J. Andersson, A Survey of Multiobjective Optimization in Engineering Design, Department of Mechanical Engineering, Linktjping University, Sweden, 2000
Pedersen, M. B., Madsen, O. B. G., & Nielsen, O. A. (2005). Optimization models and solution methods for intermodal transportation.
Q. B. Wang, and Z. X. Han, “The optimal routes and modes selection in container multimodal transportation networks,” Int. Conf. Optoelectron. Image Process, vol. 2, pp. 573-576, 2010.
Sun, Y., Lang, M., and Wang, D., (2015). Optimization Models and Solution Algorithms for Freight Routing Planning Problem in the Multi-Modal Transportation Networks: A Review of the State-of-the-Art. The Open Civil Engineering Journal, 2015, 9, 714-723.
Taha Hamdy (2011). Operations Research: An introduction. Prendice Hall.
Teaching methods
Lecture x
Demonstration
Hands on/games
Exercises
Visits at facilities
Other (describe):
Evaluation methods
Homework
Class project x
Interim examination
Final examinations
Other (describe)
……………………………………….
Creative Commons (CC) Licenses
e.g. CC-Attribution-NonCommercial-NoDerivatives
Number of topics 6

Deliverable D2.3
www.alliance-project.eu 28
Lecture content
1 Background
2 Rules
3 Basic concepts
4 Techniques
5 Software and applications
6 Suggested literature
Deliverable D2.3
www.alliance-project.eu 29
Table 3.7: Course C6
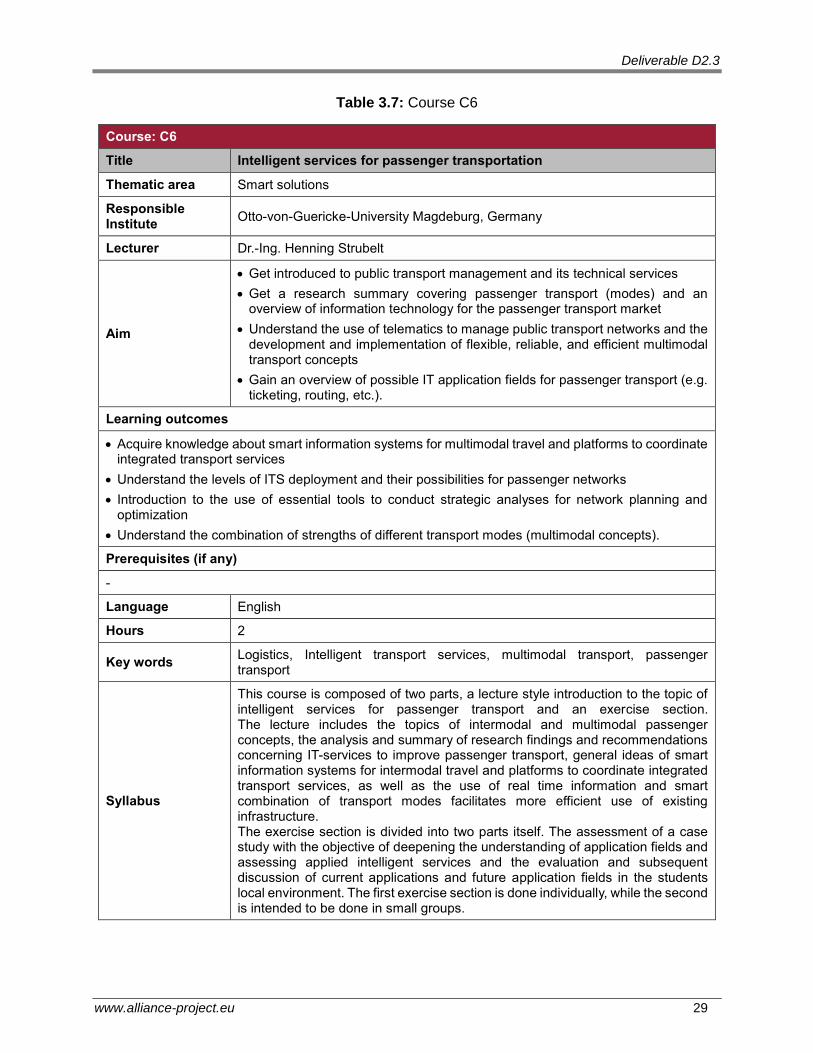
Course: C6
Title Intelligent services for passenger transportation
Thematic area Smart solutions
Responsible Institute
Otto-von-Guericke-University Magdeburg, Germany
Lecturer Dr.-Ing. Henning Strubelt
Aim
Get introduced to public transport management and its technical services
Get a research summary covering passenger transport (modes) and an overview of information technology for the passenger transport market
Understand the use of telematics to manage public transport networks and the development and implementation of flexible, reliable, and efficient multimodal transport concepts
Gain an overview of possible IT application fields for passenger transport (e.g. ticketing, routing, etc.).
Learning outcomes
Acquire knowledge about smart information systems for multimodal travel and platforms to coordinate integrated transport services
Understand the levels of ITS deployment and their possibilities for passenger networks
Introduction to the use of essential tools to conduct strategic analyses for network planning and optimization
Understand the combination of strengths of different transport modes (multimodal concepts).
Prerequisites (if any)
-
Language English
Hours 2
Key words Logistics, Intelligent transport services, multimodal transport, passenger transport
Syllabus
This course is composed of two parts, a lecture style introduction to the topic of intelligent services for passenger transport and an exercise section. The lecture includes the topics of intermodal and multimodal passenger concepts, the analysis and summary of research findings and recommendations concerning IT-services to improve passenger transport, general ideas of smart information systems for intermodal travel and platforms to coordinate integrated transport services, as well as the use of real time information and smart combination of transport modes facilitates more efficient use of existing infrastructure. The exercise section is divided into two parts itself. The assessment of a case study with the objective of deepening the understanding of application fields and assessing applied intelligent services and the evaluation and subsequent discussion of current applications and future application fields in the students local environment. The first exercise section is done individually, while the second is intended to be done in small groups.
Deliverable D2.3
www.alliance-project.eu 30
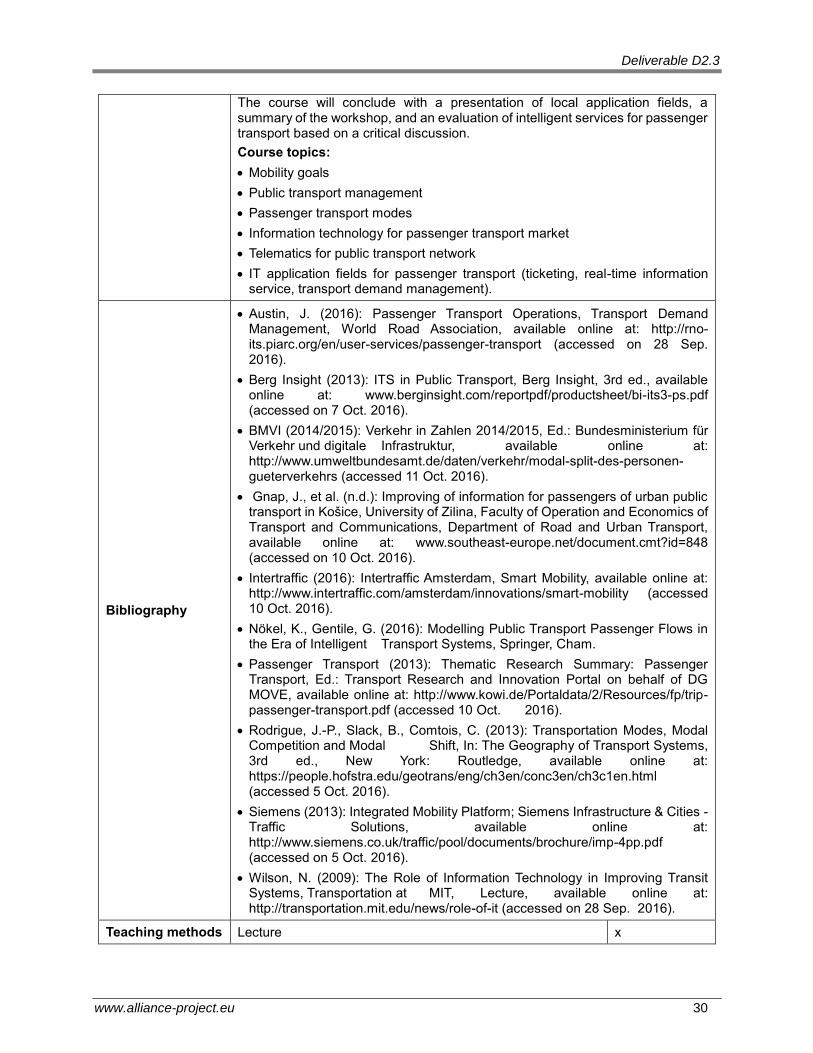
The course will conclude with a presentation of local application fields, a summary of the workshop, and an evaluation of intelligent services for passenger transport based on a critical discussion.
Course topics:
Mobility goals
Public transport management
Passenger transport modes
Information technology for passenger transport market
Telematics for public transport network
IT application fields for passenger transport (ticketing, real-time information service, transport demand management).
Bibliography
Austin, J. (2016): Passenger Transport Operations, Transport Demand Management, World Road Association, available online at: http://rno-its.piarc.org/en/user-services/passenger-transport (accessed on 28 Sep. 2016).
Berg Insight (2013): ITS in Public Transport, Berg Insight, 3rd ed., available online at: www.berginsight.com/reportpdf/productsheet/bi-its3-ps.pdf (accessed on 7 Oct. 2016).
BMVI (2014/2015): Verkehr in Zahlen 2014/2015, Ed.: Bundesministerium für Verkehr und digitale Infrastruktur, available online at: http://www.umweltbundesamt.de/daten/verkehr/modal-split-des-personen-gueterverkehrs (accessed 11 Oct. 2016).
Gnap, J., et al. (n.d.): Improving of information for passengers of urban public transport in Košice, University of Zilina, Faculty of Operation and Economics of Transport and Communications, Department of Road and Urban Transport, available online at: www.southeast-europe.net/document.cmt?id=848 (accessed on 10 Oct. 2016).
Intertraffic (2016): Intertraffic Amsterdam, Smart Mobility, available online at: http://www.intertraffic.com/amsterdam/innovations/smart-mobility (accessed 10 Oct. 2016).
Nökel, K., Gentile, G. (2016): Modelling Public Transport Passenger Flows in the Era of Intelligent Transport Systems, Springer, Cham.
Passenger Transport (2013): Thematic Research Summary: Passenger Transport, Ed.: Transport Research and Innovation Portal on behalf of DG MOVE, available online at: http://www.kowi.de/Portaldata/2/Resources/fp/trip-passenger-transport.pdf (accessed 10 Oct. 2016).
Rodrigue, J.-P., Slack, B., Comtois, C. (2013): Transportation Modes, Modal Competition and Modal Shift, In: The Geography of Transport Systems, 3rd ed., New York: Routledge, available online at: https://people.hofstra.edu/geotrans/eng/ch3en/conc3en/ch3c1en.html (accessed 5 Oct. 2016).
Siemens (2013): Integrated Mobility Platform; Siemens Infrastructure & Cities - Traffic Solutions, available online at: http://www.siemens.co.uk/traffic/pool/documents/brochure/imp-4pp.pdf (accessed on 5 Oct. 2016).
Wilson, N. (2009): The Role of Information Technology in Improving Transit Systems, Transportation at MIT, Lecture, available online at: http://transportation.mit.edu/news/role-of-it (accessed on 28 Sep. 2016).
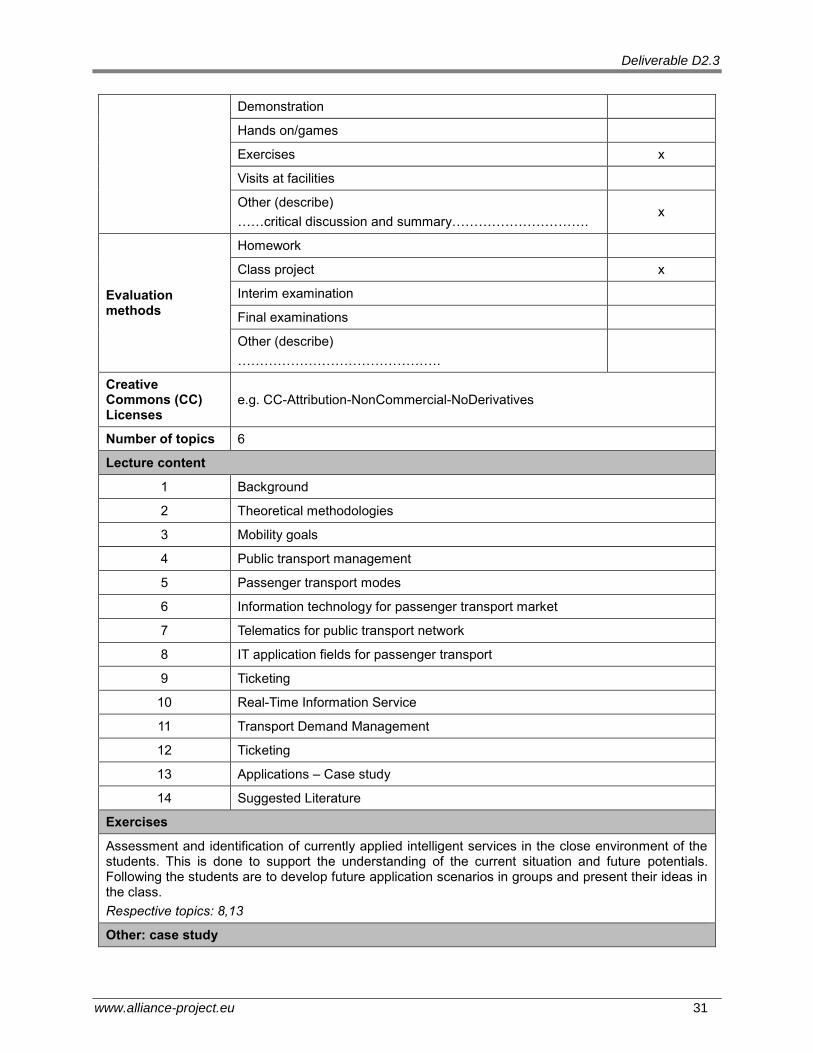
Teaching methods Lecture x
Deliverable D2.3
www.alliance-project.eu 31
Demonstration
Hands on/games
Exercises x
Visits at facilities
Other (describe)
……critical discussion and summary…………………………. x
Evaluation methods
Homework
Class project x
Interim examination
Final examinations
Other (describe)
……………………………………….
Creative Commons (CC) Licenses
e.g. CC-Attribution-NonCommercial-NoDerivatives
Number of topics 6
Lecture content
1 Background
2 Theoretical methodologies
3 Mobility goals
4 Public transport management
5 Passenger transport modes
6 Information technology for passenger transport market
7 Telematics for public transport network
8 IT application fields for passenger transport
9 Ticketing
10 Real-Time Information Service
11 Transport Demand Management
12 Ticketing
13 Applications – Case study
14 Suggested Literature
Exercises
Assessment and identification of currently applied intelligent services in the close environment of the students. This is done to support the understanding of the current situation and future potentials. Following the students are to develop future application scenarios in groups and present their ideas in the class.
Respective topics: 8,13
Other: case study

Deliverable D2.3
www.alliance-project.eu 32
A case study is used to assess current application fields of intelligent services for passenger transport and allows for a deepening of the understanding of application fields.
Respective topics: 9,12
Other: conclusion of the workshop
Concluding the main topics and findings are recapitulated. A critical discussion, involving all participants, of potentials and risks of intelligent services is initiated to conclude the lecture.
Deliverable D2.3
www.alliance-project.eu 33
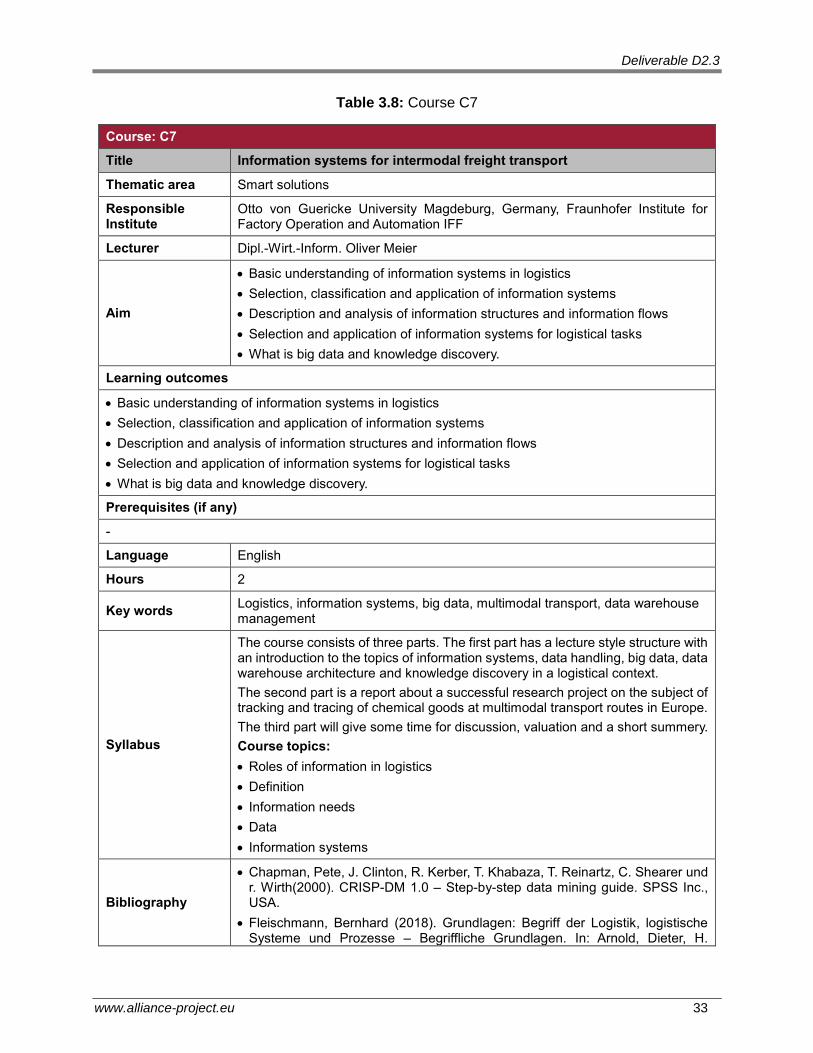
Table 3.8: Course C7
Course: C7
Title Information systems for intermodal freight transport
Thematic area Smart solutions
Responsible Institute
Otto von Guericke University Magdeburg, Germany, Fraunhofer Institute for Factory Operation and Automation IFF
Lecturer Dipl.-Wirt.-Inform. Oliver Meier
Aim
Basic understanding of information systems in logistics
Selection, classification and application of information systems
Description and analysis of information structures and information flows
Selection and application of information systems for logistical tasks
What is big data and knowledge discovery.
Learning outcomes
Basic understanding of information systems in logistics
Selection, classification and application of information systems
Description and analysis of information structures and information flows
Selection and application of information systems for logistical tasks
What is big data and knowledge discovery.
Prerequisites (if any)
-
Language English
Hours 2
Key words Logistics, information systems, big data, multimodal transport, data warehouse management
Syllabus
The course consists of three parts. The first part has a lecture style structure with an introduction to the topics of information systems, data handling, big data, data warehouse architecture and knowledge discovery in a logistical context.
The second part is a report about a successful research project on the subject of tracking and tracing of chemical goods at multimodal transport routes in Europe.
The third part will give some time for discussion, valuation and a short summery.
Course topics:
Roles of information in logistics
Definition
Information needs
Data
Information systems
Bibliography
Chapman, Pete, J. Clinton, R. Kerber, T. Khabaza, T. Reinartz, C. Shearer und r. Wirth(2000). CRISP-DM 1.0 – Step-by-step data mining guide. SPSS Inc., USA.
Fleischmann, Bernhard (2018). Grundlagen: Begriff der Logistik, logistische Systeme und Prozesse – Begriffliche Grundlagen. In: Arnold, Dieter, H.

Deliverable D2.3
www.alliance-project.eu 34
Isermann, A. Kuhn, H. Tempelmeier and K. Furmans, Hrsg.: Handbuch Logistik, Kap. A 1.1, S. 3-12. Springer Verlag, Berlin, 3. Aufl.
Kagermann, Henning, W. Wahlster und J. Helbig (2013). Deutschlands Zukunft als Produktionsstandort sichern – Umsetzungsempfehlungen für das zukunftsprojekt Industrie 4.0 – Abschlussbericht des Arbeitskreises Industrie 4.0. acatech – Deutsche Akademie der Technikwissenschaften e.V., Promotorengruppe Kommunikation der Forschungsunion Wirtschaft – Wissenschaft, Frankfurt am Main.
Koeppen, Veit, G. Saake, K.-U. Sattler (2014). Data Warehouse Technologien. Mitp, Verlagsgruppe Hüthig Jehle Rehm GmbH, 2. Aufl.
Partsch, Helmuth (2010). Requirements-Engineering systematisch. Springer-Verlag, Berlin Heidelberg, 2. Aufl.
Schenk, Michael, A. Krampe, O. Poenicke, K. Richter, H. Seidel (2012).
Informationslogistik. In: Krampe, Horst, H.-J. Lucke und M. Schenk, Hrsg.: Grundlagen der Logistik – Theorie und Prxis logistischer Systeme, Kap. 4, S. 97-129. HUSS-Verlag GmbH, München, 4. Aufl.
Straube, Frank (2004). E-Logistik – Ganzheitliches Logistikmanagement. Springer-Verlag, Berlin Heidelberg.
Turner, Vernon, D. Reinsel, J. F. Gantz und S. Minton (2014). White Paper: The Digital Universe of Opportunities: Rich Data and the Increasing Value of the Internet of Things. International Data Corporation (IDC), Framingham, USA.
Vieweg, Iris, C. Werner, K.-P. Wagner, T. Hüttle und D. Backin (2012). Einführung Wirtschaftsinformatik – IT-Grundwissen für Studium und Praxis. Gabler Verlag | Springer Fachmedien, Wiesbaden.
Weber, Rainer (2012). Technologie von Unternehmenssoftware. Springer-Verlag, Berlin Heidelberg.
Teaching methods
Lecture x
Demonstration
Hands on/games
Exercises
Visits at facilities
Other (describe)
………discussion, valuation and summary………………. x
Evaluation methods
Homework
Class project x
Interim examination
Final examinations
Other (describe)
Creative Commons (CC) Licenses
e.g. CC-Attribution-NonCommercial-NoDerivatives
Number of topics 5
Lecture content
1 Contents
Deliverable D2.3
www.alliance-project.eu 35
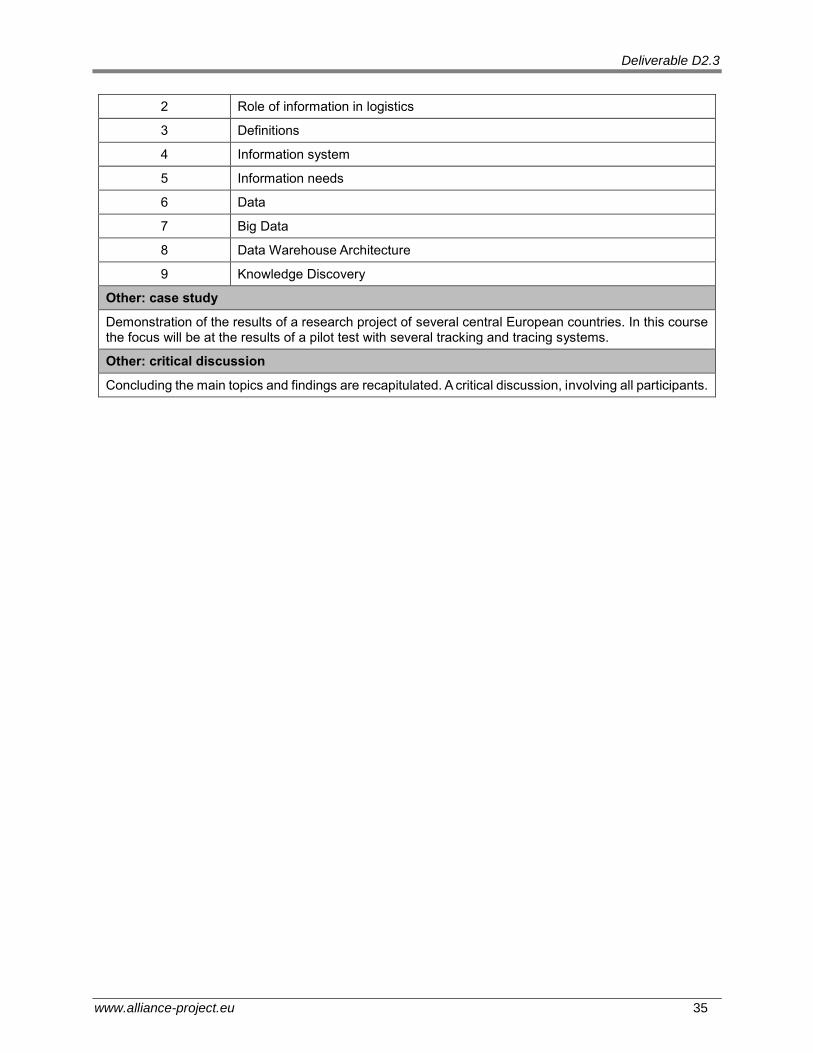
2 Role of information in logistics
3 Definitions
4 Information system
5 Information needs
6 Data
7 Big Data
8 Data Warehouse Architecture
9 Knowledge Discovery
Other: case study
Demonstration of the results of a research project of several central European countries. In this course the focus will be at the results of a pilot test with several tracking and tracing systems.
Other: critical discussion
Concluding the main topics and findings are recapitulated. A critical discussion, involving all participants.
Deliverable D2.3
www.alliance-project.eu 36
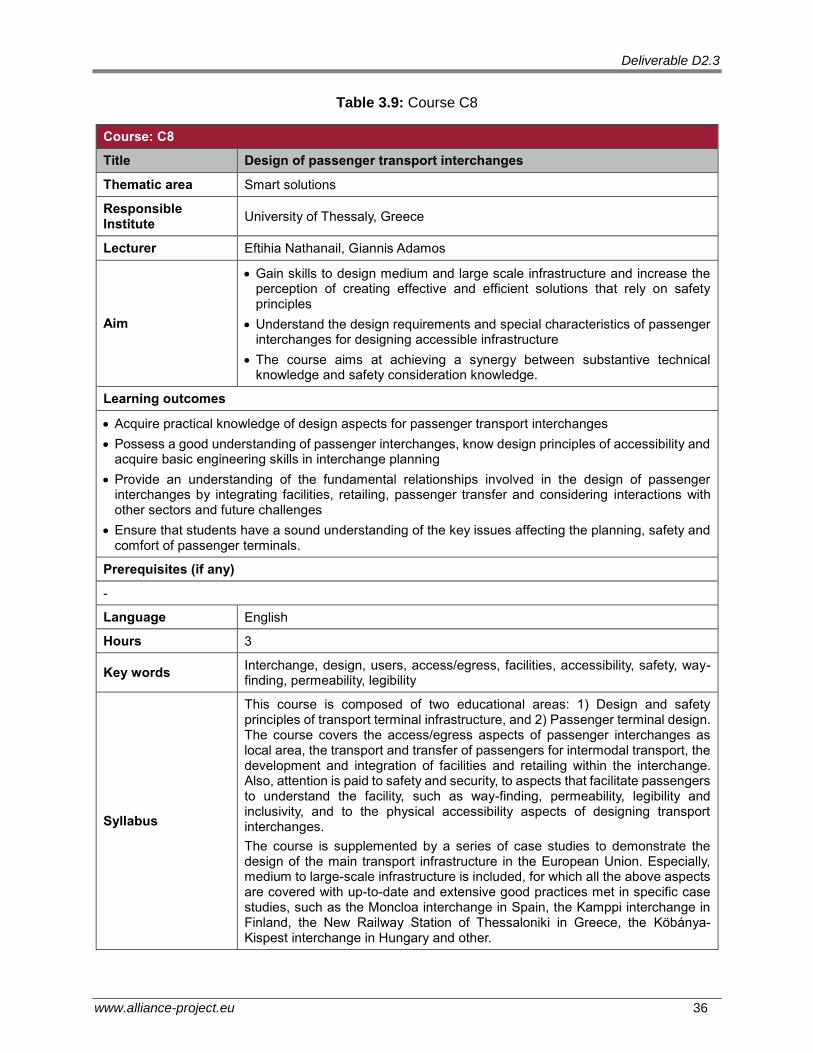
Table 3.9: Course C8
Course: C8
Title Design of passenger transport interchanges
Thematic area Smart solutions
Responsible Institute
University of Thessaly, Greece
Lecturer Eftihia Nathanail, Giannis Adamos
Aim
Gain skills to design medium and large scale infrastructure and increase the perception of creating effective and efficient solutions that rely on safety principles
Understand the design requirements and special characteristics of passenger interchanges for designing accessible infrastructure
The course aims at achieving a synergy between substantive technical knowledge and safety consideration knowledge.
Learning outcomes
Acquire practical knowledge of design aspects for passenger transport interchanges
Possess a good understanding of passenger interchanges, know design principles of accessibility and acquire basic engineering skills in interchange planning
Provide an understanding of the fundamental relationships involved in the design of passenger interchanges by integrating facilities, retailing, passenger transfer and considering interactions with other sectors and future challenges
Ensure that students have a sound understanding of the key issues affecting the planning, safety and comfort of passenger terminals.
Prerequisites (if any)
-
Language English
Hours 3
Key words Interchange, design, users, access/egress, facilities, accessibility, safety, way-finding, permeability, legibility
Syllabus
This course is composed of two educational areas: 1) Design and safety principles of transport terminal infrastructure, and 2) Passenger terminal design. The course covers the access/egress aspects of passenger interchanges as local area, the transport and transfer of passengers for intermodal transport, the development and integration of facilities and retailing within the interchange. Also, attention is paid to safety and security, to aspects that facilitate passengers to understand the facility, such as way-finding, permeability, legibility and inclusivity, and to the physical accessibility aspects of designing transport interchanges.
The course is supplemented by a series of case studies to demonstrate the design of the main transport infrastructure in the European Union. Especially, medium to large-scale infrastructure is included, for which all the above aspects are covered with up-to-date and extensive good practices met in specific case studies, such as the Moncloa interchange in Spain, the Kamppi interchange in Finland, the New Railway Station of Thessaloniki in Greece, the Köbánya-Kispest interchange in Hungary and other.
Deliverable D2.3
www.alliance-project.eu 37
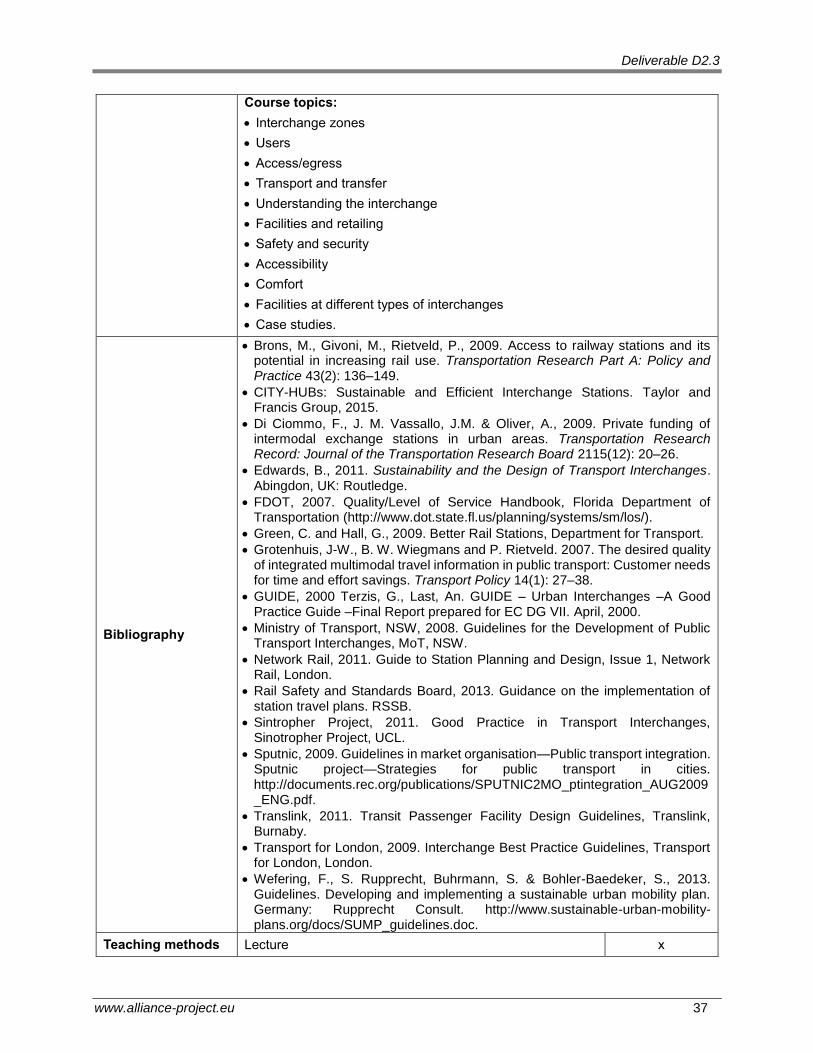
Course topics:
Interchange zones
Users
Access/egress
Transport and transfer
Understanding the interchange
Facilities and retailing
Safety and security
Accessibility
Comfort
Facilities at different types of interchanges
Case studies.
Bibliography
Brons, M., Givoni, M., Rietveld, P., 2009. Access to railway stations and its potential in increasing rail use. Transportation Research Part A: Policy and Practice 43(2): 136–149.
CITY-HUBs: Sustainable and Efficient Interchange Stations. Taylor and Francis Group, 2015.
Di Ciommo, F., J. M. Vassallo, J.M. & Oliver, A., 2009. Private funding of intermodal exchange stations in urban areas. Transportation Research Record: Journal of the Transportation Research Board 2115(12): 20–26.
Edwards, B., 2011. Sustainability and the Design of Transport Interchanges. Abingdon, UK: Routledge.
FDOT, 2007. Quality/Level of Service Handbook, Florida Department of Transportation (http://www.dot.state.fl.us/planning/systems/sm/los/).
Green, C. and Hall, G., 2009. Better Rail Stations, Department for Transport.
Grotenhuis, J-W., B. W. Wiegmans and P. Rietveld. 2007. The desired quality of integrated multimodal travel information in public transport: Customer needs for time and effort savings. Transport Policy 14(1): 27–38.
GUIDE, 2000 Terzis, G., Last, An. GUIDE – Urban Interchanges –A Good Practice Guide –Final Report prepared for EC DG VII. April, 2000.
Ministry of Transport, NSW, 2008. Guidelines for the Development of Public Transport Interchanges, MoT, NSW.
Network Rail, 2011. Guide to Station Planning and Design, Issue 1, Network Rail, London.
Rail Safety and Standards Board, 2013. Guidance on the implementation of station travel plans. RSSB.
Sintropher Project, 2011. Good Practice in Transport Interchanges, Sinotropher Project, UCL.
Sputnic, 2009. Guidelines in market organisation—Public transport integration. Sputnic project—Strategies for public transport in cities. http://documents.rec.org/publications/SPUTNIC2MO_ptintegration_AUG2009_ENG.pdf.
Translink, 2011. Transit Passenger Facility Design Guidelines, Translink, Burnaby.
Transport for London, 2009. Interchange Best Practice Guidelines, Transport for London, London.
Wefering, F., S. Rupprecht, Buhrmann, S. & Bohler-Baedeker, S., 2013. Guidelines. Developing and implementing a sustainable urban mobility plan. Germany: Rupprecht Consult. http://www.sustainable-urban-mobility-plans.org/docs/SUMP_guidelines.doc.
Teaching methods Lecture x

Deliverable D2.3
www.alliance-project.eu 38
Demonstration
Hands on/games
Exercises
Visits at facilities x
Other (describe): Case studies x
Evaluation methods
Homework
Class project x
Interim examination
Final examinations
Other (describe) ……………………………………….
Creative Commons (CC) Licenses
CC-Attribution-NonCommercial-NoDerivatives
Number of topics 11
Lecture content
1 Background
2 Basic concepts
3 Interchange zones
4 Users
5 Access/egress
6 Transport and transfer
7 Understanding the interchange
8 Facilities and retailing
9 Safety and security
10 Accessibility
11 Comfort
12 Facilities at different types of interchanges
13 Case studies
14 Suggested literature
Visit at facilities
Students will have the opportunity to visit a passenger or freight interchange in Riga, in order to see and understand how an urban interchange is designed, managed and operated, under real conditions. A shortlist of potential facilities includes: Riga International Coach Terminal, Intermodal transport interchange at Alfa shopping center, Riga international airport and Latvian post sorting complex.
Other: case study
In this course, a number of case studies is used as part of the teaching methods. Good practices in several topics, i.e. accessibility, safety and security, access/egress, comfort, facilities and retailing are presented, while the findings of a number of surveys conducted in specific European interchanges are also introduced.
Deliverable D2.3
www.alliance-project.eu 39
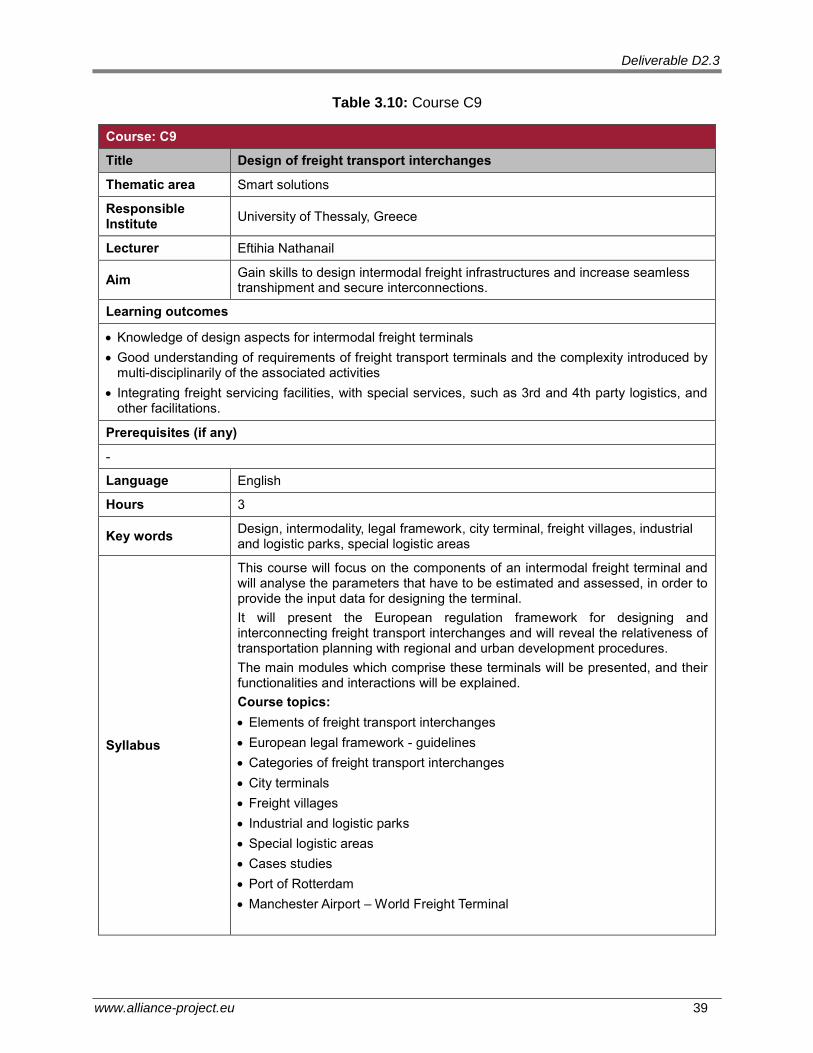
Table 3.10: Course C9
Course: C9
Title Design of freight transport interchanges
Thematic area Smart solutions
Responsible Institute
University of Thessaly, Greece
Lecturer Eftihia Nathanail
Aim Gain skills to design intermodal freight infrastructures and increase seamless transhipment and secure interconnections.
Learning outcomes
Knowledge of design aspects for intermodal freight terminals
Good understanding of requirements of freight transport terminals and the complexity introduced by multi-disciplinarily of the associated activities
Integrating freight servicing facilities, with special services, such as 3rd and 4th party logistics, and other facilitations.
Prerequisites (if any)
-
Language English
Hours 3
Key words Design, intermodality, legal framework, city terminal, freight villages, industrial and logistic parks, special logistic areas
Syllabus
This course will focus on the components of an intermodal freight terminal and will analyse the parameters that have to be estimated and assessed, in order to provide the input data for designing the terminal.
It will present the European regulation framework for designing and interconnecting freight transport interchanges and will reveal the relativeness of transportation planning with regional and urban development procedures.
The main modules which comprise these terminals will be presented, and their functionalities and interactions will be explained.
Course topics:
Elements of freight transport interchanges
European legal framework - guidelines
Categories of freight transport interchanges
City terminals
Freight villages
Industrial and logistic parks
Special logistic areas
Cases studies
Port of Rotterdam
Manchester Airport – World Freight Terminal
Deliverable D2.3
www.alliance-project.eu 40
Bibliography
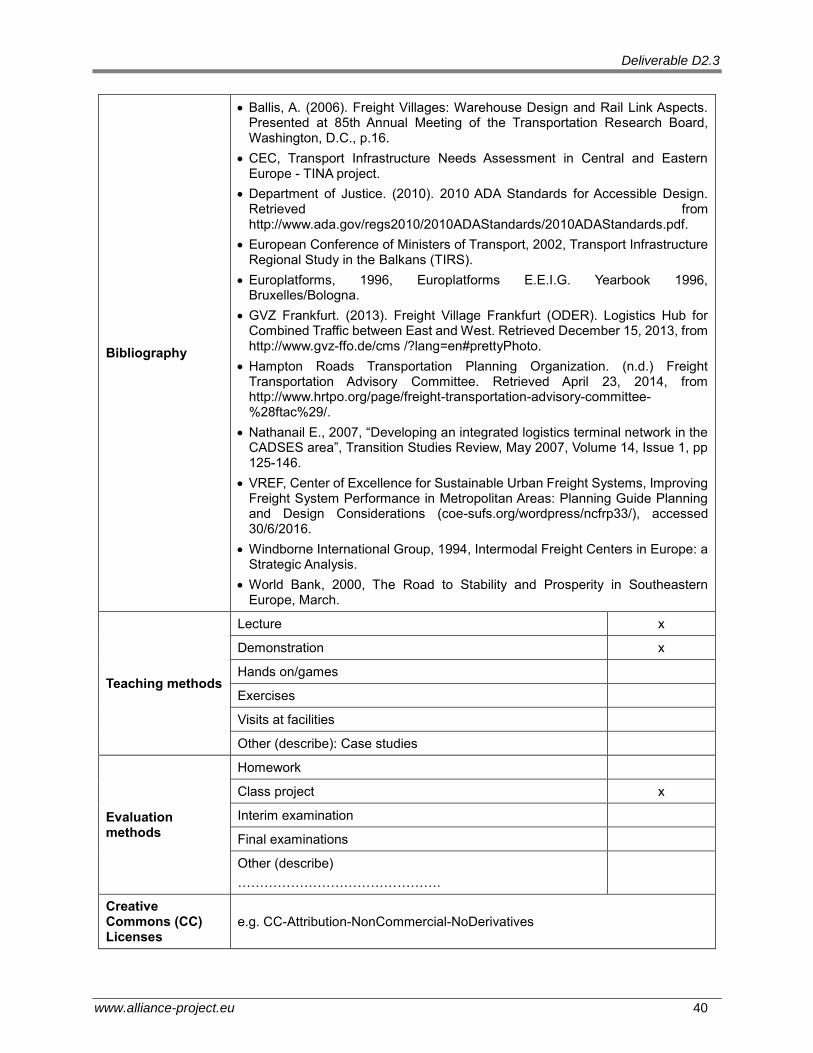
Ballis, A. (2006). Freight Villages: Warehouse Design and Rail Link Aspects. Presented at 85th Annual Meeting of the Transportation Research Board, Washington, D.C., p.16.
CEC, Transport Infrastructure Needs Assessment in Central and Eastern Europe - TINA project.
Department of Justice. (2010). 2010 ADA Standards for Accessible Design. Retrieved from http://www.ada.gov/regs2010/2010ADAStandards/2010ADAStandards.pdf.
European Conference of Ministers of Transport, 2002, Transport Infrastructure Regional Study in the Balkans (TIRS).
Europlatforms, 1996, Europlatforms E.E.I.G. Yearbook 1996, Bruxelles/Bologna.
GVZ Frankfurt. (2013). Freight Village Frankfurt (ODER). Logistics Hub for Combined Traffic between East and West. Retrieved December 15, 2013, from http://www.gvz-ffo.de/cms /?lang=en#prettyPhoto.
Hampton Roads Transportation Planning Organization. (n.d.) Freight Transportation Advisory Committee. Retrieved April 23, 2014, from http://www.hrtpo.org/page/freight-transportation-advisory-committee-%28ftac%29/.
Nathanail E., 2007, “Developing an integrated logistics terminal network in the CADSES area”, Transition Studies Review, May 2007, Volume 14, Issue 1, pp 125-146.
VREF, Center of Excellence for Sustainable Urban Freight Systems, Improving Freight System Performance in Metropolitan Areas: Planning Guide Planning and Design Considerations (coe-sufs.org/wordpress/ncfrp33/), accessed 30/6/2016.
Windborne International Group, 1994, Intermodal Freight Centers in Europe: a Strategic Analysis.
World Bank, 2000, The Road to Stability and Prosperity in Southeastern Europe, March.
Teaching methods
Lecture x
Demonstration x
Hands on/games
Exercises
Visits at facilities
Other (describe): Case studies
Evaluation methods
Homework
Class project x
Interim examination
Final examinations
Other (describe)
……………………………………….
Creative Commons (CC) Licenses
e.g. CC-Attribution-NonCommercial-NoDerivatives

Deliverable D2.3
www.alliance-project.eu 41
Number of topics 10
Lecture content
1 Introduction
2 Elements of Freight Transport Interchanges
3 European legal framework - guidelines
4 Categories of freight transport interchanges
5 City terminals
6 Freight villages
7 Industrial and logistic parks
8 Special logistic areas
9 Cases studies
10 Port of Rotterdam
11 Manchester Airport – World Freight Terminal
12 Suggested literature
Demonstration
Demonstration of videos for the case studies of the Port of Rotterdam and the Manchester Airport as freight transport interchanges.
Deliverable D2.3
www.alliance-project.eu 42
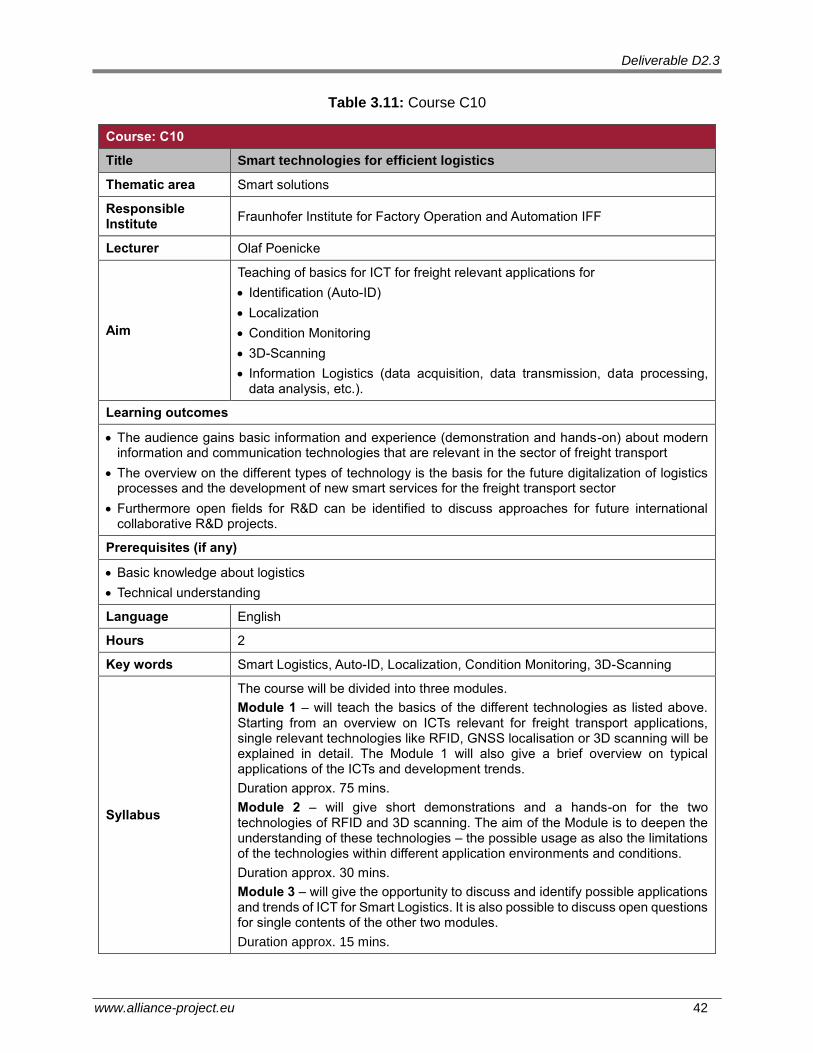
Table 3.11: Course C10
Course: C10
Title Smart technologies for efficient logistics
Thematic area Smart solutions
Responsible Institute
Fraunhofer Institute for Factory Operation and Automation IFF
Lecturer Olaf Poenicke
Aim
Teaching of basics for ICT for freight relevant applications for
Identification (Auto-ID)
Localization
Condition Monitoring
3D-Scanning
Information Logistics (data acquisition, data transmission, data processing, data analysis, etc.).
Learning outcomes
The audience gains basic information and experience (demonstration and hands-on) about modern information and communication technologies that are relevant in the sector of freight transport
The overview on the different types of technology is the basis for the future digitalization of logistics processes and the development of new smart services for the freight transport sector
Furthermore open fields for R&D can be identified to discuss approaches for future international collaborative R&D projects.
Prerequisites (if any)
Basic knowledge about logistics
Technical understanding
Language English
Hours 2
Key words Smart Logistics, Auto-ID, Localization, Condition Monitoring, 3D-Scanning
Syllabus
The course will be divided into three modules.
Module 1 – will teach the basics of the different technologies as listed above. Starting from an overview on ICTs relevant for freight transport applications, single relevant technologies like RFID, GNSS localisation or 3D scanning will be explained in detail. The Module 1 will also give a brief overview on typical applications of the ICTs and development trends.
Duration approx. 75 mins.
Module 2 – will give short demonstrations and a hands-on for the two technologies of RFID and 3D scanning. The aim of the Module is to deepen the understanding of these technologies – the possible usage as also the limitations of the technologies within different application environments and conditions.
Duration approx. 30 mins.
Module 3 – will give the opportunity to discuss and identify possible applications and trends of ICT for Smart Logistics. It is also possible to discuss open questions for single contents of the other two modules.
Duration approx. 15 mins.
Deliverable D2.3
www.alliance-project.eu 43
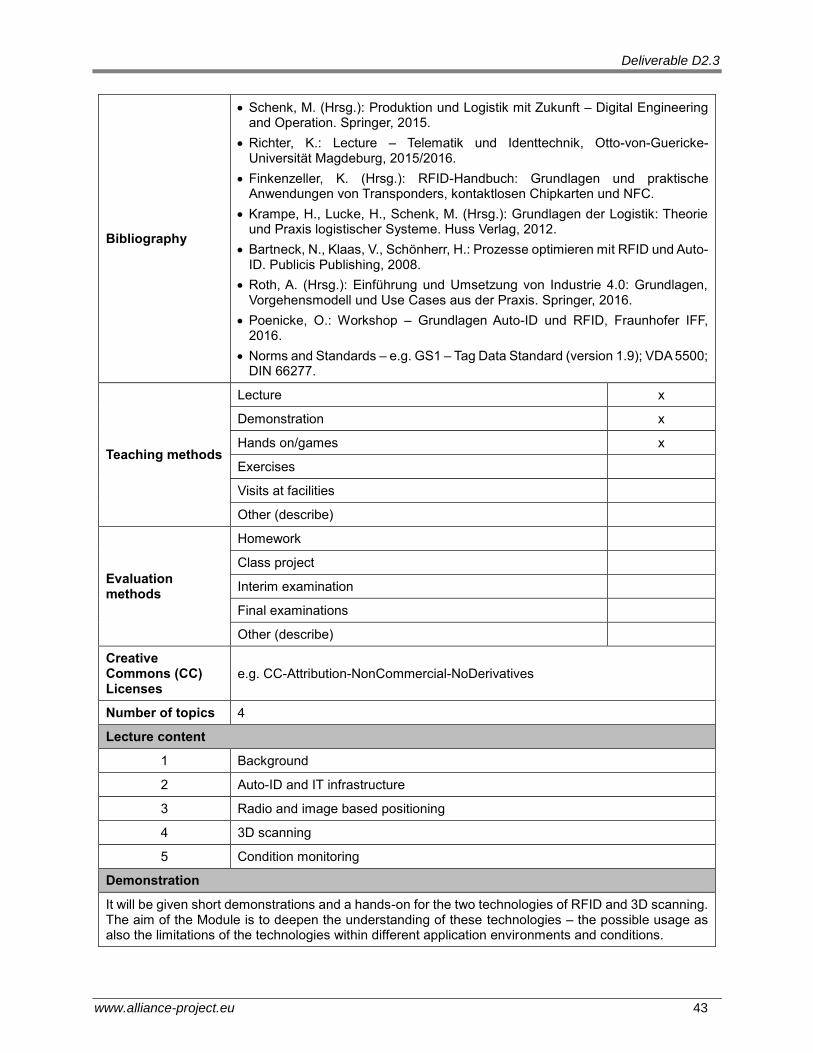
Bibliography
Schenk, M. (Hrsg.): Produktion und Logistik mit Zukunft – Digital Engineering and Operation. Springer, 2015.
Richter, K.: Lecture – Telematik und Identtechnik, Otto-von-Guericke-Universität Magdeburg, 2015/2016.
Finkenzeller, K. (Hrsg.): RFID-Handbuch: Grundlagen und praktische Anwendungen von Transponders, kontaktlosen Chipkarten und NFC.
Krampe, H., Lucke, H., Schenk, M. (Hrsg.): Grundlagen der Logistik: Theorie und Praxis logistischer Systeme. Huss Verlag, 2012.
Bartneck, N., Klaas, V., Schönherr, H.: Prozesse optimieren mit RFID und Auto-ID. Publicis Publishing, 2008.
Roth, A. (Hrsg.): Einführung und Umsetzung von Industrie 4.0: Grundlagen, Vorgehensmodell und Use Cases aus der Praxis. Springer, 2016.
Poenicke, O.: Workshop – Grundlagen Auto-ID und RFID, Fraunhofer IFF, 2016.
Norms and Standards – e.g. GS1 – Tag Data Standard (version 1.9); VDA 5500; DIN 66277.
Teaching methods
Lecture x
Demonstration x
Hands on/games x
Exercises
Visits at facilities
Other (describe)
Evaluation methods
Homework
Class project
Interim examination
Final examinations
Other (describe)
Creative Commons (CC) Licenses
e.g. CC-Attribution-NonCommercial-NoDerivatives
Number of topics 4
Lecture content
1 Background
2 Auto-ID and IT infrastructure
3 Radio and image based positioning
4 3D scanning
5 Condition monitoring
Demonstration
It will be given short demonstrations and a hands-on for the two technologies of RFID and 3D scanning. The aim of the Module is to deepen the understanding of these technologies – the possible usage as also the limitations of the technologies within different application environments and conditions.

Deliverable D2.3
www.alliance-project.eu 44
Hands on games
It will be given short demonstrations and a hands-on for the two technologies of RFID and 3D scanning. The aim of the Module is to deepen the understanding of these technologies – the possible usage as also the limitations of the technologies within different application environments and conditions.
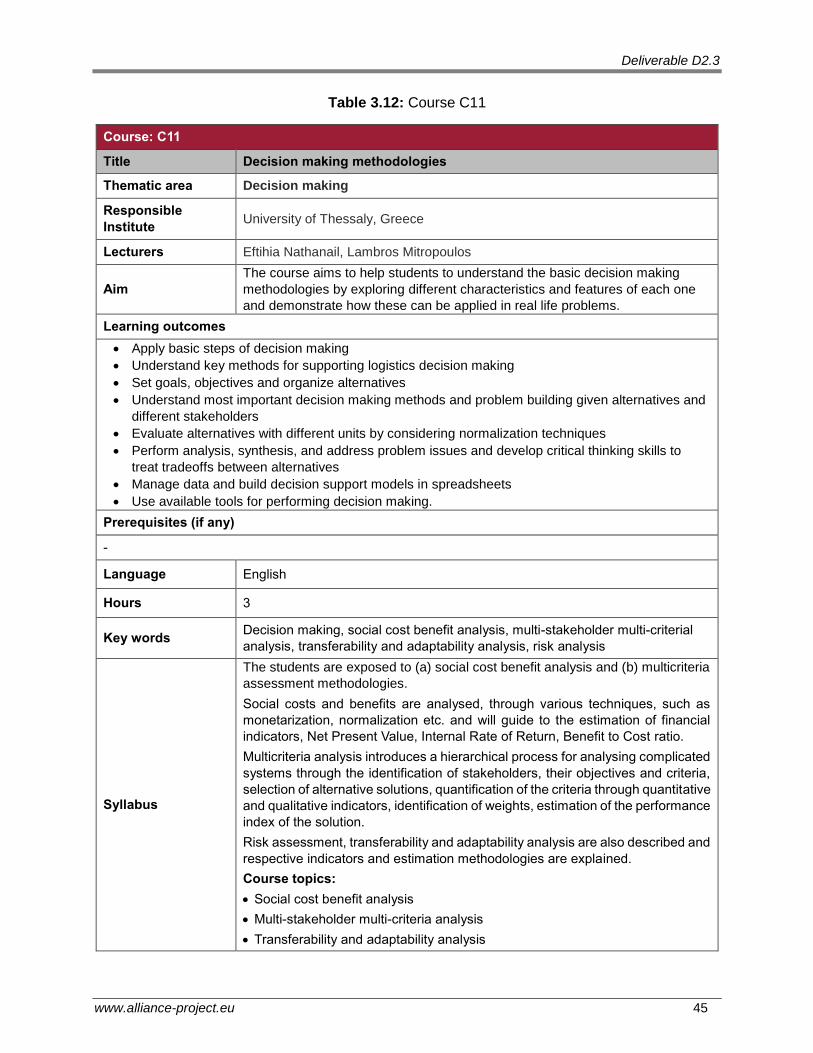
Deliverable D2.3
www.alliance-project.eu 45
Table 3.12: Course C11
Course: C11
Title Decision making methodologies
Thematic area Decision making
Responsible
Institute University of Thessaly, Greece
Lecturers Eftihia Nathanail, Lambros Mitropoulos
Aim
The course aims to help students to understand the basic decision making
methodologies by exploring different characteristics and features of each one
and demonstrate how these can be applied in real life problems.
Learning outcomes
Apply basic steps of decision making
Understand key methods for supporting logistics decision making
Set goals, objectives and organize alternatives
Understand most important decision making methods and problem building given alternatives and
different stakeholders
Evaluate alternatives with different units by considering normalization techniques
Perform analysis, synthesis, and address problem issues and develop critical thinking skills to
treat tradeoffs between alternatives
Manage data and build decision support models in spreadsheets
Use available tools for performing decision making.
Prerequisites (if any)
-
Language English
Hours 3
Key words Decision making, social cost benefit analysis, multi-stakeholder multi-criterial
analysis, transferability and adaptability analysis, risk analysis
Syllabus
The students are exposed to (a) social cost benefit analysis and (b) multicriteria
assessment methodologies.
Social costs and benefits are analysed, through various techniques, such as
monetarization, normalization etc. and will guide to the estimation of financial
indicators, Net Present Value, Internal Rate of Return, Benefit to Cost ratio.
Multicriteria analysis introduces a hierarchical process for analysing complicated
systems through the identification of stakeholders, their objectives and criteria,
selection of alternative solutions, quantification of the criteria through quantitative
and qualitative indicators, identification of weights, estimation of the performance
index of the solution.
Risk assessment, transferability and adaptability analysis are also described and
respective indicators and estimation methodologies are explained.
Course topics:
Social cost benefit analysis
Multi-stakeholder multi-criteria analysis
Transferability and adaptability analysis
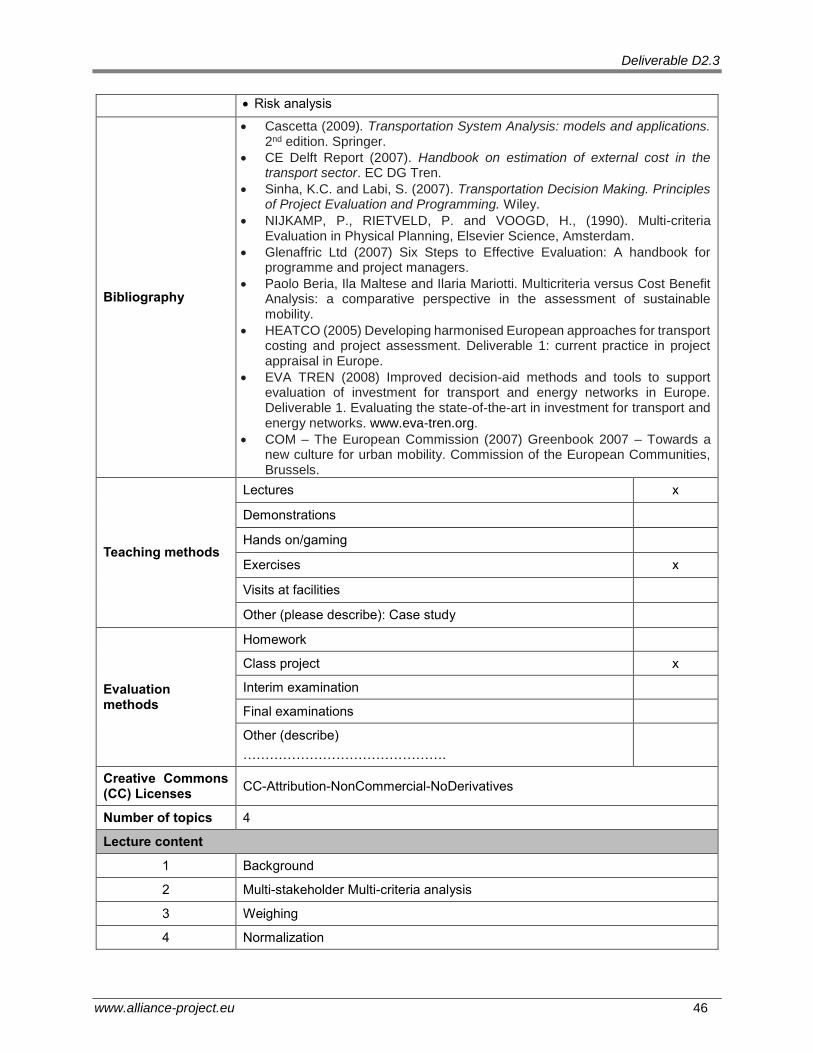
Deliverable D2.3
www.alliance-project.eu 46
Risk analysis
Bibliography
Cascetta (2009). Transportation System Analysis: models and applications. 2nd edition. Springer.
CE Delft Report (2007). Handbook on estimation of external cost in the transport sector. EC DG Tren.
Sinha, K.C. and Labi, S. (2007). Transportation Decision Making. Principles of Project Evaluation and Programming. Wiley.
NIJKAMP, P., RIETVELD, P. and VOOGD, H., (1990). Multi-criteria Evaluation in Physical Planning, Elsevier Science, Amsterdam.
Glenaffric Ltd (2007) Six Steps to Effective Evaluation: A handbook for programme and project managers.
Paolo Beria, Ila Maltese and Ilaria Mariotti. Multicriteria versus Cost Benefit Analysis: a comparative perspective in the assessment of sustainable mobility.
HEATCO (2005) Developing harmonised European approaches for transport costing and project assessment. Deliverable 1: current practice in project appraisal in Europe.
EVA TREN (2008) Improved decision-aid methods and tools to support evaluation of investment for transport and energy networks in Europe. Deliverable 1. Evaluating the state-of-the-art in investment for transport and energy networks. www.eva-tren.org.
COM – The European Commission (2007) Greenbook 2007 – Towards a new culture for urban mobility. Commission of the European Communities, Brussels.
Teaching methods
Lectures x
Demonstrations
Hands on/gaming
Exercises x
Visits at facilities
Other (please describe): Case study
Evaluation methods
Homework
Class project x
Interim examination
Final examinations
Other (describe)
……………………………………….
Creative Commons (CC) Licenses
CC-Attribution-NonCommercial-NoDerivatives
Number of topics 4
Lecture content
1 Background
2 Multi-stakeholder Multi-criteria analysis
3 Weighing
4 Normalization
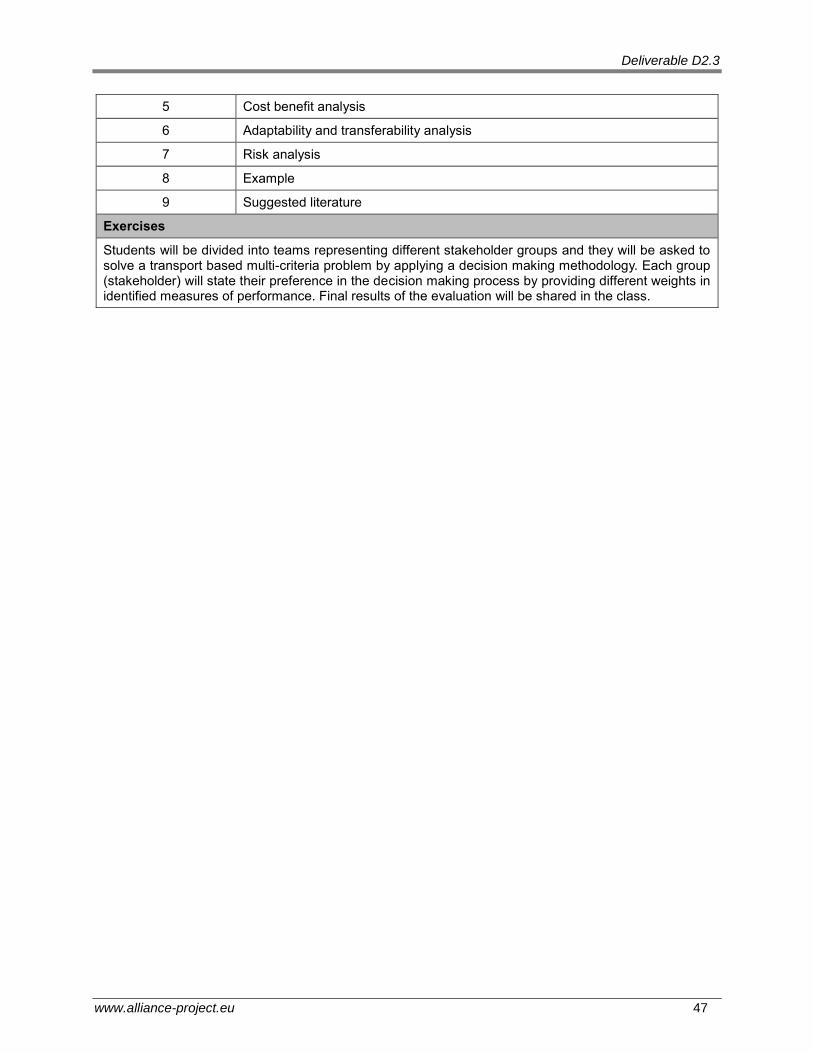
Deliverable D2.3
www.alliance-project.eu 47
5 Cost benefit analysis
6 Adaptability and transferability analysis
7 Risk analysis
8 Example
9 Suggested literature
Exercises
Students will be divided into teams representing different stakeholder groups and they will be asked to solve a transport based multi-criteria problem by applying a decision making methodology. Each group (stakeholder) will state their preference in the decision making process by providing different weights in identified measures of performance. Final results of the evaluation will be shared in the class.

Deliverable D2.3
www.alliance-project.eu 48
Table 3.13: Course C12a
Course: C12a
Title Data collection methods: Surveys
Thematic area Decision making
Responsible Institute
University of Thessaly, Greece
Lecturer Eftihia Nathanail
Aim
The aim of this course is to:
Provide an understanding of qualitative methods in data collection
Present how a qualitative transport survey is organized
Provide an overview of transport survey methods, the practical problems of sample design, the collection and application of transport-related data
Introduce the process of surveys’ analysis results in order to draw useful conclusions.
Learning outcomes
Identify appropriate methods for transport, traffic and spatial data collection.
Understand the role of sampling in data collection
Setting up a transport survey from A TO Z.
Prerequisites (if any)
-
Language English
Hours 1
Key words Data collection, surveys, qualitative methods, sampling,
Syllabus
This intercollegiate course will be organized and offered by two institutes: Fraunhofer (2 hours) (quantitative data collection methods) and University of Thessaly (1 hour) (qualitative data collection methods).
The main part will focus on describing how to set up a survey, how to cover aspects of sample estimation and experimental design and will introduce some basic statistical methods for data base preparation and analysis.
Analytically, this course will present a step-by-step guidebook for organizing and conducting transport surveys. As a first step it will provide the key elements and the principles that should be followed upon the setup of a survey. Sampling, data collection methods and techniques for qualitative data and survey design are introduced and developed as processes in sequence, presenting at the same time their strengths and weaknesses. As a last step the statistical analysis of the qualitative is further explained to the attendants.
Course topics:
Setting up a survey
Sampling
Data collection methods
Data collection techniques
Research designs
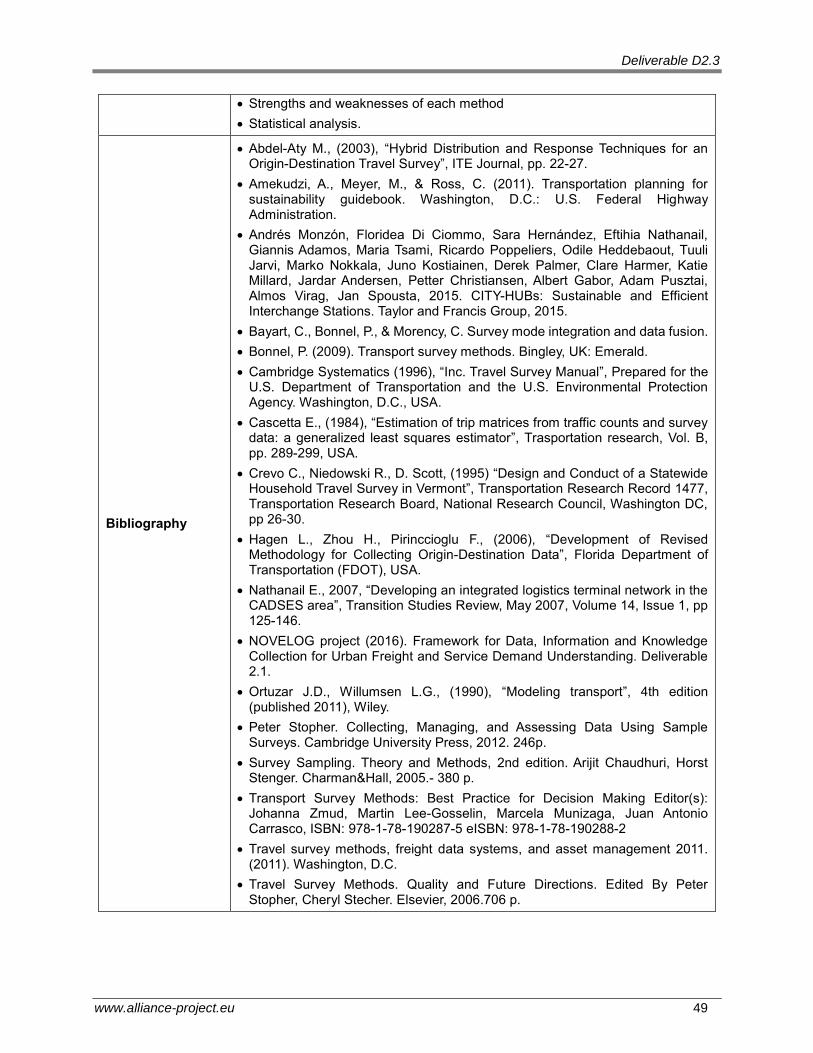
Deliverable D2.3
www.alliance-project.eu 49
Strengths and weaknesses of each method
Statistical analysis.
Bibliography
Abdel-Aty M., (2003), “Hybrid Distribution and Response Techniques for an Origin-Destination Travel Survey”, ITE Journal, pp. 22-27.
Amekudzi, A., Meyer, M., & Ross, C. (2011). Transportation planning for sustainability guidebook. Washington, D.C.: U.S. Federal Highway Administration.
Andrés Monzón, Floridea Di Ciommo, Sara Hernández, Eftihia Nathanail, Giannis Adamos, Maria Tsami, Ricardo Poppeliers, Odile Heddebaout, Tuuli Jarvi, Marko Nokkala, Juno Kostiainen, Derek Palmer, Clare Harmer, Katie Millard, Jardar Andersen, Petter Christiansen, Albert Gabor, Adam Pusztai, Almos Virag, Jan Spousta, 2015. CITY-HUBs: Sustainable and Efficient Interchange Stations. Taylor and Francis Group, 2015.
Bayart, C., Bonnel, P., & Morency, C. Survey mode integration and data fusion.
Bonnel, P. (2009). Transport survey methods. Bingley, UK: Emerald.
Cambridge Systematics (1996), “Inc. Travel Survey Manual”, Prepared for the U.S. Department of Transportation and the U.S. Environmental Protection Agency. Washington, D.C., USA.
Cascetta E., (1984), “Estimation of trip matrices from traffic counts and survey data: a generalized least squares estimator”, Trasportation research, Vol. B, pp. 289-299, USA.
Crevo C., Niedowski R., D. Scott, (1995) “Design and Conduct of a Statewide Household Travel Survey in Vermont”, Transportation Research Record 1477, Transportation Research Board, National Research Council, Washington DC, pp 26-30.
Hagen L., Zhou H., Pirinccioglu F., (2006), “Development of Revised Methodology for Collecting Origin-Destination Data”, Florida Department of Transportation (FDOT), USA.
Nathanail E., 2007, “Developing an integrated logistics terminal network in the CADSES area”, Transition Studies Review, May 2007, Volume 14, Issue 1, pp 125-146.
NOVELOG project (2016). Framework for Data, Information and Knowledge Collection for Urban Freight and Service Demand Understanding. Deliverable 2.1.
Ortuzar J.D., Willumsen L.G., (1990), “Modeling transport”, 4th edition (published 2011), Wiley.
Peter Stopher. Collecting, Managing, and Assessing Data Using Sample Surveys. Cambridge University Press, 2012. 246p.
Survey Sampling. Theory and Methods, 2nd edition. Arijit Chaudhuri, Horst Stenger. Charman&Hall, 2005.- 380 p.
Transport Survey Methods: Best Practice for Decision Making Editor(s): Johanna Zmud, Martin Lee-Gosselin, Marcela Munizaga, Juan Antonio Carrasco, ISBN: 978-1-78-190287-5 eISBN: 978-1-78-190288-2
Travel survey methods, freight data systems, and asset management 2011. (2011). Washington, D.C.
Travel Survey Methods. Quality and Future Directions. Edited By Peter Stopher, Cheryl Stecher. Elsevier, 2006.706 p.

Deliverable D2.3
www.alliance-project.eu 50
Yatskiv, A. Grakovski and E. Yurshevich. An overview of different methods available to observe traffic flows using new technologies. In: Proceedings of the international conference NTTS, 5-7 March 2013, Brussels, Belgium, 2013.
Teaching methods
Lecture x
Demonstration
Hands on/games
Exercises
Visits at facilities
Other (describe): Case studies
Evaluation methods
Homework
Class project x
Interim examination
Final examinations
Other (describe)
……………………………………….
Creative Commons (CC) Licenses
e.g. CC-Attribution-NonCommercial-NoDerivatives
Number of topics 7
Lecture content
1 Setting up a survey
2 Sampling
3 Data collection methods
4 Data collection techniques
5 Research design strengths and weaknesses of each method
6 Statistical analysis
7 Suggested literature
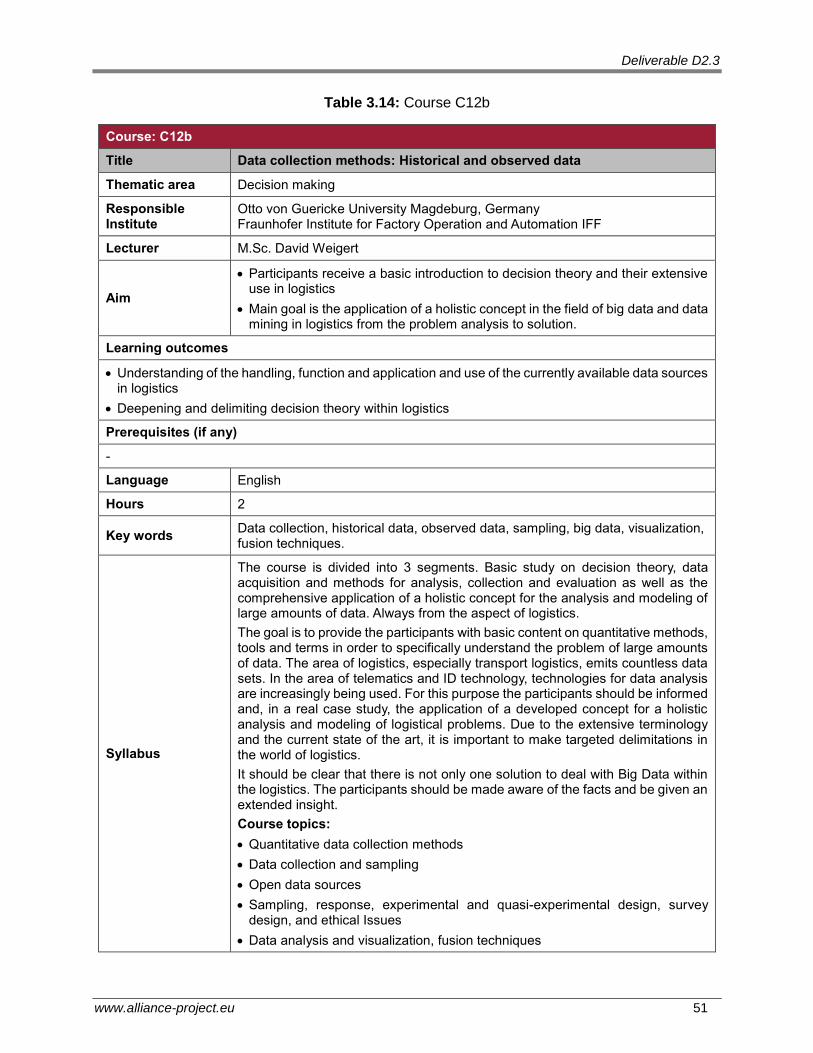
Deliverable D2.3
www.alliance-project.eu 51
Table 3.14: Course C12b
Course: C12b
Title Data collection methods: Historical and observed data
Thematic area Decision making
Responsible Institute
Otto von Guericke University Magdeburg, Germany Fraunhofer Institute for Factory Operation and Automation IFF
Lecturer M.Sc. David Weigert
Aim
Participants receive a basic introduction to decision theory and their extensive use in logistics
Main goal is the application of a holistic concept in the field of big data and data mining in logistics from the problem analysis to solution.
Learning outcomes
Understanding of the handling, function and application and use of the currently available data sources in logistics
Deepening and delimiting decision theory within logistics
Prerequisites (if any)
-
Language English
Hours 2
Key words Data collection, historical data, observed data, sampling, big data, visualization, fusion techniques.
Syllabus
The course is divided into 3 segments. Basic study on decision theory, data acquisition and methods for analysis, collection and evaluation as well as the comprehensive application of a holistic concept for the analysis and modeling of large amounts of data. Always from the aspect of logistics.
The goal is to provide the participants with basic content on quantitative methods, tools and terms in order to specifically understand the problem of large amounts of data. The area of logistics, especially transport logistics, emits countless data sets. In the area of telematics and ID technology, technologies for data analysis are increasingly being used. For this purpose the participants should be informed and, in a real case study, the application of a developed concept for a holistic analysis and modeling of logistical problems. Due to the extensive terminology and the current state of the art, it is important to make targeted delimitations in the world of logistics.
It should be clear that there is not only one solution to deal with Big Data within the logistics. The participants should be made aware of the facts and be given an extended insight.
Course topics:
Quantitative data collection methods
Data collection and sampling
Open data sources
Sampling, response, experimental and quasi-experimental design, survey design, and ethical Issues
Data analysis and visualization, fusion techniques

Deliverable D2.3
www.alliance-project.eu 52
Big data in transport
Bibliography
Alvarenga, Carlos A. und R. C. Schoenthaler (2003). A new take on supply chain event management. Supply Chain Management Review, März/April:28–35.
Ashbrook, Daniel und T. Starner (2003). Using GPS to learn significant locations and predict movement across multiple users. Personal and Ubiquitous Computing, 7(5):275–286.
Baader, Andraes und S.Montanus (2008). Transparency in Global Supply Chain Networks - Methods and Tools for Integrated Supply Chain Event Management. In: Ijioui, Raschid, H. Emmerich und M. Ceyp, Hrsg.: Strategies and Tactics in Supply Chain Event Management, S. 3–11. Springer-Verlag, Berlin Heidelberg.
Barfus, Katja (2010). Entwicklung eines Vorgehensmodells zur strategischen Planung des logistischen Netzes einer verteilten Produktion. Fraunhofer Verlag, Stuttgart.
Beierle, Christoph und G. Kern-Isberner (2006). Methoden wissensbasierter Systeme - Grundlagen - Algorithmen - Anwendungen. Friedr. Vieweg & Sohn Verlagsgesellschaft | GWV Fachverlage GmbH, Wiesbaden, 3. Aufl.
Bernard, Thomas (2011). Entscheidungsunterstützung durch Data-Mining-Werkzeuge. Automatisierungs-ATLAS 2011, SPS-Magazin, 5:608–610.
Brandau, Annegret und J. Tolujevs (2013). Modelling and analysis of logistical state data. Transport and Telecommunication, 14(2):102–115.
Brandau, Annegret und J. Tolujew (2011). Logistics Event Management. In: Schenk,Michael, Hrsg.: 9./10. Forschungskolloquium am Fraunhofer IFF 2010 – Forschung vernetzen - Innovationen beschleunigen, S. 47–51, Magdeburg. Fraunhofer Verlag.
Cunha, Catherine da, B. Agard und A. Kusiak (2005). Improving manufacturing quality by re-sequencing assembly operations: a data-mining approach. In: 18th International Conference on Production Research - ICPR 18, Fisciamo, Italy. University of Salerno.
Dong, Guozhu und J. Pei (2007). Sequence Data Mining. Springer Science+Business Media, LLC.
Düsing, Roland (2006). Knowledge Discovery in Databases - Begri, Forschungsgebiet, Prozess und System. In: Chamoni, Peter und P. Gluchowski, Hrsg.: Analytische Informationssysteme- Business Intelligence-Technologien und -Anwendungen, S. 241–262. Springer, Berlin Heidelberg, 3.Aufl.
Fayyad, Usama, G. Piatetsky-Shapiro und P. Smyth (1996a). From data mining to knowledge discovery in databases. AI Magazine, 17(3):37–54.
Fayyad, Usama M., G. Piatetsky-Shapiro und P. Smyth (1996b). From data mining to knowledge discovery: an overview. In: Fayyad, Usama M., G. Piatetsky-Shapiro, P. Smyth und R. Uthurusamy, Hrsg.: Advances in Knowledge Discovery and Data Mining, Kap. 1, S. 1–34. AAAI Press / The MIT Press, Menlo Park, California.
Ghezzi, Carlo, M. Jazayeri und D. Mandrioli (1991). Fundamentals of Software Engineering. Prentice-Hall, Inc.
Säuberlich, Frank (2000). KDD und Data Mining als Hilfsmittel zur Entscheidungsunterstützung. Peter Lang GmbH Europäischer Verlag der Wissenschaften, Frankfurt a. M.
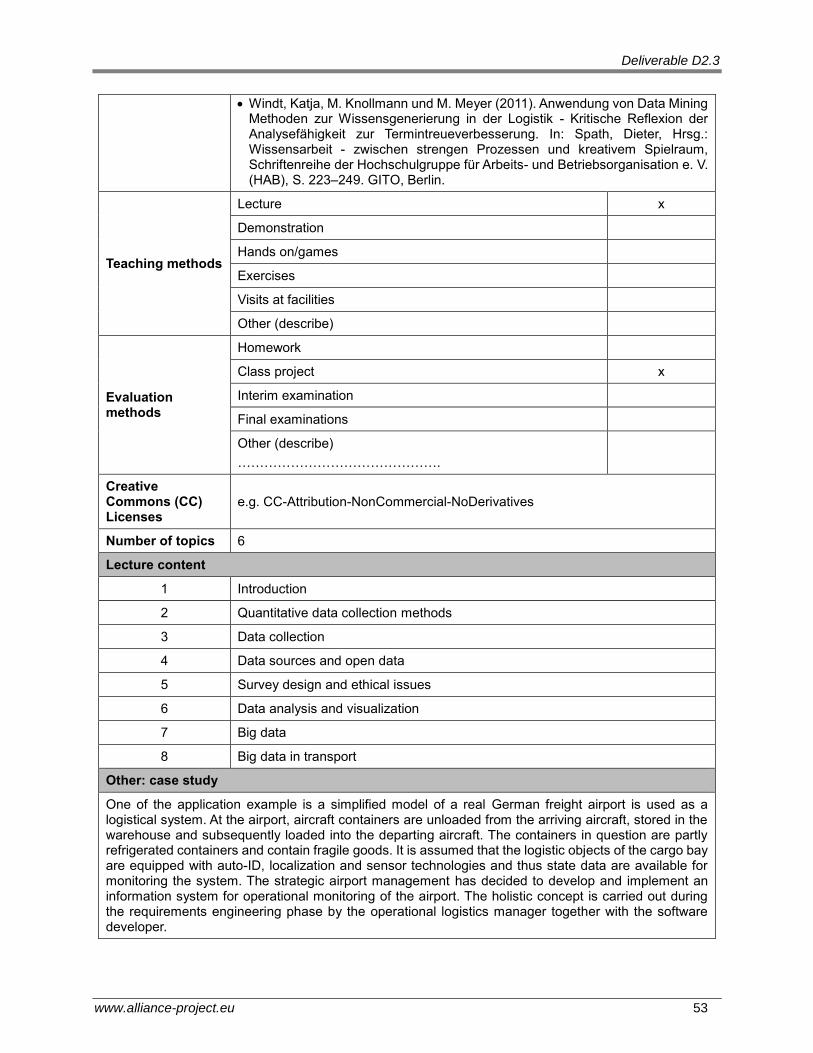
Deliverable D2.3
www.alliance-project.eu 53
Windt, Katja, M. Knollmann und M. Meyer (2011). Anwendung von Data Mining Methoden zur Wissensgenerierung in der Logistik - Kritische Reflexion der Analysefähigkeit zur Termintreueverbesserung. In: Spath, Dieter, Hrsg.: Wissensarbeit - zwischen strengen Prozessen und kreativem Spielraum, Schriftenreihe der Hochschulgruppe für Arbeits- und Betriebsorganisation e. V. (HAB), S. 223–249. GITO, Berlin.
Teaching methods
Lecture x
Demonstration
Hands on/games
Exercises
Visits at facilities
Other (describe)
Evaluation methods
Homework
Class project x
Interim examination
Final examinations
Other (describe)
……………………………………….
Creative Commons (CC) Licenses
e.g. CC-Attribution-NonCommercial-NoDerivatives
Number of topics 6
Lecture content
1 Introduction
2 Quantitative data collection methods
3 Data collection
4 Data sources and open data
5 Survey design and ethical issues
6 Data analysis and visualization
7 Big data
8 Big data in transport
Other: case study
One of the application example is a simplified model of a real German freight airport is used as a logistical system. At the airport, aircraft containers are unloaded from the arriving aircraft, stored in the warehouse and subsequently loaded into the departing aircraft. The containers in question are partly refrigerated containers and contain fragile goods. It is assumed that the logistic objects of the cargo bay are equipped with auto-ID, localization and sensor technologies and thus state data are available for monitoring the system. The strategic airport management has decided to develop and implement an information system for operational monitoring of the airport. The holistic concept is carried out during the requirements engineering phase by the operational logistics manager together with the software developer.
Deliverable D2.3
www.alliance-project.eu 54
3.2 Lectures
The first version of the program’s lectures are presented in the following sections. The material is expected to be updated in two milestones of the project thus, after the realization of each of the two summer schools.
4 References
ALLIANCE, 2016a. ALLIANCE Deliverable D2.2. Research, educational and training program in Latvia and the region.
ALLIANCE, 2016b. ALLIANCE Deliverable D2.1. Good practices of research, educational and training programs on smart solutions for the interconnection of transportation networks.
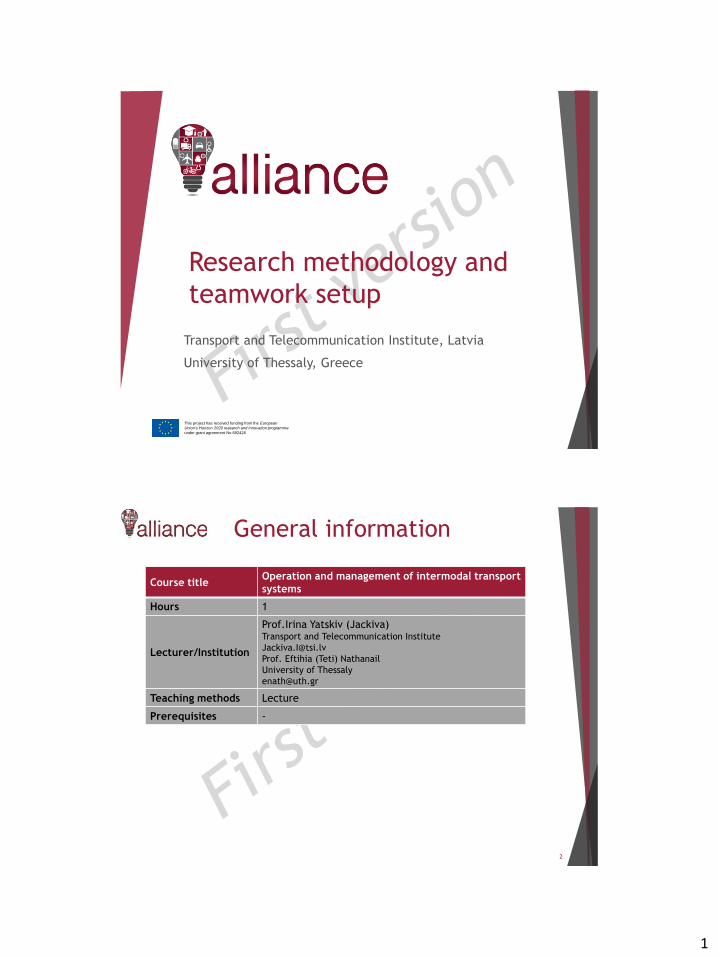
1
This project has received funding from the European
Union’s Horizon 2020 research and innovation programme
under grant agreement No 692426
Research methodology and
teamwork setup
Transport and Telecommunication Institute, Latvia
University of Thessaly, Greece
General information
2
Course title Operation and management of intermodal transport
systems
Hours 1
Lecturer/Institution
Prof.Irina Yatskiv (Jackiva)Transport and Telecommunication Institute
Prof. Eftihia (Teti) Nathanail
University of Thessaly
Teaching methods Lecture
Prerequisites -

2
Aim and learning outcomes
3
• Aim:
Present techniques of conducting literature review
Guide how to use databases, search engines and electronic libraries
Explain how to write a scientific report
Explain how to prepare and present research work
Organize teams for conducting the summer school project
• Learning outcomes:
Look into databases, search engines and electronic libraries to retrieve
information about a topic
Organize a scientific report
Conduct state-of-the-art
Document methodology and results
Work as a team member
Topics
4
1. Research process
2. Literature review
3. Quantitative research
4. Research dissemination
• Dissertation
• Research publication
• Poster
• Presentation
• Scientific report
• Oral
5. Citations and references
6. Ethics and Plagiarism
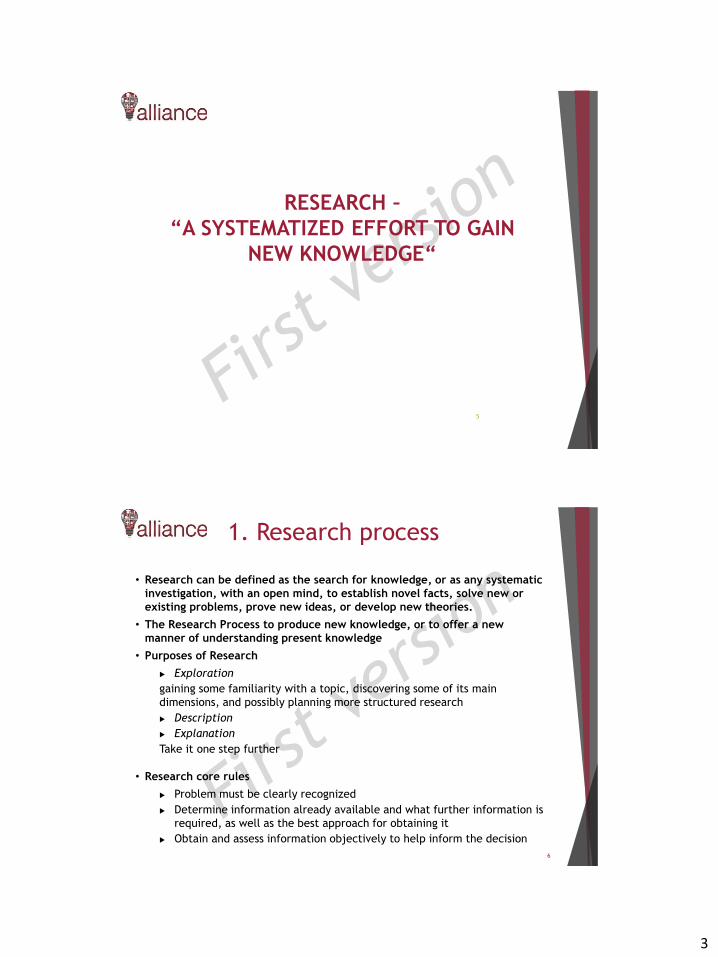
3
RESEARCH –
“A SYSTEMATIZED EFFORT TO GAIN
NEW KNOWLEDGE“
5
1. Research process
6
• Research can be defined as the search for knowledge, or as any systematic
investigation, with an open mind, to establish novel facts, solve new or
existing problems, prove new ideas, or develop new theories.
• The Research Process to produce new knowledge, or to offer a new
manner of understanding present knowledge
• Purposes of Research
Exploration
gaining some familiarity with a topic, discovering some of its main
dimensions, and possibly planning more structured research
Description
Explanation
Take it one step further
• Research core rules
Problem must be clearly recognized
Determine information already available and what further information is
required, as well as the best approach for obtaining it
Obtain and assess information objectively to help inform the decision
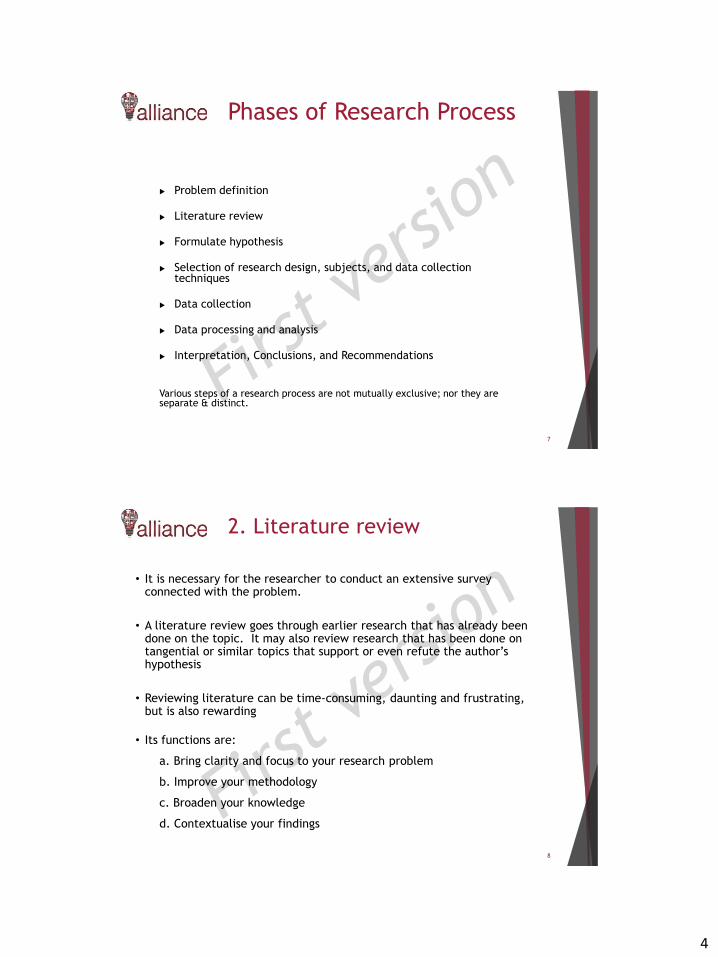
4
Phases of Research Process
7
Problem definition
Literature review
Formulate hypothesis
Selection of research design, subjects, and data collectiontechniques
Data collection
Data processing and analysis
Interpretation, Conclusions, and Recommendations
Various steps of a research process are not mutually exclusive; nor they are separate & distinct.
2. Literature review
8
• It is necessary for the researcher to conduct an extensive surveyconnected with the problem.
• A literature review goes through earlier research that has already beendone on the topic. It may also review research that has been done ontangential or similar topics that support or even refute the author’shypothesis
• Reviewing literature can be time-consuming, daunting and frustrating,but is also rewarding
• Its functions are:
a. Bring clarity and focus to your research problem
b. Improve your methodology
c. Broaden your knowledge
d. Contextualise your findings
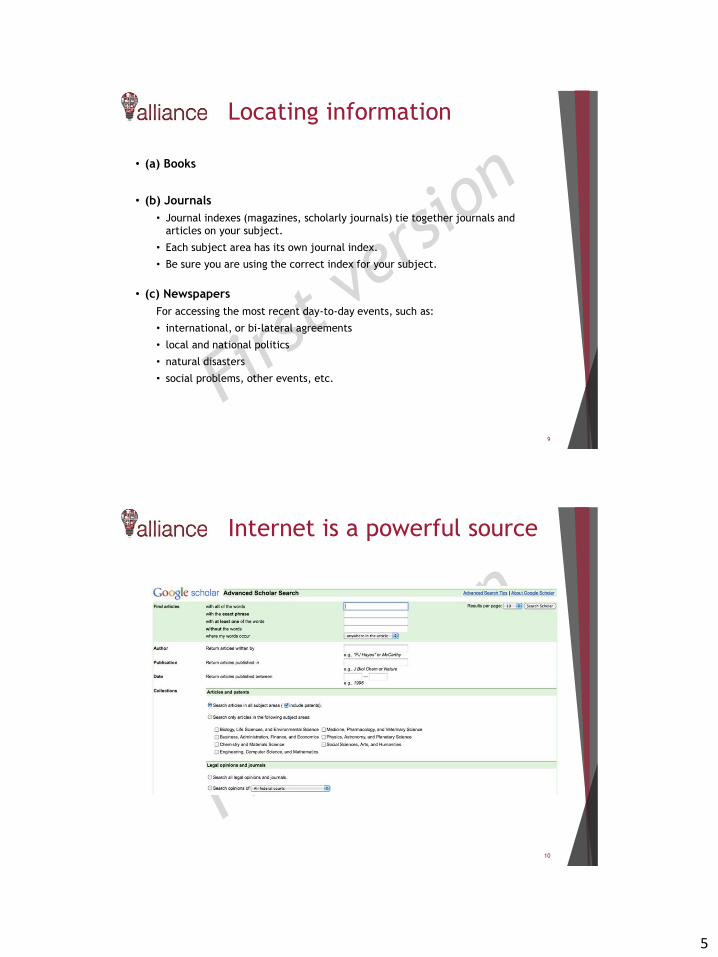
5
Locating information
9
• (a) Books
• (b) Journals
• Journal indexes (magazines, scholarly journals) tie together journals and
articles on your subject.
• Each subject area has its own journal index.
• Be sure you are using the correct index for your subject.
• (c) Newspapers
For accessing the most recent day-to-day events, such as:
• international, or bi-lateral agreements
• local and national politics
• natural disasters
• social problems, other events, etc.
Internet is a powerful source
10
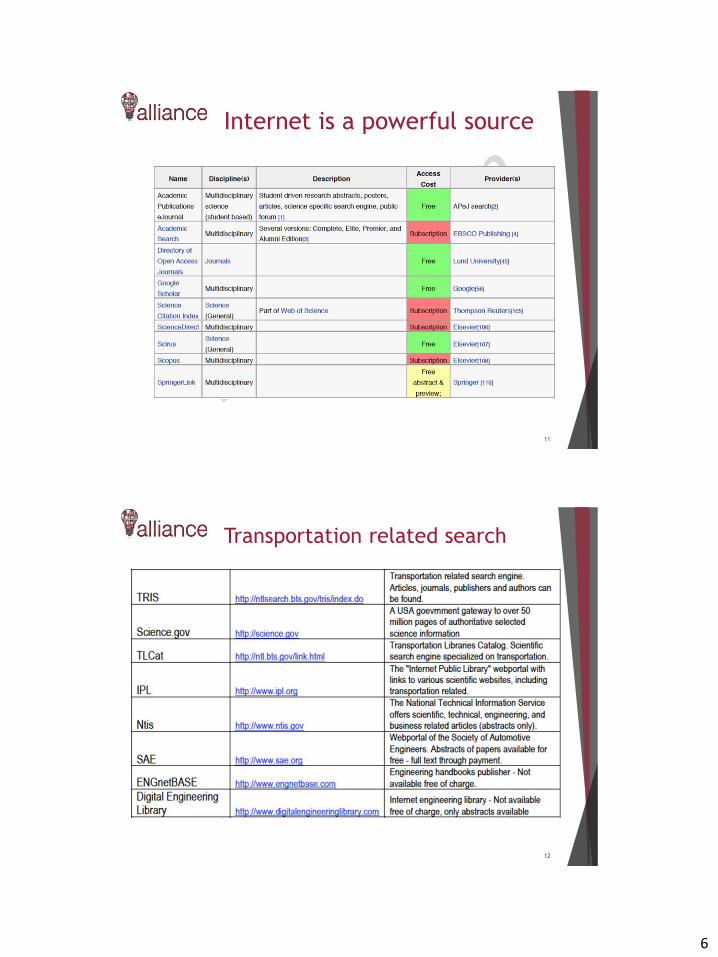
6
Internet is a powerful source
11
Transportation related search
12
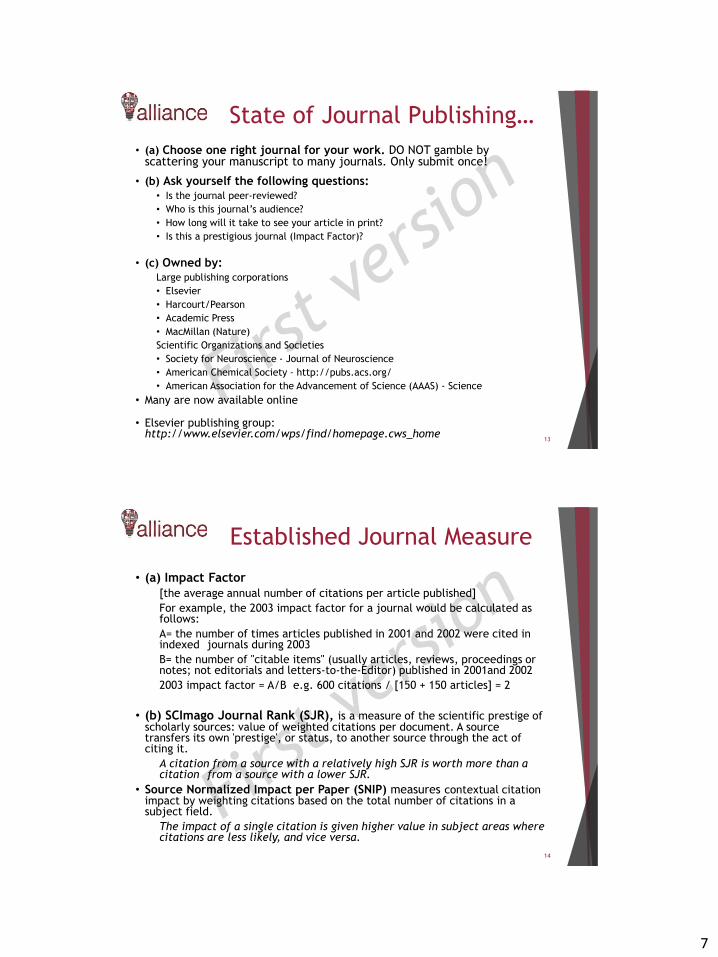
7
State of Journal Publishing…
13
• (a) Choose one right journal for your work. DO NOT gamble byscattering your manuscript to many journals. Only submit once!
• (b) Ask yourself the following questions:• Is the journal peer-reviewed?
• Who is this journal’s audience?
• How long will it take to see your article in print?
• Is this a prestigious journal (Impact Factor)?
• (c) Owned by:Large publishing corporations
• Elsevier
• Harcourt/Pearson
• Academic Press
• MacMillan (Nature)
Scientific Organizations and Societies
• Society for Neuroscience - Journal of Neuroscience
• American Chemical Society - http://pubs.acs.org/
• American Association for the Advancement of Science (AAAS) - Science
• Many are now available online
• Elsevier publishing group:http://www.elsevier.com/wps/find/homepage.cws_home
Established Journal Measure
14
• (a) Impact Factor
[the average annual number of citations per article published]
For example, the 2003 impact factor for a journal would be calculated as follows:
A= the number of times articles published in 2001 and 2002 were cited in indexed journals during 2003
B= the number of "citable items" (usually articles, reviews, proceedings or notes; not editorials and letters-to-the-Editor) published in 2001and 2002
2003 impact factor = A/B e.g. 600 citations / [150 + 150 articles] = 2
• (b) SCImago Journal Rank (SJR), is a measure of the scientific prestige ofscholarly sources: value of weighted citations per document. A sourcetransfers its own 'prestige', or status, to another source through the act ofciting it.
A citation from a source with a relatively high SJR is worth more than a citation from a source with a lower SJR.
• Source Normalized Impact per Paper (SNIP) measures contextual citationimpact by weighting citations based on the total number of citations in asubject field.
The impact of a single citation is given higher value in subject areas where citations are less likely, and vice versa.

8
Writing a Literature Review Paper.
Select and read your sources
15
• Explore the articles available by doing a quick search in a database specificto your field.
• Once you choose a database, enter your topic and run a search.
• To create your search, think about your topic and the words that bestdescribe it. These are your keywords.
• If your search pulls up thousands of results, this means you need to narrowyour topic some more.
• Often databases will suggest ways to focus your topic by providing lists ofsubtopics. Each click on these will narrow your results further.
• Often databases will suggest ways to focus your topic by providing lists ofsubtopics. Each click on these will narrow your results further.
• If you’ve tried all these techniques and still don’t have a workable topic,ask your professor for help.
Writing a Literature Review Paper.
Select and read your sources
16
• Once you’ve settled on a topic, the next step is to choose which resources to review.When looking at articles, read the abstract first. This short synopsis will give you anidea of the article’s content and whether it fits your topic.
• If the abstract looks good, open up the article and read the Conclusion section. If italso looks interesting, put the article in your “to read” pile.
• As you start collecting articles, books and reports, it’s helpful to categorize them bythe methods they use, the arguments they make or any other classification that worksfor you.
• So far, you’ve been scanning material and making your initial selections. Now it’s timeto read them thoroughly. As you do, look for issues that arise, differences in theoriesand approaches, and how the author has contributed to your field of study.
• Begin taking clear and consistent notes, including all of the citation information youwill need: author, title, date created, source (this can be a journal name or URL),and page numbers, if it's a print item.
• To read the simplest articles first. This will give you the vocabulary you need and helpyou understand the more challenging articles in your collection. Give yourself time tounderstand each article. If you’re confused, it’s going to be reflected in your paper.
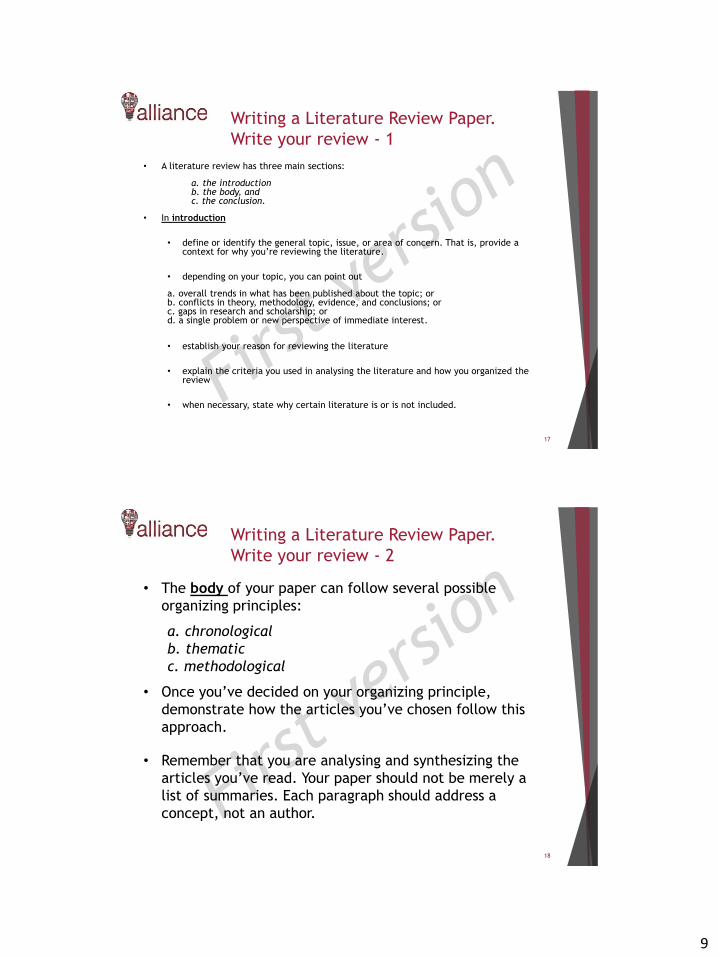
9
Writing a Literature Review Paper.
Write your review - 1
17
• A literature review has three main sections:
a. the introductionb. the body, andc. the conclusion.
• In introduction
• define or identify the general topic, issue, or area of concern. That is, provide acontext for why you’re reviewing the literature.
• depending on your topic, you can point out
a. overall trends in what has been published about the topic; orb. conflicts in theory, methodology, evidence, and conclusions; orc. gaps in research and scholarship; ord. a single problem or new perspective of immediate interest.
• establish your reason for reviewing the literature
• explain the criteria you used in analysing the literature and how you organized thereview
• when necessary, state why certain literature is or is not included.
Writing a Literature Review Paper.
Write your review - 2
18
• The body of your paper can follow several possible
organizing principles:
a. chronological
b. thematic
c. methodological
• Once you’ve decided on your organizing principle,
demonstrate how the articles you’ve chosen follow this
approach.
• Remember that you are analysing and synthesizing the
articles you’ve read. Your paper should not be merely a
list of summaries. Each paragraph should address a
concept, not an author.

10
Writing a Literature Review Paper.
Write your review - 3
19
• For the conclusion of paper:
a. summarize major contributions of significant studies
and articles to the body of knowledge under review
b. point out major methodological flaws or gaps in
research, inconsistencies in theory and findings, and
areas or issues pertinent to future study
c. tween the central topic of the literature review and a
larger area of study, such as a discipline, a scientific
endeavor, or a profession.
Material adapted from:The University of Wisconsin, Madison: Review of Literature (©2009) at
http://writing.wisc.edu/Handbook/ReviewofLiterature.html
3.Quantitative research
20
• Quantitative research refers to the systematic empirical investigationof any phenomena via statistical, mathematical or computationaltechniques.
• The objective of quantitative research is to develop and employmathematical models, theories and/or hypotheses pertaining tophenomena
• Quantitative research is generally made using scientific methods,which can include:
The generation of models, theories and hypotheses
The development of instruments and methods for measurement
Experimental control and manipulation of variables
Collection of empirical data
Modelling and analysis of data
Evaluation of results

11
4.Research dissemination
21
• Promote and exchange knowledge.
• Inform the scientific community.
• Safeguard research results.
• Contact potential cooperators.
• Demonstrate accountability.
• Facilitate fund raising.
• Enable researcher’s promotion.
Research dissemination through …
22
• Dissertation: go through a lengthy review process. The author has
his/her work reviewed by peers (fellow professors or researchers) for
both content clarity and grammar. Due to their length, dissertations are
organized into chapters and usually end with a final concluding chapter.
• Research publication: articles go through a much shorter
review process, anywhere from three months to one year. However,
they are also reviewed by peers (scholars who are experts in the field
of study) and journal editors. Because of their conciseness, they tend
to follow a standard format.
“The goal of scientific research is publication…A scientific experiment, no
matter how spectacular the results, is not complete until the results are
published.”
@Robert A. Day – How to write and Publish a Scientific Paper
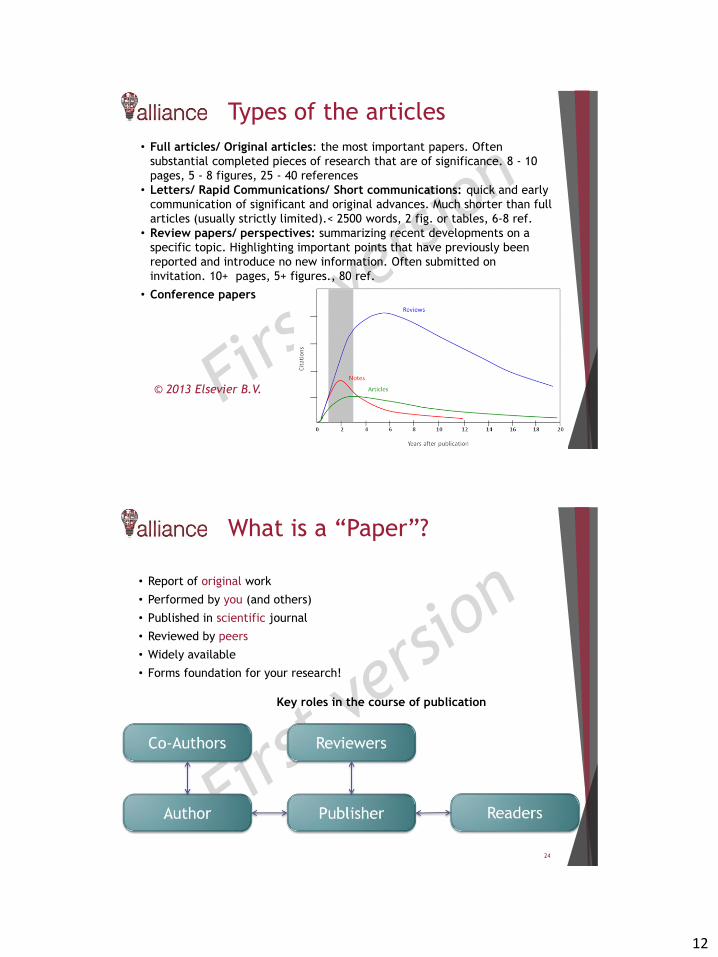
12
Types of the articles
23
• Full articles/ Original articles: the most important papers. Often
substantial completed pieces of research that are of significance. 8 - 10
pages, 5 - 8 figures, 25 - 40 references
• Letters/ Rapid Communications/ Short communications: quick and early
communication of significant and original advances. Much shorter than full
articles (usually strictly limited).< 2500 words, 2 fig. or tables, 6-8 ref.
• Review papers/ perspectives: summarizing recent developments on a
specific topic. Highlighting important points that have previously been
reported and introduce no new information. Often submitted on
invitation. 10+ pages, 5+ figures., 80 ref.
• Conference papers
© 2013 Elsevier B.V.
What is a “Paper”?
24
• Report of original work
• Performed by you (and others)
• Published in scientific journal
• Reviewed by peers
• Widely available
• Forms foundation for your research!
Key roles in the course of publication
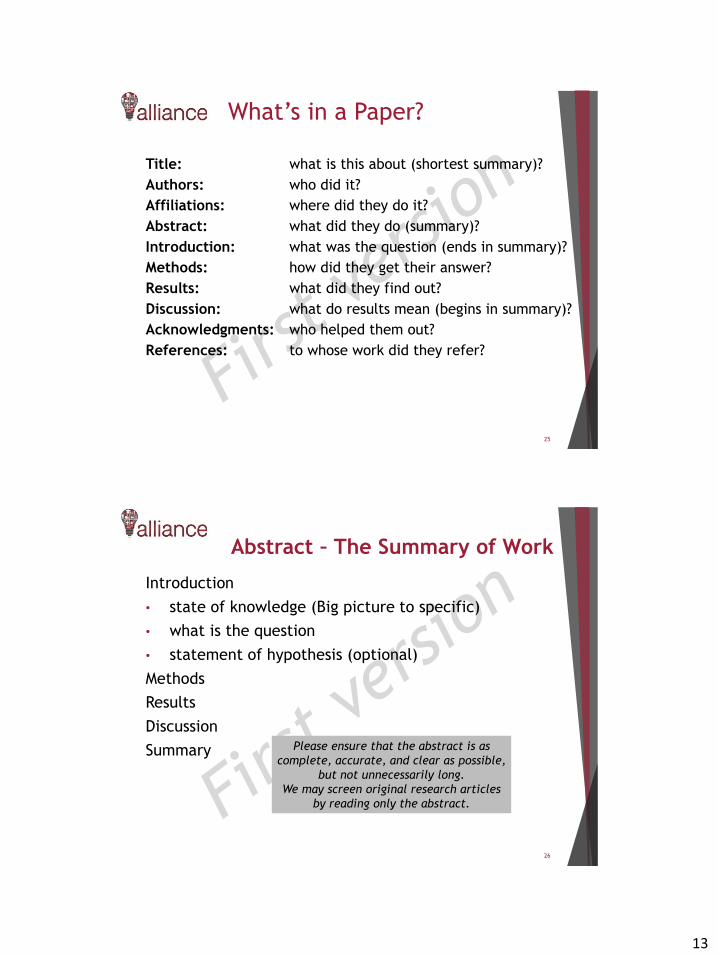
13
What’s in a Paper?
25
Title: what is this about (shortest summary)?
Authors: who did it?
Affiliations: where did they do it?
Abstract: what did they do (summary)?
Introduction: what was the question (ends in summary)?
Methods: how did they get their answer?
Results: what did they find out?
Discussion: what do results mean (begins in summary)?
Acknowledgments: who helped them out?
References: to whose work did they refer?
Abstract – The Summary of Work
26
Introduction
• state of knowledge (Big picture to specific)
• what is the question
• statement of hypothesis (optional)
Methods
Results
Discussion
Summary Please ensure that the abstract is as
complete, accurate, and clear as possible,
but not unnecessarily long.
We may screen original research articles
by reading only the abstract.

14
Basic Rules in scientific writing
27
• Avoid Long Phrases
• Parallel Sentences
• Omit Needless Words
• Creating a flow between sentences
• Avoid Repetition
• Sneaky Plurals
• Avoid Gender Specific Pronouns
• Use because to mean "because"
• Correct use of Verbs
Research dissemination through …
28
• Poster: A well designed poster provides a concise, easy to follow and
attractive snapshot of work.
• Avoid long textual passages and use graphs and diagrams as much as
possible.
• Arrange materials in columns rather than in rows so that viewers can move
to the right as they finish reading each column.
• Focus your attention on a few key points that follows the main headings in
your abstract typically Purpose, Methods, Results, and Conclusion and don’t
forget Acknowledgments and your Contact Information.
http://www.cpc.unc.edu/aboutcpc/services/research/library/graphics/graphics/posters
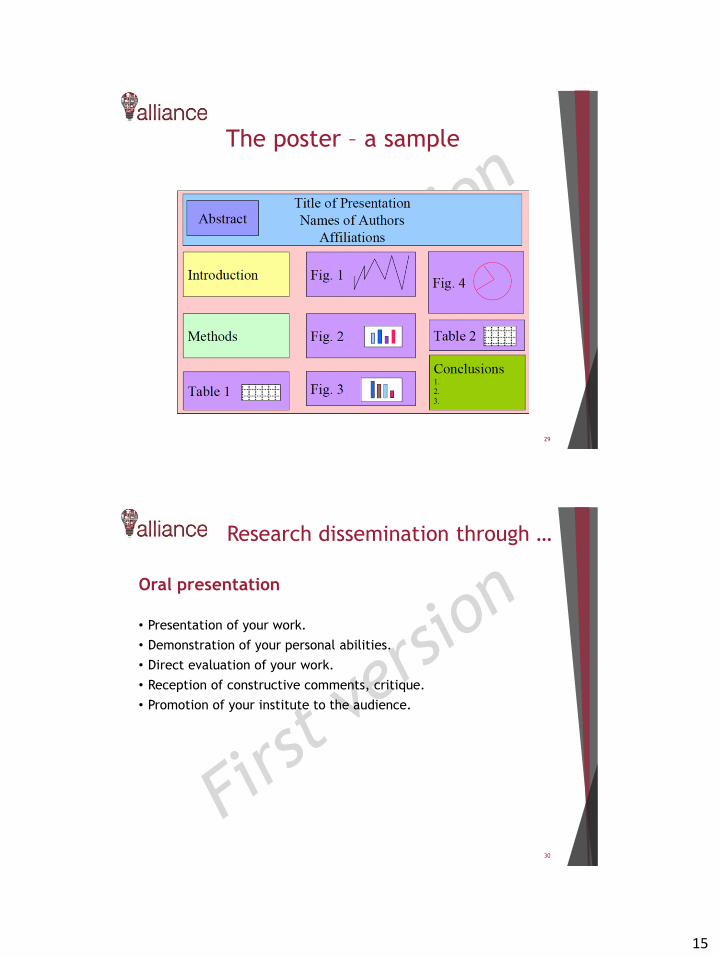
15
The poster – a sample
29
Research dissemination through …
30
Oral presentation
• Presentation of your work.
• Demonstration of your personal abilities.
• Direct evaluation of your work.
• Reception of constructive comments, critique.
• Promotion of your institute to the audience.

16
Oral Presentation
31
1. Design the talk for the audience
2. Prepare thoroughly and rehearse the talk
3. Produce clear, legible slides
4. Arrive early and check the lecture room
5. Speak slowly and loudly
6. Be enthusiastic about what you say
7. Look at the audience as you speak
8. Don’t fidget with the slides or the pointer
9. Finish on time (or early)
10. Answer questions courteously and concisely, and admit if you
don’t know the answer.
Sourse: Nicholas Higham (1998). Handbook of Writing for the Mathematical
Sciences, University of Manchester, UK
DOI: http://dx.doi.org/10.1137/1.9780898719550
5.Citations and references
32
Proper selection of references:
• Show your knowledge in the related area,
• Give credit to other researchers (reviewers are usually chosen from thereferences),
• Cite good quality work (particularly when citing your own work) and up todate work.
Related work should:
• Be organized to serve your topic,
• Emphasize on the significance / originality of your work (Introducing yourwork out)
Format of references:
• Consistent with the format, ordering, etc.
• Standard format of books / journal papers / conference papers / Web-sources etc.
• Do NOT use non-standard abbrev.
Source: CITY-HUBs, 2015
17
6.Ethics of Research
33
Scientific misconduct
• Fabrication : making up data or results, and recording or reporting them
• Falsification of results
Publication misconduct
• Plagiarism
• Different forms / severities
• The paper must be original to the authors
• Duplicate submission
• Duplicate publication
• No acknowledgement of prior research and researchers
• No identification of all co-authors
Scientific ethics are not considered to have
national variants or characteristics – there is a
single ethical standard for science.
Ethics and Plagiarism
34
Oxford English Dictionary defines plagiarism as:
• The action or practice of taking someone else's work, idea, etc., and
passing it off as one's own; literary theft.
• Plagiarism, claiming credit for results of others, misreport sources or
invent results, data with questionable accuracy, concealing objections
that cannot be rebutted, caricaturing or distorting opposing views,
destroy or conceal sources and data important for those who follow
18
Avoiding plagiarism
35
In the body of your paper
• Provide proper citations for all quotations, summaries, paraphrases, or
any other work or idea that is borrowed from others.
• Using quotations: When using exact words, phrases, or sentences from a
source, make sure to properly use quotation marks and cite where the
information was taken from
• Summarizing & Paraphrasing:
• Paraphrasing is when you take the ideas or phrases from a source and rewrite
them using your own words.
• Summarizing is condensing a source into a few lines, focusing on the author’s
main points. In both cases, credit is given to the original author or authors
Ethics and Authorship
36
Authorship credit should be based only on substantial contribution to:
conception and design, or data analysis andinterpretation
drafting the article or revising it critically forimportant intellectual content
and final approval of the version to be published
All these conditions must be met.
Participation solely in the acquisition of funding or thecollection of data does not justify authorship.
All authors included on a paper must fulfil the criteria
No one who fulfils the criteria should be excluded
And agree authorship
before starting the study!
19
References
37
• The Writing Lab & The OWL at Purdue and Purdue University (1995-2011)
• A Guide for Writing Research Papers Based on Modern Language Association (MLA),
documentation prepared by the Humanities Department as part of The Guide to
Grammar and Writing and the Arthur C. Banks Jr. Library Capital Community College
Hartford, Connecticut.
• Bates College, “How to Write a Paper in Scientific Journal Style and Format”
http://abacus.bates.edu/~ganderso/biology/resources/writing/HTWgeneral.html
• Alan Stevens, “Preparing the scientific paper, or: Confessions of a Journal Editor”.
• Kate L. Turabian, “A Manual for Writers of Research Papers, Theses, and
Dissertations”, Seventh Edition.
• Richard Pears and Graham Shields, (2005), “Cite them right: the essential guide to
referencing and plagiarism”. Pear Tree Books, Newcastle upon Tyne,
http:www.citethmright.co.uk.
• Elsevier. Publishing Ethics Resource Kit (PERK). Available at:
http://www.elsevier.com/wps/find/editorshome.editors/Introduction.Accessed:
June 11, 2012
• Gustavii, B. (2008). How to Write and Illustrate a Scientific Paper. Second Edition.
Cambridge: Cambridge University Press. 178 p.
• Jonker J. Pennink, B. (2010). The Essence of Research Methodology. A Concise Guide
for Master and PhD Students in Management Science. Berlin. Heidelberg: Springer –
Verlag. 250 p.
Thank you for your attention!
38
1
This project has received funding from the European
Union’s Horizon 2020 research and innovation programme
under grant agreement No 692426
The European policy on
intermodal transport
University of Thessaly, Greece
Content
2
• Background
• Basic concepts
• Transportation in an era of change
• Future changes in European Transport Policy
• Obstacles and problems
• Decision-making framework
• Actors and interrelations
• European institutional and legal framework
• Planning and financing schemes
• Applications
• Suggested literature
2
Background
3
Background
4
• Transportation is directly associated to the every-day activitiesof humans and covers the need of people to be transported tospecific locations, but also to receive goods required for theiractivities
• The increase of passenger transportation demand and the growthof goods movements cause congestion, environmental impacts,excessive energy consumption and accidents
• For the elimination of these negative impacts, sustainabletransportation is required!
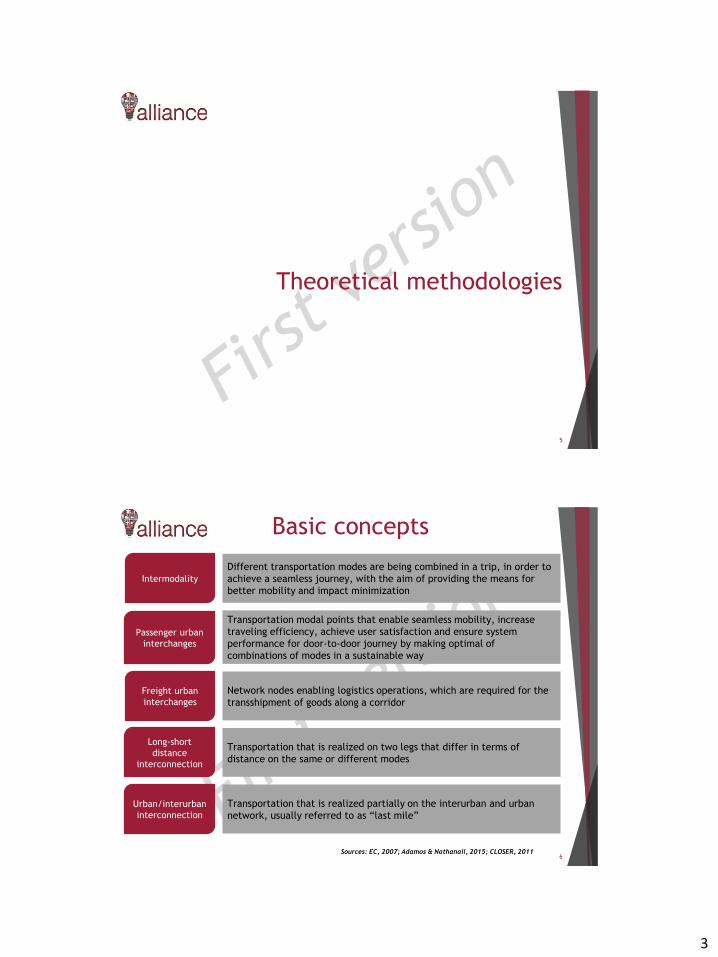
3
Theoretical methodologies
5
Basic concepts
6
Intermodality
Different transportation modes are being combined in a trip, in order to
achieve a seamless journey, with the aim of providing the means for
better mobility and impact minimization
Passenger urban
interchanges
Transportation modal points that enable seamless mobility, increase
traveling efficiency, achieve user satisfaction and ensure system
performance for door-to-door journey by making optimal of
combinations of modes in a sustainable way
Freight urban
interchanges
Network nodes enabling logistics operations, which are required for the
transshipment of goods along a corridor
Long-short
distance
interconnection
Transportation that is realized on two legs that differ in terms of
distance on the same or different modes
Urban/interurban
interconnection
Transportation that is realized partially on the interurban and urban
network, usually referred to as “last mile”
Sources: EC, 2007; Adamos & Nathanail, 2015; CLOSER, 2011

4
7
Transportation in an era of change
Future changes in European Transport
Policy (1/2)
8
Trends and challenges that will influence the shaping of future
European Transport Policy
• Ageing
By 2060, the median age 7 years more in Europe (Source: Eurostat)
Number of people above 65 years will be 30% of the population (today
is 17%) (Source: Eurostat)
• Migration and internal mobility
56 million people will be added in European population (Source:
Eurostat)
Increase of internal mobility for work
• Environmental challenges
Further reduction of emissions
Further reduction of noise and air pollution
Global warming

5
Future changes in European Transport
Policy (2/2)
9
Trends and challenges that will influence the shaping of future
European Transport Policy
• Increasing scarcity of fossil fuels
Oil and other fossil fuels will become more expensive
Alternative energy sources
Concerns about energy security
• Urbanisation
72% of the population in 2007, 84% in 2050 (Source: United Nations)
Generation of additional congestion and environmental pollution
Availability of land (denser cities)
• Global trends affecting European transport policy
Globalization, integration with neighboring regions (E. Asia, N. Africa)
Economic crises and geopolitical instability
By 2050 world population 9 billion (Source: United Nations)
Defining obstacles & problems
10
• Involvement of more than one entity in the stages of decision
making process
• Absence of a strict hierarchical flow chart of responsibilities
resulting to complicated procedures
• Conflict of interests of the involved stakeholders
• Absence of the relative legal framework for interconnection
• Lack of obligations regarding intermodality, for existing or new
terminals
• Limited national funding for land acquisition
• Lack of required infrastructure
Source: CLOSER, 2012
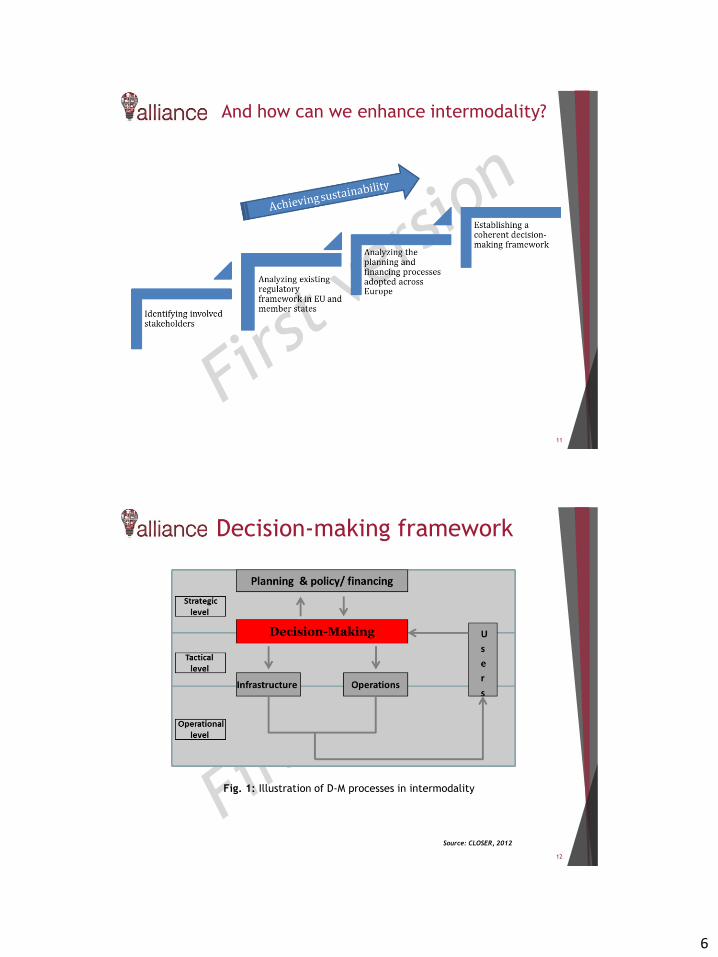
6
And how can we enhance intermodality?
11
Decision-making framework
12
Fig. 1: Illustration of D-M processes in intermodality
Source: CLOSER, 2012
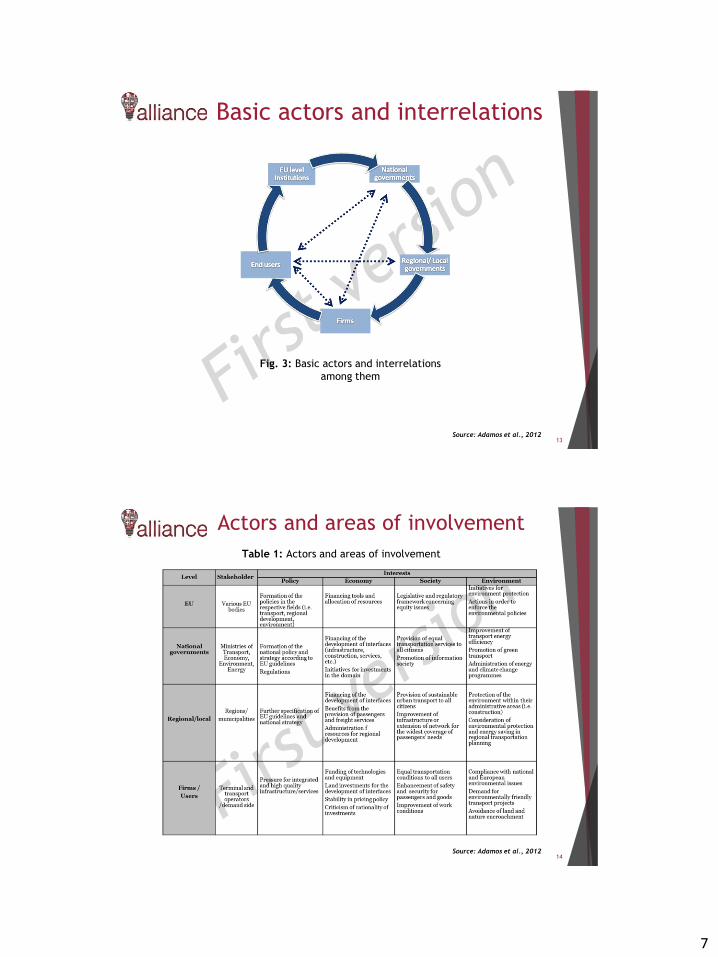
7
Basic actors and interrelations
13
Fig. 3: Basic actors and interrelations
among them
Source: Adamos et al., 2012
Actors and areas of involvement
14
Table 1: Actors and areas of involvement
Source: Adamos et al., 2012
8
Transport has gradually become one of the main
fields of concern of the European policy, with a
continuous expanding scope for action…
15
European institutional framework
16
• European Union (EU) is an organization of economic and political cooperationbetween governments in which the Members States remain independent sovereignnations
• Founded on four Treaties
The Treaty establishing the European Coal and Steel Community (1951) The Treaty establishing the European Atomic Energy Consumption (1957) The Treaty establishing the European Economic Community (1957) Treaty on European Union (1992)
• The above Treaties were amended and resulted in the Single European Act (1986)amending
The European Coal and Steel Community Treaty The Treaty of Amsterdam (1997) The Treaty of Nice (2001) The Treaty of Lisbon (2007)
• EU legal instruments:
European Parliament Council of the EU European Commission Court of Justice Court of Auditors Other:- European Economic and Social Committee- European Investment Bank- European Central Bank
Source: htpp://europa.eu
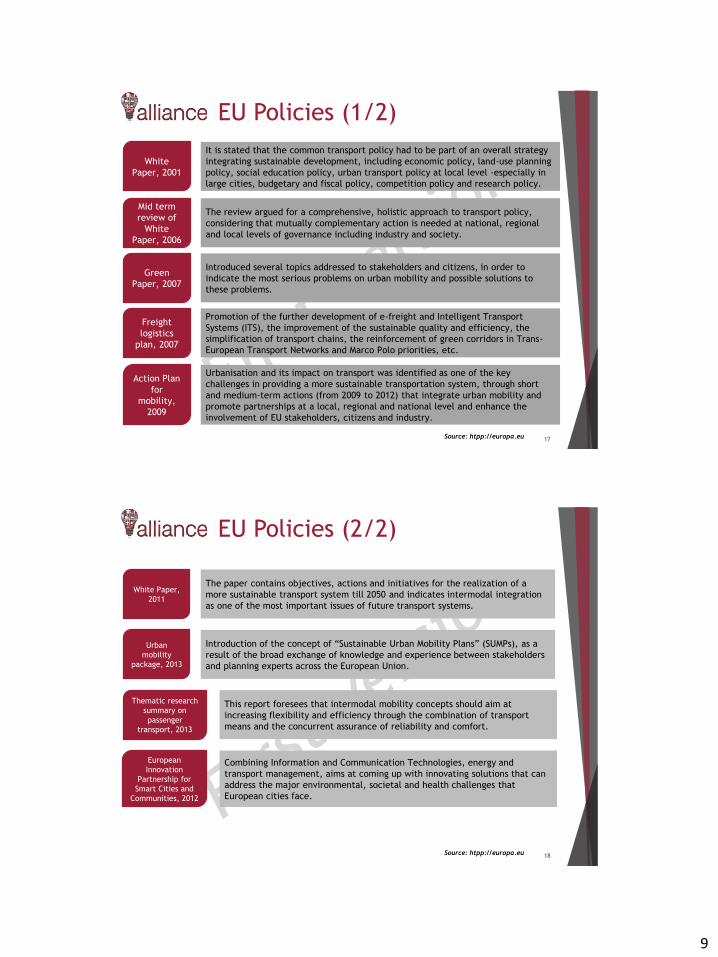
9
EU Policies (1/2)
17
It is stated that the common transport policy had to be part of an overall strategy
integrating sustainable development, including economic policy, land-use planning
policy, social education policy, urban transport policy at local level -especially in
large cities, budgetary and fiscal policy, competition policy and research policy.
White
Paper, 2001
Mid term
review of
White
Paper, 2006
The review argued for a comprehensive, holistic approach to transport policy,
considering that mutually complementary action is needed at national, regional
and local levels of governance including industry and society.
Action Plan
for
mobility,
2009
Urbanisation and its impact on transport was identified as one of the key
challenges in providing a more sustainable transportation system, through short
and medium-term actions (from 2009 to 2012) that integrate urban mobility and
promote partnerships at a local, regional and national level and enhance the
involvement of EU stakeholders, citizens and industry.
Freight
logistics
plan, 2007
Introduced several topics addressed to stakeholders and citizens, in order to
indicate the most serious problems on urban mobility and possible solutions to
these problems.
Green
Paper, 2007
Promotion of the further development of e-freight and Intelligent Transport
Systems (ITS), the improvement of the sustainable quality and efficiency, the
simplification of transport chains, the reinforcement of green corridors in Trans-
European Transport Networks and Marco Polo priorities, etc.
Source: htpp://europa.eu
EU Policies (2/2)
18Source: htpp://europa.eu
Urban
mobility
package, 2013
Introduction of the concept of “Sustainable Urban Mobility Plans” (SUMPs), as a
result of the broad exchange of knowledge and experience between stakeholders
and planning experts across the European Union.
Thematic research
summary on
passenger
transport, 2013
This report foresees that intermodal mobility concepts should aim at
increasing flexibility and efficiency through the combination of transport
means and the concurrent assurance of reliability and comfort.
European
Innovation
Partnership for
Smart Cities and
Communities, 2012
Combining Information and Communication Technologies, energy and
transport management, aims at coming up with innovating solutions that can
address the major environmental, societal and health challenges that
European cities face.
White Paper,
2011
The paper contains objectives, actions and initiatives for the realization of a
more sustainable transport system till 2050 and indicates intermodal integration
as one of the most important issues of future transport systems.
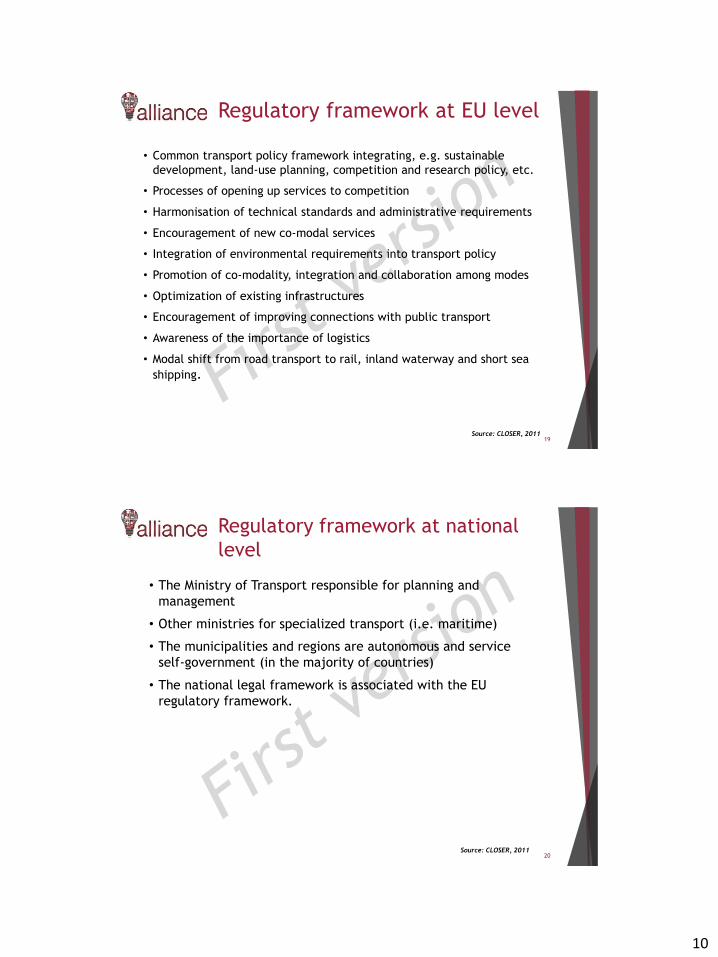
10
Regulatory framework at EU level
19
• Common transport policy framework integrating, e.g. sustainable
development, land-use planning, competition and research policy, etc.
• Processes of opening up services to competition
• Harmonisation of technical standards and administrative requirements
• Encouragement of new co-modal services
• Integration of environmental requirements into transport policy
• Promotion of co-modality, integration and collaboration among modes
• Optimization of existing infrastructures
• Encouragement of improving connections with public transport
• Awareness of the importance of logistics
• Modal shift from road transport to rail, inland waterway and short sea
shipping.
Source: CLOSER, 2011
Regulatory framework at national
level
20Source: CLOSER, 2011
• The Ministry of Transport responsible for planning and
management
• Other ministries for specialized transport (i.e. maritime)
• The municipalities and regions are autonomous and service
self-government (in the majority of countries)
• The national legal framework is associated with the EU
regulatory framework.
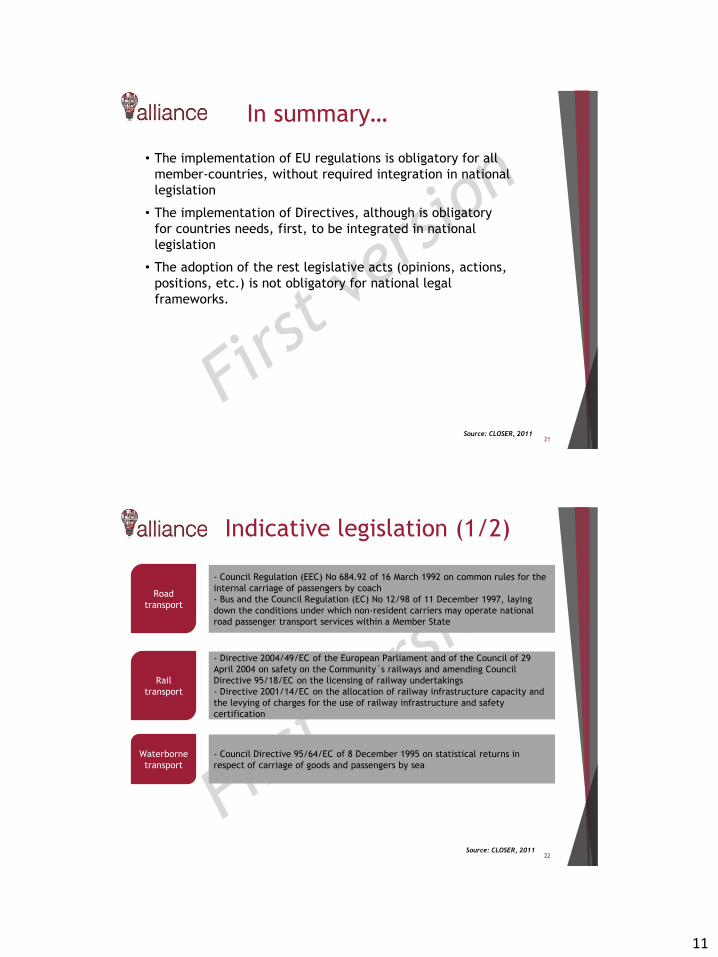
11
In summary…
21Source: CLOSER, 2011
• The implementation of EU regulations is obligatory for all
member-countries, without required integration in national
legislation
• The implementation of Directives, although is obligatory
for countries needs, first, to be integrated in national
legislation
• The adoption of the rest legislative acts (opinions, actions,
positions, etc.) is not obligatory for national legal
frameworks.
Indicative legislation (1/2)
22Source: CLOSER, 2011
- Council Regulation (EEC) No 684.92 of 16 March 1992 on common rules for the
internal carriage of passengers by coach
- Bus and the Council Regulation (EC) No 12/98 of 11 December 1997, laying
down the conditions under which non-resident carriers may operate national
road passenger transport services within a Member State
Road
transport
- Directive 2004/49/EC of the European Parliament and of the Council of 29
April 2004 on safety on the Community´s railways and amending Council
Directive 95/18/EC on the licensing of railway undertakings
- Directive 2001/14/EC on the allocation of railway infrastructure capacity and
the levying of charges for the use of railway infrastructure and safety
certification
Rail
transport
- Council Directive 95/64/EC of 8 December 1995 on statistical returns in
respect of carriage of goods and passengers by sea
Waterborne
transport
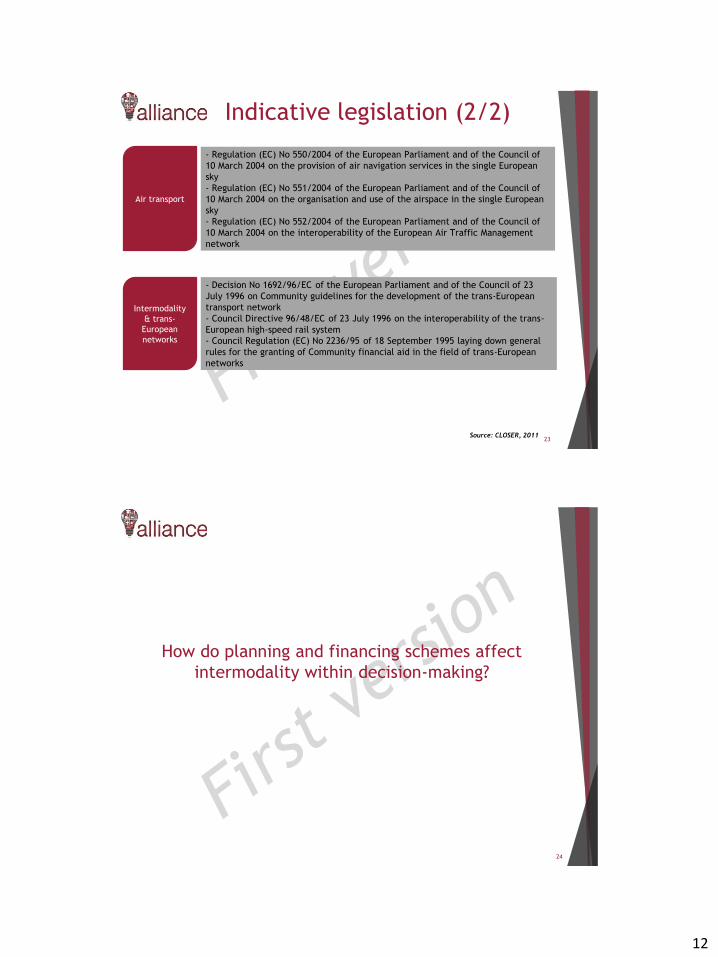
12
Indicative legislation (2/2)
23Source: CLOSER, 2011
- Regulation (EC) No 550/2004 of the European Parliament and of the Council of
10 March 2004 on the provision of air navigation services in the single European
sky
- Regulation (EC) No 551/2004 of the European Parliament and of the Council of
10 March 2004 on the organisation and use of the airspace in the single European
sky
- Regulation (EC) No 552/2004 of the European Parliament and of the Council of
10 March 2004 on the interoperability of the European Air Traffic Management
network
Air transport
- Decision No 1692/96/EC of the European Parliament and of the Council of 23
July 1996 on Community guidelines for the development of the trans-European
transport network
- Council Directive 96/48/EC of 23 July 1996 on the interoperability of the trans-
European high-speed rail system
- Council Regulation (EC) No 2236/95 of 18 September 1995 laying down general
rules for the granting of Community financial aid in the field of trans-European
networks
Intermodality
& trans-
European
networks
How do planning and financing schemes affect
intermodality within decision-making?
24
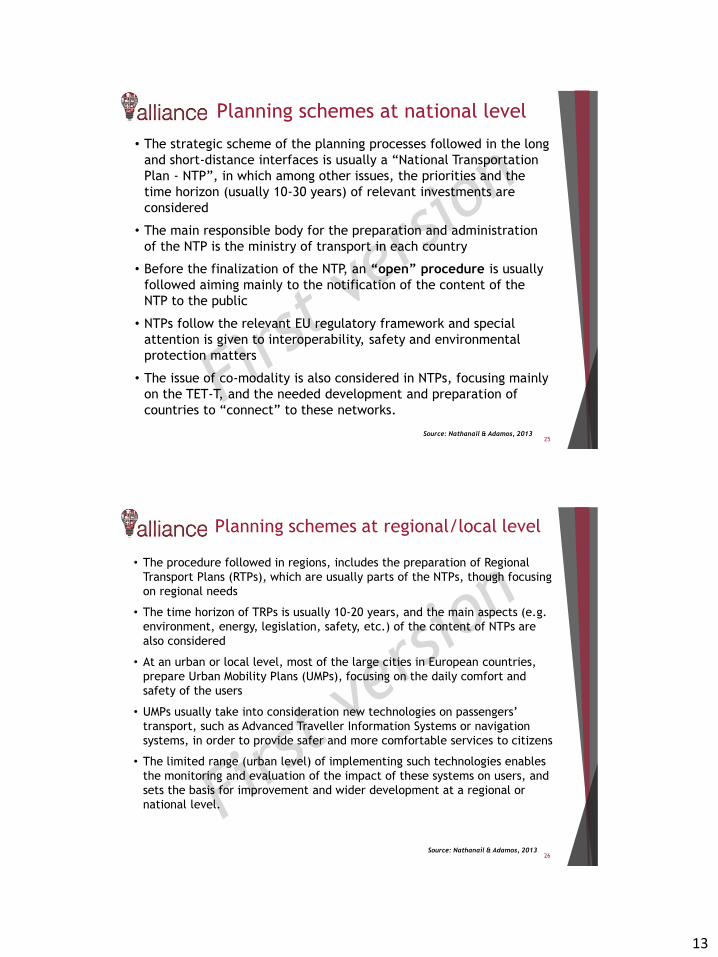
13
Planning schemes at national level
25
• The strategic scheme of the planning processes followed in the long
and short-distance interfaces is usually a “National Transportation
Plan - NTP”, in which among other issues, the priorities and the
time horizon (usually 10-30 years) of relevant investments are
considered
• The main responsible body for the preparation and administration
of the NTP is the ministry of transport in each country
• Before the finalization of the NTP, an “open” procedure is usually
followed aiming mainly to the notification of the content of the
NTP to the public
• NTPs follow the relevant EU regulatory framework and special
attention is given to interoperability, safety and environmental
protection matters
• The issue of co-modality is also considered in NTPs, focusing mainly
on the TET-T, and the needed development and preparation of
countries to “connect” to these networks.
Source: Nathanail & Adamos, 2013
Planning schemes at regional/local level
26Source: Nathanail & Adamos, 2013
• The procedure followed in regions, includes the preparation of Regional
Transport Plans (RTPs), which are usually parts of the NTPs, though focusing
on regional needs
• The time horizon of TRPs is usually 10-20 years, and the main aspects (e.g.
environment, energy, legislation, safety, etc.) of the content of NTPs are
also considered
• At an urban or local level, most of the large cities in European countries,
prepare Urban Mobility Plans (UMPs), focusing on the daily comfort and
safety of the users
• UMPs usually take into consideration new technologies on passengers’
transport, such as Advanced Traveller Information Systems or navigation
systems, in order to provide safer and more comfortable services to citizens
• The limited range (urban level) of implementing such technologies enables
the monitoring and evaluation of the impact of these systems on users, and
sets the basis for improvement and wider development at a regional or
national level.
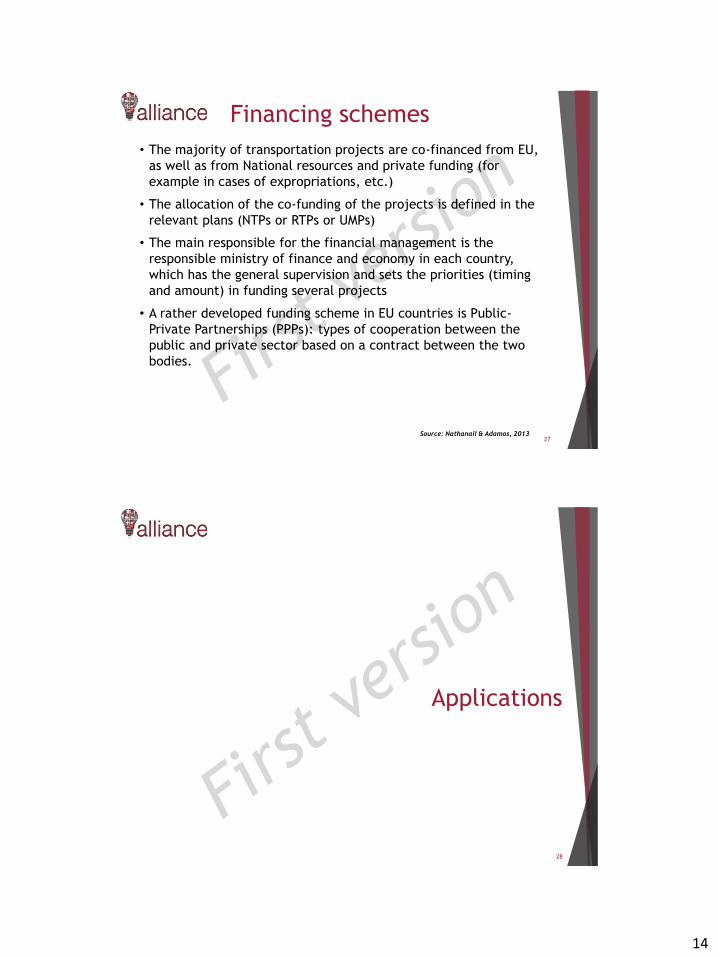
14
Financing schemes
27Source: Nathanail & Adamos, 2013
• The majority of transportation projects are co-financed from EU,
as well as from National resources and private funding (for
example in cases of expropriations, etc.)
• The allocation of the co-funding of the projects is defined in the
relevant plans (NTPs or RTPs or UMPs)
• The main responsible for the financial management is the
responsible ministry of finance and economy in each country,
which has the general supervision and sets the priorities (timing
and amount) in funding several projects
• A rather developed funding scheme in EU countries is Public-
Private Partnerships (PPPs): types of cooperation between the
public and private sector based on a contract between the two
bodies.
Applications
28

15
Ports
29Source: Nathanail & Adamos, 2013
• The port works under a concession
agreement between the state and the
ThPA S.A.
• ThPA S.A. has the exclusive right to use
and exploit land, buildings and
facilities of the port, owned by the
state
• All stages of the planning process are
under the responsibility of the ThPA
S.A., expect from the regulatory
framework, which is under the scope
of the state
• The funding scheme is exclusively
direct investment.
Thessaloniki Port
Authority – ThPA S.A.
• The Norwegian Coastal Administration is the
national agency for coastal management,
maritime safety and communication in Norway
• The initiatives for investments, procurement and
feasibility study are under the responsibility of
national and regional/local authorities
• The technical specifications and the regulatory
framework under national authorities
• The state is involved in all stages, while regional
and local authorities are responsible for
engineering/design, construction, management,
operation/maintenance and control
• The financing scheme is direct investments, and
PPPs in the cases of engineering/design,
construction and operation/maintenance.
Norwegian Coastal
Administration
Airports
30Source: Nathanail & Adamos, 2013
• Oslo Airport LTD and the mother company
Avinor LTD, are responsible for all stages of
planning, excluding operation/maintenance
and regulatory framework, which are under
the authority of the Oslo Airport
• Avinor LTD is responsible for the funding of
land acquisition, engineering/design,
construction and management
• Oslo Airport is involved in
engineering/design, construction,
management, operation/maintenance and
control
• Land acquisition is funded through state
and private loans
• Resources for engineering/design,
construction and management are provided
by the state and private loans and direct
finance from the Oslo Airport.
Oslo airport
Gardermoen
• The exclusive responsibility of initiative for
investments, technical specifications,
procurement and evaluation/selection is
under national authorities
• Feasibility studies, construction and
operation/maintenance is under private
actors
• The regulatory framework is under the scope
of national and regional/local bodies
• National authorities are involved in land
acquisition, construction, management and
control, and PPPs in all stages
• Financing in land acquisition, engineering
and management is direct investment.
Prague airport Ruzyn
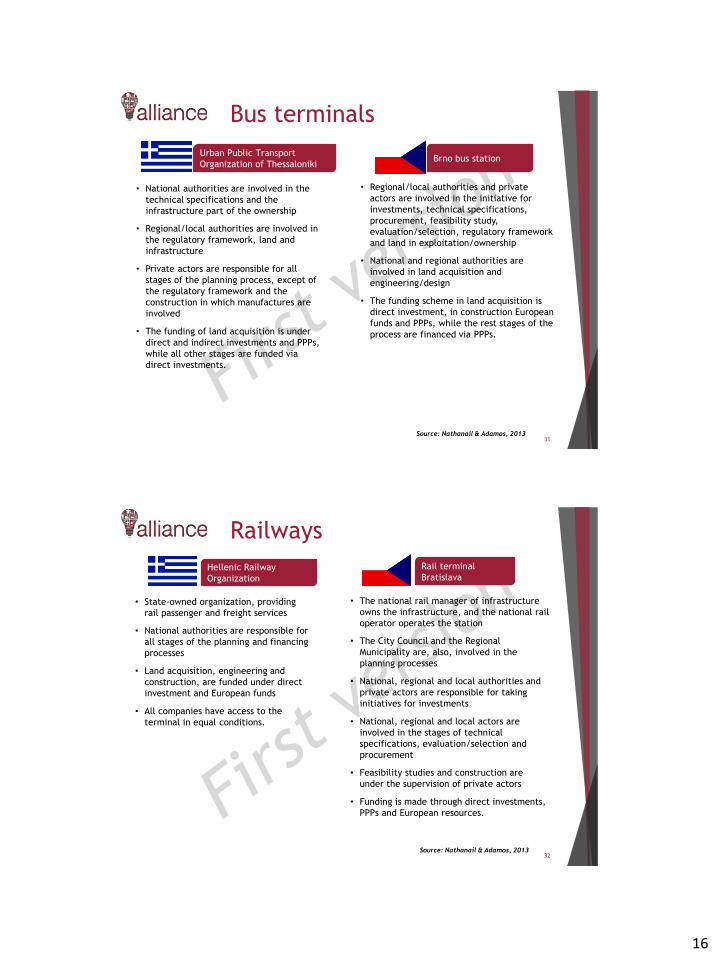
16
Bus terminals
31Source: Nathanail & Adamos, 2013
• National authorities are involved in the
technical specifications and the
infrastructure part of the ownership
• Regional/local authorities are involved in
the regulatory framework, land and
infrastructure
• Private actors are responsible for all
stages of the planning process, except of
the regulatory framework and the
construction in which manufactures are
involved
• The funding of land acquisition is under
direct and indirect investments and PPPs,
while all other stages are funded via
direct investments.
Urban Public Transport
Organization of Thessaloniki
• Regional/local authorities and private
actors are involved in the initiative for
investments, technical specifications,
procurement, feasibility study,
evaluation/selection, regulatory framework
and land in exploitation/ownership
• National and regional authorities are
involved in land acquisition and
engineering/design
• The funding scheme in land acquisition is
direct investment, in construction European
funds and PPPs, while the rest stages of the
process are financed via PPPs.
Brno bus station
Railways
32Source: Nathanail & Adamos, 2013
• State-owned organization, providing
rail passenger and freight services
• National authorities are responsible for
all stages of the planning and financing
processes
• Land acquisition, engineering and
construction, are funded under direct
investment and European funds
• All companies have access to the
terminal in equal conditions.
Hellenic Railway
Organization
• The national rail manager of infrastructure
owns the infrastructure, and the national rail
operator operates the station
• The City Council and the Regional
Municipality are, also, involved in the
planning processes
• National, regional and local authorities and
private actors are responsible for taking
initiatives for investments
• National, regional and local actors are
involved in the stages of technical
specifications, evaluation/selection and
procurement
• Feasibility studies and construction are
under the supervision of private actors
• Funding is made through direct investments,
PPPs and European resources.
Rail terminal
Bratislava
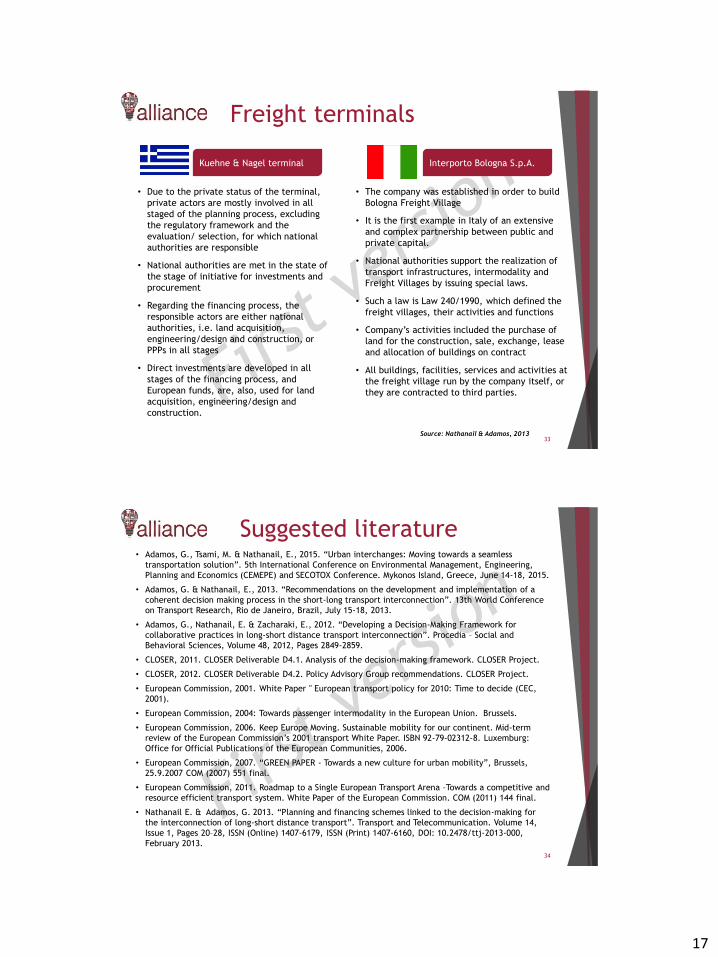
17
Freight terminals
33Source: Nathanail & Adamos, 2013
• Due to the private status of the terminal,
private actors are mostly involved in all
staged of the planning process, excluding
the regulatory framework and the
evaluation/ selection, for which national
authorities are responsible
• National authorities are met in the state of
the stage of initiative for investments and
procurement
• Regarding the financing process, the
responsible actors are either national
authorities, i.e. land acquisition,
engineering/design and construction, or
PPPs in all stages
• Direct investments are developed in all
stages of the financing process, and
European funds, are, also, used for land
acquisition, engineering/design and
construction.
Kuehne & Nagel terminal Interporto Bologna S.p.A.
• The company was established in order to build
Bologna Freight Village
• It is the first example in Italy of an extensive
and complex partnership between public and
private capital.
• National authorities support the realization of
transport infrastructures, intermodality and
Freight Villages by issuing special laws.
• Such a law is Law 240/1990, which defined the
freight villages, their activities and functions
• Company’s activities included the purchase of
land for the construction, sale, exchange, lease
and allocation of buildings on contract
• All buildings, facilities, services and activities at
the freight village run by the company itself, or
they are contracted to third parties.
Suggested literature
34
• Adamos, G., Tsami, M. & Nathanail, E., 2015. “Urban interchanges: Moving towards a seamless
transportation solution”. 5th International Conference on Environmental Management, Engineering,
Planning and Economics (CEMEPE) and SECOTOX Conference. Mykonos Island, Greece, June 14-18, 2015.
• Adamos, G. & Nathanail, E., 2013. “Recommendations on the development and implementation of a
coherent decision making process in the short-long transport interconnection”. 13th World Conference
on Transport Research, Rio de Janeiro, Brazil, July 15-18, 2013.
• Adamos, G., Nathanail, E. & Zacharaki, E., 2012. “Developing a Decision-Making Framework for
collaborative practices in long-short distance transport interconnection”. Procedia – Social and
Behavioral Sciences, Volume 48, 2012, Pages 2849-2859.
• CLOSER, 2011. CLOSER Deliverable D4.1. Analysis of the decision-making framework. CLOSER Project.
• CLOSER, 2012. CLOSER Deliverable D4.2. Policy Advisory Group recommendations. CLOSER Project.
• European Commission, 2001. White Paper " European transport policy for 2010: Time to decide (CEC,
2001).
• European Commission, 2004: Towards passenger intermodality in the European Union. Brussels.
• European Commission, 2006. Keep Europe Moving. Sustainable mobility for our continent. Mid-term
review of the European Commission’s 2001 transport White Paper. ISBN 92-79-02312-8. Luxemburg:
Office for Official Publications of the European Communities, 2006.
• European Commission, 2007. “GREEN PAPER - Towards a new culture for urban mobility”, Brussels,
25.9.2007 COM (2007) 551 final.
• European Commission, 2011. Roadmap to a Single European Transport Arena –Towards a competitive and
resource efficient transport system. White Paper of the European Commission. COM (2011) 144 final.
• Nathanail E. & Adamos, G. 2013. “Planning and financing schemes linked to the decision-making for
the interconnection of long-short distance transport”. Transport and Telecommunication. Volume 14,
Issue 1, Pages 20–28, ISSN (Online) 1407-6179, ISSN (Print) 1407-6160, DOI: 10.2478/ttj-2013-000,
February 2013.
18
References
35
• Adamos, G., Tsami, M. & Nathanail, E., 2015. “Urban interchanges: Moving towards a seamless transportation
solution”. 5th International Conference on Environmental Management, Engineering, Planning and Economics
(CEMEPE) and SECOTOX Conference. Mykonos Island, Greece, June 14-18, 2015.
• Adamos, G. & Nathanail, E., 2013. “Recommendations on the development and implementation of a coherent
decision making process in the short-long transport interconnection”. 13th World Conference on Transport
Research, Rio de Janeiro, Brazil, July 15-18, 2013.
• Adamos, G., Nathanail, E. & Zacharaki, E., 2012. “Developing a Decision-Making Framework for collaborative
practices in long-short distance transport interconnection”. Procedia – Social and Behavioral Sciences, Volume
48, 2012, Pages 2849-2859.
• CLOSER, 2011. CLOSER Deliverable D4.1. Analysis of the decision-making framework. CLOSER Project.
• CLOSER, 2012. CLOSER Deliverable D4.2. Policy Advisory Group recommendations. CLOSER Project.
• European Commission, 2007. “GREEN PAPER- Towards a new culture for urban mobility”, Brussels, 25.9.2007
COM (2007) 551 final.
• European Commission (2009) A sustainable future for transport — Towards an integrated, technology-led and
user-friendly system Luxembourg: Publications Office of the European Union 2009 — 26 pp. — 21 x 29.7 cm ISBN
978-92-79-13114-1.
• Eurostat (population and social conditions), Statistics in Focus No 72/2008; and European Commission,
‘Demography report 2008: Meeting social needs in an ageing society’. SEC(2008) 2911.
• Nathanail E. & Adamos, G. 2013. “Planning and financing schemes linked to the decision-making for the
interconnection of long-short distance transport”. Transport and Telecommunication. Volume 14, Issue 1, Pages
20–28, ISSN (Online) 1407-6179, ISSN (Print) 1407-6160, DOI: 10.2478/ttj-2013-000, February 2013.
• United Nations Population Division (2009), ‘World population prospects — The 2008 revision’.
1
This project has received funding from the European
Union’s Horizon 2020 research and innovation programme
under grant agreement No 692426
Building business models for
intermodal transport
interchanges
Dr.-Ing. Henning Strubelt
Otto von Guericke University Magdeburg, Germany
• Business models
• Stakeholder´s governance models
• Intermodal transport
• Modes of transport
• Interchange zones
• Safety and Security
• Sustainable interchanges
• Ownership structures
• Case study
• Suggested literature
2
ContentGeneral introduction to
and deepening
knowledge of the topic
Exercise: Evaluation of transport modes from
differing perspectives (technological, ecological,
economic). Application of learnings (put
knowledge to work)
Deepening the understanding of application
(fields) and supporting the assessment of
intermodal interchanges. Selection based on
own evaluation. Reasoning & presentation for
discussion
Further knowledge sources
• Summary & critical discussion
Consolidation of newly acquired knowledge
and feedback

2
Business models
3
4
Business models
Definitions:
“A business model describes the value logic of an organization in terms of
how it creates and captures customer value.” [Fielt (2011), p. 3.]
“A business model is the way in which a company generates revenue and
makes a profit from company operations. Analysts use the metric gross profit
as a way to compare the efficiency and effectiveness of a firm's business
model. Gross profit is calculated by subtracting the cost of goods sold from
revenues.” [investopia (n.d.)]
“A business model describes the rationale of how an organization creates,
delivers, and captures value.” [Osterwalder, Pigneur, (2010)]

3
5
Business models
Business model
Partner network
Distribution channels
Value Proposition
Target customer
Customer relationship
Core capabilities
Value proposition
Cost structure
Business model components:
6
Business models
• Good business models are increasingly considered as a reason for
profitable firm growth
• The two primary levers of a company's business model are pricing and
costs
• Driven by the current environmental challenges, the profitability of
established business models is decreasingly sustainable
Need for business model innovation
• Different types of business models:
Localized low-cost business model
Low-budget innovation business model
Community-funded business model
Sustainability-focused business model
Beyond advertising business model
Unlimited niches business model
In-crowd business model

4
Stakeholders’ governance
models
7
Stakeholders’ governance models
8
• Coordinative model:
Continuous efforts in coordination between various parts of the governing
body
The framework is created by governing and governed bodies
The governing body is formed by actors who have the authority to decide
These actors:
Express the public interest
Determine the need for strategic planning
Select best policies and programmes
• Governance through competition:
Originates from political theory, market economy and the pluralist model
of democracy
Considered as a competition between actors of different interests
• Communicative planning:
Process of agreement between all involved stakeholders
Appropriate for the good management and operation of complex
transport infrastructure, such as interchanges.
Source: Di Ciommo, 2004; Martens, 2007
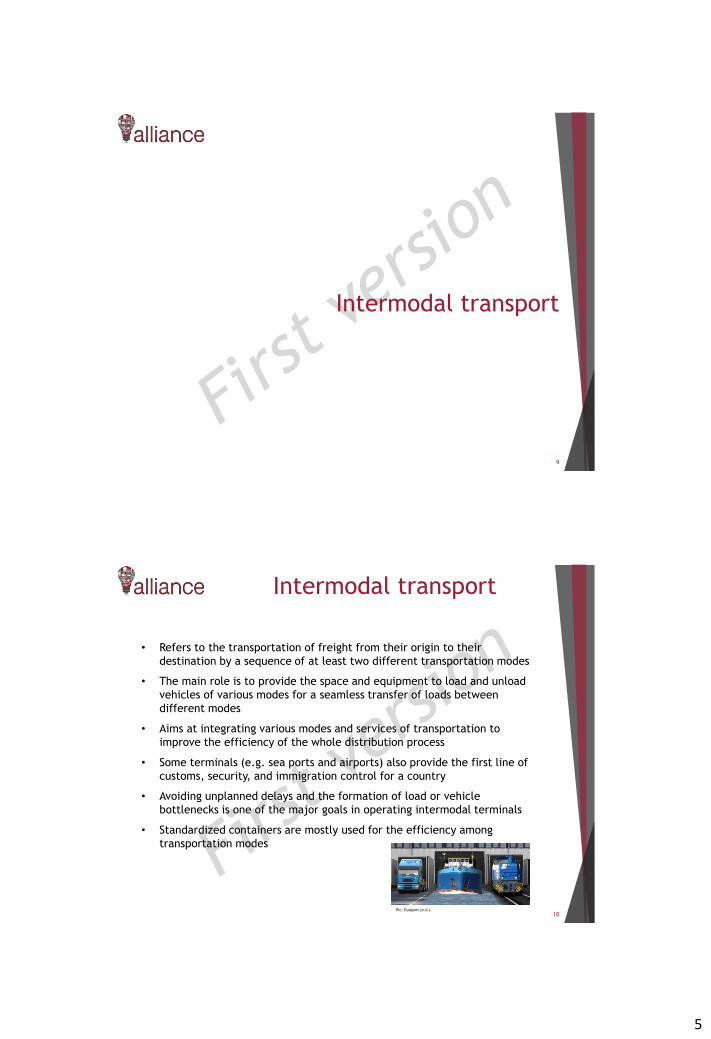
5
Intermodal transport
9
Intermodal transport
10
• Refers to the transportation of freight from their origin to their
destination by a sequence of at least two different transportation modes
• The main role is to provide the space and equipment to load and unload
vehicles of various modes for a seamless transfer of loads between
different modes
• Aims at integrating various modes and services of transportation to
improve the efficiency of the whole distribution process
• Some terminals (e.g. sea ports and airports) also provide the first line of
customs, security, and immigration control for a country
• Avoiding unplanned delays and the formation of load or vehicle
bottlenecks is one of the major goals in operating intermodal terminals
• Standardized containers are mostly used for the efficiency among
transportation modes
Pic: Duisport (n.d.).
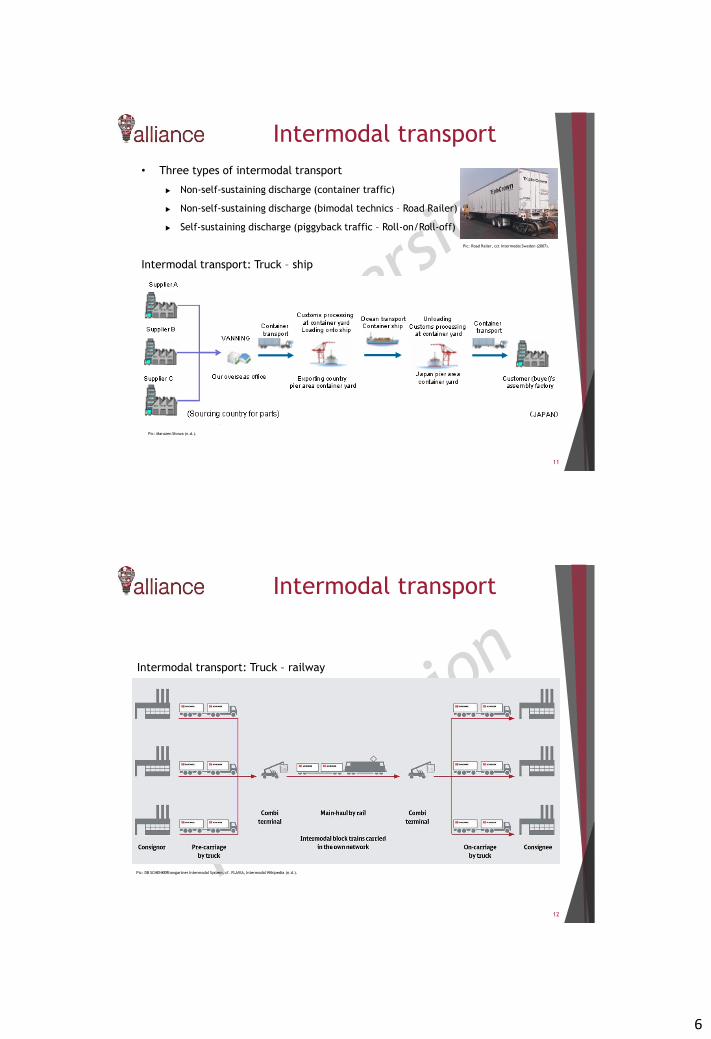
6
Intermodal transport
11
Intermodal transport: Truck – ship
• Three types of intermodal transport
Non-self-sustaining discharge (container traffic)
Non-self-sustaining discharge (bimodal technics – Road Railer)
Self-sustaining discharge (piggyback traffic – Roll-on/Roll-off)
Pic: Maruzen Showa (n.d.).
Pic: Road Railer, cct Intermodal Sweden (2007).
Intermodal transport
12
Intermodal transport: Truck – railway
Pic: DB SCHENKERhangartner Intermodal System, cf. FLAVIA, Intermodal Wikipedia (n.d.).
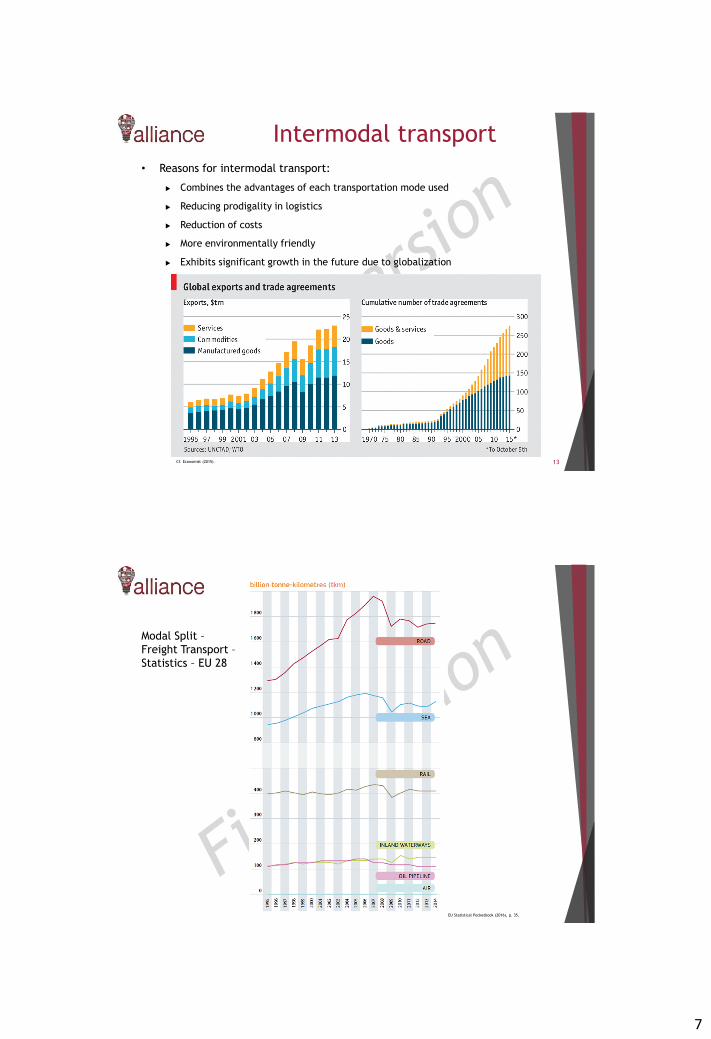
7
Intermodal transport
13
• Reasons for intermodal transport:
Combines the advantages of each transportation mode used
Reducing prodigality in logistics
Reduction of costs
More environmentally friendly
Exhibits significant growth in the future due to globalization
Cf. Economist (2015).
Modal Split –
Freight Transport –
Statistics – EU 28
EU Statistical Pocketbook (2016), p. 35.

8
Intermodal transport
• Comparison of the greenhouse gas emission between different
transportation modes
15Mathers, J.(2015) based on World Economic Forum.
Intermodal transport
16
• Requirements:
Infrastructure
• Airport, water, rails, roads
Standardized containers for more efficiency
• Container reduces potential for damage and theft
• Less transit time of the container
• Ships, railcars and highway chassis are designed for the size of the container
• Container is picked up by the spreader and their twistlocks at the corners
Pic: Full option spreader OCT, VDL
Containersystemen (2012).
Pic: Brinkmann, B. (2005).
Pic: Container spreader Timars C-lift, Timars (n.d.).
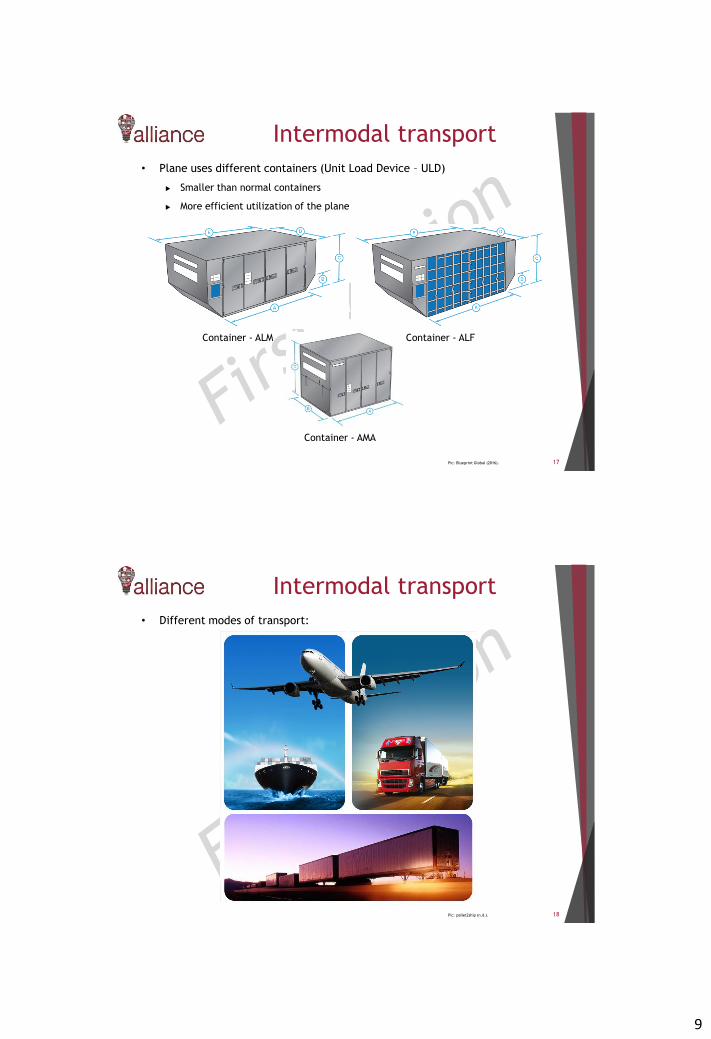
9
Intermodal transport
17
• Plane uses different containers (Unit Load Device – ULD)
Smaller than normal containers
More efficient utilization of the plane
Container - ALFContainer - ALM
Container - AMA
Pic: Blueprint Global (2016).
Intermodal transport
18
• Different modes of transport:
Pic: pallet2ship (n.d.).

10
19
Ship
Railway
Truck
Advantages:
- Flexibility
- Infrastructure exists
- Speed
Disadvantages:
- Increasing traffic
- High costs
Plane
Modes of transport
Advantages:
- High volume of cargo
- Low prices
- High transport safety
- Ecologically friendly
Disadvantages:
- Low speed
- Infrastructure (transport on
rivers)
Advantages:
- International transport
- Flexibility & Reliability
- Speed
Disadvantages:
- Price for transport
- Cargo capacity
- Pollution
Advantages:
- Ecologically friendly
- High transport safety
Disadvantages:
- Poor infrastructure
- Priority of passenger
transportation
20
Modes of transport
Truck RailInland
vesselShip Plane
Transport
time
Adherence to
schedule
Transport
costs
Flexibility
Infrastructure
Exercise
Legend: very well awfully bad
Cf. Pfohl, H.C. (2010), p. 156.
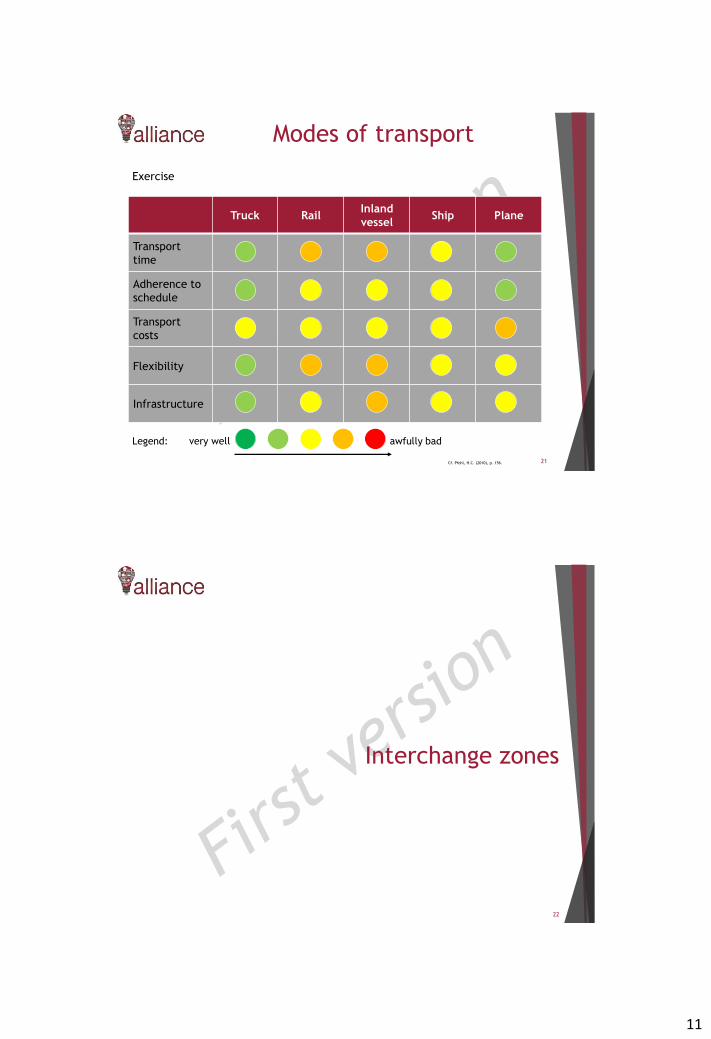
11
21
Modes of transport
Truck RailInland
vesselShip Plane
Transport
time
Adherence to
schedule
Transport
costs
Flexibility
Infrastructure
Exercise
Legend: very well awfully bad
Cf. Pfohl, H.C. (2010), p. 156.
Interchange zones
22

12
Interchange zones
23
• An interchange zone is a facility designed for the loading and unloading of
containers and trailers from a transportation mode to another
transportation mode
• It protects the function of interchanges by maximizing the capacity of the
interchanges for safe movement from the mainline highway facility and
provides safe and efficient operation between connecting roadways
• Most of the time only for two or three modes of transport – depends on
the surrounding environment
• Goals at an interchange zone:
Reduce the waiting time for trucks, rails, planes and ships to a minimum
Container loading as fast as possible
Reduction of warehouse capacity
24
• Used vehicles for loading processes:
Reach Stacker Lift AGV
Straddle Carrier
AGV
Interchange zones
Cargo & Container LoaderMobile truck
Pic: Kalmar industries (2010).
Pic: Reach Stacker C 4026-4535 CH, Linde (n.d.).
Pic: Delticgroup (2012).
Pic: Terex Gottwald Lift AGV, Terex (n.d.).Pic: AGV, Terex (n.d.).
Pic: MOBILER, Rail Cargo Austria, Verkehrsrundschau (2012).
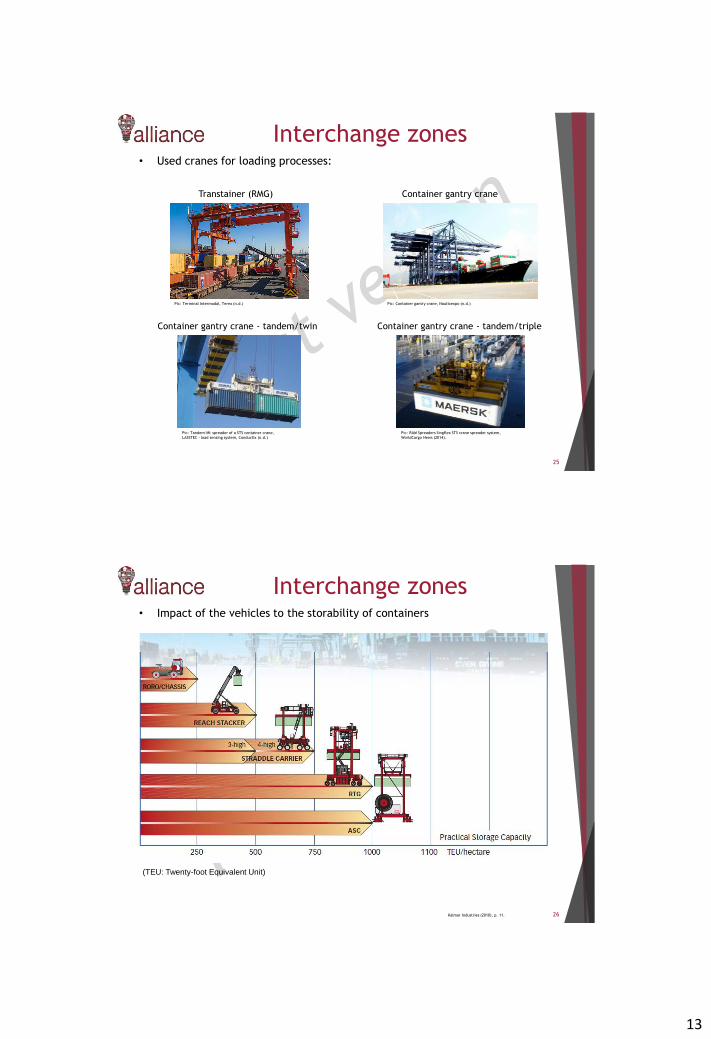
13
25
• Used cranes for loading processes:
Container gantry crane
Container gantry crane - tandem/tripleContainer gantry crane - tandem/twin
Interchange zones
Transtainer (RMG)
Pic: Terminal Intermodal, Terex (n.d.) Pic: Container gantry crane, Nauticexpo (n.d.)
Pic: Tandem lift spreader of a STS container crane,
LASSTEC - load sensing system, Conductix (n.d.)
Pic: RAM Spreaders Singflex STS crane spreader system,
WorldCargo News (2014).
26
• Impact of the vehicles to the storability of containers
(TEU: Twenty-foot Equivalent Unit)
Interchange zones
Kalmar Industries (2010), p. 11.
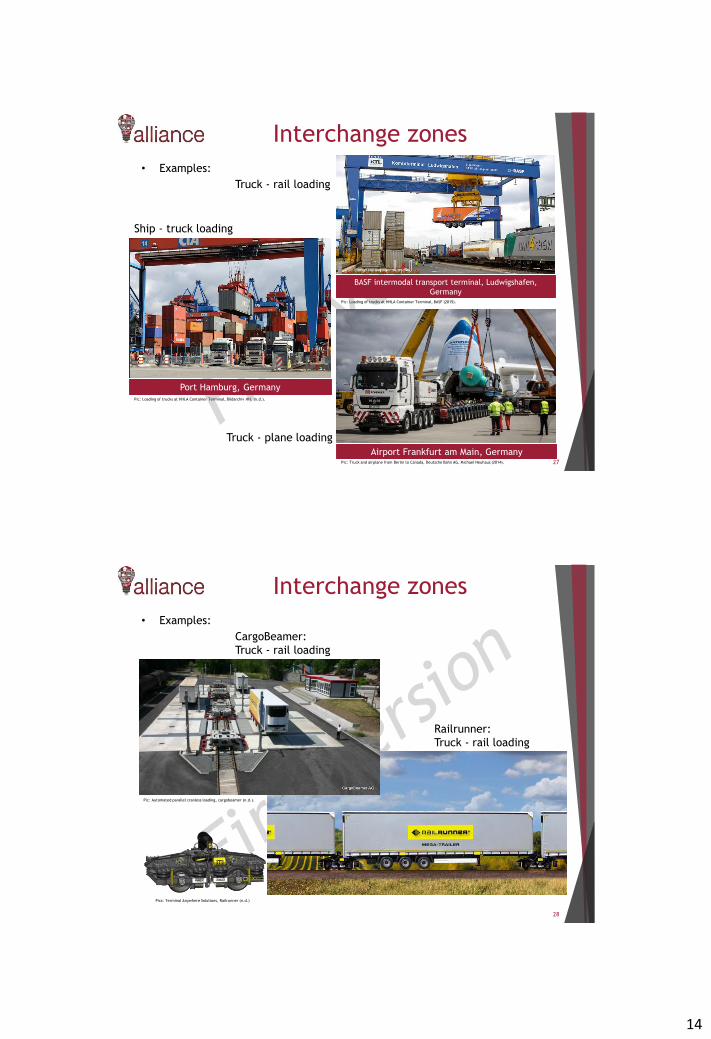
14
• Examples:
BASF intermodal transport terminal, Ludwigshafen,
Germany
Port Hamburg, Germany
Ship - truck loading
Truck - rail loading
Airport Frankfurt am Main, Germany
Truck - plane loading
Interchange zones
Pic: Loading of trucks at HHLA Container Terminal, Bildarchiv HH. (n.d.).
Pic: Loading of trucks at HHLA Container Terminal, BASF (2015).
Pic: Truck and airplane from Berlin to Canada, Deutsche Bahn AG, Michael Neuhaus (2014). 27
• Examples:
CargoBeamer:
Truck - rail loading
Interchange zones
Pic: Automated parallel cranless loading, cargobeamer (n.d.).
28
Railrunner:
Truck - rail loading
Pics: Terminal Anywhere Solutions, Railrunner (n.d.)
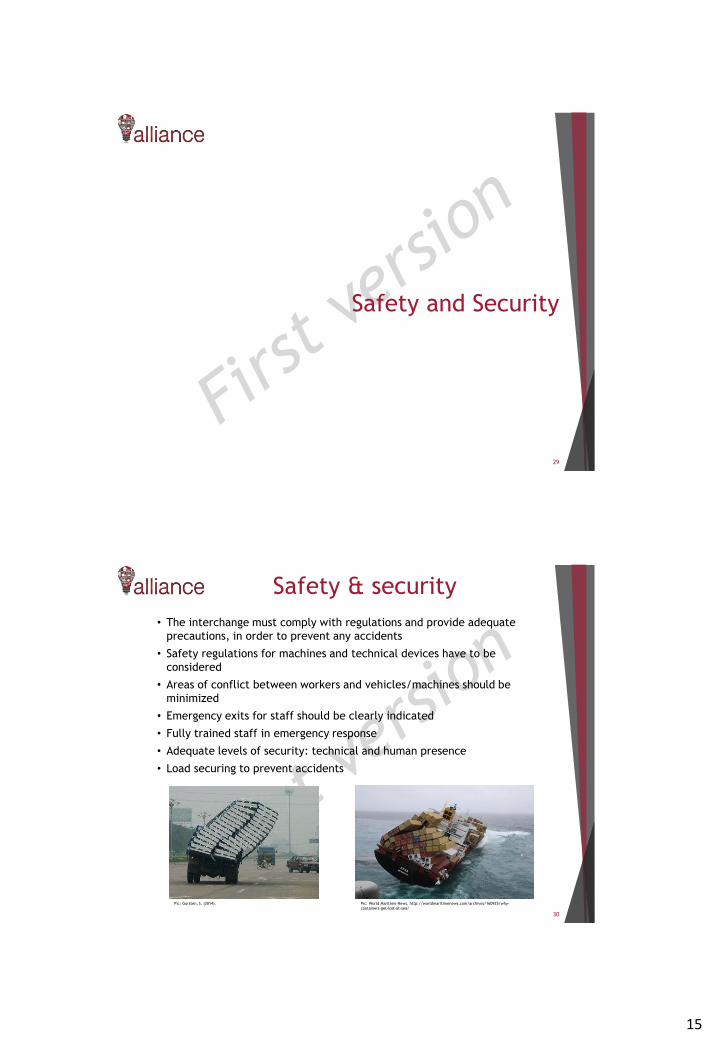
15
Safety and Security
29
Safety & security
30
• The interchange must comply with regulations and provide adequate
precautions, in order to prevent any accidents
• Safety regulations for machines and technical devices have to be
considered
• Areas of conflict between workers and vehicles/machines should be
minimized
• Emergency exits for staff should be clearly indicated
• Fully trained staff in emergency response
• Adequate levels of security: technical and human presence
• Load securing to prevent accidents
Pic: World Maritime News, http://worldmaritimenews.com/archives/160925/why-
containers-get-lost-at-sea/
Pic: Gursten, S. (2014).

16
Sustainable interchanges
31
Sustainable interchanges
32
• Three pillars of sustainable development
Cf. PennState University, Credits:Mark Fedkin. Adopted from the University of Michigan Sustainability Assessment [Rodriguez et al., 2002]
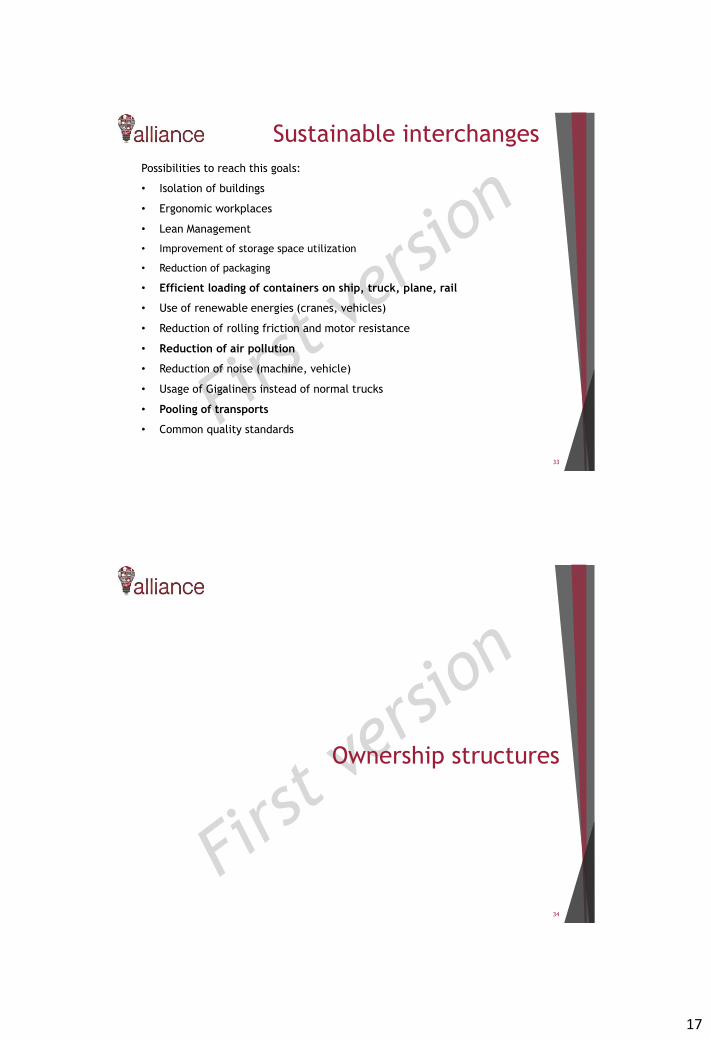
17
Sustainable interchanges
33
Possibilities to reach this goals:
• Isolation of buildings
• Ergonomic workplaces
• Lean Management
• Improvement of storage space utilization
• Reduction of packaging
• Efficient loading of containers on ship, truck, plane, rail
• Use of renewable energies (cranes, vehicles)
• Reduction of rolling friction and motor resistance
• Reduction of air pollution
• Reduction of noise (machine, vehicle)
• Usage of Gigaliners instead of normal trucks
• Pooling of transports
• Common quality standards
Ownership structures
34
18
Ownership structures
35
• Ownership at interchanges is directly associated with the financing scheme
and the arrangements of the initial investments and operations
• Common ownership structures:
Publicly owned and maintained interchanges
Privately owned and maintained interchanges
Public-private partnerships
• The most profitable operating models include public ownership of assets
• Concession agreements with private companies can generate the required
management efficiency
• The sell-off of assets by public sector actors can generate one-time
revenues, but they are not an answer to ongoing maintenance and
operating cost recovery in the long run.
Source: City-HUB, 2013
Main principles for ownership structures
36
• Closer interaction between the public and private sectors is needed,
since there are opportunities for commercially successful utilization of
the available space in the interchanges for services provided by the
private sector
• Partnerships with the private sector could introduce business models,
which can complement the skills of the public sector
• There is a variety of different business models that can be used to
operate and manage the facility, and this is guided by local/national
regulations, but there are also opportunities for an international
knowledge and experience transfer.
Source: City-HUB, 2013

19
Case study
37
Case study
38
Railport:
A railport or rail cargo logistics center is a multifunctional logistics location with direct rail link in order to connect several transport modes. Due to its dominant position within the transport system, this is usually road transport with connections to the highway network and direct access to the distribution network in the catchment area. It is also possible and reasonable to provide connections to inland waterways, airports, and pipeline networks.
Deutsche Bahn AG and its transport and logistics department DB Schenker pursue the idea of offering their customers an integrated door-to-door service by making use of these multifunctional and multimodal rail logistics centers throughout Europe. The development of this concept was triggered by the idea of more deeply integrating the railroad system in order to unlock new logistics potential. This also helps decongest the road infrastructure and thus decreases the ecological impact by using eco-friendly modes of transport. Railports are mostly built in the vicinity of already existing freight depots or cargo terminals.
Railports offer the possibility of transshipping and storing many different types of goods:
Units of combined cargo traffic (e.g. container, swap bodies, trailers)
Cranable large-sized goods (e.g. steel products, pipes, wood, machines)
General cargo (e.g. palletized goods, paper rolls, furniture)
However, the services offered at railports go much beyond the mere storage and transshipment of goods. Goods also need to be prepared for on-carriage and distribution throughout the region. This involves services such as picking, inventory management, quality checks, clearing, and delivery or collection of the goods to the region or from the region.
Cf. Gleissner, Fermerling (2013), p. 46.
20
Case study
39
Exercise:
Design a transportation system for this case study with different
transportation modes in strict accordance to the used technical
vehicles/machine at the loading processes between the transportation
modes.
Furthermore, the aspect of sustainability and the costs of the interchange
zone should be considered.
Suggested literature
40
21
Suggested literature
41
• Comtois, C. and B.P.Y. Loo (2015): Sustainable Railway Futures: Issues and Challenges,Transport and Mobility Series, London: Ashgate.
• Crainic, T. G., Kim, K. H. (2007): Intermodal Transportation, In: TransportationAmsterdam, Elsevier North-Holland, pp. 467-537.
• Dudek, G., Stadtler, H. (2005): Negotiation-based collaborative planning between supplychain partners. European Journal of Operational Research, 163, pp 668–687.
• Gleissner, H., Femerling, J. C. (2013): Logistics : Basics - Exercises - Case Studies,Springer, Cham.
• Lun, Y.H., Lai, K.H., Cheng, E. (2010): shipping and logistics management, Springerpublishing.
• Muller, G. (1999): Intermodal Freight Transportation, 4th Edition, Eno TransportationFoundation
• Osterwalder, A., Pigneur, Y. (2010): Business Model Generation: A Handbook forVisionaries, Game Changers, and Challengers, Wiley & Sons, Hoboken, NJ.
• Piotrowicz, W., Cuthbertson, R. (2015): Supply chain design and management foremerging markets: learning from countries and regions, Springer International Publishing.
• Puettmann, C. (2010): Collaborative Planning in Intermodal Freight Transportation,Gabler Verlag.
• Rodrigue, J.-P., Slack, B., Comtois, C. (2013): Transportation Modes, Modal Competitionand Modal Shift, In: The Geography of Transport Systems, 3rd ed., New York: Routledge.
• Trapp. M. (2014): Realizing Business Model Innovation: A Strategic Approach for BusinessUnit Managers, Springer Fachmedien, Wiesbaden.
References (1/4)
42
• Bildarchiv HH (n.d.): HHLA Container Terminal Hamburg Altenwerder, Beladung von LKW mit Containern,
available online at: http://www.bildarchiv-
hamburg.de/folders/HHLA%20Container%20Terminal%20Hamburg%20Altenwerder%20(%20CTA%20)/0480-
0241_Beladung-von-LKW-mit-Containern.jpg , (accessed on 16 Sep. 2016).
• BASF (2015): Intermodal transport – the key to reducing emissions in logistics, We take a holistic view:
Reducing emissions along the value chain, available online at:
https://www.basf.com/us/en/company/sustainability/environment/energy-and-climate-
protection/reducing-emission-along-the-value-chain.html, (accessed 10 Oct. 2016).
• Blueprint Global (2016): ULD - Unit Load Device, Container, available online at: http://www.blueprint-
global.com.au/bp/index.php?option=com_content&view=article&id=20&Itemid=4#AMA, (accessed 24 Sep. 2016).
• Brinkmann, B. (2005): Seehäfen, Planung und Entwurf, Springer, Berlin.
• cargobeamer (n.d.): Waggonaufsaetze, automatisierte parallele kranlose Verladung von Sattelauflieger, available
online at: http://www.cargobeamer.com/Waggonaufsaetze-848768.html?src7939743=4#src7939743, (accessed 10
Oct. 2016).
• cct Intermodal Sweden (2007): Road Railer, available online at:
http://cctim.se/english/road-railer-e.html, (accessed 16 Sep. 2016).
• Conductix (n.d.): Tandem lift spreader of a STS container crane, LASSTEC - load sensing system, available online
at: http://www.conductix.com/de/produktgruppen/lasstec-twistlock-lastmesssystem#, (accessed 10 Oct. 2016).
• Delticgroup (2012): Self Propelled Cargo Pallet and Container Transporter/Loader
http://www.delticgroup.com/selfpropelledcargopallet.html, (accessed 26 Sep. 2016).
22
References (2/4)
43
• Deutsche Bahn AG (2015): DB Schenker bringt 141-Tonnen-Zylinder von Berlin nach Kanada, Foto: Michael
Neuhaus, available online at: http://www.presseportal.de/pm/31465/2770003, (accessed 10 Oct. 2016).
• Duisport (n.d.): Logistische Dienstleistungen, Der beste Weg ist ein effizientes Transportkonzept, available online
at: http://www.duisport.de/dienstleistungen/verkehr-und-logistische-dienstleistungen/intermodale-
transportkonzepte.html, (accessed 10 Oct. 2016).
• Economist (2015): Global trade, in graphics - Why everyone is so keen to agree new trade deals, The
Economist Newspaper, available online at: http://www.economist.com/blogs/
graphicdetail/2015/10/global-trade-graphics, (accessed 16 Sep. 2016).
• EU Statistical Pocketbook (2016): EU Transport in Figures, Mobility and Transport, Publications Office of the
European Union, Luxembourg, available online at: http://ec.europa.eu/transport/facts-
fundings/statistics/pocketbook-2016_en, (accessed 10 Oct. 2016).
• Fielt, E. (2011): Business Model Definition. Business Service Management, Smart Services CRC Pty Ltd., Vol. 3.
• FLAVIA (n.d.): Freight and Logistics Advancement in Central/South-East Europe - Validation of trade and
transport processes, Implementation and Application, Intermodal Wikipedia, available online at:
http://www.th-wildau.de/flavia/dokuwiki/doku.php/start, (accessed 16 Sep. 2016).
• Gleissner, H., Femerling, J. C. (2013): Logistics : Basics - Exercises - Case Studies, Springer, Cham.
• Gursten, S. (2014): What do lawyers handling load shift truck accident cases need to know?, Truck Accident -
Attorneys Roundtable, available online at: http://www.truckaccidentattorneysroundtable.com/blog/load-shift-
truck-accident-cases, (accessed 10 Oct. 2016).
• Investopedia (n.d.): Business Model, available online at:
http://www.investopedia.com/terms/b/businessmodel.asp, (accessed 26 Sep. 2016).
References (3/4)
44
• Kalmar Industries (2010): Kalmar container handling systems, Complete range of products and knowhow,
available online at: http://www.portmizer.com/download/Container%20Handling%20Systems%20brochure.pdf,
(accessed 28 Sep. 2016).
• Linde (n.d.): Linde Material Handling, Reach Stacker C 4026-4535 CH, available online at: http://www.linde-
world.de/mh-products/start.view?dealer=1&app=Stapeln&range=C+4026-
4535+CH&context=uk&rangeIndex=0&l=de&ippId=p_c4026-4535&type=Reach+Stacker, (accessed 10 Oct. 2016).
• Maruzen Showa (n.d.): Intermodal Transport, Buyer`s Consolidation Diagram, available online at:
http://www.maruzenshowa.co.jp/en/service/global_logistics/combined_transport.html, (accessed 22 Sep.
2016).
• Mathers, J. (2015): To Drive Down CO2 Emissions, Focus on Freight, Environmental Defense Fund, available
online at: http://business.edf.org/blog/2015/02/11/to-drive-down-co2-emissions-focus-on-freight/, (accessed
10 Sep. 2016).
• Nauticexpo (n.d.): Terminal Equipment, available online at: http://www.nauticexpo.com/cat/terminal-
equipment-BB.html, (accessed 26 Sep. 2016).
• Osterwalder, A., Pigneur, Y. (2010): Business Model Generation: A Handbook for Visionaries, Game Changers, and
Challengers, Wiley & Sons, Hoboken, NJ.
• pallet2ship (n.d.): Freight Transportation Modes, available online at: http://www.pallet2ship.co.uk/blog-
entry.php?article=55, (accessed 26 Sep. 2016).
• PennState University (n.d.): Sustainability Definitions, Three Pillars of Sustainability, Credit: Mark Fedkin.
Adopted from the University of Michigan Sustainability Assessment [Rodriguez et al., 2002], available online at:
https://www.e-education.psu.edu/eme807/node/575, (accesssed 11 Oct. 2016).
23
References (4/4)
45
• Pfohl, H.C. (2010): Logistiksysteme, Betriebswirtschaftliche Grundlagen, Springer, Cham.
• Railrunner (n.d.): Terminal Anywhere Solution, Intermediate Rail Unit, available online at:
http://railrunner.com/terminal-anywhere-solution/intermediate-rail-unit/, (accessed 10 Oct. 2016).
• Terex (n.d.): Terex Port Solutions, available online at: http://www.terex.com/port-solutions/en/, (accessed 26
Sep. 2016).
• Timars (n.d.): Container spreaders, Container spreader Timars C-lift, available online at:
http://www.timars.se/container_spreader_timars_c-lift.htm, (accessed 26 Sep. 2016).
• Verkehrsrundschau (2012): Rail Cargo Austria forciert Mobiler-Verkehr, Mobiler-System, available online at:
www.verkehrsrundschau.de/rail-cargo-austria-forciert-mobiler-verkehr-1110922.html, (accessed 16 Sep. 2016).
• VDL Containersystemen (2012): Full option spreader für OCT, available online at:
http://www.vdlcontainersystemen.com/?news/973322/Full+option+Spreader+f%C3%BCr+OCT.aspx#.V__
wh8m1TC4, (accessed 26 Sep. 2016).
• WorldCargo News (2014): London Gateway handles twin 40fts, available online at:
http://www.worldcargonews.com/htm/w20140123.730347.htm, (accessed 10 Oct. 2016).
• City-HUB, 2013. City-HUB Deliverable D4.1. Integrated management of efficient urban interchanges.
• Di Ciommo, F. 2004. La regιnιration urbaine ΰ Naples, Paris et Milan: la fiabilitι du politique, condition de
participation des acteurs ιconomiques. PhD. Thesis. Marne-la-Vallιe, ENPC. http://www.theses.fr/2004ENPC0443
• Martens, K. 2007. In G. De Roo and G. Porter (Eds), Actors in a fuzzy governance environment. Fuzzy
Planning:The Role of Actors in a Fuzzy Governance Environment, Burlington, VT: Ashgate.
1
This project has received funding from the European
Union’s Horizon 2020 research and innovation programme
under grant agreement No 692426
Sustainable
development and
transportation planningUniversity of Thessaly, Greece
1. Transportation planning principles
2. Planning process
3. Forecasting methodologies
4. Transport impacts
5. Sustainability assessment
6. Smart solutions in sustainable transport planning
7. Sustainable urban development and mobility plans
8. Environmental impact assessment
9. Suggested literature
Content
2
2
Transportation planning
principles
3
General
Planning Process of deciding what to do and how to do it
Planning at many levels Community land use and transport
planning
Planners Professionals who facilitate decision-making
Planners Support decision-makers (managers, public
officials, citizens) by coordinating information and activities
Role Create a logical, systematic decision-making process
that results in the best actions.
4
Reference: http://www.vtpi.org/planning.pdf
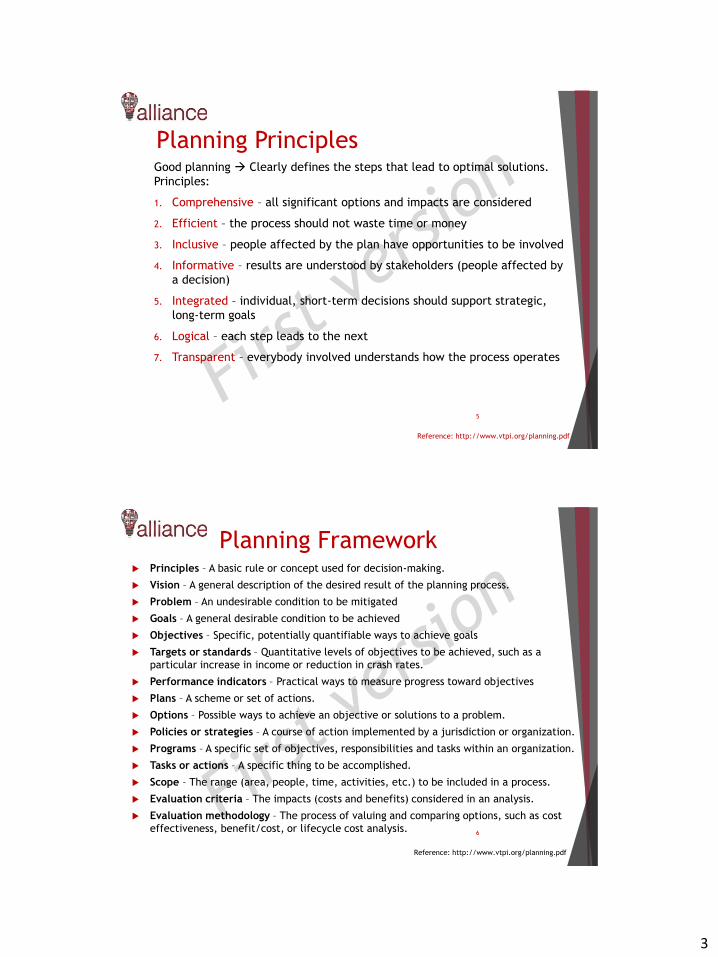
3
Planning PrinciplesGood planning Clearly defines the steps that lead to optimal solutions.
Principles:
1. Comprehensive – all significant options and impacts are considered
2. Efficient – the process should not waste time or money
3. Inclusive – people affected by the plan have opportunities to be involved
4. Informative – results are understood by stakeholders (people affected by
a decision)
5. Integrated – individual, short-term decisions should support strategic,
long-term goals
6. Logical – each step leads to the next
7. Transparent – everybody involved understands how the process operates
5
Reference: http://www.vtpi.org/planning.pdf
Planning Framework Principles – A basic rule or concept used for decision-making.
Vision – A general description of the desired result of the planning process.
Problem – An undesirable condition to be mitigated
Goals – A general desirable condition to be achieved
Objectives – Specific, potentially quantifiable ways to achieve goals
Targets or standards – Quantitative levels of objectives to be achieved, such as a
particular increase in income or reduction in crash rates.
Performance indicators – Practical ways to measure progress toward objectives
Plans – A scheme or set of actions.
Options – Possible ways to achieve an objective or solutions to a problem.
Policies or strategies – A course of action implemented by a jurisdiction or organization.
Programs – A specific set of objectives, responsibilities and tasks within an organization.
Tasks or actions – A specific thing to be accomplished.
Scope – The range (area, people, time, activities, etc.) to be included in a process.
Evaluation criteria – The impacts (costs and benefits) considered in an analysis.
Evaluation methodology – The process of valuing and comparing options, such as cost
effectiveness, benefit/cost, or lifecycle cost analysis.6
Reference: http://www.vtpi.org/planning.pdf
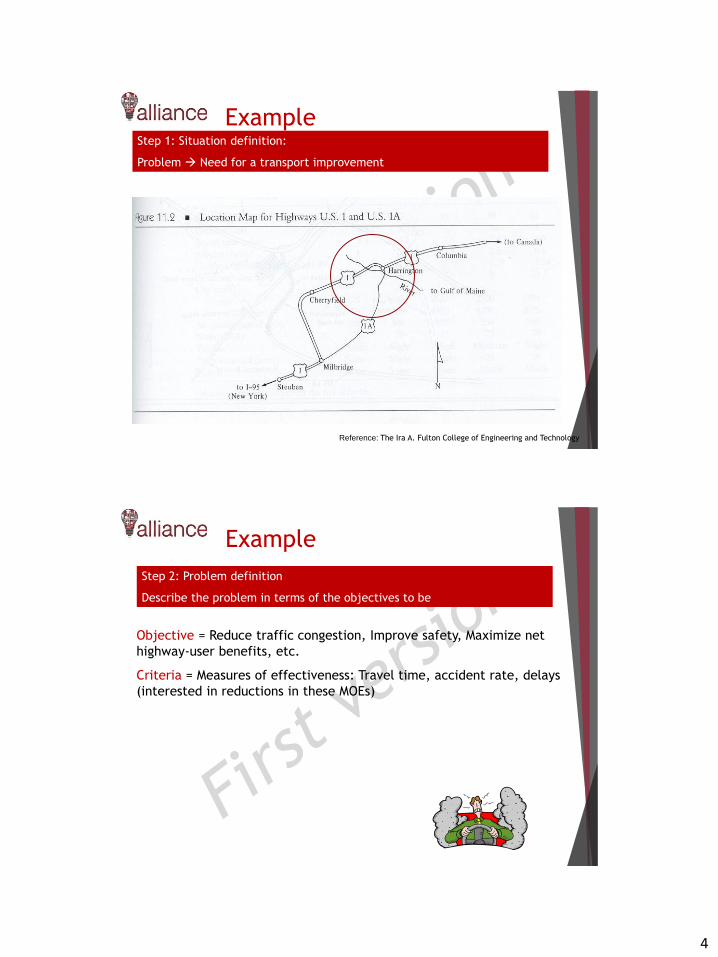
4
ExampleStep 1: Situation definition:
Problem Need for a transport improvement
Reference: The Ira A. Fulton College of Engineering and Technology
Objective = Reduce traffic congestion, Improve safety, Maximize net
highway-user benefits, etc.
Criteria = Measures of effectiveness: Travel time, accident rate, delays
(interested in reductions in these MOEs)
Step 2: Problem definition
Describe the problem in terms of the objectives to be
Example
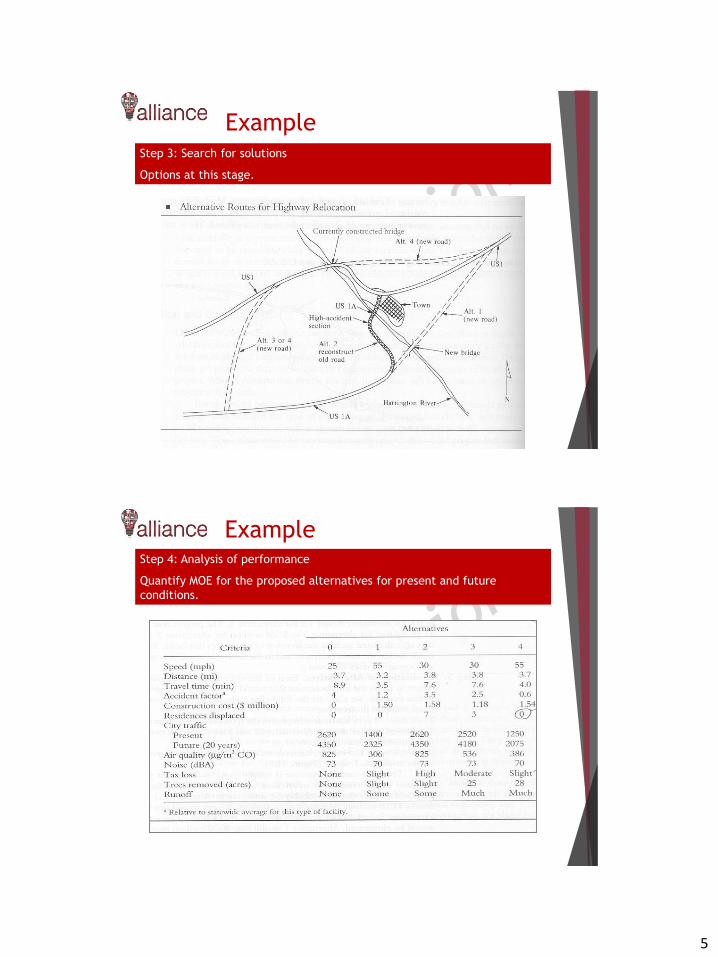
5
Step 3: Search for solutions
Options at this stage.
Example
Step 4: Analysis of performance
Quantify MOE for the proposed alternatives for present and future
conditions.
Example

6
Step 5: Ranking of alternatives (in terms of MOE)
Example
Multi-objective evaluation
problem.
Cost-wise best
Improvement-wise superior
Improves this
way
Improves this
way
Step 6: Evaluation
Estimate criteria and compare alternatives
Example
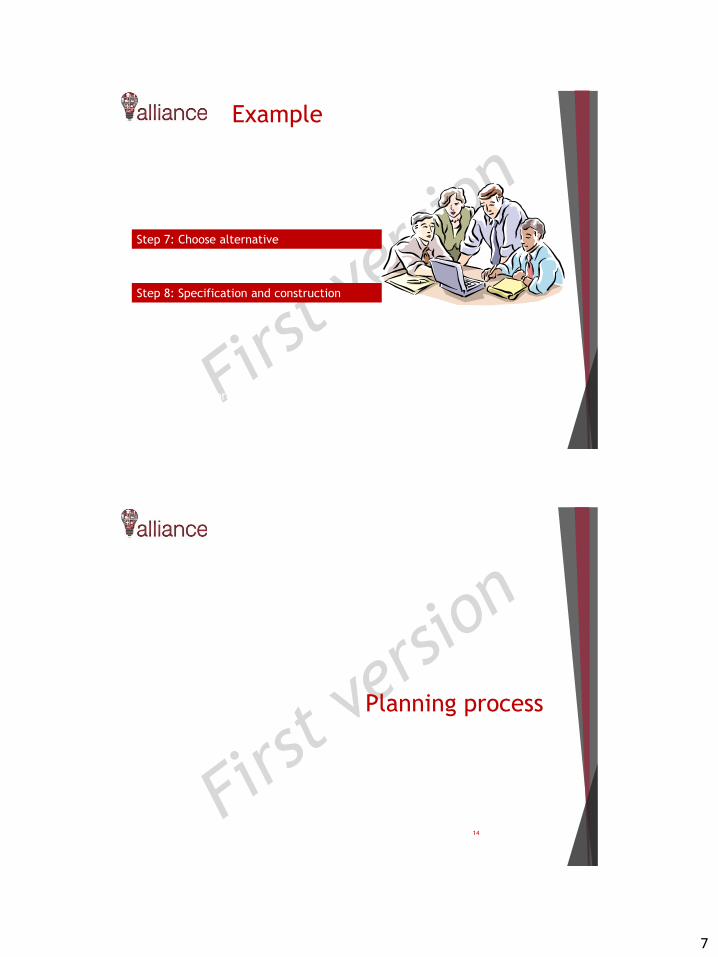
7
Once the project has been chosen, a detailed design phase is begun, in
which each of the components of the facility is specified.
Step 7: Choose alternative
Step 8: Specification and construction
Example
Planning process
14
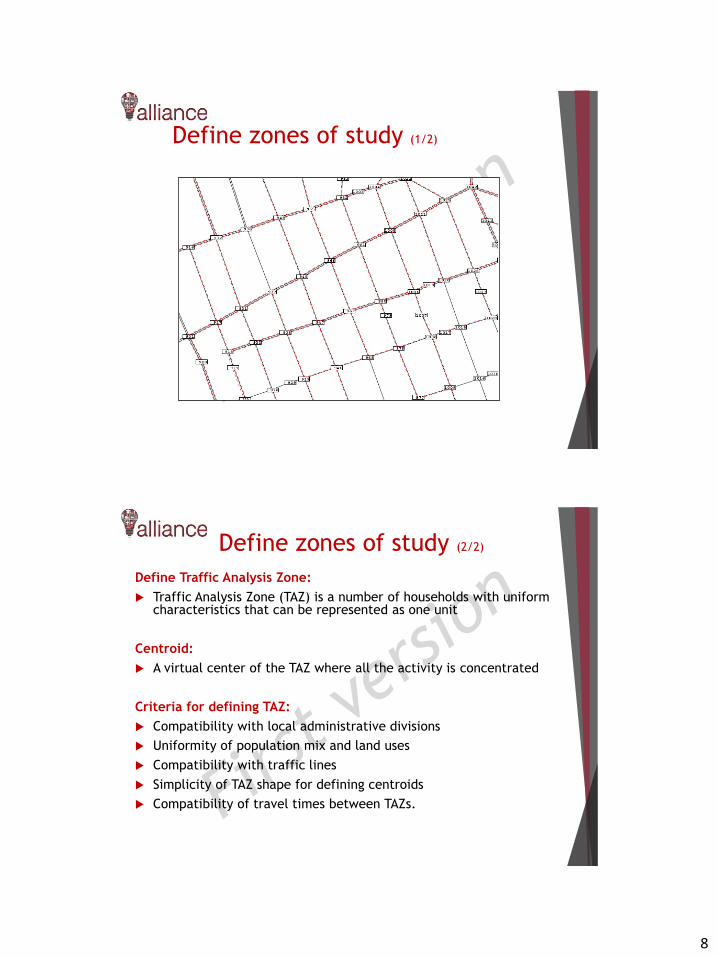
8
Define zones of study (1/2)
Define Traffic Analysis Zone:
Traffic Analysis Zone (TAZ) is a number of households with uniformcharacteristics that can be represented as one unit
Centroid:
A virtual center of the TAZ where all the activity is concentrated
Criteria for defining TAZ:
Compatibility with local administrative divisions
Uniformity of population mix and land uses
Compatibility with traffic lines
Simplicity of TAZ shape for defining centroids
Compatibility of travel times between TAZs.
Define zones of study (2/2)
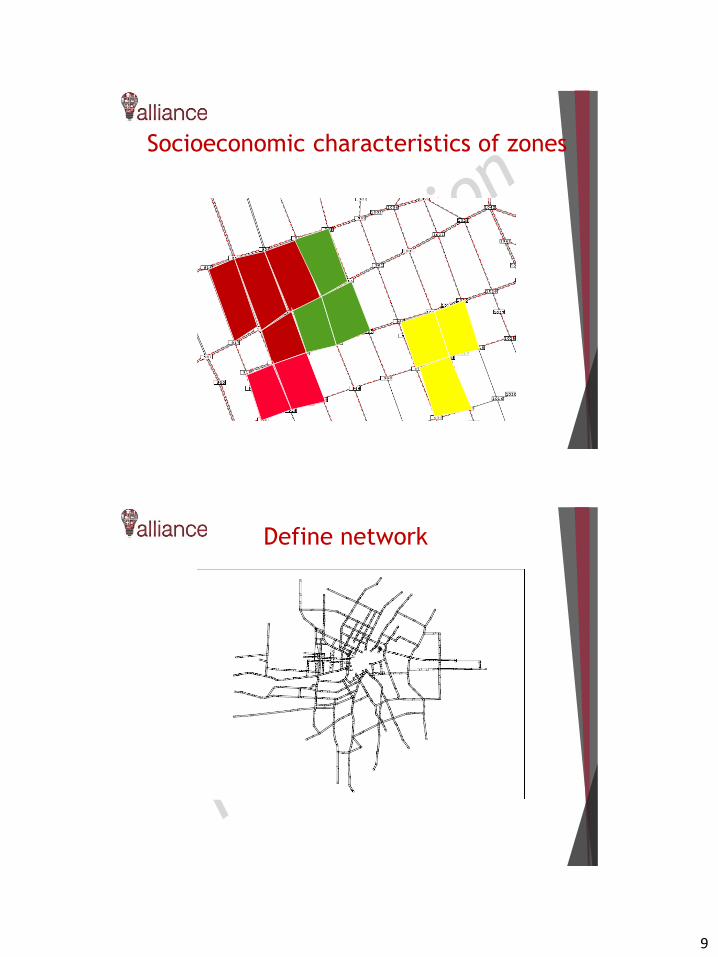
9
Socioeconomic characteristics of zones
Define network
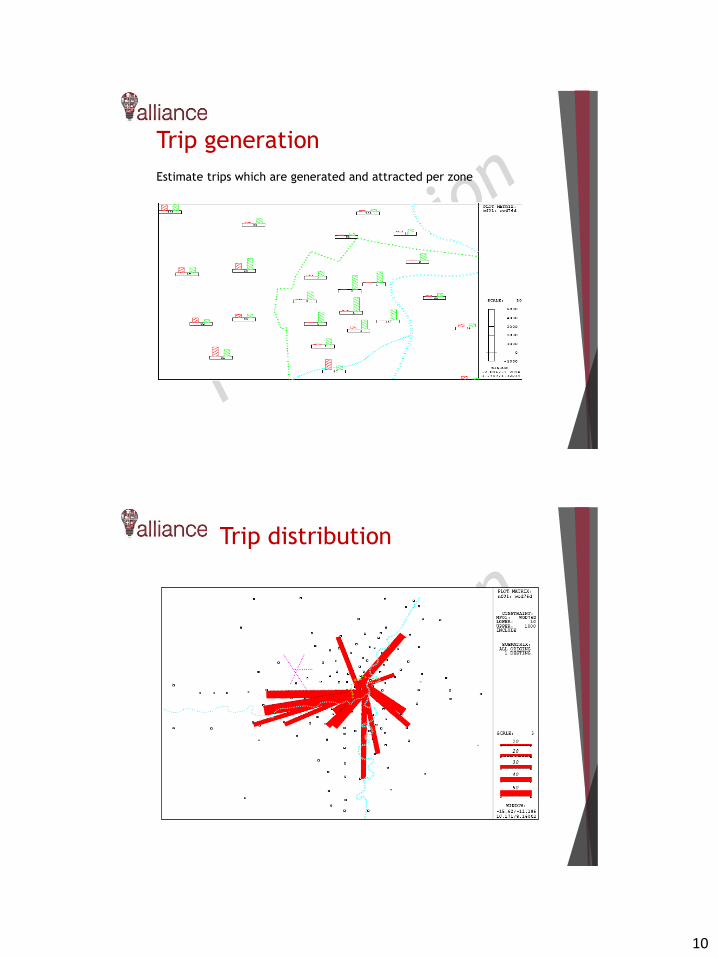
10
Trip generation
Estimate trips which are generated and attracted per zone
Trip distribution
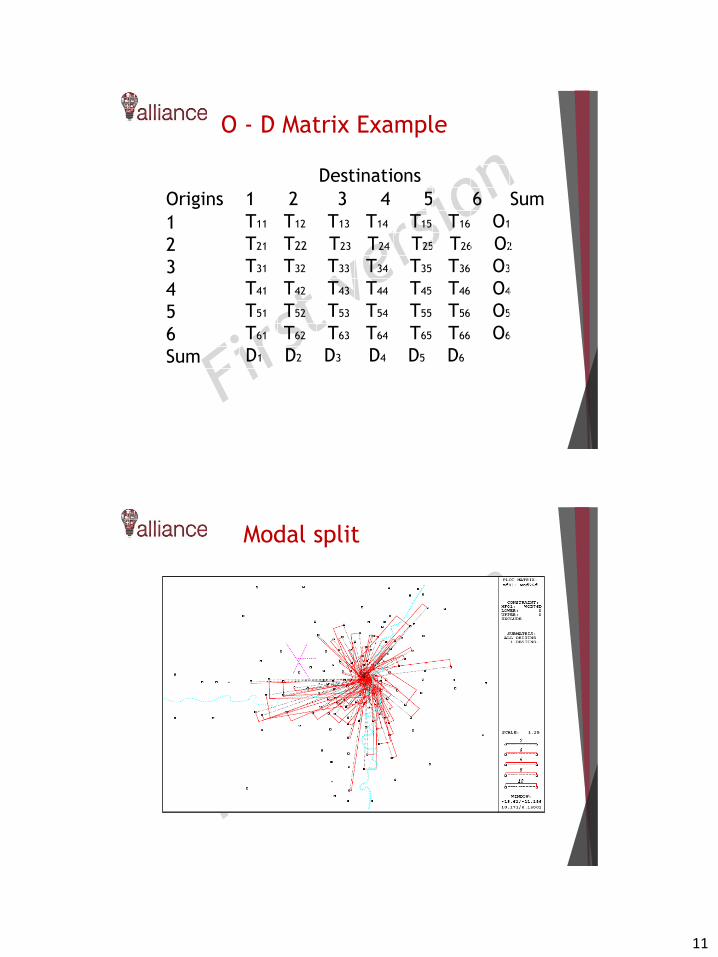
11
O - D Matrix Example
Destinations
1
2
3
4
5
6
Sum
Origins 1 2 3 4 5 6 Sum
T11 T12 T13 T14 T15 T16 O1
T21 T22 T23 T24 T25 T26 O2
T31 T32 T33 T34 T35 T36 O3
T41 T42 T43 T44 T45 T46 O4
T51 T52 T53 T54 T55 T56 O5
T61 T62 T63 T64 T65 T66 O6
D1 D2 D3 D4 D5 D6
Modal split
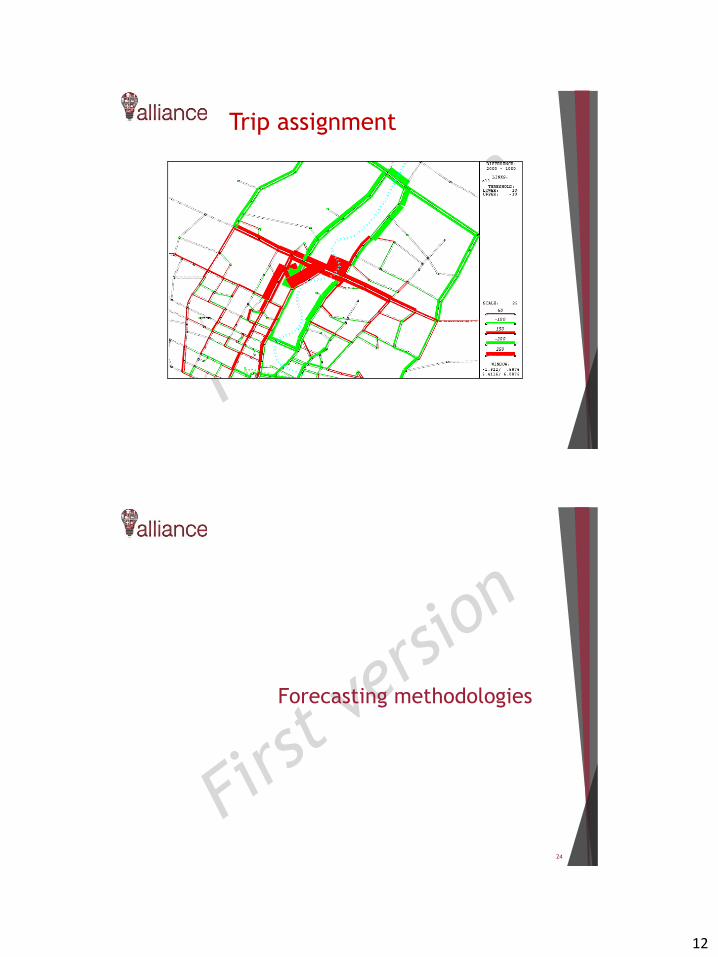
12
Trip assignment
Forecasting methodologies
24
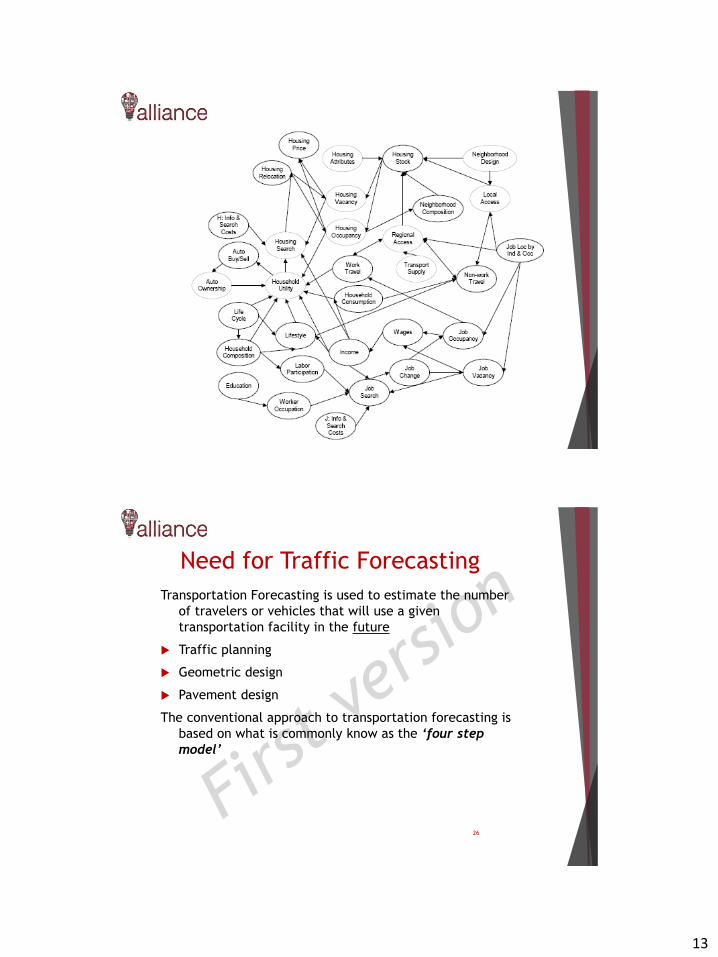
13
25
26
Need for Traffic Forecasting
Transportation Forecasting is used to estimate the number
of travelers or vehicles that will use a given
transportation facility in the future
Traffic planning
Geometric design
Pavement design
The conventional approach to transportation forecasting is
based on what is commonly know as the ‘four step
model’
14
What is it used for?
Transportation forecasting models have often been used in a
‘predict and provide’ mode to determine the highway
capacity needed in response to predicted growth in traffic
volumes.
Often, in this case, the full impact of changes in land use is
not properly taken into account and the resulting induced
traffic is over looked.
Norman W. Garrick
Four basic elements of the urban
transportation forecasting process
1. Data collection (population, land use, etc.)
2. Analysis of existing conditions and calibration
3. Forecast of future travel demand
4. Analysis of the results
15
Process of developing transport models:
1. Convert real world into Traffic Analysis Zones – Then converthighways and traffic analysis zones into a set of nodes and links building a graph
2. Data collection
3. Developing mathematical model
4. Model calibration
5. Define variables
6. Apply model
7. Evaluating model
Developing transport models
Step 1
Study area is the area that is affected by project under study
Strategic planning should include major origin destination points
In smaller areas traffic changes should be captured by the transportmodel
Transport models
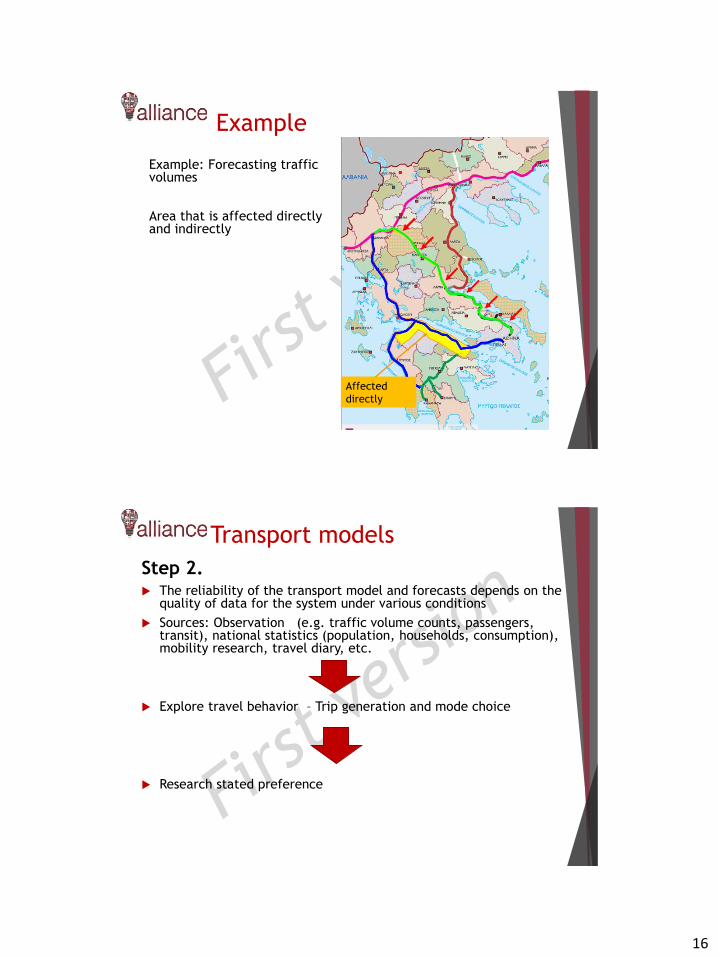
16
Example: Forecasting traffic volumes
Area that is affected directly and indirectly
Affected
directly
Example
Step 2. The reliability of the transport model and forecasts depends on the
quality of data for the system under various conditions
Sources: Observation (e.g. traffic volume counts, passengers,transit), national statistics (population, households, consumption),mobility research, travel diary, etc.
Explore travel behavior – Trip generation and mode choice
Research stated preference
Transport models
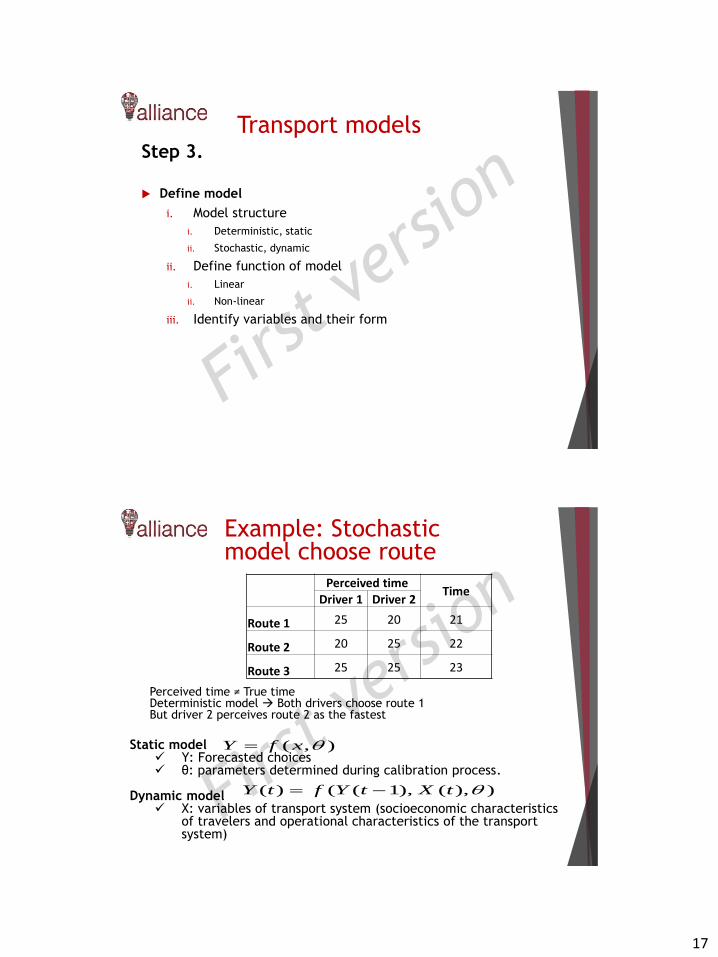
17
Step 3.
Define model
i. Model structure
i. Deterministic, static
ii. Stochastic, dynamic
ii. Define function of model
i. Linear
ii. Non-linear
iii. Identify variables and their form
Transport models
Example: Stochastic model choose route
Perceived timeTime
Driver 1 Driver 2
Route 1 25 20 21
Route 2 20 25 22
Route 3 25 25 23
Static model Υ: Forecasted choices θ: parameters determined during calibration process.
Dynamic model Χ: variables of transport system (socioeconomic characteristics
of travelers and operational characteristics of the transport system)
),( xfY
)),(),1(()( tXtYftY
Perceived time ≠ True timeDeterministic model Both drivers choose route 1But driver 2 perceives route 2 as the fastest
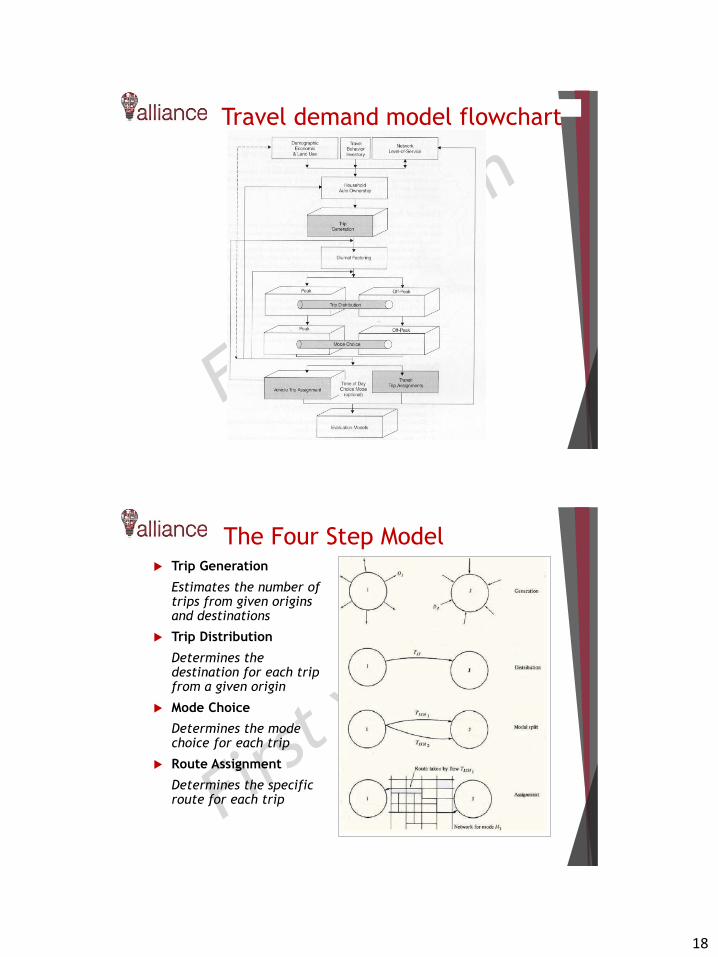
18
Travel demand model flowchart
The Four Step Model Trip Generation
Estimates the number oftrips from given originsand destinations
Trip Distribution
Determines thedestination for each tripfrom a given origin
Mode Choice
Determines the modechoice for each trip
Route Assignment
Determines the specificroute for each trip
Norman W. Garrick
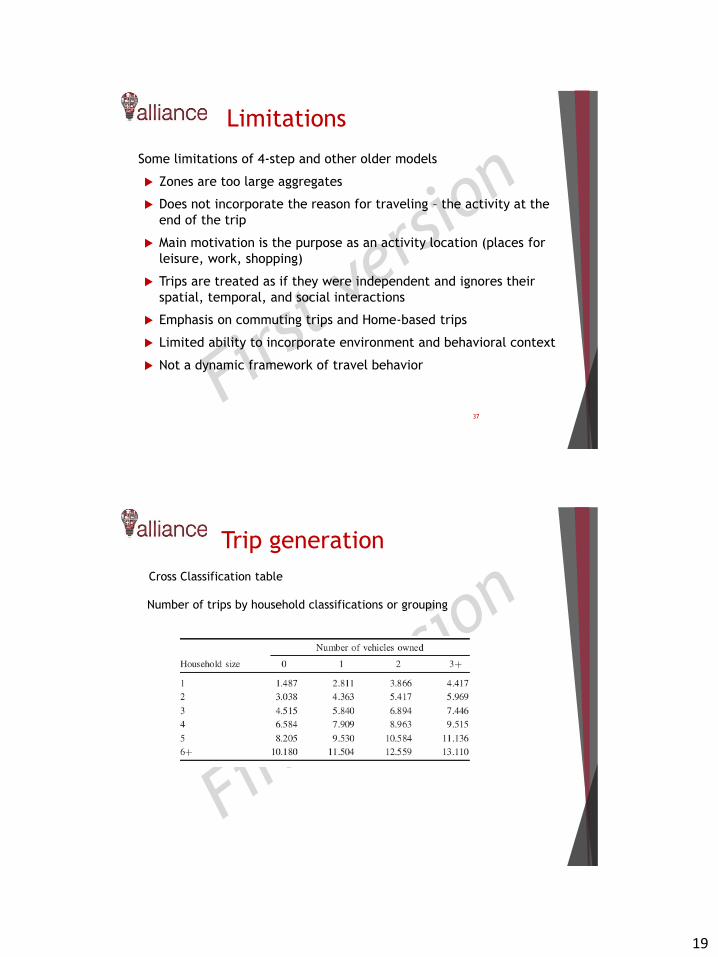
19
Limitations
Some limitations of 4-step and other older models
Zones are too large aggregates
Does not incorporate the reason for traveling – the activity at the
end of the trip
Main motivation is the purpose as an activity location (places for
leisure, work, shopping)
Trips are treated as if they were independent and ignores their
spatial, temporal, and social interactions
Emphasis on commuting trips and Home-based trips
Limited ability to incorporate environment and behavioral context
Not a dynamic framework of travel behavior
37
Trip generation
Number of trips by household classifications or grouping
Cross Classification table
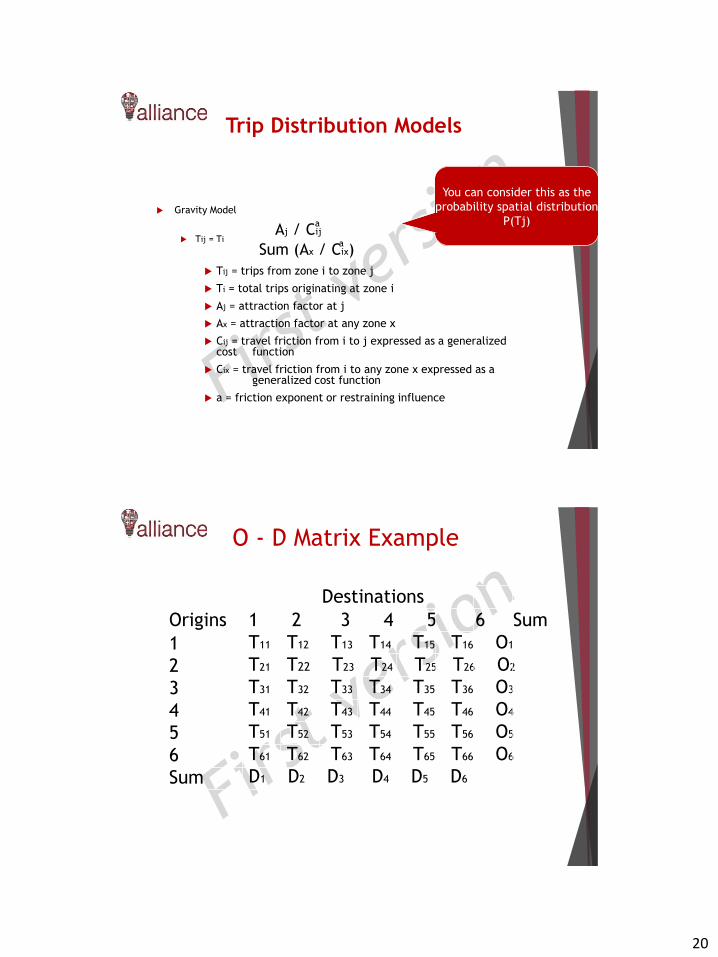
20
Trip Distribution Models
Gravity Model
Tij = Ti
Tij = trips from zone i to zone j
Ti = total trips originating at zone i
Aj = attraction factor at j
Ax = attraction factor at any zone x
Cij = travel friction from i to j expressed as a generalizedcost function
Cix = travel friction from i to any zone x expressed as ageneralized cost function
a = friction exponent or restraining influence
Sum (Ax / Cix)a
Aj / Cija
You can consider this as the
probability spatial distribution
P(Tj)
O - D Matrix Example
Destinations
1
2
3
4
5
6
Sum
Origins 1 2 3 4 5 6 Sum
T11 T12 T13 T14 T15 T16 O1
T21 T22 T23 T24 T25 T26 O2
T31 T32 T33 T34 T35 T36 O3
T41 T42 T43 T44 T45 T46 O4
T51 T52 T53 T54 T55 T56 O5
T61 T62 T63 T64 T65 T66 O6
D1 D2 D3 D4 D5 D6
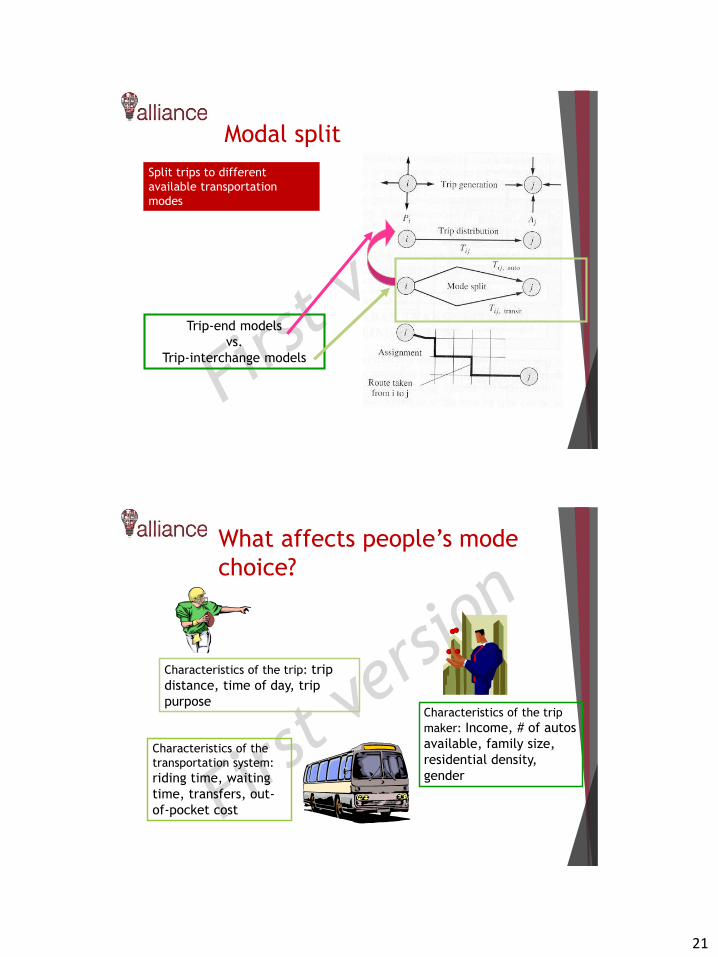
21
Modal split
Split trips to different
available transportation
modes
Trip-end models
vs.
Trip-interchange models
What affects people’s mode
choice?
Characteristics of the trip
maker: Income, # of autos
available, family size,
residential density,
gender
Characteristics of the trip: trip
distance, time of day, trip
purpose
Characteristics of the
transportation system:
riding time, waiting
time, transfers, out-
of-pocket cost
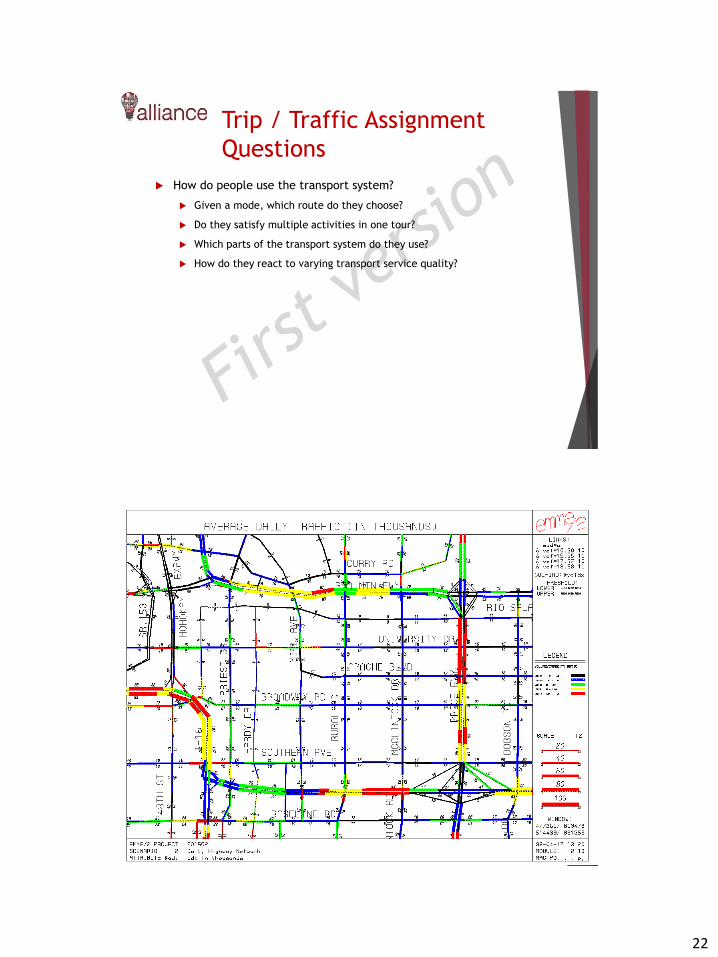
22
Trip / Traffic Assignment
Questions
How do people use the transport system?
Given a mode, which route do they choose?
Do they satisfy multiple activities in one tour?
Which parts of the transport system do they use?
How do they react to varying transport service quality?
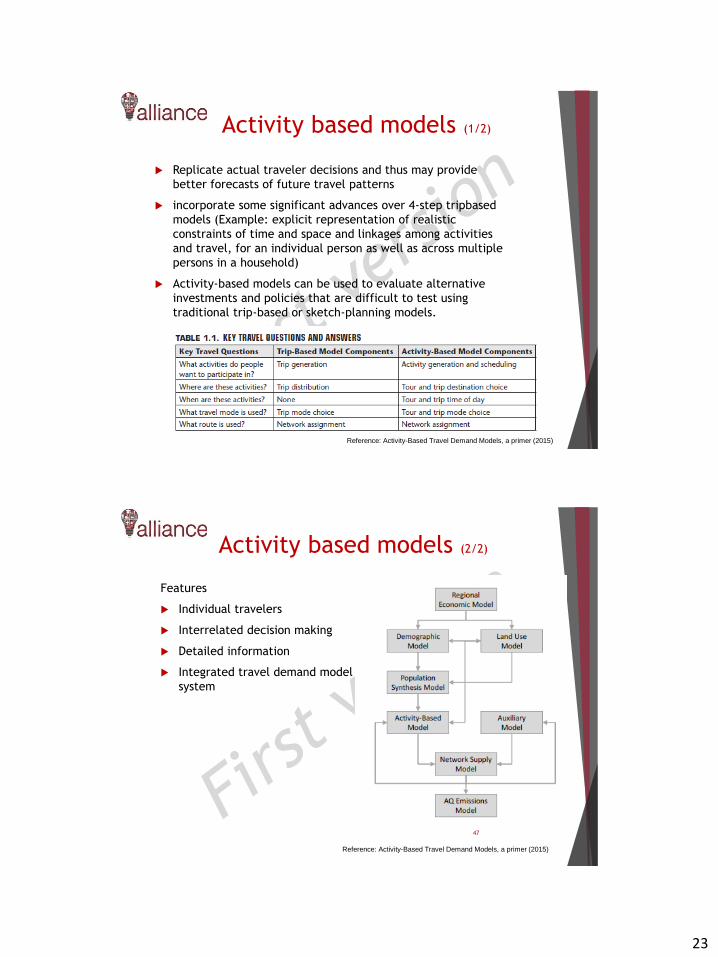
23
Activity based models (1/2)
Replicate actual traveler decisions and thus may provide
better forecasts of future travel patterns
incorporate some significant advances over 4-step tripbased
models (Example: explicit representation of realistic
constraints of time and space and linkages among activities
and travel, for an individual person as well as across multiple
persons in a household)
Activity-based models can be used to evaluate alternative
investments and policies that are difficult to test using
traditional trip-based or sketch-planning models.
Reference: Activity-Based Travel Demand Models, a primer (2015)
Features
Individual travelers
Interrelated decision making
Detailed information
Integrated travel demand model
system
47
Activity based models (2/2)
Reference: Activity-Based Travel Demand Models, a primer (2015)
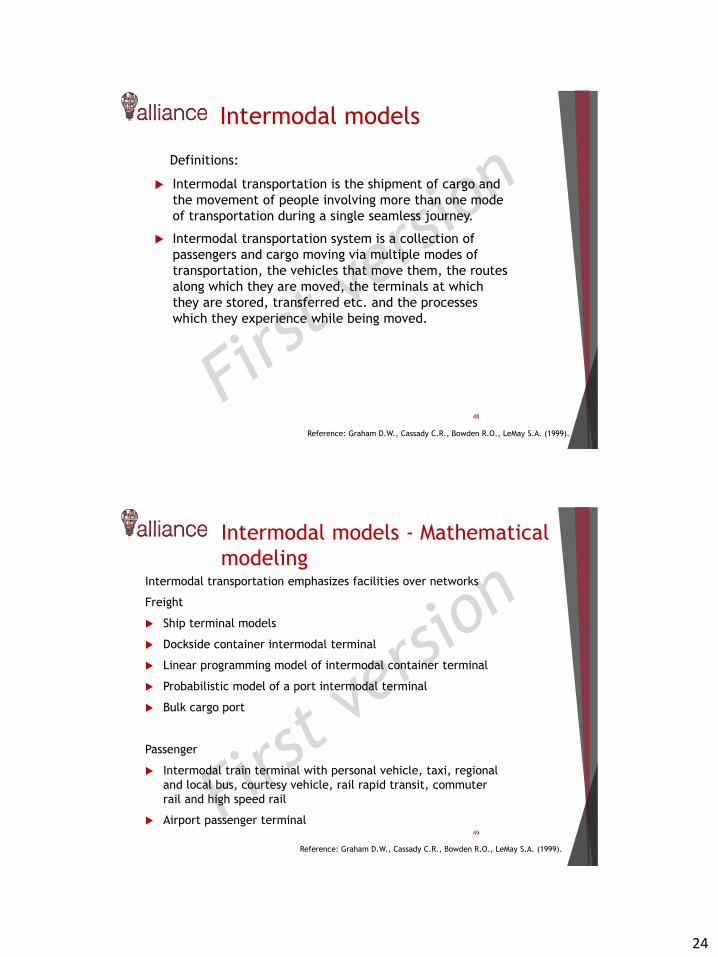
24
Intermodal models
Intermodal transportation is the shipment of cargo and
the movement of people involving more than one mode
of transportation during a single seamless journey.
Intermodal transportation system is a collection of
passengers and cargo moving via multiple modes of
transportation, the vehicles that move them, the routes
along which they are moved, the terminals at which
they are stored, transferred etc. and the processes
which they experience while being moved.
48
Definitions:
Reference: Graham D.W., Cassady C.R., Bowden R.O., LeMay S.A. (1999).
Intermodal models - Mathematical
modelingIntermodal transportation emphasizes facilities over networks
Freight
Ship terminal models
Dockside container intermodal terminal
Linear programming model of intermodal container terminal
Probabilistic model of a port intermodal terminal
Bulk cargo port
Passenger
Intermodal train terminal with personal vehicle, taxi, regional
and local bus, courtesy vehicle, rail rapid transit, commuter
rail and high speed rail
Airport passenger terminal49
Reference: Graham D.W., Cassady C.R., Bowden R.O., LeMay S.A. (1999).
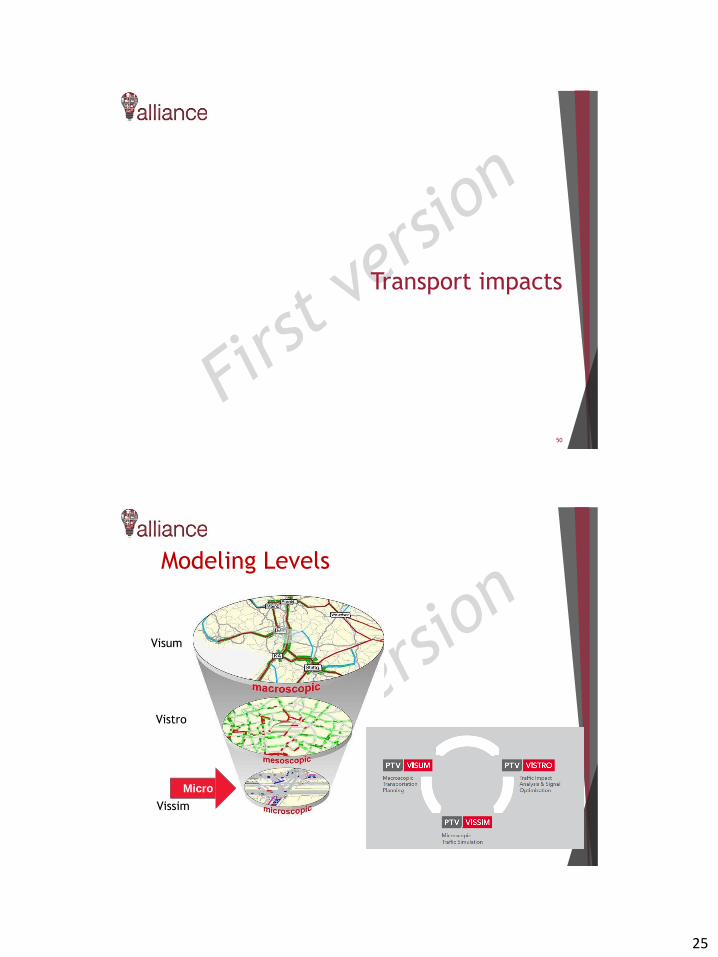
25
Transport impacts
50
Modeling Levels
Micro
Visum
Vistro
Vissim
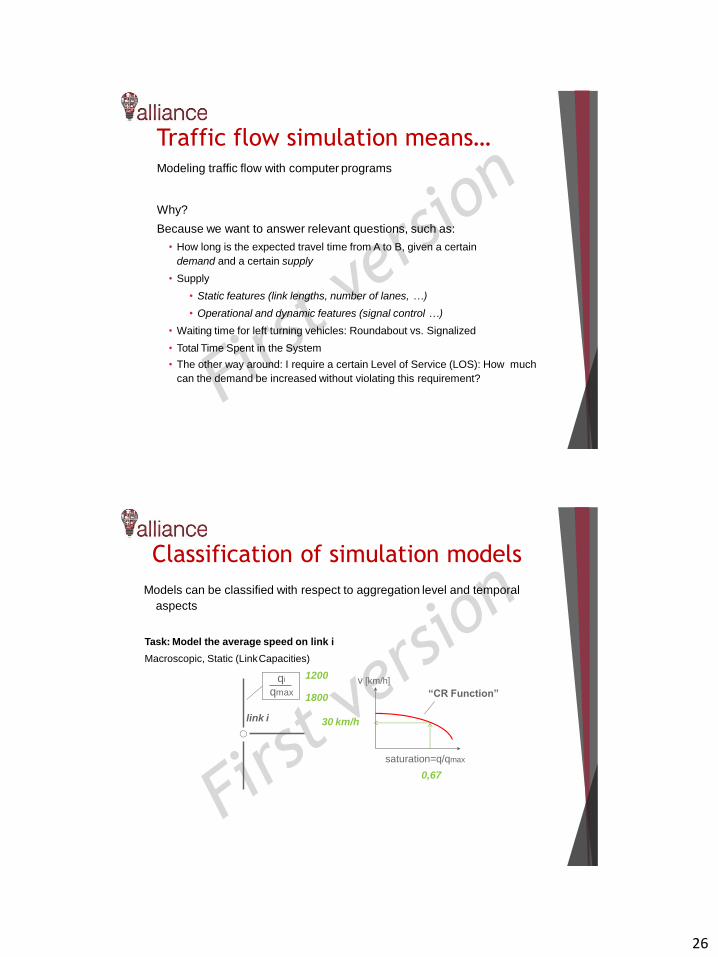
26
Modeling traffic flow with computer programs
Why?
Because we want to answer relevant questions, such as:
• How long is the expected travel time from A to B, given a certain
demand and a certain supply
• Supply
• Static features (link lengths, number of lanes, …)
• Operational and dynamic features (signal control …)
• Waiting time for left turning vehicles: Roundabout vs. Signalized
• Total Time Spent in the System
• The other way around: I require a certain Level of Service (LOS): How much
can the demand be increased without violating this requirement?
Traffic flow simulation means…
Task: Model the average speed on link i
Macroscopic, Static (LinkCapacities)
Classification of simulation models
v [km/h]qi
qmax
1200
1800
saturation=q/qmax
0,67
30 km/h
“CR Function”
link i
Models can be classified with respect to aggregation level and temporal
aspects
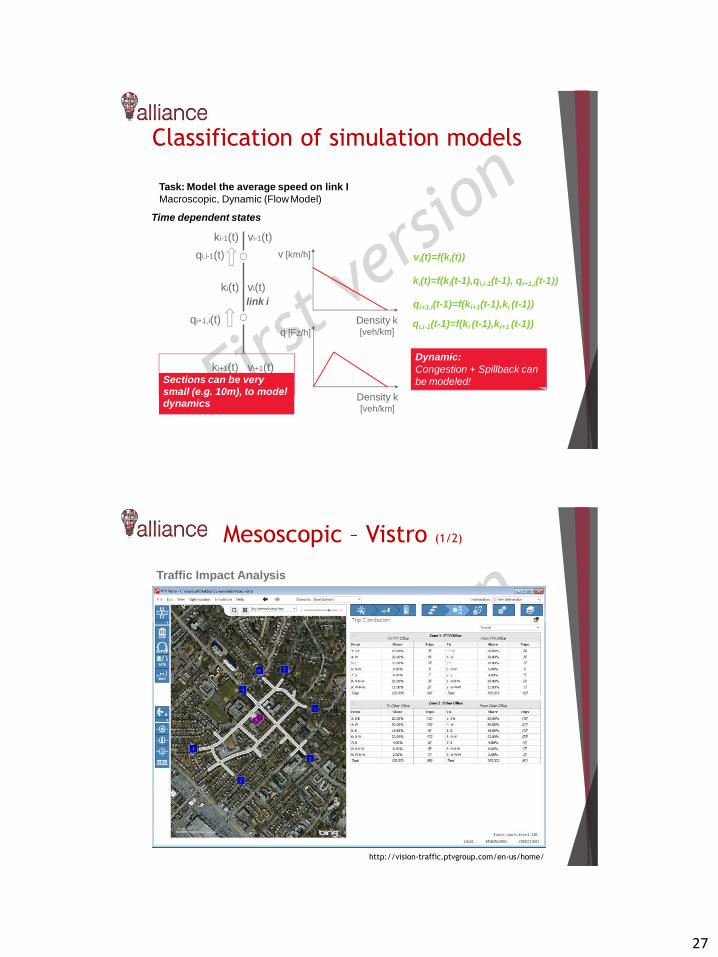
27
Classification of simulation models
qi+1,i(t)
ki(t)
v [km/h]
Density k[veh/km]q [Fz/h]
Density k[veh/km]
Dynamic:
Congestion + Spillback can
be modeled!
Task: Model the average speed on link I
Macroscopic, Dynamic (Flow Model)
Time dependent states
vi(t)
link i
ki-1(t) vi-1(t)
qi,i-1(t) vi(t)=f(ki(t))
ki(t)=f(ki(t-1),qi,i-1(t-1), qi+1,i(t-1))
qi+1,i(t-1)=f(ki+1(t-1),ki (t-1))
qi,i-1(t-1)=f(ki (t-1),ki+1 (t-1))
ki+1(t) vi+1(t) Sections can be very small (e.g. 10m), to model dynamics
Mesoscopic – Vistro (1/2)
55
Traffic Impact Analysis
http://vision-traffic.ptvgroup.com/en-us/home/
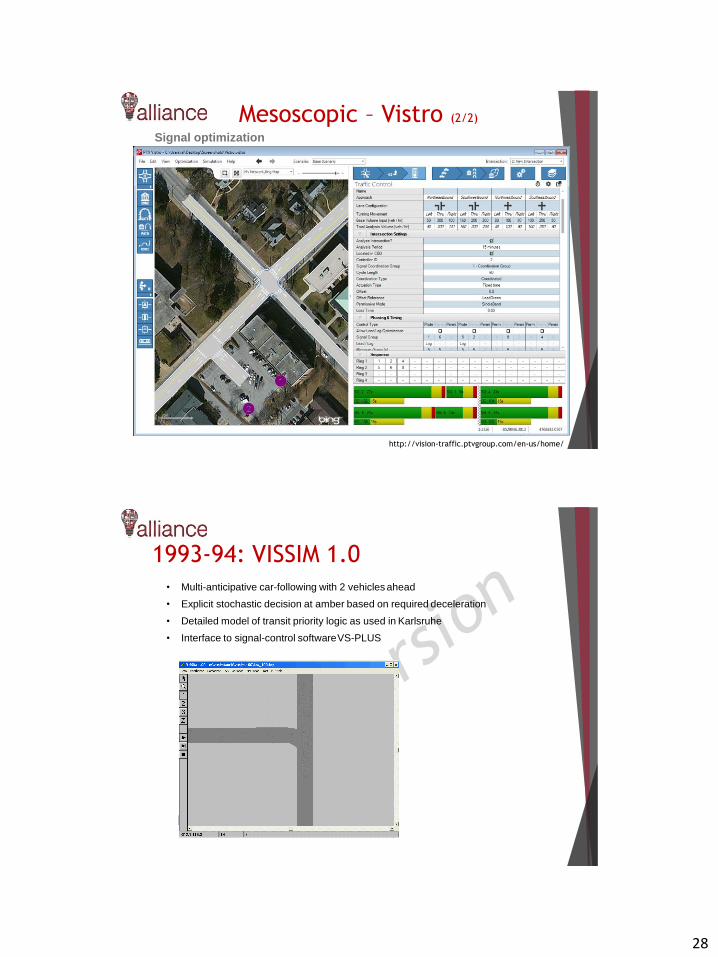
28
56
Mesoscopic – Vistro (2/2)
Signal optimization
http://vision-traffic.ptvgroup.com/en-us/home/
www.ptvgroup.com
1993-94: VISSIM 1.0
• Multi-anticipative car-following with 2 vehicles ahead
• Explicit stochastic decision at amber based on required deceleration
• Detailed model of transit priority logic as used in Karlsruhe
• Interface to signal-control softwareVS-PLUS
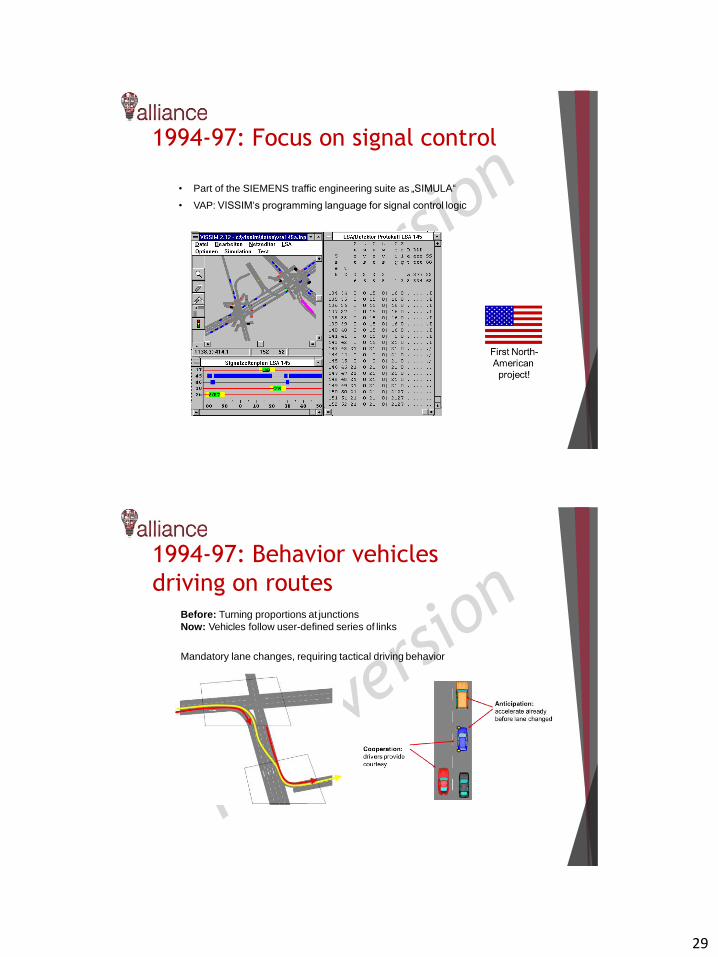
29
1994-97: Focus on signal control
• Part of the SIEMENS traffic engineering suite as „SIMULA“
• VAP: VISSIM‘s programming language for signal control logic
1994-97: Behavior vehicles
driving on routesBefore: Turning proportions at junctions
Now: Vehicles follow user-defined series of links
Mandatory lane changes, requiring tactical driving behavior
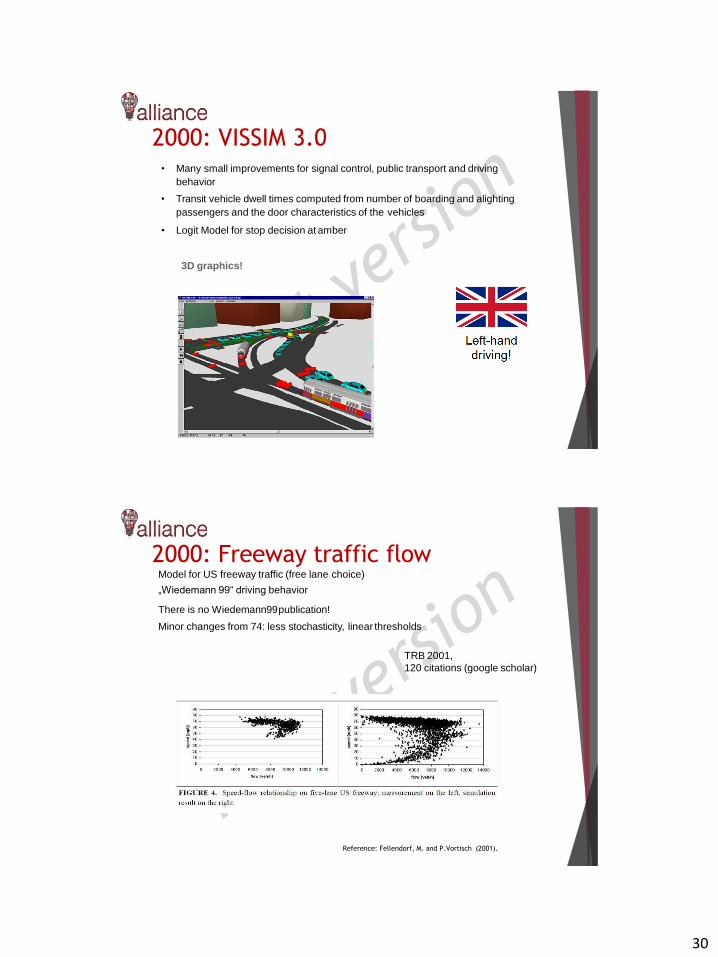
30
2000: VISSIM 3.0• Many small improvements for signal control, public transport and driving
behavior
• Transit vehicle dwell times computed from number of boarding and alighting
passengers and the door characteristics of the vehicles
• Logit Model for stop decision at amber
3D graphics!
2000: Freeway traffic flowModel for US freeway traffic (free lane choice)
„Wiedemann 99“ driving behavior
There is no Wiedemann99publication!
Minor changes from 74: less stochasticity, linear thresholds
TRB 2001,
120 citations (google scholar)
Reference: Fellendorf, M. and P.Vortisch (2001).

31
2001: Continuous lateral movement
• Federal research project about cyclists in the German HCM
• Lateral position now anywhere in the lane
• Pretty simple lateral behaviourmodel
2006: First steps towards pedestrians
Prototype interface to Dirk Helbing‘s Social Force Model
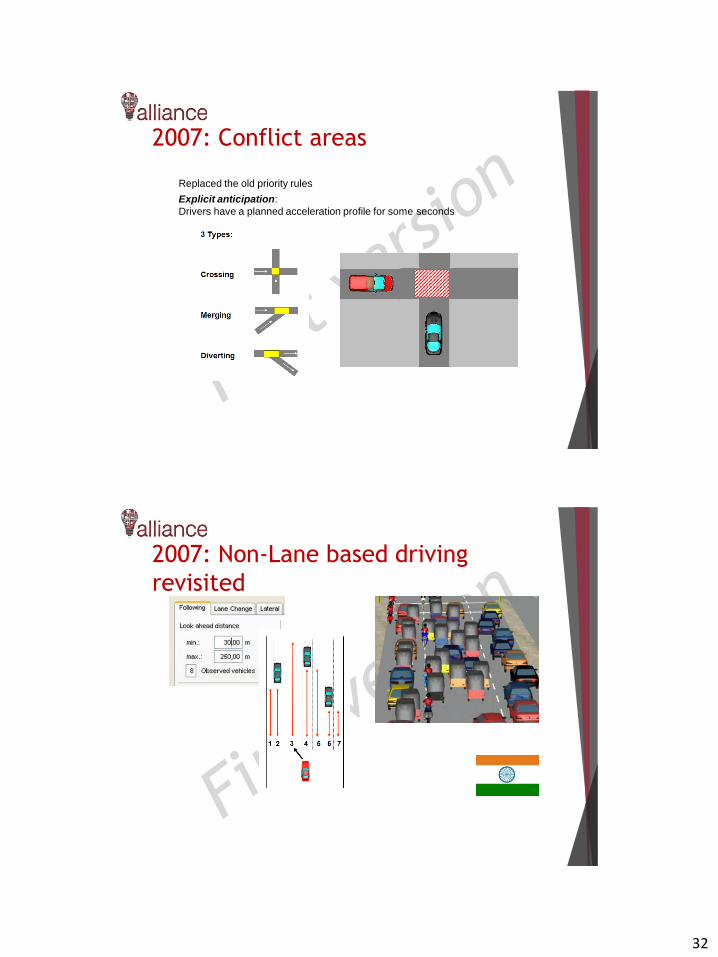
32
2007: Conflict areas
Replaced the old priority rules
Explicit anticipation:
Drivers have a planned acceleration profile for some seconds
2007: Non-Lane based driving
revisited
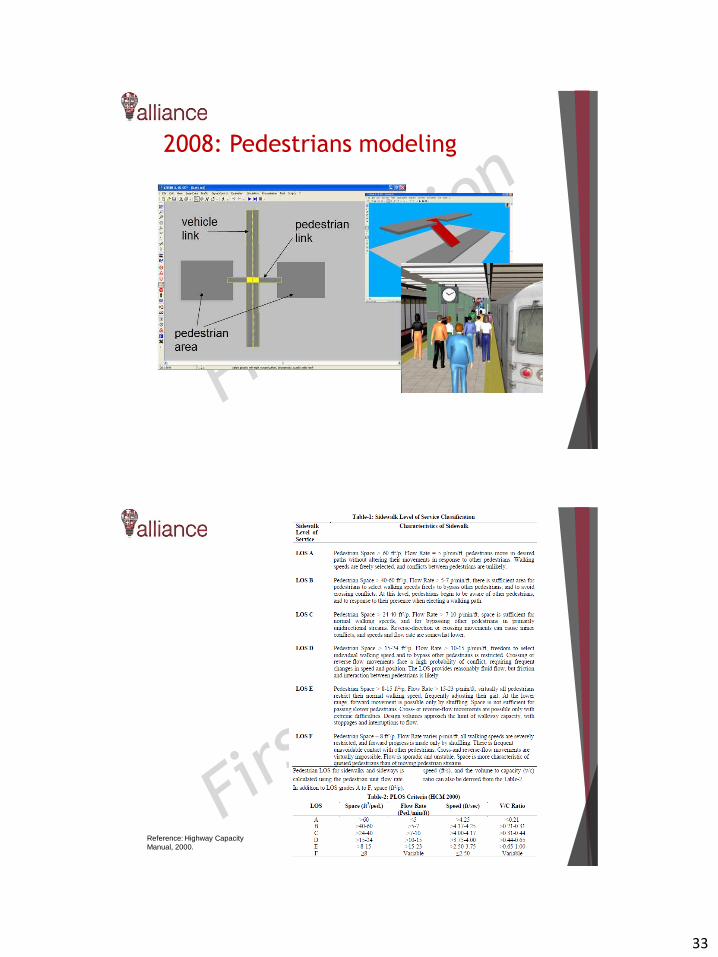
33
2008: Pedestrians modeling
67Reference: Highway Capacity
Manual, 2000.
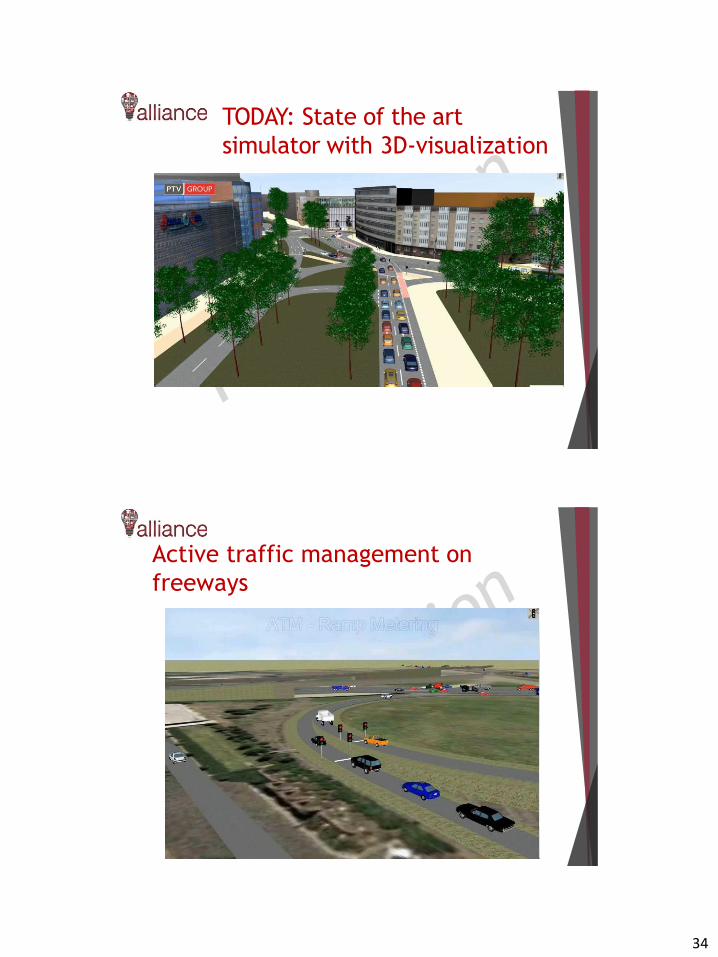
34
TODAY: State of the art
simulator with 3D-visualization
www.ptvgroup.com I Slide 34
Active traffic management on
freeways
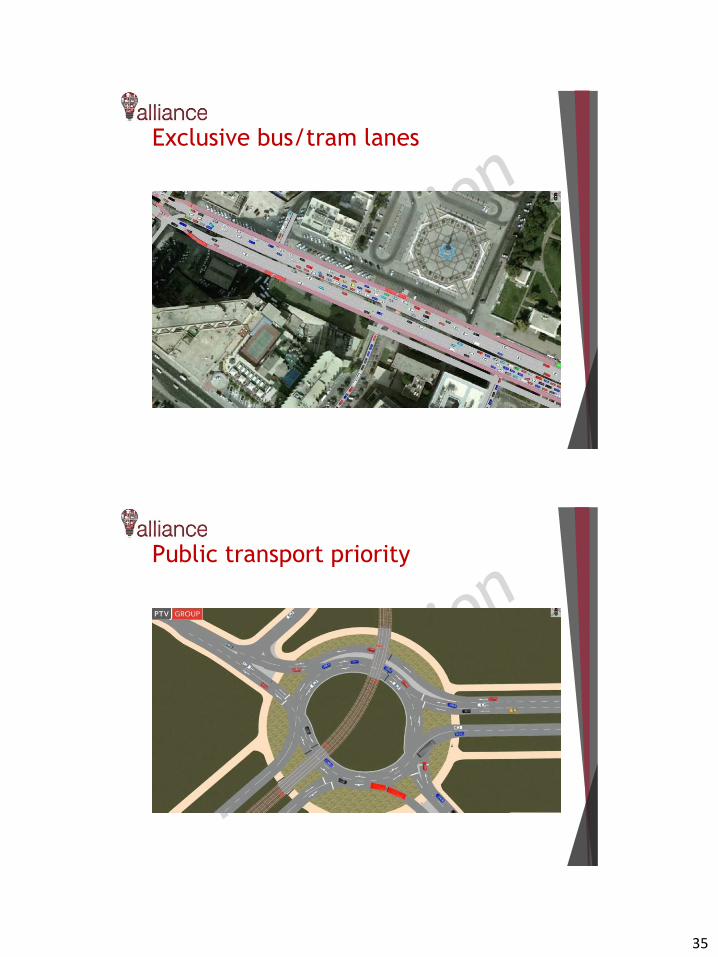
35
Exclusive bus/tram lanes
Public transport priority
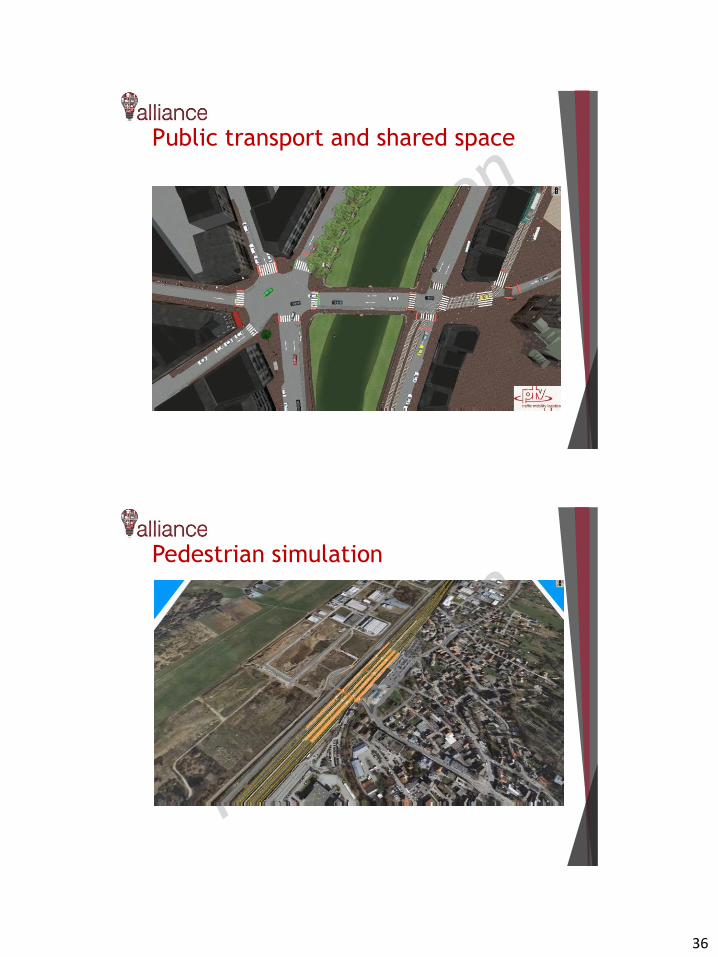
36
Public transport and shared space
Pedestrian simulation
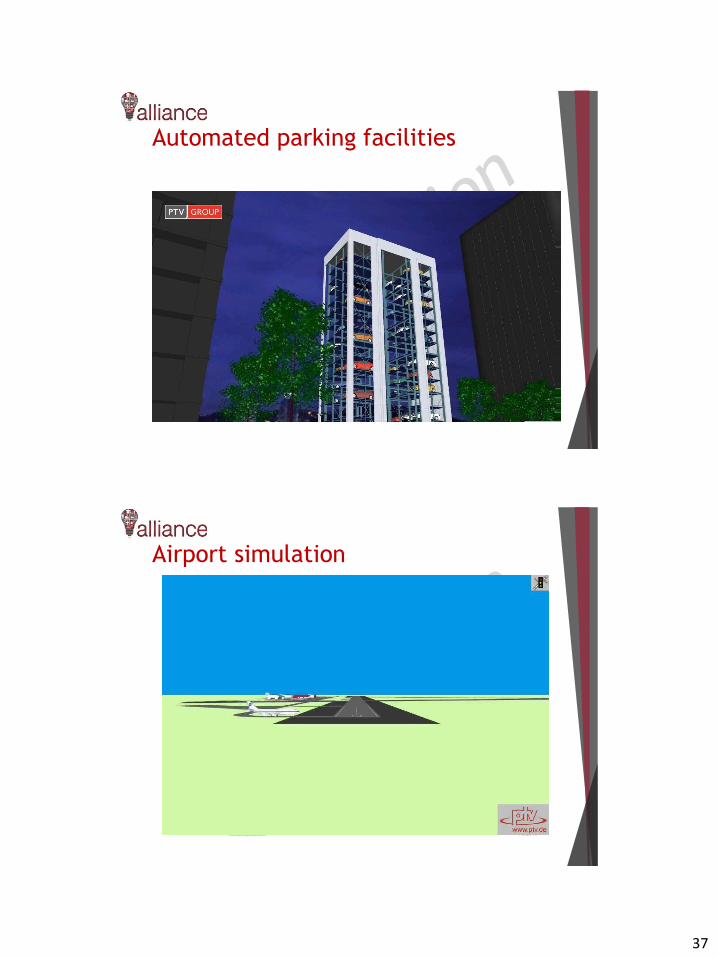
37
Automated parking facilities
www.ptvgroup.com I Slide 40
Airport simulation

38
www.ptvgroup.com I
Container terminals
Slide 76
New transport systems - PRT
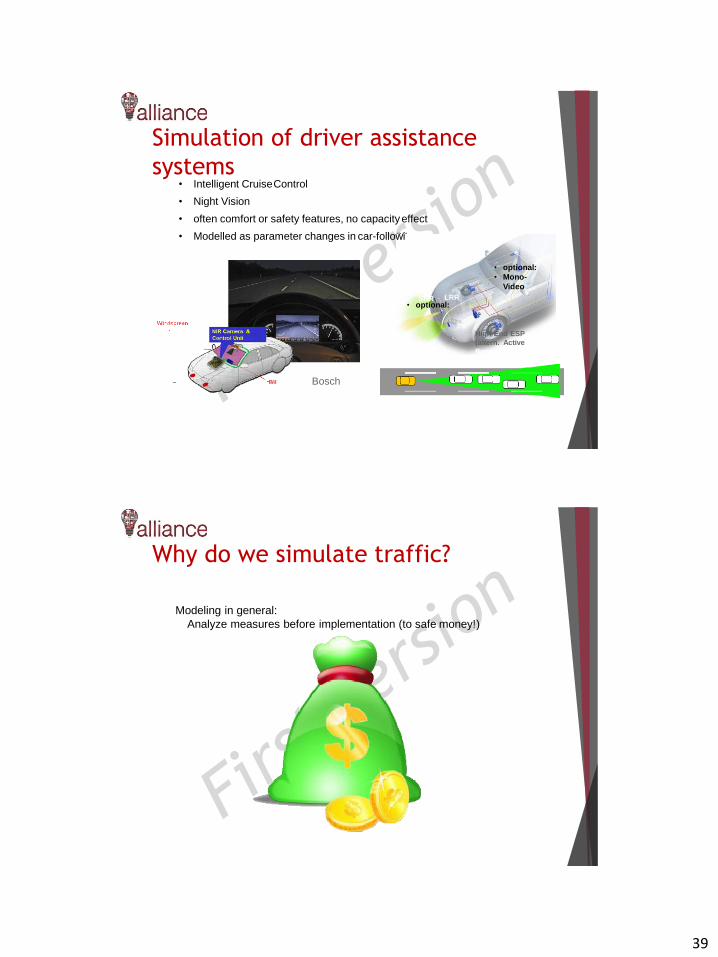
39
Simulation of driver assistance
systems
ng
• Intelligent CruiseControl
• Night Vision
• often comfort or safety features, no capacityeffect
• Modelled as parameter changes in car-followi
• optional:
• Mono-
Video
• optional:SRR LRR
High End ESP
(altern. Active
Booster)
Bosch
Why do we simulate traffic?
Modeling in general:
Analyze measures before implementation (to safe money!)
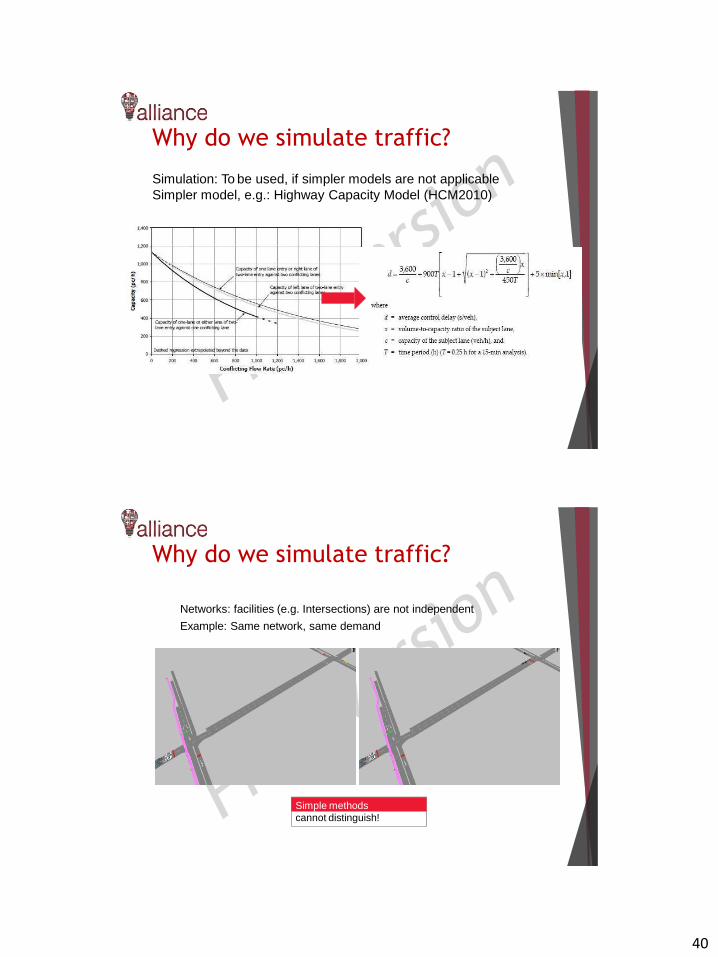
40
Simulation: To be used, if simpler models are not applicable
Simpler model, e.g.: Highway Capacity Model (HCM2010)
Why do we simulate traffic?
Why do we simulate traffic?
Networks: facilities (e.g. Intersections) are not independent
Example: Same network, same demand
Simple methods
cannot distinguish!
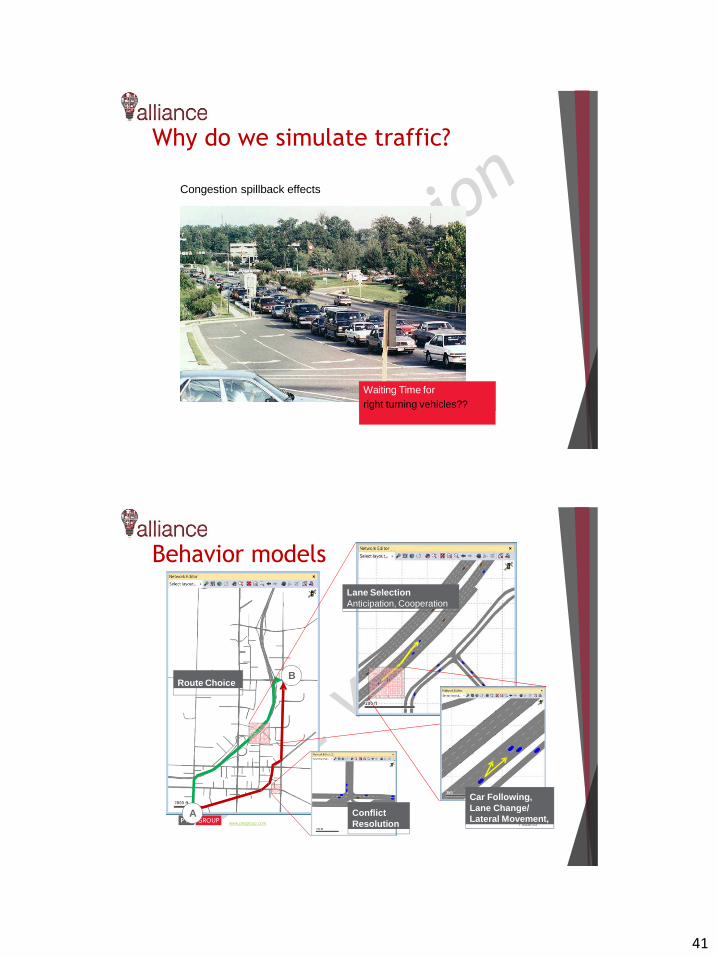
41
Why do we simulate traffic?
Congestion spillback effects
Waiting Time for
right turning vehicles??
www.ptvgroup.com I Slide 53
Behavior models
A
BRoute Choice
Lane Selection
Anticipation, Cooperation
Car Following,
Lane Change/
Lateral Movement,Conflict
Resolution

42
How does a vehicle (“Follower”) behave, given the behavior of a
„leading vehicle“ (“Leader”)?
Traffic Dynamics from an individual drivers’perspective
One Lane only (fornow)
Covering all traffic situations: High speed, stop-and-go, jam, …
Special Case:
Free (unconstrained) driving no interaction with the “Leader”
Car following basics
LeaderFollower
Lane changing basics
Situation: Multiple Lanes
In some situations, drivers want to change the lane (“lane
selection” later)
There are decisions and actions
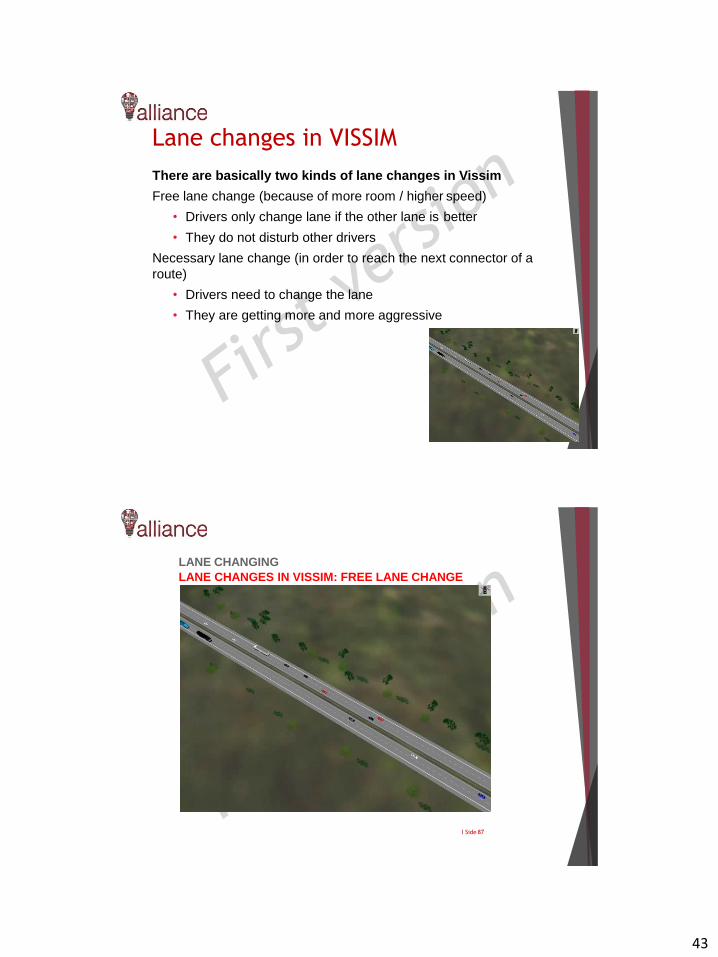
43
There are basically two kinds of lane changes in Vissim
Free lane change (because of more room / higher speed)
• Drivers only change lane if the other lane is better
• They do not disturb other drivers
Necessary lane change (in order to reach the next connector of a
route)
• Drivers need to change the lane
• They are getting more and more aggressive
Lane changes in VISSIM
LANE CHANGING
LANE CHANGES IN VISSIM: FREE LANE CHANGE
I Side 87
44
Sustainability assessment
88
Definition
89
“Sustainable transportation is about meeting or
helping meet the mobility needs of the present
without compromising the ability of the future
generations to meet their needs.”

45
DefinitionThe CST defines a sustainable transportation system as one that:
Allows the basic access needs of individuals and societies
to be met safely and in a manner consistent with human
and ecosystem health, and with equity within and
between generations.
Is affordable, operates efficiently, offers choice of
transport mode, and supports a vibrant economy
Limits emissions and waste within the planet's ability to
absorb them, minimizes consumption of non-renewable
resources, limits consumption of renewable resources to
the sustainable yield level, reuses and recycles its
components, and minimizes the use of land and the
production of noise 90
Why Sustainable Transport? (1/3)
Transportation outcomes:
Traffic congestion
19852005: Increase of 72% in delay & 85% in total cost of congestion (TTI 2007)
Emissions
19902003: 20% increase in U.S (BTS 2005)
Noise
Road transport : 60% of total transportation noise
Road safety
Globally 1.2million deaths & 500m injuries (WHO 2004)
91

46
Transportation – environmental concerns in U.S.
Combustion of fossil fuels accounts for about 31% of total
CO2 emissions and 26% of total greenhouse gas emissions in 2011
Total consumption of petroleum products appears to be leveling
off
11% decrease of CO2 emissions between 2004 and 2010
Improvements in vehicle efficiency and
changes in vehicle travel
Why Sustainable Transport? (2/3)
Vehicle efficiency and new travel modes:
Hybrid electric vehicle sales increased by 30% between 2005 and
2010
Huge increase in car-sharing (CS) 2000=A few hundred 2012 =~
800,000
CS users reduce their vehicle miles traveled by an average 44%
CS results vary: In Europe, a CS vehicle reduces the need for 4 to
10 privately owned vehicles; it is 6 to 23 privately owned
vehicles in N. America
Why Sustainable Transport? (3/3)
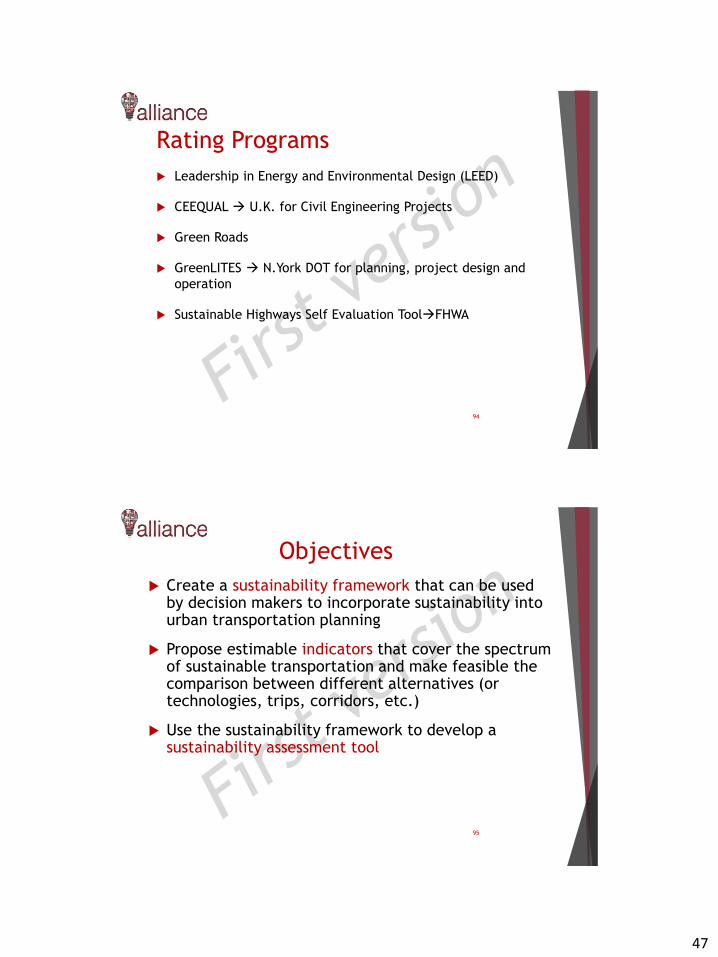
47
Rating Programs
Leadership in Energy and Environmental Design (LEED)
CEEQUAL U.K. for Civil Engineering Projects
Green Roads
GreenLITES N.York DOT for planning, project design and
operation
Sustainable Highways Self Evaluation ToolFHWA
94
Objectives
Create a sustainability framework that can be usedby decision makers to incorporate sustainability intourban transportation planning
Propose estimable indicators that cover the spectrumof sustainable transportation and make feasible thecomparison between different alternatives (ortechnologies, trips, corridors, etc.)
Use the sustainability framework to develop asustainability assessment tool
95

48
Multicriteria assessment
Analytic Hierarchy Process (AHP),
Multi-Attribute Utility Theory (MAUT),
Preference Ranking Organization Method for Enrichment of
Evaluations (PROMETHEE)
ELimination Et Choix Traduisant la REalite (ELECTRE)
Dominance-based Rough Set Approach (DRSA)
Technique for Order Preference by Similarity to Ideal Solution
(TOPSIS)
Simple Multi Attribute Rated Technique (SMART)
Weighted Sum model (WSM)
Weighted Product model (WPM)
96
Smart solutions in sustainable
transport planning
97

49
Smart Transportation
Smart Transportation Planning deals with the
sustainable evaluation, assessment and design of
movement of people and goods through transport
networks.
98
Technology and data New technologies transforming traffic management systems and
the analysis of travel activity and transport modelling.
Technology and data to make life in cities safer, smarter and more
sustainable.
Smart solutions involve data gathering, real-time processing, data
analytics and visualization.
Using data ultimately aims to support better decision and enable
innovation.
Transport-related data gaps may limit ability to take advantage of
“intelligent mobility” market.
Open transport data, sensor data, crowdsourcing and other social
media sources,
Big data support decision-making in important policy areas.https://blog.idoxgroup.com/2015/07/16/how-data-and-smart-city-infrastructure-can-support-
transport-planning/
99
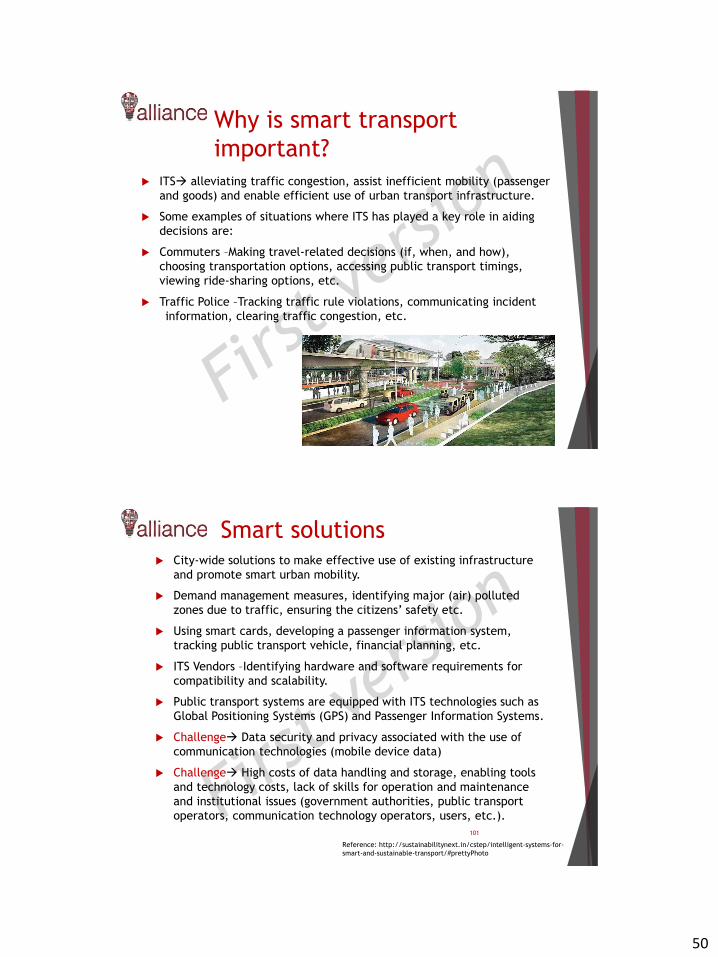
50
Why is smart transport
important?
ITS alleviating traffic congestion, assist inefficient mobility (passenger
and goods) and enable efficient use of urban transport infrastructure.
Some examples of situations where ITS has played a key role in aiding
decisions are:
Commuters –Making travel-related decisions (if, when, and how),
choosing transportation options, accessing public transport timings,
viewing ride-sharing options, etc.
Traffic Police –Tracking traffic rule violations, communicating incident
information, clearing traffic congestion, etc.
100
Smart solutions City-wide solutions to make effective use of existing infrastructure
and promote smart urban mobility.
Demand management measures, identifying major (air) polluted
zones due to traffic, ensuring the citizens’ safety etc.
Using smart cards, developing a passenger information system,
tracking public transport vehicle, financial planning, etc.
ITS Vendors –Identifying hardware and software requirements for
compatibility and scalability.
Public transport systems are equipped with ITS technologies such as
Global Positioning Systems (GPS) and Passenger Information Systems.
Challenge Data security and privacy associated with the use of
communication technologies (mobile device data)
Challenge High costs of data handling and storage, enabling tools
and technology costs, lack of skills for operation and maintenance
and institutional issues (government authorities, public transport
operators, communication technology operators, users, etc.).
101
Reference: http://sustainabilitynext.in/cstep/intelligent-systems-for-
smart-and-sustainable-transport/#prettyPhoto
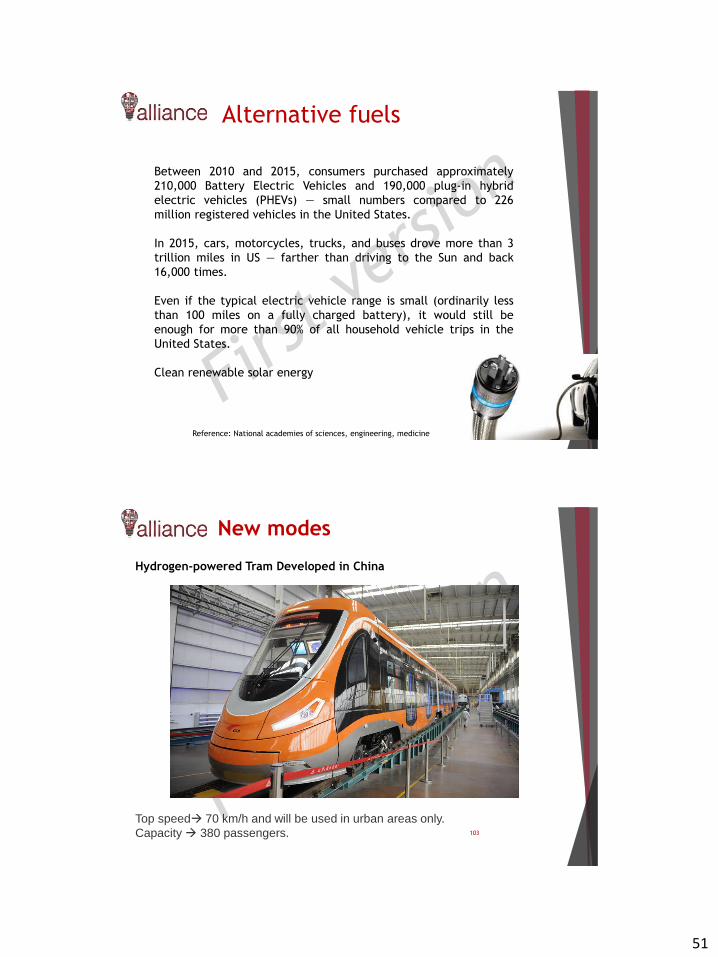
51
Alternative fuels
102
Between 2010 and 2015, consumers purchased approximately
210,000 Battery Electric Vehicles and 190,000 plug-in hybrid
electric vehicles (PHEVs) — small numbers compared to 226
million registered vehicles in the United States.
In 2015, cars, motorcycles, trucks, and buses drove more than 3
trillion miles in US — farther than driving to the Sun and back
16,000 times.
Even if the typical electric vehicle range is small (ordinarily less
than 100 miles on a fully charged battery), it would still be
enough for more than 90% of all household vehicle trips in the
United States.
Clean renewable solar energy
Reference: National academies of sciences, engineering, medicine
New modes
103
Top speed 70 km/h and will be used in urban areas only.
Capacity 380 passengers.
Hydrogen-powered Tram Developed in China
52
104
Sustainable urban
development and
mobility plan
Support the uptake of SUMP (2010-13)
Common understanding of SUMP
Seminars and workshops
Guidelines on the process of 'Developing
and Implementing a Sustainable Urban
Mobility Plan'
Final version published 2013
Referenced in DG MOVE's Urban Mobility
Package of 2013
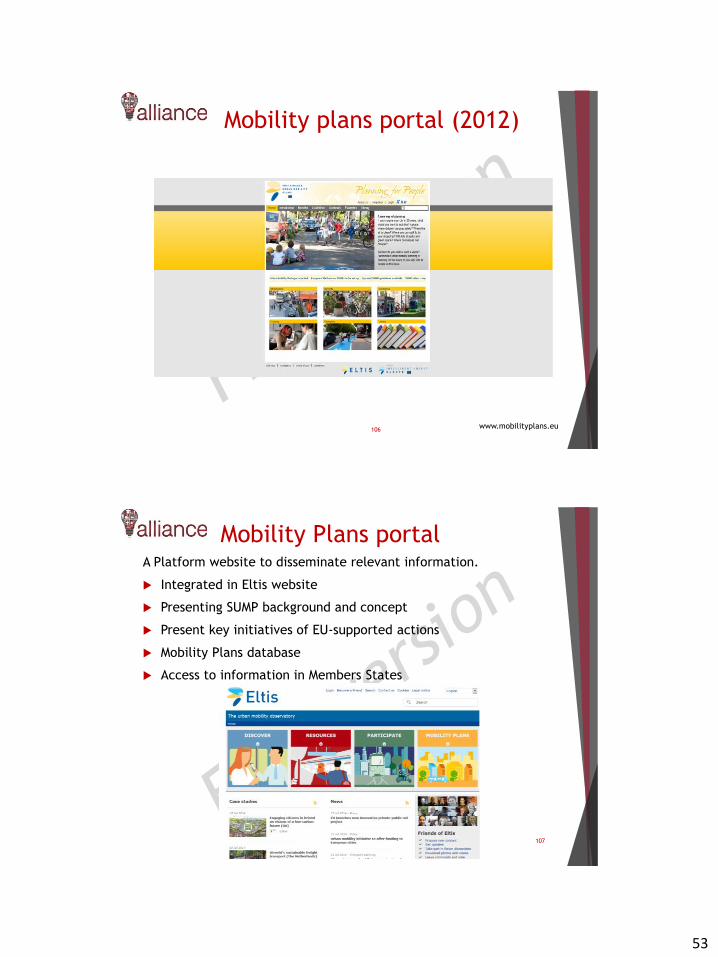
53
Mobility plans portal (2012)
106www.mobilityplans.eu
Mobility Plans portalA Platform website to disseminate relevant information.
Integrated in Eltis website
Presenting SUMP background and concept
Present key initiatives of EU-supported actions
Mobility Plans database
Access to information in Members States
107
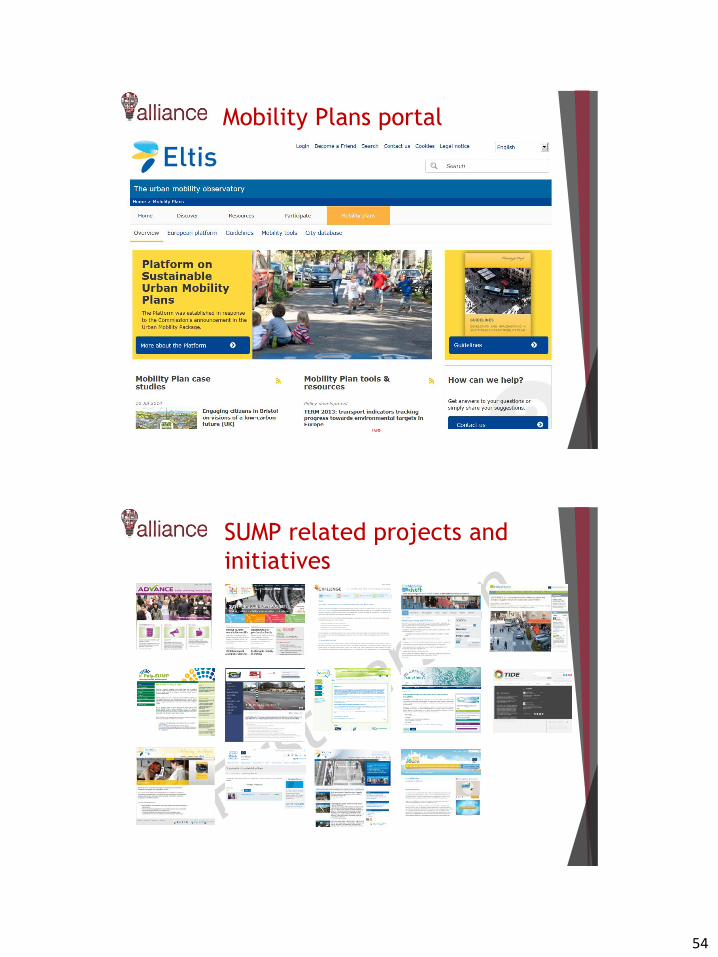
54
Mobility Plans portal
108
SUMP related projects and
initiatives

55
European Platform on SUMP
Objectives
Support the further development of the SUMP concept and of
necessary tools
Provide interested parties with a "one-stop shop"
Realise synergies from coordination and cooperation across the
different actions
Increase the visibility for EU-supported actions on Sustainable Urban
Mobility Plans.
What is the scope?
The policies and measures should address comprehensively
all modes and forms of transport
Sustainable Urban Mobility Plans builds on and expands
existing plan documents.
111
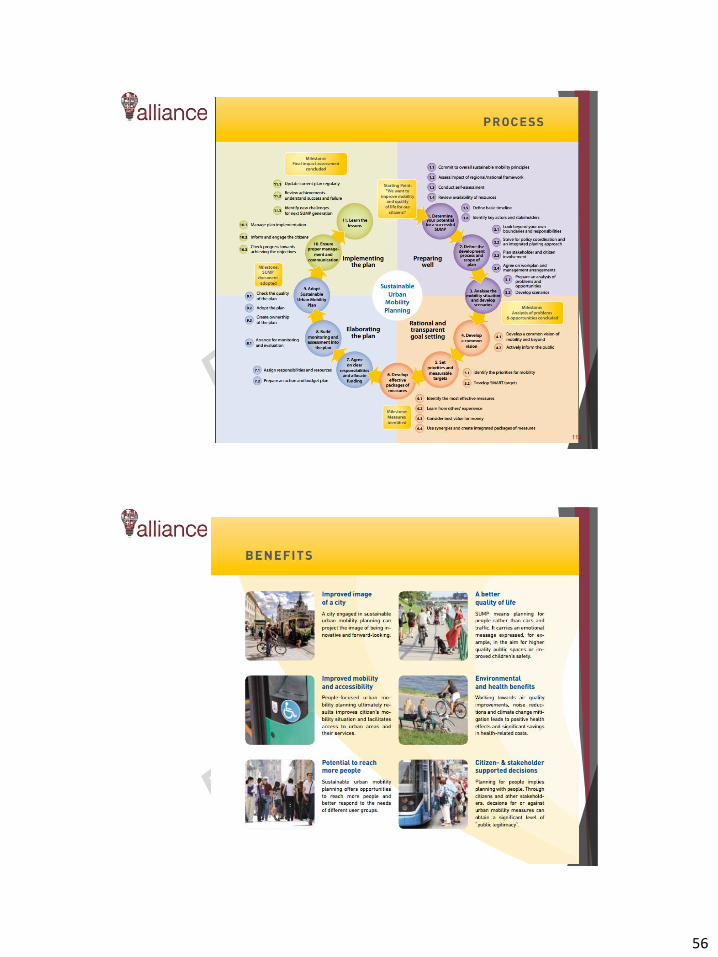
56
112
113
57
Environmental impact
assessment
114
COPERT
It calculates emissions of all (important) pollutants from road
transport (e.g., CO, NOx, volatile organic compounds (VOC), and
particulate matter) as well as CO2 emissions on the basis of fuel
consumption
It draws main elements from projects including MEET, the COST
319 action on the Estimation of Emissions from Transport,
PARTICULATES, and ARTEMIS
Total emissions are calculated as a product of activity data
provided by the user and speed-dependent emission factors
calculated by the model (“average speed model)
115

58
COPERT
Emissions in the model are estimated from three general
processes: emissions produced during thermally stabilized engine
operation (hot emissions); emissions occurring during engine start
from ambient temperature (cold-start and warming-up effects);
and NMVOC emissions due to fuel evaporation.
The model also distinguishes between urban, rural and highway
driving to account for variations in driving performance. Different
activity data and emission factors are attributed to each driving
situation. Cold-start emissions are attributed to urban driving
because the assumption is made that most vehicles start any trip
in an urban area.
It covers all (important) vehicle classes (passenger cars, light and
heavy duty vehicles, mopeds and motorcycles) and can be applied
in all European countries and in several Asian ones.
116
117
Input Data
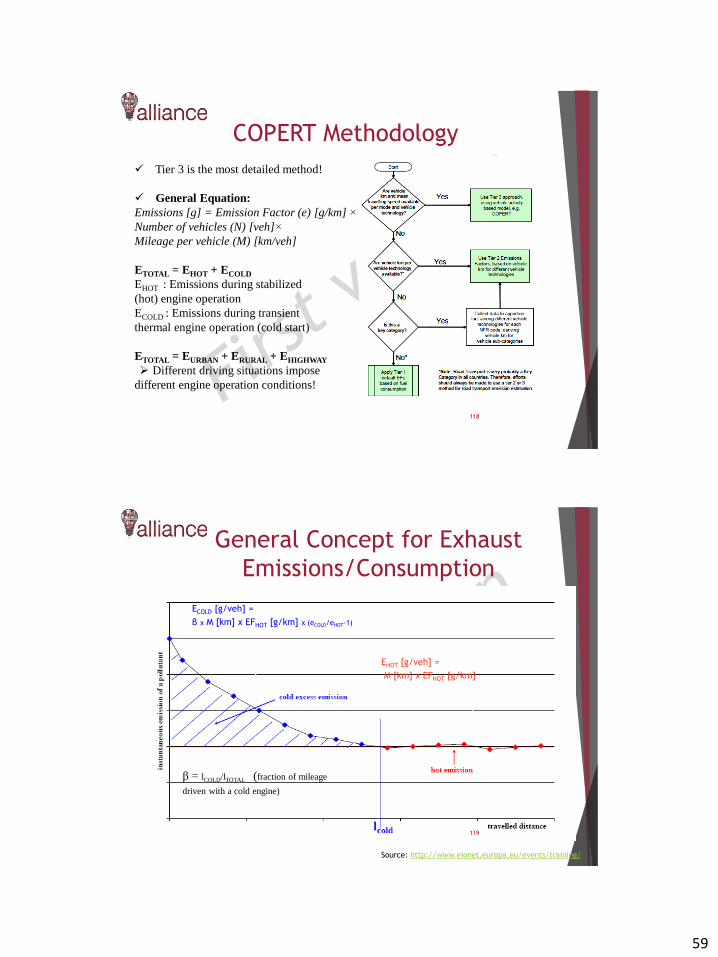
59
118
Tier 3 is the most detailed method!
General Equation:
Emissions [g] = Emission Factor (e) [g/km] ×
Number of vehicles (N) [veh]×
Mileage per vehicle (M) [km/veh]
ETOTAL = EHOT + ECOLD
EHOT : Emissions during stabilized
(hot) engine operation
ECOLD : Emissions during transient
thermal engine operation (cold start)
ETOTAL = EURBAN + ERURAL + EHIGHWAY
Different driving situations impose
different engine operation conditions!
COPERT Methodology
General Concept for Exhaust
Emissions/Consumption
EHOT [g/veh] =
M [km] x EFHOT [g/km]
ECOLD [g/veh] =
β x M [km] x EFHOT [g/km] x (eCOLD/eHOT-1)
β = lCOLD/lTOTAL (fraction of mileage
driven with a cold engine)
Source: http://www.eionet.europa.eu/events/training/
119
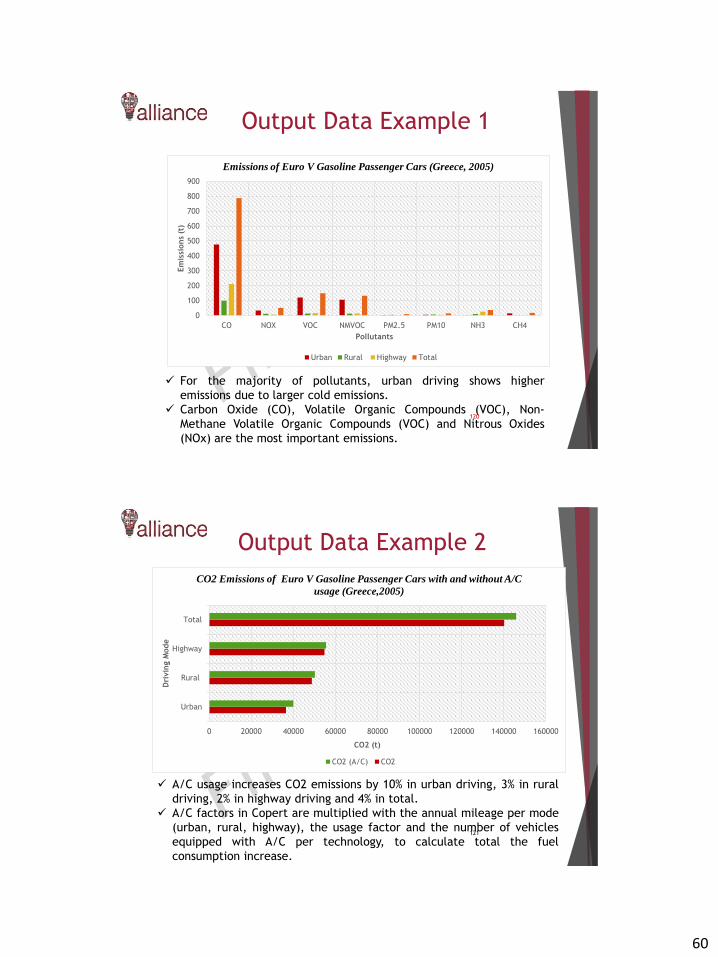
60
Output Data Example 1
0
100
200
300
400
500
600
700
800
900
CO NOX VOC NMVOC PM2.5 PM10 NH3 CH4
Em
issi
ons
(t)
Pollutants
Emissions of Euro V Gasoline Passenger Cars (Greece, 2005)
Urban Rural Highway Total
For the majority of pollutants, urban driving shows higher
emissions due to larger cold emissions.
Carbon Oxide (CO), Volatile Organic Compounds (VOC), Non-
Methane Volatile Organic Compounds (VOC) and Nitrous Oxides
(NOx) are the most important emissions.
120
0 20000 40000 60000 80000 100000 120000 140000 160000
Urban
Rural
Highway
Total
CO2 (t)
Dri
vin
g M
ode
CO2 Emissions of Euro V Gasoline Passenger Cars with and without A/C
usage (Greece,2005)
CO2 (A/C) CO2
A/C usage increases CO2 emissions by 10% in urban driving, 3% in rural
driving, 2% in highway driving and 4% in total.
A/C factors in Copert are multiplied with the annual mileage per mode
(urban, rural, highway), the usage factor and the number of vehicles
equipped with A/C per technology, to calculate total the fuel
consumption increase.
121
Output Data Example 2
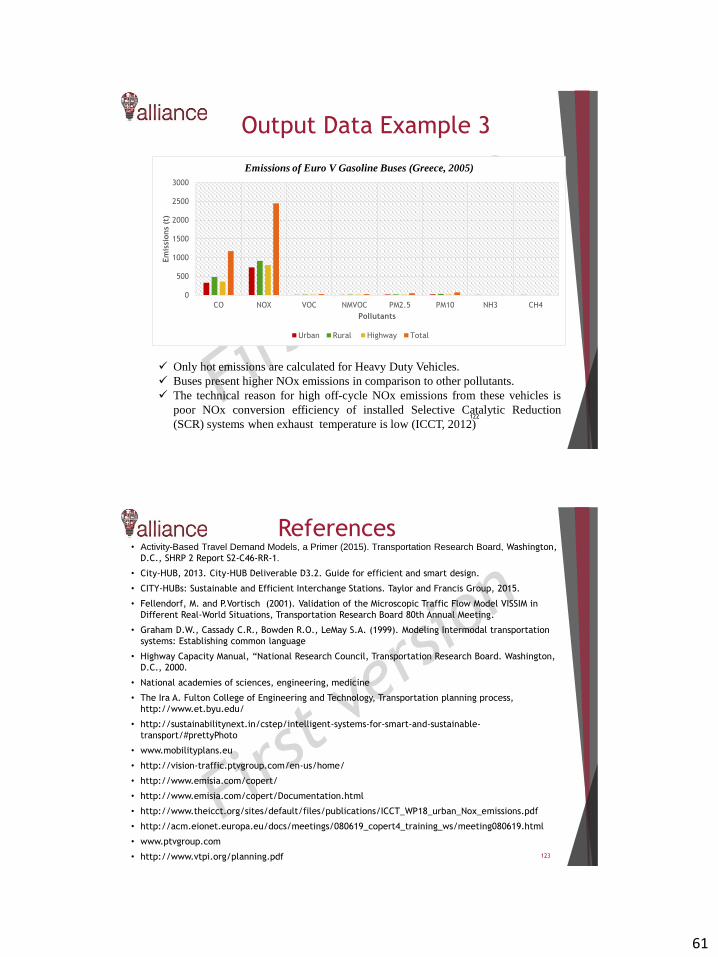
61
0
500
1000
1500
2000
2500
3000
CO NOX VOC NMVOC PM2.5 PM10 NH3 CH4
Em
issi
ons
(t)
Pollutants
Emissions of Euro V Gasoline Buses (Greece, 2005)
Urban Rural Highway Total
Only hot emissions are calculated for Heavy Duty Vehicles.
Buses present higher NOx emissions in comparison to other pollutants.
The technical reason for high off-cycle NOx emissions from these vehicles is
poor NOx conversion efficiency of installed Selective Catalytic Reduction
(SCR) systems when exhaust temperature is low (ICCT, 2012)122
Output Data Example 3
References
123
• Activity-Based Travel Demand Models, a Primer (2015). Transportation Research Board, Washington,
D.C., SHRP 2 Report S2-C46-RR-1.
• City-HUB, 2013. City-HUB Deliverable D3.2. Guide for efficient and smart design.
• CITY-HUBs: Sustainable and Efficient Interchange Stations. Taylor and Francis Group, 2015.
• Fellendorf, M. and P.Vortisch (2001). Validation of the Microscopic Traffic Flow Model VISSIM in
Different Real-World Situations, Transportation Research Board 80th Annual Meeting.
• Graham D.W., Cassady C.R., Bowden R.O., LeMay S.A. (1999). Modeling Intermodal transportation
systems: Establishing common language
• Highway Capacity Manual, “National Research Council, Transportation Research Board. Washington,
D.C., 2000.
• National academies of sciences, engineering, medicine
• The Ira A. Fulton College of Engineering and Technology, Transportation planning process,
http://www.et.byu.edu/
• http://sustainabilitynext.in/cstep/intelligent-systems-for-smart-and-sustainable-
transport/#prettyPhoto
• www.mobilityplans.eu
• http://vision-traffic.ptvgroup.com/en-us/home/
• http://www.emisia.com/copert/
• http://www.emisia.com/copert/Documentation.html
• http://www.theicct.org/sites/default/files/publications/ICCT_WP18_urban_Nox_emissions.pdf
• http://acm.eionet.europa.eu/docs/meetings/080619_copert4_training_ws/meeting080619.html
• www.ptvgroup.com
• http://www.vtpi.org/planning.pdf

62
Suggested literature
124
• Cascetta (2009). Transportation System Analysis: models and applications. 2nd edition.
Springer.
• Denos C. Gazis, Traffic Theory, Kluwer Academic Publishers, 2002.
• Hensher D.A., Button K.J., Handbook of Transport Modelling, Pergamon, 2000.
• Meyer M. and E.Miller (2000). Urban Transportation Planning 2nd Edition, McGraw-Hill
Series in Transportation.
• Moshe E. Ben-Akiva, Steven R. Lerman (1985) Discrete Choice Analysis: Theory and
Application to Travel Demand, The MIT Press.
• Oppenheim, N. Urban Travel Demand Modeling, From Individual Choices to General
Equilibrium, J. Wiley & Sons, 1995.
• Ortuzar, J. D. and L. G. Willumsen, Modelling Transport, J. Wiley & Sons, 2011.
• Richardson, E. Ampt, and A. Meyburg, Survey Methods for Transport Planning, Eucalyptus
Press, 1995.
• Stopher P. and M.Lee-Gosselin, Understanding travel behaviour in an era of change,
Pergamon, 1997.
• Trip generation manual, 9th edition, Institute of Transportation Engineers ITE, 2014.
1
This project has received funding from the European
Union’s Horizon 2020 research and innovation programme
under grant agreement No 692426
Operation and management of
intermodal transport systems
University of Thessaly, Greece
Content
2
• Background
• Stakeholders’ engagement and management
• Policy
• Operational structures
• Management structures
• The role of interchanges in urban planning
• Main principles for management and operational
structures
• Integrated information systems and ticketing
• Case studies
• Suggested literature
2
Background
3
Background
4
• Governance and policy cover issues related to the interconnection
of transportation with land planning, institutional and organization
frameworks
• There are few examples of policies, regulations and guidance that
incorporate the design, construction, management and operation of
interchanges as a whole
• The interchange facility and its catchment area are not considered
satisfactory in transport planning
• The roles and responsibilities of stakeholders involved in the
interchange are often addressed by the regulatory framework of
each mode
• Decision makers, service providers and end users are three groups of
stakeholders that affect intermodal transport
• The challenge of efficient intermodal transport is to satisfy each
specific group, its needs and requirements
3
Theoretical methodologies
5
Stakeholders’ engagement and
management
6
• Stakeholders’ identification:
Why involve stakeholders?
When to involve stakeholders?
Which stakeholders to involve?
• Stakeholders’ engagement:
Strategy
Public involvement
Techniques for public involvement
4
Why involve stakeholders?
7
• Local stakeholders can highlight local challenges that may be
addressed by localized solutions
• Political support and public acceptance can be achieved more easily
• Input from stakeholders who are involved in real-time implementation
and operation of intermodal interchanges can help to identify
potential barriers, problems and concerns
• Establishing a process of dialogue between the public and
professionals helps to make both parties become more aware of the
issues and options available, which will assist the latter stages of
implementation
When to involve stakeholders?
8
In the interchange planning process, stakeholders may be involved, when:
• Setting the objectives/goals for the interchange
• Identifying current and potential future problems
• Developing ideas for measures/facilities to be associated with theinterchange
• Indicating levels of support for different proposals
• Deciding on the preferred plan for the interchange
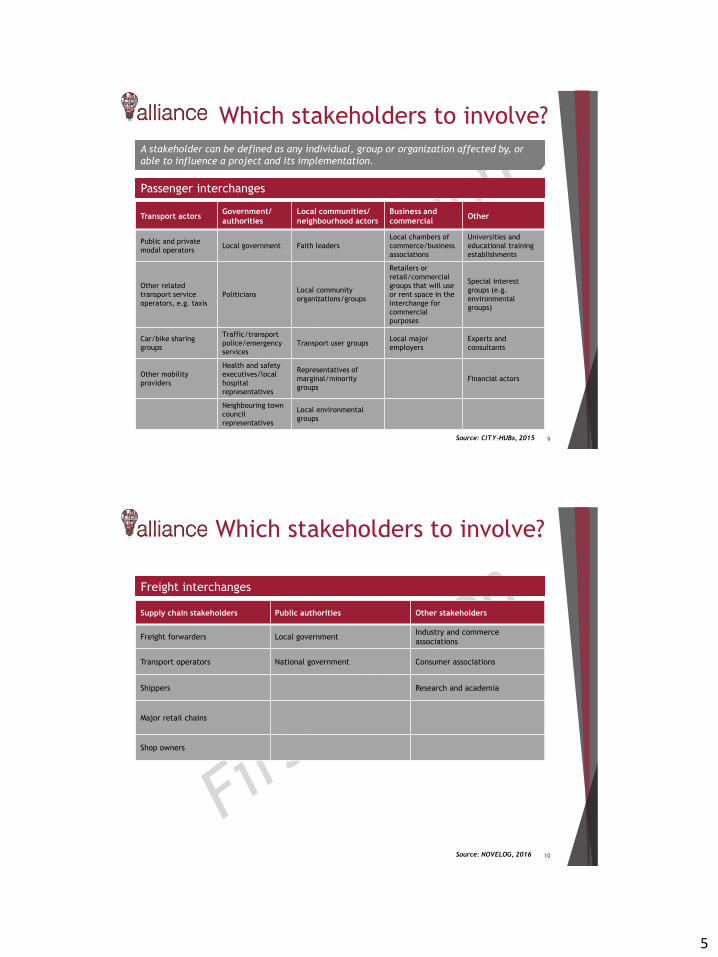
5
Which stakeholders to involve?
9
Passenger interchanges
A stakeholder can be defined as any individual, group or organization affected by, or
able to influence a project and its implementation.
Transport actorsGovernment/
authorities
Local communities/
neighbourhood actors
Business and
commercialOther
Public and private
modal operators Local government Faith leaders
Local chambers of
commerce/business
associations
Universities and
educational training
establishments
Other related
transport service
operators, e.g. taxis
PoliticiansLocal community
organizations/groups
Retailers or
retail/commercial
groups that will use
or rent space in the
interchange for
commercial
purposes
Special interest
groups (e.g.
environmental
groups)
Car/bike sharing
groups
Traffic/transport
police/emergency
services
Transport user groups Local major
employers
Experts and
consultants
Other mobility
providers
Health and safety
executives/local
hospital
representatives
Representatives of
marginal/minority
groups
Financial actors
Neighbouring town
council
representatives
Local environmental
groups
Source: CITY-HUBs, 2015
Which stakeholders to involve?
10
Freight interchanges
Supply chain stakeholders Public authorities Other stakeholders
Freight forwarders Local governmentIndustry and commerce
associations
Transport operators National government Consumer associations
Shippers Research and academia
Major retail chains
Shop owners
Source: NOVELOG, 2016

6
How to involve stakeholders?
11
A stakeholder engagement strategy should include the following steps:
Step 1 Specify the issues to be addressed
Step 4Establish the consultation/involvement process and the options for giving
input
Step 2 Identify the stakeholders to involve
Step 3Set out the ways in which they are to be involved and their potential
contribution
Step 5Execute consultation processes: Care should be taken to ensure that all
voices are heard and different groupings of stakeholders may be required
Step 6 Evaluate and follow-up
Source: CITY-HUBs, 2015
Public involvement
12
• Engaging stakeholders is an ongoing dynamic process
• Public consultation may occur when an interchange is being:
Planned
Designed and built
Redesigned or upgraded
• The aim is to build effective and trustful partnerships
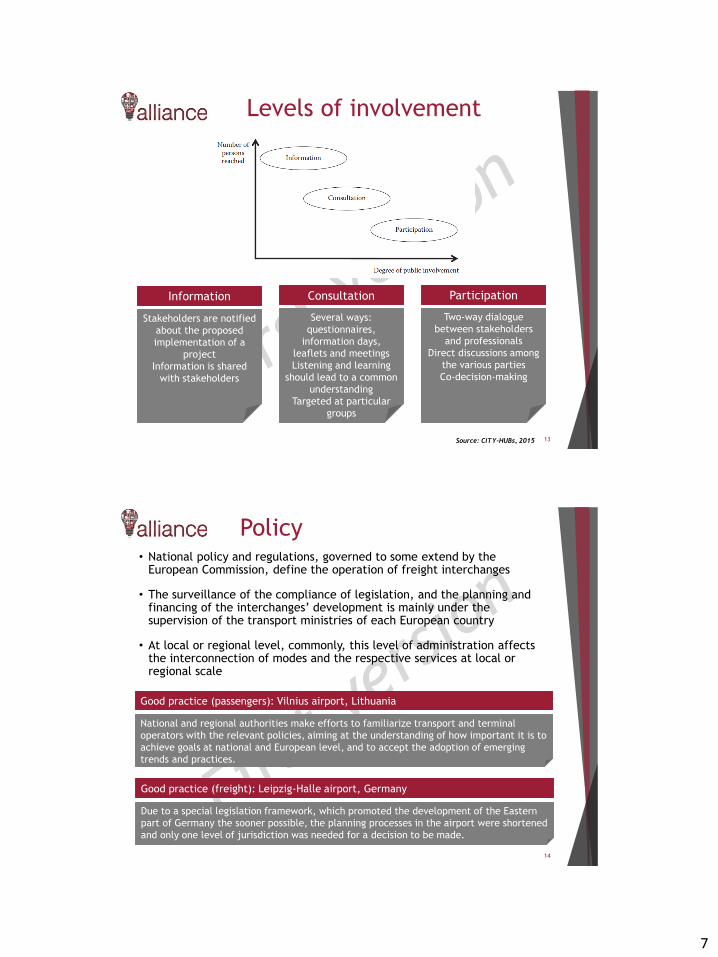
7
Levels of involvement
13
Information
Stakeholders are notified
about the proposed
implementation of a
project
Information is shared
with stakeholders
Consultation
Several ways:
questionnaires,
information days,
leaflets and meetings
Listening and learning
should lead to a common
understanding
Targeted at particular
groups
Participation
Two-way dialogue
between stakeholders
and professionals
Direct discussions among
the various parties
Co-decision-making
Source: CITY-HUBs, 2015
Policy
14
• National policy and regulations, governed to some extend by theEuropean Commission, define the operation of freight interchanges
• The surveillance of the compliance of legislation, and the planning andfinancing of the interchanges’ development is mainly under thesupervision of the transport ministries of each European country
• At local or regional level, commonly, this level of administration affectsthe interconnection of modes and the respective services at local orregional scale
Good practice (passengers): Vilnius airport, Lithuania
National and regional authorities make efforts to familiarize transport and terminal
operators with the relevant policies, aiming at the understanding of how important it is to
achieve goals at national and European level, and to accept the adoption of emerging
trends and practices.
Good practice (freight): Leipzig-Halle airport, Germany
Due to a special legislation framework, which promoted the development of the Eastern
part of Germany the sooner possible, the planning processes in the airport were shortened
and only one level of jurisdiction was needed for a decision to be made.
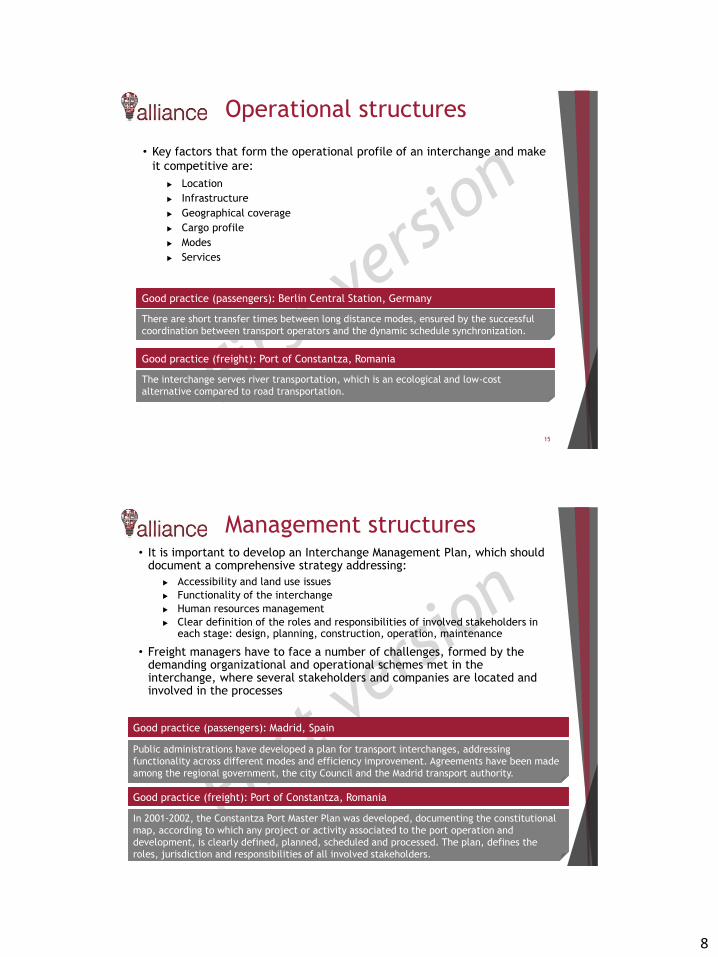
8
Operational structures
15
• Key factors that form the operational profile of an interchange and make
it competitive are:
Location
Infrastructure
Geographical coverage
Cargo profile
Modes
Services
Good practice (freight): Port of Constantza, Romania
The interchange serves river transportation, which is an ecological and low-cost
alternative compared to road transportation.
Good practice (passengers): Berlin Central Station, Germany
There are short transfer times between long distance modes, ensured by the successful
coordination between transport operators and the dynamic schedule synchronization.
Management structures
16
• It is important to develop an Interchange Management Plan, which shoulddocument a comprehensive strategy addressing:
Accessibility and land use issues
Functionality of the interchange
Human resources management
Clear definition of the roles and responsibilities of involved stakeholders ineach stage: design, planning, construction, operation, maintenance
• Freight managers have to face a number of challenges, formed by thedemanding organizational and operational schemes met in theinterchange, where several stakeholders and companies are located andinvolved in the processes
Good practice (freight): Port of Constantza, Romania
In 2001-2002, the Constantza Port Master Plan was developed, documenting the constitutional
map, according to which any project or activity associated to the port operation and
development, is clearly defined, planned, scheduled and processed. The plan, defines the
roles, jurisdiction and responsibilities of all involved stakeholders.
Good practice (passengers): Madrid, Spain
Public administrations have developed a plan for transport interchanges, addressing
functionality across different modes and efficiency improvement. Agreements have been made
among the regional government, the city Council and the Madrid transport authority.

9
Problem stating and
solution approach
17
The role of interchanges in urban planning
18
-The pyramid of urban interchanges elements-
Source: Adamos et al., 2015
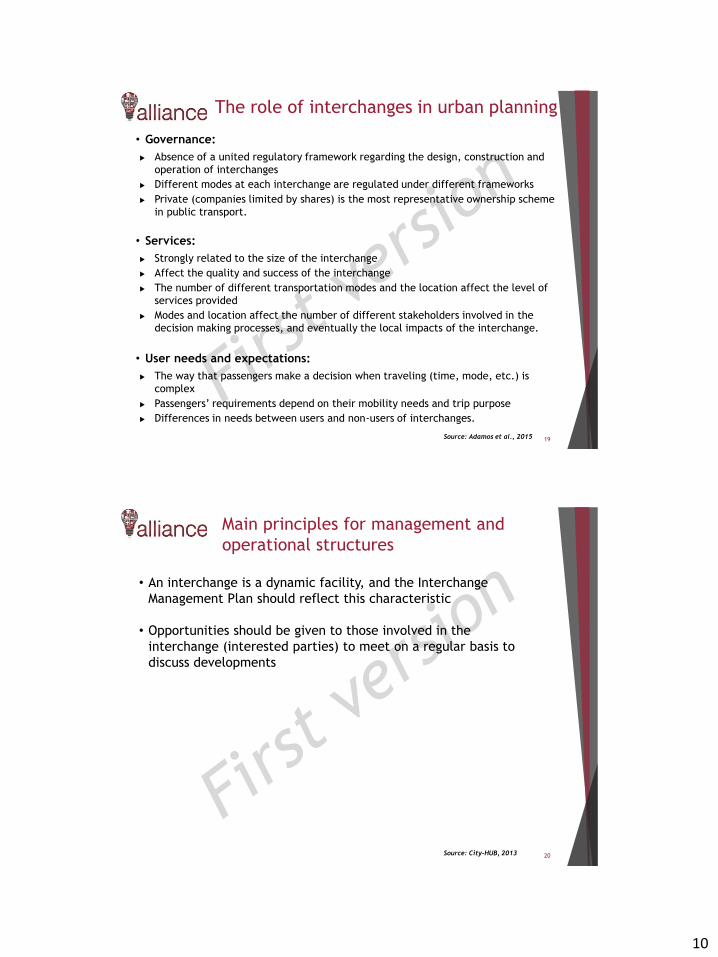
10
The role of interchanges in urban planning
19
• Governance:
Absence of a united regulatory framework regarding the design, construction and
operation of interchanges
Different modes at each interchange are regulated under different frameworks
Private (companies limited by shares) is the most representative ownership scheme
in public transport.
• Services:
Strongly related to the size of the interchange
Affect the quality and success of the interchange
The number of different transportation modes and the location affect the level of
services provided
Modes and location affect the number of different stakeholders involved in the
decision making processes, and eventually the local impacts of the interchange.
• User needs and expectations:
The way that passengers make a decision when traveling (time, mode, etc.) is
complex
Passengers’ requirements depend on their mobility needs and trip purpose
Differences in needs between users and non-users of interchanges.
Source: Adamos et al., 2015
Main principles for management and
operational structures
20
• An interchange is a dynamic facility, and the Interchange
Management Plan should reflect this characteristic
• Opportunities should be given to those involved in the
interchange (interested parties) to meet on a regular basis to
discuss developments
Source: City-HUB, 2013

11
Integrated information systems and
ticketing
21
• Clear information systems are needed for the provision of easy,
efficient and seamless information
• This information should be integrated between different operators and
modes
• Integrated, smart ticketing facilitates easy transfer, and promotes the
use of public transport
• Open data is becoming more and more common in transportation:
Integration of different timetables is available is some cases
Coverage of all operators and modes is needed
A centralized web service or mobile application for all options, can make
transferring and use of interchanges much easier
Source: City-HUB, 2013
Applications
22
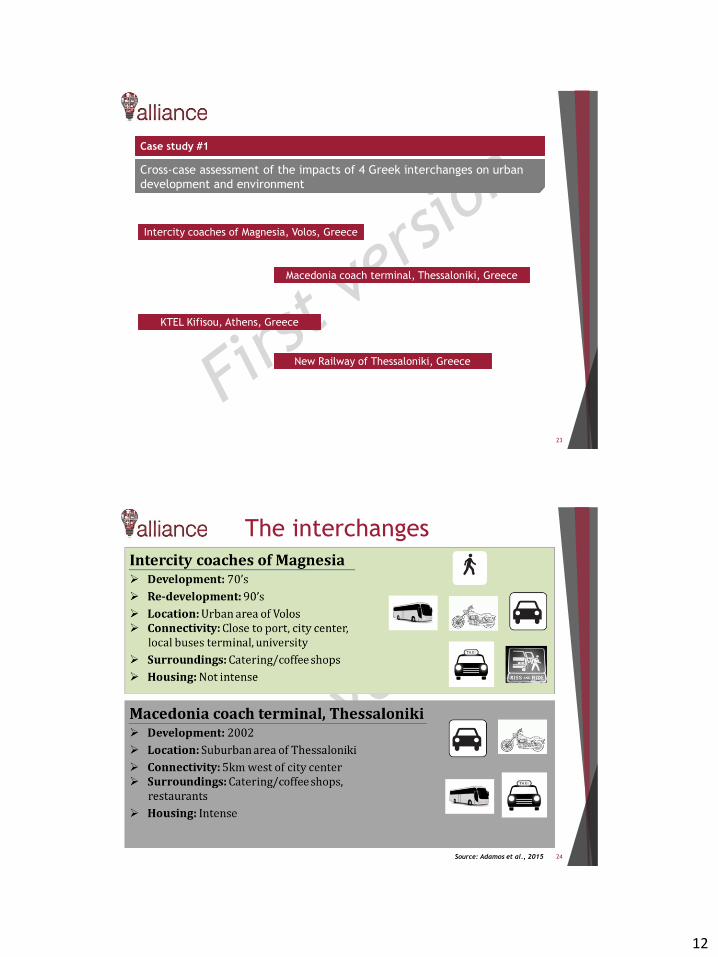
12
23
Case study #1
Cross-case assessment of the impacts of 4 Greek interchanges on urban
development and environment
New Railway of Thessaloniki, Greece
Intercity coaches of Magnesia, Volos, Greece
Macedonia coach terminal, Thessaloniki, Greece
KTEL Kifisou, Athens, Greece
24
The interchanges
Source: Adamos et al., 2015
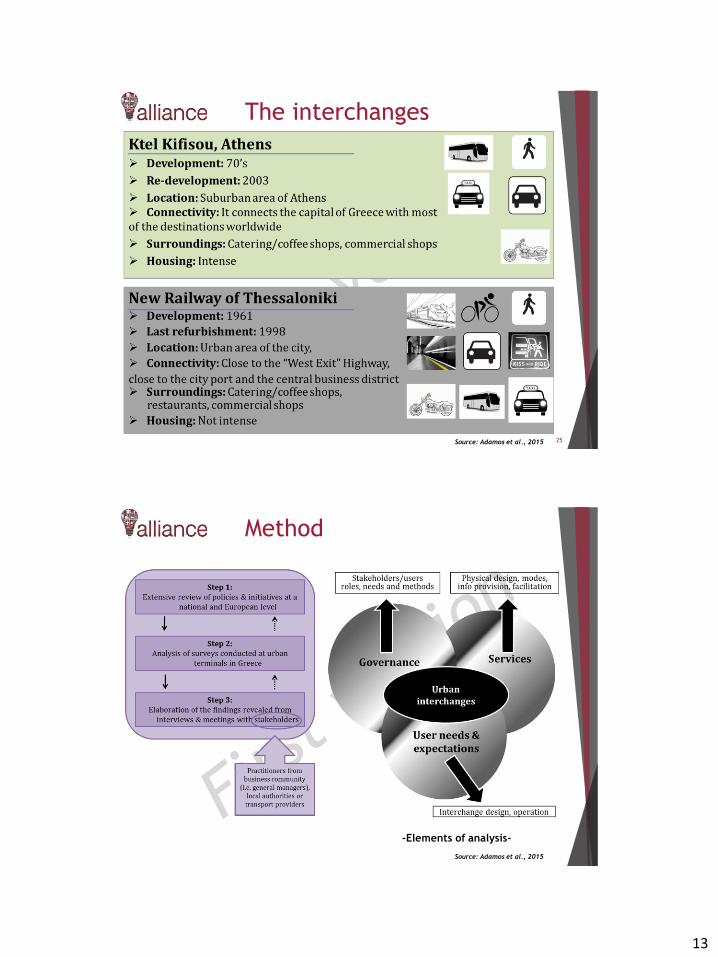
13
25
The interchanges
Source: Adamos et al., 2015
Method
-Elements of analysis-
Source: Adamos et al., 2015
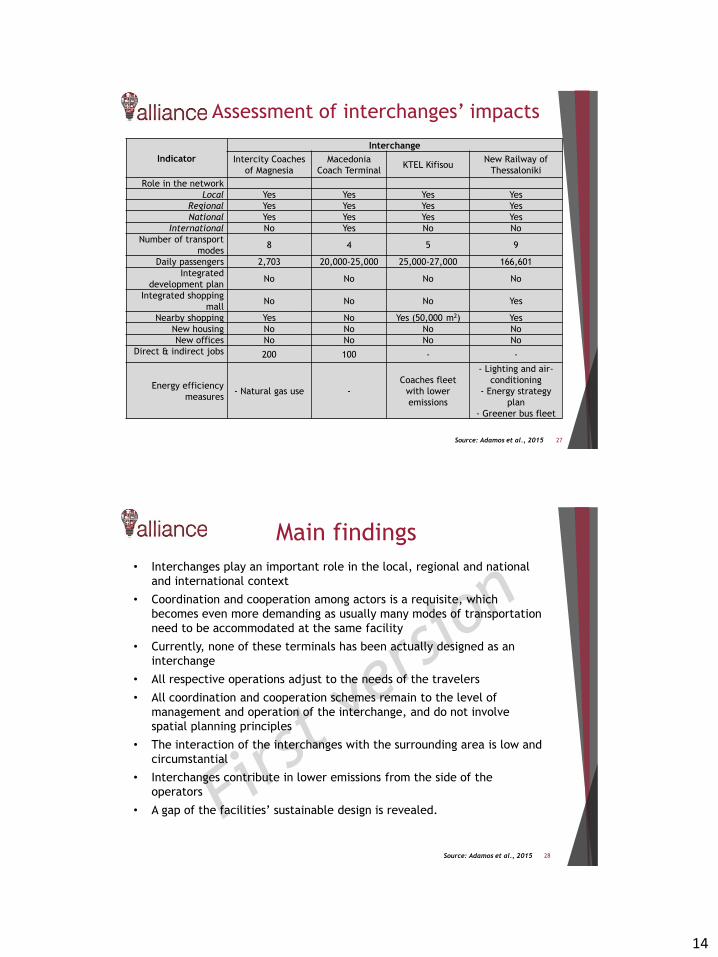
14
27
Assessment of interchanges’ impacts
Indicator
Interchange
Intercity Coaches
of Magnesia
Macedonia
Coach TerminalKTEL Kifisou
New Railway of
Thessaloniki
Role in the network
Local Yes Yes Yes Yes
Regional Yes Yes Yes Yes
National Yes Yes Yes Yes
International No Yes No No
Number of transport
modes 8 4 5 9
Daily passengers 2,703 20,000-25,000 25,000-27,000 166,601
Integrated
development planNo No No No
Integrated shopping
mallNo No No Yes
Nearby shopping Yes No Yes (50,000 m2) Yes
New housing No No No No
New offices No No No No
Direct & indirect jobs 200 100 - -
Energy efficiency
measures- Natural gas use -
Coaches fleet
with lower
emissions
- Lighting and air-
conditioning
- Energy strategy
plan
- Greener bus fleet
Source: Adamos et al., 2015
Main findings
28
• Interchanges play an important role in the local, regional and national
and international context
• Coordination and cooperation among actors is a requisite, which
becomes even more demanding as usually many modes of transportation
need to be accommodated at the same facility
• Currently, none of these terminals has been actually designed as an
interchange
• All respective operations adjust to the needs of the travelers
• All coordination and cooperation schemes remain to the level of
management and operation of the interchange, and do not involve
spatial planning principles
• The interaction of the interchanges with the surrounding area is low and
circumstantial
• Interchanges contribute in lower emissions from the side of the
operators
• A gap of the facilities’ sustainable design is revealed.
Source: Adamos et al., 2015
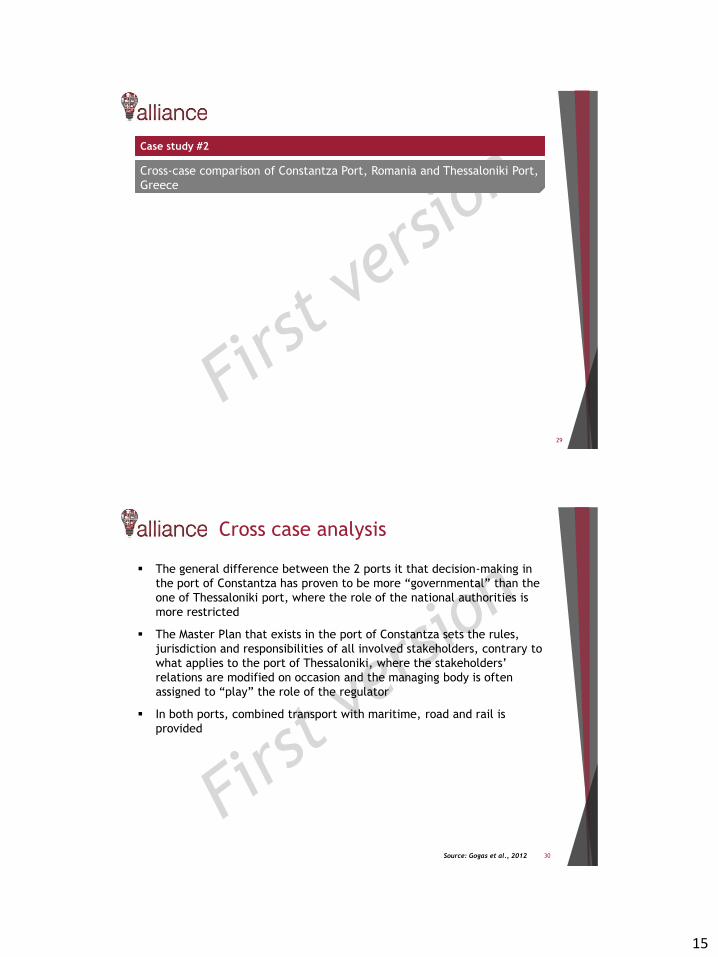
15
29
Case study #2
Cross-case comparison of Constantza Port, Romania and Thessaloniki Port,
Greece
Cross case analysis
30
The general difference between the 2 ports it that decision-making in
the port of Constantza has proven to be more “governmental” than the
one of Thessaloniki port, where the role of the national authorities is
more restricted
The Master Plan that exists in the port of Constantza sets the rules,
jurisdiction and responsibilities of all involved stakeholders, contrary to
what applies to the port of Thessaloniki, where the stakeholders’
relations are modified on occasion and the managing body is often
assigned to “play” the role of the regulator
In both ports, combined transport with maritime, road and rail is
provided
Source: Gogas et al., 2012
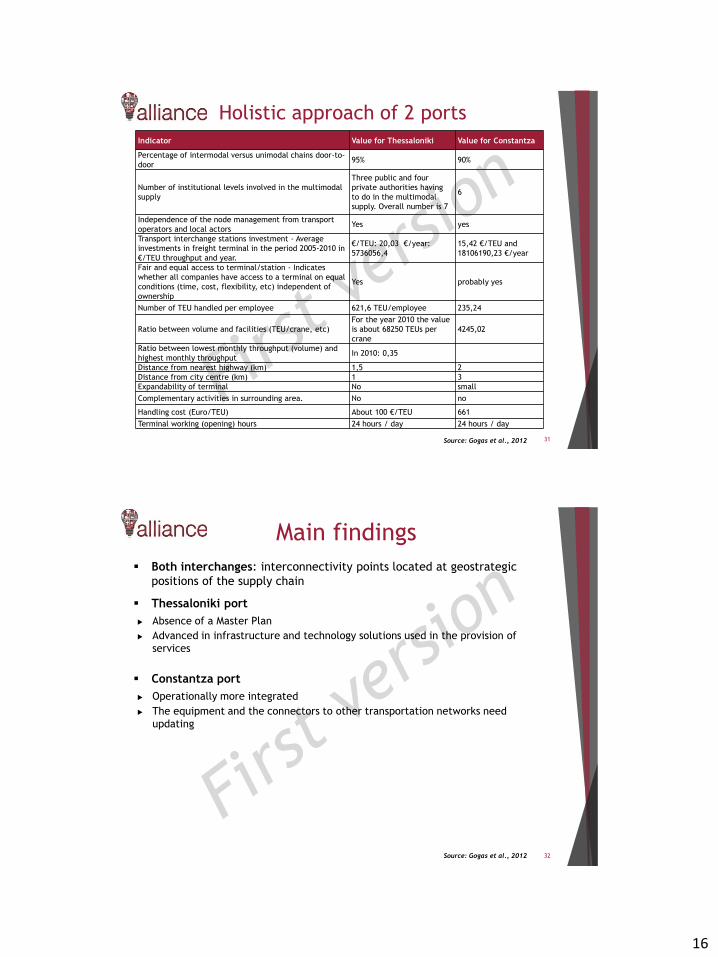
16
Holistic approach of 2 ports
31Source: Gogas et al., 2012
Indicator Value for Thessaloniki Value for Constantza
Percentage of intermodal versus unimodal chains door-to-
door95% 90%
Number of institutional levels involved in the multimodal
supply
Three public and four
private authorities having
to do in the multimodal
supply. Overall number is 7
6
Independence of the node management from transport
operators and local actorsYes yes
Transport interchange stations investment - Average
investments in freight terminal in the period 2005-2010 in
€/TEU throughput and year.
€/TEU: 20,03 €/year:
5736056,4
15,42 €/TEU and
18106190,23 €/year
Fair and equal access to terminal/station - Indicates
whether all companies have access to a terminal on equal
conditions (time, cost, flexibility, etc) independent of
ownership
Yes probably yes
Number of TEU handled per employee 621,6 TEU/employee 235,24
Ratio between volume and facilities (TEU/crane, etc)
For the year 2010 the value
is about 68250 TEUs per
crane
4245,02
Ratio between lowest monthly throughput (volume) and
highest monthly throughputIn 2010: 0,35
Distance from nearest highway (km) 1,5 2
Distance from city centre (km) 1 3
Expandability of terminal No small
Complementary activities in surrounding area. No no
Handling cost (Euro/TEU) About 100 €/TEU 661
Terminal working (opening) hours 24 hours / day 24 hours / day
Main findings
32
Both interchanges: interconnectivity points located at geostrategic
positions of the supply chain
Thessaloniki port
Absence of a Master Plan
Advanced in infrastructure and technology solutions used in the provision of
services
Constantza port
Operationally more integrated
The equipment and the connectors to other transportation networks need
updating
Source: Gogas et al., 2012
17
Guidance to further
knowledge acquisition
33
Suggested literature
34
• Ballis, A., 2004. Introducing Level Of Service Standards for Intermodal Freight Terminals. Transportation
Research Record: Journal of the Transportation Research Board, Vol 1873, Washington DC, pp. 79-88.
• Banister, D. & Berechman, Y., 2001. Transport investement and the promotion of economic growth. Journal of
Transport Geography, 9(2001) 209-218.
• Bask, A. 1999. Third Party Relationships in Logistics Services, Helsinki School of Economics and Business
Administration, Licentiate Thesis, Helsinki. 140 p.
• City-HUB, 2013. City-HUB Deliverable D4.1. Integrated management of efficient urban interchanges.
• City-HUB, 2015. City-HUB Deliverable D5.2. City-HUB Handbook.
• European Commission, 2001. White Paper " European transport policy for 2010: Time to decide (CEC, 2001).
• European Commission, 2006. Keep Europe Moving. Sustainable mobility for our continent. Mid-term review of the
European Commission’s 2001 transport White Paper. ISBN 92-79-02312-8. Luxemburg: Office for Official
Publications of the European Communities, 2006.
• European Communities, 2009. Communication from the Commission to the European Parliament, the Council,
the European Economic and Social Committee and the Committee of the Regions. Action Plan of Urban Mobility.
COM (2009) 490 final. Brussels, Belgium.
• European Commission, 2011. Roadmap to a Single European Transport Area – Towards a competitive and resource
efficient transport system. White Paper. COM (2011) 144 final. European Commission. Brussels, Belgium.
• GUIDE, 2000. Terzis, G., Last, An. GUIDE – Urban Interchanges – A Good Practice Guide – Final Report prepared
for EC DG VII. April, 2000.
• Grotenhuis, J.W., W.W. Bart and P. Rietveld (2007). “The desired quality of integrated multimodal travel
information in public transport: Customer needs for time and effort saving”. Transport Policy, Vol. 14, pp. 27-38.
• IMONODE, 2005. WP3: Supply side – Intermodal network analysis. IMONODE – Efficient Integration of Cargo
Transport Modes & Nodes in CADSES area.
• PIRATE project, 2001. Final report. Accessed by http://www.transport-
research.info/web/projects/project_details.cfm?ID=593 on 11/03/2013.
18
References
35
• Adamos, G., Nathanail, E. & Tsami, M., 2015. Urban interchanges: Moving towards a
seamless transportation solution. 5th International Conference on Environmental
Management, Engineering, Planning and Economics (CEMEPE) and SECOTOC Conference.
Mykonos Island, Greece, June 14-18, 2015.
• City-HUB, 2013. City-HUB Deliverable D4.1. Integrated management of efficient urban
interchanges.
• CITY-HUBs: Sustainable and Efficient Interchange Stations. Taylor and Francis Group,
2015.
• Di Ciommo, F. 2004. La regιnιration urbaine ΰ Naples, Paris et Milan: la fiabilitι du
politique, condition de participation des acteurs ιconomiques. PhD. Thesis. Marne-la-
Vallιe, ENPC. http://www.theses.fr/2004ENPC0443.
• Gogas, M., Papoutsis, K., Nathanail, E., Adamos, G. & Kapetanopoulou, P., 2012. A
comparison study on urban-interurban interfaces on ports – The Constantza and
Thessaloniki ports case studies. 2nd International Conference on Supply Chains, Katerini,
Greece, October 5-6, 2012.
• Martens, K. 2007. In G. De Roo and G. Porter (Eds), Actors in a fuzzy governance
environment. Fuzzy Planning: The Role of Actors in a Fuzzy Governance Environment,
Burlington, VT: Ashgate.
• NOVELOG, 2016. NOVELOG Deliverable D2.2. Urban freight and service transport in
European cities.

1
This project has received funding from the European
Union’s Horizon 2020 research and innovation programme
under grant agreement No 692426
Optimization of intermodal
transport systems
University of Thessaly (UTh), Greece
Content
• Background
• Rules
• Basic concepts
• Techniques
• Software and applications
• Suggested literature
2

2
Background
3
Optimization Principles
• Formulation of theproblem = art and skill =as a new language
• Multiple formulations mayexist - some are betterthan others
4
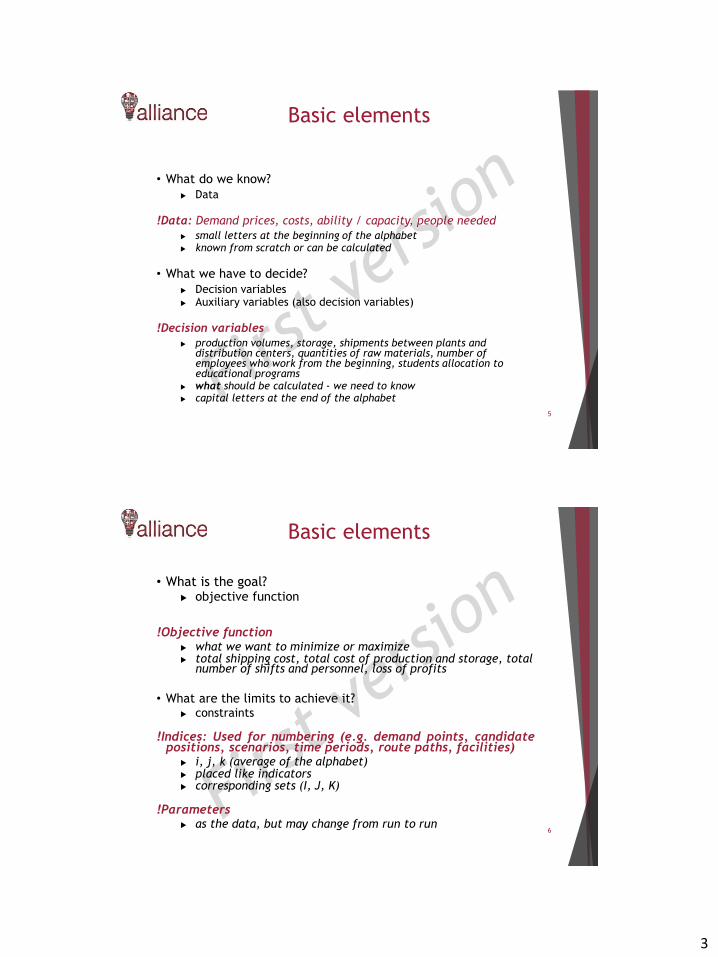
3
Basic elements
• What do we know?
Data
!Data: Demand prices, costs, ability / capacity, people needed
small letters at the beginning of the alphabet known from scratch or can be calculated
• What we have to decide?
Decision variables Auxiliary variables (also decision variables)
!Decision variables
production volumes, storage, shipments between plants anddistribution centers, quantities of raw materials, number of employees who work from the beginning, students allocation to educational programs
what should be calculated - we need to know capital letters at the end of the alphabet
5
Basic elements
• What is the goal? objective function
!Objective function what we want to minimize or maximize total shipping cost, total cost of production and storage, total
number of shifts and personnel, loss of profits
• What are the limits to achieve it? constraints
!Indices: Used for numbering (e.g. demand points, candidatepositions, scenarios, time periods, route paths, facilities)
i, j, k (average of the alphabet) placed like indicators corresponding sets (I, J, K)
!Parameters as the data, but may change from run to run
6
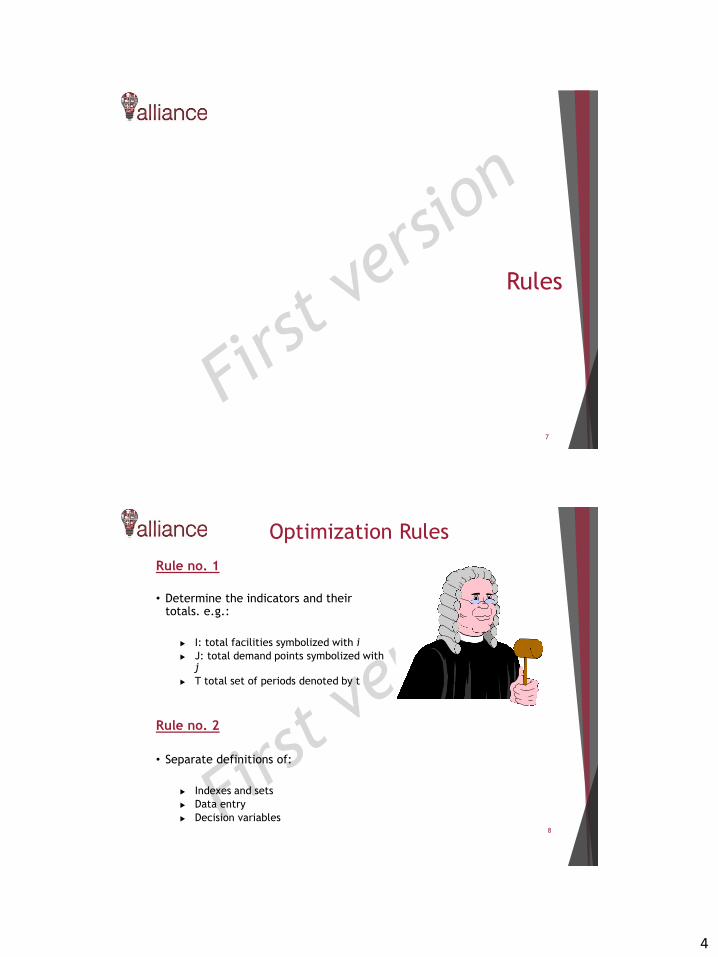
4
Rules
7
Optimization Rules
Rule no. 1
• Determine the indicators and theirtotals. e.g.:
I: total facilities symbolized with i
J: total demand points symbolized withj
T total set of periods denoted by t
8
Rule no. 2
• Separate definitions of:
Indexes and sets
Data entry
Decision variables
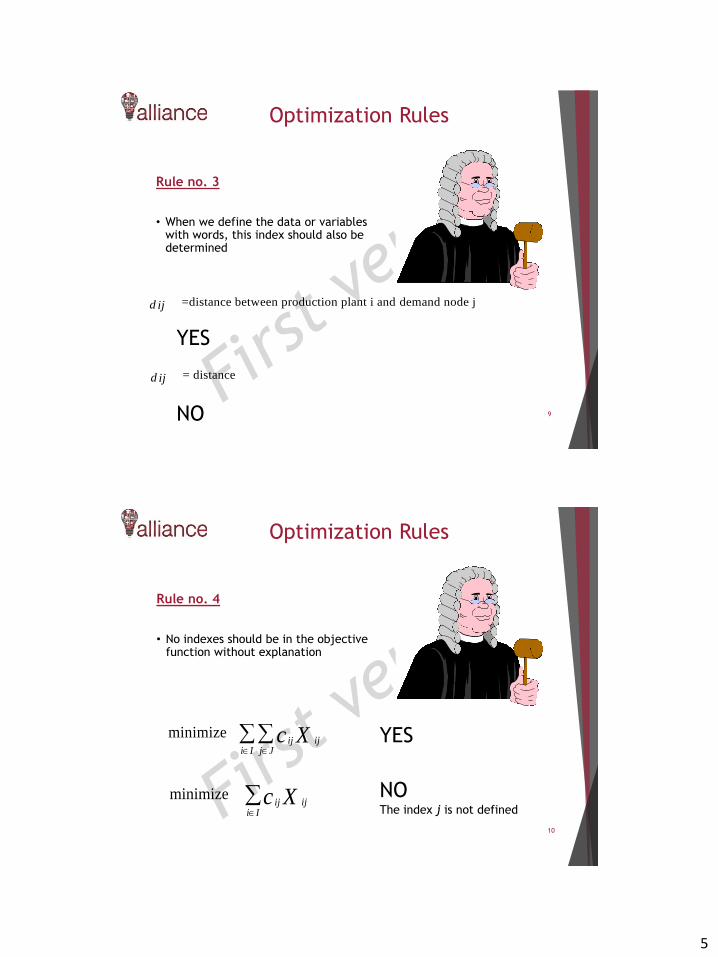
5
Rule no. 3
• When we define the data or variableswith words, this index should also bedetermined
9
=distance between production plant i and demand node jd ij
= distanced ij
YES
NO
Optimization Rules
Rule no. 4
• No indexes should be in the objectivefunction without explanation
10
minimize ijij
i I j J
c X
minimizeijij
i Ic X
NOThe index j is not defined
YES
Optimization Rules

6
Rule no. 5
• At least some decision variables shouldbe shown in the objective function andsome to the constraints:
11
minimize ijij
i I j J
c X
NO if dij is given as entry data.
Decision variables are not shown.subject to 0
ijd
YES
Optimization Rules
Rule no. 6
• Confirmation that all the variables arelinked to each other, otherwise theproblem is fragmented and there isprobably an error.
12
Example
maximize
subject to
0,1
0,1
iii I
jj J
i
j
P
i I
j J
h Z
X
Z
X
• X and Z variables are not linked. An additional constraint is needed,e.g.
0 i jij
j
i IaZ X
Optimization Rules
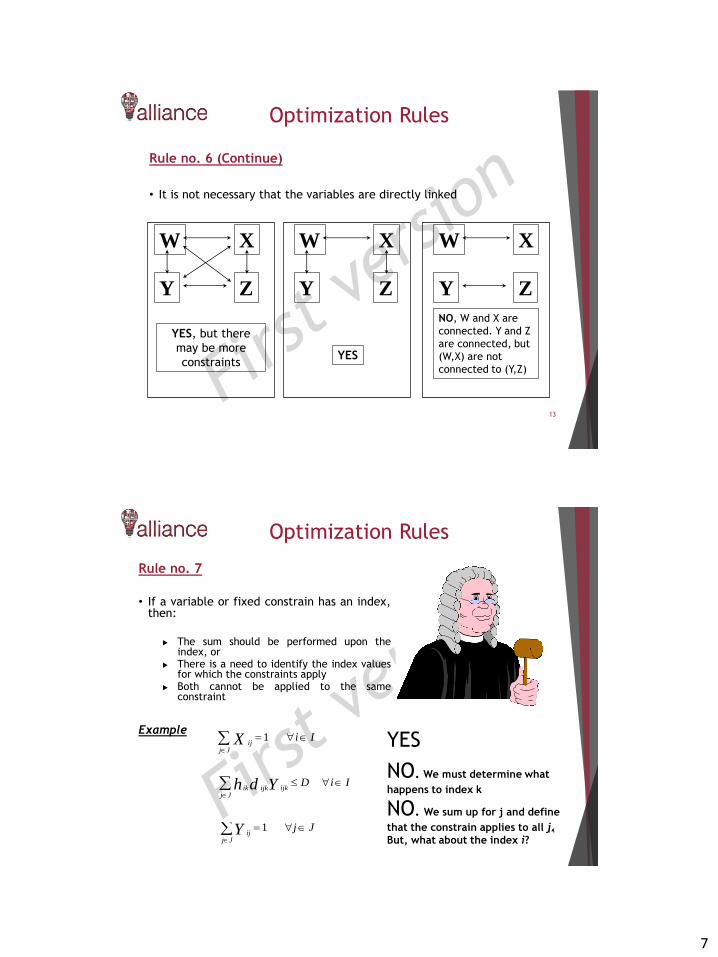
7
Rule no. 6 (Continue)
• It is not necessary that the variables are directly linked
13
W
Y Z
X W
Y Z
X W
Y Z
X
YES, but there
may be more
constraintsYES
NO, W and X are
connected. Y and Z
are connected, but
(W,X) are not
connected to (Y,Z)
Optimization Rules
Rule no. 7
• If a variable or fixed constrain has an index,then:
The sum should be performed upon theindex, or
There is a need to identify the index valuesfor which the constraints apply
Both cannot be applied to the sameconstraint
14
Example1
ijj J
i IX
ijkik ijk
j J
D i Ih d Y
NO. We must determine what
happens to index k
1 ij
j J
j JY
NO. We sum up for j and define
that the constrain applies to all j.
But, what about the index i?
YES
Optimization Rules
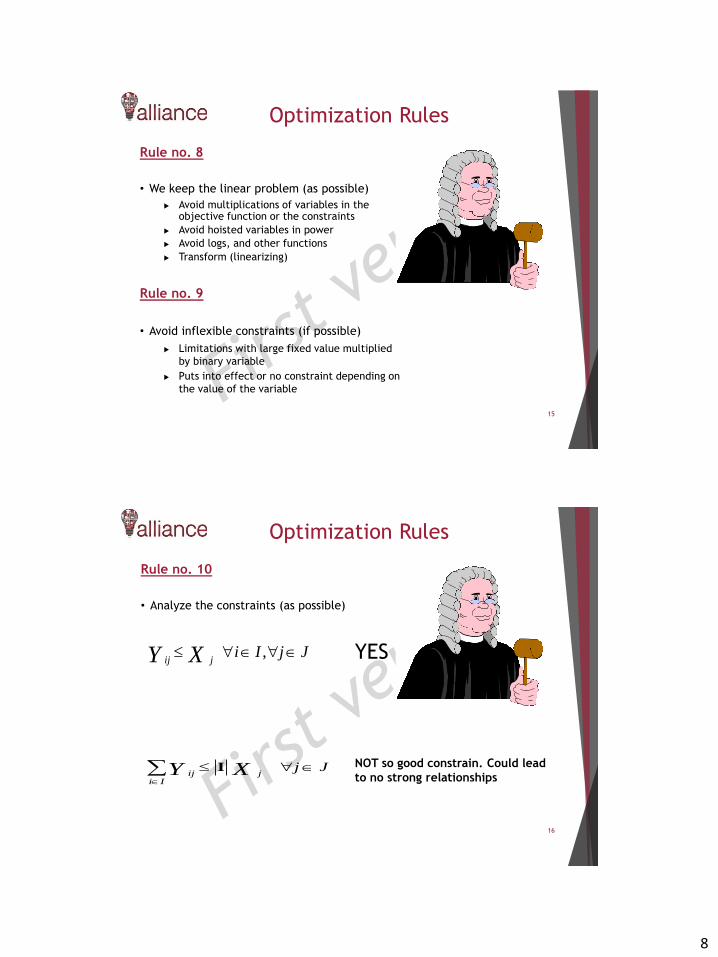
8
Rule no. 8
• We keep the linear problem (as possible)
Avoid multiplications of variables in theobjective function or the constraints
Avoid hoisted variables in power
Avoid logs, and other functions
Transform (linearizing)
15
Rule no. 9
• Avoid inflexible constraints (if possible)
Limitations with large fixed value multiplied
by binary variable
Puts into effect or no constraint depending on
the value of the variable
Optimization Rules
Rule no. 10
• Analyze the constraints (as possible)
16
,ij j
i I j JY X
ij j
i I
j JY X
I NOT so good constrain. Could lead
to no strong relationships
YES
Optimization Rules
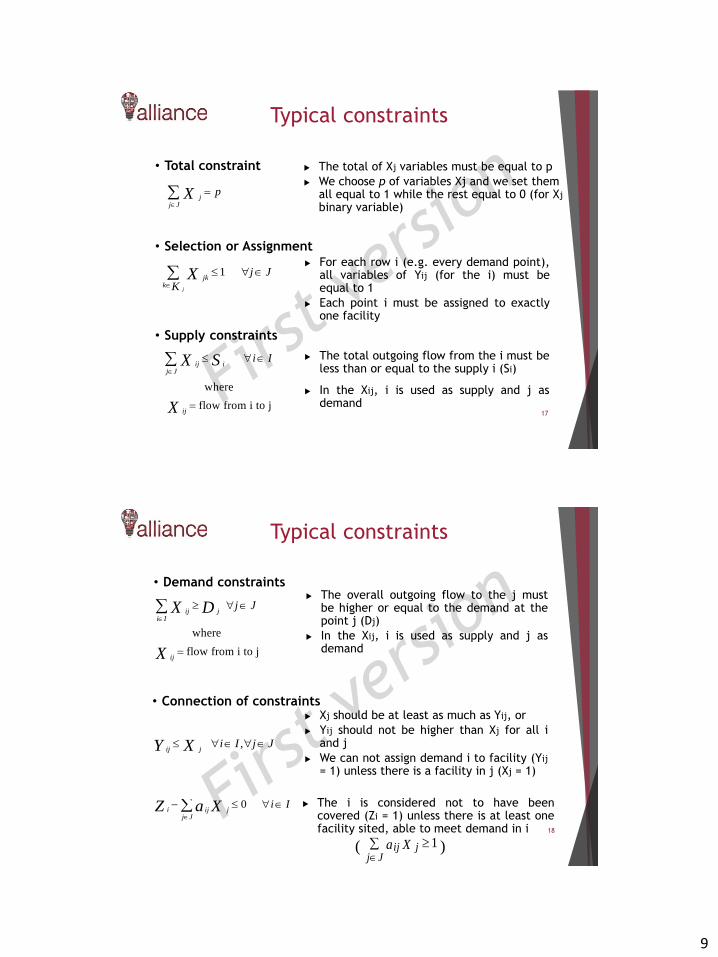
9
Typical constraints
• Total constraint
17
jj J
pX
The total of Xj variables must be equal to p
We choose p of variables Xj and we set themall equal to 1 while the rest equal to 0 (for Xj
binary variable)
• Selection or Assignment
1
j
jkk
j J
KX
For each row i (e.g. every demand point),
all variables of Yij (for the i) must beequal to 1
Each point i must be assigned to exactlyone facility
• Supply constraints
where
flow from i to j
ij ij J
ij
i ISX
X
The total outgoing flow from the i must beless than or equal to the supply i (Si)
In the Xij, i is used as supply and j asdemand
Typical constraints
• Demand constraints
18
The overall outgoing flow to the j mustbe higher or equal to the demand at thepoint j (Dj)
In the Xij, i is used as supply and j asdemand
where
flow from i to j
ij ji I
ij
j JX D
X
• Connection of constraints
,ij j
i I j JY X
Xj should be at least as much as Yij, or
Yij should not be higher than Xj for all iand j
We can not assign demand i to facility (Yij
= 1) unless there is a facility in j (Xj = 1)
0 i jij
j J
i IaZ X
The i is considered not to have beencovered (Zi = 1) unless there is at least onefacility sited, able to meet demand in i
1Jj
jij Xa( )
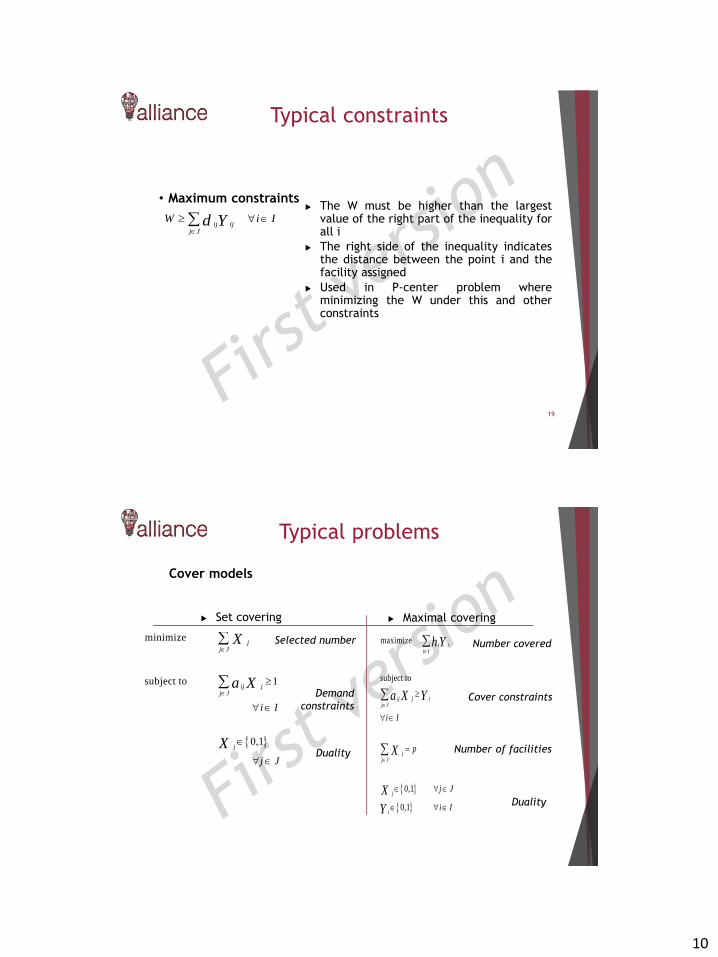
10
Typical constraints
• Maximum constraints
19
The W must be higher than the largestvalue of the right part of the inequality forall i
The right side of the inequality indicatesthe distance between the point i and thefacility assigned
Used in P-center problem whereminimizing the W under this and otherconstraints
ijij
j J
W i Id Y
Typical problems
Cover models
Set covering Maximal covering
Selected number
Demand
constraints
Duality
Number covered
Cover constraints
Number of facilities
Duality
maximize
subject to
0,1
0,1
iii I
j iijj J
jj J
j
i
i I
p
j J
i I
h Y
a X Y
X
X
Y
minimize
subject to 1
0,1
jj J
jijj J
j
i I
j J
X
a X
X
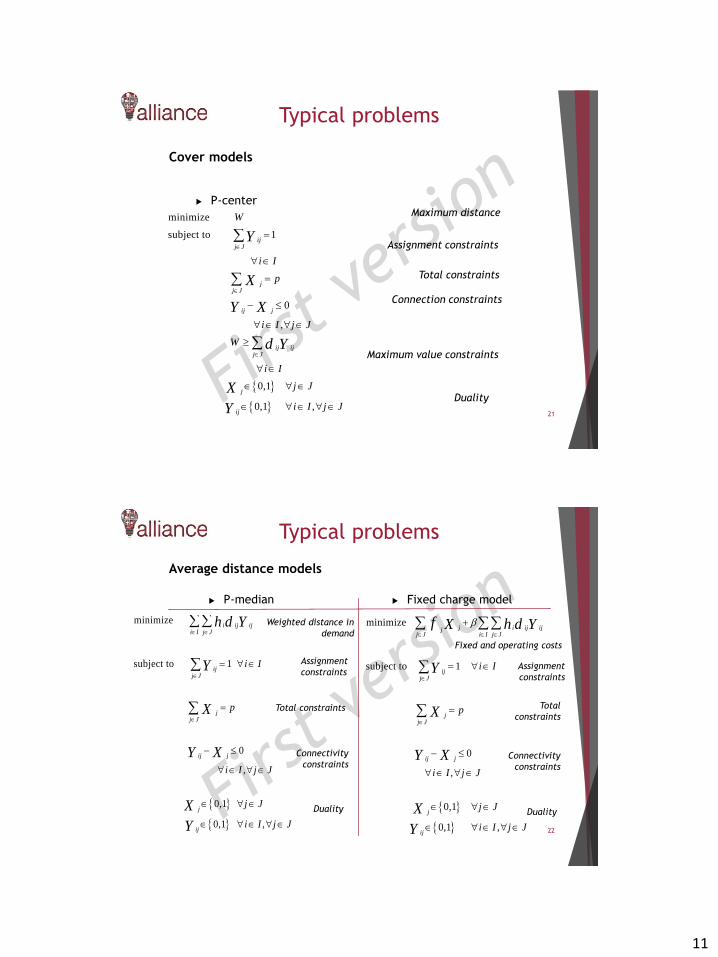
11
Typical problems
21
Cover models
P-center
minimize
subject to 1
0
,
ijj J
jj J
ij j
ijijj J
W
i I
p
i I j J
W
Y
X
Y X
d Y
0,1
0,1 ,
j
ij
i I
j J
i I j J
X
Y
Maximum distance
Assignment constraints
Total constraints
Connection constraints
Maximum value constraints
Duality
22
Typical problems
Average distance models
P-median Fixed charge model
minimize
subject to 1
0
,
0,1
0,1 ,
iji iji I j J
ijj J
jj J
ij j
j
ij
i I
p
i I j J
j J
i I j J
h d Y
Y
X
Y X
X
Y
Weighted distance in
demand
Assignment
constraints
Total constraints
Connectivity
constraints
Duality
minimize
subject to 1
0
,
0,1
0,1 ,
j iji ijjj J i I j J
ijj J
jj J
ij j
j
ij
i I
p
i I j J
j J
i I j J
f h dX Y
Y
X
Y X
X
Y
Fixed and operating costs
Assignment
constraints
Total
constraints
Connectivity
constraints
Duality
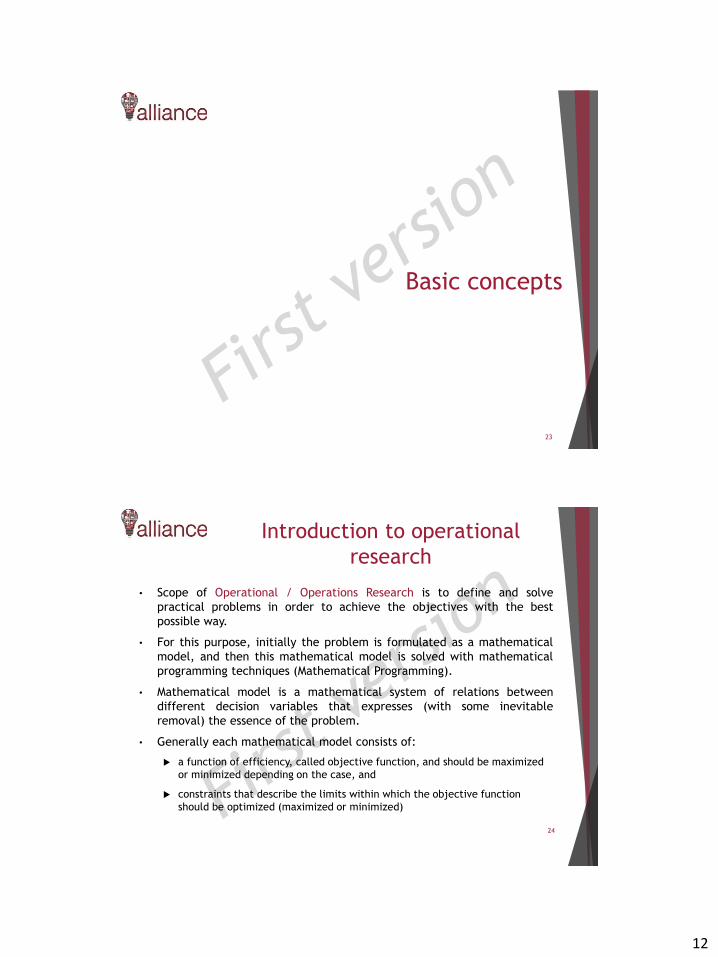
12
Basic concepts
23
Introduction to operational
research
• Scope of Operational / Operations Research is to define and solve
practical problems in order to achieve the objectives with the best
possible way.
• For this purpose, initially the problem is formulated as a mathematical
model, and then this mathematical model is solved with mathematical
programming techniques (Mathematical Programming).
• Mathematical model is a mathematical system of relations between
different decision variables that expresses (with some inevitable
removal) the essence of the problem.
• Generally each mathematical model consists of:
a function of efficiency, called objective function, and should be maximized
or minimized depending on the case, and
constraints that describe the limits within which the objective function
should be optimized (maximized or minimized)
24
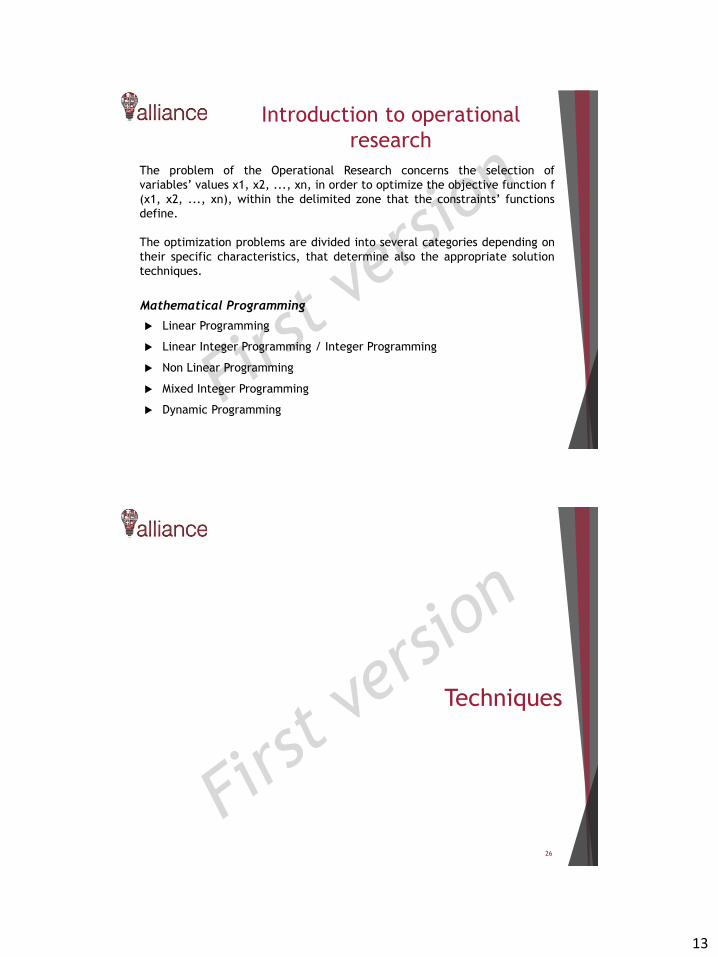
13
Mathematical Programming
The problem of the Operational Research concerns the selection of
variables’ values x1, x2, ..., xn, in order to optimize the objective function f
(x1, x2, ..., xn), within the delimited zone that the constraints’ functions
define.
The optimization problems are divided into several categories depending on
their specific characteristics, that determine also the appropriate solution
techniques.
Linear Programming
Linear Integer Programming / Integer Programming
Non Linear Programming
Mixed Integer Programming
Dynamic Programming
Introduction to operational
research
Techniques
26

14
Linear Programming (LP)
Linear Programming: the area of mathematical programming which is the
most widely applied
Setting up the model
Variables x1, x2, x3, …, xn
Objective function
max Z= f(x) = c1x1+ c2x2 + c3x3 +…+ cnxn
Constraints
α11x1+ α12x2 + α13x3 + … + α1nxn b1
α21x1+ α22x2 + α23x3 + … + α2nxn b2
…
αm1x1+ αm2x2 + αm3x3 + … + αmnxn bm
x1 0, x2 0, x3 0, …, xn 0
Linear objective function
Linear constraints (structure - non-negativity)
Linear Programming (LP)
Alternative set up of the model (vectors and matrices)
Objective function max Z = f (x) = c x
constraints
A x b
x 0
c: 1xn vector series
A: mxn matrix with elements aij
b: mx1 column vector with bi elements
Example of Linear Programming
200 products of type 1 and 2 should be produced. Determine the production of each
product type in order to maximize the profit.
Product 1 2
Working hours 9 6
Raw material requirements (kg) 12 16
Profit (€) 350 300
Available
1566 working hours
2880 kg raw material

15
Steps for the development of a
linear optimization model
Step 1. Understanding of the problem
Step 2. Determination of decision variables
X1= number of type 1 products
X2 = number of type 2 products
Step 3. Configuration of the objective function as a linear combination of
the decision variables
MAX: 350X1 + 300X2
Step 4. Definition of constraints as a linear combination of the decision
variables
1X1 + 1X2 ≤ 200 } total production
9X1 + 6X2 ≤ 1566 } working hours
12X1 + 16X2 ≤ 2880 } raw material
Non-negativity constraints
X1 ≥ 0
X2 ≥ 0
X2
X1
250
200
150
100
50
0
0 50 100 150 200 250
(0, 200)
(200, 0)
The first constraint
Total ProductionX1 + X2 = 200
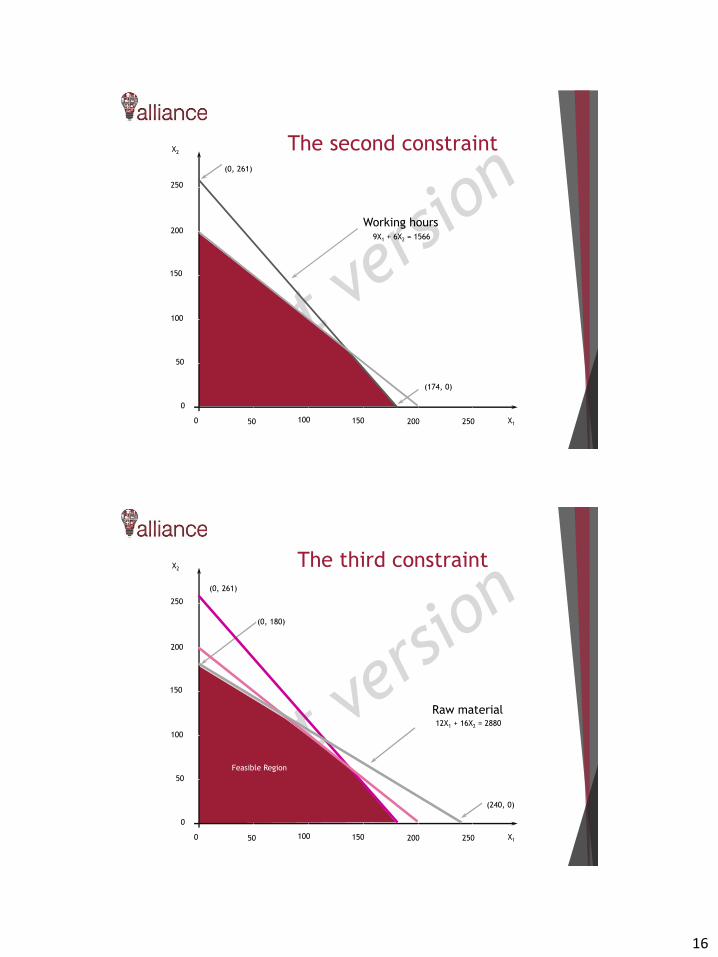
16
X2
X1
250
200
150
100
50
0
0 50 100 150 200 250
(0, 261)
(174, 0)
Working hours9X1 + 6X2 = 1566
The second constraint
X2
X1
250
200
150
100
50
0
0 50 100 150 200 250
(0, 180)
(240, 0)
Raw material12X1 + 16X2 = 2880
Feasible Region
(0, 261)
The third constraint
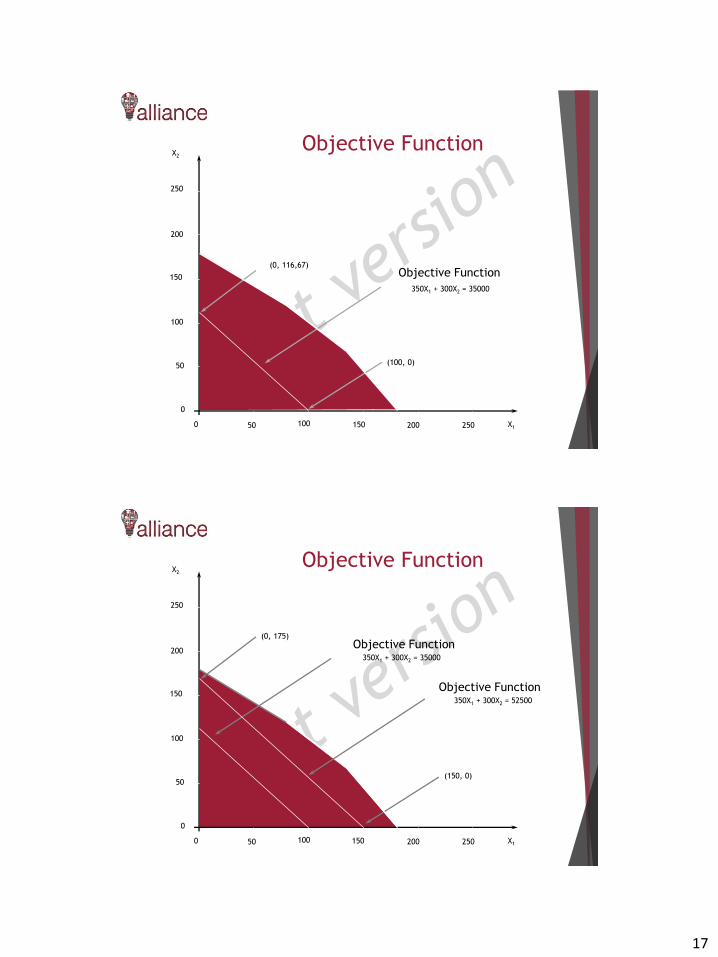
17
X2
X1
250
200
150
100
50
0
0 50 100 150 200 250
(0, 116,67)
(100, 0)
Objective Function
350X1 + 300X2 = 35000
Οργάνωση και Διαχείριση Συστημάτων Εμπορευματικών Μεταφορών και Συστημάτων Logistics
Objective Function
X2
X1
250
200
150
100
50
0
0 50 100 150 200 250
(0, 175)
(150, 0)
350X1 + 300X2 = 35000
350X1 + 300X2 = 52500
Objective Function
Objective Function
Objective Function
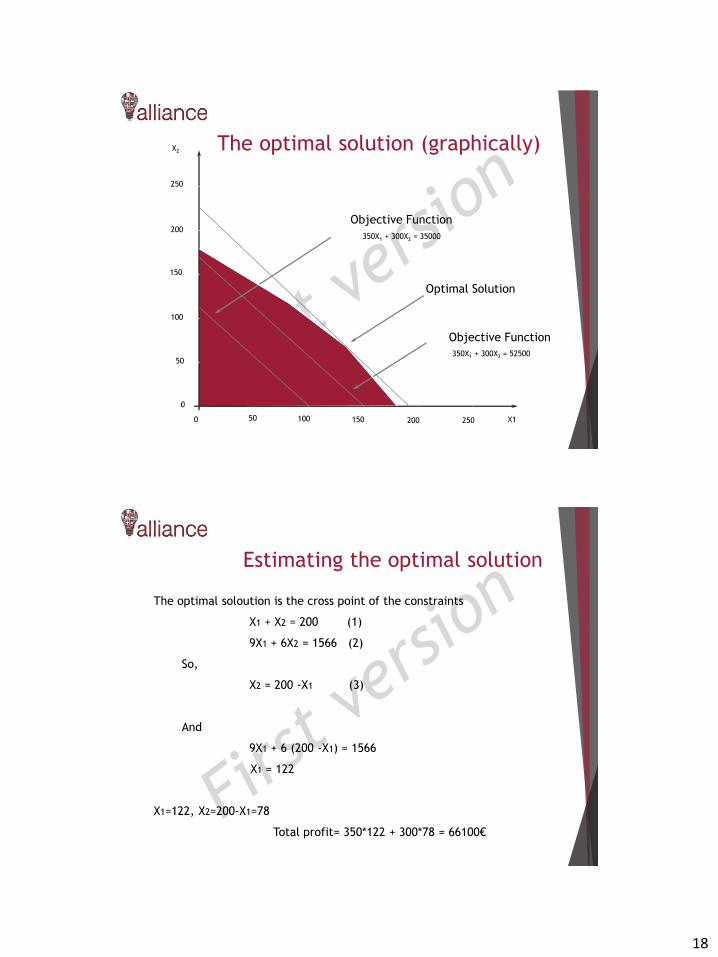
18
X2
X1
250
200
150
100
50
0
0 50 100 150 200 250
350X1 + 300X2 = 35000
350X1 + 300X2 = 52500
Objective Function
Objective Function
Optimal Solution
The optimal solution (graphically)
The optimal soloution is the cross point of the constraints
X1 + X2 = 200 (1)
9X1 + 6X2 = 1566 (2)
So,
X2 = 200 -X1 (3)
And
9X1 + 6 (200 -X1) = 1566
X1 = 122
X1=122, X2=200-X1=78
Total profit= 350*122 + 300*78 = 66100€
Estimating the optimal solution
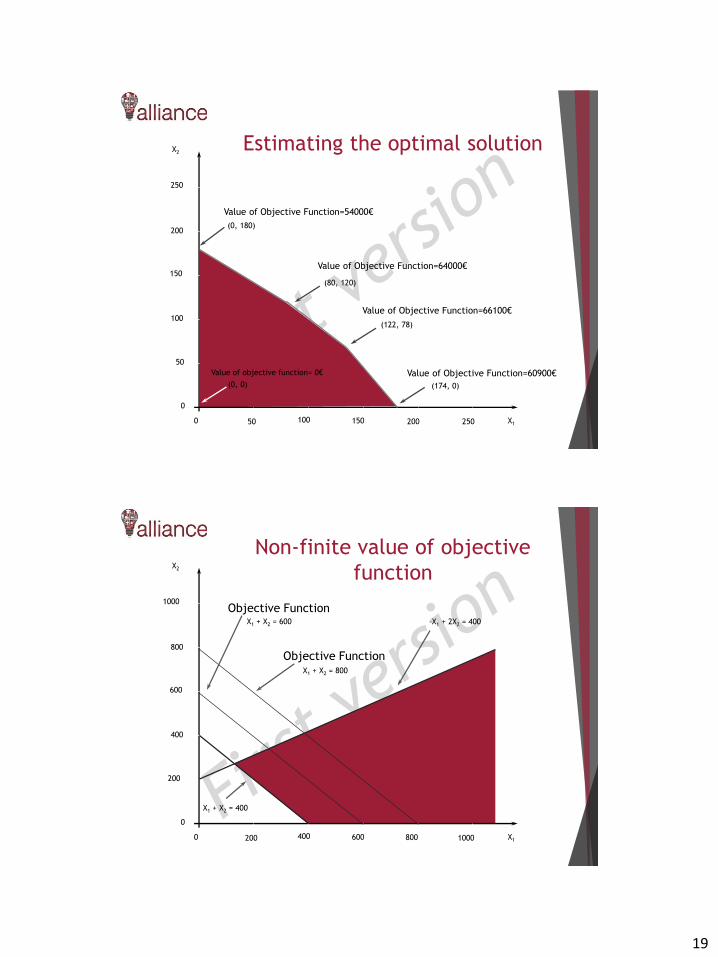
19
X2
X1
250
200
150
100
50
0
0 50 100 150 200 250
(0, 180)
(174, 0)
(122, 78)
(80, 120)
(0, 0)
Value of objective function= 0€
Estimating the optimal solution
Value of Objective Function=54000€
Value of Objective Function=64000€
Value of Objective Function=66100€
Value of Objective Function=60900€
X2
X1
1000
800
600
400
200
0
0 200 400 600 800 1000
X1 + X2 = 400
X1 + X2 = 600
X1 + X2 = 800
-X1 + 2X2 = 400
Objective Function
Objective Function
Non-finite value of objective
function
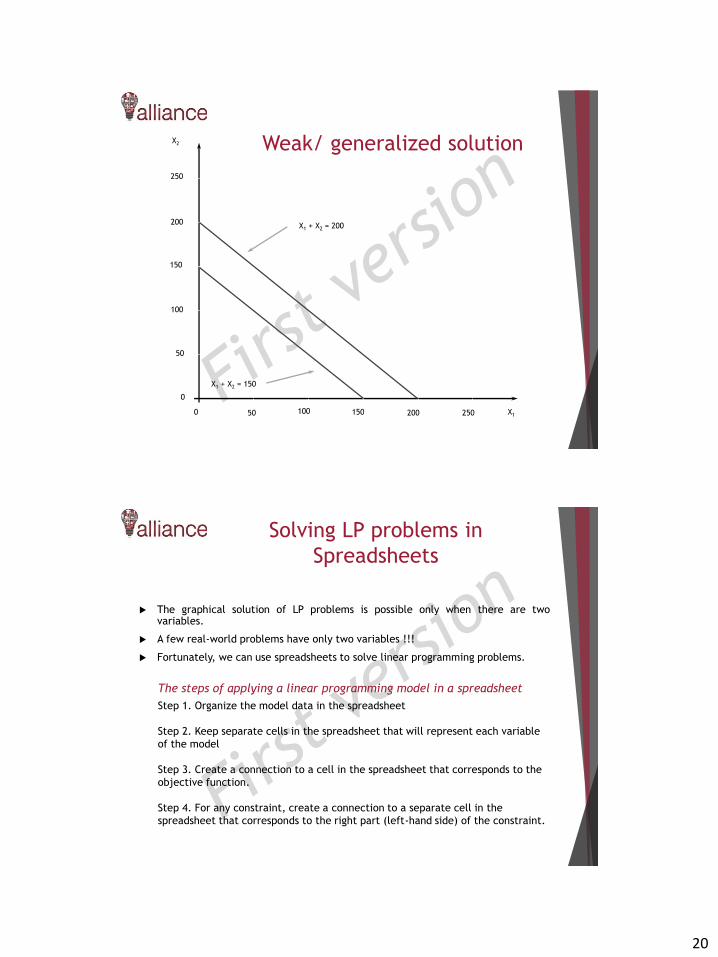
20
X2
X1
250
200
150
100
50
0
0 50 100 150 200 250
X1 + X2 = 200
X1 + X2 = 150
Weak/ generalized solution
Solving LP problems in
Spreadsheets
The graphical solution of LP problems is possible only when there are twovariables.
A few real-world problems have only two variables !!!
Fortunately, we can use spreadsheets to solve linear programming problems.
The steps of applying a linear programming model in a spreadsheet
Step 1. Organize the model data in the spreadsheet
Step 2. Keep separate cells in the spreadsheet that will represent each variable
of the model
Step 3. Create a connection to a cell in the spreadsheet that corresponds to the
objective function.
Step 4. For any constraint, create a connection to a separate cell in the
spreadsheet that corresponds to the right part (left-hand side) of the constraint.
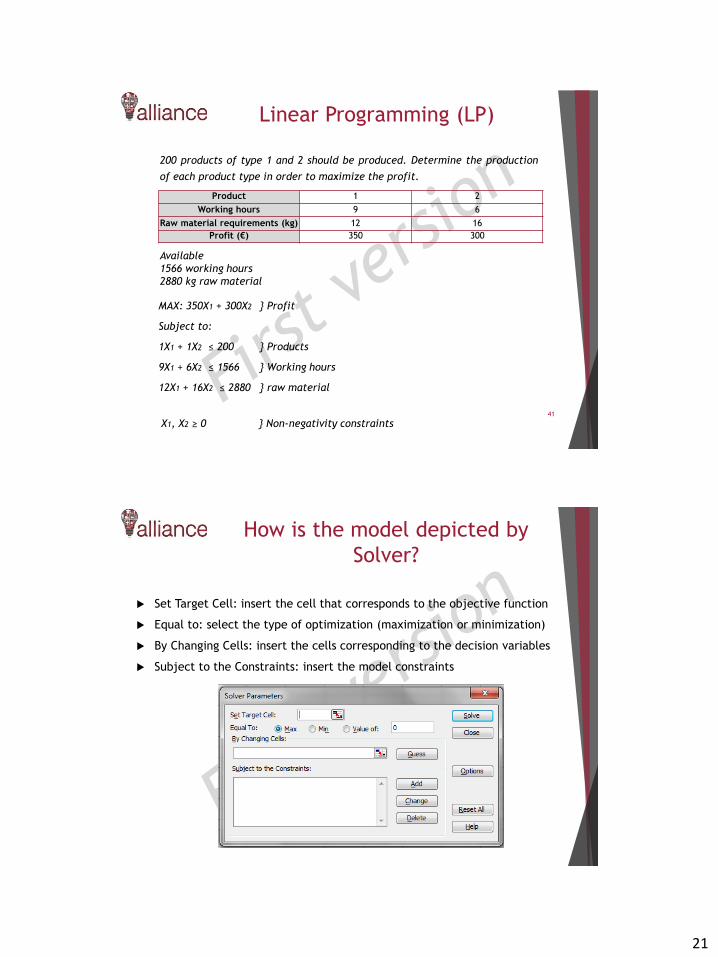
21
41
200 products of type 1 and 2 should be produced. Determine the production
of each product type in order to maximize the profit.
Product 1 2
Working hours 9 6
Raw material requirements (kg) 12 16
Profit (€) 350 300
Available
1566 working hours
2880 kg raw material
MAX: 350X1 + 300X2 } Profit
Subject to:
1X1 + 1X2 ≤ 200 } Products
9X1 + 6X2 ≤ 1566 } Working hours
12X1 + 16X2 ≤ 2880 } raw material
X1, X2 ≥ 0 } Non-negativity constraints
Linear Programming (LP)
How is the model depicted by
Solver?
Set Target Cell: insert the cell that corresponds to the objective function
Equal to: select the type of optimization (maximization or minimization)
By Changing Cells: insert the cells corresponding to the decision variables
Subject to the Constraints: insert the model constraints

22
EXCEL - LP - Example
Example of Linear Programming
(continue)
Examplel
Defining the Decision Variables
M1 = Number of model 1 slip rings to make in-house
M2 = Number of model 2 slip rings to make in-house
M3 = Number of model 3 slip rings to make in-house
B1 = Number of model 1 slip rings to buy from competitor
B2 = Number of model 2 slip rings to buy from competitor
B3 = Number of model 3 slip rings to buy from competitor
Defining the Objective Function
Minimize the total cost of filling the order:
MIN: 50M1 + 83M2 + 130M3 + 61B1 + 97B2 + 145B3
Defining the constraints
Linear Programming Make vs. Buy problem
Demand constraints:
M1 + B1 = 3000
M2 + B2 = 2000
M3 + B3 = 900
Resource constraints:
2M1 + 1.5M2 + 3M3 ≤ 10000
1M1 + 2.0M2 + 1M3 ≤ 5000
Non negativity constraints:
M1, M2, M3, B1, B2, B3 ≥ 0
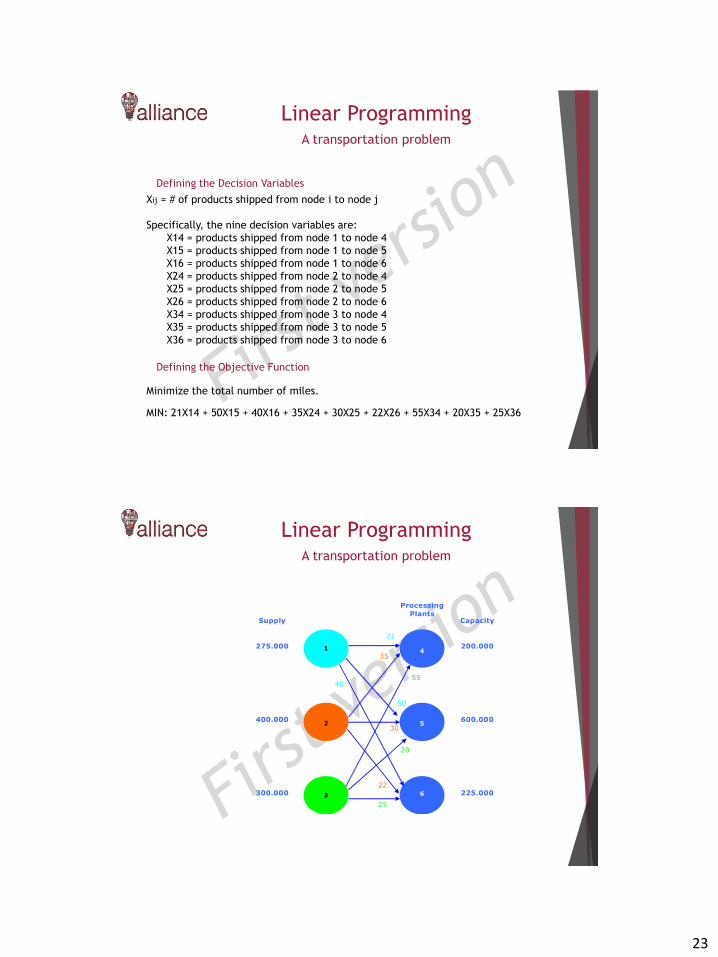
23
Linear ProgrammingA transportation problem
Defining the Decision Variables
Xij = # of products shipped from node i to node j
Specifically, the nine decision variables are:
X14 = products shipped from node 1 to node 4
X15 = products shipped from node 1 to node 5
X16 = products shipped from node 1 to node 6
X24 = products shipped from node 2 to node 4
X25 = products shipped from node 2 to node 5
X26 = products shipped from node 2 to node 6
X34 = products shipped from node 3 to node 4
X35 = products shipped from node 3 to node 5
X36 = products shipped from node 3 to node 6
Defining the Objective Function
Minimize the total number of miles.
MIN: 21X14 + 50X15 + 40X16 + 35X24 + 30X25 + 22X26 + 55X34 + 20X35 + 25X36
Supply Capacity
275.000
400.000
300.000 225.000
600.000
200.000
Processing
Plants
1
5
4
2
3 6
21
40
50
22
35
30
55
20
25
Linear ProgrammingA transportation problem
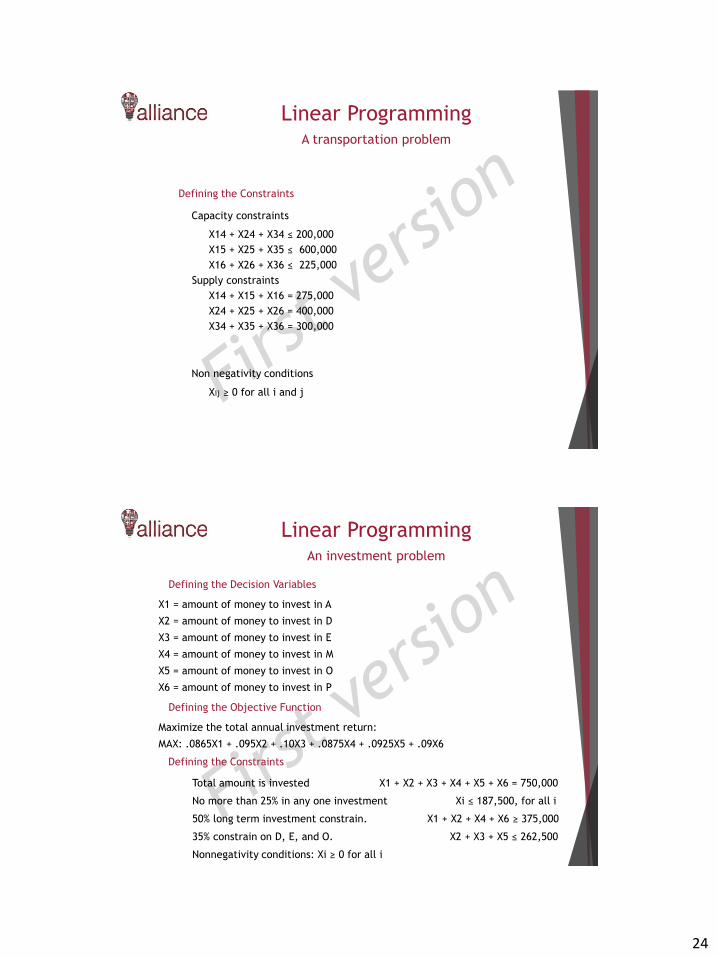
24
Defining the Constraints
Capacity constraints
X14 + X24 + X34 ≤ 200,000
X15 + X25 + X35 ≤ 600,000
X16 + X26 + X36 ≤ 225,000
Supply constraints
X14 + X15 + X16 = 275,000
X24 + X25 + X26 = 400,000
X34 + X35 + X36 = 300,000
Non negativity conditions
Xij ≥ 0 for all i and j
Linear ProgrammingA transportation problem
Defining the Decision Variables
X1 = amount of money to invest in A
X2 = amount of money to invest in D
X3 = amount of money to invest in E
X4 = amount of money to invest in M
X5 = amount of money to invest in O
X6 = amount of money to invest in P
Defining the Objective Function
Maximize the total annual investment return:
MAX: .0865X1 + .095X2 + .10X3 + .0875X4 + .0925X5 + .09X6
Defining the Constraints
Total amount is invested X1 + X2 + X3 + X4 + X5 + X6 = 750,000
No more than 25% in any one investment Xi ≤ 187,500, for all i
50% long term investment constrain. X1 + X2 + X4 + X6 ≥ 375,000
35% constrain on D, E, and O. X2 + X3 + X5 ≤ 262,500
Nonnegativity conditions: Xi ≥ 0 for all i
Linear ProgrammingAn investment problem
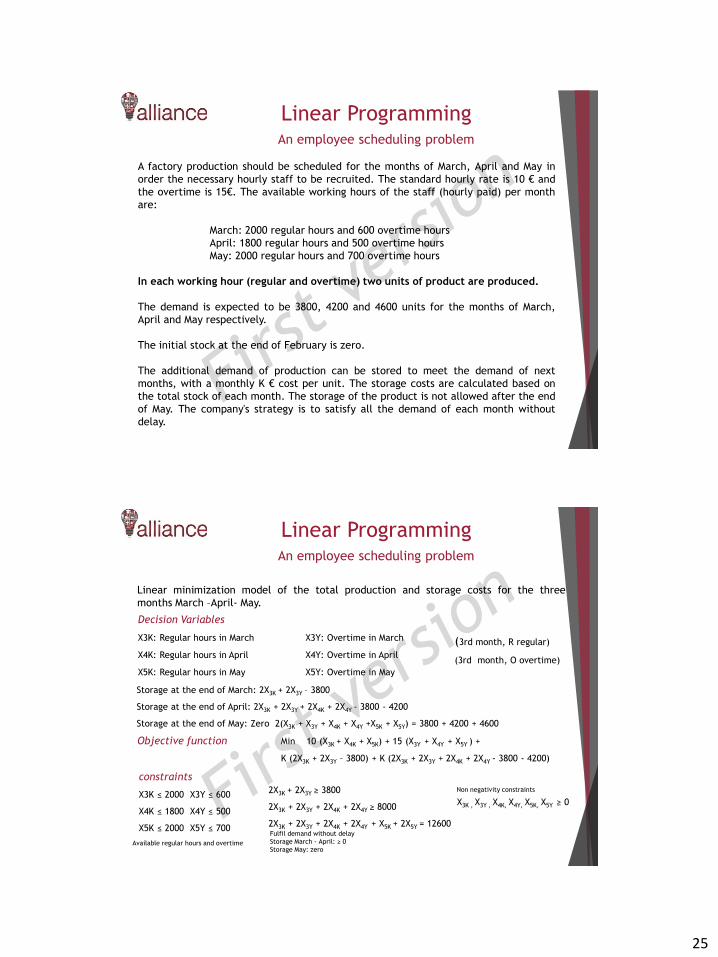
25
A factory production should be scheduled for the months of March, April and May in
order the necessary hourly staff to be recruited. The standard hourly rate is 10 € and
the overtime is 15€. The available working hours of the staff (hourly paid) per month
are:
March: 2000 regular hours and 600 overtime hours
April: 1800 regular hours and 500 overtime hours
May: 2000 regular hours and 700 overtime hours
In each working hour (regular and overtime) two units of product are produced.
The demand is expected to be 3800, 4200 and 4600 units for the months of March,
April and May respectively.
The initial stock at the end of February is zero.
The additional demand of production can be stored to meet the demand of next
months, with a monthly K € cost per unit. The storage costs are calculated based on
the total stock of each month. The storage of the product is not allowed after the end
of May. The company's strategy is to satisfy all the demand of each month without
delay.
Linear ProgrammingAn employee scheduling problem
Decision Variables
X3Κ: Regular hours in March X3Υ: Overtime in March
X4Κ: Regular hours in April X4Υ: Overtime in April
X5Κ: Regular hours in May X5Υ: Overtime in May
Linear minimization model of the total production and storage costs for the three
months March –April- May.
Storage at the end of March: 2X3Κ + 2X3Υ – 3800
Storage at the end of April: 2X3Κ + 2X3Υ + 2X4Κ + 2X4Υ - 3800 - 4200
Storage at the end of May: Zero 2(X3Κ + X3Υ + X4Κ + X4Υ +X5Κ + X5Υ) = 3800 + 4200 + 4600
Objective function Min 10 (X3Κ + X4Κ + X5Κ) + 15 (X3Υ + X4Υ + X5Υ ) +
Κ (2X3Κ + 2X3Υ – 3800) + Κ (2X3Κ + 2X3Υ + 2X4Κ + 2X4Υ - 3800 - 4200)
(3rd month, R regular)
(3rd month, O overtime)
constraints
X3Κ ≤ 2000 X3Υ ≤ 600
X4Κ ≤ 1800 X4Υ ≤ 500
X5Κ ≤ 2000 X5Υ ≤ 700
Available regular hours and overtime
2X3Κ + 2X3Υ ≥ 3800
2X3Κ + 2X3Υ + 2X4Κ + 2X4Υ ≥ 8000
2X3Κ + 2X3Υ + 2X4Κ + 2X4Υ + X5Κ + 2X5Υ = 12600Fulfil demand without delay
Storage March - April: ≥ 0
Storage May: zero
X3Κ , X3Υ , X4Κ, X4Υ, X5Κ, X5Υ ≥ 0
Non negativity constraints
Linear ProgrammingAn employee scheduling problem

26
An engineering company manufactures two special products in three laboratories. From the
total capacity of each laboratory, only a percentage of 4%, 12% and 8%, respectively, is
available for the production of the two specific products.
The capacity percentages of every laboratory that are required for the production rate of
one unit per min are 1%, 0% and 3% for the first product and 0%, 2% and 2% for the second
product in laboratories 1,2 and 3 respectively.
The net profit from the production of each product unit is 3 € for the first product and 5 €
for the second product.
Determine the production rate of the two products in the three laboratories on the basis of
maximizing profit.
Objective function Max Z = 3 x1 + 5 x2
constraints x1 4 (Laboratory 1)
2x2 12 (Laboratory 2)
3x1 + 2x2 18 (Laboratory 3)
x1 0, x2 0
If x1 and x2 are the production rates (in units / min) of products 1 and 2 respectively. The
problem is to determine the values of x1 and x2 that optimize the linear model
Linear ProgrammingA production planning problem
Linear ProgrammingA production planning problem

27
Best solution: x1 = 2, x2 = 6 which maximizes the objective function maxZ = 36
Linear ProgrammingA production planning problem
A fundamental assumption of the linear programming model is that all variables are
constant and can take fractional values. In many practical problems, some or all
variables have a meaning only if they have integer values.
In cases where the requirement for integrity of certain variables is the only deviation
from the linear model, the problem belongs to the integer programming area.
Integer programming problems also arise when decisions have to be taken where only
two alternatives exist (positive or negative decision).
The integer models categorized by type of variables.
When all the variables are integer the integer model is called pure (pure integer
programming).
When certain variables are integer and others are continuous, the model is called
mixed (mixed integer programming).
Based on the type of the integer variables, models are divided into binary (binary
integer programming), where all the integer variables are: binary (a value of 0 or 1),
or
general (general integer programming), where at least one integer variable is not
binary, and may take any integer value.
Linear Integer Programming (LIP)
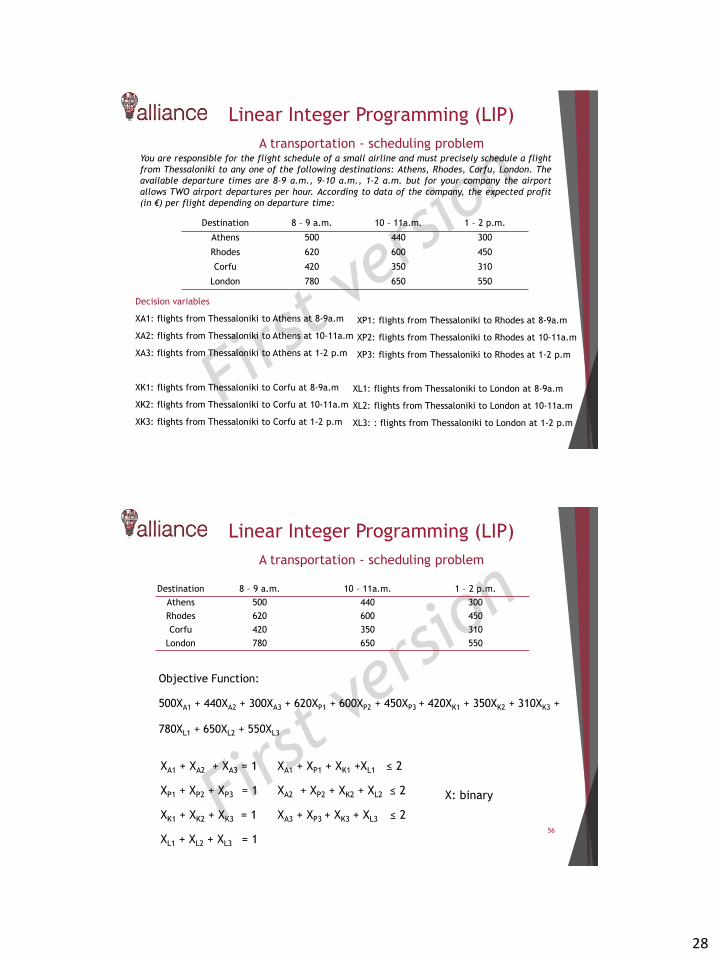
28
Destination 8 – 9 a.m. 10 – 11a.m. 1 – 2 p.m.
Athens 500 440 300
Rhodes 620 600 450
Corfu 420 350 310
London 780 650 550
Linear Integer Programming (LIP)
A transportation - scheduling problemYou are responsible for the flight schedule of a small airline and must precisely schedule a flight
from Thessaloniki to any one of the following destinations: Athens, Rhodes, Corfu, London. The
available departure times are 8-9 a.m., 9-10 a.m., 1-2 a.m. but for your company the airport
allows TWO airport departures per hour. According to data of the company, the expected profit
(in €) per flight depending on departure time:
Decision variables
XA1: flights from Thessaloniki to Athens at 8-9a.m
XA2: flights from Thessaloniki to Athens at 10-11a.m
XA3: flights from Thessaloniki to Athens at 1-2 p.m
XΚ1: flights from Thessaloniki to Corfu at 8-9a.m
XΚ2: flights from Thessaloniki to Corfu at 10-11a.m
XΚ3: flights from Thessaloniki to Corfu at 1-2 p.m
XΡ1: flights from Thessaloniki to Rhodes at 8-9a.m
XΡ2: flights from Thessaloniki to Rhodes at 10-11a.m
XΡ3: flights from Thessaloniki to Rhodes at 1-2 p.m
XL1: flights from Thessaloniki to London at 8-9a.m
XL2: flights from Thessaloniki to London at 10-11a.m
XL3: : flights from Thessaloniki to London at 1-2 p.m
56
Destination 8 – 9 a.m. 10 – 11a.m. 1 – 2 p.m.
Athens 500 440 300
Rhodes 620 600 450
Corfu 420 350 310
London 780 650 550
Objective Function:
500XA1 + 440ΧΑ2 + 300ΧΑ3 + 620XΡ1 + 600ΧΡ2 + 450ΧΡ3 + 420ΧΚ1 + 350XΚ2 + 310XΚ3 +
780XL1 + 650XL2 + 550XL3
XA1 + ΧΑ2 + ΧΑ3 = 1
XΡ1 + ΧΡ2 + ΧΡ3 = 1
ΧΚ1 + XΚ2 + XΚ3 = 1
XL1 + XL2 + XL3 = 1
XA1 + XΡ1 + ΧΚ1 +XL1 ≤ 2
ΧΑ2 + ΧΡ2 + XΚ2 + XL2 ≤ 2
ΧΑ3 + ΧΡ3 + XΚ3 + XL3 ≤ 2
X: binary
Linear Integer Programming (LIP)
A transportation - scheduling problem
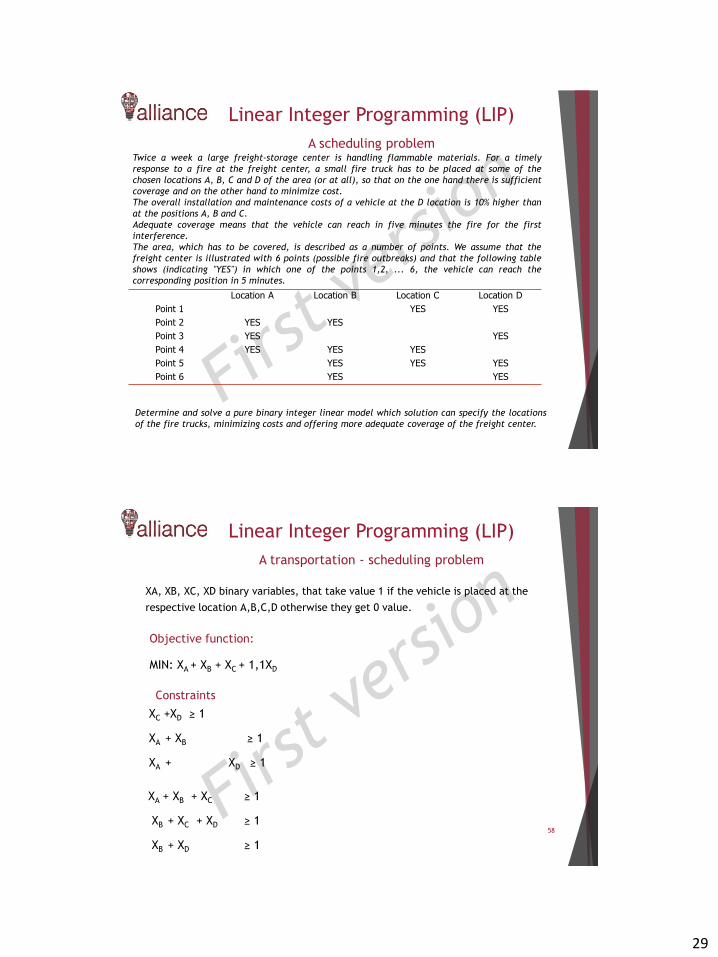
29
Twice a week a large freight-storage center is handling flammable materials. For a timely
response to α fire at the freight center, a small fire truck has to be placed at some of the
chosen locations A, B, C and D of the area (or at all), so that on the one hand there is sufficient
coverage and on the other hand to minimize cost.
The overall installation and maintenance costs of a vehicle at the D location is 10% higher than
at the positions A, B and C.
Adequate coverage means that the vehicle can reach in five minutes the fire for the first
interference.
The area, which has to be covered, is described as a number of points. We assume that the
freight center is illustrated with 6 points (possible fire outbreaks) and that the following table
shows (indicating "YES") in which one of the points 1,2, ... 6, the vehicle can reach the
corresponding position in 5 minutes.
Location Α Location Β Location C Location D
Point 1 YES YES
Point 2 YES YES
Point 3 YES YES
Point 4 YES YES YES
Point 5 YES YES YES
Point 6 YES YES
Determine and solve a pure binary integer linear model which solution can specify the locations
of the fire trucks, minimizing costs and offering more adequate coverage of the freight center.
Linear Integer Programming (LIP)
A scheduling problem
58
XA, XB, XC, XD binary variables, that take value 1 if the vehicle is placed at the
respective location Α,Β,C,D otherwise they get 0 value.
Objective function:
MIN: XA + ΧΒ + ΧC + 1,1ΧD
Constraints
ΧC +XD ≥ 1
ΧΑ + ΧB ≥ 1
ΧΑ + XD ≥ 1
ΧA + XB + XC ≥ 1
ΧB + ΧC + XD ≥ 1
ΧB + XD ≥ 1
Linear Integer Programming (LIP)
A transportation - scheduling problem
30
Software and applications
- The SITATION software
59Source: Mark S. Daskin, Department of IE/MS, Northwestern U., Evanston, IL
Summer,
2010©, M.S. Daskin, 2010, Univ. of Michigan 60
What is SITATION?
• Software to solve location problems
Set covering P-median
Maximal Covering Uncap. Fixed charge
P-center Loc./Inv. Model
Partial covering P-center
Partial Covering Set covering
Covering- Medial Tradeoff
• Forcing sites in/out of solution
• Different solution algorithms Heuristic Improvement
Lagrangian relaxation in branch and bound (optimal))
• Mapping• Reporting• Manual facility exchanges (for some objectives)
Options include:
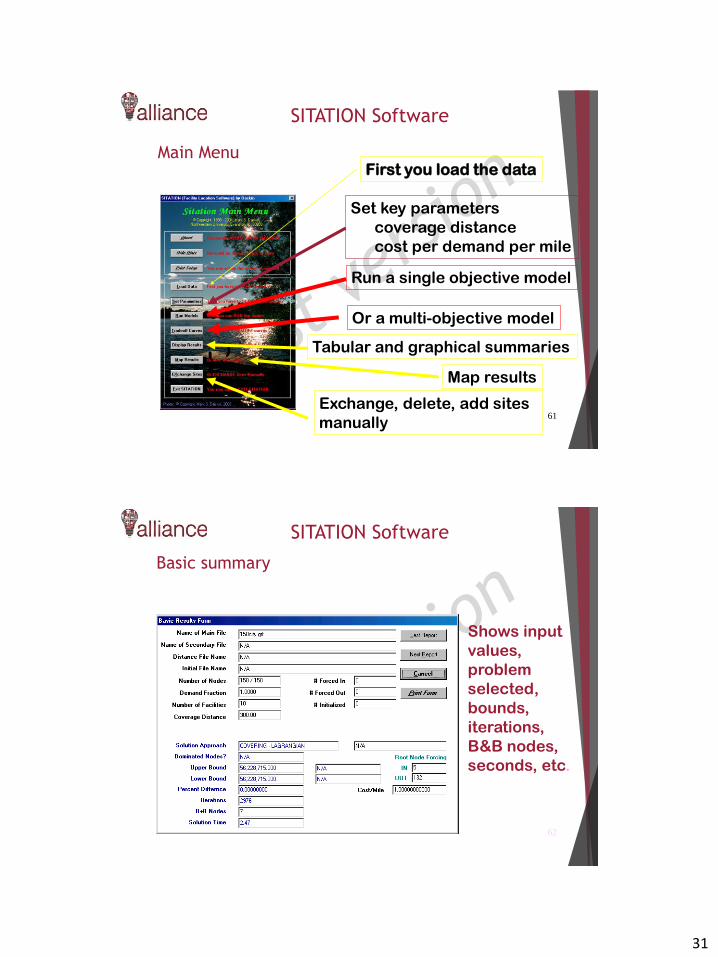
31
Main Menu
©, M.S. Daskin, 2010, Univ. of Michigan 61
First you load the data
SITATION Software
Set key parameters
coverage distance
cost per demand per mile
Or a multi-objective model
Run a single objective model
Tabular and graphical summaries
Map results
Exchange, delete, add sites
manually
Basic summary
Summer,
2010©, M.S. Daskin, 2010, Univ. of Michigan 62
Shows input
values,
problem
selected,
bounds,
iterations,
B&B nodes,
seconds, etc.
SITATION Software
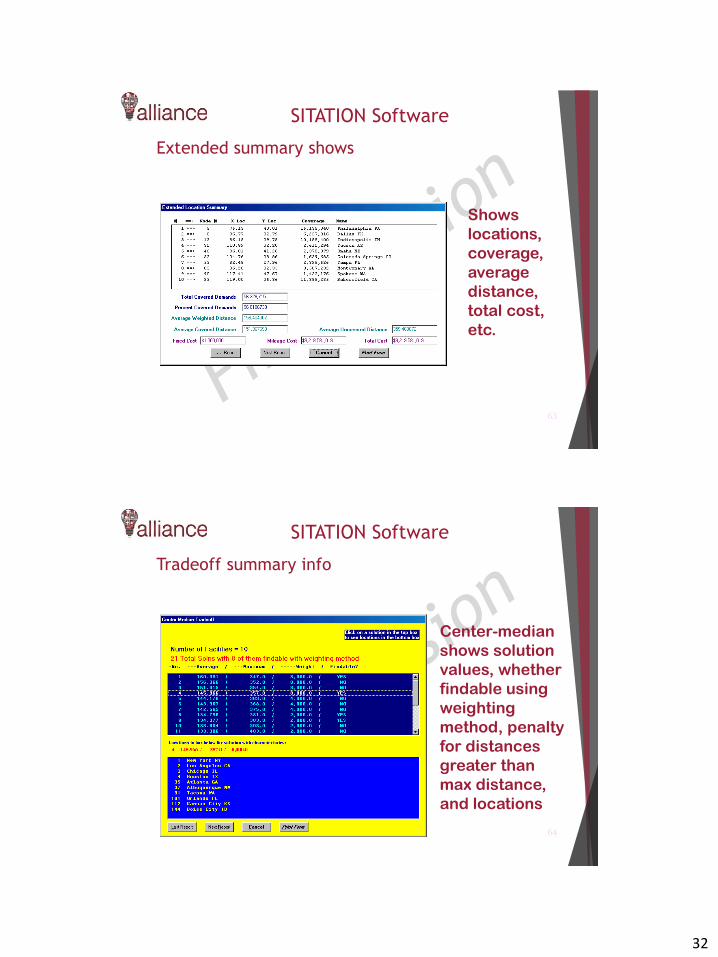
32
Extended summary shows
Summer,
2010©, M.S. Daskin, 2010, Univ. of Michigan 63
Shows
locations,
coverage,
average
distance,
total cost,
etc.
SITATION Software
Tradeoff summary info
Summer,
2010©, M.S. Daskin, 2010, Univ. of Michigan 64
Center-median
shows solution
values, whether
findable using
weighting
method, penalty
for distances
greater than
max distance,
and locations
SITATION Software

33
Graph of tradeoff
Summer,
2010©, M.S. Daskin, 2010, Univ. of Michigan 65
SITATION Software
Alter how graph is displayed
Summer,
2010©, M.S. Daskin, 2010, Univ. of Michigan 66
SITATION Software
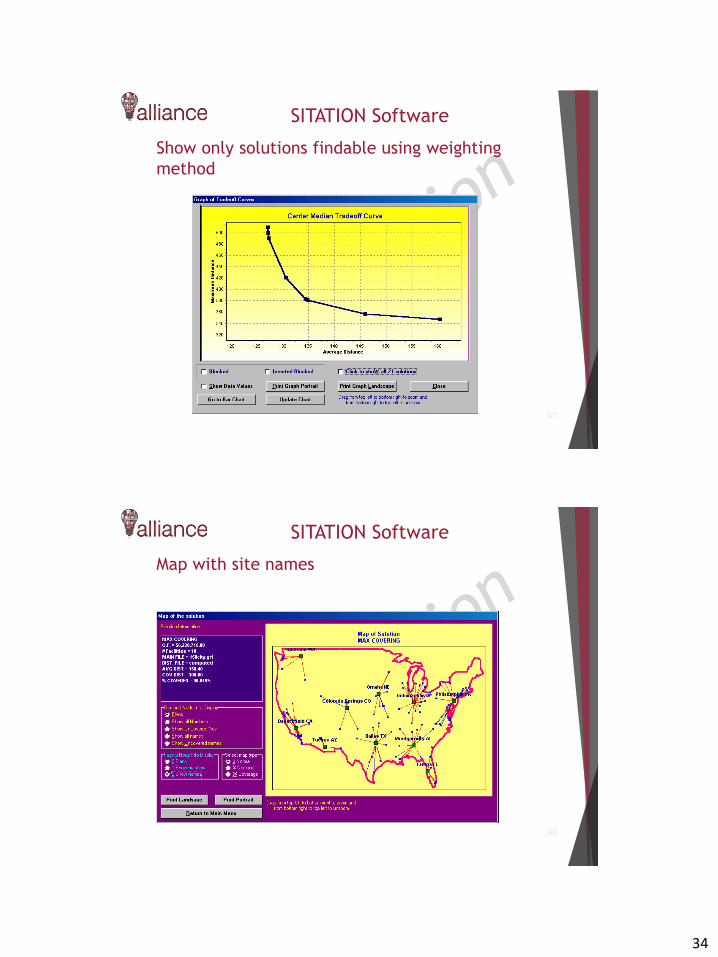
34
Show only solutions findable using weighting
method
Summer,
2010©, M.S. Daskin, 2010, Univ. of Michigan 67
SITATION Software
Map with site names
Summer,
2010©, M.S. Daskin, 2010, Univ. of Michigan 68
SITATION Software
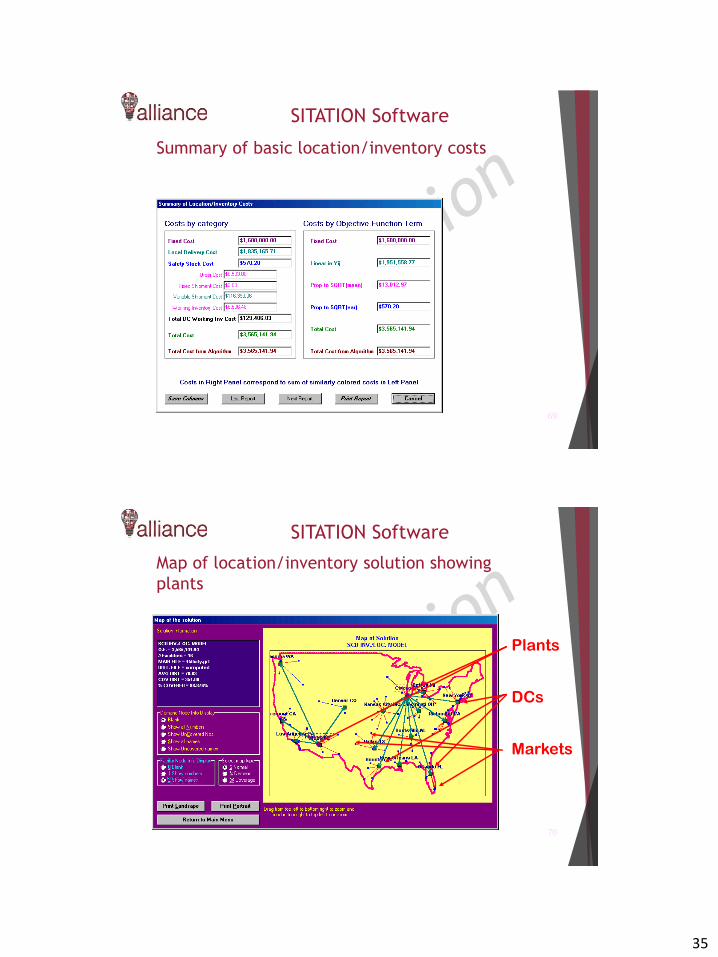
35
Summary of basic location/inventory costs
Summer,
2010©, M.S. Daskin, 2010, Univ. of Michigan 69
SITATION Software
Map of location/inventory solution showing
plants
Summer,
2010©, M.S. Daskin, 2010, Univ. of Michigan 70
Plants
DCs
Markets
SITATION Software
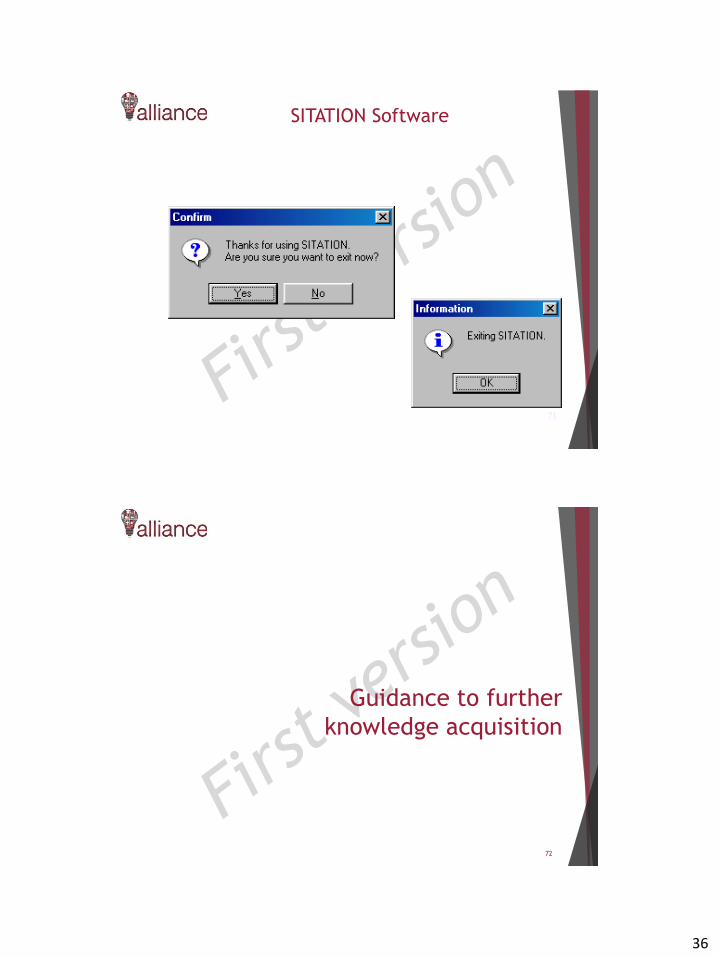
36
Summer,
2010©, M.S. Daskin, 2010, Univ. of Michigan 71
SITATION Software
Guidance to further
knowledge acquisition
72
37
Suggested literature
73
Bertsimas DJ, Jaillet P, Odoni AR, “A priori optimization”, Operations research
38/1, 1019 – 1033, 1990
Bodin LD, Golden BL, Assad AA, Ball MO, “Routing & scheduling of vehicles and
crews: The state of the art”, Computers and Operations Research, 10/2, 63-211,
1983
Christofides N, Mingozzi A, Toth P, “The vehicle routing problem”, in Christofides
N, Mingozzi A, Toth P & Sandi C, eds, Combinatorial Optimization, Wiley, New
York, NY, 315-338, 1979
Crainic Theodor Gabriel, Gilbert Laporte, “Planning models for freight
transportation”, European Journal of Operational Research, 1997.
D. W. Wang, J. W. Wang, R. Y. Zhang, and Z. Guo, Ed. Intelligent Optimization
Methods. Higher Education Press, Beijing, 2007.
Daskin MS, “Networks and discrete location”, Wiley, New York, NY, 1995
Gambardella, L.M., Mastrolilli, M., Rizzoli, A.E., and Zaffalon, M. (2001). An
optimization methodology for intermodal terminal management. Journal of
intelligent manufacturing 12:521:534.
J. Andersson, A Survey of Multiobjective Optimization in Engineering Design,
Department of Mechanical Engineering, Linktjping University, Sweden, 2000
Suggested literature
74
Pedersen, M. B., Madsen, O. B. G., & Nielsen, O. A. (2005). Optimization models
and solution methods for intermodal transportation.
Q. B. Wang, and Z. X. Han, “The optimal routes and modes selection in container
multimodal transportation networks,” Int. Conf. Optoelectron. Image Process.,
vol. 2, pp. 573-576, 2010.
Sun, Y., Lang, M., and Wang, D., (2015). Optimization Models and Solution
Algorithms for Freight Routing Planning Problem in the Multi-Modal Transportation
Networks: A Review of the State-of-the-Art. The Open Civil Engineering Journal,
2015, 9, 714-723
Taha Hamdy (2011). Operations Research: An introduction. Prendice Hall

38
References
75
• Hillier, F.S., & Lieberman, G.J., (2000) Introduction to Operation Research,
McGraw Hill, 7th Edition.
• Daskin, M.S., (2010) Department of IOE, University of Michigan, Ann Arbor, MI
48109
• Ragsdale, C.T., (1998) Spreadsheets Modeling and Decision Analysis: A practical
Introduction to Management Science, South-Western College Publishing, 2nd
edition.
• Tagaras, G., (2001) Operational Research. University notes, AUTH.
76
Thank you
for your attention

1
This project has received funding from the European
Union’s Horizon 2020 research and innovation programme
under grant agreement No 692426
Intelligent services for
passenger
transportation
Dr.-Ing. Henning Strubelt
Otto von Guericke Universit Magdeburg, Germany
Content
2
• Background
• Theoretical methodologies
• Mobility goals
• Public transport management
• Passenger transport modes
• Information technology for passenger transport market
• Telematics for public transport network
• IT application fields for passenger transport
• Ticketing
• Real-Time Information Service
• Transport Demand Management
• Applications – Case study
• Exercise
• Additional suggested literature
General introduction to
the topic Deepening knowledge of
topic
Deepening the understanding of application
(fields) and supporting the assessment of
services
Further knowledge sources
Application of learnings (put knowledge to work)
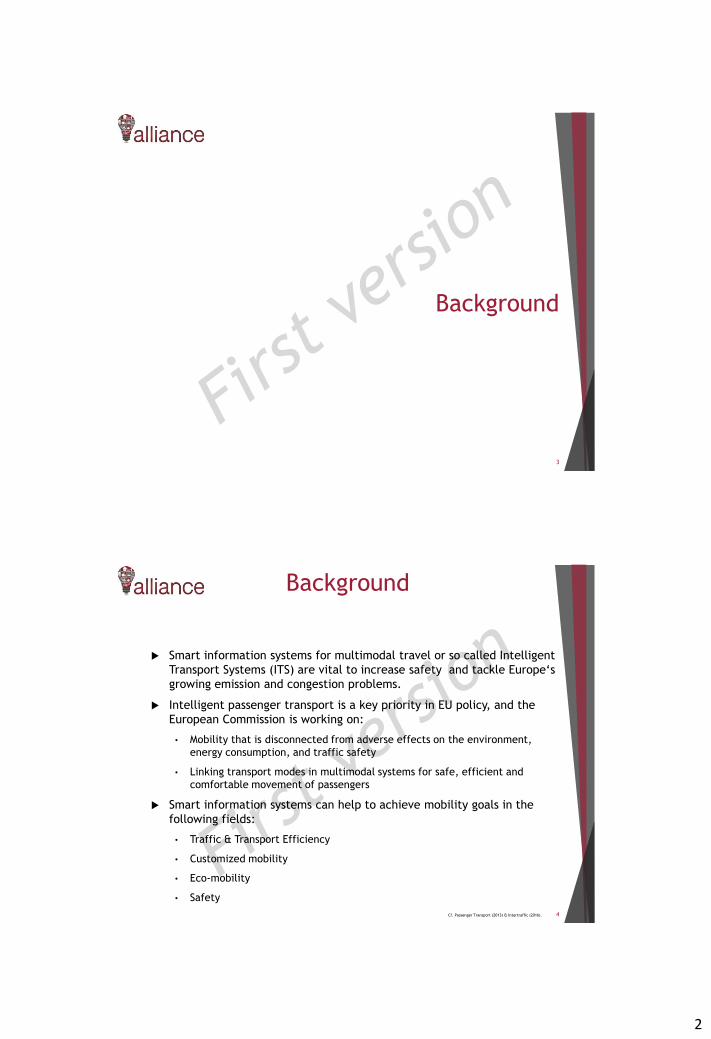
2
Background
3
Background
Smart information systems for multimodal travel or so called Intelligent
Transport Systems (ITS) are vital to increase safety and tackle Europe‘s
growing emission and congestion problems.
Intelligent passenger transport is a key priority in EU policy, and the
European Commission is working on:
• Mobility that is disconnected from adverse effects on the environment,
energy consumption, and traffic safety
• Linking transport modes in multimodal systems for safe, efficient and
comfortable movement of passengers
Smart information systems can help to achieve mobility goals in the
following fields:
• Traffic & Transport Efficiency
• Customized mobility
• Eco-mobility
• Safety
4Cf. Passenger Transport (2013) & Intertraffic (2016).
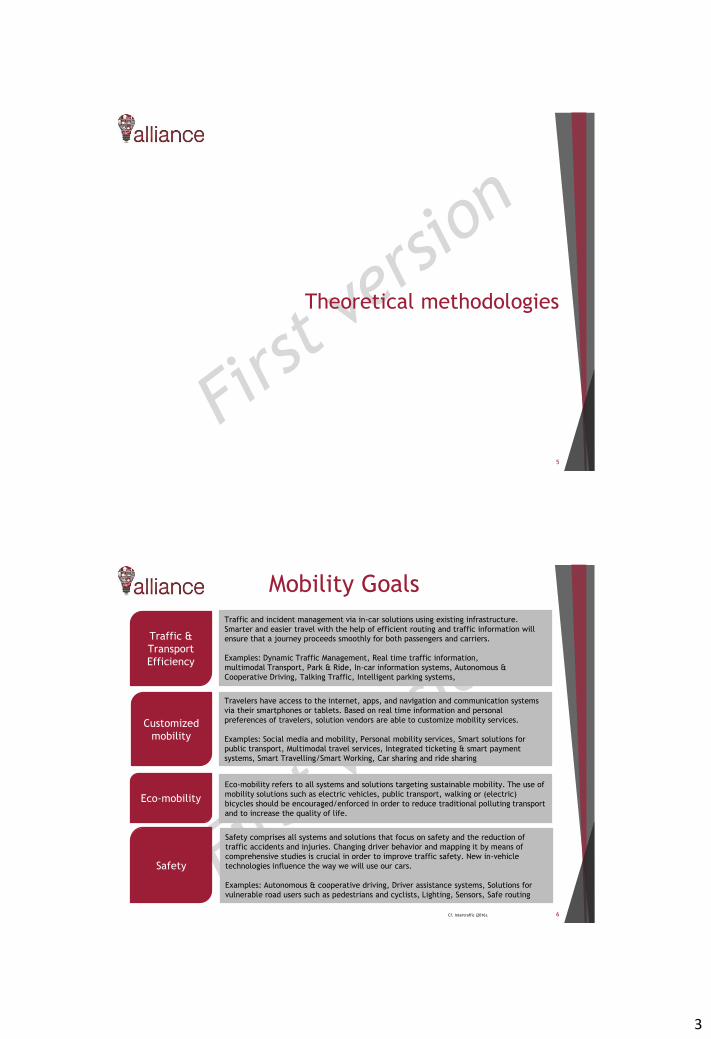
3
Theoretical methodologies
5
Mobility Goals
6
Traffic &
Transport
Efficiency
Customized
mobility
Eco-mobility
Traffic and incident management via in-car solutions using existing infrastructure.
Smarter and easier travel with the help of efficient routing and traffic information will
ensure that a journey proceeds smoothly for both passengers and carriers.
Examples: Dynamic Traffic Management, Real time traffic information,
multimodal Transport, Park & Ride, In-car information systems, Autonomous &
Cooperative Driving, Talking Traffic, Intelligent parking systems,
Travelers have access to the internet, apps, and navigation and communication systems
via their smartphones or tablets. Based on real time information and personal
preferences of travelers, solution vendors are able to customize mobility services.
Examples: Social media and mobility, Personal mobility services, Smart solutions for
public transport, Multimodal travel services, Integrated ticketing & smart payment
systems, Smart Travelling/Smart Working, Car sharing and ride sharing
Eco-mobility refers to all systems and solutions targeting sustainable mobility. The use of
mobility solutions such as electric vehicles, public transport, walking or (electric)
bicycles should be encouraged/enforced in order to reduce traditional polluting transport
and to increase the quality of life.
Safety
Safety comprises all systems and solutions that focus on safety and the reduction of
traffic accidents and injuries. Changing driver behavior and mapping it by means of
comprehensive studies is crucial in order to improve traffic safety. New in-vehicle
technologies influence the way we will use our cars.
Examples: Autonomous & cooperative driving, Driver assistance systems, Solutions for
vulnerable road users such as pedestrians and cyclists, Lighting, Sensors, Safe routing
Cf. Intertraffic (2016).
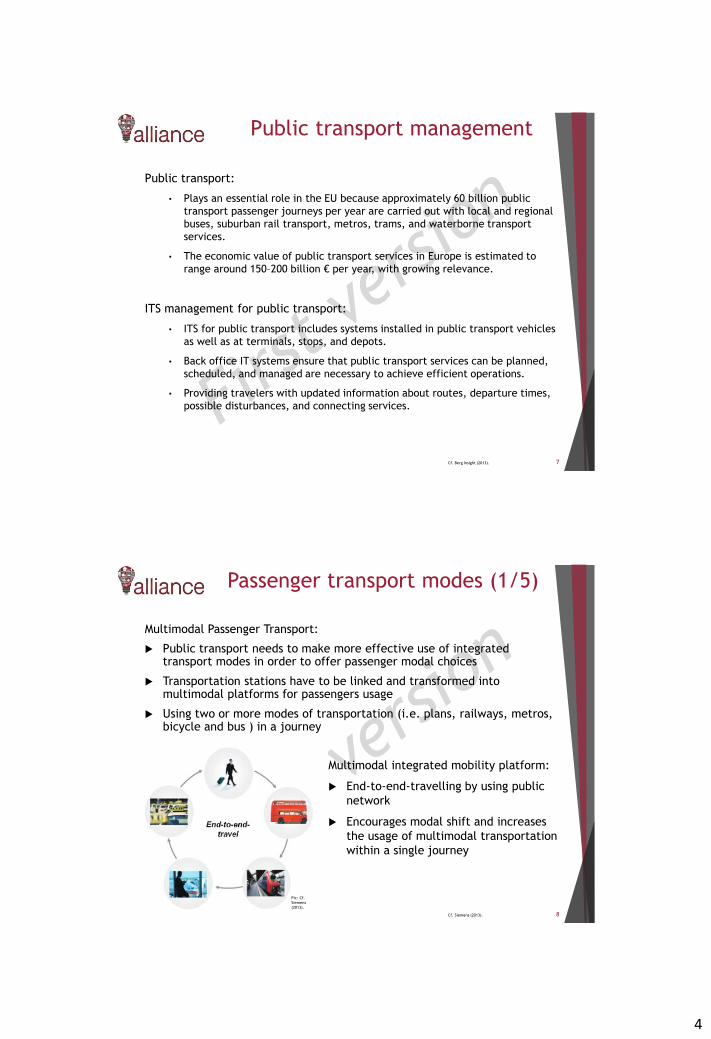
4
Public transport management
Public transport:
• Plays an essential role in the EU because approximately 60 billion public
transport passenger journeys per year are carried out with local and regional
buses, suburban rail transport, metros, trams, and waterborne transport
services.
• The economic value of public transport services in Europe is estimated to
range around 150–200 billion € per year, with growing relevance.
ITS management for public transport:
• ITS for public transport includes systems installed in public transport vehicles
as well as at terminals, stops, and depots.
• Back office IT systems ensure that public transport services can be planned,
scheduled, and managed are necessary to achieve efficient operations.
• Providing travelers with updated information about routes, departure times,
possible disturbances, and connecting services.
7Cf. Berg Insight (2013).
Passenger transport modes (1/5)
Multimodal Passenger Transport:
Public transport needs to make more effective use of integratedtransport modes in order to offer passenger modal choices
Transportation stations have to be linked and transformed intomultimodal platforms for passengers usage
Using two or more modes of transportation (i.e. plans, railways, metros,bicycle and bus ) in a journey
8
Pic: Cf.
Siemens
(2013).
Multimodal integrated mobility platform:
End-to-end-travelling by using public
network
Encourages modal shift and increases
the usage of multimodal transportation
within a single journey
Cf. Siemens (2013).

5
Passenger transport modes (2/5)
9
Air
Scheduled
Charter
Road
Car
Taxi
Van/Bus
Motorcycle
Rail
Intercity
HSR
Transit
Subway
Maritime
Cruise
Ferry
Bicycle
Walking
Commuter
LRT
Monorail
RoRo
High Speed
Diversity and characterization of transportation modes
Cf. Rodrigue, J.-P., et al. (2013): Main Passenger Modal
Options.
Passenger transport modes (3/5)
10
Diversity and characterization of transportation modes
Air
• Routes are practically unlimited
• Long distance mobility
• Used for transport of passenger and high value freight
Road
• Infrastructures are large consumers of space with the lowest level of physical
constraints of all transportation modes
• Historically developed to support non-motorized forms of transportation modes
• Average operational flexibility (vehicles can serve several purposes but are rarely able
to move outside roads)
• High maintenance costs for road transport systems (vehicles and infrastructure)
Cf. Rodrigue, J.-P., et al. (2013.
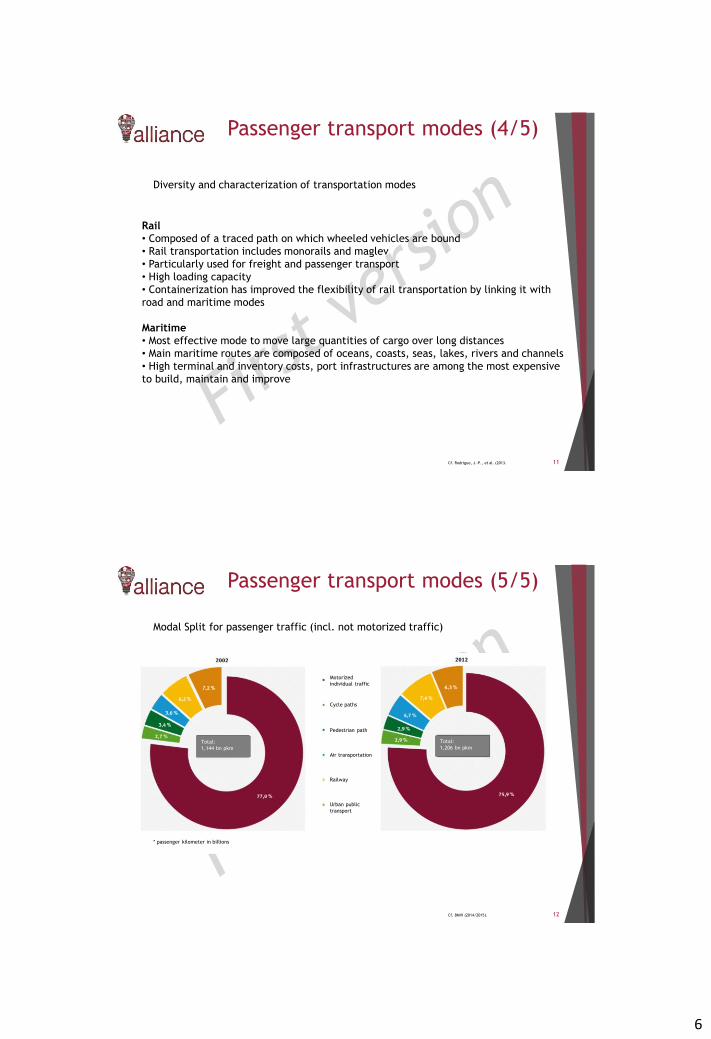
6
Passenger transport modes (4/5)
11
Diversity and characterization of transportation modes
Rail
• Composed of a traced path on which wheeled vehicles are bound
• Rail transportation includes monorails and maglev
• Particularly used for freight and passenger transport
• High loading capacity
• Containerization has improved the flexibility of rail transportation by linking it with
road and maritime modes
Maritime
• Most effective mode to move large quantities of cargo over long distances
• Main maritime routes are composed of oceans, coasts, seas, lakes, rivers and channels
• High terminal and inventory costs, port infrastructures are among the most expensive
to build, maintain and improve
Cf. Rodrigue, J.-P., et al. (2013.
12
Passenger transport modes (5/5)
Modal Split for passenger traffic (incl. not motorized traffic)
Cf. BMVI (2014/2015).
Motorized
individual traffic
Cycle paths
Pedestrian path
Air transportation
Railway
Urban public
transport
* passenger kilometer in billions
Total:
1,144 bn pkm
Total:
1,206 bn pkm

7
Information technology for passenger
transport (1/4)
ITS Solutions for Fleet Management allows:
• Real-time tracking, location, monitoring and visualization of PT vehicles
• Collect data for analysis of performance and for planning purposes
• High-quality real-time passenger information services both on-board and
off-board
• Dynamic control and advisory systems through on-board communication
• Improved punctuality of bus/tram services through coordinating lines and
transfers
• Transit Signal Priority (TSP) at traffic lights and equipment diagnostics and
maintenance planning and scheduling
Improving the efficiency, reliability and the environmental impact of
public transportation (PT) systems
13Cf. Nökel, K., Gentile, G. (2016).
Information technology for passenger
transport (2/4)
Best way to monitor and PT systems with ITS technologies is through a centralizedcontrol center using a two-way communication protocol (practice in some Europeancities)
• Provides real-time information to the control centre with automatic vehicle location (AVL)systems
• Produces guidance instructions to each vehicle, through the driver display or byinformation panels along the line
• Different electronic data interchange (EDI) protocols support this continuouscommunication between control centre and vehicles
14
This communication helps to:
• Overcome road-obstacles
• Solving any emergency or accident
rapidly
• Deliver real time information to
the travelers at the stops or
stations
• Shows waiting time for the next
services and reports on incidents
Cf. Nökel, K., Gentile, G. (2016).
Pic: Modelling public transport passenger flows, cf. Nökel,
K., Gentile, G. (2016).
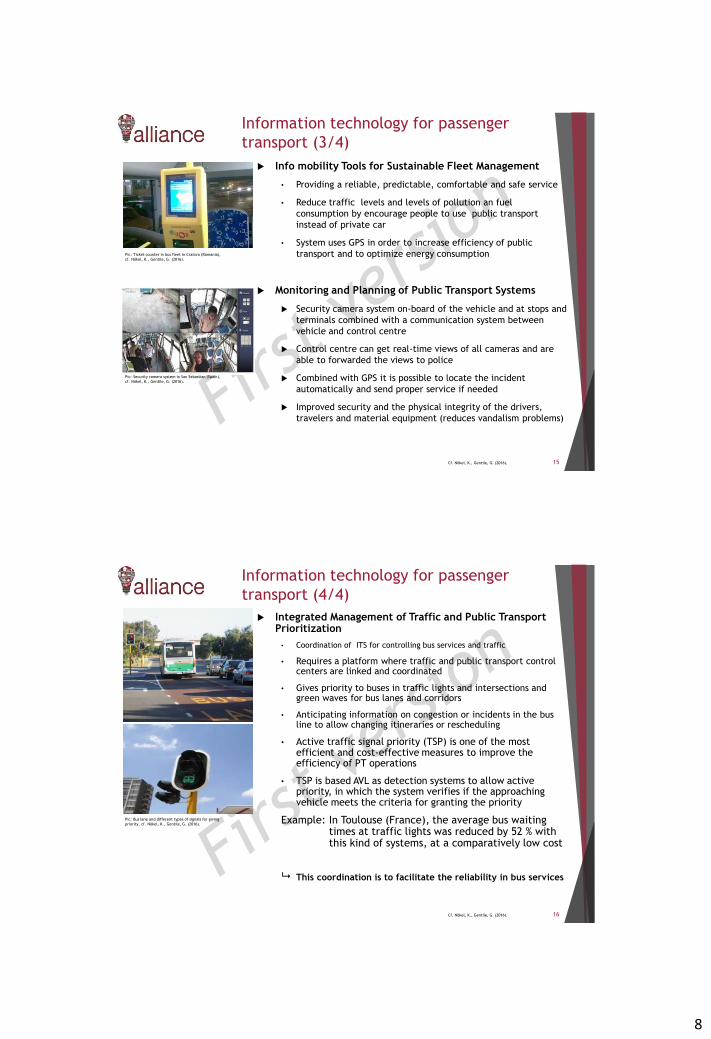
8
Information technology for passenger
transport (3/4)
Info mobility Tools for Sustainable Fleet Management
• Providing a reliable, predictable, comfortable and safe service
• Reduce traffic levels and levels of pollution an fuel
consumption by encourage people to use public transport
instead of private car
• System uses GPS in order to increase efficiency of public
transport and to optimize energy consumption
Monitoring and Planning of Public Transport Systems
Security camera system on-board of the vehicle and at stops and
terminals combined with a communication system between
vehicle and control centre
Control centre can get real-time views of all cameras and are
able to forwarded the views to police
Combined with GPS it is possible to locate the incident
automatically and send proper service if needed
Improved security and the physical integrity of the drivers,
travelers and material equipment (reduces vandalism problems)
15Cf. Nökel, K., Gentile, G. (2016).
Pic: Ticket counter in bus fleet in Craiova (Romania),
cf. Nökel, K., Gentile, G. (2016).
Pic: Security camera system in San Sebastian (Spain),
cf. Nökel, K., Gentile, G. (2016).
Information technology for passenger
transport (4/4)
Integrated Management of Traffic and Public TransportPrioritization
• Coordination of ITS for controlling bus services and traffic
• Requires a platform where traffic and public transport controlcenters are linked and coordinated
• Gives priority to buses in traffic lights and intersections andgreen waves for bus lanes and corridors
• Anticipating information on congestion or incidents in the busline to allow changing itineraries or rescheduling
• Active traffic signal priority (TSP) is one of the mostefficient and cost-effective measures to improve theefficiency of PT operations
• TSP is based AVL as detection systems to allow activepriority, in which the system verifies if the approachingvehicle meets the criteria for granting the priority
Example: In Toulouse (France), the average bus waiting times at traffic lights was reduced by 52 % with this kind of systems, at a comparatively low cost
This coordination is to facilitate the reliability in bus services
16Cf. Nökel, K., Gentile, G. (2016).
Pic: Bus lane and different types of signals for giving
priority, cf. Nökel, K., Gentile, G. (2016).
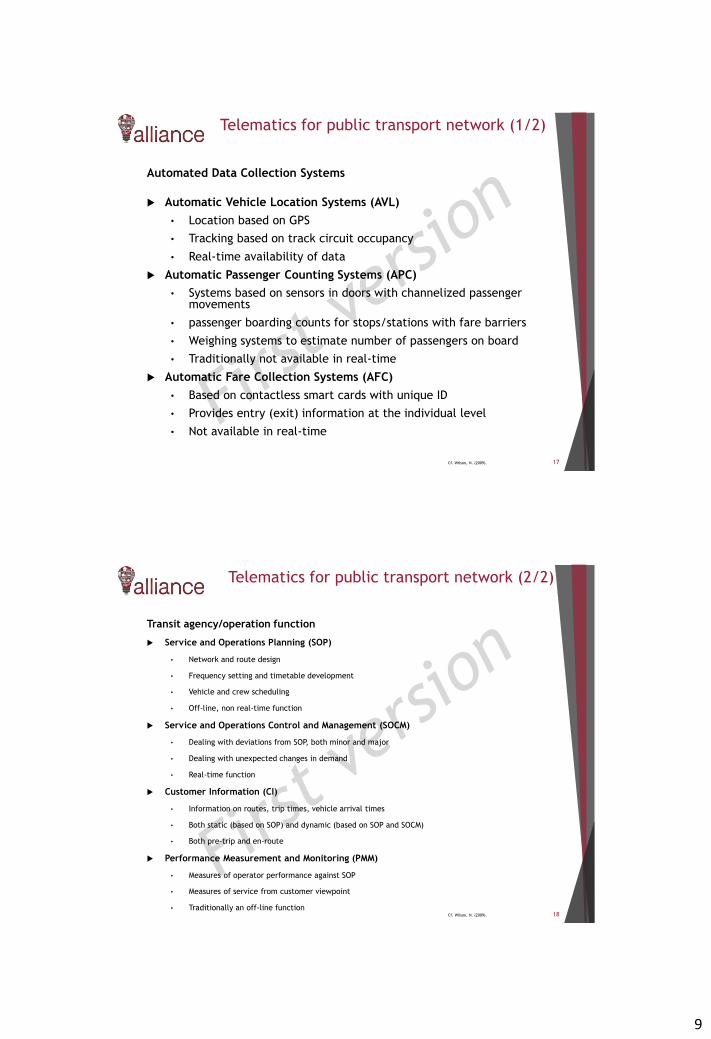
9
Telematics for public transport network (1/2)
17
Automated Data Collection Systems
Automatic Vehicle Location Systems (AVL)
• Location based on GPS
• Tracking based on track circuit occupancy
• Real-time availability of data
Automatic Passenger Counting Systems (APC)
• Systems based on sensors in doors with channelized passengermovements
• passenger boarding counts for stops/stations with fare barriers
• Weighing systems to estimate number of passengers on board
• Traditionally not available in real-time
Automatic Fare Collection Systems (AFC)
• Based on contactless smart cards with unique ID
• Provides entry (exit) information at the individual level
• Not available in real-time
Cf. Wilson, N. (2009).
Telematics for public transport network (2/2)
18
Transit agency/operation function
Service and Operations Planning (SOP)
• Network and route design
• Frequency setting and timetable development
• Vehicle and crew scheduling
• Off-line, non real-time function
Service and Operations Control and Management (SOCM)
• Dealing with deviations from SOP, both minor and major
• Dealing with unexpected changes in demand
• Real-time function
Customer Information (CI)
• Information on routes, trip times, vehicle arrival times
• Both static (based on SOP) and dynamic (based on SOP and SOCM)
• Both pre-trip and en-route
Performance Measurement and Monitoring (PMM)
• Measures of operator performance against SOP
• Measures of service from customer viewpoint
• Traditionally an off-line function Cf. Wilson, N. (2009).

10
IT application fields
19
Ticketing (1/2)Negative factors by using different public transportation systems is the need to buy different tickets and use different kind of payments!
Integrated Ticketing
Key issue for the use of public transport and acceptance of intermodality
Near field communication (NFC) protocols provide contactless payment systemsfor all transport modes in the city
Electronic payment by using intelligent smart cards
• Contactless and different payment options
• Convenient for designing different price schemes (special groups, different times of aday)
• Provides useful information for transport managers and planners
• Option to avoid survey costs or counting of number of passengers using time-consumingand labor-intensive data collection methods
Ticketing data for improving transit planning and scheduling services
• AVL data, which inform driver and may lead to a next time bus stop point
• Measures of effectiveness include average waiting and standing time per passengeraverage holding time and delay per bus
• AVL, APC and AFC are also used to assess transit system performance and reliability
• Estimates dwell time and passenger waiting times as related to service reliability
20Cf. Nökel, K., Gentile, G. (2016).
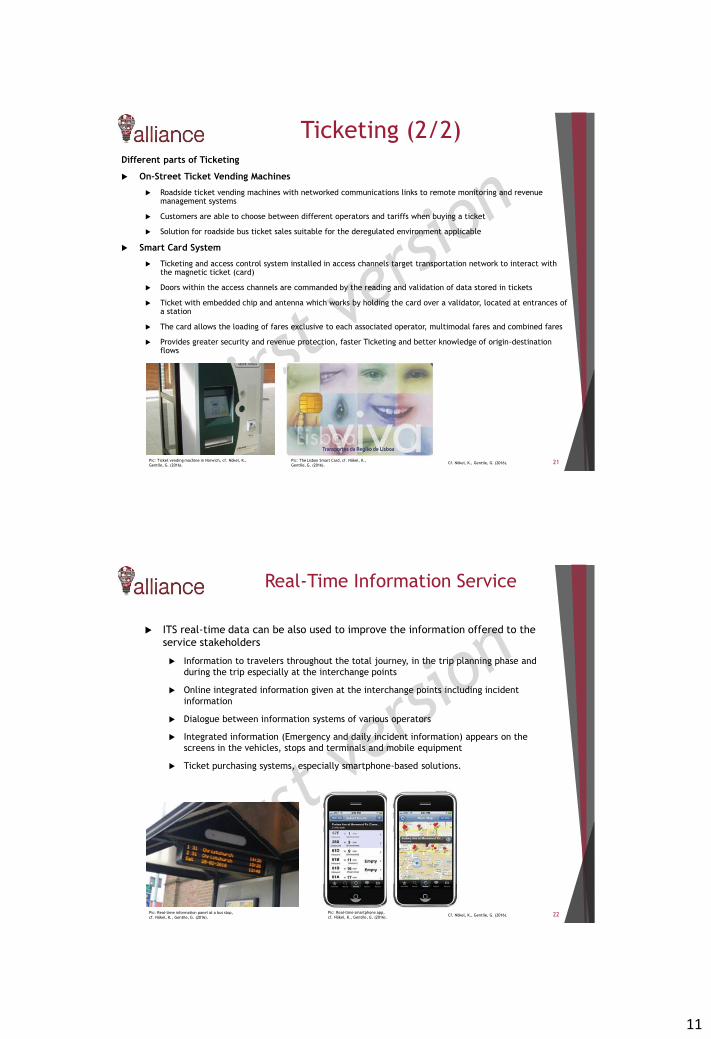
11
Ticketing (2/2)Different parts of Ticketing
On-Street Ticket Vending Machines
Roadside ticket vending machines with networked communications links to remote monitoring and revenue management systems
Customers are able to choose between different operators and tariffs when buying a ticket
Solution for roadside bus ticket sales suitable for the deregulated environment applicable
Smart Card System
Ticketing and access control system installed in access channels target transportation network to interact with the magnetic ticket (card)
Doors within the access channels are commanded by the reading and validation of data stored in tickets
Ticket with embedded chip and antenna which works by holding the card over a validator, located at entrances of a station
The card allows the loading of fares exclusive to each associated operator, multimodal fares and combined fares
Provides greater security and revenue protection, faster Ticketing and better knowledge of origin-destination flows
21Cf. Nökel, K., Gentile, G. (2016).Pic: Ticket vending machine in Norwich, cf. Nökel, K.,
Gentile, G. (2016).
Pic: The Lisbon Smart Card, cf. Nökel, K.,
Gentile, G. (2016).
Real-Time Information Service
ITS real-time data can be also used to improve the information offered to the
service stakeholders
Information to travelers throughout the total journey, in the trip planning phase and
during the trip especially at the interchange points
Online integrated information given at the interchange points including incident
information
Dialogue between information systems of various operators
Integrated information (Emergency and daily incident information) appears on the
screens in the vehicles, stops and terminals and mobile equipment
Ticket purchasing systems, especially smartphone-based solutions.
22Cf. Nökel, K., Gentile, G. (2016).Pic: Real-time information panel at a bus stop,
cf. Nökel, K., Gentile, G. (2016).
Pic: Real-time smartphone app,
cf. Nökel, K., Gentile, G. (2016).

12
Transport Demand Management (1/3)
Transport Demand Management
Application of strategies and policies to reduce travel in single-
occupancy private vehicles
Reduce negative externalities of public transport such as congestion or
pollution
Cost-effective alternative to increasing capacity of the fleet
Deliver better environmental outcomes, improved public health and
more livable and attractive cities
Besides involved non-technical approaches ITS applications can play a
major role in order to reducing traffic demand by encouraging changes
in traveler behavior
• Routing
• Ride sharing/Matching
• Shared-Ownership Vehicle-Sharing
23Cf. Austin, J. (2016).
Transport Demand Management (2/3)
Routing
The software of Dynamic Routing or Scheduling requires digital maps of the
road
Routes can be calculated in real-time to enable ride matching to take place
Software shows road widths and restrictions so that the system can calculate
the shortest appropriate routes accurately
service requires in-vehicle devices to guide the driver and links to the
control centre
calculation of ride sharing and matching is performed in the control centre
After re-calculated scheduled the waiting passenger can get information in
real-time
Ride sharing/Matching
ITS-based ride-sharing platform
Potential users contact a control centre to specify their destination,
preferred time of travel, and any special needs
Centre uses algorithms to identify the most appropriate vehicle operating
that matches requirements as closely as possible24Cf. Austin, J. (2016).
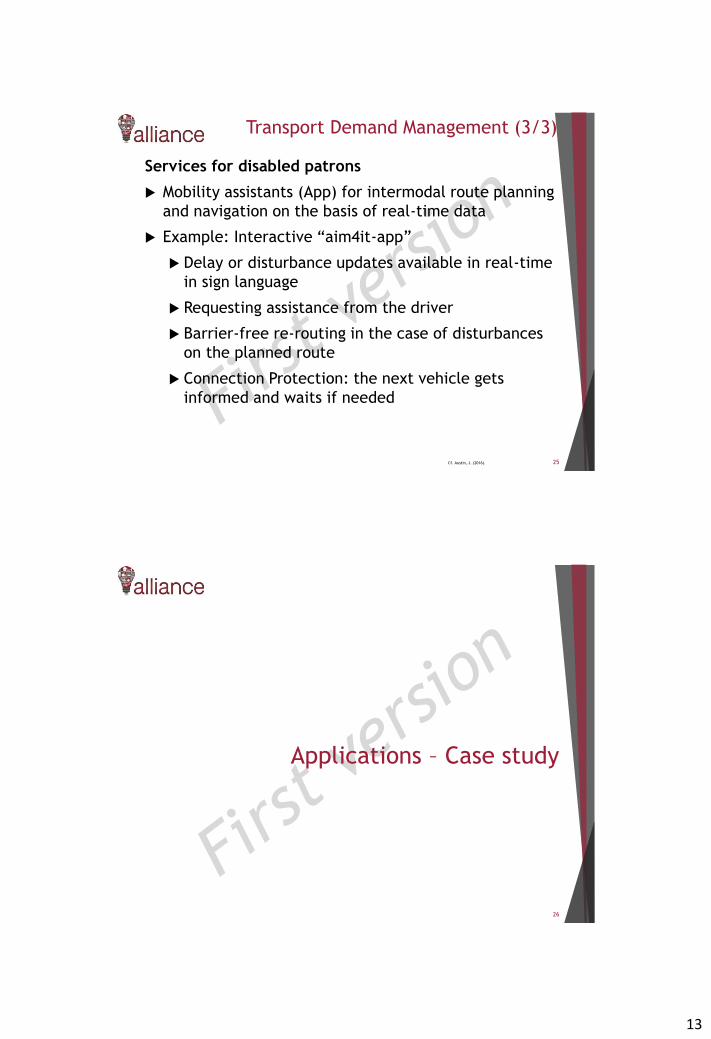
13
Transport Demand Management (3/3)
Services for disabled patrons
Mobility assistants (App) for intermodal route planning
and navigation on the basis of real-time data
Example: Interactive “aim4it-app”
Delay or disturbance updates available in real-time
in sign language
Requesting assistance from the driver
Barrier-free re-routing in the case of disturbances
on the planned route
Connection Protection: the next vehicle gets
informed and waits if needed
25Cf. Austin, J. (2016).
Applications – Case study
26
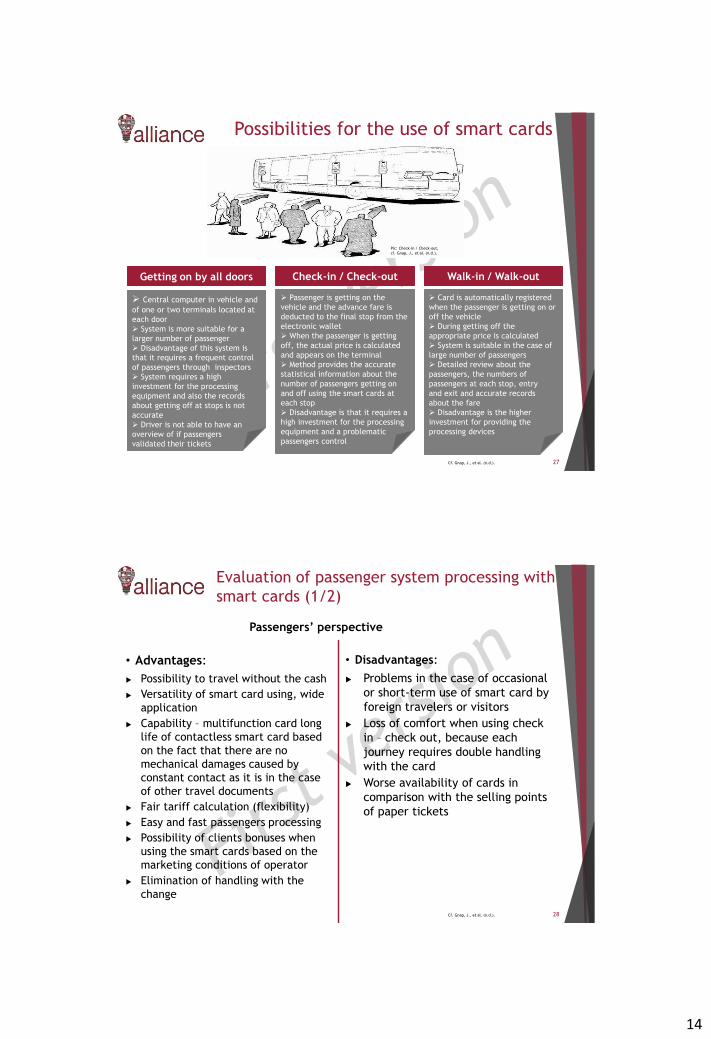
14
Possibilities for the use of smart cards
27
Getting on by all doors
Central computer in vehicle and
of one or two terminals located at
each door
System is more suitable for a
larger number of passenger
Disadvantage of this system is
that it requires a frequent control
of passengers through inspectors
System requires a high
investment for the processing
equipment and also the records
about getting off at stops is not
accurate
Driver is not able to have an
overview of if passengers
validated their tickets
Check-in / Check-out
Passenger is getting on the
vehicle and the advance fare is
deducted to the final stop from the
electronic wallet
When the passenger is getting
off, the actual price is calculated
and appears on the terminal
Method provides the accurate
statistical information about the
number of passengers getting on
and off using the smart cards at
each stop
Disadvantage is that it requires a
high investment for the processing
equipment and a problematic
passengers control
Walk-in / Walk-out
Card is automatically registered
when the passenger is getting on or
off the vehicle
During getting off the
appropriate price is calculated
System is suitable in the case of
large number of passengers
Detailed review about the
passengers, the numbers of
passengers at each stop, entry
and exit and accurate records
about the fare
Disadvantage is the higher
investment for providing the
processing devices
Cf. Gnap, J., et al. (n.d.).
Pic: Check-in / Check-out,
cf. Gnap, J., et al. (n.d.).
Evaluation of passenger system processing with
smart cards (1/2)
28
• Advantages:
Possibility to travel without the cash
Versatility of smart card using, wide
application
Capability – multifunction card long
life of contactless smart card based
on the fact that there are no
mechanical damages caused by
constant contact as it is in the case
of other travel documents
Fair tariff calculation (flexibility)
Easy and fast passengers processing
Possibility of clients bonuses when
using the smart cards based on the
marketing conditions of operator
Elimination of handling with the
change
• Disadvantages:
Problems in the case of occasional
or short-term use of smart card by
foreign travelers or visitors
Loss of comfort when using check
in – check out, because each
journey requires double handling
with the card
Worse availability of cards in
comparison with the selling points
of paper tickets
Passengers’ perspective
Cf. Gnap, J., et al. (n.d.).
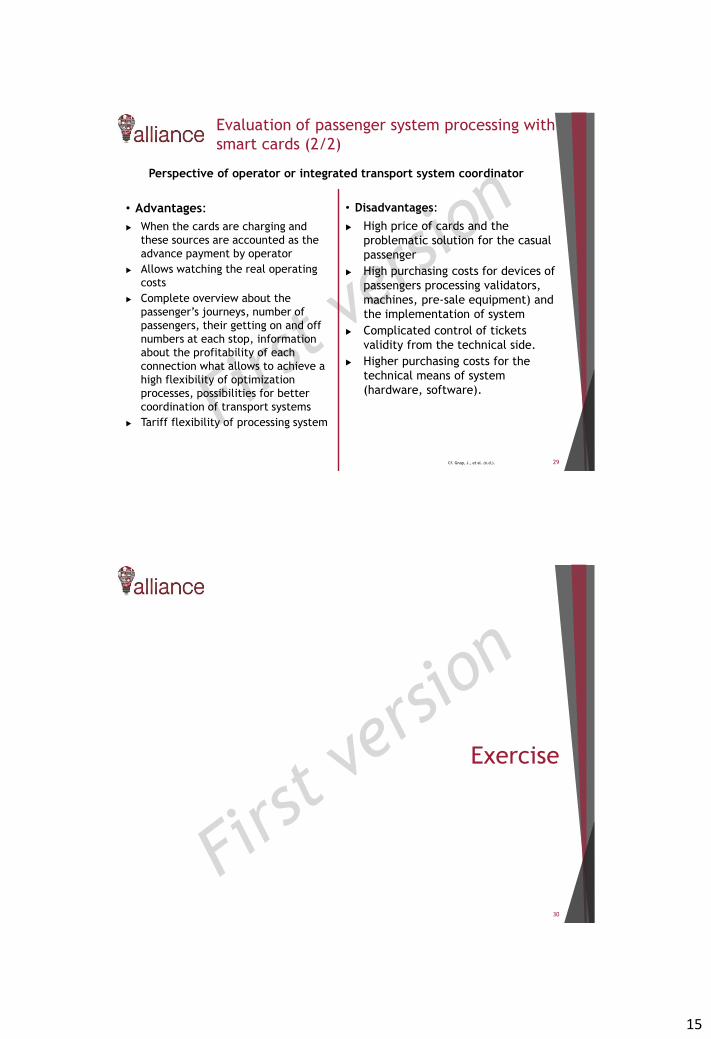
15
Evaluation of passenger system processing with
smart cards (2/2)
29
• Advantages:
When the cards are charging and
these sources are accounted as the
advance payment by operator
Allows watching the real operating
costs
Complete overview about the
passenger’s journeys, number of
passengers, their getting on and off
numbers at each stop, information
about the profitability of each
connection what allows to achieve a
high flexibility of optimization
processes, possibilities for better
coordination of transport systems
Tariff flexibility of processing system
• Disadvantages:
High price of cards and the
problematic solution for the casual
passenger
High purchasing costs for devices of
passengers processing validators,
machines, pre-sale equipment) and
the implementation of system
Complicated control of tickets
validity from the technical side.
Higher purchasing costs for the
technical means of system
(hardware, software).
Perspective of operator or integrated transport system coordinator
Cf. Gnap, J., et al. (n.d.).
Exercise
30
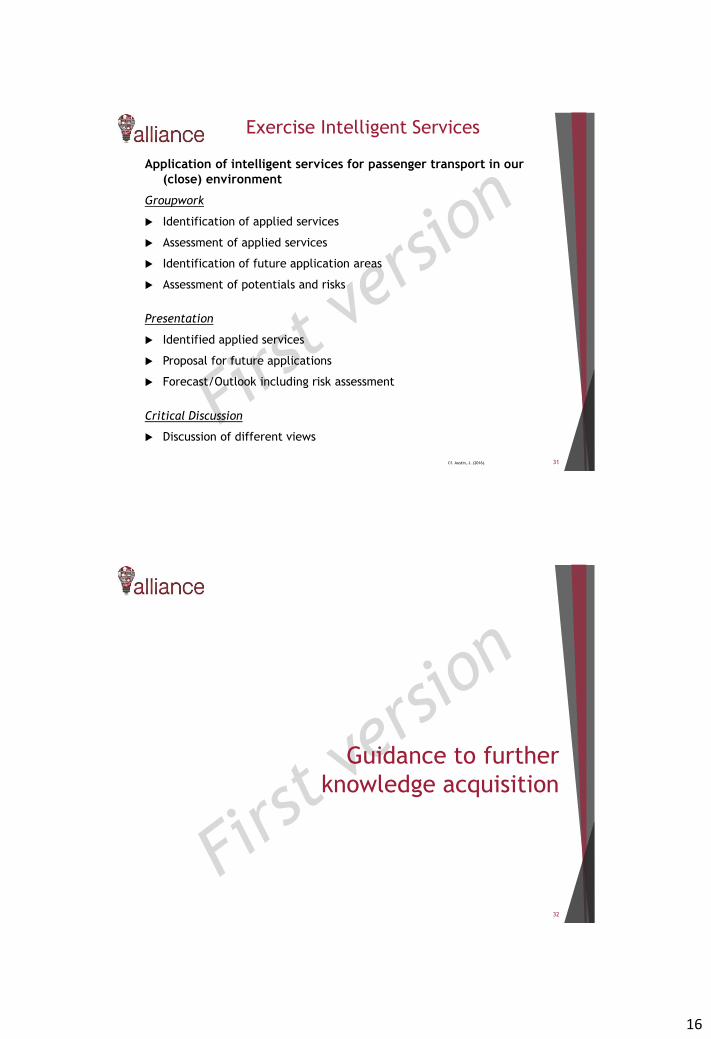
16
Exercise Intelligent Services
Application of intelligent services for passenger transport in our
(close) environment
Groupwork
Identification of applied services
Assessment of applied services
Identification of future application areas
Assessment of potentials and risks
Presentation
Identified applied services
Proposal for future applications
Forecast/Outlook including risk assessment
Critical Discussion
Discussion of different views
31Cf. Austin, J. (2016).
Guidance to further
knowledge acquisition
32
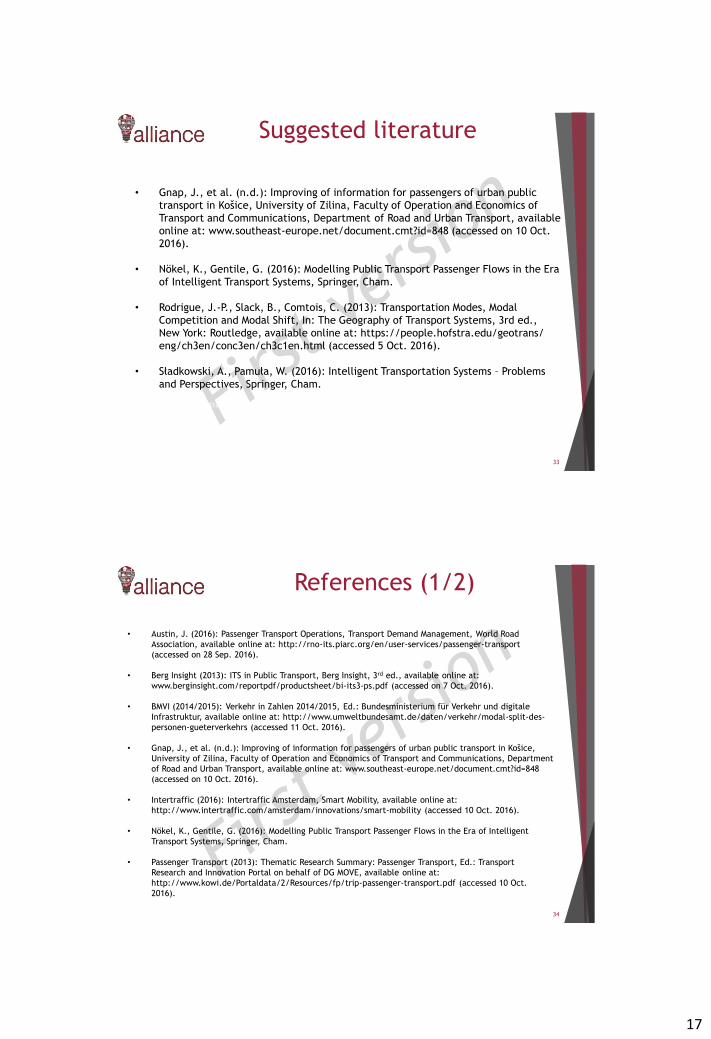
17
Suggested literature
33
• Gnap, J., et al. (n.d.): Improving of information for passengers of urban public
transport in Košice, University of Zilina, Faculty of Operation and Economics of
Transport and Communications, Department of Road and Urban Transport, available
online at: www.southeast-europe.net/document.cmt?id=848 (accessed on 10 Oct.
2016).
• Nökel, K., Gentile, G. (2016): Modelling Public Transport Passenger Flows in the Era
of Intelligent Transport Systems, Springer, Cham.
• Rodrigue, J.-P., Slack, B., Comtois, C. (2013): Transportation Modes, Modal
Competition and Modal Shift, In: The Geography of Transport Systems, 3rd ed.,
New York: Routledge, available online at: https://people.hofstra.edu/geotrans/
eng/ch3en/conc3en/ch3c1en.html (accessed 5 Oct. 2016).
• Sładkowski, A., Pamuła, W. (2016): Intelligent Transportation Systems – Problems
and Perspectives, Springer, Cham.
•https://people.hofstra.edu/geotrans/eng/ch3en/conc3en/ch3c1en.html
References (1/2)
34
• Austin, J. (2016): Passenger Transport Operations, Transport Demand Management, World Road
Association, available online at: http://rno-its.piarc.org/en/user-services/passenger-transport
(accessed on 28 Sep. 2016).
• Berg Insight (2013): ITS in Public Transport, Berg Insight, 3rd ed., available online at:
www.berginsight.com/reportpdf/productsheet/bi-its3-ps.pdf (accessed on 7 Oct. 2016).
• BMVI (2014/2015): Verkehr in Zahlen 2014/2015, Ed.: Bundesministerium für Verkehr und digitale
Infrastruktur, available online at: http://www.umweltbundesamt.de/daten/verkehr/modal-split-des-
personen-gueterverkehrs (accessed 11 Oct. 2016).
• Gnap, J., et al. (n.d.): Improving of information for passengers of urban public transport in Košice,
University of Zilina, Faculty of Operation and Economics of Transport and Communications, Department
of Road and Urban Transport, available online at: www.southeast-europe.net/document.cmt?id=848
(accessed on 10 Oct. 2016).
• Intertraffic (2016): Intertraffic Amsterdam, Smart Mobility, available online at:
http://www.intertraffic.com/amsterdam/innovations/smart-mobility (accessed 10 Oct. 2016).
• Nökel, K., Gentile, G. (2016): Modelling Public Transport Passenger Flows in the Era of Intelligent
Transport Systems, Springer, Cham.
• Passenger Transport (2013): Thematic Research Summary: Passenger Transport, Ed.: Transport
Research and Innovation Portal on behalf of DG MOVE, available online at:
http://www.kowi.de/Portaldata/2/Resources/fp/trip-passenger-transport.pdf (accessed 10 Oct.
2016).

18
References (2/2)
35
• Rodrigue, J.-P., Slack, B., Comtois, C. (2013): Transportation Modes, Modal Competition and Modal
Shift, In: The Geography of Transport Systems, 3rd ed., New York: Routledge, available online at:
https://people.hofstra.edu/geotrans/eng/ch3en/conc3en/ch3c1en.html (accessed 5 Oct. 2016).
• Siemens (2013): Integrated Mobility Platform; Siemens Infrastructure & Cities - Traffic Solutions,
available online at: http://www.siemens.co.uk/traffic/pool/documents/brochure/imp-4pp.pdf
(accessed on 5 Oct. 2016).
• Wilson, N. (2009): The Role of Information Technology in Improving Transit Systems, Transportation at
MIT, Lecture, available online at: http://transportation.mit.edu/news/role-of-it (accessed on 28 Sep.
2016).
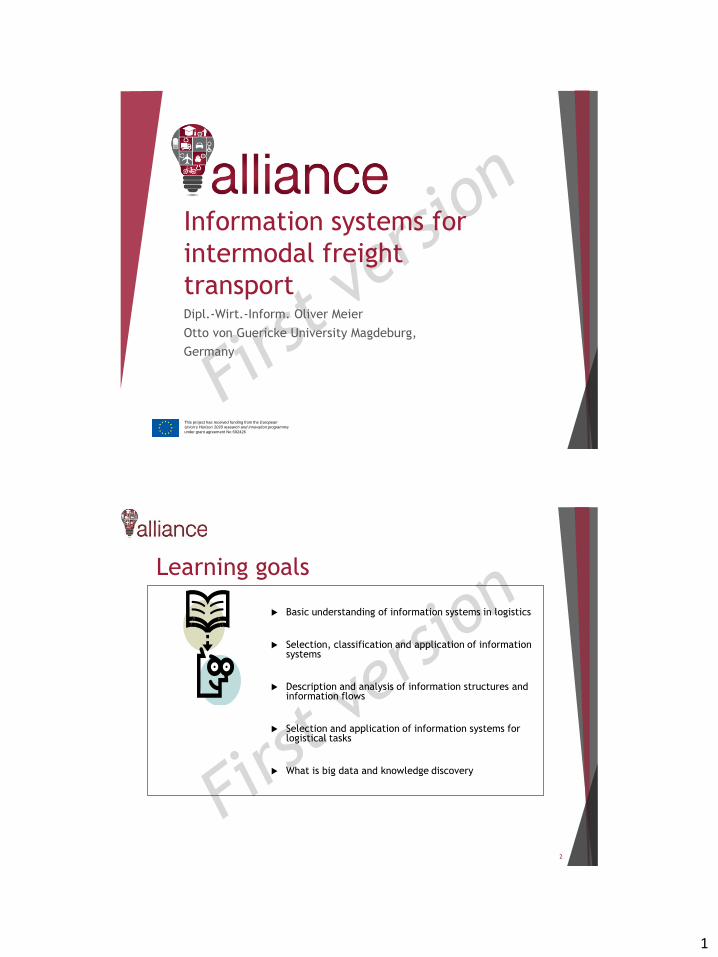
1
This project has received funding from the European
Union’s Horizon 2020 research and innovation programme
under grant agreement No 692426
Information systems for
intermodal freight
transportDipl.-Wirt.-Inform. Oliver Meier
Otto von Guericke University Magdeburg,
Germany
Learning goals
2
Basic understanding of information systems in logistics
Selection, classification and application of informationsystems
Description and analysis of information structures andinformation flows
Selection and application of information systems forlogistical tasks
What is big data and knowledge discovery
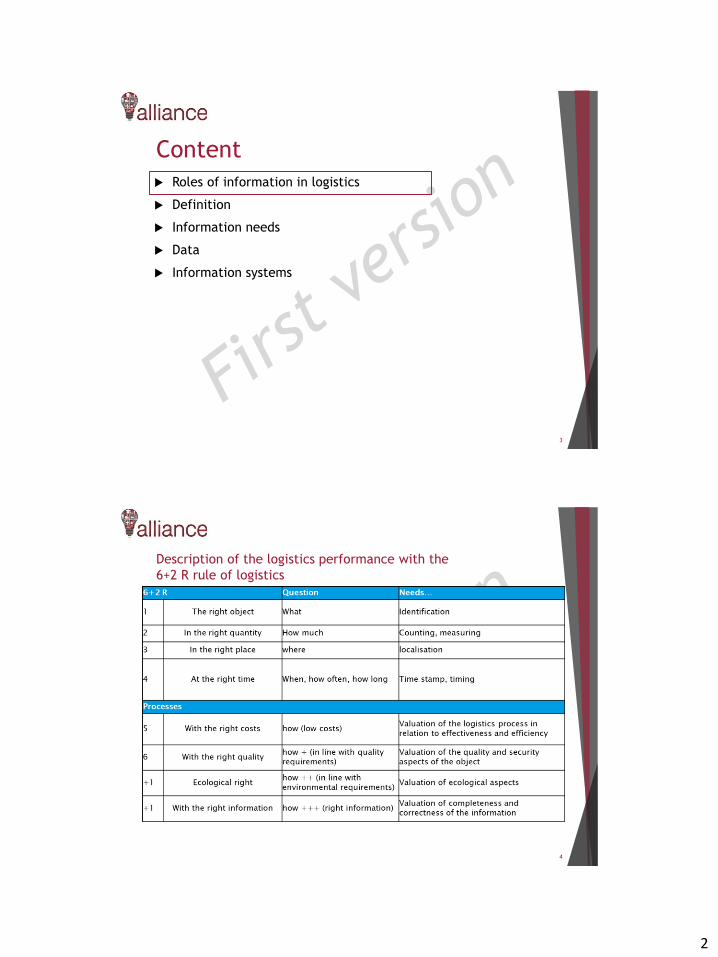
2
Content
Roles of information in logistics
Definition
Information needs
Data
Information systems
3
Description of the logistics performance with the
6+2 R rule of logistics
4
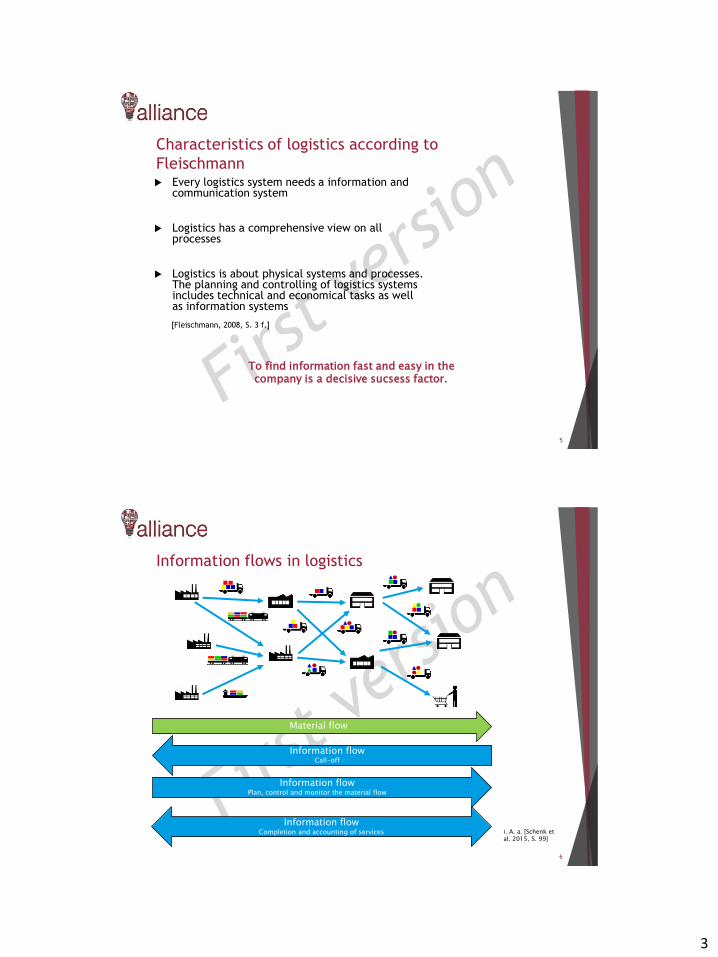
3
Characteristics of logistics according to
Fleischmann Every logistics system needs a information and
communication system
Logistics has a comprehensive view on allprocesses
Logistics is about physical systems and processes.The planning and controlling of logistics systemsincludes technical and economical tasks as wellas information systems
[Fleischmann, 2008, S. 3 f.]
5
To find information fast and easy in thecompany is a decisive sucsess factor.
Information flows in logistics
6
Material flow
Information flowCall-off
Information flowPlan, control and monitor the material flow
Information flowCompletion and accounting of services i. A. a. [Schenk et
al. 2015, S. 99]
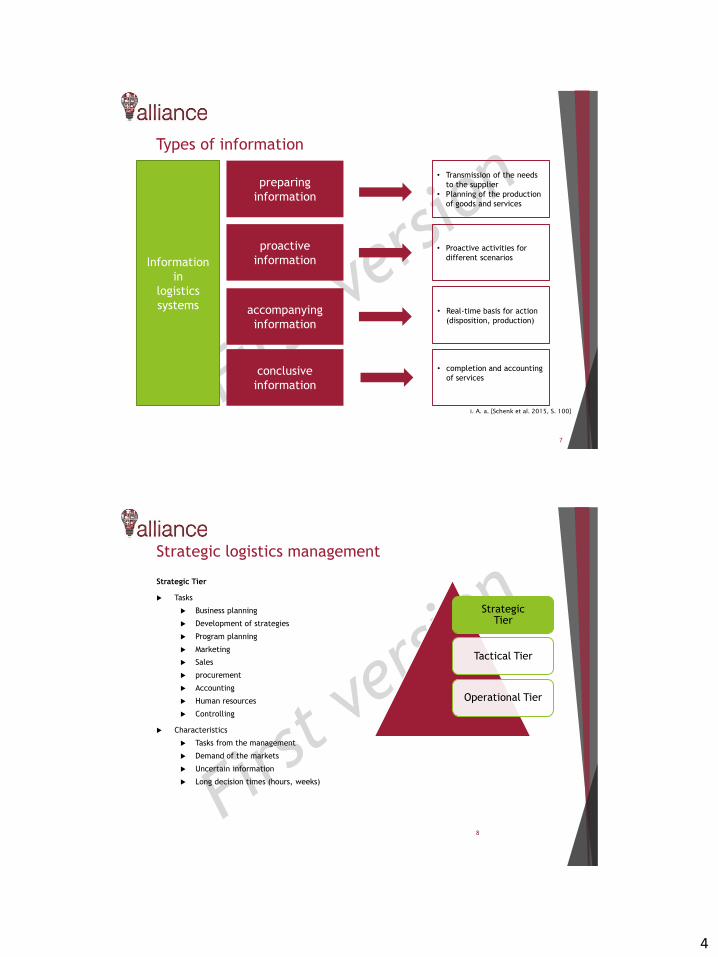
4
Types of information
7
Information
in
logistics
systems
preparing
information
proactive
information
accompanying
information
conclusive
information
• Transmission of the needs
to the supplier
• Planning of the production
of goods and services
• Proactive activities for
different scenarios
• Real-time basis for action
(disposition, production)
• completion and accounting
of services
i. A. a. [Schenk et al. 2015, S. 100]
Strategic logistics management
Strategic Tier
Tasks
Business planning
Development of strategies
Program planning
Marketing
Sales
procurement
Accounting
Human resources
Controlling
Characteristics
Tasks from the management
Demand of the markets
Uncertain information
Long decision times (hours, weeks)
8
StrategicTier
Tactical Tier
Operational Tier
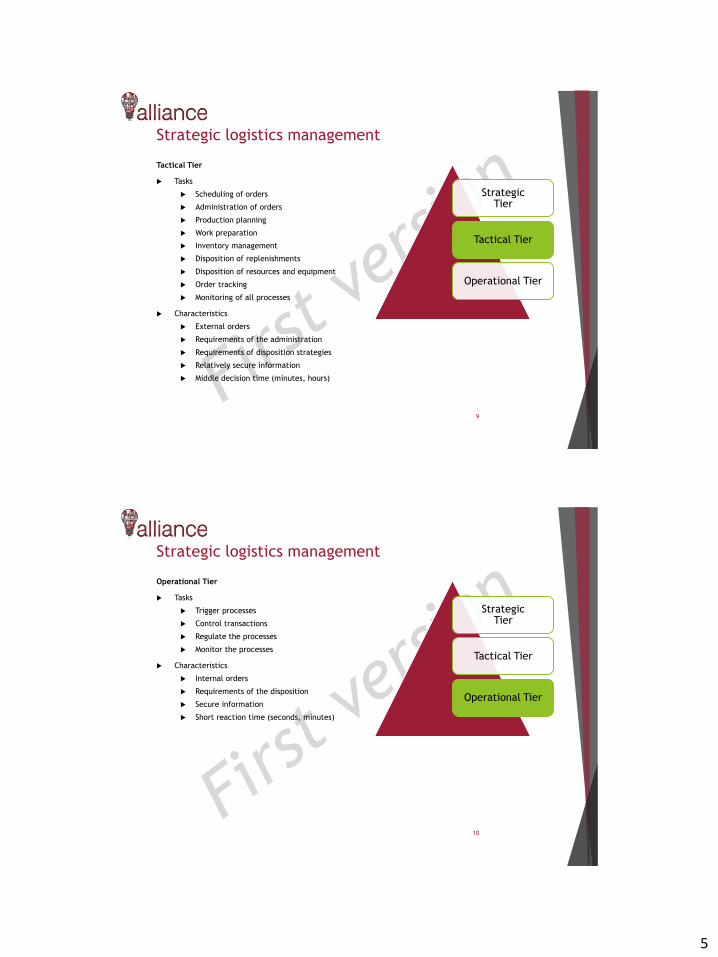
5
Strategic logistics management
Tactical Tier
Tasks
Scheduling of orders
Administration of orders
Production planning
Work preparation
Inventory management
Disposition of replenishments
Disposition of resources and equipment
Order tracking
Monitoring of all processes
Characteristics
External orders
Requirements of the administration
Requirements of disposition strategies
Relatively secure information
Middle decision time (minutes, hours)
9
StrategicTier
Tactical Tier
Operational Tier
Strategic logistics management
Operational Tier
Tasks
Trigger processes
Control transactions
Regulate the processes
Monitor the processes
Characteristics
Internal orders
Requirements of the disposition
Secure information
Short reaction time (seconds, minutes)
10
StrategicTier
Tactical Tier
Operational Tier
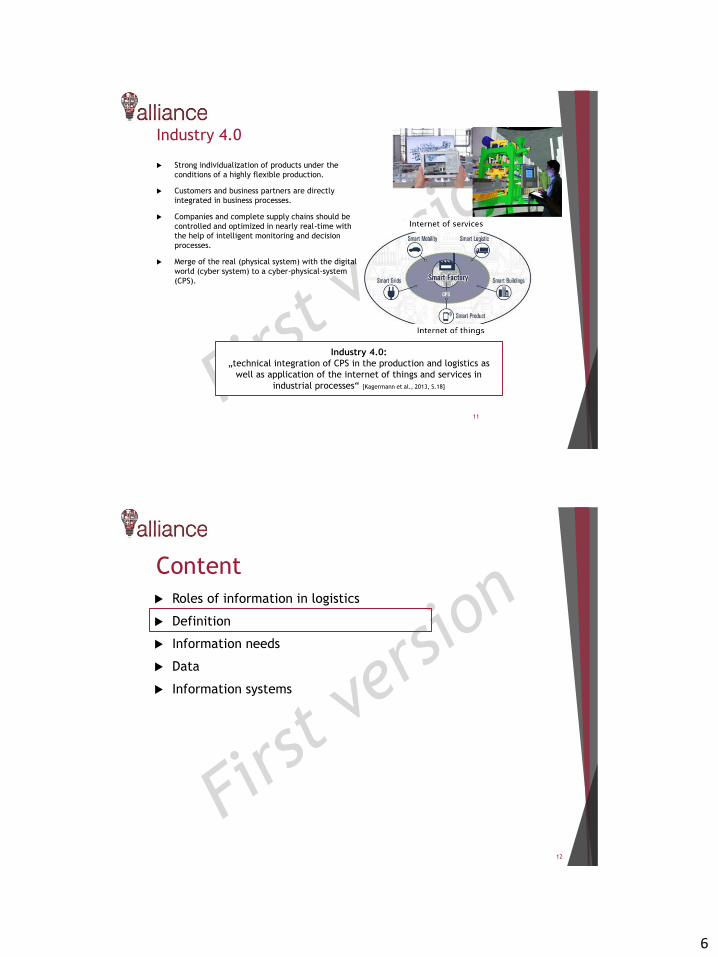
6
Industry 4.0
Strong individualization of products under the
conditions of a highly flexible production.
Customers and business partners are directly
integrated in business processes.
Companies and complete supply chains should be
controlled and optimized in nearly real-time with
the help of intelligent monitoring and decision
processes.
Merge of the real (physical system) with the digital
world (cyber system) to a cyber-physical-system
(CPS).
11
Industry 4.0:
„technical integration of CPS in the production and logistics as
well as application of the internet of things and services in
industrial processes“ [Kagermann et al., 2013, S.18]
Content
Roles of information in logistics
Definition
Information needs
Data
Information systems
12
7
Definition – message, data, character
CHARACTER
… are the basic elements for the form of presentation
of information
DATA
… are the form of presentation of information.
A MESSAGE
… is the specific type of notification of the (abstract) information.
… can only be presented in the form of data.
… can convey information.
… a information is conveyed by a message and its meaning
for the recipient.
=> an information needs a message, but a message don‘t
have to contain a information.
13
Definition – information, knowledge
INFORMATION is (in this context of production and logistics)
… a description of circumstances in the past, present or future, if they are
understandable and usable for specific recipients and if they are used by at
least one recipient.
KNOWLEDGE is
… the requirement to recognize and describe circumstances as well as to make
decisions.
14
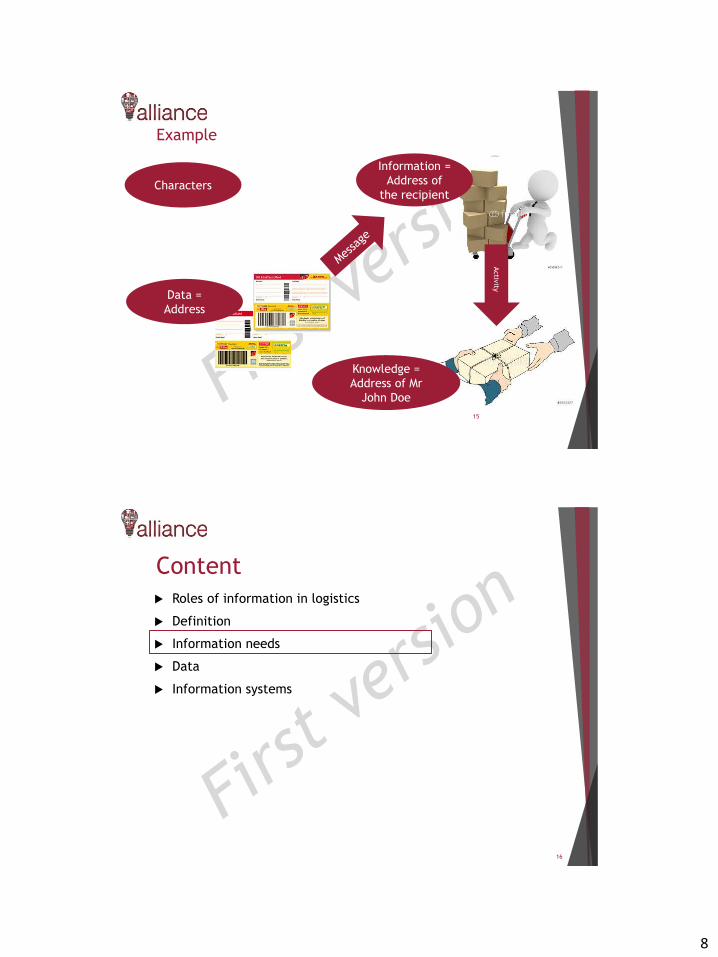
8
Example
15
RecipientJohn Doe1st street #912345 Springfield
Characters
Data =
Address
Information =
Address of
the recipient
Activ
ity
Knowledge =
Address of Mr
John Doe
Content
Roles of information in logistics
Definition
Information needs
Data
Information systems
16
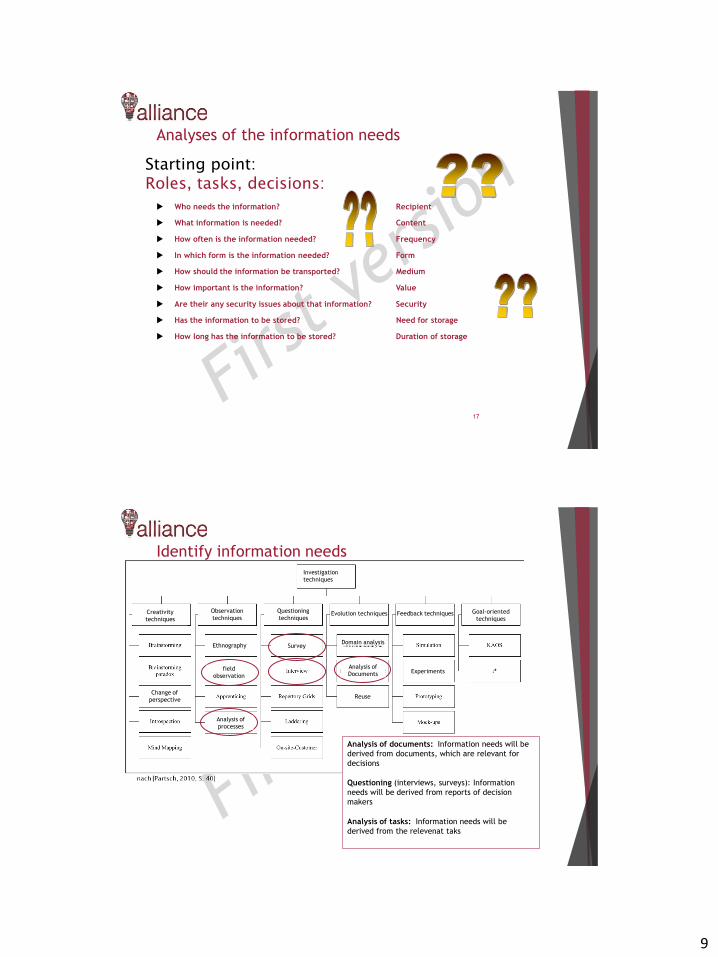
9
Analyses of the information needs
Who needs the information? Recipient
What information is needed? Content
How often is the information needed? Frequency
In which form is the information needed? Form
How should the information be transported? Medium
How important is the information? Value
Are their any security issues about that information? Security
Has the information to be stored? Need for storage
How long has the information to be stored? Duration of storage
17
Starting point:Roles, tasks, decisions:
Identify information needs
18
Investigation
techniques
Creativity
techniques
Change of
perspective
Observation
techniques
Ethnography
field
observation
Analysis of
processes
Questioning
techniques
Survey
Evolution techniques
Domain analysis
Analysis of
Documents
Reuse
Feedback techniques
Experiments
Goal-oriented
techniques
Analysis of documents: Information needs will be
derived from documents, which are relevant for
decisions
Questioning (interviews, surveys): Information
needs will be derived from reports of decision
makers
Analysis of tasks: Information needs will be
derived from the relevenat taks

10
Principles of synchronisation
Hierarchical principle
• Higher (central) instance activates the considered unit
Predecessor principle
• Following instance activates the unit
Sucessor principle
• Preciding instance activates the unit Activation
Activation
Activation
Basic principles
Pick-up principle
activ for the recipient
= I have to collect information
= activation by recipient
Delivery principle
passiv for the recipient
= I would be informed
= Activation by triggering event
(e.g. arrival of a messenger, arrival of an e-mail etc.)
„pick-up principle”
„delivery principle”

11
Content
Roles of information in logistics
Definition
Information needs
Data
Information systems
21
Types of data
DATA
… are the form of presentation of information.
Characteristic Type of data
Type of character numeric alphabetic alphanumeric
Formatting formatted unformatted
Structure structured unstructured
Handling process input data output data
Duration master data transaction data
Time-relevance active passive
Status transition status data event data

12
Types of data – types of characters, formatting,
structure
Address data
Text
graphics (CAD, etc.)
Picture data (from scanner, film camera, camera, etc.)
Digital tone sequences
Characteristic Type of data
Type of character numeric alphabetic alphanumeric
Formatting formatted unformatted
Structure structured unstructured
Types of data – handling process
Input data
• orders
• Actual stock
• Supplier data
• Customer data
• …
Output data
• Prepared data:
repots, lists,
indicators
• …Information system
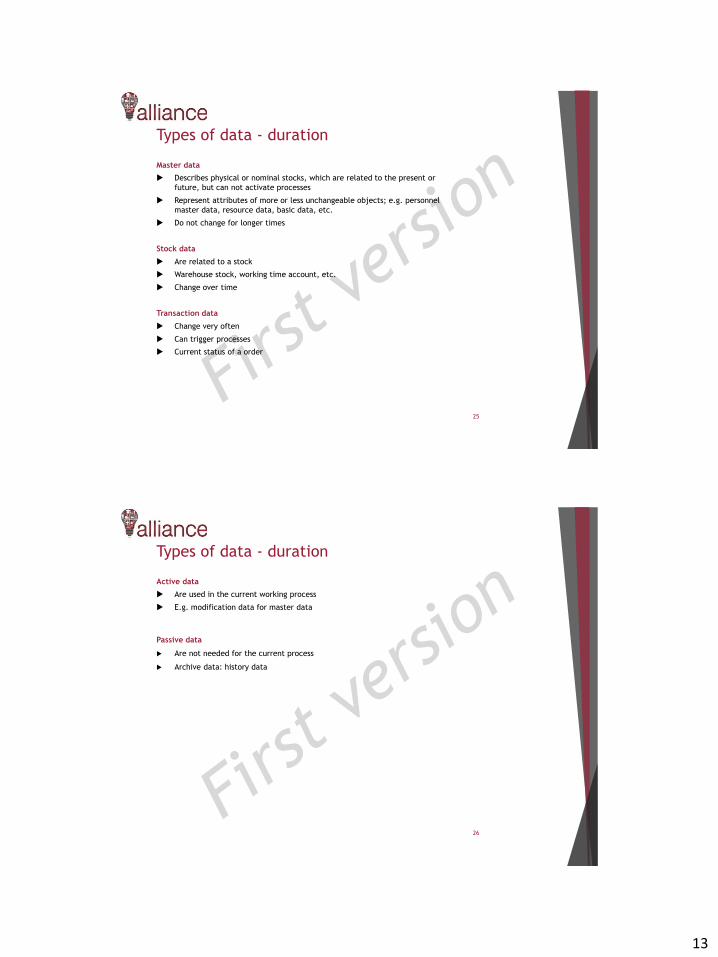
13
Types of data - duration
Master data
Describes physical or nominal stocks, which are related to the present or
future, but can not activate processes
Represent attributes of more or less unchangeable objects; e.g. personnel
master data, resource data, basic data, etc.
Do not change for longer times
Stock data
Are related to a stock
Warehouse stock, working time account, etc.
Change over time
Transaction data
Change very often
Can trigger processes
Current status of a order
25
Types of data - duration
Active data
Are used in the current working process
E.g. modification data for master data
Passive data
Are not needed for the current process
Archive data: history data
26

14
Types of data – status transition
Current status:
The current status of a logistical object is described by actual values of
predefined attributes (e.g. position)
Event:
An event is the modification of the value of an attribute.
27
ID Time Location
ULD033 23:47:00 Dolly17
ULD033 23:47:03 warehouse
ID Time Location 1 Location 2
ULD033 23:47:03 Dolly17 warehouse
status event
Basic data in companies I – master data
Organization chart: organizational structure of a company
Procedures: standard procedures in the company are defined and
documented in the quality manual
Parts lists: structure and quantity of products and parts in a graphical form
and as a table
28
Plant
manager
Department
manager
Department A
Department
manager
Department B
Department
manager
Department C
15
Basic data in companies II – master data
Work plan: define sequence and duration of work processes as well as
needed resources
Testing plan: type, scale and documentation of quality control
Workplaces: Organizational entity for working
Product and material master data
Personnel master data: person-related and workplace-related data
Basic resource data: Machine type, year of construction, investment
29
Content
Roles of information in logistics
Definition
Information needs
Data
Information systems
30
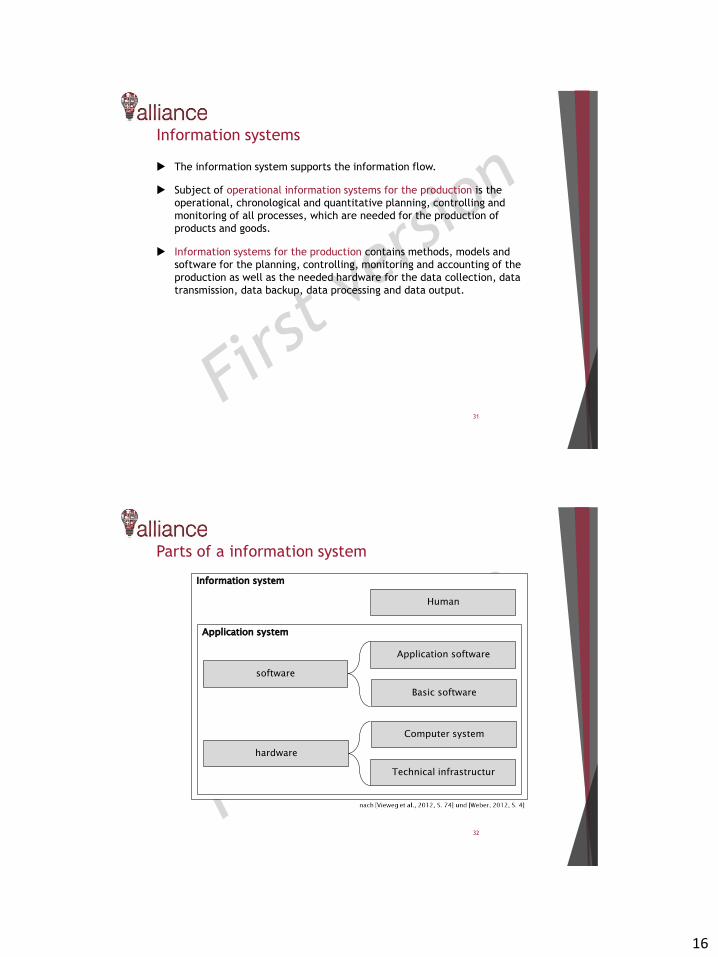
16
Information systems
The information system supports the information flow.
Subject of operational information systems for the production is the
operational, chronological and quantitative planning, controlling and
monitoring of all processes, which are needed for the production of
products and goods.
Information systems for the production contains methods, models and
software for the planning, controlling, monitoring and accounting of the
production as well as the needed hardware for the data collection, data
transmission, data backup, data processing and data output.
31
Parts of a information system
32
Information system
Application system
Human
Application software
Basic software
Computer system
Technical infrastructur
software
hardware
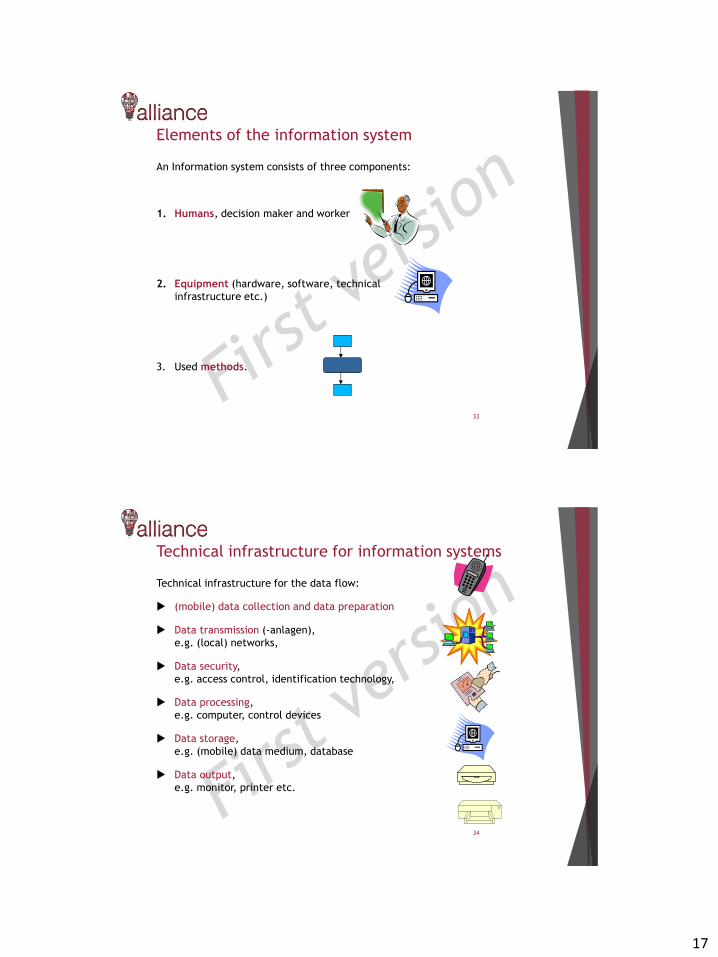
17
Elements of the information system
An Information system consists of three components:
1. Humans, decision maker and worker
2. Equipment (hardware, software, technical
infrastructure etc.)
3. Used methods.
33
Technical infrastructure for information systems
Technical infrastructure for the data flow:
(mobile) data collection and data preparation
Data transmission (-anlagen),
e.g. (local) networks,
Data security,
e.g. access control, identification technology,
Data processing,
e.g. computer, control devices
Data storage,
e.g. (mobile) data medium, database
Data output,
e.g. monitor, printer etc.
34

18
Classification of common logistical information
systems
35
Data-Warehouse-System
Auto-ID-, localization and sensor technologies
raw dataReal System
Procurement Production Storage Distribution Sale
Planning
Organisation & provision
cControl&
regulation
Monitoring
Enterprise Resource PlanningSystems
Supply Chain Management Execution
System
Supply Chain Management Planning System
Transport Management
System
Supply ChainEvent Management System
Warehouse Management
System
Transport Management
System
Warehouse Management System
Advanced Planning and Scheduling System
Manufacturing Execution
System
Customer Relation-
shipManage-
mentSystem
Pla
nnin
gsyste
mO
pera
tional syste
mM
onit
ori
ng
syste
m
Productionplanning
and controllsystem
Data
Example – Operational logistics management
36
Information system
Operational logitics
manager
Application system
Data-Warehouse-
System
analyses
info
rmati
on
require
ments
regulating variables
Logistical system
technologies
raw data
information
application system
!
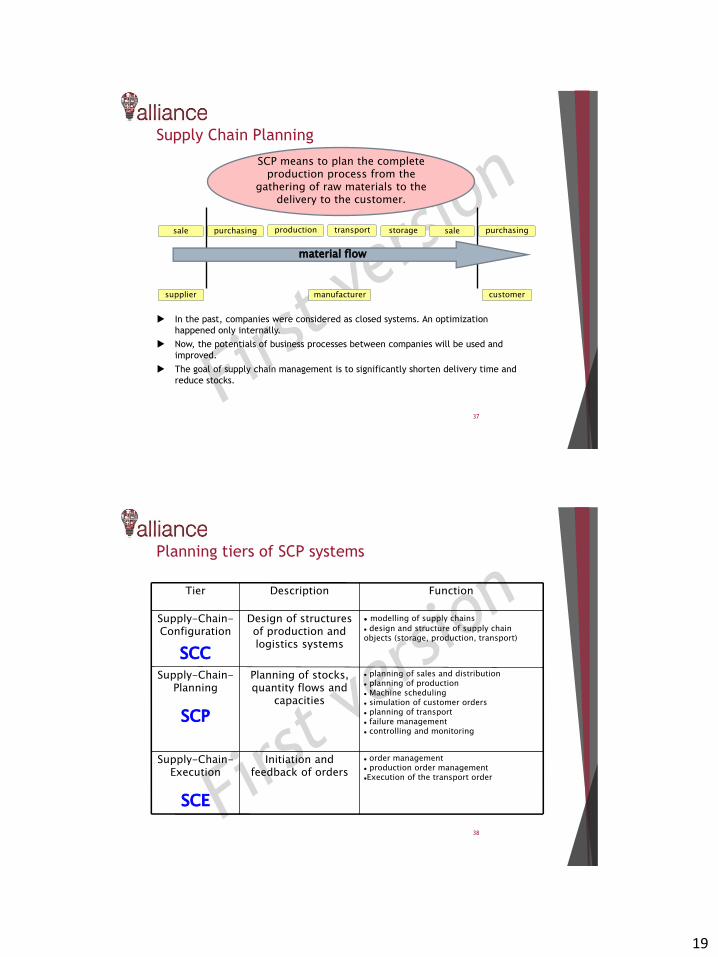
19
Supply Chain Planning
In the past, companies were considered as closed systems. An optimization
happened only internally.
Now, the potentials of business processes between companies will be used and
improved.
The goal of supply chain management is to significantly shorten delivery time and
reduce stocks.
37
SCP means to plan the complete production process from the
gathering of raw materials to the delivery to the customer.
sale purchasing production transport storage sale purchasing
supplier manufacturer customer
material flow
Planning tiers of SCP systems
38
order management production order managementExecution of the transport order
Initiation and feedback of orders
Supply-Chain-Execution
SCE
planning of sales and distribution planning of production Machine scheduling simulation of customer orders planning of transport failure management controlling and monitoring
Planning of stocks,quantity flows and
capacities
Supply-Chain-Planning
SCP
modelling of supply chains
design and structure of supply chain objects (storage, production, transport)
Design of structuresof production and logistics systems
Supply-Chain-Configuration
SCC
FunctionDescriptionTier
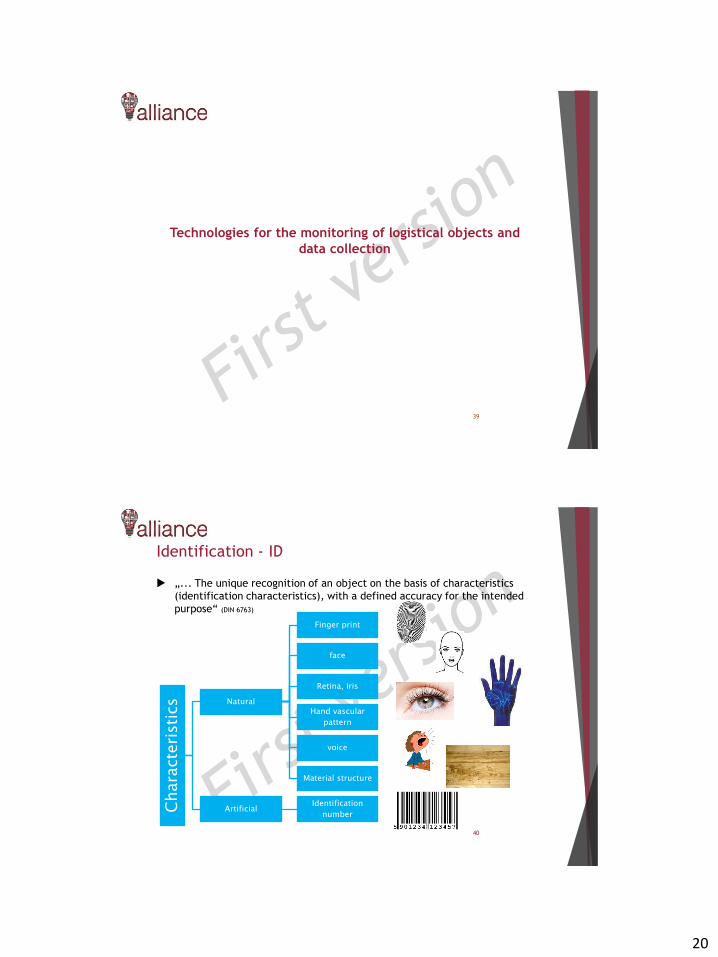
20
39
Technologies for the monitoring of logistical objects and
data collection
Identification - ID
„... The unique recognition of an object on the basis of characteristics
(identification characteristics), with a defined accuracy for the intended
purpose“ (DIN 6763)
40
Chara
cte
risti
cs Natural
Finger print
face
Retina, iris
Hand vascular
pattern
voice
Material structure
ArtificialIdentification
number
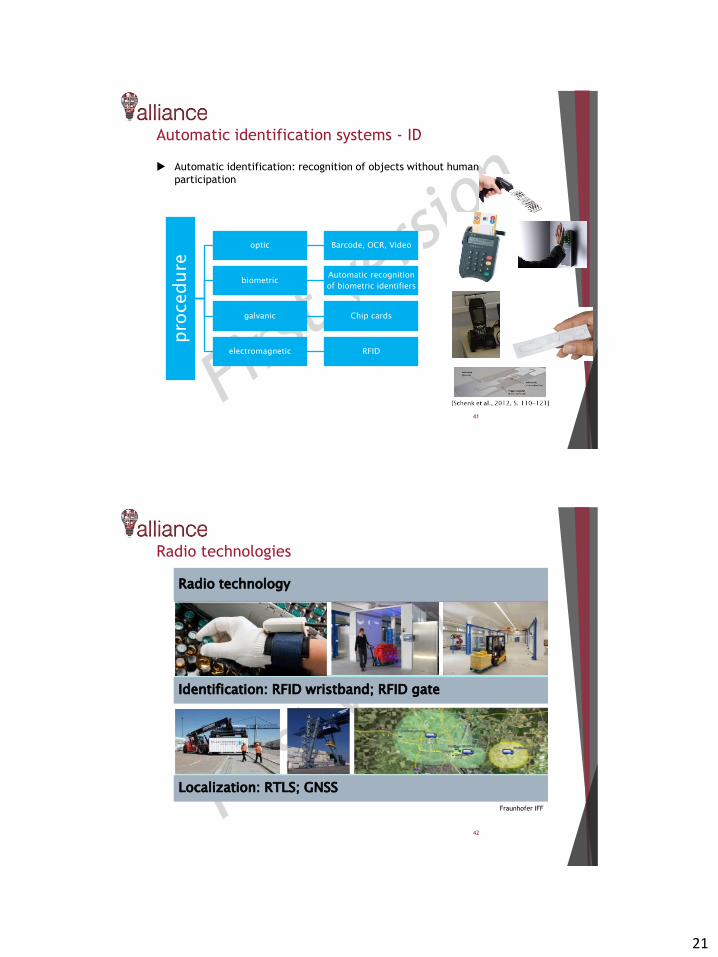
21
Automatic identification systems - ID
Automatic identification: recognition of objects without human
participation
41
pro
ced
ure
optic Barcode, OCR, Video
biometricAutomatic recognition
of biometric identifiers
galvanic Chip cards
electromagnetic RFID
Radio technologies
42
Radio technology
Identification: RFID wristband; RFID gate
Localization: RTLS; GNSS
Fraunhofer IFF
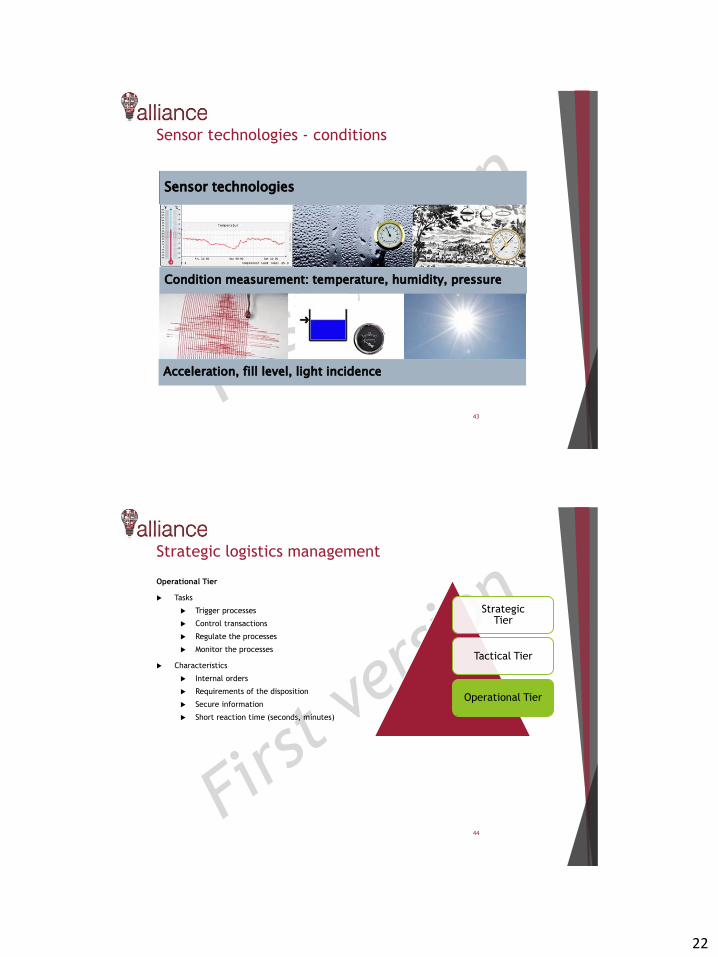
22
Sensor technologies - conditions
43
Sensor technologies
Condition measurement: temperature, humidity, pressure
Acceleration, fill level, light incidence
Strategic logistics management
Operational Tier
Tasks
Trigger processes
Control transactions
Regulate the processes
Monitor the processes
Characteristics
Internal orders
Requirements of the disposition
Secure information
Short reaction time (seconds, minutes)
44
StrategicTier
Tactical Tier
Operational Tier
23
45
DATA WAREHOUSE SYSTEM
Requirements to the architecture of a data
warehouse system
Independence between data source and analyzing systems
permanent provision of integrated and diverted data (persistence)
Reusability of the data
execution of any desired analysis
individual views
expandability
automated procedures
Clearness of data structures, access authorization and processes (transparency)
design oriented to the purpose of the data analysis
support of decision making
46
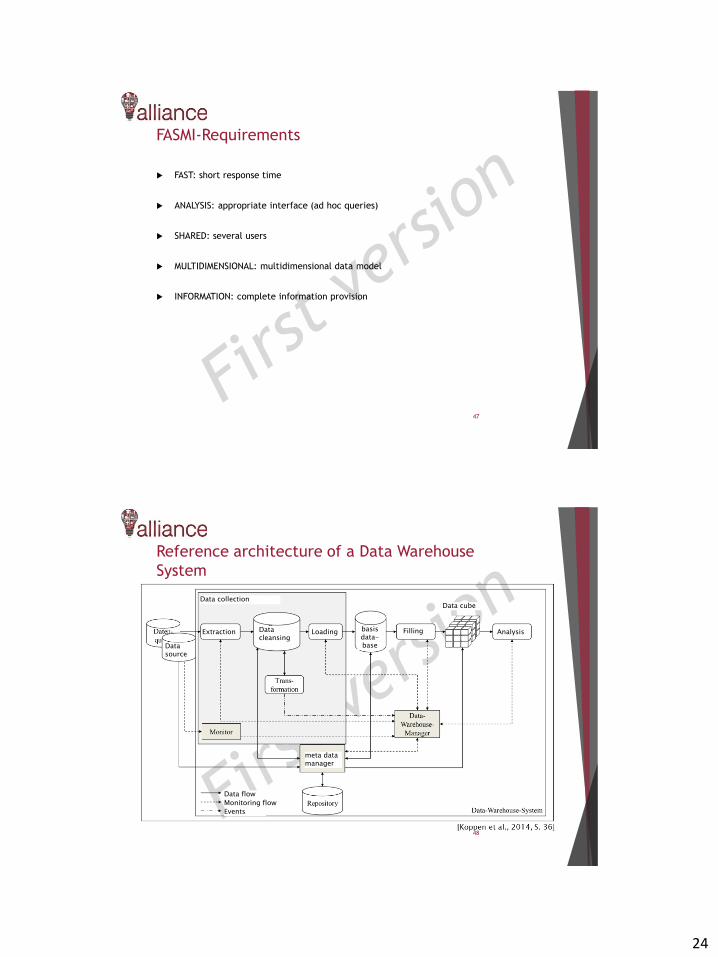
24
FASMI-Requirements
FAST: short response time
ANALYSIS: appropriate interface (ad hoc queries)
SHARED: several users
MULTIDIMENSIONAL: multidimensional data model
INFORMATION: complete information provision
47
Reference architecture of a Data Warehouse
System
48
Data source
Extraction
meta data manager
Loading basis data-base
Data cube
AnalysisFillingData cleansing
Data flow
Monitoring flow
Events
Data collection
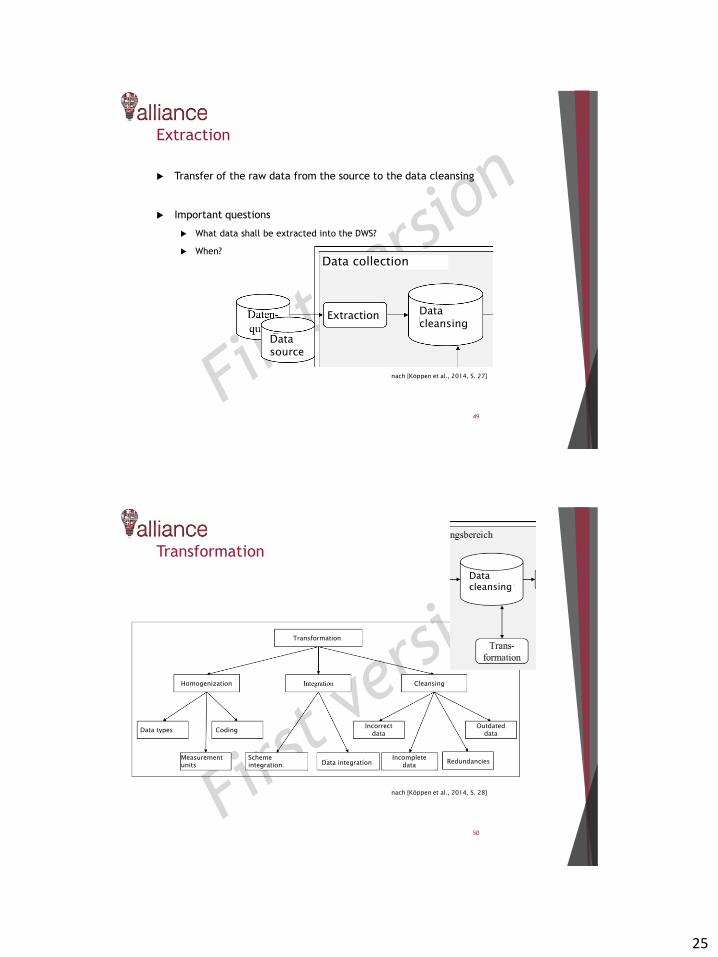
25
Extraction
Transfer of the raw data from the source to the data cleansing
Important questions
What data shall be extracted into the DWS?
When?
49
Datasource
Extraction Datacleansing
Data collection
nach [Köppen et al., 2014, S. 27]
Transformation
50
nach [Köppen et al., 2014, S. 28]
Homogenization
Data types Coding
Measurement units Data integration
Scheme integration
Cleansing
Incorrect data
Outdated data
Incomplete data
Redundancies
Transformation
Data cleansing
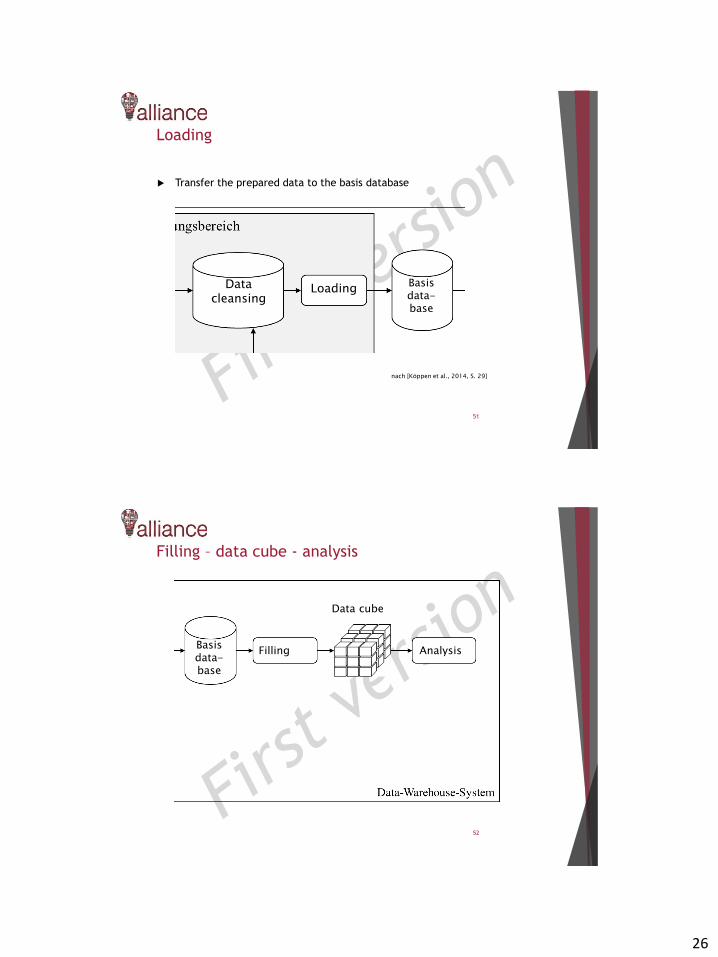
26
Loading
Transfer the prepared data to the basis database
51
nach [Köppen et al., 2014, S. 29]
Datacleansing
LoadingBasisdata-base
Filling – data cube - analysis
52
Basisdata-base
Filling
Data cube
Analysis
27
Case study
53
Tracking and Tracing of chemical goods in the EU-
project “ChemLog”
Method description:
Demonstration of the results of a research
project of several central European countries. In
this course the focus will be at the results of a
pilot test with several tracking and tracing
systems.
Bibliography• Chapman, Pete, J. Clinton, R. Kerber, T. Khabaza, T. Reinartz, C. Shearer und r. Wirth(2000). CRISP-DM 1.0 –
Step-by-step data mining guide. SPSS Inc., USA.
• Fleischmann, Bernhard (2018). Grundlagen: Begriff der Logistik, logistische Systeme und Prozesse – Begriffliche Grundlagen. In: Arnold, Dieter, H. Isermann, A. Kuhn, H. Tempelmeier and K. Furmans, Hrsg.: Handbuch Logistik, Kap. A 1.1, S. 3-12. Springer Verlag, Berlin, 3. Aufl.
• Kagermann, Henning, W. Wahlster und J. Helbig (2013). Deutschlands Zukunft als Produktionsstandort sichern –Umsetzungsempfehlungen für das zukunftsprojekt Industrie 4.0 – Abschlussbericht des Arbeitskreises Industrie 4.0. acatech – Deutsche Akademie der Technikwissenschaften e.V., Promotorengruppe Kommunikation der Forschungsunion Wirtschaft – Wissenschaft, Frankfurt am Main.
• Koeppen, Veit, G. Saake, K.-U. Sattler (2014). Data Warehouse Technologien. Mitp, Verlagsgruppe Hüthig JehleRehm GmbH, 2. Aufl.
• Partsch, Helmuth (2010). Requirements-Engineering systematisch. Springer-Verlag, Berlin Heidelberg, 2. Aufl.
• Schenk, Michael, A. Krampe, O. Poenicke, K. Richter, H. Seidel (2012).
• Informationslogistik. In: Krampe, Horst, H.-J. Lucke und M. Schenk, Hrsg.: Grundlagen der Logistik – Theorie und Prxis logistischer Systeme, Kap. 4, S. 97-129. HUSS-Verlag GmbH, München, 4. Aufl.
• Straube, Frank (2004). E-Logistik – Ganzheitliches Logistikmanagement. Springer-Verlag, Berlin Heidelberg.
• Turner, Vernon, D. Reinsel, J. F. Gantz und S. Minton (2014). White Paper: The Digital Universe of Opportunities: Rich Data and the Increasing Value oft he Internet of Things. International Data Corporation (IDC), Framingham, USA.
• Vieweg, Iris, C. Werner, K.-P. Wagner, T. Hüttle und D. Backin (2012). Einführung Wirtschaftsinformatik – IT-Grundwissen für Studium und Praxis. Gabler Verlag | Springer Fachmedien, Wiesbaden.
• Weber, Rainer (2012). Technologie von Unternehmenssoftware. Springer-Verlag, Berlin Heidelberg.
54

1
This project has received funding from the European
Union’s Horizon 2020 research and innovation programme
under grant agreement No 692426
Design of passenger
transport interchanges
University of Thessaly, Greece
Content
2
• Background
• Basic concepts
• Interchange zones
• Users
• Access/egress
• Transport and transfer
• Understanding the interchange
• Facilities and retailing
• Safety and security
• Accessibility
• Comfort
• Facilities at different types of interchanges
• Case studies
• Suggested literature
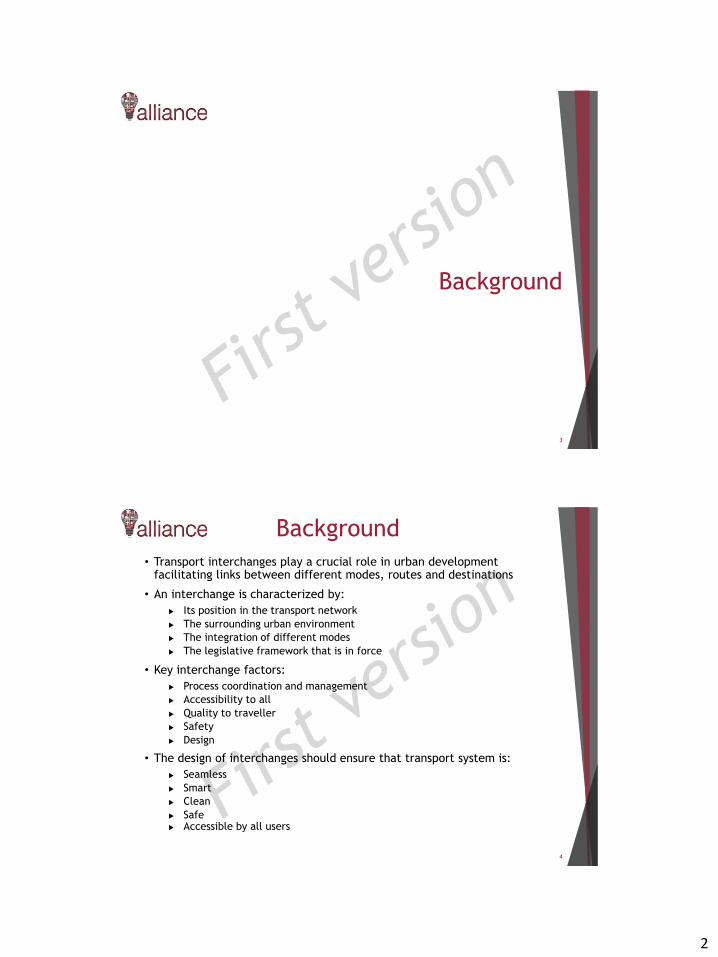
2
Background
3
Background
4
• Transport interchanges play a crucial role in urban developmentfacilitating links between different modes, routes and destinations
• An interchange is characterized by:
Its position in the transport network
The surrounding urban environment
The integration of different modes
The legislative framework that is in force
• Key interchange factors:
Process coordination and management
Accessibility to all
Quality to traveller
Safety
Design
• The design of interchanges should ensure that transport system is:
Seamless
Smart
Clean
Safe Accessible by all users
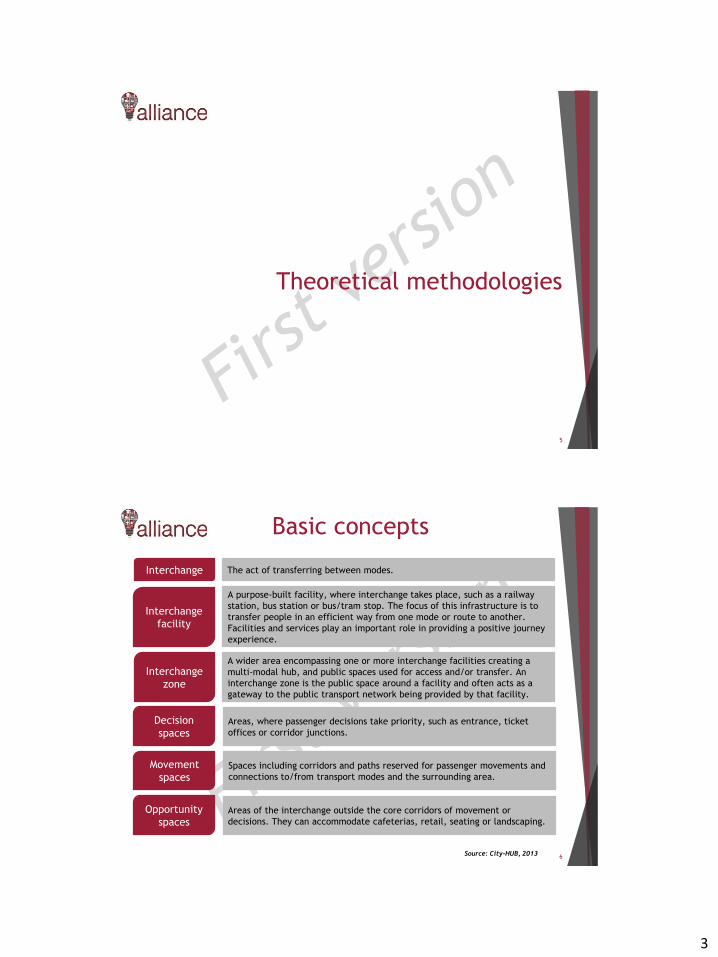
3
Theoretical methodologies
5
Basic concepts
6
Interchange The act of transferring between modes.
Interchange
facility
Interchange
zone
Decision
spaces
A purpose-built facility, where interchange takes place, such as a railway
station, bus station or bus/tram stop. The focus of this infrastructure is to
transfer people in an efficient way from one mode or route to another.
Facilities and services play an important role in providing a positive journey
experience.
A wider area encompassing one or more interchange facilities creating a
multi-modal hub, and public spaces used for access and/or transfer. An
interchange zone is the public space around a facility and often acts as a
gateway to the public transport network being provided by that facility.
Areas, where passenger decisions take priority, such as entrance, ticket
offices or corridor junctions.
Movement
spaces Spaces including corridors and paths reserved for passenger movements and
connections to/from transport modes and the surrounding area.
Opportunity
spacesAreas of the interchange outside the core corridors of movement or
decisions. They can accommodate cafeterias, retail, seating or landscaping.
Source: City-HUB, 2013

4
7
Interchange zones (1/2)
Source: CITY-HUBs, 2015
Interchange zones (2/2)
8
• Access/egress zone:
Different types of users arriving at and leaving from the interchange
Safe and efficient movement in and out of the interchange should be
provided
• Transport/transfer zone:
Users waiting for transport modes within the interchange
Waiting rooms, up-to-date travel information and help points should
be available
• Facilities/retail zone:
Users having more time available to spend
Shops, food outlets, toilets, seating areas, ticketing facilities and
real-time information should be available
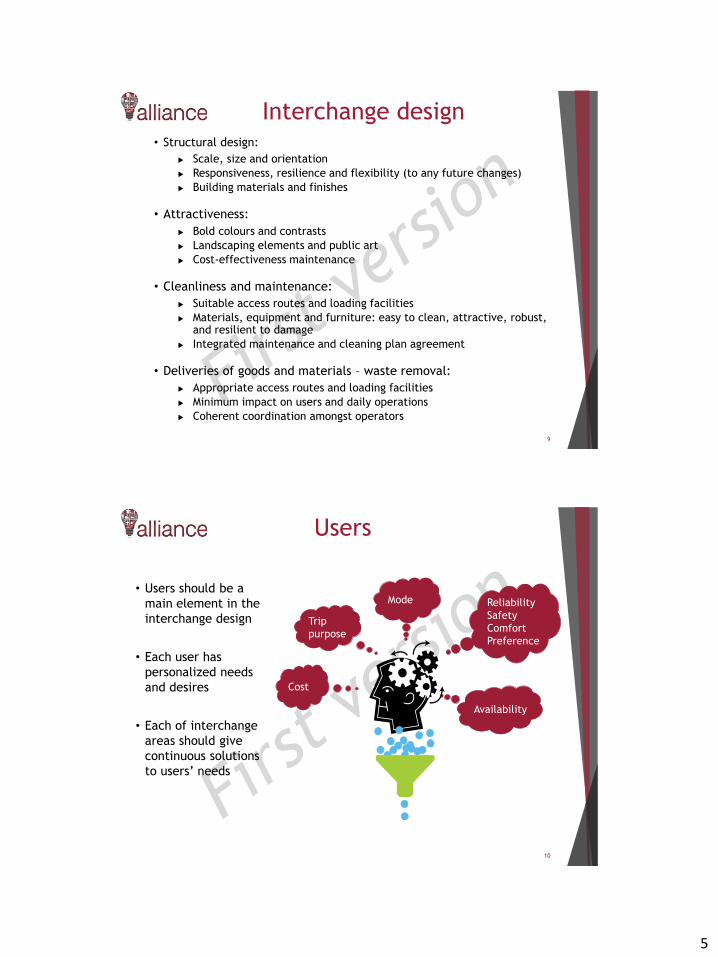
5
Interchange design
9
• Structural design:
Scale, size and orientation
Responsiveness, resilience and flexibility (to any future changes)
Building materials and finishes
• Attractiveness:
Bold colours and contrasts
Landscaping elements and public art
Cost-effectiveness maintenance
• Cleanliness and maintenance:
Suitable access routes and loading facilities
Materials, equipment and furniture: easy to clean, attractive, robust,and resilient to damage
Integrated maintenance and cleaning plan agreement
• Deliveries of goods and materials – waste removal:
Appropriate access routes and loading facilities
Minimum impact on users and daily operations
Coherent coordination amongst operators
Users
10
• Users should be a
main element in the
interchange design
• Each user has
personalized needs
and desires
• Each of interchange
areas should give
continuous solutions
to users’ needs
Availability
Mode
Cost
Reliability
Safety
Comfort
Preference
Trip
purpose
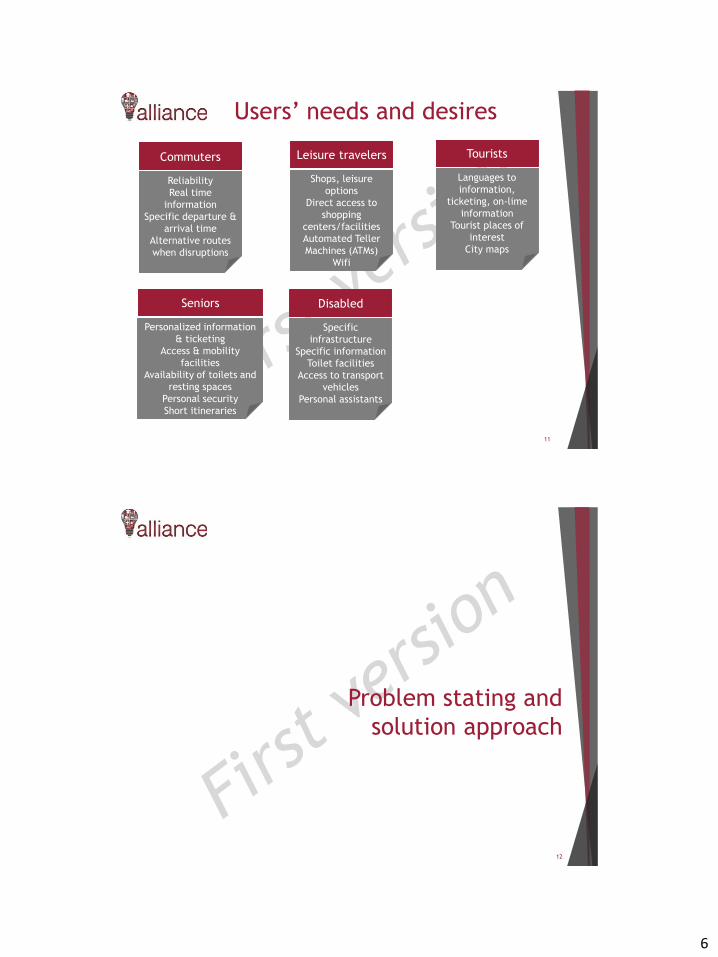
6
Users’ needs and desires
11
Commuters Leisure travelers
Shops, leisure
options
Direct access to
shopping
centers/facilities
Automated Teller
Machines (ATMs)
Wifi
Tourists
Languages to
information,
ticketing, on-lime
information
Tourist places of
interest
City maps
Commuters
Reliability
Real time
information
Specific departure &
arrival time
Alternative routes
when disruptions
Seniors
Personalized information
& ticketing
Access & mobility
facilities
Availability of toilets and
resting spaces
Personal security
Short itineraries
Disabled
Specific
infrastructure
Specific information
Toilet facilities
Access to transport
vehicles
Personal assistants
Problem stating and
solution approach
12
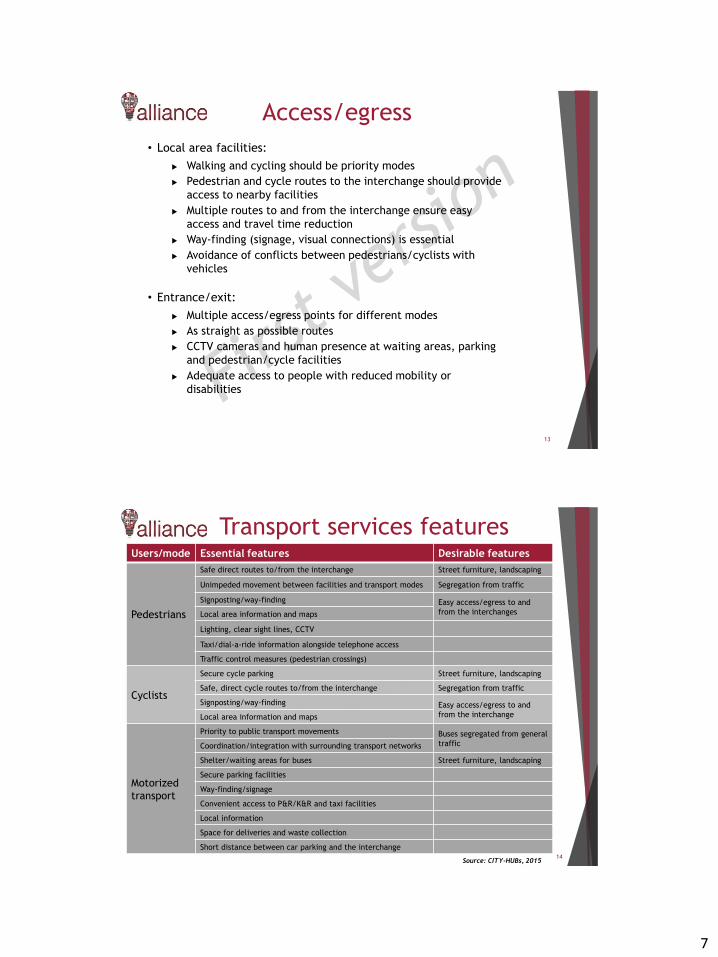
7
Access/egress
13
• Local area facilities:
Walking and cycling should be priority modes
Pedestrian and cycle routes to the interchange should provide
access to nearby facilities
Multiple routes to and from the interchange ensure easy
access and travel time reduction
Way-finding (signage, visual connections) is essential
Avoidance of conflicts between pedestrians/cyclists with
vehicles
• Entrance/exit:
Multiple access/egress points for different modes
As straight as possible routes
CCTV cameras and human presence at waiting areas, parking
and pedestrian/cycle facilities
Adequate access to people with reduced mobility or
disabilities
14
Transport services featuresUsers/mode Essential features Desirable features
Pedestrians
Safe direct routes to/from the interchange Street furniture, landscaping
Unimpeded movement between facilities and transport modes Segregation from traffic
Signposting/way-finding Easy access/egress to and
from the interchanges Local area information and maps
Lighting, clear sight lines, CCTV
Taxi/dial-a-ride information alongside telephone access
Traffic control measures (pedestrian crossings)
Cyclists
Secure cycle parking Street furniture, landscaping
Safe, direct cycle routes to/from the interchange Segregation from traffic
Signposting/way-finding Easy access/egress to and
from the interchange Local area information and maps
Motorized
transport
Priority to public transport movements Buses segregated from general
traffic Coordination/integration with surrounding transport networks
Shelter/waiting areas for buses Street furniture, landscaping
Secure parking facilities
Way-finding/signage
Convenient access to P&R/K&R and taxi facilities
Local information
Space for deliveries and waste collection
Short distance between car parking and the interchange
Source: CITY-HUBs, 2015
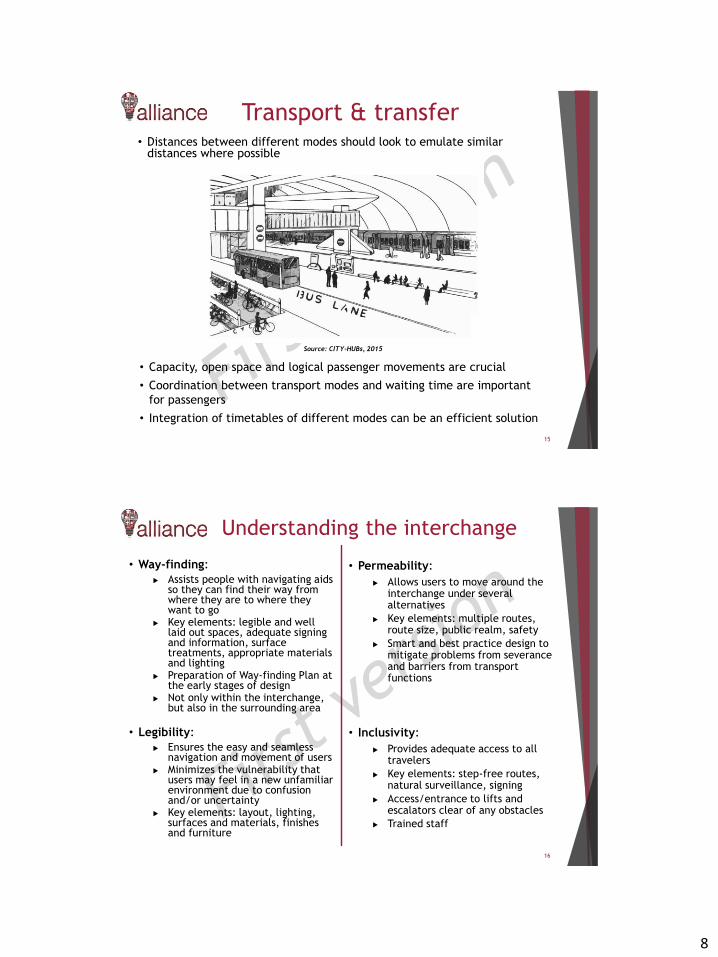
8
Transport & transfer
15
• Distances between different modes should look to emulate similardistances where possible
• Capacity, open space and logical passenger movements are crucial
• Coordination between transport modes and waiting time are important
for passengers
• Integration of timetables of different modes can be an efficient solution
Source: CITY-HUBs, 2015
Understanding the interchange
16
• Way-finding:
Assists people with navigating aidsso they can find their way fromwhere they are to where theywant to go
Key elements: legible and welllaid out spaces, adequate signingand information, surfacetreatments, appropriate materialsand lighting
Preparation of Way-finding Plan atthe early stages of design
Not only within the interchange,but also in the surrounding area
• Legibility:
Ensures the easy and seamlessnavigation and movement of users
Minimizes the vulnerability thatusers may feel in a new unfamiliarenvironment due to confusionand/or uncertainty
Key elements: layout, lighting,surfaces and materials, finishesand furniture
• Permeability:
Allows users to move around theinterchange under severalalternatives
Key elements: multiple routes,route size, public realm, safety
Smart and best practice design tomitigate problems from severanceand barriers from transportfunctions
• Inclusivity:
Provides adequate access to alltravelers
Key elements: step-free routes,natural surveillance, signing
Access/entrance to lifts andescalators clear of any obstacles
Trained staff
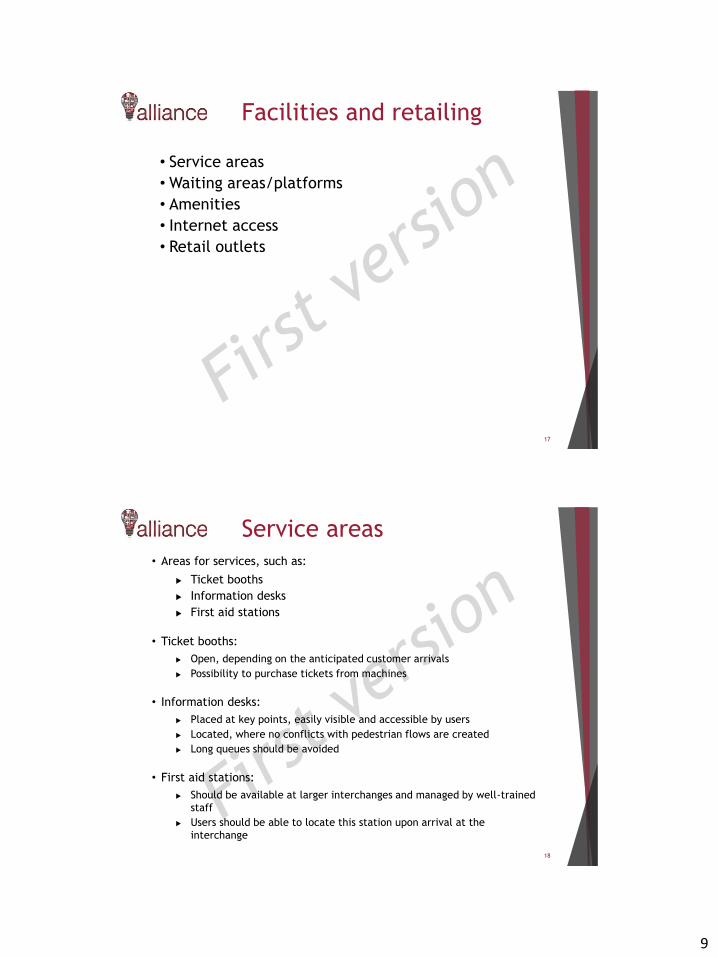
9
Facilities and retailing
17
• Service areas
• Waiting areas/platforms
• Amenities
• Internet access
• Retail outlets
Service areas
18
• Areas for services, such as:
Ticket booths
Information desks
First aid stations
• Ticket booths:
Open, depending on the anticipated customer arrivals
Possibility to purchase tickets from machines
• Information desks:
Placed at key points, easily visible and accessible by users
Located, where no conflicts with pedestrian flows are created
Long queues should be avoided
• First aid stations:
Should be available at larger interchanges and managed by well-trained
staff
Users should be able to locate this station upon arrival at the
interchange

10
Waiting areas/platforms
19
• Users need to feel comfortable and secure while waiting
• The interchange should provide comfortable seating and
areas for standing and leaning
• Waiting rooms should be well lit, heated and/or ventilated
• Passenger information should be provided on screens and
through audio announcements
• Passengers need to be protected from bad weather
• Continuous shelter should be provided throughout the
interchange and the transfer areas
• Restrooms should be available for all users and in convenient
locations
Amenities
20
Internet access• Allow waiting time to be
usefully spent:
Coffee shops
Restaurants
Entertainment
Play areas
Pharmacies
Tourist information desks
Bank branches
Automated Teller Machines
(ATMs)
Post boxes
• Enables travelers to use internet,browse, check their emails, etc.
• Useful at interchanges with highvolumes of commuters

11
Retail outlets
21
• When deciding which outlets to provide within an interchange, the
size, location and level of service need to be considered
• Retail services available nearby affect business opportunities for
shops in new interchanges
• Local demand should be considered when selecting the location of
shops
• Direct employment in the interchange affects the regeneration of
the surrounding area
• Retail outlets should be complementary to one another and
improve the attractiveness of the interchange
Example of retailing: Kamppi Interchange, Helsinki, Finland
The interchange is in a very central location in downtown Helsinki, combined
with a shopping centre with an area of approximately four hectares. A total of
170 businesses operate in the interchange shopping centre, including 106 stores,
35 restaurants and cafes, and 29 services such as beauty salons, gyms, banks and
laundry.
Safety & security
22
• The interchange must comply with regulations and provide
adequate precautions, in order to prevent any accidents
• Areas of conflict between pedestrians and vehicles should be
minimized
• Emergency exits should be clearly indicated
• Fully trained staff in emergency response
• Adequate levels of security: technical and human presence
Example of security: Birkenhead bus station, United Kingdom
The station was designed with passenger security foresight, and therefore much
of the station’s structure is made from large panels of clear, toughened glass,
providing clear sight lines to the surrounding area.
Examples of safety: Moncloa station, Spain / Kamppi interchange, Finland
In Moncloa station, bus bays ensure that passengers do not use areas the buses
operation.
In Kamppi interchange, doors open only when it is time for the buses to depart.
12
Accessibility
23
• Interchanges should provide effective access for people with reduced
mobility or disabilities
• This concern is also beneficial for the majority of travelers, including the
elderly, people with small children, etc.
• Step-free access between all parts of an interchange would be ideal
• The minimum possible number of levels should be achieved
• Free-step routes should not be isolated from the main passenger routes
• Information on step- and obstacle-free routes should be provided by
proper signing
• Lifts and escalators should be located close to movement spaces
• Staff should be available to assist all users
Example of accessibility: Köbánya-Kispest interchange, Hungary
In this interchange, signs and information are accessibly for people with visual
impairments: boarding buttons emit a lot frequency sound, which indicates that
the bus is ready to load passengers.
Comfort
24
• Even if comfort is subjective, it is significantly dependent of the
availability of facilities in an interchange and makes the time
user spends there more pleasant
• Issues related to comfort:
Space and seating arrangements
Temperature
Noise levels
Cleanliness
Lighting
Access to amenities
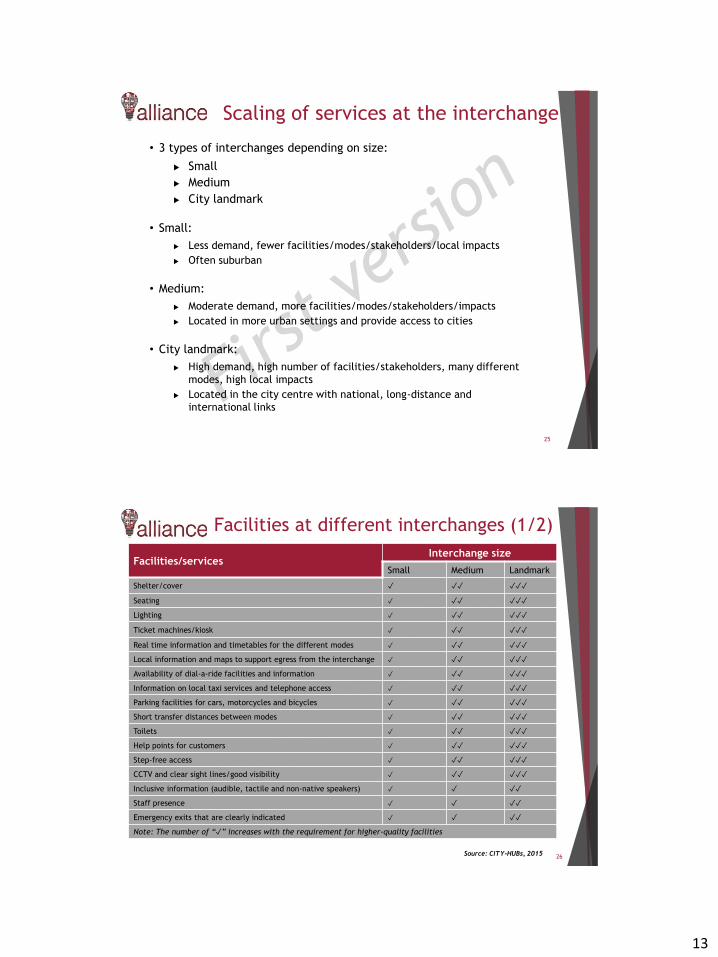
13
Scaling of services at the interchange
25
• 3 types of interchanges depending on size:
Small
Medium
City landmark
• Small:
Less demand, fewer facilities/modes/stakeholders/local impacts
Often suburban
• Medium:
Moderate demand, more facilities/modes/stakeholders/impacts
Located in more urban settings and provide access to cities
• City landmark:
High demand, high number of facilities/stakeholders, many different
modes, high local impacts
Located in the city centre with national, long-distance and
international links
26
Facilities/servicesInterchange size
Small Medium Landmark
Shelter/cover ✓ ✓✓ ✓✓✓
Seating ✓ ✓✓ ✓✓✓
Lighting ✓ ✓✓ ✓✓✓
Ticket machines/kiosk ✓ ✓✓ ✓✓✓
Real time information and timetables for the different modes ✓ ✓✓ ✓✓✓
Local information and maps to support egress from the interchange ✓ ✓✓ ✓✓✓
Availability of dial-a-ride facilities and information ✓ ✓✓ ✓✓✓
Information on local taxi services and telephone access ✓ ✓✓ ✓✓✓
Parking facilities for cars, motorcycles and bicycles ✓ ✓✓ ✓✓✓
Short transfer distances between modes ✓ ✓✓ ✓✓✓
Toilets ✓ ✓✓ ✓✓✓
Help points for customers ✓ ✓✓ ✓✓✓
Step-free access ✓ ✓✓ ✓✓✓
CCTV and clear sight lines/good visibility ✓ ✓✓ ✓✓✓
Inclusive information (audible, tactile and non-native speakers) ✓ ✓ ✓✓
Staff presence ✓ ✓ ✓✓
Emergency exits that are clearly indicated ✓ ✓ ✓✓
Note: The number of “✓” increases with the requirement for higher-quality facilities
Facilities at different interchanges (1/2)
Source: CITY-HUBs, 2015
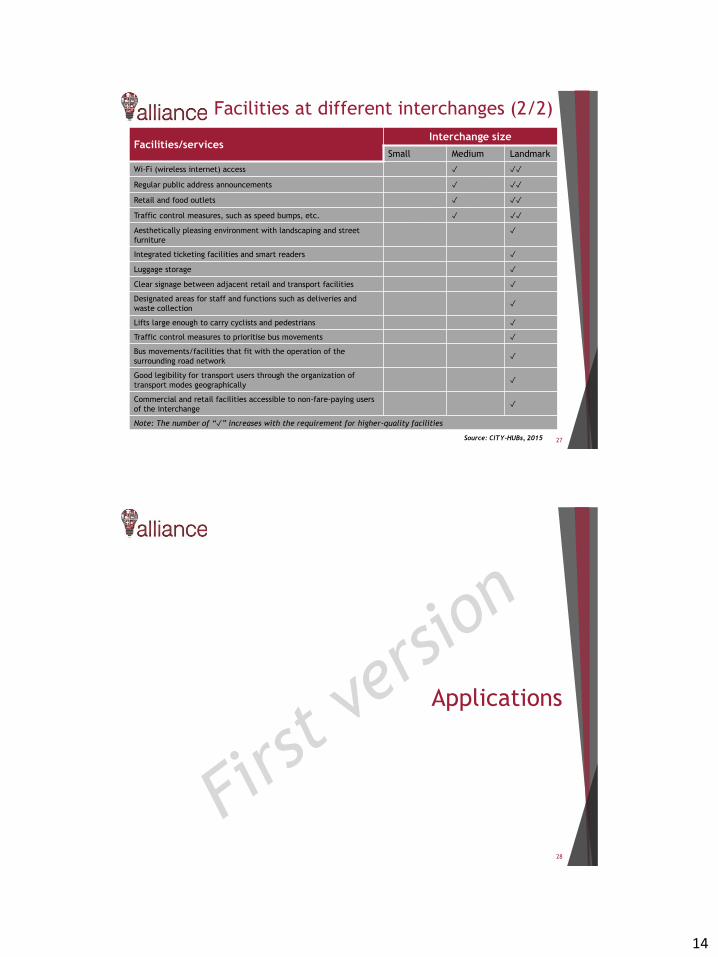
14
27
Facilities at different interchanges (2/2)
Facilities/servicesInterchange size
Small Medium Landmark
Wi-Fi (wireless internet) access ✓ ✓✓
Regular public address announcements ✓ ✓✓
Retail and food outlets ✓ ✓✓
Traffic control measures, such as speed bumps, etc. ✓ ✓✓
Aesthetically pleasing environment with landscaping and street
furniture
✓
Integrated ticketing facilities and smart readers ✓
Luggage storage ✓
Clear signage between adjacent retail and transport facilities ✓
Designated areas for staff and functions such as deliveries and
waste collection ✓
Lifts large enough to carry cyclists and pedestrians ✓
Traffic control measures to prioritise bus movements ✓
Bus movements/facilities that fit with the operation of the
surrounding road network ✓
Good legibility for transport users through the organization of
transport modes geographically ✓
Commercial and retail facilities accessible to non-fare-paying users
of the interchange ✓
Note: The number of “✓” increases with the requirement for higher-quality facilities
Source: CITY-HUBs, 2015
Applications
28
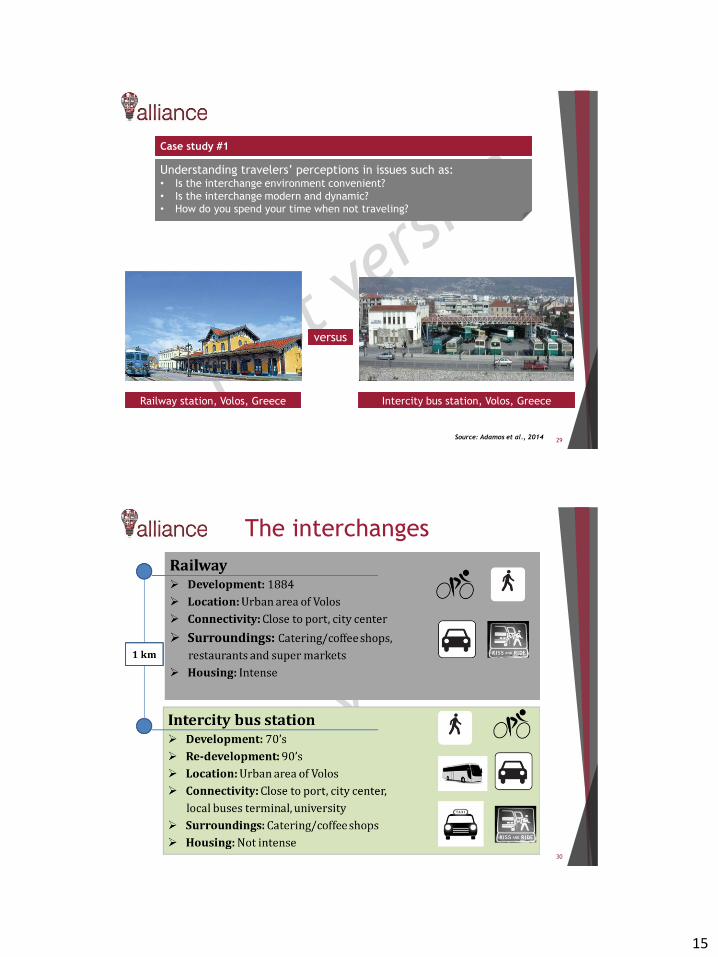
15
29
Case study #1
Understanding travelers’ perceptions in issues such as: • Is the interchange environment convenient?
• Is the interchange modern and dynamic?
• How do you spend your time when not traveling?
Railway station, Volos, Greece Intercity bus station, Volos, Greece
versus
Source: Adamos et al., 2014
30
The interchanges
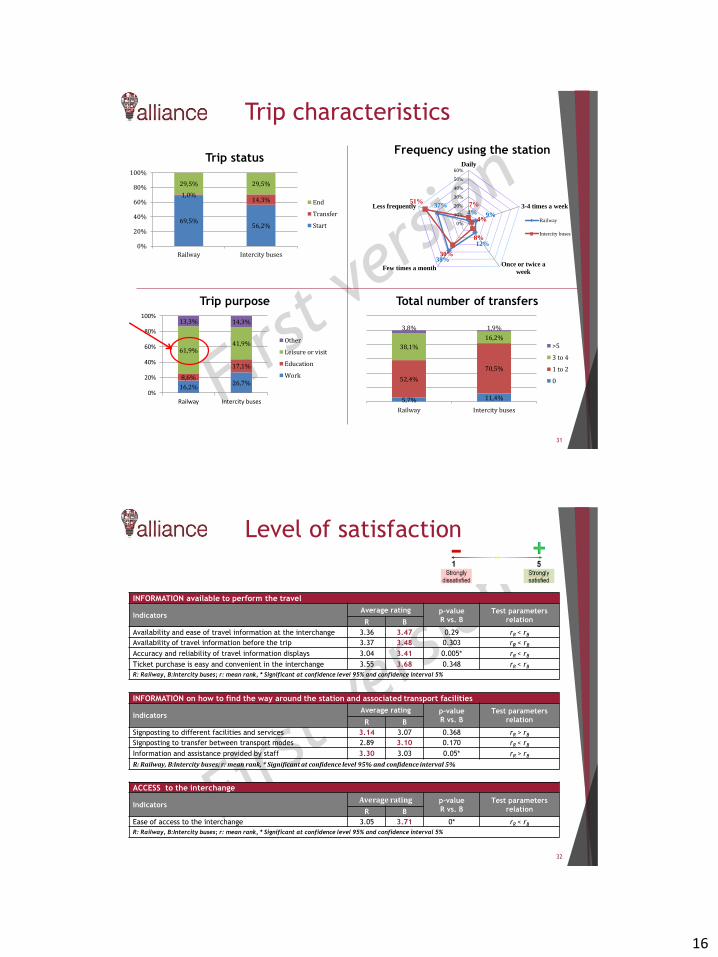
16
31
Trip characteristics
69,5%56,2%
1,0%14,3%
29,5% 29,5%
0%
20%
40%
60%
80%
100%
Railway Intercity buses
Trip status
End
Transfer
Start
16,2%26,7%
8,6%
17,1%
61,9%41,9%
13,3% 14,3%
0%
20%
40%
60%
80%
100%
Railway Intercity buses
Trip purpose
Other
Leisure or visit
Education
Work
5,7% 11,4%
52,4%
70,5%
38,1%
16,2%
3,8% 1,9%
Railway Intercity buses
Total number of transfers
>5
3 to 4
1 to 2
0
4% 9%
12%
38%
37% 7%
4%
8%
30%
51%
0%
10%
20%
30%
40%
50%
60%Daily
3-4 times a week
Once or twice a
weekFew times a month
Less frequently
Railway
Intercity buses
Frequency using the station
32
Level of satisfaction
INFORMATION available to perform the travel
IndicatorsAverage rating p-value
R vs. B
Test parameters
relation R B
Availability and ease of travel information at the interchange 3.36 3.47 0.29 rR < rB
Availability of travel information before the trip 3.37 3.48 0.303 rR < rB
Accuracy and reliability of travel information displays 3.04 3.41 0.005* rR < rB
Ticket purchase is easy and convenient in the interchange 3.55 3.68 0.348 rR < rB
R: Railway, B:Intercity buses; r: mean rank, * Significant at confidence level 95% and confidence interval 5%
INFORMATION on how to find the way around the station and associated transport facilities
IndicatorsAverage rating p-value
R vs. B
Test parameters
relation R B
Signposting to different facilities and services 3.14 3.07 0.368 rR > rB
Signposting to transfer between transport modes 2.89 3.10 0.170 rR < rB
Information and assistance provided by staff 3.30 3.03 0.05* rR > rB
R: Railway, B:Intercity buses; r: mean rank, * Significant at confidence level 95% and confidence interval 5%
ACCESS to the interchange
IndicatorsAverage rating p-value
R vs. B
Test parameters
relation R B
Ease of access to the interchange 3.05 3.71 0* rR < rB
R: Railway, B:Intercity buses; r: mean rank, * Significant at confidence level 95% and confidence interval 5%
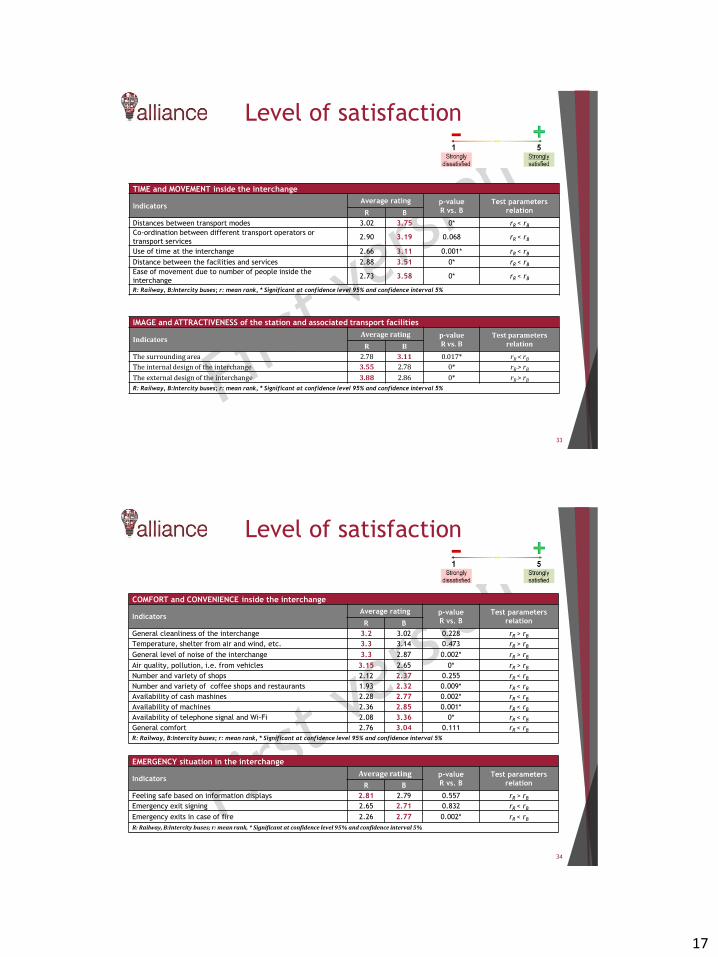
17
33
Level of satisfaction
TIME and MOVEMENT inside the interchange
IndicatorsAverage rating p-value
R vs. B
Test parameters
relation R B
Distances between transport modes 3.02 3.75 0* rR < rB
Co-ordination between different transport operators or
transport services 2.90 3.19 0.068 rR < rB
Use of time at the interchange 2.66 3.11 0.001* rR < rB
Distance between the facilities and services 2.88 3.51 0* rR < rB
Ease of movement due to number of people inside the
interchange 2.73 3.58 0* rR < rB
R: Railway, B:Intercity buses; r: mean rank, * Significant at confidence level 95% and confidence interval 5%
IMAGE and ATTRACTIVENESS of the station and associated transport facilities
IndicatorsAverage rating p-value
R vs. BTest parameters
relation R B
The surrounding area 2.78 3.11 0.017* rR < rB
The internal design of the interchange 3.55 2.78 0* rR > rB
The external design of the interchange 3.88 2.86 0* rR > rB
R: Railway, B:Intercity buses; r: mean rank, * Significant at confidence level 95% and confidence interval 5%
34
Level of satisfaction
COMFORT and CONVENIENCE inside the interchange
IndicatorsAverage rating p-value
R vs. B
Test parameters
relation R B
General cleanliness of the interchange 3.2 3.02 0.228 rR > rB
Temperature, shelter from air and wind, etc. 3.3 3.14 0.473 rR > rB
General level of noise of the interchange 3.3 2.87 0.002* rR > rB
Air quality, pollution, i.e. from vehicles 3.15 2.65 0* rR > rB
Number and variety of shops 2.12 2.37 0.255 rR < rB
Number and variety of coffee shops and restaurants 1.93 2.32 0.009* rR < rB
Availability of cash mashines 2.28 2.77 0.002* rR < rB
Availability of machines 2.36 2.85 0.001* rR < rB
Availability of telephone signal and Wi-Fi 2.08 3.36 0* rR < rB
General comfort 2.76 3.04 0.111 rR < rB
R: Railway, B:Intercity buses; r: mean rank, * Significant at confidence level 95% and confidence interval 5%
EMERGENCY situation in the interchange
IndicatorsAverage rating p-value
R vs. B
Test parameters
relation R B
Feeling safe based on information displays 2.81 2.79 0.557 rR > rB
Emergency exit signing 2.65 2.71 0.832 rR < rB
Emergency exits in case of fire 2.26 2.77 0.002* rR < rB
R: Railway, B:Intercity buses; r: mean rank, * Significant at confidence level 95% and confidence interval 5%
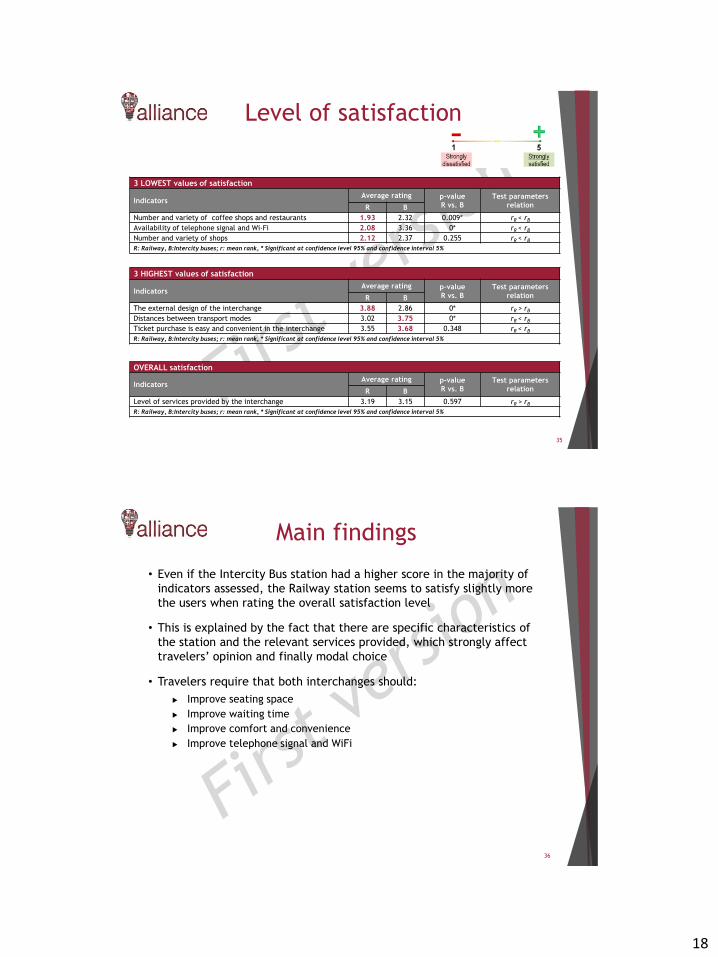
18
35
Level of satisfaction
OVERALL satisfaction
IndicatorsAverage rating p-value
R vs. B
Test parameters
relation R B
Level of services provided by the interchange 3.19 3.15 0.597 rR > rB
R: Railway, B:Intercity buses; r: mean rank, * Significant at confidence level 95% and confidence interval 5%
3 LOWEST values of satisfaction
IndicatorsAverage rating p-value
R vs. B
Test parameters
relation R B
Number and variety of coffee shops and restaurants 1.93 2.32 0.009* rR < rB
Availability of telephone signal and Wi-Fi 2.08 3.36 0* rR < rB
Number and variety of shops 2.12 2.37 0.255 rR < rB
R: Railway, B:Intercity buses; r: mean rank, * Significant at confidence level 95% and confidence interval 5%
3 HIGHEST values of satisfaction
IndicatorsAverage rating p-value
R vs. B
Test parameters
relation R B
The external design of the interchange 3.88 2.86 0* rR > rB
Distances between transport modes 3.02 3.75 0* rR < rB
Ticket purchase is easy and convenient in the interchange 3.55 3.68 0.348 rR < rB
R: Railway, B:Intercity buses; r: mean rank, * Significant at confidence level 95% and confidence interval 5%
Main findings
36
• Even if the Intercity Bus station had a higher score in the majority of
indicators assessed, the Railway station seems to satisfy slightly more
the users when rating the overall satisfaction level
• This is explained by the fact that there are specific characteristics of
the station and the relevant services provided, which strongly affect
travelers’ opinion and finally modal choice
• Travelers require that both interchanges should:
Improve seating space
Improve waiting time
Improve comfort and convenience
Improve telephone signal and WiFi
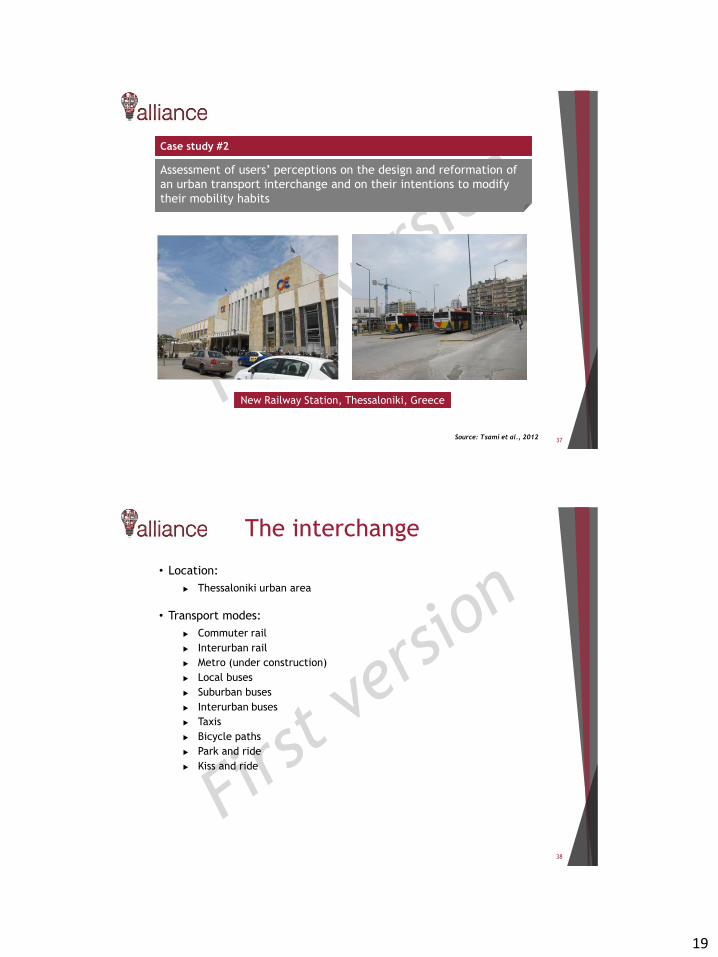
19
37
Case study #2
Assessment of users’ perceptions on the design and reformation of
an urban transport interchange and on their intentions to modify
their mobility habits
New Railway Station, Thessaloniki, Greece
Source: Tsami et al., 2012
38
The interchange
• Location:
Thessaloniki urban area
• Transport modes:
Commuter rail
Interurban rail
Metro (under construction)
Local buses
Suburban buses
Interurban buses
Taxis
Bicycle paths
Park and ride
Kiss and ride
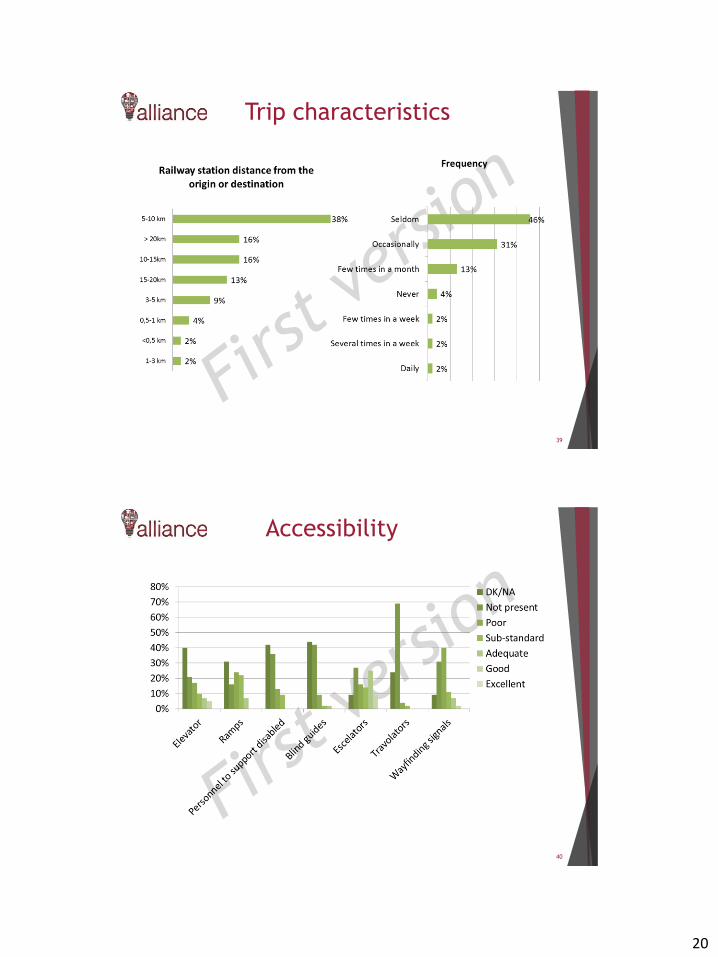
20
39
Trip characteristics
40
Accessibility

21
41
Interchange design
42
Station connectivity
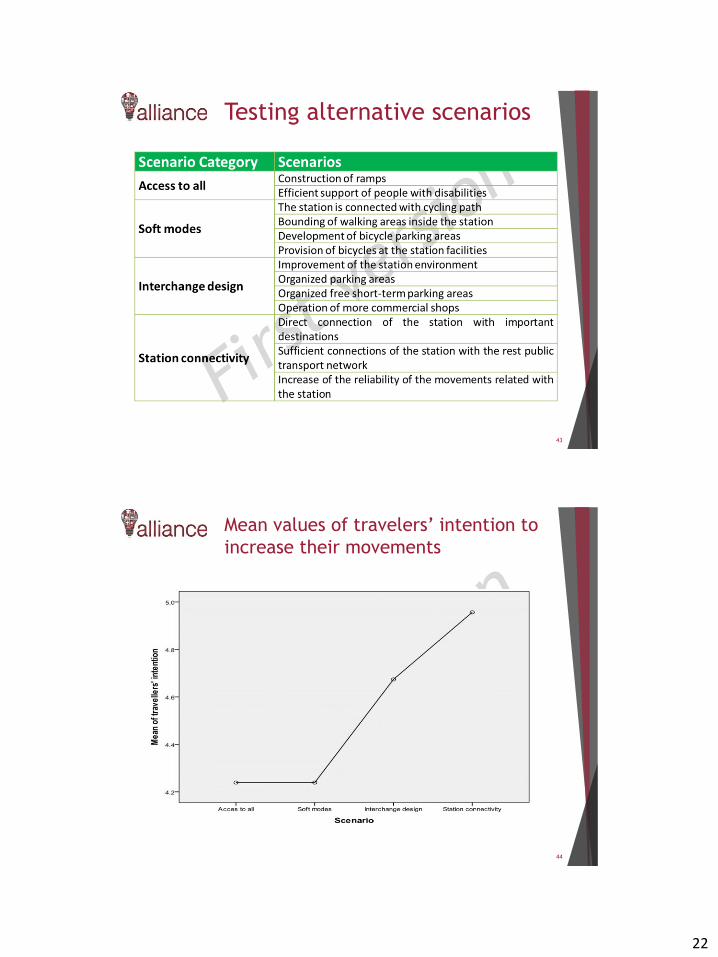
22
43
Testing alternative scenarios
44
Mean values of travelers’ intention to
increase their movements
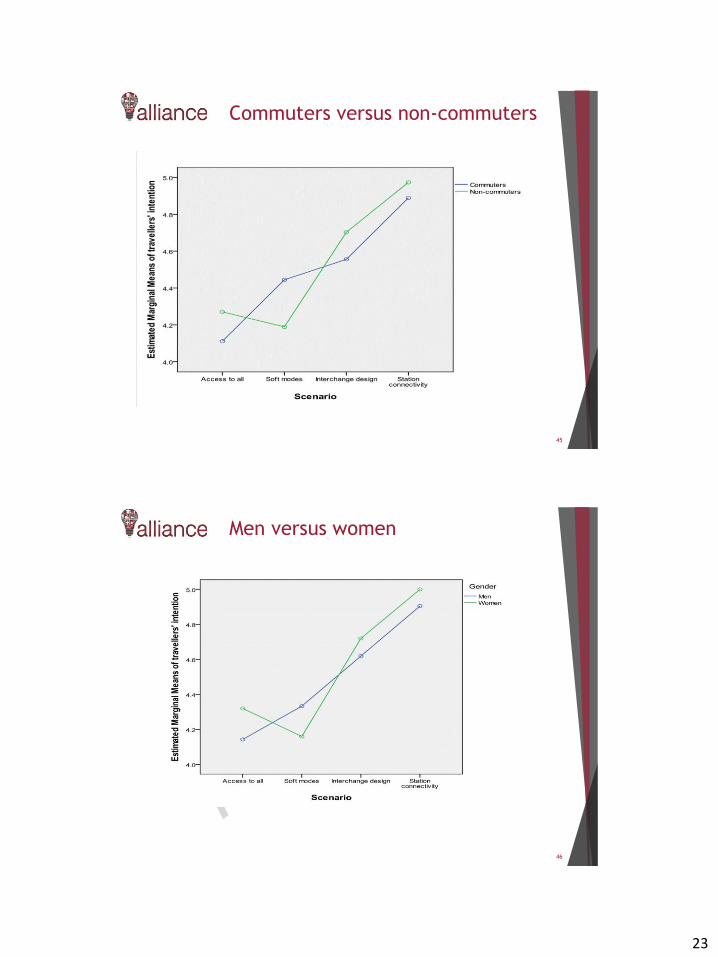
23
45
Commuters versus non-commuters
46
Men versus women

24
47
Younger versus older users
Main findings
48
• Most of the respondents addressed the absence of appropriate
infrastructure for walking and cycling, and highlighted the need
for the reformation of the station
• Station connectivity scenarios are the most likely to modify users
mobility habits
• Women, compared to men, are more intended to change their
mobility behavior under the scenarios testing “access to all”,
“interchange design” and “station connectivity”
25
Guidance to further
knowledge acquisition
49
Suggested literature
50
• Auckland Transport (2013) Public Transport Interchange Design Guidelines, Auckland
Transport, Auckland..
• CITY-HUBs: Sustainable and Efficient Interchange Stations. Taylor and Francis Group,
2015.
• ERA (Unknown) Rail Service Quality Standards and Reports Publication Procedure and
Contents. Available at: http://www.era.europa.eu/Document-
Register/Documents/Minimum%20content%20of%20rail%20service%20quality%20reports.%2
0Guidelines.pdf.
• FDOT, 2007. Quality/Level of Service Handbook, Florida Department of Transportation
(http://www.dot.state.fl.us/planning/systems/sm/los/).
• Green, C. and Hall, G. (2009) Better Rail Stations, Department for Transport.
• GUIDE (2000) Terzis, G., Last, An. GUIDE – Urban Interchanges –A Good Practice Guide –
Final Report prepared for EC DG VII. April, 2000.
• Ministry of Transport, NSW (2008) Guidelines for the Development of Public Transport
Interchanges, MoT, NSW.
• Network Rail (2011) Guide to Station Planning and Design, Issue 1, Network Rail, London.
• Sintropher Project (2011) Good Practice in Transport Interchanges, Sinotropher Project,
UCL.
• Translink (2011) Transit Passenger Facility Design Guidelines, Translink, Burnaby.
• Transport for London (2009) Interchange Best Practice Guidelines, Transport for London,
London.

26
References
51
• Adamos, G., Nathanail, E. & Tsami, M., 2014. Designing sustainable urban transport
interchanges. 2nd Conference on Sustainable Urban Mobility, 05-06 May 2014, Volos,
Greece.
• City-HUB, 2013. City-HUB Deliverable D3.2. Guide for efficient and smart design.
• CITY-HUBs: Sustainable and Efficient Interchange Stations. Taylor and Francis Group,
2015.
• Tsami, M., Adamos, G. & Nathanail, E., 2013. Sustainable development design for the
transformation of the Thessaloniki’s railway station into a city hub. European Transport
Conference (ETC) 2013, Frankfurt, Germany, 30 September – 2 October 2013.
1
This project has received funding from the European
Union’s Horizon 2020 research and innovation programme
under grant agreement No 692426
Design of freight
transport interchanges
University of Thessaly (UTh), Greece
Content
2
• Introduction
• Elements of Freight Transport Interchanges
• European legal framework - guidelines
• Categories of freight transport interchanges
City terminals
Freight villages
Industrial and logistic parks
Special logistic areas
• Cases studies
Port of Rotterdam
Manchester Airport – World Freight Terminal
• Suggested literature
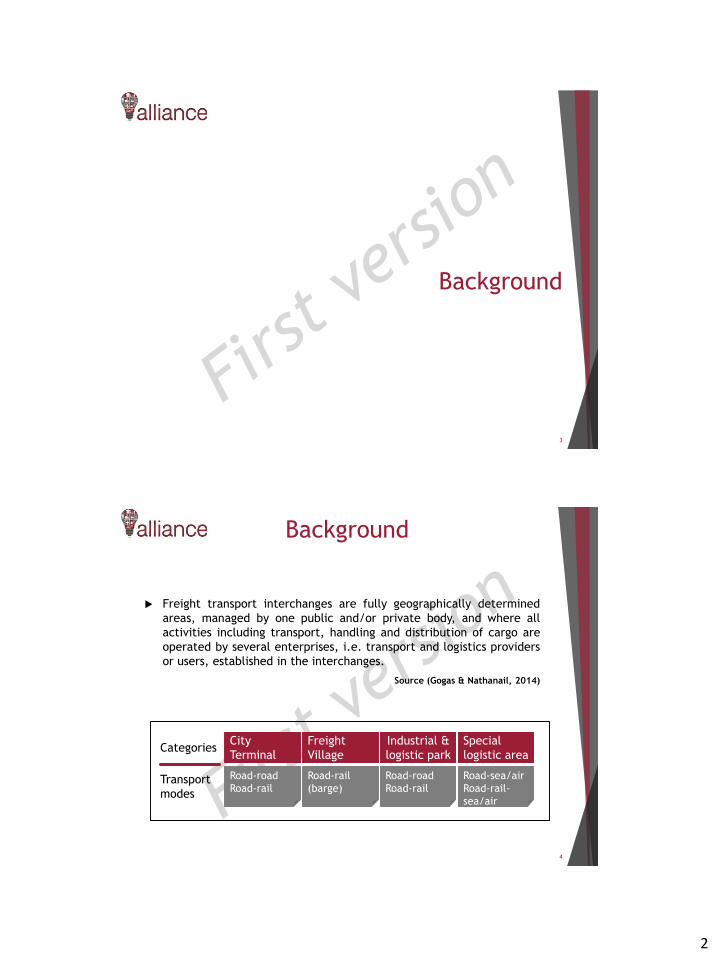
2
Background
3
Background
4
Freight transport interchanges are fully geographically determined
areas, managed by one public and/or private body, and where all
activities including transport, handling and distribution of cargo are
operated by several enterprises, i.e. transport and logistics providers
or users, established in the interchanges.
Source (Gogas & Nathanail, 2014)
Industrial &
logistic park
Road-road
Road-rail
Freight
Village
Road-rail
(barge)
Special
logistic area
Road-sea/air
Road-rail-
sea/air
City
Terminal
Road-road
Road-rail
Categories
Transport
modes
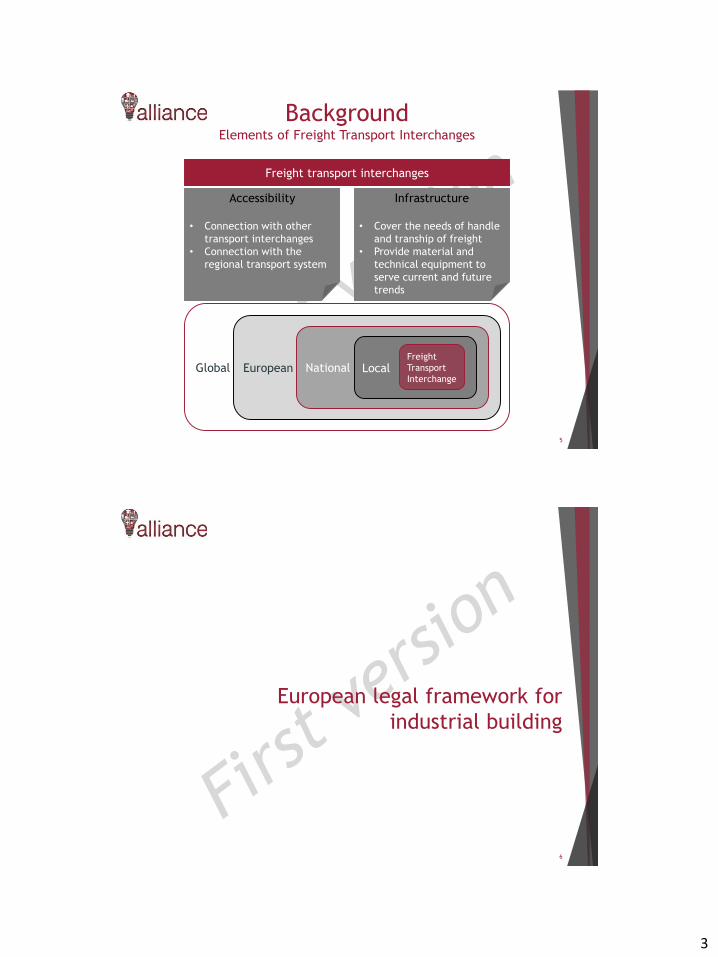
3
BackgroundElements of Freight Transport Interchanges
5
Freight transport interchanges
Accessibility
• Connection with other
transport interchanges
• Connection with the
regional transport system
Infrastructure
• Cover the needs of handle
and tranship of freight
• Provide material and
technical equipment to
serve current and future
trends
Global European National LocalFreight
Transport
Interchange
European legal framework for
industrial building
6
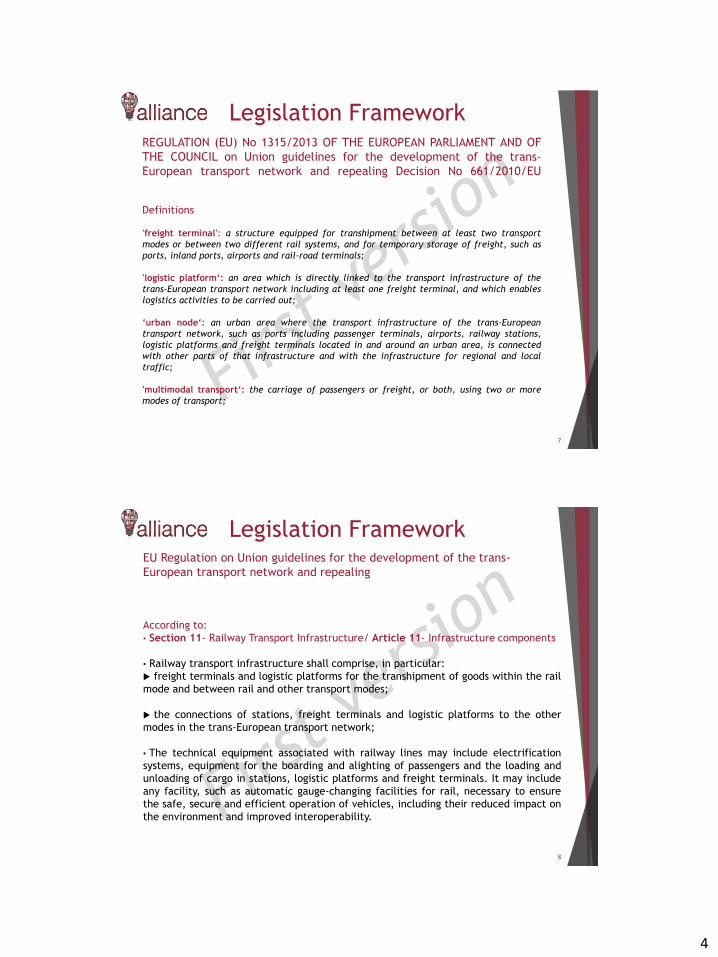
4
REGULATION (EU) No 1315/2013 OF THE EUROPEAN PARLIAMENT AND OF
THE COUNCIL on Union guidelines for the development of the trans-
European transport network and repealing Decision No 661/2010/EU
7
Definitions
'freight terminal': a structure equipped for transhipment between at least two transport
modes or between two different rail systems, and for temporary storage of freight, such as
ports, inland ports, airports and rail-road terminals;
'logistic platform‘: an area which is directly linked to the transport infrastructure of the
trans-European transport network including at least one freight terminal, and which enables
logistics activities to be carried out;
‘urban node‘: an urban area where the transport infrastructure of the trans-European
transport network, such as ports including passenger terminals, airports, railway stations,
logistic platforms and freight terminals located in and around an urban area, is connected
with other parts of that infrastructure and with the infrastructure for regional and local
traffic;
'multimodal transport‘: the carriage of passengers or freight, or both, using two or more
modes of transport;
Legislation Framework
8
EU Regulation on Union guidelines for the development of the trans-
European transport network and repealing
According to:
• Section 11- Railway Transport Infrastructure/ Article 11- Infrastructure components
• Railway transport infrastructure shall comprise, in particular:
freight terminals and logistic platforms for the transhipment of goods within the rail
mode and between rail and other transport modes;
the connections of stations, freight terminals and logistic platforms to the other
modes in the trans-European transport network;
• The technical equipment associated with railway lines may include electrification
systems, equipment for the boarding and alighting of passengers and the loading and
unloading of cargo in stations, logistic platforms and freight terminals. It may include
any facility, such as automatic gauge-changing facilities for rail, necessary to ensure
the safe, secure and efficient operation of vehicles, including their reduced impact on
the environment and improved interoperability.
Legislation Framework
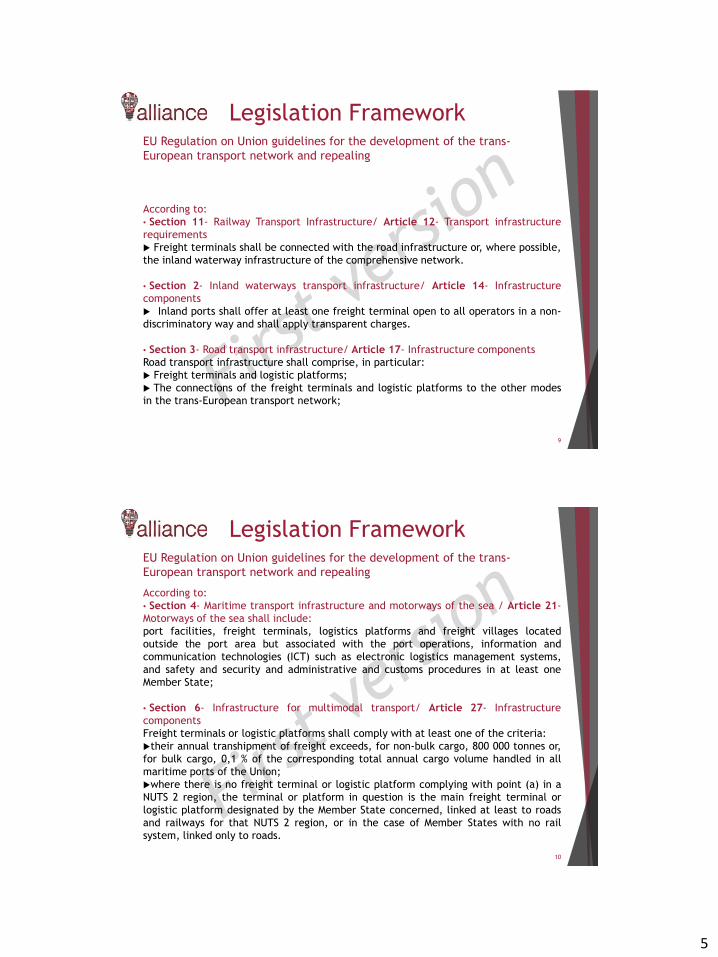
5
9
According to:
• Section 11- Railway Transport Infrastructure/ Article 12- Transport infrastructure
requirements
Freight terminals shall be connected with the road infrastructure or, where possible,
the inland waterway infrastructure of the comprehensive network.
• Section 2- Inland waterways transport infrastructure/ Article 14- Infrastructure
components
Inland ports shall offer at least one freight terminal open to all operators in a non-
discriminatory way and shall apply transparent charges.
• Section 3- Road transport infrastructure/ Article 17- Infrastructure components
Road transport infrastructure shall comprise, in particular:
Freight terminals and logistic platforms;
The connections of the freight terminals and logistic platforms to the other modes
in the trans-European transport network;
EU Regulation on Union guidelines for the development of the trans-
European transport network and repealing
Legislation Framework
10
According to:
• Section 4- Maritime transport infrastructure and motorways of the sea / Article 21-
Motorways of the sea shall include:
port facilities, freight terminals, logistics platforms and freight villages located
outside the port area but associated with the port operations, information and
communication technologies (ICT) such as electronic logistics management systems,
and safety and security and administrative and customs procedures in at least one
Member State;
• Section 6- Infrastructure for multimodal transport/ Article 27- Infrastructure
components
Freight terminals or logistic platforms shall comply with at least one of the criteria:
their annual transhipment of freight exceeds, for non-bulk cargo, 800 000 tonnes or,
for bulk cargo, 0,1 % of the corresponding total annual cargo volume handled in all
maritime ports of the Union;
where there is no freight terminal or logistic platform complying with point (a) in a
NUTS 2 region, the terminal or platform in question is the main freight terminal or
logistic platform designated by the Member State concerned, linked at least to roads
and railways for that NUTS 2 region, or in the case of Member States with no rail
system, linked only to roads.
EU Regulation on Union guidelines for the development of the trans-
European transport network and repealing
Legislation Framework
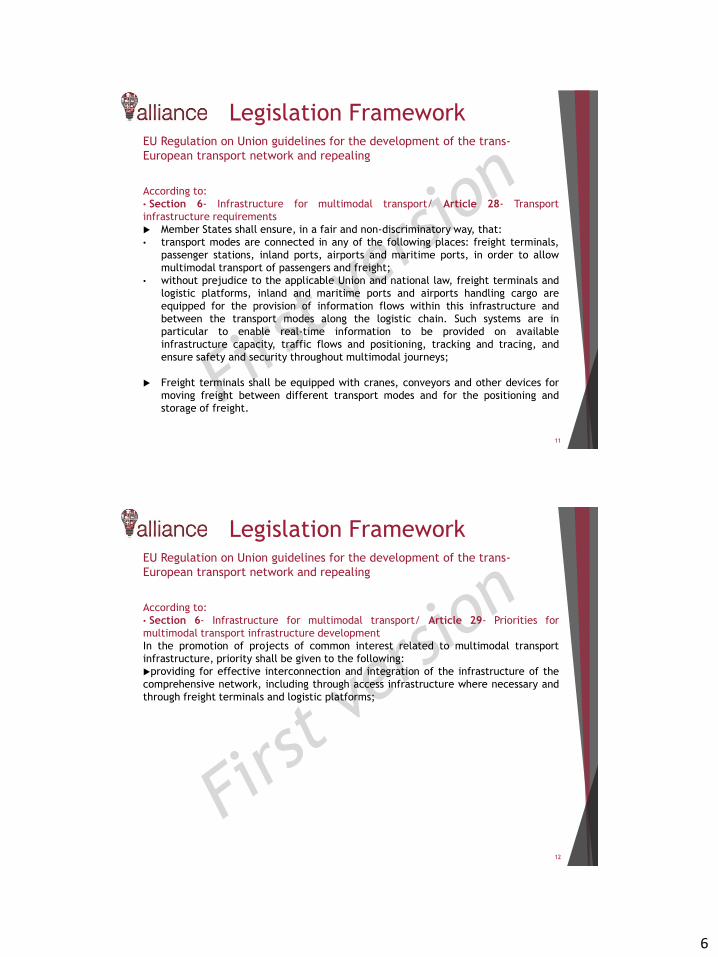
6
11
According to:
• Section 6- Infrastructure for multimodal transport/ Article 28- Transport
infrastructure requirements
Member States shall ensure, in a fair and non-discriminatory way, that:
• transport modes are connected in any of the following places: freight terminals,
passenger stations, inland ports, airports and maritime ports, in order to allow
multimodal transport of passengers and freight;
• without prejudice to the applicable Union and national law, freight terminals and
logistic platforms, inland and maritime ports and airports handling cargo are
equipped for the provision of information flows within this infrastructure and
between the transport modes along the logistic chain. Such systems are in
particular to enable real-time information to be provided on available
infrastructure capacity, traffic flows and positioning, tracking and tracing, and
ensure safety and security throughout multimodal journeys;
Freight terminals shall be equipped with cranes, conveyors and other devices for
moving freight between different transport modes and for the positioning and
storage of freight.
EU Regulation on Union guidelines for the development of the trans-
European transport network and repealing
Legislation Framework
12
According to:
• Section 6- Infrastructure for multimodal transport/ Article 29- Priorities for
multimodal transport infrastructure development
In the promotion of projects of common interest related to multimodal transport
infrastructure, priority shall be given to the following:
providing for effective interconnection and integration of the infrastructure of the
comprehensive network, including through access infrastructure where necessary and
through freight terminals and logistic platforms;
EU Regulation on Union guidelines for the development of the trans-
European transport network and repealing
Legislation Framework
7
13
According to:
• Section 7- Common provisions/ Article 30- Urban nodes
When developing the comprehensive network in urban nodes, Member States shall,
where feasible, aim to ensure:
for passenger transport: interconnection between rail, road, air and, as
appropriate, inland waterway and maritime infrastructure of the comprehensive
network;
for freight transport: interconnection between rail, road, and, as appropriate,
inland waterway, air and maritime infrastructure of the comprehensive network;
adequate connection between different railway stations, ports or airports of the
comprehensive network within an urban node
seamless connection between the infrastructure of the comprehensive network and
the infrastructure for regional and local traffic and urban freight delivery, including
logistic consolidation and distribution centres;
mitigation of the exposure of urban areas to negative effects of transiting rail and
road transport, which may include bypassing of urban areas;
promotion of efficient low-noise and low-carbon urban freight delivery.
EU Regulation on Union guidelines for the development of the trans-
European transport network and repealing
Legislation Framework
Categories of Freight Transport
Interchanges
14
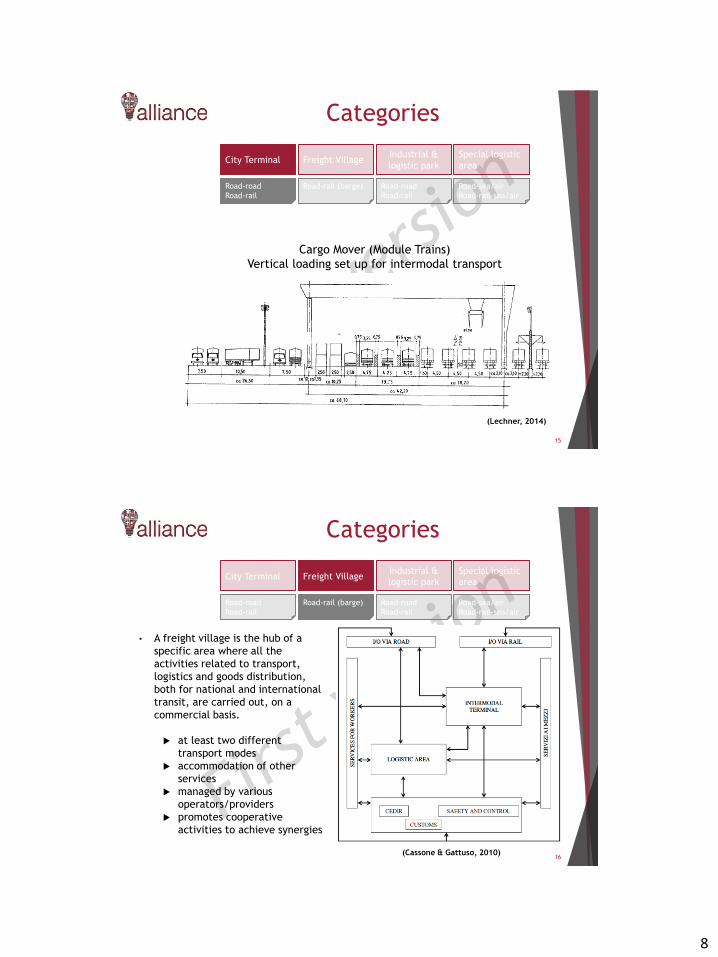
8
Categories
15
Industrial &
logistic park
Road-road
Road-rail
Freight Village
Road-rail (barge)
Special logistic
area
Road-sea/air
Road-rail-sea/air
City Terminal
Road-road
Road-rail
Cargo Mover (Module Trains)
Vertical loading set up for intermodal transport
(Lechner, 2014)
Categories
16
Industrial &
logistic park
Road-road
Road-rail
Freight Village
Road-rail (barge)
Special logistic
area
Road-sea/air
Road-rail-sea/air
City Terminal
Road-road
Road-rail
(Cassone & Gattuso, 2010)
• A freight village is the hub of a
specific area where all the
activities related to transport,
logistics and goods distribution,
both for national and international
transit, are carried out, on a
commercial basis.
at least two different
transport modes
accommodation of other
services
managed by various
operators/providers
promotes cooperative
activities to achieve synergies
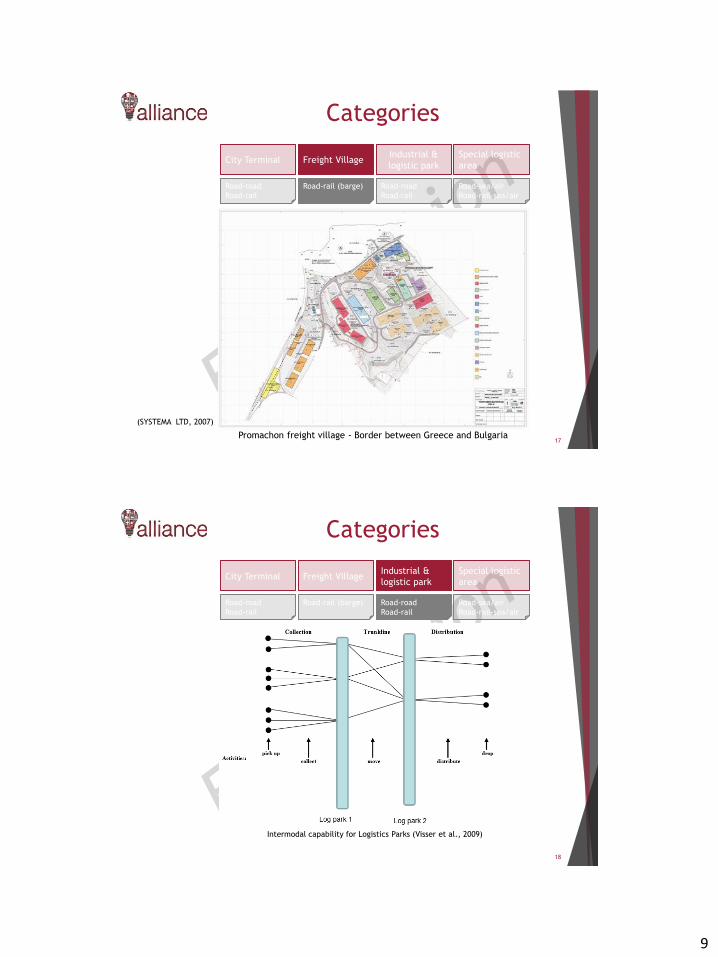
9
Categories
17
Industrial &
logistic park
Road-road
Road-rail
Freight Village
Road-rail (barge)
Special logistic
area
Road-sea/air
Road-rail-sea/air
City Terminal
Road-road
Road-rail
Promachon freight village - Border between Greece and Bulgaria
(SYSTEMA LTD, 2007)
Categories
18
Industrial &
logistic park
Road-road
Road-rail
Freight Village
Road-rail (barge)
Special logistic
area
Road-sea/air
Road-rail-sea/air
City Terminal
Road-road
Road-rail
Intermodal capability for Logistics Parks (Visser et al., 2009)
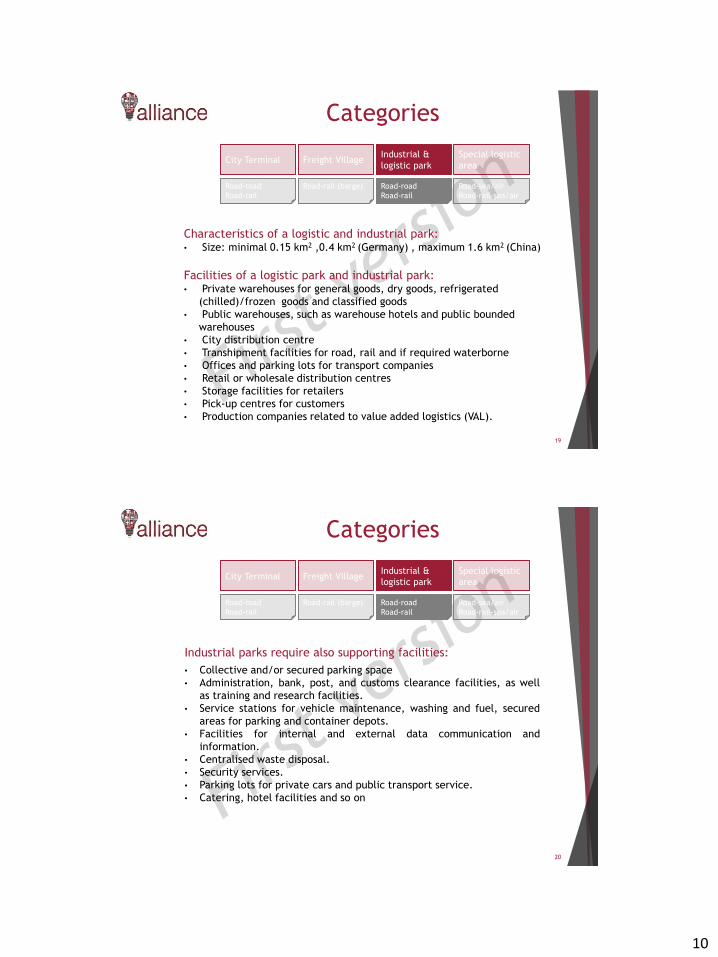
10
Categories
19
Industrial &
logistic park
Road-road
Road-rail
Freight Village
Road-rail (barge)
Special logistic
area
Road-sea/air
Road-rail-sea/air
City Terminal
Road-road
Road-rail
Characteristics of a logistic and industrial park:• Size: minimal 0.15 km2 ,0.4 km2 (Germany) , maximum 1.6 km2 (China)
Facilities of a logistic park and industrial park:• Private warehouses for general goods, dry goods, refrigerated
(chilled)/frozen goods and classified goods
• Public warehouses, such as warehouse hotels and public bounded
warehouses
• City distribution centre
• Transhipment facilities for road, rail and if required waterborne
• Offices and parking lots for transport companies
• Retail or wholesale distribution centres
• Storage facilities for retailers
• Pick-up centres for customers
• Production companies related to value added logistics (VAL).
Categories
20
Industrial &
logistic park
Road-road
Road-rail
Freight Village
Road-rail (barge)
Special logistic
area
Road-sea/air
Road-rail-sea/air
City Terminal
Road-road
Road-rail
Industrial parks require also supporting facilities:
• Collective and/or secured parking space
• Administration, bank, post, and customs clearance facilities, as well
as training and research facilities.
• Service stations for vehicle maintenance, washing and fuel, secured
areas for parking and container depots.
• Facilities for internal and external data communication and
information.
• Centralised waste disposal.
• Security services.
• Parking lots for private cars and public transport service.
• Catering, hotel facilities and so on
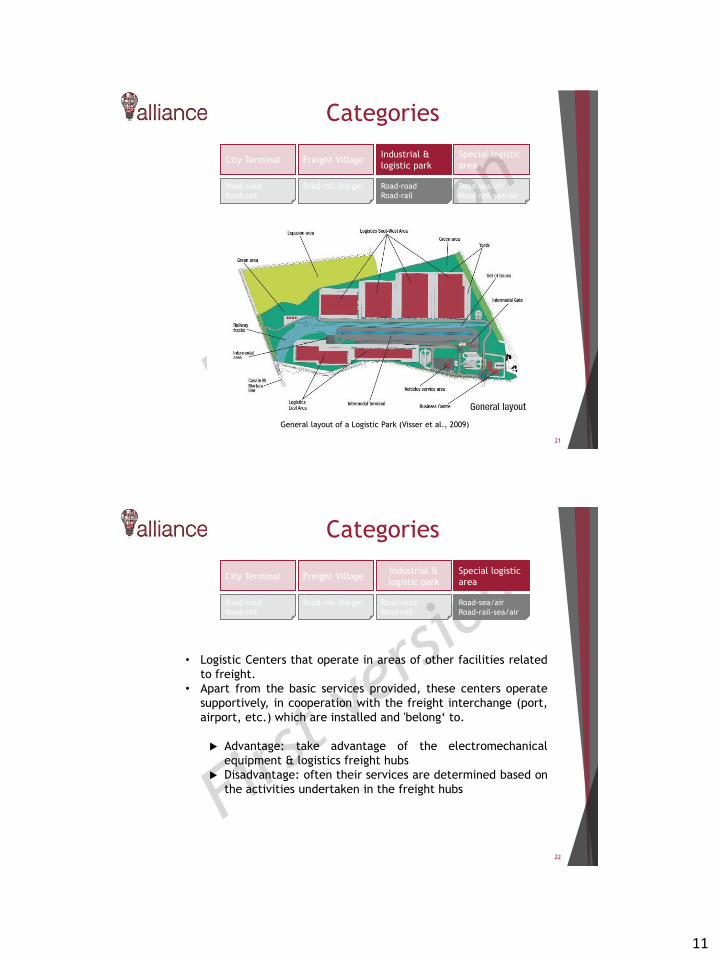
11
Categories
21
Industrial &
logistic park
Road-road
Road-rail
Freight Village
Road-rail (barge)
Special logistic
area
Road-sea/air
Road-rail-sea/air
City Terminal
Road-road
Road-rail
General layout of a Logistic Park (Visser et al., 2009)
Categories
22
Industrial &
logistic park
Road-road
Road-rail
Freight Village
Road-rail (barge)
Special logistic
area
Road-sea/air
Road-rail-sea/air
City Terminal
Road-road
Road-rail
• Logistic Centers that operate in areas of other facilities related
to freight.
• Apart from the basic services provided, these centers operate
supportively, in cooperation with the freight interchange (port,
airport, etc.) which are installed and 'belong‘ to.
Advantage: take advantage of the electromechanical
equipment & logistics freight hubs
Disadvantage: often their services are determined based on
the activities undertaken in the freight hubs
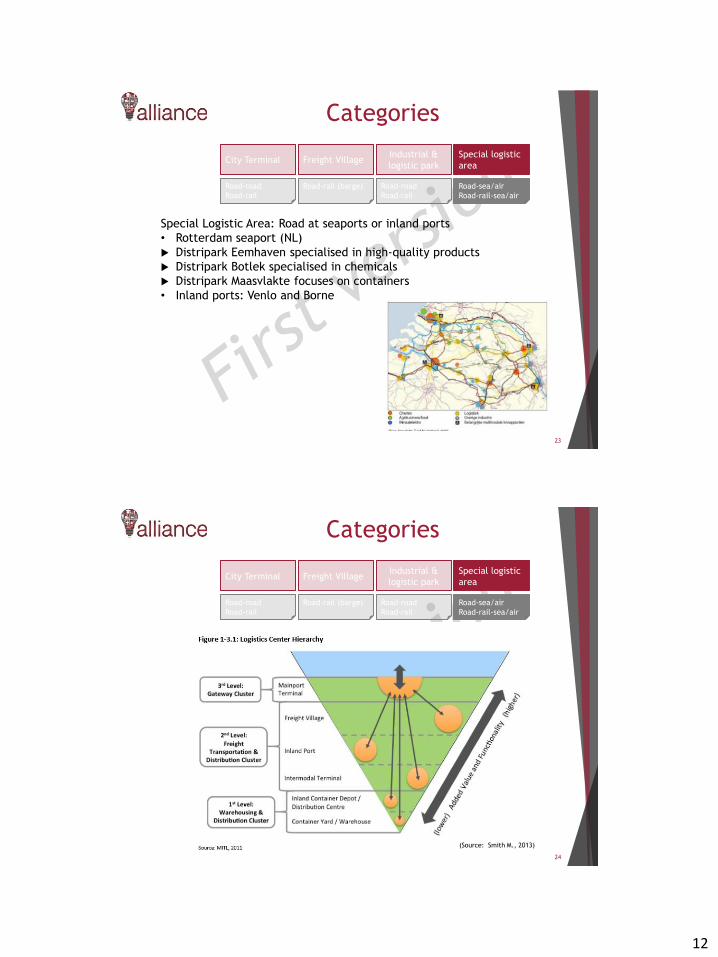
12
Categories
23
Industrial &
logistic park
Road-road
Road-rail
Freight Village
Road-rail (barge)
Special logistic
area
Road-sea/air
Road-rail-sea/air
City Terminal
Road-road
Road-rail
Special Logistic Area: Road at seaports or inland ports
• Rotterdam seaport (NL)
Distripark Eemhaven specialised in high-quality products
Distripark Botlek specialised in chemicals
Distripark Maasvlakte focuses on containers
• Inland ports: Venlo and Borne
Categories
24
Industrial &
logistic park
Road-road
Road-rail
Freight Village
Road-rail (barge)
Special logistic
area
Road-sea/air
Road-rail-sea/air
City Terminal
Road-road
Road-rail
(Source: Smith M., 2013)

13
Categories
25
Industrial &
logistic park
Road-road
Road-rail
Freight Village
Road-rail (barge)
Special logistic
area
Road-sea/air
Road-rail-sea/air
City Terminal
Road-road
Road-rail
(Source: Visser et al., 2009)
Categories
26
Industrial &
logistic park
Road-road
Road-rail
Freight Village
Road-rail (barge)
Special logistic
area
Road-sea/air
Road-rail-sea/air
City Terminal
Road-road
Road-rail
Dalian International
Logistic center
Shanghai Lingang
Logistic center(Source: Visser et al., 2009)

14
Categories
27
Industrial &
logistic park
Road-road
Road-rail
Freight Village
Road-rail (barge)
Special logistic
area
Road-sea/air
Road-rail-sea/air
City Terminal
Road-road
Road-rail
Special Logistic Area: at airports
For air freight related activities
Usually close to freight terminals, but not part of the air side activities
Examples: Charles de Gaulle (Paris), Schiphol (Amsterdam), Shenzhen
airport
Logistic center at
Shenzen airport
(Source: Visser et al., 2009)
Case studies
28
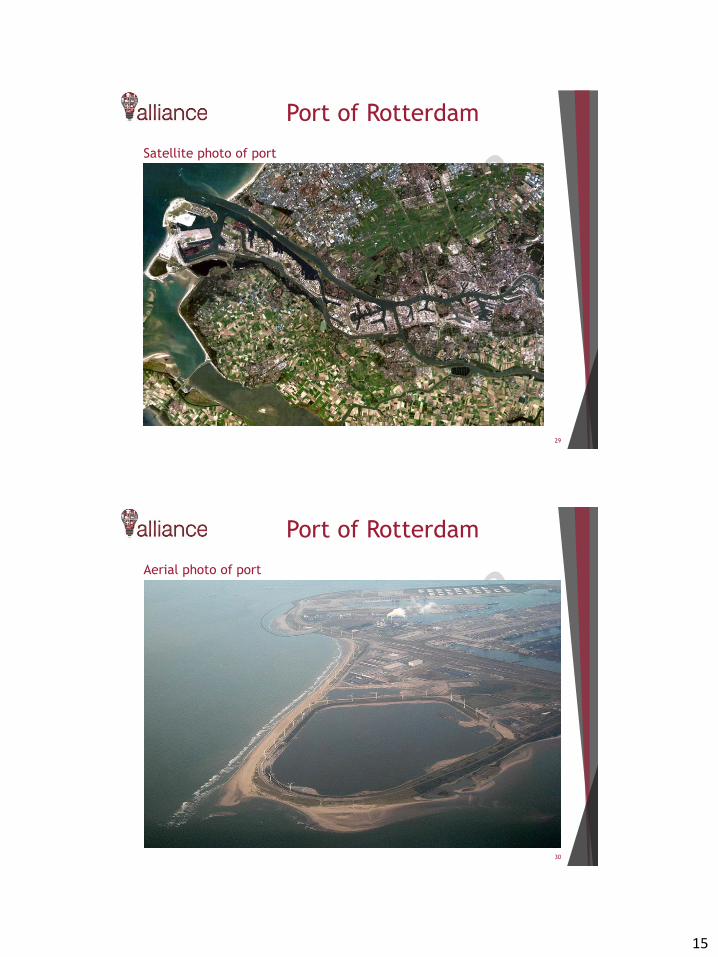
15
29
Satellite photo of port
Port of Rotterdam
30
Aerial photo of port
Port of Rotterdam

16
31
Container station of port
Port of Rotterdam
Port of Rotterdam
• Basic elements
Created in the 14th century in Netherlands
The most important (tonnage) port of the world in the period 1962
to 2004 (now, after Shanghai, Singapore and Hong Kong)
10th largest port in the world (container traffic)
Area: 105 square kilometers
Deep, 24 m (1 of the 2 ports worldwide) and advanced equipment
to serve both bulk cargoes and containers (autonomous robotic
cranes, automated container placement stowage space - port
community system)
Links to road (200 trucks per day) and rail (340 regular service on
a weekly basis) and conductors
32
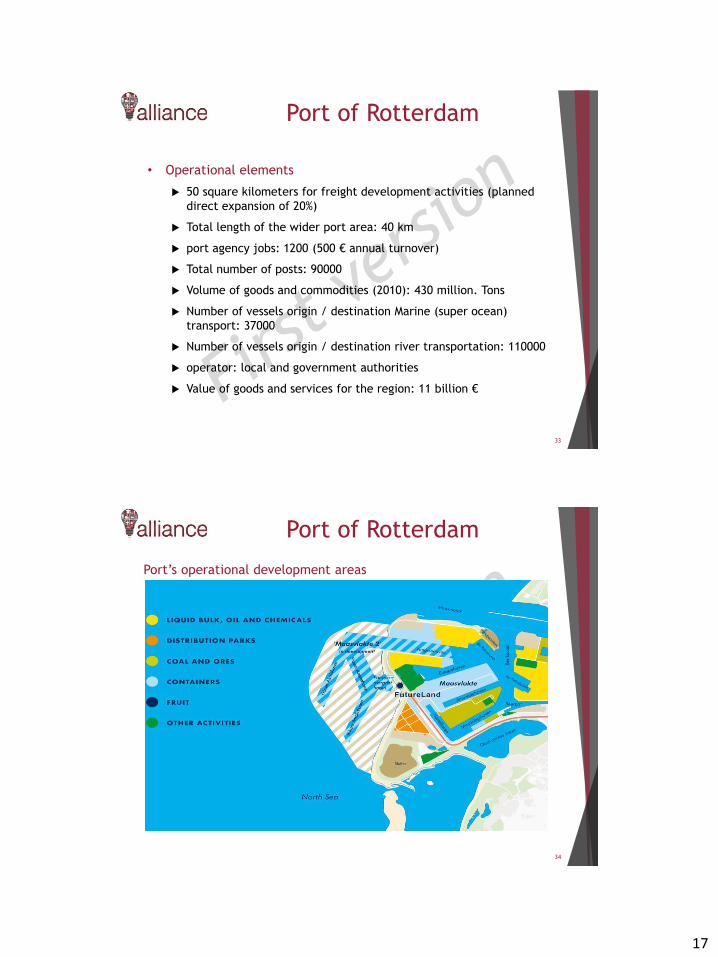
17
Port of Rotterdam
• Operational elements
50 square kilometers for freight development activities (planned
direct expansion of 20%)
Total length of the wider port area: 40 km
port agency jobs: 1200 (500 € annual turnover)
Total number of posts: 90000
Volume of goods and commodities (2010): 430 million. Tons
Number of vessels origin / destination Marine (super ocean)
transport: 37000
Number of vessels origin / destination river transportation: 110000
operator: local and government authorities
Value of goods and services for the region: 11 billion €
33
34
Port’s operational development areas
Port of Rotterdam
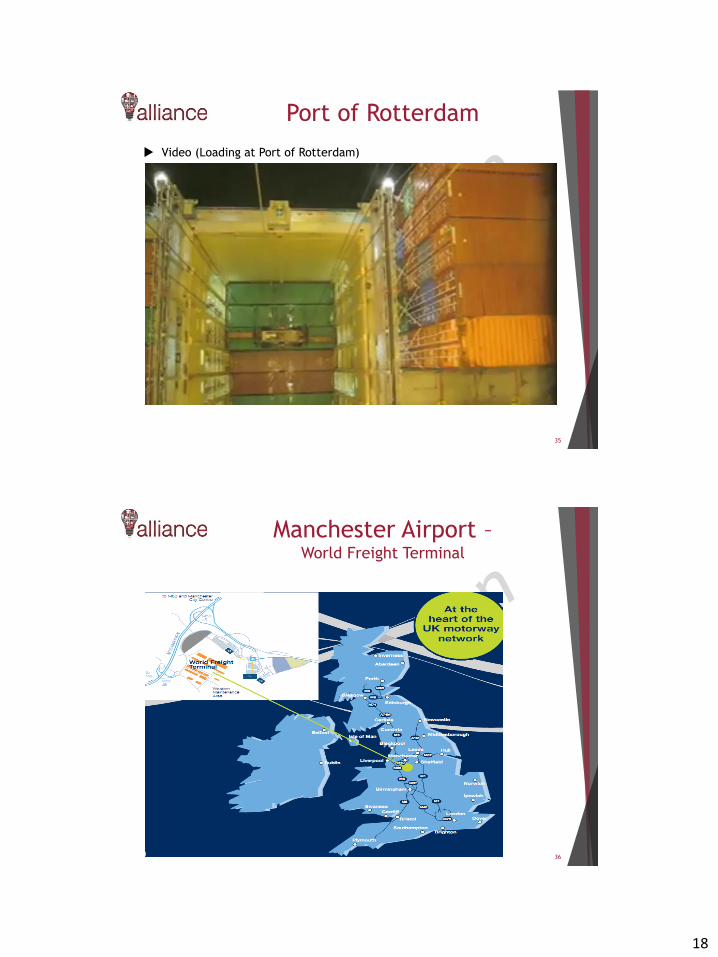
18
35
Video (Loading at Port of Rotterdam)
Port of Rotterdam
36
Manchester Airport –World Freight Terminal
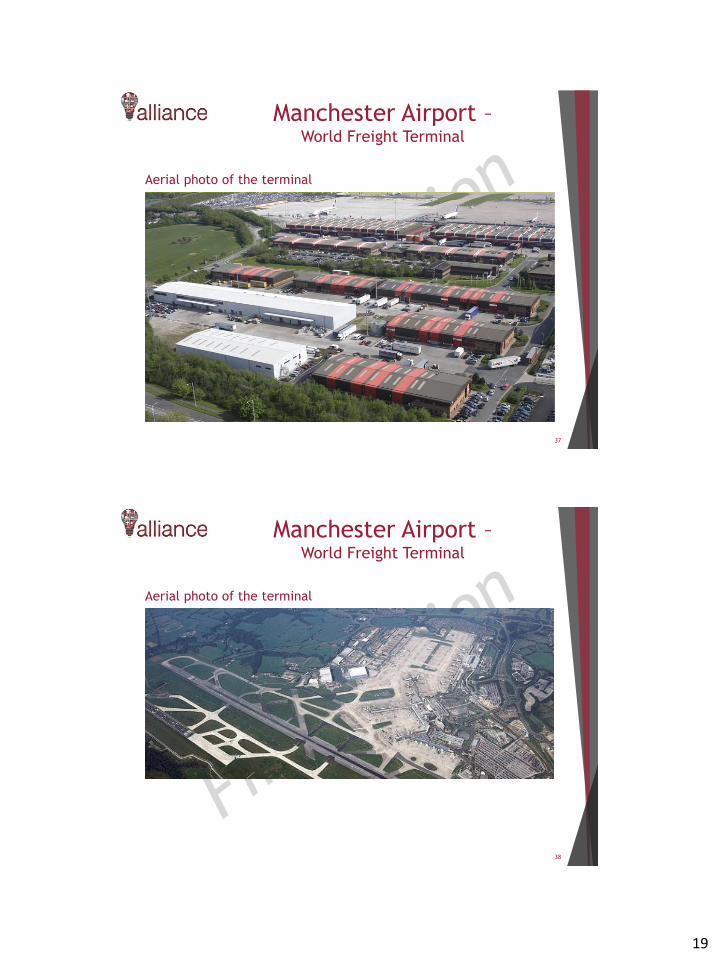
19
37
Manchester Airport –World Freight Terminal
Aerial photo of the terminal
38
Manchester Airport –World Freight Terminal
Aerial photo of the terminal

20
• Basic and operational elements
'World Freight Terminal': the 'heart' of transport networks
In the wider area of Manchester city center (14 Km from the town)
Area (buildings and warehouses): 60 sq. kilometers
3rd biggest airport of Great. Britain (in freight load)
Total load served: 250000 tons (2015)
Property & management: local authorities (city council) together
with MAG (Manchester Airports Group) - Shareholder of airline and
other companies of the wider region
Three terminals (co-location of passenger and freight)
Connection by road and rail (train, tram) transport
Service: more than 100 airlines, 22 destinations
39
Manchester Airport –World Freight Terminal
40
Manchester Airport –World Freight Terminal
Airplane loading
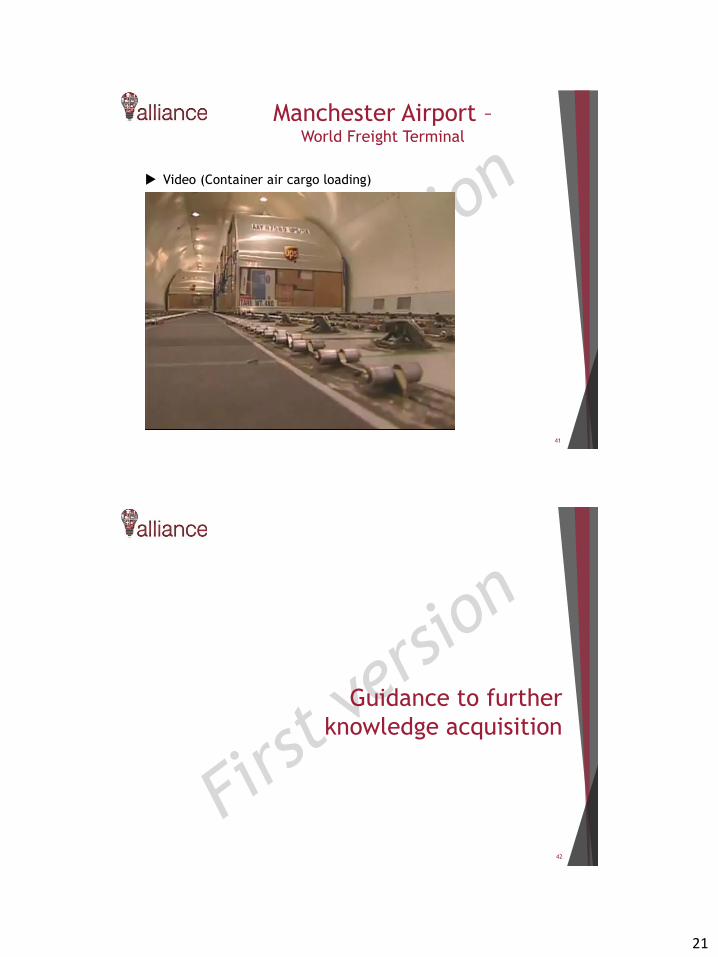
21
41
Manchester Airport –World Freight Terminal
Video (Container air cargo loading)
Guidance to further
knowledge acquisition
42
22
Suggested literature
43
Ballis, A. (2006). Freight Villages: Warehouse Design and Rail Link Aspects.
Presented at 85th Annual Meeting of the Transportation Research Board,
Washington, D.C., p.16.
CEC, Transport Infrastructure Needs Assessment in Central and Eastern Europe -
TINA project.
Department of Justice. (2010). 2010 ADA Standards for Accessible Design.
Retrieved from
http://www.ada.gov/regs2010/2010ADAStandards/2010ADAStandards.pdf.
European Conference of Ministers of Transport, 2002, Transport Infrastructure
Regional Study in the Balkans (TIRS).
Europlatforms, 1996, Europlatforms E.E.I.G. Yearbook 1996, Bruxelles/Bologna.
GVZ Frankfurt. (2013). Freight Village Frankfurt (ODER). Logistics Hub for
Combined Traffic between East and West. Retrieved December 15, 2013, from
http://www.gvz-ffo.de/cms /?lang=en#prettyPhoto.
Hampton Roads Transportation Planning Organization. (n.d.) Freight
Transportation Advisory Committee. Retrieved April 23, 2014, from
http://www.hrtpo.org/page/freight-transportation-advisory-committee-
%28ftac%29/.
Suggested literature
44
Nathanail E., 2007, “Developing an integrated logistics terminal network in the
CADSES area”, Transition Studies Review, May 2007, Volume 14, Issue 1, pp 125-
146.
VREF, Center of Excellence for Sustainable Urban Freight Systems, Improving
Freight System Performance in Metropolitan Areas: Planning Guide Planning and
Design Considerations (coe-sufs.org/wordpress/ncfrp33/), accessed 30/6/2016.
Windborne International Group, 1994, Intermodal Freight Centers in Europe: a
Strategic Analysis.
World Bank, 2000, The Road to Stability and Prosperity in Southeastern Europe,
March.
23
References
45
• Ballis, A. (2006). Freight Villages: Warehouse Design and Rail Link Aspects. Presented at 85th
Annual Meeting of the Transportation Research Board, Washington, D.C., p.16.
• Bertorello, C., (2008) Efficiently Plan Your Warehouse or Distribution Center. Distribution
Solutions TriFactor.
• Cassone, G.C., & Gattuso, D., (2010) European Transport \ Trasporti Europei n. 46 (2010): 72-
85
• Gogas, M. & Nathanail, E., (2014) Multilevel multicriteria design of intermodal transport
freight center networks. OPT-i: International Conference on Engineering and Applied Sciences
Optimization. Kos Island, Greece, 4-6 June 2014.
• Higgins, C.D. & Ferguson, M.R., (2011) An Exploration of the Freight Village Concept and Its
Applicability to Ontario. McMaster Institute for Transportation Logistics.
• Lechner, B., (2014) Station. Notes from Course Infrastructure, Transportation Systems MSc
Program, Technical University of Munich
• Nathanail, E., (2007) Developing an integrated logistics terminal network in the CADSES area,
Transition Studies Review, issue 45.
• Official Journal of the European Union, (2013) REGULATION (EU) No 1315/2013 OF THE
EUROPEAN PARLIAMENT AND OF THE COUNCIL on Union guidelines for the development of the
trans-European transport network and repealing Decision No 661/2010/EU.
• Rodrigue, J. P. Topic 4 – Trasportation Terminals. Transport Geography.
• Smith, M., (2013) Port of Richmond Gateway- Freight Village. Master of Urban and Regional
Planning Program, Virginia Commonwealth University.
References
46
• Steffey, D.W., (2009) Layout design analysis for the storage area in a distribution center.
Master Thesis, Department of Industrial Engineering University of Louisville.
• Visser, J., Hassall, K., Welsh, & K., (2009) Introduction into the concept of logistics parks.

1
This project has received funding from the European
Union’s Horizon 2020 research and innovation programme
under grant agreement No 692426
Smart Technologies for
Efficient LogisticsOlaf Poenicke
Fraunhofer Institute for Factory Operation andAutomation IFF Magdeburg, Germany
Course Overview
This course will provide basic information on and experience
with advanced information and communications
technologies relevant to the shipping industry.
It addresses basic ICT such as:
Auto-ID technologies,
Image processing,
Image based localization, and
3D scanning systems.
It provides an overview of typical applications.
2

2
Course Overview
The course is divided into three modules:
1. Lecture on ICT and typical applications
Auto-ID and IT infrastructure
Radio and image-based positioning
3D scanning
Condition monitoring
2. Brief demonstration and hands-on training
RFID scanning
3D scanning
3. Questions and Discussion
3
Course OverviewThe technologies discussed are relevant to the basic logistics
processes in logistics operation – e.g.:
4
Collision detection
based on image
processing, object
identification and
localisation
Identification of incoming goods:
RFID-tagged transport items / Barcodes
Situation Analysis based on Image
processing and localisation
Identification of outgoing goods:
RFID-tagged transport items / Barcodes
3D-Scanning of goods
for storage and
transport planning
3
Auto-ID Technologies
5
AUTO-ID Basics Overview of Auto-ID Technologies
The term automatic identification and data capture or simply
automatic identification (Auto-ID) refers to methods of
identifying objects, capturing and collecting data on them and
transmitting that data.
It is primarily used in:
Retail product marking
Manufacturing and logistics tracking and tracing throughout
supply chains production – storage – dispatch – delivery
Security access control systems
Corporate data industrial data acquisition
Within Logistics operations either the product itself or the
transport unit (parcel / pallet / …) is identified by Auto-ID.
6
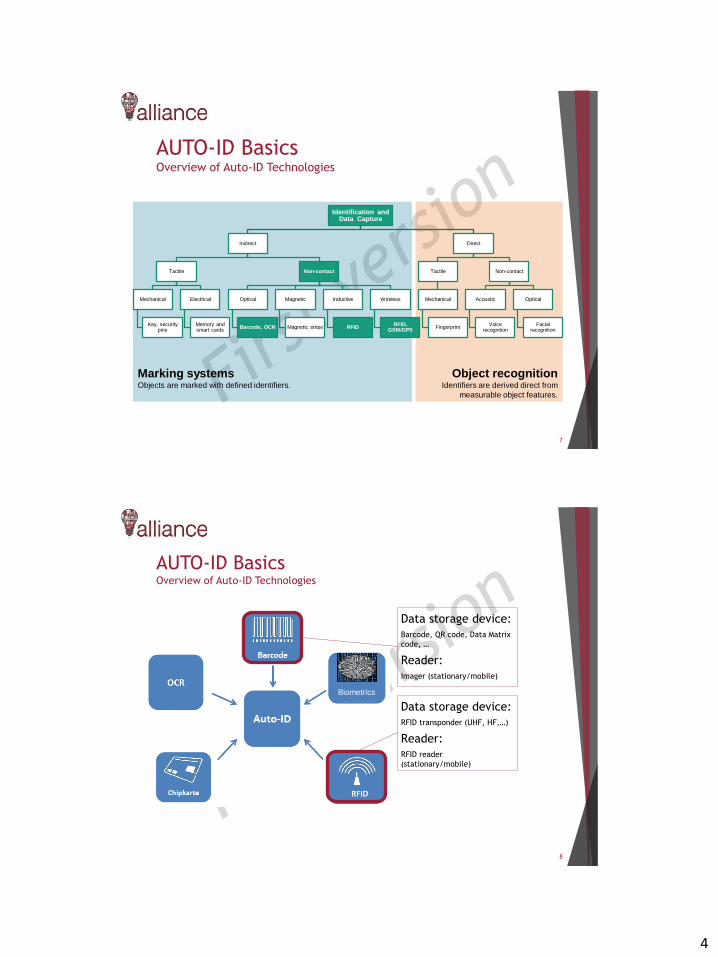
4
AUTO-ID Basics Overview of Auto-ID Technologies
7
Object recognitionIdentifiers are derived direct from
measurable object features.
Marking systemsObjects are marked with defined identifiers.
Identification and Data Capture
Indirect
Tactile
Mechanical
Key, security pins
Electrical
Memory and smart cards
Non-contact
Optical
Barcode, OCR
Magnetic
Magnetic stripe
Inductive
RFID
Wireless
RFID, GSM/GPS
Direct
Tactile
Mechanical
Fingerprint
Non-contact
Acoustic
Voice recognition
Optical
Facial recognition
AUTO-ID Basics Overview of Auto-ID Technologies
8
Data storage device:
Barcode, QR code, Data Matrix
code, …
Reader:
Imager (stationary/mobile)
Data storage device:
RFID transponder (UHF, HF,…)
Reader:
RFID reader
(stationary/mobile)
Biometrics
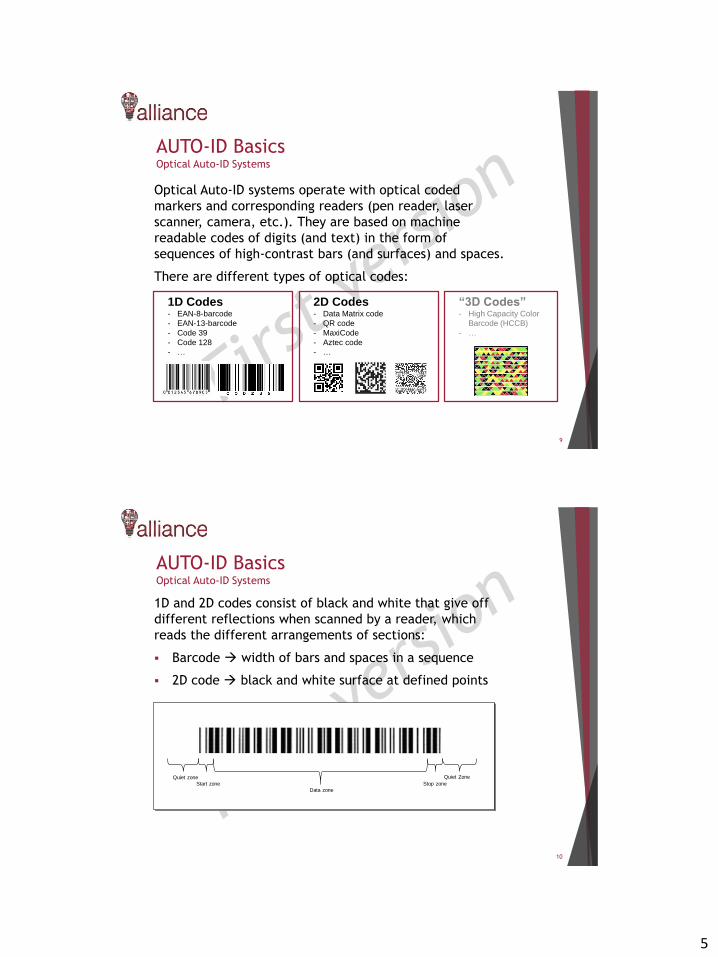
5
AUTO-ID Basics Optical Auto-ID Systems
Optical Auto-ID systems operate with optical coded
markers and corresponding readers (pen reader, laser
scanner, camera, etc.). They are based on machine
readable codes of digits (and text) in the form of
sequences of high-contrast bars (and surfaces) and spaces.
There are different types of optical codes:
9
1D Codes- EAN-8-barcode
- EAN-13-barcode
- Code 39
- Code 128
- …
2D Codes- Data Matrix code
- QR code
- MaxiCode
- Aztec code
- …
“3D Codes”- High Capacity Color
Barcode (HCCB)
- …
AUTO-ID Basics Optical Auto-ID Systems
1D and 2D codes consist of black and white that give off
different reflections when scanned by a reader, which
reads the different arrangements of sections:
Barcode width of bars and spaces in a sequence
2D code black and white surface at defined points
10
Quiet zone
Start zone Stop zone
Data zone
Quiet Zone

6
AUTO-ID Basics Optical Auto-ID Systems
Along with the individual subfields filled in, 2D codes
always also have orientation marks used to align the code
read by the reader.
Other industrial marking systems have been developed in
addition to optical codes printed on paper. To an extent,
the lighting has to be right when codes are being read.
11
(data field)
AUTO-ID Basics Optical Auto-ID Systems
The different types of optical codes were developed over
time
to code larger quantities of data and
to boost robustness against damage and soiling.
12
Note:EAN-13-code
codes12 digits
(+ 1 check digit)
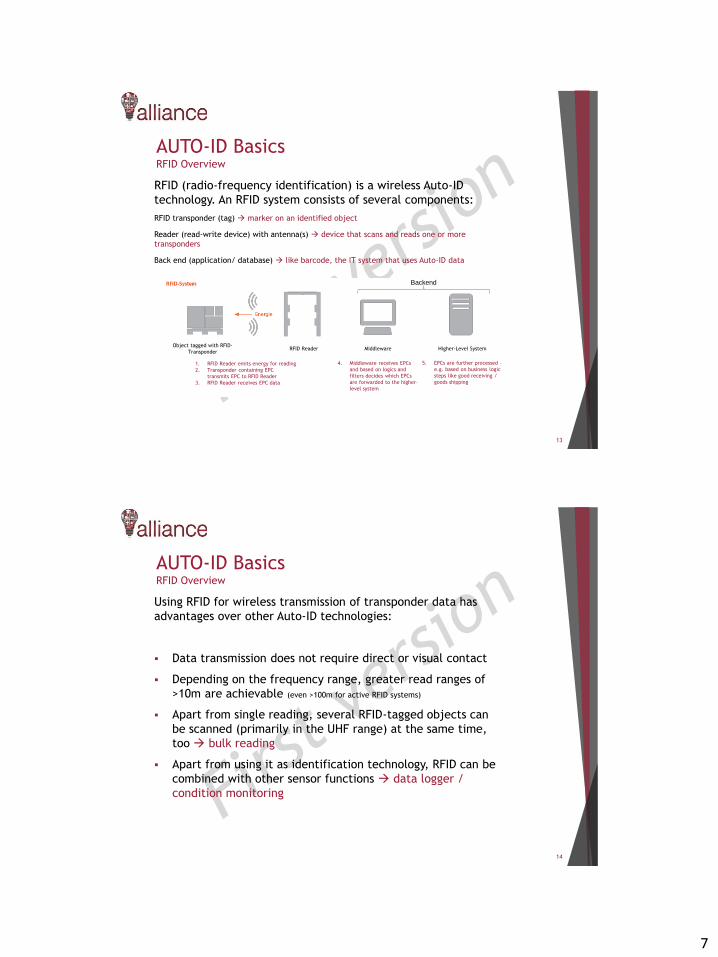
7
AUTO-ID Basics RFID Overview
RFID (radio-frequency identification) is a wireless Auto-ID
technology. An RFID system consists of several components:
RFID transponder (tag) marker on an identified object
Reader (read-write device) with antenna(s) device that scans and reads one or more
transponders
Back end (application/ database) like barcode, the IT system that uses Auto-ID data
13
Backend
Object tagged with RFID-
TransponderRFID Reader Middleware Higher-Level System
1. RFID Reader emits energy for reading
2. Transponder containing EPC
transmits EPC to RFID Reader
3. RFID Reader receives EPC data
4. Middleware receives EPCs
and based on logics and
filters decides which EPCs
are forwarded to the higher-
level system
5. EPCs are further processed –
e.g. based on business logic
steps like good receiving /
goods shipping
AUTO-ID Basics RFID Overview
Using RFID for wireless transmission of transponder data has
advantages over other Auto-ID technologies:
Data transmission does not require direct or visual contact
Depending on the frequency range, greater read ranges of
>10m are achievable (even >100m for active RFID systems)
Apart from single reading, several RFID-tagged objects can
be scanned (primarily in the UHF range) at the same time,
too bulk reading
Apart from using it as identification technology, RFID can be
combined with other sensor functions data logger /
condition monitoring
14
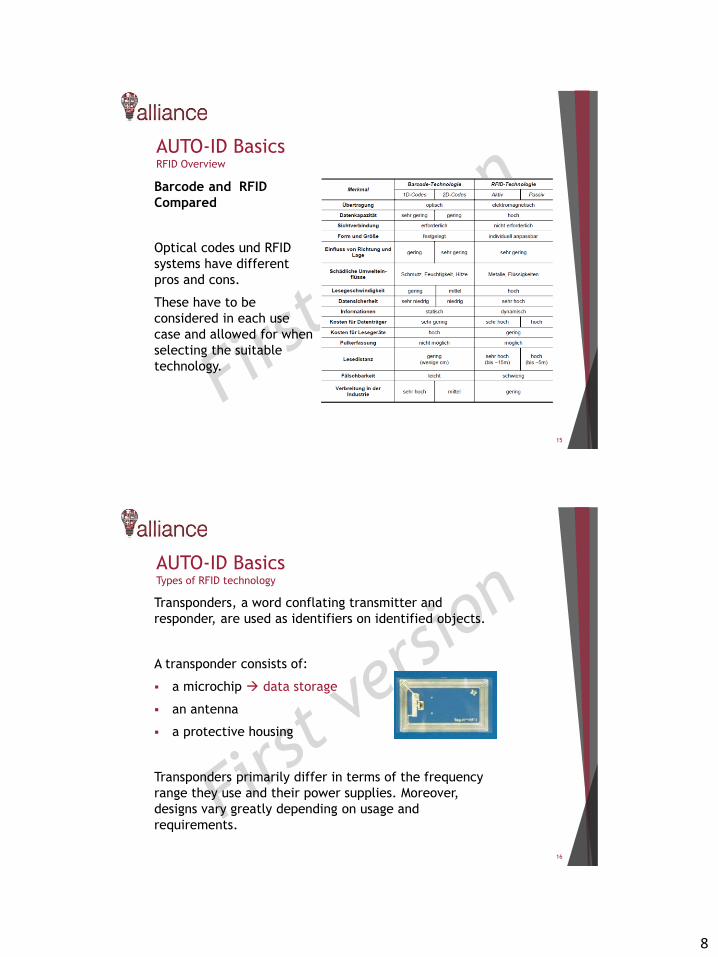
8
AUTO-ID Basics RFID Overview
Barcode and RFID
Compared
Optical codes und RFID
systems have different
pros and cons.
These have to be
considered in each use
case and allowed for when
selecting the suitable
technology.
15
AUTO-ID Basics Types of RFID technology
Transponders, a word conflating transmitter and
responder, are used as identifiers on identified objects.
A transponder consists of:
a microchip data storage
an antenna
a protective housing
Transponders primarily differ in terms of the frequency
range they use and their power supplies. Moreover,
designs vary greatly depending on usage and
requirements.
16
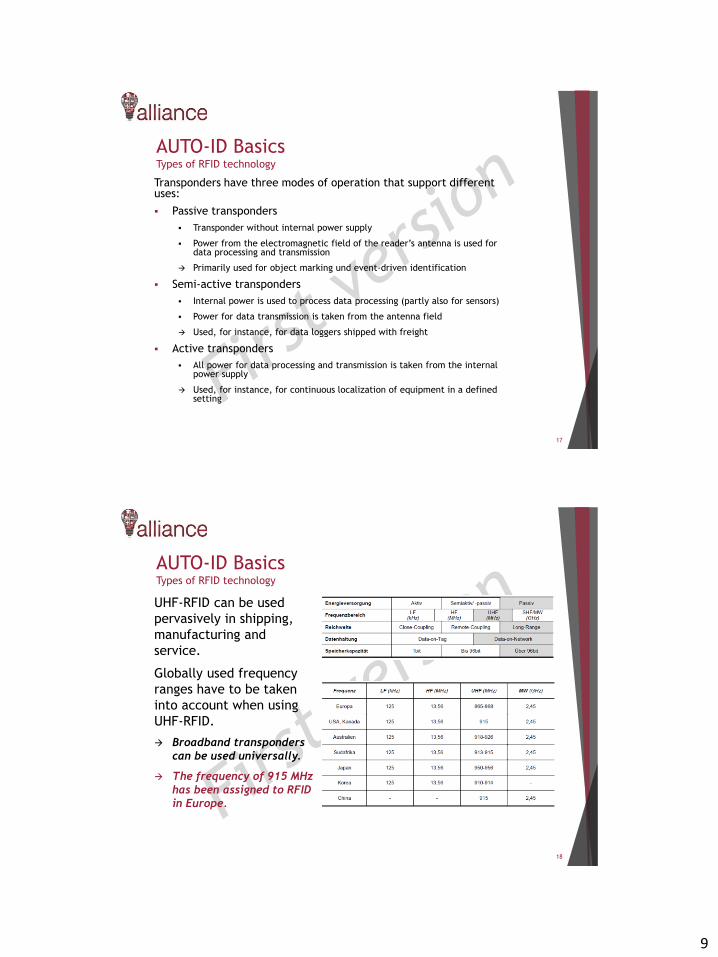
9
AUTO-ID Basics Types of RFID technology
Transponders have three modes of operation that support different uses:
Passive transponders
Transponder without internal power supply
Power from the electromagnetic field of the reader’s antenna is used fordata processing and transmission
Primarily used for object marking und event-driven identification
Semi-active transponders
Internal power is used to process data processing (partly also for sensors)
Power for data transmission is taken from the antenna field
Used, for instance, for data loggers shipped with freight
Active transponders
All power for data processing and transmission is taken from the internalpower supply
Used, for instance, for continuous localization of equipment in a definedsetting
17
AUTO-ID Basics Types of RFID technology
UHF-RFID can be used
pervasively in shipping,
manufacturing and
service.
Globally used frequency
ranges have to be taken
into account when using
UHF-RFID.
Broadband transponders
can be used universally.
The frequency of 915 MHz
has been assigned to RFID
in Europe.
18
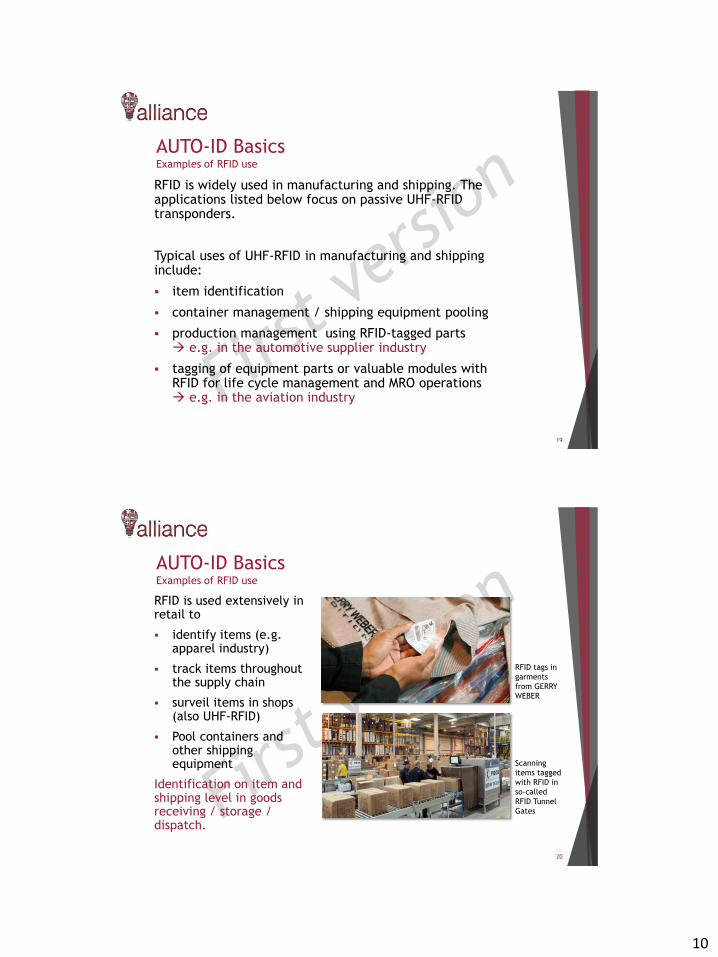
10
AUTO-ID Basics Examples of RFID use
RFID is widely used in manufacturing and shipping. The applications listed below focus on passive UHF-RFID transponders.
Typical uses of UHF-RFID in manufacturing and shipping include:
item identification
container management / shipping equipment pooling
production management using RFID-tagged parts e.g. in the automotive supplier industry
tagging of equipment parts or valuable modules withRFID for life cycle management and MRO operations e.g. in the aviation industry
19
AUTO-ID Basics Examples of RFID use
RFID is used extensively in retail to
identify items (e.g.apparel industry)
track items throughoutthe supply chain
surveil items in shops(also UHF-RFID)
Pool containers andother shippingequipment
Identification on item and shipping level in goods receiving / storage / dispatch.
20
Scanning
items tagged
with RFID in
so-called
RFID Tunnel
Gates
RFID tags in
garments
from GERRY
WEBER

11
AUTO-ID Basics Examples of RFID use
One example of use is
prototyping in the
automotive industry:
Control of the
complexity of varying
parts
Early incorporation of
RFID in the design
phase
Parallel testing of
durability and
readability of RFID tags
during trials
21
OEM
The goal is widespread use RFID in
automotive mass production.
AUTO-ID Basics Examples of RFID use
The tracking and tracing von RTIs is an
important use in the shipping industry:
Shipping equipment is tagged with
in retail (e.g. Düsseldorfer Paletten)
in automotive manufacturing
Industry-specific data are used in part
as identifiers RTIs (e.g. VDA standard)
VDA is overseeing development of new
generations of small containers (KLT)
with integrated RFID
Over 100 mill. KLTs are in circulation
New generation of KLTs in 2017
22
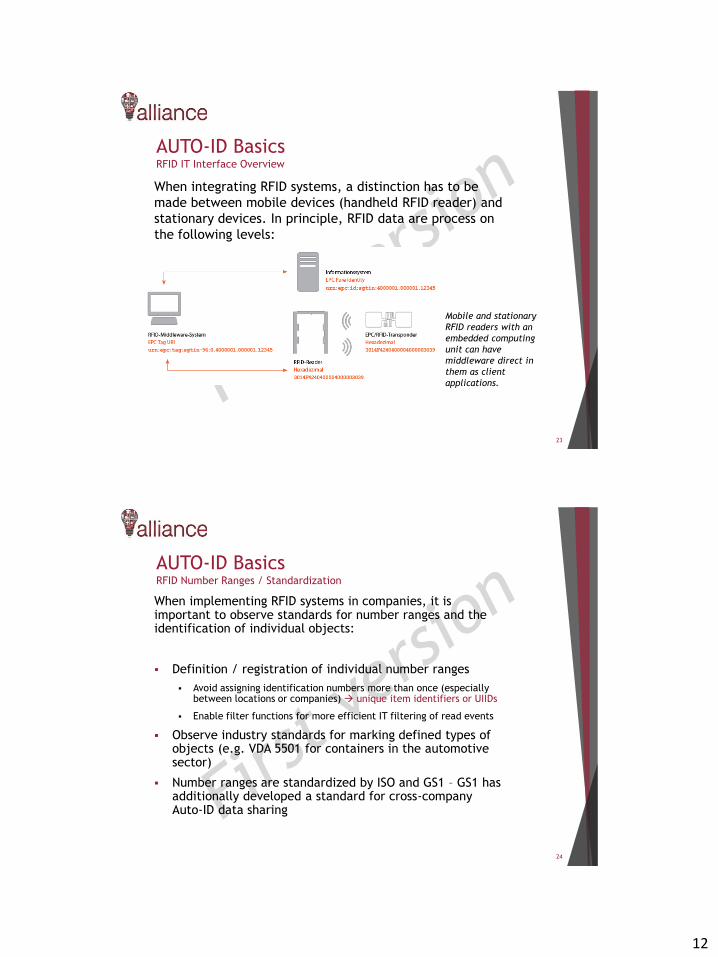
12
AUTO-ID Basics RFID IT Interface Overview
When integrating RFID systems, a distinction has to be
made between mobile devices (handheld RFID reader) and
stationary devices. In principle, RFID data are process on
the following levels:
23
Mobile and stationary
RFID readers with an
embedded computing
unit can have
middleware direct in
them as client
applications.
AUTO-ID Basics RFID Number Ranges / Standardization
When implementing RFID systems in companies, it is important to observe standards for number ranges and the identification of individual objects:
Definition / registration of individual number ranges
Avoid assigning identification numbers more than once (especiallybetween locations or companies) unique item identifiers or UIIDs
Enable filter functions for more efficient IT filtering of read events
Observe industry standards for marking defined types ofobjects (e.g. VDA 5501 for containers in the automotivesector)
Number ranges are standardized by ISO and GS1 – GS1 hasadditionally developed a standard for cross-companyAuto-ID data sharing
24
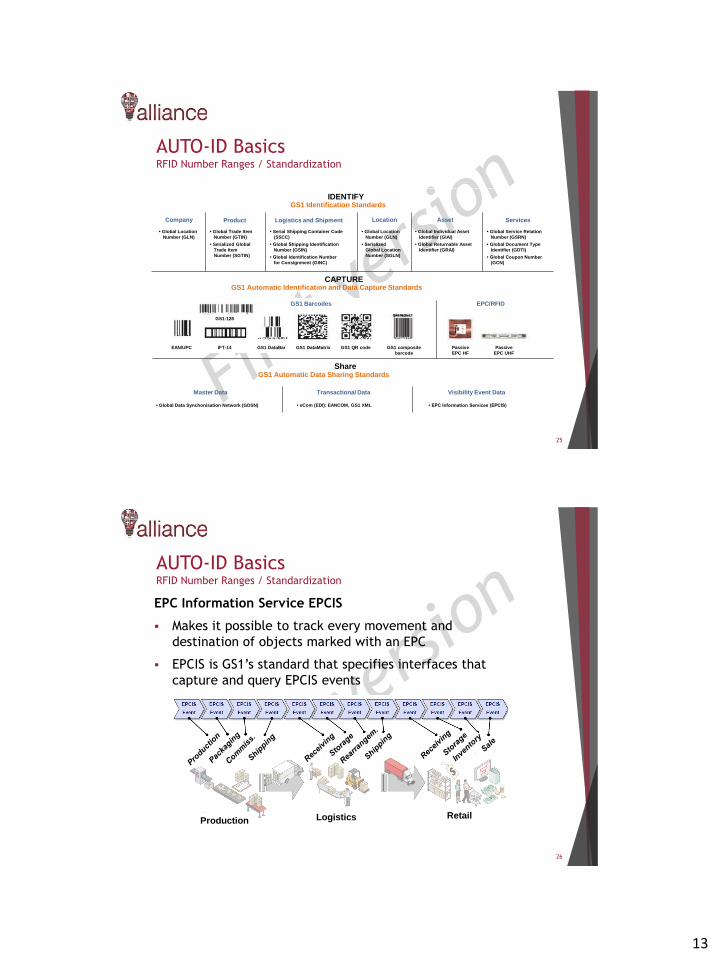
13
AUTO-ID Basics RFID Number Ranges / Standardization
25
IDENTIFYGS1 Identification Standards
Company Product Logistics and Shipment Location Asset Services
• Global Location
Number (GLN)
• Global Trade Item
Number (GTIN)
• Serialized Global
Trade Item
Number (SGTIN)
• Serial Shipping Container Code
(SSCC)
• Global Shipping Identification
Number (GSIN)
• Global Identification Number
for Consignment (GINC)
• Global Location
Number (GLN)
• Serialized
Global Location
Number (SGLN)
• Global Individual Asset
Identifier (GIAI)
• Global Returnable Asset
Identifier (GRAI)
• Global Service Relation
Number (GSRN)
• Global Document Type
Identifier (GDTI)
• Global Coupon Number
(GCN)
CAPTUREGS1 Automatic Identification and Data Capture Standards
GS1-128
EAN/UPC IFT-14 GS1 DataBar GS1 QR codeGS1 DataMatrix GS1 composite
barcode
Passive
EPC HF
Passive
EPC UHF
EPC/RFIDGS1 Barcodes
ShareGS1 Automatic Data Sharing Standards
Master Data Transactional Data Visibility Event Data
• Global Data Synchonisation Network (GDSN) • eCom (EDI): EANCOM, GS1 XML • EPC Information Services (EPCIS)
AUTO-ID Basics RFID Number Ranges / Standardization
EPC Information Service EPCIS
Makes it possible to track every movement and
destination of objects marked with an EPC
EPCIS is GS1’s standard that specifies interfaces that
capture and query EPCIS events
26
Production Logistics Retail
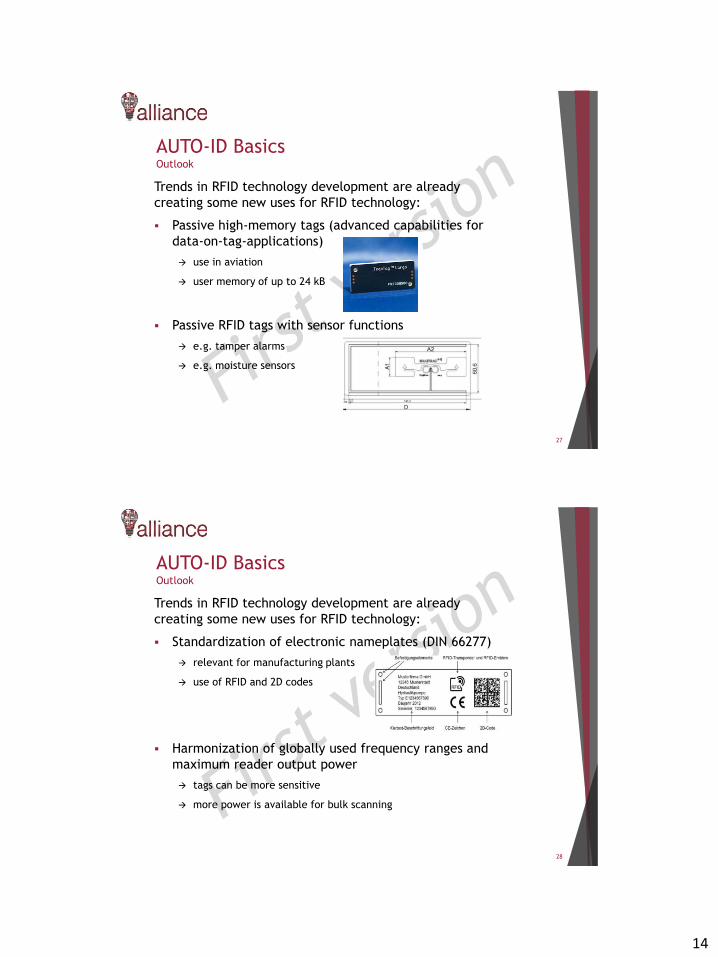
14
AUTO-ID Basics Outlook
Trends in RFID technology development are already
creating some new uses for RFID technology:
Passive high-memory tags (advanced capabilities for
data-on-tag-applications)
use in aviation
user memory of up to 24 kB
Passive RFID tags with sensor functions
e.g. tamper alarms
e.g. moisture sensors
27
AUTO-ID Basics Outlook
Trends in RFID technology development are already
creating some new uses for RFID technology:
Standardization of electronic nameplates (DIN 66277)
relevant for manufacturing plants
use of RFID and 2D codes
Harmonization of globally used frequency ranges and
maximum reader output power
tags can be more sensitive
more power is available for bulk scanning
28
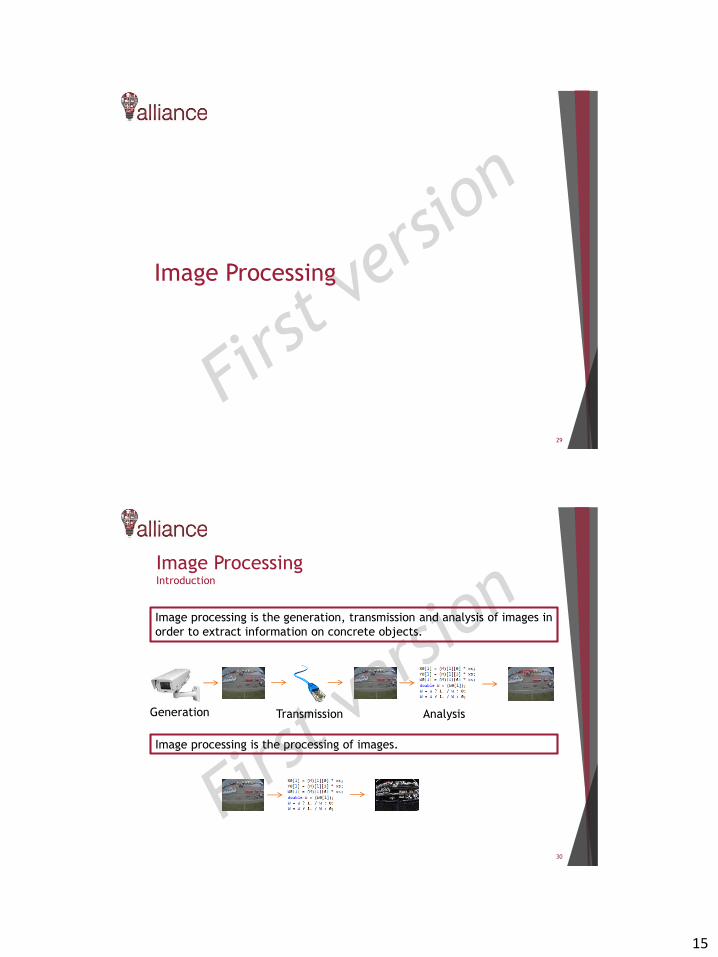
15
Image Processing
29
Image ProcessingIntroduction
30
Image processing is the generation, transmission and analysis of images in
order to extract information on concrete objects.
Image processing is the processing of images.
Generation Transmission Analysis

16
Image ProcessingIntroduction
Image capture / imaging:Generation of images
Image analysis / imageinterpretation / imageunderstanding: Analysis ofimages
Image editing: Altering ofimages for their representation
Computer graphic: Generationof images from data, e.g.geometric specification ofbodies.
31
Image processing is the generation, transmission and analysis of images in
order to extract information on concrete objects.
Image editing/photo manipulationnews.at
Image ProcessingImaging
32
Illustrative: An image is the outcome of optical imaging (photo).
Computer: An image is a specific array (matrix) of numbers, each of
which represents a brightness (color).
Color cameraInfrared camera Hyperspectral cameraTime-of-flight camera Grayscale camera
Numbers are the basis of analysis methods! a computer is dumb at
first – Intelligence comes from processing numbers

17
Image ProcessingImage Channels
Grayscale camera (infrared camera, time-of-flight camera)images have one image channel
Color camera images have three image channels: R (red), G(green), B (blue). Every image channel is represented as a matrixin a computer (image stack).
= + +
Hyperspectral camera images have100+ image channels (imagecube).
33
Image ProcessingQuiz
1. When they have the same size (height and width)
2. When they have the same number of image channels.
3. When every image channel is represented by the same
matrix, B1 - B2 = 0.
34
B1 B2 B1 - B2
Differential imaging detects objects’ movements.
When are two images
identical?
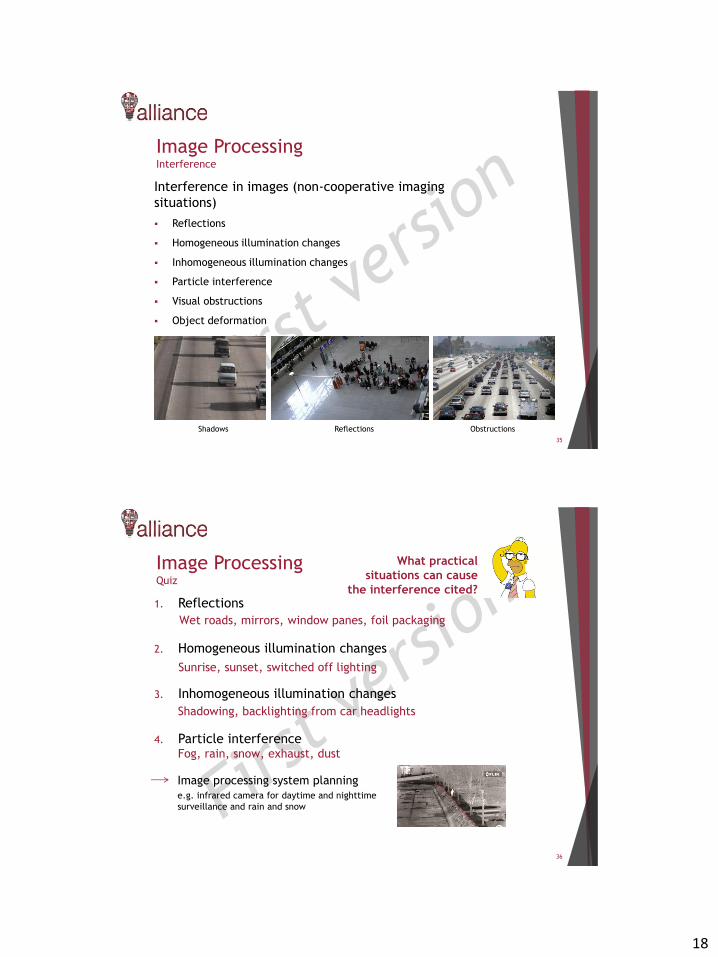
18
Image ProcessingInterference
Interference in images (non-cooperative imaging
situations)
Reflections
Homogeneous illumination changes
Inhomogeneous illumination changes
Particle interference
Visual obstructions
Object deformation
35
Shadows Reflections Obstructions
Image ProcessingQuiz
1. Reflections
2. Homogeneous illumination changes
3. Inhomogeneous illumination changes
4. Particle interference
36
What practical
situations can cause
the interference cited?
Image processing system planning
e.g. infrared camera for daytime and nighttime
surveillance and rain and snow
Wet roads, mirrors, window panes, foil packaging
Sunrise, sunset, switched off lighting
Shadowing, backlighting from car headlights
Fog, rain, snow, exhaust, dust

19
Image-Based Localization
37
Image-Bases Localization Introduction
Logistical background
Chaotic warehousing: Shipping units are stored in themost convenient storage bin (no assigned locations)
Maintenance: Forklifts have to be serviced periodically(operating time)
Focus on warehousing operations storage / removal
Technical and environmental conditions
Storage facilities are mostly indoors (weatherproofstorage)
The absolute accuracy required is between 25cm toseveral meters
Metallic environment with moving metal bodies such asforklifts, cranes or coils
Device frequently cannot be mounted on forkliftsbecause they are rental vehicles
Image-based solution: Vehicle Positioning System
Passive planar image markers atop vehicles
Cameras on the ceiling
38

20
Image-Bases Localization Introduction
Camera on vehicle Camera to vehicle
Advantages Cost efficient if only a few vehicles
are located in a particular area
Only a small amount of data has to be
sent through the network
Advantages No electronic devices on vehicles
Cost efficient if many vehicles are
located in a particular area
Combinable with other image
processing systems (documentation,
visualization, object detection)
Disadvantages Electronic devices on vehicle
Not combinable with other image
processing systems (documentation,
visualization, object detection)
Disadvantages Not cost efficient if only a few
vehicles are located in a particular
area
A large amount of data has to be sent
through the network
39
After weighing all of the pros and cons, the decision was made to
implement a camera-to-vehicle system.
Image-Bases Localization System Overview
Main components
Cameras
Passive planar image markers
Software analysis module
Processing units (hardware)
Cameras
Various camera types can be
uses
Security cameras are
currently being used (data
volume, quality and costs)
Aimed at the area used by
vehicles
40

21
Image-Bases Localization System Overview
Passive planar image markers
Square in shape
Simple black and white markers
Metal plates, aluminum composite panels or
plastic panels with printed or glued on code
Mounted atop vehicles
Marker code
Uniquely identifies a vehicle
Marker code must be rotationally asymmetric
Different sizes: 3 x 3, 4 x 4, 5 x 5, etc.
41
3 x 3 markers 5 x 5 markers
Image-Bases Localization Marker Recognition
Marker recognition entails searchingtop-view images generated by GPC formarkers.
Static marker recognition
Finds markers in well-defined zones, e.g.entrances, exits, or other critical points
Dynamic marker recognition
Finds any undetected markers in zones,which, rather than being known a priori arepredicted continuously based on a vehicle’strajectory
Advantages
Reduction of false positives in hard-to-readzones
Increase in the detection rate of truepositives in hard-to-read zones
Performance
42
Dynamic zone
Entrance zone
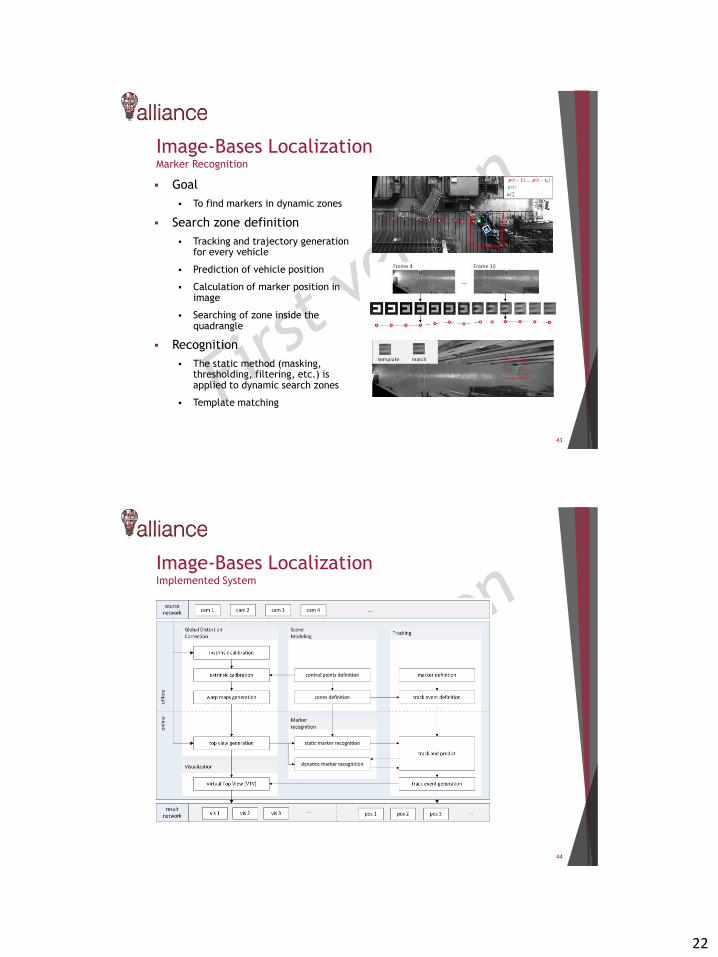
22
Image-Bases Localization Marker Recognition
Goal
To find markers in dynamic zones
Search zone definition
Tracking and trajectory generationfor every vehicle
Prediction of vehicle position
Calculation of marker position inimage
Searching of zone inside thequadrangle
Recognition
The static method (masking,thresholding, filtering, etc.) isapplied to dynamic search zones
Template matching
43
Image-Bases Localization Implemented System
44
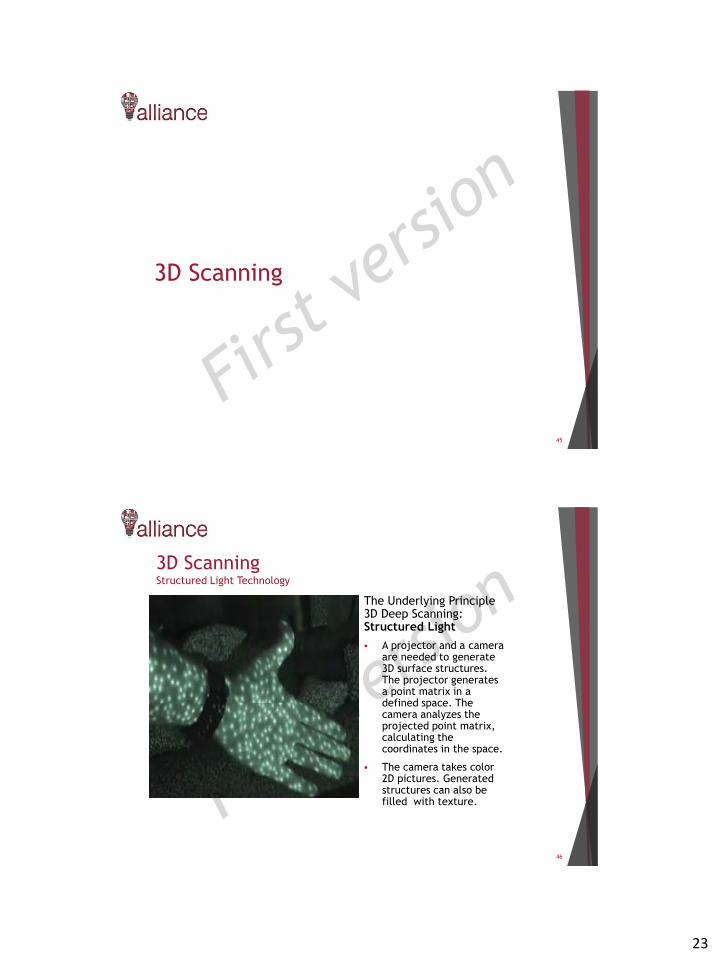
23
3D Scanning
45
3D Scanning Structured Light Technology
The Underlying Principle 3D Deep Scanning: Structured Light
A projector and a cameraare needed to generate3D surface structures.The projector generatesa point matrix in adefined space. Thecamera analyzes theprojected point matrix,calculating thecoordinates in the space.
The camera takes color2D pictures. Generatedstructures can also befilled with texture.
46
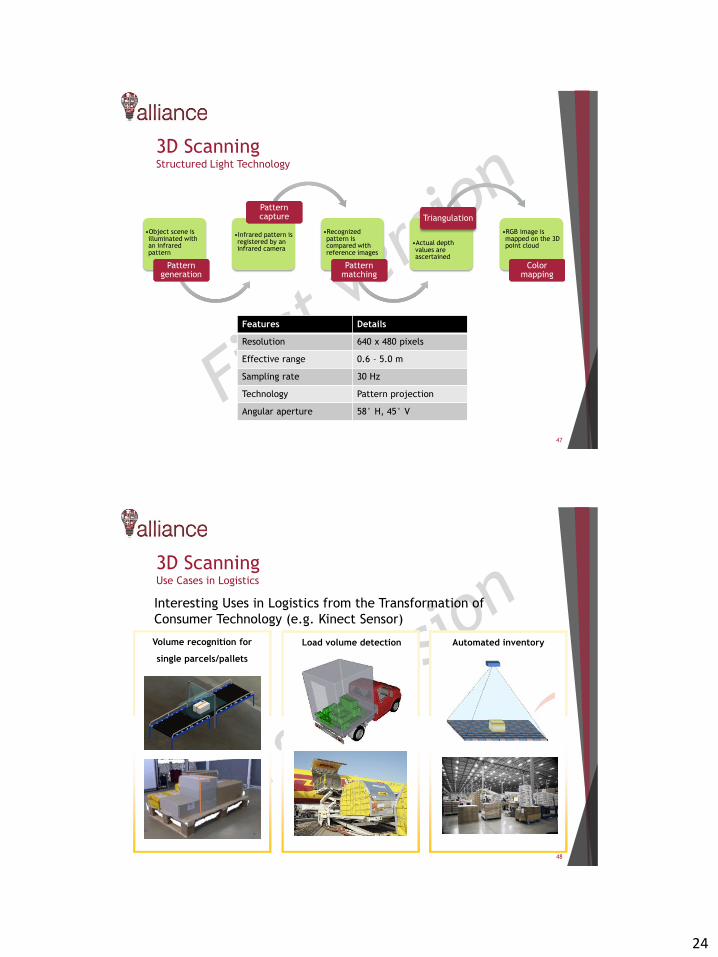
24
3D Scanning Structured Light Technology
47
•Object scene is illuminated with an infrared pattern
Pattern generation
•Infrared pattern is registered by an infrared camera
Pattern capture
•Recognized pattern is compared with reference images
Pattern matching
•Actual depth values are ascertained
Triangulation
•RGB image is mapped on the 3Dpoint cloud
Color mapping
Features Details
Resolution 640 x 480 pixels
Effective range 0.6 – 5.0 m
Sampling rate 30 Hz
Technology Pattern projection
Angular aperture 58° H, 45° V
3D Scanning Use Cases in Logistics
Interesting Uses in Logistics from the Transformation of
Consumer Technology (e.g. Kinect Sensor)
48
Volume recognition for
single parcels/pallets
Load volume detection Automated inventory
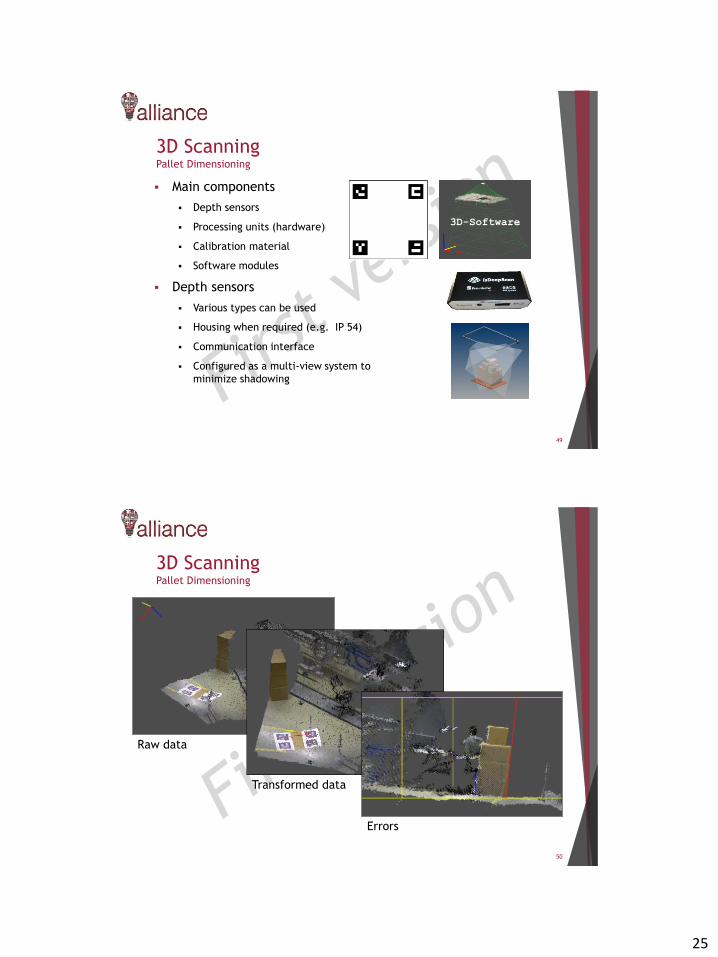
25
3D Scanning Pallet Dimensioning
Main components
Depth sensors
Processing units (hardware)
Calibration material
Software modules
Depth sensors
Various types can be used
Housing when required (e.g. IP 54)
Communication interface
Configured as a multi-view system to
minimize shadowing
49
3D-Software
3D Scanning Pallet Dimensioning
50
Raw data
Transformed data
Errors

26
3D Scanning Pallet Dimensioning
Fine calibration
Placement of a plate in the sensor’snear field
Segmentation
Optimization of transformation(Levenberg-Marquardt)
Effective range
Setting of the sensor’s specificeffective range
Dynamic adjustment during sensing (xand y coordinates)
51
3D Scanning Pallet Dimensioning
Calculating an elevation model from a point cloud
Assignment of points to a grid
Ascertainment of the elevation value of each grid point fromthe assigned points
Adjustment of the elevation values of the grid elements by aspatial median filter (optionally by computing the convexhull)
Deriving shipment data from the elevation model
Length, width and height
Volume
Depth histogram
52

27
Bibliography• Schenk, M. (Hrsg.): Produktion und Logistik mit Zukunft – Digital Engineering and
Operation. Springer, 2015.
• Richter, K.: Lecture – Telematik und Identtechnik, Otto-von-Guericke-UniversitätMagdeburg, 2015/2016.
• Finkenzeller, K. (Hrsg.): RFID-Handbuch: Grundlagen und praktische Anwendungenvon Transponders, kontaktlosen Chipkarten und NFC.
• Krampe, H., Lucke, H., Schenk, M. (Hrsg.): Grundlagen der Logistik: Theorie undPraxis logistischer Systeme. Huss Verlag, 2012.
• Bartneck, N., Klaas, V., Schönherr, H.: Prozesse optimieren mit RFID und Auto-ID.Publicis Publishing, 2008.
• Roth, A. (Hrsg.): Einführung und Umsetzung von Industrie 4.0: Grundlagen,Vorgehensmodell und Use Cases aus der Praxis. Springer, 2016.
• Poenicke, O.: Workshop – Grundlagen Auto-ID und RFID, Fraunhofer IFF, 2016.
• Norms and Standards – e.g. GS1 – Tag Data Standard (version 1.9); VDA 5500; DIN66277
53
1
This project has received funding from the European
Union’s Horizon 2020 research and innovation programme
under grant agreement No 692426
Decision making
methodologiesUniversity of Thessaly, Greece
Content
1. Background
2. Multi-stakeholder Multi-criteria analysis
3. Weighing
4. Normalization
5. Cost benefit analysis
6. Adaptability and transferability analysis
7. Risk analysis
8. Example
9. Suggested literature
2

2
Background
3
Evaluation
What is evaluation
“set of activities to conveniently arrange the information needed
for a choice in order that the various participants in the choice
process are enabled to make this choice as balanced as possible”
[Nijkamp et al., 1990]
3
Why do we evaluate?
Decision Making
Design
Measuring Performance
Monitoring
Why do we evaluate?
To understand if the systems works and how:
Efficacy: are we doing what we planned and does it
actually work towards objectives?
Efficiency: are we doing things right in terms of cost
and quality?
Effectiveness: are we doing right things that meet our
policy goals and objectives and give us positive net
benefits?
4
Rationalization
Awareness
Options
Impacts
Consistency
Internally
externally
Comparableness
Flexibility
New options and effects
Context changes
Usual types of comparing
Ex-post evaluation - how well project goals and
objectives are being achieved after implementation.
Ex-ante evaluation - how goals/objectives/plan are
expected to be achieved when being implemented. It
employs:
expert findings and knowledge (a qualitative
assessment)
comparison with similar projects in other countries
or cities (best practice);
modelling: the proposed solution is investigated by
the microscopic or macroscopic simulation models.
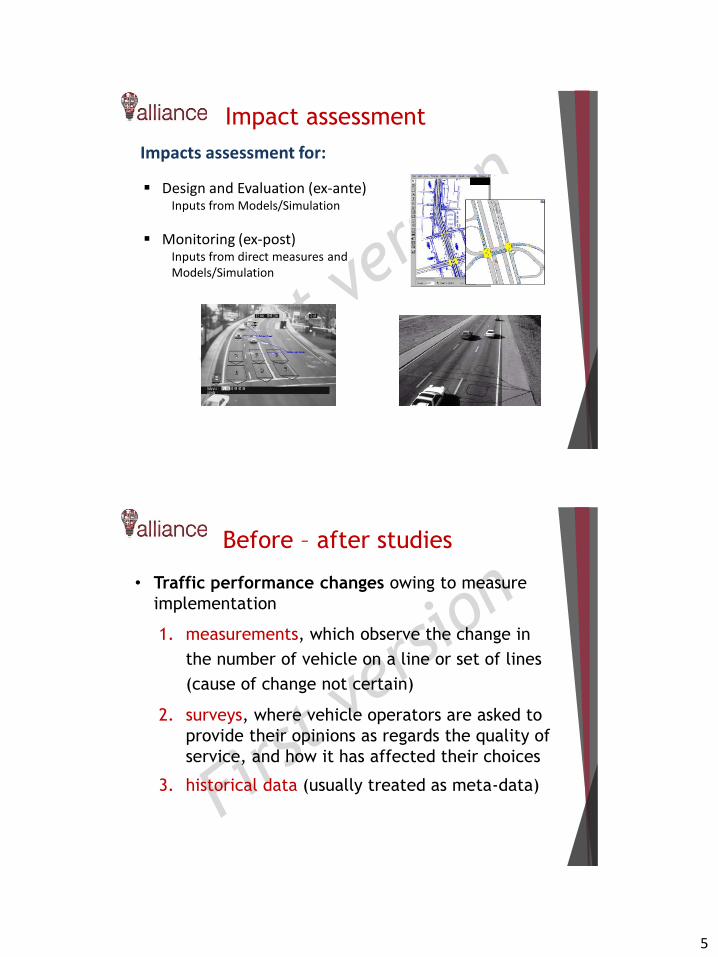
5
Impact assessment
Impacts assessment for:
Design and Evaluation (ex-ante)Inputs from Models/Simulation
Monitoring (ex-post)Inputs from direct measures andModels/Simulation
• Traffic performance changes owing to measure
implementation
1. measurements, which observe the change in
the number of vehicle on a line or set of lines
(cause of change not certain)
2. surveys, where vehicle operators are asked to
provide their opinions as regards the quality of
service, and how it has affected their choices
3. historical data (usually treated as meta-data)
Before – after studies
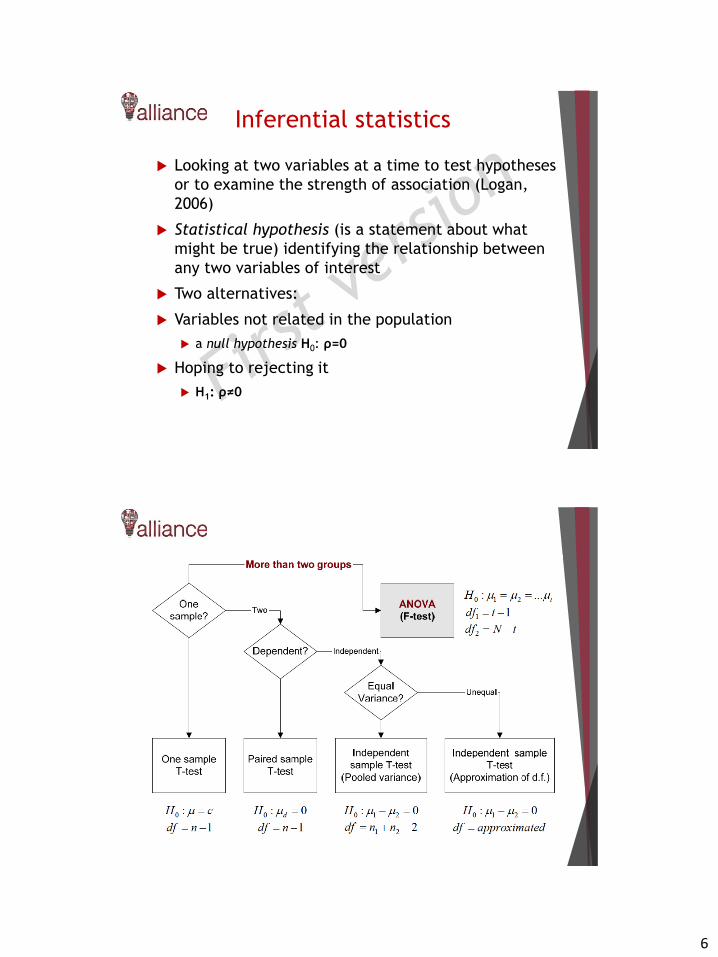
6
Inferential statistics
Looking at two variables at a time to test hypotheses
or to examine the strength of association (Logan,
2006)
Statistical hypothesis (is a statement about what
might be true) identifying the relationship between
any two variables of interest
Two alternatives:
Variables not related in the population
a null hypothesis Η0: ρ=0
Hoping to rejecting it
Η1: ρ≠0
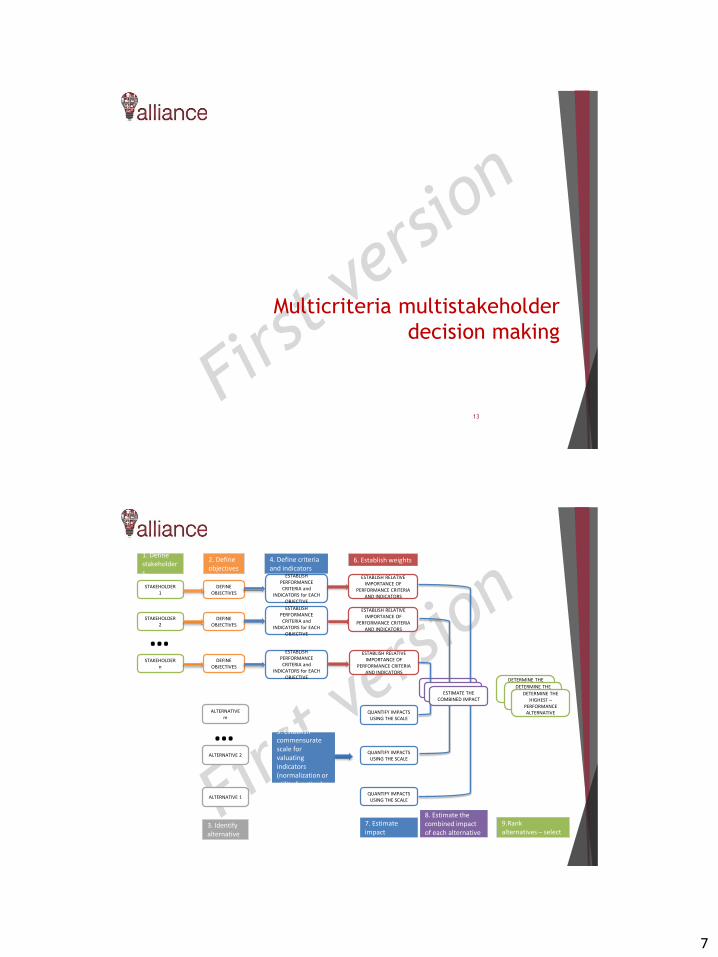
7
Multicriteria multistakeholder
decision making
13
ESTIMATE THE COMBINED IMPACT
ESTABLISH PERFORMANCE CRITERIA and
INDICATORS for EACH OBJECTIVE
DEFINE OBJECTIVES
STAKEHOLDER 1
STAKEHOLDER 2
STAKEHOLDER n
…
9.Rank alternatives – select
1. Define stakeholders
2. Define objectives
4. Define criteria and indicators
6. Establish weights
DEFINE OBJECTIVES
DEFINE OBJECTIVES
ESTABLISH PERFORMANCE CRITERIA and
INDICATORS for EACH OBJECTIVE
ESTABLISH PERFORMANCE CRITERIA and
INDICATORS for EACH OBJECTIVE
ESTABLISH RELATIVE IMPORTANCE OF
PERFORMANCE CRITERIA AND INDICATORS
ESTABLISH RELATIVE IMPORTANCE OF
PERFORMANCE CRITERIA AND INDICATORS
ESTABLISH RELATIVE IMPORTANCE OF
PERFORMANCE CRITERIA AND INDICATORS
3. Identifyalternative
ALTERNATIVE m
ALTERNATIVE 2
ALTERNATIVE 1
…
7. Estimate impact
QUANTIFY IMPACTS USING THE SCALE
5. Establishcommensurate scale for valuatingindicators(normalization or utility function)
QUANTIFY IMPACTS USING THE SCALE
QUANTIFY IMPACTS USING THE SCALE
8. Estimate the combined impact of each alternative
ESTIMATE THE COMBINED IMPACTESTIMATE THE
COMBINED IMPACT
DETERMINE THE HIGHEST –
PERFORMANCE ALTERNATIVE
DETERMINE THE HIGHEST –
PERFORMANCE ALTERNATIVE
DETERMINE THE HIGHEST –
PERFORMANCE ALTERNATIVE
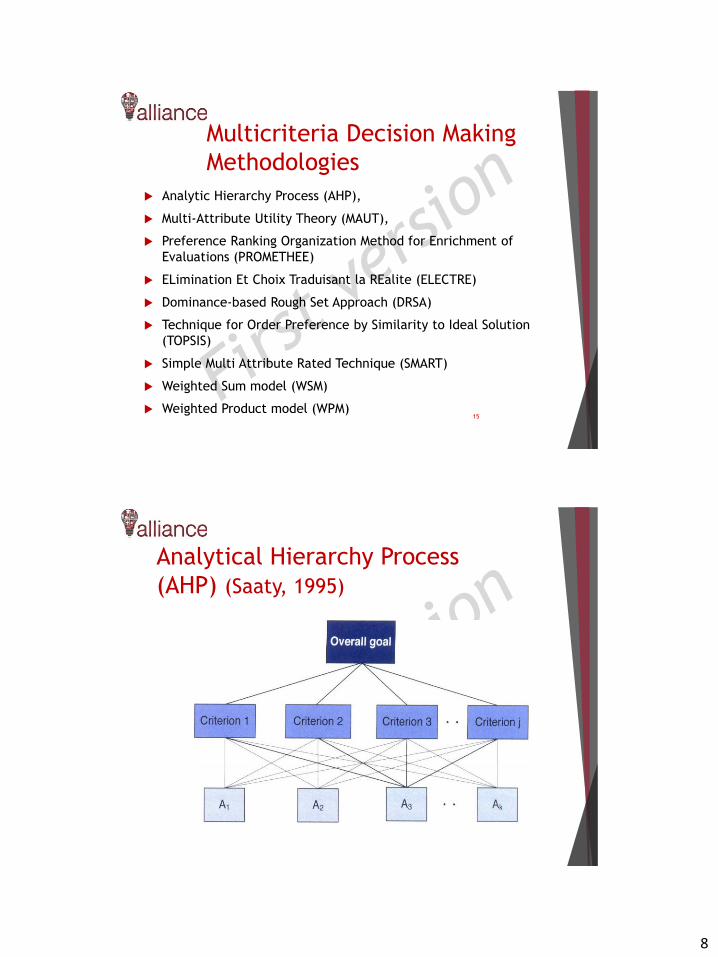
8
Multicriteria Decision Making
Methodologies
Analytic Hierarchy Process (AHP),
Multi-Attribute Utility Theory (MAUT),
Preference Ranking Organization Method for Enrichment of
Evaluations (PROMETHEE)
ELimination Et Choix Traduisant la REalite (ELECTRE)
Dominance-based Rough Set Approach (DRSA)
Technique for Order Preference by Similarity to Ideal Solution
(TOPSIS)
Simple Multi Attribute Rated Technique (SMART)
Weighted Sum model (WSM)
Weighted Product model (WPM)15
Analytical Hierarchy Process
(AHP) (Saaty, 1995)

9
AHP steps
Define criteria
Define indicators for each criterion
Attribute comparative importance in pairs
Select alternatives
Estimate impacts = quantify measures
Compare alternatives performance for each criterion
Measures of Performance (MoP) -
Criteria
Criterion 1 Criterion 2 Criterion 3 … Criterion m
Measure 1
Measure 2
Measure 3
Measure n
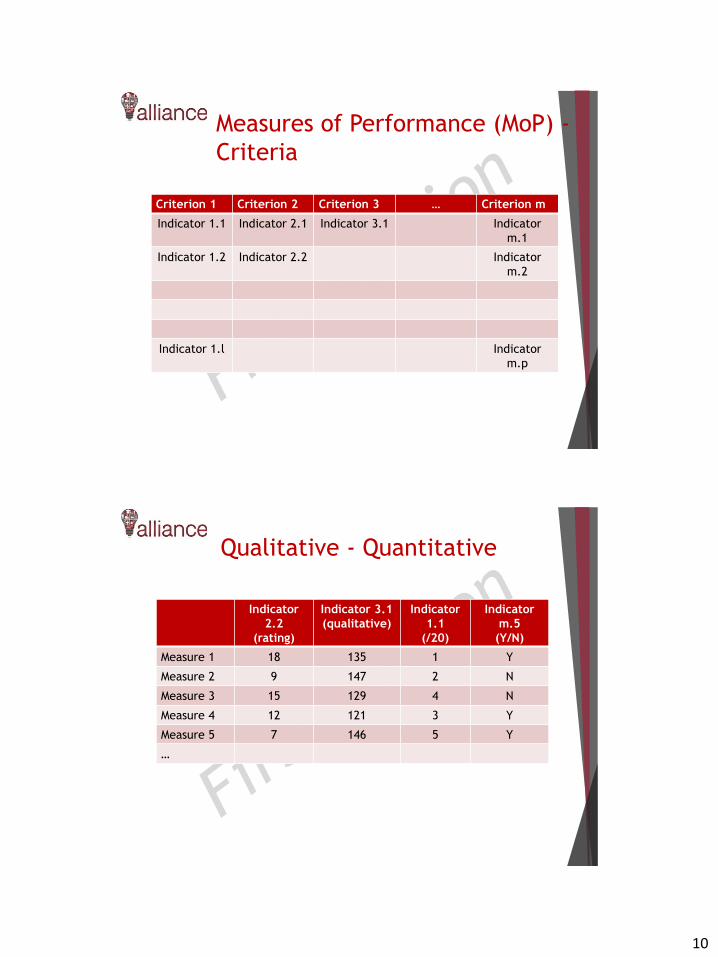
10
Measures of Performance (MoP) -
Criteria
Criterion 1 Criterion 2 Criterion 3 … Criterion m
Indicator 1.1 Indicator 2.1 Indicator 3.1 Indicator
m.1
Indicator 1.2 Indicator 2.2 Indicator
m.2
Indicator 1.l Indicator
m.p
Qualitative - Quantitative
Indicator
2.2
(rating)
Indicator 3.1
(qualitative)
Indicator
1.1
(/20)
Indicator
m.5
(Y/N)
Measure 1 18 135 1 Y
Measure 2 9 147 2 N
Measure 3 15 129 4 N
Measure 4 12 121 3 Y
Measure 5 7 146 5 Y
…
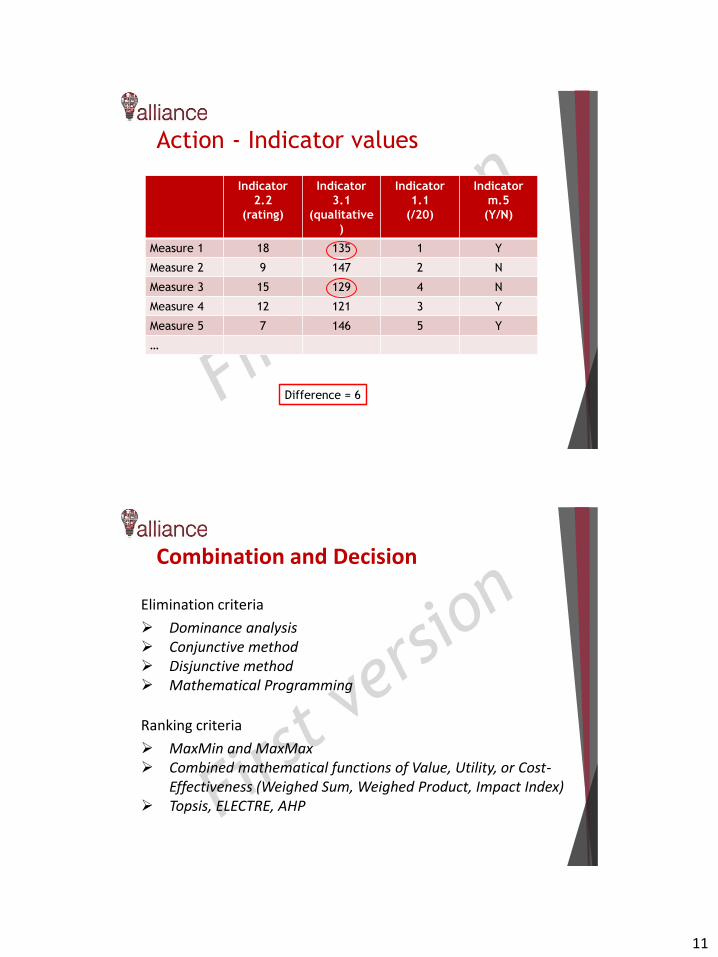
11
Action - Indicator values
Indicator
2.2
(rating)
Indicator
3.1
(qualitative
)
Indicator
1.1
(/20)
Indicator
m.5
(Y/N)
Measure 1 18 135 1 Y
Measure 2 9 147 2 N
Measure 3 15 129 4 N
Measure 4 12 121 3 Y
Measure 5 7 146 5 Y
…
Difference = 6
Elimination criteria
Dominance analysis Conjunctive method Disjunctive method Mathematical Programming
Ranking criteria
MaxMin and MaxMax Combined mathematical functions of Value, Utility, or Cost-
Effectiveness (Weighed Sum, Weighed Product, Impact Index) Topsis, ELECTRE, AHP
Combination and Decision
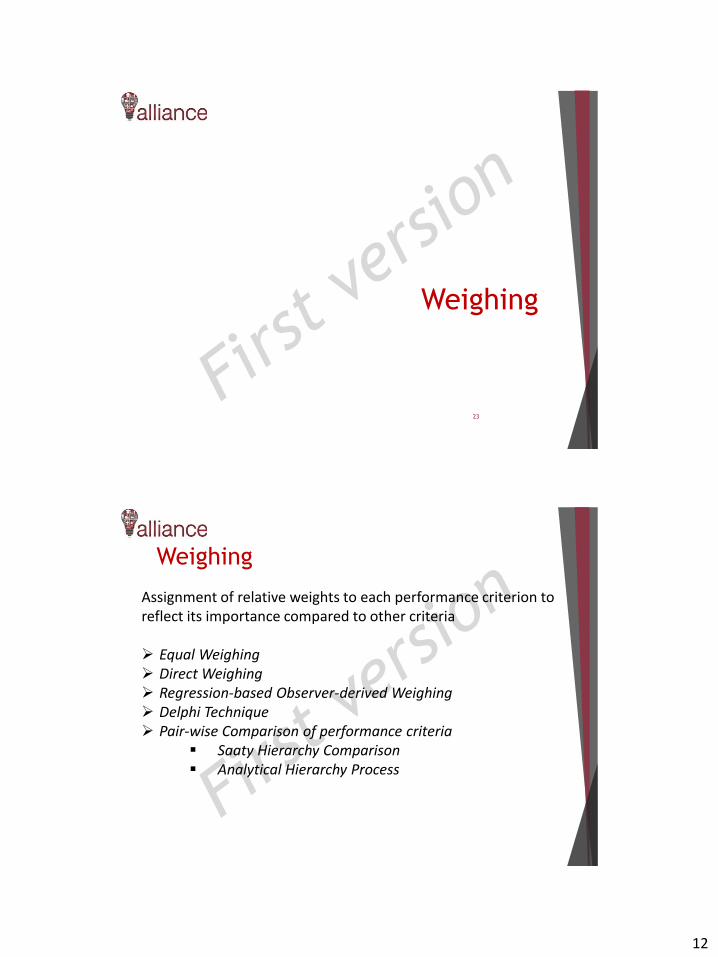
12
Weighing
23
Assignment of relative weights to each performance criterion to reflect its importance compared to other criteria
Equal Weighing Direct Weighing Regression-based Observer-derived Weighing Delphi Technique Pair-wise Comparison of performance criteria
Saaty Hierarchy Comparison Analytical Hierarchy Process
Weighing
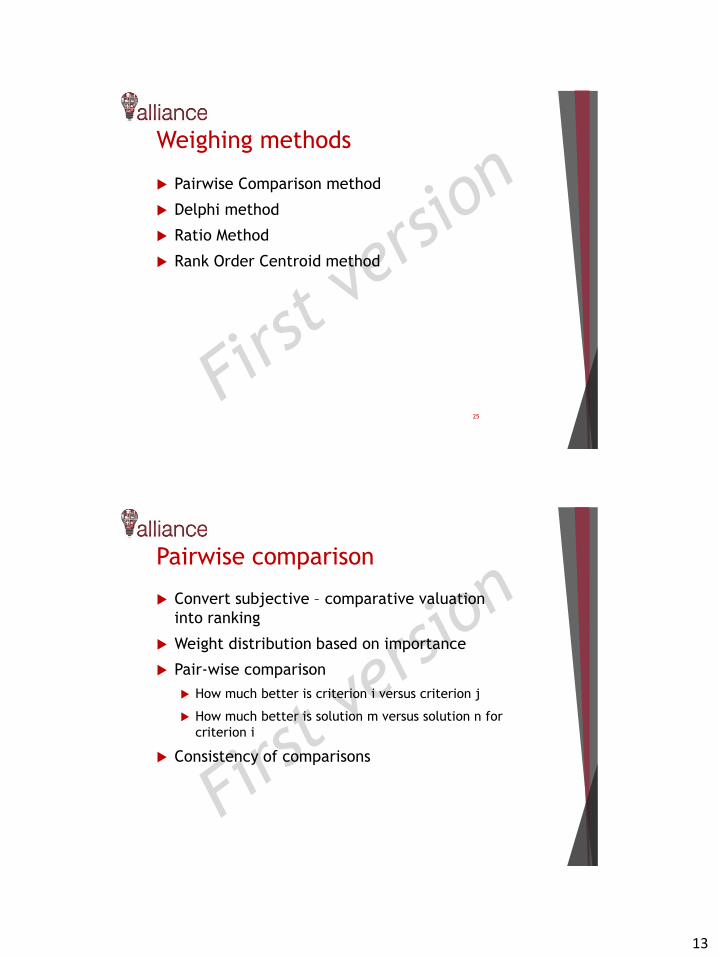
13
Weighing methods
Pairwise Comparison method
Delphi method
Ratio Method
Rank Order Centroid method
25
Pairwise comparison
Convert subjective – comparative valuation
into ranking
Weight distribution based on importance
Pair-wise comparison
How much better is criterion i versus criterion j
How much better is solution m versus solution n for
criterion i
Consistency of comparisons
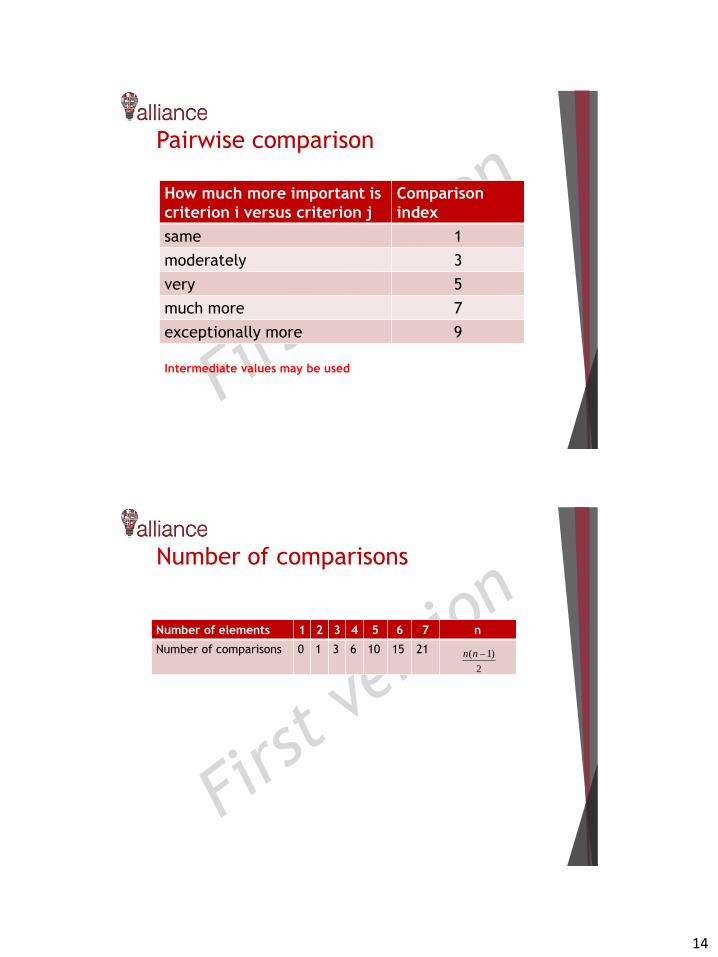
14
Pairwise comparison
How much more important is
criterion i versus criterion j
Comparison
index
same 1
moderately 3
very 5
much more 7
exceptionally more 9
Intermediate values may be used
Number of comparisons
Number of elements 1 2 3 4 5 6 7 n
Number of comparisons 0 1 3 6 10 15 21
2
)1( nn
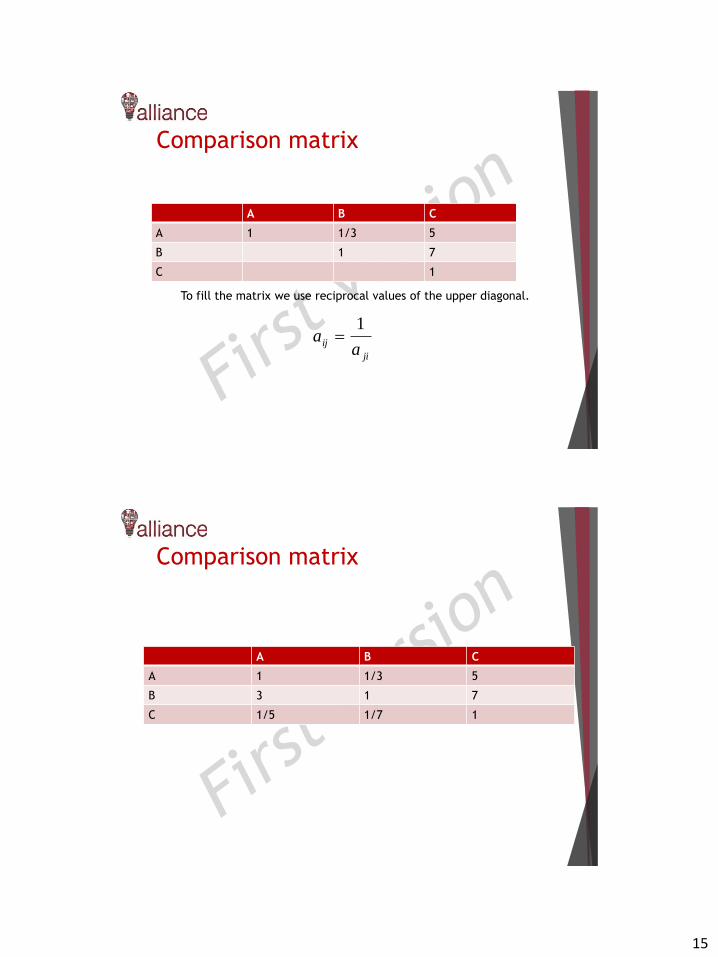
15
Comparison matrix
A B C
A 1 1/3 5
B 1 7
C 1
To fill the matrix we use reciprocal values of the upper diagonal.
aij 1
a ji
Comparison matrix
A B C
A 1 1/3 5
B 3 1 7
C 1/5 1/7 1
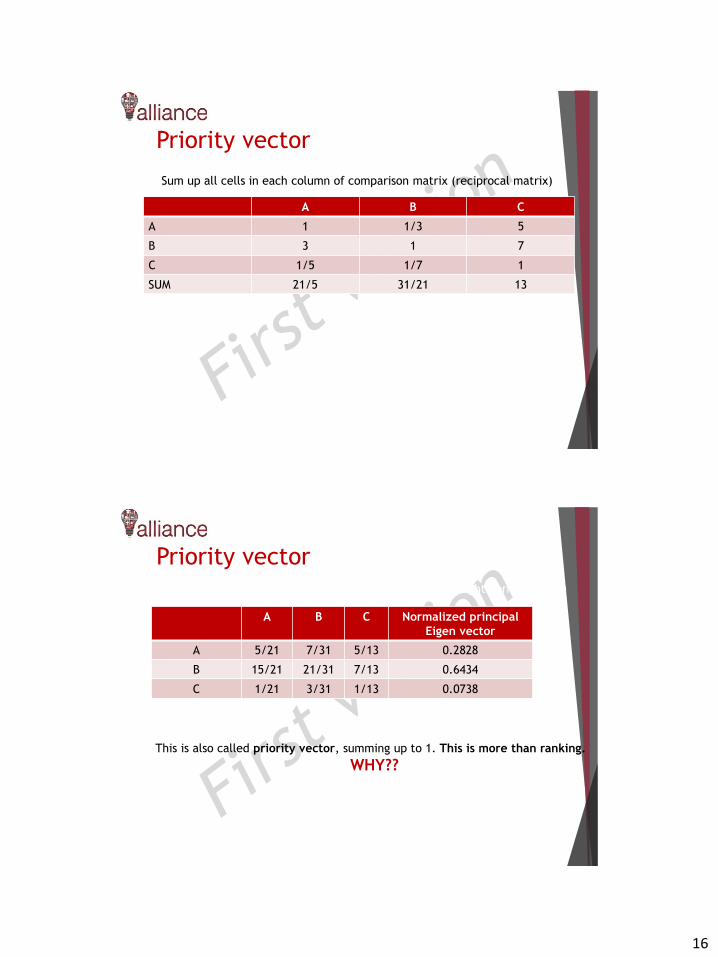
16
Priority vector
A B C
A 1 1/3 5
B 3 1 7
C 1/5 1/7 1
SUM 21/5 31/21 13
Sum up all cells in each column of comparison matrix (reciprocal matrix)
Priority vector
A B C Normalized principal
Eigen vector
A 5/21 7/31 5/13 0.2828
B 15/21 21/31 7/13 0.6434
C 1/21 3/31 1/13 0.0738
Divide each element with the sum of its column (weight normalization)
This is also called priority vector, summing up to 1. This is more than ranking.
WHY??
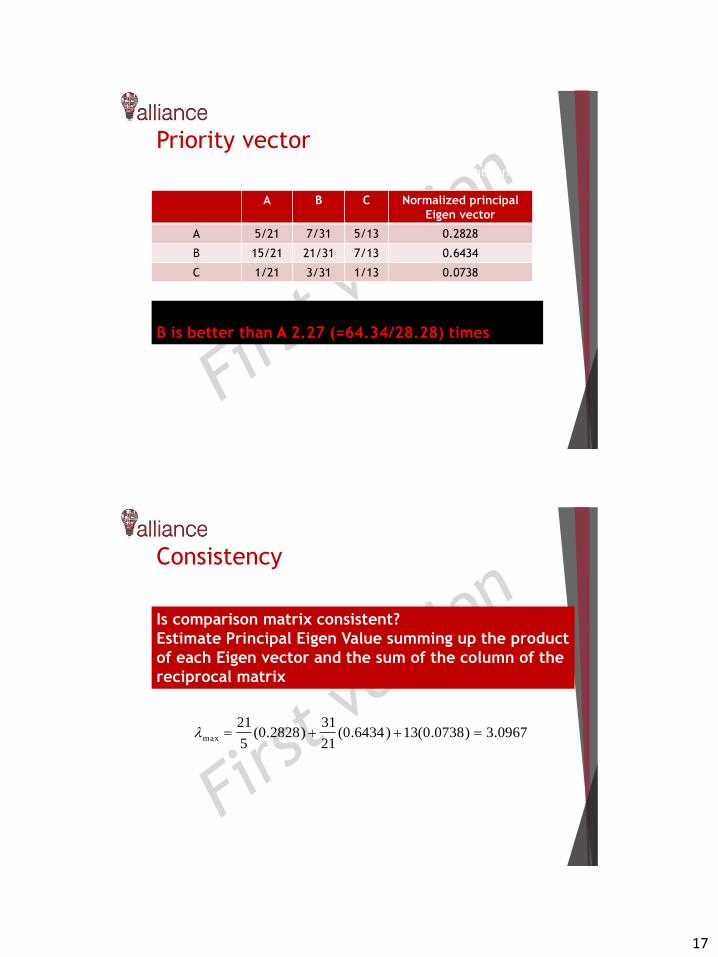
17
Priority vector
A B C Normalized principal
Eigen vector
A 5/21 7/31 5/13 0.2828
B 15/21 21/31 7/13 0.6434
C 1/21 3/31 1/13 0.0738
Divide each element with the sum of its column (weight normalization)
B is better than A 2.27 (=64.34/28.28) times
Consistency
Is comparison matrix consistent?
Estimate Principal Eigen Value summing up the product
of each Eigen vector and the sum of the column of the
reciprocal matrix
max 21
5(0.2828)
31
21(0.6434) 13(0.0738) 3.0967

18
Consistency Index and
Consistency Ratio
If B > A and A > C
Then it is expected that B > C (transitive property)
It is proven that for n = size of matrix
Consistency index: nmax
CI max n
n 1
3.0967 3
2 0.0484
CI Comparison
CI is compared versus the average
consistency index of 500 matrices,
randomly generated, the Random
Consistency Index (RI)
n 1 2 3 4 5 6 7 8 9 10
RI 0 0 0.58 0.9 1.12 1.24 1.32 1.41 1.45 1.49
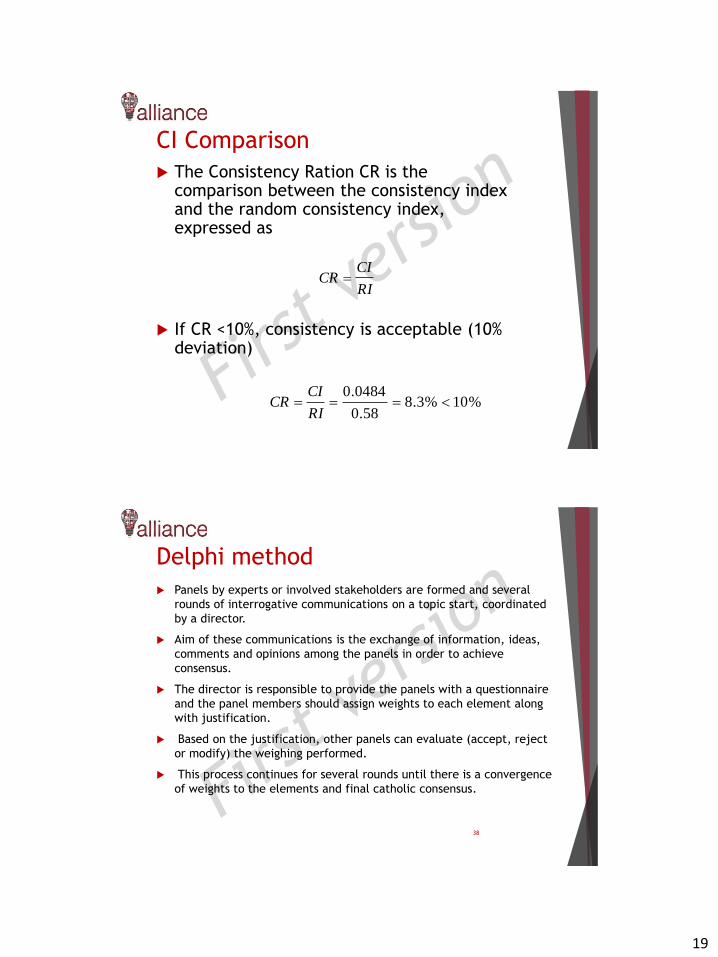
19
CI Comparison
The Consistency Ration CR is thecomparison between the consistency indexand the random consistency index,expressed as
If CR <10%, consistency is acceptable (10%deviation)
CR CI
RI
CR CI
RI
0.0484
0.58 8.3% 10%
Delphi method
Panels by experts or involved stakeholders are formed and several
rounds of interrogative communications on a topic start, coordinated
by a director.
Aim of these communications is the exchange of information, ideas,
comments and opinions among the panels in order to achieve
consensus.
The director is responsible to provide the panels with a questionnaire
and the panel members should assign weights to each element along
with justification.
Based on the justification, other panels can evaluate (accept, reject
or modify) the weighing performed.
This process continues for several rounds until there is a convergence
of weights to the elements and final catholic consensus.
38
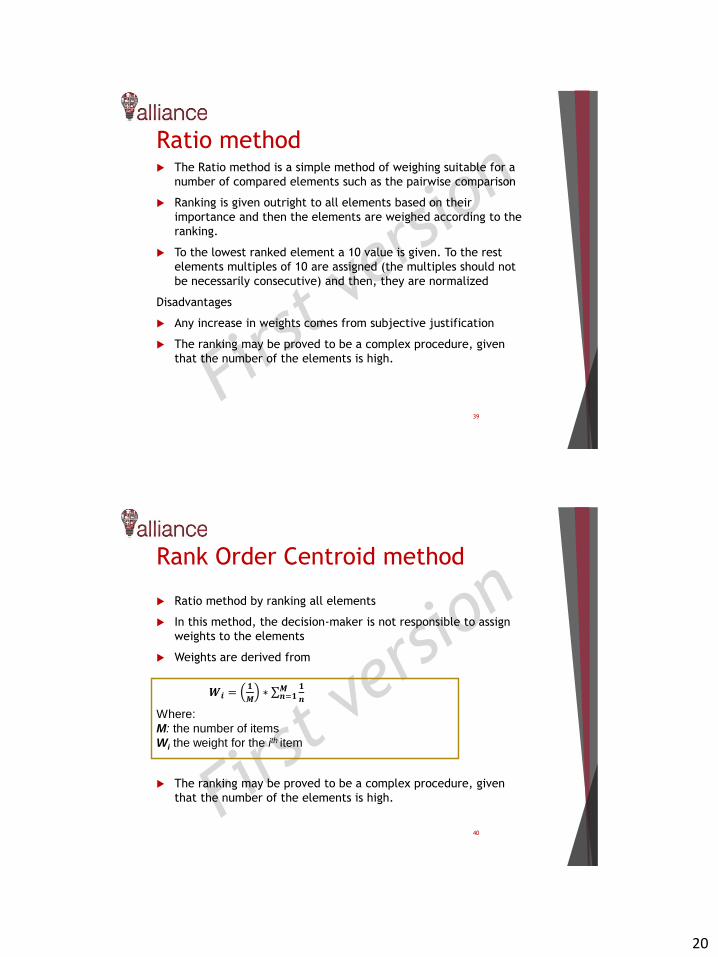
20
Ratio method The Ratio method is a simple method of weighing suitable for a
number of compared elements such as the pairwise comparison
Ranking is given outright to all elements based on their
importance and then the elements are weighed according to the
ranking.
To the lowest ranked element a 10 value is given. To the rest
elements multiples of 10 are assigned (the multiples should not
be necessarily consecutive) and then, they are normalized
Disadvantages
Any increase in weights comes from subjective justification
The ranking may be proved to be a complex procedure, given
that the number of the elements is high.
39
Rank Order Centroid method
Ratio method by ranking all elements
In this method, the decision-maker is not responsible to assign
weights to the elements
Weights are derived from
The ranking may be proved to be a complex procedure, given
that the number of the elements is high.
40
𝑾𝒊 =𝟏
𝑴∗ 𝒏=𝟏
𝑴 𝟏
𝒏
Where:
M: the number of items
Wi the weight for the ith item
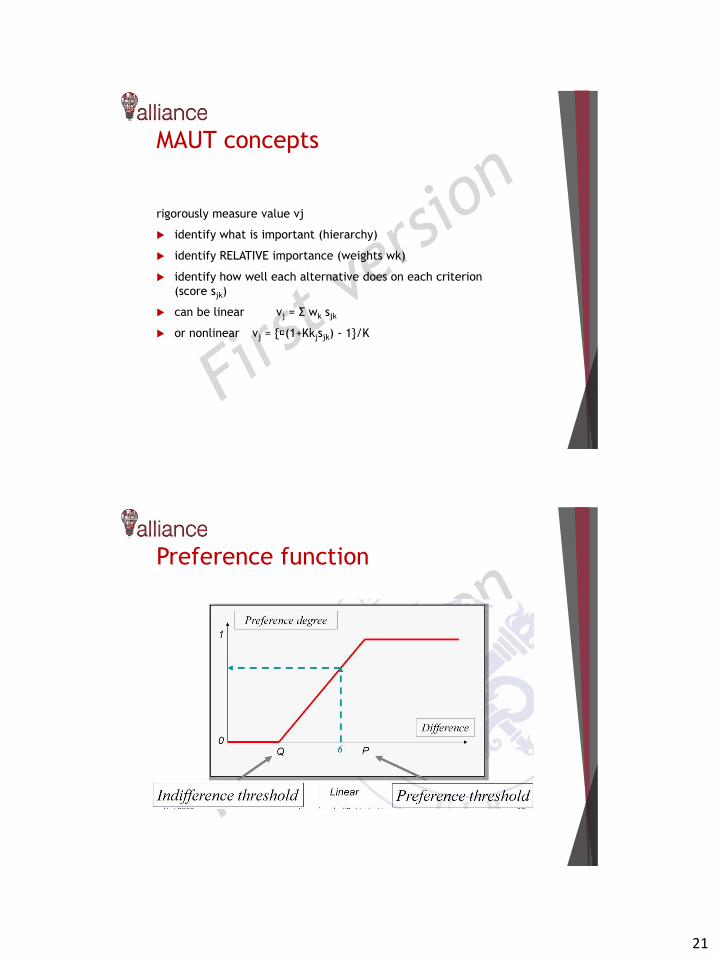
21
MAUT concepts
rigorously measure value vj
identify what is important (hierarchy)
identify RELATIVE importance (weights wk)
identify how well each alternative does on each criterion
(score sjk)
can be linear vj = Σ wk sjk
or nonlinear vj = { (1+Kkjsjk) - 1}/K
Preference function
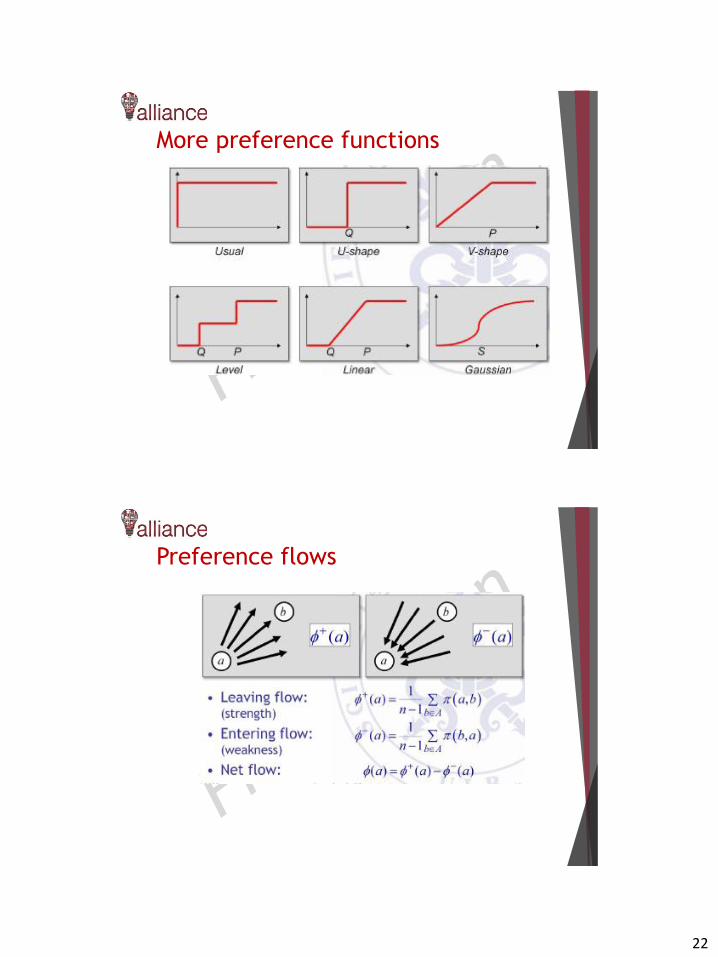
22
More preference functions
Preference flows

23
Normalization
45
Scaling or normalization
Using indicators of different context, nature and values
in a common assessment methodology, requires
establishment of a commensurate scale, thus making
indicator values dimensionless.
Data normalization consists of rescaling the attribute
values of the data into a single specified range, such as
from 0 to 1 or from 0 to 100.

24
Normalization techniques (1/3)
Normalization by comparison with the best alternative
𝒓𝒊𝒋 =𝑰𝒊𝒋
𝒎𝒂𝒙𝒋𝑰𝒊𝒋
Classic normalization
𝒓𝒊𝒋 =𝑰𝒊𝒋
𝒋=𝟏𝒎 𝑰𝒊𝒋
47
Normalization techniques (2/3)
Max and min normalization
𝒓𝒊𝒋 =𝑰𝒊𝒋−𝒎𝒊𝒏𝒋𝑰𝒊𝒋
𝒎𝒂𝒙𝒋𝑰𝒊𝒋−𝒎𝒊𝒏𝒋𝑰𝒊𝒋
Vector normalization
𝒓𝒊𝒋 =𝑰𝒊𝒋
𝒋=𝟏𝒏 𝑰𝒊𝒋
𝟐
Statistical z score
𝒓𝒊𝒋 = 𝒆𝒙𝒑−𝒛𝟐/𝟐,𝐰𝐡𝐞𝐫𝐞 𝒛 =(𝑰𝒊𝒋−𝑰𝒊
𝟎)
𝝈𝒊48
25
Normalization techniques (3/3)
Different MCDM methods prefer their specific methods
of normalization.
Different normalization techniques have been used in
transportation given different needs and data
availability.
Indicators have a positive (+) impact, or a negative (-)
impact; the larger the absolute value of the indicator
is, the more positive or negative impact it has in the
assessment of alternatives. Usually, in MCDMs both
types of indicators are used.
49
Cost benefit analysis
and social cost benefit
50
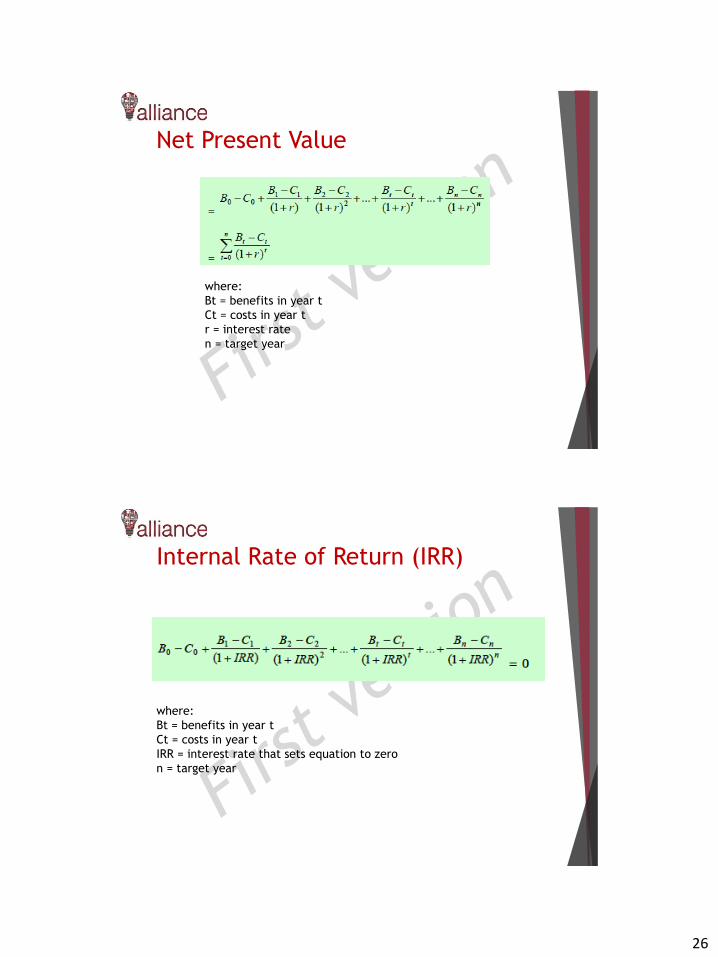
26
Net Present Value
where:
Bt = benefits in year t
Ct = costs in year t
r = interest rate
n = target year
Internal Rate of Return (IRR)
where:
Bt = benefits in year t
Ct = costs in year t
IRR = interest rate that sets equation to zero
n = target year
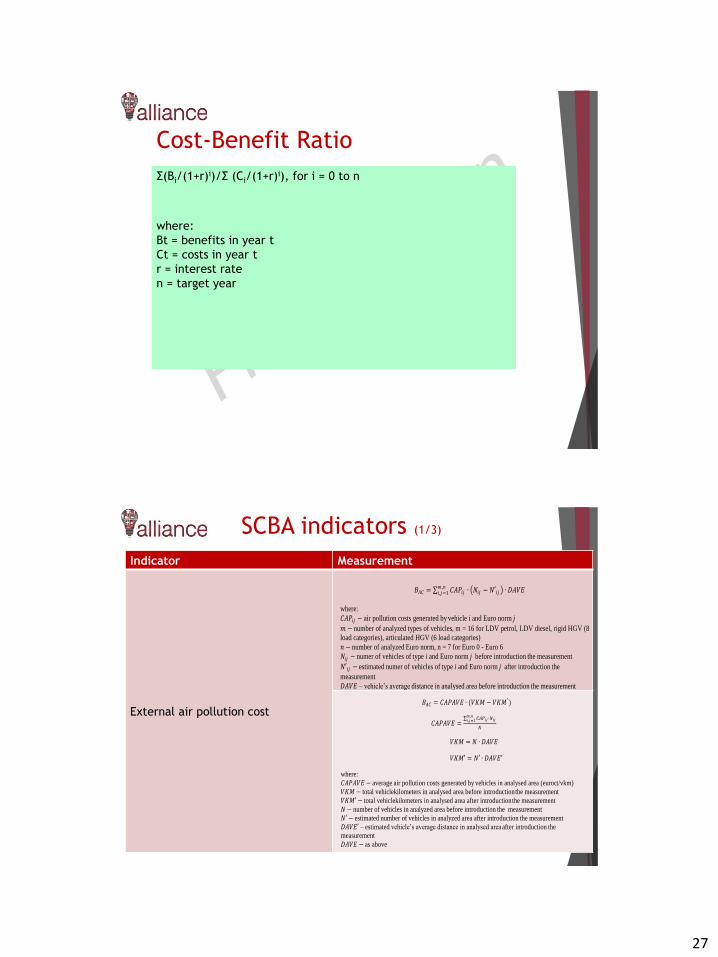
27
Cost-Benefit Ratio
Σ(Bi/(1+r)i)/Σ (Ci/(1+r)i), for i = 0 to n
where:
Bt = benefits in year t
Ct = costs in year t
r = interest rate
n = target year
SCBA indicators (1/3)
Indicator Measurement
External air pollution cost
𝐵𝐴𝐶 = 𝐶𝐴𝑃𝑖𝑗 ∙ 𝑁𝑖𝑗 − 𝑁′𝑖𝑗 𝑚 ,𝑛𝑖 ,𝑗=1 ∙ 𝐷𝐴𝑉𝐸
where:
𝐶𝐴𝑃𝑖𝑗 − air pollution costs generated by vehicle i and Euro norm j
𝑚 − number of analyzed types of vehicles, m = 16 for LDV petrol, LDV diesel, rigid HGV (8
load categories), articulated HGV (6 load categories)
𝑛 − number of analyzed Euro norm, n = 7 for Euro 0 - Euro 6
𝑁𝑖𝑗 − numer of vehicles of type i and Euro norm j before introduction the measurement
𝑁′𝑖𝑗 − estimated numer of vehicles of type i and Euro norm j after introduction the
measurement
𝐷𝐴𝑉𝐸 – vehicle’s average distance in analysed area before introduction the measurement
𝐵𝐴𝐶 = 𝐶𝐴𝑃𝐴𝑉𝐸 ∙ (𝑉𝐾𝑀 − 𝑉𝐾𝑀′)
𝐶𝐴𝑃𝐴𝑉𝐸 = 𝐶𝐴𝑃𝑖𝑗 ∙𝑁𝑖𝑗
𝑚 ,𝑛𝑖 ,𝑗=1
𝑁
𝑉𝐾𝑀 = 𝑁 ∙ 𝐷𝐴𝑉𝐸
𝑉𝐾𝑀′ = 𝑁′ ∙ 𝐷𝐴𝑉𝐸′
where:
𝐶𝐴𝑃𝐴𝑉𝐸 − average air pollution costs generated by vehicles in analysed area (euroct/vkm)
𝑉𝐾𝑀 − total vehiclekilometers in analysed area before introduction the measurement
𝑉𝐾𝑀′ − total vehiclekilometers in analysed area after introduction the measurement
𝑁 − number of vehicles in analyzed area before introduction the measurement
𝑁′ − estimated number of vehicles in analyzed area after introduction the measurement
𝐷𝐴𝑉𝐸′ – estimated vehicle’s average distance in analysed area after introduction the
measurement
𝐷𝐴𝑉𝐸 − as above
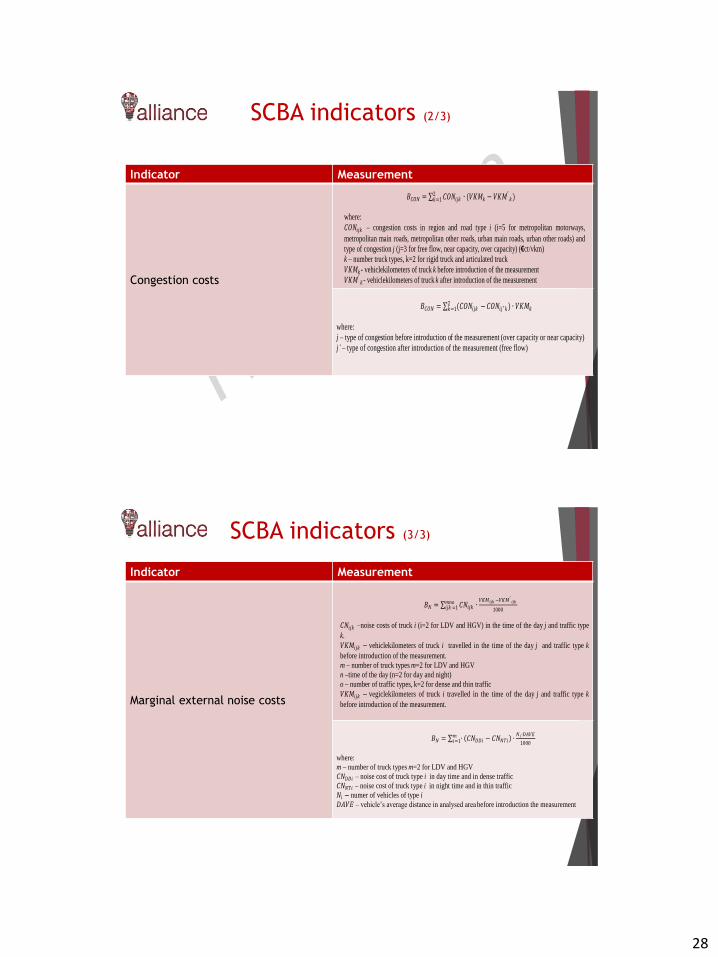
28
SCBA indicators (2/3)
Indicator Measurement
Congestion costs
𝐵𝐶𝑂𝑁 = 𝐶𝑂𝑁𝑖𝑗𝑘2𝑘=1 ∙ (𝑉𝐾𝑀𝑘 − 𝑉𝐾𝑀′
𝑘)
where:
𝐶𝑂𝑁𝑖𝑗𝑘 – congestion costs in region and road type i (i=5 for metropolitan motorways,
metropolitan main roads, metropolitan other roads, urban main roads, urban other roads) and
type of congestion j (j=3 for free flow, near capacity, over capacity) (€ct/vkm)
k – number truck types, k=2 for rigid truck and articulated truck
𝑉𝐾𝑀𝑘- vehiclekilometers of truck k before introduction of the measurement
𝑉𝐾𝑀′𝑘 - vehiclekilometers of truck k after introduction of the measurement
𝐵𝐶𝑂𝑁 = (𝐶𝑂𝑁𝑖𝑗𝑘 −2𝑘=1 𝐶𝑂𝑁𝑖𝑗 ′𝑘) ∙ 𝑉𝐾𝑀𝑘
where:
j – type of congestion before introduction of the measurement (over capacity or near capacity)
j’ – type of congestion after introduction of the measurement (free flow)
SCBA indicators (3/3)
Indicator Measurement
Marginal external noise costs
𝐵𝑁 = 𝐶𝑁𝑖𝑗𝑘𝑚𝑛𝑜𝑖𝑗𝑘 =1 ∙
𝑉𝐾𝑀𝑖𝑗𝑘 −𝑉𝐾𝑀′𝑖𝑗𝑘
1000
𝐶𝑁𝑖𝑗𝑘 –noise costs of truck i (i=2 for LDV and HGV) in the time of the day j and traffic type
k.
𝑉𝐾𝑀𝑖𝑗𝑘 − vehiclekilometers of truck i travelled in the time of the day j and traffic type k
before introduction of the measurement.
m – number of truck types m=2 for LDV and HGV
n –time of the day (n=2 for day and night)
o – number of traffic types, k=2 for dense and thin traffic
𝑉𝐾𝑀𝑖𝑗𝑘 − vegiclekilometers of truck i travelled in the time of the day j and traffic type k
before introduction of the measurement.
𝐵𝑁 = ∙ 𝐶𝑁𝐷𝐷𝑖 − 𝐶𝑁𝑁𝑇𝑖 𝑚𝑖=1 ∙
𝑁𝑖 ∙𝐷𝐴𝑉𝐸
1000
where:
m – number of truck types m=2 for LDV and HGV
𝐶𝑁𝐷𝐷𝑖 – noise cost of truck type i in day time and in dense traffic
𝐶𝑁𝑁𝑇𝑖 – noise cost of truck type i in night time and in thin traffic
𝑁𝑖 − numer of vehicles of type i
𝐷𝐴𝑉𝐸 – vehicle’s average distance in analysed area before introduction the measurement
29
Adaptability and
transferability
57
Adaptability and transferability
• Identification of factors defining the approach for the UFT
measures implementation process.
• Preparation of assumptions for the goal identification in UFT
implementation.
• Preparation of the assumptions for proper selection of measures to
be adapted.
• Establishing the requirements for utilization of adaptability index
for the evaluation of implementation of good practices
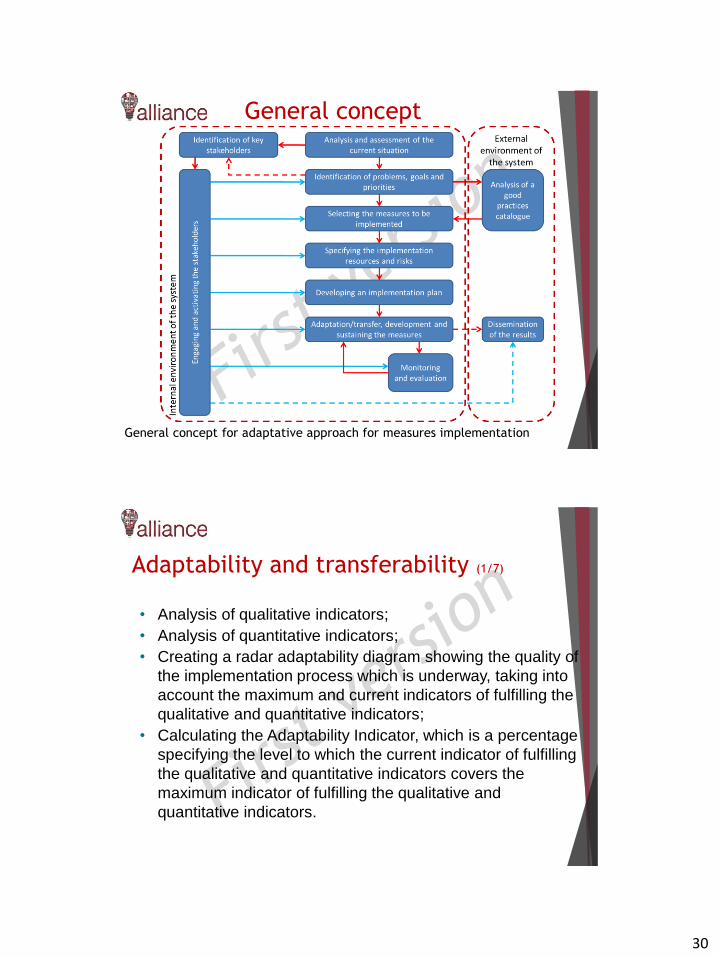
30
General concept
General concept for adaptative approach for measures implementation
Adaptability and transferability (1/7)
• Analysis of qualitative indicators;
• Analysis of quantitative indicators;
• Creating a radar adaptability diagram showing the quality of
the implementation process which is underway, taking into
account the maximum and current indicators of fulfilling the
qualitative and quantitative indicators;
• Calculating the Adaptability Indicator, which is a percentage
specifying the level to which the current indicator of fulfilling
the qualitative and quantitative indicators covers the
maximum indicator of fulfilling the qualitative and
quantitative indicators.
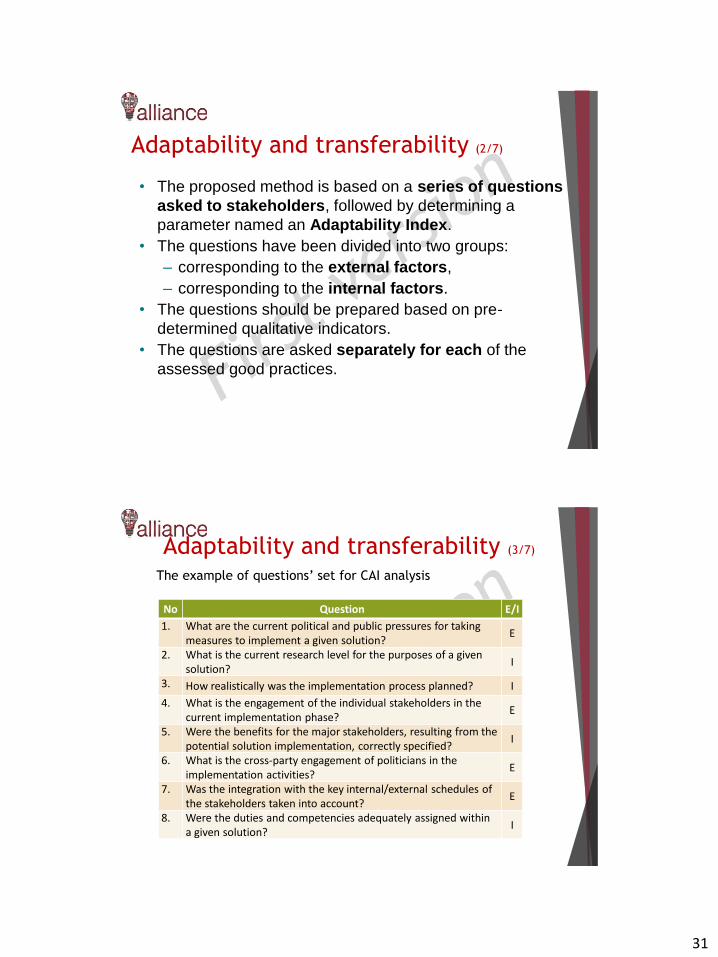
31
Adaptability and transferability (2/7)
• The proposed method is based on a series of questions
asked to stakeholders, followed by determining a
parameter named an Adaptability Index.
• The questions have been divided into two groups:
– corresponding to the external factors,
– corresponding to the internal factors.
• The questions should be prepared based on pre-
determined qualitative indicators.
• The questions are asked separately for each of the
assessed good practices.
The example of questions’ set for CAI analysis
No Question E/I
1. What are the current political and public pressures for taking measures to implement a given solution?
E
2. What is the current research level for the purposes of a given solution?
I
3. How realistically was the implementation process planned? I
4. What is the engagement of the individual stakeholders in the current implementation phase?
E
5. Were the benefits for the major stakeholders, resulting from the potential solution implementation, correctly specified?
I
6. What is the cross-party engagement of politicians in the implementation activities?
E
7. Was the integration with the key internal/external schedules of the stakeholders taken into account?
E
8. Were the duties and competencies adequately assigned within a given solution?
I
Adaptability and transferability (3/7)
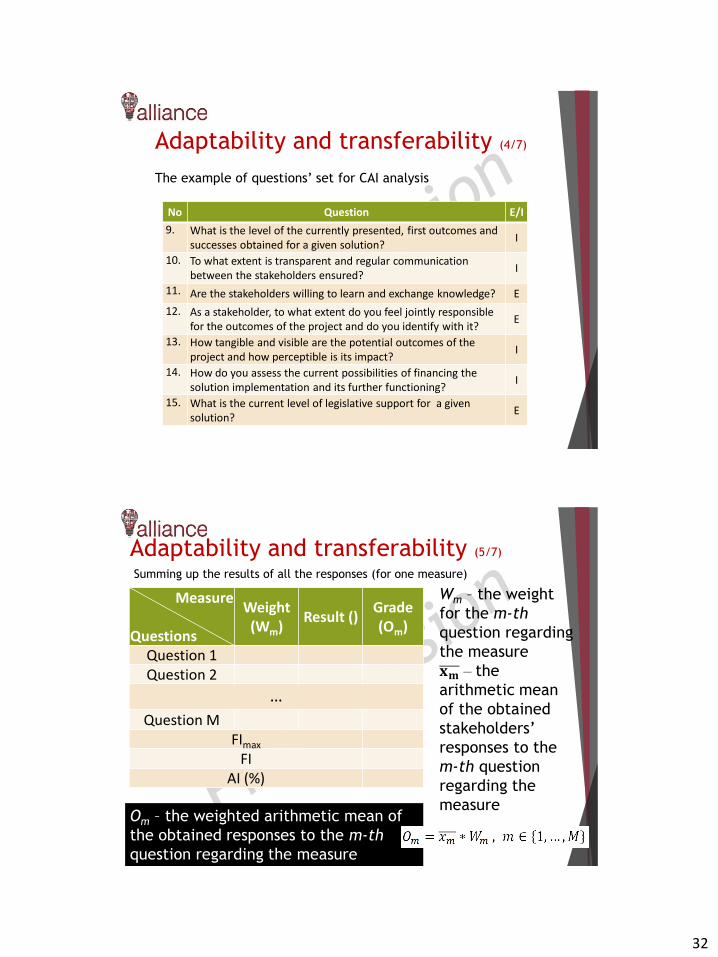
32
The example of questions’ set for CAI analysis
No Question E/I
9. What is the level of the currently presented, first outcomes and successes obtained for a given solution?
I
10. To what extent is transparent and regular communication between the stakeholders ensured?
I
11. Are the stakeholders willing to learn and exchange knowledge? E
12. As a stakeholder, to what extent do you feel jointly responsible for the outcomes of the project and do you identify with it?
E
13. How tangible and visible are the potential outcomes of the project and how perceptible is its impact?
I
14. How do you assess the current possibilities of financing the solution implementation and its further functioning?
I
15. What is the current level of legislative support for a given solution?
E
Adaptability and transferability (4/7)
Summing up the results of all the responses (for one measure)
Measure
Questions
Weight (Wm)
Result ()Grade (Om)
Question 1Question 2
…
Question MFImax
FIAI (%)
Wm – the weight
for the m-th
question regarding
the measure
𝐱𝐦 – the
arithmetic mean
of the obtained
stakeholders’
responses to the
m-th question
regarding the
measureOm – the weighted arithmetic mean of
the obtained responses to the m-th
question regarding the measure
Adaptability and transferability (5/7)
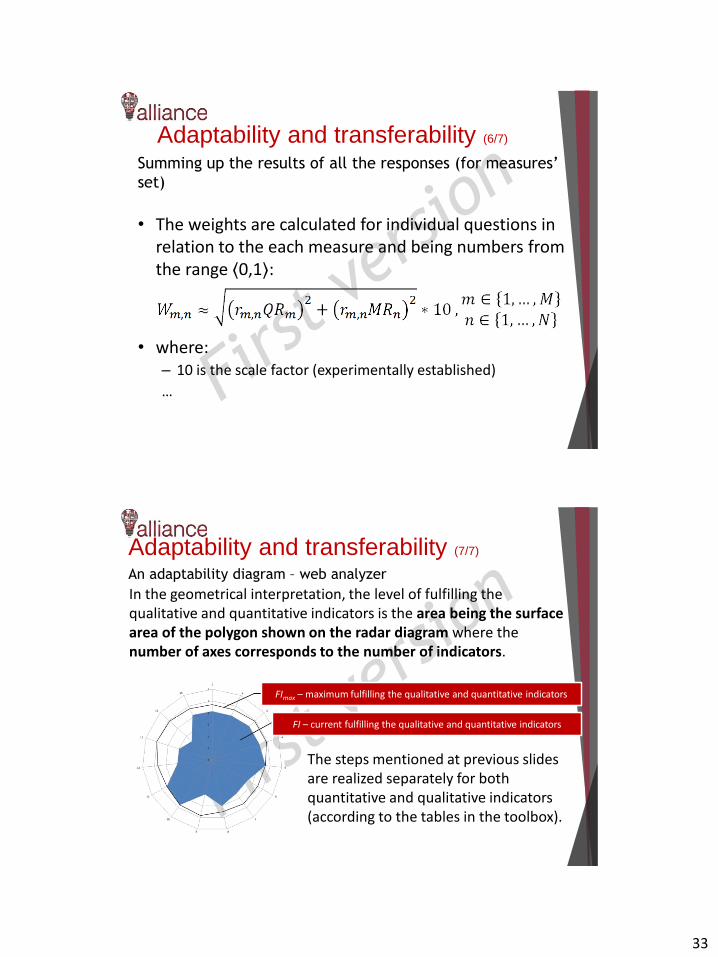
33
• The weights are calculated for individual questions inrelation to the each measure and being numbers fromthe range ⟨0,1⟩:
• where:– 10 is the scale factor (experimentally established)
…
Summing up the results of all the responses (for measures’
set)
Adaptability and transferability (6/7)
In the geometrical interpretation, the level of fulfilling the qualitative and quantitative indicators is the area being the surface area of the polygon shown on the radar diagram where the number of axes corresponds to the number of indicators.
An adaptability diagram – web analyzer
FImax – maximum fulfilling the qualitative and quantitative indicators
FI – current fulfilling the qualitative and quantitative indicators
The steps mentioned at previous slides are realized separately for both quantitative and qualitative indicators (according to the tables in the toolbox).
Adaptability and transferability (7/7)
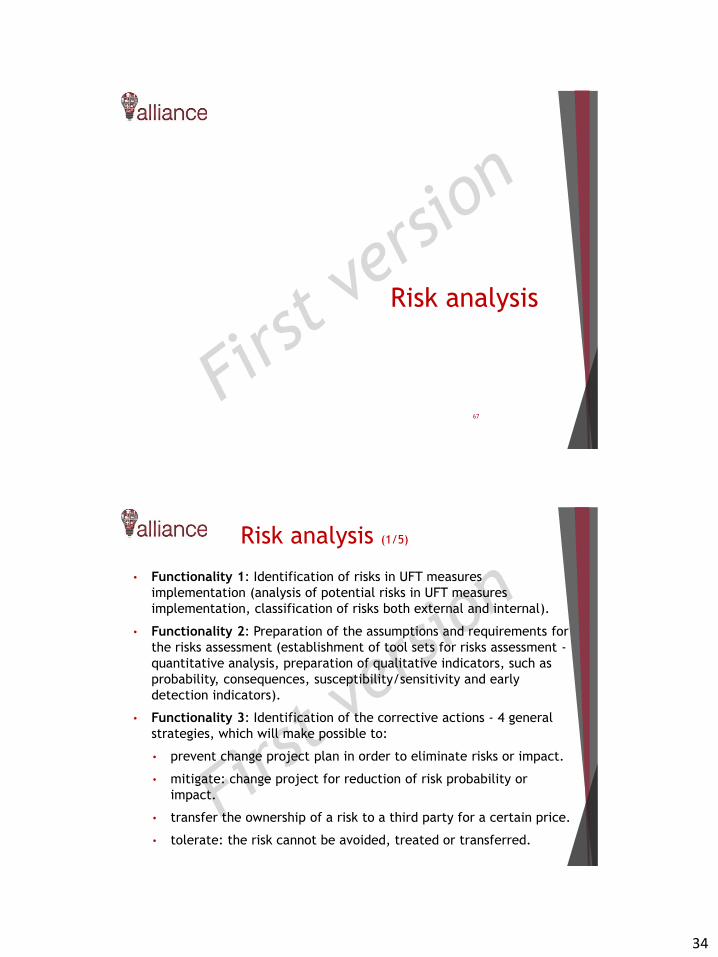
34
Risk analysis
67
Risk analysis (1/5)
• Functionality 1: Identification of risks in UFT measures
implementation (analysis of potential risks in UFT measures
implementation, classification of risks both external and internal).
• Functionality 2: Preparation of the assumptions and requirements for
the risks assessment (establishment of tool sets for risks assessment -
quantitative analysis, preparation of qualitative indicators, such as
probability, consequences, susceptibility/sensitivity and early
detection indicators).
• Functionality 3: Identification of the corrective actions - 4 general
strategies, which will make possible to:
• prevent change project plan in order to eliminate risks or impact.
• mitigate: change project for reduction of risk probability or
impact.
• transfer the ownership of a risk to a third party for a certain price.
• tolerate: the risk cannot be avoided, treated or transferred.
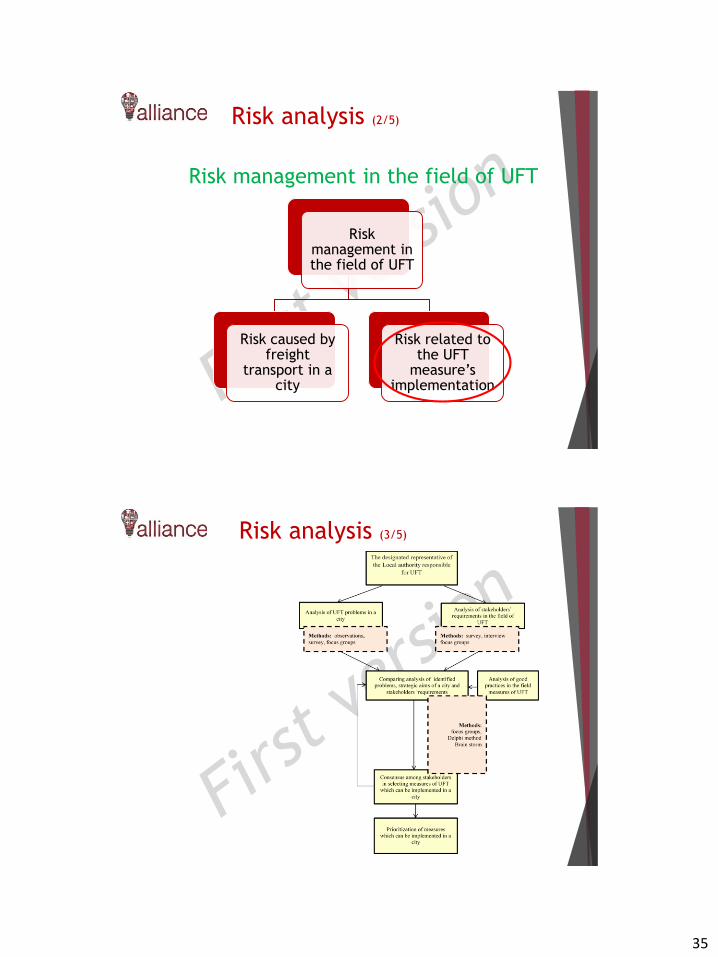
35
Riskmanagement in the field of UFT
Risk caused by freight
transport in a city
Risk related to the UFT
measure’simplementation
Risk analysis (2/5)
Risk management in the field of UFT
Risk analysis (3/5)
The procedure of risk management in the field of Urban Freight Transport

36
Risk analysis (4/5)
The procedure of risk management in the field of Urban Freight Transport
Risk analysis (5/5)
Risk matrix
Ris
k p
rob
ab
ilit
y
Almost
certain
Optional corrective
actions but
monitoring required
Likely
Optional corrective
actions but monitoring
required
Corrective actions and monitoring
of risk factors required
Possible
Optional corrective actions but
monitoring
required
Unlikely
Risk mitigation is not required
Rare
Risk mitigation is
not required
Optional corrective actions but
monitoring
required
Negligible Minor Medium Major Severe
Risk impact

37
Example
73
City logistics[S
ourc
e:
stra
ights
o-p
roje
ct.
eu]

38
Estimating impacts
44%
40%
6%5% 4% 1%
Accident Cost Savings
Time Savings
Emissions / Fuel
Operating Cost Savings
Agency Cost Savings
Other
The sequence of actions
City
Stakeholder
Objectives
Measures
Lifecycle
stage
Weights
Indicators
Criteria
Normalization
Aggregation
Index per impact area,
stakeholder & stage
LSI per
measure
Impact area
Comparative
LSI
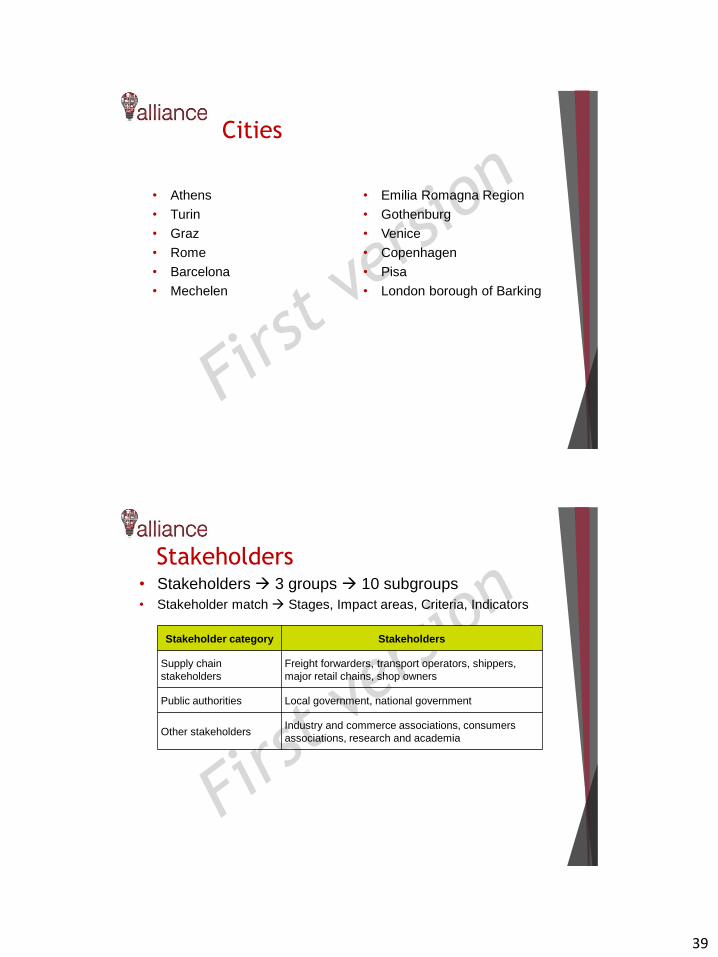
39
• Athens
• Turin
• Graz
• Rome
• Barcelona
• Mechelen
• Emilia Romagna Region
• Gothenburg
• Venice
• Copenhagen
• Pisa
• London borough of Barking
Cities
• Stakeholders 3 groups 10 subgroups
• Stakeholder match Stages, Impact areas, Criteria, Indicators
Stakeholder category Stakeholders
Supply chain
stakeholders
Freight forwarders, transport operators, shippers,
major retail chains, shop owners
Public authorities Local government, national government
Other stakeholders Industry and commerce associations, consumers
associations, research and academia
Stakeholders

40
• Objectives City based
• For example: Athens objectives
Objectives
Pilot Title Integrated rail-road system for urban deliveries
City’s main
objectives
Economic
increase LSP's economic sustainability (revenues vs cost)
increase logistics services quality
Environmental
reduce CO2 emissions
reduce noise emissions
Social
change behaviour towards sustainable UFT
reduce congestion
City's second
level objectives
introduce/adopt ICT/ITS
increase delivery load factor
adopt new business models
provide evidence/incentives for further adoption
Measures
• Measures
22
• Measure
suggestion
• Measure
selection (City
planning)
MEASURES
No. Measure
COOPERATIVE LOGISTICS
1 Multimodality for urban freight
2 Urban consolidation centers
3 Trans-shipment facilities
4 ITS for freight monitoring and planning/routing
5 Home deliveries system
6 E-commerce system for small shops
7 Cargo bikes for B2B and B2C
8 Electric vehicles diffusion in businesses (zero-emission transport)
9 Reverse logistics integration into supply chain
10 Lockers introduction
ADMINISTRATIVE & REGULATORY SCHEMES & INCENTIVES
11 Loading/unloading areas and parking
12 Access: time windows, emission zones
13 Access by load factor
14 Multi-users lanes
15 Enforcement and ITS adoption for control and traffic management
16 Businesses recognition scheme
17 Public transport indirect promotion for shopping
18 Urban planning measures
19 Harmonization and simplification of city logistics rules
20 Off peak deliveries
21 Public transport for freight
22 Freight travel plans
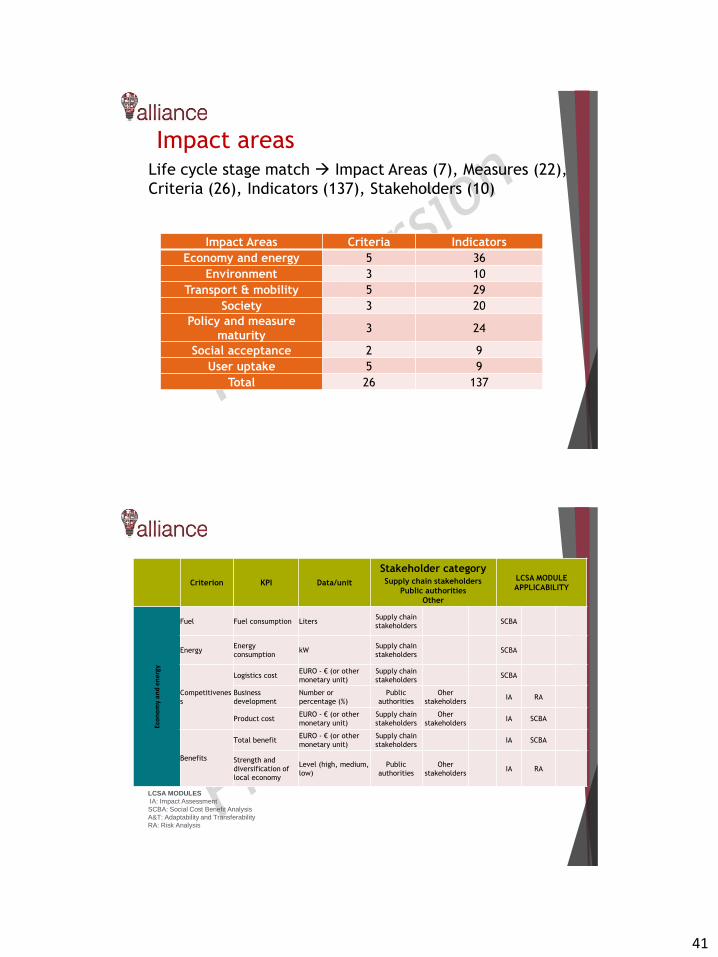
41
Impact areasLife cycle stage match Impact Areas (7), Measures (22),
Criteria (26), Indicators (137), Stakeholders (10)
Impact Areas Criteria Indicators
Economy and energy 5 36
Environment 3 10
Transport & mobility 5 29
Society 3 20
Policy and measure
maturity3 24
Social acceptance 2 9
User uptake 5 9
Total 26 137
Criterion KPI Data/unit
Stakeholder categorySupply chain stakeholders
Public authorities
Other
LCSA MODULE
APPLICABILITY
Eco
no
my
and
en
ergy
Fuel Fuel consumption LitersSupply chain
stakeholdersSCBA
EnergyEnergy
consumptionkW
Supply chain
stakeholdersSCBA
Competitivenes
s
Logistics costEURO - € (or other
monetary unit)
Supply chain
stakeholdersSCBA
Business
development
Number or
percentage (%)
Public
authorities
Oher
stakeholdersIA RA
Product costEURO - € (or other
monetary unit)
Supply chain
stakeholders
Oher
stakeholdersIA SCBA
Benefits
Total benefitEURO - € (or other
monetary unit)
Supply chain
stakeholdersIA SCBA
Strength and
diversification of
local economy
Level (high, medium,
low)
Public
authorities
Oher
stakeholdersIA RA
LCSA MODULES
IA: Impact Assessment
SCBA: Social Cost Benefit Analysis
A&T: Adaptability and Transferability
RA: Risk Analysis
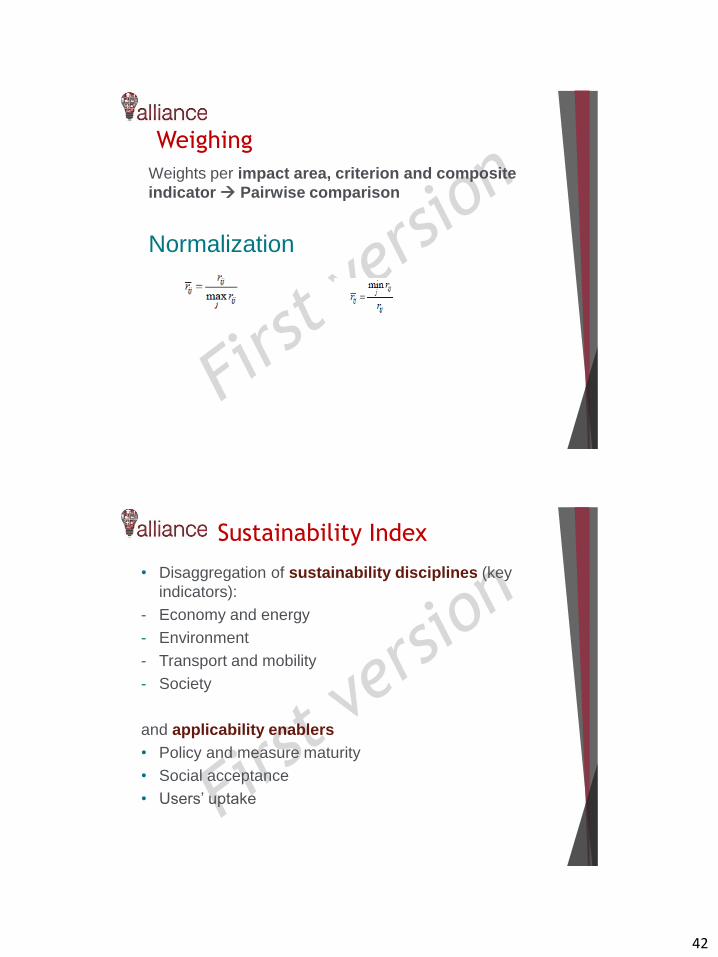
42
Weighing
Weights per impact area, criterion and composite
indicator Pairwise comparison
Normalization
Sustainability Index
• Disaggregation of sustainability disciplines (key
indicators):
- Economy and energy
- Environment
- Transport and mobility
- Society
and applicability enablers
• Policy and measure maturity
• Social acceptance
• Users’ uptake
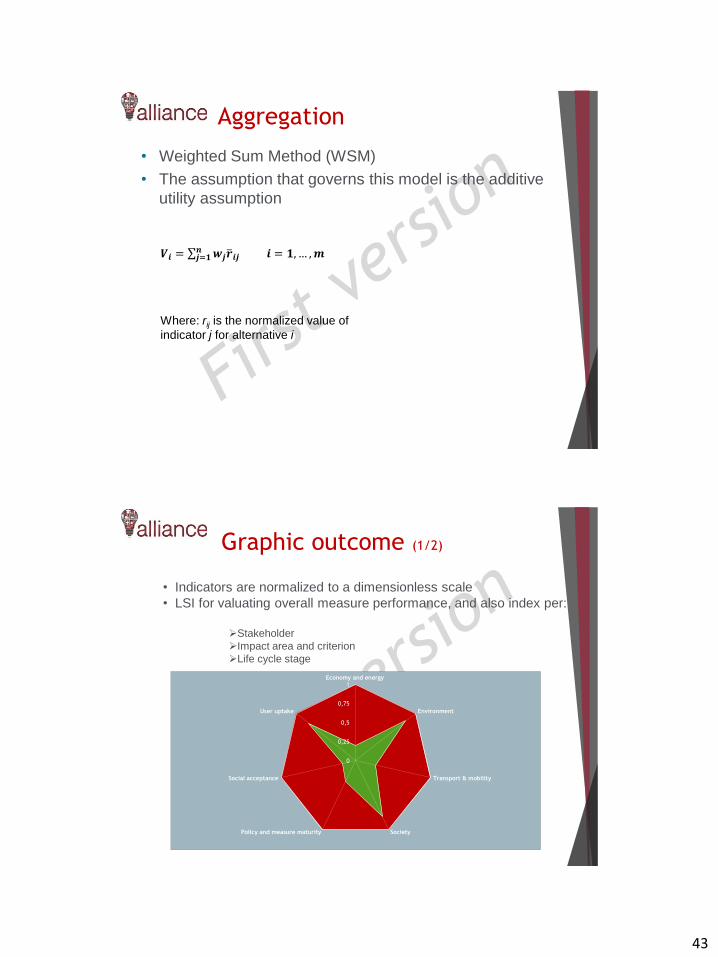
43
Aggregation
• Weighted Sum Method (WSM)
• The assumption that governs this model is the additive
utility assumption
𝑽𝒊 = 𝒋=𝟏𝒏 𝒘𝒋 𝒓𝒊𝒋 𝒊 = 𝟏,… ,𝒎
Where: rij is the normalized value of
indicator j for alternative i
• Indicators are normalized to a dimensionless scale
• LSI for valuating overall measure performance, and also index per:
Stakeholder
Impact area and criterion
Life cycle stage
0
0,25
0,5
0,75
1Economy and energy
Environment
Transport & mobility
SocietyPolicy and measure maturity
Social acceptance
User uptake
Graphic outcome (1/2)

44
• Comparative analysis
• Proportion of optimum (max sustainability) levels the
measure covers (% of area)
• Proportional difference between measures
• Degree of convergence between measures (similarity &
difference = convergence)
0
0,25
0,5
0,75
1Economy and energy
Environment
Transport & mobility
SocietyPolicy and measure maturity
Social acceptance
User uptake
Graphic outcome (2/2)
References
NIJKAMP, P., RIETVELD, P. and VOOGD, H., (1990). Multi-criteria Evaluation in
Physical Planning, Elsevier Science, Amsterdam.
Urban Transportation Planning. Michael D.Meyer, Eric J.Miller, 2001, New York, The
McGraw-Hill Companies, Inc..
Glenaffric Ltd (2007) Six Steps to Effective Evaluation: A handbook for programme
and project managers
CPB and NEI (2000). Evaluatie van infrastructuurprojecten: leidraad voor kosten-
baten analyse (Evaluation of infrastructural projects: guide for cost-benefit
analysis). CPB/NEI, The Hague/Rotterdam.
Paolo Beria , Ila Maltese and Ilaria Mariotti. Multicriteria versus Cost Benefit
Analysis: a comparative perspective in the assessment of sustainable mobility
HMT (2003) Green Book: Appraisal and Evaluation in Central Government. London:
HMSO
HEATCO (2005) Developing harmonised European approaches for transport costing
and project assessment. Deliverable 1: current practice in project appraisal in
Europe
Estimating the Benefits and Costs of Public Transit Projects: A Guidebook for
Practitioners. 2002. Washington, D.C.: Transportation Research Board, National
Research Council. TCRP Report 78.
45
References OECD, ECMT (2005) National systems of transport infrastructures planning. ECMT
Round Table 128, Paris, 26–27 February 2004
PIARC (2004) Economic evaluation methods for road projects in PIARC member
countries. PIARC
EVA TREN (2008) Improved decision-aid methods and tools to support evaluation of
investment for transport and energy networks in Europe. Deliverable 1. Evaluating
the state-of-the-art in investment for transport and energy networks. www.eva-
tren.org.
COM – The European Commission (2007) Greenbook 2007 – Towards a new culture
for urban mobility. Commission of the European Communities, Brussels
World bank (1996) Sustainable transport: priorities for policy reform. World Bank,
Washington DC
Litman, Todd. 1999. Evaluating Public Transit Benefits and Cost. Victoria, B.C.:
Victoria Transport Policy Institute. September 9.
Hensher, D. A., Button, K. J.:
Handbook of Transport Modelling, Pergamon, 2000.
Ortuzar, J. de Dios, Willemsen, Luis G:
Modelling Transport, 3rd edition, John Wiley and Sons Ltd., 2001.
Suggested literature Cascetta (2009). Transportation System Analysis: models and applications. 2nd edition.
Springer.
CE Delft Report (2007). Handbook on estimation of external cost in the transport sector. EC
DG Tren.
COM – The European Commission (2007) Greenbook 2007 – Towards a new culture for urban
mobility. Commission of the European Communities, Brussels
EVA TREN (2008) Improved decision-aid methods and tools to support evaluation of
investment for transport and energy networks in Europe. Deliverable 1. Evaluating the state-
of-the-art in investment for transport and energy networks. www.eva-tren.org.
Glenaffric Ltd (2007) Six Steps to Effective Evaluation: A handbook for programme and
project managers
HEATCO (2005) Developing harmonised European approaches for transport costing and project
assessment. Deliverable 1: current practice in project appraisal in Europe
NIJKAMP, P., RIETVELD, P. and VOOGD, H., (1990). Multi-criteria Evaluation in Physical
Planning, Elsevier Science, Amsterdam.
Paolo Beria, Ila Maltese and Ilaria Mariotti. Multicriteria versus Cost Benefit Analysis: a
comparative perspective in the assessment of sustainable mobility
Sinha, K.C. and Labi, S. (2007). Transportation Decision Making. Principles of Project
Evaluation and Programming. Wiley.
90
1
This project has received funding from the European
Union’s Horizon 2020 research and innovation programme
under grant agreement No 692426
Data collection methods:
Surveys
University of Thessaly, Greece
Content
2
Qualitative data collection methods
• Setting up a survey
• Sampling
• Data collection methods
• Data collection techniques
• Research designs strengths and weaknesses of each method
• Statistical analysis
• Suggested literature
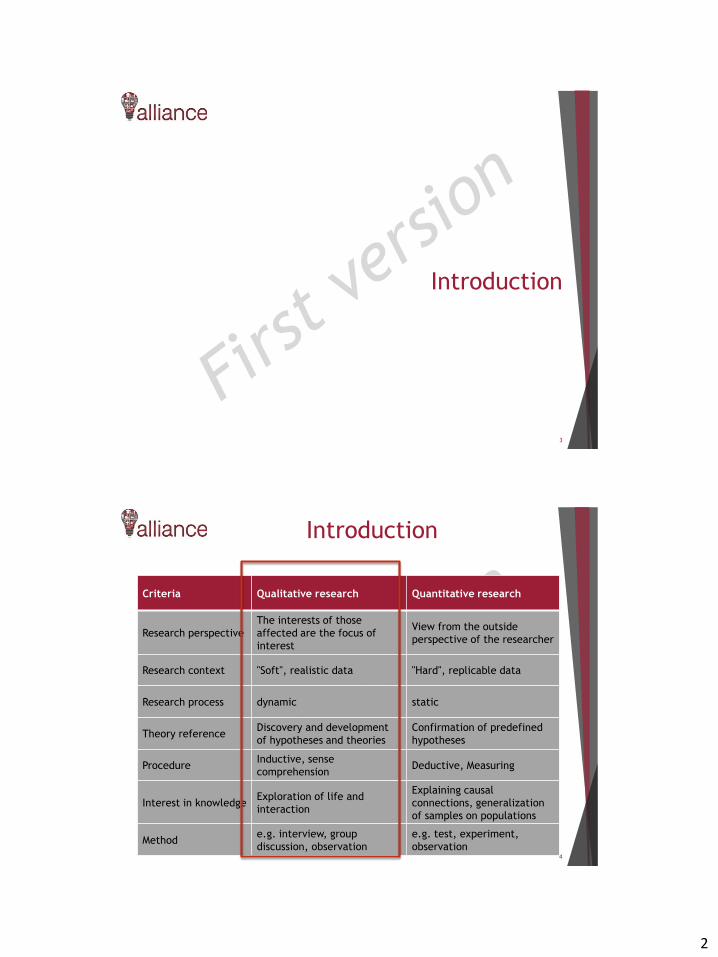
2
Introduction
3
Introduction
4
Criteria Qualitative research Quantitative research
Research perspective
The interests of those
affected are the focus of
interest
View from the outside
perspective of the researcher
Research context "Soft", realistic data "Hard", replicable data
Research process dynamic static
Theory referenceDiscovery and development
of hypotheses and theories
Confirmation of predefined
hypotheses
ProcedureInductive, sense
comprehensionDeductive, Measuring
Interest in knowledgeExploration of life and
interaction
Explaining causal
connections, generalization
of samples on populations
Methode.g. interview, group
discussion, observation
e.g. test, experiment,
observation
3
Setting up a survey
5
Setting up a survey
6
• General principles:
simple questions
minimization of open questions
trips should be associated with the activities that create the
travel need
all the household members aged> 12 years should participate
the questions’ order should generate progressive sense of
intimacy - difficult questions (e.g. interviewee’s income) should
be asked at the end of the interview
• Survey parts:
personal characteristics
trip characteristics
household characteristics

4
Setting up a survey
7
• Personal characteristics:
gender - age
possession of a driving license
education - employment
participation in activities
• Trip characteristics
origin- destination
trip purpose
departure time and arrival time
mean of transport
distance traveled on foot (including transit)
public transport line, waiting time and transit time, boarding/
alighting station
Setting up a survey
8
• Household characteristics:
socioeconomic characteristics
income
possession of private car
property and characteristics oh the house
!Date of survey: It depends on the purpose of the research, usually refers to
the data collection of the commuters behavior during a typical weekday.
!Day of survey: excluded days Monday and Friday, preferred days Wednesday
and Thursday.
!Period (duration) of the survey: given the large number of interviews
required, the survey is usually conducted over several days by a relatively
small group of specialized researchers that can be easily trained and inspected.
5
Sampling
9
Sampling
10
• Population: The set of items for which specific information is required.
Theoretically these elements could be counted, but this is practically
impossible.
• Sample: A subset of the population that has been specifically selected to
represent the characteristics of the population being analyzed.
• Sampling: The elements needed both for the analysis of transport systems and the
development of transport models derive from observations, analysis
and investigation of the characteristics of the sample. Analysis of the
entire population is not feasible for both economic and technical
reasons.
Due to the fluctuation of prices / variability of the characteristics of
the population, it is necessary that the sample represents this
variability, i.e. be representative of the population.
The purpose of the design of the sampling is to ensure that the
analyzed data provide optimal information about the population at the
lowest possible cost.
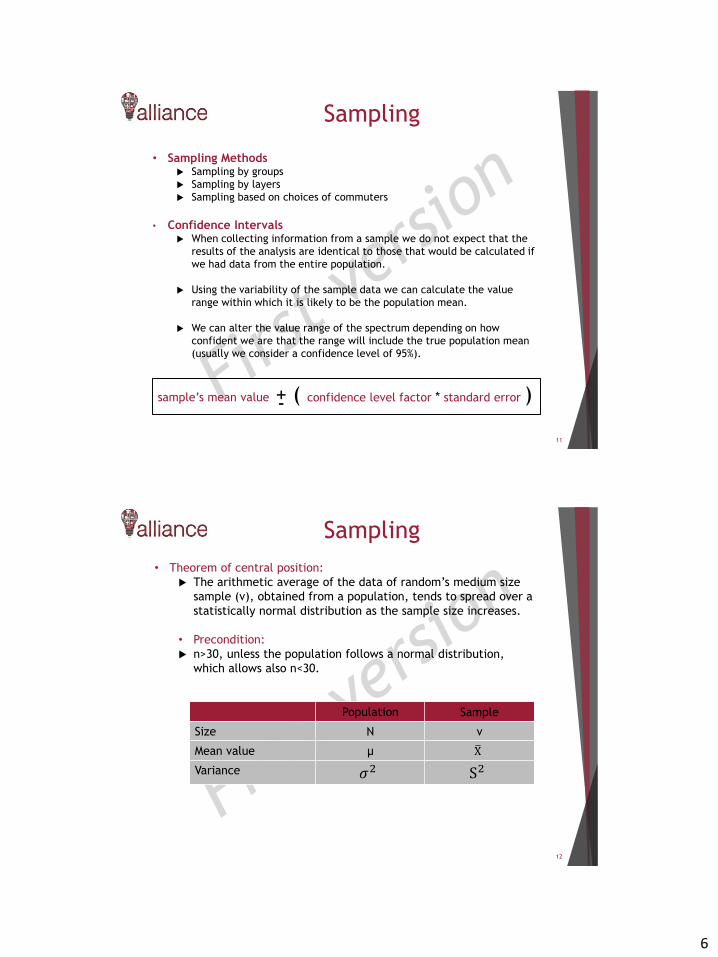
6
Sampling
11
• Sampling Methods Sampling by groups
Sampling by layers
Sampling based on choices of commuters
• Confidence Intervals When collecting information from a sample we do not expect that the
results of the analysis are identical to those that would be calculated if
we had data from the entire population.
Using the variability of the sample data we can calculate the value
range within which it is likely to be the population mean.
We can alter the value range of the spectrum depending on how
confident we are that the range will include the true population mean
(usually we consider a confidence level of 95%).
sample’s mean value +- ( confidence level factor * standard error )
Sampling
12
• Theorem of central position:
The arithmetic average of the data of random’s medium size
sample (v), obtained from a population, tends to spread over a
statistically normal distribution as the sample size increases.
• Precondition:
n>30, unless the population follows a normal distribution,
which allows also n<30.
Population Sample
Size Ν ν
Mean value μ Χ
Variance 𝜎2 S2
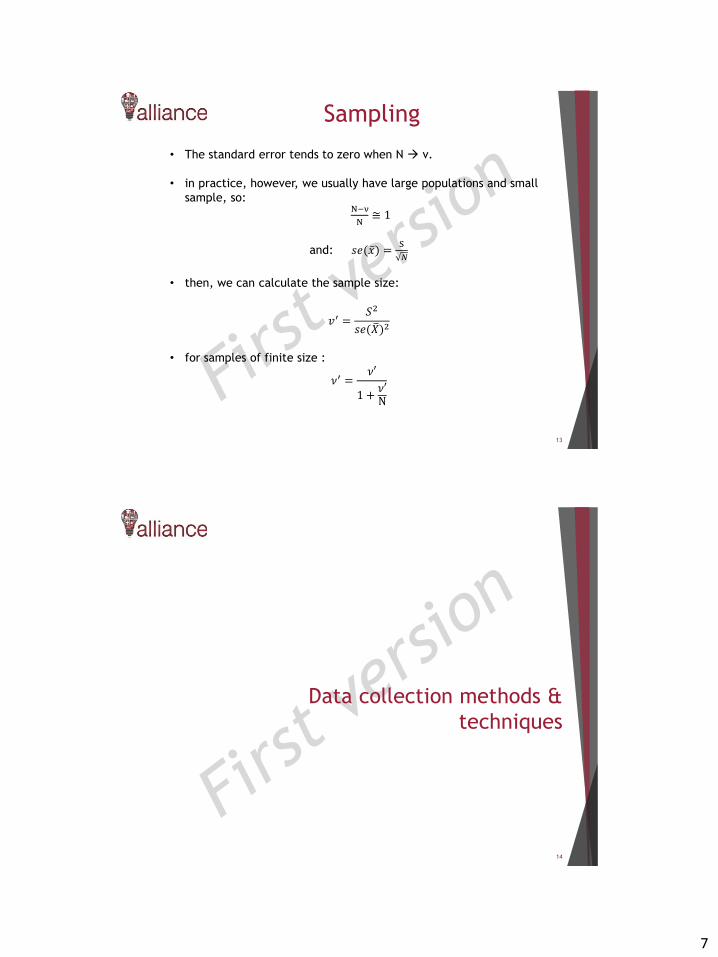
7
Sampling
13
• The standard error tends to zero when N ν.
• in practice, however, we usually have large populations and small
sample, so:Ν−ν
Ν≅ 1
and: 𝑠𝑒( 𝑥) =S
𝑁
• then, we can calculate the sample size:
𝑣′ =𝑆2
𝑠𝑒( 𝑋)2
• for samples of finite size :
𝜈′ =𝜈′
1 +𝜈′Ν
Data collection methods &
techniques
14
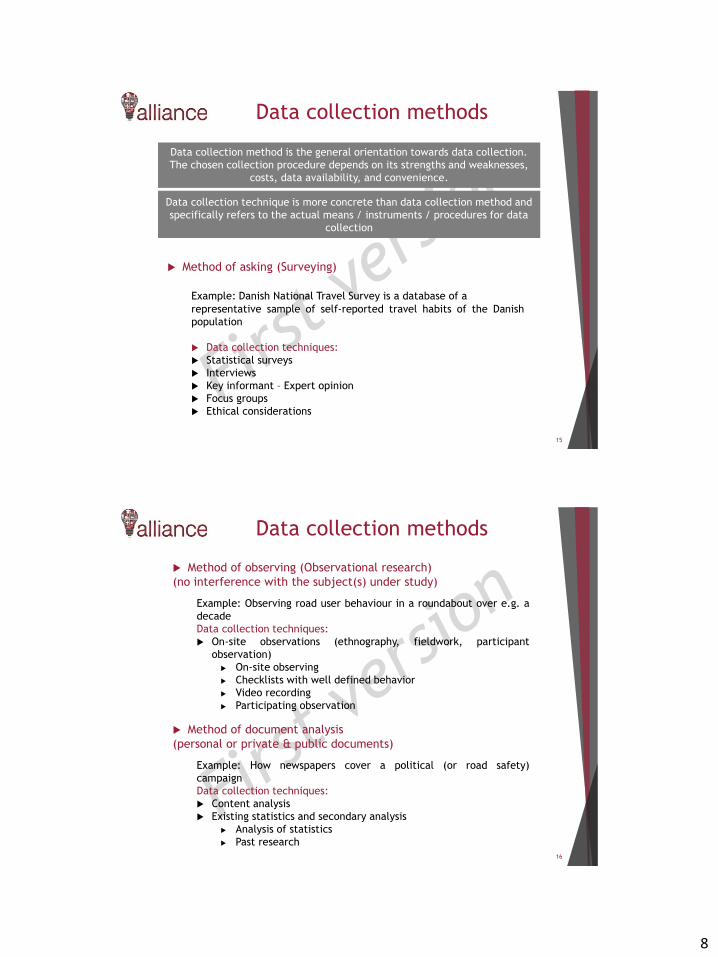
8
Data collection methods
15
Method of asking (Surveying)
Example: Danish National Travel Survey is a database of a
representative sample of self-reported travel habits of the Danish
population
Data collection techniques:
Statistical surveys
Interviews
Key informant – Expert opinion
Focus groups
Ethical considerations
Data collection method is the general orientation towards data collection.
The chosen collection procedure depends on its strengths and weaknesses,
costs, data availability, and convenience.
Data collection technique is more concrete than data collection method and
specifically refers to the actual means / instruments / procedures for data
collection
Data collection methods
16
Method of observing (Observational research)
(no interference with the subject(s) under study)
Example: Observing road user behaviour in a roundabout over e.g. a
decade
Data collection techniques:
On-site observations (ethnography, fieldwork, participant
observation)
On-site observing
Checklists with well defined behavior
Video recording
Participating observation
Method of document analysis
(personal or private & public documents)
Example: How newspapers cover a political (or road safety)
campaign
Data collection techniques:
Content analysis
Existing statistics and secondary analysis
Analysis of statistics
Past research
9
Research design
17
Research Design
18
Framework which structures (integrates) the tasks of implementation and
evaluation, so that it shows how all the major elements of the research process
are related in answering the research question(s).
• Types of research design
Experimental (preferred)
subjects are randomly allocated to different groups
ensure stronger internal validity than quasi-experimental
designs, because they totally rely upon random selection
and assignment of subjects or groups of subjects to
different treatment conditions
Quasi-experimental
control-group designs without random assignment
Non-experimental
no multiple measurements or control groups
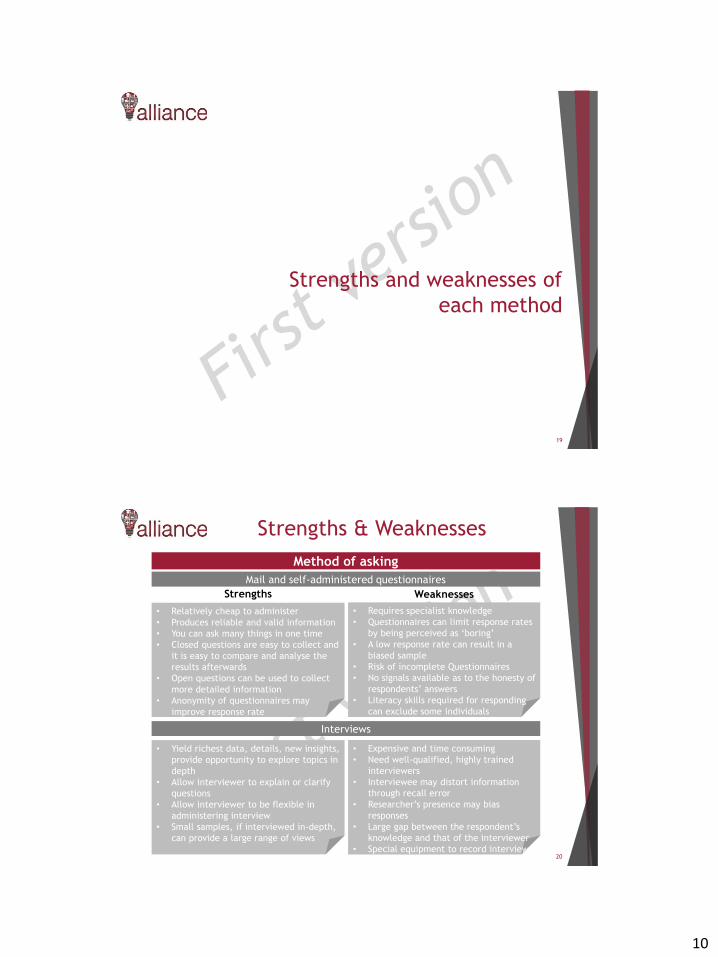
10
Strengths and weaknesses of
each method
19
Strengths & Weaknesses
20
Method of asking
Mail and self-administered questionnaires
• Relatively cheap to administer
• Produces reliable and valid information
• You can ask many things in one time
• Closed questions are easy to collect and
it is easy to compare and analyse the
results afterwards
• Open questions can be used to collect
more detailed information
• Anonymity of questionnaires may
improve response rate
• Requires specialist knowledge
• Questionnaires can limit response rates
by being perceived as ‘boring’
• A low response rate can result in a
biased sample
• Risk of incomplete Questionnaires
• No signals available as to the honesty of
respondents’ answers
• Literacy skills required for responding
can exclude some individuals
Strengths Weaknesses
• Yield richest data, details, new insights,
provide opportunity to explore topics in
depth
• Allow interviewer to explain or clarify
questions
• Allow interviewer to be flexible in
administering interview
• Small samples, if interviewed in-depth,
can provide a large range of views
• Expensive and time consuming
• Need well-qualified, highly trained
interviewers
• Interviewee may distort information
through recall error
• Researcher’s presence may bias
responses
• Large gap between the respondent’s
knowledge and that of the interviewer
• Special equipment to record interviews
Interviews
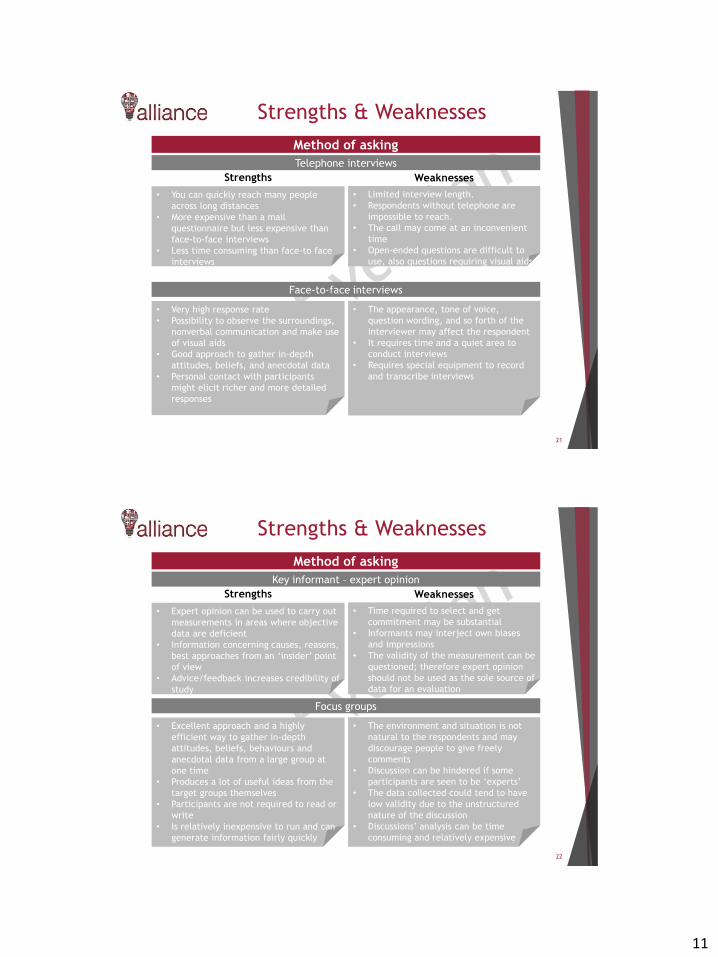
11
Strengths & Weaknesses
21
Method of asking
Telephone interviews
• You can quickly reach many people
across long distances
• More expensive than a mail
questionnaire but less expensive than
face-to-face interviews
• Less time consuming than face-to face
interviews
• Limited interview length.
• Respondents without telephone are
impossible to reach.
• The call may come at an inconvenient
time
• Open-ended questions are difficult to
use, also questions requiring visual aids
Strengths Weaknesses
• Very high response rate
• Possibility to observe the surroundings,
nonverbal communication and make use
of visual aids
• Good approach to gather in-depth
attitudes, beliefs, and anecdotal data
• Personal contact with participants
might elicit richer and more detailed
responses
• The appearance, tone of voice,
question wording, and so forth of the
interviewer may affect the respondent
• It requires time and a quiet area to
conduct interviews
• Requires special equipment to record
and transcribe interviews
Face-to-face interviews
Strengths & Weaknesses
22
Method of asking
Key informant – expert opinion
• Expert opinion can be used to carry out
measurements in areas where objective
data are deficient
• Information concerning causes, reasons,
best approaches from an ‘insider’ point
of view
• Advice/feedback increases credibility of
study
• Time required to select and get
commitment may be substantial
• Informants may interject own biases
and impressions
• The validity of the measurement can be
questioned; therefore expert opinion
should not be used as the sole source of
data for an evaluation
Strengths Weaknesses
• Excellent approach and a highly
efficient way to gather in-depth
attitudes, beliefs, behaviours and
anecdotal data from a large group at
one time
• Produces a lot of useful ideas from the
target groups themselves
• Participants are not required to read or
write
• Is relatively inexpensive to run and can
generate information fairly quickly
• The environment and situation is not
natural to the respondents and may
discourage people to give freely
comments
• Discussion can be hindered if some
participants are seen to be ‘experts’
• The data collected could tend to have
low validity due to the unstructured
nature of the discussion
• Discussions’ analysis can be time
consuming and relatively expensive
Focus groups
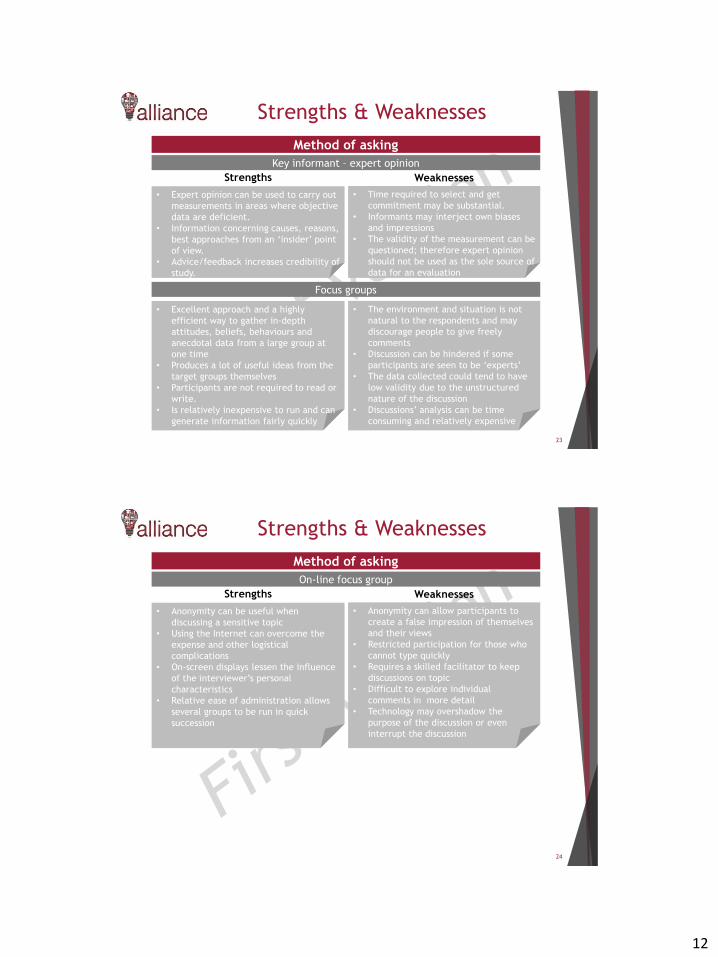
12
Strengths & Weaknesses
23
Method of asking
Key informant – expert opinion
• Expert opinion can be used to carry out
measurements in areas where objective
data are deficient.
• Information concerning causes, reasons,
best approaches from an ‘insider’ point
of view.
• Advice/feedback increases credibility of
study.
• Time required to select and get
commitment may be substantial.
• Informants may interject own biases
and impressions
• The validity of the measurement can be
questioned; therefore expert opinion
should not be used as the sole source of
data for an evaluation
Strengths Weaknesses
• Excellent approach and a highly
efficient way to gather in-depth
attitudes, beliefs, behaviours and
anecdotal data from a large group at
one time
• Produces a lot of useful ideas from the
target groups themselves
• Participants are not required to read or
write.
• Is relatively inexpensive to run and can
generate information fairly quickly
• The environment and situation is not
natural to the respondents and may
discourage people to give freely
comments
• Discussion can be hindered if some
participants are seen to be ‘experts’
• The data collected could tend to have
low validity due to the unstructured
nature of the discussion
• Discussions’ analysis can be time
consuming and relatively expensive
Focus groups
Strengths & Weaknesses
24
Method of asking
On-line focus group
• Anonymity can be useful when
discussing a sensitive topic
• Using the Internet can overcome the
expense and other logistical
complications
• On-screen displays lessen the influence
of the interviewer’s personal
characteristics
• Relative ease of administration allows
several groups to be run in quick
succession
• Anonymity can allow participants to
create a false impression of themselves
and their views
• Restricted participation for those who
cannot type quickly
• Requires a skilled facilitator to keep
discussions on topic
• Difficult to explore individual
comments in more detail
• Technology may overshadow the
purpose of the discussion or even
interrupt the discussion
Strengths Weaknesses

13
Strengths & Weaknesses
25
Method of observing
On-site observations
• Yield data sensitive to changes caused
by interventions and can be analysed
for time trends
• Excellent techniques to discover,
observe, and evaluate actual behaviour
of participants in a natural setting.
• Provide direct information about
behaviour of individuals and groups.
• Provide good opportunities for
identifying unanticipated outcomes and
unusual aspects
• Permit evaluator to enter into and
understand the situation/context
• Researcher can record information as it
is revealed
• Useful in exploring topics that may
uncomfortable for participants to
discuss or who have difficulty directly
communicating their views
• It can be expensive and time consuming
to plan and carry out field trips to
collect representative data. It requires
time to observe and record
observations
• Need well-qualified, highly trained
observers
• Observers may encounter difficulties
determining gender, age and behaviour
of participants. The data recorded is
subjective
• Restricted viewing angles may obscure
important details
• Cannot ask questions of participants
during observation for example it is not
possible to identify those who
have/have not seen the road safety
campaign
Strengths Weaknesses
Strengths & Weaknesses
26
Method of document analysis
Content Analysis
• As written evidence, it saves a
researcher the time and expense of
transcribing
• Useful for determining value, interest,
positions, political climate, public
attitudes, historical trends or
sequences
• An unobtrusive source of information
• Audio/visual material allows
participants to share their ‘reality’
• Analysis may be time consuming
• Requires transcribing or optically
scanning for computer entry
• The documents may not be authentic or
accurate
• A file review rarely yields information
on control groups, except in special
cases, such as when files on rejected
applicants to a study exist
Strengths Weaknesses
• An unobtrusive source of information –
can be accessed at a time convenient to
the researcher
• Can be used to collect baseline data
• Analysis of statistics is relatively
straightforward and can provide
powerful statistical evidence for the
effectiveness of an intervention
• Missing data is especially a problem
when researchers cover a long time
periods
• In order to obtain reliable and good
quality results, a large amount of data
is needed
• It is often difficult to determine the
accuracy of secondary data
• Equivalence reliability can also be a
problem
Existing statistics
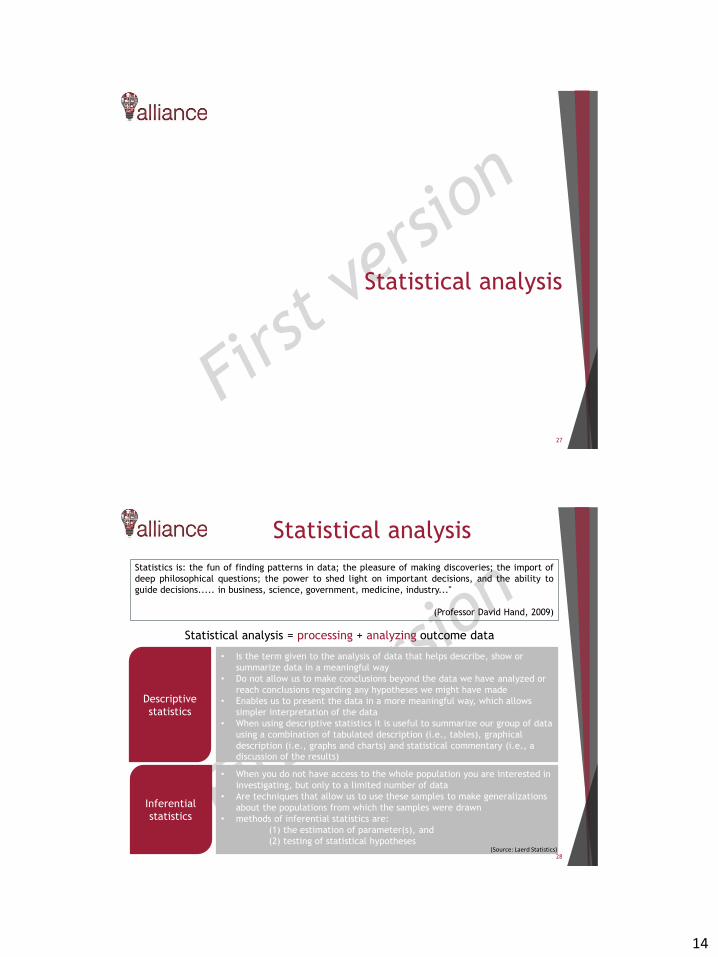
14
Statistical analysis
27
Statistical analysis
28
Statistical analysis = processing + analyzing outcome data
Descriptive
statistics
• Is the term given to the analysis of data that helps describe, show or
summarize data in a meaningful way
• Do not allow us to make conclusions beyond the data we have analyzed or
reach conclusions regarding any hypotheses we might have made
• Enables us to present the data in a more meaningful way, which allows
simpler interpretation of the data
• When using descriptive statistics it is useful to summarize our group of data
using a combination of tabulated description (i.e., tables), graphical
description (i.e., graphs and charts) and statistical commentary (i.e., adiscussion of the results)
Inferential
statistics
• When you do not have access to the whole population you are interested in
investigating, but only to a limited number of data
• Are techniques that allow us to use these samples to make generalizations
about the populations from which the samples were drawn
• methods of inferential statistics are:
(1) the estimation of parameter(s), and
(2) testing of statistical hypotheses
Statistics is: the fun of finding patterns in data; the pleasure of making discoveries; the import of
deep philosophical questions; the power to shed light on important decisions, and the ability to
guide decisions..... in business, science, government, medicine, industry..."
(Professor David Hand, 2009)
(Source: Laerd Statistics)
15
Guidance to further
knowledge acquisition
29
Suggested literature
30
Abdel-Aty M., (2003), “Hybrid Distribution and Response Techniques for an Origin-
Destination Travel Survey”, ITE Journal, pp. 22-27.
Amekudzi, A., Meyer, M., & Ross, C. (2011). Transportation planning for
sustainability guidebook. Washington, D.C.: U.S. Federal Highway Administration.
Andrés Monzón, Floridea Di Ciommo, Sara Hernández, Eftihia Nathanail, Giannis
Adamos, Maria Tsami, Ricardo Poppeliers, Odile Heddebaout, Tuuli Jarvi, Marko
Nokkala, Juno Kostiainen, Derek Palmer, Clare Harmer, Katie Millard, Jardar
Andersen, Petter Christiansen, Albert Gabor, Adam Pusztai, Almos Virag, Jan
Spousta, 2015. CITY-HUBs: Sustainable and Efficient Interchange Stations. Taylor
and Francis Group, 2015.
Bayart, C., Bonnel, P., & Morency, C. Survey mode integration and data fusion.
Bonnel, P. (2009). Transport survey methods. Bingley, UK: Emerald.
Cambridge Systematics (1996), “Inc. Travel Survey Manual”, Prepared for the U.S.
Department of Transportation and the U.S. Environmental Protection Agency.
Washington, D.C., USA.
Cascetta E., (1984), “Estimation of trip matrices from traffic counts and survey
data: a generalized least squares estimator”, Trasportation research, Vol. B, pp.
289-299, USA.
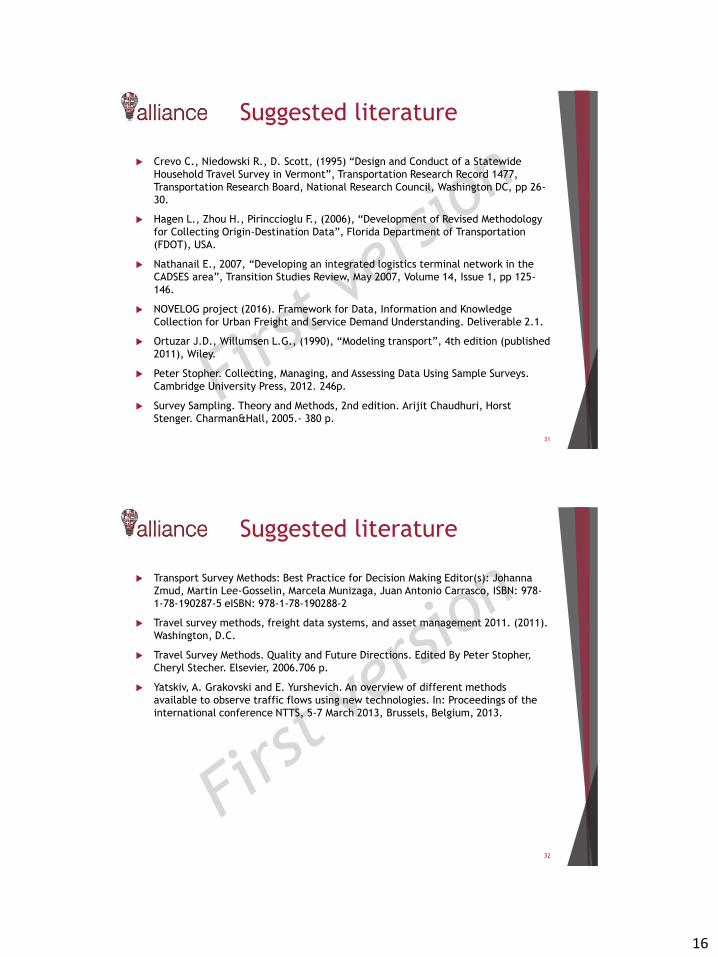
16
Suggested literature
31
Crevo C., Niedowski R., D. Scott, (1995) “Design and Conduct of a Statewide
Household Travel Survey in Vermont”, Transportation Research Record 1477,
Transportation Research Board, National Research Council, Washington DC, pp 26-
30.
Hagen L., Zhou H., Pirinccioglu F., (2006), “Development of Revised Methodology
for Collecting Origin-Destination Data”, Florida Department of Transportation
(FDOT), USA.
Nathanail E., 2007, “Developing an integrated logistics terminal network in the
CADSES area”, Transition Studies Review, May 2007, Volume 14, Issue 1, pp 125-
146.
NOVELOG project (2016). Framework for Data, Information and Knowledge
Collection for Urban Freight and Service Demand Understanding. Deliverable 2.1.
Ortuzar J.D., Willumsen L.G., (1990), “Modeling transport”, 4th edition (published
2011), Wiley.
Peter Stopher. Collecting, Managing, and Assessing Data Using Sample Surveys.
Cambridge University Press, 2012. 246p.
Survey Sampling. Theory and Methods, 2nd edition. Arijit Chaudhuri, Horst
Stenger. Charman&Hall, 2005.- 380 p.
Suggested literature
32
Transport Survey Methods: Best Practice for Decision Making Editor(s): Johanna
Zmud, Martin Lee-Gosselin, Marcela Munizaga, Juan Antonio Carrasco, ISBN: 978-
1-78-190287-5 eISBN: 978-1-78-190288-2
Travel survey methods, freight data systems, and asset management 2011. (2011).
Washington, D.C.
Travel Survey Methods. Quality and Future Directions. Edited By Peter Stopher,
Cheryl Stecher. Elsevier, 2006.706 p.
Yatskiv, A. Grakovski and E. Yurshevich. An overview of different methods
available to observe traffic flows using new technologies. In: Proceedings of the
international conference NTTS, 5-7 March 2013, Brussels, Belgium, 2013.

17
References
33
• CAST, 2009. CAST Deliverable 2.3 Evaluation tool for road safety campaigns.
• CAST, 2007. CAST Deliverable 2.2 Comparison of research designs.
• https://statistics.laerd.com/statistical-guides/descriptive-inferential-
statistics.php
• D Hand, 2009. President of the Royal Statistical Society (RSS), RSS
Conference Presentation, November 2009.

1
This project has received funding from the European
Union’s Horizon 2020 research and innovation programme
under grant agreement No 692426
Data collection methods:
Historical and observed data M.Sc. David Weigert
Fraunhofer Institute for Factory Operation and Automation IFFMagdeburg, Germany
Content
2
• Introduction
• Quantitative data collection methods
• Data collection
• Data sources and open data
• Survey design and ethical issues
• Data analysis and visualization
• Big data
• Big data in transport
2
Introduction
• The integration of digital into the real world has foundits way into logistics and production systems and iscalled the fourth industrial revolution (Industrie 4.0)
• The annual global data volume will increase tenfold inthe next few years and be only manageable ifinformation systems can process this purposefully. Alarge number of the physical objects of a logisticsystem are already equipped with technologies thatpermanently record and process the current states ofthe objects.
• In order to fully exploit the information potentials ofthe state data for the operational monitoring andcontrol of the logistics processes, interdisciplinarymodeling and analysis concepts have to be developed,which take into account both the viewpoints of logisticsas well as those of computer science. 3
Introduction
• Decision making is the core of management of
organisational systems
• Nowadays, decision problems are complex, especially
in global multi-echelon supply chains
• Technological advancements facilitate decision
making because data and information is available
accurate and in real time
• Decision problems and situations in logistics are
different from other functional areas of an organisation
4

3
Introduction
• logistics operations are carried out in time and
space (in contrast to, manufacturing operations which are usually
executed in time and place - fixed place)
• logistics operations are realized not only in one
organisation but also among the organisation and its
supply chain partners
• logistics operations and necessity to communicate
and collaborate with other organisations
5
• higher complexity of some decision making situations
• increase level of uncertainty in decision making
• …
Introduction
6
Criteria Qualitative research Quantitative research
Research perspective
The interests of those
affected are the focus of
interest
View from the outside
perspective of the researcher
Research context "Soft", realistic data "Hard", replicable data
Research process dynamic static
Theory referenceDiscovery and development
of hypotheses and theories
Confirmation of predefined
hypotheses
ProcedureInductive, sense
comprehensionDeductive, Measuring
Interest in knowledgeExploration of life and
interaction
Explaining causal
connections, generalization
of samples on populations
Methodeg. interview, group
discussion, observation
eg. test, experiment,
observation
4
Quantitative data collection
methods
7
• Quantitative and qualitative techniques provide a
tradeoff between breadth and depth, and between
generalizability and targeting to specific (sometimes very
limited) populations
• Data collected through quantitative methods are often
believed to yield more objective and accurate
information
• they were collected using standardized methods, can
be replicated, and, unlike qualitative data, can be
analyzed using sophisticated statistical techniques
Quantitative data collection
methods
8
• Qualitative methods describe (in logistics):
• Different methods of descriptive statistics
• Discrete and continuous distribution functions
• Laws of Probability
• Methods of closing statistics, e.g. Confidence intervals and hypothesis tests
• Importance of operations research
• Models and methods of linear programming to solve planning problems
• Methods and techniques of transport planning as well as the concepts of
network theory and selected methods of network optimization, e.g.
Method for determining the shortest path
• Round trip and tour planning problems and methods for their solution
• Surveys, interviews, traffic counts, etc.

5
Data sources
9
• After data collection, evaluation and preparation has been
explained, it is important to explain the origin of the data.
Data sources
10
• Bluetooth ®:Is a wireless technology standard for exchanging data overshort distances (using short-wavelength UHF radio waves in theISM band from 2.4 to 2.485 GHz) from fixed and mobiledevices, and building personal area networks (PANs). Inventedby telecom vendor Ericsson in 1994.
• GPS:Also known as Navstar is a global navigation satellite system (GNSS)that provides location and time information in all weather conditions,anywhere on or near the Earth where there is an unobstructed line ofsight to four or more GPS satellites. The GPS system operatesindependently of any telephonic or internet reception, though thesetechnologies can enhance the usefulness of the GPS positioninginformation.
Other systems arte the Russian equivalent (GLONASS), the Indian equivalent (IRNSS), other similar systems (GNSS), the Chinese equivalent (BeiDou-2tf), or the European equivalent (GALILEO).
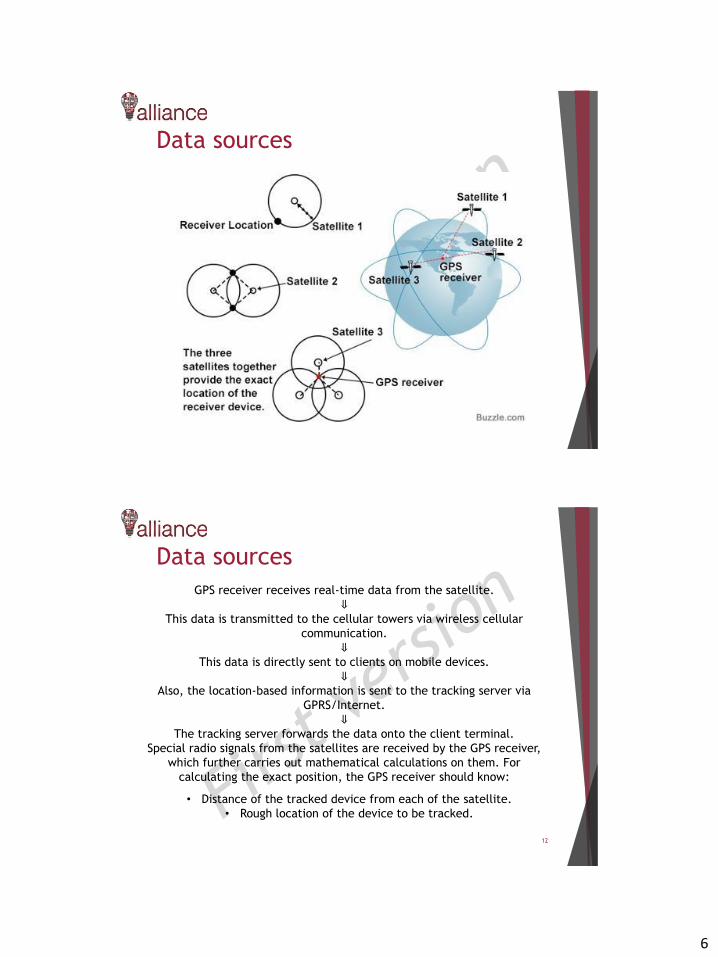
6
Data sources
11
Data sources
12
GPS receiver receives real-time data from the satellite.
⇓This data is transmitted to the cellular towers via wireless cellular
communication.
⇓This data is directly sent to clients on mobile devices.
⇓Also, the location-based information is sent to the tracking server via
GPRS/Internet.
⇓The tracking server forwards the data onto the client terminal.
Special radio signals from the satellites are received by the GPS receiver,
which further carries out mathematical calculations on them. For
calculating the exact position, the GPS receiver should know:
• Distance of the tracked device from each of the satellite.
• Rough location of the device to be tracked.
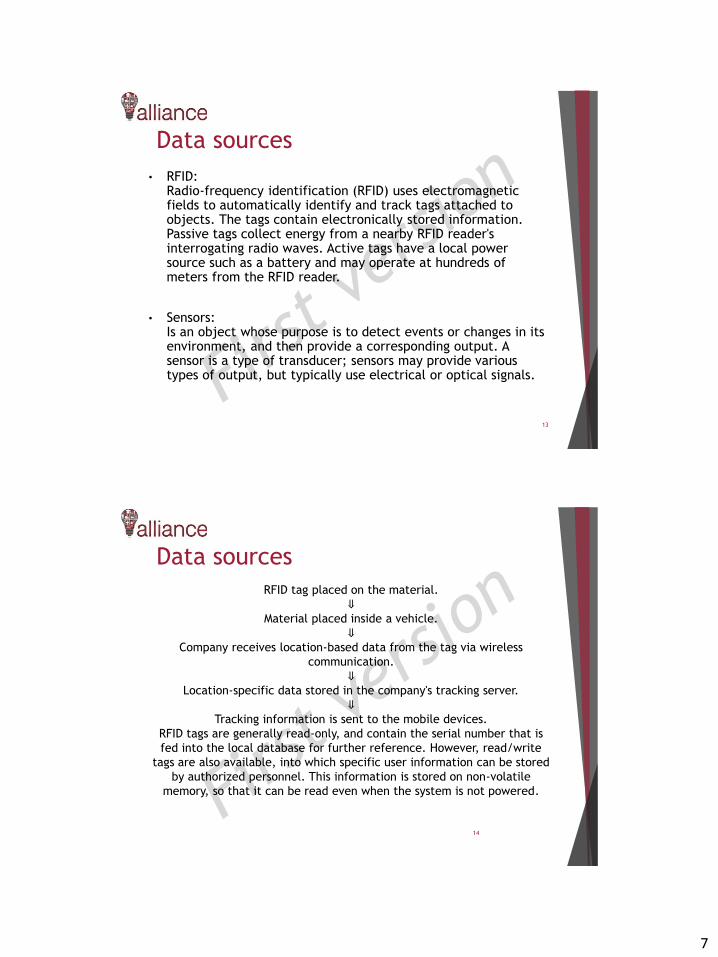
7
Data sources
13
• RFID:Radio-frequency identification (RFID) uses electromagneticfields to automatically identify and track tags attached toobjects. The tags contain electronically stored information.Passive tags collect energy from a nearby RFID reader'sinterrogating radio waves. Active tags have a local powersource such as a battery and may operate at hundreds ofmeters from the RFID reader.
• Sensors:Is an object whose purpose is to detect events or changes in itsenvironment, and then provide a corresponding output. Asensor is a type of transducer; sensors may provide varioustypes of output, but typically use electrical or optical signals.
Data sources
14
RFID tag placed on the material.
⇓Material placed inside a vehicle.
⇓Company receives location-based data from the tag via wireless
communication.
⇓Location-specific data stored in the company's tracking server.
⇓Tracking information is sent to the mobile devices.
RFID tags are generally read-only, and contain the serial number that is
fed into the local database for further reference. However, read/write
tags are also available, into which specific user information can be stored
by authorized personnel. This information is stored on non-volatile
memory, so that it can be read even when the system is not powered.
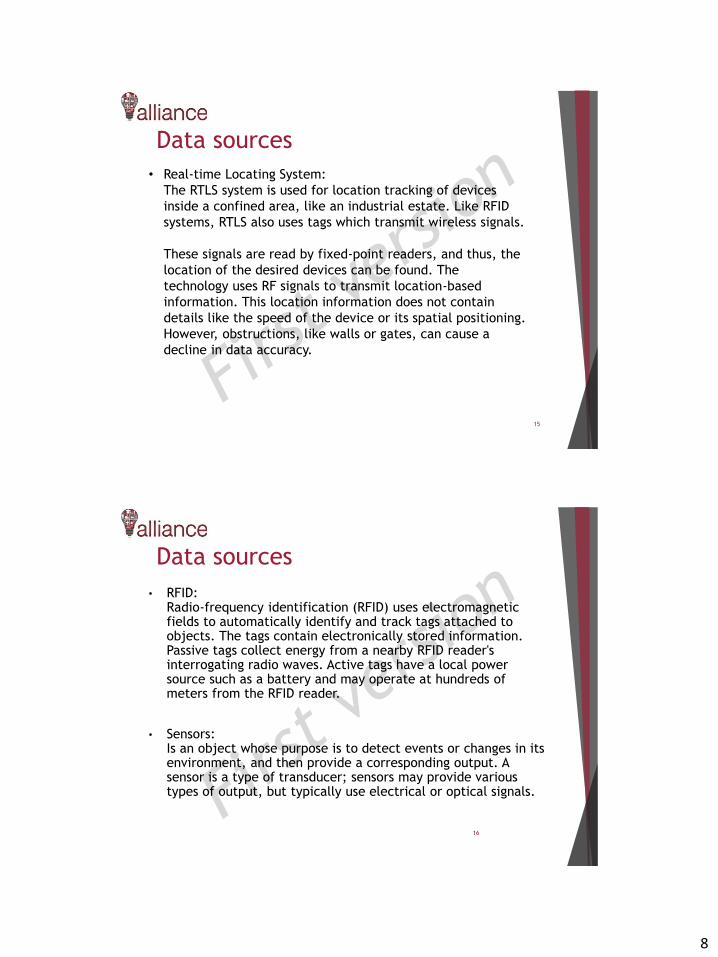
8
Data sources
15
• Real-time Locating System:
The RTLS system is used for location tracking of devices
inside a confined area, like an industrial estate. Like RFID
systems, RTLS also uses tags which transmit wireless signals.
These signals are read by fixed-point readers, and thus, the
location of the desired devices can be found. The
technology uses RF signals to transmit location-based
information. This location information does not contain
details like the speed of the device or its spatial positioning.
However, obstructions, like walls or gates, can cause a
decline in data accuracy.
Data sources
16
• RFID:Radio-frequency identification (RFID) uses electromagneticfields to automatically identify and track tags attached toobjects. The tags contain electronically stored information.Passive tags collect energy from a nearby RFID reader'sinterrogating radio waves. Active tags have a local powersource such as a battery and may operate at hundreds ofmeters from the RFID reader.
• Sensors:Is an object whose purpose is to detect events or changes in itsenvironment, and then provide a corresponding output. Asensor is a type of transducer; sensors may provide varioustypes of output, but typically use electrical or optical signals.
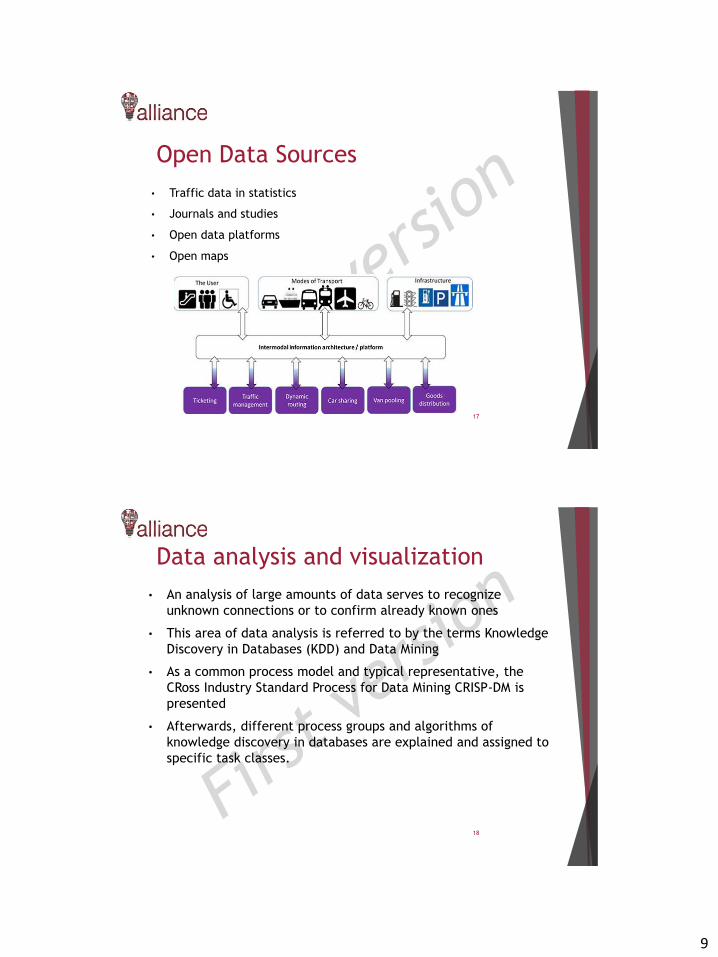
9
Open Data Sources
17
• Traffic data in statistics
• Journals and studies
• Open data platforms
• Open maps
Data analysis and visualization
18
• An analysis of large amounts of data serves to recognize
unknown connections or to confirm already known ones
• This area of data analysis is referred to by the terms Knowledge
Discovery in Databases (KDD) and Data Mining
• As a common process model and typical representative, the
CRoss Industry Standard Process for Data Mining CRISP-DM is
presented
• Afterwards, different process groups and algorithms of
knowledge discovery in databases are explained and assigned to
specific task classes.
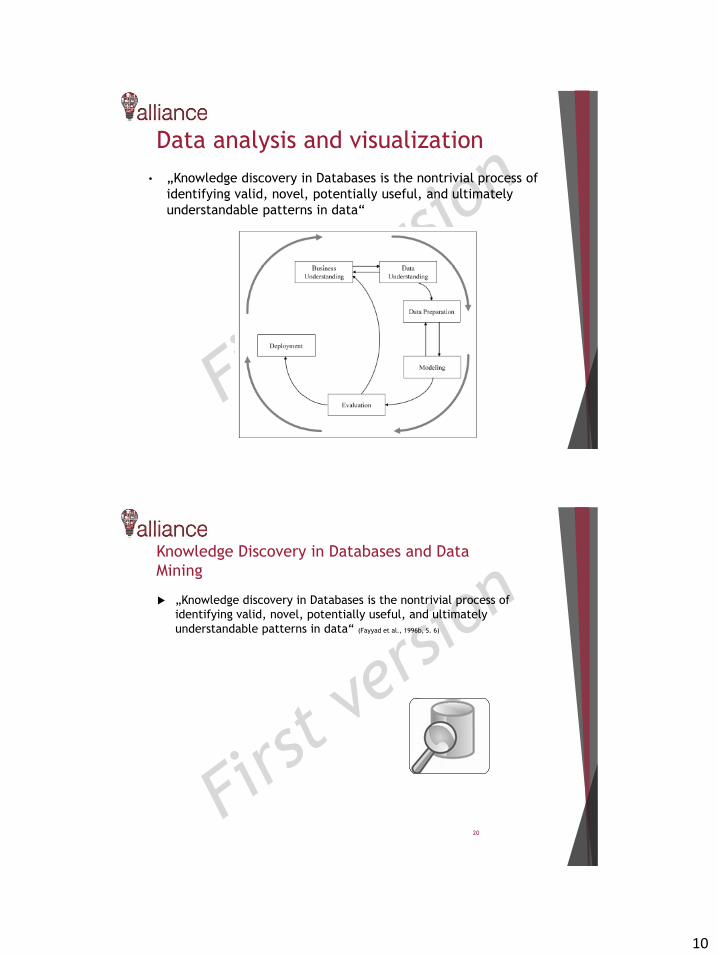
10
Data analysis and visualization
19
• „Knowledge discovery in Databases is the nontrivial process of
identifying valid, novel, potentially useful, and ultimately
understandable patterns in data“
Knowledge Discovery in Databases and Data
Mining
„Knowledge discovery in Databases is the nontrivial process of
identifying valid, novel, potentially useful, and ultimately
understandable patterns in data“ (Fayyad et al., 1996b, S. 6)
20
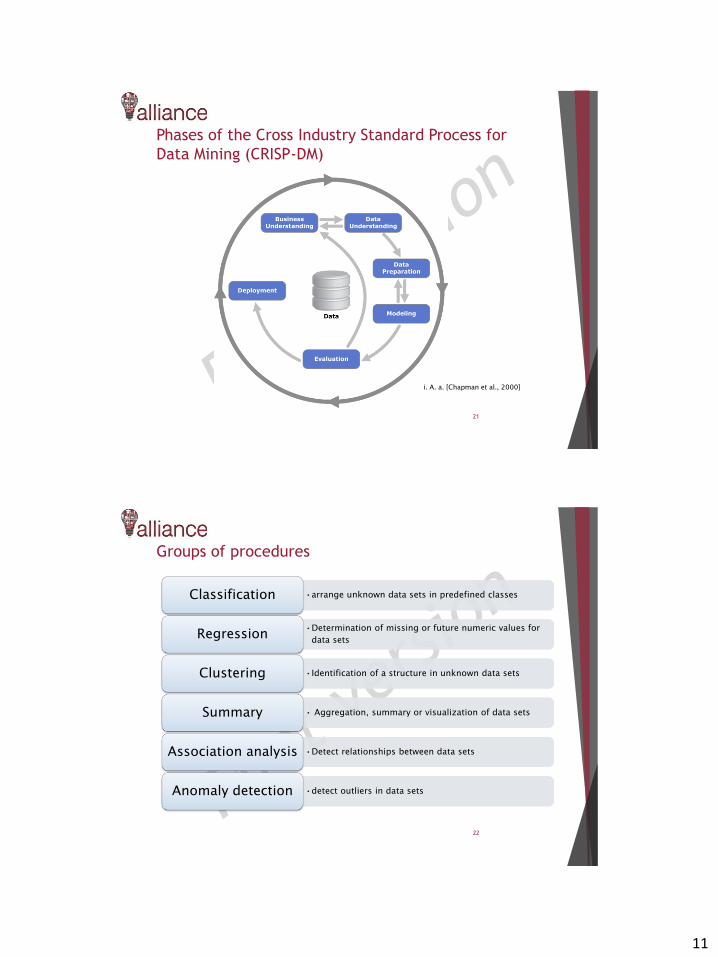
11
Phases of the Cross Industry Standard Process for
Data Mining (CRISP-DM)
21
i. A. a. [Chapman et al., 2000]
Groups of procedures
22
•arrange unknown data sets in predefined classesClassification
•Determination of missing or future numeric values for
data setsRegression
•Identification of a structure in unknown data setsClustering
• Aggregation, summary or visualization of data setsSummary
•Detect relationships between data setsAssociation analysis
•detect outliers in data setsAnomaly detection
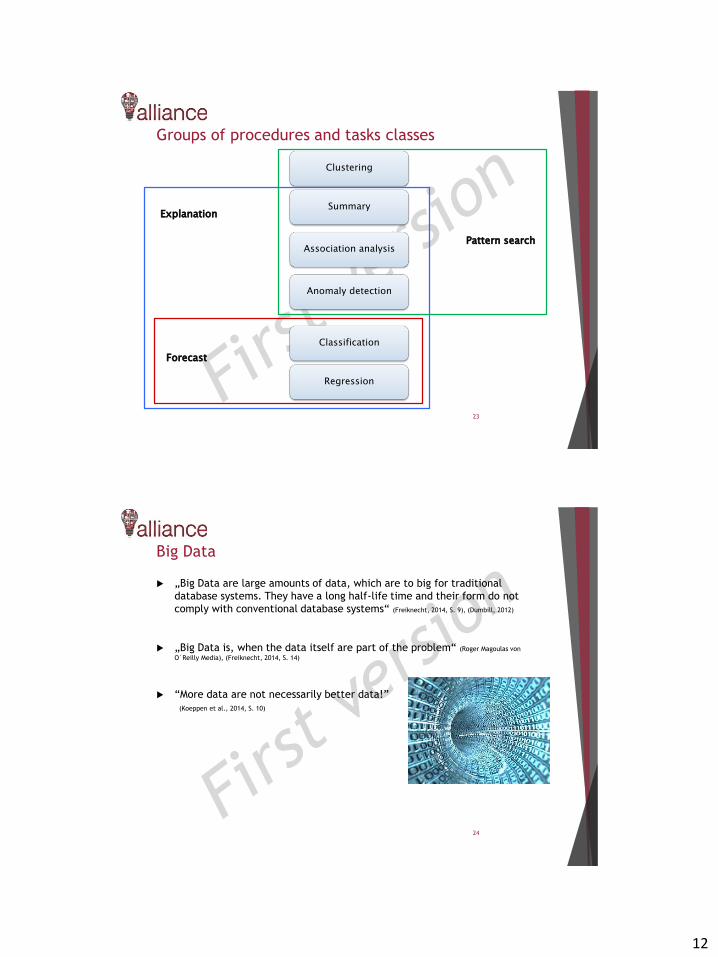
12
Groups of procedures and tasks classes
23
Classification
Regression
Clustering
Summary
Association analysis
Anomaly detection
Forecast
Pattern search
Explanation
Big Data
„Big Data are large amounts of data, which are to big for traditional
database systems. They have a long half-life time and their form do not
comply with conventional database systems“ (Freiknecht, 2014, S. 9), (Dumbill, 2012)
„Big Data is, when the data itself are part of the problem“ (Roger Magoulas von
O´Reilly Media), (Freiknecht, 2014, S. 14)
“More data are not necessarily better data!”
(Koeppen et al., 2014, S. 10)
24
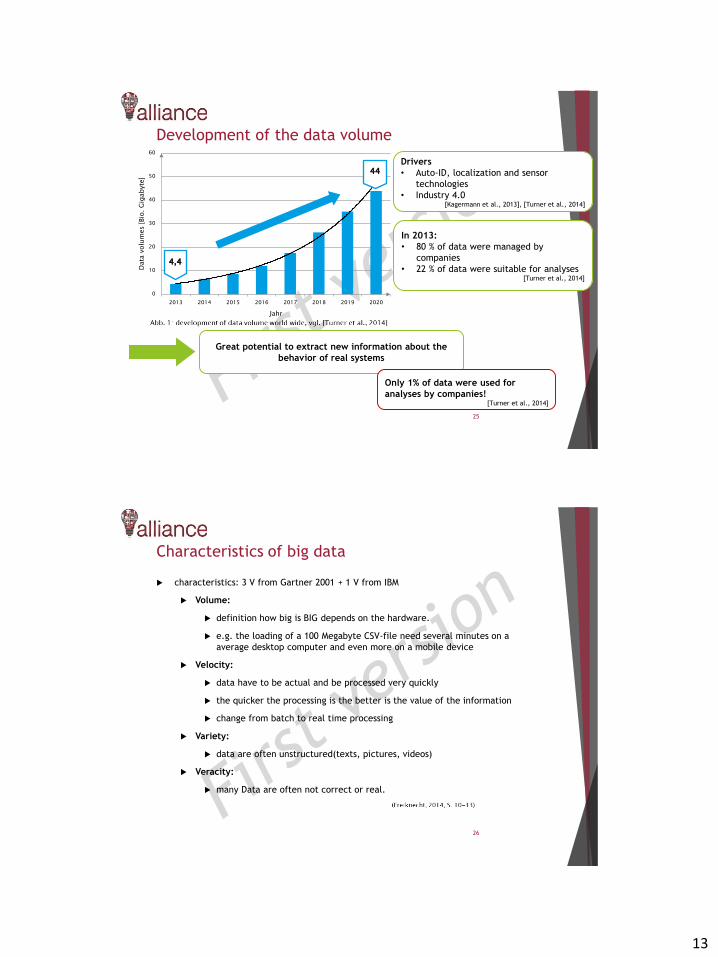
13
Development of the data volume
25
0
10
20
30
40
50
60
2013 2014 2015 2016 2017 2018 2019 2020
Data
volu
mes [Bio
. G
igab
yte
]
Jahr
4,4
44
In 2013:
• 80 % of data were managed by
companies
• 22 % of data were suitable for analyses[Turner et al., 2014]
Drivers
• Auto-ID, localization and sensor
technologies
• Industry 4.0[Kagermann et al., 2013], [Turner et al., 2014]
Great potential to extract new information about the
behavior of real systems
Only 1% of data were used for
analyses by companies! [Turner et al., 2014]
Characteristics of big data
characteristics: 3 V from Gartner 2001 + 1 V from IBM
Volume:
definition how big is BIG depends on the hardware.
e.g. the loading of a 100 Megabyte CSV-file need several minutes on a
average desktop computer and even more on a mobile device
Velocity:
data have to be actual and be processed very quickly
the quicker the processing is the better is the value of the information
change from batch to real time processing
Variety:
data are often unstructured(texts, pictures, videos)
Veracity:
many Data are often not correct or real.
26
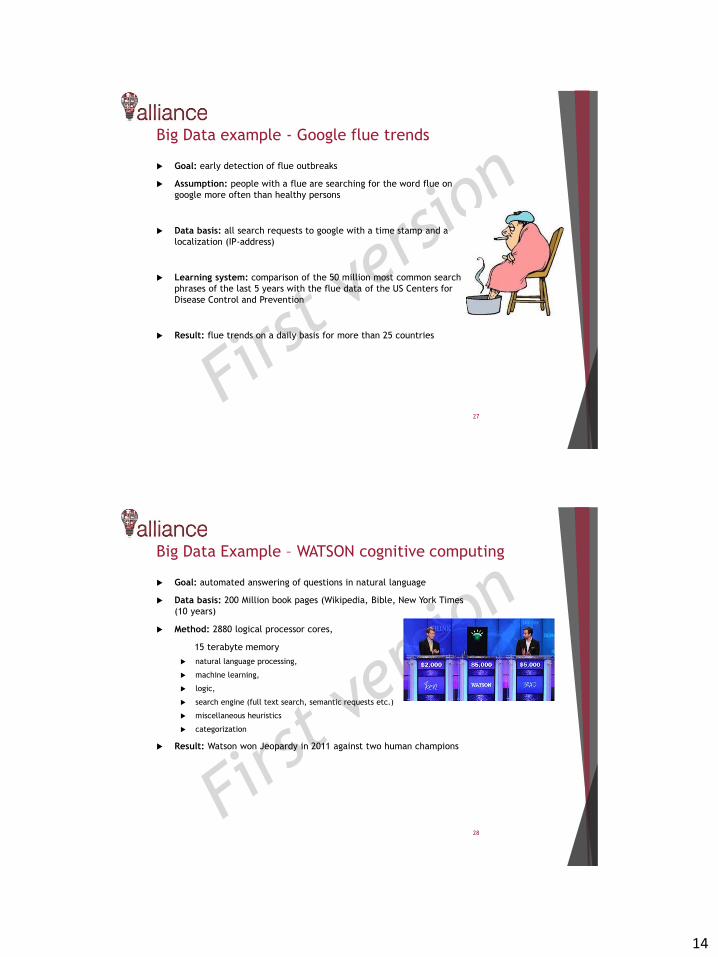
14
Big Data example - Google flue trends
Goal: early detection of flue outbreaks
Assumption: people with a flue are searching for the word flue on
google more often than healthy persons
Data basis: all search requests to google with a time stamp and a
localization (IP-address)
Learning system: comparison of the 50 million most common search
phrases of the last 5 years with the flue data of the US Centers for
Disease Control and Prevention
Result: flue trends on a daily basis for more than 25 countries
27
Big Data Example – WATSON cognitive computing
Goal: automated answering of questions in natural language
Data basis: 200 Million book pages (Wikipedia, Bible, New York Times
(10 years)
Method: 2880 logical processor cores,
15 terabyte memory
natural language processing,
machine learning,
logic,
search engine (full text search, semantic requests etc.)
miscellaneous heuristics
categorization
Result: Watson won Jeopardy in 2011 against two human champions
28
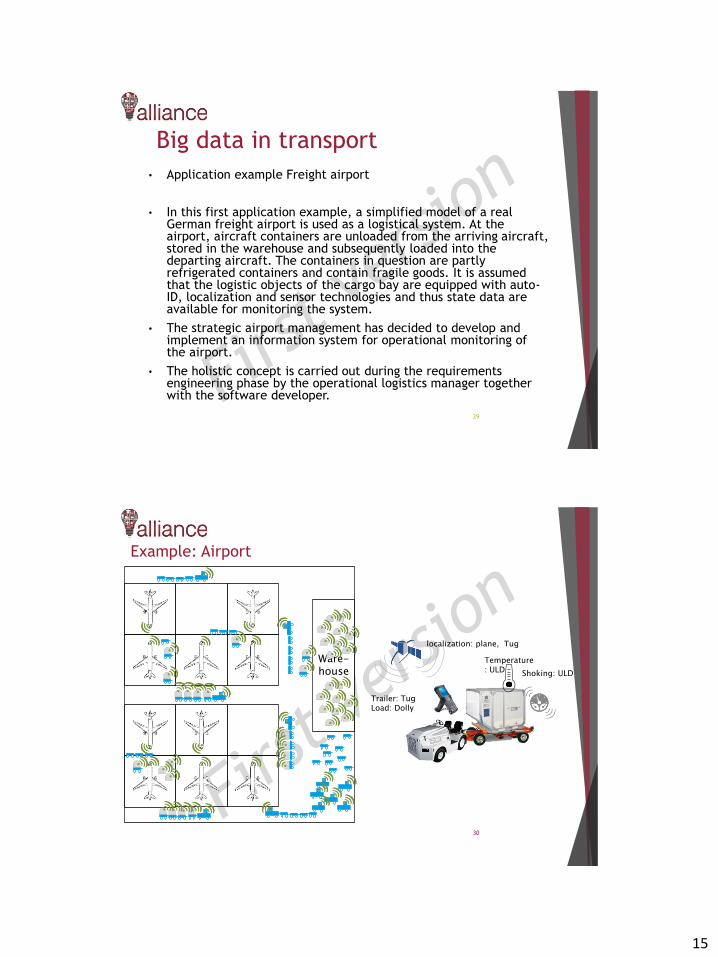
15
Big data in transport
29
• Application example Freight airport
• In this first application example, a simplified model of a realGerman freight airport is used as a logistical system. At theairport, aircraft containers are unloaded from the arriving aircraft,stored in the warehouse and subsequently loaded into thedeparting aircraft. The containers in question are partlyrefrigerated containers and contain fragile goods. It is assumedthat the logistic objects of the cargo bay are equipped with auto-ID, localization and sensor technologies and thus state data areavailable for monitoring the system.
• The strategic airport management has decided to develop andimplement an information system for operational monitoring ofthe airport.
• The holistic concept is carried out during the requirementsengineering phase by the operational logistics manager togetherwith the software developer.
Example: Airport
30
localization: plane, Tug
Shoking: ULD
Temperature: ULD
Trailer: TugLoad: Dolly
Ware-house
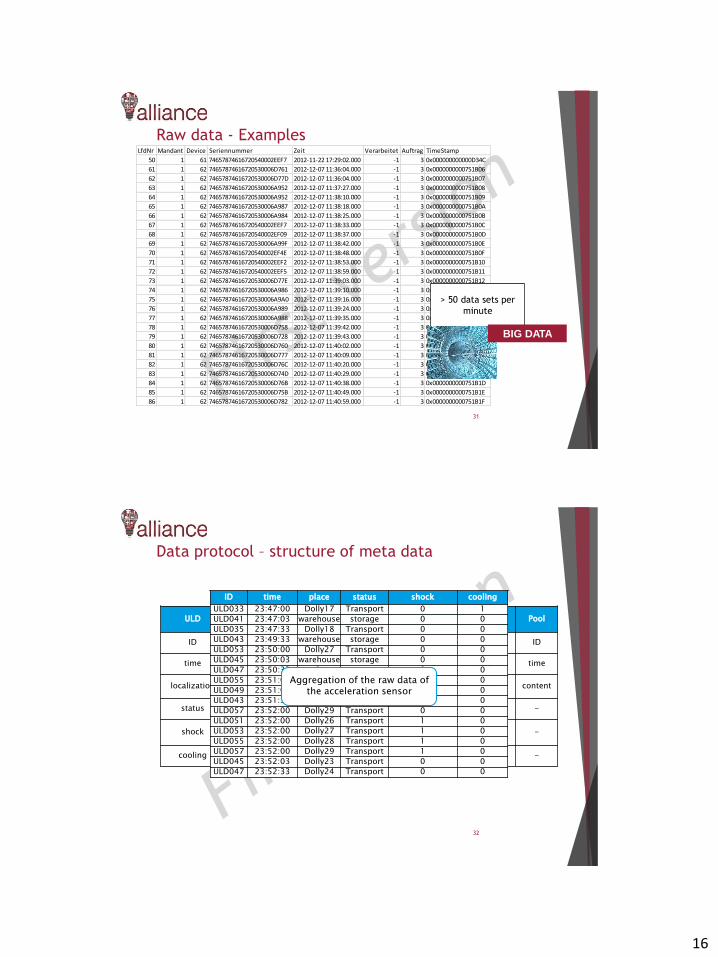
16
Raw data - Examples
31
LfdNr Mandant Device Seriennummer Zeit Verarbeitet Auftrag TimeStamp
50 1 61 74657874616720540002EEF7 2012-11-22 17:29:02.000 -1 3 0x000000000000D34C
61 1 62 74657874616720530006D761 2012-12-07 11:36:04.000 -1 3 0x0000000000751B06
62 1 62 74657874616720530006D77D 2012-12-07 11:36:04.000 -1 3 0x0000000000751B07
63 1 62 74657874616720530006A952 2012-12-07 11:37:27.000 -1 3 0x0000000000751B08
64 1 62 74657874616720530006A952 2012-12-07 11:38:10.000 -1 3 0x0000000000751B09
65 1 62 74657874616720530006A987 2012-12-07 11:38:18.000 -1 3 0x0000000000751B0A
66 1 62 74657874616720530006A984 2012-12-07 11:38:25.000 -1 3 0x0000000000751B0B
67 1 62 74657874616720540002EEF7 2012-12-07 11:38:33.000 -1 3 0x0000000000751B0C
68 1 62 74657874616720540002EF09 2012-12-07 11:38:37.000 -1 3 0x0000000000751B0D
69 1 62 74657874616720530006A99F 2012-12-07 11:38:42.000 -1 3 0x0000000000751B0E
70 1 62 74657874616720540002EF4E 2012-12-07 11:38:48.000 -1 3 0x0000000000751B0F
71 1 62 74657874616720540002EEF2 2012-12-07 11:38:53.000 -1 3 0x0000000000751B10
72 1 62 74657874616720540002EEF5 2012-12-07 11:38:59.000 -1 3 0x0000000000751B11
73 1 62 74657874616720530006D77E 2012-12-07 11:39:03.000 -1 3 0x0000000000751B12
74 1 62 74657874616720530006A986 2012-12-07 11:39:10.000 -1 3 0x0000000000751B13
75 1 62 74657874616720530006A9A0 2012-12-07 11:39:16.000 -1 3 0x0000000000751B14
76 1 62 74657874616720530006A989 2012-12-07 11:39:24.000 -1 3 0x0000000000751B15
77 1 62 74657874616720530006A988 2012-12-07 11:39:35.000 -1 3 0x0000000000751B16
78 1 62 74657874616720530006D758 2012-12-07 11:39:42.000 -1 3 0x0000000000751B17
79 1 62 74657874616720530006D728 2012-12-07 11:39:43.000 -1 3 0x0000000000751B18
80 1 62 74657874616720530006D760 2012-12-07 11:40:02.000 -1 3 0x0000000000751B19
81 1 62 74657874616720530006D777 2012-12-07 11:40:09.000 -1 3 0x0000000000751B1A
82 1 62 74657874616720530006D76C 2012-12-07 11:40:20.000 -1 3 0x0000000000751B1B
83 1 62 74657874616720530006D74D 2012-12-07 11:40:29.000 -1 3 0x0000000000751B1C
84 1 62 74657874616720530006D76B 2012-12-07 11:40:38.000 -1 3 0x0000000000751B1D
85 1 62 74657874616720530006D75B 2012-12-07 11:40:49.000 -1 3 0x0000000000751B1E
86 1 62 74657874616720530006D782 2012-12-07 11:40:59.000 -1 3 0x0000000000751B1F
> 50 data sets per
minute
BIG DATA
Data protocol – structure of meta data
32
ULD plane Dolly TugWare-house
StandTransport
routePool
ID ID ID ID ID ID ID ID
time time time time time time time time
localizationlocalizati
onlocalizati
onlocalizati
oncontent content content content
status status status status - - - -
shock content content trailer - - - -
cooling - - - - - - -
ID time place status shock cooling
ULD033 23:47:00 Dolly17 Transport 0 1
ULD041 23:47:03 warehouse storage 0 0
ULD035 23:47:33 Dolly18 Transport 0 0
ULD043 23:49:33 warehouse storage 0 0
ULD053 23:50:00 Dolly27 Transport 0 0
ULD045 23:50:03 warehouse storage 0 0
ULD047 23:50:33 warehouse storage 0 0
ULD055 23:51:00 Dolly28 Transport 0 0
ULD049 23:51:03 warehouse storage 0 0
ULD043 23:51:33 Dolly22 Transport 0 0
ULD057 23:52:00 Dolly29 Transport 0 0
ULD051 23:52:00 Dolly26 Transport 1 0
ULD053 23:52:00 Dolly27 Transport 1 0
ULD055 23:52:00 Dolly28 Transport 1 0
ULD057 23:52:00 Dolly29 Transport 1 0
ULD045 23:52:03 Dolly23 Transport 0 0
ULD047 23:52:33 Dolly24 Transport 0 0
Aggregation of the raw data of the acceleration sensor
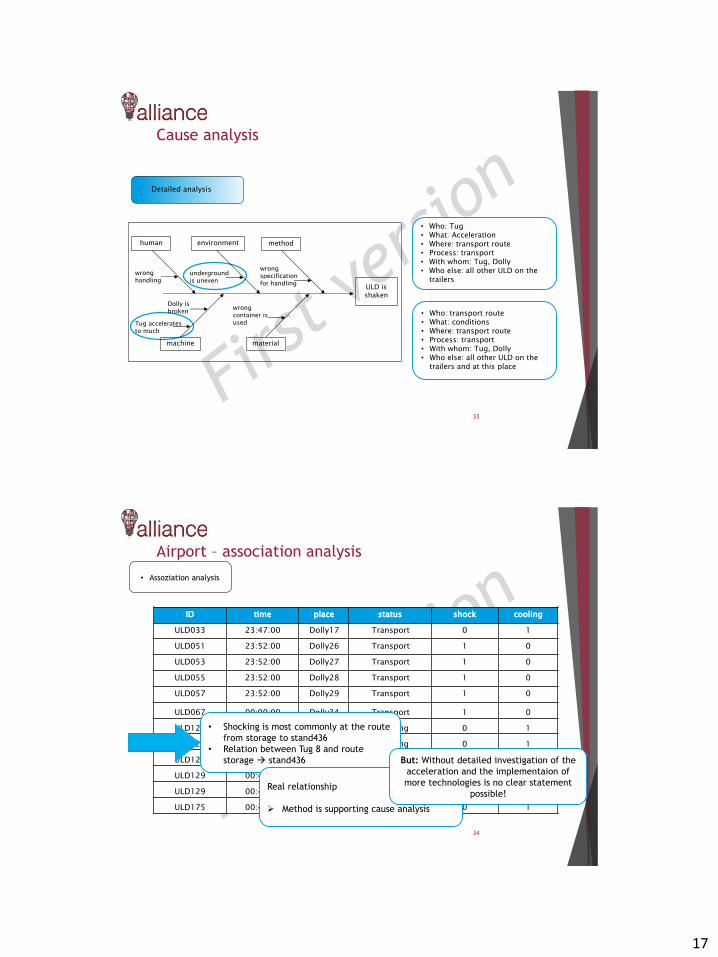
17
Cause analysis
33
• Who: Tug• What: Acceleration• Where: transport route• Process: transport• With whom: Tug, Dolly• Who else: all other ULD on the
trailers
Detailed analysis
• Who: transport route• What: conditions• Where: transport route• Process: transport• With whom: Tug, Dolly• Who else: all other ULD on the
trailers and at this place
ULD isshaken
human environment method
machine material
underground is uneven
wrong handling
wrong specification for handling
wrong container is usedTug accelerates
to much
Dolly is broken
Airport – association analysis
34
• Assoziation analysis
ID time place status shock cooling
ULD033 23:47:00 Dolly17 Transport 0 1
ULD051 23:52:00 Dolly26 Transport 1 0
ULD053 23:52:00 Dolly27 Transport 1 0
ULD055 23:52:00 Dolly28 Transport 1 0
ULD057 23:52:00 Dolly29 Transport 1 0
ULD067 00:00:00 Dolly34 Transport 1 0
ULD127 00:43:43 Lager Lagerung 0 1
ULD129 00:44:13 Lager Lagerung 0 1
ULD123 00:44:43 Dolly23 Transport 0 1
ULD129 00:46:13 Dolly26 Transport 1 1
ULD129 00:46:13 Dolly26 Transport 1 1
ULD175 00:47:00 Dolly08 Transport 0 1
• Shocking is most commonly at the route
from storage to stand436
• Relation between Tug 8 and route
storage stand436
Real relationship
Method is supporting cause analysis
But: Without detailed investigation of the
acceleration and the implementaion of
more technologies is no clear statement
possible!

18
Bibliography• [Alvarenga und Schoenthaler, 2003] Alvarenga, Carlos A. und R. C. Schoenthaler (2003). A
new take on supply chain event management. Supply Chain Management Review, März/April:28–35.
• [Ashbrook und Starner, 2003] Ashbrook, Daniel und T. Starner (2003). Using GPS to learnsignificant locations and predict movement across multiple users. Personal and Ubiquitous Computing, 7(5):275–286.
• [Baader und Montanus, 2008] Baader, Andraes und S.Montanus (2008). Transparency inGlobal Supply Chain Networks - Methods and Tools for Integrated Supply Chain Event Management. In: Ijioui, Raschid, H. Emmerich und M. Ceyp, Hrsg.: Strategies and Tactics inSupply Chain Event Management, S. 3–11. Springer-Verlag, Berlin Heidelberg.
• [Barfus, 2010] Barfus, Katja (2010). Entwicklung eines Vorgehensmodells zur strategischenPlanung des logistischen Netzes einer verteilten Produktion. Fraunhofer Verlag, Stuttgart.
• [Beierle und Kern-Isberner, 2006] Beierle, Christoph und G. Kern-Isberner (2006). Methodenwissensbasierter Systeme - Grundlagen - Algorithmen - Anwendungen. Friedr. Vieweg & SohnVerlagsgesellschaft | GWV Fachverlage GmbH, Wiesbaden, 3. Aufl.
• [Bernard, 2011] Bernard, Thomas (2011). Entscheidungsunterstützung durch Data-Mining-Werkzeuge. Automatisierungs-ATLAS 2011, SPS-Magazin, 5:608–610.
• [Brandau und Tolujevs, 2013] Brandau, Annegret und J. Tolujevs (2013). Modelling and analysis of logistical state data. Transport and Telecommunication, 14(2):102–115.
• [Brandau und Tolujew, 2011] Brandau, Annegret und J. Tolujew (2011). Logistics Event Management. In: Schenk,Michael, Hrsg.: 9./10. Forschungskolloquium am Fraunhofer IFF 2010 – Forschung vernetzen - Innovationen beschleunigen, S. 47–51, Magdeburg. Fraunhofer Verlag.
35
Bibliography• [da Cunha et al., 2005] Cunha, Catherine da, B. Agard und A. Kusiak (2005). Improving manufacturing quality
by re-sequencing assembly operations: a data-mining approach. In: 18th International Conference on
Production Research - ICPR 18, Fisciamo, Italy. University of Salerno.
• [Dong und Pei, 2007] Dong, Guozhu und J. Pei (2007). Sequence Data Mining. Springer Science+Business
Media, LLC.
• [Düsing, 2006] Düsing, Roland (2006). Knowledge Discovery in Databases - Begri, Forschungsgebiet, Prozess
und System. In: Chamoni, Peter und P. Gluchowski, Hrsg.: Analytische Informationssysteme- Business
Intelligence-Technologien und -Anwendungen, S. 241–262. Springer, Berlin Heidelberg, 3.Aufl.
• [Fayyad et al., 1996a] Fayyad, Usama, G. Piatetsky-Shapiro und P. Smyth (1996a). From data mining to
knowledge discovery in databases. AI Magazine, 17(3):37–54.
• [Fayyad et al., 1996b] Fayyad, Usama M., G. Piatetsky-Shapiro und P. Smyth (1996b). From data mining to
knowledge discovery: an overview. In: Fayyad, Usama M., G. Piatetsky-Shapiro, P. Smyth und R.
Uthurusamy, Hrsg.: Advances in Knowledge Discovery and Data Mining, Kap. 1, S. 1–34. AAAI Press / The MIT
Press, Menlo Park, California.
• [Ghezzi et al., 1991] Ghezzi, Carlo, M. Jazayeri und D. Mandrioli (1991). Fundamentals of Software
Engineering. Prentice-Hall, Inc.
• [Säuberlich, 2000] Säuberlich, Frank (2000). KDD und Data Mining als Hilfsmittel zur
Entscheidungsunterstützung. Peter Lang GmbH Europäischer Verlag der Wissenschaften, Frankfurt a. M.
• [Windt et al., 2011] Windt, Katja, M. Knollmann und M. Meyer (2011). Anwendung von Data Mining Methoden
zur Wissensgenerierung in der Logistik - Kritische Reflexion der Analysefähigkeit zur
Termintreueverbesserung. In: Spath, Dieter, Hrsg.: Wissensarbeit - zwischen strengen Prozessen und
kreativem Spielraum, Schriftenreihe der Hochschulgruppe für Arbeits- und Betriebsorganisation e. V. (HAB),
S. 223–249. GITO, Berlin.36