Cost Development Guidelines - PJM
139
PJM © 2013 Revision 20, Effective Date 4/1/2013 i PJM Manual 15: Cost Development Guidelines Revision: 2829 Effective Date: TBD Prepared by: Cost Development Subcommittee © PJM 20162017
-
Upload
khangminh22 -
Category
Documents
-
view
0 -
download
0
Transcript of Cost Development Guidelines - PJM
PJM © 2013 Revision 20, Effective Date 4/1/2013
i
PJM Manual 15:
Cost Development Guidelines
Revision: 2829
Effective Date: TBD
Prepared by:
Cost Development Subcommittee
© PJM 20162017
Manual 15: Cost Development Guidelines Approval and Current Revision
PJM © 2014 Revision 26, Effective Date: 11/05/2015 ii
PJM Manual 15:
Cost Development Guidelines
Table of Contents
Table of Contents ..................................................................................................... ii Table of Exhibits ..................................................................................................... xi Approval ................................................................................................................ xiii Current Revision ................................................................................................... xiii Section 1: Introduction ............................................................................................ 1
1.1 ABOUT PJM MANUALS .................................................................................................................... 1
1.2 HOW TO USE THIS MANUAL ............................................................................................................. 1
1.3 THE INTENDED AUDIENCES FOR THIS MANUAL: ................................................................................. 1
1.4 WHAT IS IN THIS MANUAL? .............................................................................................................. 1 1.5 COST DEVELOPMENT SUBCOMMITTEE MISSION ................................................................................ 1
1.6 PURPOSE OF THIS MANUAL ............................................................................................................. 2
1.6.1 Reason for Cost Based Offers: Market Power Mitigation ..................................................... 2 1.7 COMPONENTS OF COST .................................................................................................................. 3
1.7.1 Generator offer curves .......................................................................................................... 3 1.7.2 Start-up Cost ......................................................................................................................... 3 1.7.3 No Load Cost ........................................................................................................................ 4 1.7.4 Incremental Cost ................................................................................................................... 4 1.7.5 Total Production Cost ........................................................................................................... 4
1.8 UNDEFINED COST OR METHODOLOGY – SUBMISSION AND APPROVAL PROCESS ............................... 5
1.9 REFERENCES ................................................................................................................................. 5
Section 2: Policies for All Unit Types ..................................................................... 7 2.1 HEAT RATES .................................................................................................................................. 7
2.1.1 Heat Rate Policy ................................................................................................................... 7 2.2 PERFORMANCE FACTORS ................................................................................................................ 8
2.2.1 Engineering Judgment in Performance Factors ................................................................... 8 2.2.2 Higher Heating Value of Fuel ................................................................................................ 8 2.2.3 Calculation Methods of Performance Factors ...................................................................... 9 2.2.4 ‘Like’ Units for Performance Factors ................................................................................... 10
2.3 FUEL COST POLICIES AND GUIDELINES .......................................................................................... 10
2.3.3 Total Fuel Related Costs .................................................................................................... 14 2.3.4 Types of Fuel Costs ............................................................................................................ 14 2.3.5 Emission Allowances .......................................................................................................... 14 2.3.6 Leased Fuel Transportation Equipment.............................................................................. 15
2.4 START-UP COST ........................................................................................................................... 16
2.4.1 Start-up Cost Definitions ..................................................................................................... 16 2.4.2 Engineering Judgment in Start Costs ................................................................................. 16
2.5 NO LOAD ...................................................................................................................................... 17
2.5.1 No-Load Definitions ............................................................................................................ 17
Manual 15: Cost Development Guidelines Approval and Current Revision
PJM © 2014 Revision 26, Effective Date: 11/05/2015 iii
2.5.2 No-Load Fuel ...................................................................................................................... 17 2.5.3 No Load Calculation............................................................................................................ 17
2.6 VARIABLE MAINTENANCE COST ..................................................................................................... 18
2.6.1 Escalation Index .................................................................................................................. 19 2.6.2 Maintenance Period ............................................................................................................ 20 2.6.3 Incremental Adjustment Parameter .................................................................................... 21 2.6.4 Equivalent Hourly Maintenance Cost .................................................................................. 21 2.6.5 Immature Units: Maintenance Costs ................................................................................... 22
2.7 SYNCHRONIZED RESERVE ............................................................................................................. 24
2.8 REGULATION SERVICE .................................................................................................................. 24
Section 3: Nuclear Unit Cost Guidelines ............................................................. 31 3.1 NUCLEAR HEAT RATE ................................................................................................................... 31
3.2 PERFORMANCE FACTOR................................................................................................................ 31 3.3 FUEL COST .................................................................................................................................. 31
3.3.1 Basic Nuclear Fuel Cost ..................................................................................................... 31 3.3.2 Total Fuel-Related Costs for Nuclear Units ........................................................................ 31
3.4 START-UP COSTS ......................................................................................................................... 32
3.4.1 Hot Start-up Cost ................................................................................................................ 32 3.4.2 Intermediate Start-up Cost .................................................................................................. 32 3.4.3 Cold Start-up Cost .............................................................................................................. 32 3.4.4 Additional Components Applied to Hot, Intermediate and Cold Start-up Costs ................. 33
3.5 NO-LOAD COST ............................................................................................................................ 33
3.6 MAINTENANCE COST ..................................................................................................................... 33
3.6.1 Configuration Addition Maintenance Adder ........................................................................ 33 3.6.2 Calculation of the Configuration Addition Maintenance Adder: .......................................... 35 3.6.3 Reductions in Total Maintenance Costs: ............................................................................ 36
3.7 SYNCHRONIZED RESERVE COST ................................................................................................... 37
3.8 REGULATION COST ....................................................................................................................... 37
Section 4: Fossil Steam Unit Cost Development ................................................ 38 4.1 HEAT RATE .................................................................................................................................. 38
4.2 PERFORMANCE FACTOR................................................................................................................ 38 4.3 FUEL COST .................................................................................................................................. 38
4.3.1 Total Fuel Related Cost ...................................................................................................... 38 4.4 START-UP COST ........................................................................................................................... 39
4.4.1 Hot Start-up Cost ................................................................................................................ 39 4.4.2 Intermediate Start-up Cost .................................................................................................. 40 4.4.3 Cold Start-up Cost .............................................................................................................. 40
4.5 NO-LOAD COST ............................................................................................................................ 41
4.6 MAINTENANCE COST ..................................................................................................................... 41
4.6.1 Configuration Addition Maintenance Adder ........................................................................ 43 4.6.2 Calculation of the Configuration Addition Maintenance Adder: .......................................... 43 4.6.3 Reductions in Total Maintenance Costs: ............................................................................ 44
4.7 SYNCHRONIZED RESERVE ............................................................................................................. 44
4.8 REGULATION ................................................................................................................................ 45
Manual 15: Cost Development Guidelines Approval and Current Revision
PJM © 2014 Revision 26, Effective Date: 11/05/2015 iv
Section 5: Combined Cycle (CC) Cost Development .......................................... 46 5.1 HEAT RATE .................................................................................................................................. 46
5.2 PERFORMANCE FACTORS .............................................................................................................. 46
5.3 FUEL COST .................................................................................................................................. 46
5.4 START-UP COST ........................................................................................................................... 46
5.5 NO-LOAD COST ............................................................................................................................ 47
5.6 MAINTENANCE COST ..................................................................................................................... 48 5.6.1 Combined Cycle / CT Long Term Service Contract Cost Recovery ................................... 48 5.6.2 Long Term Maintenance Expenses .................................................................................... 48 5.6.3 Equivalent service hours (ESH) .......................................................................................... 48
5.7 SYNCHRONIZED RESERVE ............................................................................................................. 49
5.8 REGULATION ................................................................................................................................ 50
Section 6: Combustion Turbine (CT) and Diesel Engine Costs ......................... 51 6.1 COMBUSTION TURBINE AND DIESEL ENGINE HEAT RATE ................................................................ 51 6.2 PERFORMANCE FACTOR................................................................................................................ 51
6.3 FUEL COST .................................................................................................................................. 51
6.3.1 Combustion Turbine other Fuel-Related Costs .................................................................. 52 6.3.2 Total Fuel Related Cost Equation for CTs .......................................................................... 52
6.4 START-UP COST ........................................................................................................................... 52 6.5 NO-LOAD COST CALCULATION FOR CTS ........................................................................................ 53
6.6 MAINTENANCE COST ..................................................................................................................... 53
6.6.1 Combustion Turbine Maintenance Adder Example ............................................................ 54 6.6.2 Combustion Turbine Long Term Service Contract Cost Recovery .................................... 55 6.6.3 Equivalent service hours ..................................................................................................... 55 6.6.4 Diesel Incremental Maintenance Adder Calculation ........................................................... 56
6.7 SYNCHRONIZED RESERVE: COSTS TO CONDENSE .......................................................................... 56
6.8 REGULATION COST ....................................................................................................................... 56
Section 7: Hydro .................................................................................................... 57 7.1 PUMPING EFFICIENCY (PUMPED STORAGE HYDRO ONLY) ............................................................... 57
7.2 PERFORMANCE FACTORS .............................................................................................................. 58
7.3 FUEL COST .................................................................................................................................. 58
7.3.1 Total Energy Input Related Costs for Pumped Storage Hydro Plant Generation .............. 59 7.4 START-UP COST ........................................................................................................................... 59
7.5 NO-LOAD COST ............................................................................................................................ 59
7.6 MAINTENANCE .............................................................................................................................. 59
7.7 SYNCHRONIZED RESERVE: HYDRO UNIT COSTS TO CONDENSE ...................................................... 60
7.8 REGULATION COST ....................................................................................................................... 61
Section 8 : Demand Resource (DR) ...................................................................... 62 8.1 DEMAND RESOURCE (DR) COST TO PROVIDE SYNCHRONOUS RESERVES ....................................... 62
Manual 15: Cost Development Guidelines Approval and Current Revision
PJM © 2014 Revision 26, Effective Date: 11/05/2015 v
Section 9: Wind Units ............................................................................................ 63 9.1 HEAT RATES ................................................................................................................................ 63
9.2 PERFORMANCE FACTORS .............................................................................................................. 63
9.3 FUEL COST .................................................................................................................................. 63
9.4 START-UP COST ........................................................................................................................... 63
9.5 NO-LOAD COST ............................................................................................................................ 63
9.6 MAINTENANCE .............................................................................................................................. 64 9.7 SYNCHRONIZED RESERVE: WIND UNIT COSTS TO CONDENSE ......................................................... 64
9.8 REGULATION COST ....................................................................................................................... 64
Section 10: Solar Units .......................................................................................... 65 10.1 HEAT RATES .............................................................................................................................. 65
10.2 PERFORMANCE FACTORS ............................................................................................................ 65
10.3 FUEL COST ................................................................................................................................ 65
10.4 START-UP COST ......................................................................................................................... 65 10.5 NO-LOAD COST .......................................................................................................................... 65
10.6 MAINTENANCE ............................................................................................................................ 65
10.7 SYNCHRONIZED RESERVE COST ................................................................................................. 66
10.8 REGULATION COST ..................................................................................................................... 66
Section 11: Energy Storage Resource ................................................................. 67 11.1 HEAT RATES .............................................................................................................................. 67 11.2 PERFORMANCE FACTORS ............................................................................................................ 67
11.3 FUEL COST ................................................................................................................................ 67
11.4 START-UP COST ......................................................................................................................... 67
11.5 NO-LOAD COST .......................................................................................................................... 67
11.6 MAINTENANCE ............................................................................................................................ 67
11.7 SYNCHRONIZED RESERVE COST ................................................................................................. 68 11.8 REGULATION COST ..................................................................................................................... 68
Section 12: Energy Market Opportunity Cost and Non-Regulatory Opportunity Cost Guidelines ...................................................................................................... 70
12.1 OPPORTUNITY COST POLICY ....................................................................................................... 70
12.2.1 Energy Market Opportunity Costs ..................................................................................... 70 12.2.2 Non-Regulatory Opportunity Cost: Physical Equipment Limitations: ............................... 70 12.2.3 Non-Regulatory Opportunity Cost: Fuel Limitations ......................................................... 70
12.3 CALCULATION METHOD OPTIONS: TWO METHODOLOGIES FOR CALCULATING OPPORTUNITY COST . 71 12.3.1 Long Term Method (greater than 30 days) ....................................................................... 71 12.3.2 Short Term Method (30 days or less) ............................................................................... 71
12.4 DEFINITIONS ............................................................................................................................... 71
12.5 LONG TERM METHODOLOGY ....................................................................................................... 72
Manual 15: Cost Development Guidelines Approval and Current Revision
PJM © 2014 Revision 26, Effective Date: 11/05/2015 vi
12.5.1 Step 1: Derive Historical Monthly LMP Basis Differential between the generation bus and western hub ................................................................................................................................. 72 12.5.2 Step 2: Derive hourly volatility scalars to incorporate hourly volatility into the LMP forecast ........................................................................................................................................ 76 12.5.3 Step 3: Create three sets of hourly forecasted bus values ............................................... 78 12.5.4 Step 4: Create a daily fuel volatility scalar ........................................................................ 79 12.5.5 Step 5: Create three daily delivered fuel forecasts ........................................................... 80 12.5.6 Step 6: Create generating unit(s) cost for each of the three forecasts ............................. 82 12.5.7 Step 7: Calculate the margin for every hour in the three hourly forecasts ....................... 84 12.5.8 Step 8: Determine the opportunity cost component ......................................................... 86
12.6 SHORT TERM METHODOLOGY ..................................................................................................... 86
12.6.1 Step 1: Derive Historical Monthly LMP Basis Differential between the generation bus and western hub ................................................................................................................................. 87 12.6.2 Step 2: Derive hourly volatility scalars to incorporate hourly volatility into the LMP forecast ........................................................................................................................................ 89 12.6.3 Step 3: Create three sets of hourly forecasted bus values ............................................... 90 12.6.4 Step 4: Fuel Price ............................................................................................................. 91 12.6.5 Step 5: Create generating unit’s cost for each of the three forecasts .............................. 93 12.6.6 Step 6: Calculate the margin for every hour in the three hourly forecasts ....................... 94 12.6.7 Step 7: Determine the opportunity cost adder .................................................................. 96
Attachment A: Applicable FERC System of Accounts ...................................... 98 A.1 BALANCE SHEET ACCOUNTS ......................................................................................................... 98
A.1.1 FERC FORM 1 ACCOUNT 151: Fuel Stock (Major only). ................................................. 98 A.2 EXPENSE ACCOUNTS .................................................................................................................... 98
A.2.1 FERC FORM 1 ACCOUNT 501: Fuel ................................................................................ 98 A.2.2. FERC FORM 1 ACCOUNT 509: Allowances .................................................................... 99 A.2.3 FERC FORM 1 ACCOUNT 512: Maintenance of Boiler Plant (Major only) ..................... 100 A.2.4 FERC FORM 1 ACCOUNT 513: Maintenance of Electric Plant (Major only) .................. 100 A.2.5 FERC FORM 1 ACCOUNT 518: Nuclear Fuel Expense (Major only) ............................. 100 A.2.6 FERC FORM 1 ACCOUNT 530: Maintenance of Reactor Plant Equipment (Major only)101 A.2.7 FERC FORM 1 ACCOUNT 531: Maintenance of Electric Plant (Major only) .................. 101 A.2.8 FERC FORM 1 ACCOUNT 543: Maintenance of Reservoirs, Dams, and Waterways (Major only) ................................................................................................................................ 101 A.2.9 FERC FORM 1 ACCOUNT 544: Maintenance of Electric Plant (Major only) .................. 101
A.3 OPERATING EXPENSE INSTRUCTIONS 2 AND 3 ............................................................................. 101
A.3.1 OPERATING EXPENSE INSTRUCTION 2: Maintenance ............................................... 101 A.3.2 OPERATING EXPENSE INSTRUCTION 3: Rents ......................................................... 102
Attachment B: NoLoad Calculation Examples ................................................................ 104 B.1 NO-LOAD FUEL .......................................................................................................................... 104
B.2 TYPICAL STEAM UNIT EXAMPLE .................................................................................................. 105
B.3 TYPICAL COMBUSTION TURBINE EXAMPLE ................................................................................... 109
B.4 TYPICAL 2 ON 1 COMBINED CYCLE WITH DUCT BURNING EXAMPLE ............................................... 113 B.5 NO-LOAD COST ADJUSTMENTS ................................................................................................... 116
B.6 COMBUSTION TURBINE ZERO NO-LOAD EXAMPLE ........................................................................ 121
Revision History ................................................................................................... 124 Table of Contents ..................................................................................................... ii Table of Exhibits ................................................................................................... xiv
Manual 15: Cost Development Guidelines Approval and Current Revision
PJM © 2014 Revision 26, Effective Date: 11/05/2015 vii
Approval .............................................................................................................. xviii Current Revision ................................................................................................. xviii Section 1: Introduction ............................................................................................ 1
1.1 ABOUT PJM MANUALS 1
1.2 HOW TO USE THIS MANUAL 1
1.3 THE INTENDED AUDIENCES FOR THIS MANUAL: 1
1.4 WHAT IS IN THIS MANUAL? 1
1.5 COST DEVELOPMENT SUBCOMMITTEE MISSION 2
1.6 PURPOSE OF THIS MANUAL 2 1.6.1 Reason for Cost Based Offers: Market Power Mitigation ..................................................... 2
1.7 COMPONENTS OF COST 3
1.7.1 Generator offer curves .......................................................................................................... 3 1.7.2 Start-up Cost ......................................................................................................................... 3 1.7.3 No Load Cost ........................................................................................................................ 4 1.7.4 Incremental Cost ................................................................................................................... 4 1.7.5 Total Production Cost ........................................................................................................... 4
1.8 COST METHODOLOGY AND APPROVAL PROCESS 5
1.9 REFERENCES 5
Section 2: Policies for All Unit Types ..................................................................... 7 2.1 HEAT RATES 7
2.1.1 Heat Rate Policy ................................................................................................................... 7 2.2 PERFORMANCE FACTORS 8
2.2.1 Engineering Judgment in Performance Factors ................................................................... 9 2.2.2 Higher Heating Value of Fuel ................................................................................................ 9 2.2.3 Calculation Methods of Performance Factors ...................................................................... 9 2.2.4 ‘Like’ Units for Performance Factors ................................................................................... 10
2.3 FUEL COST GUIDELINES 10 2.3.1 Modifications to Fuel Cost Policies ..................................................................................... 10 2.3.2 Fuel Cost Calculation .......................................................................................................... 11 2.3.3 Total Fuel Related Costs .................................................................................................... 12 2.3.4 Types of Fuel Costs ............................................................................................................ 12 2.3.5 Emission Allowances .......................................................................................................... 13 2.3.6 Leased Fuel Transportation Equipment.............................................................................. 13
2.4 START-UP COST 14
2.4.1 Start Cost Definitions .......................................................................................................... 14 2.4.2 Engineering Judgment in Start Costs ................................................................................. 15
2.5 NO LOAD 15
2.5.1 No-Load Definitions ............................................................................................................ 15 2.5.2 No-Load Fuel ...................................................................................................................... 15 2.5.3 No Load Calculation............................................................................................................ 15
2.6 VARIABLE MAINTENANCE COST 17
2.6.1 Escalation Index .................................................................................................................. 18 2.6.2 Maintenance Period ............................................................................................................ 19 2.6.3 Incremental Adjustment Parameter .................................................................................... 20 2.6.4 Equivalent Hourly Maintenance Cost .................................................................................. 20
Formatted ...
Formatted ...
Formatted ...
Formatted ...
Formatted ...
Formatted ...
Formatted ...
Formatted ...
Formatted ...
Formatted ...
Formatted ...
Formatted ...
Formatted ...
Formatted ...
Formatted ...
Formatted ...
Formatted ...
Formatted ...
Formatted ...
Formatted ...
Formatted ...
Formatted ...
Formatted ...
Formatted ...
Formatted ...
Formatted ...
Formatted ...
Formatted ...
Formatted ...
Formatted ...
Formatted ...
Formatted ...
Formatted ...
Formatted ...
Formatted ...
Formatted ...
Formatted ...
Formatted ...
Formatted ...
Formatted ...
Formatted ...
Manual 15: Cost Development Guidelines Approval and Current Revision
PJM © 2014 Revision 26, Effective Date: 11/05/2015 viii
2.6.5 Immature Units: Maintenance Costs ................................................................................... 21 2.7 SYNCHRONIZED RESERVE 23
2.8 REGULATION SERVICE 23
Section 3: Nuclear Unit Cost Guidelines ............................................................. 31 3.1 NUCLEAR HEAT RATE 31
3.2 PERFORMANCE FACTOR 31
3.3 FUEL COST 31 3.3.1 Basic Nuclear Fuel Cost ..................................................................................................... 31 3.3.2 Total Fuel-Related Costs for Nuclear Units ........................................................................ 31
3.4 START COSTS 32
3.4.1 Hot Start Cost ..................................................................................................................... 32 3.4.2 Intermediate Start Cost ....................................................................................................... 32 3.4.3 Cold Start Cost .................................................................................................................... 32 3.4.4 Additional Components Applied to Hot, Intermediate and Cold Start-Up Costs ................ 33
3.5 NO LOAD COST 33
3.6 MAINTENANCE COST 33
3.6.1 Configuration Addition Maintenance Adder ........................................................................ 33 3.6.2 Calculation of the Configuration Addition Maintenance Adder: .......................................... 35 3.6.3 Reductions in Total Maintenance Costs: ............................................................................ 36
3.7 SYNCHRONIZED RESERVE COST 37
3.8 REGULATION COST 37
Section 4: Fossil Steam Unit Cost Development ................................................ 38 4.1 HEAT RATE 38
4.2 PERFORMANCE FACTOR 38
4.3 FUEL COST 38 4.3.1 Total Fuel Related Cost ...................................................................................................... 38
4.4 HOT START COST, INTERMEDIATE START COST, AND COLD START COST 39
4.4.1 Hot Start Cost ..................................................................................................................... 39 4.4.2 Intermediate Start Cost ....................................................................................................... 40 4.4.3 Cold Start Cost .................................................................................................................... 40
4.5 NO LOAD COST 41 4.6 MAINTENANCE COST 41
4.6.1 Configuration Addition Maintenance Adder ........................................................................ 43 4.6.2 Calculation of the Configuration Addition Maintenance Adder: .......................................... 43 4.6.3 Reductions in Total Maintenance Costs: ............................................................................ 44
4.7 SYNCHRONIZED RESERVE 44
4.8 REGULATION 45
Section 5: Combined Cycle (CC) Cost Development .......................................... 47 5.1 HEAT RATE 47
5.2 PERFORMANCE FACTORS 47
5.3 FUEL COST 47
5.4 START COST 47
Formatted ...
Formatted ...
Formatted ...
Formatted ...
Formatted ...
Formatted ...
Formatted ...
Formatted ...
Formatted ...
Formatted ...
Formatted ...
Formatted ...
Formatted ...
Formatted ...
Formatted ...
Formatted ...
Formatted ...
Formatted ...
Formatted ...
Formatted ...
Formatted ...
Formatted ...
Formatted ...
Formatted ...
Formatted ...
Formatted ...
Formatted ...
Formatted ...
Formatted ...
Formatted ...
Formatted ...
Formatted ...
Formatted ...
Formatted ...
Formatted ...
Formatted ...
Formatted ...
Formatted ...
Formatted ...
Formatted ...
Formatted ...
Formatted ...
Manual 15: Cost Development Guidelines Approval and Current Revision
PJM © 2014 Revision 26, Effective Date: 11/05/2015 ix
5.5 NO LOAD COST 49
5.6 MAINTENANCE COST 49
5.6.1 Combined Cycle / Combustion Turbine Long Term Service Contract Cost Recovery ....... 49 5.6.2 Long Term Maintenance Expenses .................................................................................... 49 5.6.3 Equivalent service hours (ESH) .......................................................................................... 49
5.7 SYNCHRONIZED RESERVE 50 5.8 REGULATION 51
Section 6: Combustion Turbine (CT) and Diesel Engine Costs ......................... 52 6.1 COMBUSTION TURBINE AND DIESEL ENGINE HEAT RATE 52
6.2 PERFORMANCE FACTOR 52
6.3 FUEL COST 53
6.3.1 Combustion Turbine other Fuel-Related Costs .................................................................. 53 6.3.2 Total Fuel Related Cost Equation for CTs .......................................................................... 53
6.4 START COST 53
6.5 NO LOAD COST CALCULATION FOR CTS 54
6.6 MAINTENANCE COST 55
6.6.1 Combustion Turbine Maintenance Adder Example ............................................................ 55 6.6.2 Combustion Turbine Long Term Service Contract Cost Recovery .................................... 56 6.6.3 Equivalent service hours (ESH) .......................................................................................... 57 6.6.4 Diesel Incremental Maintenance Adder Calculation ........................................................... 57
6.7 SYNCHRONIZED RESERVE: COSTS TO CONDENSE 57
6.8 REGULATION COST 58
Section 7: Hydro .................................................................................................... 59 7.1 PUMPING EFFICIENCY (PUMPED HYDRO ONLY) 59
7.2 PERFORMANCE FACTORS 60 7.3 FUEL COST 60
7.3.1 Total Energy Input Related Costs for Pumped Storage Hydro Plant Generation .............. 61 7.4 START COST 61
7.5 NO LOAD 61
7.6 MAINTENANCE 62
7.7 SYNCHRONIZED RESERVE: HYDRO UNIT COSTS TO CONDENSE 62 7.8 REGULATION COST 63
Section 8 : Demand Side Response (DSR) .......................................................... 64 8.1 DEMAND SIDE RESPONSE (DSR) COST TO PROVIDE SYNCHRONOUS RESERVES 64
Section 9: Wind Units ............................................................................................ 65 9.1 HEAT RATES 65
9.2 PERFORMANCE FACTORS 65
9.3 FUEL COST 65 9.4 START COST 65
Formatted: Default Paragraph Font, Checkspelling and grammar, Small caps
Formatted: Default Paragraph Font, Checkspelling and grammar, Small caps
Formatted: Default Paragraph Font, Font:Italic, Check spelling and grammar
Formatted ...
Formatted ...
Formatted ...
Formatted ...
Formatted ...
Formatted ...
Formatted ...
Formatted ...
Formatted ...
Formatted ...
Formatted ...
Formatted ...
Formatted ...
Formatted ...
Formatted ...
Formatted ...
Formatted ...
Formatted ...
Formatted ...
Formatted ...
Formatted ...
Formatted ...
Formatted ...
Formatted ...
Formatted ...
Formatted ...
Formatted ...
Formatted ...
Formatted ...
Formatted ...
Formatted ...
Formatted ...
Formatted ...
Formatted ...
Formatted ...
Formatted ...
Manual 15: Cost Development Guidelines Approval and Current Revision
PJM © 2014 Revision 26, Effective Date: 11/05/2015 x
9.5 NO LOAD 65
9.6 MAINTENANCE 66
9.7 SYNCHRONIZED RESERVE: WIND UNIT COSTS TO CONDENSE 66
9.8 REGULATION COST 66
Section 10: Solar Units .......................................................................................... 67 10.1 HEAT RATES 67
10.2 PERFORMANCE FACTORS 67 10.3 FUEL COST 67
10.4 START COST 67
10.5 NO LOAD 67
10.6 MAINTENANCE 67
10.7 SYNCHRONIZED RESERVE COST 68
10.8 REGULATION COST 68
Section 11: Energy Storage .................................................................................. 69 11.1 HEAT RATES 69
11.2 PERFORMANCE FACTORS 69
11.3 FUEL COST 69
11.4 START COST 69
11.5 NO LOAD 69 11.6 MAINTENANCE 69
11.7 SYNCHRONIZED RESERVE COST 70
11.8 REGULATION COST 70
Section 12: Energy Market Opportunity Cost and Non-Regulatory Opportunity Cost Guidelines ...................................................................................................... 72
12.1 OPPORTUNITY COST POLICY 72
12.2 BASIS FOR OPPORTUNITY COST TO BE INCLUDED IN COST OFFERS 72
12.2.1 Energy Market Opportunity Costs ..................................................................................... 72 12.2.2 Non-Regulatory Opportunity Cost: Physical Equipment Limitations: ............................... 72 12.2.3 Non-Regulatory Opportunity Cost: Fuel Limitations ......................................................... 72
12.3 CALCULATION METHOD OPTIONS: TWO METHODOLOGIES FOR CALCULATING OPPORTUNITY COST 73
12.3.1 Long Term Method (greater than 30 days) ....................................................................... 73 12.3.2 Short Term Method (30 days or less) ............................................................................... 73
12.4 DEFINITIONS 73
12.5 LONG TERM METHODOLOGY 74
12.5.1 Step 1: Derive Historical Monthly LMP Basis Differential between the generation bus and western hub ................................................................................................................................. 74 12.5.2 Step 2: Derive hourly volatility scalars to incorporate hourly volatility into the LMP forecast ........................................................................................................................................ 78
Formatted: Default Paragraph Font, Checkspelling and grammar, Small caps
Formatted: Default Paragraph Font, Checkspelling and grammar, Small caps
Formatted: Default Paragraph Font, Checkspelling and grammar, Small caps
Formatted: Default Paragraph Font, Checkspelling and grammar, Small caps
Formatted: Default Paragraph Font, Font:Bold, Check spelling and grammar
Formatted: Default Paragraph Font, Checkspelling and grammar, Small caps
Formatted: Default Paragraph Font, Checkspelling and grammar, Small caps
Formatted: Default Paragraph Font, Checkspelling and grammar, Small caps
Formatted: Default Paragraph Font, Checkspelling and grammar, Small caps
Formatted ...
Formatted ...
Formatted ...
Formatted ...
Formatted ...
Formatted ...
Formatted ...
Formatted ...
Formatted ...
Formatted ...
Formatted ...
Formatted ...
Formatted ...
Formatted ...
Formatted ...
Formatted ...
Formatted ...
Formatted ...
Formatted ...
Formatted ...
Formatted ...
Formatted ...
Formatted ...
Formatted ...
Formatted ...
Formatted ...
Manual 15: Cost Development Guidelines Approval and Current Revision
PJM © 2014 Revision 26, Effective Date: 11/05/2015 xi
12.5.3 Step 3: Create three sets of hourly forecasted bus values ............................................... 80 12.5.4 Step 4: Create a daily fuel volatility scalar ........................................................................ 81 12.5.5 Step 5: Create three daily delivered fuel forecasts ........................................................... 82 12.5.6 Step 6: Create generating unit(s) cost for each of the three forecasts ............................. 84 12.5.7 Step 7: Calculate the margin for every hour in the three hourly forecasts ....................... 86 12.5.8 Step 8: Determine the opportunity cost component ......................................................... 88
12.6 SHORT TERM METHODOLOGY 88
12.6.1 Step 1: Derive Historical Monthly LMP Basis Differential between the generation bus and western hub ................................................................................................................................. 89 12.6.2 Step 2: Derive hourly volatility scalars to incorporate hourly volatility into the LMP forecast ........................................................................................................................................ 91 12.6.3 Step 3: Create three sets of hourly forecasted bus values ............................................... 93 12.6.4 Step 4: Fuel Price ............................................................................................................. 94 12.6.5 Step 5: Create generating unit’s cost for each of the three forecasts .............................. 95 12.6.6 Step 6: Calculate the margin for every hour in the three hourly forecasts ....................... 97 12.6.7 Step 7: Determine the opportunity cost adder .................................................................. 99
Attachment A: Applicable FERC System of Accounts .................................... 101 A.1 BALANCE SHEET ACCOUNTS 101
A.1.1 FERC FORM 1 ACCOUNT 151: Fuel Stock (Major only). ............................................... 101 A.2 EXPENSE ACCOUNTS 101
A.2.1 FERC FORM 1 ACCOUNT 501: Fuel .............................................................................. 101 A.2.2. FERC FORM 1 ACCOUNT 509: Allowances .................................................................. 103 A.2.3 FERC FORM 1 ACCOUNT 512: Maintenance of Boiler Plant (Major only) ..................... 103 A.2.4 FERC FORM 1 ACCOUNT 513: Maintenance of Electric Plant (Major only) .................. 103 A.2.5 FERC FORM 1 ACCOUNT 518: Nuclear Fuel Expense (Major only) ............................. 103 A.2.6 FERC FORM 1 ACCOUNT 530: Maintenance of Reactor Plant Equipment (Major only)104 A.2.7 FERC FORM 1 ACCOUNT 531: Maintenance of Electric Plant (Major only) .................. 104 A.2.8 FERC FORM 1 ACCOUNT 543: Maintenance of Reservoirs, Dams, and Waterways (Major only) ................................................................................................................................ 104 A.2.9 FERC FORM 1 ACCOUNT 544: Maintenance of Electric Plant (Major only) .................. 104
A.3 OPERATING EXPENSE INSTRUCTIONS 2 AND 3 104
A.3.1 OPERATING EXPENSE INSTRUCTION 2: Maintenance ............................................... 104 A.3.2 OPERATING EXPENSE INSTRUCTION 3: Rents ......................................................... 105
Attachment B: No Load Calculation Examples ................................................. 107 B.1 NO-LOAD FUEL 107
B.2 TYPICAL STEAM UNIT EXAMPLE 108
B.3 TYPICAL COMBUSTION TURBINE EXAMPLE 112 B.4 TYPICAL 2 ON 1 COMBINED CYCLE WITH DUCT BURNING EXAMPLE 116
B.5 NO-LOAD COST ADJUSTMENTS 119
B.6 COMBUSTION TURBINE ZERO NO-LOAD EXAMPLE 124
Revision History ................................................................................................... 127 Table of Exhibits
EXHIBIT 1: HANDY WHITMAN INDEX 20
EXHIBIT 2: EXAMPLE CALCULATION OF MAINTENANCE ADDER FOR A CT USING A 10 YEAR MAINTENANCE PERIOD 22
Formatted: Default Paragraph Font, Font:Italic, Check spelling and grammar
Formatted: Default Paragraph Font, Font:Italic, Check spelling and grammar
Formatted: Default Paragraph Font, Font:Italic, Check spelling and grammar
Formatted: Default Paragraph Font, Font:Italic, Check spelling and grammar
Formatted ...
Formatted ...
Formatted ...
Formatted ...
Formatted ...
Formatted ...
Formatted ...
Formatted ...
Formatted ...
Formatted ...
Formatted ...
Formatted ...
Formatted ...
Formatted ...
Formatted ...
Formatted ...
Formatted ...
Formatted ...
Formatted ...
Formatted ...
Formatted ...
Formatted ...
Formatted ...
Formatted ...
Formatted ...
Formatted ...
Formatted ...
Formatted ...
Formatted ...
Formatted ...
Formatted ...
Formatted ...
Formatted ...
Formatted ...
Manual 15: Cost Development Guidelines Approval and Current Revision
PJM © 2014 Revision 26, Effective Date: 11/05/2015 xii
EXHIBIT 3: IMMATURE UNIT 24
EXHIBIT 4: VOM FOR ALL HYDRO UNITS OR NON-HYDRO UNITS PROVIDING SERVICE FOR LESS THAN 10 YEARS 26
EXHIBIT 5: EXAMPLE OF VOM FOR NON-HYDRO UNITS PROVIDING REGULATION FOR MORE THAN 10 YEARS: 26
EXHIBIT 6: REGULATION MAXIMUM ALLOWABLE COST ADDER EXAMPLE 29
EXHIBIT 7: NUCLEAR UNIT’S SAMPLE FORMULA OF MAINTENANCE ADDER 34
EXHIBIT 8: NUCLEAR UNIT’S SAMPLE FORMULA OF START MAINTENANCE ADDER 35
EXHIBIT 9: NUCLEAR UNIT’S SAMPLE FORMULA OF CONFIGURATION ADDITION MAINTENANCE ADDER 36
EXHIBIT 10: FOSSIL STEAM UNIT’S SAMPLE FORMULA OF MAINTENANCE ADDER 42
EXHIBIT 11: FOSSIL STEAM UNIT’S SAMPLE FORMULA OF START MAINTENANCE ADDER 43
EXHIBIT 12: FOSSIL UNIT’S SAMPLE FORMULA OF CONFIGURATION ADDITION MAINTENANCE ADDER 44
EXHIBIT 13: STEAM UNIT SYNCHRONIZED RESERVE EXAMPLE 45
EXHIBIT 14: COMBINED CYCLE UNIT SYNCHRONIZED RESERVE EXAMPLE 50
EXHIBIT 15: COMBUSTION TURBINE MAINTENANCE COST ADDER EXAMPLE 55
EXHIBIT 16: THREE HOURLY BASIS DIFFERENTIAL RATIOS VALUES FOR THE SAME HOUR IN EACH OF THREE HISTORICAL YEARS: 73
EXHIBIT 17: MONTHLY PEAK BASIS DIFFERENTIALS FOR THE THREE HISTORICAL PERIODS: 74
EXHIBIT 18: FORECASTED MONTHLY BUS PRICES FOR THREE HISTORICAL PERIODS: 76
EXHIBIT 19: FORECASTED BUS LMPS FOR ONE HOUR FOR EACH OF THE THREE HISTORICAL BASE YEARS: 78
EXHIBIT 20: THREE DAILY FUEL VOLATILITY SCALARS VALUES DEVELOPED FOR JUNE 3 IN EACH OF THREE HISTORIC YEARS FOR A UNIT WITH A SINGLE FUEL: 80
EXHIBIT 21: CREATE THREE DAILY DELIVERED FUEL FORECASTS FROM THE VOLATILITIES OF THREE HISTORIC YEARS: 81
EXHIBIT 22: DAILY UNIT COST: 83
EXHIBIT 23: CALCULATING TOTAL MARGINS WITH A MINIMUM RUNTIME OF ONE HOUR (I.E. NO MINIMUM RUNTIME RESTRICTION), USING HISTORICAL DATA FROM THE PAST THREE CALENDAR YEARS 85
EXHIBIT 24: A UNIT WITH 700 RUN HOURS: 86
EXHIBIT 25: THREE HOURLY BASIS DIFFERENTIAL RATIOS VALUES FOR THE SAME HOUR IN EACH OF THREE HISTORICAL YEARS: 87
Manual 15: Cost Development Guidelines Approval and Current Revision
PJM © 2014 Revision 26, Effective Date: 11/05/2015 xiii
EXHIBIT 26: MONTHLY PEAK BASIS DIFFERENTIALS FOR THE THREE HISTORICAL PERIODS: 88
EXHIBIT 27: FORECASTED MONTHLY BUS PRICES FOR THREE HISTORICAL PERIODS: 89
EXHIBIT 28: DAILY UNIT COST: 94
EXHIBIT 29: CALCULATING TOTAL MARGINS WITH A MINIMUM RUN TIME OF ONE HOUR (I.E. NO MINIMUM RUN TIME RESTRICTION), USING HISTORICAL DATA FROM THE PAST THREE CALENDAR YEARS 95
EXHIBIT 30: A UNIT WITH 700 RUN HOURS LEFT: 96
Approval
Approval Date: Effective Date:
Jeffrey R Schmitt, Chairman
Cost Development Subcommittee
Current Revision Revision 29(): Fuel Cost Policy and Hourly Offers conforming changes
• Section 1.8 • Section 2.3 • Section 2.3.1 • Additional changes to require submission of items to be submitted to
PJM and MMU Revision 28 (): Biennial Review and Administrative Changes
⦁ Unit Owner changed to Market Seller ⦁ Capitalization, Abbreviations, Grammar ⦁ Pumped Storage Hydro ⦁ Demand Resource
Manual 15: Cost Development Guidelines Section 1: Introduction
PJM © 2016 1 Revision 28, Effective Date:
Section 1: Introduction
1.1 About PJM Manuals
The PJM Manuals are the instructions, rules, procedures, and guidelines established by PJM for the operation, planning, and accounting requirements of PJM and the PJM Markets.
1.2 How to Use This Manual
The PJM Manual 15: Cost Development Guidelines is one in a series of the PJM Manuals. This Manual is maintained by the PJM Cost Development Subcommittee (CDS) under the auspices of the PJM Market and Reliability Committee (MRC). To use this Manual, read sections one and two then go to the chapter for unit type for possible additional information. All capitalized terms that are not otherwise defined herein shall have the same meaning as they are defined in the Amended and Restated Operating Agreement of PJM Interconnection, L.L.C. (PJM Operating Agreement), PJM Open Access Transmission Tariff (PJM Tariff) or the Reliability Assurance Agreement Among Load Serving Entities in the PJM Region. Throughout this manual, the term MMBtu is one million British Thermal Units (BTU).
1.3 The intended audiences for this Manual:
• Market Seller
• PJM staff
• MMU
• Regulators
1.4 What is in this Manual?
• A table of contents that lists two levels of subheadings within each of the sections
• An approval page that lists the required approvals and a brief outline of the current revision
• Sections containing the specific guidelines, requirements, or procedures including PJM actions and Market Seller actions
• Attachments
1.5 Cost Development Subcommittee Mission
Manual 15: Cost Development Guidelines Section 1: Introduction
PJM © 2016 2 Revision 28, Effective Date:
The CDS reports to the MRC and is responsible for developing, reviewing, and recommending procedures for calculating the costs of products or services provided to PJM at a cost-based rate for Market Sellers. CDS responsibilities can be found in the CDS’ charter.
1.6 Purpose of this Manual
This document details the standards recognized by PJM for determining cost components for markets where products or services are provided to PJM at cost-based rates, as referenced in Schedule 1, Section 6 of the PJM Operating Agreement.
1.6.1 Reason for Cost Based Offers: Market Power Mitigation The following material is provided for background and should be used for information only. Structural market power is the ability of seller, or a group of sellers, to alter the market price of a good or service for a sustained period. To mitigate the potential exercise of market power, market rules can offer cap units in various markets. The Three Pivotal Supplier (TPS) test is used to determine if structural market power exists in a given market. If structural market power is found to exist, some Market Sellers may be mitigated to cost-based offers to prevent any exercise of that market power. The TPS test is a test for structural market power. The test examines the concentration of ownership of the supply compared to the level of demand. The test does not examine the competitiveness of offers or other factors. The general concept of the TPS test is to control a constraint; a certain amount of MW of relief is needed. If there are not enough MWs to satisfy the constraint without using the top two suppliers’ output plus the output of the supplier being tested, then those three suppliers are jointly pivotal. According to the criteria utilized by the TPS test, because the supply can be constrained by those three owners and the demand could potentially not be satisfied, they are considered to have structural market power. If any one supplier fails, then the top two suppliers also fail. A test failure means that the ownership of the supply needed to meet is concentrated among few suppliers and therefore those suppliers have the potential to exercise market power or structural market power. It does not mean those suppliers are attempting to exercise market power. A test failure triggers mitigation as a preventative step in the event of a concentration of ownership. If a generator is brought on for constraint control and its supplier fails a TPS test, then the unit is dispatched at the lower of the cost or price offer. The purpose of this Manual is to outline the development of the cost-based offer to ensure that PJM Members who own or control a generating unit(s) with structural market power cannot exercise it.
Manual 15: Cost Development Guidelines Section 1: Introduction
PJM © 2016 3 Revision 28, Effective Date:
1.7 Components of Cost
This Manual is designed to instruct Market Sellers on how to develop their cost based offers. A Market Seller who is required to submit a cost-based offer for a resource shall be responsible for the development and accuracy of all information to support the calculation of a resource’s cost-based offer and shall provide such information to PJM or the MMU, either directly or indirectly through an agent or other entity, upon request or as required by applicable PJM market rules. These cost-based offers are used by PJM to schedule generation in cases in which structural market power is found to exist. PJM uses the information provided from Market Sellers to determine each unit’s production costs. Production costs are the costs to operate a unit for a particular period. Several different cost components are needed to determine a generating unit's total production cost. The total production cost includes:
• Start-up Cost
• No-Load Cost
• Incremental costs (energy cost per segment of output range)
Production costs have a direct impact on which units are scheduled by PJM. In general, generation will be scheduled to achieve the lowest possible overall costs to the system. The following material is provided for background and should be used for information only.
1.7.1 Generator offer curves Generator offer curves are representations of a generator’s willingness to provide energy. Offer curves are used in determining incremental and total production costs. An offer curve can have up to ten points defined. The first point describes the lowest MW amount offered for a unit. The offer curve may be a smooth line or a block curve depending on how the points between each segment are calculated. The Market Seller can determine how the slope of the offer curve is defined; however, the slope must be monotonically increasing.
1.7.2 Start-up Cost Start-up Costs are defined as the unit costs to bring the boiler, turbine and generator from shutdown conditions to the point after breaker closure which is typically indicated by telemetered or aggregated state estimator MWs greater than zero and is determined based on the cost of start fuel, total fuel-related cost, performance factor, electrical costs (station service), start maintenance adder, and additional labor cost if required above normal station manning. Start-up Costs can vary with the unit offline
Manual 15: Cost Development Guidelines Section 1: Introduction
PJM © 2016 4 Revision 28, Effective Date:
time being categorized in three unit temperature conditions: hot, intermediate and cold. Start-up Cost is a dollar cost and is incurred once each time the unit operates regardless of the period of operation. See Start-up Cost in Section 2.4.
1.7.3 No Load Cost No-Load Fuel (MMBtu/hour) is the total fuel to sustain zero net output MW at synchronous generator speed. No-Load Cost ($/hour) – The hourly cost required to create the starting point of a monotonically increasing incremental offer curve for a generating unit. The calculated No-Load Cost may have to be adjusted to ensure that the slope of the Generator Offer Curve is monotonically increasing.
1.7.4 Incremental Cost Hourly production cost is the cost per hour to operate a unit assuming a start has already occurred. It is calculated by summing all costs, which are incurred during one hour of operation including the hourly No-Load Cost and the incremental energy cost. The incremental energy cost is the cost per MWh to produce all of the energy segments above the Economic Minimum level (minimum generation level with the unit available for economic dispatch). No-Load Costs are not included in the incremental costs. It is calculated by summing the cost of each segment of energy in the unit’s incremental cost curve up to the generation level. This cost is a dollar per hour ($/MWh) rate.
1.7.5 Total Production Cost Total production cost is calculated by adding all of the costs associated with starting a unit and operating it over a period. Total production costs include two categories of costs: Start-up Costs and hourly production costs. To determine the total production cost of a unit, the following formula is used:
Total Production Cost = Startup Costs +�Hourly Production Costs𝑥𝑥
0
Where x= number of hours a unit is run at a certain MW level
It is important to remember that PJM will schedule generation day-ahead based on the above but dispatch using the incremental (marginal) cost, as represented by its generation offer. The incremental (marginal) cost will represent the cost to generate the next MW from the unit. See Heat Rate in Section 2.1, Performance Factor in Section 2.2, Performance Factors in Section 2.2, and Fuel Cost in Section 2.3, No-Load Cost in Section 2.5 and 2.6 Maintenance Cost.

Manual 15: Cost Development Guidelines Section 1: Introduction
PJM © 2016 5 Revision 28, Effective Date:
1.8 Cost Methodology and Approval Process
A Market Seller which seeks to obtain an exemption, exception or change to any time frame, process, methodology, calculation or policy set forth in this Manual, or the approval of any cost or methodology that is not specifically permitted by the PJM Tariff, PJM Operating Agreement or this Manual not related to the Fuel Cost Policy, shall submit a request to PJM and the MMU for consideration and determination along with documentation supporting its request. except as otherwise specified herein. After receipt of such a request, the MMU shall notify the Market Seller of its determination of the request no later than fifteen (15) calendar days after the submission of the request. If the Market Seller and the MMU agree on the determination of the request, the request shall be deemed to be approved. PJM and MMU will review the request and PJM will notify the Market Seller and MMU whether the request is approved no later than thirty (30) calendar days after submission of the request. If the Market Seller and the MMU cannot agree on the determination of the request, the Market Seller may submit its request to PJM in writing for consideration and approval. In its written request to PJM, the Market Seller must notify PJM of all prior determinations of the MMU with respect to any such request and must provide a copy of such request to the MMU within one (1) calendar day of submitting the request to PJM. This process shall be referred to in this Manual as the “Cost Methodology and Approval Process.”
1.9 References
The References to other documents that provide background or additional detail directly related to the PJM Manual for Cost Development Guidelines are:
• PJM Manual for Pre-Scheduling Operations (M-10) • PJM Manual for Scheduling Operations (M-11) • PJM Manual for Generator Operational Requirements (M-14D) • PJM Manual for Open Access Transmission Tariff Accounting (M-27) • PJM Manual for Operating Agreement Accounting (M-28) • PJM Manual for Definitions and Acronyms (M-35) • Markets Gateway User Guide • PJM Markets Database Dictionary

Manual 15: Cost Development Guidelines Section 1: Introduction
PJM © 2016 6 Revision 28, Effective Date:
• Energy Market Opportunity Cost Calculator in Markets Gateway • A Review of Generation Compensation and Cost Elements in the PJM Markets • Member Information Reporting Application
Manual 15: Cost Development Guidelines Section 2: Policies for All Unit Types
PJM © 2016 7 Revision 28, Effective Date:
Section 2: Policies for All Unit Types
This section contains information that is relevant for the development of a cost offer for all types of units.
2.1 Heat Rates
Heat Rate equals the MMBtu content of the heat input divided by the MWh of power output. The smaller the heat rate value the greater the efficiency. The heat rate can also be referred to as the input-output function.
Total Heat Rate =MMBtuMWh
=Heat Input
Net MW
The Incremental heat rate is the relationship between an additional MW of output and the heat input necessary to produce it. Graphically, the incremental heat rate can be determined from the ratio of the change in fuel input to the change in unit MW output; which is the slope of the input/output curve. Mathematically, the incremental heat rate curve can be expressed as the first derivative of the heat rate curve (input heat versus MW output).
Incremental Heat Rate = ∆MMBtu/∆MWh
= (Change in Fuel Going in)/(Change in Energy Coming Out)
= □(24&𝑑𝑑𝑑𝑑)/□(24&𝑑𝑑𝑑𝑑) Total Heat Rate
Economic Minimum is the lowest level of energy in MW the unit can produce and maintain a stable level of operation under normal operation. Economic Maximum is the highest unrestricted level of energy, in MW, that the operating company operates the unit under normal operation. This represents the highest output available from the unit for economic dispatch.
2.1.1 Heat Rate Policy All Market Sellers shall develop Heat Rates. These heat rate curves show heat input from burning fuel versus MW output for each of their generating units. The heat rate curves then serve as the basis for the theoretical incremental heat rate curves for fuel consumption and performance factor development. A Market Seller is allowed to use either net or gross MW values in determination of the incremental heat rate curves as

Manual 15: Cost Development Guidelines Section 2: Policies for All Unit Types
PJM © 2016 8 Revision 28, Effective Date:
long as gross or net MW value consistency is maintained throughout the cost development process. Heat rate information provided to the Office of the Interconnection should be on a net MW basis.
• Heat rate curves (one curve per fuel type for each operating mode) will be based on design or comparable unit data modified by actual unit test data (when available).
• Data for the heat rate curve development, ideally, should include Economic Minimum and Economic Maximum MW points. The heat rate curve will be fitted from available data.
• This heat rate curve (or curves) will be used as the basis for incremental heat rate curves, incremental costs and performance factor calculations.
2.2 Performance Factors
Performance Factor is the calculated ratio of actual fuel burn to either theoretical fuel burn (design heat input) or other current tested heat input. Actual burn may vary from standard burn due to factors such as unit age or modification, changes in fuel properties, seasonal ambient conditions, etc.
The Performance Factor shall be calculated on either the total fuel consumed or a monthly spot check test basis. The Performance Factor for nuclear and steam units shall be reviewed (and updated if changed) at least once every twelve months. The Performance Factors for combustion turbine (“CT”), diesel units, and combined-cycle (“CC”) units shall be updated at least once during:
• Twelve months, or
• The year in which a unit reaches 1,000 accumulated running hours since its last Performance Factor update, whichever represents a longer period, not to exceed five years.
Requests for exemptions from these periods should first be submitted to PJM and the MMU for evaluation pursuant to the Cost Methodology and Approval Process. The overall Performance Factor can be modified by a seasonal Performance Factor to reflect ambient conditions.
2.2.1 Engineering Judgment in Performance Factors The calculated performance factor may be superseded by estimates based on sound engineering judgment. If the period during which estimated performance factors are used exceeds three months, documentation concerning reasons for the override must be maintained and available for review.
2.2.2 Higher Heating Value of Fuel
Manual 15: Cost Development Guidelines Section 2: Policies for All Unit Types
PJM © 2016 9 Revision 28, Effective Date:
Higher Heating Value of Fuel - the amount of heat released by a specified quantity once it is combusted and the products have returned to an original temperature. Higher Heating Value (HHV) of fuel may be based on any of:
• As burned test
• In stock test
• As received test
• As shipped test
• Contract value
• Seller's invoice
• Seller's quote
• Nominal value based on Industry Standard
2.2.3 Calculation Methods of Performance Factors There are three options available for use in determining a unit’s performance factor:
1. Total Fuel
2. Separate
3. Fixed start approach
These three methods are described with their corresponding equations as follows: Performance Factors are used in calculating start fuel as well as operating fuel. When the (1) total fuel approach is used, the Performance Factor would represent the ratio:
With the total fuel approach, fuel quantities measured during start tests should be modified by the Performance Factor in effect at the time of the test so that theoretical or standard start fuel quantities will be on the same basis as the standard operating fuel quantity. Conditions encountered during the start of certain units may make it preferable to assign separate Performance Factors for start and operating fuel. If (2) separate Performance Factors are calculated for start fuel prior to calculating the "operating fuel" Performance Factor, this Operating Fuel Performance Factor will represent the ratio:
Manual 15: Cost Development Guidelines Section 2: Policies for All Unit Types
PJM © 2016 10 Revision 28, Effective Date:
Due to the variability and difficulty in measuring actual start fuel, a Market Seller may choose to set a (3) fixed start Performance Factor of one, implicitly assigning all performance variations to no-load and incremental loading costs. In order to account for all fuel actually consumed, the operating fuel Performance Factor will represent the ratio:
Where total theoretical start fuel consumed = fuel quantity used in the Start-up Cost calculation
2.2.4 ‘Like’ Units for Performance Factors An average Performance Factor may be calculated and applied for groups of like units burning the same type of fuel. Please see the Generation sections for further detail of ‘like’ units.
2.3 Fuel Cost Policies and Guidelines
Any Market Sellers may only must submit a non-zero cost–based offer if it has a PJM-approved fFuel cCost pPolicy consistent with its fuel type in accordance with section 2.3.1 of this manual and Operating Agreement, Schedule 2. to the MMU pursuant to the Cost Methodology and Approval Process. The Ffuel cCost Ppolicy will be submitted in MIRA, or other system(s) made available for submission of such data. Submission to MIRA, or other system(s) made available is considered submission to PJM and the MMU.
2.3.1 Submission of and/or Modifications to Fuel Cost Policies
2.3.1.1 Annual Review On an annual basis, all Market Sellers will be required to either submit to PJM and the MMU an updated Fuel Cost Policy that complies with Operating Agreement, Schedule 2 and this manual, or confirm that their currently effective and approved Fuel Cost Policy remains compliant. Market Sellers must submit such information by no later than June 15 of each year. PJM shall consult with the Market Monitoring Unit, and consider any input timely received from the Market Monitoring Unit, in its determination of whether to approve a Market Seller’s updated Fuel Cost Policy. After it has completed its evaluation of the request, PJM shall notify the Market Seller in writing, with a copy to the MMU, of its determination whether the updated Fuel Cost Policy is approved or rejected by no later than November 1. If a Market Seller
Manual 15: Cost Development Guidelines Section 2: Policies for All Unit Types
PJM © 2016 11 Revision 28, Effective Date:
desires to update its Fuel Cost Policy, or PJM determines either on its own or based on input received from the Market Monitoring Unit, that the Market Seller must update its Fuel Cost Policy outside of the annual review process, the Market Seller shall follow the applicable processes and deadlines specified below. All approved Fuel Cost Policies will have an effective date and will be in effect until superseded or revoked. PJM shall notify the Market Seller as to the effective date of the approved Fuel Cost Policy. During the annual review process, PJM and the MMU will jointly review any policy submitted along with the supporting documentation. Market Sellers shall have five (5) Business Days to provide additional documentation or information on any request from PJM or the MMU. If the Market Seller does not believe it can provide the information within (5) Business Day timeframe, it can request an alternative deadline for submission of the data from PJM no later than one (1) Business Day before the due date of the request for additional data. If PJM consents to extend the deadline, PJM will advise the Market Seller and the MMU of the new deadline. The MMU shall inform PJM of such request at the time it is made. Failure to meet a data request deadline may result in PJM rejecting the policy. If PJM rejects a Market Seller’s updated Fuel Cost Policy, PJM must include an explanation for why the Fuel Cost Policy was rejected in its written notification and will establish a deadline for all required updates to the policy. If the current policy under review is rejected, the Market Seller will continue to use the previously approved Fuel Cost Policy; unless a previously approved policy does not exist in which case, a penalty will be assessed as described in PJM’s Operating Agreement, Schedule 2.
2.3.1.2 Outside Annual Review/New Resource Fuel cost policy updates may also be submitted outside of the annual review period:
• If a Market Seller has an approved Fuel Cost Policy currently in place and needs to alter it in order to conform it to the provisions of this Manual or any applicable provisions of PJM’s governing documents,
• If any action by a governmental or regulatory agency external to a Market Seller results in a need for the Market Seller to change its method of fuel cost calculation,
• If there are any material changes to Fuel Cost Policy, • If PJM requests a Market Seller to submit an updated Fuel Cost Policy the
Market Seller shall provide the updated policy to PJM and the MMU within five (5) Business Days or an alternative deadline agreed to by PJM, or
• The Market Seller will be offering a new resource into PJM’s energy markets that does not have an existing Fuel Cost Policy.
The Market Seller shall notify PJM and the MMU that an update to an existing Fuel Cost Policy or the need for a Fuel Cost Policy for a new resource is required at the earliest possible opportunity.
Manual 15: Cost Development Guidelines Section 2: Policies for All Unit Types
PJM © 2016 12 Revision 28, Effective Date:
• For new resources, follow the process delineated in Operating Agreement Schedule 2 Section II (b).
• For existing resources, the Market Seller’s previously approved Fuel Cost Policy will be used for making cost-based offers while the requested update or new policy is under evaluation; unless a previously approved policy does not exist for a resource that is not new to PJM’s markets in which case a penalty will be assessed as described in PJM’s Operating Agreement Schedule 2.
Outside the annual review period, PJM and the MMU will have an initial 30 Business Days for review. Market Sellers shall have five (5) Business Days or an alternative deadline agreed to by PJM, to provide additional documentation or information on any request from PJM or the MMU. If the Market Seller does not believe it can provide the information within (5) Business Day timeframe, it can request an alternative deadline for submission of the data from PJM no later than one (1) Business Day before the due date of the request for additional data. If PJM consents to extend the deadline, PJM will advise the Market Seller and the MMU of the new deadline. The MMU shall inform PJM of such request at the time it is made. Failure to meet a data request deadline may result in PJM rejection of the policy. If additional documentation or information has been requested by PJM or the MMU, PJM has five (5) Business Days after the deadline for the Market Seller submittal of such additional information or documentation to notify the Market Seller and MMU of its approval or rejection of the Fuel Cost Policy. If PJM rejects a Market Seller’s updated Fuel Cost Policy, PJM must include an explanation for why the Fuel Cost Policy was rejected in its written notification and provide a deadline for providing any additional information or documentation to seek approval of updates to the policy. All approved Fuel Cost Policies will have an effective date indicated by PJM in its written notification to the Market Seller and MMU and will be in effect until superseded or revoked.
2.3.1.3 Revocation If PJM revokes a Market Seller’s approved Fuel Cost Policy, the Market Seller is not allowed to submit a non-zero cost-based offer consistent with fuel type in the PJM energy market and will be assessed a penalty as described in PJM’s Operating Agreement Schedule 2. Market Sellers who have a Fuel Cost Policy revoked by PJM will be provided a three (3) business day rebuttal period, starting from the date of revocation, to submit supporting documentation to PJM demonstrating that the revoked Fuel Cost Policy accurately reflects the fuel source, transportation cost, procurement process used, applicable adders, or commodity cost for such generation resource such that the Fuel Cost Policy results in a submitted cost-based offer that is not greater than its actual fuel cost. If at the end of the rebuttal period the Fuel Cost Policy is still required to be updated, the Market Seller shall submit a Fuel Cost Policy pursuant the out of annual review process to correct the deficiencies in the revocation notice. The penalty described in Section 2 of the Operating Agreement will continue to be assessed until the newly submitted Fuel Cost Policy is approved.
Manual 15: Cost Development Guidelines Section 2: Policies for All Unit Types
PJM © 2016 13 Revision 28, Effective Date:
A request to change the method of calculation of Basic Fossil or Nuclear Fuel Cost shall be submitted to the MMU for evaluation pursuant to the Cost Methodology and Approval Process in advance of the proposed change (this is referred to below as “the proposal”.) Any Market Seller and the MMU shall discuss the proposal and the Market Seller will provide documentation supporting its request to the MMU. The MMU shall provide an initial response to the Market Seller in writing within 30 days of the member’s submission of the request to the MMU, indicating its agreement with the request or areas of concern pursuant to the Cost Methodology and Approval Process. The changed method of calculation may be implemented immediately upon final approval pursuant to the Cost Methodology and Approval Process. If any action by a governmental or regulatory agency external to a Market Seller that results in a need for the Market Seller to change its method of fuel cost calculation, the affected Market Seller may immediately submit a request to the MMU for evaluation, pursuant to the Cost Methodology and Approval Process to change the method of calculation in advance of the proposed change.
2.3.2 Fuel Cost Calculation The method of calculation of fuel cost may be updated by the Market Seller no more frequently than once every 12 months, on a rolling basis typically in the annual review process. Each Market Seller must review and document its fuel costs in MIRA, or other system(s) made available for submission of such data, at minimum once per month (12 times per year). Additionally, each review must occur within forty (40) days of the preceding review. The results of this review will be used to determine whether a fuel cost update and subsequent change to the Fuel Cost Policy is necessary. The method of calculation of fuel cost in MIRA, or other system(s) made available for submission of such data, may include the use of actual fuel prices paid, e.g. the contract price paid for fuel, or the spot price for fuel. The contract price for fuel must include the locational cost of fuel for the generating unit. The source used for spot price for fuel must be publicly available and reflect the locational cost of fuel for the generating unit. The locational cost of fuel shall include specification of any additional incremental costs of delivery for the generating unit. Each Market Seller will be responsible for establishing its own method of calculating delivered fossil fuel cost, limited to inventoried cost, replacement cost or a combination thereof, that reflect the way fuel is purchased or scheduled for purchase. The method of calculation will be consistent with the current effective Fuel Cost Policy. may only be changed by receipt of final approval pursuant to Section 2.3.1.the Cost Methodology and Approval Process in advance of the proposed change.
Manual 15: Cost Development Guidelines Section 2: Policies for All Unit Types
PJM © 2016 14 Revision 28, Effective Date:
Fossil fuel cost adjustments compensating for previous estimate inaccuracies should not be considered when determining the basic fossil cost component of Total Fuel Related Cost. Units that co-fire more than one fuel shall weight average the cost of the fuel on a per MMBtu basis. Units that fire solid waste, bio-mass, or landfill gas shall include the cost of such fuel when calculating the average even when the cost of such fuel is negative. However, cost offers for units that fire solid waste, biomass, or landfill gas are not required to be less than zero.
2.3.3 Total Fuel Related Costs Total Fuel Related Cost is the sum of fuel costs, fuel related cost, emission allowance cost, and maintenance cost.
Total Fuel Related Costs =fuel costs + fuel related costs + SO2 Allowance cost + CO2 Allowance cost +
NO𝑥𝑥 Allowance cost + maintenance adder
Escalation of previous year dollar amounts is permitted when the term of calculation exceeds twelve months. When used, escalation indexes will be the same as those developed for calculation of incremental Maintenance Adders. The other fuel-related cost components of TFRC may be calculated based on a fixed or rolling average of values from one to five years in length, reviewed (and updated if changed) annually, or a rolling average from twelve to sixty months in length, reviewed (and updated if changed) monthly. Both the term and the frequency of the other fuel-related costs calculation shall be included in the Market Seller’s Ffuel Ccost Ppolicy.
2.3.4 Types of Fuel Costs Basic Fuel Cost – The cost of fuel calculated as stated in the Market Sellers’ Ffuel Ccost Ppolicy (excluding fixed lease expenses).
NOTE: Basic Fuel Cost for each unit type will be addressed in subsequent sections.
Incremental Energy Cost –The incremental heat or fuel required to produce an incremental MWh at a specific unit loading level multiplied by the applicable Performance Factor, multiplied by the fuel cost plus the appropriate maintenance cost. Total Cost – The total theoretical heat input minus the no-load heat input at a specific unit loading level, multiplied by the applicable Performance Factor, multiplied by the fuel cost plus the appropriate maintenance cost, plus the No-Load Cost.
2.3.5 Emission Allowances
Manual 15: Cost Development Guidelines Section 2: Policies for All Unit Types
PJM © 2016 15 Revision 28, Effective Date:
Each unit that requires SO2 /CO2 /NOx emission allowances (EAs) to operate may include in the unit's TFRC the cost ($/MMBtu) of the EAs as determined in the Market Seller's Emissions Policyfuel cost policy. Each Market Seller must submit a policy that would state its the method of determining the cost of SO2 /CO2 /NOx EAs for evaluation pursuant to the Cost Methodology and Approval Process. An example of the calculation must be included in the policy. The method of calculation may be changed only after evaluation pursuant to the Cost Methodology and Approval Process. The period used for determining the projected SO2 /CO2 /NOx discharge and the MMBtu’s burned must be included in the Market Seller's policy and may be based on historical or projected data. For units that have dual fuel firing capability, a Market Seller should use different EA factors based on the SO2 /CO2 /NOx emitted for each particular fuel or fuel mix. NOx /CO2 emissions costs will be included in TFRC only during a NOx /CO2 compliance period and only by affected generating units. Details of the cost calculation methodology and example calculations will be contained in each Market Seller’s Emissions policyPolicy. Compliance requirements and dates may vary by geographic region.
2.3.6 Leased Fuel Transportation Equipment Leased Fuel Transportation Equipment Cost –Expenses incurred using leased equipment to transport fuel to the plant gate. If expenses are fixed, they must be excluded from fuel cost determination. When calculating the Total Fuel Related Costs, fixed charges for transportation equipment (e.g., pipelines, train cars, and barges) should be excluded. Dollars that represent lease charges are considered fixed charges if the total amount to be paid over a period is fixed regardless of the amount of fuel transported. Should the terms of the lease agreement be such that there is a fixed charge plus a charge for every unit of fuel delivered, the "charge per unit of fuel delivered" should be included in the Fuel on Board (FOB) delivered cost or in the calculation of the "other fuel related costs" as per the documented fFuel cCost pPolicy. The above guideline applies when a unit, plant, or system is served totally by leased fuel transportation equipment. When fuel is supplied by both leased and common carrier fuel transportation systems, the common carrier rate should be included in the Fuel On Board (FOB) delivered cost or included in the calculation of the "other fuel related costs" as per the documented fFuel cCost pPolicy of each Market Seller. This assumes that the leased fuel transportation equipment would serve base fuel requirements, while common carrier deliveries would change, based on incremental generation changes.
Manual 15: Cost Development Guidelines Section 2: Policies for All Unit Types
PJM © 2016 16 Revision 28, Effective Date:
2.3.7 Engineering Judgement in Fuel Cost Calculations A Market Seller may apply engineering judgement to manufacturer’s data, operating data or the results of start and run tests in order to derive the components of the total fuel cost. A record of the results of these determinations shall be kept on file by each Market Seller for use as a single, consistent basis for scheduling, operating, and accounting applications. These records shall be made available to PJM or the MMU upon request.
2.4 Start-up Cost
2.4.1 Start-up Cost Definitions Start-up Cost ($) The unit costs required to bring the boiler, turbine, and generator from shut-down conditions to the point after breaker closure which is typically indicated by telemetered or aggregated state estimator MWs greater than zero and is determined based on the cost of start fuel, total fuel-related cost, Performance Factor, electrical costs (station service), start maintenance adder, and additional labor cost if required above normal station manning levels.
Start up Cost ($/Start) =
[Start Fuel (MMBtu/(Start)) ∗ TFRC ($/MMBtu) ∗ Performance Factor)]
+[Station Service (MWh) ∗ Station Service Rate ($/MWh))]
+Start Maintenance Adder ($/Start) + Start Additional Labor Cost ($/Start)
Station Service Rate – A $/MWh value based on the 12-month rolling average off-peak energy prices updated quarterly by the Office of the Interconnection. Station Service Rates Link. Start Fuel - Fuel consumed from first fire of start process (initial reactor criticality for nuclear units) to breaker closing (including auxiliary boiler fuel) plus fuel expended from breaker opening of the previous shutdown to initialization of the (hot) unit start-up, excluding normal plant heating/auxiliary equipment fuel requirements Start Maintenance Adder – see Section 2.6 Start Additional Labor Cost – Additional labor costs for startup required above normal station manning levels.
2.4.2 Engineering Judgment in Start Costs
Manual 15: Cost Development Guidelines Section 2: Policies for All Unit Types
PJM © 2016 17 Revision 28, Effective Date:
A Market Seller may apply engineering judgment to manufacturers' data, operational data, or the results of start tests in order to derive the components of unit Start –up Cost. A record of the results of these determinations shall be kept on file by each Market Seller for use as a single, consistent basis for scheduling, operating, and accounting applications. These records shall be made available to the MMU or PJM upon request.
2.5 No Load
2.5.1 No-Load Definitions No-Load Cost ($/hour) - The hourly cost required to create the starting point of a monotonically increasing incremental offer curve for a generating unit.
2.5.2 No-Load Fuel All Market Sellers shall develop No-Load Costs for their units. The no-load heat input may be determined by collecting heat input values as a function of output and performing a regression analysis. The heat input values as a function of output may be either created from heat rate test data or the initial design heat input curve for an immature unit. The minimum number of points to develop a heat input curve shall be 2 points for a dispatchable unit with a variable output and 1 point for a unit with a fixed output. Sufficient documentation for each generating unit's no-load point in MMBtu’s (or fuel) per hour shall consist of a single contact person and/or document to serve as a consistent basis for scheduling, operating and accounting applications. PJM and Tthe MMU can verify calculation methods used subject toare in accordance with the currently approved Fuel Cost Policy and the Cost Methodology and Approval Process including the elements of Attachment B.
2.5.3 No Load Calculation The initial estimate of a unit’s No-Load Cost ($/Hr) is the No-Load fuel Cost multiplied by the Performance Factor, multiplied by the (Total Fuel-Related Cost (TFRC))
No Load Cost ($/Hour) = (No Load Fuel ∗ Performance Factor ∗ TFRC)
The unit’s generator offer curve must comply with PJM’s monotonically increasing curve requirement. In some instances, the calculated No-Load Cost may have to be adjusted to ensure that the slope of the generator offer curve is monotonically increasing. The No-Load Cost adjustment is limited to a maximum difference of $1/MWh between the unit’s first and second incremental cost offers. As an alternative to adjusting the No-Load Cost, No-Load Cost may also be calculated by subtracting the incremental cost (unit’s Economic Minimum cost-offer value multiplied by MW value) at the unit’s Economic Minimum point from the total cost
Manual 15: Cost Development Guidelines Section 2: Policies for All Unit Types
PJM © 2016 18 Revision 28, Effective Date:
(from the heat input at Economic Minimum value) at the unit’s Economic Minimum point.
No Load Cost ($/Hour) = (Economic Minimum Heat Input ∗ Performance Factor ∗ (TFRC + VOM)−
(Economic Minimum Incremental Cost ($/MWh) ∗ Economic Minimum (MW))
Note that if the unit of Variable Operations and Maintenance (VOM) cost is in terms of dollars per Equivalent Service Hours (ESH), the equation changes to:
No Load Cost ($/Hour) =
(Economic Minimum Head Input ∗ Performance Factor ∗ TFRC) + VOM− (Economic Minimum Incremental Cost ($/MWh)∗ Economic Minimum (MW))
When using No-Load Fuel to calculate No-Load Cost, the Market Seller must submit block average cost and cannot select “Use Offer Slope” when entering cost information into Markets Gateway. When using the alternative incremental cost method to calculate No-Load Cost, the Market Seller must submit incremental cost and select “Use Offer Slope” when entering cost information into Markets Gateway.
2.6 Variable Maintenance Cost
Variable Maintenance cost is the parts and labor expenses of maintaining equipment and facilities in satisfactory operating condition.
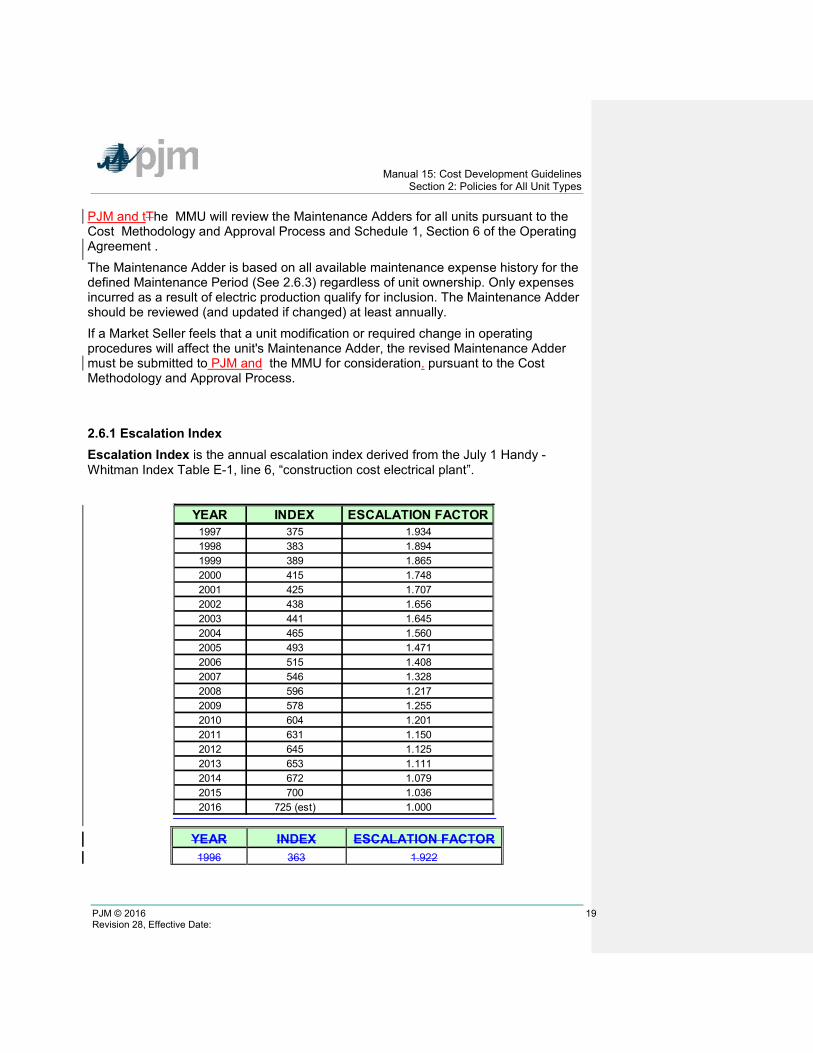
Manual 15: Cost Development Guidelines Section 2: Policies for All Unit Types
PJM © 2016 19 Revision 28, Effective Date:
PJM and tThe MMU will review the Maintenance Adders for all units pursuant to the Cost Methodology and Approval Process and Schedule 1, Section 6 of the Operating Agreement . The Maintenance Adder is based on all available maintenance expense history for the defined Maintenance Period (See 2.6.3) regardless of unit ownership. Only expenses incurred as a result of electric production qualify for inclusion. The Maintenance Adder should be reviewed (and updated if changed) at least annually. If a Market Seller feels that a unit modification or required change in operating procedures will affect the unit's Maintenance Adder, the revised Maintenance Adder must be submitted to PJM and the MMU for consideration. pursuant to the Cost Methodology and Approval Process.
2.6.1 Escalation Index Escalation Index is the annual escalation index derived from the July 1 Handy - Whitman Index Table E-1, line 6, “construction cost electrical plant”.
YEAR INDEX ESCALATION FACTOR 1996 363 1.922
YEAR INDEX ESCALATION FACTOR1997 375 1.9341998 383 1.8941999 389 1.8652000 415 1.7482001 425 1.7072002 438 1.6562003 441 1.6452004 465 1.5602005 493 1.4712006 515 1.4082007 546 1.3282008 596 1.2172009 578 1.2552010 604 1.2012011 631 1.1502012 645 1.1252013 653 1.1112014 672 1.0792015 700 1.0362016 725 (est) 1.000
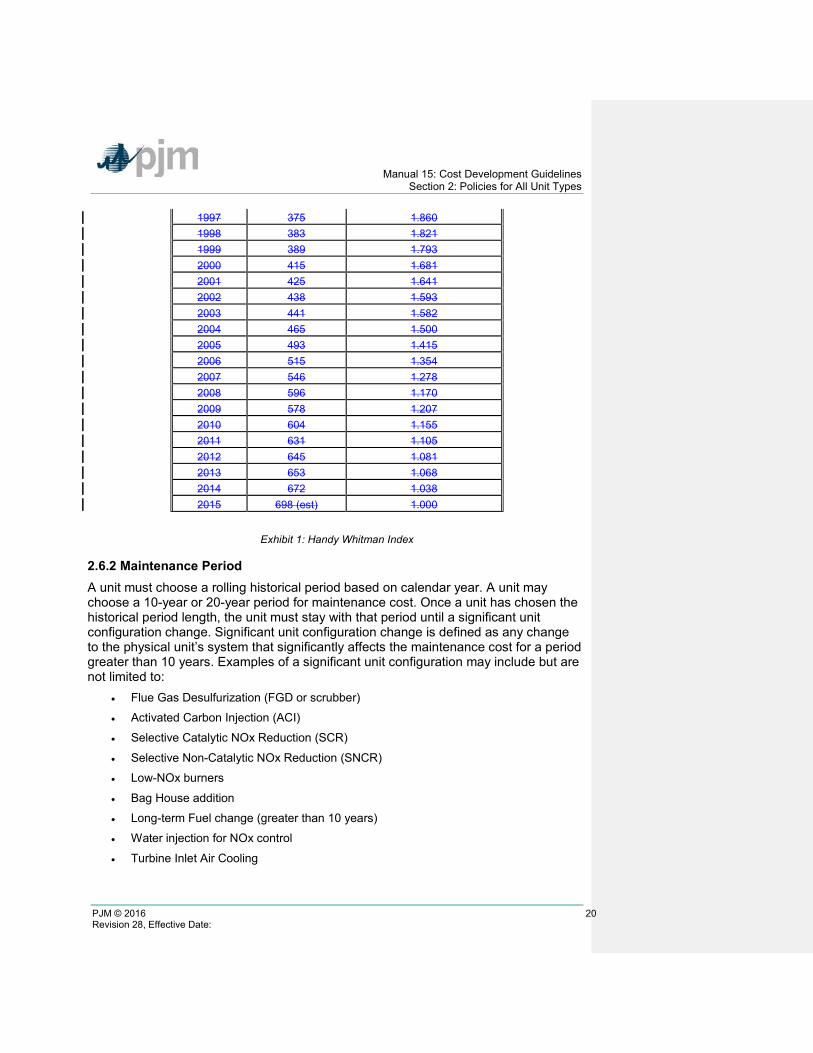
Manual 15: Cost Development Guidelines Section 2: Policies for All Unit Types
PJM © 2016 20 Revision 28, Effective Date:
1997 375 1.860 1998 383 1.821 1999 389 1.793 2000 415 1.681 2001 425 1.641 2002 438 1.593 2003 441 1.582 2004 465 1.500 2005 493 1.415 2006 515 1.354 2007 546 1.278 2008 596 1.170 2009 578 1.207 2010 604 1.155 2011 631 1.105 2012 645 1.081 2013 653 1.068 2014 672 1.038 2015 698 (est) 1.000
Exhibit 1: Handy Whitman Index
2.6.2 Maintenance Period A unit must choose a rolling historical period based on calendar year. A unit may choose a 10-year or 20-year period for maintenance cost. Once a unit has chosen the historical period length, the unit must stay with that period until a significant unit configuration change. Significant unit configuration change is defined as any change to the physical unit’s system that significantly affects the maintenance cost for a period greater than 10 years. Examples of a significant unit configuration may include but are not limited to:
• Flue Gas Desulfurization (FGD or scrubber)
• Activated Carbon Injection (ACI)
• Selective Catalytic NOx Reduction (SCR)
• Selective Non-Catalytic NOx Reduction (SNCR)
• Low-NOx burners
• Bag House addition
• Long-term Fuel change (greater than 10 years)
• Water injection for NOx control
• Turbine Inlet Air Cooling
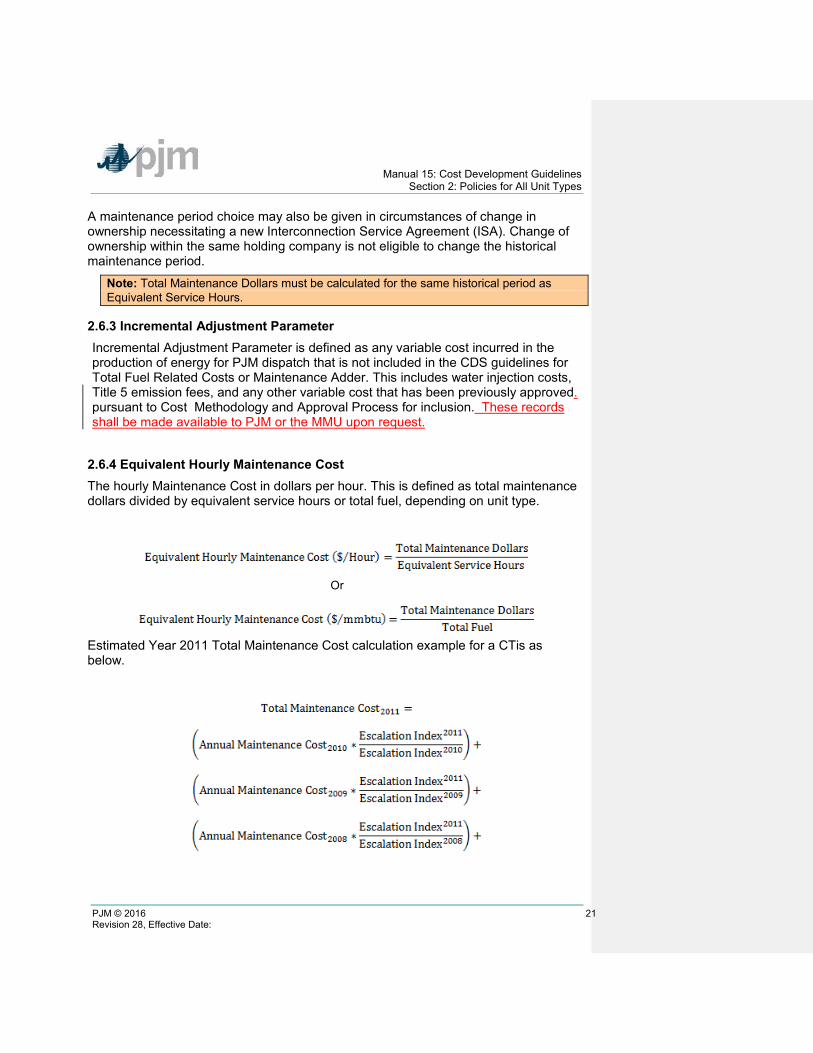
Manual 15: Cost Development Guidelines Section 2: Policies for All Unit Types
PJM © 2016 21 Revision 28, Effective Date:
A maintenance period choice may also be given in circumstances of change in ownership necessitating a new Interconnection Service Agreement (ISA). Change of ownership within the same holding company is not eligible to change the historical maintenance period.
Note: Total Maintenance Dollars must be calculated for the same historical period as Equivalent Service Hours.
2.6.3 Incremental Adjustment Parameter Incremental Adjustment Parameter is defined as any variable cost incurred in the production of energy for PJM dispatch that is not included in the CDS guidelines for Total Fuel Related Costs or Maintenance Adder. This includes water injection costs, Title 5 emission fees, and any other variable cost that has been previously approved. pursuant to Cost Methodology and Approval Process for inclusion. These records shall be made available to PJM or the MMU upon request.
2.6.4 Equivalent Hourly Maintenance Cost The hourly Maintenance Cost in dollars per hour. This is defined as total maintenance dollars divided by equivalent service hours or total fuel, depending on unit type.
Or
Estimated Year 2011 Total Maintenance Cost calculation example for a CTis as below.
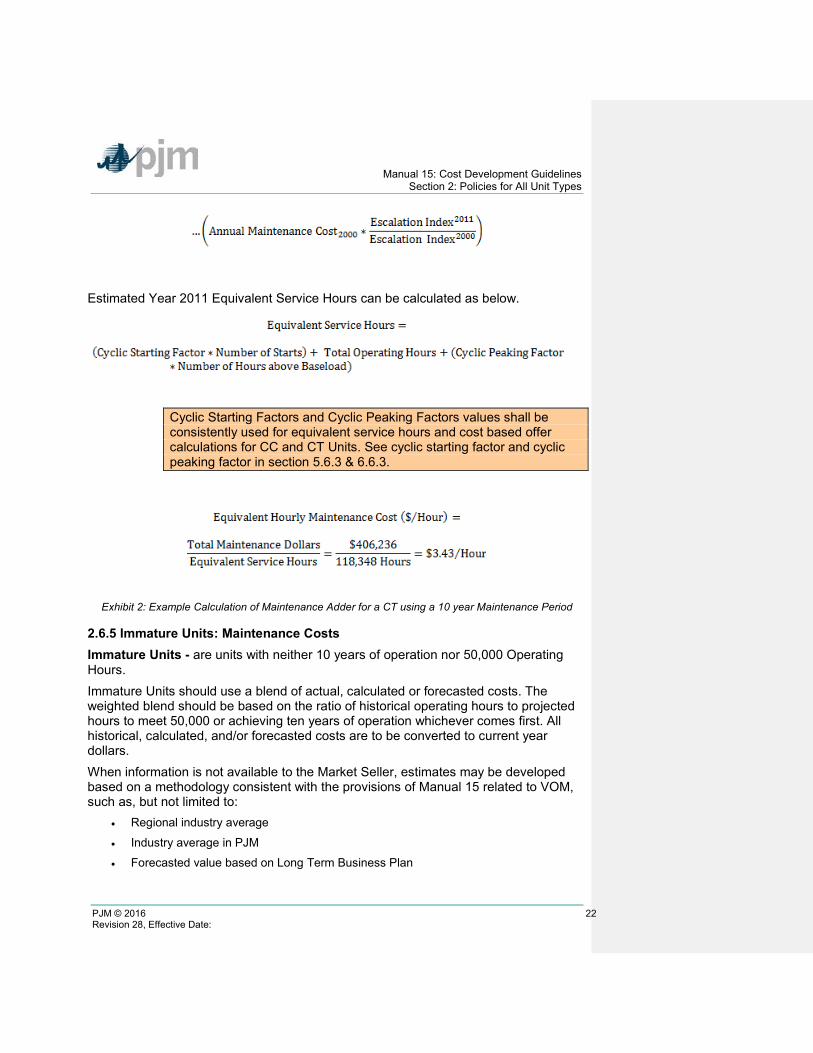
Manual 15: Cost Development Guidelines Section 2: Policies for All Unit Types
PJM © 2016 22 Revision 28, Effective Date:
Estimated Year 2011 Equivalent Service Hours can be calculated as below.
Cyclic Starting Factors and Cyclic Peaking Factors values shall be consistently used for equivalent service hours and cost based offer calculations for CC and CT Units. See cyclic starting factor and cyclic peaking factor in section 5.6.3 & 6.6.3.
Exhibit 2: Example Calculation of Maintenance Adder for a CT using a 10 year Maintenance Period
2.6.5 Immature Units: Maintenance Costs Immature Units - are units with neither 10 years of operation nor 50,000 Operating Hours. Immature Units should use a blend of actual, calculated or forecasted costs. The weighted blend should be based on the ratio of historical operating hours to projected hours to meet 50,000 or achieving ten years of operation whichever comes first. All historical, calculated, and/or forecasted costs are to be converted to current year dollars. When information is not available to the Market Seller, estimates may be developed based on a methodology consistent with the provisions of Manual 15 related to VOM, such as, but not limited to:
• Regional industry average
• Industry average in PJM
• Forecasted value based on Long Term Business Plan
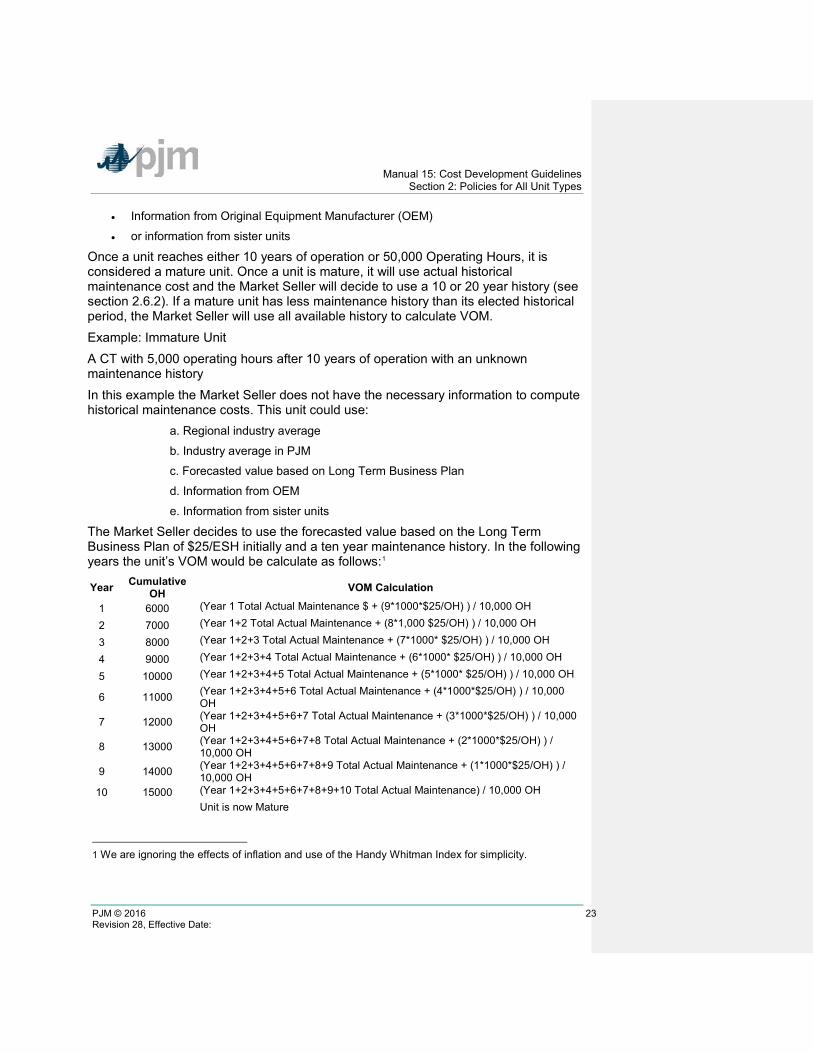
Manual 15: Cost Development Guidelines Section 2: Policies for All Unit Types
PJM © 2016 23 Revision 28, Effective Date:
• Information from Original Equipment Manufacturer (OEM)
• or information from sister units
Once a unit reaches either 10 years of operation or 50,000 Operating Hours, it is considered a mature unit. Once a unit is mature, it will use actual historical maintenance cost and the Market Seller will decide to use a 10 or 20 year history (see section 2.6.2). If a mature unit has less maintenance history than its elected historical period, the Market Seller will use all available history to calculate VOM. Example: Immature Unit A CT with 5,000 operating hours after 10 years of operation with an unknown maintenance history In this example the Market Seller does not have the necessary information to compute historical maintenance costs. This unit could use:
a. Regional industry average
b. Industry average in PJM
c. Forecasted value based on Long Term Business Plan
d. Information from OEM
e. Information from sister units
The Market Seller decides to use the forecasted value based on the Long Term Business Plan of $25/ESH initially and a ten year maintenance history. In the following years the unit’s VOM would be calculate as follows:1
Year Cumulative OH VOM Calculation
1 6000 (Year 1 Total Actual Maintenance $ + (9*1000*$25/OH) ) / 10,000 OH
2 7000 (Year 1+2 Total Actual Maintenance + (8*1,000 $25/OH) ) / 10,000 OH
3 8000 (Year 1+2+3 Total Actual Maintenance + (7*1000* $25/OH) ) / 10,000 OH
4 9000 (Year 1+2+3+4 Total Actual Maintenance + (6*1000* $25/OH) ) / 10,000 OH
5 10000 (Year 1+2+3+4+5 Total Actual Maintenance + (5*1000* $25/OH) ) / 10,000 OH
6 11000 (Year 1+2+3+4+5+6 Total Actual Maintenance + (4*1000*$25/OH) ) / 10,000 OH
7 12000 (Year 1+2+3+4+5+6+7 Total Actual Maintenance + (3*1000*$25/OH) ) / 10,000 OH
8 13000 (Year 1+2+3+4+5+6+7+8 Total Actual Maintenance + (2*1000*$25/OH) ) / 10,000 OH
9 14000 (Year 1+2+3+4+5+6+7+8+9 Total Actual Maintenance + (1*1000*$25/OH) ) / 10,000 OH
10 15000 (Year 1+2+3+4+5+6+7+8+9+10 Total Actual Maintenance) / 10,000 OH Unit is now Mature
1 We are ignoring the effects of inflation and use of the Handy Whitman Index for simplicity.
Manual 15: Cost Development Guidelines Section 2: Policies for All Unit Types
PJM © 2016 24 Revision 28, Effective Date:
Exhibit 3: Immature Unit
2.7 Synchronized Reserve
Synchronized Reserve is the capability that can be converted fully into energy within 10 minutes or customer load that can be removed from the system within 10 minutes of the request from the PJM dispatcher, and must be provided by equipment electrically synchronized to the system. Market Sellers that request and receive reimbursement from PJM for the costs associated with operating a generating unit in the condensing mode or for altering the output of a generator at the request of PJM in order to provide Synchronized Reserves must maintain records to document how those costs were calculated. These records shall be made available to PJM upon request.
2.8 Regulation Service
Regulation is the capability of a specific resource with appropriate telecommunications, control and response capability to increase or decrease its output in response to a regulating control signal to control for frequency deviations The cost-based regulation offer is split into two portions: The Regulation Capability portion consists of the fuel cost increase and unit specific heat rate degradation due to operating at lower loads and the margin risk adder; The Regulation Performance portion consists of the cost increase in VOM, cost increase due to heat rate increase during non-steady state operation and, where applicable, energy losses for energy storage devices. The $/MW value determined in the performance offer will be converted to cost per mileage $/ΔMW by dividing the value by the mileage ΔMW/MW for the applicable signal for that offer as described in Manual 11. Regulation Capability costs to provide Regulation Service from a unit shall include the following components up to but not exceeding:
Regulation Capability
Regulation Performance costs to provide Regulation Service from a unit shall include the following components up to but not exceeding:
Manual 15: Cost Development Guidelines Section 2: Policies for All Unit Types
PJM © 2016 25 Revision 28, Effective Date:
ΔMW/MW
Fuel Cost Increase and Unit Specific Heat Rate Degradation due to Operating at lower loads:
The costs (in $/MWh of Regulation) to provide Regulation Service from units shall not exceed the fuel cost increase due to operating the unit at lower loads than at the optimal economic dispatch level load and the unit specific heat rate degradation from operating at lower loads, resulting from operating the unit at lower MW output incurred from the provision of Regulation over the entire generator MW range of providing Regulation Service. Cost Increase due to Heat Rate increase during non-steady state:
The cost (in $/MWh of Regulation) increase due to the heat rate increase resulting from operating the unit at a non steady-state condition. This heat rate loss factor rate shall not exceed 0.35% of the top Regulation load MW heat rate value. Margin/Risk Adder:
Margin Risk Adder shall not exceed $12.00 per MWh of Regulation Service provided. Energy Storage Unit Losses:
Energy storage unit losses can only be greater than zero for energy storage type devices and calculated in accordance with the guidance provided in section 11.8. Cost increase in VOM:
The cost increase (in $/MWh of Regulation) of variable operations and maintenance (VOM) cost resulting from operating the unit at lower MW output incurred from the provision of Regulation. VOM costs shall be calculated by the following methods and shall not exceed those levels below: For non-hydro units that have been providing Regulation Service for less than 10 years, or all hydro units regardless of the historical years of Regulation Service, the following variable operation and maintenance (VOM) costs can be applied by unit type up to the following:
• Super-critical Steam: $10.00 per MWh of Regulation
Manual 15: Cost Development Guidelines Section 2: Policies for All Unit Types
PJM © 2016 26 Revision 28, Effective Date:
• Sub-critical Steam: $3.50 per MWh of Regulation
• Combined Cycle: $2.50 per MWh of Regulation
• Combustion Turbine: $2.00 per MWh of Regulation
• Hydro: $1.00 per MWh of Regulation
• Energy Storage: Based on OEM estimates initially and actual as history is available
Exhibit 4: VOM for All Hydro Units or Non-Hydro Units providing service for less than 10 years
For non-hydro units that have been providing Regulation Service for more than 10 years, the VOM rates above can be utilized only if the annual VOM dollar amounts resulting from those rates and included in Regulation cost based offers, are subtracted from the escalated 10 or 20 year historical total VOM accounts and the Regulation MWh based on the average of the last three years. Energy storage units that participate only in regulation Service shall include all their VOM Cost increase in VOM adder in Regulation cost offers. For example, a 100 MW sub-critical coal fired steam unit that has been providing Regulation Service for 30 years. The unit averaged 5,000 MWh of Regulation Service over the last three years and the escalated 20 year historical total VOM = $10,000,000. Annual VOM costs to subtract = ($3.50 per Regulation MWh * 5,000 MWh) * 20 years = $17,500 per year * 20 years = $350,000 20-year balance of historical total VOM accounts = $10,000,000 - $350,000 = $ 9,650,000 Actual Regulation VOM incremental costs submitted and evaluated pursuant to the Cost Methodology and Approval Process.
Exhibit 5: Example of VOM for Non-Hydro Units providing Regulation for more than 10 years:
For Example for a Sub-critical Coal-Fired Steam Unit providing Regulation Service for the last seven years:
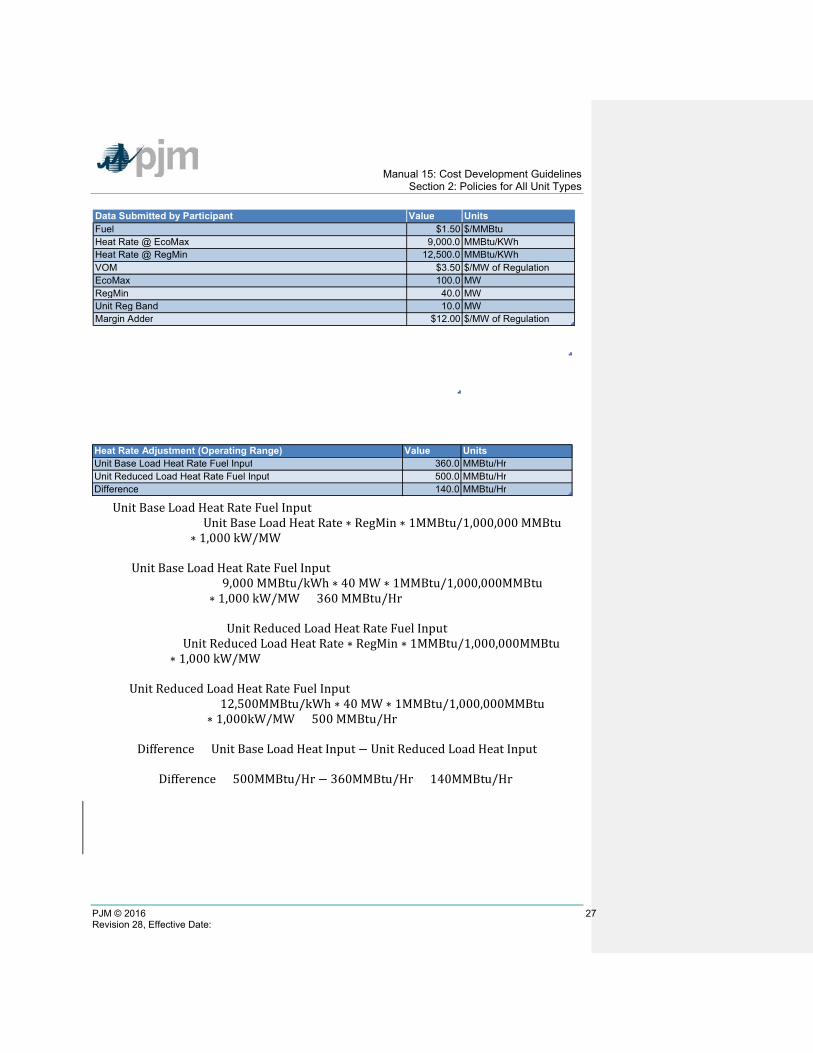
Manual 15: Cost Development Guidelines Section 2: Policies for All Unit Types
PJM © 2016 27 Revision 28, Effective Date:
Unit Base Load Heat Rate Fuel Input
= Unit Base Load Heat Rate ∗ RegMin ∗ 1MMBtu/1,000,000 MMBtu∗ 1,000 kW/MW
Unit Base Load Heat Rate Fuel Input
= 9,000 MMBtu/kWh ∗ 40 MW ∗ 1MMBtu/1,000,000MMBtu∗ 1,000 kW/MW = 360 MMBtu/Hr
Unit Reduced Load Heat Rate Fuel Input
= Unit Reduced Load Heat Rate ∗ RegMin ∗ 1MMBtu/1,000,000MMBtu∗ 1,000 kW/MW
Unit Reduced Load Heat Rate Fuel Input
= 12,500MMBtu/kWh ∗ 40 MW ∗ 1MMBtu/1,000,000MMBtu∗ 1,000kW/MW = 500 MMBtu/Hr
Difference = Unit Base Load Heat Input − Unit Reduced Load Heat Input
Difference = 500MMBtu/Hr − 360MMBtu/Hr = 140MMBtu/Hr
Data Submitted by Participant Value Units Fuel $1.50 $/MMBtu Heat Rate @ EcoMax 9,000.0 MMBtu/KWh Heat Rate @ RegMin 12,500.0 MMBtu/KWh VOM $3.50 $/MW of Regulation EcoMax 100.0 MW RegMin 40.0 MW Unit Reg Band 10.0 MW Margin Adder $12.00 $/MW of Regulation
Heat Rate Adjustment (Operating Range) Value Units Unit Base Load Heat Rate Fuel Input 360.0 MMBtu/Hr Unit Reduced Load Heat Rate Fuel Input 500.0 MMBtu/Hr Difference 140.0 MMBtu/Hr
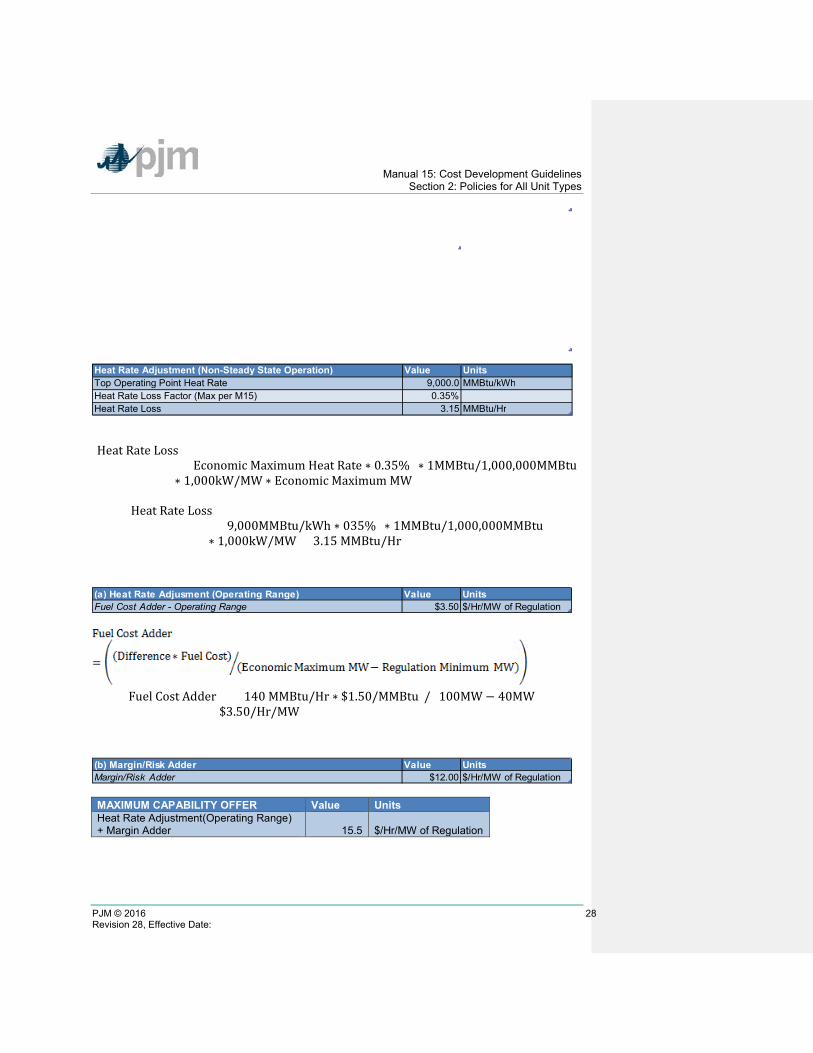
Manual 15: Cost Development Guidelines Section 2: Policies for All Unit Types
PJM © 2016 28 Revision 28, Effective Date:
Heat Rate Loss
= (Economic Maximum Heat Rate ∗ 0.35%) ∗ 1MMBtu/1,000,000MMBtu∗ 1,000kW/MW ∗ Economic Maximum MW
Heat Rate Loss
= (9,000MMBtu/kWh ∗ 035%) ∗ 1MMBtu/1,000,000MMBtu∗ 1,000kW/MW = 3.15 MMBtu/Hr
Fuel Cost Adder = ((140 MMBtu/Hr ∗ $1.50/MMBtu)/ (100MW − 40MW))
= $3.50/Hr/MW
MAXIMUM CAPABILITY OFFER Value Units Heat Rate Adjustment(Operating Range) + Margin Adder 15.5 $/Hr/MW of Regulation
(a) Heat Rate Adjusment (Operating Range) Value UnitsFuel Cost Adder - Operating Range $3.50 $/Hr/MW of Regulation
(b) Margin/Risk Adder Value UnitsMargin/Risk Adder $12.00 $/Hr/MW of Regulation
Heat Rate Adjustment (Non-Steady State Operation) Value Units Top Operating Point Heat Rate 9,000.0 MMBtu/kWh Heat Rate Loss Factor (Max per M15) 0.35% Heat Rate Loss 3.15 MMBtu/Hr
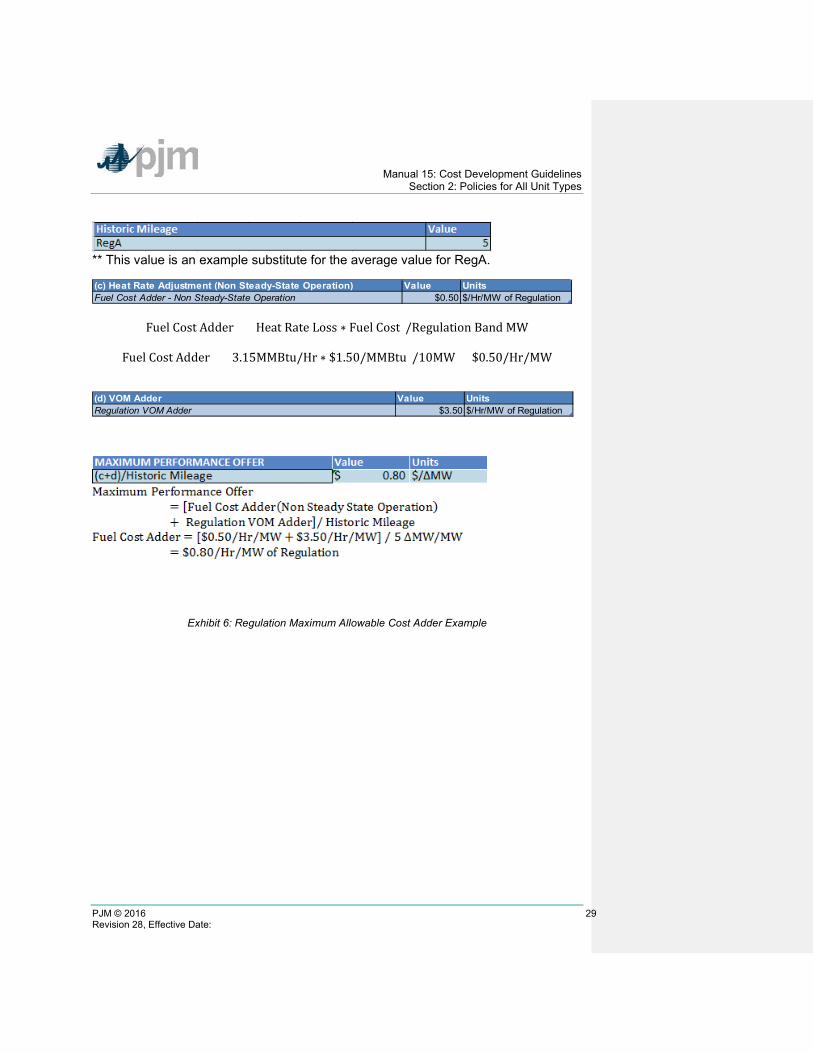
Manual 15: Cost Development Guidelines Section 2: Policies for All Unit Types
PJM © 2016 29 Revision 28, Effective Date:
** This value is an example substitute for the average value for RegA.
Fuel Cost Adder = (Heat Rate Loss ∗ Fuel Cost)/Regulation Band MW
Fuel Cost Adder = (3.15MMBtu/Hr ∗ $1.50/MMBtu)/10MW = $0.50/Hr/MW
Exhibit 6: Regulation Maximum Allowable Cost Adder Example
(c) Heat Rate Adjustment (Non Steady-State Operation) Value UnitsFuel Cost Adder - Non Steady-State Operation $0.50 $/Hr/MW of Regulation
(d) VOM Adder Value UnitsRegulation VOM Adder $3.50 $/Hr/MW of Regulation
Manual 15: Cost Development Guidelines Section 2: Policies for All Unit Types
PJM © 2016 30 Revision 28, Effective Date:
How to Use this Manual
To use this Manual, read sections one and two then go to the chapter for unit type for additional information.
Section 3: Nuclear Unit Cost Guidelines
Section 4: Fossil Steam Unit Cost Development
Section 5: Combined Cycle (CC) Cost Development
Section 6: Combustion Turbine (CT) and Diesel Engine Costs
Section 7: Hydro
Section 8: Demand Side Response (DSR)
Section 9: Wind Units
Section 10: Solar Units
Section 11: Energy Storage
Attachment A: Applicable FERC System of Accounts
Attachment B: No Load Calculation Examples

Manual 15: Cost Development Guidelines Section 3: Nuclear Unit Cost Guidelines
PJM © 2016 31 Revision 28, Effective Date:
Section 3: Nuclear Unit Cost Guidelines
This section presents information relevant for cost development for nuclear units. Nuclear Plant – A facility that is licensed to produce commercial power from controlled nuclear reactions to heat water to produce steam that drives steam turbines generators.
3.1 Nuclear Heat Rate
Note: The information in Section 2.1 contains basic Heat Rate information relevant for all unit types including nuclear units.
3.2 Performance Factor
Note: The information in Section 2.2 contains basic Performance Factor information relevant for all unit types including nuclear units.
3.3 Fuel Cost
Note: The information in Section 2.3 contains basic Fuel Cost information relevant for all unit types. The following information only pertains to nuclear units.
3.3.1 Basic Nuclear Fuel Cost Basic Nuclear Fuel Cost -Basic nuclear fuel cost shall be based on the dollars in FERC Account 518, less in-service interest charges (whether related to fuel that is leased or capitalized). This quantity shall be calculated in units of dollars per MMBtu, as forecast for the applicable fuel cycle.
Basic Nuclear Fuel Cost ($/MMBtu) = Dollars in FERC Account 518− Interest Cost
See definition in FERC account 518 in A.2.5
3.3.2 Total Fuel-Related Costs for Nuclear Units
Manual 15: Cost Development Guidelines Section 3: Nuclear Unit Cost Guidelines
PJM © 2016 32 Revision 28, Effective Date:
3.4 Start-up Costs
Note: The information in Section 2.4 contains basic Start-up Cost information relevant for all unit types. The following information only pertains to nuclear units.
Start-up Cost – The dollars per start as determined from start fuel, Total Fuel-Related Cost, Performance Factor, electrical costs, start maintenance adder, and additional labor cost, if required above normal station manning levels. Start Fuel – Fuel consumed from first fire of start process (initial reactor criticality for nuclear units) to breaker closing and fuel expended from breaker opening of the previous shutdown to initialization of the (hot) unit start-up, excluding normal plant heating/auxiliary equipment fuel requirements.
3.4.1 Hot Start-up Cost Hot Start-up Cost is the expected cost to start a steam unit, which is in the "hot" condition. Hot conditions vary unit by unit, but in general, a unit is hot after an overnight shutdown. Components of hot start cost include:
• Total Fuel-Related Cost from first fire of start process (initial reactor criticality for nuclear units) to breaker closing priced at the cost of fuel currently in effect
• And shutdown fuel cost defined as the cost of fuel expended from breaker opening of the previous shutdown to initialization of the (hot) unit start-up, excluding normal plant heating/auxiliary equipment fuel requirements.
3.4.2 Intermediate Start-up Cost Intermediate Start-up Cost is the expected cost to start a steam unit during a period where neither hot or cold conditions apply. Use of intermediate start cost is optional based on Market Seller’s policy and physical machine characteristics. The only restriction is that once an intermediate Start-up Cost is defined for a unit, the cost must be used consistently in scheduling and accounting. Components of intermediate Start-up Cost include:
• Total Fuel-Related Cost from first fire (initial reactor criticality for nuclear units) to breaker closing priced at the cost of fuel currently in effect
• And shutdown fuel cost defined as the cost of fuel expended from breaker opening of the previous shutdown to initialization of the (intermediate) unit start-up, excluding normal plant heating/auxiliary equipment fuel requirements.
3.4.3 Cold Start-up Cost
Manual 15: Cost Development Guidelines Section 3: Nuclear Unit Cost Guidelines
PJM © 2016 33 Revision 28, Effective Date:
Cold Start-up Cost is the expected cost to start a steam unit that is in the "cold" condition. Cold conditions vary unit by unit, but in general, a unit is cold after a two or three-day shutdown. Components of cold Start-up Cost include:
• Total Fuel-Related Cost from first fire (initial reactor criticality for nuclear units) to breaker closing priced at the cost of fuel currently in effect
• And shutdown fuel cost defined as the cost of fuel expended from breaker opening of the previous shutdown to shutdown of equipment needed for normal cool down of plant components, excluding normal plant heating/auxiliary equipment fuel requirements.
3.4.4 Additional Components Applied to Hot, Intermediate and Cold Start-up Costs These additional components for station service, labor and maintenance apply to all types of starts and should be added to the cost.
• Station service from initiation of start sequence to breaker closing (total station use minus normal base station use) priced at the Station Service rate.
• Station service after breaker opening during shutdown (station service during shutdown should be that associated with the normal unit auxiliary equipment operated during shutdown in excess of base unit use, this station service is not to include maintenance use or non-normal use) priced at the Station Service rate.
• Additional labor costs in excess of normal station manning requirements that are incurred when starting the unit.
• Start Maintenance Adder.
3.5 No-Load Cost
Note: The information in Section 2.5 contains basic No-Load Cost information relevant for all unit types including nuclear units.
3.6 Maintenance Cost
Note: The information in Section 2.6 contains basic Maintenance Cost information relevant for all unit types including nuclear units.
Nuclear Maintenance Adder - The dollars per unit of fuel (or heat) as derived from FERC Accounts 530 and 531 for nuclear steam units.
3.6.1 Configuration Addition Maintenance Adder For units undergoing a significant system or unit Configuration Addition the use of an additional “Configuration Addition Maintenance Adder” may be included in the determination of the total maintenance adder. It is not intended to be used for upgrades to existing equipment
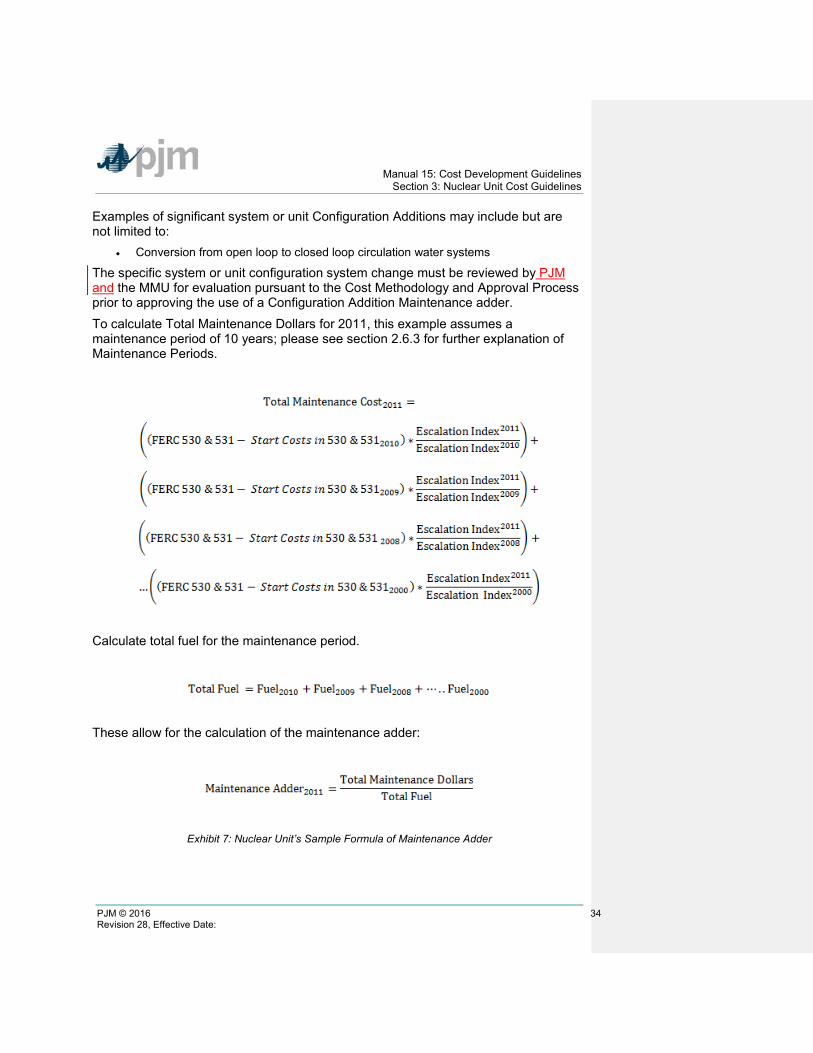
Manual 15: Cost Development Guidelines Section 3: Nuclear Unit Cost Guidelines
PJM © 2016 34 Revision 28, Effective Date:
Examples of significant system or unit Configuration Additions may include but are not limited to:
• Conversion from open loop to closed loop circulation water systems
The specific system or unit configuration system change must be reviewed by PJM and the MMU for evaluation pursuant to the Cost Methodology and Approval Process prior to approving the use of a Configuration Addition Maintenance adder. To calculate Total Maintenance Dollars for 2011, this example assumes a maintenance period of 10 years; please see section 2.6.3 for further explanation of Maintenance Periods.
Calculate total fuel for the maintenance period.
These allow for the calculation of the maintenance adder:
Exhibit 7: Nuclear Unit’s Sample Formula of Maintenance Adder
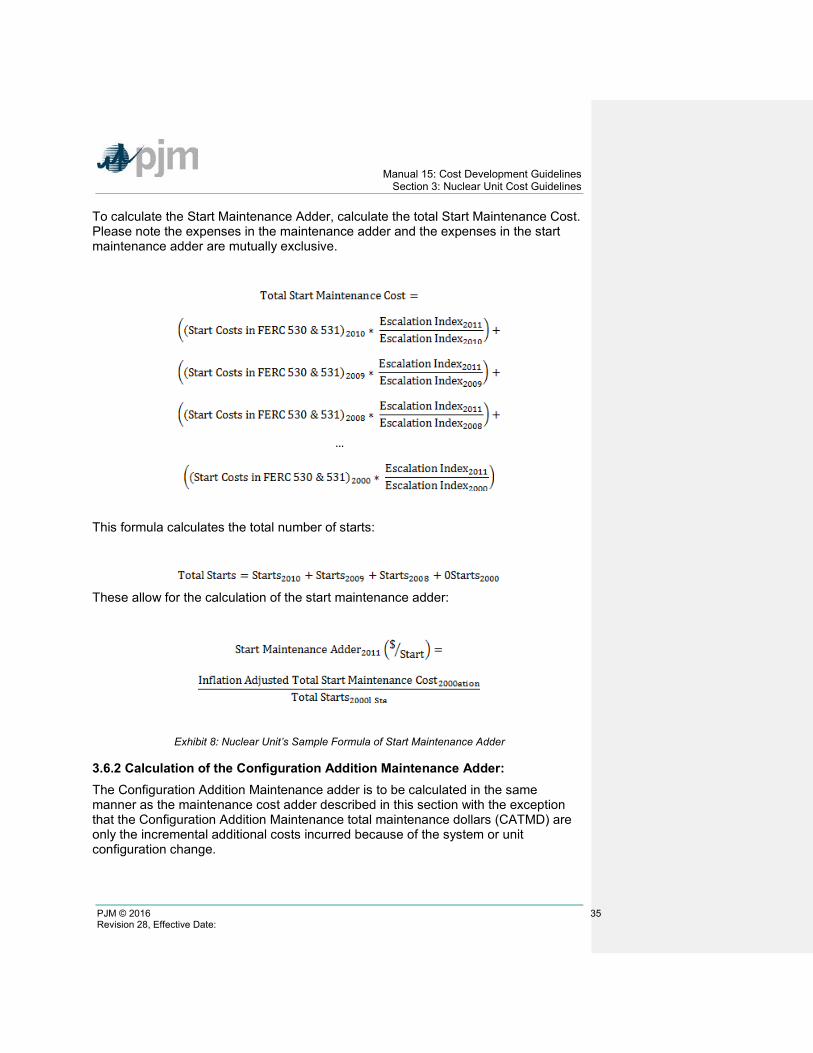
Manual 15: Cost Development Guidelines Section 3: Nuclear Unit Cost Guidelines
PJM © 2016 35 Revision 28, Effective Date:
To calculate the Start Maintenance Adder, calculate the total Start Maintenance Cost. Please note the expenses in the maintenance adder and the expenses in the start maintenance adder are mutually exclusive.
…
This formula calculates the total number of starts:
These allow for the calculation of the start maintenance adder:
Exhibit 8: Nuclear Unit’s Sample Formula of Start Maintenance Adder
3.6.2 Calculation of the Configuration Addition Maintenance Adder: The Configuration Addition Maintenance adder is to be calculated in the same manner as the maintenance cost adder described in this section with the exception that the Configuration Addition Maintenance total maintenance dollars (CATMD) are only the incremental additional costs incurred because of the system or unit configuration change.
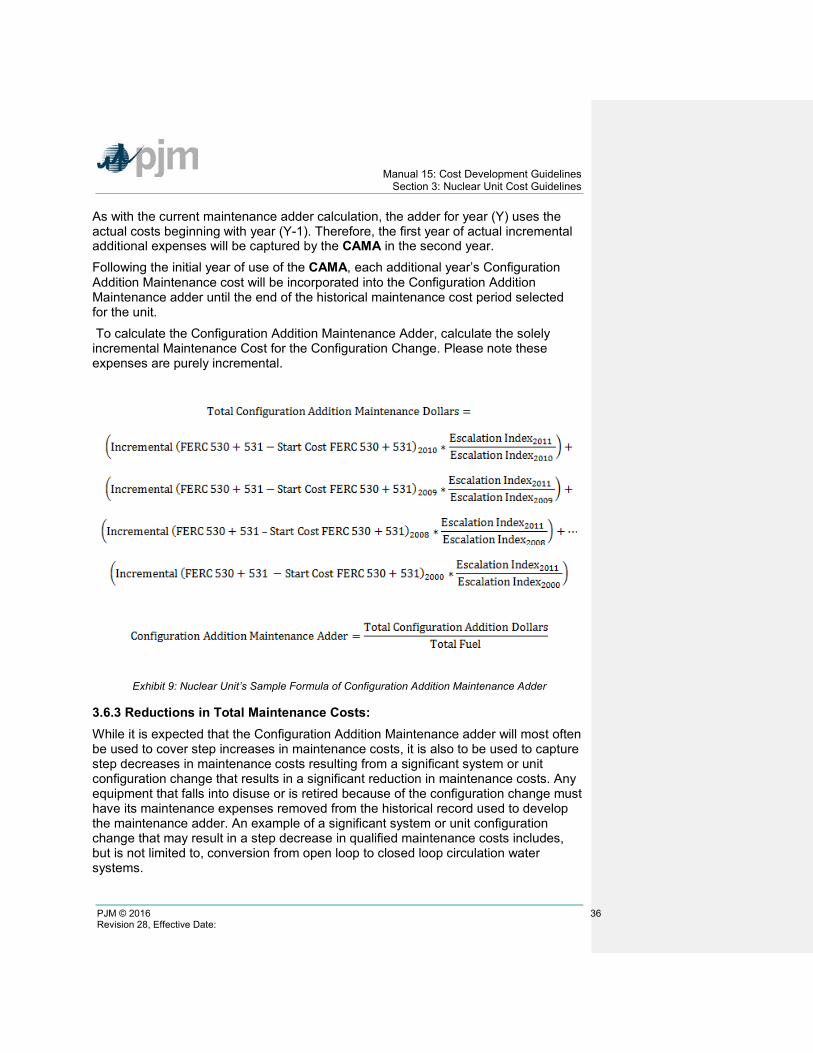
Manual 15: Cost Development Guidelines Section 3: Nuclear Unit Cost Guidelines
PJM © 2016 36 Revision 28, Effective Date:
As with the current maintenance adder calculation, the adder for year (Y) uses the actual costs beginning with year (Y-1). Therefore, the first year of actual incremental additional expenses will be captured by the CAMA in the second year. Following the initial year of use of the CAMA, each additional year’s Configuration Addition Maintenance cost will be incorporated into the Configuration Addition Maintenance adder until the end of the historical maintenance cost period selected for the unit. To calculate the Configuration Addition Maintenance Adder, calculate the solely incremental Maintenance Cost for the Configuration Change. Please note these expenses are purely incremental.
Exhibit 9: Nuclear Unit’s Sample Formula of Configuration Addition Maintenance Adder
3.6.3 Reductions in Total Maintenance Costs: While it is expected that the Configuration Addition Maintenance adder will most often be used to cover step increases in maintenance costs, it is also to be used to capture step decreases in maintenance costs resulting from a significant system or unit configuration change that results in a significant reduction in maintenance costs. Any equipment that falls into disuse or is retired because of the configuration change must have its maintenance expenses removed from the historical record used to develop the maintenance adder. An example of a significant system or unit configuration change that may result in a step decrease in qualified maintenance costs includes, but is not limited to, conversion from open loop to closed loop circulation water systems.
Manual 15: Cost Development Guidelines Section 3: Nuclear Unit Cost Guidelines
PJM © 2016 37 Revision 28, Effective Date:
3.7 Synchronized Reserve Cost
Note: The information in Section 2.7 contains basic Synchronized Reserve information relevant for all unit types including nuclear units where applicable.
3.8 Regulation Cost
Note: The information in Section 2.8 contains basic Regulation information relevant for all unit types including nuclear units where applicable.
Manual 15: Cost Development Guidelines Section 4: Fossil Steam Unit Cost Development
PJM © 2016 38 Revision 28, Effective Date:
Section 4: Fossil Steam Unit Cost Development
This section contains information pertaining to Fossil Steam Unit Cost development. Fossil Steam Turbine plants use combusted fossil fuels to heat water and create steam that generates the dynamic pressure to turn the blades of a steam turbine generator. Units that fire solid waste, biomass, or landfill gas solely or in conjunction with fossil fuels to heat water and create steam to drive a steam turbine generator are considered to be Fossil Steam Turbine plants.
4.1 Heat Rate
Note: The information in Section 2.1 contains basic Heat Rate information relevant for all unit types including fossil steam units.
4.2 Performance Factor
Note: The information in Section 2.2 contains basic Performance Factor information relevant for all unit types. The following information only pertains to fossil steam units.
Like units that can be used for calculation of Performance Factors are units having similar ratings, steam conditions, make or model and same site location.
4.3 Fuel Cost
Note: The information in Section 2.3 contains basic Fuel information relevant for all unit types. The following information only pertains to fossil steam units.
Fossil fuel cost adjustments compensating for previous estimate inaccuracies should not be considered when determining the basic fossil cost component of Total Fuel Related Cost. Fossil Other Fuel-Related Costs. The dollars in FERC Account 501 Fuel plus incremental expenses for fuel treatment and pollution control (excluding SO2 and NOX emission allowance costs) that were not included in FERC Account 501; minus the fuel expenses from FERC Account 151 that were charged into FERC Account 501, all divided by the fuel (heat content or quantity) shifted from FERC Account 151 into FERC Account 501.
4.3.1 Total Fuel Related Cost
Manual 15: Cost Development Guidelines Section 4: Fossil Steam Unit Cost Development
PJM © 2016 39 Revision 28, Effective Date:
Total Fuel Related Cost is the sum of the Basic Fuel Cost, applicable Other Fuel-Related Costs and the Maintenance Adder, CO2, SO2 and NOX emission allowance costs.
Total Fuel Related Cost ($/MMBtu) =
Fuel Cost + Other Fuel Related Cost + SO2 Allowance Cost + CO2 Allowance Cost+ NOx Allowance Cost + Maintenance Adder
TFRC = Total Fuel Related Cost
4.4 Start-up Cost
Note: The information in Section 2.4 contains basic Start-up Cost information relevant for all unit types. The following information only pertains to fossil steam units.
In some instances, a Steam Unit with a Start-up plus Notification time greater than 48 hours may enter a state called “Extended Cold Start” as defined in M10, M13, M14D and the Markets Gateway User Guide. Steam units in this state, calculate the Start Cost information associated with this state in accordance with the “Cold Start Cost” Section below and enter this value into the “Cold Start Cost” field in Markets Gateway
Start up Cost($/Start) =
[Start Fuel Consumed (MMBtu/Start) ∗ TFRC($/MMBtu) ∗ Performance Factor] +[Station Service (MWh) ∗ Station Service Rate ($/MWh)] + Start Maintenance Adder ($/
Start) + Start Additional Labor Cost ($/Start)
4.4.1 Hot Start-up Cost Hot Start-up Cost is the expected cost to start a steam unit, which is in the "hot" condition. Hot conditions vary unit by unit, but in general, a unit is hot after an overnight shutdown. Components of hot Start-up Cost include: Total fuel-related cost are the costs from first fire of start process to breaker closing (including auxiliary boiler fuel) priced at the cost of fuel currently in effect including shutdown fuel cost defined as the cost of fuel expended from breaker opening of the previous shutdown to initialization of the (hot) unit start-up, excluding normal plant heating/auxiliary equipment fuel requirements. Station Service from initiation of start sequence to breaker closing (total station use minus normal base station use) priced at the Station Service rate and station service after breaker opening during shutdown (station service during shutdown should be
Manual 15: Cost Development Guidelines Section 4: Fossil Steam Unit Cost Development
PJM © 2016 40 Revision 28, Effective Date:
that associated with the normal unit auxiliary equipment operated during shutdown in excess of base unit use, this station service is not to include maintenance use or non-normal use) priced at the Station Service rate. Additional labor costs in excess of normal station manning requirements that are incurred when starting the unit. Start Maintenance Adder Section 2.6 contains information regarding calculation of Maintenance Adder.
4.4.2 Intermediate Start-up Cost Intermediate Start-up Cost is the expected cost to start a steam unit during a period where neither hot nor cold conditions apply. Use of intermediate Start-up Cost is optional based on company policy and physical machine characteristics. The only restriction is that once an intermediate Start-up Cost is defined for a unit, the cost must be used consistently in scheduling and accounting. Components of intermediate Start-up cost include: Total fuel-related cost is the cost from first fire to breaker closing (including auxiliary boiler fuel) priced at the cost of fuel currently in effect, and shutdown fuel cost defined as the cost of fuel expended from breaker opening of the previous shutdown to initialization of the (intermediate) unit start-up, excluding normal plant heating/auxiliary equipment fuel requirements. Station Service from initiation of start sequence to breaker closing (total station use minus normal base station use) priced at the Station Service rate and station service after breaker opening during shutdown (station service during shutdown should be that associated with the normal unit auxiliary equipment operated during shutdown in excess of base unit use, this station service is not to include maintenance use or non-normal use) priced at the Station Service rate. Additional labor costs in excess of normal station manning requirements that are incurred when starting the unit. Start Maintenance Adder Section 2.6 contains information for calculation of the Maintenance Adder.
4.4.3 Cold Start-up Cost Cold Start-up Cost is the expected cost to start a steam unit that is in the "cold" condition. Cold conditions vary unit by unit, but in general, a unit is cold after a two or three-day shutdown. Components of cold Start-up Cost include: Total fuel-related cost from first fire to breaker closing (including auxiliary boiler fuel) priced at the cost of fuel currently in effect, and shutdown fuel cost defined as the cost of fuel expended from breaker opening of the previous shutdown to shutdown of equipment needed for normal cool down of plant components, excluding normal plant heating/auxiliary equipment fuel requirements.
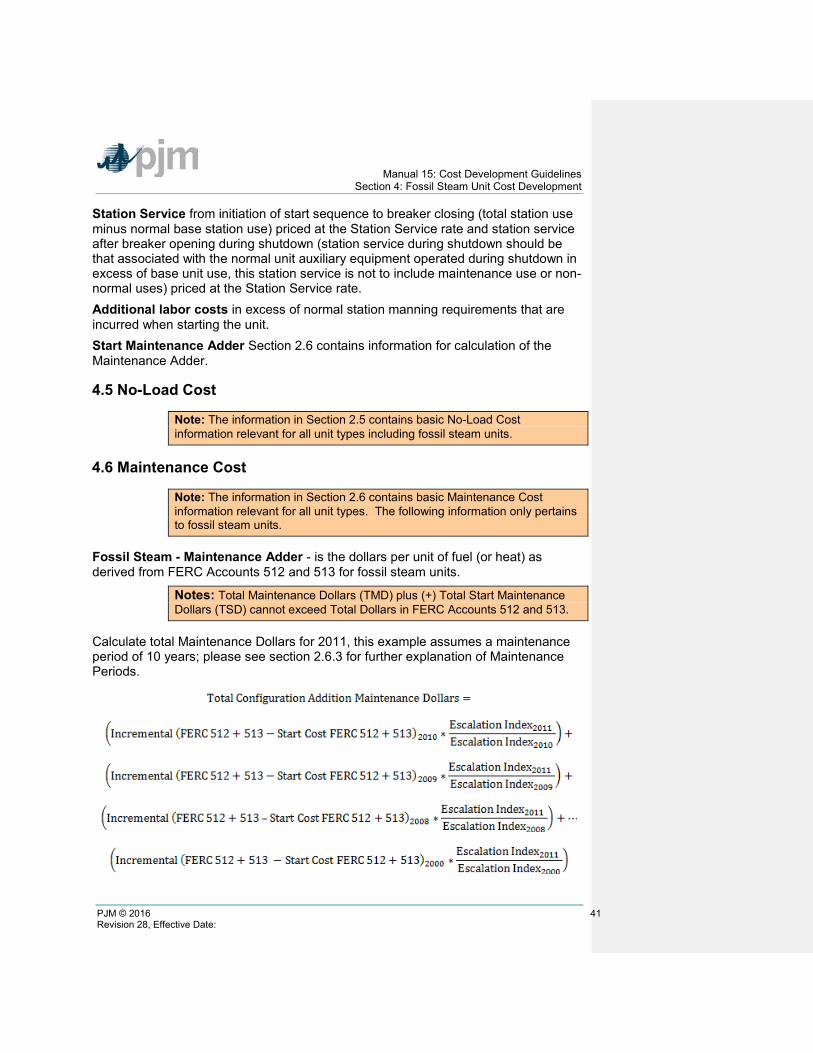
Manual 15: Cost Development Guidelines Section 4: Fossil Steam Unit Cost Development
PJM © 2016 41 Revision 28, Effective Date:
Station Service from initiation of start sequence to breaker closing (total station use minus normal base station use) priced at the Station Service rate and station service after breaker opening during shutdown (station service during shutdown should be that associated with the normal unit auxiliary equipment operated during shutdown in excess of base unit use, this station service is not to include maintenance use or non-normal uses) priced at the Station Service rate. Additional labor costs in excess of normal station manning requirements that are incurred when starting the unit. Start Maintenance Adder Section 2.6 contains information for calculation of the Maintenance Adder.
4.5 No-Load Cost
Note: The information in Section 2.5 contains basic No-Load Cost information relevant for all unit types including fossil steam units.
4.6 Maintenance Cost
Note: The information in Section 2.6 contains basic Maintenance Cost information relevant for all unit types. The following information only pertains to fossil steam units.
Fossil Steam - Maintenance Adder - is the dollars per unit of fuel (or heat) as derived from FERC Accounts 512 and 513 for fossil steam units.
Notes: Total Maintenance Dollars (TMD) plus (+) Total Start Maintenance Dollars (TSD) cannot exceed Total Dollars in FERC Accounts 512 and 513.
Calculate total Maintenance Dollars for 2011, this example assumes a maintenance period of 10 years; please see section 2.6.3 for further explanation of Maintenance Periods.
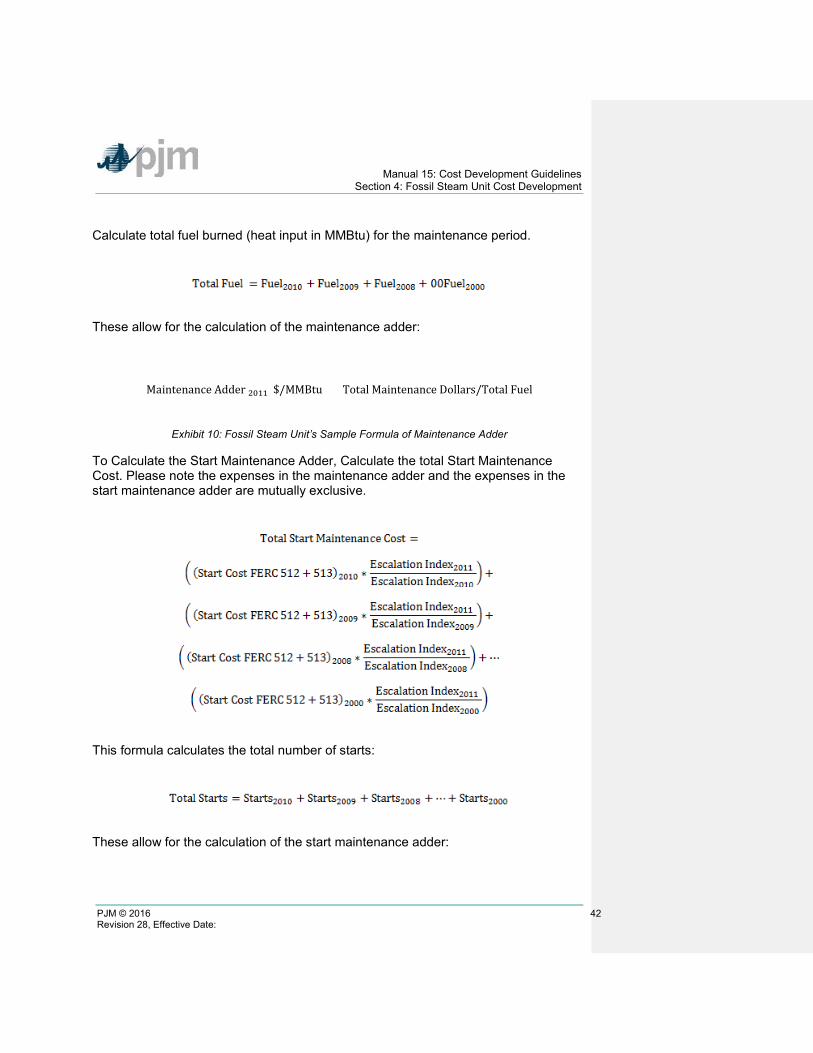
Manual 15: Cost Development Guidelines Section 4: Fossil Steam Unit Cost Development
PJM © 2016 42 Revision 28, Effective Date:
Calculate total fuel burned (heat input in MMBtu) for the maintenance period.
These allow for the calculation of the maintenance adder:
Maintenance Adder 2011($/MMBtu) = Total Maintenance Dollars/Total Fuel
Exhibit 10: Fossil Steam Unit’s Sample Formula of Maintenance Adder
To Calculate the Start Maintenance Adder, Calculate the total Start Maintenance Cost. Please note the expenses in the maintenance adder and the expenses in the start maintenance adder are mutually exclusive.
This formula calculates the total number of starts:
These allow for the calculation of the start maintenance adder:
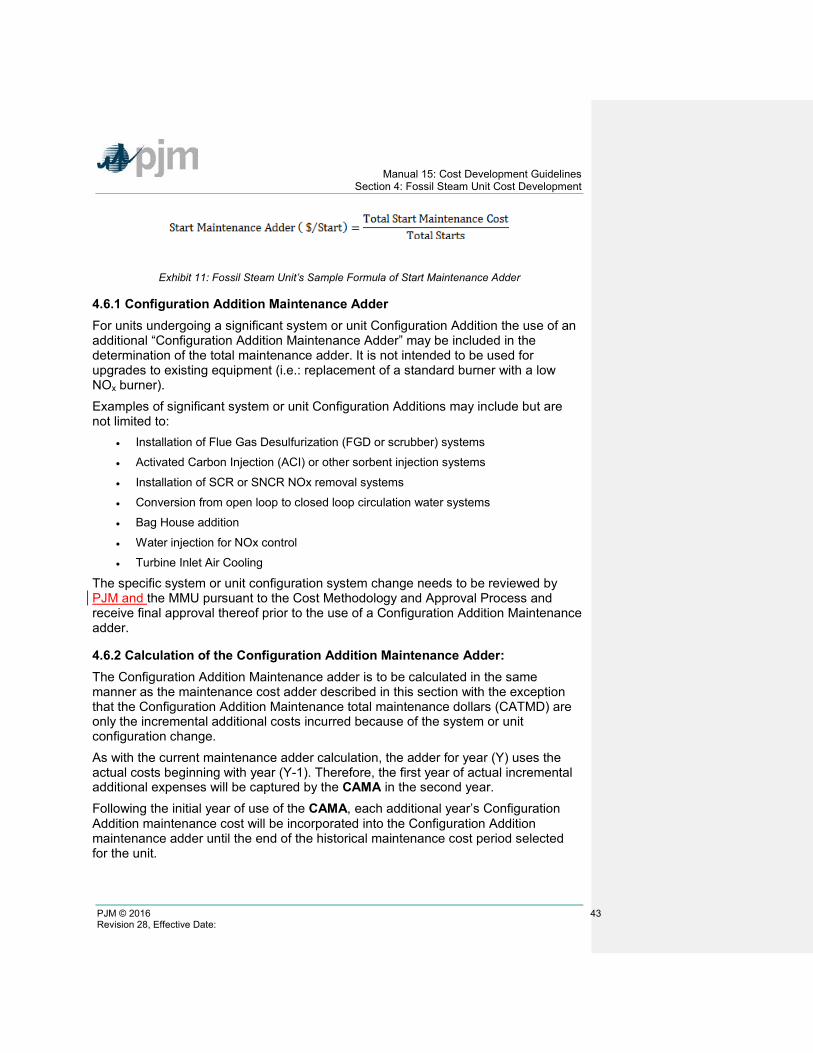
Manual 15: Cost Development Guidelines Section 4: Fossil Steam Unit Cost Development
PJM © 2016 43 Revision 28, Effective Date:
Exhibit 11: Fossil Steam Unit’s Sample Formula of Start Maintenance Adder
4.6.1 Configuration Addition Maintenance Adder For units undergoing a significant system or unit Configuration Addition the use of an additional “Configuration Addition Maintenance Adder” may be included in the determination of the total maintenance adder. It is not intended to be used for upgrades to existing equipment (i.e.: replacement of a standard burner with a low NOx burner). Examples of significant system or unit Configuration Additions may include but are not limited to:
• Installation of Flue Gas Desulfurization (FGD or scrubber) systems
• Activated Carbon Injection (ACI) or other sorbent injection systems
• Installation of SCR or SNCR NOx removal systems
• Conversion from open loop to closed loop circulation water systems
• Bag House addition
• Water injection for NOx control
• Turbine Inlet Air Cooling
The specific system or unit configuration system change needs to be reviewed by PJM and the MMU pursuant to the Cost Methodology and Approval Process and receive final approval thereof prior to the use of a Configuration Addition Maintenance adder.
4.6.2 Calculation of the Configuration Addition Maintenance Adder: The Configuration Addition Maintenance adder is to be calculated in the same manner as the maintenance cost adder described in this section with the exception that the Configuration Addition Maintenance total maintenance dollars (CATMD) are only the incremental additional costs incurred because of the system or unit configuration change. As with the current maintenance adder calculation, the adder for year (Y) uses the actual costs beginning with year (Y-1). Therefore, the first year of actual incremental additional expenses will be captured by the CAMA in the second year. Following the initial year of use of the CAMA, each additional year’s Configuration Addition maintenance cost will be incorporated into the Configuration Addition maintenance adder until the end of the historical maintenance cost period selected for the unit.
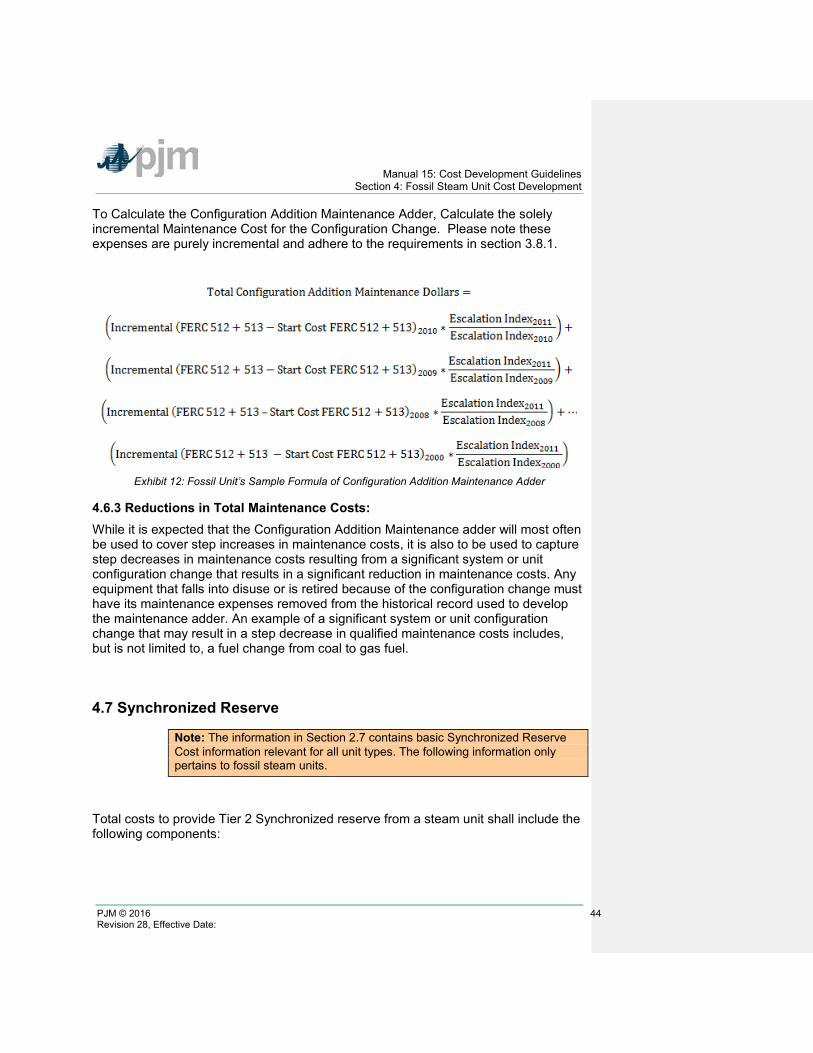
Manual 15: Cost Development Guidelines Section 4: Fossil Steam Unit Cost Development
PJM © 2016 44 Revision 28, Effective Date:
To Calculate the Configuration Addition Maintenance Adder, Calculate the solely incremental Maintenance Cost for the Configuration Change. Please note these expenses are purely incremental and adhere to the requirements in section 3.8.1.
Exhibit 12: Fossil Unit’s Sample Formula of Configuration Addition Maintenance Adder
4.6.3 Reductions in Total Maintenance Costs: While it is expected that the Configuration Addition Maintenance adder will most often be used to cover step increases in maintenance costs, it is also to be used to capture step decreases in maintenance costs resulting from a significant system or unit configuration change that results in a significant reduction in maintenance costs. Any equipment that falls into disuse or is retired because of the configuration change must have its maintenance expenses removed from the historical record used to develop the maintenance adder. An example of a significant system or unit configuration change that may result in a step decrease in qualified maintenance costs includes, but is not limited to, a fuel change from coal to gas fuel.
4.7 Synchronized Reserve
Note: The information in Section 2.7 contains basic Synchronized Reserve Cost information relevant for all unit types. The following information only pertains to fossil steam units.
Total costs to provide Tier 2 Synchronized reserve from a steam unit shall include the following components:
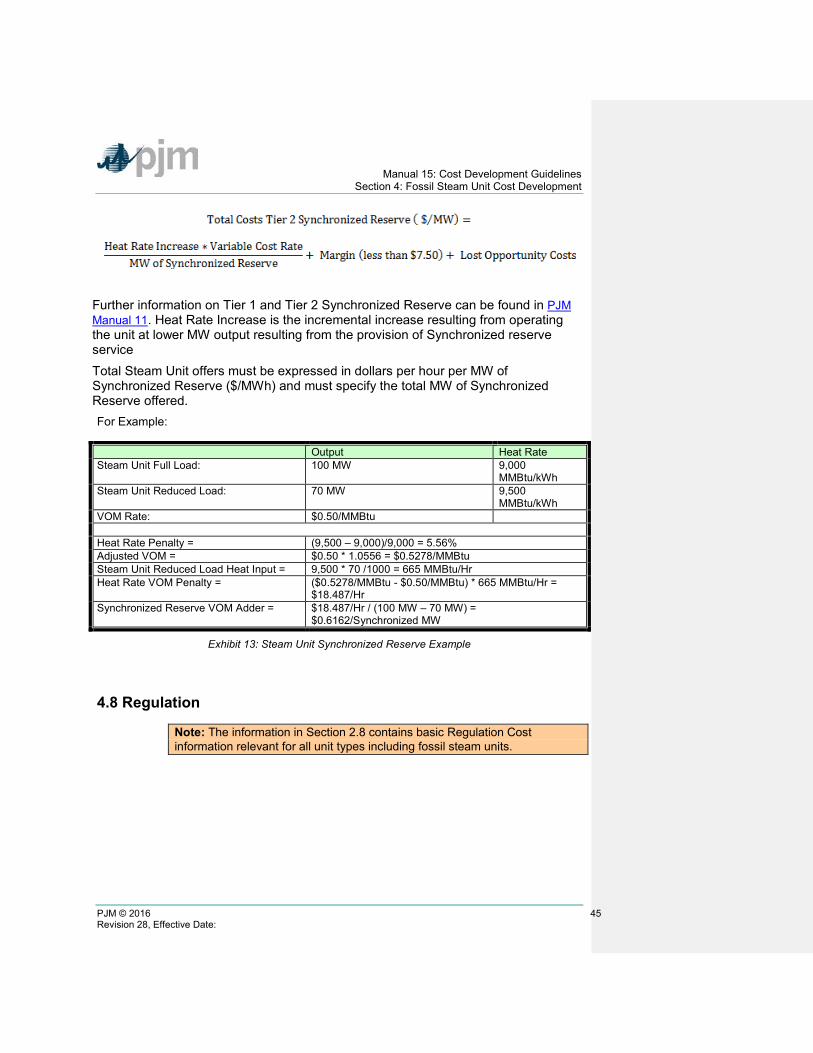
Manual 15: Cost Development Guidelines Section 4: Fossil Steam Unit Cost Development
PJM © 2016 45 Revision 28, Effective Date:
Further information on Tier 1 and Tier 2 Synchronized Reserve can be found in PJM Manual 11. Heat Rate Increase is the incremental increase resulting from operating the unit at lower MW output resulting from the provision of Synchronized reserve service Total Steam Unit offers must be expressed in dollars per hour per MW of Synchronized Reserve ($/MWh) and must specify the total MW of Synchronized Reserve offered. For Example:
Output Heat Rate Steam Unit Full Load: 100 MW 9,000
MMBtu/kWh Steam Unit Reduced Load: 70 MW 9,500
MMBtu/kWh VOM Rate: $0.50/MMBtu Heat Rate Penalty = (9,500 – 9,000)/9,000 = 5.56% Adjusted VOM = $0.50 * 1.0556 = $0.5278/MMBtu Steam Unit Reduced Load Heat Input = 9,500 * 70 /1000 = 665 MMBtu/Hr Heat Rate VOM Penalty = ($0.5278/MMBtu - $0.50/MMBtu) * 665 MMBtu/Hr =
$18.487/Hr Synchronized Reserve VOM Adder = $18.487/Hr / (100 MW – 70 MW) =
$0.6162/Synchronized MW
Exhibit 13: Steam Unit Synchronized Reserve Example
4.8 Regulation
Note: The information in Section 2.8 contains basic Regulation Cost information relevant for all unit types including fossil steam units.
Manual 15: Cost Development Guidelines Section 5: Combined Cycle (CC) Cost Development
PJM © 2016 46 Revision 28, Effective Date:
Section 5: Combined Cycle (CC) Cost Development
This section contains information pertaining to CC Cost development. Combined Cycle - An electric generating technology in which electricity is generated by both a CT generator (the Brayton Cycle) and a steam turbine generator (the Rankine Cycle) hence the name CC. The CT exhaust heat flows to a conventional boiler or to a heat recovery steam generator (HRSG) to produce steam for use by a steam turbine generator in the production of electricity. Heat recovery steam generator (HRSG) – A CT exhaust feeds hot gas into a heat to steam exchanger installed on combined-cycle power plants designed to utilize the heat in the CT exhaust to produce steam to drive a conventional steam turbine generator.
5.1 Heat Rate
Note: The information in Section 2.1 contains basic Heat Rate information relevant for all unit types including CC.
5.2 Performance Factors
Note: The information in Section 2.2 contains basic Performance Factor information relevant for all unit types including CC units.
5.3 Fuel Cost
Note: The information in Section 2.3 contains basic Fuel Cost information relevant for all unit types including CCunits.
5.4 Start-up Cost
Note: The information in Section 2.4 contains basic Start-up Cost information relevant for all unit types. The following additional information only pertains to CC units.
Start-up Costs for Combined Cycle (CC) plants shall include only the following components and shall never be less than zero:

Manual 15: Cost Development Guidelines Section 5: Combined Cycle (CC) Cost Development
PJM © 2016 47 Revision 28, Effective Date:
TFRC = Total Fuel Related Cost
Start up Cost ($/Start) =
(Start Fuel Consumed (MMBtu/Start) ∗ TFRC($/MMBtu) ∗ Performance Factor)
+(Station Service (MWh) ∗ Station Service Rate ($/MWh))
+ Start Maintenance Adder ($/Start) + Start Incremental Labor Cost ($/Start)
Start Fuel Consumed Cost is the cost of start fuel (basic fuel cost plus fuel handling and other fuel-related costs) from first CT fire to breaker closing for the steam turbine generator, as measured during a normal start sequence, and the cost of shutdown fuel from last breaker opening to fuel valve closure.Additionally, this includes the cost of start fuel from CT first fire to the point where heat recovery steam generator (HRSG) steam pressure matches steam turbine inlet pressure, for any CT unit/HRSG combinations started after synchronization of the steam turbine generator. Station service is included from initiation of start sequence of initial CT to breaker closing of the steam turbine generator (total station use minus normal base station use) priced at the Station Service Rate. Add to this (+) station service after breaker opening of the last component when finished operating as a CC unit, priced at the Station Service rate. (Station service during shutdown should be that associated with the normal unit auxiliary equipment operated during shutdown in excess of base unit use. This station service is not to include maintenance use or non-normal uses.) Minus (-) the integration of net generation from CT synchronization to steam turbine generator synchronization or to HRSG steam output at line pressure, priced at the actual cost of the unit. Minus (-) the integration of net generation during the shutdown period, priced at the actual cost of the unit. Incremental labor costs in excess of normal station manning requirements (only when necessary to start the CC unit). Start Maintenance Adder. This quantity includes both the previously defined CT Starting Maintenance Cost
5.5 No-Load Cost
Note: The information in Section 2.5 contains basic Start-up Cost information relevant for all unit types including CC units.
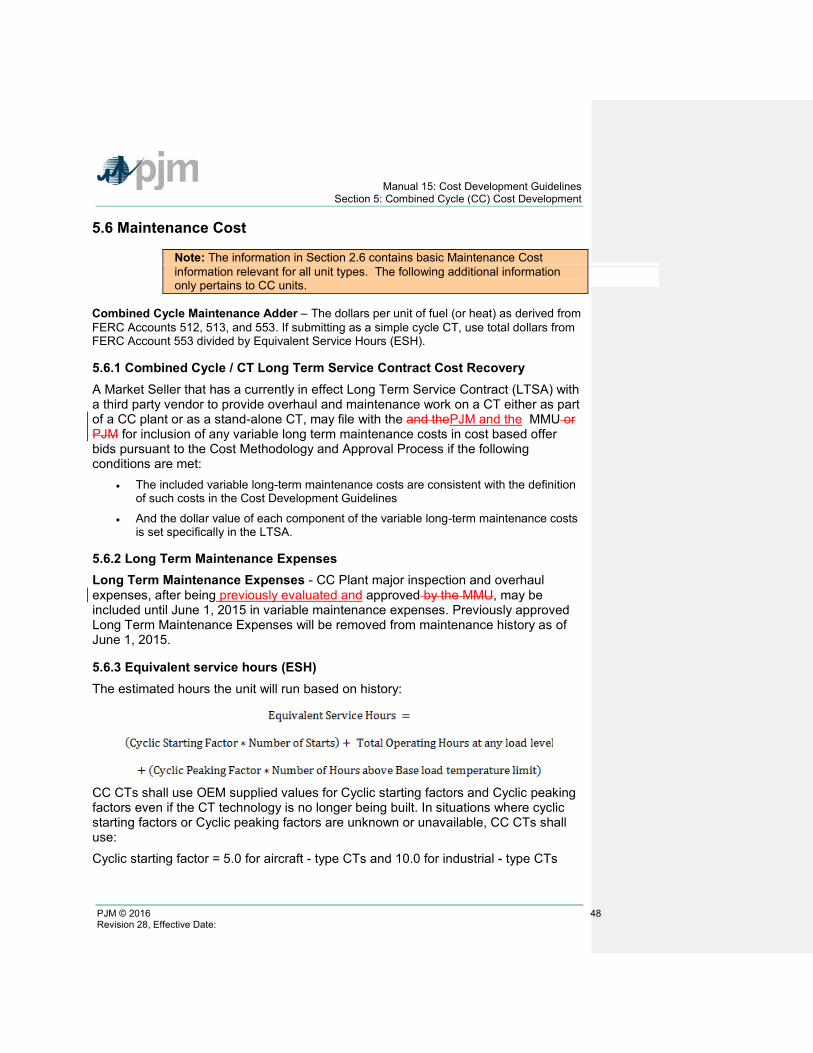
Manual 15: Cost Development Guidelines Section 5: Combined Cycle (CC) Cost Development
PJM © 2016 48 Revision 28, Effective Date:
5.6 Maintenance Cost
Note: The information in Section 2.6 contains basic Maintenance Cost information relevant for all unit types. The following additional information only pertains to CC units.
Combined Cycle Maintenance Adder – The dollars per unit of fuel (or heat) as derived from FERC Accounts 512, 513, and 553. If submitting as a simple cycle CT, use total dollars from FERC Account 553 divided by Equivalent Service Hours (ESH).
5.6.1 Combined Cycle / CT Long Term Service Contract Cost Recovery A Market Seller that has a currently in effect Long Term Service Contract (LTSA) with a third party vendor to provide overhaul and maintenance work on a CT either as part of a CC plant or as a stand-alone CT, may file with the and thePJM and the MMU or PJM for inclusion of any variable long term maintenance costs in cost based offer bids pursuant to the Cost Methodology and Approval Process if the following conditions are met:
• The included variable long-term maintenance costs are consistent with the definition of such costs in the Cost Development Guidelines
• And the dollar value of each component of the variable long-term maintenance costs is set specifically in the LTSA.
5.6.2 Long Term Maintenance Expenses Long Term Maintenance Expenses - CC Plant major inspection and overhaul expenses, after being previously evaluated and approved by the MMU, may be included until June 1, 2015 in variable maintenance expenses. Previously approved Long Term Maintenance Expenses will be removed from maintenance history as of June 1, 2015.
5.6.3 Equivalent service hours (ESH) The estimated hours the unit will run based on history:
CC CTs shall use OEM supplied values for Cyclic starting factors and Cyclic peaking factors even if the CT technology is no longer being built. In situations where cyclic starting factors or Cyclic peaking factors are unknown or unavailable, CC CTs shall use: Cyclic starting factor = 5.0 for aircraft - type CTs and 10.0 for industrial - type CTs
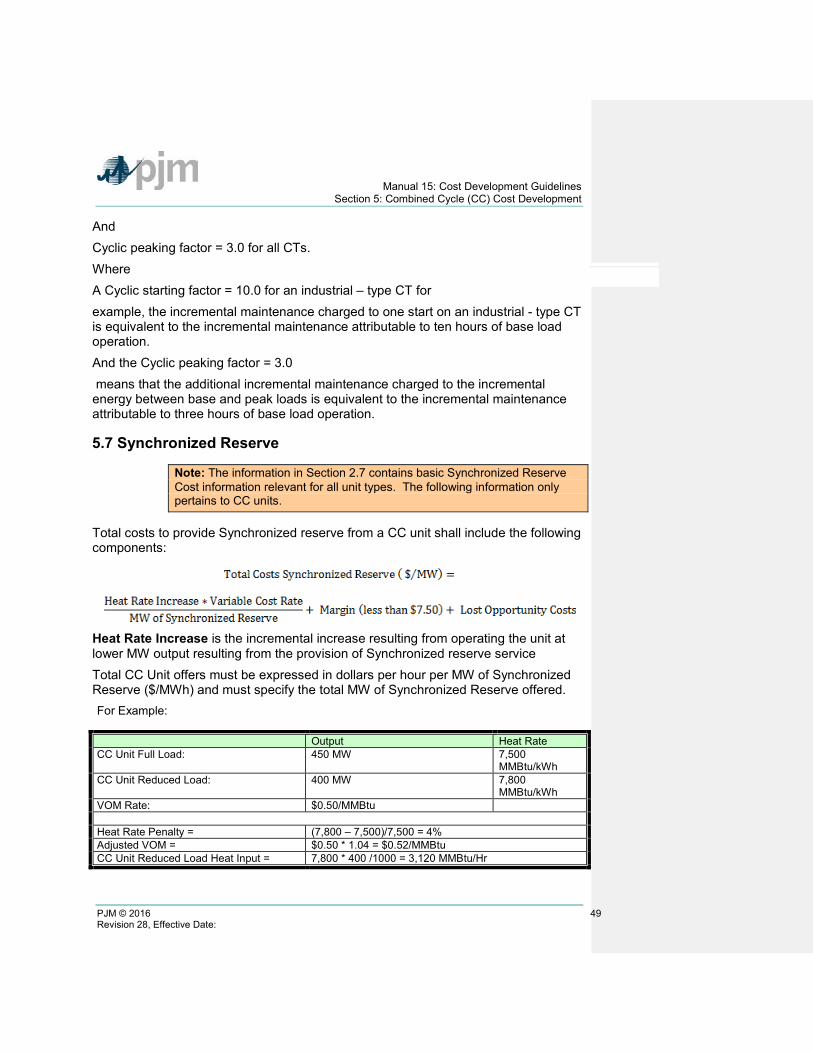
Manual 15: Cost Development Guidelines Section 5: Combined Cycle (CC) Cost Development
PJM © 2016 49 Revision 28, Effective Date:
And Cyclic peaking factor = 3.0 for all CTs. Where A Cyclic starting factor = 10.0 for an industrial – type CT for example, the incremental maintenance charged to one start on an industrial - type CT is equivalent to the incremental maintenance attributable to ten hours of base load operation. And the Cyclic peaking factor = 3.0 means that the additional incremental maintenance charged to the incremental energy between base and peak loads is equivalent to the incremental maintenance attributable to three hours of base load operation.
5.7 Synchronized Reserve
Note: The information in Section 2.7 contains basic Synchronized Reserve Cost information relevant for all unit types. The following information only pertains to CC units.
Total costs to provide Synchronized reserve from a CC unit shall include the following components:
Heat Rate Increase is the incremental increase resulting from operating the unit at lower MW output resulting from the provision of Synchronized reserve service Total CC Unit offers must be expressed in dollars per hour per MW of Synchronized Reserve ($/MWh) and must specify the total MW of Synchronized Reserve offered. For Example:
Output Heat Rate CC Unit Full Load: 450 MW 7,500
MMBtu/kWh CC Unit Reduced Load: 400 MW 7,800
MMBtu/kWh VOM Rate: $0.50/MMBtu Heat Rate Penalty = (7,800 – 7,500)/7,500 = 4% Adjusted VOM = $0.50 * 1.04 = $0.52/MMBtu CC Unit Reduced Load Heat Input = 7,800 * 400 /1000 = 3,120 MMBtu/Hr
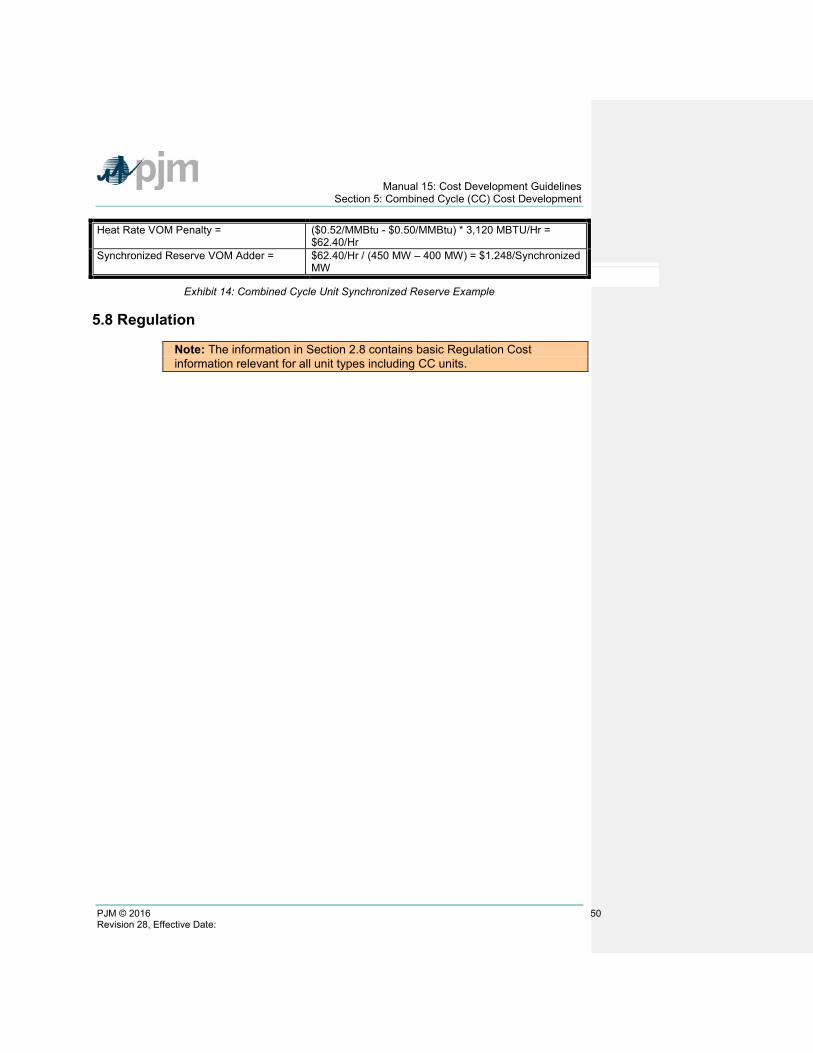
Manual 15: Cost Development Guidelines Section 5: Combined Cycle (CC) Cost Development
PJM © 2016 50 Revision 28, Effective Date:
Heat Rate VOM Penalty = ($0.52/MMBtu - $0.50/MMBtu) * 3,120 MBTU/Hr = $62.40/Hr
Synchronized Reserve VOM Adder = $62.40/Hr / (450 MW – 400 MW) = $1.248/Synchronized MW
Exhibit 14: Combined Cycle Unit Synchronized Reserve Example
5.8 Regulation
Note: The information in Section 2.8 contains basic Regulation Cost information relevant for all unit types including CC units.
Manual 15: Cost Development Guidelines Section 6: Combustion Turbine (CT) and Diesel Engine Costs
PJM © 2016 51 Revision 28, Effective Date:
Section 6: Combustion Turbine (CT) and Diesel Engine Costs
This section details specific information for the cost development of units that are CTs or diesel engines. Combustion Turbine Unit – A generating unit in which a natural gas or oil fired CT engine is the prime mover for an electrical generator. CTs that fire landfill gas solely or in conjunction with fossil fuels as a prime mover for an electrical generator are considered to be a Combustion Turbine Unit. Diesel Engine – A generating unit in which a diesel reciprocating engine is the prime mover for an electrical generator. Reciprocating engines that fire landfill gas solely or in conjunction with fossil fuels as a prime mover for an electrical generator are considered to be a Diesel Engine.
6.1 Combustion Turbine and Diesel Engine Heat Rate
Note: The information in Section 2.1 contains basic Heat Rate information relevant for all unit types. The following additional information only pertains to CT and diesel engine units.
For CT generating units, no-load fuel shall be the theoretical or actual fuel burn rate expressed in MMBtu/Hr at the point of electric bus synchronization.
6.2 Performance Factor
Note: The information in Section 2.2 contains basic Performance Factor information relevant for all unit types. The following additional information only pertains to CT and diesel engine units.
‘Like’ CT Units - An average Performance Factor may be calculated and applied for groups of like units burning the same type of fuel. Like includes same primary manufacturer not necessarily engine or generator manufacturer, but one with overall system responsibility. The following are two examples:
• Worthington sells CT's with P&W engines and a GE generator. Worthington would be considered the primary manufacturer.
• Same general frame size - a manufacturer may modify a basic design to produce units with varying capabilities. Units built with such variations may be placed in a may be placed in a single group.
6.3 Fuel Cost
Manual 15: Cost Development Guidelines Section 6: Combustion Turbine (CT) and Diesel Engine Costs
PJM © 2016 52 Revision 28, Effective Date:
Note: The information in Section 2.3 contains basic Fuel Cost information relevant for all unit types. The following additional information only pertains to CT and diesel engine units.
CT Maintenance Adder is included directly with the individual operating cost components on a $/hour basis.
6.3.1 Combustion Turbine other Fuel-Related Costs The dollars in FERC Account 547, plus incremental expenses for fuel treatment and pollution control excluding SO2 and NOX emission allowance costs that were not included in Account 547; minus the fuel expenses from FERC Account 151 that were charged into Account 547, all divided by the fuel (heat content or quantity) shifted from Account 151 into Account 547.
6.3.2 Total Fuel Related Cost Equation for CTs
Note: CT Maintenance Adder is included directly in start, no-load and peak segment components.
6.4 Start-up Cost
Note: The information in Section 2.4 contains basic Start-up Cost information relevant for all unit types. The following additional information only pertains to CT and diesel engine units.
Start-up costs for all CTs and diesel units shall include only the following components:
Start up Cost ($/Start) =
(Start Fuel Consumed (MMBtu/Start) ∗ TFRC($/MMBtu) ∗ Performance Factor)
+(Station Service (MWh) ∗ Station Service Rate ($/MWh))
+ Start Maintenance Adder ($/Start) + Start Incremental Labor Cost ($/Start)
TFRC = Total Fuel Related Cost Start Fuel Consumed * Total Fuel Related Cost (TRFC) * Performance Factor is the cost of start fuel (basic fuel cost plus fuel handling and other fuel-related costs)
Manual 15: Cost Development Guidelines Section 6: Combustion Turbine (CT) and Diesel Engine Costs
PJM © 2016 53 Revision 28, Effective Date:
from first fire to unit breaker closing, Plus (+) cost of shutdown fuel from unit breaker opening to fuel valve closure (basic fuel cost plus fuel handling and other fuel-related costs). Incremental labor costs are the costs in excess of normal station manning requirements (only when necessary to start a CT unit). Station Service * Station Service Rate from initiation of start sequence to breaker closing (total station use minus normal base station use) priced at the Station Service rate. Plus (+) station service after breaker opening during shutdown (station service during shutdown should be that associated with the normal unit auxiliary equipment operated during shutdown in excess of base unit use, this station service is not to include maintenance use or non-normal uses) priced at the Station Service rate.
NOTE: Starting Maintenance Cost, please see section 6.6.3
Reminder: CT Maintenance Adder is included directly in start, no-load and peak segment components.
6.5 No-Load Cost Calculation for CTs
Note: The information in Section 2.5 contains basic No-Load Cost information relevant for all unit types. The following additional information only pertains to CT and diesel engine units.
Note: CT Maintenance Adder is included directly in start, No-Load and peak segment components.
6.6 Maintenance Cost
Note: The information in Section 2.6 contains basic Maintenance Cost information relevant for all unit types. The following additional information only pertains to CT and diesel engine units.
CT - Maintenance Adder – The total dollars from FERC Account 553 divided by Equivalent Service Hours (ESH). Industrial CT – This is a CT developed specifically for power generation. Aircraft - Type CT – These are CTs originally designed for aircraft and modified for power generation. Diesel - Maintenance Adder – The total dollars from FERC Account 553 divided by total fuel burned (in MMBtu’s).
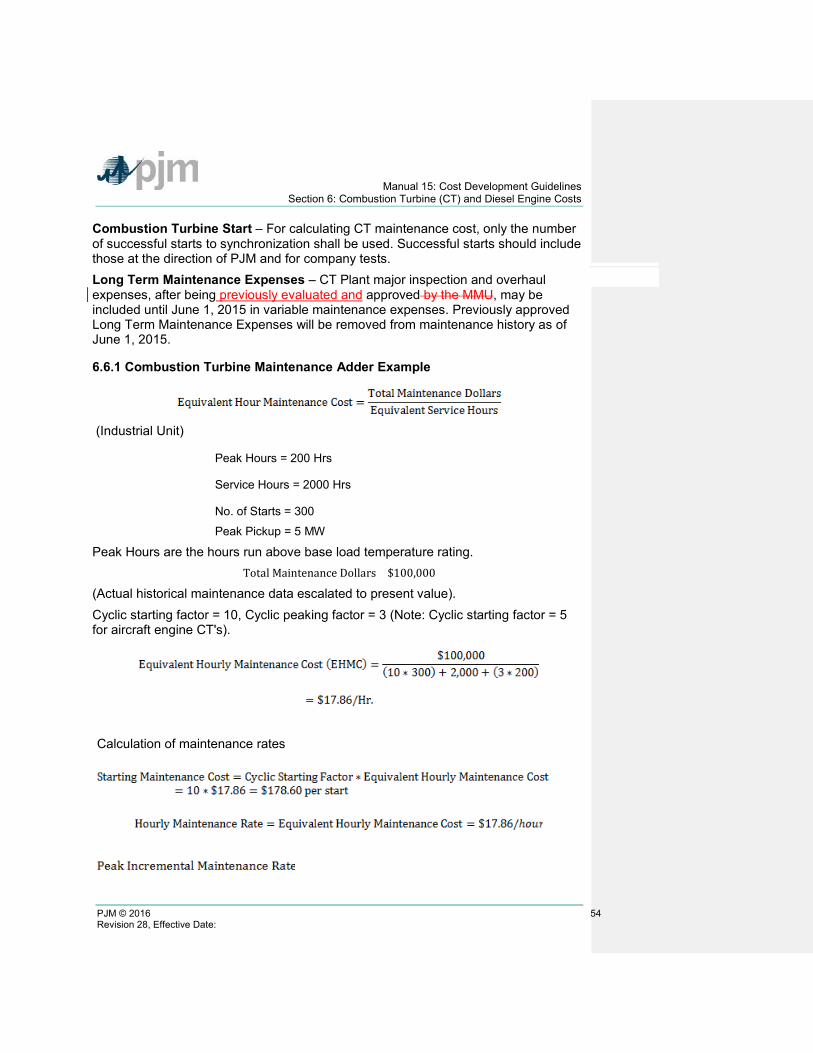
Manual 15: Cost Development Guidelines Section 6: Combustion Turbine (CT) and Diesel Engine Costs
PJM © 2016 54 Revision 28, Effective Date:
Combustion Turbine Start – For calculating CT maintenance cost, only the number of successful starts to synchronization shall be used. Successful starts should include those at the direction of PJM and for company tests. Long Term Maintenance Expenses – CT Plant major inspection and overhaul expenses, after being previously evaluated and approved by the MMU, may be included until June 1, 2015 in variable maintenance expenses. Previously approved Long Term Maintenance Expenses will be removed from maintenance history as of June 1, 2015.
6.6.1 Combustion Turbine Maintenance Adder Example
(Industrial Unit)
Peak Hours = 200 Hrs
Service Hours = 2000 Hrs
No. of Starts = 300
Peak Pickup = 5 MW
Peak Hours are the hours run above base load temperature rating. Total Maintenance Dollars =$100,000
(Actual historical maintenance data escalated to present value). Cyclic starting factor = 10, Cyclic peaking factor = 3 (Note: Cyclic starting factor = 5 for aircraft engine CT's).
Calculation of maintenance rates
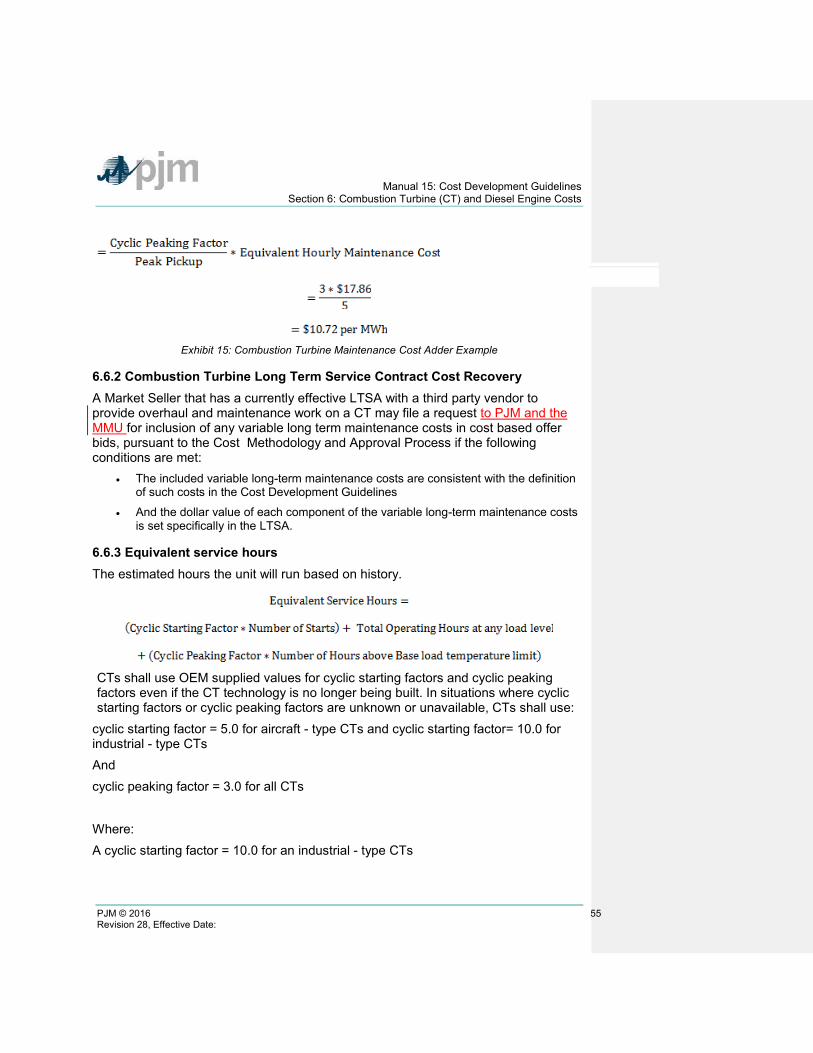
Manual 15: Cost Development Guidelines Section 6: Combustion Turbine (CT) and Diesel Engine Costs
PJM © 2016 55 Revision 28, Effective Date:
Exhibit 15: Combustion Turbine Maintenance Cost Adder Example
6.6.2 Combustion Turbine Long Term Service Contract Cost Recovery A Market Seller that has a currently effective LTSA with a third party vendor to provide overhaul and maintenance work on a CT may file a request to PJM and the MMU for inclusion of any variable long term maintenance costs in cost based offer bids, pursuant to the Cost Methodology and Approval Process if the following conditions are met:
• The included variable long-term maintenance costs are consistent with the definition of such costs in the Cost Development Guidelines
• And the dollar value of each component of the variable long-term maintenance costs is set specifically in the LTSA.
6.6.3 Equivalent service hours The estimated hours the unit will run based on history.
CTs shall use OEM supplied values for cyclic starting factors and cyclic peaking factors even if the CT technology is no longer being built. In situations where cyclic starting factors or cyclic peaking factors are unknown or unavailable, CTs shall use:
cyclic starting factor = 5.0 for aircraft - type CTs and cyclic starting factor= 10.0 for industrial - type CTs And cyclic peaking factor = 3.0 for all CTs Where: A cyclic starting factor = 10.0 for an industrial - type CTs
Manual 15: Cost Development Guidelines Section 6: Combustion Turbine (CT) and Diesel Engine Costs
PJM © 2016 56 Revision 28, Effective Date:
for example, the incremental maintenance charged to one start on an industrial - type CT is equivalent to the incremental maintenance attributable to ten hours of base load operation. And a cyclic peaking factor = 3.0 means that the additional incremental maintenance charged to the incremental energy between base and peak loads is equivalent to the incremental maintenance attributable to three hours of base load operation.
6.6.4 Diesel Incremental Maintenance Adder Calculation The incremental Maintenance Adder for diesel units will be calculated and applied on a "per MMBtu (or other unit of fuel)" basis. The calculation will be based on actual operation and escalated maintenance expenses for all available history in the Maintenance Period.
6.7 Synchronized Reserve: Costs to Condense
Note: The information in Section 2.7 contains basic Synchronized Reserve Cost information relevant for all unit types. The following additional information only pertains to CT and diesel engine units.
Total synchronous condensing costs for CTs and diesel units shall include the following components:
• Start-up Costs if applicable, shall be applied when a unit moves from cold to condensing operations and when a unit moves from condensing operations to energy generation, but shall not be applied when a unit moves from energy generation to condensing operations.
• Variable Operating and Maintenance cost (EHMC) in $/Hr divided by the Synchronized MW provided.
• Actual cost of power consumed during condensing operations at real time bus LMP as determined by Market Settlements. MW consumed must be included in the offer.
• Margin up to $7.50 per MW of Synchronized Reserve service provided.
The CT condensing offers must be expressed in dollars per hour per MW of Synchronized Reserve ($/MWh) and must specify the total MW of Synchronized Reserve offered.
6.8 Regulation Cost
Note: The information in Section 2.8 contains basic Regulation Cost information relevant for all unit types. The following additional information only pertains to CT and diesel engine units.
Manual 15: Cost Development Guidelines Section 7: Hydro
PJM © 2016 57 Revision 28, Effective Date:
Section 7: Hydro
This section contains information for the development of Hydro or Pumped Storage Hydro cost offers. Hydro Units – Generating unit in which the energy of flowing water drives the turbine generator to produce electricity. This classification includes pumped and run-of-river hydro. Pumped Storage Hydro Unit – Hydroelectric power generation that stores energy in the form of water by pumping from a lower elevation source to a higher elevation reservoir, then allowing the upper reservoir to drain turning the turbines to produce power.
7.1 Pumping Efficiency (Pumped Storage Hydro Only)
Pumping Efficiency is the Pumped Storage Hydro Unit’s version of a heat rate. It measures the ratio of generation produced to the amount of generation used as fuel. Pumping Efficiency (PE) is calculated by dividing the MWh of generation produced while operating in generation mode by the MWh required to pump the water needed to produce the generation MWh.
For example, it requires 1,000 ft3 to produce one MWh of generation as water flows from the pond to the sink and it requires 1.4 MWh of pumping load to pump 1,000 ft3 of water from the sink to the pond. The resultant efficiency is:
In order to account for environmental and physical factors associated with the characteristics of the pond and pumping operations that limit the accuracy of calculating short term pumping efficiency, a seven day rolling total of pumping and generation MWh are utilized for pumping efficiency calculations. PE can be calculated by one of three methods. A Market Seller must make the choice of method by December 31 prior to the year of operation and cannot change to another method for a period of one calendar year.
Manual 15: Cost Development Guidelines Section 7: Hydro
PJM © 2016 58 Revision 28, Effective Date:
• Option 1: Twelve month calendar actual Pumping Efficiency.
o The previous 12-month calendar year average Pumping Efficiency based on actual pumping operations.
• Option 2: Three month rolling Pumping Efficiency.
o The previous three months rolling actual efficiency where the average monthly availability is 50% or greater. The calculation must be updated after each month.
• Option 3: The previous month actual Pumping Efficiency.
o The previous month actual efficiency where the availability is 50% or greater. The calculation must be updated monthly.
7.2 Performance Factors
Note: The information in Section 2.2 contains basic Performance Factor information relevant for all unit types. The following additional information only pertains to hydro units.
7.3 Fuel Cost
The fuel costs for a run-of-river hydro Unit are equal to zero. For a Pumped Storage Hydro Unit to be consistent with other PJM units within this manual the term fuel cost is used to account for the energy necessary to pump from the lower reservoir to the upper reservoir.
Note: The information in Section 2.3 contains basic Fuel Cost information relevant for all unit types. The following additional information only pertains to Pumped Storage Hydro Units.
If a Market Seller wishes to change its method of calculation of pumped storage TFRC, the Market Seller shall notify PJM and MMU in writing by December 31 prior to the year of operation, to be evaluated pursuant to the Cost Methodology and Approval Process before the beginning of the cycle in which the new method is to become effective. The new cycle starts on February 1st and continues for a period of one year Basic Pumped Storage Fuel Cost – Pumped storage fuel cost shall be calculated on a seven (7) day rolling basis by multiplying the real time bus LMP at the plant node by the actual power consumed when pumping divided by the pumping efficiency. The pumping efficiency is determined annually based on actual pumping operations or by OEM curves if annual data is not available due to the immaturity of the unit. The following equations govern pumping storage fuel cost:
Manual 15: Cost Development Guidelines Section 7: Hydro
PJM © 2016 59 Revision 28, Effective Date:
7.3.1 Total Energy Input Related Costs for Pumped Storage Hydro Plant Generation Total energy input-related costs for all pumped storage hydro units shall be defined as follows:
7.4 Start-up Cost
See 7.7 Condensing Start Costs.
7.5 No-Load Cost
Hydro Units do not have No-Load Costs.
7.6 Maintenance
Manual 15: Cost Development Guidelines Section 7: Hydro
PJM © 2016 60 Revision 28, Effective Date:
Note: The information in Section 2.6 contains basic Maintenance Cost information relevant for all unit types. The following additional information only pertains to hydro units.
This account shall include the cost of labor, materials used and expenses incurred in the maintenance of plant, includible in Account 332, Reservoirs, Dams, and Waterways. (See operating expense instruction 2.) However, the cost of labor materials used and expenses incurred in the maintenance of fish and wildlife, and recreation facilities, the book cost of which is includible in Account 332, Reservoirs, Dams, and Waterways, shall be charged to Account 545, Maintenance of Miscellaneous Hydraulic Plant. Further, Pumped Storage Hydro Units scheduled by the Office of the Interconnection pursuant to the hydro optimization tool in the Day-ahead Energy Market may not include maintenance costs in their offers because such offers may not exceed an energy offer price of $0.00/MWh.
7.7 Synchronized Reserve: Hydro Unit Costs to Condense
Note: The information in Section 2.7 contains basic Synchronized Reserve Cost information relevant for all unit types. The following additional information only pertains to hydro units if applicable.
Some Hydro Units have the ability to purge the turbines of water and run backwards effectively creating a capacitor. This method of operation of the machine is referred to as operating the Hydro unit in synchronous condensing mode. Total synchronous condensing costs for Hydro units shall include the following components:
Condensing Start costs if applicable, start costs shall be applied when a unit moves from cold to condensing operations and when a unit moves from condensing operations to energy generation, but shall not be applied when a unit moves from energy generation to condensing operations. In addition (+) identified variable Operating and Maintenance cost in $/Hr. divided by the Synchronized MW provided. These costs shall be totaled over the Maintenance Period and divided by total MWh generated over the maintenance period. These variable Operating and Maintenance costs shall include:
• Maintenance of Electric Plant as derived from FERC Account 544
• Maintenance of Reservoirs as derived from FERC Account 543

Manual 15: Cost Development Guidelines Section 7: Hydro
PJM © 2016 61 Revision 28, Effective Date:
In addition (+) margin up to $7.50 per MW of Synchronized Reserve service provided. Total hydro condensing offers must be expressed in dollars per hour per MW of Synchronized Reserve ($/MWh) and must specify the total MW of Synchronized Reserve offered.
7.8 Regulation Cost
Note: The information in Section 2.8 contains basic Regulation Cost information relevant for all unit types.
Manual 15: Cost Development Guidelines Section 8: Demand Side Response (DSR)
PJM © 2016 62 Revision 28, Effective Date:
Section 8 : Demand Resource (DR)
. Demand Resource – DR means a resource that has the capability to provide a reduction in load..
8.1 Demand Resource (DR) Cost to Provide Synchronous Reserves
The cost to provide synchronous reserves from DR resources shall be equal to the margin up to $7.50 per MWh of reserves provided. Demand Resource shutdown costs shall be zero. Any exceptions to this rule are covered under the Cost Methodology and Approval Process.
Manual 15: Cost Development Guidelines Section 9: Wind Units
PJM © 2016 63 Revision 28, Effective Date:
Section 9: Wind Units This section contains information for the development of Wind unit cost offers. Wind Units – Generating unit in which the energy of blowing wind drives the turbine generator to produce electricity.
9.1 Heat Rates
Wind units do not burn fuel so heat rates are not applicable.
9.2 Performance Factors
Note: The information in Section 2.2 contains basic Performance Factor information relevant for all unit types. The following additional information only pertains to Wind units.
Wind units do not burn fuel so Performance Factors are equal to 1.0.
9.3 Fuel Cost
Note: The information in Section 2.3 contains basic Fuel Cost information relevant for all unit types. The following additional information only pertains to wind units.
"Fuel Cost Policy" will be provided to the PJM and MMU annually pusuant to Section 2.3.1. The fFuel cCost pPolicy should include how the generator intends to account for Renewable Energy Credits (RECs) and Production Tax Credits (PTCs).
9.4 Start-up Cost
Note: The information in Section 2.3 contains basic Start-up Cost information relevant for all unit types. The following additional information only pertains to wind units.
Start-up cost for a wind unit is station service cost.
9.5 No-Load Cost
Wind Units do not have No-load costs.
Manual 15: Cost Development Guidelines Section 9: Wind Units
PJM © 2016 64 Revision 28, Effective Date:
9.6 Maintenance
Note: The information in Section 2.6 contains basic Maintenance Cost information relevant for all unit types. The following additional information only pertains to wind units.
Maintenance Cost includes short run Wear and Tear on the Unit (including preventative and scheduled; not including capital). Rolling twelve month historic maintenance cost divided by MWh for the same period.
9.7 Synchronized Reserve: Wind Unit Costs to Condense
Note: The information in Section 2.7 contains basic Synchronized Reserve Cost information relevant for all unit types. The following additional information only pertains to wind units if applicable.
9.8 Regulation Cost
Note: The information in Section 2.8 contains basic Regulation Cost information relevant for all unit types.
Manual 15: Cost Development Guidelines Section 10: Solar Units
PJM © 2016 65 Revision 28, Effective Date:
Section 10: Solar Units This section contains information for the development of solar unit cost offers. Solar Units – Solar units use photovoltaic cell collectors made from semiconductors to convert solar radiation directly to electricity.
10.1 Heat Rates
Solar units do not burn fuel so heat rates are not applicable.
10.2 Performance Factors
Note: The information in Section 2.2 contains basic Performance Factor information relevant for all unit types. The following additional information only pertains to solar units.
Solar units do not burn fuel so Performance Factors are equal to 1.0.
10.3 Fuel Cost
Note: The information in Section 2.3 contains basic Fuel Cost information relevant for all unit types. The following additional information only pertains to solar units.
Solar unit’s fuel costs are equal to zero.
10.4 Start-up Cost
Note: The information in Section 2.3 contains basic Start-up Cost information relevant for all unit types. The following additional information only pertains to solar units.
Solar unit’s Start Fuel and Total Fuel Related Costs are equal to zero.
10.5 No-Load Cost
Solar units do not have No-Load Costs.
10.6 Maintenance
Note: The information in Section 2.6 contains basic Maintenance Cost information relevant for all unit types. The following additional information only pertains to solar units.
Manual 15: Cost Development Guidelines Section 10: Solar Units
PJM © 2016 66 Revision 28, Effective Date:
10.7 Synchronized Reserve Cost
Note: The information in Section 2.7 contains basic Synchronized Reserve Cost information relevant for all unit types.
10.8 Regulation Cost
Note: The information in Section 2.8 contains basic Regulation Cost information relevant for all unit types.
Manual 15: Cost Development Guidelines Section 11: Energy Storage
PJM © 2016 67 Revision 28, Effective Date:
Section 11: Energy Storage Resource This section contains information for the development of Energy Storage Resource cost offers. .
11.1 Heat Rates
Energy Storage Resources do not burn fuel so heat rates are not applicable.
11.2 Performance Factors
Note: The information in Section 2.2 contains basic Performance Factor information relevant for all unit types. The following additional information only pertains to Energy Storage Resources.
Energy Storage Resources do not burn fuel so Performance Factors are equal to 1.0.
11.3 Fuel Cost
Note: The information in Section 2.3 contains basic Fuel Cost information relevant for all unit types. The following additional information only pertains to Energy Storage Resources
Energy Storage Resource’s fuel costs are equal to zero.
11.4 Start-up Cost
Energy Storage Resource’s Start Fuel and Total Fuel Related Costs are equal to zero.
11.5 No-Load Cost
Energy Storage Resources do not have No-load costs.
11.6 Maintenance
Note: The information in Section 2.6 contains basic Maintenance Cost information relevant for all unit types. The following additional information only pertains to Energy Storage Resources.
Manual 15: Cost Development Guidelines Section 11: Energy Storage
PJM © 2016 68 Revision 28, Effective Date:
11.7 Synchronized Reserve Cost
Note: The information in Section 2.7 contains basic Synchronized Reserve Cost information relevant for all unit types. The following additional information only pertains to Energy Storage Resources if applicable.
11.8 Regulation Cost
Note: The information in Section 2.8 contains basic Regulation Cost information relevant for all unit types. The following additional information only pertains to Energy Storage Resources.
Energy Storage Resources shall calculate Energy Storage Unit Losses in accordance with the equation below. The “Cost Increase due to Heat Rate Increase during non-steady state operation” and the “Fuel Cost Increase and Unit Specific Heat Rate Degradation due to Operating at lower loads” shall be equal to zero. If a Market Seller wishes to change its method of calculating these losses, the Market Seller shall submit to change its Fuel a cCost Ppolicy to PJM and the MMU pursuant to Section 2.3.1.the Cost Methodology and Approval Process. The approved method of calculation may be implemented upon approval and may be updated no more frequently than once every 12 months. If any action by a government or regulatory agency that results in a need for the Market Seller to change its method of cost calculation, the affected Market Seller may submit a request, or notification as appropriate, to PJM and the MMU for evaluation, pursuant to the Cost Methodology and Approval Process.Section 2.3.1 Energy Storage Unit Losses ($/MW) – shall be the calculated average of seven (7) days of rolling hourly periods where the real time bus LMP ($/MWh) at the plant node is multiplied by the net energy consumed (MWh) when regulating divided by the regulation offer (MW). The seven (7) days of rolling hourly periods shall consist of the unit’s last 168 hour periods with accepted regulation offers. The following equation governs energy storage unit’s fuel cost increase:

Manual 15: Cost Development Guidelines Section 11: Energy Storage
PJM © 2016 69 Revision 28, Effective Date:

Manual 15: Cost Development Guidelines Section 12: Energy Market Opportunity Cost & Non-Regulatory Opportunity Cost Guidelines
PJM © 2016 70 Revision 28, Effective Date:
Section 12: Energy Market Opportunity Cost and Non-Regulatory Opportunity Cost Guidelines
12.1 Opportunity Cost Policy
Opportunity Cost may be a component of cost under certain circumstances. • Specific business rules for Opportunity Costs have been defined in the Operating
Agreement for various products including energy and regulation.
• Requests for recovery of Opportunity Costs not defined in the Operating Agreement should be submitted to PJM and the MMU pursuant to the Cost Methodology and Approval Process.
• 12.2 Basis for Opportunity Cost to be included in Cost Offers
There are three reasons for the application of Opportunity Costs as contained in this section.
12.2.1 Energy Market Opportunity Costs Energy Market Opportunity Costs associated with an externally imposed environmental run-hour restriction on a generation unit. Examples would include a limit on emissions for the unit imposed by a regulatory agency or legislation, a direct run hour restriction in the operating permit, or a heat input limitation defined by a regulatory decision or operating permit.
12.2.2 Non-Regulatory Opportunity Cost: Physical Equipment Limitations: Physical Equipment Limitations must have supporting evidence submitted by the Market Seller. Documentation such as an OEM recommendation or bulletin and/or insurance carrier restrictions would meet this criterion. Only limitations that cause the unit to experience a restriction in the number of starts or run hours would be eligible for Non-Regulatory Opportunity Cost.
12.2.3 Non-Regulatory Opportunity Cost: Fuel Limitations Fuel Limitations are eligible for Non-Regulatory Opportunity Costs for a fuel supply limitation, for up to one year, resulting from an event of force majeure. Force Majeure is defined as: Any cause beyond the control of the affected Interconnection Party or Construction Party, including but not restricted to, acts of God, flood, drought, earthquake, storm, fire, lightning, epidemic, war, riot, civil disturbance or disobedience, labor dispute, labor or material shortage, sabotage, acts of public enemy, explosions, orders, regulations or restrictions imposed by governmental, military, or lawfully established civilian authorities, which, in any of the foregoing cases, by ,.exercise of due diligence such party could not reasonably have been expected to avoid, and which, by the exercise of due diligence, it has been
Manual 15: Cost Development Guidelines Section 12: Energy Market Opportunity Cost & Non-Regulatory Opportunity Cost Guidelines
PJM © 2016 71 Revision 28, Effective Date:
unable to overcome. Force Majeure does not include (i) a failure of performance that is due to an affected party’s own negligence or intentional wrongdoing; (ii) any removable or remediable causes (other than settlement of a strike or labor dispute) which an affected party fails to remove or remedy within a reasonable time; or (iii) economic hardship of an affected party.
12.3 Calculation Method Options: Two Methodologies for calculating Opportunity Cost
Market Sellers may opt to follow one of the two following methodologies; the difference between the methodologies being the applicable time period. Market Sellers may develop alternative methods specific to their units and submit those methods for approval. Requests for recovery of opportunity costs using other methods not defined in the Operating Agreement should be initially submitted to PJM and to the MMU for evaluation pursuant to Section 1.8 and shall receive PJM’s approval prior to using the alternative method. under the Cost Methodology and Approval Process. Energy Market Opportunity Costs and Non-Regulatory Opportunity Costs are a distinct component of the cost-based offer. As is the case with any computation of the cost-based offer in Manual 15, Market Sellers may elect to enter their cost-based offer at a value less than the computed cost-based offer. However, they may not exceed the computed value.
12.3.1 Long Term Method (greater than 30 days) This method uses monthly forward prices as the basis for forecasts of fuel and electricity costs in the future. Opportunity costs calculated with this method will change frequently. Given that electricity and fuel futures can change daily, the opportunity costs computed can likewise change daily. Market Sellers who include opportunity costs in their cost-based offers must recalculate their long term opportunity cost no less frequently than once per every 7 days.
12.3.2 Short Term Method (30 days or less) This method uses daily forward prices as the basis for forecasts of fuel and electricity costs in the future. Market Sellers who include opportunity costs in their cost-based offers must recalculate their short term opportunity cost every day.
12.4 Definitions
N=number of hours in the month (on-peak/off-peak)
y=year
m=month
d=day of the month

Manual 15: Cost Development Guidelines Section 12: Energy Market Opportunity Cost & Non-Regulatory Opportunity Cost Guidelines
PJM © 2016 72 Revision 28, Effective Date:
h=hour
t= Number of hours remaining in the compliance period
Peak=off-peak hours only or on-peak hours only
FY=future year
BUSLMP=LMP at the unit’s bus
PJMWHLMP=PJM Western Hub LMP
PJMWHFRP= PJM Western Hub Forward Price
DAPJMWHFRP=Day Ahead PJM Western Hub Forward Price
Trading Day=In respect of a particular futures market a day on which that Market open for trading
Dm=Delivery Month; Month the commodity contract is to deliver the commodity in the future.
Base year= one of the three historical years used to create volatility in the fuel and power forecasts
Peak=Peak hours are from 7:00 AM to 11:00 PM (the hour ending 0800 to the hour ending 2300) prevailing local time. Peak days are Mondays through Fridays, excluding North American Electric Reliability Corporation (NERC) holidays.
Off-peak=Off-peak hours are from midnight to 7:00 AM (the hour ending 0100 to the hour ending 0700) and 11:00 PM to midnight (the hour ending 2400) Mondays through Fridays; also, all day Saturdays and Sundays (the hour ending 0100 to the hour ending 2400) and North American Electric Reliability Corporation holidays
Frequently mitigated unit (FMU) = A unit that was offer-capped for more than a defined proportion of its real-time run hours in the most recent 12-month period. FMU thresholds are 60 percent, 70 percent and 80 percent of run hours. Such units are permitted a defined adder to their cost-based offers in place of the usual 10 percent adder.
Unit Cost = Cost of Dispatch without Start-up Cost
Unit Dispatch Cost= Cost of Dispatch with Start-up Cost Included
All inputs use prevailing width preserving decimal precision of historical record.
12.5 Long Term Methodology
12.5.1 Step 1: Derive Historical Monthly LMP Basis Differential between the generation bus and western hub
Inputs required for STEP 1: Platts-ICE Forward Curve for “PJM west” from the recent trading day, Three years of historical hourly real-time LMPs at the generation bus, and Three years of historical hourly real-time PJM Western Hub LMPs

Manual 15: Cost Development Guidelines Section 12: Energy Market Opportunity Cost & Non-Regulatory Opportunity Cost Guidelines
PJM © 2016 73 Revision 28, Effective Date:
The mismatch between the location of the forward contract delivery point (Western Hub) and the relevant generator bus can be accounted for in the historic, monthly average basis differential for both peak and off-peak hours. This basis differential can be expressed as the average, over all peak or off-peak hours in a month, of the ratio of the hourly bus LMP to the hourly Western Hub LMP. If this ratio is greater than one, it means the bus LMP is greater than the Western Hub LMP on average. If this ratio is less than one, it means the bus LMP is less than the Western Hub LMP on average. Platts-ICE Forward Curve for “PJM west” (PJM Western Hub) must be collected for this first step (http://www.platts.com/). These PJM Western Hub Forwards multiplied by a historical basis adjustment ratio for delivery to the generator’s bus creates monthly delivered bus prices. The three prior calendar year’s historical data is used to make this calculation. For example, when calculating opportunity costs for July 2, 2010 for a unit with a calendar year compliance period, use historical LMP data from July 2nd (2007,2008,2009) to December 31st (2007,2008,2009). The Opportunity Cost Calculator is also able to provide forecasts for a rolling compliance period (e.g. a rolling 12 months) rather than a calendar year period. For units with a 12 month rolling compliance period, use LMP data from the previous three years, beginning on the date calculated and ending two days previous. For example, when a unit is calculating opportunity cost for July 2nd, 2010 with a rolling 12 month compliance period, use historical LMP data from July 2nd (2007,2008,2009) to June 30th (2008, 2009, 2010). Begin by taking the hourly bus prices for the three prior calendar years at the generator’s bus, and for every hour, divide that hour’s price by the corresponding price at PJM Western Hub. The historic hourly basis differential in hour h, day d, month m, and year y is
HourlyBasisDifferentialRatioy,m,d,h =BUSLMPy,m,d,h
PJMWHLMPy,m,d,h
Exhibit 16: Three hourly basis differential ratios values for the same hour in each of three historical
years:
HourlyBasisDifferentialRatioJune 3,2007 H11 =BUSLMPJune 3,2007 H11
PJMWHLMPJune 3,2007 H11
HourlyBasisDifferentialRatioJune 3,2008 H11 =BUSLMPJune 3,2008 H11
PJMWHLMPJune 3,2008 H11
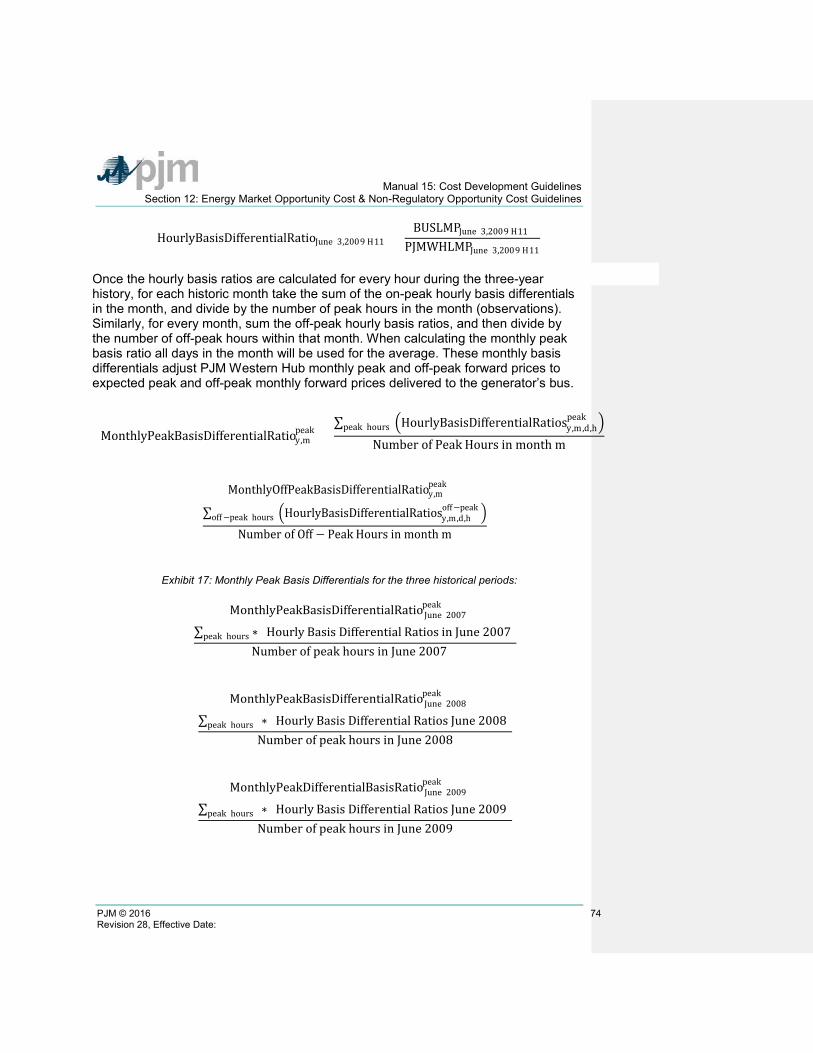
Manual 15: Cost Development Guidelines Section 12: Energy Market Opportunity Cost & Non-Regulatory Opportunity Cost Guidelines
PJM © 2016 74 Revision 28, Effective Date:
HourlyBasisDifferentialRatioJune 3,2009 H11 =BUSLMPJune 3,2009 H11
PJMWHLMPJune 3,2009 H11
Once the hourly basis ratios are calculated for every hour during the three-year history, for each historic month take the sum of the on-peak hourly basis differentials in the month, and divide by the number of peak hours in the month (observations). Similarly, for every month, sum the off-peak hourly basis ratios, and then divide by the number of off-peak hours within that month. When calculating the monthly peak basis ratio all days in the month will be used for the average. These monthly basis differentials adjust PJM Western Hub monthly peak and off-peak forward prices to expected peak and off-peak monthly forward prices delivered to the generator’s bus.
MonthlyPeakBasisDifferentialRatioy,mpeak =
∑ �HourlyBasisDifferentialRatiosy,m,d,hpeak �peak hours
Number of Peak Hours in month m
MonthlyOffPeakBasisDifferentialRatioy,mpeak
=∑ �HourlyBasisDifferentialRatiosy,m,d,h
off−peak �off−peak hours
Number of Off − Peak Hours in month m
Exhibit 17: Monthly Peak Basis Differentials for the three historical periods:
MonthlyPeakBasisDifferentialRatio June 2007peak
=∑ ∗ (Hourly Basis Differential Ratios in June 2007)peak hours
Number of peak hours in June 2007
MonthlyPeakBasisDifferentialRatio June 2008peak
=∑ ∗ (Hourly Basis Differential Ratios June 2008)peak hours
Number of peak hours in June 2008
MonthlyPeakDifferentialBasisRatio June 2009peak
=∑ ∗ (Hourly Basis Differential Ratios June 2009)peak hours
Number of peak hours in June 2009
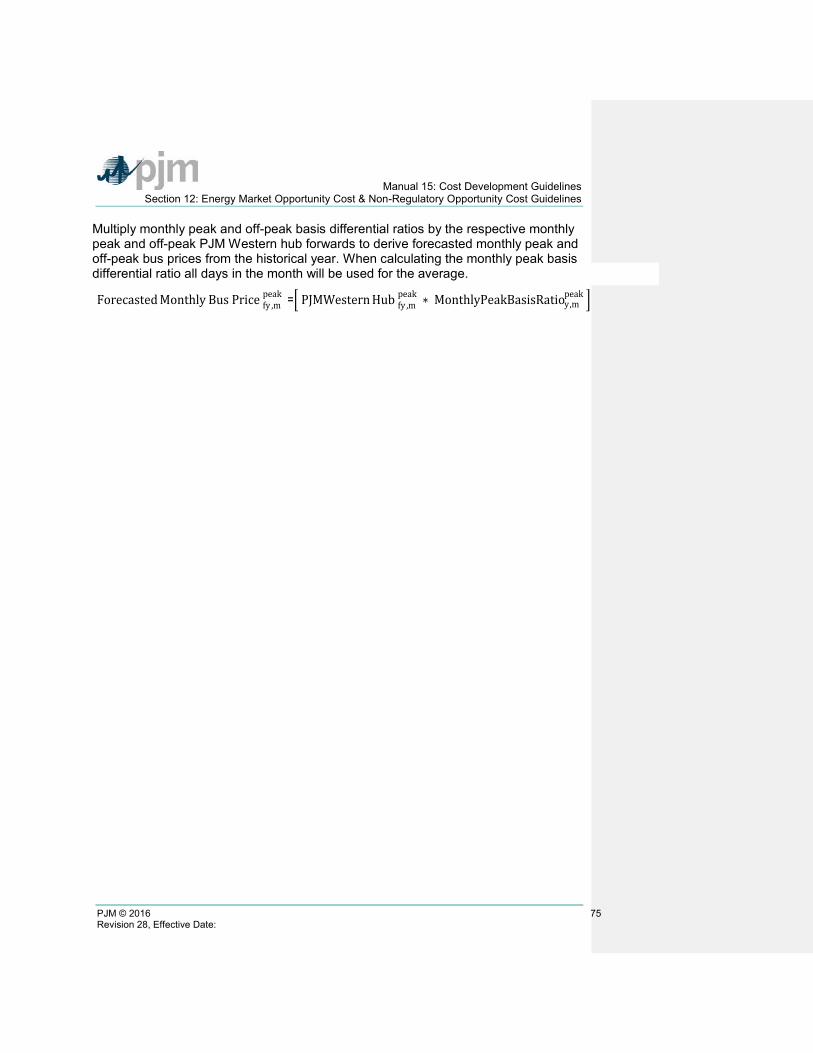
Manual 15: Cost Development Guidelines Section 12: Energy Market Opportunity Cost & Non-Regulatory Opportunity Cost Guidelines
PJM © 2016 75 Revision 28, Effective Date:
Multiply monthly peak and off-peak basis differential ratios by the respective monthly peak and off-peak PJM Western hub forwards to derive forecasted monthly peak and off-peak bus prices from the historical year. When calculating the monthly peak basis differential ratio all days in the month will be used for the average.
Forecasted Monthly Bus Price fy ,mpeak =� PJMWestern Hub fy ,m
peak ∗ MonthlyPeakBasisRatioy,mpeak �
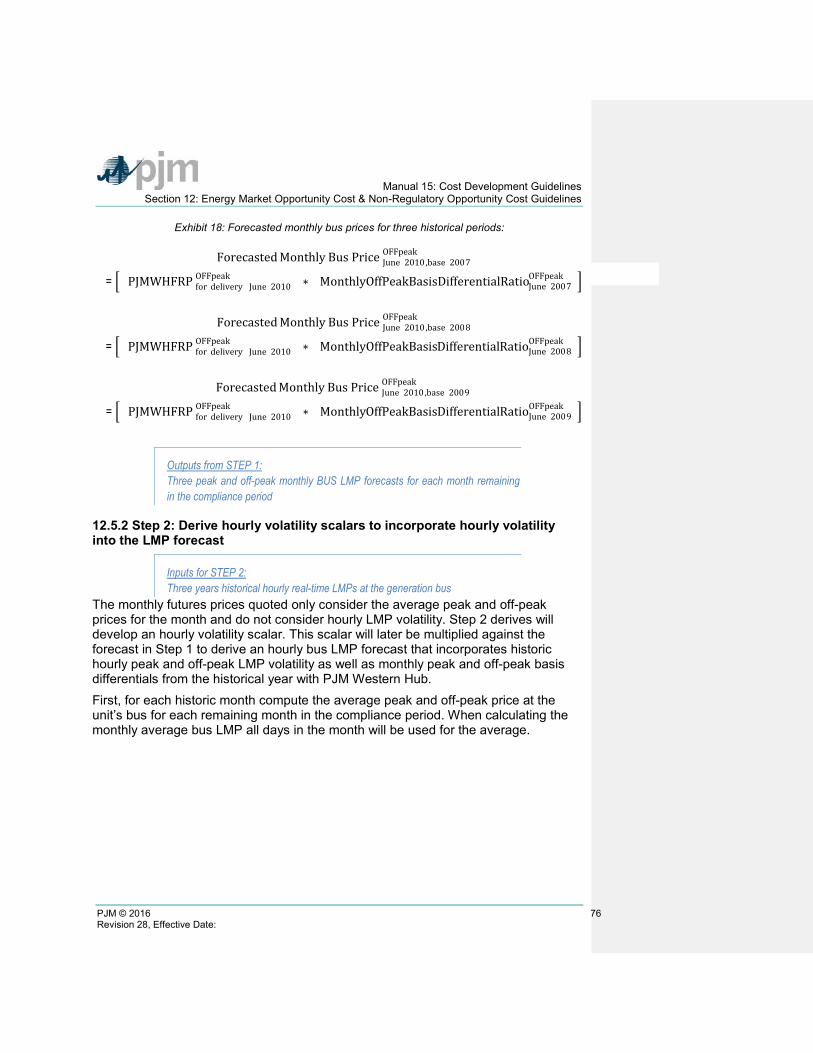
Manual 15: Cost Development Guidelines Section 12: Energy Market Opportunity Cost & Non-Regulatory Opportunity Cost Guidelines
PJM © 2016 76 Revision 28, Effective Date:
Exhibit 18: Forecasted monthly bus prices for three historical periods:
Forecasted Monthly Bus Price June 2010,base 2007OFFpeak
= � (PJMWHFRP for delivery June 2010 OFFpeak ) ∗ ( MonthlyOffPeakBasisDifferentialRatioJune 2007
OFFpeak )�
Forecasted Monthly Bus Price June 2010,base 2008OFFpeak
= � (PJMWHFRP for delivery June 2010 OFFpeak ) ∗ ( MonthlyOffPeakBasisDifferentialRatioJune 2008
OFFpeak )�
Forecasted Monthly Bus Price June 2010,base 2009 OFFpeak
= � (PJMWHFRP for delivery June 2010 OFFpeak ) ∗ ( MonthlyOffPeakBasisDifferentialRatioJune 2009
OFFpeak )�
Outputs from STEP 1: Three peak and off-peak monthly BUS LMP forecasts for each month remaining in the compliance period
12.5.2 Step 2: Derive hourly volatility scalars to incorporate hourly volatility into the LMP forecast
Inputs for STEP 2: Three years historical hourly real-time LMPs at the generation bus
The monthly futures prices quoted only consider the average peak and off-peak prices for the month and do not consider hourly LMP volatility. Step 2 derives will develop an hourly volatility scalar. This scalar will later be multiplied against the forecast in Step 1 to derive an hourly bus LMP forecast that incorporates historic hourly peak and off-peak LMP volatility as well as monthly peak and off-peak basis differentials from the historical year with PJM Western Hub. First, for each historic month compute the average peak and off-peak price at the unit’s bus for each remaining month in the compliance period. When calculating the monthly average bus LMP all days in the month will be used for the average.
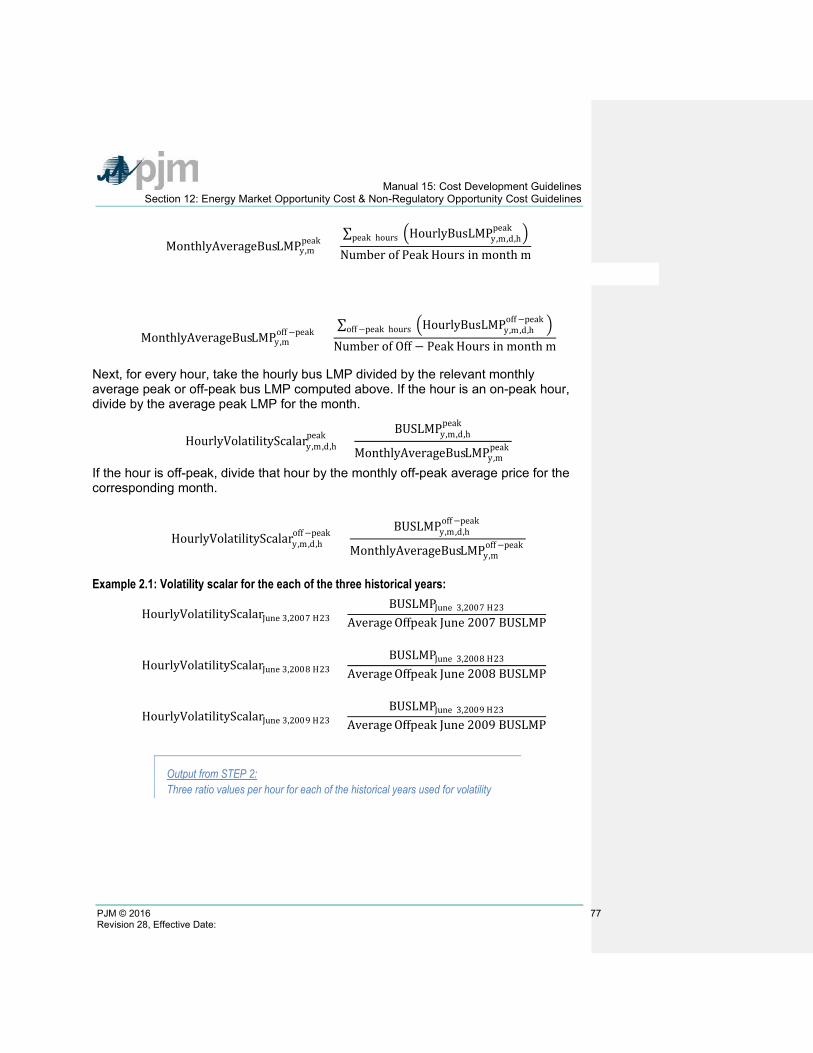
Manual 15: Cost Development Guidelines Section 12: Energy Market Opportunity Cost & Non-Regulatory Opportunity Cost Guidelines
PJM © 2016 77 Revision 28, Effective Date:
MonthlyAverageBusLMPy,mpeak =
∑ �HourlyBusLMPy,m,d,hpeak �peak hours
Number of Peak Hours in month m
MonthlyAverageBusLMPy,moff−peak =
∑ �HourlyBusLMPy,m,d,hoff−peak �off−peak hours
Number of Off − Peak Hours in month m
Next, for every hour, take the hourly bus LMP divided by the relevant monthly average peak or off-peak bus LMP computed above. If the hour is an on-peak hour, divide by the average peak LMP for the month.
HourlyVolatilityScalary,m,d,hpeak =
BUSLMPy,m,d,hpeak
MonthlyAverageBusLMPy,mpeak
If the hour is off-peak, divide that hour by the monthly off-peak average price for the corresponding month.
HourlyVolatilityScalary,m,d,hoff−peak =
BUSLMPy,m,d,hoff−peak
MonthlyAverageBusLMPy,moff−peak
Example 2.1: Volatility scalar for the each of the three historical years:
HourlyVolatilityScalarJune 3,2007 H23 =BUSLMPJune 3,2007 H23
Average Offpeak June 2007 BUSLMP
HourlyVolatilityScalarJune 3,2008 H23 =BUSLMPJune 3,2008 H23
Average Offpeak June 2008 BUSLMP
HourlyVolatilityScalarJune 3,2009 H23 =BUSLMPJune 3,2009 H23
Average Offpeak June 2009 BUSLMP
Output from STEP 2: Three ratio values per hour for each of the historical years used for volatility
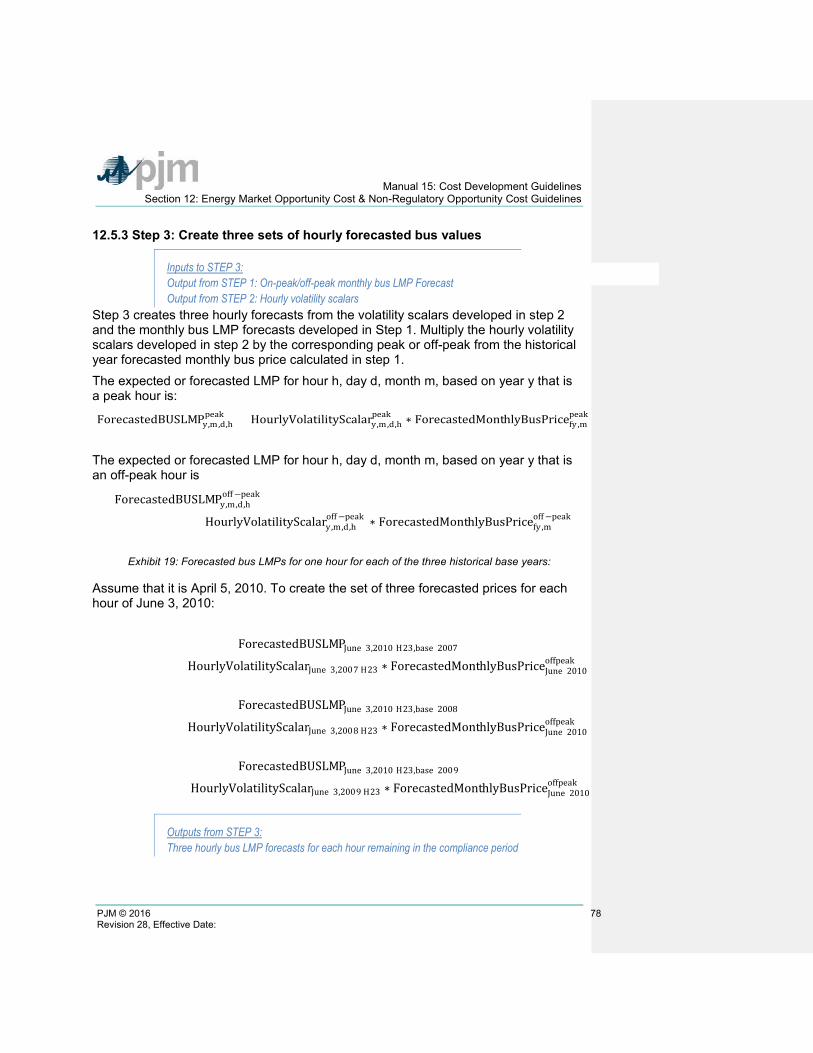
Manual 15: Cost Development Guidelines Section 12: Energy Market Opportunity Cost & Non-Regulatory Opportunity Cost Guidelines
PJM © 2016 78 Revision 28, Effective Date:
12.5.3 Step 3: Create three sets of hourly forecasted bus values
Inputs to STEP 3: Output from STEP 1: On-peak/off-peak monthly bus LMP Forecast Output from STEP 2: Hourly volatility scalars
Step 3 creates three hourly forecasts from the volatility scalars developed in step 2 and the monthly bus LMP forecasts developed in Step 1. Multiply the hourly volatility scalars developed in step 2 by the corresponding peak or off-peak from the historical year forecasted monthly bus price calculated in step 1. The expected or forecasted LMP for hour h, day d, month m, based on year y that is a peak hour is:
ForecastedBUSLMPy,m,d,hpeak = HourlyVolatilityScalary,m,d,h
peak ∗ ForecastedMonthlyBusPricefy ,mpeak
The expected or forecasted LMP for hour h, day d, month m, based on year y that is an off-peak hour is
ForecastedBUSLMPy,m,d,hoff−peak
= HourlyVolatilityScalary,m,d,hoff−peak ∗ ForecastedMonthlyBusPricefy ,m
off−peak
Exhibit 19: Forecasted bus LMPs for one hour for each of the three historical base years:
Assume that it is April 5, 2010. To create the set of three forecasted prices for each hour of June 3, 2010:
ForecastedBUSLMPJune 3,2010 H23,base 2007
= HourlyVolatilityScalarJune 3,2007 H23 ∗ ForecastedMonthlyBusPriceJune 2010offpeak
ForecastedBUSLMPJune 3,2010 H23,base 2008
= HourlyVolatilityScalarJune 3,2008 H23 ∗ ForecastedMonthlyBusPriceJune 2010offpeak
ForecastedBUSLMPJune 3,2010 H23,base 2009
= HourlyVolatilityScalarJune 3,2009 H23 ∗ ForecastedMonthlyBusPriceJune 2010offpeak
Outputs from STEP 3: Three hourly bus LMP forecasts for each hour remaining in the compliance period
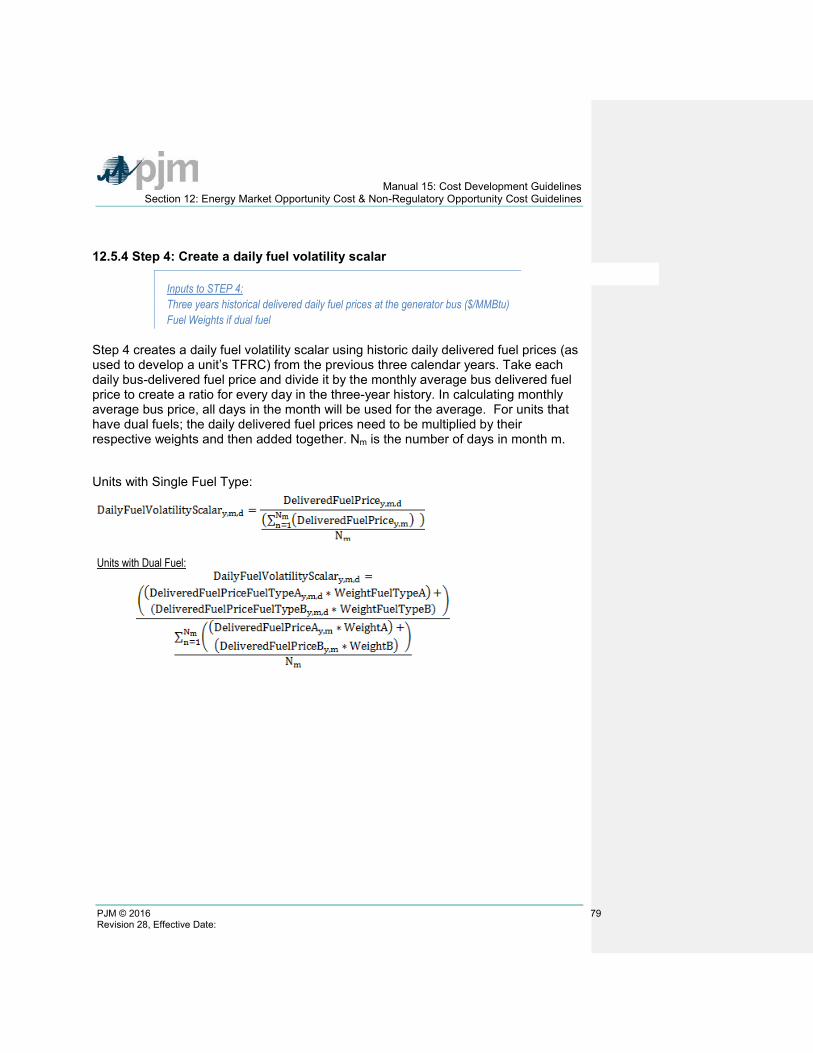
Manual 15: Cost Development Guidelines Section 12: Energy Market Opportunity Cost & Non-Regulatory Opportunity Cost Guidelines
PJM © 2016 79 Revision 28, Effective Date:
12.5.4 Step 4: Create a daily fuel volatility scalar
Inputs to STEP 4: Three years historical delivered daily fuel prices at the generator bus ($/MMBtu) Fuel Weights if dual fuel
Step 4 creates a daily fuel volatility scalar using historic daily delivered fuel prices (as used to develop a unit’s TFRC) from the previous three calendar years. Take each daily bus-delivered fuel price and divide it by the monthly average bus delivered fuel price to create a ratio for every day in the three-year history. In calculating monthly average bus price, all days in the month will be used for the average. For units that have dual fuels; the daily delivered fuel prices need to be multiplied by their respective weights and then added together. Nm is the number of days in month m. Units with Single Fuel Type:
Units with Dual Fuel:
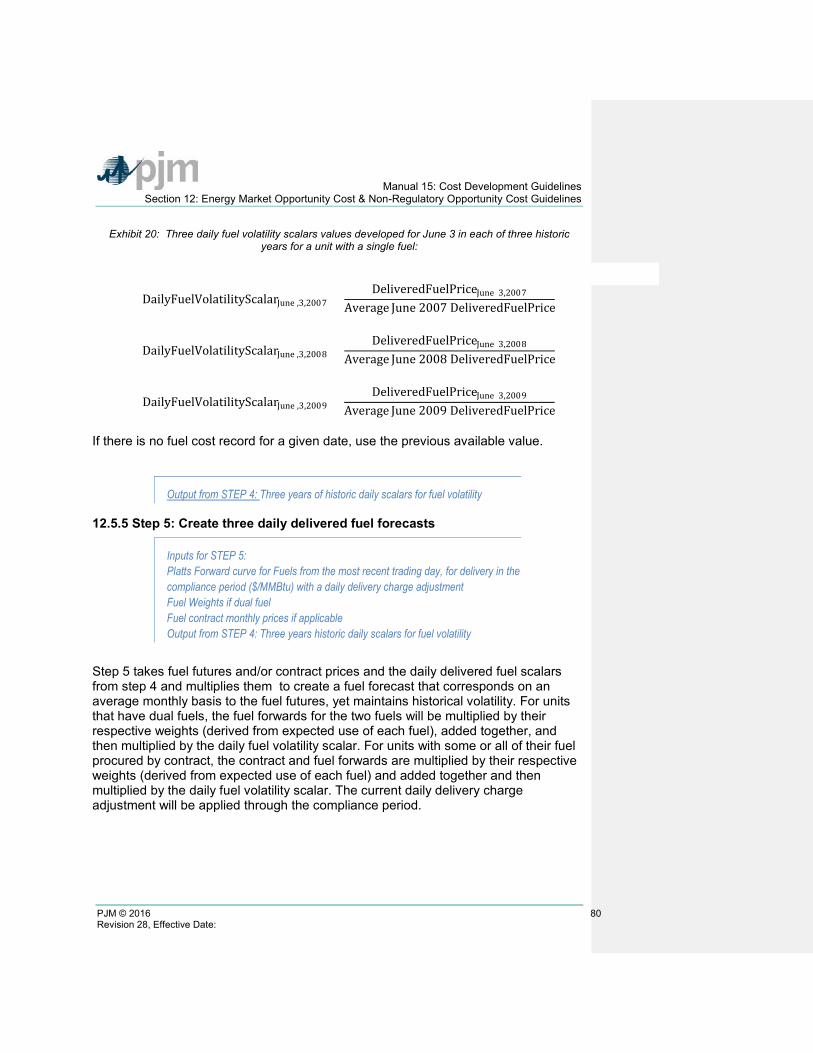
Manual 15: Cost Development Guidelines Section 12: Energy Market Opportunity Cost & Non-Regulatory Opportunity Cost Guidelines
PJM © 2016 80 Revision 28, Effective Date:
Exhibit 20: Three daily fuel volatility scalars values developed for June 3 in each of three historic years for a unit with a single fuel:
DailyFuelVolatilityScalarJune ,3,2007 =DeliveredFuelPriceJune 3,2007
Average June 2007 DeliveredFuelPrice
DailyFuelVolatilityScalarJune ,3,2008 =DeliveredFuelPriceJune 3,2008
Average June 2008 DeliveredFuelPrice
DailyFuelVolatilityScalarJune ,3,2009 =DeliveredFuelPriceJune 3,2009
Average June 2009 DeliveredFuelPrice
If there is no fuel cost record for a given date, use the previous available value.
Output from STEP 4: Three years of historic daily scalars for fuel volatility
12.5.5 Step 5: Create three daily delivered fuel forecasts
Inputs for STEP 5: Platts Forward curve for Fuels from the most recent trading day, for delivery in the compliance period ($/MMBtu) with a daily delivery charge adjustment Fuel Weights if dual fuel Fuel contract monthly prices if applicable Output from STEP 4: Three years historic daily scalars for fuel volatility
Step 5 takes fuel futures and/or contract prices and the daily delivered fuel scalars from step 4 and multiplies them to create a fuel forecast that corresponds on an average monthly basis to the fuel futures, yet maintains historical volatility. For units that have dual fuels, the fuel forwards for the two fuels will be multiplied by their respective weights (derived from expected use of each fuel), added together, and then multiplied by the daily fuel volatility scalar. For units with some or all of their fuel procured by contract, the contract and fuel forwards are multiplied by their respective weights (derived from expected use of each fuel) and added together and then multiplied by the daily fuel volatility scalar. The current daily delivery charge adjustment will be applied through the compliance period.
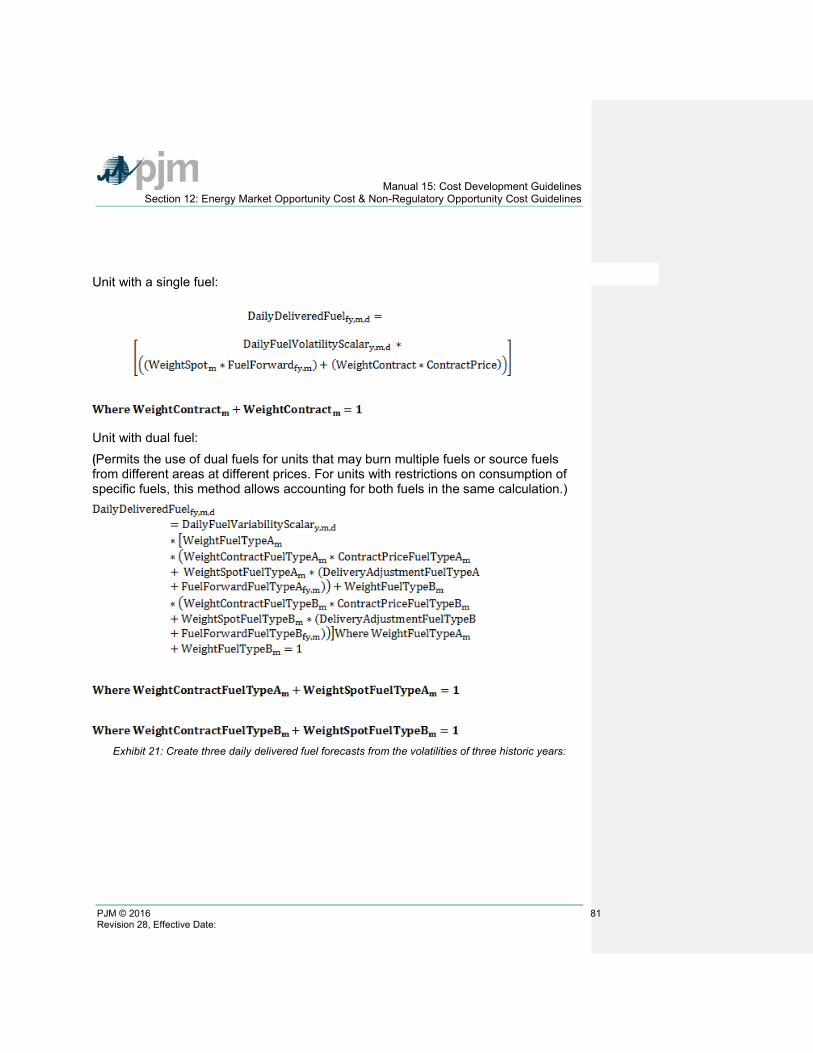
Manual 15: Cost Development Guidelines Section 12: Energy Market Opportunity Cost & Non-Regulatory Opportunity Cost Guidelines
PJM © 2016 81 Revision 28, Effective Date:
Unit with a single fuel:
Unit with dual fuel: (Permits the use of dual fuels for units that may burn multiple fuels or source fuels from different areas at different prices. For units with restrictions on consumption of specific fuels, this method allows accounting for both fuels in the same calculation.)
Exhibit 21: Create three daily delivered fuel forecasts from the volatilities of three historic years:
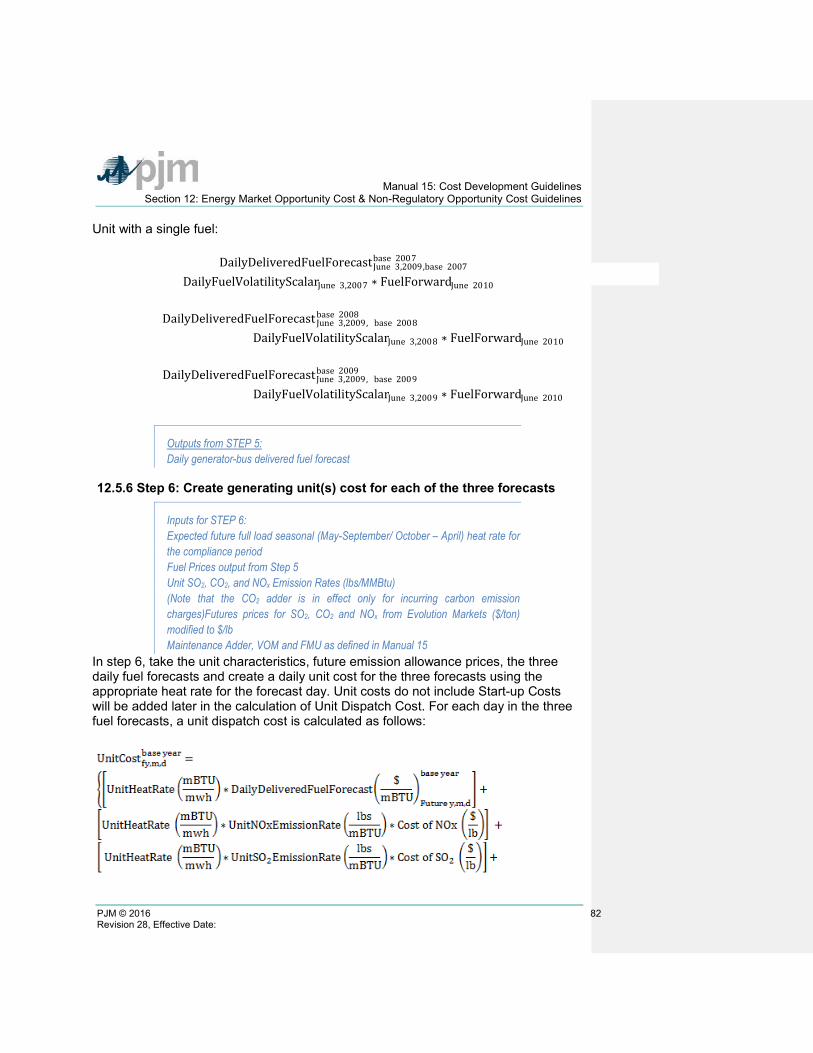
Manual 15: Cost Development Guidelines Section 12: Energy Market Opportunity Cost & Non-Regulatory Opportunity Cost Guidelines
PJM © 2016 82 Revision 28, Effective Date:
Unit with a single fuel:
DailyDeliveredFuelForecast June 3,2009,base 2007 base 2007
= DailyFuelVolatilityScalarJune 3,2007 ∗ FuelForwardJune 2010
DailyDeliveredFuelForecast June 3,2009, base 2008base 2008
= DailyFuelVolatilityScalarJune 3,2008 ∗ FuelForwardJune 2010
DailyDeliveredFuelForecast June 3,2009, base 2009 base 2009
= DailyFuelVolatilityScalarJune 3,2009 ∗ FuelForwardJune 2010
Outputs from STEP 5: Daily generator-bus delivered fuel forecast
12.5.6 Step 6: Create generating unit(s) cost for each of the three forecasts
Inputs for STEP 6: Expected future full load seasonal (May-September/ October – April) heat rate for the compliance period Fuel Prices output from Step 5 Unit SO2, CO2, and NOx Emission Rates (lbs/MMBtu) (Note that the CO2 adder is in effect only for incurring carbon emission charges)Futures prices for SO2, CO2 and NOx from Evolution Markets ($/ton) modified to $/lb Maintenance Adder, VOM and FMU as defined in Manual 15
In step 6, take the unit characteristics, future emission allowance prices, the three daily fuel forecasts and create a daily unit cost for the three forecasts using the appropriate heat rate for the forecast day. Unit costs do not include Start-up Costs will be added later in the calculation of Unit Dispatch Cost. For each day in the three fuel forecasts, a unit dispatch cost is calculated as follows:
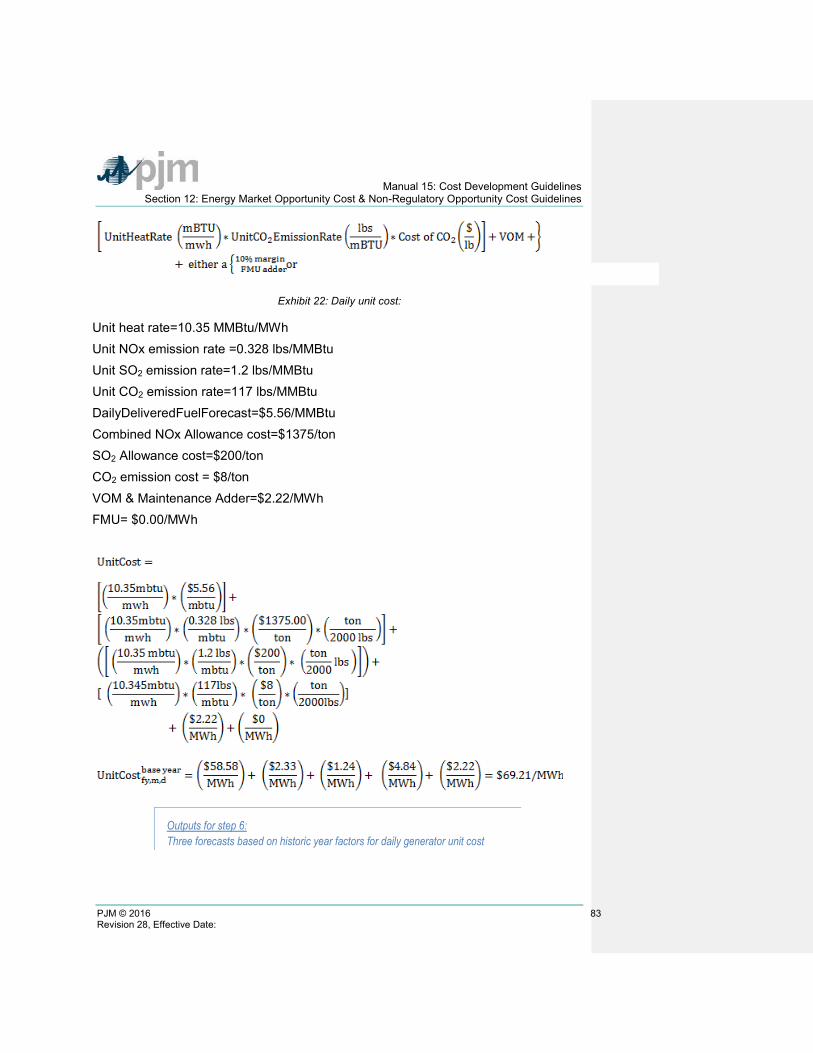
Manual 15: Cost Development Guidelines Section 12: Energy Market Opportunity Cost & Non-Regulatory Opportunity Cost Guidelines
PJM © 2016 83 Revision 28, Effective Date:
Exhibit 22: Daily unit cost:
Unit heat rate=10.35 MMBtu/MWh Unit NOx emission rate =0.328 lbs/MMBtu Unit SO2 emission rate=1.2 lbs/MMBtu Unit CO2 emission rate=117 lbs/MMBtu DailyDeliveredFuelForecast=$5.56/MMBtu Combined NOx Allowance cost=$1375/ton SO2 Allowance cost=$200/ton CO2 emission cost = $8/ton VOM & Maintenance Adder=$2.22/MWh FMU= $0.00/MWh
Outputs for step 6: Three forecasts based on historic year factors for daily generator unit cost
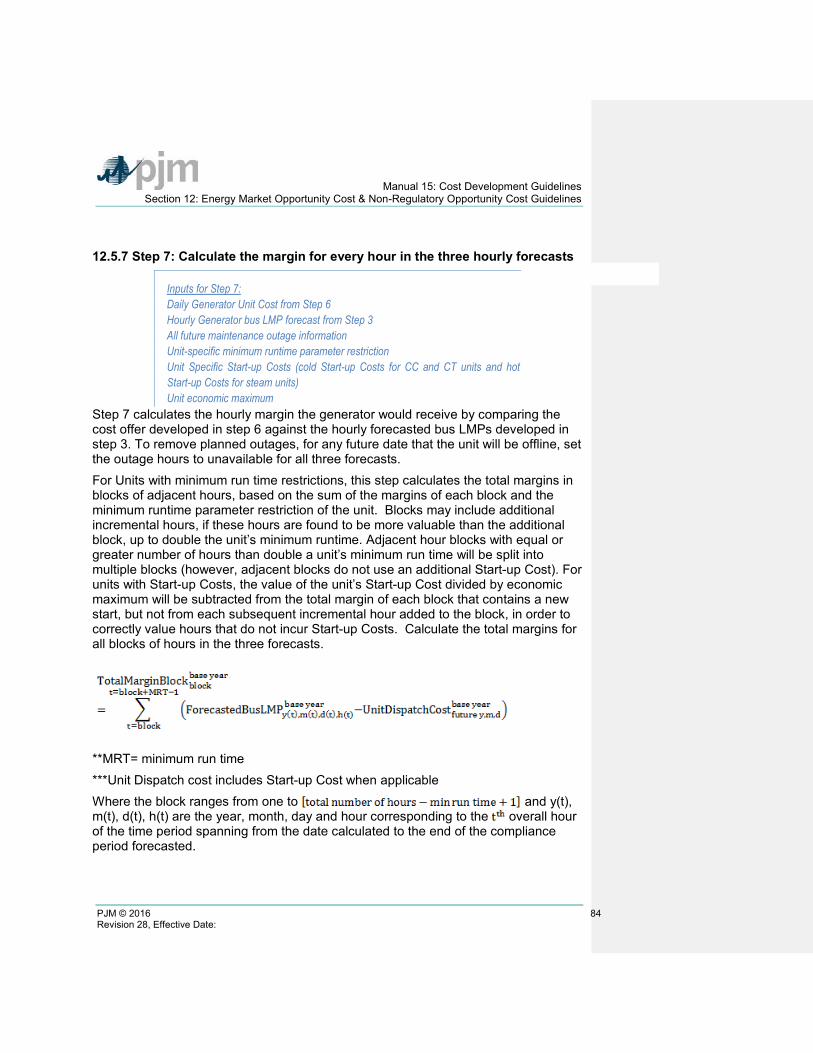
Manual 15: Cost Development Guidelines Section 12: Energy Market Opportunity Cost & Non-Regulatory Opportunity Cost Guidelines
PJM © 2016 84 Revision 28, Effective Date:
12.5.7 Step 7: Calculate the margin for every hour in the three hourly forecasts
Inputs for Step 7: Daily Generator Unit Cost from Step 6 Hourly Generator bus LMP forecast from Step 3 All future maintenance outage information Unit-specific minimum runtime parameter restriction Unit Specific Start-up Costs (cold Start-up Costs for CC and CT units and hot Start-up Costs for steam units) Unit economic maximum
Step 7 calculates the hourly margin the generator would receive by comparing the cost offer developed in step 6 against the hourly forecasted bus LMPs developed in step 3. To remove planned outages, for any future date that the unit will be offline, set the outage hours to unavailable for all three forecasts. For Units with minimum run time restrictions, this step calculates the total margins in blocks of adjacent hours, based on the sum of the margins of each block and the minimum runtime parameter restriction of the unit. Blocks may include additional incremental hours, if these hours are found to be more valuable than the additional block, up to double the unit’s minimum runtime. Adjacent hour blocks with equal or greater number of hours than double a unit’s minimum run time will be split into multiple blocks (however, adjacent blocks do not use an additional Start-up Cost). For units with Start-up Costs, the value of the unit’s Start-up Cost divided by economic maximum will be subtracted from the total margin of each block that contains a new start, but not from each subsequent incremental hour added to the block, in order to correctly value hours that do not incur Start-up Costs. Calculate the total margins for all blocks of hours in the three forecasts.
**MRT= minimum run time ***Unit Dispatch cost includes Start-up Cost when applicable Where the block ranges from one to and y(t), m(t), d(t), h(t) are the year, month, day and hour corresponding to the overall hour of the time period spanning from the date calculated to the end of the compliance period forecasted.
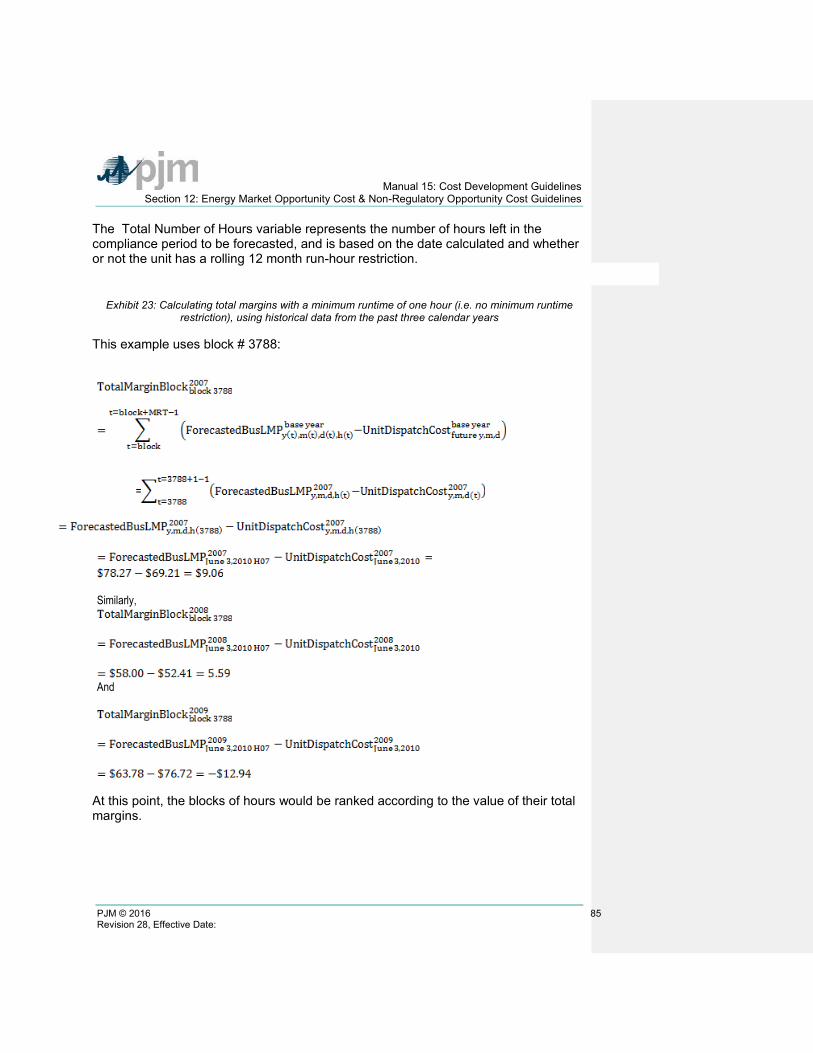
Manual 15: Cost Development Guidelines Section 12: Energy Market Opportunity Cost & Non-Regulatory Opportunity Cost Guidelines
PJM © 2016 85 Revision 28, Effective Date:
The Total Number of Hours variable represents the number of hours left in the compliance period to be forecasted, and is based on the date calculated and whether or not the unit has a rolling 12 month run-hour restriction.
Exhibit 23: Calculating total margins with a minimum runtime of one hour (i.e. no minimum runtime
restriction), using historical data from the past three calendar years
This example uses block # 3788:
=
Similarly,
And
At this point, the blocks of hours would be ranked according to the value of their total margins.
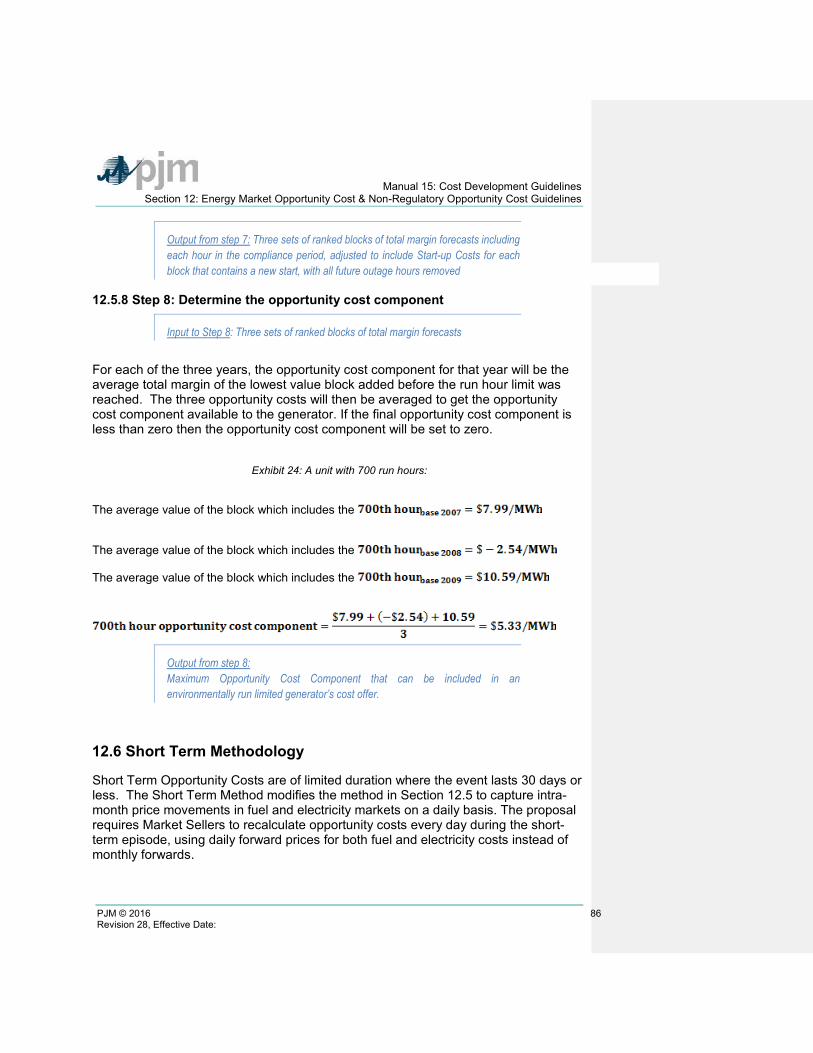
Manual 15: Cost Development Guidelines Section 12: Energy Market Opportunity Cost & Non-Regulatory Opportunity Cost Guidelines
PJM © 2016 86 Revision 28, Effective Date:
Output from step 7: Three sets of ranked blocks of total margin forecasts including each hour in the compliance period, adjusted to include Start-up Costs for each block that contains a new start, with all future outage hours removed
12.5.8 Step 8: Determine the opportunity cost component
Input to Step 8: Three sets of ranked blocks of total margin forecasts For each of the three years, the opportunity cost component for that year will be the average total margin of the lowest value block added before the run hour limit was reached. The three opportunity costs will then be averaged to get the opportunity cost component available to the generator. If the final opportunity cost component is less than zero then the opportunity cost component will be set to zero.
Exhibit 24: A unit with 700 run hours:
The average value of the block which includes the
The average value of the block which includes the
The average value of the block which includes the
Output from step 8: Maximum Opportunity Cost Component that can be included in an environmentally run limited generator’s cost offer.
12.6 Short Term Methodology
Short Term Opportunity Costs are of limited duration where the event lasts 30 days or less. The Short Term Method modifies the method in Section 12.5 to capture intra-month price movements in fuel and electricity markets on a daily basis. The proposal requires Market Sellers to recalculate opportunity costs every day during the short-term episode, using daily forward prices for both fuel and electricity costs instead of monthly forwards.
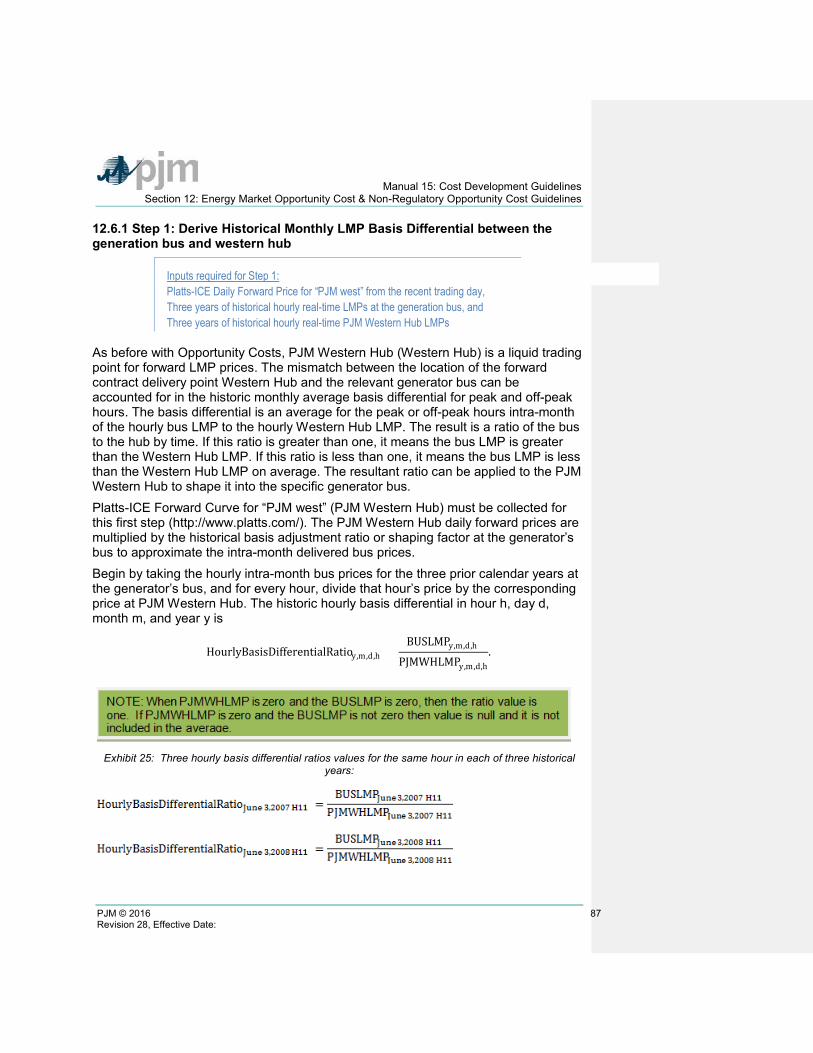
Manual 15: Cost Development Guidelines Section 12: Energy Market Opportunity Cost & Non-Regulatory Opportunity Cost Guidelines
PJM © 2016 87 Revision 28, Effective Date:
12.6.1 Step 1: Derive Historical Monthly LMP Basis Differential between the generation bus and western hub
Inputs required for Step 1: Platts-ICE Daily Forward Price for “PJM west” from the recent trading day, Three years of historical hourly real-time LMPs at the generation bus, and Three years of historical hourly real-time PJM Western Hub LMPs
As before with Opportunity Costs, PJM Western Hub (Western Hub) is a liquid trading point for forward LMP prices. The mismatch between the location of the forward contract delivery point Western Hub and the relevant generator bus can be accounted for in the historic monthly average basis differential for peak and off-peak hours. The basis differential is an average for the peak or off-peak hours intra-month of the hourly bus LMP to the hourly Western Hub LMP. The result is a ratio of the bus to the hub by time. If this ratio is greater than one, it means the bus LMP is greater than the Western Hub LMP. If this ratio is less than one, it means the bus LMP is less than the Western Hub LMP on average. The resultant ratio can be applied to the PJM Western Hub to shape it into the specific generator bus. Platts-ICE Forward Curve for “PJM west” (PJM Western Hub) must be collected for this first step (http://www.platts.com/). The PJM Western Hub daily forward prices are multiplied by the historical basis adjustment ratio or shaping factor at the generator’s bus to approximate the intra-month delivered bus prices. Begin by taking the hourly intra-month bus prices for the three prior calendar years at the generator’s bus, and for every hour, divide that hour’s price by the corresponding price at PJM Western Hub. The historic hourly basis differential in hour h, day d, month m, and year y is
HourlyBasisDifferentialRatioy,m,d,h =BUSLMPy,m,d,h
PJMWHLMPy,m,d,h.
Exhibit 25: Three hourly basis differential ratios values for the same hour in each of three historical
years:

Manual 15: Cost Development Guidelines Section 12: Energy Market Opportunity Cost & Non-Regulatory Opportunity Cost Guidelines
PJM © 2016 88 Revision 28, Effective Date:
Once the hourly basis ratios are calculated for every hour in the historic period take the sum of the on-peak hourly basis differentials, and divide by the number of peak hours. Similarly sum the off-peak hourly basis ratios, for the month then divide by the number of off-peak hours. When calculating the intra-month peak basis differential ratio, all days in the month will be used for the average. The intra-month basis differentials adjust PJM Western Hub daily peak and off-peak DA prices to expected peak and off-peak daily forward prices delivered to the generator’s bus.
MonthlyPeakBasisDifferentialRatioy,mpeak =
∑ �HourlyBasisDifferentialRatiosy,m,d,hpeak �peak hours
Number of Peak Hours in month m
MonthlyOffPeakBasisDifferentialRatioy,mpeak
=∑ �HourlyBasisDifferentialRatiosy,m,d,h
off−peak �off−peak hours
Number of Off − Peak Hours in month m
Exhibit 26: Monthly Peak Basis Differentials for the three historical periods:
MonthlyPeakBasisDifferentialRatio June 2007peak
=∑ (Hourly Basis Differential Ratios in June 2007)peak hours
Number of peak hours in June 2007
MonthlyPeakBasisDifferentialRatio June 2008peak
=∑ (Hourly Basis Differential Ratios June 2008)peak hours
Number of peak hours in June 2008
MonthlyPeakDifferentialBasisRatio June 2009peak
=∑ (Hourly Basis Differential Ratios June 2009)peak hours
Number of peak hours in June 2009
Multiply peak and off-peak basis differential ratios by the respective peak and off-peak PJM Western hub forwards to derive forecasted peak and off-peak bus prices
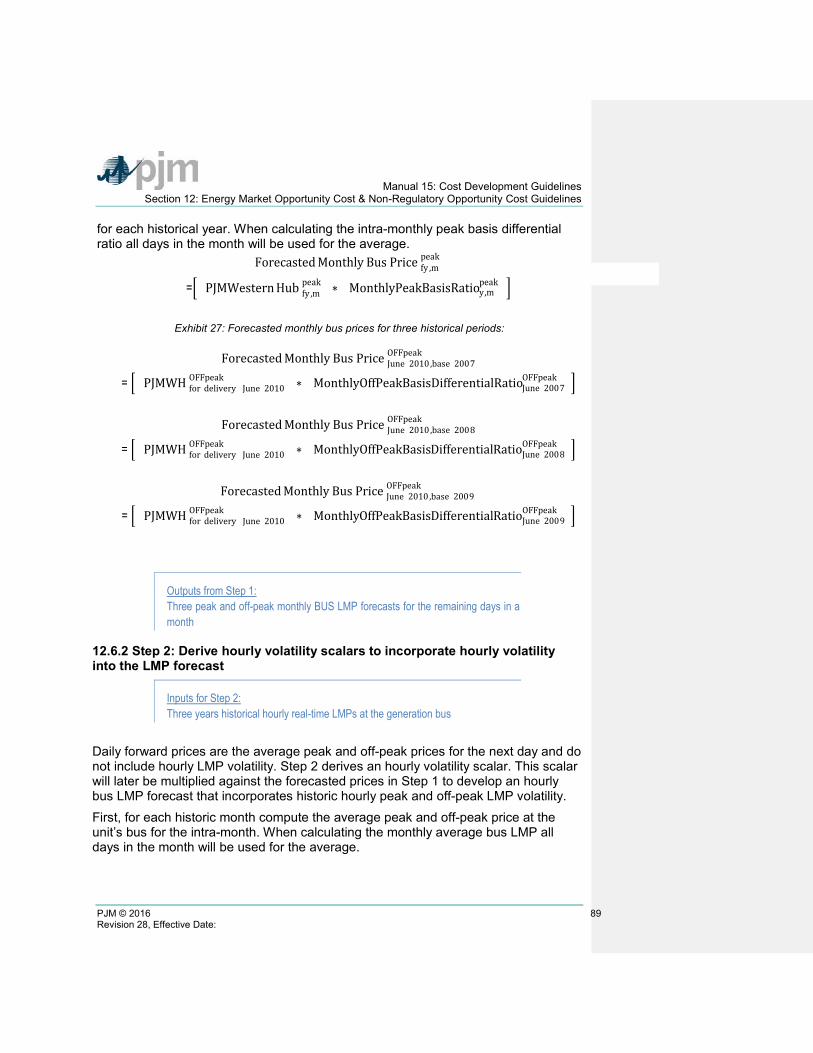
Manual 15: Cost Development Guidelines Section 12: Energy Market Opportunity Cost & Non-Regulatory Opportunity Cost Guidelines
PJM © 2016 89 Revision 28, Effective Date:
for each historical year. When calculating the intra-monthly peak basis differential ratio all days in the month will be used for the average.
Forecasted Monthly Bus Price fy ,mpeak
=� (PJMWestern Hub fy ,m peak ) ∗ ( MonthlyPeakBasisRatioy,m
peak )�
Exhibit 27: Forecasted monthly bus prices for three historical periods:
Forecasted Monthly Bus Price June 2010,base 2007OFFpeak
= � (PJMWH for delivery June 2010 OFFpeak ) ∗ ( MonthlyOffPeakBasisDifferentialRatioJune 2007
OFFpeak )�
Forecasted Monthly Bus Price June 2010,base 2008OFFpeak
= � (PJMWH for delivery June 2010 OFFpeak ) ∗ ( MonthlyOffPeakBasisDifferentialRatioJune 2008
OFFpeak )�
Forecasted Monthly Bus Price June 2010,base 2009 OFFpeak
= � (PJMWH for delivery June 2010 OFFpeak ) ∗ ( MonthlyOffPeakBasisDifferentialRatioJune 2009
OFFpeak )�
Outputs from Step 1: Three peak and off-peak monthly BUS LMP forecasts for the remaining days in a month
12.6.2 Step 2: Derive hourly volatility scalars to incorporate hourly volatility into the LMP forecast
Inputs for Step 2: Three years historical hourly real-time LMPs at the generation bus
Daily forward prices are the average peak and off-peak prices for the next day and do not include hourly LMP volatility. Step 2 derives an hourly volatility scalar. This scalar will later be multiplied against the forecasted prices in Step 1 to develop an hourly bus LMP forecast that incorporates historic hourly peak and off-peak LMP volatility. First, for each historic month compute the average peak and off-peak price at the unit’s bus for the intra-month. When calculating the monthly average bus LMP all days in the month will be used for the average.
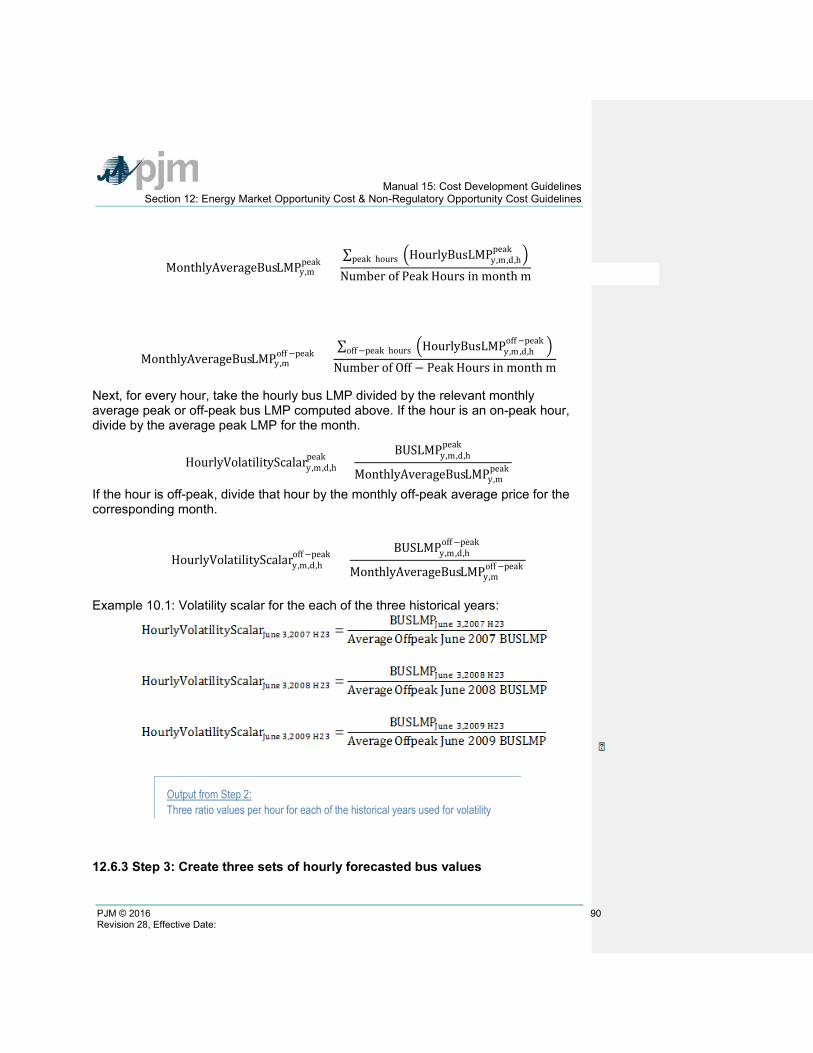
Manual 15: Cost Development Guidelines Section 12: Energy Market Opportunity Cost & Non-Regulatory Opportunity Cost Guidelines
PJM © 2016 90 Revision 28, Effective Date:
MonthlyAverageBusLMPy,mpeak =
∑ �HourlyBusLMPy,m,d,hpeak �peak hours
Number of Peak Hours in month m
MonthlyAverageBusLMPy,moff−peak =
∑ �HourlyBusLMPy,m,d,hoff−peak �off−peak hours
Number of Off − Peak Hours in month m
Next, for every hour, take the hourly bus LMP divided by the relevant monthly average peak or off-peak bus LMP computed above. If the hour is an on-peak hour, divide by the average peak LMP for the month.
HourlyVolatilityScalary,m,d,hpeak =
BUSLMPy,m,d,hpeak
MonthlyAverageBusLMPy,mpeak
If the hour is off-peak, divide that hour by the monthly off-peak average price for the corresponding month.
HourlyVolatilityScalary,m,d,hoff−peak =
BUSLMPy,m,d,hoff−peak
MonthlyAverageBusLMPy,moff−peak
Example 10.1: Volatility scalar for the each of the three historical years:
Output from Step 2: Three ratio values per hour for each of the historical years used for volatility
12.6.3 Step 3: Create three sets of hourly forecasted bus values
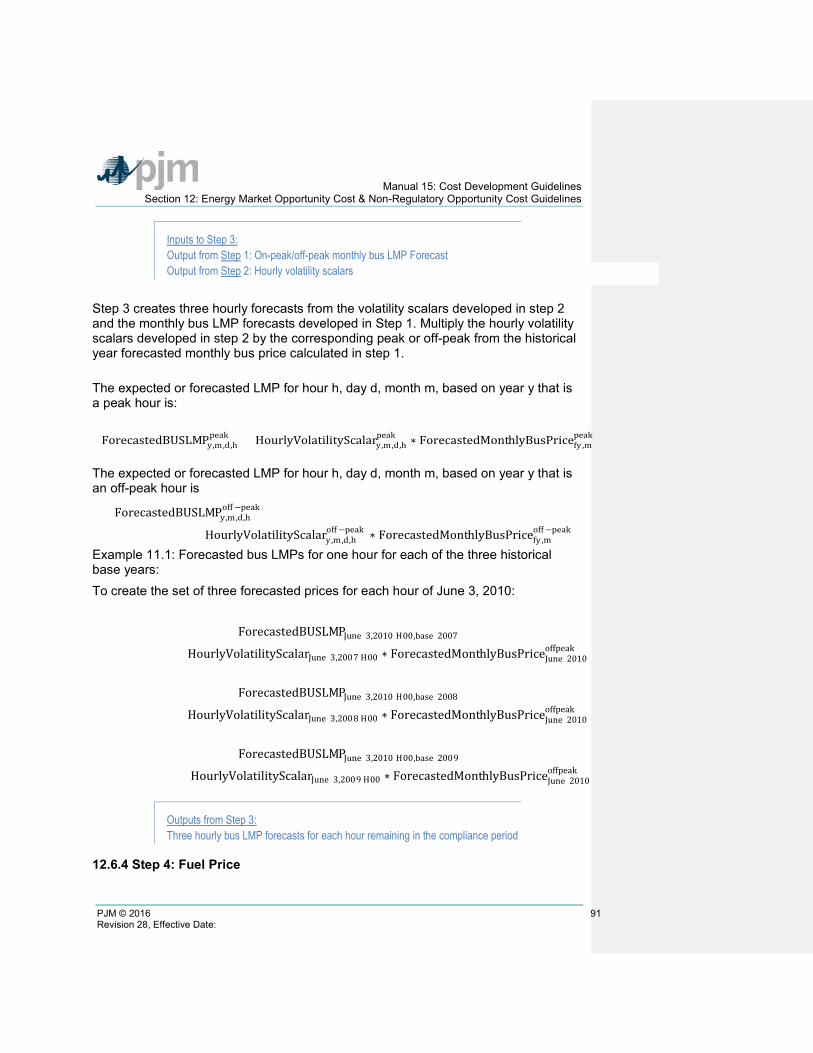
Manual 15: Cost Development Guidelines Section 12: Energy Market Opportunity Cost & Non-Regulatory Opportunity Cost Guidelines
PJM © 2016 91 Revision 28, Effective Date:
Inputs to Step 3: Output from Step 1: On-peak/off-peak monthly bus LMP Forecast Output from Step 2: Hourly volatility scalars
Step 3 creates three hourly forecasts from the volatility scalars developed in step 2 and the monthly bus LMP forecasts developed in Step 1. Multiply the hourly volatility scalars developed in step 2 by the corresponding peak or off-peak from the historical year forecasted monthly bus price calculated in step 1.
The expected or forecasted LMP for hour h, day d, month m, based on year y that is a peak hour is:
ForecastedBUSLMPy,m,d,h
peak = HourlyVolatilityScalary,m,d,hpeak ∗ ForecastedMonthlyBusPricefy ,m
peak
The expected or forecasted LMP for hour h, day d, month m, based on year y that is an off-peak hour is
ForecastedBUSLMPy,m,d,hoff−peak
= HourlyVolatilityScalary,m,d,hoff−peak ∗ ForecastedMonthlyBusPricefy ,m
off−peak Example 11.1: Forecasted bus LMPs for one hour for each of the three historical base years: To create the set of three forecasted prices for each hour of June 3, 2010:
ForecastedBUSLMPJune 3,2010 H00,base 2007
= HourlyVolatilityScalarJune 3,2007 H00 ∗ ForecastedMonthlyBusPriceJune 2010offpeak
ForecastedBUSLMPJune 3,2010 H00,base 2008
= HourlyVolatilityScalarJune 3,2008 H00 ∗ ForecastedMonthlyBusPriceJune 2010offpeak
ForecastedBUSLMPJune 3,2010 H00,base 2009
= HourlyVolatilityScalarJune 3,2009 H00 ∗ ForecastedMonthlyBusPriceJune 2010offpeak
Outputs from Step 3: Three hourly bus LMP forecasts for each hour remaining in the compliance period
12.6.4 Step 4: Fuel Price
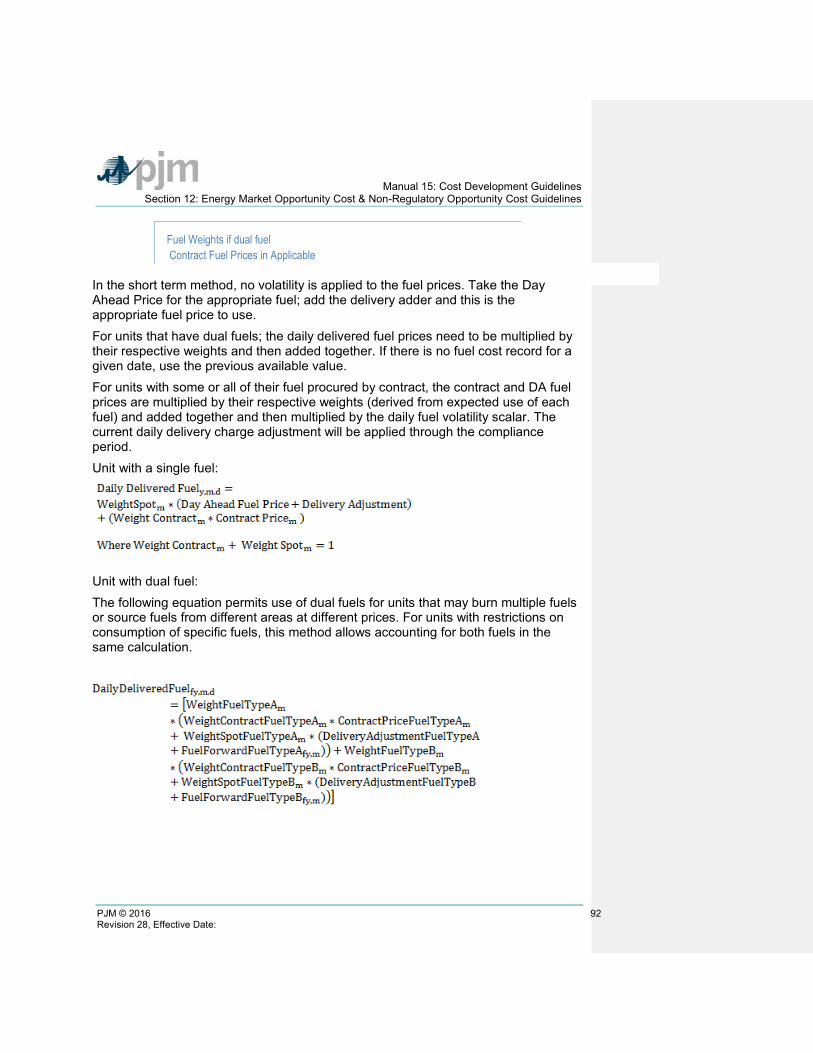
Manual 15: Cost Development Guidelines Section 12: Energy Market Opportunity Cost & Non-Regulatory Opportunity Cost Guidelines
PJM © 2016 92 Revision 28, Effective Date:
Fuel Weights if dual fuel Contract Fuel Prices in Applicable
In the short term method, no volatility is applied to the fuel prices. Take the Day Ahead Price for the appropriate fuel; add the delivery adder and this is the appropriate fuel price to use. For units that have dual fuels; the daily delivered fuel prices need to be multiplied by their respective weights and then added together. If there is no fuel cost record for a given date, use the previous available value. For units with some or all of their fuel procured by contract, the contract and DA fuel prices are multiplied by their respective weights (derived from expected use of each fuel) and added together and then multiplied by the daily fuel volatility scalar. The current daily delivery charge adjustment will be applied through the compliance period. Unit with a single fuel:
Unit with dual fuel: The following equation permits use of dual fuels for units that may burn multiple fuels or source fuels from different areas at different prices. For units with restrictions on consumption of specific fuels, this method allows accounting for both fuels in the same calculation.
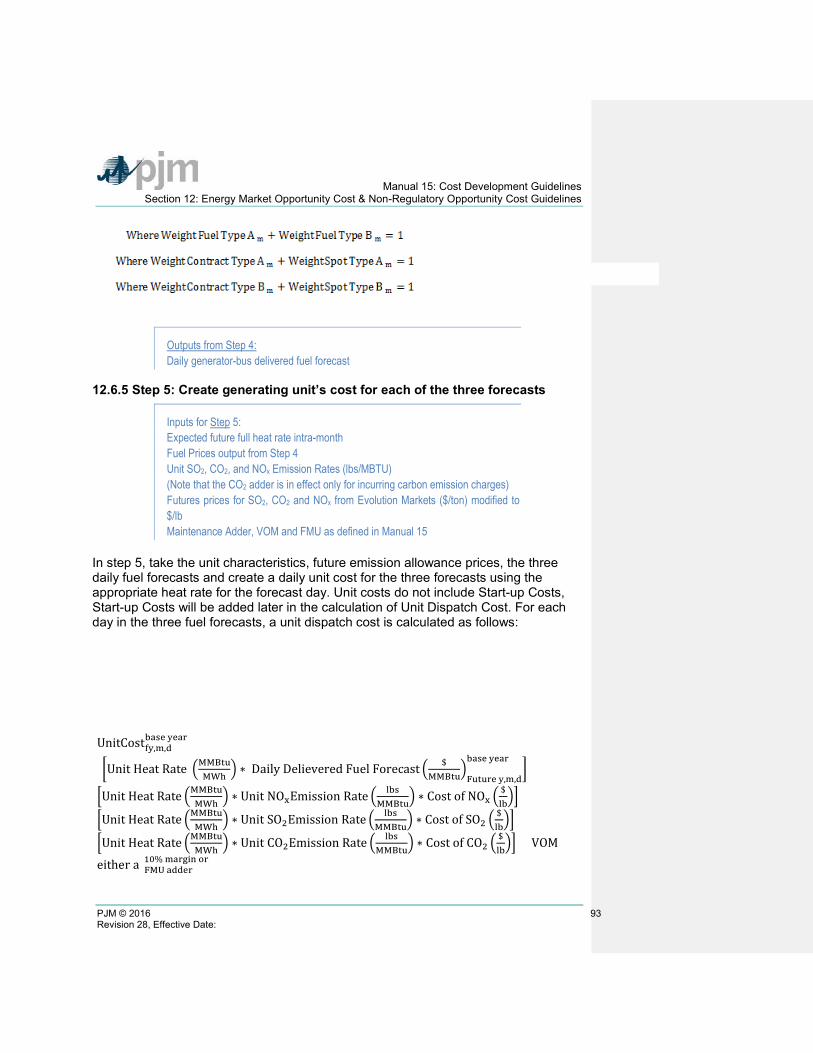
Manual 15: Cost Development Guidelines Section 12: Energy Market Opportunity Cost & Non-Regulatory Opportunity Cost Guidelines
PJM © 2016 93 Revision 28, Effective Date:
Outputs from Step 4: Daily generator-bus delivered fuel forecast
12.6.5 Step 5: Create generating unit’s cost for each of the three forecasts
Inputs for Step 5: Expected future full heat rate intra-month Fuel Prices output from Step 4 Unit SO2, CO2, and NOx Emission Rates (lbs/MBTU) (Note that the CO2 adder is in effect only for incurring carbon emission charges) Futures prices for SO2, CO2 and NOx from Evolution Markets ($/ton) modified to $/lb Maintenance Adder, VOM and FMU as defined in Manual 15
In step 5, take the unit characteristics, future emission allowance prices, the three daily fuel forecasts and create a daily unit cost for the three forecasts using the appropriate heat rate for the forecast day. Unit costs do not include Start-up Costs, Start-up Costs will be added later in the calculation of Unit Dispatch Cost. For each day in the three fuel forecasts, a unit dispatch cost is calculated as follows:
UnitCostfy,m,d
base year =
{�Unit Heat Rate �MMBtuMWh
� ∗ Daily Delievered Fuel Forecast � $MMBtu
�Future y,m,d
base year� +
�Unit Heat Rate �MMBtuMWh
� ∗ Unit NOxEmission Rate � lbsMMBtu
� ∗ Cost of NOx �$lb�� +
�Unit Heat Rate �MMBtuMWh
� ∗ Unit SO2Emission Rate � lbsMMBtu
� ∗ Cost of SO2 �$lb�� +
�Unit Heat Rate �MMBtuMWh
� ∗ Unit CO2Emission Rate � lbsMMBtu
� ∗ Cost of CO2 �$lb�� + VOM} +
either a{FMU adder10% margin or
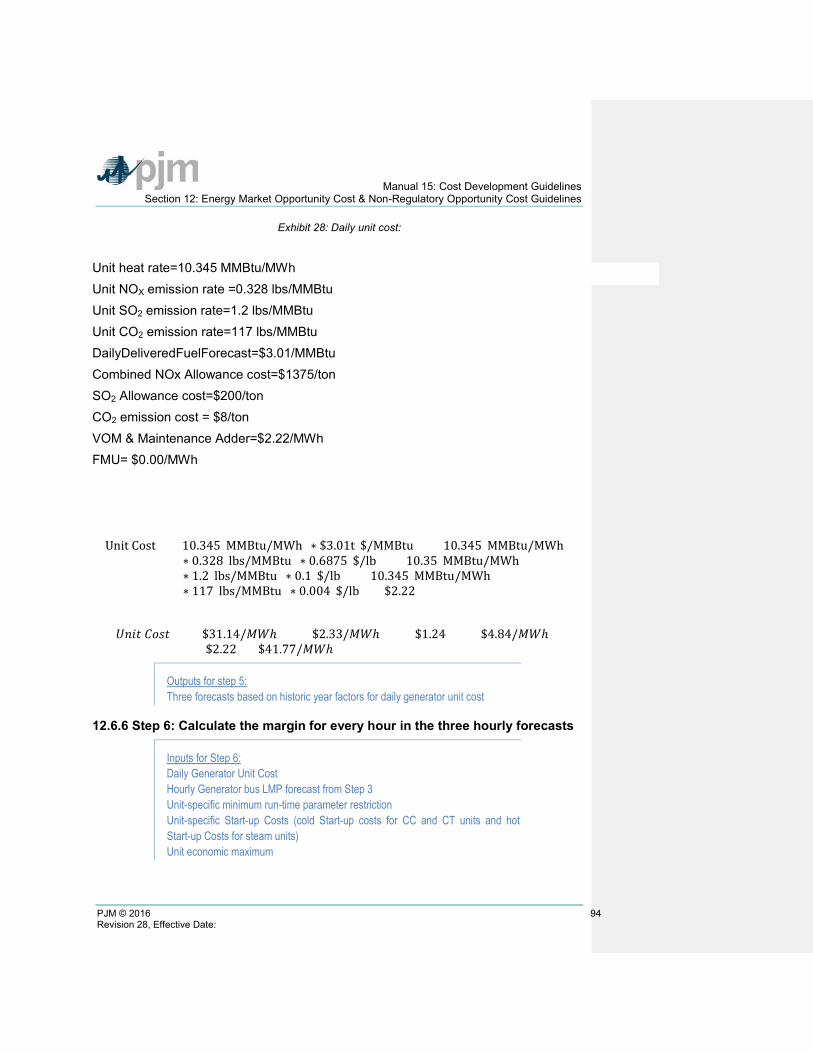
Manual 15: Cost Development Guidelines Section 12: Energy Market Opportunity Cost & Non-Regulatory Opportunity Cost Guidelines
PJM © 2016 94 Revision 28, Effective Date:
Exhibit 28: Daily unit cost:
Unit heat rate=10.345 MMBtu/MWh Unit NOX emission rate =0.328 lbs/MMBtu Unit SO2 emission rate=1.2 lbs/MMBtu Unit CO2 emission rate=117 lbs/MMBtu DailyDeliveredFuelForecast=$3.01/MMBtu Combined NOx Allowance cost=$1375/ton SO2 Allowance cost=$200/ton CO2 emission cost = $8/ton VOM & Maintenance Adder=$2.22/MWh FMU= $0.00/MWh
Unit Cost = {[10.345(MMBtu/MWh) ∗ $3.01t($/MMBtu)] + [10.345(MMBtu/MWh)∗ 0.328(lbs/MMBtu) ∗ 0.6875($/lb)] + [10.35(MMBtu/MWh)∗ 1.2(lbs/MMBtu) ∗ 0.1($/lb)] + [10.345(MMBtu/MWh)∗ 117(lbs/MMBtu) ∗ 0.004($/lb)] + $2.22}
𝑈𝑈𝑈𝑈𝑈𝑈𝑈𝑈 𝐶𝐶𝐶𝐶𝐶𝐶𝑈𝑈 = {[($31.14/𝑀𝑀𝑀𝑀ℎ)] + [($2.33/𝑀𝑀𝑀𝑀ℎ)] + [($1.24)] + [($4.84/𝑀𝑀𝑀𝑀ℎ)]+ $2.22} = $41.77/𝑀𝑀𝑀𝑀ℎ
Outputs for step 5: Three forecasts based on historic year factors for daily generator unit cost
12.6.6 Step 6: Calculate the margin for every hour in the three hourly forecasts
Inputs for Step 6: Daily Generator Unit Cost Hourly Generator bus LMP forecast from Step 3 Unit-specific minimum run-time parameter restriction Unit-specific Start-up Costs (cold Start-up costs for CC and CT units and hot Start-up Costs for steam units) Unit economic maximum
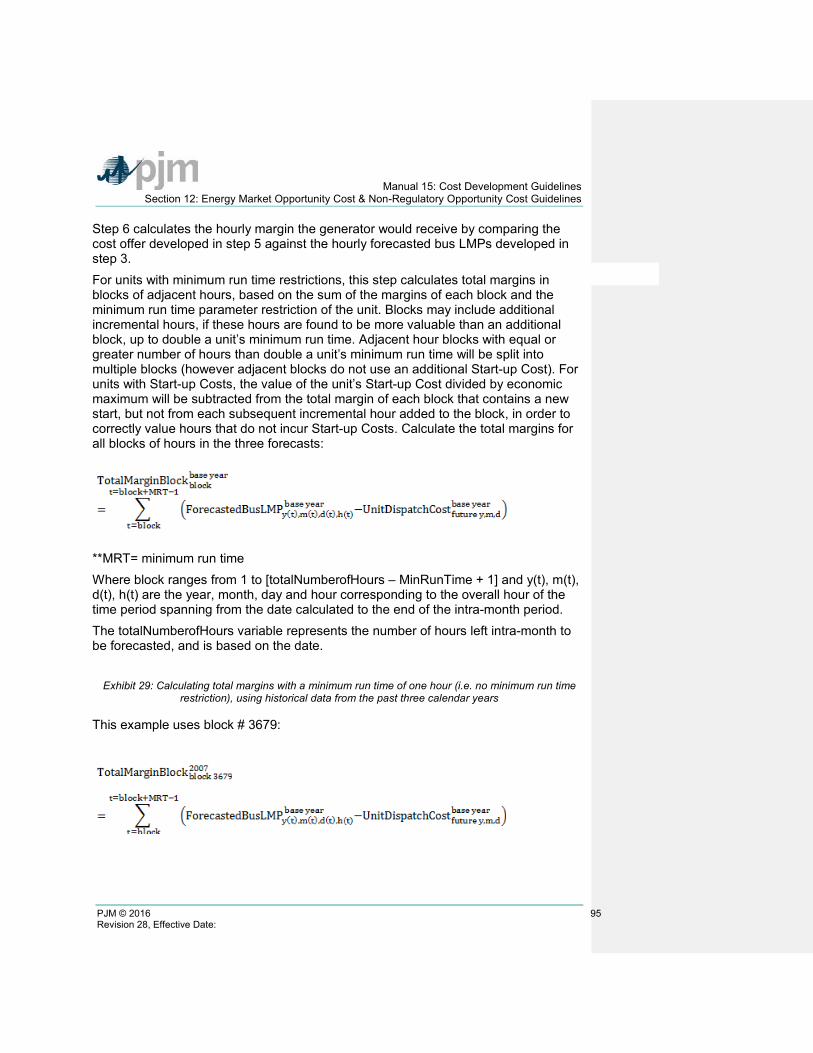
Manual 15: Cost Development Guidelines Section 12: Energy Market Opportunity Cost & Non-Regulatory Opportunity Cost Guidelines
PJM © 2016 95 Revision 28, Effective Date:
Step 6 calculates the hourly margin the generator would receive by comparing the cost offer developed in step 5 against the hourly forecasted bus LMPs developed in step 3. For units with minimum run time restrictions, this step calculates total margins in blocks of adjacent hours, based on the sum of the margins of each block and the minimum run time parameter restriction of the unit. Blocks may include additional incremental hours, if these hours are found to be more valuable than an additional block, up to double a unit’s minimum run time. Adjacent hour blocks with equal or greater number of hours than double a unit’s minimum run time will be split into multiple blocks (however adjacent blocks do not use an additional Start-up Cost). For units with Start-up Costs, the value of the unit’s Start-up Cost divided by economic maximum will be subtracted from the total margin of each block that contains a new start, but not from each subsequent incremental hour added to the block, in order to correctly value hours that do not incur Start-up Costs. Calculate the total margins for all blocks of hours in the three forecasts:
**MRT= minimum run time Where block ranges from 1 to [totalNumberofHours – MinRunTime + 1] and y(t), m(t), d(t), h(t) are the year, month, day and hour corresponding to the overall hour of the time period spanning from the date calculated to the end of the intra-month period. The totalNumberofHours variable represents the number of hours left intra-month to be forecasted, and is based on the date. Exhibit 29: Calculating total margins with a minimum run time of one hour (i.e. no minimum run time
restriction), using historical data from the past three calendar years
This example uses block # 3679:

Manual 15: Cost Development Guidelines Section 12: Energy Market Opportunity Cost & Non-Regulatory Opportunity Cost Guidelines
PJM © 2016 96 Revision 28, Effective Date:
=
Similarly
And
At this point, the blocks of hours would be ranked according to the value of their total margins.
Output from step 6: Three sets of ranked blocks of total margin forecasts including each hour in the compliance period, adjusted to include Start-up Costs for each block that contains a new start, with all future outage hours removed
12.6.7 Step 7: Determine the opportunity cost adder
Input for Step 7: Three sets of ranked blocks of total margin forecasts For each of the three years, the opportunity cost for that year will be the average total margin of the lowest value block added before the run hour limit was reached. The three opportunity costs will then be averaged to get the opportunity cost adder available to the generator. If the opportunity cost adder is less than 0, the opportunity cost adder will be set to 0.
Exhibit 30: A unit with 700 run hours left:
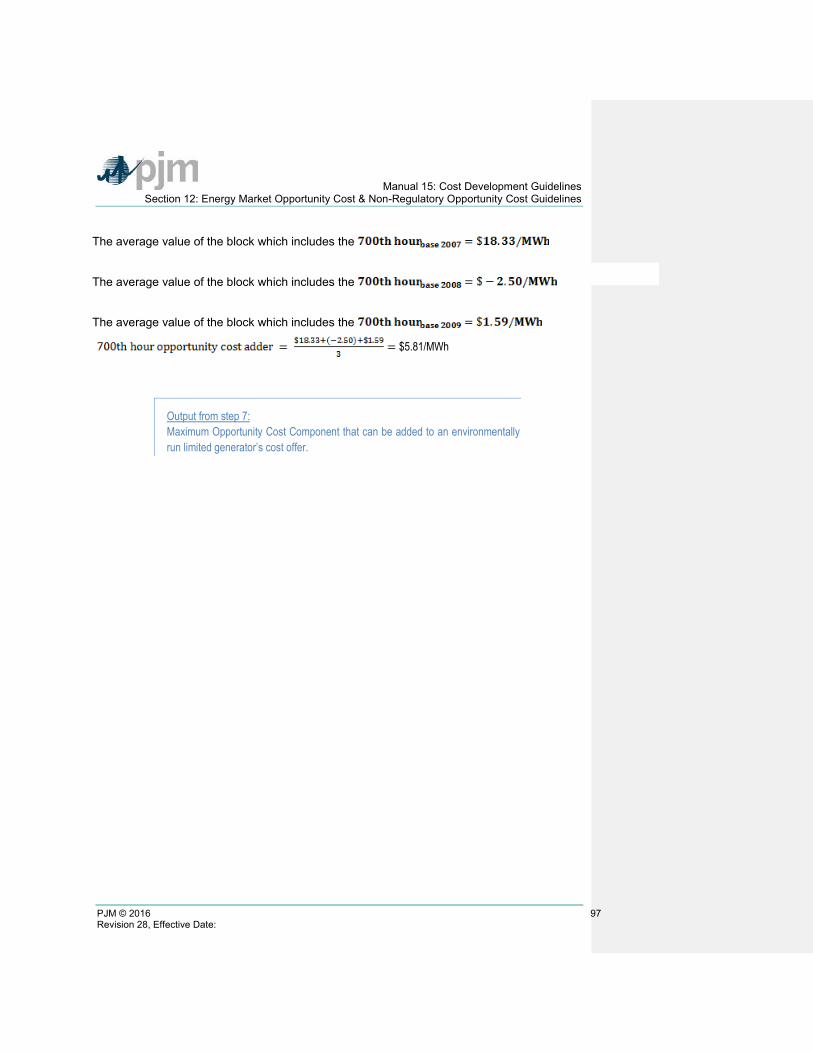
Manual 15: Cost Development Guidelines Section 12: Energy Market Opportunity Cost & Non-Regulatory Opportunity Cost Guidelines
PJM © 2016 97 Revision 28, Effective Date:
The average value of the block which includes the
The average value of the block which includes the
The average value of the block which includes the
$5.81/MWh
Output from step 7: Maximum Opportunity Cost Component that can be added to an environmentally run limited generator’s cost offer.
Manual 15: Cost Development Guidelines Attachment A: Applicable FERC System of Accounts
PJM © 2016 98 Revision 28, Effective Date:
Attachment A: Applicable FERC System of Accounts The information included in this Attachment A provides the descriptions and definitions of several account numbers and Operating Expenses Instructions as they appear in the FERC System of Accounts and named in this document. The FERC System of Accounts was created when a predominant amount of the nation’s electrical generating resources were “utility owned”. Although many of those resources are now owned by non-vertically integrated entities, such as, Independent Power Producers (IPPs) and Generating Companies (GENCOs), the descriptions of the accounts are the important concepts. Accounting Principal Regarding FERC System of Accounts Whenever there is reference in this manual to a FERC Account, it is implicitly understood that the FERC System of Accounts may be replaced by any other accounting method mapped back to the current FERC System of Accounts (see Attachment B) if approved for use by PJM and the MMU. The accounts named in this document provide the information to allow the development of cost based bids for submission to PJM.
A.1 Balance Sheet Accounts
A.1.1 FERC FORM 1 ACCOUNT 151: Fuel Stock (Major only). This account shall include the book cost of fuel on hand. Items
• Invoice price of fuel less any cash or other discounts.
• Freight, switching, demurrage and other transportation charges, not including, however, any charges for unloading from the shipping medium.
• Excise taxes, purchasing agents’ commissions, insurance and other expenses directly assignable to cost of fuel.
• Operating, maintenance and depreciation expenses and ad valorem taxes on utility-owned transportation equipment used to transport fuel from the point of acquisition to the unloading point.
• Lease or rental costs of transportation equipment used to transport fuel from the point of acquisition to the unloading point.
A.2 Expense Accounts
A.2.1 FERC FORM 1 ACCOUNT 501: Fuel • This account shall include the cost of fuel used in the production of steam for the
generation of electricity, including expenses in unloading fuel from the shipping media and handling thereof up to the point where the fuel enters the first boiler plant
Manual 15: Cost Development Guidelines Attachment A: Applicable FERC System of Accounts
PJM © 2016 99 Revision 28, Effective Date:
bunker, hopper, bucket, tank or holder of the boiler-house structure. Records shall be maintained to show the quantity, MMBtu content and cost of each type of fuel used.
• The cost of fuel shall be charged initially to Account 151, Fuel Stock (for Non-major utilities, appropriate fuel accounts carried under Account 154, Plant Materials and Operating Supplies), and cleared to this account on the basis of the fuel used. Fuel handling expenses may be charged to this account as incurred or charged initially to Account 152, Fuel Stock Expenses Undistributed (for Non-major utilities, an appropriate sub account of Account 154, Plant Materials and Operating Supplies). In the latter event, they shall be cleared to this account based on the fuel used. Respective amounts of fuel stock and fuel stock expenses shall be readily available.
Items
Labor:
• Supervising purchasing and handling of fuel.
• All routine fuel analysis.
• Unloading from shipping facility and putting in storage.
• Moving of fuel in storage and transferring fuel from one station to another.
• Handling from storage or shipping facility to first bunker, hopper, bucket, tank or holder of boiler-house structure.
• Operation of mechanical equipment, such as locomotives, trucks, cars, boats, barges, cranes, etc.
Materials and expenses:
• Operating, maintenance and depreciation expenses and ad valorem taxes on utility-owned transportation equipment used to transport fuel from the point of acquisition to the unloading point (Major only).
• Lease or rental costs of transportation equipment used to transport fuel from the point of acquisition to the unloading point (Major only).
• Cost of fuel including freight, switching, demurrage and other transportation charges.
• Excise taxes, insurance, purchasing commissions and similar items.
• Stores expense to extent applicable to fuel.
• Transportation and other expenses in moving fuel in storage.
• Tools, lubricants and other supplies.
• Operating supplies for mechanical equipment.
• Residual disposal expenses less any proceeds from sale of residuals.
NOTE: Abnormal fuel handling expenses occasioned by emergency conditions shall be charge to expense as incurred.
A.2.2. FERC FORM 1 ACCOUNT 509: Allowances
Manual 15: Cost Development Guidelines Attachment A: Applicable FERC System of Accounts
PJM © 2016 100 Revision 28, Effective Date:
This account shall include the cost of allowances expensed concurrent with the monthly emission of sulfur dioxide.
A.2.3 FERC FORM 1 ACCOUNT 512: Maintenance of Boiler Plant (Major only) • This account shall include the cost of labor, materials used and expenses incurred in
the maintenance of steam plant, the book cost of which is includible in Account 312, Boiler Plant Equipment. (See operating expense instruction 2; which can be found in this manual, Attachment A.3.1)
• For the purposes of making charges hereto and to Account 513, Maintenance of Electric Plant, the point at which steam plant is distinguished from electric plant is defined as follows:
o Inlet flange of throttle valve on prime mover.
o Flange of all steam extraction lines on prime mover.
o Hotwell pump outlet on condensate lines.
o Inlet flange of all turbine-room auxiliaries.
o Connection to line side of motor starter for all boiler-plant equipment.
A.2.4 FERC FORM 1 ACCOUNT 513: Maintenance of Electric Plant (Major only) This account shall include the cost of labor, materials used and expenses incurred in the maintenance of electric plant, the book cost of which is includible in Account 313, Engines and Engine-Driven Generators, Account 314, Turbogenerator Units, and Account 315, Accessory Electric Equipment. (See operating expense instruction 2, which can be found in this manual, Attachment A.3.1and paragraph B of Account 512.which can be found above in A.2.3)
A.2.5 FERC FORM 1 ACCOUNT 518: Nuclear Fuel Expense (Major only) • This account shall debit and Account 120.5, Accumulated Provision for Amortization
of Nuclear Fuel Assemblies, credited for the amortization of the net cost of nuclear fuel assemblies used in the production of energy. The net cost of nuclear fuel assemblies subject to amortization shall be the cost of the nuclear fuel assemblies plus or less the expected net salvage of uranium, plutonium, and other byproducts and unburned fuel. The utility shall adopt the necessary procedures to assure that charges to this account are distributed according to the thermal energy produced in such periods.
• This account shall also include the costs involved when fuel is leased.
• This account shall also include the cost of other fuels, used for ancillary steam facilities, including superheat.
• This account shall be debited or credited as appropriate for significant changes in the amounts estimated as the net salvage value of uranium, plutonium, and other byproducts contained in Account 157, Nuclear Materials Held for Sale and the amount realized upon the final disposition of the materials. Significant declines in the estimated realizable value of items carried in Account 157 may be recognized at the
Manual 15: Cost Development Guidelines Attachment A: Applicable FERC System of Accounts
PJM © 2016 101 Revision 28, Effective Date:
time of market price declines by charging this account and crediting Account 157. When the declining change occurs while the fuel is recorded in Account 120.3, Nuclear Fuel Assemblies in Reactor, the effect shall be amortized over the remaining life of the fuel.
A.2.6 FERC FORM 1 ACCOUNT 530: Maintenance of Reactor Plant Equipment (Major only) This account shall include the cost of labor, materials used and expenses incurred in the maintenance of reactor plant, the book cost of which is includible in Account 322, Reactor Plant Equipment.
A.2.7 FERC FORM 1 ACCOUNT 531: Maintenance of Electric Plant (Major only) This account shall include the cost of labor, materials used and expenses incurred in the maintenance of electric plant, the book cost of which is includible in Account 323, Turbo-generator Units, and account 324, Accessory Electric Equipment.
A.2.8 FERC FORM 1 ACCOUNT 543: Maintenance of Reservoirs, Dams, and Waterways (Major only) This account shall include the cost of labor, materials used and expenses incurred in the maintenance of plant, includible in Account 332, Reservoirs, Dams, and Waterways. (See operating expense instruction 2, which can be found in this manual, Attachment A.3.1.) However, the cost of labor materials used and expenses incurred in the maintenance of fish and wildlife, and recreation facilities, the book cost of which is includible in Account 332, Reservoirs, Dams, and Waterways, shall be charged to Account 545, Maintenance of Miscellaneous Hydraulic Plant.
A.2.9 FERC FORM 1 ACCOUNT 544: Maintenance of Electric Plant (Major only) This account shall include the cost of labor, materials used and expenses incurred in the maintenance of plant includible in Account 333, Water Wheels, Turbines and Generators, and Account 334, Accessory Electric Equipment. (See operating expense instruction 2, which can be found in this manual, Attachment A.3.1.) A.2.10 FERC FORM 1 ACCOUNT 553: Maintenance of Generating and Electrical Equipment (Major only) This account shall include the cost of labor, materials used and expenses incurred in the maintenance of plant, the book cost of which is includible in Account 343, Prime Movers, Account 344, Generators, and Account 345, Accessory Electric Equipment.
A.3 Operating Expense Instructions 2 and 3
A.3.1 OPERATING EXPENSE INSTRUCTION 2: Maintenance • The cost of maintenance chargeable to the various operating expense and clearing
accounts includes labor, materials, overheads and other expenses incurred in maintenance work. A list of work operations applicable generally to utility plant is
Manual 15: Cost Development Guidelines Attachment A: Applicable FERC System of Accounts
PJM © 2016 102 Revision 28, Effective Date:
included hereunder. Other work operations applicable to specific classes of plant are listed in functional maintenance expense accounts.
• Materials recovered in connection with the maintenance of property shall be credited to the same account to which the maintenance cost was charged.
• If the book cost of any property is carried in Account 102, Electric Plant Purchased or Sold, the cost of maintaining such property shall be charged to the accounts for maintenance of property of the same class and use, the book cost of which is carried in other electric plant in service accounts. Maintenance of property leased from others shall be treated as provided in operating expense instruction 3.
Items
• Direct field supervision of maintenance
• Inspecting, testing, and reporting on condition of plant specifically to determine the need for repairs, replacements, rearrangements and changes and inspecting and testing the adequacy of repairs that have been made
• Work performed specifically for the purpose of preventing failure, restoring serviceability or maintaining life of plant
• Rearranging and changing the location of plant not retired
• Repairing for reuse materials recovered from plant
• Testing for locating and clearing trouble
• Net cost of installing, maintaining, and removing temporary facilities to prevent interruptions in service
• Replacing or adding minor items of plant that do not constitute a retirement unit (See electric plant instruction 10)
NOTE: ELECTRIC PLANT INSTRUCTION 10 Rents includes amounts paid for the use of construction quarters and office space occupied by construction forces and amounts properly includible in construction costs for such facilities jointly used.
A.3.2 OPERATING EXPENSE INSTRUCTION 3: Rents • The rent expense accounts provided under the several functional groups of expense
accounts shall include all rents, including taxes paid by the lessee on leased property, for property used in utility operations, except (1) minor amounts paid for occasional or infrequent use of any property or equipment and all amounts paid for use of equipment that, if owned, would be includible in plant Accounts 391 and 398, inclusive, which shall be treated as an expense item and included in the appropriate functional account and (2) rents which are chargeable to clearing accounts, and distributed there from/to the appropriate account. If rents cover property used for more than one function, such as production and transmission, or by more than one department, the rents shall be apportioned to the appropriate rent expense or clearing accounts of each department on an actual, or if necessary, an estimated basis.

Manual 15: Cost Development Guidelines Attachment A: Applicable FERC System of Accounts
PJM © 2016 103 Revision 28, Effective Date:
• When a portion of property or equipment rented from others for use in connection with utility operations is subleased, the revenue derived from such subleasing shall be credited to the rent revenue account in operating revenues; provided, however, that in case the rent was charged to a clearing account, amounts received from subleasing the property shall be credited to such clearing account.
• The cost, when incurred by the lessee, of operating and maintaining leased property, shall be charged to the accounts appropriate for the expense if the property were owned.
• The cost incurred by the lessee of additions and replacements to electric plant leased from others shall be accounted for as provided in electric plant instruction.
Manual 15: Cost Development Guidelines Attachment B: No Load Calculation Examples
PJM © 2016 104 Revision 28, Effective Date:
Attachment B: NoLoad Calculation Examples
The information included in this Attachment B provides guidance for calculating No-Load Costs for various types of generating units.
B.1 No-Load Fuel
All Market Sellers shall use No-Load Fuel to develop No-Load Costs for their units. Since generating units cannot normally be run stable at zero net output, the no-load fuel may be determined by: Collecting heat input values as a function of output and performing a regression analysis, Using heat input values as provided by OEM and performing a regression analysis, Using the initial design heat input curve for an immature unit and performing a regression analysis Determining the measured value of fuel consumed at zero net output from test data (moment of generator output breaker closure).
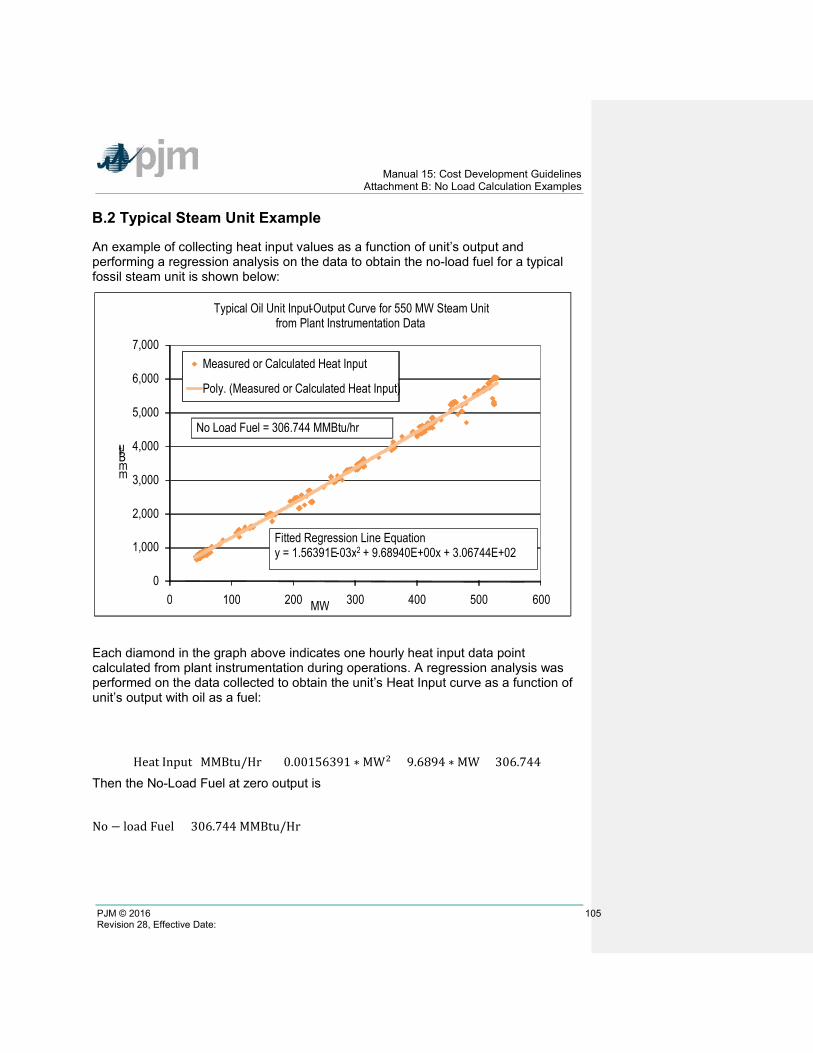
Manual 15: Cost Development Guidelines Attachment B: No Load Calculation Examples
PJM © 2016 105 Revision 28, Effective Date:
B.2 Typical Steam Unit Example
An example of collecting heat input values as a function of unit’s output and performing a regression analysis on the data to obtain the no-load fuel for a typical fossil steam unit is shown below:
Each diamond in the graph above indicates one hourly heat input data point calculated from plant instrumentation during operations. A regression analysis was performed on the data collected to obtain the unit’s Heat Input curve as a function of unit’s output with oil as a fuel:
Heat Input (MMBtu/Hr) = 0.00156391 ∗ MW2 + 9.6894 ∗ MW + 306.744 Then the No-Load Fuel at zero output is No − load Fuel = 306.744 MMBtu/Hr
0
1,000
2,000
3,000
4,000
5,000
6,000
7,000
0 100 200 300 400 500 600
m m B t u
MW
Typical Oil Unit Input - Output Curve for 550 MW Steam Unit from Plant Instrumentation Data
Measured or Calculated Heat Input
Poly. (Measured or Calculated Heat Input)
Fitted Regression Line Equation y = 1.56391E - 03x 2 + 9.68940E+00x + 3.06744E+02
No Load Fuel = 306.744 MMBtu/hr
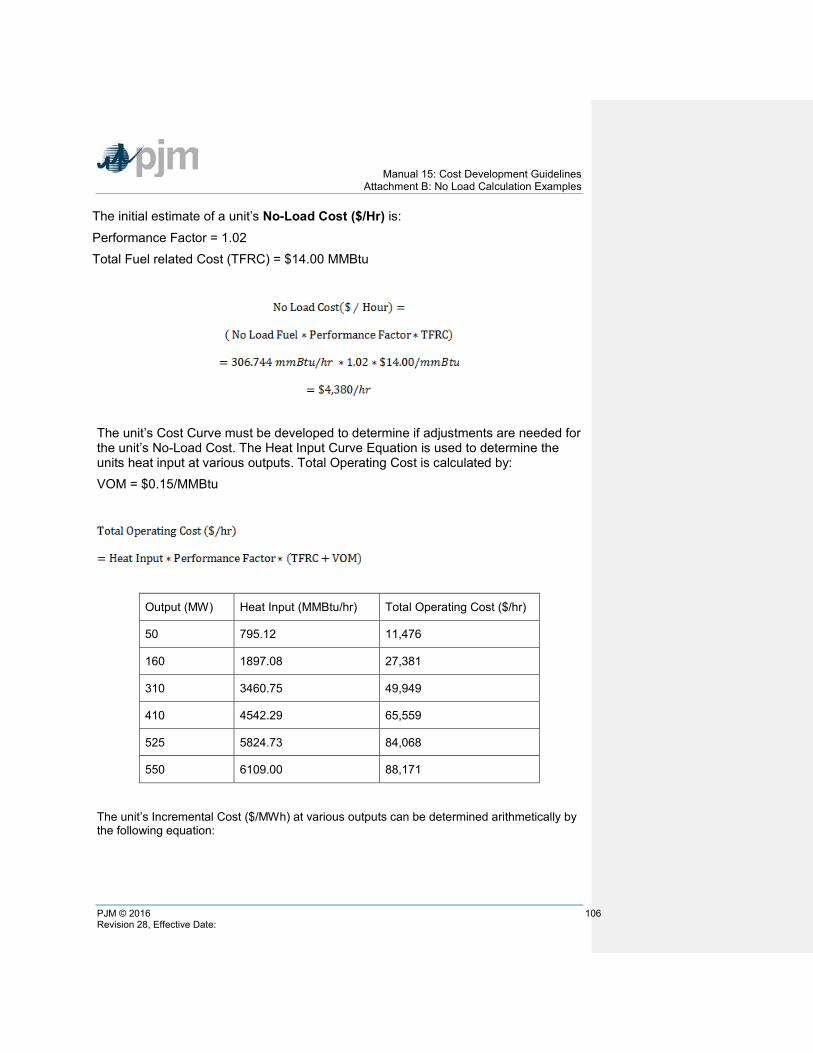
Manual 15: Cost Development Guidelines Attachment B: No Load Calculation Examples
PJM © 2016 106 Revision 28, Effective Date:
The initial estimate of a unit’s No-Load Cost ($/Hr) is:
Performance Factor = 1.02 Total Fuel related Cost (TFRC) = $14.00 MMBtu
The unit’s Cost Curve must be developed to determine if adjustments are needed for the unit’s No-Load Cost. The Heat Input Curve Equation is used to determine the units heat input at various outputs. Total Operating Cost is calculated by: VOM = $0.15/MMBtu
Output (MW) Heat Input (MMBtu/hr) Total Operating Cost ($/hr)
50 795.12 11,476
160 1897.08 27,381
310 3460.75 49,949
410 4542.29 65,559
525 5824.73 84,068
550 6109.00 88,171
The unit’s Incremental Cost ($/MWh) at various outputs can be determined arithmetically by the following equation:
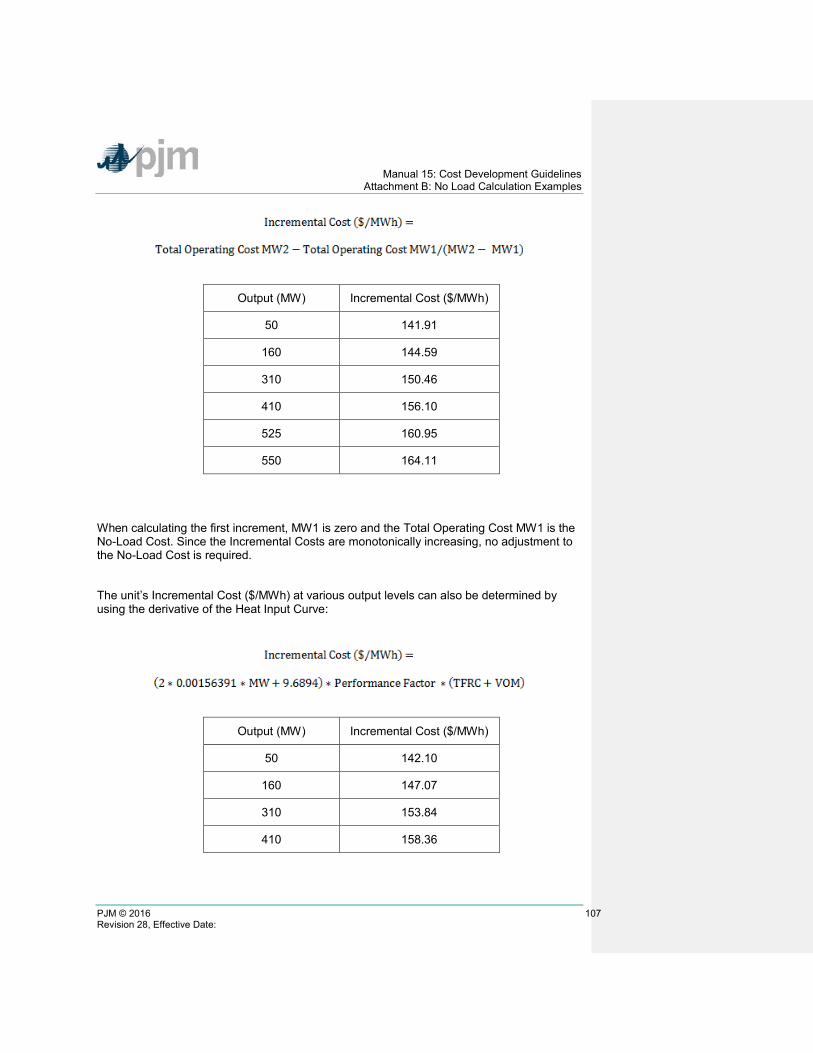
Manual 15: Cost Development Guidelines Attachment B: No Load Calculation Examples
PJM © 2016 107 Revision 28, Effective Date:
Output (MW) Incremental Cost ($/MWh)
50 141.91
160 144.59
310 150.46
410 156.10
525 160.95
550 164.11
When calculating the first increment, MW1 is zero and the Total Operating Cost MW1 is the No-Load Cost. Since the Incremental Costs are monotonically increasing, no adjustment to the No-Load Cost is required.
The unit’s Incremental Cost ($/MWh) at various output levels can also be determined by using the derivative of the Heat Input Curve:
Output (MW) Incremental Cost ($/MWh)
50 142.10
160 147.07
310 153.84
410 158.36
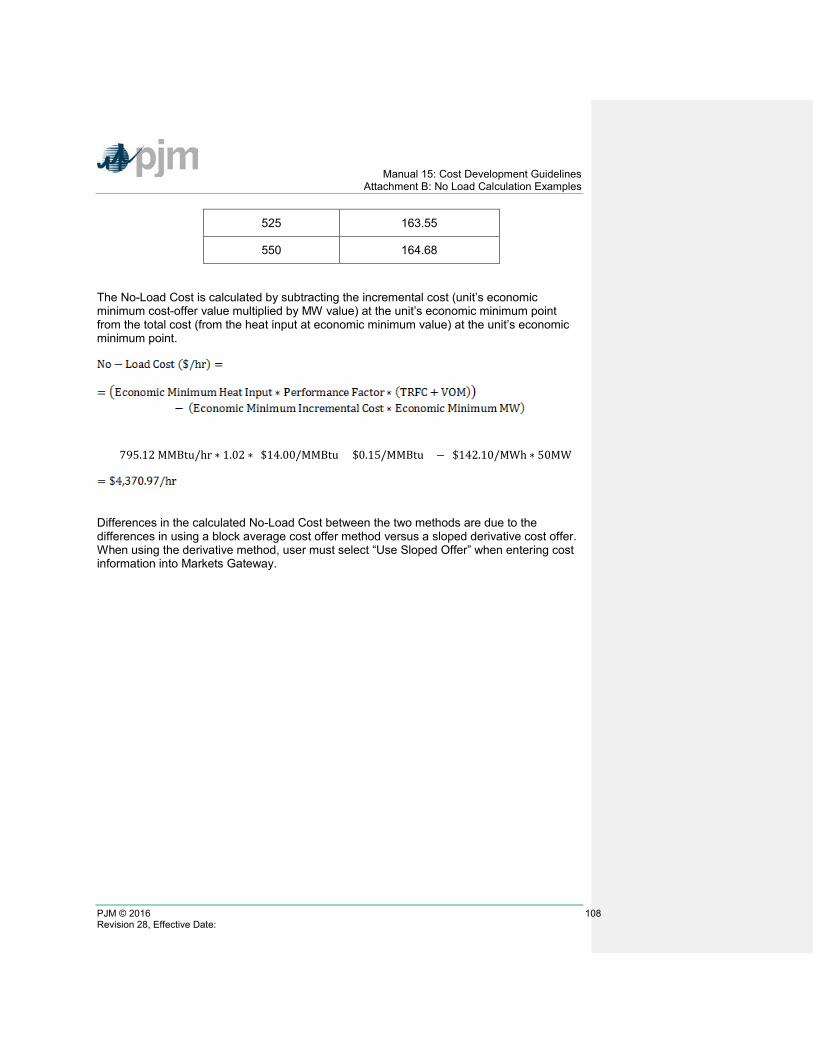
Manual 15: Cost Development Guidelines Attachment B: No Load Calculation Examples
PJM © 2016 108 Revision 28, Effective Date:
525 163.55
550 164.68
The No-Load Cost is calculated by subtracting the incremental cost (unit’s economic minimum cost-offer value multiplied by MW value) at the unit’s economic minimum point from the total cost (from the heat input at economic minimum value) at the unit’s economic minimum point.
= (795.12 MMBtu/hr ∗ 1.02 ∗ ($14.00/MMBtu + $0.15/MMBtu)) − ($142.10/MWh ∗ 50MW)
Differences in the calculated No-Load Cost between the two methods are due to the differences in using a block average cost offer method versus a sloped derivative cost offer. When using the derivative method, user must select “Use Sloped Offer” when entering cost information into Markets Gateway.
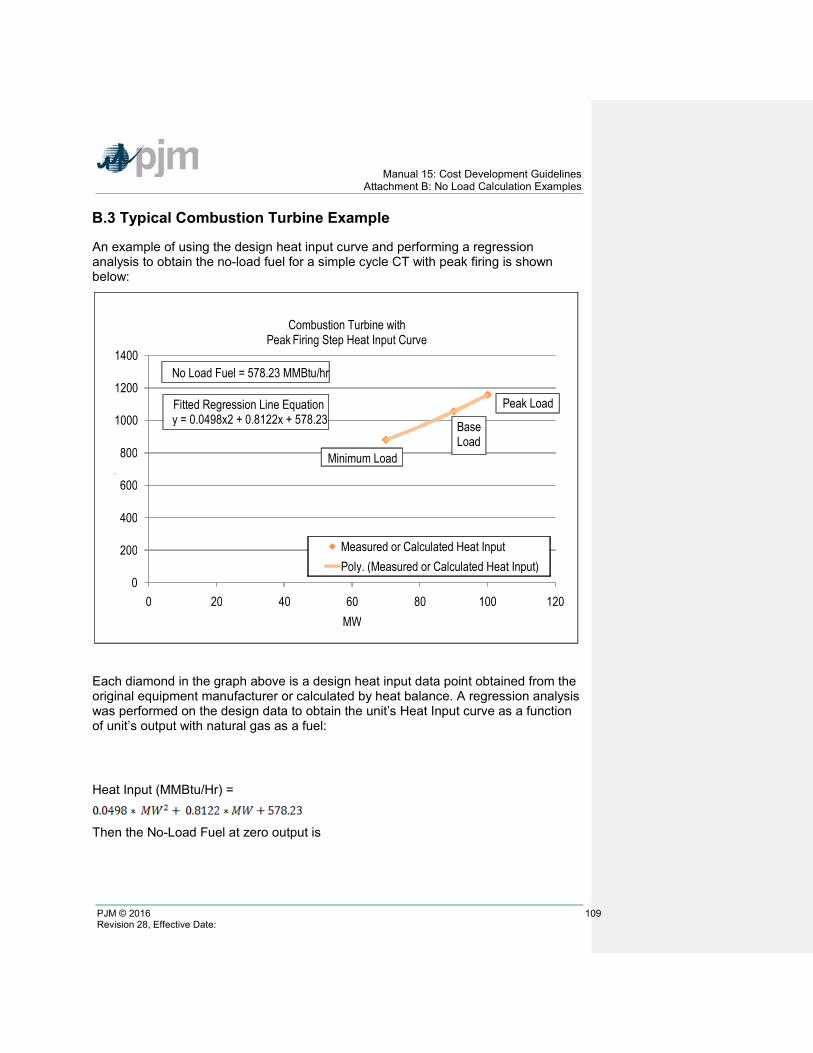
Manual 15: Cost Development Guidelines Attachment B: No Load Calculation Examples
PJM © 2016 109 Revision 28, Effective Date:
B.3 Typical Combustion Turbine Example
An example of using the design heat input curve and performing a regression analysis to obtain the no-load fuel for a simple cycle CT with peak firing is shown below:
Each diamond in the graph above is a design heat input data point obtained from the original equipment manufacturer or calculated by heat balance. A regression analysis was performed on the design data to obtain the unit’s Heat Input curve as a function of unit’s output with natural gas as a fuel: Heat Input (MMBtu/Hr) =
Then the No-Load Fuel at zero output is
0
200
400
600
800
1000
1200
1400
0 20 40 60 80 100 120
mmBtu
MW
Measured or Calculated Heat Input Poly. (Measured or Calculated Heat Input)
Fitted Regression Line Equation y = 0.0498x2 + 0.8122x + 578.23
No Load Fuel = 578.23 MMBtu/hr
Minimum Load
Base Load
Peak Load
Combustion Turbine with Peak Firing Step Heat Input Curve
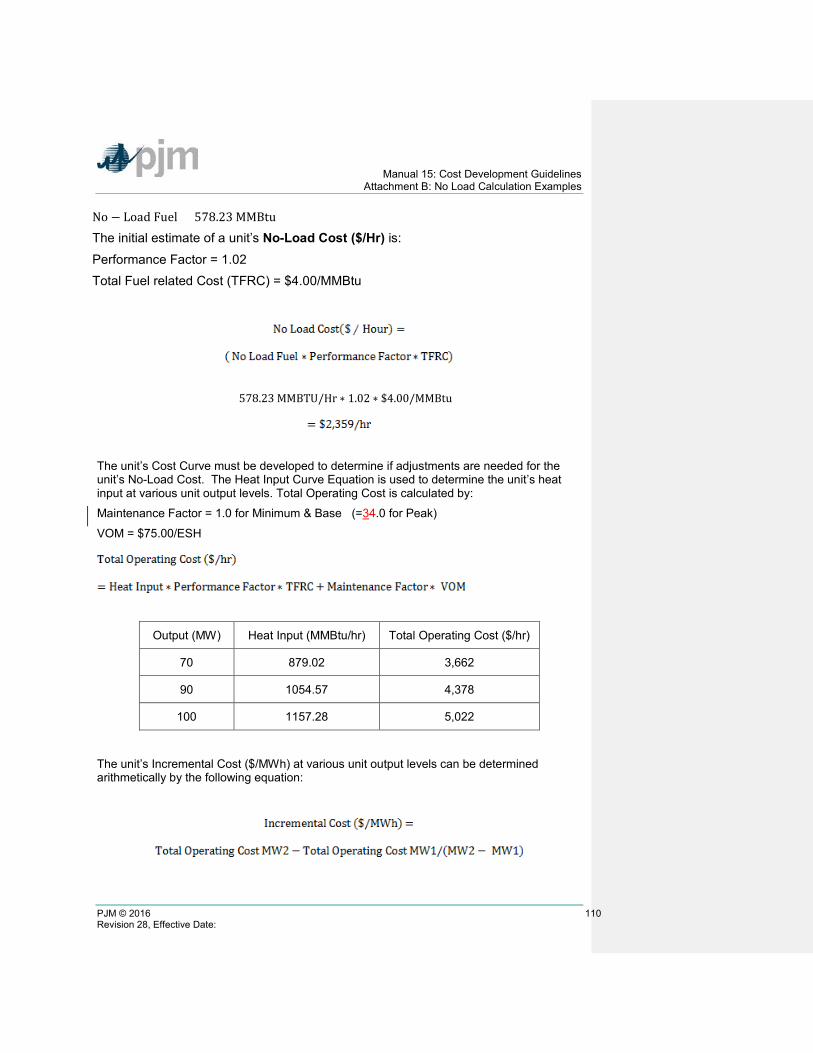
Manual 15: Cost Development Guidelines Attachment B: No Load Calculation Examples
PJM © 2016 110 Revision 28, Effective Date:
No − Load Fuel = 578.23 MMBtu The initial estimate of a unit’s No-Load Cost ($/Hr) is:
Performance Factor = 1.02 Total Fuel related Cost (TFRC) = $4.00/MMBtu
= 578.23 MMBTU/Hr ∗ 1.02 ∗ $4.00/MMBtu
The unit’s Cost Curve must be developed to determine if adjustments are needed for the unit’s No-Load Cost. The Heat Input Curve Equation is used to determine the unit’s heat input at various unit output levels. Total Operating Cost is calculated by:
Maintenance Factor = 1.0 for Minimum & Base (=34.0 for Peak)
VOM = $75.00/ESH
Output (MW) Heat Input (MMBtu/hr) Total Operating Cost ($/hr)
70 879.02 3,662
90 1054.57 4,378
100 1157.28 5,022
The unit’s Incremental Cost ($/MWh) at various unit output levels can be determined arithmetically by the following equation:
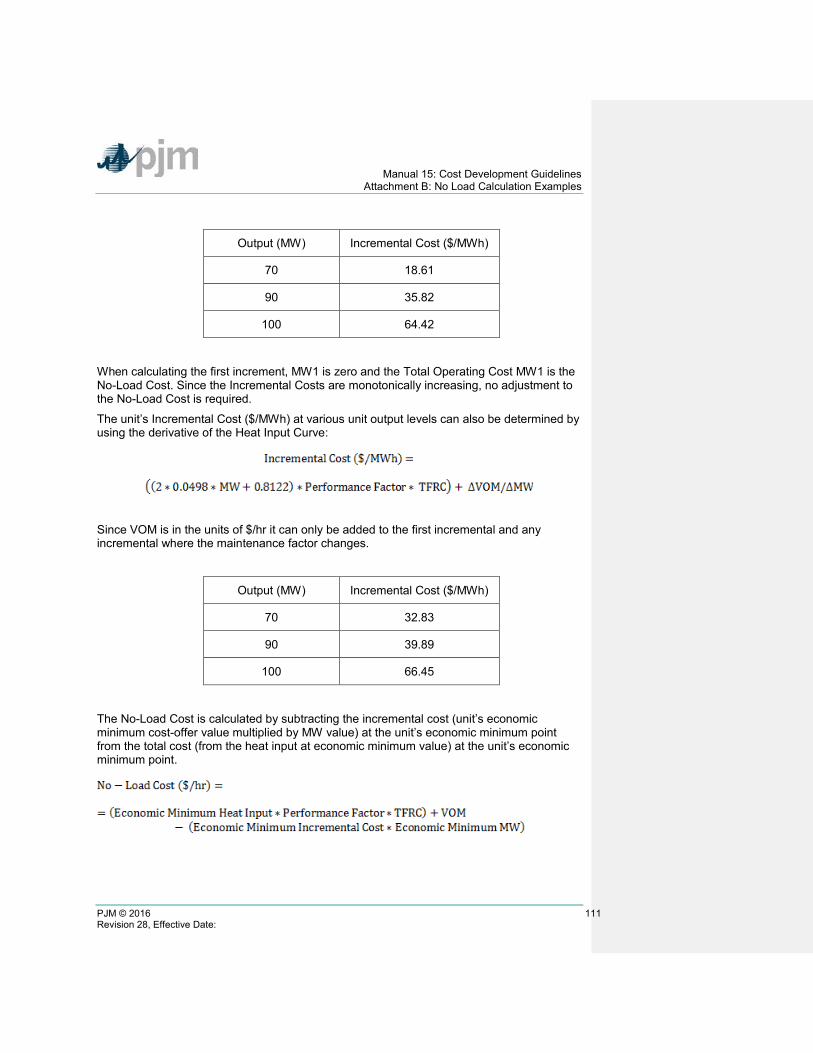
Manual 15: Cost Development Guidelines Attachment B: No Load Calculation Examples
PJM © 2016 111 Revision 28, Effective Date:
Output (MW) Incremental Cost ($/MWh)
70 18.61
90 35.82
100 64.42
When calculating the first increment, MW1 is zero and the Total Operating Cost MW1 is the No-Load Cost. Since the Incremental Costs are monotonically increasing, no adjustment to the No-Load Cost is required.
The unit’s Incremental Cost ($/MWh) at various unit output levels can also be determined by using the derivative of the Heat Input Curve:
Since VOM is in the units of $/hr it can only be added to the first incremental and any incremental where the maintenance factor changes.
Output (MW) Incremental Cost ($/MWh)
70 32.83
90 39.89
100 66.45
The No-Load Cost is calculated by subtracting the incremental cost (unit’s economic minimum cost-offer value multiplied by MW value) at the unit’s economic minimum point from the total cost (from the heat input at economic minimum value) at the unit’s economic minimum point.

Manual 15: Cost Development Guidelines Attachment B: No Load Calculation Examples
PJM © 2016 112 Revision 28, Effective Date:
= (879.02 MMBtu/hr ∗ 1.02 ∗ $4.00/MMBtu) + ($75.00/ESH)− ($32.83/MWh ∗ 70 MW)
Differences in the calculated No-Load Cost between the two methods are due to the differences in using a block average cost offer method versus a sloped derivative cost offer. When using the derivative method, user must select “Use Sloped Offer” when entering cost information into Markets Gateway.
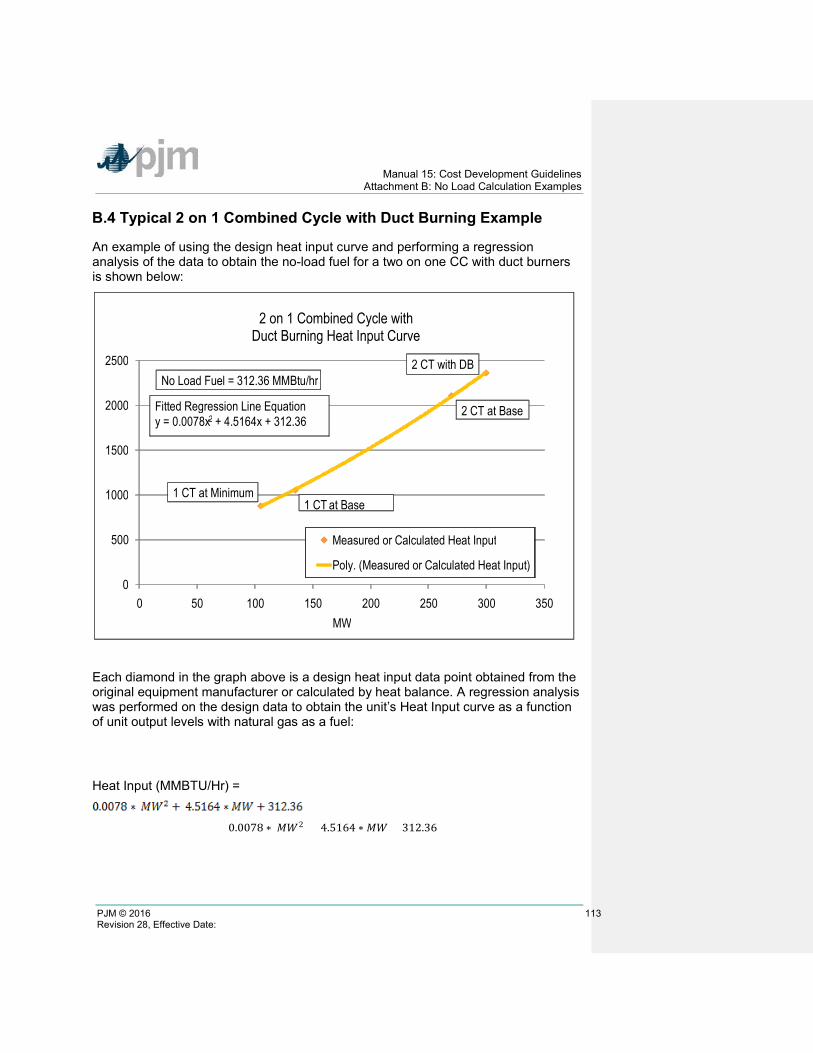
Manual 15: Cost Development Guidelines Attachment B: No Load Calculation Examples
PJM © 2016 113 Revision 28, Effective Date:
B.4 Typical 2 on 1 Combined Cycle with Duct Burning Example
An example of using the design heat input curve and performing a regression analysis of the data to obtain the no-load fuel for a two on one CC with duct burners is shown below:
Each diamond in the graph above is a design heat input data point obtained from the original equipment manufacturer or calculated by heat balance. A regression analysis was performed on the design data to obtain the unit’s Heat Input curve as a function of unit output levels with natural gas as a fuel: Heat Input (MMBTU/Hr) =
0.0078 ∗ 𝑀𝑀𝑀𝑀2 + 4.5164 ∗ 𝑀𝑀𝑀𝑀 + 312.36
0
500
1000
1500
2000
2500
0 50 100 150 200 250 300 350
mmBtu
MW
2 on 1 Combined Cycle with Duct Burning Heat Input Curve
Measured or Calculated Heat Input
Poly. (Measured or Calculated Heat Input)
Fitted Regression Line Equation y = 0.0078x 2 + 4.5164x + 312.36
No Load Fuel = 312.36 MMBtu/hr
1 CT at Minimum 1 CT at Base
2 CT at Base
2 CT with DB
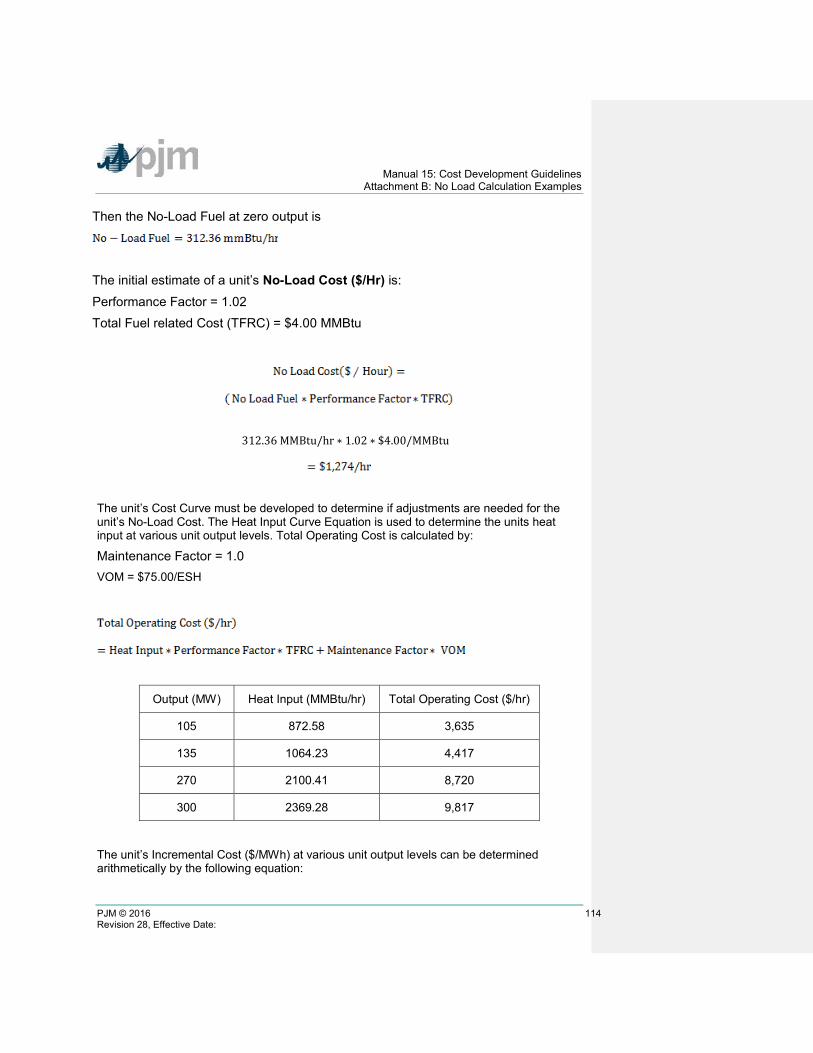
Manual 15: Cost Development Guidelines Attachment B: No Load Calculation Examples
PJM © 2016 114 Revision 28, Effective Date:
Then the No-Load Fuel at zero output is
The initial estimate of a unit’s No-Load Cost ($/Hr) is:
Performance Factor = 1.02 Total Fuel related Cost (TFRC) = $4.00 MMBtu
= 312.36 MMBtu/hr ∗ 1.02 ∗ $4.00/MMBtu
The unit’s Cost Curve must be developed to determine if adjustments are needed for the unit’s No-Load Cost. The Heat Input Curve Equation is used to determine the units heat input at various unit output levels. Total Operating Cost is calculated by:
Maintenance Factor = 1.0 VOM = $75.00/ESH
Output (MW) Heat Input (MMBtu/hr) Total Operating Cost ($/hr)
105 872.58 3,635
135 1064.23 4,417
270 2100.41 8,720
300 2369.28 9,817
The unit’s Incremental Cost ($/MWh) at various unit output levels can be determined arithmetically by the following equation:
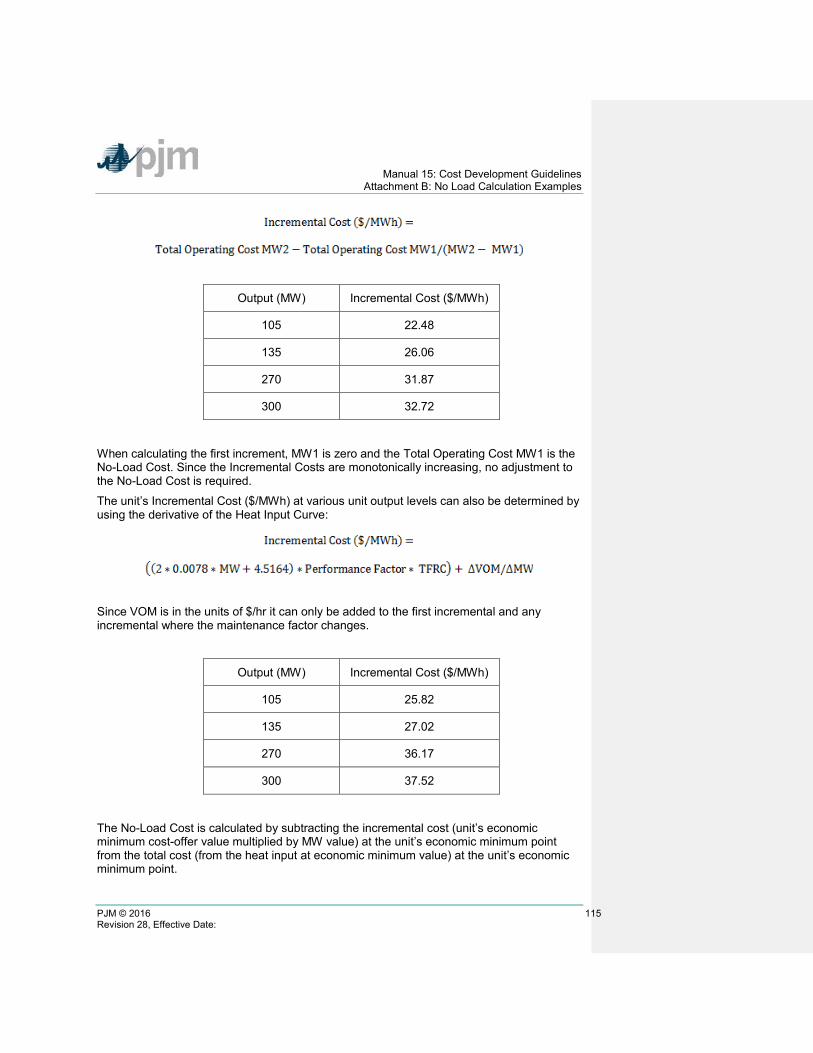
Manual 15: Cost Development Guidelines Attachment B: No Load Calculation Examples
PJM © 2016 115 Revision 28, Effective Date:
Output (MW) Incremental Cost ($/MWh)
105 22.48
135 26.06
270 31.87
300 32.72
When calculating the first increment, MW1 is zero and the Total Operating Cost MW1 is the No-Load Cost. Since the Incremental Costs are monotonically increasing, no adjustment to the No-Load Cost is required.
The unit’s Incremental Cost ($/MWh) at various unit output levels can also be determined by using the derivative of the Heat Input Curve:
Since VOM is in the units of $/hr it can only be added to the first incremental and any incremental where the maintenance factor changes.
Output (MW) Incremental Cost ($/MWh)
105 25.82
135 27.02
270 36.17
300 37.52
The No-Load Cost is calculated by subtracting the incremental cost (unit’s economic minimum cost-offer value multiplied by MW value) at the unit’s economic minimum point from the total cost (from the heat input at economic minimum value) at the unit’s economic minimum point.
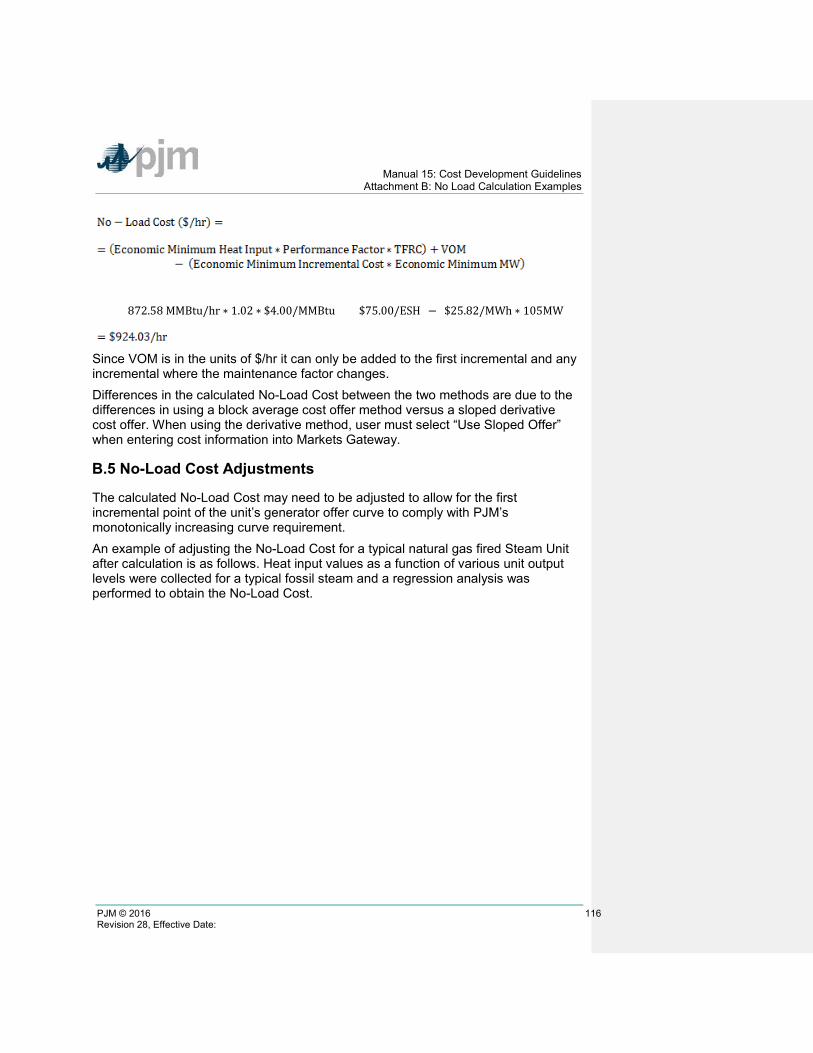
Manual 15: Cost Development Guidelines Attachment B: No Load Calculation Examples
PJM © 2016 116 Revision 28, Effective Date:
= (872.58 MMBtu/hr ∗ 1.02 ∗ $4.00/MMBtu) + ($75.00/ESH) − ($25.82/MWh ∗ 105MW)
Since VOM is in the units of $/hr it can only be added to the first incremental and any incremental where the maintenance factor changes. Differences in the calculated No-Load Cost between the two methods are due to the differences in using a block average cost offer method versus a sloped derivative cost offer. When using the derivative method, user must select “Use Sloped Offer” when entering cost information into Markets Gateway.
B.5 No-Load Cost Adjustments
The calculated No-Load Cost may need to be adjusted to allow for the first incremental point of the unit’s generator offer curve to comply with PJM’s monotonically increasing curve requirement. An example of adjusting the No-Load Cost for a typical natural gas fired Steam Unit after calculation is as follows. Heat input values as a function of various unit output levels were collected for a typical fossil steam and a regression analysis was performed to obtain the No-Load Cost.
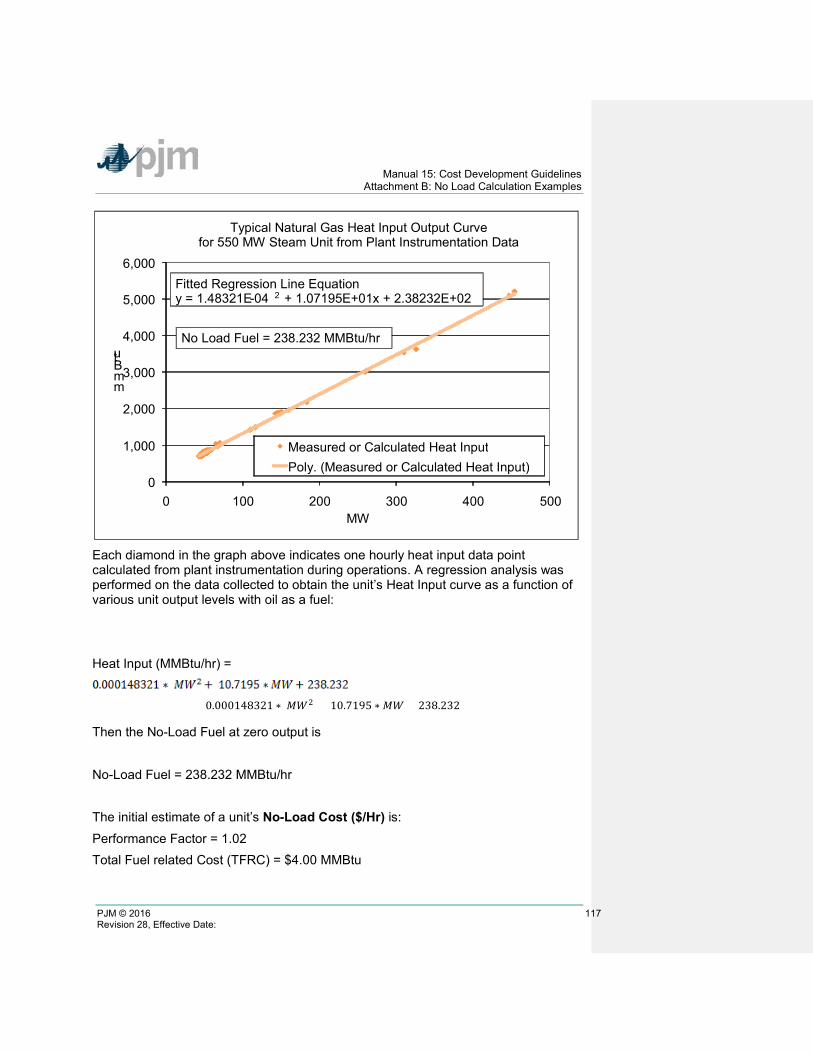
Manual 15: Cost Development Guidelines Attachment B: No Load Calculation Examples
PJM © 2016 117 Revision 28, Effective Date:
Each diamond in the graph above indicates one hourly heat input data point calculated from plant instrumentation during operations. A regression analysis was performed on the data collected to obtain the unit’s Heat Input curve as a function of various unit output levels with oil as a fuel: Heat Input (MMBtu/hr) =
0.000148321 ∗ 𝑀𝑀𝑀𝑀2 + 10.7195 ∗ 𝑀𝑀𝑀𝑀 + 238.232 Then the No-Load Fuel at zero output is No-Load Fuel = 238.232 MMBtu/hr The initial estimate of a unit’s No-Load Cost ($/Hr) is:
Performance Factor = 1.02 Total Fuel related Cost (TFRC) = $4.00 MMBtu
0
1,000
2,000
3,000
4,000
5,000
6,000
0 100 200 300 400 500
m m B t u
MW
Typical Natural Gas Heat Input Output Curve for 550 MW Steam Unit from Plant Instrumentation Data
Measured or Calculated Heat Input Poly. (Measured or Calculated Heat Input)
No Load Fuel = 238.232 MMBtu/hr
Fitted Regression Line Equation y = 1.48321E - 04
2 + 1.07195E+01x + 2.38232E+02
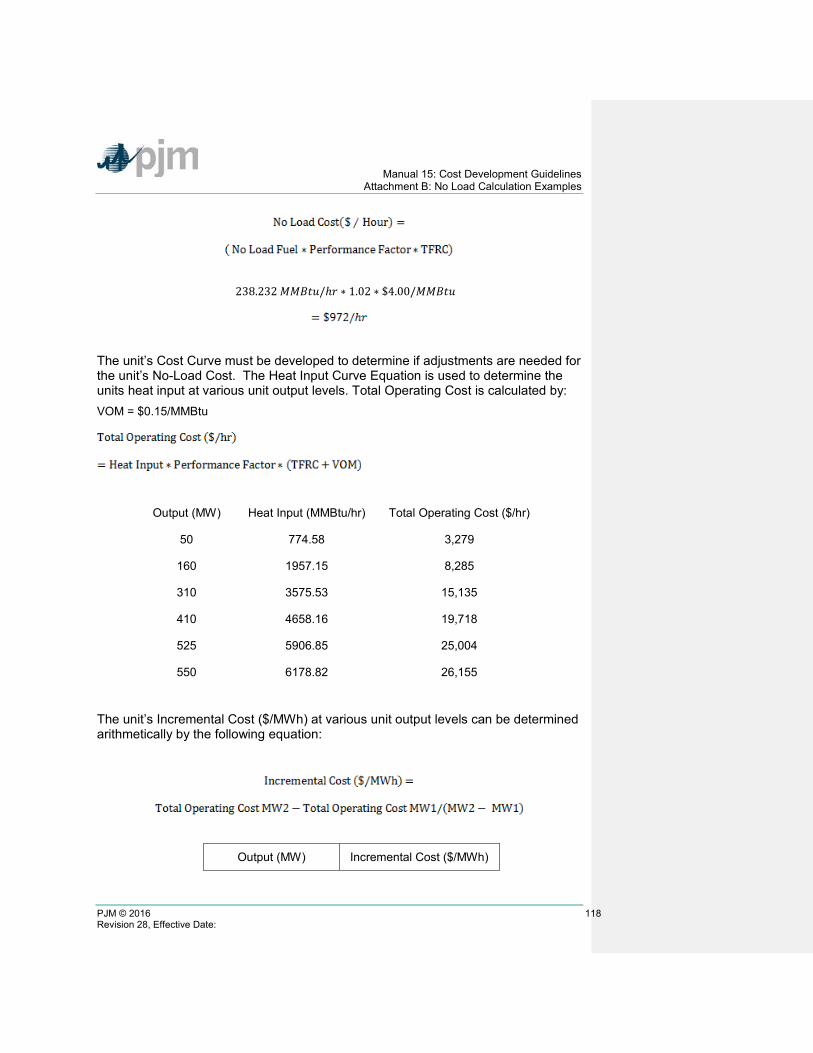
Manual 15: Cost Development Guidelines Attachment B: No Load Calculation Examples
PJM © 2016 118 Revision 28, Effective Date:
= 238.232 𝑀𝑀𝑀𝑀𝑀𝑀𝑈𝑈𝑀𝑀/ℎ𝑟𝑟 ∗ 1.02 ∗ $4.00/𝑀𝑀𝑀𝑀𝑀𝑀𝑈𝑈𝑀𝑀
The unit’s Cost Curve must be developed to determine if adjustments are needed for the unit’s No-Load Cost. The Heat Input Curve Equation is used to determine the units heat input at various unit output levels. Total Operating Cost is calculated by: VOM = $0.15/MMBtu
Output (MW) Heat Input (MMBtu/hr) Total Operating Cost ($/hr)
50 774.58 3,279
160 1957.15 8,285
310 3575.53 15,135
410 4658.16 19,718
525 5906.85 25,004
550 6178.82 26,155
The unit’s Incremental Cost ($/MWh) at various unit output levels can be determined arithmetically by the following equation:
Output (MW) Incremental Cost ($/MWh)

Manual 15: Cost Development Guidelines Attachment B: No Load Calculation Examples
PJM © 2016 119 Revision 28, Effective Date:
50 46.14
160 45.51
310 45.67
410 45.83
525 45.96
550 46.05
When calculating the first increment, MW1 is zero and the Total Operating Cost MW1 is the No-Load Cost. However due to the quality of the heat input data, the first increment of the cost offer was greater than the second increment. This is shown in the graph below:
$40
$41
$42
$43
$44
$45
$46
$47
$48
8,000
9,000
10,000
11,000
12,000
13,000
14,000
15,000
16,000
0 100 200 300 400 500 600
$/MWH Btu /Kwh
MW
Typical Natural Gas Unit Heat Rate & Cost Curves for 550 MW Steam Unit
Heat Rate Incremental Heat rate Cost Offer - $/MWH
No Load Cost = No Load Fuel * Fuel Cost = $971.99 $/hr
Fuel Cost = $4/MMBtu VOM Cost = $0.15/MMBtu
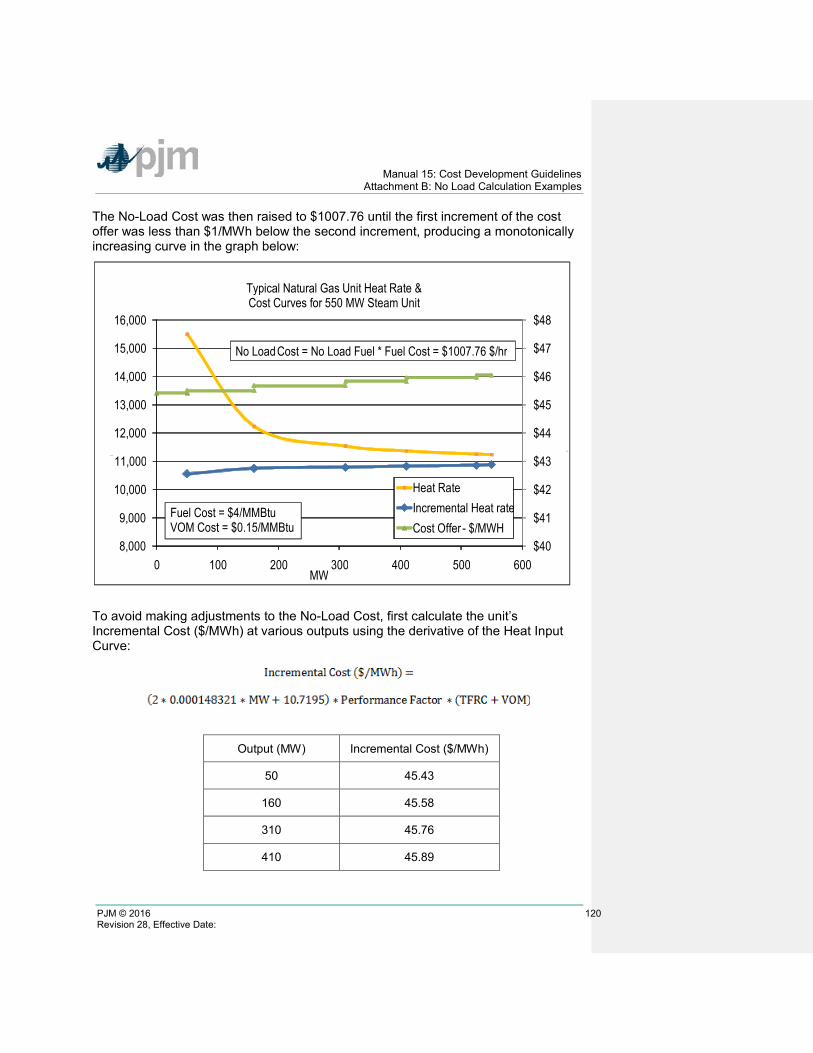
Manual 15: Cost Development Guidelines Attachment B: No Load Calculation Examples
PJM © 2016 120 Revision 28, Effective Date:
The No-Load Cost was then raised to $1007.76 until the first increment of the cost offer was less than $1/MWh below the second increment, producing a monotonically increasing curve in the graph below:
To avoid making adjustments to the No-Load Cost, first calculate the unit’s Incremental Cost ($/MWh) at various outputs using the derivative of the Heat Input Curve:
Output (MW) Incremental Cost ($/MWh)
50 45.43
160 45.58
310 45.76
410 45.89
$40
$41
$42
$43
$44
$45
$46
$47
$48
8,000
9,000
10,000
11,000
12,000
13,000
14,000
15,000
16,000
0 100 200 300 400 500 600
$/MWH Btu /Kwh
MW
Typical Natural Gas Unit Heat Rate & Cost Curves for 550 MW Steam Unit
Heat Rate Incremental Heat rate Cost Offer - $/MWH
No Load Cost = No Load Fuel * Fuel Cost = $1007.76 $/hr
Fuel Cost = $4/MMBtu VOM Cost = $0.15/MMBtu
Manual 15: Cost Development Guidelines Attachment B: No Load Calculation Examples
PJM © 2016 121 Revision 28, Effective Date:
525 46.03
550 46.06
The No-Load Cost is calculated by subtracting the incremental cost (unit’s economic minimum cost-offer value multiplied by MW value) at the unit’s economic minimum point from the total cost (from the heat input at economic minimum value) at the unit’s economic minimum point.
= (774.58 MMBtu/hr ∗ 1.02 ∗ ($4.00/MMBtu + $0.15/MMBtu)) − ($45.43/MWh ∗ 50MW)
Differences in the calculated No-Load Cost between the two methods are due to the differences in using a block average cost offer method versus a sloped derivative cost offer. When using the derivative method, user must select “Use Sloped Offer” when entering cost information into Markets Gateway.
B.6 Combustion Turbine Zero No-Load Example
A zero No-Load example for a simple cycle combustion turbine with a single offer block is shown below:
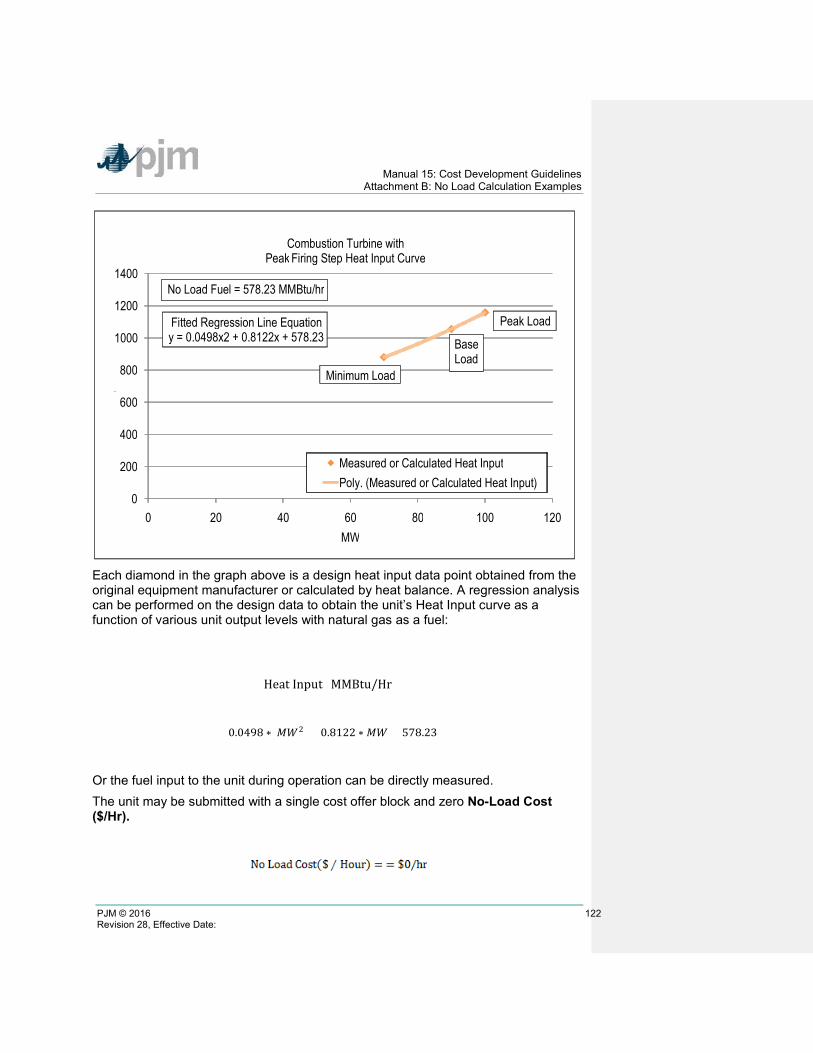
Manual 15: Cost Development Guidelines Attachment B: No Load Calculation Examples
PJM © 2016 122 Revision 28, Effective Date:
Each diamond in the graph above is a design heat input data point obtained from the original equipment manufacturer or calculated by heat balance. A regression analysis can be performed on the design data to obtain the unit’s Heat Input curve as a function of various unit output levels with natural gas as a fuel:
Heat Input (MMBtu/Hr) =
0.0498 ∗ 𝑀𝑀𝑀𝑀2 + 0.8122 ∗ 𝑀𝑀𝑀𝑀 + 578.23 Or the fuel input to the unit during operation can be directly measured. The unit may be submitted with a single cost offer block and zero No-Load Cost ($/Hr).
0
200
400
600
800
1000
1200
1400
0 20 40 60 80 100 120
mmBtu
MW
Measured or Calculated Heat Input Poly. (Measured or Calculated Heat Input)
Fitted Regression Line Equation y = 0.0498x2 + 0.8122x + 578.23
No Load Fuel = 578.23 MMBtu/hr
Minimum Load
Base Load
Peak Load
Combustion Turbine with Peak Firing Step Heat Input Curve
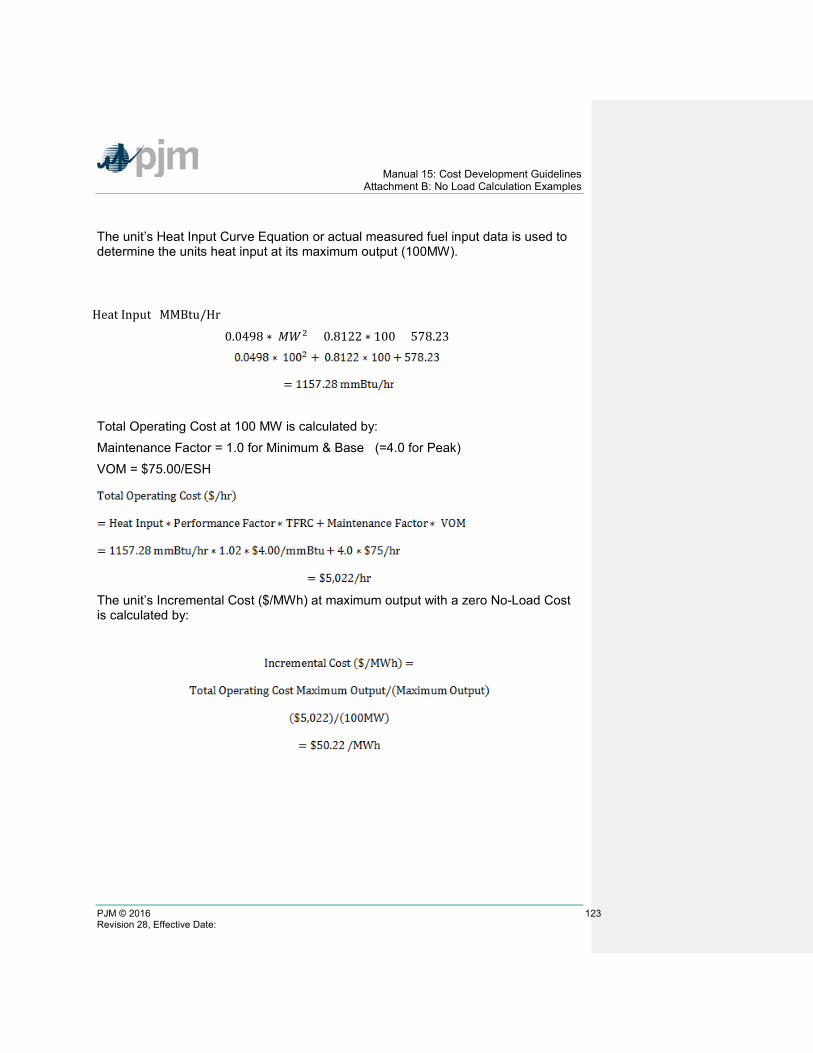
Manual 15: Cost Development Guidelines Attachment B: No Load Calculation Examples
PJM © 2016 123 Revision 28, Effective Date:
The unit’s Heat Input Curve Equation or actual measured fuel input data is used to determine the units heat input at its maximum output (100MW).
Heat Input (MMBtu/Hr) =
0.0498 ∗ 𝑀𝑀𝑀𝑀2 + 0.8122 ∗ 100 + 578.23
Total Operating Cost at 100 MW is calculated by: Maintenance Factor = 1.0 for Minimum & Base (=4.0 for Peak) VOM = $75.00/ESH
The unit’s Incremental Cost ($/MWh) at maximum output with a zero No-Load Cost is calculated by:

Manual 15: Cost Development Guidelines Revision History
PJM © 2016 124 Revision 28, Effective Date:
Revision History Revision 26 (11/05/2014):
• Correct Mileage Ratio in Section 2.8 to Mileage
Revision 25 (07/28/2014): • Update to the Handy Whitman Index numbers chart in section 2.6.1
Revision 24 (03/01/2014): • Cyclic peaking and starting factors for combined cycle and combustion turbines in
sections 2.6.4, 4, 5, and 6 were updated to reflect how to use OEM values. A reference was added for extended cold start.
Revision 23 (08/01/2013): • Regulation Cost Based Offer update shifting manual language from Manual 11 to
Manual 15
• Updated Section 2.8 related to Regulation cost based offers and 11.8 for Energy Storage units and Regulation
Revision 22 (06/01/2013): • Update to the Handy Whitman Index numbers chart in section 2.6.1
Revision 21 (04/01/2013): • Added sections for hydro, energy storage, wind, solar and biofuel powered generation
resources.
• Added shutdown cost language for DSR resources participating in synchronous reserve.
• Modified the Cost Development and Approval process to include more than generation resources.
Revision 20 (11/01/2012): • Added section 2.6.5 to define maintenance cost calculation for immature units
• Updated Long Term Maintenance Cost language for Combustion Turbines and Combined Cycles for additional clarity
Revision 19 (06/01/2012): • Updated Handy Whitman Index with actual for 2011 and estimate for 2012.
Revision 18 (02/08/2012): Removes overhaul costs for Combined Cycles and (CCs) Combustion Turbines (CTs) from Variable Operation and Maintenance Cost (VOM). Section 5.6, 5.6.2 and 6.2 Adds clarity to the development of No Load Costs. Section 1.7.3, 2.1 and Attachment B
Manual 15: Cost Development Guidelines Revision History
PJM © 2016 125 Revision 28, Effective Date:
Updates Manual 15 to be consistent with the tariff with respect to Non-Regulatory and nergy Market Opportunity Costs. Section 9 Revision 17 (06/01/2011): Handy Whitman Update Section 2.6.1, Exhibit 1: Updated Handy Whitman Index Numbers for the year 2011. Section 9: Opportunity Cost Guideline is updated per the informational filing submitted by PJM on May 12, 2011, in Docket No. EL08-47-005. Revision 16 (04/06/2011): Rewrite of entire Manual 15 This revision improves readability and addresses changes as a result of FERC Order 719 (Docket Nos. ER09-1063-000 and ER09-1063-001) requirements). Revision 15 (10/27/2010): Modifies Section 8: Opportunity Cost Guidelines to conform to FERC Order EL08-47-005 allowing for the inclusion of Opportunity Costs for Energy or Environmental Limitation Revision 14 (06/01/2010): Section 5: Updated Chronology of Maintenance Adder Escalation Index Numbers for the year 2010. Revision 13 (05/07/2010): Section 5: Updated Maintenance Period for the choice of 20 years or 10 years and added Unit Configuration Addition Maintenance Adder language Revision 12 (02/23/2010): Section 9: Updated Regulation Cost Guidelines approved 8/25/2009 Revision 11 (12/02/2009): Section 4: Updated Fuel Cost Policy Guidelines Revision 10 (06/01/2009): Section 5: Updated Chronology of Maintenance Adder Escalation Index Numbers for the year 2009. Revision 09 (01/23/2009): Section 4: Added CO2 emission allowance cost to TFRC calculation. Updates to the TFRC cost equation reflect addition of CO2 emission allowance cost. Section 5L: Updated Chronology of Maintenance Adder Escalation Index Numbers for the year 2008. Attachment A: TFRC equation updated to reflect addition of CO2 emission allowance cost. Revision 08 (10/16/2007): Exhibit 1 — Updated Chronology of Maintenance Adder Escalation Index Numbers for the year 2007. Section 9 — Modified the components of cost to supply Regulation Service. Revision 07 (08/03/2006):

Manual 15: Cost Development Guidelines Revision History
PJM © 2016 126 Revision 28, Effective Date:
Exhibit 1—Updated to include the new Manual 30: Alternative Collateral Program. Section 4—Added definition for Total Fuel-Related Costs for Pumped Storage Hydro Plant Generation. Section 5—Added guidelines for Long Term Service Contract Cost Recovery. Exhibit 2—Updated Chronology of Maintenance Adder Escalation Index Numbers for the year 2006. Section 7—Modified terminology for Spinning Synchronized Reserve. Revision 06 (03/02/06): Added guidelines for no-load fuel costs for Combustion Turbines to Section 1 and Section 2. Added “Long Term Maintenance Expenses” definition for Combustion Turbine and Combined Cycle Plants to Section 5. Revisions were made on the following pages: 8, 9, and 20-22. Revision 05 (08/18/05): Updated Exhibit 1 to include new PJM Manuals. Updated Exhibit 2, Chronology of Maintenance Adder Escalation Index Numbers, for the year 2005. Revision 04 (09/01/04): Insert new section nine into the CDS Manual Revision 03 (06/01/04): Revised table "Chronology of Maintenance Adder Escalation Index Numbers" in Section 5 to reflect figures for the year 2004. Reformatted to reflect the new PJM format and style. Updated list of PJM Manuals to reflect title changes and additional Manuals Revision 02 (06/01/03): Revised table in Section 5.6, “Chronology of Maintenance Adder Escalation Index Numbers”, for the year 2003 Revision 01 (12/01/02): This revision incorporates changes to Section 7: Spinning Cost Guidelines. These changes reflect the rules associated with the new PJM Spinning Reserve Market. Revision 00 (12/01/02): This revision is the preliminary draft of the PJM Manual for Cost Development Guidelines (M-15). Prior to Revision 00 of this Manual, a document with this name existed under direction of the PJM Operating Committee. Revision 00 was the first issuance of this Manual under the approval of the PJM Board of Directors, pursuant to Schedule 2 of the Operating Agreement of the PJM Interconnection, L.L.C.