
Cone Penetration Testing in Geotechnical Practice - Taylor ...
IEEE SYSTEMS JOURNAL, VOL. 6, NO. 2, JUNE 2012 205
Potential Impact of Solar Energy Penetration onPJM Electricity Market
Jeremy Lin, Senior Member, IEEE
Abstract—Renewable energy resources, such as wind and solar,have become important parts of today’s generating resourcemix. Along with them, these resources also bring their inherentcharacteristics of variability and uncertainty. Hence, resourceplanners must be adaptable to accommodate these resources inconducting resource planning. Understanding their impact on theelectric grid must be prior and critical. In this paper, we havestudied the potential impact of solar energy penetration in aparticular location of PJM electricity market. Key economic andsystem variables that were analyzed include system productioncost, market prices (average zonal prices), congestion (both hoursand dollars), and transmission losses. We find that significantpenetration of solar energy resources can produce system-wideeconomic benefits in the respective transmission areas as well asthe entire system.
Index Terms—Economic analysis, electricity market, renewableenergy, solar penetration.
Nomenclature
A. Sets and IndicesT Total study period in hours t ∈ T .
B. Economic ParametersBCi Bid curve of generator i.CCik Congestion cost between bus k and bus i.ECi Emission cost of generator i.FCi Fuel cost of generator i.NLi No load cost of generator i.OMi O&M cost of generator i.PCi Production cost of generator i.STi Startup cost of generator i.SDi Shut down cost of generator i.
C. VariablesFl Real power flow on line l.LMPk Hourly LMP at bus k.LMPi Hourly LMP at generator bus i.LMPref Hourly LMP at reference bus.MLi Marginal loss factor at bus i.PD Total real power load.Pi Real power produced at generator i.
Manuscript received September 2, 2010; revised February 18, 2011; ac-cepted May 25, 2011. Date of publication August 30, 2011; date of currentversion May 22, 2012. Any errors or omissions are solely those of the author.
The author is with PJM Interconnection, Norristown, PA 19403 USA(e-mail: [email protected]).
Color versions of one or more of the figures in this paper are availableonline at http://ieeexplore.ieee.org.
Digital Object Identifier 10.1109/JSYST.2011.2162885
PL Total real power loss.SPxy Shadow price of constraint x in contingency y.SFxyi Shift factor for real load at bus i on constraint
x in contingency y.
D. Constantsai, bi, and ci Coefficients of bid curve for generator i.Fmax
l Maximum real power flow limit of line l.Pmin
i Minimum real power limit of generator i.Pmax
i Maximum real power limit of generator i.
I. Introduction
THE RENEWABLE energy resources, such as wind andsolar, have been proposed and developed in the U.S.
due to mandatory state legislation on renewable energy re-quirements standards (RES) and influence of potential climatechange policies at the federal level. For this reason, renewableenergy resources will take more important roles in resourceplanning in both traditional standalone utility and organizedmultilateral market environments. Variability and uncertaintyare inherent characteristics of renewable energy resources.This poses significant challenges to the system planners andoperators.
Different states have different RES targets and goals. TheRES requirements for states with RES mandate fall between4% and 30% of electricity which must be generated fromrenewable sources by a specified date. As of August 2010 [1],29 states plus the District of Columbia have renewable stan-dards, while additional seven states have renewable portfoliogoals. For example, California has renewable energy mandatethat 33% of energy be generated from renewable energy by2020. Similarly, New York State requires 29% by 2015 andPennsylvania requires about 18% by 2021, including non-renewable alternative resources.
Development and penetration of wind energy has beensignificant due to its decreasing cost and federally supportedproduction tax credit. Wind resources have become more eco-nomically competitive compared with conventional resources.However, the cost of solar energy, particularly fixed cost,has been prohibitively high to have large penetration into theelectric grid. Recently, U.S. government set out a goal ofdoubling its renewable energy generation capacity from wind,solar, and geothermal resources by 2012 [2]. It also plans tohalve the cost of solar energy by 2015, leading a way to makethe solar energy more competitive with electricity from otherresources in the electric grid.
1932-8184/$26.00 c© 2011 IEEE
206 IEEE SYSTEMS JOURNAL, VOL. 6, NO. 2, JUNE 2012
Consequently, in the near future, the solar energy can havesignificant potential to penetrate into the power grid andelectricity market areas. Solar energy penetration will morelikely be in smaller, gradual, and incremental scale, such asrooftop applications, installed at residential, commercial, andindustrial buildings.
The key feature of these resources, including certain hydroresources, is their “intermittency” or “non-dispatchability.” Inthe case of hydro resources, except runoff river type, therelease of water can be controlled, hence dispatchable. Sincewind and solar energy resources depend on the availabilityof wind and solar energy, these resources are generally non-dispatchable. In other words, these resources generate poweronly when there is wind blowing or sun shining, not whenthe system operators call them to do so. Hence, it is morechallenging to incorporate these resources into the systemplanning and operation. As a consequence, the system plannersand operators, including electricity market operators, havebeen concerned with the potential impact of penetration,especially the large amount, of renewable energy resourcesin their operating areas.
The key questions that draw some attention recently includewhether these intermittent resources are going to have someimpact—positive and/or negative—on the system in termsof economic, reliability, and operation. Economic impact onthe system includes observing and measuring the changes inthe key economic variables such as system production cost,congestion, market prices, and others, with and without thoseenergy resources.
Some studies [3], [4] have been conducted to understandbetter about the potential impact of wind energy penetrationon the New York power market. While these studies werequite comprehensive, the key findings was that New Yorkbulk power system can reliably accommodate at least 10%penetration, 3300 MW, of wind generation with only minoradjustments to its existing planning, operation, and reliabilitypractices. The authors found that there is a $1.8/MW averagereduction in spot prices in New York State for the simulatedstudy year.
Recent studies [5]–[7] include an investigative study [7]on the operational impact of up to 35% energy penetrationof wind, photovoltaics (PV), and concentrating solar poweron the power system operated by the WestConnect group.1
This paper shows that it is operationally feasible for West-Connect to accommodate 30% wind and 5% solar energypenetration, with recommended changes in a number of oper-ational areas, including increased balancing area cooperation,increased utilization of transmission, and more coordinatedcommitment/dispatch of generation over wider regions.
California Independent System Operator (ISO) [8] has re-cently conducted a study2 on integration of renewable re-sources which include wind, solar, small hydro, geothermal,and biomass/biogas. The study was done to understand the
1WestConnect includes group of utilities operating in Arizona, Colorado,Nevada, New Mexico, and Wyoming.
2Except this particular study, the author is not aware of any other relevantstudy, being conducted or been conducted at any other regional transmissionorganization (RTO)/ISOs.
operational and market impact of meeting the requirement that20% of all electricity supply come from eligible renewableresources by 2010, required by California’s existing RES. Themodeled renewable resource portfolio in the study includes2246 MW of solar power in addition to other resources.Operational impact includes the load-following (up/down) andregulation (up/down) requirements by existing generation fleet.Key finding of the study was that the combination of (someamount of) wind and solar resources can lessen the operationalrequirements, as compared to wind resource alone becausesolar resources are ramping up when wind resources areramping down, and vice versa. It also can lead to reduction inmarket clearing prices as well as displacement of energy fromthermal (gas-fired) generation in both the daily off-peak andon-peak hours.
A review of literature showed that many of the previouswork on solar energy fall into either technical (operation)or economics or combination of the two. Most of the work[9]–[12] on technical category searched for new methods—simulation and analytical—to estimate the solar energy output,with or without additional storage battery capacity so as todetermine the optimal size of PV system. Some of these works[13]–[17] also evaluate the reliability of PV system whichstudies the loss-of-load probability of PV system based onvarious factors. Some recent works [18]–[22] extend technicalwork by including aspects of economic analysis into the PVsystem valuation.
However, most of these works were focused solely onstandalone PV system and thus did not consider the impacton the larger system (larger utility area or larger regionaltransmission area) with the penetration of large amount ofstandalone PV resources. While there were some studies onthe impact of wind energy resources on the electric grid andelectricity market, no such study was done to understand thepotential impact of solar energy penetration on a power grid,particularly, under an operating electricity market environ-ment. In this respect, our paper has attempted to make someimportant contribution to fill that gap.
This paper is organized as follows. We describe the studybackground of solar energy penetration in Section II, themethodology and assumptions in Section III, the results inSection IV, and the conclusion and further discussion inSection V. We also provide, in the appendixes, a concise math-ematical formulation of locational marginal pricing (LMP)methodology used in the market simulation method.
II. Study Background of Solar
Energy Penetration
In this section, we provide a brief description of PJMelectricity market and rationale for modeling solar energypenetration as load reduction.
A. PJM Electricity Market
PJM Interconnection is a RTO which operates the world’slargest wholesale electricity market in a defined control area.It is also an experienced operator of successful wholesaleelectricity markets and is responsible for reliability of electric
LIN: POTENTIAL IMPACT OF SOLAR ENERGY PENETRATION ON PJM ELECTRICITY MARKET 207
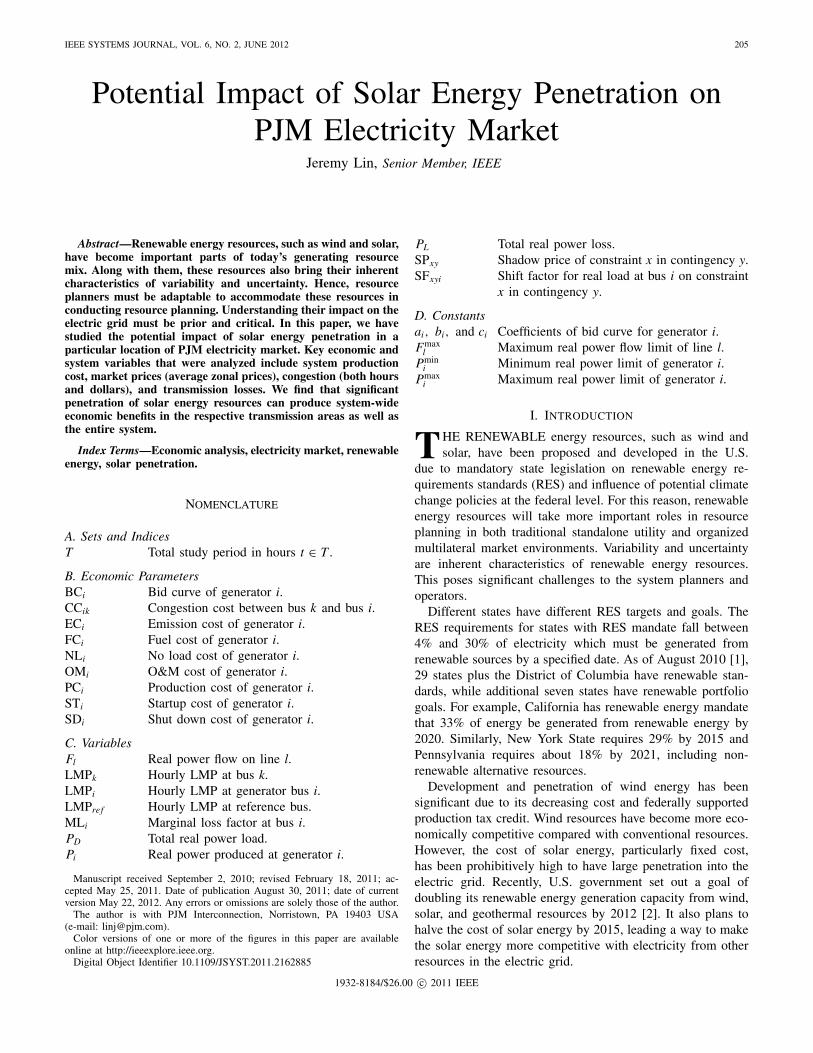
Fig. 1. PJM operating footprint.
transmission system. PJM operates the following markets:energy (both day-ahead and real-time), financial transmissionrights, ancillary services (regulation, spinning reserve, etc.),and capacity market known as reliability pricing model.
Among the RTOs under Federal Energy Regulatory Com-mission’s jurisdiction, PJM is the largest RTO with the peakload of over 140 GW on August 2, 2006, with more than 1000generating units. PJM control area covers all or parts of 13states and the District of Columbia in the mid-Atlantic region.The operating territory of PJM is shown in Fig. 1.
Since the operating territory of PJM expands many states,the potential state legislation related to electric grid can havepotentially significant impact on operation, and planning of itstransmission system and electricity market.
Primarily, renewable energy standards are mandated byindividual states to reduce carbon emissions from electricpower generators, diversify the fuel, and location from whichelectric supply comes, and to achieve electric cost stability.Thus, state regulatory bodies are interested in analyzing andunderstanding the potential impact of large penetration of theseintermittent resources, in their state territories. Note that theelectrical boundaries of zonal (control) areas do not necessarilymatch with the state boundaries. However, we can analyzetheir impact within a state boundary by studying the impacton relevant zonal areas that are approximately located insidethat state territory.
B. Modeling of Solar Energy Penetration
On a particular solar device level, such as solar panel,the output from one solar panel has particular energy profile[23] which typically has a rounded step-function, due toavailability of sun, i.e., insolation. Individual solar panelscommonly experience power output variations in the one-second to several-minute timeframe. When many solar panelsare grouped together in a particular building or site, theshort-term variations of individual solar devices are attenuatedas a percentage of the aggregate and the dominant poweroutput variations for the entire solar building or site occurin the minute-to-hour time frame. Similarly, the minute-to-minute power output of individual solar buildings or sites areattenuated in systems with multiple solar energy resources,
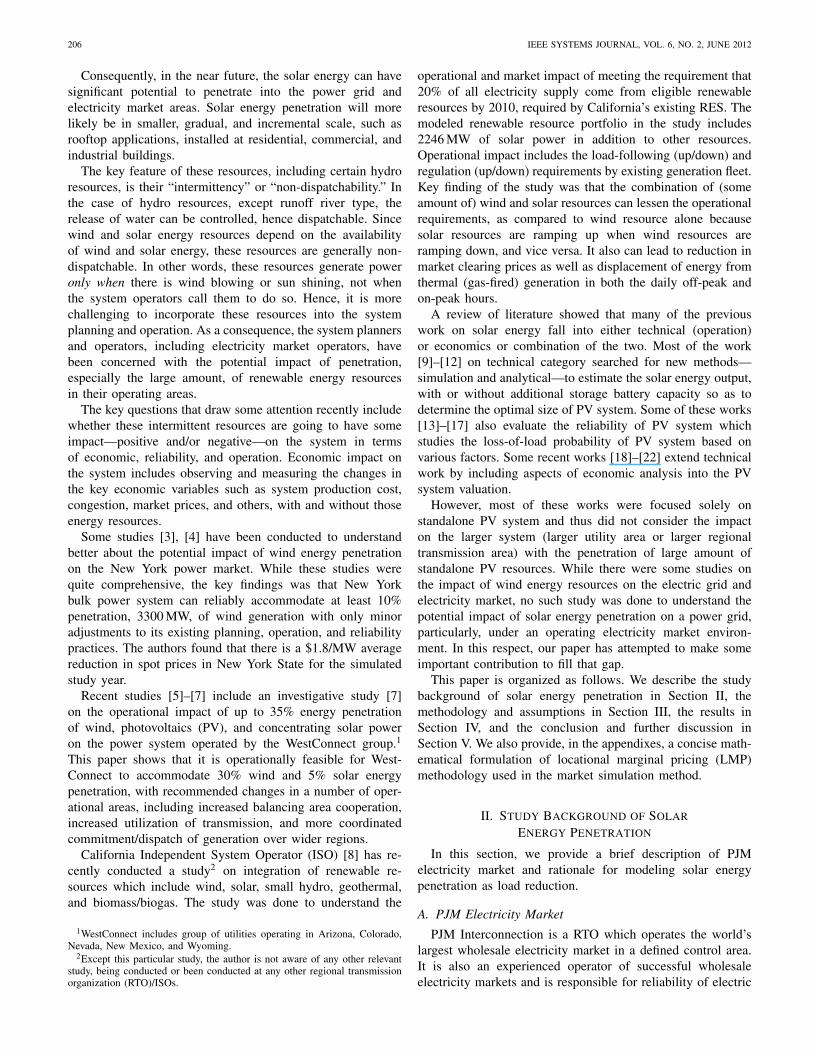
Fig. 2. Daily load shape.
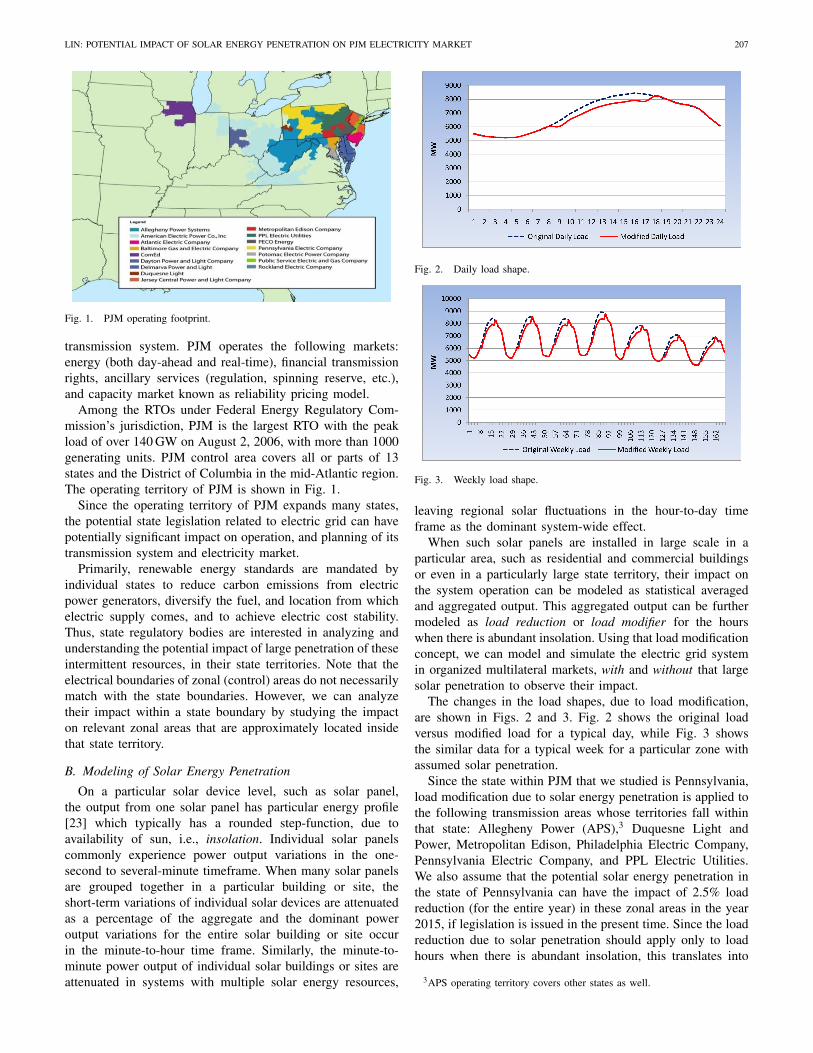
Fig. 3. Weekly load shape.
leaving regional solar fluctuations in the hour-to-day timeframe as the dominant system-wide effect.
When such solar panels are installed in large scale in aparticular area, such as residential and commercial buildingsor even in a particularly large state territory, their impact onthe system operation can be modeled as statistical averagedand aggregated output. This aggregated output can be furthermodeled as load reduction or load modifier for the hourswhen there is abundant insolation. Using that load modificationconcept, we can model and simulate the electric grid systemin organized multilateral markets, with and without that largesolar penetration to observe their impact.
The changes in the load shapes, due to load modification,are shown in Figs. 2 and 3. Fig. 2 shows the original loadversus modified load for a typical day, while Fig. 3 showsthe similar data for a typical week for a particular zone withassumed solar penetration.
Since the state within PJM that we studied is Pennsylvania,load modification due to solar energy penetration is applied tothe following transmission areas whose territories fall withinthat state: Allegheny Power (APS),3 Duquesne Light andPower, Metropolitan Edison, Philadelphia Electric Company,Pennsylvania Electric Company, and PPL Electric Utilities.We also assume that the potential solar energy penetration inthe state of Pennsylvania can have the impact of 2.5% loadreduction (for the entire year) in these zonal areas in the year2015, if legislation is issued in the present time. Since the loadreduction due to solar penetration should apply only to loadhours when there is abundant insolation, this translates into
3APS operating territory covers other states as well.
208 IEEE SYSTEMS JOURNAL, VOL. 6, NO. 2, JUNE 2012
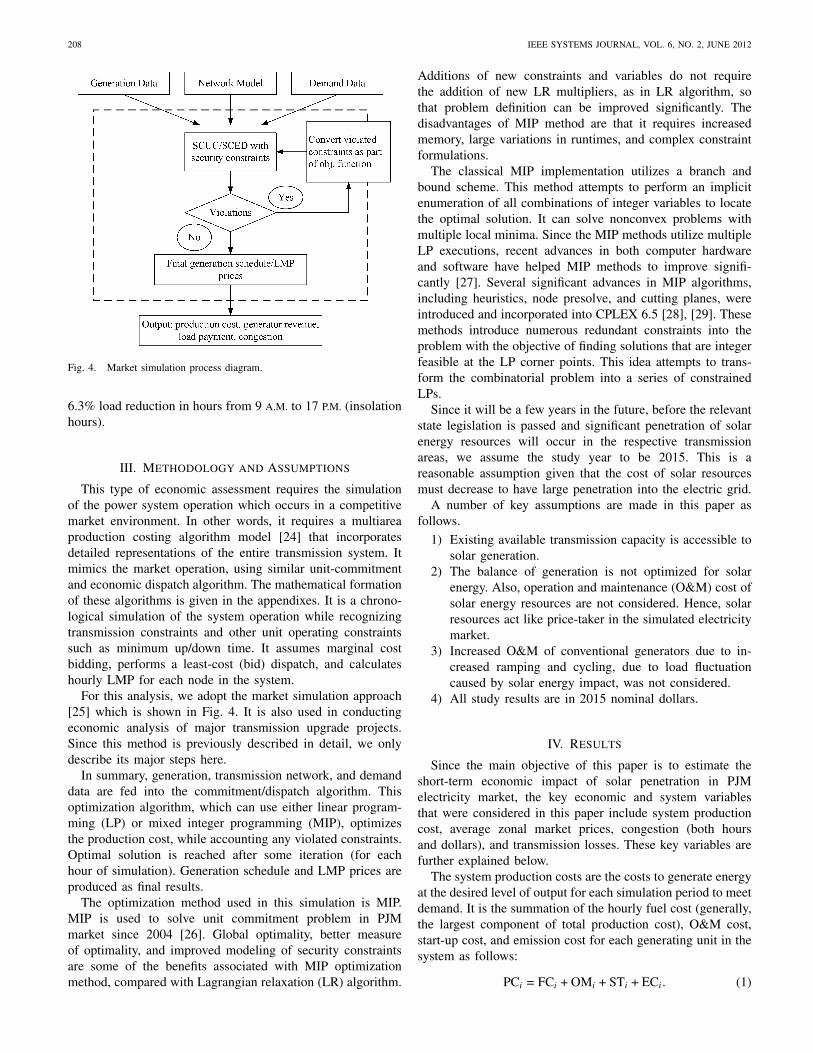
Fig. 4. Market simulation process diagram.
6.3% load reduction in hours from 9 A.M. to 17 P.M. (insolationhours).
III. Methodology and Assumptions
This type of economic assessment requires the simulationof the power system operation which occurs in a competitivemarket environment. In other words, it requires a multiareaproduction costing algorithm model [24] that incorporatesdetailed representations of the entire transmission system. Itmimics the market operation, using similar unit-commitmentand economic dispatch algorithm. The mathematical formationof these algorithms is given in the appendixes. It is a chrono-logical simulation of the system operation while recognizingtransmission constraints and other unit operating constraintssuch as minimum up/down time. It assumes marginal costbidding, performs a least-cost (bid) dispatch, and calculateshourly LMP for each node in the system.
For this analysis, we adopt the market simulation approach[25] which is shown in Fig. 4. It is also used in conductingeconomic analysis of major transmission upgrade projects.Since this method is previously described in detail, we onlydescribe its major steps here.
In summary, generation, transmission network, and demanddata are fed into the commitment/dispatch algorithm. Thisoptimization algorithm, which can use either linear program-ming (LP) or mixed integer programming (MIP), optimizesthe production cost, while accounting any violated constraints.Optimal solution is reached after some iteration (for eachhour of simulation). Generation schedule and LMP prices areproduced as final results.
The optimization method used in this simulation is MIP.MIP is used to solve unit commitment problem in PJMmarket since 2004 [26]. Global optimality, better measureof optimality, and improved modeling of security constraintsare some of the benefits associated with MIP optimizationmethod, compared with Lagrangian relaxation (LR) algorithm.
Additions of new constraints and variables do not requirethe addition of new LR multipliers, as in LR algorithm, sothat problem definition can be improved significantly. Thedisadvantages of MIP method are that it requires increasedmemory, large variations in runtimes, and complex constraintformulations.
The classical MIP implementation utilizes a branch andbound scheme. This method attempts to perform an implicitenumeration of all combinations of integer variables to locatethe optimal solution. It can solve nonconvex problems withmultiple local minima. Since the MIP methods utilize multipleLP executions, recent advances in both computer hardwareand software have helped MIP methods to improve signifi-cantly [27]. Several significant advances in MIP algorithms,including heuristics, node presolve, and cutting planes, wereintroduced and incorporated into CPLEX 6.5 [28], [29]. Thesemethods introduce numerous redundant constraints into theproblem with the objective of finding solutions that are integerfeasible at the LP corner points. This idea attempts to trans-form the combinatorial problem into a series of constrainedLPs.
Since it will be a few years in the future, before the relevantstate legislation is passed and significant penetration of solarenergy resources will occur in the respective transmissionareas, we assume the study year to be 2015. This is areasonable assumption given that the cost of solar resourcesmust decrease to have large penetration into the electric grid.
A number of key assumptions are made in this paper asfollows.
1) Existing available transmission capacity is accessible tosolar generation.
2) The balance of generation is not optimized for solarenergy. Also, operation and maintenance (O&M) cost ofsolar energy resources are not considered. Hence, solarresources act like price-taker in the simulated electricitymarket.
3) Increased O&M of conventional generators due to in-creased ramping and cycling, due to load fluctuationcaused by solar energy impact, was not considered.
4) All study results are in 2015 nominal dollars.
IV. Results
Since the main objective of this paper is to estimate theshort-term economic impact of solar penetration in PJMelectricity market, the key economic and system variablesthat were considered in this paper include system productioncost, average zonal market prices, congestion (both hoursand dollars), and transmission losses. These key variables arefurther explained below.
The system production costs are the costs to generate energyat the desired level of output for each simulation period to meetdemand. It is the summation of the hourly fuel cost (generally,the largest component of total production cost), O&M cost,start-up cost, and emission cost for each generating unit in thesystem as follows:
PCi = FCi + OMi + STi + ECi. (1)
LIN: POTENTIAL IMPACT OF SOLAR ENERGY PENETRATION ON PJM ELECTRICITY MARKET 209
TABLE I
Changes in System Production Cost
TABLE II
Changes in Congestion
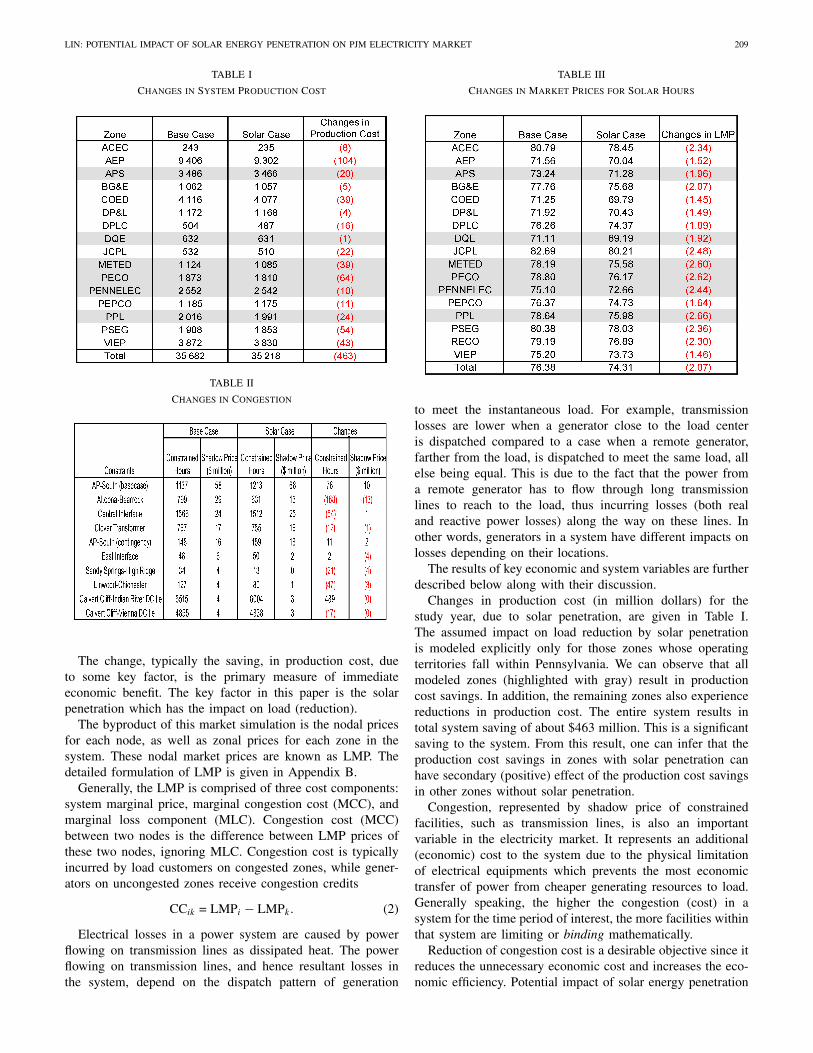
The change, typically the saving, in production cost, dueto some key factor, is the primary measure of immediateeconomic benefit. The key factor in this paper is the solarpenetration which has the impact on load (reduction).
The byproduct of this market simulation is the nodal pricesfor each node, as well as zonal prices for each zone in thesystem. These nodal market prices are known as LMP. Thedetailed formulation of LMP is given in Appendix B.
Generally, the LMP is comprised of three cost components:system marginal price, marginal congestion cost (MCC), andmarginal loss component (MLC). Congestion cost (MCC)between two nodes is the difference between LMP prices ofthese two nodes, ignoring MLC. Congestion cost is typicallyincurred by load customers on congested zones, while gener-ators on uncongested zones receive congestion credits
CCik = LMPi − LMPk. (2)
Electrical losses in a power system are caused by powerflowing on transmission lines as dissipated heat. The powerflowing on transmission lines, and hence resultant losses inthe system, depend on the dispatch pattern of generation
TABLE III
Changes in Market Prices for Solar Hours
to meet the instantaneous load. For example, transmissionlosses are lower when a generator close to the load centeris dispatched compared to a case when a remote generator,farther from the load, is dispatched to meet the same load, allelse being equal. This is due to the fact that the power froma remote generator has to flow through long transmissionlines to reach to the load, thus incurring losses (both realand reactive power losses) along the way on these lines. Inother words, generators in a system have different impacts onlosses depending on their locations.
The results of key economic and system variables are furtherdescribed below along with their discussion.
Changes in production cost (in million dollars) for thestudy year, due to solar penetration, are given in Table I.The assumed impact on load reduction by solar penetrationis modeled explicitly only for those zones whose operatingterritories fall within Pennsylvania. We can observe that allmodeled zones (highlighted with gray) result in productioncost savings. In addition, the remaining zones also experiencereductions in production cost. The entire system results intotal system saving of about $463 million. This is a significantsaving to the system. From this result, one can infer that theproduction cost savings in zones with solar penetration canhave secondary (positive) effect of the production cost savingsin other zones without solar penetration.
Congestion, represented by shadow price of constrainedfacilities, such as transmission lines, is also an importantvariable in the electricity market. It represents an additional(economic) cost to the system due to the physical limitationof electrical equipments which prevents the most economictransfer of power from cheaper generating resources to load.Generally speaking, the higher the congestion (cost) in asystem for the time period of interest, the more facilities withinthat system are limiting or binding mathematically.
Reduction of congestion cost is a desirable objective since itreduces the unnecessary economic cost and increases the eco-nomic efficiency. Potential impact of solar energy penetration
210 IEEE SYSTEMS JOURNAL, VOL. 6, NO. 2, JUNE 2012
TABLE IV
Changes in Market Prices for All Hours
on congestion (both hours and dollars) is shown in Table II.For illustrative purpose, only the top ten constraints, of thestudy year, which have highest shadow prices, are shown. Inother words, these top constraints contributed highest conges-tion cost to the entire system. In the case with solar penetration(solar case in the figures), the congestion costs of sevenconstraints, out of ten, have decreased. The total reductionof congestion cost for the entire system is about $18 million.
Based on fundamental economic theory, market prices areexcellent indicators of efficient allocation of scarce resources.It represents the (efficient) equilibrium price for the momentof interest, determined by available supply and demand to bemet. The scarce resource, in this case, is electricity. Electricitymarkets have been using market prices, represented by LMP,to achieve that short-term economic efficiency. Higher marketprices represent a situation where there are less or insufficientsupply to meet the demand. Lower market prices represent anopposite situation.
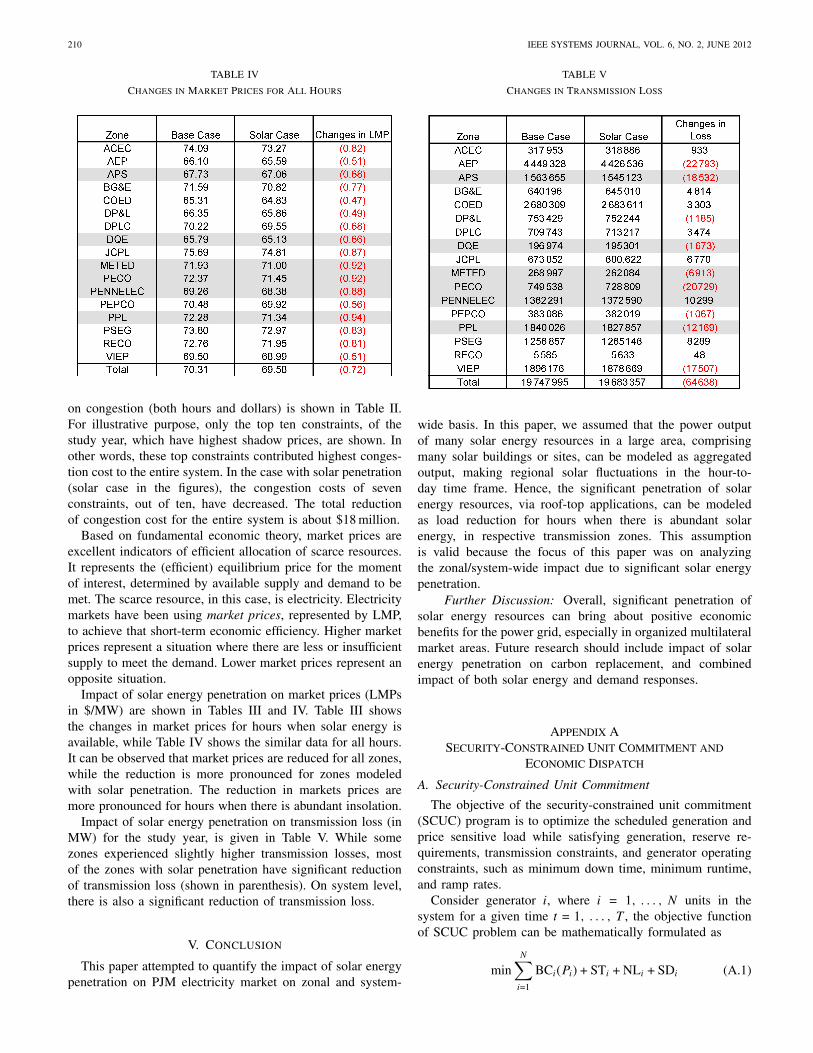
Impact of solar energy penetration on market prices (LMPsin $/MW) are shown in Tables III and IV. Table III showsthe changes in market prices for hours when solar energy isavailable, while Table IV shows the similar data for all hours.It can be observed that market prices are reduced for all zones,while the reduction is more pronounced for zones modeledwith solar penetration. The reduction in markets prices aremore pronounced for hours when there is abundant insolation.
Impact of solar energy penetration on transmission loss (inMW) for the study year, is given in Table V. While somezones experienced slightly higher transmission losses, mostof the zones with solar penetration have significant reductionof transmission loss (shown in parenthesis). On system level,there is also a significant reduction of transmission loss.
V. Conclusion
This paper attempted to quantify the impact of solar energypenetration on PJM electricity market on zonal and system-
TABLE V
Changes in Transmission Loss
wide basis. In this paper, we assumed that the power outputof many solar energy resources in a large area, comprisingmany solar buildings or sites, can be modeled as aggregatedoutput, making regional solar fluctuations in the hour-to-day time frame. Hence, the significant penetration of solarenergy resources, via roof-top applications, can be modeledas load reduction for hours when there is abundant solarenergy, in respective transmission zones. This assumptionis valid because the focus of this paper was on analyzingthe zonal/system-wide impact due to significant solar energypenetration.
Further Discussion: Overall, significant penetration ofsolar energy resources can bring about positive economicbenefits for the power grid, especially in organized multilateralmarket areas. Future research should include impact of solarenergy penetration on carbon replacement, and combinedimpact of both solar energy and demand responses.
Appendix A
Security-Constrained Unit Commitment and
Economic Dispatch
A. Security-Constrained Unit Commitment
The objective of the security-constrained unit commitment(SCUC) program is to optimize the scheduled generation andprice sensitive load while satisfying generation, reserve re-quirements, transmission constraints, and generator operatingconstraints, such as minimum down time, minimum runtime,and ramp rates.
Consider generator i, where i = 1, . . . , N units in thesystem for a given time t = 1, . . . , T , the objective functionof SCUC problem can be mathematically formulated as
minN∑
i=1
BCi(Pi) + STi + NLi + SDi (A.1)
LIN: POTENTIAL IMPACT OF SOLAR ENERGY PENETRATION ON PJM ELECTRICITY MARKET 211
where BCi is bid curve ($/h) with bid price and generation(normally quadratic) for unit i, which is described as
BCi(Pi) = aiP2i + biPi + ci. (A.2)
This objective function is subject to both equality andinequality constraints which are described later.
B. Security-Constrained Economic Dispatch
The objective of the security-constrained economic dispatch(SCED) is to find the minimum cost or bid (depending onthe decision variable) for real power generation subject tovarious equality and inequality constraints in relation to powerbalance, voltage limits, and other security constraints.
Again, consider generator i, where i = 1, . . . , N units in thesystem for a given time t = 1, . . . , T , the objective functionof SCED problem can be mathematically formulated as
minN∑
i=1
BCi(Pi) (A.3)
subject toN∑
i=1
Pi = PD + PL (A.4)
Pmini ≤ Pi ≤ Pmax
i ∀i (A.5)
Fl ≤ Fmaxl ∀i. (A.6)
Equations (A.4)–(A.6) represent power balance constraintin the study system, real power limits (min, max) of eachgenerator, and real power flow limits of each transmission line.
Appendix B
Formulation of LMP
We assume “average loss” in the paper. Following theformulation used for SCED, we can further modify (A.4)–(A.6) by adding appropriate Lagrangian multipliers to theequality and inequality constraints as follows:
minN∑
i=1
BCi (Pi) (A.7)
subject toN∑
i=1
Pi = PD + PL : λ (A.8)
Pmini ≤ Pi ≤ Pmax
i ∀i : μ (A.9)
Fl ≤ Fmaxl ∀i : θ. (A.10)
Equations (A.8)–(A.10) are similar to (A.4)–(A.6), exceptthat they are written with extra variables. These extra variables,λ, μ, and θ [30] are known as Lagrangian multipliers andrepresent penalty for imbalance of supply and demand, penaltyfor binding generator limits, and shadow prices for respectivebinding transmission lines. These shadow prices form thebasis for congestion components of LMP, when there arecongestions—binding transmission flow—in the system.
Then, LMP at each bus i in the system can be written as
LMPi = (1 + MLi) LMref +X∑
x=1
Y∑
y=1
SPxySFxyi. (A.11)
This equation decomposes the locational price into the priceof energy at a reference bus (LMPref ), the cost of lossesrelative to the reference bus (MLi
∗ LMPref ), and the costof congestion (�x�ySPxySFxyi).
Acknowledgment
The author would like to thank M. K. Abdurrahman fromPJM, Norristown, PA, for his support in conducting theanalysis provided here.
References
[1] Database of State Incentives for Renewables and Efficiency (DSIRE)[Online]. Available: http://www.dsireusa.org
[2] The Economic Impact of the American Recovery and Reinvestment Actof 2009, Council of Economic Advisors, Fourth Quarterly Report, Jul.2010.
[3] The Effects of Integrating Wind Power on Transmission System Planning,Reliability, and Operations: Report on Phase 1: Preliminary Overall Re-liability Assessment, New York State Energy Research and DevelopmentAuthority (NYSERDA) Report, Feb. 2004.
[4] The Effects of Integrating Wind Power on Transmission System Planning,Reliability, and Operations: Report on Phase 2: System PerformanceEvaluation, New York State Energy Research and Development Au-thority (NYSERDA) Report, Mar. 2005.
[5] Ontario Wind Integration Study, Ontario Power Authority (OPA), In-dependent Electricity System Operator (IESO), Canadian Wind EnergyAssociation (CanWEA) Report, Oct. 2006.
[6] Analysis of Wind Generation Impact on ERCOT Ancillary ServicesRequirements, Electric Reliability Council of Texas (ERCOT) Report,Mar. 2008.
[7] Western Wind and Solar Integration Study, National Renewable EnergyLaboratory (NREL) Report, May 2010.
[8] Integration of Renewable Resources: Operational Requirements andGeneration Fleet Capability at 20% RPS, California Independent SystemOperator (CalISO) Report, Aug. 31, 2010.
[9] R. B. Bagen, “Evaluation of different operating strategies in smallstandalone power systems,” IEEE Trans. Energy Conversion, vol. 20,no. 3, pp. 654–660, May 2005.
[10] J. B. Ayer, “Design of a stand-alone photovoltaic power system,” inProc. 16th IEEE Photovoltaic Spec. Conf., Sep. 1982, pp. 1443–1453.
[11] J. Samimi, E. A. Soleimani, and M. S. Zabhi, “Optimal sizing of PVsystems in varied climates,” Solar Energy, vol. 60, no. 2, pp. 97–107,1997.
[12] L. Barra, S. Catalanotti, F. Fontana, and F. Lavorante, “An analyticalmethod to determine the optimal size of a photovoltaic plant,” SolarEnergy, vol. 33, no. 6, pp. 509–514, 1984.
[13] R. Karki and R. Billinton, “Reliability/cost implications of PV and windenergy utilization in small isolated power systems,” IEEE Trans. EnergyConversion, vol. 16, no. 4, pp. 368–373, Dec. 2001.
[14] P. R. Mishra and J. C. Joshi, “Reliability estimation for components ofphotovoltaic systems,” Energy Conversion Manag., vol. 37, no. 9, pp.1371–1382, Sep. 1996.
[15] P. Tsalides and A. Thanailakis, “Loss-of-load probability and related pa-rameters in optimum computer-aided design of stand-alone PV systems,”Solar Cells, vol. 18, no. 2, pp. 115–127, Aug. 1986.
[16] E. Ofry and A. Braunstein, “The loss of power supply probability as atechnique for designing stand-alone solar electrical PV systems,” IEEETrans. Power App. Syst., vol. PAS-102, no. 5, pp. 1171–1175, May 1983.
[17] M. Kolhe, J. C. Joshi, and D. P. Kothari, “Determination of loss-of-loadprobability of a stand-alone PV system,” Int. J. Energy Technol. Policy,vol. 1, no. 3, pp. 315–323, 2003.
[18] H. Saha, P. Basu, and S. B. Roy, “Applications of PV systems: Aneconomic appraisal with reference to India,” Solar Energy, vol. 41, no.6, pp. 513–519, 1988.

212 IEEE SYSTEMS JOURNAL, VOL. 6, NO. 2, JUNE 2012
[19] M. K. C. Marwali, S. M. Shahidehpour, and M. Daneshdoost, “Prob-abilistic production costing for PV-utility system with battery storage,”IEEE Trans. Energy Conversion, vol. 12, no. 2, pp. 175–180, Jun. 1997.
[20] M. Kolhe, S. Kolhe, and J. C. Joshi, “Economic viability of stand-alone photovoltaic system in comparison with diesel powered systemfor India,” Energy Eco., vol. 24, no. 2, pp. 155–165, 2002.
[21] M. Kolhe, J. C. Joshi, G. Agnihotri, and A. M. Shandilya, “Marketpenetration and pay-back period analysis of solar photovoltaic systemfor Indian conditions,” Int. J. Energy Technol. Policy, vol. 1, nos. 1–2,pp. 166–180, 2002.
[22] M. Kolhe, “Techno-economic optimum sizing of a stand-alone solarphotovoltaic system,” IEEE Trans. Energy Conversion, vol. 24, no. 2,pp. 511–519, Jun. 2009.
[23] Y. Lin and G. Gross, “Production cost analysis of dispersed generationoptions in a transmission-constrained load pocket of an interconnectedsystem,” IEEE Trans. Energy Conversion, vol. 19, no. 1, pp. 151–156,Mar. 2004.
[24] Y. Lin, G. Jordan, J. Zhu, M. Sanford, and W. H. Babcock, “Economicanalysis of establishing regional transmission organization and standardmarket design in the Southeast,” IEEE Trans. Power Syst., vol. 21, no.4, pp. 1520–1527, Nov. 2006.
[25] J. Lin, “Market-based transmission planning model in PJM electricitymarket,” in Proc. 6th Int. Conf. Eur. Energy Market, May 2009, pp. 1–6.
[26] D. Streiffert, R. Philbrick, and A. Ott, “A mixed integer programmingsolution for market clearing and reliability analysis,” in Proc. IEEE PESGeneral Meet., Jun. 2005, pp. 2724–2731.
[27] R. E. Bixby, “Solving real-world linear programs: A decade and moreof progress,” Oper. Res., vol. 50, no. 1, pp. 3–15, Jan.–Feb. 2002.
[28] R. E. Bixby, M. Fenolon, Z. Gu, E. Rothberg, and R. Wunderling,MIP: Theory and Practice: Closing the Gap. Incline Village, NV: ILOGCPLEX Division [Online]. Available: http://www.ilog.com
[29] CPLEX, ILOG, Inc., Incline Village, NV.[30] A. J. Wood and B. F. Wollenberg, Power Generation, Operation and
Control, 2nd ed. New York: Wiley, 1996.
Jeremy Lin (SM’05) received the B.E. degree inelectrical power engineering from the Rangoon In-stitute of Technology, Rangoon, Burma, in 1993, theM.E. degree in electric power system managementfrom the Asian Institute of Technology, Pathumthani,Thailand, in 1997, the M.S. degree in electrical andcomputer engineering from the University of Illinoisat Urbana-Champaign, Urbana, in 1999, and theM.B.A. degree in finance from Villanova University,Villanova, PA, in 2010. He is currently pursuing thePh.D. degree in electrical and computer engineering
from the Drexel University, Philadelphia, PA.He is affiliated with PJM Interconnection, Norristown, PA. He was with
GE Energy/Energy Consulting, Schenectady, NY, and Mid-America Intercon-nected Network, Inc., Lombard, IL. His current research interests includepower systems modeling, optimization, computation, analysis, economics,operation, planning, and design of electricity markets, particularly at the nexusof economics, network, and optimization.
Copyright © 2022 FDOKUMEN