Cost-Effectiveness of Hypertension Therapy According to 2014 Guidelines
9
The new england journal of medicine n engl j med 372;5 nejm.org january 29, 2015 447 special article Cost-Effectiveness of Hypertension Therapy According to 2014 Guidelines Andrew E. Moran, M.D., M.P.H., Michelle C. Odden, Ph.D., Anusorn Thanataveerat, M.P.H., Keane Y. Tzong, M.P.H., Petra W. Rasmussen, M.P.H., David Guzman, M.S.P.H., Lawrence Williams, M.S., Kirsten Bibbins-Domingo, Ph.D., M.D., Pamela G. Coxson, Ph.D., and Lee Goldman, M.D., M.P.H. From the College of Physicians and Sur- geons, Columbia University (A.E.M., L.G.), and Division of General Medicine, Colum- bia University Medical Center (A.E.M., A.T., K.Y.T., P.W.R.) — both in New York; School of Biological and Population Health Sciences, Oregon State University, Corvallis (M.C.O.); Department of Medi- cine, University of California, San Fran- cisco (D.G., K.B.-D., P.G.C.); and Partners Health Care, Boston (L.W.). Address re- print requests to Dr. Moran at Columbia University Division of General Medicine, Presbyterian Hospital, 9th Fl. East, Rm. 105, 622 West 168th St., New York, NY 10032, or at [email protected]. N Engl J Med 2015;372:447-55. DOI: 10.1056/NEJMsa1406751 Copyright © 2015 Massachusetts Medical Society. ABSTRACT Background On the basis of the 2014 guidelines for hypertension therapy in the United States, many eligible adults remain untreated. We projected the cost-effectiveness of treat- ing hypertension in U.S. adults according to the 2014 guidelines. Methods We used the Cardiovascular Disease Policy Model to simulate drug-treatment and monitoring costs, costs averted for the treatment of cardiovascular disease, and quality-adjusted life-years (QALYs) gained by treating previously untreated adults between the ages of 35 and 74 years from 2014 through 2024. We assessed cost- effectiveness according to age, hypertension level, and the presence or absence of chronic kidney disease or diabetes. Results The full implementation of the new hypertension guidelines would result in ap- proximately 56,000 fewer cardiovascular events and 13,000 fewer deaths from car- diovascular causes annually, which would result in overall cost savings. The projec- tions showed that the treatment of patients with existing cardiovascular disease or stage 2 hypertension would save lives and costs for men between the ages of 35 and 74 years and for women between the ages of 45 and 74 years. The treatment of men or women with existing cardiovascular disease or men with stage 2 hypertension but without cardiovascular disease would remain cost-saving even if strategies to increase medication adherence doubled treatment costs. The treatment of stage 1 hypertension was cost-effective (defined as <$50,000 per QALY) for all men and for women between the ages of 45 and 74 years, whereas treating women between the ages of 35 and 44 years with stage 1 hypertension but without cardiovascular dis- ease had intermediate or low cost-effectiveness. Conclusions The implementation of the 2014 hypertension guidelines for U.S. adults between the ages of 35 and 74 years could potentially prevent about 56,000 cardiovascular events and 13,000 deaths annually, while saving costs. Controlling hypertension in all patients with cardiovascular disease or stage 2 hypertension could be effective and cost-saving. (Funded by the National Heart, Lung, and Blood Institute and others.)
-
Upload
independent -
Category
Documents
-
view
0 -
download
0
Transcript of Cost-Effectiveness of Hypertension Therapy According to 2014 Guidelines

T h e n e w e ngl a nd j o u r na l o f m e dic i n e
n engl j med 372;5 nejm.org january 29, 2015 447
special article
Cost-Effectiveness of Hypertension Therapy According to 2014 Guidelines
Andrew E. Moran, M.D., M.P.H., Michelle C. Odden, Ph.D., Anusorn Thanataveerat, M.P.H., Keane Y. Tzong, M.P.H., Petra W. Rasmussen, M.P.H., David Guzman, M.S.P.H.,
Lawrence Williams, M.S., Kirsten Bibbins-Domingo, Ph.D., M.D., Pamela G. Coxson, Ph.D., and Lee Goldman, M.D., M.P.H.
From the College of Physicians and Sur-geons, Columbia University (A.E.M., L.G.), and Division of General Medicine, Colum-bia University Medical Center (A.E.M., A.T., K.Y.T., P.W.R.) — both in New York; School of Biological and Population Health Sciences, Oregon State University, Corvallis (M.C.O.); Department of Medi-cine, University of California, San Fran-cisco (D.G., K.B.-D., P.G.C.); and Partners Health Care, Boston (L.W.). Address re-print requests to Dr. Moran at Columbia University Division of General Medicine, Presbyterian Hospital, 9th Fl. East, Rm. 105, 622 West 168th St., New York, NY 10032, or at [email protected].
N Engl J Med 2015;372:447-55.DOI: 10.1056/NEJMsa1406751Copyright © 2015 Massachusetts Medical Society.
A BS TR AC T
Background
On the basis of the 2014 guidelines for hypertension therapy in the United States, many eligible adults remain untreated. We projected the cost-effectiveness of treat-ing hypertension in U.S. adults according to the 2014 guidelines.
Methods
We used the Cardiovascular Disease Policy Model to simulate drug-treatment and monitoring costs, costs averted for the treatment of cardiovascular disease, and quality-adjusted life-years (QALYs) gained by treating previously untreated adults between the ages of 35 and 74 years from 2014 through 2024. We assessed cost-effectiveness according to age, hypertension level, and the presence or absence of chronic kidney disease or diabetes.
Results
The full implementation of the new hypertension guidelines would result in ap-proximately 56,000 fewer cardiovascular events and 13,000 fewer deaths from car-diovascular causes annually, which would result in overall cost savings. The projec-tions showed that the treatment of patients with existing cardiovascular disease or stage 2 hypertension would save lives and costs for men between the ages of 35 and 74 years and for women between the ages of 45 and 74 years. The treatment of men or women with existing cardiovascular disease or men with stage 2 hypertension but without cardiovascular disease would remain cost-saving even if strategies to increase medication adherence doubled treatment costs. The treatment of stage 1 hypertension was cost-effective (defined as <$50,000 per QALY) for all men and for women between the ages of 45 and 74 years, whereas treating women between the ages of 35 and 44 years with stage 1 hypertension but without cardiovascular dis-ease had intermediate or low cost-effectiveness.
Conclusions
The implementation of the 2014 hypertension guidelines for U.S. adults between the ages of 35 and 74 years could potentially prevent about 56,000 cardiovascular events and 13,000 deaths annually, while saving costs. Controlling hypertension in all patients with cardiovascular disease or stage 2 hypertension could be effective and cost-saving. (Funded by the National Heart, Lung, and Blood Institute and others.)

T h e n e w e ngl a nd j o u r na l o f m e dic i n e
n engl j med 372;5 nejm.org january 29, 2015448
In the United States, more deaths from cardiovascular causes are attributed to elevated blood pressure than to any other risk
factor.1,2 Since 1960, there has been a decline of approximately 10% in the mean systolic blood pressure and a decline of approximately 13% in the mean diastolic blood pressure among adults over the age of 40 years, in part because of greater awareness of the risk and more widespread treat-ment of hypertension.3 Nonetheless, the number of persons with hypertension is increasing, and an estimated 44% of the 64 million U.S. adults with hypertension did not have this condition controlled in 2014. Thus, there is an enormous potential for improving population health by ex-panding treatment and improving control.4
A decade ago, the 2003 hypertension guide-lines of the Seventh Joint National Committee focused on controlling elevated systolic blood pressure in all adults with hypertension and recommended a similar blood-pressure goal re-gardless of age, with the exception of more ag-gressive treatment to a lower target in patients with diabetes or chronic kidney disease.5 The 2014 guidelines of the Eighth Joint National Com-mittee recommended three important changes to the 2003 guidelines: focusing on diastolic (rather than systolic) blood pressure for adults under the age of 60 years and setting more conservative blood-pressure goals for adults 60 years of age or older (150/90 mm Hg) and for patients with dia-betes or chronic kidney disease (140/90 mm Hg) (Table 1).6 As compared with the recommenda-tions in the previous guidelines, implementation of the 2014 guidelines would make approximately 1% of young adults and 8% of older adults ineli-gible to receive hypertension-lowering treatment. However, an estimated 28 million adults still would have uncontrolled hypertension according to the relaxed standards.4
Recently, the American College of Cardiology
and the American Heart Association called for the inclusion of cost-effectiveness assessments and recommendations in practice guidelines.7 The main objective of this study was to estimate the incremental health gains and cost-effective-ness of implementing the strongest recommen-dations for hypertension therapy (i.e., those based on the results of clinical trials) in the 2014 guide-lines among U.S. adults.
Me thods
Study Model
The Cardiovascular Disease Policy Model is a computer-simulation, state-transition model of the incidence, prevalence, mortality, and costs of coronary heart disease and stroke among per-sons between the ages of 35 and 94 years in the United States. (For an overview of the model, see the Methods section and Fig. S1 in the Supple-mentary Appendix, available with the full text of this article at NEJM.org.) We estimated risk-fac-tor exposure levels and classifications according to age and sex on the basis of survey-weighted analyses of the National Health and Nutrition Ex-amination Survey (NHANES)8 from 2007 through 2010. The model uses competing-risk Cox propor-tional-hazards regression equations estimated from the results of the Framingham Heart Study to predict the incidence of coronary heart dis-ease, stroke, and death from noncardiovascular causes among persons without cardiovascular disease, on the basis of age, sex, systolic and dia-stolic blood pressure, self-reported use or nonuse of antihypertensive medications, levels of high-density-lipoprotein and low-density-lipoprotein cholesterol, and status regarding chronic kidney disease, smoking, and diabetes mellitus. The model also predicts subsequent life-years and rates of cardiovascular events, coronary revascu-larization procedures, and death from cardiovas-cular causes or any cause among patients with cardiovascular disease. The model was calibrated to reproduce U.S. national data on myocardial infarction, stroke, and death from cardiovascular causes or any cause in 2010 to within less than 1% of absolute-number targets for each sex and 10-year age category.
Blood-Pressure Variables and Treatment Assumptions
In NHANES from 2007 through 2010, systolic blood pressure was categorized as less than
Table 1. Recommendations for Hypertension Treatment in the 2014 Guidelines for Adults, According to Major Treatment Group.
Treatment GroupAge Range
in StudyBlood-Pressure Treatment
Goal for Main Analysis
Age <60 yr, without diabetes or chronic kidney disease
35–59 yr Diastolic <90 mm Hg
Age ≥60 yr, without diabetes or chronic kidney disease
60–74 yr Systolic <150 mm Hg and diastolic <90 mm Hg
All adults, with diabetes or chronic kidney disease
35–74 yr Systolic <140 mm Hg and diastolic <90 mm Hg

COST-EFFECTIVENESS OF HYPERTENSION THER APY
n engl j med 372;5 nejm.org january 29, 2015 449
140 mm Hg, 140 to 159 mm Hg (stage 1 hyper-tension), or 160 mm Hg or higher (stage 2 hyper-tension). To assess the 2014 guideline recommen-dations for adults between the ages of 60 and 74 years, we further divided stage 1 hypertension into 140 to 149 mm Hg and 150 to 159 mm Hg. Categories for diastolic blood pressure were less than 90 mm Hg, 90 to 99 mm Hg (stage 1 hyper-tension), and 100 mm Hg or higher (stage 2 hy-pertension). Patients were considered to have un-treated hypertension if they answered no to the following two questions on NHANES: “Because of your high blood pressure or hypertension, have you ever been told to take prescribed medi-cine?” and “Are you currently taking medication to lower your blood pressure?”
In our study, we assumed that a reduction in the risk of cardiovascular disease was due to a reduction in blood pressure9 and that blood pressure was lowered to a similar extent across drug classes in comparisons of standard doses per class.10,11 Using data from the Prospective Studies Collaboration,12 a meta-analysis of 61 prospective studies of vascular risk factors and cause-specific mortality involving 1 million par-ticipants, we started by calculating observational age-specific relative risks and 95% confidence intervals for coronary heart disease and stroke according to a change of 10 mm Hg in systolic blood pressure or 5 mm Hg in diastolic blood pressure.12
We calibrated age-specific relative risks to be within 0.02 of these estimates and overall rela-tive risks within the 95% confidence intervals for the summary estimates from a large meta-analysis of randomized clinical trials of hyper-tension treatment (see the Methods section and Tables S2 and S3 in the Supplementary Appen-dix).9 We validated the resulting assumptions with respect to relative risk for the treatment of systolic blood pressure in patients between the ages of 60 and 74 years by simulating the treat-ment and placebo groups of the Systolic Hyper-tension in the Elderly Program (SHEP) trial13 and comparing simulated relative risks with those observed in the trial (Table 2, and Table S4 in the Supplementary Appendix).
For each standard-dose or half-standard-dose medication, the reduction in blood pressure was calculated on the basis of the pretreatment blood pressure (Table S5 in the Supplementary Appendix). Variance in the change in blood pres-sure associated with antihypertensive treatment
was based on the standard deviation for the main estimated change in blood pressure ob-served in a meta-analysis.10
For consistency, our main analyses assumed a medication adherence rate of 75%, as observed in the same clinical trials that were used to es-timate relative risks of treatment.9 The costs of hypertension treatment included medications, monitoring, and side effects (Table S6 in the Sup-plementary Appendix). Medication costs were calculated as the means of the lowest wholesale prices for numbers of standard doses across drug classes in the 2014 Red Book; combination pills were included when available.14 Rates of side effects of medications were based on a meta-analysis of treatment trials for common events10 and on postmarketing reports for rare events (Table S6 in the Supplementary Appendix). We translated rates of adverse events into im-pairments in quality-adjusted life-years (QALYs) and added costs related to events ranging from transient symptoms accompanied by an office visit (common event; QALY penalty of 0.23 per day), to adverse effects requiring hospitalization (infrequent event; QALY penalty of 0.50 per day), to death (rare event).
Main Analysis
A status quo simulation provided a projection of events from coronary heart disease and stroke, costs, and QALYs for the U.S. adult population between the ages of 35 and 74 years during the period from 2014 through 2024, on the assump-tion that untreated patients would remain un-treated. Simulated strategies for hypertension treatments reduced events from coronary heart disease and stroke, reduced costs, and added QALYs. We assumed that hypertension treatment would reduce rates of death from hypertensive heart disease and renal failure, but to be conser-vative, we assumed no change in future costs as-sociated with these effects. In an analysis of sec-ondary prevention, we simulated treatment to a target blood pressure of 140/90 mm Hg in pa-tients with hypertension who were currently un-treated and who had a history of stroke or coro-nary heart disease (approximately one fifth of patients with chronic cardiovascular disease).8 For primary prevention, we simulated three treatment groups, with each group added to treatment in patients with cardiovascular disease and untreated hypertension: patients with stage 2 hypertension, patients with stage 1 hyperten-

T h e n e w e ngl a nd j o u r na l o f m e dic i n e
n engl j med 372;5 nejm.org january 29, 2015450
sion and diabetes or chronic kidney disease, and patients with stage 1 hypertension but without diabetes or chronic kidney disease. We assessed incremental cost-effectiveness ratios (which were calculated as the incremental change in costs divided by the incremental change in QALYs) as follows: costs of less than $50,000 per QALY gained were considered to be cost-effective, costs ranging from $50,000 to less than $150,000 per QALY gained were considered to be of intermedi-ate value, and costs of $150,000 or more per QALY gained were considered to be of low value.7 All analyses were approached from a payer’s per-
spective. All future costs and QALYs were dis-counted annually by 3% of the values for the previ-ous year, according to standard practice.
All data analyses for this study involved sec-ondary analyses of publicly available, deidenti-fied data. For this reason, no ethics board ap-proval was sought for this study.
Sensitivity Analyses
We used lower and upper uncertainty boundaries for all main variables to perform one-way sensi-tivity analyses (Table 2, and Table S6 in the Sup-plementary Appendix). In addition, we modeled
Table 2. Main Effectiveness Assumptions and Uncertainty Ranges Used for Estimating the Cost-Effectiveness of Implementation of the 2014 Guidelines for Hypertension Treatment.*
Variable Main Estimate Lower Estimate Upper Estimate
Average relative risk per 10 mm Hg reduction in systolic blood pressure or 5 mm Hg reduction in diastolic blood pressure (range)†
Age 35–59 yr
Coronary heart disease 0.73 (0.72–0.74) 0.70 (0.67–0.72) 0.77 (0.76–0.78)
Stroke 0.64 (0.61–0.66) 0.59 (0.54–0.63) 0.69 (0.68–0.69)
Death from any cause 0.86 (0.83–0.89) 0.76 0.95
Age 60–74 yr
Coronary heart disease 0.77 (0.74–0.78) 0.74 (0.72–0.76) 0.79 (0.76–0.81)
Stroke 0.69 (0.66–0.71) 0.64 (0.62–0.64) 0.74 (0.69–0.78)
Death from any cause 0.91 (0.91–0.92) 0.80 1.02
Average systolic blood-pressure reduction — mm Hg‡
Stage 2 hypertension
Age <60 yr; pretreatment, ≥160 mm Hg; target, 140 mm Hg; 3.0–4.0 standard-dose medications
31.0–34.7 26.0–29.4 36.0–39.9
Age ≥60 yr; pretreatment, ≥160 mm Hg; target, 150 mm Hg; 2.0–3.0 standard-dose medications
22.1–24.2 18.1–18.9 27.2–29.2
Stage 1 hypertension
Age <60 yr; pretreatment, 140–159 mm Hg; target, <140 mm Hg; 0.5–2.0 standard-dose medications
7.9–10.9 5.9–8.3 9.9–13.4
Age ≥60 yr; pretreatment, 150–159 mm Hg; target, <150 mm Hg; 0.5 standard-dose medication
7.1 3.2 11.0
Average diastolic blood-pressure reduction — mm Hg
Stage 2 hypertension; all ages; target, 90 mm Hg; 3.0 standard-dose medications
17.1 12.0 22.2
Stage 1 hypertension; all ages; target, 90 mm Hg; 1.0 standard-dose medication
5.3 3.7 6.9
* Data were derived from Law et al.9 Data for the calculations of relative risks for effectiveness in patients between the ages of 60 and 74 years were derived from the Systolic Hypertension in the Elderly Program (SHEP) trial.13
† Data in parentheses are the lowest and highest relative risks according to age and sex among main estimates and among estimates of up-per and lower 95% confidence intervals. The ranges for relative risks of death from any cause are not included for the lower and upper esti-mates because no variability according to age or sex was assumed on the basis of available evidence.
‡ Changes in blood pressure are dependent on the age- and sex-specific distribution of baseline blood pressures within stage 1 or stage 2 cat-egory and the number of standard-dose antihypertensive medications required to achieve the blood-pressure goal. As a result, in some cas-es, there was a range in blood pressures according to age and sex, whereas in other cases, variability was negligible and no range is listed.
COST-EFFECTIVENESS OF HYPERTENSION THER APY
n engl j med 372;5 nejm.org january 29, 2015 451
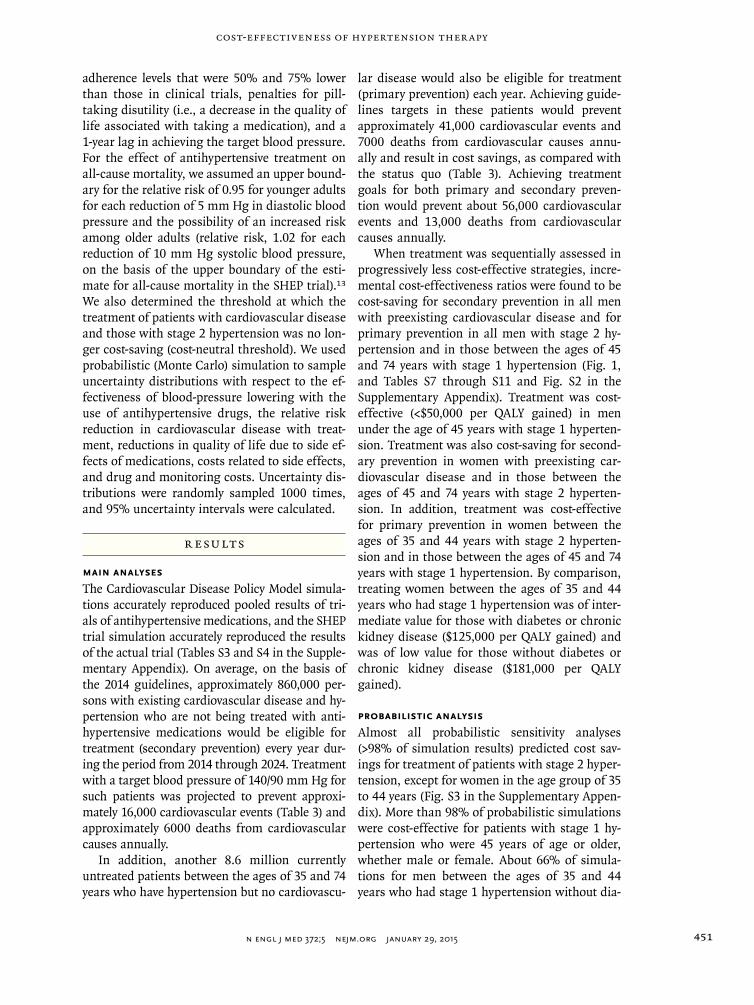
adherence levels that were 50% and 75% lower than those in clinical trials, penalties for pill-taking disutility (i.e., a decrease in the quality of life associated with taking a medication), and a 1-year lag in achieving the target blood pressure. For the effect of antihypertensive treatment on all-cause mortality, we assumed an upper bound-ary for the relative risk of 0.95 for younger adults for each reduction of 5 mm Hg in diastolic blood pressure and the possibility of an increased risk among older adults (relative risk, 1.02 for each reduction of 10 mm Hg systolic blood pressure, on the basis of the upper boundary of the esti-mate for all-cause mortality in the SHEP trial).13 We also determined the threshold at which the treatment of patients with cardiovascular disease and those with stage 2 hypertension was no lon-ger cost-saving (cost-neutral threshold). We used probabilistic (Monte Carlo) simulation to sample uncertainty distributions with respect to the ef-fectiveness of blood-pressure lowering with the use of antihypertensive drugs, the relative risk reduction in cardiovascular disease with treat-ment, reductions in quality of life due to side ef-fects of medications, costs related to side effects, and drug and monitoring costs. Uncertainty dis-tributions were randomly sampled 1000 times, and 95% uncertainty intervals were calculated.
R esult s
Main Analyses
The Cardiovascular Disease Policy Model simula-tions accurately reproduced pooled results of tri-als of antihypertensive medications, and the SHEP trial simulation accurately reproduced the results of the actual trial (Tables S3 and S4 in the Supple-mentary Appendix). On average, on the basis of the 2014 guidelines, approximately 860,000 per-sons with existing cardiovascular disease and hy-pertension who are not being treated with anti-hypertensive medications would be eligible for treatment (secondary prevention) every year dur-ing the period from 2014 through 2024. Treatment with a target blood pressure of 140/90 mm Hg for such patients was projected to prevent approxi-mately 16,000 cardiovascular events (Table 3) and approximately 6000 deaths from cardiovascular causes annually.
In addition, another 8.6 million currently untreated patients between the ages of 35 and 74 years who have hypertension but no cardiovascu-
lar disease would also be eligible for treatment (primary prevention) each year. Achieving guide-lines targets in these patients would prevent approximately 41,000 cardiovascular events and 7000 deaths from cardiovascular causes annu-ally and result in cost savings, as compared with the status quo (Table 3). Achieving treatment goals for both primary and secondary preven-tion would prevent about 56,000 cardiovascular events and 13,000 deaths from cardiovascular causes annually.
When treatment was sequentially assessed in progressively less cost-effective strategies, incre-mental cost-effectiveness ratios were found to be cost-saving for secondary prevention in all men with preexisting cardiovascular disease and for primary prevention in all men with stage 2 hy-pertension and in those between the ages of 45 and 74 years with stage 1 hypertension (Fig. 1, and Tables S7 through S11 and Fig. S2 in the Supplementary Appendix). Treatment was cost-effective (<$50,000 per QALY gained) in men under the age of 45 years with stage 1 hyperten-sion. Treatment was also cost-saving for second-ary prevention in women with preexisting car-diovascular disease and in those between the ages of 45 and 74 years with stage 2 hyperten-sion. In addition, treatment was cost-effective for primary prevention in women between the ages of 35 and 44 years with stage 2 hyperten-sion and in those between the ages of 45 and 74 years with stage 1 hypertension. By comparison, treating women between the ages of 35 and 44 years who had stage 1 hypertension was of inter-mediate value for those with diabetes or chronic kidney disease ($125,000 per QALY gained) and was of low value for those without diabetes or chronic kidney disease ($181,000 per QALY gained).
Probabilistic Analysis
Almost all probabilistic sensitivity analyses (>98% of simulation results) predicted cost sav-ings for treatment of patients with stage 2 hyper-tension, except for women in the age group of 35 to 44 years (Fig. S3 in the Supplementary Appen-dix). More than 98% of probabilistic simulations were cost-effective for patients with stage 1 hy-pertension who were 45 years of age or older, whether male or female. About 66% of simula-tions for men between the ages of 35 and 44 years who had stage 1 hypertension without dia-

T h e n e w e ngl a nd j o u r na l o f m e dic i n e
n engl j med 372;5 nejm.org january 29, 2015452
betes or chronic kidney disease and 92% of simu-lations for women between the ages of 35 and 44 years who had stage 2 hypertension were cost-effective, but almost none were cost-saving. None of the results for women with stage 1 hyperten-sion between the ages of 35 and 44 years were cost-effective.
Sensitivity Analyses
We projected that treatment costs could more than triple for men with cardiovascular disease ($1,280 more invested per patient annually) or almost double for men with stage 2 hypertension ($600 more) before these strategies would no
longer save costs. The corresponding additional investments for women between the ages of 45 and 74 years were up to $650 higher (for second-ary prevention in patients with cardiovascular disease) or $260 higher (for primary prevention in patients with stage 2 hypertension).
In one-way sensitivity analyses of assump-tions with respect to effectiveness, adherence, costs of monitoring and medications, and side-effect frequency, all primary prevention strate-gies in all men and in women with stage 2 hy-pertension were projected to be cost-effective (Table S12 in the Supplementary Appendix). Strategies for women with stage 1 hypertension
Table 3. Projected Average Annual Incremental Results of Providing Therapy for Patients with Untreated Hypertension between the Ages of 35 and 74 Years (2014–2024).*
Strategy
Newly Treated Patients,
as Compared with Status Quo
Cardiovascular Events Averted, as Compared
with Status Quo
Change in Cardiovascular
Costs, as Compared
with Status Quo
ICER, as Compared
with Status Quo
ICER, as Compared with Previous
Strategy†
no. $
Women
Treat all patients with cardiovascular disease‡ 161,000 6,000 −287,000 Cost-saving Cost-saving
Treat patients with stage 2 hypertension who do not have cardiovascular disease
844,000 15,000 −552,000 Cost-saving Cost-saving
Treat patients with stage 1 hypertension plus diabetes or chronic kidney disease
1,164,000 8,000 −246,000 Cost-saving Cost-effective§
Treat patients with stage 1 hypertension who do not have diabetes or chronic kidney disease
2,487,000 8,000 −149,000 Cost-saving Cost-effective§
Men
Treat all patients with cardiovascular disease‡ 705,000 9,000 −755,000 Cost-saving Cost-saving
Treat patients with stage 2 hypertension who do not have cardiovascular disease
1,948,000 26,000 −1,640,000 Cost-saving Cost-saving
Treat patients with stage 1 hypertension plus diabetes or chronic kidney disease
1,649,000 20,000 −904,000 Cost-saving Cost-saving
Treat patients with stage 1 hypertension who do not have diabetes or chronic kidney disease
3,093,000 14,000 −122,000 Cost-saving Cost-saving
* Data were calculated with the use of the Cardiovascular Disease Policy Model on the basis of a simulation of the 2014 guidelines of the Eighth Joint National Committee for hypertension treatment. A status quo simulation provided a projection of coronary heart disease and stroke events, costs, and quality-adjusted life-years (QALYs) for the U.S. adult population between the ages of 35 and 74 years during the period from 2014 through 2024, on the assumption that untreated patients would remain untreated. ICER denotes incremental cost-effec-tiveness ratio.
† In this comparison, each incremental strategy is compared with the step before it in the study model as follows: step 1, simulate status quo of no treatment in these patients; step 2, treat all patients with untreated hypertension and cardiovascular disease and compare with step 1; step 3, treat patients with stage 2 hypertension who do not have cardiovascular disease and compare with step 2; step 4, treat patients with stage 1 hypertension plus diabetes or chronic kidney disease and compare with steps 2 and 3 combined; and step 5, treat patients with stage 1 hypertension who do not have diabetes or chronic kidney disease and compare with steps 2, 3, and 4 combined.
‡ Patients in this group were included in analyses of all the other listed strategies, except for the status quo of no treatment.§ Treatment was considered to be cost-effective if the cost was less than $50,000 per QALY. The ICER for women with stage 1 hypertension
and cardiovascular disease was $9,000 per QALY gained for those with diabetes or chronic kidney disease and $22,000 per QALY gained for those without diabetes or chronic kidney disease.

COST-EFFECTIVENESS OF HYPERTENSION THER APY
n engl j med 372;5 nejm.org january 29, 2015 453
between the ages of 35 and 59 years were pro-jected to range from $51,000 to $100,000 per QALY gained (thus falling into the intermediate-value range) on the assumption that the dia-stolic blood-pressure level would be reduced by 1.6 mm Hg less, drug costs would be increased by a factor of 2.4, monitoring would be twice as frequent, or side effects would be twice as costly or 50% more severe. The treatment of women between the ages of 35 and 44 years without diabetes or chronic kidney disease was cost-effective only if an additional $150 or more could be saved per person treated each year. Treatment of women between the ages of 60 and 74 years with stage 1 hypertension was of inter-mediate value on the assumption that drug costs would increase by a factor of 2.4. Health gains from hypertension treatment persisted among all adults between the ages of 60 and 74 years and among men under the age of 60 years with stage 2 hypertension, even on the assumption that the inconvenience of taking antihyperten-sive medications would decrease the quality of life. The same pill-taking disutility led to a pro-jected loss in QALYs in all patients with stage 1 hypertension and in women under the age of 60 years with stage 2 hypertension. Because lower adherence reduced effectiveness and costs in equal proportions, a reduction of 25% or 50% in the main assumption for adherence (effectively,
adherence rates of 56% and 38%, respectively) had little effect on the results. The assumption of full intervention costs but a 1-year delay in realizing health gains attenuated incremental cost-effectiveness ratios only slightly.
Discussion
Our model predicts that the achievement of goals for the treatment of hypertension as outlined in the 2014 guidelines would be cost-saving in re-ducing mortality and morbidity associated with cardiovascular disease in previously untreated adults with hypertension. Effectiveness and cost savings were mainly driven by very favorable re-sults that we projected for secondary prevention in patients with cardiovascular disease and for primary prevention in patients with stage 2 hy-pertension. In the latter group, cost savings re-mained robust in sensitivity analyses of effective-ness, cost, and side effects.
These findings suggest that more frequent office visits, home blood-pressure monitoring, pharmacist interventions, or interventions to improve adherence15 may add substantial value, even if they require an additional annual invest-ment of up to $1,230 per patient in men with cardiovascular disease, $600 in men with stage 2 hypertension without cardiovascular disease, and $650 in women with cardiovascular disease.
Groups withoutPrior Cardiovascular
Disease Men Women
33–44 Yr
45–59 Yr
60–74 Yr
Stage 2hypertension
Stage 1hypertension,
diabetesor CKD
Stage 1hypertension,no diabetes
or CKDStage 2
hypertension
Stage 1hypertension,
diabetesor CKD
Stage 1hypertension,no diabetes
or CKD
Cost-saving Cost-effective(ICER <$50,000)
Intermediate value(ICER ≥$50,000 and <$150,000)
Low value(ICER ≥$150,000)
$13,000Cost-saving
Cost-saving
Cost-saving
Cost-saving
Cost-saving
Cost-saving
Cost-saving
Cost-saving
Cost-saving
$40,000 $26,000 $125,000 $181,000
$16,000 $22,000
$3,000 $7,000
Figure 1. Projected Average Cost-Effectiveness of Full Implementation of the 2014 Guidelines for Hypertension Treatment in Patients without Cardiovascular Disease, According to Sex, Age, Hypertension Stage, and Status with Respect to Diabetes and Chronic Kidney Disease.
Treatment of each group is compared with the strategy outlined in the previous incremental step in the study model for patients in the same age category. Patients with stage 2 hypertension who do not have cardiovascular disease are compared with patients with cardiovascular disease. CKD denotes chronic kidney disease, and ICER incremental cost-effectiveness ratio.

T h e n e w e ngl a nd j o u r na l o f m e dic i n e
n engl j med 372;5 nejm.org january 29, 2015454
In a hypertension-treatment protocol at Kaiser Permanente Northern California, the use of trained medical assistants and extended moni-toring visits increased the proportion of patients in whom hypertension was controlled from 44% to 87% during a 10-year period.16 A 2013 Science Advisory of the American Heart Association, the American College of Cardiology, and the Centers for Disease Control and Prevention also recom-mended the use of hypertension-treatment algo-rithms17 for multiple-provider and multiple- intervention approaches.
We projected that achieving the blood-pres-sure treatment goal of 150/90 mm Hg for pa-tients between the ages of 60 and 74 years, as recommended in the 2014 guidelines, would be cost-effective, even when we assumed a higher rate of medication side effects in this group. However, patients between the ages of 60 and 74 years have variable levels of functional status and susceptibility to side effects of medications and adverse events. Better predictors of adverse effects of medications are needed to guide the decision to withhold or withdraw treatment from individual patients in this age group. Con-troversy persists about the systolic blood-pres-sure treatment target of 150 mm Hg in the 2014 guidelines,18 and future research must address the question of whether a lower target is indi-cated and, if so, in which patients.
For short-term treatment of stage 1 hyperten-sion in patients between the ages of 35 and 44 years, our simulations projected cost-effective-ness in men and intermediate or low value in women. However, longitudinal cohort studies with long-term follow-up suggest that a history of high blood pressure dating back to young adulthood is an independent predictor of risk for cardiovascular events in later life,19-23 an effect that was not modeled in this study.
Although our analysis focused on the 2014 guidelines, our projections of health benefits and cost-effectiveness are broadly consistent with the results of previous cost-effectiveness analyses of hypertension treatment.3,24,25 The methods and reporting of this study conform to Consolidated Health Economic Evaluation Reporting Standards (CHEERS)26 and Quality of Health Economic Studies instrument standards recommended for cost-effectiveness analyses of U.S. guidelines regarding risk factors for cardiovascular dis-ease.7,27 Effectiveness assumptions were ground-ed in a large meta-analysis of randomized trials
of antihypertensive treatments, and the simula-tion of the SHEP trial produced results similar to those observed in the actual trial.
However, like all other computer-simulation analyses, ours was limited by reliance on multi-ple assumptions and data derived from multiple sources and study types. Because of limited evi-dence from clinical trials and the need to con-sider the complications of frailty, cognitive func-tion, and an increased risk of side effects among patients 75 years of age or older, we limited our analyses to persons between the ages of 35 and 74 years. Because of our conservative approach, we did not capture disability or costs attribut-able to hypertensive heart disease, peripheral arterial disease, or end-stage renal disease and other noncardiovascular outcomes associated with hypertension. Therefore, we probably underesti-mated cost savings and QALY gains associated with hypertension treatment. We did not analyze effective diet and lifestyle interventions for low-ering blood pressure in patients with hyperten-sion,28,29 and we did not analyze the cost-effec-tiveness or other relative merits of specific antihypertensive medication classes or combina-tions.30-32 Finally, we did not analyze the poten-tial synergistic benefits of simultaneous imple-mentation of the 2014 hypertension guidelines and guidelines for controlling high cholesterol, diabetes, obesity, and other risk factors for car-diovascular disease, nor did we assess the value of hypertension treatment as part of an inte-grated guideline for managing all risk factors for cardiovascular disease on the basis of calcu-lated global risk.24,25,33
In conclusion, our model results suggest that controlling hypertension in untreated patients according to the 2014 guidelines not only would prevent about 56,000 cardiovascular events and 13,000 deaths from cardiovascular causes annu-ally but also would result in cost savings. Among the groups that we considered, the treatment of men and women with cardiovascular disease and those with stage 2 hypertension without cardio-vascular disease appeared to provide the most value, and the treatment of women under the age of 60 years with stage 1 hypertension appeared to provide the least value.
Dr. Bibbins-Domingo is a member and vice chair of the U.S. Preventive Services Task Force (USPSTF). The views expressed in this article are those of the authors and do not necessarily rep-resent the views and policies of the USPSTF.
Supported by a grant from the National Heart, Lung, and Blood Institute (R01 HL107475-01), a grant from the American

COST-EFFECTIVENESS OF HYPERTENSION THER APY
n engl j med 372;5 nejm.org january 29, 2015 455
Heart Association Founder’s Affiliate Clinical Research Pro-gram (10CRP4140089), and a Columbia University Irving schol-arship (all to Dr. Moran); and by a grant from the National Insti-tute for Neurological Disorders and Stroke (U54NS081760, to Dr. Bibbins-Domingo).
Disclosure forms provided by the authors are available with the full text of this article at NEJM.org.
We thank Dr. David Fairley for designing and programming the Monte Carlo function of the Cardiovascular Disease Policy Model software.
References
1. US Burden of Disease Collaborators. The state of US health, 1990-2010: burden of diseases, injuries, and risk factors. JAMA 2013;310:591-608.2. Danaei G, Ding EL, Mozaffarian D, et al. The preventable causes of death in the United States: comparative risk assess-ment of dietary, lifestyle, and metabolic risk factors. PLoS Med 2009;6(4):e1000058.3. Cutler DM, Long G, Berndt ER, et al. The value of antihypertensive drugs: a per-spective on medical innovation. Health Aff (Millwood) 2007;26:97-110.4. Navar-Boggan AM, Pencina MJ, Wil-liams K, Sniderman AD, Peterson ED. Proportion of US adults potentially af-fected by the 2014 hypertension guide-line. JAMA 2014;311:1424-9.5. Chobanian AV, Bakris GL, Black HR, et al. The Seventh Report of the Joint Na-tional Committee on Prevention, Detec-tion, Evaluation, and Treatment of High Blood Pressure: the JNC 7 report. JAMA 2003;289:2560-72.6. James PA, Oparil S, Carter BL, et al. 2014 Evidence-based guideline for the management of high blood pressure in adults: report from the panel members appointed to the Eighth Joint National Committee (JNC 8). JAMA 2014;311:507-20.7. Anderson JL, Heidenreich PA, Barnett PG, et al. ACC/AHA statement on cost/value methodology in clinical practice guidelines and performance measures: a report of the American College of Cardi-ology/American Heart Association Task Force on Performance Measures and Task Force on Practice Guidelines. Circulation 2014;129:2329-45.8. National Health and Nutrition Survey home page (http://www.cdc.gov/nchs/about/major/nhanes/datalink.htm).9. Law MR, Morris JK, Wald NJ. Use of blood pressure lowering drugs in the pre-vention of cardiovascular disease: meta-analysis of 147 randomised trials in the context of expectations from prospective epidemiological studies. BMJ 2009;338: b1665.10. Law MR, Wald NJ, Morris JK, Jordan RE. Value of low dose combination treat-ment with blood pressure lowering drugs: analysis of 354 randomised trials. BMJ 2003;326:1427.11. Turnbull F. Effects of different blood-pressure-lowering regimens on major cardiovascular events: results of prospec-tively-designed overviews of randomised trials. Lancet 2003;362:1527-35.
12. Lewington S, Clarke R, Qizilbash N, Peto R, Collins R. Age-specific relevance of usual blood pressure to vascular mor-tality: a meta-analysis of individual data for one million adults in 61 prospective studies. Lancet 2002;360:1903-13.13. SHEP Cooperative Research Group. Prevention of stroke by antihypertensive drug treatment in older persons with iso-lated systolic hypertension: final results of the Systolic Hypertension in the Elderly Program (SHEP). JAMA 1991;265:3255-64.14. Average wholesale price (AWP) policy. Red Book Drug References 2014 (http://redbook.com/redbook/awp).15. Glynn LG, Murphy AW, Smith SM, Schroeder K, Fahey T. Interventions used to improve control of blood pressure in patients with hypertension. Cochrane Database Syst Rev 2010;3:CD005182.16. Jaffe MG, Lee GA, Young JD, Sidney S, Go AS. Improved blood pressure control associated with a large-scale hyperten-sion program. JAMA 2013;310:699-705.17. Go AS, Bauman MA, Coleman King SM, et al. An effective approach to high blood pressure control: a science advisory from the American Heart Association, the American College of Cardiology, and the Centers for Disease Control and Preven-tion. Hypertension 2014;63:878-85.18. Wright JT Jr, Fine LJ, Lackland DT, Ogedegbe G, Dennison Himmelfarb CR. Evidence supporting a systolic blood pres-sure goal of less than 150 mm Hg in pa-tients aged 60 years or older: the minority view. Ann Intern Med 2014;160:499-503.19. Harris T, Cook EF, Kannel WB, Gold-man L. Proportional hazards analysis of risk factors for coronary heart disease in individuals aged 65 or older: the Framing-ham Heart Study. J Am Geriatr Soc 1988; 36:1023-8.20. Gray L, Lee IM, Sesso HD, Batty GD. Blood pressure in early adulthood, hyper-tension in middle age, and future cardio-vascular disease mortality: HAHS (Har-vard Alumni Health Study). J Am Coll Cardiol 2011;58:2396-403.21. McCarron P, Smith GD, Okasha M, McEwen J. Blood pressure in young adult-hood and mortality from cardiovascular disease. Lancet 2000;355:1430-1.22. Miura K, Daviglus ML, Dyer AR, et al. Relationship of blood pressure to 25-year mortality due to coronary heart disease, cardiovascular diseases, and all causes in young adult men: the Chicago Heart As-
sociation Detection Project in Industry. Arch Intern Med 2001;161:1501-8.23. McCarron P, Okasha M, McEwen J, Davey Smith G. Blood pressure in early life and cardiovascular disease mortality. Arch Intern Med 2002;162:610-1.24. Eddy DM, Adler J, Patterson B, Lucas D, Smith KA, Morris M. Individualized guidelines: the potential for increasing quality and reducing costs. Ann Intern Med 2011;154:627-34.25. Sussman J, Vijan S, Hayward R. Using benefit-based tailored treatment to im-prove the use of antihypertensive medica-tions. Circulation 2013;128:2309-17.26. Husereau D, Drummond M, Petrou S, et al. Consolidated Health Economic Eval-uation Reporting Standards (CHEERS) statement. BMJ 2013;346:f1049. abstract.27. Ofman JJ, Sullivan SD, Neumann PJ, et al. Examining the value and quality of health economic analyses: implications of utilizing the QHES. J Manag Care Pharm 2003;9:53-61.28. Appel LJ, Champagne CM, Harsha DW, et al. Effects of comprehensive lifestyle modification on blood pressure control: main results of the PREMIER clinical trial. JAMA 2003;289:2083-93.29. Appel LJ, Moore TJ, Obarzanek E, et al. A clinical trial of the effects of dietary patterns on blood pressure. N Engl J Med 1997;336:1117-24.30. Heidenreich PA, Davis BR, Cutler JA, et al. Cost-effectiveness of chlorthali-done, amlodipine, and lisinopril as first-step treatment for patients with hyperten-sion: an analysis of the Antihypertensive and Lipid-Lowering Treatment to Prevent Heart Attack Trial (ALLHAT). J Gen In-tern Med 2008;23:509-16.31. Timbie JW, Hayward RA, Vijan S. Di-minishing efficacy of combination ther-apy, response-heterogeneity, and treat-ment intolerance limit the attainability of tight risk factor control in patients with diabetes. Health Serv Res 2010;45:437-56.32. Ramsey SD, Neil N, Sullivan SD, Per-fetto E. An economic evaluation of the JNC hypertension guidelines using data from a randomized controlled trial. J Am Board Fam Pract 1999;12:105-14.33. Sundström J, Arima H, Woodward M, et al. Blood pressure-lowering treatment based on cardiovascular risk: a meta-analysis of individual patient data. Lancet 2014;384:591-8.Copyright © 2015 Massachusetts Medical Society.