Increasing the Efficiency of Existing Coal-Fired Power Plants
Upload
khangminh22Category
view
3download
0
econstorMake Your Publications Visible.
A Service of
zbwLeibniz-InformationszentrumWirtschaftLeibniz Information Centrefor Economics
Kumar, Ravinder; Sharma, Avdesh Kr.; Tewari, P. C.
Article
Cost analysis of a coal-fired power plant using theNPV method
Journal of Industrial Engineering International
Provided in Cooperation with:Islamic Azad University (IAU), Tehran
Suggested Citation: Kumar, Ravinder; Sharma, Avdesh Kr.; Tewari, P. C. (2015) : Costanalysis of a coal-fired power plant using the NPV method, Journal of Industrial EngineeringInternational, ISSN 2251-712X, Springer, Heidelberg, Vol. 11, pp. 495-504,http://dx.doi.org/10.1007/s40092-015-0116-8
This Version is available at:http://hdl.handle.net/10419/157460
Standard-Nutzungsbedingungen:
Die Dokumente auf EconStor dürfen zu eigenen wissenschaftlichenZwecken und zum Privatgebrauch gespeichert und kopiert werden.
Sie dürfen die Dokumente nicht für öffentliche oder kommerzielleZwecke vervielfältigen, öffentlich ausstellen, öffentlich zugänglichmachen, vertreiben oder anderweitig nutzen.
Sofern die Verfasser die Dokumente unter Open-Content-Lizenzen(insbesondere CC-Lizenzen) zur Verfügung gestellt haben sollten,gelten abweichend von diesen Nutzungsbedingungen die in der dortgenannten Lizenz gewährten Nutzungsrechte.
Terms of use:
Documents in EconStor may be saved and copied for yourpersonal and scholarly purposes.
You are not to copy documents for public or commercialpurposes, to exhibit the documents publicly, to make thempublicly available on the internet, or to distribute or otherwiseuse the documents in public.
If the documents have been made available under an OpenContent Licence (especially Creative Commons Licences), youmay exercise further usage rights as specified in the indicatedlicence.
http://creativecommons.org/licenses/by/4.0/
www.econstor.eu
ORIGINAL RESEARCH
Cost analysis of a coal-fired power plant using the NPV method
Ravinder Kumar1 • Avdhesh Kr. Sharma2 • P. C. Tewari3
Received: 5 November 2014 / Accepted: 30 May 2015 / Published online: 23 June 2015
� The Author(s) 2015. This article is published with open access at Springerlink.com
Abstract The present study investigates the impact of
various factors affecting coal-fired power plant economics
of 210 MW subcritical unit situated in north India for
electricity generation. In this paper, the cost data of various
units of thermal power plant in terms of power output
capacity have been fitted using power law with the help of
the data collected from a literature search. To have a
realistic estimate of primary components or equipment, it is
necessary to include the latest cost of these components.
The cost analysis of the plant was carried out on the basis
of total capital investment, operating cost and revenue. The
total capital investment includes the total direct plant cost
and total indirect plant cost. Total direct plant cost involves
the cost of equipment (i.e. boiler, steam turbine, condenser,
generator and auxiliary equipment including condensate
extraction pump, feed water pump, etc.) and other costs
associated with piping, electrical, civil works, direct
installation cost, auxiliary services, instrumentation and
controls, and site preparation. The total indirect plant cost
includes the cost of engineering and set-up. The net present
value method was adopted for the present study. The work
presented in this paper is an endeavour to study the influ-
ence of some of the important parameters on the lifetime
costs of a coal-fired power plant. For this purpose, para-
metric study with and without escalation rates for a period
of 35 years plant life was evaluated. The results predicted
that plant life, interest rate and the escalation rate were
observed to be very sensitive on plant economics in com-
parison to other factors under study.
Keywords Net present value � Economic analysis �Escalation rate � Thermal power plant
List of symbols
ai, bi Values of constant obtained through curve fit
Avoverall Overall plant availability
Ci Component cost
Co Total operating cost
Cs Labour average annual salary
Ccc Fuel cost per tonne
Cdirect Direct plant cost (INR)
Cindirect Indirect plant cost (INR)
CEqp Cost of equipment (INR)
Cpiping Cost of piping (INR)
Cpumping Cost of pumping (INR)
Ccoalhandling Cost of coal handling (INR)
Cashhandling Cost of ash handling (INR)
Cother Other costs due to direct installation,
auxiliary services, instrumentation and
controls and site preparation (INR)
Ctci Total capital investment (INR)
Ccoal Coal cost (INR)
Cins Insurance cost (INR)
Clab Labour cost (INR)
& Ravinder Kumar
Avdhesh Kr. Sharma
P. C. Tewari
1 Department of Mechanical Engineering, Maharishi
Markandeshwar University, Mullana, Ambala, Haryana,
India
2 Department of Mechanical Engineering, Deenbandhu Chhotu
Ram University of Science and Technology, Murthal,
Sonepat, India
3 Department of Mechanical Engineering, National Institute of
Technology, Kurukshetra, India
123
J Ind Eng Int (2015) 11:495–504
DOI 10.1007/s40092-015-0116-8
Cmaint Maintenance cost (INR)
fMW Percentage of net electric energy power plant
output assumed as 90 % of MW available for
sale
fconversion A conversion factor
i Interest rate
J Escalation rate of labour salary
K Escalation rate of fuel cost
K kth year
MW Plant capacity
mj Mass flow rate through the ‘jth’ pump
mcoal, k Coal consumption rate at the ‘kth’ year
(tonne/h)
nL Number of labourers employed
NPVlifetime Plant lifetime net present value
O Escalation rate of insurance cost
Pl Plant life (in years)
PWFk Present worth factor at the ‘kth’ year
Q Escalation rate of maintenance cost
Ran Revenue earned (INR)
Rlifetime Plant lifetime revenue earned (INR)
Greek symbols
1 Factor for direct installation, auxiliary,
instrumentation and control
gpump Pump efficiency
n Factor to account for engineering and plant start-
up
Introduction
Profitable capital investment leads to the growth and
prosperity of an economy. If profitability is low, invest-
ment will shrink. These economic indices provide a basis
to evaluate the net present value index for the analysis of
process industries. However, there is considerable scope
for a coal-fired electric power generation facility to be cost-
effective. The objective of the present work is to achieve
profitable capital investment in a 210 MW coal-fired
thermal power plant situated in north India. Thus, a bal-
anced integration of the cost analysis module of coal-fired
power plant and economics needs to be carried out, so that
the power plant economic indices of coal-fired power plant
in terms of total capital investment, operating cost (i.e. fuel
cost, operations and maintenance cost), revenue and net
present value could be analysed. The basis of most design
decisions is economic; thus, economical consideration
plays a significant role as the economics of coal-fired
power plant is closely associated with technical aspects.
Various methods have been developed for controlling the
economics of thermal power plant, namely annual cost
method, capitalized cost method and present worth method.
Peters et al. (1991) proposed that to account for the cost of
the investment, the total capital cost must be placed on an
annual basis (i.e. due to interest accumulated on the
investment, depreciation, maintenance, insurance and
taxes). There is always deterioration of equipment life and
thus its depreciation cost loses value.
Researchers reported considerable work on economic
analysis using the net present worth method in various
process industries. Remer and Nieto (1995) presented 25
techniques implemented to make an assessment of the
economic desirability of projects. They categorized them
into five types, viz., net present value methods, rate of
return methods, ratio methods, payback methods and
accounting methods. They provided insight into the
advantages and limitations of these project evaluation
methods by comparing and contrasting them. Manninen
and Zhu (1998) presented a new methodology which
combines the benefits of thermodynamics, economics and
mathematical optimization for the new design of power
plants. Giri and Dohi (2004) implemented the net present
value approach to determine the economic manufacturing
quantities for an unreliable production system over an
infinite planning horizon. From numerical experiments, it
was observed that the decision based on the average cost
can be 10 % worse than the decision based on net present
value depending upon the machine failure rate. Caputo
et al. (2005) investigated and evaluated the feasibility of
using biomass to provide electricity in combustion and
gasification plants. Moreover, to evaluate the impact of
logistics on the bio-energy plant’s profitability, the effects
of main logistic variables such as specific vehicle transport
costs, vehicle capacity, specific purchased biomass costs
and distribution density have been examined. Davison
(2007) presented performance, cost and emissions data for
coal and natural gas-fired power plants, based on infor-
mation from studies carried out recently for the IEA
Greenhouse Gas research and development programme by
major engineering contractors and process licensors.
Madlener and Stoverink (2012) discussed the economic
feasibility of constructing a 560 MW coal-fired power
plant in Turkey, using real options theory. They developed
a sequential investment model based on the binomial tree
model. They found that the real option analysis can be very
useful, especially in the strategic planning of projects.
Zhang et al. (2013) presented a detailed method for the
estimation of straw-based power generation and concluded
that the cost of straw-based power generation is indeed
higher than the coal-fired power generation with life cycle
analysis. Numerous studies were conducted on cost/eco-
nomic analysis; the empirical relations to represent the cost
of components/equipment in thermal power plant are rel-
atively scarce and age old. From literature survey, it was
observed that less work was found to be related to the cost
496 J Ind Eng Int (2015) 11:495–504
123
analysis of the thermal power plant and it was difficult to
arrange the various component costs of the plant by any
empirical relation. The present study deals with the cost
analysis of the thermal power plant and the parametric
study results have also been represented in the plant life-
time cost. To achieve this goal, the data for each equip-
ment/component cost in terms of power output capacity
have been obtained from the literature search, which is not
common in open literature.
Economic analysis module
To have a realistic estimate of primary components or
equipment, it is necessary to include the latest cost of these
components. Thus, the data for costs for each equip-
ment/component of the plant in terms of power output
capacity was obtained from literature search (Caputo et al.
2005; Hasler et al. 2009; Pauschert 2009; NETL 2012), and
the cost of each component is fitted using power law in
terms of installed capacity of the plant. The cost of the ith
component (Ci) is defined as
Ci ¼ aiMWbi ; ð1Þ
where i is the steam boiler, steam turbine and generator,
boiler feed pump, condensate extraction pump and con-
denser, respectively.
Boiler is subcritical, radiant reheat, dry bottom, natural
circulation, single drum, semi-outdoor type, direct fired,
balance draft, top supported type having provision for fir-
ing coal as the primary fuel. Turbine subsystem is tandem
compounded, horizontal, reheat type, single shaft machine
under this study. The condenser is used to condense the
exhaust steam from the low-pressure turbine and to pro-
duce the deepest possible vacuum to maximize the heat
drop and the turbine output. The condensate extraction
pump is attached to the condenser. The condensate
extraction pump (Ce) is a centrifugal, vertical pump, con-
sisting of the pump body, the can, the distributor housing
and the driver lantern. It has three units working in parallel
with 100 % capacity. Boiler feed pump has one unit
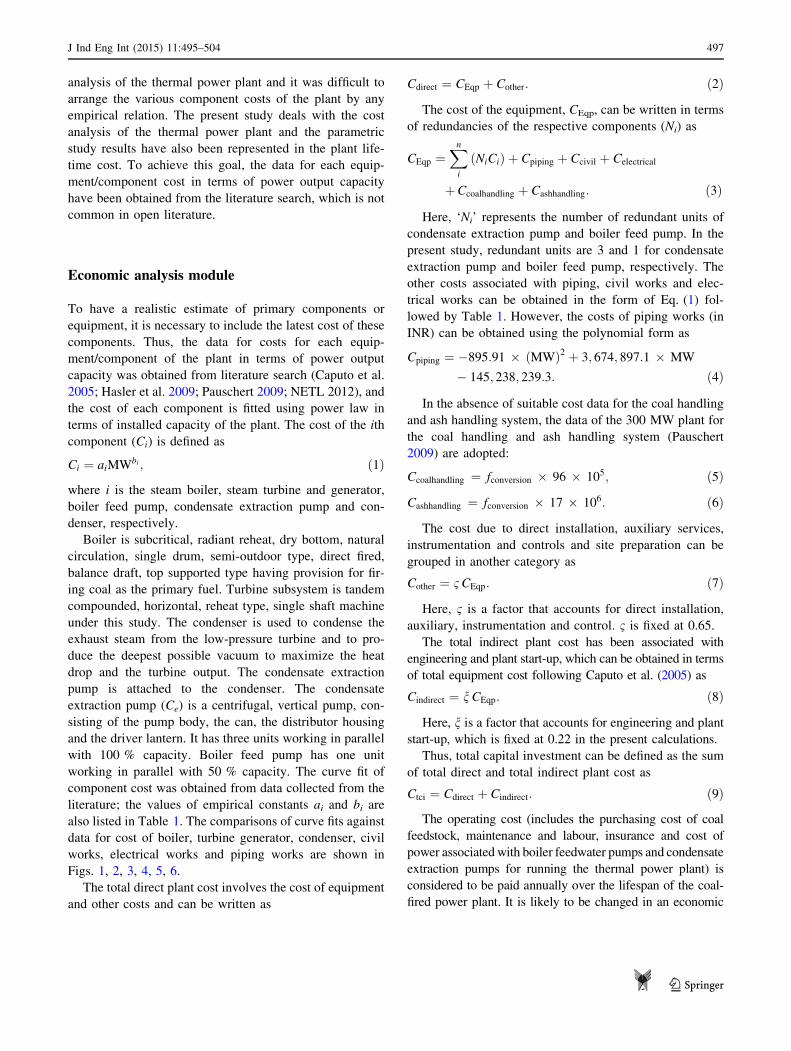
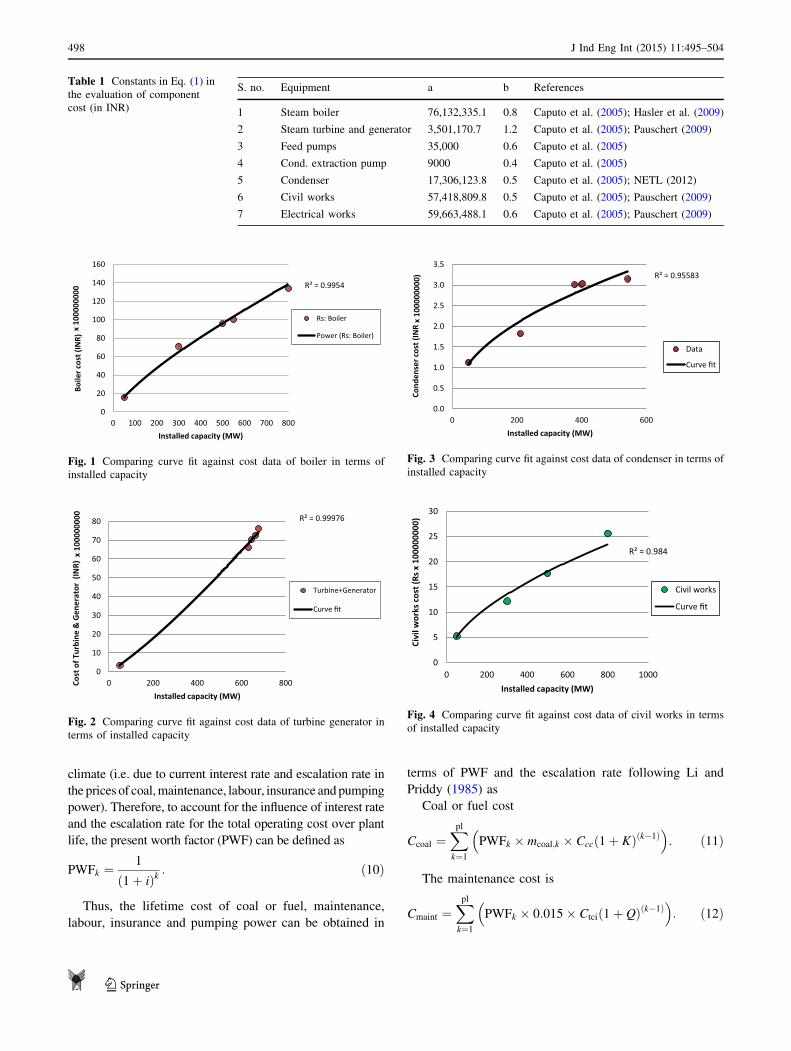
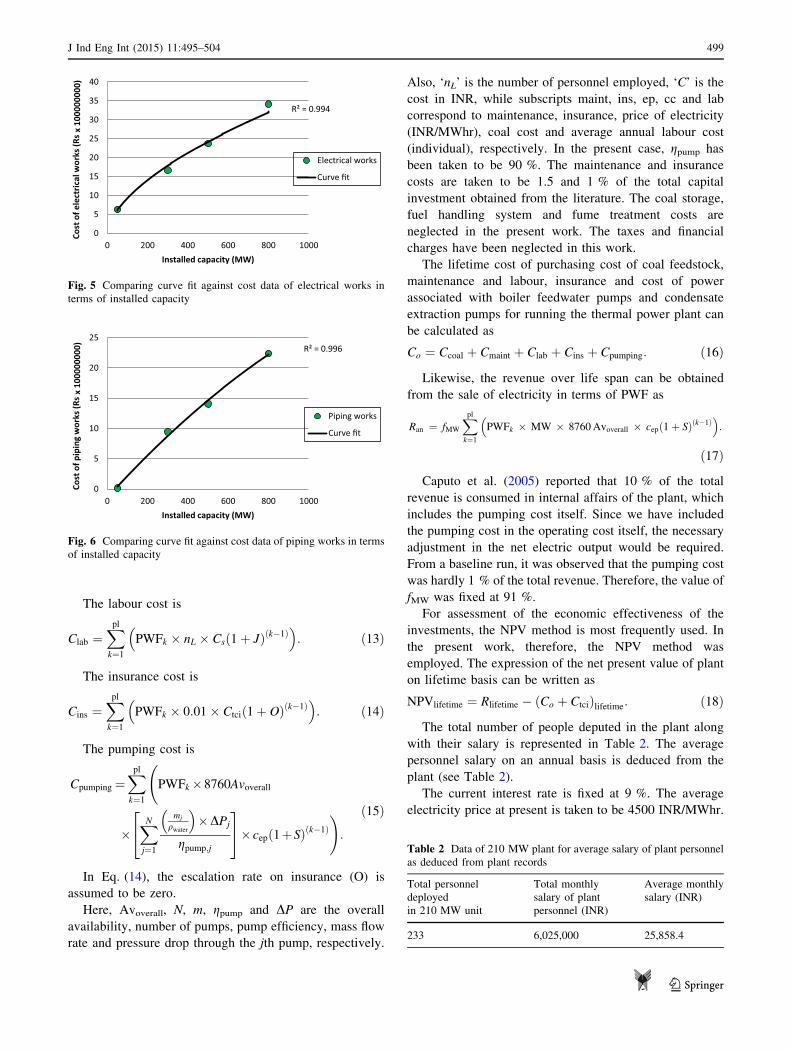
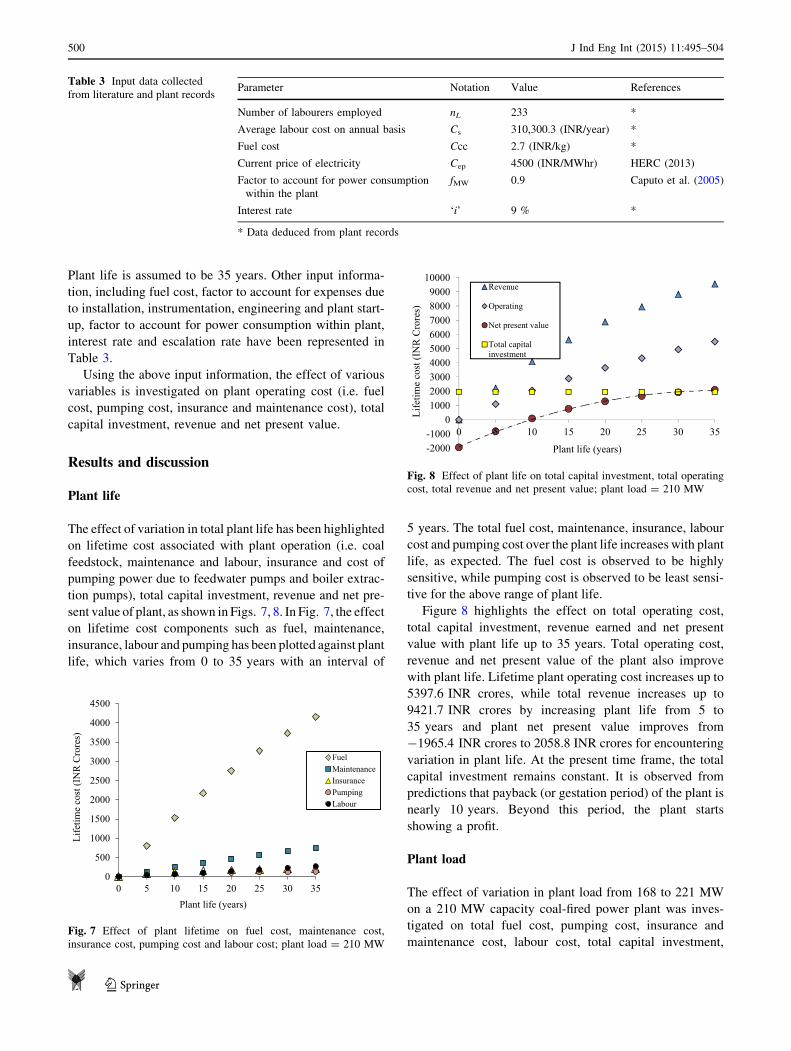
working in parallel with 50 % capacity. The curve fit of
component cost was obtained from data collected from the
literature; the values of empirical constants ai and bi are
also listed in Table 1. The comparisons of curve fits against
data for cost of boiler, turbine generator, condenser, civil
works, electrical works and piping works are shown in
Figs. 1, 2, 3, 4, 5, 6.
The total direct plant cost involves the cost of equipment
and other costs and can be written as
Cdirect ¼ CEqp þ Cother: ð2Þ
The cost of the equipment, CEqp, can be written in terms
of redundancies of the respective components (Ni) as
CEqp ¼Xn
i
NiCið Þ þ Cpiping þ Ccivil þ Celectrical
þCcoalhandling þ Cashhandling: ð3Þ
Here, ‘Ni’ represents the number of redundant units of
condensate extraction pump and boiler feed pump. In the
present study, redundant units are 3 and 1 for condensate
extraction pump and boiler feed pump, respectively. The
other costs associated with piping, civil works and elec-
trical works can be obtained in the form of Eq. (1) fol-
lowed by Table 1. However, the costs of piping works (in
INR) can be obtained using the polynomial form as
Cpiping ¼ �895:91 � ðMWÞ2 þ 3; 674; 897:1 � MW
� 145; 238; 239:3: ð4Þ
In the absence of suitable cost data for the coal handling
and ash handling system, the data of the 300 MW plant for
the coal handling and ash handling system (Pauschert
2009) are adopted:
Ccoalhandling ¼ fconversion � 96 � 105; ð5Þ
Cashhandling ¼ fconversion � 17 � 106: ð6Þ
The cost due to direct installation, auxiliary services,
instrumentation and controls and site preparation can be
grouped in another category as
Cother ¼ 1CEqp: ð7Þ
Here, 1 is a factor that accounts for direct installation,
auxiliary, instrumentation and control. 1 is fixed at 0.65.
The total indirect plant cost has been associated with
engineering and plant start-up, which can be obtained in terms
of total equipment cost following Caputo et al. (2005) as
Cindirect ¼ nCEqp: ð8Þ
Here, n is a factor that accounts for engineering and plant
start-up, which is fixed at 0.22 in the present calculations.
Thus, total capital investment can be defined as the sum
of total direct and total indirect plant cost as
Ctci ¼ Cdirect þ Cindirect: ð9Þ
The operating cost (includes the purchasing cost of coal
feedstock, maintenance and labour, insurance and cost of
power associated with boiler feedwater pumps and condensate
extraction pumps for running the thermal power plant) is
considered to be paid annually over the lifespan of the coal-
fired power plant. It is likely to be changed in an economic
J Ind Eng Int (2015) 11:495–504 497
123
climate (i.e. due to current interest rate and escalation rate in
the prices of coal,maintenance, labour, insurance and pumping
power). Therefore, to account for the influence of interest rate
and the escalation rate for the total operating cost over plant
life, the present worth factor (PWF) can be defined as
PWFk ¼1
ð1þ iÞk: ð10Þ
Thus, the lifetime cost of coal or fuel, maintenance,
labour, insurance and pumping power can be obtained in
terms of PWF and the escalation rate following Li and
Priddy (1985) as
Coal or fuel cost
Ccoal ¼Xpl
k¼1
PWFk � mcoal;k � Cccð1þ KÞðk�1Þ� �
: ð11Þ
The maintenance cost is
Cmaint ¼Xpl
k¼1
PWFk � 0:015� Ctcið1þ QÞðk�1Þ� �
: ð12Þ
R² = 0.9954
0
20
40
60
80
100
120
140
160
0 100 200 300 400 500 600 700 800
Boile
r cos
t (IN
R) x
100
0000
00
Installed capacity (MW)
Rs: Boiler
Power (Rs: Boiler)
Fig. 1 Comparing curve fit against cost data of boiler in terms of
installed capacity
R² = 0.99976
0
10
20
30
40
50
60
70
80
0 200 400 600 800Cost
of T
urbi
ne &
Gen
erat
or (
INR)
x 1
0000
0000
Installed capacity (MW)
Turbine+Generator
Curve fit
Fig. 2 Comparing curve fit against cost data of turbine generator in
terms of installed capacity
R² = 0.95583
0.0
0.5
1.0
1.5
2.0
2.5
3.0
3.5
0 200 400 600Co
nden
ser c
ost (
INR
x 10
0000
000)
Installed capacity (MW)
Data
Curve fit
Fig. 3 Comparing curve fit against cost data of condenser in terms of
installed capacity
R² = 0.984
0
5
10
15
20
25
30
0 200 400 600 800 1000
Civi
l wor
ks c
ost (
Rs x
100
0000
00)
Installed capacity (MW)
Civil works
Curve fit
Fig. 4 Comparing curve fit against cost data of civil works in terms
of installed capacity
Table 1 Constants in Eq. (1) in
the evaluation of component
cost (in INR)
S. no. Equipment a b References
1 Steam boiler 76,132,335.1 0.8 Caputo et al. (2005); Hasler et al. (2009)
2 Steam turbine and generator 3,501,170.7 1.2 Caputo et al. (2005); Pauschert (2009)
3 Feed pumps 35,000 0.6 Caputo et al. (2005)
4 Cond. extraction pump 9000 0.4 Caputo et al. (2005)
5 Condenser 17,306,123.8 0.5 Caputo et al. (2005); NETL (2012)
6 Civil works 57,418,809.8 0.5 Caputo et al. (2005); Pauschert (2009)
7 Electrical works 59,663,488.1 0.6 Caputo et al. (2005); Pauschert (2009)
498 J Ind Eng Int (2015) 11:495–504
123
The labour cost is
Clab ¼Xpl
k¼1
PWFk � nL � Csð1þ JÞðk�1Þ� �
: ð13Þ
The insurance cost is
Cins ¼Xpl
k¼1
PWFk � 0:01� Ctcið1þ OÞðk�1Þ� �
: ð14Þ
The pumping cost is
Cpumping ¼Xpl
k¼1
PWFk�8760Avoverall
�XN
j¼1
mj
qwater
� ��DPj
gpump;j
24
35� cepð1þSÞðk�1Þ
!:
ð15Þ
In Eq. (14), the escalation rate on insurance (O) is
assumed to be zero.
Here, Avoverall, N, m, gpump and DP are the overall
availability, number of pumps, pump efficiency, mass flow
rate and pressure drop through the jth pump, respectively.
Also, ‘nL’ is the number of personnel employed, ‘C’ is the
cost in INR, while subscripts maint, ins, ep, cc and lab
correspond to maintenance, insurance, price of electricity
(INR/MWhr), coal cost and average annual labour cost
(individual), respectively. In the present case, gpump has
been taken to be 90 %. The maintenance and insurance
costs are taken to be 1.5 and 1 % of the total capital
investment obtained from the literature. The coal storage,
fuel handling system and fume treatment costs are
neglected in the present work. The taxes and financial
charges have been neglected in this work.
The lifetime cost of purchasing cost of coal feedstock,
maintenance and labour, insurance and cost of power
associated with boiler feedwater pumps and condensate
extraction pumps for running the thermal power plant can
be calculated as
Co ¼ Ccoal þ Cmaint þ Clab þ Cins þ Cpumping: ð16Þ
Likewise, the revenue over life span can be obtained
from the sale of electricity in terms of PWF as
Ran ¼ fMW
Xpl
k¼1
PWFk � MW � 8760Avoverall � cepð1þ SÞðk�1Þ� �
:
ð17Þ
Caputo et al. (2005) reported that 10 % of the total
revenue is consumed in internal affairs of the plant, which
includes the pumping cost itself. Since we have included
the pumping cost in the operating cost itself, the necessary
adjustment in the net electric output would be required.
From a baseline run, it was observed that the pumping cost
was hardly 1 % of the total revenue. Therefore, the value of
fMW was fixed at 91 %.
For assessment of the economic effectiveness of the
investments, the NPV method is most frequently used. In
the present work, therefore, the NPV method was
employed. The expression of the net present value of plant
on lifetime basis can be written as
NPVlifetime ¼ Rlifetime � Co þ Ctcið Þlifetime: ð18Þ
The total number of people deputed in the plant along
with their salary is represented in Table 2. The average
personnel salary on an annual basis is deduced from the
plant (see Table 2).
The current interest rate is fixed at 9 %. The average
electricity price at present is taken to be 4500 INR/MWhr.
R² = 0.994
0
5
10
15
20
25
30
35
40
0 200 400 600 800 1000
Cost
of e
lect
rical
wor
ks (R
s x
1000
0000
0)
Installed capacity (MW)
Electrical works
Curve fit
Fig. 5 Comparing curve fit against cost data of electrical works in
terms of installed capacity
R² = 0.996
0
5
10
15
20
25
0 200 400 600 800 1000
Cost
of p
ipin
g w
orks
(Rs
x 10
0000
000)
Installed capacity (MW)
Piping works
Curve fit
Fig. 6 Comparing curve fit against cost data of piping works in terms
of installed capacity
Table 2 Data of 210 MW plant for average salary of plant personnel
as deduced from plant records
Total personnel
deployed
in 210 MW unit
Total monthly
salary of plant
personnel (INR)
Average monthly
salary (INR)
233 6,025,000 25,858.4
J Ind Eng Int (2015) 11:495–504 499
123
Plant life is assumed to be 35 years. Other input informa-
tion, including fuel cost, factor to account for expenses due
to installation, instrumentation, engineering and plant start-
up, factor to account for power consumption within plant,
interest rate and escalation rate have been represented in
Table 3.
Using the above input information, the effect of various
variables is investigated on plant operating cost (i.e. fuel
cost, pumping cost, insurance and maintenance cost), total
capital investment, revenue and net present value.
Results and discussion
Plant life
The effect of variation in total plant life has been highlighted
on lifetime cost associated with plant operation (i.e. coal
feedstock, maintenance and labour, insurance and cost of
pumping power due to feedwater pumps and boiler extrac-
tion pumps), total capital investment, revenue and net pre-
sent value of plant, as shown in Figs. 7, 8. In Fig. 7, the effect
on lifetime cost components such as fuel, maintenance,
insurance, labour and pumping has been plotted against plant
life, which varies from 0 to 35 years with an interval of
5 years. The total fuel cost, maintenance, insurance, labour
cost and pumping cost over the plant life increases with plant
life, as expected. The fuel cost is observed to be highly
sensitive, while pumping cost is observed to be least sensi-
tive for the above range of plant life.
Figure 8 highlights the effect on total operating cost,
total capital investment, revenue earned and net present
value with plant life up to 35 years. Total operating cost,
revenue and net present value of the plant also improve
with plant life. Lifetime plant operating cost increases up to
5397.6 INR crores, while total revenue increases up to
9421.7 INR crores by increasing plant life from 5 to
35 years and plant net present value improves from
-1965.4 INR crores to 2058.8 INR crores for encountering
variation in plant life. At the present time frame, the total
capital investment remains constant. It is observed from
predictions that payback (or gestation period) of the plant is
nearly 10 years. Beyond this period, the plant starts
showing a profit.
Plant load
The effect of variation in plant load from 168 to 221 MW
on a 210 MW capacity coal-fired power plant was inves-
tigated on total fuel cost, pumping cost, insurance and
maintenance cost, labour cost, total capital investment,
Table 3 Input data collected
from literature and plant recordsParameter Notation Value References
Number of labourers employed nL 233 *
Average labour cost on annual basis Cs 310,300.3 (INR/year) *
Fuel cost Ccc 2.7 (INR/kg) *
Current price of electricity Cep 4500 (INR/MWhr) HERC (2013)
Factor to account for power consumption
within the plant
fMW 0.9 Caputo et al. (2005)
Interest rate ‘i’ 9 % *
* Data deduced from plant records
0
500
1000
1500
2000
2500
3000
3500
4000
4500
0 5 10 15 20 25 30 35
Life
time
cost
(IN
R C
rore
s)
Plant life (years)
FuelMaintenanceInsurancePumpingLabour
Fig. 7 Effect of plant lifetime on fuel cost, maintenance cost,
insurance cost, pumping cost and labour cost; plant load = 210 MW
-2000-1000
0100020003000400050006000700080009000
10000
0 5 10 15 20 25 30 35
Life
time
cost
(IN
R C
rore
s)
Plant life (years)
Revenue
Operating
Net present value
Total capitalinvestment
Fig. 8 Effect of plant life on total capital investment, total operating
cost, total revenue and net present value; plant load = 210 MW
500 J Ind Eng Int (2015) 11:495–504
123
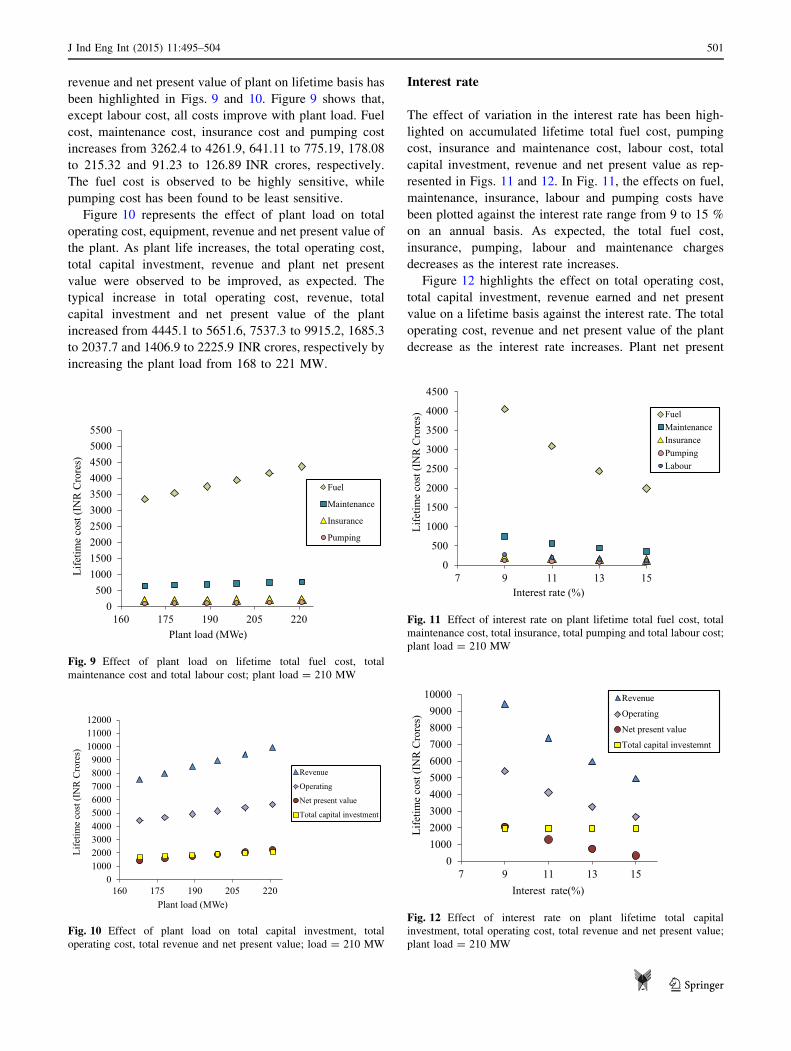
revenue and net present value of plant on lifetime basis has
been highlighted in Figs. 9 and 10. Figure 9 shows that,
except labour cost, all costs improve with plant load. Fuel
cost, maintenance cost, insurance cost and pumping cost
increases from 3262.4 to 4261.9, 641.11 to 775.19, 178.08
to 215.32 and 91.23 to 126.89 INR crores, respectively.
The fuel cost is observed to be highly sensitive, while
pumping cost has been found to be least sensitive.
Figure 10 represents the effect of plant load on total
operating cost, equipment, revenue and net present value of
the plant. As plant life increases, the total operating cost,
total capital investment, revenue and plant net present
value were observed to be improved, as expected. The
typical increase in total operating cost, revenue, total
capital investment and net present value of the plant
increased from 4445.1 to 5651.6, 7537.3 to 9915.2, 1685.3
to 2037.7 and 1406.9 to 2225.9 INR crores, respectively by
increasing the plant load from 168 to 221 MW.
Interest rate
The effect of variation in the interest rate has been high-
lighted on accumulated lifetime total fuel cost, pumping
cost, insurance and maintenance cost, labour cost, total
capital investment, revenue and net present value as rep-
resented in Figs. 11 and 12. In Fig. 11, the effects on fuel,
maintenance, insurance, labour and pumping costs have
been plotted against the interest rate range from 9 to 15 %
on an annual basis. As expected, the total fuel cost,
insurance, pumping, labour and maintenance charges
decreases as the interest rate increases.
Figure 12 highlights the effect on total operating cost,
total capital investment, revenue earned and net present
value on a lifetime basis against the interest rate. The total
operating cost, revenue and net present value of the plant
decrease as the interest rate increases. Plant net present
0500
1000150020002500300035004000450050005500
160 175 190 205 220
Life
time
cost
(IN
R C
rore
s)
Plant load (MWe)
Fuel
Maintenance
Insurance
Pumping
Fig. 9 Effect of plant load on lifetime total fuel cost, total
maintenance cost and total labour cost; plant load = 210 MW
0100020003000400050006000700080009000
100001100012000
160 175 190 205 220
Life
time
cost
(IN
R C
rore
s)
Plant load (MWe)
Revenue
Operating
Net present value
Total capital investment
Fig. 10 Effect of plant load on total capital investment, total
operating cost, total revenue and net present value; load = 210 MW
0
500
1000
1500
2000
2500
3000
3500
4000
4500
7 9 11 13 15
Life
time
cost
(IN
R C
rore
s)
Interest rate (%)
FuelMaintenanceInsurancePumpingLabour
Fig. 11 Effect of interest rate on plant lifetime total fuel cost, total
maintenance cost, total insurance, total pumping and total labour cost;
plant load = 210 MW
0100020003000400050006000700080009000
10000
7 9 11 13 15
Life
time
cost
(IN
R C
rore
s)
Interest rate(%)
Revenue
Operating
Net present value
Total capital investemnt
Fig. 12 Effect of interest rate on plant lifetime total capital
investment, total operating cost, total revenue and net present value;
plant load = 210 MW
J Ind Eng Int (2015) 11:495–504 501
123
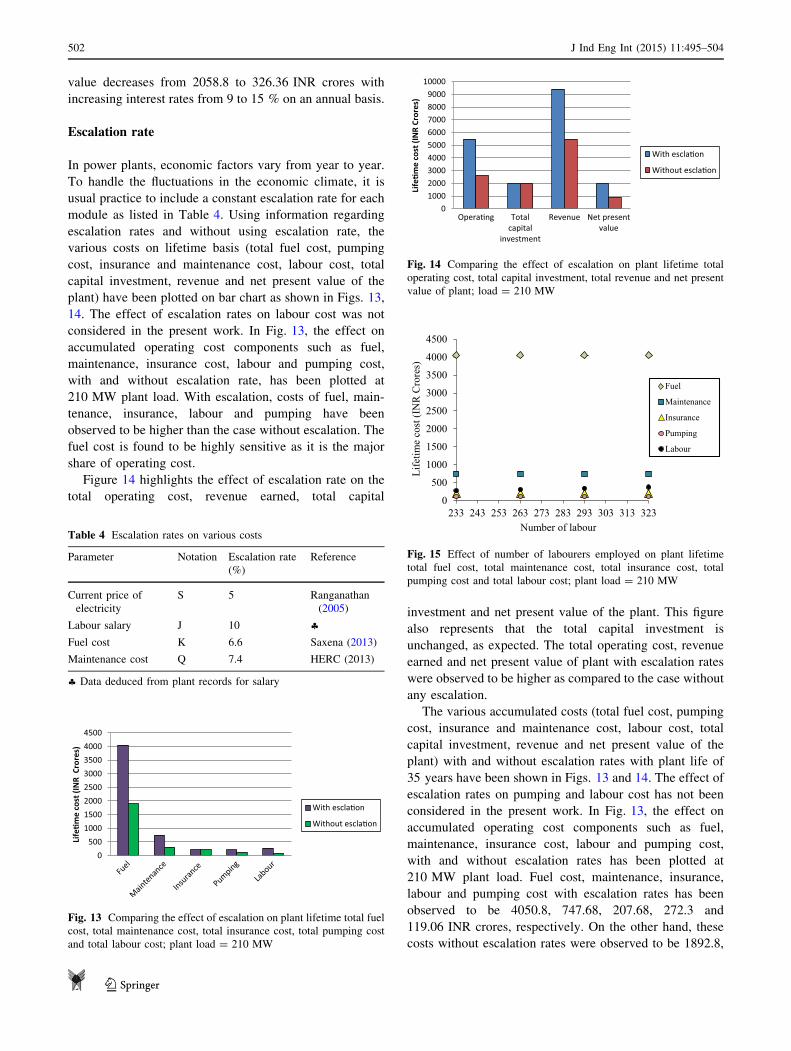
value decreases from 2058.8 to 326.36 INR crores with
increasing interest rates from 9 to 15 % on an annual basis.
Escalation rate
In power plants, economic factors vary from year to year.
To handle the fluctuations in the economic climate, it is
usual practice to include a constant escalation rate for each
module as listed in Table 4. Using information regarding
escalation rates and without using escalation rate, the
various costs on lifetime basis (total fuel cost, pumping
cost, insurance and maintenance cost, labour cost, total
capital investment, revenue and net present value of the
plant) have been plotted on bar chart as shown in Figs. 13,
14. The effect of escalation rates on labour cost was not
considered in the present work. In Fig. 13, the effect on
accumulated operating cost components such as fuel,
maintenance, insurance cost, labour and pumping cost,
with and without escalation rate, has been plotted at
210 MW plant load. With escalation, costs of fuel, main-
tenance, insurance, labour and pumping have been
observed to be higher than the case without escalation. The
fuel cost is found to be highly sensitive as it is the major
share of operating cost.
Figure 14 highlights the effect of escalation rate on the
total operating cost, revenue earned, total capital
investment and net present value of the plant. This figure
also represents that the total capital investment is
unchanged, as expected. The total operating cost, revenue
earned and net present value of plant with escalation rates
were observed to be higher as compared to the case without
any escalation.
The various accumulated costs (total fuel cost, pumping
cost, insurance and maintenance cost, labour cost, total
capital investment, revenue and net present value of the
plant) with and without escalation rates with plant life of
35 years have been shown in Figs. 13 and 14. The effect of
escalation rates on pumping and labour cost has not been
considered in the present work. In Fig. 13, the effect on
accumulated operating cost components such as fuel,
maintenance, insurance cost, labour and pumping cost,
with and without escalation rates has been plotted at
210 MW plant load. Fuel cost, maintenance, insurance,
labour and pumping cost with escalation rates has been
observed to be 4050.8, 747.68, 207.68, 272.3 and
119.06 INR crores, respectively. On the other hand, these
costs without escalation rates were observed to be 1892.8,
0500
10001500200025003000350040004500
Life
�me
cost
(IN
R C
rore
s)
With escla�on
Without escla�on
Fig. 13 Comparing the effect of escalation on plant lifetime total fuel
cost, total maintenance cost, total insurance cost, total pumping cost
and total labour cost; plant load = 210 MW
0100020003000400050006000700080009000
10000
Opera�ng Totalcapital
investment
Revenue Net presentvalue
Life
�me
cost
(IN
R Cr
ores
)
With escla�on
Without escla�on
Fig. 14 Comparing the effect of escalation on plant lifetime total
operating cost, total capital investment, total revenue and net present
value of plant; load = 210 MW
Table 4 Escalation rates on various costs
Parameter Notation Escalation rate
(%)
Reference
Current price of
electricity
S 5 Ranganathan
(2005)
Labour salary J 10 §Fuel cost K 6.6 Saxena (2013)
Maintenance cost Q 7.4 HERC (2013)
§ Data deduced from plant records for salary
0
500
1000
1500
2000
2500
3000
3500
4000
4500
233 243 253 263 273 283 293 303 313 323
Life
time
cost
(IN
R C
rore
s)
Number of labour
Fuel
Maintenance
Insurance
Pumping
Labour
Fig. 15 Effect of number of labourers employed on plant lifetime
total fuel cost, total maintenance cost, total insurance cost, total
pumping cost and total labour cost; plant load = 210 MW
502 J Ind Eng Int (2015) 11:495–504
123
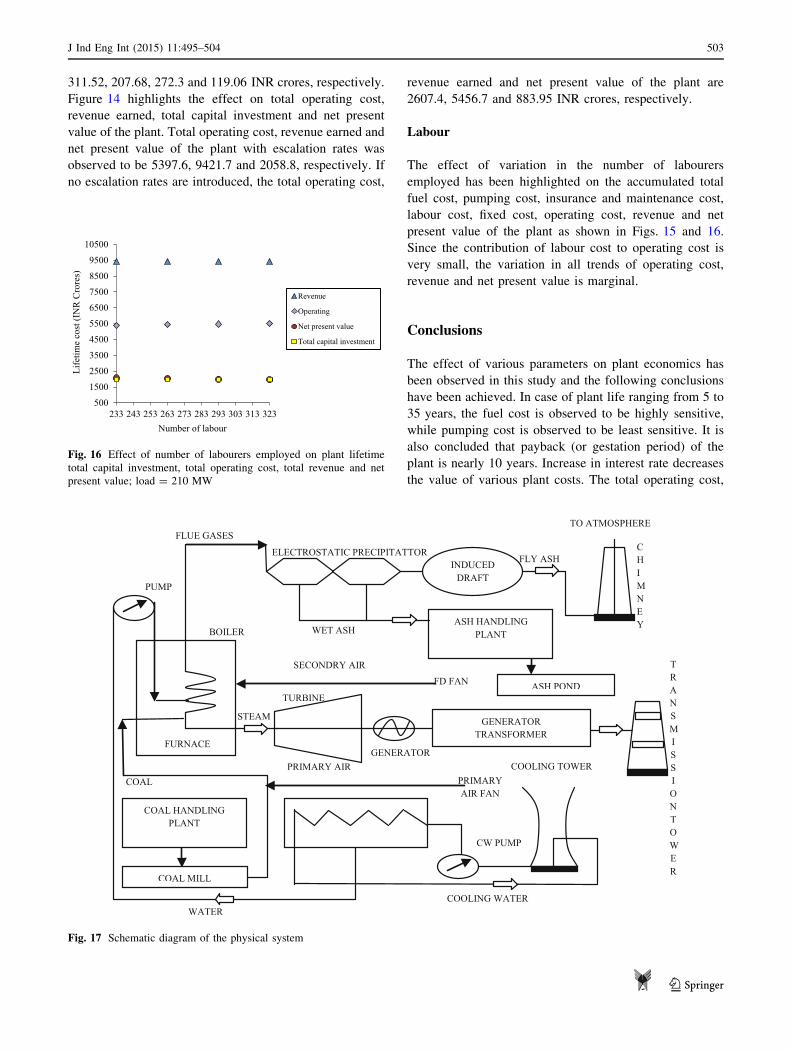
311.52, 207.68, 272.3 and 119.06 INR crores, respectively.
Figure 14 highlights the effect on total operating cost,
revenue earned, total capital investment and net present
value of the plant. Total operating cost, revenue earned and
net present value of the plant with escalation rates was
observed to be 5397.6, 9421.7 and 2058.8, respectively. If
no escalation rates are introduced, the total operating cost,
revenue earned and net present value of the plant are
2607.4, 5456.7 and 883.95 INR crores, respectively.
Labour
The effect of variation in the number of labourers
employed has been highlighted on the accumulated total
fuel cost, pumping cost, insurance and maintenance cost,
labour cost, fixed cost, operating cost, revenue and net
present value of the plant as shown in Figs. 15 and 16.
Since the contribution of labour cost to operating cost is
very small, the variation in all trends of operating cost,
revenue and net present value is marginal.
Conclusions
The effect of various parameters on plant economics has
been observed in this study and the following conclusions
have been achieved. In case of plant life ranging from 5 to
35 years, the fuel cost is observed to be highly sensitive,
while pumping cost is observed to be least sensitive. It is
also concluded that payback (or gestation period) of the
plant is nearly 10 years. Increase in interest rate decreases
the value of various plant costs. The total operating cost,
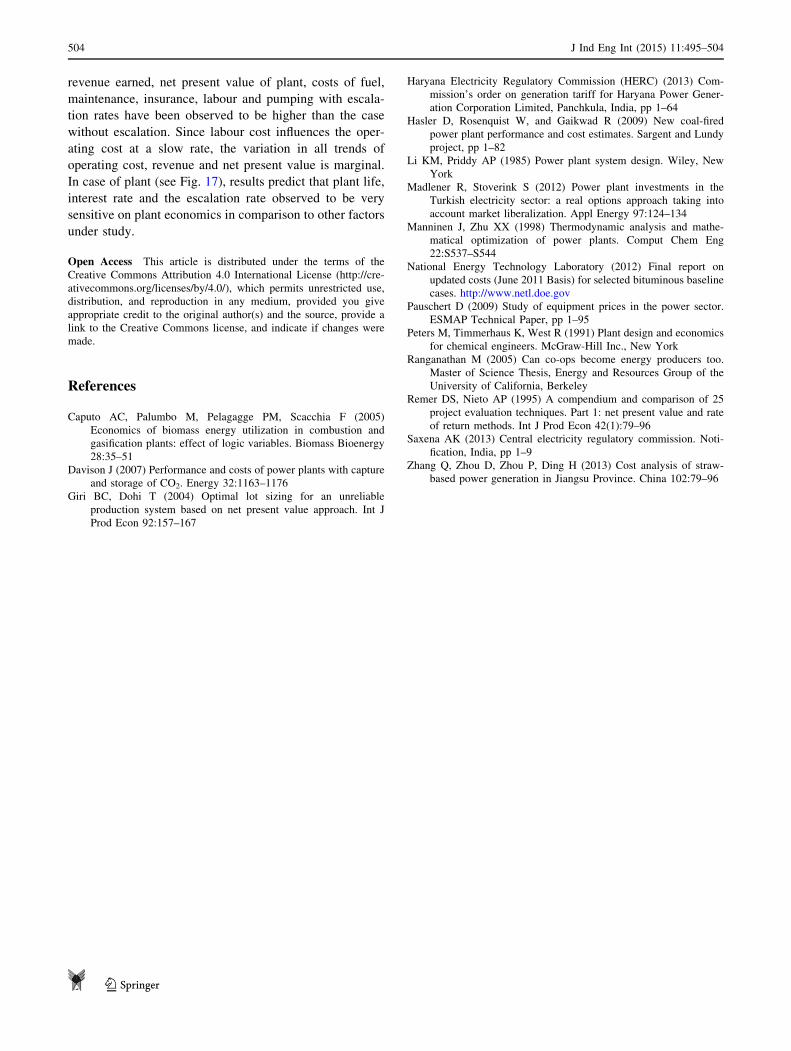
ASH HANDLING PLANT
ASH POND
INDUCED DRAFT
GENERATOR TRANSFORMER
COAL HANDLING PLANT
COAL MILL
ELECTROSTATIC PRECIPITATTOR
WATER
PRIMARY AIR FAN
PRIMARY AIR
SECONDRY AIR
FD FAN
FURNACE
COAL
BOILER
PUMP
WET ASH
TRANSMISSION TOWER
COOLING TOWER
CW PUMP
COOLING WATER
FLUE GASES
GENERATOR
TURBINE
CHIMNEY
FLY ASH
STEAM
TO ATMOSPHERE
Fig. 17 Schematic diagram of the physical system
500
1500
2500
3500
4500
5500
6500
7500
8500
9500
10500
233 243 253 263 273 283 293 303 313 323
Life
time
cost
(IN
R C
rore
s)
Number of labour
Revenue
Operating
Net present value
Total capital investment
Fig. 16 Effect of number of labourers employed on plant lifetime
total capital investment, total operating cost, total revenue and net
present value; load = 210 MW
J Ind Eng Int (2015) 11:495–504 503
123
revenue earned, net present value of plant, costs of fuel,
maintenance, insurance, labour and pumping with escala-
tion rates have been observed to be higher than the case
without escalation. Since labour cost influences the oper-
ating cost at a slow rate, the variation in all trends of
operating cost, revenue and net present value is marginal.
In case of plant (see Fig. 17), results predict that plant life,
interest rate and the escalation rate observed to be very
sensitive on plant economics in comparison to other factors
under study.
Open Access This article is distributed under the terms of the
Creative Commons Attribution 4.0 International License (http://cre-
ativecommons.org/licenses/by/4.0/), which permits unrestricted use,
distribution, and reproduction in any medium, provided you give
appropriate credit to the original author(s) and the source, provide a
link to the Creative Commons license, and indicate if changes were
made.
References
Caputo AC, Palumbo M, Pelagagge PM, Scacchia F (2005)
Economics of biomass energy utilization in combustion and
gasification plants: effect of logic variables. Biomass Bioenergy
28:35–51
Davison J (2007) Performance and costs of power plants with capture
and storage of CO2. Energy 32:1163–1176
Giri BC, Dohi T (2004) Optimal lot sizing for an unreliable
production system based on net present value approach. Int J
Prod Econ 92:157–167
Haryana Electricity Regulatory Commission (HERC) (2013) Com-
mission’s order on generation tariff for Haryana Power Gener-
ation Corporation Limited, Panchkula, India, pp 1–64
Hasler D, Rosenquist W, and Gaikwad R (2009) New coal-fired
power plant performance and cost estimates. Sargent and Lundy
project, pp 1–82
Li KM, Priddy AP (1985) Power plant system design. Wiley, New
York
Madlener R, Stoverink S (2012) Power plant investments in the
Turkish electricity sector: a real options approach taking into
account market liberalization. Appl Energy 97:124–134
Manninen J, Zhu XX (1998) Thermodynamic analysis and mathe-
matical optimization of power plants. Comput Chem Eng
22:S537–S544
National Energy Technology Laboratory (2012) Final report on
updated costs (June 2011 Basis) for selected bituminous baseline
cases. http://www.netl.doe.gov
Pauschert D (2009) Study of equipment prices in the power sector.
ESMAP Technical Paper, pp 1–95
Peters M, Timmerhaus K, West R (1991) Plant design and economics
for chemical engineers. McGraw-Hill Inc., New York
Ranganathan M (2005) Can co-ops become energy producers too.
Master of Science Thesis, Energy and Resources Group of the
University of California, Berkeley
Remer DS, Nieto AP (1995) A compendium and comparison of 25
project evaluation techniques. Part 1: net present value and rate
of return methods. Int J Prod Econ 42(1):79–96
Saxena AK (2013) Central electricity regulatory commission. Noti-
fication, India, pp 1–9
Zhang Q, Zhou D, Zhou P, Ding H (2013) Cost analysis of straw-
based power generation in Jiangsu Province. China 102:79–96
504 J Ind Eng Int (2015) 11:495–504
123
Copyright © 2022 FDOKUMEN