Cosmology in two dimensions: the concentration-mass relation for galaxy clusters
18
Mon. Not. R. Astron. Soc. 000, 1–18 (2012) Printed 31 July 2012 (MN L A T E X style file v2.2) Cosmology in 2D: the concentration-mass relation for galaxy clusters Carlo Giocoli 1,2,3? , Massimo Meneghetti 2,3 , Stefano Ettori 2,3 , Lauro Moscardini 1,2,3 1 Dipartimento di Astronomia, Universit` a di Bologna, via Ranzani 1, 40127, Bologna, Italy 2 INAF - Osservatorio Astronomico di Bologna, via Ranzani 1, 40127, Bologna, Italy 3 INFN - Sezione di Bologna, viale Berti Pichat 6/2, 40127, Bologna, Italy ABSTRACT The aim of this work is to perform a systematic study of the measures of the mass and concentration estimated by fitting the convergence profile of a large sample of mock galaxy cluster size lenses, created with the publicly available code MOKA. We found that the main contribution to the bias in mass and in concentration is due to the halo triaxiality and second to the presence of substructures within the host halo virial radius. We show that knowing the cluster elongation along the line of sight helps in correcting the mass bias, but still keeps a small negative bias for the concentration. If these mass and concentration biases will characterize the galaxy cluster sample of a wide field survey it will be difficult to well recover within one sigma the cosmological parameters that mainly influence the c - M relation, using as reference a 3D c - M relation measured in cosmological N -body simulation. In this work we propose how to correct the c - M relation for projection effects and for adiabatic contraction and suggest to use these as reference for real observed data. Correcting mass and concentration estimates, as we propose, gives a measurement of the cosmological parameter within 1 - σ confidence contours. Key words: galaxies: halos - cosmology: theory - dark matter - methods: analytical - gravitational lensing: strong 1 INTRODUCTION Galaxy clusters represent a very important cosmic labora- tory. Their abundance and structural properties are corre- lated with the content, the formation and the evolution his- tory of the universe. Recent observational analyses have fa- vored the dark energy as dominant component, contributing to the late accelerate expansion of the universe (Perlmutter et al. 1998, 1999), and the dark matter as the second one, made up of some kind of non-baryonic weakly interacting elementary particle, left over from the Big Bang, this rep- resents the concordance ΛCDM model. Galaxy clusters, the most bound and late forming structures of the universe, pos- sess a matter content which is compatible with the cosmic one (Ettori et al. 2009). About 85% of the total galaxy clus- ter mass is in form of dark matter, while 15% is attributed to baryons: 75% of which is in form of hot and 7% of cold gas, other baryon fractions count for the remaining 18%. For this reason, cluster number counts represent a very impor- tant probe for the nature of dark energy and matter, as like ? E-mail: [email protected] as the study of their mass and concentration, that we will present and discuss in this work. Observing them at different wavelengths gives the possibility to study their whole con- tent: the hot and cold gas, stars in galaxies and the presence of dark matter. Numerical simulations of structure formation in the ΛCDM framework predict the halo concentration, defined as the ratio between the virial and the scale radii of the density profile, to be a monotonic function of the host halo mass: smaller haloes, forming at higher redshifts than larger ones, tend to possess a larger value of the concentration. Re- cently, increasing the force and the mass resolution in nu- merical simulation has given the possibility to span a very large halo mass range down to the size of dwarf-galaxies. Dolag et al. (2004); Neto et al. (2007); Macci` o et al. (2007, 2008); Gao et al. (2008), interpreting the results of different numerical simulations, agree in finding a power-law relation between the average values of mass and concentration. On the other hand, more theoretical interpretations have been given to the average c - M relation by Zhao et al. (2009); Giocoli et al. (2012b), that relate the concentration to the time at which the main halo progenitor assembles a certain arXiv:1205.2375v2 [astro-ph.CO] 30 Jul 2012
Transcript of Cosmology in two dimensions: the concentration-mass relation for galaxy clusters
Mon. Not. R. Astron. Soc. 000, 1–18 (2012) Printed 31 July 2012 (MN LATEX style file v2.2)
Cosmology in 2D: the concentration-mass relation forgalaxy clusters
Carlo Giocoli1,2,3?, Massimo Meneghetti2,3, Stefano Ettori2,3, Lauro Moscardini1,2,3
1 Dipartimento di Astronomia, Universita di Bologna, via Ranzani 1, 40127, Bologna, Italy2 INAF - Osservatorio Astronomico di Bologna, via Ranzani 1, 40127, Bologna, Italy3 INFN - Sezione di Bologna, viale Berti Pichat 6/2, 40127, Bologna, Italy
ABSTRACT
The aim of this work is to perform a systematic study of the measures of themass and concentration estimated by fitting the convergence profile of a large sampleof mock galaxy cluster size lenses, created with the publicly available code MOKA.We found that the main contribution to the bias in mass and in concentration isdue to the halo triaxiality and second to the presence of substructures within thehost halo virial radius. We show that knowing the cluster elongation along the lineof sight helps in correcting the mass bias, but still keeps a small negative bias forthe concentration. If these mass and concentration biases will characterize the galaxycluster sample of a wide field survey it will be difficult to well recover within onesigma the cosmological parameters that mainly influence the c −M relation, usingas reference a 3D c − M relation measured in cosmological N -body simulation. Inthis work we propose how to correct the c − M relation for projection effects andfor adiabatic contraction and suggest to use these as reference for real observed data.Correcting mass and concentration estimates, as we propose, gives a measurement ofthe cosmological parameter within 1 − σ confidence contours.
Key words: galaxies: halos - cosmology: theory - dark matter - methods: analytical- gravitational lensing: strong
1 INTRODUCTION
Galaxy clusters represent a very important cosmic labora-tory. Their abundance and structural properties are corre-lated with the content, the formation and the evolution his-tory of the universe. Recent observational analyses have fa-vored the dark energy as dominant component, contributingto the late accelerate expansion of the universe (Perlmutteret al. 1998, 1999), and the dark matter as the second one,made up of some kind of non-baryonic weakly interactingelementary particle, left over from the Big Bang, this rep-resents the concordance ΛCDM model. Galaxy clusters, themost bound and late forming structures of the universe, pos-sess a matter content which is compatible with the cosmicone (Ettori et al. 2009). About 85% of the total galaxy clus-ter mass is in form of dark matter, while 15% is attributedto baryons: 75% of which is in form of hot and 7% of coldgas, other baryon fractions count for the remaining 18%. Forthis reason, cluster number counts represent a very impor-tant probe for the nature of dark energy and matter, as like
? E-mail: [email protected]
as the study of their mass and concentration, that we willpresent and discuss in this work. Observing them at differentwavelengths gives the possibility to study their whole con-tent: the hot and cold gas, stars in galaxies and the presenceof dark matter.
Numerical simulations of structure formation in theΛCDM framework predict the halo concentration, definedas the ratio between the virial and the scale radii of thedensity profile, to be a monotonic function of the host halomass: smaller haloes, forming at higher redshifts than largerones, tend to possess a larger value of the concentration. Re-cently, increasing the force and the mass resolution in nu-merical simulation has given the possibility to span a verylarge halo mass range down to the size of dwarf-galaxies.Dolag et al. (2004); Neto et al. (2007); Maccio et al. (2007,2008); Gao et al. (2008), interpreting the results of differentnumerical simulations, agree in finding a power-law relationbetween the average values of mass and concentration. Onthe other hand, more theoretical interpretations have beengiven to the average c −M relation by Zhao et al. (2009);Giocoli et al. (2012b), that relate the concentration to thetime at which the main halo progenitor assembles a certain
c© 2012 RAS
arX
iv:1
205.
2375
v2 [
astr
o-ph
.CO
] 3
0 Ju
l 201
2
2 Giocoli et al. 2012
fraction of their mass. Since observationally the halo forma-tion time, tf – defined as the time at which the main haloprogenitor assembles half of its mass (Lacey & Cole 1993;Giocoli et al. 2007) – is not a direct measurable quantity, weneed a good and unbiased estimate of the host halo mass andconcentration to translate them in tf (Giocoli et al. 2012b).The Cluster Lensing And Supernova survey with Hubble(CLASH) project (?), together with X-ray and ground-basedoptical observations, is providing the 2D mass distributionof a sample of 25 X-ray selected galaxy clusters. The clustersare selected as dynamically relaxed and span a range of red-shifts going from z = 0.18 up to z = 0.9. The cluster massdensity distribution is reconstructed combining both strongand weak lensing analyses. The strong lensing analysis isperformed thanks to the identification of multiple images(Zitrin et al. 2009) allowed by the excellent HST angularresolution. The reconstruction of the mass distribution isperformed assuming that the galaxy cluster light traces thematter distribution made up of three components: the clus-ter galaxies, a dark matter halo and an external shear to ac-count for additional ellipticity in the mass distribution. Theweak lensing analysis, which probes the mass distributionoutside the strong lensing region, is conducted using widerground-based images obtained from Subaru (Umetsu et al.2009; Okabe et al. 2010a), combined together with KPNOMayall 4-m imaging and spectroscopy from MMT/Hctospec.In this case, selected background galaxies are identified fromthe wider cluster images and used to measure the observedshear and magnification. Deriving the mass profile simul-taneously combining the strong and weak lensing analysesallows a very good determination of both the halo mass andconcentration (Meneghetti et al. 2010b; Rasia et al. 2012).Unlike most other methods that are used to measure themass and concentration of galaxy clusters, like X-ray anal-yses that need to assume hydrostatic equilibrium for thehot intracluster medium or satellite galaxy velocity distri-bution function that needs virial equilibrium (Becker et al.2007), lensing analyses do not require any assumption ofthe dynamical state of the cluster. The interpretation basedon the assumption of hydrostatic and virial equilibrium issometimes complicated by the presence of massive and/ornumerous substructures and by the fact that most clustersare not really relaxed.
Most of the analyses performed on combined weakand strong lensing observations tend to find clusters over-concentrated with respect to what is expected in a ΛCDMuniverse. This bias can be due both to intrinsic projection ef-fects – main halo triaxiality (Meneghetti et al. 2007b) and/orpresence of substructures along the line of sight – and tothe presence of a massive background structure (Coe et al.2012). To be able to recover a good and unbiased estimateof the dark mass and concentration is important to betterconstrain cosmological parameters.
Meneghetti et al. (2010b); Rasia et al. (2012), study-ing galaxy clusters extracted from numerical simulations,have shown that fitting projected quantities, using a Navarroet al. (1997) (hereafter; NFW) function, recovers a mass thatcould be underestimated down to 10− 15%. The halo masstends to be more biased generally when the 2D projectedmass is unrelaxed due to presence of nearby structures.
Recently, Bahe et al. (2012) have produced mock ob-servations of a sample of massive clusters extracted at red-
shift z = 0.2 from the Millennium Simulation (Springel et al.2005), to obtain a projected estimate for both halo mass andconcentration through simulated weak lensing only analysis.They showed that the slope and the normalization of the de-rived 2D c−M relation tend to be lower than the underlying3D ones by 40 and 15 percent respectively. An underestima-tion of the mass measured from weak gravitational lensinghas been also found by Becker & Kravtsov (2011), usingcluster-size haloes extracted from a numerical simulation.Their analysis includes correlated and uncorrelated LSS plusgaussian noise in the tangential shear measurement.
Light travelling from background sources to the ob-server is also deflected by the presence of large scale struc-tures (LSS) along the line of sight: the observed lensing sig-nal is a combination of the cluster and the cosmic shear sig-nal (Hoekstra 2003). This combination limits the accuracywith which both mass and concentration can be estimated,not introducing any particular bias. Hoekstra et al. (2011),also using the Millennium Simulation results, derived thatthis contribution adds an error budget which is compara-ble to the statistical errors. In order to bypass the effect ofLSS and also the errors and the biases that could be intro-duced on the cluster mass reconstructions by the data analy-sis software pipelines, we build a large sample of galaxy clus-ter convergence maps using the publicly available softwareMOKA (Giocoli et al. 2012a), and fit their derived sphericalaveraged profile to recover their mass and concentration.
Throught this work we use a ΛCDM reference model,according to WMAP7-year results (Komatsu et al. 2011):Ωm = 0.272 (DM+baryons), ΩΛ = 0.728, w = −1, σ8 =0.809 and h = 0.704 at z = 0.
The paper is organized as follow. In Section 2 we sum-marize the ingredients used to create our cluster size-haloes.In Section 3 we quantify the bias and scatter caused by in-trinsic halo properties. Section 4 is devoted to study howwell cosmological parameters can be constrained using thec−M relation of objects extracted from a wide field survey.Summary and conclusions are discussed in Section 5.
2 THE METHOD
2.1 The MOKA Code
MOKA (Giocoli et al. 2012a) is a new and fast code able tocreate realistic gravitational lenses, whose size spans fromgalaxies up to clusters of galaxies1. The algorithm uses therecent results obtained from numerical simulations to modelthe structural properties of the lenses. In creating cluster2D-maps MOKA is very fast, its utilization is friendly allowingthe possibility of switching on and off different halo proper-ties. The user can also easily change and redefine the char-acteristics of the main halo, of subhaloes and of the brightcentral galaxy.
2.2 Presence of Substructures and of a BrightCentral Galaxy
In this work we produced a set of simulations creating asample of different galaxy cluster size lenses at various red-
1 web page: cgiocoli.wordpress.com/research-interests/moka
c© 2012 RAS, MNRAS 000, 1–18
Cosmology in 2D 3
shifts. We have divided the haloes in nine mass bins from1013.5 up to 1015.5M/h, logarithmically equally spacedwith d log(M) = 0.25. In each mass bin, with mass Mvir, wehave generated a sample of 128 lenses, that differ in concen-tration cvir, randomly sampling a log-normal distribution,around the average value for that mass, with a given σln c,and in subhalo abundance. In what follows we summarizethe ingredients included in the input file of the algorithm.
• One of the main result obtained studying virializedstructures in numerical simulations is that haloes possessa relatively flat density profile ∝ r−1 near the center andsteeper ∝ r−3 outside (Navarro et al. 1997). The scale ra-dius rs where the slope changes defines the halo concentra-tion cvir ≡ Rvir/rs. For each halo, the smooth halo compo-nent is modelled with a NFW profile, to which is assigned aconcentration csm such that:
ρNFW,vir(r|Mvir, cvir) = ρNFW,s(r|Msm, csm) +
Ntot∑i=1
ρsub(r − ri|msub,i) , (1)
where the subscript vir, sm and sub refer to the total halo,the smooth component and the substructures respectively, riindicates the distance of the subhalo from the host halo cen-ter and ρsub(< r) is the subhalo density profile. The equationabove is solved numerically by minimizing:
χ2(csm) =
ρNFW,vir(r|Mvir, cvir)− (2)
[ρNFW,s(r|Msm, csm) +
Ntot∑i=1
ρsub(r − ri|msub,i)
]2
.
• In the standard scenario of structure formation haloescollapse as consequence of gravitational instability, with thesmall systems assembling first, in a denser universe, thanthe large ones (Wechsler et al. 2002). This translates in smallhaloes to be typically more concentrated than the large ones.In our model we use the Zhao et al. (2009) relation to takeinto account this effect, which relates the concentration ofthe halo with the time t0.04 at which the main halo progen-itor assembles 4% of its mass through the equation:
cvir(Mvir, z) = 4
1 +
[t(z)
3.75t0.04
]8.41/8
. (3)
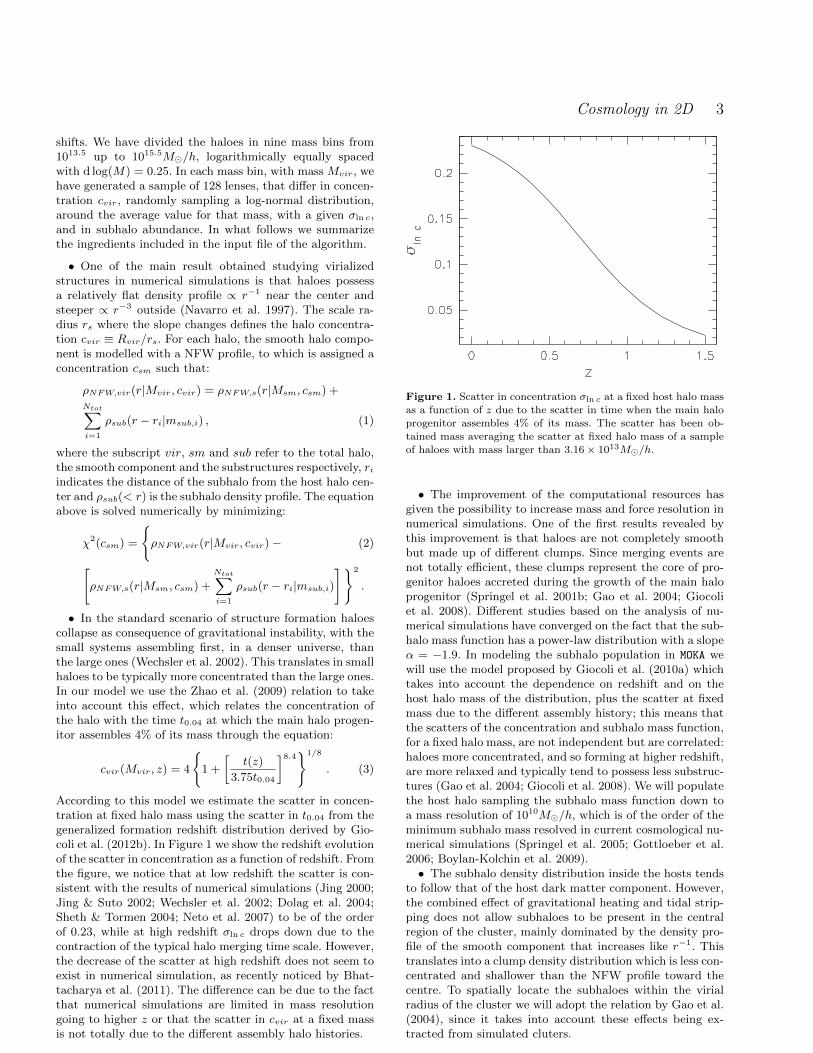
According to this model we estimate the scatter in concen-tration at fixed halo mass using the scatter in t0.04 from thegeneralized formation redshift distribution derived by Gio-coli et al. (2012b). In Figure 1 we show the redshift evolutionof the scatter in concentration as a function of redshift. Fromthe figure, we notice that at low redshift the scatter is con-sistent with the results of numerical simulations (Jing 2000;Jing & Suto 2002; Wechsler et al. 2002; Dolag et al. 2004;Sheth & Tormen 2004; Neto et al. 2007) to be of the orderof 0.23, while at high redshift σln c drops down due to thecontraction of the typical halo merging time scale. However,the decrease of the scatter at high redshift does not seem toexist in numerical simulation, as recently noticed by Bhat-tacharya et al. (2011). The difference can be due to the factthat numerical simulations are limited in mass resolutiongoing to higher z or that the scatter in cvir at a fixed massis not totally due to the different assembly halo histories.
Figure 1. Scatter in concentration σln c at a fixed host halo mass
as a function of z due to the scatter in time when the main haloprogenitor assembles 4% of its mass. The scatter has been ob-
tained mass averaging the scatter at fixed halo mass of a sample
of haloes with mass larger than 3.16 × 10¹³M/h.
• The improvement of the computational resources hasgiven the possibility to increase mass and force resolution innumerical simulations. One of the first results revealed bythis improvement is that haloes are not completely smoothbut made up of different clumps. Since merging events arenot totally efficient, these clumps represent the core of pro-genitor haloes accreted during the growth of the main haloprogenitor (Springel et al. 2001b; Gao et al. 2004; Giocoliet al. 2008). Different studies based on the analysis of nu-merical simulations have converged on the fact that the sub-halo mass function has a power-law distribution with a slopeα = −1.9. In modeling the subhalo population in MOKA wewill use the model proposed by Giocoli et al. (2010a) whichtakes into account the dependence on redshift and on thehost halo mass of the distribution, plus the scatter at fixedmass due to the different assembly history; this means thatthe scatters of the concentration and subhalo mass function,for a fixed halo mass, are not independent but are correlated:haloes more concentrated, and so forming at higher redshift,are more relaxed and typically tend to possess less substruc-tures (Gao et al. 2004; Giocoli et al. 2008). We will populatethe host halo sampling the subhalo mass function down toa mass resolution of 1010M/h, which is of the order of theminimum subhalo mass resolved in current cosmological nu-merical simulations (Springel et al. 2005; Gottloeber et al.2006; Boylan-Kolchin et al. 2009).• The subhalo density distribution inside the hosts tends
to follow that of the host dark matter component. However,the combined effect of gravitational heating and tidal strip-ping does not allow subhaloes to be present in the centralregion of the cluster, mainly dominated by the density pro-file of the smooth component that increases like r−1. Thistranslates into a clump density distribution which is less con-centrated and shallower than the NFW profile toward thecentre. To spatially locate the subhaloes within the virialradius of the cluster we will adopt the relation by Gao et al.(2004), since it takes into account these effects being ex-tracted from simulated cluters.
c© 2012 RAS, MNRAS 000, 1–18
4 Giocoli et al. 2012
• Haloes trace the dark matter density field in the Uni-verse and their clustering is a function of both the mass andthe redshift. Their mutual gravitational interaction tends topull and stretch their matter distribution making the haloestriaxial. We model the halo triaxiality using the results byJing & Suto (2002) from numerical studies. This model cor-relates the axial ratios ea/ec and eb/ec (ea < eb < ec) withthe typical collapsed mass M∗, at the considered redshift,and the matter content of the universe Ωm; apart from thisno other tighter correlation between the halo triaxiality andits formation time is assumed.• Orbiting in the potential well of the host, subhalo den-
sity profile tends to be modified since (i) the particles areheated at the local temperature of the host, (ii) pushed to-ward the tidal radius and (iii) eventually stripped. This phe-nomenology modifies the initial NFW profile into somethingthat is well described by a singular isothermal sphere (SIS)(Metcalf & Madau 2001). The radius of the subhaloes iscomputed in such away preserve the subhalo mass msub andis defined as:
Rsub =Gmsub
2σ2v
. (4)
As discussed in Giocoli et al. (2012a) we notice that typi-cally, if the subhalo is located at a distance r from the hosthalo center, the following condition is valid Rt(r) 6 Rsub,with Rt(r) defined as (Tormen et al. 1998):
Rt = r
msub
[2− ∂ lnMvir(r)/∂ ln r]Mvir(r)
1/3
, (5)
where Mvir(r) represents the mass density profile of the hosthalo. The SIS profile will be used to model the matter den-sity distribution around clumps.• In the standard scenario (White & Rees 1978), the
structure formation process is driven by the dark mattercomponent. Baryons, feeling the halo gravitational poten-tial, shock, cool and eventually form stars. This phenomenol-ogy drives the formation of a massive and bright galaxy atthe center of the main halo progenitor. The correct model-ing of the bright central galaxy (BCG) is important sinceit influences the lensing cross section of galaxy clusters(Meneghetti et al. 2003). The central galaxy populationis modeled in MOKA using the halo occupation distribution(HOD) approach. We use the relation by Wang et al. (2006)to estimate the BCG stellar mass MBCG, assuming thatMBCG correlates with the depth of the potential well of thehalo within which it formed, thus:
MBCG =2Mstar,0
(Mvir/M0)−α + (Mvir/M0)−β. (6)
In this relation, we include a Gaussian scatter in MBCG
for given host halo mass with σMBCG = 0.148, we set theparameters α = 0.39, β = 1.96, log(Mstar,0) = 10.35 andM0 = 3.16 × 10¹¹M/h (see Wang et al. (2006) for moredetalis about the parameters).• The BCG stellar density profile is described following
the Hernquist (1990) profile:
ρstar(r) =ρg
(r/rf )(1 + r/rg)3, (7)
where the scale radius rg is related to the half-mass (or effec-tive) radius Re by rg = 0.551Re. As done by Keeton (2001)we define the effective radius to be Re = 0.003Rvir. The
scale density ρg can be estimated by the definition of thetotal mass of a Hernquist model:
ρg =Mstar
2πr3g
. (8)
We checked the robustness of our results using a Jaffe (1983)profile which keeps unchanged our results.
In Table 1 we summarize the whole set of simulations wehave performed: the first two samples, SPH and SPHwBCG, as-sume the haloes to be spherical, while the last two, ELLwBCGand ELLwBCGwADC, consider the haloes to be triaxial. In thelatter case the axial ratios are obtained randomly samplingthe distributions suggested by Jing & Suto (2002). We alsonotice that the last three samples include the presence of aBCG. In all samples we included the contribution from thesubhalo population. We recall the reader that the total halomass Mvir is defined as the sum of all components, so:
Mvir = Msmooth +
Ntot∑i=1
msub,i [ +MBCG] . (9)
In SPHwBCG and ELLwBCG, the presence of a dissipative bary-onic component in the host halo centre does not influence thedark matter density distribution. This phenomenology, act-ing on the dark matter component mainly in proximity of thehost halo centre and known as adiabatic contraction (Blu-menthal et al. 1986; Rix et al. 1997; Keeton 2001; Gnedinet al. 2011). The effects of baryons on the total mass profileare generally found to only modify halo concentrations atthe 10% level, although some studies suggest that low masssystems may me significantly affected by baryonic cooling(Fedeli 2011). ELLwBCGwADC includes adiabatic contraction,and in Appendix A we discuss how the mass and concen-tration estimates are biased with respect to the ELLwBCG
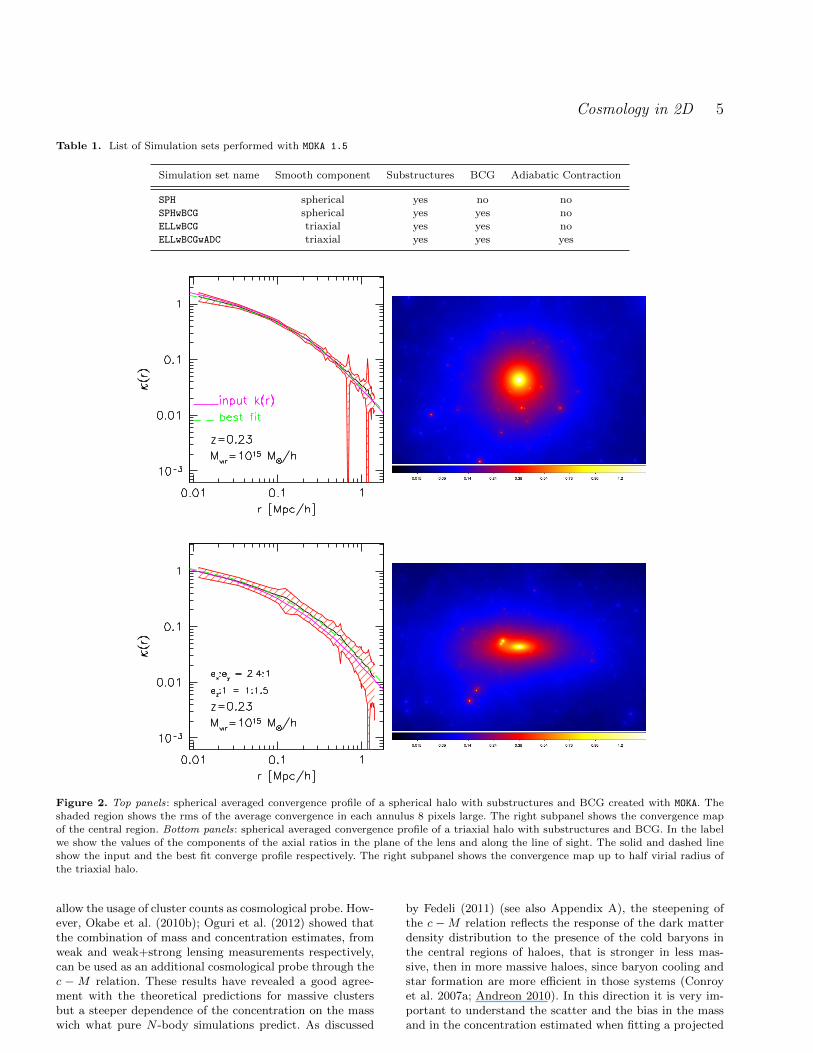
sample.As example, in the Figure 2 we show the spherical av-
eraged convergence profiles and the maps of two clusters,with substructures and BCG. In the top panels, we presentthe case of a spherical system while in the bottom panelswe show a triaxial one (the label reports the values of theaxial ratios projected in the plane of the lens and along theline of sight). We underline that in all our simulations wedo not consider perturbations of the projected matter den-sity due to the large scale structures along the line of sight(Hoekstra 2003). This is because we are mainly interestedto understand how the halo properties their-selves affect therecovered mass and concentration fitting a projected quan-tity. The map of each halo is resolved with a resolution of1024 × 1024 pixels up to the virial radius Rvir defined asthe radius enclosing the density contrast predicted by thespherical collapse model (Eke et al. 1996). The profile isbuilt binning linearly the convergence on annulus of 8 pixelson which also the rms is estimated, showed by the shadedregion in the convergence profile of the figure.
3 FITTING THE CONVERGENCE PROFILE
The estimate of the total galaxy cluster mass is importantbecause it is by far the most accurate predicted halo prop-erty from theory. Ongoing and future surveys require an es-timate of the mass with a bias smaller than 10% in order to
c© 2012 RAS, MNRAS 000, 1–18
Cosmology in 2D 5
Table 1. List of Simulation sets performed with MOKA 1.5
Simulation set name Smooth component Substructures BCG Adiabatic Contraction
SPH spherical yes no no
SPHwBCG spherical yes yes noELLwBCG triaxial yes yes no
ELLwBCGwADC triaxial yes yes yes
Figure 2. Top panels: spherical averaged convergence profile of a spherical halo with substructures and BCG created with MOKA. Theshaded region shows the rms of the average convergence in each annulus 8 pixels large. The right subpanel shows the convergence mapof the central region. Bottom panels: spherical averaged convergence profile of a triaxial halo with substructures and BCG. In the label
we show the values of the components of the axial ratios in the plane of the lens and along the line of sight. The solid and dashed line
show the input and the best fit converge profile respectively. The right subpanel shows the convergence map up to half virial radius ofthe triaxial halo.
allow the usage of cluster counts as cosmological probe. How-ever, Okabe et al. (2010b); Oguri et al. (2012) showed thatthe combination of mass and concentration estimates, fromweak and weak+strong lensing measurements respectively,can be used as an additional cosmological probe through thec −M relation. These results have revealed a good agree-ment with the theoretical predictions for massive clustersbut a steeper dependence of the concentration on the masswich what pure N -body simulations predict. As discussed
by Fedeli (2011) (see also Appendix A), the steepening ofthe c −M relation reflects the response of the dark matterdensity distribution to the presence of the cold baryons inthe central regions of haloes, that is stronger in less mas-sive, then in more massive haloes, since baryon cooling andstar formation are more efficient in those systems (Conroyet al. 2007a; Andreon 2010). In this direction it is very im-portant to understand the scatter and the bias in the massand in the concentration estimated when fitting a projected
c© 2012 RAS, MNRAS 000, 1–18
6 Giocoli et al. 2012
quantity: the convergence profile. We are aware of the factthat the convergence is not a direct observable and thatthe most standard way to measure the cluster mass profilewith weak lensing is the tangential shear, but our work ismeant to study the scatter and the bias introduced in themass and in the concentration measurements going from a3D to a 2D quantity of the measurement halo profiles. Sinceour idea is to illustrate the intrinsic scatter and the bias inthe mass and concentration estimates, obtained when fittingprojected quantities, we present and discuss our results as-suming no observational error in the cluster converge map.The situation would have been different if we had used thetangential shear profile, where the dominant source of noiseis the intrinsic ellipticity distribution of background galaxiesσe ≈ 0.3 (Okabe et al. 2010a) that gives a Gaussian noise ineach region of area A where is measured given by:
σ2s =
σ2e
ngalA, (10)
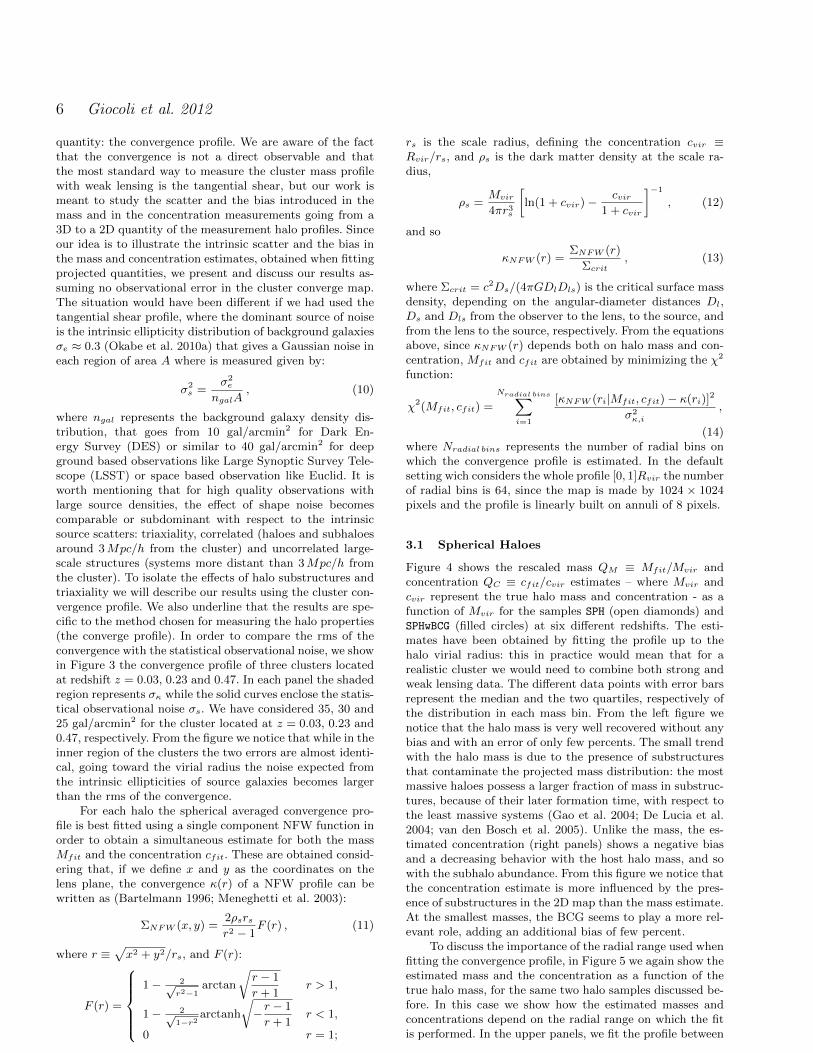
where ngal represents the background galaxy density dis-tribution, that goes from 10 gal/arcmin2 for Dark En-ergy Survey (DES) or similar to 40 gal/arcmin2 for deepground based observations like Large Synoptic Survey Tele-scope (LSST) or space based observation like Euclid. It isworth mentioning that for high quality observations withlarge source densities, the effect of shape noise becomescomparable or subdominant with respect to the intrinsicsource scatters: triaxiality, correlated (haloes and subhaloesaround 3Mpc/h from the cluster) and uncorrelated large-scale structures (systems more distant than 3Mpc/h fromthe cluster). To isolate the effects of halo substructures andtriaxiality we will describe our results using the cluster con-vergence profile. We also underline that the results are spe-cific to the method chosen for measuring the halo properties(the converge profile). In order to compare the rms of theconvergence with the statistical observational noise, we showin Figure 3 the convergence profile of three clusters locatedat redshift z = 0.03, 0.23 and 0.47. In each panel the shadedregion represents σκ while the solid curves enclose the statis-tical observational noise σs. We have considered 35, 30 and25 gal/arcmin2 for the cluster located at z = 0.03, 0.23 and0.47, respectively. From the figure we notice that while in theinner region of the clusters the two errors are almost identi-cal, going toward the virial radius the noise expected fromthe intrinsic ellipticities of source galaxies becomes largerthan the rms of the convergence.
For each halo the spherical averaged convergence pro-file is best fitted using a single component NFW function inorder to obtain a simultaneous estimate for both the massMfit and the concentration cfit. These are obtained consid-ering that, if we define x and y as the coordinates on thelens plane, the convergence κ(r) of a NFW profile can bewritten as (Bartelmann 1996; Meneghetti et al. 2003):
ΣNFW (x, y) =2ρsrsr2 − 1
F (r) , (11)
where r ≡√x2 + y2/rs, and F (r):
F (r) =
1− 2√
r2−1arctan
√r − 1
r + 1r > 1,
1− 2√1−r2
arctanh
√−r − 1
r + 1r < 1,
0 r = 1;
rs is the scale radius, defining the concentration cvir ≡Rvir/rs, and ρs is the dark matter density at the scale ra-dius,
ρs =Mvir
4πr3s
[ln(1 + cvir)−
cvir1 + cvir
]−1
, (12)
and so
κNFW (r) =ΣNFW (r)
Σcrit, (13)
where Σcrit = c2Ds/(4πGDlDls) is the critical surface massdensity, depending on the angular-diameter distances Dl,Ds and Dls from the observer to the lens, to the source, andfrom the lens to the source, respectively. From the equationsabove, since κNFW (r) depends both on halo mass and con-centration, Mfit and cfit are obtained by minimizing the χ2
function:
χ2(Mfit, cfit) =
Nradial bins∑i=1
[κNFW (ri|Mfit, cfit)− κ(ri)]2
σ2κ,i
,
(14)where Nradial bins represents the number of radial bins onwhich the convergence profile is estimated. In the defaultsetting wich considers the whole profile [0, 1]Rvir the numberof radial bins is 64, since the map is made by 1024 × 1024pixels and the profile is linearly built on annuli of 8 pixels.
3.1 Spherical Haloes
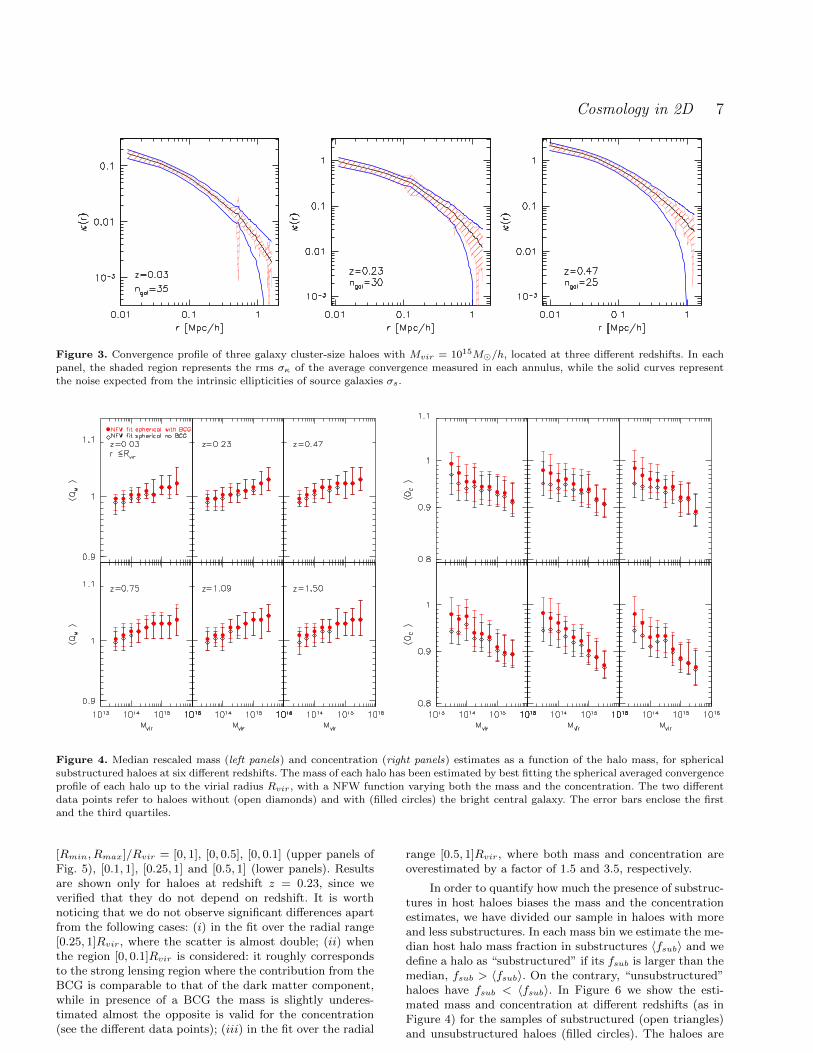
Figure 4 shows the rescaled mass QM ≡ Mfit/Mvir andconcentration QC ≡ cfit/cvir estimates – where Mvir andcvir represent the true halo mass and concentration - as afunction of Mvir for the samples SPH (open diamonds) andSPHwBCG (filled circles) at six different redshifts. The esti-mates have been obtained by fitting the profile up to thehalo virial radius: this in practice would mean that for arealistic cluster we would need to combine both strong andweak lensing data. The different data points with error barsrepresent the median and the two quartiles, respectively ofthe distribution in each mass bin. From the left figure wenotice that the halo mass is very well recovered without anybias and with an error of only few percents. The small trendwith the halo mass is due to the presence of substructuresthat contaminate the projected mass distribution: the mostmassive haloes possess a larger fraction of mass in substruc-tures, because of their later formation time, with respect tothe least massive systems (Gao et al. 2004; De Lucia et al.2004; van den Bosch et al. 2005). Unlike the mass, the es-timated concentration (right panels) shows a negative biasand a decreasing behavior with the host halo mass, and sowith the subhalo abundance. From this figure we notice thatthe concentration estimate is more influenced by the pres-ence of substructures in the 2D map than the mass estimate.At the smallest masses, the BCG seems to play a more rel-evant role, adding an additional bias of few percent.
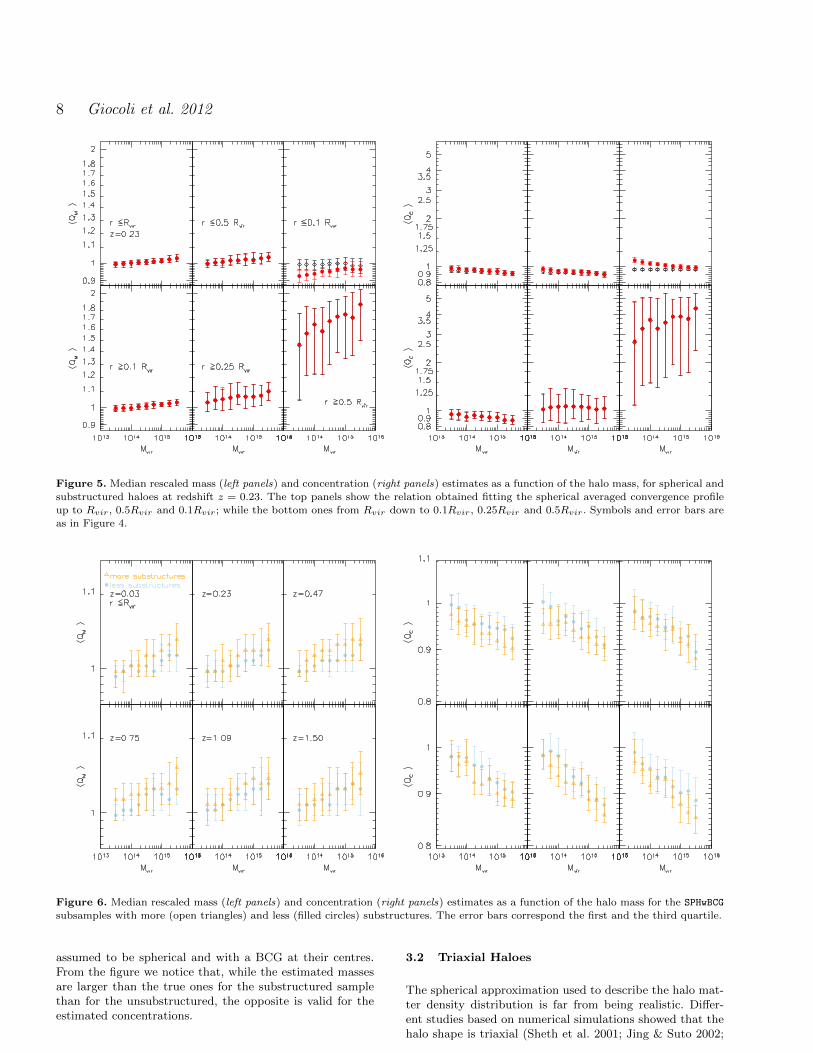
To discuss the importance of the radial range used whenfitting the convergence profile, in Figure 5 we again show theestimated mass and the concentration as a function of thetrue halo mass, for the same two halo samples discussed be-fore. In this case we show how the estimated masses andconcentrations depend on the radial range on which the fitis performed. In the upper panels, we fit the profile between
c© 2012 RAS, MNRAS 000, 1–18
Cosmology in 2D 7
Figure 3. Convergence profile of three galaxy cluster-size haloes with Mvir = 1015M/h, located at three different redshifts. In eachpanel, the shaded region represents the rms σκ of the average convergence measured in each annulus, while the solid curves represent
the noise expected from the intrinsic ellipticities of source galaxies σs.
Figure 4. Median rescaled mass (left panels) and concentration (right panels) estimates as a function of the halo mass, for sphericalsubstructured haloes at six different redshifts. The mass of each halo has been estimated by best fitting the spherical averaged convergence
profile of each halo up to the virial radius Rvir, with a NFW function varying both the mass and the concentration. The two differentdata points refer to haloes without (open diamonds) and with (filled circles) the bright central galaxy. The error bars enclose the first
and the third quartiles.
[Rmin, Rmax]/Rvir = [0, 1], [0, 0.5], [0, 0.1] (upper panels ofFig. 5), [0.1, 1], [0.25, 1] and [0.5, 1] (lower panels). Resultsare shown only for haloes at redshift z = 0.23, since weverified that they do not depend on redshift. It is worthnoticing that we do not observe significant differences apartfrom the following cases: (i) in the fit over the radial range[0.25, 1]Rvir, where the scatter is almost double; (ii) whenthe region [0, 0.1]Rvir is considered: it roughly correspondsto the strong lensing region where the contribution from theBCG is comparable to that of the dark matter component,while in presence of a BCG the mass is slightly underes-timated almost the opposite is valid for the concentration(see the different data points); (iii) in the fit over the radial
range [0.5, 1]Rvir, where both mass and concentration areoverestimated by a factor of 1.5 and 3.5, respectively.
In order to quantify how much the presence of substruc-tures in host haloes biases the mass and the concentrationestimates, we have divided our sample in haloes with moreand less substructures. In each mass bin we estimate the me-dian host halo mass fraction in substructures 〈fsub〉 and wedefine a halo as “substructured” if its fsub is larger than themedian, fsub > 〈fsub〉. On the contrary, “unsubstructured”haloes have fsub < 〈fsub〉. In Figure 6 we show the esti-mated mass and concentration at different redshifts (as inFigure 4) for the samples of substructured (open triangles)and unsubstructured haloes (filled circles). The haloes are
c© 2012 RAS, MNRAS 000, 1–18
8 Giocoli et al. 2012
Figure 5. Median rescaled mass (left panels) and concentration (right panels) estimates as a function of the halo mass, for spherical and
substructured haloes at redshift z = 0.23. The top panels show the relation obtained fitting the spherical averaged convergence profile
up to Rvir, 0.5Rvir and 0.1Rvir; while the bottom ones from Rvir down to 0.1Rvir, 0.25Rvir and 0.5Rvir. Symbols and error bars areas in Figure 4.
Figure 6. Median rescaled mass (left panels) and concentration (right panels) estimates as a function of the halo mass for the SPHwBCG
subsamples with more (open triangles) and less (filled circles) substructures. The error bars correspond the first and the third quartile.
assumed to be spherical and with a BCG at their centres.From the figure we notice that, while the estimated massesare larger than the true ones for the substructured samplethan for the unsubstructured, the opposite is valid for theestimated concentrations.
3.2 Triaxial Haloes
The spherical approximation used to describe the halo mat-ter density distribution is far from being realistic. Differ-ent studies based on numerical simulations showed that thehalo shape is triaxial (Sheth et al. 2001; Jing & Suto 2002;
c© 2012 RAS, MNRAS 000, 1–18
Cosmology in 2D 9
Kazantzidis et al. 2004). This is because during the collapsephase a halo is influenced by its surrounding tidal field whichstretches and shears its matter distribution. Various obser-vations of galaxy clusters, both in optical and in X-rays,have confirmed this picture and have revealed that a dis-crete number of X-ray-selected clusters present also theirmajor axis elongated along the line of sight. This conditionis typically sufficient, but not necessary, to cause, in theiroptical images, the presence of very distorted gravitationalarcs and large Einstein rings, and also a discrepancy betweengalaxy cluster masses and concentrations determined fromX-ray and gravitational lensing observations. Combining X-ray, weak and strong lensing observations, Morandi et al.(2010) have proposed a method to determine the galaxy clus-ter elongation along the line of sight (with an error of theorder of 5%) and reconcile the discrepancy of the mass andthe concentration estimates. The observational estimate ofthe elongation of the cluster halo along of the line of sightis very challenging and only possibile for clusters that arevery massive and located at low redshifts.
Let us now consider the case of a triaxial prolate oroblate halo, and define its axes as ea, eb and ec; if the halois spherical in the plane of the sky (ea = eb = 1) and ec isparallel of the line of sight, the convergence of the halo willbe defined as:
Σ(x, y) = ec
∫ ∞−∞
ρ(x, y, ζ′)dζ′ , (15)
with ζ′ ≡ ζ/ec.In MOKA we have included the model proposed by Jing &
Suto (2002) to describe the main halo ellipticity, accordingto which the stellar component of the BCG and the subhalospatial distribution are also perturbed. Using the axial ratioprobability distributions we estimate ea, eb and ec, requiringthat eaebec = 1. Once the axial ratios are known, we ran-domly orient the halo choosing a point on a sphere identifiedby its azimuthal and elevation angles; according to this werotate the halo ellipsoid and deform the convergence map.The elongation ez represents the largest component of theellipsoid axes projected along the line of sight.
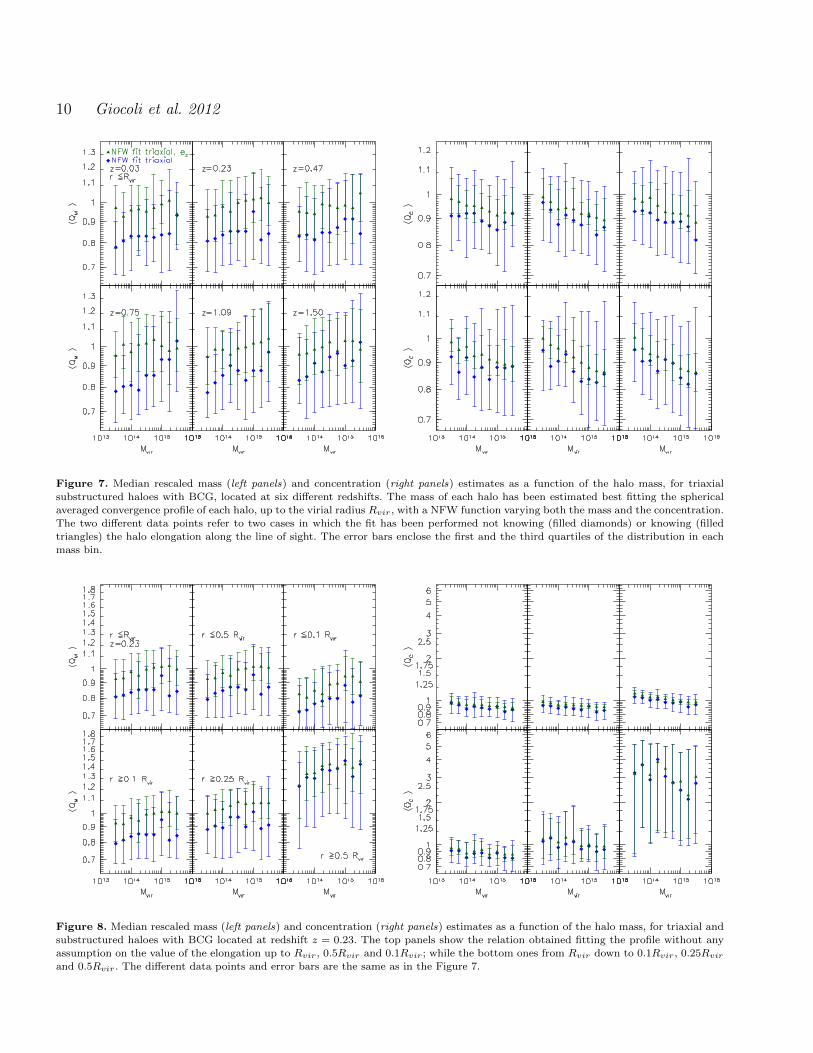
In Figure 7, we show QM and Qc as a function of thehost halo mass, obtained by fitting the convergence pro-files of the ELLwBCG sample up to Rvir and at six differ-ent redshifts. In fitting the convergence profile of the triax-ial clusters, and in estimating mass and concentration, weproceed in two ways: (i) in the first case we make use di-rectly of κNFW (r) from equations 11 and 13 and minimizeχ2(Mfir, cfit) (eq. 14); (ii) in the second case we multiplyκNFW (r) by ez, the elongation of the halo along the line ofsight (assumed without error), and estimate Mfit and cfitagain minimizing χ2. We refer to this last case as mass andconcentration estimates corrected for elongation.
In the left panels of Fig. 7, we notice that the massbias, found also by Meneghetti et al. (2011) and Rasia et al.(2012) - who fitted the tangential shear profile using sim-ulated observations of galaxy clusters - almost disappearswhen we correct for elongation. In the right panels we showthe results for the concentration. When we do not includethe elongation in the calculations, both QM and Qc are un-derestimated of 10 − 20%. Conversely, when we correct forelongation, the mass estimate is unbiased, while the result-ing concentration is still slightly underestimated, since QM
and Qc are not independent of each other, considering thatcvir ∼ M
1/3vir they do not scale in the same way but as:
∆Qc = (∆QM )1/3.To discuss the importance of the range used to fit the
convergence profile, in Figure 8 we show the median rescaledmass and concentration as a function of the true halo mass,when the fit of the convergence profile is done on differentradial ranges. These are the same chosen for the analysispresented in Fig. 5. Again we note that the error bars be-come larger when fitting on a narrower radial range. In thefigure we do not observe significant differences in the radialranges [0, 1]Rvir, [0, 0.5]Rvir, [0.1, 1]Rvir and [0.25, 1]Rvir.Fitting the most central region, where the BCG dominatesthe convergence profile, the masses and the concentrationsare slightly underestimated and overestimated, respectively.As show for the spherical case, fitting the profile outside0.5Rvir we overestimate both the halo mass and concen-tration with not much difference between the two cases inwhich we do or do not correct the convergence profile forelongation.
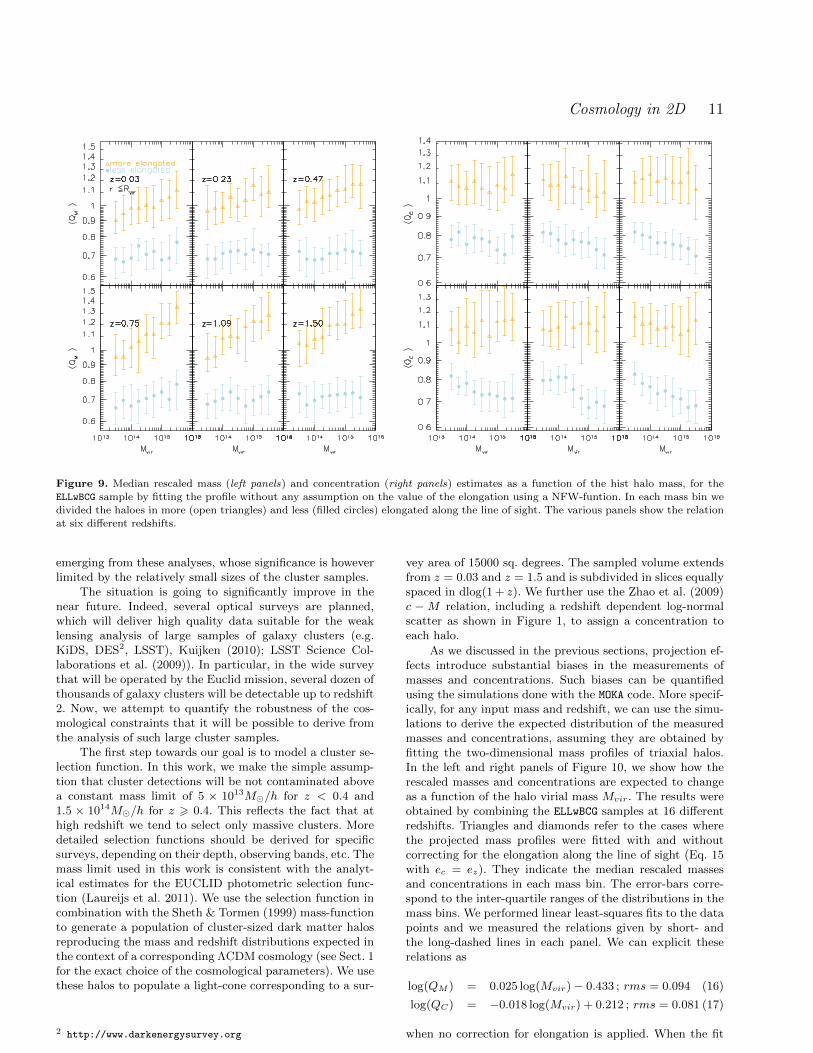
Fitting the profile without any assumption on the valueof the elongation creates a strong bias in the mass estimatesdue to the elongation along the line of sight. This can be bet-ter quantified dividing the halo sample, in each mass bin ac-cording to the level of elongation, in more and less elongatedsystems. In Figure 9 we again show the median masses andconcentrations as a function of the true mass for the samplesof haloes with large and small elongation. The separation ofhaloes in these two classes was made by measuring the me-dian elongation 〈ez〉 in each mass bin. We define as “lesselongated” haloes those with ez < 〈ez〉, and vice-versa. Thisanalysis shows that the two samples have a large differencesboth in mass (left panel) and in concentration (right panel)of about 35− 40%. We can summarize that while more andless substructured haloes have a difference in the estimatesof the order of few percent, the estimates between more andless elongated haloes can differ up to more than 50%, in thecase of very massive clusters.
This can originate very important systematics whentrying to recover cosmological information from the massand concentration estimates based on lensing analysis with-out taking into account possible projection effects (Sereno& Zitrin 2012; Coe et al. 2012).
4 COSMOLOGY FROM THE C −M RELATIONOF A WIDE FIELD SURVEY
Several studies aimed at constraining cosmological parame-ters by measuring the c−M relation of galaxy clusters. Forexample, Ettori et al. (2010) used a sample of 44 X-ray lumi-nous clusters observed with XMM-Newton. They measuredthe masses and the concentrations by assuming sphericallysymmetric X-ray emitting gas distributions in hydrostaticequilibrium with the cluster gravitational potentials, whichare modeled by NFW functionals. By comparing with the-oretical c −M relations, they constrain the degeneracy be-tween Ωm and σ8. Checking the consistency of the observedcluster c −M relation with the theoretical expectations inthe framework of the ΛCDM cosmology is also one of thegoals of the ongoing CLASH Multi-Cycle-Treasury programof the Hubble Space Telescope (?). Interesting results are
c© 2012 RAS, MNRAS 000, 1–18
10 Giocoli et al. 2012
Figure 7. Median rescaled mass (left panels) and concentration (right panels) estimates as a function of the halo mass, for triaxial
substructured haloes with BCG, located at six different redshifts. The mass of each halo has been estimated best fitting the spherical
averaged convergence profile of each halo, up to the virial radius Rvir, with a NFW function varying both the mass and the concentration.The two different data points refer to two cases in which the fit has been performed not knowing (filled diamonds) or knowing (filled
triangles) the halo elongation along the line of sight. The error bars enclose the first and the third quartiles of the distribution in each
mass bin.
Figure 8. Median rescaled mass (left panels) and concentration (right panels) estimates as a function of the halo mass, for triaxial andsubstructured haloes with BCG located at redshift z = 0.23. The top panels show the relation obtained fitting the profile without anyassumption on the value of the elongation up to Rvir, 0.5Rvir and 0.1Rvir; while the bottom ones from Rvir down to 0.1Rvir, 0.25Rvirand 0.5Rvir. The different data points and error bars are the same as in the Figure 7.
c© 2012 RAS, MNRAS 000, 1–18
Cosmology in 2D 11
Figure 9. Median rescaled mass (left panels) and concentration (right panels) estimates as a function of the hist halo mass, for the
ELLwBCG sample by fitting the profile without any assumption on the value of the elongation using a NFW-funtion. In each mass bin we
divided the haloes in more (open triangles) and less (filled circles) elongated along the line of sight. The various panels show the relationat six different redshifts.
emerging from these analyses, whose significance is howeverlimited by the relatively small sizes of the cluster samples.
The situation is going to significantly improve in thenear future. Indeed, several optical surveys are planned,which will deliver high quality data suitable for the weaklensing analysis of large samples of galaxy clusters (e.g.KiDS, DES2, LSST), Kuijken (2010); LSST Science Col-laborations et al. (2009)). In particular, in the wide surveythat will be operated by the Euclid mission, several dozen ofthousands of galaxy clusters will be detectable up to redshift2. Now, we attempt to quantify the robustness of the cos-mological constraints that it will be possible to derive fromthe analysis of such large cluster samples.
The first step towards our goal is to model a cluster se-lection function. In this work, we make the simple assump-tion that cluster detections will be not contaminated abovea constant mass limit of 5 × 10¹³M/h for z < 0.4 and1.5 × 1014M/h for z > 0.4. This reflects the fact that athigh redshift we tend to select only massive clusters. Moredetailed selection functions should be derived for specificsurveys, depending on their depth, observing bands, etc. Themass limit used in this work is consistent with the analyt-ical estimates for the EUCLID photometric selection func-tion (Laureijs et al. 2011). We use the selection function incombination with the Sheth & Tormen (1999) mass-functionto generate a population of cluster-sized dark matter halosreproducing the mass and redshift distributions expected inthe context of a corresponding ΛCDM cosmology (see Sect. 1for the exact choice of the cosmological parameters). We usethese halos to populate a light-cone corresponding to a sur-
2 http://www.darkenergysurvey.org
vey area of 15000 sq. degrees. The sampled volume extendsfrom z = 0.03 and z = 1.5 and is subdivided in slices equallyspaced in dlog(1 + z). We further use the Zhao et al. (2009)c −M relation, including a redshift dependent log-normalscatter as shown in Figure 1, to assign a concentration toeach halo.
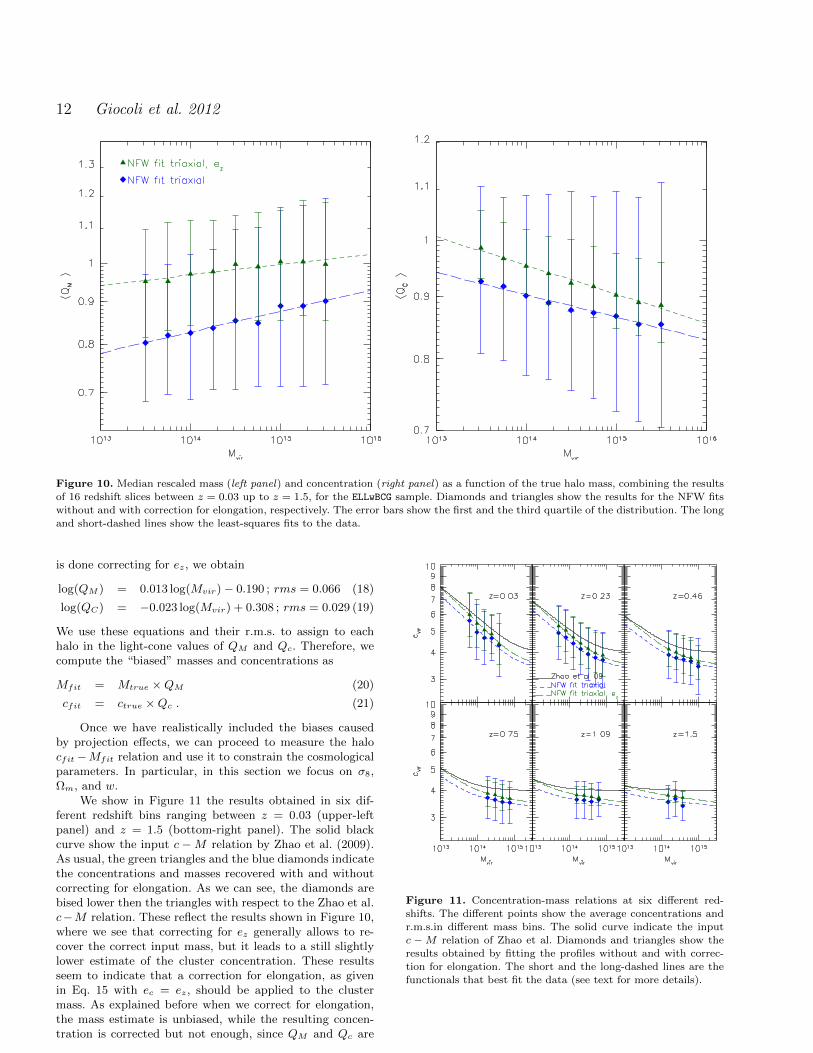
As we discussed in the previous sections, projection ef-fects introduce substantial biases in the measurements ofmasses and concentrations. Such biases can be quantifiedusing the simulations done with the MOKA code. More specif-ically, for any input mass and redshift, we can use the simu-lations to derive the expected distribution of the measuredmasses and concentrations, assuming they are obtained byfitting the two-dimensional mass profiles of triaxial halos.In the left and right panels of Figure 10, we show how therescaled masses and concentrations are expected to changeas a function of the halo virial mass Mvir. The results wereobtained by combining the ELLwBCG samples at 16 differentredshifts. Triangles and diamonds refer to the cases wherethe projected mass profiles were fitted with and withoutcorrecting for the elongation along the line of sight (Eq. 15with ec = ez). They indicate the median rescaled massesand concentrations in each mass bin. The error-bars corre-spond to the inter-quartile ranges of the distributions in themass bins. We performed linear least-squares fits to the datapoints and we measured the relations given by short- andthe long-dashed lines in each panel. We can explicit theserelations as
log(QM ) = 0.025 log(Mvir)− 0.433 ; rms = 0.094 (16)
log(QC) = −0.018 log(Mvir) + 0.212 ; rms = 0.081 (17)
when no correction for elongation is applied. When the fit
c© 2012 RAS, MNRAS 000, 1–18
12 Giocoli et al. 2012
Figure 10. Median rescaled mass (left panel) and concentration (right panel) as a function of the true halo mass, combining the results
of 16 redshift slices between z = 0.03 up to z = 1.5, for the ELLwBCG sample. Diamonds and triangles show the results for the NFW fits
without and with correction for elongation, respectively. The error bars show the first and the third quartile of the distribution. The longand short-dashed lines show the least-squares fits to the data.
is done correcting for ez, we obtain
log(QM ) = 0.013 log(Mvir)− 0.190 ; rms = 0.066 (18)
log(QC) = −0.023 log(Mvir) + 0.308 ; rms = 0.029 (19)
We use these equations and their r.m.s. to assign to eachhalo in the light-cone values of QM and Qc. Therefore, wecompute the “biased” masses and concentrations as
Mfit = Mtrue ×QM (20)
cfit = ctrue ×Qc . (21)
Once we have realistically included the biases causedby projection effects, we can proceed to measure the halocfit−Mfit relation and use it to constrain the cosmologicalparameters. In particular, in this section we focus on σ8,Ωm, and w.
We show in Figure 11 the results obtained in six dif-ferent redshift bins ranging between z = 0.03 (upper-leftpanel) and z = 1.5 (bottom-right panel). The solid blackcurve show the input c−M relation by Zhao et al. (2009).As usual, the green triangles and the blue diamonds indicatethe concentrations and masses recovered with and withoutcorrecting for elongation. As we can see, the diamonds arebised lower then the triangles with respect to the Zhao et al.c−M relation. These reflect the results shown in Figure 10,where we see that correcting for ez generally allows to re-cover the correct input mass, but it leads to a still slightlylower estimate of the cluster concentration. These resultsseem to indicate that a correction for elongation, as givenin Eq. 15 with ec = ez, should be applied to the clustermass. As explained before when we correct for elongation,the mass estimate is unbiased, while the resulting concen-tration is corrected but not enough, since QM and Qc are
Figure 11. Concentration-mass relations at six different red-
shifts. The different points show the average concentrations andr.m.s.in different mass bins. The solid curve indicate the inputc −M relation of Zhao et al. Diamonds and triangles show the
results obtained by fitting the profiles without and with correc-tion for elongation. The short and the long-dashed lines are the
functionals that best fit the data (see text for more details).
c© 2012 RAS, MNRAS 000, 1–18
Cosmology in 2D 13
not independent of each other, considering that cvir ∼M1/3vir
they do not scale in the same way but as: ∆Qc = (∆QM )1/3.We fit the triangles and the diamonds with functions of
the kind
c2D(M) = c3D(M)×N Mλ , (22)
where c3D is the input c−M relation (in our case the modelby Zhao et al. (2009)) and we find that they are well fittedby the following functional forms:
c2D(M) = c3D(M)×
1.630 M−0.018, (short− dashed)
2.033 M−0.023, (long − dashed),(23)
respectively. Finally, we use the recovered cfit −Mfit rela-tions to constrain the cosmological parameters. To do so,we compare them to corresponding c−M relations of Zhaoet al. recalculated by varying the cosmological parameters.In this experiment, we vary only two of the investigatedcosmological parameters simultaneously, while we keep thethird fixed and equal to value used in our simulations. Thepurpose of this experiment is to quantify the degeneraciesbetween cosmological parameters when constraining themusing the c−M relation. If the couple of parameters whichis changed is (Φ,Ψ), we define the χ2 variable as
χ2(Φ,Ψ) =
redshifts∑j
Nmass bin∑i
(24)
log[cfit,i(zj)]− log[cmodel(Mfit,i, zj |Φ,Ψ)]2
σ2log c,i
where σlog c,i represents the concentration rms in a givenmass bin. Then, we find the couples of cosmological param-eters, (Φ, Ψ), that minimize χ2.
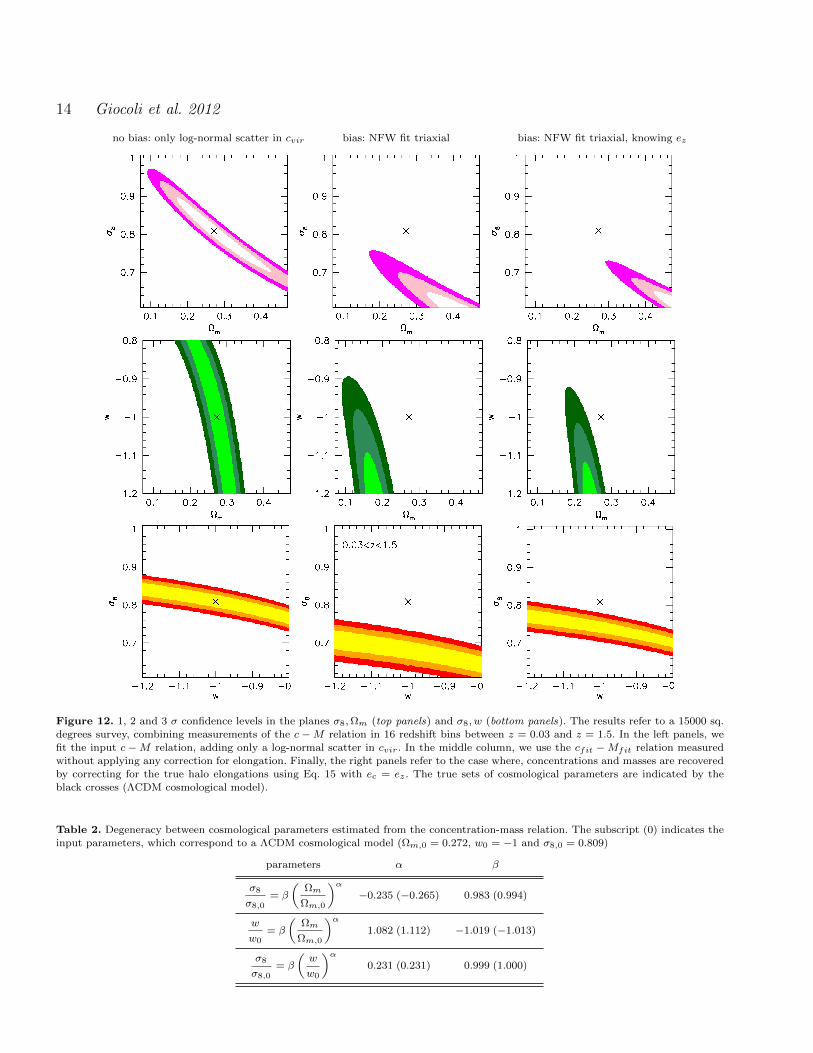
In Figure 12, we show the 1, 2, and 3σ confidence levelsfor the couples of cosmological parameters (σ8, w) (top pan-els), (w,Ωm) (middle panels), and (σ8, w) (bottom panels).The results refer to a 15000 sq. degrees survey, combiningmeasurements of the c −M relation in 16 redshift bins be-tween z = 0.03 and z = 1.5. In the left panels , we fit theinput c −M relation, adding only a log-normal scatter incvir. As expected, we recover the input sets of cosmolog-ical parameters, corresponding to the ΛCDM cosmologicalmodel. In the middle column, we use the cfit−Mfit relationmeasured without applying any correction for elongation. Inthis case, the c −M relation is best fitted by models withlower σ8 and lower Ωm when we fix w = −1 (upper panel).Keeping σ8 = 0.809 (middle panel), the results are sensi-tive to Ωm, and values of w lower than −1 are preferred(phantom dark energy). In both upper and middle panels,however, the input cosmological parameters are outside the3σ of the recovered sets of parameters. Fixing Ωm = 0.272(bottom panel), the input values of σ8 and w are outsidethe measurements. The right panels refer to the case whereconcentrations and masses are recovered by correcting forthe true halo elongations using Eq. 15 with ec = ez. Theresults of the fit in this case are qualitatively similar tothose shown in the panels in the middle column, but theoffset between recovered and input cosmological parametersis slightly weaker.
In Table 2, we quantify the degeneracy between thecouples of cosmological parameters estimated from the
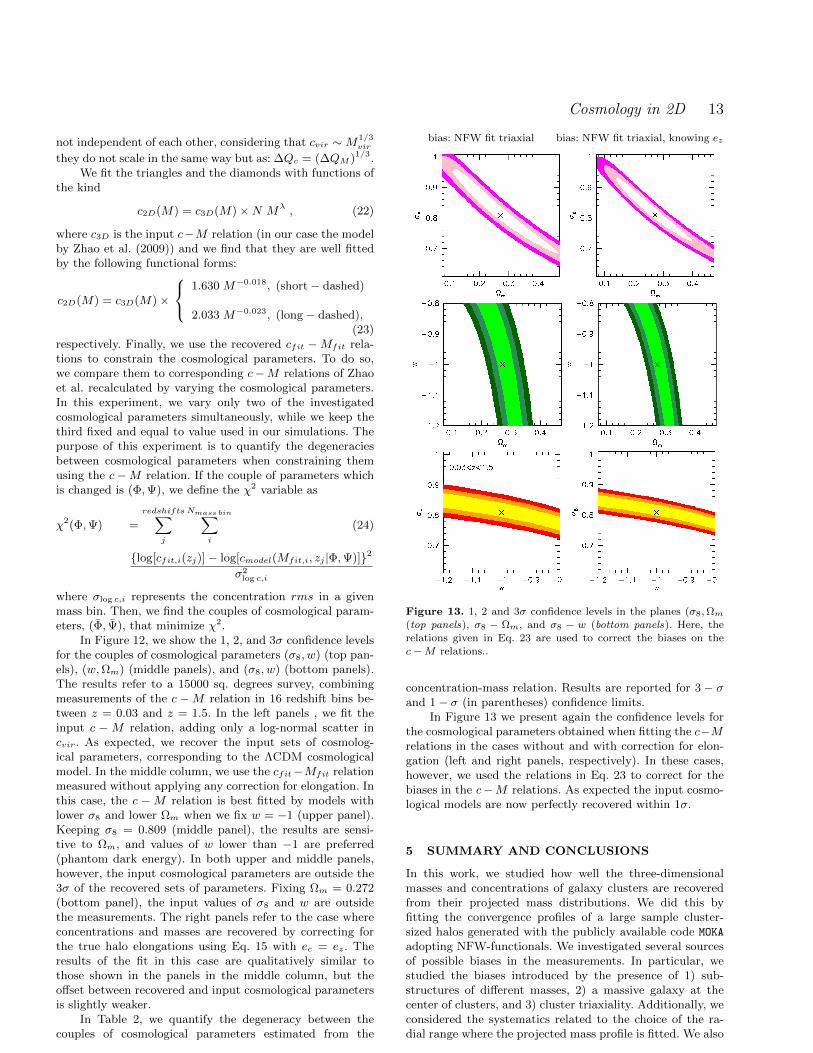
bias: NFW fit triaxial bias: NFW fit triaxial, knowing ez
Figure 13. 1, 2 and 3σ confidence levels in the planes (σ8,Ωm(top panels), σ8 − Ωm, and σ8 − w (bottom panels). Here, the
relations given in Eq. 23 are used to correct the biases on the
c−M relations..
concentration-mass relation. Results are reported for 3 − σand 1− σ (in parentheses) confidence limits.
In Figure 13 we present again the confidence levels forthe cosmological parameters obtained when fitting the c−Mrelations in the cases without and with correction for elon-gation (left and right panels, respectively). In these cases,however, we used the relations in Eq. 23 to correct for thebiases in the c−M relations. As expected the input cosmo-logical models are now perfectly recovered within 1σ.
5 SUMMARY AND CONCLUSIONS
In this work, we studied how well the three-dimensionalmasses and concentrations of galaxy clusters are recoveredfrom their projected mass distributions. We did this byfitting the convergence profiles of a large sample cluster-sized halos generated with the publicly available code MOKA
adopting NFW-functionals. We investigated several sourcesof possible biases in the measurements. In particular, westudied the biases introduced by the presence of 1) sub-structures of different masses, 2) a massive galaxy at thecenter of clusters, and 3) cluster triaxiality. Additionally, weconsidered the systematics related to the choice of the ra-dial range where the projected mass profile is fitted. We also
c© 2012 RAS, MNRAS 000, 1–18
14 Giocoli et al. 2012
no bias: only log-normal scatter in cvir bias: NFW fit triaxial bias: NFW fit triaxial, knowing ez
Figure 12. 1, 2 and 3 σ confidence levels in the planes σ8,Ωm (top panels) and σ8, w (bottom panels). The results refer to a 15000 sq.
degrees survey, combining measurements of the c −M relation in 16 redshift bins between z = 0.03 and z = 1.5. In the left panels, wefit the input c −M relation, adding only a log-normal scatter in cvir. In the middle column, we use the cfit −Mfit relation measured
without applying any correction for elongation. Finally, the right panels refer to the case where, concentrations and masses are recovered
by correcting for the true halo elongations using Eq. 15 with ec = ez . The true sets of cosmological parameters are indicated by theblack crosses (ΛCDM cosmological model).
Table 2. Degeneracy between cosmological parameters estimated from the concentration-mass relation. The subscript (0) indicates theinput parameters, which correspond to a ΛCDM cosmological model (Ωm,0 = 0.272, w0 = −1 and σ8,0 = 0.809)
parameters α β
σ8
σ8,0= β
(Ωm
Ωm,0
)α−0.235 (−0.265) 0.983 (0.994)
w
w0= β
(Ωm
Ωm,0
)α1.082 (1.112) −1.019 (−1.013)
σ8
σ8,0= β
(w
w0
)α0.231 (0.231) 0.999 (1.000)
c© 2012 RAS, MNRAS 000, 1–18
Cosmology in 2D 15
investigated how the mass and concentration measurementschange by adding a correction factor that takes into accountthe cluster elongation along the line-of-sight. Finally, we in-vestigated the robustness of cosmological constraints derivedfrom the concentration-mass relation measured in large sam-ples of galaxy clusters.
Our findings can be summarized as follows:
• by distributing substructures in spherically symmetriccluster halos, we found that the concentrations recoveredfrom cluster convergence profiles are on average biased lowby ∼ 5 − 6%. This bias tends to increase as a function ofmass, because the most massive haloes are expected to pos-sess a larger fraction of their mass in substructures. Thesesubstructures have an even smaller effect on the cluster massestimates, which differ from the input masses by just a fewpercent;• the presence of massive galaxies at the cluster center
generally causes tiny over-estimate of the mass, when theconvergence profile is fitted with simple NFW functionals.Such over-estimate is slightly more evident for small-masshalos, where it is of order few percent;• the above mentioned results have little dependence on
redshift, while they depend more significantly on the radialrange chosen to perform the fit of the convergence profile.More precisely, the effects of massive central galaxies areremarkable if the fit is restricted to the very inner region ofthe clusters (r < 0.1Rvir). In this case, the cluster mass canbe under-estimate by up to 10%, while the concentrationcan be over-estimated by the same amount;• modeling the halo triaxiality following the Jing & Suto
(2002) prescription and assuming random halo orientations,the three-dimensional masses recovered from the fit of theconvergence profiles are on average biased low by∼ 10−20%.However, for more massive clusters the mass bias is notlarger than 10%, as also found by Meneghetti et al. (2011);Rasia et al. (2012) using the tangential shear profile of sim-ulated galaxy clusters. This bias is larger than what foundby Corless & King (2009) whose triaxial clusters are con-structed without substructures and with a different modelfor the axial ratios ea/ec and eb/ec (Shaw et al. 2006) im-posing eaebec = 1, as we do, but with ea < eb < ec = 1. Weexplained such under-estimate of the mass as due to a largerprobability to observe clusters elongated on the plane of thesky than along the line-of-sight and to the combined effectsof triaxiality and presence of substructures – as quantifiedand discussed in Section 3. We notice that in this case, wealso measure low concentrations, this bias in halo proper-ties estimates has also been studied and discussed is severalother studies (Clowe et al. 2004; Oguri et al. 2005; Gavazzi2005; Corless & King 2007);• introducing a correction for elongation multipling the
convergence by ez, we found that the bias in mass can beremoved. This correction also moves Qc toward unity butstill keeping a small negative bias;• by simulating a cluster survey covering an area of 15000
sq. degrees, we estimated that triaxiality and substructureinduced biases on the 3D c−M relation, that would translateinto biases on the values of cosmological parameters like σ8,Ωm, and w, if no correction for elongation is applied. Thebiases decrease when correcting for elongation.
We conclude that, in order to use the cluster c − M
relation, measured from the cluster projected density profilesas they might be determined by means of the cluster lensingsignal (see e.g. Coe et al. 2012; Sereno & Zitrin 2012), toconstrain the cosmological parameters, it is necessary to takeinto account possible biases due to substructures and halotriaxiality. This can be done introducing a 2D c−M relationcorrecting the 3D one for projection effects.
ACKNOWLEDGEMENTS
We thank the anonymus referee for his useful comments thathelped to improve the presentation and the discussion of ourresults.
We also thank Giulia Despali, Ravi K. Sheth andGiuseppe Tormen for useful comments and interesting sug-gestions.
We acknowledge financial contributions from con-tracts I/009/10/0, EUCLID-IC phase A/B1, PRIN-INAF2009, ASI-INAF I/023/05/0, ASI-INAF I/088/06/0, ASII/016/07/0 COFIS, ASI Euclid-DUNE I/064/08/0, ASI-UniBologna-Astronomy Department Euclid-NIS I/039/10/0and PRIN MIUR dark energy and cosmology with largegalaxy surveys. CG’s research has been partially supportedby the project GLENCO, funded under the Seventh Frame-work Programme, Ideas, Grant Agreement n. 259349.
APPENDIX A: ADIABATIC CONTRACTION
The presence of a dissipative baryonic component influencesthe dark matter distribution. This is because cold baryonsthat settle at the host halo centre act contracting the darkmatter. Blumenthal et al. (1986) described the adiabaticcontraction analytically, finding a good agreement with nu-merical simulations. However the halo contraction, as mea-sured in numerical simulations with gas physics, may dependon the parameters that model the star formation processesand the gas physics. In these cases, the evolution of thecentral density may also be affected by spurious numericaleffects due to two-body scattering of massive particles. Alsothe differences in some models can be due to a higher densitythreshold for star formation, for example in the case in whichthe supernova energy release is more concentrated and cre-ates rapid potential fluctuations near the center. The modelby Blumenthal et al. (1986) assumes that a spherically sym-metric halo can be thought of as a sequence of concentricshells, made of particles on circular orbits, which homoge-neously contract while conserving the angular momentum.The initial and final density profiles – characterized by aninitial radius ri and a final radius rf , when a central galaxyis present – are related by
r [MBCG(r) +MDM,f ] = riMDM,i(ri) , (A1)
where
MDM,f = MDM,i (1− fcool) , (A2)
and fcool is the baryon fraction in the halo that cools toform the central galaxy. To solve the adiabatic-contractionequation, we need to derive r from equation (A1). When
c© 2012 RAS, MNRAS 000, 1–18
16 Giocoli et al. 2012
the stellar density distribution is described by a Hernquistmodel we can read:
fcoolr3 + (r + rh)2 [(1− fcool)r − ri]mi(ri) = 0 , (A3)
while for a Jaffe model we have:
[fcool +mi(ri)(1− fcool)] r2 +
mi(ri)(rj − fcrj + ri)r + rirjmi(ri) = 0 (A4)
where rh and rj represent respectively the scale radius of thetwo models. The two equations have a single positive realroot. We recall that mi in the previous equations defines theinitial mass profile normalized by the halo virial mass. Fromthe equation above results that the presence of a dissipativebaryonic component contracts the dark matter distribution.
The model we described above, and used to model thedark matter contraction in our haloes, is often defined asstandard adiabatic contraction (SAC). Gnedin et al. (2011)have defined a modified adiabatic contraction (MAC) modelthat takes into account the results from numerical simula-tions in which gas physics and merging events are included.They argue that the MAC model gives excellent predictionsto the data, while the SAC model tends to overestimate thedark matter content toward the halo centre. We also stressthat the adiabatic contraction observed in numerical simu-lations depends directly on the adopted parameters. Cosmo-logical simulations performed by different authors, with verydifferent codes and physics inputs, agree that the contrac-tion effect is present, but at a weaker level than suggested bythe SAC model and with a significant variation from systemto system and from input model to input model.
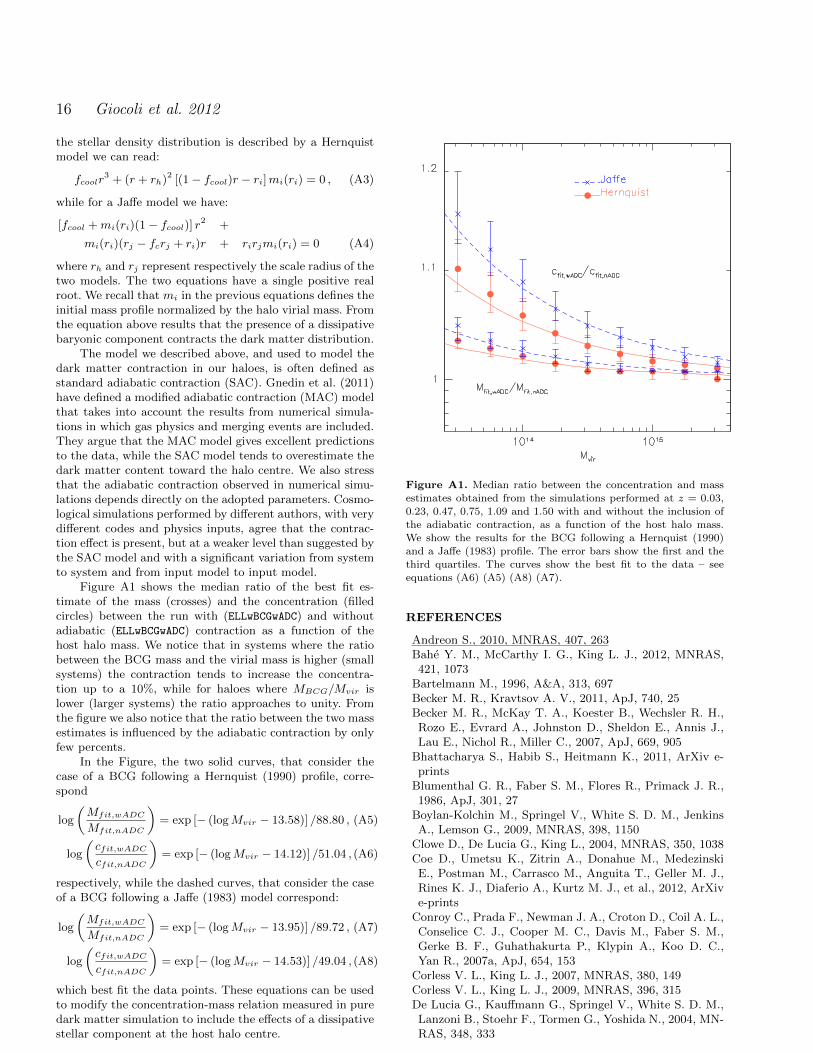
Figure A1 shows the median ratio of the best fit es-timate of the mass (crosses) and the concentration (filledcircles) between the run with (ELLwBCGwADC) and withoutadiabatic (ELLwBCGwADC) contraction as a function of thehost halo mass. We notice that in systems where the ratiobetween the BCG mass and the virial mass is higher (smallsystems) the contraction tends to increase the concentra-tion up to a 10%, while for haloes where MBCG/Mvir islower (larger systems) the ratio approaches to unity. Fromthe figure we also notice that the ratio between the two massestimates is influenced by the adiabatic contraction by onlyfew percents.
In the Figure, the two solid curves, that consider thecase of a BCG following a Hernquist (1990) profile, corre-spond
log
(Mfit,wADC
Mfit,nADC
)= exp [− (logMvir − 13.58)] /88.80 , (A5)
log
(cfit,wADCcfit,nADC
)= exp [− (logMvir − 14.12)] /51.04 , (A6)
respectively, while the dashed curves, that consider the caseof a BCG following a Jaffe (1983) model correspond:
log
(Mfit,wADC
Mfit,nADC
)= exp [− (logMvir − 13.95)] /89.72 , (A7)
log
(cfit,wADCcfit,nADC
)= exp [− (logMvir − 14.53)] /49.04 , (A8)
which best fit the data points. These equations can be usedto modify the concentration-mass relation measured in puredark matter simulation to include the effects of a dissipativestellar component at the host halo centre.
Figure A1. Median ratio between the concentration and massestimates obtained from the simulations performed at z = 0.03,
0.23, 0.47, 0.75, 1.09 and 1.50 with and without the inclusion of
the adiabatic contraction, as a function of the host halo mass.We show the results for the BCG following a Hernquist (1990)
and a Jaffe (1983) profile. The error bars show the first and the
third quartiles. The curves show the best fit to the data – seeequations (A6) (A5) (A8) (A7).
REFERENCES
Andreon S., 2010, MNRAS, 407, 263Bahe Y. M., McCarthy I. G., King L. J., 2012, MNRAS,421, 1073
Bartelmann M., 1996, A&A, 313, 697Becker M. R., Kravtsov A. V., 2011, ApJ, 740, 25Becker M. R., McKay T. A., Koester B., Wechsler R. H.,Rozo E., Evrard A., Johnston D., Sheldon E., Annis J.,Lau E., Nichol R., Miller C., 2007, ApJ, 669, 905
Bhattacharya S., Habib S., Heitmann K., 2011, ArXiv e-prints
Blumenthal G. R., Faber S. M., Flores R., Primack J. R.,1986, ApJ, 301, 27
Boylan-Kolchin M., Springel V., White S. D. M., JenkinsA., Lemson G., 2009, MNRAS, 398, 1150
Clowe D., De Lucia G., King L., 2004, MNRAS, 350, 1038Coe D., Umetsu K., Zitrin A., Donahue M., MedezinskiE., Postman M., Carrasco M., Anguita T., Geller M. J.,Rines K. J., Diaferio A., Kurtz M. J., et al., 2012, ArXive-prints
Conroy C., Prada F., Newman J. A., Croton D., Coil A. L.,Conselice C. J., Cooper M. C., Davis M., Faber S. M.,Gerke B. F., Guhathakurta P., Klypin A., Koo D. C.,Yan R., 2007a, ApJ, 654, 153
Corless V. L., King L. J., 2007, MNRAS, 380, 149Corless V. L., King L. J., 2009, MNRAS, 396, 315De Lucia G., Kauffmann G., Springel V., White S. D. M.,Lanzoni B., Stoehr F., Tormen G., Yoshida N., 2004, MN-RAS, 348, 333
c© 2012 RAS, MNRAS 000, 1–18
Cosmology in 2D 17
Dolag K., Bartelmann M., Perrotta F., Baccigalupi C.,Moscardini L., Meneghetti M., Tormen G., 2004, A&A,416, 853
Eke V. R., Cole S., Frenk C. S., 1996, MNRAS, 282, 263
Ettori S., Gastaldello F., Leccardi A., Molendi S., RossettiM., Buote D., Meneghetti M., 2010, A&A, 524, A68+
Ettori S., Morandi A., Tozzi P., Balestra I., Borgani S.,Rosati P., Lovisari L., Terenziani F., 2009, A&A, 501, 61
Fedeli C., 2011, ArXiv e-prints
Gao L., Navarro J. F., Cole S., Frenk C. S., White S. D. M.,Springel V., Jenkins A., Neto A. F., 2008, MNRAS, 387,536
Gao L., White S. D. M., Jenkins A., Stoehr F., SpringelV., 2004, MNRAS, 355, 819
Gavazzi R., 2005, A&A, 443, 793
Giocoli C., Meneghetti M., Bartelmann M., Moscardini L.,Boldrin M., 2012a, MNRAS, 421, 3343
Giocoli C., Moreno J., Sheth R. K., Tormen G., 2007, MN-RAS, 376, 977
Giocoli C., Tormen G., Sheth R. K., 2012b, MNRAS, 422,185
Giocoli C., Tormen G., Sheth R. K., van den Bosch F. C.,2010a, MNRAS, 404, 502
Giocoli C., Tormen G., van den Bosch F. C., 2008, MNRAS,386, 2135
Gnedin O. Y., Ceverino D., Gnedin N. Y., Klypin A. A.,Kravtsov A. V., Levine R., Nagai D., Yepes G., 2011,ArXiv e-prints
Gottloeber S., Yepes G., Wagner C., Sevilla R., 2006,ArXiv Astrophysics e-prints
Hernquist L., 1990, ApJ, 356, 359
Hoekstra H., 2003, MNRAS, 339, 1155
Hoekstra H., Hartlap J., Hilbert S., van Uitert E., 2011,MNRAS, 412, 2095
Jaffe W., 1983, MNRAS, 202, 995
Jing Y. P., 2000, ApJ, 535, 30
Jing Y. P., Suto Y., 2002, ApJ, 574, 538
Kazantzidis S., Kravtsov A. V., Zentner A. R., Allgood B.,Nagai D., Moore B., 2004, ApJ, 611, L73
Keeton C. R., 2001, ApJ, 561, 46
Komatsu E., Smith K. M., Dunkley J., Bennett C. L., GoldB., Hinshaw G., Jarosik N., Larson D., Nolta M. R., et al.2011, ApJS, 192, 18
Kuijken K., 2010, in Block D. L., Freeman K. C., Puerari I.,eds, Galaxies and their Masks Dark Haloes as Seen withGravitational Lensing. p. 361
Lacey C., Cole S., 1993, MNRAS, 262, 627
Laureijs R., Amiaux J., Arduini S., Augueres J. ., Brinch-mann J., Cole R., Cropper M., Dabin C., Duvet L., et al.2011, ArXiv e-prints
LSST Science Collaborations Abell P. A., Allison J., An-derson S. F., Andrew J. R., Angel J. R. P., Armus L., Ar-nett D., Asztalos S. J., Axelrod T. S., et al. 2009, ArXive-prints
Maccio A. V., Dutton A. A., van den Bosch F. C., 2008,MNRAS, 391, 1940
Maccio A. V., Dutton A. A., van den Bosch F. C., MooreB., Potter D., Stadel J., 2007, MNRAS, 378, 55
Meneghetti M., Argazzi R., Pace F., Moscardini L., DolagK., Bartelmann M., Li G., Oguri M., 2007b, A&A, 461,25
Meneghetti M., Bartelmann M., Moscardini L., 2003, MN-RAS, 346, 67
Meneghetti M., Fedeli C., Zitrin A., Bartelmann M., Broad-hurst T., Gottlober S., Moscardini L., Yepes G., 2011,A&A, 530, A17+
Meneghetti M., Rasia E., Merten J., Bellagamba F., EttoriS., Mazzotta P., Dolag K., Marri S., 2010b, A&A, 514,A93+
Metcalf R. B., Madau P., 2001, MNRAS, 563, 9Morandi A., Pedersen K., Limousin M., 2010, ApJ, 713,491
Navarro J. F., Frenk C. S., White S. D. M., 1997, ApJ, 490,493
Neto A. F., Gao L., Bett P., Cole S., Navarro J. F., FrenkC. S., White S. D. M., Springel V., Jenkins A., 2007, MN-RAS, 381, 1450
Oguri M., Bayliss M. B., Dahle H., Sharon K., GladdersM. D., Natarajan P., Hennawi J. F., Koester B. P., 2012,MNRAS, 420, 3213
Oguri M., Takada M., Umetsu K., Broadhurst T., 2005,ApJ, 632, 841
Okabe N., Okura Y., Futamase T., 2010a, ApJ, 713, 291Okabe N., Takada M., Umetsu K., Futamase T., SmithG. P., 2010b, PASJ, 62, 811
Perlmutter S., Aldering G., della Valle M., Deustua S., EllisR. S., Fabbro S., Fruchter A., Goldhaber G., Groom D. E.,et al. 1998, Nature, 391, 51
Perlmutter S., Aldering G., Goldhaber G., Knop R. A.,Nugent P., Castro P. G., Deustua S., Fabbro S., GoobarA., et al. 1999, ApJ, 517, 565
Rasia E., Meneghetti M., Martino R., Borgani S., BonafedeA., Dolag K., Ettori S., Fabjan D., Giocoli C., MazzottaP., Merten J., Radovich M., Tornatore L., 2012, ArXive-prints
Rix H.-W., de Zeeuw P. T., Cretton N., van der Marel R. P.,Carollo C. M., 1997, ApJ, 488, 702
Sereno M., Zitrin A., 2012, MNRAS, 419, 3280Shaw L. D., Weller J., Ostriker J. P., Bode P., 2006, ApJ,646, 815
Sheth R. K., Mo H. J., Tormen G., 2001, MNRAS, 323, 1Sheth R. K., Tormen G., 1999, MNRAS, 308, 119Sheth R. K., Tormen G., 2004, MNRAS, 349, 1464Springel V., White S. D. M., Jenkins A., Frenk C. S.,Yoshida N., Gao L., Navarro J., Thacker R., Croton D.,Helly J., Peacock J. A., Cole S., Thomas P., CouchmanH., Evrard A., Colberg J., Pearce F., 2005, Nature, 435,629
Springel V., White S. D. M., Tormen G., Kauffmann G.,2001b, MNRAS, 328, 726
Tormen G., Diaferio A., Syer D., 1998, MNRAS, 299, 728Umetsu K., Birkinshaw M., Liu G.-C., Wu J.-H. P.,Medezinski E., Broadhurst T., Lemze D., Zitrin A., HoP. T. P., Huang C.-W. L., Koch P. M., Liao et al., 2009,ApJ, 694, 1643
van den Bosch F. C., Tormen G., Giocoli C., 2005, MNRAS,359, 1029
Wang L., Li C., Kauffmann G., De Lucia G., 2006, MN-RAS, 371, 537
Wechsler R. H., Bullock J. S., Primack J. R., KravtsovA. V., Dekel A., 2002, ApJ, 568, 52
White S. D. M., Rees M. J., 1978, MNRAS, 183, 341Zhao D. H., Jing Y. P., Mo H. J., Bnorner G., 2009, ApJ,
c© 2012 RAS, MNRAS 000, 1–18
18 Giocoli et al. 2012
707, 354Zitrin A., Broadhurst T., Umetsu K., Coe D., Benıtez N.,Ascaso B., Bradley L., Ford H., Jee J., Medezinski E.,Rephaeli Y., Zheng W., 2009, MNRAS, 396, 1985
c© 2012 RAS, MNRAS 000, 1–18