Adiabatic scaling relations of galaxy clusters
12
arXiv:astro-ph/0605720v1 30 May 2006 Mon. Not. R. Astron. Soc. 000, 000–000 (0000) Printed 5 February 2008 (MN L A T E X style file v2.2) Adiabatic scaling relations of galaxy clusters Y. Ascasibar 1⋆ , R. Sevilla 2 , G. Yepes, 2 V. M¨ uller 1 and S. Gottl¨ober 1 1 Astrophysikalisches Institut Potsdam, An der Sternwarte 16, Potsdam D-14482 (Germany) 2 Grupo de Astrof´ ısica, Universidad Aut´onoma de Madrid, Madrid E-28049 (Spain) 5 February 2008 ABSTRACT The aim of the present work is to show that, contrary to popular belief, galaxy clusters are not expected to be self-similar, even when the only energy sources available are gravity and shock-wave heating. In particular, we investigate the scaling relations between mass, luminosity and temperature of galaxy groups and clusters in the absence of radiative processes. Theoretical expectations are derived from a polytropic model of the intracluster medium and compared with the results of high-resolution adiabatic gasdynamical simulations. It is shown that, in addition to the well-known relation between the mass and concentration of the dark matter halo, the effective polytropic index of the gas also varies systematically with cluster mass, and therefore neither the dark matter nor the gas profiles are exactly self-similar. It is remarkable, though, that the effects of concentration and polytropic index tend to cancel each other, leading to scaling relations whose logarithmic slopes roughly match the predictions of the most basic self-similar models. We provide a phenomenological fit to the relation between polytropic index and concentration, as well as a self-consistent scheme to derive the non-linear scaling relations expected for any cosmology and the best-fit normalizations of the M-T, L-T and F-T relations appropriate for a ΛCDM universe. The predicted scaling relations reproduce observational data reasonably well for massive clusters, where the effects of cooling and star formation are expected to play a minor role. Key words: galaxies: clusters: general — X-rays: galaxies: clusters — cosmology: theory 1 INTRODUCTION The physics of massive galaxy clusters is relatively simple, at least compared to that of smaller objects. In the stan- dard cold dark matter (CDM) scenario, their mass is domi- nated by the dark component, while most baryons are in the form of a hot diffuse plasma in hydrostatic equilibrium with the gravitational potential created by the CDM halo. The intracluster medium (ICM) gas is shock-heated to approxi- mately the virial temperature of the object, and its thermal bremsstrahlung emission has been detected by X-ray satel- lites for the last three decades. In the absence of any other process, it is often stated that galaxy clusters are expected to be self-similar, and their global properties should obey power-law scaling relations. As long as the shape of a cluster’s potential does not depend systematically on its mass, the radial structure of the ICM ought to be scale-free, and the global properties of galaxy clusters, such as halo mass, emission-weighted temperature, or X-ray luminosity, would scale self-similarly (Kaiser 1986). Indeed, numerical simulations that include ⋆ E-mail: [email protected] adiabatic gasdynamics are reported to produce clusters of galaxies that obey such scaling laws (e.g. Navarro et al. 1995; Evrard et al. 1996; Bryan & Norman 1998; Eke et al. 1998). In real clusters, deviations from self-similarity are ex- pected to arise from merging (e.g. Jing & Suto 2000) and additional physics acting on the intracluster gas (see e.g. Tozzi & Norman 2001; Babul et al. 2002; Voit et al. 2002, and references therein). Radiative cooling and energy injec- tion by supernova and/or active galactic nuclei (AGN) may be particularly relevant for low-mass systems, where they can make a significant contribution to the total energy bud- get. Observations seem to corroborate that the self-similar picture is indeed too simplistic, and it fails to predict the observed scalings of cluster mass and luminosity with respect to the ICM gas temperature. Although some observational studies (e.g. Horner et al. 1999; Neumann & Arnaud 1999; Allen et al. 2001) are con- sistent with the self-similar expectation, M ∝ T 1.5 , the ob- served mass-temperature relation has often been found to be steeper (e.g. Sanderson et al. 2003), particularly in the group regime (e.g. Nevalainen et al. 2000; Finoguenov et al.
Transcript of Adiabatic scaling relations of galaxy clusters

arX
iv:a
stro
-ph/
0605
720v
1 3
0 M
ay 2
006
Mon. Not. R. Astron. Soc. 000, 000–000 (0000) Printed 5 February 2008 (MN LATEX style file v2.2)
Adiabatic scaling relations of galaxy clusters
Y. Ascasibar1⋆, R. Sevilla2, G. Yepes,2 V. Muller1 and S. Gottlober1
1Astrophysikalisches Institut Potsdam, An der Sternwarte 16, Potsdam D-14482 (Germany)2Grupo de Astrofısica, Universidad Autonoma de Madrid, Madrid E-28049 (Spain)
5 February 2008
ABSTRACT
The aim of the present work is to show that, contrary to popular belief, galaxy clustersare not expected to be self-similar, even when the only energy sources available aregravity and shock-wave heating. In particular, we investigate the scaling relationsbetween mass, luminosity and temperature of galaxy groups and clusters in the absenceof radiative processes. Theoretical expectations are derived from a polytropic modelof the intracluster medium and compared with the results of high-resolution adiabaticgasdynamical simulations. It is shown that, in addition to the well-known relationbetween the mass and concentration of the dark matter halo, the effective polytropicindex of the gas also varies systematically with cluster mass, and therefore neither thedark matter nor the gas profiles are exactly self-similar. It is remarkable, though, thatthe effects of concentration and polytropic index tend to cancel each other, leading toscaling relations whose logarithmic slopes roughly match the predictions of the mostbasic self-similar models. We provide a phenomenological fit to the relation betweenpolytropic index and concentration, as well as a self-consistent scheme to derive thenon-linear scaling relations expected for any cosmology and the best-fit normalizationsof the M-T, L-T and F-T relations appropriate for a ΛCDM universe. The predictedscaling relations reproduce observational data reasonably well for massive clusters,where the effects of cooling and star formation are expected to play a minor role.
Key words: galaxies: clusters: general — X-rays: galaxies: clusters — cosmology:theory
1 INTRODUCTION
The physics of massive galaxy clusters is relatively simple,at least compared to that of smaller objects. In the stan-dard cold dark matter (CDM) scenario, their mass is domi-nated by the dark component, while most baryons are in theform of a hot diffuse plasma in hydrostatic equilibrium withthe gravitational potential created by the CDM halo. Theintracluster medium (ICM) gas is shock-heated to approxi-mately the virial temperature of the object, and its thermalbremsstrahlung emission has been detected by X-ray satel-lites for the last three decades. In the absence of any otherprocess, it is often stated that galaxy clusters are expectedto be self-similar, and their global properties should obeypower-law scaling relations.
As long as the shape of a cluster’s potential does notdepend systematically on its mass, the radial structure ofthe ICM ought to be scale-free, and the global propertiesof galaxy clusters, such as halo mass, emission-weightedtemperature, or X-ray luminosity, would scale self-similarly(Kaiser 1986). Indeed, numerical simulations that include
⋆ E-mail: [email protected]
adiabatic gasdynamics are reported to produce clusters ofgalaxies that obey such scaling laws (e.g. Navarro et al.1995; Evrard et al. 1996; Bryan & Norman 1998; Eke et al.1998).
In real clusters, deviations from self-similarity are ex-pected to arise from merging (e.g. Jing & Suto 2000) andadditional physics acting on the intracluster gas (see e.g.Tozzi & Norman 2001; Babul et al. 2002; Voit et al. 2002,and references therein). Radiative cooling and energy injec-tion by supernova and/or active galactic nuclei (AGN) maybe particularly relevant for low-mass systems, where theycan make a significant contribution to the total energy bud-get.
Observations seem to corroborate that the self-similarpicture is indeed too simplistic, and it fails to predict theobserved scalings of cluster mass and luminosity with respectto the ICM gas temperature.
Although some observational studies (e.g. Horner et al.1999; Neumann & Arnaud 1999; Allen et al. 2001) are con-sistent with the self-similar expectation, M ∝ T 1.5, the ob-served mass-temperature relation has often been found tobe steeper (e.g. Sanderson et al. 2003), particularly in thegroup regime (e.g. Nevalainen et al. 2000; Finoguenov et al.

2 Y. Ascasibar et al.
2001; Xu et al. 2001; Arnaud et al. 2005). It has also beennoted (Ettori et al. 2002) that the slope of the M − T re-lation might depend on the limiting overdensity. Regardingthe normalization, the reported value is in most cases ∼ 40per cent lower than in numerical simulations, although thereis a certain degeneracy with the precise value of the slope.
On the other hand, it has been known since thefirst generation of X-ray satellites (e.g. Edge & Stewart1991; David et al. 1993) that the slope of the luminosity-temperature relation, α ∼ 3, is significantly steeperthan the self-similar value, α = 2 (although the ex-act value varies for a limited energy band). It has beenshown (e.g. Allen & Fabian 1998; Markevitch et al. 1998;Arnaud & Evrard 1999) that the scatter in the L − T re-lation is significantly reduced, and the discrepancy is some-what less severe, when cooling flows are excised or sampleswith only weak cooling cores are considered. Actually, it hasbeen recently claimed (O’Hara et al. 2005) that cool corerelated phenomena, and not merging processes, are the pri-mary contributor to the scatter in all the scaling relations.
Observational data have thus motivated significant ef-forts attempting to build a physical model of the ICMthat breaks self-similarity, either by removing low-entropygas from the centres of clusters via radiative cooling(Bryan 2000) or by introducing non-gravitational heating(Evrard & Henry 1991; Kaiser 1991). In both cases, the ‘ex-cess’ entropy produces a flattening of the density profile thatbrings the X-ray properties of the modelled clusters in agree-ment with the observed scaling relations (see e.g. Voit et al.2003; Borgani et al. 2004, and references therein). Neverthe-less, the source and precise amount of heating and coolingrequired are still a matter of debate. Recent observations(e.g. Ponman et al. 2003) suggest that the shape of the en-tropy profile is similar in groups and clusters of galaxies,which rules out the simplest scenarios.
In this paper, we claim that dark matter haloes are notexactly self-similar, and therefore both the cluster’s poten-tial and the properties of the ICM gas do indeed depend onthe total mass (or temperature) of the object. In particular,there is no compelling reason to expect that the scaling re-lations between any two physical properties, integrated upto a given overdensity, should obey a power law, even in thepurely gravitational case.
We present a theoretical prediction of these relationsbased on a polytropic model of the ICM, and compare itwith a set of high-resolution adiabatic gasdynamical simu-lations. It will be shown that self-similar models implicitlyassume that all clusters have the same concentration andpolytropic index. Relaxing these hypotheses yields the scal-ing relations derived in Section 2, which we compare withthe results of numerical experiments in Section 3. Observa-tional implications are discussed in Section 4, and Section 5summarizes our main conclusions.
2 THEORETICAL MODEL
As shown by Ascasibar et al. (2003), relaxed clusters andminor mergers found in adiabatic gasdynamical simulationscan be considered to be in approximate thermally-supportedhydrostatic equilibrium up to ∼ 0.8r200. Furthermore, theICM gas is fairly well described by a polytropic equation
of state with an effective polytropic index γ ≃ 1.18. Usingthe phenomenological formula proposed by Navarro et al.(1997, hereafter NFW) to model the density profile of thedark matter halo,
ρ(r) =ρs
(r/rs)(1 + r/rs)2, (1)
the gas temperature is given by
T (r) = T0ln(1 + r/rs)
r/rs, (2)
where the central temperature,
kT0 = 4πGµmpγ − 1
γρsr
2s , (3)
is set by the boundary condition that the ICM density andtemperature vanish at infinity. The gas density profile canbe computed from the polytropic relation
ρg(r) = ρ0(γ)
[
ln(1 + r/rs)
r/rs
] 1
γ−1
, (4)
where the central gas density, ρ0(γ), can be constrained bynormalizing the baryon fraction to match the cosmic valueat xb = rb/rs ∼ 3,
ρ0(γ) =Ωb
Ωdmρs
[
ln(1 + xb)
xb
]−1
γ−1[
xb(1 + xb)2]−1
. (5)
This analytic prescription is simpler than the one proposedin Ascasibar et al. (2003), and it provides better results forextreme values of the polytropic index γ. The choice xb ∼ 3is somewhat arbitrary, and in principle one could leave thenormalization of the gas density as a free parameter of themodel.
We consider, though, that it is desirable to reduce thenumber of free parameters as much as possible. In fact, thevery existence of relatively tight scaling relations suggeststhat real galaxy clusters can indeed be described by onlyone free parameter, which could be taken to be the massof the halo. Once xb is set, our model still has three pa-rameters, two of them related to the dark matter halo (thecharacteristic density and radius, ρs and rs) and one re-lated to the intracluster gas (the effective polytropic indexγ). The first two are known to be correlated (Navarro et al.1997; Bullock et al. 2001; Eke et al. 2001), and we proposea phenomenological relation between polytropic index andconcentration in Section 3 below.
It is important to note, though, that the fact that clus-ters could be described by a one-parameter family of func-tions would give rise to universal scaling relations both fortheir radial profiles as well as for their global (integratedor averaged) physical properties. However, it does not im-ply that such relations ought to be self-similar in any sense.The precise functional form of the different scalings wouldbe specified by the two independent relations between ρs, rs
and γ.In the present work, we are interested in the scaling
relations between several quantities, integrated up to theradius r∆ encompassing an overdensity ∆ with respect tothe critical density, i.e.
M∆ ≡ M(r∆) = ∆4π
3ρc r3
∆, (6)

Adiabatic scaling relations of galaxy clusters 3
where ρc ≡ 3H2
0
8πG= 2.8 × 10¹¹ h2 M⊙ Mpc−3 is the critical
density and H0 ≡ 100 h km s−1 Mpc−1 is the Hubble con-
stant. Defining c∆ ≡ r∆/rs and g(x) ≡[
ln(1 + x) − x1+x
]−1,
we obtain
M∆ ≃ M∆dm = 4πρsr
3s g−1(c∆) (7)
and
ρs =∆H2
0
8πGc3∆ g(c∆). (8)
Let us define the function
y(η, c) ≡∫ c
0
[
ln(1 + x)
x
]η
x2 dx, (9)
which must be integrated numerically. In terms of this func-tion, we can express in a very compact form both the cumu-lative gas mass,
M∆g = 4πρ0r
3s y(
1
γ − 1, c∆), (10)
and mass-weighted temperature,
T∆ = T0
y( γγ−1
, c∆)
y( 1γ−1
, c∆). (11)
Assuming that thermal bremsstrahlung is the dominantcooling mechanism, the X-ray power radiated by the ICMgas per unit volume may be estimated as
P =64π
3
(
π
6
)1
2
(
e2
4πǫ0
)3 [
kT
(mec2)3
]1
2
gne
∑
i
Z2i ni, (12)
where e, me and ne are the electron charge, mass and num-ber density, respectively. ǫ0 is the permittivity of free space,k is Boltzmann’s constant, c is the speed of light and g isthe average Gaunt factor, which we take to be unity. Thesum takes into account the atomic number Zi and numberdensity ni of each ion species i. For a fully-ionized plasmaof primordial composition (∼ 75 per cent of the mass inhydrogen and 25 per cent in helium),
P ≃ 2 × 10¹⁷
(
ρ
M⊙ Mpc−3
)2(
kT
keV
)
1
2
erg s−1 Mpc−3. (13)
Integrating up to r∆, the bolometric X-ray luminosity wouldbe
L∆X = ΛX ρ2
0 (kT0)1
2 4πr3s y(
2
γ − 1+
1
2, c∆) (14)
with ΛX ≃ 2 × 10¹⁷ erg s−1 Mpc3 M⊙−2 keV− 1
2 , while theemission-weighted temperature is given by
T∆X = T0
y( 2γ−1
+ 32, c∆)
y( 2γ−1
+ 12, c∆)
. (15)
Combining equations (3), (7), (8) and (15), simple al-gebra yields the mass-temperature relation
M∆ =
√2
GH0∆−1/2
[
kT∆X
µmp
]3/2
YMT(γ, c∆), (16)
where
YMT(γ, c∆) ≡[
γ − 1
γc∆ g(c∆)
y( 2γ−1
+ 32, c∆)
y( 2γ−1
+ 12, c∆)
]−3
2
. (17)
Analogously, expressions (7) and (10) tell us that thecumulative baryon fraction does not depend explicitly onthe object mass or temperature,
F∆ ≡M∆
g
M∆
Ωdm
Ωb=
ρ0(γ)
ρs
Ωdm
Ωbg(c∆) y(
1
γ − 1, c∆). (18)
Finally, the luminosity-temperature relation can be ex-pressed in the form
L∆X =
ΛXH0
(µmp)3
2 25
2 π G2
(
kT∆X
)2∆
1
2 YLX(γ, c∆) (19)
with
YLX(γ, c∆)≡[
ρ0(γ)
ρs
]2[
γ c∆
γ − 1
]−3
2
g1
2(c∆)y3( 2
γ−1+ 1
2, c∆)
y2( 2γ−1
+ 32, c∆)
, (20)
according to (3), (8), (14) and (15).
3 SIMULATIONS
For constant values of the polytropic index and concentra-tion, equations (16), (18) and (19) become the well-knownself-similar scalings, with logarithmic slopes 3/2, 0 and 2, re-spectively. The precise ‘universal’ values of γ and c∆ wouldsimply set the normalization.
However, both quantities might well depend systemati-cally on the mass of the object. We address such dependencein the present section, where we also compute the expectedscaling relations and compare them to our numerical data.
3.1 Numerical experiments
Our cluster sample consists of 42 objects formed in aflat ΛCDM universe (Ωm = 0.3; Ωb = 0.04; ΩΛ = 0.7;h = 0.7; σ8 = 0.9). 28 of them have been extractedfrom a 80 h−1 Mpc cubic box simulated with a version ofthe parallel Tree-SPH code Gadget (Springel et al. 2001)that implements the entropy-conserving scheme proposed bySpringel & Hernquist (2002). For a thorough description ofthese experiments, the reader is referred to Ascasibar (2003).In order to extend our numerical sample of clusters to awider temperature (mass) range, we have also simulated a500 h−1 Mpc box with the code Gadget2 (Springel 2005),from which we have considered 14 objects. Details aboutthese simulations can be found in Yepes et al. (2004).
In each case, high resolution has been achieved bymeans of the multiple-mass technique (see Klypin et al.2001). An unconstrained random realization of the ΛCDMpower spectrum was generated with 10243 and 20483 par-ticles for the 80 and 500 h−1 Mpc boxes, respectively.Haloes were selected at z = 0 from a low-resolution ex-periment evolved with 1283 dark matter particles, and thenre-simulated with three and five levels of mass refinement(so that the final mass resolution of both subsamples issimilar). The gravitational softening length was set to ǫ =2−5 h−1 kpc, depending on number of dark matter particleswithin the virial radius of the object (following Power et al.2003). Gas particles have only been added in the highestrefinement level.
Basic information about the objects in our numericalcluster sample is summarized in Table 1. They span two or-ders of magnitude in mass (∼ 1013 − 1015 M⊙) and cover
4 Y. Ascasibar et al.
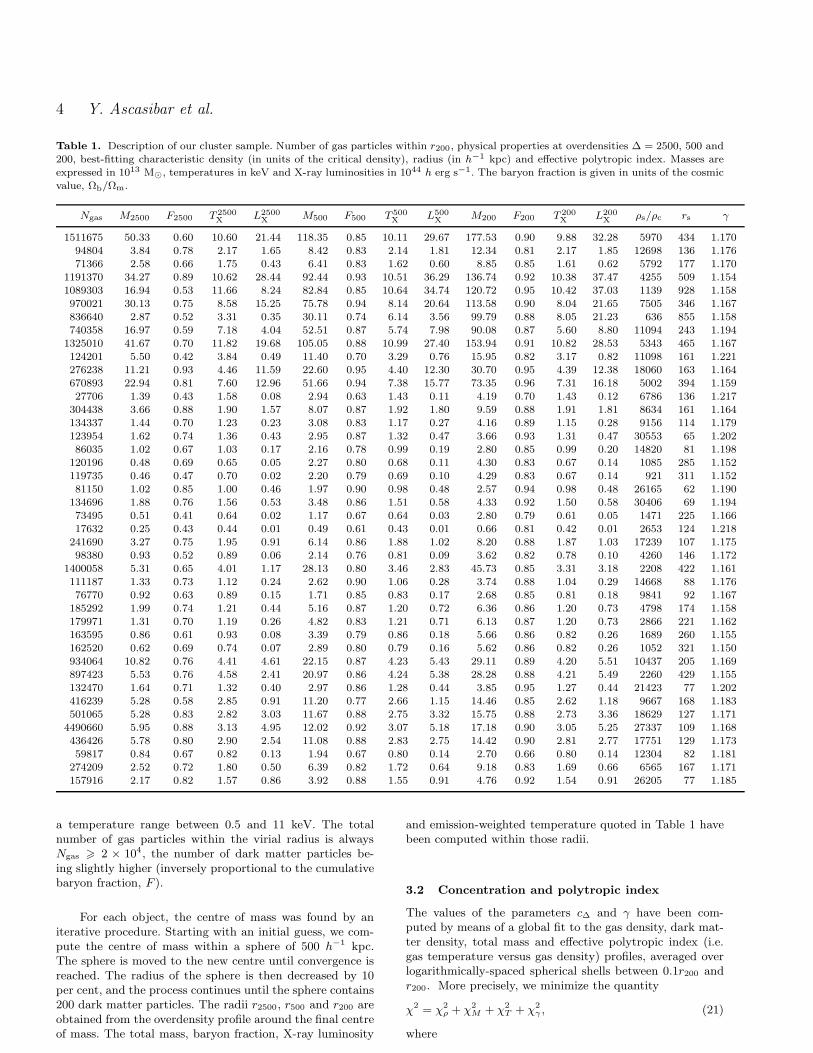
Table 1. Description of our cluster sample. Number of gas particles within r200, physical properties at overdensities ∆ = 2500, 500 and200, best-fitting characteristic density (in units of the critical density), radius (in h−1 kpc) and effective polytropic index. Masses areexpressed in 1013 M⊙, temperatures in keV and X-ray luminosities in 1044 h erg s−1. The baryon fraction is given in units of the cosmicvalue, Ωb/Ωm.
Ngas M2500 F2500 T 2500X L2500
X M500 F500 T 500X L500
X M200 F200 T 200X L200
X ρs/ρc rs γ
1511675 50.33 0.60 10.60 21.44 118.35 0.85 10.11 29.67 177.53 0.90 9.88 32.28 5970 434 1.17094804 3.84 0.78 2.17 1.65 8.42 0.83 2.14 1.81 12.34 0.81 2.17 1.85 12698 136 1.17671366 2.58 0.66 1.75 0.43 6.41 0.83 1.62 0.60 8.85 0.85 1.61 0.62 5792 177 1.170
1191370 34.27 0.89 10.62 28.44 92.44 0.93 10.51 36.29 136.74 0.92 10.38 37.47 4255 509 1.1541089303 16.94 0.53 11.66 8.24 82.84 0.85 10.64 34.74 120.72 0.95 10.42 37.03 1139 928 1.158970021 30.13 0.75 8.58 15.25 75.78 0.94 8.14 20.64 113.58 0.90 8.04 21.65 7505 346 1.167836640 2.87 0.52 3.31 0.35 30.11 0.74 6.14 3.56 99.79 0.88 8.05 21.23 636 855 1.158740358 16.97 0.59 7.18 4.04 52.51 0.87 5.74 7.98 90.08 0.87 5.60 8.80 11094 243 1.194
1325010 41.67 0.70 11.82 19.68 105.05 0.88 10.99 27.40 153.94 0.91 10.82 28.53 5343 465 1.167124201 5.50 0.42 3.84 0.49 11.40 0.70 3.29 0.76 15.95 0.82 3.17 0.82 11098 161 1.221276238 11.21 0.93 4.46 11.59 22.60 0.95 4.40 12.30 30.70 0.95 4.39 12.38 18060 163 1.164670893 22.94 0.81 7.60 12.96 51.66 0.94 7.38 15.77 73.35 0.96 7.31 16.18 5002 394 1.15927706 1.39 0.43 1.58 0.08 2.94 0.63 1.43 0.11 4.19 0.70 1.43 0.12 6786 136 1.217
304438 3.66 0.88 1.90 1.57 8.07 0.87 1.92 1.80 9.59 0.88 1.91 1.81 8634 161 1.164134337 1.44 0.70 1.23 0.23 3.08 0.83 1.17 0.27 4.16 0.89 1.15 0.28 9156 114 1.179123954 1.62 0.74 1.36 0.43 2.95 0.87 1.32 0.47 3.66 0.93 1.31 0.47 30553 65 1.20286035 1.02 0.67 1.03 0.17 2.16 0.78 0.99 0.19 2.80 0.85 0.99 0.20 14820 81 1.198
120196 0.48 0.69 0.65 0.05 2.27 0.80 0.68 0.11 4.30 0.83 0.67 0.14 1085 285 1.152119735 0.46 0.47 0.70 0.02 2.20 0.79 0.69 0.10 4.29 0.83 0.67 0.14 921 311 1.15281150 1.02 0.85 1.00 0.46 1.97 0.90 0.98 0.48 2.57 0.94 0.98 0.48 26165 62 1.190
134696 1.88 0.76 1.56 0.53 3.48 0.86 1.51 0.58 4.33 0.92 1.50 0.58 30406 69 1.19473495 0.51 0.41 0.64 0.02 1.17 0.67 0.64 0.03 2.80 0.79 0.61 0.05 1471 225 1.16617632 0.25 0.43 0.44 0.01 0.49 0.61 0.43 0.01 0.66 0.81 0.42 0.01 2653 124 1.218
241690 3.27 0.75 1.95 0.91 6.14 0.86 1.88 1.02 8.20 0.88 1.87 1.03 17239 107 1.17598380 0.93 0.52 0.89 0.06 2.14 0.76 0.81 0.09 3.62 0.82 0.78 0.10 4260 146 1.172
1400058 5.31 0.65 4.01 1.17 28.13 0.80 3.46 2.83 45.73 0.85 3.31 3.18 2208 422 1.161111187 1.33 0.73 1.12 0.24 2.62 0.90 1.06 0.28 3.74 0.88 1.04 0.29 14668 88 1.17676770 0.92 0.63 0.89 0.15 1.71 0.85 0.83 0.17 2.68 0.85 0.81 0.18 9841 92 1.167
185292 1.99 0.74 1.21 0.44 5.16 0.87 1.20 0.72 6.36 0.86 1.20 0.73 4798 174 1.158179971 1.31 0.70 1.19 0.26 4.82 0.83 1.21 0.71 6.13 0.87 1.20 0.73 2866 221 1.162163595 0.86 0.61 0.93 0.08 3.39 0.79 0.86 0.18 5.66 0.86 0.82 0.26 1689 260 1.155162520 0.62 0.69 0.74 0.07 2.89 0.80 0.79 0.16 5.62 0.86 0.82 0.26 1052 321 1.150934064 10.82 0.76 4.41 4.61 22.15 0.87 4.23 5.43 29.11 0.89 4.20 5.51 10437 205 1.169897423 5.53 0.76 4.58 2.41 20.97 0.86 4.24 5.38 28.28 0.88 4.21 5.49 2260 429 1.155132470 1.64 0.71 1.32 0.40 2.97 0.86 1.28 0.44 3.85 0.95 1.27 0.44 21423 77 1.202416239 5.28 0.58 2.85 0.91 11.20 0.77 2.66 1.15 14.46 0.85 2.62 1.18 9667 168 1.183501065 5.28 0.83 2.82 3.03 11.67 0.88 2.75 3.32 15.75 0.88 2.73 3.36 18629 127 1.171
4490660 5.95 0.88 3.13 4.95 12.02 0.92 3.07 5.18 17.18 0.90 3.05 5.25 27337 109 1.168436426 5.78 0.80 2.90 2.54 11.08 0.88 2.83 2.75 14.42 0.90 2.81 2.77 17751 129 1.17359817 0.84 0.67 0.82 0.13 1.94 0.67 0.80 0.14 2.70 0.66 0.80 0.14 12304 82 1.181
274209 2.52 0.72 1.80 0.50 6.39 0.82 1.72 0.64 9.18 0.83 1.69 0.66 6565 167 1.171157916 2.17 0.82 1.57 0.86 3.92 0.88 1.55 0.91 4.76 0.92 1.54 0.91 26205 77 1.185
a temperature range between 0.5 and 11 keV. The totalnumber of gas particles within the virial radius is alwaysNgas > 2 × 10⁴, the number of dark matter particles be-ing slightly higher (inversely proportional to the cumulativebaryon fraction, F ).
For each object, the centre of mass was found by aniterative procedure. Starting with an initial guess, we com-pute the centre of mass within a sphere of 500 h−1 kpc.The sphere is moved to the new centre until convergence isreached. The radius of the sphere is then decreased by 10per cent, and the process continues until the sphere contains200 dark matter particles. The radii r2500, r500 and r200 areobtained from the overdensity profile around the final centreof mass. The total mass, baryon fraction, X-ray luminosity
and emission-weighted temperature quoted in Table 1 havebeen computed within those radii.
3.2 Concentration and polytropic index
The values of the parameters c∆ and γ have been com-puted by means of a global fit to the gas density, dark mat-ter density, total mass and effective polytropic index (i.e.gas temperature versus gas density) profiles, averaged overlogarithmically-spaced spherical shells between 0.1r200 andr200. More precisely, we minimize the quantity
χ2 = χ2ρ + χ2
M + χ2T + χ2
γ , (21)
where

Adiabatic scaling relations of galaxy clusters 5
Figure 1. Concentration at different overdensities and ef-fective polytropic index of each object. Solid lines representour theoretical model, based on the mass-concentration rela-tion of Bullock et al. (2001) and our proposed fit to the depen-dence of the effective polytropic index on concentration, equa-tion (23). Dotted lines show the one-sigma scatter expected from∆cvir/cvir ≃ 0.3 (Colın et al. 2004). The linear fit to the γ − crelation proposed by Komatsu & Seljak (2001) is shown by thedashed lines on the right panels.
χ2x =
nbins∑
b=1
log2[ x(b)/xmodel(b) ]
1/n(b)(22)
and x denotes the number of particles within each bin,n(b), the total enclosed mass, M(b), the average tempera-
ture within the bin, T (b) =∑n(b)
i=1Ti/n(b), and the quantity
T (b)n1−γ(b).A grid of analytical profiles is generated for the intervals
1.1 < γ < 1.25 and 10 < rs/(h−1kpc) < 1000, in uniform
steps ∆γ = 0.001 and ∆rs = 1 h−1 kpc. Since all the mea-sured quantities are proportional to the characteristic den-sity ρs, its best-fitting value has been trivially found fromthe average of the logarithmic residuals.
Results of the minimization procedure are quoted inTable 1, and best-fitting concentrations and effective poly-tropic indices are plotted in Figure 1. Solid lines depict thetoy model for the mass-concentration relation proposed by
Bullock et al. (2001)1, with F = 0.001 and K = 3. We trans-form the values of cvir ≃ c100 to the other overdensities ac-cording to the NFW profile. Dotted lines show the one-sigmascatter ∆cvir/cvir ≃ 0.3 reported by Colın et al. (2004) forrelaxed systems. Finally, we find that the phenomenologicalrelation
γ = a + b c200 (23)
with a = 1.145± 0.007 and b = 0.005± 0.002 fits reasonablywell our results for the polytropic index (although there ex-ists a certain degeneracy between the best-fitting values ofboth parameters). Dotted lines show the one-sigma scatterin γ(c) expected from ∆cvir.
A correlation between γ and c is expected if bothquantities (and therefore the radial structure of the ICM)vary smoothly with the mass of the object. In fact, an ap-proximately linear dependence has already been advocatedby Komatsu & Seljak (2001) in order to enforce constantbaryon fraction at large radii. Their fit (dashed lines in Fig-ure 1) is however significantly steeper than equation (23).Although it works somewhat better for large c, it does notseem to adequately describe the least concentrated systems,suggesting that, most probably, the precise functional formof γ(c) is not as simple as a straight line. We therefore adviseagainst extrapolating our fit towards values of the concen-tration parameter outside the range covered by the presentwork. Moreover, additional physics is expected to play animportant role in less massive (more concentrated) systems,and therefore the polytropic approximation itself will nolonger to be valid, since it fails to describe the presence of acentral cool core.
Some of our objects deviate appreciably from both themass-concentration relation and the γ − c relation given byexpression (23). These tend to be merging systems, whichhave formed (or are forming) more recently than relaxed ob-jects. In the spherical collapse picture, that means they havecollapsed around density peaks on larger scales, and there-fore the resulting density profiles are less concentrated thanrelaxed haloes of the same mass (Ascasibar et al. 2004). Asnoted by Gottlober et al. (2001), merging is more commonon the scale of galaxy groups. The effective polytropic indexseems to be systematically higher in these objects, althoughit is important to bear in mind that they are not particularlywell described by a polytropic equation of state. Actually,the gas distribution shows obvious asymmetries, as well asan offset between the gas and dark matter peak which re-sults in an artificially flat gas density profile in the centralregions. Such flattening is responsible for both the abnor-mally low baryon fraction measured at ∆ = 2500 and theunusually high value of γ obtained by our fitting routine.
3.3 Scaling relations
The scaling relations of total mass, baryon fraction and X-ray luminosity with respect to the emission-weighted tem-perature are represented in Figure 2, divided by the ap-propriate values of the structure factors YMT, F∆ and YLX
1 Nearly identical results are obtained when the prescriptiongiven in Eke et al. (2001) is used.

6 Y. Ascasibar et al.
Figure 2. M −TX, F −TX and LX −TX scaling relations of our cluster sample at different overdensities, corrected by the factors YMT,F∆ and YLX, respectively. Dashed lines represent the theoretical predictions given by expressions (16), (18) and (19).
corresponding to each object. These are computed by sub-stituting the best-fitting values of γ and c∆ into expressions(17), (18) and (20).
As shown by Ascasibar et al. (2003), polytropic modelsprovide a fairly accurate description of the radial structure ofgalaxy groups and clusters. It is therefore not surprising thatthey are able to match the scaling relations as well. Whenthe factors YMT, F∆ and YLX are taken into account, boththe normalization and the logarithmic slope (equal to theself-similar models) of the scaling relations are correctly pre-dicted by equations (16), (18) and (19). The scatter aroundthe theoretical expectation is quite low, and only mergingsystems deviate appreciably from the predicted relation. Inthese objects, the dark matter potential may differ consid-erably from the NFW form, and the assumptions of hydro-
static equilibrium and a polytropic equation of state providerather poor approximations (Ascasibar et al. 2003).
Uncorrected scaling relations are plotted in Figure 3.Solid lines show our theoretical prediction, using the mass-concentration relation from Bullock et al. (2001) and our fit(23) to estimate c∆ and γ as a function of the cluster mass. Itturns out that the dependencies on concentration and poly-tropic index seem to cancel each other so that the resultingscaling relations look as if the clusters were actually self-similar. Indeed, all the relations considered in the presentstudy can be accurately fit by an ‘average’ concentrationcvir = 8 (which implies c200 ≃ 6, c500 ≃ 4, c2500 ≃ 1.8 andγ ≃ 1.176). The corresponding scaling relations,
M∆ = M∆0 ∆−1/2
(
TX
1 keV
)3/2
(24)
F∆ = F∆0 (25)

Adiabatic scaling relations of galaxy clusters 7
Figure 3. Numerical scaling relations (points), compared to our theoretical prediction (solid lines) based on a variable c(M) and γ(c),see text. Dotted lines show the scatter arising from ∆cvir/cvir ≃ 0.3, and dashed lines indicate the scaling relations expected for a fixedconcentration cvir = 8 and effective polytropic index γ = 1.176.
Table 2. Normalization of the approximate scaling relationsobtained for cvir = 8 and γ = 1.176. M∆
0 is expressed in1014 h−1 M⊙, L∆
0 in 1043 h erg s−1 and F∆0 in units of the
cosmic baryon fraction.
∆ M∆0 F∆
0 L∆0
2500 5.65 0.771 2.18500 5.47 0.885 2.69200 4.71 0.885 2.74
L∆X = L∆
0
(
TX
1 keV
)2
, (26)
have been plotted as dashed lines, and their normalizationsare given in Table 2.
It is to some extent remarkable that concentration andpolytropic index conspire to produce scaling relations thatmatch so closely the self-similar slope. Such effect is illus-trated more clearly in Figure 4, where the contributions ofγ and c to the scaling relations are plotted separately.
The value of the concentration sets the ratio betweenthe radii r∆ and the characteristic radius rs. Since massiveobjects are substantially less concentrated than smaller sys-tems, their r∆ are much closer to the centre in terms of rs,and thus the mass within a given overdensity (which is anincreasing function of r/rs) will be smaller than indicated bythe ‘average’ scaling relation based on a higher value of cvir.Conversely, M∆ in the least massive objects would be biasedhigh with respect to the self-similar relation. The effect isparticularly noticeable for ∆ = 2500, where r∆ ≪ rs andthe enclosed mass is a rapidly increasing function of r/rs;

8 Y. Ascasibar et al.
Figure 4. Effects of concentration (dotted) and polytropic index (dashed) on initially self-similar scaling relations where cvir = 8 andγ = 1.176 for all objects (grey solid). Black solid lines show our prediction, taking into account both effects simultaneously.
for r > rs, it increases only logarithmically, and differencesin r∆/rs are much less important.
The emission-weighted temperature decreases withr/rs, and therefore it is expected to be biased high (low) forlarge (small) systems. However, the effect is arguably small,since the average is biased towards the central part, wherethe gas temperature is roughly constant. As shown by thedotted lines on the top panels of Figure 4, the net result is ashallower mass-temperature relation at ∆ = 2500, while nosignificant change can be appreciated at lower overdensities.
The baryon fraction and the X-ray luminosity are steepfunctions of r/rs, and hence more sensitive to the precisevalue of cvir. The effect on these quantities is also strongerat large overdensities, but unlike the M−T relation, the sys-tematic variation of concentration would yield a noticeableimprint on the F − T and L − T relations at ∆ = 200.
On the other hand, the effective polytropic index con-trols the slope of the gas density profile. According to (23),larger masses, which imply lower concentrations, also meanlower effective polytropic index. The gas density profile be-comes increasingly steep, which boosts the central baryonfraction and the X-ray luminosity, increasing the emission-weighted temperature only slightly and leaving the the to-tal mass mostly unaffected. Given the small variation of thepolytropic index throughout the interesting mass range, theeffect is never larger than a factor of two, comparable to orsmaller than that of the concentration, but it always acts inthe opposite sense.
Finally, we would also like to note that, apart from thenormalization, our model can estimate the scatter aroundthe average scaling relations by assuming that it arises com-pletely from the scatter in the mass-concentration relation.

Adiabatic scaling relations of galaxy clusters 9
Table 3. Normalization M∆0 (in 1014 h−1 M⊙) and logarithmic
slope α of the M − T relation reported in previous numericalstudies.
Reference ∆ M∆0 α
Navarro et al. (1995) 200 6.14 1.5Evrard et al. (1996) 2500 7.85 1.5
500 7.84 1.5Bryan & Norman (1998) 200 8.68 1.5Pen (1998) 200 7.28 1.5Eke et al. (1998) 100 6.12 1.5Yoshikawa et al. (2000) 100 5.56 1.5Mathiesen & Evrard (2001) 500 8.18 1.52
200 7.65 1.54Muanwong et al. (2002) 200 13.9 1.5
Such estimate, indicated by the dotted lines in Figure 3, hasbeen obtained by combining the value c′ = 1.3cvir with theeffective polytropic index γ′ = γ(cvir/1.3), and c′′ = cvir/1.3with γ′′ = γ(1.3cvir), where in both cases γ(c) has been com-puted according to equation (23). Comparing to Figure 2, itseems that the internal structure of clusters (accounted forby the factors YMT, F∆ and YLX) is indeed responsible for asignificant fraction of the scatter in the observed scaling re-lations, as recently suggested by O’Hara et al. (2005). Note,however, that in our case the differences in internal struc-ture are obviously not related to the presence of a cool coreor the action of any external source of energy, but rather tothe different formation histories of each object.
3.4 Comparison with previous work
The mass-temperature relation in the absence of radiativeprocesses has been extensively studied by means of cosmo-logical numerical simulations. A summary of previous resultsis given in Table 3. Slopes consistent with 3/2 are found inmost studies, with normalizations showing a relatively lowscatter around M∆
0 ∼ (7−8)×1014 h−1 M⊙. Similar resultsare obtained when cooling and stellar feedback are consid-ered (e.g. Borgani et al. 2004), although there is a trendtowards steeper slopes and lower normalizations, in betteragreement with observational data.
The M − T relation predicted by our model (see Ta-ble 2) is also considerably lower than the values found inprevious experiments based on purely adiabatic gasdynam-ics. We think that this is to a great extent a resolution effect,coupled to the use of an entropy-conserving scheme to solvethe SPH equations.
Most if not all of the earlier work on the adiabatic scal-ing relations of galaxy clusters relied on the traditional for-mulation of SPH (Lucy 1977; Gingold & Monaghan 1977).It has been recently shown (e.g. Springel & Hernquist 2002;Ascasibar et al. 2003; O’Shea et al. 2005) that poor entropyconservation leads to spurious entropy losses in the clustercores, and thus previous codes tend to systematically over-estimate the central density and underestimate the centralgas temperature.
On the other hand, lack of resolution results in artifi-cially flattened density and temperature profiles, i.e. nearlyisothermal and isentropic cores. Actually, some studies (e.g.Mathiesen & Evrard 2001; Muanwong et al. 2002) even re-
Table 4. L − T relation found in previous simulations, with L∆0
expressed in 1043 h erg s−1.
Reference ∆ L∆0 α
Navarro et al. (1995) 200 4.61 2Bryan & Norman (1998) 200 2.67 2Eke et al. (1998) 100 0.85 2Bialek et al. (2001) 500 2.44 2.02
port decreasing temperature profiles towards the centre.This is in strong disagreement with our results, as well aswith those of independent numerical work based on high-resolution Eulerian simulations (e.g. Loken et al. 2002), inwhich the temperature profile in the absence of radiativeprocesses is also found to decrease monotonically with ra-dius. Under such conditions, the emission-weighted temper-ature (which is biased towards the central, dense and X-ray bright regions of the cluster) is larger than the mass-weighted average, and thus the resulting normalization ofM −T relation becomes considerably lower when TX is usedand the central parts of the objects under study are wellresolved.
Concerning the LX − TX relation, there is relatively lit-tle numerical work based on adiabatic gasdynamical simu-lations. This is also a reflection of the stringent resolutionrequirements, due to the fact that a significant fraction ofthe X-ray photons are expected to be produced in the in-nermost regions. A further problem affecting cosmologicalnumerical experiments is that the smallest objects are typ-ically resolved with less particles, so their bolometric X-rayluminosity is underestimated and the resulting L − T rela-tion is artificially steepened (see e.g. Bryan & Norman 1998;Yoshikawa et al. 2000; Yepes et al. 2004). Most of our ob-jects (see Table 1) have more than 105 gas particles, and inprinciple they should not be severely affected by this prob-lem (see e.g. Borgani et al. 2002, 2005). Nevertheless, it isalways wise to bear this consideration in mind when drawingconclusions from numerical data.
Table 4 shows several fits to the adiabatic L−T relationreported in the literature. The normalizations are in thiscase broadly consistent with our results (Table 2), althoughthe scatter between different estimates is extremely large.This is not entirely unexpected, given the sensitivity of theX-ray luminosity to the details of the gas density profile inthe central regions.
Finally, the baryonic content of galaxy clusters has beenrecently investigated by Kravtsov et al. (2005). For theiradiabatic simulations, they find F2500 = 0.85 ± 0.08 andF500 = 0.94± 0.03 in units of the cosmic value. As noted bythese authors, the baryon fractions obtained with the Eu-lerian code ART (Kravtsov et al. 2002) are systematicallyless concentrated than those obtained with Gadget, evenwhen entropy conservation is enforced, but nevertheless thecumulative baryon fractions beyond r2500 are about about3 − 5 per cent higher. Since the results of Kravtsov et al.(2005) are based on a subset of the cluster sample studiedhere, the interested reader is referred to that paper for anextensive comparison between both codes.
Our results are also compatible with the baryon fractionmeasured by Ettori et al. (2006) in their non-radiative runs,

10 Y. Ascasibar et al.
when the standard implementation of the artificial SPH vis-cosity is used. As pointed out by these authors, it is interest-ing how an improved scheme may lower the baryon fractionin the innermost regions by about 15 per cent. Althoughnot dramatic, it seems clear that the details of the numeri-cal technique do have a measurable impact on the predictedradial profiles near the centre, as well as on the scaling re-lations at high overdensities. These relatively small discrep-ancies between different algorithms should nevertheless beconsidered as part of the theoretical uncertainty.
4 OBSERVATIONS
It is the aim of the present work to provide a sound theo-retical prediction of the cluster scaling relations when onlygravity, adiabatic gasdynamics and shock-wave heating acton the intracluster medium. In real life, additional physi-cal processes, such as radiative cooling, energy injection bystars and AGN or thermal conduction, may play an impor-tant role or even determine the exact form of the scaling rela-tions. However, the influence of all these phenomena outsidethe central regions is expected to be relatively small whencompared to shock heating, especially for the most massivesystems.
Therefore, one may expect a priori that the adiabaticscaling relations roughly match the observed ones. Depar-tures would measure the effect of additional physics, andin principle should be more noticeable at high overdensitiesand for low-temperature systems.
Our predictions for the adiabatic case are comparedwith observational data in Figure 5. We find a fairly goodagreement, both in shape and, to some extent, scatter, withthe observed M −T relation at different overdensities. Onlythe dataset from Piffaretti et al. (2005) is not well describedby our model. From visual inspection of Figure 5, though,it seems that the dark matter masses inferred for some ofthese systems are lower not only than our results but alsothan the other observations.
On the other hand, the luminosity-temperature relationobserved for galaxy clusters is roughly consistent with ourtheoretical prediction, but the slope is appreciably steeper.As one approaches the group regime, real systems can beone order of magnitude less bright than the model. The X-ray luminosity is much more sensitive to the details of thecentral parts than the total mass or the emission-weightedtemperature, and thus it is not surprising that the L − Trelation deviates from the adiabatic prediction more signifi-cantly than the mass-temperature relation.
The lower X-ray emissivity seems to be intimately con-nected to the shape of the gas density profile. Our modelscorrectly predict that the baryon fraction should be an in-creasing function of radius, and such a trend is clearly consis-tent with the observational data. However, they also predictthat, at a given overdensity, the baryon fraction should beroughly independent on cluster mass.
This is blatantly at odds with observations. As notedby Vikhlinin et al. (2005), the conversion of gas into starsis a crucial factor that should be taken into account. Ac-tually, it would be very interesting to measure whether itcould completely explain the observed central baryon de-pletion on its own, or by the contrary some other physical
mechanism (e.g. heating) must be invoked in order to ex-plain the observed density and temperature profiles (see e.g.Borgani et al. 2005, for a recent discussion on this issue).
In any case, radiative processes must obviously affectthe physical properties of real clusters to some extent. As re-cently shown by O’Hara et al. (2005), the scaling relations ofclusters with and without a cool core are clearly offset fromeach other, and the observed scatter can be significantly re-duced by introducing the peak strength (characterized bythe central X-ray surface brightness) as an additional pa-rameter.
Although such a parameter would measure a mixturebetween the intensity of cooling and the internal structureof the halo, a visual comparison between the simulation re-sults plotted in Figure 3 and the observational data shown inFigure 5 suggests that observed systems display a somewhatlarger scatter than our simulated clusters, which points inthe direction that both processes may have a comparablecontribution to the total scatter. Measurement errors, mostnotably for cluster mass estimates, also contribute to thescatter in the observed scaling relations, although they havebeen reported to be relatively small compared to the in-trinsic scatter (O’Hara et al. 2005). We have also neglectedredshift evolution, which can modify the observed massesand luminosities by a factor H(z)/H0, which for a ΛCDMuniverse amounts to about 40 per cent at z = 0.2. A rig-orous statistical analysis (and a larger dataset) would berequired in order to make a quantitative assessment.
5 CONCLUSIONS
In this paper, the scaling relations between gas and darkmatter mass, X-ray luminosity and emission-weighted tem-perature of galaxy groups and clusters have been investi-gated from a theoretical point of view. As a starting point,we have considered a relatively simple case in which the in-fluence of radiative processes on the observable properties ofthe ICM gas has been completely neglected. Our estimatesof the adiabatic scaling relations have been computed fromthe polytropic models described in Ascasibar et al. (2003),based on the results of high-resolution gasdynamical simu-lations.
Our main conclusions can be summarized as follows:
(i) Dark matter haloes are well known not to scale self-similarly, but according to a certain mass-concentration re-lation. We find that the effective polytropic index of the gasalso varies systematically with mass, and propose the phe-nomenological fit γ = 1.145 + 0.005 c200, equation (23), tomodel the dependence of γ on the concentration c of thedark matter halo.
(ii) Given c(M) and γ(c), the whole structure of the ICMis fully specified by our model. It turns out that the effects ofthe varying polytropic index and concentration tend to can-cel out at all overdensities, yielding scaling relations thatare well described by simple power laws whose exponentscoincide with the self-similar prediction, and whose normal-izations are well fitted by a ‘typical’ cvir ≃ 8.
(iii) Our model provides an excellent match to numericaldata. The normalization of the M-T relation is significantlylower than previous values reported in the literature, whichwe attribute to a resolution effect. The scaling of the baryon

Adiabatic scaling relations of galaxy clusters 11
Figure 5. Observed M − TX, F − TX and LX − TX scaling relations, compared to our theoretical prediction (solid lines) and theone-sigma scatter expected from ∆cvir/cvir ≃ 0.3 (dotted lines).
fraction and the L − T relation are broadly consistent withindependent numerical work.
(iv) Additional physics (most notably, radiative coolingand star formation) has an important effect on the densityand temperature profiles of real clusters. The M−T relationis not severely affected, but the baryon fraction observedin low-mass systems is considerably below our theoreticalprediction. This results in a lower X-ray luminosity, and itis ultimately responsible for the steepness of the observedL − T relation. On the other hand, the precise strength ofcool cores (which cannot form in our simulations) seems toincrease the scatter around the average scaling relations.
ACKNOWLEDGMENTS
This work has been partially supported by the Plan
Nacional de Astronomıa y Astrofısica (AYA2003-0973),the Acciones Integradas Hispano-Alemanas (HA2000-0026),
the Deutscher Akademischer Austausch Dienst and NASAgrants G02-3164X and G04-5152X. We thank the CIEMAT,the Forschungszentrum Julich and the Astrophysikalisches
Institut Potsdam for kindly allowing us to use their super-computer facilities to carry out the numerical simulationsused in this article.
REFERENCES
Allen S. W., Fabian A. C., 1998, MNRAS, 297, L57Allen S. W., Schmidt R. W., Fabian A. C., 2001, MNRAS,328, L37
Allen S. W., Schmidt R. W., Fabian A. C., 2002, MNRAS,334, L11
Arnaud M., Evrard A. E., 1999, MNRAS, 305, 631Arnaud M., Pointecouteau E., Pratt G. W., 2005, A&A,441, 893

12 Y. Ascasibar et al.
Ascasibar Y., 2003, PhD thesis, Universidad Autonoma deMadrid (Spain), (astro-ph/0305250)
Ascasibar Y., Yepes G., Gottlober S., Muller V., 2004, MN-RAS, 352, 1109
Ascasibar Y., Yepes G., Muller V., Gottlober S., 2003, MN-RAS, 346, 731
Babul A., Balogh M. L., Lewis G. F., Poole G. B., 2002,MNRAS, 330, 329
Bialek J. J., Evrard A. E., Mohr J. J., 2001, ApJ, 555, 597Borgani S., Dolag K., Murante G., Cheng L. ., SpringelV., Diaferio A., Moscardini L., Tormen G., Tornatore L.,Tozzi P., 2005, (astro-ph/0512506)
Borgani S., Governato F., Wadsley J., Menci N., Tozzi P.,Quinn T., Stadel J., Lake G., 2002, MNRAS, 336, 409
Borgani S., Murante G., Springel V., Diaferio A., Dolag K.,Moscardini L., Tormen G., Tornatore L., Tozzi P., 2004,MNRAS, 348, 1078
Bryan G. L., 2000, ApJ, 544, L1Bryan G. L., Norman M. L., 1998, ApJ, 495, 80Bullock J. S., Dekel A., Kolatt T. S., Kravtsov A. V.,Klypin A. A., Porciani C., Primack J. R., 2001, ApJ, 555,240
Castillo-Morales A., Schindler S., 2003, A&A, 403, 433Colın P., Klypin A., Valenzuela O., Gottlober S., 2004,ApJ, 612, 50
David L. P., Slyz A., Jones C., Forman W., Vrtilek S. D.,Arnaud K. A., 1993, ApJ, 412, 479
Edge A. C., Stewart G. C., 1991, MNRAS, 252, 428Eke V. R., Navarro J. F., Frenk C. S., 1998, ApJ, 503, 569Eke V. R., Navarro J. F., Steinmetz M., 2001, ApJ, 554,114
Ettori S., De Grandi S., Molendi S., 2002, A&A, 391, 841Ettori S., Dolag K., Borgani S., Murante G., 2006, MN-RAS, 365, 1021
Evrard A. E., Henry J. P., 1991, ApJ, 383, 95Evrard A. E., Metzler C. A., Navarro J. F., 1996, ApJ, 469,494
Finoguenov A., Arnaud M., David L. P., 2001, ApJ, 555,191
Gingold R. A., Monaghan J. J., 1977, MNRAS, 181, 375Gottlober S., Klypin A., Kravtsov A. V., 2001, ApJ, 546,223
Horner D. J., Mushotzky R. F., Scharf C. A., 1999, ApJ,520, 78
Jing Y. P., Suto Y., 2000, ApJ, 529, L69Kaiser N., 1986, MNRAS, 222, 323Kaiser N., 1991, ApJ, 383, 104Klypin A., Kravtsov A. V., Bullock J. S., Primack J. R.,2001, ApJ, 554, 903
Komatsu E., Seljak U., 2001, MNRAS, 327, 1353Kravtsov A. V., Klypin A., Hoffman Y., 2002, ApJ, 571,563
Kravtsov A. V., Nagai D., Vikhlinin A. A., 2005, ApJ, 625,588
Loken C., Norman M. L., Nelson E., Burns J., Bryan G. L.,Motl P., 2002, ApJ, 579, 571
Lucy L. B., 1977, AJ, 82, 1013Markevitch M., Forman W. R., Sarazin C. L., Vikhlinin A.,1998, ApJ, 503, 77
Mathiesen B. F., Evrard A. E., 2001, ApJ, 546, 100Muanwong O., Thomas P. A., Kay S. T., Pearce F. R.,2002, MNRAS, 336, 527
Navarro J. F., Frenk C. S., White S. D. M., 1995, MNRAS,275, 720
Navarro J. F., Frenk C. S., White S. D. M., 1997, ApJ, 490,493
Neumann D. M., Arnaud M., 1999, A&A, 348, 711Nevalainen J., Markevitch M., Forman W., 2000, ApJ, 532,694
O’Hara T. B., Mohr J. J., Bialek J. J., Evrard A. E., 2005,(astro-ph/0510064)
O’Shea B. W., Nagamine K., Springel V., Hernquist L.,Norman M. L., 2005, ApJS, 160, 1
Osmond J. P. F., Ponman T. J., 2004, MNRAS, 350, 1511Pen U., 1998, ApJS, 115, 19Piffaretti R., Jetzer P., Kaastra J. S., Tamura T., 2005,A&A, 433, 101
Ponman T. J., Sanderson A. J. R., Finoguenov A., 2003,MNRAS, 343, 331
Power C., Navarro J. F., Jenkins A., Frenk C. S., WhiteS. D. M., Springel V., Stadel J., Quinn T., 2003, MNRAS,338, 14
Reiprich T. H., Bohringer H., 2002, ApJ, 567, 716Sanderson A. J. R., Ponman T. J., Finoguenov A., Lloyd-Davies E. J., Markevitch M., 2003, MNRAS, 340, 989
Springel V., 2005, MNRAS, 364, 1105Springel V., Hernquist L., 2002, MNRAS, 333, 649Springel V., Yoshida N., White S. D. M., 2001, New As-tronomy, 6, 79
Tozzi P., Norman C., 2001, ApJ, 546, 63Vikhlinin A., Kravtsov A., Forman W., Jones C., Marke-vitch M., Murray S. S., Van Speybroeck L., 2005,(astro-ph/0507092)
Voit G. M., Balogh M. L., Bower R. G., Lacey C. G., BryanG. L., 2003, ApJ, 593, 272
Voit G. M., Bryan G. L., Balogh M. L., Bower R. G., 2002,ApJ, 576, 601
Xu H., Jin G., Wu X., 2001, ApJ, 553, 78Yepes G., Ascasibar Y., Sevilla R., Gottlober S., Muller V.,2004, in IAU Colloq. 195, 274 (astro-ph/0404556)
Yoshikawa K., Jing Y. P., Suto Y., 2000, ApJ, 535, 593