
CORRIGENDUM to “Depth dependence of the single chamber response function of the I’mRT MatriXX...
10
This article appeared in a journal published by Elsevier. The attached copy is furnished to the author for internal non-commercial research and education use, including for instruction at the authors institution and sharing with colleagues. Other uses, including reproduction and distribution, or selling or licensing copies, or posting to personal, institutional or third party websites are prohibited. In most cases authors are permitted to post their version of the article (e.g. in Word or Tex form) to their personal website or institutional repository. Authors requiring further information regarding Elsevier’s archiving and manuscript policies are encouraged to visit: http://www.elsevier.com/authorsrights
-
Upload
independent -
Category
Documents
-
view
0 -
download
0
Transcript of CORRIGENDUM to “Depth dependence of the single chamber response function of the I’mRT MatriXX...

This article appeared in a journal published by Elsevier. The attachedcopy is furnished to the author for internal non-commercial researchand education use, including for instruction at the authors institution
and sharing with colleagues.
Other uses, including reproduction and distribution, or selling orlicensing copies, or posting to personal, institutional or third party
websites are prohibited.
In most cases authors are permitted to post their version of thearticle (e.g. in Word or Tex form) to their personal website orinstitutional repository. Authors requiring further information
regarding Elsevier’s archiving and manuscript policies areencouraged to visit:
http://www.elsevier.com/authorsrights
Author's personal copy
ORIGINALARBEIT
Depth dependence of the single chamber response function of theI’mRT MatriXX array in a 6 MV photon beam
Saleh Alashrah1,2,∗, Sivamany Kandaiya2, Liang Soo Lum3, Soon Keong Cheng3
1 Department of Physics, College of Science, Qassim University, Saudi Arabia2 School of Physics, Universiti Sains Malaysia, Penang, Malaysia3 Mt Miriam Hospital, Penang, Malaysia
Received 19 April 2012; accepted 3 September 2013
Abstract
One of the factors which influence the spatial resolution ofa 2D detector array is the size of the single detector, anotherthe transport of the secondary electrons from the walls intothe measuring volume. In this study, the single ion cham-ber dose response function of an I’mRT MatriXX array wasdetermined by comparison between slit beam dose profilesmeasured with the array and with EBT2 radiochromic filmin a solid water-equivalent phantom at a shallow depth of0.5 cm and at a depth of 5 cm beyond the depth dose maxi-mum for a 6 MV photon beam. The dose response functionswere obtained using two methods, the best fit method andthe deconvolution method. At the shallow depth, a Lorentzfunction and at 5 cm depth a Gaussian function, both withthe same FWHM of 7.4 mm within limits of uncertainty,were identified as the best suited dose response functionsof the 4.5 mm diameter single array chamber. These doseresponse functions were then tested on various dose pro-files whose true shape had been determined with EBT2 filmand with the IC03 ionization chamber. By convolving thesewith the Lorentz kernel (at shallow depth) and the Gauss-ian kernel (at 5 cm depth) the signal profiles measuredwith the I’mRT MatriXX array were closely approx-imated. Thus, the convolution of TPS-calculated doseprofiles with these dose response functions can minimize
Tiefenabhängigkeit derDosisansprechfunktion für das I’mRTMatriXX array für 6 MV Photonen
Zusammenfassung
Die räumliche Auflösung eines 2D-Detektor-Arrays wirddurch die Größe des einzelnen Detektors und durch denTransport der Sekundärelektronen von den Detektorwän-denänden in das Messvolumen bestimmt. In dieser Studiewurde die Dosis-Ansprechfunktion einer Einzelkammerdes I’mRT MatriXX-Arrays durch Vergleich zwischen denmit dem Array und dem Radiochromfilm EBT2 gemesse-nen Schlitzstrahl-Signalprofilen ermittelt. Die Messungenwurden in einem wasseräquivalenten Festkörperphan-tom in Tiefen 0,5 cm bzw. 5 cm, d.h. hinter demDosismaximum für 6 MV Photonenstrahlung, durchge-führt. Die Dosis-Ansprechfunktion der Einzelkammerwurde nach der Entfaltungsmethode und der “best-fit”-Methode bestimmt. Für eine Einzelkammer mit 0,45cm Durchmesser eignen sich als Dosis-Ansprechfunktion(0,5 cm Tiefe) am besten eine Lorentz-Funktion bzw.eine Gauß-Funktion bei 5 cm Tiefe (Halbwerts-breiten etwa 0,74 cm). Die Dosis-Ansprechfunktionwurde an verschiedenen Dosisprofilen getestet, deren
∗ Corresponding author: Saleh Alashrah, Universiti Sains Malaysia, Physics, 2B-17-2 Desa Airmas Cond, Jalan Helang 11700, Sungai dua, P. Penang,Penang, 11700, Malaysia.
E-mail addresses: [email protected], [email protected] (S. Alashrah).
Z. Med. Phys. 23 (2013) 270–278http://dx.doi.org/10.1016/j.zemedi.2013.09.001
http://journals.elsevier.de/zemedi
Author's personal copy
S. Alashrah et al. / Z. Med. Phys. 23 (2013) 270–278 271
the differences between calculation and measurementwhich occur due to the limited spatial resolution of theI’mRT MatriXX detector.
Keywords: Lorentz kernel, Gaussian kernel, I’mRTMatriXX array
Form mit EBT2-Film bzw. IonisationskammermessungenIC03 ermittelt wurden. Durch Faltung dieser Dosispro-file mit Lorentz-Kern (in 0,5 cm Tiefe) und Gauß-Kern(in 5 cm Tiefe) wurden die mit dem I’mRT-MatriXX-Arrayerhaltenen Signalprofile sehr gut angenähert. Die Faltungeiner TPS-geplanten Dosisverteilung mit der Dosis-Ansprechfunktion des Arrays kann die Fehler durch dasbeschränkte räumliche Auflösungsvermögen des I’mRT-MatriXX-Array deutlich reduzieren.
Schlüsselwörter: Lorentz-Funktion, Gauß-Funktion,I’mRT-MatriXX-Array
1 Introduction
In intensity-modulated radiation therapy (IMRT) improveddose conformity to the target and a reduced dose to the sur-rounding healthy tissues is the goal. IMRT uses non-uniformradiation beam intensities as well as small segments which aredetermined using computer based optimization techniques.The dose distribution in the target can be further shaped bymodulating the intensity in each field used. One of the finalsteps in the quality assurance (QA) of patient specific IMRTplanning is to ensure close matching between the dose deliv-ered to the patient and the dose calculated by the TPS. Fordosimetric plan verification, the treatment plan is recalculatedin a QA phantom with all the beams perpendicular to the phan-tom surface. The planar dose distribution is then verified usingeither films or a 2D array of pixel ionization chambers. Filmsare widely used as they have good spatial resolution but thefilms have to be calibrated against dose. Gafchromic filmswhich have been refined for clinical radiotherapy dosimetry[1,2] are self developing and require no physical/chemicalprocessing. However these films are normally scanned after a24 hour post-irradiation and the results are not immediatelyavailable [3,4]. 2D ionization chamber arrays have provideddirect measurement of dose without frequent calibration, andthe measurements are in real time [5–7].
The limited spatial resolution of ionization chamber arrayshas been attributed to the finite size of the single detectors aswell as to the transport of secondary electrons from the wallsinto the detector volume [8,9,31,32]. This disadvantage canbe overcome by the method proposed by Poppe et al [10],who convolved the calculated dose profile provided by theTPS with the dose response function of the single ionizationchamber and used the convolution product for the gamma-index based comparison with the measured 2D array profile.A detector’s line spread function of I’mRT MatriXX was rep-resented as a Gaussian function by Li et al [9] as well asa trapezoidal function [8]. The convolution can be readilyperformed by MATLAB [11].
Alternatively, the limited resolution of an ionization cham-ber array might be dealt with by deconvolution with the
response function of the single chamber, and the result wouldbe compared to the TPS values. However, this method isproblematic because dividing by the kernel at high frequen-cies in the Fourier domain involves dividing by very smallnumbers, which is equivalent to multiplication by very largenumbers, and this will strongly affect the deconvolution result[12].
Another factor which influences the spatial resolution of the2D array is the center to center distance between the detectors[10]. The chamber spacing of 0.76 cm between the detectorsin the I’mRT MatriXX corresponds to a sampling frequencyof 0.13 mm−1. For the I’mRT MatriXX to faithfully transmitand reconstruct the original image, its sampling frequencyshould be higher than the Nyquist frequency which is twicethe highest spatial frequency in the original image [8,13].Therefore, as far as the sampling frequency is concerned,the I’mRT MatriXX array is able to reconstruct faithfully theIMRT dose distributions as long as their Nyquist frequencydoes not exceed 0.13 mm−1.
The basic dosimetric properties of the 2D ionization cham-ber array I’mRT MatriXX investigated in this study werereported in a previous paper [7]. These tests included thelocation of the effective point of measurement, dose linear-ity, energy dependence, the start-up behavior of the I’mRTMatriXX, field size dependence, dose rate effect and the sta-bility of the detector over time. The aim of the present studywas to determine the dose response function of a finite sizesingle detector in the 2D array at 0.5 cm depth and at a depthof 5 cm, which is beyond the depth dose maximum. The doseresponse function was then verified by the convolution of thetrue cross plane dose distribution with this response func-tion, and the result was compared with the measured 2Darray readings. Gafchromic (EBT2) film was used in thiswork to provide the true beam dose profiles. The cross planedose profiles for field sizes from 2 × 2 cm2 till 20 × 20 cm2
at depth 5 cm have also been obtained using the ionizationchamber IC03. These have been convolved with the singlearray detector response functions obtained at 0.5 and 5 cmdepth and then compared with the measured data from the 2Darray.
Author's personal copy
272 S. Alashrah et al. / Z. Med. Phys. 23 (2013) 270–278
2 Materials and Methods
2.1 2D array I’mRT MatriXX
The pixel-segmented ionization chamber array, I’mRTMatriXX (Scanditronics, Wellhöfer, Germany) has beendesigned to ease the 2-dimensional verification of fieldswith complex shapes like IMRT. The detector features a32 × 32 matrix into a 24 × 24 cm2 active area, divided in1020 independent vented parallel plate ion chambers. Thereare no ion chambers at the four corners [15]. The sensitivevolume of each ionization chamber is 0.08 cm3 (4.5 mm diam-eter × 5 mm height). The ionization chambers are equallyspaced with a center to center distance of 0.76 cm. The mini-mum sampling acquisition time is 20 ms. The buildup materialof the detector array is made of acrylonitrile butadiene styrene.It is 3.3 mm thick and its density is 1.06 g/cm3, thus the buildupmaterial approximately corresponds to 0.4 cm of water. Thesoftware used for communication and data acquisition withthe I’mRT MatriXX is OmniPro-I’mRT. The calibration andthe uniformity correction of the I’mRT MatriXX detector wasdone by the manufacturer. This calibration was verified bycomparing the I’mRT MatriXX results with a Farmer ioniza-tion chamber (FC65-G) at a depth of 5 cm in the RW3 solidwater phantom, and the deviation was less than 0.5% on thecentral axis. The background radiation was subtracted fromthe readings. The detector was exposed to levels above 1500cGy and required an initial warm-up of 60 minutes for thedetector readings to be stable [7]. The effective depth of thedetector was taken from the manufacturer-specified value of3.6 ± 0.1 mm. For alignment purpose, there are three markson the three sides of the detector.
All measurements were performed with x-rays from aSiemens Artiste accelerator (6 MV) in a solid water phantom(RW3). The radiation beam was perpendicular to the phantomsurface and the 2D array for all measurements. Beam pro-file measurements were obtained using either 5 cm of solidwater on the surface of the I’mRT MatriXX array, so thatthe resulting depth of measurement was 5.36 cm (this willbe shortly denoted as “5 cm”) or using 0.1 cm of solid waterso that the resulting depth of measurement was 0.46 cm (thiswill be shortly denoted as “0.5 cm”). The source-to-surfacedistance (SSD) was 100 cm. For all field sizes, the measure-ments were performed using 6 MV photons of the SiemensArtiste accelerator and 100 monitor units.
2.2 Dose response function of a single detector of the2D array
The single detector’s dose response function of the I’mRTMatriXX array can be defined as the convolution kernel K(x)that transforms the true dose profile D(x) into the measuredsignal profile M(x) and thereby characterizes the broadeningof the slit-beam dose profile [16,17,31,32]. It is affected bythe detector size, the replacement of water by air, the wall
and the central electrode of the detector as well as the geo-metrical form of the chamber itself [16,32]. As the ranges ofhigh-energy secondary electrons traversing each chamber arerelatively large, the measured chamber signal is not only due tosecondary electrons entering the chamber from the front side,but also from the ridges between the single chambers [10,32].Therefore, each ion chamber has a dose response functionwhich is also affected by the transport of secondary electrons.
The dose response function was obtained using two meth-ods, both based on shifting a narrow slit beam stepwise overa single detector of the I’mRT MatriXX array, so that the slitbeam signal profile M(x) measured by the detector is obtained.This was done with the detector either at 5 cm or 0.5 cm depth.The EBT2 film was also placed at these depths, and the highspatial resolution of the film was utilized to determine the truedose profiles D(x). In the first method, the “best fit method”used by Looe et al [32], K(x) was determined by a systematicsearch for the kernel that would transform D(x) into M(x), asdescribed in section 2.2.3. The second method was to obtainK(x) by deconvolution of M(x) with D(x) as earlier performedby Poppe et al [10], Herzen et al [6] and Looe et al [32]; thisis described in section 2.2.4.
2.2.1 Slit beam production
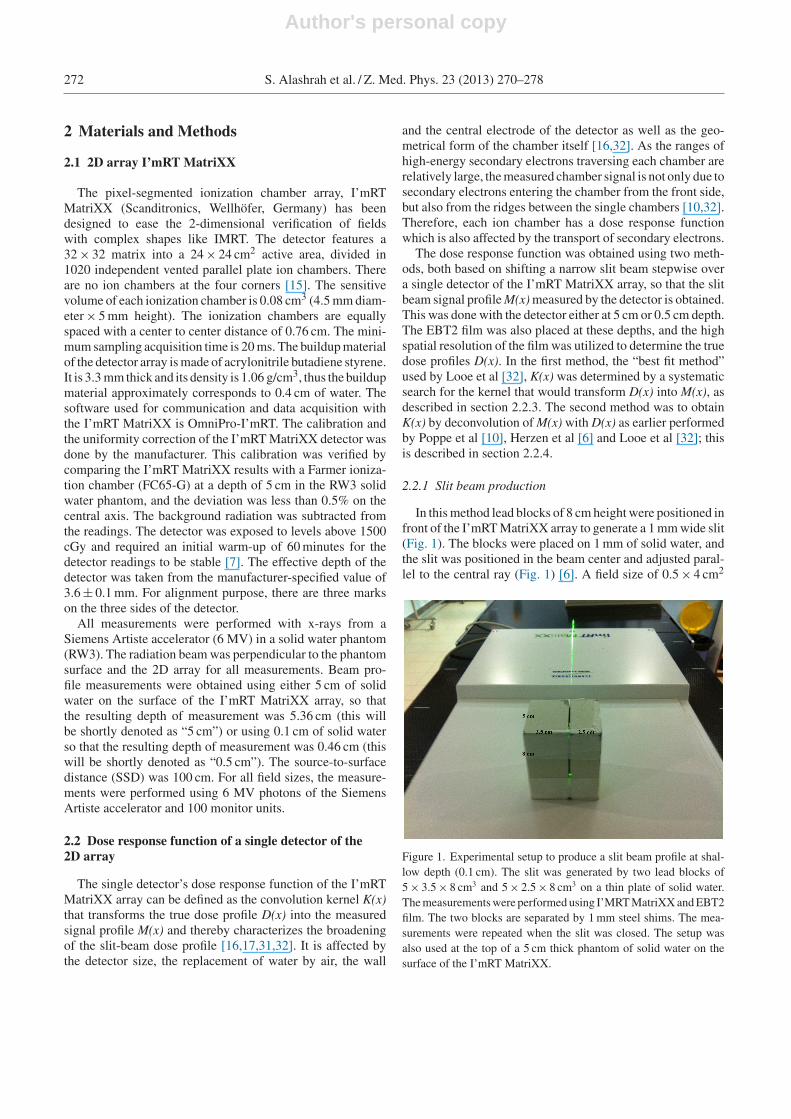
In this method lead blocks of 8 cm height were positioned infront of the I’mRT MatriXX array to generate a 1 mm wide slit(Fig. 1). The blocks were placed on 1 mm of solid water, andthe slit was positioned in the beam center and adjusted paral-lel to the central ray (Fig. 1) [6]. A field size of 0.5 × 4 cm2
Figure 1. Experimental setup to produce a slit beam profile at shal-low depth (0.1 cm). The slit was generated by two lead blocks of5 × 3.5 × 8 cm3 and 5 × 2.5 × 8 cm3 on a thin plate of solid water.The measurements were performed using I’MRT MatriXX and EBT2film. The two blocks are separated by 1 mm steel shims. The mea-surements were repeated when the slit was closed. The setup wasalso used at the top of a 5 cm thick phantom of solid water on thesurface of the I’mRT MatriXX.
Author's personal copy
S. Alashrah et al. / Z. Med. Phys. 23 (2013) 270–278 273
was selected to minimize scattering. The measured signal wascorrected for background and leakage by repeating the mea-surement with a closed slit [6]. The scanning length of the slitbeam was from -20 mm to +20 mm in steps of 1 mm usingthe couch movement. The isocenter was at the effective pointof measurement (EPOM) of the I’mRT MatriXX which islocated at 3.6 mm depth. The measurements were repeatedusing 5 cm of solid water phantom on the surface the I’mRTMatriXX 2D array, and the source- to- surface distance (SSD)was maintained at 100 cm.
2.2.2 Fitting functions
MATLAB (R2009a), with command: cftool, method: leastsquares, algorithm: trust region, was applied to fit the mea-sured functions M(x) and D(x), using as candidates both theLorentz function and Gaussian function as given in equations1 and 2.
f (x) = 100
1 + x2
λ2
(1)
f (x) = 100 e−x2/(2σ2) (2)
According to equation 1, 2� is the full width at half max-imum of the Lorentz function. This function is known fromthe physics of forced resonance and spectral line broadening.It has a bell shaped, non-Gaussian, narrow core, wide lateraltails and suitable convolution properties [18]. According toequation 2, � is the Gaussian shape parameter.
2.2.3 Best fit method
The best fit method may be used to determine kernel K(x).Its basis is that beam broadening in the penumbra region isencountered in a 2D array I’mRT MatriXX especially forsmall field sizes. This effect results from the detector sizeand the secondary electron transport [9,10,27,32]. This effectis mathematically modeled by the convolution of the truedose profile with a convolution kernel representing the doseresponse function of the single detector:
M(x) =+∞∫−∞
D(u)K(x − u)du (3)
M(x) is the measured signal profile and is described as theconvolution of the true dose profile D(u) with the detector doseresponse function K(x-u) [12]. MATLAB R2009a was thenused to convolve the true dose profile with a set of Lorentzand Gaussian functions with varied parameters � and �. Theresulting functions M(x) were compared with the measuredM(x), and the parameters � and � yielding the best fit wereselected.
2.2.4 Deconvolution method
The dose response function or convolution kernel K(x) isobtained by dividing the Fourier transformed measured pro-file (I’mRT MatriXX profile) M(x) by the Fourier transformedtrue profile (film profile) D(x) and then performing the inverseFourier transformation of this quotient, as indicated in equa-tion (4):
F (K(x)) = F (M(x))
F (D(x))(4)
Accordingly, the measured signal profiles of the arraychamber were deconvolved with the EBT2 film profilesin order to obtain the dose spread functions of the arraychamber.
2.3 Ionization chamber (IC03)
In the application examples, a small graphite thimble cham-ber IC03 (Wellhöfer, Germany) was used to provide highspatial resolution measurements in the penumbra regions as ithad no energy and field size dependence [15,20]. This cham-ber is sufficiently small (0.028 cm3 active volume). Its lengthand diameter is 3 mm. Hence, it is suited to resolve steepdose gradients [21]. Furthermore, it satisfies the recommen-dation of Paskalev et al. [22] that the detector is 6-7 timessmaller than the nominal field size [14]. The measurementsusing the IC03 were performed in a water phantom and theywere corrected for air pressure and temperature. In commis-sioning the linear accelerator for clinical use, all collecteddata were from the IC03 which was then used in the treatmentplanning system.
2.4 Gafchromic film (EBT2)
EBT2 film has low energy dependence and high spatialresolution, is insensitive to light and requires no chemicalprocessing [23–25]. A single box of 25 sheets of GafchromicEBT2 film (lot #A052810-02BA, expiry date May 2012) wasused in this investigation. Film pieces (5 × 3 cm2) were irra-diated with 6 MV photons at 0.5 and 5 cm depth in the solidwater phantom. The films were exposed to different doses (0 -500 cGy) to obtain the calibration curve. Next, the EBT2 filmpieces were used for dose profile measurements.
The films were scanned two days after irradiation in the por-trait mode using the EPSON (EPSON perfection V700 photo)scanner. The exposed films were scanned ten times using thetransmission-mode at 48 bit color (red, green, blue) and at aresolution of 72 dpi [24]. The ImageJ (http://rsb.info.nih.gov)program was then used to extract the red component of thered-green-blue (RGB) range [26]. Subsequently, the net opti-cal densities (ODs) of the irradiated films were determined.The net ODs were converted to dose by using the calibra-tion curve and normalized to the maximum dose to obtain the
Author's personal copy
274 S. Alashrah et al. / Z. Med. Phys. 23 (2013) 270–278
beam profiles of the different field sizes. The results were thencompared with those obtained using the ionization chamber(IC03). The film was selected to measure the true slit beamdose profile, and in these slit-beam measurements the dosevalues obtained with closed slit were subtracted.
3 Results
3.1 Results of the best fit method
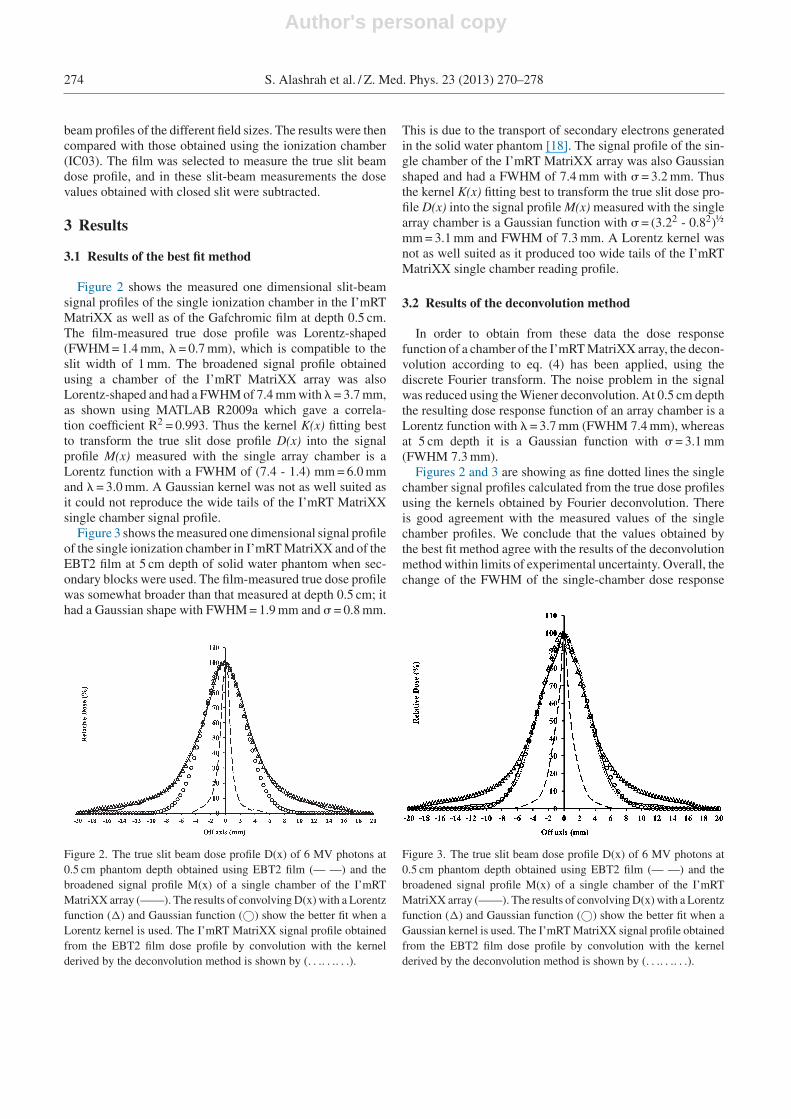
Figure 2 shows the measured one dimensional slit-beamsignal profiles of the single ionization chamber in the I’mRTMatriXX as well as of the Gafchromic film at depth 0.5 cm.The film-measured true dose profile was Lorentz-shaped(FWHM = 1.4 mm, � = 0.7 mm), which is compatible to theslit width of 1 mm. The broadened signal profile obtainedusing a chamber of the I’mRT MatriXX array was alsoLorentz-shaped and had a FWHM of 7.4 mm with � = 3.7 mm,as shown using MATLAB R2009a which gave a correla-tion coefficient R2 = 0.993. Thus the kernel K(x) fitting bestto transform the true slit dose profile D(x) into the signalprofile M(x) measured with the single array chamber is aLorentz function with a FWHM of (7.4 - 1.4) mm = 6.0 mmand � = 3.0 mm. A Gaussian kernel was not as well suited asit could not reproduce the wide tails of the I’mRT MatriXXsingle chamber signal profile.
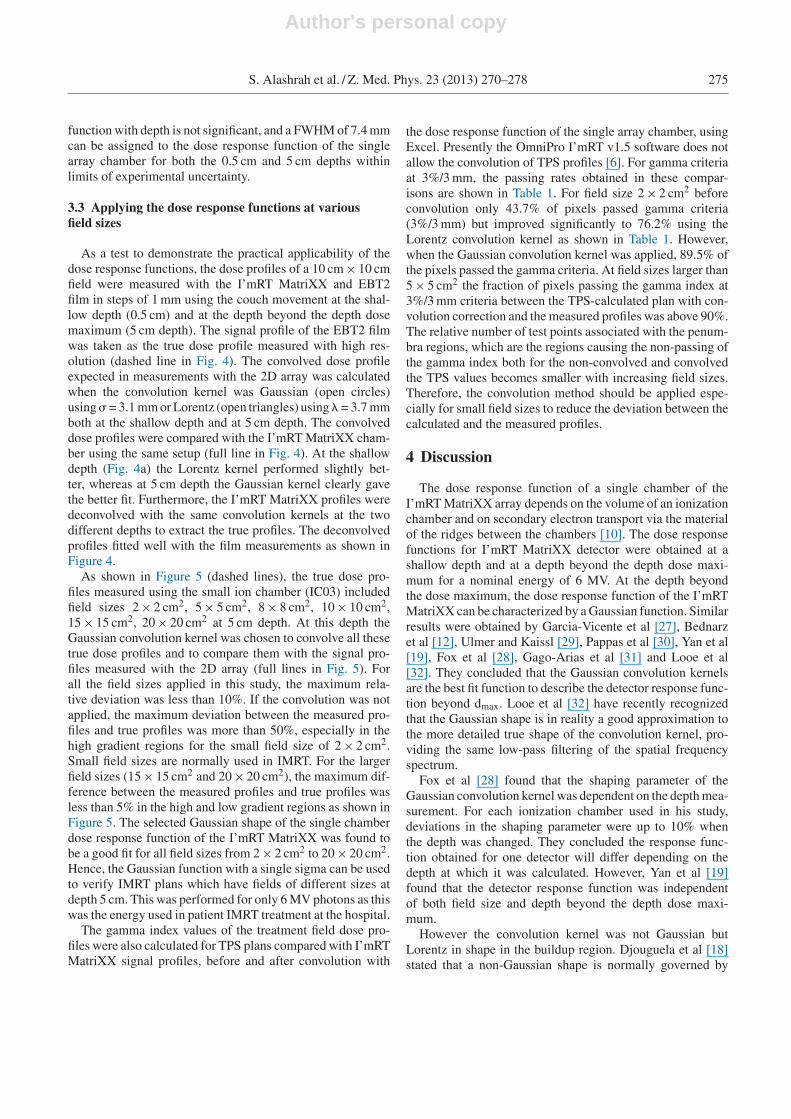
Figure 3 shows the measured one dimensional signal profileof the single ionization chamber in I’mRT MatriXX and of theEBT2 film at 5 cm depth of solid water phantom when sec-ondary blocks were used. The film-measured true dose profilewas somewhat broader than that measured at depth 0.5 cm; ithad a Gaussian shape with FWHM = 1.9 mm and � = 0.8 mm.
Figure 2. The true slit beam dose profile D(x) of 6 MV photons at0.5 cm phantom depth obtained using EBT2 film (— —) and thebroadened signal profile M(x) of a single chamber of the I’mRTMatriXX array (——). The results of convolving D(x) with a Lorentzfunction (�) and Gaussian function (©) show the better fit when aLorentz kernel is used. The I’mRT MatriXX signal profile obtainedfrom the EBT2 film dose profile by convolution with the kernelderived by the deconvolution method is shown by (. . .. . .. . .).
This is due to the transport of secondary electrons generatedin the solid water phantom [18]. The signal profile of the sin-gle chamber of the I’mRT MatriXX array was also Gaussianshaped and had a FWHM of 7.4 mm with � = 3.2 mm. Thusthe kernel K(x) fitting best to transform the true slit dose pro-file D(x) into the signal profile M(x) measured with the singlearray chamber is a Gaussian function with � = (3.22 - 0.82)½
mm = 3.1 mm and FWHM of 7.3 mm. A Lorentz kernel wasnot as well suited as it produced too wide tails of the I’mRTMatriXX single chamber reading profile.
3.2 Results of the deconvolution method
In order to obtain from these data the dose responsefunction of a chamber of the I’mRT MatriXX array, the decon-volution according to eq. (4) has been applied, using thediscrete Fourier transform. The noise problem in the signalwas reduced using the Wiener deconvolution. At 0.5 cm depththe resulting dose response function of an array chamber is aLorentz function with � = 3.7 mm (FWHM 7.4 mm), whereasat 5 cm depth it is a Gaussian function with � = 3.1 mm(FWHM 7.3 mm).
Figures 2 and 3 are showing as fine dotted lines the singlechamber signal profiles calculated from the true dose profilesusing the kernels obtained by Fourier deconvolution. Thereis good agreement with the measured values of the singlechamber profiles. We conclude that the values obtained bythe best fit method agree with the results of the deconvolutionmethod within limits of experimental uncertainty. Overall, thechange of the FWHM of the single-chamber dose response
Figure 3. The true slit beam dose profile D(x) of 6 MV photons at0.5 cm phantom depth obtained using EBT2 film (— —) and thebroadened signal profile M(x) of a single chamber of the I’mRTMatriXX array (——). The results of convolving D(x) with a Lorentzfunction (�) and Gaussian function (©) show the better fit when aGaussian kernel is used. The I’mRT MatriXX signal profile obtainedfrom the EBT2 film dose profile by convolution with the kernelderived by the deconvolution method is shown by (. . .. . .. . .).
Author's personal copy
S. Alashrah et al. / Z. Med. Phys. 23 (2013) 270–278 275
function with depth is not significant, and a FWHM of 7.4 mmcan be assigned to the dose response function of the singlearray chamber for both the 0.5 cm and 5 cm depths withinlimits of experimental uncertainty.
3.3 Applying the dose response functions at variousfield sizes
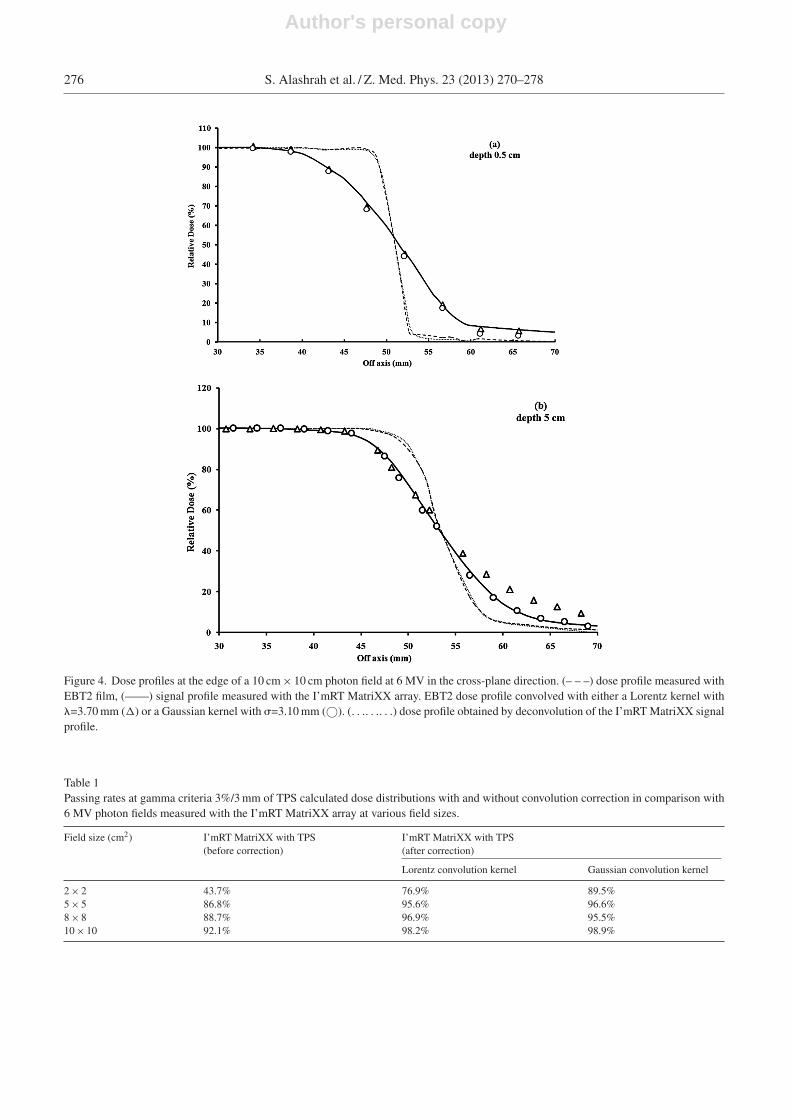
As a test to demonstrate the practical applicability of thedose response functions, the dose profiles of a 10 cm × 10 cmfield were measured with the I’mRT MatriXX and EBT2film in steps of 1 mm using the couch movement at the shal-low depth (0.5 cm) and at the depth beyond the depth dosemaximum (5 cm depth). The signal profile of the EBT2 filmwas taken as the true dose profile measured with high res-olution (dashed line in Fig. 4). The convolved dose profileexpected in measurements with the 2D array was calculatedwhen the convolution kernel was Gaussian (open circles)using � = 3.1 mm or Lorentz (open triangles) using � = 3.7 mmboth at the shallow depth and at 5 cm depth. The convolveddose profiles were compared with the I’mRT MatriXX cham-ber using the same setup (full line in Fig. 4). At the shallowdepth (Fig. 4a) the Lorentz kernel performed slightly bet-ter, whereas at 5 cm depth the Gaussian kernel clearly gavethe better fit. Furthermore, the I’mRT MatriXX profiles weredeconvolved with the same convolution kernels at the twodifferent depths to extract the true profiles. The deconvolvedprofiles fitted well with the film measurements as shown inFigure 4.
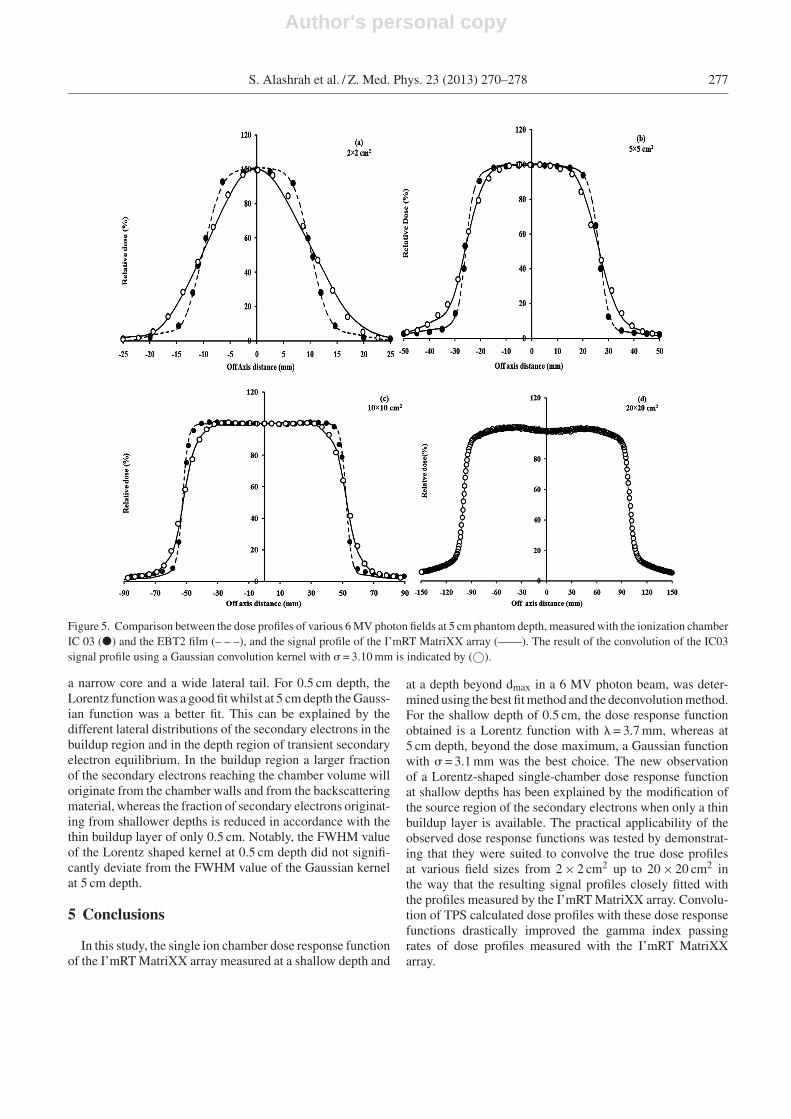
As shown in Figure 5 (dashed lines), the true dose pro-files measured using the small ion chamber (IC03) includedfield sizes 2 × 2 cm2, 5 × 5 cm2, 8 × 8 cm2, 10 × 10 cm2,15 × 15 cm2, 20 × 20 cm2 at 5 cm depth. At this depth theGaussian convolution kernel was chosen to convolve all thesetrue dose profiles and to compare them with the signal pro-files measured with the 2D array (full lines in Fig. 5). Forall the field sizes applied in this study, the maximum rela-tive deviation was less than 10%. If the convolution was notapplied, the maximum deviation between the measured pro-files and true profiles was more than 50%, especially in thehigh gradient regions for the small field size of 2 × 2 cm2.Small field sizes are normally used in IMRT. For the largerfield sizes (15 × 15 cm2 and 20 × 20 cm2), the maximum dif-ference between the measured profiles and true profiles wasless than 5% in the high and low gradient regions as shown inFigure 5. The selected Gaussian shape of the single chamberdose response function of the I’mRT MatriXX was found tobe a good fit for all field sizes from 2 × 2 cm2 to 20 × 20 cm2.Hence, the Gaussian function with a single sigma can be usedto verify IMRT plans which have fields of different sizes atdepth 5 cm. This was performed for only 6 MV photons as thiswas the energy used in patient IMRT treatment at the hospital.
The gamma index values of the treatment field dose pro-files were also calculated for TPS plans compared with I’mRTMatriXX signal profiles, before and after convolution with
the dose response function of the single array chamber, usingExcel. Presently the OmniPro I’mRT v1.5 software does notallow the convolution of TPS profiles [6]. For gamma criteriaat 3%/3 mm, the passing rates obtained in these compar-isons are shown in Table 1. For field size 2 × 2 cm2 beforeconvolution only 43.7% of pixels passed gamma criteria(3%/3 mm) but improved significantly to 76.2% using theLorentz convolution kernel as shown in Table 1. However,when the Gaussian convolution kernel was applied, 89.5% ofthe pixels passed the gamma criteria. At field sizes larger than5 × 5 cm2 the fraction of pixels passing the gamma index at3%/3 mm criteria between the TPS-calculated plan with con-volution correction and the measured profiles was above 90%.The relative number of test points associated with the penum-bra regions, which are the regions causing the non-passing ofthe gamma index both for the non-convolved and convolvedthe TPS values becomes smaller with increasing field sizes.Therefore, the convolution method should be applied espe-cially for small field sizes to reduce the deviation between thecalculated and the measured profiles.
4 Discussion
The dose response function of a single chamber of theI’mRT MatriXX array depends on the volume of an ionizationchamber and on secondary electron transport via the materialof the ridges between the chambers [10]. The dose responsefunctions for I’mRT MatriXX detector were obtained at ashallow depth and at a depth beyond the depth dose maxi-mum for a nominal energy of 6 MV. At the depth beyondthe dose maximum, the dose response function of the I’mRTMatriXX can be characterized by a Gaussian function. Similarresults were obtained by Garcia-Vicente et al [27], Bednarzet al [12], Ulmer and Kaissl [29], Pappas et al [30], Yan et al[19], Fox et al [28], Gago-Arias et al [31] and Looe et al[32]. They concluded that the Gaussian convolution kernelsare the best fit function to describe the detector response func-tion beyond dmax. Looe et al [32] have recently recognizedthat the Gaussian shape is in reality a good approximation tothe more detailed true shape of the convolution kernel, pro-viding the same low-pass filtering of the spatial frequencyspectrum.
Fox et al [28] found that the shaping parameter of theGaussian convolution kernel was dependent on the depth mea-surement. For each ionization chamber used in his study,deviations in the shaping parameter were up to 10% whenthe depth was changed. They concluded the response func-tion obtained for one detector will differ depending on thedepth at which it was calculated. However, Yan et al [19]found that the detector response function was independentof both field size and depth beyond the depth dose maxi-mum.
However the convolution kernel was not Gaussian butLorentz in shape in the buildup region. Djouguela et al [18]stated that a non-Gaussian shape is normally governed by
Author's personal copy
276 S. Alashrah et al. / Z. Med. Phys. 23 (2013) 270–278
Figure 4. Dose profiles at the edge of a 10 cm × 10 cm photon field at 6 MV in the cross-plane direction. (– – –) dose profile measured withEBT2 film, (——) signal profile measured with the I’mRT MatriXX array. EBT2 dose profile convolved with either a Lorentz kernel with�=3.70 mm (�) or a Gaussian kernel with �=3.10 mm (©). (. . .. . .. . .) dose profile obtained by deconvolution of the I’mRT MatriXX signalprofile.
Table 1Passing rates at gamma criteria 3%/3 mm of TPS calculated dose distributions with and without convolution correction in comparison with6 MV photon fields measured with the I’mRT MatriXX array at various field sizes.
Field size (cm2) I’mRT MatriXX with TPS(before correction)
I’mRT MatriXX with TPS(after correction)
Lorentz convolution kernel Gaussian convolution kernel
2 × 2 43.7% 76.9% 89.5%5 × 5 86.8% 95.6% 96.6%8 × 8 88.7% 96.9% 95.5%10 × 10 92.1% 98.2% 98.9%
Author's personal copy
S. Alashrah et al. / Z. Med. Phys. 23 (2013) 270–278 277
Figure 5. Comparison between the dose profiles of various 6 MV photon fields at 5 cm phantom depth, measured with the ionization chamberIC 03 (�) and the EBT2 film (– – –), and the signal profile of the I’mRT MatriXX array (——). The result of the convolution of the IC03signal profile using a Gaussian convolution kernel with � = 3.10 mm is indicated by (©).
a narrow core and a wide lateral tail. For 0.5 cm depth, theLorentz function was a good fit whilst at 5 cm depth the Gauss-ian function was a better fit. This can be explained by thedifferent lateral distributions of the secondary electrons in thebuildup region and in the depth region of transient secondaryelectron equilibrium. In the buildup region a larger fractionof the secondary electrons reaching the chamber volume willoriginate from the chamber walls and from the backscatteringmaterial, whereas the fraction of secondary electrons originat-ing from shallower depths is reduced in accordance with thethin buildup layer of only 0.5 cm. Notably, the FWHM valueof the Lorentz shaped kernel at 0.5 cm depth did not signifi-cantly deviate from the FWHM value of the Gaussian kernelat 5 cm depth.
5 Conclusions
In this study, the single ion chamber dose response functionof the I’mRT MatriXX array measured at a shallow depth and
at a depth beyond dmax in a 6 MV photon beam, was deter-mined using the best fit method and the deconvolution method.For the shallow depth of 0.5 cm, the dose response functionobtained is a Lorentz function with � = 3.7 mm, whereas at5 cm depth, beyond the dose maximum, a Gaussian functionwith � = 3.1 mm was the best choice. The new observationof a Lorentz-shaped single-chamber dose response functionat shallow depths has been explained by the modification ofthe source region of the secondary electrons when only a thinbuildup layer is available. The practical applicability of theobserved dose response functions was tested by demonstrat-ing that they were suited to convolve the true dose profilesat various field sizes from 2 × 2 cm2 up to 20 × 20 cm2 inthe way that the resulting signal profiles closely fitted withthe profiles measured by the I’mRT MatriXX array. Convolu-tion of TPS calculated dose profiles with these dose responsefunctions drastically improved the gamma index passingrates of dose profiles measured with the I’mRT MatriXXarray.
Author's personal copy
278 S. Alashrah et al. / Z. Med. Phys. 23 (2013) 270–278
Acknowledgements
We are indebted to Universiti Sains Malaysia for providingus a short-term grant and to the Radiotherapy Unit of theMt. Miriam Hospital in Penang, Malaysia, for the use of theLINAC and the I’mRT MatriXX. S. Alashrah was financiallysupported by the Qassim University. According to Germantranslation, the author wants to thank Prof. Dr. M. El-Hagary.We also take this opportunity to thank all the reviewers fortheir critical comments and suggestions to vastly improve thequality and readability of the paper.
References
[1] Chu R, Lewis D, O’Hara K, Buckland B, Dinelle F, Van Dyk G.GafchromicTM dosimetry media: a new high dose, thin film rou-tine dosimeter and dose mapping tool. Int J Rad Appl Inst Part C1990;35:767–73.
[2] Devic S, Seuntjens J, Hegyi G, Podgorsak EB, Soares CG, Kirov AS,et al. Dosimetric properties of improved GafChromic films for sevendifferent digitizers. Med Phys 2004;31:2392–401.
[3] Zeidan OA, Stephenson SAL, Meeks SL, Wagner TH, Willoughby TR,Kupelian PA, et al. Characterization and use of EBT radiochromic filmfor IMRT dose verification. Med Phys 2006;33:4064–72.
[4] Kamomae T, Miyabe Y, Sawada A, Matoba O, Nakata M, Yano S, et al.Simulation for improvement of system sensitivity of radiochromic filmdosimetry with different band-pass filters and scanner light intensities.Rad Phys Tech 2011;4:140–7.
[5] Spezi E, Angelini A, Romani F, Ferri A. Characterization of a 2D ionchamber array for the verification of radiotherapy treatments. Phys MedBiol 2005;50:3361–73.
[6] Herzen J, Todorovic M, Cremers F, Platz V, Albers D, Bartels A, et al.Dosimetric evaluation of a 2D pixel ionization chamber for implemen-tation in clinical routine. Phys Med Biol 2007;52:1197–208.
[7] Alashrah S, Kandaiya S, Yong S, Cheng S. Characterization of a 2Dionization chamber array for IMRT plan verification. Nucl Instrum MethPhys Res 2010;619:181–5.
[8] Poppe B, Blechschmidt A, Djouguela A, Willborn K, Rühmann A,Harder D. Spatial resolution of 2D ionization chamber arrays for IMRTdose verification: single-detector size and sampling step width. PhysMed Biol 2007;52:2921.
[9] Li JG, Yan G, Liu C. Comparison of two commercial detector arraysfor IMRT quality assurance. J Appl Clin Med Phys 2009;10:2942–54.
[10] Poppe B, Blechschmidt A, Djouguela A, Kollhoff R, Rubach A, Will-born KC, et al. Two-dimensional ionization chamber arrays for IMRTplan verification. Med Phys 2006;33:1005–15.
[11] Warkentin B, Steciw S, Rathee S, Fallone B. Dosimetric IMRT verifi-cation with a flat-panel EPID. Med Phys 2003;30:3143–55.
[12] Bednarz G, Huq MS, Rosenow U. Deconvolution of detector size effectfor output factor measurement for narrow Gamma Knife radiosurgerybeams. Phys Med Biol 2002;47:3643–9.
[13] Li HS, Romeijn HE, Dempsey JF. A Fourier analysis on the maximumacceptable grid size for discrete proton beam dose calculation. Med Phys2006;33:3508–18.
[14] Lydon J. Theoretical and experimental validation of treatment plan-ning for narrow MLC defined photon fields. Phys Med Biol2005;50:2701–14.
[15] Han Z, Ng SK, Bhagwat MS, Lyatskaya Y, Zygmanski P. Evaluationof MatriXX for IMRT and VMAT dose verifications in peripheral doseregions. Med Phys 2010;37:3704–14.
[16] van’t Veld, Luijk P, Praamstra F, van der Hulst P. Detector line spreadfunctions determined analytically by transport of Compton recoil elec-trons. Med Phys 2001;28:738–51.
[17] Charland P, El-Khatib E, Wolters J. The use of deconvolution and totalleast squares in recovering a radiation detector line spread function. MedPhys 1998;25:152–60.
[18] Djouguela A, Harder D, Kollhoff R, Foschepoth S, Kunth W, RühmannA, et al. Fourier deconvolution reveals the role of the Lorentz func-tion as the convolution kernel of narrow photon beams. Phys Med Biol2009;54:2807–27.
[19] Yan G, Fox C, Liu C, Li JG. The extraction of true profiles for TPScommissioning and its impact on IMRT patient-specific QA. Med Phys2008;35:3661–70.
[20] Meeks SL, Bova FJ, Kim S, Tomé WA, Buatti JM, Friedman WA.Dosimetric characteristics of a double-focused miniature multileaf col-limator. Med Phys 1999;26:729–33.
[21] Fischer M, Todorovic M, Drud E, Cremers F. Commissioning of adouble-focused micro multileaf collimator (�MLC). J Appl Clin MedPhys 2010;11:3131–41.
[22] Paskalev K, Seuntjens JP, Podgorsak EB. Dosimetry of ultra smallphoton fields Proc IntWorkshop on Accurate Radiation Dosimetry(American Association of Physicists in Medicine proceedings Series13). 2002: ed J P Seuntjens and P N Mobit:298-318.
[23] Arjomandy B, Sahoo N, Ding X, Gillin M. Use of a two-dimensionalionization chamber array for proton therapy beam quality assurance.Med Phys 2008;35:3889–94.
[24] Richley L, John A, Coomber H, Fletcher S. Evaluation and optimizationof the new EBT2 radiochromic film dosimetry system for patient doseverification in radiotherapy. Phys Med Biol 2010;55:2601–3617.
[25] Arnfield MR, Otto K, Aroumougame VR, Alkins RD. The use of filmdosimetry of the penumbra region to improve the accuracy of intensitymodulated radiotherapy. Med Phys 2005;32:12–8.
[26] Matney JE, Parker BC, Neck DW, Henkelmann G, Rosen II. Evalua-tion of a commercial flatbed document scanner and radiographic filmscanner for radiochromic EBT film dosimetry. J Appl Clin Med Phys2010;11:3165–75.
[27] Garcia-Vicente F, Delgado J, Rodriguez C. Exact analytical solu-tion of the convolution integral equation for a general profile fittingfunction and Gaussian detector kernel. Phys Med Biol 1999;45:645–50.
[28] Fox C, Simon T, Simon B, Dempsey JF, Kahler D, Palta JR, et al.Assessment of the setup dependence of detector response functions formega-voltage linear accelerators. Med Phys 2010;37:477–84.
[29] Ulmer W, Kaissl W. The inverse problem of a Gaussian convolutionand its application to the finite size of the measurement cham-bers/detectors in photon and proton dosimetry. Phys Med Biol 2003;48:707–27.
[30] Pappas E, Maris TG, Papadakis A, Zacharopoulou F, Damilakis J,Papanikolaou N, et al. Experimental determination of the effect of detec-tor size on profile measurements in narrow photon beams. Med Phys2006;29:3700–4104.
[31] Gago-Arias A, Brualla-González L, González-Castano DM, Gómez F,García MS, Vega VL, et al. Evaluation of chamber response functioninfluence on IMRT verification using 2D commercial detector arrays.Phys Med Biol 2012;57:2005–20.
[32] Looe HK, Stelljes TS, Foschepoth S, Harder D, Willborn K, Poppe B.The dose response functions of ionization chambers in photon dosimetry- Gaussian or non-Gaussian? Z Med Phys 2013;23:129–43.
Available online at www.sciencedirect.com
ScienceDirect