FIRM CHARACTERISTICS AND FINANCIAL REPORTING QUALITY OF LISTED MANUFACTURING FIRMS IN NIGERIA
Upload
teknologimalaysiaCategory
view
1download
0
International Journal of Business and Development Studies Vol. 5, No. 1, (2013) pp.77-96
Corporate diversification’s effects on Efficiency and productivity: case
study of Manufacturing firms listed in Bursa Malaysia
Meysam Doaei• Babooshka Shavazipour•• Abstract
In the past few years, diversification has turned into a highly controversial issue amongst numerous managers in almost each and every business. It is contended by many that diversification is vitally important and highly effective especially when it comes to evaluating the financial performance. There are several studies about the relationship between diversification and financial performance. However, there is no agreement that diversified firms are more efficient than focus firms. In this paper, the manufacturing firms listed in Bursa Malaysia are ranked based on their efficiency scores calculating by Data Envelopment Analysis (DEA) models and the effect of diversification on the efficiency scores of these corporations have been investigated. Moreover, by slack analysis, the proposed improvement strategies for inefficient firms have been cited. Ultimately, the Malmquist index of productivity (MIP) has been utilized to further comparison and analysis.
Keywords: Product Diversification, International Diversification, Financial performance, Data Envelopment Analysis, Malmquist Productivity index.
1 - Introduction
Most recently, diversification has turned into a significantly controversial issue in business world (Cernas Ortiz, 2011). This phenomenon has a tremendous impact on financial performance. However, there is no agreement that diversified firms are more efficient than focus firms (Doaei et al., 2012). In this study, the firm’s efficiency, regarding diversification and financial performance variables, are evaluated. There are many definitions of corporate diversification. The scholars defined diversification as firm enters new sector (Iacobucci and Rosa, 2005), or new industry (Jacquemin and Berry, 1979), or new
• Corresponding author- Department of Business Administration, Faculty of Management, Universiti Teknologi Malaysia, Skudai, Johor Bahro, Malaysia- E-mail: [email protected] •• Department of Mathematics, Mashhad Branch, Islamic Azad University, Mashhad, Iran- E-mail: [email protected]
Meysam Doaei and Babooshka Shavazipour
78
segment (Denis et al., 1999) or a new line of businesse (Montgomery, 1994). Furthermore, according to Ansoff (1957), corporate diversification classified into two groups, product diversification and international (geographic) diversification. Product diversification means a firm produces more than one kind of product and international diversification means a firm acts in abroad markets (Hitt et al., 2007).
Product Diversification is introduced through three main methods which are: Standard Industrial Classification (SIC) codes, Herfindahl index and Entropy index (see (Doaei et al., 2012)). In addition, there is no agreement of which measurement is the best one for determining corporate diversification (Shackman, 2007). However, as Park and Jang (2011) said, Entropy Index is objective, continues and decomposable.
International Diversification means a firm acts in the market which is not in its country (Hitt et al., 2007). As a matter of fact, international diversification has several privileges for firms (Kogut, 1993; Ghoshal, 1987; Kim et al., 1989; Kim et al., 1993).
On the other hand, the DEA applications to evaluating performance have been increased because of its powerful quantitative and analytical tools in recent years (Cooper et al., 2011). The first authors applied DEA approaches in finance area in the mid-1990s (Chalos and Cherian, 1995; Thore et al., 1994; Worthington, 1998; Yeh, 1996). They used financial ratios for inputs and outputs based on their objectives. Some authors demonstrated DEA is more reliable measurement instead of traditional ratio analysis (Feroz et al., 2003). Duzakin and Duzakin selected appropriate variables as inputs and output, developed new model of DEA and examined performance of 500 industrial firms in Turkey (2007). Malhotra and Malhotra (2008) found out that DEA approaches have many advantages versus traditional financial statement. While, Margaritis and Psillaki (2010) examined the relationship between capital structure and efficiency in French manufacturing firms with DEA. They concluded the high efficient firms would like to have more financial leverage. Mat Nor et al. (2006) applied DEA to ascertain that there is no difference in the efficiency and financial performance between the pre and post-merger periods for ten main Malaysian banks. Meanwhile, Sufian (2009) investigated Malaysian Banking efficiency in 1997 and found out the high level of inefficiency after the East Asian crisis in one year. Furthermore, Sufian and Habibollah (2009) found out that the merger has resulted in higher mean cost efficiency of Malaysian Banking sector post-merger.

Corporate diversification’s effects on Efficiency and …
79
Tahir et al. (2009) evaluated efficiency of domestic and foreign banks in Malaysia. They concluded domestic banks have a high score of efficiency than foreign banks.
Likewise, DEA is used for measuring financial efficiency of SMEs in Malaysia. Hooy et al. (2009) used DEA for 1047 SMEs in Kedah, Penang and Perak for 2007 and they reported 20 SMEs scored hundred percent efficiency and they are mostly from Kedah and Perak. They found out that financial efficiency was not related to firm size; secondly, oversize in capital was more critical than profit generation in determining relative efficiency; finally, the distribution of financial efficiency was not balanced across the three statuses in Northern Corridor Economic Region.
A DEA-based Malmquist productivity index developed by Fare et al. (1994) which measures the productivity change over time. Firstly, The Malmquist index was suggested by Malmquist (1953) as a quantity index for utilize in the analysis of consumption of inputs, Fare et al. (1994) combined ideas on the measurement of productivity from Caves et al. (1982) and the measurement of efficiency from Farrell (1957) to construct a Malmquist productivity index directly from input and output data using DEA. This DEA-based Malmquist productivity index has proven itself to be a good tool for measuring the productivity change of DMUs. We are using the Malmquist productivity index and its decomposition to analysis of the productivity of the manufacturing firms listed in Bursa Malaysia and finding the resources of their productivity.
The paper is organized as follows. The next section briefly describes the Data Envelopment Analysis models. Section 3 describes the Malmquist Productivity index’s concept and its relations. Research methodology is presented in section four. Section 5 contains the data, empirical methodology and results. Further discussions have been cited in section 6. Section 7 is debated about the sources of the productivity of corporations in Bursa Malaysian. The final section offers some concluding remarks and some possible directions of future research.
2 - Efficiency and Data Envelopment Analysis (DEA)
Data Envelopment Analysis (DEA) was presented in 1978 by Charnes, Cooper and Rhodes for measuring efficiency in public programs (Charnes et al., 1978), where this tool is used in many research areas. However, with respect to developing DEA models and its several advantages, Emrouznejad et al. (2008) pointed out that the number of research
Meysam Doaei and Babooshka Shavazipour
80
increased about 360 per year after 2004. Due to its successful application as well as case studies, DEA is given more consideration and is expand by scholars (Toloo and Nalchigar, 2011).
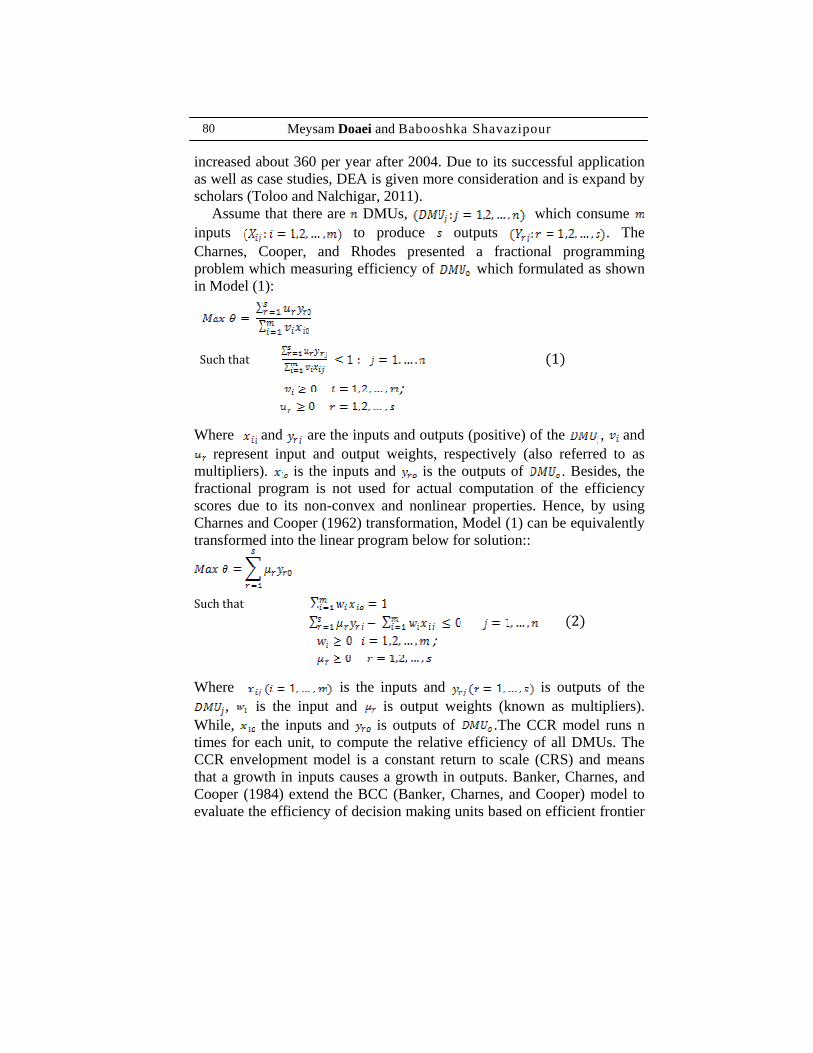
Assume that there are DMUs, which consume inputs to produce outputs . The Charnes, Cooper, and Rhodes presented a fractional programming problem which measuring efficiency of which formulated as shown in Model (1):
Such that 1
;
Where and are the inputs and outputs (positive) of the , and represent input and output weights, respectively (also referred to as
multipliers). is the inputs and is the outputs of . Besides, the fractional program is not used for actual computation of the efficiency scores due to its non-convex and nonlinear properties. Hence, by using Charnes and Cooper (1962) transformation, Model (1) can be equivalently transformed into the linear program below for solution::
Such that 2
; Where is the inputs and is outputs of the
, is the input and is output weights (known as multipliers). While, the inputs and is outputs of .The CCR model runs n times for each unit, to compute the relative efficiency of all DMUs. The CCR envelopment model is a constant return to scale (CRS) and means that a growth in inputs causes a growth in outputs. Banker, Charnes, and Cooper (1984) extend the BCC (Banker, Charnes, and Cooper) model to evaluate the efficiency of decision making units based on efficient frontier
Corporate diversification’s effects on Efficiency and …
81
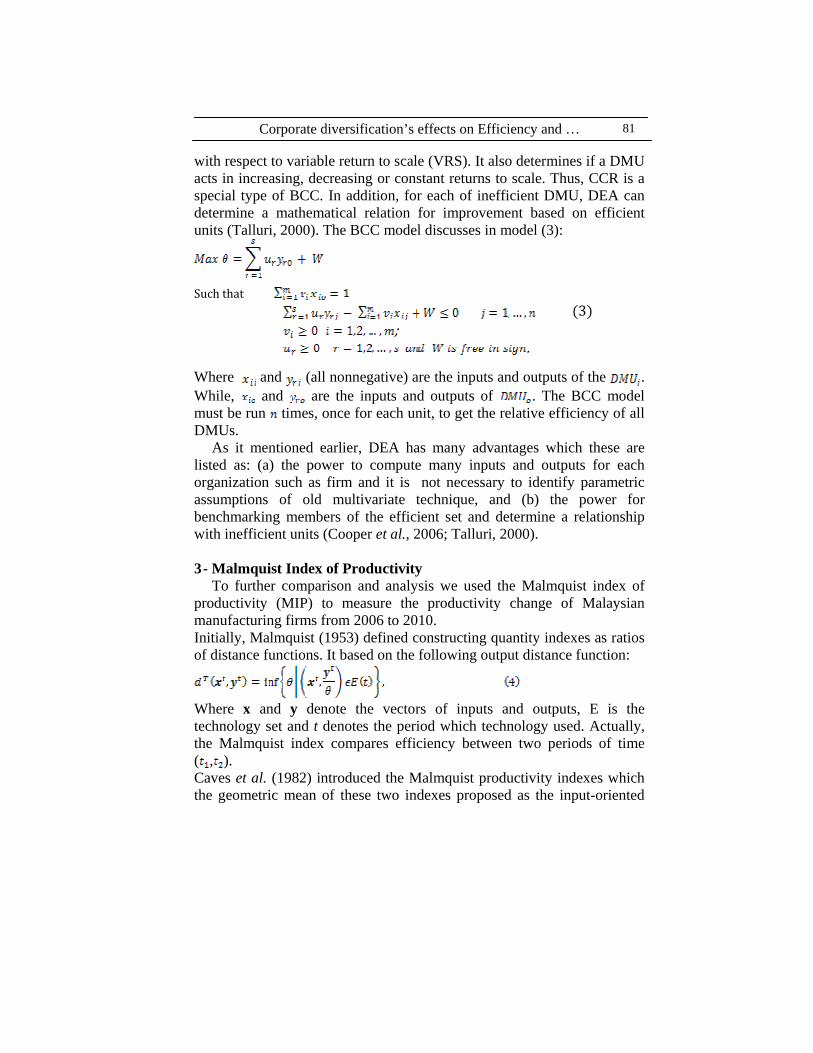
with respect to variable return to scale (VRS). It also determines if a DMU acts in increasing, decreasing or constant returns to scale. Thus, CCR is a special type of BCC. In addition, for each of inefficient DMU, DEA can determine a mathematical relation for improvement based on efficient units (Talluri, 2000). The BCC model discusses in model (3):
Such that 3 ; . Where and (all nonnegative) are the inputs and outputs of the . While, and are the inputs and outputs of . The BCC model must be run times, once for each unit, to get the relative efficiency of all DMUs.
As it mentioned earlier, DEA has many advantages which these are listed as: (a) the power to compute many inputs and outputs for each organization such as firm and it is not necessary to identify parametric assumptions of old multivariate technique, and (b) the power for benchmarking members of the efficient set and determine a relationship with inefficient units (Cooper et al., 2006; Talluri, 2000). 3 - Malmquist Index of Productivity
To further comparison and analysis we used the Malmquist index of productivity (MIP) to measure the productivity change of Malaysian manufacturing firms from 2006 to 2010. Initially, Malmquist (1953) defined constructing quantity indexes as ratios of distance functions. It based on the following output distance function:
Where x and y denote the vectors of inputs and outputs, E is the technology set and t denotes the period which technology used. Actually, the Malmquist index compares efficiency between two periods of time ( , ). Caves et al. (1982) introduced the Malmquist productivity indexes which the geometric mean of these two indexes proposed as the input-oriented

Meysam Doaei and Babooshka Shavazipour
82
Malmquist productivity (FGLR) index by Fare et al. (1992). They decomposed it into the product of catch-up (first component) reflecting change in technical efficiency and frontier shift (second component) measuring the technology frontier shift between time period and as follows:
= = (5)
CU shows progress in technical efficiency, while CU means decline and CU=1 denotes no changes in technical efficiency. Similarly, FS , FS and FS=1 indicate improved, dived and no shift in technology frontier. For the case of a single input and output and the variable returns to scale (VRS) technology, these concepts illustrated in
Figure 1. The VRS Production Possibility Set (PPS) in time Period t1 and t2.
Corporate diversification’s effects on Efficiency and …
83
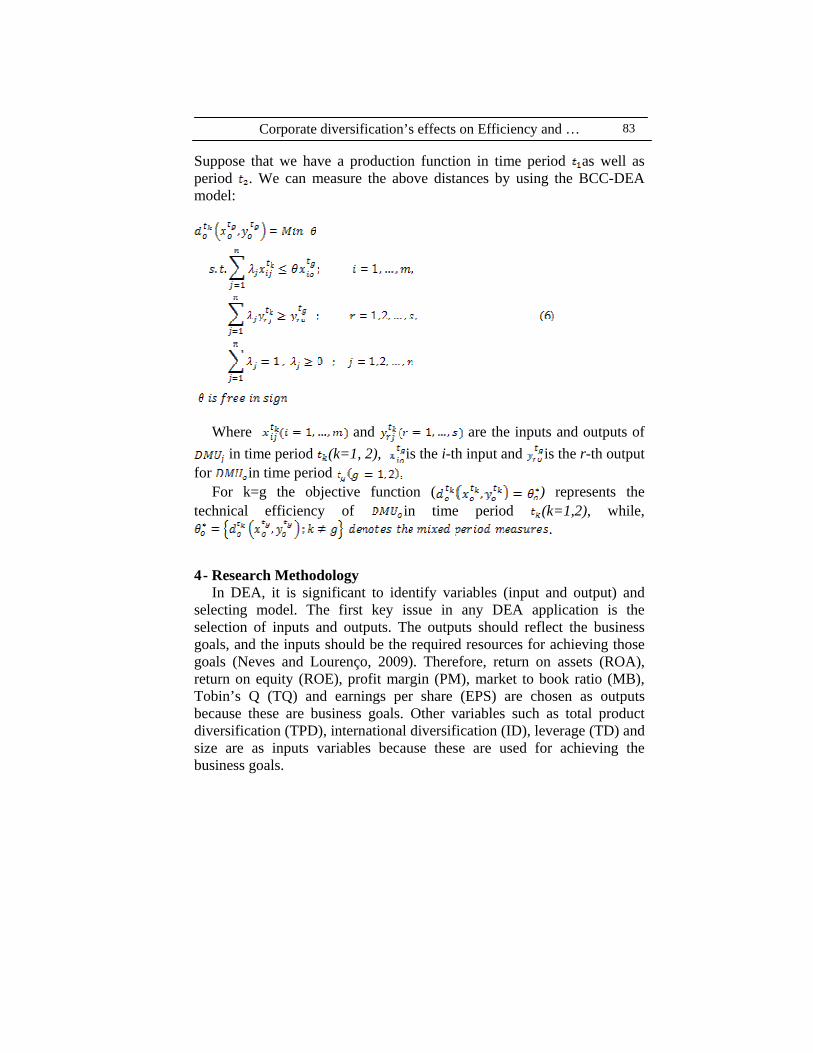
Suppose that we have a production function in time period as well as period . We can measure the above distances by using the BCC-DEA model:
Where and are the inputs and outputs of in time period (k=1, 2), is the i-th input and is the r-th output
for in time period For k=g the objective function ( ) represents the
technical efficiency of in time period (k=1,2), while, .
4 - Research Methodology In DEA, it is significant to identify variables (input and output) and
selecting model. The first key issue in any DEA application is the selection of inputs and outputs. The outputs should reflect the business goals, and the inputs should be the required resources for achieving those goals (Neves and Lourenço, 2009). Therefore, return on assets (ROA), return on equity (ROE), profit margin (PM), market to book ratio (MB), Tobin’s Q (TQ) and earnings per share (EPS) are chosen as outputs because these are business goals. Other variables such as total product diversification (TPD), international diversification (ID), leverage (TD) and size are as inputs variables because these are used for achieving the business goals.

Meysam Doaei and Babooshka Shavazipour
84
Table.1. DEA Variable
Name of Variable Symbol Kind of Variable How measure
total product diversification TPD Input
6
Where, is the share sale of segment i in total
sales of the firm and n is the number of firm’s segments international diversification ID Input The ratio of foreign sales to total sales.
size Size Input The logarithm of total sales leverage TD Input The ratio of total assets minus total equity to total assets
Return on assets ROA Output
Return on equity ROE Output
Profit margin PM Output
Market to book ratio MB Output
Earnings per share EPS Output
Tobin’s Q TQ Output
The next important issue is how select a model. As appropriate DEA model is chosen with options such as input minimizing or output maximizing, and constant or variable returns to scale. Malhotra (2009) states some criteria for choosing DEA model. The output-based should be used if the managers cannot fully control inputs. On the contrary, if the outputs that are an outcome of managerial goals, input-based DEA formulations are more appropriate. Furthermore, the objective of the input-oriented models is to minimize inputs while the same levels of outputs can still be produced (Nikoomaram and Mahmoodi, 2010). Furthermore, the characteristics of the application dictate the use of constant or variable returns to scale.
As a result, the study is applied input-oriented, because the researcher wants to know the level of inputs (minimize the inputs variables with regard to constant the output variables) which is called the BCC Envelopment model for finding the degree of efficiency in this research as noted in below
Corporate diversification’s effects on Efficiency and …
85
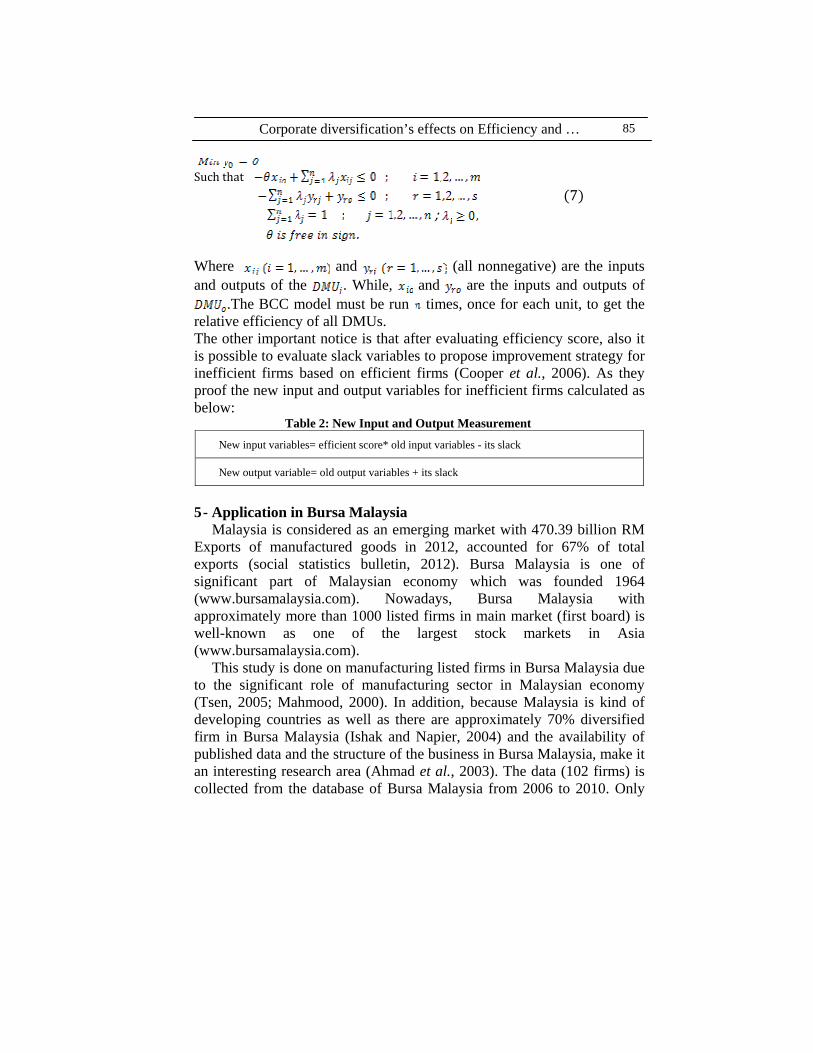
Such that 7 ; . Where and (all nonnegative) are the inputs and outputs of the . While, and are the inputs and outputs of
.The BCC model must be run times, once for each unit, to get the relative efficiency of all DMUs. The other important notice is that after evaluating efficiency score, also it is possible to evaluate slack variables to propose improvement strategy for inefficient firms based on efficient firms (Cooper et al., 2006). As they proof the new input and output variables for inefficient firms calculated as below:
Table 2: New Input and Output Measurement
New input variables= efficient score* old input variables - its slack
New output variable= old output variables + its slack
5 - Application in Bursa Malaysia
Malaysia is considered as an emerging market with 470.39 billion RM Exports of manufactured goods in 2012, accounted for 67% of total exports (social statistics bulletin, 2012). Bursa Malaysia is one of significant part of Malaysian economy which was founded 1964 (www.bursamalaysia.com). Nowadays, Bursa Malaysia with approximately more than 1000 listed firms in main market (first board) is well-known as one of the largest stock markets in Asia (www.bursamalaysia.com).
This study is done on manufacturing listed firms in Bursa Malaysia due to the significant role of manufacturing sector in Malaysian economy (Tsen, 2005; Mahmood, 2000). In addition, because Malaysia is kind of developing countries as well as there are approximately 70% diversified firm in Bursa Malaysia (Ishak and Napier, 2004) and the availability of published data and the structure of the business in Bursa Malaysia, make it an interesting research area (Ahmad et al., 2003). The data (102 firms) is collected from the database of Bursa Malaysia from 2006 to 2010. Only

Meysam Doaei and Babooshka Shavazipour
86
12
21
17
21 20
0
5
10
15
20
25
2006 2007 2008 2009 2010
six DMUs (DMU 9, 12, 58, 59, 61 and 62) are efficient in all years. The total number of efficient DMUs in each year shows in figure 2.
Figure 2: Total Number of Efficient DMUs Table 3 represents the mean of total diversification entropy of diversified firms is about 0.35. The maximum amount of Efficiency, product diversification and international diversification are respectively 1, 1.97 and 1. In addition, the minimum ratio of total debt is 0.027 and the maximum is 0.81. Furthermore, the maximum size of firm is 4.11.
Table 3: Summary of descriptive statistics
Mean Median Maximum Minimum Std. Dev. Sum TPD 0.352215 0.202937 1.973291 0 0.391808 179.6295 ID 0.206237 0.122412 1 0 0.24254 105.1808
TD 0.3796 0.3805 0.819 0.027 0.177392 193.596 Size 2.364688 2.260187 4.107895 1.0086 0.5496 1205.991 ROA 28.223 30.475 79.5 1 10.75512 14393.73 ROE 64.62773 62.465 273.7 1 22.74315 32960.14 PM 149.6872 181.635 302.4 1 72.42219 76340.45 MB 1.39822 0.797 26.1 0.226 2.575058 713.092 TQ 1.070841 0.8345 9.28 0.359 0.963146 546.129 EPS 19.28894 12.7 285.2 2.58 26.14614 9837.36
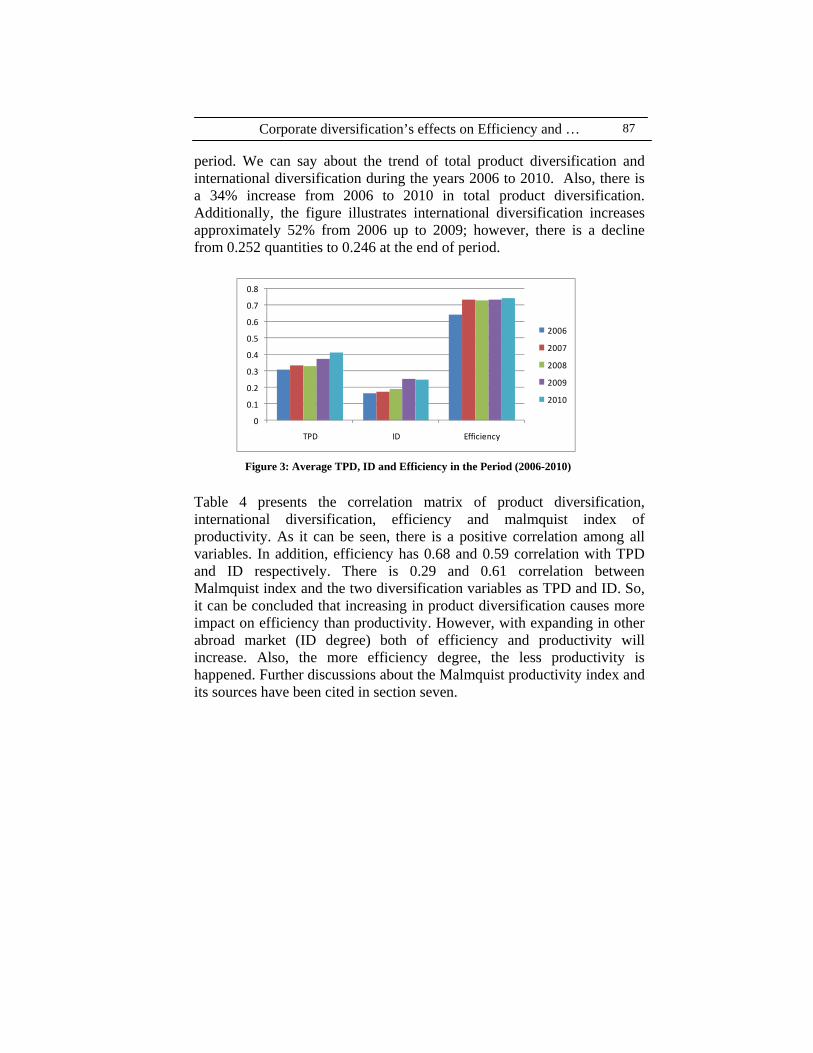
3 depicts the annual average of product diversification, international diversification and efficiency scores on Malaysian manufacturing firms from 2006 to 2010. The annual average of their efficiency has an increasing trend (i.e., 0.6454 in 2006, 0.7450 in 2010) in the observed period. However, the efficiency score is 0.73499 in 2007, 0.72969 in 2008 and 0.7337 in 2009; so, for these three years there is a fluctuation in the
Corporate diversification’s effects on Efficiency and …
87
period. We can say about the trend of total product diversification and international diversification during the years 2006 to 2010. Also, there is a 34% increase from 2006 to 2010 in total product diversification. Additionally, the figure illustrates international diversification increases approximately 52% from 2006 up to 2009; however, there is a decline from 0.252 quantities to 0.246 at the end of period.
Figure 3: Average TPD, ID and Efficiency in the Period (2006-2010)
Table 4 presents the correlation matrix of product diversification, international diversification, efficiency and malmquist index of productivity. As it can be seen, there is a positive correlation among all variables. In addition, efficiency has 0.68 and 0.59 correlation with TPD and ID respectively. There is 0.29 and 0.61 correlation between Malmquist index and the two diversification variables as TPD and ID. So, it can be concluded that increasing in product diversification causes more impact on efficiency than productivity. However, with expanding in other abroad market (ID degree) both of efficiency and productivity will increase. Also, the more efficiency degree, the less productivity is happened. Further discussions about the Malmquist productivity index and its sources have been cited in section seven.
0
0.1
0.2
0.3
0.4
0.5
0.6
0.7
0.8
TPD ID Efficiency
2006
2007
2008
2009
2010

Meysam Doaei and Babooshka Shavazipour
88
Table 4: The correlation matrix of main variables
6 - Slack analysis To propose improvement strategies for the inefficient firms, slack
values for each of the factor and consumption variables are computed according to BCC model. Typically, for efficient firms (that are on the efficiency frontier), the slack variables are zero, and for inefficient firms the slack variables are non-zero. All the efficient firms in the data have zero slack variables. Thus, the decision maker can use the DEA analysis (both benchmark firms and slack variables) to devise new policies and direction for the inefficient firms.
Table 5: Inputs, Outputs, Slacks and new suggestions of DMU 7
Old Data Slack New Suggestions
Inpu
ts
TPD 0 0 0.575211*0-0=0 ID 0.4676 0.23 0.575211*0.4676-0.23=0.04 TD 0.403 0.12 0.575211*0.403-0.12=0.11 Size 1.99 0 0.575211*1.99-0=1.15
Out
puts
ROA 34.48 1.59 34.48+1.59=36.07 ROE 72.96 3.01 72.96+3.01=75.97 PM 216.93 6.94 216.93+6.94=223.87 MB 0.9 0 0.9+0=0.9 TQ 0.91 0.48 0.91+0.48=1.39 EPS 33.4 33.4+0=33.4
As an illustration, taking DMU 7 in 2006 as an example (the data is available by request), the efficiency score for this DMU is 0.575211; so it is inefficient. Based on the input and output slack variables for this DMU and Table , suggestions of the new input and output variables are written in Table 5. It is suggested that decision maker should decrease the level of ID, TD and Size to 0.04, 0.11 and 1.15 and should increase ROA, ROE, PM, and TQ to 36.04, 75.97, 223.87 and 1.39, respectively. If the decision maker does these actions, the DMU 7 will be lie on efficiency frontier.
TPD ID E MI
TPD 1.00 × × ×
ID 0.90 1.00 × ×
E 0.68 0.59 1.00 ×
MI 0.29 0.61 0.10 1.00
Corporate diversification’s effects on Efficiency and …
89
Similarly, by applying this method for all inefficient corporations in each year, the improvement strategy can be reached. 7 - Finding the sources of the productivity
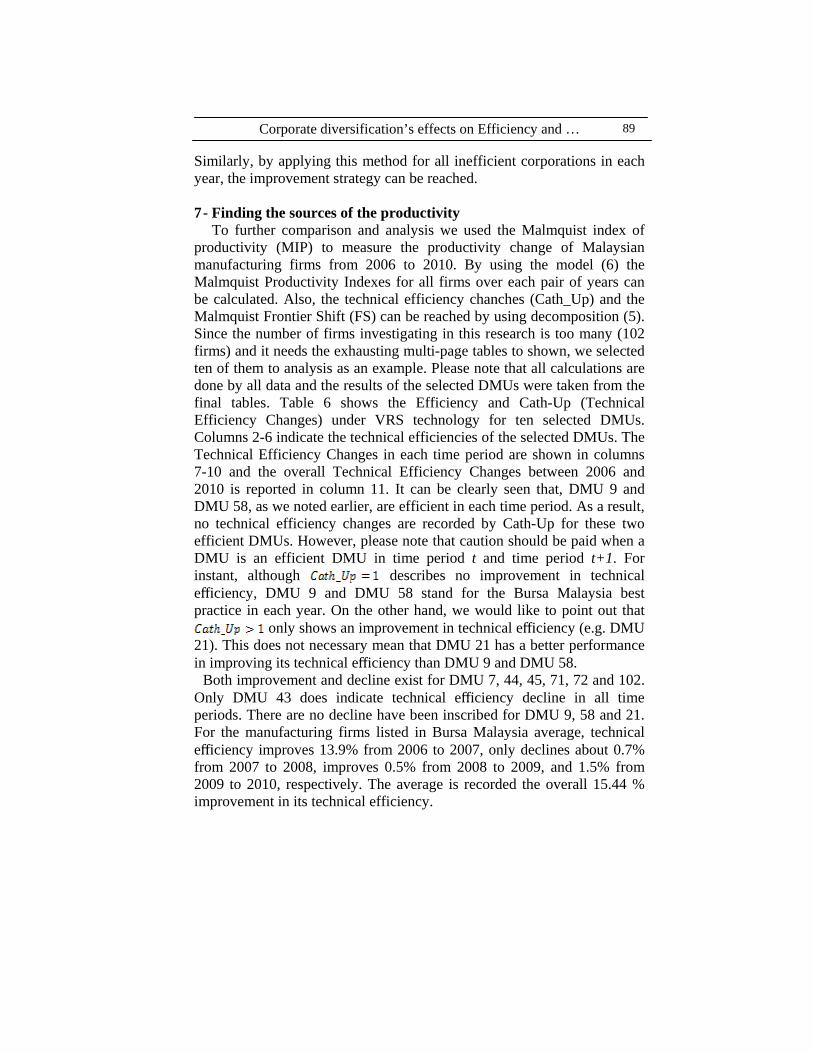
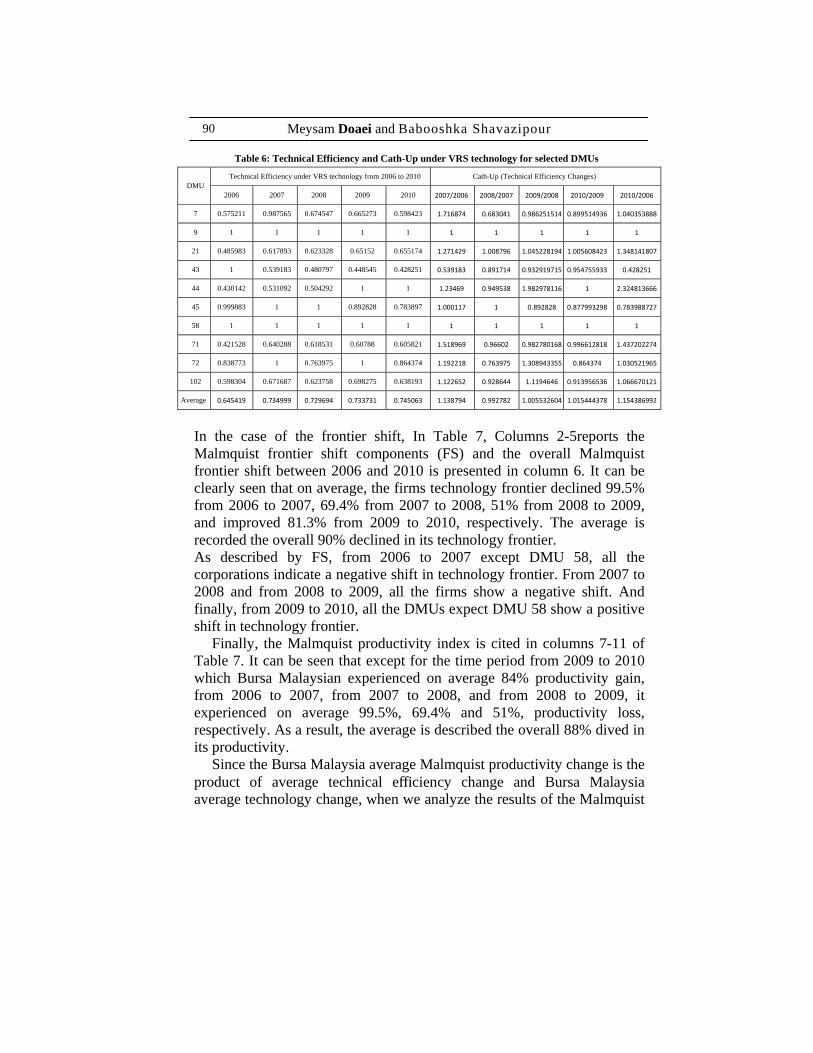
To further comparison and analysis we used the Malmquist index of productivity (MIP) to measure the productivity change of Malaysian manufacturing firms from 2006 to 2010. By using the model (6) the Malmquist Productivity Indexes for all firms over each pair of years can be calculated. Also, the technical efficiency chanches (Cath_Up) and the Malmquist Frontier Shift (FS) can be reached by using decomposition (5). Since the number of firms investigating in this research is too many (102 firms) and it needs the exhausting multi-page tables to shown, we selected ten of them to analysis as an example. Please note that all calculations are done by all data and the results of the selected DMUs were taken from the final tables. Table 6 shows the Efficiency and Cath-Up (Technical Efficiency Changes) under VRS technology for ten selected DMUs. Columns 2-6 indicate the technical efficiencies of the selected DMUs. The Technical Efficiency Changes in each time period are shown in columns 7-10 and the overall Technical Efficiency Changes between 2006 and 2010 is reported in column 11. It can be clearly seen that, DMU 9 and DMU 58, as we noted earlier, are efficient in each time period. As a result, no technical efficiency changes are recorded by Cath-Up for these two efficient DMUs. However, please note that caution should be paid when a DMU is an efficient DMU in time period t and time period t+1. For instant, although describes no improvement in technical efficiency, DMU 9 and DMU 58 stand for the Bursa Malaysia best practice in each year. On the other hand, we would like to point out that
only shows an improvement in technical efficiency (e.g. DMU 21). This does not necessary mean that DMU 21 has a better performance in improving its technical efficiency than DMU 9 and DMU 58.
Both improvement and decline exist for DMU 7, 44, 45, 71, 72 and 102. Only DMU 43 does indicate technical efficiency decline in all time periods. There are no decline have been inscribed for DMU 9, 58 and 21. For the manufacturing firms listed in Bursa Malaysia average, technical efficiency improves 13.9% from 2006 to 2007, only declines about 0.7% from 2007 to 2008, improves 0.5% from 2008 to 2009, and 1.5% from 2009 to 2010, respectively. The average is recorded the overall 15.44 % improvement in its technical efficiency.
Meysam Doaei and Babooshka Shavazipour
90
Table 6: Technical Efficiency and Cath-Up under VRS technology for selected DMUs
DMU Technical Efficiency under VRS technology from 2006 to 2010 Cath-Up (Technical Efficiency Changes)
2006 2007 2008 2009 2010 2007/2006 2008/2007 2009/2008 2010/2009 2010/2006
7 0.575211 0.987565 0.674547 0.665273 0.598423 1.716874 0.683041 0.986251514 0.899514936 1.040353888
9 1 1 1 1 1 1 1 1 1 1
21 0.485983 0.617893 0.623328 0.65152 0.655174 1.271429 1.008796 1.045228194 1.005608423 1.348141807
43 1 0.539183 0.480797 0.448545 0.428251 0.539183 0.891714 0.932919715 0.954755933 0.428251
44 0.430142 0.531092 0.504292 1 1 1.23469 0.949538 1.982978116 1 2.324813666
45 0.999883 1 1 0.892828 0.783897 1.000117 1 0.892828 0.877993298 0.783988727
58 1 1 1 1 1 1 1 1 1 1
71 0.421528 0.640288 0.618531 0.60788 0.605821 1.518969 0.96602 0.982780168 0.996612818 1.437202274
72 0.838773 1 0.763975 1 0.864374 1.192218 0.763975 1.308943355 0.864374 1.030521965
102 0.598304 0.671687 0.623758 0.698275 0.638193 1.122652 0.928644 1.1194646 0.913956536 1.066670121
Average 0.645419 0.734999 0.729694 0.733731 0.745063 1.138794 0.992782 1.005532604 1.015444378 1.154386992
In the case of the frontier shift, In Table 7, Columns 2-5reports the Malmquist frontier shift components (FS) and the overall Malmquist frontier shift between 2006 and 2010 is presented in column 6. It can be clearly seen that on average, the firms technology frontier declined 99.5% from 2006 to 2007, 69.4% from 2007 to 2008, 51% from 2008 to 2009, and improved 81.3% from 2009 to 2010, respectively. The average is recorded the overall 90% declined in its technology frontier. As described by FS, from 2006 to 2007 except DMU 58, all the corporations indicate a negative shift in technology frontier. From 2007 to 2008 and from 2008 to 2009, all the firms show a negative shift. And finally, from 2009 to 2010, all the DMUs expect DMU 58 show a positive shift in technology frontier.
Finally, the Malmquist productivity index is cited in columns 7-11 of Table 7. It can be seen that except for the time period from 2009 to 2010 which Bursa Malaysian experienced on average 84% productivity gain, from 2006 to 2007, from 2007 to 2008, and from 2008 to 2009, it experienced on average 99.5%, 69.4% and 51%, productivity loss, respectively. As a result, the average is described the overall 88% dived in its productivity.
Since the Bursa Malaysia average Malmquist productivity change is the product of average technical efficiency change and Bursa Malaysia average technology change, when we analyze the results of the Malmquist

Corporate diversification’s effects on Efficiency and …
91
productivity change, we need refer to Cath-Up and FS. Based upon these three components, it can be seen that from 2006 to 2007, the extreme average productivity loss (99.5% (M=0.005143)) is a combined effect of an average improvement in technical efficiency (13.9% (Cath-Up=1.138794)) and an average negative shift in technology frontier (99.5% (FS=0.004517)). Therefore, a decrease in technology frontier is the only source of productivity loss. From 2007 to 2008, the average productivity trend shown (69.4% (M=0.313498)) is a combined effect of a slight average decline in technical efficiency (0.7% (Cath-Up=0.992782)) and an extreme average negative shift in the technology frontier (69.4% (FS=0.315777)). Thus, a loss in frontier shift is mostly the source of the productivity regression. However, from 2008 to 2009, the average extreme productivity loss (51% (M=0.492668)) is a combined effect of an average progress in technical efficiency (0.5% (Cath-Up=1.005532604)) and an average of extremely negative shift in technology frontier (51%(FS=0.489957)). Thus, a huge productivity loss is due to a negative shift in frontier technology. Finally, from 2009 to 2010, the average significant productivity gain (84% (M=1.841042)) is a combined effect of an average improvement in technical efficiency (1.5% (Cath-Up=1.015444378)) and an average of remarkably positive shift in technology frontier (81.3% (FS=1.813041)). Thus, a tremendous productivity gain is mostly because of a positive shift in frontier technology and slightly due to a technical efficiency progress.
Table 7: Frontier Shift and the Malmquist productivity index between two periods of time for selected DMUs
DMU Frontier-Shift (FS) Malmquist Productivity Indexes
2007/2006 2008/2007 2009/2008 2010/2009 2010/2006 2007/2006 2008/2007 2009/2008 2010/2009 2010/2006
7 0.517084 0.775377 0.69939 1.586587 0.618631 0.887769 0.529614 0.689775 1.427158 0.643595
9 0.932059 0.734178 0.778217 1.154954 0.795372 0.932059 0.734178 0.778217 1.154954 0.795372
21 0.678399 0.651441 0.70863 1.998009 0.541236 0.862537 0.657171 0.74068 2.009214 0.729663
43 0.927536 0.60488 0.764123 4.041464 0.945684 0.500111 0.53938 0.712865 3.858612 0.40499
44 0.655272 0.674356 0.347529 1.955472 0.43275 0.809058 0.640326 0.689142 1.955472 1.006062
45 0.891947 0.625297 0.701999 1.434444 0.635467 0.892051 0.625297 0.626764 1.259432 0.498199
58 3.608146 0.520137 0.938829 0.754026 3.774339 3.608146 0.520137 0.938829 0.754026 3.774339
71 0.630243 0.678179 0.743636 1.448734 0.636823 0.957319 0.655135 0.730831 1.443827 0.915244
72 0.999374 0.584653 0.684443 1.544107 0.65399 1.191472 0.44666 0.895897 1.334686 0.673951
102 0.703957 0.72854 0.728796 1.453769 0.609918 0.790299 0.676554 0.815861 1.328682 0.650581
Average 0.004517 0.315777 0.489957 1.813041 0.100666 0.005143 0.313498 0.492668 1.841042 0.116207
Meysam Doaei and Babooshka Shavazipour
92
8 - Conclusion In short, this research contributes to literature as stated below:
i. The degree of corporate diversification (product and international diversification) in Malaysian manufacturing listed firms in Bursa Malaysia for five years is documented. ii. New approach to measuring performance by exploring Data Envelopment Analysis has been applied. iii. To further comparison and analysis the Malmquist index of productivity (MIP) has been utilized to measure the productivity change of Malaysian manufacturing firms from 2006 to 2010.
In this paper we studied on manufacturing listed firms in Bursa Malaysia. The data (102 firms) is collected from the database of Bursa Malaysia from 2006 to 2010. Six output variables and four input variables are selected to use in DEA approach. By applying the input-oriented BCC model, the efficiency scores of 102 selected firms listing in Bursa Malaysia were calculated over the given period. As a result, only six DMUs (DMU 9, 12, 58, 59, 61 and 62) are efficient in all years. Results also show that increasing in the product diversification and international diversification can leave a positive effect on efficiency and raise the corporation’s efficiency score. Then, the improvement strategy has been suggested by slack analysis.
Further analysis on the Malmquist productivity Index indicate that Bursa Malaysian experienced on average 88% productivity loss from 2006 to 2010. Decomposition of the MIP is described that a negative shift in frontier technology (about 88%) is the only source of productivity loss and the overall 15.44% improvement in its technical efficiency could not rectify these huge productivity regression.
As other studied, there are some limitations in this research. First of all, the data for manufacturing firms during five years are not available. Secondly, it cannot be possible to identify related and unrelated product diversification, if it would possible, the search may be completed than this research by measuring Entropy formula.
For future studies, researchers should find a way to measuring related and unrelated product diversification. In addition, they will compare the corporate diversification between manufacturing firms and other sectors in Bursa Malaysia. Furthermore, because of high rate of diversification in Bursa Malaysia, it is good research area for comparing with other stock exchanges.

Corporate diversification’s effects on Efficiency and …
93
References 1- Ahmad, A. C., Ishak, Z. & Manaf, N. A. A. (2003). Corporate governance, ownership structure and corporate diversification: Evidence from the Malaysian listed companies. Asian Academy of Management Journal, 8, 67-89. 2- Ansoff, H. I. (1957). Strategies for diversification. Harvard business review, 35, 113-124. 3- Banker, R. D., Charnes, A. & Cooper, W. W. (1984). Some models for estimating technical and scale inefficiencies in data envelopment analysis. Management science, 1078-1092. 4- Caves, D. W., Christensen, L. R. & Diewert, W. E. (1982). The economic theory of index numbers and the measurement of input, output, and productivity. Econometrica: Journal of the Econometric Society, 1393-1414. 5- Cernas Ortiz, D. A. (2011). Examining Curvilinearity and Moderation in the Relationship between the Degree of Relatedness of Individual Diversification Actions and Firm Performance. Doctor of Philosophy (Management), UNIVERSITY OF NORTH TEXAS. 6- Chalos, P. & Cherian, J. (1995). An application of data envelopment analysis to public sector performance measurement and accountability. Journal of Accounting and Public Policy, 14, 143-160. 7- Charnes, A. & Cooper, W. W. (1962). Programming with linear fractional functionals. Naval Research logistics quarterly, 9, 181-186. 8- Charnes, A., Cooper, W. W. & Rhodes, E. (1978). Measuring the efficiency of decision-making units. European Journal of Operational Research, 2, 429-444. 9- Cooper, W. W., Seiford, L. M. & Tone, K. (2006). Introduction to data envelopment analysis and its uses: with DEA-solver software and references, Springer Verlag. 10- Cooper, W. W., Seiford, L. M. & Zhu, J. (2011). Data Envelopment Analysis: History, Models, and Interpretations. Handbook on data envelopment analysis, 1-39. 11- Denis, D. J., Denis, D. K. & Sarin, A. (1999). Agency theory and the influence of equity ownership structure on corporate diversification strategies. Strategic Management Journal, 20, 1071-1076. 12- Doaei, M., Anuar, M. B. A. & Hamid, N. I. N. A. (2012). Corporate Diversification and Financial Performance: A Review of Literature. Asian Journal of Finance & Accounting, 4, 56-74.
Meysam Doaei and Babooshka Shavazipour
94
13- Duzakin, E. & Duzakin, H. (2007). Measuring the performance of manufacturing firms with super slacks based model of data envelopment analysis: An application of 500 major industrial enterprises in Turkey. European Journal of Operational Research, 182, 1412-1432. 14- Emrouznejad, A., Parker, B. R. & Tavares, G. (2008). Evaluation of research in efficiency and productivity: A survey and analysis of the first 30 years of scholarly literature in DEA. Socio-Economic Planning Sciences, 42, 151-157. 15- Färe, R., Grosskopf, S., Lindgren, B. & Roos, P. (1992). Productivity changes in Swedish pharamacies 1980–1989: A non-parametric Malmquist approach. Journal of Productivity Analysis, 3, 85-101. 16- Fare, R., Grosskopf, S. & Lovell, C. K. (1994). Production frontiers, Cambridge University Press. 17- Farrell, M. J. (1957). The measurement of productive efficiency. Journal of the Royal Statistical Society. Series A (General), 120, 253-290. 18- Feroz, E., Kim, S. & Raab, R. (2003). Financial statement analysis: A data envelopment analysis approach. Journal of the Operational Research Society, 54, 48-58. 19- Ghoshal, S. (1987). Global strategy: An organizing framework. Strategic Management Journal, 8, 425-440. 20- Hitt, M. A., Ireland, R. D. & Hoskisson, R. E. (2007). Strategic management: Competitiveness and globalization, South-Western Pub. 21- Hooy, C. W., Khim, H. G. & Masron, T. A. (2009). Financial Efficiency of SMEs in the Northern Corridor Economic Region: a DEA Analaysis. Capital Markets Review, 17, 1-9. 22- Iacobucci, D. & Rosa, P. (2005). Growth, diversification, and business group formation in entrepreneurial firms. Small Business Economics, 25, 65-82. 23- Ishak, Z. & Napier, C. 2004. Corporate Ultimate Ownership and Corporate Diversification in Malaysia. The Fourth Asia Pacific Interdisciplinary Research in Accounting Conference. Singapore. 24- Jacquemin, A. P. & Berry, C. H. (1979). Entropy measure of diversification and corporate growth. The Journal of Industrial Economics, 27, 359-369. 25- Kim, W., Hwang, P. & Burgers, W. (1989). Global diversification strategy and corporate profit performance. Strategic Management Journal, 10, 45-57.
Corporate diversification’s effects on Efficiency and …
95
26- Kim, W. C., Hwang, P. & Burgers, W. P. (1993). Multinationals' diversification and the risk‐return trade‐off. Strategic Management Journal, 14, 275-286. 27- Kogut, B. (1993). Designing global strategies: profiting from operational flexibility'. Readings in International Business, The MIT Press, Cambridge, MA, 195-213. 28- Mahmood, A. (Year). Export specialization and competitiveness of the Malaysian manufacturing: trends, challenges, and prospects. In: Conference on International Trade Education and Research, 2000 Monash University, Australia. Citeseer. 29- Malhotra, D. K. & Malhotra, R. (2008). Analyzing Financial Statements Using Data Envelopment Analysis. Commercial Lending Review, 23, 25-61. 30- Malhotra, R., Malhotra, D. & Lermack, H. (2009). Using data envelopment analysis to analyze the performance of North American class I freight railroads. Financial Modeling Applications and Data Envelopment Applications (Applications of Management Science, Volume 13), Emerald Group Publishing Limited, 13, 113-131. 31- Malmquist, S. (1953). Index numbers and indifference surfaces. Trabajos de Estadística y de Investigación Operativa, 4, 209-242. 32- Margaritis, D. & Psillaki, M. (2010). Capital structure, equity ownership and firm performance. Journal of Banking & Finance, 34, 621-632. 33- Mat Nor, F., Said, R. M. & Hisham, M. (2006). Fnancial performance and efficiency changes of Malaysian banking institutes in mergers and aquistions. Banks and Bank Systems International Research Journal, 1, 102-109. 34- Montgomery, C. (1994). Corporate diversification. The Journal of Economic Perspectives, 8, 163-178. 35- Neves, J. C. & Lourenço, S. (2009). Using data envelopment analysis to select strategies that improve the performance of hotel companies. International Journal of Contemporary Hospitality Management, 21, 698-712. 36- Nikoomaram, H. & Mahmoodi, M. M. (2010). Efficiency Measurement of Enterprises Using the Financial Variables of Performance Assessment and Data Envelopment Analysis. Applied Mathematical Sciences, 4, 1843-1854.
Meysam Doaei and Babooshka Shavazipour
96
37- Park, K. & Jang, S. C. S. (2011). Effect of diversification on firm performance: Application of the entropy measure. International Journal of Hospitality Management. 38- Shackman, J. D. (2007). Corporate diversification, vertical integration, and internal capital markets: A cross-country study. Management International Review, 47, 479-504. 39- Sufian, F. (2009). Determinants of bank efficiency during unstable macroeconomic environment: Empirical evidence from Malaysia. Research in International Business and Finance, 23, 54-77. 40- Sufian, F. & Habibollah, M. S. (2009). Assessing the impact of mergers and acquisitions on bank cost efficiecny. Capital Markets Review, 17, 21-42. 41- Tahir, I. M., Bakar, N. M. A. & Haron, S. (2009). Evaluating efficiency of Malaysian banks using data envelopment analysis. International Journal of Business and Management, 4, 96-106. 42- Talluri, S. (2000). Data envelopment analysis: models and extensions. Decision Line, 31, 8-11. 43- Thore, S., Kozmetsky, G. & Phillips, F. (1994). DEA of financial statements data: the US computer industry. Journal of Productivity Analysis, 5, 229-248. 44- Toloo, M. & Nalchigar, S. (2011). A new DEA method for supplier selection in presence of both cardinal and ordinal data. Expert Systems with Applications. 45- Tsen, W. H. (2005). The Determinants of Foreign Direct Investment in the Manufacturing Industry of Malaysia. Journal of economic cooperation, 26, 91-110. 46- Worthington, A. C. (1998). The application of mathematical programming techniques to financial statement analysis: Australian gold production and exploration. Australian Journal of Management, 23, 97-113. 47- Yeh, Q. J. (1996). The application of data envelopment analysis in conjunction with financial ratios for bank performance evaluation. Journal of the Operational Research Society, 980-988.
Copyright © 2022 FDOKUMEN