An Empirical Investigation of Compliance and Disclosure Quality Under FRS 36 for Singaporean Listed...
31
Electronic copy available at: http://ssrn.com/abstract=1550416 1 AN EMPIRICAL INVESTIGATION OF COMPLIANCE AND DISCLOSURE QUALITY UNDER FRS 36 FOR SINGAPOREAN LISTED FIRMS Tyrone M Carlin Faculty of Economics and Business, The University of Sydney, NSW, 2006, Australia Nigel Finch Faculty of Economics and Business, The University of Sydney, NSW, 2006, Australia Khairil Khairi Macquarie Graduate School of Management, Macquarie University, NSW, 2109, Australia ABSTRACT Drawing on data from a sample of 168 firms listed on the Singapore Stock Exchange (SGX) over three consecutive years (2005, 2006 and 2007), this study focuses on the issue of IFRS compliance and disclosure quality. Using the requirements of FRS 36 in relation to goodwill impairment testing as the particular focal point for the analysis, the results of this study demonstrate poor levels of compliance and transparency on the part of SGX listed firms with goodwill in relation to their goodwill impairment testing processes and assumptions. This study adds to the literature by providing insights into this phenomenon from the standpoint of an advanced Asia Pacific region jurisdiction not previously subjected to scrutiny on the dimensions drawn upon for the purposes of this study and through the use of a multi-year research design. The results complement and reinforce the significance of earlier research conducted in relation to the focal phenomenon in Australia, Malaysia and New Zealand and suggest the existence of persistent cross-border difficulties with the implementation of the complex technical provisions of the IFRS goodwill impairment testing regime. Keywords: Goodwill, Impairment, Financial reporting, Creative accounting, Singapore JEL classification: M40, M41 Correspondence details: Dr Tyrone M Carlin Professor of Financial Reporting & Regulation Faculty of Economics & Business The University of Sydney NSW 2006 AUSTRALIA Phone: + 61 2 9036 7230 Fax: + 61 2 9351 7471 [email protected]
Transcript of An Empirical Investigation of Compliance and Disclosure Quality Under FRS 36 for Singaporean Listed...

Electronic copy available at: http://ssrn.com/abstract=1550416
1
AN EMPIRICAL INVESTIGATION OF COMPLIANCE AND DISCLOSURE
QUALITY UNDER FRS 36 FOR SINGAPOREAN LISTED FIRMS
Tyrone M Carlin Faculty of Economics and Business, The University of Sydney, NSW, 2006, Australia
Nigel Finch
Faculty of Economics and Business, The University of Sydney, NSW, 2006, Australia
Khairil Khairi Macquarie Graduate School of Management, Macquarie University, NSW, 2109, Australia
ABSTRACT
Drawing on data from a sample of 168 firms listed on the Singapore Stock Exchange (SGX) over three
consecutive years (2005, 2006 and 2007), this study focuses on the issue of IFRS compliance and disclosure
quality. Using the requirements of FRS 36 in relation to goodwill impairment testing as the particular focal point
for the analysis, the results of this study demonstrate poor levels of compliance and transparency on the part of
SGX listed firms with goodwill in relation to their goodwill impairment testing processes and assumptions. This
study adds to the literature by providing insights into this phenomenon from the standpoint of an advanced Asia
Pacific region jurisdiction not previously subjected to scrutiny on the dimensions drawn upon for the purposes
of this study and through the use of a multi-year research design. The results complement and reinforce the
significance of earlier research conducted in relation to the focal phenomenon in Australia, Malaysia and New
Zealand and suggest the existence of persistent cross-border difficulties with the implementation of the complex
technical provisions of the IFRS goodwill impairment testing regime.
Keywords: Goodwill, Impairment, Financial reporting, Creative accounting, Singapore JEL classification: M40, M41 Correspondence details:
Dr Tyrone M Carlin Professor of Financial Reporting & Regulation Faculty of Economics & Business The University of Sydney NSW 2006 AUSTRALIA Phone: + 61 2 9036 7230 Fax: + 61 2 9351 7471 [email protected]
Electronic copy available at: http://ssrn.com/abstract=1550416
2
1. INTRODUCTION
Goodwill has been widely acknowledged as a complex phenomenon. It has been described as
a thing easy to describe but very difficult to define.1 Commensurate with this, at times heated
debates in relation to goodwill and goodwill accounting have occurred in many jurisdictions
throughout the world. Irrespective of the differences of thought evident in these arguments,
substantial homogenisation of fundamental goodwill accounting practice has emerged across
the globe over the past decade. For example, both US GAAP and IFRS have dispensed with
the long tradition of periodic amortisation of goodwill against earnings and instead
substituted a process of periodic impairment testing.
Proponents of this approach have argued strongly that the retirement of the amortisation
approach to goodwill accounting and its replacement with an impairment testing led system
have delivered an enhanced capacity for financial statements to reflect and signal the
underlying economic position of reporting entities (Wang, 2005). Consistent with this
approach, Harper (2001) noted that the implementation of annual impairment testing as
required under an impairment based regime for goodwill reporting offers a clearer picture to
financial reporting user. Similarly, Wyatt (2005) argues that the changed reporting
arrangements are likely beneficial to financial reporting because better judgment in goodwill
valuation is required.
In contrast to the optimistic expectations for the impact of the amortisation approach set out
above, concerns have been raised in the research literature in relation to the impact of the
approach. Arguably, the shift from amortization to periodic reviews puts a new and
continuous responsibility on management to determine the value of goodwill. In turn, this
represents a new burden on auditors, regulatory bodies, and investors in their efforts to
evaluate management decisions and determinations (Hayn & Hughes, 2006).
The literature has thrown up a series of other concerns in relation to the efficacy and impact
of impairment testing based regimes for goodwill. These include a lack of evidence that
earnings numbers derived from the regime are more value relevant than those generated
under the previous capitalize and amortize approach (Chen et al., 2006); evidence that write
1 Inland Revenue Commissioner v Muller & Co’s Margarine Ltd (1901) AC 217 at 223 per Lord Macnaghten.
3
off timing is consistent with managerial opportunism (Anantharaman, 2007); evidence of
undue delays in recognizing impairment losses (Henning & Shaw, 2003; Hayn & Hughes,
2006; Ramanna & Watts, 2007) and evidence of gaming in the manner in which goodwill is
allocated between reporting units in a bid to minimize the chance of forced impairment losses
(Zhang & Zhang, 2007). Arguably, impairment based approaches have the capacity to be
disruptive to both the process of financial statement preparation and interpretation (Moehrle
& Reynolds-Moehrle, 2001).
In approaching the topic of goodwill reporting, the main contribution of this paper is to add to
the developing literature on compliance with aspects of the impairment reporting regime.
Much extant literature on impairment accounting specifically and financial reporting more
generally appears to be predicated on the assumption that in producing their financial
statements, firms exhibit strong compliance with the requirements of financial reporting
rules. By contrast, a series of recent studies2 have brought the credibility of this assumption
into question. This has implications for researchers interested in financial reporting,3 analysts,
auditors, litigators, policy makers and regulators alike. Unlike earlier contributions on this
theme, this paper concentrates on the situation in Singapore, an advanced and economically
significant economy and capital market in the heart of Asia, with a highly skilled professional
workforce and strong institutional and financial infrastructure to support quality financial
reporting.
In pursuit of this goal, the remainder of the present paper is organized as follows. The next
section describes the overview of key developments in the regulation of goodwill accounting
and reporting in Singapore. This is followed in Section 3 with a brief review of the research
sample and methodology used for the purpose of this study. A discussion of the key results is
provided in Section 4. Finally, Section 5 offers conclusions and suggests possible
implications of this study for potential further research.
2. OVERVIEW OF GOODWILL REPORTING ARRANGEMENTS IN
SINGAPORE
2 See, for example, Carlin & Finch (2009), Carlin et al., (2009), and Carlin & Finch, (2010). 3 Since the datasets with which they work may not have the homogenous quality researchers assume them to have, nor necessarily correspond to the phenomena in which researchers have interest – adding to the difficulty of cross sectional and time series analysis.

4
The reporting framework in Singapore that deals with the disclosure of goodwill accounting
is prescribed through the combined effects of the new internationalized Singaporean financial
reporting standards in FRS 103 Business Combinations, FRS 38 Intangible Assets, and FRS
36 Impairment of Asset.4 These standards should be applied on acquisition to goodwill
purchased in business combinations. These standards were released by the ASC5 with the
stated objective of improving the information content of goodwill reporting in Singapore.
In Singapore, the professional accounting body that deals in accounting standards is the
Institute of Certified Public Accountants of Singapore (ICPAS), hereinafter referred to as the
Institute. The Institute, a member of the IASC traditionally played a leading role in the
development of accounting standards for use in Singapore. However, in August 2002, the
Singapore government created the Council on Corporate Disclosure and Governance (CCDG)
to replace the ICPAS as the accounting setter for all companies incorporated in Singapore and
to review and recommend corporate governance and disclosure practices on a continuing
basis. With the enactment of the Accounting Standards Act, passed in Parliament on 27
August 2007 and the dissolution of the CCDG, the Accounting Standards Council (ASC)
took over the task of prescribing accounting standards from the CCDG.
Historically, the accounting of goodwill in Singapore has largely been based on the IAS
standards. IAS 22 Business Combinations was adopted and issued as SAS 22 without any
notable non-conforming items as at 31 December 1986. In SAS 22, paragraph 41, goodwill
was defined as “…any excess of the cost of acquisition over the fair values of the net
identifiable assets acquired…”. In addition, paragraph 20 stated that “those who recognize
goodwill arising on acquisition as an asset in the consolidated financial statements believe
that it represents a payment made in anticipation of future income”.
SAS 22 required the recognition of purchased goodwill in the accounts so long as it was
supported by future income (paragraph 41). Internally generated goodwill was not explicitly
excluded from recognition, although paragraph 22 argues against the non-amortization of
goodwill on the basis that this treatment implicitly recognises goodwill developed subsequent
to acquisition. Goodwill was to be calculated by reference to the fair value of the
4 See www.asc.gov.sg./frs/index.htm 5 The Accounting Standards Council of Singapore, which is the local standard setting agency.
5
consideration given. Essentially, SAS 22 embodied what might be termed a classic capitalise
and amortise regime for goodwill accounting and reporting.
This state of affairs changed with the promulgation of accounting standard FRS 36 in
Singapore, effective from 1 July 2004. Under FRS 36, goodwill is not amortized any longer
and it is considered to be an asset with indefinite life. It however has to be subjected to a
stringent impairment test, either annually, or at shorter notice if the need arises, to assess
erosion in value. In the event of impairment, the income statement is charged with the
computed impairment loss to ensure the immediate highlighting of poorly performing
business units. Goodwill is thus not seen as a steadily wasting asset but one with indefinite
life and with a value linked to the performance of the unit or units within the organisation to
which it relates.
Another significant change in the treatment of goodwill has arisen out of the requirement for
treating all business combinations as purchases (FRS 103). This will eliminate the possibility
of firms' not recording goodwill by pooling the assets and liabilities of various firms together
for preparation of financial statements. Thus, management now has to explain what the
goodwill amount represents. Each of these new requirements poses a series of challenges to
many entities considering acquisitions.
The test for impairment of goodwill under the FRS is carried out at the level of the cash
generating unit (CGU) or a group of CGUs which represent the lowest level at which
management monitor goodwill. FRS 36 also stipulates that the level for assessing impairment
must never be higher than a business or a geographical segment. This kind of requirement has
been criticized because it is argued to leave significant room for management interpretation,
judgment and bias (Massoud & Raiborn, 2003).
The test is a one stage process wherein the recoverable amount of the CGU is calculated on
the basis of the higher of (a) the fair value less costs to sell or (b) the value in use, and then
compared to the carrying amount. In case the assessed value is lesser than the carrying cost,
an appropriate charge is made to the profit and loss account. The goodwill appropriated to the
CGU is reduced pro rata. The CGU based impairment testing process is complex and in light
of this, FRS 36 requires detailed disclosures to be published regarding the nature of annual
impairment tests. These disclosures include information relating to the assumptions made for

6
the purposes of the impairment tests, and the sensitivity of the results of the impairment tests
to changes in these assumptions. These disclosures are presumably intended to give users
more information about the acquisitions, the likely benefit to the acquiring firm and the
effectiveness and reasonableness of periodic impairment reviews.
In order to have a better understanding of the characteristics of the goodwill reporting regime
under FRS 36, developing an understanding of the level of compliance and quality
disclosures related to the important requirements of this Standard is a matter of substantial
significance. In the presence of high complexity, deviations from required practice have the
potential to materially and rapidly diminish information quality, hence the focus on
compliance in this study. Section 3 below sets out details of the data drawn upon and
methodology employed for the purposes of investigating this issue.
3. DATA AND METHODOLOGY
This study covers the first three years of reporting pursuant to FRS 36 in Singapore. The
Worldscope DataStream database was used to identify population of firms listed on the
Singapore Stock Exchange (SGX) in each of 2005, 2006 and 2007.6 From these, 168 firms
which were listed across the entire period of interest and which had goodwill in each of the
three years the subject of investigation were identified. These firms constituted the final
sample for the purposes of this research. These firms represented approximately 70% of the
total market capitalisation of the SGX across the period studied.
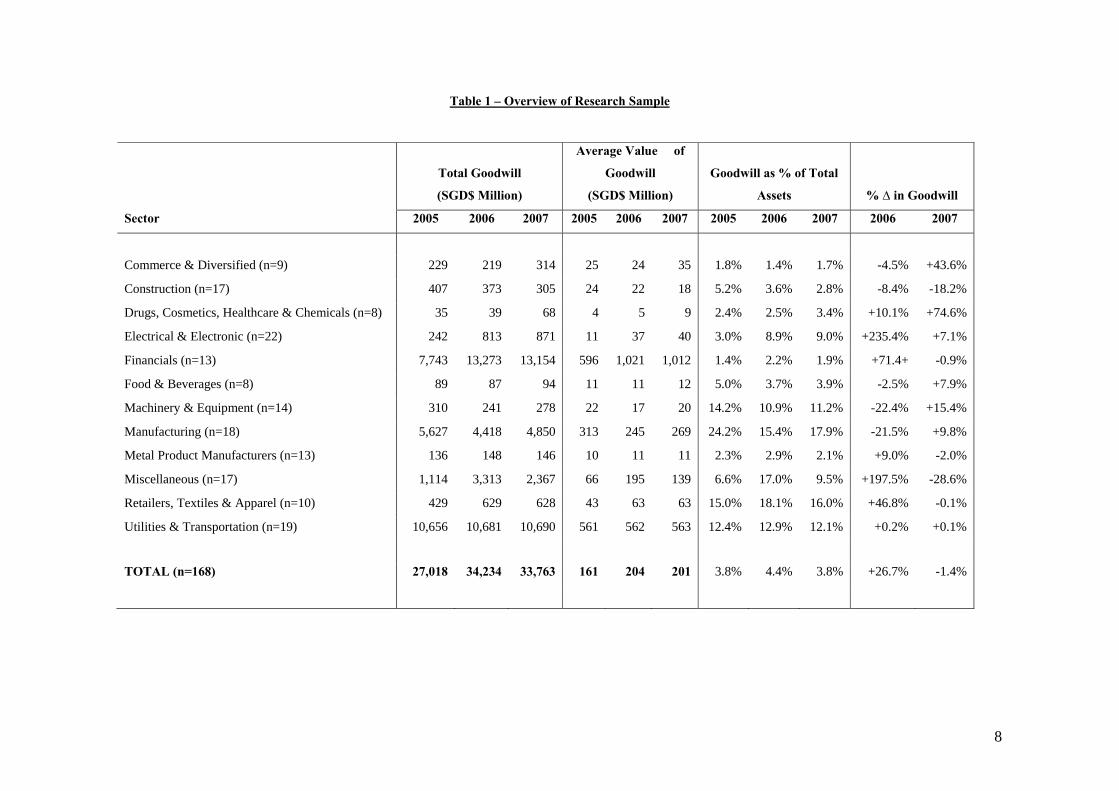
At the date of sampling, the 168 firms included in the final sample controlled assets valued at
$708,453, $781,494 and $886,975 million, which included total goodwill of $27,018,
$34,234 and $33,763 million for 2005, 2006 and 2007 respectively. Table 1 below sets out
basic descriptive data relating to the research sample for the years investigated
Following earlier research7 on the compliance issue in other jurisdictions, two key groups of
compliance related issues are subject to investigation for the purposes of this paper. The first
relates to the role of CGUs as key devices determining the shape and impact of the
impairment testing process. The second relates to inspection of key assumptions based upon
6 In 2005 there were 562 such firms. This grew to 593 in 2006 and 623 by 2007. 7 See, for example, Carlin & Finch (2009).

7
which the recoverable amount of CGU assets has been estimated. Therefore, a dual layered
comparative/evaluative methodology is employed. This first requires a comparison to be
made between the content of a firm’s impairment testing disclosure with a checklist of
requirements derived from the text of FRS 36. Through this comparison, firm disclosures are
categorized according to a bi-modal “comply” or “non-comply” taxonomy.
The second layer of the methodology looks beyond distribution of disclosures into the basic
categories of “comply” and “non-comply” and recognizes that within the “comply” an
additional element of the methodology employed is the construction of multi-category
disclosure quality taxonomies which provide a more nuanced perspective on disclosure
practice than a binomial “comply” versus “non-comply” categorization
.
8
Table 1 – Overview of Research Sample
Sector
Total Goodwill
(SGD$ Million)
Average Value of
Goodwill
(SGD$ Million)
Goodwill as % of Total
Assets % ∆ in Goodwill
2005 2006 2007 2005 2006 2007 2005 2006 2007 2006 2007
Commerce & Diversified (n=9) 229 219 314 25 24 35 1.8% 1.4% 1.7% -4.5% +43.6%
Construction (n=17) 407 373 305 24 22 18 5.2% 3.6% 2.8% -8.4% -18.2%
Drugs, Cosmetics, Healthcare & Chemicals (n=8) 35 39 68 4 5 9 2.4% 2.5% 3.4% +10.1% +74.6%
Electrical & Electronic (n=22) 242 813 871 11 37 40 3.0% 8.9% 9.0% +235.4% +7.1%
Financials (n=13) 7,743 13,273 13,154 596 1,021 1,012 1.4% 2.2% 1.9% +71.4+ -0.9%
Food & Beverages (n=8) 89 87 94 11 11 12 5.0% 3.7% 3.9% -2.5% +7.9%
Machinery & Equipment (n=14) 310 241 278 22 17 20 14.2% 10.9% 11.2% -22.4% +15.4%
Manufacturing (n=18) 5,627 4,418 4,850 313 245 269 24.2% 15.4% 17.9% -21.5% +9.8%
Metal Product Manufacturers (n=13) 136 148 146 10 11 11 2.3% 2.9% 2.1% +9.0% -2.0%
Miscellaneous (n=17) 1,114 3,313 2,367 66 195 139 6.6% 17.0% 9.5% +197.5% -28.6%
Retailers, Textiles & Apparel (n=10) 429 629 628 43 63 63 15.0% 18.1% 16.0% +46.8% -0.1%
Utilities & Transportation (n=19) 10,656 10,681 10,690 561 562 563 12.4% 12.9% 12.1% +0.2% +0.1%
TOTAL (n=168) 27,018 34,234 33,763 161 204 201 3.8% 4.4% 3.8% +26.7% -1.4%

9
Referring to the role of CGUs, paragraph 80 of FRS 36 requires that for the purpose of impairment
testing, goodwill is to be allocated to each of the reporting entity’s CGUs (or groups of CGUs) expected
to benefit from the goodwill. To avoid the creation of an excessive reporting systems burden, this
allocation is only required down to CGUs or groups of CGUs which represent the lowest level at which
goodwill is monitored for internal management purposes.
However, to guard against inappropriate aggregation,8 paragraph 80 stipulates that the CGUs (or groups
thereof) should not be larger than segments defined for the purpose of segment reporting.9
This is important because the allocation of goodwill to CGUs is a crucial process as the number of
CGUs to which goodwill is allocated has the capacity to impact an impairment loss being recognised.
The risk relating to allocation of goodwill to CGU’s is known as the CGU aggregation problem (Carlin
& Finch, 2007; Carlin et al., 2007; Carlin & Finch, 2009), where too few CGUs are defined in the
process of allocation of goodwill to CGUs. Inappropriate CGU aggregation leads to the risk that
impairment charges which should occur are avoided, or at least inappropriately delayed. This is
important because various types of operations may have differing prospects of growth, rates of
profitability, and also degrees of risk.
Therefore, in coming to a better understanding of the characteristics of the goodwill reporting regime,
developing an image of the apparent level of “aggregation” of CGUs as defined by reporting entities is
of prime significance.10 This is pursued by comparing the number of reported controlled subsidiary
entities, business segments and defined CGUs for each firm of the studied sample.
Thus, it is a starting point to assess the compliance dimensions in relation to which firms defined CGUs
and allocated goodwill to them. The investigation process begins by first comparing each firm's total
goodwill balance with the total disclosed CGU goodwill allocation. If the total disclosed goodwill of the
8 The CGU aggregation problem has also been recognized elsewhere in the past literature. For example, Wines et al.,(2007). It is notable that the literature concerning segment reporting, which shares close parallels with aspects of the literature which touches on CGU definition also reports high variation in practice, and a tendency to report fewer rather than more sectors, given the potential competitive costs associated with these disclosures. See also Rennie & Emmanuel, (1992); Doupnik & Seese, (2001). 9 Pursuant to FRS 14 – Segment Reporting 10 See, Carlin & Finch (2007).
10
firm is less than the total value of goodwill allocated to CGUs, the quality and completeness of
disclosure is classified as lower, and vice versa.
The next step is comparing the number of CGUs and business segments for firms on the industry by
industry basis. The important aspect in this process is to look at the level of aggregation of CGUs by
those firms. This data assists with the development of insight into the level of compliance with basic
disclosure requirement set out in FRS 36.
Lastly, comparing the average number of reported controlled subsidiary entities, business segments and
defined CGUs for each firm in the sample, allowing a CGU to business segment ratio to be calculated
for each of the sample firms. This analysis builds upon the procedure described in step two (above) and
also goes to the likelihood of CGU aggregation behaviour among reporting entities.
Having examined the aggregation issue, a further aspect that needs to be more attention in assessing the
quality of the requirements of goodwill accounting standard is on inspection of key assumptions that the
recoverable amount of CGU assets has been estimated. Recoverable amount is defined as the higher of
an asset’s or a CGU’s fair value less costs to sell and its value in use” (FRS 36, para. 6). Fair value less
costs to sell is defined as “the amount obtainable from the sale of an asset or CGU in an arm’s length
transaction between knowledgeable, willing parties, less the costs of disposal” while value in use is
defined as the present value of the future cash flows expected to be derived from an asset or CGU (FRS
36 para. 6). This involves a selection of fair value or value in use and firms are required to disclosure
which method has been adopted.
FRS 36 stipulates11 that adoption of a fair value method in the determination of recoverable amount is
not dependent on the existence of an active market for the assets in question, but also makes clear the
need for some reasonable basis for making a reliable estimate of the amount obtainable from the
disposal of assets in arm’s length transactions between knowledgeable and willing parties as a
prerequisite to the adoption of this method. Jarva (2008) argued that the fair value standards allow the
reporting entity to use its own data and realistic assumption to develop unobservable inputs, if
observable prices from an active market are not available. Carlin et al. (2007) point out that the
11 Paragraph 20 of FRS 36.
11
disclosure requirements for those firms using the fair value method as a basis for determining the
recoverable amount of CGUs are limited compared to those required in instances where the value in use
approach is adopted. Consequently, the circumstances in which this choice is exercised also represents
an object of research interest, and the frequency with which sample firms resorted to either method is
reported in next section of this study.
On the other hand, the disclosure requirement for firms adopting value in use should result in more
useful information for financial statements user groups because of the far more detailed disclosures
associated with the use of this approach. These disclosures are required to include;
i. a description of each key assumption on which management has based its cash flow projections for
the period covered by the most recent budgets/forecasts. Key assumptions are those to which the
unit’s (group of units’) recoverable amount is most sensitive;12
ii. a description of management’s approach to determining the value(s) assigned to each key
assumption, whether those value(s) reflect past experience or, if appropriate, are consistent with
external sources of information, and, if not, how and why they differ from past experience or
external sources of information;13
iii. the period over which management has projected cash flows based on financial budgets/forecasts
approved by management and, when a period greater than five years is used for a cash-generating
unit (group of units), an explanation of why that longer period is justified;14
iv. the growth rate used to extrapolate cash flow projections beyond the period covered by the most
recent budgets/forecasts, and the justification for using any growth rate that exceeds the long-term
average growth rate for the products, industries, or country or countries in which the entity
operates, or for the market to which the unit (group of units) is dedicated;15
v. the discount rate(s) applied to the cash flow projections.16
The key assumptions such as discount rates, growth rates, forecast periods and terminal value periods
are scrutinised in order to yield a greater understanding of the operation of goodwill reporting regime.
12 FRS 36, Paragraph 134 d (i) 13 FRS 36, Paragraph 134 d (ii) 14 FRS 36, Paragraph 134 d (iii) 15 FRS 36, Paragraph 134 d (iv) 16 FRS 36, Paragraph 134 d (v)
12
The disclosure pertaining to discount rates and growth rates made by firms in the sample is reported in
section 4.
Since this main objective of the study is to examine and assess the quality of disclosures in relation to
goodwill impairment requirements, the analysis of the key assumptions used to estimate the recoverable
amount, this study draws upon the same approach as applied in previous studies by Carlin & Finch
(2007) and Carlin et al. (2007). In order to assess the quality of disclosure, it was necessary to develop
taxonomy for both discount rates and growth rates based disclosure. For the discount rate disclosures,
the taxonomy applied for discount rates required each firm in the sample to allocate one of four elements
i.e. ‘multiple explicit discount rates’, ‘single explicit discount rates’, and ‘range of discount rate’, and
‘no effective disclosure’.
Allocation of a firm in the first category signified that the firm fully complied with the requirements of
FRS 36 in relation to discount rate that used in estimating the recoverable amount of CGU. Firms in this
category disclosed the details of the specific discount rates used to discount cashflows for the purpose of
impairment testing for each of the CGU, and used varying discount rates which reflect the risk
characteristics of each CGU.
Firms in the second category i.e. ‘single explicit discount rate’ indicated that the firms disclose a single
discount for each of the CGU. In this scenario, firms use the same discount rate for each CGU even
though risk levels may arguably differ between CGUs within the same economic entity. In assessing the
level quality of compliance and disclosure, firms in this category are classified as exhibiting lower
disclosure quality than those in the first category.
In the third category i.e. ‘range of discount rates’ firms still provided information in general terms about
a range of discount rates used across their portfolio of CGUs, without specifying the rate applicable to
any CGU in particular. This practice is questionable in terms of fulfilling the requirements of FRS 36
and as a result, the quality of disclosure for this category is classified as lower than the two above
categories.

13
Finally, firms in fourth category i.e. ‘no effective disclosure’ provided insufficient disclosure no
valuable information for external user groups relating to discount rates used in the impairment testing
process. Therefore, firms in this category totally breached the requirements of FRS 36 and it can be
concluded that the quality of disclosure of these firms is poor.
Relating to assumed growth rate disclosures as required under FRS 36, the same methodology was
employed. Firms in the research sample are allocated to four categories depending on the explicitness
and comprehensiveness of their information disclosures i.e. ‘multiple explicit growth rates’, ‘single
explicit growth rate’, ‘range of growth rates’ and ‘no effective disclosure’. The results of the analysis of
this study are reported in Section 4, below.
4. RESULTS AND DISCUSSION
In investigating compliance and disclosure quality in relation to FRS 36, as defined above, a threshold
question of interest was the degree to which the total reported value of each sample firm’s goodwill
could be allocated to the sum of goodwill value discloses as having been allocated to the firm’s defined
CGUs. The annual reports of the studied firms revealed two different clusters of practice.
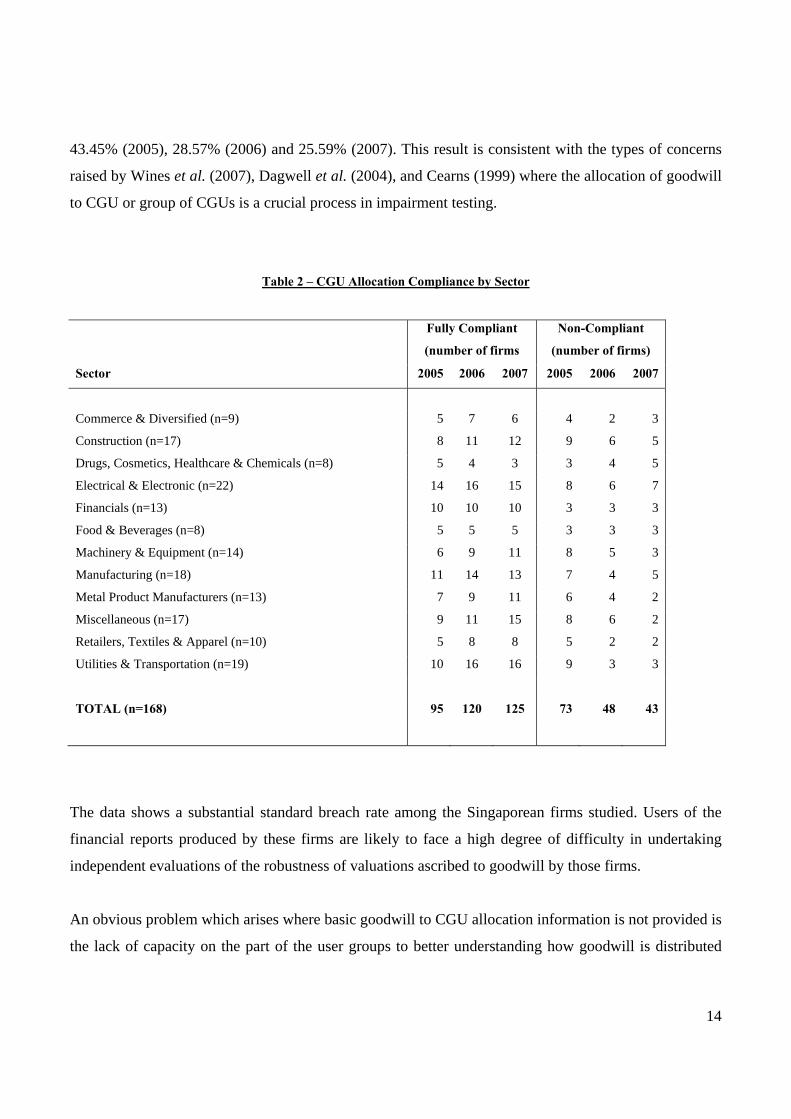
Table 2 below shows that firms in the sample were categorized as fully compliant or non-compliant with
the disclosure requirements under FRS 36. The first and dominant cluster comprised 95, 120 and 125
firms which were fully compliant with this threshold disclosure requirement for 2005, 2006 and 2007
respectively. These firms allocated the total amount of goodwill to CGUs in an explicit and transparent
manner, as required. In 2007 and 2006 in comparison to 2005, the rate of compliance among the
Singapore listed firms increased from 56.55% in 2005 to 71.43% (2006) and 74.40% (2007),
conclusively indicating improvements in the rate of compliance with this requirement over the period of
the study.
The second cluster comprised 73, 48 and 43 firms where it was not possible in any meaningful way to
draw a link between the value of reported goodwill and any the firm’s defined CGUs. In other words,
these firms failed to comply with the basic disclosure requirement in FRS 36 requiring reconciliation
between balance sheet total goodwill and the amount of goodwill disclosed as having been allocated to
CGUs. The number of firms in second cluster was surprisingly high; comprising approximately at
14
43.45% (2005), 28.57% (2006) and 25.59% (2007). This result is consistent with the types of concerns
raised by Wines et al. (2007), Dagwell et al. (2004), and Cearns (1999) where the allocation of goodwill
to CGU or group of CGUs is a crucial process in impairment testing.
Table 2 – CGU Allocation Compliance by Sector
Sector
Fully Compliant
(number of firms
Non-Compliant
(number of firms)
2005 2006 2007 2005 2006 2007
Commerce & Diversified (n=9) 5 7 6 4 2 3
Construction (n=17) 8 11 12 9 6 5
Drugs, Cosmetics, Healthcare & Chemicals (n=8) 5 4 3 3 4 5
Electrical & Electronic (n=22) 14 16 15 8 6 7
Financials (n=13) 10 10 10 3 3 3
Food & Beverages (n=8) 5 5 5 3 3 3
Machinery & Equipment (n=14) 6 9 11 8 5 3
Manufacturing (n=18) 11 14 13 7 4 5
Metal Product Manufacturers (n=13) 7 9 11 6 4 2
Miscellaneous (n=17) 9 11 15 8 6 2
Retailers, Textiles & Apparel (n=10) 5 8 8 5 2 2
Utilities & Transportation (n=19) 10 16 16 9 3 3
TOTAL (n=168) 95 120 125 73 48 43
The data shows a substantial standard breach rate among the Singaporean firms studied. Users of the
financial reports produced by these firms are likely to face a high degree of difficulty in undertaking
independent evaluations of the robustness of valuations ascribed to goodwill by those firms.
An obvious problem which arises where basic goodwill to CGU allocation information is not provided is
the lack of capacity on the part of the user groups to better understanding how goodwill is distributed
15
across a business, where it is concentrated and what types of underlying business activities it is
principally associated with. This results in a diminished capacity on the part of user groups to develop
detailed understandings of the firms reporting on impairment risk profiles.
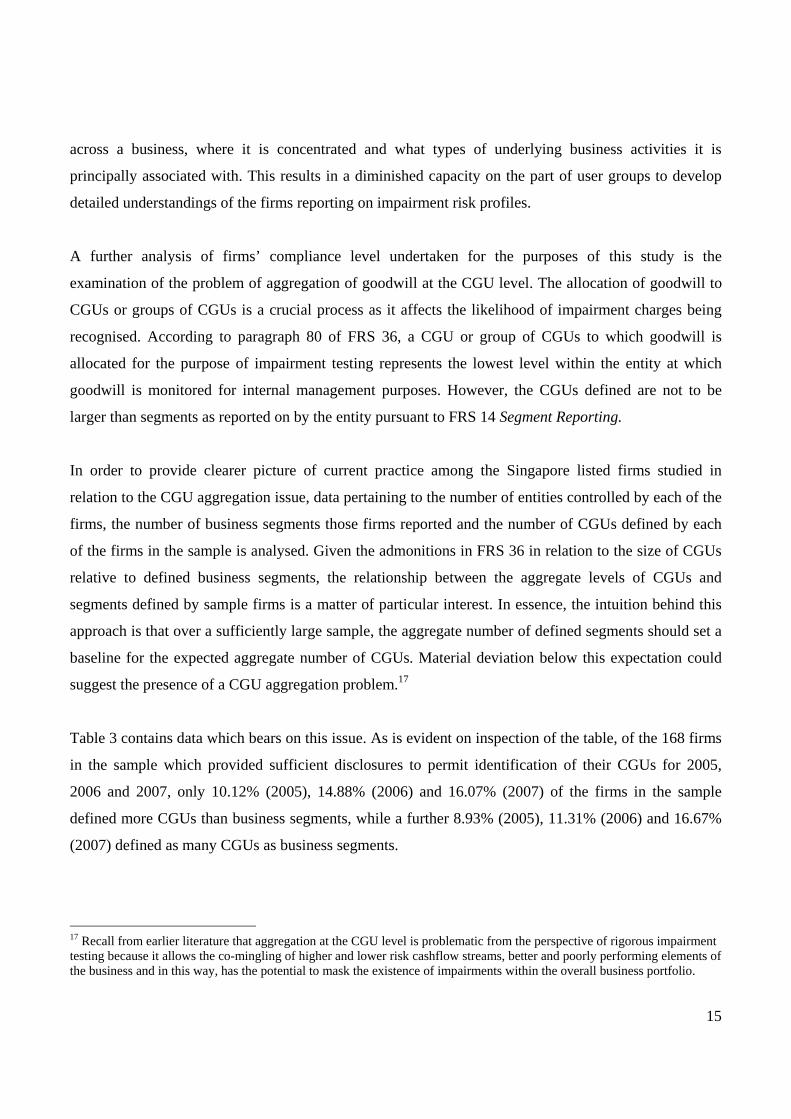
A further analysis of firms’ compliance level undertaken for the purposes of this study is the
examination of the problem of aggregation of goodwill at the CGU level. The allocation of goodwill to
CGUs or groups of CGUs is a crucial process as it affects the likelihood of impairment charges being
recognised. According to paragraph 80 of FRS 36, a CGU or group of CGUs to which goodwill is
allocated for the purpose of impairment testing represents the lowest level within the entity at which
goodwill is monitored for internal management purposes. However, the CGUs defined are not to be
larger than segments as reported on by the entity pursuant to FRS 14 Segment Reporting.
In order to provide clearer picture of current practice among the Singapore listed firms studied in
relation to the CGU aggregation issue, data pertaining to the number of entities controlled by each of the
firms, the number of business segments those firms reported and the number of CGUs defined by each
of the firms in the sample is analysed. Given the admonitions in FRS 36 in relation to the size of CGUs
relative to defined business segments, the relationship between the aggregate levels of CGUs and
segments defined by sample firms is a matter of particular interest. In essence, the intuition behind this
approach is that over a sufficiently large sample, the aggregate number of defined segments should set a
baseline for the expected aggregate number of CGUs. Material deviation below this expectation could
suggest the presence of a CGU aggregation problem.17
Table 3 contains data which bears on this issue. As is evident on inspection of the table, of the 168 firms
in the sample which provided sufficient disclosures to permit identification of their CGUs for 2005,
2006 and 2007, only 10.12% (2005), 14.88% (2006) and 16.07% (2007) of the firms in the sample
defined more CGUs than business segments, while a further 8.93% (2005), 11.31% (2006) and 16.67%
(2007) defined as many CGUs as business segments.
17 Recall from earlier literature that aggregation at the CGU level is problematic from the perspective of rigorous impairment testing because it allows the co-mingling of higher and lower risk cashflow streams, better and poorly performing elements of the business and in this way, has the potential to mask the existence of impairments within the overall business portfolio.

16
The results also reveal the existence of a high proportion of firms which disclosed fewer CGUs than
business segments (approximately half the sample firms in each year) and a substantial (though falling)
proportion of firms which provided no effective disclosure at all in relation to CGUs. The high number
of firms which defined fewer CGUs than segments suggests that amongst the total research sample,
there likely exist examples of organisations where the low CGU definition rates were driven by factors
other than a narrow incidence of goodwill throughout the firm.
Further, these results are consistent with the findings of earlier research in relation to Australian and
Malaysian firms (Carlin & Finch, 2009; Carlin et al., 2009). In turn, this consistency sheds new light and
complexion on those earlier published studies. The Singapore results show that substantial deviation
from required reporting practice was not an idiosyncratic characteristic of a single jurisdiction. Rather,
the consistency apparent in the results now available for three jurisdictions suggests the existence of a
systematic pattern.
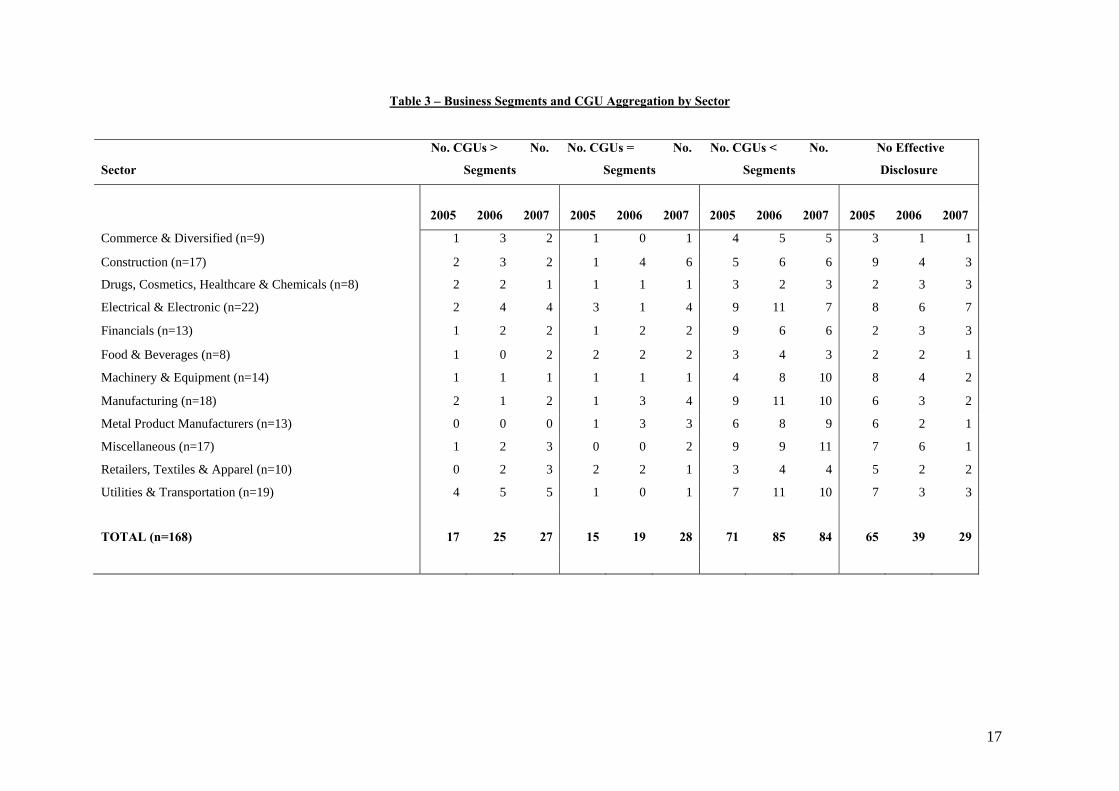
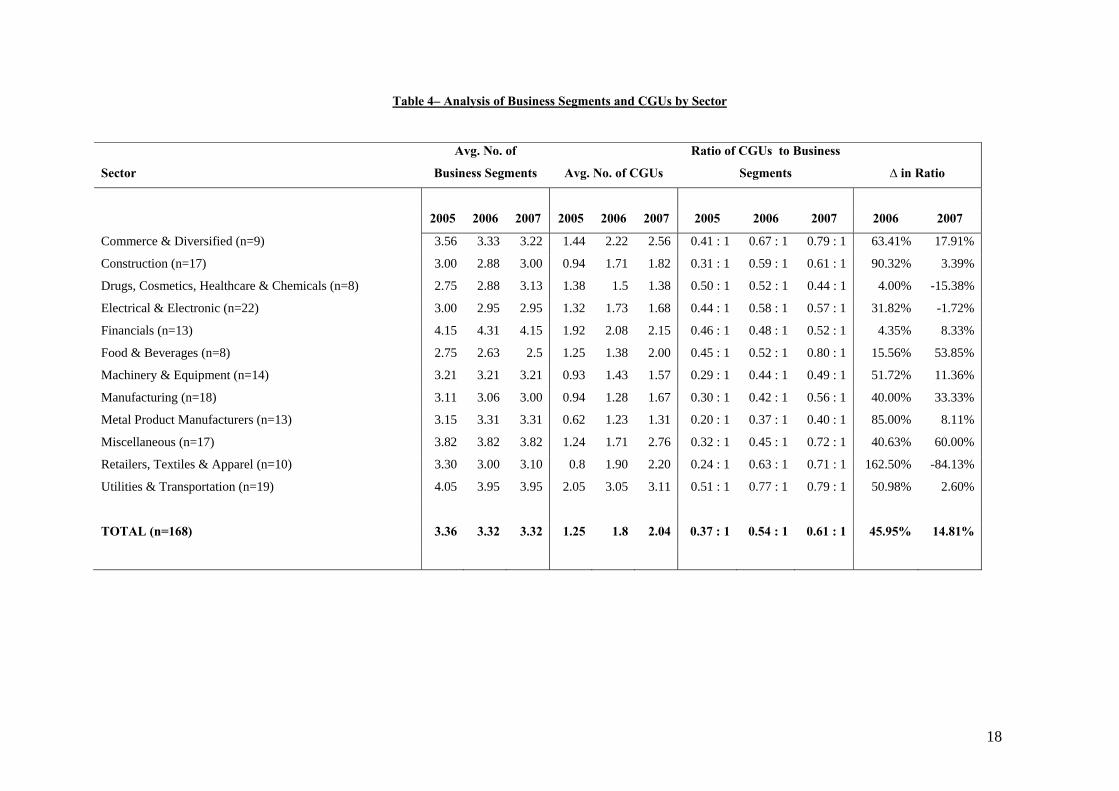
Table 4 contains further data which bears on the CGU aggregation issue, through calculation of the
CGU to business segment ratio for the sample. Whist built using the same underlying data as used to
generate Table 3, the advantage of the ratio based analysis set out in Table 4 is that it facilitates a whole
of sample (and industry segment by industry segment) overview of the quantitative relationships
between segment frequency counts and CGU frequency counts.
The interpretation of this data is based on the intuition that CGU to segment ratios materially less than
one suggest the existence of a heightened risk of aggregation problems, given the expectation raised in
FRS 36 that CGUs be no larger than defined business segments. The results set out in Table 4 suggest
that there is reason for concern that this has been a problem in the Singaporean context, since for the
sample as a whole, sample firms only defined 0.37, 0.54 and 0.61 CGUs for each business segment in
2005, 2006 and 2007 respectively.18
18 These CGU to Segment ratios are also materially lower than those observed in other advanced economic jurisdictions in the Asia-Pacific region. See Carlin & Finch (2009) for further and better particulars of the contemporary Australian situation.
17
Table 3 – Business Segments and CGU Aggregation by Sector
Sector
No. CGUs > No.
Segments
No. CGUs = No.
Segments
No. CGUs < No.
Segments
No Effective
Disclosure
2005 2006 2007 2005 2006 2007 2005 2006 2007 2005 2006 2007
Commerce & Diversified (n=9) 1 3 2 1 0 1 4 5 5 3 1 1
Construction (n=17) 2 3 2 1 4 6 5 6 6 9 4 3
Drugs, Cosmetics, Healthcare & Chemicals (n=8) 2 2 1 1 1 1 3 2 3 2 3 3
Electrical & Electronic (n=22) 2 4 4 3 1 4 9 11 7 8 6 7
Financials (n=13) 1 2 2 1 2 2 9 6 6 2 3 3
Food & Beverages (n=8) 1 0 2 2 2 2 3 4 3 2 2 1
Machinery & Equipment (n=14) 1 1 1 1 1 1 4 8 10 8 4 2
Manufacturing (n=18) 2 1 2 1 3 4 9 11 10 6 3 2
Metal Product Manufacturers (n=13) 0 0 0 1 3 3 6 8 9 6 2 1
Miscellaneous (n=17) 1 2 3 0 0 2 9 9 11 7 6 1
Retailers, Textiles & Apparel (n=10) 0 2 3 2 2 1 3 4 4 5 2 2
Utilities & Transportation (n=19) 4 5 5 1 0 1 7 11 10 7 3 3
TOTAL (n=168) 17 25 27 15 19 28 71 85 84 65 39 29
18
Table 4– Analysis of Business Segments and CGUs by Sector
Sector
Avg. No. of
Business Segments Avg. No. of CGUs
Ratio of CGUs to Business
Segments ∆ in Ratio
2005 2006 2007 2005 2006 2007 2005 2006 2007 2006 2007
Commerce & Diversified (n=9) 3.56 3.33 3.22 1.44 2.22 2.56 0.41 : 1 0.67 : 1 0.79 : 1 63.41% 17.91%
Construction (n=17) 3.00 2.88 3.00 0.94 1.71 1.82 0.31 : 1 0.59 : 1 0.61 : 1 90.32% 3.39%
Drugs, Cosmetics, Healthcare & Chemicals (n=8) 2.75 2.88 3.13 1.38 1.5 1.38 0.50 : 1 0.52 : 1 0.44 : 1 4.00% -15.38%
Electrical & Electronic (n=22) 3.00 2.95 2.95 1.32 1.73 1.68 0.44 : 1 0.58 : 1 0.57 : 1 31.82% -1.72%
Financials (n=13) 4.15 4.31 4.15 1.92 2.08 2.15 0.46 : 1 0.48 : 1 0.52 : 1 4.35% 8.33%
Food & Beverages (n=8) 2.75 2.63 2.5 1.25 1.38 2.00 0.45 : 1 0.52 : 1 0.80 : 1 15.56% 53.85%
Machinery & Equipment (n=14) 3.21 3.21 3.21 0.93 1.43 1.57 0.29 : 1 0.44 : 1 0.49 : 1 51.72% 11.36%
Manufacturing (n=18) 3.11 3.06 3.00 0.94 1.28 1.67 0.30 : 1 0.42 : 1 0.56 : 1 40.00% 33.33%
Metal Product Manufacturers (n=13) 3.15 3.31 3.31 0.62 1.23 1.31 0.20 : 1 0.37 : 1 0.40 : 1 85.00% 8.11%
Miscellaneous (n=17) 3.82 3.82 3.82 1.24 1.71 2.76 0.32 : 1 0.45 : 1 0.72 : 1 40.63% 60.00%
Retailers, Textiles & Apparel (n=10) 3.30 3.00 3.10 0.8 1.90 2.20 0.24 : 1 0.63 : 1 0.71 : 1 162.50% -84.13%
Utilities & Transportation (n=19) 4.05 3.95 3.95 2.05 3.05 3.11 0.51 : 1 0.77 : 1 0.79 : 1 50.98% 2.60%
TOTAL (n=168) 3.36 3.32 3.32 1.25 1.8 2.04 0.37 : 1 0.54 : 1 0.61 : 1 45.95% 14.81%
19
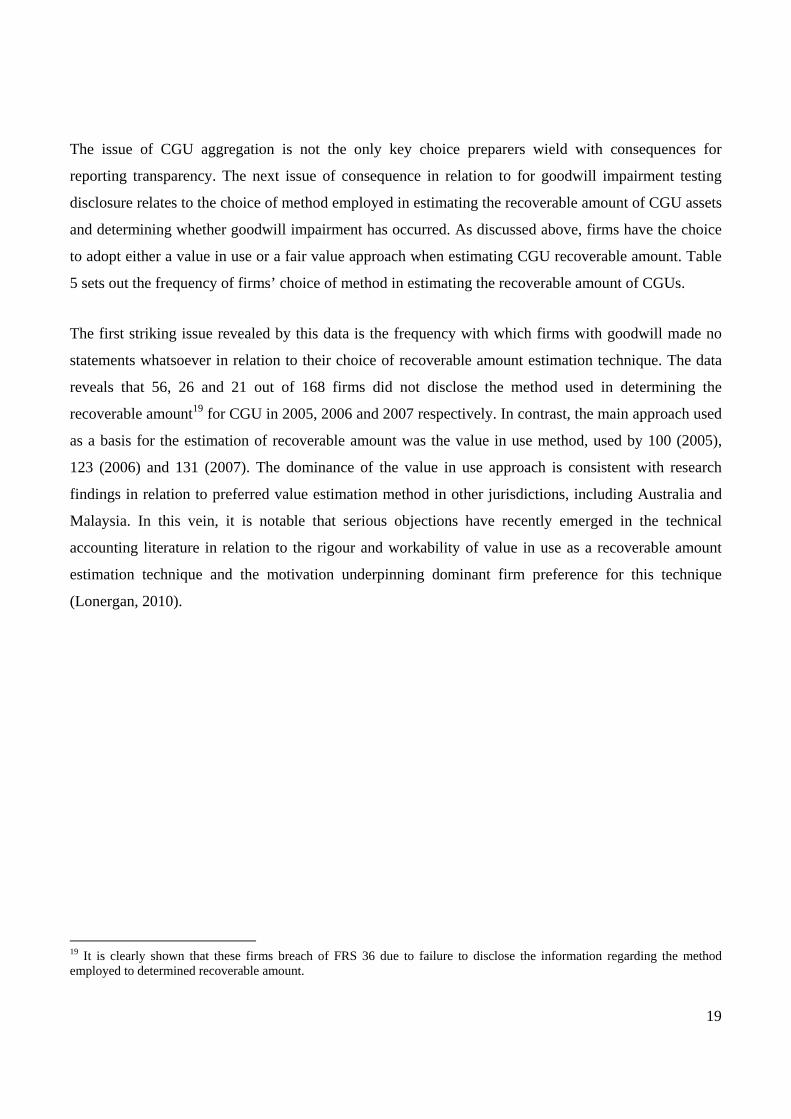
The issue of CGU aggregation is not the only key choice preparers wield with consequences for
reporting transparency. The next issue of consequence in relation to for goodwill impairment testing
disclosure relates to the choice of method employed in estimating the recoverable amount of CGU assets
and determining whether goodwill impairment has occurred. As discussed above, firms have the choice
to adopt either a value in use or a fair value approach when estimating CGU recoverable amount. Table
5 sets out the frequency of firms’ choice of method in estimating the recoverable amount of CGUs.
The first striking issue revealed by this data is the frequency with which firms with goodwill made no
statements whatsoever in relation to their choice of recoverable amount estimation technique. The data
reveals that 56, 26 and 21 out of 168 firms did not disclose the method used in determining the
recoverable amount19 for CGU in 2005, 2006 and 2007 respectively. In contrast, the main approach used
as a basis for the estimation of recoverable amount was the value in use method, used by 100 (2005),
123 (2006) and 131 (2007). The dominance of the value in use approach is consistent with research
findings in relation to preferred value estimation method in other jurisdictions, including Australia and
Malaysia. In this vein, it is notable that serious objections have recently emerged in the technical
accounting literature in relation to the rigour and workability of value in use as a recoverable amount
estimation technique and the motivation underpinning dominant firm preference for this technique
(Lonergan, 2010).
19 It is clearly shown that these firms breach of FRS 36 due to failure to disclose the information regarding the method employed to determined recoverable amount.

20
Table 5 – Method Employed to Determine Recoverable Amount by Sector
Sector Fair Value Method
Value in Use
Method Mixed Method
Method Not
Disclosed
2005 2006 2007 2005 2006 2007 2005 2006 2007 2005 2006 2007
Commerce & Diversified (n=9) - - - 7 8 9 - - - 2 1 -
Construction (n=17) 1 1 1 11 14 15 - - - 5 2 1
Drugs, Cosmetics, Healthcare &
Chemicals (n=8) - - - 8 8 8 - - - - - -
Electrical & Electronic (n=22) - - - 15 16 16 - 1 - 7 5 6
Financials (n=13) 1 - - 8 8 9 3 4 3 1 1 1
Food & Beverages (n=8) - - - 6 6 6 - - - 2 2 2
Machinery & Equipment (n=14) - 1 1 6 11 11 1 1 1 7 1 1
Manufacturing (n=18) 1 - - 7 15 15 - - - 10 3 3
Metal Product Manufacturers (n=13) - 1 1 7 9 10 - - - 6 3 2
Miscellaneous (n=17) 3 2 2 9 8 11 - 3 3 5 4 1
Retailers, Textiles & Apparel (n=10) - 1 2 5 7 6 - 1 1 5 1 1
Utilities & Transportation (n=19) 1 1 1 11 13 15 1 2 - 6 3 3
TOTAL (n=168) 7 7 8 100 123 131 5 12 8 56 26 21

21
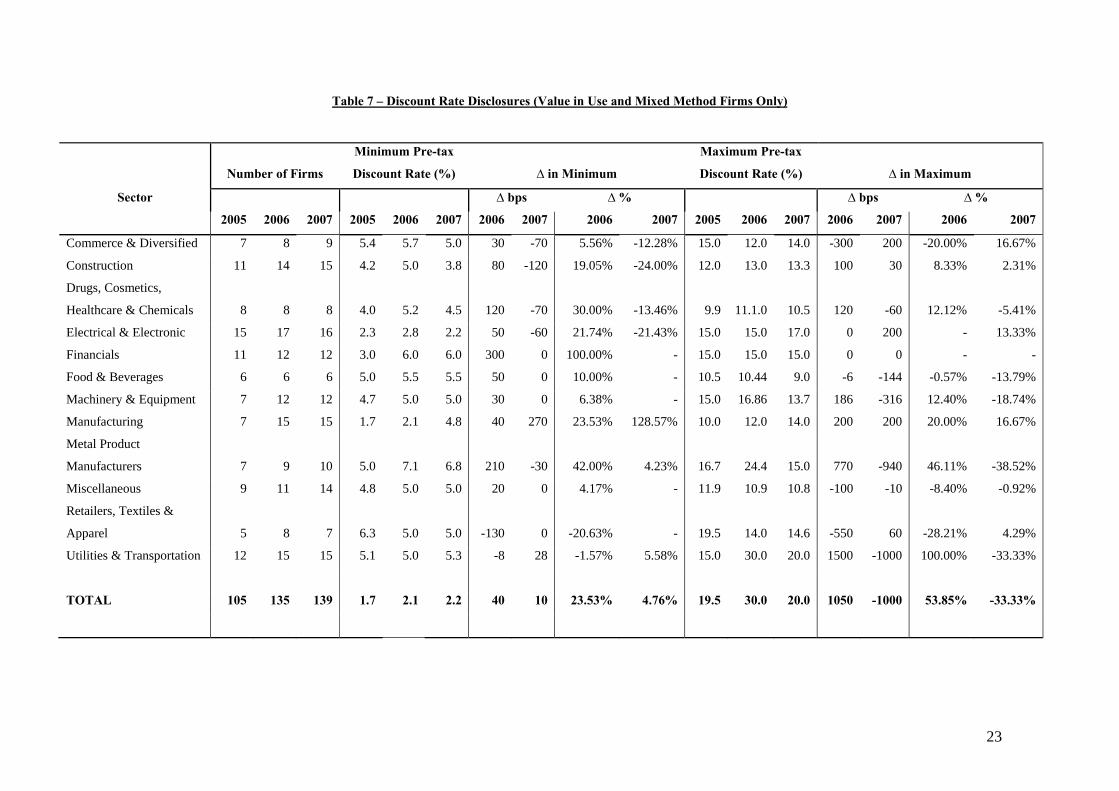
One of the consequences of the decision to adopt value in use as a basis for recoverable amount
estimation is the requirement that firms provide detailed disclosures in relation to the discount rates,
growth rates and the time horizons assumed as elements of the discounted cashflow modelling approach
which supports the generation of value in use estimates. Each of these matters has the capacity to
materially influence the outcome of the value estimation process.
In relation to discount rates, where firms adopt value in use as their method in impairment testing
process, Paragraph 134 (d) of FRS 36 requires disclosures relating to discount rates applied to the cash
flow projections and specifies that these discount rates shall be stated on a pre-tax basis. Discount rate
disclosures are important for firms in process of modelling the CGU asset portfolio recoverable amount.
This means that the discount rates employed should not reflect firm financing structure decisions and at
the same time be able to show variation across CGUs where business risk differs. The information
related to the discount rates is of material significance to financial statement users seeking to
independently evaluate the impairment testing process applied by a firm. The variation in discount rate
disclosures of the Singapore listed firms for 2005, 2006 and 2007 are details in Table 6.
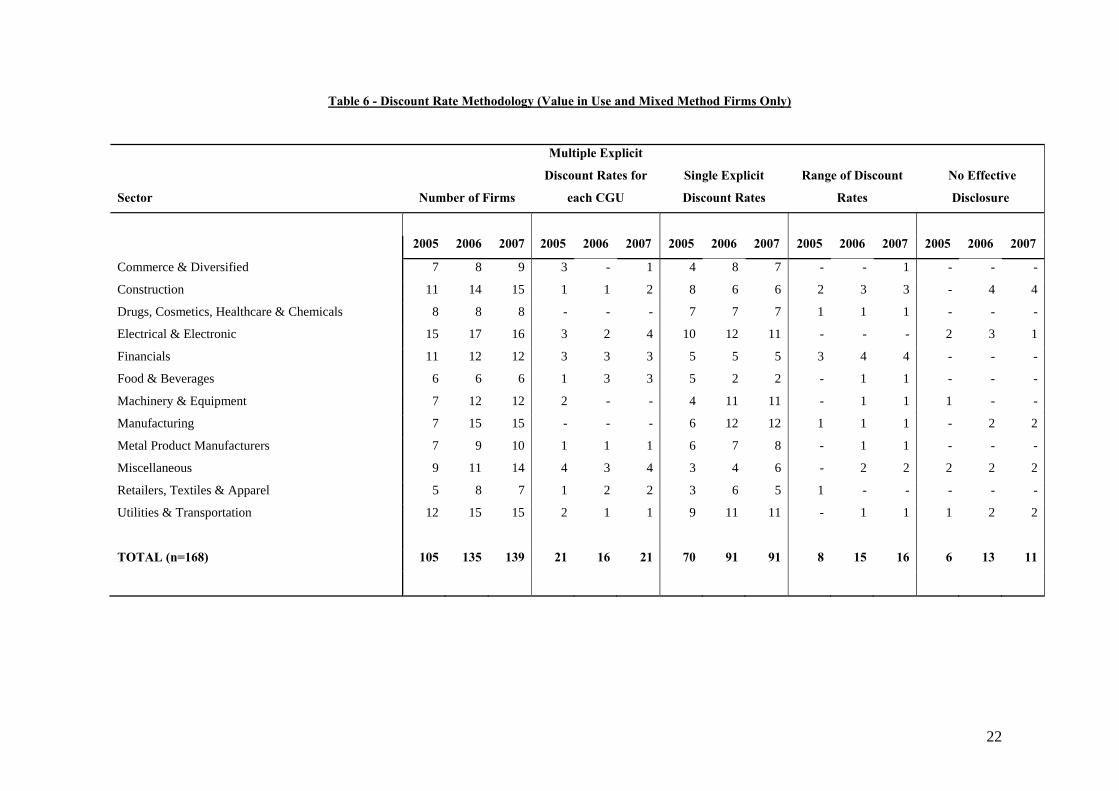
Table 6 clearly shows that the disclosure of discount rates among Singapore firms in the sample was in
aggregate inadequate when benchmarked against the requirements of the standard. Overall, a very high
proportion of firms provided no information which would enable meaningful quantification of the
discount rate used as part of the cash flow projections used in recoverable amount estimation.
The dominant choice of discount rate disclosure among those firms which made explicit and specific
disclosures relating to the discount rates they had utilised in the context of impairment testing was to
acknowledge the use of a single firm wide discount rate. Despite the admonition that discount rates
should be crafted to fit the explicit contours of the risks associated with each CGU, it was comparatively
rare for sample firms to define explicit CGU specific discount rates which exhibited variation within
firm. The data also demonstrates the existence of discount rates which appear to be unusually low,
though the extent to which these vary from reasonable risk adjusted rates is a matter not adverted to
specifically in this study.20
20 However, see Carlin & Finch (2009) for a detailed treatment of this particular issue.
22
Table 6 - Discount Rate Methodology (Value in Use and Mixed Method Firms Only)
Sector Number of Firms
Multiple Explicit
Discount Rates for
each CGU
Single Explicit
Discount Rates
Range of Discount
Rates
No Effective
Disclosure
2005 2006 2007 2005 2006 2007 2005 2006 2007 2005 2006 2007 2005 2006 2007
Commerce & Diversified 7 8 9 3 - 1 4 8 7 - - 1 - - -
Construction 11 14 15 1 1 2 8 6 6 2 3 3 - 4 4
Drugs, Cosmetics, Healthcare & Chemicals 8 8 8 - - - 7 7 7 1 1 1 - - -
Electrical & Electronic 15 17 16 3 2 4 10 12 11 - - - 2 3 1
Financials 11 12 12 3 3 3 5 5 5 3 4 4 - - -
Food & Beverages 6 6 6 1 3 3 5 2 2 - 1 1 - - -
Machinery & Equipment 7 12 12 2 - - 4 11 11 - 1 1 1 - -
Manufacturing 7 15 15 - - - 6 12 12 1 1 1 - 2 2
Metal Product Manufacturers 7 9 10 1 1 1 6 7 8 - 1 1 - - -
Miscellaneous 9 11 14 4 3 4 3 4 6 - 2 2 2 2 2
Retailers, Textiles & Apparel 5 8 7 1 2 2 3 6 5 1 - - - - -
Utilities & Transportation 12 15 15 2 1 1 9 11 11 - 1 1 1 2 2
TOTAL (n=168) 105 135 139 21 16 21 70 91 91 8 15 16 6 13 11
23
Table 7 – Discount Rate Disclosures (Value in Use and Mixed Method Firms Only)
Sector
Number of Firms
Minimum Pre-tax
Discount Rate (%) ∆ in Minimum
Maximum Pre-tax
Discount Rate (%) ∆ in Maximum
∆ bps ∆ % ∆ bps ∆ %
2005 2006 2007 2005 2006 2007 2006 2007 2006 2007 2005 2006 2007 2006 2007 2006 2007
Commerce & Diversified 7 8 9 5.4 5.7 5.0 30 -70 5.56% -12.28% 15.0 12.0 14.0 -300 200 -20.00% 16.67%
Construction 11 14 15 4.2 5.0 3.8 80 -120 19.05% -24.00% 12.0 13.0 13.3 100 30 8.33% 2.31%
Drugs, Cosmetics,
Healthcare & Chemicals 8 8 8 4.0 5.2 4.5 120 -70 30.00% -13.46% 9.9 11.1.0 10.5 120 -60 12.12% -5.41%
Electrical & Electronic 15 17 16 2.3 2.8 2.2 50 -60 21.74% -21.43% 15.0 15.0 17.0 0 200 - 13.33%
Financials 11 12 12 3.0 6.0 6.0 300 0 100.00% - 15.0 15.0 15.0 0 0 - -
Food & Beverages 6 6 6 5.0 5.5 5.5 50 0 10.00% - 10.5 10.44 9.0 -6 -144 -0.57% -13.79%
Machinery & Equipment 7 12 12 4.7 5.0 5.0 30 0 6.38% - 15.0 16.86 13.7 186 -316 12.40% -18.74%
Manufacturing 7 15 15 1.7 2.1 4.8 40 270 23.53% 128.57% 10.0 12.0 14.0 200 200 20.00% 16.67%
Metal Product
Manufacturers 7 9 10 5.0 7.1 6.8 210 -30 42.00% 4.23% 16.7 24.4 15.0 770 -940 46.11% -38.52%
Miscellaneous 9 11 14 4.8 5.0 5.0 20 0 4.17% - 11.9 10.9 10.8 -100 -10 -8.40% -0.92%
Retailers, Textiles &
Apparel 5 8 7 6.3 5.0 5.0 -130 0 -20.63% - 19.5 14.0 14.6 -550 60 -28.21% 4.29%
Utilities & Transportation 12 15 15 5.1 5.0 5.3 -8 28 -1.57% 5.58% 15.0 30.0 20.0 1500 -1000 100.00% -33.33%
TOTAL 105 135 139 1.7 2.1 2.2 40 10 23.53% 4.76% 19.5 30.0 20.0 1050 -1000 53.85% -33.33%
24
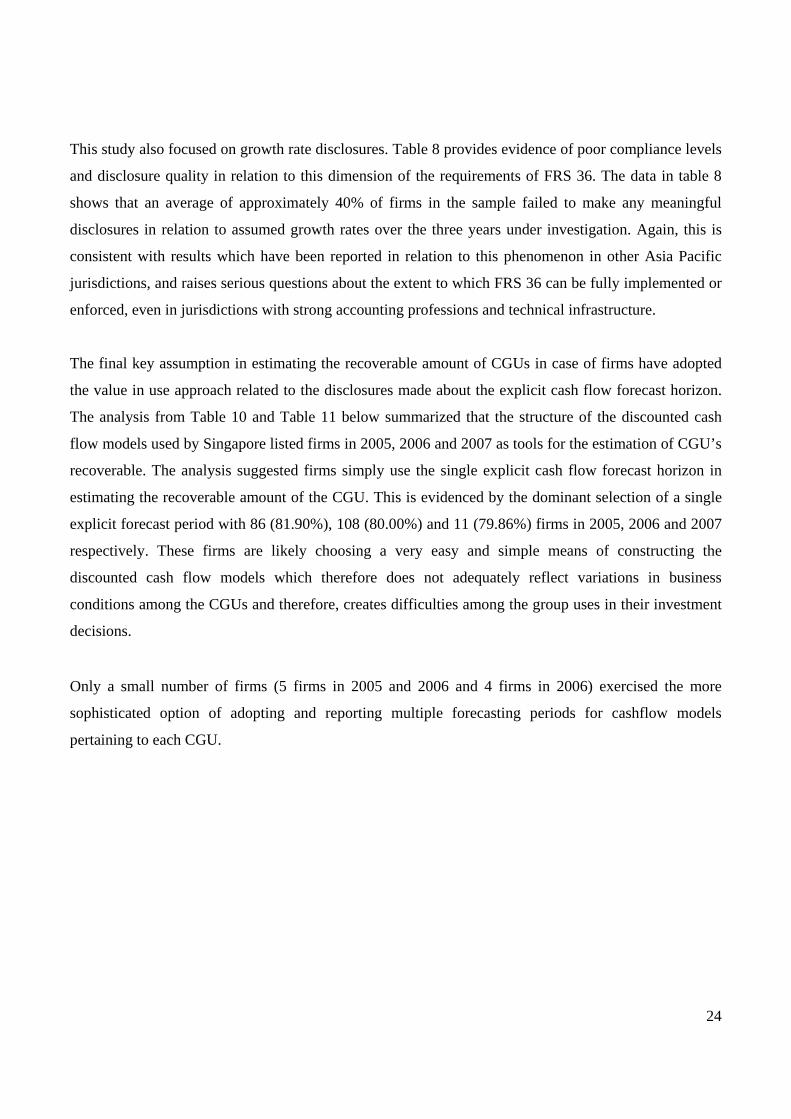
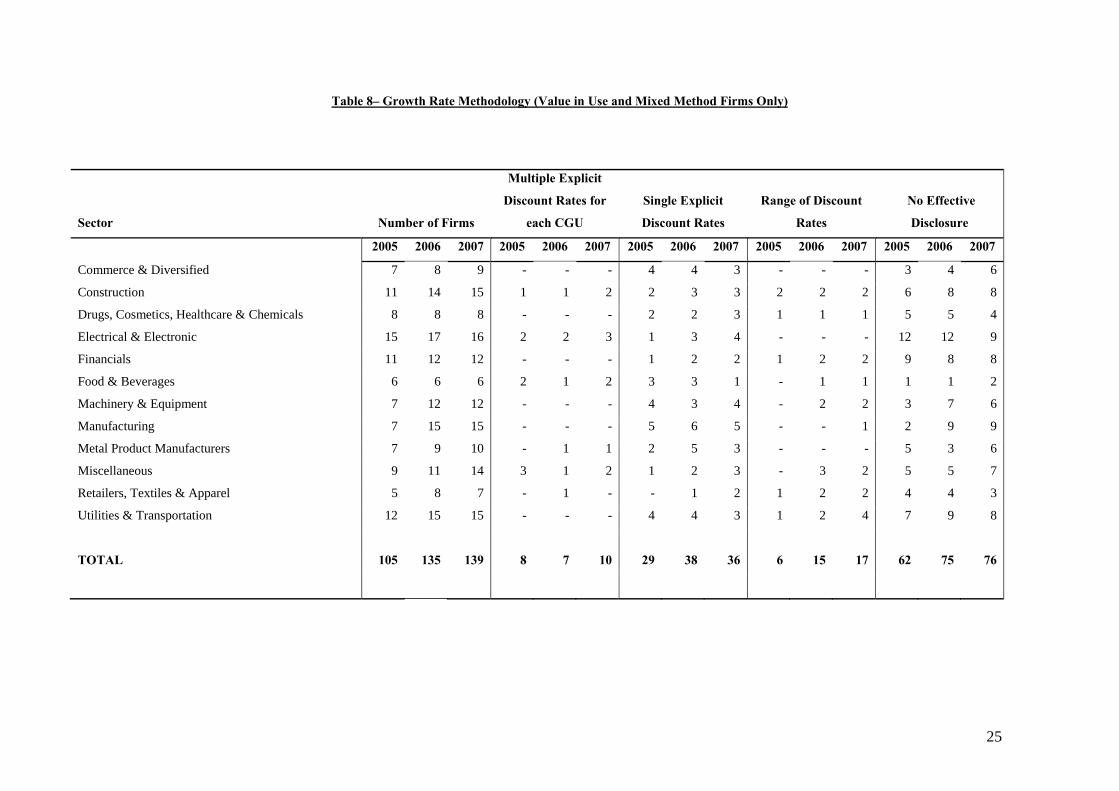
This study also focused on growth rate disclosures. Table 8 provides evidence of poor compliance levels
and disclosure quality in relation to this dimension of the requirements of FRS 36. The data in table 8
shows that an average of approximately 40% of firms in the sample failed to make any meaningful
disclosures in relation to assumed growth rates over the three years under investigation. Again, this is
consistent with results which have been reported in relation to this phenomenon in other Asia Pacific
jurisdictions, and raises serious questions about the extent to which FRS 36 can be fully implemented or
enforced, even in jurisdictions with strong accounting professions and technical infrastructure.
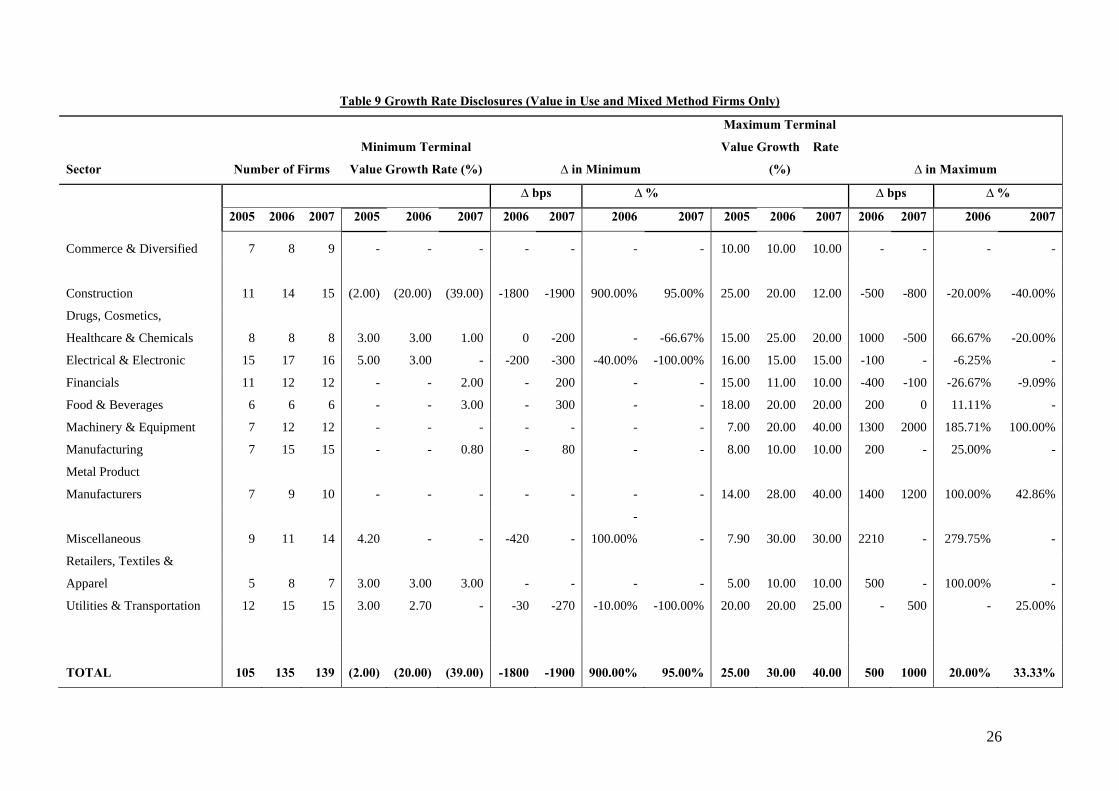
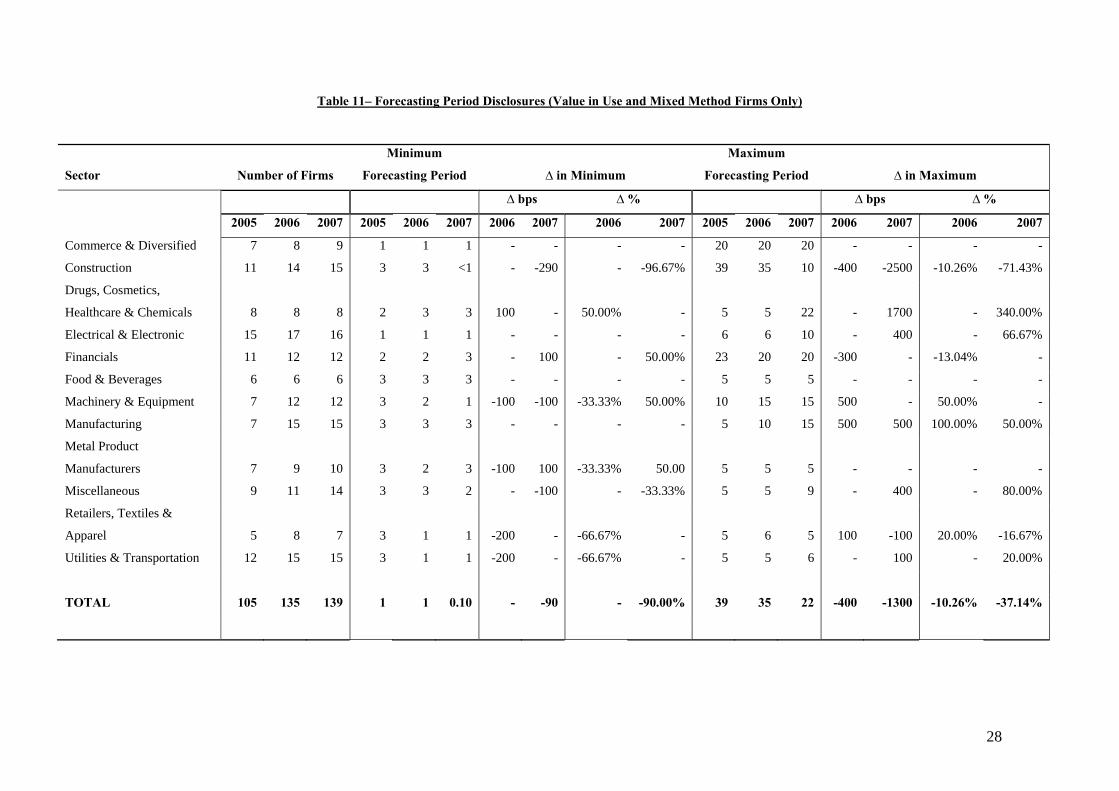
The final key assumption in estimating the recoverable amount of CGUs in case of firms have adopted
the value in use approach related to the disclosures made about the explicit cash flow forecast horizon.
The analysis from Table 10 and Table 11 below summarized that the structure of the discounted cash
flow models used by Singapore listed firms in 2005, 2006 and 2007 as tools for the estimation of CGU’s
recoverable. The analysis suggested firms simply use the single explicit cash flow forecast horizon in
estimating the recoverable amount of the CGU. This is evidenced by the dominant selection of a single
explicit forecast period with 86 (81.90%), 108 (80.00%) and 11 (79.86%) firms in 2005, 2006 and 2007
respectively. These firms are likely choosing a very easy and simple means of constructing the
discounted cash flow models which therefore does not adequately reflect variations in business
conditions among the CGUs and therefore, creates difficulties among the group uses in their investment
decisions.
Only a small number of firms (5 firms in 2005 and 2006 and 4 firms in 2006) exercised the more
sophisticated option of adopting and reporting multiple forecasting periods for cashflow models
pertaining to each CGU.
25
Table 8– Growth Rate Methodology (Value in Use and Mixed Method Firms Only)
Sector Number of Firms
Multiple Explicit
Discount Rates for
each CGU
Single Explicit
Discount Rates
Range of Discount
Rates
No Effective
Disclosure
2005 2006 2007 2005 2006 2007 2005 2006 2007 2005 2006 2007 2005 2006 2007
Commerce & Diversified 7 8 9 - - - 4 4 3 - - - 3 4 6
Construction 11 14 15 1 1 2 2 3 3 2 2 2 6 8 8
Drugs, Cosmetics, Healthcare & Chemicals 8 8 8 - - - 2 2 3 1 1 1 5 5 4
Electrical & Electronic 15 17 16 2 2 3 1 3 4 - - - 12 12 9
Financials 11 12 12 - - - 1 2 2 1 2 2 9 8 8
Food & Beverages 6 6 6 2 1 2 3 3 1 - 1 1 1 1 2
Machinery & Equipment 7 12 12 - - - 4 3 4 - 2 2 3 7 6
Manufacturing 7 15 15 - - - 5 6 5 - - 1 2 9 9
Metal Product Manufacturers 7 9 10 - 1 1 2 5 3 - - - 5 3 6
Miscellaneous 9 11 14 3 1 2 1 2 3 - 3 2 5 5 7
Retailers, Textiles & Apparel 5 8 7 - 1 - - 1 2 1 2 2 4 4 3
Utilities & Transportation 12 15 15 - - - 4 4 3 1 2 4 7 9 8
TOTAL 105 135 139 8 7 10 29 38 36 6 15 17 62 75 76
26
Table 9 Growth Rate Disclosures (Value in Use and Mixed Method Firms Only)
Sector Number of Firms
Minimum Terminal
Value Growth Rate (%) ∆ in Minimum
Maximum Terminal
Value Growth Rate
(%) ∆ in Maximum
∆ bps ∆ % ∆ bps ∆ %
2005 2006 2007 2005 2006 2007 2006 2007 2006 2007 2005 2006 2007 2006 2007 2006 2007
Commerce & Diversified 7 8 9 - - - - - - - 10.00 10.00 10.00 - - - -
Construction 11 14 15
(2.00)
(20.00)
(39.00) -1800 -1900 900.00% 95.00% 25.00 20.00 12.00 -500 -800 -20.00% -40.00%
Drugs, Cosmetics,
Healthcare & Chemicals 8 8 8 3.00 3.00 1.00 0 -200 - -66.67% 15.00 25.00 20.00 1000 -500 66.67% -20.00%
Electrical & Electronic 15 17 16 5.00 3.00 - -200 -300 -40.00% -100.00% 16.00 15.00 15.00 -100 - -6.25% -
Financials 11 12 12 - - 2.00 - 200 - - 15.00 11.00 10.00 -400 -100 -26.67% -9.09%
Food & Beverages 6 6 6 - - 3.00 - 300 - - 18.00 20.00 20.00 200 0 11.11% -
Machinery & Equipment 7 12 12 - - - - - - - 7.00 20.00 40.00 1300 2000 185.71% 100.00%
Manufacturing 7 15 15 - - 0.80 - 80 - - 8.00 10.00 10.00 200 - 25.00% -
Metal Product
Manufacturers 7 9 10 - - - - - - - 14.00 28.00 40.00 1400 1200 100.00% 42.86%
Miscellaneous 9 11 14 4.20 - - -420 -
-
100.00% - 7.90 30.00 30.00 2210 - 279.75% -
Retailers, Textiles &
Apparel 5 8 7 3.00 3.00 3.00 - - - - 5.00 10.00 10.00 500 - 100.00% -
Utilities & Transportation 12 15 15 3.00 2.70 - -30 -270 -10.00% -100.00% 20.00 20.00 25.00 - 500 - 25.00%
TOTAL 105 135 139
(2.00)
(20.00)
(39.00) -1800 -1900 900.00% 95.00% 25.00 30.00 40.00 500 1000 20.00% 33.33%
27
Table 10– Forecasting Period Methodology (Value in Use and Mixed Method Firms Only)
Sector Number of Firms
Multiple Forecasting
Period for each CGU
Single Forecasting
Period
Range of Forecasting
Period
No Effective
Disclosure
2005 2006 2007 2005 2006 2007 2005 2006 2007 2005 2006 2007 2005 2006 2007
Commerce & Diversified 7 8 9 1 - - 5 8 9 - - - 1 - -
Construction 11 14 15 - - 1 10 11 11 - 1 1 1 2 2
Drugs, Cosmetics, Healthcare & Chemicals 8 8 8 - - - 8 8 8 - - - - - -
Electrical & Electronic 15 17 16 - - - 12 14 13 1 1 1 2 2 2
Financials 11 12 12 2 1 1 8 9 8 1 1 1 - 1 2
Food & Beverages 6 6 6 - 1 1 6 4 5 - - - - 1 -
Machinery & Equipment 7 12 12 - - - 7 11 11 - - - - 1 1
Manufacturing 7 15 15 - - 1 7 11 10 - 1 1 - 3 3
Metal Product Manufacturers 7 9 10 - - - 6 9 10 - - - 1 - -
Miscellaneous 9 11 14 1 1 1 4 4 8 - 1 - 4 5 5
Retailers, Textiles & Apparel 5 8 7 - 1 - 4 6 6 - - - 1 1 1
Utilities & Transportation 12 15 15 1 - - 9 13 12 - - - 2 2 3
TOTAL 105 135 139 5 4 5 86 108 111 2 5 4 12 18 19
28
Table 11– Forecasting Period Disclosures (Value in Use and Mixed Method Firms Only)
Sector Number of Firms
Minimum
Forecasting Period ∆ in Minimum
Maximum
Forecasting Period ∆ in Maximum
∆ bps ∆ % ∆ bps ∆ %
2005 2006 2007 2005 2006 2007 2006 2007 2006 2007 2005 2006 2007 2006 2007 2006 2007
Commerce & Diversified 7 8 9 1 1 1 - - - - 20 20 20 - - - -
Construction 11 14 15 3 3 <1 - -290 - -96.67% 39 35 10 -400 -2500 -10.26% -71.43%
Drugs, Cosmetics,
Healthcare & Chemicals 8 8 8 2 3 3 100 - 50.00% - 5 5 22 - 1700 - 340.00%
Electrical & Electronic 15 17 16 1 1 1 - - - - 6 6 10 - 400 - 66.67%
Financials 11 12 12 2 2 3 - 100 - 50.00% 23 20 20 -300 - -13.04% -
Food & Beverages 6 6 6 3 3 3 - - - - 5 5 5 - - - -
Machinery & Equipment 7 12 12 3 2 1 -100 -100 -33.33% 50.00% 10 15 15 500 - 50.00% -
Manufacturing 7 15 15 3 3 3 - - - - 5 10 15 500 500 100.00% 50.00%
Metal Product
Manufacturers 7 9 10 3 2 3 -100 100 -33.33% 50.00 5 5 5 - - - -
Miscellaneous 9 11 14 3 3 2 - -100 - -33.33% 5 5 9 - 400 - 80.00%
Retailers, Textiles &
Apparel 5 8 7 3 1 1 -200 - -66.67% - 5 6 5 100 -100 20.00% -16.67%
Utilities & Transportation 12 15 15 3 1 1 -200 - -66.67% - 5 5 6 - 100 - 20.00%
TOTAL 105 135 139 1 1 0.10 - -90 - -90.00% 39 35 22 -400 -1300 -10.26% -37.14%

29
5. CONCLUSION
This study extends prior research through the presentation of a multi year study of the impairment
testing disclosure compliance and quality phenomenon in Singapore. Applying a methodology
consistent with earlier published studies of this question in relation to Australia, New Zealand and
Malaysia, three substantial issues stand out. First, compliance rates with basic elements of the
mandatory disclosure framework mandated under Singapore standard FRS 36 (an analogue to IAS 36)
are surprisingly poor, particularly in light of the advanced nature of Singapore’s economy, capital
markets, financial and regulatory institutions. Second, poor compliance and patchy disclosure quality
cannot be explained simply by reference to first year adoption teething effects. Third, the results evident
on the basis of the data from Singapore are strikingly resemblant of the results uncovered in analogous
research conducted in other Asia Pacific jurisdictions. This increases the likelihood that the revelations
of poor compliance and patchy disclosure quality in those jurisdictions was not a product of jurisdiction
specific idiosyncrasies, but more likely, a systemic problem which transcends borders and manifests
wherever IFRS has been adopted or is in the process of being adopted.
The results of this research reinforce the significance of the compliance issue as a matter for serious
contemplation by academic researchers, practitioners, policy makers and regulators alike. Arguably,
compliance continues to represent a phenomenon overlooked by many in the financial reporting research
community, particularly in cases where research methodologies draw upon data compiled in commercial
databases. In these instances, compliance quality is not a salient variable, since the underlying quality of
the primary financial disclosures drawn upon as a basis for database construction are not visible or
salient to researchers. In contemplating the rigour of research design, this is a matter for concern and
caution.
30
REFERENCES
Anantharaman, D., (2007), Has SFAS 142 Diminished the Reliability of Goodwill Writeoff? Columbia Business School Working Paper.
Carlin, T. M. & Finch, N., (2007), "Early Impressions of Australia's Brave New World of Goodwill",
SSRN, http://ssrn.com/abstract=954667 Carlin, T. M. & Finch, N., (2009), "Evidence of Australia’s Compliance with IFRS Goodwill
Impairment Testing Disclosures", International Journal of Economic Issues, vol. 2, iss. 1, pp. 53-73.
Carlin, T. M. & Finch, N., (2010), "Resisting Compliance with IFRS Goodwill Accounting and
Reporting Disclosures – Evidence from Australia", Journal of Accounting & Organizational Change, vol. 6, iss. 2, pp. forthcoming.
Carlin, T. M., Finch, N. & Ford, G., (2007), "Goodwill Impairment - An Assessment of Disclosure
Quality and Compliance Levels by Large Listed Australian Firms", SSRN, http://ssrn.com/abstract=963078
Carlin, T. M., Finch, N. & Laili, N. H., (2009), "Goodwill Accounting in Malaysia and the Transition to
IFRS - A Compliance Assessment of Large First Year Adopters'", Journal of Financial Reporting & Accounting, vol. 7, iss. 1, pp. 75-104.
Cearns, K., (1999), "Impairment: Understanding CGU’s", Accountancy, vol. 123, iss. 1267, pp. 104-105. Chen, C., Kohlbeck, M. J. & Warfield, T., (2006), Goodwill Valuation Effects of the Initial Adoption of
SFAS 142. Working Paper, University of Wisconsin. Dagwell, R., Windsor, C. & Wines, G., (2004), The Proposed Goodwill Impairment Test-Implications
for Preparers, Auditors and Corporate Governance. One-Day Symposium on Accountability, Governance and Performance in Transition Griffith University, Australia, Griffith Business School.
Doupnik, T. S. & Seese, L. P., (2001), "Geographic Area Disclosures Under SFAS 131: Materiality and
Fineness", Journal of International Accounting, Auditing and Taxation, vol. 10, iss. 2, pp. 117-138.
Harper, S., (2001), "Impairment Test Offers Clearer Picture of Goodwill", California CPA, vol. 70, iss.
2, pp. 13-14. Hayn, C. & Hughes, P., (2006), "Leading Indicators of Goodwill Impairment", Journal of Accounting,
Auditing and Finance, vol. 21 iss. 3, pp. 223-265.

31
Henning, S. L. & Shaw, W. H., (2003), "Is the Selection of the Amortization Period of Goodwill a Strategic Choice?", Review of Quantitative Finance and Accounting, vol. 20, iss. 4, pp. 315-333.
Jarva, H., (2008), "Do Firms Manage Fair Value Estimates? An Examination of SFAS 142 Goodwill
Impairments", SSRN, http://ssrn.com/abstract=1090836 Lonergan, W., (2010), "Impairment – a commercial perspective", Managerial Finance, vol. 36, iss. 7,
pp. forthcoming. Massoud, M. F. & Raiborn, C. A., (2003), "Accounting for Goodwill? Are We Better Off?", Review of
Business, vol. 24, iss. 2, pp. 26-33. Moehrle, S. R. & Reynolds-Moehrle, J. A., (2001), "Say Good-bye to Pooling and Goodwill
Amortization", Journal of Accountancy, vol. 192, iss. 3, pp. 31-38. Ramanna, K. & Watts, R. L., (2007), "Evidence on the Effects of Unverifiable Fair-Value Accounting",
SSRN, http://ssrn.com/abstract=1012139 Rennie, E. D. & Emmanuel, C. R., (1992), "Segmental Disclosure Practice: Thirteen Years On",
Accounting and Business Research, vol. 22, iss. 86, pp. 151-159. Wang, L., (2005), The Effect of SFAS No. 142 on Earnings Persistence 2005 AAA Annual Meeting. San
Francisco. Wines, G., Dagwell, R. & Windsor, C., (2007), "Implications of the IFRS Goodwill Accounting
Treatment", Managerial Auditing Journal, vol. 22, iss. 9, pp. 862-880. Wyatt, A., (2005), "Accounting Recognition of Intangibles Assets: Theory and Evidence on Economic
Determinants", The Accounting Review, vol. 80, iss. 3, pp. 967-1003. Zhang, I. & Zhang, Y., (2007), Accounting Discretion and Purchase Price Allocation After Acquisitions.
AAA 2007 Financial Accounting & Reporting Section (FARS) Meeting Paper.