
Introduction of Credit Default Swaps Draft Guidelines Purpose ...
Upload
khangminh22Category
view
1download
0
1
BARAKAT Habib, H05020
COSCAS Jérémie, H05088
Final year thesis - Majeure Finance
Listed dividend swaps on Eurex:
Does mispricing mean arbitrage opportunities?
Under the supervision of Mr. Christophe PERIGNON
Abstract
With the development of dividend-based strategies, dividends emerged as a genuine asset-
class over the last ten years. Mainly OTC, the market for dividend derivatives proved to be
imbalanced between supply and demand, creating mispricing. Some products, however,
tend to become standardized: Dividend swaps on the EURO STOXX 50 Index were launched
on Eurex in June 2008. Our paper aims at testing whether these dividend swaps are fairly
priced. We find that there is mispricing regarding these products and we try to quantify
potential arbitrage opportunities. Unfortunately for arbitrageurs, the products’ low liquidity
(epitomised by large bid-ask spreads) reduce significantly their number.
HEC Group
May 11, 2009

2
CONTENT
INTRODUCTION .......................................................................................................................... 3
1. MARKET AND PRODUCT PRESENTATIONS ........................................................................... 7
1.1. The market for dividend derivatives .......................................................................... 7
1.2. The market for dividend swaps .................................................................................. 8
1.2.1. Characteristics of a dividend swap ..................................................................... 8
1.2.2. Supply and demand: The cause of mispricing .................................................. 10
1.2.3. Benefits and drawbacks of this market and this product ................................ 11
2. EMPIRICAL STUDY .............................................................................................................. 14
2.1. Description of the sample ........................................................................................ 14
2.2. Methodology and analysis ....................................................................................... 16
2.2.1. Mispricing detection ........................................................................................ 16
2.2.2. Addressing main pitfalls ................................................................................... 25
CONCLUSION ............................................................................................................................ 33
ACKNOWLEDGMENT ................................................................................................................ 35
REFERENCES ............................................................................................................................. 36
APPENDIX: Additional graphs which show our results ............................................................ 37
3
INTRODUCTION
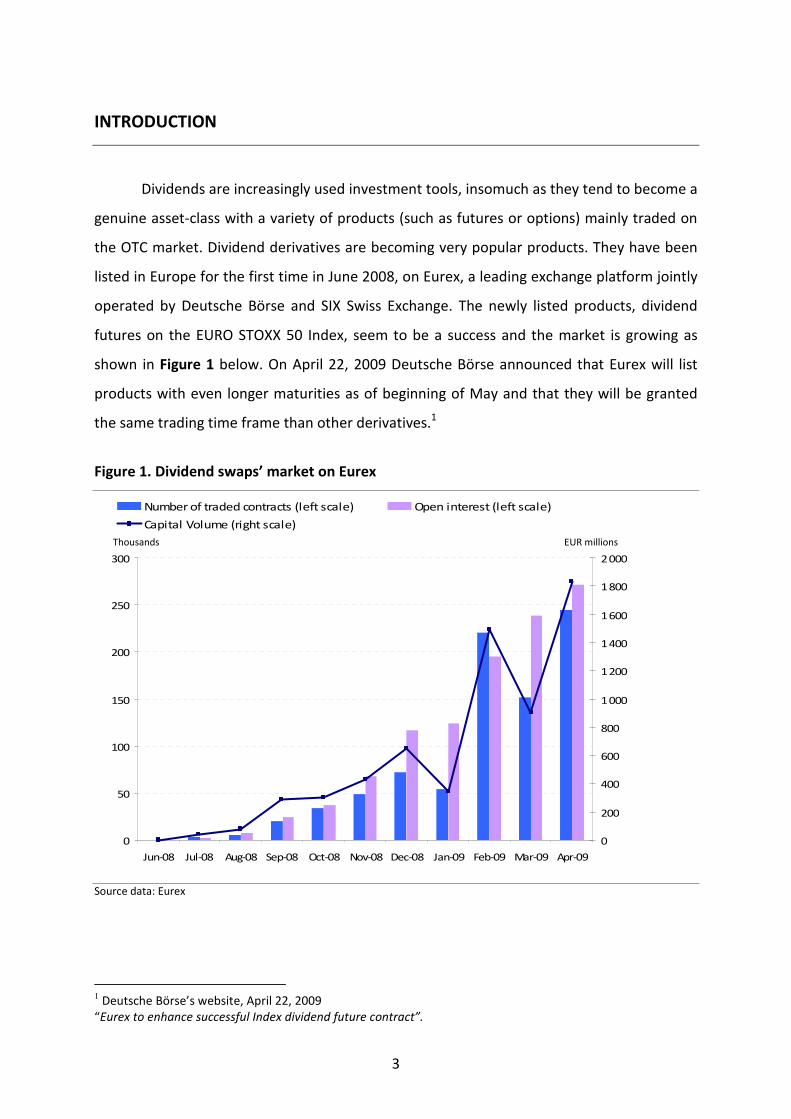
Dividends are increasingly used investment tools, insomuch as they tend to become a
genuine asset-class with a variety of products (such as futures or options) mainly traded on
the OTC market. Dividend derivatives are becoming very popular products. They have been
listed in Europe for the first time in June 2008, on Eurex, a leading exchange platform jointly
operated by Deutsche Börse and SIX Swiss Exchange. The newly listed products, dividend
futures on the EURO STOXX 50 Index, seem to be a success and the market is growing as
shown in Figure 1 below. On April 22, 2009 Deutsche Börse announced that Eurex will list
products with even longer maturities as of beginning of May and that they will be granted
the same trading time frame than other derivatives.1
Figure 1. Dividend swaps’ market on Eurex
0
50
100
150
200
250
300
Jun-08 Jul-08 Aug-08 Sep-08 Oct-08 Nov-08 Dec-08 Jan-09 Feb-09 Mar-09 Apr-09
0
200
400
600
800
1 000
1 200
1 400
1 600
1 800
2 000
Number of traded contracts (left scale) Open interest (left scale)
Capital Volume (right scale)
Source data: Eurex
1 Deutsche Börse’s website, April 22, 2009
“Eurex to enhance successful Index dividend future contract”.
Thousands EUR millions
4
Such an event is quite surprising as it occurs during an unprecedented financial crisis.
One indeed is most likely to expect asset-classes to disappear, not to be created. However,
there is still some room for such products in the market. It is all the more surprising so as it is
an asset-class born on pure uncertainty. In fact, all products are more or less directly linked
to an economic factor whereas dividends are direct functions of companies distribution
policies. To be more precise, following the dichotomy suggested by a Research Paper of
Goldman Sachs (released in September 2006), the distribution policy is only accounting for
half the truth as it constitutes the “propensity to pay dividends” of a firm. There is also
another factor: The firm’s “capacity to pay dividends”, which is determined by its capacity to
generate profit. Thus, the payoff of such a product is made up of two uncertainties; one
relying on the ability of the company to increase its earnings and the other on its will to
distribute some. In a former article, Black (1976) argued that “the harder we look at the
dividend picture, the more it seems like a puzzle, with pieces that just don’t fit together.”
Following his idea, it is practically impossible to know why companies do pay dividends and
why investors do pay attention to dividends. As a matter of fact he showed that companies
have equal (or even more) reasons not to pay dividends. Thus, why such a success for these
newly listed products? We will show how the market has emerged and describe its
characteristics. Assuming that supply and demand exist, the answer can be provided as
follows: Listed products, at least on Eurex, are on indexes and not single-stocks.2 This
reduces dramatically the uncertainty relative to whether the firm will pay dividends or not as
the index (the EURO STOXX 50 Index in our case) can be considered as a basket of single-
stocks. Thus, it can be rational to assume that at least one of the constituent companies of
the index will pay dividends. So the payoff of an index dividend swap exists and has a very
low probability to be equal to zero. The study of Fama and French (2001) seems to grant us
credit on this assertion. They were indeed able to determine the characteristics of dividend
payers that we summarized in Table 1 in the next page.
2 This idea is developed further away in our study.

5
Table 1. Dividend payers’ characteristics
Former payers Firms that have never paid
dividends Dividend payers
Profitability Low earnings
(distressed) Low earnings but profitable
Relatively high
earnings
Investment Few investments Strong investments (exceed
earnings) Less than earnings
Size Small or large Small Large Source data: Fama and French (2000)
According to their study, large profitable firms are the most likely to pay dividends.
As the EURO STOXX 50 Index is constituted by the 50 largest European firms in terms of
market capitalization, we can think not only that the payoff exists and is not equal to zero,
but also that it can be potentially substantial, as these companies are able to attract
investors, potentially with increases in dividends. However, Fama and French qualify that
conclusion: They showed that the number of firms paying dividends decreased drastically
during the 1926-1999 period mainly because of an increase in publicly traded firms having
the ”characteristics of firms that have never paid”; but also because there is a general lower
propensity of firms to pay dividends. The latter reward shareholders by other means such as
share repurchases for example.3 Thus, the payoff exists but it is nevertheless uncertain;
quite an unattractive feature for an investor in today’s markets a priori. So where does this
infatuation for such products stems from? Are these newly atypical listed products fairly
priced? We address these issues in two sections. The first is dedicated to the markets of
dividend derivatives and dividend swaps; the second is an empirical study which aims at
checking whether there is mispricing, and should the case arise, if arbitrage opportunities
can be exploited by investors. If the financial literature is rich with articles about the market
for such products, it seems relatively poor to the best of our knowledge as for their pricing
(because the market is very young as we will see). However, a study about pricing violations
and arbitrage opportunities on dividend swaps listed on Eurex was conducted by Wilkens
and Wimschulte (2009) a few months ago. The aim of our thesis is thereby to go further by
undertaking our own empirical study so as to draw our own conclusions and compare it to
theirs. For sake of clarity, we stress the importance of the nuance that exists for us between
mispricing and arbitrage in this case. We will show that mispricing exists but it may not
3 This idea is not only developed by Fama and French (2000), but also by Black (1976).

6
necessarily be synonym of arbitrage. If by replication we find price discrepancies, they seem
not viable because of the intrinsic characteristics of the products, especially their low
liquidity (large bid-ask spreads).
7
1. MARKET AND PRODUCT PRESENTATIONS
1.1. The market for dividend derivatives
Eleven years ago, Brennan (1998) foresaw the creation of a market for dividend
strips, necessary for various reasons. First, he argued that such a market (and by extent a
market for dividend derivatives) would provide valuable information about what he called
the “current fundamentals of the market”, namely dividends. Indeed, equity markets should
clearly reflect the growth rate of dividends, which is an important input in stock prices, that
are in fact considered as perpetuities on dividends.4 But according to Brennan, equity
markets are opaque on this topic, leading to market levels completely disconnected from
rational expectations: Investors not being able to extract the information can only rely on
their “hopes on future resale values” and they “cannot pit their estimates against those of
the market”. Hence the necessity to find a way to shed light on these market implicit
fundamentals. At that time, Brennan was convinced that such markets would eventually
emerge. In the light of his argumentation we understand that creating a market for dividend
derivatives responds to a financial necessity. But how did this market appear in practice? To
answer this interrogation we will rely on the comprehensive article of Manley and Mueller-
Glissmann (2008). Before going ahead, it is interesting to observe that they seem to agree
with Brennan’s argument. They indeed acknowledge that estimating dividends “can be
crucial for competitive pricing”, especially for products with long maturities which bear more
risks if dividends are not estimated correctly “because the cumulative dividends paid until
maturity have to be estimated”. Thus, the importance of dividends is crucial. That is why
such a market is needed.
According to Manley and Mueller-Glissmann the market actually emerged around
1999, even though products on dividends were marginally exchanged before, under the
form of over-the-counter transactions. It developed with “an excess supply in the derivatives
market”: Banks increasingly issuing structured products for retail and institutional investors
4 This is the Gordon-Shapiro formula (1956) which is also explained by Brennan (1998): “the rational [stock]
price is equal to the current dividend divided by the difference between the expected rate of return and the
expected dividend growth rate”.
8
tend to bear dividend risks that they want to get out of their books as much as possible. To
put it in concrete terms, banks are “short calls from selling structures with asymmetrical
upside exposure such as capital-guaranteed products and long puts from selling reverse
convertibles”.5 Reading between the lines, we understand that capital-guaranteed products
incorporate call options that banks sell. Thus, to hedge their market risk and have a delta-
neutral position banks have to be long the underlying. As the underlying is in general an
equity component (index or stock), the bank becomes long dividend. The same reasoning
goes for the long put position: If banks buy puts, they must also be long the underlying to
delta-hedge their positions. So in both cases banks are long the underlying, and
consequently long dividends. Therefore the primary need for such a market is hedging (for
banks). In order to minimize this dividend risk, they have to seek counterparties which are
willing to get an exposure to the dividends paid by the underlying. So the market appears to
be purely institutional, the parties being mainly, at least at the beginning, banks and
derivatives dealers. This accounts for the cradle of the dividend derivatives in the light of
Manley and Mueller-Glissmann. So among all the derivatives on dividends that we can think
of, why is it the dividend swap that focuses investors’ attention? We deal with this topic in
the next subsection but first we need to present the characteristics of such a product.
1.2. The market for dividend swaps
1.2.1. Characteristics of a dividend swap
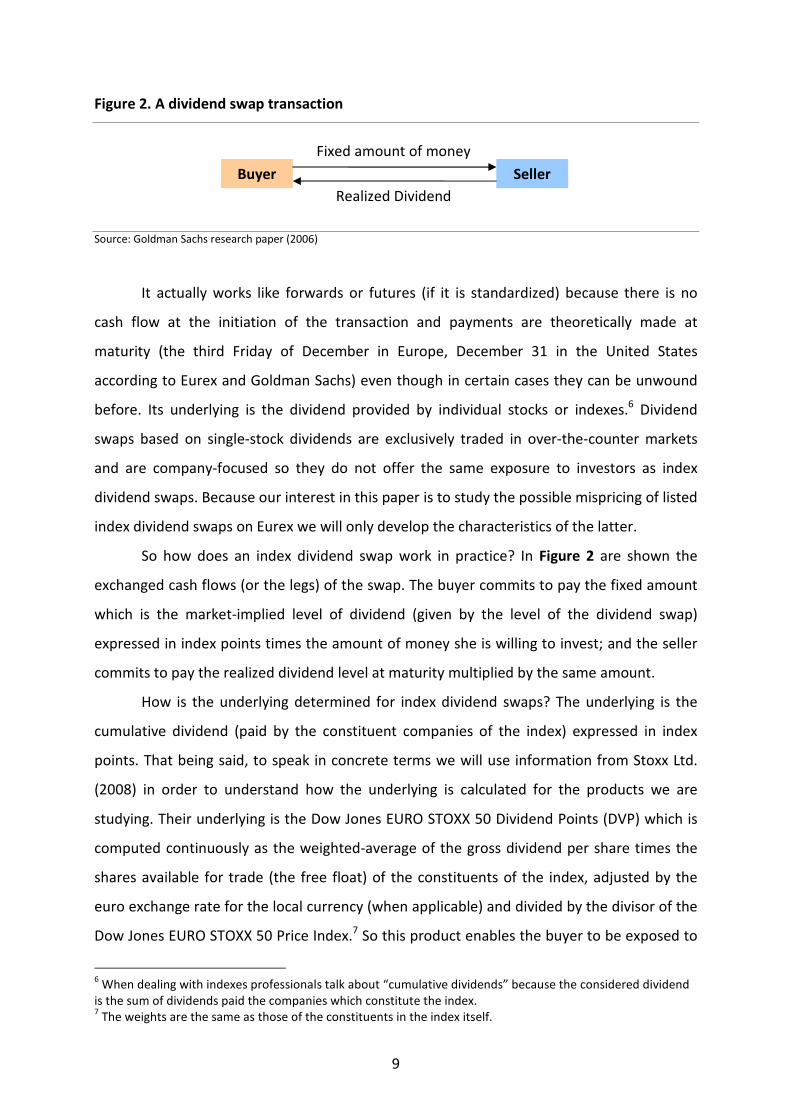
A dividend swap may be defined as a financial derivative product which gives to its
buyer an exposure to market realized dividends in exchange of a fixed amount. The
transaction is illustrated in Figure 2 in the next page.
5 Manley and Mueller-Glissmann explain that a reverse convertible is “a bond that can be converted into the
underlying asset at the discretion of the issuer at the set date if the price of the underlying is below a preset
strike level. In return the investor gets a higher yield than on a straight bond”.
9
Figure 2. A dividend swap transaction
Source: Goldman Sachs research paper (2006)
It actually works like forwards or futures (if it is standardized) because there is no
cash flow at the initiation of the transaction and payments are theoretically made at
maturity (the third Friday of December in Europe, December 31 in the United States
according to Eurex and Goldman Sachs) even though in certain cases they can be unwound
before. Its underlying is the dividend provided by individual stocks or indexes.6 Dividend
swaps based on single-stock dividends are exclusively traded in over-the-counter markets
and are company-focused so they do not offer the same exposure to investors as index
dividend swaps. Because our interest in this paper is to study the possible mispricing of listed
index dividend swaps on Eurex we will only develop the characteristics of the latter.
So how does an index dividend swap work in practice? In Figure 2 are shown the
exchanged cash flows (or the legs) of the swap. The buyer commits to pay the fixed amount
which is the market-implied level of dividend (given by the level of the dividend swap)
expressed in index points times the amount of money she is willing to invest; and the seller
commits to pay the realized dividend level at maturity multiplied by the same amount.
How is the underlying determined for index dividend swaps? The underlying is the
cumulative dividend (paid by the constituent companies of the index) expressed in index
points. That being said, to speak in concrete terms we will use information from Stoxx Ltd.
(2008) in order to understand how the underlying is calculated for the products we are
studying. Their underlying is the Dow Jones EURO STOXX 50 Dividend Points (DVP) which is
computed continuously as the weighted-average of the gross dividend per share times the
shares available for trade (the free float) of the constituents of the index, adjusted by the
euro exchange rate for the local currency (when applicable) and divided by the divisor of the
Dow Jones EURO STOXX 50 Price Index.7 So this product enables the buyer to be exposed to
6 When dealing with indexes professionals talk about “cumulative dividends” because the considered dividend
is the sum of dividends paid the companies which constitute the index. 7 The weights are the same as those of the constituents in the index itself.
Buyer Seller
Fixed amount of money
Realized Dividend
10
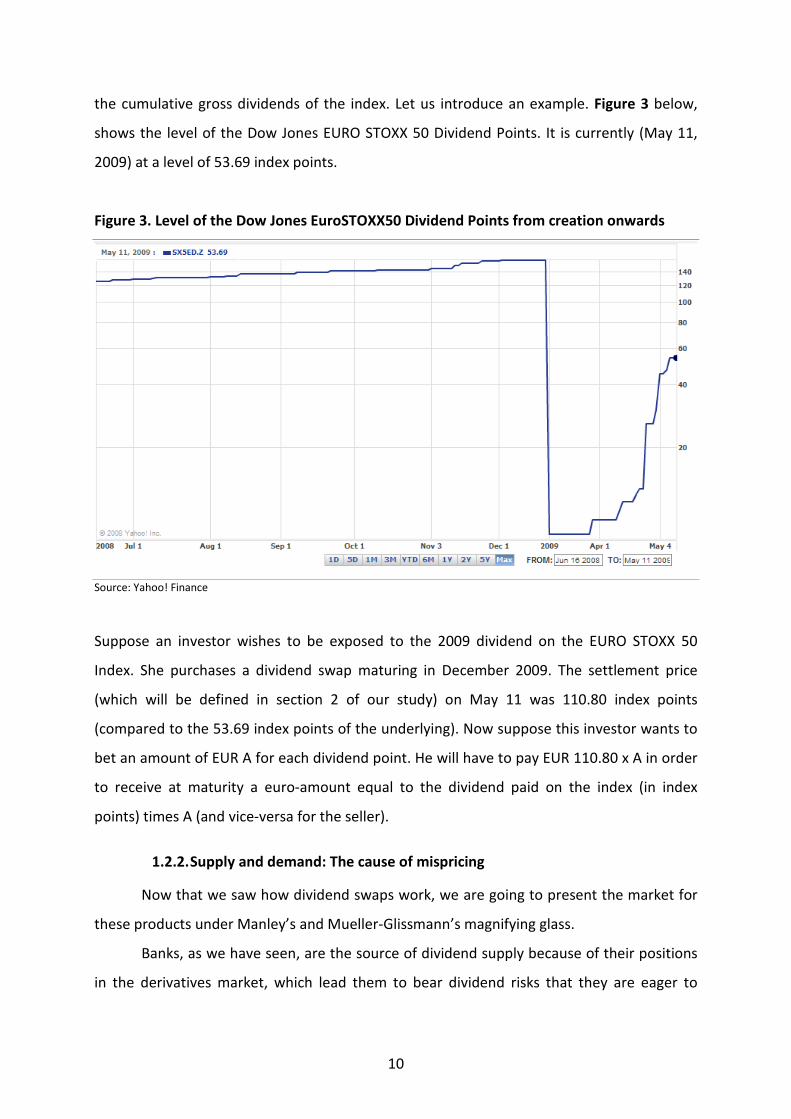
the cumulative gross dividends of the index. Let us introduce an example. Figure 3 below,
shows the level of the Dow Jones EURO STOXX 50 Dividend Points. It is currently (May 11,
2009) at a level of 53.69 index points.
Figure 3. Level of the Dow Jones EuroSTOXX50 Dividend Points from creation onwards
Source: Yahoo! Finance
Suppose an investor wishes to be exposed to the 2009 dividend on the EURO STOXX 50
Index. She purchases a dividend swap maturing in December 2009. The settlement price
(which will be defined in section 2 of our study) on May 11 was 110.80 index points
(compared to the 53.69 index points of the underlying). Now suppose this investor wants to
bet an amount of EUR A for each dividend point. He will have to pay EUR 110.80 x A in order
to receive at maturity a euro-amount equal to the dividend paid on the index (in index
points) times A (and vice-versa for the seller).
1.2.2. Supply and demand: The cause of mispricing
Now that we saw how dividend swaps work, we are going to present the market for
these products under Manley’s and Mueller-Glissmann’s magnifying glass.
Banks, as we have seen, are the source of dividend supply because of their positions
in the derivatives market, which lead them to bear dividend risks that they are eager to
11
minimize. It seems that “many of them prefer to fully or partially offload dividend risk via
dividend swaps”. Hence the importance of these products.
The demand side is more scalable through time. As we underlined previously, the
main counterparties of banks when the market for dividend derivatives emerged (around
year 2000) were derivatives dealers. But this demand was far from being enough to match
the supply level. Indeed, supply levels were very high, especially for index dividend swaps,
and the derivatives dealers seemed not to be willing to have such an exposure to realized
dividends. Thus, as in any other market in which supply exceeds demand, prices were pulled
down and the products were traded at a discount: “Following an increasing supply of
dividends, especially for indices, and limited demand, market-implied levels of OTC trades
were at deep discounts relative to subsequently realized levels and often implied negative or
no future dividend growth”. As Manley and Mueller-Glissmann then underline, the discounts
accounted for the increasing number of transactions. Institutional investors, and more
specifically hedge funds, have made up the most of demand since 2004: “Dividend swaps
were a major profit contributor to multi-strategy and macro hedge funds in 2005 and 2007”.
Since its creation the market has evolved and its evolution is expected to accelerate
in the future years. However, if price discounts tend to mitigate, mispricing is persistent as
we will show in the second section of our study. Moreover, the main sales’ argument for
selling such products is the deep discount that buyers could benefit.8 In difficult times, they
are still mostly traded at a discount.
1.2.3. Benefits and drawbacks of this market and this product
“There is considerably less risk associated with the dividends on the S&P 500 in any
given year than associated with the market itself”. This assertion of Brennan (1998) suggests
that the S&P 500 is more volatile than its dividends. So if we extend his observation to any
other equity index, then as a rule of thumb, dividend markets tend to be less volatile than
equity markets. Basing his argument on what he calls the “simple Gordon model”, presented
earlier as the Gordon-Shapiro formula, he pointed out that dividends were the main
component of equity markets. But they are not exclusive, there are many other factors
influencing equity markets indirectly (one may think of oil prices for example). Thus,
additional factors add uncertainty, therefore volatility. So obviously the benefit of such a
8 According to Mr. Jean-Paul Corda, Salesperson at Goldman Sachs (April 10, 2009).

12
market for dividend swaps is, as borne out by Manley and Mueller-Glissmann, that “the
dividend market provides investment opportunities with attractive risk-return trade-offs for
fundamental investors”. This property is also acknowledged in the brochure release by Eurex
in 2008.
Dividend swaps also offer other properties such as “low correlation to traditional
asset classes of bonds and equities” and “rise with inflation” (Eurex, 2008). Indeed, Eurex
“carried a study out of the relationship between (daily) changes in the Dow Jones EURO
STOXX 50 Index December 2008 dividend swap and the (daily) change in three-month
EURIBOR, in Dow Jones EURO STOXX 50 Index and in generic ten-year European government
bond yield for the period from March 16, 2006 to March 14, 2008”. Thus Eurex decided to
measure the correlation between the December 2008 dividend swap and three other market
factors. The results of this study, based on regressions, show very low correlations between
these factors with R2 statistics close to 1% for any of the three regressions.9 Thus, the
dividend market is less volatile than the equity market, and less correlated to traditional
asset classes. As for inflation, it appears that dividend swaps are a good way of hedging it.
Manley and Mueller-Glissmann indeed emphasize that dividends are function of the
companies’ nominal earnings and not real earnings. As the latter are not adjusted for
inflation, the investor is fully exposed to “economic performance”.
Moreover, and more importantly, Brennan (1998) saw two major ways that a
potential market in dividend strips (and by extension a market in dividend swaps) “could
enhance the efficiency in the economy”. First, it would allow investors to invest in a market
more closely related to the expectations on the economy, namely dividends (what he calls
the “current fundamentals in the economy”); and second, it would increase “the
informational efficiency of the market”. As we discussed in the beginning of this section,
such markets could transmit information such as implied dividend growth so as to improve
the pricing in equity markets. Manley and Mueller-Glissmann also argue that such a market
would provide information of credit markets. Indeed, following the idea of Black (1976),
dividends can be seen as a return to shareholders but also as a potential loss for creditors.
He said that there was no easiest way for a company to prejudice its creditors than “to pay
out all of its assets in the form of a dividend, and leave the creditors holding an empty shell”.
Thus dividends are right in the middle of the everlasting conflict of interest between a
9 For more information please refer to the brochure released by Eurex in 2008 (listed in our references).
13
company’s shareholders and creditors. Conversely, a company cutting its dividends might
signal that it is distressed, owing to its debt burden. As Manley and Mueller-Glissmann put it:
“Because increases in dividends might be a disadvantage for a company’s creditors whereas
cuts might help them, dividend growth may change a company’s credit risk”.
However, if these benefits appear to be substantial, they argue that “trading
dividends through dividend swaps does present some problems”. They indeed identify three
major problems, as a mirror of the three benefits listed previously.
First, the market for dividend swap (as we have seen) exists in its actual form from an
imbalance between supply and demand. Market implied dividends (measured by dividend
swaps) may therefore differ substantially from realized dividends if demand’s risk-aversion
increases. This situation may lead to an increase in volatility and mitigate the benefits of
lower risk that the market for dividend swaps theoretically offers.
Second, with this potential rise in volatility, the correlation between dividend swaps
and other asset-classes may increase significantly and reduce the potential diversification
benefit that an investor would currently (theoretically) enjoy.
Third, the market for dividend swaps is very young and do not offer sufficient depth
and liquidity for information to be conveyed properly. We will show in the next section that
the market seems to price products with large bid-ask spreads.
Thus, the market for dividend is young but growing. When it comes to pricing, is a
transparent market efficient? We will now try to answer this question by undertaking an
empirical study based on data provided by Eurex.
14
2. EMPIRICAL STUDY
As mispricing opportunities tend to be more frequent with new derivatives, we
studied whether the newly listed dividend swaps on Eurex are fairly priced. Wilkens and
Wimschulte (2009) provided a first empirical study about the pricing of dividend futures in
the European market and pointed out that there existed substantial pricing imbalances.
According to them, violation of the put-call parity for dividend paying stocks “cannot be fully
explained by transaction costs and other potential trading constraints”. Following this paper,
arbitrageurs should have made this situation disappear, unless some other elements prevent
them from making a profit.
The main goal of our study is to quantify the amplitude of the mispricing and to
assess to what extent traders can take advantage of the situation. We also focus on different
replication strategies in order to check whether some of the latter constantly allow
arbitrageurs to make a profit. Finally, when a situation of mispricing is detected, we try to
provide explanations for it.
2.1. Description of the sample
Our study mainly focuses on the pricing of the Dow Jones EURO STOXX 50 Index
Dividend Futures, listed on Eurex since June 2008. As suggested by the brochure released by
Eurex in 2008, our approach is to check whether the implied index dividend swap given by
the put-call parity relationship for dividend paying stocks (adapted to an index) provides a
result consistent with the effective product’s market price.10
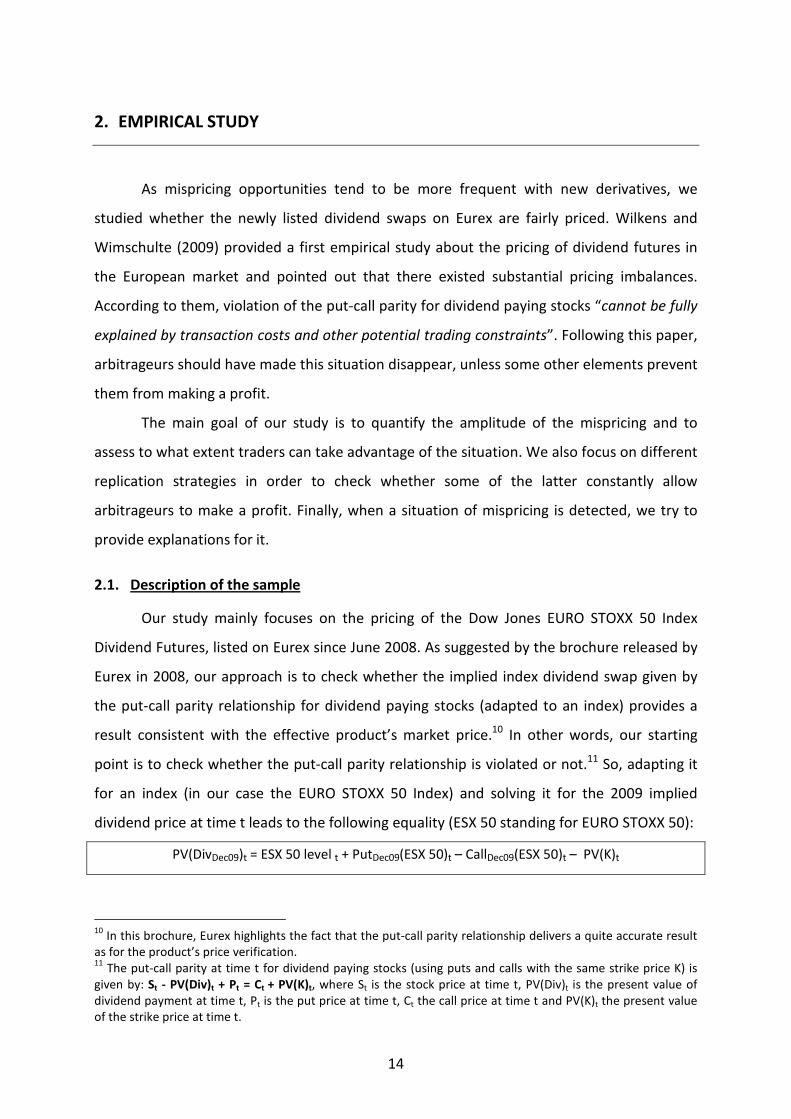
In other words, our starting
point is to check whether the put-call parity relationship is violated or not.11
So, adapting it
for an index (in our case the EURO STOXX 50 Index) and solving it for the 2009 implied
dividend price at time t leads to the following equality (ESX 50 standing for EURO STOXX 50):
PV(DivDec09)t = ESX 50 level t + PutDec09(ESX 50)t – CallDec09(ESX 50)t – PV(K)t
10
In this brochure, Eurex highlights the fact that the put-call parity relationship delivers a quite accurate result
as for the product’s price verification. 11
The put-call parity at time t for dividend paying stocks (using puts and calls with the same strike price K) is
given by: St - PV(Div)t + Pt = Ct + PV(K)t, where St is the stock price at time t, PV(Div)t is the present value of
dividend payment at time t, Pt is the put price at time t, Ct the call price at time t and PV(K)t the present value
of the strike price at time t.
15
Before we give further details on our study please note that:
• The dividend swaps listed on Eurex all mature in December each year, which explains
why we focused on the December implied dividend in the previous formula.
Obviously, for the relationship to hold we must consider options on the index also
maturing in December each year.
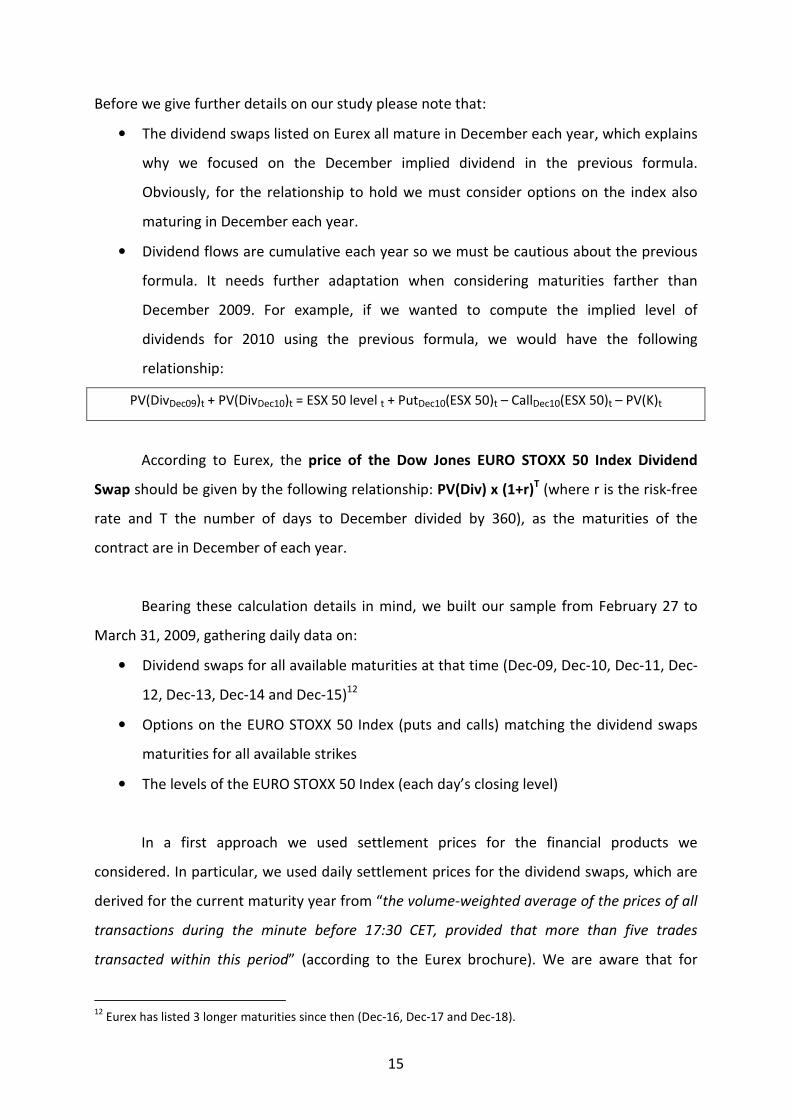
• Dividend flows are cumulative each year so we must be cautious about the previous
formula. It needs further adaptation when considering maturities farther than
December 2009. For example, if we wanted to compute the implied level of
dividends for 2010 using the previous formula, we would have the following
relationship:
PV(DivDec09)t + PV(DivDec10)t = ESX 50 level t + PutDec10(ESX 50)t – CallDec10(ESX 50)t – PV(K)t
According to Eurex, the price of the Dow Jones EURO STOXX 50 Index Dividend
Swap should be given by the following relationship: PV(Div) x (1+r)T (where r is the risk-free
rate and T the number of days to December divided by 360), as the maturities of the
contract are in December of each year.
Bearing these calculation details in mind, we built our sample from February 27 to
March 31, 2009, gathering daily data on:
• Dividend swaps for all available maturities at that time (Dec-09, Dec-10, Dec-11, Dec-
12, Dec-13, Dec-14 and Dec-15)12
• Options on the EURO STOXX 50 Index (puts and calls) matching the dividend swaps
maturities for all available strikes
• The levels of the EURO STOXX 50 Index (each day’s closing level)
In a first approach we used settlement prices for the financial products we
considered. In particular, we used daily settlement prices for the dividend swaps, which are
derived for the current maturity year from “the volume-weighted average of the prices of all
transactions during the minute before 17:30 CET, provided that more than five trades
transacted within this period” (according to the Eurex brochure). We are aware that for
12
Eurex has listed 3 longer maturities since then (Dec-16, Dec-17 and Dec-18).
16
these products such an approximation may lead to results that do not reflect real market
situations. However, as a first approach, we think this approximation may be acceptable as
the settlement prices result from real transaction prices. As for options, Eurex states that
“the Daily Settlement Prices for equity index options (as well as Weekly Options) are
determined through the Black/Scholes 76 model. If necessary, dividend expectations, current
interest rates or other payments are taken into consideration.” Here again, as a first
approach, we used settlement prices for options in our study. In the second part of this
section, we will try to reflect real market conditions by correcting these approximations: We
add bid–ask spreads to these settlement prices for dividend swaps and options.
As for the interest rate, we used Libor 9m for December 2009 dividend swaps and,
for longer maturities, the appropriate rate on the euro area central government bonds yield
curve, i.e. the rate matching dividend swaps’ different maturities.13
Again, we are aware that
in reality, investors have to add some spread to the risk-free rate. In the second part of our
study, we will also try to compute the optimal funding spread that would allow investors to
make a profit on average.
2.2. Methodology and analysis
2.2.1. Mispricing detection
Using our previous sample of data, we calculated the theoretical price of dividend
swaps on the EURO STOXX 50 Index for all maturities, with all available options. We then
computed the difference between the implicit level of dividend that is priced by the market
(given by the replicating portfolio made up of the corresponding options as detailed
previously) and the price of the dividend swap for a given maturity.
One of the main difficulties of our study was the treatment of intermediary flows of
dividends. We consider two ways to address this issue. First, in order to be exposed to the
dividend flow of, let’s say, 2010, one can consider that it is possible to hedge the 2009
dividend flow by a 2009 dividend swap. For example, by replicating a long position on the
2010 dividend flow with options maturing in 2010 (using the put-call parity) and by taking a
13
Source: British Bankers Association: www.bba.org.uk
17
short position on December 2009 dividend swaps, we are able to assess whether the
December 2010 dividend swap is mispriced or not. However, if mispricing is detected, a part
of it can be due to a mispricing in December 2009 dividend swaps.
The second way would be to take a cumulative exposure on the dividend flows from
today to maturity by replicating the dividend flows to maturity with options (using again the
put-call parity for dividend paying stocks) and taking the opposite position on all available
dividend swaps. For example, one can replicate the dividend flows until 2010 with options
and, in order to make a profit, take the opposite position on December 2009 and December
2010 dividend swaps. Acting this way enables an investor to have a cumulative exposure to a
potential mispricing in the dividend swaps. Nevertheless, if a mispricing arises, it may be
difficult to tell which dividend swap is at the origin of the mispricing.
Thus, when there is more than one dividend flow, it does not seem possible to
perfectly replicate the final dividend flow. That being said, both methods should lead to the
same results as one gets the same exposure to a potential mispricing.
Once the implicit level of dividends that is priced by the market (i.e. using the
replication strategy) is computed, we compare it to the levels of the dividend swaps. The
situation we consider is being short the dividend swap and long the replication portfolio
(made up of options with the same trade directions than in the put-call parity formula).
Thus, if the difference is positive, it would seem theoretically possible to make a profit by
selling the dividend swap and buying the replication portfolio. Conversely, if the difference is
negative, it would seem theoretically possible to make a profit by taking a long position in
the dividend swap and a short position in the replication strategy. The results are presented
in Table 2 in the next page.

18
Table 2. Amplitude of the mispricing for dividend swaps on the EuroSTOXX50 Index
Source data: Eurex & Yahoo! Finance
As the number of available options on the EURO STOXX 50 Index and tradable on
Eurex decreases with longer maturities, the number of replication strategies also decreases
when the maturity of dividend swaps increases.
Table 2 shows the numbers of strategies that could replicate the dividend swaps and
quantify the potential profit and loss for investors following the strategy described before.
For instance, for the December 2010 row, over the 2,177 possible replication strategies
(options with different strikes and different maturities), 1,268 lead to a difference in prices
that is between minus 1.0% and 0.0%; 819 lead to a difference in prices between 0.0% and
+1.0% and none lead to a difference in prices superior to +1.0%. The maximum loss of the
strategy consisting in being short dividend swaps and long the replication portfolio for the
December 2010 dividend swap is 1.73% and the maximum profit is 0.99%.
Thus, our findings reveal first that mispricing is persistent. Despite the fact that the
market is aware that dividend swaps are mispriced, there is no arbitrageur to take advantage
of such a situation. It would be interesting in a future study to understand the corresponding
reasons.
Minimum <(5%) (5%)-(3%) (3%)-(1%) (1%)-0% 0%-1% >1% Maximum Total
Dec 09 (5.59%) 7 12 154 2,040 167 0 0.76% 2,380
0% 1% 6% 86% 7% 0% 100%
Dec 10 (1.73%) 0 0 90 1,268 819 0 0.99% 2,177
0% 0% 4% 58% 38% 0% 100%
Dec 11 (5.15%) 1 41 679 789 161 0 0.81% 1,671
0% 2% 41% 47% 10% 0% 100%
Dec 12 (10.03%) 63 198 631 287 62 1 1.01% 1,242
5% 16% 51% 23% 5% 0% 100%
Dec 13 (12.95%) 178 365 446 110 5 0 0.34% 1,104
16% 33% 40% 10% 0% 0% 100%
Dec 14 (18.02%) 491 321 290 25 0 0 (0.29%) 1,127
44% 28% 26% 2% 0% 0% 100%
Dec 15 (24.47%) 724 251 127 2 0 0 (0.88%) 1,104
66% 23% 12% 0% 0% 0% 100%
19
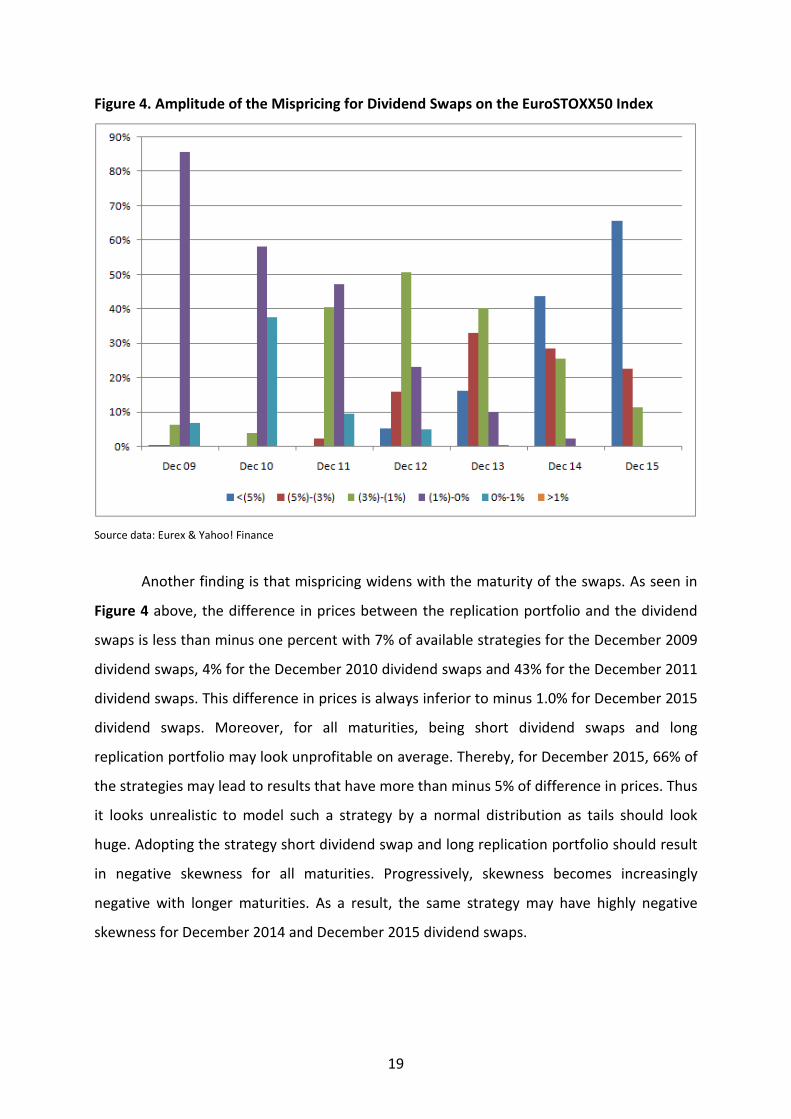
Figure 4. Amplitude of the Mispricing for Dividend Swaps on the EuroSTOXX50 Index
Source data: Eurex & Yahoo! Finance
Another finding is that mispricing widens with the maturity of the swaps. As seen in
Figure 4 above, the difference in prices between the replication portfolio and the dividend
swaps is less than minus one percent with 7% of available strategies for the December 2009
dividend swaps, 4% for the December 2010 dividend swaps and 43% for the December 2011
dividend swaps. This difference in prices is always inferior to minus 1.0% for December 2015
dividend swaps. Moreover, for all maturities, being short dividend swaps and long
replication portfolio may look unprofitable on average. Thereby, for December 2015, 66% of
the strategies may lead to results that have more than minus 5% of difference in prices. Thus
it looks unrealistic to model such a strategy by a normal distribution as tails should look
huge. Adopting the strategy short dividend swap and long replication portfolio should result
in negative skewness for all maturities. Progressively, skewness becomes increasingly
negative with longer maturities. As a result, the same strategy may have highly negative
skewness for December 2014 and December 2015 dividend swaps.

20
Furthermore, the profits and losses of such a strategy soar with longer maturities: for
December 2009, the P&L ranges between -5.59% and +0.76% and for December 2015, it
ranges between -24.47% and -0.88%.
One potential explanation for these findings lays in the fact that dividend swaps listed
on Eurex include only gross ordinary dividends i.e. “unadjusted cash dividends declared and
paid on that individual equity constituent of the index”. Thus, these dividend swaps exclude
special dividends, extraordinary dividends and return of capital payments because these
adjustments are made directly to the EURO STOXX 50 Index. According to this definition,
some potential adjustments may be included in any of the so-called replication portfolios
but not in the dividend swaps. This could explain a part of the difference.
Another explanation may be found in the tax treatment of dividends for investors. As
all investors do not face the same tax rate for dividends and for realized profit from financial
products such as dividend swaps, one may consider that some of them should prefer paying
a tax on “real” dividends (i.e. stemming from stocks) rather than on the profits resulting
from a dividend swap. Thus, there may be a tax incentive for some investors to prefer what
we called the “replication portfolio”, allowing them to get the same exposure to dividends.
However, if this argument is valid, the replication strategy should always lead to the same
results than the dividend swaps, adjusted by a constant factor. This factor should represent
the difference of tax rate in the treatment of “real” dividends and the profit realized on
dividend swaps. Unfortunately, as we can read in Table 2 in page 18, there does not exists
such a coefficient. So, despite the fact that this argument has to be taken into account, it
does not explain all the price difference between the two strategies.
On the other hand, it should be interesting to consider the liquidity of dividend
swaps. As we know, there exists a liquidity premium for products that are widely traded. For
instance, the existence of a liquidity premium can explain the well-known arbitrage between
on-the-run and off-the-run T-Bills. The same principle may be applicable in this case: As
options and cash are liquid instruments from the investors’ point of view, a premium should
be added to the replication strategy as it may be more liquid than the dividend swaps. In this
case, we know that millions of options on the EURO STOXX 50 Index are traded each day.
What about dividend swaps? In July 2008, Eurex estimated that daily dividend swaps
turnover was almost EUR 1bn in over-the-counter markets.

21
Table 3. Daily Notional of Dividend Swaps on the EURO STOXX 50 Index listed on Eurex
(EUR millions)
Source data: Eurex
Table 3 above shows daily data for dividend swaps on the EURO STOXX 50 Index
traded on Eurex during the sample period. If the data is correct then these products
represent 0.24% to 10.8% of the total daily dividend swaps turnover, with € 43.9m traded on
average every day from February 27 to March 31, 2009. From these observations, the
liquidity of dividend swaps does not seem to be a source of discrepancy in the pricing of
dividend swaps compared to replication strategies.
However, we assumed before that options are uniformly liquid in a way that there
are hundreds of thousands, or even millions of each type of options traded every day. Here
again, it would be more reasonable to assume that options that have a strike price within a
certain range around the level of the EURO STOXX 50 Index are more liquid than options that
are far out-of-the-money or far in-the-money. Thus, we should pay particular attention to
€m Dec 09 Dec 10 Dec 11 Dec 12 Dec 13 Dec 14 Dec 15 Total
03/31/2009 8.2 36.3 24.2 0.1 3.5 0.0 0.0 72.2
03/30/2009 1.7 86.9 2.7 0.0 0.2 5.8 0.0 97.3
03/27/2009 0.9 70.3 26.6 0.0 0.0 0.8 0.0 98.6
03/26/2009 0.0 21.6 62.1 0.0 0.0 4.2 1.6 89.5
03/25/2009 0.6 30.9 3.0 1.7 0.0 0.0 0.2 36.4
03/24/2009 1.6 6.6 0.4 1.4 0.0 3.9 0.0 13.9
03/23/2009 0.0 3.6 1.0 0.0 7.6 1.9 0.0 14.1
03/20/2009 0.0 0.0 3.0 0.0 0.0 0.0 8.3 11.3
03/19/2009 0.8 12.8 17.0 3.2 0.6 7.2 2.7 44.4
03/18/2009 24.1 4.2 3.4 1.1 0.0 0.0 0.0 32.8
03/17/2009 3.5 2.3 4.9 3.9 0.0 0.0 0.0 14.6
03/16/2009 0.1 14.6 6.4 4.3 0.0 5.4 0.3 31.2
03/13/2009 0.8 7.5 19.4 8.9 0.0 0.6 0.0 37.2
03/12/2009 14.5 13.2 4.7 1.7 0.0 1.7 4.6 40.5
03/11/2009 16.5 6.2 21.4 2.8 0.0 0.3 0.0 47.3
03/10/2009 1.1 19.0 10.1 1.9 0.0 13.4 33.2 78.7
03/09/2009 0.9 10.6 0.0 3.4 0.0 0.3 1.3 16.5
03/06/2009 1.8 4.3 6.9 2.0 0.1 0.4 0.0 15.4
03/05/2009 13.0 46.2 0.4 0.0 0.0 0.1 0.0 59.7
03/04/2009 12.5 15.5 1.2 0.5 5.9 3.1 3.1 41.8
03/03/2009 0.0 0.0 0.3 2.2 0.0 1.8 1.6 6.0
03/02/2009 0.0 0.6 0.3 1.5 0.0 0.0 0.0 2.4
02/27/2009 83.5 5.7 17.2 0.0 1.5 0.0 0.0 108.0
Average 8.1 18.2 10.3 1.8 0.9 2.2 2.5 43.9

22
where mispricing stems from. As the daily settlement price for options is not related to
realized transactions (but from the Black-Scholes formula as stated previously), their bid-ask
spreads should widen for strikes far from the level of the index. In addition, we do not have
any information on the parameters that are taken into account by Eurex in option pricing. As
a consequence, we can make the assumption that mispricing may arise when the dividend
swap is replicated with options that are not liquid, i.e. with strikes far from the level of the
EURO STOXX 50 Index. Thus, taking advantage of such a situation may be very difficult in
practice. In order to address this issue, we compared the amplitude of the price
discrepancies between the dividend swaps and replication strategies with all available
options (every strike) for all maturities at a given date.
Figure 5. Discrepancy between the Dividend Swap and the Replication Portfolio (02/27/09)
Source data: Eurex & Yahoo! Finance
Figure 5 shows the amplitude of the discrepancy between both strategies in percent
of the daily level of the EURO STOXX 50 Index as of February 27, 2009 (the first day of our
study) for all available dividend swaps replicated using options with strike prices that range
from 51% to 405% of the level of the EURO STOXX 50 Index. We found that mispricing
becomes larger with longer maturities and even more larger when the replication strategy is
based on options having a strike price far above the level of the EURO STOXX 50 Index. For
instance, the discrepancy between the replication strategy and the dividend swap ranges

23
between -3.58% to +0.67% for maturities Dec-09 to Dec-12. As for Dec-13, replication of the
dividend swap made with options that have a strike price far above the level of the index, i.e.
more than 248% relative to the level of the EURO STOXX 50 Index, leads to a difference of
more than -4.0%. It is interesting to notice in complement that for Dec-14 and Dec-15
maturities the discrepancy is small when the replication strategy includes options with strike
prices that are below the level of the index and this discrepancy is getting wider and wider as
options with strike prices higher than the index level are used for the replication of the
dividend flow. The highest difference is found for maturity Dec-15 when options with a strike
level of 8,000 (405% the index level of the EURO STOXX 50) are used for the replication of
the dividend flow. Conversely, the smallest difference is found for maturity Dec-12 when
options with a strike of 2,000 (101% the index level of the EURO STOXX 50) are used for the
replication of the dividend flow. At mid-month and at the end of the month our conclusions
are the same, as shown in Figures 6 below and 7 in the next page, highlighting the amplitude
of the discrepancies between both strategies in percent of the daily value of the EURO
STOXX 50 Index for all available dividend swaps replicated using options with strikes that
range from 1,000 to 8,000, i.e. 49% to 393% the index level of the EURO STOXX 50 as of
March 16 and 48% to 386% the level of the EURO STOXX 50 Index as of March 31, 2009.
Figure 6. Discrepancy between the Dividend Swap and the Replication Portfolio (03/16/09)
Source data: Eurex & Yahoo! Finance
24
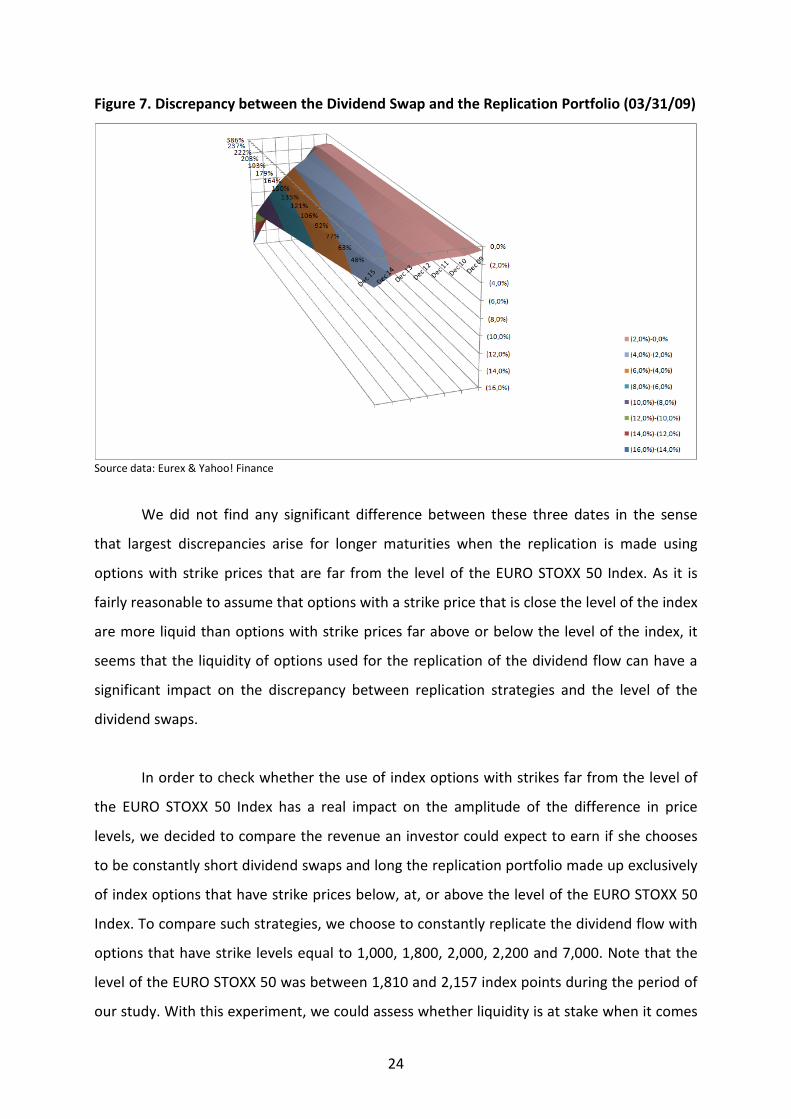
Figure 7. Discrepancy between the Dividend Swap and the Replication Portfolio (03/31/09)
Source data: Eurex & Yahoo! Finance
We did not find any significant difference between these three dates in the sense
that largest discrepancies arise for longer maturities when the replication is made using
options with strike prices that are far from the level of the EURO STOXX 50 Index. As it is
fairly reasonable to assume that options with a strike price that is close the level of the index
are more liquid than options with strike prices far above or below the level of the index, it
seems that the liquidity of options used for the replication of the dividend flow can have a
significant impact on the discrepancy between replication strategies and the level of the
dividend swaps.
In order to check whether the use of index options with strikes far from the level of
the EURO STOXX 50 Index has a real impact on the amplitude of the difference in price
levels, we decided to compare the revenue an investor could expect to earn if she chooses
to be constantly short dividend swaps and long the replication portfolio made up exclusively
of index options that have strike prices below, at, or above the level of the EURO STOXX 50
Index. To compare such strategies, we choose to constantly replicate the dividend flow with
options that have strike levels equal to 1,000, 1,800, 2,000, 2,200 and 7,000. Note that the
level of the EURO STOXX 50 was between 1,810 and 2,157 index points during the period of
our study. With this experiment, we could assess whether liquidity is at stake when it comes

25
to replication: If the use of options with a strike price far above or far below the index level
the EURO STOXX 50 lead to results that are significantly different from those we get with
options that have strike levels more or less equal to the level of the index, we could
conclude that liquidity has an effect on replication and this effect cannot be neglected.
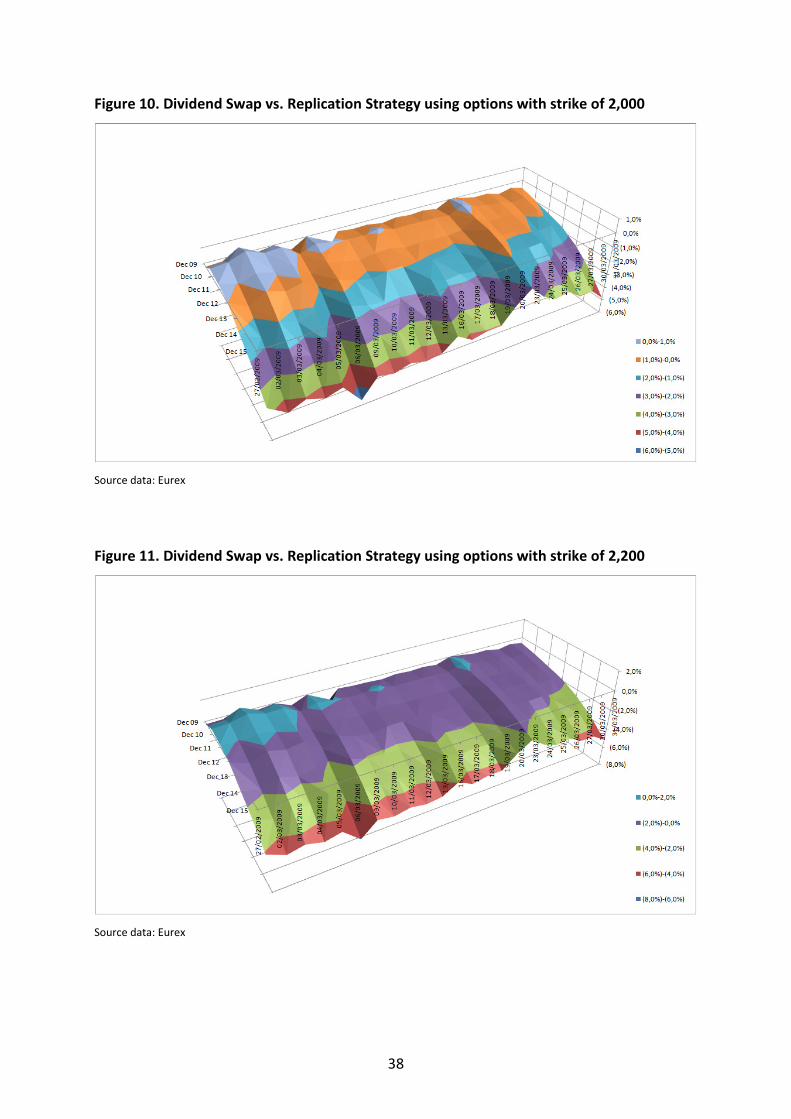
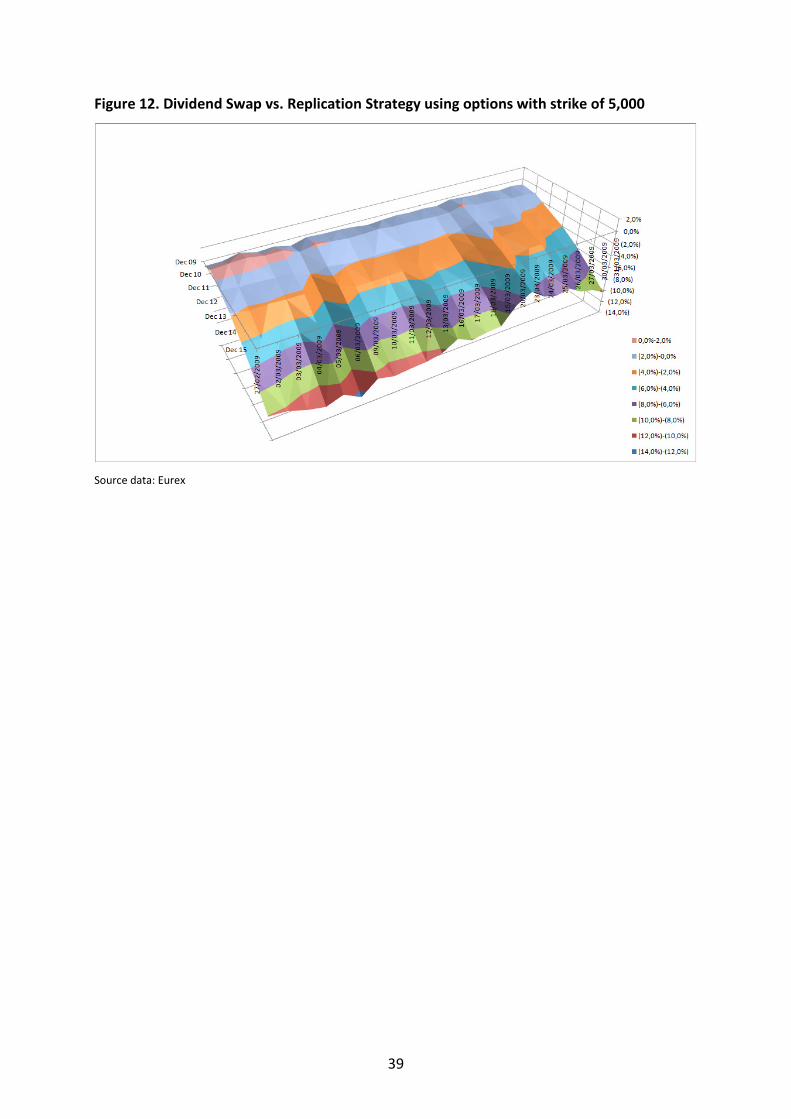
Results are shown in Figures 8 to 12 in Appendix.14
For all dates, we note that all replication
strategies give more or less the same prices than dividend swaps for the 2009, 2010, 2011
and 2012 dividend flows. However, we noticed that the discrepancy is getting increasingly
wider with (i) the maturity of the options (the higher the maturity, the wider the
discrepancy) and (ii) their strikes (the more they are away from the level of the EURO STOXX
50 Index, the higher the discrepancy). It seems that dividend swaps listed on Eurex globally
undervalue the level of dividends for a given year in comparison to the dividend level priced
by the market. The discrepancy widens with longer maturities and when the replication
strategy relies on options that have a strike price which is far above the level of the EURO
STOXX 50 Index.
As a result, as options with strikes far from the level of the index are less liquid than
at-the-money options, and as the discrepancies between replication strategies and dividend
swaps widen when the former are based on options with strike prices far above the level of
the EURO STOXX 50 Index, liquidity may have a significant impact on the replication of the
dividend flow. For that matter we tried to address this issue by adding bid and ask spreads to
option prices and dividend swaps. As the EURO STOXX 50 Index is very liquid, we considered
that such procedure was not necessary for this product.
2.2.2. Addressing main pitfalls
In the following part of our study, we try to address all issues that affect transaction
prices or strategies’ returns in reality. We chose to take a step back from our previous
theoretical approach. It appears that the previous study relied on two strong assumptions
that are not necessarily true in practice.
14
We changed scale for figures 11 and 12 and used 2% units instead of 1% for sake of clarity

26
First, we used the so-called “settlement prices” for options and for dividend swaps on
the EURO STOXX 50 Index. But we saw that liquidity is a real issue for such products,
especially for dividend swaps and options that are far in and out-of-the-money. So we had to
reflect it somehow in our study. As we did not have easy access to such data we contacted
investment bank insiders in order to obtain the spreads for dividend futures and options
over the sample period. As a result, we applied the following spreads15
:
Product Spread
Dividend Futures 10%
ATM Options 1.5%
25% ITM Options 2.0%
25% OTM Options 10%
In order to replicate reality accurately we ignored options that have strikes below
1,000 and above 3,000 index points. Using the data summarized in the array above, we
computed bid and ask prices for options and dividend swaps on the EURO STOXX 50 Index.
We then computed the implicit level of dividend that we can obtain using what we called
before the “replication strategy”. Due to the existence of the bid-ask spread, we get
different levels of dividend whether we replicate a long or a short position in dividend.16
We compared the levels obtained to those of the dividend swaps. A mispricing
appears (i) if the bid price of the dividend swap exceeds the implied level of dividend
obtained by replication of a long position dividend or (ii) if the ask price of the dividend swap
is less than the implied level of dividend obtained by replication of a short position in
dividend. In order to avoid a potential problem caused by the existence of intermediary
dividend flow(s), we decided to focus on December 2009 dividend swaps. As shown in
Figures 13 and 14 in the next page, we found that a strategy consisting in buying the
dividend swaps and selling the replication portfolio leads to a maximum potential gain of
3.73% and a maximum loss of 2.32% of the level of the EURO STOXX 50 Index with an
average loss of 0.94%. On the other hand, a strategy consisting in selling the dividend swap
15
Data provided by Mr. Nicolas Mougeot, Research Derivative Department, Deutsche Bank (April 2009). 16
We adjusted the put-call parity for dividend paying stocks at time t with bids and asks. Depending on the
direction of the trade, we have: Long PV(Div)t = St + PAsk,t – CBid,t – PV(K)t, and Short PV(Div)t = CAsk,t + PV(K)t – St –
PBid,t, where as usual PV stands for present value, Div for the dividend payment, S for the stock price, P for the
put price, C for the call price and K for the strike.
27
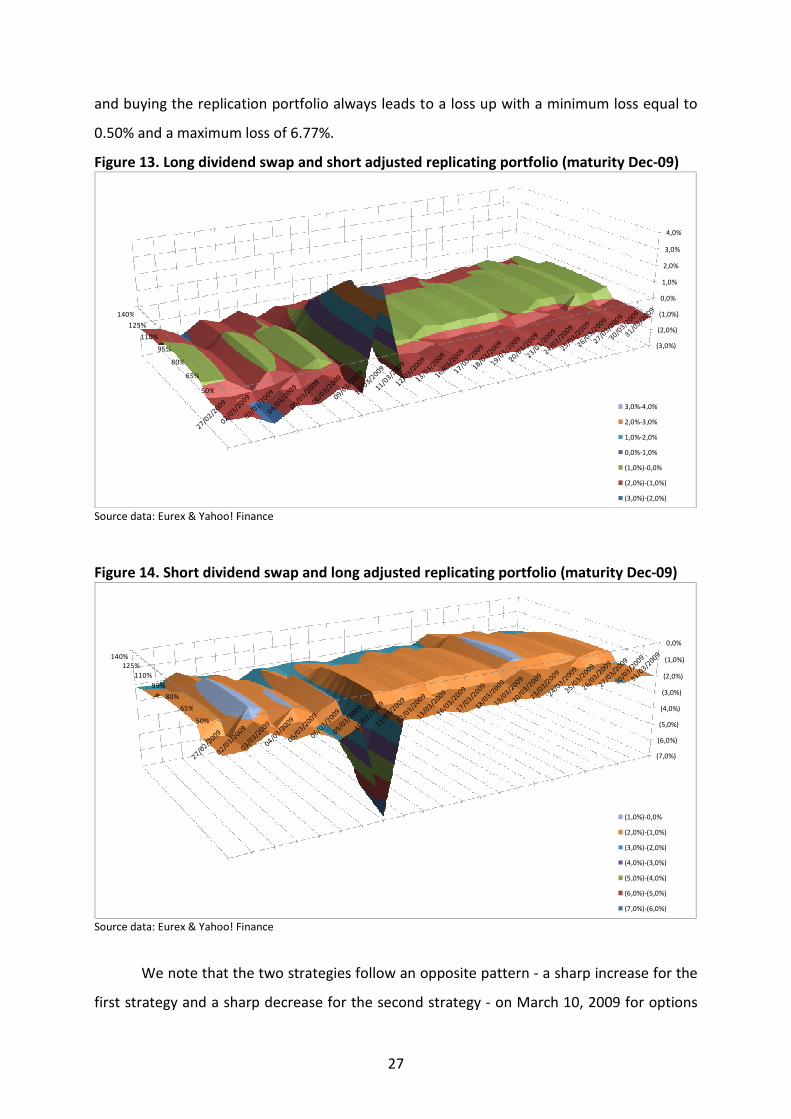
and buying the replication portfolio always leads to a loss up with a minimum loss equal to
0.50% and a maximum loss of 6.77%.
Figure 13. Long dividend swap and short adjusted replicating portfolio (maturity Dec-09)
(3,0%)
(2,0%)
(1,0%)
0,0%
1,0%
2,0%
3,0%
4,0%
50%
65%
80%
95%
110%
125%
140%
3,0%-4,0%
2,0%-3,0%
1,0%-2,0%
0,0%-1,0%
(1,0%)-0,0%
(2,0%)-(1,0%)
(3,0%)-(2,0%)
Source data: Eurex & Yahoo! Finance
Figure 14. Short dividend swap and long adjusted replicating portfolio (maturity Dec-09)
(7,0%)
(6,0%)
(5,0%)
(4,0%)
(3,0%)
(2,0%)
(1,0%)
0,0%
50%
65%
80%
95%
110%
125%
140%
(1,0%)-0,0%
(2,0%)-(1,0%)
(3,0%)-(2,0%)
(4,0%)-(3,0%)
(5,0%)-(4,0%)
(6,0%)-(5,0%)
(7,0%)-(6,0%)
Source data: Eurex & Yahoo! Finance
We note that the two strategies follow an opposite pattern - a sharp increase for the
first strategy and a sharp decrease for the second strategy - on March 10, 2009 for options

28
with a strike price far below the level of the EURO STOXX 50 Index and a relatively flat trend
otherwise. We found no rational explanation for this peak.
Figure 15. Difference in % of the level of the EURO STOXX 50 Index of the strategy
described in figure 14 minus that of figure 13
(12,0%)
(10,0%)
(8,0%)
(6,0%)
(4,0%)
(2,0%)
0,0%
2,0%
50%
65%
80%
95%
110%
125%
140%
0,0%-2,0%
(2,0%)-0,0%
(4,0%)-(2,0%)
(6,0%)-(4,0%)
(8,0%)-(6,0%)
(10,0%)-(8,0%)
(12,0%)-(10,0%)
Source data: Eurex & Yahoo! Finance
Moreover, Figure 15 shows that the strategy consisting in long short dividend swap
and short replication portfolio is systematically better than the strategy consisting in being
short dividend swap and long replication portfolio because the difference between both
strategies is almost always negative.
One reason for such a discrepancy can be found in the assumption that spreads are
not symmetric, i.e. spreads for OTM and ITM options are not the same. Note that some
traders consider that spreads should be symmetric. Thus, we also considered the following
spreads:
Product Spread
Dividend Futures 10%
ATM Options 1.5%
25% ITM Options 10%
25% OTM Options 10%

29
Figure 16. Long dividend swap and short adjusted replicating portfolio (maturity Dec-09)
(8,0%)
(6,0%)
(4,0%)
(2,0%)
0,0%
2,0%
4,0%
50%
65%
80%
95%
110%
125%
140%
2,0%-4,0%
0,0%-2,0%
(2,0%)-0,0%
(4,0%)-(2,0%)
(6,0%)-(4,0%)
(8,0%)-(6,0%)
Source data: Eurex & Yahoo! Finance
Figure 17. Short dividend swap and long adjusted replicating portfolio (maturity Dec-09)
(10,0%)
(9,0%)
(8,0%)
(7,0%)
(6,0%)
(5,0%)
(4,0%)
(3,0%)
(2,0%)
(1,0%)
0,0%
50%
65%
80%
95%
110%
125%
140%
(1,0%)-0,0%
(2,0%)-(1,0%)
(3,0%)-(2,0%)
(4,0%)-(3,0%)
(5,0%)-(4,0%)
(6,0%)-(5,0%)
(7,0%)-(6,0%)
(8,0%)-(7,0%)
(9,0%)-(8,0%)
(10,0%)-(9,0%) Source data: Eurex & Yahoo! Finance
We found that a strategy consisting in buying the dividend swaps and selling the replication
portfolio leads to a potential maximum gain of 3.15% and to a maximum loss of 7.58% of the
level of the EURO STOXX 50 Index with an average loss of 2.68%. So, a rise in the spreads of
ITM options increases the average return of such a strategy. However, the return is still
30
negative on average. On the other hand, a strategy consisting in selling the dividend swap
and buying the replication portfolio always leads to a loss up to 9.96%. Moreover, returns of
strategies built on OTM or ITM options are negative and symmetric in this case.
We did the same experience for dividend swaps maturing in December 2010. In order
to detect potential mispricing, we had to tackle the issue of the intermediary dividend flow,
i.e. dividend flows for 2009. Adjusting the formula we’ve seen in the previous subsection
with bids and asks, we obtain:
PV(Div2009)t + PV(Div2010)t = St + PAsk,t – CBid,t – PV(K)t
Leading to: PV(Div2010)t = St + PAsk,t – CBid,t – PV(K)t – PV(Div2009)t
As a proxy for PV(Div2009) we used the December 2009 dividend swap. So, in order to
replicate a long position in the 2010 dividend, one has to sell the December 2009 dividend
swap (negative sign in the above formula). Thus, we use its bid price. Conversely, when
replicating a short position in the 2010 dividend, one has to buy the December 2009
dividend swap. Thus, we use the ask price. Note that we used non symmetric spreads.
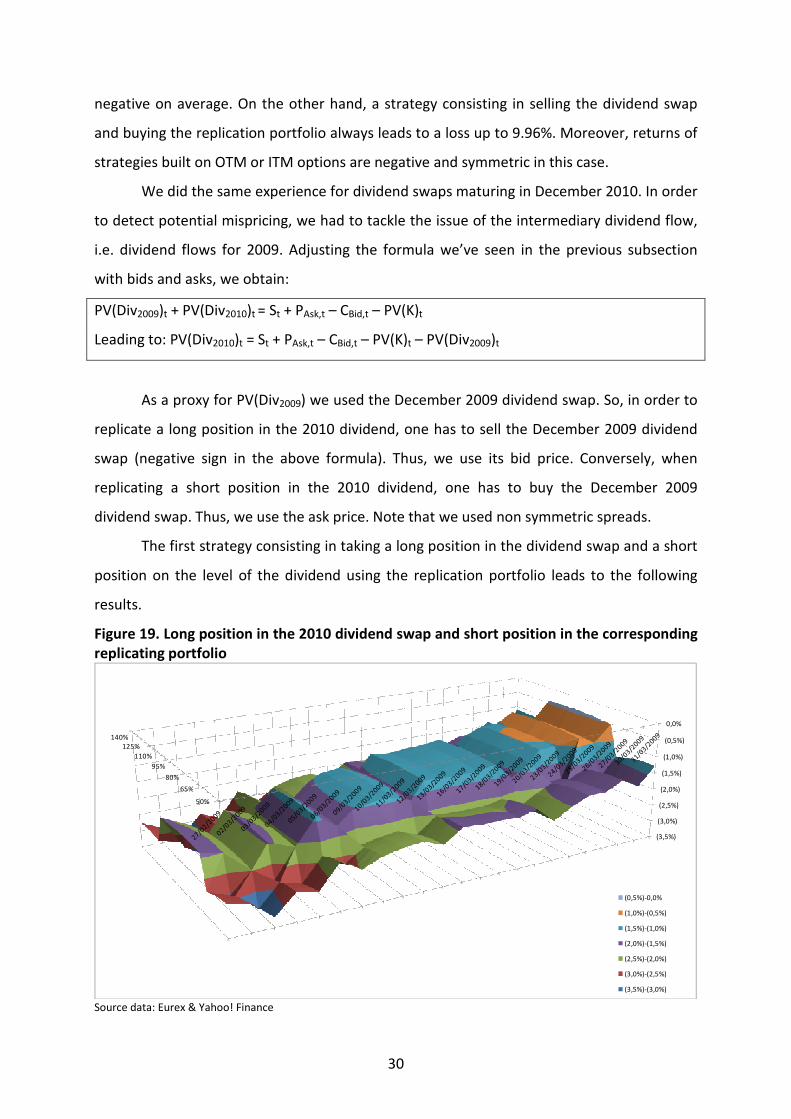
The first strategy consisting in taking a long position in the dividend swap and a short
position on the level of the dividend using the replication portfolio leads to the following
results.
Figure 19. Long position in the 2010 dividend swap and short position in the corresponding
replicating portfolio
(3,5%)
(3,0%)
(2,5%)
(2,0%)
(1,5%)
(1,0%)
(0,5%)
0,0%
50%
65%
80%
95%
110%
125%
140%
(0,5%)-0,0%
(1,0%)-(0,5%)
(1,5%)-(1,0%)
(2,0%)-(1,5%)
(2,5%)-(2,0%)
(3,0%)-(2,5%)
(3,5%)-(3,0%)
Source data: Eurex & Yahoo! Finance
31
Here again, we found that not even one arbitrage opportunity arises from the
previous strategy due to the existence of bid-ask spreads. Indeed the low liquidity induces a
huge bid-ask spread that wipes out mispricing in favor of the investors, as shown in Figure
19 above.
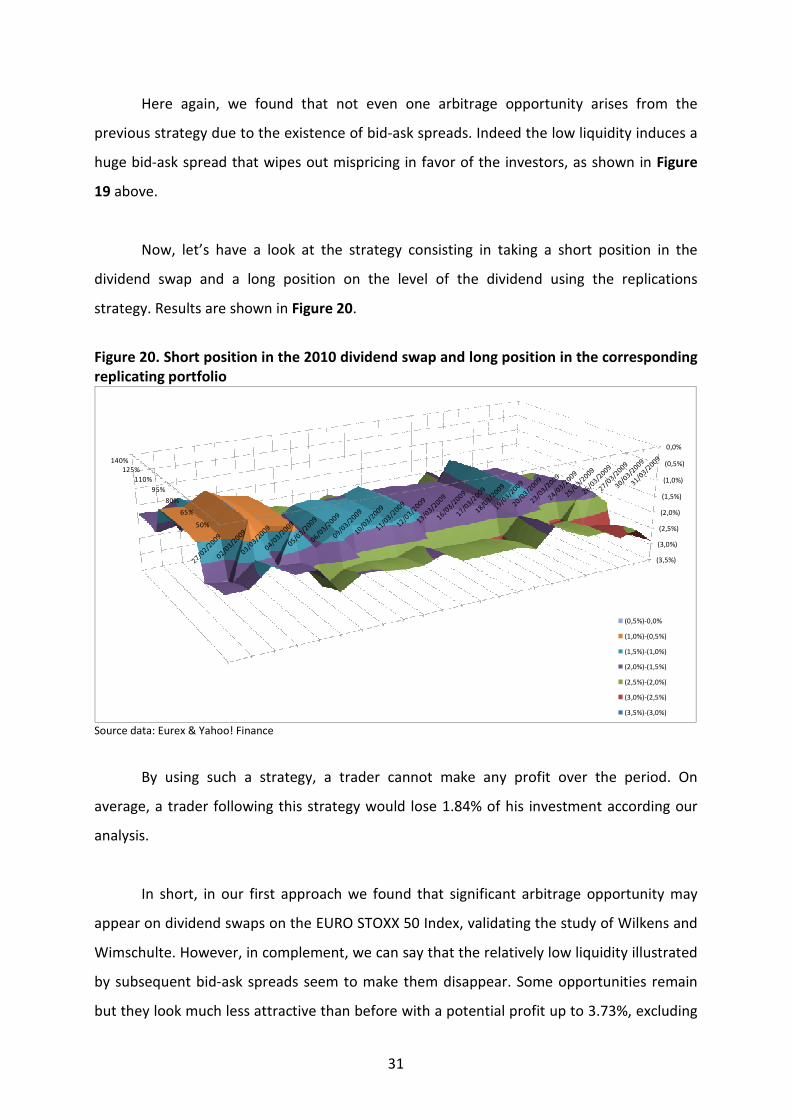
Now, let’s have a look at the strategy consisting in taking a short position in the
dividend swap and a long position on the level of the dividend using the replications
strategy. Results are shown in Figure 20.
Figure 20. Short position in the 2010 dividend swap and long position in the corresponding
replicating portfolio
(3,5%)
(3,0%)
(2,5%)
(2,0%)
(1,5%)
(1,0%)
(0,5%)
0,0%
50%
65%
80%
95%
110%
125%
140%
(0,5%)-0,0%
(1,0%)-(0,5%)
(1,5%)-(1,0%)
(2,0%)-(1,5%)
(2,5%)-(2,0%)
(3,0%)-(2,5%)
(3,5%)-(3,0%)
Source data: Eurex & Yahoo! Finance
By using such a strategy, a trader cannot make any profit over the period. On
average, a trader following this strategy would lose 1.84% of his investment according our
analysis.
In short, in our first approach we found that significant arbitrage opportunity may
appear on dividend swaps on the EURO STOXX 50 Index, validating the study of Wilkens and
Wimschulte. However, in complement, we can say that the relatively low liquidity illustrated
by subsequent bid-ask spreads seem to make them disappear. Some opportunities remain
but they look much less attractive than before with a potential profit up to 3.73%, excluding

32
transaction costs and funding issues. Moreover, as profitable as any strategy may prove to
be, there is a strong timing component.
The second pitfall we wanted to address in our study is the assumption we made that
investors have access to particularly attractive funding conditions. We decided to focus
mainly on December 2009 dividend swaps for which investors initially benefit from Libor 9m
as funding rate. This approximation has to be clarified, in particular when liquidity is at stake.
In order to address this issue, we considered two situations:
• For the strategy consisting in taking a short position in the dividend swap and a long
position on the level of the dividend using replication, investors are mainly short cash.
Thus, a decrease in the interest rate should increase the return of the strategy. In order
to study the impact of a decrease in the interest rate, we tried to find the optimal
(negative) spread over Libor 9m that an investor should enjoy in order to make a profit
on average. Unfortunately, it is not possible to find an optimal interest rate that makes
this strategy profitable on average, as this so called optimal interest should be
negative.17
• For the strategy consisting in taking a long position in the dividend swap and a short
position on the level of the dividend using replication, investors benefit from an increase
in the interest rate because of the long cash position. Thus, an increase in the interest
rate should also increase the return of the strategy. We found that with an interest rate
of LIBOR 9m + 1.19%, investor can make this strategy profitable on average.
Interest rates are at stake when it comes to replicate the dividend flow using a
portfolio of options. In order to solve this problem, we tried to find the optimal interest rate
that makes a strategy profitable on average. Unfortunately for potential investors, we found
that no realistic funding conditions would allow them to make a profit on average with the
strategy consisting in taking a short position in the dividend swap and a long position on the
level of the dividend using replication. Should an investor adopt the opposite strategy, he
could make a profit on average if he can get a rate of LIBOR 9m + 1.19% for both, his funding
and his long cash position.
17
Source: British Bankers Association: www.bba.org.uk
33
CONCLUSION
As replication of dividend flow is relatively easy for investors due mainly to a high level of
liquidity of the financial tools needed (which are mainly options), dividend swaps on the
EURO STOXX 50 Index seem to offer arbitrage opportunities. On a first approach, we found
that significant mispricing appears, in particular for dividend swaps with longer maturities
and when replication is made with options far in or far out-of-the-money. Looking at the
results in details, we found that opportunities appear where liquidity is at stake. We then
tried to address this issue by adding a bid-ask spread to derivatives used for the replication
strategy. We thought that such procedure was not necessary for the EURO STOXX 50 Index,
as this product is widely traded. As for dividend swaps and options on the EURO STOXX 50
Index, we added up to a 10.0% spread to the settlement price. By adding such spreads, we
found that mispricings almost completely disappear and that the remaining opportunities
that arise lead to smaller profit than before (up to 3.73% before transaction costs and
funding spread). Moreover, should an investor want to take advantage of the situation,
there is a strong timing component. As for the funding spread, we found that the strategy
consisting in taking a short position in the dividend swap and a long position on the level of
the dividend using replication mainly benefit from a decrease in the interest rate. We also
found that no realistic funding conditions would allow an investor to make a profit on
average for this strategy. On the other hand, with the opposite strategy, an investor could
make a profit on average if he can get a rate of LIBOR 9m + 1.19% for both, his funding and
his long cash position.
34
Looking forward
The aim of our study was to quantify potential arbitrage opportunities on a newly
listed product. We found that opportunities are relatively limited and do not allow investors
to make substantial profit.
However, there is still some room for improvement, in particular on the following
points:
� Our study may be affected by sample selection and time-period biases. We
indeed excluded dividend swaps maturing after December 2015 since they were
not listed during our study. Moreover, we conducted our study over a very short
period of one month which may lead to time-specific results. Thus, there is still
room to conduct a study on more comprehensive data over a longer period.
� The spread on options and dividend swaps we used are average spreads given by
professionals. It could have been more appropriate to use daily quoted bid-ask
spread on such products in order to improve data accuracy.
� We did not take into account transaction costs because they are very small
relative to bid-ask spreads. However, due to the complexity of what we called
the replication strategies, they can represent a substantial amount of money per
trade. Thus, some potential opportunities can be completely unwound by the
existence of transaction costs, making potential profit even more difficult to
capture.
� Should the data be available, it could be interesting to study tick by tick data,
because of potential opportunities that could arise all along the trading day.
� One of the main issues we tried to address is the treatment of intermediary
dividend flows. All along the study, we considered that dividend swaps are a
good proxy for intermediary dividend flows. On the other hand, we are aware
that some mispricing may appear regarding dividend swaps. Thus, we limited our
in-depth study to dividend swaps maturing in December 2009. Unfortunately,
the first approach suggested that significant opportunities arise for dividend
swaps having longer maturities. Further research should be necessary to address
this issue.
35
ACKNOWLEDGMENT
We thank very much Mr. Christophe Perignon for his availability, his guidance and his
encouragements. We hope our study answered his curiosity on the subject.
We would also like to thank the professionals who helped us have a better
understanding of the dividend markets and products, especially Mr. Nicolas Mougeot
(Managing Director – Research department at Deutsche Bank) whose course on hidden
assets led us to do this thesis, Mr. Ali Bassit (former trader at JPMorgan & Chase), Mr.
Gabriel Messika (trader Equity and Derivatives at BNP Paribas) and Mr. Jean-Paul Corda
(salesman at Goldman Sachs International) who provided us valuable information.
36
REFERENCES
♦ Black, Fisher. 1976. “The Dividend Puzzle”. Journal of Portfolio Management. Winter
issue. Pages 5 to 8.
♦ Brennan, Michael J. 1998. “Stripping the S&P 500 Index”. Financial Analysts Journal, vol.
54, no. 1 (January/February). Pages 12 to 22.
♦ Deutsche Börse. April 22, 2009. “Eurex to enhance successful Index dividend future
contract”. Press release.
http://deutsche-
boerse.com/dbag/dispatch/en/notescontent/gdb_navigation/press/10_Latest_Press_Rel
eases/30_Eurex/INTEGRATE/mr_pressreleases?notesDoc=23B6661D78A82B46C12575A0
00280655&newstitle=eurextoenhancesuccessfulindexd&location=press
♦ Eurex. July 2008. “Eurex Dow Jones Euro STOXX 50 Index Dividend Futures – Pricing &
Applications for the Institutional Investor”. Brochure.
http://www.eurexchange.com/download/documents/publications/study_djeuroSTOXX5
0_div_fut.pdf
♦ Fama, Eugene F., and Kenneth R. French. 2001. “Disappearing dividends: Changing Firm
Characteristics or Lower Propensity to Pay?”. Journal of financial economics, vol. 60.
Pages 3 to 43.
♦ Goldman Sachs. September 2006. “US Portfolio strategy – Turning cash into value”.
Research paper. Unknown author.
http://www2.goldmansachs.com/ideas/portfolio-strategy/us-portfolio-turning-cash-
pdf.pdf
♦ Gordon, M.J., and E. Shapiro. October 1956. “Capital Equipment Analysis: The Required
Rate of Profit”. Management Science, vol. 3, no. 1. Pages 102 to 110.
♦ Manley, Richard, Mueller-Glissman Christian. 2008. “The Market for Dividends and
Related Investment Strategies”. Financial Analysts Journal, vol. 64, no. 3. Pages 17 to 29.
♦ Stoxx Ltd. October 2008. “Dow Jones EURO STOXX 50 Dividend Points Calculation Guide”.
http://www.stoxx.com/download/indices/rulebooks/calculation_guide_dvp.pdf
♦ Wilkens, Sascha, and Jens Wimschulte. February 2009. “The pricing of dividend futures in
the European market: A first empirical analysis“. Working paper, submitted for
publication. London/Cologne.
http://papers.ssrn.com/sol3/papers.cfm?abstract_id=1350788

37
APPENDIX: Additional graphs which show our results
Figure 8. Dividend Swap vs. Replication Strategy using options with strike of 1,000
Source data: Eurex
Figure 9. Dividend Swap vs. Replication Strategy using options with strike of 1,800
Source data: Eurex
38
Figure 10. Dividend Swap vs. Replication Strategy using options with strike of 2,000
Source data: Eurex
Figure 11. Dividend Swap vs. Replication Strategy using options with strike of 2,200
Source data: Eurex
39
Figure 12. Dividend Swap vs. Replication Strategy using options with strike of 5,000
Source data: Eurex
Copyright © 2022 FDOKUMEN