CAPITAL STRUCTURE AND CORPORATE PERFORMANCE EMPIRICAL STUDY ON THE PUBLIC JORDANIAN SHAREHOLDINGS...
17
European Scientific Journal October edition vol. 8, No.22 ISSN: 1857 – 7881 (Print) e - ISSN 1857- 7431 173 CAPITAL STRUCTURE AND CORPORATE PERFORMANCE EMPIRICAL STUDY ON THE PUBLIC JORDANIAN SHAREHOLDINGS FIRMS LISTED IN THE AMMAN STOCK MARKET Mustafa M Soumadi Osama Suhail Hayajneh Financial and Administrative Sciences Department Al-Balqa Applied University, Jordan Abstract: The study investigates the effect of capital structure on the performance of the public Jordanian firms listed in Amman stock market. The study used multiple regression model represented by ordinary least squares (OLS) as a technique to examine what is the effect of capital structure on the performance by applying on 76 firms (53 industrial firms and 23 service corporation) for the period(2001-2006).The results of the study concluded that capital structure associated negatively and statistically with firm performance on the study sample generally. In addition, the study found out that there was no significant difference to the impact of the financial leverage between high financial leverage firms and low financial leverage firms on their performance. Finally, the study also showed that the effect of financial leverage on the basis of the growth that there is no difference between the financial leverage of high growth firms and low growth firms on the performance, which it was negatively and statistically. Keywords: Capital structure, performance, profitability, debt, financial leverage, firm and Jordan Introduction The relationship between capital structure and firm performance is considering of argumentative topics in the literature of corporate finance and that sparked the financial economists whether to be financial or non financial firms. As is will known, that global economy is witnessing investments movements, especially in recent decades and this
-
Upload
independent -
Category
Documents
-
view
4 -
download
0
Transcript of CAPITAL STRUCTURE AND CORPORATE PERFORMANCE EMPIRICAL STUDY ON THE PUBLIC JORDANIAN SHAREHOLDINGS...
European Scientific Journal October edition vol. 8, No.22 ISSN: 1857 – 7881 (Print) e - ISSN 1857- 7431
173
CAPITAL STRUCTURE AND CORPORATE PERFORMANCE
EMPIRICAL STUDY ON THE PUBLIC JORDANIAN
SHAREHOLDINGS FIRMS LISTED IN THE AMMAN STOCK
MARKET
Mustafa M Soumadi
Osama Suhail Hayajneh
Financial and Administrative Sciences Department Al-Balqa Applied University, Jordan
Abstract:
The study investigates the effect of capital structure on the performance of the public
Jordanian firms listed in Amman stock market. The study used multiple regression model
represented by ordinary least squares (OLS) as a technique to examine what is the effect of
capital structure on the performance by applying on 76 firms (53 industrial firms and 23
service corporation) for the period(2001-2006).The results of the study concluded that capital
structure associated negatively and statistically with firm performance on the study sample
generally. In addition, the study found out that there was no significant difference to the
impact of the financial leverage between high financial leverage firms and low financial
leverage firms on their performance. Finally, the study also showed that the effect of financial
leverage on the basis of the growth that there is no difference between the financial leverage
of high growth firms and low growth firms on the performance, which it was negatively and
statistically.
Keywords: Capital structure, performance, profitability, debt, financial leverage, firm and
Jordan
Introduction
The relationship between capital structure and firm performance is considering of
argumentative topics in the literature of corporate finance and that sparked the financial
economists whether to be financial or non financial firms. As is will known, that global
economy is witnessing investments movements, especially in recent decades and this
European Scientific Journal October edition vol. 8, No.22 ISSN: 1857 – 7881 (Print) e - ISSN 1857- 7431
174
consistent with the Jordan economy which developed as a result of its openness on the outside
world, and this in turn led to expansion the operations and activities of Jordanian firms,
therefore it requires financial sources to finance these operations and activities.
It should be noted that there are multiple financing sources, where the firms can
depend on it to finance their investments. Financing sources categorize into two sources, the
internal financing which includes common stock issuance, preferred stocks, reserves and
retained earnings. Another source called external financing which consists short and long term
loans and bonds issuance. At this case ,firms must choose the best financing sources to reach
the optimal capital structure to be in harmony with firms requirements to take suitable
financing decision and then reflect positively on their performance.
Capital structure of Jordanian firms contain, as shown on the balance sheets of
industrial and services firms, account payables , banking loans, short term loans and accruals
as current liabilities and long term of notes payable and loans and bonds issuance as long term
liabilities. With regard of internal financing implies owner equity that includes capital in
paid(common stock),compulsory and voluntary reserves and retained earnings.
The study examines what is the effect of capital structure on firms performance? ,and
in particular debt. To answer of this question , it will discuss some scenarios which relate
with the nature of the impact of capital structure on firms performance. First scenario involves
positive relation between capital structure and firm performance which indicates when the
firms depend on debt as much as firms needs , it will lead to enhance their performance .It can
explain that when the financial manager depends on debt as financing source more than
owner equity. Financial manager prefers debt source more than equity refers to two reasons:
the cost of debt is less than equity cost and the tax advantage of debt , which would therefore
maximize the firm performance .
Second scenario designate, that there is an inverse correlation between capital
structure and firm performance. Whenever, the firm depends on debt without employing it
into profitable investments. Thus ,the cost of debt will exceed the return that firm will obtain
it .Consequently , it will lead to increase the bankruptcy risks which effect inversely on firm
performance.
Finally, third scenario is that, there is no relationship between capital structure and
firm performance .Since this scenario supposes that cost of debt is relatively stable and the
cost of equity is not constant. When the debt reaches to certain level , any additional
borrowing will lead to inability of firm to meet its financial obligations. Therefore ; owners
European Scientific Journal October edition vol. 8, No.22 ISSN: 1857 – 7881 (Print) e - ISSN 1857- 7431
175
equity will be exposed to operating risks and they will require additional compensation. This
might proof that capital structure is not linked to the performance of the firm.
The study will try to contribute to provide further evidence to test the impact of capital
structure on firm performance by answering the following questions:
- How does the capital structure effect on Jordanian firms performance generally?
- Is there a difference in performance between the high levered firms and low levered
firms in regard to the impact of capital structure.
- Does the effect of performance have more impact on high growth firms or low
growth firms or vice versa?
The rest of research in addition to first part will be organized as follows: Part II will
contain the literature review theoretically and empirically. Part III will cover the sample and
variables. Part IV will review the hypotheses and the econometric model of study. Part V will
present the empirical analysis and final part will demonstrate the study conclusion.
2- Theoretical and empirical literature review
2-1-Theoritical literature review
After the research process around the title of article ,there are little studies take this
subject ,whereas the most studies focus on the determinants of capital structure .The roots of
capital structure theory refers to more than fifty decades since the seminal work which
presented by Modigliani and Miller 1958(thereafter MM) .They proved, under restrictive
assumptions (no taxes and transactions costs) that cost of capital does not affect on capital
structure ,particularly debt then not effect on firm value where this theory called irrelevancy
preposition. In other words, the value of levered firm equals the value of unlevered firm.
Latterly , Modigliani and Miller(1963) presented new proof that cost of capital affect
on capital structure, and therefore affect on value of the firm with relaxing unrealistic
assumptions that there are existing taxes, which indicate that borrowing give tax advantage,
where the interest deducted from the tax and it will result tax shields ,which in turn reduce the
cost of borrowing and then maximize the firm performance(Miller,1977) and this require
from the firm to make trade off between the cost of debt from side and the benefits of using
debt from another side.
Sequencely, the researchers studied the relationship between capital structure and the
value of the firm through appearing new theory called the agency theory which indicates to
potential conflict between shareholders and managers from on the one hand and the potential
conflict between shareholders and debtors form on the other hand. Potential conflict between
European Scientific Journal October edition vol. 8, No.22 ISSN: 1857 – 7881 (Print) e - ISSN 1857- 7431
176
shareholders and managers arises when the shareholders choose the manager as an agent of
their selves to mange the firm in order to maximize their wealth's ,but the mangers
concentrate on the high profitable and risky projects to achieve their interests at first that
represented incentives and rewards, and after that concerning of shareholders benefits, all of
these lead to maximize the firm value(Jensen and Meckling (1976),Harri and Raviv(1991),
and Myer(2001)).
Many studies proved that growth opportunities play important role in determining the
capital structure and therefore effect on firm performance. Myer(1977) discussed that the role
of growth opportunity in effect of the nature and the composition of capital structure that high
growth opportunities firms most likely will suffer from appearing the debt problem and this
will lead to arise risks accompanying with debt of which the firm gives up the profitable
investment opportunities. In addition, the firm will be relying on the equity sources more than
debt sources to face that’s risks and to finance expected growth opportunities , thus it will
reflect positively on firm performance (Hovakimian,Opler and Titman,2001) .
Another viewpoint related with agency costs that the firm will expect to achieve new
growth opportunity in the future. High growth firms will borrow loans and issuing new bonds
comparing with low growth firms. If the firm wants to issue debt in the future ,the firm will
expose of bankruptcy risk by reason of increasing the debt costs ,leading to reduce the firm
performance (Ross(1977), Majumdar and Chhibber(1997)).
It can be look to bankruptcy risks from another viewpoint, which provide for that
bankruptcy considers high cost for the managers , it may refer to their fears from losing
control benefits of the firm and their reputation .Then , the debt creates for the managers an
incentive to work hardly and actively in spite of the decrease the increments that may can
make it, but this will encourage them to utilize the best invested opportunities and this will
lead to reduce of bankruptcy(Grossman and Hart(1982) and therefore it will reduce debt cost
and thus enhancing the firm performance.
2-2-Empirical literature review
This section discusses some scientific studies, which examined the impact of capital
structure on firm performance. This section will divide into three parts: first part presents
some studies that indicate a positive relationship between capital structure and firm
performance. Second part shows a negative correlation between capital structure and firm
performance. Last part displays mixed results.
European Scientific Journal October edition vol. 8, No.22 ISSN: 1857 – 7881 (Print) e - ISSN 1857- 7431
177
2-2-1 Positive relationship between capital structure and firm performance
Wippern (1966) investigated the relationship between financial leverage and firm
value on some industries which marked on high degree in difference characteristics from
where growth, cost and demand. The study used debt to equity ratio as financial leverage
indicator and earnings to market value of common stock as performance indicator. Results
revealed that leverage effect positively on firm value and this traditional evidence which said
that shareholders wealth can enhance by using outside financing. In this manner , Holz(2002)
found that capital structure (debt ratio) related positively with the firm performance , the
result ascribes to the willing of firms managers to finance their projects by borrowing and
then use theses money optimally to maximize the performance. Accordingly to this result, if
the banks want to lend money , it shall study the feasibility of projects that want to finance its
accurately before offer loans until that the firms can achieve required returns to meet their
obligations.
On the same manner , Dessi and Robertson (2003) found that financial leverage affect
positively on the expected performance, where they explained this result to that low growth
firms attempt to depend on the borrowing for utilizing the expected growth opportunities and
investing borrowing money at the profitable projects , therefore it will increase the firm
performance .Margrates and Psillaki (2010) proved also that financial leverage (debt ratio)
correlated positively and significantly with firm performance(added value, labor and capital).
2-1-2-Negative relationship between capital structure and firm performance
In the contrast to the above, most studies had proved that capital structure related
negatively with firm performance .Majumdar and Chhibber (1997) and Ghosh(2007) reached
that level debt(capital structure) associated inversely with firms performance. The result refers
to the creditors who are using loans as disciplinary tool on the firm. This tool bases on the
restrictions that impose by creditors on the firm as prevention the firm from distribute the
earnings on the shareholders or impose restrictive conditions on the loans by increasing the
interest rates or impose sufficient collaterals on loans , thus , these restrictions will lead firm
to focus on how pay the debt burden without concerning in achieving earnings and reflect
adversely on firm performance .Abor(2005) noted that various capital structure measure
which represented short term debt , long term debt and total debt associated negatively and
statistically with firm performance .The conclusion refers to that firms rely on borrowing
extremely , it will not achieve tax shields and then it lead to increase borrowing cost of which
the firm exposes to the bankruptcy risks and reduce the return.
European Scientific Journal October edition vol. 8, No.22 ISSN: 1857 – 7881 (Print) e - ISSN 1857- 7431
178
Moreover, Rao,Hamed,Al-yahee and Syed(2007) reached that capital structure related
inversely on financial performance on Oman firms. The relationship refers to high borrowing
costs in Oman economy and to the weakness of the debt market activity in Oman. They
suggested that tax savings as a result of debt using are not sufficient to meet the costs of debt
and it would be the cost of debt greater than the rate of return. Krishnan and Moyer(1997)
,Gleason ,Mathur and Mathur(2000) ,Simerly and Li(2000) ,King and Santor(2008) and
Onalapo and Kajola(2010) proved that capital structure also related negatively with firm
performance.
2-1-3-Mixed results of capital structure and firm performance
Hurdle(1973) revealed that financial leverage effects negatively with profitability in
accordance with two stage least squares(2SLS) and positively according to ordinary least
squares(OLS).McConnell and Servaes(1995) and Agarwal and Zhao(2007) presented
additional evidence on how the growth of the firm may affect on the relationship between
capital structure and performance. High growth firms effect negatively between financial
leverage and firm value, while low growth firms effect positively.
Weill (2007) investigated the effect of financial leverage on the firm performance in
seven European countries. The study summarized that financial leverage related positively
and significantly on firm performance in Spain and Italy, whereas negatively and significantly
in Germany ,France ,Belgium and Norway ,but insignificantly in Portugal. Cheng,Liu and
Chien (2010) used threshold regression model on 650 Chinese firms(2001-2006).The results
revealed that debt ratio and firm value positively when the debt ratio between(53.97%-
70.48%),on the contrary , relationship be negatively when the debt ratio more than 70.48%.
Eventually, Li Meng ,Wang and Zhou(2008) proved that financial leverage related negatively
with return on asset ,but it is positive relation with return on equity.
3-Sample and variables of study
3-1- Study sample
The society of study contains manufactured and services firms that listed in Amman
bourse for the period(2001-2006).Financial data extracted from two main sources :annual
financial reports that issued by the firms at end of each year and the public shareholding firms
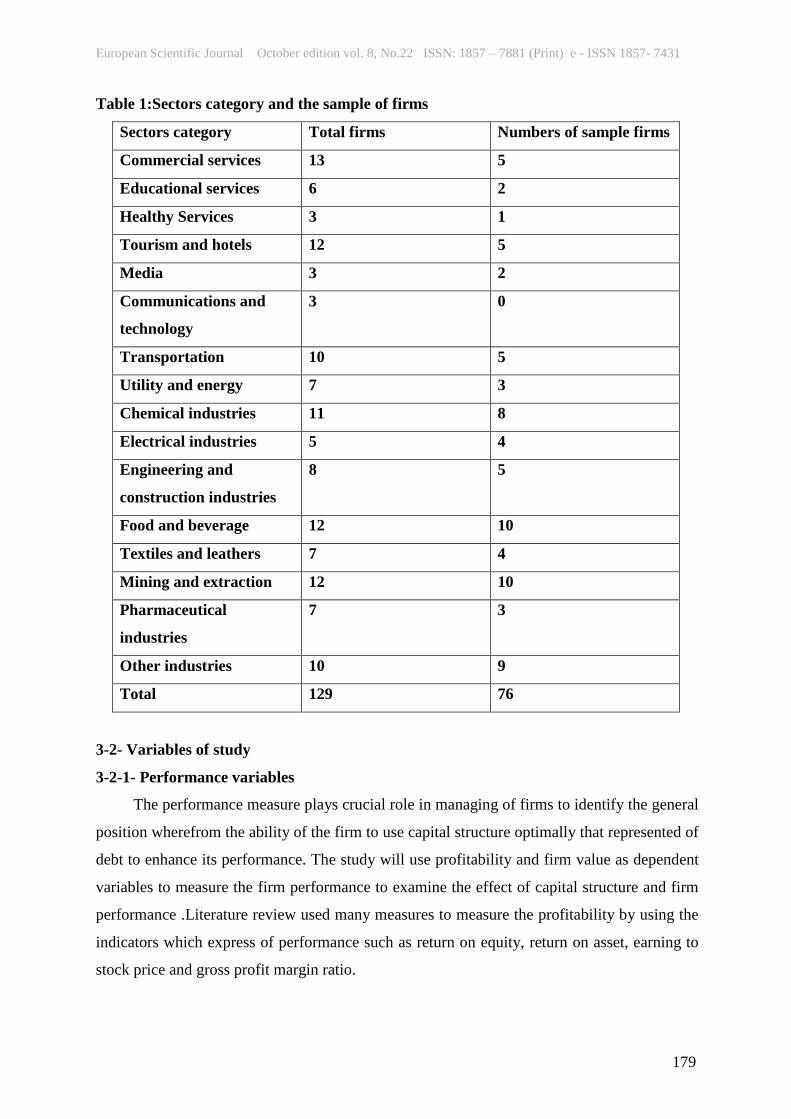
guide. The sample of study consists 76 firms(53 manufactured firms and 23 services firms)
from the total of 129 firms as shown in table (1) with excluding financial firms because the
characteristics differ than sample of study and unavailable firms data.
European Scientific Journal October edition vol. 8, No.22 ISSN: 1857 – 7881 (Print) e - ISSN 1857- 7431
179
Table 1:Sectors category and the sample of firms
Numbers of sample firms Total firms Sectors category
5 13 Commercial services
2 6 Educational services
1 3 Healthy Services
5 12 Tourism and hotels
2 3 Media
0 3 Communications and
technology
5 10 Transportation
3 7 Utility and energy
8 11 Chemical industries
4 5 Electrical industries
5 8 Engineering and
construction industries
10 12 Food and beverage
4 7 Textiles and leathers
10 12 Mining and extraction
3 7 Pharmaceutical
industries
9 10 Other industries
76 129 Total
3-2- Variables of study
3-2-1- Performance variables
The performance measure plays crucial role in managing of firms to identify the general
position wherefrom the ability of the firm to use capital structure optimally that represented of
debt to enhance its performance. The study will use profitability and firm value as dependent
variables to measure the firm performance to examine the effect of capital structure and firm
performance .Literature review used many measures to measure the profitability by using the
indicators which express of performance such as return on equity, return on asset, earning to
stock price and gross profit margin ratio.
European Scientific Journal October edition vol. 8, No.22 ISSN: 1857 – 7881 (Print) e - ISSN 1857- 7431
180
- Return on equity as profitability measure which measure the return that shareholders
can obtain its from utilize the capital structure efficiently by the firm management. Return on
equity measured by dividing net income after tax to book value of owner equity(Onalapo and
Kajola(2010) and Krishnan and Moyer(1997)).
- Tobin q :It express the firm value which measure by dividing the market value of
owner equity plus the book value of total liabilities to the book value of total
assets(Ghosh(2007),Agarawal and Zhao(2007) and King and Santor(2008)).
3-2-2- Independent variables
the study implies four independent variables to identify what is the effect of capital
structure on firm performance that includes:
- Financial leverage: The variable considers the main variable to express the capital
structure which measure by dividing the book value of total liabilities to the book value of
total assets(King and Santor(2008),Ghosh(2007),Weill(2007) and Margrates and
Psillaki(2010)).
- Tangible assets: It considers of control variable and measure by dividing the net fixed
assets to total assets(Dessi and Robertson (2003),Weill(2007) and Margrates and
Psillaki(2010)).
- Firm size: It is control variable which measure by natural logarithm of total
assets(Onaolapo and Kajola(2010) and King and Santor(2008)).
- Firm growth :It is measure by find the difference rate in the book value of total
assets.
1- Hypotheses and econometric model of study
4-1-Hypotheses of the study
First hypothesis: under stable environmental conditions, if the firm depends on
financial leverage extremely , it will lead to enhance the firm performance.
Second hypothesis: cetres paribus, there are significant differences between the
financial leverage of high levered firms and the financial leverage of low levered firms in
effect on firm performance.

European Scientific Journal October edition vol. 8, No.22 ISSN: 1857 – 7881 (Print) e - ISSN 1857- 7431
181
Third hypothesis: cetres paribus ,there are no significant differences between the
financial leverage of high growth firms and the financial leverage of low growth firms in
effect on firm performance.
4-2- Econometric model
The study tries to investigate the previous hypotheses by using ordinary least squares
model to determine what is the effect of capital structure on firm performance .The study
builds general multi-regression model as following:
Yi,t = αi + βiXi, t + ei,t (1)
Where: Y
i,t :dependent variable for firm i in year t. αi: constant coefficient for firm i. βi: slope
coefficient of independent variables of firm i , Xi,t: independent variables for firm i in year t,
ei,t: standard error of firm i in year t.
Based on previous model, following two equations demonstrate the effect of capital structure
on firm performance which implies two measures of performance: return equity and firm
value.
ROE i,t = αi + β1Lev i, t + β2Tani, t + β3Siz i, t + β4Groi, t + ei, (2) Tobin
qi,t = αi + β2Lev i, t + β2Tani, t + β3Siz i, t + β4Groi, t + ei (3)
Where: ROE i,t: return on equity for firm i in year t.Tobin q i,t :firm value for firm i at year t
.Levi, t :financial leverage for firm i at year t .Tani, t:tangible assets for firm i at year t. Siz i,
t:size of the firm i at year t. Groi, t:growth of the firm i at year t.
5-Empirical analysis
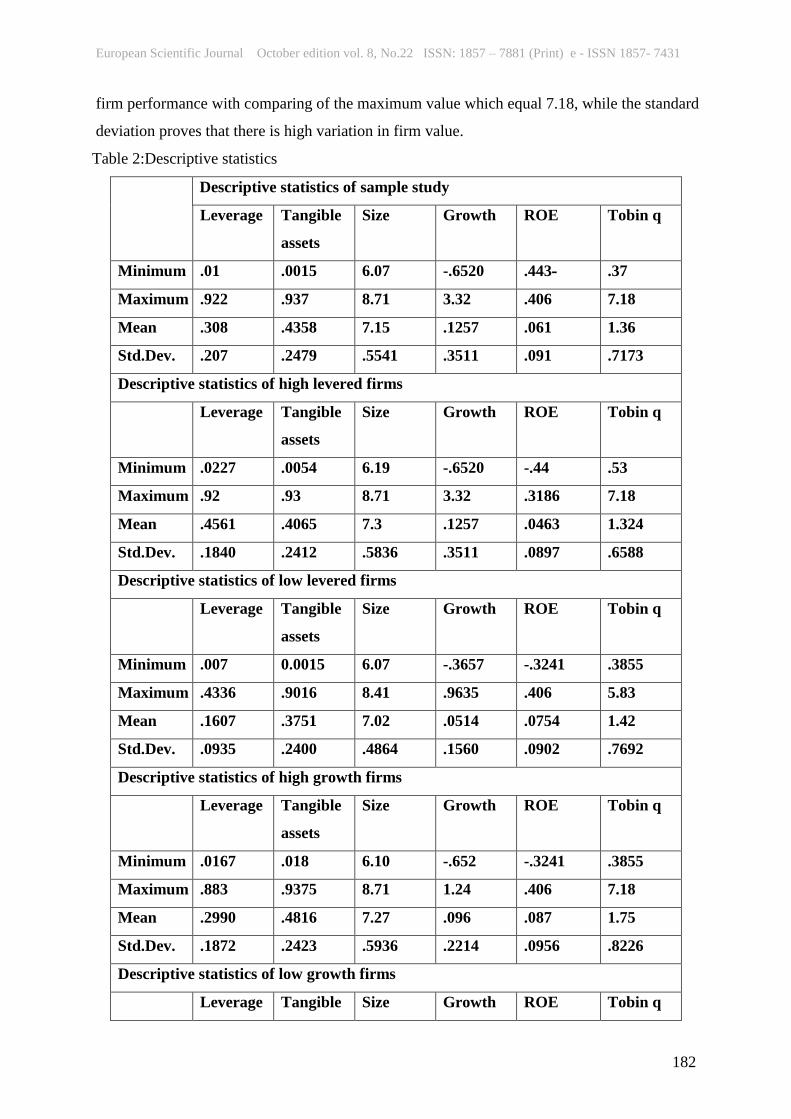
5-1-Descriptive statistics
This section shows the descriptive statistics for the variables of the study that used in
the analysis to identify the nature of data and the extent of its suitability for using. Where it is
noted form table 2 that the average financial leverages for sample of study 31%
approximately and this percent considers moderate for the firms. As well as analysis indicates
that the minimum percent of financial leverage is 1%, wheras the maximum value reached it
is 92% and this percent is very high. This denotes that there is high variation in using
financial leverage. With regard to return on equity , the average of return reached 6.1% and
these percent is very low with comparing of high return which is 40.6%.it refers to some firms
achieve large losses and this indicate to weakness of firm performance generally. Firm value
represented by Tobin q which the average is 1.36 and also the results indicates to decline the
European Scientific Journal October edition vol. 8, No.22 ISSN: 1857 – 7881 (Print) e - ISSN 1857- 7431
182
firm performance with comparing of the maximum value which equal 7.18, while the standard
deviation proves that there is high variation in firm value.
Table 2:Descriptive statistics
Descriptive statistics of sample study
Tobin q ROE Growth Size Tangible
assets
Leverage
.37 .443- -.6520 6.07 .0015 .01 Minimum
7.18 .406 3.32 8.71 .937 .922 Maximum
1.36 .061 .1257 7.15 .4358 .308 Mean
.7173 .091 .3511 .5541 .2479 .207 Std.Dev.
Descriptive statistics of high levered firms
Tobin q ROE Growth Size Tangible
assets
Leverage
.53 -.44 -.6520 6.19 .0054 .0227 Minimum
7.18 .3186 3.32 8.71 .93 .92 Maximum
1.324 .0463 .1257 7.3 .4065 .4561 Mean
.6588 .0897 .3511 .5836 .2412 .1840 Std.Dev.
Descriptive statistics of low levered firms
Tobin q ROE Growth Size Tangible
assets
Leverage
.3855 -.3241 -.3657 6.07 0.0015 .007 Minimum
5.83 .406 .9635 8.41 .9016 .4336 Maximum
1.42 .0754 .0514 7.02 .3751 .1607 Mean
.7692 .0902 .1560 .4864 .2400 .0935 Std.Dev.
Descriptive statistics of high growth firms
Tobin q ROE Growth Size Tangible
assets
Leverage
.3855 -.3241 -.652 6.10 .018 .0167 Minimum
7.18 .406 1.24 8.71 .9375 .883 Maximum
1.75 .087 .096 7.27 .4816 .2990 Mean
.8226 .0956 .2214 .5936 .2423 .1872 Std.Dev.
Descriptive statistics of low growth firms
Tobin q ROE Growth Size Tangible Leverage
European Scientific Journal October edition vol. 8, No.22 ISSN: 1857 – 7881 (Print) e - ISSN 1857- 7431
183
assets
.3917 -.4431 -.4763 6.07 .0015 .01 Minimum
1.93 .2932 3.32 8.56 .9146 .92 Maximum
0.9971 .0346 .0814 7.04 .3939 .3084 Mean
.2657 .0825 .3173 .5125 .2450 .2239 Std.Dev.
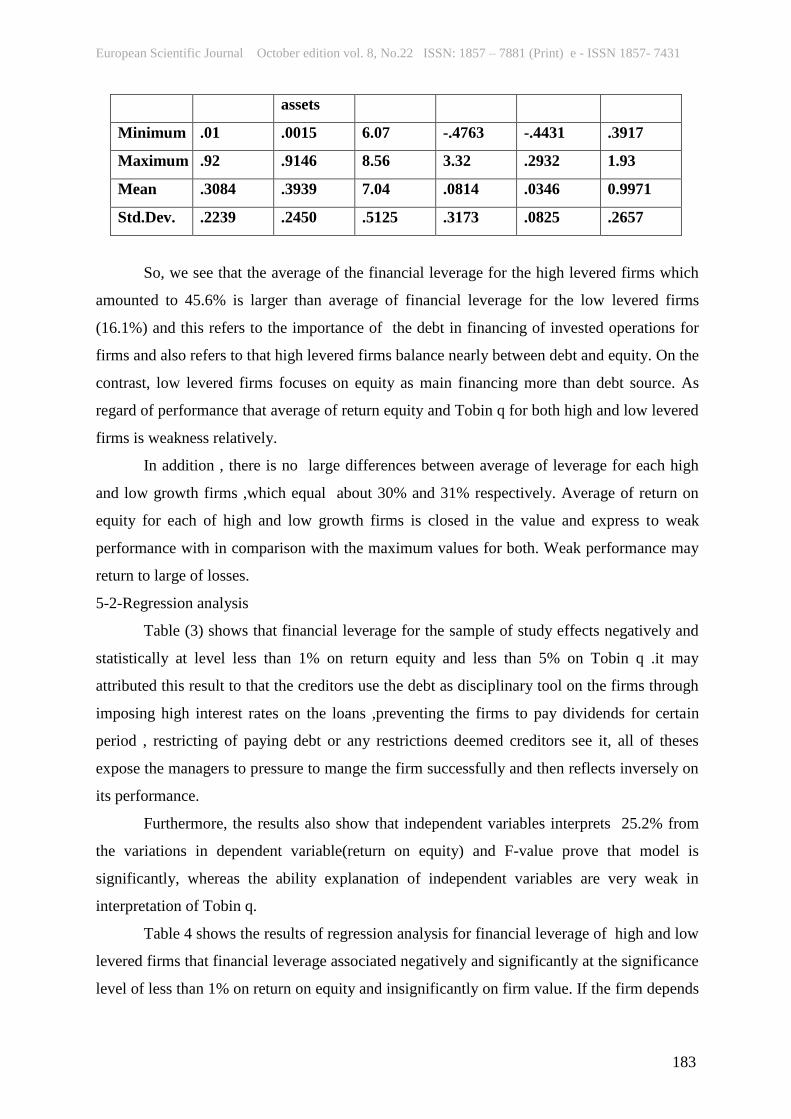
So, we see that the average of the financial leverage for the high levered firms which
amounted to 45.6% is larger than average of financial leverage for the low levered firms
(16.1%) and this refers to the importance of the debt in financing of invested operations for
firms and also refers to that high levered firms balance nearly between debt and equity. On the
contrast, low levered firms focuses on equity as main financing more than debt source. As
regard of performance that average of return equity and Tobin q for both high and low levered
firms is weakness relatively.
In addition , there is no large differences between average of leverage for each high
and low growth firms ,which equal about 30% and 31% respectively. Average of return on
equity for each of high and low growth firms is closed in the value and express to weak
performance with in comparison with the maximum values for both. Weak performance may
return to large of losses.
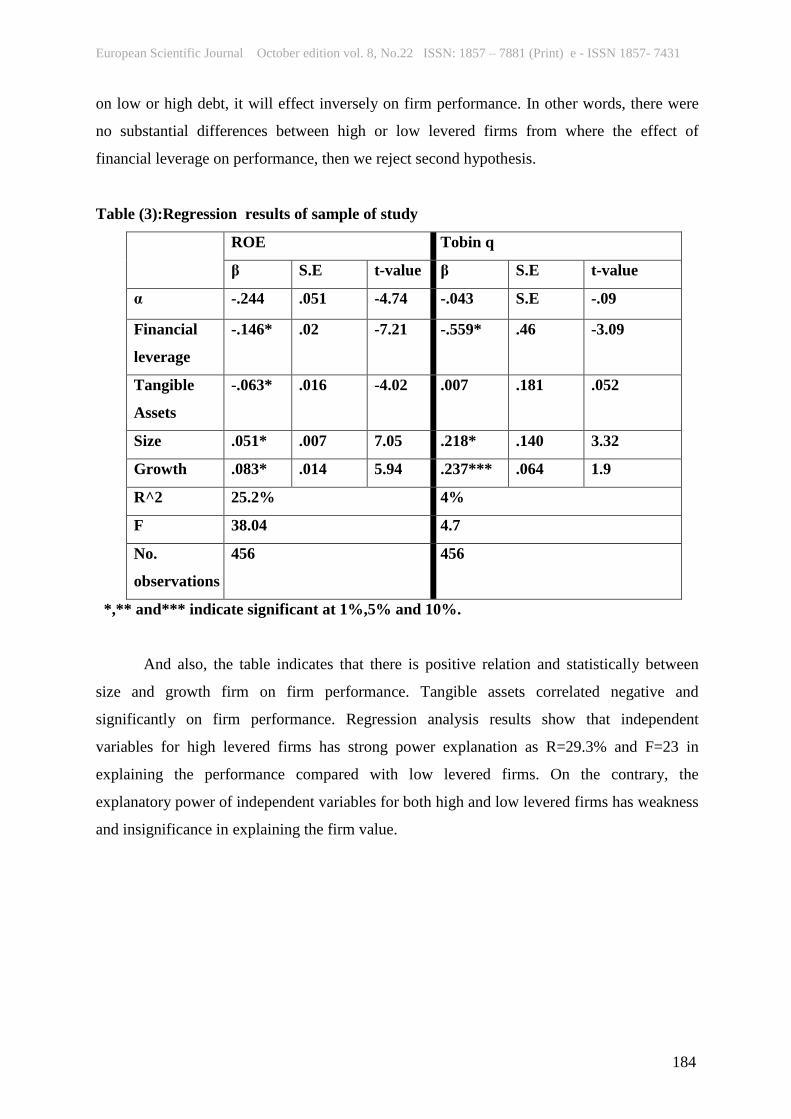
5-2-Regression analysis
Table (3) shows that financial leverage for the sample of study effects negatively and
statistically at level less than 1% on return equity and less than 5% on Tobin q .it may
attributed this result to that the creditors use the debt as disciplinary tool on the firms through
imposing high interest rates on the loans ,preventing the firms to pay dividends for certain
period , restricting of paying debt or any restrictions deemed creditors see it, all of theses
expose the managers to pressure to mange the firm successfully and then reflects inversely on
its performance.
Furthermore, the results also show that independent variables interprets 25.2% from
the variations in dependent variable(return on equity) and F-value prove that model is
significantly, whereas the ability explanation of independent variables are very weak in
interpretation of Tobin q.
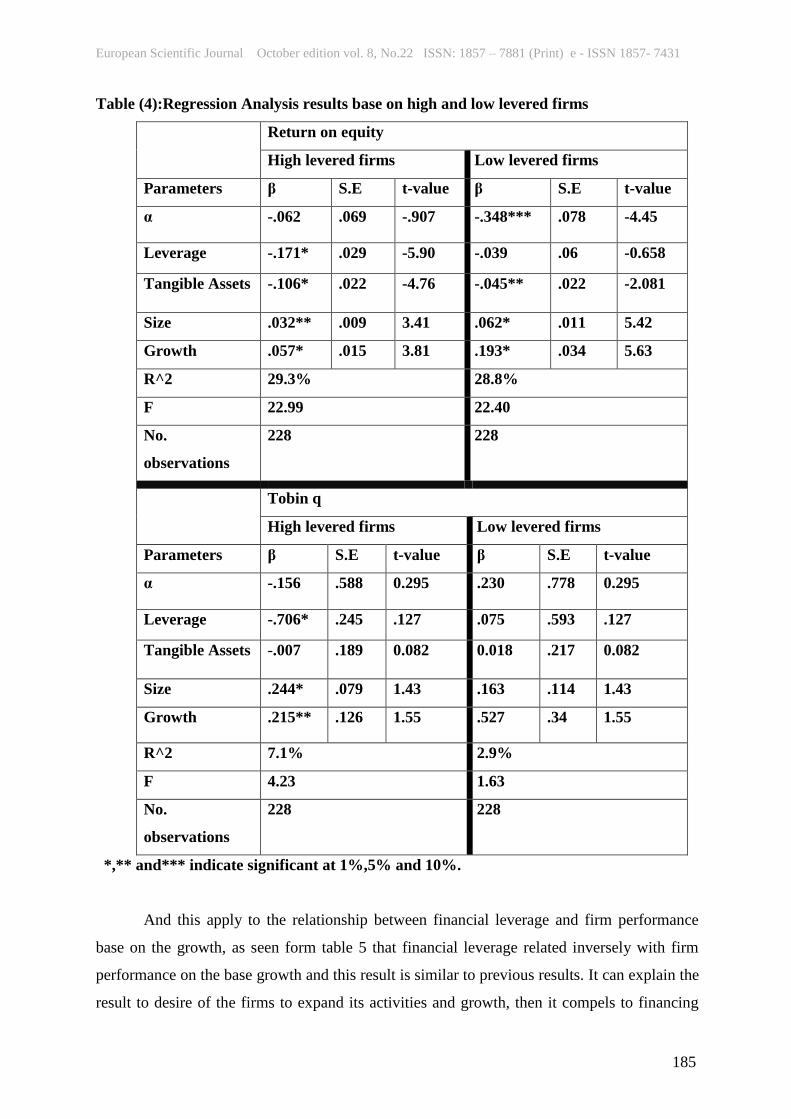
Table 4 shows the results of regression analysis for financial leverage of high and low
levered firms that financial leverage associated negatively and significantly at the significance
level of less than 1% on return on equity and insignificantly on firm value. If the firm depends
European Scientific Journal October edition vol. 8, No.22 ISSN: 1857 – 7881 (Print) e - ISSN 1857- 7431
184
on low or high debt, it will effect inversely on firm performance. In other words, there were
no substantial differences between high or low levered firms from where the effect of
financial leverage on performance, then we reject second hypothesis.
Table (3):Regression results of sample of study
Tobin q ROE
t-value S.E β t-value S.E β
-.09 S.E -.043 -4.74 .051 -.244 α
-3.09 .46 -.559* -7.21 .02 -.146* Financial
leverage
.052 .181 .007 -4.02 .016 -.063* Tangible
Assets
3.32 .140 .218* 7.05 .007 .051* Size
1.9 .064 .237*** 5.94 .014 .083* Growth
4% 25.2% R^2
4.7 38.04 F
456 456 No.
observations
*,** and*** indicate significant at 1%,5% and 10%.
And also, the table indicates that there is positive relation and statistically between
size and growth firm on firm performance. Tangible assets correlated negative and
significantly on firm performance. Regression analysis results show that independent
variables for high levered firms has strong power explanation as R=29.3% and F=23 in
explaining the performance compared with low levered firms. On the contrary, the
explanatory power of independent variables for both high and low levered firms has weakness
and insignificance in explaining the firm value.
European Scientific Journal October edition vol. 8, No.22 ISSN: 1857 – 7881 (Print) e - ISSN 1857- 7431
185
Table (4):Regression Analysis results base on high and low levered firms
Return on equity
Low levered firms High levered firms
t-value S.E β t-value S.E β Parameters
-4.45 .078 -.348*** -.907 .069 -.062 α
-0.658 .06 -.039 -5.90 .029 -.171* Leverage
-2.081 .022 -.045** -4.76 .022 -.106* Tangible Assets
5.42 .011 .062* 3.41 .009 .032** Size
5.63 .034 .193* 3.81 .015 .057* Growth
28.8% 29.3% R^2
22.40 22.99 F
228 228 No.
observations
Tobin q
Low levered firms High levered firms
t-value S.E β t-value S.E β Parameters
0.295 .778 .230 0.295 .588 -.156 α
.127 .593 .075 .127 .245 -.706* Leverage
0.082 .217 0.018 0.082 .189 -.007 Tangible Assets
1.43 .114 .163 1.43 .079 .244* Size
1.55 .34 .527 1.55 .126 .215** Growth
2.9% 7.1% R^2
1.63 4.23 F
228 228 No.
observations
*,** and*** indicate significant at 1%,5% and 10%.
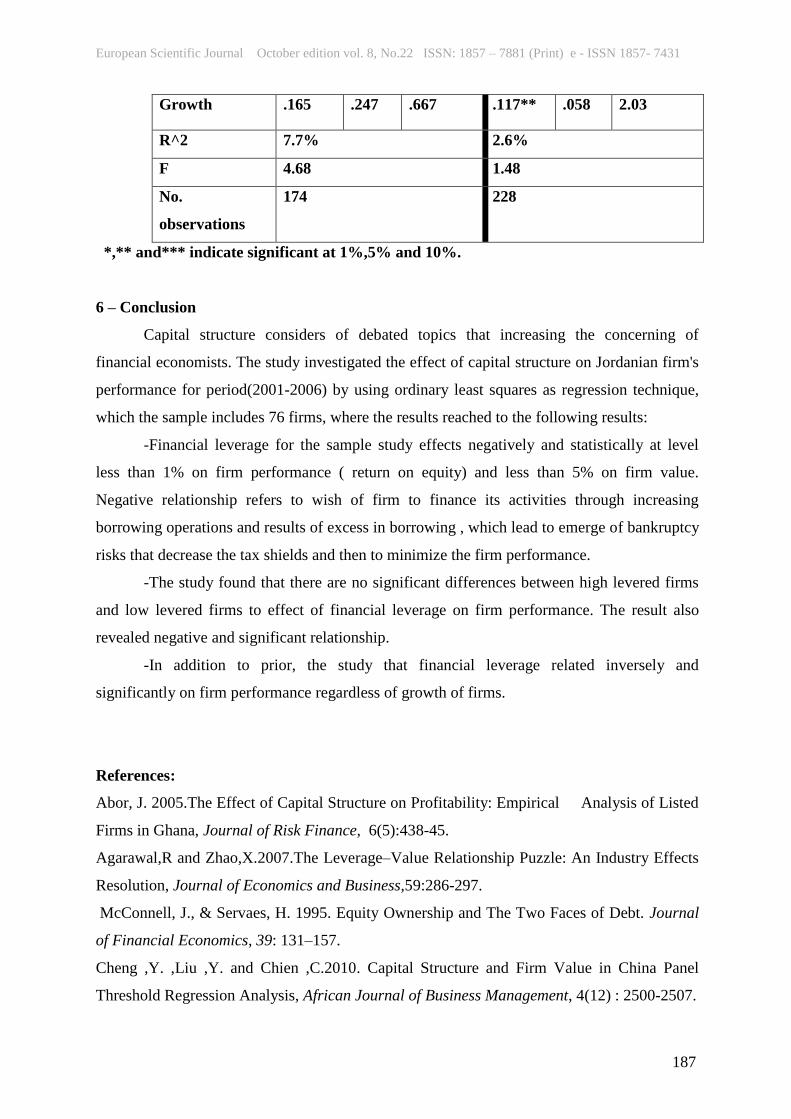
And this apply to the relationship between financial leverage and firm performance
base on the growth, as seen form table 5 that financial leverage related inversely with firm
performance on the base growth and this result is similar to previous results. It can explain the
result to desire of the firms to expand its activities and growth, then it compels to financing
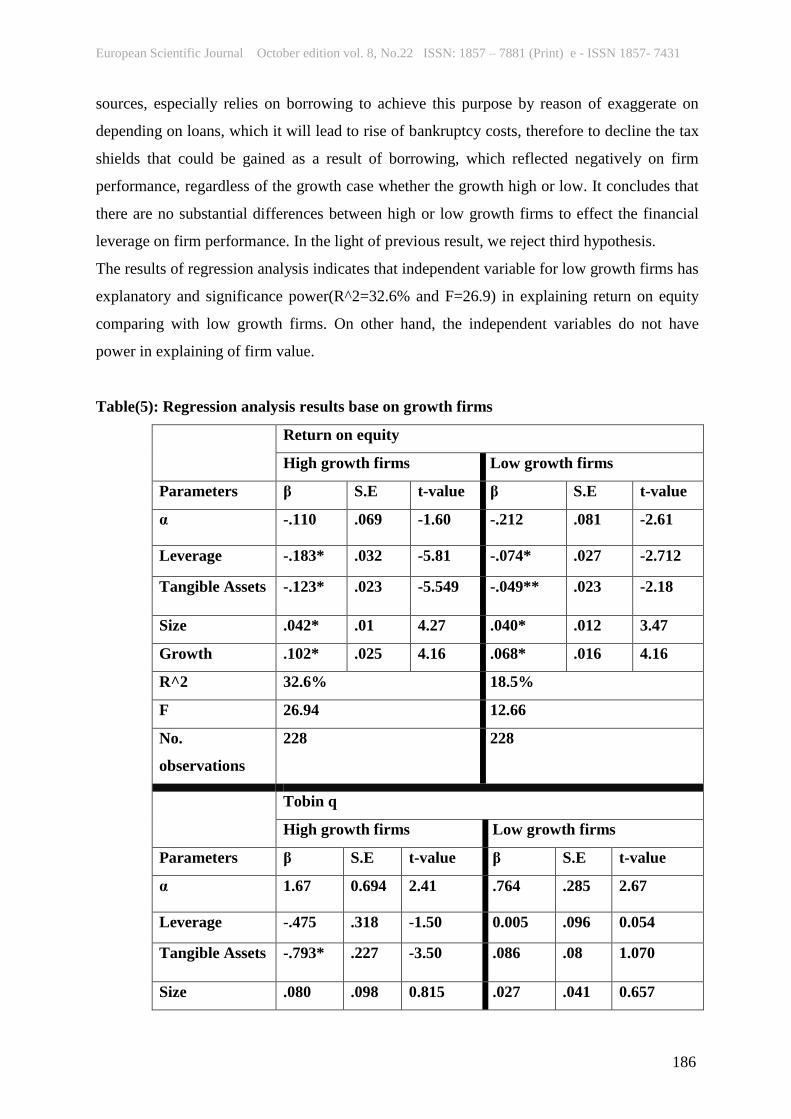
European Scientific Journal October edition vol. 8, No.22 ISSN: 1857 – 7881 (Print) e - ISSN 1857- 7431
186
sources, especially relies on borrowing to achieve this purpose by reason of exaggerate on
depending on loans, which it will lead to rise of bankruptcy costs, therefore to decline the tax
shields that could be gained as a result of borrowing, which reflected negatively on firm
performance, regardless of the growth case whether the growth high or low. It concludes that
there are no substantial differences between high or low growth firms to effect the financial
leverage on firm performance. In the light of previous result, we reject third hypothesis.
The results of regression analysis indicates that independent variable for low growth firms has
explanatory and significance power(R^2=32.6% and F=26.9) in explaining return on equity
comparing with low growth firms. On other hand, the independent variables do not have
power in explaining of firm value.
Table(5): Regression analysis results base on growth firms
Return on equity
Low growth firms High growth firms
t-value S.E β t-value S.E β Parameters
-2.61 .081 -.212 -1.60 .069 -.110 α
-2.712 .027 -.074* -5.81 .032 -.183* Leverage
-2.18 .023 -.049** -5.549 .023 -.123* Tangible Assets
3.47 .012 .040* 4.27 .01 .042* Size
4.16 .016 .068* 4.16 .025 .102* Growth
18.5% 32.6% R^2
12.66 26.94 F
228 228 No.
observations
Tobin q
Low growth firms High growth firms
t-value S.E β t-value S.E β Parameters
2.67 .285 .764 2.41 0.694 1.67 α
0.054 .096 0.005 -1.50 .318 -.475 Leverage
1.070 .08 .086 -3.50 .227 -.793* Tangible Assets
0.657 .041 .027 0.815 .098 .080 Size
European Scientific Journal October edition vol. 8, No.22 ISSN: 1857 – 7881 (Print) e - ISSN 1857- 7431
187
2.03 .058 .117** .667 .247 .165 Growth
2.6% 7.7% R^2
1.48 4.68 F
228 174 No.
observations
*,** and*** indicate significant at 1%,5% and 10%.
6 – Conclusion
Capital structure considers of debated topics that increasing the concerning of
financial economists. The study investigated the effect of capital structure on Jordanian firm's
performance for period(2001-2006) by using ordinary least squares as regression technique,
which the sample includes 76 firms, where the results reached to the following results:
-Financial leverage for the sample study effects negatively and statistically at level
less than 1% on firm performance ( return on equity) and less than 5% on firm value.
Negative relationship refers to wish of firm to finance its activities through increasing
borrowing operations and results of excess in borrowing , which lead to emerge of bankruptcy
risks that decrease the tax shields and then to minimize the firm performance.
-The study found that there are no significant differences between high levered firms
and low levered firms to effect of financial leverage on firm performance. The result also
revealed negative and significant relationship.
-In addition to prior, the study that financial leverage related inversely and
significantly on firm performance regardless of growth of firms.
References:
Abor, J. 2005.The Effect of Capital Structure on Profitability: Empirical Analysis of Listed
Firms in Ghana, Journal of Risk Finance, 6(5):438-45.
Agarawal,R and Zhao,X.2007.The Leverage–Value Relationship Puzzle: An Industry Effects
Resolution, Journal of Economics and Business,59:286-297.
McConnell, J., & Servaes, H. 1995. Equity Ownership and The Two Faces of Debt. Journal
of Financial Economics, 39: 131–157.
Cheng ,Y. ,Liu ,Y. and Chien ,C.2010. Capital Structure and Firm Value in China Panel
Threshold Regression Analysis, African Journal of Business Management, 4(12) : 2500-2507.
European Scientific Journal October edition vol. 8, No.22 ISSN: 1857 – 7881 (Print) e - ISSN 1857- 7431
188
Harris, M., and Raviv, A. 1991. The Theory of Capital Structure, The Journal of Finance,
46:297-355.
Holz,Carsten A.2002. The Impact of The Liability-Asset Ratio on Profitability in China's
Industrial State-Owned Enterprises , China Economic Review,13: 1-26.
Ghosh,S.2007. Leverage, Managerial Monitoring and Firm Valuation:
A Simultaneous Equation Approach, Research in Economics ,61: 84–98.
Gleason, K. C., L. K Mathur, and I. Mathur.2000.The Interrelationship between Culture,
Capital Structure, and Performance: Evidence from European Retailers, Journal of Business
Research, 50:185-191.
Grossman, S. J. and Hart, O.1982.Corporate Financial Structure and Management Incentives”,
In: The Economics of Information and Uncertainty,:107–140. University of Chicago Press,
Chicago.
Hovakimain,A., Opler,T. and Titman,S.2001, The Debt-Equity Choice, Journal of Financial
and Quantitative Analysis, 36( 1):PP.1-24.
Hurdle,G.1973.Leverage,Risk, Market Structure and Profitability, The Review of Economics
and Statistics :478-485.
Jensen, M.and Meckling, W. 1976.Theory of The Firm: Managerial Behavior, Agency Costs
and Ownership Structure , Journal of Financial Economics, 3 :305-60.
King,M. and Santor,E.2008.Family Values: Ownership Structure, Performance and Capital
Structure of Canadian Firms, Journal of Banking and Finance,32:2423-2432.
Krishnan,V. and Moyer,R.1997. Performance, Capital Structure and Home Country: An
Analysis of Asian Corporation, Global Finance Journal,8(1):130-143.
Li,H. ,Meng,L., Wang,Q .and Zhou,L.2008. Political Connections, Financing and Firm
Performance: Evidence from Chinese Private Firms, Journal of Development Economics,
87:283–299.
Majumdar, S.K., Chhibber, P. 1999.Capital Structure and Performance: Evidence from a
Transition Economy on an Aspect of Corporate Governance, Public Choice,98:287-305.
Margaritis ,D and Psillaki, M.2010. Capital Structure, Equity Ownership and Firm
Performance ,Journal of Banking and Finance, 34:621-632.
Margaritis, D. and Psillaki, M.2007.Capital Structure and Firm Efficiency, Journal of
Business Finance & Accounting, 34: 1447–1469.
Miller MH .1977.Debt and Taxes, Journal of Finance, 32(2): 261-275.
Modigliani, F., Miller, M.1958.The Cost of Capital, Corporation Finance and The Theory of
Investment, The American Economic Review,48 (3) :261-97.
European Scientific Journal October edition vol. 8, No.22 ISSN: 1857 – 7881 (Print) e - ISSN 1857- 7431
189
Modigliani, F. and Miller, M. 1963.Corporate Income Taxes and The Cost of Capital: a
Correction, The American Economic Review,53:443-53.
Myers, S.1977.Determinants of Corporate Borrowing, Journal of Financial Economics, 5:
147-176.
Myers, S.C.1984.The Capital Structure Puzzle, Journal of Finance, 39 :575-92.
Myers .S. C.2001.Capital Structure, Journal of Economic perspectives, 15(2):81-102.
Onaolapo,A. and Kajola,O.2010. Capital Structure and Firm Performance: Evidence from
Nigeria, European Journal of Economics, Finance and Administrative Sciences, 25:70-82.
Rao,N,V.,Al-Yahyee,K and Syed.L.2007. Capital Structure and Financial Performance:
Evidence from Oman, Indian Journal of Economics and Business,:1-23.
Roberta D. & Donald R. 2003.Debt, Incentives and Performance: Evidence from UK Panel
Data ,Economic Journal, Royal Economic Society, 113(490):903-91.
Ross, S.1977.The Determination of Financial Structure: The Incentive Signaling Approach,
Bell Journal of Economics, 8:23-40.
Simerly,R. and Li,M.2000.Environmental Dynamism ,Capital Structure and Performance: A
Theoretical Integration and an Empirical Test, Strategic Management Journal, 21:31–49.
Weill ,L.2008. Leverage and Corporate Performance: Does Institutional Environment
Matter?, Small Business Economics , 30:.251–265.
Wippern,R.1966.Financial Structure and The Value of The Firm, The Journal of
Finance,21(4):615-633.