Asia Pacific Daily - 26 July 2019 - Bursa Marketplace
29
IMPORTANT DISCLOSURES, INCLUDING ANY REQUIRED RESEARCH CERTIFICATIONS, ARE PROVIDED AT THE END OF THIS REPORT. IF THIS REPORT IS DISTRIBUTED IN THE UNITED STATES IT IS DISTRIBUTED BY CGS-CIMB SECURITIES (USA), INC. AND IS CONSIDERED THIRD-PARTY AFFILIATED RESEARCH. Powered by the EFA Platform Asia Pacific Daily - 26 July 2019 Equity Research Reports… ▌China/Hong Kong Property - Overall (NEUTRAL) - 10% earnings growth expected for 1H19 | P2 ——————————————————————————————————————————————————————————————————————————————————————— ▌India Asian Paints Limited (HOLD, tp:Rs1,520.00▲) - Fairly priced; maintain Hold | P3 Mahindra & Mahindra Fin. (ADD, tp:Rs400.00▼) - Economic slowdown hurts asset quality | P4 Shriram Transport Finance (ADD, tp:Rs1,350.00▼) - Growth drops – asset quality largely … | P5 SKF India Ltd (ADD, tp:Rs2,150.00▼) - 1QFY20: Steady quarter | P6 Tata Motors (ADD, tp:Rs277.00) - JLR volatility concerns | P7 ——————————————————————————————————————————————————————————————————————————————————————— ▌Indonesia Bank Central Asia (HOLD, tp:Rp28,500.00) - 1H19 results: Strong PPOP offset by higher … | P8 ——————————————————————————————————————————————————————————————————————————————————————— ▌South Korea Korea Shipbuilding & Offshore (ADD, tp:W170,000.00▼) - Good earnings, weak sentiment | P9 LG Household & Health Care Ltd (ADD, tp:W1,500,000.00) - 2Q19 review: virtue of ... | P10 Mando Corporation (ADD▲, tp:W40,000.00▲) - Self-driving outside China | P11 NAVER (HOLD▲, tp:W140,000.00▲) - Positive on Naver Pay’s spinoff | P12 SK Hynix (ADD, tp:W95,000.00▲) - Moving in the right direction for a recovery | P13 ——————————————————————————————————————————————————————————————————————————————————————— ▌Malaysia Axis REIT (HOLD, tp:RM1.95) - Narrowing down its acquisition prospects | P14 CapitaLand Malaysia Mall Trust (HOLD, tp:RM1.03▼) - Prolonged impact from rental ... | P15 Pavilion REIT (HOLD, tp:RM1.91▲) - Working on DA MEN’s gradual turnaround | P16 ——————————————————————————————————————————————————————————————————————————————————————— ▌Singapore Cache Logistics Trust (HOLD, tp:S$0.76▼) - Looking for a better 3Q | P17 Mapletree Commercial Trust (ADD, tp:S$2.24) - A good start | P18 ST Engineering (ADD, tp:S$4.43) - How high can it go? | P19 Thai Beverage (ADD, tp:S$0.96▲) - NDR takeaways: Solidifying its presence | P20 ——————————————————————————————————————————————————————————————————————————————————————— ▌Thailand Carabao Group (ADD, tp:THB80.00▲) - More energy to run | P21 KCE Electronics (REDUCE, tp:THB13.60▼) - Strong earnings rebound not in sight | P22 Recent CGS-CIMB Research Ideas —————————————————————————————————— KRW: Technology Components 23/07 Diverging prospects for LGI & BH ———— ——— ——— ——— ——— ——— ——— ——— ——— ——— ——— ——— ——— ——— ——— ——— ——— ——— ——— ——— ——— ——— ——— ——— ——— ——— —— THB: Hotels 17/7 NCPO legalisation will boost room supply ———— ——— ——— ——— ——— ——— ——— ——— ——— ——— ——— ——— ——— ——— ——— ——— ——— ——— ——— ——— ——— ——— ——— ——— ——— ——— —— CHN: Universal Scientific Industrial 16/07 Finding the golden child ———— ——— ——— ——— ——— ——— ——— ——— ——— ——— ——— ——— ——— ——— ——— ——— ——— ——— ——— ——— ——— ——— ——— ——— ——— ——— —— MAL: Rubber Gloves 12/07 Golden gloves ———— ——— ——— ——— ——— ——— ——— ——— ——— ——— ——— ——— ——— ——— ——— ——— ——— ——— ——— ——— ——— ——— ——— ——— ——— ——— —— KRW: Navigating South Korea: Technology Components 10/07 Integration is key for future display tech ———— ——— ——— ——— ——— ——— ——— ——— ——— ——— ——— ——— ——— ——— ——— ——— ——— ——— ——— ——— ——— ——— ——— ——— ——— ——— —— Regional Equity Research Contact ————————————————————————————————— Bertram LAI Head of Research T: (852) 2532 1111 E: [email protected] ———— ——— ——— ——— ——— ——— ——— ——— ——— ——— ——— ——— ——— ——— ——— ——— ——— ——— ——— ——— ——— ——— ——— ——— ——— ——— ——— — Show Style "View Doc Map"
-
Upload
khangminh22 -
Category
Documents
-
view
1 -
download
0
Transcript of Asia Pacific Daily - 26 July 2019 - Bursa Marketplace
IMPORTANT DISCLOSURES, INCLUDING ANY REQUIRED RESEARCH CERTIFICATIONS, ARE PROVIDED AT THE END OF THIS REPORT. IF THIS REPORT IS DISTRIBUTED IN THE UNITED STATES IT IS DISTRIBUTED BY CGS-CIMB SECURITIES (USA), INC. AND IS CONSIDERED THIRD-PARTY AFFILIATED RESEARCH.
Powered by the EFA Platform
Asia Pacific Daily - 26 July 2019 Equity Research Reports…
▌China/Hong Kong Property - Overall (NEUTRAL) - 10% earnings growth expected for 1H19 | P2 ———————————————————————————————————————————————————————————————————————————————————————
▌India Asian Paints Limited (HOLD, tp:Rs1,520.00▲) - Fairly priced; maintain Hold | P3
Mahindra & Mahindra Fin. (ADD, tp:Rs400.00▼) - Economic slowdown hurts asset quality | P4 Shriram Transport Finance (ADD, tp:Rs1,350.00▼) - Growth drops – asset quality largely … | P5
SKF India Ltd (ADD, tp:Rs2,150.00▼) - 1QFY20: Steady quarter | P6
Tata Motors (ADD, tp:Rs277.00) - JLR volatility concerns | P7 ———————————————————————————————————————————————————————————————————————————————————————
▌Indonesia
Bank Central Asia (HOLD, tp:Rp28,500.00) - 1H19 results: Strong PPOP offset by higher … | P8 ———————————————————————————————————————————————————————————————————————————————————————
▌South Korea Korea Shipbuilding & Offshore (ADD, tp:W170,000.00▼) - Good earnings, weak sentiment | P9 LG Household & Health Care Ltd (ADD, tp:W1,500,000.00) - 2Q19 review: virtue of ... | P10
Mando Corporation (ADD▲, tp:W40,000.00▲) - Self-driving outside China | P11 NAVER (HOLD▲, tp:W140,000.00▲) - Positive on Naver Pay’s spinoff | P12
SK Hynix (ADD, tp:W95,000.00▲) - Moving in the right direction for a recovery | P13 ———————————————————————————————————————————————————————————————————————————————————————
▌Malaysia Axis REIT (HOLD, tp:RM1.95) - Narrowing down its acquisition prospects | P14
CapitaLand Malaysia Mall Trust (HOLD, tp:RM1.03▼) - Prolonged impact from rental ... | P15 Pavilion REIT (HOLD, tp:RM1.91▲) - Working on DA MEN’s gradual turnaround | P16 ———————————————————————————————————————————————————————————————————————————————————————
▌Singapore Cache Logistics Trust (HOLD, tp:S$0.76▼) - Looking for a better 3Q | P17 Mapletree Commercial Trust (ADD, tp:S$2.24) - A good start | P18
ST Engineering (ADD, tp:S$4.43) - How high can it go? | P19 Thai Beverage (ADD, tp:S$0.96▲) - NDR takeaways: Solidifying its presence | P20 ———————————————————————————————————————————————————————————————————————————————————————
▌Thailand Carabao Group (ADD, tp:THB80.00▲) - More energy to run | P21 KCE Electronics (REDUCE, tp:THB13.60▼) - Strong earnings rebound not in sight | P22
Sources: CIMB. COMPANY REPORTS
Recent CGS-CIMB Research Ideas ——————————————————————————————————
KRW: Technology Components 23/07 Diverging prospects for LGI & BH —————————————————————————————————————————————————————————————————————————————————
THB: Hotels 17/7
NCPO legalisation will boost room supply —————————————————————————————————————————————————————————————————————————————————
CHN: Universal Scientific Industrial 16/07
Finding the golden child —————————————————————————————————————————————————————————————————————————————————
MAL: Rubber Gloves 12/07 Golden gloves —————————————————————————————————————————————————————————————————————————————————
KRW: Navigating South Korea: Technology
Components 10/07 Integration is key for future display tech —————————————————————————————————————————————————————————————————————————————————
Regional Equity Research Contact ————————————————————————————————— Bertram LAI
Head of Research T: (852) 2532 1111 E: [email protected]
———————————————————————————————————————————————————————————————————————————————————
Show Style "View Doc Map"
Sector Note Property │ China │ July 25, 2019
IMPORTANT DISCLOSURES, INCLUDING ANY REQUIRED RESEARCH CERTIFICATIONS, ARE PROVIDED AT THE END OF THIS REPORT. IF THIS REPORT IS DISTRIBUTED IN THE UNITED STATES IT IS DISTRIBUTED BY CGS-CIMB SECURITIES (USA), INC. AND IS CONSIDERED THIRD-PARTY AFFILIATED RESEARCH.
Powered by the EFA Platform
Property - Overall 10% earnings growth expected for 1H19
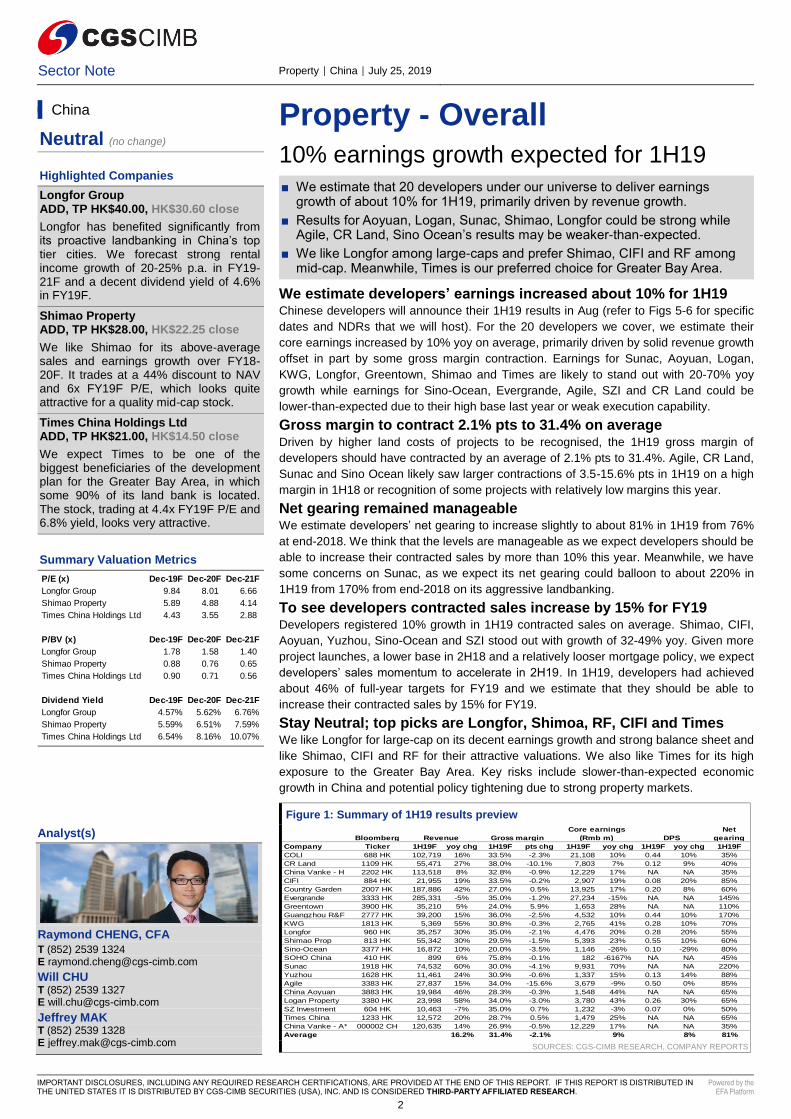
■ We estimate that 20 developers under our universe to deliver earnings growth of about 10% for 1H19, primarily driven by revenue growth.
■ Results for Aoyuan, Logan, Sunac, Shimao, Longfor could be strong while Agile, CR Land, Sino Ocean’s results may be weaker-than-expected.
■ We like Longfor among large-caps and prefer Shimao, CIFI and RF among mid-cap. Meanwhile, Times is our preferred choice for Greater Bay Area.
We estimate developers’ earnings increased about 10% for 1H19 Chinese developers will announce their 1H19 results in Aug (refer to Figs 5-6 for specific
dates and NDRs that we will host). For the 20 developers we cover, we estimate their
core earnings increased by 10% yoy on average, primarily driven by solid revenue growth
offset in part by some gross margin contraction. Earnings for Sunac, Aoyuan, Logan,
KWG, Longfor, Greentown, Shimao and Times are likely to stand out with 20-70% yoy
growth while earnings for Sino-Ocean, Evergrande, Agile, SZI and CR Land could be
lower-than-expected due to their high base last year or weak execution capability.
Gross margin to contract 2.1% pts to 31.4% on average Driven by higher land costs of projects to be recognised, the 1H19 gross margin of
developers should have contracted by an average of 2.1% pts to 31.4%. Agile, CR Land,
Sunac and Sino Ocean likely saw larger contractions of 3.5-15.6% pts in 1H19 on a high
margin in 1H18 or recognition of some projects with relatively low margins this year.
Net gearing remained manageable We estimate developers’ net gearing to increase slightly to about 81% in 1H19 from 76%
at end-2018. We think that the levels are manageable as we expect developers should be
able to increase their contracted sales by more than 10% this year. Meanwhile, we have
some concerns on Sunac, as we expect its net gearing could balloon to about 220% in
1H19 from 170% from end-2018 on its aggressive landbanking.
To see developers contracted sales increase by 15% for FY19 Developers registered 10% growth in 1H19 contracted sales on average. Shimao, CIFI,
Aoyuan, Yuzhou, Sino-Ocean and SZI stood out with growth of 32-49% yoy. Given more
project launches, a lower base in 2H18 and a relatively looser mortgage policy, we expect
developers’ sales momentum to accelerate in 2H19. In 1H19, developers had achieved
about 46% of full-year targets for FY19 and we estimate that they should be able to
increase their contracted sales by 15% for FY19.
Stay Neutral; top picks are Longfor, Shimoa, RF, CIFI and Times We like Longfor for large-cap on its decent earnings growth and strong balance sheet and
like Shimao, CIFI and RF for their attractive valuations. We also like Times for its high
exposure to the Greater Bay Area. Key risks include slower-than-expected economic
growth in China and potential policy tightening due to strong property markets.
Figure 1: Summary of 1H19 results preview
SOURCES: CGS-CIMB RESEARCH, COMPANY REPORTS
China
Neutral (no change)
Highlighted Companies
Longfor Group ADD, TP HK$40.00, HK$30.60 close
Longfor has benefited significantly from its proactive landbanking in China’s top tier cities. We forecast strong rental income growth of 20-25% p.a. in FY19-21F and a decent dividend yield of 4.6% in FY19F.
Shimao Property ADD, TP HK$28.00, HK$22.25 close
We like Shimao for its above-average sales and earnings growth over FY18-20F. It trades at a 44% discount to NAV and 6x FY19F P/E, which looks quite attractive for a quality mid-cap stock.
Times China Holdings Ltd ADD, TP HK$21.00, HK$14.50 close
We expect Times to be one of the biggest beneficiaries of the development plan for the Greater Bay Area, in which some 90% of its land bank is located. The stock, trading at 4.4x FY19F P/E and 6.8% yield, looks very attractive.
Summary Valuation Metrics
Insert
Analyst(s)
Raymond CHENG, CFA
T (852) 2539 1324 E [email protected]
Will CHU T (852) 2539 1327 E [email protected]
Jeffrey MAK T (852) 2539 1328 E [email protected]
P/E (x) Dec-19F Dec-20F Dec-21F
Longfor Group 9.84 8.01 6.66
Shimao Property 5.89 4.88 4.14
Times China Holdings Ltd 4.43 3.55 2.88
P/BV (x) Dec-19F Dec-20F Dec-21F
Longfor Group 1.78 1.58 1.40
Shimao Property 0.88 0.76 0.65
Times China Holdings Ltd 0.90 0.71 0.56
Dividend Yield Dec-19F Dec-20F Dec-21F
Longfor Group 4.57% 5.62% 6.76%
Shimao Property 5.59% 6.51% 7.59%
Times China Holdings Ltd 6.54% 8.16% 10.07%
Bloomberg
Net
gearing
Company Ticker 1H19F yoy chg 1H19F pts chg 1H19F yoy chg 1H19F yoy chg 1H19F
COLI 688 HK 102,719 16% 33.5% -2.3% 21,108 10% 0.44 10% 35%
CR Land 1109 HK 55,471 27% 38.0% -10.1% 7,803 7% 0.12 9% 40%
China Vanke - H 2202 HK 113,518 8% 32.8% -0.9% 12,229 17% NA NA 35%
CIFI 884 HK 21,955 19% 33.5% -0.2% 2,907 19% 0.08 20% 85%
Country Garden 2007 HK 187,886 42% 27.0% 0.5% 13,925 17% 0.20 8% 60%
Evergrande 3333 HK 285,331 -5% 35.0% -1.2% 27,234 -15% NA NA 145%
Greentown 3900 HK 35,210 5% 24.0% 5.9% 1,653 28% NA NA 110%
Guangzhou R&F 2777 HK 39,200 15% 36.0% -2.5% 4,532 10% 0.44 10% 170%
KWG 1813 HK 5,369 55% 30.8% -0.3% 2,765 41% 0.28 10% 70%
Longfor 960 HK 35,257 30% 35.0% -2.1% 4,476 20% 0.28 20% 55%
Shimao Prop 813 HK 55,342 30% 29.5% -1.5% 5,393 23% 0.55 10% 60%
Sino-Ocean 3377 HK 16,872 10% 20.0% -3.5% 1,146 -26% 0.10 -29% 80%
SOHO China 410 HK 899 6% 75.8% -0.1% 182 -6167% NA NA 45%
Sunac 1918 HK 74,532 60% 30.0% -4.1% 9,931 70% NA NA 220%
Yuzhou 1628 HK 11,461 24% 30.9% -0.6% 1,337 15% 0.13 14% 88%
Agile 3383 HK 27,837 15% 34.0% -15.6% 3,679 -9% 0.50 0% 85%
China Aoyuan 3883 HK 19,984 46% 28.3% -0.3% 1,548 44% NA NA 65%
Logan Property 3380 HK 23,998 58% 34.0% -3.0% 3,780 43% 0.26 30% 65%
SZ Investment 604 HK 10,463 -7% 35.0% 0.7% 1,232 -3% 0.07 0% 50%
Times China 1233 HK 12,572 20% 28.7% 0.5% 1,479 25% NA NA 65%
China Vanke - A* 000002 CH 120,635 14% 26.9% -0.5% 12,229 17% NA NA 35%
Average 16.2% 31.4% -2.1% 9% 8% 81%
Gross margin
Core earnings
(Rmb m)Revenue DPS
2
Company Note Building Materials │ India │ July 25, 2019
IMPORTANT DISCLOSURES, INCLUDING ANY REQUIRED RESEARCH CERTIFICATIONS, ARE PROVIDED AT THE END OF THIS REPORT. IF THIS REPORT IS DISTRIBUTED IN THE UNITED STATES IT IS DISTRIBUTED BY CGS-CIMB SECURITIES (USA), INC. AND IS CONSIDERED THIRD-PARTY AFFILIATED RESEARCH.
Powered by the EFA Platform
Insert
Asian Paints Limited
Fairly priced; maintain Hold
■ 1QFY3/20 volume growth at c.17%, ahead of our estimate, was a positive surprise. We estimate FY20F volume growth to be in the double-digits.
■ Share gains from unorganised players, increasing trend in premium products and use of waterproofing solutions will ensure double-digit volume growth.
■ We maintain our Hold call with a higher TP of Rs1,520 (47x Mar 21 EPS).
Impressive volume-led domestic sales growth Asian Paints’ 1QFY3/20 standalone revenue rose 18.2% to Rs43.8bn (our est:
Rs40.4bn). Decorative volume growth continued to be in the double-digits (c.17%). The
double-digit volume growth in the mid-premium end of the portfolio was reassuring. The
1QFY20 growth was due to 1) the offer of innovative schemes to dealers leading to
channel filling, 2) higher growth in smaller towns compared to large cities, 3) higher
marriage days, and 4) base quarter being affected by inventory destocking led by GST
rate cut. However, management cited that uncertainty looms over the demand scenario
which hinges much on economic recovery and monsoon.
International business and domestic JVs drag down overall growth Consolidated net sales were up by 16.9% to Rs51.3bn (our est: Rs47.9bn). Subsidiary
revenue grew by 9.7% to Rs7.5bn. Challenging business conditions continued to affect
Sri Lanka and Egypt. Both the domestic JVs were affected by the slowdown in the Indian
market, with the automotive JV being severely affected. Focus on product portfolio and
network expansion has ensured decent growth for the Home Improvement business amid
a slowdown in new construction.
Tight cost control leads to margin expansion 1QFY20 consolidated gross margin saw a modest uptick of 30bp to 43.5%. APNT
undertook retail price cuts of c.2-3% (0.4% on aggregate portfolio level) in its solvent
based enamel portfolio in 1Q to pass on the benefits of benign raw material cost.
EBITDA was up 24.4% yoy to Rs1.2bn as EBITDA margins expanded by 140bp to
22.5%. Advancement of ad spends to 4QFY19 and benefits from freight costs arising
from shorter distance-to-market post commercialisation of new factories led to an
operating margin expansion.
Minor tweaks in estimates; maintain Hold Asian Paints has surprised us and the market positively with higher-than-expected
volume growth. We revise our estimates mainly to incorporate the effects of the
implementation of the new accounting standard. Our revised estimates bake in revenue/
earnings CAGR of 13%/19.2% for FY19-22F. We maintain Hold with a revised target
price of Rs1,520 (47x Mar 21F, 5-year average P/E, vs. 43x earlier). Upside/downside
risks are higher-/lower-than-expected revenue growth.
SOURCES: CGS-CIMB RESEARCH, COMPANY REPORTS
India
HOLD (no change)
Consensus ratings*: Buy 22 Hold 11 Sell 5
Current price: Rs1,483
Target price: Rs1,520
Previous target: Rs1,415
Up/downside: 2.5%
CGS-CIMB / Consensus: 3.6%
Reuters: ASPN.NS
Bloomberg: APNT IN
Market cap: US$20,627m
Rs1,422,874m
Average daily turnover: US$27.37m
Rs1,899m
Current shares o/s: 959.2m
Free float: 47.2% *Source: Bloomberg
Key changes in this note
Revenue for FY20-22F cut by 1-2%.
Core EPS for FY20-21F cut by 1-2%.
Source: Bloomberg
Price performance 1M 3M 12M
Absolute (%) 7.8 2.3 1.1
Relative (%) 11.1 5.4 -1.7
Major shareholders % held Promoter & Promoter Group 52.8
LIC of India 6.5 Blackrock Inc 1.3
Insert
Analyst(s)
Amit PUROHIT
T (91) 22 4880 5178
Harsh SHAH T (91) 22 4880 5179 E [email protected]
Financial Summary Mar-18A Mar-19A Mar-20F Mar-21F Mar-22F
Revenue (Rsm) 168,246 193,415 216,735 245,931 278,877
Operating EBITDA (Rsm) 31,976 37,621 45,980 54,285 63,129
Net Profit (Rsm) 20,950 21,557 26,472 31,038 36,554
Core EPS (Rs) 21.37 22.47 27.60 32.36 38.11
Core EPS Growth 3.0% 5.1% 22.8% 17.3% 17.8%
FD Core P/E (x) 69.40 66.00 53.75 45.84 38.93
DPS (Rs) 8.70 9.79 11.64 13.65 16.06
Dividend Yield 0.59% 0.66% 0.78% 0.92% 1.08%
EV/EBITDA (x) 44.31 37.65 30.98 25.83 21.88
P/FCFE (x) 151.2 154.6 122.5 36.9 35.9
Net Gearing (10.6%) (10.2%) (2.1%) (19.7%) (31.9%)
P/BV (x) 16.92 14.95 13.20 11.60 10.15
ROE 25.6% 24.0% 26.1% 26.9% 27.8%
% Change In Core EPS Estimates (0.72%) (1.65%) 1.03%
CIMB/consensus EPS (x) 1.03 1.01 1.01
83.0
87.4
91.9
96.3
100.8
1,100
1,200
1,300
1,400
1,500
Price Close Relative to SENSEX (RHS)
5
10
Jul-18 Oct-18 Jan-19 Apr-19
Vol m
3
Company Note Finance Companies │ India │ July 25, 2019
IMPORTANT DISCLOSURES, INCLUDING ANY REQUIRED RESEARCH CERTIFICATIONS, ARE PROVIDED AT THE END OF THIS REPORT. IF THIS REPORT IS DISTRIBUTED IN THE UNITED STATES IT IS DISTRIBUTED BY CGS-CIMB SECURITIES (USA), INC. AND IS CONSIDERED THIRD-PARTY AFFILIATED RESEARCH.
Powered by the EFA Platform
Insert Insert
Mahindra & Mahindra Finance Economic slowdown hurts asset quality
■ The disappointing 1QFY3/20 earnings were driven by a spike in GNPLs (up 150bp qoq), Rs6.2bn of provisions and a 45% spike in opex.
■ AUM growth was robust at 22% yoy but outlook is weak due to a slowdown in the economy.
■ We cut FY20-21F EPS due to higher provisions and lower loan growth estimates. Our TP is reduced to Rs400 (1.7x FY21 BV). Maintain Add.
Sharp deterioration in asset quality a key highlight of 1QFY3/20 Asset quality witnessed a sharp deterioration with headline gross NPLs increasing 150bp qoq to 7.4% in 1QFY20; consequently, credit costs rose to 3.58% vs. 2.1% in 4QFY19. Net NPLs also rose by 90bp qoq and stood at 7.4% in 1QFY20 with a PCR of 24.9%. Provisions were unexpectedly high and formed 85.5% of PPP. As per management, no additional provisions are expected unless the realisable value of disposable assets is substantially lower than expected. 1QFY20 PAT made up just 6% of our FY20F estimate.
Management guides a 15% AUM growth Management expects overall AUM/disbursement growth to weaken at ~15%/10% yoy respectively in FY20. Assets under management (AUM) growth was strong at 22% yoy in 1Q, however disbursements growth came in weak at 2.5% yoy with overall economic slowdown and poor auto demand. AUM growth was largely driven by the commercial vehicle (CV)/construction equipment (CE) segment which grew at a robust 65% yoy. The CV/CE segment comprised 19% of overall AUM vs. 18% in 4Q19.
Spreads declined driven by fall in yields Management highlighted that liquidity remains comfortable despite uncertainty in the credit market. Management said asset liability management (ALM) is comfortable in the near term. Overall spreads contracted 50bp qoq in 1QFY20 with sequential dip in yields of 40bp and stands at 14.2%. Cost of funds were flat qoq at 6.6%.
Sharp spike in opex also led to tepid PPP Net interest income for the quarter grew at 17.5% yoy. Overall PAT was down 74.6% at Rs6.84bn due to higher opex and provisions made during the quarter. Management highlighted high opex growth of 45% yoy was on account of higher employee expenses and depreciation. The cost-to-income ratio was at 43.6% in 1QFY20 vs. 41.6% in 4QFY19. Provisions formed 85.5% of operating profit, dragging the credit cost to 3.58% vs. 2.11% in 1QFY19.
Cut FY20F/21F EPS by 17.6%/12.8%; maintain Add Given the current weak economic scenario and overall auto sales, we expect loan growth to be sluggish with largely stable spreads in the medium term. As such, we cut our earnings by 17.6%/12.8% for FY20F/21F and reduce our TP to Rs400 (Rs540 previously), based on 1.7x FY21F P/BV at the company level and Rs50 for its housing subsidiary. However, we keep our Add call as valuations are attractive at 1.3x FY21F P/BV. Key risks are lower-than-expected AUM growth and weak asset quality. Potential catalysts are strong loan growth and improving asset quality.
SOURCES: CGS-CIMB RESEARCH, COMPANY REPORTS
India
ADD (no change)
Consensus ratings*: Buy 27 Hold 3 Sell 6
Current price: Rs304.5
Target price: Rs400.0
Previous target: Rs540.0
Up/downside: 31.4%
CGS-CIMB / Consensus: -17.4%
Reuters: MMFS.NS
Bloomberg: MMFS IN
Market cap: US$2,727m
Rs188,079m
Average daily turnover: US$13.26m
Rs920.7m
Current shares o/s: 614.9m
Free float: 48.8% *Source: Bloomberg
Key changes in this note
FY20F core EPS decreased by 17.6%.
FY21F core EPS decreased by 12.8%.
FY22F numbers introduced
Source: Bloomberg
Price performance 1M 3M 12M Absolute (%) -21.8 -29.8 -36.9
Relative (%) -18.5 -26.7 -39.7
Major shareholders % held Mahindra & Mahindra 51.2 LIC 3.1 UTI FUNDS MANAGEMENT 2.2
Insert
Analyst(s)
Dhiren SHAH
T (91) 22 4880 5170 E [email protected]
Siddharth TELI T (91) 22 4880 5158 E [email protected]
Saili CHHEDA T (91) 22 4880 5184 E [email protected]
Financial Summary Mar-18A Mar-19A Mar-20F Mar-21F Mar-22F
Net Interest Income (Rsm) 35,025 46,700 51,803 62,065 72,010
Total Non-Interest Income (Rsm) 1,660 1,953 2,148 2,363 2,600
Operating Revenue (Rsm) 36,686 48,653 53,950 64,428 74,611
Total Provision Charges (Rsm) (5,681) (6,352) (8,599) (9,208) (10,681)
Net Profit (Rsm) 10,761 15,571 15,067 19,082 21,807
Core EPS (Rs) 18.25 25.33 24.50 31.03 35.46
Core EPS Growth 157% 39% (3%) 27% 14%
FD Core P/E (x) 16.69 12.02 12.42 9.81 8.58
DPS (Rs) 2.00 3.50 3.50 3.50 3.50
Dividend Yield 0.66% 1.15% 1.15% 1.15% 1.15%
BVPS (Rs) 156.6 177.4 197.8 224.8 256.1
P/BV (x) 1.94 1.72 1.54 1.35 1.19
ROE 13.3% 15.2% 13.1% 14.7% 14.8%
% Change In Core EPS Estimates (17.6%) (12.8%)
CIMB/consensus EPS (x) 0.78 0.81 0.90
55.0
67.0
79.0
91.0
103.0
115.0
280
330
380
430
480
530
Price Close Relative to SENSEX (RHS)
10
20
30
Jul-18 Oct-18 Jan-19 Apr-19
Vol m
4
Company Note Finance Companies │ India │ July 25, 2019
IMPORTANT DISCLOSURES, INCLUDING ANY REQUIRED RESEARCH CERTIFICATIONS, ARE PROVIDED AT THE END OF THIS REPORT. IF THIS REPORT IS DISTRIBUTED IN THE UNITED STATES IT IS DISTRIBUTED BY CGS-CIMB SECURITIES (USA), INC. AND IS CONSIDERED THIRD-PARTY AFFILIATED RESEARCH.
Powered by the EFA Platform
Insert Insert
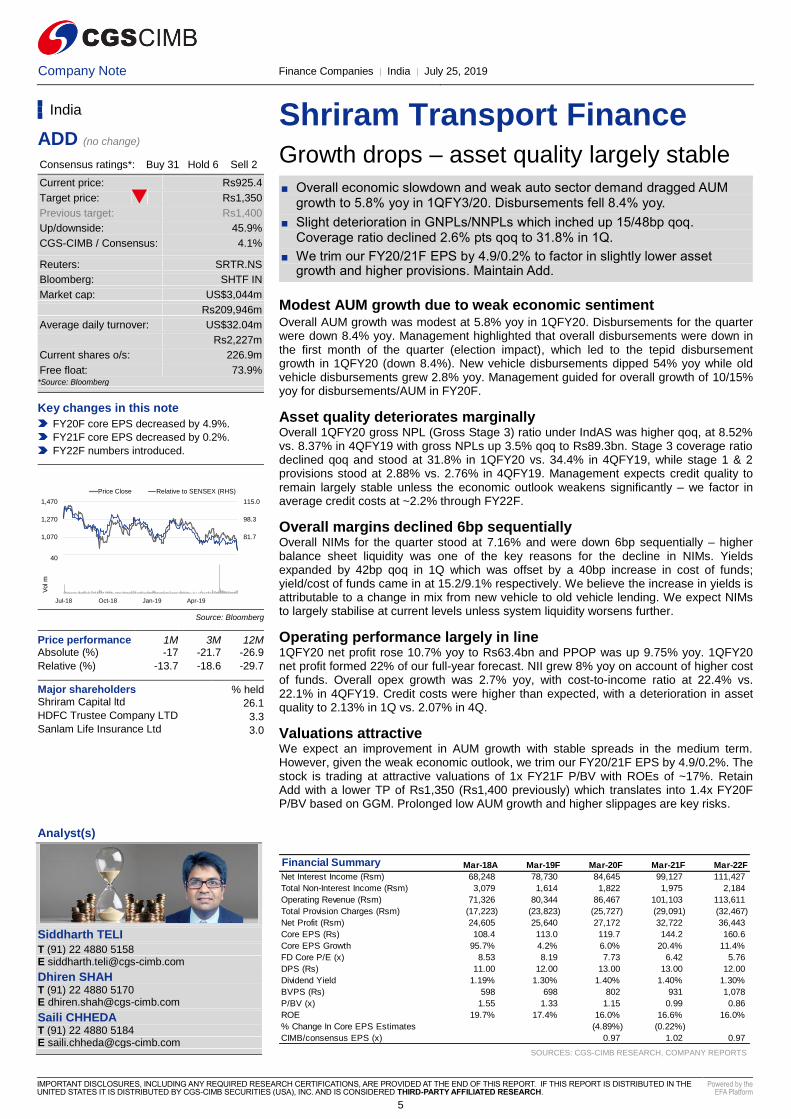
Shriram Transport Finance Growth drops – asset quality largely stable
■ Overall economic slowdown and weak auto sector demand dragged AUM growth to 5.8% yoy in 1QFY3/20. Disbursements fell 8.4% yoy.
■ Slight deterioration in GNPLs/NNPLs which inched up 15/48bp qoq. Coverage ratio declined 2.6% pts qoq to 31.8% in 1Q.
■ We trim our FY20/21F EPS by 4.9/0.2% to factor in slightly lower asset growth and higher provisions. Maintain Add.
Modest AUM growth due to weak economic sentiment Overall AUM growth was modest at 5.8% yoy in 1QFY20. Disbursements for the quarter were down 8.4% yoy. Management highlighted that overall disbursements were down in the first month of the quarter (election impact), which led to the tepid disbursement growth in 1QFY20 (down 8.4%). New vehicle disbursements dipped 54% yoy while old vehicle disbursements grew 2.8% yoy. Management guided for overall growth of 10/15% yoy for disbursements/AUM in FY20F.
Asset quality deteriorates marginally Overall 1QFY20 gross NPL (Gross Stage 3) ratio under IndAS was higher qoq, at 8.52% vs. 8.37% in 4QFY19 with gross NPLs up 3.5% qoq to Rs89.3bn. Stage 3 coverage ratio declined qoq and stood at 31.8% in 1QFY20 vs. 34.4% in 4QFY19, while stage 1 & 2 provisions stood at 2.88% vs. 2.76% in 4QFY19. Management expects credit quality to remain largely stable unless the economic outlook weakens significantly – we factor in average credit costs at ~2.2% through FY22F.
Overall margins declined 6bp sequentially Overall NIMs for the quarter stood at 7.16% and were down 6bp sequentially – higher balance sheet liquidity was one of the key reasons for the decline in NIMs. Yields expanded by 42bp qoq in 1Q which was offset by a 40bp increase in cost of funds; yield/cost of funds came in at 15.2/9.1% respectively. We believe the increase in yields is attributable to a change in mix from new vehicle to old vehicle lending. We expect NIMs to largely stabilise at current levels unless system liquidity worsens further.
Operating performance largely in line 1QFY20 net profit rose 10.7% yoy to Rs63.4bn and PPOP was up 9.75% yoy. 1QFY20 net profit formed 22% of our full-year forecast. NII grew 8% yoy on account of higher cost of funds. Overall opex growth was 2.7% yoy, with cost-to-income ratio at 22.4% vs. 22.1% in 4QFY19. Credit costs were higher than expected, with a deterioration in asset quality to 2.13% in 1Q vs. 2.07% in 4Q.
Valuations attractive We expect an improvement in AUM growth with stable spreads in the medium term. However, given the weak economic outlook, we trim our FY20/21F EPS by 4.9/0.2%. The stock is trading at attractive valuations of 1x FY21F P/BV with ROEs of ~17%. Retain Add with a lower TP of Rs1,350 (Rs1,400 previously) which translates into 1.4x FY20F P/BV based on GGM. Prolonged low AUM growth and higher slippages are key risks.
SOURCES: CGS-CIMB RESEARCH, COMPANY REPORTS
India
ADD (no change)
Consensus ratings*: Buy 31 Hold 6 Sell 2
Current price: Rs925.4
Target price: Rs1,350
Previous target: Rs1,400
Up/downside: 45.9%
CGS-CIMB / Consensus: 4.1%
Reuters: SRTR.NS
Bloomberg: SHTF IN
Market cap: US$3,044m
Rs209,946m
Average daily turnover: US$32.04m
Rs2,227m
Current shares o/s: 226.9m
Free float: 73.9% *Source: Bloomberg
Key changes in this note
FY20F core EPS decreased by 4.9%.
FY21F core EPS decreased by 0.2%.
FY22F numbers introduced.
Source: Bloomberg
Price performance 1M 3M 12M Absolute (%) -17 -21.7 -26.9
Relative (%) -13.7 -18.6 -29.7
Major shareholders % held Shriram Capital ltd 26.1 HDFC Trustee Company LTD 3.3 Sanlam Life Insurance Ltd 3.0
Insert
Analyst(s)
Siddharth TELI
T (91) 22 4880 5158 E [email protected]
Dhiren SHAH T (91) 22 4880 5170 E [email protected]
Saili CHHEDA T (91) 22 4880 5184 E [email protected]
Financial Summary Mar-18A Mar-19F Mar-20F Mar-21F Mar-22F
Net Interest Income (Rsm) 68,248 78,730 84,645 99,127 111,427
Total Non-Interest Income (Rsm) 3,079 1,614 1,822 1,975 2,184
Operating Revenue (Rsm) 71,326 80,344 86,467 101,103 113,611
Total Provision Charges (Rsm) (17,223) (23,823) (25,727) (29,091) (32,467)
Net Profit (Rsm) 24,605 25,640 27,172 32,722 36,443
Core EPS (Rs) 108.4 113.0 119.7 144.2 160.6
Core EPS Growth 95.7% 4.2% 6.0% 20.4% 11.4%
FD Core P/E (x) 8.53 8.19 7.73 6.42 5.76
DPS (Rs) 11.00 12.00 13.00 13.00 12.00
Dividend Yield 1.19% 1.30% 1.40% 1.40% 1.30%
BVPS (Rs) 598 698 802 931 1,078
P/BV (x) 1.55 1.33 1.15 0.99 0.86
ROE 19.7% 17.4% 16.0% 16.6% 16.0%
% Change In Core EPS Estimates (4.89%) (0.22%)
CIMB/consensus EPS (x) 0.97 1.02 0.97
65.0
81.7
98.3
115.0
870
1,070
1,270
1,470
Price Close Relative to SENSEX (RHS)
10
20
30
40
Jul-18 Oct-18 Jan-19 Apr-19
Vo
l m
5
Company Note Industrial Machinery │ India │ July 25, 2019
IMPORTANT DISCLOSURES, INCLUDING ANY REQUIRED RESEARCH CERTIFICATIONS, ARE PROVIDED AT THE END OF THIS REPORT. IF THIS REPORT IS DISTRIBUTED IN THE UNITED STATES IT IS DISTRIBUTED BY CGS-CIMB SECURITIES (USA), INC. AND IS CONSIDERED THIRD-PARTY AFFILIATED RESEARCH.
Powered by the EFA Platform
Insert Insert
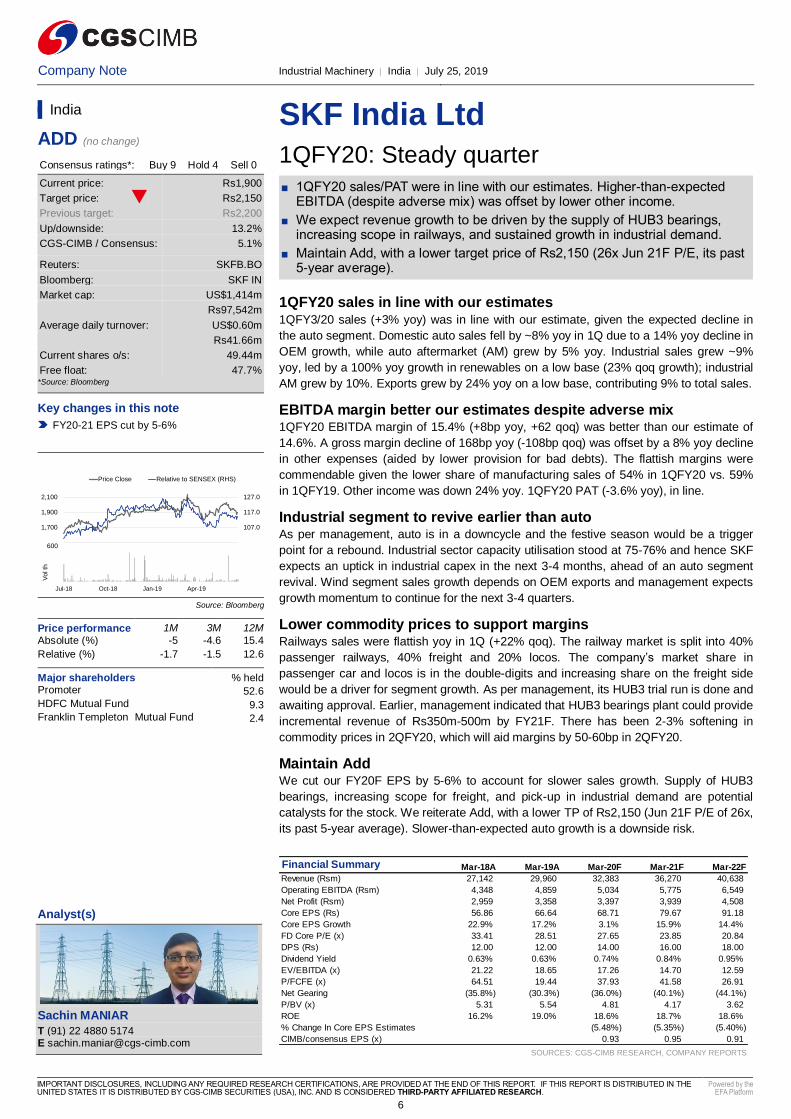
SKF India Ltd
1QFY20: Steady quarter
■ 1QFY20 sales/PAT were in line with our estimates. Higher-than-expected EBITDA (despite adverse mix) was offset by lower other income.
■ We expect revenue growth to be driven by the supply of HUB3 bearings, increasing scope in railways, and sustained growth in industrial demand.
■ Maintain Add, with a lower target price of Rs2,150 (26x Jun 21F P/E, its past 5-year average).
1QFY20 sales in line with our estimates 1QFY3/20 sales (+3% yoy) was in line with our estimate, given the expected decline in
the auto segment. Domestic auto sales fell by ~8% yoy in 1Q due to a 14% yoy decline in
OEM growth, while auto aftermarket (AM) grew by 5% yoy. Industrial sales grew ~9%
yoy, led by a 100% yoy growth in renewables on a low base (23% qoq growth); industrial
AM grew by 10%. Exports grew by 24% yoy on a low base, contributing 9% to total sales.
EBITDA margin better our estimates despite adverse mix 1QFY20 EBITDA margin of 15.4% (+8bp yoy, +62 qoq) was better than our estimate of
14.6%. A gross margin decline of 168bp yoy (-108bp qoq) was offset by a 8% yoy decline
in other expenses (aided by lower provision for bad debts). The flattish margins were
commendable given the lower share of manufacturing sales of 54% in 1QFY20 vs. 59%
in 1QFY19. Other income was down 24% yoy. 1QFY20 PAT (-3.6% yoy), in line.
Industrial segment to revive earlier than auto As per management, auto is in a downcycle and the festive season would be a trigger
point for a rebound. Industrial sector capacity utilisation stood at 75-76% and hence SKF
expects an uptick in industrial capex in the next 3-4 months, ahead of an auto segment
revival. Wind segment sales growth depends on OEM exports and management expects
growth momentum to continue for the next 3-4 quarters.
Lower commodity prices to support margins Railways sales were flattish yoy in 1Q (+22% qoq). The railway market is split into 40%
passenger railways, 40% freight and 20% locos. The company’s market share in
passenger car and locos is in the double-digits and increasing share on the freight side
would be a driver for segment growth. As per management, its HUB3 trial run is done and
awaiting approval. Earlier, management indicated that HUB3 bearings plant could provide
incremental revenue of Rs350m-500m by FY21F. There has been 2-3% softening in
commodity prices in 2QFY20, which will aid margins by 50-60bp in 2QFY20.
Maintain Add We cut our FY20F EPS by 5-6% to account for slower sales growth. Supply of HUB3
bearings, increasing scope for freight, and pick-up in industrial demand are potential
catalysts for the stock. We reiterate Add, with a lower TP of Rs2,150 (Jun 21F P/E of 26x,
its past 5-year average). Slower-than-expected auto growth is a downside risk.
[Add FP Header] [Add FP BodyText]
SOURCES: CGS-CIMB RESEARCH, COMPANY REPORTS
India
ADD (no change)
Consensus ratings*: Buy 9 Hold 4 Sell 0
Current price: Rs1,900
Target price: Rs2,150
Previous target: Rs2,200
Up/downside: 13.2%
CGS-CIMB / Consensus: 5.1%
Reuters: SKFB.BO
Bloomberg: SKF IN
Market cap: US$1,414m
Rs97,542m
Average daily turnover: US$0.60m
Rs41.66m
Current shares o/s: 49.44m
Free float: 47.7% *Source: Bloomberg
Key changes in this note
FY20-21 EPS cut by 5-6%
Source: Bloomberg
Price performance 1M 3M 12M
Absolute (%) -5 -4.6 15.4
Relative (%) -1.7 -1.5 12.6
Major shareholders % held Promoter 52.6
HDFC Mutual Fund 9.3 Franklin Templeton Mutual Fund 2.4
Insert
Analyst(s)
Sachin MANIAR
T (91) 22 4880 5174 E [email protected]
Financial Summary Mar-18A Mar-19A Mar-20F Mar-21F Mar-22F
Revenue (Rsm) 27,142 29,960 32,383 36,270 40,638
Operating EBITDA (Rsm) 4,348 4,859 5,034 5,775 6,549
Net Profit (Rsm) 2,959 3,358 3,397 3,939 4,508
Core EPS (Rs) 56.86 66.64 68.71 79.67 91.18
Core EPS Growth 22.9% 17.2% 3.1% 15.9% 14.4%
FD Core P/E (x) 33.41 28.51 27.65 23.85 20.84
DPS (Rs) 12.00 12.00 14.00 16.00 18.00
Dividend Yield 0.63% 0.63% 0.74% 0.84% 0.95%
EV/EBITDA (x) 21.22 18.65 17.26 14.70 12.59
P/FCFE (x) 64.51 19.44 37.93 41.58 26.91
Net Gearing (35.8%) (30.3%) (36.0%) (40.1%) (44.1%)
P/BV (x) 5.31 5.54 4.81 4.17 3.62
ROE 16.2% 19.0% 18.6% 18.7% 18.6%
% Change In Core EPS Estimates (5.48%) (5.35%) (5.40%)
CIMB/consensus EPS (x) 0.93 0.95 0.91
97.0
107.0
117.0
127.0
1,500
1,700
1,900
2,100
Price Close Relative to SENSEX (RHS)
200
400
600
Jul-18 Oct-18 Jan-19 Apr-19
Vo
l th
6
Company Flash Note Autos │ India │ July 26, 2019
IMPORTANT DISCLOSURES, INCLUDING ANY REQUIRED RESEARCH CERTIFICATIONS, ARE PROVIDED AT THE END OF THIS REPORT. IF THIS REPORT IS DISTRIBUTED IN THE UNITED STATES IT IS DISTRIBUTED BY CGS-CIMB SECURITIES (USA), INC. AND IS CONSIDERED THIRD-PARTY AFFILIATED RESEARCH.
Powered by the EFA Platform
Insert Insert
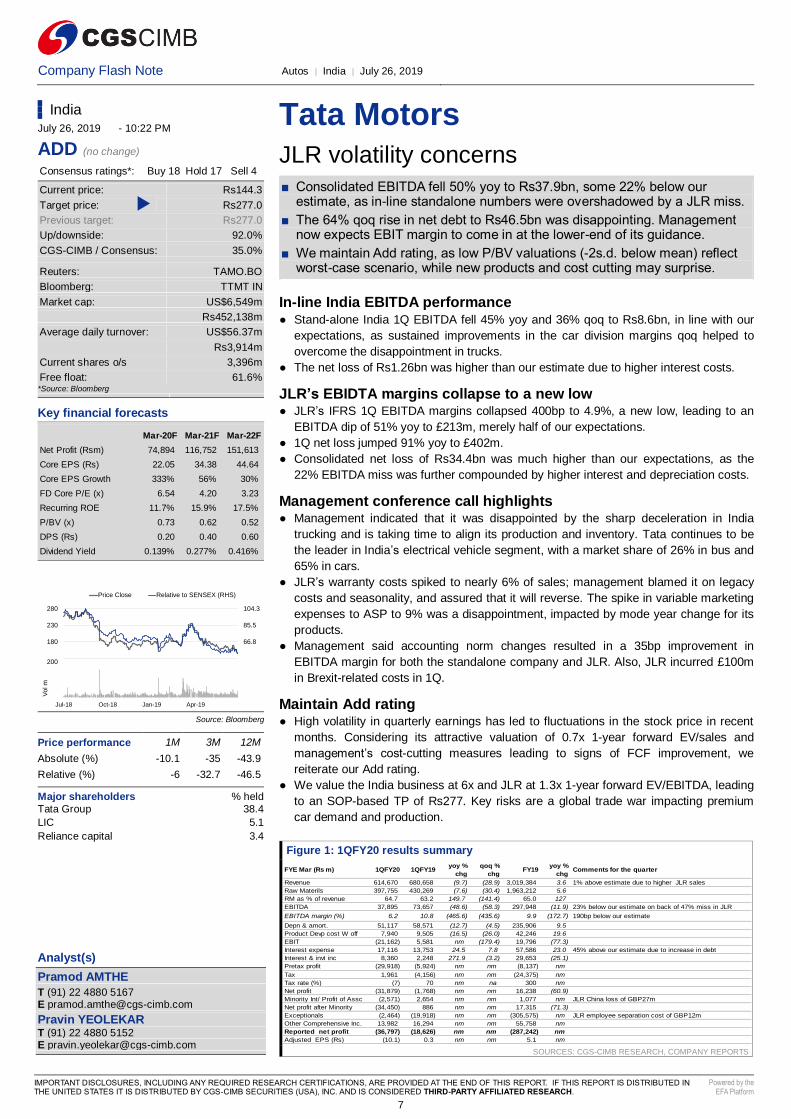
Tata Motors
JLR volatility concerns
■ Consolidated EBITDA fell 50% yoy to Rs37.9bn, some 22% below our estimate, as in-line standalone numbers were overshadowed by a JLR miss.
■ The 64% qoq rise in net debt to Rs46.5bn was disappointing. Management now expects EBIT margin to come in at the lower-end of its guidance.
■ We maintain Add rating, as low P/BV valuations (-2s.d. below mean) reflect worst-case scenario, while new products and cost cutting may surprise.
In-line India EBITDA performance ● Stand-alone India 1Q EBITDA fell 45% yoy and 36% qoq to Rs8.6bn, in line with our
expectations, as sustained improvements in the car division margins qoq helped to
overcome the disappointment in trucks.
● The net loss of Rs1.26bn was higher than our estimate due to higher interest costs.
JLR’s EBIDTA margins collapse to a new low ● JLR’s IFRS 1Q EBITDA margins collapsed 400bp to 4.9%, a new low, leading to an
EBITDA dip of 51% yoy to £213m, merely half of our expectations.
● 1Q net loss jumped 91% yoy to £402m.
● Consolidated net loss of Rs34.4bn was much higher than our expectations, as the
22% EBITDA miss was further compounded by higher interest and depreciation costs.
Management conference call highlights ● Management indicated that it was disappointed by the sharp deceleration in India
trucking and is taking time to align its production and inventory. Tata continues to be
the leader in India’s electrical vehicle segment, with a market share of 26% in bus and
65% in cars.
● JLR’s warranty costs spiked to nearly 6% of sales; management blamed it on legacy
costs and seasonality, and assured that it will reverse. The spike in variable marketing
expenses to ASP to 9% was a disappointment, impacted by mode year change for its
products.
● Management said accounting norm changes resulted in a 35bp improvement in
EBITDA margin for both the standalone company and JLR. Also, JLR incurred £100m
in Brexit-related costs in 1Q.
Maintain Add rating ● High volatility in quarterly earnings has led to fluctuations in the stock price in recent
months. Considering its attractive valuation of 0.7x 1-year forward EV/sales and
management’s cost-cutting measures leading to signs of FCF improvement, we
reiterate our Add rating.
● We value the India business at 6x and JLR at 1.3x 1-year forward EV/EBITDA, leading
to an SOP-based TP of Rs277. Key risks are a global trade war impacting premium
car demand and production.
Figure 1: 1QFY20 results summary
SOURCES: CGS-CIMB RESEARCH, COMPANY REPORTS
FYE Mar (Rs m) 1QFY20 1QFY19 yoy %
chg
qoq %
chg FY19
yoy %
chg Comments for the quarter
Revenue 614,670 680,658 (9.7) (28.9) 3,019,384 3.6 1% above estimate due to higher JLR sales
Raw Materils 397,755 430,269 (7.6) (30.4) 1,963,212 5.6
RM as % of revenue 64.7 63.2 149.7 (141.4) 65.0 127
EBITDA 37,895 73,657 (48.6) (58.3) 297,948 (11.9) 23% below our estimate on back of 47% miss in JLR
EBITDA margin (%) 6.2 10.8 (465.6) (435.6) 9.9 (172.7) 190bp below our estimate
Depn & amort. 51,117 58,571 (12.7) (4.5) 235,906 9.5
Product Devp cost W off 7,940 9,505 (16.5) (26.0) 42,246 19.6
EBIT (21,162) 5,581 nm (179.4) 19,796 (77.3)
Interest expense 17,116 13,753 24.5 7.8 57,586 23.0 45% above our estimate due to increase in debt
Interest & invt inc 8,360 2,248 271.9 (3.2) 29,653 (25.1)
Pretax profit (29,918) (5,924) nm nm (8,137) nm
Tax 1,961 (4,156) nm nm (24,375) nm
Tax rate (%) (7) 70 nm na 300 nm
Net profit (31,879) (1,768) nm nm 16,238 (60.9)
Minority Int/ Profit of Assc (2,571) 2,654 nm nm 1,077 nm JLR China loss of GBP27m
Net profit after Minority (34,450) 886 nm nm 17,315 (71.3)
Exceptionals (2,464) (19,918) nm nm (305,575) nm JLR employee separation cost of GBP12m
Other Comprehensive Inc. 13,982 16,294 nm nm 55,758 nm
Reported net profit (36,797) (18,626) nm nm (287,242) nm
Adjusted EPS (Rs) (10.1) 0.3 nm nm 5.1 nm
India
July 26, 2019 - 10:22 PM
ADD (no change) Consensus ratings*: Buy 18 Hold 17 Sell 4
Current price: Rs144.3
Target price: Rs277.0
Previous target: Rs277.0
Up/downside: 92.0%
CGS-CIMB / Consensus: 35.0%
Reuters: TAMO.BO
Bloomberg: TTMT IN
Market cap: US$6,549m
Rs452,138m
Average daily turnover: US$56.37m
Rs3,914m
Current shares o/s 3,396m
Free float: 61.6% *Source: Bloomberg
Key financial forecasts
Source: Bloomberg
Price performance 1M 3M 12M
Absolute (%) -10.1 -35 -43.9
Relative (%) -6 -32.7 -46.5
Major shareholders % held
Tata Group 38.4
LIC 5.1
Reliance capital 3.4
Insert
Analyst(s)
Pramod AMTHE
T (91) 22 4880 5167 E [email protected]
Pravin YEOLEKAR T (91) 22 4880 5152 E [email protected]
Mar-20F Mar-21F Mar-22F
Net Profit (Rsm) 74,894 116,752 151,613
Core EPS (Rs) 22.05 34.38 44.64
Core EPS Growth 333% 56% 30%
FD Core P/E (x) 6.54 4.20 3.23
Recurring ROE 11.7% 15.9% 17.5%
P/BV (x) 0.73 0.62 0.52
DPS (Rs) 0.20 0.40 0.60
Dividend Yield 0.139% 0.277% 0.416%
48.0
66.8
85.5
104.3
130
180
230
280
Price Close Relative to SENSEX (RHS)
50
100
150
200
Jul-18 Oct-18 Jan-19 Apr-19
Vol m
7
Company Note Banks │ Indonesia │ July 25, 2019
IMPORTANT DISCLOSURES, INCLUDING ANY REQUIRED RESEARCH CERTIFICATIONS, ARE PROVIDED AT THE END OF THIS REPORT. IF THIS REPORT IS DISTRIBUTED IN THE UNITED STATES IT IS DISTRIBUTED BY CGS-CIMB SECURITIES (USA), INC. AND IS CONSIDERED THIRD-PARTY AFFILIATED RESEARCH.
Powered by the EFA Platform
Insert Insert
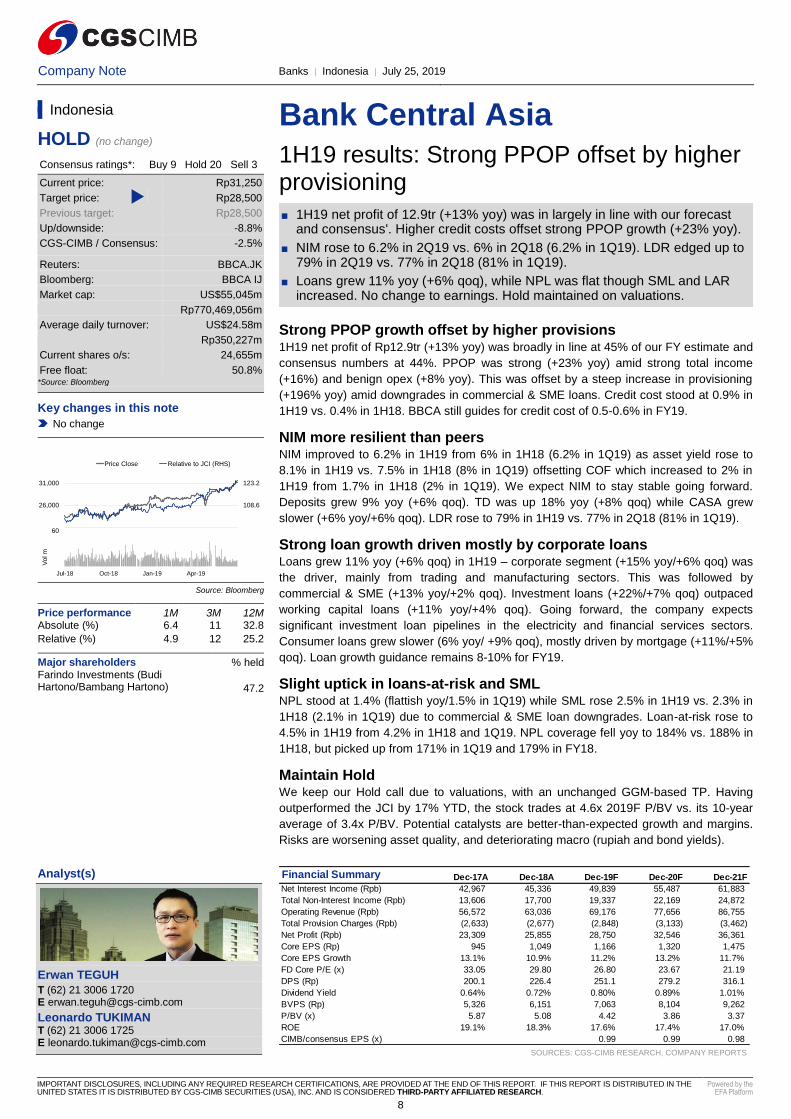
Bank Central Asia 1H19 results: Strong PPOP offset by higher provisioning
■ 1H19 net profit of 12.9tr (+13% yoy) was in largely in line with our forecast and consensus'. Higher credit costs offset strong PPOP growth (+23% yoy).
■ NIM rose to 6.2% in 2Q19 vs. 6% in 2Q18 (6.2% in 1Q19). LDR edged up to 79% in 2Q19 vs. 77% in 2Q18 (81% in 1Q19).
■ Loans grew 11% yoy (+6% qoq), while NPL was flat though SML and LAR increased. No change to earnings. Hold maintained on valuations.
Strong PPOP growth offset by higher provisions 1H19 net profit of Rp12.9tr (+13% yoy) was broadly in line at 45% of our FY estimate and
consensus numbers at 44%. PPOP was strong (+23% yoy) amid strong total income
(+16%) and benign opex (+8% yoy). This was offset by a steep increase in provisioning
(+196% yoy) amid downgrades in commercial & SME loans. Credit cost stood at 0.9% in
1H19 vs. 0.4% in 1H18. BBCA still guides for credit cost of 0.5-0.6% in FY19.
NIM more resilient than peers NIM improved to 6.2% in 1H19 from 6% in 1H18 (6.2% in 1Q19) as asset yield rose to
8.1% in 1H19 vs. 7.5% in 1H18 (8% in 1Q19) offsetting COF which increased to 2% in
1H19 from 1.7% in 1H18 (2% in 1Q19). We expect NIM to stay stable going forward.
Deposits grew 9% yoy (+6% qoq). TD was up 18% yoy (+8% qoq) while CASA grew
slower (+6% yoy/+6% qoq). LDR rose to 79% in 1H19 vs. 77% in 2Q18 (81% in 1Q19).
Strong loan growth driven mostly by corporate loans Loans grew 11% yoy (+6% qoq) in 1H19 – corporate segment (+15% yoy/+6% qoq) was
the driver, mainly from trading and manufacturing sectors. This was followed by
commercial & SME (+13% yoy/+2% qoq). Investment loans (+22%/+7% qoq) outpaced
working capital loans (+11% yoy/+4% qoq). Going forward, the company expects
significant investment loan pipelines in the electricity and financial services sectors.
Consumer loans grew slower (6% yoy/ +9% qoq), mostly driven by mortgage (+11%/+5%
qoq). Loan growth guidance remains 8-10% for FY19.
Slight uptick in loans-at-risk and SML NPL stood at 1.4% (flattish yoy/1.5% in 1Q19) while SML rose 2.5% in 1H19 vs. 2.3% in
1H18 (2.1% in 1Q19) due to commercial & SME loan downgrades. Loan-at-risk rose to
4.5% in 1H19 from 4.2% in 1H18 and 1Q19. NPL coverage fell yoy to 184% vs. 188% in
1H18, but picked up from 171% in 1Q19 and 179% in FY18.
Maintain Hold We keep our Hold call due to valuations, with an unchanged GGM-based TP. Having
outperformed the JCI by 17% YTD, the stock trades at 4.6x 2019F P/BV vs. its 10-year
average of 3.4x P/BV. Potential catalysts are better-than-expected growth and margins.
Risks are worsening asset quality, and deteriorating macro (rupiah and bond yields).
SOURCES: CGS-CIMB RESEARCH, COMPANY REPORTS
Indonesia
HOLD (no change)
Consensus ratings*: Buy 9 Hold 20 Sell 3
Current price: Rp31,250
Target price: Rp28,500
Previous target: Rp28,500
Up/downside: -8.8%
CGS-CIMB / Consensus: -2.5%
Reuters: BBCA.JK
Bloomberg: BBCA IJ
Market cap: US$55,045m
Rp770,469,056m
Average daily turnover: US$24.58m
Rp350,227m
Current shares o/s: 24,655m
Free float: 50.8% *Source: Bloomberg
Key changes in this note
No change
Source: Bloomberg
Price performance 1M 3M 12M Absolute (%) 6.4 11 32.8
Relative (%) 4.9 12 25.2
Major shareholders % held Farindo Investments (Budi Hartono/Bambang Hartono) 47.2
Insert
Analyst(s)
Erwan TEGUH
T (62) 21 3006 1720 E [email protected]
Leonardo TUKIMAN T (62) 21 3006 1725 E [email protected]
Financial Summary Dec-17A Dec-18A Dec-19F Dec-20F Dec-21F
Net Interest Income (Rpb) 42,967 45,336 49,839 55,487 61,883
Total Non-Interest Income (Rpb) 13,606 17,700 19,337 22,169 24,872
Operating Revenue (Rpb) 56,572 63,036 69,176 77,656 86,755
Total Provision Charges (Rpb) (2,633) (2,677) (2,848) (3,133) (3,462)
Net Profit (Rpb) 23,309 25,855 28,750 32,546 36,361
Core EPS (Rp) 945 1,049 1,166 1,320 1,475
Core EPS Growth 13.1% 10.9% 11.2% 13.2% 11.7%
FD Core P/E (x) 33.05 29.80 26.80 23.67 21.19
DPS (Rp) 200.1 226.4 251.1 279.2 316.1
Dividend Yield 0.64% 0.72% 0.80% 0.89% 1.01%
BVPS (Rp) 5,326 6,151 7,063 8,104 9,262
P/BV (x) 5.87 5.08 4.42 3.86 3.37
ROE 19.1% 18.3% 17.6% 17.4% 17.0%
CIMB/consensus EPS (x) 0.99 0.99 0.98
94.0
108.6
123.2
21,000
26,000
31,000
Price Close Relative to JCI (RHS)
20
40
60
Jul-18 Oct-18 Jan-19 Apr-19
Vo
l m
8
Company Note Shipbuilding │ South Korea │ July 25, 2019
IMPORTANT DISCLOSURES, INCLUDING ANY REQUIRED RESEARCH CERTIFICATIONS, ARE PROVIDED AT THE END OF THIS REPORT. IF THIS REPORT IS DISTRIBUTED IN THE UNITED STATES IT IS DISTRIBUTED BY CGS-CIMB SECURITIES (USA), INC. AND IS CONSIDERED THIRD-PARTY AFFILIATED RESEARCH.
Powered by the EFA Platform
HIGH
CONVICTION
Insert Insert
Korea Shipbuilding & Offshore Good earnings, weak sentiment
■ 2Q19 EBIT was in line with our forecast, thanks to 1) 25% yoy sales growth, 2) product mix improvement, 3) a weak Won and 4) lower steel prices.
■ The management reaffirmed strong order enquiries and maintained its shipbuilding order target for FY19F (US$8bn parent-base).
■ KSO has successfully raised prices for LNGC orders that suffered delayed option exercise YTD. We expect further newbuild price hike in 2H19F.
■ SOP-based target price cut to W170,000 to reflect the weak sentiment.
2Q19 turns around as expected KSO’s W55bn 2Q19 EBIT was broadly in line with our forecast (W60bn) and way above
Bloomberg consensus (W7bn), buoyed by: 1) 25% yoy revenue growth; 2) product mix
improvement (36% of sales represented by LNGC); 3) a weak Won; and 4) lower steel
prices. Shipbuilding division posted 44% yoy revenue growth with 4% OPM, offsetting the
W31bn loss at the offshore/plant division. Net profit surprise (W202bn) was driven by a
one-off taxation write-back following KSO’s intermediate holding company transition.
Shipbuilding order target intact Despite the weak order run rate YTD, the management reaffirmed strong order enquiries
and maintained its FY19F shipbuilding order target (US$8bn parent-base). KSO is upbeat
on potential order wins across LPGC, very-large-crude-carriers (VLCC) and ad-hoc
LNGC (e.g. those dedicated to spot market demand, apart from the mega-orders
expected from Qatar/Mozambique) in Jul-Aug. KSO does not see competition with China
as a threat for LNG-marine-fuel containers, as China banks no longer offer 0% down-
payment scheme in their ship finance terms.
Priority still on LNGC price hike We were relieved by the company’s confirmation that it has raised prices for the delayed
option exercise of LNGCs already ordered (10 units), which were impacted by the US-
China trade tensions, as these are allegedly tied to charter contracts to China, i.e. which
has newly emerged as the no.1 importer of LNG globally. Given the constrained yard
capacity for LNGC globally, we see minimal risk of KSO locking in orders at a higher
price range of US$190m-195m ahead (i.e. only a few delivery slots left for FY22F while
slots for FY23-24F look set to be guaranteed by orders from Qatar/Mozambique in
4Q19F-1Q20F).
Add: Wait for sentiment recovery Given the robust earnings growth, we see the recent correction as overdone. However,
our SOP TP is trimmed to W170,000 with a lower 10x target EV/EBITDA multiple (on par
with Airbus), as we reflect slower order run-rate and dampened industrial sector
sentiment due to the trade war, weak macros (EU) and political unrest (Iran). We foresee
an inflection point with LNGC order recommencement, while Japan’s potential reluctance
to approve KSO’s merger with DSME remains the key downside risk to our call.
SOURCES: CGS-CIMB RESEARCH, COMPANY REPORTS
South Korea
ADD (no change)
Consensus ratings*: Buy 27 Hold 2 Sell 1
Current price: W102,500
Target price: W170,000
Previous target: W200,000
Up/downside: 65.9%
CGS-CIMB / Consensus: 5.0%
Reuters: 009540.KS
Bloomberg: 009540 KS
Market cap: US$6,159m
W7,254,245m
Average daily turnover: US$18.26m
W22,136m
Current shares o/s: 70.77m
Free float: 57.8% *Source: Bloomberg
Key changes in this note
FY19F EPS raised by 93%.
Source: Bloomberg
Price performance 1M 3M 12M Absolute (%) -15.6 -16 4
Relative (%) -13.4 -10.7 12.7
Major shareholders % held Hyundai Heavy Industries Holdings 31.0 National Pension Service 9.4 KCC Corp 6.6
Insert
Analyst(s)
KJ HWANG
T (82) 2 6730 6123 E [email protected]
Alex PARK T (82) 2 6730 6131 E [email protected]
Financial Summary Dec-17A Dec-18A Dec-19F Dec-20F Dec-21F
Revenue (Wb) 15,469 13,120 14,572 16,309 18,519
Operating EBITDA (Wb) 601 (128) 632 1,042 1,438
Net Profit (Wb) 2,458 (489) 322 794 1,149
Normalised EPS (W) 37,059 (7,675) 4,544 11,221 16,234
Normalised EPS Growth 417% (121%) 147% 45%
FD Normalised P/E (x) 2.77 NA 22.56 9.14 6.31
DPS (W) - - - - -
Dividend Yield 0% 0% 0% 0% 0%
EV/EBITDA (x) 17.72 NA 13.64 7.63 4.91
P/FCFE (x) 5.68 54.07 19.60 15.30 10.57
Net Gearing 22.2% 13.5% 4.6% 0.1% (5.2%)
P/BV (x) 0.52 0.61 0.62 0.58 0.53
ROE 18.2% (4.3%) 2.7% 6.5% 8.8%
% Change In Normalised EPS Estimates 92.9% 0.0% (0.0%)
Normalised EPS/consensus EPS (x) 306.5 3.7 2.8
94.0
117.3
140.7
164.0
94,000
114,000
134,000
154,000
Price Close Relative to KOSPI (RHS)
1
1
2
2
Jul-18 Oct-18 Jan-19 Apr-19
Vo
l m
9
Company Flash Note Personal Products │ South Korea │ July 25, 2019
IMPORTANT DISCLOSURES, INCLUDING ANY REQUIRED RESEARCH CERTIFICATIONS, ARE PROVIDED AT THE END OF THIS REPORT. IF THIS REPORT IS DISTRIBUTED IN THE UNITED STATES IT IS DISTRIBUTED BY CGS-CIMB SECURITIES (USA), INC. AND IS CONSIDERED THIRD-PARTY AFFILIATED RESEARCH.
Powered by the EFA Platform
Insert Insert
LG Household & Health Care Ltd 2Q19 review: virtue of consistency
■ 2Q19 OP of W302bn (+13% yoy) was largely in line with our/Street estimate.
■ Whoo brand’s sales rose a robust 24% yoy; Sum’s weaker-than-expected sales were offset by positive sales surprise from O HUI.
■ We reiterate Add with a TP of W1.5m. Sound sales growth from China should invalidate recent concerns on weak cosmetics export data.
2Q19 review : sales/OP in line ● LG Household & Health Care (LG H&H) reported 2Q19 preliminary sales of W1.83tr
(+11% yoy, -2% qoq) and OP of W302bn (+13% yoy, -6% qoq). Both figures were
largely in line with our estimates and consensus.
● The Beautiful division’s sales/OP of W1.11tr/W226bn were just 2% below our estimate
due to O HUI sales making up for lower-than-expected Sum sales.
● The non-core divisions -- Healthy and Refreshing (divisions) reported sales/OP that
were broadly in line with our estimates. Notably, LG H&H guided for marginal
downside risk in the Healthy division’s growth rate in 2H19F on the back of its recent
legal dispute with one of Korea’s prominent e-commerce companies -- Coupang
(unlisted), as LG H&H has ceased selling all products from the Refreshing division to
Coupang.
O HUI compensates for Sum’s weaker-than-expected growth ● Whoo sales rose +24% yoy in 2Q19 (+30% yoy in duty-free (DF), +34% in China on-
shore), largely in line with our estimate.
● But Sum’s sales were disappointing at merely +7% yoy (+5% yoy in DF, +43% in
China on-shore). The muted sales growth stemmed from poor sales trend in DF and
ex-DF domestic channels, on the back of Waterful product line’s waning popularity, in
our view.
● On a positive note, O HUI sales were a surprising +12% yoy (both DF and China on-
shore grew 50%+, according to company guidance), on the back of higher sales
contribution from O HUI The First (+43% yoy), its premium product line-up.
Subsequently, sales/OP shortfall due to Sum was offset to 2%/4% vs. our estimates.
Concerns on China demand look unfounded; reiterate Add ● LG H&H’s +30% yoy sales growth in China on-shore invalidates recent investor
concerns on LG H&H’s sales growth in China, stemming from Korea’s gloomy 2Q19
cosmetics export data (-5% yoy). The divergence signifies LG H&H’s unrivalled brand
positioning in the luxury segment, in our view, vs. other domestic brands, which in
aggregate are largely experiencing weaker China sales.
● We reiterate our Add call on LG H&H with an SOP-based TP of W1.5m. Higher-than-
expected luxury brand demand should catalyse the share price. Risks to our Add call
are weaker-than-expected 1) domestic DF sales growth, and 2) China onshore sales
growth. LG H&H is our top pick within the sector.
Figure 1: 2Q19 preliminary results
SOURCES: CGS-CIMB RESEARCH, COMPANY REPORTS
(W bn) 2Q19A 2Q19F Diff. (%) BBG Diff. (%) 2Q18 1Q19 % yoy % qoqSales 1,833 1,852 -1% 1,835 0% 1,653 1,875 11% -2%Beautiful 1,109 1,134 -2% 953 1,140 16% -3%Healthy 343 337 2% 337 401 2% -14%Refreshing 380 382 0% 362 334 5% 14%OP 301.5 311.5 -3% 300.4 0% 267 322 13% -6%Beautiful 225.8 234.7 -4% 194.5 246.3 16% -8%Healthy 28.2 28.0 1% 27.3 43.4 3% -35%Refreshing 47.5 48.9 -3% 45.6 32.4 4% 47%Net non-op profit -14.1 -11.9 na -13 -16 na naRecurring profit 287.4 299.6 -4% 254 307 13% -6%Tax 75.9 80.9 -6% 67 81 13% -6%Net profit 208.2 215.5 -3% 213.3 -2% 185 224 13% -7%EPS 13,331 13,798 -3% na 11,824 14,311 13% -7%OPM 16.5% 16.8% -0.4% 16.4% 0.1% 16% 17% 0% -1%NPM 11.4% 11.6% -0.3% 11.6% -0.3% 11% 12% 0% -1%
South Korea July 25, 2019 - 5:22 PM
ADD (no change) Consensus ratings*: Buy 32 Hold 2 Sell 1
Current price: W1,308,000
Target price: W1,500,000
Previous target: W1,500,000
Up/downside: 14.7%
CGS-CIMB / Consensus: -7.7%
Reuters: 051900.KS
Bloomberg: 051900 KS
Market cap: US$17,344m
W20,428,602m
Average daily turnover: US$26.81m
W31,681m
Current shares o/s 17.72m
Free float: 52.7% *Source: Bloomberg
Key financial forecasts
Source: Bloomberg
Price performance 1M 3M 12M
Absolute (%) -0.9 -6.2 4.1
Relative (%) 1.3 -0.9 12.8
Major shareholders % held LG Corp 34.0
National Pension Service 7.2
LG Household & Health Care Ltd 6.1
Insert
Analyst(s)
Jun LIM
T (82) 2 6730 6130 E [email protected]
Dec-19F Dec-20F Dec-21F
Net Profit (Wb) 826 929 1,046
Normalised EPS (W) 46,640 52,450 59,055
Normalised EPS Growth 21.0% 12.5% 12.6%
FD Normalised P/E (x) 28.04 24.94 22.15
Recurring ROE 21.9% 21.0% 20.1%
P/BV (x) 5.73 4.84 4.12
DPS (W) 11,274 13,946 15,703
Dividend Yield 0.86% 1.07% 1.20%
86.0
100.0
114.0
1,000,000
1,200,000
1,400,000
Price Close Relative to KOSPI (RHS)
50
100
Jul-18 Oct-18 Jan-19 Apr-19
Vo
l th
10
Company Note Auto Parts │ South Korea │ July 25, 2019
IMPORTANT DISCLOSURES, INCLUDING ANY REQUIRED RESEARCH CERTIFICATIONS, ARE PROVIDED AT THE END OF THIS REPORT. IF THIS REPORT IS DISTRIBUTED IN THE UNITED STATES IT IS DISTRIBUTED BY CGS-CIMB SECURITIES (USA), INC. AND IS CONSIDERED THIRD-PARTY AFFILIATED RESEARCH.
Powered by the EFA Platform
Insert Insert
Mando Corporation Self-driving outside China
■ Mando’s W52bn 2Q19 EBIT was supported by rising margin contribution from Korea/US which offset a 30% sales decline in China.
■ Attractive risk-reward from subdued price cut in Korea/US, rising ADAS sales from HMC/Kia’s new models and Chinese restocking demand in 2H19F.
■ Double-upgrade to Add prompted by 12%-35% EPS hikes for FY19F-20F.
■ Our new target price is based on a 0.3x P/SR (50% discounted to Mobis).
2Q19: Decoupling from China Mando’s W52bn 2Q19 EBIT was in line with our estimate and 12% above Bloomberg
consensus forecast even without currency boost (e.g. Won-US$ hedging policy).
Regionally, W1.46tr revenue (+2% yoy) was supported by Korea (+7.2% yoy) and North
America (+25% yoy) which offset the 30% decline in China revenue. The sales proportion
of autonomous-driving-assistance-system (ADAS) edged up to 12%.
Guiding for a 3.5% FY19F OPM During the conference call, Mando cut its FY19F EBIT margin target to 3.5% due to the
prolonged demand weakness in China, while indicating for a better 2H19F profit outlook
from Korea/US and cost savings (e.g. W6bn in FY19F/cut 10% of China’s workforce in
1Q19 and 5% in 2Q19). Mando kept its FY19F new order target at W11tr.
Korea/US outweigh China risks We believe it is still too early to eye an earnings turnaround in China until 4Q19F (e.g.
China’s MTD wholesale volume fell 14% yoy in July), but we see the 3.6% OPM as
sustainable in 2H19F, given: 1) firm margin expansion in Korea/US (c.5.5%/c.1.0%) even
after profit erosion from China (-2% EBIT contribution); 2) falling sales proportion of
China’s local OEMs (c.9%); and 3) the potentially subdued price pressure by HMC/Kia.
We raise our FY19F-20F EPS by 12%-35%.
Double-upgrade to Add (TP 40k) We double-upgrade Mando from Reduce to Add. Our new target price is based on a 0.3x
P/SR (50% discounted to Mobis which enjoys premium of after-service business). While
the share price has had high correlation with the wholesale volume in China and local
OEMs since last year (figure 2), we attribute the recent decoupling to: 1) Mando’s order
diversification to non-captive clients (e.g. US$2.1bn expected in FY19F vs. US$1.7bn in
FY18); and 2) its rising footprint in the green car space (e.g. EV production platform, E-
GMP/potential ADAS orders from foreign EV makers).
Buy parts makers / Sell HMC/Kia We see attractive risk reward in 2H19F, premised on the rising adoption rate of ADAS
products in HMC/Kia’s new models and restocking demand from Chinese car dealers in
2H19F. Meanwhile, slower-than-expected wholesale volume recovery at Chinese local
OEMs remains the key downside risk to our call.
SOURCES: CGS-CIMB RESEARCH, COMPANY REPORTS
South Korea
ADD (previously REDUCE)
Consensus ratings*: Buy 20 Hold 4 Sell 5
Current price: W31,800
Target price: W40,000
Previous target: W22,000
Up/downside: 25.8%
CGS-CIMB / Consensus: 19.5%
Reuters: 204320.KS
Bloomberg: 204320 KS
Market cap: US$1,268m
W1,493,236m
Average daily turnover: US$9.28m
W11,253m
Current shares o/s: 46.96m
Free float: 56.3% *Source: Bloomberg
Key changes in this note
FY19F EPS increased by 12%.
FY20F EPS increased by 35%.
FY21F EPS increased by 32%.
Source: Bloomberg
Price performance 1M 3M 12M Absolute (%) 8.3 -8.2 -20.2
Relative (%) 10.5 -2.9 -11.5
Major shareholders % held HALLA HOLDINGS CORPORATION 30.3 NATIONAL PENSION SERVICES 13.6
Insert
Analyst(s)
KJ HWANG
T (82) 2 6730 6123 E [email protected]
Alex PARK T (82) 2 6730 6131 E [email protected]
Financial Summary Dec-17A Dec-18A Dec-19F Dec-20F Dec-21F
Revenue (Wb) 5,685 5,665 5,804 5,811 5,843
Operating EBITDA (Wb) 328.6 469.1 493.6 552.2 569.2
Net Profit (Wb) 4.8 105.7 99.1 144.2 157.5
Normalised EPS (W) 509 2,250 2,109 3,071 3,354
Normalised EPS Growth (98%) 342% (6%) 46% 9%
FD Normalised P/E (x) 62.44 14.13 15.08 10.36 9.48
DPS (W) 1,000.0 500.0 1,000.0 1,000.0 1,000.0
Dividend Yield 3.14% 1.57% 3.14% 3.14% 3.14%
EV/EBITDA (x) 4.35 6.37 6.47 5.93 5.89
P/FCFE (x) NA NA NA NA NA
Net Gearing 80% 100% 122% 116% 110%
P/BV (x) 0.22 1.05 1.15 1.06 0.98
ROE 0.3% 7.6% 7.3% 10.7% 10.7%
% Change In Normalised EPS Estimates 11.9% 34.5% 32.6%
Normalised EPS/consensus EPS (x) 0.87 0.99 0.91
69.0
80.1
91.2
102.3
25,000
30,000
35,000
40,000
Price Close Relative to KOSPI (RHS)
1
1
2
2
Jul-18 Oct-18 Jan-19 Apr-19
Vo
l m
11
Company Note IT Services │ South Korea │ July 25, 2019
IMPORTANT DISCLOSURES, INCLUDING ANY REQUIRED RESEARCH CERTIFICATIONS, ARE PROVIDED AT THE END OF THIS REPORT. IF THIS REPORT IS DISTRIBUTED IN THE UNITED STATES IT IS DISTRIBUTED BY CGS-CIMB SECURITIES (USA), INC. AND IS CONSIDERED THIRD-PARTY AFFILIATED RESEARCH.
Powered by the EFA Platform
Insert Insert
NAVER Positive on Naver Pay’s spinoff
■ Naver’s 2Q19 OP of W128.3bn was below our estimates, no thanks to Line.
■ We still think LINE’s ramp-up could take more time. But strong domestic business likely dispels concerns on waning consolidated earnings in 2H19F.
■ We upgrade Naver to Hold and raise our SOP-based TP to W140k. We are positive on the Naver Pay spinoff, which could be worth over W1.5tr.
Concerns over LINE Pay’s competitiveness Due to LINE’s widening operating loss, Naver reported a weak 2Q19 consolidated OP of
W128.3bn, -48.8% yoy. This is 17.0% below our estimate and 17.2% below Bloomberg
consensus. However, the market seems to be ignoring the weak earnings as the share
price has risen by as much as 8% after the 2Q19 earnings conference call during which
management revealed plans to spin off Naver Pay into a separate entity.
Parent company’s performance was still strong Excluding LINE, Naver reported a solid parent-only OP of W322.5bn (17% yoy), in line
with our estimate. Naver’s CPM ad revenue rose +12% yoy, the first double-digit yoy
increase since 2Q18. Our Reduce call was premised on Naver’s warning of the threat
posed by YouTube and Instagram ads taking Naver’s market share. This apprehension
proved unfounded as CPM (click per mille) revenue growth improved in 1H19.
Positive on the spinoff; likely boosted by Naver Pay in 2H19 Naver’s Business Platform division, including Naver Shopping, registered substantial
revenue growth of 17% yoy in 2Q19. IT platform, including Naver Pay, recorded a 22.6%
yoy revenue growth, due to synergies with Naver’s strong commerce platform. Naver
announced that it plans to spin off Naver Pay, which will become a separate entity named
Naver Financial. Mirae Asset Daewoo (006800 KS, Not rated) will invest W500bn in the
new entity and likely become its second biggest shareholder after Naver.
Naver Financial could be worth W1.5tr We previously did not factor Pay’s equity value into Naver’s SOP valuation as the
business entity did not independently generate material income. However, after the
spinoff and external funding, new entity Naver Financial is likely to seek business
opportunities outside Naver, such as selling insurance, loans or securities. Using the peer
comparable valuation method (see fig 1), we now include the value of Naver’s stake in
Naver Financial’s in our SOP valuation, which could be worth over W1.5tr.
Upgrade to Hold with a higher TP of W140k We upgrade Naver from a Reduce to Hold and raise our SOP-based TP to W140K. We
raised FY20-21F EPS forecasts to reflect the higher-than-expected domestic ad revenue
growth rate. Upside risks are faster-than-expected profit contribution from LINE and an
increase in domestic video platform market share. Downside risk is decreasing market
share in domestic ad market in 2H19F.
SOURCES: CGS-CIMB RESEARCH, COMPANY REPORTS
South Korea
HOLD (previously REDUCE)
Consensus ratings*: Buy 31 Hold 3 Sell 2
Current price: W134,000
Target price: W140,000
Previous target: W100,000
Up/downside: 4.5%
CGS-CIMB / Consensus: -7.3%
Reuters: 035420.KS
Bloomberg: 035420 KS
Market cap: US$18,751m
W22,084,994m
Average daily turnover: US$40.58m
W50,361m
Current shares o/s: 164.8m
Free float: 75.0% *Source: Bloomberg
Key changes in this note
FY19F/20F Revenue increased by 2%/2%.
FY19F/20F OP increased by 10%/15%.
FY19F/20F/21F EPS increased by 2%/6%/10%.
Source: Bloomberg
Price performance 1M 3M 12M Absolute (%) 17 11.2 -10.2
Relative (%) 19.2 16.5 -1.5
Major shareholders % held National Pension Service 10.0 BlackRock Inc 5.7
Insert
Analyst(s)
Namjun LEE
T (82) 2 6730 6135 E [email protected]
Financial Summary Dec-17A Dec-18A Dec-19F Dec-20F Dec-21F
Revenue (Wb) 4,678 5,587 6,474 6,959 7,508
Operating EBITDA (Wb) 1,385 1,204 1,200 1,529 1,689
Net Profit (Wb) 772.9 648.8 521.8 657.8 720.2
Normalised EPADS (W) 4,705 3,907 3,186 3,992 4,370
Normalised EPS Growth 1.9% (17.0%) (18.4%) 25.3% 9.5%
FD Normalised P/E (x) 28.48 34.30 42.05 33.57 30.66
DPADS (W) 197.7 257.7 278.5 156.7 217.1
Dividend Yield 0.96% 0.21% 0.12% 0.16% 0.18%
EV/EBITDA (x) 13.95 16.40 16.70 12.99 11.62
P/FCFE (x) NA 16.8 NA 130.1 101.0
Net Gearing (62.2%) (51.3%) (44.6%) (44.3%) (44.3%)
P/BV (x) 4.64 4.21 4.01 3.70 3.40
ROE 18.6% 12.9% 9.8% 11.5% 11.6%
% Change In Normalised EPADS Estimates 2.2% 5.9% 10.3%
Normalised EPADS/consensus EPADS (x) 0.97 0.87 0.76
77.0
87.0
97.0
107.0
100,000
120,000
140,000
160,000
Price Close Relative to KOSPI (RHS)
1
1
2
2
Jul-18 Oct-18 Jan-19 Apr-19
Vo
l m
12
Company Note Semiconductor │ South Korea │ July 25, 2019
IMPORTANT DISCLOSURES, INCLUDING ANY REQUIRED RESEARCH CERTIFICATIONS, ARE PROVIDED AT THE END OF THIS REPORT. IF THIS REPORT IS DISTRIBUTED IN THE UNITED STATES IT IS DISTRIBUTED BY CGS-CIMB SECURITIES (USA), INC. AND IS CONSIDERED THIRD-PARTY AFFILIATED RESEARCH.
Powered by the EFA Platform
Insert Insert
SK Hynix Moving in the right direction for a recovery
■ 2Q19 OP was broadly in line with our and the latest Bloomberg consensus; net profit beat our estimate by 27% due to lower tax rate.
■ Our takeaways from Hynix’s earnings conference were positive, reaffirming our view of a constructive memory cycle recovery in FY20F.
■ We maintain Add with a higher TP, based on 1.4x FY20F P/BV (previously 1.3x), in line with its mid-cycle multiple, reflecting earnings upgrade.
Strong NAND volume growth driving revenue beat in 2Q19… While 2Q19 ASP decline (-24% qoq/-25% qoq for DRAM/NAND vs. our -26%/-22%)
appears to be in line with market expectations, NAND bit growth (40% qoq) exceeded our
estimate of 23% and the company’s previous guidance (25%). This resulted in 2Q19
revenue beating our estimate by 5% and Bloomberg consensus by 2%. 2Q19 OP came
in at W638bn, largely within expectations (our W611bn, Bloomberg: W703bn).
…leading to healthier NAND inventory exiting this year We estimate Hynix’s NAND inventory level fell to eight weeks in 2Q19 from the recent
peak of nine weeks in 1Q19, thanks to strong shipment growth in 2Q19. With increased
production cut (15% yoy by end of FY19F vs. previous plan of 10%) and elastic demand
recovery on NAND price weakness, we believe Hynix’s NAND inventory should get
normalised to 4-5 weeks level by end-FY19F, paving the way for better FY20F NAND
ASP (-7% yoy vs. -56% yoy in FY19F).
Supply discipline raising DRAM recovery visibility for FY20F We are encouraged by the management guidance of ‘significant’ capex reduction in
FY20F, which should help improve DRAM supply-demand balance next year, despite
limited demand visibility. We forecast FY20F capex to be decreased by 30-40% from our
FY19F capex estimate of W13tr (24% below W17tr in FY18). Moreover, we also welcome
Hynix’s decision to convert M10 DRAM fab into image sensor chip production (starting
from 4Q19F), which could reduce Hynix’s DRAM wafer capacity by up to 10-12%.
Potential supply disruption likely triggering restocking demand Hynix indicated that protracted control of key semiconductor raw material export by
Japan could adversely impact its memory production. Toshiba’s (6502 JP, Not rated)
power outage has already proved conducive to reviving customers’ NAND restocking
appetite, and Korea-Japan trade tension could be another swing factor in 2H19F.
Maintain Add; Risk-reward remains positive We find Hynix’s guidance as an encouraging sign of memory cycle turnaround, applying
a higher target multiple (still conservatively pegged to a mid-cycle level) with our earnings
upgrade on better memory pricing assumptions. More concerted efforts by memory
players on production discipline and improved visibility for demand should catalyse the
stock. Key risks to our call include further delay in demand recovery.
SOURCES: CGS-CIMB RESEARCH, COMPANY REPORTS
South Korea
ADD (no change)
Consensus ratings*: Buy 34 Hold 5 Sell 2
Current price: W77,600
Target price: W95,000
Previous target: W86,000
Up/downside: 22.4%
CGS-CIMB / Consensus: 11.4%
Reuters: 000660.KS
Bloomberg: 000660 KS
Market cap: US$47,964m
W56,492,984m
Average daily turnover: US$196.1m
W230,712m
Current shares o/s: 728.0m
Free float: 67.8% *Source: Bloomberg
Key changes in this note
FY19F/20F EPS increased by 9%.
Source: Bloomberg
Price performance 1M 3M 12M Absolute (%) 16 -1.2 -7.2
Relative (%) 18.1 4.2 1.5
Major shareholders % held SKT 20.1
Insert
Analyst
Dohoon LEE
T (82) 2 6730 6121 E [email protected]
Financial Summary Dec-17A Dec-18A Dec-19F Dec-20F Dec-21F
Revenue (Wb) 30,109 40,445 25,149 25,545 27,164
Net Profit (Wb) 10,642 15,540 1,936 2,615 3,655
Normalised EPS (W) 14,617 21,346 2,659 3,593 5,020
Normalised EPS Growth 260% 46% (88%) 35% 40%
FD Normalised P/E (x) 5.31 3.64 29.19 21.60 15.46
Price To Sales (x) 1.88 1.40 2.25 2.21 2.08
DPS (W) 970 1,409 1,409 1,409 1,409
Dividend Yield 1.25% 1.82% 1.82% 1.82% 1.82%
EV/EBITDA (x) 2.68 1.73 4.65 4.22 3.75
P/FCFE (x) 21.67 29.59 NA NA 60.75
Net Gearing (13.0%) (6.6%) 4.4% 4.3% 5.1%
P/BV (x) 1.67 1.21 1.18 1.14 1.08
ROE 36.8% 38.5% 4.1% 5.4% 7.2%
% Change In Normalised EPS Estimates 8.93% 8.68% 0.09%
Normalised EPS/consensus EPS (x) 0.71 0.60 0.45
79.0
87.6
96.1
104.7
54,000
64,000
74,000
84,000
Price Close Relative to KOSPI (RHS)
5
10
15
Jul-18 Oct-18 Jan-19 Apr-19
Vo
l m
13
Company Note REIT │ Malaysia │ July 26, 2019 Shariah Compliant
IMPORTANT DISCLOSURES, INCLUDING ANY REQUIRED RESEARCH CERTIFICATIONS, ARE PROVIDED AT THE END OF THIS REPORT. IF THIS REPORT IS DISTRIBUTED IN THE UNITED STATES IT IS DISTRIBUTED BY CGS-CIMB SECURITIES (USA), INC. AND IS CONSIDERED THIRD-PARTY AFFILIATED RESEARCH.
Powered by the EFA Platform
Insert Insert
Axis REIT
Narrowing down its acquisition prospects
■ Axis REIT continues with its aggressive pipeline of asset acquisitions with seven new potential deals by end-2019. Total value estimated at RM242m.
■ The focus will be industrial-type assets in Nusajaya, Shah Alam, Sabah and Negeri Sembilan, with a few at advance stages of SPA.
■ Potential share placement in 4Q19 is likely, while benefits of the 25bp cut in the OPR in May will be felt in 2H19, in our view.
■ We are upbeat about the acquisition pipeline but expectations of positive newsflow in 2H19 looks largely priced-in for now. Maintain Hold and TP.
Targets new acquisitions in 2H19 We attended Axis REIT’s post-2Q19 results briefing. Axis REIT targets to secure seven
new asset acquisitions in 2H19. The focus continues to be the industrial and warehousing
segment, which is the sole bright spot in the property sector. The group highlighted an
overall RM242m of potential value of asset acquisition targets. To date it has secured two
from the recent Penang acquisitions, including its third lucrative built-to-suit (BTS)
contract with FedEx. It also signed a sale and purchase agreement (SPA) for another
industrial asset in Bayan Lepas (RM20.5m). Separately, the group targets to secure
tenants for Axis Mega Distribution Centre 2 (DC) by end-2019; its fourth BTS asset.
Niche industrial-type assets in the pipeline Acquisition focus continues to be industrial-type assets: 1) Two in Nusajaya (Johor):
RM55.8m, 2) Two in Shah Alam (Selangor): RM55.8m, 3) One in Kota Kinabalu (Sabah):
RM60m and 4) One in Nilai (Negeri Sembilan): RM50m. We gather that a few prospects
are in the advance stages for a signing of the SPA in August. The group is also keen on a
potential deal in Sabah given the long-term 15-year lease and positioning within the Kota
Kinabalu Industrial Park (KKIP).
Potential share placement likely; impact of 25bp OPR cut in 2H19 We estimate that the largely debt-funded acquisition pipeline would increase gross
gearing to 0.46x from 0.38x as at end-2Q19. The group guided that a share placement
exercise is therefore a possibility in 4Q19, as it intends to sustain gearing at c. 0.4x. A
hypothetical 10% share placement at a 10% discount to current share price of RM1.85
would raise RM206m or 85% of the total required capex for all seven new assets.
Separately, Axis REIT expects the impact of the 25bp cut in the OPR in May to be felt in
2H19. Some 36% of end-Jun’s RM1.1bn total debt is pegged to a floating/variable rate.
Upbeat on expansion targets but looks priced-in; maintain Hold We came away feeling upbeat about Axis REIT’s acquisition pipeline but expectations of
more positive newsflow in 2H19 looks largely priced-in for now. Maintain Hold and TP
(TG: of 2%, COE of 7.1%). Larger asset acquisitions in 2H19F are upside risks.
Downside risk is weak portfolio rental reversions. Our FY19-21F DPU translates to
dividend yields of 4.9-5.6% vs. Malaysia’s 10-year MGS yield of 3.6%.
SOURCES: CGS-CIMB RESEARCH, COMPANY REPORTS
Malaysia
HOLD (no change)
Consensus ratings*: Buy 4 Hold 6 Sell 1
Current price: RM1.85
Target price: RM1.95
Previous target: RM1.95
Up/downside: 5.3%
CGS-CIMB / Consensus: 5.1%
Reuters: AXSR.KL
Bloomberg: AXRB MK
Market cap: US$556.3m
RM2,289m
Average daily turnover: US$0.89m
RM3.69m
Current shares o/s: 1,237m
Free float: 68.2% *Source: Bloomberg
Key changes in this note
No changes
Source: Bloomberg
Price performance 1M 3M 12M
Absolute (%) 5.7 4.5 23.3
Relative (%) 6.9 3.2 29.4
Major shareholders % held Employees Provident Fund (EPF) 15.8 Kumpulan Wang Persaraan (KWAP) 10.3 Amanah Raya Trustees 5.7
Insert
Analyst(s)
Sharizan ROSELY
T (60) 3 2261 9077 E [email protected]
Financial Summary Dec-17A Dec-18A Dec-19F Dec-20F Dec-21F
Gross Property Revenue (RMm) 172.7 210.6 213.3 220.1 232.7
Net Property Income (RMm) 146.2 182.8 183.2 189.8 200.5
Net Profit (RMm) 122.6 155.0 114.6 119.6 128.8
Distributable Profit (RMm) 104.3 88.9 113.5 118.4 127.5
Core EPS (RM) 0.08 0.09 0.09 0.10 0.10
Core EPS Growth (0.1%) 13.8% 0.0% 4.4% 7.7%
FD Core P/E (x) 23.70 19.89 19.89 19.05 17.70
DPS (RM) 0.08 0.07 0.09 0.10 0.10
Dividend Yield 4.58% 3.90% 4.98% 5.20% 5.59%
Asset Leverage 33.0% 37.3% 38.2% 38.1% 38.0%
BVPS (RM) 1.29 1.35 1.35 1.35 1.35
P/BV (x) 1.43 1.37 1.37 1.37 1.37
Recurring ROE 6.11% 7.04% 6.90% 7.21% 7.75%
CIMB/consensus DPS (x) 0.99 1.01 1.00
92.0
101.0
110.0
119.0
128.0
137.0
1.400
1.500
1.600
1.700
1.800
1.900
Price Close Relative to FBMKLCI (RHS)
2
4
6
8
Jul-18 Oct-18 Jan-19 Apr-19
Vo
l m
14
Company Note REIT │ Malaysia │ July 26, 2019
IMPORTANT DISCLOSURES, INCLUDING ANY REQUIRED RESEARCH CERTIFICATIONS, ARE PROVIDED AT THE END OF THIS REPORT. IF THIS REPORT IS DISTRIBUTED IN THE UNITED STATES IT IS DISTRIBUTED BY CGS-CIMB SECURITIES (USA), INC. AND IS CONSIDERED THIRD-PARTY AFFILIATED RESEARCH.
Powered by the EFA Platform
Insert Insert
CapitaLand Malaysia Mall Trust Prolonged impact from rental downtime
■ 1H19 results were below expectations; we turn cautious on 2H19F outlook.
■ The delay in SWP’s AEI and the exit of an anchor tenant at The Mines are negative setbacks. We cut FY19-21F EPS/DPU by 7-19%.
■ Hold retained. Still-attractive revised DPU yields of 5.7-6.3%, but we cut TP.
1H19 results below expectations; DPU slipped 19% yoy 1H19 core net profit (excluding a RM30m fair valuation loss and the expected one-off
deferred tax charge) made up 42-44% of our and consensus’ full-year forecasts. The
results were below expectations as we expect 2H19F earnings to be flattish vs. 1H19, at
best, on account of a prolonged rental downtime for Sungei Wang Plaza (SWP) and
weak rental income for The Mines. Overall core net profit fell 12% yoy. 1H19 DPU fell
19% yoy to 3.2 sen; it is unlikely to meet our FY19F DPU forecast of 7.6 sen, in our view.
Portfolio rental reversion of -6.3% in 1H19 Overall portfolio rental reversion of -6.3% in 1H19 was contributed by negative reversion
of -7% for East Coast Mall (ECM), -14% for Sungei Wang Plaza (SWP), -14.9% for The
Mines, and -5.6% for 3 Damansara. Only Gurney Plaza booked a sequentially higher
positive rental reversion of +3.3% in 1H19 (1Q19: +1.5%). For its sole office asset,
Tropicana City Office Tower recorded a -3.6% rental reversion.
Prolonged rental downtime for SWP due to AEI delay During the conference call, the group highlighted that the completion of the asset
enhancement initiative (AEI) to accommodate “Jumpa” at SWP has been delayed from
mid-2019 to end-Sep, suggesting a prolonged 9-month rental downtime, which is a
negative surprise. New rental income from the total net lettable area (NLA) of 112k sq ft
is now expected to commence in 4Q19. Leasing progress stood at c.65% as at end-Jun,
with a targeted 85% of Jumpa’s NLA by 4Q19.
Negative surprise from exit of The Mines’ anchor tenant Another surprise setback at The Mines shopping mall is the exit of its anchor tenant Giant
Hypermarket in 2Q19. Forgone rental income works out to RM190k/month, likely over the
next few months, pending a targeted replacement tenant in 4Q19. Overall, we turn
cautious on earnings outlook and cut our FY19-21F EPS by 7-12% and DPU by 15-19%
which is based on a more conservative payout ratio of 91%.
Maintain Hold but with a lower TP Maintain Hold due to the still attractive revised FY19-21F DPU yields of 5-7-6.3% but we
lower our DDM-based TP to RM1.03 (COE: 7.4%; TG: 1%). Upside risk to our call is a
turnaround in rental reversions. Downside risks are prolonged negative reversions, rental
downtime at The Mines, and further delays in SWP’s AEI.
SOURCES: CGS-CIMB RESEARCH, COMPANY REPORTS
Malaysia
HOLD (no change)
Consensus ratings*: Buy 2 Hold 6 Sell 2
Current price: RM1.07
Target price: RM1.03
Previous target: RM1.06
Up/downside: -3.5%
CGS-CIMB / Consensus: -6.5%
Reuters: CAMA.KL
Bloomberg: CMMT MK
Market cap: US$531.6m
RM2,187m
Average daily turnover: US$0.22m
RM0.91m
Current shares o/s: 2,181m
Free float: 42.7% *Source: Bloomberg
Key changes in this note
FY19-21F EPS cut by 7-12%
FY19-21F DPU cut by 15-19%
Source: Bloomberg
Price performance 1M 3M 12M Absolute (%) 1.9 -2.7 -13.7
Relative (%) 3.1 -4 -7.6
Major shareholders % held CMMT Investment Limited 35.5 Employee Provident Fund Board 9.5 Amanah Saham Bumiputra 12.3
Insert
Analyst(s)
Sharizan ROSELY
T (60) 3 2261 9077 E [email protected]
Financial Summary Dec-17A Dec-18A Dec-19F Dec-20F Dec-21F
Gross Property Revenue (RMm) 368.9 350.1 330.5 337.3 351.9
Net Property Income (RMm) 237.1 215.0 205.8 208.7 216.4
Net Profit (RMm) 162.1 135.6 125.4 129.4 137.9
Distributable Profit (RMm) 167.7 161.3 138.0 142.5 152.6
Core EPS (RM) 0.077 0.066 0.061 0.063 0.067
Core EPS Growth (4.0%) (15.1%) (7.2%) 2.8% 6.1%
FD Core P/E (x) 13.81 18.23 21.76 21.16 19.92
DPS (RM) 0.082 0.079 0.061 0.063 0.067
Dividend Yield 7.68% 7.37% 5.72% 5.88% 6.27%
Asset Leverage 32.0% 31.8% 31.9% 31.7% 31.5%
BVPS (RM) 1.32 1.05 1.04 1.05 1.05
P/BV (x) 0.81 1.02 1.03 1.02 1.02
Recurring ROE 5.88% 5.03% 4.71% 4.85% 5.13%
% Change In DPS Estimates (19.3%) (18.6%) (14.6%)
CIMB/consensus DPS (x) 0.87 0.87 0.91
83.0
88.7
94.4
100.1
0.900
1.000
1.100
1.200
Price Close Relative to FBMKLCI (RHS)
2
4
6
8
Jul-18 Oct-18 Jan-19 Apr-19
Vo
l m
15
Company Note REIT │ Malaysia │ July 26, 2019
IMPORTANT DISCLOSURES, INCLUDING ANY REQUIRED RESEARCH CERTIFICATIONS, ARE PROVIDED AT THE END OF THIS REPORT. IF THIS REPORT IS DISTRIBUTED IN THE UNITED STATES IT IS DISTRIBUTED BY CGS-CIMB SECURITIES (USA), INC. AND IS CONSIDERED THIRD-PARTY AFFILIATED RESEARCH.
Powered by the EFA Platform
Insert Insert
Pavilion REIT
Working on DA MEN’s gradual turnaround
■ 1H19 results were broadly in line; core net profit/DPU grew 1.4-1.8% yoy.
■ High occupancy rates and positive reversions drove overall numbers. DA MEN mall remains the weakest link pending new tenant pipeline.
■ Hold maintained with a higher TP; FY19-21F dividend yields of 5.1-5.5% are attractive and supportive of share price, in our view.
1H19 results broadly in line with expectations Pavilion REIT’s 1H19 core net profit made up 47-48% of our and consensus full-year
forecasts. We deem the results broadly in line given that 2Q19 is seasonally a slow
period for tenant sales, which only mildly improved in Jun. Overall revenue grew 11% yoy
in 1H19, despite the still-weak performance from DA MEN mall. The slight drop in 1H19
EBITDA margin to 60% in 1H19 (1H18: 63%) was largely expected given the higher
property expenses incurred. Core net profit rose 1.8% yoy in 1H19, also dented by higher
interest expenses. 1H19 DPU of 4.4 sen (+1.4% yoy) was within expectations.
Occupancy rates of 94-95% but a decline for DA MEN Excluding DA MEN Mall, Pavillion Mall, Elite Pavilion Mall (EPM), and Intermark Mall
managed to sustain occupancy rates of 94-96% as at end-Jun. The slight drop in
Pavillion Mall’s occupancy rate to 96% in end-Jun (vs. 98% in end-Mar) is not huge
concern, as it was due to the impact of temporary renovations and changeover to new
tenants. In terms of rental reversions, Pavillion Mall booked in positive mid-single-digit
rental reversion, slightly lower than Intermark Mall’s. Rental reversion for DA MEN mall
remained subdued in 2Q19.
New tenants pipeline for DA MEN mall During the conference call, the group said it expects gradual improvements in the
occupancy rate at DA MEN mall from 3Q19 onwards. End-Jun occupancy rate of 65.4%
remains subdued, down from 68% at end-Mar. The positive news is that there are several
new tenants in the pipeline, including 1) Music Box occupying 11k sq ft, 2) three new F&B
outlets, and 3) two fast food chains, among others, which will occupy level 4 of the mall.
Also, by 1Q20, a major cinema operator will occupy a 35k sq ft area offering seven
cinema halls. All in, the group expects a turnaround in occupancy rate to 85-87% for DA
MEN mall once all new tenants are in place.
Maintain Hold with a higher TP No changes to our FY19-21F EPS. We raise our DDM-based TP to RM1.91, pegged to a
lower COE of 6.9% (7.7% previously) due to the lower adjusted beta, and unchanged TG
of 1.5%. Retain a Hold rating in view of the limited upside to its share price. Its FY19-21F
dividend yields of 5.1%-5.5% are attractive vs. the 10-year MGS yield of 3.6%. Upside
risks include higher rental reversions and a recovery in occupancy rates at DA MEN. A
downside risk is increased competition from suburban malls.
SOURCES: CGS-CIMB RESEARCH, COMPANY REPORTS
Malaysia
HOLD (no change)
Consensus ratings*: Buy 2 Hold 9 Sell 0
Current price: RM1.89
Target price: RM1.91
Previous target: RM1.81
Up/downside: 1.2%
CGS-CIMB / Consensus: 7.7%
Reuters: PREI.KL
Bloomberg: PREIT MK
Market cap: US$1,396m
RM5,744m
Average daily turnover: US$0.26m
RM1.08m
Current shares o/s: 3,034m
Free float: 25.2% *Source: Bloomberg
Key changes in this note
No change.
Source: Bloomberg
Price performance 1M 3M 12M
Absolute (%) 3.3 4.4 13.9
Relative (%) 4.5 3.1 20
Major shareholders % held Qatar Investment Authority 35.8 Datuk Lim Siew Choon 29.7 Datin Tan Kewi Yong 9.3
Insert
Analyst(s)
Sharizan ROSELY
T (60) 3 2261 9077 E [email protected]
Financial Summary Dec-17A Dec-18A Dec-19F Dec-20F Dec-21F
Gross Property Revenue (RMm) 490.0 555.0 600.4 618.3 638.1
Net Property Income (RMm) 322.9 374.8 395.7 407.5 420.5
Net Profit (RMm) 249.4 288.7 267.6 279.0 291.6
Distributable Profit (RMm) 242.9 266.4 290.3 302.0 314.9
Core EPS (RM) 0.077 0.084 0.088 0.092 0.095
Core EPS Growth (1.25%) 9.66% 4.70% 3.97% 4.23%
FD Core P/E (x) 24.64 22.47 21.46 20.64 19.80
DPS (RM) 0.08 0.09 0.10 0.10 0.10
Dividend Yield 4.36% 4.65% 5.05% 5.24% 5.45%
Asset Leverage 25.9% 33.8% 33.6% 33.3% 32.9%
BVPS (RM) 1.30 1.31 1.31 1.33 1.35
P/BV (x) 1.45 1.44 1.44 1.42 1.40
Recurring ROE 5.91% 6.44% 6.72% 6.93% 7.12%
% Change In DPS Estimates (0.002%) (0.004%) (0.005%)
CIMB/consensus DPS (x) 1.06 1.07 1.05
88.0
95.8
103.6
111.3
119.1
1.500
1.600
1.700
1.800
1.900
Price Close Relative to FBMKLCI (RHS)
5
10
Jul-18 Oct-18 Jan-19 Apr-19
Vo
l m
16
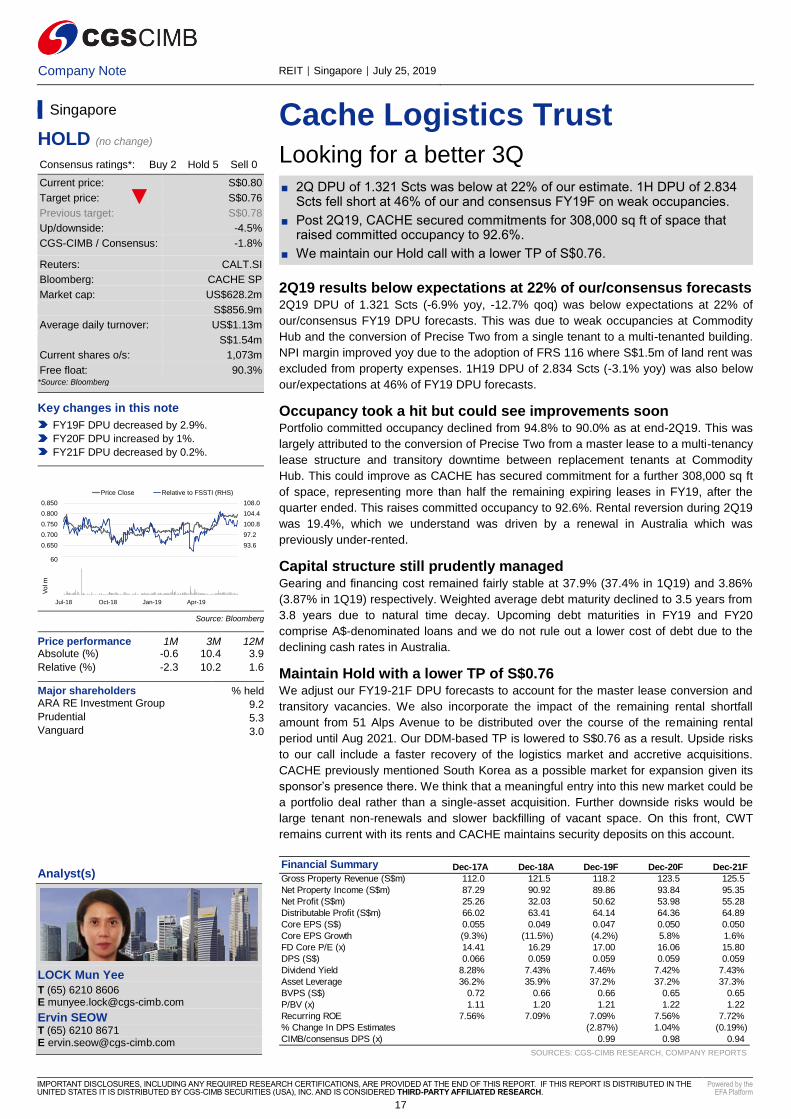
Company Note REIT │ Singapore │ July 25, 2019
IMPORTANT DISCLOSURES, INCLUDING ANY REQUIRED RESEARCH CERTIFICATIONS, ARE PROVIDED AT THE END OF THIS REPORT. IF THIS REPORT IS DISTRIBUTED IN THE UNITED STATES IT IS DISTRIBUTED BY CGS-CIMB SECURITIES (USA), INC. AND IS CONSIDERED THIRD-PARTY AFFILIATED RESEARCH.
Powered by the EFA Platform
Insert Insert
Cache Logistics Trust Looking for a better 3Q
■ 2Q DPU of 1.321 Scts was below at 22% of our estimate. 1H DPU of 2.834 Scts fell short at 46% of our and consensus FY19F on weak occupancies.
■ Post 2Q19, CACHE secured commitments for 308,000 sq ft of space that raised committed occupancy to 92.6%.
■ We maintain our Hold call with a lower TP of S$0.76.
2Q19 results below expectations at 22% of our/consensus forecasts 2Q19 DPU of 1.321 Scts (-6.9% yoy, -12.7% qoq) was below expectations at 22% of
our/consensus FY19 DPU forecasts. This was due to weak occupancies at Commodity
Hub and the conversion of Precise Two from a single tenant to a multi-tenanted building.
NPI margin improved yoy due to the adoption of FRS 116 where S$1.5m of land rent was
excluded from property expenses. 1H19 DPU of 2.834 Scts (-3.1% yoy) was also below
our/expectations at 46% of FY19 DPU forecasts.
Occupancy took a hit but could see improvements soon Portfolio committed occupancy declined from 94.8% to 90.0% as at end-2Q19. This was
largely attributed to the conversion of Precise Two from a master lease to a multi-tenancy
lease structure and transitory downtime between replacement tenants at Commodity
Hub. This could improve as CACHE has secured commitment for a further 308,000 sq ft
of space, representing more than half the remaining expiring leases in FY19, after the
quarter ended. This raises committed occupancy to 92.6%. Rental reversion during 2Q19
was 19.4%, which we understand was driven by a renewal in Australia which was
previously under-rented.
Capital structure still prudently managed Gearing and financing cost remained fairly stable at 37.9% (37.4% in 1Q19) and 3.86%
(3.87% in 1Q19) respectively. Weighted average debt maturity declined to 3.5 years from
3.8 years due to natural time decay. Upcoming debt maturities in FY19 and FY20
comprise A$-denominated loans and we do not rule out a lower cost of debt due to the
declining cash rates in Australia.
Maintain Hold with a lower TP of S$0.76 We adjust our FY19-21F DPU forecasts to account for the master lease conversion and
transitory vacancies. We also incorporate the impact of the remaining rental shortfall
amount from 51 Alps Avenue to be distributed over the course of the remaining rental
period until Aug 2021. Our DDM-based TP is lowered to S$0.76 as a result. Upside risks
to our call include a faster recovery of the logistics market and accretive acquisitions.
CACHE previously mentioned South Korea as a possible market for expansion given its
sponsor’s presence there. We think that a meaningful entry into this new market could be
a portfolio deal rather than a single-asset acquisition. Further downside risks would be
large tenant non-renewals and slower backfilling of vacant space. On this front, CWT
remains current with its rents and CACHE maintains security deposits on this account.
SOURCES: CGS-CIMB RESEARCH, COMPANY REPORTS
Singapore
HOLD (no change)
Consensus ratings*: Buy 2 Hold 5 Sell 0
Current price: S$0.80
Target price: S$0.76
Previous target: S$0.78
Up/downside: -4.5%
CGS-CIMB / Consensus: -1.8%
Reuters: CALT.SI
Bloomberg: CACHE SP
Market cap: US$628.2m
S$856.9m
Average daily turnover: US$1.13m
S$1.54m
Current shares o/s: 1,073m
Free float: 90.3% *Source: Bloomberg
Key changes in this note
FY19F DPU decreased by 2.9%.
FY20F DPU increased by 1%.
FY21F DPU decreased by 0.2%.
Source: Bloomberg
Price performance 1M 3M 12M Absolute (%) -0.6 10.4 3.9
Relative (%) -2.3 10.2 1.6
Major shareholders % held ARA RE Investment Group 9.2 Prudential 5.3 Vanguard 3.0
Insert
Analyst(s)
LOCK Mun Yee
T (65) 6210 8606 E [email protected]
Ervin SEOW T (65) 6210 8671 E [email protected]
Financial Summary Dec-17A Dec-18A Dec-19F Dec-20F Dec-21F
Gross Property Revenue (S$m) 112.0 121.5 118.2 123.5 125.5
Net Property Income (S$m) 87.29 90.92 89.86 93.84 95.35
Net Profit (S$m) 25.26 32.03 50.62 53.98 55.28
Distributable Profit (S$m) 66.02 63.41 64.14 64.36 64.89
Core EPS (S$) 0.055 0.049 0.047 0.050 0.050
Core EPS Growth (9.3%) (11.5%) (4.2%) 5.8% 1.6%
FD Core P/E (x) 14.41 16.29 17.00 16.06 15.80
DPS (S$) 0.066 0.059 0.059 0.059 0.059
Dividend Yield 8.28% 7.43% 7.46% 7.42% 7.43%
Asset Leverage 36.2% 35.9% 37.2% 37.2% 37.3%
BVPS (S$) 0.72 0.66 0.66 0.65 0.65
P/BV (x) 1.11 1.20 1.21 1.22 1.22
Recurring ROE 7.56% 7.09% 7.09% 7.56% 7.72%
% Change In DPS Estimates (2.87%) 1.04% (0.19%)
CIMB/consensus DPS (x) 0.99 0.98 0.94
90.0
93.6
97.2
100.8
104.4
108.0
0.600
0.650
0.700
0.750
0.800
0.850
Price Close Relative to FSSTI (RHS)
20
40
60
Jul-18 Oct-18 Jan-19 Apr-19
Vo
l m
17
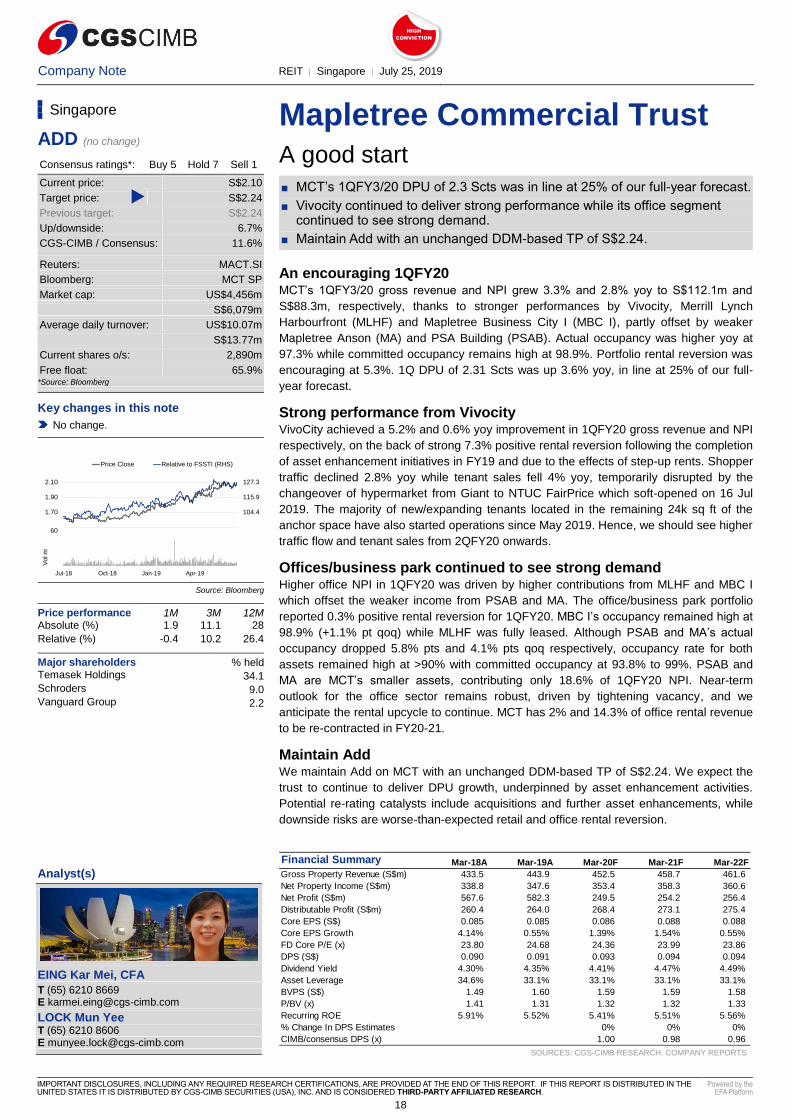
Company Note REIT │ Singapore │ July 25, 2019
IMPORTANT DISCLOSURES, INCLUDING ANY REQUIRED RESEARCH CERTIFICATIONS, ARE PROVIDED AT THE END OF THIS REPORT. IF THIS REPORT IS DISTRIBUTED IN THE UNITED STATES IT IS DISTRIBUTED BY CGS-CIMB SECURITIES (USA), INC. AND IS CONSIDERED THIRD-PARTY AFFILIATED RESEARCH.
Powered by the EFA Platform
HIGH
CONVICTION
Insert Insert
Mapletree Commercial Trust A good start
■ MCT’s 1QFY3/20 DPU of 2.3 Scts was in line at 25% of our full-year forecast.
■ Vivocity continued to deliver strong performance while its office segment continued to see strong demand.
■ Maintain Add with an unchanged DDM-based TP of S$2.24.
An encouraging 1QFY20 MCT’s 1QFY3/20 gross revenue and NPI grew 3.3% and 2.8% yoy to S$112.1m and
S$88.3m, respectively, thanks to stronger performances by Vivocity, Merrill Lynch
Harbourfront (MLHF) and Mapletree Business City I (MBC I), partly offset by weaker
Mapletree Anson (MA) and PSA Building (PSAB). Actual occupancy was higher yoy at
97.3% while committed occupancy remains high at 98.9%. Portfolio rental reversion was
encouraging at 5.3%. 1Q DPU of 2.31 Scts was up 3.6% yoy, in line at 25% of our full-
year forecast.
Strong performance from Vivocity VivoCity achieved a 5.2% and 0.6% yoy improvement in 1QFY20 gross revenue and NPI
respectively, on the back of strong 7.3% positive rental reversion following the completion
of asset enhancement initiatives in FY19 and due to the effects of step-up rents. Shopper
traffic declined 2.8% yoy while tenant sales fell 4% yoy, temporarily disrupted by the
changeover of hypermarket from Giant to NTUC FairPrice which soft-opened on 16 Jul
2019. The majority of new/expanding tenants located in the remaining 24k sq ft of the
anchor space have also started operations since May 2019. Hence, we should see higher
traffic flow and tenant sales from 2QFY20 onwards.
Offices/business park continued to see strong demand Higher office NPI in 1QFY20 was driven by higher contributions from MLHF and MBC I
which offset the weaker income from PSAB and MA. The office/business park portfolio
reported 0.3% positive rental reversion for 1QFY20. MBC I’s occupancy remained high at
98.9% (+1.1% pt qoq) while MLHF was fully leased. Although PSAB and MA’s actual
occupancy dropped 5.8% pts and 4.1% pts qoq respectively, occupancy rate for both
assets remained high at >90% with committed occupancy at 93.8% to 99%. PSAB and
MA are MCT’s smaller assets, contributing only 18.6% of 1QFY20 NPI. Near-term
outlook for the office sector remains robust, driven by tightening vacancy, and we
anticipate the rental upcycle to continue. MCT has 2% and 14.3% of office rental revenue
to be re-contracted in FY20-21.
Maintain Add We maintain Add on MCT with an unchanged DDM-based TP of S$2.24. We expect the
trust to continue to deliver DPU growth, underpinned by asset enhancement activities.
Potential re-rating catalysts include acquisitions and further asset enhancements, while
downside risks are worse-than-expected retail and office rental reversion.
SOURCES: CGS-CIMB RESEARCH, COMPANY REPORTS
Singapore
ADD (no change)
Consensus ratings*: Buy 5 Hold 7 Sell 1
Current price: S$2.10
Target price: S$2.24
Previous target: S$2.24
Up/downside: 6.7%
CGS-CIMB / Consensus: 11.6%
Reuters: MACT.SI
Bloomberg: MCT SP
Market cap: US$4,456m
S$6,079m
Average daily turnover: US$10.07m
S$13.77m
Current shares o/s: 2,890m
Free float: 65.9% *Source: Bloomberg
Key changes in this note
No change.
Source: Bloomberg
Price performance 1M 3M 12M Absolute (%) 1.9 11.1 28
Relative (%) -0.4 10.2 26.4
Major shareholders % held Temasek Holdings 34.1 Schroders 9.0 Vanguard Group 2.2
Insert
Analyst(s)
EING Kar Mei, CFA
T (65) 6210 8669 E [email protected]
LOCK Mun Yee T (65) 6210 8606 E [email protected]
Financial Summary Mar-18A Mar-19A Mar-20F Mar-21F Mar-22F
Gross Property Revenue (S$m) 433.5 443.9 452.5 458.7 461.6
Net Property Income (S$m) 338.8 347.6 353.4 358.3 360.6
Net Profit (S$m) 567.6 582.3 249.5 254.2 256.4
Distributable Profit (S$m) 260.4 264.0 268.4 273.1 275.4
Core EPS (S$) 0.085 0.085 0.086 0.088 0.088
Core EPS Growth 4.14% 0.55% 1.39% 1.54% 0.55%
FD Core P/E (x) 23.80 24.68 24.36 23.99 23.86
DPS (S$) 0.090 0.091 0.093 0.094 0.094
Dividend Yield 4.30% 4.35% 4.41% 4.47% 4.49%
Asset Leverage 34.6% 33.1% 33.1% 33.1% 33.1%
BVPS (S$) 1.49 1.60 1.59 1.59 1.58
P/BV (x) 1.41 1.31 1.32 1.32 1.33
Recurring ROE 5.91% 5.52% 5.41% 5.51% 5.56%
% Change In DPS Estimates 0% 0% 0%
CIMB/consensus DPS (x) 1.00 0.98 0.96
93.0
104.4
115.9
127.3
1.50
1.70
1.90
2.10
Price Close Relative to FSSTI (RHS)
20
40
60
Jul-18 Oct-18 Jan-19 Apr-19
Vo
l m
18
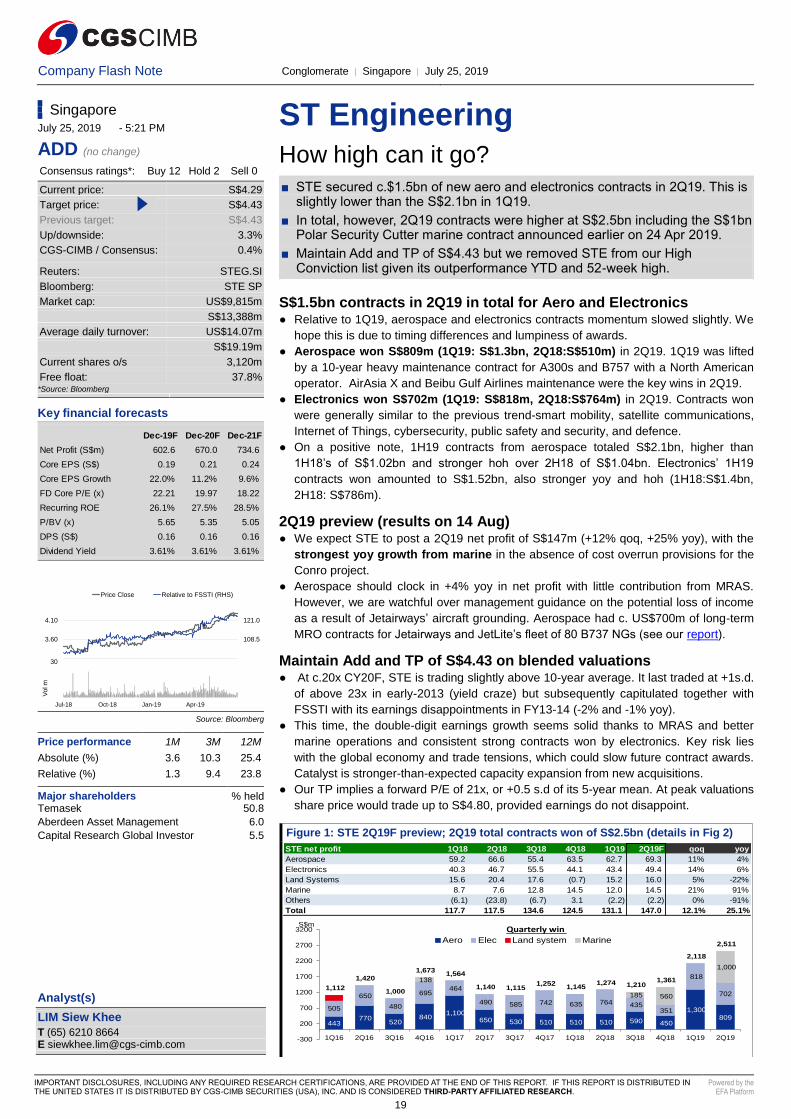
Company Flash Note Conglomerate │ Singapore │ July 25, 2019
IMPORTANT DISCLOSURES, INCLUDING ANY REQUIRED RESEARCH CERTIFICATIONS, ARE PROVIDED AT THE END OF THIS REPORT. IF THIS REPORT IS DISTRIBUTED IN THE UNITED STATES IT IS DISTRIBUTED BY CGS-CIMB SECURITIES (USA), INC. AND IS CONSIDERED THIRD-PARTY AFFILIATED RESEARCH.
Powered by the EFA Platform
Insert Insert
ST Engineering How high can it go?
■ STE secured c.$1.5bn of new aero and electronics contracts in 2Q19. This is slightly lower than the S$2.1bn in 1Q19.
■ In total, however, 2Q19 contracts were higher at S$2.5bn including the S$1bn Polar Security Cutter marine contract announced earlier on 24 Apr 2019.
■ Maintain Add and TP of S$4.43 but we removed STE from our High Conviction list given its outperformance YTD and 52-week high.
S$1.5bn contracts in 2Q19 in total for Aero and Electronics ● Relative to 1Q19, aerospace and electronics contracts momentum slowed slightly. We
hope this is due to timing differences and lumpiness of awards.
● Aerospace won S$809m (1Q19: S$1.3bn, 2Q18:S$510m) in 2Q19. 1Q19 was lifted
by a 10-year heavy maintenance contract for A300s and B757 with a North American
operator. AirAsia X and Beibu Gulf Airlines maintenance were the key wins in 2Q19.
● Electronics won S$702m (1Q19: S$818m, 2Q18:S$764m) in 2Q19. Contracts won
were generally similar to the previous trend-smart mobility, satellite communications,
Internet of Things, cybersecurity, public safety and security, and defence.
● On a positive note, 1H19 contracts from aerospace totaled S$2.1bn, higher than
1H18’s of S$1.02bn and stronger hoh over 2H18 of S$1.04bn. Electronics’ 1H19
contracts won amounted to S$1.52bn, also stronger yoy and hoh (1H18:S$1.4bn,
2H18: S$786m).
2Q19 preview (results on 14 Aug) ● We expect STE to post a 2Q19 net profit of S$147m (+12% qoq, +25% yoy), with the
strongest yoy growth from marine in the absence of cost overrun provisions for the
Conro project.
● Aerospace should clock in +4% yoy in net profit with little contribution from MRAS.
However, we are watchful over management guidance on the potential loss of income
as a result of Jetairways’ aircraft grounding. Aerospace had c. US$700m of long-term
MRO contracts for Jetairways and JetLite’s fleet of 80 B737 NGs (see our report).
Maintain Add and TP of S$4.43 on blended valuations ● At c.20x CY20F, STE is trading slightly above 10-year average. It last traded at +1s.d.
of above 23x in early-2013 (yield craze) but subsequently capitulated together with
FSSTI with its earnings disappointments in FY13-14 (-2% and -1% yoy).
● This time, the double-digit earnings growth seems solid thanks to MRAS and better
marine operations and consistent strong contracts won by electronics. Key risk lies
with the global economy and trade tensions, which could slow future contract awards.
Catalyst is stronger-than-expected capacity expansion from new acquisitions.
● Our TP implies a forward P/E of 21x, or +0.5 s.d of its 5-year mean. At peak valuations
share price would trade up to S$4.80, provided earnings do not disappoint.
Figure 1: STE 2Q19F preview; 2Q19 total contracts won of S$2.5bn (details in Fig 2)
SOURCES: CGS-CIMB RESEARCH, COMPANY REPORTS
STE net profit 1Q18 2Q18 3Q18 4Q18 1Q19 2Q19F qoq yoy
Aerospace 59.2 66.6 55.4 63.5 62.7 69.3 11% 4%
Electronics 40.3 46.7 55.5 44.1 43.4 49.4 14% 6%
Land Systems 15.6 20.4 17.6 (0.7) 15.2 16.0 5% -22%
Marine 8.7 7.6 12.8 14.5 12.0 14.5 21% 91%
Others (6.1) (23.8) (6.7) 3.1 (2.2) (2.2) 0% -91%
Total 117.7 117.5 134.6 124.5 131.1 147.0 12.1% 25.1%
443770
520 840
1,100 650 530 510 510 510 590 450
1,300 809
505
650
480
695 464
490 585 742 635 764 435 351
818
702
138
185 560
1,000
1,112
1,420
1,000
1,673 1,564
1,140 1,115 1,252
1,145 1,274 1,210
1,361
2,118
2,511
-300
200
700
1200
1700
2200
2700
3200
1Q16 2Q16 3Q16 4Q16 1Q17 2Q17 3Q17 4Q17 1Q18 2Q18 3Q18 4Q18 1Q19 2Q19
Aero Elec Land system Marine
S$mQuarterly win
Singapore July 25, 2019 - 5:21 PM
ADD (no change) Consensus ratings*: Buy 12 Hold 2 Sell 0
Current price: S$4.29
Target price: S$4.43
Previous target: S$4.43
Up/downside: 3.3%
CGS-CIMB / Consensus: 0.4%
Reuters: STEG.SI
Bloomberg: STE SP
Market cap: US$9,815m
S$13,388m
Average daily turnover: US$14.07m
S$19.19m
Current shares o/s 3,120m
Free float: 37.8% *Source: Bloomberg
Key financial forecasts
Source: Bloomberg
Price performance 1M 3M 12M
Absolute (%) 3.6 10.3 25.4
Relative (%) 1.3 9.4 23.8
Major shareholders % held Temasek 50.8
Aberdeen Asset Management 6.0
Capital Research Global Investor 5.5
Insert
Analyst(s)
LIM Siew Khee
T (65) 6210 8664 E [email protected]
Dec-19F Dec-20F Dec-21F
Net Profit (S$m) 602.6 670.0 734.6
Core EPS (S$) 0.19 0.21 0.24
Core EPS Growth 22.0% 11.2% 9.6%
FD Core P/E (x) 22.21 19.97 18.22
Recurring ROE 26.1% 27.5% 28.5%
P/BV (x) 5.65 5.35 5.05
DPS (S$) 0.16 0.16 0.16
Dividend Yield 3.61% 3.61% 3.61%
96.0
108.5
121.0
3.10
3.60
4.10
Price Close Relative to FSSTI (RHS)
10
20
30
Jul-18 Oct-18 Jan-19 Apr-19
Vol m
19
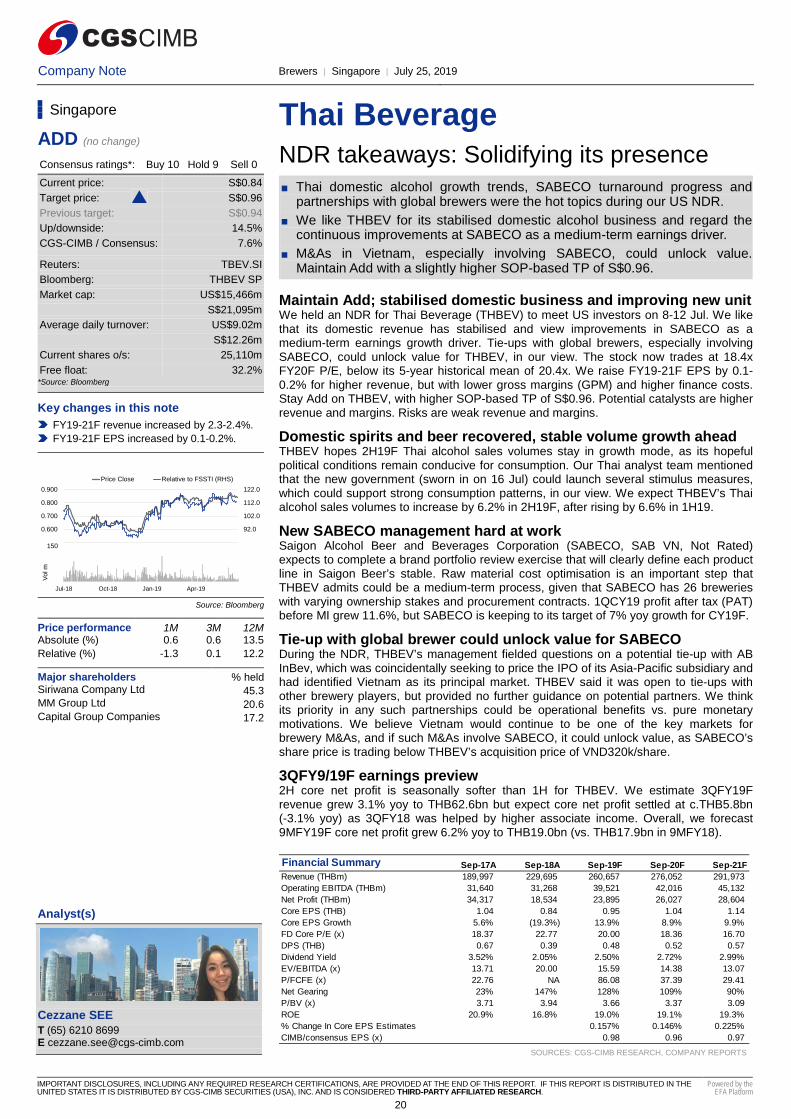
Company Note Brewers │ Singapore │ July 25, 2019
Insert Insert
Thai Beverage NDR takeaways: Solidifying its presence
■ Thai domestic alcohol growth trends, SABECO turnaround progress and partnerships with global brewers were the hot topics during our US NDR.
■ We like THBEV for its stabilised domestic alcohol business and regard the continuous improvements at SABECO as a medium-term earnings driver.
■ M&As in Vietnam, especially involving SABECO, could unlock value. Maintain Add with a slightly higher SOP-based TP of S$0.96.
Maintain Add; stabilised domestic business and improving new unit We held an NDR for Thai Beverage (THBEV) to meet US investors on 8-12 Jul. We like
that its domestic revenue has stabilised and view improvements in SABECO as a medium-term earnings growth driver. Tie-ups with global brewers, especially involving
SABECO, could unlock value for THBEV, in our view. The stock now trades at 18.4x FY20F P/E, below its 5-year historical mean of 20.4x. We raise FY19-21F EPS by 0.1-
0.2% for higher revenue, but with lower gross margins (GPM) and higher finance costs. Stay Add on THBEV, with higher SOP-based TP of S$0.96. Potential catalysts are higher
revenue and margins. Risks are weak revenue and margins.
Domestic spirits and beer recovered, stable volume growth ahead THBEV hopes 2H19F Thai alcohol sales volumes stay in growth mode, as its hopeful
political conditions remain conducive for consumption. Our Thai analyst team mentioned that the new government (sworn in on 16 Jul) could launch several stimulus measures,
which could support strong consumption patterns, in our view. We expect THBEV’s Thai alcohol sales volumes to increase by 6.2% in 2H19F, after rising by 6.6% in 1H19.
New SABECO management hard at work Saigon Alcohol Beer and Beverages Corporation (SABECO, SAB VN, Not Rated) expects to complete a brand portfolio review exercise that will clearly define each product
line in Saigon Beer’s stable. Raw material cost optimisation is an important step that THBEV admits could be a medium-term process, given that SABECO has 26 breweries
with varying ownership stakes and procurement contracts. 1QCY19 profit after tax (PAT) before MI grew 11.6%, but SABECO is keeping to its target of 7% yoy growth for CY19F.
Tie-up with global brewer could unlock value for SABECO During the NDR, THBEV’s management fielded questions on a potential tie-up with AB
InBev, which was coincidentally seeking to price the IPO of its Asia-Pacific subsidiary and had identified Vietnam as its principal market. THBEV said it was open to tie-ups with
other brewery players, but provided no further guidance on potential partners. We think its priority in any such partnerships could be operational benefits vs. pure monetary
motivations. We believe Vietnam would continue to be one of the key markets for brewery M&As, and if such M&As involve SABECO, it could unlock value, as SABECO’s
share price is trading below THBEV’s acquisition price of VND320k/share.
3QFY9/19F earnings preview 2H core net profit is seasonally softer than 1H for THBEV. We estimate 3QFY19F
revenue grew 3.1% yoy to THB62.6bn but expect core net profit settled at c.THB5.8bn (-3.1% yoy) as 3QFY18 was helped by higher associate income. Overall, we forecast
9MFY19F core net profit grew 6.2% yoy to THB19.0bn (vs. THB17.9bn in 9MFY18).
SOURCES: CGS-CIMB RESEARCH, COMPANY REPORTS
Singapore
ADD (no change)
Consensus ratings*: Buy 10 Hold 9 Sell 0
Current price: S$0.84
Target price: S$0.96
Previous target: S$0.94 Up/downside: 14.5%
CGS-CIMB / Consensus: 7.6%
Reuters: TBEV.SI
Bloomberg: THBEV SP
Market cap: US$15,466m
S$21,095m
Average daily turnover: US$9.02m
S$12.26m
Current shares o/s: 25,110m
Free float: 32.2% *Source: Bloomberg
Key changes in this note
FY19-21F revenue increased by 2.3-2.4%.
FY19-21F EPS increased by 0.1-0.2%.
Source: Bloomberg
Price performance 1M 3M 12M Absolute (%) 0.6 0.6 13.5
Relative (%) -1.3 0.1 12.2
Major shareholders % held Siriwana Company Ltd 45.3 MM Group Ltd 20.6 Capital Group Companies 17.2
Insert
Analyst(s)
Cezzane SEE
T (65) 6210 8699 E [email protected]
Financial Summary Sep-17A Sep-18A Sep-19F Sep-20F Sep-21F
Revenue (THBm) 189,997 229,695 260,657 276,052 291,973
Operating EBITDA (THBm) 31,640 31,268 39,521 42,016 45,132
Net Profit (THBm) 34,317 18,534 23,895 26,027 28,604
Core EPS (THB) 1.04 0.84 0.95 1.04 1.14
Core EPS Growth 5.6% (19.3%) 13.9% 8.9% 9.9%
FD Core P/E (x) 18.37 22.77 20.00 18.36 16.70
DPS (THB) 0.67 0.39 0.48 0.52 0.57
Dividend Yield 3.52% 2.05% 2.50% 2.72% 2.99%
EV/EBITDA (x) 13.71 20.00 15.59 14.38 13.07
P/FCFE (x) 22.76 NA 86.08 37.39 29.41
Net Gearing 23% 147% 128% 109% 90%
P/BV (x) 3.71 3.94 3.66 3.37 3.09
ROE 20.9% 16.8% 19.0% 19.1% 19.3%
% Change In Core EPS Estimates 0.157% 0.146% 0.225%
CIMB/consensus EPS (x) 0.98 0.96 0.97
82.0
92.0
102.0
112.0
122.0
0.500
0.600
0.700
0.800
0.900
Price Close Relative to FSSTI (RHS)
50
100
150
Jul-18 Oct-18 Jan-19 Apr-19
Vo
l m
IMPORTANT DISCLOSURES, INCLUDING ANY REQUIRED RESEARCH CERTIFICATIONS, ARE PROVIDED AT THE END OF THIS REPORT. IF THIS REPORT IS DISTRIBUTED IN THE UNITED STATES IT IS DISTRIBUTED BY CGS-CIMB SECURITIES (USA), INC. AND IS CONSIDERED THIRD-PARTY AFFILIATED RESEARCH.
Powered by the EFA Platform
20
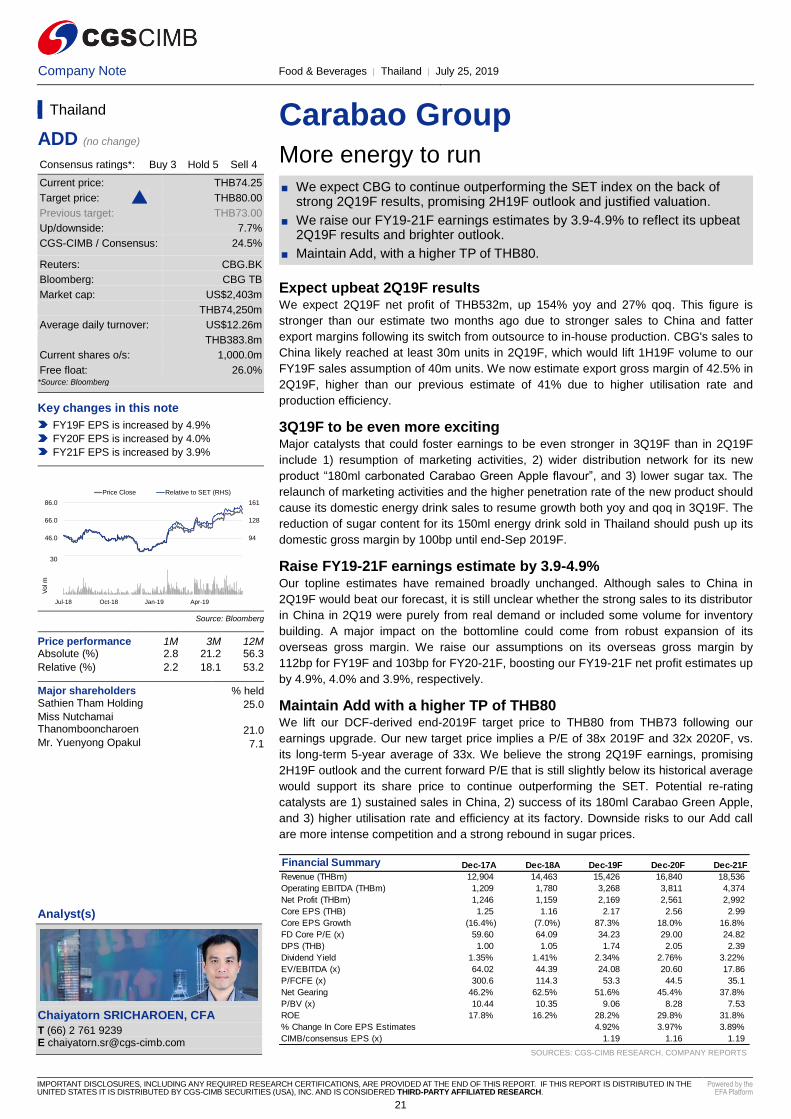
Company Note Food & Beverages │ Thailand │ July 25, 2019
IMPORTANT DISCLOSURES, INCLUDING ANY REQUIRED RESEARCH CERTIFICATIONS, ARE PROVIDED AT THE END OF THIS REPORT. IF THIS REPORT IS DISTRIBUTED IN THE UNITED STATES IT IS DISTRIBUTED BY CGS-CIMB SECURITIES (USA), INC. AND IS CONSIDERED THIRD-PARTY AFFILIATED RESEARCH.
Powered by the EFA Platform
Insert Insert
Carabao Group More energy to run
■ We expect CBG to continue outperforming the SET index on the back of strong 2Q19F results, promising 2H19F outlook and justified valuation.
■ We raise our FY19-21F earnings estimates by 3.9-4.9% to reflect its upbeat 2Q19F results and brighter outlook.
■ Maintain Add, with a higher TP of THB80.
Expect upbeat 2Q19F results We expect 2Q19F net profit of THB532m, up 154% yoy and 27% qoq. This figure is
stronger than our estimate two months ago due to stronger sales to China and fatter
export margins following its switch from outsource to in-house production. CBG's sales to
China likely reached at least 30m units in 2Q19F, which would lift 1H19F volume to our
FY19F sales assumption of 40m units. We now estimate export gross margin of 42.5% in
2Q19F, higher than our previous estimate of 41% due to higher utilisation rate and
production efficiency.
3Q19F to be even more exciting Major catalysts that could foster earnings to be even stronger in 3Q19F than in 2Q19F
include 1) resumption of marketing activities, 2) wider distribution network for its new
product “180ml carbonated Carabao Green Apple flavour”, and 3) lower sugar tax. The
relaunch of marketing activities and the higher penetration rate of the new product should
cause its domestic energy drink sales to resume growth both yoy and qoq in 3Q19F. The
reduction of sugar content for its 150ml energy drink sold in Thailand should push up its
domestic gross margin by 100bp until end-Sep 2019F.
Raise FY19-21F earnings estimate by 3.9-4.9% Our topline estimates have remained broadly unchanged. Although sales to China in
2Q19F would beat our forecast, it is still unclear whether the strong sales to its distributor
in China in 2Q19 were purely from real demand or included some volume for inventory
building. A major impact on the bottomline could come from robust expansion of its
overseas gross margin. We raise our assumptions on its overseas gross margin by
112bp for FY19F and 103bp for FY20-21F, boosting our FY19-21F net profit estimates up
by 4.9%, 4.0% and 3.9%, respectively.
Maintain Add with a higher TP of THB80 We lift our DCF-derived end-2019F target price to THB80 from THB73 following our
earnings upgrade. Our new target price implies a P/E of 38x 2019F and 32x 2020F, vs.
its long-term 5-year average of 33x. We believe the strong 2Q19F earnings, promising
2H19F outlook and the current forward P/E that is still slightly below its historical average
would support its share price to continue outperforming the SET. Potential re-rating
catalysts are 1) sustained sales in China, 2) success of its 180ml Carabao Green Apple,
and 3) higher utilisation rate and efficiency at its factory. Downside risks to our Add call
are more intense competition and a strong rebound in sugar prices.
SOURCES: CGS-CIMB RESEARCH, COMPANY REPORTS
Thailand
ADD (no change)
Consensus ratings*: Buy 3 Hold 5 Sell 4
Current price: THB74.25
Target price: THB80.00
Previous target: THB73.00
Up/downside: 7.7%
CGS-CIMB / Consensus: 24.5%
Reuters: CBG.BK
Bloomberg: CBG TB
Market cap: US$2,403m
THB74,250m
Average daily turnover: US$12.26m
THB383.8m
Current shares o/s: 1,000.0m
Free float: 26.0% *Source: Bloomberg
Key changes in this note
FY19F EPS is increased by 4.9%
FY20F EPS is increased by 4.0%
FY21F EPS is increased by 3.9%
Source: Bloomberg
Price performance 1M 3M 12M Absolute (%) 2.8 21.2 56.3
Relative (%) 2.2 18.1 53.2
Major shareholders % held Sathien Tham Holding 25.0 Miss Nutchamai Thanombooncharoen 21.0 Mr. Yuenyong Opakul 7.1
Insert
Analyst(s)
Chaiyatorn SRICHAROEN, CFA
T (66) 2 761 9239 E [email protected]
Financial Summary Dec-17A Dec-18A Dec-19F Dec-20F Dec-21F
Revenue (THBm) 12,904 14,463 15,426 16,840 18,536
Operating EBITDA (THBm) 1,209 1,780 3,268 3,811 4,374
Net Profit (THBm) 1,246 1,159 2,169 2,561 2,992
Core EPS (THB) 1.25 1.16 2.17 2.56 2.99
Core EPS Growth (16.4%) (7.0%) 87.3% 18.0% 16.8%
FD Core P/E (x) 59.60 64.09 34.23 29.00 24.82
DPS (THB) 1.00 1.05 1.74 2.05 2.39
Dividend Yield 1.35% 1.41% 2.34% 2.76% 3.22%
EV/EBITDA (x) 64.02 44.39 24.08 20.60 17.86
P/FCFE (x) 300.6 114.3 53.3 44.5 35.1
Net Gearing 46.2% 62.5% 51.6% 45.4% 37.8%
P/BV (x) 10.44 10.35 9.06 8.28 7.53
ROE 17.8% 16.2% 28.2% 29.8% 31.8%
% Change In Core EPS Estimates 4.92% 3.97% 3.89%
CIMB/consensus EPS (x) 1.19 1.16 1.19
61
94
128
161
26.0
46.0
66.0
86.0
Price Close Relative to SET (RHS)
10
20
30
Jul-18 Oct-18 Jan-19 Apr-19
Vo
l m
21
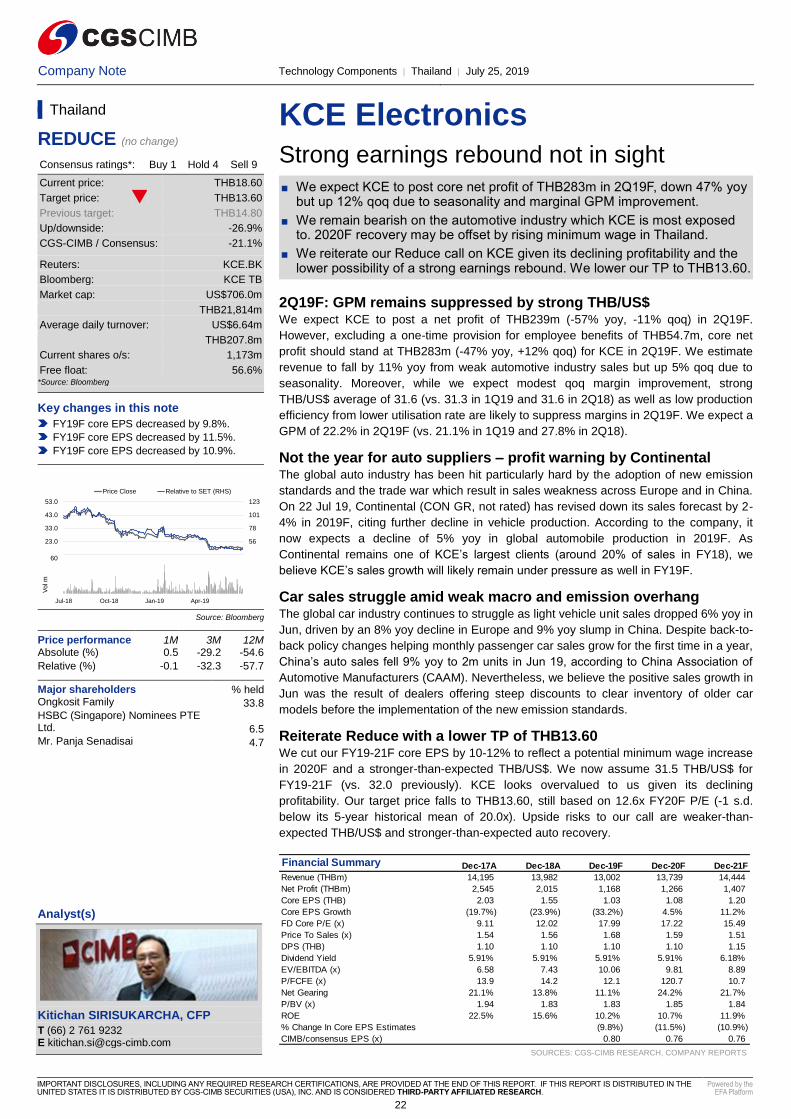
Company Note Technology Components │ Thailand │ July 25, 2019
IMPORTANT DISCLOSURES, INCLUDING ANY REQUIRED RESEARCH CERTIFICATIONS, ARE PROVIDED AT THE END OF THIS REPORT. IF THIS REPORT IS DISTRIBUTED IN THE UNITED STATES IT IS DISTRIBUTED BY CGS-CIMB SECURITIES (USA), INC. AND IS CONSIDERED THIRD-PARTY AFFILIATED RESEARCH.
Powered by the EFA Platform
Insert Insert
KCE Electronics Strong earnings rebound not in sight
■ We expect KCE to post core net profit of THB283m in 2Q19F, down 47% yoy but up 12% qoq due to seasonality and marginal GPM improvement.
■ We remain bearish on the automotive industry which KCE is most exposed to. 2020F recovery may be offset by rising minimum wage in Thailand.
■ We reiterate our Reduce call on KCE given its declining profitability and the lower possibility of a strong earnings rebound. We lower our TP to THB13.60.
2Q19F: GPM remains suppressed by strong THB/US$ We expect KCE to post a net profit of THB239m (-57% yoy, -11% qoq) in 2Q19F.
However, excluding a one-time provision for employee benefits of THB54.7m, core net
profit should stand at THB283m (-47% yoy, +12% qoq) for KCE in 2Q19F. We estimate
revenue to fall by 11% yoy from weak automotive industry sales but up 5% qoq due to
seasonality. Moreover, while we expect modest qoq margin improvement, strong
THB/US$ average of 31.6 (vs. 31.3 in 1Q19 and 31.6 in 2Q18) as well as low production
efficiency from lower utilisation rate are likely to suppress margins in 2Q19F. We expect a
GPM of 22.2% in 2Q19F (vs. 21.1% in 1Q19 and 27.8% in 2Q18).
Not the year for auto suppliers – profit warning by Continental The global auto industry has been hit particularly hard by the adoption of new emission
standards and the trade war which result in sales weakness across Europe and in China.
On 22 Jul 19, Continental (CON GR, not rated) has revised down its sales forecast by 2-
4% in 2019F, citing further decline in vehicle production. According to the company, it
now expects a decline of 5% yoy in global automobile production in 2019F. As
Continental remains one of KCE’s largest clients (around 20% of sales in FY18), we
believe KCE’s sales growth will likely remain under pressure as well in FY19F.
Car sales struggle amid weak macro and emission overhang The global car industry continues to struggle as light vehicle unit sales dropped 6% yoy in
Jun, driven by an 8% yoy decline in Europe and 9% yoy slump in China. Despite back-to-
back policy changes helping monthly passenger car sales grow for the first time in a year,
China’s auto sales fell 9% yoy to 2m units in Jun 19, according to China Association of
Automotive Manufacturers (CAAM). Nevertheless, we believe the positive sales growth in
Jun was the result of dealers offering steep discounts to clear inventory of older car
models before the implementation of the new emission standards.
Reiterate Reduce with a lower TP of THB13.60 We cut our FY19-21F core EPS by 10-12% to reflect a potential minimum wage increase
in 2020F and a stronger-than-expected THB/US$. We now assume 31.5 THB/US$ for
FY19-21F (vs. 32.0 previously). KCE looks overvalued to us given its declining
profitability. Our target price falls to THB13.60, still based on 12.6x FY20F P/E (-1 s.d.
below its 5-year historical mean of 20.0x). Upside risks to our call are weaker-than-
expected THB/US$ and stronger-than-expected auto recovery.
SOURCES: CGS-CIMB RESEARCH, COMPANY REPORTS
Thailand
REDUCE (no change)
Consensus ratings*: Buy 1 Hold 4 Sell 9
Current price: THB18.60
Target price: THB13.60
Previous target: THB14.80
Up/downside: -26.9%
CGS-CIMB / Consensus: -21.1%
Reuters: KCE.BK
Bloomberg: KCE TB
Market cap: US$706.0m
THB21,814m
Average daily turnover: US$6.64m
THB207.8m
Current shares o/s: 1,173m
Free float: 56.6% *Source: Bloomberg
Key changes in this note
FY19F core EPS decreased by 9.8%.
FY19F core EPS decreased by 11.5%.
FY19F core EPS decreased by 10.9%.
Source: Bloomberg
Price performance 1M 3M 12M Absolute (%) 0.5 -29.2 -54.6
Relative (%) -0.1 -32.3 -57.7
Major shareholders % held Ongkosit Family 33.8 HSBC (Singapore) Nominees PTE Ltd. 6.5 Mr. Panja Senadisai 4.7
Insert
Analyst(s)
Kitichan SIRISUKARCHA, CFP
T (66) 2 761 9232 E [email protected]
Financial Summary Dec-17A Dec-18A Dec-19F Dec-20F Dec-21F
Revenue (THBm) 14,195 13,982 13,002 13,739 14,444
Net Profit (THBm) 2,545 2,015 1,168 1,266 1,407
Core EPS (THB) 2.03 1.55 1.03 1.08 1.20
Core EPS Growth (19.7%) (23.9%) (33.2%) 4.5% 11.2%
FD Core P/E (x) 9.11 12.02 17.99 17.22 15.49
Price To Sales (x) 1.54 1.56 1.68 1.59 1.51
DPS (THB) 1.10 1.10 1.10 1.10 1.15
Dividend Yield 5.91% 5.91% 5.91% 5.91% 6.18%
EV/EBITDA (x) 6.58 7.43 10.06 9.81 8.89
P/FCFE (x) 13.9 14.2 12.1 120.7 10.7
Net Gearing 21.1% 13.8% 11.1% 24.2% 21.7%
P/BV (x) 1.94 1.83 1.83 1.85 1.84
ROE 22.5% 15.6% 10.2% 10.7% 11.9%
% Change In Core EPS Estimates (9.8%) (11.5%) (10.9%)
CIMB/consensus EPS (x) 0.80 0.76 0.76
33
56
78
101
123
13.0
23.0
33.0
43.0
53.0
Price Close Relative to SET (RHS)
20
40
60
Jul-18 Oct-18 Jan-19 Apr-19
Vo
l m
22
Asia Pacific Daily | Equity Research | July 26, 2019
7
REGIONAL HEAD
Bertram LAI Regional Head of Research +852 2532 1111
COUNTRY HEADS OF RESEARCH
Ivy NG, CFA Siew Khee. LIM Erwan TEGUH Kasem PRUNRATANAMALA, CFA Raymond CHENG Malaysia Singapore Indonesia Thailand Hong Kong/China +60 (3) 2261-9073 +65 6210-8664 +62 (21) 3006-1720 +66 (2) 657-9221 +852 2539-1324 [email protected] [email protected] [email protected] [email protected] [email protected] Dohoon LEE Pramod AMTHE South Korea India +82 (2) 6730-6121 +91 (22) 4880-5167 [email protected] [email protected]
Yolan SEIMON Anirban LAHIRI
Sri Lanka Vietnam +94 (11) 230-6273 +8428 7300-0688 (ext: 21242) [email protected] [email protected] Coverage via partnership arrangement with John
Keells Stock Brokers
Coverage via partnership arrangement with
VNDirect Securities Corporation
REGIONAL SECTOR HEADS
KJ KWANG Ivy NG, CFA Raymond YAP, CFA Offshore & Marine Plantations Transportation +82 (2) 6730-6123 +60 (3) 2261-9073 +60 (3) 2261-9072 [email protected] [email protected] [email protected]
23
Asia Pacific Daily | Equity Research | July 26, 2019
8
DISCLAIMER The content of this report (including the views and opinions expressed therein, and the information comprised therein) has been prepared by and belongs to CGS-CIMB save that (i) if it is a report written by the analyst(s) of John Keells Stock Brokers (“John Keells”), it belongs to John Keells; (ii) if it is a report written by the analyst(s) of SB Equities Inc (“SBE”), it belongs to SBE; and (iii) if it is a report written by the analyst(s) of Morgans Financial Limited (“Morgans”), it belongs to Morgans. This report is distributed by CGS-CIMB, and in respect of sections of the report relating to (i), (ii) and/or (iii) aforesaid, it is distributed pursuant to an arrangement between CGS-CIMB and John Keells, SBE and Morgans respectively and none of the aforesaid parties is an affiliate of CGS-CIMB.
This report is not directed to, or intended for distribution to or use by, any person or entity who is a citizen or resident of or located in any locality, state, country or other jurisdiction where such distribution, publication, availability or use would be contrary to law or regulation.
By accepting this report, the recipient hereof represents and warrants that he is entitled to receive such report in accordance with the restrictions set forth below and agrees to be bound by the limitations contained herein (including the “Restrictions on Distributions” set out below). Any failure to comply with these limitations may constitute a violation of law. This publication is being supplied to you strictly on the basis that it will remain confidential. No part of this report may be (i) copied, photocopied, duplicated, stored or reproduced in any form by any means or (ii) redistributed or passed on, directly or indirectly, to any other person in whole or in part, for any purpose without the prior written consent of CGS-CIMB.
The information contained in this research report is prepared from data believed to be correct and reliable at the time of issue of this report. CGS-CIMB, John Keells, SBE and/or Morgans, as the case may be, may or may not issue regular reports on the subject matter of this report at any frequency and may cease to do so or change the periodicity of reports at any time. None of CGS-CIMB, John Keells, SBE or Morgans is under any obligation to update this report in the event of a material change to the information contained in this report. None of CGS-CIMB, John Keells, SBE or Morgans has any and none of them will accept any, obligation to (i) check or ensure that the contents of this report remain current, reliable or relevant, (ii) ensure that the content of this report constitutes all the information a prospective investor may require, (iii) ensure the adequacy, accuracy, completeness, reliability or fairness of any views, opinions and information, and accordingly, CGS-CIMB, John Keells, SBE and Morgans and their respective affiliates and related persons including China Galaxy International Financial Holdings Limited (“CGIFHL”) and CIMB Group Sdn. Bhd. (“CIMBG”) and their respective related corporations (and their respective directors, associates, connected persons and/or employees) shall not be liable in any manner whatsoever for any consequences (including but not limited to any direct, indirect or consequential losses, loss of profits and damages) of any reliance thereon or usage thereof. In particular, CGS-CIMB, John Keells, SBE and Morgans disclaim all responsibility and liability for the views and opinions set out in this report.
Unless otherwise specified, this report is based upon reasonable sources. Such sources will, unless otherwise specified, for market data, be market data and prices available from the main stock exchange or market where the relevant security is listed, or, where appropriate, any other market. Information on the accounts and business of company(ies) will generally be based on published statements of the company(ies), information disseminated by regulatory information services, other publicly available information and information resulting from our research.
Whilst every effort is made to ensure that statements of facts made in this report are accurate, all estimates, projections, forecasts, expressions of opinion and other subjective judgments contained in this report are based on assumptions considered to be reasonable as of the date of the document in which they are contained and must not be construed as a representation that the matters referred to therein will occur. Past performance is not a reliable indicator of future performance. The value of investments may go down as well as up and those investing may, depending on the investments in question, lose more than the initial investment. No report shall constitute an offer or an invitation by or on behalf of CGS-CIMB, John Keells, SBE or Morgans or their respective affiliates (including CGIFHL, CIMBG and their respective related corporations) to any person to buy or sell any investments.
CGS-CIMB, John Keells, SBE and/or Morgans and/or their respective affiliates and related corporations (including CGIFHL, CIMBG and their respective related corporations), their directors, associates, connected parties and/or employees may own or have positions in securities of the company(ies) covered in this research report or any securities related thereto and may from time to time add to or dispose of, or may be materially interested in, any such securities. Further, CGS-CIMB, John Keells, SBE and/or Morgans and/or their respective affiliates and related corporations (including CGIFHL, CIMBG and their respective related corporations) do and seek to do business with the company(ies) covered in this research report and may from time to time act as market maker or have assumed an underwriting commitment in securities of such company(ies), may sell them to or buy them from customers on a principal basis and may also perform or seek to perform significant investment banking, advisory, underwriting or placement services for or relating to such company(ies) as well as solicit such investment, advisory or other services from any entity mentioned in this report.
CGS-CIMB, John Keells, SBE and/or Morgans and/or their respective affiliates (including CGIFHL, CIMBG and their respective related corporations) may enter into an agreement with the company(ies) covered in this report relating to the production of research reports. CGS-CIMB, John Keells, SBE and/or Morgans may disclose the contents of this report to the company(ies) covered by it and may have amended the contents of this report following such disclosure.
The analyst responsible for the production of this report hereby certifies that the views expressed herein accurately and exclusively reflect his or her personal views and opinions about any and all of the issuers or securities analysed in this report and were prepared independently and autonomously. No part of the compensation of the analyst(s) was, is, or will be directly or indirectly related to the inclusion of specific recommendations(s) or view(s) in this report. The analyst(s) who prepared this research report are prohibited from receiving any compensation, incentive or bonus based on specific investment banking transactions or for providing a specific recommendation for, or view of, a particular company. Information barriers and other arrangements may be established where necessary to prevent conflicts of interests arising. However, the analyst(s) may receive compensation that is based on his/their coverage of company(ies) in the performance of his/their duties or the performance of his/their recommendations and the research personnel involved in the preparation of this report may also participate in the solicitation of the businesses as described above. In reviewing this research report, an investor should be aware that any or all of the foregoing, among other things, may give rise to real or potential conflicts of interest. Additional information is, subject to the duties of confidentiality, available on request.
The term “John Keells Stock Brokers” shall, unless the context otherwise requires, mean each of John Keells Stock Brokers and its affiliates, subsidiaries and related corporations. The term “SB Equities Inc.” shall, unless the context otherwise requires, mean each of SB Equities Inc. and its
24
Asia Pacific Daily | Equity Research | July 26, 2019
9
affiliates, subsidiaries and related corporations. The term “Morgans Financial Limited” shall, unless the context otherwise requires, mean each of Morgans Financial Limited and its affiliates, subsidiaries and related corporations. The term “CGS-CIMB” shall denote, where appropriate, the relevant entity distributing or disseminating the report in the particular jurisdiction referenced below, or, in every other case except as otherwise stated herein, CGS-CIMB Securities International Pte. Ltd. and its affiliates, subsidiaries and related corporations.
CGS-CIMB Country CGS-CIMB Entity Regulated by Hong Kong CGS-CIMB Securities (Hong Kong) Limited Securities and Futures Commission Hong Kong India CGS-CIMB Securities (India) Private Limited Securities and Exchange Board of India (SEBI) Indonesia PT CGS-CIMB Sekuritas Indonesia Financial Services Authority of Indonesia Malaysia CGS-CIMB Securities Sdn. Bhd. (formerly known as Jupiter
Securities Sdn. Bhd.) Securities Commission Malaysia
Singapore CGS-CIMB Research Pte. Ltd. Monetary Authority of Singapore South Korea CGS-CIMB Securities (Hong Kong) Limited, Korea Branch Financial Services Commission and Financial Supervisory Service Thailand CGS-CIMB Securities (Thailand) Co. Ltd. Securities and Exchange Commission Thailand
Information in this report is a summary derived from individual research reports. As such, readers are directed to the individual research report or note to review the individual Research Analyst’s full analysis of the subject company. Important disclosures relating to the companies that are the subject of research reports published by CGS-CIMB, John Keells, SBE or Morgans, as the case may be, and the proprietary position by each of them and shareholdings of its Research Analysts’ who prepared the report in the securities of the company(s) are available in the individual research report.
This report does not purport to contain all the information that a prospective investor may require. CGS-CIMB, John Keells, SBE and Morgans and their respective affiliates (including CGIFHL, CIMBG and their respective related corporations) do not make any guarantee, representation or warranty, express or implied, as to the adequacy, accuracy, completeness, reliability or fairness of any such information and opinion contained in this report. None of CGS-CIMB, John Keells, SBE, Morgans and their respective affiliates and related persons (including CGIFHL, CIMBG and their respective related corporations) shall be liable in any manner whatsoever for any consequences (including but not limited to any direct, indirect or consequential losses, loss of profits and damages) of any reliance thereon or usage thereof.
This report is general in nature and has been prepared for information purposes only. It is intended for circulation amongst CGS-CIMB’s and its affiliates’ (including CGIFHL’s, CIMBG’s and their respective related corporations’s) clients generally and does not have regard to the specific investment objectives, financial situation and the particular needs of any specific person who may receive this report. The information and opinions in this report are not and should not be construed or considered as an offer, recommendation or solicitation to buy or sell the subject securities, related investments or other financial instruments or any derivative instrument, or any rights pertaining thereto.
Investors are advised to make their own independent evaluation of the information contained in this research report, consider their own individual investment objectives, financial situation and particular needs and consult their own professional and financial advisers as to the legal, business, financial, tax and other aspects before participating in any transaction in respect of the securities of company(ies) covered in this research report.
The securities of such company(ies) may not be eligible for sale in all jurisdictions or to all categories of investors.
Restrictions on Distributions
Australia : The distribution of this report is not an offer to buy or sell to any person within or outside Australia or a solicitation to any person within or outside of Australia to buy or sell any instrument described herein. This report is being issued outside Australia to a limited number of institutional investors and may not be provided to any person other than the original recipient and may not be reproduced or used for any other purposes.
Canada: This research report has not been prepared in accordance with the disclosure requirements of Dealer Member Rule 3400 – Research Restrictions and Disclosure Requirements of the Investment Industry Regulatory Organization of Canada. For any research report distributed by CIBC, further disclosures related to CIBC conflicts of interest can be found at https://researchcentral.cibcwm.com .
China: For the purpose of this report, the People’s Republic of China (“PRC”) does not include the Hong Kong Special Administrative Region, the Macau Special Administrative Region or Taiwan. The distributor of this report has not been approved or licensed by the China Securities Regulatory Commission or any other relevant regulatory authority or governmental agency in the PRC. This report contains only marketing information. The distribution of this report is not an offer to buy or sell to any person within or outside PRC or a solicitation to any person within or outside of PRC to buy or sell any instruments described herein. This report is being issued outside the PRC to a limited number of institutional investors and may not be provided to any person other than the original recipient and may not be reproduced or used for any other purpose.
France: Only qualified investors within the meaning of French law shall have access to this report. This report shall not be considered as an offer to subscribe to, or used in connection with, any offer for subscription or sale or marketing or direct or indirect distribution of financial instruments and it is not intended as a solicitation for the purchase of any financial instrument.
Germany: This report is only directed at persons who are professional investors as defined in sec 31a(2) of the German Securities Trading Act (WpHG). This publication constitutes research of a non-binding nature on the market situation and the investment instruments cited here at the time of the publication of the information.
The current prices/yields in this issue are based upon closing prices from Bloomberg as of the day preceding publication. Please note that neither the German Federal Financial Supervisory Agency (BaFin), nor any other supervisory authority exercises any control over the content of this report.
Hong Kong: This report is issued by CGS-CIMB, John Keells, SBE or Morgans, as the case may be, and distributed in Hong Kong by CGS-CIMB Securities (Hong Kong) Limited (“CHK”) which is licensed in Hong Kong by the Securities and Futures Commission for Type 1 (dealing in securities), Type 4 (advising on securities) and Type 6 (advising on corporate finance) activities. Any investors wishing to purchase or otherwise deal in the securities covered in this report should contact the Head of Sales at CGS-CIMB Securities (Hong Kong) Limited. The views and opinions in this research report are of CGS-CIMB, John Keells, SBE or Morgans, as the case may be, as of the date hereof and are subject to change. If the Financial Services and Markets Act of the United Kingdom or the rules of the Financial Conduct Authority apply to a recipient, our obligations owed to such recipient therein are unaffected. CHK has no obligation to update the opinion or the information in this research report .
25
Asia Pacific Daily | Equity Research | July 26, 2019
10
This publication is strictly confidential and is for private circulation only to clients of CHK.
India: This report is issued by CGS-CIMB, John Keells, SBE or Morgans, as the case may be, and distributed in India by CGS-CIMB Securities (India) Private Limited (“CGS-CIMB India”). CGS-CIMB India is a subsidiary of CGS-CIMB Securities International Pte. Ltd. which in turn is a 50:50 joint venture company of CGIFHL and CIMBG. The details of the members of the group of companies of CGS-CIMB can be found at www.cgs-cimb.com, CGIFHL at www.chinastock.com.hk/en/ACG/ContactUs/index.aspx and CIMBG at www.cimb.com/en/who-we-are.html. CGS-CIMB India is registered with the National Stock Exchange of India Limited and BSE Limited as a trading and clearing member (Merchant Banking Number: INM000012037) under the Securities and Exchange Board of India (Stock Brokers and Sub-Brokers) Regulations, 1992. In accordance with the provisions of Regulation 4(g) of the Securities and Exchange Board of India (Investment Advisers) Regulat ions, 2013, CGS-CIMB India is not required to seek registration with the Securities and Exchange Board of India (“SEBI”) as an Investment Adviser. CGS-CIMB India is registered with SEBI (SEBI Registration Number: INZ000157134) as a Research Analyst (INH000000669) pursuant to the SEBI (Research Analysts) Regulations, 2014 ("Regulations").
This report does not take into account the particular investment objectives, financial situations, or needs of the recipients. It is not intended for and does not deal with prohibitions on investment due to law/jurisdiction issues etc. which may exist for certain persons/entities. Recipients should rely on their own investigations and take their own professional advice before investment.
The report is not a “prospectus” as defined under Indian Law, including the Companies Act, 2013, and is not, and shall not be, approved by, or filed or registered with, any Indian regulator, including any Registrar of Companies in India, SEBI, any Indian stock exchange, or the Reserve Bank of India. No offer, or invitation to offer, or solicitation of subscription with respect to any such securities listed or proposed to be listed in India is being made, or intended to be made, to the public, or to any member or section of the public in India, through or pursuant to this report.
The research analysts, strategists or economists principally responsible for the preparation of this research report are segregated from the other activities of CGS-CIMB India and they have received compensation based upon various factors, including quality, accuracy and value of research, firm profitability or revenues, client feedback and competitive factors. Research analysts', strategists' or economists' compensation is not linked to investment banking or capital markets transactions performed or proposed to be performed by CGS-CIMB India or its affiliates.
CGS-CIMB India does not have actual / beneficial ownership of 1% or more securities of the subject company in this research report, at the end of the month immediately preceding the date of publication of this research report. However, since affi liates of CGS-CIMB India are engaged in the financial services business, they might have in their normal course of business financial interests or actual / beneficial ownership of one per cent or more in various companies including the subject company in this research report.
CGS-CIMB India or its associates, may: (a) from time to time, have long or short position in, and buy or sell the securities of the subject company in this research report; or (b) be engaged in any other transaction involving such securities and earn brokerage or other compensation or act as a market maker in the financial instruments of the subject company in this research report or act as an advisor or lender/borrower to such company or may have any other potential conflict of interests with respect to any recommendation and other related information and opinions.
CGS-CIMB India, its associates and the analyst engaged in preparation of this research report have not received any compensation for investment banking, merchant banking or brokerage services from the subject company mentioned in the research report in the past 12 months.
CGS-CIMB India, its associates and the analyst engaged in preparation of this research report have not managed or co-managed public offering of securities for the subject company mentioned in the research report in the past 12 months. The analyst from CGS-CIMB India engaged in preparation of this research report or his/her relative (a) do not have any financial interests in the subject company mentioned in this research report; (b) do not own 1% or more of the equity securities of the subject company mentioned in the research report as of the last day of the month preceding the publication of the research report; (c) do not have any material conflict of interest at the time of publication of the research report
Indonesia: This report is issued by CGS-CIMB, John Keells, SBE or Morgans, as the case may be, and distributed by PT CGS-CIMB Sekuritas Indonesia (“CGS-CIMB Indonesia”). The views and opinions in this research report are those of the issuer of the report, as of the date hereof and are subject to change. CGS-CIMB Indonesia has no obligation to update the opinion or the information in this research report. This report is for private circulation only to clients of CGS-CIMB Indonesia. Neither this report nor any copy hereof may be distributed in Indonesia or to any Indonesian citizens wherever they are domiciled or to Indonesian residents except in compliance with applicable Indonesian capital market laws and regulations.
This research report is not an offer of securities in Indonesia. The securities referred to in this research report have not been registered with the Financial Services Authority (Otoritas Jasa Keuangan) pursuant to relevant capital market laws and regulations, and may not be offered or sold within the territory of the Republic of Indonesia or to Indonesian citizens through a public offering or in circumstances which constitute an offer within the meaning of the Indonesian capital market law and regulations.
Ireland: CGS-CIMB is not an investment firm authorised in the Republic of Ireland and no part of this document should be construed as CGS-CIMB acting as, or otherwise claiming or representing to be, an investment firm authorised in the Republic of Ireland.
Malaysia: This report is issued by CGS-CIMB, John Keells, SBE or Morgans, as the case may be, and distributed in Malaysia by CGS-CIMB Securities Sdn. Bhd. (formerly known as Jupiter Securities Sdn. Bhd.) (“CGS-CIMB Malaysia”) solely for the benefit of and for the exclusive use of our clients. Recipients of this report are to contact CGS-CIMB Malaysia, at 29th Floor Menara CIMB No. 1 Jalan Stesen Sentral 2, Kuala Lumpur Sentral 50470 Kuala Lumpur, Malaysia, in respect of any matters arising from or in connection with this report. CGS-CIMB Malaysia has no obligation to update, revise or reaffirm the opinion or the information in this research reports after the date of this report.
New Zealand: In New Zealand, this report is for distribution only to persons who are wholesale clients pursuant to section 5C of the Financial Advisers Act 2008.
Singapore: This report is issued by CGS-CIMB, John Keells, SBE or Morgans, as the case may be, and distributed by CGS-CIMB Research Pte Ltd (“CGS-CIMBR”). CGS-CIMBR is a financial adviser licensed under the Financial Advisers Act, Cap 110 (“FAA”) for advising on investment products, by issuing or promulgating research analyses or research reports, whether in electronic, print or other form. Accordingly CGS-CIMBR is a subject to the applicable rules under the FAA unless it is able to avail itself to any prescribed exemptions.
Recipients of this report are to contact CGS-CIMB Research Pte Ltd, 50 Raffles Place, #16-02 Singapore Land Tower, Singapore in respect of any matters arising from, or in connection with this report. CGS-CIMBR has no obligation to update the opinion or the information in this research report. This publication is strictly confidential and is for private circulation only. If you have not been sent this report by CGS-CIMBR directly, you may not
26
Asia Pacific Daily | Equity Research | July 26, 2019
11
rely, use or disclose to anyone else this report or its contents.
If the recipient of this research report is not an accredited investor, expert investor or institutional investor, CGS-CIMBR accepts legal responsibility for the contents of the report without any disclaimer limiting or otherwise curtailing such legal responsibility. If the recipient is an accredited investor, expert investor or institutional investor, the recipient is deemed to acknowledge that CGS-CIMBR is exempt from certain requirements under the FAA and its attendant regulations, and as such, is exempt from complying with the following :
(a) Section 25 of the FAA (obligation to disclose product information);
(b) Section 27 (duty not to make recommendation with respect to any investment product without having a reasonable basis where you may be reasonably expected to rely on the recommendation) of the FAA;
(c) MAS Notice on Information to Clients and Product Information Disclosure [Notice No. FAA-N03];
(d) MAS Notice on Recommendation on Investment Products [Notice No. FAA-N16];
(e) Section 36 (obligation on disclosure of interest in specified products), and
(f) any other laws, regulations, notices, directive, guidelines, circulars and practice notes which are relates to the above, to the extent permitted by applicable laws, as may be amended from time to time, and any other laws, regulations, notices, directive, guidelines, circulars, and practice notes as we may notify you from time to time. In addition, the recipient who is an accredited investor, expert investor or institutional investor acknowledges that as CGS-CIMBR is exempt from Section 27 of the FAA, the recipient will also not be able to file a civil claim against CGS-CIMBR for any loss or damage arising from the recipient’s reliance on any recommendation made by CGS-CIMBR which would otherwise be a right that is available to the recipient under Section 27 of the FAA, the recipient will also not be able to file a civil claim against CGS-CIMBR for any loss or damage arising from the recipient’s reliance on any recommendation made by CGS-CIMBR which would otherwise be a right that is available to the recipient under Section 27 of the FAA.
CGS-CIMBR, its affiliates and related corporations, their directors, associates, connected parties and/or employees may own or have positions in specified products of the company(ies) covered in this research report or any specified products related thereto and may from time to time add to or dispose of, or may be materially interested in, any such specified products. Further, CGS-CIMBR, its affiliates and its related corporations do and seek to do business with the company(ies) covered in this research report and may from time to time act as market maker or have assumed an underwriting commitment in specified products of such company(ies), may sell them to or buy them from customers on a principal basis and may also perform or seek to perform significant investment banking, advisory, underwriting or placement services for or relating to such company(ies) as well as solicit such investment, advisory or other services from any entity mentioned in this report..
South Korea: This report is issued by CGS-CIMB, John Keells, SBE or Morgans, as the case may be, and distributed in South Korea by CGS-CIMB Securities (Hong Kong) Limited, Korea Branch (“CGS-CIMB Korea”) which is licensed as a cash equity broker, and regulated by the Financial Services Commission and Financial Supervisory Service of Korea. In South Korea, this report is for distribution only to professional investors under Article 9(5) of the Financial Investment Services and Capital Market Act of Korea (“FSCMA”).
Spain: This document is a research report and it is addressed to institutional investors only. The research report is of a general nature and not personalised and does not constitute investment advice so, as the case may be, the recipient must seek proper advice before adopting any investment decision. This document does not constitute a public offering of securities.
CGS-CIMB is not registered with the Spanish Comision Nacional del Mercado de Valores to provide investment services.
Sweden: This report contains only marketing information and has not been approved by the Swedish Financial Supervisory Authority. The distribution of this report is not an offer to sell to any person in Sweden or a solicitation to any person in Sweden to buy any instruments described herein and may not be forwarded to the public in Sweden.
Switzerland: This report has not been prepared in accordance with the recognized self-regulatory minimal standards for research reports of banks issued by the Swiss Bankers’ Association (Directives on the Independence of Financial Research).
Thailand: This report is issued by CGS-CIMB, John Keells, SBE or Morgans, as the case may be, and distributed by CGS-CIMB Securities (Thailand) Co., Ltd. (“CGS-CIMB Thailand”) based upon sources believed to be reliable (but their accuracy, completeness or correctness is not guaranteed). The statements or expressions of opinion herein were arrived at after due and careful consideration for use as information for investment. Such opinions are subject to change without notice and CGS-CIMB Thailand has no obligation to update the opinion or the information in this research report.
CGS-CIMB Thailand may act or acts as Market Maker, and issuer and offerer of Derivative Warrants and Structured Note which may have the following securities as its underlying securities. Investors should carefully read and study the details of the derivative warrants in the prospectus before making investment decisions.
AAV, ADVANC, AMATA, AOT, AP, BANPU, BBL, BCH, BCP, BCPG, BDMS, BEAUTY, BEM, BGRIM, BJC, BH, BLA, BLAND, BPP, BTS, CBG, CENTEL, CHG, CK, CKP, COM7, CPALL, CPF, CPN, DELTA, DTAC, EA, EGCO, EPG, ERW, ESSO, GGC, GFPT, GLOBAL, GLOW, GPSC, GUNKUL, HANA, HMPRO, INTUCH, IRPC, ITD, IVL, KBANK, KCE, KKP, KTB, KTC, LH, LPN, MAJOR, MEGA, MINT, MTLS, ORI, PRM, PSH, PSL, PTG, PTT, PTTEP, PTTGC, QH, RATCH, ROBINS, RS, SAWAD, SCB, SCC, SGP, SIRI, SPALI, SPRC, STA, STEC, SUPER, TASCO, TCAP, THAI, THANI, TISCO, TKN, TMB, TOA, TOP, TPIPL, TPIPP, TRUE, TTW, TU, TVO, UV, WHA, WHAUP, WORK.
Corporate Governance Report:
The disclosure of the survey result of the Thai Institute of Directors Association (“IOD”) regarding corporate governance is made pursuant to the policy of the Office of the Securities and Exchange Commission. The survey of the IOD is based on the information of a company listed on the Stock Exchange of Thailand and the Market for Alternative Investment disclosed to the public and able to be accessed by a general public investor. The result, therefore, is from the perspective of a third party. It is not an evaluation of operation and is not based on inside information.
The survey result is as of the date appearing in the Corporate Governance Report of Thai Listed Companies. As a result, the survey result may be changed after that date. CGS-CIMB Thailand does not confirm nor certify the accuracy of such survey result.
Score Range: 90 - 100 80 - 89 70 - 79 Below 70 or No Survey Result
Description: Excellent Very Good Good N/A
27
Asia Pacific Daily | Equity Research | July 26, 2019
12
United Arab Emirates: The distributor of this report has not been approved or licensed by the UAE Central Bank or any other relevant licensing authorities or governmental agencies in the United Arab Emirates. This report is strictly private and confidential and has not been reviewed by, deposited or registered with UAE Central Bank or any other licensing authority or governmental agencies in the United Arab Emirates. This report is being issued outside the United Arab Emirates to a limited number of institutional investors and must not be provided to any person other than the original recipient and may not be reproduced or used for any other purpose. Further, the information contained in this report is not intended to lead to the sale of investments under any subscription agreement or the conclusion of any other contract of whatsoever nature within the territory of the United Arab Emirates.
United Kingdom and European Economic Area (EEA): In the United Kingdom and European Economic Area, this material is issued by CGS-CIMB, John Keells, SBE or Morgans, as the case may be, and is being distributed by CGS-CIMB Securities (UK) Limited (“CGS-CIMB UK”). CGS-CIMB UK is authorized and regulated by the Financial Conduct Authority and its registered office is at 27 Knightsbridge, London, SW1X7YB. The material distributed by CGS-CIMB UK has been prepared in accordance with CGS-CIMB Group’s policies for managing conflicts of interest arising as a result of publication and distribution of this material. This material is for distribution only to, and is solely directed at, selected persons on the basis that those persons: (a) are eligible counterparties and professional clients of CGS-CIMB UK; (b) have professional experience in matters relating to investments falling within Article 19(5) of the Financial Services and Markets Act 2000 (Financial Promotion) Order 2005 (as amended, the “Order”), (c) fall within Article 49(2)(a) to (d) (“high net worth companies, unincorporated associations etc”) of the Order; (d) are outside the United Kingdom subject to relevant regulation in each jurisdiction, material(all such persons together being referred to as “relevant persons”). This material is directed only at relevant persons and must not be acted on or relied on by persons who are not relevant persons. Any investment or investment activity to which this material relates is available only to relevant persons and will be engaged in only with relevant persons.
Where this material is labelled as non-independent, it does not provide an impartial or objective assessment of the subject matter and does not constitute independent “research” under the applicable rules of the Financial Conduct Authority in the UK. Consequently, any such non-independent material will not have been prepared in accordance with legal requirements designed to promote the independence of research and will not subject to any prohibition on dealing ahead of the dissemination of research. Any such non-independent material must be considered as a marketing communication.
United States: This research report is issued by CGS-CIMB, John Keells, SBE or Morgans, as the case may be, and distributed in the United States of America by CGS-CIMB Securities (USA) Inc, a U.S. registered broker-dealer and a related corporation of CGS-CIMB Securities Sdn. Bhd. (formerly known as Jupiter Securities Sdn. Bhd.), CGS-CIMB Research Pte Ltd, PT CGS-CIMB Sekuritas Indonesia, CGS-CIMB Securities (Thailand) Co. Ltd., CGS-CIMB Securities (Hong Kong) Limited and CGS-CIMB Securities (India) Private Limited, and is distributed solely to persons who qualify as “U.S. Institutional Investors” as defined in Rule 15a-6 under the Securities and Exchange Act of 1934. This communication is only for Institutional Investors whose ordinary business activities involve investing in shares, bonds, and associated securities and/or derivative securities and who have professional experience in such investments. Any person who is not a U.S. Institutional Investor or Major Institutional Investor must not rely on this communication. The delivery of this research report to any person in the United States of America is not a recommendation to effect any transactions in the securities discussed herein, or an endorsement of any opinion expressed herein. CGS-CIMB Securities (USA) Inc, is a FINRA/SIPC member and takes responsibility for the content of this report. For further information or to place an order in any of the above-mentioned securities please contact a registered representative of CGS-CIMB Securities (USA) Inc.
Other jurisdictions: In any other jurisdictions, except if otherwise restricted by laws or regulations, this report is only for distribution to professional, institutional or sophisticated investors as defined in the laws and regulations of such jurisdictions.
Corporate Governance Report of Thai Listed Companies (CGR). CG Rating by the Thai Institute of Directors Association (Thai IOD) in 2018, Anti-Corruption 2018
ADVANC – Excellent, Certified, AEONTS – Good, n/a, AH – Very Good, n/a, AMATA – Excellent, Declared, ANAN – Excellent, Declared, AOT – Excellent, Declared, AP – Excellent, Certified, ASP – Very Good, Certified, BANPU – Excellent, Certified, BAY – Excellent, Certified, BBL – Very Good, Certified, BCH – Good, Certified, BCP - Excellent, Certified, BCPG – Excellent, Certified, BEM – Very Good, n/a, BDMS – Very Good, n/a, BEAUTY – Good, n/a, BEC – Very Good, n/a, , BGRIM – Very Good, Declared, BH - Good, n/a, BJC – Very Good, Declared, BJCHI – Very Good, Certified, BLA – Very Good, Certified, BPP – Very Good, Declared, BR - Good, Declared, BTS - Excellent, Certified, CBG – Very Good, n/a, CCET – Good, n/a, CENTEL – Very Good, Certified, CHG – Very Good, Declared, CK – Excellent, n/a, COL – Excellent, Declared, CPALL – Very Good, Certified, CPF – Excellent, Certified, CPN - Excellent, Certified, DELTA - Excellent, n/a, DEMCO – Excellent, Certified, DDD – Very Good, Declared, DIF – not available, n/a, DREIT – not available, n/a, DTAC – Excellent, Certified, EA – Excellent, n/a, ECL – Very Good, Certified, EGCO - Excellent, Certified, EPG – Very Good, n/a, ERW – Very Good, n/a, GFPT - Excellent, Certified, GGC – Excellent, Certified, GLOBAL – Very Good, n/a, GLOW – Very Good, Certified, GPSC – Excellent, Certified, GULF – Very Good, n/a, GUNKUL – Excellent, Certified, HANA - Excellent, Certified, HMPRO - Excellent, Certified, HREIT - Excellent, Certified ICHI – Excellent, Declared, HUMAN – not available, n/a, III – Good, n/a, INTUCH - Excellent, Certified, IRPC – Excellent, Certified, ITD* – Very Good, n/a, IVL - Excellent, Certified, JASIF – not available, n/a, JWD – Very Good, n/a, KBANK - Excellent, Certified, KCE - Excellent, Certified, KKP – Excellent, Certified, KSL – Excellent, Certified, KTB - Excellent, Certified, KTC – Excellent, Certified, LH - Very Good, n/a, LPN – Excellent, Certified, M – Very Good, Certified, MACO – Very Good, n/a, MAJOR – Very Good, n/a, MAKRO – Excellent, Declared, MALEE – Very Good, Certified, MC – Very Good, Certified, MCOT – Excellent, Certified, MEGA – Very Good, n/a, MINT - Excellent, Certified, MTC – Excellent, Declared, NETBAY – Good, n/a, OSP – not available, n/a,PLANB – Excellent, Declared, PLAT – Very Good, Certified, PR9 – not available, n/a, PSH – Excellent, Certified, PSTC – Good, Certified, PTT - Excellent, Certified, PTTEP - Excellent, Certified, PTTGC - Excellent, Certified, QH – Excellent, Certified, RATCH – Excellent, Certified, ROBINS – Excellent, Certified, RS – Very Good, n/a, RSP – not available, n/a, S – Very Good, n/a, SAMART - Excellent, n/a, SAPPE – Very Good, Declared, SAT – Excellent, Certified, SAWAD – Very Good, n/a, SC – Excellent, Declared, SCB - Excellent, Certified, SCC – Excellent, Certified, SCN – Very Good, Certified, SF – Good, n/a, SIRI – Very Good, Certified, SPA - Good, n/a, SPALI - Excellent, n/a, SPRC – Excellent, Certified, STA – Very Good, Certified, STEC – Excellent, n/a, SVI – Excellent, Certified, SYNEX – Very Good, Declared, TASCO – Excellent, Certified, TCAP – Excellent, Certified, THANI – Excellent, Certified, TIPCO – Very Good, Certified, TISCO - Excellent, Certified, TKN – Very Good, Declared, TMB - Excellent, Certified, TNR – Very Good, Declared, TOP - Excellent, Certified, TPCH – Good, n/a, TPIPP – Good, n/a, TRUE – Excellent, Certified, TU – Excellent, Certified, TVO – Very Good, Declared, UNIQ – Good, n/a, VGI – Excellent, Certified, WHA – Excellent, Certified, WHART – not available, n/a, WICE – Very Good, Certified, WORK –
28
Asia Pacific Daily | Equity Research | July 26, 2019
13
Good, n/a. Companies participating in Thailand’s Private Sector Collective Action Coalition Against Corruption programme (Thai CAC) under Thai Institute of Directors (as of August 31, 2018) are categorized into:
- Companies that have declared their intention to join CAC, and
- Companies certified by CAC
* The company, its director or management had been reportedly accused for breaching proper corporate governance such as violation of the SEC’s regulations or charged with corruption.
Recommendation Framework
Stock Ratings Definition:
Add The stock’s total return is expected to exceed 10% over the next 12 months.
Hold The stock’s total return is expected to be between 0% and positive 10% over the next 12 months.
Reduce The stock’s total return is expected to fall below 0% or more over the next 12 months.
The total expected return of a stock is defined as the sum of the: (i) percentage difference between the target price and the current price and (ii) the forward net dividend yields of the stock. Stock price targets have an investment horizon of 12 months.
Sector Ratings Definition:
Overweight An Overweight rating means stocks in the sector have, on a market cap-weighted basis, a positive absolute recommendation.
Neutral A Neutral rating means stocks in the sector have, on a market cap-weighted basis, a neutral absolute recommendation.
Underweight An Underweight rating means stocks in the sector have, on a market cap-weighted basis, a negative absolute recommendation.
Country Ratings Definition:
Overweight An Overweight rating means investors should be positioned with an above-market weight in this country relative to benchmark.
Neutral A Neutral rating means investors should be positioned with a neutral weight in this country relative to benchmark.
Underweight An Underweight rating means investors should be positioned with a below-market weight in this country relative to benchmark.
WJV#05b
29