Corihuarmi Gold Project National Instrument 43-101 Technical ...
128
Corihuarmi Gold Project National Instrument 43-101 Technical Report Prepared by Coffey Mining Pty Ltd on behalf of: Minera IRL Limited Effective Date: 6th April 2010 Qualified Person : Beau Nicholls - BSc (Geol), MAIG Doug Corley - BSc (Hons) Geology MAIG Alex Virisheff - BSc (Hons) (Geo) MAusIMM Jean-Francois St-Onge, eng. - B.Sc.A.(Mining), MAuslMM Barry Cloutt - BAppSc (Eng Met), MAusIMM MINEWPER00466AE
-
Upload
khangminh22 -
Category
Documents
-
view
0 -
download
0
Transcript of Corihuarmi Gold Project National Instrument 43-101 Technical ...

Corihuarmi Gold Project
National Instrument 43-101 Technical Report
Prepared by Coffey Mining Pty Ltd on behalf of:
Minera IRL Limited
Effective Date: 6th April 2010
Qualified Person: Beau Nicholls - BSc (Geol), MAIG Doug Corley - BSc (Hons) Geology MAIG Alex Virisheff - BSc (Hons) (Geo) MAusIMM Jean-Francois St-Onge, eng. - B.Sc.A.(Mining), MAuslMM Barry Cloutt - BAppSc (Eng Met), MAusIMM
MINEWPER00466AE

Coffey Mining Pty Ltd
DOCUMENT INFORMATION
Corihuarmi Gold Project – MINEWPER00466AE 43-101 Technical Report – 6th April 2010
Author(s): Beau Nicholls Geology Manager – Brazil BSc (Geo) MAIG
Doug Corley Associate Resource Geologist BSc (Hons) Geology MAIG
Jean-Francois St-Onge, eng. Specialist Mining Engineer B.Sc.A. (Mining), MAusIMM
Barry Cloutt Chief Metallurgist BAppSc (Eng Met), MAusIMM
Alex Virisheff Principal Consultant, Resources BSc (Hons) (Geo) MAusIMM
Date: 6th April 2010
Project Number: MINEWPER00466AE
Version / Status: final
Path & File Name: F:\MINE\Projects\Minera IRL\MINEWPER00466AE_Minera IRL_43-101 Update\Report\CMWPr_MineraIRL_43-101_Corihuarmi_TechRpt_6April2010_SEDAR.docx
Print Date: Wednesday, 28 April 2010
Copies: Minera IRL Limited (2)
Coffey Mining – Perth (1)
Document Change Control
Version Description (section(s) amended) Author(s) Date
Document Review and Sign Off
[signed] [signed] Primary Author Beau Nicholls
Supervising Principal Harry Warries

Coffey Mining Pty Ltd
Corihuarmi Gold Project – MINEWPER00466AE 43-101 Technical Report – 6th April 2010
Table of Contents
1 Summary .......................................................................................................................................1
1.1 Introduction ........................................................................................................................1
1.2 Location .............................................................................................................................1
1.3 Tenure ...............................................................................................................................1
1.4 Geology and Mineralization ...............................................................................................1
1.5 Resources and Reserves ..................................................................................................2
1.6 Other Relevant Data and Information................................................................................3
1.6.1 Geotechnical and hydrogeological studies .............................................................. 3
1.6.2 Life of Mine Plan ...................................................................................................... 4
1.6.3 Mining Capital Costs ............................................................................................... 4
1.6.4 Mining Operating Costs ........................................................................................... 5
1.6.5 Economical Considerations ..................................................................................... 5
1.6.6 Tax and Royalties .................................................................................................... 5
1.6.7 Cash Flow and Sensitivity ....................................................................................... 5
1.7 Recommendations.............................................................................................................5
1.7.1 Exploration .............................................................................................................. 5
1.7.2 Resource ................................................................................................................. 6
1.8 Authors ..............................................................................................................................6
2 Introduction ..................................................................................................................................7
2.1 Scope of Work ...................................................................................................................7
2.2 Qualifications and Experience ...........................................................................................7
2.3 Independence ....................................................................................................................8
2.4 Principal Sources of Information .......................................................................................8
2.5 Abbreviations .....................................................................................................................9
3 Reliance on Other Experts ....................................................................................................... 10
4 Property Description and Location ......................................................................................... 11
4.1 Project Location .............................................................................................................. 11
4.2 Tenement Status ............................................................................................................ 12
4.3 Permits ........................................................................................................................... 14
4.4 Royalties and Agreements ............................................................................................. 14
4.5 Environmental Liabilities ................................................................................................. 14
5 Accessibility, Climate, Local Resources, Infrastructure and Physiography ...................... 17
5.1 Project Access ................................................................................................................ 17
5.2 Physiography and Climate ............................................................................................. 17
5.3 Local Infrastructure and Services ................................................................................... 17
6 History ........................................................................................................................................ 18
6.1 Exploration History ......................................................................................................... 18
6.2 Mining History ................................................................................................................. 18
7 Geological Setting ..................................................................................................................... 19

Coffey Mining Pty Ltd
Corihuarmi Gold Project – MINEWPER00466AE 43-101 Technical Report – 6th April 2010
7.1 Regional Setting ............................................................................................................. 19
7.2 Project Geology .............................................................................................................. 20
8 Deposit Types ............................................................................................................................ 21
9 Mineralization ............................................................................................................................ 22
10 Exploration ................................................................................................................................. 27
11 Drilling ........................................................................................................................................ 28
11.1 Introduction ..................................................................................................................... 28
11.2 Drilling Procedures ......................................................................................................... 28
11.2.1 Diamond Drilling Procedures ................................................................................. 28
11.2.2 Reverse Circulation Drilling Procedures ................................................................ 28
11.2.3 Blasthole Drilling .................................................................................................... 28
11.3 Drilling Orientation .......................................................................................................... 29
11.4 Surveying Procedures .................................................................................................... 29
11.4.1 Accuracy of Drillhole Collar Locations ................................................................... 29
11.4.2 Downhole Surveying Procedures .......................................................................... 29
12 Sampling Method and Approach ............................................................................................. 30
12.1 Diamond Core Sampling ................................................................................................ 30
12.2 Reverse Circulation Sampling ........................................................................................ 30
12.3 Blast Hole Sampling ....................................................................................................... 30
12.4 Surface Trench Sampling ............................................................................................... 31
12.5 Logging ........................................................................................................................... 31
13 Sample Preparation, Analyses and Security .......................................................................... 32
13.1 Sample Security ............................................................................................................. 32
13.2 Sample Preparation and Analysis .................................................................................. 32
13.2.1 CIMM Laboratory ................................................................................................... 32
13.2.2 Corihuarmi Mine Assay Laboratory ....................................................................... 32
13.3 Adequacy of Procedures ................................................................................................ 32
14 Data Verification ........................................................................................................................ 33
14.1 AMEC Review 2006 ....................................................................................................... 33
14.2 Standards and Duplicates Review ................................................................................. 33
14.2.1 MIRL Standards .................................................................................................... 33
14.2.2 MIRL Duplicate Analysis ....................................................................................... 34
14.3 Verification Sampling ...................................................................................................... 39
14.4 Adequacy of Procedures ................................................................................................ 39
15 Adjacent Properties .................................................................................................................. 40
16 Mineral Processing and Metallurgical Testing ....................................................................... 41
16.1 Mill Operations ................................................................................................................ 41
16.1.1 Introduction ............................................................................................................ 41
16.1.2 Process Description and Flowsheet ...................................................................... 41
16.1.3 Plant Production .................................................................................................... 44
16.2 Testwork ......................................................................................................................... 53

Coffey Mining Pty Ltd
Corihuarmi Gold Project – MINEWPER00466AE 43-101 Technical Report – 6th April 2010
17 Mineral Resource and Mineral Reserve Estimates ................................................................ 58
17.1 Introduction ..................................................................................................................... 58
17.2 MZT Resource Estimates ............................................................................................... 58
17.2.1 Data ....................................................................................................................... 59
17.2.2 Geological Model ................................................................................................... 60
17.2.3 Compositing, Basic Statistics and High Grade Cuts ............................................. 60
17.2.4 Variography ........................................................................................................... 62
17.2.5 Block Model Development and Estimation ............................................................ 65
17.2.6 Model Validation .................................................................................................... 67
17.2.7 Resource Classification ......................................................................................... 67
17.3 Review and Validation of the MZT Resource Estimates ................................................ 69
17.3.1 Data ....................................................................................................................... 69
17.3.2 Geological Model ................................................................................................... 69
17.3.3 Compositing, Basic Statistics and High Grade Cuts ............................................. 69
17.3.4 Variography ........................................................................................................... 74
17.3.5 Block Model Development and Estimation ............................................................ 74
17.3.6 Model Validation by Coffey Mining ........................................................................ 75
17.3.7 Reconciliation of Resource Model against Actual Mining Data ............................. 79
17.3.8 Resource Classification ......................................................................................... 85
17.4 Scree Resource Estimate ............................................................................................... 88
17.4.1 Database Validation .............................................................................................. 88
17.4.2 Geological Interpretation and Modelling ................................................................ 88
17.4.4 Compositing, Statistical Analysis and High Grade Cuts ........................................ 90
17.4.5 Variography ........................................................................................................... 94
17.4.6 Block Modelling ..................................................................................................... 98
17.4.7 Grade Estimation ................................................................................................... 99
17.4.8 Resource Classification ....................................................................................... 101
17.5 Reported Resource for Corihuarmi Au Project ............................................................. 101
17.6 Reported Reserve for Corihuarmi Au Deposits ............................................................ 104
18 Other Relevant Data and Information .................................................................................... 105
18.1 Geotechnical Input and Conditions .............................................................................. 105
18.2 Hydrogeology Input ...................................................................................................... 106
18.3 Mine Design .................................................................................................................. 106
18.4 Mining Schedule ........................................................................................................... 106
18.5 Drill and Blast ............................................................................................................... 107
18.6 Grade Control ............................................................................................................... 107
18.7 Load and Haul .............................................................................................................. 107
18.8 Infrastructure ................................................................................................................ 107
18.9 Mine Operation ............................................................................................................. 108
18.10 Mining Capital Costs..................................................................................................... 108
18.11 Mining Operating Costs ................................................................................................ 108
18.12 Economical Considerations .......................................................................................... 109
18.12.1 Gold Supply and Demand ................................................................................... 109
18.12.2 Tax and Royalties ................................................................................................ 110

Coffey Mining Pty Ltd
Corihuarmi Gold Project – MINEWPER00466AE 43-101 Technical Report – 6th April 2010
18.12.3 Cash Flow and Sensitivity ................................................................................... 111
19 Interpretation and Conclusions ............................................................................................. 112
20 Recommendations .................................................................................................................. 112
20.1 Exploration .................................................................................................................... 112
20.2 Resource ...................................................................................................................... 112
21 References ............................................................................................................................... 113
22 Date and Signature Page ........................................................................................................ 114
23 Certificates of Authors ............................................................................................................ 115

Coffey Mining Pty Ltd
Corihuarmi Gold Project – MINEWPER00466AE 43-101 Technical Report – 6th April 2010
List of Tables Table 1.5_1 – Susan and Diana Deposits Grade Tonnage 2
Table 1.5_2 – Corihuarmi Scree Deposit Grade Tonnage 3
Table 1.5_3 – Minable Reserve Summary LOM 1 January 2010 3
Table 1.6.2_1 – Life of Mine Plan Summary 4
Table 1.8_1 – Responsibility of Qualified Persons 6
Table 2.5_1 – List of Abbreviations 9
Table 4.2_1 – Corihuarmi Project – Tenement Schedule 13
Table 4.3_1 – Permits 15
Table 11.1_1 – Summary Drilling Statistics 28
Table 14.2_1 – Standards Utilized by Minera 34
Table 16.1.3_1 – Feasibility Study Recovery Estimates 49
Table 16.2_1 – Summary of Cyanidation Tests in Leach Columns 54
Table 17.2.1_1 – Summary of Drilling Grouped by Deposit 59
Table 17.2.3_1 – MZT - Appendix A Summary Statistics Comparison– Diana and Susan 61
Table 17.2.4_1 – MZT Variogram Parameters for Diana and Susan Deposits 65
Table 17.2.5_1 – Block Model Parameters – Diana Deposit 66
Table 17.2.5_2 – Block Model Parameters – Susan Deposit 66
Table 17.3.3_1 – Raw vs Composite Statistics – SIL 69
Table 17.3.3_2 – Coffey Mining Summary Statistics - 5m Composites 69
Table 17.3.3_3 – Coffey Mining Summary Statistics - Cut 5m Composites 71
Table 17.3.6_1 – Composites (High Grade Cut) versus OK Model Estimates – Diana and Susan 78
Table 17.3.6_2 – Composites (uncut) versus OK Model Estimates – Diana and Susan 78
Table 17.3.7_1 – Bench by Bench Comparison – Resource Model versus Mining Data 82
Table 17.3.8_1 – Confidence of Key Criteria for Resource Classification 87
Table 17.4.4_1 – 2m Composite Descriptive Statistics 90
Table 17.4.4_2 – Composite Descriptive Statistics – Types and Phases 91
Table 17.4.4_3 – Outlier Statistics 94
Table 17.4.5_1 – Variogram Models – Gold 95
Table 17.4.6_1 – Block Model Extents 98
Table 17.4.7_1 – Sample Search Parameters 100
Table 17.4.8_1 – Confidence Levels of Key Criteria 102
Table 17.5_1 – Susan and Diana Deposits Grade Tonnage 102
Table 17.5_2 – Corihuarmi Scree Deposit Grade Tonnage 103
Table 17.6_1 – Minable Reserve Summary LOM 2009 104
Table 17.6_2 – Reserve Classification Comparison 104
Table 18.3_1 – Summary of Pit Design Material Inventory 106
Table 18.4_1 – Life of Mine Plan Summary 107
Table 18.9_1 – CyM Equipment List 108
Table 18.11_1 – 2010 LOM Operational Cost Per Ounce Summary 109
Table 18.12.3_1 – Cash Flow and NPV @ 10% 111

Coffey Mining Pty Ltd
Corihuarmi Gold Project – MINEWPER00466AE 43-101 Technical Report – 6th April 2010
List of Figures Figure 4.1_1 – Location Plan of Corihuarmi Project 11
Figure 4.2_1 – Plan of Corihuarmi Project Tenements 12
Figure 7.1_1 – Regional Setting 19
Figure 7.2_1 – Project Geology 20
Figure 9_1 – Main Block Geology 22
Figure 9_2 – Susan and Diana Zones 23
Figure 9_3 – Susan Deposit – Representative Drill Section 24
Figure 9_4 – Diana Deposit – Representative Drill Section 25
Figure 9_5 – Corihuarmi Project – Main Block Alteration 26
Figure 9_6 – Corihuarmi Project – Main Block Metallogenic Zonation 26
Figure 14.2.2_1 – Diamond Core Field Duplicates 35
Figure 14.2.2_2 – Diamond Core Pulp Duplicates 36
Figure 14.2.2_3 – RC Field Duplicates 37
Figure 14.2.2_4 – RC Pulp Duplicates 38
Figure 16.1.2_1 – Process Flowsheet 42
Figure 16.1.3_1 – Ore Placed on Heap Leach Pad 45
Figure 16.1.3_2 – Gold in Ore Since Inception 46
Figure 16.1.3_3 – Cumulative Ore Head Grade Since Inception 47
Figure 16.1.3_4 – Gold Production Since Inception 48
Figure 16.1.3_5 – Cumulative Gold Recovery 49
Figure 16.1.3_6 – Heap Leach Testwork Sample Sizing 50
Figure 16.1.3_7 – Heap Leach Testwork Extraction Results 50
Figure 16.1.3_8 – Operating Cost Data 52
Figure 16.1.3_9 – Lime and Cyanide Consumption 53
Figure 16.2_1 – Gold Leach Kinetics for the 2:1 Susan/Scree Slope Blend and 1:1 Susan/Scree Slope Blend 55
Figure 16.2_2 – Size by Size Recovery for the 2:1 Susan/Scree Slope Blend 56
Figure 16.2_3 – Size by Size Recovery for the 1:1 Susan/Scree Slope Blend (including 2kg/t cement) 56
Figure 16.2_4 – Recovery versus Quantity per Size Fraction for the 2:1 Susan/Scree Slope Blend 57
Figure 16.2_5 – Recovery versus Quantity per Size Fraction for the 1:1 Susan/Scree Slope Blend 57
Figure 17.2.1_1 – Drillhole Type by Deposit – Perspective View 59
Figure 17.2.2_1 – Siliceous Alteration with Drillhole data – Perspective View 60
Figure 17.2.3_1 – Histogram of MZT 5m Composite Dataset (SIL data) - Diana 61
Figure 17.2.3_2 – Histogram of MZT 5m Composite Dataset (SIL data) – Diana 61
Figure 17.2.4_1 – MZT Diana Variogram (Nugget;SIL data) 63
Figure 17.2.4_2 – MZT Diana Variogram; (SIL data) 63
Figure 17.2.4_3 – MZT Susan Variogram (Nugget) Log Transformed Dataset (SIL data) 64
Figure 17.2.4_4 – MZT Susan Variogram Log Transformed Dataset (SIL data) 64
Figure 17.2.5_1 – Blocks Estimated and Data used in Susan and Diana 67
Figure 17.2.6_1 – Susan Deposit - MZT Visual Validation 68
Figure 17.3.3_1 – Histogram of Coffey Mining 5m Composite Dataset (SIL data) – Diana 70
Figure 17.3.3_2 – Histogram of Coffey Mining 5m Composite Dataset (SIL data) – Susan 71

Coffey Mining Pty Ltd
Corihuarmi Gold Project – MINEWPER00466AE 43-101 Technical Report – 6th April 2010
Figure 17.3.3_3 – Effect of High Grade Cut on Coffey Mining 5m Composite Dataset (SIL data) - Diana 72
Figure 17.3.3_4 – Effect of High Grade Cut on Composited Dataset (SIL) - Susan 72
Figure 17.3.3_5 – Susan Deposit - QQ Plot (DC versus RC data) – Coffey Mining 5m Composite Data (Au) 73
Figure 17.3.3_6 – Diana Deposit - QQ Plot (DC versus RC data) – Coffey Mining 5m Composite Data (Au) 73
Figure 17.3.6_1 – OK Block Model vs Composite Sample Data Comparison - Diana Deposit : Au by Northing 75
Figure 17.3.6_2 – OK Block Model vs Composite Sample Data Comparison - Diana Deposit : Au by Easting 76
Figure 17.3.6_3 – OK Block Model vs Composite Sample Data Comparison - Diana Deposit : Au by RL 76
Figure 17.3.6_4 – OK Block Model vs Composite Sample Data Comparison - Susan Deposit : Au by Northing 77
Figure 17.3.6_5 – OK Block Model vs Composite Sample Data Comparison - Susan Deposit : Au by Easting 77
Figure 17.3.6_6 – OK Block Model vs Composite Sample Data Comparison - Susan Deposit : Au by RL 78
Figure 17.3.7_1 – Example of Mining Blocks on 5m Bench, Diana Pit, 4815 Level 79
Figure 17.3.7_2 – Ore and Waste Mining Blocks - 5m Benches 80
Figure 17.3.7_3 – Resource Model Blocks versus Mining Blocks and BH Data - Diana 81
Figure 17.3.7_4 – Resource Model Blocks versus Mining Blocks and BH data - Susan 82
Figure 17.3.7_5 – Resource Block Model vs Mining Blocks by Bench, Tonnes and Grade – Diana Deposit 83
Figure 17.3.7_6 – Resource Model vs Mining Blocks by Bench, Gold Ounces - Diana Deposit 83
Figure 17.3.7_7 – Resource Model vs Mining Blocks by Bench, Tonnes and Grade - Susan Deposit 84
Figure 17.3.7_8 – Resource Model vs Mining Blocks by Bench, Gold Ounces - Susan Deposit 84
Figure 17.3.8_1 – Diana Deposit – Drillhole Density Against Interpolated Blocks 85
Figure 17.3.8_2 – Susan Deposit – Drillhole Density Against Interpolated Blocks 86
Figure 17.4.3_1 – Mineralisation Interpretation, NW Oblique View 89
Figure 17.4.3_2 – Mineralisation Interpretation, Base of Mineralisation Wireframe 89
Figure 17.4.3_3 – Mineralisation Interpretation, Typical Sectional View 90
Figure 17.4.4_1 – Histogram and Probability Plot – Mineralisation 92
Figure 17.4.4_2 – Histogram and Probability Plot – Background 93
Figure 17.4.5_1 – Modelled Variography – Mineralisation 96
Figure 17.4.5_2 – Modelled Variography – Background 97
Figure 17.4.6_1 – Cross Section - Coded Block Model 98
Figure 17.4.7_1 – Cross Section - OK Grade Estimates 100
Figure 17.4.7_2 – Composite vs OK Grade Block Estimate - RL 101
Figure 17.5_1 – Grade Tonnage Curve – Scree Deposit 103
Figure 18.1_1 – Diana Pit Final Wall 105
Figure 18.12.1_1 – Gold Price Last Five Years 110
Figure 18.12.3_1 – Project LOM Sensitivity 111
Coffey Mining Pty Ltd
Corihuarmi Gold Project – MINEWPER00466AE Page: 1 43-101 Technical Report – 6th April 2010
1 SUMMARY
1.1 Introduction
Coffey Mining Pty Ltd (Coffey Mining) was commissioned by Minera IRL Limited (MIRL) to
complete a technical report for the Corihuarmi Gold Project (the Project) in Peru. Coffey
Mining was requested by MIRL to prepare the technical report for inclusion in a listing
document to be submitted to the Toronto Stock Exchange (TSX).
1.2 Location
The Project is located in the high Andes of Central Peru, approximately 160km southeast of
the capital city of Lima (-75.57 Longitude and -12.57° Latitude). Access to the Project is via
the 330km long sealed main highway east from Lima, over the Andean divide to La Oroya.
More specifically, it is located southeast to the city of Huancayo, the regional capital of Junin
Department.
The Project lies at elevations between 4,500m and 5,050m above sea level, straddling the
main Andean divide. Despite the elevation, the topography is relatively subdued, comprising
a series of hills and ranges that rise approximately 500m above an undulating alpine plateau.
1.3 Tenure
The Property consists of 14 concessions totalling 9,315ha. These concessions are made out
of six mining concessions totalling approximately 3,418ha and eight exploration concessions
totalling 5,897ha. No litigation or legal issues related to the project are pending.
MIRL is 100% owner of the tenements, which are subject to a government royalty up to 3% of
the sales as well as a vendor royalty up to 3% when the gold price is above US$350/oz.
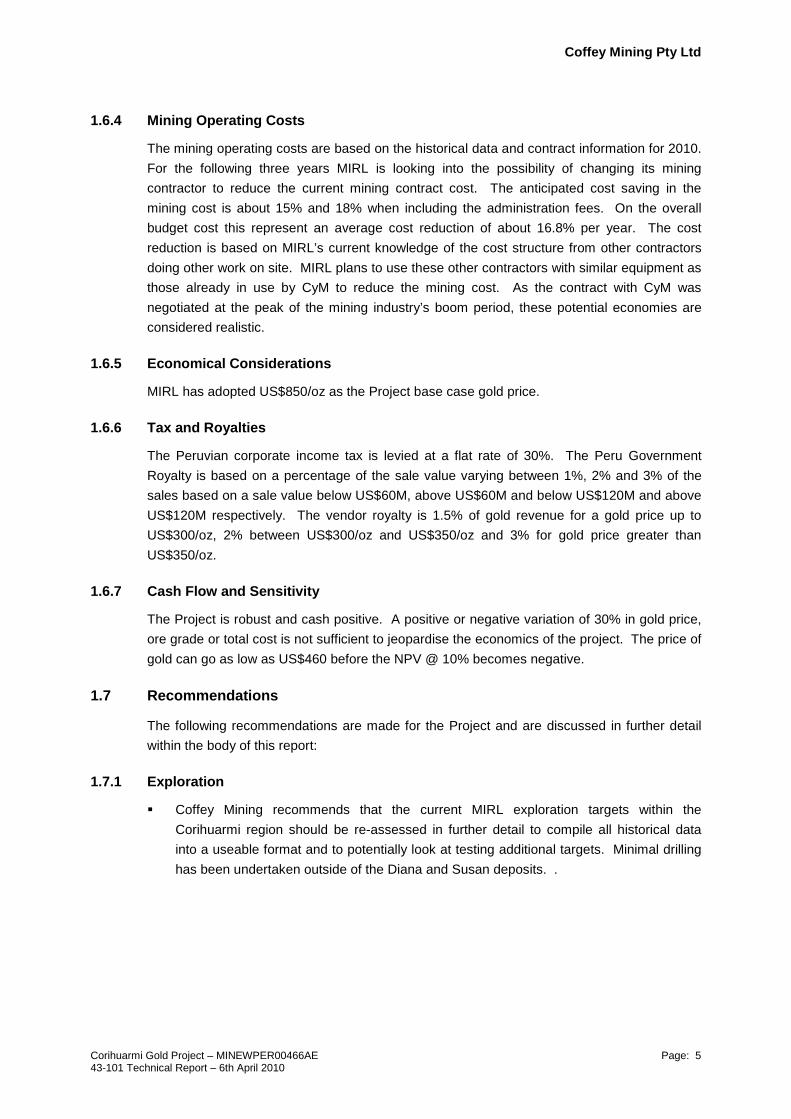
1.4 Geology and Mineralization
The Project is situated within the northern extremity of the Southern Peru Epithermal Au-Ag
Belt, associated with middle to upper Tertiary volcanics and intrusives of the Andean
Cordillera, which lies between the Peru-Chile oceanic trench to the west and the Brazilian
Craton to the east.
Mineralization identified to date within the Project comprises a high sulphidation epithermal
precious metal system that formed at relatively shallow depth. Gold and silver mineralization
is essentially confined to remnant zones of silicification and brecciation that dominantly lie
along the northeast margin of the volcanic complex.
Two main deposits are currently being mined. The Susan deposit measures approximately
200m by 350m in size, being confined at the margins by cliffs. The smaller Diana Zone is
approximately 150m by 250m in area, and to some extent remains open to the northwest and
southeast along the ridge-line.

Coffey Mining Pty Ltd
Corihuarmi Gold Project – MINEWPER00466AE Page: 2 43-101 Technical Report – 6th April 2010
A scree (colluvial) deposit is located at the base of the Diana and Susan deposits. This
material is directly related to the weathering and collapse of the Diana and Susan peaks.
1.5 Resources and Reserves
Coffey Mining has reviewed the Mineral Resource for the Susan and Diana Deposits as
completed by Mr. Miguel Zulueta Torres in May 2009 (Senior Geologist with MZT Consulting
(MZT) based in Peru). Coffey Mining has depleted the Mineral Resource as of 1st January
2010, using MIRL’s preferred cutoffs (0.3g/t gold cutoff at Susan deposit and a 0.25g/t gold
cutoff at Diana deposit). A total Measured and Indicated Resource of 5.3Mt at an average
gold grade 0.6g/t Au for 103k oz Au are reported from the combined deposits, remaining in-
situ as of the 1st January 2010 (Table 1.5_1).
Table 1.5_1
Corihuarmi Project MZT 2009 Models for Susan and Diana Deposits
Grade Tonnage as of January 1, 2010 Gold Grade Estimates obtained Using Ordinary Kriging (OK)
Block Model (5m x 5m x 5m Parent Cell size)
Lower Cutoff Grade
Measured Indicated Measured + Indicated
Tonnes (kt)
Au (g/t)
Metal (kozs)
Tonnes (Kt)
Au (g/t)
Metal (kozs)
Tonnes (Kt)
Au (g/t)
Metal (kozs)
Diana Deposit
0 1,345 0.42 18.3 1 0.27 0.008 1,346 0.42 18.3
0.2 1,173 0.46 17.4 1 0.27 0.008 1,174 0.46 17.4
0.25 1,028 0.50 16.4 1 0.28 0.006 1,029 0.49 16.4 0.3 871 0.53 15.0 - - - 871 0.53 15.0 0.5 371 0.73 8.7 - - - 371 0.73 8.7
Susan Deposit
0 8,197 0.41 107.1 136 0.15 0.7 8,333 0.40 107.7
0.2 5,508 0.54 95.6 19 0.29 0.2 5,527 0.54 95.8 0.25 4,448 0.62 88.0 11 0.33 0.1 4,459 0.61 88.1 0.3 3,509 0.71 79.7 6 0.37 0.07 3,515 0.71 79.8
0.5 1,817 1.01 59.0 0.2 0.63 0.004 1,817 1.01 59.0
Susan and Diana Combined (Susan @ 0.25 g/t cutoff & Diana @ 0.3 g/t cutoff)
- 5,318 0.60 102.9 11 0.33 0.1 5,329 0.60 103.0
In addition, Coffey Mining has estimated the Mineral Resource for the Scree Deposit of the
Corihuarmi Gold Project as at 28th of February 2010 (Table 1.5_2). The estimation of gold
grades was completed using Ordinary Kriging (OK). A total Inferred Resource of 3.76Mt at an
average gold grade 0.45g/t Au for 55k oz Au are reported.
The resource estimate for Corihuarmi has been classified as an NI 43-101 compliant Mineral
Resource, in accordance with the NI 43-101 and the CIM standards, based on the confidence
levels of the key criteria that were considered during the resource estimation.

Coffey Mining Pty Ltd
Corihuarmi Gold Project – MINEWPER00466AE Page: 3 43-101 Technical Report – 6th April 2010
Table 1.5_2
Minera IRL Limited Corihuarmi Scree Deposit
Grade Tonnage- 28th February 2010 Gold Grade Estimates obtained Using Ordinary Kriging (OK)
Block Model (12.5m x 12.5m x 2.5m – Parent Cell size) No Lower Grade Cutoff Applied
Lower Cutoff Grade
Measured Indicated Inferred
Tonnes (Mt)
Au (g/t)
Metal (kozs)
Tonnes (Mt)
Au (g/t)
Metal (kozs)
Tonnes (Mt)
Au (g/t)
Metal (kozs)
Corihuarmi Scree Deposit
0 - - - - - - 3.765 0.45 54.6
The Diana and Susan resource models were also reconciled against 6 months of actual
mining data, from January 1, 2009 to June 30, 2009 comparing the resource model with the
reported mined figures. Grade control drilling has shown a positive reconciliation to the
resource model to date at Diana; however with depth there appears to be a closer
reconciliation developing. The reconciliation data at Susan to date is showing a much closer
reconciliation.
The Mineral Reserve estimates are, in accordance with the NI 43-101 and the CIM standards,
based on the current operating parameters described in this report. Table 1.5_3 provides a
summary of the Mineral Reserves that were determined for the Susan and Diana gold
deposits. All stated reserves are completely included within the quoted resources. No
reserves have been allocated to the Scree Deposit due to the Inferred classification.
Table1.5_3
Corihuarmi Project
Minable Reserve Summary As of 31 December 2009
Cutoff (g/t) Deposit
Mineral Reserves
Proven Probable Total
Tonnes [Mt]
Grade [g/t Au]
In-Situ Au [Koz]
Tonnes [Mt]
Grade [g/t Au]
In-Situ Au [Koz]
Tonnes [Mt]
Grade [g/t Au]
In-Situ Au [Koz]
0.30 Diana 0.7 0.54 11.9 0.7 0.54 11.9
0.25 Susan 4.4 0.67 93.9 4.4 0.67 93.9
Total 5.1 0.65 105.9 5.1 0.65 105.9
1.6 Other Relevant Data and Information
1.6.1 Geotechnical and hydrogeological studies
The geotechnical evaluation was completed by Vector (2005). The evaluation was based on
existing geological data, field structural and geotechnical mapping and drillhole core logging.
In summary, the evaluation resulted in the recommendation of 70º batters and 8.5m berms for
every 20m in vertical wall height. The final wall, located to the north of the Diana pit was
exposed during the first year of mining. The wall condition is good and the recommended wall
parameters appear to be adequate. No bench scale failures were identified during the Coffey
Mining site visit.

Coffey Mining Pty Ltd
Corihuarmi Gold Project – MINEWPER00466AE Page: 4 43-101 Technical Report – 6th April 2010
A hydrogeology study conducted by Vector (2006) concluded that given the elevated nature of
the mineralized outcrops above the surrounding plateau, no material adverse effects due to
groundwater are expected to interfere with the mining operation and haven’t been observed
during the site visit.
1.6.2 Life of Mine Plan
The life of mine pit (LOM) design was completed by AMC to conventional industry standards
during the feasibility study.
The mine design respects the geotechnical slope angle proposed. No issues were noted
either for the pits or the waste dump designs.
The current LOM plan uses this same design. The pit inventory comprises 5.1Mt of mill feed
at 0.65g/t Au with 1.2Mt of waste for a waste to ore strip ratio of 0.2: 1. The mining schedule is
summarised in the Table 1.6.2_1
Table 1.6.2_1
Corihuarmi Project
Life of Mine Plan Summary
Year Tonnes Ore Grade Au (g/t) Ounces Tonnes
waste Ratio (SR) Rec Au Ounces
2010 1.45Mt 0.8 39.5koz 125.0kt 0.09 28.1 2011 1.45Mt 0.8 35.0koz 336.7kt 0.23 25.0 2012 1.45Mt 0.5 22.3koz 460.8kt 0.32 16.1 2013 0.73Mt 0.4 9.0koz 254.7kt 0.35 6.7
Total 5.08Mt 0.6 105.8koz 1,177.2kt 0.23 75.9
MIRL has opted for a contract mining operation to establish the project. The Contractor, CyM
Contratistas Generales SAC (CyM), supplies and operates all the mining equipment under
MIRL staff supervision.
1.6.3 Mining Capital Costs
CyM is employed to carry out the mining activities and, as such, the capital depreciation of the
mining equipment is incorporated into the mine operating unit rates.
The sustaining capital expenditure that MIRL has planned is related to mining computer
hardware and software, light vehicles, office requirements and other miscellaneous items and
is expected to be $250k per year from 2010 to 2013.
Coffey Mining Pty Ltd
Corihuarmi Gold Project – MINEWPER00466AE Page: 5 43-101 Technical Report – 6th April 2010
1.6.4 Mining Operating Costs
The mining operating costs are based on the historical data and contract information for 2010.
For the following three years MIRL is looking into the possibility of changing its mining
contractor to reduce the current mining contract cost. The anticipated cost saving in the
mining cost is about 15% and 18% when including the administration fees. On the overall
budget cost this represent an average cost reduction of about 16.8% per year. The cost
reduction is based on MIRL’s current knowledge of the cost structure from other contractors
doing other work on site. MIRL plans to use these other contractors with similar equipment as
those already in use by CyM to reduce the mining cost. As the contract with CyM was
negotiated at the peak of the mining industry’s boom period, these potential economies are
considered realistic.
1.6.5 Economical Considerations
MIRL has adopted US$850/oz as the Project base case gold price.
1.6.6 Tax and Royalties
The Peruvian corporate income tax is levied at a flat rate of 30%. The Peru Government
Royalty is based on a percentage of the sale value varying between 1%, 2% and 3% of the
sales based on a sale value below US$60M, above US$60M and below US$120M and above
US$120M respectively. The vendor royalty is 1.5% of gold revenue for a gold price up to
US$300/oz, 2% between US$300/oz and US$350/oz and 3% for gold price greater than
US$350/oz.
1.6.7 Cash Flow and Sensitivity
The Project is robust and cash positive. A positive or negative variation of 30% in gold price,
ore grade or total cost is not sufficient to jeopardise the economics of the project. The price of
gold can go as low as US$460 before the NPV @ 10% becomes negative.
1.7 Recommendations
The following recommendations are made for the Project and are discussed in further detail
within the body of this report:
1.7.1 Exploration
� Coffey Mining recommends that the current MIRL exploration targets within the
Corihuarmi region should be re-assessed in further detail to compile all historical data
into a useable format and to potentially look at testing additional targets. Minimal drilling
has been undertaken outside of the Diana and Susan deposits. .

Coffey Mining Pty Ltd
Corihuarmi Gold Project – MINEWPER00466AE Page: 6 43-101 Technical Report – 6th April 2010
1.7.2 Resource
� That no factor be applied to the resource model for the Diana deposit. Grade control
drilling has shown a positive reconciliation to the resource model to date; however with
depth there appears to be a closer reconciliation developing.
� Susan deposit is performing well against the mining data collected to date.
� That mined ore tonnes are reconciled against a weightometer, to check whether the truck
factor assumptions are correct. Ore volumes should also be reconciled against
weightometer values to check if bulk density assumptions for each deposit are correct.
� Continue to monitor QA/QC for BH sampling, including field duplicates, inclusion of
certified standards and blanks and umpire laboratory testing.
� Although additional close spaced drilling is required to increase the resource confidence
of the Scree deposit, MIRL should weight the associated risks of this additional drilling
investment as opposed to direct mining.
1.8 Authors
Table 1.8_1 summarises the responsibility of each qualified person as authors of this report.
Table 1.8_1
Corihuarmi Project
Responsibility of Qualified Persons
Qualified Person Association Responsible for Sections Co-Responsible for Sections
Beau Nicholls MAIG All sections excluding 16, 17 and 18 1 Jean-Francois St-Onge Eng., AusIMM 17.6, 18 1 Barry Cloutt AusIMM 16 Doug Corley MAIG 17.1-17.3 1, 17.5 and 19-21 Alex Virisheff AusIMM 17.4 1, 17.5 and 19-21

Coffey Mining Pty Ltd
Corihuarmi Gold Project – MINEWPER00466AE Page: 7 43-101 Technical Report – 6th April 2010
2 INTRODUCTION
2.1 Scope of Work
Coffey Mining Pty Ltd (Coffey Mining) was commissioned by Minera IRL Limited (MIRL) to
complete a technical report for the Corihuarmi Project (the Project) in Peru. Coffey Mining
was requested by MIRL to prepare the technical report for inclusion in a listing document to be
submitted to the Toronto Stock Exchange (TSX).
The Project is an operating open pit gold mine located in the high Andes of Central Peru,
approximately 160km southeast of the capital city of Lima.
This report is prepared to comply with reporting requirements set forth in the Canadian
National Instrument 43-101 (NI 43-101).
2.2 Qualifications and Experience
Coffey Mining is an international mining consulting firm specializing in the areas of geology,
mining and geotechnical engineering, metallurgy, hydrogeology, hydrology, tailings disposal,
environmental science and social and physical infrastructure.
The “qualified persons” (as defined in NI 43-101) for the purpose of this report are
Mr. Beau Nicholls, Mr. Barry Cloutt, Mr. Jean-Francois St-Onge eng, Mr Alex Virisheff and
Mr. Doug Corley, each of whom is an employee of Coffey Mining.
Mr. Nicholls is a professional geologist with 15 years experience in exploration and mining
geology. He is a consulting geologist for Coffey Mining’s Brazil operations. Mr. Nicholls is
also a Member of the Australian Institute of Geosciences (MAIG) and has the appropriate
relevant qualifications, experience and independence as defined in the Canadian National
Instrument 43-101. Mr Nicholls visited the Corihuarmi Project between 12th and 14th May
2009.
Mr Corley is a professional resource geologist with 16 years experience in resource and
mining geology. Mr Corley is a member of the Australian Institute of Geoscientists (MAIG)
and has the appropriate relevant qualifications, experience and independence as defined in
the Canadian National Instrument 43-101. Mr Corley has not visited the Corihuarmi Project.
Mr Corley is currently employed as an Associate Resource Geologist with the firm of Coffey
Mining Pty Ltd.
Mr Virisheff is a professional resource geologist with over 25 years experience in resource
and mining geology. Mr Virisheff is a member of the Australasian Institute of Mining and
Metallurgy (AusIMM) and has the appropriate relevant qualifications, experience and
independence as defined in the Canadian National Instrument 43-101. Mr Virisheff has not
visited the Corihuarmi Project. Mr Virisheff is currently employed as a Principal Resource
Geologist with the firm of Coffey Mining Pty Ltd.

Coffey Mining Pty Ltd
Corihuarmi Gold Project – MINEWPER00466AE Page: 8 43-101 Technical Report – 6th April 2010
Mr. Cloutt is a professional metallurgist with 28 years of metallurgical experience. He is Chief
Metallurgist for Coffey Mining. Mr. Cloutt is also a Member of the AusIMM and has the
appropriate relevant qualifications, experience and independence as defined in the Canadian
National Instrument 43-101. Mr Cloutt has not visited the Corihuarmi Project.
Mr. St-Onge is an engineer non-resident member of the Ordre des Ingénieurs du Québec
(OIQ) with 15 years experience in mining engineering. He is a Specialist Mining Engineer
with Coffey Mining. Mr. St-Onge is also a Member of the AusIMM and has the appropriate
relevant qualifications, experience and independence as defined in the Canadian National
Instrument 43-101. Mr. St-Onge visited the Corihuarmi Project between 12th and 14th May
2009.
2.3 Independence
Neither Coffey Mining, nor the authors of this report, have or have had previously any material
interest in MIRL or related entities or interests. Our relationship with MIRL is solely one of
professional association between client and independent consultant. This report is prepared
in return for fees based upon agreed commercial rates and the payment of these fees is in no
way contingent on the results of this report.
Specific sections of the report that the Qualified Persons are responsible for are provided in
Table 1.8_1 and are repeated in the attached Qualified Persons certificates.
2.4 Principal Sources of Information
In addition to site visits undertaken to the Corihuarmi Project between the 12th and 14th May
2009 by Mr. Nicholls and Mr. St-Onge, the authors of this report have relied extensively on
information provided by MIRL, extensive discussion with MIRL, and studies completed by
other independent consulting and engineering groups. A full listing of the principal sources of
information is included in Section 21 of this report and a summary is provided below:
� Coffey Mining (formerly RSG Global Consulting Pty Ltd (April 2007) – Competent
Person’s Report.
� Kappes, Cassiday & Associates, 2006,” Corihuarmi Feasibility Study 1,000,000 Tonne
per Year Heap Leach Project” Technical report prepared for Minera IRL S.A.
� Vector Peru S.A.C. 2006, “Bankable Feasibility Study Leach Pad, Waste Rock Disposal
and Mine Access Road Facilities Design” Technical report prepared for Minera IRL S.A
� Smee and Associates Consulting Ltd (February, 2009) - A Review of the Minera IRL S.A
Quality Control Protocol, Core and Blasthole Sampling Protocol, and Two Laboratories,
Peru
Coffey Mining has made all reasonable enquiries to establish the completeness and
authenticity of the information provided, and a final draft of this report was provided to MIRL
along with a written request to identify any material errors or omissions prior to lodgement.

Coffey Mining Pty Ltd
Corihuarmi Gold Project – MINEWPER00466AE Page: 9 43-101 Technical Report – 6th April 2010
2.5 Abbreviations
A full listing of abbreviations used in this report is provided in Table 2.5_1 below.
Table 2.5_1
Corihuarmi Project
List of Abbreviations
Description Description
$ United States of America dollars l/hr/m² litres per hour per square metre µ microns M Million
3D three dimensional M Metres
AAS atomic absorption spectrometer Ma thousand years
Au gold MIK Multiple Indicator Kriging
Bcm bank cubic metres Ml Millilitre
CC correlation coefficient Mm Millimetres
Cfm cubic feet per minute MMI mobile metal ion CIC carbon in column Moz million ounces
CIL carbon-in-leach Mtpa million tonnes per annum
Cm centimetre N (Y) Northing
Cusum cumulative sum of the deviations NaCN sodium cyanide
CV coefficient of variation NATA National Association of Testing Authorities
DDH diamond drillhole NPV net present value
DTM digital terrain model NQ2 size of diamond drill rod/bit/core
E (X) easting ºC degrees centigrade EDM electronic distance measuring OK Ordinary Kriging
EV expected value Oz troy ounce
G gram P80 -75µ 80% passing 75 microns
g/m³ grams per cubic metre PAL pulverise and leach
g/t grams per tonne Ppb parts per billion
HARD half the absolute relative difference Ppm parts per million
HDPE high density poly ethylene Psi pounds per square inch HQ2 size of diamond drill rod/bit/core PVC poly vinyl chloride
Hr hours QC quality control
HRD half relative difference Q-Q quantile-quantile
ICP-MS inductivity coupled plasma mass spectroscopy RAB rotary air blast
ID Inverse Distance weighting RC reverse circulation
ID² Inverse Distance Squared RL (Z) reduced level
IPS integrated pressure stripping ROM run of mine
IRR internal rate of return RQD rock quality designation ISO International Standards Organisation SD standard deviation
ITS Inchcape Testing Services SGS Société Générale de Surveillance
Kg kilogram SMU simulated mining unit
kg/t kilogram per tonne T tonnes
Km kilometres t/m³ tonnes per cubic metre
km² square kilometres

Coffey Mining Pty Ltd
Corihuarmi Gold Project – MINEWPER00466AE Page: 10 43-101 Technical Report – 6th April 2010
3 RELIANCE ON OTHER EXPERTS
Neither Coffey Mining nor the authors of this report are qualified to provide comment on legal
issues associated with the Project included in Section 4 of this report. Inclusion of these
aspects was based on information provided by MIRL solicitors, Francisco Tong,
Estudio Rodrigo, Elías y Medrano Abogados and has not been independently verified by
Coffey Mining.

Coffey Mining Pty Ltd
Corihuarmi Gold Project – MINEWPER00466AE Page: 11 43-101 Technical Report – 6th April 2010
4 PROPERTY DESCRIPTION AND LOCATION
4.1 Project Location
The Project is located in the high Andes of Central Peru, approximately 160km southeast of
the capital city of Lima (-75.57 Longitude and -12.57° Latitude) (Figure 4.1_1). The
boundaries of the concessions have not been surveyed as this is not a requirement of Peru’s
mining code, however the concession corners have been physically marked in the field by
previous owners The tenement boundaries are defined by UTM coordinates with the datum of
PSAD 56, Zone 18S. The Project tenements straddle the junction between the administrative
Departments of Junin, Lima and Huancavelica.
Figure 4.1_1
Location Plan of Corihuarmi Project

Coffey Mining Pty Ltd
Corihuarmi Gold Project – MINEWPER00466AE Page: 12 43-101 Technical Report – 6th April 2010
4.2 Tenement Status
As shown in Figure 4.2_1 and Table 4.2_1, the Corihuarmi Property consists of 14 concessions
totalling 9,315.83ha. These concessions are held 100% by MIRL and are made out of six
mining concessions totalling approximately 3,418.65ha and eight exploration concessions or
petitorios (application stage for mining concession, totalling 5,897.18ha.
Figure 4.2_1
Plan of Corihuarmi Project Tenements
The Main Block is an irregular rectangle approximately 6km by 7km that consists of six
contiguous mining concessions totalling 3,418.65ha. As shown in Figure 4.2_1, totally
enclosed within the Main Block is an exploration concession, Tambo Nuevo 11, held by a third
party (Geologix Explorations Inc.), since early 2004.
The eight exploration concessions (5,897.18ha) which make up the other five blocks cover
early-stage exploration targets with minimal work completed over them.
The mining concessions are in good standing. No litigation or legal issues related to the
project are pending. Concessions are generally irrevocable but may lapse or terminate in the
following two circumstances:
� Failure by a concession holder to pay the mining validity fee (derecho de vigencia) for
two consecutive years; or
� Failure by a concession holder to pay the penalty (penalidad) for two consecutive years,
for not achieving exemption from the penalty by meeting investment requirements or for
not meeting minimum annual production targets.

Coffey Mining Pty Ltd
Corihuarmi Gold Project – MINEWPER00466AE Page: 13 43-101 Technical Report – 6th April 2010
Table 4.2_1
Corihuarmi Project
Tenement Schedule
Concession Name Number Type Holder Area (ha) Application Date Expiry Date
Tupe 2 01-02016-94 Mining Concession Minera Andina Exploraciones SAA 600 06/04/1994 See Note 1 Tupe 3 01-02017-94 Mining Concession Minera Andina Exploraciones SAA 600 06/04/1994 See Note 1 Tupe 5 01-03635-94 Mining Concession Minera Andina Exploraciones SAA 300 20/06/1994 See Note 1 Vera I 01-03795-04 Mining Concession Minera IRL SA 800 10/12/2004 See Note 1 Vera II 01-03796-04 Mining Concession Minera IRL SA 700 10/12/2004 See Note 1 Vera III 01-03797-04 Mining Concession Minera IRL SA 418.65 10/12/2004 See Note 1 Vera IV 01-00713-05 Exploration Concession Minera IRL SA 700 18/03/2005 See Note 1 Vera V 01-00713-05 Exploration Concession Minera IRL SA 900 18/03/2005 See Note 1 Vera VI 01-00715-05 Exploration Concession Minera IRL SA 700 18/03/2005 See Note 1 Vera VII 01-00716-05 Exploration Concession Minera IRL SA 600 18/03/2005 See Note 1 Fiopo I 01-03379-05 Exploration Concession Minera IRL SA 1,000 01/09/2005 See Note 1 Vera IX 01-01317-05 Exploration Concession Minera IRL SA 900 01/06/2005 See Note 1 Vera X 01-03795-05 Exploration Concession Minera IRL SA 600 01/06/2005 See Note 1 Vera XI 01-03795-05 Exploration Concession Minera IRL SA 500 22/05/2005 See Note 1
Note 1 No extinction provision applies to Mining Concessions under Peruvian legislation, as long as its titleholder complies with the administrative obligations established by law in order to maintain its validity.

Coffey Mining Pty Ltd
Corihuarmi Gold Project – MINEWPER00466AE Page: 14 43-101 Technical Report – 6th April 2010
4.3 Permits
The permits presented in Table 4.3_1 are in place for the current mining operation.
4.4 Royalties and Agreements
The Peru Government Royalty is based on a percentage of the sale value varying between
1%, 2% and 3% of the sales based on a sale value below US$60M, above US$60 and below
US$120M and above US$120M respectively.
In October, 2005 MIRL fulfilled the terms of an option agreement with Minera Andina
Exploraciones to acquire 100% interest in the Tupe 2, 3 and 5 mining concessions. The
terms of the agreement called for MIRL to make a series of quarterly cash payments (totaling
US$903,309) over a three year period. Minera Andina retains a sliding scale Net Smelter
Royalty based on the price of gold. This vendor royalty is 1.5% of gold revenue for a gold
price of up to US$300/oz, 2% between US$300/oz and US$350/oz and 3% for a gold price
greater than US$350/oz.
4.5 Environmental Liabilities
Vector Engineering (Vector), as part of the April 2006 feasibility study, had prepared the
Environmental and Social Impact Assessment (EIA) in accordance with Peruvian legislation
and international standards. According to the newly released IFC performance standards, the
Project is classified as a Category B project, with limited adverse social and environmental
impacts that are few in number, generally site-specific, largely reversible and readily
addressed through mitigation measures.
The primary impacts identified and to be resolved under the mine closure plan are
� Changes of topography created by the principal mining infrastructure components,
namely removal of the Diana and Susan outcrops, partial fill of the upper reaches of the
ravine that faces the Ujujuy lake by waste rock, and creation of a flat pad at the base of
Cayhua mountain;
� A total surface impact limited to 40ha at the end of operation and after restoration;
� Long-term potential impacts to water quality with the waste rock and the ore stacked on
the leach pad having potential for causing acid rock drainage issues. Therefore,
mitigation measures have been implemented for an adequate control.

Coffey Mining Pty Ltd
Corihuarmi Gold Project – MINEWPER00466AE Page: 15 43-101 Technical Report – 6th April 2010
Table 4.3_1
Corihuarmi Project
Permits
Date Permit Type Group Report Number Purpose Expiry
19-May-06 R.A. NRO. 094-2006-Inrena-IRH/ATDRM ATDR JUNIN
Notification NRO. 381-2006-INRENA-IRH/ATDRM.
Approves the Projects: "Corihuarmi Mining Camp Drinkable Water Supply System" and "Pumping System of the Coyllorcocha Lagoon for Mining and Industrial Purposes".
February 2007 Technical Opinion NRO. 059-07-Inrena-OGATEIRN-UGAT
INRENA Environmental Impact Study of the Corihuarmi Exploitation and Benefit Project to be Developed In Tupe 2, 3 and 5. ND
27 March 2007 R.D. NRO. 117-2007-MEM/AAM DGAA/MEM Report NRO. 372-2007/MEM-AAM/EA/FVF/MRC Environmental Impact Study of the Corihuarmi Exploitation and Benefit Project to be Developed in Tupe 2, 3 and 5. ND
31 July 2007 R.D. NRO.1950/2007/DIGESA/SA DIGESA File Nº 085-2006 PD) Sanitary Authorization for the Domestic Residual Water Treatment System and Sanitary Authorization for Using Again Domestic Residual Water Treated in the Indicated System for use in the Land Flattening, Dust Control in the Access Routes and Irrigation of Vegetables
31/07/2009 (2 años)
3 September 2007 NRO REGISTRO: 0016-CDMV-15-2007 DGH File NRO. 1715533 Proof OF Direct Consumer Registry with Installations (Permit to have a service station while constructing the definitive service station).
In Process
17 September 2007 Work Design Certificate OSINERG File NRO. 138071-CD-051-2007 Work Design Certificate of Liquid Combustible Direct Consumer (To construct the definitive service station). In Process
27 September 2007 R.P. NRO. 1372-2007-INGEMMET/PCD/PM INGEMMET
Approves the Metallic Rights Tupe 2, 3 and 5, Vera I, II and III with the Constitution of the Administrative and Economic Unit (UEA) Corihuarmi in Favor of IRL S.A. ND
05 November 2007 NRO. COM215-2007 DGM/MEM File NRO. 1731167 COM 2007
14 December 2007 NRO. COM 084-2008-C DGM/MEM File NRO. 1741836 COM 2008
19 December 2007 NRO. 20505174896-DICIQ DIRANDRO Report NRO. 1099-DICIQ-CYV IQPF User Certificate 12/19/2009
28 December 2007 R.D. NRO. 4031-2007-IN-1703-2 DICSCAMEC To Grant THE Functioning Permit OF 5 Special Magazines Type "C" (Containers). 12/28/2008
09 January 2008 R.D. NRO. 0037/2008/DIGESA/SA DIGESA File Nº 139.07.VI To Grant Sanitary Authorization FOR THE Treatment System and Sanitary Disposition of Industrial Residual Water of Corihuarmi Production Unit Project ND
February 2008 Technical Opinion NRO. 046-08-Inrena-OGATEIRN-UGAT INRENA
Environmental Impact Study "Definitive Study of the First Line IN 22,9Kv S.E. CHUMPE - Corihuarmi Mining Unit and Corihuarmi Exit Module 22,9/12.6Kv, 1 MVA DE LA S.E. CHUMPE". ND
20 February 2008 R.D. NRO. 0615-2008-IN-1703-2 DICSCAMEC Global Authorization for the 1ST Semester 2008 --
28 March 2008 Under Current Evaluation BY MEM DGAA/MEM Submit of the Mine Closure Plan Study
21 April 2008 R.D. Nro. 090-2008-MEM/AAM DGAA/MEM Report NRO. 425-2008/MEM-AAM/PRN/EA
Environmental Impact Study "Definitive Study of the Primary Line in 22,9Kv S.E. CHUMPE - Corihuarmi Mining Unit and Corihuarmi Exit Module 22,9/12.6Kv, 1 MVA of S.E. CHUMPE". ND
28 Aril 2008 Administrative Resolution Nº 329-2008-ATDRM-DRA/J
Junin Agricultural Regional Office
Notification NRO. 376-2008-ATDRM-DRA/J Water Use License with Population Purposes of Coyllorcocha Lagoon ND
28 April 2008 Administrative Resolution Nº 330-2008-ATDRM-DRA/J
Junin Agricultural Regional Office
Notification NRO. 377-2008-ATDRM-DRA/J Water Use License with Mining-Industrial Purposes Granted to Minera IRL - Coyllorcocha Lagoon ND
9-May-08 R.D. NRO. 1716-2008-IN-1703-2 DICSCAMEC Use of Explosives as an Advance of the Second Semester of the Global Authorization 2008. -
22-May-08 R.D. NRO. 937-2008-MEM/DGM DGM/MEM Report NRO. 022-2008-MEM-DGM-DTM/PM
Approval of the Mining Plan of Susan and Idana Pits and Authorization of the Beginning of Open Pit Exploitation Activities ND
05 June 2008 R.D. NRO. 2025/2008/DIGESA/SA. I DIGESA Report Nº 915-2008/DSB/DIGESA Sanitary Authorization for the Treatment System of Drinkable Water for Corihuarmi Mining Camp -
06 June 2008 R.D. NRO. 334-2008-MEM-DGM/V DGM/MEM Report NRO. 098-2008-MEM-DGM-DTM/PB
Approval of Supervision Report of Construction, Installation and Conditioning Verification of Corihuarmi Benefit Plant. ND
06 June 2008 R.D. NRO. 954-2008-MEM/DGM DGM/MEM Report Nº 0031-2010/DSB/DIGESA
Grant the Corihuarmi Benefit Concession Title and the Functioning of Corihuarmi Benefit Plant- Capacity of 3000TM/Day. ND
24 June 2008 R.D. NRO. 2356-2008-IN-1703-2 DICSCAMEC Grants the Global Authorization for the Second Semester 2008 -
21 August 2008 OFICIO N| 6393-20087DG7DIGESA DIGESA Report N| 1422-20087DSB7DIGESA
Favorable Technical Opinion of the Infrastructure Project of Corihuarmi Solid Residues
22 August 2008 R.D N° 3113-2008-IN-1703-2 DICSCAMEC File N° 308557 Extension of the Global Authorization with RDN° 615 -2008-IN-1703-2 Dated February 20 and R.D N° 2356-2 008-IN-1703-2 Dated June 24 2008 of the 1° and 2° Semester 2008, use of Explosives
1° and 2° Semester 2008
23 December 2008 R.D N° 4592 DICSCAMEC File N° 3133 76 Functioning License of 5 Magazines "Special Type" (Containers), for the Storage of Explosives and Blasting Accessories. 1 Year
31 December 2008 Resolution N° 4713/2008-IN-1703-2 DICSCAMEC File N° 313375 Global Authorization for t he Use of Explosives and/OR Related 1° Semester 2009

Coffey Mining Pty Ltd
Corihuarmi Gold Project – MINEWPER00466AE Page: 16 43-101 Technical Report – 6th April 2010
Date Permit Type Group Report Number Purpose Expiry
30 March 2009 R.D N° 971/2009-IN-1703-2 DICSCAMEC F ile N° 302530 Functioning License of 1 Magazine "Special" Type (Container) for the Storage of Ammonitrate, ANFO, Located in Corihuarmi Landscape 1 Year
4-May-09 Resolution N° 090-2009-MEM/DGM DGM/MEM Report N° 106-2009-MEM-DGM/PB
Extension of the Corihuarmi Benefit Concession AREA in 67.5 Hectares, and Modification of the Total Area of the Concession to 127.5 Hectares. Authorization for Minera IRL S.A for the Leach Pad Operation PHASE II (2A) and the Functioning of the Crushing System Incorporated in the Corihuarmi Benefit Plant.
ND
5 June 2009 OSINERGMIN N° 2522-2009-OS/GFHL-UCHL OSINERGMIN
Technical Report N° 159506-itf-051-2009
Authorization for Direct Consumer of Liquid Combustibles, Located on the West Side of Corihuarmi Mining Project-Yanacancha, District of Huantan, Province of YAUYOS, Department of Lima, with OSINERGMIN Code N°83472 ND
15 July 2009 Resolution N° 2354/2009-IN-1703-2 DICS CAMEC File N° 306402 Global Authorization for the U se of Explosives and or Related 2° Semester 2009
21 October 2009 Official Letter Nº 4080-2009/DEPA/DIGESA DIGESA
Report Nº 4768-2009/DEPA-APRHI/DIGESA
Favorable Technical Opinion for Granting the Authorization of Treated Industrial Residual Water Discharges of Waste Dump, Inappropriate Material Dump and Sedimentation Ponds ND
28 October 2009 Resolution N° 858-2009-MEM-DGM/V DG M/MEM Report N° 274-2009-MEM-DGM-DTM/PB
Authorization for the Benefit Modification of Corihuarmi, for the Capacity Extension of Corihuarmi Benefit Plant from 3000 to 4500 TM/day, Presented BY Minera IRL S.A. ND
29 October 2009 OFICIO Nº 4080-2009/DEPA/DIGESA DIGESA Report Nº 4908-2009/DEPA-APRHI/DIGESA
Favorable Technical Opinion for Granting the Authorization of Exit Treated Industrial Residual Water from the Grease Trap of THE Service Station, Vehicle Washhouse, Warehouse of Dangerous Residues and Sedimentation Pond. ND
14 December 2009 Certificate N° 20505174896-DIVICIQ Production Department Written Evidence N° 15-01810 IQPF User Certificate 14 December 2011
12 January 2010 Oficio N º 002-2010/DSB/DIGESA DIGESA Report Nº 0031-2010/DSB/DIGESA
Favorable Technical Opinion of the Treatment System and Sanitary Regulation of Domestic Residual Water Through the Re-Use of the Corihuarmi Mining Unit - Minera IRL S.A. ND
19 January 2010 R.D N° 235 / 2010-IN_1703-2 DICSCAM EC Report N° 90-2010-IN-1703-2 Functioning License of 1 Magazine "Special" Type (Container) for the Storage of AMMONITRATE, ANFO, Located in the Corihuarmi Landscape 12 January 2011
25 January 2010 R.D N° 308-2010-IN-1703-2 DICSCAMEC Global Authorization for the Use of Explosives and or Related Products 30 June 2009

Coffey Mining Pty Ltd
Corihuarmi Gold Project – MINEWPER00466AE Page: 17 43-101 Technical Report – 6th April 2010
5 ACCESSIBILITY, CLIMATE, LOCAL RESOURCES, INFRASTRUCTURE AND PHYSIOGRAPHY
5.1 Project Access
Access to the Project is via the 330km long sealed main highway east from Lima, over the
Andean divide to La Oroya. More specifically, it is located southeast to the city of Huancayo,
the regional capital of Junin Department. Vehicle travel between Lima and Huancayo takes
approximately six hours due to the rough route over the Andes. From Huancayo, access is
gained via the Andean plateau by travelling southwest on formed gravel roads for a further
115km through the villages of Chupuro and Vista Alegre to the mine. This portion of the
journey takes approximately four hours by vehicle due to the rough road conditions.
5.2 Physiography and Climate
The Project lies at elevations between 4,500m and 5,050m above sea level, straddling the
main Andean divide. Despite the elevation, the topography is relatively subdued, comprising
a series of hills and ranges that rise approximately 500m above an undulating alpine plateau.
The Project experiences a high mountain dry tundra climatic regime. Precipitation is markedly
seasonal and total annual precipitation averages 730mm. The vegetation is solely comprised
of alpine tussock grassland across the plateau, with the adjacent hills and ridges essentially
barren of vegetation, particularly in areas of argillic alteration. Agricultural activities are
confined to extensive summer livestock grazing, principally sheep, cattle and camelids (alpaca
and llama).
5.3 Local Infrastructure and Services
A camp accommodating approximately 140 employees has been constructed to the east of
the plant facilities. Existing buildings includes the offices, warehouse, messing facilities a
soccer field and other buildings.
The principal mining related infrastructure comprise the waste dump, haul roads, mining
contractor workshop and related infrastructure, fuel farm and explosives storage facility.
Although poorly maintained, the access dirt road from Huancayo is passable in all weather
conditions. Power is provided from the grid via an overhead line a limited backup power
capacity is also available for the mine by way of diesel generator. Abundant water is available
from two main reservoirs feeding the regional hydro-electric system, along with numerous
natural alpine lakes and tarns. Huancayo represents the nearest centre providing goods and
services.

Coffey Mining Pty Ltd
Corihuarmi Gold Project – MINEWPER00466AE Page: 18 43-101 Technical Report – 6th April 2010
6 HISTORY
6.1 Exploration History
Between 1996 and 1997, Minera Andina de Exploraciones (Minandex) identified the Project
based on LandSat imagery colour anomalies defining the extensive alteration system.
Minandex completed geological mapping, chip-channel sampling and limited diamond core
drilling (3 holes; 775m), identifying the Susan and Diana zones.
The Project was held by Cardero Resource Corporation (Cardero) between 1998 and 2000,
with work variously completed in their own right and under joint venture arrangements with
Barrick Gold Corporation (Barrick) and Newmont Mining Corporation (Newmont). Exploration
involved geological mapping, an alteration study, portable infrared mineral analysis (PIMA), a
controlled source audio magnetotellurics (CSAMT) survey that was reinterpreted by Newmont,
and drilling to test the CSAMT anomalies (9 holes; 1,971.15m). Only one hole was drilled
near the north end of the Diana Zone and no drilling was completed at the Susan Zone. The
company concluded that the environment was not favourable for the development of large
zones of epithermal gold mineralization, electing to return the property to Minandex in late
2000.
MIRL acquired the project in 2002. Between 2003 and 2005, the company completed a
programme, primarily concentrating on the Susan and Diana zones, comprising geological
mapping, extensive horizontal and vertical chip-channel sampling, three phases of diamond
core drilling (53 holes; 3,551.95m), metallurgical testwork, geotechnical studies, internal and
independent resource estimates, and an internal feasibility study. An external feasibility study
was subsequently commissioned and completed by Kappes Cassiday and Associates (KCA)
in April 2006.
MIRL also initiated investigations into the potential for additional low grade mineralization
comprising a veneer of scree on the slopes directly beneath the Diana and Susan deposits.
The mineralization was delineated via a ground penetrating radar (GPR) survey, 625 samples
collected from surface pits on a 25m by 25m grid, along with 85 shallow RC drillholes
completed on a nominal 50m by 50m grid. The programme confirmed the presence of a
persistent blanket of generally low grade mineralization along the flanks of the Susan and, to
a lesser extent, Diana outcrops that may ultimately represent additional resources for the
proposed heap leach processing operations. This resource has been estimated by Coffey
Mining and is included in Section 17 of this report.
6.2 Mining History
Prior to the commencement of mining by MIRL only small scale artisan workings existed in the
area.

Coffey Mining Pty Ltd
Corihuarmi Gold Project – MINEWPER00466AE Page: 19 43-101 Technical Report – 6th April 2010
7 GEOLOGICAL SETTING
7.1 Regional Setting
The Project is situated within the Andean Cordillera, which lies between the Peru-Chile
oceanic trench to the west and the Brazilian Craton to the east. The Andes Range formed as
a result of the convergence between the oceanic Nazca Plate (of the Pacific Basin) and the
South American continent. The denser lower portion of the Nazca Plate was subducted
beneath the South American continent along the Peru-Chile Trench, resulting in crustal
melting and magmatic (volcanic) activity, while the lighter marine sediments of the upper
Nazca Plate were obducted onto the continental landmass, resulting in collision and
compression.
The Andean Cordillera consists of two parallel ranges, with the younger Western Cordillera
corresponding to a Cenozoic magmatic arc, while the Eastern Cordillera represents a zone of
progressive uplift since Permian times. The intervening zone is occupied by the Altiplano, a
high plateau of relatively subdued relief where inter-montaine basins were developed during
the Cenozoic period. The Western Cordillera and Altiplano host the majority of Peru’s
economically significant precious and base metal deposits, occurring in a series of
metallogenically distinct belts or domains as shown in Figure 7.1_1.
Figure 7.1_1
Figure Description
The Project is located at the northern extremity of the Southern Peru Epithermal Au-Ag Belt,
associated with middle to upper Tertiary volcanics and intrusives of the Western Cordillera.
These are separated from deformed Mesozoic sediments of the Altiplano immediately east of
the project area by a major northwest trending thrust.

Coffey Mining Pty Ltd
Corihuarmi Gold Project – MINEWPER00466AE Page: 20 43-101 Technical Report – 6th April 2010
7.2 Project Geology
The geological understanding of the Project is essentially confined to the central group of
tenements, referred to as the Main Block, which host all known Resources and Reserves, and
the majority of significant prospects.
The geology of the Main Block is dominated by a significant volcanic centre of Miocene to
Pliocene age, comprising a series of dacite and rhyodacite domes of the Caudalosa
Formation and broadly coeval volcanics of the overlying Astobamba Formation (Figure 7.2_1).
The dacite domes broadly define the margins of a collapsed caldera structure, measuring
some 4.5km by 3.5km and elongate in a north-northwest orientation. The overlying volcanics
variously comprise dacitic and andesitic flows, ignimbrites and pyroclastic tuffs that conform to
the dome margins.
Figure 7.2_1
Corihuarmi Project – Geology
The general structural orientation within the Corihuarmi area is consistent with the northwest
Andean trend, mimicked by fold axes within Mesozoic sediments to the east, the major thrust
separating these sediments from the younger volcanics, and the general orientation of the
alteration system and associated caldera structure within the volcanics themselves. A series
of east-west and northeast trending tensional structures appear to provide the focus for
breccia development, alteration and mineralization within the vicinity of dacite domes. These
high angle faults are variously characterised by either normal vertical or dextral horizontal
displacements.

Coffey Mining Pty Ltd
Corihuarmi Gold Project – MINEWPER00466AE Page: 21 43-101 Technical Report – 6th April 2010
8 DEPOSIT TYPES
The Susan and Diana Au oxide mineralization of Corihuarmi are associated with epithermal
deposit types. Epithermal gold deposits form in hydrothermal systems related to volcanic
activity. These systems, while active, discharge to the surface as hot springs or fumaroles.
Epithermal gold deposits occur largely in volcano-plutonic arcs (island arcs as well as
continental arcs) associated with subduction zones, with ages similar to those of volcanism.
The deposits form at shallow depth, <1km, and are hosted mainly by volcanic rocks.
There are two end-member styles of epithermal gold deposits, high sulfidation (HS) and low
sulfidation (LS). The two deposit styles form from fluids of distinctly different chemical
composition in contrasting volcanic environment. The Diana and Susan deposits are of the
HS style.
Examples of economically significant epithermal gold deposits are Yanacocha, Pierina and
Lagunas Norte in Peru, Pueblo Viejo in the Dominican Republic, Pascua-Lama, El Indio and
El Peñon in Chile, Veladero and Cerro Vanguardia in Argentina, Porgera and Ladolam in
Papua New Guinea, Bagio and Lepanto in the Philippines, McLaughlin, Round Mountain,
Summitville and Goldfields in the USA, and Emperor in Fiji.

Coffey Mining Pty Ltd
Corihuarmi Gold Project – MINEWPER00466AE Page: 22 43-101 Technical Report – 6th April 2010
9 MINERALIZATION
Mineralization identified to date within the Corihuarmi Project comprises a high sulphidation
epithermal precious metal system that formed at relatively shallow depth. Gold and silver
mineralization is essentially confined to remnant zones of silicification and brecciation that
dominantly lie along the northeast margin of the volcanic complex (Figure 9_1). Horizontal
metallogenic zonation provides evidence that this siliceous layer was once continuous,
effectively capping the hydrothermal system.
Figure 9_1
Corihuarmi Project – Main Block Geology
The most significant mineralization is associated with the Susan and Diana zones
(Figure 9_2), which comprise resistant remnant mineralized silicified bluffs separated by some
180m. The Susan deposit measures approximately 200m by 350m in size, being confined at
the margins by cliffs. The smaller Diana Zone is approximately 150m by 250m in area, and to
some extent remains open to the northwest and southeast along the ridge-line. The siliceous
layer is shallow dipping to sub-horizontally disposed, ranging in thickness from 10m to 75m,
and averaging approximately 45m.

Coffey Mining Pty Ltd
Corihuarmi Gold Project – MINEWPER00466AE Page: 23 43-101 Technical Report – 6th April 2010
Figure 9_2 Corihuarmi Project – Susan (right) and Diana (left) Zones
Drilling has defined a zone of higher relative grade (>1g/t Au) near the top of the Diana
deposit and immediately below a barren siliceous cap at the Susan deposit (Figure 9_3 and
Figure 9_4). These zones range from 5m to 50m in thickness and their attitude is consistent
with the sub-horizontal morphology of the exposures. The tenor of mineralization diminishes
rapidly below these higher grade zones, the exception being isolated intersections of higher
grade that are interpreted to represent a series of northwest and northeast trending faults that
acted as ‘feeder’ structures for multiple hydrothermal mineralising events.
The mineralized material is almost exclusively comprised of amorphous vuggy silica with the
dacite protore generally being modified beyond textural or mineralogical recognition.
Subordinate interstitial alunite increases in abundance towards the base of the mineralized
zones, while zones of annealed breccias and quartz veining attest to multiple episodes of
hydrothermal activity. The massive siliceous material grades laterally downwards into a zone
of intense silica-alunite alteration.
While the project resources and reserves are confined to the Susan and Diana zones, a
series of other siliceous exposures have been recognised elsewhere within the Main Block
tenements. These include the prospective Ely, Cayhua, Laura, Coyllor and Elena areas.

Coffey Mining Pty Ltd
Corihuarmi Gold Project – MINEWPER00466AE Page: 24 43-101 Technical Report – 6th April 2010
Figure 9_3 Corihuarmi Project - Susan Deposit – Representative Drill Section
Mapping has identified a zoned alteration halo that broadly conforms to the interpreted
caldera structure. The mineralogical zonation grades vertically downwards and laterally away
from the identified zones of mineralized silicic material comprising the remnant cap to the
hydrothermal system as shown in Figure 9_5. Immediately below and laterally away from the
exposures of vuggy silica is an extensive zone of silica-alunite alteration, which grades into a
silica-clay zone, essentially defining the caldera structure. This is surrounded by pervasive
argillic alteration that extends throughout remaining portions of the entire volcanic centre.
A distinctive metallogenic zonation also appears to define elements of the caldera structure, as
evident in a compilation of the various geochemical datasets as shown in Figure 9_6. The
caldera appears to be defined by an outer halo of anomalous zinc, along with an inner halo of
coincident barium, gold, arsenic, antimony, bismuth and mercury. Stronger copper and
molybdenum identified by drilling along the southern margin of the mineralized bodies is most
likely to represent root zone or feeder structures that transgress the dacite dome. An isolated
zone of propylitic alteration is mapped at the northern extremity of the structure. It is unclear,
however, if this is related to the same system or a preserved remnant of an earlier regional
alteration event that has been over-printed by the main mineralising system.

Coffey Mining Pty Ltd
Corihuarmi Gold Project – MINEWPER00466AE Page: 25 43-101 Technical Report – 6th April 2010
Figure 9_4 Corihuarmi Project - Diana Deposit – Representative Drill Section

Coffey Mining Pty Ltd
Corihuarmi Gold Project – MINEWPER00466AE Page: 26 43-101 Technical Report – 6th April 2010
Figure 9_5 Corihuarmi Project – Main Block Alteration
Figure 9_6
Corihuarmi Project – Main Block Metallogenic Zonation

Coffey Mining Pty Ltd
Corihuarmi Gold Project – MINEWPER00466AE Page: 27 43-101 Technical Report – 6th April 2010
10 EXPLORATION
Bedrock sampling, particularly chip channel sampling in conjunction with diamond core (DC)
and Reverse Circulation (RC) drilling have been the dominant exploration tools of MIRL for
defining Mineral Resources at the Diana and Susan Zones. In addition they have utilised
geological mapping, and geochemistry sampling, along with CSAMT geophysical surveys.
In addition to the main Susan and Diana current mine areas, the property includes the Laura,
Ely and Cayhua prospects that have been defined by a combination of soil geochemistry and
exploration diamond drilling. Results from the drilling have not been positive and as such no
further proposed drilling has been proposed by MIRL on these prospects.
Exploration surveys and interpretations completed to date within the Project have largely been
planned, executed and supervised by national MIRL personnel, supplemented by consultants
and contractors for more specialised or technical roles. The data is considered to be of good
quality (refer to Sections 11 to 14).
Coffey Mining considers the exploration targets justify further exploration as drilling of these
epithermal targets to date is minimal and there is potential to identify additional mineralization
in the MIRL permits.

Coffey Mining Pty Ltd
Corihuarmi Gold Project – MINEWPER00466AE Page: 28 43-101 Technical Report – 6th April 2010
11 DRILLING
11.1 Introduction
The principal methods used for exploration drilling at Corihuarmi have been diamond core
(DC) drilling. Reverse circulation (RC) drilling has also been utilised in grade control definition
and drilling of the Scree mineralization. In addition, 60 surface trenches were completed,
totalling 4,120m in length.
Table 11.1_1 summarises pertinent drilling statistics. The Susan and Diana deposits have
been drilled at a nominal spacing of 25m to 50m.
Table 11.1_1
Corihuarmi Project
Summary Drilling Statistics
Company/Year Drillholes Metres Contractor Drill Rig Sample Size
Minandex (1997) 3 755 Unknown Longyear LF70 Unknown
Cardero (2000) 9 1975,15 Unknown Unknown HQ, NQ MIRL (2003 - 2010) 109 6621 MDH Longyear 34 HQ
MIRL (2005 - 2010) 148 8190 Not provided Not provided RC – 5 ¼
MIRL (2005 - 2010) 18955 97743 Not provided Not provided Blast Hole -6’
11.2 Drilling Procedures
11.2.1 Diamond Drilling Procedures
All diamond drilling was completed by MDH contractor. Most diamond core holes were drilled
HQ diameter.
Based upon inspection of various core trays available on site and review of the available
reports, Coffey Mining considers that diamond core drilling has been carried out to expected
industry standards. One issue that has potentially affected the underestimation of gold from
the initial feasibility resource estimate is that the diamond drilling and subsequent cutting of
the core has effectively washed some of the fines material out of the sample. These fines can
preferentially contain gold and as a result the sample method may underestimate the
contained gold.
11.2.2 Reverse Circulation Drilling Procedures
Sample recoveries were not recorded by MIRL although were reportedly high. Coffey Mining
is unable to validate the recoveries of this RC drilling.
11.2.3 Blasthole Drilling
Blasthole drilling is used for blasting and also for grade control sampling. The holes are all
vertical to about 5m depth and are rotary air blast samples which effectively result in wall
contamination.

Coffey Mining Pty Ltd
Corihuarmi Gold Project – MINEWPER00466AE Page: 29 43-101 Technical Report – 6th April 2010
11.3 Drilling Orientation
DC and RC Drillholes were generally drilled to north northwest at between -34 degrees to -
90 degrees dip. Holes were targeted to perpendicularly intersect the main trend of
mineralization. The Diana and Susan deposits have been drilled at a nominal spacing of 25m
to 50m.
11.4 Surveying Procedures
11.4.1 Accuracy of Drillhole Collar Locations
Drillhole collars were surveyed by MIRL surveyors using total station. Survey accuracy is
reported as ±0.5m.
Accuracy of the survey measurements meets acceptable industry standards.
11.4.2 Downhole Surveying Procedures
No downhole surveys have been undertaken. The deviation is however expected to be
limited as the holes are generally less than 100m.
Coffey Mining would expect the short holes to have minimal deviation but have recommended
to MIRL that in future they undertake surveys at the commencement of drilling to verify this.

Coffey Mining Pty Ltd
Corihuarmi Gold Project – MINEWPER00466AE Page: 30 43-101 Technical Report – 6th April 2010
12 SAMPLING METHOD AND APPROACH
12.1 Diamond Core Sampling
HQ and NQ diameter diamond core was sampled at lengths on average of 2m. Samples
were numbered and collected in individual plastic bags with sample tags inserted inside.
Core mark-up and sampling has been conventional and appropriate. Core is not orientated
for structural measurements. Coffey Mining recommends orienting core in future.
12.2 Reverse Circulation Sampling
RC samples were collected at 5m intervals and quartered in riffle splitters. Sub-samples
weighed approximately 1kg and were collected in cloth-lined sample bags.
Coffey Mining considers that 5m composites are too big to accurately and representatively
split down to 1kg sub samples. The mineralization shows moderate homogeneity and Coffey
recommend that shorter sample lengths (Commencing with 1m then potentially trialling 2m
intervals be used in future).
The samples for the Scree RC drilling were collected on 1m and 2m intervals.
12.3 Blast Hole Sampling
Smee (2009) observed the blasthole sampling methodology and made the following
comments:
“Samples are taken with a small blasthole drill that is equipped with a suction device at the
head that removes the finer particles from the cuttings as they are being blown up the hole.
The cuttings are sent to a cyclone that dumps the coarser fragments into a bucket, and the
fine particles are sent down a pipe to be discharged at the rear of the drill. That is, the sample
is divided into three fractions according to particle size.
This division of sample according to particle size may compromise the validity of the grade
estimate. It would be far better to have the blasthole drill produce a single pile of sample at the
drill head. The normal method of collecting blasthole samples is to place a skirt around the
head to prevent cuttings from flying all over and to protect the cuttings from wind and water
loss. Pie samplers are used to collect a representative sample of the cuttings. The pie
samplers are inserted under the skirt before the hole is started, and removed when the proper
depth of hole is reached. The sampler can be removed before the over drill is done so as to
alleviate the potential of dilution from the overdrill cuttings.”

Coffey Mining Pty Ltd
Corihuarmi Gold Project – MINEWPER00466AE Page: 31 43-101 Technical Report – 6th April 2010
12.4 Surface Trench Sampling
Digging and sampling procedures for the surface trenches were not available. The trench
data was used in a very broad manner to help model the mineralized zones, but was not
included in the actual resource estimation completed by Miguel Zulueta Torres on behalf of
MIRL (refer to Section 17.2.
RSG Global (now Coffey Mining) undertook a number of analyses in the 2006 Resource
estimate to establish if trench/channel samples are materially different to those obtained from
drillholes.
Coffey Mining did not identify any conclusive and consistent bias between the average trench
and diamond drilling grades, and between sampling with significantly different volumetric
support and orientations. Based on this analysis, Coffey Mining did not identify any reason for
the trench data to be excluded from the resource estimate.
12.5 Logging
Diamond core was logged in detail for geological, structural and geotechnical information,
including rock quality designation (RQD) and core recovery. Whole core was routinely
photographed. Review by Coffey Mining of selected geological logs against actual core
showed no significant discrepancies or inconsistencies.
Diamond core and RC chip logging have been conventional and appropriate.

Coffey Mining Pty Ltd
Corihuarmi Gold Project – MINEWPER00466AE Page: 32 43-101 Technical Report – 6th April 2010
13 SAMPLE PREPARATION, ANALYSES AND SECURITY
13.1 Sample Security
Reference material is retained and stored in Lima, including half-core and photographs
generated by diamond drilling, and duplicate pulps and residues of all submitted samples. All
pulps are stored in Lima at the MIRL storage base.
13.2 Sample Preparation and Analysis
13.2.1 CIMM Laboratory
The CIMM laboratory was responsible for the preparation and analysis of the assay samples
taken from the resource holes. The procedure for this laboratory is described below.
Samples were digitally weighed, dried to a maximum of 120ºC (for wet samples), crushed to
70% < 2mm (10 mesh), riffle split to 250g, and pulverised to 85% < 75µm (200 mesh). 50g
pulps were submitted for chemical analysis.
Chemical analysis consisted of fire assay (FA) with atomic absorption spectrometry (AAS) finish,
using 50g sub-samples. Those samples that analysed ≥ 5g/t Au were analysed using gravimetric
methods.
13.2.2 Corihuarmi Mine Assay Laboratory
The Mine laboratory was commissioned in 2007 and commenced analysis of all blast hole
sampled for grade control purposes. (CIMM continued to analyses for the resources holes)
Smee (Feb 2009) completed a mine laboratory audit and made a number of recommendations
to improve the mine laboratory procedures. His recommendations included:
� Replace the old jaw crusher
� Replace pulverisers with LM-2 units
� Increase compressed air for cleaning units
� Insert preparation duplicates 1 in 30
� Use certified weights for the microbalance
� Improve overall ventilation and extraction and save the crushed reject
� Utilise certified standards
MIRL had implemented these changes which were in place during the Coffey Mining visit in
May 2009. The laboratory has a similar methodology to the CIMM laboratory including:-
� 500g sample pulverised to 90% passing #200
� 50g sample digested by aqua regia then analysed by 50g Fire Assay with an AAS finish.
13.3 Adequacy of Procedures
Coffey Mining considers the sample preparation to be conventional with no issues identified.

Coffey Mining Pty Ltd
Corihuarmi Gold Project – MINEWPER00466AE Page: 33 43-101 Technical Report – 6th April 2010
14 DATA VERIFICATION
14.1 AMEC Review 2006
In January 2006 AMEC completed a review of the QAQC data up until that date. The study
into the QAQC of the collected data for the Project included the history of exploration, drilling,
sample collection, sample preparation and analysis and documents the results of AMEC’s
investigation into the data quality and data validation. The following summarizes their key
findings:
� AMEC identified inconsistencies in the location of drillholes but concluded these were not
significant as the differences were of 1 to 2m in any direction.
� Downhole surveys were not obtained for all drillholes. AMEC concluded that significant
deviations are unlikely given most drillholes were of less 100m in depth.
� AMEC assessed the results of the final MIRL QAQC program and concluded that in
general results were within acceptable limits of ±10%.
� For the trench and channel sampling, AMEC identified a number of inconsistencies.
MIRL subsequently resurveyed their locations and modified the database accordingly to
resolve the inconsistencies.
� AMEC have stated that no QAQC was completed on the surface channel samples and
suggested that perhaps the area of influence of these samples be restricted for the
purpose of grade estimation or alternatively excluded all together.
� Several errors in both drillhole and trench/channel information were identified by AMEC
during the review of the project’s database. MIRL has reported that it has been able to
resolve a majority of the issues.
AMEC have acknowledged that MIRL has attempted to resolve many of the anomalies and
issues identified during their study but consider most not to be of a material impact for
resource estimation. The exception is the reliability of the surface trench samples.
14.2 Standards and Duplicates Review
Coffey Mining completed a review of the available standards and duplicates data using the
QC Assure statistical software. MIRL never utilised a QAQC program up until 2005 at which
time it commenced inserting standards, blanks and duplicates at a frequency of 1 in 30.
14.2.1 MIRL Standards
MIRL has utilized 11 standards that were certified by the Actlab laboratory in Lima. The
standards were prepared with mineralized rock from Corihuarmi.
Coffey Mining has not been provided the results for A9051, B9052 and C9053 but it was
reviewed by AMEC in 2005 and AMEC reported no outliers.

Coffey Mining Pty Ltd
Corihuarmi Gold Project – MINEWPER00466AE Page: 34 43-101 Technical Report – 6th April 2010
Table 14.2.1_1
Corihuarmi Project
Standards Utilized by Minera Submitted Standards
Standard (ppm)
Expected Value (EV)
+/-10% (EV) Failed No. of
Analyses Min. (%)
Max. (%)
Mean (%)
% Within +/- 10 of EV
% RSD (from EV)
% Bias (from EV)
A9051 0.74 0.66 to 0.81 0 10 100 5
B9052 0.429 0.38 to 0.47 0 5 100 8.2
C9053 0.326 0.29 to 0.36 0 11 100 6.2
A 1.168 1.05 to 1.28 3 23 0.94 1.17 1.06 87
B 1.133 1.02 to 1.25 3 23 0.96 1.14 1.04 87
C 1.59 1.43 to 1.75 3 24 1.04 1.71 1.43 88
D 10.035 9.03 to 11.04 2 23 10.01 10.57 10.26 91
STD9051 0.752 0.68 to 0.83 1 14 0.6 0.85 0.76 93
STD9052 0.412 0.37 to 0.45 10 12 0.39 0.51 0.48 17
STD9053 0.327 0.29 to 0.36 1 15 0.1 0.38 0.32 93
STD9054 Blank <0.05 0 16 100
Coffey Mining reviewed the remaining standards results. Generally the laboratory results
returned for these standards show acceptable accuracy with some obvious outliers that could be
attributed to sample mix-ups and most just outside the 10% threshold applied by Coffey Mining.
STD9052 was consistently high but this could be a factor of the quality of the standard used.
Coffey Mining recommends that MIRL purchase a sequence of commercially available certified
standards which undergo more rigorous certification processes under a round robin program.
14.2.2 MIRL Duplicate Analysis
Diamond Core Field Duplicates
A field duplicate was completed every 20 to 30 samples by MIRL. The method explained by
MIRL was to randomly select one sample interval every 20m and to break it up using a
hammer into small fragments <2cm, then to split these either by parting manually or via a
splitter. Coffey Mining considers this practice flawed in that it is susceptible to human error
and does not guarantee the crushing of the core to <2mm and to equal split.
Coffey Mining compared the results using the QC Assure software. The precision returned is
poor as shown in Figure 14.2.2_1 with 69% of the data within 30% HARD precision limits
(305 samples in dataset).
This is possibly a reflection of the poor methodology of preparation explained above.
Diamond Core Pulp Duplicate
During the Corihuarmi Drilling Program, CIMM laboratory provided two pulps obtained from
each sampled interval. MIRL personnel recoded all the samples and regularly sent the second
pulp of the same sample as a Quality Control Procedure, with a new code, so it was blind to the
laboratory.
The pulp duplicates returned a very good precision (104 samples) of 96% passing 10% HARD.

Coffey Mining Pty Ltd
Corihuarmi Gold Project – MINEWPER00466AE Page: 35 43-101 Technical Report – 6th April 2010
Figure 14.2.2_1 Diamond Core Field Duplicates
Au_ORIG Au_DUP Units ResultNo. Pairs: 305 305 Pearson CC: 0.71Minimum: 0.00 0.00 g/t Spearman CC: 0.88Maximum: 9.87 23.29 g/t Mean HARD: 25.12Mean: 0.34 0.49 g/t Median HARD: 17.17Median 0.04 0.04 g/tStd. Deviation: 1.00 2.26 g/t Mean HRD: 1.14Coefficient of Variation: 2.92 4.58 Median HRD 0.00
0
50
100
0.001 0.01 0.1 1 10 100
HARD (%)
Mean of Data Pair (g/t)
Mean vs. HARD Plot
(DC Field Duplicate)
Mean HARD: 25.12 Median HARD: 17.17Precision: 30%
0
50
100
0 10 20 30 40 50 60 70 80 90 100
HARD (%)
Rank (%)
Rank HARD Plot
(DC Field Duplicate)
Precision: 30%
68.85% of data are within
Precision limits
0
5
10
-1.0 0.0 1.0
Frequency (%)
HRD (/100)
HRD Histogram
(DC Field Duplicate)
Mean HRD: 1.14 Median HRD: 0.00Precision: +/-30.00%
-100
-50
0
50
100
0.001 0.01 0.1 1 10 100
HRD (%)
Mean of Data Pair (g/t)
Mean vs. HRD Plot
(DC Field Duplicate)
Mean HRD: 1.14 Median HRD: 0.00Precision: +/-30%
0.0001
0.01
1
100
0.001 0.01 0.1 1 10 100
Absolute Difference (g/t)
Mean of Data Pair (g/t)
T & H Precision Plot (Assay Pairs)
(DC Field Duplicate)
10% 20% 30% 50%
0.0001
0.001
0.01
0.1
1
0.001 0.01 0.1 1 10
Median AD (g/t)
Grouped Mean of Pair (g/t)
T & H Precision Plot (Grouped Pairs)
(DC Field Duplicate)
10% 20% 30% 50%
-10
0
10
20
30
0 10 20 30
Au_DUP (g/t)
Au_ORIG (g/t)
Correlation Plot
(DC Field Duplicate)
P.CC= 0.71 S.CC= 0.88 Ref. Liney = 1.61x -0.06
-10
0
10
20
30
0 10 20 30
Au_DUP (g/t)
Au_ORIG (g/t)
QQ Plot
(DC Field Duplicate)
Ref. Line y = 2.10x -0.23
Summary(DC Field Duplicate)
Printed: 21-Oct-2009 15:25:05 Data Imported: 21-Oct-2009 15:13:48 Page 1

Coffey Mining Pty Ltd
Corihuarmi Gold Project – MINEWPER00466AE Page: 36 43-101 Technical Report – 6th April 2010
Figure 14.2.2_2 Corihuarmi Project- Diamond Core Pulp Duplicate
Au_ORIG Au_DUP Units ResultNo. Pairs: 104 104 Pearson CC: 1.00Minimum: 0.01 0.01 g/t Spearman CC: 0.99Maximum: 1.16 1.18 g/t Mean HARD: 1.98Mean: 0.16 0.16 g/t Median HARD: 0.82Median 0.10 0.11 g/tStd. Deviation: 0.17 0.17 g/t Mean HRD: -0.14Coefficient of Variation: 1.11 1.11 Median HRD 0.00
0
10
20
30
40
0.001 0.01 0.1 1 10
HARD (%)
Mean of Data Pair (g/t)
Mean vs. HARD Plot
(DC Pulp Duplicate)
Mean HARD: 1.98 Median HARD: 0.82Precision: 10%
0
50
100
0 10 20 30 40 50 60 70 80 90 100
HARD (%)
Rank (%)
Rank HARD Plot
(DC Pulp Duplicate)
Precision: 10%
96.15% of data are within
Precision limits
0
50
100
-1.0 0.0 1.0
Frequency (%)
HRD (/100)
HRD Histogram
(DC Pulp Duplicate)
Mean HRD: -0.14 Median HRD: 0.00Precision: +/-10.00%
-40
-20
0
20
0.001 0.01 0.1 1 10
HRD (%)
Mean of Data Pair (g/t)
Mean vs. HRD Plot
(DC Pulp Duplicate)
Mean HRD: -0.14 Median HRD: 0.00Precision: +/-10%
0.0001
0.001
0.01
0.1
1
0.001 0.01 0.1 1 10
Absolute Difference (g/t)
Mean of Data Pair (g/t)
T & H Precision Plot (Assay Pairs)
(DC Pulp Duplicate)
10% 20% 30% 50%
0.0001
0.001
0.01
0.1
1
0.001 0.01 0.1 1 10
Median AD (g/t)
Grouped Mean of Pair (g/t)
T & H Precision Plot (Grouped Pairs)
(DC Pulp Duplicate)
10% 20% 30% 50%
0.0
0.5
1.0
1.5
2.0
0.0 0.2 0.4 0.6 0.8 1.0 1.2 1.4 1.6 1.8 2.0
Au_DUP (g/t)
Au_ORIG (g/t)
Correlation Plot
(DC Pulp Duplicate)
P.CC= 1.00 S.CC= 0.99 Ref. Liney = 0.99x + 0.00
0.0
0.5
1.0
1.5
2.0
0.0 0.2 0.4 0.6 0.8 1.0 1.2 1.4 1.6 1.8 2.0
Au_DUP (g/t)
Au_ORIG (g/t)
QQ Plot
(DC Pulp Duplicate)
Ref. Line y = 1.00x -0.00
Summary(DC Pulp Duplicate)
Printed: 21-Oct-2009 15:56:35 Data Imported: 21-Oct-2009 15:13:48 Page 1

Coffey Mining Pty Ltd
Corihuarmi Gold Project – MINEWPER00466AE Page: 37 43-101 Technical Report – 6th April 2010
Figure 14.2.2_3 RC Field Duplicates
Au_ORIG Au_DUP Units ResultNo. Pairs: 190 190 Pearson CC: 0.95Minimum: 0.01 0.02 g/t Spearman CC: 0.99Maximum: 4.40 7.07 g/t Mean HARD: 5.63Mean: 0.39 0.40 g/t Median HARD: 2.91Median 0.22 0.21 g/tStd. Deviation: 0.58 0.70 g/t Mean HRD: 1.08Coefficient of Variation: 1.47 1.76 Median HRD 0.05
0
10
20
30
40
0.01 0.1 1 10
HARD (%)
Mean of Data Pair (g/t)
Mean vs. HARD Plot
(RC Field Duplicate)
Mean HARD: 5.63 Median HARD: 2.91Precision: 30%
0
50
100
0 10 20 30 40 50 60 70 80 90 100
HARD (%)
Rank (%)
Rank HARD Plot
(RC Field Duplicate)
Precision: 30%
97.89% of data are within
Precision limits
0
20
40
60
-1.0 0.0 1.0
Frequency (%)
HRD (/100)
HRD Histogram
(RC Field Duplicate)
Mean HRD: 1.08 Median HRD: 0.05Precision: +/-30.00%
-40
-20
0
20
40
0.01 0.1 1 10
HRD (%)
Mean of Data Pair (g/t)
Mean vs. HRD Plot
(RC Field Duplicate)
Mean HRD: 1.08 Median HRD: 0.05Precision: +/-30%
0.001
0.01
0.1
1
10
0.01 0.1 1 10
Absolute Difference (g/t)
Mean of Data Pair (g/t)
T & H Precision Plot (Assay Pairs)
(RC Field Duplicate)
10% 20% 30% 50%
0.001
0.01
0.1
1
0.01 0.1 1 10
Median AD (g/t)
Grouped Mean of Pair (g/t)
T & H Precision Plot (Grouped Pairs)
(RC Field Duplicate)
10% 20% 30% 50%
-5
0
5
10
0 1 2 3 4 5 6 7 8 9 10
Au_DUP (g/t)
Au_ORIG (g/t)
Correlation Plot
(RC Field Duplicate)
P.CC= 0.95 S.CC= 0.99 Ref. Liney = 1.16x -0.05
-5
0
5
0 1 2 3 4 5 6 7 8
Au_DUP (g/t)
Au_ORIG (g/t)
QQ Plot
(RC Field Duplicate)
Ref. Line y = 1.18x -0.06
Summary(RC Field Duplicate)
Printed: 21-Oct-2009 15:43:09 Data Imported: 21-Oct-2009 15:13:48 Page 1

Coffey Mining Pty Ltd
Corihuarmi Gold Project – MINEWPER00466AE Page: 38 43-101 Technical Report – 6th April 2010
Figure 14.2.2_4 Corihuarmi Project- RC Pulp Duplicate
Au_ORIG Au_DUP Units ResultNo. Pairs: 40 40 Pearson CC: 1.00Minimum: 0.02 0.01 g/t Spearman CC: 1.00Maximum: 6.90 6.77 g/t Mean HARD: 2.82Mean: 0.66 0.62 g/t Median HARD: 1.57Median 0.21 0.20 g/tStd. Deviation: 1.24 1.18 g/t Mean HRD: 0.68Coefficient of Variation: 1.89 1.89 Median HRD 0.79
0
5
10
15
20
0.01 0.1 1 10
HARD (%)
Mean of Data Pair (g/t)
Mean vs. HARD Plot
(RC Pulp Duplicates)
Mean HARD: 2.82 Median HARD: 1.57Precision: 10%
0
50
100
0 10 20 30 40 50 60 70 80 90 100
HARD (%)
Rank (%)
Rank HARD Plot
(RC Pulp Duplicates)
Precision: 10%
95.00% of data are within
Precision limits
0
20
40
60
80
-1.0 0.0 1.0
Frequency (%)
HRD (/100)
HRD Histogram
(RC Pulp Duplicates)
Mean HRD: 0.68 Median HRD: 0.79Precision: +/-10.00%
-20
-10
0
10
20
0.01 0.1 1 10
HRD (%)
Mean of Data Pair (g/t)
Mean vs. HRD Plot
(RC Pulp Duplicates)
Mean HRD: 0.68 Median HRD: 0.79Precision: +/-10%
0.0001
0.001
0.01
0.1
1
10
0.01 0.1 1 10
Absolute Difference (g/t)
Mean of Data Pair (g/t)
T & H Precision Plot (Assay Pairs)
(RC Pulp Duplicates)
10% 20% 30% 50%
0.001
0.01
0.1
1
0.01 0.1 1 10
Median AD (g/t)
Grouped Mean of Pair (g/t)
T & H Precision Plot (Grouped Pairs)
(RC Pulp Duplicates)
10% 20% 30% 50%
0
2
4
6
8
0 1 2 3 4 5 6 7 8
Au_DUP (g/t)
Au_ORIG (g/t)
Correlation Plot
(RC Pulp Duplicates)
P.CC= 1.00 S.CC= 1.00 Ref. Liney = 0.95x + 0.00
0
2
4
6
8
0 1 2 3 4 5 6 7 8
Au_DUP (g/t)
Au_ORIG (g/t)
QQ Plot
(RC Pulp Duplicates)
Ref. Line y = 0.95x + 0.00
Summary(RC Pulp Duplicates)
Printed: 21-Oct-2009 15:45:15 Data Imported: 21-Oct-2009 15:13:48 Page 1

Coffey Mining Pty Ltd
Corihuarmi Gold Project – MINEWPER00466AE Page: 39 43-101 Technical Report – 6th April 2010
RC Field Duplicates
A RC field duplicate is completed every 30 samples by MIRL. This field duplicate is complete
on the final 5kg sample remaining after reducing from 5m. This is not a true reflection of the
precision of a 5m composite but a reflection of a 5kg composite. To complete a true field
duplicate Coffey Mining would recommend that the duplicate is created in the same method
as the original sample.
Coffey Mining compared the data using the QC Assure software. The RC Field Duplicate
returned a very good precision (190 samples) of 98% passing 30% HARD. This reflects that
the precision of splitting a 5kg sample is very good but as explained above does not reflect
the 5m samples. Coffey Mining recommends that a maximum 2m composite is used in future.
RC Pulp Duplicate
During the Corihuarmi drilling program, CIMM laboratory provided two pulps obtained from
each sampled interval. MIRL personnel recoded all the samples and regularly sent the
second pulp of the same sample as a Quality Control Procedure, with a new code, so it was
blind to the laboratory.
The RC pulp duplicates returned a very good precision (40 samples) of 96% passing 10% HARD.
14.3 Verification Sampling
Independent verification sampling has not been carried out by Coffey Mining as this is an
operating mine.
14.4 Adequacy of Procedures
Up until 2005 MIRL had no QAQC program in place. A comprehensive study was undertaken
by AMEC at this time including some umpire assaying of pulps. AMEC did not identify any
material issues.
Coffey Mining believes that the field duplicate results are not appropriately reflecting the 5m
composite methodology and recommends reducing the composite length of RC to a maximum
of 2m, given the style of gold mineralization
Coffey Mining has reviewed the available QAQC data from MIRL and can conclude that
although there are a number of deficiencies in the methodologies that no material flaws were
identified.
Coffey Mining recommends that although not practical given the stage of mining at
Corihuarmi, that in future twin holes of the DC and the RC be undertaken to identify if any
washing of gold bearing fines is occurring that will result in a negative gold bias.

Coffey Mining Pty Ltd
Corihuarmi Gold Project – MINEWPER00466AE Page: 40 43-101 Technical Report – 6th April 2010
15 ADJACENT PROPERTIES
There are no advanced gold properties in the immediate vicinity of Corihuarmi.
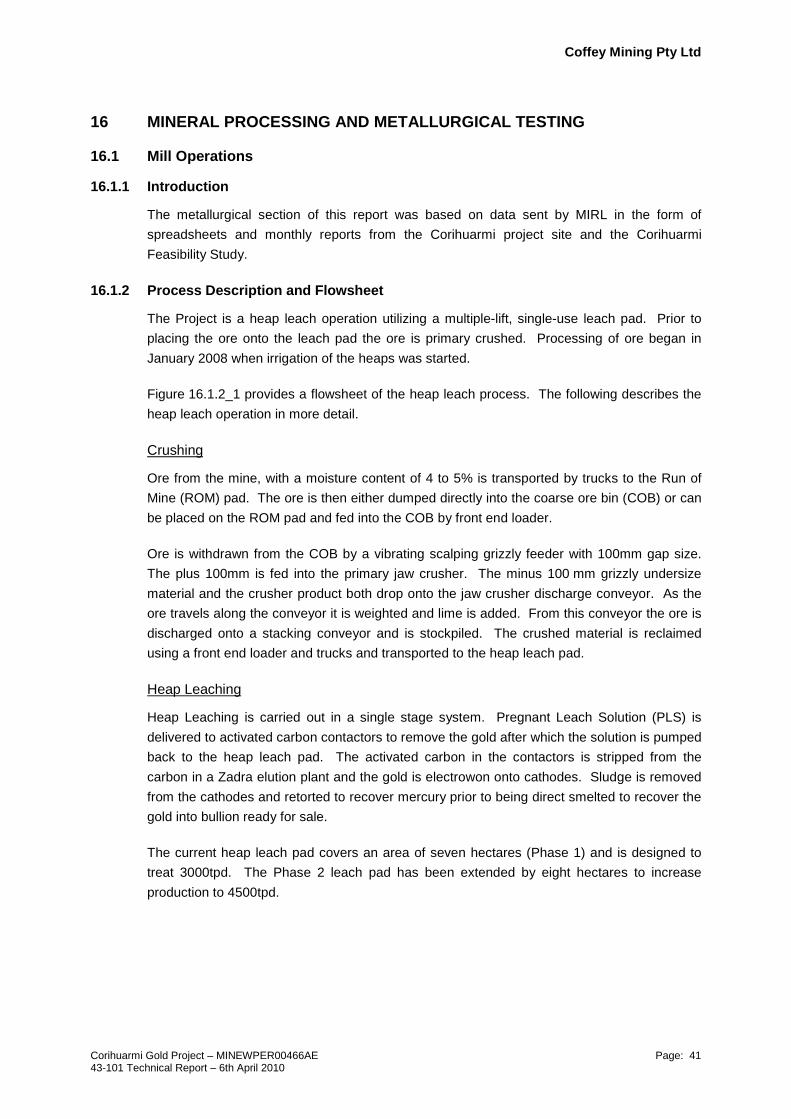
Coffey Mining Pty Ltd
Corihuarmi Gold Project – MINEWPER00466AE Page: 41 43-101 Technical Report – 6th April 2010
16 MINERAL PROCESSING AND METALLURGICAL TESTING
16.1 Mill Operations
16.1.1 Introduction
The metallurgical section of this report was based on data sent by MIRL in the form of
spreadsheets and monthly reports from the Corihuarmi project site and the Corihuarmi
Feasibility Study.
16.1.2 Process Description and Flowsheet
The Project is a heap leach operation utilizing a multiple-lift, single-use leach pad. Prior to
placing the ore onto the leach pad the ore is primary crushed. Processing of ore began in
January 2008 when irrigation of the heaps was started.
Figure 16.1.2_1 provides a flowsheet of the heap leach process. The following describes the
heap leach operation in more detail.
Crushing
Ore from the mine, with a moisture content of 4 to 5% is transported by trucks to the Run of
Mine (ROM) pad. The ore is then either dumped directly into the coarse ore bin (COB) or can
be placed on the ROM pad and fed into the COB by front end loader.
Ore is withdrawn from the COB by a vibrating scalping grizzly feeder with 100mm gap size.
The plus 100mm is fed into the primary jaw crusher. The minus 100 mm grizzly undersize
material and the crusher product both drop onto the jaw crusher discharge conveyor. As the
ore travels along the conveyor it is weighted and lime is added. From this conveyor the ore is
discharged onto a stacking conveyor and is stockpiled. The crushed material is reclaimed
using a front end loader and trucks and transported to the heap leach pad.
Heap Leaching
Heap Leaching is carried out in a single stage system. Pregnant Leach Solution (PLS) is
delivered to activated carbon contactors to remove the gold after which the solution is pumped
back to the heap leach pad. The activated carbon in the contactors is stripped from the
carbon in a Zadra elution plant and the gold is electrowon onto cathodes. Sludge is removed
from the cathodes and retorted to recover mercury prior to being direct smelted to recover the
gold into bullion ready for sale.
The current heap leach pad covers an area of seven hectares (Phase 1) and is designed to
treat 3000tpd. The Phase 2 leach pad has been extended by eight hectares to increase
production to 4500tpd.

Coffey Mining Pty Ltd
Corihuarmi Gold Project – MINEWPER00466AE Page: 42 43-101 Technical Report – 6th April 2010
Figure 16.1.2_1 Process Flowsheet

Coffey Mining Pty Ltd
Corihuarmi Gold Project – MINEWPER00466AE Page: 43 43-101 Technical Report – 6th April 2010
Trucks enter the leach pad via a ramp at one end and dump the ore within one to two metres
from the edge of the heap. A bulldozer is then used to push the material over the edge to
achieve an even surface over the top at the lift height of eight metres.
The leach pad has a polyethylene geomembrane layer on the base and is divided into cells
with an average area of 2,000m². Each cell holds 20,000 tonnes of ore.
Irrigation of the cells begins with the primary pipe network, consisting of a barren solution
tank, 200HP pump and 10” Ø HDPE. This line is located in lined channel and runs to a
manifold at the top of the heap. From the manifold the secondary pipe network completes the
irrigation. The secondary pipe network consists of a 4” Ø Lay Flat pipes running down the
leaching cells. Each Lay Flat pipe has hoses branching from them with drippers for irrigation.
Sprinklers that are connected to the pipes have been in use since 2008 as a means of
increasing the production rate to 4500t/d. The heap is irrigated at a rate of 10Lt/h/m².
Caustic soda is added to the barren solution tank to maintain the pH of the solution between
10.0 and 10.5 to avoid cyanide losses. Cyanide is also added to the barren solution tank to
maintain a concentration of 200ppm
The solution that percolates through the heap is collected by the underdrainage piping
network which is connected to two HDPE pipes that transfer the solution to the Pregnant
Leach Solution (PLS) pond. From the PLS pond the solution is pumped to the adsorption
circuit. The adsorption circuit is filled with activated carbon. The activated carbon adsorbs
the gold from solution and the barren solution (BS) exiting the adsorption circuit gravity flows
back to the barren solution tank and is used for re-irrigating the heap again. The leaching
cycle is completed in 90 days.
Anti-scalant is added to the barren solution to reduce the formation of scales on the irrigation
pipes, heap top and the activated carbon.
An excess solution (storm water) pond is included to contain leach solution in excess of that
required for normal operations due to storm events. Excess solution will ultimately return to
the barren tank as makeup solution to replace water lost in the process due to evaporation
and wetting of the ore.
Adsorption and Elution
The present adsorption plant is capable of treating 200m³/hr of solution pregnant. The circuit
consists of 5 cascade columns configure in series each containing 2t of activated carbon. The
activated carbon adsorbs the cyanided gold complexes, silver and other metals in solution to
remove them from the solution. When the carbon is loaded up 8,000g/t Au in the first carbon
column, the carbon is removed from the column and sent to the elution circuit. Once this
column is empty of carbon, carbon from the second column is loaded until it also reaches
approximately 8,000g/t Au. All of the columns in the circuit will be cycled in series in this
manner, with any of the columns being able to used to load gold prior to stripping. The last
tank in the series is always filled with activated carbon that has been stripped and reactivated.

Coffey Mining Pty Ltd
Corihuarmi Gold Project – MINEWPER00466AE Page: 44 43-101 Technical Report – 6th April 2010
Stripping of the gold from the carbon (elution) is conducted in a 2t Zadra circuit at a
temperature of 135ºC. Barren solution, from the desportion tank, is pumped through a
secondary heat exchanger and then into the primary heat exchanger prior to entering the
column. The solution exiting the top of the column passed through the other side of the
secondary heat exchanger, through a cooling heat exchanger to drop the temperature to
65ºC. After cooling the solution passes into the electrowinning cell where the gold and any
silver that is present is electrowon. The solution exiting the cell gravitates into the desorption
tank and is then reused for stripping the gold from the carbon. The total time for desorption
ranges between 11 hours and 13 hours.
The activated carbon is reactivated in a regeneration kiln followed by acid washing prior to
being cycled back to the adsorption columns for further adsorption of gold and silver.
Harvesting and Smelting
The electrowinning cell contains 18 stainless steel cathodes and 19 anodes. The loaded
cathodes are washed with high pressure water to remove the gold and silver from the
surfaces. The precious metals are collected and filtrated and placed in a retort to remove any
mercury that was collected in the process. The mercury free material is then smelted in a
tilting furnace to produce Doré.
16.1.3 Plant Production
Ore to Heap Leach Pad
The ore placed on the heap leach pad since inception in January 2008 up to February 2010 is
presented in Figure 16.1.3_1 in tonnes per month and tonnes to date.
Initially ore placement on the leach pad was slow due to commissioning issues such as
having a tight mining area and oversize in the ore to feed to the crusher.
After April 2009 the rate of placement has exceeded the budget every month and hence the
yearly budget. In the last month of 2008 the placement rate slowed again due to cessation of
mining as the budgeted tonnes had been exceeded.
In early 2009 the placement was slow as a priority was placed on mining waste from the
Susan pit to reach the high grade benches.

Coffey Mining Pty Ltd
Corihuarmi Gold Project – MINEWPER00466AE Page: 45 43-101 Technical Report – 6th April 2010
Figure 16.1.3_1 Ore placed on Heap Leach Pad
-
20,000
40,000
60,000
80,000
100,000
120,000
140,000
160,000
Ore
on
Leac
h P
ad (T
onne
s pe
r mon
th)
Date
Actual Tonnes Processed Budgeted Tonnes Processed
0
500,000
1,000,000
1,500,000
2,000,000
2,500,000
3,000,000
Cum
ulat
ive
Ore
on
Leac
h P
ad (t
onne
)
Date
Cumulative Actual Tonnes Processed Cumultaive Budget Tonnes Processed

Coffey Mining Pty Ltd
Corihuarmi Gold Project – MINEWPER00466AE Page: 46 43-101 Technical Report – 6th April 2010
Gold in Ore
Figure 16.1.3_2 shows the gold in the ore compared with the budgeted gold since January
2008.to date.
Figure 16.1.3_2
Gold in Ore Since Inception
0
2,000
4,000
6,000
8,000
10,000
12,000
Cum
ulat
ive
Gol
d in
Ore
To
Dat
e (o
z)
Date
Actual Gold in Ore (oz) Budget Gold in Ore (oz)
0
20,000
40,000
60,000
80,000
100,000
120,000
140,000
Cum
ulat
ive
Gol
d in
Ore
To
Dat
e (o
z)
Date
Cumulative Actual Gold in Ore (oz) Cumulative Budget Gold in Ore (oz)

Coffey Mining Pty Ltd
Corihuarmi Gold Project – MINEWPER00466AE Page: 47 43-101 Technical Report – 6th April 2010
It can be seen that the gold in the ore to date has exceeded the budgeted gold for the majority
of months. This is due to the actual head grade being significantly higher than budget in
some months. The tonnage mined has fallen significantly behind budget from August to
December 2009 placing extra pressure on the operations. Figure 16.1.3_3 shows the
cumulative gold head grade for the project up to January 2010. The actual head grade has
exceeded the budgeted head grade by 24%.
Figure 16.1.3_3
Cumulative Ore Head Grade Since Inception
0.00
0.50
1.00
1.50
2.00
2.50
3.00
3.50
Cum
mul
ativ
e O
re H
ead
Gra
de (A
u g/
t)
Date
Actual Head Grade (g/t Au) Budget Head Grade (g/t Au)
0.00
0.50
1.00
1.50
2.00
2.50
3.00
3.50
Cum
mul
ativ
e O
re H
ead
Gra
de (A
u g/
t)
Date
Cumulative Actual Head Grade (g/t Au) Cumulative Budget Head Grade (g/t Au)

Coffey Mining Pty Ltd
Corihuarmi Gold Project – MINEWPER00466AE Page: 48 43-101 Technical Report – 6th April 2010
Gold Production
Gold production (Gold in Dore) since inception is shown against budget and gold shipped
(Payable gold) in Figure 16.1.3_4. These figures show that the gold produced exceeded the
budgeted gold by 16.2% over the first two years, due to higher head grades placed.
Figure 16.1.3_4
Gold Production Since Inception
-
1,000
2,000
3,000
4,000
5,000
6,000
7,000
8,000
9,000
10,000
Gol
d (o
z./m
onth
)
Date
Gold Shipped (oz) Gold Produced (oz) Budget Gold Produced (oz)
0
10000
20000
30000
40000
50000
60000
70000
80000
90000
100000
Gol
d to
Dat
e (o
zs.)
Date
Cumulative Gold Shipped (oz) Cumulative Gold Produced (oz) Cumulative Budget Gold Produced (oz)
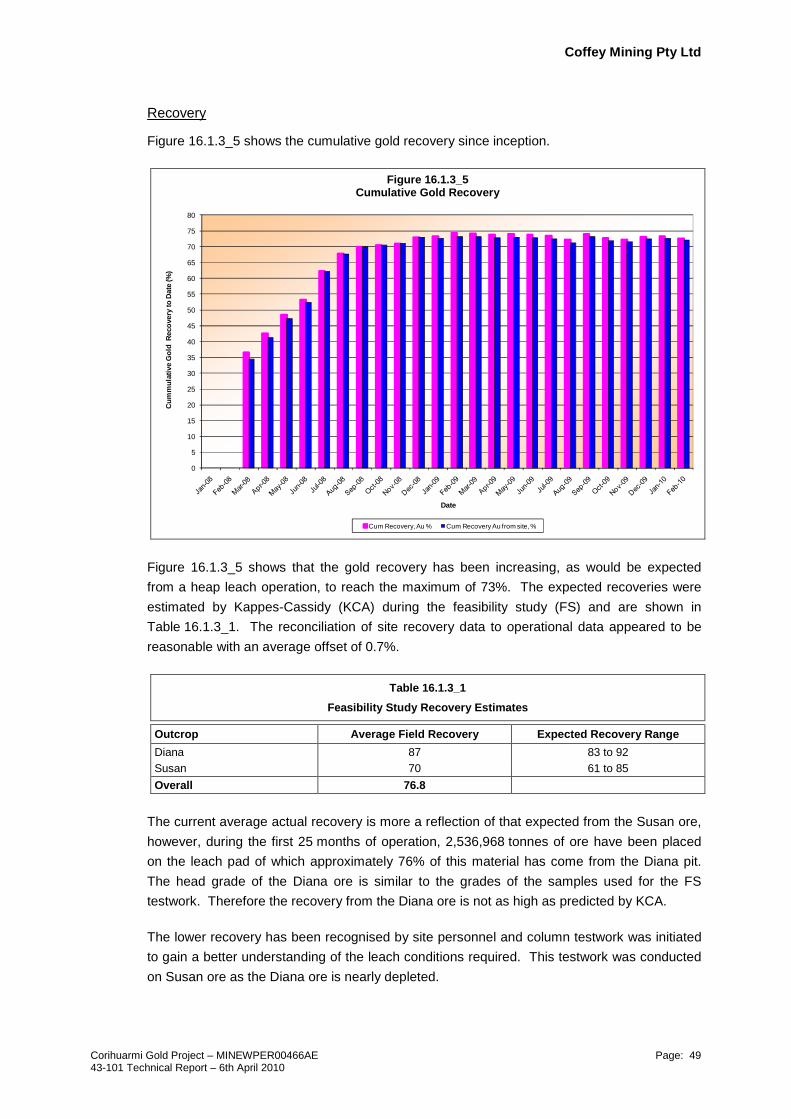
Coffey Mining Pty Ltd
Corihuarmi Gold Project – MINEWPER00466AE Page: 49 43-101 Technical Report – 6th April 2010
Recovery
Figure 16.1.3_5 shows the cumulative gold recovery since inception.
Figure 16.1.3_5
Cumulative Gold Recovery
Figure 16.1.3_5 shows that the gold recovery has been increasing, as would be expected
from a heap leach operation, to reach the maximum of 73%. The expected recoveries were
estimated by Kappes-Cassidy (KCA) during the feasibility study (FS) and are shown in
Table 16.1.3_1. The reconciliation of site recovery data to operational data appeared to be
reasonable with an average offset of 0.7%.
Table 16.1.3_1
Feasibility Study Recovery Estimates
Outcrop Average Field Recovery Expected Recovery Range
Diana 87 83 to 92 Susan 70 61 to 85
Overall 76.8
The current average actual recovery is more a reflection of that expected from the Susan ore,
however, during the first 25 months of operation, 2,536,968 tonnes of ore have been placed
on the leach pad of which approximately 76% of this material has come from the Diana pit.
The head grade of the Diana ore is similar to the grades of the samples used for the FS
testwork. Therefore the recovery from the Diana ore is not as high as predicted by KCA.
The lower recovery has been recognised by site personnel and column testwork was initiated
to gain a better understanding of the leach conditions required. This testwork was conducted
on Susan ore as the Diana ore is nearly depleted.
0
5
10
15
20
25
30
35
40
45
50
55
60
65
70
75
80
Cum
mul
ativ
e G
old
Rec
over
y to
Dat
e (%
)
Date
Cum Recovery, Au % Cum Recovery Au from site, %

Coffey Mining Pty Ltd
Corihuarmi Gold Project – MINEWPER00466AE Page: 50 43-101 Technical Report – 6th April 2010
The testwork was conducted using 3.2m high columns. Three tests were conducted with
different cyanide strengths, namely 200ppm, 300ppm and 400ppm.
The size distribution of the samples and the gold extraction rates are depicted in
Figures 16.1.3_6 and Figure 16.1.3_7 respectively.
Figure 16.1.3_6
Heap Leach Testwork Sample Sizing
Figure 16.1.3_7
Heap Leach Testwork Extraction Results
0
10
20
30
40
50
60
70
80
90
0.074 75 50 25.4 12.7 1.68 0.841 0.297 0.149 0.074
Particle Size
% P
assi
ng,
mm
Cinetica de Extraccion Au
0
10
20
30
40
50
60
70
80
90
0 10 20 30 40 50 60 70 80 90 100 110
Dias
% Extraccion Au
200 ppm 300 ppm 400 ppm
Gold Extraction Kinetics

Coffey Mining Pty Ltd
Corihuarmi Gold Project – MINEWPER00466AE Page: 51 43-101 Technical Report – 6th April 2010
The following was noted from the testwork:
� The extraction data indicated that the target operating cyanide concentration of 200ppm
being used on site is low. This may have contributed to the low recoveries. A new target
of 350ppm cyanide concentration has now been set, although this may increase the
cyanide consumption.
� Distribution of gold by size fraction showed that the majority of the gold, ~14% is not
recovered from the finer fractions (<74µm).
� The extraction data also shows that at least 100 days of leaching is required to reach
74% extraction. In the first half of 2008 the leach cycle of the Diana material was less
than 80 days and this would also have contributed to the lower extraction. Since then the
leach cycle has been increased to almost 120 days.
� Operating costs
The plant operating costs since project commencement are shown in Figure 16.1.3_8.
Figure 16.1.3_8 indicates the plant operating costs were well below budget for each month
when being fed from the Diana pit but cost have been shown to have risen above budget
since the inception of the Susan pit. In 2008 the reclaim costs to load and haul the crushed
material to the leach pad were included in the leaching budget but the actual costs were
reported in the mining costs. The budget for 2009 includes the reclaim costs in the mining
budget and therefore the plant is operating closer to budget as a result.
Lower operating costs are also attributed to the lower cyanide and lime consumptions which
were considerably lower than that predicted by the FS.
Reagent Consumptions
Data for the cyanide and lime consumptions rates were supplied and are depicted in
Figure 16.1.3_9.
Figure 16.1.3_9 shows that the lime and cyanide consumptions have been well below that
predicted in the FS. From November 2008 to June 2009, the consumption rate of lime rose,
although both the cyanide and lime consumptions were still well below the FS prediction.
Since June 2009 till February 2010, the lime consumption rate has fallen to levels similar to
early commission levels. Whilst the cyanide consumption levels have been seen to fluctuate,
they are now approximately twice the levels seen in 2008.

Coffey Mining Pty Ltd
Corihuarmi Gold Project – MINEWPER00466AE Page: 52 43-101 Technical Report – 6th April 2010
Figure 16.1.3_8 Operating Cost Data
0
50,000
100,000
150,000
200,000
250,000
300,000
350,000
400,000
Pro
cess
ing
Cos
ts (
$/m
onth
)
Date
Actual Processing Costs Budget Processing Costs
0
500,000
1,000,000
1,500,000
2,000,000
2,500,000
3,000,000
3,500,000
4,000,000
4,500,000
5,000,000
Pro
cess
ing
Cos
ts T
o D
ate
($)
Date
Cumulative Actual Processing Costs Cumulative Budget Processing Costs

Coffey Mining Pty Ltd
Corihuarmi Gold Project – MINEWPER00466AE Page: 53 43-101 Technical Report – 6th April 2010
Figure 16.1.3_9 Lime and Cyanide Consumption by Month
16.2 Testwork
Two column leach tests on Scree Slope ore were carried out from October 2009 to January
2010 by MIRL metallurgical personnel. The tests were carried out to examine the response of
Scree Slope material when blended with Susan ore at different ratios and cement addition
rates.
The tests were carried out in columns that were 3.4m in height and 0.8m in internal diameter.
The materials tested consisted of Susan and Scree Slope material at a blend ratio of 2:1 and
Susan and Scree Slope material blended at a ratio of 1:1 with a cement binder addition of
2kg/t. The feed materials were screened, weighed, sampled and assayed in five discrete
fractions varying from minus 100mm to material passing 12.7mm.
Table 16.2_1 summaries the results of the testwork carried out over an 83 day period.
The tests were aimed to be carried out at a pH of between 10.6 and 11.5, a free cyanide
concentration of 300ppm and at an irrigation rate of 10 l/h/m². Each column contained 2.3t of
feed material.
0
50
100
150
200
250
300
0.00
0.20
0.40
0.60
0.80
1.00
1.20
Cya
nide
Con
sum
ptio
n, g
/t
Lim
e C
onsu
mpt
ion,
kg/
t
DateActual Lime Consumption Feasibility Study Lime Consumption Actual Cyanide Consumption Feasibility Study Cyanide Consumption

Coffey Mining Pty Ltd
Corihuarmi Gold Project – MINEWPER00466AE Page: 54 43-101 Technical Report – 6th April 2010
Table 16.2_1
Corihuarmi Project
Summary of Cyanidation Tests in Leach Columns
Test Days of Leaching
Calculated Head Grade Extraction % Adsorption Recovery Reagent Consumption Percolation Rate
m/day Au g/t Ag g/t Au Ag Au Ag NaCN kg/t CaO kg/t
Susan/Scree Slope 2:1 83 1.15 1.07 70.36 41.28 92.11 82.82 0.635 0.314 1.7 Susan/Scree Slope 1:1 with 2kg/t cement 83 1.10 1.00 69.22 37.27 96.51 82.52 0.418 0.158 1.6
Average 83 1.13 1.04 69.79 39.28 94.31 82.67 0.53 0.24 1.65

Coffey Mining Pty Ltd
Corihuarmi Gold Project – MINEWPER00466AE Page: 55 43-101 Technical Report – 6th April 2010
Table 16.2_1 shows that the recoveries of metal to be quite similar between each blend of
feed materials; however, there appeared to be a significant reduction in cyanide usage when
the feed is agglomerated in the presence of cement. The lime usage was also seen to be
lower in the presence of cement, but this may be due to the alkaline nature of the cement
itself. The percolation rate through the two columns was seen to be reasonable with no
increase shown as a result of agglomeration techniques. No pooling was seen on the top of
the columns throughout the test program.
Figure 16.2_1 shows the comparison of leach kinetics for gold in the two separate test
columns.
Figure 16.2_1
Gold Leach Kinetics for the 2:1 Susan/Scree Slope Blend and 1:1 Susan/Scree Slope Blend
The leach kinetics is seen to be consistent between both blends and leaching still takes place
at the completion of the test program. 50% of the gold was shown to have been recovered
within 10 days for both blends.
Figure 16.2_2 and Figure 16.2_3 show the recovery by size fraction of the two column tests.
The size by size fraction of the material tested in each column is shown to be quite similar.
This is also the case when comparing the recovery response per size fraction. Figure 16.2_4
and Figure 16.2_5 show the recovery of metal versus the quantity of metal per size fraction to
be relatively independent of the size. A slight increase in recovery is shown to exist as the
size fractions become smaller. There is also a similar trend in recovery between gold and
silver.
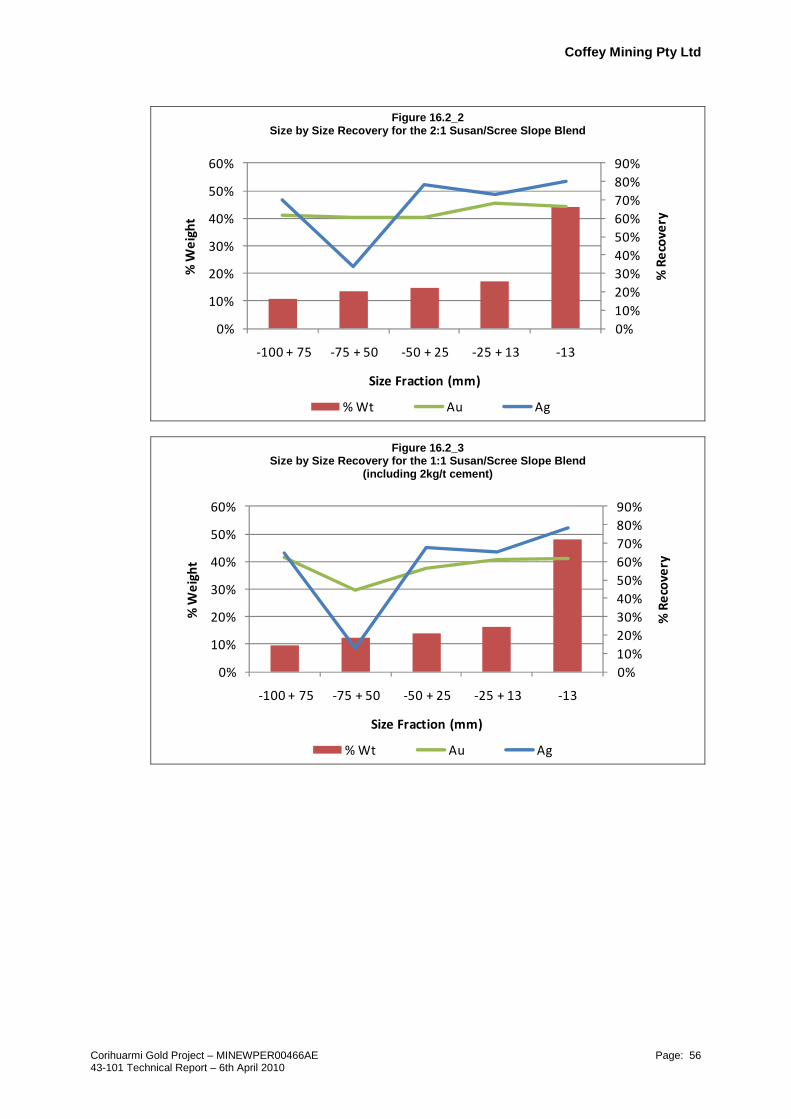
Coffey Mining Pty Ltd
Corihuarmi Gold Project – MINEWPER00466AE Page: 56 43-101 Technical Report – 6th April 2010
Figure 16.2_2 Size by Size Recovery for the 2:1 Susan/Scree Slope Blend
Figure 16.2_3
Size by Size Recovery for the 1:1 Susan/Scree Slope Blend (including 2kg/t cement)
0%
10%
20%
30%
40%
50%
60%
70%
80%
90%
0%
10%
20%
30%
40%
50%
60%
-100 + 75 -75 + 50 -50 + 25 -25 + 13 -13
% R
eco
very
% W
eig
ht
Size Fraction (mm)
% Wt Au Ag
0%
10%
20%
30%
40%
50%
60%
70%
80%
90%
0%
10%
20%
30%
40%
50%
60%
-100 + 75 -75 + 50 -50 + 25 -25 + 13 -13
% R
eco
very
% W
eig
ht
Size Fraction (mm)
% Wt Au Ag
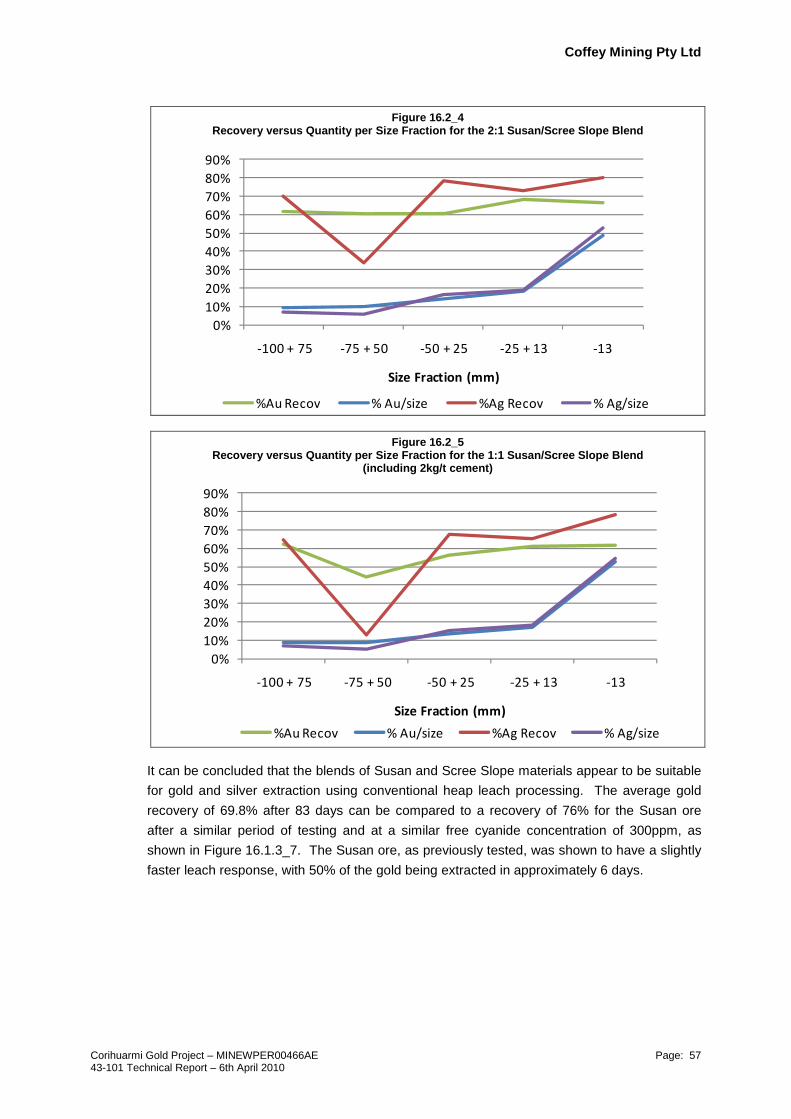
Coffey Mining Pty Ltd
Corihuarmi Gold Project – MINEWPER00466AE Page: 57 43-101 Technical Report – 6th April 2010
Figure 16.2_4 Recovery versus Quantity per Size Fraction for the 2:1 Susan/Scree Slope Blend
Figure 16.2_5
Recovery versus Quantity per Size Fraction for the 1:1 Susan/Scree Slope Blend (including 2kg/t cement)
It can be concluded that the blends of Susan and Scree Slope materials appear to be suitable
for gold and silver extraction using conventional heap leach processing. The average gold
recovery of 69.8% after 83 days can be compared to a recovery of 76% for the Susan ore
after a similar period of testing and at a similar free cyanide concentration of 300ppm, as
shown in Figure 16.1.3_7. The Susan ore, as previously tested, was shown to have a slightly
faster leach response, with 50% of the gold being extracted in approximately 6 days.
0%
10%
20%
30%
40%
50%
60%
70%
80%
90%
-100 + 75 -75 + 50 -50 + 25 -25 + 13 -13
Size Fraction (mm)
%Au Recov % Au/size %Ag Recov % Ag/size
0%
10%
20%
30%
40%
50%
60%
70%
80%
90%
-100 + 75 -75 + 50 -50 + 25 -25 + 13 -13
Size Fraction (mm)
%Au Recov % Au/size %Ag Recov % Ag/size

Coffey Mining Pty Ltd
Corihuarmi Gold Project – MINEWPER00466AE Page: 58 43-101 Technical Report – 6th April 2010
17 MINERAL RESOURCE AND MINERAL RESERVE ESTIMATES
17.1 Introduction
Coffey Mining has reviewed the Mineral Resource for the Susan and Diana Deposits
(Section 17.2 and Section 17.3) as completed by Mr. Miguel Zulueta Torres in May 2009
(Senior Geologist with MZT Consulting (MZT) based in Peru). These Mineral Resource
models were based on an undepleted volume below the December 31, 2008 mining surface.
Coffey Mining has depleted the Mineral Resource as of 1st January 2010, using MIRL’s
preferred cutoffs (0.3g/t gold cutoff at Susan deposit and a 0.25g/t gold cutoff at Diana
deposit). A total Measured and Indicated Resource of 5.3Mt at an average gold grade
0.6g/t Au for 103koz Au are reported from the combined deposits, remaining in-situ as of the
1st January 2010.
In addition, Coffey Mining has estimated the Mineral Resource for the Scree Deposit
(Section 17.1.3) of the Corihuarmi Gold Project as at 28th of February 2010. The estimation of
gold grades was completed using Ordinary Kriging (OK). A total Inferred Resource of 3.76Mt
at an average gold grade 0.45g/t Au for 55k oz Au are reported.
17.2 MZT Resource Estimates
The previous 2006 resource model completed by Coffey Mining was used to produce both the
initial (FS) reserve model and the mine plan and design for mining to date. The 2006
resource model was based upon trench and DC data generated in 2005.
Initial reconciliation of the 2006 resource model against grade control drilling (5m x 5m spaced
blasthole (BH) sampling), indicated the resource model was possibly under-estimating Au
grade by up to 25%. While BH sample quality is poor and not definitive, this result was also
supported by better than expected gold ounces being recovered from the heap leach up to
December 31, 2008 (as advised by MIRL).
As a consequence, a total of 65 RC holes were drilled at the Diana and Susan Au deposits to
test the perceived issues related to the DC data and the associated 2006 resource models.
The 2009 Mineral Resource estimate for the Susan and Diana Deposits was completed by
Mr. Miguel Zulueta Torres who is not a Qualified Person under the NI 43-101 guidelines.
Therefore, a review was carried out by Coffey Mining to compare the 2009 MZT model
estimates with the drilling data used and to validate the methods and assumptions used to
estimate the model for Au. The current 2009 MZT models were reconciled with 6 months of
mining data from January 1, 2009 to June 30, 2009. The comparison was based on grade
control BH assay data and recorded truck figures on a 5 metre bench-by-bench basis. Due to
the stacked heap leaching method employed and uncertain recoveries, it is not possible to
reconcile specific parcels of mined ore further to actual recovered Au.

Coffey Mining Pty Ltd
Corihuarmi Gold Project – MINEWPER00466AE Page: 59 43-101 Technical Report – 6th April 2010
17.2.1 Data
The Susan and Diana resource estimates are based on a combination of DC and RC drilling.
The Diana Deposit contains 49 DC holes totalling 2,952.75m and 29 RC holes totalling
1,955 metres. Susan Deposit contains 57 DC holes totalling 3,099.4m and 36 RC holes totalling
3,545m. The DC holes were drilled in 2005, while the RC holes were drilled from the end of
2008 to early 2009. A summary of the drilling as of May 1, 2009 is provided in Table 17.2.1_1.
Table 17.2.1_1
Corihuarmi Project
Summary of Minera IRL Drilling as of May 1, 2009 Grouped by Deposit
Deposit DC Drillholes RC Drillholes
Holes Metres Holes Metres
Diana 49 2952.75 29 1,955.00 Susan 57 3099.40 36 3,545.00
Total 106 6052.15 65 5,500.00
A perspective view of the two deposits, showing the density of RC and DC is shown in
Figure 17.2.1_1. The surface shown in Figure 17.2.1_1 is the topographic surface as of
December 31, 2008.
A total of 238 bulk density determinations were collected from the 2005 diamond drilling
campaign and used as the basis for tonnage reporting. From the Diana deposit, a total of
157 samples were used to give an average in-situ dry bulk density of 2.35g/cm³, and from the
Susan deposit, a total of 81 samples were used to give an average in-situ dry bulk density of
2.22g/cm³.
Figure 17.2.1_1
Drillhole Type by Deposit – Perspective View
(Blue Holes = Diamond / Red Holes = RC)
DIANA
SUSAN

Coffey Mining Pty Ltd
Corihuarmi Gold Project – MINEWPER00466AE Page: 60 43-101 Technical Report – 6th April 2010
17.2.2 Geological Model
The geological information compiled from the drilling data defines two key styles of alteration:
� Siliceous alteration (SIL) which effectively contains all economic gold mineralisation.
� Advanced argillic alteration (AA) containing broad low grade gold mineralisation.
No structural geological information was provided for the technical review.
The 2009 MZT resource models were restricted to the material interpreted as SIL based on
the drillhole logging. Figure 17.2.2_1 shows the SIL interpretation as five metre spaced
contour lines, represented at the mining mid-bench positions, including the DC and RC drilling
data in and around each deposit.
Figure 17.2.2_1
Corihuarmi Project Siliceous Alteration (SIL) with Drillhole (RC and Diamond) Data by Deposit – Perspective View
(Red Holes & Strings = Diana / Blue Holes & Strings = Susan)
17.2.3 Compositing, Basic Statistics and High Grade Cuts
A statistical analysis was completed by MZT on five metre downhole composites. The
compositing was completed using the Datamine™ mining software package although no
details are documented by MZT regarding the exact method used or treatment of residuals.
Basic statistics were generated for the combined RC and DC data at both Diana and Susan
deposits.
As a check, Coffey Mining generated a similar set of composites and comparisons were made
between the two datasets, at both Diana and Susan deposits (Section 17.3).
DIANA
SUSAN

Coffey Mining Pty Ltd
Corihuarmi Gold Project – MINEWPER00466AE Page: 61 43-101 Technical Report – 6th April 2010
Table 17.2.3_1 summarises the statistics reported by MZT.
Table 17.2.3_1
Corihuarmi Project
Summary Statistics as Reported by MZT (Appendix A)– Diana and Susan (SIL data) 5m Composites (no High Grade Cuts Applied)
Variable Count Min Max Mean Std. Dev. Variance CV
Diana Au (g/t) 1425 0.008 9.40 0.537 0.827 0.684 1.541 Susan Au (g/t) 1223 0.008 9.40 0.543 0.863 0.745 1.589
Histograms of the combined RC and DC MZT composite data from Diana and Susan are
shown in Figure 17.2.3_1 and Figure 17.2.3_2 respectively, both of which show positively
skewed datasets.
MZT have applied high grade cuts to data from Susan and Diana primarily for use in
variography. The general approach was based on high grade cuts derived from the mean
plus two times the standard deviation (to approximate the 95th percentile of data in a normally
distributed datasets). The actual high grade cut values used for Diana and Susan deposits
were not stated in the report by MZT.
As calculated by Coffey Mining, the method described translates to high grade cuts of
approximately 2.08g/t Au for Susan and 2.41g/t Au for Diana. Summary statistics for the
Coffey Mining 5m composite data with high grade cuts applied are provided in Section 17.3.3.
Figure 17.2.3_1
Histogram of MZT 5m Composite Dataset (SIL data) – Diana
Source: Torres (2009), (Figure 4)

Coffey Mining Pty Ltd
Corihuarmi Gold Project – MINEWPER00466AE Page: 62 43-101 Technical Report – 6th April 2010
Figure 17.2.3_2 Histogram of MZT 5m Composite Dataset (SIL data) - Susan
Source: Torres (2009), (Figure 6)
17.2.4 Variography
Introduction
Variography is used to describe the spatial variability or correlation of an attribute (e.g. Au).
The spatial variability is traditionally measured by means of a variogram, which is generated
by determining the averaged squared difference of data points at a nominated distance (h), or
lag. The averaged squared difference (variogram or γ(h)) for each lag distance is plotted on a
bivariate plot, where the X-axis is the lag distance and the Y-axis represents the average
squared differences (γ(h)) for the nominated lag distance. The term variogram will be used as
a generic term to describe all spatial measures in this document.
Variography
The variography was generated by MZT using Datamine mining software. The final
variograms and variogram models used for nugget variance and major, semi-major and minor
axis calculation, for Diana and Susan deposits are displayed in Figure 17.2.4_1 to
Figure 17.2.4_4.
The high grade cut data was transformed into a log normal distribution to produce better
variograms for Susan. Spherical models where applied.

Coffey Mining Pty Ltd
Corihuarmi Gold Project – MINEWPER00466AE Page: 63 43-101 Technical Report – 6th April 2010
Figure 17.2.4_1 MZT Diana Variography
(Used for Nugget calculation;SIL data)
Source: Torres (2009), (Section 3.3.2)
Figure 17.2.4_2
MZT Diana Variography (Used for Major, Semi-Major and Minor Axis Calculation;SIL data)
Source: Torres (2009), (Section 3.3.2)
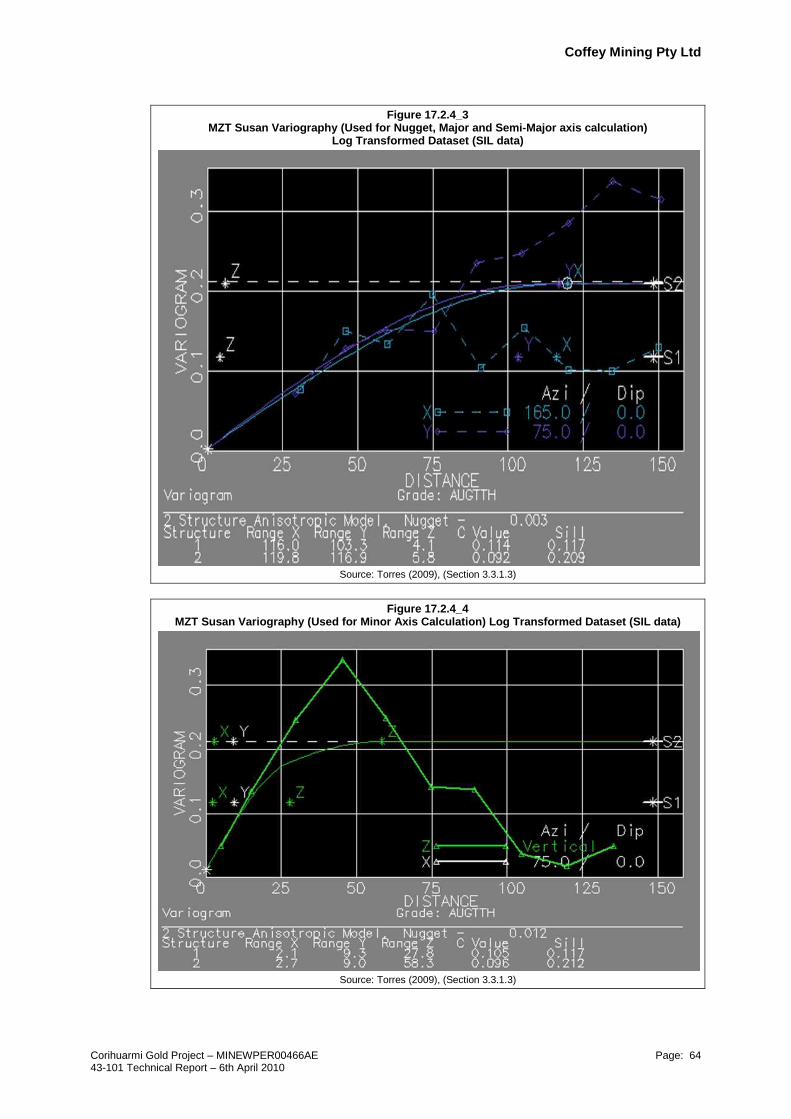
Coffey Mining Pty Ltd
Corihuarmi Gold Project – MINEWPER00466AE Page: 64 43-101 Technical Report – 6th April 2010
Figure 17.2.4_3 MZT Susan Variography (Used for Nugget, Major and Semi-Major axis calculation)
Log Transformed Dataset (SIL data)
Source: Torres (2009), (Section 3.3.1.3)
Figure 17.2.4_4
MZT Susan Variography (Used for Minor Axis Calculation) Log Transformed Dataset (SIL data)
Source: Torres (2009), (Section 3.3.1.3)
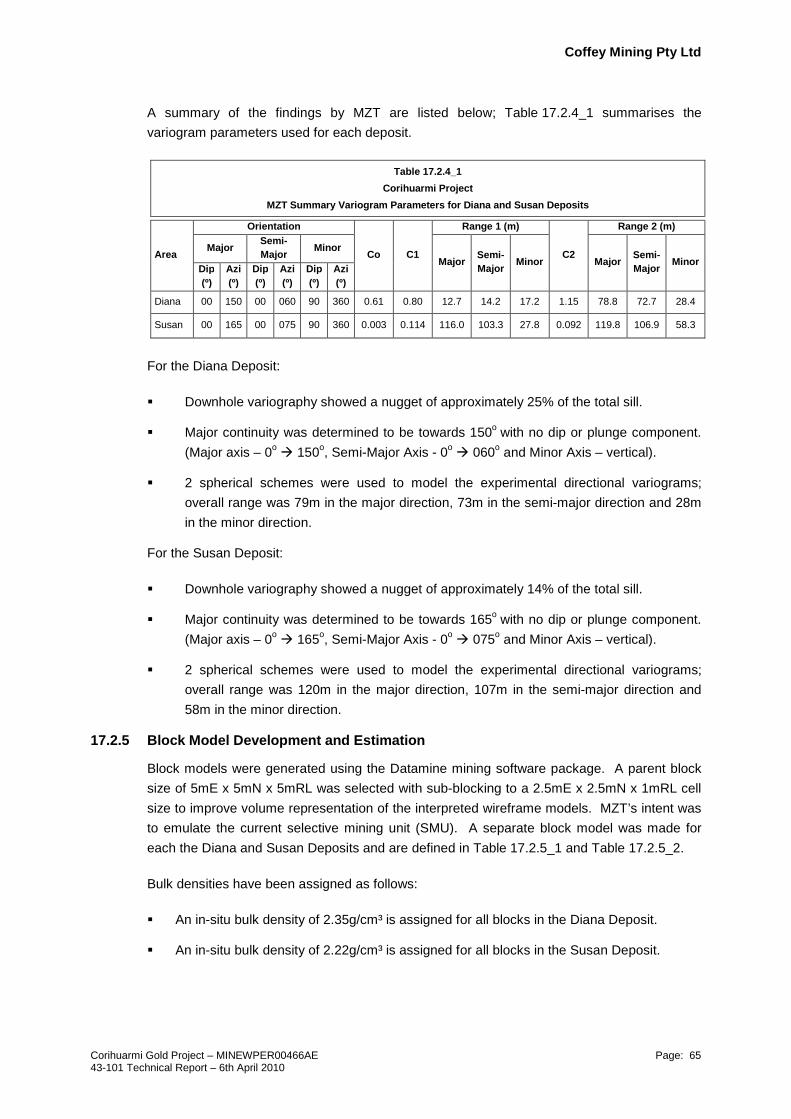
Coffey Mining Pty Ltd
Corihuarmi Gold Project – MINEWPER00466AE Page: 65 43-101 Technical Report – 6th April 2010
A summary of the findings by MZT are listed below; Table 17.2.4_1 summarises the
variogram parameters used for each deposit.
Table 17.2.4_1
Corihuarmi Project
MZT Summary Variogram Parameters for Diana and Susan Deposits
Area
Orien tation
Co C1
Range 1 (m)
C2
Range 2 (m)
Major Semi -Major
Minor Major
Semi-Major
Minor Major Semi-Major
Minor Dip (º)
Azi (º)
Dip (º)
Azi (º)
Dip (º)
Azi (º)
Diana 00 150 00 060 90 360 0.61 0.80 12.7 14.2 17.2 1.15 78.8 72.7 28.4
Susan 00 165 00 075 90 360 0.003 0.114 116.0 103.3 27.8 0.092 119.8 106.9 58.3
For the Diana Deposit:
� Downhole variography showed a nugget of approximately 25% of the total sill.
� Major continuity was determined to be towards 150o with no dip or plunge component.
(Major axis – 0o � 150o, Semi-Major Axis - 0o � 060o and Minor Axis – vertical).
� 2 spherical schemes were used to model the experimental directional variograms;
overall range was 79m in the major direction, 73m in the semi-major direction and 28m
in the minor direction.
For the Susan Deposit:
� Downhole variography showed a nugget of approximately 14% of the total sill.
� Major continuity was determined to be towards 165o with no dip or plunge component.
(Major axis – 0o � 165o, Semi-Major Axis - 0o � 075o and Minor Axis – vertical).
� 2 spherical schemes were used to model the experimental directional variograms;
overall range was 120m in the major direction, 107m in the semi-major direction and
58m in the minor direction.
17.2.5 Block Model Development and Estimation
Block models were generated using the Datamine mining software package. A parent block
size of 5mE x 5mN x 5mRL was selected with sub-blocking to a 2.5mE x 2.5mN x 1mRL cell
size to improve volume representation of the interpreted wireframe models. MZT’s intent was
to emulate the current selective mining unit (SMU). A separate block model was made for
each the Diana and Susan Deposits and are defined in Table 17.2.5_1 and Table 17.2.5_2.
Bulk densities have been assigned as follows:
� An in-situ bulk density of 2.35g/cm³ is assigned for all blocks in the Diana Deposit.
� An in-situ bulk density of 2.22g/cm³ is assigned for all blocks in the Susan Deposit.

Coffey Mining Pty Ltd
Corihuarmi Gold Project – MINEWPER00466AE Page: 66 43-101 Technical Report – 6th April 2010
Table 17.2.5_1
Corihuarmi Project
Block Model Parameters – Diana Deposit
East North Elevation
Origin 439,200 8,610,100 4700 Extent (m) 400 400 190 Parent Block size (m) 5 5 5 Sub-Block Size (m) 2.5 2.5 1 Number of Blocks (parent) 80 80 38
Table 17.2.5_2
Corihuarmi Project
Block Model Parameters – Susan Deposit
East North Elevation
Origin 439,600 8,609,900 4800 Extent (m) 500 500 155 Parent Block size (m) 5 5 5 Sub-Block Size (m) 2.5 2.5 1 Number of Blocks (parent) 100 100 31
For the grade estimates, Au was interpolated using both Ordinary Kriging (OK) and Log
Kriging (LK) techniques. For the purposes of this report, only the OK Au estimation is
considered appropriate and suitable.
OK is one of the more common geostatistical methods for estimating the block grade. In this
interpolation technique, contributing composites samples are identified using a search volume
applied from the centre of each block. Weights are determined so as to minimise the error
variance considering both the spatial location of the selected composites and the modelled
variogram. Variography describes the correlation between the composite samples as a
function of distance. The weighted composite sample grades are then combined to generate
a block estimate and variance.
Based on a statistical review of the MZT models by Coffey Mining, the OK estimates used
uncut Au grades.
The estimated blocks in both Diana and Susan were restricted to parent cells and sub-cells
which were both below the topographic surface as of December 31, 2008, and within the
siliceous alteration (SIL) wireframes (Figure 17.2.5_1).
MZT states that blocks were estimated using the Datamine sub-cell estimation parameter
(where grades are estimated and assigned to each sub-cell potentially resulting in different
grades occurring for each sub-cell within a parent cell).
In Both Diana and Susan deposits, a minimum of two and a maximum of 16 composites were
used to estimate block grades. No detail of search radii was reported by MZT.

Coffey Mining Pty Ltd
Corihuarmi Gold Project – MINEWPER00466AE Page: 67 43-101 Technical Report – 6th April 2010
Figure 17.2.5_1 Susan and Diana - Blocks Estimated (within SIL and Below Topographic Surface) and
Data Used (Logged as SIL)
SIL 5m Bench Strings – Red / Data Used for Estimate – Blue
17.2.6 Model Validation
The validation by MZT indicated that the resource model replicates the source input data well
in regions of higher density drilling. For regions of lower data density, smoothing is evident.
The validation process included:
� Review of the block estimates and the composite data in cross section, and plan views.
A plan and section view of the block Au grade estimates of the Susan deposit are shown
in Figure 17.2.6_1.
17.2.7 Resource Classification
The grade estimates for Diana and Susan Deposits have been classified as a combination of
Measured and Indicated Mineral Resources in accordance with the criteria laid out in the
Canadian National Instrument 43-101 (“NI 43-101”) guidelines. No material has been
classified as Inferred.
The Measured Mineral Resource classification on both the Susan and Diana deposits was
based on having 12 or more composites used to estimate the block grades. The Indicated
Mineral Resource classification on both deposits was based on having six to 11 composites
used to estimate the block grades.
The reported resource for the Susan and Diana Au deposits is given in Section 17.4.
SUSANDIANA

Coffey Mining Pty Ltd
Corihuarmi Gold Project – MINEWPER00466AE Page: 68 43-101 Technical Report – 6th April 2010
Figure 17.2.6_1 Susan Deposit – MZT Visual Validation, Plan and Section Views
Source: Torres (2009), (Section 3.6.1)

Coffey Mining Pty Ltd
Corihuarmi Gold Project – MINEWPER00466AE Page: 69 43-101 Technical Report – 6th April 2010
17.3 Review and Validation of the MZT Resource Estimates
17.3.1 Data
Coffey Mining has checked the zonal statistics for the bulk density data. The bulk densities
applied to the block model are considered to be consistent with the high sulphidation
epithermal style of mineralisation and rock types encountered at the Corihuarmi deposits.
17.3.2 Geological Model
Coffey Mining concurs with the use of the silica and advanced argillic alteration zones as
appropriate domains for resource estimation.
17.3.3 Compositing, Basic Statistics and High Grade Cuts
Coffey Mining regenerated the 5m downhole composite dataset. The effect of the compositing
process on the data statistics is summarised by deposit in Table 17.3.3_1, and shows
negligible effect on the mean grades between raw and composite data.
Table 17.3.3_1
Corihuarmi Project
Summary of Raw versus Composite Statistics (SIL data) for Au (g/t) by Area
Area Total Raw Data Total Composite Data
% Length Difference
% Mean Difference Length
(m) Au (g/t) Mean
Au (g/t) Variance
Length (m)
Au (g/t) Mean
Au (g/t) Variance
Diana 2228.50 0.612 1.626 2220.75 0.549 0.865 -0.35% -11.44%
Susan 4712.29 0.534 0.604 4712.29 0.533 0.597 -0.00% -0.13%
These Coffey Mining 5m composite statistics (from the SIL zones) were compared against the
MZT statistical values (reported in Table 17.2.3_1). No material differences were identified.
Table 17.3.3_2 summarises the Coffey Mining 5m composite data, including an analysis on
the declustered dataset based on a cell size of 25mE x 25mN x 10mRL.
Table 17.3.3_2
Corihuarmi Project
Summary Statistics – Diana and Susan (SIL data) Coffey Mining 5m Composites No High Grade Cuts Applied
Variable Count Min Max Mean Std. Dev. Variance CV
Declustered Mean
(25mx25mx10m)
Declustered Std Dev
(25mx25mx10m)
Diana Au (g/t) 445 0.005 8.88 0.549 0.930 0.865 1.693 0.576 1.002 Susan Au (g/t) 941 0.001 9.40 0.533 0.773 0.597 1.450 0.530 0.794
The variations between the MZT and Coffey Mining composites are attributed to probable
minor differences in compositing methods and treatment of residual intervals. However the
statistical comparison indicates no material difference, and that the MZT composites used for
resource estimation are valid.

Coffey Mining Pty Ltd
Corihuarmi Gold Project – MINEWPER00466AE Page: 70 43-101 Technical Report – 6th April 2010
Histograms of the combined RC and DC Coffey Mining 5m composite data from Diana and
Susan are shown in Figure 17.3.3_1 and Figure 17.3.3_2 respectively, defining positively
skewed datasets as identified by MZT.
Figure 17.3.3_1
Histogram of Coffey Mining 5m Composite Dataset (SIL data) – Diana
(Weighted by Declustering Weights)
MZT have applied high grade cuts to composite data from Susan and Diana used for the
variography but not the resource estimates. Although the high grade cutting approach that
MZT used is documented, the exact values of the high grade cuts applied are not recorded.
Using the method documented, Coffey Mining has calculated that the high grade cuts used
were approximately 2.08g/t Au for Susan and 2.41g/t Au for Diana. Summary statistics for the
Coffey Mining cut 5m composite data are provided in Table 17.3.3_3.
0
0
5
5
10
10
Au_N
0.0 0.0
0.1 0.1
0.2 0.2
0.3 0.3
Frequencies
Nb Samples: 445Minimum: 0.00500Maximum: 8.88064Mean: 0.57576Std. Dev.: 1.00157
Isatis

Coffey Mining Pty Ltd
Corihuarmi Gold Project – MINEWPER00466AE Page: 71 43-101 Technical Report – 6th April 2010
Figure 17.3.3_2 Histogram of Coffey Mining 5m Composite Dataset (SIL data) – Susan
(Weighted by Declustering Weights)
Table 17.3.3_3
Corihuarmi Project
Summary Statistics – Diana and Susan (SIL data) Coffey Mining 5m Composites
High Grade Cuts Applied
Variable Count Min Max Mean Std. Dev. Variance CV
Declustered Mean
(25mx25mx10m)
Declustered Std Dev
(25mx25mx10m)
Diana Au (g/t) 445 0.005 2.41 0.469 0.549 0.302 1.171 0.480 0.586
Susan Au (g/t) 941 0.001 2.08 0.477 0.519 0.270 1.088 0.471 0.514
Figure 17.3.3_3 and Figure 17.3.3_4 shows the effect of the high grade cuts on the Coffey
Mining 5m composite datasets, depicted as a cross section of gold grade (easting verses RL),
with red squares indicating data affected by the high grade cuts. Clustering of some of the
high grade data is noted.
0
0
5
5
10
10
Au_N
0.0 0.0
0.1 0.1
0.2 0.2
0.3 0.3
Frequencies
Nb Samples: 941Minimum: 0.00100Maximum: 9.40000Mean: 0.52950Std. Dev.: 0.79438
Isatis

Coffey Mining Pty Ltd
Corihuarmi Gold Project – MINEWPER00466AE Page: 72 43-101 Technical Report – 6th April 2010
Figure 17.3.3_3 Effect of High Grade Cut on Coffey Mining 5m Composite Dataset (SIL data) – Diana
Cross Section of Gold Grade (Easting (x) vs RL (z))
Red Squares indicate data affected by High Grade Cut of 2.41g/t Au
Figure 17.3.3_4
Effect of High Grade Cut on Composited Dataset (SIL) – Susan Cross Section of Gold Grade (Easting (x) vs RL (z))
Red Squares indicate data affected by High Grade Cut of 2.08g/t Au
439200
439200
439300
439300
439400
439400
439500
439500
X (m)
X (m)
4700 4700
4750 4750
4800 4800
4850 4850
4900 4900 Z (m)
Z (m)
Isatis
439750
439750
439800
439800
439850
439850
439900
439900
439950
439950
440000
440000
X (m)
X (m)
4750 4750
4800 4800
4850 4850
4900 4900
4950 4950
Z (m)
Z (m)
Isatis

Coffey Mining Pty Ltd
Corihuarmi Gold Project – MINEWPER00466AE Page: 73 43-101 Technical Report – 6th April 2010
As two different data collection methods (RC and DC drilling) were used for the estimation, a
comparison was made of both methods at Diana and Susan deposits. Figure 17.3.3_5 and
Figure 17.3.3_6 provide Quantile-Quantile (QQ) probability plots (DC data versus RC data) of
the Coffey Mining 5m composite data for gold in Susan and Diana respectively, only data
below the 31 December 2008 topographic surface, logged as SIL was compared.
Figure 17.3.3_5
Susan Deposit - QQ Plot (DC versus RC data) – Coffey Mining 5m Composite Data (Au)
Figure 17.3.3_6
Diana Deposit - QQ Plot (DC versus RC data) – Coffey Mining 5m Composite Data
0
1
2
3
4
5
6
0 1 2 3 4 5 6
DC Data (g/t)
RC Data (Au g/t)
QQ Plot - Susan Deposit
(Data below 31 December 2008 Topographic Surface Logged as SIL)
Ref. Line y = 0.93x + 0.07
0
1
2
3
4
5
0 1 2 3 4 5
DC Data (Au g/t)
RC Data (Au g/t)
QQ Plot - Diana Deposit
(Data below December 31 2008 Topographic Surface Logged as SIL )
Ref. Line y = 0.41x -0.01
Coffey Mining Pty Ltd
Corihuarmi Gold Project – MINEWPER00466AE Page: 74 43-101 Technical Report – 6th April 2010
The QQ plots show a good correlation between the DC and RC data at Susan. However, for
Diana, the QQ plot indicates a low bias of the DC data relative to the RC data. This is possibly
explained by anecdotal evidence collected during the 2005 DC drilling campaign where all
sludge sample returns (fines generated by the drill bit while cutting the core sample) were
sampled and analysed. The Diana sludge samples returned Au grades that were consistently
higher than those returned from the Susan deposit suggesting that there may have been some
elevated proportion of high grade fines lost to drilling fluids during drilling at Diana. However,
the comparison of the sludge data with the core samples is not conclusive due to both the high
volumes of water added during drilling and the lag times for sludge to reach the surface.
Considering the lack of directly twinned drillholes, Coffey Mining was not able to determine a
definite and systematically quantifiable difference between the two drilling methods used,
although there does appear to be a possible relative low bias issue for DC data at Diana.
17.3.4 Variography
The Coffey Mining calculated 5m composite data was reviewed using Isatis geostatistical
software, and it was concluded that the variogram model orientations and anisotropies are
consistent with geological controls and trends for the Au mineralisation. While the
transformation into a log normal distribution by MZT was not a preferred approach for OK
estimates, the results are reasonably consistent with variogram models generated by Coffey
Mining using other methods.
17.3.5 Block Model Development and Estimation
A parent block size of 5mE x 5mN x 5mRL was selected with sub-blocking to a 2.5mE x
2.5mN x 1mRL cell size to improve volume representation of the interpreted wireframe
models. While Coffey Mining would prefer block estimates to use larger panels to manage
issues of conditional bias given the current drillhole spacing, MZT’s intent was to emulate the
current selective mining unit (SMU). On a global basis with lower cutoff grades applied, the
block model outcomes would be reasonably similar.
The bulk densities applied to the model are consistent with the rock types and style of
mineralisation encountered at Corihuarmi.
For the grade estimates, Au was interpolated using both OK and LK techniques. For the
purposes of this report, only the OK Au estimation is considered appropriate and suitable.
Based on a statistical review of the MZT models by Coffey Mining, the OK estimates used
uncut Au grades. Coffey Mining would prefer that the high grade cuts were applied for the OK
estimates, but note that the potential outliers are clustered, moderated by the large amount of
relatively close spaced data available and there is a history to-date of positive reconciliations
between the 2006 resource model and production data.
Coffey Mining would prefer that grades were estimated for parent cell volumes and applied to
subcells. However, the expected difference in outcomes for the grade estimates would be
minimal.

Coffey Mining Pty Ltd
Corihuarmi Gold Project – MINEWPER00466AE Page: 75 43-101 Technical Report – 6th April 2010
A minimum of two and a maximum of 16 composites were used to generate block estimates.
For a small blocked SMU model, the large maximum number of composites used has resulted
in some over-smoothing of the block estimates locally. However, globally, it is not a
significant issue. No documentation of the level of point discretisation used for block
estimates is made by MZT.
Coffey Mining considers that the OK Au grade estimates are satisfactory. Detailed validation
of the models is discussed in Section 17.3.6.
17.3.6 Model Validation by Coffey Mining
Extensive visual and statistical validation of the MZT grade estimates was completed using
5m composite data generated by Coffey Mining. This process included:
� Comparison of Diana and Susan of un-cut (re-calculated) composite grades and OK
block model grades by Northing, Easting and RL zones (see Figure 17.3.6_1 to
Figure 17.3.6_3 for Diana and Figure 17.3.6_4 to Figure 17.3.6_6 for Susan).
� Comparison of the mean grade of the high grade cut (re-calculated) and un-cut (re-
calculated) composite data versus the mean grade of the model estimate, by deposit
(see Table 17.3.6_1 and Table 17.3.6_2 respectively).
The validation indicates that the resource model replicates the source input data well in
regions of higher density drilling. For regions of lower data density, smoothing is evident. The
estimates are considered appropriate. No material errors were found during the model
validation.
Figure 17.3.6_1
OK Block Model vs Composite Sample Data Comparison Diana Deposit - Au (g/t) by Northing (25m)
0
0.1
0.2
0.3
0.4
0.5
0.6
0.7
0.8
0.9
8610
100
8610
125
8610
150
8610
175
8610
200
8610
225
8610
250
8610
275
8610
300
8610
325
Northing
Au
(g/t)
0
20
40
60
80
100
120
140
No.
of S
ampl
es
Model OK - Au (g/)t Composite Data - Au (g/t) No. of Samples

Coffey Mining Pty Ltd
Corihuarmi Gold Project – MINEWPER00466AE Page: 76 43-101 Technical Report – 6th April 2010
Figure 17.3.6_2 OK Block Model vs Composite Sample Data Comparison
Diana Deposit - Au (g/t) by Northing (25m)
Figure 17.3.6_3
OK Block Model vs Composite Sample Data Comparison Diana Deposit - Au (g/t) by RL (5m)
0
0.1
0.2
0.3
0.4
0.5
0.6
0.7
0.8
4392
75
4393
00
4393
25
4393
50
4393
75
4394
00
4394
25
4394
50
4394
75
4395
00
Easting
Au
(g/t)
0
10
20
30
40
50
60
70
80
No.
of S
ampl
es
Model OK - Au (g/)t Composite Data - Au (g/t) No. of Samples
0
0.1
0.2
0.3
0.4
0.5
0.6
0.7
0.8
0.9
4700
4710
4720
4730
4740
4750
4760
4770
4780
4790
4800
4810
4820
4830
4840
RL (m)
Au
(g/t
)
0
5
10
15
20
25
30
35
No.
of S
amp
les
Model OK - Au (g/)t Composite Data - Au (g/t) No. of Samples

Coffey Mining Pty Ltd
Corihuarmi Gold Project – MINEWPER00466AE Page: 77 43-101 Technical Report – 6th April 2010
Figure 17.3.6_4 OK Block Model vs Composite Sample Data Comparison
Susan Deposit - Au (g/t) by Northing (25m)
Figure 17.3.6_5
OK Block Model vs Composite Sample Data Comparison Susan Deposit - Au (g/t) by Easting (25m)
0
0.1
0.2
0.3
0.4
0.5
0.6
0.7
0.8
0.9
8610
025
8610
050
8610
075
8610
100
8610
125
8610
150
8610
175
8610
200
8610
225
8610
250
8610
275
8610
300
Northing
Au
(g/t)
0
20
40
60
80
100
120
140
160
180
200
No.
of S
ampl
es
Model OK - Au (g/)t Composite Data - Au (g/t) No. of Samples
0
0.2
0.4
0.6
0.8
1
1.2
1.4
4397
25
4397
50
4397
75
4398
00
4398
25
4398
50
4398
75
4399
00
4399
25
4399
50
4399
75
Easting
Au
(g
/t)
0
50
100
150
200
250
No.
of S
amp
les
Model OK - Au (g/)t Composite Data - Au (g/t) No. of Samples

Coffey Mining Pty Ltd
Corihuarmi Gold Project – MINEWPER00466AE Page: 78 43-101 Technical Report – 6th April 2010
Figure 17.3.6_6 OK Block Model vs Composite Sample Data Comparison
Susan Deposit - Au (g/t) by RL (5m)
Table 17.3.6_1
Corihuarmi Project Diana and Susan Deposits
Comparison Statistics of High Grade Cut – 5m (SIL) Re-Calculated Composites versus OK Model Estimates
Deposit Variable
5m – High Grade Cut Composites (SIL Data) Block Model
Mean Standard Deviation
Declustered. Mean
(25x25x10)
Declustered Std Dev
(25x25x10)
Sub-Celled Datamine Model Volume
Weighted Mean Weighted Std. Dev.
Diana Au (g/t) 0.47 0.549 0.48 0.586 0.46 0.286
Susan Au (g/t) 0.48 0.519 0.47 0.514 0.48 0.595
Table 17.3.6_2
Corihuarmi Project Diana and Susan Deposits
Comparison Statistics of Un-Cut – 5m (SIL) Re-Calculated Composites versus OK Model Estimates
Deposit Variable
5m – Composites (No-Cut Applied) (SIL Data) Block Model
Mean Standard Deviation
Declustered. Mean
(25x25x10)
Declustered Std Dev
(25x25x10)
Sub-Celled Datamine Model Volume
Weighted Mean Weighted Std. Dev.
Diana Au (g/t) 0.55 0.930 0.58 1.002 0.46 0.286
Susan Au (g/t) 0.53 0.773 0.53 0.794 0.48 0.595
0
0.2
0.4
0.6
0.8
1
1.2
1.4
1.6
4805
4815
4825
4835
4845
4855
4865
4875
4885
4895
4905
4915
4925
4935
4945
RL
Au
(g/t)
0
10
20
30
40
50
60
No.
of S
ampl
es
Model OK - Au (g/)t Composite Data - Au (g/t) No. of Samples

Coffey Mining Pty Ltd
Corihuarmi Gold Project – MINEWPER00466AE Page: 79 43-101 Technical Report – 6th April 2010
17.3.7 Reconciliation of Resource Model against Actual Mining Data
Introduction
In order to test the performance of the 2009 resource model at both Susan and Diana
deposits, the resource models were compared to actual mining data on a 5 metre bench-by-
bench basis, for the six month period from January 1, 2009 to June 30, 2009.
The mining data consists of grade control delineated ore and waste blocks, determined by
close spaced (5m x 5m) blast hole (BH) sampling, based on a single 5m downhole sample.
The mining block grade is determined by the arithmetic average of all BH data within the
designed block shape. Figure 17.3.7_1 shows an example of the mining blocks delineated for
a 5 metre bench (Diana at 4815mRL).
Figure 17.3.7_1
Example of Mining Blocks on 5m Bench, Diana Pit, 4815 Level
Waste Blocks are Coloured Blue
Mining is effectively restricted to the SIL which contains the economic mineralisation. The
mining cutoff grades are as follows:
� Susan deposit 0.25g/t Au.
� Diana deposit 0.30g/t Au.
Mined tonnages are determined by trucks counts from each block mined with an associated
truck tonnage factor. A truck factor of 27.3 tonnes / truck is currently used based on the current
truck fleet.

Coffey Mining Pty Ltd
Corihuarmi Gold Project – MINEWPER00466AE Page: 80 43-101 Technical Report – 6th April 2010
To date, no reconciliation or testing has been completed to validate the truck factor. Coffey
Mining recommends testing of this truck factor against surveyed volumes for parcels of mined
ore and / or periodic checks against truck scales. Coffey Mining understands that MIRL may
also be installing a calibrated weightometer at the heap-leach stacker in the future to test the
validity of the factor used.
Study Data
In order to test the current resource models against mining figures, all delineated mining blocks
(strings) by bench were compiled and evaluated using the BH data. Figure 17.3.7_2 shows the
location of the mining blocks relative to the topographic surface as of June 30, 2009.
Figure 17.3.7_2
Ore and Waste Mining Blocks - 5m Benches
(Topographic Surface as of June 30, 2009)
Ore Blocks – Red / Waste Blocks – Blue
Figure 17.3.7_3 and Figure 17.3.7_4 show the comparison of the current resource model
against mining blocks and raw BH data used to delineate the mining blocks. There is good
correlation globally. At Diana, higher Au grades are noted in the BH data along the eastern
side of the deposit relative to the resource model for the corresponding area. Local variations
are the result of short scale variability in the gold grades revealed by the close spaced BH
drilling. Apart from the difference in data density, the OK method employed in the resource
modelling using the wider spaced drillhole data results in some smoothing of the estimated
grades.
SUSAN
DIANA

Coffey Mining Pty Ltd
Corihuarmi Gold Project – MINEWPER00466AE Page: 81 43-101 Technical Report – 6th April 2010
Figure 17.3.7_3 Resource Model Blocks versus Mining Blocks and BH Data, Diana – 4815 Bench
Ore Blocks – Red / Waste Blocks – Blue
A comparison of the mining figures against the current resource model on a bench by bench
basis, for the period January 1, 2009 to June 30, 2009 is given in Table 17.3.7_1. The Diana
deposit is consistently returning a higher grades and more contained metal from mining blocks
than shown from the current resource model for the corresponding volumes. Globally, the
current mining at Diana has reported 154% of the gold ounces, delineated by the resource
model. However, from bench 4815, an improved correlation between mining block data and
the resource model is noted with increased depth.
The Susan deposit is performing well on the comparison of current mining against resource
model figures. Globally, the mining at Susan is reporting 106% of the gold ounces delineated
by the resource model.
Figure 17.3.7_5 to Figure 17.3.7_8 are graphical representations of the data presented in
Table 17.3.7_1 for both Diana and Susan Deposits.
Figure 17.3.7_5 shows an improved performance of the resource model tonnage relative to
the mined tonnage with increasing depth at Diana, especially below the 4815 Bench. Grades
are consistently underestimated. Metal shows a corresponding constant under-performance
for the benches (Figure 17.3.7_6).

Coffey Mining Pty Ltd
Corihuarmi Gold Project – MINEWPER00466AE Page: 82 43-101 Technical Report – 6th April 2010
Figure 17.3.7_4 Resource Model Blocks versus Mining Blocks and BH Data, Susan – 4930 Bench
Ore Blocks – Red / Waste Blocks – Blue
Table 17.3.7_1
Corihuarmi Project Susan and Diana Deposits
Reconciliation of 2009 Resource Model versus as-Mined Figures – Bench by Bench For 6 month period from January 1, 2009 to June 30, 2009l
Bench
Resource Model (2009) Mined Actual % Difference
Mined Actual to Resource
Tonnes * (t)
Au (g/t)
Metal (oz)
Tonnes # (t)
Au (g/t)
Metal (oz)
Tonnes (t)
Au (g/t)
Metal (oz)
Diana Deposit (0.3g/t cutoff used for Resource model)
4825 940 0.33 10 3,713 0.43 51 395% 130% 510% 4820 21,813 0.40 281 66,203 0.49 1,045 304% 123% 372% 4815 82,111 0.60 1,591 93,776 0.74 2,229 114% 123% 140% 4810 51,106 0.93 1,533 55,556 1.14 2,043 109% 123% 133% 4805 32,262 1.20 1,245 36,309 1.55 1,810 113% 129% 145% Total 188,231 0.77 4,659 255,555 0.87 7,177 136% 113% 154%
Susan Deposit (0.25g/t cutoff used for Resource Model)
4930 44,813 0.55 789 25,535 0.58 477 57% 105% 60% 4925 118,036 0.57 2,178 105,982 0.76 2,587 90% 133% 119% 4920 161,101 0.77 4,004 165,783 0.87 4,618 103% 113% 115% 4915 87,951 1.29 3,635 97,649 1.23 3,857 111% 95% 106% 4910 15,252 1.35 663 10,702 1.22 421 70% 90% 63%
Total 427,154 0.82 11,270 405,651 0.92 11,960 95% 112% 106%
* Mined Tonnes calculated on total trucks x Truck Factor (27.3 t) – for both Susan and Diana # Resource Tonnes calculated on total block volume x Density ( 2.22t/m³ for Susan and 2.35t/m³ for Diana)

Coffey Mining Pty Ltd
Corihuarmi Gold Project – MINEWPER00466AE Page: 83 43-101 Technical Report – 6th April 2010
Figure 17.3.7_5 Resource Model versus Mining Blocks by Bench, Tonnes and Grade – Diana Deposit
Reconciliation Period January 1, 2009 to June 30, 2009
Figure 17.3.7_6
Resource Model versus Mining Blocks by Bench, Gold Ounces – Diana Deposit
The Susan deposit shows a good correlation between the model and as-mined figures with
slightly negative reconciliation for tonnes, and slightly positive reconciliations for both grade
and metal on a bench-by-bench basis for the 6 month period (Figures 17.3.7_7 and 17.3.7_8).
No reconciliation of the resource model or as-mined production figures against recovered gold
was possible due to the heap leach treatment process, uncertain metal recoveries in the pile,
and the lag time involved for the recovered metal. The truck tonnage factors remain untested.
0
10,000
20,000
30,000
40,000
50,000
60,000
70,000
80,000
90,000
100,000
4825 4820 4815 4810 4805BENCH TOE (RL)
Ton
nes
per
Ben
ch
0.0
0.2
0.4
0.6
0.8
1.0
1.2
1.4
1.6
1.8
2.0
Au
(g/t)
Actual Tonnes Model Tonnes
Actual Grade Model Grade
0
500
1,000
1,500
2,000
2,500
4825 4820 4815 4810 4805
BENCH TOE (RL)
Oz
(Au)
Actual Oz (Au)
Model Oz (Au)

Coffey Mining Pty Ltd
Corihuarmi Gold Project – MINEWPER00466AE Page: 84 43-101 Technical Report – 6th April 2010
Figure 17.3.7_7 Resource Model versus Mining Blocks by Bench, Tonnes and Grade – Susan Deposit
Reconciliation Period January 1, 2009 to June 30, 2009
Figure 17.3.7_8
Resource Model versus Mining Blocks by Bench, Gold Ounces – Susan Deposit Reconciliation Period January 1, 2009 to June 30, 2009
On that basis, the current conclusion is that:
� The Diana resource model probably reconciles conservatively (low) relative to mining
due to both general data density/location issues and sample quality issues related to
the DC holes.
� The Susan resource model appears to reconcile well based on the short period of
mining to-date.
0
20,000
40,000
60,000
80,000
100,000
120,000
140,000
160,000
180,000
4930 4925 4920 4915 4910BENCH TOE (RL)
Tonn
es p
er B
ench
0.1
0.3
0.5
0.7
0.9
1.1
1.3
1.5
1.7
1.9
Au
(g/t)
Actual Tonnes Model Tonnes
Actual Grade Model Grade
0
500
1,000
1,500
2,000
2,500
3,000
3,500
4,000
4,500
5,000
4930 4925 4920 4915 4910
BENCH TOE (RL)
Oz
(Au)
Actual Oz (Au)
Model Oz (Au)

Coffey Mining Pty Ltd
Corihuarmi Gold Project – MINEWPER00466AE Page: 85 43-101 Technical Report – 6th April 2010
17.3.8 Resource Classification
Considering that the estimate was confined to the siliceous alteration (SIL) and drillhole
spacing was globally 20m x 20m (locally 10mx10m or better), and is well within the
variography ranges discussed in Section 17.2.4 for each deposit, Coffey Mining considers the
results of the classification criteria to be adequate. Figure 17.3.8_1 and Figure 17.3.8_2
shows the sample density around the estimated blocks.
The classification of the resource estimates has been reviewed through assessment of the
input data, geological interpretation and grade estimate quality. The criteria assessed as part
of the resource classification is set out in Table 17.3.8_1.
Figure 17.3.8_1
Diana Deposit – Drillhole Density Against Interpolated Blocks
(Plan View at 4815mRL +/-5m RL) – Grid 20m x 20m
(Measured Blocks – Red / Indicated Blocks– Blue)
Drill Data
Siliceous Alteration Wireframe
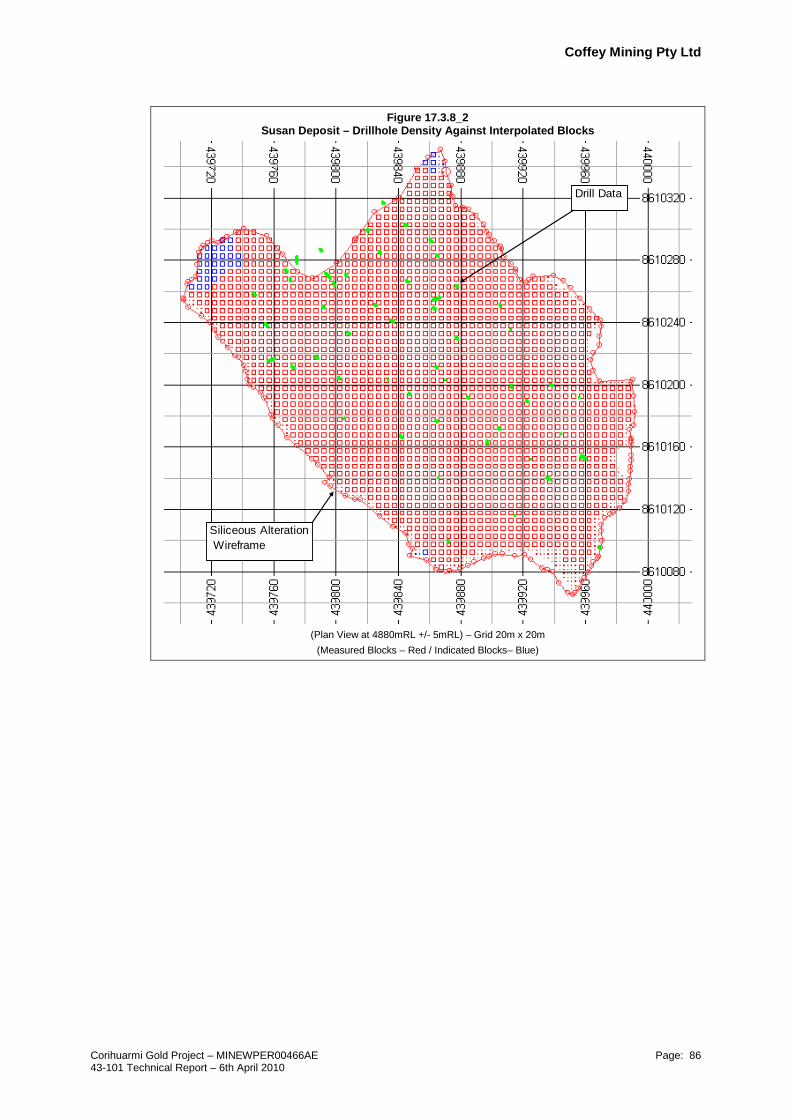
Coffey Mining Pty Ltd
Corihuarmi Gold Project – MINEWPER00466AE Page: 86 43-101 Technical Report – 6th April 2010
Figure 17.3.8_2 Susan Deposit – Drillhole Density Against Interpolated Blocks
(Plan View at 4880mRL +/- 5mRL) – Grid 20m x 20m
(Measured Blocks – Red / Indicated Blocks– Blue)
Siliceous Alteration Wireframe
Drill Data

Coffey Mining Pty Ltd
Corihuarmi Gold Project – MINEWPER00466AE Page: 87 43-101 Technical Report – 6th April 2010
Table 17.3.8_1
Corihuarmi Project Susan and Diana Deposits
Confidence of Key Criteria for Resource Classification
Items Discussion Confidence
Drilling Techniques Diamond / RC - Industry Standard approach High
Logging Standard nomenclature and apparent high quality. High
Drill Sample Recovery Recoveries were recorded during diamond drilling. Uncertainty regarding RC drilling sample recoveries. Moderate
Sub-sampling Techniques and Sample Preparation
Industry standard for both Diamond and RC. High
Quality of Assay Data QAQC data since 2005 has been acceptable but prior to 2005 no QAQC program was in place Moderate
Verification of Sampling and Assaying
Field duplicates for RC have not been executed to reflect the precision of the 5m samples. No true twin holes are available to compare the apparent negative bias of DC versus RC
Moderate
Location of Sampling Points Consistent collar survey/pick-up procedures that have produced coordinates consistent with topographic survey. Diamond drilling has limited available downhole survey. No downhole surveys were completed for the RC drilling campaign.
Moderate
Data Density and Distribution Globally, the mineralisation is defined using notional 20mE x 20mN drill spacing. Locally drill spacing can be 10m x10m or better. High
Audits or Reviews Coffey Mining (RSG Global) completed a resource model of Susan and Diana deposits in 2006, using both OK and Multiple Indicator Kriging (MIK) based on a 5mx5mx5m SMU estimation. Review of the current model by MZT has been completed by Coffey and is the subject of this report.
Moderate
Database Integrity QAQC data had not been monitored by MIRL in any way until following the Coffey Mining site visit. No material issues had been identified. Moderate
Geological Interpretation Estimation was confined within the siliceous alteration zone which is considered appropriate for modelling of the gold mineralisation in this style of deposit.
Moderate
Estimation and Modelling Techniques
Ordinary Kriging for estimation of gold grades which is an industry standard method and appropriate for this style of mineralisation. Topcuts have not been used directly for grade estimation. Estimation has been directly into small SMU sized blocks with potential to refine estimation parameters for marginally more robust estimates.
Moderate
Cutoff Grades Grade and tonnes have been reported at a range of cutoff grades. For mining purposes the economic cutoff grades used are 0.25g/t Au for the Susan deposit and 0.3g/t for the Diana deposit. The cutoffs are appropriate both for the style of mineralisation at Corihuarmi and the open pit mining method for treatment on heap leach pads.
High
Mining Factors or Assumptions
Reconciliation of 2009 resource model against grade control drilling and mining figures for the period 1st January 2009 to 30th June 2009 was completed by Coffey Mining, for both Susan and Diana Deposits. Grade control drilling has shown a positive reconciliation to the resource model to date at Diana; however with depth there appears to be a closer reconciliation developing. The reconciliation of the model against mining data at Susan to date is showing a much closer reconciliation with the data available. The OK model has SMU sized blocks which are smaller than ideal, however it is expected there will be minimal edge loss / dilution due to the style of mineralisation (broad zones above cutoff).
Moderate

Coffey Mining Pty Ltd
Corihuarmi Gold Project – MINEWPER00466AE Page: 88 43-101 Technical Report – 6th April 2010
17.4 Scree Resource Estimate
Coffey Mining has estimated the Mineral Resource for the Scree Deposit of the Corihuarmi
Gold Project as at 28th of February 2010. The estimation of gold grades was completed using
OK. This estimation approach was considered appropriate based on review of a number of
factors, including the quantity and spacing of available data, the interpreted controls on
mineralisation and the style of mineralisation. The grade estimation was constrained with
geological and mineralisation interpretations.
17.4.1 Database Validation
The resource estimation was based on the available exploration drillhole data provided to
Coffey Mining. This data was reviewed and validated by Coffey Mining prior to commencing
the resource estimation study.
Data included samples from trenches / soil pits and reverse circulation (RC) drilling samples
were included for use in the modelling process. The resource estimate was based on a total
of 95 RC drillholes and 27 trenches. The RC drill samples were taken at 1m or 2m intervals
while trench samples varied from 1m to 2.5m in length.
Validation of the database included checks of:
� Overlapping and missing intervals.
� Downhole survey.
� Consistency of depths between different data tables.
The database was loaded into Datamine.
The samples were composited to 2m down-hole lengths with residual intervals of less than 1m
length being combined with previous intervals to retain all the data. This resulted in
composites lengths ranging from 1m to 2.5m and a total of 1,421 composites being created.
17.4.2 Geological Interpretation and Modelling
Based on grade information (nominal 0.2g/t Au lower grade cutoff) and geological
observations, a lower bound to the mineralised domain has been interpreted and a wireframe
developed to constrain resource estimation for the Scree deposit. Interpretation and digitising
of this constraining bound has been undertaken on cross sections orientated at nominal 40º
(drill line orientation). A wireframe surface has been built using the interpreted digitised
boundaries. The interpretation and wireframe models have been developed using the
Datamine mining software package.

Coffey Mining Pty Ltd
Corihuarmi Gold Project – MINEWPER00466AE Page: 89 43-101 Technical Report – 6th April 2010
17.4.3 Mineralisation Interpretation
For the purpose of resource estimation, a single mineralised domain was interpreted and
modelled based on a lower cutoff grade of 0.2g/t Au. The mineralisation occurs on the
southern slopes of the Diana and Susan deposits. It is contained within a sequence of
detritals (alluvials, colluvials and scree) deposited there. Roughly, the domain dips shallowly
towards to the southwest (Figure 17.4.3_1, Figure 17. 4.3_2 and Figure 17. 4.3_3.
Figure 17.4.3_1
Minera IRL Limited - Corihuarmi Scree Deposit Mineralisation Interpretation NW Oblique View : Sampling and Topography
Figure 17.4.3_2
Mineralisation Interpretation NW Oblique View, Sampling and Base of Mineralisation Wireframe

Coffey Mining Pty Ltd
Corihuarmi Gold Project – MINEWPER00466AE Page: 90 43-101 Technical Report – 6th April 2010
Figure 17.4.3_3 Mineralisation Interpretation Typical Sectional View
For composites above the base of mineralisation, a value of one was assigned to the domain
field, Minzon otherwise a value of zero (background) was allocated. No surface depicting the
scree and solid rock was not defined as there is insufficient information to establish this
boundary.
17.4.4 Compositing, Statistical Analysis and High Grade Cuts
A statistical analysis was undertaken to determine an appropriate composite length. The
dominant sample lengths were 1m (85.3%) and 2m (11.7%) with the remainder predominantly
being 2.5m, 4m and 5m in length.
A total of 1,421 composites based on a nominal 2m length were generated from the 122 RC
holes and trenches. All composites were flagged to match the domain within which they
occur. Statistical analysis was undertaken based on 2m composites of the gold assay data
only (Table 17.4.4_1).
Table 17.4.4_1
Minera IRL Limited Corihuarmi Scree Deposit
2m Composite Descriptive Statistics
Horizon All Mineralised (Minzon=1)
Background (Minzon=0)
Item Gold (g/t)
Count 1,421 547 874 Minimum 0.005 0.005 0.005 Maximum 8.434 8.434 2.131 Mean 0.214 0.446 0.069 Median 0.100 0.335 0.055 Standard Deviation 0.375716 0.516688 0.087781 Variance 0.141163 0.266966 0.007705 CV 1.76 1.16 1.28

Coffey Mining Pty Ltd
Corihuarmi Gold Project – MINEWPER00466AE Page: 91 43-101 Technical Report – 6th April 2010
Further statistical analysis was completed on the different types and phases of sample collection
and compared (Table 17.4.4_2). The two phases of RC drilling are similar while the trenching is
different due to its restricted extent and relatively shallow sampled depth (maximum 4.5m).
Table 17.4.4_2
Minera IRL Limited Corihuarmi Scree Deposit
2m Composite Descriptive Statistics Types and Phases
Horizon Mineralisation (Minzon=1)
Type All
RC Drilling Trenches
Hole Prefix All RC5 RC09 CAL C
Item Gold (g/t)
Count 547 508 339 169 18 21 Minimum 0.005 0.005 0.005 0.110 0.005 0.046 Maximum 8.434 4.500 2.015 4.500 3.211 8.434 Mean 0.446 0.422 0.388 0.490 0.392 1.056 Median 0.335 0.330 0.315 0.360 0.131 0.569 Standard Deviation 0.516688 0.361579 0.265228 0.494945 0.732896 1.715365 Variance 0.266966 0.13074 0.070346 0.244971 0.537136 2.942475 CV 1.16 0.86 0.68 1.01 1.87 1.62
Horizon Background (Minzon=0)
Count 874 868 694 174 6 0 Minimum 0.005 0.005 0.005 0.020 0.005 Maximum 2.131 0.420 0.420 0.300 2.131 Mean 0.069 0.066 0.062 0.081 0.419 Median 0.055 0.055 0.050 0.070 0.064 Standard Deviation 0.087781 0.052907 0.05351 0.047442 0.770811 Variance 0.007705 0.002799 0.002863 0.002251 0.59415 CV 1.28 0.80 0.86 0.58 1.84
Histograms, log histograms and probability plots of gold grades have been compiled for the
domains (Figure 17.4.4_1 to Figure 17.4.4_2). Distributions of gold grades exhibit
lognormality and are characterised by strong positive skewness for both domains as is typical
of many gold deposits. The coefficient of variation (‘CV’) of Minzon 1 and 0 are relatively low.
An outlier analysis was also completed to determine if the application of high grade cuts was
warranted. A small number of elevated grades were considered to be anomalous resulting in
high grade cuts (topcuts) being applied to both domains. The approach used in assessing the
outliers is summarised as follows:
� Detailed review of histograms and probability plots, with significant breaks in populations
used to interpret possible outliers.
� Investigation of clustering of the higher-grade data. High grade data that are clustered are
considered to be real while high grade composites that are not clustered are considered to
be outliers, requiring further consideration either via cutting and/or search restriction.
� The ranking of the composite data and the investigation of the influence of individual
composites on the mean and standard deviation (mean v std-dev plots).

Coffey Mining Pty Ltd
Corihuarmi Gold Project – MINEWPER00466AE Page: 92 43-101 Technical Report – 6th April 2010
Figure 17.4.4_1 Minera IRL Limited : Corihuarmi Scree Deposit
Histogram and Probability Plot Mineralisation (Minzon=1)
Unweighted Weighted UnitsSamples: 547 N/AMinimum: 0.005000 N/A g/tMaximum: 8.434000 N/A g/tMean: 0.445571 N/A g/tMedian 0.335000 N/A g/tStd. Deviation: 0.516688 N/A g/tCoefficient of Variation: 1.159607 N/A
0
2
4
6
8
10
12
14
0 1 2 3 4 5 6 7 8 9 10
Frequency (%)
Au (g/t)
Histogram Plot(Mineralised (Minzon=1))
0
2
4
6
8
0.001
0.01
0.1 1
10
Frequency (%)
Au (g/t)
Log Histogram Plot(Mineralised (Minzon=1))
15
1020304050607080909599
99.9
0.001 0.01 0.1 1 10
Probability
Au (g/t)
Probability Plot (Unweighted)(Mineralised (Minzon=1))
Corihuarmi Scree Slope Deposit(Mineralised (Minzon=1))
Printed: 11-Mar-2010 12:23:57 Data Imported: 22-Feb-2010 16:39:03 Page 1

Coffey Mining Pty Ltd
Corihuarmi Gold Project – MINEWPER00466AE Page: 93 43-101 Technical Report – 6th April 2010
Figure 17.4.4_2 Minera IRL Limited : Corihuarmi Scree Deposit
Histogram and Probability Plot Background (Minzon=0)
Unweighted Weighted UnitsSamples: 874 N/AMinimum: 0.005000 N/A g/tMaximum: 2.131250 N/A g/tMean: 0.068533 N/A g/tMedian 0.055000 N/A g/tStd. Deviation: 0.087781 N/A g/tCoefficient of Variation: 1.280858 N/A
0
10
20
30
40
50
0 1 2 3 4 5
Frequency (%)
Au (g/t)
Histogram Plot(Unmineralised (Minzon=0))
0
2
4
6
8
10
12
0.001
0.01
0.1 1
10
Frequency (%)
Au (g/t)
Log Histogram Plot(Unmineralised (Minzon=0))
15
1020304050607080909599
99.9
0.001 0.01 0.1 1 10
Probability
Au (g/t)
Probability Plot (Unweighted)
(Unmineralised (Minzon=0))
Corihuarmi Scree Slope Deposit(Unmineralised (Minzon=0))
Printed: 11-Mar-2010 12:28:45 Data Imported: 22-Feb-2010 16:39:03 Page 1

Coffey Mining Pty Ltd
Corihuarmi Gold Project – MINEWPER00466AE Page: 94 43-101 Technical Report – 6th April 2010
The applied topcuts are listed below with only a relatively small number of composites being
cut in each of the zones.
Table 17.4.4_3
Minera IRL Limited Corihuarmi Scree Deposit
Outlier Statistics 2m Composites - Gold (g/t)
Domain Uncut Cut
% Change in Mean Number
Data Mean Std Dev CV Upper
Cut Number Data Cut Mean Std
Dev CV
Mineralised (Minzon=1) 547 0.45 0.5167 1.16 2.90 3 0.43 0.0878 0.86 3.1
Background (Minzon=0) 874 0.07 0.0878 1.28 0.42 1 0.07 0.0545 0.82 2.9
17.4.5 Variography
Introduction
Variography is used to describe the spatial variability or correlation of an attribute (gold, silver,
sulphur, etc). The spatial variability is traditionally measured by means of a variogram, which
is generated by determining the averaged squared difference of data points at a nominated
distance (h), or lag (Srivastava and Isaacs, 1989). The averaged squared difference
(variogram or γ(h)) for each lag distance is plotted on a bivariate plot where the X-axis is the
lag distance and the Y-axis represents the average squared differences (γ(h)) for the
nominated lag distance.
In this document, the term “variogram” is used as a generic word to designate the function
characterising the variability of variables versus the distance between two samples. Both a
traditional measure and a correlogram have been applied for the estimation studies completed
for the Corihuarmi Scree Project.
Fitted to the determined experimental variography is a series of mathematical models which,
when used in the kriging algorithm, will recreate the spatial continuity observed in the
variography.
The geostatistical software, Isatis, has been employed to generate and model the
variography. The rotations are reported as input for grade estimation, with X (rotation around
Z axis), Y (rotation around Y`) and Z (rotation around X``) also being referred to as the major,
semi-major and minor axes.
Variographic Discussion
The mineralisation and background horizon of the scree deposit were evaluated separately.
Initially, downhole experimental variograms were calculated to establish the nugget for modelling
the directional variograms for both grade and indicators. To determine the major direction,
variograms were calculated in various directions, maps constructed and contoured. The geology
and geometry of mineralisation controls were also considered in selecting the orientation.
Orthogonal directions were reviewed to establish the semi-major and minor orientations.

Coffey Mining Pty Ltd
Corihuarmi Gold Project – MINEWPER00466AE Page: 95 43-101 Technical Report – 6th April 2010
When the experimental variograms did not exhibit robust structures, general relative, pairwise
relative and correlograms were examined. Correlograms were found to be relatively well
structured and therefore provided the best description of the spatial variability.
Downhole variograms were examined and for the mineralisation horizon (Minzon=1) a nugget
of 32% of the total sill was determined while for background (Minzon=0), it was 20%. Two
structure spherical models were fitted to the variograms. For mineralisation, the range for first
structure was 5m with an overall range of 25m. The ranges for background were 8m and 39m
respectively.
For gold grade directional variography, the interpreted major direction of continuity dips at 15º
towards 221º and exhibits reasonably good structure and displays moderate anisotropy
between the axes. Two spherical models have been fitted to the experimental variograms
(Table 17.4.5_1). For mineralisation, the short-range structure was modelled with ranges of
18m, 15m and 3m for the major, semi-major and minor axis respectively while the fitted
overall ranges were 74m, 40m and 24m. The non-nugget variance is roughly evenly split
between the two structures (Figure 17_4.5_1). In modelling the background experimental
directional variogram, the first structure was modelled using ranges of 50m, 25m and 6m with
second structure ranges of 90m, 80m and 23m for the major, semi-major, and minor axis
respectively. Most of the non-nugget variance was assigned to the second structure
(Figure 17_4.5_2).
Table 17.4.5_1
Minera IRL Limited Corihuarmi Scree Deposit
Variogram Models – Gold (Aucut g/t)
Domain Nugget (C0)
Sill 1 (C1)
Range 1 (m) Sill 2 (C2)
Range 2 (m)
Major Semi Major Minor Major Semi
Major Minor
(Rotation:- 3: 131, 2: 15, 3: 0)
Mineralisation (Minzon=1) 0.32 0.33 18 15 3.0 0.35 74 40 24
Background (Minzon=0)
0.20 0.33 50 25 6.0 0.50 90 80 23
Notes: 1) The rotations are reported as input into Datamine for grade estimation, with 3 (rotation around Z axis), 2 (rotation around Y`) and 3 (rotation around Z``) also being referred to as the major, semi-major and minor axis.
2) Spherical models were applied

Coffey Mining Pty Ltd
Corihuarmi Gold Project – MINEWPER00466AE Page: 96 43-101 Technical Report – 6th April 2010
Figure 17.4.5_1 Modelled Variography
Mineralisation (Minzon=1)
N41 D-15
N221 D-75
-100
-100
0
0
100
100
200
200
Distance (m)
Distance (m)
0.0 0.0
0.5 0.5
1.0 1.0
Correlogram : Au_cut
Correlogram : Au_cut
Isatis2m_cmps/all2(Minzon_1)- Variable #1 : Au_cutExperimental Variogram : in 3 direction(s)D1 : N311 Angular tolerance = 15.00 Lag = 29.00m, Count = 15 lags, Tolerance = 50.00%D2 : N41 D-15 Angular tolerance = 15.00 Lag = 29.00m, Count = 15 lags, Tolerance = 50.00%D3 : N221 D-75 Angular tolerance = 22.00 Lag = 4.00m, Count = 21 lags, Tolerance = 50.00%Model : 3 basic structure(s)Global rotation = Azimuth=N131.00 Dip=15.00 Pitch=-180.00 (Geologist)S1 - Nugget effect, Sill = 0.32S2 - Spherical - Range = 3.00m, Sill = 0.33 Directional Scales = ( 18.00m, 15.00m, 3.00m)S3 - Spherical - Range = 24.00m, Sill = 0.35 Directional Scales = ( 74.00m, 40.00m, 24.00m)
alex_virisheff
Mar 11 2010 14:56:58
MWP466AE_scslp

Coffey Mining Pty Ltd
Corihuarmi Gold Project – MINEWPER00466AE Page: 97 43-101 Technical Report – 6th April 2010
Figure 17.4.2_2 Modelled Variography
Background (Minzon=0)
N311
N41 D-15
N221 D-75
-200
-200
-100
-100
0
0
100
100
200
200
300
300
Distance (m)
Distance (m)
0.0 0.0
0.5 0.5
1.0 1.0
Correlogram : Au_cut
Correlogram : Au_cut
Isatis2m_cmps/all2(Minzon_0)- Variable #1 : Au_cutExperimental Variogram : in 3 direction(s)D1 : N311 Angular tolerance = 30.00 Lag = 37.50m, Count = 15 lags, Tolerance = 50.00%D2 : N41 D-15 Angular tolerance = 30.00 Lag = 37.50m, Count = 15 lags, Tolerance = 50.00%D3 : N221 D-75 Angular tolerance = 20.00 Lag = 2.50m, Count = 31 lags, Tolerance = 50.00%Model : 3 basic structure(s)Global rotation = Azimuth=N131.00 Dip=15.00 Pitch=-180.00 (Geologist)S1 - Nugget effect, Sill = 0.2S2 - Spherical - Range = 6.00m, Sill = 0.3 Directional Scales = ( 50.00m, 25.00m, 6.00m)S3 - Spherical - Range = 23.00m, Sill = 0.5 Directional Scales = ( 90.00m, 80.00m, 23.00m)
alex_virisheff
Mar 11 2010 15:24:56
MWP466AE_scslp

Coffey Mining Pty Ltd
Corihuarmi Gold Project – MINEWPER00466AE Page: 98 43-101 Technical Report – 6th April 2010
17.4.6 Block Modelling
Introduction
For the purpose of resource estimation, a three-dimensional block model was constructed for
the Corihuarmi Scree deposit, encompassing the interpreted mineralisation zone and
surrounding background to allow for later mining studies.
Block Construction Parameters
The block model was firstly rotated to 040º to adequately represent the overall strike direction of
mineralisation. A parent block size 12.5mE x 12.5mN x 2.5mRL (relative north x east x RL) was
considered to fit the style of deposit, available data, the data characteristics (variability as
defined by variography) and the current mining in adjacent Diana and Susan deposits.
Sub-blocking to a 2.5mE x 2.5mN x 0.5mRL cell size was undertaken to allow the effective
volume representation of the interpretation and topography based wireframes. The block model
extents were set to encompass the entire deposit and are defined in Table 17.4.6_1 below.
Table 17.4.6_1
Minera IRL Limited Corihuarmi Scree Deposit
Block Model Extents
Coordinates Extents Number of
Blocks Block Size
(m) Minimum Maximum Range
Easting 439093.39556mE 440272.41428mE 1000m 80 12.5 Northing 8610064.27876mN 8610380.37188mN 700m 56 12.5 Elevation 4650mRL 4975mRL 325m 130 2.55
The model orientation has been rotated by 40º clockwise around the Z-axis.
The mineralisation attribute, Minzon was coded into the block model as for drillholes and
trenches. A visual review of the wireframe surfaces and the block model indicates robust
flagging of the block model (Figure 17.4.6_1).
Figure 17.4.6_1
Cross Section - Coded Block Model
Coffey Mining Pty Ltd
Corihuarmi Gold Project – MINEWPER00466AE Page: 99 43-101 Technical Report – 6th April 2010
17.4.7 Grade Estimation
Introduction
The OK method was applied in obtaining grade estimates for gold within the outlined domains.
This method of grade interpolation is one of the more common geostatistical methods for
estimating the block grade. In this interpolation technique, contributing composite samples
are identified using a search volume applied from the centre of each block. Weights are
determined so as to minimise the error variance considering both the spatial location of the
selected composites and the modelled variogram. Variography describes the correlation
between composite samples as a function of distance. The weighted composite sample
grades are then combined to generate a block estimate and variance.
Grade estimates were obtained using the Datamine implementation of the ordinary kriging
algorithm. Inverse Distance Squared and Nearest Neighbour grade estimates were also
completed within these domains to allow comparison.
Grade Estimate Approach
Grade estimates within the domains (hard boundary between mineralisation and background)
were generated from 2m composites using the OK interpolation. Prior to estimation, high
grade cuts were applied to the composites. Domain control was used for both composite and
block selections implemented through the Minzon field. Grade estimates were interpolated
into parent cells (all subcells were assigned the parent cell grades) within the mineralised
envelope only. Parent blocks were discretised using four points in the east dimension,
four points in the north dimension, and two points in the RL dimension, for a total of
32 discretisation points per block.
It was decided to constrain the influence of trench samples due to their shallow nature. Using
a nearest neighbour approach, those blocks within a 25m by 14m by 3m search of a trench
sample were firstly coded. Grade estimates were generated for the coded blocks using all
composite data.
Subsequently, the remaining grade estimates were obtained using only the RC data. For a
successful grade estimate in either case, the following search strategy was applied:-
� Pass 1 (PassAu=1), the minimum and maximum number of composites was set to 16
and 24 respectively. The number of composites from any one hole was restricted to five.
This restriction is to ensure contribution from other drillholes, while acknowledging that
the data density is insufficient to ensure all blocks receive estimates.
� Pass 2 (PassAu=2) was implemented by expanding the search by a factor of 1.5 only.
� Pass 3 (PassAu=3) was established by expanding the search by a factor of two and
reducing the minimum sample number to 12. The aim of this third pass was to assign
grade estimates into a majority of blocks.

Coffey Mining Pty Ltd
Corihuarmi Gold Project – MINEWPER00466AE Page: 100 43-101 Technical Report – 6th April 2010
None of the applied search regimes involved octant methodology. The sample search
parameters (Table 17.4.7_1) were defined based on the variography as discussed in
Section 17.4.5.
Table 17.4.7_1
Minera IRL Limited Corihuarmi Scree Deposit
Sample Search Parameters Ordinary Kriging Estimates
Domain Pass Major Axis (m)
Semi-Major Axis (m)
Minor Axis (m)
Minimum Samples
Maximum Samples
Maximum Per
Holes
(Rotation:- 3: 131, 2: 15, 3: 0)
Mineralisation (Minzon=1)
1 60 40 12 12 24 5 2 90 60 18 12 24 5
3 120 80 24 8 24 5
Background (Minzon=0)
1 55 35 12 12 24 5
2 82.5 52.5 18 12 24 5 3 110 70 24 8 24 5
Notes: The rotations are reported as input into Datamine for grade estimation, with 3 (rotation around Z axis), 2 (rotation around Y`) and 3 (rotation around Z``) also being referred to as the major, semi-major and minor axis.
To monitor the interpolation process, variables were set up to record which search
neighbourhood was used, how many composites were drawn on, the distance to the nearest
composite and the variance. The slope of regression and kriging efficiency can be used to
evaluate the quality of estimation within each block. These measures were derived from the
Lagrange parameter and F-value generated for each block during the grade estimation.
A detailed visual and statistical review was undertaken on the estimated resource with the
following activities completed:-Firstly, visual checks of cross sections (Figure 17.4.7_1) and
plans were completed.
Figure 17.4.7_1
Cross Section - Coded Block Model, OK Grade Estimates

Coffey Mining Pty Ltd
Corihuarmi Gold Project – MINEWPER00466AE Page: 101 43-101 Technical Report – 6th April 2010
A comparison of the kriging (whole grade estimate) versus the mean of the composite dataset
was carried out in three directions aligned with the block model orientation.
An acceptable level of reproducibility was noted between the input composites and the block
estimates during visual review and as such it is considered the resource estimate is
appropriate and robust.
Figure 17.4.7_2
Composite vs OK Grade Block Estimate at 2.5mRL Increment
17.4.8 Resource Classification
The grade estimates for mineralisation (Minzon=1) have been classified as an Inferred Mineral
Resource in accordance with NI 43-101 guidelines based on the confidence levels of the key
criteria that were considered during the resource estimation. The key criteria that were
considered for the resource classification are presented in Table 17.4.8_1.
17.5 Reported Resource for Corihuarmi Au Project
The grade estimates for Diana and Susan Deposits have been classified as a combination of
Measured and Indicated Mineral Resources in accordance with the criteria laid out in the
Canadian National Instrument 43-101 (“NI 43-101”) guidelines and the classifications adopted
by CIM Council in December 2005. The reportable resources for the mineralised zones of the
Diana and Susan deposits have been calculated for a range of gold cutoffs by Coffey Mining
(0, 0.2, 0.25, 0.3 and 0.5g/t gold), and are presented in Table 17.5_1.
Using MIRL’s preferred cutoffs (0.3g/t gold cutoff at Susan deposit and a 0.25g/t gold cutoff at
Diana deposit), a total of 5.3Mt at an average gold grade 0.6g/t Au for 103.0koz Au are
reported from the combined deposits, remaining in-situ as of January 1, 2010.
0.00010.00020.00030.00040.00050.00060.000
0
50
100
150
200
0.00 0.50 1.00 1.50 2.00 2.50 3.00
Number
Rel
ativ
e R
L
Gold (g/t)
c_Au11(Mineralised)
c_Au06 (Background)
m_Au11(Mineralised)
m_Au06 (Background)
c_NUM11(Mineralised)
c_NUM06 (Background)
`

Coffey Mining Pty Ltd
Corihuarmi Gold Project – MINEWPER00466AE Page: 102 43-101 Technical Report – 6th April 2010
Table 17.4.8_1
Minera IRL Limited Corihuarmi Scree Deposit
Confidence Levels of Key Criteria
Items Discussion Confidence
Drilling Techniques RC drilling in line with industry standard approach; trench sampling was completed using a defined procedure. Moderate
Logging Standard nomenclature and apparent high quality. Moderate
Drill Sample Recovery RC recovery adequate for 2009 drilling program. High
Sub-sampling Techniques and Sample Preparation Industry standard for both RC and trench. Moderate
Quality of Assay Data Available data shows minor anomalies related to data management. Moderate
Verification of Sampling and Assaying
No channel sampling that twin original RC drill intercepts. Dedicated twin sampling is recommended. High
Location of Sampling Points Survey of all collars and hole setup orientation. No downhole survey although as holes shallow and generally vertical expected deviation should be minimal.
High
Data Density and Distribution
Mineralisation defined on a notional 50mE x 50mN sampled spacing. Further RC drilling is required to replace trenches. Infill drilling is required to raise the confidence in grade continuity and extent as well as geological detail.
Moderate
Audits or Reviews Coffey Mining is unaware of external reviews. N/A
Database Integrity No errors were identified. High
Geological Interpretation
The extent of alluvials, colluvials and scree components are unknown. Elevated grades (>=0.2g/t Au) domained as mineralisation occurs near surface with grades reducing with depth. Closer spaced drilling recommended to overcome the uncertainty in geological and grade continuity / complexity.
Low
Rock Dry Bulk Density Dry bulk density measurements obtained primarily from near surface samples. The procedure is defined using laboratory input. Further determinations are required particularly vertically.
Low to Moderate
Estimation and Modelling Techniques Ordinary Kriging. High
Mining Factors or Assumptions None N/A
Table 17.5_1
Corihuarmi Project MZT 2009 Models for Susan and Diana Deposits
Grade Tonnage as of January 1, 2010 Gold Grade Estimates obtained Using Ordinary Kriging (OK)
Block Model (5m x 5m x 5m Parent Cell size)
Lower Cutoff Grade
Measured Indicated Measured + Indicated
Tonnes (kt)
Au (g/t)
Metal (kozs)
Tonnes (Kt)
Au (g/t)
Metal (kozs)
Tonnes (Kt)
Au (g/t)
Metal (kozs)
Diana Deposit
0 1,345 0.42 18.3 1 0.27 0.008 1,346 0.42 18.3
0.2 1,173 0.46 17.4 1 0.27 0.008 1,174 0.46 17.4 0.25 1,028 0.50 16.4 1 0.28 0.006 1,029 0.49 16.4 0.3 871 0.53 15.0 - - - 871 0.53 15.0 0.5 371 0.73 8.7 - - - 371 0.73 8.7
Susan Deposit
0 8,197 0.41 107.1 136 0.15 0.7 8,333 0.40 107.7 0.2 5,508 0.54 95.6 19 0.29 0.2 5,527 0.54 95.8 0.25 4,448 0.62 88.0 11 0.33 0.1 4,459 0.61 88.1 0.3 3,509 0.71 79.7 6 0.37 0.07 3,515 0.71 79.8 0.5 1,817 1.01 59.0 0.2 0.63 0.004 1,817 1.01 59.0
Susan and Diana Combined (Susan @ 0.25 g/t cutoff & Diana @ 0.3 g/t cutoff)
- 5,318 0.60 102.9 11 0.33 0.1 5,329 0.60 103.0

Coffey Mining Pty Ltd
Corihuarmi Gold Project – MINEWPER00466AE Page: 103 43-101 Technical Report – 6th April 2010
A summary grade tonnage of the estimated resources for the Corihuarmi Scree deposit is
provided in Table 17.5_2 below. The in situ dry bulk density applied to all blocks was
2.08t/m³. A total Inferred Mineral Resource of 3.765Mt @ 0.45g/t Au has been identified with
no lower grade cutoff applied.
Table 17.5_2
Minera IRL Limited Corihuarmi Scree Deposit
Grade Tonnage- 28 th February 2010 Gold Grade Estimates obtained Using Ordinary Kriging (OK)
Block Model (12.5m x 12.5m x 2.5m – Parent Cell size) No Lower Grade Cutoff Applied
Lower Cutoff Grade
Measured Indicated Inferred
Tonnes (Mt)
Au (g/t)
Metal (kozs)
Tonnes (Mt)
Au (g/t)
Metal (kozs)
Tonnes (Mt)
Au (g/t)
Metal (kozs)
Corihuarmi Scree Deposit
0 - - - - - - 3.765 0.45 54.6
A grade tonnage curve was also compiled for the Scree that demonstrates as the lower grade
cutoff is increased the tonnage reduces significantly reflecting the grade distribution observed
in the sample data.
Figure 17.5_1
Grade Tonnage Curve Inferred Mineral Resources – Mineralisation Horizon
The reported resources have been compiled by Mr Beau Nicholls, Mr Doug Corley and
Mr Alex Virisheff. Mr Nicholls, Mr Corley and Mr Virisheff are Members of the Australasian
Institute of Geoscientists and an employee of Coffey Mining. They have sufficient experience,
relevant to the style of mineralisation and type of deposit under consideration and to the
activity they have undertaken, to qualify as a Qualified Person as defined in the NI 43-101.
0.0
0.2
0.4
0.6
0.8
1.0
1.2
1.4
1.6
0.0
0.5
1.0
1.5
2.0
2.5
3.0
3.5
4.0
0.00 0.10 0.20 0.30 0.40 0.50 0.60 0.70 0.80 0.90 1.00
Ave
rage
Au
Gra
de
(g/t
)
Ton
nage
(Mt)
Au (g/t) Lower Cutoff Grade
3_Tonnes_11
3_Au_11

Coffey Mining Pty Ltd
Corihuarmi Gold Project – MINEWPER00466AE Page: 104 43-101 Technical Report – 6th April 2010
17.6 Reported Reserve for Corihuarmi Au Deposits
The Mineral Reserve estimates are based on the input parameters described in Section 18 of
this report. Table 17.6_1 provides a summary of the Mineral Reserves that were determined for
the Susan and Diana gold deposits. All stated reserves are completely included within the
quoted resources.
Table17.6_1
Corihuarmi Project
Minable Reserve Summary As of 31 December 2009
Cutoff (g/t) Deposit
Mineral Reserves
Proven Probable Total
Tonnes [Mt]
Grade [g/t Au]
In-Situ Au [Koz]
Tonnes [Mt]
Grade [g/t Au]
In-Situ Au [Koz]
Tonnes [Mt]
Grade [g/t Au]
In-Situ Au [Koz]
0.30 Diana 0.7 0.54 11.9 0.7 0.54 11.9 0.25 Susan 4.4 0.67 93.9 4.4 0.67 93.9
Total 5.1 0.65 105.9 5.1 0.65 105.9
The scree deposit is of inferred category and therefore it cannot be included in the reserve. It
is Coffey’s understanding that MIRL will evaluate the options available to develop this deposit
in the near future as it offers a good potential to increase the current mine life. Mineral
resources that are not mineral reserves do not have demonstrated economic viability.
This reserve estimate has been determined and reported in accordance with Canadian
National Instrument 43-101, ‘Standards of Disclosure for Mineral Projects’ of December 2005
(the Instrument) and the classifications adopted by CIM Council in December 2005.
Furthermore, the reserve classifications are also consistent with the ‘Australasian Code for
Reporting of Mineral Resources and Ore Reserves’ of December 2004 (“JORC Code”) as
prepared by the Joint Ore Reserves Committee of the Australasian Institute of Mining and
Metallurgy, Australian Institute of Geoscientists and Mineral Council of Australia (JORC).
The reserve classifications for both reporting systems are essentially the same, with only minor
semantic differences in the naming conventions. Reserves are called “Ore Reserves” under the
JORC Code and “Mineral Reserves” under the CIM standards. “Proved Reserves” under the
JORC code are called “Proven Reserves” under the CIM Standards. The reserve naming
convention for both systems is summarised in Table 17.6_2 below for the sake of completeness.
Table 17.6_2
Reserve Classification Comparison
Resource Classification Reserve Classification
JORC Code National Instrument 43-101
Measured Proved Proven Indicated Probable Probable
The reported reserves have been compiled by Mr Jean-Francois St-Onge eng. Mr St-Onge is a
non-resident Member of the Ordre des Ingénieurs du Québec and a Member of the Australasian
Institute of Mining and Metallurgy and an employee of Coffey Mining. He has sufficient
experience, relevant to the style of mineralisation and type of deposit under consideration and to
the activity he has undertaken, to qualify as a Qualified Person as defined in the NI 43-101.

Coffey Mining Pty Ltd
Corihuarmi Gold Project – MINEWPER00466AE Page: 105 43-101 Technical Report – 6th April 2010
18 OTHER RELEVANT DATA AND INFORMATION
18.1 Geotechnical Input and Conditions
The geotechnical evaluation was completed by Vector (2005). The evaluation was based on
existing geological data, field structural and geotechnical mapping and drillhole core logging.
In summary, the evaluation resulted in the recommendation of 70º batters and 8.5m berms for
every 20m in vertical wall height. If softer rock is encountered in localised areas Vector
suggested reducing the batter slopes to 60º.
Further geotechnical drilling was recommended by Vector in 2005 and subsequently
completed. It included some oriented diamond holes for the detailed mine design phase, the
results of which were used to finalise the design of waste dumps, leach pads and access
roads in the Bankable Feasibility Study, Rev. 1 (Vector 2006).
The final wall, located to the north of the Diana pit was exposed during the first year of mining.
The wall condition is good and the recommended wall parameters appear to be adequate. No
bench scale failures were identified during the Coffey site visit. An example of Diana Pit final
wall is presented in Figure 18.1_1. Berms are kept clean and will therefore properly serve as
a catchment for rock.
Figure 18.1_1
Diana Pit Final Wall

Coffey Mining Pty Ltd
Corihuarmi Gold Project – MINEWPER00466AE Page: 106 43-101 Technical Report – 6th April 2010
18.2 Hydrogeology Input
A hydrogeology study was conducted by Vector (2006).
Outside the mineralized areas, groundwater levels are very close to surface (average depth to
water of 5.8m) although the depth to groundwater is generally greater at higher elevations
(ranging up to 17.7m below surface). The highest measured groundwater levels are
4,800masl, while the lowest measured groundwater elevations at the site were about
4,668masl. It was estimated by Vector that the maximum water elevation at Susan is below
4,870 masl and the maximum water elevation at Diana is below 4,830 masl. The depth to
groundwater within the actual ore deposits at Susan and Diana is considerably greater due to
the presence of extensive permeable vuggy silica at these locations. It has purportedly been
reported that groundwater was not encountered during exploration drilling at these locations.
Given the elevated nature of the mineralized outcrops above the surrounding plateau, no
material adverse affects due to groundwater are expected to interfere with the mining operation.
18.3 Mine Design
The life of mine (LOM) open pit design was completed by AMC Consultants (AMC) to
conventional industry standards during the feasibility study.
The mine design respects the geotechnical slope angle proposed. No issues were detected
either from the pits or the waste dump designs.
The current LOM plan uses this same design but a lower cutoff grade of 0.25g/t Au for the
Susan Pit and 0.30g/t Au for the Diana Pit was applied. The pit inventory comprises 5.1Mt of
ore at 0.65g/t Au with 1.2Mt of waste for a waste to ore strip ratio of 0.2:1 as presented in
Table 18.3_1.
Table 18.3_1
Corihuarmi Project
Summary of Pit Design Material Inventory
Pit Tonnes Ore
Grade Au (g/t) Ounces Tonnes
Waste Ratio (SR)
Rec Au Ounces
Diana 0.7Mt 0.5g/t 11.9koz 32.9kt 0.1 10.2koz Susan 4.4Mt 0.7g/t 93.9koz 1144.4kt 0.3 65.7koz
Total 5.1Mt 0.6g/t 105.8koz 1177.3kt 0.2 75.9koz
18.4 Mining Schedule
The LOM plan as prepared by MIRL in 2009 was developed using the MineSight software,
utilising bench by bench ore and waste scheduling units. The schedule was prepared on a
yearly basis with the objective of maintaining a Diana to Susan pit blend of 1 to 6.4 until the
depletion of the Diana pit and minimise variation in the average grade. Table 18.4_1
summarises the production plan for the LOM plan.

Coffey Mining Pty Ltd
Corihuarmi Gold Project – MINEWPER00466AE Page: 107 43-101 Technical Report – 6th April 2010
Table 18.4_1
Corihuarmi Project
Life of Mine Plan Summary
Year Tonnes Ore
Grade Au (g/t) Ounces Tonnes
Waste Ratio (SR)
Rec Au Ounces
2010 1.45Mt 0.8 39.5koz 125.0kt 0.09 28.1 2011 1.45Mt 0.8 35.0koz 336.7kt 0.23 25.0 2012 1.45Mt 0.5 22.3koz 460.8kt 0.32 16.1 2013 0.73Mt 0.4 9.0koz 254.7kt 0.35 6.7
Total 5.08Mt 0.6 105.8koz 1,177.2kt 0.23 75.9
18.5 Drill and Blast
Both Diana and Susan pits require blasting prior to loading. The drilling is performed with a
Sandvik DX-700 Ranger, the holes diameter is 127mm (4½in). The drill pattern generally
varies from 3m x 3m to 5m x 5m depending on rock hardness. The blast are loaded with
emulsion based explosives and initiated with NONEL type detonators.
18.6 Grade Control
For grade control purposes a representative sample of the drill cuttings produced from blast
holes is used for grade determination (Blast hole sampling). In light of the apparent
underestimation of the diamond core drilling reverse circulation drilling has also been adopted
in Diana pit for grade control purposes. The samples is analysed in the on-site laboratory.
18.7 Load and Haul
Loading is performed using either a Caterpillar 320C (20t) excavator or a Hyundai R360LC
(36t) excavator. Both of these machines are considered suitable for the Project.
The Truck fleet comprises 14 Volvo FM12 carrying on average 27t per load.
The truck loads were measured at an earlier stage of the mining operation, however, the truck
scale broke down in early 2008 and the average truck weight as measured previously was
assumed from then onwards. The truck loads are not currently measured and the tonnes
hauled are based on the truck count and the assumed average truck weight (truck factor).
18.8 Infrastructure
A camp to accommodate approximately 140 employees was constructed to the east of the
plant facilities. Existing buildings includes the offices, warehouse, messing facilities and other
buildings.
The principal mining related infrastructure comprise the waste dump, haul roads, mining
contractor workshop and related infrastructure, fuel farm and explosives storage facility.

Coffey Mining Pty Ltd
Corihuarmi Gold Project – MINEWPER00466AE Page: 108 43-101 Technical Report – 6th April 2010
18.9 Mine Operation
At the commencement of the mining operation MIRL opted contract mining to establish the
Project. The Contractor, CyM Contratistas Generales SAC (CyM), supplies and operates all
the mining equipment under MIRL staff supervision. Table 18.9_1 provides the current list of
the equipment used for the mining operation and leach pad construction.
Table 18.9_1
Corihuarmi Project
CyM Equipment List
Equipment Types Manufacturer Model Fleet Size
Excavator Caterpillar 320C 1
Hyundai 360 LC 1
Trucks Volvo FM12 14 Loader Caterpillar 966H 1 Grader Caterpillar 140H 1
Track dozer Caterpillar D8R D6D 1
Vibratory compactor Caterpillar CS533 1 Drill Sandvik DX-700 Ranger 1
Under the contract terms MIRL has the right to terminate this contract after thirty-six (36)
months, at their sole discretion.
During 2009 MIRL employed around 132 employees, with CyM employing another 91 employees
and all other contractor combined employing approximately 98 people for a total of over
321 personnel on site.
18.10 Mining Capital Costs
CyM is employed to carry out the mining activities and, as such, the capital depreciation of the
mining equipment is incorporated into the mine operating unit rates.
The sustaining capital expenditure that MIRL has planned is related to mining computer
hardware and software, light vehicles, office requirements and other miscellaneous items and
is expected to be $250k per year from 2010 to 2013.
18.11 Mining Operating Costs
The 2010 projected mining operating costs are based on the historical data and contract
information. For the following three years MIRL is looking into the possibility of changing its
mining contractor in order to reduce the current mining contract cost. The anticipated cost
saving in the mining cost is about 15% and 18% when including the administration fees. On
the overall budget cost this represent an average cost reduction of about 16.8% per year.

Coffey Mining Pty Ltd
Corihuarmi Gold Project – MINEWPER00466AE Page: 109 43-101 Technical Report – 6th April 2010
The cost reduction is based on MIRL’s current knowledge of the cost structure from other
contractors doing other work on site. MIRL plans to use these other contractors with similar
equipment as those already in use by CyM to realise the reduction in the mining cost. As the
contract with CyM was negotiated at the peak of the mining industry’s boom period, these
potential cost savings are considered realistic.
In the event that MIRL is not able to reduce the mining cost and the mining costs remain
similar to the current CyM contract costs, it would require in 2013 a gold price of more than
US$880 to maintain a positive cash flow. Table 18.11_1 shows the annual cost per ounces
for the LOM Plan using the current mining costs and the cost per ounces including the
reduction in mining cost.
Table 18.11_1
Corihuarmi Project
2010 LOM Operational Cost Per Ounce Summary with Current Mining Cost versus Reduced Mining Cost
Scenario Cost per ounce (US$/oz)
2010 2011 2012 2013
LOM Plan using original Mining costs 400 453 721 882 2010 LOM Plan with reduced Mining costs 400 388 615 758
18.12 Economical Considerations
18.12.1 Gold Supply and Demand
Information on the demand and supply of gold is extensive. The following is from the World
Gold Council’s web site:
The gold price finished 2009 25% higher than where it started. After recovering from a first
quarter correction, the middle part of the year was broadly characterised by a period of range
trading in a $US900-$1,000/oz band. Finally, the sustained break above the key $1,000/oz
level came in early September, with record highs being repeatedly tested during the
remainder of the year.
Identifiable demand in 2009 was down 11% on 2008 levels, but if we add inferred investment
(which represents the less visible investment flows as well as some residual error), there was
a rise in total demand of 11%. Weaker jewellery and industrial demand were offset by
significantly higher levels of investment. However, as with the supply side, the annual figures
disguise several significant changes that occurred within the sectors during the course of the
year.
We expect investor support for gold in 2010 to remain solid. The search by investors and
asset managers for portfolio diversification is expected to continue and on a more tactical
note, the high levels of economic, inflation and exchange rate uncertainty are unlikely to
disappear anytime soon. Furthermore, as global economic conditions improve, jewellery and
industrial demand are likely to continue to recover.

Coffey Mining Pty Ltd
Corihuarmi Gold Project – MINEWPER00466AE Page: 110 43-101 Technical Report – 6th April 2010
The price of gold has been volatile in recent times and this is expected to continue during the
mining of Corihuarmi. MIRL have undertaken research into what gold price is appropriate and
have chosen US$850/oz as the Project base case. This is supported by prices and the trend
over the last five years as shown in Figure 18.12.1_1.
Figure 18.12.1_1
Gold Price Last Five Years
18.12.2 Tax and Royalties
The Peru Government Royalty is based on the following:
� Companies with sales of up to US$60 million per year – 1% of sales;
� Companies with sales of above US$60 million and up to US$120 million per year – 2% of
sales; and
� Companies with sales over US$120 million per year – 3% of sales.
The vendor royalty is based on the following rates:
� Gold price less than US$300/oz, a sales royalty of 1.5%;
� Gold price from US$300/oz to US$350/oz, a sales royalty rate of 2.0%
� Gold price over US$350/oz, a sales royalty rate of 3.0%.
In addition to these the Peruvian corporate income tax is levied at a flat rate of 30%.

Coffey Mining Pty Ltd
Corihuarmi Gold Project – MINEWPER00466AE Page: 111 43-101 Technical Report – 6th April 2010
18.12.3 Cash Flow and Sensitivity
Using the Proven Reserve reported in Section 17.6, a net gold price of US$850/oz, the net
present value (NPV) of the LOM plan discounted at 10% is US$30.2M as shown in
Table 18.12.3_1.
Table 18.12.3_1
Corihuarmi Project
Cash Flow and NPV @ 10%
Values Reported in US$M 2010 2011 2012 2013 Total
Revenue 25.3 22.5 14.5 6.0 68.3 Cost 11.3 9.7 9.9 5.1 35.9 Cash Flow 14.1 12.8 4.6 0.9 32.4 NPV @ 10% 14.1 11.6 3.8 0.7 30.2
The Project is robust and cash positive. As presented in Figure 18.12.3_1 a positive or
negative variation of up to 30% in gold price, ore grade or total cost is not sufficient to
jeopardise the economics of the project. The price of gold can go as low as US$460 before
the NPV @ 10% reaches a negative value.
Figure 18.12.3_1
Project LOM Sensitivity
0.0
5.0
10.0
15.0
20.0
25.0
30.0
35.0
40.0
45.0
50.0
-40% -30% -20% -10% 0% 10% 20% 30% 40%
NP
V @
10
% (U
S$M
)
GRADE Au Total Cost Price of Gold

Coffey Mining Pty Ltd
Corihuarmi Gold Project – MINEWPER00466AE Page: 112 43-101 Technical Report – 6th April 2010
19 INTERPRETATION AND CONCLUSIONS
The pertinent observations and interpretations which have been developed in producing this
report are detailed in the sections above.
From the work completed to date Coffey Mining believes the Project to be reasonably robust.
20 RECOMMENDATIONS
The following recommendations are made:
20.1 Exploration
Coffey Mining recommends that the current MIRL exploration targets within the Corihuarmi
region should be re-assessed in further detail to compile all historical data into a useable
format and to potentially look at testing additional targets. Minimal drilling has been
undertaken outside of the Diana and Susan deposits. An initial follow up exploration program
would require a budget of approximately $240k.
20.2 Resource
Coffey Mining recommends the following:
� That no grade call factor be applied to the resource model for the Diana deposit. Grade
control drilling has shown a positive reconciliation to the resource model to date; however
with depth there appears to be a closer reconciliation developing.
� Susan deposit is performing well against the mining data collected to date.
� That mined ore tonnes are reconciled against a weightometer, to check whether the truck
factor assumptions are correct. Ore volumes should also be reconciled against
weightometer values to check if bulk density assumptions for each deposit are also
correct.
� Continue to monitor QA/QC for BH sampling, including field duplicates, inclusion of
certified standards and blanks and umpire laboratory testing.
� Although additional close spaced drilling is required to increase the resource confidence
of the Scree deposit, MIRL should weight the associated risks of this additional drilling
investment as opposed to direct mining.

Coffey Mining Pty Ltd
Corihuarmi Gold Project – MINEWPER00466AE Page: 113 43-101 Technical Report – 6th April 2010
21 REFERENCES
Coriuarmi Minesite Personnel- 2007 to 2009 - Monthly Corporate Reports March 2007 to February 2009
Minera IRL Metallurgical Research Department - Contreras, C, 2010, “Final Report of Research, Metallurgical
No. 5 – Tests on Columns Cyanidation Screen Material with High Slope”
Coffey Mining (RSG Global) - Virisheff, A., 2006, Corihuarmi Gold Project – Resource Estimation, Project
Number PCOR03, , 1162 Hay Street, West Perth 6005 Australia.
Coffey Mining (RSG Global) - Yeates, R. et al., 2007, Competent Persons Report – April 2007, Project Number
PINV01, 1162 Hay Street, West Perth 6005 Australia.
Kappes, Cassiday & Associates, 2006-” Corihuarmi Feasibility Study 1,000,000 Tonne per Year Heap Leach
Project” Technical report prepared for Minera IRL S.A.
MTZ Consultant (Peru)- Torres, M.Z., 2009, “Mineral Resources Estimation for Susan and Diana Pits,
Corihuarmi Mine ; Apr-May 2009:, for Minera IRL S.A. Internal Report
Vector Peru S.A.C. 2006- “Bankable Feasibility Study Leach Pad, Waste Rock Disposal and Mine Access
Road Facilities Design” Technical report prepared for Minera IRL S.A.
Vector Peru S.A.C. 2005- “Geotechnical Evaluation of Final Slopes” Technical report prepared for Minera IRL
S.A.

Coffey Mining Pty Ltd
Corihuarmi Gold Project – MINEWPER00466AE Page: 114 43-101 Technical Report – 6th April 2010
22 DATE AND SIGNATURE PAGE
The effective date of this Report is 6th April 2010.
[signed]
B Nicholls B.Sc Geol. MAIG Geology Consultant - Brazil Coffey Mining Pty Ltd
6th April 2010
[signed]
Jean-François St-Onge, eng. B.Sc.A. (Mining), MAusIMM
Specialist Mining Engineer Coffey Mining Pty Ltd 6th April 2010
[signed]
D A Corley BAppSc (Geol) BSc (Hons), MAIG
Associate Resource Geologist Coffey Mining Pty Ltd 6th April 2010
[signed]
Barry Cloutt BAppSc (Eng Met) MAusIMM Chief Metallurgist Coffey Mining Pty Ltd
6th April 2010
[signed]
Alex Virisheff BAppSc (Eng Met) MAusIMM Principal Resource Geologist Coffey Mining Pty Ltd
6th April 2010

Coffey Mining Pty Ltd
Corihuarmi Gold Project – MINEWPER00466AE Page: 115 43-101 Technical Report – 6th April 2010
23 CERTIFICATES OF AUTHORS
Certificate of Qualified Person As the primary author of the report entitled “Corihuarmi Gold Project, Technical Report” (the Report),
dated 6 April 2010, I hereby state:
1. I, Beau Nicholls, Consulting Geologist of Coffey Mining Pty Ltd, 1162 Hay Street, West Perth, Western Australia, Australia, do hereby certify that:
2. I am a practising geologist with 15 years of Mining and Exploration geological experience. I have worked in Australia, Eastern Europe, West Africa and currently Brazil. I am a member of the Australian Institute of Geoscientists (“MAIG”).
3. I am a graduate of Western Australian School of Mines – Kalgoorlie and hold a Bachelor of Science Degree in Mineral Exploration and Mining Geology (1994). I have practiced my profession continuously since 1995.
4. I am a “qualified person” as that term is defined in National Instrument 43-101 (Standards of Disclosure for Mineral Projects) (the “Instrument”).
5. I visited the property that is the subject of this Report between the 12th and 14th of May 2009.
6. I am responsible or co responsible for all sections of this report (excluding Sections 16, 17 and 18).
7. I hereby consent to the use of this Report and my name in the preparation of documents for a public filing including a prospectus, an annual information filing,, brokered or non-brokered financing(s), or for the submission to any Provincial or Federal regulatory authority.
8. I am not aware of any material fact or material change with respect to the subject matter of the Report that is not reflected in the Report, or the omission to disclose which makes the Report misleading and that as of the date of this certificate, to the best of my knowledge, information and belief, the Report contains all scientific and technical information that is required to be disclosed to make the Report not misleading.
9. I have read and understand the National Instrument 43-101 and am independent of the issuer as defined in Section 1.4 and prior to visiting Corihuarmi I had no involvement in or knowledge of the property that is the subject of this Report.
10. I have read the National Instrument and Form 43-101F1 (the “Form”) and the Report has been prepared in compliance with the Instrument and the Form.
11. I have not received, nor do I expect to receive, any interest, directly or indirectly, in the Property that is the subject of this report and do not hold nor expect to receive securities of Minera IRL Limited.
Dated at Perth, Western Australia, Australia, on the 6th of April 2010. [signed]
Beau Nicholls B.Sc Geol MAIG Geology Manager - Brazil Coffey Mining Pty Ltd
Coffey Mining Pty Ltd
Corihuarmi Gold Project – MINEWPER00466AE Page: 116 43-101 Technical Report – 6th April 2010
Certificate of Qualified Person
As the co-author of the report entitled “Corihuarmi Gold Project, Technical Report” (the Report), dated
6 April 2010, I hereby state:
1. I, Jean-Francois St-Onge, eng., Employee and Specialist Mining Engineer of Coffey Mining Pty Ltd, 1162 Hay Street, West Perth, Western Australia, Australia, do hereby certify that:
2. I am a non-resident member of the OIQ (Ordre des Ingénieurs du Québec - 111717) as well as a member of the AusIMM (Australasian Institute of Mining and Metallurgy), and a ‘Qualified Person’ in relation to the subject matter of this report. .
3. I graduated from the University Laval, Québec, Qc, Canada with a B.Sc.A. (Mining) Degree in 1992. I have practiced my profession continuously since then.
4. I am a “qualified person” as that term is defined in National Instrument 43-101 (Standards of Disclosure for Mineral Projects) (the “Instrument”).
5. I visited the property that is the subject of this report between the 12th and 14th May 2009.
6. I am responsible for Sections 17.6 and 18 of this report.
7. I am co responsible for Sections 1 of this report.
8. I hereby consent to the use of my name in the preparation of documents for a prospectus, annual information filing, initial public offering, brokered or non-brokered financing(s), for the submission to any Provincial or Federal regulatory authority.
9. I am not aware of any material fact or material change with respect to the subject matter of the Report that is not reflected in the Report, or the omission to disclose which makes the Report misleading and that as of the date of this certificate, to the best of my knowledge, information and belief, the Report contains all scientific and technical information that is required to be disclosed to make the Report not misleading.
10. I have read and understand National Instrument 43-101 and am considered independent of the issuer as defined in Section 1.4.
11. I have read the National Instrument and Form 43-101F1 (the “Form”) and the Report has been prepared in compliance with the Instrument and the Form.
12. I have not received, nor do I expect to receive, any interest, directly or indirectly, in the Property that is the subject of this report and do not hold nor expect to receive securities of Minera IRL Limited.
Dated at Perth, Western Australia, Australia, on the 6th of April 2010. [signed]
Jean-François St-Onge eng. B.Sc.A. (Mining), MAusIMM Specialist Mining Engineer Coffey Mining Pty Ltd

Coffey Mining Pty Ltd
Corihuarmi Gold Project – MINEWPER00466AE Page: 117 43-101 Technical Report – 6th April 2010
Certificate of Qualified Person
As co-author of the report entitled “Corihuarmi Gold Project, Technical Report” (the Report), dated
6 April 2010, I hereby state:
1. I, Barry Cloutt, am the Chief Metallurgist with the firm Coffey Mining Pty Ltd, 1162 Hay Street, West Perth, Western Australia, Australia, do hereby certify that:
2. I am a practising metallurgist and I am a Member of AusIMM (Australasian Institute of Mining and Metallurgy).
3. I am a graduate of the Western Australian Institute of Technology (Curtin University and hold a Bachelor of Applied Science (Engineering Metallurgy) degree 1981. I have practiced my profession continuously since 1982.
4. I am a “qualified person” as that term is defined in National Instrument 43-101 (Standards of Disclosure for Mineral Projects) (the “Instrument”).
5. I have not visited the property that is the subject of this report.
6. I am responsible for Section 16 of this report.
7. I am not aware of any material fact or material change with respect to the subject matter of the Report that is not reflected in the Report, or the omission to disclose which makes the Report misleading and that as of the date of this certificate, to the best of my knowledge, information and belief, the Report contains all scientific and technical information that is required to be disclosed to make the Report not misleading.
8. I have read and understand the National Instrument 43-101 and am considered independent of the issuer as defined in Section 1.4.
9. I have read the National Instrument and Form 43-101F1 (the “Form”) and the Report has been prepared in compliance with the Instrument and the Form.
10. I have not received, nor do I expect to receive, any interest, directly or indirectly, in the Properties that are the subject of this report and do not hold nor expect to receive securities of Minera IRL Limited.
Dated at Perth, Western Australia, Australia, on 6th April 2010. [signed]
Barry Cloutt BAppSc (Eng Met) MAusIMM
Chief Metallurgist Coffey Mining Pty Ltd
Coffey Mining Pty Ltd
Corihuarmi Gold Project – MINEWPER00466AE Page: 118 43-101 Technical Report – 6th April 2010
Certificate of Qualified Person As co-author of the report entitled “Corihuarmi Gold Project, Technical Report” (the Report), dated
6 April 2010, I hereby state:
1. I, Doug Corley, am an Associate Resource Geologist with the firm Coffey Mining Pty Ltd, 1162 Hay Street, West Perth, Western Australia, Australia, do hereby certify that:
2. I am a practising resource geologist and I am a Member of the AIG (Australasian Institute of Geoscientists).
3. I am a graduate of Queensland University Technology and James Cook University and hold a Bachelor of Applied Science (Geology) degree 1989 and Bachelor of Science (Honours) 1991. I have practiced my profession continuously since 1991.
4. I am a “qualified person” as that term is defined in National Instrument 43-101 (Standards of Disclosure for Mineral Projects) (the “Instrument”).
5. I have not visited the property that is the subject of this report.
6. I prepared Sections 17.1-17.3 of this report.
7. I am co responsible for Sections 1, 17.5 and 19-21 of this report.
8. I am not aware of any material fact or material change with respect to the subject matter of the Report that is not reflected in the Report, or the omission to disclose which makes the Report misleading and that as of the date of this certificate, to the best of my knowledge, information and belief, the Report contains all scientific and technical information that is required to be disclosed to make the Report not misleading.
9. I have read and understand the National Instrument 43-101 and am considered independent of the issuer as defined in Section 1.4.
10. I have read the National Instrument and Form 43-101F1 (the “Form”) and the Report has been prepared in compliance with the Instrument and the Form.
11. I have not received, nor do I expect to receive, any interest, directly or indirectly, in the Properties that are the subject of this report and do not hold nor expect to receive securities of Minera IRL Limited.
Dated at Perth, Western Australia, Australia, on 6th April 2010. [signed]
Doug Corley BSc (Hons) Geology MAIG
Associate Resource Geologist Coffey Mining Pty Ltd

Coffey Mining Pty Ltd
Corihuarmi Gold Project – MINEWPER00466AE Page: 119 43-101 Technical Report – 6th April 2010
Certificate of Qualified Person As co-author of the report entitled “Corihuarmi Gold Project, Technical Report” (the Report), dated 6 April
2010, I hereby state:
1. I, Alex Virisheff, am a Principal Resource Geologist with the firm Coffey Mining Pty Ltd, 47 Doggett Street, Newstead, Queensland, Australia, do hereby certify that:
2. I am a practising resource geologist and I am a Member of the Australasian Institute of Mining and Metallurgy (AusIMM).
3. I am a graduate of University of Queensland and hold a Bachelor of Science (Honours Geology) degree 1974. I have practiced my profession continuously since 1974.
4. I am a “qualified person” as that term is defined in National Instrument 43-101 (Standards of Disclosure for Mineral Projects) (the “Instrument”).
5. I have not visited the property that is the subject of this report.
6. I prepared Sections 17.4 of the Report.
7. I am co responsible for Sections 1, 17.5 and 19-21 of this report.
8. I am not aware of any material fact or material change with respect to the subject matter of the Report that is not reflected in the Report, or the omission to disclose which makes the Report misleading and that as of the date of this certificate, to the best of my knowledge, information and belief, the Report contains all scientific and technical information that is required to be disclosed to make the Report not misleading.
9. I have read and understand the National Instrument 43-101 and am considered independent of the issuer as defined in Section 1.4.
10. I have read the National Instrument and Form 43-101F1 (the “Form”) and the Report has been prepared in compliance with the Instrument and the Form.
11. I have not received, nor do I expect to receive, any interest, directly or indirectly, in the Properties that are the subject of this report and do not hold nor expect to receive securities of Minera IRL Limited.
Dated at Perth, Western Australia, Australia, on 6th April 2010. [signed]
Alex Virisheff BSc (Hons) (Geo) MAusIMM
Principal Resource Geologist Coffey Mining Pty Ltd


![[3937]-101 P553](https://static.fdokumen.com/doc/165x107/63338430a6138719eb0aa5bc/3937-101-p553.jpg)