Contributions of Spatial Working Memory to Visuomotor Learning
182
CONTRIBUTIONS OF SPATIAL WORKING MEMORY TO VISUOMOTOR ADAPTATION by Joaquin A. Anguera A dissertation submitted in partial fulfillment of the requirements for the degree of Doctor of Philosophy (Kinesiology) in The University of Michigan 2008 Doctoral Committee: Assistant Professor Rachael D. Seidler, Chair Professor Patricia A. Reuter-Lorenz Associate Professor Susan Holly Curwin Brown Associate Professor William J. Gehring Assistant Professor Cindy Ann Lustig
Transcript of Contributions of Spatial Working Memory to Visuomotor Learning
CONTRIBUTIONS OF SPATIAL WORKING MEMORY TO VISUOMOTOR ADAPTATION
by
Joaquin A. Anguera
A dissertation submitted in partial fulfillment of the requirements for the degree of
Doctor of Philosophy (Kinesiology)
in The University of Michigan 2008
Doctoral Committee:
Assistant Professor Rachael D. Seidler, Chair Professor Patricia A. Reuter-Lorenz Associate Professor Susan Holly Curwin Brown Associate Professor William J. Gehring Assistant Professor Cindy Ann Lustig

ii
© Joaquin A. Anguera 2008 All Rights Reserved
ii
ACKNOWLEDGMENTS
I would first like to thank my dissertation committee members for all of
their patience, guidance, support, and advice throughout this process. In
particular, I wish to thank my advisor Rachael Seidler, who has been (and will
continue to be) an incredible role model for me as a scientist. I have had the
great fortune to work with a number of outstanding undergraduate students
whose hard work made it possible to complete these studies: Bryan Benson,
Hasan Cheema, Kamran Haydar, Clare Porter, Colleen Russell, Adam Savine,
Aparna Shah, and Carla Tcruz. I am also grateful for having had the opportunity
to work with the graduate students and post-doctoral fellows from the
Neuromotor Behavior Laboratory (Ashley Bangert, Jessica Bernard, Jin Bo, Brett
Fling, Jeanne Langan, and Youngbin Kwak), as they made this a truly wonderful
environment to learn and work in. There are so many individuals to thank who
have made my experience here at Michigan such a positive one. I often think
about how lucky I am to have the friends that I do, and how their friendships and
talents helped shape my graduate career. Annie, Ant, Dann, Greg, Julia, Keith,
Meghann, Nick, Simon, Steve, LIFE fellows, Gehring lab folks, PARL lab folks,
KINBALL friends, this list could go (and actually does go) on and on…I look
forward to telling each of you how much you’ve helped me along the way and
how much I value your friendships.
I would also like to thank my parents, sisters, new brothers, and newer
nephew for their incredible support and encouragement, especially during my

iii
time at Michigan. My efforts here are a direct reflection of my family, as they
have helped inspire me to achieve things I truly did not believe were possible.
Finally, I could not have completed this dissertation without my significant
other, Christine Walsh. It was a long road to get to this point, and I am lucky to
have had her love and support throughout the journey. This process would not
have been possible without you or your encouragement. To her, and to the rest
of the individuals who have helped me reach this milestone in my life, thank you
again from the bottom of my heart.
iv
TABLE OF CONTENTS
Acknowledgements...........................................................................................................ii List of figures......................................................................................................................v List of tables. .....................................................................................................................vi List of abbreviations. ......................................................................................................viii List of appendices. .............................................................................................................. CHAPTER I - General Introduction. ..............................................................................1
Skill learning..........................................................................................................1 Skill learning in advancing age. .........................................................................5 Overview. ...............................................................................................................8 References. .........................................................................................................10
CHAPTER II - Does spatial working memory contribute to visuomotor adaptation in young adults? . ...........................................................................................................15
Abstract................................................................................................................15 Introduction..........................................................................................................17 Methods. ..............................................................................................................20 Results. ................................................................................................................32 Discussion. ..........................................................................................................48 Conclusions.........................................................................................................55 References. .........................................................................................................56
CHAPTER III - Contributions of spatial working memory to visuomotor adaptation in older adults..................................................................................................................61
Abstract................................................................................................................61 Introduction..........................................................................................................63 Method. ................................................................................................................66 Results. ................................................................................................................70 Discussion. ..........................................................................................................93 Conclusions.......................................................................................................101 References. .......................................................................................................103
CHAPTER IV - General discussion and conclusions. ............................................109 Overview. ...........................................................................................................109 The potential role of inhibition. .......................................................................109 Do young adults rely on SWM for other forms of motor learning? . .........112 Do age-related SWM deficits impact other forms of motor learning? . ....114 Visuomotor adaptation generalization: cause and effects. ........................115 Cognitive training in older adults....................................................................117 Aging, fitness, and visuomotor adaptation differences. .............................121 Limitations. ........................................................................................................123 Conclusions.......................................................................................................124 References. .......................................................................................................126
v
List of figures Figure 2.1. Spatial rotation and spatial control tasks schematic. ....................... 22 Figure 2.2. Visuomotor adaptation task schematic and apparatus. ................... 24 Figure 2.3. Direction error measurement. .......................................................... 28 Figure 2.4. Examples of visuomotor adaptation performance. .......................... 34 Figure 2.5. Visuomotor adaptation task performance across all blocks............. 34 Figure 2.6. Performance correlation between card rotation and early adaptation rate of learning.................................................................................................... 39 Figure 2.7. ROI activation. ................................................................................. 47 Figure 2.8. Right inferior frontal gyrus (IFG) activation correlation with direction error (DE) early average score. .......................................................................... 48 Figure 3.1. Examples of older adult and young adults visuomotor adaptation performance at early adaptation (A) and late adaptation (B). ............................. 72 Figure 3.2. Visuomotor adaptation task (group mean ± SD) ............................. 73 Figure 3.3. Correlations between early rate of learning and card rotation task for young and older adults (panel A), and correlations between early adaptation rate of learning and Corsi forward task (panel B) for HIGH and LOW OAs.. ............. 79 Figure 3.4. Young and older adults SWM > SWMc glass brain activation profiles.. .............................................................................................................. 81 Figure 3.5. ROI activation from regions defined by the SWM > SWMc contrasts for young and older adults .................................................................................. 87 Figure 3.6. Right DLPFC activation correlation with early rate of adaptation..... 88 Figure 3.7. ROI activation for HIGH older adults, LOW older adults, and young adults subgroup. ................................................................................................. 92 Figure A.1. COLOR primary task and each secondary task. ........................... 135 Figure A.2. Accuracy on SWM and COLOR primary tasks under each secondary task condition.................................................................................................... 139 Figure A.3. Secondary task accuracy when combined with each primary task140 Figure C.1. HIGH and LOW older adult ROI activation at the non-vision and after-effect blocks. ............................................................................................ 166 Figure C.2. Young adults (red) early adaptation > control activation and older adult (green) early mean DE score correlation with whole brain activation. ..... 167 Figure C.3. Young adults (red) early SWM > SWMc activation and older adult > young adult (green) SWM alone activation. ...................................................... 168
vi
List of tables Table 2.1. Condition by block for the visuomotor adaptation task ..................... 25 Table 2.2. Group mean and standard deviation for each behavioral measure .. 33 Table 2.3. Adaptation slopes for each combination of adaptation blocks .......... 35 Table 2.4. Behavioral correlation analysis. ........................................................ 38 Table 2.5. SWM > SWMc .................................................................................. 41 Table 2.6. Early VMA > control condition........................................................... 42 Table 2.7. Overlapping regions of activation between early VMA and SWM processes ........................................................................................................... 43 Table 2.8. DE early slope correlation with 1st 3 adaptation blocks activation..... 44 Table 2.9. DE late slope correlation with final 3 adaptation blocks activation.... 44 Table 3.1. Group mean and standard deviation for performance on each behavioral measure ............................................................................................ 70 Table 3.2. Older adult performance correlations................................................ 78 Table 3.3. DE early slope correlation with 1st 3 adaptation blocks activation.... 82 Table 3.4. Mean DE early score correlation with 1st 3 adaptation blocks activation ........................................................................................................... .83 Table 3.5. Young adults > older adult at early adaptation.................................. 86 Table 3.6. YA (n=9) > HIGH OA 1st 3 adaptation blocks.................................... 91 Table 3.7. YA (n=9) > LOW OA 1st 3 adaptation blocks .................................... 91 Table A.1. Group mean and SD RT (msec) for each primary task under each secondary condition......................................................................................... .138 Table A.2. Group mean and SD RT (msec) for each secondary task under each primary condition ............................................................................................. .141 Table B.1. Mean DE early score correlation with 1st 3 adaptation blocks activation…...................................................................................................... .144 Table B.2. Correlation Table - SWM accuracy with SWM blocks .................... 145 Table B.3. Correlation Table - SWM RT with SWM blocks.............................. 145 Table B.4. Regions of activation for non-vision blocks > control...................... 146 Table B.5. Regions of activation for after-effect blocks > control..................... 147 Table B.6. Regions of activation for after-effect blocks > non-vision blocks .... 148 Table C.1. Early adaptation > control .............................................................. 150 Table C.2. Late adaptation > control ............................................................... 150 Table C.3. SWM > SWM control...................................................................... 151 Table C.4. After-effects > control ..................................................................... 152 Table C.5. Regions of activation for non-vision > control................................. 152 Table C.6. Mean DE late score correlation with final 3 adaptation blocks activation…....................................................................................................... 153
vii
Table C.7. SWM accuracy correlated with SWM activation............................. 154 Table C.8. SWM RT correlated with SWM activation ...................................... 155 Table C.9. Young adults > older adults after-effects........................................ 156 Table C.10. Older adults > young adults SWM activation................................. 157 Table C.11. Young adults > older adults SWM activation................................. 158 Table C.12. SWM ROI characteristics for young and older adults................... 159 Table C.13. LOW OA > HIGH OA early adaptation ......................................... 160 Table C.14. LOW OA > HIGH OA final 3 adaptation blocks ............................ 160 Table C.15. HIGH OA > LOW OA at non-vision blocks ................................... 161 Table C.16. HIGH OA > LOW OA SWM activation.......................................... 162 Table C.17. YA (n=9) > HIGH OA final 3 adaptation blocks ............................ 163 Table C.18. HIGH OA > YA (n=9) SWM activation.......................................... 164 Table C.19. LOW OA > YA (n=9) SWM activation........................................... 165
viii
List of appendices
APPENDIX A - Testing spatial working memory resources under dual-task conditions. .....................................................................................................................133
Objective............................................................................................................133 Methods. ............................................................................................................134 Results. ..............................................................................................................137 Conclusions.......................................................................................................141
APPENDIX B - Supplementary activation tables for young adults.......................143 APPENDIX C - Supplementary activation tables for older adults. .......................149 APPENDIX D - Health Questionnaire. ......................................................................169
ix
List of abbreviations ANOVA……............................................................................ Analysis of variance YA……………………………………………………….…..………….……Young Adult OA……………………………………..….…………….……..………..….…Older Adult HIGH OA………………………..…………...…………...High Performing Older Adult LOW OA.…………………………..………….………..…Low Performing Older Adult VMA..…………………………………………….….…………..Visuomotor Adaptation DE.………………………...……………………................................... Direction Error SWM….…………………...………………………….………Spatial Working Memory SWMc..…………………………..………………….Spatial Working Memory Control RT….……………………………...………….…………………………..Reaction Time DLPFC.…..…….......................................................Dorsolateral Prefrontal Cortex ACC.................................................................................Anterior Cingulate Cortex CG..................................................................................................Cingulate Gyrus IFG......................................................................................... Inferior Frontal Gyrus IPL......................................................................................nfereior Parietal Lobule SPL...................................................................................Superior Parietal Lobule Prec........................................................................................................Precuneus MOG............................................................................ .......Middle Occiptital Gyrus SOG.................................................................................Superior Occiptital Gyrus IOG.....................................................................................Inferior Occiptital Gyrus ITG.....................................................................................Inferior Temporal Gyrus MTG................................................................................... Middle Temporal Gyrus SPL....................................................................................Superior Parietal Lobule STG.................................................................................Superior Temporal Gyrus M1............................................................................................Primary Motor Cortx S1..............................................................................Primary Sensorimotor Cortex MeFG......................................................................................Medial Frontal Gyrus VLPMc.....................................................................Ventrallateral Premotor Cortex DLPMc......................................................................Dorsolateral Premotor Cortex SMA..............................................................................Supplementary Motor Area Lingual...............................................................................................Lingual Gyrus Hippo..................................................................................................Hippocampus fMRI........................................................Functional Magnetic Resonance Imaging PET....................................................................... Positron Emission Tomography FDR.......................................................................................False Discovery Rate ADL....................................................................................Activities of Daily Living EEG..................................................................................Electroencephalography AAL.............................................................................Automated Anatomical Atlas FWHM..........................................................................Full Width at Half Maximum
1
CHAPTER I
General Introduction
Skill learning
On any given day at the local driving range, golfers of all ages and skill
levels can be found practicing their golf swing. The better players exhibit a
seemingly effortless swing in striking the ball, unlike their novice counterparts.
This raises the question: how does performance improve with practice? Each of
us can surely recall a motor task which was initially challenging but then became
automatic following sufficient practice. One way to examine the motor learning
process is through comparisons between novice and skilled performers.
Movements of skilled performers are effective, consistent (while still adaptable),
and appear to require only minimal attention. For the novice performer,
improvements in any of these characteristics would be indicative of learning.
A number of useful revelations regarding how humans represent and interact
with their environment have been extracted from study of a particular type of
motor learning, visuomotor adaptation.
Visuomotor adaptation involves the recalibration of a well-learned spatial-
motor association. The study of motor performance under transformed spatial
mappings spans over one hundred years. Helmholtz (1866) originally used
2
prisms to invert the visual world, while more recent investigations make use of
computer displays to transform visual feedback of movement (Cunningham,
1989; Ghilardi et al., 1995; Krakauer et al., 2000; Seidler et al., 2006). These
studies have demonstrated that sensorimotor adaptation occurs when
movements are actively made in the new environment. It is thought that updated
visuomotor mappings are stored as an internal model, housed in the cerebellum
(Imamizu et al. 2000, 2003; Wolpert and Miall, 1996; Shadmehr & Mussa-Ivaldi,
1994; Wolpert and Ghahramani, 2000).
Visuomotor adaptation clearly involves sensorimotor processes, but
cognitive processes such as visuospatial attention and working memory are also
thought to play a role (Eversheim and Bock, 2001; McNay and Willingham, 1998;
Taylor and Thoroughman, 2007, 2008). Working memory here refers to a
system that involves both active storage and processing to manipulate
information for a given cognitive process (Baddeley, 1986; Miyake and Shah,
1999). Baddeley (1986) proposed the existence of a working memory subsystem
specialized for processing visuo-spatial information (“a visuo-spatial sketch pad”).
Revised versions of this model (Logie, 1995; Cornoldi and Vecchi, 2003) suggest
tasks which require information manipulation (‘active’; i.e. mental rotation) have
greater processing demands than ‘passive’ tasks (i.e. storage tasks; Cornoldi
and Vecchi, 2003). Given that increased executive demands have been shown
to compromise motor adaptation (Taylor and Thoroughman, 2007, 2008), the
contributions of ‘active’ spatial working memory may be integral for visuomotor
adaptation.
3
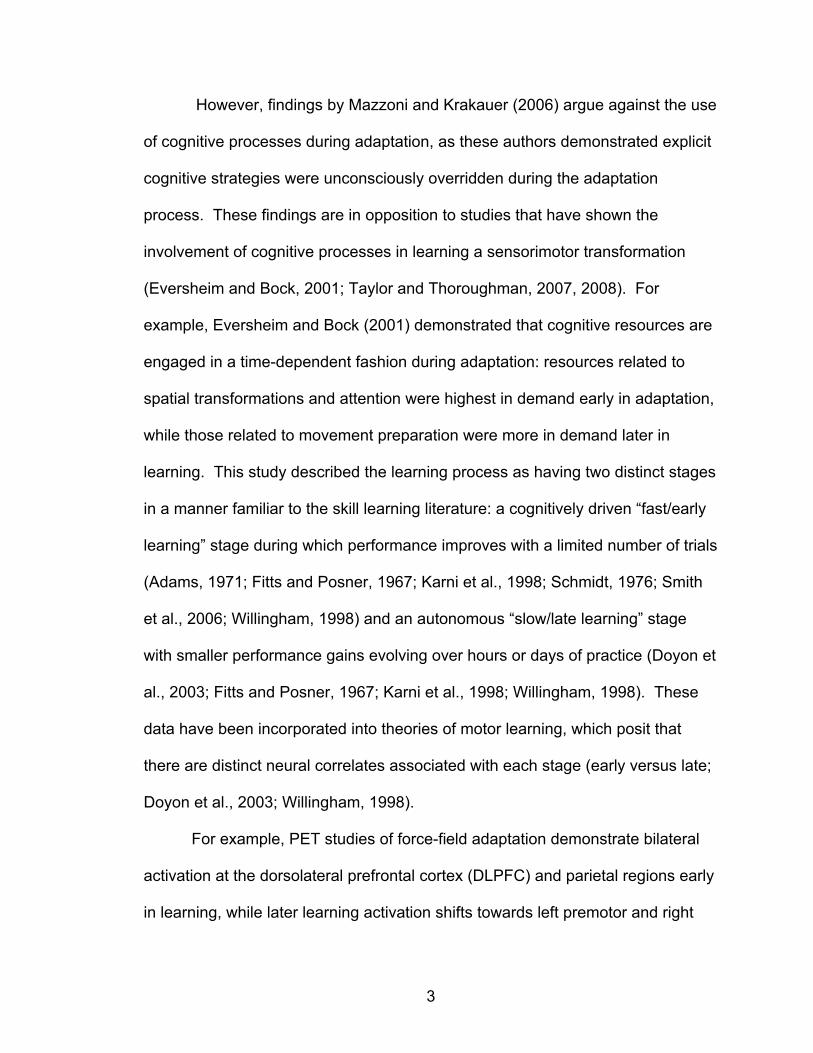
However, findings by Mazzoni and Krakauer (2006) argue against the use
of cognitive processes during adaptation, as these authors demonstrated explicit
cognitive strategies were unconsciously overridden during the adaptation
process. These findings are in opposition to studies that have shown the
involvement of cognitive processes in learning a sensorimotor transformation
(Eversheim and Bock, 2001; Taylor and Thoroughman, 2007, 2008). For
example, Eversheim and Bock (2001) demonstrated that cognitive resources are
engaged in a time-dependent fashion during adaptation: resources related to
spatial transformations and attention were highest in demand early in adaptation,
while those related to movement preparation were more in demand later in
learning. This study described the learning process as having two distinct stages
in a manner familiar to the skill learning literature: a cognitively driven “fast/early
learning” stage during which performance improves with a limited number of trials
(Adams, 1971; Fitts and Posner, 1967; Karni et al., 1998; Schmidt, 1976; Smith
et al., 2006; Willingham, 1998) and an autonomous “slow/late learning” stage
with smaller performance gains evolving over hours or days of practice (Doyon et
al., 2003; Fitts and Posner, 1967; Karni et al., 1998; Willingham, 1998). These
data have been incorporated into theories of motor learning, which posit that
there are distinct neural correlates associated with each stage (early versus late;
Doyon et al., 2003; Willingham, 1998).
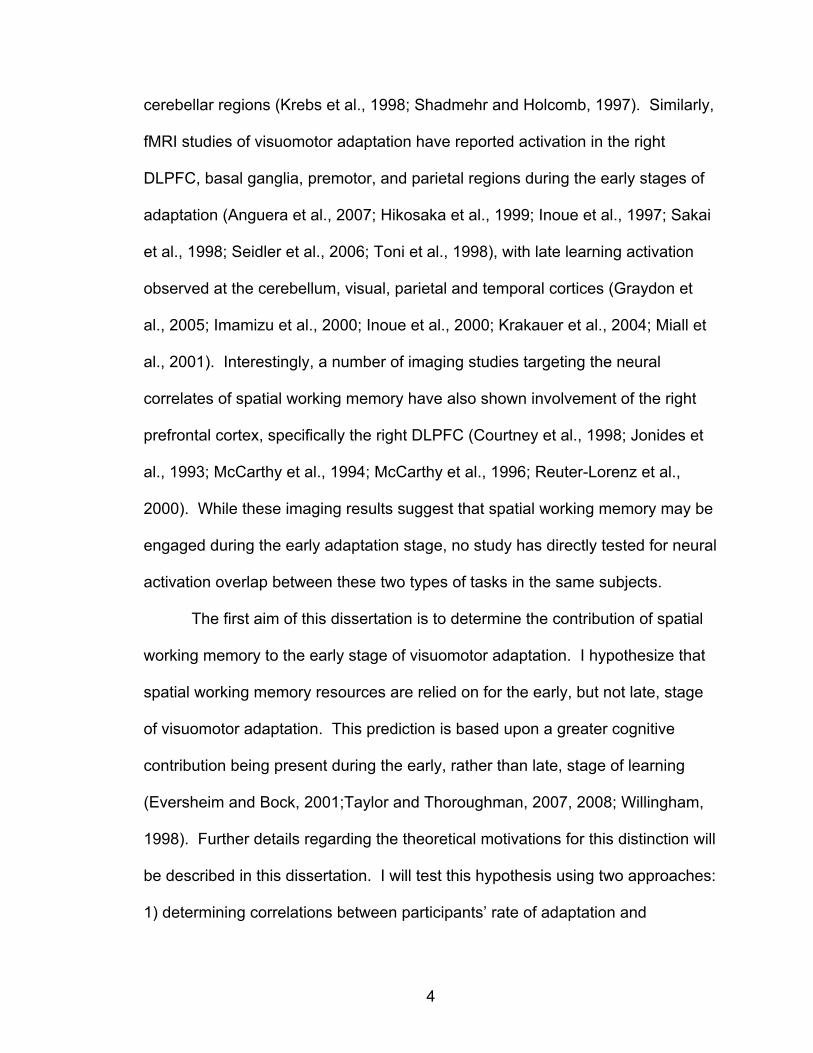
For example, PET studies of force-field adaptation demonstrate bilateral
activation at the dorsolateral prefrontal cortex (DLPFC) and parietal regions early
in learning, while later learning activation shifts towards left premotor and right
4
cerebellar regions (Krebs et al., 1998; Shadmehr and Holcomb, 1997). Similarly,
fMRI studies of visuomotor adaptation have reported activation in the right
DLPFC, basal ganglia, premotor, and parietal regions during the early stages of
adaptation (Anguera et al., 2007; Hikosaka et al., 1999; Inoue et al., 1997; Sakai
et al., 1998; Seidler et al., 2006; Toni et al., 1998), with late learning activation
observed at the cerebellum, visual, parietal and temporal cortices (Graydon et
al., 2005; Imamizu et al., 2000; Inoue et al., 2000; Krakauer et al., 2004; Miall et
al., 2001). Interestingly, a number of imaging studies targeting the neural
correlates of spatial working memory have also shown involvement of the right
prefrontal cortex, specifically the right DLPFC (Courtney et al., 1998; Jonides et
al., 1993; McCarthy et al., 1994; McCarthy et al., 1996; Reuter-Lorenz et al.,
2000). While these imaging results suggest that spatial working memory may be
engaged during the early adaptation stage, no study has directly tested for neural
activation overlap between these two types of tasks in the same subjects.
The first aim of this dissertation is to determine the contribution of spatial
working memory to the early stage of visuomotor adaptation. I hypothesize that
spatial working memory resources are relied on for the early, but not late, stage
of visuomotor adaptation. This prediction is based upon a greater cognitive
contribution being present during the early, rather than late, stage of learning
(Eversheim and Bock, 2001;Taylor and Thoroughman, 2007, 2008; Willingham,
1998). Further details regarding the theoretical motivations for this distinction will
be described in this dissertation. I will test this hypothesis using two approaches:
1) determining correlations between participants’ rate of adaptation and
5
behavioral measures of spatial working memory, and 2) looking for neural
overlap between brain regions engaged during the early adaptation period and
for a spatial working memory task.
Skill learning in advancing age
The older adult population in the U.S. in 2030 has been projected to be
nearly twice as large it was in 2000, growing from 35 to approximately 71.5
million (http://agingstats.gov). This group would then constitute nearly 20% of
the total U.S. population (http://agingstats.gov). The 85+ year old population (the
‘oldest old’) is also projected to increase from 4.2 million in 2000 to 7.3 million in
2020 (http://agingstats.gov). This dramatic shift in the population demographics
has resulted in an increased awareness regarding the need for developing
programs and interventions that would facilitate activities of daily living (ADLs).
This is especially important considering that ADLs have been shown to be a
reliable measure of health and longevity in older adults (Mahurin et al., 1991;
Roos and Havens, 1991). Unfortunately, within this growing population will also
be a greater number of individuals affected by a neurological disease or injury,
providing another reason for age-appropriate interventions and rehabilitative
approaches.
Declining cognitive and motor functions obviously have detrimental effects
on the quality of life in older adults. The aging process is accompanied by a
number of physiological changes in motor (Brooks & Faulkner, 1994; Brown,

6
1972; Swash & Fox, 1972), sensory (Adamo et al., 2007; Demer, 1994;
Galganski et al., 1993; Horak et al., 1989), and cognitive systems (Kramer et al.,
1994; Park et al., 2002). These changes can proceed in a gradual fashion with
‘normal’ aging, or with an accelerated trajectory due to injury or disease. In
either case, these changes typically require an individual to adapt the way they
approach a task to achieve a desired goal. The striking growth of the older adult
population highlights the need for studying the underlying mechanisms of skill
acquisition, as these studies form the foundation of effective preventative and
rehabilitative programs.
It is well documented that increased age is accompanied by declines in
motor skill performance (Cooke et al., 1989; Darling et al., 1989; Seidler-Dobrin
et al., 1998; Welford 1984), with movements becoming more variable (Contreras-
Vidal et al., 1998; Cooke et al., 1989; Darling et al., 1989). It has also been
shown that older adults do not acquire new motor skills as quickly as young
adults (i.e. rate of learning; Brown, 1996; Raz et al., 2000; Rodrigue et al., 2005;
Seidler-Dobrin et al., 1998; Seidler, 2006; alternatively, see Durkin et al., 1995).
With regards to age-related studies involving visuomotor adaptation, the literature
is inconsistent: some studies have shown no age-related adaptation deficits
(Canavan et al. 1990; Roller et al. 2002) while others have demonstrated that
aging results in slower and reduced adaptation (Etnier and Landers 1998;
Fernandez-Ruiz et al. 2000; McNay and Willingham 1998; Seidler, 2006;
Teulings et al. 2002).
7
While the findings regarding visuomotor adaptation and aging have been
inconsistent, the literature on cognitive declines with advancing age has been
much more constant (Craik and Salthouse, 1992; Craik and Salthouse, 2000).
Older adults show impaired spatial working memory performance (Park et al.,
2002; Shaw et al., 2006). Moreover, there is a negative relationship between
age and general spatial ability (Kirasic, 2000); accordingly, older adults do not
perform as well as younger adults on spatial tasks, including mental rotation
(Dobson et al. 1995; Hertzog and Rypma, 1993; Salthouse et al., 1989;
Salthouse, 1994). While the relationship between sensory and cognitive decline
is currently unknown, age-related declines in these systems are thought to lead
to increased coupling between the two domains (Baltes and Lindenberger, 1997;
Li et al., 2001; Lindenberger et al., 2000). This is not only the case for older
adults, but also for individuals afflicted with a neurological disease (e.g.
Parkinson’s disease) or injury (e.g. stroke), as studies have shown visuospatial
impairments along with motor deficits in each population (Maeshima et al., 1997).
While the nature of the relationship between these two domains is unclear, these
findings suggest the possibility that age-related declines in certain cognitive
processes may affect the early stages of skill acquisition in older adults.
If spatial working memory plays an essential role during the early learning
period in young adults, then degraded spatial working memory processes in older
adults may underlie age-related declines in motor learning. The overarching goal
for the second aim of this dissertation is to examine whether older adults’ spatial
working memory deficiencies can partially explain age-related deficits in
8
visuomotor adaptation. The findings from this study will provide valuable insight
into the motor learning process in older adults from both a behavioral and neural
perspective. It will also allow me to potentially identify correlates of successful
aging in skill learning, which would be an important precursor to the development
of rehabilitative interventions.
The current investigation
There are still several important questions related to visuomotor
adaptation and spatial working memory (SWM) that have not been addressed in
the existing literature. Therefore, I asked the following questions:
i) Does SWM contribute to visuomotor adaptation in young adults? I
tested this by determining whether SWM performance, as assessed by
neuropsychological tests, was correlated across participants with the
rate of visuomotor adaptation, and by looking for neural activation
overlap between a SWM and a visuomotor adaptation task.
ii) Do age-related declines in SWM partially explain age-related deficits in
visuomotor adaptation? In order to assess this, I tested older adults
using the same methods as outlined for the young adults.
I tested Aim #1 by having 18 young adults (18-30 years old) perform a
visuomotor adaptation task as well as a test of SWM in an fMRI scanner. In
addition, these participants performed neuropsychological tests of working
9
memory (spatial and non-spatial), allowing me to test for correlations between
these standardized measures and performance on the experimental tasks
performed in the fMRI scanner.
I tested Aim #2 by having 18 older adults (65-80 years old) undergo the
same procedures as outlined above, in addition to screening for cognitive and
general health status. I hypothesized that I would observe reduced performance
on both tasks by the older adults, in addition to under-recruitment of brain areas
that were engaged in an overlapping fashion during SWM and visuomotor
adaptation for the young adults.
I also performed a behavioral validation study (see appendix A) to
strengthen my interpretations of the cognitive mechanisms that mediate
performance on the SWM task.
10
References Adamo, D. E., Martin, B. J., & Brown, S. H. (2007). Age-related differences in
upper limb proprioceptive acuity. Percept Mot Skills, 104(3 Pt 2), 1297-1309.
Adams, J. (1971). A closed-loop theory of motor learning. J Mot Behav, 3(2), 111-149.
Anguera, J., Russell, C., Noll, D., & Seidler, R. (2007). Neural correlates associated with intermanual transfer of sensorimotor adaptation. Brain Res, 1185, 136-151.
Baddeley AD (1986). Working memory. Oxford: Oxford University Press. Baltes, P., & Lindenberger, U. (1997). Emergence of a powerful connection
between sensory and cognitive functions across the adult life span: a new window to the study of cognitive aging? Psychol Aging, 12(1), 12-21.
Brooks, S. V., & Faulkner, J. A. (1994). Skeletal muscle weakness in old age: underlying mechanisms. Med Sci Sports Exerc, 26(4), 432-439.
Brown, S. (1996). Control of simple arm movements in the elderly. In A.-M. Ferrandez & N. Teasdale (Eds.), Changes in Sensory Motor Behavior in Aging (pp. 27-52). Amsterdam ; New York: Elsevier.
Brown, W. F. (1972). A method for estimating the number of motor units in thenar muscles and the changes in motor unit count with ageing. J Neurol Neurosurg Psychiatry, 35(6), 845-852.
Canavan, A., Passingham, R., Marsden, C., Quinn, N., Wyke, M., & Polkey, C. (1990). Prism adaptation and other tasks involving spatial abilities in patients with Parkinson's disease, patients with frontal lobe lesions and patients with unilateral temporal lobectomies. Neuropsychologia, 28(9), 969-984.
Contreras-Vidal, J., Teulings, H., & Stelmach, G. (1998). Elderly subjects are impaired in spatial coordination in fine motor control. Acta Psychol (Amst), 100(1-2), 25-35.
Cooke, J., Brown, S., & Cunningham, D. (1989). Kinematics of arm movements in elderly humans. Neurobiology of Aging, 10(2), 159-165.
Cornoldi, C., & Vecchi, T. (2003). Visuospatialworking memory and individual differences.Hove, UK: Psychology Press. Courtney, S., Petit, L., Maisog, J., Ungerleider, L., & Haxby, J. (1998). An area specialized for spatial working memory in human frontal cortex. Science, 279(5355), 1347-1351. Craik, F.I.M. and Salthouse, T.A. (Eds.), The handbook of aging and cognition. Hillsdale, NJ: Erlbaum (1992). Craik, F.I.M. and Salthouse T.A. (Eds), Handbook of Aging and Cognition II, Erlbaum, Mahwah (2000). Cunningham HA (1989). Aiming error under transformed spatial mappings suggests a structure for visual-motor maps. Journal of Experimental Psychology: Human Perception and Performance, 15, 493-506. Darling, W., Cooke, J., & Brown, S. (1989). Control of simple arm movements in
elderly humans. Neurobiology of Aging, 10(2), 149-157.
11
Demer, J. (1994). Effect of aging on vertical visual tracking and visual-vestibular interaction. J Vestib Res, 4(5), 355-370.
Dobson, S., Kirasic, K., & Allen, G. (1995). Age-Related Differences in Adults Spatial Task-Performance - Influences of Task Complexity and Perceptual Speed. Aging and Cognition, 2(1), 19-38.
Doyon, J., Penhune, V., & Ungerleider, L. (2003). Distinct contribution of the cortico-striatal and cortico-cerebellar systems to motor skill learning. Neuropsychologia, 41(3), 252-262.
Durkin, M., Prescott, L., Furchtgott, E., Cantor, J., & Powell, D. (1995). Performance but not acquisition of skill learning is severely impaired in the elderly. Arch Gerontol Geriatr, 20(2), 167-183.
Etnier, J., & Landers, D. (1998). Motor performance and motor learning as a function of age and fitness. Res Q Exerc Sport, 69(2), 136-146.
Eversheim, U., & Bock, O. (2001). Evidence for processing stages in skill acquisition: a dual-task study. Learn Mem, 8(4), 183-189.
Fernández-Ruiz, J., Hall, C., Vergara, P., & Díiaz, R. (2000). Prism adaptation in normal aging: slower adaptation rate and larger aftereffect. Brain Res Cogn Brain Res, 9(3), 223-226.
Fitts, P. M., & Posner, M. I. (1967). Human performance: Brooks/Cole Publishing Company, Belmont, Calif.
Galganski, M. E., Fuglevand, A. J., & Enoka, R. M. (1993). Reduced control of motor output in a human hand muscle of elderly subjects during submaximal contractions. J Neurophysiol, 69(6), 2108-2115.
Ghilardi, M., Gordon, J., & Ghez, C. (1995). Learning a visuomotor transformation in a local area of work space produces directional biases in other areas. J Neurophysiol, 73(6), 2535-2539.
Graydon, F., Friston, K., Thomas, C., Brooks, V., & Menon, R. (2005). Learning-related fMRI activation associated with a rotational visuo-motor transformation. Brain Res Cogn Brain Res, 22(3), 373-383.
Helmholtz H von. (1962). A treatise on physiological optics (J. P. C. Southall, Trans.). New York: Dover. (Original work published 1866) Hertzog, C., Vernon, M., & Rypma, B. (1993). Age differences in mental rotation
task performance: the influence of speed/accuracy tradeoffs. J Gerontol, 48(3), P150-156.
Hikosaka, O., Nakahara, H., Rand, M., Sakai, K., Lu, X., Nakamura, K., et al. (1999). Parallel neural networks for learning sequential procedures. Trends Neurosci, 22(10), 464-471.
Horak, F. B., Shupert, C. L., & Mirka, A. (1989). Components of postural dyscontrol in the elderly: a review. Neurobiol Aging, 10(6), 727-738.
Imamizu, H., Kuroda, T., Miyauchi, S., Yoshioka, T., & Kawato, M. (2003). Modular organization of internal models of tools in the human cerebellum. Proc Natl Acad Sci U S A, 100(9), 5461-5466.
Imamizu, H., Miyauchi, S., Tamada, T., Sasaki, Y., Takino, R., Pütz, B., et al. (2000). Human cerebellar activity reflecting an acquired internal model of a new tool. Nature, 403(6766), 192-195.
Inoue, K., Kawashima, R., Satoh, K., Kinomura, S., Goto, R., Sugiura, M., et al.
12
(1997). Activity in the parietal area during visuomotor learning with optical rotation. Neuroreport, 8(18), 3979-3983.
Inoue, K., Kawashima, R., Satoh, K., Kinomura, S., Sugiura, M., Goto, R., et al. (2000). A PET study of visuomotor learning under optical rotation. Neuroimage, 11(5 Pt 1), 505-516.
Jonides, J., Smith, E., Koeppe, R., Awh, E., Minoshima, S., & Mintun, M. (1993). Spatial working memory in humans as revealed by PET. Nature, 363(6430), 623-625.
Karni, A., Meyer, G., Rey-Hipolito, C., Jezzard, P., Adams, M., Turner, R., et al. (1998). The acquisition of skilled motor performance: fast and slow experience-driven changes in primary motor cortex. Proc Natl Acad Sci U S A, 95(3), 861-868.
Kirasic, K. (2000). Age differences in adults’ spatial abilities, learning environmental layout, and wayfinding behavior. Spatial Cognition and
Computation 2: 117–134. Krakauer, J., Ghilardi, M., Mentis, M., Barnes, A., Veytsman, M., Eidelberg, D., et
al. (2004). Differential cortical and subcortical activations in learning rotations and gains for reaching: a PET study. J Neurophysiol, 91(2), 924-933.
Krakauer, J., Pine, Z., Ghilardi, M., & Ghez, C. (2000). Learning of visuomotor transformations for vectorial planning of reaching trajectories. J Neurosci, 20(23), 8916-8924.
Kramer, A., Humphrey, D., Larish, J., Logan, G., & Strayer, D. (1994). Aging and inhibition: beyond a unitary view of inhibitory processing in attention. Psychol Aging, 9(4), 491-512.
Krebs, H., Brashers-Krug, T., Rauch, S., Savage, C., Hogan, N., Rubin, R., et al. (1998). Robot-aided functional imaging: Application to a motor learning study. Human Brain Mapping, 6(1), 59-72.
Li, K., Lindenberger, U., Freund, A., & Baltes, P. (2001). Walking while memorizing: age-related differences in compensatory behavior. Psychol Sci, 12(3), 230-237.
Lindenberger, U., Marsiske, M., & Baltes, P. (2000). Memorizing while walking: increase in dual-task costs from young adulthood to old age. Psychol Aging, 15(3), 417-436.
Logie RH (1995). Visuospatial working memory. Hove, U.K.: Erlbaum. Maeshima, S., Itakura, T., Nakagawa, M., Nakai, K., & Komai, N. (1997).
Visuospatial impairment and activities of daily living in patients with Parkinson's disease: a quantitative assessment of the cube-copying task. Am J Phys Med Rehabil, 76(5), 383-388.
Mahurin, R., DeBettignies, B., & Pirozzolo, F. (1991). Structured assessment of independent living skills: preliminary report of a performance measure of functional abilities in dementia. J Gerontol, 46(2), P58-66.
Mazzoni, P., & Krakauer, J. (2006). An implicit plan overrides an explicit strategy during visuomotor adaptation. Journal of Neuroscience, 26(14), 3642-3645.
McCarthy, G., Blamire, A., Puce, A., Nobre, A., Bloch, G., Hyder, F. (1994).
13
Functional magnetic-resonance-imaging of human prefrontal cortex activation during a spatial working-memory task. Proceedings of the National Academy of Sciences of the United States of America, 91(18), 8690-8694.
McCarthy, G., Puce, A., Constable, R., Krystal, J., Gore, J., & Goldman-Rakic, P. (1996). Activation of human prefrontal cortex during spatial and nonspatial working memory tasks measured by functional MRI. Cereb Cortex, 6(4), 600-611.
McNay, E., & Willingham, D. (1998). Deficit in learning of a motor skill requiring strategy, but not of perceptuomotor recalibration, with aging. Learn Mem, 4(5), 411-420.
Miall, R., Reckess, G., & Imamizu, H. (2001). The cerebellum coordinates eye and hand tracking movements. Nature Neuroscience, 4(6), 638-644.
Miyake, A., & Shah, P. (1999). (Eds.). Models of working memory: Mechanisms of active maintenance and executive control. New York: Cambridge University Press.
Park, D., Lautenschlager, G., Hedden, T., Davidson, N., Smith, A., & Smith, P. (2002). Models of visuospatial and verbal memory across the adult life span. Psychol Aging, 17(2), 299-320.
Raz, N., Williamson, A., Gunning-Dixon, F., Head, D., & Acker, J. (2000). Neuroanatomical and cognitive correlates of adult age differences in acquisition of a perceptual-motor skill. Microsc Res Tech, 51(1), 85-93.
Reuter-Lorenz, P., Jonides, J., Smith, E., Hartley, A., Miller, A., Marshuetz, C., et al. (2000). Age differences in the frontal lateralization of verbal and spatial working memory revealed by PET. Journal of Cognitive Neuroscience, 12(1), 174-187.
Rodrigue, K., Kennedy, K., & Raz, N. (2005). Aging and longitudinal change in perceptual-motor skill acquisition in healthy adults. J Gerontol B Psychol Sci Soc Sci, 60(4), P174-181.
Roller, C., Cohen, H., Kimball, K., & Bloomberg, J. (2002). Effects of normal aging on visuo-motor plasticity. Neurobiol Aging, 23(1), 117-123.
Roos, N., & Havens, B. (1991). Predictors of successful aging: a twelve-year study of Manitoba elderly. Am J Public Health, 81(1), 63-68.
Sakai, K., Hikosaka, O., Miyauchi, S., Takino, R., Sasaki, Y., & Pütz, B. (1998). Transition of brain activation from frontal to parietal areas in visuomotor sequence learning. J Neurosci, 18(5), 1827-1840.
Salthouse, T. (1994). Aging associations: influence of speed on adult age differences in associative learning. J Exp Psychol Learn Mem Cogn, 20(6), 1486-1503.
Salthouse, T., & Mitchell, D. (1989). Structural and operational capacities in integrative spatial ability. Psychol Aging, 4(1), 18-25.
Schmidt RA (1976). The schema as a solution to some persistent problems in motor-learning theory. In G. E. Stelmach (Ed.), Motor control: Issues and trends (pp. 41-65). New York: Academic Press.
Seidler-Dobrin RD & Stelmach GE (1998). Persistence in visual feedback control by the elderly. Experimental Brain Research 119: 467-474.
14
Seidler, R., Alberts, J., & Stelmach, G. (2002). Changes in multi-joint performance with age. Motor Control, 6(1), 19-31.
Seidler, R., Noll, D., & Chintalapati, P. (2006). Bilateral basal ganglia activation associated with sensorimotor adaptation. Experimental Brain Research, 175(3), 544-555.
Shadmehr, R., & Holcomb, H. (1997). Neural correlates of motor memory consolidation. Science, 277(5327), 821-825.
Shadmehr, R., & Mussa-Ivaldi, F. (1994). Adaptive representation of dynamics during learning of a motor task. J Neurosci, 14(5 Pt 2), 3208-3224.
Shaw R., Helmes, E., Mitchell, D. (2006). Age-related change in visual, spatial and verbal memory. Australasian Journal on Ageing, Vol 25(1), 14-19.
Smith, M., Ghazizadeh, A., & Shadmehr, R. (2006). Interacting adaptive processes with different timescales underlie short-term motor learning. PLoS Biol, 4(6), e179.
Swash, M., & Fox, K. P. (1972). The effect of age on human skeletal muscle. Studies of the morphology and innervation of muscle spindles. J Neurol Sci, 16(4), 417-432.
Taylor, J., & Thoroughman, K. (2007). Divided attention impairs human motor adaptation but not feedback control. J Neurophysiol, 98(1), 317-326.
Taylor, J., & Thoroughman, K. (2008). Motor adaptation scaled by the difficulty of a secondary cognitive task. PLoS ONE 3: e2485.
Teulings, H., Contreras-Vidal, J., Stelmach, G., & Adler, C. (2002). Adaptation of handwriting size under distorted visual feedback in patients with Parkinson's disease and elderly and young controls. J Neurol Neurosurg Psychiatry, 72(3), 315-324.
Toni, I., Krams, M., Turner, R., & Passingham, R. (1998). The time course of changes during motor sequence learning: a whole-brain fMRI study. Neuroimage, 8(1), 50-61.
Welford, A. (1984). Between bodily changes and performance: some possible reasons for slowing with age. Exp Aging Res, 10(2), 73-88.
Willingham, D. (1998). A neuropsychological theory of motor skill learning. Psychol Rev, 105(3), 558-584.
Wolpert, D., & Ghahramani, Z. (2000). Computational principles of movement neuroscience. Nat Neurosci, 3 Suppl, 1212-1217.
Wolpert, D., & Miall, R. (1996). Forward Models for Physiological Motor Control. Neural Netw, 9(8), 1265-1279.
15
CHAPTER II
Does Spatial Working Memory Contribute to Visuomotor Adaptation in Young Adults?
Abstract
Previous studies of motor learning have described the importance of
cognitive processes during the early stages of learning; however, the identity of
these processes remains unclear. The present study tested the function of one
specific cognitive process, spatial working memory (SWM), during a visuomotor
adaptation task. I hypothesized that SWM would play a role early in adaptation,
reflected by i) correlations between the rate of adaptation and SWM measures,
and ii) overlapping neural substrates between the two types of tasks. I found that
performance on a behavioral test of SWM involving mental rotation correlated
with the rate of early, but not late, visuomotor adaptation. Using SWM brain
activation as a limiting mask during the early adaptation period, participants
showed overlapping activation in the right dorsolateral prefrontal cortex and
bilateral inferior parietal cortex, regions previously identified in other SWM
studies. A similar analysis performed with the late phase of adaptation produced
no commonly activated regions. These findings reveal that the early phase of
visuomotor adaptation engages SWM processes related to mental rotation, while

16
SWM ability does not appear to be a determinant of the rate of late phase
adaptation.
17
Introduction
Skill learning has been defined as an increase in spatial and temporal
accuracy of movements with practice (Willingham, 1998). It is characterized by
at least two stages: an initial learning stage (“fast/early learning”) in which within-
session improvements can be induced through a limited number of trials on a
time scale of minutes (Adams, 1971; Brooks et al., 1983, 1995; Fitts and Posner,
1967; Karni et al., 1998; Puttemans et al., 2005; Schmidt, 1976; Smith et al.,
2006; Willingham, 1998), and a “slow/late learning” stage, where improvement
occurs in a more incremental fashion over hours or even days of practice (Doyon
et al., 2003; Karni et al., 1998; Willingham, 1998). In general, the early learning
stage is described as being cognitively demanding, while the late learning stage
is described as being more autonomous (Fitts and Posner, 1967).
A specific type of skill learning, visuomotor adaptation1, has provided
important insights into how humans represent and interact with their
environment. This type of learning requires the modification of a well-learned
sensorimotor transformation, thought to be based in part on neural maps which
encode this information for use by the motor control system (Cunningham, 1989).
These maps are thought to be represented as internal models (cf. Wolpert and
Ghahramani, 2000), which use an efferent copy of the motor commands to
predict the sensory consequences of action (Wolpert and Miall, 1996). These
1 The terms learning and adaptation from this point forward are used interchangeably. Both describe a relatively permanent change in performance, with adaptation being more specific to the task at hand.
18
models are updated via error feedback during sensorimotor adaptation
(Shadmehr & Mussa-Ivaldi, 1994).
Neuroimaging studies of visuomotor adaptation have shown that early
learning engages prefrontal regions (Anguera et al., 2007; Clower et al., 1996;
Hikosaka et al., 1999; Inoue et al., 1997; Sakai et al., 1998; Seidler et al., 2006;
Seidler & Noll, 2008; Toni et al., 1998), suggesting that this phase of learning is
under cognitive control. The late learning phase is associated with a shift in
activation towards the visual, parietal and temporal cortices, as well as the
cerebellum (Graydon et al., 2005; Imamizu et al., 2000, 2003, 2004; Inoue et al.,
2000; Krakauer et al., 2004; Miall et al., 2001), which is thought to support
internal model formation. Although these studies have shown prefrontal
activation during the early visuomotor adaptation stage, it is unclear which
cognitive process(es) may be supported with this activation.
Eversheim and Bock (2001) used a dual tasking methodology and found
that secondary spatial attention and sensorimotor transformation tasks interfered
with the early phase of adaptation. Similarly, Taylor and Thoroughman (2007)
examined the role of attention in adaptation, and found that performance of a
secondary tone counting task disrupted error encoding, which in turn impaired
internal model updating. While these studies support a role for cognitive
processes in sensorimotor adaptation, Mazzoni and Krakauer (2006) found that
cognitive strategies were unconsciously overridden by participants during the
adaptation process, suggesting that these processes do not contribute to

19
adaptation. Similarly, Bock (2005) reported a lack of correlation between the
magnitude of visuomotor adaptation and performance on the trail-making test,
which measures multiple cognitive domains including spatial organization and
visual pursuit. It may be, though, that other cognitive processes are contributing
to the adaptation process, especially those which the trail-making test is unable
to directly test.
One cognitive system which I hypothesize plays a role in visuomotor
adaptation, particularly in the early stage, is spatial working memory (SWM).
Neuroimaging studies of SWM have reported activation of the right prefrontal
cortex (Courtney et al., 1998; Jonides et al., 1993; McCarthy et al., 1994;
McCarthy et al., 1996; Reuter-Lorenz et al., 2000) and parietal cortex (Jonides et
al., 1993; Nystrom et al., 2000; Reuter-Lorenz et al., 2000; Walter et al., 2003).
As described above, these regions are also engaged during the early stage of
visuomotor adaptation. However, these regions are engaged in many other
cognitive tasks (cf. Cabeza and Nyberg, 2000), suggesting that common
activation does not necessarily mean that the same processes are being
engaged. Therefore, I tested whether SWM plays a role during the early stage of
visuomotor adaptation through performance correlations and overlapping neural
activation patterns.
In the current study, participants performed a joystick-controlled
visuomotor adaptation task. They were required to make manual aiming
movements to targets under veridical and rotated visual feedback. Furthermore,
20
they performed a test of SWM, as well as a battery of neuropsychological
assessments of several cognitive processes. I hypothesized that SWM would
play a role during early, but not late, adaptation, evidenced by correlations
between the rate of early adaptation and SWM measures, as well as overlapping
neural substrates for the performance of SWM and visuomotor adaptation tasks.
Methods
Participants
Eighteen participants (21.1 ± 2.5 yrs; 9 males) were recruited from the
University of Michigan student population and were paid for their participation.
Each participant signed an IRB-approved informed consent document and filled
out a health history questionnaire prior to their participation. All participants were
right-handed as assessed using the 20-item version of the Edinburgh Inventory
(Oldfield, 1971; mean handedness score = .83 ±.10).
Experimental setup and procedure
Testing occurred on two separate days for this experiment. On day one,
participants performed a battery of neuropsychological tests to assess the
following cognitive processes: 1) SWM involving mental rotation abilities were
tested using Thurston’s card rotation and cube rotation tasks (Ekstrome et al.,
1976); 2) short term visuospatial memory was assessed by the forward Corsi
Block tapping test (Corsi, 1972); 3) sensorimotor processing speed was
21
determined by the digit-symbol substitution task from WAIS-R; 4) short-term
verbal memory was evaluated by the forward digit span tasks from WAIS-R
(Wechsler, 1997) and the reading span task (Daneman & Carpenter, 1980); 5)
verbal working memory was assessed by the backward digit span task from
WAIS-R (Wechsler, 1997), while serial visuospatial working memory was
assessed through the backward Corsi Block tapping task (Corsi, 1972); 6) The
DEX questionnaire (dysexecutive syndrome; Wilson et al., 1996) determined
whether individuals had difficulty with abstract thinking, planning, or other tasks
associated with executive functioning. Participants also practiced three blocks of
joystick aiming movements made under veridical feedback conditions, as well as
1 block of a SWM control task (detailed below), to familiarize them with basic
task requirements before subsequent testing in the fMRI scanner.
The second day of testing was completed within 1 week following the first
day of testing. During this testing session, participants performed the visuomotor
adaptation task, the SWM control task (SWMc), and the SWM task. For these
tasks, participants lay supine in a 3.0 Tesla magnet (General Electric) with their
head comfortably restrained to prevent excess head movement. Task
presentation and response collection were accomplished with custom Labview
6.1 software (National Instruments) for the visuomotor adaptation task, and E-
prime 1.1 software for the SWM tasks (Psychology Software Tools, Inc.). Stimuli
were presented through a mirror mounted on a set of specialized goggles,
reflecting a video projection screen placed at the rear of the scanner. For the
22
SWM tasks, E-prime recorded participants' responses via a right-handed button-
glove.
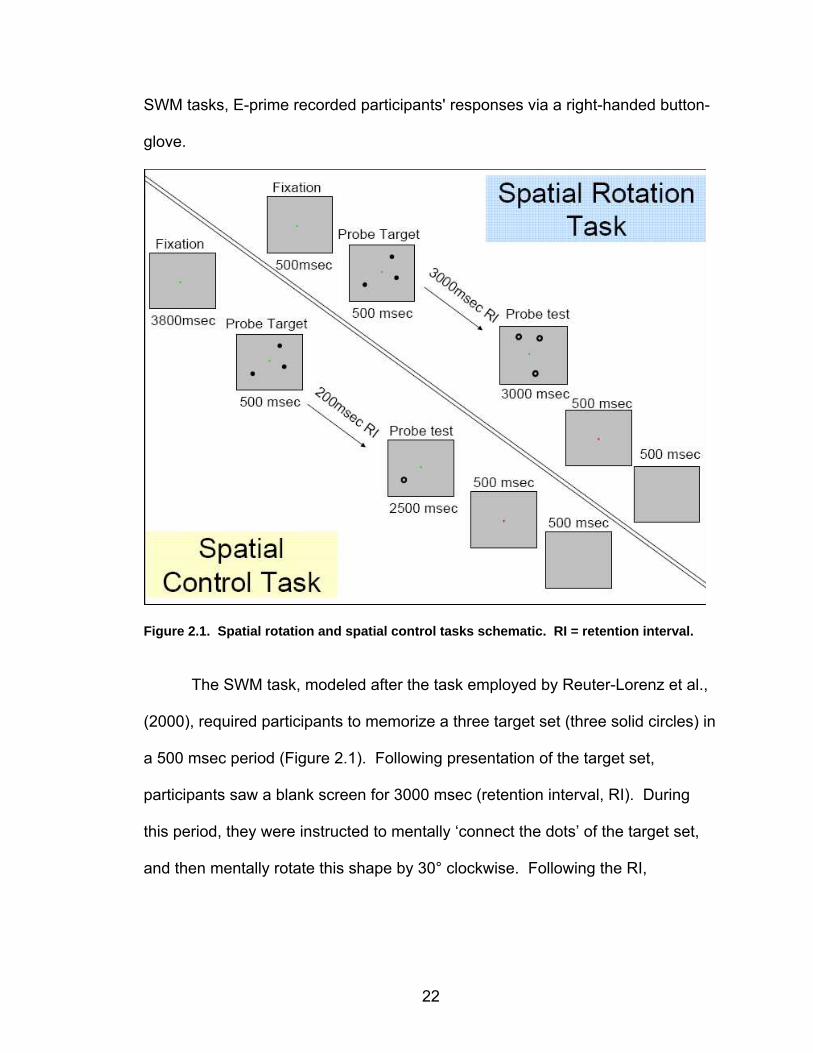
Figure 2.1. Spatial rotation and spatial control tasks schematic. RI = retention interval.
The SWM task, modeled after the task employed by Reuter-Lorenz et al.,
(2000), required participants to memorize a three target set (three solid circles) in
a 500 msec period (Figure 2.1). Following presentation of the target set,
participants saw a blank screen for 3000 msec (retention interval, RI). During
this period, they were instructed to mentally ‘connect the dots’ of the target set,
and then mentally rotate this shape by 30° clockwise. Following the RI,

23
participants were given 3000 msec to decide whether the subsequently
presented probe set of open circles formed the same configuration as the target
set that they had mentally rotated. There was a 30 second visual fixation
baseline period before and after each set of 10 trials. Participants performed 2
runs of this task, with 30 trials within each run. 70% of the trials were ‘match’
trials in which the probe set was rotated 30° clockwise; the remaining ‘non-match’
trials had two of the three probe circles displaced by 1.1cm (hard), 1.5cm
(medium), and 1.9cm (easy) from the original target dot configuration.
Participants also performed a SWMc task (1 block of 40 trials; see Figure 2.1)
modeled after the control task used by Reuter-Lorenz et al. (2000). This task
involved the presentation of three solid circles for 500 msec, followed by a 200
msec RI. Following this, participants were presented with a single circle for
2500 msec and asked to determine whether its spatial location matched that of a
previously observed dot. There was a 30 second visual fixation baseline period
before and after each set of 10 trials. This control task included all of the
cognitive components of the SWM task (e.g. perceptual encoding, response
selection, preparation, and initiation) except for the working memory and mental
rotation components. Thus, the subtraction of images from the control condition
should reveal areas actively involved with working memory and mental rotation.
In order to establish that SWM processes were specifically being engaged during
the RI, a separate group of participants were tested on the SWM task under dual
task conditions (see appendix A for further details and results).
24
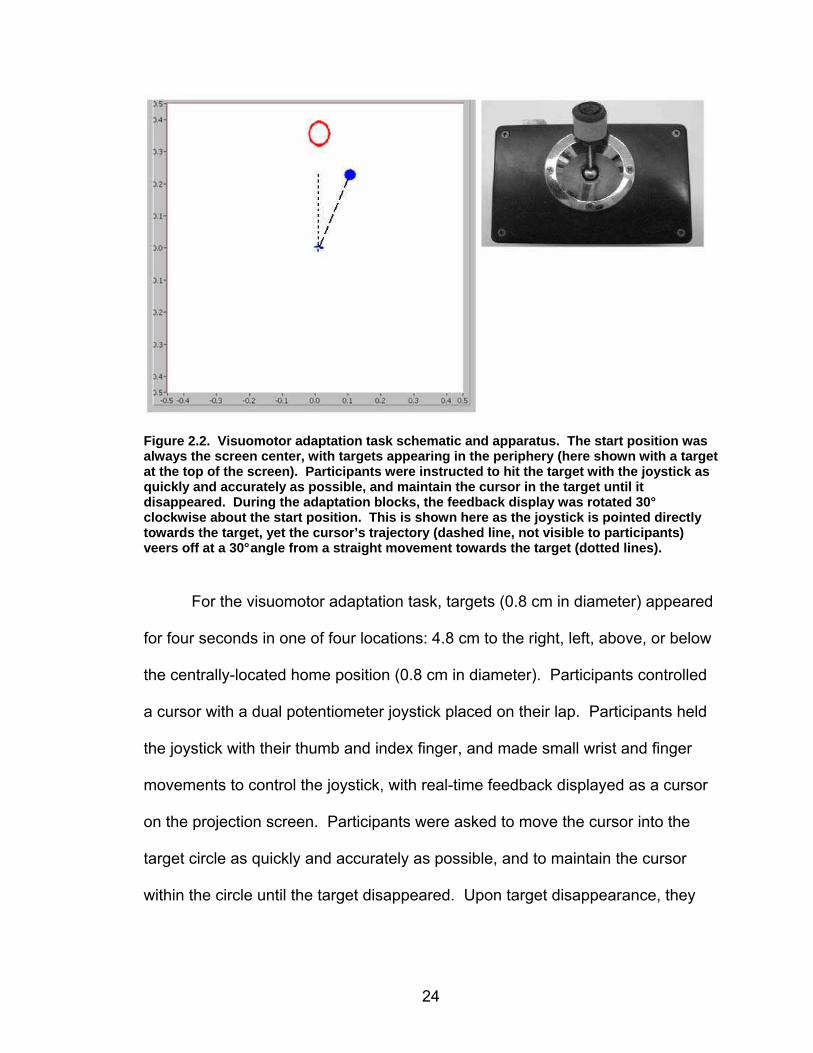
Figure 2.2. Visuomotor adaptation task schematic and apparatus. The start position was always the screen center, with targets appearing in the periphery (here shown with a target at the top of the screen). Participants were instructed to hit the target with the joystick as quickly and accurately as possible, and maintain the cursor in the target until it disappeared. During the adaptation blocks, the feedback display was rotated 30° clockwise about the start position. This is shown here as the joystick is pointed directly towards the target, yet the cursor’s trajectory (dashed line, not visible to participants) veers off at a 30° angle from a straight movement towards the target (dotted lines).
For the visuomotor adaptation task, targets (0.8 cm in diameter) appeared
for four seconds in one of four locations: 4.8 cm to the right, left, above, or below
the centrally-located home position (0.8 cm in diameter). Participants controlled
a cursor with a dual potentiometer joystick placed on their lap. Participants held
the joystick with their thumb and index finger, and made small wrist and finger
movements to control the joystick, with real-time feedback displayed as a cursor
on the projection screen. Participants were asked to move the cursor into the
target circle as quickly and accurately as possible, and to maintain the cursor
within the circle until the target disappeared. Upon target disappearance, they
25
were told to release the spring-loaded joystick handle so that it would re-center
for the subsequent trial. The next trial began one second later, resulting in an
inter-trial interval (from one target presentation to the next) of five seconds.
Participants performed 17 blocks (B; Table 2.1) as separate fMRI runs of the task
(24 trials per block), with 30 second visual fixation baseline periods at the
beginning and end of each block.
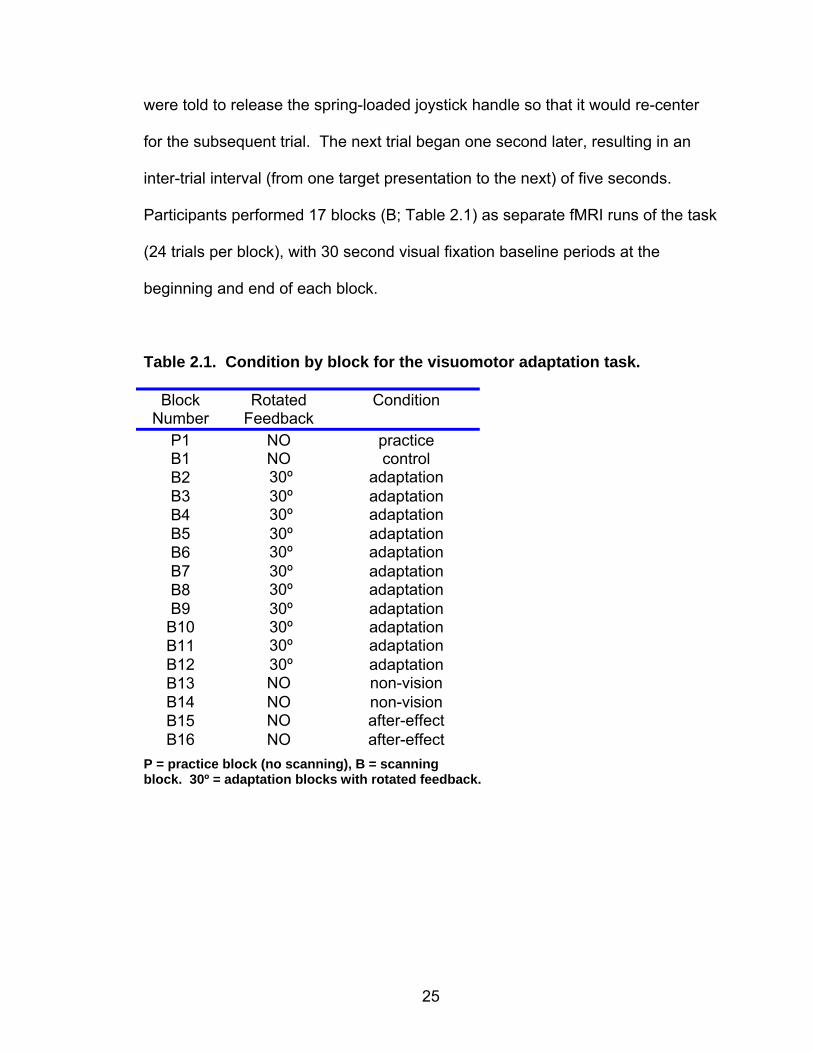
Table 2.1. Condition by block for th e visuomotor adaptation task.
P = practice block (no scanning), B = scanning block. 30º = adaptation blocks with rotated feedback.
Block Number
Rotated Feedback
Condition
P1 NO practice B1 NO control
B2 30º adaptation
B3 30º adaptation
B4 30º adaptation
B5 30º adaptation
B6 30º adaptation
B7 30º adaptation
B8 30º adaptation
B9 30º adaptation B10 30º adaptation
B11 30º adaptation
B12 30º adaptation
B13 NO non-vision
B14 NO non-vision
B15 NO after-effect
B16 NO after-effect
26
The 1st block was treated as a practice block (P) in order for the participant
to become familiar with the task in the fMRI environment; thus it was not included
in the analysis. The first block of trials (B1) was performed under normal visual
feedback conditions (control condition), while the subsequent 11 blocks (B2-B12;
adaptation period) were performed with visual feedback rotated 30º clockwise
about the center of the screen. Following the adaptation period, I explained to
participants how the visual feedback they had been presented during B2-B12
had been rotated in a clockwise fashion by 30º. They were then told that they
should perform the subsequent blocks like they did under the non-perturbed
conditions, such as they had experienced during B1. They were also informed
that, while this rotation effect would be absent for subsequent blocks, there would
be no visual feedback of their movements for B13-14. Participants were again
encouraged to perform the task as quickly and accurately as they had during the
control condition and adaptation periods. The final two blocks (B15-B16) were
performed under non-perturbed conditions with visual feedback present. B13-14
allowed me to determine activation associated with adaptive realignment of
control. Similarly, B15-16 would reflect activation associated with after-effects of
adaptation, as visual feedback now would illustrate whether previously applied
corrections during the adaptation period persisted.
fMRI acquisition parameters
27
Functional images were acquired using a single-shot gradient-echo
reverse spiral pulse sequence (Börnert et al., 2000). The field of view was 220 x
220 mm, voxel size was 3.2 x 3.2 x 3.2 mm, TR (repeat time to accomplish a full
volume) was 2 seconds, and TE (echo time) was 30 msec. Forty contiguous
axial slices were acquired, encompassing the whole brain, including the
cerebellum. Structural images were acquired using a T1-weighted gradient echo
pulse sequence (TE/TR/FA = 3msec/250msec/25 degrees) with a field of view of
240 x 240 mm, voxel size = 1.4 mm x 1.4 mm x 3.2 mm).
Behavioral data processing
For both the SWMc and SWM task, I calculated the reaction time and
percentage of correct answers in the identification of matching spatial locations
and rotated triangles, respectively. The X and Y coordinates from the joystick
were recorded at a rate of 100 Hz. I analyzed the joystick data offline using
custom Labview 6.1 software (National Instruments) to track behavioral changes
with learning. I first filtered the data with a dual low pass Butterworth digital filter
(cf. Winter, 1990), using a cutoff frequency of 10 Hz. The resultant joystick path
was calculated by computing the square root of the sum of the squared X and Y
coordinate data at each time point. The tangential velocity profile was then
calculated through differentiation of the resultant position data. Movement onset
and offset were computed through the application of Teasdale et al.’s (1993)
optimal algorithm to the velocity profile for each movement. I assessed learning
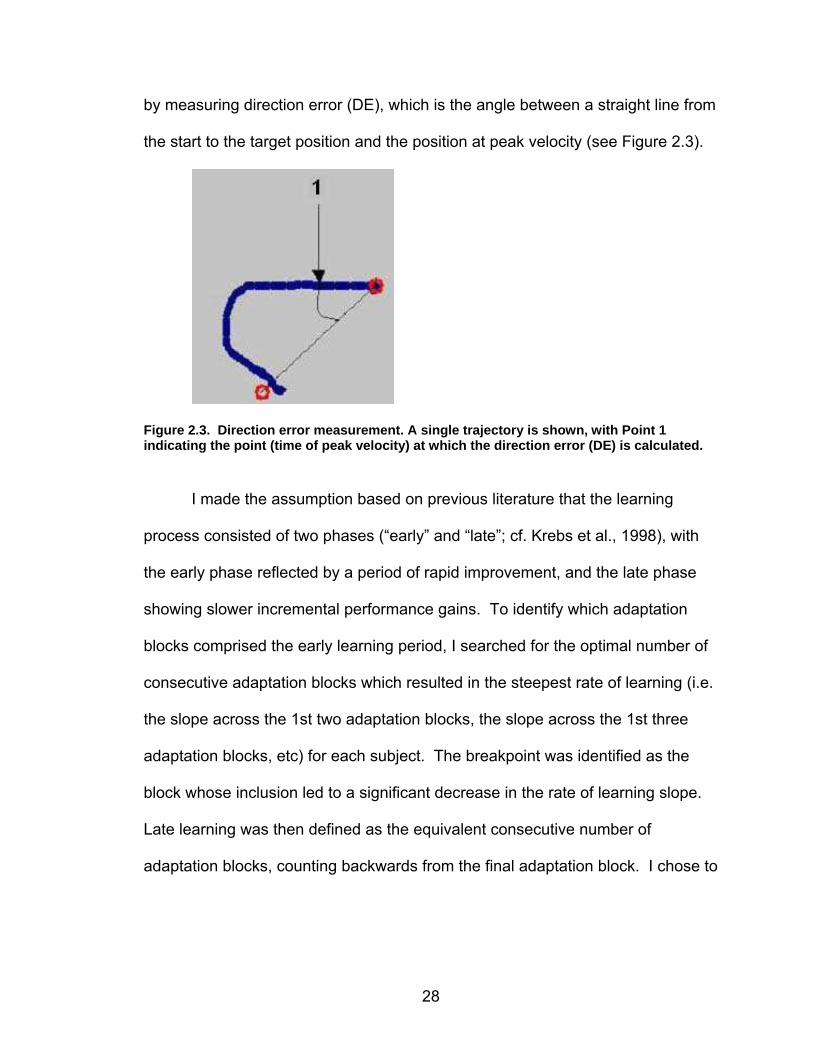
28
by measuring direction error (DE), which is the angle between a straight line from
the start to the target position and the position at peak velocity (see Figure 2.3).
Figure 2.3. Direction error measurement. A single trajectory is shown, with Point 1 indicating the point (time of peak velocity) at which the direction error (DE) is calculated.
I made the assumption based on previous literature that the learning
process consisted of two phases (“early” and “late”; cf. Krebs et al., 1998), with
the early phase reflected by a period of rapid improvement, and the late phase
showing slower incremental performance gains. To identify which adaptation
blocks comprised the early learning period, I searched for the optimal number of
consecutive adaptation blocks which resulted in the steepest rate of learning (i.e.
the slope across the 1st two adaptation blocks, the slope across the 1st three
adaptation blocks, etc) for each subject. The breakpoint was identified as the
block whose inclusion led to a significant decrease in the rate of learning slope.
Late learning was then defined as the equivalent consecutive number of
adaptation blocks, counting backwards from the final adaptation block. I chose to
29
focus on rate of learning as my primary measure, as these slopes describe the
adaptation span multiple adaptation blocks while also reflecting differences in
performance. Mean DE was also examined to provide a within-block index of
learning; I performed a block x trial repeated measures analysis of variance (RM
ANOVA) on DE to test for differences across blocks and trials. Significant
interactions were followed up with simple contrasts. The Huynh-Feldt epsilon
(Huynh and Feldt, 1970) was evaluated to determine whether the repeated
measures data met the assumption of sphericity (Σ > 0.75). I also computed
Pearson correlations between performance on each of the neuropsychological
tests and accuracy and reaction time for each SWM task, as well as the rate of
learning for each adaptation period for DE.
fMRI data processing
The first three volumes of each run were discarded to allow the MRI signal
to reach its steady state. I performed movement correction for excessive head
motion using the Automated Image Registration (AIR) package (Woods et al.,
1998). Structural images were skull-stripped using FSL’s Brain Extraction Tool
(http://www.fmrib.ox.ac.uk/fsl). fMRI data were processed and analyzed using
Statistical Parametric Mapping 2 (SPM2; Wellcome Department of Cognitive
Neurology, London, UK). Following the computation of a mean functional image
for each participant, their structural image was coregistered to this mean image
and then spatially normalized to the Montreal Neurological Institute (MNI)
30
template (Evans et al., 1994). These images were then spatially smoothed with
a Gaussian kernel with a full width at half maximum (FWHM) of 8mm. In
addition, head movement parameters were added as covariates of no interest to
correct for potential confounding effects induced by head movement.
I created boxcar models time-locked to the effect of interest and convolved
with an estimate of the canonical hemodynamic response function. Analyses
were performed at the single participant and group levels through SPM2 to
determine regions activated in association with task performance. Significant
areas of activation were then localized using the automated anatomical atlas
(AAL; Tzourio-Mazoyer et al., 2002) and confirmed with the Talairach atlas
(Talairach and Tournoux, 1988; see http://www.mrc-cbu.cam.ac.uk/Imaging/) and
visual inspection. Medial motor areas were identified as in Picard and Strick
(1996) and Mayka et al. (2006), and cerebellar regions as in Schmahmann et al.
(1999).
fMRI contrasts and region of interest analyses
I designed different contrasts to examine the visuomotor adaptation task
and the SWM task, using an uncorrected p-value of .005 and cluster magnitude ≥
10 voxels as a threshold for significance. The SWM contrast searched for
regions of statistically greater activation for the two SWM blocks in comparison to
the SWM control block. The first adaptation contrast (early adaptation) searched
for regions of statistically greater activation across the first 3 adaptation blocks

31
(defined as the early learning phase by the breakpoint analysis) versus the first
control block (B1). The second adaptation contrast evaluated the late adaptation
period using the final 3 adaptation blocks (late adaptation) versus B1. I
examined the activation at the after-effect blocks (B15-16) by searching for
greater activation at these blocks versus i) control (B1; after-effect 1) and ii) non-
vision blocks (B13-14; after-effect 2). I quantified the activation for the non-vision
blocks by searching for greater activation at these blocks (B13-B14) versus i)
control (B1; non-vision 1) and ii) after-effects (B15-16; non-vision 2).
In order to evaluate overlapping regions of activation between the SWM
task and each stage of learning during the visuomotor adaptation task, I applied
an inclusive mask of the SWM contrast using an uncorrected p-value of .05 to
both the early and late adaptation activation maps, then searched for significance
using a False Discovery Rate (FDR)-corrected threshold p-value of .05
(Genovese et al., 2002). I also performed correlations between the following
behavioral performance measures and activation at their corresponding scanning
blocks in whole brain analyses: DE early average block score and rate of early
adaptation, DE late average block score and rate of late adaptation.
I created regions of interest (ROIs) using areas which reached
significance for the early and late adaptation contrasts after they had been
masked using the SWM contrast using the MARSBAR toolbox (Brett et al.,
2002). Following ROI creation, I used custom software to calculate the percent
signal change for each scanning block. I calculated the mean magnitude of
32
activation during the visual fixation baseline period before and after each block of
testing. The visual fixation baseline period activation was then subtracted from
the mean magnitude of activation during the task period, and this value was then
divided by the mean control period activation and changed to a percentile for
each scanning block to yield percent signal change. I computed Pearson
correlations between this activation from each ROI during the early and late
adaptation periods and the participants’ rate of learning and average DE scores
for the early and late learning periods.
Results
fMRI data from two participants were excluded due to complications with
the collection process. This left 18 participants for the behavioral analysis, and
16 for the imaging portion (8 males).
Behavioral dependent measures
Table 2.2 shows the group mean and standard deviation for performance
on each of the neuropsychological tests, as well as performance on the SWM
tests. The SWM task resulted in reduced accuracy (t(1, 17)= 6.85, p< .0001) and a
longer reaction time (t(1, 17)= -7.27, p< .0001) compared to the SWMc task.
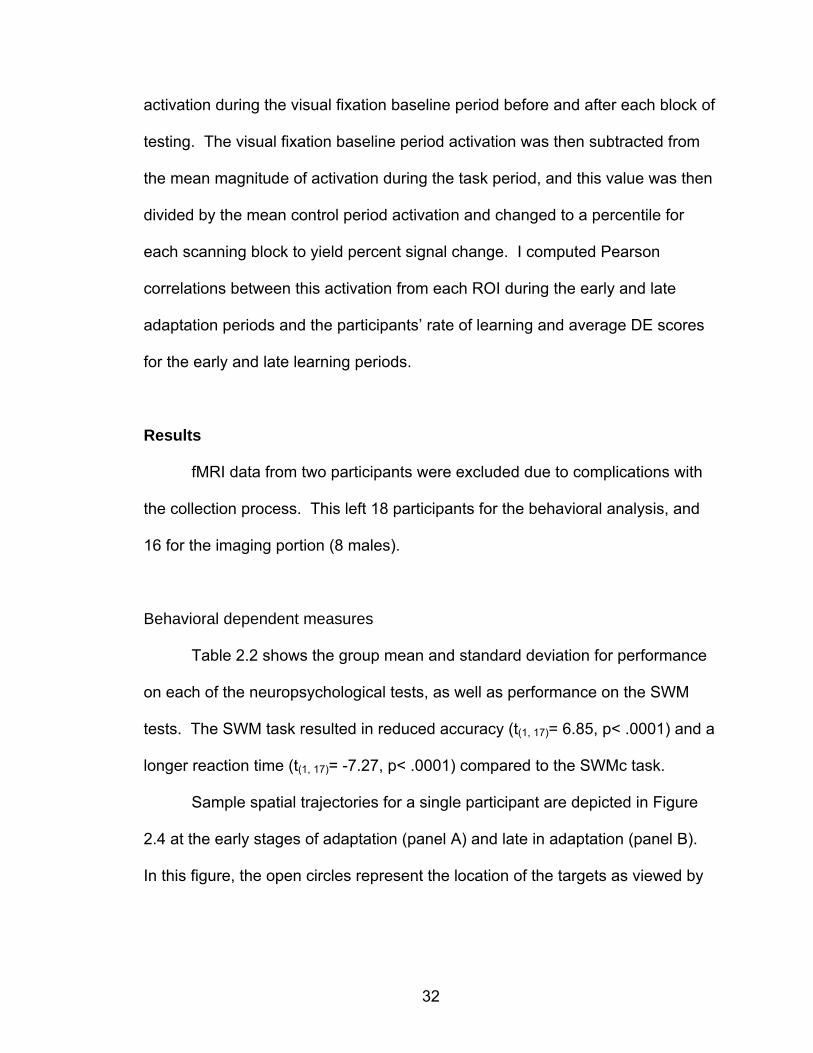
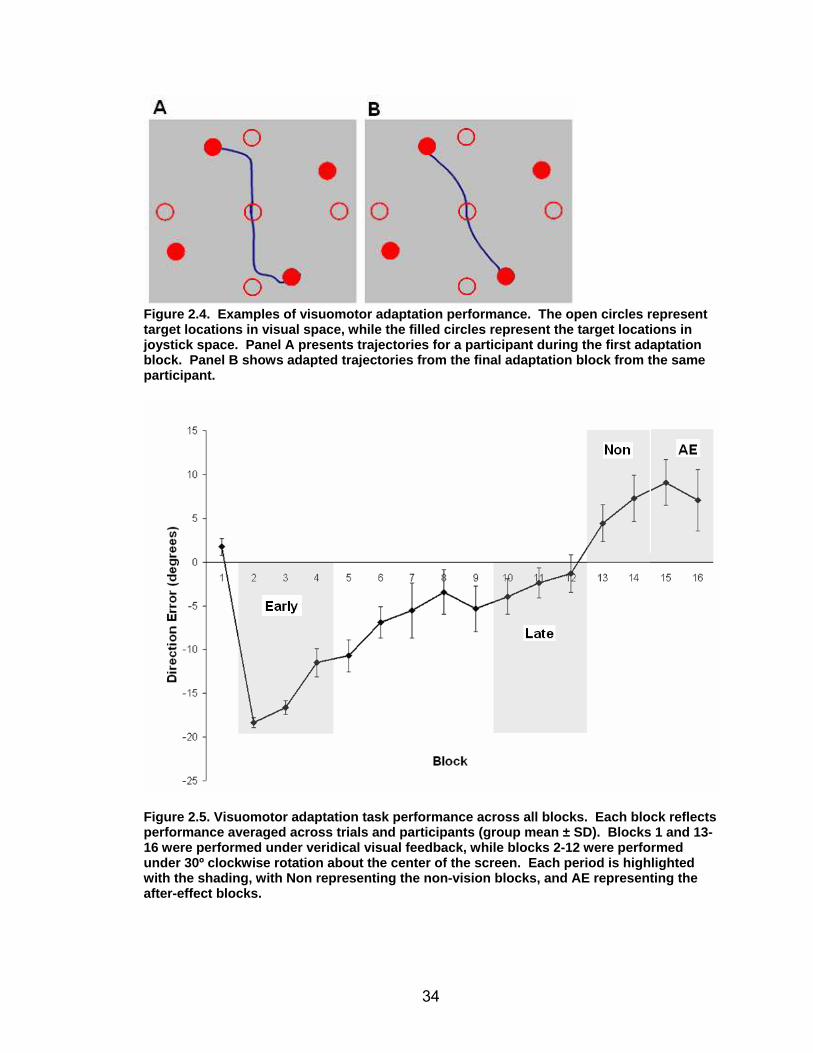
Sample spatial trajectories for a single participant are depicted in Figure
2.4 at the early stages of adaptation (panel A) and late in adaptation (panel B).
In this figure, the open circles represent the location of the targets as viewed by
33
the participant in real time, while the closed circles represent the location of the
targets under the feedback rotation. Adaptation to the rotated feedback is shown
through the less distorted trajectories employed in reaching the targets in panel B
versus panel A.
Table 2.2. Group mean (M) and standard deviation (SD) for each behavioral measure.
Task Units M SD
Neuropsych
Card rotation # of correct-incorrect cards (3 min) 52.3 20.4
Cube rotation # of correct-incorrect cubes (3 min) 8.4 6.4
Digit symbol # of correct symbols (2 min) 79.6 16.2
Corsi forward # of correct trials 8.7 1.9
Corsi backward # of correct trials 8.5 1.9
Digit span forward # of correct trials 11.8 2.6
Digit span backward # of correct trials 7.8 2.5
Reading span # of words recalled 30.2 6.3
Edinburgh inventory handedness index .83 .11
DEX executive impairment 19.8 8.4
SWMc
Spatial control accuracy
% correct 93% 3%
Spatial control RT msec 905 147
SWM
Spatial rotation accuracy
% correct 81% 7%
Spatial rotation RT msec 1257 209
VMA
DE (early) linear slope at early 3.4 1.0
DE (late) linear slope at late 1.3 0.9 (2/3 min) = time limit for each task to accurately answer as may question as possible. VMA = visuomotor adaptation.
34
Figure 2.4. Examples of visuomotor adaptati on performance. The open circles represent target locations in visual space, while the filled circles represent the target locations in joystick space. Panel A presents trajectories for a participant during the first adaptation block. Panel B shows adapted trajectories fr om the final adaptation block from the same participant.
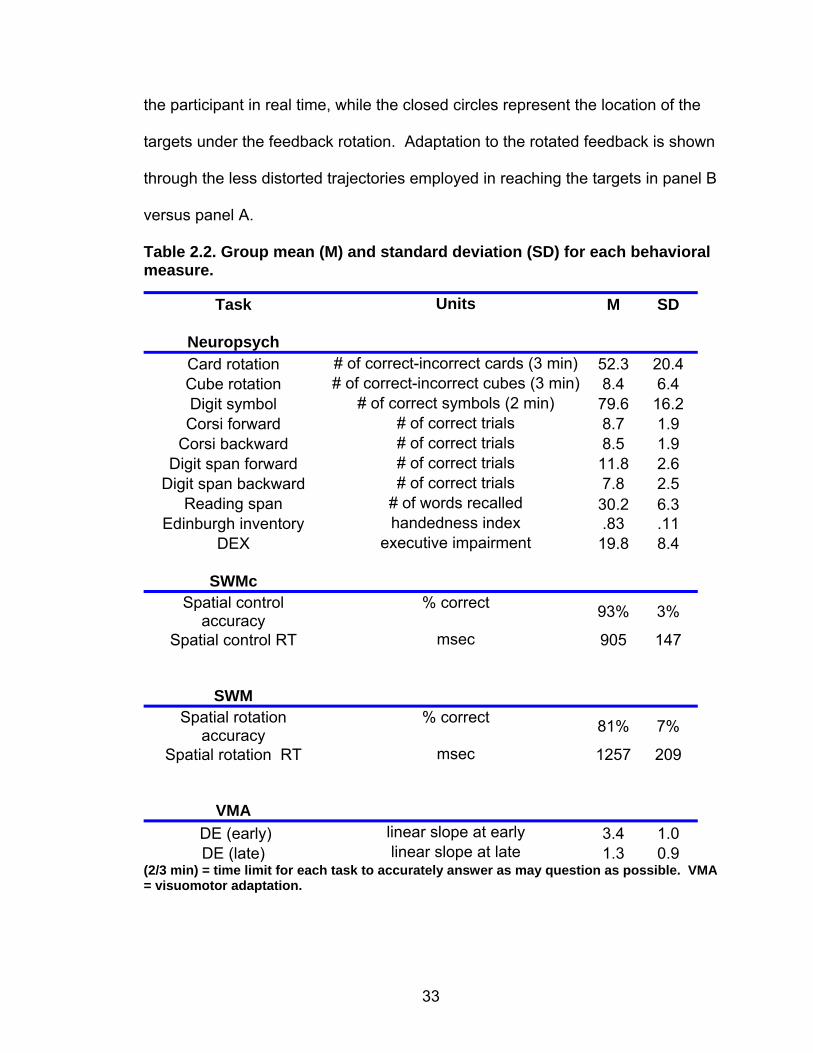
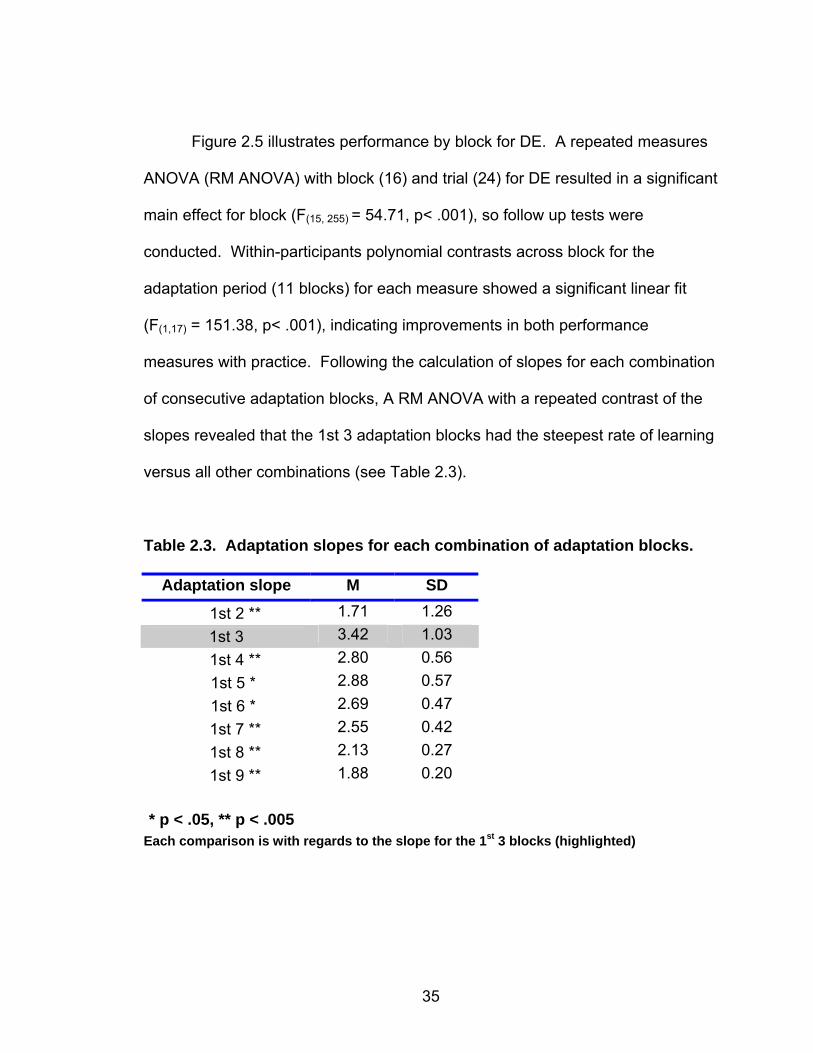
Figure 2.5. Visuomotor adaptation task performa nce across all blocks. Each block reflects performance averaged across trials and participants (group mean ± SD). Blocks 1 and 13-16 were performed under veridical visual feedback, while blocks 2-12 were performed under 30º clockwise rotation about the center of the screen. Each period is highlighted with the shading, with Non representing the non-vision blocks, and AE representing the after-effect blocks.
35
Figure 2.5 illustrates performance by block for DE. A repeated measures
ANOVA (RM ANOVA) with block (16) and trial (24) for DE resulted in a significant
main effect for block (F(15, 255) = 54.71, p< .001), so follow up tests were
conducted. Within-participants polynomial contrasts across block for the
adaptation period (11 blocks) for each measure showed a significant linear fit
(F(1,17) = 151.38, p< .001), indicating improvements in both performance
measures with practice. Following the calculation of slopes for each combination
of consecutive adaptation blocks, A RM ANOVA with a repeated contrast of the
slopes revealed that the 1st 3 adaptation blocks had the steepest rate of learning
versus all other combinations (see Table 2.3).
Table 2.3. Adaptation slopes for each combination of adaptation blocks.
Adaptation slope M SD
1st 2 ** 1.71 1.26
1st 3 3.42 1.03
1st 4 ** 2.80 0.56
1st 5 * 2.88 0.57
1st 6 * 2.69 0.47
1st 7 ** 2.55 0.42
1st 8 ** 2.13 0.27
1st 9 ** 1.88 0.20
* p < .05, ** p < .005
Each comparison is with regards to the slope for the 1 st 3 blocks (highlighted)
36
Evidence for the 1st 3 adaptation blocks comprising the early adaptation
period was established by a difference between the 3 and 4 block slopes (F(1,17)
= 10.49, p< .01), and lack of difference between the 4 and 5 block slopes (F(1,17)
= .32, p> .50). There was a difference in the adaptation slope between the early
and late periods (t(1,17)= 7.08, p< .0001). There was no significant difference
between the late slope across the final 8 adaptation blocks versus the final 3
adaptation blocks (t(1, 17) = -1.40, p > .15). Therefore, I analyzed the
neuroimaging data using the final 3 adaptation blocks as the late period, in order
to have an equal number of blocks for the early and late learning periods.
Removal of the visual feedback rotation led to persistent compensatory
actions, as trajectory deviations were opposite to the previously imposed
perturbation, when compared to the control condition (B13: F(1,17) = 31.67, p<
.0001; B14: F(1,17) = 20.98, p< .0001). This was also the case during the after-
effect blocks, as again performance was significantly poorer than at the control
condition (B15: F(1,17) = 20.06, p< .0001; B16: F(1,17) = 31.84, p< .0001). There
was no difference in performance between the non-vision blocks and the after-
effect blocks (F(1,17) = .13, p> .70).
Behavioral Correlation Analysis
Table 2.4 shows the results of the correlation analyses between the
neuropsychological tests, measures of accuracy and RT for the SWM task, and
the rate of adaptation for each stage of learning. The card rotation task
37
correlated with both accuracy and RT on the SWM task (r = .63, p< .05 and r = -
.52, p< .05, respectively). The card rotation task also correlated with the DE rate
of learning during the early adaptation period (r = .57, p< .05; see Figure 2.6), but
not during the late period (r = -.42, p> .05), supporting the hypothesis that SWM
plays a role in early visuomotor adaptation. The digit symbol task, which tests
sensorimotor processing speed, also showed a correlation with the DE rate of
learning during the early adaptation period (r = .50, p< .05), but not during the
late (r = .30, p> .05) . Tests of short term verbal memory (i.e. forward digit span
and reading span) did not show a correlation with either SWM task or the rate of
learning for either period of the visuomotor adaptation task.
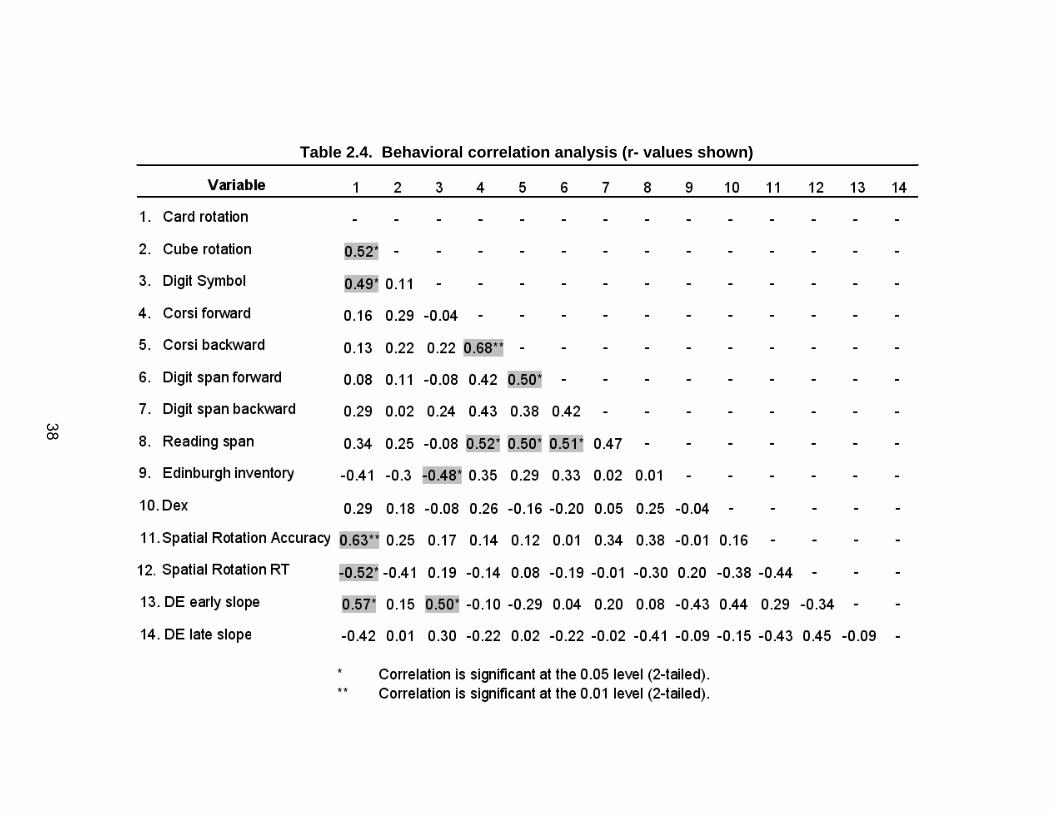
38
Table 2.4. Behavioral correla tion analysis (r- values shown)
38
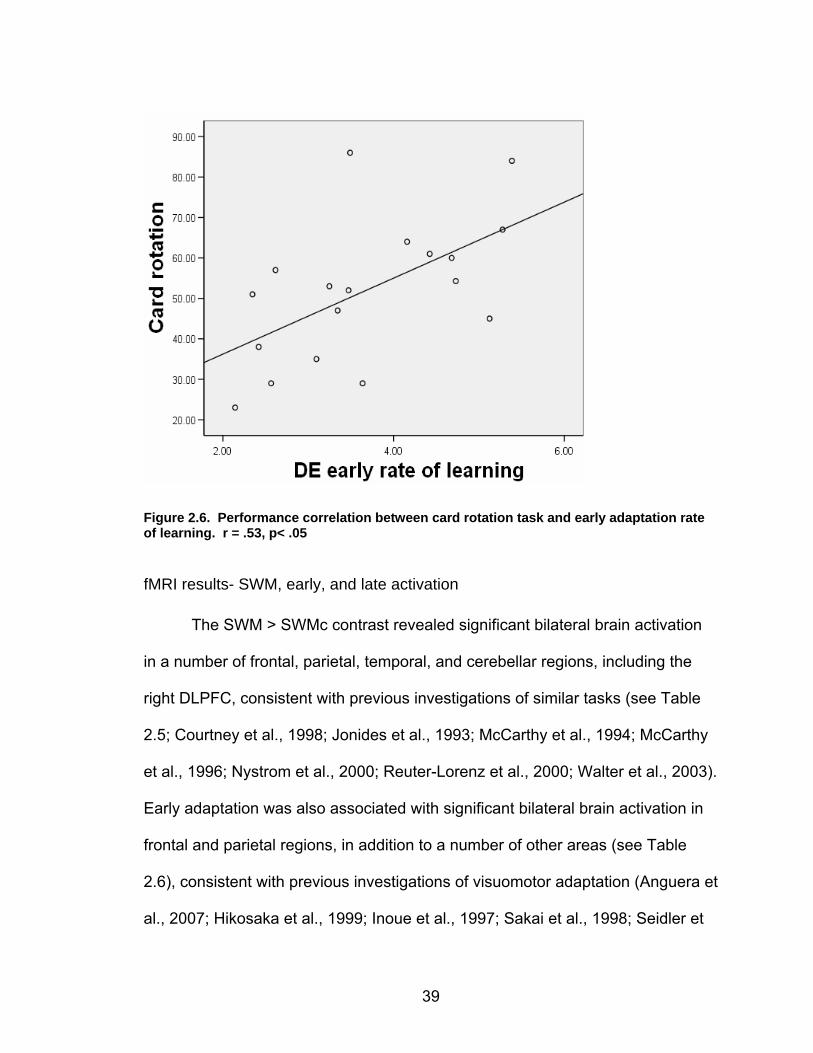
39
Figure 2.6. Performance correlation between card rotation task and early adaptation rate of learning. r = .53, p< .05
fMRI results- SWM, early, and late activation
The SWM > SWMc contrast revealed significant bilateral brain activation
in a number of frontal, parietal, temporal, and cerebellar regions, including the
right DLPFC, consistent with previous investigations of similar tasks (see Table
2.5; Courtney et al., 1998; Jonides et al., 1993; McCarthy et al., 1994; McCarthy
et al., 1996; Nystrom et al., 2000; Reuter-Lorenz et al., 2000; Walter et al., 2003).
Early adaptation was also associated with significant bilateral brain activation in
frontal and parietal regions, in addition to a number of other areas (see Table
2.6), consistent with previous investigations of visuomotor adaptation (Anguera et
al., 2007; Hikosaka et al., 1999; Inoue et al., 1997; Sakai et al., 1998; Seidler et
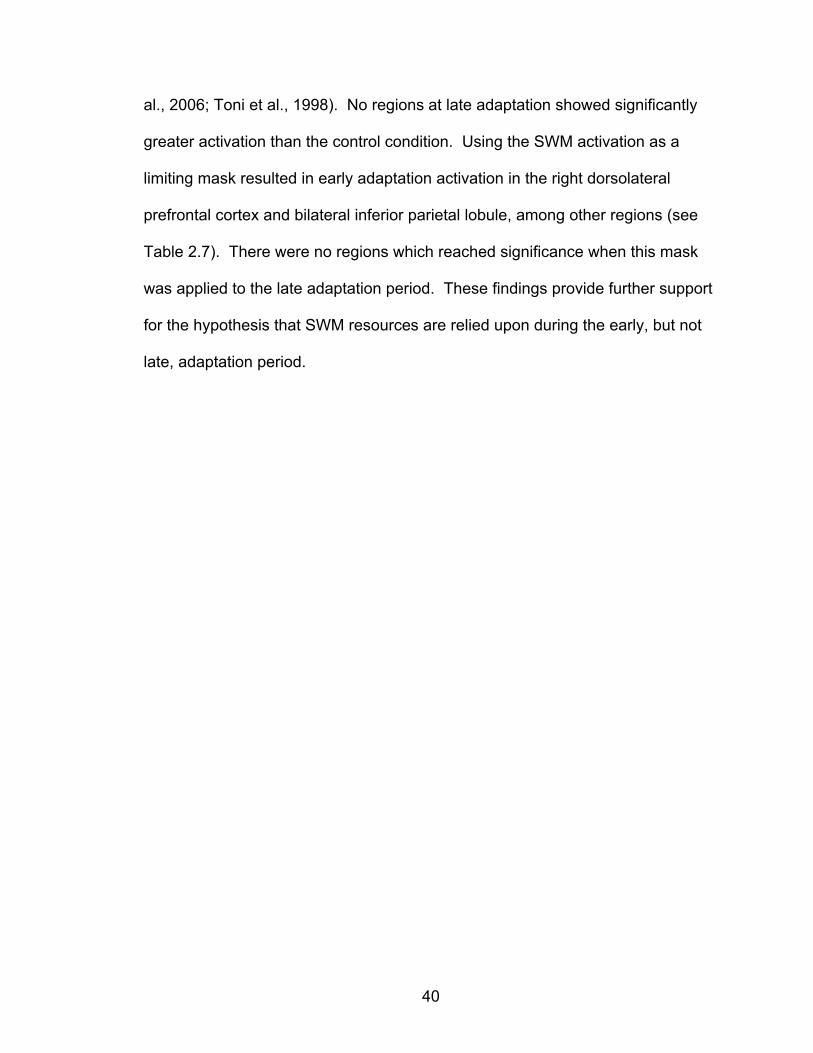
40
al., 2006; Toni et al., 1998). No regions at late adaptation showed significantly
greater activation than the control condition. Using the SWM activation as a
limiting mask resulted in early adaptation activation in the right dorsolateral
prefrontal cortex and bilateral inferior parietal lobule, among other regions (see
Table 2.7). There were no regions which reached significance when this mask
was applied to the late adaptation period. These findings provide further support
for the hypothesis that SWM resources are relied upon during the early, but not
late, adaptation period.
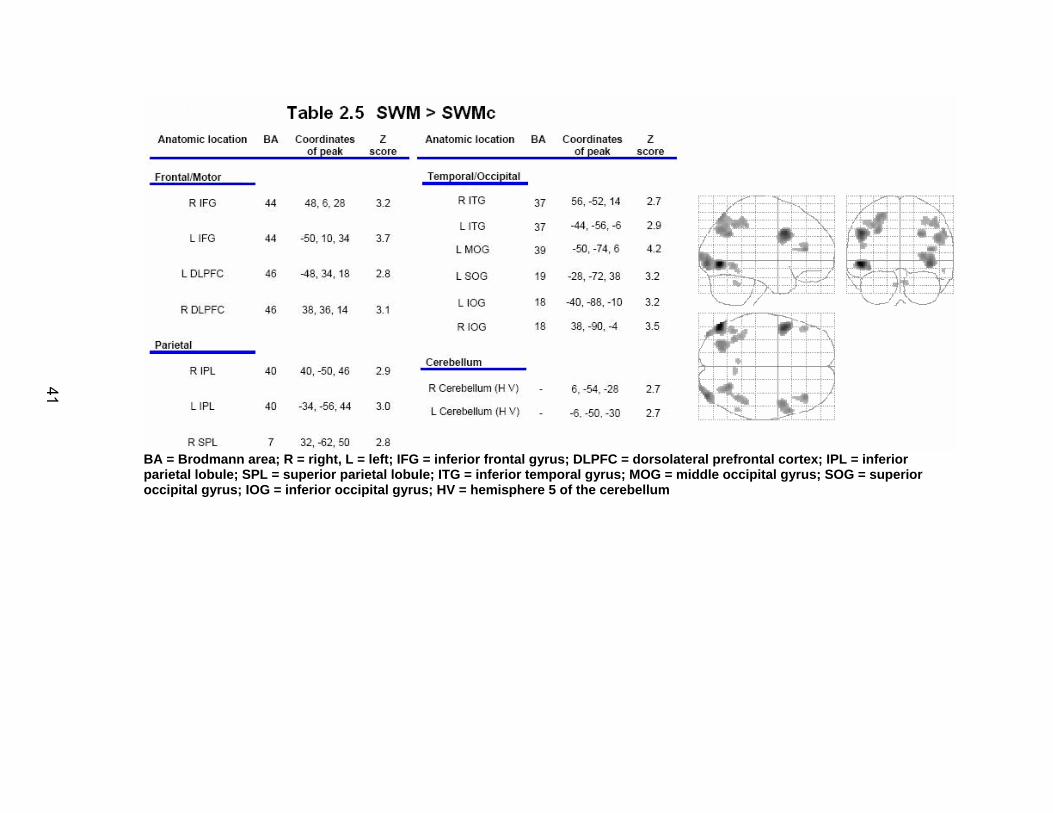
41
BA = Brodmann area; R = right, L = left; IFG = inferior frontal gy rus; DLPFC = dorsolateral prefrontal cortex; IPL = inferior parietal lobule; SPL = superior parietal lobule; ITG = inferior temporal gyrus; MOG = middle occipital gyrus; SOG = superior occipital gyrus; IOG = inferior occipital gyrus; HV = hemisphere 5 of the cerebellum
41
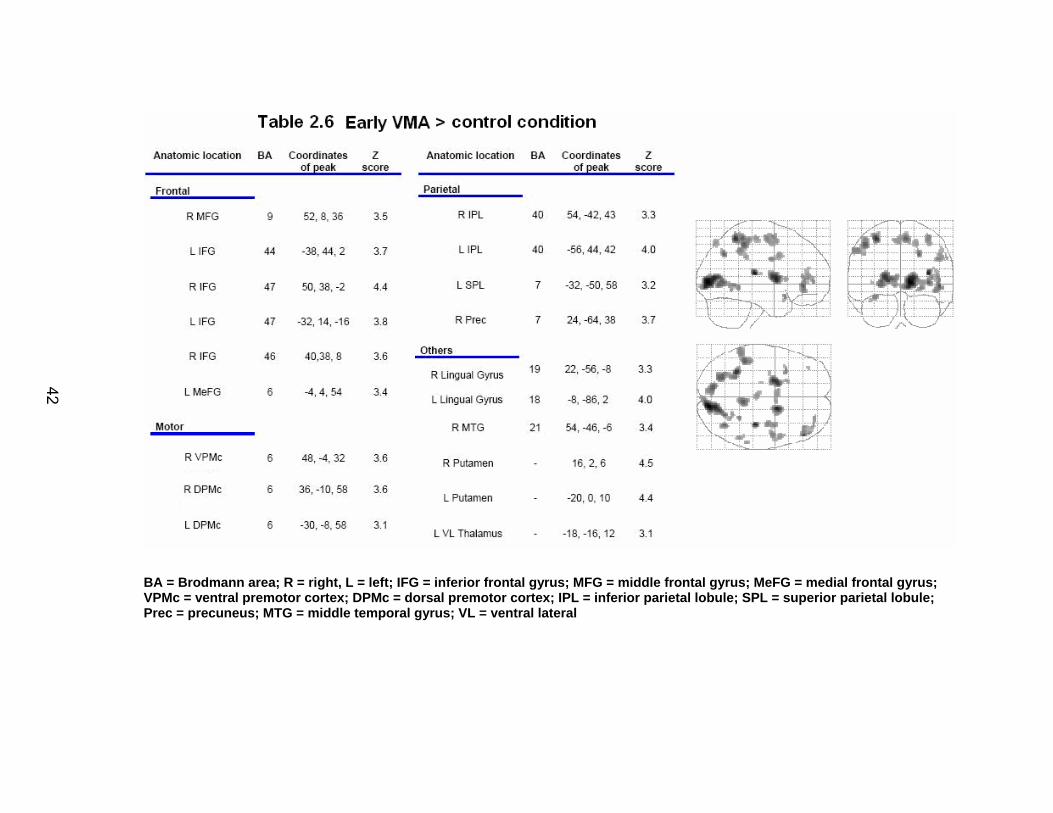
42
BA = Brodmann area; R = right, L = left; IFG = inferior frontal gy rus; MFG = middle frontal gyrus; MeFG = medial frontal gyrus; VPMc = ventral premotor cortex; DPMc = dorsal premotor cortex; IP L = inferior parietal lobule; SPL = superior parietal lobule; Prec = precuneus; MTG = middle temporal gyrus; VL = ventral lateral
42
43
BA = Brodmann area; R = right, L = left; IFG = in ferior frontal gyrus; DLPFC = dorsolateral prefrontal cortex; LPMc = lateral premotor cortex; IPL = inferior parietal lobule; SPL = superior parietal lobule; Prec = precuneus; SOG = superior occipital gyrus
fMRI- Correlations with whole brain activation
Table 2.8 shows activation in the left middle frontal gyrus (MFG)/DLPFC
and caudate obtained from a whole brain correlation analysis of early visuomotor
activation with the rate of early adaptation slope. Using the same analysis with
the rate of late adaptation resulted in activation in the left MTG and STG, as well
as the left cerebellum (Table 2.9). Left Cerebellum activation was observed
when the early mean DE score was correlated with early adaptation activation
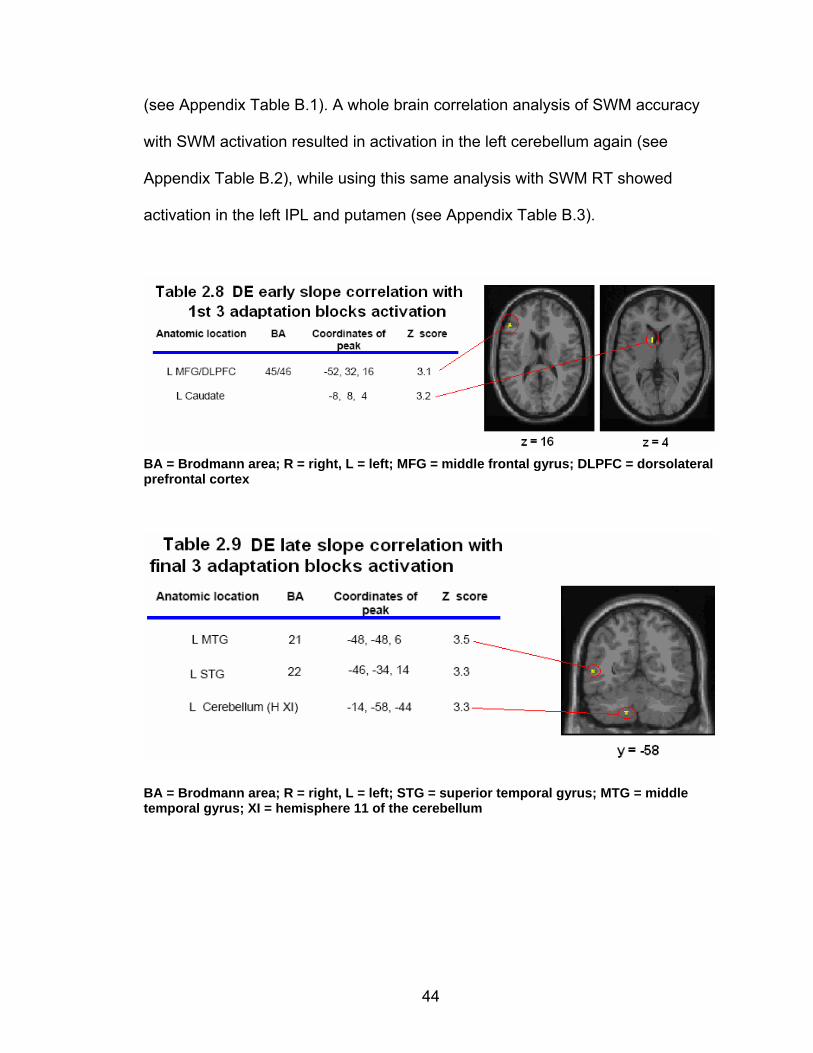
44
(see Appendix Table B.1). A whole brain correlation analysis of SWM accuracy
with SWM activation resulted in activation in the left cerebellum again (see
Appendix Table B.2), while using this same analysis with SWM RT showed
activation in the left IPL and putamen (see Appendix Table B.3).
BA = Brodmann area; R = right, L = left; MFG = middle frontal gyrus; DLPFC = dorsolateral prefrontal cortex
BA = Brodmann area; R = right, L = left; STG = superior temporal gyrus; MTG = middle temporal gyrus; XI = hemisphere 11 of the cerebellum
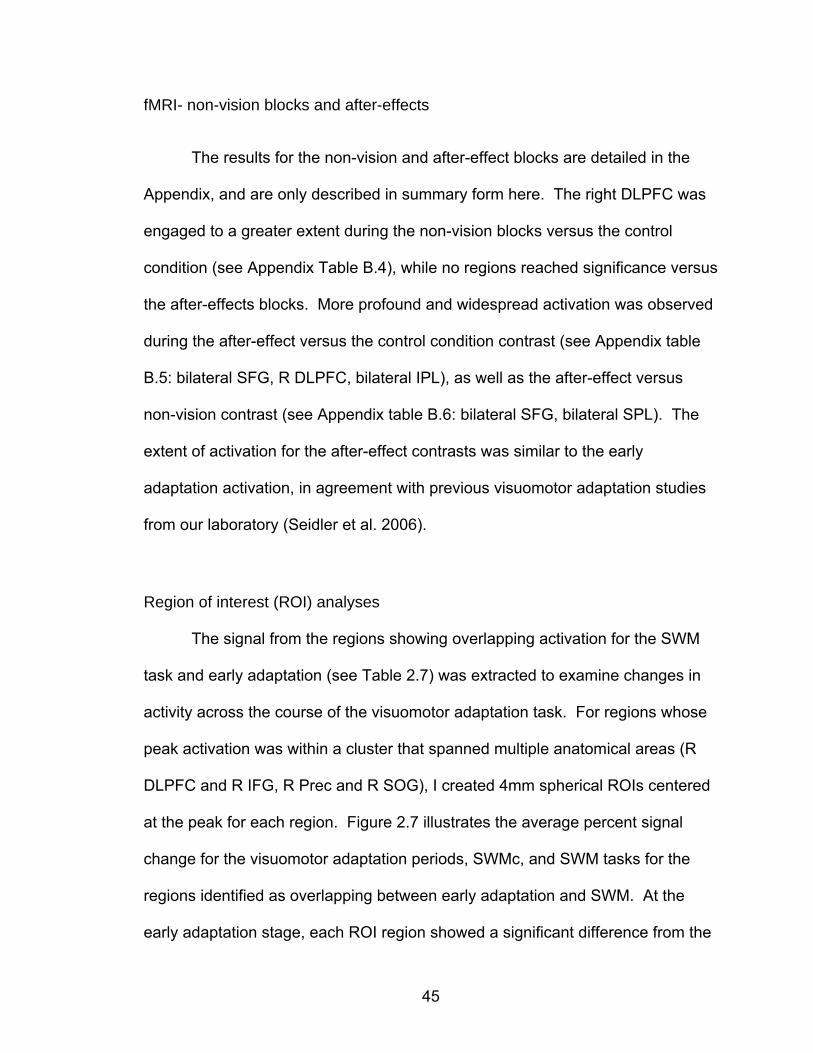
45
fMRI- non-vision blocks and after-effects
The results for the non-vision and after-effect blocks are detailed in the
Appendix, and are only described in summary form here. The right DLPFC was
engaged to a greater extent during the non-vision blocks versus the control
condition (see Appendix Table B.4), while no regions reached significance versus
the after-effects blocks. More profound and widespread activation was observed
during the after-effect versus the control condition contrast (see Appendix table
B.5: bilateral SFG, R DLPFC, bilateral IPL), as well as the after-effect versus
non-vision contrast (see Appendix table B.6: bilateral SFG, bilateral SPL). The
extent of activation for the after-effect contrasts was similar to the early
adaptation activation, in agreement with previous visuomotor adaptation studies
from our laboratory (Seidler et al. 2006).
Region of interest (ROI) analyses
The signal from the regions showing overlapping activation for the SWM
task and early adaptation (see Table 2.7) was extracted to examine changes in
activity across the course of the visuomotor adaptation task. For regions whose
peak activation was within a cluster that spanned multiple anatomical areas (R
DLPFC and R IFG, R Prec and R SOG), I created 4mm spherical ROIs centered
at the peak for each region. Figure 2.7 illustrates the average percent signal
change for the visuomotor adaptation periods, SWMc, and SWM tasks for the
regions identified as overlapping between early adaptation and SWM. At the
early adaptation stage, each ROI region showed a significant difference from the
46
control condition, with the R DLPFC and R IPL activation being equivalent
between late learning and the control condition. The percent signal change at
early adaptation for all regions did not correlate with the rate of early or late
adaptation; however, R IFG signal change did correlate with the mean early DE
score (Figure 2.8).
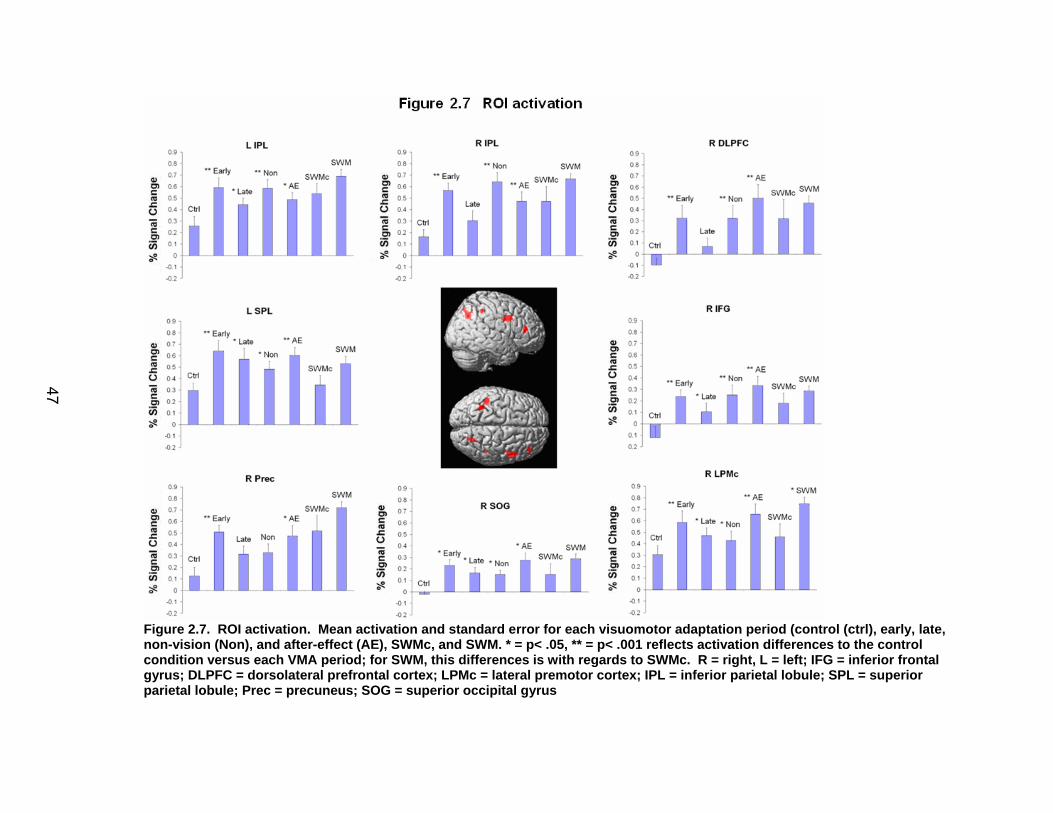
47
Figure 2.7. ROI activation. Mean activation and standard e rror for each visuomotor adaptation period (control (ctrl), early, late, non-vision (Non), and after-effect (AE), SWMc, and SWM. * = p< .05, ** = p< .001 refl ects activation differences to the control condition versus each VMA period; for SWM, this differences is wi th regards to SWMc. R = right, L = left; IFG = inferior front al gyrus; DLPFC = dorsolateral prefrontal cortex; LPMc = lateral pr emotor cortex; IPL = inferior parietal lobule; SPL = superior parietal lobule; Prec = precuneus; SOG = superior occipital gyrus
47
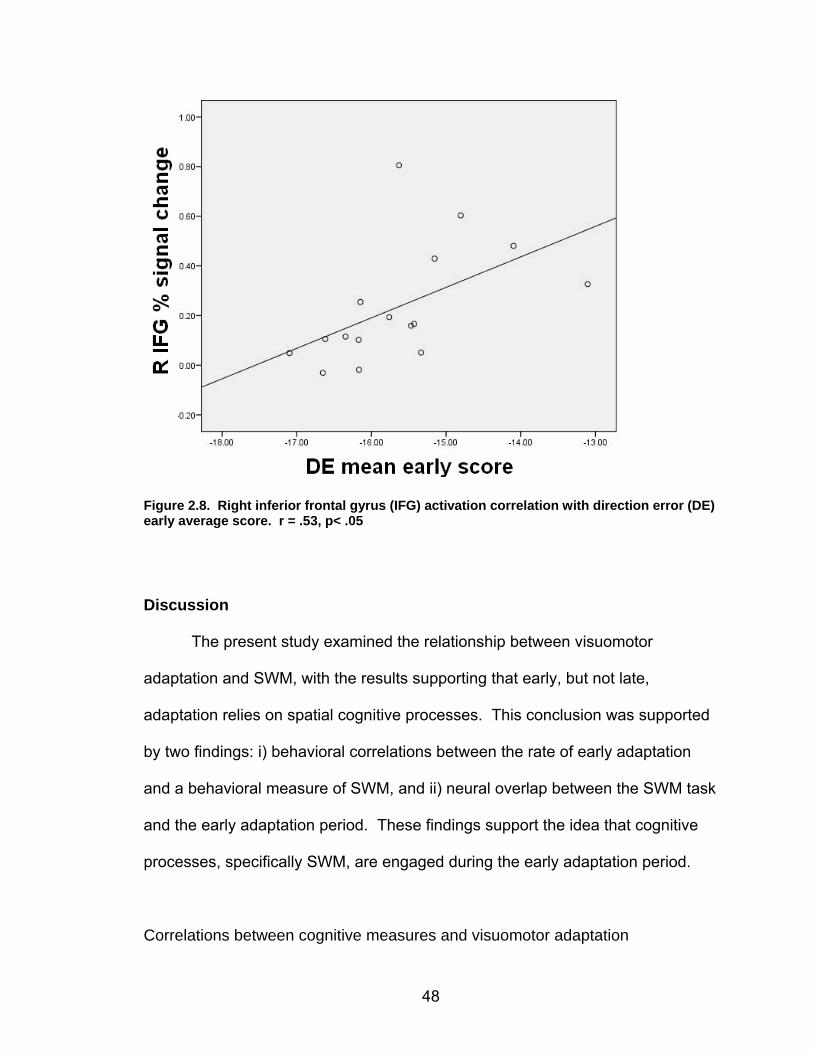
48
Figure 2.8. Right inferior frontal gyrus (IFG) activation correlation with direction error (DE) early average score. r = .53, p< .05 Discussion
The present study examined the relationship between visuomotor
adaptation and SWM, with the results supporting that early, but not late,
adaptation relies on spatial cognitive processes. This conclusion was supported
by two findings: i) behavioral correlations between the rate of early adaptation
and a behavioral measure of SWM, and ii) neural overlap between the SWM task
and the early adaptation period. These findings support the idea that cognitive
processes, specifically SWM, are engaged during the early adaptation period.
Correlations between cognitive measures and visuomotor adaptation
49
In agreement with previous studies of visuomotor adaptation (Anguera et
al., 2007; Cunningham, 1989; Ghilardi et al., 1995; Krakauer et al., 2000; Seidler
et al., 2006; Smith et al., 2006), as well as motor learning theories (Doyon et al.,
2003; Karni et al., 1998), more rapid improvement was observed at the early
adaptation stage versus the late adaptation stage. Support for distinct
mechanisms underlying the two stages of learning was evidenced by the rate of
early, but not late, visuomotor adaptation being correlated with the card rotation
task and the digit symbol task. I also observed a correlation between the card
rotation task and both the accuracy and reaction time for the SWM task,
providing support that both tasks engage similar cognitive processes related to
SWM. This finding was further supported by the results presented in the
appendix regarding the use of SWM resources during the retention interval of the
SWM task (see appendix A).
The relationship between SWM and mental rotation plays a key part in
explaining the previous significant behavioral correlations. SWM has been
described as an active storage and processing system for manipulating
information (Baddeley, 1986; Miyake and Shah, 1999). This definition addresses
why active cognitive manipulations like mental rotation require SWM processes
versus passive visuospatial storage measures (i.e. Corsi block forward). These
type of passive tasks have been shown to rely on a related, yet distinct, cognitive
process from SWM, short term memory (Miyake and Shah, 1999). This is
reflected in the present findings through the correlation with the card rotation and
SWM task, while neither measure correlates with the Corsi block task. Simply
50
stated, solving a mental rotation task cannot be accomplished utilizing short term
memory resources as the processing components required for manipulation and
comparison are absent. These results also suggest why SWM versus short term
memory resources are necessary during the early stage of learning: the
transformation of the visuomotor mapping requires active processing. This
interpretation is supported by the observed correlation with the rate of early
learning for the card rotation task, and the null correlation with the Corsi block
forward task.
The lack of SWM measures correlating with the late learning slope is in
line with Fitts and Posner’s (1967) description of the late learning stage being
autonomous and not requiring the same level of cognitive processes as early
learning. In addition, there were no correlations between the early or late rate of
adaptation and non-SWM tasks (i.e. digit span, reading span). This suggests
that the correlation between SWM and the early phase of adaptation is not simply
a general executive effect, but rather reflects overlap in spatial cognitive
resources between these two tasks. These results also highlight the importance
of targeting specific cognitive processes when trying to establish correlations with
motor learning variables. The failure to find a correlation between adaptation and
the trail-making test previously reported by Bock (2005) may be because the
trail-making test does not engage the relevant cognitive processes. These
findings also seemingly contradict earlier work that proposed the use of verbal
processes during the early stage of learning (Adams, 1971; Fitts and Posner,
1967; Gentile, 1972). I do not believe that the present findings redefine long held
51
views of skill learning; rather, the engagement of cognitive processes here is
likely not in a manner initially envisioned by these authors. The amount of verbal
versus cognitive processing during early learning may be task specific, with the
present task not appearing to engage verbal resources in a substantial manner.
SWM, early, and late activation
Activation associated with the SWM > SWMc contrast was observed
bilaterally in the prefrontal and parietal cortices, including the right DLPFC.
Activation in these regions is in accord with other imaging studies of SWM and
mental rotation (Cohen et al., 1996; Courtney et al., 1998; Gauthier et al., 2002;
Jonides et al., 1993; McCarthy et al., 1994; McCarthy et al., 1996; Nystrom et al.,
2000; Reuter-Lorenz et al., 2000; Walter et al., 2003). The observed activation in
premotor, prefrontal, temporal, and parietal regions during the early adaptation
phase also agrees with previous imaging studies of visuomotor adaptation
(Anguera et al., 2007; Clower et al. 1996; Krakauer et al. 2004; Seidler et al.,
2006). No regions at late learning reached significance, in agreement with each
of the above studies as well.
Neural overlap between SWM and visuomotor adaptation
Upon masking both the early and late adaptation periods with the
activation from the SWM task, only the early adaptation period showed significant
activation. In particular, the right DLPFC and right IPL, regions which have
previously been associated with mental rotation in SWM tasks (Cohen et al.,
52
1996, Gauthier et al., 2002), were engaged. In addition to these regions, I also
observed activation in the right IFG and right PMC, supporting previous work
from this laboratory which suggested that these right lateralized regions comprise
a network that contributes to spatial cognitive processes of adaptation,
specifically SWM and spatial attention (Seidler et al., 2006). Other studies have
also reported right lateralized activation with the same task (Ghilardi et al., 2000;
Inoue et al., 1997; Krakauer et al., 2004), but have not interpreted this activation
as supporting SWM processes.
The present findings suggest that prefrontal activation during the early
stage of adaptation is contributing to SWM processes, supporting the idea of
early adaptation being under cognitive control. These data support previous
findings suggesting that cognitive processes play a role in the adaptation process
(Eversheim and Bock, 2001, Taylor and Thoroughman, 2007, 2008), and are
also in line with theories of motor learning regarding the engagement of distinct
neural correlates at different stages of learning (Doyon et al., 2003; Smith et al.,
2006; Willingham et al., 1998).
Visuomotor adaptation – Neural correlates, non-vision & after-effect blocks
Whole brain correlations of early activation and the rate of early adaptation
engaged the left middle frontal gyrus (MFG)/DLPFC. This region was also
engaged for the SWM contrast, supporting the importance of SWM processes for
early adaptation. At late learning, left middle temporal gyrus (MTG) activation
was correlated with the rate of late adaptation. This region was previously
53
observed during late learning for a sensorimotor adaptation task (Krebs et al.,
1998). Mean early DE score also correlated with ROI activation at the right
inferior frontal gyrus (IFG), a region previously shown to be activated during the
early adaptation period (Anguera et al., 2007; Seidler et al., 2006). This region
has been implicated in inhibition of responses regarding visuomotor conditional
learning, memory encoding, and memory retrieval (cf. Aron et al., 2004). I
suggest that the activation here in this task at early learning reflects an inhibition
of a previous, flawed visuomotor mapping which is no longer applicable;
however, this hypothesis requires further testing.
The right DLPFC was engaged to a greater extent during the non-vision
and after-effect blocks than the control condition (see Appendix tables B.4-B.6).
This laboratory has previously shown this region’s engagement during an after-
effect period for a visuomotor adaptation task (Seidler et al., 2006). This result
provides further support that this region, implicated in SWM, plays a role in re-
adaptation. Similar to the present findings, Jueptner et al. (1997) showed that
prefrontal activation returned to early learning levels when participants were told
to attend to their actions following a learning period. In the present study, making
participants aware of the non-vision task environment led to a unique
performance strategy compared to the control condition, suggesting that the
activation at these non-vision blocks reflects a novelty effect of performing the
task under different conditions. Without having tested participant performance
under the non-vision conditions before the adaptation period, however, I cannot
54
say for certain that the observed activation is solely attributable to spatial
adaptation processes.
When and how is SWM used in the motor learning process?
Recent dual-tasking studies of motor adaptation and executive function
have provided a framework for when and how SWM would most likely be relied
upon during the early adaptation period. Taylor and Thoroughman (2007, 2008)
have shown that the adaptation process is most affected when attentional
resources are distracted by a dual task between adaptation trials. As they did
not observe interference effects when a secondary task was performed within a
trial, these authors suggested that cognitive resources are engaged between
trials to encode errors and update visuomotor maps for the subsequent trial.
Similar to Eversheim and Bock (2001), these studies did not set out to test the
contributions of distinct cognitive processes. The present results extend the
findings of both Eversheim and Bock (2001) and Taylor and Thoroughman (2007,
2008) by indentifying SWM as one specific cognitive process (SWM) contributing
to adaptation.
How does SWM contribute to visuomotor adaptation? I propose its
contribution involves the modification of visuomotor maps using mental rotation.
This hypothesis is based on the relationship between SWM and mental rotation,
as well as the correlation between the card rotation task and the rate of early
adaptation. Just and Carpenter (1976) described the stages of mental rotation
as i) searching, ii) transforming and comparing, and iii) confirmation. In terms of
the present study, SWM resources would assist with recalling and manipulating
55
the original visuomotor mapping, and then evaluating this new mapping to ensure
improved accuracy for subsequent movements. It should be noted that other
cognitive processes (i.e. inhibition) may also be contributing to the adaptation
process; however, this would require further evaluation.
Conclusions
The early, but not late, stage of adaptation relies on cognitive processes,
specifically SWM. This was evidenced through both behavioral performance
correlations and overlapping neural activation patterns between this period and a
SWM task involving mental rotation. These findings highlight the importance of
spatial cognition early in the motor learning process, and provide insight into the
function of prefrontal and parietal regions that are engaged during the visuomotor
adaptation process.

56
References
Adams, J. (1971). A closed-loop theory of motor learning. J Mot Behav, 3(2),
111-149. Anguera, J., Russell, C., Noll, D., & Seidler, R. (2007). Neural correlates
associated with intermanual transfer of sensorimotor adaptation. Brain Res, 1185, 136-151.
Aron, A., Robbins, T., & Poldrack, R. (2004). Inhibition and the right inferior frontal cortex. Trends in Cognitive Sciences, 8(4), 170-177.
Baddeley AD (1986). Working memory. Oxford: Oxford University Press. Bock, O. (2005). Components of sensorimotor adaptation in young and elderly
subjects. Exp Brain Res, 160(2), 259-263. Börnert, P., Aldefeld, B., & Eggers, H. (2000). Reversed spiral MR imaging.
Magn Reson Med, 44(3), 479-484. Brett, M., Anton, J., Valabregue, R., Poline, J. (2002). Region of interest analysis
using an SPM toolbox [abstract] Presented at the 8th International Conference on Functional Mapping of the Human Brain, June 2-6, 2002, Sendai, Japan. Available on CD-ROM in NeuroImage, Vol 16, No 2.
Brooks, V., Hilperath, F., Brooks, M., Ross, H., & Freund, H. (1995). Learning "what" and "how" in a human motor task. Learn Mem, 2(5), 225-242.
Brooks, V., Kennedy, P., & Ross, H. (1983). Movement programming depends on understanding of behavioral requirements. Physiol Behav, 31(4), 561-563.
Cabeza, R., & Nyberg, L. (2000). Imaging cognition II: An empirical review of 275 PET and fMRI studies. J of Cog Neuro, 12(1), 1-47.
Clower, D., Hoffman, J., Votaw, J., Faber, T., Woods, R., & Alexander, G. (1996). Role of posterior parietal cortex in the recalibration of visually guided reaching. Nature, 383(6601), 618-621.
Cohen, M., Kosslyn, S., Breiter, H., DiGirolamo, G., Thompson, W., Anderson, A., et al. (1996). Changes in cortical activity during mental rotation - A mapping study using functional MRI. Brain, 119, 89-100.
Cornoldi, C., & Vecchi, T. (2003). Visuospatialworking memory and individual differences. Hove, UK: Psychology Press. Corsi, P. M. 1972. Human memory and the medial temporal region of the brain. Dissertation Abstracts International, 34 (02), 819B. (University Microfilms No. AAI05-77717). Courtney, S., Petit, L., Maisog, J., Ungerleider, L., & Haxby, J. (1998). An area
specialized for spatial working memory in human frontal cortex. Science, 279(5355), 1347-1351.
Cunningham, H. (1989). Aiming error under transformed spatial mappings suggests a structure for visual-motor maps. J Exp Psychol Hum Percept Perform, 15(3), 493-506.
Daneman M, Carpenter PA. Individual differences in working memory and reading. Journal of Verbal Learning and Behaviour 1980; 19: 450– 466. Doyon, J., Penhune, V., & Ungerleider, L. (2003). Distinct contribution of the
57
cortico-striatal and cortico-cerebellar systems to motor skill learning. Neuropsychologia, 41(3), 252-262.
Ekstrome RB, French JW, Harman HH, et al. (1976). Manual for kit of factor referenced cognitive tests. Princeton, New Jersey: Educational Testing Service. Evans AC, Kamber M, Collins DL, Macdonald D (1994) An MRI-based probabilistic atlas of neuroanatomy. In: Shorvon S, Fish D, Andermann F, Bydder GM, Stefan H (eds) Magnetic resonance scanning and epilepsy. NATO ASI Series A, Life Sciences, vol 264. Plenum Press, New York, pp263–274. Eversheim, U., & Bock, O. (2001). Evidence for processing stages in skill
acquisition: a dual-task study. Learn Mem, 8(4), 183-189. Fitts, P. M., & Posner, M. I. (1967). Human performance: Brooks/Cole Publishing
Company, Belmont, Calif. Gauthier, I., Hayward, W., Tarr, M., Anderson, A., Skudlarski, P., & Gore, J.
(2002). BOLD activity during mental rotation and viewpoint-dependent object recognition. Neuron, 34(1), 161-171.
Genovese, C., Lazar, N., & Nichols, T. (2002). Thresholding of statistical maps in functional neuroimaging using the false discovery rate. Neuroimage, 15(4), 870-878.
Gentile, A.M (1972). A working memory model of skill acquisition with application to teaching. Quest Monograph XVII, 3-23.
Ghilardi, M., Ghez, C., Dhawan, V., Moeller, J., Mentis, M., Nakamura, T., et al. (2000). Patterns of regional brain activation associated with different forms of motor learning. Brain Res, 871(1), 127-145.
Graydon, F., Friston, K., Thomas, C., Brooks, V., & Menon, R. (2005). Learning-related fMRI activation associated with a rotational visuo-motor transformation. Brain Res Cogn Brain Res, 22(3), 373-383.
Hikosaka, O., Nakahara, H., Rand, M., Sakai, K., Lu, X., Nakamura, K., et al. (1999). Parallel neural networks for learning sequential procedures. Trends Neurosci, 22(10), 464-471.
Huynh H, Feldt LS (1970) Conditions under which the mean square ratios in repeated measures designs have exact F-distributions. J Am Stat Assoc 65:1582–1589. Imamizu, H., Kuroda, T., Miyauchi, S., Yoshioka, T., & Kawato, M. (2003).
Modular organization of internal models of tools in the human cerebellum. Proc Natl Acad Sci U S A, 100(9), 5461-5466.
Imamizu, H., Kuroda, T., Yoshioka, T., & Kawato, M. (2004). Functional magnetic resonance imaging examination of two modular architectures for switching multiple internal models. J Neurosci, 24(5), 1173-1181.
Imamizu, H., Miyauchi, S., Tamada, T., Sasaki, Y., Takino, R., Pütz, B., et al. (2000). Human cerebellar activity reflecting an acquired internal model of a new tool. Nature, 403(6766), 192-195.
Inoue, K., Kawashima, R., Satoh, K., Kinomura, S., Goto, R., Sugiura, M., et al. (1997). Activity in the parietal area during visuomotor learning with optical rotation. Neuroreport, 8(18), 3979-3983.

58
Inoue, K., Kawashima, R., Satoh, K., Kinomura, S., Sugiura, M., Goto, R., et al. (2000). A PET study of visuomotor learning under optical rotation. Neuroimage, 11(5 Pt 1), 505-516.
Jonides, J., Smith, E., Koeppe, R., Awh, E., Minoshima, S., & Mintun, M. (1993). Spatial working memory in humans as revealed by PET. Nature, 363(6430), 623-625.
Jueptner, M., Stephan, K., Frith, C., Brooks, D., Frackowiak, R., & Passingham, R. (1997). Anatomy of motor learning. I. Frontal cortex and attention to action. J Neurophysiol, 77(3), 1313-1324.
Just, A., and Carpenter, P. (1976). Eye fixations and cognitive processes. Cognitive Psychology, 8, 441-480.
Karni, A., Meyer, G., Rey-Hipolito, C., Jezzard, P., Adams, M., Turner, R., et al. (1998). The acquisition of skilled motor performance: fast and slow experience-driven changes in primary motor cortex. Proc Natl Acad Sci U S A, 95(3), 861-868.
Krakauer, J., Ghilardi, M., Mentis, M., Barnes, A., Veytsman, M., Eidelberg, D., et al. (2004). Differential cortical and subcortical activations in learning rotations and gains for reaching: a PET study. J Neurophysiol, 91(2), 924-933.
Krebs, H., Brashers-Krug, T., Rauch, S., Savage, C., Hogan, N., Rubin, R., et al. (1998). Robot-aided functional imaging: application to a motor learning study. Hum Brain Mapp, 6(1), 59-72.
Logie RH (1995). Visuospatial working memory. Hove, U.K.: Erlbaum. Mayka, M., Corcos, D., Leurgans, S., & Vaillancourt, D. (2006). Three-
dimensional locations and boundaries of motor and premotor cortices as defined by functional brain imaging: a meta-analysis. Neuroimage, 31(4), 1453-1474.
Mazzoni, P., & Krakauer, J. (2006). An implicit plan overrides an explicit strategy during visuomotor adaptation. Journal of Neuroscience, 26(14), 3642-3645.
McCarthy, G., Blamire, A., Puce, A., Nobre, A., Bloch, G., Hyder, F. (1994). Functional magnetic-resonance-imaging of human prefrontal cortex activation during a spatial working-memory task. Proceedings of the National Academy of Sciences of the United States of America, 91(18), 8690-8694.
McCarthy, G., Puce, A., Constable, R., Krystal, J., Gore, J., & Goldman-Rakic, P. (1996). Activation of human prefrontal cortex during spatial and nonspatial working memory tasks measured by functional MRI. Cereb Cortex, 6(4), 600-611.
Miall, R., Reckess, G., & Imamizu, H. (2001). The cerebellum coordinates eye and hand tracking movements. Nature Neuroscience, 4(6), 638-644.
Miyake, A., & Shah, P. (1999). (Eds.). Models of working memory: Mechanisms of active maintenance and executive control. New York: Cambridge University Press.
Nystrom, L., Braver, T., Sabb, F., Delgado, M., Noll, D., & Cohen, J. (2000). Working memory for letters, shapes, and locations: fMRI evidence against
59
stimulus-based regional organization in human prefrontal cortex. Neuroimage, 11(5 Pt 1), 424-446.
Oldfield, R. (1971). The assessment and analysis of handedness: the Edinburgh inventory. Neuropsychologia, 9(1), 97-113.
Picard, N., & Strick, P. (1996). Motor areas of the medial wall: a review of their location and functional activation. Cereb Cortex, 6(3), 342-353.
Puttemans, V., Wenderoth, N., & Swinnen, S. (2005). Changes in brain activation during the acquisition of a multifrequency bimanual coordination task: from the cognitive stage to advanced levels of automaticity. J Neurosci, 25(17), 4270-4278.
Reuter-Lorenz, P., Jonides, J., Smith, E., Hartley, A., Miller, A., Marshuetz, C., et al. (2000). Age differences in the frontal lateralization of verbal and spatial working memory revealed by PET. J Cogn Neurosci, 12(1), 174-187.
Sakai, K., Hikosaka, O., Miyauchi, S., Takino, R., Sasaki, Y., & Pütz, B. (1998). Transition of brain activation from frontal to parietal areas in visuomotor sequence learning. J Neurosci, 18(5), 1827-1840.
Schmahmann, J., Doyon, J., McDonald, D., Holmes, C., Lavoie, K., Hurwitz, A., et al. (1999). Three-dimensional MRI atlas of the human cerebellum in proportional stereotaxic space. Neuroimage, 10(3 Pt 1), 233-260.
Schmidt RA (1976). The schema as a solution to some persistent problems in motor-learning theory. In G. E. Stelmach (Ed.), Motor control: Issues and trends (pp. 41-65). New York: Academic Press.
Seidler, R., & Noll, D. (2008). Neuroanatomical correlates of motor acquisition and motor transfer. J Neurophysiol, 99(4), 1836-1845.
Seidler, R., Noll, D., & Chintalapati, P. (2006). Bilateral basal ganglia activation associated with sensorimotor adaptation. Experimental Brain Research, 175(3), 544-555.
Shadmehr, R., & Mussa-Ivaldi, F. (1994). Adaptive representation of dynamics during learning of a motor task. J Neurosci, 14(5 Pt 2), 3208-3224.
Smith, M., Ghazizadeh, A., & Shadmehr, R. (2006). Interacting adaptive processes with different timescales underlie short-term motor learning. PLoS Biol, 4(6), e179.
Taylor, J., & Thoroughman, K. (2007). Divided attention impairs human motor adaptation but not feedback control. J Neurophysiol, 98(1), 317-326.
Taylor, J., & Thoroughman, K. (2008). Motor adaptation scaled by the difficulty of a secondary cognitive task. PLoS ONE 3: e2485.
Teasdale, N., Bard, C., Fleury, M., Young, D., & Proteau, L. (1993). Determining movement onsets from temporal series. J Mot Behav, 25(2), 97-106.
Toni, I., Krams, M., Turner, R., & Passingham, R. (1998). The time course of changes during motor sequence learning: a whole-brain fMRI study. Neuroimage, 8(1), 50-61.
Tzourio-Mazoyer, N., Landeau, B., Papathanassiou, D., Crivello, F., Etard, O., Delcroix, N., et al. (2002). Automated anatomical labeling of activations in SPM using a macroscopic anatomical parcellation of the MNI MRI single-subject brain. Neuroimage, 15(1), 273-289.
Walter, H., Bretschneider, V., Grön, G., Zurowski, B., Wunderlich, A., Tomczak,
60
R., et al. (2003). Evidence for quantitative domain dominance for verbal and spatial working memory in frontal and parietal cortex. Cortex, 39(4-5), 897-911.
Wechsler, D. (1997). Wechsler Adult Intelligence Scale (3rd ed.). San Antonio, TX: Psychological Corporation. Willingham, D. (1998). A neuropsychological theory of motor skill learning.
Psychol Rev, 105(3), 558-584. Wilson, B. A., Alderman, N., Burgess, P. W., Emslie, H. E., & Evans, J. J. (1996). Behavioural Assessment of the Dysexecutive Syndrome. Bury St. Edmunds, UK: Thames Valley Test Company. Winter DA (1990) Biomechanics and motor control of human movement. 2nd edn. Wiley, New York Wolpert, D., & Ghahramani, Z. (2000). Computational principles of movement neuroscience. Nat Neurosci, 3 Suppl, 1212-1217. Wolpert, D., & Miall, R. (1996). Forward Models for Physiological Motor Control. Neural Netw, 9(8), 1265-1279. Woods, R., Grafton, S., Holmes, C., Cherry, S., & Mazziotta, J. (1998). Automated image registration: I. General methods and intrasubject, intramodality validation. J Comput Assist Tomogr, 22(1), 139-152.
61
CHAPTER III
Contributions of Spatia l Working Memory to Vi suomotor Adaptation in Older Adults
Abstract
It is well documented that motor learning abilities decline with normative
aging. Given that motor learning has a cognitive component, these deficits may
be due to declines in cognitive capabilities like spatial working memory (SWM).
The purpose of this study was to investigate whether age-related declines in
SWM partially explain age-related deficits in visuomotor adaptation. The
visuomotor adaptation task required participants to adapt manual aiming
movements to a 30º rotation of the visual feedback display. Young adults had a
steeper learning curve for the visuomotor adaptation task than older adults, and
were also more accurate on a SWM task. Young and older adults showed very
similar brain activation for the SWM task, including the engagement of the right
dorsolateral prefrontal cortex (DLPFC). Using their SWM activation as a mask,
older adults did not show neural activation overlap at the early (or late)
adaptation period (unlike young adults). Accordingly, older adults’ rate of early
adaptation did not correlate with SWM performance, while young adults’ did.
However, a partial correlation controlling for age revealed that the rate of early
adaptation was associated with activation at the right DLFPC. Young adults
62
showed equivalent activation at this region to high performing older adults (HIGH
OAs), and greater activation here versus the low performing older adults (LOW
OAs). These findings suggest that the effective engagement of SWM processes
helps to explain these adaptation differences between young adults and older
adults.
63
Introduction
Older adults exhibit numerous motor performance deficits including
increased movement slowing and variability (Contreras-Vidal et al., 1998; Cooke
et al., 1989; Seidler-Dobrin and Stelmach, 1998; Seidler et al., 2002a; Welford,
1984), as well as a reduced rate of acquiring new motor skills in comparison to
young adults (Brown, 1996; Raz et al., 2000; Rodrigue et al., 2005; Seidler,
2006; alternatively, see Durkin et al., 1995). One specific type of motor learning
that has been used extensively to examine how humans represent and interact
with their environment is visuomotor adaptation. Visuomotor adaptation involves
the modification of a well-learned sensorimotor transformation and tests one’s
ability to adapt to environmental changes. Studies investigating the effects of
age on visuomotor adaptation have had mixed results: some groups have
reported age-related impairments (Bock et al., 2005; Fernandez-Ruiz et al. 2000;
McNay and Willingham 1998; Seidler et al, 2006; Teulings et al. 2002) while
others have not (Canavan et al. 1990; Roller et al. 2002). The cause of these
deficits is unclear as age-related declines in motor (Booth et al., 1994; Galea,
1996; Galganski et al., 1993), sensory (Baltes & Lindenberger, 1997; Demer,
1994; Lindenberger & Baltes, 1994), or cognitive function (Park et al., 2002)
could explain these differences.
The examination of neural structures associated with sensorimotor
adaptation is another avenue for exploring these age-related differences. For
example, a comparison of brain regions that young and older adults engage for
visuomotor adaptation may shed light on the underlying mechanisms of age-
64
related declines. It has been suggested that the cerebellum contributes to
visuomotor adaptation for eye-hand coordination (Miall et al., 2001) and internal
model formation (Imamizu et al., 2000, 2003; Seidler and Noll, 2008). Cerebellar
volumetric age-related declines have been shown to be correlated with reduced
motor skill performance (Raz et al., 2000). Similarly, individuals with lesions of
the posterior parietal cortex also show visuomotor adaptation deficits (Pisella et
al., 2000, 2004), suggesting that age-related declines in this structure may also
contribute to adaptation impairments for older adults. Furthermore, the prefrontal
cortex undergoes the highest degree of age-related atrophy (Raz et al., 1997;
Tisserand et al., 2004). Given that young adults engage the right prefrontal
cortex during visuomotor adaptation (Anguera Chapter 2; Seidler et al., 2006), it
may be that age-related structural and functional changes here also contribute to
impairments in visuomotor adaptation.
The right prefrontal cortex has been shown to contribute not only to the
early stages of skill acquisition (see Anguera Chapter 2; Hikosaka et al., 1999;
Seidler et al., 2006; Toni et al., 1998), but also to spatial working memory (SWM)
processes (Courtney et al., 1998; Jonides et al., 1993; McCarthy et al., 1994;
McCarthy et al., 1996; Reuter-Lorenz et al., 2000). SWM has been shown to
decline with age (Jenkins et al., 2000; Myerson et al., 1999; Park et al. 2002), as
reflected through a negative relationship between age and general spatial ability
(Kirasic, 2000), including tasks involving mental rotation (Dobson et al. 1995;
Hertzog and Rypma 1991; Salthouse et al., 1989; Salthouse 1994). My recent
work has shown that in young adults, the early stage of adaptation is associated
65
with SMW (see Anguera Chapter 2). Given the relationship between SWM and
age, along with the findings from Chapter 2, I chose to evaluate whether declines
in SWM contribute to age-related deficits in visuomotor adaptation.
There is some evidence in the literature to suggest that cognitive declines
may contribute to visuomotor adaptation deficits. For example, Raz et al. (2000)
found that both prefrontal volume and a composite score of nonverbal working
memory measures2 were significant predictors of performance on a pursuit rotor
task. McNay and Willingham (1998) reported age-related visuomotor adaptation
deficits, but none when visual feedback was removed. As older adults’
adaptation was impaired only when cognitive strategies could be used, these
authors suggested that age-related adaptation declines could be due to reduced
working memory resources. These studies, as well as the young adult findings
from Chapter 2, suggest that declines in SWM processes may provide at least a
partial explanation for age-related differences in visuomotor adaptation.
In the present study, older adults performed both a SWM task and a
joystick-controlled visuomotor adaptation task while lying prone in an MRI
scanner. The visuomotor adaptation task involved making manual aiming
movements to targets under veridical and rotated visual feedback. Participants
also performed a battery of neuropsychological and health assessments. I
hypothesized that age-related declines in SWM would underlie deficits in
visuomotor adaptation for older adults, especially at the early stages of
2 Raz et al. (2000) measured spatial abilities in young and older adults using two tasks: a size judgment span task and a spatial relations test. The size judgment task involved repeating the final 4 objects from an expanding list in order of size from smallest to largest. The spatial relations test required participants to choose the correct combination of components to assemble a given shape. Performance on each task was transformed in order to make a composite score of “nonverbal working memory.”
66
adaptation. Support for this hypothesis would be reflected as a lack of
correlation and lack of neural overlap between the SWM and visuomotor
adaptation tasks. I previously demonstrated that young adults show a correlation
and neural overlap for these tasks (see Anguera Chapter 2). In order to better
characterize correlates of successful aging, I subdivided the older adults into high
and low performing subgroups based upon each individual’s rate of early
adaptation, then tested for differences between these two groups and versus
young adults.
Methods Participants
Eighteen older (71.4 ± 4.2 yrs; 9 males) and young participants (these
participants and their data have previously been reported in Chapter 2) were
recruited from the community and were paid for their participation. Each
participant signed an IRB-approved informed consent document and filled out a
health history questionnaire (see Appendix D) prior to their participation. All
participants were right-handed as assessed using the 20-item version of the
Edinburgh Inventory (Oldfield, 1971; Older adult mean handedness score = 93
±.05).
Experimental setup and procedure
There were two separate days of testing for this experiment. On day one
participants performed a series of questionnaires providing an assessment of
67
their cognitive status. Older adults were administered the Mini-Mental State
Exam (MMSE; Folstein et al., 1975) and the Mattis dementia rating scale (Mattis,
1988) in order to potentially exclude participants exhibiting signs of dementia and
confirm that participants were representative of their respective age group. A
minimum MMSE score of 27 and a Mattis score of 123 were required for
participation. Older adults were also given a health history questionnaire as well
as the CHAMPS physical activity questionnaire (Stewart et al., 2001) in order to
better quantify each participants’ daily activities and general health status. These
participants were given the same battery of neuropsychological tests that were
given to the young adults (see Anguera Chapter 2), and were tested on the
visuomotor adaptation task, SWM control task (SWMc), and SWM task in the
same manner as outlined in Anguera Chapter 2.
fMRI acquisition parameters
The functional images were acquired using the same parameters as for
the young adults (see Anguera Chapter 2).
Behavioral data processing
The behavioral data were processed in the same manner as for the young
adults (see Anguera Chapter 2). I made the assumption based on previous
literature that the learning process consisted of two phases (“early” and “late”; cf.
Krebs et al., 1998). The early phase would be reflected by a period of rapid
improvement, while the late phase would be characterized by slower incremental
68
performance gains. To identify which adaptation blocks comprised the early
learning period for the group, I searched for the optimal number of consecutive
adaptation blocks which resulted in the steepest rate of learning (i.e. the slope
across the 1st two adaptation blocks, the slope across the 1st three adaptation
blocks, etc.) for the direction error (DE) measure for each subject (see Anguera
Chapter 2 for description of this measure). But unlike the young adults (see table
2.2), older adult’s adaptation slope analysis failed to reveal a breakpoint for the
early learning period.
Thus, I designated the 1st 3 and final 3 adaptation blocks as the early and
late learning periods, respectively, in order to match the young adults
parameters. I divided the older adults into separate high and low performing
groups (HIGH OA and LOW OA) based on a median split of their rate of early
adaptation. This was done to examine adaptation differences between each
group, then use the other measures to potentially explain these differences.
While this group division creates a limitation of power, it is not uncommon to
observe this procedure in the cognitive aging literature. Furthermore, all
performance effects within the older adult group were already taken into account
by testing across this group. As with the young adults, I computed Pearson
correlations between the rate of learning for each adaptation period with
performance on the SWM task, measures of health, and performance on each of
the neuropsychological tests.
fMRI data processing
69
The fMRI data processing steps were the same as with the young adults
(see Anguera Chapter 2).
fMRI contrasts and regions of interest analyses
The same fMRI contrasts and whole brain activation correlations
performed with the young adults were also administered for the older adult group
(see Anguera Chapter 2). In addition to the within-group analyses, I also
examined activation differences between each population using a second-level
random-effects analysis: young versus older adults, HIGH versus LOW older
adults, and differences between a randomly selected subgroup of 9 young adults
(from Anguera Chapter 2) and the HIGH and LOW OAs. Each of these between
group analyses used an uncorrected p-value of .001 as a threshold for
significance, and cluster size ≥ 10 voxels.
To better characterize age-related differences in brain activation, I created
regions of interest (ROIs) using the MARSBAR toolbox (Brett et al., 2002) for
areas that both groups had in common for the SWM > SMWc contrast. These
ROIs were based on each group’s separate activation sites to allow for slight
differences in localization with age. Following ROI creation, I used the same
software and parameters for calculating signal change as with the young adults
(see Anguera Chapter 2). For each ROI, I also examined activation differences
between the HIGH and LOW OAs, as well as these groups versus the young
adult subgroup. I also computed Pearson correlations for young and older adults
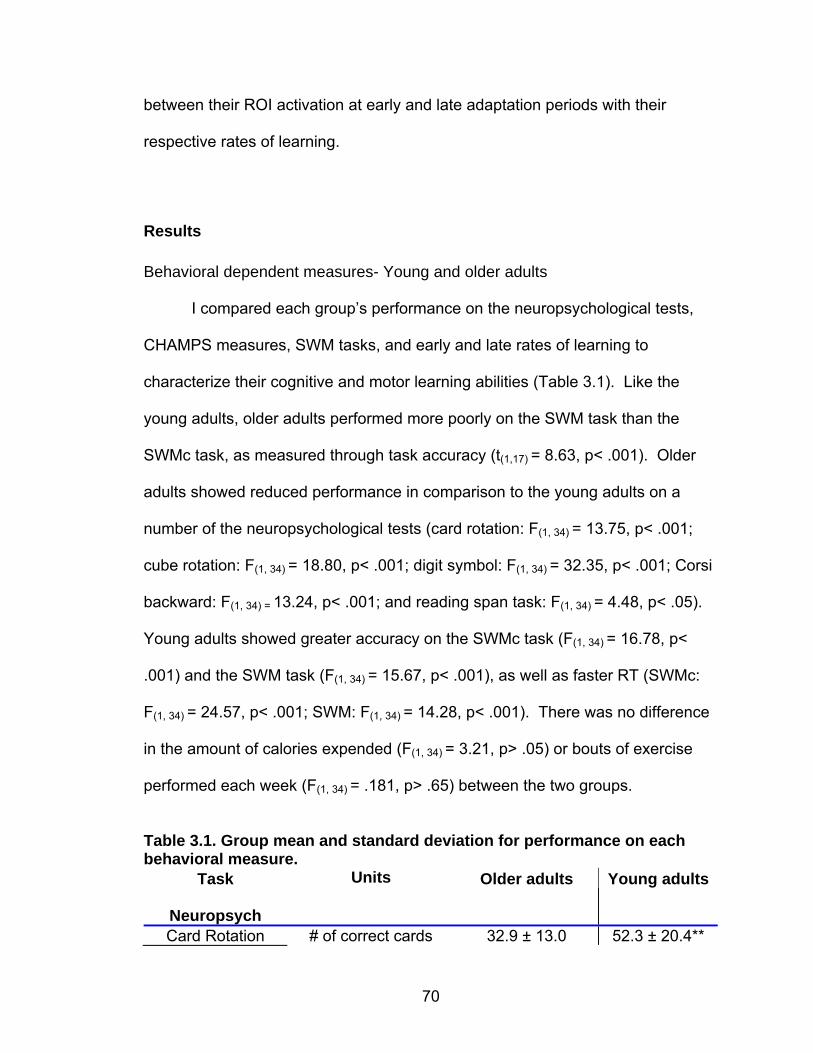
70
between their ROI activation at early and late adaptation periods with their
respective rates of learning.
Results
Behavioral dependent measures- Young and older adults
I compared each group’s performance on the neuropsychological tests,
CHAMPS measures, SWM tasks, and early and late rates of learning to
characterize their cognitive and motor learning abilities (Table 3.1). Like the
young adults, older adults performed more poorly on the SWM task than the
SWMc task, as measured through task accuracy (t(1,17) = 8.63, p< .001). Older
adults showed reduced performance in comparison to the young adults on a
number of the neuropsychological tests (card rotation: F(1, 34) = 13.75, p< .001;
cube rotation: F(1, 34) = 18.80, p< .001; digit symbol: F(1, 34) = 32.35, p< .001; Corsi
backward: F(1, 34) = 13.24, p< .001; and reading span task: F(1, 34) = 4.48, p< .05).
Young adults showed greater accuracy on the SWMc task (F(1, 34) = 16.78, p<
.001) and the SWM task (F(1, 34) = 15.67, p< .001), as well as faster RT (SWMc:
F(1, 34) = 24.57, p< .001; SWM: F(1, 34) = 14.28, p< .001). There was no difference
in the amount of calories expended (F(1, 34) = 3.21, p> .05) or bouts of exercise
performed each week (F(1, 34) = .181, p> .65) between the two groups.
Table 3.1. Group mean and standard deviation for performance on each behavioral measure.
Task Units Older adults Young adults
Neuropsych
Card Rotation # of correct cards 32.9 ± 13.0 52.3 ± 20.4**
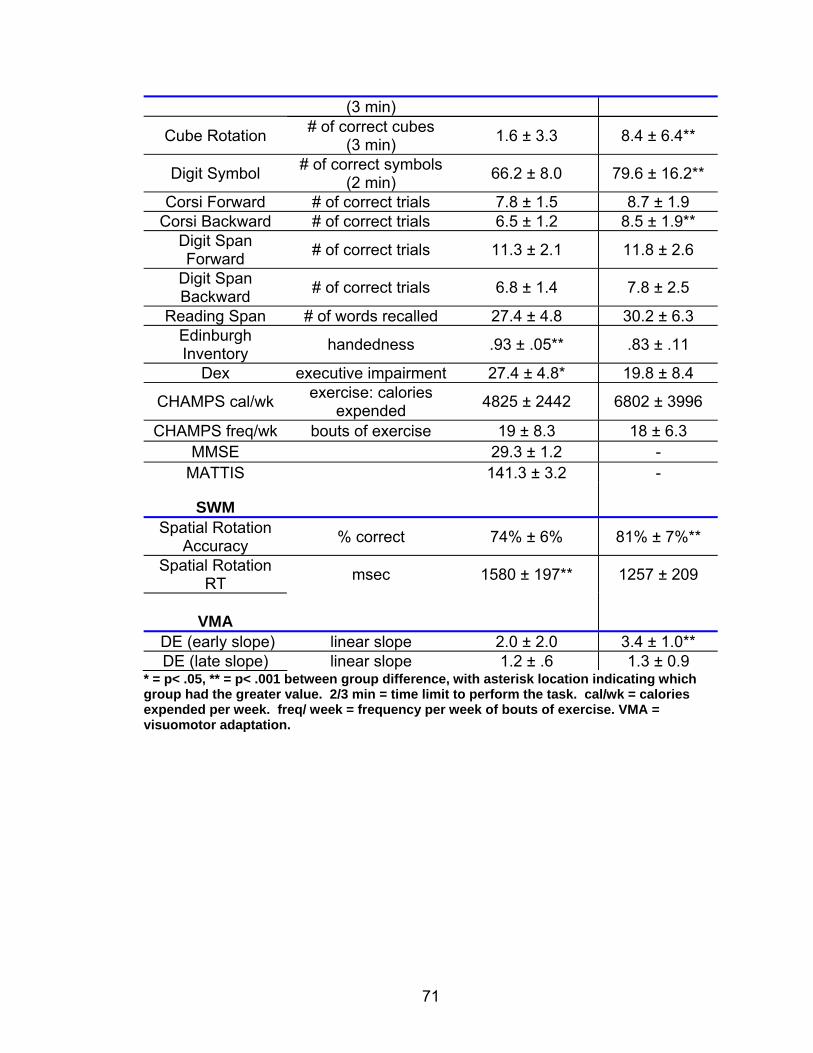
71
(3 min)
Cube Rotation # of correct cubes
(3 min) 1.6 ± 3.3 8.4 ± 6.4**
Digit Symbol # of correct symbols
(2 min) 66.2 ± 8.0 79.6 ± 16.2**
Corsi Forward # of correct trials 7.8 ± 1.5 8.7 ± 1.9
Corsi Backward # of correct trials 6.5 ± 1.2 8.5 ± 1.9**
Digit Span Forward
# of correct trials 11.3 ± 2.1 11.8 ± 2.6
Digit Span Backward
# of correct trials 6.8 ± 1.4 7.8 ± 2.5
Reading Span # of words recalled 27.4 ± 4.8 30.2 ± 6.3
Edinburgh Inventory
handedness .93 ± .05** .83 ± .11
Dex executive impairment 27.4 ± 4.8* 19.8 ± 8.4
CHAMPS cal/wk exercise: calories
expended 4825 ± 2442 6802 ± 3996
CHAMPS freq/wk bouts of exercise 19 ± 8.3 18 ± 6.3
MMSE 29.3 ± 1.2 -
MATTIS 141.3 ± 3.2 -
SWM
Spatial Rotation Accuracy
% correct 74% ± 6% 81% ± 7%**
Spatial Rotation RT
msec 1580 ± 197** 1257 ± 209
VMA
DE (early slope) linear slope 2.0 ± 2.0 3.4 ± 1.0**
DE (late slope) linear slope 1.2 ± .6 1.3 ± 0.9 * = p< .05, ** = p< .001 between group diffe rence, with asterisk location indicating which group had the greater value. 2/3 min = time limit to perform the task. cal/wk = calories expended per week. freq/ week = frequency per week of bouts of exercise. VMA = visuomotor adaptation.
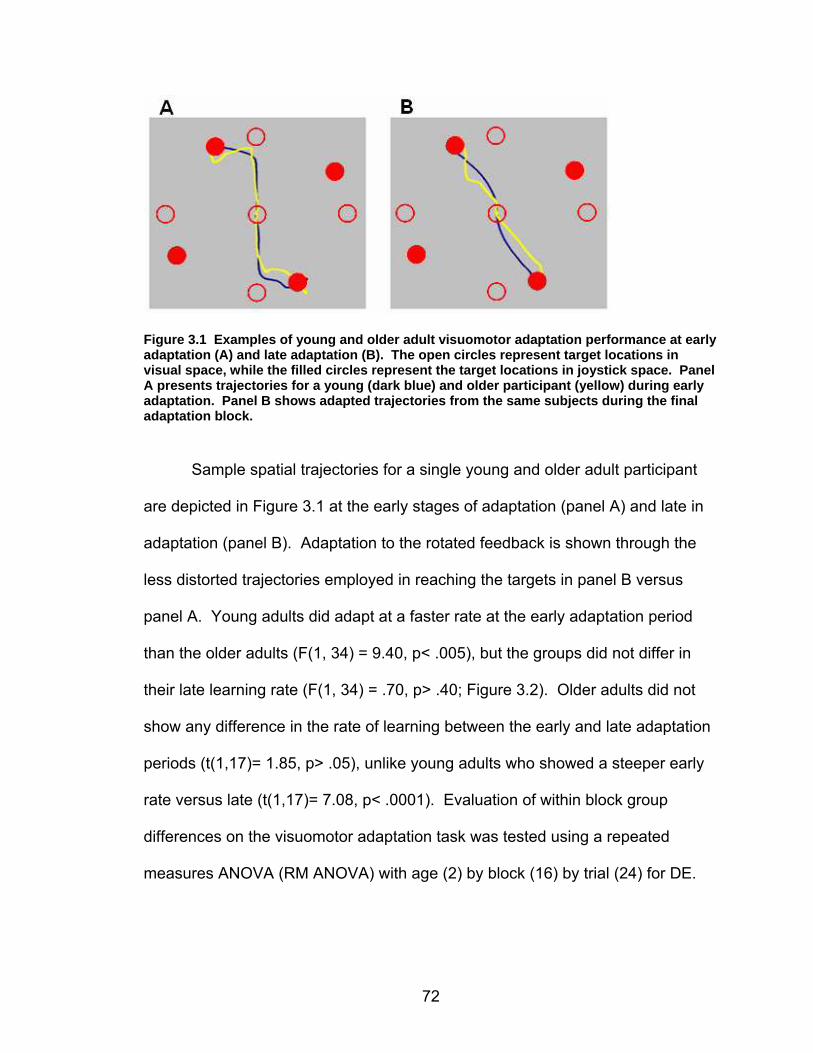
72
Figure 3.1 Examples of young and older adult visuomotor adaptation performance at early adaptation (A) and late adaptation (B). The open circles represent target locations in visual space, while the filled circles represent th e target locations in joystick space. Panel A presents trajectories for a young (dark blue) and older participant (yellow) during early adaptation. Panel B shows adapted trajector ies from the same subjects during the final adaptation block.
Sample spatial trajectories for a single young and older adult participant are depicted in Figure 3.1 at the early stages of adaptation (panel A) and late in adaptation (panel B). Adaptation to the rotated feedback is shown through the less distorted trajectories employed in reaching the targets in panel B versus panel A. Young adults did adapt at a faster rate at the early adaptation period than the older adults (F(1, 34) = 9.40, p< .005), but the groups did not differ in their late learning rate (F(1, 34) = .70, p> .40; Figure 3.2). Older adults did not show any difference in the rate of learning between the early and late adaptation periods (t(1,17)= 1.85, p> .05), unlike young adults who showed a steeper early rate versus late (t(1,17)= 7.08, p< .0001). Evaluation of within block group differences on the visuomotor adaptation task was tested using a repeated measures ANOVA (RM ANOVA) with age (2) by block (16) by trial (24) for DE.
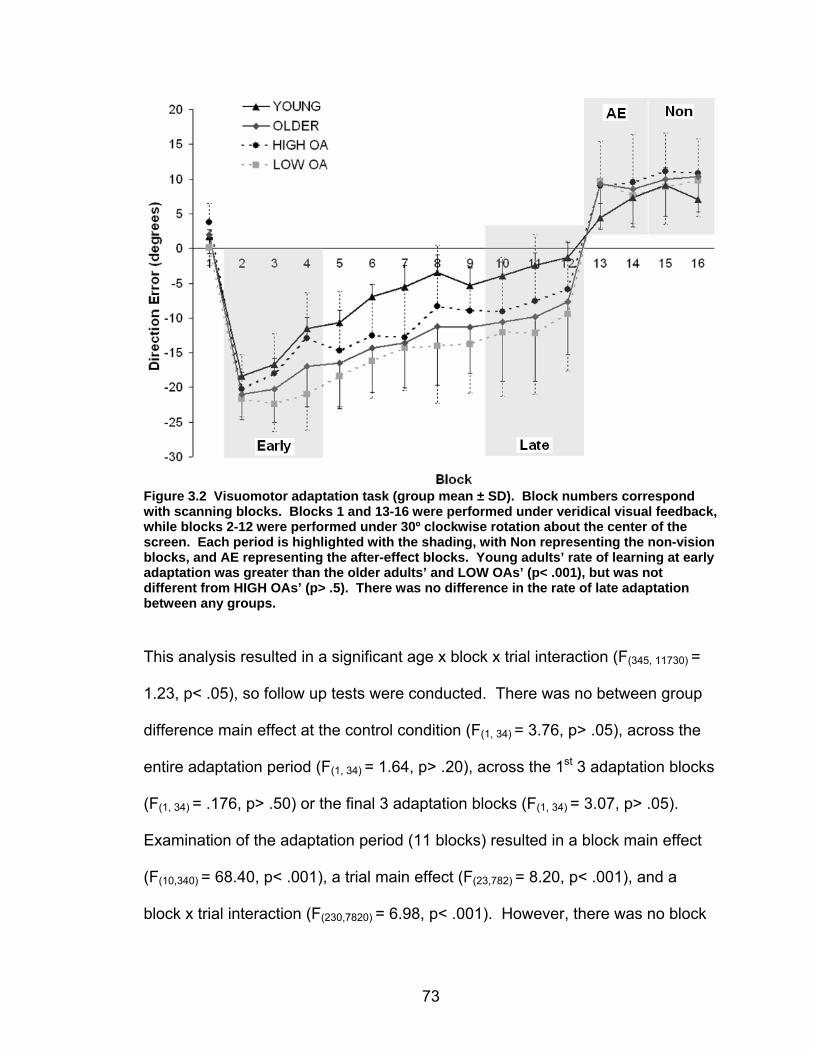
73
Figure 3.2 Visuomotor adaptation task (group mean ± SD). Block numbers correspond with scanning blocks. Blocks 1 and 13-16 were performed under veridical visual feedback, while blocks 2-12 were performed under 30º clockwise rotation about the center of the screen. Each period is highlighted with the shading, with Non representing the non-vision blocks, and AE representing the after-effect bl ocks. Young adults’ rate of learning at early adaptation was greater than the older adults’ and LOW OAs’ (p< .001), but was not different from HIGH OAs’ (p> .5). There was no difference in the rate of late adaptation between any groups.
This analysis resulted in a significant age x block x trial interaction (F(345, 11730) =
1.23, p< .05), so follow up tests were conducted. There was no between group
difference main effect at the control condition (F(1, 34) = 3.76, p> .05), across the
entire adaptation period (F(1, 34) = 1.64, p> .20), across the 1st 3 adaptation blocks
(F(1, 34) = .176, p> .50) or the final 3 adaptation blocks (F(1, 34) = 3.07, p> .05).
Examination of the adaptation period (11 blocks) resulted in a block main effect
(F(10,340) = 68.40, p< .001), a trial main effect (F(23,782) = 8.20, p< .001), and a
block x trial interaction (F(230,7820) = 6.98, p< .001). However, there was no block
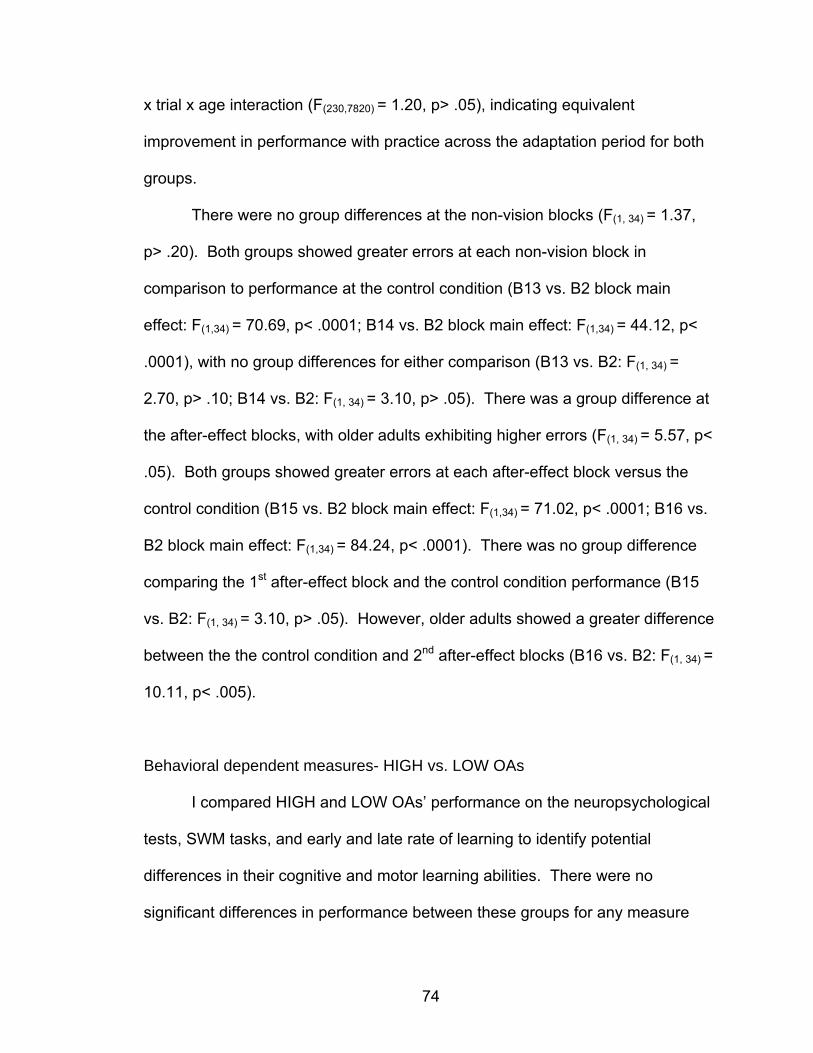
74
x trial x age interaction (F(230,7820) = 1.20, p> .05), indicating equivalent
improvement in performance with practice across the adaptation period for both
groups.
There were no group differences at the non-vision blocks (F(1, 34) = 1.37,
p> .20). Both groups showed greater errors at each non-vision block in
comparison to performance at the control condition (B13 vs. B2 block main
effect: F(1,34) = 70.69, p< .0001; B14 vs. B2 block main effect: F(1,34) = 44.12, p<
.0001), with no group differences for either comparison (B13 vs. B2: F(1, 34) =
2.70, p> .10; B14 vs. B2: F(1, 34) = 3.10, p> .05). There was a group difference at
the after-effect blocks, with older adults exhibiting higher errors (F(1, 34) = 5.57, p<
.05). Both groups showed greater errors at each after-effect block versus the
control condition (B15 vs. B2 block main effect: F(1,34) = 71.02, p< .0001; B16 vs.
B2 block main effect: F(1,34) = 84.24, p< .0001). There was no group difference
comparing the 1st after-effect block and the control condition performance (B15
vs. B2: F(1, 34) = 3.10, p> .05). However, older adults showed a greater difference
between the the control condition and 2nd after-effect blocks (B16 vs. B2: F(1, 34) =
10.11, p< .005).
Behavioral dependent measures- HIGH vs. LOW OAs
I compared HIGH and LOW OAs’ performance on the neuropsychological
tests, SWM tasks, and early and late rate of learning to identify potential
differences in their cognitive and motor learning abilities. There were no
significant differences in performance between these groups for any measure
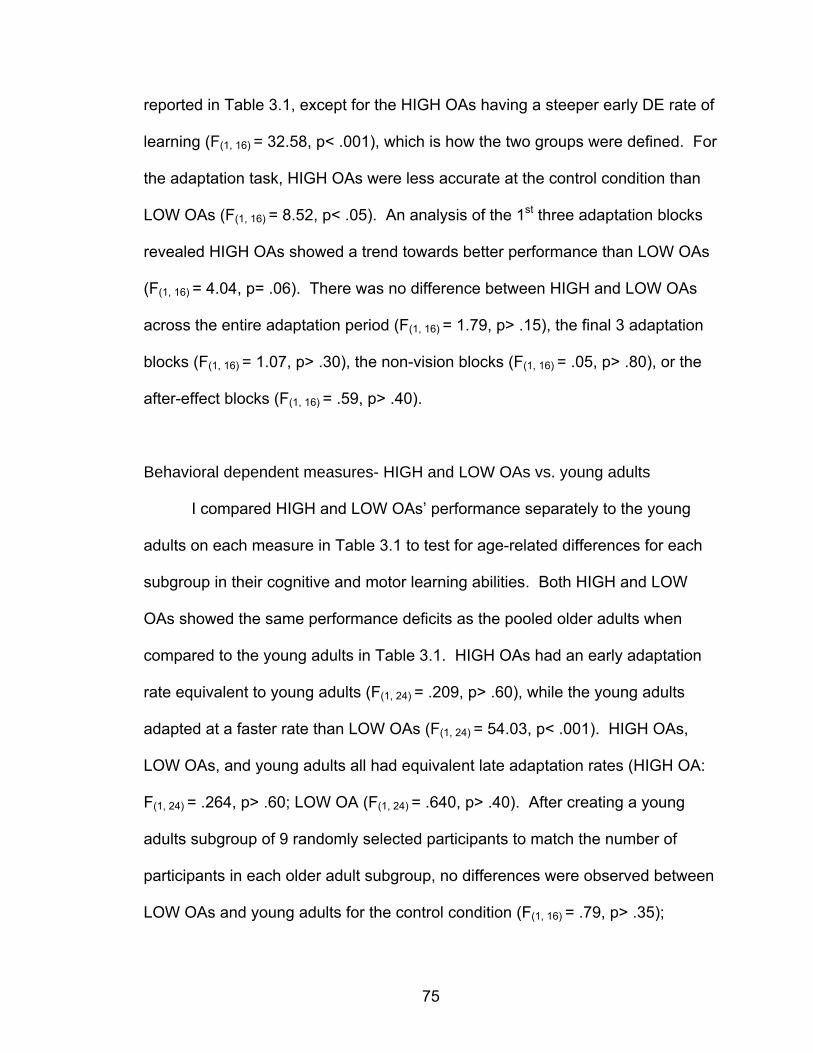
75
reported in Table 3.1, except for the HIGH OAs having a steeper early DE rate of
learning (F(1, 16) = 32.58, p< .001), which is how the two groups were defined. For
the adaptation task, HIGH OAs were less accurate at the control condition than
LOW OAs (F(1, 16) = 8.52, p< .05). An analysis of the 1st three adaptation blocks
revealed HIGH OAs showed a trend towards better performance than LOW OAs
(F(1, 16) = 4.04, p= .06). There was no difference between HIGH and LOW OAs
across the entire adaptation period (F(1, 16) = 1.79, p> .15), the final 3 adaptation
blocks (F(1, 16) = 1.07, p> .30), the non-vision blocks (F(1, 16) = .05, p> .80), or the
after-effect blocks (F(1, 16) = .59, p> .40).
Behavioral dependent measures- HIGH and LOW OAs vs. young adults
I compared HIGH and LOW OAs’ performance separately to the young
adults on each measure in Table 3.1 to test for age-related differences for each
subgroup in their cognitive and motor learning abilities. Both HIGH and LOW
OAs showed the same performance deficits as the pooled older adults when
compared to the young adults in Table 3.1. HIGH OAs had an early adaptation
rate equivalent to young adults (F(1, 24) = .209, p> .60), while the young adults
adapted at a faster rate than LOW OAs (F(1, 24) = 54.03, p< .001). HIGH OAs,
LOW OAs, and young adults all had equivalent late adaptation rates (HIGH OA:
F(1, 24) = .264, p> .60; LOW OA (F(1, 24) = .640, p> .40). After creating a young
adults subgroup of 9 randomly selected participants to match the number of
participants in each older adult subgroup, no differences were observed between
LOW OAs and young adults for the control condition (F(1, 16) = .79, p> .35);
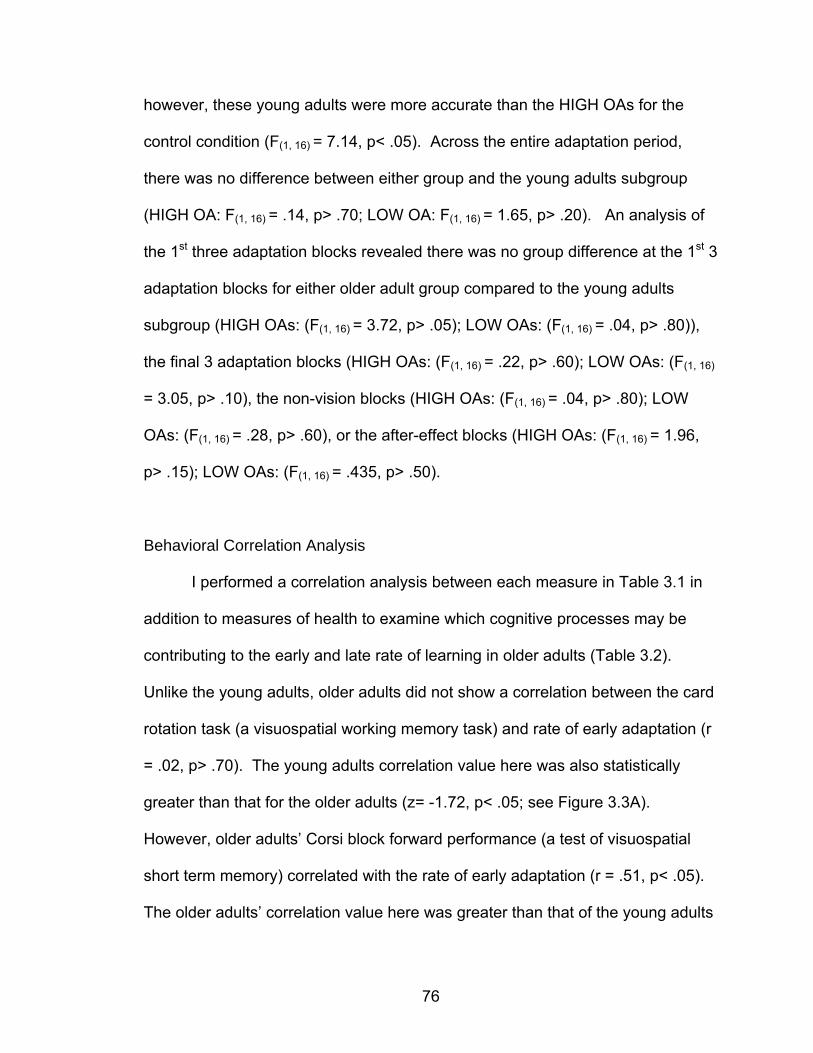
76
however, these young adults were more accurate than the HIGH OAs for the
control condition (F(1, 16) = 7.14, p< .05). Across the entire adaptation period,
there was no difference between either group and the young adults subgroup
(HIGH OA: F(1, 16) = .14, p> .70; LOW OA: F(1, 16) = 1.65, p> .20). An analysis of
the 1st three adaptation blocks revealed there was no group difference at the 1st 3
adaptation blocks for either older adult group compared to the young adults
subgroup (HIGH OAs: (F(1, 16) = 3.72, p> .05); LOW OAs: (F(1, 16) = .04, p> .80)),
the final 3 adaptation blocks (HIGH OAs: (F(1, 16) = .22, p> .60); LOW OAs: (F(1, 16)
= 3.05, p> .10), the non-vision blocks (HIGH OAs: (F(1, 16) = .04, p> .80); LOW
OAs: (F(1, 16) = .28, p> .60), or the after-effect blocks (HIGH OAs: (F(1, 16) = 1.96,
p> .15); LOW OAs: (F(1, 16) = .435, p> .50).
Behavioral Correlation Analysis
I performed a correlation analysis between each measure in Table 3.1 in
addition to measures of health to examine which cognitive processes may be
contributing to the early and late rate of learning in older adults (Table 3.2).
Unlike the young adults, older adults did not show a correlation between the card
rotation task (a visuospatial working memory task) and rate of early adaptation (r
= .02, p> .70). The young adults correlation value here was also statistically
greater than that for the older adults (z= -1.72, p< .05; see Figure 3.3A).
However, older adults’ Corsi block forward performance (a test of visuospatial
short term memory) correlated with the rate of early adaptation (r = .51, p< .05).
The older adults’ correlation value here was greater than that of the young adults
77
(z= 1.82, p< .05). Further examination of this correlation revealed its significance
depended upon the HIGH OAs, who had a greater correlation value than the
LOW OAs (z= 1.64, p< .05; see Figure 3.3B). However, these significant
correlations were driven by one HIGH OA. Although this individual was not a
statistical outlier, removal of their data point abolished the significant correlations
(Older adults: p = .12, HIGH OAs: p = .09). Similarly, the removal of the lowest
LOW OA, although not a statistical outlier again, led to a significant Corsi block
forward correlation for this group (p< .05). Tests of short term verbal memory
(i.e. digit span, reading span) also did not correlate with the rate of early or late
adaptation, suggesting that older adults did not utilize these non-spatial cognitive
resources to reach similar levels of performance as the young adults. Similarly,
no measure of health or mental status correlated with the rate of early or late
adaptation for the older adults.
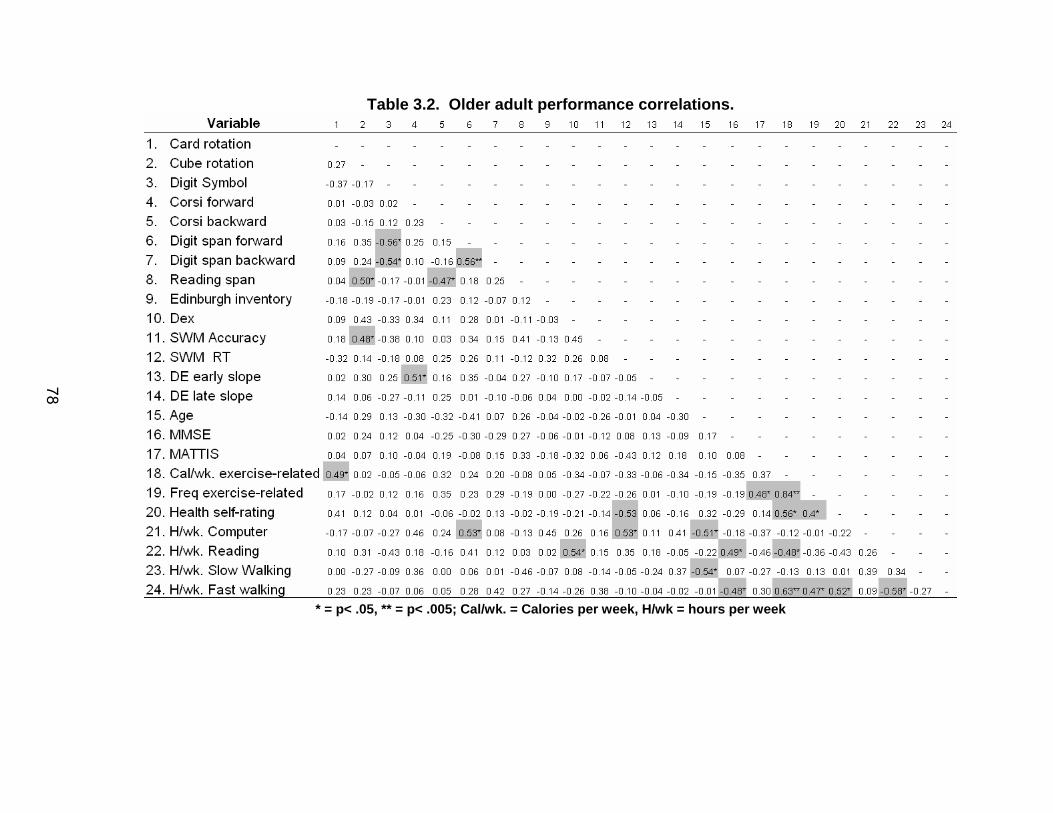
78
Table 3.2. Older adult performance correlations.
* = p< .05, ** = p< .005; Cal/wk. = Calories per week, H/wk = hours per week
78
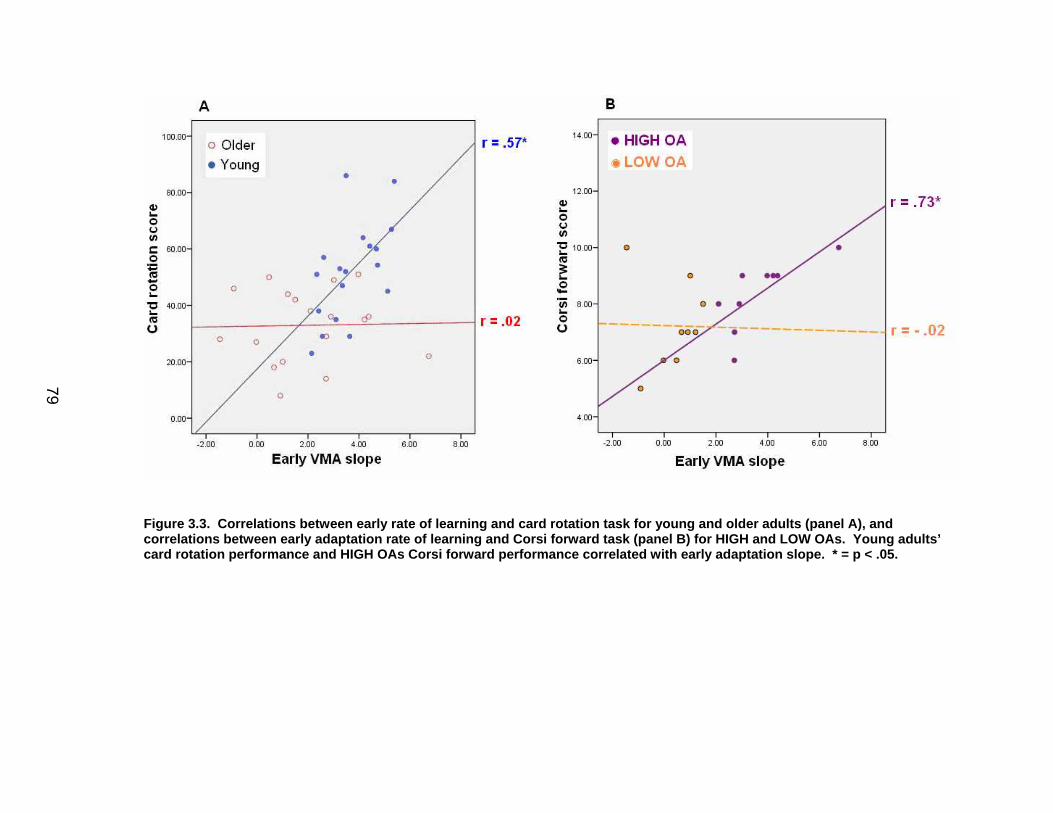
79
Figure 3.3. Correlations between early rate of learning and card rotation task for young and older adults (panel A), and correlations between early adaptation rate of learning and Corsi forward task (panel B) for HIGH and LOW OAs. Young adults’ card rotation performance and HIGH OAs Corsi forward performance correlated with early adaptation slope. * = p < .05.
79
80
fMRI- Older adult within group SWM and visuomotor adaptation activation
The behavioral correlation analysis suggested that older adults were not
using SWM resources during the early adaptation period. This was further tested
by creating a limiting mask from the older adult SWM > SWMc contrast activation
(as in Anguera Chapter 2) and applying it to the early and late adaptation
periods. This analysis confirmed that there were no brain regions that
overlapped with either early or late visuomotor adaptation. All within older adult
group results regarding the SWM and adaptation task are described briefly here,
with tables for each contrast presented as supplementary material in the
appendix (see Appendix Tables C.1-C.5). Older adult early adaptation activation,
with respect to the non-rotated control blocks, was observed in the right medial
frontal/cingulate gyrus and middle temporal gyrus (see Appendix Table C.1).
Late adaptation activation was in turn observed in the right inferior parietal lobule
(IPL; see Appendix Table C.2). Older adult SWM > SWMc activation was
associated with bilateral DLPFC and IPL activation, consistent with a previous
investigation using a similar task (Reuter-Lorenz et al., 2000; see Appendix Table
C.3) and comparable to what I previously found with the young adults (see Figure
3.4). Activation at the non-vision and after-effect blocks compared to the control
condition both showed activation again in the right IPL (see Appendix Table C.4-
C.5).
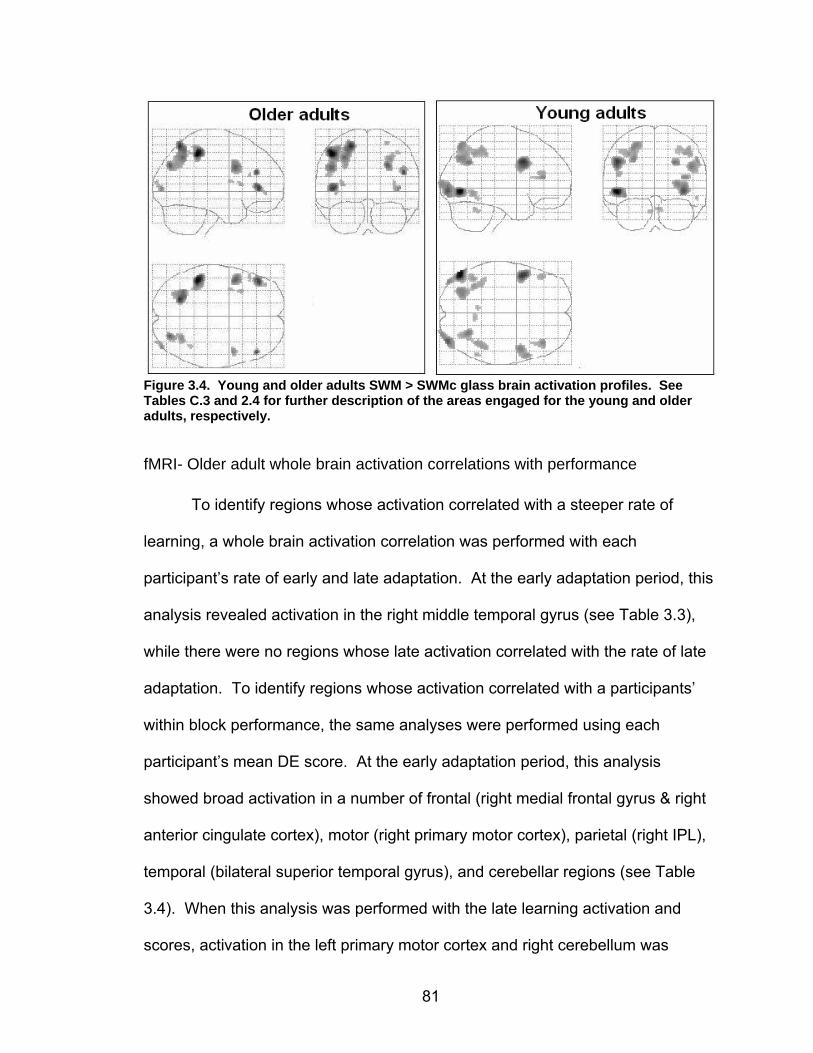
81
Figure 3.4. Young and older adults SWM > SWMc glass brain activation profiles. See Tables C.3 and 2.4 for further description of the areas engaged for the young and older adults, respectively.
fMRI- Older adult whole brain activation correlations with performance
To identify regions whose activation correlated with a steeper rate of
learning, a whole brain activation correlation was performed with each
participant’s rate of early and late adaptation. At the early adaptation period, this
analysis revealed activation in the right middle temporal gyrus (see Table 3.3),
while there were no regions whose late activation correlated with the rate of late
adaptation. To identify regions whose activation correlated with a participants’
within block performance, the same analyses were performed using each
participant’s mean DE score. At the early adaptation period, this analysis
showed broad activation in a number of frontal (right medial frontal gyrus & right
anterior cingulate cortex), motor (right primary motor cortex), parietal (right IPL),
temporal (bilateral superior temporal gyrus), and cerebellar regions (see Table
3.4). When this analysis was performed with the late learning activation and
scores, activation in the left primary motor cortex and right cerebellum was
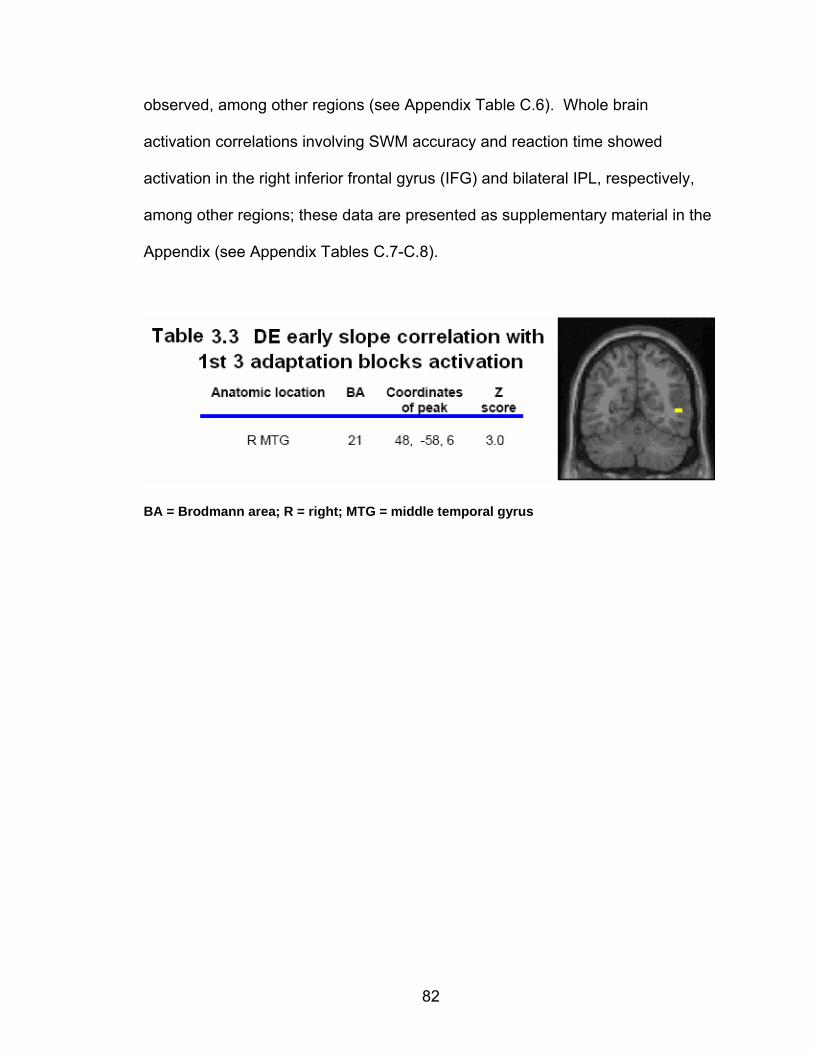
82
observed, among other regions (see Appendix Table C.6). Whole brain
activation correlations involving SWM accuracy and reaction time showed
activation in the right inferior frontal gyrus (IFG) and bilateral IPL, respectively,
among other regions; these data are presented as supplementary material in the
Appendix (see Appendix Tables C.7-C.8).
BA = Brodmann area; R = right; MTG = middle temporal gyrus
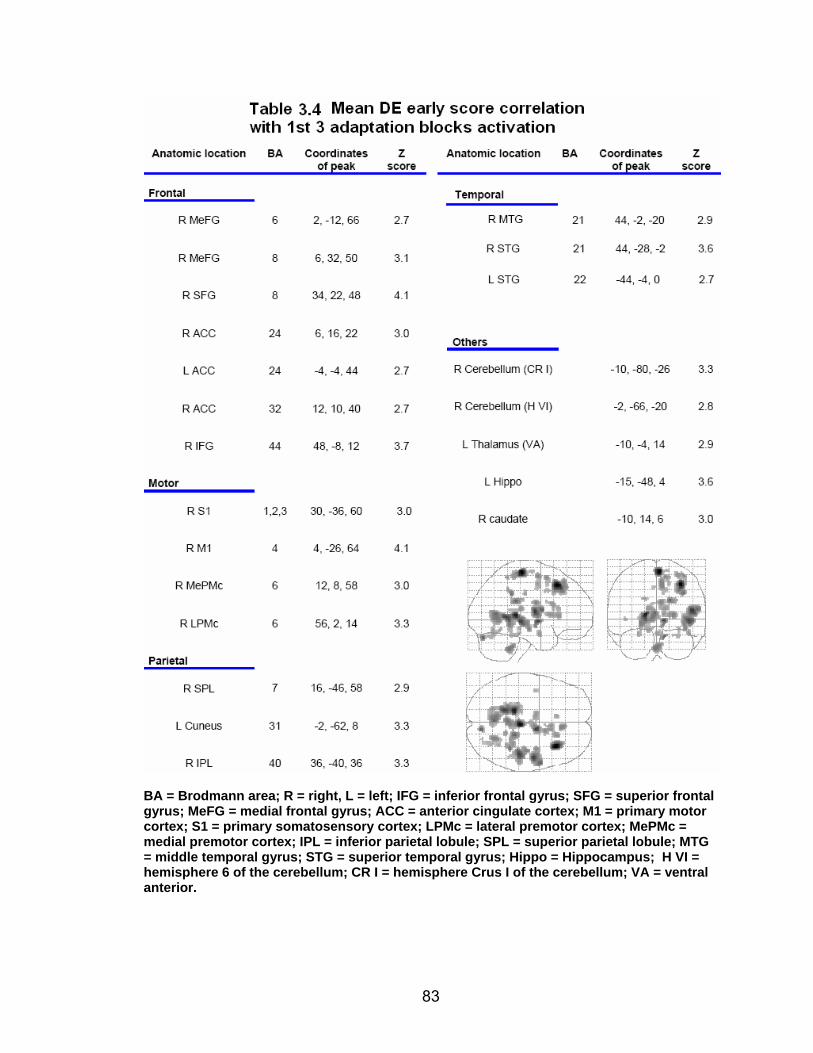
83
BA = Brodmann area; R = right, L = left; IFG = inferior frontal gyrus; SFG = superior frontal gyrus; MeFG = medial frontal gyrus; ACC = an terior cingulate cortex; M1 = primary motor cortex; S1 = primary somatosensory cortex; LPMc = lateral premotor cortex; MePMc = medial premotor cortex; IPL = inferior parietal lobule; SPL = superior parietal lobule; MTG = middle temporal gyrus; STG = superior temporal gyrus; Hippo = Hippocampus; H VI = hemisphere 6 of the cerebellum; CR I = hemisphe re Crus I of the cereb ellum; VA = ventral anterior.
84
fMRI- Young versus older adults
Young adults steeper early rate of learning than older adults suggested a
potential difference in the underlying neural activation patterns, so I performed a
between group analysis at early and late adaptation. Young adults activated a
number of frontal and motor regions, including the right MFG/DLPFC, to a
greater extent than older adults at the early adaptation period (Table 3.5), while
older adults did not activate any region to a greater extent than the young adults
during early learning. There were no between group activation differences
observed at late adaptation or the non-vision blocks. Young adults showed
greater prefrontal activation, including bilateral MeFG, than the older adults at the
after-effects blocks (see Appendix Table C.9), while older adults did not activate
any region to a greater extent than the young adults. For the SWM task, older
adults engaged a number of regions, including the right MFG/DLPFC, to a
greater extent than the young adults (see Appendix Table C.10), while young
adults showed greater activation than older adults only at the right IPL during this
task (see Appendix Table C.11). The older adult activation here was more
bilateral in nature compared to the young adult SWM > SWMc contrast (see
Appendix Figure C.3).
In general, the ROI activations followed a similar pattern as the between
group activation contrasts: young adults showed equal or greater activation than
the older adults for both early and late adaptation, while older adults displayed
comparable or greater activation for the SWM task (see Figure 3.5). A 2 (task,
early adaptation x SWM) by 6 (each ROI) ANOVA resulted in a task x group
85
interaction (F (1, 32) = 14.25, p < .0001) as well as a ROI x group interaction (F (5,
160) = 3.80, p < .01). Follow up tests of the ROI x group interaction revealed a
significant task x group effect for each ROI (all greater than F (1, 32) = 7.01, p <
.01) except for the R DLPFC (F (1, 32) = 2.60, p > .10). ROI activation for each
period and their behavioral counterparts (early and late rate of learning, SWM
accuracy) were entered into a pooled group partial correlation controlling for age.
One significant correlation emerged: early DE rate of learning was significantly
correlated with the right DLPFC early activation (r = .42, p< .05; see Figure 3.6).
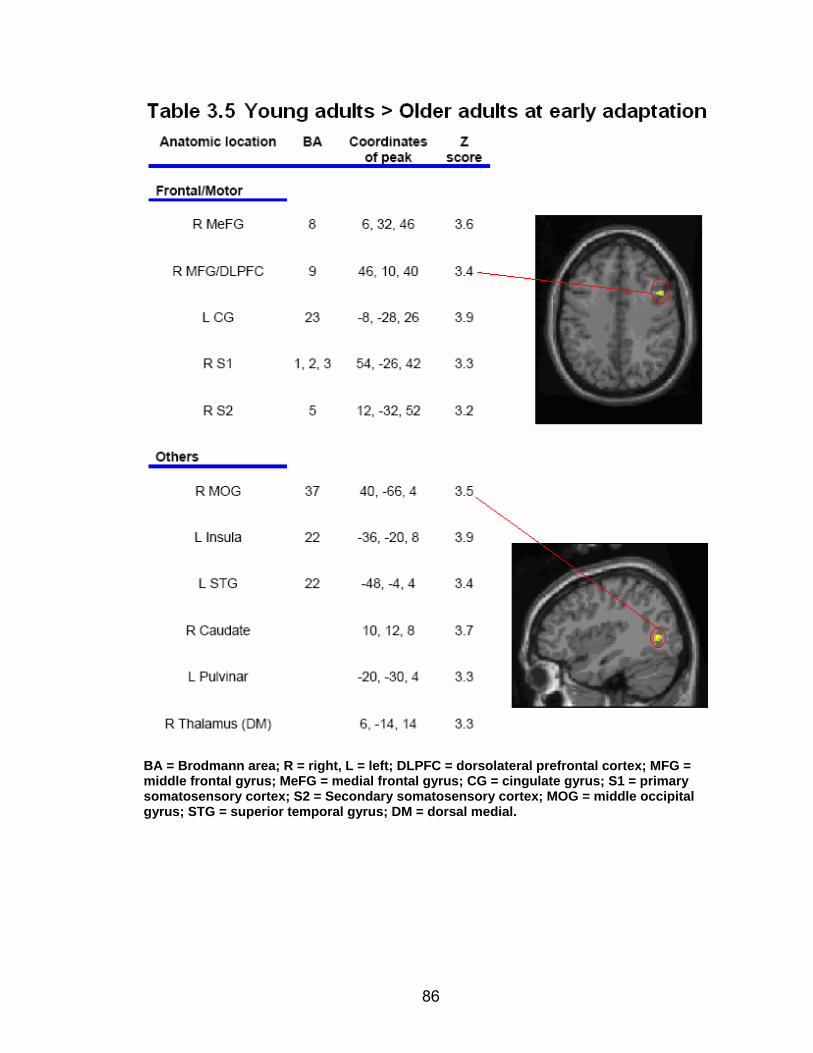
86
BA = Brodmann area; R = right, L = left; DLPFC = dorsolateral prefrontal cortex; MFG = middle frontal gyrus; MeFG = medial frontal gyrus; CG = cingulate gyrus; S1 = primary somatosensory cortex; S2 = Secondary somatosensory cortex; MOG = middle occipital gyrus; STG = superior temporal gyrus; DM = dorsal medial.
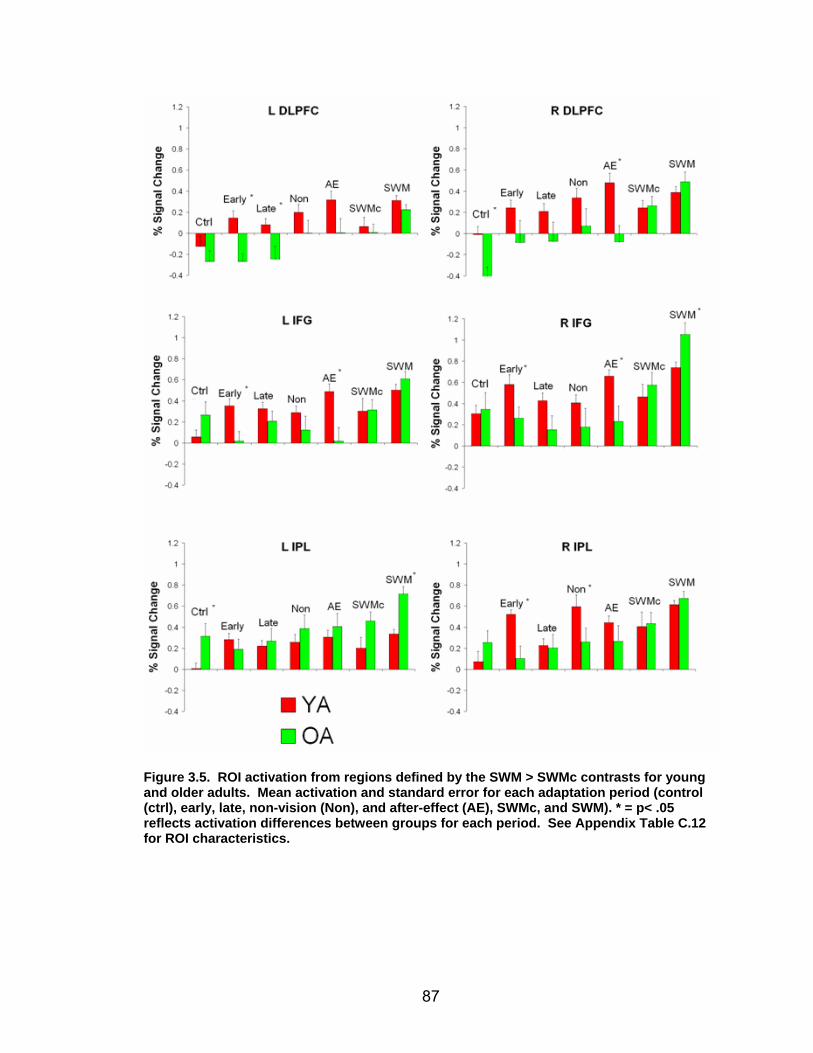
87
Figure 3.5. ROI activation from regions defined by the SWM > SWMc contrasts for young and older adults. Mean activation and standard error for each adaptation period (control (ctrl), early, late, non-vision (Non), and afte r-effect (AE), SWMc, and SWM). * = p< .05 reflects activation differences between groups for each period. See Appendix Table C.12 for ROI characteristics.
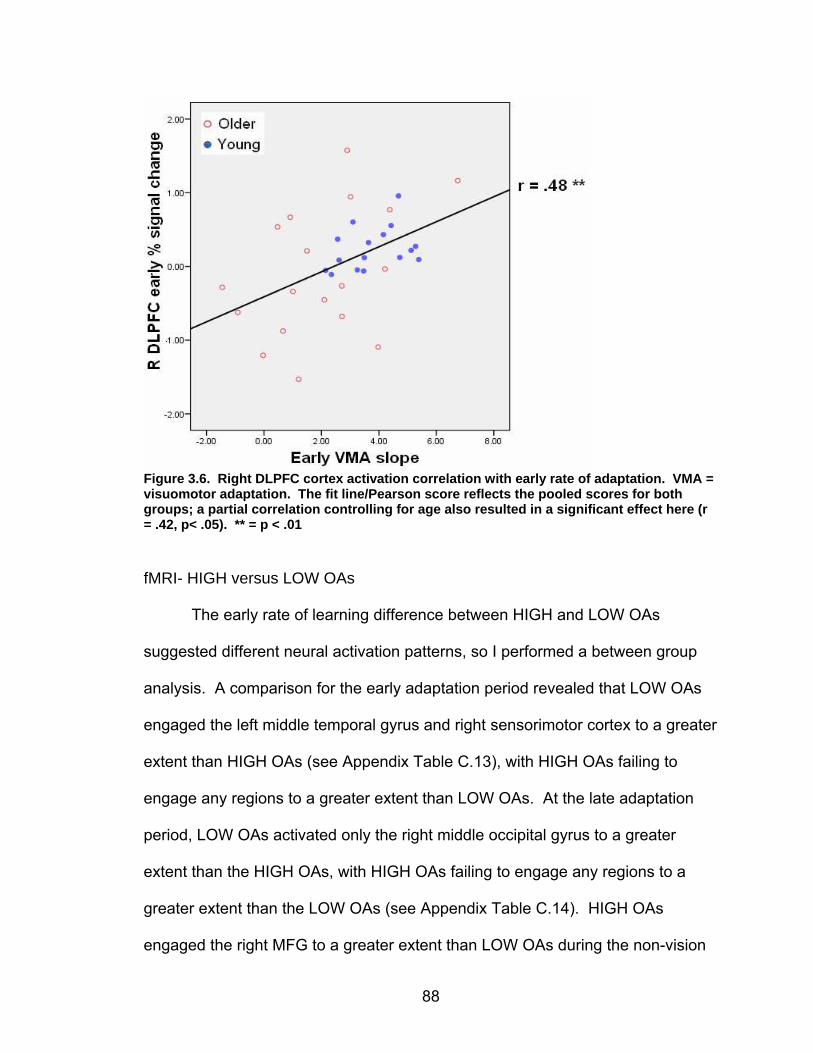
88
Figure 3.6. Right DLPFC cortex activation correla tion with early rate of adaptation. VMA = visuomotor adaptation. The fit line/Pears on score reflects the pooled scores for both groups; a partial correlation controlling for age also resulted in a significant effect here (r = .42, p< .05). ** = p < .01
fMRI- HIGH versus LOW OAs
The early rate of learning difference between HIGH and LOW OAs
suggested different neural activation patterns, so I performed a between group
analysis. A comparison for the early adaptation period revealed that LOW OAs
engaged the left middle temporal gyrus and right sensorimotor cortex to a greater
extent than HIGH OAs (see Appendix Table C.13), with HIGH OAs failing to
engage any regions to a greater extent than LOW OAs. At the late adaptation
period, LOW OAs activated only the right middle occipital gyrus to a greater
extent than the HIGH OAs, with HIGH OAs failing to engage any regions to a
greater extent than the LOW OAs (see Appendix Table C.14). HIGH OAs
engaged the right MFG to a greater extent than LOW OAs during the non-vision

89
blocks, with LOW OAs failing to engage any regions to a greater extent than
HIGH OAs here (see Appendix Table C.15). There were no group differences in
activation during the after-effect period. For the SWM activation, HIGH OAs
engaged a number of regions to a greater extent, including the right IFG, left
MFG, and bilateral MTG, while LOW OAs failed to engage any regions to a
greater extent than the HIGH OAs (see Appendix Table C.16).
There were no between group differences observed for any of the ROI
activation at the early, late, or SWM periods. However, at the non-vision blocks
HIGH OAs showed greater activation at the right IFG and bilateral IPL; there
were no group differences at the after-effect blocks except for the right IFG (see
appendix figure C.1). A 2 (task, early adaptation x SWM) by 6 (each ROI)
ANOVA also resulted in no significant interactions.
fMRI- HIGH and LOW OAs versus young adults subgroup
The similar early rate of learning between the young adult subgroup and
HIGH OAs, with both groups showing a steeper rate compared to the LOW OAs,
spurred further between group examinations of this period to better characterize
these findings. The young adults subgroup engaged a number of frontal (right
MeFG) and temporal (right MTG and STG) regions to a greater extent than the
HIGH OAs during early adaptation (Table 3.7). Compared to LOW OAs, the
young adults subgroup engaged the right IFG and pre-SMA, among other
regions (Table 3.8) to a greater extent. There were no regions which either older
adult subgroup activated more than their young adults counterparts at early
90
learning. At late learning, the young adults subgroup engaged the left
cerebellum to a greater extent than the HIGH OAs (see Appendix Table C.17).
There were no areas which the young adults subgroup activated to a greater
extent that the LOW OAs, nor were there any regions which either older adult
subgroup engaged to a greater extent than these young adults at late learning.
Activation differences between the HIGH and LOW OAs and the young adults
subgroup for the SWM periods are described in detail in the appendix (see
Appendix Tables C.18-19).
The young adults subgroup showed greater ROI activation than the LOW
OAs, with HIGH OAs exhibiting equivalent activation, in the right DLPFC and left
IFG during the early adaptation period (see Figure 3.6). These young adults also
showed greater activation than both groups in the left DLPFC and right IPL. The
activation difference in the left DLPFC between the young adults subgroup and
LOW OAs persisted into the late adaptation. A 2 (task, early adaptation x SWM)
by 6 (each ROI) ANOVA resulted in a task x group interaction (F (2, 24) = 6.28, p <
.01) and a near significant ROI x group interaction (F (10, 120) = 1.93, p = .052).
Follow up tests of the ROI x group interaction revealed a significant task x group
effect for each ROI (all greater than F (2, 24) = 3.53, p < .05) except for the R
DLPFC (F (2, 24) = 2.37, p > .10).
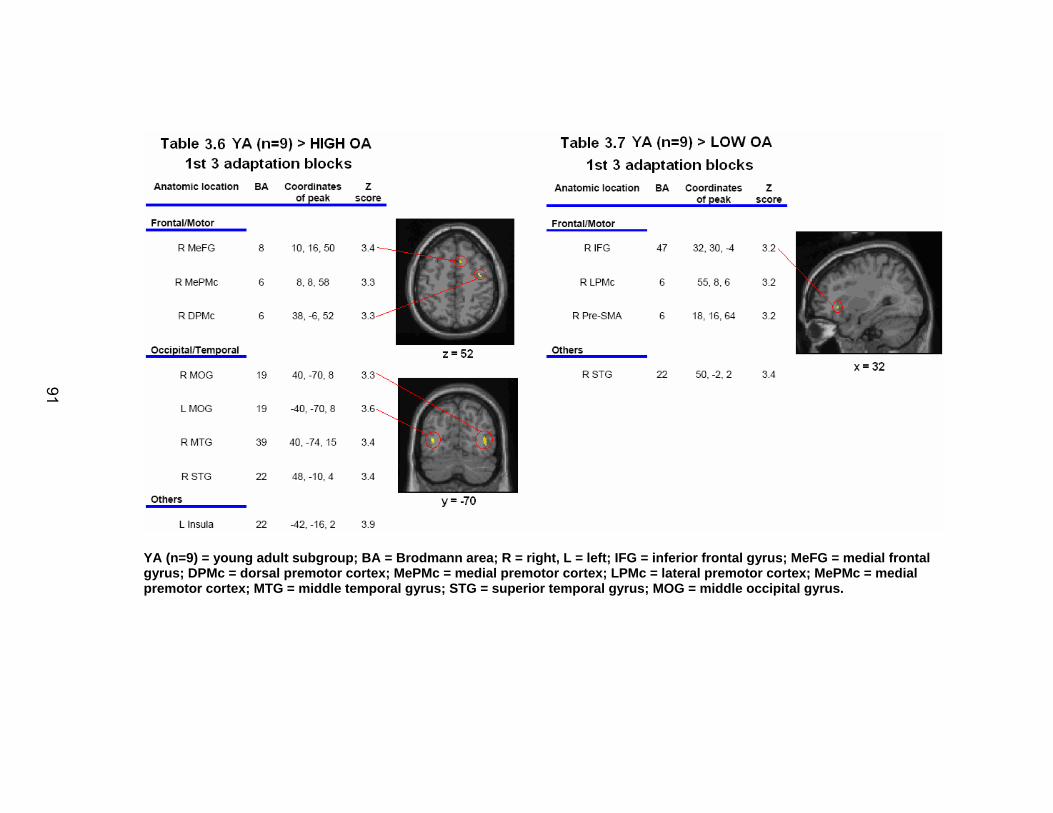
91
YA (n=9) = young adult subgroup; BA = Brodmann area; R = right, L = left; IFG = inferior frontal gy rus; MeFG = medial frontal gyrus; DPMc = dorsal premotor cortex; MePMc = medial premotor cortex; LPMc = lateral premotor cortex; MePMc = medial premotor cortex; MTG = middle temporal gyrus; STG = su perior temporal gyrus; MOG = middle occipital gyrus.
91
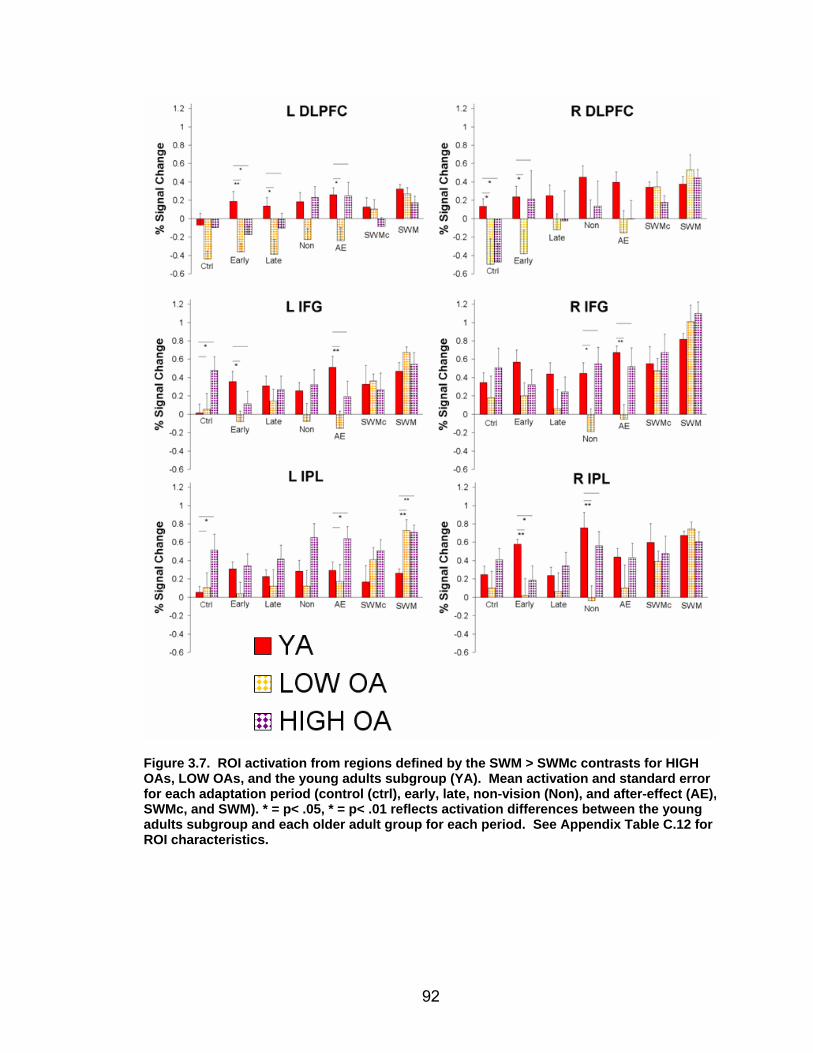
92
Figure 3.7. ROI activation from regions de fined by the SWM > SWMc contrasts for HIGH OAs, LOW OAs, and the young adults subgroup (YA). Mean activation and standard error for each adaptation period (control (ctrl), early, late, non-vision (Non), and after-effect (AE), SWMc, and SWM). * = p< .05, * = p< .01 reflects activation differences between the young adults subgroup and each older adult group for each period. See Appendix Table C.12 for ROI characteristics.
93
Discussion
In this study, I tested the hypothesis that age-related declines in SWM
could partially explain age-related declines in visuomotor adaptation. By
examining the age-related neural correlates of sensorimotor adaptation using
fMRI, support was provided for neural-based hypotheses described in previous
behavioral work regarding aging and visuomotor adaptation. My findings
revealed that older adults’ rate of early adaptation did not correlate with SWM
measures, nor did their activation at this period overlap with their SWM activation
despite having a pattern of SWM activation comparable to or greater than that of
young adults. Given that these relationships were significant in young adults, the
results support my hypothesis that age-related differences in SWM at least
partially explain age-related declines in visuomotor adaptation.
Behavioral SWM correlations with visuomotor adaptation Older adults’ rates of early and late adaptation were equivalent, with the
early adaptation rate being slower than that of the young adults. Moreover, older
adults’ card rotation, cube rotation, and SWM accuracy were significantly poorer
compared to the young adults, with none of these tests correlating with rate of
early adaptation for the older adults (unlike the young adults, see Anguera
Chapter 2). It is important to clarify that older adults’ deficits in SWM measures
did not explain their reduced early rate of adaptation, as there was no correlation
between these measures. Rather, these findings suggest age-related
ineffectiveness in SWM resource utilization during the early adaptation period
94
compared to the young adults. This interpretation leads to the following question:
how are older adults performing visuomotor adaptation compared to young
adults?
I previously proposed that SWM contributes to visuomotor adaptation for
recalling, manipulating, and comparing the original visuomotor mapping to the
rotated state, with these series of steps being comparable to those engaged
during mental rotation tasks (see Anguera Chapter 2). While older adults
showed poorer performance versus the young adults on the SWM measures,
they still were able to complete these tasks at a level above chance. This
suggests that older adults may have been using some yet to be determined
additional strategy, in addition to their reduced SWM resources, during each
SWM measure and the visuomotor adaptation task. This question also highlights
an important distinction between performance and the rate of adaptation: at the
early adaptation period, both groups showed equivalent performance at early
learning, while young adults adapted at a faster rate than the older adults. Thus,
older adults were still able to perform this task, but the inability to effectively
utilize their SWM resources at this period is evidenced by the slower rate of
adaptation (as well as the greater performance variability during early
adaptation).
Aside from the significant difference in the early rate of adaptation (which
is how the groups were defined), HIGH versus LOW OAs did not differ in
performance on any of the neuropsychological assessments of working memory,
dementia screening tests, age, or self-reports of fitness level and health. The
95
lack of difference here may reflect the challenge of selecting appropriate and
sensitive measures that would distinguish these differences. Likewise, the older
adult variability from this university-area population tested may be an issue, given
that these individuals may be considered HIGH OA compared to the overall older
adult population.
SWM, early, and late adaptation activation – Young and older adults
Older adults showed bilateral frontal and parietal activation, including the
right DLPFC, for the SWM task. These results were in agreement with older
adult SWM activation previously reported for this paradigm (Reuter-Lorenz et al.,
2000), with older adults showing greater bilateral activation than the young adults
(see Appendix Figure C.3). This pattern of activation is in line with cognitive
aging research describing a compensatory effect of bilateral activation in older
adults (Cabeza et al., 2002; Reuter-Lorenz et al., 2000) although these
differences were evaluated here in a qualitative fashion. Older adult SWM
activation was also very similar to the pattern of activation observed for the
young adults performing this task (see Figure 3.4, Anguera Chapter 2 Table 2.5).
When the early adaptation period was masked with this SWM activation, older
adults did not show any significant overlap (unlike young adults). Even when a
much more liberal threshold for significance was used (uncorrected p< .25), no
regions reached significance, suggesting that these results were not simply due
to a lower signal to noise ratio (SNR) in the older adults (D’Esposito et al., 1999;
Huettel et al., 2001).
96
Examination of the ROI activation suggests that older adults were able to
successfully engage several regions involved in the SWM network during the
SWM task, but then failed to recruit these areas effectively during the early
adaptation period. The importance of SWM regions in early adaptation was
supported through the task x group interaction observed as well as the partial
correlation (controlling for age) between the early rate of adaptation and
activation at the right DLPFC. It was not the case that older adults recruited
these regions later in the adaptation period than the young adults; rather, they
may be relying on other (yet to be determined) strategies in addition to their
reduced SWM resources. These findings follow those from the behavioral
correlations: that is, young adults’ more effective engagement of SWM resources
during early adaptation than older adults led to a between-group rate of learning
difference.
Young adults engaged a number of motor and frontal (including the right
DLPFC) regions to a greater extent than older adults during early adaptation.
Similarly, the ROI activation at early learning also showed that young adults had
greater bilateral IFG, left DLPFC, and right IPL activation versus older adults.
These findings are in contrast to several imaging studies showing that older
adults exhibit stronger and/or more widespread brain activation patterns than
young adults during the execution of a tapping (Calautti et al., 2001; Mattay et al.,
2002), gripping (Ward and Frackowiak, 2003), and a complex interlimb
coordination task (Heuninckx et al., 2005; 2008a; 2008b). These studies differ
from the current investigation, however, in that they focused on stable motor
97
performance rather than motor learning. These previous studies either used a
very simple motor task (Mattay et al., 2002) or had participants practice the task
until a specified level of performance was reached before scanning (Calautti et
al., 2001; Heuninckx et al., 2005; 2008a; 2008b; Ward and Frackowiak, 2003), in
essence removing learning-related activation. Given young adults’ faster rate of
early adaptation, the greater activation likely reflects areas involved with both the
adaptation and performance processes.
HIGH and LOW OA activation
The early adaptation between group contrasts revealed that LOW OAs
showed greater activation than HIGH OAs. This activation pattern is opposite to
what has frequently been reported for HIGH versus LOW OAs for cognitive tasks
(Cabeza et al., 2002; Rypma and D’Esposito, 2000). However, Jaeggi et al.
(2007) reported that high performing young adults had less activation compared
to low performing young adults for a challenging cognitive task (also see Rypma
and D’Esposito, 1999; Rypma et al., 2002). Specifically, low performing young
adults engaged additional/non-pertinent resources during the early (‘cognitively
challenging’) task period, while high performing young adults showed minimal
activation. The authors interpreted this as reflecting more efficient processing,
which corresponded with better performance. The present findings suggest that
the HIGH OAs are more “efficient”, in accord with Haier and colleagues’ (1992)
neural efficiency hypothesis, which suggests that learning results in decreased
use of extraneous or inefficient brain areas. These results, supported by the lack
98
of task x group and task x ROI interactions, suggest that the pattern of activation
differences between HIGH and LOW performing OAs may be task dependent.
Older adult visuomotor correlations between performance/activation
Only the right middle temporal gyrus (MTG) showed activation that was
correlated with the rate of early adaptation for the older adults. Activation in this
region has been previously observed during late adaptation for young adults
(Della-Maggiore and McIntosh, 2005), with its function associated with
visuospatial endpoint control (Anguera et al., 2007; Graydon et al., 2005). Older
adults’ mean early DE score (which did not show age-related declines) whole
brain correlation with early adaptation activation resembled young adults’ early
adaptation activation (see Appendix Figure C.2). However, older adults’
activation did not include the right DLPFC (unlike the young adults), supporting
an age-related dissociation at the early adaptation period involving this region
and its associations with SWM. This interpretation is supported by the pooled
partial correlation between the early adaptation rate of learning and activation at
the right DLPFC. However, this correlation was only significant with both groups
pooled, as each group alone did not show this correlation. Increased power
through group pooling appears to be driving this effect, as well as a range effect
given the differences in variability between the two groups. This variability in the
older adults also appears to be driving the non-significant R DLPFC ROI x group
interactions.
99
Larger early mean DE error was associated with greater activation at a
number of regions including the right inferior parietal lobule (IPL), right motor and
premotor regions, right anterior cingulate cortex (ACC), and right cerebellum,
among others. Neuroimaging studies of sensorimotor adaptation have reported
ACC activation during the adaptation process (Miall et al., 2001; Graydon et al.,
2005; Seidler et al., 2006; Anguera et al., 2007). Activation at this region is
thought to reflect an active monitoring system that reacts to the presence of
conflict and/or performance errors (Botvinick et al., 1999; Carter et al., 1998;
Gehring et al.1993; Gehring & Knight, 2000; Yeung et al., 2004), with activity
scaling with visuomotor adaptation error magnitude (Anguera et al., in
preparation). This interpretation is in agreement with the present findings, as
poorer performance (higher errors) for the older adults was associated with
increased activation at this region.
Cerebellar activation has also been reported in visuomotor adaptation
neuroimaging studies (Clower et al., 1996; Imamizu et al., 2000, 2003; Krakauer
et al., 2004; Seidler and Noll, 2008). This region is also associated with
movement trajectory production, as shown in experiments with cerebellar
patients (Brown et al., 1993), and plays a role in internal model formation
(Imamizu et al., 2000, 2003; Kawato, 1999; Kawato and Wolpert, 1998; Wolpert
et al., 1998; Seidler and Noll, 2008). Raz et al. (2000) demonstrated that age-
related cerebellar volume declines were associated with reduced performance on
a pursuit rotor task, in line with greater activation here reflecting better task
performance. The correlation between cerebellar activation and performance at
100
both the early and late adaptation periods suggests a progressive development
of the internal model (cf. Imamizu et al., 2000, 2003). Thus, less effective
engagement of cerebellar regions may underlie age-related deficits in visuomotor
adaptation; however, this interpretation requires further analysis given that the
between group activation contrasts at early and late learning did not reveal
cerebellar activation differences.
Non-vision & after-effects
All subjects showed persistent errors during the non-vision and aftereffect
periods, supporting that adaptive recalibration had occurred. McNay and
Willingham (1998) reported no age group differences during a visuomotor
adaptation non-vision period following adaptation. These authors suggested that
any age-related working memory deficits impacting cognitive strategy utilization
would be absent during this period (unlike the adaptation period), as strategies
would be less effective without visual feedback to support their use. The current
behavioral results partially support this statement, as SWM resources played a
distinct role in young adults versus older adults at the early adaptation stage.
No whole brain activation differences were observed between older adults
and young adults during the non-vision period. However, the ROI activation
during the non-vision period in the right IPL was greater in young adults versus
older adults, as well as the young adults subgroup versus LOW older adults.
This region has been shown to contribute to visuomotor adaptation (Anguera et
al., 2007; Anguera Chapter 2; Clower et al., 1996; Inoue et al., 1997, 2000), with
101
age differences in ROI activation also present at early adaptation. I suggest that
the activation difference may underlie performance deficits in transformation of
the sensorimotor coordinates to the non-vision condition.
At the after-effect blocks, older adults showed greater behavioral after-
effects than the young adults, in agreement with previous visuomotor adaptation
studies (Fernández-Ruiz et al., 2000; Seidler, 2006; however, see Bock, 2005;
Buch et al., 2003). Young adults showed greater engagement of prefrontal
regions versus older adults at this period, through both activation contrasts (right
MFG, bilateral MeFG) and the ROI activation differences (right DLPFC, bilateral
IFG). The engagement of these cognitive control areas suggests that they
contribute to the re-adaptation process, reflected by young adults having less
persistent after-effects than older adults. These findings support previous data
suggesting that strategic control implementation is affected by advancing age
(McNay and Willingham, 1998).
Conclusions
Age-related difficulties in the effective engagement of SWM resources
were associated with age-related visuomotor adaptation deficits, especially
during the early adaptation period. This was evidenced by a lack of neural
overlap between the early adaptation period and SWM task performance, as well
as the partial correlation with early adaptation rate of learning with the right
DLPFC ROI activation. Importantly, older adults engaged similar regions during
the SWM task as the young adults; however, they failed to utilize these regions
102
effectively during the early adaptation period. HIGH OAs not only had a greater
rate of early adaptation than LOW OAs, they also showed equivalent early
adaptation ROI activation compared to the young adults subgroup at a SWM-
associated region (right DLPFC), unlike LOW OAs. HIGH OAs also showed
‘cooler brains’ during the early adaptation period, suggesting that reduced
performance for the LOW OAs was a reflection of excessive or inefficient neural
activation. These findings suggest age-related differences in the rate of
visuomotor adaptation can be attributed to specific cognitive factors, with the
effective engagement of spatial resources beginning to explain these differences.
103
References
Anguera, J., Seidler, R., & Gehring (in preparation). Changes in performance
monitoring during motor learning. Anguera, J., Russell, C., Noll, D., & Seidler, R. (2007). Neural correlates
associated with intermanual transfer of sensorimotor adaptation. Brain Res, 1185, 136-151.
Baltes, P., & Lindenberger, U. (1997). Emergence of a powerful connection between sensory and cognitive functions across the adult life span: a new window to the study of cognitive aging? Psychol Aging, 12(1), 12-21.
Bock, O. (2005). Components of sensorimotor adaptation in young and elderly subjects. Exp Brain Res, 160(2), 259-263.
Booth, F., Weeden, S., & Tseng, B. (1994). Effect of aging on human skeletal muscle and motor function. Med Sci Sports Exerc, 26(5), 556-560.
Botvinick, M., Nystrom, L., Fissell, K., Carter, C., & Cohen, J. (1999). Conflict monitoring versus selection-for-action in anterior cingulate cortex. Nature, 402(6758), 179-181.
Brett, M., Anton, J., Valabregue, R., Poline, J. (2002). Region of interest analysis using an SPM toolbox [abstract] Presented at the 8th International Conference on Functional Mapping of the Human Brain, June 2-6, 2002, Sendai, Japan. Available on CD-ROM in NeuroImage, Vol 16, No 2.
Brown, S. (1996). Control of simple arm movements in the elderly. In A.-M. Ferrandez & N. Teasdale (Eds.), Changes in Sensory Motor Behavior in Aging (pp. 27-52). Amsterdam ; New York: Elsevier.
Brown, S., Kessler, K., Hefter, H., Cooke, J., & Freund, H. (1993). Role of the cerebellum in visuomotor coordination. I. Delayed eye and arm initiation in patients with mild cerebellar ataxia. Exp Brain Res, 94(3), 478-488.
Buch, E., Young, S., & Contreras-Vidal, J. (2003). Visuomotor adaptation in normal aging. Learn Mem, 10(1), 55-63.
Cabeza, R., Anderson, N., Locantore, J., & McIntosh, A. (2002). Aging gracefully: compensatory brain activity in high-performing older adults. Neuroimage, 17(3), 1394-1402.
Calautti, C., Serrati, C., & Baron, J. (2001). Effects of age on brain activation during auditory-cued thumb-to-index opposition: A positron emission tomography study. Stroke, 32(1), 139-146.
Canavan, A., Passingham, R., Marsden, C., Quinn, N., Wyke, M., & Polkey, C. (1990). Prism adaptation and other tasks involving spatial abilities in patients with Parkinson's disease, patients with frontal lobe lesions and patients with unilateral temporal lobectomies. Neuropsychologia, 28(9), 969-984.
Carter C, Braver T, Barch D, Botvinick M, Noll D, and Cohen J. Anterior cingulate cortex, error detection, and the online monitoring of performance. Science 280: 747-749, 1998. Clower, D., Hoffman, J., Votaw, J., Faber, T., Woods, R., & Alexander, G. (1996).
Role of posterior parietal cortex in the recalibration of visually guided
104
reaching. NATURE, 383(6601), 618-621. Contreras-Vidal, J., Teulings, H., & Stelmach, G. (1998). Elderly subjects are
impaired in spatial coordination in fine motor control. Acta Psychol (Amst), 100(1-2), 25-35.
Cooke, J., Brown, S., & Cunningham, D. (1989). Kinematics of arm movements in elderly humans. Neurobiology of Aging, 10(2), 159-165.
Courtney, S., Petit, L., Maisog, J., Ungerleider, L., & Haxby, J. (1998). An area specialized for spatial working memory in human frontal cortex. Science, 279(5355), 1347-1351.
D'Esposito, M., Aguirre, G., Zarahn, E., Ballard, D., Shin, R., & Lease, J. (1998). Functional MRI studies of spatial and nonspatial working memory. Brain Res Cogn Brain Res, 7(1), 1-13.
D'Esposito, M., Zarahn, E., Aguirre, G., & Rypma, B. (1999). The effect of normal aging on the coupling of neural activity to the bold hemodynamic response. Neuroimage, 10(1), 6-14.
Darling, W., Cooke, J., & Brown, S. (1989). Control of simple arm movements in elderly humans. Neurobiology of Aging, 10(2), 149-157.
Della-Maggiore, V., & McIntosh, A. (2005). Time course of changes in brain activity and functional connectivity associated with long-term adaptation to a rotational transformation. Journal of Neurophysiology, 93(4), 2254-2262.
Demer, J. (1994). Effect of aging on vertical visual tracking and visual-vestibular interaction. J Vestib Res, 4(5), 355-370.
Dobson, S., Kirasic, K., & Allen, G. (1995). Age-Related Differences in Adults Spatial Task-Performance - Influences of Task Complexity and Perceptual Speed. Aging and Cognition, 2(1), 19-38.
Durkin, M., Prescott, L., Furchtgott, E., Cantor, J., & Powell, D. (1995). Performance but not acquisition of skill learning is severely impaired in the elderly. Arch Gerontol Geriatr, 20(2), 167-183.
Engle, R., Tuholski, S., Laughlin, J., & Conway, A. (1999). Working memory, short-term memory, and general fluid intelligence: a latent-variable approach. J Exp Psychol Gen, 128(3), 309-331.
Etnier, J., & Landers, D. (1998). Motor performance and motor learning as a function of age and fitness. Res Q Exerc Sport, 69(2), 136-146.
Fernández-Ruiz, J., Hall, C., Vergara, P., & Díiaz, R. (2000). Prism adaptation in normal aging: slower adaptation rate and larger aftereffect. Brain Res Cogn Brain Res, 9(3), 223-226.
Folstein, M., Folstein, S., & McHugh, P. (1975). "Mini-mental state". A practical method for grading the cognitive state of patients for the clinician. J Psychiatr Res, 12(3), 189-198.
Galea, V. (1996). Changes in motor unit estimates with aging. J Clin Neurophysiol, 13(3), 253-260.
Galganski, M. E., Fuglevand, A. J., & Enoka, R. M. (1993). Reduced control of motor output in a human hand muscle of elderly subjects during submaximal contractions. J Neurophysiol, 69(6), 2108-2115.
Gehring W, Goss B, Coles M, Meyer D, and Donchin E. A neural system for error-detection and compensation. Psychological Science 4: 385-390,
105
1993. Gehring, W., & Knight, R. (2000). Prefrontal-cingulate interactions in action
monitoring. Nat Neurosci, 3(5), 516-520. Graydon, F., Friston, K., Thomas, C., Brooks, V., & Menon, R. (2005). Learning-
related fMRI activation associated with a rotational visuo-motor transformation. Brain Res Cogn Brain Res, 22(3), 373-383.
Haier, R., Siegel, B. J., MacLachlan, A., Soderling, E., Lottenberg, S., & Buchsbaum, M. (1992). Regional glucose metabolic changes after learning a complex visuospatial/motor task: a positron emission tomographic study. Brain Res, 570(1-2), 134-143.
Hertzog, C., Vernon, M., & Rypma, B. (1993). Age differences in mental rotation task performance: the influence of speed/accuracy tradeoffs. J Gerontol, 48(3), P150-156.
Heuninckx, S., Wenderoth, N., Debaere, F., Peeters, R., & Swinnen, S. (2005). Neural basis of aging: the penetration of cognition into action control. J Neurosci, 25(29), 6787-6796.
Heuninckx, S., Wenderoth, N., & Swinnen, S. (2008a). Age-related reduction in the differential pathways involved in internal and external movement generation. Neurobiol Aging.
Heuninckx, S., Wenderoth, N., & Swinnen, S. (2008b). Systems neuroplasticity in the aging brain: recruiting additional neural resources for successful motor performance in elderly persons. J Neurosci, 28(1), 91-99.
Hikosaka, O., Nakahara, H., Rand, M., Sakai, K., Lu, X., Nakamura, K., et al. (1999). Parallel neural networks for learning sequential procedures. Trends Neurosci, 22(10), 464-471.
Huettel, S., Singerman, J., & McCarthy, G. (2001). The effects of aging upon the hemodynamic response measured by functional MRI. Neuroimage, 13(1), 161-175.
Imamizu, H., Kuroda, T., Miyauchi, S., Yoshioka, T., & Kawato, M. (2003). Modular organization of internal models of tools in the human cerebellum. Proc Natl Acad Sci U S A, 100(9), 5461-5466.
Imamizu, H., Miyauchi, S., Tamada, T., Sasaki, Y., Takino, R., Pütz, B., et al. (2000). Human cerebellar activity reflecting an acquired internal model of a new tool. Nature, 403(6766), 192-195.
Inoue, K., Kawashima, R., Satoh, K., Kinomura, S., Goto, R., Sugiura, M., et al. (1997). Activity in the parietal area during visuomotor learning with optical rotation. Neuroreport, 8(18), 3979-3983.
Inoue, K., Kawashima, R., Satoh, K., Kinomura, S., Sugiura, M., Goto, R., et al. (2000). A PET study of visuomotor learning under optical rotation. Neuroimage, 11(5 Pt 1), 505-516.
Jaeggi, S., Buschkuehl, M., Etienne, A., Ozdoba, C., Perrig, W., & Nirkko, A. (2007). On how high performers keep cool brains in situations of cognitive overload. Cogn Affect Behav Neurosci, 7(2), 75-89.
Jenkins, L., Myerson, J., Hale, S., & Fry, A. (1999). Individual and developmental differences in working memory across the life span. Psychon Bull Rev, 6(1), 28-40.
106
Jonides, J., Smith, E., Koeppe, R., Awh, E., Minoshima, S., & Mintun, M. (1993). Spatial working memory in humans as revealed by PET. Nature, 363(6430), 623-625.
Kawato, M. (1999). Internal models for motor control and trajectory planning. Curr Opin Neurobiol, 9(6), 718-727.
Kawato, M., & Wolpert, D. (1998). Internal models for motor control. Novartis Found Symp, 218, 291-304; discussion 304-297.
Kirasic, K. (2000). Age differences in adults’ spatial abilities, learning environmental layout, and wayfinding behavior. Spatial Cognition and
Computation 2: 117–134. Krakauer, J., Ghilardi, M., Mentis, M., Barnes, A., Veytsman, M., Eidelberg, D., et
al. (2004). Differential cortical and subcortical activations in learning rotations and gains for reaching: a PET study. J Neurophysiol, 91(2), 924-933.
Krebs, H., Brashers-Krug, T., Rauch, S., Savage, C., Hogan, N., Rubin, R., et al. (1998). Robot-aided functional imaging: application to a motor learning study. Hum Brain Mapp, 6(1), 59-72.
Lindenberger, U., & Baltes, P. (1994). Sensory functioning and intelligence in old age: a strong connection. Psychol Aging, 9(3), 339-355.
Mattay, V., Fera, F., Tessitore, A., Hariri, A., Das, S., Callicott, J., et al. (2002). Neurophysiological correlates of age-related changes in human motor function. Neurology, 58(4), 630-635.
Mattis, S. (1988). Dementia Rating Scale: Professional Manual. Odessa, FL: Psychological Assessment Resources.
McCarthy, G., Blamire, A., Puce, A., Nobre, A., Bloch, G., Hyder, F. (1994). Functional magnetic-resonance-imaging of human prefrontal cortex activation during a spatial working-memory task. Proceedings of the National Academy of Sciences of the United States of America, 91(18), 8690-8694.
McCarthy, G., Puce, A., Constable, R., Krystal, J., Gore, J., & Goldman-Rakic, P. (1996). Activation of human prefrontal cortex during spatial and nonspatial working memory tasks measured by functional MRI. Cereb Cortex, 6(4), 600-611.
McNay, E., & Willingham, D. (1998). Deficit in learning of a motor skill requiring strategy, but not of perceptuomotor recalibration, with aging. Learn Mem, 4(5), 411-420.
Miall, R., Reckess, G., & Imamizu, H. (2001). The cerebellum coordinates eye and hand tracking movements. Nature Neuroscience, 4(6), 638-644.
Miyake, A., Friedman, N., Rettinger, D., Shah, P., & Hegarty, M. (2001). How are visuospatial working memory, executive functioning, and spatial abilities related? A latent-variable analysis. J Exp Psychol Gen, 130(4), 621-640.
Myerson, J., Hale, S., Rhee, S., & Jenkins, L. (1999). Selective interference with verbal and spatial working memory in young and older adults. J Gerontol B Psychol Sci Soc Sci, 54(3), P161-164.
Oldfield, R. (1971). The assessment and analysis of handedness: the Edinburgh inventory. Neuropsychologia, 9(1), 97-113.
107
Park, D., Lautenschlager, G., Hedden, T., Davidson, N., Smith, A., & Smith, P. (2002). Models of visuospatial and verbal memory across the adult life span. Psychol Aging, 17(2), 299-320.
Pisella, L., Gréa, H., Tilikete, C., Vighetto, A., Desmurget, M., Rode, G., et al. (2000). An 'automatic pilot' for the hand in human posterior parietal cortex: toward reinterpreting optic ataxia. Nat Neurosci, 3(7), 729-736.
Pisella, L., Michel, C., Gréa, H., Tilikete, C., Vighetto, A., & Rossetti, Y. (2004). Preserved prism adaptation in bilateral optic ataxia: strategic versus adaptive reaction to prisms. Exp Brain Res, 156(4), 399-408.
Raz, N., Gunning, F., Head, D., Dupuis, J., McQuain, J., Briggs, S., et al. (1997). Selective aging of the human cerebral cortex observed in vivo: differential vulnerability of the prefrontal gray matter. Cereb Cortex, 7(3), 268-282.
Raz, N., Williamson, A., Gunning-Dixon, F., Head, D., & Acker, J. (2000). Neuroanatomical and cognitive correlates of adult age differences in acquisition of a perceptual-motor skill. Microsc Res Tech, 51(1), 85-93.
Reuter-Lorenz, P., Jonides, J., Smith, E., Hartley, A., Miller, A., Marshuetz, C., et al. (2000). Age differences in the frontal lateralization of verbal and spatial working memory revealed by PET. J Cogn Neurosci, 12(1), 174-187.
Rodrigue, K., Kennedy, K., & Raz, N. (2005). Aging and longitudinal change in perceptual-motor skill acquisition in healthy adults. J Gerontol B Psychol Sci Soc Sci, 60(4), P174-181.
Roller, C., Cohen, H., Kimball, K., & Bloomberg, J. (2002). Effects of normal aging on visuo-motor plasticity. Neurobiol Aging, 23(1), 117-123.
Rypma, B., Berger, J., & D'Esposito, M. (2002). The influence of working-memory demand and subject performance on prefrontal cortical activity. J Cogn Neurosci, 14(5), 721-731.
Rypma, B., & D'Esposito, M. (1999). The roles of prefrontal brain regions in components of working memory: effects of memory load and individual differences. Proc Natl Acad Sci U S A, 96(11), 6558-6563.
Rypma, B., & D'Esposito, M. (2000). Isolating the neural mechanisms of age-related changes in human working memory. Nat Neurosci, 3(5), 509-515.
Salthouse, T. (1994). Aging associations: influence of speed on adult age differences in associative learning. J Exp Psychol Learn Mem Cogn, 20(6), 1486-1503.
Salthouse, T., & Mitchell, D. (1989). Structural and operational capacities in integrative spatial ability. Psychol Aging, 4(1), 18-25.
Seidler, R. (2007). Aging affects motor learning but not savings at transfer of learning. Learn Mem, 14(1-2), 17-21.
Seidler, R., Alberts, J., & Stelmach, G. (2002a). Changes in multi-joint performance with age. Motor Control, 6(1), 19-31.
Seidler, R., Noll, D., & Chintalapati, P. (2006). Bilateral basal ganglia activation associated with sensorimotor adaptation. Experimental Brain Research, 175(3), 544-555.
Seidler, R., & Noll, D. (2008). Neuroanatomical correlates of motor acquisition and motor transfer. J Neurophysiol, 99(4), 1836-1845.
Seidler-Dobrin, R., & Stelmach, G. (1998). Persistence in visual feedback control
108
by the elderly. Experimental Brain Research, 119(4), 467-474. Stewart, A., Mills, K., King, A., Haskell, W., Gillis, D., & Ritter, P. (2001).
CHAMPS physical activity questionnaire for older adults: outcomes for interventions. Medicine and Science in Sports and Exercise, 33(7), 1126-1141.
Teulings, H., Contreras-Vidal, J., Stelmach, G., & Adler, C. (2002). Adaptation of handwriting size under distorted visual feedback in patients with Parkinson's disease and elderly and young controls. J Neurol Neurosurg Psychiatry, 72(3), 315-324.
Thornton, W., & Raz, N. (2006). Aging and the role of working memory resources in visuospatial attention. Neuropsychol Dev Cogn B Aging Neuropsychol Cogn, 13(1), 36-61.
Tisserand, D., van Boxtel, M., Pruessner, J., Hofman, P., Evans, A., & Jolles, J. (2004). A voxel-based morphometric study to determine individual differences in gray matter density associated with age and cognitive change over time. Cereb Cortex, 14(9), 966-973.
Toni, I., Krams, M., Turner, R., & Passingham, R. (1998). The time course of changes during motor sequence learning: a whole-brain fMRI study. Neuroimage, 8(1), 50-61.
Ward, N., & Frackowiak, R. (2003). Age-related changes in the neural correlates of motor performance. Brain, 126(Pt 4), 873-888.
Welford, A. (1984). Between bodily changes and performance: some possible reasons for slowing with age. Exp Aging Res, 10(2), 73-88.
Wolpert, D., Goodbody, S., & Husain, M. (1998). Maintaining internal representations: the role of the human superior parietal lobe. Nat Neurosci, 1(6), 529-533.
Yeung N, Cohen J, and Botvinick M. The neural basis of error detection: conflict monitoring and the error-related negativity. Psychol Rev 111: 931-959, 2004.
109
CHAPTER IV:
General Discussion and Conclusions
Overview
The goal of this dissertation was to determine whether spatial working
memory (SWM) plays a role in visuomotor adaptation for young and older adults.
I found evidence that young adults engage SWM processes during the early, but
not late, phase of visuomotor adaptation (Chapter 2). In contrast, older adults do
not, despite showing relatively intact brain activation patterns during performance
of a SWM task (Chapter 3). These results support the idea that the early stage
of visuomotor adaptation relies on cognitive processes (Eversheim and Bock,
2001; Taylor and Thoroughman, 2007, 2008; however, see Mazzoni and
Krakauer, 2006), with older adults showing a reduced rate of adaptation possibly
due to ineffective engagement of these processes. These findings lead to a
number of future directions regarding age-related deficits in visuomotor
adaptation, several of which are described below.
The potential role of inhibition The young adults neural overlap results support a role for SWM in
visuomotor adaptation; however, there were other brain areas associated with
early adaptation outside of the SWM mask analysis. For example, the young
110
adults early adaptation > control contrast showed bilateral basal ganglia
activation (see Table 2.5). Basal ganglia engagement has previously been
reported using the same adaptation task (Seidler et al., 2006), and is suggested
to support both spatial cognitive and sensorimotor processes contributing to
adaptation. Whole brain activation correlations with older adults’ mean early DE
score showed bilateral activation in the premotor cortex (PMC), the anterior
cingulate cortex (ACC), and right cerebellum (see Table 3.4)3. Bilateral PMC
activation has been previously observed for this task (Anguera et al., 2007), with
right PMC engagement believed to contribute to movement preparation (Praeg et
al., 2005), while left PMC engagement has been associated with online
movement corrections (Lee and van Donkelaar, 2006). The activation at these
other regions outside of the SWM mask suggests that additional underlying
cognitive mechanisms are contributing to visuomotor adaptation.
Another cognitive process that may play a role during early adaptation is
inhibition. There are many different types of inhibition (response inhibition, task
switching, interference resolution, etc; cf. Aron, 2007), each of which could
contribute to visuomotor adaptation. For example, participants need to inhibit
their prior visuomotor mapping while developing a new representation during the
adaptation period. Inhibition has primarily been associated with activation in the
right IFG (cf. Aron et al., 2004), although there is also evidence for bilateral and
left IFG recruitment for assisting interference resolution (D’Esposito et al., 1999;
Jonides et al., 1998; Thompson-Schill et al., 2002) and response inhibition on
3 The proposed roles of the ACC and cerebellum in early visuomotor adaptation have been
discussed earlier in Chapter 3.
111
Go/NoGo tasks (Konishi et al., 1999). Young adults showed a correlation
between activation in the right IFG and the mean DE score during early learning
(Figure 2.8), as well as greater activation here versus older adults (Figure 3.4).
These findings suggest the possibility of at least one form of inhibition
contributing to the rate of early adaptation group differences.
As previously described, one possible role for inhibition during visuomotor
adaptation is the suppression of the previously learned visuomotor mapping.
Brosseau and colleagues (2007) hypothesized that inhibitory control deficits
regarding competing motor memories may explain age-related difficulties with
mirror tracing (Brosseau et al., 2007). Selecting among competing
representations has been associated with left IFG engagement (Zhang et al.,
2004), which in the present study may reflect performing in the veridical versus
rotated environment. Matsubara et al. (2004) showed that left IFG engagement
was also associated with the inhibition of a well-learned manual behavior. More
specifically, these authors observed left IFG activation when participants were
instructed to lose when playing rock-paper-scissors. In the present study, young
adults showed greater left IFG activation compared to older adults and LOW
OAs, providing additional support for early adaptation deficits being associated
with age-related declines in inhibition. This hypothesis would obviously require
additional testing, but it appears to be a fruitful avenue for future research.
Examining the role of inhibition during visuomotor adaptation would
involve disentangling the contributions of the different types of inhibition. The
involvement associated with each type of inhibition could be tested through

112
behavioral correlations, as inter-correlations among different inhibitory measures
have shown to be low (Kramer et al., 1994; Davidson and Glisky, 2002). Smith
et al. (2008) were able to dissociate between motor and non-motor inhibition
effects in an EEG GO/NOGO study, providing additional support that
distinguishing between inhibition types during the motor learning process may be
possible. A dual-task approach that identifies the time-course of reliance of
certain processes (cf. Eversheim and Bock, 2001) could also be useful in
attempting to examine the different contributions of distinct forms of inhibition.
Both approaches would potentially provide evidence regarding how inhibition
plays a role in the motor learning process, further supporting the use of cognitive
control processes during motor learning.
Do young adults rely on SWM for other forms of motor learning? One remaining question is whether SWM also contributes to other types of
motor learning such as sequence learning, trajectory learning, or even other
forms of visuomotor adaptation such as mirror tracing. For example, pursuit rotor
task performance has shown to be correlated with nonverbal working memory
measures (Raz et al., 2000)4. PET and functional near-infrared spectroscopy
(fNIRS) imaging studies of this task have reported activation in a number of
regions including the cerebellum, primary motor cortex, SMA, preSMA, and IPL
(Grafton et al., 1992, 1994; Hatakenaka et al., 2007). However, none of these
studies reported activation in the right prefrontal cortex, a region which has
4 These measures are described in greater detail in Chapter 3.
113
repeatedly been associated with SWM tasks (Cohen et al., 1996; Courtney et al.,
1998; Gauthier et al., 2002; Jonides et al., 1993; McCarthy et al., 1996; Reuter-
Lorenz et al., 2000; Walter et al., 2003).
Imaging studies of maze tracing have shown similar activation patterns as
the pursuit rotor task (e.g. cerebellum, primary motor cortex, SMA, preSMA, and
IPL, among others), with the right prefrontal cortex showing deactivation during
tracing (Balslev et al., 2004; Van Meir et al., 1998). This is not surprising given
that maze tracing (and pursuit rotor) do not require making a visuospatial
transformation. However, mirror tracing (which requires formation of a new
visuomotor map) has shown increased bilateral activation at the prefrontal cortex
(Balslev et al., 2004), suggesting the engagement of SWM processes for learning
the new visuomotor mapping. Thus, the use of SWM resources appears to be
dictated by the task.
Imaging studies of sequence learning have shown young adults utilize
working memory resources during learning (Jenkins et al., 1994; Jueptner et al.,
1997a; Hazeltine et al., 1997), including the right DLPFC (Toni et al., 1998;
Seidler et al., 2002). Recent work from this laboratory has also demonstrated
young adults’ reliance on spatial processes during sequence learning, as their
performance was impaired when the spatial components of the response were
removed (Bo and Seidler, 2007). Doyon and colleagues (2003) have outlined
literature showing that both motor sequence and motor adaptation tasks recruit
similar cerebral structures in the early learning phase, including prefrontal
regions. Thus, it may be that SWM is relied on in a similar fashion and time-
114
course to visuomotor adaptation for sequence learning. However, even if the
same neural regions are engaged, it does not mean that there is an overlap of
the processing components (e.g. Dahlin et al., 2008)5. Thus, future work is
warranted to establish whether both the underlying strategies and neural regions
engaged for sequence learning overlap with those of visuomotor adaptation.
Do age-related SWM deficits impact other forms of motor learning?
Another remaining question is whether a failure to effectively recruit SWM
processes in the early adaptation period would account for age-related deficits in
other forms of motor learning. Age-related differences have been observed for
the pursuit rotor task (Raz et al., 2000; Kennedy et al., 2007), mirror tracing tasks
(Etnier and Landers, 1988; Rodrigue et al., 2005; Kennedy et al., 2005), and
sequence learning tasks (Curran et al., 1997; Dennis et al., 2006; Negash et al.,
2003; Howard et al., 2004; however, see Howard & Howard, 1989, 1992;
Frensch & Miner, 1994). Pursuit rotor and mirror tracing task performance have
been shown to correlate with prefrontal volumetric declines (Raz et al., 2000;
Kennedy et al., 2005) as well as nonverbal working memory measures (Raz et
al., 2000; Kennedy et al., 2007). These findings suggest that ineffective
recruitment of SWM resources during early learning may also underlie age-
related deficits for these tasks.
Age-related deficits in sequence learning have also been attributed to
working memory deficits (Curran et al., 1997), as reduced working memory span
5 The limitation regarding similar neural engagement by Dahlin et al. (2008) with respect to the overlapping SWM and early adaptation activation is further discussed on page 119.
115
may negatively impact the size of the sequence ‘chunk’ being learned. Findings
by Cherry and Stadler (1995) support this hypothesis, as ‘high ability’ older adults
(as defined by education and employment) showed greater sequence learning
and verbal working memory performance than ‘low ability’ older adults. However,
it is not clear how this relates to the current study because the authors tested
verbal rather than SWM.
Age-related sequence learning deficits have still been observed following
the removal of the spatial aspects of sequence stimulus presentation (Negash et
al., 2003; Dennis et al., 2003). However, this finding is not surprising given that
Willingham and colleagues (2000) demonstrated that participants learn a series
of response locations during sequence learning. Recent work from this
laboratory has shown that older adults’ performance does benefit from the
removal of spatial aspects associated with the response component compared to
young adults (Bo and Seidler, 2007). These findings leave open the possibility of
older adults’ SWM resources being ineffectively engaged during sequence
learning like at the early adaptation period.
Visuomotor adaptation generalization: cause and effects Visuomotor adaptation requires the integration of multiple processes:
anticipation of environmental constraints, the interpretation of sensory
information, and adapting behavior to achieve a desired result. Age-related
impairments in visuomotor adaptation are also multi-factorial, given the
deterioration of musculoskeletal, neuromuscular, and sensory systems with age.
116
More specifically, age-related declines in musculoskeletal and neuromuscular
systems have been observed for muscle fibers (Brooks & Faulkner, 1994),
muscle spindles (Swash & Fox, 1972), and motor unit number (Brown, 1972;
Campbell et al., 1973; Galganski et al., 1993). Similarly, sensory age-related
declines have been noted for the visual (Demer, 1994) and vestibular systems
(Bugnariu and Fung, 2007; Cinelli et al., 2008; Horak et al., 1989), including age-
related deficits in upper-limb proprioception (Adamo et al., 2007). These
declines require re-weighting of sensory information and adjusting motor outputs
to complete a given task. This can be especially difficult for older adults,
considering the timecourse and extent of these declines may not be parallel for
each system.
The ability to adapt to age-related changes in motor and sensory systems
can also be indicative of one’s quality of life with advancing age. One way of
assessing sensorimotor plasticity is through visuomotor adaptation, as this
measure can provide insights regarding an individual’s ability to adapt to age-
related motor and sensory declines. Age-related kinematic studies of visuomotor
adaptation have shown, for the most part, reduced sensorimotor plasticity in
older adults (Bock et al., 2005; Fernandez-Ruiz et al. 2000; McNay and
Willingham 1998; Seidler et al, 2006; Teulings et al. 2002; however, see
Canavan et al. 1990; Roller et al. 2002). However, visuomotor adaptation has
also been shown to be an effective therapeutic intervention for post-stroke
individuals using virtual reality techniques (Holden et al., 1999; Sveistrup, 2004),
117
suggesting that sensorimotor changes can result from visuomotor adaptation
training.
To the best of my knowledge, there has not been a training study where
participants practiced a visuomotor adaptation paradigm like the one studied
here and then looked for transfer to ADLs. However, the present work was
motivated by the idea that age-related declines in one domain (cognitive) would
negatively affect another (sensorimotor). Given that cognition-based
interventions have shown preserved plasticity in older adults (Kramer and Willis,
2002; Kramer et al., 2004; Willis and Nesselroade, 1990; Erickson et al. 2007),
facilitating sensorimotor changes with age may be best accomplished using a
less-than-direct approach. More specifically, training specific cognitive factors
(e.g. SWM, inhibition, short-term memory) may have positive effects on
sensorimotor plasticity, with potential approaches described below.
Cognitive training in older adults
Beyond a basic science perspective, the current results could be
integrated into programs designed to facilitate skill acquisition in older adults.
The 2007 profile of older Americans projects that the older adult population will
burgeon between the years 2010 and 2030, which is when the "baby boom"
generation reaches age 65 (http://agingstats.gov). These developments have
fostered a recent surge in age-related interventions targeting physical and
cognitive declines. For example, there has been a number of laboratory-based
cognitive interventions for older adults (cf. Colcombe and Kramer, 2003) showing
118
positive results for memory-based (Baron and Mattila, 1989; Erickson et al.,
2006; Verhaeghen et al., 1992) as well as motor-based training interventions
(Bherer et al., 2008).
An interesting and important issue involves how a change in cognitive
performance would be reflected by corresponding changes in neural activation.
Cognitive training studies have shown that improved task performance is also
reflected by corresponding activation changes (Olesen et al., 2004; Thimm et al.,
2005; Westerberg et al., 2007). However, there are only a few of these types of
studies with young adults and older adults (Dahlin et al., 2008; Nyberg et al.,
2003; Erickson et al., 2007). Erickson et al. (2007) showed training-based
performance gains for a flanker task that correlated with reduced age-related
differences in ventral and dorsal prefrontal activation. Dahlin et al. (2008) also
observed training based performance gains for a verbal short term memory task,
with activation changes localized to the striatum. However, Nyberg et al. (2003)
did not observe training-based changes in frontal activation in older adults, unlike
their young adults counterparts. One important difference between these studies
involves the amount of training given: Erickson et al. (2007) provided 5 training
sessions, Dahlin et al. (2008) provided 15 sessions, while Nyberg et al. (2003)
had only one. This training difference appears to account for changes in neural
activation patterns, supporting the need for multiple training bouts for neural
activation patterns to evolve in older adults. These findings also suggest that the
effectiveness of a given training study can potentially be associated with these
119
neural activation changes, providing another direction and useful measure of
improvement for future interventions.
With regards to the design of new training studies, the most effective
interventions would have aspects that transfer to related, yet unpracticed, tasks.
Dahlin et al. (2008) demonstrated that cognitive training will only generalize if the
training and transfer tasks utilize overlapping cognitive processes and brain
regions. These authors showed that while older adults engaged similar regions
as young adults following training, these gains did not transfer, suggesting the
utilization of different processing components. The present findings parallel
these results: young adults and older adults showed similar activation during the
SWM task, including the engagement of right prefrontal regions. However, older
adults’ rate of early adaptation did not correlate with any measures of SWM, nor
did they show any neural activation overlap for each task, unlike young adults.
Another future direction regarding the present work would be to develop a
SWM training paradigm and test whether these gains transfer to visuomotor
adaptation. As SWM resources appear to play a critical role during early
adaptation, training could hypothetically boost performance in young adults and
older adults. This approach is supported in theory by Westerberg and colleagues
(2007), who suggested that training-related improvements on a visuospatial
working memory task would “be similar to skill acquisition” (pg. 187, Westerberg
et al., 2007). This group observed greater right prefrontal and parietal activation
following training on a visuospatial working memory task (Olesen et al., 2004;
Westerberg et al., 2007). Given the association of these regions with SWM and
120
the early stages of skill acquisition, this approach may have promising outcomes
but would obviously require follow-up testing.
Support for promoting visuomotor adaptation by boosting SWM
performance in the present work is evidenced by the young adult correlation
between the card rotation performance and DE rate of early adaptation.
Similarly, the correlation between the right DLPFC activation and the pooled
group rate of early adaptation (see Figure 3.5) also supports this idea from a
neural activation perspective. The combination of these results suggests that
SWM training may have the intended effect. It warrants mentioning that this type
of training study would require controlling for improvements in general executive
processing, motivation, and several other potential explanatory variables.
However, rather than depending upon correlations as in the present study, a
training intervention would provide more direct evidence of the role of SWM in
visuomotor adaptation, provided that SWM gains would generalize to this type of
task.
An important note regarding these training studies and their potential
impact on visuomotor adaptation involves the use of explicit cognitive strategies.
Transferring training gains to an unlearned task has been shown to be facilitated
by the use of explicit strategies (Mahncke et al., 2006). This idea was
implemented in several of the previous cognitive training studies (Baron and
Mattila, 1989; Bherer et al., 2008; Kramer et al., 1995; Verhaeghen et al., 1992),
as practice alone does not always lead to the development of effective
performance strategies (Maquestiaux et al., 2004). However, the value of explicit
121
cognitive strategies with a visuomotor adaptation task is unclear, as Mazzoni and
Krakauer (2006) demonstrated that implicit adaptation processes override explicit
strategies during visuomotor adaptation. However, this outcome may have
resulted from the use of a strategy which conflicted with the adaptation process.
Cognitive instruction that matches the adaptation process may facilitate
visuomotor adaptation, although this would again require follow-up testing.
Aging, fitness, and visuomotor adaptation differences
Older adults with better fitness levels have shown less age-related
declines in motor learning tasks (Etnier et al., 2001) and cognitive abilities
(Colcombe and Kramer, 2003). These findings suggest that differing fitness
levels may explain the visuomotor adaptation rate of learning differences
between HIGH and LOW OAs; however, this was not the case. In addition to all
of the neuropsychological measures, older adults were also characterized in
terms of their general health and physical activity using self-reports (“On a scale
of 1-5, how would you classify your current health status (1 = poor, 5 = very
good)”; see Appendix D) and the CHAMPS questionnaire (Stewart et al., 2001).
However, HIGH and LOW OAs did not differ on their physical activity levels
based on the CHAMPS questionnaire, age, self-reports of physical health, or
performance on any of the neuropsychological measures. When these specific
health and CHAMPS measures were added to the older adults’ behavioral
correlations, none was associated with either the early or late adaptation rate of
learning (see Table 4.1). These results were surprising given the association
122
between fitness and executive cognitive measures (cf. Colcombe and Kramer,
2003). Although speculative, the lack of difference here is likely a reflection of
the university-area population that I tested. These older adults would likely be
considered HIGH OAs in many respects, including health, education, and socio-
economic status (SES), compared to the overall older adult population. In this
case, finding differences between HIGH and LOW OAs would be challenging
given our sample size.
The CHAMPS questionnaire also provides more specific questions that
allowed for some additional insights regarding the population tested (ex. “How
many hours per week do you use a computer?”; “How many hours per week are
spent walking at a slow pace?”). For example, there was a positive correlation
between SWM RT and hours spent using a computer per week, suggesting that
computer usage did not facilitate performance on the SWM task for older adult.
Card rotation performance showed a positive correlation with the number of
calories expended per week, while SWM RT negatively correlated with self-
reported health status. These findings suggest that the more active and healthy
older adults in the present study showed fewer performance declines on tasks
requiring SWM and mental rotation processes. This agrees with previous work
regarding older adults fitness levels and cognitive abilities (Colcombe and
Kramer, 2003), suggesting that our sample does appear to follow a normal
distribution with respect to the general older adult population.
123
Limitations
The significance in having overlapping processing components in addition
to overlapping activation (e.g. Dahlin et al., 2008) highlights an important
limitation in the present work. The young adults correlation between the card
rotation performance and rate of early adaptation suggested that similar neural
processes were engaged between these tasks. However, the rate of early
adaptation did not correlate with SWM task accuracy. This is important as SWM
neural activation was measured using the SWM task, not the card rotation task,
to establish the overlap of SWM processes at the early adaptation period. The
lack of significant correlation here casts some doubt on claims regarding the use
of SWM processes during early adaptation. However, there was a significant
correlation between the card rotation task and SWM accuracy with both groups
pooled, suggesting that these tasks do share similar processes.
Another limitation of the present work was the inability to identify
differences between the HIGH and LOW OAs with any of the neuropsychological
or health measures taken. This null result highlights the importance (and
difficulty) of selecting appropriate and sensitive measures that would distinguish
these differences. For example, Bock (2005) found no correlations between
visuomotor adaptation and the trail-making test, a task which encompasses
several cognitive constructs including attention, concentration, resistance to
distraction, and cognitive flexibility. Given that visuospatial attention and working
memory have been associated with early adaptation by this group (Eversheim
and Bock, 2001), the importance of having precise measures for a given
124
construct is apparent. This absent group difference may also be indicative of
other unmeasured cognitive processes contributing to the adaptation process.
For example, I hypothesized earlier that inhibition may play a role during early
adaptation; a behavioral test of this construct along with its correlation with early
adaptation performance would provide support for this idea. Future work in this
area should consider other neuropsychological, health, and fitness measures that
may identify correlates of successful aging in terms of motor learning tasks.
One final concern is whether there was a potential bias between young
adults and older adults in their computer use, and how this would translate to
using a joystick for the visuomotor adaptation task. However, there was no
performance difference between these groups at the control period of the
visuomotor adaptation task (when veridical feedback of movements was
provided). There was also no difference in the hours per week of computer use
between young adults and older adults (or HIGH and LOW older adults) as
measured by the CHAMPS questionnaire. Again, this null result may be a
function of the university-area population that was tested, given that these older
adults would likely be considered HIGH older adults in many respects compared
to the overall older adult population.
Conclusions This dissertation provides evidence of SWM playing a role in the early
adaptation period for young adults, with older adults failing to utilize their
relatively intact SWM resources in an effective manner when needed. Other
cognitive processes that have shown age-related declines (e.g. inhibition) may
125
also play a role in visuomotor adaptation. However, it is unclear whether older
adults would also fail to effectively utilize these resources when needed like
SWM. The use of SWM processes during early adaptation may generalize to
other forms of skill acquisition (i.e. mirror tracing, sequence learning). Likewise,
older adults’ SWM deficits may factor into age-related declines for these other
motor learning tasks.
Training interventions may also mitigate age-related visuomotor
adaptation deficits by strengthening specific cognitive processes engaged during
the adaptation process. However, it warrants mentioning that these interventions
may not be as beneficial for visuomotor adaptation as hypothesized, given that
older adults may be using some yet to be determined strategies which these
training paradigms may not affect. Fitness and health measures did not differ
between the HIGH and LOW OAs, suggesting that other measures are required
to reveal the mechanisms of the rate of learning difference between these
groups. In conclusion, the present findings and suggested follow up studies may
provide a template which specifically targets the promotion of increased rates of
skill acquisition in young and older adults. These findings may also contribute to
the development of age-appropriate interventions for both healthy older adults
and individuals who have suffered specific sensory or motor loss with age.
126
References
Adamo, D. E., Martin, B. J., & Brown, S. H. (2007). Age-related differences in
upper limb proprioceptive acuity. Percept Mot Skills, 104(3 Pt 2), 1297-1309.
Anguera, J., Russell, C., Noll, D., & Seidler, R. (2007). Neural correlates associated with intermanual transfer of sensorimotor adaptation. Brain Res, 1185, 136-151.
Aron, A., Robbins, T., & Poldrack, R. (2004). Inhibition and the right inferior frontal cortex. Trends in Cognitive Sciences, 8(4), 170-177.
Aron, A. R. (2007). The neural basis of inhibition in cognitive control. Neuroscientist, 13(3), 214-228.
Balslev, D., Christensen, L., Lee, J., Law, I., Paulson, O., & Miall, R. (2004). Enhanced accuracy in novel mirror drawing after repetitive transcranial magnetic stimulation-induced proprioceptive deafferentation. J Neurosci, 24(43), 9698-9702.
Balslev, D., Nielsen, F. A., Frutiger, S. A., Sidtis, J. J., Christiansen, T. B., Svarer, C., et al. (2002). Cluster analysis of activity-time series in motor learning. Hum Brain Mapp, 15(3), 135-145.
Baron, A., & Mattila, W. (1989). Response slowing of older adults: effects of time-limit contingencies on single- and dual-task performances. Psychol Aging, 4(1), 66-72.
Bherer, L., Kramer, A. F., Peterson, M. S., Colcombe, S., Erickson, K., & Becic, E. (2008). Transfer effects in task-set cost and dual-task cost after dual-task training in Young and older adults: further evidence for cognitive plasticity in attentional control in late adulthood. Exp Aging Res, 34(3), 188-219.
Bo, J. & Seidler R.D. (2007). The role of spatial processing in sequence learning for young and old adults. SFN abstract, 204.12.
Bock, O. (2005). Components of sensorimotor adaptation in young and elderly subjects. Exp Brain Res, 160(2), 259-263.
Brooks, S. V., & Faulkner, J. A. (1994). Skeletal muscle weakness in old age: underlying mechanisms. Med Sci Sports Exerc, 26(4), 432-439.
Brosseau, J., Potvin, M. J., & Rouleau, I. (2007). Aging affects motor skill learning when the task requires inhibitory control. Dev Neuropsychol, 32(1), 597-613.
Brown, W. F. (1972). A method for estimating the number of motor units in thenar muscles and the changes in motor unit count with ageing. J Neurol Neurosurg Psychiatry, 35(6), 845-852.
Bugnariu, N., & Fung, J. (2007). Aging and selective sensorimotor strategies in the regulation of upright balance. J Neuroeng Rehabil, 4, 19.
Campbell, M. J., McComas, A. J., & Petito, F. (1973). Physiological changes in ageing muscles. J Neurol Neurosurg Psychiatry, 36(2), 174-182.
Canavan, A., Passingham, R., Marsden, C., Quinn, N., Wyke, M., & Polkey, C. (1990). Prism adaptation and other tasks involving spatial abilities in
127
patients with Parkinson's disease, patients with frontal lobe lesions and patients with unilateral temporal lobectomies. Neuropsychologia, 28(9), 969-984.
Cherry, K., & Stadler, M. (1995). Implicit learning of a nonverbal sequence in younger and older adults. Psychol Aging, 10(3), 379-394.
Cinelli, M., Patla, A., & Stuart, B. (2008). Age-related differences during a gaze reorientation task while standing or walking on a treadmill. Exp Brain Res, 185(1), 157-164.
Cohen, M., Kosslyn, S., Breiter, H., DiGirolamo, G., Thompson, W., Anderson, A., et al. (1996). Changes in cortical activity during mental rotation - A mapping study using functional MRI. Brain, 119, 89-100.
Colcombe, A. M., Kramer, A. F., Irwin, D. E., Peterson, M. S., Colcombe, S., & Hahn, S. (2003). Age-related effects of attentional and oculomotor capture by onsets and color singletons as a function of experience. Acta Psychol (Amst), 113(2), 205-225.
Colcombe, S., & Kramer, A. F. (2003). Fitness effects on the cognitive function of older adults: a meta-analytic study. Psychol Sci, 14(2), 125-130.
Colcombe, S. J., Kramer, A. F., McAuley, E., Erickson, K. I., & Scalf, P. (2004). Neurocognitive aging and cardiovascular fitness: recent findings and future directions. J Mol Neurosci, 24(1), 9-14.
Courtney, S., Petit, L., Maisog, J., Ungerleider, L., & Haxby, J. (1998). An area specialized for spatial working memory in human frontal cortex. Science, 279(5355), 1347-1351.
Curran, T. (1997). Effects of aging on implicit sequence learning: accounting for sequence structure and explicit knowledge. Psychol Res, 60(1-2), 24-41.
D'Esposito, M., Postle, B. R., Ballard, D., & Lease, J. (1999). Maintenance versus manipulation of information held in working memory: an event-related fMRI study. Brain Cogn, 41(1), 66-86.
Dahlin, E., Neely, A. S., Larsson, A., Backman, L., & Nyberg, L. (2008). Transfer of learning after updating training mediated by the striatum. Science, 320(5882), 1510-1512.
Davidson, P. S., & Glisky, E. L. (2002). Neuropsychological correlates of recollection and familiarity in normal aging. Cogn Affect Behav Neurosci, 2(2), 174-186.
Demer, J. (1994). Effect of aging on vertical visual tracking and visual-vestibular interaction. J Vestib Res, 4(5), 355-370.
Dennis, N. A., Howard, J. H., Jr., & Howard, D. V. (2003). Age deficits in learning sequences of spoken words. J Gerontol B Psychol Sci Soc Sci, 58(4), P224-227.
Dennis, N., Howard, J. J., & Howard, D. (2006). Implicit sequence learning without motor sequencing in young and old adults. Exp Brain Res, 175(1), 153-164.
Doyon, J., Penhune, V., & Ungerleider, L. (2003). Distinct contribution of the cortico-striatal and cortico-cerebellar systems to motor skill learning. Neuropsychologia, 41(3), 252-262.
128
Enoka, R. M., Christou, E. A., Hunter, S. K., Kornatz, K. W., Semmler, J. G., Taylor, A. M., et al. (2003). Mechanisms that contribute to differences in motor performance between young and old adults. J Electromyogr Kinesiol, 13(1), 1-12.
Erickson, K. I., Colcombe, S. J., Wadhwa, R., Bherer, L., Peterson, M. S., Scalf, P. E., et al. (2007). Training-induced plasticity in older adults: effects of training on hemispheric asymmetry. Neurobiol Aging, 28(2), 272-283.
Etnier, J., & Berry, M. (2001). Fluid intelligence in an older COPD sample after short- or long-term exercise. Med Sci Sports Exerc, 33(10), 1620-1628.
Etnier, J. L., & Landers, D. M. (1998). Motor performance and motor learning as a function of age and fitness. Res Q Exerc Sport, 69(2), 136-146.
Eversheim, U., & Bock, O. (2001). Evidence for processing stages in skill acquisition: a dual-task study. Learn Mem, 8(4), 183-189.
Fernández-Ruiz, J., Hall, C., Vergara, P., & Díiaz, R. (2000). Prism adaptation in normal aging: slower adaptation rate and larger aftereffect. Brain Res Cogn Brain Res, 9(3), 223-226.
Frensch, P., & Miner, C. (1994). Effects of presentation rate and individual differences in short-term memory capacity on an indirect measure of serial learning. Mem Cognit, 22(1), 95-110.
Galganski, M. E., Fuglevand, A. J., & Enoka, R. M. (1993). Reduced control of motor output in a human hand muscle of elderly subjects during submaximal contractions. J Neurophysiol, 69(6), 2108-2115.
Gauthier, I., Hayward, W., Tarr, M., Anderson, A., Skudlarski, P., & Gore, J. (2002). BOLD activity during mental rotation and viewpoint-dependent object recognition. Neuron, 34(1), 161-171.
Grafton, S. T. (1994). Cortical control of movement. Ann Neurol, 36(1), 3-4. Grafton, S. T., Mazziotta, J. C., Presty, S., Friston, K. J., Frackowiak, R. S., &
Phelps, M. E. (1992). Functional anatomy of human procedural learning determined with regional cerebral blood flow and PET. J Neurosci, 12(7), 2542-2548.
Hatakenaka, M., Miyai, I., Mihara, M., Sakoda, S., & Kubota, K. (2007). Frontal regions involved in learning of motor skill--A functional NIRS study. Neuroimage, 34(1), 109-116.
Hazeltine, E., Grafton, S., & Ivry, R. (1997). Attention and stimulus characteristics determine the locus of motor-sequence encoding. A PET study. Brain, 120 ( Pt 1), 123-140.
Holden, J., Flach, J., & Donchin, Y. (1999). Perceptual-motor coordination in an endoscopic surgery simulation. Surg Endosc, 13(2), 127-132.
Horak, F. B., Shupert, C. L., & Mirka, A. (1989). Components of postural dyscontrol in the elderly: a review. Neurobiol Aging, 10(6), 727-738.
Howard, D., & Howard, J. J. (1989). Age differences in learning serial patterns: direct versus indirect measures. Psychol Aging, 4(3), 357-364.
Howard, D., & Howard, J. J. (1992). Adult age differences in the rate of learning serial patterns: evidence from direct and indirect tests. Psychol Aging, 7(2), 232-241.
Howard, D., Howard, J. J., Japikse, K., DiYanni, C., Thompson, A., & Somberg,
129
R. (2004). Implicit sequence learning: effects of level of structure, adult age, and extended practice. Psychol Aging, 19(1), 79-92.
Jenkins, I., Brooks, D., Nixon, P., Frackowiak, R., & Passingham, R. (1994). Motor sequence learning: a study with positron emission tomography. J Neurosci, 14(6), 3775-3790.
Jenkins, L., Myerson, J., Hale, S., & Fry, A. (1999). Individual and developmental differences in working memory across the life span. Psychon Bull Rev, 6(1), 28-40.
Jonides, J., Smith, E., Koeppe, R., Awh, E., Minoshima, S., & Mintun, M. (1993). Spatial working memory in humans as revealed by PET. Nature, 363(6430), 623-625.
Jueptner, M., Stephan, K., Frith, C., Brooks, D., Frackowiak, R., & Passingham, R. (1997). Anatomy of motor learning. I. Frontal cortex and attention to action. J Neurophysiol, 77(3), 1313-1324.
Kennedy, K. M., Partridge, T., & Raz, N. (2007). Age-Related Differences in Acquisition of Perceptual-Motor Skills: Working Memory as a Mediator. Neuropsychol Dev Cogn B Aging Neuropsychol Cogn, 1-19.
Kennedy, K. M., & Raz, N. (2005). Age, sex and regional brain volumes predict perceptual-motor skill acquisition. Cortex, 41(4), 560-569.
Konishi, S., Nakajima, K., Uchida, I., Kikyo, H., Kameyama, M., & Miyashita, Y. (1999). Common inhibitory mechanism in human inferior prefrontal cortex revealed by event-related functional MRI. Brain, 122 ( Pt 5), 981-991.
Kramer AF, Bherer L, Colcombe SJ, Dong W, Greenough WT. Environmental influences on cognitive and brain plasticity during aging. J Gerontol A Biol
Sci Med Sci 59(9):940–57. Kramer, A. F., Colcombe, S. J., McAuley, E., Eriksen, K. I., Scalf, P., Jerome, G.
J., et al. (2003). Enhancing brain and cognitive function of older adults through fitness training. J Mol Neurosci, 20(3), 213-221.
Kramer, A. F., Humphrey, D. G., Larish, J. F., Logan, G. D., & Strayer, D. L. (1994). Aging and inhibition: beyond a unitary view of inhibitory processing in attention. Psychol Aging, 9(4), 491-512.
Kramer AF, Larish JF, Strayer DL. Training for attentional control in dual task settings: a comparison of young and old adults. J Exp Psychol: Appl 1(1):50–76. Kramer AF,Willis SL. (2002). Enhancing the cognitive vitality of older adults. Curr Dir Psychol Sci,11:173–6. Lee, J. H., & van Donkelaar, P. (2006). The human dorsal premotor cortex
generates on-line error corrections during sensorimotor adaptation. J Neurosci, 26(12), 3330-3334.
Mahncke, H. W., Connor, B. B., Appelman, J., Ahsanuddin, O. N., Hardy, J. L., Wood, R. A., et al. (2006). Memory enhancement in healthy older adults using a brain plasticity-based training program: a randomized, controlled study. Proc Natl Acad Sci U S A, 103(33), 12523-12528.
Maquestiaux, F., Hartley, A. A., & Bertsch, J. (2004). Can practice overcome age-related differences in the psychological refractory period effect? Psychol Aging, 19(4), 649-667.
130
Matsubara, M., Yamaguchi, S., Xu, J., & Kobayashi, S. (2004). Neural correlates for the suppression of habitual behavior: a functional MRI study. J Cogn Neurosci, 16(6), 944-954.
Mazzoni, P., & Krakauer, J. (2006). An implicit plan overrides an explicit strategy during visuomotor adaptation. Journal of Neuroscience, 26(14), 3642-3645.
McCarthy, G., Puce, A., Constable, R., Krystal, J., Gore, J., & Goldman-Rakic, P. (1996). Activation of human prefrontal cortex during spatial and nonspatial working memory tasks measured by functional MRI. Cereb Cortex, 6(4), 600-611.
McNay, E., & Willingham, D. (1998). Deficit in learning of a motor skill requiring strategy, but not of perceptuomotor recalibration, with aging. Learn Mem, 4(5), 411-420.
Negash, S., Howard, D. V., Japikse, K. C., & Howard, J. H. (2003). Age-related differences in implicit learning of non-spatial sequential patterns. Aging Neuropsychology and Cognition, 10, 108-121.
Nyberg, L., Sandblom, J., Jones, S., Neely, A. S., Petersson, K. M., Ingvar, M., et al. (2003). Neural correlates of training-related memory improvement in adulthood and aging. Proc Natl Acad Sci U S A, 100(23), 13728-13733.
Olesen, P. J., Westerberg, H., & Klingberg, T. (2004). Increased prefrontal and parietal activity after training of working memory. Nat Neurosci, 7(1), 75-79.
Poldrack, R., & Gabrieli, J. (2001). Characterizing the neural mechanisms of skill learning and repetition priming: evidence from mirror reading. Brain, 124(Pt 1), 67-82.
Praeg, E., Herwig, U., Lutz, K., & Jancke, L. (2005). The role of the right dorsal premotor cortex in visuomotor learning: a transcranial magnetic stimulation study. Neuroreport, 16(15), 1715-1718.
Raz, N., Williamson, A., Gunning-Dixon, F., Head, D., & Acker, J. (2000). Neuroanatomical and cognitive correlates of adult age differences in acquisition of a perceptual-motor skill. Microsc Res Tech, 51(1), 85-93.
Reuter-Lorenz, P., Jonides, J., Smith, E., Hartley, A., Miller, A., Marshuetz, C., et al. (2000). Age differences in the frontal lateralization of verbal and spatial working memory revealed by PET. J Cogn Neurosci, 12(1), 174-187.
Rodrigue, K. M., Kennedy, K. M., & Raz, N. (2005). Aging and longitudinal change in perceptual-motor skill acquisition in healthy adults. J Gerontol B Psychol Sci Soc Sci, 60(4), P174-181.
Roller, C., Cohen, H., Kimball, K., & Bloomberg, J. (2002). Effects of normal aging on visuo-motor plasticity. Neurobiol Aging, 23(1), 117-123.
Seidler, R., Noll, D., & Chintalapati, P. (2006). Bilateral basal ganglia activation associated with sensorimotor adaptation. Experimental Brain Research, 175(3), 544-555.
Seidler, R., Purushotham, A., Kim, S., Ugurbil, K., Willingham, D., & Ashe, J. (2002). Cerebellum activation associated with performance change but not motor learning. Science, 296(5575), 2043-2046.
131
Smith, J. L., Johnstone, S. J., & Barry, R. J. (2008). Movement-related potentials in the Go/NoGo task: the P3 reflects both cognitive and motor inhibition. Clin Neurophysiol, 119(3), 704-714.
Stewart, A., Mills, K., King, A., Haskell, W., Gillis, D., & Ritter, P. (2001). CHAMPS physical activity questionnaire for older adults: outcomes for interventions. Medicine and Science in Sports and Exercise, 33(7), 1126-1141.
Sveistrup, H. (2004). Motor rehabilitation using virtual reality. J Neuroeng Rehabil, 1(1), 10.
Swash, M., & Fox, K. P. (1972). The effect of age on human skeletal muscle. Studies of the morphology and innervation of muscle spindles. J Neurol Sci, 16(4), 417-432.
Taylor, J., & Thoroughman, K. (2007). Divided attention impairs human motor adaptation but not feedback control. J Neurophysiol, 98(1), 317-326.
Taylor, J., & Thoroughman, K. (2008). Motor adaptation scaled by the difficulty of a secondary cognitive task. PLoS ONE 3: e2485.
Teulings, H., Contreras-Vidal, J., Stelmach, G., & Adler, C. (2002). Adaptation of handwriting size under distorted visual feedback in patients with Parkinson's disease and elderly and young controls. J Neurol Neurosurg Psychiatry, 72(3), 315-324.
Thimm, M., Fink, G. R., Kust, J., Karbe, H., & Sturm, W. (2006). Impact of alertness training on spatial neglect: a behavioural and fMRI study. Neuropsychologia, 44(7), 1230-1246.
Thompson-Schill, S. L., Jonides, J., Marshuetz, C., Smith, E. E., D'Esposito, M., Kan, I. P., et al. (2002). Effects of frontal lobe damage on interference effects in working memory. Cogn Affect Behav Neurosci, 2(2), 109-120.
Toni, I., Krams, M., Turner, R., & Passingham, R. (1998). The time course of changes during motor sequence learning: a whole-brain fMRI study. Neuroimage, 8(1), 50-61.
van Mier, H., Tempel, L. W., Perlmutter, J. S., Raichle, M. E., & Petersen, S. E. (1998). Changes in brain activity during motor learning measured with PET: effects of hand of performance and practice. J Neurophysiol, 80(4), 2177-2199.
Verhaeghen, P., Marcoen, A., & Goossens, L. (1992). Improving memory performance in the aged through mnemonic training: a meta-analytic study. Psychol Aging, 7(2), 242-251.
Walter, H., Bretschneider, V., Grön, G., Zurowski, B., Wunderlich, A., Tomczak, R., et al. (2003). Evidence for quantitative domain dominance for verbal and spatial working memory in frontal and parietal cortex. Cortex, 39(4-5), 897-911.
Westerberg, H., & Klingberg, T. (2007). Changes in cortical activity after training of working memory--a single-subject analysis. Physiol Behav, 92(1-2), 186-192.
Willis SL, Nesselroade CS. Long-term effects of fluid ability training in old–old age. Dev Psychol 26(6):905–10.

132
Zhang, J. X., Feng, C. M., Fox, P. T., Gao, J. H., & Tan, L. H. (2004). Is left inferior frontal gyrus a general mechanism for selection? Neuroimage, 23(2), 596-603.
133
Appendix A
Testing spatial working memory resources under dual-task conditions
Objective
This study examined to what extent spatial resources were engaged when
participants performed the spatial working memory (SWM) task. It could be
argued that participants were not utilizing SWM and/or mental rotation resources
to perform this task, but instead used an object identification strategy when the
probe set was presented. Arguably, a ‘matching’ strategy would be sufficient in
order to correctly identify the rotated shapes. To address this potential criticism, I
conducted a dual tasking control study where participants performed the SWM
task simultaneously with either a spatial or non-spatial task. I hypothesized that
performing the SWM task along with a spatial task would tax the participants’
spatial processes, leading to diminished accuracy on the SWM task. I
hypothesized, however, that SWM performance would not be affected when
participants performed a non-spatial task, as these tasks would be calling on
different working memory resources. The results of this control study confirmed
that SWM resources were utilized for accurate performance of the SWM task, as
134
evidenced by the corresponding effects on SWM task accuracy with each
secondary task.
Methods
15 participants (21.1 ± 2.5 yrs; 9 males) were recruited from the University
of Michigan student population and were given class credit for their participation.
These individuals did not participate in the study outlined in Chapter 2. Each
participant signed an IRB-approved informed consent document prior to their
participation.
Participants performed the same SWM task as the fMRI participants in
Chapter 2, involving the mental rotation and identification of similar shapes (for
details, see Figure 2.1). Additionally, participants also performed a color
identification primary task (COLOR; see Figure A.1) which involved recalling
whether a dot’s color matched that of one of the previously presented circles,
regardless of spatial location. The timing parameters for the COLOR task were
the same as for the SWM task (detailed in Anguera Chapter 2). During the RI for
the SWM and COLOR tasks, participants also performed either a spatial, non-
spatial, or control secondary task (see figure A.1).
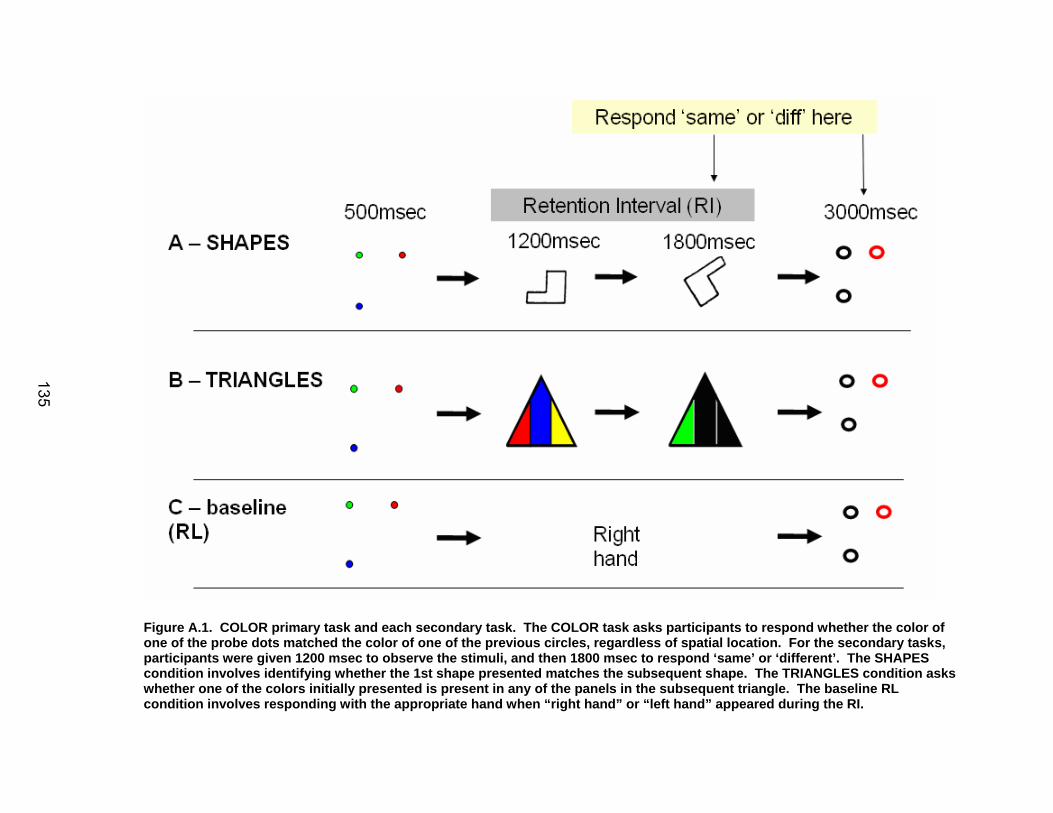
135
Figure A.1. COLOR primary task and each secondary task. The COLOR task asks participants to respond whether the color of one of the probe dots matched the color of one of the previous circles, regardless of spatial location. For the secondary task s, participants were given 1200 msec to observe the stimuli, and th en 1800 msec to respond ‘same’ or ‘different’. The SHAPES condition involves identifying whether the 1st shape presented matches the subsequent shape. The TRIANGLES condition asks whether one of the colors initially presented is present in any of the panels in the subsequent triangle. The baseline RL condition involves responding with the appropriate hand when “right hand” or “left hand” appeared during the RI.
135
136
The spatial secondary task was based upon Thurston’s card rotation task
(Ekstrome et al., 1976) which requires both SWM and mental rotation processes
(SHAPES; see Figure A.1, panel A). During the RI, a target shape was
presented for 1200msec, followed by the presentation of a probe shape for
1800msec. Participants had to decide whether the two shapes ‘matched’,
requiring a mental rotation of the probe shape within the plane of the screen.
However, if the probe shape was the mirror image of the target shape (i.e.
requiring participants to ‘flip’ the shape outside the plane of the screen), the two
shapes were considered ‘different’.
The non-spatial secondary task involved color identification
(TRIANGLES), as participants were presented a target triangle with 3 colored
dots, followed by a single colored circle (see Figure A.1, panel B). At this time,
participants responded whether the colored circle matched one of the dot colors
(without regards to the spatial location of the colors in either triangle).
There was also a control task which required responding with either the
right or left hand when “right hand” or “left hand” was flashed on the screen for
3000msec (RL). This secondary task acted as a control measure with which to
compare the effect on accuracy and reaction time (RT) of the other tasks.
Each of these potential combinations were presented randomly, with 3
blocks (1 block = 20 trials) of each condition combination presented throughout
the course of the experiment. Each secondary task was also performed alone to
establish baseline accuracy levels outside of the dual-task paradigm. I used four
separate ANOVAs to test overall mean accuracy and RT for each condition
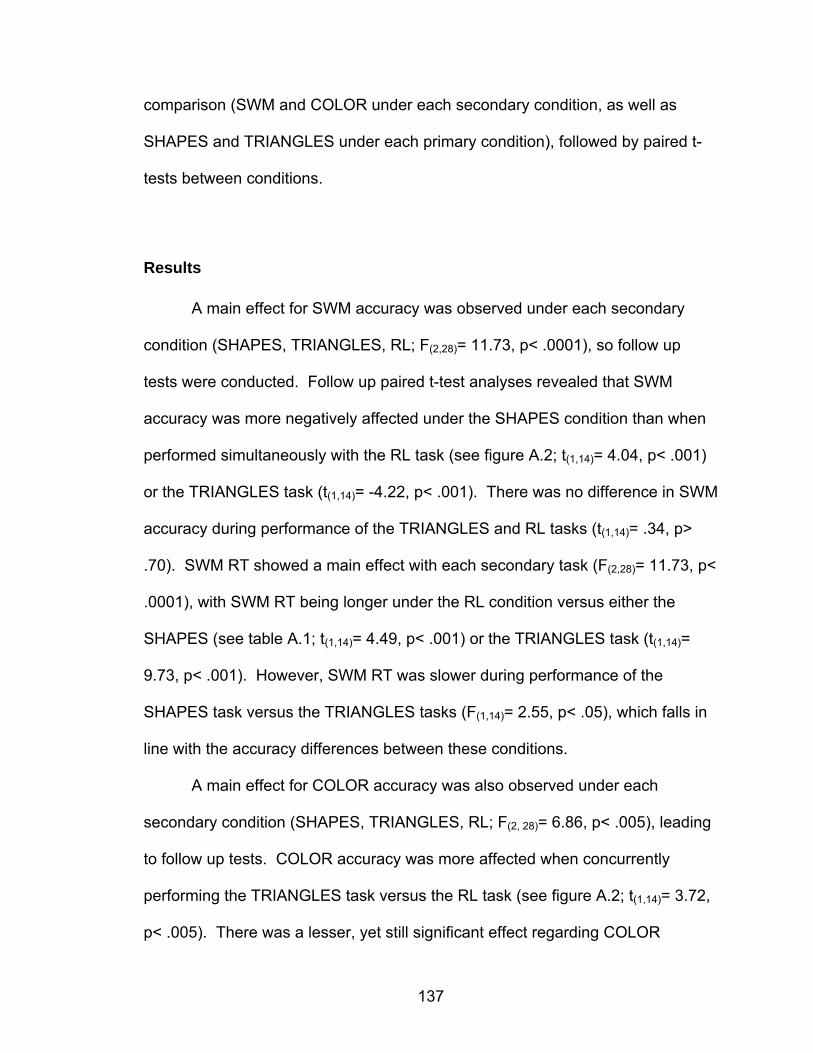
137
comparison (SWM and COLOR under each secondary condition, as well as
SHAPES and TRIANGLES under each primary condition), followed by paired t-
tests between conditions.
Results
A main effect for SWM accuracy was observed under each secondary
condition (SHAPES, TRIANGLES, RL; F(2,28)= 11.73, p< .0001), so follow up
tests were conducted. Follow up paired t-test analyses revealed that SWM
accuracy was more negatively affected under the SHAPES condition than when
performed simultaneously with the RL task (see figure A.2; t(1,14)= 4.04, p< .001)
or the TRIANGLES task (t(1,14)= -4.22, p< .001). There was no difference in SWM
accuracy during performance of the TRIANGLES and RL tasks (t(1,14)= .34, p>
.70). SWM RT showed a main effect with each secondary task (F(2,28)= 11.73, p<
.0001), with SWM RT being longer under the RL condition versus either the
SHAPES (see table A.1; t(1,14)= 4.49, p< .001) or the TRIANGLES task (t(1,14)=
9.73, p< .001). However, SWM RT was slower during performance of the
SHAPES task versus the TRIANGLES tasks (F(1,14)= 2.55, p< .05), which falls in
line with the accuracy differences between these conditions.
A main effect for COLOR accuracy was also observed under each
secondary condition (SHAPES, TRIANGLES, RL; F(2, 28)= 6.86, p< .005), leading
to follow up tests. COLOR accuracy was more affected when concurrently
performing the TRIANGLES task versus the RL task (see figure A.2; t(1,14)= 3.72,
p< .005). There was a lesser, yet still significant effect regarding COLOR
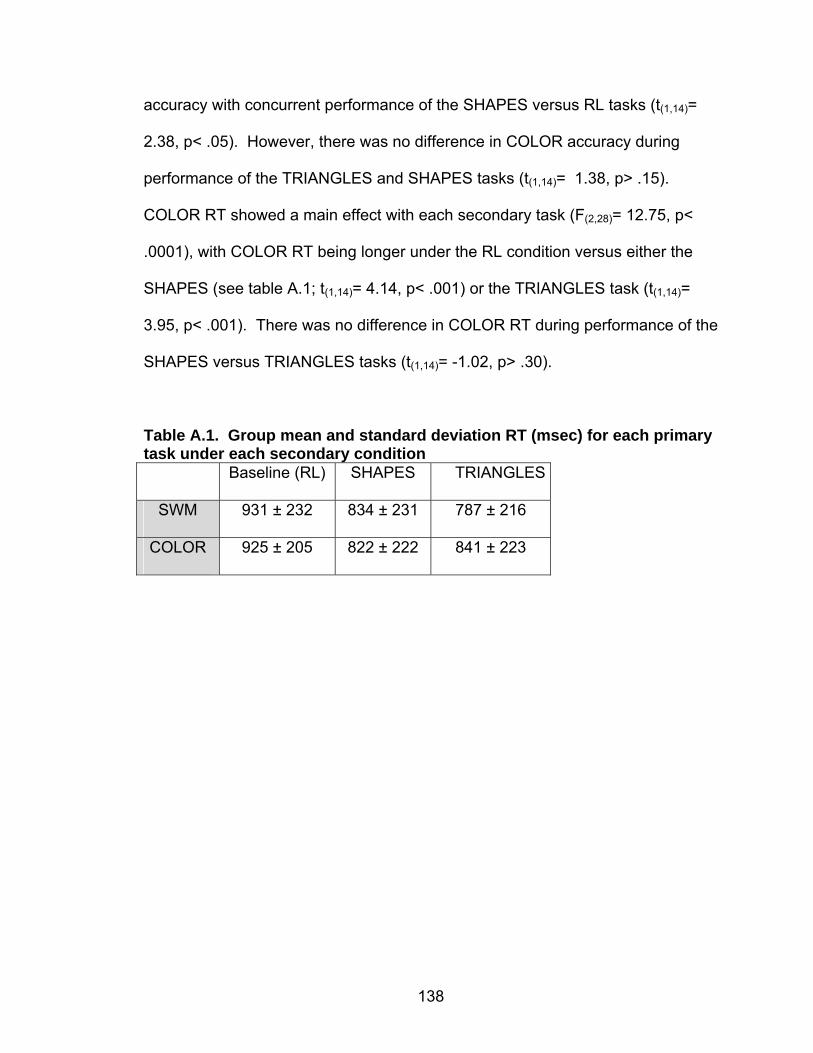
138
accuracy with concurrent performance of the SHAPES versus RL tasks (t(1,14)=
2.38, p< .05). However, there was no difference in COLOR accuracy during
performance of the TRIANGLES and SHAPES tasks (t(1,14)= 1.38, p> .15).
COLOR RT showed a main effect with each secondary task (F(2,28)= 12.75, p<
.0001), with COLOR RT being longer under the RL condition versus either the
SHAPES (see table A.1; t(1,14)= 4.14, p< .001) or the TRIANGLES task (t(1,14)=
3.95, p< .001). There was no difference in COLOR RT during performance of the
SHAPES versus TRIANGLES tasks (t(1,14)= -1.02, p> .30).
Table A.1. Group mean and standard deviation RT (msec) for each primary task under each secondary condition
Baseline (RL) SHAPES TRIANGLES
SWM 931 ± 232 834 ± 231 787 ± 216
COLOR 925 ± 205 822 ± 222 841 ± 223
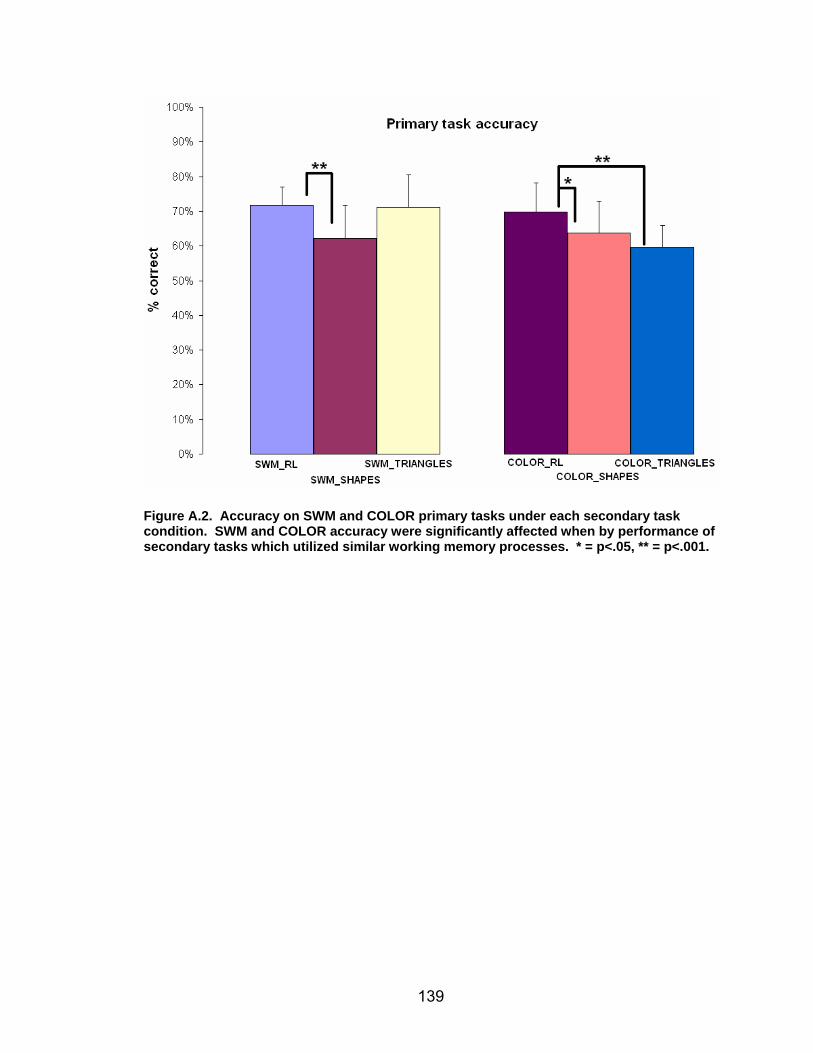
139
Figure A.2. Accuracy on SWM and COLOR primary tasks under each secondary task condition. SWM and COLOR accuracy were significantly affected when by performance of secondary tasks which utilized similar working memory processes. * = p<.05, ** = p<.001.
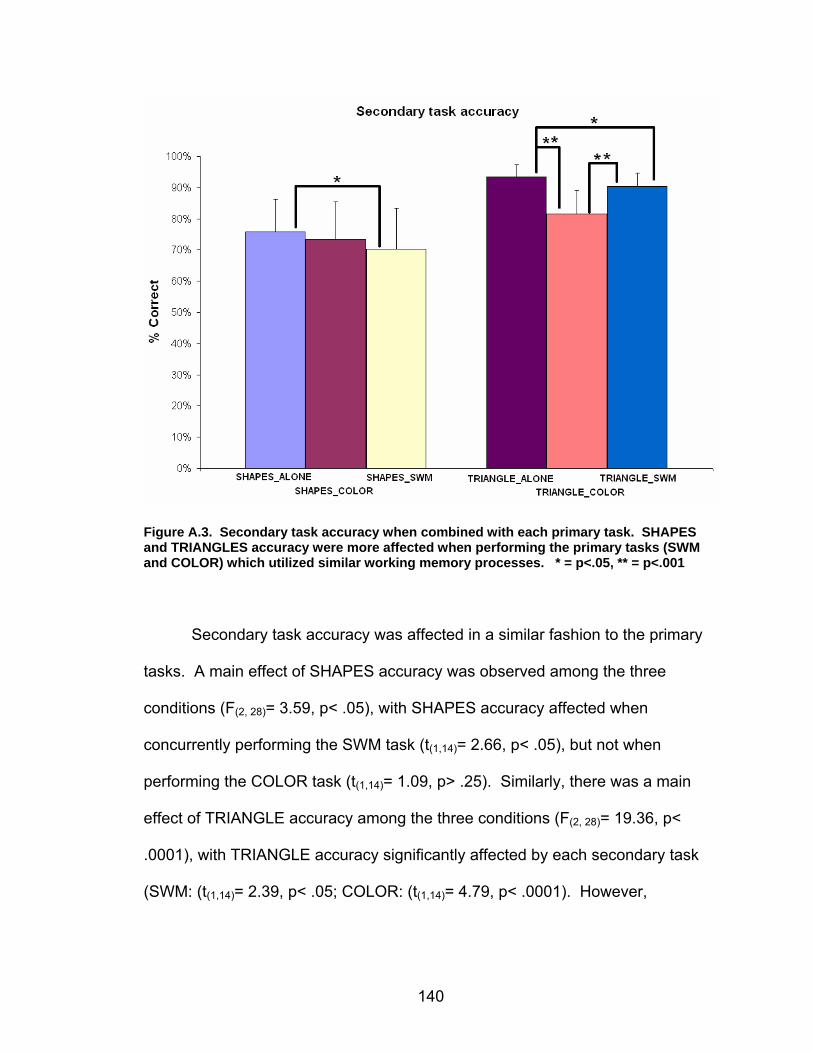
140
Figure A.3. Secondary task accuracy when combined with each primary task. SHAPES and TRIANGLES accuracy were more affected when performing the primary tasks (SWM and COLOR) which utilized similar working me mory processes. * = p<.05, ** = p<.001
Secondary task accuracy was affected in a similar fashion to the primary
tasks. A main effect of SHAPES accuracy was observed among the three
conditions (F(2, 28)= 3.59, p< .05), with SHAPES accuracy affected when
concurrently performing the SWM task (t(1,14)= 2.66, p< .05), but not when
performing the COLOR task (t(1,14)= 1.09, p> .25). Similarly, there was a main
effect of TRIANGLE accuracy among the three conditions (F(2, 28)= 19.36, p<
.0001), with TRIANGLE accuracy significantly affected by each secondary task
(SWM: (t(1,14)= 2.39, p< .05; COLOR: (t(1,14)= 4.79, p< .0001). However,
141
TRIANGLE accuracy was more compromised under concurrent performance of
the COLOR task than the SWM task (t(1,14)= 4.41, p< .0001).
SHAPES RT showed a main effect difference with each primary task
(F(2,28)= 10.34, p< .0001), with SHAPES RT alone being longer compared to the
SWM (see table A.2; t(1,14)= 3.35, p< .01) or COLORS tasks (t(1,14)= 3.44, p< .01).
There was no difference in SHAPES RT during performance of the SWM or
COLORS tasks (t(1,14)= 1.13, p> .25). TRIANGLES RT showed a main effect
difference with each primary task (F(2,28)= 8.07, p< .01), with TRIANGLES RT
alone being longer compared to the SWM task (see table A.2; t(1,14)= 4.16, p<
0.01), but not versus the COLORS tasks (t(1,14)= .79, p< .40). TRIANGLES RT
was slower during performance of the COLORS task versus the SWM task
(t(1,14)= -4.17, p< .001).
Table A.2. Group mean and standa rd deviation RT (msec) for each secondary task under each primary condition
Alone SWM COLOR
SHAPES 1117 ± 285 1008 ± 274 987 ± 274
TRIANGLES 837 ± 212 755 ± 201 816 ± 225
Conclusions
The present findings support the hypothesis that spatial cognitive
resources were used during the SWM task RI. I found a double dissociation
between SWM and COLOR accuracy under each dual-task condition. More
142
specifically, SWM accuracy and RT were most compromised while concurrently
performing the SHAPES task, with SHAPES accuracy also being most affected
during the SWM task. Similarly, COLOR accuracy (although not RT) was most
affected by the TRIANGLES task, with TRIANGLE RT being fastest when non-
related resources were being taxed (SWM). These findings support that
participants were not using a visual matching strategy when performing the SWM
task of Chapter 2, but rather relied on SWM resources.
References
Ekstrome RB, French JW, Harman HH, et al. (1976). Manual for kit of factor referenced cognitive tests. Princeton, New Jersey: Educational Testing Service.
143
Appendix B - Supplementary acti vation tables for young adults
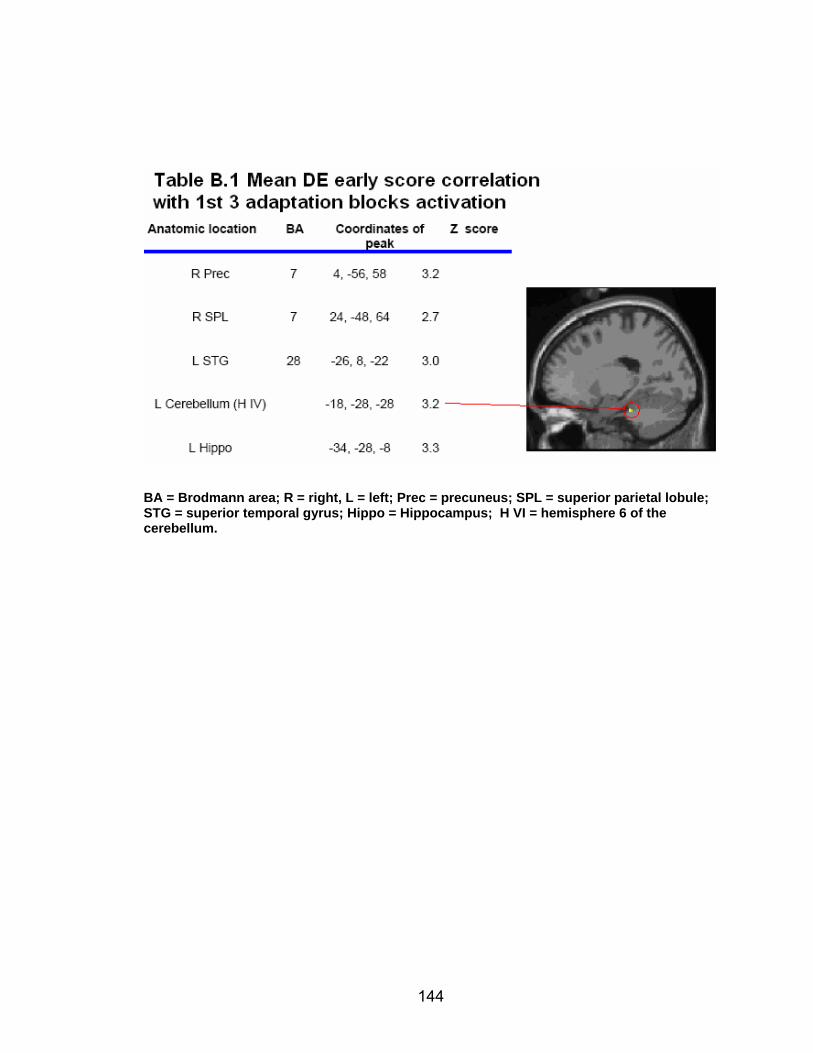
144
BA = Brodmann area; R = right, L = left; Prec = precuneus; SPL = superior parietal lobule; STG = superior temporal gyrus; Hippo = Hippocampus; H VI = hemisphere 6 of the cerebellum.
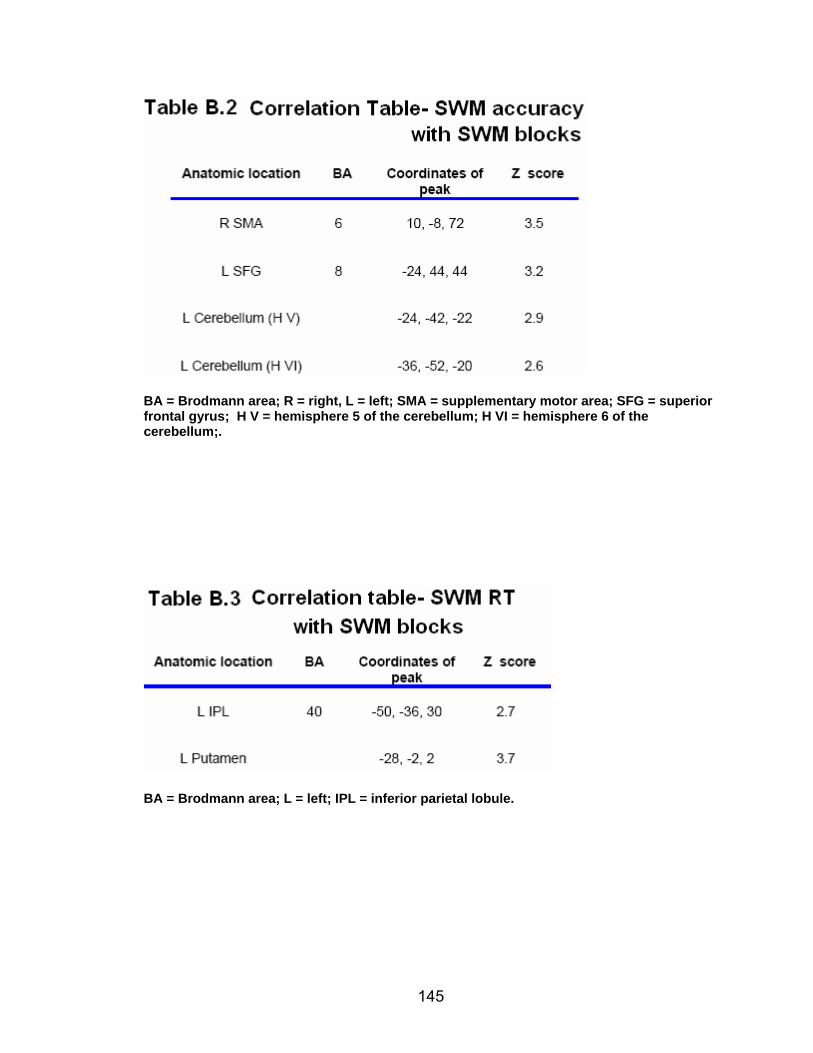
145
BA = Brodmann area; R = right, L = left; SMA = supplementary motor area; SFG = superior frontal gyrus; H V = hemisphere 5 of the cerebellum; H VI = hemisphere 6 of the cerebellum;.
BA = Brodmann area; L = left; IPL = inferior parietal lobule.
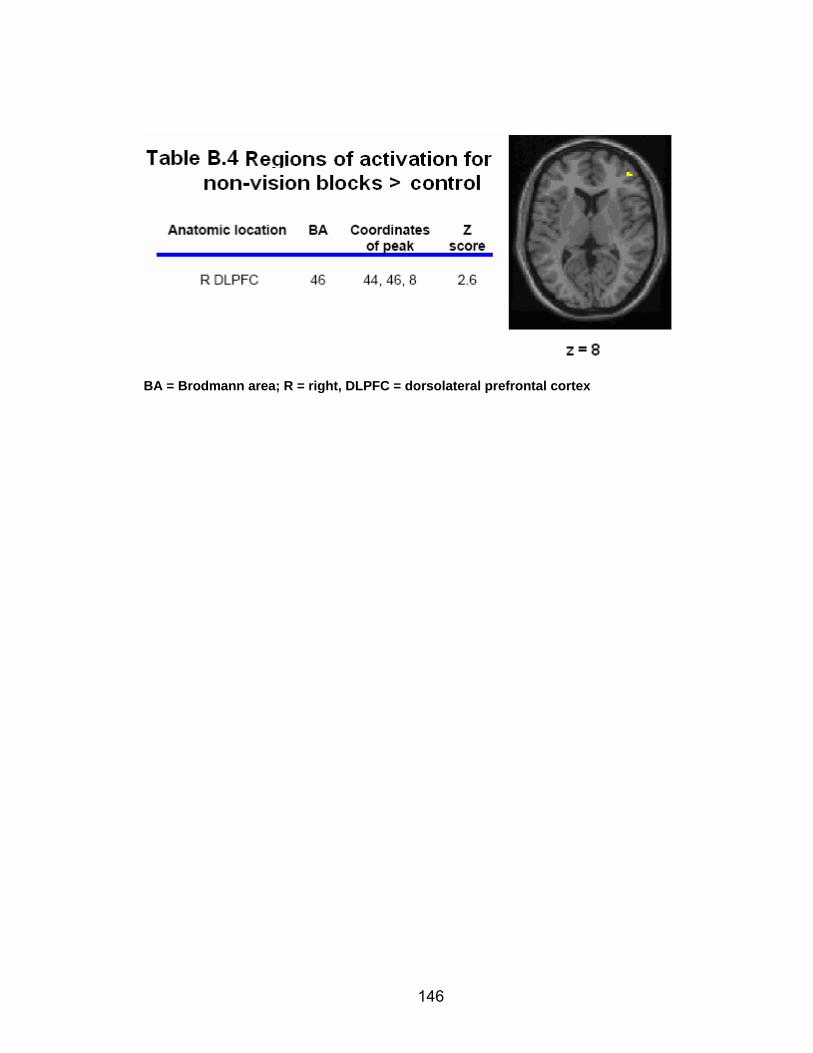
146
BA = Brodmann area; R = right, DLPFC = dorsolateral prefrontal cortex
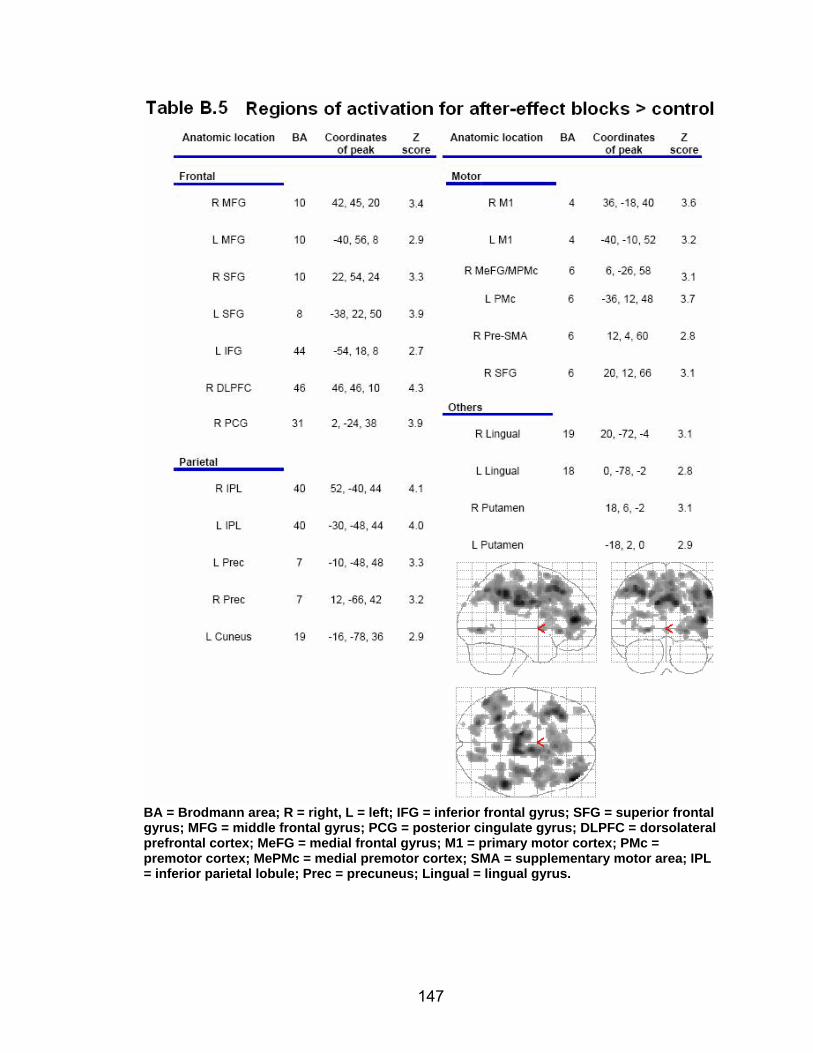
147
BA = Brodmann area; R = right, L = left; IFG = inferior frontal gyrus; SFG = superior frontal gyrus; MFG = middle frontal gyrus; PCG = posterior cingulate gyrus; DLPFC = dorsolateral prefrontal cortex; MeFG = medial frontal gyrus; M1 = primary motor cortex; PMc = premotor cortex; MePMc = medial premotor cortex; SMA = supplementary motor area; IPL = inferior parietal lobule; Prec = precuneus; Lingual = lingual gyrus.
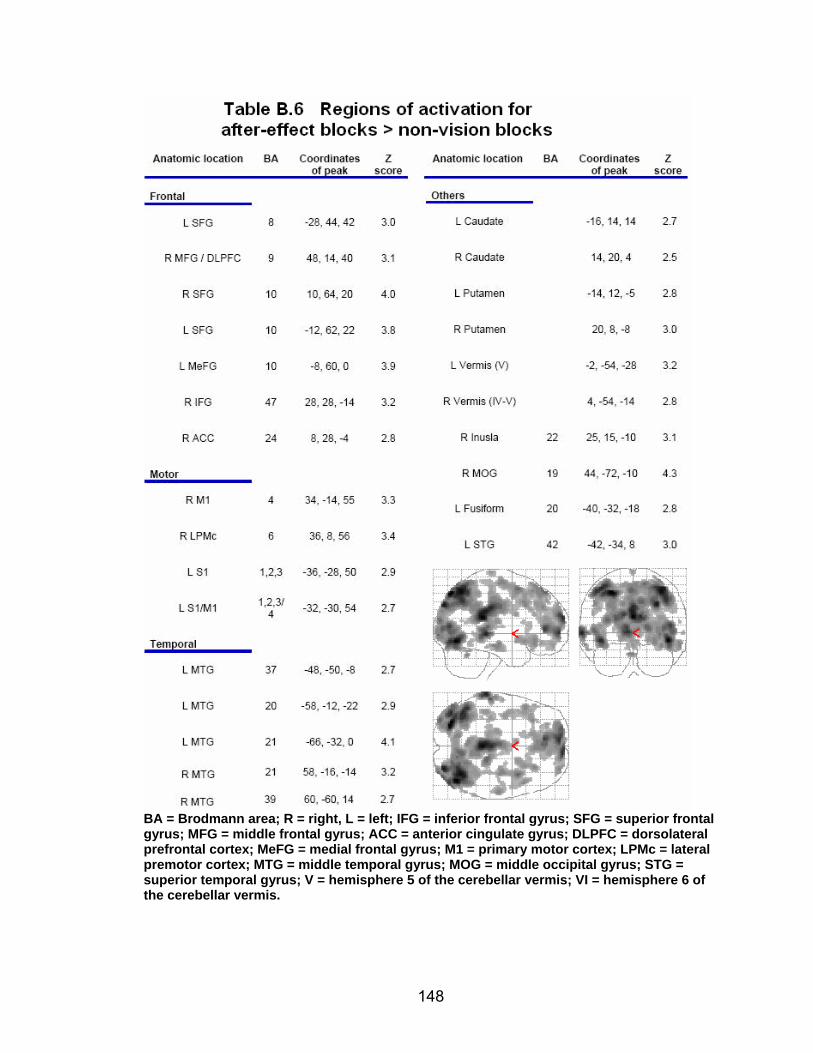
148
BA = Brodmann area; R = right, L = left; IFG = inferior frontal gyrus; SFG = superior frontal gyrus; MFG = middle frontal gyrus; ACC = anterior cingulate gyrus; DLPFC = dorsolateral prefrontal cortex; MeFG = medial frontal gyru s; M1 = primary motor cortex; LPMc = lateral premotor cortex; MTG = middle temporal gyrus; MOG = middle occipital gyrus; STG = superior temporal gyrus; V = hemisphere 5 of the cerebellar vermis; VI = hemisphere 6 of the cerebellar vermis.

149
Appendix C - Supplementary activat ion tables for older adults
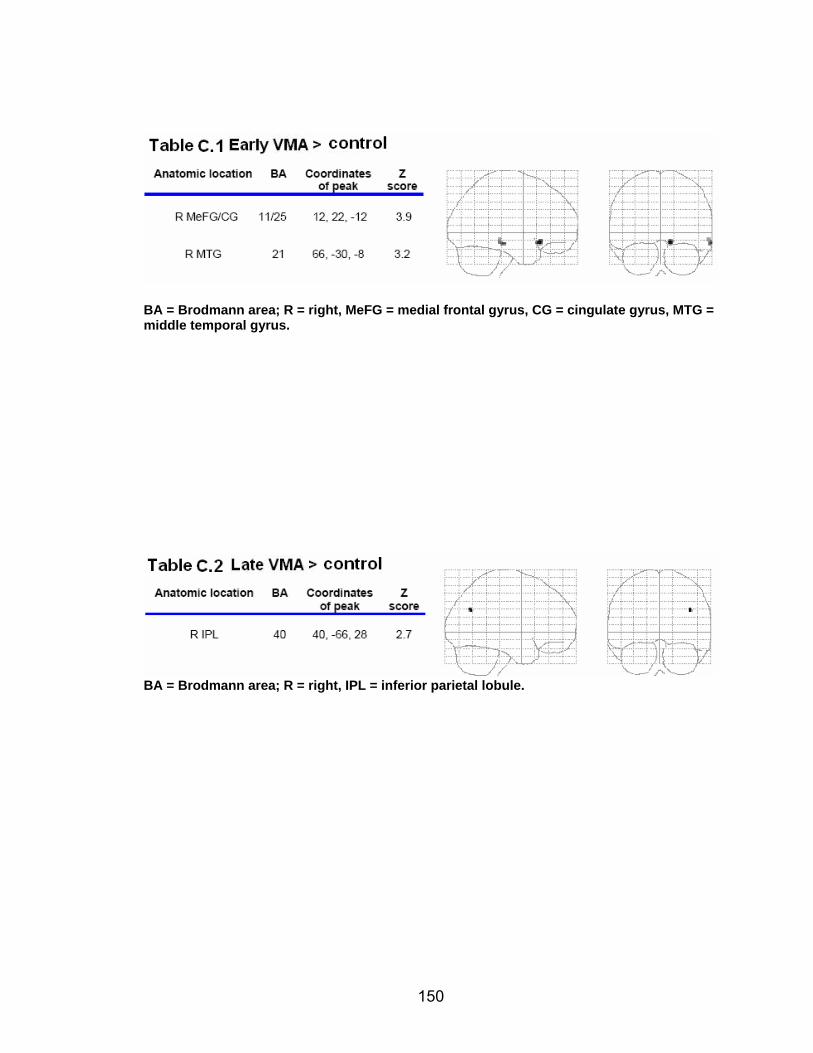
150
BA = Brodmann area; R = right, MeFG = medial fr ontal gyrus, CG = cingulate gyrus, MTG = middle temporal gyrus.
BA = Brodmann area; R = right, IPL = inferior parietal lobule.
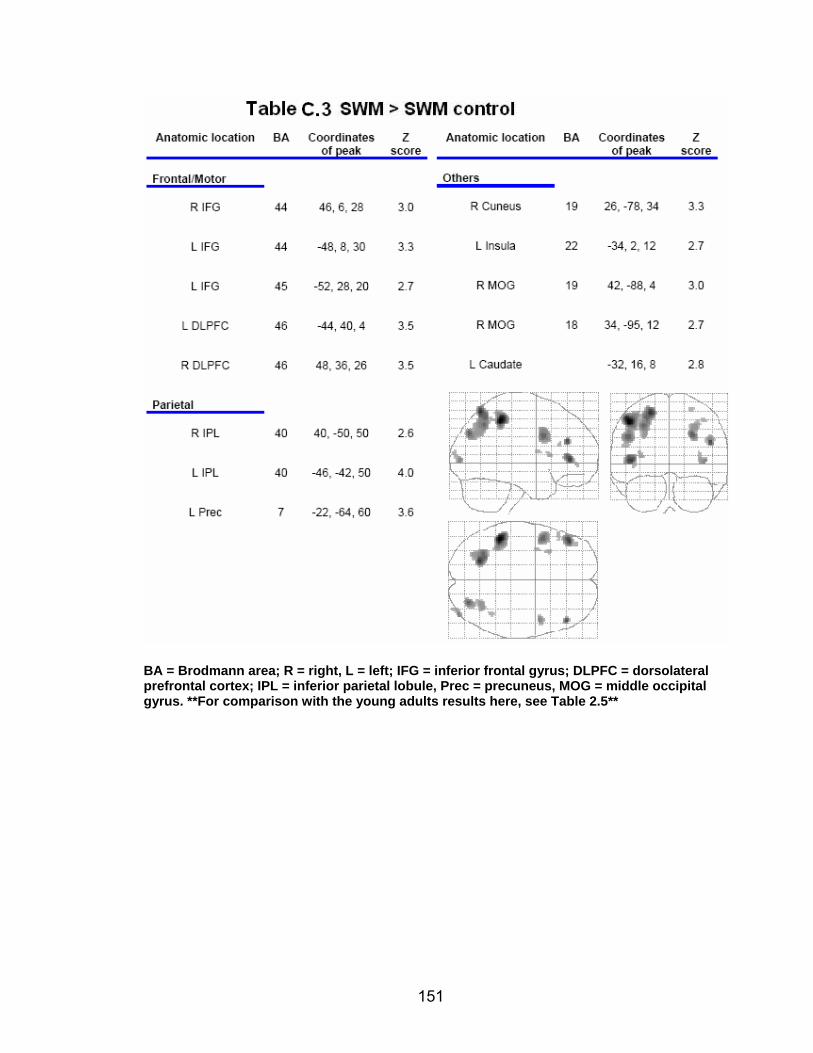
151
BA = Brodmann area; R = right, L = left; IFG = in ferior frontal gyrus; DLPFC = dorsolateral prefrontal cortex; IPL = inferior parietal l obule, Prec = precuneus, MOG = middle occipital gyrus. **For comparison with the young adults results here, see Table 2.5**
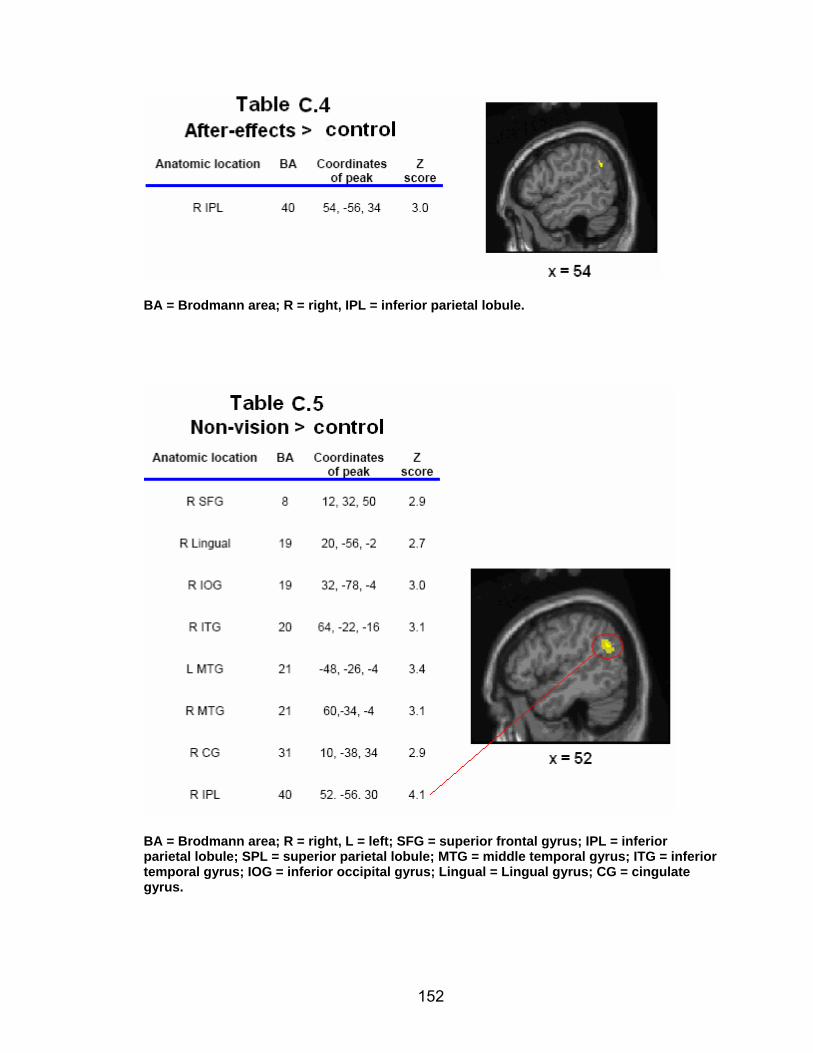
152
BA = Brodmann area; R = right, IPL = inferior parietal lobule.
BA = Brodmann area; R = right, L = left; SFG = superior frontal gyrus; IPL = inferior parietal lobule; SPL = superior parietal lobule; MTG = middle temporal gyrus; ITG = inferior temporal gyrus; IOG = inferior occipital gy rus; Lingual = Lingual gyrus; CG = cingulate gyrus.
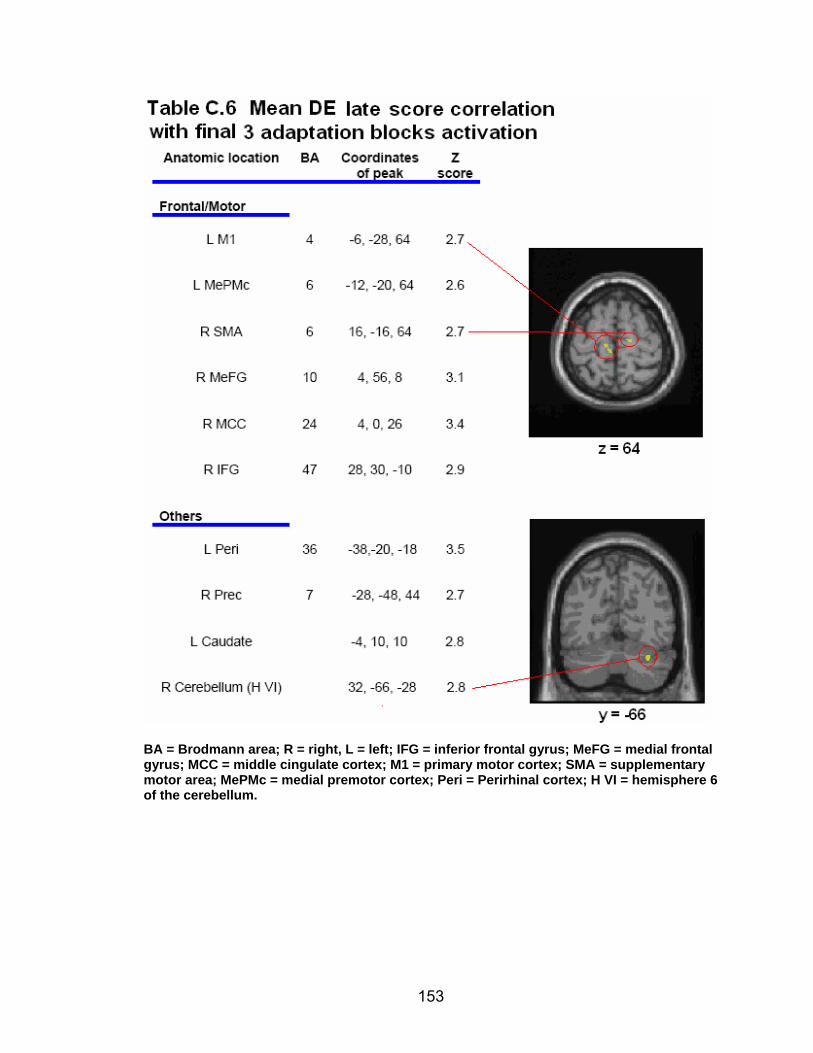
153
BA = Brodmann area; R = right, L = left; IFG = inferior frontal gyrus; MeFG = medial frontal gyrus; MCC = middle cingulate cortex; M1 = primary motor cortex; SMA = supplementary motor area; MePMc = medial premotor cortex; Peri = Perirhinal cortex; H VI = hemisphere 6 of the cerebellum.
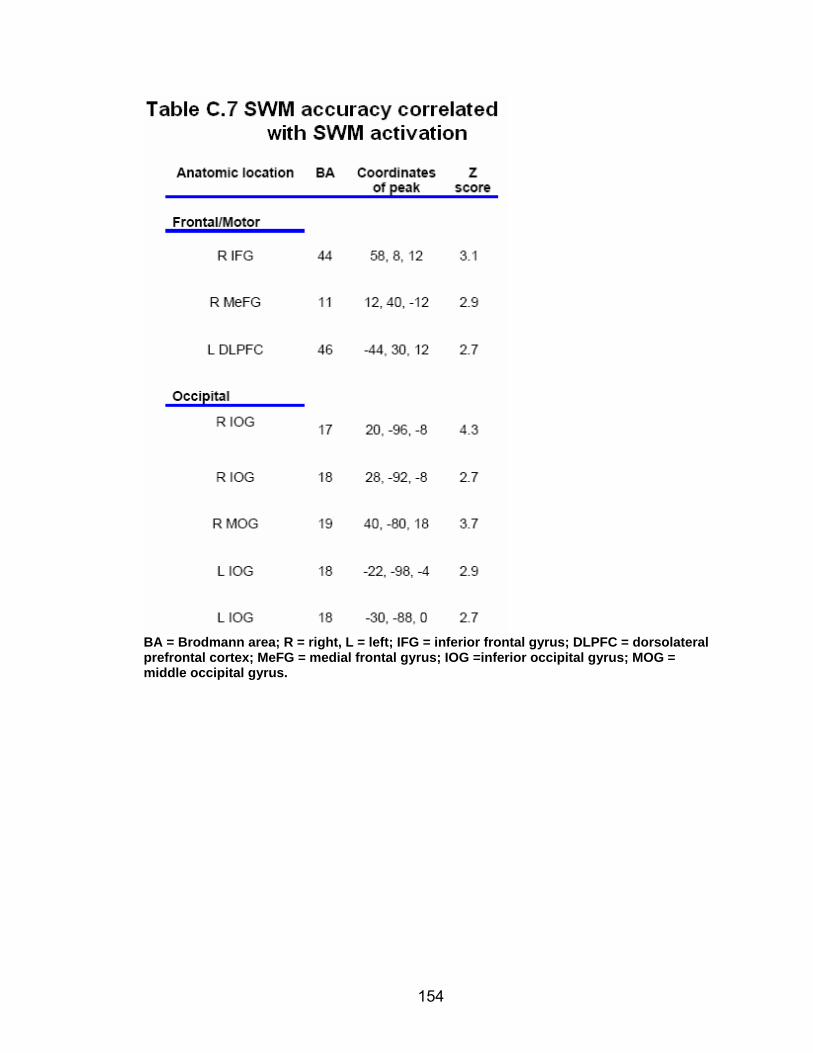
154
BA = Brodmann area; R = right, L = left; IFG = in ferior frontal gyrus; DLPFC = dorsolateral prefrontal cortex; MeFG = medial frontal gy rus; IOG =inferior occipital gyrus; MOG = middle occipital gyrus.
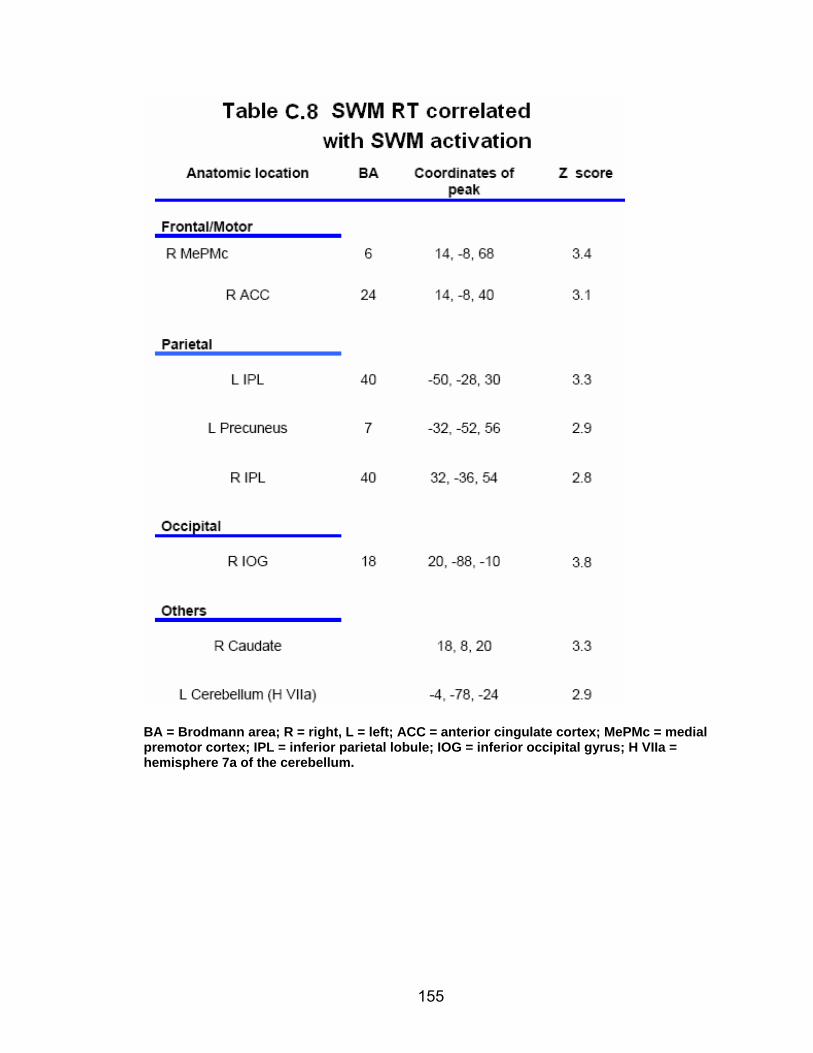
155
BA = Brodmann area; R = right, L = left; ACC = anterior cingulate cortex; MePMc = medial premotor cortex; IPL = inferior parietal lobule; IOG = inferior occipital gyrus; H VIIa = hemisphere 7a of the cerebellum.
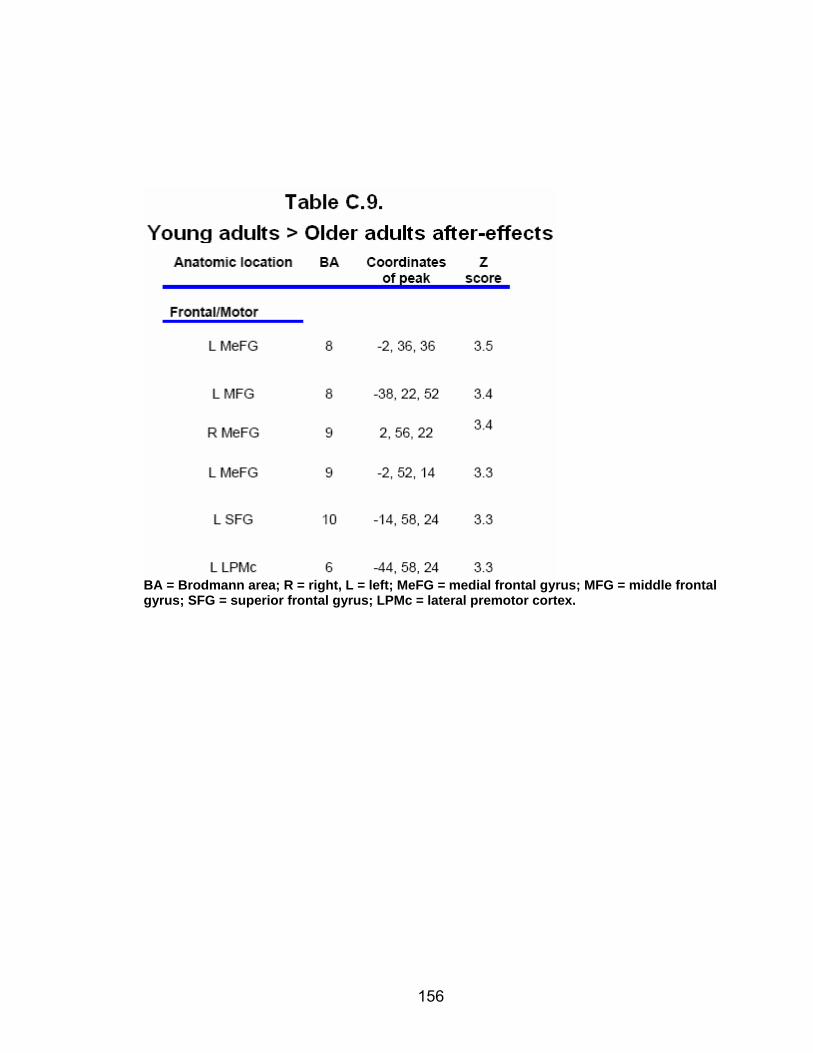
156
BA = Brodmann area; R = right, L = left; MeFG = medial frontal gyrus; MFG = middle frontal gyrus; SFG = superior frontal gyrus; LPMc = lateral premotor cortex.
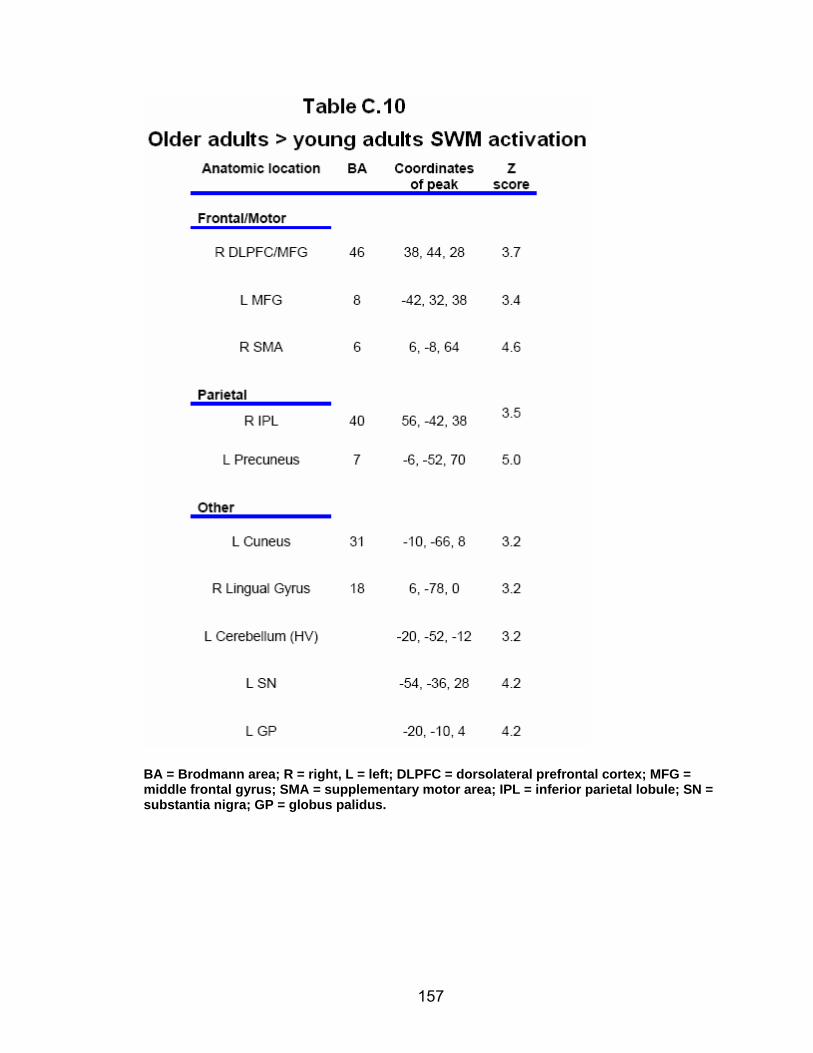
157
BA = Brodmann area; R = right, L = left; DLPFC = dorsolateral prefrontal cortex; MFG = middle frontal gyrus; SMA = supplementary motor area; IPL = inferior parietal lobule; SN = substantia nigra; GP = globus palidus.
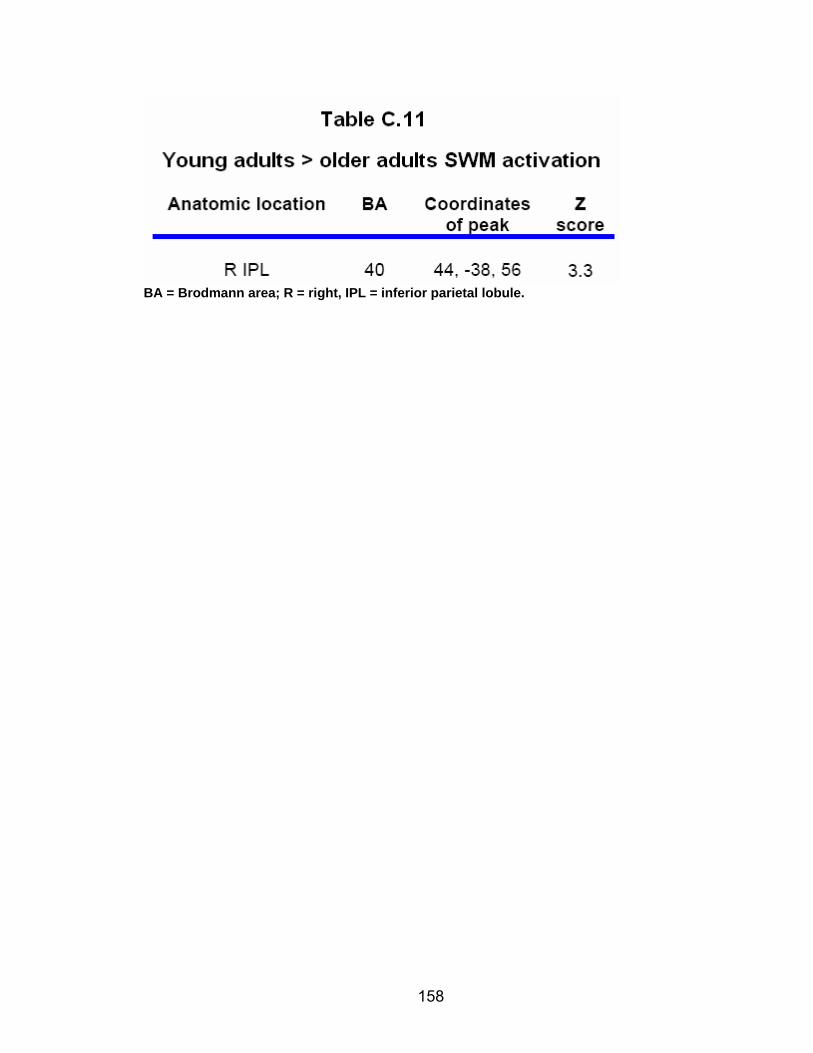
158
BA = Brodmann area; R = right, IPL = inferior parietal lobule.
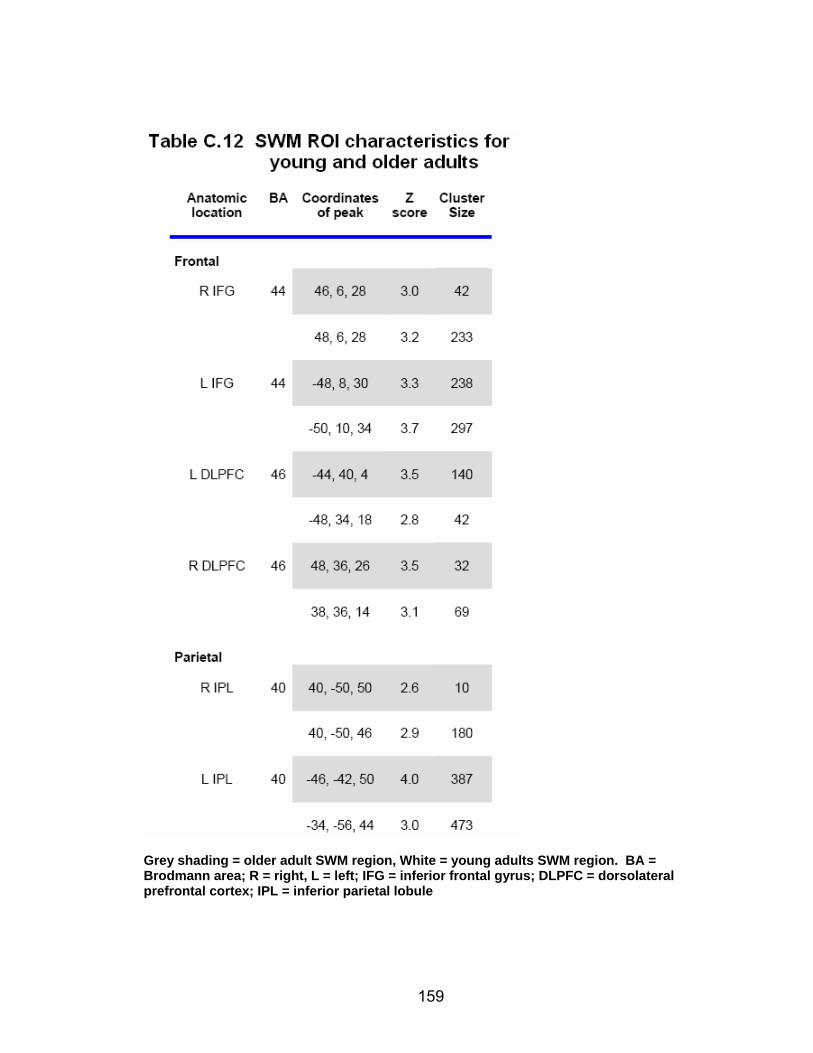
159
Grey shading = older adult SWM region, White = young adults SWM region. BA = Brodmann area; R = right, L = left; IFG = infe rior frontal gyrus; DLPFC = dorsolateral prefrontal cortex; IPL = inferior parietal lobule
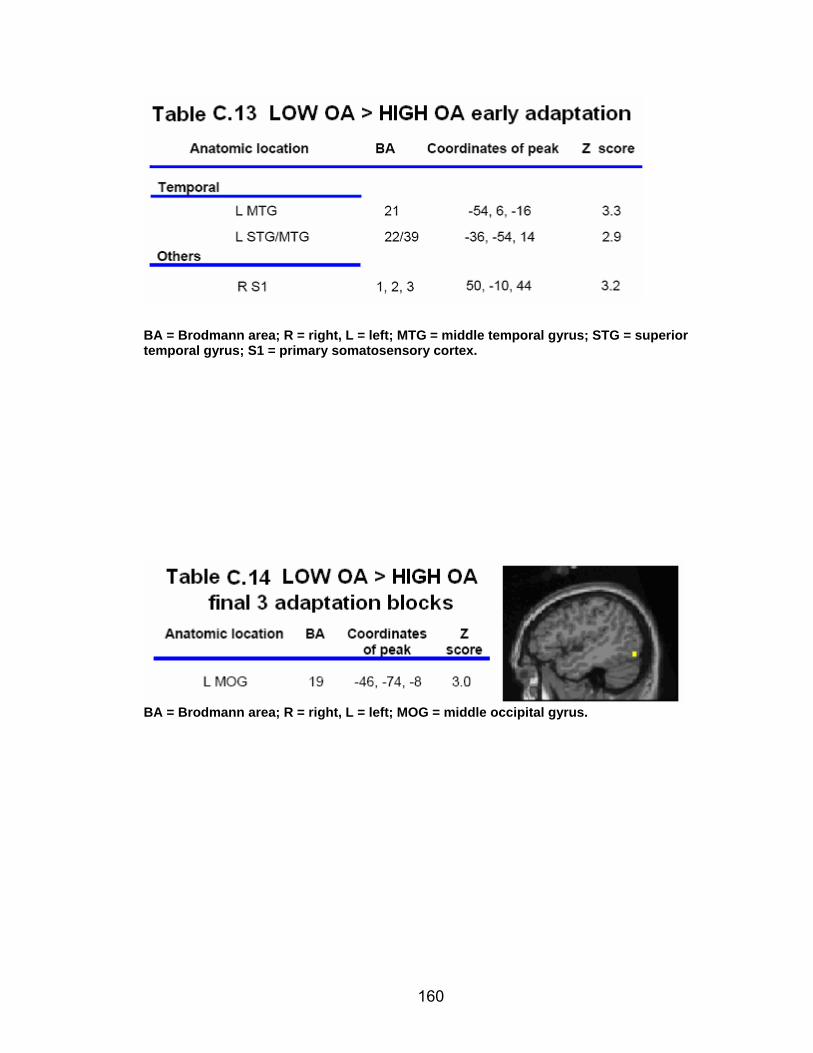
160
BA = Brodmann area; R = right, L = left; MTG = middle temporal gyrus; STG = superior temporal gyrus; S1 = primary somatosensory cortex.
BA = Brodmann area; R = right, L = left ; MOG = middle occipital gyrus.
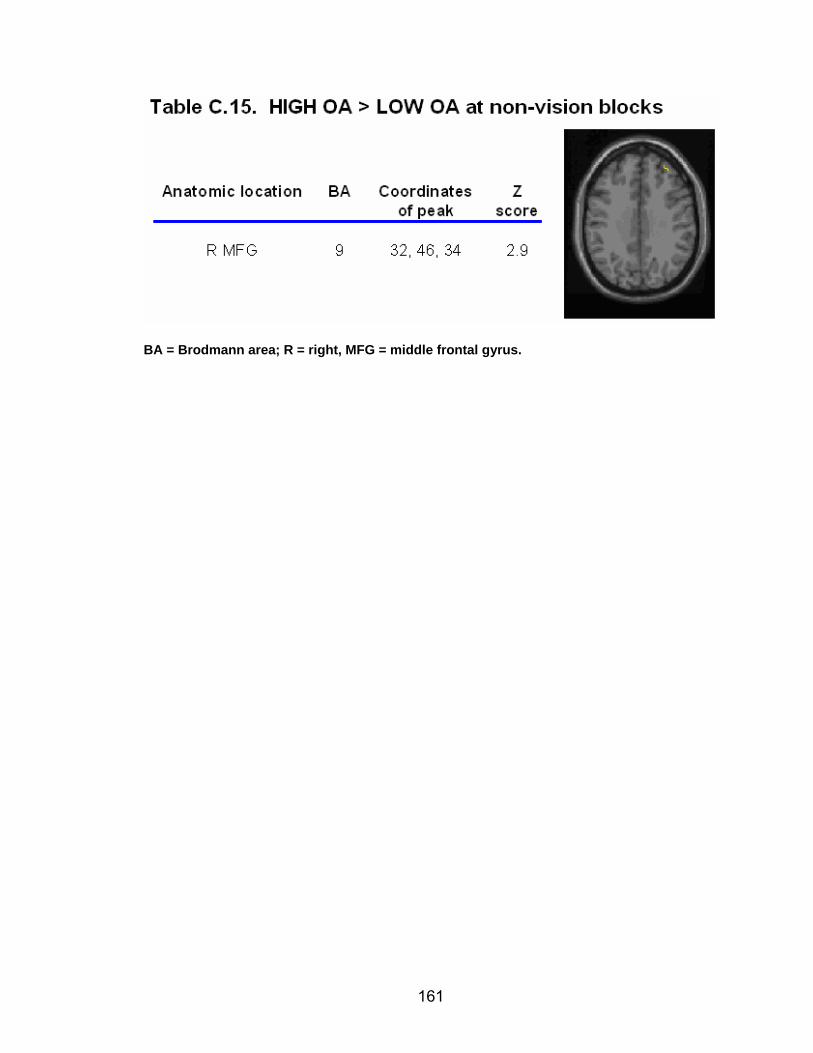
161
BA = Brodmann area; R = right, MFG = middle frontal gyrus.
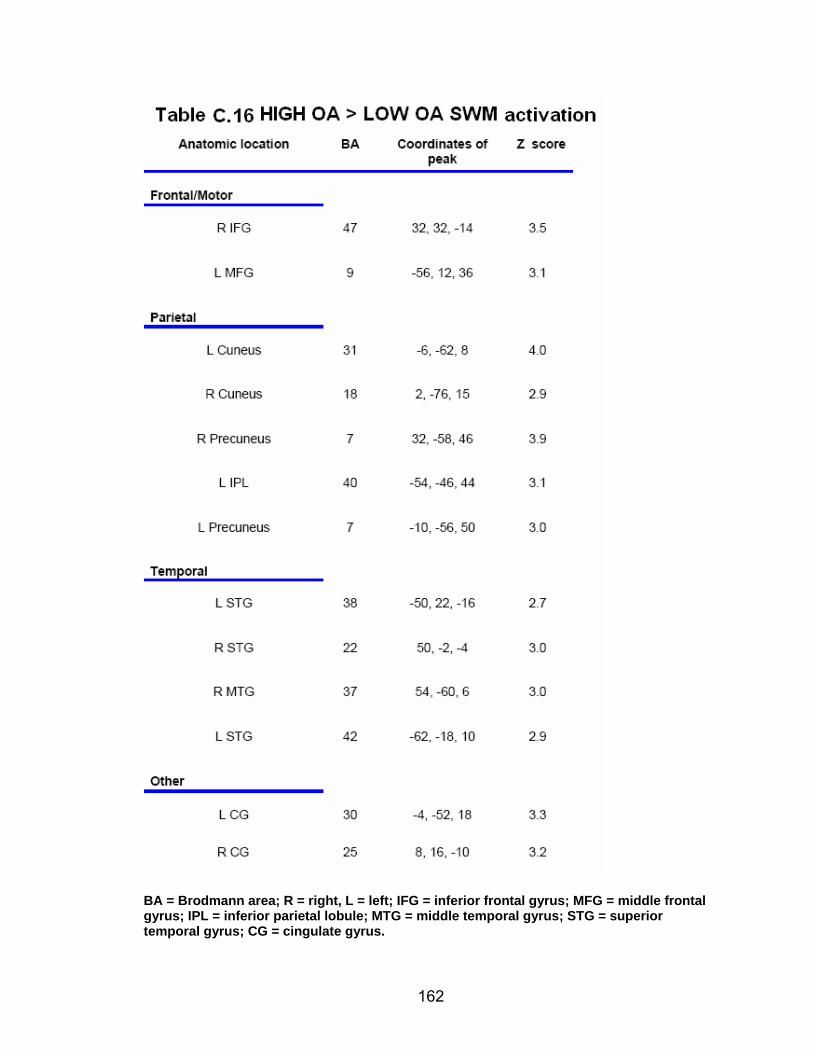
162
BA = Brodmann area; R = right, L = left; IFG = inferior frontal gyrus; MFG = middle frontal gyrus; IPL = inferior parietal lobule; MT G = middle temporal gyrus; STG = superior temporal gyrus; CG = cingulate gyrus.
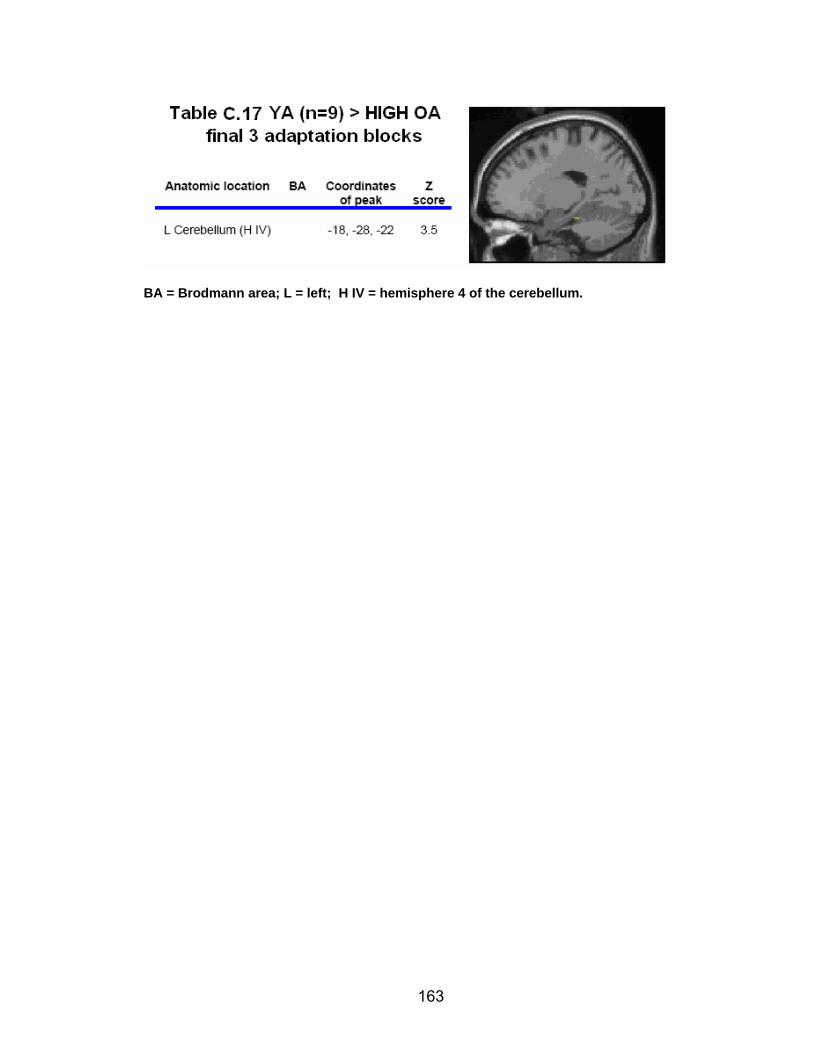
163
BA = Brodmann area; L = left; H IV = hemisphere 4 of the cerebellum.
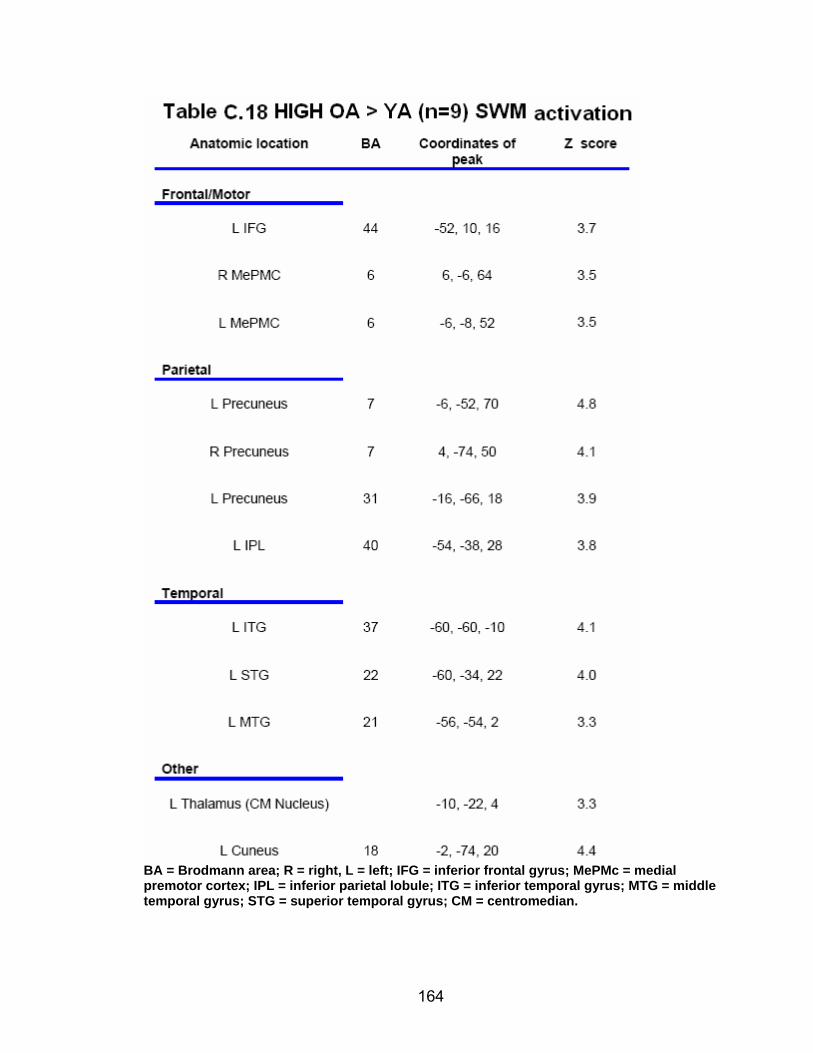
164
BA = Brodmann area; R = right, L = left; IFG = inferior frontal gyrus; MePMc = medial premotor cortex; IPL = inferior parietal lobule; ITG = inferior temporal gyrus; MTG = middle temporal gyrus; STG = superior temporal gyrus; CM = centromedian.
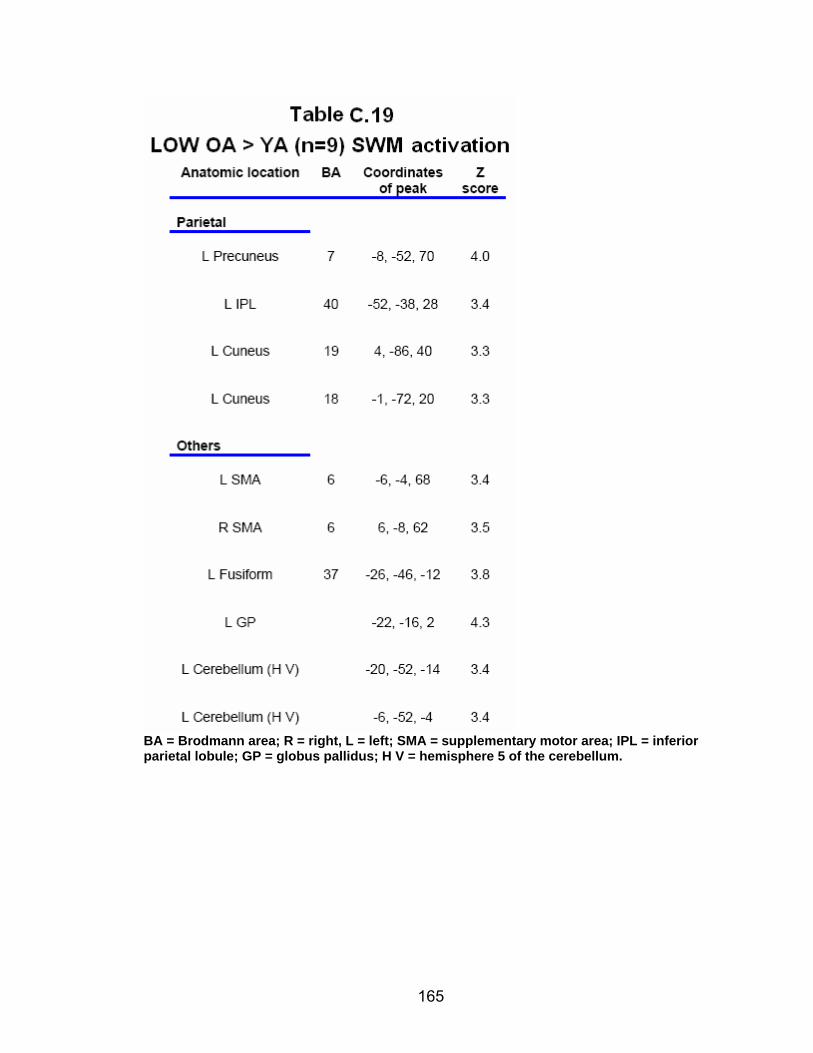
165
BA = Brodmann area; R = right, L = left; SMA = supplementary motor area; IPL = inferior parietal lobule; GP = globus pallidus; H V = hemisphere 5 of the cerebellum.
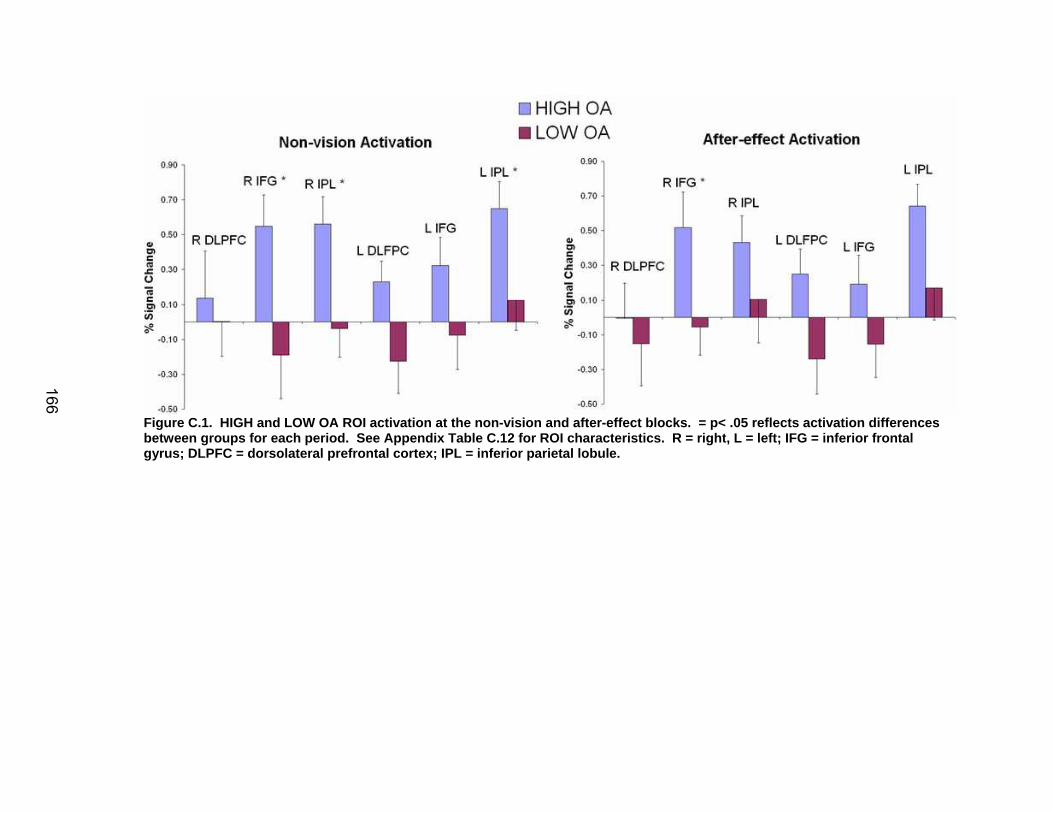
166
Figure C.1. HIGH and LOW OA ROI activation at the non-vision a nd after-effect blocks. = p< .05 reflects activation difference s between groups for each period. See Appendix Table C.12 for ROI characteristics. R = right, L = left; IFG = inferior frontal gyrus; DLPFC = dorsolateral prefrontal cortex; IPL = inferior parietal lobule.
166
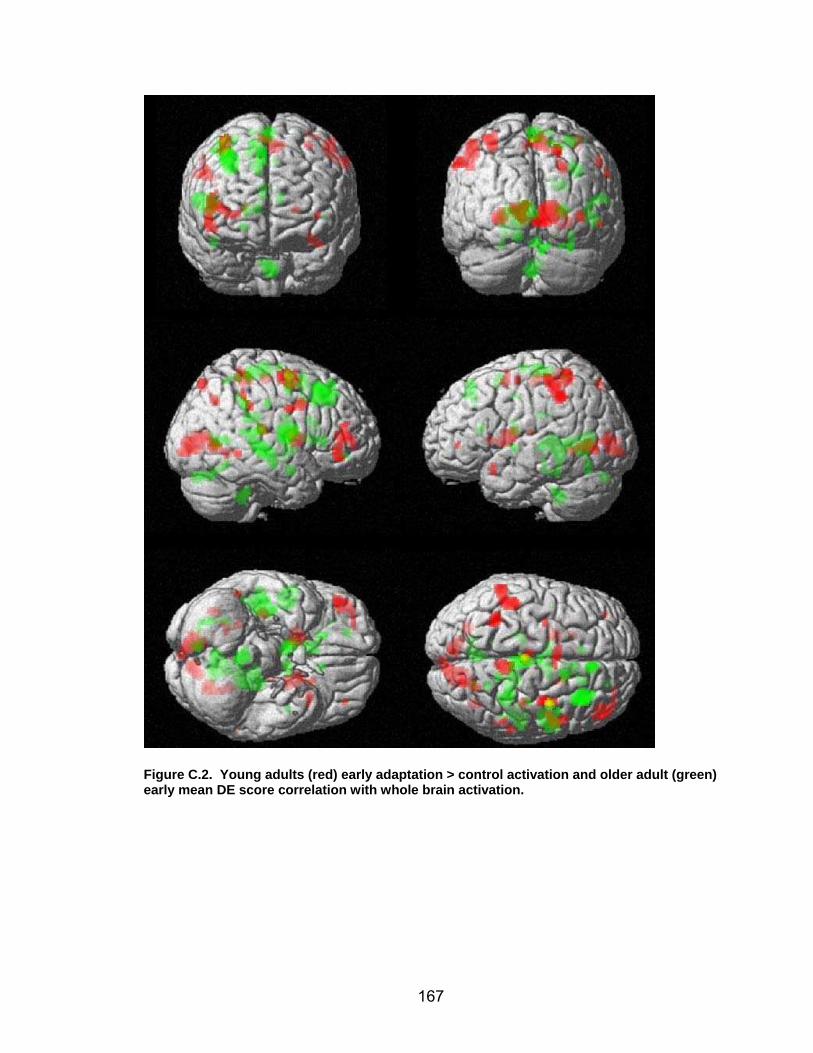
167
Figure C.2. Young adults (red) early adaptati on > control activation and older adult (green) early mean DE score correlation with whole brain activation.
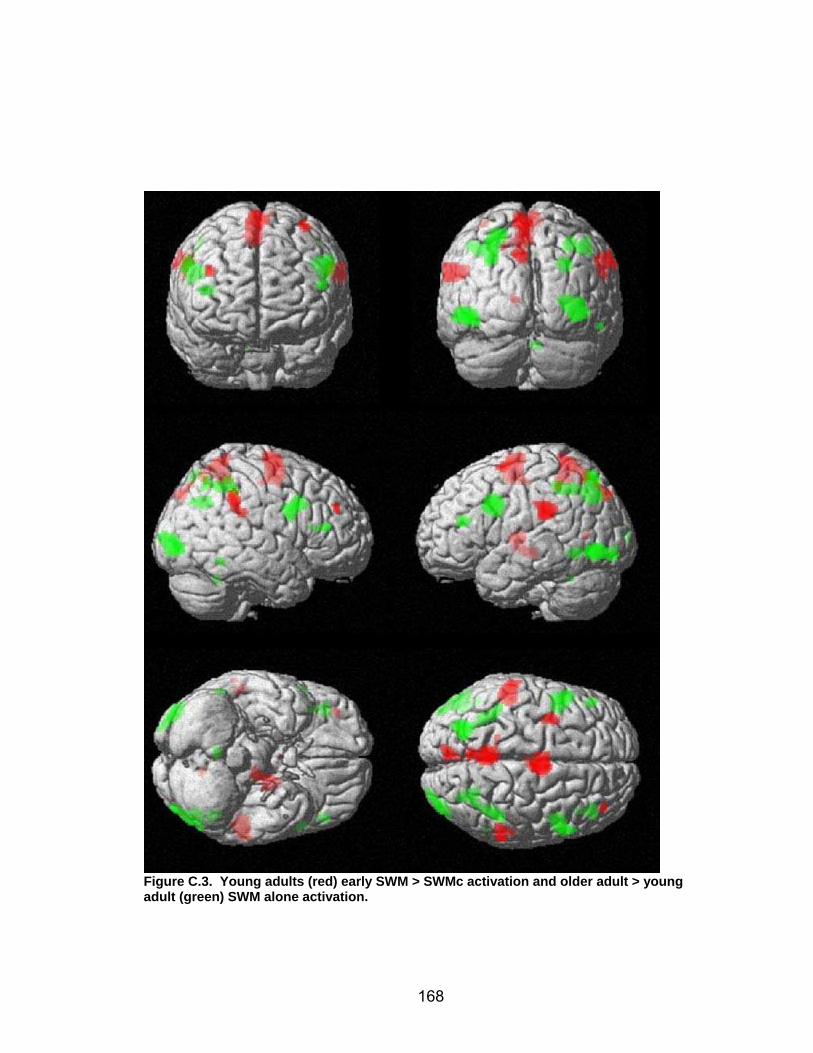
168
Figure C.3. Young adults (red) early SWM > SWMc activation and older adult > young adult (green) SWM alone activation.

169
Appendix D – Health Questionnaire

170
1. Compared to other people your own age, how would you rate your physical
health?
1 2 3 4 5
Much Worse Worse than Average Better Than Much Better
Than Average Average Average Than Average
2. How satisfied are you with your present health?
1 2 3 4 5
Not At All Not Very Neither Satisfied Somewhat Extremely Satisfied Satisfied Nor Dissatisfied Satisfied Satisfied
3. How often do health problems stand in the way of your doing the things you want to do?
1 2 3 4 5
Never Seldom Sometimes Often Always
4. Have you ever lost consciousness for more than ten minutes because of a head injury?
1 Yes 2 No
5. Are you on post-menopausal estrogen therapy?
1 Yes 2 No 6. Do you take any other medication (prescription or non-prescription) on a
regular basis (at least once a week)?
1 Yes- Please Answer Question 7 2 No- Skip To Question 8 7. List all prescription and nonprescription medications you use at least once a
week:

171
Name of Medication Strength (If
Known) Numbers of times used per week
8. Please check which of the following conditions you have now, or have had in
the past:
Condition In your lifetime
Now
Chronic Migrane Headaches Diabetes Encephalitis or meningitis Epilepsy Heart attack or bypass Surgery Multiple sclerosis Parkinson’s disease Rheumatoid arthritis or other autoimmune disorders Osteoarthritis Stroke Other significant illnesses or medical diagnoses (please list)
11. How many BONE FRACTURES have you had in the LAST FIVE YEARS?
1 None

172
2 1 3 2 4 3-5
5 More than 5 12. How many SURGERIES have you had in the LAST FIVE YEARS?
1 None
2 1 3 2 4 3-5
5 More than 5 13. How many times have you been HOSPITALIZED in the LAST FIVE YEARS?
1 None
2 1 3 2 4 3-5
5 6-10
6 More than 10