Conservation Contributions of Ecotourism Enterprises
324
Conservation Contributions of Ecotourism Enterprises Author Wardle, Cassandra J Published 2019-11-25 Thesis Type Thesis (PhD Doctorate) School School of Environment and Sc DOI https://doi.org/10.25904/1912/2848 Copyright Statement The author owns the copyright in this thesis, unless stated otherwise. Downloaded from http://hdl.handle.net/10072/389697 Griffith Research Online https://research-repository.griffith.edu.au
-
Upload
khangminh22 -
Category
Documents
-
view
0 -
download
0
Transcript of Conservation Contributions of Ecotourism Enterprises

Conservation Contributions of Ecotourism Enterprises
Author
Wardle, Cassandra J
Published
2019-11-25
Thesis Type
Thesis (PhD Doctorate)
School
School of Environment and Sc
DOI
https://doi.org/10.25904/1912/2848
Copyright Statement
The author owns the copyright in this thesis, unless stated otherwise.
Downloaded from
http://hdl.handle.net/10072/389697
Griffith Research Online
https://research-repository.griffith.edu.au

Conservation Contributions of Ecotourism
Enterprises
Cassandra Wardle
BSc, MEnv
A thesis submitted in fulfilment of the requirements of the degree of
Doctor of Philosophy
School of Environment and Science
Griffith Sciences
Griffith University, Australia
July 2019


i
Abstract
Context:
Non-traditional means of environmental protection are being used with increasing
frequency to address the global conservation crisis and make up the shortfall in government
conservation spending. Ecotourism is one such mechanism that has been adopted widely for
community development and conservation purposes in both practice and policy, particularly
in developing nations due to the potential to combine social and commercial benefits with
conservation goals. However, evaluations of how ecotourism enterprises fit into the
ecotourism-conservation relationship are a relatively recent trend. Findings from the
literature review of this thesis reveal that our current understanding of this relationship is
limited to (1) hand-picked sites located primarily in developing nations; (2) a narrow group
of predominantly visitor and community focused conservation activities; and (3)
inconsistent evaluation approaches that often lack repeatability and transferability. As such,
the evidence base for this relationship is currently insufficient.
Aim:
This thesis addressed this gap through a multidisciplinary mixed methods approach to
identify and explore the conservation practices of ecotourism enterprises at both a broad
global scale and a detailed national scale within Australia.
Approach:
An evaluation framework incorporating a matrix of 27 feasible actions and 26 potential
conservation outcomes was constructed through data mining, qualitative content analysis
and iterative inductive coding of sources from a range of disciplines and sectors.
This framework was used to guide an assessment of the conservation activities of 86 fixed-
site eco-certified enterprises in Australia and evaluate their contributions to national
conservation priorities. Certification by the national industry association, Ecotourism
Australia, is pervasive in Australia, so these 86 sites are likely to represent the highest
performing enterprises and their aggregate achievements provide a good approximation to
continental scale contributions.
Finally, the conservation practices of these 86 sites and the content of the national
certification program were compared with the national conservation policy landscape to

ii
identify key overlaps and gaps for progressing the ecotourism-conservation relationship in
Australia.
Findings:
Findings demonstrate that this group of Australian ecotourism enterprises generate a myriad
of conservation gains through social and ecological actions. However, the significance of
the conservation practices of these sites varied greatly, with some sites making important
contributions to threatened species or ecosystems, and others simply listing actions with
little focus on their extent or outcomes.
All sites took some action to revegetate cleared land and remove non-native flora, and 75%
of sites targeted non-native fauna. However, only 54% of sites reported improved habitat;
only 7% successfully eradicated at least one weed species; and just 6% eradicated at least
one introduced fauna species (including feral cats, foxes and rabbits). Legally binding
conservation agreements were established by 63% of sites covering 2,400km2 in total;
however, these are in-perpetuity agreements for just 25 sites covering 1,550km2.
Nevertheless, 41% of sites share a border with a public protected area, effectively extending
the public protected area network by an additional 650km2.
Specific conservation actions such as threat management and nest provision were reported
for 61 threatened plant and animal species. These include 27 bird species, 15 mammals, 8
plants, 4 reptiles, 2 rays, and a single monotreme, amphibian, crustacean, freshwater fish,
and insect. Fifteen of these species are covered by National Recovery Plans or Priority
Plans including 4 mammals: the woylie bettong, 2 species of quoll, and 1 subspecies of
bandicoot. How many individuals of each of these species occur on each of these
ecotourism sites, however, is generally not specified, so these contributions cannot currently
be quantified.
Conclusions:
Many of these certified ecotourism enterprises claim a range of contributions to
conservation. The emphasis in the reporting practices of enterprises, however, is on: actions
taken rather than ecologically quantified outcomes; achievements reported qualitatively
rather than quantitatively; and unspecified contributions to larger-scale efforts, such as
National Recovery Plans for threatened species. One reason for this is that the eco-
certification program relies only on a tick-box list of actions rather than a set of quantified,
monitored, and ecologically significant conservation outcomes. It appears that some of

iii
these ecotourism enterprises do indeed make ecologically significant contributions,
commensurate with their relatively small scale; but in its current form, the certification
program neither encourages nor rewards these. For this program to progress beyond “a
commitment to nature conservation” and contribute meaningfully to conservation goals, it
will need substantial reworking.
Additionally, findings demonstrate several areas where the conservation activities of
ecotourism sites overlap with national conservation priorities, highlighting the collaboration
potential between these sectors. However, this study also reveals that tourism is
predominantly acknowledged by national conservation policy in Australia as a driver for
environmental protection as well as an impact that must be managed, and is not yet widely
acknowledged as an industry that can contribute to conservation goals.
By (1) developing a framework for systematically evaluating the conservation impacts of
ecotourism enterprises; (2) providing a contribution to the evidence base necessary for the
substantiated use of ecotourism as a conservation mechanism; (3) identifying key
opportunities for conservation-ecotourism collaborations and strategic investments; and (4)
highlighting priority improvement areas for ecotourism sites and Ecotourism Australia to
increase their eligibility and attractiveness as investment options for government grants and
programs, this thesis has important implications for operators, researchers, policymakers,
and eco-certification bodies.

iv
Statement of originality
This work has not previously been submitted for a degree or diploma in any university. To
the best of my knowledge and belief, the thesis contains no material previously published or
written by another person except where due reference is made in the thesis itself.
_________________________
Cassandra Wardle
9 July 2019

v
Dedication
Dedicated to
Dennis Hermann
Grandad, sage, and best-cup-of-tea-maker-in-the-whole-world
1933-2018
The humblest trailblazer who demonstrated that it’s possible
to defy every stereotype of a generation without ever being defiant;
to work 100-hour weeks for decades while being the greatest family man; and
to have next-to-nothing but always find something to give to those in need.
The world is a little darker without the twinkle in his eyes, but his kindness and generosity
will continue to ripple around the world through the thousands of lives that he touched.

vi
Table of contents
Abstract .................................................................................................................................... i
Statement of originality ............................................................................................................iv
Dedication ................................................................................................................................ v
Table of contents......................................................................................................................vi
List of tables ...........................................................................................................................xii
List of figures ........................................................................................................................ xiv
Acronyms, abbreviations and glossary ................................................................................... xvi
Acknowledgement of papers included in this thesis ..............................................................xviii
Acknowledgements ............................................................................................................... xxii
Chapter 1 : Introduction ............................................................................................................ 1
1.1 Ecotourism and conservation ........................................................................................... 1
1.2 Academic research extent and gaps .................................................................................. 3
1.2.1 Ecotourism and the environment ............................................................................... 3
1.2.2 Ecotourism and conservation .................................................................................... 4
1.2.3 Summary .................................................................................................................. 5
1.3 Thesis objectives ............................................................................................................. 6
1.4 Thesis boundaries and scope ............................................................................................ 6
1.4.1 Ecotourism ............................................................................................................... 6
1.4.2 Conservation ............................................................................................................ 8
1.4.3 Biodiversity .............................................................................................................. 9
1.4.4 Academic and grey literature .................................................................................... 9
1.5 Content and structure of thesis ......................................................................................... 9
1.6 Project significance ....................................................................................................... 12
Statement of contribution to co-authored published paper for Chapter 2 .................................. 15
Chapter 2 : Context and literature review ................................................................................ 16
2.1 Ecotourism concepts...................................................................................................... 16
2.2 Ecotourism trends .......................................................................................................... 18
2.2.1 Global trends .......................................................................................................... 18

vii
2.2.2 Australian trends ..................................................................................................... 20
2.3 Eco-certification ............................................................................................................ 22
2.3.1 Global trends .......................................................................................................... 22
2.3.2 Australian trends ..................................................................................................... 22
2.4 The state of the environment.......................................................................................... 24
2.4.1 The global environment .......................................................................................... 24
2.4.2 The Australian environment .................................................................................... 25
2.5 Ecosystem services and the value of biodiversity ........................................................... 26
2.6 Context of biodiversity conservation .............................................................................. 27
2.6.1 International context ............................................................................................... 27
2.6.2 Australian context ................................................................................................... 29
2.6.3 State context ........................................................................................................... 33
2.6.4 Programs, initiatives and incentives ........................................................................ 33
2.7 Ecotourism and conservation: systematic quantitative literature review .......................... 34
2.8 Ecotourism-conservation pathways ................................................................................ 68
Chapter 3 : Methodology......................................................................................................... 71
3.1 Introduction ................................................................................................................... 71
3.2 Overview of research ..................................................................................................... 71
3.2.1 Research design ...................................................................................................... 71
3.2.2 Research components ............................................................................................. 72
3.2.3 Research tools and data sources .............................................................................. 74
3.3 Conservation Evaluation Framework for ecotourism enterprises .................................... 79
3.3.1 Data collection........................................................................................................ 79
3.3.2 Data analysis .......................................................................................................... 82
3.3.3 Framework demonstration ...................................................................................... 84
3.4 Conservation evaluation of private Australian ecotourism enterprises ............................ 85
3.4.1 Site selection (Step 1) ............................................................................................. 86
3.4.2 Data collection (Step 2) .......................................................................................... 87
3.4.3 Site evaluations (Step 3) ......................................................................................... 88

viii
3.4.4 Frequencies and trends (Step 4) .............................................................................. 89
3.4.5 Conservation significance screening process (Step 5) .............................................. 90
3.5 Conservation gaps and overlaps ..................................................................................... 93
3.5.1 Eco-certification: conservation coverage and gaps .................................................. 93
3.5.2 National Conservation Agenda: conservation and ecotourism gaps .......................... 95
3.5.3 Policy, practice, and eco-certification: overlaps and gaps ...................................... 102
Chapter 4 : Conservation Evaluation Framework for ecotourism enterprises .......................... 108
4.1 Introduction ................................................................................................................. 108
4.2 Conservation Activities Matrix .................................................................................... 109
4.2.1 Biophysical landscape........................................................................................... 114
4.2.2 Fauna ................................................................................................................... 118
4.2.3 Visitors ................................................................................................................. 121
4.2.4 Local communities ............................................................................................... 123
4.2.5 Organisational and political .................................................................................. 127
4.3 Conservation Evaluation Framework ........................................................................... 130
4.3.1 Site selection process ............................................................................................ 131
4.3.2 Conservation Activities Matrix application process ............................................... 131
4.3.3 Amalgamation ...................................................................................................... 133
4.3.4 Comparisons and pattern analysis ......................................................................... 133
4.3.5 Conservation significance screening process ......................................................... 133
4.4 Demonstration application of the CE Framework application ....................................... 134
4.4.1 Site selection ........................................................................................................ 134
4.4.2 Application of Conservation Activities Matrix ...................................................... 134
4.4.3 Amalgamation ...................................................................................................... 136
4.4.4 Comparison and pattern analysis ........................................................................... 136
4.4.5 Conservation significance screening ..................................................................... 136
Chapter 5 : Conservation evaluation of private Australian ecotourism enterprises .................. 138
5.1 Introduction ................................................................................................................. 138
5.2 Sites ............................................................................................................................ 140

ix
5.3 Conservation trends ..................................................................................................... 141
5.3.1 Frequencies .......................................................................................................... 141
5.3.2 Patterns among sites ............................................................................................. 144
5.3.3 Patterns among Conservation Items ...................................................................... 147
5.4 Conservation Contributions ......................................................................................... 148
5.4.1 Ecological contributions ....................................................................................... 149
5.4.2 Socio-political contributions ................................................................................. 162
5.5 Conservation challenges and innovations ..................................................................... 169
5.5.1 Resources, staff and costs ..................................................................................... 169
5.5.2 Landscape and climatic conditions ........................................................................ 170
5.5.3 Neighbouring properties and community............................................................... 170
5.5.4 Conversion to tourism ........................................................................................... 171
5.5.5 Monitoring ........................................................................................................... 171
Chapter 6 : Ecotourism-conservation gaps and overlaps in Australia ..................................... 174
6.1 Introduction ................................................................................................................. 174
6.2 Eco-certification: conservation coverage and gaps ....................................................... 175
6.2.1 Coverage levels .................................................................................................... 175
6.2.2 Conservation Items and site practices .................................................................... 175
6.2.3 Coverage of Conservation Categories ................................................................... 179
6.3 National Conservation Agenda (NCA): ecotourism and conservation management ...... 180
6.3.1 NCA and tourism .................................................................................................. 180
6.3.2 NCA and conservation themes .............................................................................. 182
6.3.3 NCA and the broader conservation context ........................................................... 185
6.4 Policy, practice, and eco-certification: overlaps and gaps ............................................. 187
Chapter 7 : Discussion .......................................................................................................... 191
7.1 Introduction ................................................................................................................. 191
7.2 Thesis significance and contributions........................................................................... 191
7.2.1 Research Objective 1 ............................................................................................ 191
7.2.2 Research Objective 2 ............................................................................................ 192
x
7.2.3 Research Objectives 3 and 4 ................................................................................. 192
7.2.4 Research Objective 5 ............................................................................................ 193
7.3 Ecotourism and ecological conservation practices ........................................................ 193
7.3.1 Frequencies and patterns ....................................................................................... 194
7.3.2 Private land and protected areas ............................................................................ 195
7.3.3 Landscape management ........................................................................................ 196
7.4 Ecotourism as a social driver for conservation ............................................................. 198
7.4.1 Frequencies and patterns ....................................................................................... 198
7.4.2 Public engagement and social capital .................................................................... 199
7.4.3 Economic priorities and political pressure ............................................................. 200
7.5 Implications of this research ........................................................................................ 201
7.5.1 Ecotourism-conservation evaluations .................................................................... 201
7.5.2 Eco-certification and conservation in Australia ..................................................... 202
7.5.3 Policy and practice................................................................................................ 205
7.6 Limitations and future research directions .................................................................... 208
7.6.1 Framework development ...................................................................................... 208
7.6.2 Site evaluations .................................................................................................... 208
7.6.3 Conservation significance ..................................................................................... 209
7.6.4 Research scope ..................................................................................................... 210
7.7 Conclusion .................................................................................................................. 210
References ............................................................................................................................ 212
Appendix A: Example of CA Matrix data template used for Research Component 2.............. 242
Appendix B: Sources used for each category of the CA Matrix.............................................. 244
Appendix C: Amalgamation of site data for ecological Conservation Items ........................... 262
C1 Biophysical landscape actions ...................................................................................... 262
C2 Wildlife actions ........................................................................................................... 272
C3 Physical natural environment outcomes ....................................................................... 278
C4 Fauna outcomes ........................................................................................................... 281
Appendix D: Amalgamation of site data for socio-political Conservation Items ..................... 284

xi
D1 Visitor actions ............................................................................................................. 284
D2 Community Actions..................................................................................................... 285
D3 Organisational/political actions .................................................................................... 290
D4 Visitor outcomes ......................................................................................................... 294
D5 Community outcomes .................................................................................................. 295
D6 Organisational/political outcomes ................................................................................ 296

xii
List of tables
Table 2.1 Reported estimates of nature-based tourism and ecotourism in Australia ................. 21
Table 2.2 Numbers of at-risk flora and fauna at a national level and for each state and territory
............................................................................................................................................... 25
Table 3.1 Abbreviated name, TOPs, and length of the eight policies in the NCA ..................... 76
Table 3.2 Details on the three items referred to as NCTs in this thesis ..................................... 77
Table 3.3 Categories of each enterprise characteristic ............................................................. 87
Table 3.4 Policies, directives and regulations utilised in the conservation significance screening
process for site evaluations...................................................................................................... 91
Table 3.5 Covenanting programs in Australian jurisdictions and primary legislation (modified
from Fitzsimons (2015)).......................................................................................................... 92
Table 3.6 Explanation of coverage levels used to inform the coding of Conservation Items
within the EA Questionnaire ................................................................................................... 95
Table 3.7 Search terms used to check for tourism related content in the NCA policies ............ 96
Table 3.8 Coding guide for the coverage levels of tourism related themes in the NCA using the
theme of ‘tourism as a driver of conservation goals’ as an example ......................................... 97
Table 3.9 Explanation of the level of importance assigned to themes within the NCA and NCTs
............................................................................................................................................... 99
Table 3.10 Conservation Items and search terms for ecological themes in the NCA .............. 100
Table 3.11 Conservation Items and search terms for socio-political themes in the NCA ........ 101
Table 3.12 The three groups and data sources utilised in this research sub-component .......... 102
Table 3.13 Substitutions and cut-offs for converting group categories to star ratings ............. 102
Table 3.14 Details of calculations for site prevalence, potential site prevalence, and EA
Questionnaire coverage to facilitate comparisons across themes ............................................ 104
Table 3.15 Details of calculations for site prevalence, potential site prevalence, and EA
Questionnaire coverage to facilitate comparisons across themes ............................................ 105
Table 3.16 Symbol and level of importance assigned to gap and overlap scores .................... 106
Table 4.1 The direct and indirect relationships of the 53 Conservation Items, five categories and
two meta-categories of the Conservation Activities Matrix .................................................... 112
Table 4.2 Potential biophysical landscape conservation actions of ecotourism enterprises and
their outcomes ...................................................................................................................... 114
Table 4.3 Potential conservation actions of ecotourism enterprises related to fauna and their
outcomes .............................................................................................................................. 119
Table 4.4 Potential conservation actions of ecotourism enterprises related to visitors and their
outcomes .............................................................................................................................. 122
Table 4.5 Potential conservation actions of ecotourism enterprises related to local communities
and their outcomes ................................................................................................................ 124

xiii
Table 4.6 Potential organisational/political conservation actions of ecotourism enterprises and
their outcomes ...................................................................................................................... 128
Table 4.7 Text excerpts relating to the revegetation practices of the three enterprises, extracted
from company websites in November 2017 ........................................................................... 135
Table 5.1 Proportion of ecological actions and outcomes undertaken by each site (n = 86) .... 142
Table 5.2 Proportion of socio-political actions and outcomes undertaken by each site (n = 86)
............................................................................................................................................. 143
Table 5.3 Average biophysical and fauna indices across the 86 sites ..................................... 144
Table 5.4 Significant associations between site characteristics and ecological Conservation
Items..................................................................................................................................... 145
Table 5.5 Average community and political indices across the 86 sites ................................. 146
Table 5.6 Significant associations between site characteristics and socio-political Conservation
Items..................................................................................................................................... 146
Table 5.7 Explanation of national conservation directives referred to in this section .............. 149
Table 5.8 Number and size of sites within each protection level category .............................. 150
Table 5.9 Threatened species and associated conservation actions of the 86 Australian
ecotourism sites .................................................................................................................... 152
Table 5.10 Number of ecotourism sites targeting, reducing or eradicating non-native fauna .. 158
Table 5.11 Non-native flora species reduced or eradicated by Australian ecotourism sites ..... 160
Table 5.12 Proportion of sites covering the interpretation themes and methods ..................... 163
Table 5.13 Proportion of sites reporting community environmental engagement activities .... 164
Table 5.14 Proportion of sites addressing each of the political advocacy actions and topics ... 166
Table 5.15 Proportion of sites addressing the various research topics and engaging in
collaborations ....................................................................................................................... 167
Table 6.1 Number of Conservation Items from CA Matrix (Chapter 4) within each level of
coverage in the EA Questionnaire ......................................................................................... 175
Table 6.2 EA Questionnaire coverage of ecological actions and outcomes with site frequencies
(from Chapter 5) for comparison ........................................................................................... 176
Table 6.3 EA Questionnaire coverage of socio-political actions and outcomes with site
frequencies (from Chapter 5) for comparison ........................................................................ 177
Table 6.4 NCA coverage of the three tourism themes ........................................................... 181
Table 6.5 Ecological conservation themes covered by the NCA and NCTs ........................... 183
Table 6.6 Socio-political conservation themes covered by the NCA and NCTs ..................... 184
Table 6.7 Comparisons and implications of NCA focus, site practices and the EA Questionnaire
(‘EAQ’) across key conservation themes ............................................................................... 189
xiv
List of figures
Figure 1.1 Conceptual path linking ecotourism to conservation outcomes. ................................ 2
Figure 1.2 Examples of key ecotourism research focus areas. ................................................... 3
Figure 1.3 Linkages between the thesis chapters (excluding Chapter 3 which provides the
methods for Chapters 4, 5 and 6). ............................................................................................ 10
Figure 1.4 Detailed conceptual model of the linkages between the research components,
methods and objectives. .......................................................................................................... 11
Figure 2.1 Conceptual overview of Chapter 2. ........................................................................ 16
Figure 2.2 An example of the multiple types of tourism that may overlap with ecotourism...... 17
Figure 2.3 Comparison of key themes used in ecotourism definitions as identified by Chandel
and Mishra (2016) and Fennell (2001). Crosses in place of a bar indicate socio-economic
aspects that were not included in one of the studies: the style of data presentation and nuanced
differences in meanings prevented the merging of these aspects. ............................................. 18
Figure 2.4 Timeline of Ecotourism Australia’s growth and expansion. .................................... 23
Figure 2.5 Timeline of key biodiversity conservation developments. Blue text highlights
Australian actions and green text highlights internationally agreed goals and targets. ............... 28
Figure 2.6 Conceptual model of the socio-political ecotourism-conservation pathways
demonstrated in the academic literature to occur in-practice. ................................................... 68
Figure 2.7 Conceptual model of the ecological ecotourism-conservation pathways demonstrated
in the academic literature to occur in-practice. ......................................................................... 69
Figure 3.1 Conceptual depiction of the methods and results of the three interlinked research
components within the thesis. .................................................................................................. 71
Figure 3.2 Conceptual model of the research approach for the three research components
detailed in this chapter (modified from Figure 1.4). ................................................................. 73
Figure 3.3 Conceptual flow chart depicting shared data sources and linkages across the three
research components detailed in this chapter (data sources in grey boxes, chapters in blue
boxes). .................................................................................................................................... 74
Figure 3.4 Conceptual flow chart of the data collection and analysis steps followed in Research
Component 1. ......................................................................................................................... 82
Figure 3.5 Conceptual flow chart of the data collection and data analysis steps followed in
Research Component 2. .......................................................................................................... 86
Figure 4.1 Conceptual depiction of the three interlinked research components highlighting the
setting of this chapter within the thesis (modified from Figure 3.1 in Chapter 3). ................... 108
Figure 4.2 A depiction of the direct and indirect conservation outcomes that can be achieved
through revegetation activities (as an example action). .......................................................... 110
xv
Figure 4.3 A depiction of the actions that can directly and indirectly reduce competition with,
and predation on, native fauna by non-native species (as an example outcome). Grey boxes
indicate outcomes that can also contribute to reductions in competition and predation rates. .. 110
Figure 4.4 Conservation Evaluation Framework. Diamonds represent processes (numbered 1-
5); rectangles represent products; ‘As and Os’ refers to ‘actions and outcomes’. .................... 131
Figure 5.1 Conceptual depiction of the three interlinked research components highlighting the
location and function of this chapter within the thesis (modified from Figure 3.1 in Chapter 3).
............................................................................................................................................. 138
Figure 5.2 Components of the CE Framework covered by this research component. ............. 139
Figure 5.3 Location of the 86 sites used in this study (numbers in circles indicate multiple sites
within close proximity). ........................................................................................................ 140
Figure 5.4 Proportion of sites within each category of site characteristics (n=86) .................. 141
Figure 5.5 Standard error plot of fauna indices for sites within the six property categories. ... 144
Figure 5.6 MDS of similarities between ecological actions grouped by level of effort, using
three levels of clustering: 25%, 50% and 75%. ...................................................................... 147
Figure 5.7 MDS of similarities between all socio-political actions reported by at least one site,
using three levels of clustering: 25%, 50% and 75% (with 13 actions clumped in the middle).
............................................................................................................................................. 148
Figure 5.8 Proportion of sites (that reported on the extent of revegetation) within each
revegetation category (n = 26). .............................................................................................. 161
Figure 6.1 Conceptual depiction of the three interlinked research components highlighting the
location and function of this chapter within the thesis (modified from Figure 3.1 in Chapter 3).
............................................................................................................................................. 174
Figure 6.2 Comparison of coverage levels in the Pre-2015 EA Questionnaire and the number of
sites reporting each Conservation Item. ................................................................................. 178
Figure 6.3 Comparison of coverage levels in the Post-2015 EA Questionnaire and the number
of sites reporting each Conservation Item. ............................................................................. 179
Figure 6.4 Proportion of Conservation Item meta-categories within each of the Pre-2015 EA
Questionnaire coverage levels. .............................................................................................. 179
Figure 6.5 Proportion of Conservation Item meta-categories within each of the Post-2015 EA
Questionnaire coverage levels. .............................................................................................. 180
Figure 7.6 The almost identical logos for the three tiers of EA’s ECO Certification Program 204

xvi
Acronyms, abbreviations and glossary
ABC Strategy Australia’s Biodiversity Conservation Strategy: 2010 – 2030, one of the eight policies in the NCA.
Bonn Convention Alternate name for the CMS, after the city in which the Convention was signed.
CA Matrix Conservation Activities Matrix – a construction of the potential conservation activities of ecotourism enterprises and the direct and indirect relationships between actions and conservation outcomes, as described in Section 4.2.
CAMBA China-Australia Migratory Bird Agreement
CBD Convention on Biological Diversity
CE Framework Conservation Evaluation Framework – depicts critical components of conservation evaluations as a series of steps to guide evaluations of the conservation activities of ecotourism enterprises, as described in Section 4.3.
CMS Convention on the Conservation of Migratory Species of Wild Animals
Conservation Items
This is an umbrella term created for this thesis to cover the 53 conservation actions and outcomes that make up the CA Matrix, as described in Section 4.2
EA Ecotourism Australia, the organisation responsible for the design and management of Australia’s national eco-certification programs.
EA Questionnaire Refers to the application questionnaire used by EA in their certification process, as described in Section 3.2.3.4.
EPBC Act 1999 Environment Protection and Biodiversity Conservation Act 1999
GSTC Global Sustainable Tourism Council
Heritage Strategy Australian Heritage Strategy 2015, one of the eight policies in the NCA.
JAMBA Japan-Australia Migratory Bird Agreement
Migratory Species Lists
Migratory species listed under the EPBC Act 1999 as well as the Bonn Convention/CMS, JAMBA, CAMBA and ROKAMBA.
National Conservation Agenda (NCA)
This is an umbrella term created for this thesis to cover the eight key national conservation policies, as described in Section 2.6.2.2 and Section 3.2.3.3.

xvii
National Conservation Threats (NCTs)
This is an umbrella term created for this thesis to cover three national conservation directives and regulations: Key Threatening Processes, Threat Abatement Plans, and Weeds of National Significance, as described in Section 3.2.3.3.
Nature Strategy Australia’s Strategy for Nature 2018-2030 (draft), one of the eight policies in the NCA.
NCA National Conservation Agenda
NCTs National Conservation Threats
Pest Strategy Australian Pest Animal Strategy 2017-2027, one of the eight policies in the NCA.
PPA Private protected area
Ramsar Convention
International treaty – the Ramsar Convention on Wetlands of International Importance especially as Waterfowl Habitat (1971)
Reserve Strategy Strategy for Australia's National Reserve System 2009-2030, one of the eight policies in the NCA.
ROKAMBA Republic of Korea–Australia Migratory Bird Agreement
Species Strategy Threatened Species Strategy 2015, one of the eight policies in the NCA.
TOPs TOPs refers to the ‘Targets, Objectives and Priorities’ of the NCA policies, as described in Section 3.2.3.3.
Vegetation Framework
Australia's Native Vegetation Framework 2012, one of the eight policies in the NCA.
Weeds Strategy Australian Weeds Strategy 2017-2027, one of the eight policies in the NCA.

xviii
Acknowledgement of papers included in this thesis
Context
Section 9.1 of the Griffith University Code for the Responsible Conduct of Research (“Criteria for Authorship”), in accordance with Section 5 of the Australian Code for the Responsible Conduct of Research, states:
To be named as an author, a researcher must have made a substantial scholarly contribution to the creative or scholarly work that constitutes the research output, and be able to take public responsibility for at least that part of the work they contributed. Attribution of authorship depends to some extent on the discipline and publisher policies, but in all cases, authorship must be based on substantial contributions in a combination of one or more of:
• Conception and design of the research project.
• Analysis and interpretation of research data.
• Drafting or making significant parts of the creative or scholarly work or critically revising it so as to contribute significantly to the final output.
Section 9.3 of the Griffith University Code (“Responsibilities of Researchers”), in accordance with Section 5 of the Australian Code, states:
Researchers are expected to:
• Offer authorship to all people, including research trainees, who meet the criteria for authorship listed above, but only those people.
• Accept or decline offers of authorship promptly in writing.
• Include in the list of authors only those who have accepted authorship.
• Appoint one author to be the executive author to record authorship and manage correspondence about the work with the publisher and other interested parties.
• Acknowledge all those who have contributed to the research, facilities or materials but who do not qualify as authors, such as research assistants, technical staff, and advisors on cultural or community knowledge. Obtain written consent to name individuals.
Acknowledgement of paper
Included in this thesis is a paper in Chapter 2 which is co-authored with other researchers. My contribution to this co-authored paper is outlined at the front of the relevant chapter. The bibliographic details for this paper including all authors, are:
Wardle, C., Buckley, R., Shakeela, A., & Castley, J. G. (2018). Ecotourism’s contributions to conservation: analysing patterns in published studies. Journal of Ecotourism. doi:10.1080/14724049.2018.1424173
This paper is subject to the copyright conditions of the journal with which it was published; as such it may not be reproduced or distributed without prior consent of the publisher.

xix
Additional relevant publications and outputs
The following list incorporates all outputs produced during candidature including outputs in the thesis, outputs based on the thesis, and outputs linked to the thesis topic.
Journal articles in prep
Wardle, C., Buckley, R., Shakeela, A., & Castley, J. G. (in prep). Conservation contributions of ecotourism: mechanisms and framework for evaluation.
Wardle, C., Castley, J. G., Buckley, R., & Shakeela, A. (in prep). An evaluation of the use of ecotourism on private land for conservation in Australia.
Wardle, C., Buckley, R., Shakeela, A., & Castley, J. G. (in prep). Ecotourism as a social driver for conservation in Australia.
Wardle, C., Buckley, R., Castley, J. G., & Shakeela, A. (in prep). Conservation and ecotourism: the conservation gap in eco-certification and the ecotourism gap in national conservation policy.
Peer-reviewed publications
Wardle, C., Buckley, R., Shakeela, A., & Castley, J. G. (2018). Ecotourism’s contributions to conservation: analysing patterns in published studies. Journal of Ecotourism. https://doi.org/10.1080/14724049.2018.1424173
Wardle, C., Buckley, R., Castley, J. G., & Shakeela, A. (2017). Evaluating the conservation contributions of ecotourism. Proceedings of the 5th Interdisciplinary Tourism Research Conference, Cartagena, Spain, pp. 533-537. Available from: https://anatoliajournal.com/interdisciplinary/wp-content/uploads/2016/09/5inter2017-book.pdf
Morrison, C. F., Wardle, C. and Castley, J. G. (2016). Repeatability and Reproducibility of Population Viability Analysis (PVA) and the Implications for Threatened Species Management. Frontiers in Ecology and Evolution, 4(98):1-7. Available from: https://doi.org/10.3389/fevo.2016.00098
Zhong, L., Buckley, R. C., Wardle, C., & Wang, L. (2015). Environmental and visitor management in a thousand protected areas in China. Biological Conservation, 181(2015), 219-225. Available from: http://dx.doi.org/10.1016/j.biocon.2014.11.007
Wardle, C., & Buckley, R. (2014). Tourism citations in other disciplines. Annals of Tourism Research, 46(0), 166-168. Available from: https://doi.org/10.1016/j.annals.2014.01.002
Reports
Wardle, C. (2018). Conservation contributions of Ecotourism Australia’s Advanced certified operators: preliminary findings. Report for Ecotourism Australia.

xx
Wardle, C. (2018). Review of conservation criteria in the ECO Certification Program. Report for Ecotourism Australia.
Becken, S. & Wardle, C. (2016). Tourism Planning in Natural World Heritage Sites. Griffith Institute for Tourism, Research Report No 13; commissioned by UNESCO. Available from: https://www.griffith.edu.au/__data/assets/pdf_file/0034/18889/UNESCO-WHA-Report13Finalfinal-1.pdf
McLennan, C.L., Bec, A., Wardle, C. & Becken, S. (2015). Gold Coast Tourism Industry Report Year Ending June 2015. Griffith Institute for Tourism, Research Report No 9; commissioned by the Gold Coast Tourism Corporation and the City of Gold Coast. Available from: https://www.griffith.edu.au/__data/assets/pdf_file/0032/18878/_June-2015-Report-9-Tourism-Industry-Report-merged.pdf
Becken, S., McLennan, C.L., & Wardle, C. (2014). Gold Coast Tourism Industry Report Year Ending December 2014. Griffith Institute for Tourism, Research Report No 6; commissioned by the Gold Coast Tourism Corporation and the City of Gold Coast. Available from: https://www.griffith.edu.au/__data/assets/pdf_file/0031/18877/_Final-merged-report-for-printing-20150730.pdf
Becken, S., McLennan, C.L., Gardiner, S. & Wardle, C. (2014). Gold Coast 2013/14 Financial-Year Tourism Industry Report. Griffith Institute for Tourism, Research Report No 5; commissioned by the Gold Coast Tourism Corporation and the City of Gold Coast. Available from: https://www.griffith.edu.au/__data/assets/pdf_file/0032/18887/Report-5-Gold-Coast-2013-14-Financial-Year-Tourism-Industry-Report-1.pdf
Conference presentations
Wardle, C. (2018). The conservation contributions of ecotourism in Australia: How far have we come, and where to from here? Global Eco Conference, 26-28 November 2018, Townsville, Australia.
Wardle, C. (2017). Evaluating the conservation contributions of ecotourism. Interdisciplinary Tourism Research Conference, 6-11 June 2017, Cartagena, Spain.
Wardle, C. (2015). A review of the conservation actions and outcomes of wildlife tourism enterprises. Wildlife Tourism Australia Conference, 29 September – 2 October 2015, Melbourne, Australia.
Additional outputs
Contributing author (in press). Healthy People in a Healthy Environment: Key Directions Statement. Australian Committee for IUCN - Science Informing Policy Series.
Wardle, C. (in press). Science Policy Handbook: A Guide for Scientists to Engage with Public Policy. EMCR Forum, Australian Academy of Science.

xxi
Wardle, C. (2018). Loving the PhD Life. The Thesis Whisperer, May 2018, available from: https://thesiswhisperer.com/2018/05/30/loving-the-phd-life/
Becken, S. & Wardle, C. (2017). Protected Areas and Tourism Planning Indicator. Developed for the 2016 Global Sustainable Tourism Dashboard; available from: https://www.tourismdashboard.org/explore-the-data/protected-areas/
(Signed) _________________________________ (Date)______________
Cassandra Wardle
(Countersigned) ___________________________ (Date)______________
Principal supervisor: Professor Ralf Buckley

xxii
Acknowledgements
Before starting my PhD, I read many studies that emphasised it would be a challenging and isolating experience. Although at times I have indeed found myself living under a rock, I have always been surrounded by amazing people who have made this an incredibly enjoyable journey. I would therefore like to take advantage of this rare opportunity to officially document my gratitude. First and foremost, I would like to thank my super-supervisory team. I have been so fortunate to have three wonderful supervisors whose individual strengths and research interests complemented each other perfectly for this project.
Professor Ralf Buckley
Thank you for your endless supply of answers to my never-ending stream of questions, and for teaching me to see past the details to the big picture and to (sort of) let go of perfectionism.
Dr Aishath
Shakeela Thank you for sharing your wealth of knowledge on research methodologies and teaching me the importance of understanding them fully before using them; demonstrating how to find the balance between speed and quality; and convincing me to listen before leaping.
Dr J. Guy
Castley Thank you for your incredibly detailed comments on drafts and your ecological and statistical insights; for reminding me of the importance of quality over speed when I tried to rush; and for teaching me that working on my weaknesses is just as important as working to my strengths.
I would also like to acknowledge and thank all those who have assisted with my PhD and my professional development more broadly throughout my candidature, especially past colleagues at the International Centre for Ecotourism Research (special mention to Ms Wendy Smith and Dr Clare Morrison), the Australian Academy of Science (special mention to Dr Stuart Barrow), Griffith Graduate Research School (special mention to Dr Eliza Howard), Griffith School of Environment and Science, Griffith Institute for Tourism (special mention to Professor Susanne Becken), and the Queensland Universities Consortium. Additionally, I gratefully acknowledge the in-kind support provided by Ecotourism Australia, for granting me access to the EA certification data, and for providing such a friendly office space for my year of data collecting.
I would also like to express my sincere gratitude to my family, friends, and fellow HDR students along the way, in particular:
My mum, Denise Wardle
“The mind is not a vessel to be filled but a fire to be kindled” – Plutarch
Thank you for instilling in me a joy and appreciation of lifelong learning; for reading a thousand drafts from school assignments to PhD chapters; for supporting me every step of the way; and for your firm and unwavering belief in me. Words don’t exist to express the extent of my gratitude. You praise my burning need to right the wrongs I see in the world, but you gave me the kindling and the match.

xxiii
My brother, Dr Ben Wardle
Thank you for teaching me that honest reflection and self-validation are more important than praise; for always raising the bar; and for unintentionally but effectively preparing me for reviewer comments.
My grandparents,
Dennis and Una Thank you for showing me the value of long hours, hard work, and pride in a job well-done; and for your concrete belief that I will succeed at anything I put my mind to, from finding lost tv channels to submitting this thesis.
My cheer squad: Em, Courtney,
Claire, Dharsha & Brodie
“People either inspire you or they drain you – pick wisely…”
To my awesome friends who still want to hang out with me whether I’m channelling my inner Hermione Granger or my inner Steve Irwin – thank you. Your endless support and understanding have been just as vital for my sanity as all the laughs, distractions and beers along the way.
Finally, I would like to acknowledge all those who came before me – firstly, the researchers past and present who built the knowledge base and academic literature that allowed me to write this thesis; and secondly, the environmental heroes of my childhood who inspired a generation of Planeteers. And finally, to the trailblazing women whose determination and persistence tore down the barriers of inequality in educational institutions – thank you for creating a world in which it is completely unexceptional to be a woman undertaking an environmentally focused doctorate in the sciences. We do indeed stand on the shoulders of giants.

xxiv

Chapter 1: Introduction
1.1 Ecotourism and conservation
The planet is currently facing a global extinction crisis (Pimm et al., 2014; Ceballos et al.,
2015). Despite spending more than US$21.5 billion per year on conservation activities globally
(Waldron et al., 2013), efforts to achieve conservation goals continue to fall short (Tittensor et
al., 2014; Butchart et al., 2015; Hill et al., 2015). The social benefits of healthy, functioning
ecosystems and our reliance on ecosystem services have long been recognised (Costanza et al.,
1997; Costanza et al., 2017), and recent studies continue to highlight this importance (e.g.
Buckley and Brough, 2017; Kubiszewski et al., 2017; McDonough et al., 2017). However,
public conservation efforts are coming under increasing pressure due to reductions in funding,
competing priorities of governments, and insufficient protected area networks (Rodrigues et al.,
2004; Kingsford et al., 2009; Lindenmayer et al., 2010; Whitelaw, King and Tolkach, 2014;
Mallari et al., 2016).
Conservation practices on private and communal land are therefore of growing importance
(Adams and Moon, 2013; Butchart et al., 2015). There is increasing evidence that engaging with
local communities and social institutes is critical for achieving positive biodiversity outcomes
(Liu et al., 2007; Collins et al., 2011; Perrings et al., 2011; Hill et al., 2015). This is reflected in
global conservation agendas, with nearly half of the 2020 Aichi Targets focused on the
underlying social drivers of biodiversity loss (Perrings et al., 2011) and strong links between
biodiversity and the UN Sustainable Development Goals (Convention on Biological Diversity
(CBD), 2016). Conservation practices require human actions, which in turn require incentives,
motivations, and/or deterrents (Liu et al., 2007; Collins et al., 2011; Perrings et al., 2011; Hill et
al., 2015). Socio-ecological systems and alternative conservation methods are therefore gaining
traction among both researchers and practitioners (Adams and Moon, 2013; Butchart et al.,
2015; Hill et al., 2015).
Ecotourism is one such socio-ecological system, often promoted for its potential to function as a
conservation mechanism while providing social benefits and allowing for economic
development (Krüger, 2005; Pegas and Castley, 2014; Snyman, 2016). In theory, and indeed as
demonstrated under certain conditions, ecotourism can increase pro-environmental attitudes and
behaviours of visitors, local communities and other stakeholder groups by providing incentives,
deterrents and pressures (Figure 1.1) (Hunt et al., 2015; Wheaton et al., 2016; Wardle et al.,
2018). It has therefore been adopted widely in community development and conservation
strategies, especially in areas where employment options are limited and livelihoods are land-
intensive (Butcher, 2006; Lamers et al., 2014; Romero-Brito, Buckley and Byrne, 2016).
1

Chapter 1: Introduction
Figure 1.1 Conceptual path linking ecotourism to conservation outcomes.
Ecotourism1 may also circumvent many of the constraints faced by governments and
conservation organisations when implementing environmental strategies. For example,
economic development and societal needs often compete with conservation practices, especially
in many developing countries where areas with high concentrations of biodiversity and
threatened species coincide with areas of high value for human use (Salafsky et al., 2001;
Becker et al., 2005; Mbaiwa, 2011; Di Minin et al., 2013). However, ecotourism operations can
help offset conservation costs and compensate local communities, and can be utilised as a
strategy for environmental protection in areas where public protected areas are difficult to
establish (Blangy and Mehta, 2006; Ahebwa, van der Duim and Sandbrook, 2012; McCauley et
al., 2013). Furthermore, ecotourism can mobilise and increase political, financial, and broader
stakeholder and public support for conservation activities (Krüger, 2005; Buckley, 2009; Liburd
and Becken, 2017).
Ecotourism is widely referred to as one of the fastest growing segments of the global tourism
industry, itself one of the world’s largest industries (Balmford et al., 2009; Das and Syiemlieh,
2009; Erdem and Tetik, 2013). Estimates suggest that the annual spending of international
tourists in non-OECD countries far exceeds that spent on conservation projects in the
developing world by both official aid agencies and the United Nations Global Environment
1 Inclusive of ecotourism operations owned, operated or supported by all organisation types i.e. government, community, private, NGO, and so on.
2

Chapter 1: Introduction
Facility (Kirkby et al., 2011). As such, there is enormous potential for this sector to contribute
to protecting the natural environment on which it depends (Kirkby et al., 2011; Brandt and
Buckley, 2018). However, it is essential that sufficient evidence exists to support the application
and progression of this concept.
1.2 Academic research extent and gaps
Substantial academic attention has been devoted to various thematic elements captured under
the ‘ecotourism’ umbrella (Figure 1.2). For example, many economic studies have assessed the
financial viability of ecotourism operations, visitor expenditure, and economic valuations (e.g.
Barnes, Schier and Van Rooy, 1999; Tisdell, 2007; De and Devi, 2011; Tisdell and Wilson,
2012). A myriad of visitor studies have examined the ecotourists themselves including
ecotourist demographics, behaviours, experiences, and philanthropy (e.g. Lindberg, 1991;
Weaver, 2002; Galley and Clifton, 2004; Honey, 2011). Others have focused on the
implications of ecotourism for local communities including social impacts, employment, and
community development (e.g. Zeppel, 2006; Stronza and Gordillo, 2008; Ahebwa et al., 2012).
Figure 1.2 Examples of key ecotourism research focus areas.
1.2.1 Ecotourism and the environment The negative environmental impacts of tourists and tourism operators, such as weed dispersal,
have been well studied (e.g. Pickering, Harrington and Worboys, 2003; Steven, Pickering and
Castley, 2011; Ansong and Pickering, 2013). Although it should be noted that some researchers
suggest that many negative impacts of ecotourism are speculative, lack conclusive evidence, and
merit more careful analysis (Fitzgerald and Stronza, 2016). Additional well-studied aspects of
the ecotourism-environment relationship include (1) minimal impact operations and
sustainability (Buckley, 2012; Ruhanen et al., 2015); and (2) the importance of the environment
3

Chapter 1: Introduction
as a key ecotourism attraction, including visitor preferences for clean environments (e.g. Kelly
et al., 2007; Kirillova et al., 2014). A niche but growing research area within the ecotourism and
environment theme is the delivery of conservation benefits through ecotourism.
1.2.2 Ecotourism and conservation Large compendiums and broad evaluations of conservation and ecotourism in practice do exist
and provide important foundations for this area of research. However, the site selection process,
methods, focus, and level of detail of these studies limit the applicability of their findings
beyond their specified context. For example, Buckley (2009) focuses on net environmental
impacts and includes only a limited number of conservation mechanisms, while Buckley (2010)
was subjective in the inclusion of only well-known and well documented cases and context-
dependent actions. Krüger (2005) and Doan (2000) do not list or justify the cases examined and
focus predominantly on sustainability and local community issues, respectively, with only
limited referrals to conservation. Ardoin et al. (2015) focus solely on the environmental
knowledge, attitudes and behaviours of visitors; Brandt and Buckley (2018) focus solely on the
link between ecotourism and forest protection or reforestation; Romero-Brito et al. (2016)
include only NGO cases; and Mossaz, Buckley and Castley (2015) is both continent and species
specific.
Small-scale practical case studies examining the ecotourism-conservation relationship also
exist, such as Blangy and Mehta (2006); Brightsmith, Stronza and Holle (2008); and Samways
et al. (2010). However, just 70 academic journal articles had examined the conservation
activities of ecotourism operations in practice as of February 2016, and their transferability is
similarly limited (Wardle et al., 2018, see also Chapter 2). These studies focus on individual or
a select handful of sites with little explanation for site selection; concentrate primarily on visitor
interpretation and community actions; and are located predominantly in southern Africa and
South America (Wardle et al., 2018).
1.2.2.1 Visitors Environmental interpretation and the environmental attitudes and values of visitors have been
examined extensively within ecotourism and the broader areas of wildlife tourism and nature
tourism (e.g. Armstrong and Weiler, 2002; Hughes and Morrison-Saunders, 2005). However,
links to how this manifests as behavioural changes, either on or off-site, are rare (Hughes, 2013;
Wardle et al., 2018). Visitor expenditure and willingness-to-pay for natural attractions and
environmental protection measures have also been widely studied (e.g. Navrud and Mungatana,
1994; O'Malley, Lee-Brooks and Medd, 2013; Daly, Fraser and Snowball, 2015). However,
4

Chapter 1: Introduction
these are predominantly theoretical, and few tangible conservation contributions have been
identified. This theme is explored in greater detail in Section 4.2.3.
1.2.2.2 Local communities The contributions of tourism to community development have been well documented (Krüger,
2005; Zeppel, 2006) and disputed (Fletcher, 2009); however, evaluations of the linkages
between these social impacts and ecological conservation outcomes are scarce (Wardle et al.,
2018). Those that do exist (e.g. Sakata and Prideaux, 2013; Lamers et al., 2014) tend to focus on
small numbers of conservation actions, few outcomes, and individual sites in specific contexts,
limiting the transferability of their findings (Wardle et al., 2018). Furthermore, these studies
often focus on ecotourism within a region rather than assessing the conservation activities of
individual operations. This theme is explored in greater detail in Section 4.2.4
1.2.2.3 Other stakeholders The linkages of ecotourism with environmental research, political measures, and broader
organisational scale activities have been touched on by Krüger (2005) and Buckley (2009);
however, evaluations of this in practice are limited to a select handful of case studies under
specific conditions (e.g. Buckley, 2010; Liburd and Becken, 2017). This theme is explored in
greater detail in Section 4.2.5
1.2.3 Summary Our current understanding of the relationship between ecotourism operations and conservation
is limited to (1) hand-picked sites located primarily in developing nations; (2) a narrow group of
conservation aspects, predominantly indirect conservation impacts through visitor interpretation
and community benefits; and (3) self-reported perceptions of individual attitudes and behaviours
of visitors and community members (Wardle et al., 2018). This lack of systematic evaluation
utilising comparable methods, baseline data, and predetermined parameters severely hampers
the assessments of ecotourism programs, projects and conservation interventions (Kleiman et
al., 2000; Tear et al., 2005; Ferraro and Pattanayak, 2006). As such, the evidence base for
determining the legitimacy and transferability of this relationship is currently insufficient to
justify the continued placement of ecotourism operations near threatened species and
ecologically sensitive areas on the basis of assumed conservation benefits (Wardle et al., 2018).
5

Chapter 1: Introduction
1.3 Thesis objectives
The overarching aim of this thesis is to identify and explore the conservation contributions of
ecotourism enterprises, both at a global scale more broadly and a detailed national scale within
Australia. This aim is supported by the following research objectives:
Research Objective 1
Identify and synthesise existing evaluations of the conservation activities of ecotourism enterprises in the academic literature to quantify the gaps and biases that exist within this research (Chapter 2).
Research Objective 2
Identify the conservation activities that ecotourism enterprises may potentially undertake and construct an evaluation framework based on an exploration of the actions, outcomes and relationships of these conservation activities (Chapter 4).
Research Objective 3
Evaluate the conservation activities of a set of Australian ecotourism enterprises certified with Ecotourism Australia (‘EA’) (Chapter 5).
Research Objective 4
Identify if patterns exist between the conservation practices of a set of Australian ecotourism enterprises and their enterprise characteristics such as the size of the property and age of the business (Chapter 5).
Research Objective 5
Document and explore the overlaps and gaps between the EA certification criteria, conservation practices of ecotourism enterprises, and the national conservation policy landscape (Chapter 6).
1.4 Thesis boundaries and scope
1.4.1 Ecotourism The definition used for ecotourism in this thesis is one that encompasses the key elements of
most ecotourism definitions: nature-based tourism that is sustainable, has an educational or
learning component, and attempts to enhance the natural and socio-cultural environment
(Fennell, 2001; Weaver and Lawton, 2007; Cobbinah, 2015). The multitude of ecotourism
definitions and the various concepts they incorporate are discussed in detail in Section 2.1.
To ensure the sites examined in this study met the requirements of ecotourism, only Australian
ecotourism operators certified at the highest level through Ecotourism Australia were included.
1.4.1.1 Ecotourists The terms ‘tourist’, ‘visitor’, and ‘guest’ are used interchangeably in this thesis.
6

Chapter 1: Introduction
1.4.1.2 Consumptive and captivity tourism Whether consumptive tourism (such as hunting and fishing) or captivity tourism (such as zoos
and aquariums) should be included as ‘ecotourism’ is another facet of the ecotourism definition
debate, with arguments often involving substantial ethical quandaries (Mason, 2000; Novelli,
Barnes and Humavindu, 2006; Weaver and Lawton, 2007). Hunting tourism may contribute to
conservation goals through, for example, raising conservation funds, eliminating target
individuals from a population (due to disease or aggression), removing invasive species, and
reducing human-wildlife conflict through the provision of community funding (Thakadu et al.,
2005; de Boer, Stigter and Ntumi, 2007; Lindsey, Roulet and Romañach, 2007b; Gressier,
2014). Captivity tourism may contribute to conservation goals by supporting breeding
programs, generating funds, and raising awareness of environmental problems (Catibog-Sinha,
2008; Smith, Broad and Weiler, 2008; Fennell, 2013; Martin et al., 2014). However, both
practices raise ethical concerns and can produce undesired conservation outcomes such as
skewed population genetics due to hunting preferences (Harris, Wall and Allendorf, 2002) and
issues regarding animal welfare, hygiene and nutrition in captive environments (Fennell, 2013).
The details of these issues are outside the scope of this thesis, and therefore consumptive and
captivity tourism are not included as components of ecotourism in this thesis.
1.4.1.3 Ecotourism enterprises The terms ‘ecotourism enterprise’ and ‘ecotourism site’ in this thesis are umbrella terms that
refer to the ecotourism operations or activities of a business at a specific site such as an
individual reserve or lodge. The terms ‘site’, ‘enterprise’, ‘business’, ‘operator’, and
‘operations’ are therefore used interchangeably.
This thesis includes enterprises that operate under a range of ownership models including
private, NGO, and community owned, as well as combinations of these. However, government
operations are not included in this thesis. This is because the focus of this thesis is on
ecotourism as an alternate conservation mechanism to supplement more traditional models.
Furthermore, most government operated2 ecotourism exists in the form of national parks and
other public protected areas which (1) are generally not identifiable as individual enterprises, (2)
have already been studied extensively, and (3) often operate under very different conditions i.e.
both revenue and resource constraints are usually part of the larger machinery of government
and not connected solely to visitation (Buckley, 2004; 2012; Leung et al., 2014).
2 Note that this does not refer to privately operated concessions in public protected areas.
7

Chapter 1: Introduction
1.4.2 Conservation The term ‘conservation’ is generally used in the sense of conserving and protecting a resource
(Stevenson, 2010; Sandbrook, 2015), often including activities that aim to restore the ‘original
state’, the ‘natural state’ or to at least improve ecological conditions (Geist and Hawkins, 2016).
However, controversy exists over the precise meaning and purpose of the term. For example,
these restoration and remediation activities are also part of restoration ecology, which may be
classified as distinct from ‘conservation’ (Geist and Hawkins, 2016).
In this thesis, the term conservation is used in a pragmatic sense and refers to activities that aim
to generate positive impacts on the natural environment and biodiversity (Salafsky et al., 2008;
Wardle et al., 2018), “without bothering too much about semantic issues” (Geist and Hawkins,
2016, p. 944).
1.4.2.1 Conservation vs sustainability A distinction is, however, drawn between ‘conservation’ and ‘environmental sustainability’,
which includes concepts such as minimal impact, carbon neutrality, and energy efficiency. The
line between the two is often blurred; however, for the purpose of this thesis the distinction lies
in the nature of the impact: environmentally sustainable actions aim to reduce the negative
impacts that are caused by the existence of the enterprise; conservation actions aim to generate
positive environmental impacts (CBD, 1992; Salafsky et al., 2008; Wardle et al., 2018). For
example, planting native trees to replace vegetation that was cleared during the construction of
an ecotourism site is an attempt to minimise negative environmental impacts and is therefore
classified here as a sustainability activity. Alternatively, proactively planting native trees to
improve the extent of vegetation cover beyond that which existed prior to ecotourism
development constitutes a conservation activity.
However, activities that increase the sustainability or pro-environmental behaviour of others are
also classified here as conservation activities. This is because the negative or neutral
environmental behaviours of visitors, community members and so on exist independently of an
ecotourism enterprise. Therefore, if a person modifies their behaviour and reduces their own
environmental footprint based on their visit to an ecotourism enterprise, then this enterprise has
made a positive environmental difference.
1.4.2.2 Conservation actions and outcomes The term ‘conservation action’ is used in the literal sense of ‘the act of doing something’ (e.g.
planting trees) and is defined in this thesis as an activity undertaken with the intent of achieving
a conservation objective (Pullin and Stewart, 2006; Salafsky et al., 2008). Conservation
8

Chapter 1: Introduction
outcomes are those that result from these actions, such as an improvement in the quality of
habitat and vegetation density following tree planting activities.
For conservation activities to be classified as undertaken by an ecotourism enterprise, they must
be carried out by individuals who are operating on behalf of the enterprise (e.g. staff), paid for
or commissioned by the enterprise (e.g. contractors), or volunteering their time for activities led
by the enterprise (e.g. community involvement in on-site tree planting ‘working bees’). If
multiple operations are run by the same company, the actions of the company itself are
generally not incorporated unless it is made clear that the enterprise under examination
contributes directly to these actions.
1.4.3 Biodiversity Consistent with definitions provided by the Australian Biodiversity Conservation Strategy
2010-2030 and the United Nations CBD, biodiversity is defined here as all living organisms and
associated variability including within species (genetic diversity), between species (species
diversity), and of ecosystems (ecosystem diversity) (CBD, 1992; NRMMC, 2010).
1.4.4 Academic and grey literature The term ‘academic literature’ is used in this thesis to refer to research published in traditional
academic journals (Haddaway and Bayliss, 2015). Conversely, the term ‘grey literature’ refers
to publications outside of traditional academic journals such as books and government reports.
Both forms of literature are utilised in this thesis; however, common research limitations such as
time, thesis length, and lack of appropriate systematic methodologies for sampling grey
literature necessitated limiting some thesis components to only the academic literature (Adams,
Smart and Huff, 2017).
1.5 Content and structure of thesis
This thesis follows the standard thesis structure of a general introduction followed by a context
and literature review chapter, methodology chapter, data chapters, and a general discussion and
conclusion, with substantial links between chapters (Figure 1.3). Chapters 4, 5 and 6 form the
data chapters, although Chapter 2 also includes data in the form of a published literature review.
9

Chapter 1: Introduction
Figure 1.3 Linkages between the thesis chapters (excluding Chapter 3 which provides the methods for Chapters 4, 5 and 6).
Multiple synergistic approaches are used to meet the research objectives outlined in Section 1.3.
Each approach is presented as a somewhat discrete research component in the three data
chapters; however, as shown in the more detailed conceptual model in Figure 1.4 and explained
below, these are inextricably linked.
10

Chapter 1: Introduction
Figure 1.4 Detailed conceptual model of the linkages between the research components, methods and objectives.
11

Chapter 1: Introduction
Chapter 2 provides (1) a detailed context on the key themes incorporated within the thesis aims
including eco-certification, the state of the environment, and the Australian conservation policy-
practice landscape; (2) a systematic quantitative literature review3 which systematically
identifies, selects, quantifies and synthesises the current academic literature that analyses
ecotourism enterprises and their in-practice contributions to conservation (to fulfil Research
Objective 1); and (3) preliminary conservation pathways models that expand on Figure 1.1 and
lay the foundation for the research presented in Chapter 4.
Chapter 3 details the methods for Chapters 4, 5, and 6 including conceptualisation, data sources,
data collection, and analyses.
Chapter 4 explores the potential conservation pathways of ecotourism enterprises and
consolidates these into a Conservation Activities Matrix (‘CA Matrix’) to fulfil Research
Objective 2. This provides the foundation of an evidence-based framework to evaluate the
conservation contributions of ecotourism enterprises at an individual site level or accumulative
scale.
Guided by this framework, Chapter 5 evaluates the conservation activities of 86 EA-certified
Australian ecotourism operators to address Research Objectives 3 and 4. As part of the
framework, this chapter utilises a ‘conservation significance screening process’ (described in
Chapter 4) to assess the importance of these activities within the Australian conservation
context. The full summary of the results of this analysis are provided in Appendix C and
Appendix D.
Chapter 6 compares EA’s ECO Certification program, the conservation practices of the 86 sites
from Chapter 5, and the national conservation policy landscape to identify key overlaps and
gaps for progressing the ecotourism-conservation relationship in Australia.
Chapter 7 discusses the key findings of the thesis including their significance, practical
implications, and contributions to knowledge.
1.6 Project significance
Ecotourism is often promoted as a conservation mechanism; however, the legitimacy and extent
of this relationship is unclear (Geffroy et al., 2015; Fitzgerald and Stronza, 2016; Brandt and
Buckley, 2018). This thesis demonstrates that evaluations of on-the-ground conservation
3 This has been published in the Journal of Ecotourism.
12

Chapter 1: Introduction
outcomes of ecotourism enterprises are still a relatively recent trend in the academic literature,
and those that do exist lack a sufficient number of sites, transparent site selection processes,
adequate sampling strategies, baseline data, and consistency in the conservation activities
examined (Wardle et al., 2018, see also Chapter 2). In short, they are not repeatable,
reproducible, or transferable and, as such, the evidence base for using ecotourism as a
conservation mechanism is inadequate (Kleiman et al., 2000; Tear et al., 2005; Ferraro and
Pattanayak, 2006; Walsh et al., 2012; Brandt and Buckley, 2018). Furthermore, given the
paucity of detailed knowledge of the conservation contributions of ecotourism, it is difficult to
provide guidelines to industry operators on best practice activities for conservation purposes.
This thesis addresses these issues by (1) developing a framework for systematically evaluating
the conservation impacts of ecotourism enterprises; (2) reviewing the conservation practices of a
set of certified ecotourism enterprises in Australia and identifying their contributions to national
conservation goals; (3) assessing the conservation coverage of the national eco-certification
program; (4) reviewing the tourism coverage of national conservation policies and identifying
key themes for effective conservation management; and (5) comparing findings across these
research components to demonstrate key implications for operators, researchers, policymakers,
and eco-certification bodies.
As such, results from this research contribute to improving the evidence base necessary for the
substantiated use of ecotourism as a conservation mechanism and justifying, or preventing, the
continued placement of ecotourism operations near threatened species and ecosystems (Kleiman
et al., 2000; Tear et al., 2005; Walsh et al., 2012). This is particularly important given the
current state of the global environment and the urgency of stalling or reversing declines in
biodiversity (Butchart et al., 2015; Newbold et al., 2015).
Findings from this thesis were used in a review of the national eco-certification program in 2018
and in the ongoing development of a conservation guide for eco-certified operators in Australia.
Additionally, this research provides a core component of a Key Directions Statement currently
in production under the Australian National Committee for IUCN in collaboration with experts
and practitioners from government, NGOs and academia, to inform environmental policy
development in Australia.
13

14

Statement of contribution to co-authored published paper for
Chapter 2
The following chapter (Chapter 2: Context and literature review) includes a co-authored paper
in Section 2.7. The bibliographic details of the co-authored paper, including all authors, are:
Wardle, C., Buckley, R., Shakeela, A., & Castley, J. G. (2018). Ecotourism’s
contributions to conservation: analysing patterns in published studies. Journal of
Ecotourism. doi:10.1080/14724049.2018.1424173
My contribution to the paper involved: development of research aims and study design; data
collection, analysis, and interpretation; and manuscript development.
Other authors contributed to conceptual development, writing and reviewing the paper, and
providing editorial input.
(Signed) _________________________________ (Date)______________
Cassandra Wardle
(Countersigned) ___________________________ (Date)______________
Principal supervisor and co-author of paper: Professor Ralf Buckley
(Countersigned) ___________________________ (Date)______________
Associate supervisor and co-author of paper: Dr Aishath Shakeela
(Countersigned) ___________________________ (Date)______________
Associate supervisor and co-author of paper: Dr J. Guy Castley
15

Chapter 2: Context and literature review
This chapter provides the necessary ecotourism-conservation context underpinning the research
of this thesis, both globally and within Australia.
As depicted in Figure 2.1, the chapter is split into three parts. Part 1 considers the concept of
ecotourism, ecotourism trends, and eco-certification. Following this, Part 2 provides an
overview of the current state of the environment; the value of the natural environment and
biodiversity; and global and Australian conservation efforts. Finally, Part 3 presents a published
systematic quantitative literature review on the conservation activities of ecotourism enterprises,
which is used to develop an evidence-based conceptual model of ecotourism-conservation
pathways.
Figure 2.1 Conceptual overview of Chapter 2.
Part 1: Ecotourism
2.1 Ecotourism concepts
The concept of ecotourism crystallised throughout the 1970s and 80s within the context of
global environmental degradation and the negative social and environmental impacts of mass
tourism (Cobbinah, 2015). Although ecotourism activities have likely existed for centuries, the
16

Chapter 2: Context and literature review
term ‘ecotourism’ was first described in the academic literature in the 1980s by Ceballos-
Lascurain (1987, p. 14) as:
“Travelling to relatively undisturbed or uncontaminated natural areas with the specific objective of studying, admiring, and enjoying the scenery and its wild plants and animals, as well as any existing cultural manifestations (both past and present) found in these areas.”
A multitude of definitions have appeared and morphed as the concept has evolved over the
interceding decades, with varying levels of agreement (Fennell, 2001; Chandel and Mishra,
2016). However, there is widespread consensus that an ecotourism activity must satisfy three
core criteria: it must be (1) culturally and environmentally sustainable (2) nature-based tourism
with (3) an educational or learning component (Blamey, 1997; Weaver and Lawton, 2007). As
such, there is substantial overlap with other types of tourism, and ecotourism may be viewed as
a blending of several tourism focus areas (Fennell, 2001; Weaver and Lawton, 2007). For
example, although ecotourism must be nature-based and sustainable, it can also incorporate
aspects of community and adventure tourism (Figure 2.2).
Figure 2.2 An example of the multiple types of tourism that may overlap with ecotourism.
Common themes within ecotourism definitions include environmentally friendly travel that is
ethical, responsible, and provides conservation and socio-economic contributions (Sirakaya,
Sasidharan and Sönmez, 1999; Fennell, 2001; Chandel and Mishra, 2016). Interestingly, many
of these themes have their own branch of tourism with specific definitions (e.g. ‘responsible
tourism’). The ‘provision of conservation contributions’ theme includes phrasing such as the
conservation, preservation, protection, or enhancement of the natural environment, and was the
17

Chapter 2: Context and literature review
second most frequently cited theme across the 85 ecotourism definitions examined by Fennell
(2001), covering the period 1970-1999. A comparison of this comprehensive analysis with key
themes identified by Chandel and Mishra (2016)4 in their recent evaluation of definitions from
1990-2015 shows that this trend remains unchanged (Figure 2.3). Similar patterns in both the
types and frequencies of key themes have been found in additional studies of ecotourism
definitions (e.g. Sirakaya et al., 1999; Donohoe and Needham, 2006; Cobbinah, 2015).
Figure 2.3 Comparison of key themes used in ecotourism definitions as identified by Chandel and Mishra (2016) and Fennell (2001). Crosses in place of a bar indicate socio-economic
aspects that were not included in one of the studies: the style of data presentation and nuanced differences in meanings prevented the merging of these aspects.
2.2 Ecotourism trends
2.2.1 Global trends Ecotourism is purported to be one of the fastest growing segments of the global tourism industry
(Balmford et al., 2009; Das and Syiemlieh, 2009; Erdem and Tetik, 2013). However, statistics
on ecotourism trends are difficult to ascertain and estimates vary widely. This is largely due to
the lack of consensus regarding the scope of ecotourism activities described above, and a
subsequent lack of appropriate data collection by state or national agencies (Weaver, 1999;
Balmford et al., 2009; Perkins and Grace, 2009).
4 Although both studies cover the period 1990-1999, only 13 sources are duplicated across them.
0 20 40 60 80
Minimal impact
Sustainability
Local Area (People) Participation
Support and Respect for Local Culture
Benefits to locals
Reference to culture
Socio-Economic Development of Local Area
Learning, interpretation and appreciation
Supports conservation
Nature-based tourism
%
Chandel & Mishra 2016Fennell 2001
Socio-economic aspects
18

Chapter 2: Context and literature review
Reported values include: 157 to 236 million ecotourists globally with expenditures of up to
US$1.2 trillion (Ceballos-Lascurain, 1996 in West and Carrier, 2004); 43 million tourists in the
United States identifying as ecotourists (Katić et al., 2011); US$30 billion in earnings for
developing nations (Honey, 1999); US$28.8 billion spent by international tourists in non-OECD
countries in 2007 (3% of the total US$968 billion) (Kirkby et al., 2011); 40-60% of
international tourism in biodiversity-rich regions (Vaughan, 2000); and 2-20% of all
international tourism (Fletcher and Neves, 2012; Hall, 2013), with annual growth rates of 7-
30% and up to three times the industry average (Honey, 1999; Wight, 2001; Perkins and Grace,
2009; Fletcher and Neves, 2012).
An additional complication is the difficulty in verifying some of the figures that do exist. For
example, a 1997 World Tourism Organisation (WTO) article is cited as reporting that
ecotourism accounted for 10-15% of the tourism industry in October 1997, and that this figure
was increased to 20% in December 1998 (WTO News, 1997, 1998 in Wight, 2001). Despite
these statistics being repeated in multiple publications (e.g. Perkins and Grace, 2009; Fletcher,
2011; Hall, 2013), with an access date as recent as 2015 (e.g. Mukhambetov, Janguttina and
Еsaidar, 2016), the links provided in reference lists for these citations no longer work and the
original sources do not appear to be available online.
Figures for wildlife tourism and nature-based tourism are often used as substitutes due to their
overlap with ecotourism; however, these contain a similarly large amount of variance, with an
estimated market share between 10 and 40% (Rodger, Moore and Newsome, 2007; Ceballos-
Lascurain, 2008). In 2012, the WTO and UNEP (2012, p. viii) reported that “more than a third
of travellers are found to favour environmentally-friendly tourism and be willing to pay between
2 and 40% more for this experience”. Balmford et al. (2009) estimate that global visitation to
national parks results in an annual direct in-country expenditure of US$600 billion with a
consumer surplus of US$250 billion; the U.S. Fish and Wildlife Service (2018) reports that
approximately 40% of the US population spent US$156.9 billion in 2016 on wildlife-associated
recreation (including hunting and fishing), with wildlife watching alone accounting for US$75.9
billion; and Macaulay (2016) reports annual expenditure of US$814 million on day-use fees for
wildlife-associated recreation on private land in the US (2011 dollars).
Despite this uncertainty, the data clearly indicates that eco-, wildlife, and nature-based tourism
account for a substantial portion of the tourism industry (Balmford et al., 2009; Perkins and
Grace, 2009; Kirkby et al., 2011). With an estimated 1,323 million visitors making overnight
international trips worldwide in 2017 and spending approximately US$1.4 trillion (WTO,
2018), tourism is one of the world’s largest industries: even a small proportion of this is
noteworthy. Furthermore, the continued importance of the concept of ecotourism can also be
19

Chapter 2: Context and literature review
seen through the United Nation’s designation of 2002 as the International Year of Ecotourism
and, fifteen years later, 2017 as the International Year of Sustainable Tourism for Development.
2.2.2 Australian trends Statistics for ecotourism in Australia are equally as nebulous as those available globally.
Nevertheless, the data indicates that ecotourism activities form an important part of the tourism
experience for both domestic and international tourists (Table 2.1). This is further highlighted in
a 2016 survey of over 90,000 international tourists as part of the Tourism Australia Consumer
Demand Project (Tourism Research Australia [TRA], 2017). For example, survey respondents
rated natural beauty, wildlife, and aquatic and coastal experiences as (1) the most appealing
tourism experiences, and (2) the types of tourist activities most commonly associated with
Australia, followed by ‘food and wine’ for both rankings. Furthermore, the survey found that
Australia’s natural environment was rated first in a list of global destinations for three separate
criteria: (1) world class nature (followed by New Zealand and Switzerland); (2) unique and
interesting wildlife (followed by South Africa and Kenya); and (3) aquatic and coastal features
(followed by Hawaii and New Zealand) (TRA, 2017). Additionally, the Australian Productivity
Commission noted in 2015 that increases in environmental awareness and an associated
increased demand for ecotourism products are a key trend in international tourism for Australia
(Productivity Commission, 2015).
20

Chapter 2: Context and literature review
Table 2.1 Reported estimates of nature-based tourism and ecotourism in Australia
International
visitors1
Domestic visits2 Australian
adults3 Year Source Day Overnight
Nature-based tourists (visitation)
5.2 m (63%) 23.6 m (12%) 20.1 m (22%) 2016 (TTF, 2017) 5.6 m (68%) 2015-16 (EA, 2017) 5.1 m (69%) 24.5 m (28%) 2015 (TRA, 2015 cited in EA, 2017) 4.2 m (61%) 2014 (Griffith University, 2014 cited in EA 2017) 4.8 m (75%) 2013-14 (Productivity Commission, 2015) 3.8 m (62%) 12.8 m (73%) 2011-12 (TTF, 2012 cited in Queensland Government, 2013; ABS, 2013 cited in Jackson et al., 2017) 3.3 m (64%) 2009 (TRA, 2009; Director of National Parks, 2011)
Nature-based tourists (expenditure)
$20.0 b (54%) $2.1 b $18.9 b 2016 (TTF, 2017) $14.2 b (46%) $1.6 b $14.6 b 2012-13 (Department of Environment, 2014) $25.13 b (international & overnight domestic) 2011 (Tourism Australia, 2012 cited in Queensland Government, 2013)
$19.5 b 2009 (TRA, 2009; Director of National Parks, 2011) Nature-based tourism sector contributes $23 b to the economy N/A (Director of National Parks, 2011; Queensland Parks and Wildlife Service [QPWS], 2016)
Engaged in bushwalking activities
12.2 m (12.5%) 2017-18 (TRA, 2018) 7.4 m (42%) 2011-12 (ABS, 2013 cited in Department of Environment, 2014)
Visited national parks (NPs)
11.5 m (11.8%) 2017-18 (TRA, 2018) 9.1 m (52%) 2011-12 (ABS, 2013 cited in Department of Environment, 2014)
Direct expenditure attributable to NPs > $749m/year 2008 (Ballantyne et al., 2008 cited in QPWS, 2016) Wildlife tourists
2.2 m 2004 (Rodger et al., 2007) Wildlife as key motivation for travel to Australia
20% 2002 (Higginbottom and Buckley, 2003) Key: m = million, b = billion. Footnotes: 1Visitor numbers/expenditure with proportions in brackets; 2Number of visits not visitors; and 3Australian adults (>18 years of age) engaging in each activity.
21

Chapter 2: Context and Literature Review
2.3 Eco-certification
2.3.1 Global trends Eco-certification and -labelling schemes assure consumers that an organisation or product
complies with a given standard (Fogle and Duffy, 2018). Such programs originated in the
chemical industry following a major chemical spill in 1984 (Graci and Dodds, 2015); although
the first eco-certification program for tourism, the European Blue Flag Campaign for beaches,
was released soon after in 1987 (Blackman et al., 2014). The Rio Earth Summit5 in 1992
prompted significant environmental action across many industries and countries including eco-
certification schemes (Graci and Dodds, 2015). A corresponding increase in (1) consumer
willingness-to-pay for items with (perceived) lower environmental impacts; and (2) operator
participation in such schemes to gain visibility and a competitive advantage in an increasingly
crowded market maintained this momentum (Jamal, Borges and Stronza, 2006; Fuerst and
McAllister, 2011). Estimates suggest that the number of eco-certification schemes for tourism
activities has since grown to somewhere between 120 and 300 (Lebe and Vrečko, 2015;
Gössling and Buckley, 2016).
2.3.2 Australian trends Eco-certification in the Australian tourism industry began with the drafting of a national
accreditation scheme under the leadership of the Keating Government, following the release of
the National Strategy on Ecologically Sustainable Development in 1992 and the world-first
National Ecotourism Strategy in 1994 (Haaland and Aas, 2010). The development of this
scheme was taken over by a not-for-profit industry association, Ecotourism Australia (EA), who
had formed three years earlier as the Ecotourism Association of the Indo Pacific Region6, one of
the first professional ecotourism associations (Dowling, 2013). The resulting National
Ecotourism Accreditation Program7 (NEAP) was launched in 1996 as a world first (Haaland and
Aas, 2010) (Figure 2.4). It has grown from just 18 certified members in the first year of
operation to over 1,500 tourism products in the 2017/18 financial year (EA, 2018a).
Furthermore, the combined annual turnover of EA’s certified members exceeded AU$1 billion
in 2013/14 (Ecotourism Australia, 2018b) and reached AU$1.4 billion in 2017/18 (EA, 2018a).
After launching their ECO Destination Certification program in 2016, EA now manages five
certification programs (Figure 2.4).
5 The first UN Conference on Environment and Development (UNCED) held in Rio in 1992. 6 Renamed in 1992 as Ecotourism Association of Australia, and again in 2002 as Ecotourism Australia. 7 Renamed the ECO Certification Program in 2003.
22

Chapter 2: Context and Literature Review
Figure 2.4 Timeline of Ecotourism Australia’s growth and expansion.
The program of interest in this thesis is the ECO Certification Program. This is a process-based
program utilising applicant self-assessment combined with an initial site audit conducted by an
independent group, followed by three-yearly audits thereafter. It includes three levels of
certification:
Nature Tourism certification for tourism in natural areas that leaves minimal impact on the environment (base level);
Ecotourism certification for tourism in natural areas that focuses on optimal resource use, conservation practices and helping local communities (intermediate level); and
Advanced Ecotourism certification for tourism in natural areas with strong interpretation values and a commitment to nature conservation and helping local communities (advanced level).
23

Chapter 2: Context and Literature Review
Part 2: Conservation
2.4 The state of the environment
2.4.1 The global environment Global biodiversity and environmental health are at risk from the continually increasing human
population growth rates and associated impacts of land use change, resource consumption and
waste production (Kingsford et al., 2009; Pimm et al., 2014; Butchart et al., 2015; Newbold et
al., 2015). Human activities have cleared nearly 50% of the world’s forested areas (Crowther et
al., 2015), and existing formal protected areas do not provide adequate coverage for
approximately 77% of important sites for biodiversity, 60% of ecoregions, and 57% of species
(Butchart et al., 2015). Current extinction rates exceed background rates by two to three orders
of magnitude, and it is widely acknowledged that the planet is facing a global extinction crisis
(Kingsford et al., 2009; Pimm et al., 2014; Ceballos et al., 2015). Furthermore, the elimination
of many top predators across all continents has drastically altered ecosystems and ecological
function (Pimm et al., 2014).
National and international bodies have collaborated to develop guidelines and strategies to
address biodiversity loss and environmental degradation, such as the Convention on Biological
Diversity. However, despite global spending of at least US$21.5 billion on biodiversity
conservation efforts per year, progress towards conservation goals continue to fall short
(Waldron et al., 2013; Tittensor et al., 2014; Butchart et al., 2015; Hill et al., 2015). In fact,
studies have shown worsening trends on some indicator targets and increasing extinction risk
for some species (Tittensor et al., 2014; Newbold et al., 2015).
24

Chapter 2: Context and Literature Review
2.4.2 The Australian environment Australia is one of 17 mega-diverse countries which together support over 70% of global
biodiversity on less than 10% of the global surface (Lindenmayer et al., 2010). Furthermore,
after 60 million years of evolving in isolation, over 80% of Australia’s plant and animal species
are endemic (Jackson et al., 2017). However, in the two centuries since European settlement,
over 130 species have been declared extinct and nearly three-quarters of native vegetation has
been cleared or degraded (Evans, 2016; Department of the Environment and Energy [DEE]
2019b). At a national level, over 450 faunal species and 1,300 floral species are at risk as at
May 2019, with many more species at-risk across the states and territories (Table 2.2). Increases
in these figures have been reported in all national State of the Environment Reports since the
inaugural report in 1996 (Jackson et al., 2017). Furthermore, with at least 30 mammal
extinctions since European settlement in 1788, Australia has the highest rate of modern
terrestrial mammal extinctions (Woinarski, Burbidge and Harrison, 2015). For comparison,
European settlement in North America (over 200 years earlier) has seen only one mammal
extinction (Woinarski et al., 2015). In addition to irreparable ecological implications,
environmental degradation also threatens some of Australia’s primary tourism assets including
the Great Barrier Reef and the koala (Reside et al., 2017; Tisdell et al., 2017).
Table 2.2 Numbers of at-risk flora and fauna at a national level and for each state and territory
Conservation status1 Number of species listed2
AUS QLD NSW SA WA TAS NT ACT VIC3
Fauna
Extinct in the wild 1 11 / / / / 1 0 /
Critically endangered 78 / 28 / 57 / 12 0
269 Endangered 163 76 116 98 58 69 18 9
Vulnerable 202 137 169 66 134 45 70 16
Near threatened4 8 31 / 160 / 70 65 /
Total at-risk fauna 452 255 313 324 249 184 166 25 269
Flora
Extinct in the wild 0 22 / / / / 0 0 /
Critically endangered 181 / 72 / 160 / 3 0
376 Endangered 548 225 402 187 140 144 24 9
Vulnerable 590 484 230 196 129 75 54 0
Near threatened4 0 235 / 431 / 249 417 /
Total at-risk flora 1319 966 704 814 429 468 498 9 376
1Excludes ‘extinct’ and ‘not threatened’ categories; 2Data sourced from threatened species lists in relevant legislation for each jurisdiction (details in Section 3.4.5); 3Victoria only has two classifications: ‘threatened’ and ‘not-threatened’; and 4This category is named ‘conservation dependent’ at the national level and ‘rare’ for both SA and TAS.
25

Chapter 2: Context and Literature Review
2.5 Ecosystem services and the value of biodiversity
The link between environmental degradation and societal costs is acknowledged in the written
record as early as 400BC (Plato, in Daily, 1998) and 100AD (Pliny the Elder, in Andréassian,
2004). However, the term ‘ecosystem services’ wasn’t introduced in the academic literature
until 1981 (Gómez-Baggethun et al., 2010), referring to the goods and services derived from
ecosystem functions that benefit humanity (Gómez-Baggethun et al., 2010; Braat and de Groot,
2012). Examples of these services include: carbon sequestration and storage, watershed
protection and freshwater yield, building materials, food production, medicines, energy
production, nutrient cycling and soil conservation, shade and shelter, recreation and tourism
resources, and spiritual and cultural heritage (Costanza et al., 1997; Hall, 2011; Braat and de
Groot, 2012; Maes et al., 2012).
In the late 1990s a ground-breaking assessment of global ecosystem services estimated their
value at US$16-54 trillion per year (Costanza et al., 1997). Although it received some criticism
(Nunes and van den Bergh, 2001; Gómez-Baggethun et al., 2010), subsequent valuations
continue to demonstrate this significance, both in the academic literature (Cardinale et al., 2012;
Costanza et al., 2017; McDonough et al., 2017) and more broadly (e.g. Millennium Ecosystem
Assessment, 2005; TEEB, 2012; 2015; UNEP-WCMC, IUCN and NGS, 2018). For example,
the Intergovernmental Science-Policy Platform on Biodiversity and Ecosystem Services
(IPBES)8 identified that insect pollinator contributions to global food production are worth up to
$577 billion per year (IPBES, 2019); and the most common commercial pharmaceuticals
derived from plants have been valued at more than US$25 billion annually (De Luca et al.,
2012). Additionally, almost half of the global population depends directly on the natural
environment for their daily subsistence needs and livelihoods, the majority of which are situated
in developing nations (CBD, 2016). Furthermore, reductions in environmental quality increase
the time needed for collecting fuel, food, and water, which disproportionately impacts women
and children. As such, biodiversity loss and environmental degradation also perpetuate social
stratification and inequality.
There is a substantial body of research demonstrating the health benefits of engaging with
nature including decreased stress levels, blood pressure, and body size; and improved immunity,
mental health, cognition, creativity; and overall wellbeing (Townsend et al., 2015; Buckley and
Brough, 2017). Many indigenous populations also have a deep spiritual connection with the
8 The IPBES is an independent intergovernmental body established by the UN in 2012 to provide objective scientific assessments on biodiversity for policymakers. This assessment incorporated 3,000 scientific papers, 145 expert authors from over 50 countries, and indigenous and local knowledge from more than 60 locations.
26

Chapter 2: Context and Literature Review
land and biodiversity that has underpinned their history, culture, social structure, health, and
spirituality for millennia (Kingsley et al., 2009; Biddle and Swee, 2012).
Finally, biodiversity also holds significant intrinsic value and innate worth, and it has long been
acknowledged that we have a moral obligation to both the planet and to future generations
(intergenerational equity) to conserve our natural environment (Gaba, 1999; Weston, 2012;
Vucetich, Bruskotter and Nelson, 2015; Piccolo, 2017).
2.6 Context of biodiversity conservation
2.6.1 International context Biodiversity conservation is not a recent phenomenon. International agreements on
environmental protection were established as early as the 1940s, with major conventions and
treaties developed in every decade since the 1960s (Figure 2.5). The ground-breaking World
Conservation Strategy, published by IUCN in 1980, advocated that environmental conservation
could be achieved through the concept of ‘sustainable development’, arguing that “if the object
of development is to provide for social and economic welfare, the object of conservation is to
ensure Earth's capacity to sustain development and to support all life” (IUCN, 1980, p. 1). This
notion was solidified in the World Commission on Environment and Development (later known
as the Brundtland Commission) in 1983, and again through the 1992 Earth Summit in Rio. The
same year saw the creation of Agenda 21, the Rio Declaration on Environment and
Development, and the legally binding9 UN Convention on Biological Diversity (CBD) which has
grown from over 150 foundation signatory member nations to 196 nations.
In 2002 the Strategic Plan for the Convention on Biological Diversity 2002-2010 was
established, with all CBD Parties committing “to achieve by 2010 a significant reduction of the
current rate of biodiversity loss at the global, regional and national level as a contribution to
poverty alleviation and to the benefit of all life on Earth” (CBD, 2002, paragraph 11). This
aspiration was also reflected in the 2002 Millennium Development Goals10 (MDGs) in
acknowledgement of the connections between human well-being and biodiversity loss, with one
of the eight MDGs to ensure environmental sustainability. However, the 2010 CBD targets were
not met, and biodiversity pressures actually increased (Butchart et al., 2010; Waldron et al.,
2013).
9 Albeit with a range of soft, general and concrete obligations (Koester, 2002). 10 Derived from the Millennium Declaration, these eight goals were agreed to by the 189 member states of the UN in 2002 to “create an environment – at the national and global levels alike – which is conducive to development and to the elimination of poverty” by 2015 (UN General Assembly, 2000, p. 4).
27

Chapter 2: Context and Literature Review
Figure 2.5 Timeline of key biodiversity conservation developments. Blue text highlights Australian actions and green text highlights internationally agreed goals and targets.
28

Chapter 2: Context and Literature Review
In 2010 the Strategic Plan for Biodiversity 2011–2020 replaced the Strategic Plan for the
Convention on Biological Diversity 2002-2010. Through this strategy, all CBD Parties agreed to
a set of 20 biodiversity targets to be achieved by 2020: the Aichi Biodiversity Targets (‘Aichi
Targets’). More so than previous agreements, this strategy highlights the importance of effective
and urgent action (Tittensor et al., 2014), which was reinforced by the declaration of 2010 as the
UN International Year of Biodiversity and 2011-2020 as the UN Decade on Biodiversity.
However, a social–ecological systems analysis in 2015 suggested that at least 15 of the targets
would not be achieved (Hill et al., 2015). Other intermediate assessments have shown that
progress is indeed falling short (Tittensor et al., 2014; Butchart et al., 2015) and this trend is
reflected in recent IPBES assessments (IPBES, 2019).
In 2015 the 2030 Agenda for Sustainable Development (‘2030 Agenda’) and its 17 Sustainable
Development Goals (SDGs) replaced the MDGs. The 17 SDGs incorporate 169 targets to
stimulate action “for people, planet and prosperity” (United Nations, 2015, p. 5), and the 2030
Agenda acknowledges the inextricable links between biodiversity conservation and human
wellbeing and the inability to pursue one goal without incorporating the other:
“We are determined to protect the planet from degradation, including through
sustainable consumption and production, sustainably managing its natural resources
and taking urgent action on climate change, so that it can support the needs of the
present and future generations.” (United Nations, 2015, p. 5)
In 2016 several major international organisations including the UN Development Programme
and the World Bank released a joint publication that maps in detail the links between each of the
SDGs and the Aichi Targets (CBD et al., 2016). However, a review of progress in the third year
of implementation demonstrates that although there have been some improvements for some
targets, progress across most aspects is currently insufficient to meet the SDG targets by 2030
(United Nations, 2018).
2.6.2 Australian context It is against this backdrop of international agreements, conventions and treaties that Australia’s
own environmental agenda has developed. As the topic of the natural environment was not
included in the Australian constitution11, there is no provision for the Federal Government (‘the
Commonwealth’) to exercise any power over the environment on a national basis. However, the
Commonwealth is responsible for ensuring that Australia meets the obligations of its
international agreements, which includes those relating to environmental protection and
11 Commonwealth of Australia Constitution Act 1900.
29

Chapter 2: Context and Literature Review
conservation (as covered in Section 2.6.1). As such, it has been able to claim broad powers over
environmental issues through its responsibility for other areas12. For example, as a signatory of
the CBD it is the responsibility of the Commonwealth to ensure Australia submits national
reports every five years outlining measures taken to meet Convention objectives and the
effectiveness of these. Additionally, the environmental responsibilities of the Commonwealth
were further developed through the Council of Australian Governments 1992 Intergovernmental
Agreement on the Environment, the 1997 Heads of Agreement on Commonwealth and State
Roles and Responsibilities for the Environment, and several key High Court decisions (e.g.
Koowarta v Bjelke-Petersen (1982)13 and the Tasmanian Dams Case14). Furthermore, the state
and territory governments receive about half their funding from the federal government, and the
national agenda can therefore be a major driver of state-level activities.
2.6.2.1 National legislation The centrepiece of environmental legislation in Australia is the Environment Protection and
Biodiversity Conservation Act 1999 (EPBC Act 1999) which provides a legal framework to
“promote the conservation of biodiversity” and protect and manage “matters of national
environmental significance” (EPBC Act 1999, s. 3). There are currently nine such matters:
World Heritage sites; National Heritage places; nationally protected wetlands (e.g. Ramsar
wetlands); nationally listed threatened species and ecological communities; listed migratory
species (e.g. species listed under the Bonn Convention, JAMBA, CAMBA and ROKAMBA);
nuclear actions (including uranium mines); Commonwealth marine areas; the Great Barrier Reef
Marine Park; and coal seam gas or large coal mining developments likely to have a significant
impact on a water resource. Additional legally-binding conservation mechanisms under the
EPBC Act 1999 of specific relevance to this thesis include:
Key Threatening Processes
Processes that have been assessed and determined to provide a threat to the survival, abundance or evolutionary development of a native species or ecological community. There are 21 Key Threatening Processes as of March 2019.
Threat Abatement Plans
Provide a framework, identify actions, and coordinate a response to ensure the long-term survival of native species and ecological communities affected by Key Threatening Processes. There are 13 Threat Abatement Plans as of March 2019.
12 Section 51 of the Commonwealth of Australia Constitution Act 1900. 13 Koowarta v Bjelke-Petersen (1982) 153 CLR 168. 14 Commonwealth v Tasmania (1983) 158 CLR 1.
30

Chapter 2: Context and Literature Review
National Recovery Plans
Identify and coordinate research and management actions to maximise the long-term survival of targeted species. These plans remain in place until a species is no longer on the EPBC Act 1999 threatened species list. There are 449 National Recovery Plans as of March 2019.
Additional environmental legislation focuses on resource management (e.g. the Fisheries
Management Act 1991) or individual areas (e.g. the Great Barrier Reef Marine Park 1975 and
the Wet Tropics of Queensland World Heritage Area Conservation Act 1994) rather than
proactive conservation practices.
2.6.2.2 National Conservation Agenda (NCA) Public policy plays a critical role in biodiversity conservation: although not legally binding, it
directs funding and resources, guides the interpretation of legislation, and drives action and
government programs. As highlighted by the former Prime Minister of Australia, Paul Keating,
(1995, paragraph 4):
“Policy is the means by which the lives of individuals, families and communities are
shaped. It is the means by which we shape the character and future of the nation. It is
the purpose of political life, the only worthwhile measure of political success, and by
far the most significant measure of the worth of politicians and parties.”
The Australian Government developed its first national biodiversity strategy, the National
Strategy for the Conservation of Australia’s Biological Diversity 1996, to meet the requirements
of the CBD after ratifying the international agreement in 1993. A review of this strategy in 2001
(as required under the CBD) led to the development of the National Objectives and Targets for
Biodiversity Conservation 2001–2005; however, the government failed to implement these
(Department of Environment, 2016). A second review in 2006 led to the development of a
replacement biodiversity strategy, which currently provides guidance for all levels of
government within Australia to conserve national biodiversity: Australia’s Biodiversity
Conservation Strategy: 2010 – 2030 (‘ABC Strategy’).
In addition to the ABC Strategy, there are seven other key policies within the national
conservation-policy landscape in Australia. For the purpose of this thesis, this grouping of eight
national conservation policies are here termed the National Conservation Agenda (the ‘NCA’).
31

Chapter 2: Context and Literature Review
As the principal instrument for Australia to implement the required actions of the CBD, the
ABC Strategy functions as an overarching policy to bring together six of the other policies
within the NCA:
Strategy for Australia's National
Reserve System 2009-2030
Guides the management of the National Reserve System and the preparation of a five-year implementation plan by each state and territory.
Referred to in this thesis as the ‘Reserve Strategy’.
Australia's Native Vegetation
Framework 2012
Developed in cooperation with state and federal governments, this framework updates the 2001 National Framework for the Management and Monitoring of Australia’s Native Vegetation and adapts its guidance for vegetation management to emerging pressures and priorities.
Referred to in this thesis as the ‘Vegetation Strategy’15.
Australian Weeds Strategy 2017-2027 and Australian Pest
Animal Strategy 2017-2027
Originally created in 1997 and 2007, respectively, these recently updated strategies guide Australia’s management of invasive species.
Referred to in this thesis as the ‘Weeds Strategy’ and ‘Pest Strategy’, respectively.
Australian Heritage Strategy 2015
Guides the identification, conservation and protection of Australia’s heritage including the 12 World Heritage sites listed for their natural values and the 3 sites listed for their mixed cultural and natural values (of the total 19 sites).
Referred to in this thesis as the ‘Heritage Strategy’.
Threatened Species Strategy 2015
Guides the national approach to protect and recover threatened species.
Referred to in this thesis as the ‘Species Strategy’.
All CBD Parties were recently required to review, update and revise their national biodiversity
strategies and action plans (Department of Environment, 2016). As such, the ABC Strategy is in
the process of being replaced by Australia’s Strategy for Nature 2018-2030 (‘Nature Strategy’).
Currently in its draft form, the Nature Strategy makes up the eighth policy in the NCA.
15 The term ‘strategy’ rather than ‘framework’ is used for consistency (see Section 3.2.3.2).
32

Chapter 2: Context and Literature Review
2.6.3 State context Each of the eight Australian states and territories have primary responsibility for the
management of land, water and biodiversity within their jurisdiction, and therefore have their
own legislation and programs that identify and protect threatened species, populations and
ecological communities. This has resulted in a complex set of environmental policies,
legislation and regulations across the country with many inconsistencies, duplications and gaps,
greatly reducing the effectiveness of environmental management (Jackson et al., 2017).
Furthermore, each state and territory have their own threatened species lists16, threat categories
and species recovery plans in addition to those listed nationally under the EPBC Act 1999,
meaning that the status of a species may change from state to state. For example, the koala is
vulnerable at a national level and in both Queensland and New South Wales, but of Least
Concern in Victoria.
2.6.4 Programs, initiatives and incentives In addition to the above ‘command and control’ approaches, the role of private landholders has
received increasing attention in both global agreements and national policy instruments
(England, 2016; Bingham et al., 2017) and a corresponding increase in programs at the national,
state and local levels to incentivise and support conservation activities. These include market
based instruments such as carbon markets, revolving funds, and environmental taxation
concessions (Evans, 2018); community-based programs such as the National Landcare Program
(Robins, 2018); and conservation research and collaboration programs such as the National
Environmental Science Program (DEE, 2019a).
The primary mechanisms for long-term environmental protection on private land in Australia
are conservation covenants and land acquisitions (Fitzsimons, 2015). Conservation covenants
are voluntary, legally-binding agreements between a landholder and a government or other
authorised body that restrict landholder activities on a property or section of a property for
conservation purposes. There are a range of covenanting programs in Australia across the
national, state and local level with varying restrictions. However, all conservation covenanting
programs in Australia are statutory mechanisms created through legislation, and properties with
conservation covenants are therefore classified as protected areas (Fitzsimons, 2015; Hardy et
al., 2017). They often incorporate financial incentives such as tax concessions and rate rebates
that function in a similar manner to payments for ecosystem services (England, 2016), as well as
access to funding schemes that support conservation activities (Evans, 2016). For example, the
New South Wales Government is investing $240 million over five years to support and
16 These lists are provided in Section 3.4.5 and utilised in Chapter 5.
33

Chapter 2: Context and Literature Review
encourage private landholders to establish conservation covenants (State of New South Wales
and Office of Environment and Heritage, 2018). Additionally, programs such as Land for
Wildlife offer alternative or complementary17 non-legally-binding property registration options
which provide landholders with access to conservation networks, support, and resources (Prado
et al., 2018).
Part 3: Ecotourism and conservation
2.7 Ecotourism and conservation: systematic quantitative literature review
(published paper)
This section uses a systematic quantitative literature review to address Research Objective 1:
Identify and synthesise existing evaluations of the conservation activities of ecotourism enterprises in the academic literature to quantify the gaps and biases that exist within this research.
This published review covers the academic literature up to January 2016. Relevant papers
published after this point have been considered throughout the thesis where their content is
relevant to the interpretation and discussion of thesis content.
The details of this publication are:
Wardle, C., Buckley, R., Shakeela, A., & Castley, J. G. (2018). Ecotourism’s
contributions to conservation: analysing patterns in published studies. Journal of
Ecotourism. doi:10.1080/14724049.2018.1424173
17 It is not uncommon for properties to be registered with multiple conservation programs (Halliday et al., 2012).
34

Chapter 2: Published literature review (post-print version)
Ecotourism’s contributions to conservation: analysing patterns in
published studies
Ecotourism is often promoted for its potential to act as a conservation mechanism by: mobilising political,
financial and social support for conservation; increasing environmental awareness; protecting sensitive
ecosystems and threatened species; and providing an alternate income to land intensive or consumptive
practices. Although instances to date indicate that this can indeed prove highly successful in some
circumstances, the conservation impact of the ecotourism sector on a larger scale is unclear. This study
identified 70 papers published prior to January 2016 in English language academic journals that examine
the conservation actions and outcomes of ecotourism enterprises. There were three key findings within
this study. Firstly, conservation actions have been examined more frequently than conservation outcomes.
Secondly, there has been a strong focus on indirect approaches to conservation such as visitor education
and community based actions, and a shortage of studies measuring direct impacts on wildlife populations
or other components of the natural bio-physical environment. Thirdly, the majority of sites studied are
located in developing countries, but the majority of authors are located in developed countries. By
identifying these gaps and patterns that currently exist in the academic literature, this review helps to
direct and support future research agendas.
1. Introduction
In recent decades wildlife conservation efforts have come under increasing pressure worldwide.
Such pressures include: reductions in real funding for public protected area (PA) agencies;
continued clearance and degradation of land outside PAs; climate change; growth of human
populations; and an increase in both subsistence and industrial primary production across
public, private and communal land tenures (Adams & Moon, 2013; Andelman & Willig, 2003;
Kingsford et al., 2009; Pimm et al., 2014; Sanderson et al., 2002). In many countries, both
developed and developing, there are major barriers to establishing effective PAs and achieving
conservation goals. These barriers include: a lack of access to land of high conservation value;
funding shortages; ineffective management; and a lack of political will, often due to competition
from other industry sectors (Adams & Moon, 2013; Hoffmann et al., 2010; Le Saout et al.,
2013; Regan, Davis, Andelman, Widyanata, & Freese, 2007; Waldron et al., 2013).
Ecotourism has been advocated and adopted widely as a means to overcome many conservation
barriers, and has become central to conservation and community development policies in many
developing nations (Brandon, 1996; Buckley, 2010; Zeppel, 2006). It is used widely, with
varying success, by local communities and NGOs (Buckley, 2010; Ceballos-Lascurain, 2008;
Pegas & Castley, 2014; Romero-Brito, Buckley, & Byrne, 2016) as well as private conservation
tourism operations. Mechanisms leveraged through ecotourism include funding for private
reserves, and the mobilisation of both political and financial support for conservation. To date,
35
Post-p
rint p
ublic
ation

Chapter 2: Published literature review (post-print version)
however, there has been no global review and evaluation of the overall net on-the-ground
conservation contributions of the ecotourism industry. Previous reviews of ecotourism and
conservation are either outdated, narrow in scope, or the greater focus of these studies on
tourism impacts overlook the myriad of conservation actions and outcomes that can be
facilitated through ecotourism (e.g. Buckley, 2009; Doan, 2000; Krüger, 2005; Mossaz,
Buckley, & Castley, 2015; Romero-Brito et al., 2016).
The definition used for ecotourism in this paper is one that encompasses the key criteria of most
ecotourism definitions: nature-based tourism that is sustainable, has an educational or learning
component, and attempts to enhance both the natural and socio-cultural environment (Fennell,
2001; Weaver & Lawton, 2007). In the past a narrow but direct link between ‘ecotourism’ and
‘nature conservation’ has been made, although there are various terms that are commonly used
when referring to these nature-based tourism activities (see Valentine, 1993). A central element
of these generally accepted definitions is that there is some ‘contribution to conservation’
arising from the ecotourism activities. This contribution to conservation may be phrased in
multiple ways including ‘conservation’, ‘preservation’, ‘protection, and ‘enhancement of the
natural environment’, and was used in 61% of the 85 ecotourism definitions examined in
Fennell (2001). To put this in perspective, cultural, education and sustainability components,
considered as core ecotourism criteria, were only mentioned by 51%, 41% and 26% of
definitions, respectively (Fennell, 2001). It is acknowledged that both captivity and
consumptive forms of tourism can make strong contributions to conservation (Catibog-Sinha,
2008; de Boer, Stigter, & Ntumi, 2007; Fennell, 2013; Gressier, 2014; Lindsey, Roulet, &
Romañach, 2007; Martin, Lurbiecki, Joy, & Mooers, 2014). However, whether these should be
included under the category of ecotourism is a contentious issue and falls outside the scope of
this review.
This study aims to systematically identify, select and synthesise the current academic literature
analysing ecotourism enterprises carrying out conservation actions and achieving conservation
outcomes. The term ecotourism enterprise is used in this paper to refer to the ecotourism
operations/activities of a business at a specific site, for example an individual reserve or lodge.
These actions may be undertaken by operators affiliated with the enterprise (e.g. managers, tour
guides, ecologists, researchers etc.) as part of the site activities. This study included enterprises
that were operated under many ownership models (e.g. public, private, NGOs, community-
based, non-profits etc.). Specifically, this study determines: 1) the conservation actions and
outcomes of ecotourism enterprises examined in the academic literature; 2) the types of
enterprises examined; 3) the evaluation methods used to examine them; 4) the geographic
locations of this research; and 5) the gaps and biases present.
36
Post-p
rint p
ublic
ation

Chapter 2: Published literature review (post-print version)
2. Methods
A systematic quantitative review of the literature was undertaken in accordance with the review
protocol outlined by Pickering and Byrne (2014). Research papers on the conservation actions
and outcomes of ecotourism enterprises published in peer-reviewed English language journals
were obtained by searching electronic databases of scientific and tourism journals in January
2016. Key databases used were the Web of Science®, Scopus® and Leisure Tourism®.
The criteria to include papers identified in databases required a focus on ecotourism as defined
previously. Therefore, the search terms used covered a broad spectrum of ‘nature-based
tourism’ activities (e.g. wildlife tourism, bird watching) as well as those that captured the social
elements (e.g. community-based tourism). This approach was used to reduce the chance of
papers being missed. Searches were a combination of ‘conservation’ and: ‘ecotourism’, ‘eco-
tourism’, ‘eco tourism’, ‘wildlife tourism’, ‘wildlife watching’, ‘birding’, ‘bird watching’,
‘nature tourism’, ‘nature based tourism’, ‘nature-based tourism’, ‘conservation tourism’,
‘community based tourism’, ‘community-based tourism’, ‘whale watching’, ‘whale-watching’,
‘ento-tourism’, ‘entotourism’, ‘ento tourism’, and ‘safari’. A second set of searches were run
using the same search terms but also adding: ‘outcome’, ‘action’, ‘measurement’, ‘mechanism’,
‘achievement’, ‘behaviour’, ‘education’, ‘interpretation’, and ‘learning’. Personal
communications with other researchers were used to cross-check this method, as well as
searching reference lists of recent relevant papers. Once searches had been completed, papers
were reviewed as a means of filtering out those that were not directly relevant to the study.
Information was recorded in a database for each article identified for the study. Information on
the paper itself included: the authors, journal, and the year of publication. Information about the
study included: the methods and data sources used, the actions examined, and the outcomes
determined. Information about the enterprise being studied included: the type of enterprise, the
type of attraction of the enterprise, and location characteristics. The database was then analysed
using simple descriptive methods to detect patterns in the papers reviewed and the variables
examined.
In a biodiversity conservation context ‘conservation actions’ have been defined by Salafsky et
al. (2008) as interventions undertaken by staff or partners designed to reach core project (e.g.
ecotourism enterprise) objectives and ultimately conservation goals. These authors go on to
state that actions are generally synonymous with strategies, interventions, activities, responses
and measures. However, the phrase ‘conservation action’ is also used in a tourism context and
often explores how visitors change their behaviours following ecotourism experiences by
adopting conservation-related practices (e.g. reducing waste, recycling, picking up litter etc.)
37
Post-p
rint p
ublic
ation

Chapter 2: Published literature review (post-print version)
(Hughes, Packer, & Ballantyne, 2011). Conservation actions as defined in this paper align more
with achieving a conservation objective (Pullin & Stewart, 2006; Salafsky et al., 2008) and are
consequently those which go beyond minimal impact and instead generate positive
environmental effects. The term is also meant in the literal sense of ‘the act of doing
something’, for example, actively removing non-native wildlife from a particular area.
Conservation outcomes are those that result from these actions, for example decreased
competition with, and predation of, native species by non-native species, and the potential flow
on effects such as an increase in the population numbers of specific native species. The list of
conservation actions and outcomes were compiled through reviewing the included papers and
was therefore an inductive process. Actions and outcomes that were the focus of the papers (i.e.
listed by authors a priori) as well as those that arose from their analyses (i.e. a posteri) were
included. If the action or outcome was not examined in practice, then it was not included.
Only peer-reviewed studies describing the results of original research, published in academic
journals were included; review papers and conceptual or theoretical papers were not used. Grey
literature, meaning published material outside of refereed academic or scholarly journals such as
government and NGO reports, theses, books and book chapters were also excluded. Multiple
papers based on the same study (i.e. utilising the same data) were only included once. As this
review focuses on tangible conservation actions and outcomes, hypothetical studies such as
willingness to pay valuations were not included, nor were those solely looking at minimal
impacts. However, papers that covered on-the-ground conservation actions and outcomes in
addition to other unrelated aspects (e.g. economic evaluations and minimal impact studies) were
included. Ecotourism can indirectly aid conservation, for example through altering behaviours
as a result of conservation interpretation or reducing consumptive land uses as a result of
alternative employment (Almeyda Zambrano, Broadbent, & Durham, 2010; Lapeyre, 2011;
Mbaiwa, 2011). However, papers that examined these social actions were only included if the
authors also examined the relationship of these to direct on-ground conservation outcomes.
3. Results
3.1 Publications and patterns
Seventy journal articles were identified that examined the conservation actions and outcomes of
ecotourism enterprises. The first article on this topic was published in 1996 with subsequent
articles not being published until 2001, and 70% of publications have appeared since 2008
(Figure 2.7.1).
38
Post-p
rint p
ublic
ation

Chapter 2: Published literature review (post-print version)
Figure 2.7.1 The number of papers examining the conservation actions and outcomes of
ecotourism enterprises published per year
Papers have been published in 37 different journals, with the highest numbers in the Journal of
Sustainable Tourism (17%) and Journal of Ecotourism (11%) (Table 2.7.1). The journals cover
a range of disciplines including: travel, tourism and leisure (46%), environment (41%),
conservation (26%), biology (21%), science (10%), sociology (4%), business and economics
(4%), law (3%), education (1%) and energy (1%). Overarching journal fields were taken from
Ulrichsweb Global Series Directory, with most journals assigned to multiple fields. Analysis of
author affiliation and contact information reported for each paper revealed that the research has
been conducted by 203 authors from 26 countries, with 73% of authors based in developed
nations, 26% in developing nations and only 1% in a least developed nation. Unsurprisingly, the
majority of sites (68%) were located in nations where English is an official language.
39
Post-p
rint p
ublic
ation

Chapter 2: Published literature review (post-print version)
Table 2.7.1 Details of the 70 studies examining ecotourism sites carrying out conservation actions and achieving conservation outcomes
Author (year) Country Sites (and
enterprises)1,2,3 Journal
Ahebwa, van der Duim, and Sandbrook (2012)
Uganda 1 Conservation and Society
Almeyda Zambrano et al. (2010)
Costa Rica 1 Journal of Ecotourism
Almeyda, Broadbent, Wyman, and Durham (2010)
Costa Rica 1 International Journal of Tourism Research
Anup, Rijal, and Sapkota (2015)
Nepal 1 International Journal of Sustainable Development and World Ecology
Armstrong and Weiler (2002) Australia 1 (20) Journal of Ecotourism
Ballantyne et al. (2011) Australia 2 Tourism Management
Banerjee (2012) India 5 Current Issues in Tourism
Batta (2006) India 1 International Review for Environmental Strategies
Beaumont (2001) Australia 2 Journal of Sustainable Tourism
Biggs, Ban, and Hall (2012) Australia 1 (48) Environmental Conservation
Biggs, Turpie, Fabricius, and Spenceley (2011)
South Africa 11 Conservation and Society
Bride, Griffiths, Meléndez-Herrada, and McKay (2008)
Mexico 1 International Zoo Yearbook
Brightsmith, Stronza, and Holle (2008)
Peru 1 Biological Conservation
Coghlan, Fox, Prideaux, and Lück (2011)
Australia 1 (5) Tourism in Marine Environments
Cousins, Sadler, and Evans (2008)
South Africa 1 (multiple) Ecology and Society
de los Monteros (2002) Mexico 1 (multiple) Biodiversity and Conservation
Dearden, Bennett, and Rollins (2007)
Thailand 1 (15) Coastal Management
Higham and Carr (2002) New Zealand 12 Journal of Sustainable Tourism
Hill, Woodland, and Gough (2007)
Australia 1 Journal of Ecotourism
Holladay and Ormsby (2011) Belize 1 Journal of Ecotourism
Hovardas and Poirazidis (2006)
Greece 1 Environmental Management
K. Hughes et al. (2011) Australia 1 Environmental Education Research
40
Post-p
rint p
ublic
ation

Chapter 2: Published literature review (post-print version)
M. Hughes and Morrison-Saunders (2005)
Australia 2 Journal of Ecotourism
Hunt, Durham, Driscoll, and Honey (2015)
Costa Rica 10 Journal of Sustainable Tourism
Jacobs and Harms (2014) Spain 1 (multiple) Tourism Management
Lamers, Nthiga, van der Duim, and van Wijk (2014)
Kenya 1 Tourism Geographies
Lapeyre (2011) Namibia 1 Current Issues in Tourism
T. H. Lee and Jan (2015) Taiwan 4 Environmental Management
W. H. Lee and Moscardo (2005)
Australia 1 Journal of Sustainable Tourism
Li, Zhang, Liu, and Xue (2006)
China 1 Environmental Management
Lindberg, Enriquez, and Sproule (1996)
Belize 3 Annals of Tourism Research
Lück (2003) New Zealand 1 (3) Ocean and Coastal Management
Madin and Fenton (2004) Australia 1 Journal of Sustainable Tourism
Mbaiwa (2011) Botswana 3 Current Issues in Tourism
Mintzer et al. (2015) Brazil 1 Biodiversity and Conservation
Morais, Birendra, Mao, and Mosimane (2015)
Namibia 2 Tourism Review International
Mossaz et al. (2015) Southern Africa
48 Journal for Nature Conservation
Nabte et al. (2013) Argentina 1 (multiple) PLOS One
Nagendra et al. (2004) Nepal 1 Environmental Management
Nthiga, Van der Duim, Visseren-Hamakers, and Lamers (2015)
Kenya 1 Development Southern Africa
Ogada and Kibuthu (2008) Kenya 1 (multiple) Environmental Conservation
Ogutu (2002) Kenya 1 Land Degradation & Development
Osano et al. (2013) Kenya 1 Natural Resources Forum
Peake, Innes, and Dyer (2009)
Australia 1 (multiple) Journal of Sustainable Tourism
Powell and Ham (2008) Ecuador 1 Journal of Sustainable Tourism
Powell, Kellert, and Ham (2008)
Antarctica 1 (5) Polar Record
Powell, Kellert, and Ham (2009)
USA 15 Society & Natural Resources
Rattan, Eagles, and Mair (2012)
Thailand 1 Journal of Ecotourism
41
Post-p
rint p
ublic
ation

Chapter 2: Published literature review (post-print version)
Recharte, Bride, and Bowler (2014)
Peru 1 Wildlife Research
Revathy et al. (2014) India 1 International Journal of Tropical Insect Science
Roberts, Mearns, and Edwards (2014)
South Africa 1 Koedoe
Sakata and Prideaux (2013) PNG 1 Journal of Sustainable Tourism
Salum (2009) Tanzania 1 African Journal of Ecology
Samways, Hitchins, Bourquin, and Henwood (2010)
Seychelles 1 Biodiversity and Conservation
Sander (2012) Costa Rica 1 International Journal of Sustainable Society
Seales and Stein (2011) Costa Rica 1 (multiple) Environmental Conservation
Sinha, Qureshi, Uniyal, and Sen (2012)
India 1 (multiple) Journal of Ecotourism
Skibins, Powell, and Hallo (2013)
Tanzania and US
1 Biodiversity and Conservation
Smith, Ham, and Weiler (2011)
Global 1 (multiple) Anthrozoös
Snyman (2012) Namibia 6 Journal of Sustainable Tourism
Stamation, Croft, Shaughnessy, Waples, and Briggs (2007)
Australia 7 Tourism in Marine Environments
Stem, Lassoie, Lee, and Deshler (2003)
Costa Rica 3 Journal of Sustainable Tourism
Stronza (2007) Peru 1 Journal of Ecotourism
Stronza and Pegas (2008) Brazil 1 Human Dimensions of Wildlife
Tisdell and Wilson (2002) Australia 1 Biodiversity and Conservation
Tubb (2003) United Kingdom
1 Journal of Sustainable Tourism
Vaudo et al. (2012) South Africa 4 Journal of Insect Conservation
Vuohelainen, Coad, Marthews, Malhi, and Killeen (2012)
Peru 3 Environmental Management
Walker and Moscardo (2014) US 1 Journal of Sustainable Tourism
Waylen, McGowan, Pawi Study Group, and Milner-Gulland (2009)
Trinidad and Tobago
1 ORYX
1Numbers in brackets refer to the number of enterprises; 2Multiple sites examined in the same study that were not distinguished from each other were grouped as a single site; and 3The number of sites listed only refers to the number of ecotourism sites examined in each study.
42
Post-p
rint p
ublic
ation

Chapter 2: Published literature review (post-print version)
3.2 Study sites
A total of 285 sites were examined across the 70 studies. However, several studies presented
combined site information rather than listing each site. For example, Hunt, Durham, Driscoll,
and Honey (2015) examined 10 lodges on the Osa Peninsula in Costa Rica but did not name or
distinguish each lodge. In this case the multiple sites were grouped together as a single site as it
was not possible to identify which sites were involved with which actions or outcomes.
Furthermore, while some papers did discuss individual sites, the methods used and results
obtained were not differentiated between sites and these were again grouped together for this
review. As a result, 103 individual ‘sites’ were examined within this review for the purpose of
locations, biomes, and so on; however only 86 ‘sites’ were used for the purpose of approaches
adopted and actions/outcomes examined.
Multiple sites or groups of sites were examined in 70% of studies. For example, Ballantyne,
Packer, and Falk (2011) examined 2 wildlife watching sites within south east Queensland,
Australia. Control sites or groups were used by 14% of studies. For example, Vaudo, Ellis,
Cambray, and Hill (2012) compared the health of bee populations on four private reserves used
for ecotourism against four properties used for livestock farming in Grahamstown, South
Africa. Only one site was examined by more than one paper in this review, but these studies
used different methods during different time periods, and were therefore treated independently.
Studies were carried out in 28 different countries, with the highest concentration in South Africa
(17%), Australia (17%), Costa Rica (8%), and India (8%). There was also a strong geographical
emphasis on the global south, with 33% of studies located in southern Africa, 24% in Latin
America, 19% in Oceania and 17% in Asia, compared with 3% in Europe, 2% in North America
and 1% in Antarctica. Just under one-third of studies were located in developed nations and
two-thirds in developing nations, with just 4% of studies located in a least developed nation
(Figure 2.7.2).
Figure 2.7.2 Comparison between the number of authors and number of sites from each country
development level
43
Post-p
rint p
ublic
ation

Chapter 2: Published literature review (post-print version)
Seven biomes were represented across all study sites, with forest and woodland being the
dominant biome (Figure 2.7.3). Based on the information contained in the included studies and
the World Database on Protected Areas, 17% of sites were public PAs, 22% were located within
public PAs, 20% were private PAs or located within private PAs, 12% were adjacent to some
form of PA, and 29% were located entirely outside of the PA network. Eighteen percent of sites
were located within a World Heritage Site.
Figure 2.7.3 Percentage of sites located within each biome
3.3 Approaches adopted
A range of methodologies were used by the 70 papers to examine the conservation actions and
outcomes. A mixed methods approach was used by 51% of studies, and solely qualitative or
quantitative methods were used in 39% and 10% of studies, respectively. Interviews were the
most common assessment technique employed (59%), followed by questionnaire surveys with
closed-ended questions (53%) and open-ended questions (36%) (Table 2.7.2).
44
Post-p
rint p
ublic
ation

Chapter 2: Published literature review (post-print version)
Table 2.7.2 Number and percentage of papers using each methodology
Approach % Methods (n = 86) %
Qualitative 39% Interviews 59%
Document analysis 14%
Focus groups 9%
Open ended surveys 36%
Observations 10%
Quantitative 10% Questionnaire surveys/ closed ended questions 53%
Field surveys 5%
Field samples 1%
GIS analysis 9%
Mixed methods 51%
Data were derived from a wide range of sources, with the majority using visitors followed by
local community members (Figure 2.7.4). Visitor outcomes were predominantly determined
using pre- and post-visit surveys.
Figure 2.7.4 Percentage of studies utilising each data source
45
Post-p
rint p
ublic
ation

Chapter 2: Published literature review (post-print version)
3.4 Conservation actions examined
Twenty-nine different conservation actions were examined across the 70 studies. The most
commonly examined action was the use of economic development and alternative employment
for local communities followed by environmental education and interpretation for visitors
(Figure 2.7.5).
Figure 2.7.5 Percentage of studies examining each conservation action
These various actions can be grouped into five categories based on the focus of the action:
visitor actions, local community actions, organisational and political actions, natural bio-
physical environment actions and wildlife actions (Figure 2.7.6). Details of actions examined by
each source are provided in Appendix 1.
46
Post-p
rint p
ublic
ation

Chapter 2: Published literature review (post-print version)
Figure 2.7.6 Percentage of studies examining conservation actions in each of the action categories
3.5 Conservation outcomes examined
Twenty-one conservation outcomes were examined across the 70 papers, with 48% of studies
demonstrating their outcomes, 38% of studies discussing their outcomes and 14% of studies
with no reported outcomes. The majority of studies (53%) examined only one or two outcomes.
Of those that did examine outcomes, 78% of studies found positive outcomes, 19% of studies
found mixed outcomes, and 3% of studies found unsuccessful outcomes. This last category does
not mean a negative outcome had taken place but instead refers to the absence of a positive
outcome i.e. an enterprise was not successful in bringing about a specific conservation outcome.
The most common outcome discussed was the increased environmental awareness of visitors,
followed very closely by the altered behaviours and lifestyles of local communities (Figure
2.7.7). As with the conservation actions, these outcomes can be grouped into the same five
categories based on the focus of the outcome: local community outcomes, visitor outcomes,
natural bio-physical environment outcomes, wildlife outcomes and organisational and political
outcomes (Figure 2.7.8). Details of outcomes examined by each source are provided in
Appendix 2. It is worth noting that these actions and outcomes are evaluated only within the
specific context of each individual study and may not always be ecologically desirable under all
circumstances. For example, it is not advantageous or necessary to increase the population size
of a non-threatened species already at carrying capacity in the area.
47
Post-p
rint p
ublic
ation

Chapter 2: Published literature review (post-print version)
Figure 2.7.7 Percentage of studies examining each conservation outcome
Figure 2.7.8 Percentage of studies examining conservation outcomes in each of the outcome
categories
4. Discussion
4.1 Significance
This study assessed and analysed the current state of academic knowledge of the contributions
of ecotourism enterprises to conservation goals. The study identified 29 conservation actions
and 21 conservation outcomes examined by 70 papers across 285 sites. This is the most
48
Post-p
rint p
ublic
ation

Chapter 2: Published literature review (post-print version)
comprehensive review currently available that examines actions and outcomes of ecotourism
enterprises. For comparison, Ardoin, Wheaton, Bowers, Hunt, and Durham (2015) reviewed 30
empirical studies addressing just one conservation action and two conservation outcomes,
namely tourists' environmentally related attitudes and behaviours after exposure to
environmental interpretation.
This review demonstrates that although ecotourism has been adopted widely as a tool for
conservation (Buckley, 2009; Krüger, 2005; Stronza & Durham, 2008; Svoronou & Holden,
2005), and continues to be strongly advocated (Boley & Green, 2016; Buckley, Morrison, &
Castley, 2016), it is only recently, in the last 5-10 years, that this has been subject to evaluation.
This trend is continuing, with additional studies on the topic being published since the data
collection stage ended in early 2016 (e.g. Sabuhoro, Wright, Munanura, Nyakabwa, & Nibigira,
2017; Snyman, 2016). Published studies to date reveal three principal limitations within the
academic literature, which will be discussed in the following section, relating to: (1) geographic
scope; (2) methods and data sources used; and (3) conservation actions and outcomes
considered.
4.2 Patterns, gaps and biases
Clear geographic biases are apparent in this review. Most studies to date were in forest and
woodland ecosystems, with very few in the montane, arctic and alpine regions and agricultural
land. This is likely due to a combination of factors including location of ecotourism sites due to
tourist demand and accessibility, global biome distributions, and regions with threats that can be
addressed by ecotourism. Sixty-one percent of sites were located entirely outside of the public
PA network. This reflects the increasing use of ecotourism by private, community and NGO
entities for conservation purposes, an important strategy in the field of conservation due to some
of the failings of the public PA network (Bingham et al., 2017; Fitzsimons, 2015; Rodrigues et
al., 2004; Waldron et al., 2013). Furthermore, many ecotourism reviews from formal PAs have
a focus on negative impacts (Ansong & Pickering, 2013; Pickering, Hill, Newsome, & Leung,
2010; Steven, Pickering, & Castley, 2011), as these possibly limit the ability of management
agencies to achieve conservation objectives. Contrastingly, the attention given to enterprises
outside these formal networks may have a stronger focus on positive conservation outcomes as
many of these ventures may have undergone some form of land use transition. For example,
many private ecotourism models shift from a former consumptive land use (e.g. livestock,
agriculture) to one that now focuses on biodiversity conservation and tourism as a more
sustainable land use (Kerley, Knight, & Kock, 1995; Sims-Castley, Kerley, Geach, & Langholz,
2005).
49
Post-p
rint p
ublic
ation

Chapter 2: Published literature review (post-print version)
Interestingly, most of the 203 authors were located in developed countries while most sites were
in developing countries. This reflects, firstly, the high proportion of studies focusing on social
actions and community development, and secondly, the differential distribution of biodiversity
hotspots within developing nations (Lindsey et al., 2017; Myers, Mittermeier, Mittermeier, da
Fonseca, & Kent, 2000). An aspect gaining increasing attention in the literature is the role of
women in the delivery of ecotourism and how this can have conservation benefits (see Lenao &
Basupi, 2016; Mwesigwa & Mubangizi, 2016). However, these geographical limitations restrict
the generalisability of existing research across differing economic and social contexts.
Patterns in the methodologies and data sources of papers in this review clearly highlight
important gaps. Most studies used social science approaches such as interviews and
questionnaires to obtain information predominantly from visitors, community members or
tourism operators. Very few studies used ecological field research to determine the actual
impacts on the wildlife and the environment. There are a number of probable reasons for this.
Firstly, while ecotourism has at its core the enhancement of the natural bio-physical
environment, the delivery of social benefit in a sustainable manner is paramount (Fennell, 2001;
Weaver & Lawton, 2007). Therefore, this may drive the research focus towards assessing how
ecotourism enterprises are able to meet these social objectives, as failure to do so may
compromise the persistence of these ventures.
Secondly, ecological field studies are often more time consuming and expensive than the social
science methods, can involve specialised equipment, generally extend over multiple field
seasons, and require baseline data or control sites to determine trends and outcomes. Finally,
many of the papers had a strong social focus; and indeed, for several conservation actions such
as visitor interpretation, outcomes can only be determined through social science methods.
Interestingly, 11 papers claimed to have determined an increase in wildlife numbers, but only
three of these studied wildlife populations directly (Nabte et al., 2013; Revathy, Mathew, &
Narayanankutty, 2014; Vaudo et al., 2012); the other seven relied on reported observations of
local communities or tourism enterprise operators. While these can be important sources, they
only use perceptions and tend to be based on increased human-wildlife interactions. Therefore,
they may not accurately reflect wildlife population trends and can instead be driven by increased
pressures elsewhere. Furthermore, perceptions are difficult to quantify.
The vast majority of studies focus on indirect conservation actions through the visitor and local
community categories, with fewer studies examining actions with direct impacts on wildlife
populations or the natural bio-physical environment. There is, therefore, also a strong focus on
local community and visitor outcomes. Again, this reflects the high proportion of studies using
50
Post-p
rint p
ublic
ation

Chapter 2: Published literature review (post-print version)
social science methodologies as well the overlap of papers examining both social and
conservation issues. It also reflects the concentration of study sites in developing nations where
areas of high value for conservation are often also of high value for human use (Andelman &
Willig, 2003; Rodrigues et al., 2004). Furthermore, a large number of studies examined zero,
one or two outcomes, demonstrating an important gap and highlighting the need for future
studies to examine outcomes, specifically ecological outcomes.
4.3 Limitations and future directions
This review was limited to papers published in English language journals. Seventy percent of
the sites were located in nations where English is an official language, and therefore it is
possible that ecotourism and conservation literature from non-English-speaking locations could
contain insights that have not been addressed by this review. While it is estimated that more
than 90% of papers in natural science and more than 75% of papers in social science journals
are printed in English (Hamel, 2007), future research incorporating a multi-language review
could investigate this topic further.
As with any review of the academic literature, patterns identified here may not fully reflect
those occurring in practice as it is limited to the selection of sites, methods, data sources and
conservation actions and outcomes by previous authors. While we have examined the
conservation actions and outcomes that were the focus of these studies, this may preclude the
inclusion of other actions and outcomes that were inadvertently overlooked as a result of the
potentially narrow focus of these studies. Future assessments may therefore need to adopt a
more holistic approach to evaluating conservation actions and outcomes delivered through
ecotourism. Studies taking into account the negative impacts of ecotourism sites or activities
would be beneficial in determining the net conservation benefit of ecotourism. In addition, few
papers in this review provided justification for the selection of their case studies, and this may
bias evaluation of actions and outcomes to those situations where there is already some
preconceived expectation of the result. Furthermore, the lack of conservation outcomes,
especially the lack of ecological outcomes, provides an important area for future research.
5. Conclusion
This review indicates strongly that ecotourism does indeed have a significant role to play in the
conservation of biodiversity. It identifies numerous potential actions and outcomes in using
ecotourism for conservation; but shows that evaluations of each specific outcome are sparse.
Within the 70 papers identified there is a strong focus on developing nations, especially in
Africa and Latin America. Therefore, the approaches used and outcomes determined may not be
51
Post-p
rint p
ublic
ation

Chapter 2: Published literature review (post-print version)
transferable across differing governance, economic and social contexts. This review also
showed that few previous studies applied natural science methods to determine the ecological
conservation outcomes of ecotourism on the natural bio-physical environment and wildlife
populations. Instead, most previous studies relied heavily on interviews and questionnaires to
examine the indirect social aspects of conservation. Biological conservation is inherently
focused on wildlife and ecosystem processes, and therefore it is important to examine the
outcomes achieved by ecotourism enterprises that focus on these. Actions creating indirect
outcomes via social mechanisms are an important component of conservation. However, some
key conservation outcomes, such as increased size or health of threatened species populations,
can only be evaluated through ecological research on wildlife populations themselves.
Acknowledgements
This research is supported by an Australian Government Research Training Program (RTP)
Scholarship.
References
Adams, V., & Moon, K. (2013). Security and equity of conservation covenants: Contradictions of private protected area policies in Australia. Land Use Policy, 30(1), 114-119. doi:http://dx.doi.org/10.1016/j.landusepol.2012.03.009
Ahebwa, W., van der Duim, V., & Sandbrook, C. (2012). Private-community partnerships: Investigating a new approach to conservation and development in Uganda. Conservation and Society, 10(4), 305-317. doi:10.4103/0972-4923.105501
Almeyda, A., Broadbent, E., Wyman, M., & Durham, W. (2010). Ecotourism impacts in the Nicoya Peninsula, Costa Rica. International Journal of Tourism Research, 12(6), 803-819. doi:10.1002/jtr.797
Almeyda Zambrano, A., Broadbent, E., & Durham, W. (2010). Social and environmental effects of ecotourism in the Osa Peninsula of Costa Rica: The Lapa Rios case. Journal of Ecotourism, 9(1), 62-83. doi:http://dx.doi.org/10.1080/14724040902953076
Andelman, S., & Willig, M. (2003). Present patterns and future prospects for biodiversity in the Western Hemisphere. Ecology Letters, 6(9), 818-824. doi:10.1046/j.1461-0248.2003.00503.x
Ansong, M., & Pickering, C. (2013). Long-distance dispersal of Black Spear Grass (Heteropogon contortus) seed on socks and trouser legs by walkers in Kakadu National Park. Ecological Management & Restoration, 14(1), 71-74. doi:10.1111/emr.12021
Anup, K., Rijal, K., & Sapkota, R. (2015). Role of ecotourism in environmental conservation and socioeconomic development in Annapurna conservation area, Nepal. International Journal of Sustainable Development and World Ecology, 22(3), 251-258. doi:10.1080/13504509.2015.1005721
Ardoin, N., Wheaton, M., Bowers, A., Hunt, C., & Durham, W. (2015). Nature-based tourism's impact on environmental knowledge, attitudes, and behavior: a review and analysis of the literature and potential future research. Journal of Sustainable Tourism, 23(6), 838-858. doi:http://dx.doi.org/10.1080/09669582.2015.1024258
Armstrong, E., & Weiler, B. (2002). Getting the message across: an analysis of messages delivered by tour operators in protected areas. Journal of Ecotourism, 1(2/3), 104-121. doi:http://dx.doi.org/10.1080/14724040208668118
52
Post-p
rint p
ublic
ation

Chapter 2: Published literature review (post-print version)
Ballantyne, R., Packer, J., & Falk, J. (2011). Visitors’ learning for environmental sustainability:
Testing short- and long-term impacts of wildlife tourism experiences using structural equation modelling. Tourism Management, 32(6), 1243-1252. doi:http://dx.doi.org/10.1016/j.tourman.2010.11.003
Banerjee, A. (2012). Is wildlife tourism benefiting Indian protected areas? A survey. Current Issues in Tourism, 15(3), 211-227. doi:http://dx.doi.org/10.1080/13683500.2011.599367
Batta, R. (2006). Evaluating ecotourism in mountain areas: a study of three Himalayan destinations. International Review for Environmental Strategies, 6(1), 41-61.
Beaumont, N. (2001). Ecotourism and the conservation ethic: Recruiting the uninitiated or preaching to the converted? Journal of Sustainable Tourism, 9(4), 317-341. doi:http://dx.doi.org/10.1080/09669580108667405
Biggs, D., Ban, N., & Hall, C. (2012). Lifestyle values, resilience, and nature-based tourism's contribution to conservation on Australia's Great Barrier Reef. Environmental Conservation, 39(04), 370-379. doi:10.1017/S0376892912000239
Biggs, D., Turpie, J., Fabricius, C., & Spenceley, A. (2011). The value of avitourism for conservation and job creation - An analysis from South Africa. Conservation and Society, 9(1), 80-90. doi:10.4103/0972-4923.79198
Bingham, H., Fitzsimons, J., Redford, K., Mitchell, B., Bezaury-Creel, J., & Cumming, T. (2017). Privately protected areas: advances and challenges in guidance, policy and documentation. PARKS, 23.1, 13-28. doi:10.2305/IUCN.CH.2017.PARKS-23-1HB.en
Boley, B., & Green, G. (2016). Ecotourism and natural resource conservation: the ‘potential’ for a sustainable symbiotic relationship. Journal of Ecotourism, 15(1), 36-50. doi:10.1080/14724049.2015.1094080
Brandon, K. (1996). Ecotourism and conservation: A review of key issues (0821335057). The World Bank
Bride, I., Griffiths, R., Meléndez-Herrada, A., & McKay, J. (2008). Flying an amphibian flagship: Conservation of the Axolotl Ambystoma mexicanum through nature tourism at Lake Xochimilco, Mexico. International Zoo Yearbook, 42(1), 116-124. doi:10.1111/j.1748-1090.2008.00044.x
Brightsmith, D., Stronza, A., & Holle, K. (2008). Ecotourism, conservation biology, and volunteer tourism: A mutually beneficial triumvirate. Biological Conservation, 141(11), 2832-2842. doi:http://dx.doi.org/10.1016/j.biocon.2008.08.020
Buckley, R. (2009). Evaluating the net effects of ecotourism on the environment: a framework, first assessment and future research. Journal of Sustainable Tourism, 17(6), 643-672. doi:http://dx.doi.org/10.1080/09669580902999188
Buckley, R. (2010). Conservation Tourism. Wallingford: CAB International. Buckley, R., Morrison, C., & Castley, J. G. (2016). Net Effects of Ecotourism on Threatened
Species Survival. PLoS ONE, 11(2), 1-12. doi:10.1371/journal.pone.0147988 Catibog-Sinha, C. (2008). Zoo tourism: Biodiversity conservation through tourism. Journal of
Ecotourism, 7(2-3), 160-178. doi:http://dx.doi.org/10.1080/14724040802140527 Ceballos-Lascurain, H. (2008). Ecotourism and ecolodge development in the 21st century (pp.
193-203). Wallingford: CABI. Coghlan, A., Fox, K., Prideaux, B., & Lück, M. (2011). Successful interpretation in Great
Barrier Reef tourism: dive in or keep out of it? Tourism in Marine Environments, 7(3-4), 167-178. doi:http://dx.doi.org/10.3727/154427311X13195453162813
Cousins, J., Sadler, J., & Evans, J. (2008). Exploring the role of private wildlife ranching as a conservation tool in South Africa: stakeholder perspectives. Ecology and Society, 13(2), 43-60.
de Boer, W., Stigter, J., & Ntumi, C. (2007). Optimising investments from elephant tourist revenues in the Maputo Elephant Reserve, Mozambique. Journal for Nature Conservation, 15(4), 225-236. doi:10.1016/j.jnc.2006.11.002
de los Monteros, R. L. E. (2002). Evaluating ecotourism in natural protected areas of La Paz Bay, Baja California Sur, Mexico: ecotourism or nature-based tourism? Biodiversity and Conservation, 11(9), 1539-1550.
53
Post-p
rint p
ublic
ation

Chapter 2: Published literature review (post-print version)
Dearden, P., Bennett, M., & Rollins, R. (2007). Perceptions of Diving Impacts and Implications
for Reef Conservation. Coastal Management, 35(2-3), 305-317. doi:10.1080/08920750601169584
Doan, T. M. (2000). The effects of ecotourism in developing nations: An analysis of case studies. Journal of Sustainable Tourism, 8(4), 288-304. doi:http://dx.doi.org/10.1080/09669580008667365
Fennell, D. (2001). A content analysis of ecotourism definitions. Current Issues in Tourism, 4(5), 403-421. doi:http://dx.doi.org/10.1080/13683500108667896
Fennell, D. (2013). Contesting the zoo as a setting for ecotourism, and the design of a first principle. Journal of Ecotourism, 12(1), 1-14. doi:http://dx.doi.org/10.1080/14724049.2012.737796
Fitzsimons, J. (2015). Private protected areas in Australia: current status and future directions. Nature Conservation, 10, 1-23. doi:10.3897/natureconservation.10.8739
Gressier, C. (2014). An Elephant in the Room: Okavango Safari Hunting as Ecotourism? Ethnos, 79(2), 193-214. doi:http://dx.doi.org/10.1080/00141844.2012.723016
Hamel, E. (2007). The dominance of English in the international scientific periodical literature and the future of language use in science. AILA Review, 20(1), 53-71.
Higham, J., & Carr, A. (2002). Ecotourism Visitor Experiences in Aotearoa/New Zealand: Challenging the Environmental Values of Visitors in Pursuit of Pro-environmental Behaviour. Journal of Sustainable Tourism, 10(4), 277-294. doi:10.1080/09669580208667168
Hill, J., Woodland, W., & Gough, G. (2007). Can visitor satisfaction and knowledge about tropical rainforests be enhanced through biodiversity interpretation, and does this promote a positive attitude towards ecosystem conservation? Journal of Ecotourism, 6(1), 75-85. doi:http://dx.doi.org/10.2167/joe166.0
Hoffmann, M., Hilton-Taylor, C., Angulo, A., Böhm, M., Brooks, T., Butchart, S., . . . Stuart, S. (2010). The Impact of Conservation on the Status of the World’s Vertebrates. Science, 330(6010), 1503-1509. doi:10.1126/science.1194442
Holladay, P., & Ormsby, A. (2011). A comparative study of local perceptions of ecotourism and conservation at Five Blues Lake National Park, Belize. Journal of Ecotourism, 10(2), 118-134. doi:http://dx.doi.org/10.1080/14724049.2010.529910
Hovardas, T., & Poirazidis, K. (2006). Evaluation of the environmentalist dimension of ecotourism at the Dadia Forest Reserve (Greece). Environmental Management, 38(5), 810-822. doi:10.1007/s00267-006-0009-0
Hughes, K., Packer, J., & Ballantyne, R. (2011). Using post-visit action resources to support family conservation learning following a wildlife tourism experience. Environmental Education Research, 17(3), 307-328. doi:10.1080/13504622.2010.540644
Hughes, M., & Morrison-Saunders, A. (2005). Influence of on-site interpretation intensity on visitors to natural areas. Journal of Ecotourism, 4(3), 161-177. doi:http://dx.doi.org/10.1080/jJET.v4.i3.pg161
Hunt, C., Durham, W., Driscoll, L., & Honey, M. (2015). Can ecotourism deliver real economic, social, and environmental benefits? A study of the Osa Peninsula, Costa Rica. Journal of Sustainable Tourism, 23(3), 339-357. doi:10.1080/09669582.2014.965176
Jacobs, M., & Harms, M. (2014). Influence of interpretation on conservation intentions of whale tourists. Tourism Management, 42, 123-131. doi:http://dx.doi.org/10.1016/j.tourman.2013.11.009
Kerley, G., Knight, M., & Kock, M. (1995). Desertification of subtropical thicket in the Eastern Cape, South Africa: Are there alternatives? Environmental Monitoring and Assessment, 37(1), 211-230. doi:10.1007/bf00546890
Kingsford, R., Watson, J., Lundquist, C., Venter, O., Hughes, L., Johnston, E., . . . Wilson, K. (2009). Major Conservation Policy Issues for Biodiversity in Oceania. Conservation Biology, 23(4), 834-840. doi:http://dx.doi.org/10.1111/j.1523-1739.2009.01287.x
54
Post-p
rint p
ublic
ation

Chapter 2: Published literature review (post-print version)
Krüger, O. (2005). The role of ecotourism in conservation: panacea or Pandora’s box?
Biodiversity and Conservation, 14(3), 579-600. doi:http://dx.doi.org/10.1007/s10531-004-3917-4
Lamers, M., Nthiga, R., van der Duim, V. R., & van Wijk, J. (2014). Tourism-conservation enterprises as a land-use strategy in Kenya. Tourism Geographies, 16(3), 474-489. doi:10.1080/14616688.2013.806583
Lapeyre, R. (2011). The Grootberg lodge partnership in Namibia: towards poverty alleviation and empowerment for long-term sustainability? Current Issues in Tourism, 14(3), 221-234. doi:10.1080/13683500.2011.555521
Le Saout, S., Hoffmann, M., Shi, Y., Hughes, A., Bernard, C., Brooks, T., . . . Rodrigues, A. S. L. (2013). Protected Areas and Effective Biodiversity Conservation. Science, 342(6160), 803-805. doi:10.1126/science.1239268
Lee, T., & Jan, F.-H. (2015). The Effects of Recreation Experience, Environmental Attitude, and Biospheric Value on the Environmentally Responsible Behavior of Nature-Based Tourists. Environmental Management, 56(1), 193-208. doi:10.1007/s00267-015-0488-y
Lee, W., & Moscardo, G. (2005). Understanding the impact of ecotourism resort experiences on tourists' environmental attitudes and behavioural intentions. Journal of Sustainable Tourism, 13(6), 546-565. doi:http://dx.doi.org/10.1080/09669580508668581
Lenao, M., & Basupi, B. (2016). Ecotourism development and female empowerment in Botswana: A review. Tourism Management Perspectives, 18, 51-58. doi:http://doi.org/10.1016/j.tmp.2015.12.021
Li, W., Zhang, Q., Liu, C., & Xue, Q. (2006). Tourism's impacts on natural resources: A positive case from China. Environmental Management, 38(4), 572-579. doi:10.1007/s00267-004-0299-z
Lindberg, K., Enriquez, J., & Sproule, K. (1996). Ecotourism Questioned: Case studies from Belize. Annals of Tourism Research, 23(3), 543-562. doi:10.1016/0160-7383(95)00074-7
Lindsey, P., Chapron, G., Petracca, L., Burnham, D., Hayward, M., Henschel, P., . . . Dickman, A. (2017). Relative efforts of countries to conserve world’s megafauna. Global Ecology and Conservation, 10, 243-252. doi:https://doi.org/10.1016/j.gecco.2017.03.003
Lindsey, P., Roulet, P., & Romañach, S. (2007). Economic and conservation significance of the trophy hunting industry in sub-Saharan Africa. Biological Conservation, 134(4), 455-469. doi:doi:10.1016/j.biocon.2006.09.005
Lück, M. (2003). Education on marine mammal tours as agent for conservation - But do tourists want to be educated? Ocean and Coastal Management, 46(9-10), 943-956. doi:10.1016/S0964-5691(03)00071-1
Madin, E., & Fenton, D. (2004). Environmental Interpretation in the Great Barrier Reef Marine Park: An Assessment of Programme Effectiveness. Journal of Sustainable Tourism, 12(2), 121-137. doi:10.1080/09669580408667228
Martin, T., Lurbiecki, H., Joy, J., & Mooers, A. (2014). Mammal and bird species held in zoos are less endemic and less threatened than their close relatives not held in zoos. Animal Conservation, 17(2), 89-96. doi:10.1111/acv.12069
Mbaiwa, J. (2011). The effects of tourism development on the sustainable utilisation of natural resources in the Okavango delta, Botswana. Current Issues in Tourism, 14(3), 251-273. doi:http://dx.doi.org/10.1080/13683500.2011.555525
Mintzer, V., Schmink, M., Lorenzen, K., Frazer, T., Martin, A., & da Silva, V. M. F. (2015). Attitudes and behaviors toward Amazon River dolphins (Inia geoffrensis) in a sustainable use protected area. Biodiversity and Conservation, 24(2), 247-269. doi:10.1007/s10531-014-0805-4
Morais, D., Birendra, K., Mao, Y., & Mosimane, A. (2015). Wildlife Conservation Through Tourism Microentrepreneurship Among Namibian Communities. Tourism Review International, 19(1-2), 43-61. doi:http://dx.doi.org/10.3727/154427215X14338796190477
55
Post-p
rint p
ublic
ation

Chapter 2: Published literature review (post-print version)
Mossaz, A., Buckley, R., & Castley, J. G. (2015). Ecotourism contributions to conservation of
African big cats. Journal for Nature Conservation, 28, 112-118. doi:http://dx.doi.org/10.1016/j.jnc.2015.09.009
Mwesigwa, D., & Mubangizi, B. (2016). Exploring the best practices of women-centred ecotourism enterprises in Bunyoro, Uganda.
Myers, N., Mittermeier, R., Mittermeier, C., da Fonseca, G. A. B., & Kent, J. (2000). Biodiversity hotspots for conservation priorities. Nature, 403(6772), 853-858. doi:http://www.nature.com/nature/journal/v403/n6772/suppinfo/403853a0_S1.html
Nabte, M., Marino, A., Rodríguez, M., Monjeau, A., & Saba, S. (2013). Range Management Affects Native Ungulate Populations in Península Valdés, a World Natural Heritage. PLoS ONE, 8(2), 1-7. doi:http://dx.doi.org/10.1371/journal.pone.0055655
Nagendra, H., Tucker, C., Carlson, L., Southworth, J., Karmacharya, M., & Karna, B. (2004). Monitoring Parks Through Remote Sensing: Studies in Nepal and Honduras. Environmental Management, 34(5), 748-760. doi:10.1007/s00267-004-0028-7
Nthiga, R., Van der Duim, R., Visseren-Hamakers, I., & Lamers, M. (2015). Tourism-conservation enterprises for community livelihoods and biodiversity conservation in Kenya. Development Southern Africa, 32(3), 407-423. doi:10.1080/0376835x.2015.1016217
Ogada, D., & Kibuthu, P. (2008). Conserving Mackinder's eagle owls in farmlands of Kenya: Assessing the influence of pesticide use, tourism and local knowledge of owl habits in protecting a culturally loathed species. Environmental Conservation, 35(3), 252-260. doi:10.1017/S0376892908005006
Ogutu, Z. (2002). The impact of ecotourism on livelihood and natural resource management in Eselenkei, Amboseli ecosystem, Kenya. Land Degradation & Development, 13(3), 251-256. doi:10.1002/ldr.502
Osano, P., Said, M., de Leeuw, J., Ndiwa, N., Kaelo, D., Schomers, S., . . . Ogutu, J. (2013). Why keep lions instead of livestock? Assessing wildlife tourism-based payment for ecosystem services involving herders in the Maasai Mara, Kenya. Natural Resources Forum, 37(4), 242-256. doi:10.1111/1477-8947.12027
Peake, S., Innes, P., & Dyer, P. (2009). Ecotourism and conservation: factors influencing effective conservation messages. Journal of Sustainable Tourism, 17(1), 107-127. doi:10.1080/09669580802276000
Pegas, F., & Castley, J. G. (2014). Ecotourism as a conservation tool and its adoption by private protected areas in Brazil. Journal of Sustainable Tourism, 22(4), 604-625. doi:10.1080/09669582.2013.875550
Pickering, C., & Byrne, J. (2014). The benefits of publishing systematic quantitative literature reviews for PhD candidates and other early-career researchers. Higher Education Research & Development, 33(3), 534-548. doi:10.1080/07294360.2013.841651
Pickering, C., Hill, W., Newsome, D., & Leung, Y.-F. (2010). Comparing hiking, mountain biking and horse riding impacts on vegetation and soils in Australia and the United States of America. Journal of Environmental Management, 91(3), 551-562. doi:http://doi.org/10.1016/j.jenvman.2009.09.025
Pimm, S., Jenkins, C., Abell, R., Brooks, T., Gittleman, J., Joppa, L., . . . Sexton, J. (2014). The biodiversity of species and their rates of extinction, distribution, and protection. Science, 344(6187). doi:http://dx.doi.org/10.1126/science.1246752
Powell, R., & Ham, S. (2008). Can ecotourism interpretation really lead to pro-conservation knowledge, attitudes and behaviour? Evidence from the Galapagos islands. Journal of Sustainable Tourism, 16(4), 467-489. doi:10.2167/jost797.0
Powell, R., Kellert, S., & Ham, S. (2008). Antarctic tourists: ambassadors or consumers? Polar Record, 44(03), 233-241. doi:10.1017/S0032247408007456
Powell, R., Kellert, S., & Ham, S. (2009). Interactional theory and the sustainable nature-based tourism experience. Society & Natural Resources, 22(8), 761-776. doi:10.1080/08941920802017560
56
Post-p
rint p
ublic
ation

Chapter 2: Published literature review (post-print version)
Pullin, A., & Stewart, G. (2006). Guidelines for Systematic Review in Conservation and
Environmental Management. Conservation Biology, 20(6), 1647-1656. doi:10.1111/j.1523-1739.2006.00485.x
Rattan, J., Eagles, P., & Mair, H. (2012). Volunteer tourism: Its role in creating conservation awareness. Journal of Ecotourism, 11(1), 1-15. doi:http://dx.doi.org/10.1080/14724049.2011.604129
Recharte, M., Bride, I., & Bowler, M. (2014). A recovering flagship: giant otters, communities and tourism in northern Peru. Wildlife Research, 41(6), 490-498. doi:10.1071/wr14032
Regan, H., Davis, F., Andelman, S., Widyanata, A., & Freese, M. (2007). Comprehensive criteria for biodiversity evaluation in conservation planning. Biodiversity and Conservation, 16(9), 2715-2728. doi:10.1007/s10531-006-9100-3
Revathy, V., Mathew, G., & Narayanankutty, T. (2014). Role of recreated habitats in butterfly conservation: A case study at Thenmala, Kerala, India. International Journal of Tropical Insect Science, 34(4), 287-295. doi:10.1017/S1742758414000472
Roberts, M., Mearns, K., & Edwards, V. (2014). Evaluating the effectiveness of guided versus non-guided interpretation in the Kruger National Park, South Africa. Koedoe, 56(2), 1-8. doi:http://dx.doi.org/10.4102/koedoe.v56i2.1160
Rodrigues, A., Andelman, S., Bakarr, M., Boitani, L., Brooks, T., Cowling, R., . . . Yan, X. (2004). Effectiveness of the global protected area network in representing species diversity. Nature, 428(6983), 640-643. doi:http://dx.doi.org/10.1038/nature02422
Romero-Brito, T., Buckley, R., & Byrne, J. (2016). NGO Partnerships in Using Ecotourism for Conservation: Systematic Review and Meta-Analysis. PLoS ONE, 11(11), 1-19. doi:10.1371/journal.pone.0166919
Sabuhoro, E., Wright, B., Munanura, I., Nyakabwa, I., & Nibigira, C. (2017). The potential of ecotourism opportunities to generate support for mountain gorilla conservation among local communities neighboring Volcanoes National Park in Rwanda. Journal of Ecotourism, 1-17. doi:10.1080/14724049.2017.1280043
Sakata, H., & Prideaux, B. (2013). An alternative approach to community-based ecotourism: a bottom-up locally initiated non-monetised project in Papua New Guinea. Journal of Sustainable Tourism, 21(6), 880-899. doi:10.1080/09669582.2012.756493
Salafsky, N., Salzer, D., Stattersfield, A., Hilton-Taylor, C., Neugarten, R., Butchart, S., . . . Wilkie, D. (2008). A Standard Lexicon for Biodiversity Conservation: Unified Classifications of Threats and Actions. Conservation Biology, 22(4), 897-911. doi:10.1111/j.1523-1739.2008.00937.x
Salum, L. (2009). Ecotourism and biodiversity conservation in Jozani-Chwaka Bay National Park, Zanzibar. African Journal of Ecology, 47, 166-170.
Samways, M., Hitchins, P., Bourquin, O., & Henwood, J. (2010). Restoration of a tropical island: Cousine Island, Seychelles. Biodiversity and Conservation, 19(2), 425-434. doi:10.1007/s10531-008-9524-z
Sander, B. (2012). The importance of education in ecotourism ventures: Lessons from Rara Avis ecolodge, Costa Rica. International Journal of Sustainable Society, 4(4), 389-404.
Sanderson, E., Jaiteh, M., Levy, M., Redford, K., Wannebo, A., & Woolmer, G. (2002). The Human Footprint and the Last of the Wild. BioScience, 52(10), 891-904. doi:10.1641/0006-3568(2002)052[0891:THFATL]2.0.CO;2
Seales, L., & Stein, T. (2011). Linking commercial success of tour operators and agencies to conservation and community benefits in Costa Rica. Environmental Conservation, 39(1), 20-29. doi:10.1017/S0376892911000415
Sims-Castley, R., Kerley, G., Geach, B., & Langholz, J. (2005). Socio-economic significance of ecotourism-based private game reserves in South Africa’s Eastern Cape Province. Parks, 15(2), 6-18.
Sinha, B., Qureshi, Q., Uniyal, V. K., & Sen, S. (2012). Economics of wildlife tourism-contribution to livelihoods of communities around Kanha tiger reserve, India. Journal of Ecotourism, 11(3), 207-218. doi:http://dx.doi.org/10.1080/14724049.2012.721785
57
Post-p
rint p
ublic
ation

Chapter 2: Published literature review (post-print version)
Skibins, J., Powell, R., & Hallo, J. (2013). Charisma and conservation: charismatic megafauna’s
influence on safari and zoo tourists’ pro-conservation behaviors. Biodiversity and Conservation, 22(4), 959-982. doi:http://dx.doi.org/10.1007/s10531-013-0462-z
Smith, L., Ham, S., & Weiler, B. (2011). The Impacts of Profound Wildlife Experiences. Anthrozoös, 24(1), 51-64. doi:10.2752/175303711X12923300467366
Snyman, S. (2012). The role of tourism employment in poverty reduction and community perceptions of conservation and tourism in southern Africa. Journal of Sustainable Tourism, 20(3), 395-416. doi:http://dx.doi.org/10.1080/09669582.2012.657202
Snyman, S. (2016). The role of private sector ecotourism in local socio-economic development in southern Africa. Journal of Ecotourism, 1-22. doi:10.1080/14724049.2016.1226318
Stamation, K., Croft, D., Shaughnessy, P., Waples, K., & Briggs, S. (2007). Educational and conservation value of whale watching. Tourism in Marine Environments, 4(1), 41-55.
Stem, C., Lassoie, J., Lee, D., & Deshler, D. (2003). How 'eco' is ecotourism? A comparative case study of ecotourism in Costa Rica. Journal of Sustainable Tourism, 11(4), 322-347. doi:http://dx.doi.org/10.1080/09669580308667210
Steven, R., Pickering, C., & Castley, J. G. (2011). A review of the impacts of nature based recreation on birds. Journal of Environmental Management, 92(10), 2287-2294. doi:http://dx.doi.org/10.1016/j.jenvman.2011.05.005
Stronza, A. (2007). The economic promise of ecotourism for conservation. Journal of Ecotourism, 6(3), 210-230.
Stronza, A., & Durham, W. (Eds.). (2008). Ecotourism and Conservation in the Americas. Wallingford: CAB International.
Stronza, A., & Pegas, F. (2008). Ecotourism and Conservation: Two Cases from Brazil and Peru. Human Dimensions of Wildlife, 13(4), 263-279. doi:10.1080/10871200802187097
Svoronou, E., & Holden, A. (2005). Ecotourism as a Tool for Nature Conservation: The Role of WWF Greece in the Dadia-Lefkimi-Soufli Forest Reserve in Greece. Journal of Sustainable Tourism, 13(5), 456-467. doi:10.1080/09669580508668573
Tisdell, C., & Wilson, C. (2002). Ecotourism for the survival of sea turtles and other wildlife. Biodiversity and Conservation, 11(9), 1521-1538.
Tubb, K. (2003). An Evaluation of the Effectiveness of Interpretation within Dartmoor National Park in Reaching the Goals of Sustainable Tourism Development. Journal of Sustainable Tourism, 11(6), 476-498. doi:10.1080/09669580308667217
Valentine, P. (1993). Ecotourism and nature conservation. Tourism Management, 14(2), 107-115. doi:http://dx.doi.org/10.1016/0261-5177(93)90043-K
Vaudo, A., Ellis, J., Cambray, G., & Hill, M. (2012). The effects of land use on honey bee (Apis mellifera) population density and colony strength parameters in the Eastern Cape, South Africa. Journal of Insect Conservation, 16, 601-611. doi:10.1007/s10841-011-9445-0
Vuohelainen, A., Coad, L., Marthews, T., Malhi, Y., & Killeen, T. (2012). The effectiveness of contrasting protected areas in preventing deforestation in Madre de Dios, Peru. Environmental Management, 50(4), 645-663. doi:10.1007/s00267-012-9901-y
Waldron, A., Mooers, A., Miller, D., Nibbelink, N., Redding, D., Kuhn, T., . . . Gittleman, J. (2013). Targeting global conservation funding to limit immediate biodiversity declines. Proceedings of the National Academy of Sciences, 110(29), 12144-12148. doi:10.1073/pnas.1221370110
Walker, K., & Moscardo, G. (2014). Encouraging sustainability beyond the tourist experience: ecotourism, interpretation and values. Journal of Sustainable Tourism, 22(8), 1175-1196. doi:10.1080/09669582.2014.918134
Waylen, K., McGowan, P., Pawi Study Group, & Milner-Gulland, E. (2009). Ecotourism positively affects awareness and attitudes but not conservation behaviours: A case study at Grande Riviere, Trinidad. Oryx, 43(3), 343-351. doi:10.1017/S0030605309000064
Weaver, D., & Lawton, L. (2007). Twenty years on: The state of contemporary ecotourism research. Tourism Management, 28(5), 1168-1179. doi:10.1016/j.tourman.2007.03.004
Zeppel, H. (2006). Indigenous Ecotourism: Sustainable Development and Management. Wallingford: CAB International.
58
Post-p
rint p
ublic
ation

Chapter 2: Published literature review (post-print version)
Appendix 1: Studies examining each of the 29 actions
V Local community Wildlife Natural bio-physical Organisational
Envi
ronm
enta
l edu
catio
n1
Econ
omic
dev
elop
men
t2
Leas
es2
Com
pens
atio
n pa
ymen
ts2
Rev
enue
shar
ing2
Ecos
yste
m p
aym
ents
2
Envi
ronm
enta
l edu
catio
n3
Com
mun
ity C
ontri
butio
ns4
Don
atio
ns5
Trai
ning
6
Illeg
al a
ctiv
ities
7
Hum
an-w
ildlif
e co
nflic
t8
Bre
edin
g9
Tran
sloca
tion
Inva
sive
faun
a10
Mon
itorin
g
Faun
a re
sour
ces11
Nes
t site
s12
Prot
ecte
d ar
eas/c
orrid
ors13
Wee
ds14
Rev
eget
atio
n15
Prop
agat
ion16
Pollu
tion17
Res
earc
h
Act
ivis
m18
Con
serv
atio
n or
gs19
Purc
hase
s20
Loca
l con
serv
atio
n21
Con
serv
atio
n or
g m
embe
r22
Ahebwa, van der Duim, and Sandbrook (2012) Y Y
Almeyda Zambrano et al. (2010) Y Y Y
Almeyda, Broadbent, Wyman, and Durham (2010) Y Y
Anup, Rijal, and Sapkota (2015) Y
Armstrong and Weiler (2002) Y
Ballantyne et al. (2011) Y
Banerjee (2012) Y Y Y Y Y
Batta (2006) Y Y
Beaumont (2001) Y
Biggs, Ban, and Hall (2012) Y Y Y Y Y
Biggs, Turpie, Fabricius, and Spenceley (2011) Y Y Y Y
Bride, Griffiths, Meléndez-Herrada, and McKay (2008) Y Y Y Y Y Y
59Pos
t-prin
t pub
licati
on

Chapter 2: Published literature review (post-print version)
Brightsmith, Stronza, and Holle (2008) Y Y Y Y Y Y
Coghlan, Fox, Prideaux, and Lück (2011) Y
Cousins, Sadler, and Evans (2008) Y Y Y Y
de los Monteros (2002) Y Y Y
Dearden, Bennett, and Rollins (2007) Y
Higham and Carr (2002) Y
Hill, Woodland, and Gough (2007) Y
Holladay and Ormsby (2011)
Hovardas and Poirazidis (2006) Y
K. Hughes et al. (2011) Y
M. Hughes and Morrison-Saunders (2005) Y
Hunt, Durham, Driscoll, and Honey (2015) Y Y Y Y
Jacobs and Harms (2014) Y
Lamers, Nthiga, van der Duim, and van Wijk (2014) Y Y Y Y Y Y Y Y
Lapeyre (2011) Y Y Y Y
T. H. Lee and Jan (2015) Y
W. H. Lee and Moscardo (2005) Y
Li, Zhang, Liu, and Xue (2006) Y Y
Lindberg, Enriquez, and Sproule (1996) Y Y
Lück (2003) Y
Madin and Fenton (2004) Y
60Pos
t-prin
t pub
licati
on
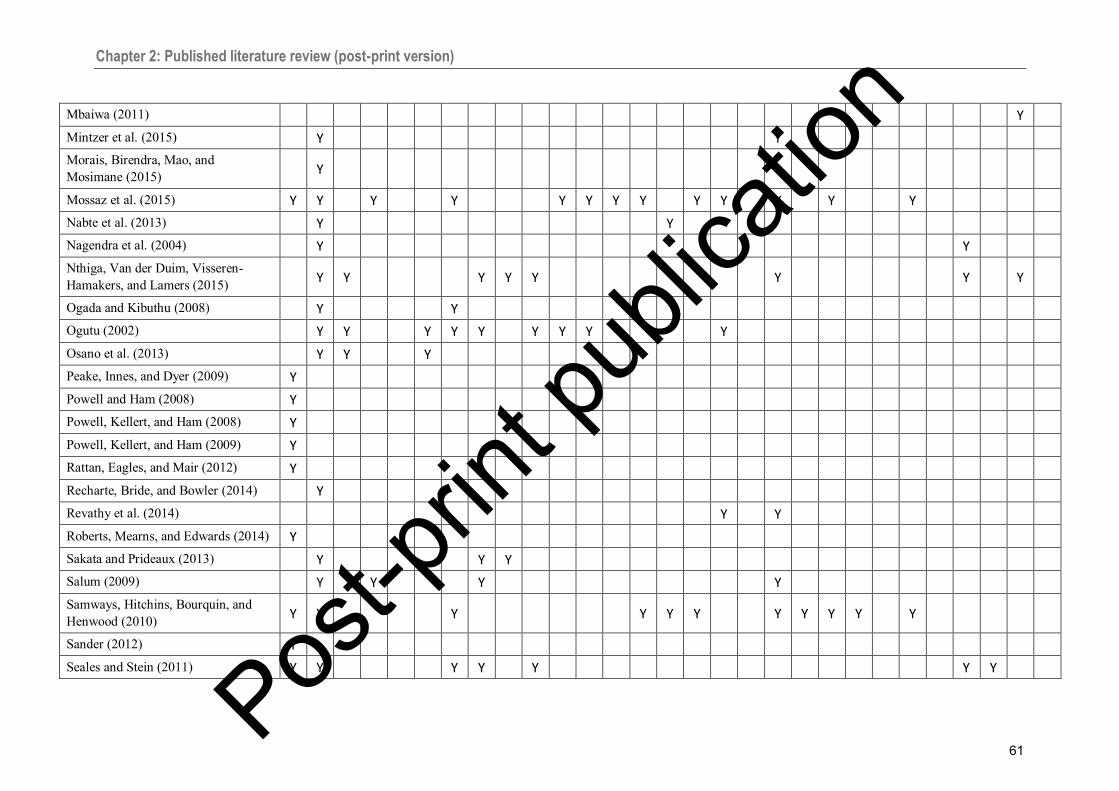
Chapter 2: Published literature review (post-print version)
Mbaiwa (2011) Y
Mintzer et al. (2015) Y Y
Morais, Birendra, Mao, and Mosimane (2015) Y
Mossaz et al. (2015) Y Y Y Y Y Y Y Y Y Y Y Y Y
Nabte et al. (2013) Y Y
Nagendra et al. (2004) Y Y
Nthiga, Van der Duim, Visseren-Hamakers, and Lamers (2015) Y Y Y Y Y Y Y Y
Ogada and Kibuthu (2008) Y Y
Ogutu (2002) Y Y Y Y Y Y Y Y Y
Osano et al. (2013) Y Y Y
Peake, Innes, and Dyer (2009) Y
Powell and Ham (2008) Y
Powell, Kellert, and Ham (2008) Y
Powell, Kellert, and Ham (2009) Y
Rattan, Eagles, and Mair (2012) Y
Recharte, Bride, and Bowler (2014) Y
Revathy et al. (2014) Y Y
Roberts, Mearns, and Edwards (2014) Y
Sakata and Prideaux (2013) Y Y Y
Salum (2009) Y Y Y Y
Samways, Hitchins, Bourquin, and Henwood (2010) Y Y Y Y Y Y Y Y Y Y Y
Sander (2012) Y
Seales and Stein (2011) Y Y Y Y Y Y Y
61Pos
t-prin
t pub
licati
on

Chapter 2: Published literature review (post-print version)
Sinha, Qureshi, Uniyal, and Sen (2012) Y Y
Skibins, Powell, and Hallo (2013) Y
Smith, Ham, and Weiler (2011)
Snyman (2012) Y
Stamation, Croft, Shaughnessy, Waples, and Briggs (2007) Y
Stem, Lassoie, Lee, and Deshler (2003) Y Y
Stronza (2007) Y Y
Stronza and Pegas (2008)
Tisdell and Wilson (2002) Y Y
Tubb (2003) Y
Vaudo et al. (2012) Y Y
Vuohelainen, Coad, Marthews, Malhi, and Killeen (2012) Y
Walker and Moscardo (2014) Y
Waylen, McGowan, Pawi Study Group, and Milner-Gulland (2009) Y Y Y
1Environmental education and interpretation for visitors; 2Economic development and alternate forms of income, including lease payments, compensation payments, revenue sharing schemes and payments for ecosystem services; 3Environmental education for local communities; 4Contributions to local communities e.g. improving infrastructure; 5Donations to community development/support purposes; 6Training, education and capacity building for locals; 7Actions to reduce illegal activities, e.g. poaching, logging, hunting; 8Actions to reduce human-wildlife conflict; 9Breeding/head starting programs; 10Actions to control non-native fauna species; 11Increased resources for fauna, e.g. food, water; 12Provision and/or management of nest sites; 13Establishment of a protected area, corridors or increased habitat; 14Actions to remove non-native flora species; 15Revegetation and habitat restoration; 16Propagation of a native threatened species; 17Rubbish clean-up programs; 18Lobbying and political activism; 19Support/donations to conservation organisations, projects and NGOs; 20Environmentally friendly purchasing; 21Formation of local conservation groups; and 22Member of conservation organisation.
62Pos
t-prin
t pub
licati
on

Chapter 2: Published literature review (post-print version)
Appendix 2: Studies examining each of the 21 outcomes
Visitors Local community Wildlife Bio-physical Org.
Envi
ronm
enta
l aw
aren
ess1
Alte
red
beha
viou
rs o
f vis
itors
(A
BV
)
AB
V –
don
atio
ns2
AV
B –
pic
king
up
litte
r
AV
B –
vol
unte
erin
g3
Envi
ronm
enta
l aw
aren
ess4
Alte
red
beha
viou
rs5
Con
sum
ptiv
e la
nd u
ses6
Impr
oved
NR
M7
Illeg
al a
ctiv
ities
8
Hum
an w
ildlif
e co
nflic
t9
Hea
lth10
Num
bers
11
Com
petit
ion/
pred
atio
n12
Def
ores
tatio
n13
Gen
etic
div
ersit
y14
Wild
life
reso
urce
s15
Wee
ds16
Veg
etat
ion
dens
ity17
Prot
ectio
n18
Kno
wle
dge19
Ahebwa, van der Duim, and Sandbrook (2012) Y
Almeyda Zambrano et al. (2010) Y Y Y Y Y
Almeyda, Broadbent, Wyman, and Durham (2010) Y Y
Anup, Rijal, and Sapkota (2015) Y Y
Armstrong and Weiler (2002) Y
Ballantyne et al. (2011) Y Y
Banerjee (2012)
Batta (2006) Y
Beaumont (2001) Y Y
Biggs, Ban, and Hall (2012)
Biggs, Turpie, Fabricius, and Spenceley (2011) Y Y Y Y
Bride, Griffiths, Meléndez-Herrada, and McKay (2008) Y Y Y Y
Brightsmith, Stronza, and Holle (2008) Y Y Y
Coghlan, Fox, Prideaux, and Lück (2011) Y
Cousins, Sadler, and Evans (2008)
63Pos
t-prin
t pub
licati
on

Chapter 2: Published literature review (post-print version)
de los Monteros (2002)
Dearden, Bennett, and Rollins (2007) Y
Higham and Carr (2002) Y
Hill, Woodland, and Gough (2007) Y
Holladay and Ormsby (2011) Y
Hovardas and Poirazidis (2006) Y
K. Hughes et al. (2011) Y Y Y Y Y
M. Hughes and Morrison-Saunders (2005) Y
Hunt, Durham, Driscoll, and Honey (2015) Y Y Y
Jacobs and Harms (2014) Y
Lamers, Nthiga, van der Duim, and van Wijk (2014) Y Y Y Y
Lapeyre (2011) Y Y Y
T. H. Lee and Jan (2015) Y
W. H. Lee and Moscardo (2005) Y
Li, Zhang, Liu, and Xue (2006) Y Y Y Y Y Y
Lindberg, Enriquez, and Sproule (1996) Y
Lück (2003) Y
Madin and Fenton (2004) Y
Mbaiwa (2011) Y Y Y Y Y Y
Mintzer et al. (2015) Y Y Y
Morais, Birendra, Mao, and Mosimane (2015) Y Y Y
Mossaz et al. (2015)
Nabte et al. (2013) Y Y Y Y
Nagendra et al. (2004) Y Y Y
Nthiga, Van der Duim, Visseren-Hamakers, and Lamers (2015) Y Y Y Y Y Y
64Pos
t-prin
t pub
licati
on

Chapter 2: Published literature review (post-print version)
Ogada and Kibuthu (2008) Y Y
Ogutu (2002) Y Y Y Y Y Y Y Y Y
Osano et al. (2013)
Peake, Innes, and Dyer (2009) Y
Powell and Ham (2008) Y Y
Powell, Kellert, and Ham (2008) Y Y
Powell, Kellert, and Ham (2009) Y Y Y Y Y
Rattan, Eagles, and Mair (2012) Y
Recharte, Bride, and Bowler (2014) Y
Revathy et al. (2014) Y
Roberts, Mearns, and Edwards (2014) Y
Sakata and Prideaux (2013) Y Y
Salum (2009)
Samways, Hitchins, Bourquin, and Henwood (2010) Y Y Y Y Y Y Y
Sander (2012) Y Y
Seales and Stein (2011)
Sinha, Qureshi, Uniyal, and Sen (2012)
Skibins, Powell, and Hallo (2013) Y
Smith, Ham, and Weiler (2011) Y Y
Snyman (2012) Y
Stamation, Croft, Shaughnessy, Waples, and Briggs (2007) Y Y Y Y Y
Stem, Lassoie, Lee, and Deshler (2003) Y Y Y
Stronza (2007) Y Y
Stronza and Pegas (2008) Y Y Y Y
Tisdell and Wilson (2002) Y Y Y Y Y Y
65Pos
t-prin
t pub
licati
on

Chapter 2: Published literature review (post-print version)
Tubb (2003) Y
Vaudo et al. (2012) Y Y
Vuohelainen, Coad, Marthews, Malhi, and Killeen (2012) Y
Walker and Moscardo (2014) Y
Waylen, McGowan, Pawi Study Group, and Milner-Gulland (2009) Y
1Increased environmental awareness of visitors; 2Altered behaviours of visitors – donations for conservation purposes; 3Altered behaviours of visitors – volunteering for conservation purposes; 4Increased environmental awareness of local communities; 5Altered behaviours of local communities and increase of sustainable practices; 6Decreased consumptive and land-intensive practices; 7Improved community natural resource management; 8Reduced illegal activities; 9Reduced human-wildlife conflict; 10Increased ecological integrity, resilience and health of wildlife populations; 11Increased numbers of wildlife; 12Reduced unnatural competition or predation from non-native wildlife; 13Reduced deforestation, fragmentation and habitat loss; 14Increased floral genetic diversity; 15Increased habitat and resources for wildlife; 16Reduced non-native floral species; 17Increased vegetation density; 18Regonition, support and protection for land rights; and 19Increased knowledge base.
66Pos
t-prin
t pub
licati
on

67

Chapter 2: Context and Literature Review
2.8 Ecotourism-conservation pathways
The review of the academic literature in Section 2.7 highlights that ecotourism can contribute to conservation through many pathways. These findings were used to develop conceptual models of the socio-political (Figure 2.6) and ecological (Figure 2.7) ecotourism-conservation pathways that have been demonstrated in the academic literature to occur in-practice, expanding on Figure 1.1 in Chapter 1. Figure 2.6 shows the groups and the social outcomes that ecotourism enterprises can influence, and the drivers that link the two. For example, ecotourism enterprises may inspire (driver) visitors (group) to donate money for conservation purposes (proactive conservation behaviour) (Sander, 2012), so that conservation projects can then generate ecological conservation outcomes.
Figure 2.6 Conceptual model of the socio-political ecotourism-conservation pathways demonstrated in the academic literature to occur in-practice.
Figure 2.7 shows the ecological conservation activities that ecotourism enterprises may
undertake and the ecological conservation outcomes that may result from these.
68

Chapter 2: Context and Literature Review
Figure 2.7 Conceptual model of the ecological ecotourism-conservation pathways demonstrated in the academic literature to occur in-practice.
Section 2.7 also highlights that most studies focus on links to the intermediary outcome of pro-
environmental attitudes and values. While over a third of the studies assessed behavioural
changes, this was generally in a very broad sense such as increased numbers of community
members employed in the tourism industry rather than through consumptive practices such as
logging or hunting (Stem et al., 2003). Additionally, very few studies examine the final link
from the intermediary outcomes to ecological conservation outcomes. However, if decreasing
the number of local loggers or grazers through increased tourism employment, for example,
does not decrease rates of land clearing or improve vegetation density and habitat quality, then
this has not achieved a conservation outcome. Furthermore, Section 2.7 also highlights that
these pathways are generally examined in isolation or in narrow groupings and therefore only
demonstrate a small number of these links in a single context.
These conceptual pathway models are explored further in Chapter 4 and provide the foundation
for the development of a ‘Conservation Activities Matrix’ which incorporates a comprehensive
list of conservation actions and outcomes and explores the direct and indirect relationships
between these. Before this, however, Chapter 3 details the methods used for the subsequent
three data chapters, including the approach used to develop this Conservation Activities Matrix.
69

70

Chapter 3: Methodology
3.1 Introduction
Multiple synergistic approaches were utilised in this thesis to address the research objectives18
outlined in the thesis structure (Section 1.5). Although inextricably linked, the three data
chapters are presented in this thesis as three somewhat discrete research components (Figure
3.1). As such, this chapter begins by discussing the overall research design in Section 3.2,
before individually detailing the methods of each research component in Sections 3.3, 3.4 and
3.5.
Figure 3.1 Conceptual depiction of the methods and results of the three interlinked research components within the thesis.
3.2 Overview of research
3.2.1 Research design This research used an exploratory sequential mixed methods approach within a pragmatic
paradigm, beginning first with an exploratory qualitative phase that provided the foundation for
the subsequent combined qualitative/quantitative research phase (Creswell, 2014). Pragmatic
18 Research objectives are listed in Section 1.3.
71

Chapter 3: Methodology
research is not constrained by methodological allegiances but instead uses any (or all) available
approaches to derive knowledge about, and understand, a problem (Creswell, 2014), focusing
on “the methods, techniques, and procedures of research that best meet [the] needs and
purposes” (p. 11). This thesis used a range of data sources, tools and methods (as described
throughout this chapter), drawing on the strengths of both qualitative and quantitative research
in the pragmatic pursuit of “socially useful knowledge” (Feilzer, 2009, p. 6). This range of data
and methods supplemented gaps in individual sources and aided with data triangulation and
validity (Crowe et al., 2011; Hancock and Algozzine, 2011).
3.2.2 Research components The review of the academic literature in Chapter 2 (Research Objective 1) revealed that there
are few established tools for evaluating the conservation outcomes of ecotourism enterprises,
and highlighted a narrow focus and lack of consistency in the tools that do exist and the in
published real-world evaluations. Three research components were therefore developed to fulfil
the remaining four thesis objectives:
1) The development of a framework to evaluate the conservation contributions of ecotourism enterprises (Research Component 1, Research Objective 2);
2) The application of this framework to ecotourism enterprises in Australia (Research Component 2, Research Objectives 3 and 4); and
3) The identification and analysis of the relevant ecotourism-conservation gaps and overlaps within the national eco-certification program and key national conservation policies (Research Component 3, Research Objective 5).
Figure 3.2 provides a conceptual overview of these three components as individual research
approaches, while Figure 3.3 provides a conceptual flow chart highlighting the links between
the components and their shared data sources.
72

Chapter 3: Methodology
Figure 3.2 Conceptual model of the research approach for the three research components detailed in this chapter (modified from Figure 1.4).
73

Chapter 3: Methodology
Figure 3.3 Conceptual flow chart depicting shared data sources and linkages across the three research components detailed in this chapter (data sources in grey boxes, chapters in blue
boxes).
3.2.3 Research tools and data sources As highlighted in the previous section, some of the methods and data sources in this thesis are
used in multiple research components. Additionally, some of these methods and terms lack
precise definitions and at times have been used somewhat interchangeably in the academic
literature (Bazeley, 2009; Vaismoradi, Turunen and Bondas, 2013). Therefore, brief
explanations of these terms and sources are provided here to ensure clarity while avoiding
duplication of content throughout this chapter. Relevant details regarding the use of each
method and data source are included in the descriptions of the three research components where
appropriate.
3.2.3.1 Document analysis, content analysis and thematic analysis Document, content and thematic analysis share many similarities, and the three terms are
sometimes used interchangeably (Bowen, 2009; Vaismoradi et al., 2013). All three approaches
systematically explore, code, and categorise data, allowing researchers to make replicable
inferences, cross-validate research findings, and build conceptual models “with the purpose of
providing knowledge, new insights, a representation of facts and a practical guide to action”
(Elo and Kyngäs, 2008, p. 108).
74

Chapter 3: Methodology
The primary difference between content and thematic analysis lies in the potential for content
analysis to also include simultaneous quantitative analysis to “determine trends and patterns of
words used, their frequency, their relationships, and the structures and discourses of
communication” (Vaismoradi et al., 2013, p. 400). However, effective content analysis goes
beyond simply counting codes and requires the researcher “to ponder, to scrutinize, to
interrogate, to experiment, to feel, to empathize, to sympathize, to speculate, to assess, to
organize, to pattern, to categorize, to connect, to integrate, to synthesize, to reflect, to
hypothesize, to assert, to conceptualize, to abstract, and… to theorize” (Saldana, 2013, p. 39).
Thematic analysis may also identify and report patterns within data; however, this is purely a
qualitative and nuanced exploration (Vaismoradi et al., 2013). Furthermore, thematic analysis
allows the researcher to explore themes within the text based on their importance to the research
question rather than the frequency with which they are used (Vaismoradi et al., 2013).
Saldana (2013, p. 269) describes content analysis as using “the contents of a data corpus
(documents, texts, videos, etc.)”. Similarly, in the context of document analysis, the term
‘document’ can refer to text, images, symbolic representations, or audio-visual remains, and can
include organisational or institutional reports, books, brochures, press releases, public records,
and so on (Bowen, 2009; Karppinen and Moe, 2012).
This thesis incorporates aspects of all three methods and, guided by the pragmatic paradigm
(Morgan, 2014), applies the most appropriate approach for each stage according to the research
needs19 (Feilzer, 2009). Both inductive (emergent and data-driven) coding and deductive
(knowledge-driven) coding were used with these methods (Elo and Kyngäs, 2008; Saldana,
2013). Reliability was enhanced through the use of coding manuals and templates, multiple
coding iterations, team discussions, and multiple coders with inter-coder agreement rates above
90% (Saldana, 2013).
3.2.3.2 National Conservation Agenda The NCA is a term created in this thesis to refer to the eight key national policies that guide
conservation practices within Australia, as detailed in Section 2.6.2.2. Each policy contains a
range of goals, targets, objectives, outcomes, and so on, with little consistency in the
terminology used for these across the eight policies (Table 3.1). To easily distinguish the most
important aspects of each policy from the general content of their combined 420 full pages of
text, these terms are here given an all-encompassing acronym of ‘TOPs’ (i.e. ‘Targets,
Objectives and Priorities’). These policies are also referred to individually throughout the thesis
and were therefore assigned shortened titles consisting of a keyword followed by the word
19 Details regarding the approach used by each of the research components are provided throughout this chapter.
75

Chapter 3: Methodology
‘Strategy’ for clarity and to minimise space in tables. The term ‘strategy’ rather than ‘policy’
was chosen as this is the most common term used for the titles of the eight policies.
Table 3.1 Abbreviated name, TOPs, and length of the eight policies in the NCA
Policies and
shortened titles
Pages
of text1
Targets, Objectives and Priorities
(TOPs)
Australia’s Biodiversity Conservation Strategy: 2010 – 2030 (‘ABC Strategy’)
77
• 1 vision • 3 priorities • 9 sub-priorities, 28 outcomes, 10 targets
and 26 actions under the 3 priorities
Australia’s Strategy for Nature 2018-2030 (draft) (‘Nature Strategy’)
15 • 1 vision • 3 goals • 12 objectives under the 3 goals
Strategy for Australia's National Reserve System 2009-2030 (‘Reserve Strategy’)
45 • 6 themes • 6 key directions, 24 strategic approaches
and 37 priority actions under the 6 themes
Australia's Native Vegetation Framework 2012 (‘Vegetation Strategy’)2
103 • 1 vision • 5 goals • 14 targets and 19 outcomes under the 5
goals
Australian Heritage Strategy 2015 (‘Heritage Strategy’)
45 • 1 vision • 3 outcomes • 11 objectives under the 3 outcomes
Threatened Species Strategy 2015 (‘Species Strategy’)
48 • 4 key action areas • 5 targets
Australian Weeds Strategy 2017-2027 (‘Weed Strategy’)
42 • 1 vision • 3 goals • 11 priorities under the 3 goals
Australian Pest Animal Strategy 2017-2027 (‘Pest Strategy’)
49 • 1 vision • 3 goals • 10 priorities under the 3 goals
Total pages: 424
1The number of pages includes TOPs but excludes title pages, contents, full page images, blank pages, back covers, and so on; and 2This abbreviated title uses the term ‘Strategy’ rather than ‘Framework’ for consistency.
3.2.3.3 National Conservation Threats The term National Conservation Threats (‘NCT’) has been created in this thesis to succinctly
refer to the three directives and regulations in Table 3.2.
76

Chapter 3: Methodology
Table 3.2 Details on the three items referred to as NCTs in this thesis
Item Details
Key Threatening Processes
Under the EPBC Act 1999, Key Threatening Processes have been assessed and determined to provide a threat to the survival, abundance or evolutionary development of a native species or ecological community.
There are 21 Key Threatening Processes as of March 2019.
Threat Abatement Plans
Under the EPBC Act 1999, Threat Abatement Plans provide a framework, identify actions, and coordinate a response to ensure the long-term survival of native species and ecological communities affected by Key Threatening Processes.
There are 13 Threat Abatement Plans as of March 2019.
Weeds of National Significance
Under the Australian Weeds Strategy 2017-2027, Weeds of National Significance (‘WoNS’) have been assessed and prioritised by Australian governments based on their invasiveness, impacts, potential to spread, and socioeconomic and environmental values.
There are 32 Weeds of National Significance in Australia as at March 2019.
3.2.3.4 EA Questionnaire and certification material The application questionnaire used by EA in their certification process (‘EA Questionnaire’)
was one of the primary data sources for this thesis. This questionnaire included 805 checklist-
style questions (‘EA Questions’) and 80 ‘open-ended questions’ (in the form of space for
additional details) across ten sections:
• Business management and operational planning,
• Business ethics,
• Responsible marketing,
• Customer satisfaction,
• Natural area focus,
• Environmental management,
• Interpretation and education,
• Contribution to conservation,
• Working with local communities, and
• Cultural respect and sensitivity.
77

Chapter 3: Methodology
There is extensive repetition in these 805 questions, particularly in the Environmental
Management section which includes 350 questions grouped into 17 provisional components that
only require completion if applicants incorporate specific activities in their tourism products
such as bushwalking, camping, snorkelling, and vehicle use.
In addition to the template questionnaire, this thesis also used the certification material of 86
certified members20 (‘sites’), as supplied by EA. This included (1) a filled-in copy of the EA
Questionnaire for each member; (2) supporting materials required for the certification
applications such as environmental management plans and visitor interpretation plans; (3) the
results of initial independent site audits as part of the certification process; (4) the three-yearly
independent audits conducted for each site as part of ongoing certification requirements; and (5)
certification upgrades undertaken by sites and supporting material for these, such as climate
action plans.
Using a survey instrument designed and implemented by EA meant there was a 100% ‘response
rate’ despite the length of the questionnaire, with considerable cross validation inherent in the
questions that minimised positive response biases. Additionally, these responses were
independently verified at the time of application. This approach therefore reduced key
limitations of document analysis, surveys, and other self-reporting measures (Bowen, 2009;
Rossi, Wright and Anderson, 2013).
However, there were two additional limitations to this approach. Firstly, the survey tool was
restricted to the content and style of questioning in the EA questionnaire as it was created
independently from the research agenda. Secondly, although the data for this thesis were
extracted in 2016, the ‘responses’ for this questionnaire are tied to the year of application for
each site and therefore occurred over an eight-year period between 2004 and 2012. The impact
of these limitations was reduced by (1) using the additional certification material described
above, which included upgrade applications for 49 of the 86 sites dated between 2010 and 2012;
and (2) publicly available information such as company websites. Additionally, the focus of this
research was to provide a baseline indication of conservation contributions and was therefore
not concerned with temporal trends.
20 The number of sites is included in this section because of the relevance it has for the use of this questionnaire as a data source. Information regarding these 86 sites is provided in Section 3.4.1.
78

Chapter 3: Methodology
Research Component 1
3.3 Conservation Evaluation Framework for ecotourism enterprises
This section describes the methods used to address the second research objective, the results of
which are presented in Chapter 4:
Research
Objective 2
Identify the potential conservation activities that ecotourism
enterprises may undertake and construct an evaluation framework
based on an exploration of the actions, outcomes and relationships of
these conservation activities.
To fulfil this objective, a comprehensive list of conservation activities (‘Conservation Items’)
that could potentially be undertaken by ecotourism enterprises were first compiled from a range
of data sources and constructed into a relationship matrix. This matrix provides the foundation
of a framework to evaluate the conservation contributions of ecotourism enterprises.
3.3.1 Data collection Conservation practices and relevant descriptive information were identified through a range of
sources including the academic literature, eco-certification criteria from multiple certification
programs, and the activities of Australian ecotourism sites, as discussed below. This involved a
recursive process of data collection in which there was ongoing examination and interpretation
of the data which helped to refine the data collection process (Stake, 2006; Hancock and
Algozzine, 2011).
79
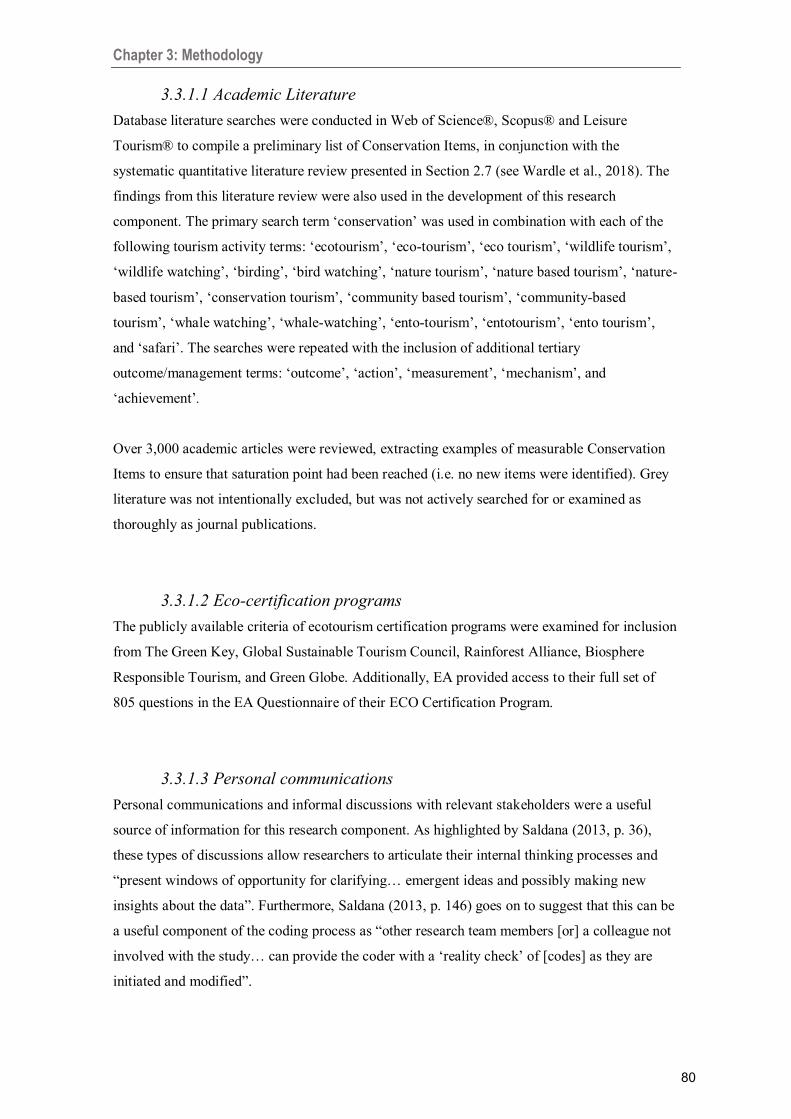
Chapter 3: Methodology
3.3.1.1 Academic Literature Database literature searches were conducted in Web of Science®, Scopus® and Leisure
Tourism® to compile a preliminary list of Conservation Items, in conjunction with the
systematic quantitative literature review presented in Section 2.7 (see Wardle et al., 2018). The
findings from this literature review were also used in the development of this research
component. The primary search term ‘conservation’ was used in combination with each of the
following tourism activity terms: ‘ecotourism’, ‘eco-tourism’, ‘eco tourism’, ‘wildlife tourism’,
‘wildlife watching’, ‘birding’, ‘bird watching’, ‘nature tourism’, ‘nature based tourism’, ‘nature-
based tourism’, ‘conservation tourism’, ‘community based tourism’, ‘community-based
tourism’, ‘whale watching’, ‘whale-watching’, ‘ento-tourism’, ‘entotourism’, ‘ento tourism’,
and ‘safari’. The searches were repeated with the inclusion of additional tertiary
outcome/management terms: ‘outcome’, ‘action’, ‘measurement’, ‘mechanism’, and
‘achievement’.
Over 3,000 academic articles were reviewed, extracting examples of measurable Conservation
Items to ensure that saturation point had been reached (i.e. no new items were identified). Grey
literature was not intentionally excluded, but was not actively searched for or examined as
thoroughly as journal publications.
3.3.1.2 Eco-certification programs The publicly available criteria of ecotourism certification programs were examined for inclusion
from The Green Key, Global Sustainable Tourism Council, Rainforest Alliance, Biosphere
Responsible Tourism, and Green Globe. Additionally, EA provided access to their full set of
805 questions in the EA Questionnaire of their ECO Certification Program.
3.3.1.3 Personal communications Personal communications and informal discussions with relevant stakeholders were a useful
source of information for this research component. As highlighted by Saldana (2013, p. 36),
these types of discussions allow researchers to articulate their internal thinking processes and
“present windows of opportunity for clarifying… emergent ideas and possibly making new
insights about the data”. Furthermore, Saldana (2013, p. 146) goes on to suggest that this can be
a useful component of the coding process as “other research team members [or] a colleague not
involved with the study… can provide the coder with a ‘reality check’ of [codes] as they are
initiated and modified”.
80

Chapter 3: Methodology
Conservation-ecotourism researchers
Four researchers working across conservation, wildlife ecology and ecotourism disciplines
reviewed the list of Conservation Items and participated in informal discussions regarding
coding of these items and their relationships.
Ecotourism Australia staff
Data collection for part of this thesis occurred on-site in the EA offices for approximately three
days per week for one year. Similar to the experience of an intern in the EA offices described by
Fogle and Duffy (2018), this process allowed for many informal discussions with EA staff and
stakeholders regarding this research as well as the activities, goals and challenges of the
organisation, the environmental management practices of their certified members, the
application process, and the independent audits.
3.3.1.4 The NCA The NCA (described in Section 3.2.3.2) was used for multiple components of this thesis
including document and content analysis (detailed in Sections 3.5.2 and 3.5.3). As such, the
eight policies were read in full in addition to many iterations of searching for key terms and
checking of quotes and themes. The NCA was therefore an influential source in the
identification of Conservation Items and the formation of the relationship matrix.
3.3.1.5 Ecotourism sites As outlined in Section 3.2, Research Component 2 involved applying the framework developed
in this research component to a set of 86 Australian ecotourism sites (detailed in Section 3.4).
However, the pragmatic paradigm encourages researchers to view research stages as “parts of an
holistic, interactive and unifying process” that “requires prolonged engagement, persistent
observation and triangulation” (Onwuegbuzie and Leech, 2005, pp. 382-383). As such, the
reflexive and recursive nature of this mixed methods research allowed for this application
component to provide another information source for building and revising the framework.
3.3.1.6 Analytic memos and research journal entries Analytic memos and research journal entries are “sites of conversation with ourselves about our
data” (Clarke, 2005, p. 202). As Saldana (2013, p. 42) explains, these “are concurrent
qualitative data analytic activities for there is ‘a reciprocal relationship between the
development of a coding system and the evolution of understanding a phenomenon’ (Weston et
81

Chapter 3: Methodology
al., 2001, p. 397)”. Analytic memos and research journal entries were recorded throughout all
research components of this thesis and were themselves coded according to overarching
research concepts.
3.3.2 Data analysis This research primarily used document analysis in which elements of content analysis and
thematic analysis were used to locate, select, appraise and synthesise data from a range of
documentary sources (Bowen, 2009). As mentioned previously, the data collection and data
analysis stages of this research component were conducted simultaneously. Therefore, although
the analysis is described here as somewhat of a linear approach with sequential steps, in practice
this was a reflexive and emergent process with many iterations and loops. Figure 3.4 presents a
simplified version of this iterative process as a conceptual flow chart, with each step described
below.
Figure 3.4 Conceptual flow chart of the data collection and analysis steps followed in Research Component 1.
82

Chapter 3: Methodology
First, data sources were imported into NVivo and text excerpts relating to conservation practices
were extracted (Step 1). These excerpts allowed for the creation of a comprehensive list of
conservation practices using a combination of inductive coding and an iterative classification
process (Step 2). There are obvious risks that come with “lining up a series of excerpts from
printed material to convey whatever idea comes to the researcher’s mind” (Bowen, 2009, p. 34).
Using a program such as NVivo helped mitigate this risk due to the ability to (1) easily code a
substantial volume of text to multiple nodes; (2) conveniently refer back to the full document
text whenever needed; and (3) create duplicate nodes for individual codes to store additional
explanatory text separately from key extracts for future reference if needed. Furthermore, this
research aimed to identify and categorise conservation activities in order to construct an
evaluation tool and was therefore largely unconcerned with latent meanings, symbolism, or the
authors or organisations from which the documents originated.
Step 3 used broad comparisons to group these codes into 53 Conservation Items made up of 27
conservation actions and 26 conservation outcomes. Actions were distinguished from outcomes
in the literal sense of ‘the act of doing something’, such as planting native trees, while outcomes
were defined as those that result from an action, such as increased vegetation density21.
Step 4 took this comparative process further by using thematic similarities to condense the
coded data into categories that emerged through focused coding, as described in Saldana (2013,
pp. 213-217). In this step, all Conservation Items were grouped into one of five categories
according to their focus, as this made “the most analytic sense” (Charmaz, 2006, p. 57): the
biophysical landscape, the fauna, the visitors, the staff and local community, and aspects of a
larger organisational or political scale.
Step 5 further explored the relationships between each of the 53 Conservation Items and the five
categories. All potential interactions between conservation actions and outcomes were examined
through additional ‘action + outcome’ database searches of the academic literature, additional
coding rounds, and discussions with conservation-ecotourism researchers to determine which
outcomes could be feasibly produced (either directly or indirectly) by each of the actions. These
relationships can be complex: many conservation goals can be achieved using different
pathways; each action may contribute to a myriad of outcomes; and some outcomes can produce
outcomes of their own. The size and complexity of the resulting dataset meant a visual model
was not a feasible option for depicting these relationships. They were therefore constructed into
a Conservation Activities Matrix (‘CA Matrix’) which clearly depicts the direct and indirect
relationships between the Conservation Items and across the five categories. Additionally, this
21 Discussed further in the thesis scope and boundaries (Section 1.4).
83

Chapter 3: Methodology
stage involved the development of ‘meta’ categories or “categories of categories” (Saldana,
2013, p. 250): the biophysical landscape and the fauna categories were grouped into an
ecological aspects meta-category, and the visitor, community, and organisational/political
categories were grouped into a socio-political aspects meta-category.
Step 6 combined the findings of the systematic quantitative literature review (Section 2.7) and
the CA Matrix to build on the analytic framework of Buckley (2009) and develop a
Conservation Evaluation Framework (‘CE Framework’) in which essential items for evaluating
the conservation contributions of ecotourism enterprises were reframed as suggested steps. The
analytic memos and research journal entries recorded throughout the research process of this
thesis were a critical component of this stage for, as Stern (2007 p. 119) states, “if data are the
building blocks of the developing theory, memos are the mortar”. This step draws on a
grounded theory approach as described by Charmaz (2006). However, by focusing on the
“content, practicality and instrumentality” (Greene and Hall, 2010, p. 138) in developing a
framework that is “useful… in guiding action in real-world settings” (Glasgow, 2013, p. 260),
this step is firmly rooted in the philosophical ideals of pragmatism. Furthermore, Feilzer (2009,
p. 14) emphasises that a pragmatic approach can be used for grounded inductive or abductive
research and highlights the value of “knowledge produced by such research in furthering our
understanding of society”.
Step 7 applied the CE Framework to a set of Australian ecotourism sites (described in Section
3.4). As stated in Section 3.3.1.5, the reflexive and recursive nature of this research allowed for
this application component to provide another step towards building and revising the
framework.
3.3.3 Framework demonstration A brief demonstration of the CE Framework is provided in Section 4.4 using three Australian
ecotourism sites. The purpose of this was to explore and demonstrate the application process
rather than complete a detailed evaluation of these sites. Therefore, only the websites of these
enterprises were used as data sources and only one conservation activity was examined.
84

Chapter 3: Methodology
Research Component 2
3.4 Conservation evaluation of private Australian ecotourism enterprises
Research Component 2 addresses the third and fourth research objectives, the results of which
are presented in Chapter 5:
Research
Objective 3
Evaluate the conservation activities of a set of Australian ecotourism
enterprises certified with EA.
Research
Objective 4
Identify if patterns exist between the conservation practices of a set of
Australian ecotourism enterprises and their enterprise characteristics
such as the size of the property and age of the business.
In this research component, the CE Framework from Research Component 1 (presented in
Section 4.3) was used to guide an evaluation of the conservation activities of a set of ecotourism
sites in Australia through convergent parallel mixed methods in which quantitative and
qualitative data were simultaneously collected and integrated “to provide a comprehensive
analysis of the research problem” (Creswell, 2014, p. 15). Additionally, as explained in Section
3.3.1.5, aspects of this research component were also included in the development of the CE
Framework. Therefore, as with Research Component 1, it is described here as a linear process
following sequential steps; but in practice was an iterative process with multiple data collection
and analysis stages. Figure 3.5 provides a conceptual flow chart of this approach, and each step
is described below.
85

Chapter 3: Methodology
Figure 3.5 Conceptual flow chart of the data collection and data analysis steps followed in Research Component 2.
3.4.1 Site selection (Step 1) A subset of ecotourism sites certified with EA were utilised for this study. Site selection criteria
included (1) fixed-site ecotourism enterprises or enterprises that are responsible for the
management of the area in which they operate; (2) non-government enterprises without captivity
or consumptive components as these fall outside the scope22 of this thesis; and (3) operators
with advanced level certification as recommended by EA as those most likely to have filled in
the conservation section of the application document. Of the 482 enterprises certified with EA at
the time of site selection in March 2016, 86 sites met these criteria and are included in this
thesis. These sites are numbered for confidentiality purposes as part of the data sharing
agreement with EA.
As described in Section 2.3.2, EA is responsible for the design and management of the
Australian ECO Certification Program. Their publicly available list of certified ecotourism
operators was chosen for this study as it is a precompiled database from a respected association
22 The scope of the thesis is detailed in Section 1.4.
86

Chapter 3: Methodology
that has been in existence since 1991, over which time it has gained important credentials and
industry connections, run annual conferences, and demonstrated to companies that it is a
worthwhile organisation to belong to. Furthermore, the requirements and criteria to achieve the
lowest level of certification are very low. It is therefore likely to provide a fairly comprehensive
list of the ecotourism enterprises in Australia. Additionally, using sites that have been confirmed
as ecotourism enterprises through eco-certification avoided potential concerns regarding
ecotourism definitions and inclusion criteria, as discussed in Section 1.4.1 and Section 2.1.
3.4.2 Data collection (Step 2) The EA Questionnaire and certification information including supporting material and
independent audits (as described in Section 3.2.3.4) formed the primary data source for this
research component. Of the 805 check-list questions in the EA Questionnaire, 157 were directly
relevant to this stage. All qualitative ‘additional information’ questions were also checked for
relevant material as there was little consistency in the structure of the information provided by
sites in these documents. Company websites for each of the 86 sites were also used as well as
independent third-party publications where available.
Quantitative and categorical data were also compiled on five enterprise characteristics: turnover,
size, age, guest capacity, and ecosystem or biome (Table 3.3). Turnover categories were set by
EA in the certification applications, however all other categories were determined a posteriori
to distinguish between the very small, small, moderate, large and very large where possible.
Data were collected in 2016, and therefore the age characteristic refers to enterprise age at that
time.
Table 3.3 Categories of each enterprise characteristic
Characteristic Categories
Turnover (AU$) <$250,000; $250,001 - $1,000,000; $1,000,000- $5,000,000; $5,000,000 - $10,000,000; >$10,000,000
Size (ha) <5; 5-19; 20-99; 100-999; 1,000-9,999; >10,000
Age (years) <10; 10-24; >25
Guest capacity <10; 10-29; 30-59; 60-99; >100
Biome Rainforest, Bushland1, Coastal, Arid/grassland/desert, Island, Mountain/alpine, Temperate, and Wetland.
1Bushland refers to all forested areas that are not rainforest, including woodland and sclerophyll forest types.
87

Chapter 3: Methodology
3.4.2.1 CA Matrix data template Data were initially extracted as text excerpts which, through deductive coding (Hanly, 2014),
were assigned to Conservation Items using the CA Matrix as a data template. This step
produced over 750 pages of text excerpts, excluding the text of the questions in the EA
Questionnaire. The data template also included a record of the data source and access date for
each text excerpt, as well as annotations made throughout the data collection process. An
example of a filled-in data template with annotations is provided in Appendix A.
As explained previously, the CA Matrix evolved over the course of the project. As such, an
earlier version of the matrix was used for this research component which differs slightly from
the version presented in Chapter 4. Additionally, due to the phrasing of relevant questions in the
EA Questionnaire, two of the conservation actions in the CA Matrix (‘increasing resources for
wildlife’ and ‘nest site provision/management’) were merged as it was not possible to
distinguish data relating to these items individually. As such, the version of the CA Matrix used
for this component has 57 Conservation Items including 30 actions and 27 outcomes.
3.4.2.2 Data preparation Approximately one-third of the 755 pages of text excerpts were manually transcribed from
scanned documents. This included several EA Questionnaires that had been completed by hand
and scanned into the EA database.
3.4.3 Site evaluations (Step 3) This approach used a combination of data-driven and theory-driven coding: deductive coding
was used to code text to each of the Conservation Items in the CA Matrix (as stated in the
previous section), and inductive coding was used to explore emergent themes within each
Conservation Item such as the extent of these activities, the mechanisms and innovations
utilised, and the challenges faced. Similar to the example of pragmatic research provided by
Feilzer (2009), this dataset was then reduced to binary presence/absence data for each
Conservation Item for each site, based on whether there was enough evidence to determine if a
site had undertaken an action or achieved an outcome. These data were then used for
quantitative pattern analyses, as described in the next step.
Due to the size of the dataset, multiple coders assessed random sections of the data to validate
the coding process and identify inconsistencies, producing an overall inter-coder agreement rate
of 92%.
88

Chapter 3: Methodology
3.4.4 Frequencies and trends (Step 4)
3.4.4.1 Patterns among sites Indices
Data across individual conservation actions and outcomes were amalgamated to construct
numerical indices for the biophysical landscape, fauna, community, and organisational/political
categories. Indices were not required for the visitor category as it had only one action and two
outcomes. Indices were calculated in two levels of aggregation. Firstly, individual biophysical,
fauna, community, and political indices were calculated for each site by determining the
proportion of actions and outcomes each site achieved in each category, so that each site index
ranged from 0 to 1. Although different actions and outcomes may be of higher priority in
different areas based on area-specific conservation goals, this analysis covered an entire
continent and therefore did not apply any weighting to individual Conservation Items. ANOVAs
were used to examine patterns between these indices and the five site characteristics. Secondly,
a higher-level biophysical index, fauna index, community index and political index were
calculated across all sites using the same approach as the individual site indices.
Ecological Conservation Items
The ecological Conservation Items were individually tested for relationships across the five site
characteristics. Chi-squares were run on each of the 13 ecological actions and outcomes that
were undertaken by at least 10% of sites, but by no more than 90% of sites, to reduce the
number of cells with zeros. Fisher’s Exact Test was used whenever cells had less than 5 cases.
A Bonferroni correction was applied to reduce the probability of a type 1 error across the 65
tests (13 Conservation Items x 5 characteristics) (Armstrong, 2014). However, the categories
and Conservation Items may also be deemed independent, and therefore the use of such a large
Bonferroni correction may increase the probability of a type 2 error (Armstrong, 2014). To
account for both arguments, three levels of Bonferroni adjustments were applied:
(1) α = 0.0007 (i.e. 0.05/65) (2) α = 0.003 (i.e. 0.05/13) (3) α = 0.01 (i.e. 0.05/5)
Finally, it is acknowledged that the use of Bonferroni corrections may be controversial (Moran,
2003), and p-values are therefore also shown for relationships significant at α = 0.05 i.e. without
any adjustment.
89

Chapter 3: Methodology
Socio-political Conservation Items
Following the same process, the socio-political Conservation Items were also independently
tested for patterns in relation to the five enterprise characteristics. Chi-squares were run on each
of the six socio-political actions and outcomes that were undertaken by at least 10% of sites, but
by no more than 90% of sites. Again, three levels of Bonferroni corrections were applied to
account for the six Conservation Items, five site characteristics, and 30 individual chi-squares:
(1) α = 0.001 (i.e. 0.05/30) (2) α = 0.008 (i.e. 0.05/6) (3) α = 0.01 (i.e. 0.05/5)
As with the ecological items, p-values are also shown for relationships significant at α = 0.05
i.e. without any adjustment.
3.4.4.2 Patterns among Conservation Items Jaccard indices were used to examine patterns between the Conservation Items by making
pairwise comparisons (Gardener, 2014p. 367). This approach used positive-positive (a),
positive-negative (b) and negative-positive (c) matches while excluding negative-negative
matches, [Js = a/(a+b+c)], to determine the likelihood of sites reporting each Conservation Item
based on their reporting of another item. Ecological and socio-political Conservation Items were
tested separately, as were actions and outcomes. MDS were run in Primer to visually examine
the similarity matrices using both factors and clusters. Three levels of clustering were used:
25%, 50% and 75%. In addition to using categories and meta-categories, factors were also
allocated for three levels of ‘effort’ based on a combination of the cost, required expertise and
necessary equipment for each ecological action: low, moderate and high. This refers to the
minimal effort required for sites to report that they undertake the action.
In addition to pair-wise similarities, the biophysical, fauna, community and organisational
actions were also tested as four groups for significant associations with site characteristics using
chi-squares.
3.4.5 Conservation significance screening process (Step 5) As part of the CE Framework, a conservation significance screening process (described in
Section 4.3.5) was used to determine the relative importance of the conservation activities of the
86 sites within the Australian conservation context. This involved checking the site activities
and all native and non-native species (including colloquial names) mentioned by any site against
the directives and regulations in Table 3.4.
90

Chapter 3: Methodology
Table 3.4 Policies, directives and regulations utilised in the conservation significance screening process for site evaluations
Item Details
National Conservation Agenda (NCA)
Eight key national conservation policies described in Section 2.6.2.2 and Section 3.2.3.2.
National Conservation Threats (NCTs)
Key Threatening Processes, Threat Abatement Plans, and Weeds of National Significance described in Section 3.2.3.3 (checked in March 2019).
State of the Environment Reports
National reports commissioned by the Australian Government every five years under the EPBC Act 1999 and compiled by a panel of experts to produce several hundred pages of comprehensive material. The most recent report, the 2016 State of the Environment Report, was released in 2017.
Additional EPBC Act 1999 directives
Threatened species lists (including fauna, flora and ecological communities), National Recovery Plans, Register of Critical Habitat, and Migratory Species Lists under the EPBC Act 1999 (checked in October 2018).
IUCN Red List Global database of threatened species (checked in October 2018).
Threatened species lists under state and territory legislation
Queensland Nature Conservation Act 1992; Nature Conservation (Wildlife) Regulation 2006; New South Wales Biodiversity Conservation Act 2016; Victorian Flora and Fauna Guarantee Act 1988; South Australian National Parks and Wildlife Act 1972; Western Australian Wildlife Conservation Act 1950; Tasmanian Threatened Species Protection Act 1995; Territory Parks and Wildlife Conservation Act; and Australian Capital Territory Nature Conservation Act 2014
(checked in October 2018).
Additionally, all conservation agreements mentioned by sites were checked against relevant
local, state and national programs to verify the information provided by sites and to identify the
relevant program when incorrect or outdated terms were provided (Table 3.5).
91

Chapter 3: Methodology
Table 3.5 Covenanting programs in Australian jurisdictions and primary legislation (modified from Fitzsimons (2015)).
Jurisdiction Program Legislation
Australian Government
Conservation Agreements Environment Protection and Biodiversity Conservation Act 1999
Western Australia
National Trust of Australia (WA) Covenanting Program
National Trust of Australia (WA) Act 1964 and Transfer of Land Act 1893
Nature Conservation Covenant Program
Conservation and Land Management Act 1984 and Transfer of Land Act 1893
Soil and Land Conservation Covenants Soil and Land Conservation Act 1945
South Australia
South Australian Heritage Agreement Program
Native Vegetation Act 1991
Victoria Trust for Nature (Victoria) Conservation Covenants
Victorian Conservation Trust Act 1972
Land Management Co-operative Agreements
Conservation, Forests and Lands Act 1987
Tasmania Private Property Conservation Program
Nature Conservation Act 2002 and Land Titles Act 1980
New South Wales
Voluntary Conservation Agreements Program
National Parks and Wildlife Act 1974
Wildlife Refuges National Parks and Wildlife Act 1974
Nature Conservation Trust covenants Nature Conservation Trust Act 2001
NSW Registered Property Agreements Program
Native Vegetation Act 2003
Queensland Queensland Nature Refuge Program Nature Conservation Act 1992 and Nature Conservation (Protected Areas) Regulations 1994
Voluntary Conservation Agreement Programs operated by south-east Queensland councils including Gold Coast, Sunshine Coast, Moreton Bay, Brisbane and Logan Local Governments
Queensland Land Title Act 1994
Northern Territory
Voluntary Conservation Covenant Program
Parks and Wildlife Commission Act 2004 and Land Title Act 2007
92

Chapter 3: Methodology
Research Component 3
3.5 Conservation gaps and overlaps of eco-certification, operator practices
and national conservation priorities in Australia
Research Component 3 addresses the fifth and final research objective, the results of which are
presented in Chapter 6:
Research
Objective 5
Document and explore the overlaps and gaps between the EA
certification criteria, conservation practices of ecotourism enterprises,
and the national conservation policy landscape in Australia.
This research component includes three sub-components: (a) an evaluation of the conservation
coverage of the EA Questionnaire in Section 3.5.1; (b) a review of the key conservation themes
and tourism gaps in the NCA in Section 3.5.2; and (c) a gap analysis in Section 3.5.3 utilising
sub-component a, sub-component b, and the site conservation practices presented in Chapter 5.
3.5.1 Eco-certification: conservation coverage and gaps Results from this research sub-component are provided in Section 6.2.
3.5.1.1 Data collection The Conservation Items from the CA Matrix (presented in Chapter 4) were used to guide an
evaluation of the conservation coverage of the EA Questionnaire (described in Section 3.2.3.4).
However, the same version of the CA Matrix with 57 Conservation Items described in Section
3.4.2.1 for Research Component 2 was used in this research component.
93

Chapter 3: Methodology
The same 157 check-list questions from the EA Questionnaire described in Section 3.4.2 for
Research Component 2 were also utilised in this research component. However, EA updated
and streamlined the EA Questionnaire in 2015: their Nature Tourism Certification, Ecotourism
Certification, Advanced Ecotourism Certification, ROC Certification, and Climate Action
Business Certification applications were consolidated into a single application, reducing the EA
Questionnaire from 805 questions and 260 pages to 325 questions and 60 pages. This reduction
stems primarily from two changes: (1) many instances in which multiple questions were merged
into single check-box items asking if a specified number of the activities in the list were carried
out; and (2) removing the 17 provisional Environmental Management sections (described in
Section 3.2.3.4) and instead providing the relevant sections to applicants at a later stage of the
application process if needed.
Although data were obtained from multiple sources, the original certification application of each
site was a key source of information. As all but one of the 86 sites were certified prior to this
change, the site evaluations presented in Chapter 5 are predominantly based on the pre-2015
version of the EA Questionnaire. Both versions are therefore examined in this analysis.
3.5.1.2 Data analysis The 157 questions in the EA Questionnaire were allocated to the 57 Conservation Items of the
CA Matrix through deductive coding, with some questions allocated to multiple items. For
example, an EA Question about the reestablishment of native vegetation following weed
removal is relevant for the Conservation Item ‘revegetation activities’ as well as the item
‘activities to remove non-native flora’. Following this, each of the Conservation Items were
assigned a categorical coverage level based on the extent to which the item was addressed in the
EA Questionnaire: extensive, moderate, minimal or no coverage. A subjective measure of
‘coverage’ was used rather than the number of EA Questions allocated to each Conservation
Item as the number of questions was found to be a poor indication of coverage. For example, the
Conservation Item ‘revegetation’ was addressed by 12 repetitive EA Questions and the item
‘effort to reduce illegal activities’ was addressed by just 2 EA Questions, but both were
assigned a moderate coverage level. Therefore, a coding guide (Table 3.6) and a second coder
were used to enhance reliability, with an overall inter-coder agreement rate of 97%. Correlations
were then used to examine the relationships between (1) the level of coverage; and (2) the
proportion of eco-certified sites undertaking these Conservation Items in practice, as presented
in Chapter 5.
94

Chapter 3: Methodology
Table 3.6 Explanation of coverage levels used to inform the coding of Conservation Items within the EA Questionnaire
Category Explanation
None No EA Questions address the Conservation Item.
Minimal At least one EA Question addresses the Conservation Item; however, it is difficult to determine if the Conservation Item was actually carried out because the EA Question is vague. For example, several EA Questions include a list of activities with only a single check-box asking if the applicant engages in “any of the following”.
Moderate It is clear from the EA Questions that the Conservation Item has been carried out; however, no further details can be determined.
Extensive It is clear from the EA Questions that the Conservation Item has been carried out, and it is also possible to determine some additional details about the activities.
3.5.2 National Conservation Agenda: conservation and ecotourism gaps The eight policies of the NCA were examined to identify (1) tourism coverage and gaps within
the NCA, and (2) key themes that highlight gaps in conservation management across Australia.
Results from these research sub-components are provided in Section 6.3.
As stated earlier in this chapter, the NCA (described in Section 3.2.3.2) was used
simultaneously for multiple research components in this thesis which involved many iterations
of reading, coding, skimming, searching for key terms, and re-checking quotes and themes. As
such, this research sub-component followed the document analysis approach described by
Bowen (2009) as iterations of superficial examination, thorough examination, and interpretation
that incorporate aspects of thematic analysis.
3.5.2.1 National Conservation Agenda: tourism coverage and gaps Data collection
Each policy was read in full and text excerpts that mentioned tourism or related terms were
extracted, noting if the excerpts came from the TOPs23 or the general policy content. To ensure
no relevant text was missed, keyword searches were also performed using tourism related terms
and activities (Table 3.7).
23 TOPs refers to the Targets, Objectives and Priorities of the policies. See Section 3.2.3.2 for details.
95

Chapter 3: Methodology
Table 3.7 Search terms used to check for tourism related content in the NCA policies
Base of
search term1
Examples of plurals, stemming terms,
and variations captured
Tour Tourism, tourists, tours, etc.
Visit Visitation, visitors, visits, etc.
Travel Travellers, travelling, travels, etc.
Recreation Recreational, recreationist, etc.
Walk Bushwalk/walker, bush-walk/walker, etc.
Hik Hiking, hiker, etc.
Rid Horse riding, riders, etc.
Cycl Cycling, cyclist, bicycle, etc.
Watch Wildlife watching, bird watcher, etc.
Camp Camping, camper, campers, etc. 1Where appropriate, only the beginnings of some words were used to account for stemming variations i.e. ‘hike’ would not capture variations of stemming terms that don’t include the letter ‘e’ such as hiking.
Data analysis
Text excerpts were coded using thematic analysis to identify key themes relating to the use of
tourism in the NCA. Coverage levels ranging from ‘none’ to ‘extensive’ were then assigned to
each of the eight policies of the NCA for each of the three themes identified.
Due to the subjective nature of this process, a coding guide using one of the three themes as an
example (‘tourism as a driver of conservation goals’) was created to enhance reliability (Table
3.8). This theme refers to policy content that highlights the importance of a healthy natural
environment for tourism, noting that these excerpts originate from a conservation context.
Additionally, a second coder was used with an overall inter-coder agreement rate of 95%.
Results from this research sub-component are provided in Section 6.3.1.
96

Chapter 3: Methodology
Table 3.8 Coding guide for the coverage levels of tourism related themes in the NCA using the theme of ‘tourism as a driver of conservation goals’ as an example
Coverage Example NCA policy and relevant excerpts
Level Explanation
None Tourism is not mentioned
-
Minimal coverage
Tourism is mentioned once or twice in a way that can be loosely connected to the theme, but with no context or emphasis
All relevant Vegetation Strategy excerpts • “Agriculture, forestry and fisheries and tourism rely on
productive and healthy native vegetation ecosystems and continue to provide great value to Australia’s economy and national development.”
• “Economically, native vegetation and its direct soil and water functions support the productive capacity of many important sectors of the Australian economy — agriculture, forestry, fisheries and aquaculture and tourism.”
• “… as well as the already established economic benefits of native vegetation already achieved in agriculture, forestry and tourism.”
Moderate coverage
Tourism is explicitly mentioned with regards to the theme
All relevant ABC Strategy excerpts • “We get artistic and spiritual inspiration from biodiversity, the
sheer enjoyment of camping in the bush, snorkelling on the Great Barrier Reef and walking in our magnificent national parks.”
• “Natural environments also enrich our culture, sport and recreation, as well as our artistic and spiritual lives.”
• “Cultural services: spiritual and religious values; knowledge system; education and inspiration; recreation and aesthetic values; and sense of place”
• “…we may lose the biodiversity that underpins much of our economic wealth—including from agriculture, forestry and tourism—and our national identity.”
Extensive coverage
Several mentions of tourism with a clear emphasis on the theme accompanied by data
Some relevant Nature Strategy excerpts • “Industries like agriculture, fisheries, forestry, tourism and
manufacturing all depend on healthy nature and natural landscapes. These are relatively simple to value, for example, in 2015–16, agriculture contributed $56 billion to the national economy and tourism contributed $52.9 billion.”
• “For tourism, in the year ending June 2017, 69 per cent (or 5.4 million) of international visitors engaged in some form of nature-based activity. The grandeur of Australia’s land and sea, our wildlife and clean, green cities, food, water and air attract visitors from around the world and are a major contributor to the economy.”
97

Chapter 3: Methodology
3.5.2.2 National Conservation Agenda: key themes and conservation gaps Key themes and focus areas were identified across the NCA to indicate conservation
management gaps within Australia under the premise that high priority areas in need of
attention (i.e. ‘gaps’) will be a key focus of these policies and, conversely, areas that do not
need to be addressed (and therefore are not gaps) will not be covered in much detail or at all. As
such, this step uses the NCA to identify gaps in conservation management, rather than
identifying conservation gaps within the NCA. Additionally, the NCTs described in Section
3.2.3.3 were incorporated as key management priorities under national legislation.
An earlier version of the CA Matrix was used to guide this analysis; however, due to the
reflexive and recursive nature of the thesis project, the analysis from this research component
was also used to build and revise the CA Matrix. Therefore, this step involved using the
Conservation Items in the CA Matrix as themes for deductive coding, while at the same time
remaining objective and allowing new themes to emerge from the NCA through an inductive
process (Bowen, 2009). Furthermore, as new Conservation Items were added to the CA Matrix,
previously analysed policies were necessarily examined again for these additional items. As
such, this approach used an inductive-deductive “hybrid coding method [that was] customized
to suit the unique needs and disciplinary concerns of [the] study” (Saldana, 2013, p. 65).
Each theme was assigned a categorical ‘importance’ level of low, moderate or high. As the
focus of this stage was on the importance of the identified themes across the NCA more broadly
rather than within the individual NCA policies, only one level of importance was assigned to
each theme across the NCA/NCT combination, rather than assigning levels to individual
policies. However, the number of policies covering each theme was also a contributing factor in
determining its overall importance, and this information was therefore recorded along with the
location of the relevant text (i.e. the TOPs or the general policy content24).
Broad guidelines were used to reduce the subjectivity of this process (Table 3.9); however, the
context of the themes within the NCA was paramount. As such, the results of this approach
include a two-page synthesis of three overarching concepts of the NCA to provide the
underlying context for the ‘importance levels’ of the themes (presented in Section 6.3.3).
24 TOPs refers to the Targets, Objectives and Priorities of the NCA policies (details in Section 3.2.3.2).
98

Chapter 3: Methodology
Table 3.9 Explanation of the level of importance assigned to themes within the NCA and NCTs
Level Explanation
Low (L) Covered by only a few policies in their general content.
Moderate (M) Covered by (1) most of the policies, or (2) in the TOPs of a smaller number of policies.
High (H) (1) Covered in the TOPs of more than half of the policies (four or more); (2) covered in the TOPs of three policies and in the general content of the remaining five policies; or (3) targeted by an individual NCA or NCT1.
1Such as the Vegetation Strategy for revegetation activities.
Some of the themes used in this sub-component are a combination of similar Conservation
Items from the CA Matrix, including actions and outcomes that focus on the same theme. This
is because the CA Matrix was used in this stage as a guide rather than the prescriptive approach
taken in Research Component 225 and the first stage of this research component26. For example,
the action ‘activities to remove non-native flora’ and the outcome ‘reduction in extent of non-
native flora’ both focus on the same theme and it is not necessary to separate these for the
purpose of this research sub-component.
In preparation for the final sub-component, the Conservation Items that are incorporated within
each of the themes are provided in Table 3.10 for ecological items and Table 3.11 for socio-
political items. These Conservation Items are from the earlier version of the CA Matrix utilised
in the aforementioned prescriptive approaches25,26.
To ensure no relevant text was overlooked, keyword searches were performed using terms
related to each of the Conservation Items, which are also included in the following tables.
Where appropriate, only the beginnings of some words were used to account for plurals,
stemming terms, and variations.
25 Site evaluation described in Section 3.4 and presented in Chapter 5. 26 Conservation coverage and gaps of the EA Questionnaire described in Section 3.5.1 and presented in Section 6.2.
99
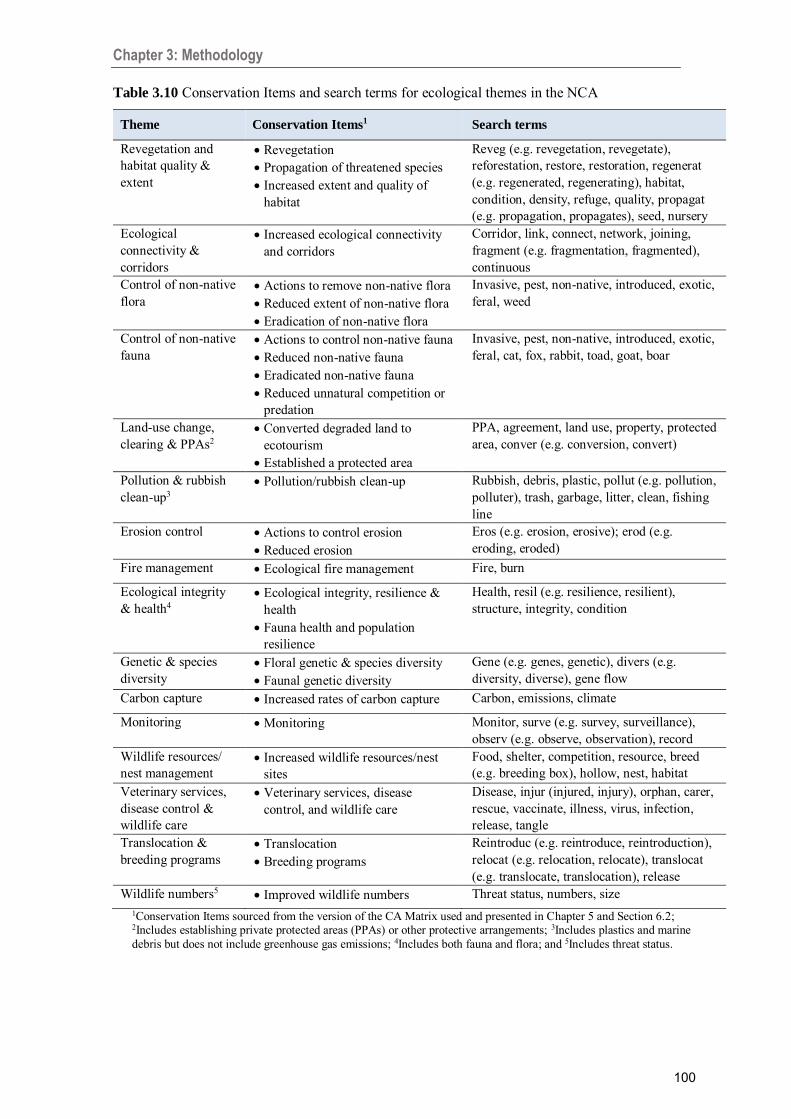
Chapter 3: Methodology
Table 3.10 Conservation Items and search terms for ecological themes in the NCA
Theme Conservation Items1 Search terms
Revegetation and habitat quality & extent
• Revegetation • Propagation of threatened species • Increased extent and quality of
habitat
Reveg (e.g. revegetation, revegetate), reforestation, restore, restoration, regenerat (e.g. regenerated, regenerating), habitat, condition, density, refuge, quality, propagat (e.g. propagation, propagates), seed, nursery
Ecological connectivity & corridors
• Increased ecological connectivity and corridors
Corridor, link, connect, network, joining, fragment (e.g. fragmentation, fragmented), continuous
Control of non-native flora
• Actions to remove non-native flora • Reduced extent of non-native flora • Eradication of non-native flora
Invasive, pest, non-native, introduced, exotic, feral, weed
Control of non-native fauna
• Actions to control non-native fauna • Reduced non-native fauna • Eradicated non-native fauna • Reduced unnatural competition or
predation
Invasive, pest, non-native, introduced, exotic, feral, cat, fox, rabbit, toad, goat, boar
Land-use change, clearing & PPAs2
• Converted degraded land to ecotourism
• Established a protected area
PPA, agreement, land use, property, protected area, conver (e.g. conversion, convert)
Pollution & rubbish clean-up3
• Pollution/rubbish clean-up Rubbish, debris, plastic, pollut (e.g. pollution, polluter), trash, garbage, litter, clean, fishing line
Erosion control • Actions to control erosion • Reduced erosion
Eros (e.g. erosion, erosive); erod (e.g. eroding, eroded)
Fire management • Ecological fire management Fire, burn
Ecological integrity & health4
• Ecological integrity, resilience & health
• Fauna health and population resilience
Health, resil (e.g. resilience, resilient), structure, integrity, condition
Genetic & species diversity
• Floral genetic & species diversity • Faunal genetic diversity
Gene (e.g. genes, genetic), divers (e.g. diversity, diverse), gene flow
Carbon capture • Increased rates of carbon capture Carbon, emissions, climate
Monitoring • Monitoring Monitor, surve (e.g. survey, surveillance), observ (e.g. observe, observation), record
Wildlife resources/ nest management
• Increased wildlife resources/nest sites
Food, shelter, competition, resource, breed (e.g. breeding box), hollow, nest, habitat
Veterinary services, disease control & wildlife care
• Veterinary services, disease control, and wildlife care
Disease, injur (injured, injury), orphan, carer, rescue, vaccinate, illness, virus, infection, release, tangle
Translocation & breeding programs
• Translocation • Breeding programs
Reintroduc (e.g. reintroduce, reintroduction), relocat (e.g. relocation, relocate), translocat (e.g. translocate, translocation), release
Wildlife numbers5 • Improved wildlife numbers Threat status, numbers, size 1Conservation Items sourced from the version of the CA Matrix used and presented in Chapter 5 and Section 6.2; 2Includes establishing private protected areas (PPAs) or other protective arrangements; 3Includes plastics and marine debris but does not include greenhouse gas emissions; 4Includes both fauna and flora; and 5Includes threat status.
100

Chapter 3: Methodology
Table 3.11 Conservation Items and search terms for socio-political themes in the NCA
Conservation theme Conservation Items1 Search terms
Conservation awareness, capacity and agency2
• Environmental interpretation and inspiration for (1) visitors, (2) staff, and (3) local community members
• Increased environmental awareness and knowledge for (1) visitors, (2) staff, and (3) local community members
Awareness, understanding, ethic, knowledge, value, appreciation, inspir (e.g. inspiration, inspire), capacity, agency, capabilit (e.g. capabilities, capability), access
Incentives/deterrents3 • Economic development & stimulation • Employment • Community contributions • Professional training & capacity building • Actions to reduce illegal activities • Actions to reduce human-wildlife conflict
Market, business, economic, financial, job, employ, career, occupation, incentiv (e.g. incentive, incentivise), deter, tax, concession, restrict, prohibit, enforce, compl (e.g. comply, compliance), illicit, legal
Conservation behaviours4
• Increased pro-environmental behaviours of (1) visitors and (2) locals
• Improved natural resource management • Reduced (1) consumptive practices, (2)
illegal activities, and (3) human-wildlife conflict
Engage, participate, involve, responsibility, partner
Conservation support5 • Support for conservation projects Donat (e.g. donation, donate), volunteer
Environmentally friendly purchasing
• Environmentally friendly purchasing Purchase, garden, consume, shop, customer, buy, biodegrad (e.g. biodegrade, biodegradable)
Research and knowledge
• Research • Increased knowledge base
• Monitoring
Research, knowledge, data, report, assess, evaluate, measure, data
Conservation technologies
• Investment in conservation related technologies
Tech (e.g. technology), innovat (e.g. innovation, innovate)
Governance and environment regulations6
• Lobbying and advocacy • Improved environmental legislation,
regulations and policies
• Recognition of environment, land and community rights
Advoca (e.g. advocacy, advocate), activism, lobby, political, politician, legislation, governance, policy, regulation, native title, Indigenous land, ownership
Support to protected area agencies7
• Support to protected area agencies Agenc (e.g. agency, agencies), manage (e.g. manager, management), facilities, support, collaborate
1Conservation Items sourced from the version of the CA Matrix used and presented in Chapter 5 and Section 6.2. 2Includes environmental values, conservation ethic, and the knowledge and support necessary to act; 3Conservation incentives include carbon markets, tax concessions, etc. (covered briefly in Section 2.6.4); 4Includes pro-environmental behaviours and engagement with conservation activities; 5Support/donations to conservation organisations and projects; 6Includes decision-making and priorities, environmental legislation and policy, and the recognition of environmental rights and community rights; and 7Support to protected area agencies and governments, and includes private-public partnerships and information-sharing.
101

Chapter 3: Methodology
3.5.3 Policy, practice, and eco-certification: overlaps and gaps The final stage of this research component synthesised and compared findings from the previous
two sub-components and Research Component 2 to identify key gaps, overlaps and implications
for the ecotourism-conservation relationship in Australia. Results from this research sub-
component are provided in Section 6.4.
3.5.3.1 Data collection This research sub-component used three groups of data sourced from previous thesis findings as
detailed in Table 3.12.
Table 3.12 The three groups and data sources utilised in this research sub-component
Group Data source Details of
approach
Presentation of
findings
Site prevalence Frequencies of ecotourism sites undertaking Conservation Items
Section 3.4 Tables 5.1 and 5.2 in Chapter 5
EA Questionnaire coverage
Coverage levels of Conservation Items in the post-2015 EA Questionnaire
Section 3.5.1 Last column of Tables 6.2 and 6.3 in Chapter 6
NCA importance Importance levels of conservation themes in the NCA
Section 3.5.2.2 ‘NCA & NCTs’ column in Tables 6.5 and 6.6 in Chapter 6
3.5.3.2 Data transformation Data obtained from the above sources were first converted to star ratings (Table 3.13) to allow
comparisons between the groups (detailed further in Section 3.5.3.3).
Table 3.13 Substitutions and cut-offs for converting group categories to star ratings
Rating Site prevalence EA Questionnaire
coverage NCA importance
× No sites No coverage No coverage
* Low (<33% of sites i.e. lower third)
Minimal Low
** Moderate (33-66% of sites i.e. middle third)
Moderate Moderate
*** High (>66% of sites i.e. top third)
Extensive High
102

Chapter 3: Methodology
As detailed in Section 3.5.2.2, some of the conservation themes of the NCA incorporate
multiple Conservation Items. For these themes, it was therefore necessary to first obtain
individual site prevalence and EA Questionnaire coverage ‘scores’ across the multiple
Conservation Items before converting these to a single star rating for the theme. This was
achieved by merging, averaging or otherwise modifying the values for the Conservation Items
in these themes.
Using the site prevalence star rating for the theme ‘control of non-native flora’ as an example:
this theme incorporates the action ‘removal of non-native flora’ (100% site frequency) and the
outcomes ‘reduced extent of non-native flora’ (13% site frequency) and ‘eradicated non-native
flora’ (7% site frequency). These two outcomes are not dependent on each other, nor are they
mutually exclusive. Therefore, site responses for the two outcomes were merged to create a new
outcome of ‘reduced and/or eradicated non-native flora’ with a site frequency of 14%. The
‘two’ items now in this theme (i.e. the one action and the one merged outcome) were then
averaged to provide a single site prevalence score of 57%. This theme was therefore given a
two-star rating for site prevalence in line with the cut-off in row two of Table 3.13 (above).
The calculations for themes with multiple Conservation Items are provided in Table 3.14 for the
ecological items and in Table 3.15 for the socio-political items.
In addition to the site prevalence ratings, a potential site prevalence rating was also calculated
for some themes that included multiple Conservation Items with large disparities in their site
frequencies due to the certification reporting requirements, which skewed the overall rating
assigned to the theme. Using the same ‘control of non-native flora’ theme as an example: 100%
of sites reported removing non-native flora, but only a small number reported reducing or
eradicating weeds as this information is not asked for in the EA Questionnaire. As such, the
moderate overall prevalence rating for this theme (i.e. 57%) does not accurately reflect the large
number of sites engaging with this conservation activity (i.e. 100%). Therefore, a three-star
potential site prevalence rating (using only the 100% frequency value for this action) was also
assigned to this theme.
Calculation details for these potential site prevalence ratings are also included in Table 3.14 and
Table 3.15.
103

Chapter 3: Methodology
Table 3.14 Details of calculations for site prevalence, potential site prevalence, and EA Questionnaire coverage to facilitate comparisons across themes
Conservation
theme Conservation Items
1 Calculating scores for site and
EA Questionnaire ratings
Revegetation and habitat quality & extent
a) Revegetation b) Propagation of threatened species c) Increased extent and quality of
habitat
Score was averaged across revegetation (a) and extent and quality of habitat (b), but excludes propagation (c).
The potential site prevalence score used the value for revegetation (a) only.
Control of non-native flora
a) Actions to remove non-native flora b) Reduced extent of non-native flora c) Eradication of non-native flora
A single outcomes value (‘d’) was created by merging site responses for (b) and (c). The score for the theme was then averaged across the values of the ‘two’ items (a) and (d).
The potential site prevalence score used the value for actions to remove non-native flora (a) only.
Control of non-native fauna
a) Actions to control non-native fauna b) Reduced non-native fauna c) Eradicated non-native fauna d) Reduced unnatural competition or
predation
A single outcomes value (‘e’) was created by merging site responses for (b), (c) and (d). The score for the theme was then averaged across the values of the ‘two’ items (a) and (e).
The potential site prevalence score used the value for actions to remove non-native fauna (a) only.
Land-use change, clearing & PPAs
a) Converted degraded land to ecotourism
b) Established a protected area
Score was averaged across (a) and (b).
Erosion a) Actions to control erosion b) Reduced erosion
Score was averaged across (a) and (b).
The potential site prevalence score used the value for actions to control erosion (a) only.
Ecological integrity & health
a) Ecological integrity, resilience & health
b) Fauna health and population resilience
Score was averaged across (a) and (b).
Genetic & species diversity
a) Floral genetic & species diversity b) Faunal genetic diversity
Score was averaged across (a) and (b).
Translocation & breeding programs
a) Translocation b) Breeding programs
Score was averaged across (a) and (b).
1Conservation Items sourced from the CA Matrix version used and presented in Chapter 5 and Section 6.2.
104

Chapter 3: Methodology
Table 3.15 Details of calculations for site prevalence, potential site prevalence, and EA Questionnaire coverage to facilitate comparisons across themes
Conservation
theme Conservation Items
1 Calculating scores for site and
EA Questionnaire ratings
Conservation awareness, capacity and agency
• Environmental interpretation and inspiration for (a) visitors, (b) staff, and (c) local community members
• Increased environmental awareness and knowledge for (d) visitors, (e) staff, and (f) local community members
A single outcomes value (‘g’) was created by merging site responses for the three outcomes (d), (e) and (f). The score was then averaged across the ‘four’ items (a), (b), (c) and (g).
The potential site prevalence score was averaged across the three environmental interpretation items (a), (b) and (c) only.
Incentives/deterrents a) Economic development & stimulation b) Employment c) Community contributions d) Professional training & capacity
building e) Actions to reduce illegal activities f) Actions to reduce human-wildlife
conflict
Score was calculated by merging site responses across all items (a), (b), (c), (d), (e) and (f).
Conservation behaviours
• Increased pro-environmental behaviours of (a) visitors and (b) locals
• Improved natural resource management (c)
• Reduced (d) consumptive practices, (e) illegal activities, and (f) human-wildlife conflict
Score was calculated by merging site responses across all items (a), (b), (c), (d), (e) and (f).
Research and knowledge
a) Research b) Increased knowledge base c) Monitoring
Score was averaged across the three items (a), (b) and (c).
The potential site prevalence score was averaged across research (a) and monitoring (c).
Governance and environment regulations
a) Lobbying and advocacy
b) Improved environmental legislation, regulations and policies
c) Recognition of environment, land and community rights
Score was averaged across the three items (a), (b) and (c).
1Conservation Items sourced from the CA Matrix version used and presented in Chapter 5 and Section 6.2.
105

Chapter 3: Methodology
3.5.3.3 Data analysis Themes with lower star ratings for site prevalence or EA Questionnaire coverage indicate a
conservation gap. Conversely, themes with higher ratings indicate conservation areas that are
commonly addressed by sites or are adequately covered in the EA Questionnaire. This
information was therefore combined with the NCA importance ratings to identify:
(1) Priority conservation gaps for sites and/or EA to improve upon within the
Australian context
NCA rating × size of gap (where the size of the gap is equal to [3 – site
prevalence rating] and [3 – EA Questionnaire
rating])
(2) Key conservation ‘overlaps’ i.e. areas in which the practices of sites and/or EA can
contribute to national conservation goals and therefore present opportunities for
strategic investments and partnerships
NCA rating × site rating
NCA rating × EA Questionnaire rating
The above calculations result in a site and EA Questionnaire ‘gap score’ and ‘overlap score’ of
1 to 9 for each theme which were then converted into four rankings of importance (Table 3.16).
A score of 6 falls into the high category for a gap score and the moderate category for an
overlap score. This is a precautionary measure to minimise the risk of over-emphasising the
policy implications of this research due to the number of times the data have been condensed.
Table 3.16 Symbol and level of importance assigned to gap and overlap scores
Ranking Symbol Gap score Overlap score
High importance 6, 7, 8, 9 7, 8, 9
Moderate importance 3, 4, 5 4, 5, 6
Low importance 1, 2 1, 2, 3
No importance ⁄ 0 0
106

107
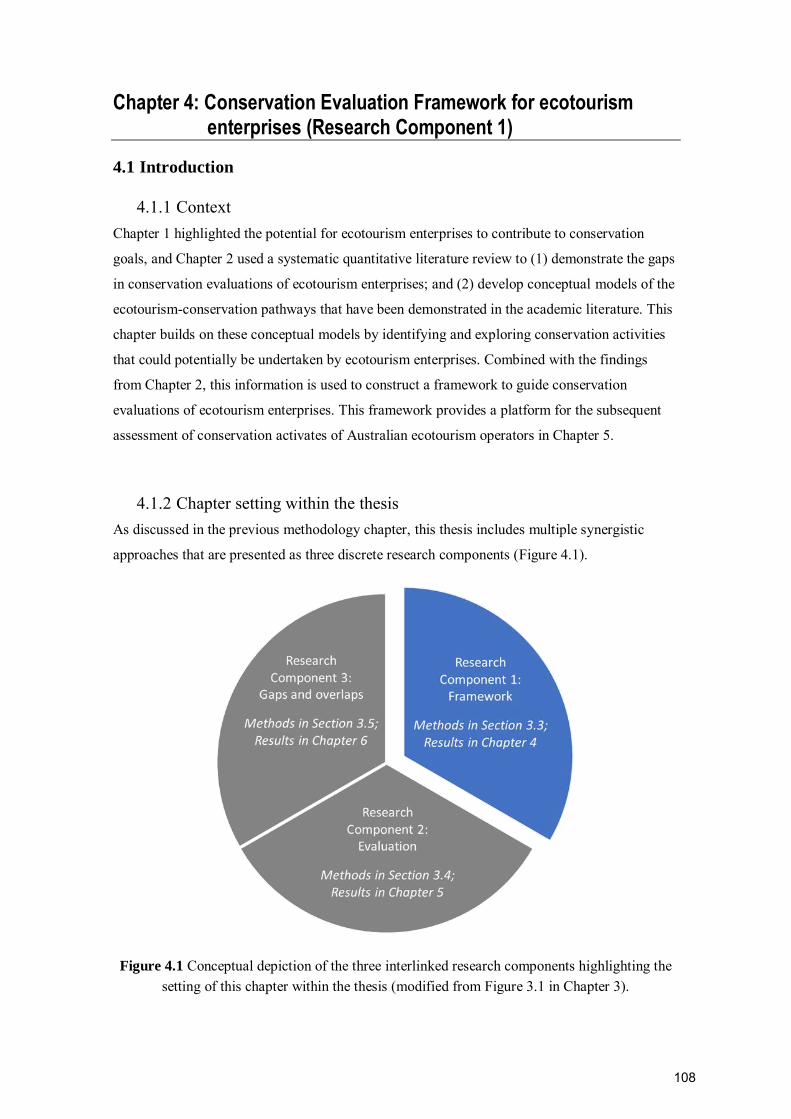
Chapter 4: Conservation Evaluation Framework for ecotourism enterprises (Research Component 1)
4.1 Introduction
4.1.1 Context Chapter 1 highlighted the potential for ecotourism enterprises to contribute to conservation
goals, and Chapter 2 used a systematic quantitative literature review to (1) demonstrate the gaps
in conservation evaluations of ecotourism enterprises; and (2) develop conceptual models of the
ecotourism-conservation pathways that have been demonstrated in the academic literature. This
chapter builds on these conceptual models by identifying and exploring conservation activities
that could potentially be undertaken by ecotourism enterprises. Combined with the findings
from Chapter 2, this information is used to construct a framework to guide conservation
evaluations of ecotourism enterprises. This framework provides a platform for the subsequent
assessment of conservation activates of Australian ecotourism operators in Chapter 5.
4.1.2 Chapter setting within the thesis As discussed in the previous methodology chapter, this thesis includes multiple synergistic
approaches that are presented as three discrete research components (Figure 4.1).
Figure 4.1 Conceptual depiction of the three interlinked research components highlighting the setting of this chapter within the thesis (modified from Figure 3.1 in Chapter 3).
108

Chapter 4: Conservation Evaluation Framework (Research Component 1)
This chapter provides the results of Research Component 1, which used a mixed methods
approach (outlined in Section 3.3) to develop a Conservation Activities Matrix (‘CA Matrix’)
and Conservation Evaluation Framework (‘CE Framework’) to address Research Objective 2:
Identify the potential conservation activities that ecotourism enterprises may undertake
and construct an evaluation framework based on an exploration of the actions,
outcomes and relationships of these conservation activities.
4.1.3 Chapter structure As the foundation of the CE Framework, this chapter first explains the structure and
composition of the CA Matrix in Section 4.2, followed by a detailed exploration of the
individual matrix items and their relationships within the five categories (Sections 4.2.1-4.2.5).
Next, Section 4.3 describes the CE Framework, and a brief demonstration of the framework
application is provided in Section 4.4.
The CE Framework is also used in Research Component 2 and the findings of this are presented
in Chapter 5. As such, Section 4.3 also includes references to relevant sections of Chapter 5 to
illustrate steps within the framework.
4.2 Conservation Activities Matrix
A comprehensive list of 53 Conservation Items were identified that could potentially be
addressed by ecotourism enterprises. These items were grouped into two distinct groups: 27
conservation actions and 26 conservation outcomes. Of the 702 potential relationships between
each of these actions and outcomes, 58 direct and 139 indirect relationships were found to be
feasible, although some will only exist in certain contexts or if specific conditions are met.
The interactions between these conservation actions and outcomes can be complex: each action
may contribute to a myriad of outcomes (Figure 4.2), and many conservation goals can be
achieved using different pathways (Figure 4.3). For example, increased habitat and reductions in
non-native fauna are themselves outcomes of the three actions in Figure 4.3, but can also
contribute to reductions in competition and predation rates.
Furthermore, as highlighted in Figure 4.2, much overlap exists, and some conservation
outcomes can have outcomes of their own. Additionally, although these Conservation Items
may be referred to as direct or indirect, this can change depending on the context and the goal of
the conservation activities. For example, revegetation activities may be a direct conservation
109

Chapter 4: Conservation Evaluation Framework (Research Component 1)
action if the goal is to decrease erosion; however, if the goal is to reduce rates of unnatural
competition between native and non-native fauna, then revegetation may be an indirect action
that contributes to this goal by increasing the availability of resources for wildlife. As such, it is
more fitting to view these terms as describing the relationships between the actions and
outcomes.
Figure 4.2 A depiction of the direct and indirect conservation outcomes that can be achieved
through revegetation activities (as an example action).
Figure 4.3 A depiction of the actions that can directly and indirectly reduce competition with,
and predation on, native fauna by non-native species (as an example outcome). Grey boxes
indicate outcomes that can also contribute to reductions in competition and predation rates.
The number and complexity of the relationships between the 53 Conservation Items make it
impractical to include all items in a single conceptual diagram such as the above figures. The
Conservation Items were therefore arranged into a matrix (Table 4.1) to clearly show the
relationships between the various actions and outcomes, with direct relationships shown by the
110

Chapter 4: Conservation Evaluation Framework (Research Component 1)
symbol ⚫ and indirect relationships shown by the symbol . A blank cell indicates that no
relationship was identified. However, this does not necessarily mean that no relationship exists:
although the CA Matrix is comprehensive, it is not claimed to be exhaustive.
To further aid with clarity, the 53 Conservation Items were also grouped into five categories
according to their focus: the biophysical landscape, the fauna, the visitors, the local community,
and those that operate at a larger organisational or political level. These five categories were
also grouped into two meta-categories: an ecological aspects meta-category incorporating the
biophysical landscape and the fauna categories; and a socio-political aspects meta-category
incorporating the visitor, community, and organisational/political categories.
Conservation actions in the socio-political meta-categories can only directly achieve
conservation outcomes within this same meta-category. Although they can achieve ecological
outcomes, they can only do so indirectly through the socio-political outcomes. As suggested in
the ecotourism-conservation pathways conceptual model in Figure 2.6 of Chapter 2, it may
therefore be more appropriate to view these socio-political outcomes as intermediary
conservation outcomes.
The Conservation Items presented in the CA Matrix are explored in detail within their five
categories in the sections that follow. However, the categorisation of the Conservation Items is
dependent on their individual focus regardless of their relationships with other actions or
outcomes. It is therefore common for actions to produce outcomes in multiple categories and,
conversely, for outcomes to be produced by actions in multiple categories. As such, these
sections include references to items in other categories where relevant.
111

Chapter 4: Conservation Evaluation Framework (Research Component 1)
Table 4.1 The direct and indirect relationships of the 53 Conservation Items, five categories and two meta-categories of the Conservation Activities Matrix
Ecological meta-category Socio-political meta-category
Outcomes
Acti
on
s
Biophysical landscape Fauna Visitor Local community Organisational/political
Prot
ecte
d ar
ea1
Wee
ds2
Rev
eget
atio
n
Deg
rade
d la
nd3
Prop
agat
ion4
Fire
man
agem
ent
Pollu
tion5
Eros
ion
cont
rol6
Mon
itorin
g
Bre
edin
g pr
ogra
ms
Tran
sloca
tion
Vet
erin
ary
serv
ices
7
Inva
sive
faun
a8
Faun
a re
sour
ces9
Nes
t site
s10
Env
inte
rpre
tatio
n11
Con
serv
atio
n su
ppor
t12
Env
inte
rpre
tatio
n13
Con
serv
atio
n su
ppor
t14
Ince
ntiv
es15
Det
erre
nts16
Res
earc
h
Adv
ocac
y17
Con
serv
atio
n su
ppor
t18
PA a
genc
ies19
Tech
nolo
gy20
Purc
hase
s21
Ecolo
gic
al
meta
-ca
tego
ry
Bio
ph
ysi
cal
en
vir
on
men
t
Decreased fragmentation22 ⚫ Ecological integrity23 ⚫ ⚫ ⚫ ⚫ Established corridors24 ⚫ ⚫ Improved diversity25 ⚫ ⚫ Increased habitat26 ⚫ ⚫ ⚫ ⚫ Carbon capture
⚫ ⚫ Reduced weeds27 ⚫ ⚫ Eradicated weeds27 ⚫ Reduced erosion ⚫ ⚫
Fa
un
a
Faun
a
Improved fauna health28
Genetic diversity29 ⚫ ⚫ Wildlife numbers30 ⚫ ⚫ ⚫ ⚫ ⚫
Competition/predation31 ⚫ ⚫
Reduced pests32 ⚫ Eradicated pests32 ⚫
V
isit
ors Increased env awareness33 ⚫ ⚫
Conservation capacity34 ⚫ ⚫ Improved env behaviour35 ⚫ ⚫
112

Chapter 4: Conservation Evaluation Framework (Research Component 1)
Ecological meta-category Socio-political meta-category
Outcomes
Acti
on
s
Biophysical landscape Fauna Visitor Local community Organisational/political
Prot
ecte
d ar
ea1
Wee
ds2
Rev
eget
atio
n
Deg
rade
d la
nd3
Prop
agat
ion4
Fire
man
agem
ent
Pollu
tion5
Eros
ion
cont
rol6
Mon
itorin
g
Bre
edin
g pr
ogra
ms
Tran
sloca
tion
Vet
erin
ary
serv
ices
7
Inva
sive
faun
a8
Faun
a re
sour
ces9
Nes
t site
s10
Env
inte
rpre
tatio
n11
Con
serv
atio
n su
ppor
t12
Env
inte
rpre
tatio
n13
Con
serv
atio
n su
ppor
t14
Ince
ntiv
es15
Det
erre
nts16
Res
earc
h
Adv
ocac
y17
Con
serv
atio
n su
ppor
t18
PA a
genc
ies19
Tech
nolo
gy20
Purc
hase
s21
So
cio
-poli
tical
meta
-ca
teg
ory
Lo
cal
com
mu
nit
y
Increased env awareness36 ⚫ ⚫ ⚫ ⚫ ⚫ Human-wildlife conflict37 ⚫ ⚫
Conservation capacity38 ⚫ ⚫
Community pressures39 ⚫ ⚫ ⚫ ⚫
Pro-env behaviours40 ⚫ ⚫ ⚫ ⚫ ⚫
P
oli
tica
l Improved env legislation41 ⚫
Land rights42 ⚫
Knowledge base43 ⚫ ⚫ ⚫
Key: ⚫ = Direct; = Indirect Footnotes: 1Established a protected area; 2Actions to remove non-native floral species; 3Changed land use/conversion of degraded land to ecotourism site; 4Propagation of at-risk native species;
5Pollution/rubbish clean-up programs i.e. roadside/trail clean-up programs; 6Includes soil health & conservation; 7Including disease control & wildlife care/rehabilitation; 8Actions to control non-native fauna species; 9Increased resources for fauna e.g. water; 10Provision and/or management of nest sites; 11Environmental interpretation/inspiration; 12Actions to increase conservation capacity of visitors; 13Environmental education/interpretation; 14Conservation support & resources to improve conservation capacity; 15Incentives such as payments for ecosystem services; 16Deterrents e.g. increased patrolling of protected areas; 17Lobbying & advocacy; 18Support/donations to conservation organisations, projects & NGOs; 19Support to protected area agencies, governments & councils; 20Investment in conservation related technologies; 21Environmentally friendly purchasing; 22Decreased habitat loss & fragmentation; 23Increased ecological integrity, resilience & health; 24Increased ecological connectivity & corridors; 25Improved floral genetic & species diversity; 26Increased extent & quality of habitat, including increased reforestation & improved vegetation density; 27Reduced/eradicated non-native flora species; 28Increased fauna health & population resilience; 29Increased faunal genetic diversity; 30Improved wildlife numbers (includes increased distribution & range of populations, as well as stabilising a decline); 31Reduced unnatural competition or predation; 32Reduced/eradicated non-native faunal species; 33Increased environmental awareness & responsibility; 34Increased environmental knowledge & conservation capacity; 35Improved pro-environmental behaviours & lifestyles; 36Increased environmental awareness & responsibility; 37Reduced human-wildlife conflict; 38Increased environmental knowledge & conservation capacity; 39Community pressures on conservation attitudes & behaviours e.g. due to the collective interest; 40Increased pro-environmental behaviours & lifestyles; 41Improved environmental legislation, policies, & regulations; 42Recognition of environment, land and community rights; and 43Increased knowledge base.
Sources: See Appendix B
113

Chapter 4: Conservation Evaluation Framework (Research Component 1)
Portions of the CA Matrix are included with the exploration of the Conservation Items in each
of the following sections. These matrix portions include all of the conservation actions and
outcomes for the relevant category, as well as conservation outcomes from other categories that
may be produced by actions within the category, as distinguished by grey italicised font. For
simplicity, these matrix portions do not include actions from other categories. The complete
collection of sources used to create each matrix portion can be found in Appendix B.
4.2.1 Biophysical landscape The biophysical landscape includes the vegetative communities, soil, and geology of the land.
Eight potential conservation actions and nine outcomes were identified in this category (Table
4.2), with an additional four outcomes from other categories (in italicised grey font) that can be
produced by the biophysical landscape actions.
Table 4.2 Potential biophysical landscape conservation actions of ecotourism enterprises and their outcomes
Outcomes:
Acti
on
s:
Prot
ecte
d ar
ea1
Wee
ds2
Rev
eget
atio
n
Deg
rade
d la
nd3
Prop
agat
ion4
Fire
man
agem
ent5
Pollu
tion6
Eros
ion7
Decreased habitat loss and fragmentation ⚫
Increased ecological integrity, resilience and health ⚫ ⚫ ⚫ ⚫
Increased ecological connectivity and corridors ⚫ ⚫
Improved floral genetic and species diversity ⚫ ⚫
Increased extent and quality of habitat8 ⚫ ⚫ ⚫ ⚫
Increased rates of carbon capture ⚫ ⚫
Reduction in extent of non-native flora species ⚫ ⚫
Eradication of non-native flora species ⚫
Reduced erosion ⚫ ⚫
Increased fauna health and population resilience
Improved wildlife numbers9
Reduced unnatural competition or predation
Increased pro-environmental community behaviours10 ⚫
Key: ⚫ = Direct; = Indirect Footnotes: 1Established a protected area; 2Actions to remove non-native floral species; 3Changed land use/
conversion of degraded land into an ecotourism site; 4Propagation of an at-risk native species; 5Ecological fire management; 6In addition to own rubbish i.e. roadside/trail clean-up programs; 7Actions to reduce/control erosion; 8Includes increased reforestation and improved vegetation density; 9Includes increased distribution and range of populations, as well as stabilising a decline; and 10Includes a decrease in environmentally destructive activities e.g. reduced logging.
Sources: See Appendix B Table B1
114

Chapter 4: Conservation Evaluation Framework (Research Component 1)
4.2.1.1 Establishment of a protected area Ecotourism operators can actively establish private protected areas (PPAs) with legal
implications (Blangy and Mehta, 2006; Lin, 2012; Pegas and Castley, 2014). For example, in
countries such as Australia and the US, it is possible for landowners to voluntarily place
protective formal covenants on their properties to prevent specified types of land-use that may
cause environmental degradation (Adams and Moon, 2013; Bingham et al., 2017; Hardy et al.,
2017). As protected areas limit the types of permissible land uses, they may not only decrease
habitat destruction but can also allow for reforestation and improved habitat quality and
connectivity, with the potential for benefits to extend beyond property boundaries (Gaston et al.,
2008; Oldekop et al., 2016).
Additionally, converting the land use of a property to ecotourism may provide a level of general
protection even without legal mechanisms through, for example, increased property surveillance
and improved reforestation rates (Almeyda et al., 2010; Almeyda Zambrano, Broadbent and
Durham, 2010; Mossaz et al., 2015). By providing suitable habitat in a changing landscape or
artificial exclosures27, both formal PPAs and informally protected properties can function as
important ecological refuges that provide (1) opportunities for genetic and ecological
adaptation, and (2) a valuable resource for studies on longer term means of recovery (Keppel et
al., 2015; Morelli et al., 2016).
4.2.1.2 Removal of non-native flora The reduction and eventual eradication of non-native flora is essential for restoring ecological
integrity; supporting native wildlife; and reducing competition with, and displacement of, native
vegetation (Brooks et al., 2004; Kohli et al., 2006; Lindenmayer et al., 2010; Young et al.,
2014). However, for weed removal activities to achieve these outcomes, there must be a net
reduction in the extent or density of a non-native species, or in the number of weed species
present.
4.2.1.3 Revegetation and habitat quality, diversity and connectivity Revegetation is a core component of conservation activities and vital for returning the
biophysical landscape to its natural state and restoring ecological functions; improving habitat
quality for wildlife populations; and enhancing ecosystem resilience, especially in a changing
climate (Lindenmayer et al., 2010; Kettenring et al., 2014; Santos Junior et al., 2016). The
success of such activities can be improved by using watering mechanisms, fertilisation, physical
protection, and propagation (Jalonen et al., 2018; Good and Johnston, 2019). Revegetation of
fragmented landscapes and wildlife corridors are critical for reducing edge effects, improving
27 Designed to exclude threats rather than enclose wildlife (Aerts, Nyssen and Haile, 2009).
115

Chapter 4: Conservation Evaluation Framework (Research Component 1)
habitat connectivity, and establishing linkages between wildlife populations that are essential
for increased dispersal, gene flow, and population resilience (Baguette et al., 2013; Goossens et
al., 2016; Newmark et al., 2017). However, misguided revegetation activities can have negative
impacts on ecological structure and ecosystem functions, and the relationship between these
actions and outcomes is not always straightforward (Lindenmayer et al., 2012). For example,
revegetation activities must ensure appropriate levels of genetic and species diversity in
vegetation communities for supporting ecosystem resilience, habitat quality, and many
ecosystem functions (Reed and Frankham, 2003; Kramer and Havens, 2009; Hoban et al., 2013;
Kettenring et al., 2014).
Furthermore, revegetation activities should not be automatically assumed to increase the extent
of habitat. For example, although Lantana camara is an invasive species in Australia and many
other countries, it can still provide important ecological functions in cleared landscapes (Gosper
and Vivian-Smith, 2006). Therefore, if established lantana thickets or other moderate to large
sized vegetation clumps are removed and replaced by native seedlings, this will initially result
in a reduction in available resources until the seedlings grow to an appropriate size.
4.2.1.4 Degraded land, pollution, and erosion Converting degraded land to an ecotourism site can include a variety of restoration activities to
increase the aesthetic value of the site including revegetation, rubbish removal and erosion
control (Derhé et al., 2016; Good and Johnston, 2019). For example, &Beyond28 restored over
13,000ha of previously degraded farmland to establish Phinda Private Game Reserve in South
Africa in 1991, followed by the reintroduction of all large mammal species native to the area,
and the consolidation and restoration of an additional 15,000ha of land (Blangy and Mehta,
2006; &Beyond, 2019a; b).
Pollution and rubbish products can have extensive impacts on ecological integrity and health
(Shahidul Islam and Tanaka, 2004; Beyene et al., 2008; Theobald, 2013), and can pose
significant problems for wildlife including, for example, entanglement or ingestion of debris
(Moncrieff, 2000; Canesi and Corsi, 2016; Avery-Gomm, Borrelle and Provencher, 2018).
Rubbish removal and clean-up programs are therefore important components of both habitat
restoration and long-term environmental maintenance.
Erosion can lead to polluted waterways from chemical runoff; decreased water quality; and
increased sedimentation, turbidity and eutrophication (Adimassu et al., 2014; García-Ruiz et al.,
2017). Erosion control activities are therefore important for improving and maintaining soil
28 Previously Conservation Corporation Africa (CCA).
116

Chapter 4: Conservation Evaluation Framework (Research Component 1)
ecosystem services such as water filtration and soil fertility, as well as ecological integrity and
ecosystem health more broadly (Kagabo et al., 2013; Borrelli et al., 2017; Xiong, Sun and Chen,
2018). Additionally, this can be an important component of carbon sequestration efforts (Ran et
al., 2018). However, erosion control can be complicated and the mechanisms involved, such as
tree planting, can take a long time to adequately stabilise soil movements (Genet et al., 2008;
Ran et al., 2018). As such, the extent of erosion should be evaluated to determine the
effectiveness of erosion-control activities. Additionally, decreased erosion rates may actually
reflect that a large proportion of the soil has been lost previously rather than being an indication
of successful erosion management activities (García-Ruiz et al., 2017).
4.2.1.5 Ecological fire management Fire is an important ecosystem process for vegetation composition, sprouting, and seed
germination through burning, soil temperatures, and chemical stimulation from smoke and/or
charred wood (Andersen et al., 2005; Bond and Keeley, 2005; Burrows, 2008). Changes to
natural fire regimes can therefore disrupt ecological processes, reduce ecosystem integrity, and
increase pressures on native fauna and flora (Brockway, Gatewood and Paris, 2002; Mackey et
al., 2008; Hess, 2016). As such, fire management activities that restore or mimic natural fire
processes can be an important conservation tool.
4.2.1.6 Increased ecological integrity, resilience and health Ecological integrity, health and resilience refer to how close an ecosystem is to its natural state,
how well the ecological processes function, and how well the system can ‘bounce back’ when
altered by external pressures such as extreme weather events or human impacts (Parrish, Braun
and Unnasch, 2003; Hermoso and Clavero, 2013). As previously stated, restoration activities
such as weed removal and revegetation are important for improving ecological integrity, health
and resilience (Parrish et al., 2003; Kettenring et al., 2014). However, the success of this
outcome can only be determined through appropriate evaluations using established measures,
scales, and parameters, which may not be readily accessible by most ecotourism operators
(Hermoso and Clavero, 2013).
4.2.1.7 Increased rates of carbon capture Carbon sequestration activities involve replacing or enhancing the capacity of natural carbon
stores such as forests and soils (Romanin et al., 2015; Ran et al., 2018). As a conservation
outcome this is grounded in the premise of generating a positive impact and therefore differs
from carbon offsetting activities undertaken to minimise an operation’s impact (Wardle et al.,
2018), although they may utilise some of the same approaches. Furthermore, although carbon
absorption is a natural outcome of revegetation, this is dependent on the specific carbon
carrying capacity of the vegetation being planted which varies substantially across vegetation
117

Chapter 4: Conservation Evaluation Framework (Research Component 1)
type, age and tree density (Vesk et al., 2008; Romanin et al., 2015). As such, revegetation
activities that follow weed removal may not result in net increases in carbon capture rates for
many years (Vesk et al., 2008).
Ocean sequestration, geo-sequestration and mineral carbonation are also potential options for
increasing rates of carbon capture; however, substantial development is required for these to
become viable or widely accessible options (Sanchez et al., 2018; Stavrakas, Spyridaki and
Flamos, 2018; Nekuda Malik, 2019). As such, research activities and investments in new
technologies by ecotourism operators have the potential to indirectly improve rates of carbon
capture.
4.2.2 Fauna Enterprises may undertake actions that intervene directly with native fauna to protect or
improve the health of wildlife populations. However, these activities only generate conservation
benefits when targeted towards restoring the natural state, and are not always ecologically
desirable. For example, it is not beneficial to increase the population size of a non-threatened
native species that is already at carrying capacity in an area.
Seven potential conservation actions and nine outcomes were identified in this category (Table
4.3), with an additional four outcomes from other categories (in italicised grey font) that can be
produced by the fauna actions.
118

Chapter 4: Conservation Evaluation Framework (Research Component 1)
Table 4.3 Potential conservation actions of ecotourism enterprises related to fauna and their
outcomes
Outcomes:
Acti
on
s:
Mon
itorin
g
Bre
edin
g1
Tran
sloca
tion
Vet
erin
ary
serv
ices
2
Inva
sive
faun
a3
Faun
a re
sour
ces4
Nes
t site
s5
Increased fauna health and population resilience
Increased faunal genetic diversity ⚫ ⚫
Improved fauna numbers6 ⚫ ⚫ ⚫ ⚫ ⚫
Reduced unnatural competition or predation ⚫ ⚫
Reduced non-native faunal species ⚫
Eradicated non-native faunal species ⚫
Increased ecological integrity, resilience and health
Reduced erosion
Reduced human-wildlife conflict
Increased knowledge base ⚫ Key: ⚫ = Direct; = Indirect
Footnotes: 1Breeding/head starting programs; 2Includes disease control and wildlife care/rehabilitation; 3Actions to control non-native fauna species; 4Increased resources for fauna, e.g. water; 5Provision and/or management of nest sites e.g. nesting boxes; and 6Includes increased distribution and range of populations, as well as stabilising a decline – all can be indicated by increased faunal sightings and it is preferable to group these outcomes rather than misattribute a score.
Sources: See Appendix B Table B2
4.2.2.1 Monitoring Monitoring activities are critical to gain an understanding of the wildlife dynamics of an area;
determine the state of wildlife populations; identify non-native fauna presence; and evaluate the
effectiveness of any previous conservation efforts (Block et al., 2001; Witmer, 2005). These
activities can vary from general observations to extensive systematic programs spanning
decades and/or targeting specific features such as wildlife behaviour or scat analysis.
Monitoring can be a valuable activity for ecotourism operators to provide information about
local wildlife to staff members, guests, and the local community, and can advance ecological
and conservation research (Davies et al., 2012; Balme et al., 2013).
4.2.2.2 Breeding and translocation Translocation, reintroduction, and breeding programs have a dual benefit of (1) increasing
numbers of charismatic species; and (2) supplementing threatened wildlife populations and
increasing their genetic diversity, thereby increasing the population’s resilience and, by
extension, ecosystem resilience and ecological integrity (Hedrick and Fredrickson, 2008;
119

Chapter 4: Conservation Evaluation Framework (Research Component 1)
Witzenberger and Hochkirch, 2011). It is not uncommon for ecotourism enterprises to engage
with activities of this nature. For example, the 28,000ha Samara Private Game Reserve, South
Africa, reintroduced cheetah to the site to restore ecological integrity while maximising tourism
opportunities (Hayward et al., 2007). As mentioned previously, however, it is critical that these
activities remain within the natural ecological state and that ecotourism operators do not
introduce species beyond their natural range (Castley, Boshoff and Kerley, 2001).
4.2.2.3 Provision of veterinary services, disease control and wildlife rehabilitation
Veterinary services, disease control, and animal rehabilitation activities target health problems
and injuries within existing wildlife populations to reduce the loss of individuals, and can also
enhance conservation knowledge (Pyke and Szabo, 2018). At the lower end of the spectrum,
this includes rescuing injured wildlife and caring for orphaned animals. At the higher end, this
may include disease control activities such as antimicrobials, anti-inflammatories and surgical
intervention for treating chlamydial disease outbreaks in koalas (Polkinghorne, Hanger and
Timms, 2013; Robbins et al., 2018) or vaccinations for Tasmanian devils against the devil facial
tumour disease (McCallum, 2008; Tovar et al., 2017).
4.2.2.4 Reducing non-native fauna Non-native fauna threaten native wildlife through unnatural predation, competition,
displacement, and hybridisation (Blackburn et al., 2004; Nogales et al., 2004; Algar et al., 2010;
Radford et al., 2018). Actions to reduce or eradicate non-native species are often crucial for
reducing threats to native populations and stabilising population declines (Allek et al., 2018).
Additionally, controlling introduced fauna can help restore ecosystem functions and improve
vegetation health. For example, hoofed animals are not native to Australia, and their presence
damages native vegetation. As such, removing these animals can allow the condition of native
vegetation to improve, and may also reduce erosion (Good and Johnston, 2019).
4.2.2.5 Increased resources for wildlife including nest management Providing or managing wildlife resources, such as water and nesting sites, can decrease
competition for available resources and help prevent wildlife losses or stabilise population
declines, especially during extreme weather events or other hardships (Epaphras et al., 2008;
Libois et al., 2012). This action includes artificial water sources, nesting boxes, and planting
targeted vegetation species for at-risk wildlife such as eucalypts for koalas.
4.2.2.6 Wildlife numbers, distribution and range Ecotourism enterprises can increase numbers of at-risk native wildlife through breeding and
translocation programs, improving environmental conditions, and reducing threats, as depicted
120

Chapter 4: Conservation Evaluation Framework (Research Component 1)
in Table 4.1. This outcome also includes stabilising a decline in wildlife numbers or reducing
the rate of decline. However, as mentioned earlier in this chapter, this outcome refers to
ecologically desirable increases in native wildlife numbers with respect to both pre-disturbed
levels and current environmental carrying capacity (Smallwood, 2001).
Restoring natural distribution patterns and individual ranges are also important conservation
goals for wildlife health and ecosystem function (Baguette et al., 2013). However, without
adequate data of wildlife trends and threats at a regional scale, ecotourism enterprises are
unlikely to be able to distinguish this outcome from an increase in wildlife numbers. For
example, increased distributions or ranges may initially result in decreased wildlife sightings
which could be interpreted as a decrease in wildlife numbers, and conversely, an increase in
wildlife sightings may be caused by increased pressures nearby that are driving wildlife closer
together (Baguette et al., 2013). Additionally, increases in the distribution of a population may
be detrimental if this pushes individuals outside protected areas (Smith et al., 2016).
4.2.2.7 Wildlife resilience, health and genetic diversity Wildlife resilience refers to the ability of wildlife populations to persist through and survive
challenging conditions such as disease, drought, and human impacts (Marino, Sillero‐Zubiri and
Macdonald, 2006; Oliver, Brereton and Roy, 2013). Low genetic diversity in wildlife
populations can reduce population health, decrease population resilience, increase mortality
rates, and impact the population’s ability to adapt to ecosystem changes (Trinkel et al., 2008;
Sommer, McDevitt and Balkenhol, 2013; Goossens et al., 2016).
Resilience and health apply to wildlife populations rather than to individual animals, and as
such, this outcome is unlikely to be achieved through basic wildlife care and rehabilitation.
However, it could result from population-level disease control activities (Pyke and Szabo,
2018).
4.2.3 Visitors Visitor education and interpretation is a major component of ecotourism (Weaver, 2001;
Weaver and Lawton, 2007) and can lead to conservation impacts through the actions of visitors
following their ecotourism experience (Powell and Ham, 2008; Hughes, 2013). Two potential
conservation actions and three outcomes were identified in this category (Table 4.4).
121

Chapter 4: Conservation Evaluation Framework (Research Component 1)
Table 4.4 Potential conservation actions of ecotourism enterprises related to visitors and their outcomes
Outcomes:
Acti
on
s:
Env
inte
rpre
tatio
n1
Con
serv
atio
n su
ppor
t2
Increased environmental awareness and responsibility ⚫ ⚫
Increased environmental knowledge and conservation capacity ⚫ ⚫
Increased conservation behaviours/lifestyles ⚫ ⚫ Key: ⚫ = Direct; = Indirect
Footnotes: 1Environmental interpretation/inspiration for visitors; and 2 Support and resources to increase the capacity of visitors to increase conservation behaviours.
Sources: See Appendix B Table B3
4.2.3.1 Environmental interpretation, support, and capacity Visitor interpretation occurs predominantly in the form of interpretative trails, brochures and
signs, guided tours, and information centres, but can also include post-visit interactions via
email and social media. Various messages can be conveyed depending on the location of the
site, the presence of key attractants and the target audience, with tailored information having the
greatest impact (Ballantyne, Packer and Hughes, 2008). When designed appropriately,
environmental interpretation combined with the ecotourism experience can provide the three
necessary components to generate visitor behaviour changes, as modified from Wheaton et al.
(2016): the desire to act, the ability to act, and the opportunity to act.
4.2.3.2 Increased environmental or conservation awareness of visitors Ecotourism experiences and environmental interpretation can increase visitor knowledge and
awareness of environmental issues and, therefore, their self-efficacy and capacity to act
(Hughes, 2011; Skibins, Powell and Hallo, 2013; Navrátil et al., 2016; Wheaton et al., 2016).
For example, Powell and Ham (2008) found that touring the Galapagos Islands resulted in an
increase in natural environment knowledge in 87% of respondents. Additionally, environmental
interpretation can enhance visitor environmental values, conservation ethic, and behavioural
intentions (Hughes, Packer and Ballantyne, 2011; Ardoin et al., 2016; Sgalitzer et al., 2016). For
example, Sander (2012) identified that the intentions of visitors to donate money for
conservation purposes increased from 53% to 81% following their stay at an ecotourism lodge
in Costa Rica.
122

Chapter 4: Conservation Evaluation Framework (Research Component 1)
4.2.3.3 Increased conservation behaviours of visitors Increased pro-environmental and conservation behaviours of visitors are a potential outcome of
the educational tools and resources used in ecotourism experiences (Armstrong and Weiler,
2002; Hovardas and Poirazidis, 2006; Zeppel, 2008; Ballantyne, Packer and Sutherland, 2011;
Hughes, 2011; Hughes et al., 2011; Skibins et al., 2013). Such behaviour changes may include
volunteering or donating money for conservation purposes, taking a stand on environmental
issues such as through voting preferences, advocating for an area or species, reporting injured
wildlife to authorities, picking up litter, and so on (Howard, 2000; Weaver and Lawton, 2002;
Tisdell and Wilson, 2005; Powell and Ham, 2008; Zeppel, 2008; Ballantyne et al., 2011;
Hughes, 2011; Weaver, 2012). Additionally, ecotourism enterprises can provide opportunities to
act through, for example, petitions or pledges, either on-site or sent in post-visit
communications (Wheaton et al., 2016). However, despite the demonstrated increase in pro-
environmental behaviour intentions as highlighted in the previous paragraph, the extent to
which this translates into actual behavioural changes is less clear (Hofman and Hughes, 2018).
On-site visitor behaviours and visitor management are aspects of minimal impact operations and
are therefore not included in this outcome. Additionally, this outcome does not include visitors
who ‘plant a tree’ during their stay as this is considered part of the visitor experience rather than
a behavioural change. However, an increase in the post-visit minimal impact behaviours of
visitors (such as improved recycling practices) can be included in this outcome as this is not part
of the visitor management of the site29.
4.2.4 Local communities Communities can have a large impact on their surrounding environment, especially outside of
cities and in developing nations where employment options may be limited and livelihoods are
often land-intensive (Butcher, 2006; Lamers et al., 2014; Romero-Brito et al., 2016). Local
community inclusion and benefits are viewed as an important component of ecotourism
operations (Fennell, 2001; Chandel and Mishra, 2016), and ecotourism enterprises may
therefore be able to influence local communities to achieve conservation outcomes directly and
indirectly (Almeyda Zambrano et al., 2010; Krüger, 2005; Nelson et al., 2010; Sakata &
Prideaux, 2013). However, the relationships between local communities, ecotourism enterprises
and conservation projects are extremely complex, and strategies are not always successful.
29 This is detailed further in Section 1.4.2.1.
123

Chapter 4: Conservation Evaluation Framework (Research Component 1)
A simplified summary of the four community-based conservation actions and five outcomes are
shown in Table 4.5, with an additional nine outcomes from other categories (in italicised grey
font) that may be produced by the community actions. There is much overlap in some of these
activities: for example, incentives such as employment or financial contributions may also be
framed as deterrents if there is a risk that these may cease. As such, this section is intended to
provide a general description of these Conservation Items rather than a precise classification
system.
Table 4.5 Potential conservation actions of ecotourism enterprises related to local communities and their outcomes
Outcomes: A
cti
on
s:
Env
inte
rpre
tatio
n1
Con
serv
atio
n su
ppor
t2
Ince
ntiv
es3
Det
erre
nts4
Increased environmental awareness and responsibility ⚫ ⚫ ⚫ ⚫
Reduced human-wildlife conflict ⚫ ⚫
Increased conservation capacity ⚫ ⚫
Community pressures ⚫ ⚫ ⚫ ⚫
Pro-environmental behaviours and lifestyles ⚫ ⚫ ⚫ ⚫
Decreased habitat loss and fragmentation
Increased ecological connectivity and corridors
Increased extent and quality of habitat
Reduction in extent of non-native flora species
Eradicated non-native flora species
Improved wildlife numbers5
Reduced non-native faunal species
Eradicated non-native faunal species
Recognition of environment, land and community rights Key: ⚫ = Direct; = Indirect
Footnotes: 1Environmental education/interpretation for staff and/or the local community; 2Provision of conservation resources and support; 3Incentives such as payments for ecosystem services; 4Deterrents such as increased patrolling of protected areas; and 5Includes increased distribution and range of populations, as well as stabilising a decline.
Sources: See Appendix B Table B4
124

Chapter 4: Conservation Evaluation Framework (Research Component 1)
4.2.4.1 Environmental knowledge, awareness and values Staff
Conservation education and training for staff can be an important avenue for ecotourism
enterprises to increase environmental awareness and change attitudes towards conservation
practices of (1) the staff involved with the operation, and (2) visitors and the wider community
as this information and values culture filter out (Krüger, 2005; Brightsmith et al., 2008;
Almeyda et al., 2010; Almeyda Zambrano et al., 2010). Increased environmental awareness of
staff can occur directly through education and training practices, or indirectly through
experiences on the job including interactions with wildlife, guides or visitors (Almeyda et al.,
2010; Ballantyne et al., 2011).
Local communities
Through public engagement and environmental interpretation with members of the local
community, ecotourism enterprises may improve the environmental values held by local
residents, increase their awareness of environmental issues, and change their attitudes towards
conservation practices (Lapeyre, 2010; Mbaiwa and Kolawole, 2013; Sakata and Prideaux,
2013). This may arise through communications with local community members such as
discussions, talks, presentations, workshops, and consultative meetings (Ogutu, 2002; Svoronou
and Holden, 2005; New, 2010; Lin, 2012); through conservation activities undertaken within the
community (Almeyda Zambrano et al., 2010); and through locals participating in activities run
by ecotourism enterprises such as guided tours and exploring visitor centres (Almeyda
Zambrano et al., 2010; Samways et al., 2010). Additionally, some studies have shown that local
communities may pick up environmentally friendly practices from watching and interacting
with visitors, such as eliminating the use of poison in fishing practices (Sakata and Prideaux,
2013). However, as in Section 4.2.3.3, the link between increasing environmental knowledge
and subsequent behavioural changes is tenuous, and assumptions should not be made about the
existence or success of this outcome without direct evidence.
4.2.4.2 Incentives, deterrents and pressures Ecotourism can provide sustainable use-values of the natural environment while delivering
social and economic benefits (Campbell and Smith, 2006; Justus et al., 2009; Oldekop et al.,
2015). For example, ecotourism enterprises can (1) create employment opportunities (Almeyda
Zambrano et al., 2010; Lapeyre, 2010; Mbaiwa and Kolawole, 2013); (2) provide direct
payments through leases and revenue sharing schemes (Ogutu, 2002; Osano et al., 2013;
Snyman, 2016); and (3) stimulate the local economy by increasing business for local stores and
trades, creating economic linkages, and bringing outside money to a region (Li et al., 2006;
125

Chapter 4: Conservation Evaluation Framework (Research Component 1)
Anand, Chandan and Singh, 2012; Hunt et al., 2015). Ecotourism enterprises can also provide
additional contributions that improve the lives of community members and increase social
capital such as the improvement and maintenance of road and water infrastructure; the provision
of healthcare facilities and community centres; and support for community projects (Mbaiwa,
2011; Sakata and Prideaux, 2013; Snyman, 2016). These benefits can increase the value of
tourism and, by extension, the value of wildlife and the natural environment as tourist
attractions. They therefore provide incentives for protecting the natural environment, as well as
a deterrent if these benefits were to disappear, and therefore increase the likelihood of
successful outcomes for conservation strategies (Campbell and Smith, 2006; Justus et al., 2009;
Oldekop et al., 2015). Additionally, these community benefits may increase pro-environmental
behaviours through social pressures, community trust, shared norms, and the desire to act for the
collective interest rather than from self-interest (Pretty, 2003; Thoyre, 2011). As such,
community benefits provided by ecotourism enterprises such as employment may directly
reduce the number of people available to participate in environmentally destructive practices
such as logging; and (2) indirectly reduce environmentally destructive practices through, for
example, increased pro-environmental values and community pressures.
Ecotourism enterprises may also undertake more direct community intervention activities to
reduce human-wildlife conflict and illegal activities such as poaching, illegal fishing or
polluting without a permit. For example, financial interventions may include payments for
ecosystem services, in which communities are paid an incentive or reward for the maintenance
of ecosystems and protection of wildlife (Li et al., 2006; Nelson et al., 2010; Osano et al.,
2013); and compensation payments to communities for loss of access to resources or damage
caused by wildlife (Ross and Wall, 1999; Adams and Infield, 2003; Salum, 2009). Physical
interventions may include patrolling and monitoring protected areas or conservation zones
(Nelson et al., 2010; Samways et al., 2010; Appiah-Opoku, 2011; Mbaiwa, 2011); conducting
anti-poaching campaigns (Ogutu, 2002); supporting community scouts or park rangers such as
providing salaries or equipment (Ogutu, 2002; Almeyda Zambrano et al., 2010; Nelson et al.,
2010; Osano et al., 2013); or constructing protective infrastructure such as electric fences to
keep destructive wildlife out of crops (de Boer et al., 2007). Additionally, ecotourism
enterprises can provide significant deterrents to illegal activities through, for example, the
presence of ecotourism staff on-site; the monitoring of sites through guided tours; and
community pressures stemming from the value of natural resources to tourism-employed
community members and the social benefits provided by tourism funds (Waylen et al., 2009;
Nelson et al., 2010; Samways et al., 2010; Mbaiwa, 2011). These direct intervention activities
can be particularly important in regional and sparsely populated areas (Henriques and Sadorsky,
1996; Dong et al., 2011).
126

Chapter 4: Conservation Evaluation Framework (Research Component 1)
4.2.4.3 Support and conservation capacity Ecotourism enterprises can provide conservation support to local communities and increase
their capacity to engage in conservation behaviours. This may include providing (1) information
on sustainable practices; (2) resources such as native seedlings or access to equipment; and (3)
increased opportunities to act, such as initiating or assisting with community conservation
projects. Furthermore, the employment, economic and social benefits discussed in the previous
section may provide alternative financial sources that enable communities to be less reliant on
land-intensive or consumptive practices such as farming, hunting, mining, logging, and wildlife
trades (including poaching) (Marcovaldi and Dei Marcovaldi, 1999; Almeyda Zambrano et al.,
2010; Mbaiwa, 2011; Schoneveld-de Lange, Meijaard and Löhr, 2016). Additionally,
ecotourism enterprises can provide training, education and upskilling opportunities for local
community members and staff that improve their professional capacity, further expanding their
employment options (Mbaiwa, 2011; Sakata and Prideaux, 2013; Snyman, 2016).
4.2.5 Organisational and political Ecotourism enterprises can enact change at a larger organisational and political level. A
summary of the six potential conservation actions and three outcomes in this category are
shown in Table 4.6, with an additional 11 outcomes from other categories (in italicised grey
font). Support for conservation projects, conservation organisations and protected area agencies
can have far reaching conservation impacts. Therefore, all conservation outcomes in the
complete CA Matrix (Table 4.1) are potential outcomes of these actions but are not shown in
Table 4.6 due to space limitations and their presence in previous tables in this chapter.
127

Chapter 4: Conservation Evaluation Framework (Research Component 1)
Table 4.6 Potential organisational/political conservation actions of ecotourism enterprises and their outcomes
Outcomes:
Acti
on
s:
Res
earc
h
Adv
ocac
y1
Con
serv
atio
n su
ppor
t2
PA a
genc
ies3
Tech
nolo
gy4
Purc
hase
s5
Improved environmental legislation, policies, regulations ⚫
Recognition of environment, land and community rights ⚫ Increased knowledge base ⚫ ⚫
Decreased habitat loss and fragmentation Increased ecological connectivity and corridors
Increased extent and quality of habitat
Increased rates of carbon capture
Reduced erosion
Improved wildlife numbers6
Increased visitor environmental awareness and responsibility
Increased conservation behaviours/lifestyles of visitors
Increased community environmental awareness ⚫
Reduced human-wildlife conflict Pro-environmental community behaviours and lifestyles7
Key: ⚫ = Direct; = Indirect Footnotes: 1Lobbying and advocacy; 2Support/donations to conservation organisations and projects; 3Support to protected
area agencies and governments; 4Investment in conservation related technologies; 5Environmentally friendly purchasing; 6Includes increased distribution of populations, as well as stabilising a decline; 7Includes improvements in natural resource management and decreases in environmentally destructive activities.
Sources: See Appendix B Table B5
4.2.5.1 Research and knowledge Ecotourism enterprises can contribute to the academic literature and to conservation knowledge
more broadly by undertaking conservation and ecological research or through providing data,
funding, or in-kind support for research or government organisations (Brightsmith et al., 2008;
Zeppel, 2008; Samways et al., 2010). For example, researchers used over 3,500 tourist photos
and long-term monitoring records from the privately operated Sabi Sands Game Reserve in
South Africa to construct life histories of leopards (Balme et al., 2013). This can aid
conservation goals through an increased understanding of ecological impacts and the provision
of data on optimal conservation processes for practitioners and decision-makers (Sutherland et
al., 2004; Cardinale et al., 2012; Balme et al., 2013). Furthermore, ecotourism operators focus
on long-term viability and can provide extensive monitoring data and much needed funds and
support for long-term research projects, while also allowing time for population recovery
128

Chapter 4: Conservation Evaluation Framework (Research Component 1)
(Brightsmith et al., 2008; Balme et al., 2013; Marnewick et al., 2014; Young et al., 2014;
Vinding et al., 2015).
4.2.5.2 Advocacy, environmental regulations and environment/land rights Through active campaigning and lobbying, ecotourism enterprises can contribute to changes in
legislation and public policy; improved regulations; and the establishment of land rights that
provide protection against mining, logging and other destructive processes (Svoronou and
Holden, 2005; Buckley, 2010; 2011). Conservation activities exist within social, political and
economic spheres, and social pressures can therefore influence conservation practices and
decision-making (Buckley, 2016). This can be seen, for example, in the implementation of
corporate emissions reduction programs in response to public environmental concerns and
consumer demands (Kolk and Levy, 2001; Okereke, 2007). Furthermore, ecotourism may
generate substantial revenue at both national and regional scales, and can subsequently lead to
“shifting priorities in various levels of administration” (Krüger, 2005, p. 593). Ecotourism
operators can also influence individual guests, such as visiting politicians, to become champions
of their cause and increase funding for conservation activities (Xiang et al., 2011).
4.2.5.3 Support for conservation organisations, conservation projects, protected area agencies, councils and governments
Ecotourism enterprises can support conservation organisations, projects and protected area
agencies, and thereby contribute to a wide range of conservation outcomes. This may be in the
form of, for example, financial support; memberships and endorsement; in-kind support or
access to facilities; or developing linkages and partnerships (Buckley, 2004; Romero-Brito et
al., 2016). There are three primary mechanisms of financial support: (1) monetary donations and
membership fees; (2) visitor fees and operating permits; and (3) as revenue if an organisation
provides both ecotourism and conservation services (Buckley et al., 2012; Steven, Castley and
Buckley, 2013). Furthermore, protected areas can be expensive to manage and monitor, and
decades of conservation can be ruined by even small numbers of intensive poachers (McCauley
et al., 2013); however, as discussed in Section 4.2.4, ecotourism enterprises can provide
significant incentives and deterrents to reduce environmentally destructive activities and
promote pro-conservation behaviours.
These can have a vast range of outcomes depending on the focus of the conservation activities
or the organisations being supported, and therefore all conservation outcomes are listed as
possible indirect outcomes of these actions.
129

Chapter 4: Conservation Evaluation Framework (Research Component 1)
4.2.5.4 Environmentally friendly purchasing and support for conservation related technologies
Ecotourism enterprises have the potential to influence consumers through the products they
endorse and the information they provide to their guests. Furthermore, they are themselves
consumers of goods and services such as energy, food products, and cleaning items. Purchasing,
supporting, and investing in environmentally friendly products and conservation technologies
allow ecotourism enterprises to ‘vote with their dollar’, support environmentally friendly
businesses, and aid conservation goals more broadly (Hansen and Schrader, 1997; Shaw,
Newholm and Dickinson, 2006).
4.3 Conservation Evaluation Framework
Four key themes emerged as critical components of conservation evaluations that are needed to
develop an adequate evidence base for the use of ecotourism as a conservation mechanism: (1) a
systematic approach with (2) a clearly defined site selection rationale that utilises (3)
comparable conservation activities and (4) evidence-based evaluation criteria (Kleiman et al.,
2000; Tear et al., 2005; Ferraro and Pattanayak, 2006). These are here reframed as a series of
steps within the CE Framework to guide evaluations of the conservation contributions of
ecotourism sites, using the CA Matrix as a core foundational component (Figure 4.4). This
framework is not intended to be prescriptive or restrictive: it is a suggested guide that should be
modified or expanded as needed.
130

Chapter 4: Conservation Evaluation Framework (Research Component 1)
Figure 4.4 Conservation Evaluation Framework. Diamonds represent processes (numbered 1-5); rectangles represent products; ‘As and Os’ refers to ‘actions and outcomes’.
4.3.1 Site selection process The site selection process involves developing selection criteria for the inclusion or exclusion of
sites to be used in an evaluation. This could include, for example, sites within a specific
location, run under a specific operation model, or marketing specific wildlife as a key attractant.
Developing a predetermined site selection process is important in systematic evaluations to
avoid ‘cherry-picking’ sites that are already known to confirm or contradict the use of
ecotourism as a conservation mechanism. However, the use of techniques such as purposeful
sampling and random sampling are valid approaches, and selection criteria could be framed to
incorporate these. For example, selection criteria could require that the research team has access
to company documentation or has previously built a rapport with the operator or other key
stakeholders to ensure information-rich analyses.
4.3.2 Conservation Activities Matrix application process As described in Section 4.2, the CA Matrix covers the various conservation actions that may be
carried out by ecotourism enterprises, the conservation outcomes they may achieve, and the
131

Chapter 4: Conservation Evaluation Framework (Research Component 1)
direct and indirect relationship between these. As such, the CA Matrix provides a guide for
identifying and collating information on the conservation activities of ecotourism enterprises, a
check-list of conservation actions and outcomes to look for, and a template for recording data.
Additionally, the matrix is bidirectional: it can be used to determine the potential outcomes of a
known action or, conversely, to determine the various actions that can potentially achieve a
specified outcome.
Where possible, quantitative data should be included such as the extent of an outcome (e.g.
proportion of threatened species being protected, km2 cleared of weeds) or the effort exerted on
an action (e.g. person-hours or proportion of budget allocated). In the absence of adequate
quantitative data, dichotomous ‘presence/absence’ data may be used instead to indicate the
existence of each action-outcome, which could be converted to Likert scales when greater detail
is available. Supportive qualitative data may also be used to add depth to the analysis, such as
the individual species targeted by the site.
An evaluation could use all Conservation Items within the CA Matrix or might instead focus
only on a single item or group of items or, conversely, exclude a group of items. For example,
the community section of the CA Matrix may be of little value if a site is located in a remote
area with no resident local community. Although the absence of a local community may be
linked to historical displacement processes, there can be no community-based conservation
activities without a physically present resident community.
Conservation Items within the two meta-categories will usually require the use of vastly
different evaluation approaches and expertise. For example, adequate and reliable measures of
ecological Conservation Items generally require ecological fieldwork such as fauna surveys;
however, these approaches are often costly and time consuming, and are not viable options for
evaluating most socio-political items. Conversely, social science methods are valuable for many
social aspects of the ecotourism-conservation relationship such as visitor environmental
awareness (Fowler, 2014; Bryman, 2016), but are impractical for many of the ecological items.
This is because social science approaches such as questionnaires and interviews rely on the
perceptions of people which are subjective, difficult to quantify, and open to errors, bias, and
exaggeration (Sandy and John, 2011; Bernard, 2013; Tracy, 2013; Karlsson and Dolnicar,
2016). Wherever possible, a range of sources and methods should be used to cross-validate
evaluation results. Using human-wildlife conflict as an example, the combination of community
interviews with quantitative records of retaliation killings over several years would allow for
more accurate evaluations of the extent of human-wildlife conflict than relying on either
approach individually (Leech, 2007; Onwuegbuzie, Johnson and Collins, 2009).
132

Chapter 4: Conservation Evaluation Framework (Research Component 1)
The CA Matrix focuses predominantly on the terrestrial environment; however, many of the
Conservation Items can equally be applied to aquatic environments. For example, the
Conservation Item ‘increased resources for wildlife’ could also include in‐stream substrate
restoration, and the item ‘improved ecosystem health and ecological integrity’ could also
include improvements in stream health regarding turbidity and dissolved oxygen content
(Parrish et al., 2003; Hermoso and Clavero, 2013).
4.3.3 Amalgamation When evaluating multiple sites, and if sufficient data is available, findings for each
Conservation Item may be amalgamated across the sites to identify group contributions, such as
the total area of private land protected under conservation arrangements (as illustrated in
Section 5.4.1.1).
This step will generally be unnecessary if evaluating a single site, unless conducting a temporal
analysis with multiple evaluations over a period of time.
4.3.4 Comparisons and pattern analysis As stated in Section 4.3.2, findings may be quantified if sufficient data is available, or may be
reduced to binary or Likert-scale categories to allow for comparisons and pattern analysis across
sites or across Conservation Items. Additionally, data may also be amalgamated within groups
of sites for both explanatory and exploratory research. For example, Section 5.3.2 uses this
approach to reveal that of the ecotourism enterprises evaluated, those with larger properties
were more likely to reduce the extent of introduced fauna.
4.3.5 Conservation significance screening process All conservation activities are not of equal importance, and the same activities performed the
same way in two different contexts may carry unequal value. For example, the use of nesting
boxes on a degraded site may be more beneficial than on a well-preserved site with extensive
old growth forest and associated nesting hollows (Vesk et al., 2008; Lindenmayer et al., 2009).
It is therefore essential that the relevance of the conservation achievements identified through
the CA Matrix are evaluated within the specific environmental context using relevant
conservation priorities. This is here termed a ‘conservation significance screening process’.
These conservation priorities can come from a variety of sources such as key targets set by
governments, funding bodies, conservation practitioners, conservation organisations, ecotourism
operators, and so on. For example, Research Component 2 utilises a range of national
conservation priorities, directives and regulations to determine the relative importance of the
133

Chapter 4: Conservation Evaluation Framework (Research Component 1)
conservation activities of sites being evaluated (detailed in Section 3.4.5 and presented in
Section 5.4).
4.4 Demonstration application of the CE Framework application
An example of an evaluation guided by the CE Framework is presented here for three
Australian ecotourism enterprises, using a single Conservation Item for brevity.
4.4.1 Site selection The selection criteria for this application included sites that were:
(1) Previously identified as one of the 86 sites examined in this thesis (and therefore
certified with Ecotourism Australia);
(2) Located in Queensland;
(3) Known to be undertaking revegetation activities; and
(4) Known to provide varying levels of detail about their revegetation practices on their
websites (minimal, moderate and extensive).
Additionally, only one site was needed for each information level. Therefore, sites were chosen
at random from the list of 86 sites and checked against criteria 2, 3 and 4 until three appropriate
sites were selected: Capricorn Caves, Lillydale Farmstay and Mt Cotton Retreat.
4.4.2 Application of Conservation Activities Matrix Data were collected for a one-off static assessment using document analysis. For simplicity,
only a single information source was used for this demonstration: the websites of the three sites,
accessed in November 2017. Each website was explored in full and all relevant text excerpts
relating to the single Conservation Item (revegetation) were extracted (Table 4.7).
If this were an application of the entire CA Matrix, all direct and indirect outcomes of
revegetation (as presented in Table 4.1) would also be examined in relation to this action.
134

Chapter 4: Conservation Evaluation Framework (Research Component 1)
Table 4.7 Text excerpts relating to the revegetation practices of the three enterprises, extracted from company websites in November 2017
Site Revegetation excerpts from websites
Capricorn Caves1
Revegetation of degraded areas with native plants.
The rare fern Tectaria devexa var. devexa [sic], seen in cave entrances, was threatened with extinction in 2006 after decades of drought. A threatened species recovery program has helped stabilise the fragile species, but we continue to closely monitor all known fern sites.
Although widely distributed in Sri Lanka, Southeast Asia and Vanuatu, the Caves district is the only known site in Australia. This relic population at Capricorn Caves declined to near extinction in 2006 with only 21 plants remaining.
Our revegetation projects are drought tolerant and need no long term irrigation, as we use seeds collected on the property and germinated in the on site nursery.
Threatened Species Recovery Program to save fern Tectaria devexa var. devexa [sic] from extinction.
Greening Australia secured a grant under the Threatened Species Recovery Program in partnership with Queensland Herbarium, Griffith University and the Society for Growing Australian Plants. WWF also provided funding to support recovery efforts. • Stage one was to reproduce more ferns in a controlled environment at Heaton’s Nursery, Nambour. This was successfully achieved with the production of 700 ferns. • Stage two: maintenance of stock and reintroduction back into its natural habitat. The drought presented challenges together with the impact of hungry rock wallabies and scrub turkeys. Covering the fern with chicken wire prevented animal foraging. Higher rainfall in 2010 and 2011 resulted in [sic] increase in natural germination on the rock face. • Stage three is maintenance of stock, ongoing monitoring and documentation for future records and guidelines. Photographic monitoring is carried out on a six monthly interval.
Lillydale Farmstay2
We have set aside part of our property to encourage native flora to re-establish our traditional Softwood Vine Scrub vegetation.
Staff and guests have planted over 3000 trees in the last 10 years.
We also regularly plant trees throughout the property to reduce carbon, soil erosion and to regenerate the native species.
We also encourage you to sponsor a tree on the property to assist in the construction of our Koala Corridor and to help offset emissions created when you drive or fly to visit us.
[Caption under a picture of a koala] This little koala is typical of what we regularly spot in the trees lining our driveway outside the cabin. We are very encouraged to see that trees planted only 16 years ago are already having such a positive impact.
Mt Cotton Retreat3
Our busy weed management and revegetation programs are ongoing and help to enhance the ecological value of our site.
1http://capricorncaves.com.au/; 2http://www.lillydale.com.au/ (however, this website is no longer owned by Lillydale Farmstay); and 3https://www.mtcottonretreat.com/
135

Chapter 4: Conservation Evaluation Framework (Research Component 1)
4.4.3 Amalgamation The lack of detail obtained by using company websites as the only information source prevents
the revegetation activities from being quantified. However, it is possible to reduce the text
excerpts to a binary category of presence/absence: revegetation is classified as ‘present’ on all
three sites.
4.4.4 Comparison and pattern analysis Statistical analyses could be incorporated into this evaluation if a larger number of sites or
Conservation Items were examined. For example, the data could be analysed to determine if
larger sites are more likely to undertake revegetation activities, or if engaging with revegetation
activities increases the likelihood of a site also undertaking another Conservation Item.
4.4.5 Conservation significance screening The conservation significance screening process employed in this example used relevant
threatened species lists, priority interventions and targets, and Regional Ecosystem data under
relevant state and national legislation, policy and programs for each of the species and
ecosystems named by the sites in connection with their revegetation work.
The revegetation work undertaken by Capricorn Caves is deemed to be of high conservation
significance. In 2006 only 21 individual ferns of the subspecies Tectaria devexa var. devexa
existed in Australia, spread across six locations in a cave system located on the property of
Capricorn Caves (DEHP, 2017b). As a direct result of the efforts of Capricorn Caves in
conjunction with conservation organisations, the Queensland Government and a university, this
population has increased by nearly 3,800%.
The detail provided on the Lillydale Farmstay website allows for some level of evaluation
regarding the conservation significance. The extent of revegetation at 3,000 trees is low to
moderate for the property size of 200ha, particularly when compared with the vegetation density
of the surrounding uncleared land. Furthermore, Regional Ecosystem mapping from 2015
presents the site as cleared (Queensland Herbarium, 2015), and photographs on the company
website in November 2017 confirm that it is predominantly farmland, which will limit the area
of land available for revegetation activities. No floral species are listed by the site, and their
description of the vegetation type as “Softwood Vine Scrub” does not match an official
vegetation category (Neldner et al., 2017). However, it is clear that the revegetation activities
are targeted at establishing a corridor for koalas, which are listed as vulnerable at both a national
and state level (DEHP, 2017a). Furthermore, habitat destruction is the dominant threat for
136

Chapter 4: Conservation Evaluation Framework (Research Component 1)
koalas in this state, highlighting the importance of revegetating cleared farmland (DEHP,
2017a). Encouraging guests to assist in planting the koala corridor also increases the value of
this action. Therefore, revegetation activities at this site are estimated to be of moderate
conservation significance. However, additional information would be required to verify this.
The information provided by Mt Cotton Retreat is enough to confirm that they do undertake
revegetation activities. However, without details of the species planted, fauna targeted, the
number of trees or extent of planting, no evaluation of the impact can be made. That is not to
say that the revegetation actions of this site are not of conservation significance; this simply
means that there is insufficient evidence using this method of data collection to evaluate the
conservation significance of their revegetation activities.
137

Chapter 5: Conservation evaluation of private Australian ecotourism enterprises (Research Component 2)
5.1 Introduction
5.1.1 Context Chapter 4 expanded the conservation pathways models developed in Chapter 2 from the 12
actions and 8 outcomes that had been demonstrated in the academic literature to 27 actions and
26 outcomes that could potentially be undertaken by ecotourism enterprises. This chapter
identifies which of these are undertaken by Australian ecotourism enterprises and evaluates their
contributions to national conservation priorities.
Due to the evolution of the CA Matrix throughout the project, an earlier version of the matrix
was used for this research component which differs slightly from the version presented in
Chapter 4. As such, this chapter utilises 57 Conservation Items consisting of 30 actions and 27
outcomes.
5.1.2 Thesis structure As explained in Section 3.2, the multiple interlinked research approaches of this thesis are
presented as three discrete components (Figure 5.1).
Figure 5.1 Conceptual depiction of the three interlinked research components highlighting the location and function of this chapter within the thesis (modified from Figure 3.1 in Chapter 3).
138

Chapter 5: Evaluation of ecotourism enterprises (Research Component 2)
This chapter provides the results of Research Component 2 which utilises the Conservation
Activities Matrix (‘CA Matrix’) and the Conservation Evaluation Framework (‘CE
Framework’) developed in the previous chapter to address the following research objectives:
Research Objective 3
Evaluate the conservation activities of a set of Australian ecotourism enterprises certified with Ecotourism Australia (‘EA’).
Research Objective 4
Identify if patterns exist between the conservation practices of a set of Australian ecotourism enterprises and their enterprise characteristics such as the size of the property and age of the business.
5.1.3 Chapter structure This chapter uses a pragmatic approach to present the data in the most appropriate way while
broadly adhering to the structure of the CE Framework (Figure 5.2). Section 5.2 provides an
overview of the sites selected for this study; Section 5.3 examines patterns among sites and their
conservation practices; and Section 5.4 explores the conservation significance of these practices.
Additionally, Section 5.5 identifies and discusses some of the conservation challenges and
innovations reported by sites. The amalgamation of conservation activities for all Conservation
Items (process 3 of the CE Framework, Section 4.3) is presented in Appendix C and Appendix
D due to the volume of information. To ensure confidentiality, details of site activities prior to
the amalgamation process are not included in the thesis.
Figure 5.2 Components of the CE Framework covered by this research component.
139

Chapter 5: Evaluation of ecotourism enterprises (Research Component 2)
As highlighted in Section 4.2, the Conservation Items in the CA Matrix can be grouped into
ecological and socio-political meta-categories, and this is the approach taken here. The
ecological group incorporates the items within the biophysical landscape (‘biophysical’) and
fauna categories. The socio-political group incorporates the items within the visitor, community,
and organisational/political categories.
5.2 Sites
At the time of site selection in early 2016, there were 86 ecotourism enterprises meeting the site
selection criteria outlined in Section 3.4.1. These sites are located predominantly along the
coastline of Australia (Figure 5.3), where most of the Australian population resides. The state of
Queensland had the largest number of sites (37), followed by South Australia (15) and New
South Wales (10).
Figure 5.3 Location of the 86 sites used in this study (numbers in circles indicate multiple sites within close proximity).
Sites ranged from 6 to 90 years of age with properties between 1ha and 70,000ha; however, the
majority were 10-24 years old and situated on properties smaller than 100ha, with turnovers less
than AU$1,000,000 (Figure 5.4). Sites were distributed fairly evenly across guest capacity
140

Chapter 5: Evaluation of ecotourism enterprises (Research Component 2)
categories and biomes. Older sites were more likely to have larger turnovers (F = 7.66; df =
2,79; p<0.001) and larger guest capacities (F = 3.98; df = 2,83; p <0.05); and sites with larger
guest capacities were more likely to have larger turnovers (F = 9.94; df = 4,77; p <0.001).
*R=Rainforest, C=Coastal, M=Mountain/alpine, A=Arid/grassland/desert, B=Bushland, I=Island, T=Temperate, and W=Wetland
Figure 5.4 Proportion of sites within each category of site characteristics (n=86)
5.3 Conservation trends
5.3.1 Frequencies Across the 86 sites the most commonly undertaken ecological actions were weed removal
(100%), revegetation (100%) and rubbish clean-up (94%) (Table 5.1). On average, biophysical
actions (M = 51, SD = 31) were undertaken by more sites than fauna actions (M = 31, SD = 26).
Only 63% of biophysical actions and 33% of fauna actions were undertaken by more than half
of the sites. The most commonly reported ecological outcome was increased ecological
connectivity and corridors (70%), followed by improved habitat quality and/or extent (45%).
The remaining 13 outcomes were reported by fewer than 20% of sites. Overall, ecological
actions (M = 42, SD = 31) were reported on more frequently than outcomes (M = 13, SD = 18).
R C M A B I T W
<10 10-24 ≥25
<$250,000 $250,000 - $1M $1M - $5M >$5M
<10 10-29 30-59 60-99 ≥100
<5 5-19 20-99100-999
1,000-9,999
≥10,000
0% 10% 20% 30% 40% 50% 60% 70% 80% 90% 100%
Biome*
Area(ha)
GuestCapacity(people)
Turnover($AU)
Age(years)
141

Chapter 5: Evaluation of ecotourism enterprises (Research Component 2)
Table 5.1 Proportion of ecological actions and outcomes undertaken by each site (n = 86)
Category Conservation Items # %
Actions
Biophysical Actions to remove non-native floral species 86 100 Revegetation 86 100 Pollution/rubbish clean-up 84 98 Established a protected area 54 63 Converted degraded land to ecotourism site 45 52 Actions to control erosion 42 49 Ecological fire management 7 8 Propagation of a threatened species 3 3
Mean: 51 (SD = 31) Fauna Actions to control non-native fauna species 66 77
Monitoring 59 69 Increased wildlife resources/nest sites 40 47 Veterinary services, disease control & wildlife care 13 15 Translocation 4 5 Breeding/head starting programs 3 3
Mean: 31 (SD = 26) Outcomes
Biophysical Increased ecological connectivity and corridors 60 70 Increased extent and quality of habitat 55 64 Increased rates of carbon capture 15 17 Reduction in extent of non-native flora species 11 13 Eradication of non-native flora species 6 7 Increased ecological integrity, resilience and health 4 5 Reduced erosion 4 5 Improved floral genetic and species diversity 3 3 Decreased habitat loss and fragmentation 0 0
Mean: 18 (SD = 22) Fauna Reduced non-native faunal species 13 15
Improved wildlife numbers 10 12 Reduced unnatural competition or predation 6 7 Eradicated non-native faunal species 5 6 Increased faunal genetic diversity 4 5 Increased fauna health and population resilience 0 0
Mean: 6 (SD = 4.2)
The most common socio-political actions were undertaken by 100% of the 86 sites:
environmental interpretation for visitors, employee environmental education and training,
support for conservation organisations or projects, and environmentally-friendly purchasing
(Table 5.2). On average, organisational/political actions (M = 62, SD = 33) were undertaken by
more sites than community actions (M = 56, SD = 34). The most commonly reported socio-
142
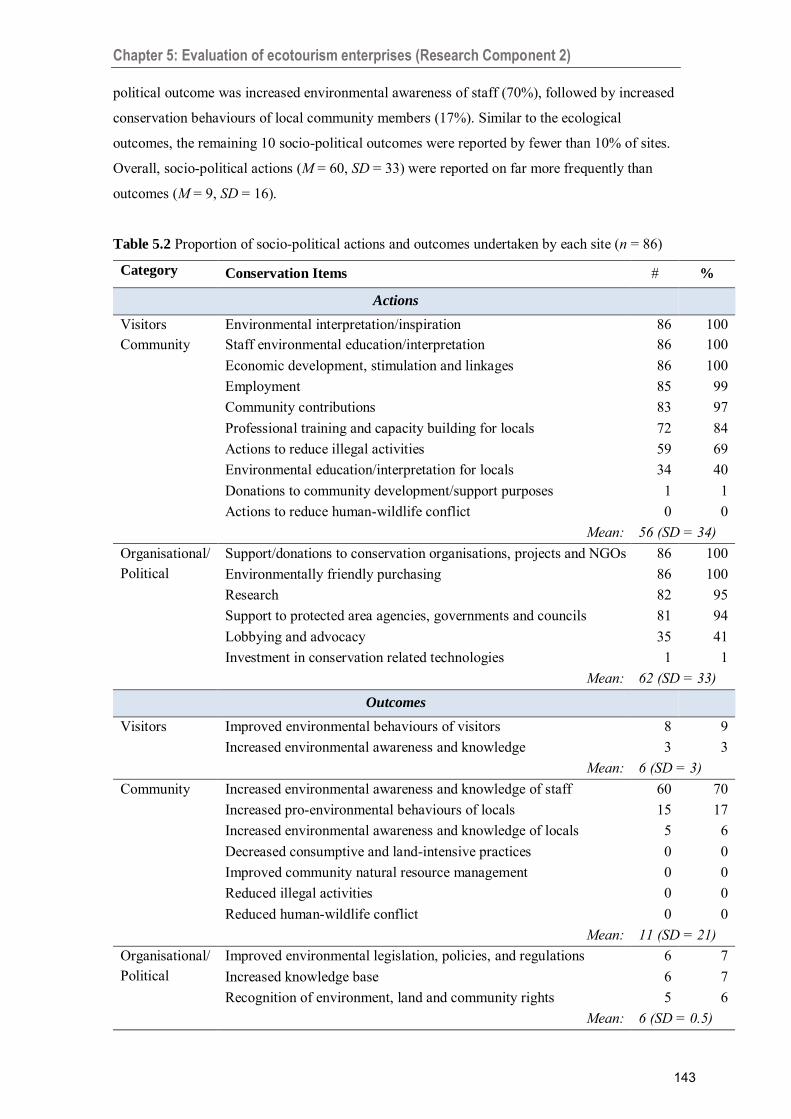
Chapter 5: Evaluation of ecotourism enterprises (Research Component 2)
political outcome was increased environmental awareness of staff (70%), followed by increased
conservation behaviours of local community members (17%). Similar to the ecological
outcomes, the remaining 10 socio-political outcomes were reported by fewer than 10% of sites.
Overall, socio-political actions (M = 60, SD = 33) were reported on far more frequently than
outcomes (M = 9, SD = 16).
Table 5.2 Proportion of socio-political actions and outcomes undertaken by each site (n = 86)
Category Conservation Items # %
Actions
Visitors Environmental interpretation/inspiration 86 100 Community Staff environmental education/interpretation 86 100
Economic development, stimulation and linkages 86 100 Employment 85 99 Community contributions 83 97 Professional training and capacity building for locals 72 84 Actions to reduce illegal activities 59 69 Environmental education/interpretation for locals 34 40 Donations to community development/support purposes 1 1 Actions to reduce human-wildlife conflict 0 0
Mean: 56 (SD = 34) Organisational/ Political
Support/donations to conservation organisations, projects and NGOs 86 100 Environmentally friendly purchasing 86 100 Research 82 95 Support to protected area agencies, governments and councils 81 94 Lobbying and advocacy 35 41 Investment in conservation related technologies 1 1
Mean: 62 (SD = 33) Outcomes
Visitors Improved environmental behaviours of visitors 8 9 Increased environmental awareness and knowledge 3 3
Mean: 6 (SD = 3) Community Increased environmental awareness and knowledge of staff 60 70
Increased pro-environmental behaviours of locals 15 17 Increased environmental awareness and knowledge of locals 5 6 Decreased consumptive and land-intensive practices 0 0 Improved community natural resource management 0 0 Reduced illegal activities 0 0 Reduced human-wildlife conflict 0 0
Mean: 11 (SD = 21) Organisational/ Political
Improved environmental legislation, policies, and regulations 6 7 Increased knowledge base 6 7 Recognition of environment, land and community rights 5 6
Mean: 6 (SD = 0.5)
143

Chapter 5: Evaluation of ecotourism enterprises (Research Component 2)
5.3.2 Patterns among sites
5.3.2.1 Ecological Indices
The indices for both the biophysical and fauna aggregate Conservation Items were on average
quite low: 0.39 (SD = 0.12) and 0.22 (SD = 0.15) respectively, across all 86 sites. A breakdown
of these indices by actions and outcomes shows that the low outcome frequencies are impacting
the low overall indices for both categories (Table 5.3). The fauna index had the greater range,
and there was only a moderate correlation between these two categories among sites (R = 0.495,
p<0.001).
Table 5.3 Average biophysical and fauna indices across the 86 sites
Mean SD Range Actions Outcomes
Biophysical 0.39 0.12 0.18 – 0.71 0.59 (± 0.16) 0.20 (± 0.15)
Fauna 0.22 0.15 0.00 – 0.75 0.36 (± 0.21) 0.07 (± 0.15)
Indices and site characteristics
Comparisons of individual site fauna indices with site characteristics revealed that only property
size generated significant associations: there were generally significantly higher indices for
larger properties than smaller properties as revealed by an LSD post-hoc test after the initial
ANOVA revealed there were differences (F = 2.46; d.f. = 5,80; p < 0.05) (Figure 5.5). There
were no significant associations between site characteristics and the individual site biophysical
indices.
Figure 5.5 Standard error plot of fauna indices for sites within the six property categories.
0.000
0.100
0.200
0.300
0.400
0.500
0 1 2 3 4 5 6 7 1,000- >10,000ha 10,000ha
<5ha 5-20ha 20-100ha 100- 1,000ha
144

Chapter 5: Evaluation of ecotourism enterprises (Research Component 2)
Conservation Items and site characteristics
Of the 65 relationships between the 1330 ecological Conservation Items and site characteristics
that were examined with chi-squares, only two showed a significant association after the first
Bonferroni correction was applied (α = 0.0007): sites with properties larger than 20ha were
more likely to establish a protected area31 than smaller sites; and sites in mountainous/alpine
biomes and on islands were less likely to improve habitat connectivity (Table 5.4). Property size
was the most influential characteristic across all adjustment levels, with larger properties
significantly associated with an increased likelihood of sites undertaking a range of
conservation activities.
Table 5.4 Significant associations between site characteristics and ecological Conservation Items
Site
characteristic
Direction (more
/less likely) Conservation Item p value
Bonferroni
correction1
Property size
>1,000ha More likely to… Reduce invasive fauna 0.00001 α = 0.0007 (1)
>10,000ha More likely to… Increase wildlife numbers 0.0024 α = 0.003 (2)
>20ha More likely to… Veterinary actions 0.0012 α = 0.003 (2)
>20ha More likely to… Established PA 0.004 α = 0.01 (3)
100-10,000ha Less likely to… Convert degraded land 0.04 None
Age
<25 years More likely to… Resources/nest sites 0.028 None
Turnover
<$1,000,000 More likely to… Improved habitat 0.041 None
<$250,000 More likely to… Veterinary services 0.012 None
Biome
Island & Alpine Less likely to… Habitat connectivity 0.0001 α = 0.0007 (1)
Bush & temperate Less likely to… Reduced invasive fauna 0.002 α = 0.003 (2) 1Four levels of Bonferroni corrections were used (see Section 3.4.4.1 for details).
5.3.2.2 Socio-political Indices
The average indices for both the community and political aggregate Conservation Items were
higher than the ecological indices but still moderately low across the 86 sites: 0.43 (SD = 0.08)
and 0.50 (SD = 0.11), respectively. As with the ecological indices, the low socio-political
30 13 ecological Conservation Items undertaken by 10-90% of sites (Section 3.4.4.1). 31 Referring to protection level categories 1 and 2 as explained in Section 5.4.1.1.
145

Chapter 5: Evaluation of ecotourism enterprises (Research Component 2)
outcome frequencies also lower the mean (Table 5.5). The political index had a slightly larger
range than the community index, and the correlation between these two categories among sites
was slightly weaker than the ecological categories (R = 0.399, p<0.001).
Table 5.5 Average community and political indices across the 86 sites
Mean SD Range Actions Outcomes
Community 0.43 0.08 0.13 – 0.63 0.65 (± 0.011) 0.13 (± 0.010)
Political 0.50 0.11 0.33 – 0.89 0.72 (± 0.011) 0.07 (± 0.020)
Indices and site characteristics
There were no significant associations between site characteristics and the individual site
community or political indices.
Conservation Items and site characteristics
Of the 30 relationships between the six32 socio-political Conservation Items and site
characteristics that were examined with chi-squares, only three were found to have significant
associations (Table 5.6). These results show that sites in rainforest, bushland and temperate
biomes were less likely to have reported increased environmental awareness of staff (p<0.001);
sites with guest capacities lower than 10 guests were more likely to undertake actions to reduce
illegal activities (p<0.01); and sites that had been established for more than 5 years were more
likely to undertake actions to increase the environmental awareness of the local community
(p<0.05).
Table 5.6 Significant associations between site characteristics and socio-political Conservation Items
Site characteristic Direction (more
/less likely) Conservation Item p value
Bonferroni
correction1
Bushland, rainforest & temperate biomes Less likely to… Increased staff
environmental awareness 0.00001 α = 0.001 (1)
<10 guests More likely to… Act to reduce illegal activities 0.006 α = 0.008 (2)
>5 years More likely to… Community environmental interpretation 0.027 None
1Four levels of Bonferroni corrections were used (see Section 3.4.4.1 for details).
32 Six socio-political Conservation Items undertaken by 10-90% of sites (Section 3.4.4.1).
146

Chapter 5: Evaluation of ecotourism enterprises (Research Component 2)
5.3.3 Patterns among Conservation Items
5.3.3.1 Ecological Jaccard indices calculated for the 91 relationships between each of the 14 individual ecological
actions revealed just 22 relationships with an association above 50%. The same 7 actions were
involved in all 22 relationships and were predominantly minimal and moderate effort actions
which do not necessarily require extensive resources or expertise such as revegetation, weed
removal and rubbish clean-up (Figure 5.6). Three of the extensive effort actions also had
associations above 25%, suggesting a similar level of expertise or conservation ethic for each of
these. Jaccard indices were also calculated for the 78 relationships between each of the 13
individual ecological outcomes reported by at least one site33, with just a single relationship
showing an association above 50%: ‘increased corridors/habitat connectivity’ and ‘improved
vegetation density/reforestation’ (Js = 0.74). No significant associations were identified
between the groups of biophysical and fauna actions and the five site characteristics.
Figure 5.6 MDS of similarities between ecological actions grouped by level of effort, using three levels of clustering: 25%, 50% and 75%.
33 Two outcomes were excluded (from the list of 15) as they were not reported by any sites: ‘increased fauna health and population resilience’ and ‘decreased habitat loss and fragmentation’ (Table 5.1).
PA = established PA; W = weed removal; V = revegetation; DL = turned degraded land into ecotourism; Pr = propagation of at-risk species; FM = fire management; C = rubbish clean-up; E = effort to reduce erosion; B = breeding programs; T = translocation; VS = veterinary services; P = pest removal; M = monitoring; and R/N = resources/nest management.
147

Chapter 5: Evaluation of ecotourism enterprises (Research Component 2)
5.3.3.2 Socio-political Jaccard indices calculated for the 105 relationships between each of the 15 socio-political
actions reported by at least one site34 revealed 55 relationships with an association above 50%.
Due to the large disparity in frequencies across the socio-political actions, the MDS highlights
that the two actions with very low (<2%) frequencies (‘financial donations for community
development’ and ‘investments in conservation technologies’) are very dissimilar to the other
thirteen actions (Figure 5.7). Jaccard indices were also calculated for the 28 relationships
between each of the eight socio-political outcomes reported by at least one site35; however, due
to the very low frequencies across all but one outcome, no relationship had an association above
0.33.
Figure 5.7 MDS of similarities between all socio-political actions reported by at least one site, using three levels of clustering: 25%, 50% and 75% (with 13 actions clumped in the middle).
5.4 Conservation Contributions
The conservation significance screening process is the fifth step in the CE Framework (Figure
5.2). As detailed in Section 3.4.5, this step explores the importance of the conservation activities
34 One action was excluded (from the list of 8) as it was not reported by any site: ‘actions to reduce human-wildlife conflict’ (Table 5.2). 35 Four outcomes were excluded (from the list of 12) as they were not reported by any site (Table 5.2).
148

Chapter 5: Evaluation of ecotourism enterprises (Research Component 2)
of the 86 sites within the context of national conservation priority areas. Table 5.7 provides a
list of the key national conservation directives that are referred to in this section.
Table 5.7 Explanation of national conservation directives referred to in this section
Item Explanation Thesis section with
relevant details
National Conservation Agenda (NCA)
Eight key national conservation policies
Section 2.6.2.2 and Section 3.2.3.2
National Conservation Threats (NCTs)
Key Threatening Processes, Threat Abatement Plans, and Weeds of National Significance
Section 3.2.3.3
2016 State of the Environment Report
The most recent release of the five-yearly national environment reports
Section 3.4.5 and listed as Jackson et al. (2017) in the reference list
National Recovery Plans and migratory species lists
Directives under EPBC Act 1999
Section 2.6.2.1
Threatened species lists Lists of at-risk species under national, state and territory legislation
Section 3.4.5
All but two of the Conservation Items from the CA Matrix are covered in the NCA (discussed
further in Section 6.3.2). As such, this section provides a synthesis of the key site contributions
to the national conservation goals and priorities of the NCA, both as a group and as individual
operations where appropriate.
5.4.1 Ecological contributions The full summary of site activities for each ecological Conservation Item can be found in
Appendix C.
5.4.1.1 Protected areas The 2016 State of the Environment Report highlights that half of all critically endangered
communities have less than 5% of their extent represented in the National Reserve System
(Jackson et al., 2017), and increasing the extent of protected areas on both public and private
land is a key focus of the Reserve Strategy and the broader NCA. It is therefore of conservation
149

Chapter 5: Evaluation of ecotourism enterprises (Research Component 2)
significance that 54 sites (63%) operate on properties with a formal nature conservation
approach as evidenced by a “nature refuges declaration” or “conservation agreement with the
relevant State or Commonwealth nature conservation agency”36 (Table 5.8). These covenanted
properties varied in size from 1ha to 70,000ha and when combined covered over 240,000ha37.
Although most covenants provide in-perpetuity protection, only 25 of these sites (covering over
150,000ha) gave enough detail to verify this. As shown in Table 5.8, these were therefore
categorised as Protection Level 1 (PR-1). Without this verification, the remaining 29 sites with
formal protection arrangements were categorised as PR-2. Table 5.8 also differentiates between
the 12 sites that provided additional commentary regarding the protective arrangements and the
17 sites that simply ticked the relevant box in the EA Questionnaire. Sites without formal
protection arrangements (PR-3) covered an additional 21,000ha, with 12 of these sites
registering their combined 4,600ha with non-legally binding conservation programs such as
Land for Wildlife.
These PR levels are also used in the following section covering site activities for at-risk species.
Table 5.8 Number and size of sites within each protection level category
Type PR1
Level Details
#
sites
Total
area (ha)
Legally binding
1 In-perpetuity conservation covenant 25 151,894
2 (a) Exact nature of covenant could not be determined; however, sites gave additional details such as “the whole property is managed for nature conservation”.
12 88,128
(b) Exact nature of protection arrangement could not be determined, and sites did not provide any other information on protection measures.
17 1,728
Not legally binding
3 (a) Conservation commitment e.g. property registered with a non-legally binding mechanism such as Land for Wildlife.
12 4,597
(b) No information was provided about any protection measures.
20 16,618
1PR Level = Protection level assigned to each site based on the details provided. Where properties had multiple conservation agreements, the more legally binding agreement was used to assign the protection level.
36 Text extract from EA Questionnaire. 37 However, just three sites contribute 185,000ha of this total.
150

Chapter 5: Evaluation of ecotourism enterprises (Research Component 2)
These properties contain a variety of habitats and areas of significance under the EPBC Act
1999 and international agreements listed in Section 2.6.1 including a Biosphere Reserve (Site
23), part of the East Asian-Australasian Flyway (Site 24), and Ramsar listed wetlands (Site 33).
Additionally, Site 23 makes up over 13% of a 383,900ha block of intact mallee, one of the
largest contiguous areas of this habitat in Australia and one of just five areas on the national
Register of Critical Habitat under the EPBC Act 1999.
5.4.1.2 At-risk species Since European settlement in Australia 130 species have been declared extinct, and an
additional 449 faunal species, 1,318 floral species, and 81 ecological communities are at risk as
at October 2018 (DEE, 2015; 2019b). Furthermore, increases in these figures have been
reported in all State of the Environment Reports since the inaugural report in 1996. It is
therefore of conservation significance that many sites undertook activities targeted to achieving
conservation outcomes for threatened species. Sites reported 53 species by name that could be
confirmed as at-risk species. These are summarised in Table 5.9 along with the sites that target
these species and the conservation activities undertaken. Some of the activities included in this
table are discussed in additional sections of this chapter where relevant, such as the control of
non-native fauna in Section 5.4.1.4.
Additionally, many sites referred broadly to at-risk species without providing names. For
example, Site 23 reported protecting breeding populations of 18 ‘threatened’ bird species,
although only six of these are listed by name and could therefore be verified and included in
Table 5.9.
Increases in native wildlife populations were reported by just 10 sites (12%). Four sites (10, 12,
17, 43) had also seen the return of native fauna species that had not been present on the
properties prior to their conversion to ecotourism (Table 5.9), including the southern cassowary
(Site 17), several species of antechinus (Site 10), and the northern quoll (Site 43). Site 12 did
not name a specific species; however, they reported “continuously seeing new fauna species on
the property, which can only be a result of the increase in native food plants that have been
planted over the past 15 years”.
151

Chapter 5: Evaluation of ecotourism enterprises (Research Component 2)
Table 5.9 Threatened species and associated conservation actions of the 86 Australian ecotourism sites
Scientific name Common name Threat status
Actions3 Sites Land
(ha)4 Additional details Aus1 State2
Mammals
Antechinus minimus maritimus
Swamp antechinus V VIC: T PR-1, PR-2, IN, M, NE, CD
10, 45 75 Reported as not present on Site 10 until owners purchased and rehabilitated the land
Bettongia penicillata ogilbyi
Woylie EN (CR)
WA: CR PR-1, IN, TR, CD, BT
25 41 Species has a National Recovery Plan; on the 20 Mammals by 2020 national priority list; 20 individuals successfully released into the 41ha predator-proof enclosure on Site 25 from a local breeding program
Cercartetus concinnus Western pygmy possum
LC SA: LC Reg: R
PR-1, M, NE 23 54,000
Dasyurus hallucatus Northern quoll EN NT: CR PR-1, CD, NE 43 70,000 Species has a National Recovery Plan
Dasyurus maculatus maculatus (south-eastern mainland population and Tasmanian population)
Spotted-tailed quoll, tiger quoll
EN VIC: T PR-2, IN, M, TR,
RE, BT, CD, CC 10 69 Both populations are of the same subspecies and both have
National Recovery Plans; Site 10 has 3 resident quolls which are (1) part of a captive breeding network maintaining genetic health as an insurance population, and (2) used to train detection dogs for monitoring
NSW: V PR-3, CD 16 7 V TAS: R PR-1 18 41
Isoodon obesulus obesulus
Southern brown bandicoot
EN VIC: T PR-1, IN, M, RE, CO
36 10
Mastacomys fuscus mordicus
Broad-toothed rat V VIC: T PR-2, M, RE, NE, CD
10 69 Reported as not present on site until owners purchased and rehabilitated the land
Perameles gunnii Victorian subspecies
Eastern barred bandicoot
EN VIC: T PR-1, IN, BT 21 57 Species has a National Recovery Plan; is on the 20 Mammals by 2020 national priority list; Site 21 reported 10 years of eradication efforts to ensure a predator-free island – 16 bandicoots (bred as part of gene pool widening project) were released in 2015; Site 21 continues to manage the 57ha site and bandicoot numbers have increased to over 100 individuals, representing 8.5% of total Australian mainland population.
152

Chapter 5: Evaluation of ecotourism enterprises (Research Component 2)
Scientific name Common name Threat status
Actions3 Sites Land
(ha)4 Additional details Aus1 State2
Petaurus australis Yellow-bellied glider N/A (NT)
VIC: LC PR-2, M, NE, CD 10 69 Reported as not present on Site 10 until owners purchased and rehabilitated the land
Petrogale xanthopus xanthopus
Yellow-footed rock wallaby
V SA: V Reg: R
PR-1, IN, M, TR, RE, N+
2 61,000 Reported as one of the most secure populations in the region due to habitat protection and the reduction of foxes (predator) and goats (competitor)
Phascolarctos cinereus Koala V
QLD: V PR-1, PR-3, M, TR, CC, GU
5, 26, 28
4,940
NSW: V PR-3, TR, CD, CC
27, 29 665
VIC: LC PR-1, PR-2, M, TR, RE, VR, CD, CC, CO
10, 21 1,874 Site 10 is part of a habitat connectivity project across multiple properties
Potorous tridactylus tridactylus
Long-nosed potoroo V VIC: T PR-2, M, RE, CD 10 69
Sarcophilus harrisii Tasmanian devil EN TAS: EN PR-1, PR-2, PR-3, M, VR, RE
18, 34, 62, 83
263
Sminthopsis crassicaudata
Fat-tailed dunnart LC SA: LC Reg: NT
PR-1 23 54,000
Tachyglossus aculeatus multiaculeatus
Kangaroo Island echidna
EN SA: LC Reg: NT
PR-1, M, RE 30 360
Lasiorhinus latifrons Southern hairy-nosed wombat
LC SA: LC Reg: NT
PR-3 64 3,000
Birds
Acanthiza iredalei iredalei (western form)
Slender-billed thornbill
LC SA: R Reg: CR
PR-1 2 61,000
Amytornis striatus Striated grasswren LC SA: R Reg: EN
PR-1 23 54,000
Amytornis merrotsyi Short-tailed grasswren
V SA: LC Reg: R
PR-1, RE 2 61,000
153

Chapter 5: Evaluation of ecotourism enterprises (Research Component 2)
Scientific name Common name Threat status
Actions3 Sites Land
(ha)4 Additional details Aus1 State2
Ardenna tenuirostris Short-tailed shearwater
LC* VIC: LC PR-1, IN, M, RE, VR
21 1,805 Listed under CAMBA, JAMBA, ROKAMBA, and EPBC Migratory Species List
Callocephalon fimbriatum
Gang-gang cockatoo LC NSW: V PR-3, N+ 6 6.5
Calyptorhynchus lathami halmaturinus (South Australian subspecies)
Glossy black-cockatoo
EN SA: EN PR-1, M, TR, RE, CO, GU
30, 37, 41
683
Calyptorhynchus lathami Glossy black-cockatoo
LC QLD: V PR-1, PR-3, TR, M, RE, CO
1, 12, 26
68
Casuarius casuarius johnsonii
Southern cassowary (wet tropics)
EN QLD: EN PR-1, PR-2, PR-3, M, TR, RE, CC
4, 8, 17, 40, 54
207 On the 20 Birds by 2020 national priority list; species has a National Recovery Plan; Site 4 collects scats and data for State Government research project
Cyclopsitta diophthalma coxeni
Coxen's fig-parrot EN QLD: EN PR-3, M 74 3 Has QLD and NSW recovery plans (species is restricted to south-east QLD and north-east NSW)
Cyclopsitta diophthalma macleayana
Macleay's fig-parrot LC QLD: V PR-1 17 93
Erythrura gouldiae Gouldian finch EN QLD: EN PR-1, IN, IV, TR, M, RE, BT, CO
24 2,000 Species has a National Recovery Plan; Site 24 breeds, tags and releases up to 100 finches annually
Erythrura trichroa Blue-faced parrot-finch
N/A QLD: NT PR-1 17 93
Eudyptula minor Little penguin LC
SA: LC Reg: EN
TR 37 N/A Not on site
VIC: LC PR-1, IN, M, VR, TR, RE
21 1,805
Hylacola pyrrhopygia parkeri
Chestnut-rumped heathwren
EN VIC: T PR-1, IN, M, RE, CO
36 10 Species has a Regional Recovery Plan
Leipoa ocellata Malleefowl V SA: V Reg: EN
PR-1, M, RE 23 54,000 On the 20 Birds by 2020 national priority list; species has a National Recovery Plan
154

Chapter 5: Evaluation of ecotourism enterprises (Research Component 2)
Scientific name Common name Threat status
Actions3 Sites Land
(ha)4 Additional details Aus1 State2
Lophochroa leadbeateri Major Mitchell cockatoo
N/A SA: R Reg: EN
PR-1 23 54,000
Macronectes giganteus Southern giant petrel EN* VIC: T PR-1, VR 21 1,805 Listed under the Bonn Convention (A2S) and EPBC Migratory Species List; species has a National Recovery Plan
Manorina melanotis Black-eared miner EN SA: EN Reg: EN
PR-1, IN, M, TR, RE, N+, BT
23 54,000 Species has a National Recovery Plan Site 23: translocated 8 colonies to supplement genetically isolated populations elsewhere in the state; is part of a network that protects two-thirds of remaining population (including habitat listed on the Register of Critical Habitat)
Neophema elegans Elegant parrot LC SA: R Reg: R
PR-2, M, RE 15 15,000
Ninox strenua Powerful owl LC QLD: V PR-1, M 26 20
NSW: V PR-3, N+ 6 6.5
Numenius madagascariensis
Eastern curlew CR* VIC: T PR-1, M, RE 21 1,805 Listed under the Bonn Convention (A1), CAMBA, JAMBA, ROKAMBA and EPBC Migratory Species List
Pachycephala rufogularis
Red-lored whistler V SA: R Reg: CR
PR-1, RE 23 54,000 Species has a National Recovery Plan
Pachyptila turtur subantarctica
Fairy prion V VIC: LC PR-1, VR 21 1,805
Poephila cincta cincta Black-throated finch EN QLD: EN PR-1 24 2,000 Species has a National Recovery Plan Polytelis anthopeplus monarchoides
Regent parrot V SA: V Reg: EN
PR-1, PR-2, TR 33, 23 55,700 Species has a National Recovery Plan
Thalasseus bergii Crested tern LC* VIC: LC PR-1, VR 21 1,805 Listed under JAMBA & EPBC Migratory Species List
Thinornis rubricollis rubricollis
Hooded plover V VIC: T Reg: V
PR-1, IN, M, RE, GU, CO
21, 45 1,811 On the 20 Birds by 2020 national priority list; Site 21 has been monitoring the population since the 1980s through nest records and tagging chicks TAS: V PR-2, M, N+ 62 140
155

Chapter 5: Evaluation of ecotourism enterprises (Research Component 2)
Scientific name Common name Threat status
Actions3 Sites Land
(ha)4 Additional details Aus1 State2
Turnix olivii Buff-breasted button-quail
EN QLD: EN PR-1, RE 24 2,000 Species has a National Recovery Plan
Reptiles, arthropods, amphibians and fishes
Vermicella annulata Common bandy bandy
LC SA: R Reg: LC
PR-1 23 54,000
Natator depressus Flatback turtle V* WA: V PR-3, M 9 N/A Listed under the Bonn Convention (A2H) and EPBC
Migratory Species List NT: LC PR-3 50 N/A Chelonia mydas Green turtle V* NT: LC PR-3 50 N/A Listed under the Bonn Convention (A1 and A2S) and
EPBC Migratory Species List Eretmochelys imbricate Hawksbill turtle V* NT: V PR-3 50 N/A Listed under the Bonn Convention (A1 and A2S) and
EPBC Migratory Species List Litoria serrata Tapping green-eyed
frog LC QLD: V PR-1 17 N/A
Ornithoptera richmondia Richmond birdwing butterfly
LC QLD: V PR-2, TR, CC 31, 32 19 Both sites are part of a landowner network that plants corridors of the near threatened Richmond birdwing vine (Pararistolochia praevenosa), the only vine on which the butterfly can lay its eggs
Astacopsis gouldi Giant freshwater crayfish
V TAS: V PR-2, M 83 N/A
Mogurnda clivicola Flinders Ranges purple-spotted gudgeon
V SA: LC Reg: CR
PR-1 2 N/A
Mobula alfredi Reef manta ray LC (V)*
QLD: LC M, GU 38 N/A Listed under the Bonn Convention (A1, A2S) and EPBC Migratory Species List
Mobula birostris Giant manta ray LC (V)*
QLD: LC M, GU 38 N/A Listed under the Bonn Convention (A1, A2S) and EPBC Migratory Species List
Flora
Acacia araneosa Spidery wattle VU SA: EN PR-1, AC 2 61,000
156

Chapter 5: Evaluation of ecotourism enterprises (Research Component 2)
Scientific name Common name Threat status
Actions3 Sites Land
(ha)4 Additional details Aus1 State2
Allocasuarina emuina Emu Mountain Sheoak
EN QLD: EN PR-3, PL 12 13 Species has a National Recovery Plan
Codonocarpus pyramidalis
Slender bell-fruit VU SA: EN PR-1 2 61,000
Eucalyptus camaldulensis
River red gum LC SA: LC Reg: NT
PR-2, AC 33 1,700
Eucalyptus leucoxylon ssp. leucoxylon
South Australian blue gum
LC SA: LC Reg: NT
PR-3, PL 70 101
Eucalyptus viminalis ssp. viminalis
Manna gum LC SA: Rare PR-3, PL 70 101
VIC: LC PR-2, PL 10 69
Pararistolochia praevenosa
Richmond Birdwing Vine
LC QLD: NT PR-2, PL 31, 32 19 Both sites are part of a landowner network that plants corridors of the vine
Tectaria devexa - EN QLD: EN PR-1, PL, AC 22 33 Propagated and planted ~800 individuals, represents 100% of total population
1Threat status is sourced from listings under the EPBC Act 1999, with IUCN Red List 2018 status included in brackets if this is a higher threat level than the national level. Additionally, a star (*) next to the threat status indicates the species is listed under an international agreement such as the Bonn Convention; 2State threat status under relevant state legislation (detailed in Section 3.4.5), includes regional status (‘reg’) if state status differs or doesn’t exist; 3Action codes are as follows: PR = protection level, as detailed in Table 5.8; IN = invasive fauna species are targeted; IV = invasive vegetation species are targeted; M = monitoring; TR = provision of targeted resources e.g. nest management, nest boxes, planting food trees; RE = research; VR = veterinary services/rehabilitation; BT = breeding/translocation; CC = corridors and connectivity; CD = conversion of degraded land; CO = community involvement with site efforts (includes schools); GU = guest involvement with site efforts; N+ = numbers have increased; NE = numbers or range have expanded (population could have increased but not enough detail to confirm); PL = actively planted; AC = actively care for (flora) e.g. watering or protection from herbivores; and 4Total amount of land covered by the sites (listed as N/A for marine and aquatic species).
157

Chapter 5: Evaluation of ecotourism enterprises (Research Component 2)
5.4.1.3 Veterinary services and rehabilitation Wildlife intervention actions including veterinary aid, rehabilitation services, wildlife rescue,
and disease control were carried out by 13 sites (15%). Species treated by sites included (1) at-
risk species such as koalas (V), little penguins (regionally EN), Tasmanian devils (EN),
southern giant petrels (EN), and fairy prions (V); (2) birds not at risk but listed under
international conventions and the EPBC Act 1999 Migratory Species Lists such as the crested
tern and short-tailed shearwater (as mentioned in Table 5.9); and (3) iconic non-threatened
fauna such as echidnas, wallabies, kangaroos, possums, and wombats.
The number of animals treated and released varied greatly across sites from a couple of
individuals every few months to several hundred per year. For example, Site 21 reported
treating 150 little penguins and “300 to 400 other native animals every year”, and had
previously treated over 400 little penguins in a single oil spill incident. Site 10 had also admitted
and treated 96 injured and/or orphaned animals over a two-year period.
5.4.1.4 Non-native fauna Non-native fauna are a key issue in the NCA and the most frequently cited threat under the
EPBC Act 1999, impacting approximately 80% of all threatened species in Australia (Jackson et
al., 2017). It is therefore of conservation significance that over three-quarters of sites (77%) had
taken action to reduce the number of non-native animals. The importance of this is further
highlighted by the species targeted by these sites (Table 5.10) which include seven of the nine
invasive species listed as Key Threatening Processes38 and all invasive species with individual
Threat Abatement Plans34 under the EPBC Act 1999.
Table 5.10 Number of ecotourism sites targeting, reducing or eradicating non-native fauna
Species # sites Key Threatening
Process
Threat
Abatement Plan Targeted Reduced Eradicated
Feral cats 17 2 2 ✓ ✓ Foxes 13 2 3 ✓ ✓ Rabbits 8 2 2 ✓ ✓ Goats 6 3 0 ✓ ✓ Rodents 4 0 0 ✓ ✓ Wild boars 3 2 0 ✓ ✓ Cane toads 2 0 0 ✓ ✓ European Wasp 2 1 0
38 Details in Section 3.2.3.3.
158

Chapter 5: Evaluation of ecotourism enterprises (Research Component 2)
Successful reductions in levels of unnatural competition or predation were reported by just six
sites (7%); actual reductions of non-native fauna by just 13 sites (15%); and complete
eradication by only five sites (6%). This does not necessarily mean that these outcomes were
not achieved by additional sites, but that the phrasing and tense used by the sites and the EA
Questionnaire preclude verification. For example, phrases such as, “we use baiting activities to
reduce the number of feral cats on the property” establishes that an action is taken but does not
demonstrate that the success of this action has been evaluated.
The extent of reduction was generally not quantifiable, but reported outcomes ranged from a
few individuals each year to 99% of a rabbit population (Site 15) and 80% of a European wasp
population (Site 34). Native species that were targeted for protection by the feral animal
removal activities varied greatly across sites and included the yellow-footed rock wallaby (V),
southern brown bandicoot (EN), woylie (EN), swamp antechinus (V), spotted-tailed quoll (EN),
black-eared miner (EN), chestnut-rumped heathwren (EN), little penguin (regionally EN),
hooded plover (V), and short-tailed shearwater (migratory species), as well as non-threatened
native species such as dunnarts, pygmy possums, bandicoots, and oyster catchers. However,
details regarding outcomes for these species were not reported.
5.4.1.5 Non-native flora The 2016 State of the Environment Report highlights that two-thirds of the approximately
60,000 plant species in Australia are introduced, and over 3,000 of these have become
naturalised (IPAC, 2016b; Jackson et al., 2017). It is therefore of conservation significance that
all sites reported undertaking weed removal actions. Although only 11 sites (13%) gave enough
information to demonstrate a reduction in the extent of weed cover, and just six sites (7%)
reported successfully eradicating a weed species, this includes nine Weeds of National
Significance39 (WoNS) (Table 5.11). An additional thirty targeted weed species were named by
sites without information on the extent of their removal activities including four WoNS:
asparagus fern Asparagus aethiopicus (Sites 51 and 75); boneseed Chrysanthemoides monilifera
spp. rotundata (Site 21); serrated tussock Nassella trichotoma (Site 21); and jumping cholla
Cylindropuntia prolifera (Site 2). Furthermore, many sites also used colloquial names or
generic terms for broad groupings of weeds which could not be verified for inclusion in this
evaluation. Five sites reported a reduction in the extent of unspecified species and two sites
reported eradicating unspecified species. For example, Site 2 reported the eradication of “non-
native cacti” and other “exotic species”.
39 Details in Section 3.2.3.3.
159

Chapter 5: Evaluation of ecotourism enterprises (Research Component 2)
Table 5.11 Non-native flora species reduced or eradicated by Australian ecotourism sites
Non-native species Number of sites
WoNS Targeted Reduced Eradicated
Lantana (Lantana camara) 5 1 1 ✓
Blackberry (Rubus laudatus) 3 1 0 ✓
Bitou bush (Chrysanthemoides monilifera ssp. monilifera)
1 0 1 ✓
Buffalo grass (Stenotaphrum secundatum) 1 0 1
Gorse (Ulex europaeus) 1 0 1 ✓
African boxthorn (Lycium ferocissimum) 1 1 0 ✓
Cane cholla (Cylindropuntia spinosior) 1 1 0 ✓
Scotch thistle (Onopordum acanthium) 1 1 0
English broom (Cytisus scoparius) 0 1 0 ✓
Madeira vine (Anredera cordifolia) 0 1 0 ✓
Oleander (Nerium oleander) 0 1 0
Rosy dock (Acetosa vesicaria) 0 1 0
Rubber vine (Cryptostegia grandiflora) 0 1 0 ✓
Snakeweed (Stachytarpheta spp.) 0 1 0
Tobacco bush (Solanum mauritianum) 0 0 1
Glycine (Neonotonia wightii) 0 0 1
The effort exerted by sites on these weed removal activities was generally not provided;
however, reports ranged from ongoing gardening through to 7,000 individual plants sprayed
annually (Site 2) or >4,000 person-hours devoted to weed removal each year (Site 21). Only
four sites reported data on the extent of weed reduction as an outcome: Site 35 had removed
weeds along 4km of riparian zone; Site 17 had removed weeds from over a third of their 90ha
property; Site 36 had cleared weeds from over 3ha; and Site 18 had reduced weed cover in one
of their assessment areas to just 1% (although the size of this area was not provided).
5.4.1.6 Revegetation and habitat connectivity With approximately 13% of Australia’s total native vegetation lost and over 60% degraded
since European settlement, revegetation quality and habitat connectivity are key issues in the
160

Chapter 5: Evaluation of ecotourism enterprises (Research Component 2)
NCA, and land clearing is listed as a Key Threatening Process40 under the EPBC Act 1999. It is
therefore of conservation significance that all sites carried out activities to address these issues.
For example, native revegetation activities were undertaken by all 86 sites. The extent of these
activities was provided by 26 sites, either as the total area covered or number of trees planted
(Figure 5.8). Although 38% of these were small scale, and in some cases as low as 60 seedlings,
these were often a species of specific use to a locally threatened specialist and were therefore
still of conservation significance. For example, she-oaks were planted by three sites to provide
forage resources for the threatened glossy black-cockatoo, which feeds only on a limited
number of these species. Reasons provided for species selection in revegetation programs
included plants utilised by threatened wildlife species (10 sites), threatened or rare floral species
(8 sites), and threatened or important ecosystems (4 sites). Two sites also reported extending or
re-establishing threatened ecosystems: manna gum woodlands (Site 10) and the candlebark
ecosystem (Site 36).
Figure 5.8 Proportion of sites (that reported on the extent of revegetation) within each revegetation category (n = 26).
Sixty sites (70%) reported creating wildlife corridors or increasing habitat connectivity. At-risk
species targeted by the corridors included koalas (Sites 10, 26, 28, and 29), spotted-tailed quolls
(Site 10), southern cassowaries (Site 54), and the Richmond birdwing butterfly (Site 31).
Additionally, Site 27 reported corridor use by “most terrestrial fauna groups” without providing
the name of any species. However, only two sites (Sites 27 and 31) reported that their corridors
had resulted in an increase in animals traversing their properties.
Thirty-five sites shared a border with a public protected area, thereby extending the public
protected area network by an additional 65,300ha, 98% of which is under legally binding, in-
perpetuity conservation agreements. However, a single property accounts for 83% of this total.
40 Details in Section 3.2.3.3.
38%
19%
35%
8%
0%
10%
20%
30%
40%
Minimal (<1ha;<1,000 trees)
Moderate (1-10ha;1,000-9,999 trees)
Large (10-50ha;10,000-99,999 trees)
Very large (>50ha;>100,000 trees)
% o
f si
tes
161

Chapter 5: Evaluation of ecotourism enterprises (Research Component 2)
Additionally, one-third of sites shared borders with areas of significance including World
Heritage Areas (16 sites) and regional landscape-level corridors (7 sites).
Improvements in vegetation density and habitat quality were reported by 55 sites (64%).
However, only three sites gave detailed information on this outcome. Site 40 used pegs and
other markings to measure forest expansion through seed dispersal by wildlife over a 16-year
period, claimed to be “equivalent to planting 2 million trees”. Site 10 reported “the germination
of around 100,000 new trees” following planting activities which had “dramatically improved
the habitat quality”, and Site 17 reported 21ha of reforestation and 34ha of acacia regrowth,
although it is not clear how these outcomes were determined.
5.4.2 Socio-political contributions The full summary of site activities for each socio-political Conservation Item can be found in
Appendix D.
5.4.2.1 Environmental interpretation, awareness and behaviours Both the ABC Strategy41 and its draft successor, the Nature Strategy, highlight the importance
of involving Australian residents and the public more broadly in conservation practices.
“Connecting all Australians with nature” is the first of the three national priorities in the Nature
Strategy (DEE, 2017, p. 9), with national objectives across both strategies highlighting the need
for actions to mainstream biodiversity, empower Australians to be active stewards of nature, and
increase public participation in conservation activities42. The activities of ecotourism sites that
aim to increase the conservation awareness and behaviours of visitors, staff, and local
communities are therefore pertinent for the NCA and are discussed in the subsequent sections.
Visitors
All 86 sites incorporated environmental interpretation into the visitor experience, using a variety
of self-driven and guided learning mechanisms (Table 5.12). Interpretation materials were
linked to improving environmental practices while traveling and in everyday life by 82 sites.
Furthermore, some sites had a very wide reach for their environmental education programs, with
Site 14 reportedly introducing over 3,000 visitors to “sustainable technologies, practices and
concepts” in a single year; and Site 6 reporting over 12,000 guests had “experienced sustainable
actions” since they began operating in 2002.
41 Australia’s overarching national conservation policy. 42 Discussed further in Section 6.3.3.
162

Chapter 5: Evaluation of ecotourism enterprises (Research Component 2)
Table 5.12 Proportion of sites covering the interpretation themes and methods
Themes % Methods %
Local natural and cultural heritage 83 Self-driven learning e.g. reference materials, displays, brochures, and interpretative signage
100
Conservation significance of the area 79
Principles of ecotourism certification 73
Climate change 71 Guided learning e.g. talks by specialists and guided tours
91
Identification of certified products 62
Several sites also included visitors in their conservation activities. For example, 10 sites
encouraged visitors to plant a tree as part of their stay. Although this practice is considered to be
part of the visitor experience (as explained in Section 4.2.3.3), findings showed that it could also
be a useful planting strategy. For example, Site 28 used this approach to plant more than 3,000
trees over 10 years and another 800 trees over the following eight years. Six sites encouraged
their guests to assist with monitoring efforts, record wildlife sightings in a log book, or
participate in wildlife surveys. Three sites also involved guests in their non-native fauna control
activities: Site 45 encouraged guests to “participate in the community fox watch by reporting
fox sightings during their visit”; Site 31 allowed guests to participate in cane toad catching
activities; and Site 85 educated guests on the management of non-native insects. Additionally,
two sites involved guests in a range of conservation activities: Site 30 offered a Working
Holiday Program in which guests visit the retreat to be “involved in landscape management
procedures”; and Site 46 ran an annual program in which guests and community members could
participate in habitat restoration and management activities including “the identification and
removal of noxious weeds”.
No specific questions in the EA Questionnaire cover outcomes of visitor interpretation43.
However, increased environmental and conservation awareness of visitors could be determined
for three sites (3%) and increased pro-environmental visitor behaviours, such as donating
money to conservation purposes, for eight sites (9%). For example, Site 4 reported that a visitor
was “so touched by his experience” that he purchased and revegetated “the adjoining
farm/rainforest block”; and Site 6 reported that 5% of all guests make conservation donations
online when booking and “a further 5% make donations while on site”.
43 Details in Section 6.2.2.
163

Chapter 5: Evaluation of ecotourism enterprises (Research Component 2)
Staff
All 86 sites provided environmental interpretation and conservation information for their staff
through both staff inductions and ongoing training programs. Self-guided learning materials
such as research journals and updates from scientific research programs were utilised by all
sites, with 64% also providing specialised talks for their staff. Outcomes were reported by 60
sites (70%) who confirmed that their staff are “aware of monitoring, research, and conservation
programs carried out within or involving the operation”44.
Local community
Thirty-four sites (40%) undertook additional environmental education and engagement activities
with local schools (22%) and tertiary institutes (15%), and within their local communities more
broadly (38%), as detailed in Table 5.13.
Table 5.13 Proportion of sites reporting community environmental engagement activities
Site activities
% of sites
Com
mu
nit
y
Sch
ools
Ter
tiary
Assist groups with conservation activities 13 0 0
Talks and presentations 9 0 0
Workshops 8 3 1
Provision of materials e.g. information packs, fact sheets 7 7 0
Groups visit site for education and conservation activities 0 19 8
Provision of conservation training and work experience 0 0 5
Provision of research scholarship for Honours or Masters students 0 0 1
Increased environmental awareness of local communities was reported by just five sites (6%);
however, behavioural and lifestyle changes were reported by 15 sites (17%) as identified
through information provided on community engagement with site-run conservation activities.
This was predominantly through on-site conservation work carried out by community
volunteers, which was at times of considerable scale. For example, Site 37 reported more than
2000 volunteers planting 400,000 seedlings over 150ha through five separate planting
“festivals”; and Site 10 reported more than 100 volunteers planting 25,000 trees over two days.
44 Text extract from EA Questionnaire.
164

Chapter 5: Evaluation of ecotourism enterprises (Research Component 2)
Five sites (6%) also supported and participated in local environmental events such as a
Conservation Week run by a local council; five sites (6%) ran community days or weekends for
locals to participate in conservation activities; and three sites supplied seedlings free of charge
for local landowners to plant (Site 10, Site 11, and Site 17). Additionally, Site 4 reported that
their encouragement of neighbouring properties to undertake revegetation projects has resulted
in “all neighbours, without exception… replanting to extend habitat”.
5.4.2.2 Advocacy and lobbying Political activism and advocacy activities were undertaken by 41% of sites (Table 5.14), with
successful changes in legislation and regulations reported by 7% of sites, and recognition or
protection of environment and land rights by 6% of sites. For example, Site 2 spent years
fighting for the legal protection of their property and surrounding area by lobbying, debating,
and developing “posters and press releases, T-shirts and bumper stickers, and street theatre” to
gain public support and media coverage. This eventually resulted in the legislation of a new
State Act in 2012 for “secure long-term protection from mining”. In another example, Site 12
organised protests of up to 1,000 people and a 10-day blockade against a Coal Seam Gas (CSG)
“exploration drill rig that had no social licence or council approvals”. They reported that their
political activism resulted in “the cessation of any further CSG exploration and elicited a
promise from [the State Premier] to protect the area”. Additionally, Site 7 claims to have been
instrumental in the implementation of speed limits on a local river to reduce erosion of the river
bank and minimise the impact of motored vessels on wildlife; and Site 13 donated their land to
the state government in return for exclusive operating rights, extending the boundary of an
adjacent national park.
165

Chapter 5: Evaluation of ecotourism enterprises (Research Component 2)
Table 5.14 Proportion of sites addressing each of the political advocacy actions and topics
% Actions Topics
20-30 • Involvement in climate change initiatives • Climate change
5-10 • Writing letters and emails to politicians • Participation in climate change forums • Submissions to the government
• Establishment of protected areas • General conservation issues
<5 • General lobbying • Attending protests • Arranging site visits for politicians
• Local recycling program • Sustainable tourism
Single sites
• Attending political meetings • Presentations to government ministers • “Voting for and supporting political
candidates” with good environmental policies
• Water quality • Erosion • Sand mining • Dredging/dumping in GBRMP • Rainforest logging • Coal mining & CSG • Wetland infringements
5.4.2.3 Support for conservation organisations and protected area agencies
The need for businesses, landowners and the general public to support or partner with
conservation organisations and parks agencies is a strong theme throughout the NCA. This
includes strategic partnerships across sectors; landscape management approaches across
borders; and information sharing through collaborations45. It is therefore of conservation
significance that all sites in this study reported providing support for conservation organisations
and projects including physical, financial, and/or in-kind assistance. The amount of financial
support was generally not disclosed, but varied from one-off donations or monthly membership
fees to a “base amount of at least $60,000 per annum” (Site 74). Additionally, over 50% of sites
participated in a conservation project or program; 63% were members of a conservation
organisation; 9% established or reported to have been instrumental in the establishment of
conservation organisations; and the owners or operators of 5% of sites held positions within
conservation organisations such as the Treasurer.
Support was provided to protected area agencies by 81 sites (94%) including the provision of
information on wildlife sightings (64%) and collaboration or partnerships with parks agencies
e.g. cross-boundary weed control (42%). Nearly a quarter of sites (23%) participated in
government environment programs such as the Great Barrier Reef Marine Park Authority’s Eye
45 Discussed further in Section 6.3.3.
166

Chapter 5: Evaluation of ecotourism enterprises (Research Component 2)
on the Reef Program. Furthermore, 10% of sites assisted with facilities management. As stated
by Site 3, “this gives the rangers more time to apply their specialist knowledge and conduct
research within the National Park”.
Additionally, 59 sites (69%) reported “suspected infringements, incidents and pollution”46 to
protected area managers. For example, the owners of Site 2 were actively vigilant following
mining exploration in their region and discovered 38 tonnes of drill samples, plastics, mineral
waste and discarded operational material illegally buried in a sanctuary.
5.4.2.4 Research and knowledge According to the 2016 State of the Environment Report, knowledge of ecosystem processes that
support biodiversity in Australia is currently insufficient for 99% of species, and the NCA and
reports across all jurisdictions raise the lack of long-term monitoring and adequate reporting as
a major barrier to effective environmental management (Jackson et al., 2017). It is therefore of
conservation significance that 82 sites (95%) undertook or participated in environmental
research projects (Table 5.15). Furthermore, 62 sites (72%) aided research projects through the
provision of in-kind support, data, access to land and staff assistance; and 7 sites (8%) gave
financial support to external research projects. The types of research activities undertaken by
sites varied from static data points to broad, longitudinal studies spanning decades. For
example, Site 21 had been monitoring the vulnerable hooded plover since the 1980s through
nest records and tagging chicks. Furthermore, several sites conducted monitoring and research
activities for a number of species with National Recovery Plans that highlight a critical need for
research, data collection and data sharing, including the spotted-tailed quoll (Site 10); buff-
breasted button-quail and Gouldian finch (Site 24); black-eared miner, malleefowl and red-lored
whistler (Site 23); chestnut-rumped heathwren (Site 36); Coxen’s fig parrot (Site 74); and
southern cassowary (Sites 4, 8, 40 and 54).
Table 5.15 Proportion of sites addressing the various research topics and engaging in collaborations
Research topics % Collaborators %
Regional tourism impact studies 64 Universities 24
Local flora & fauna e.g. breeding, health, DNA analysis 33 NGOs 15
Property e.g. land, soil, water, resource mapping, geology, burning techniques
26 Government bodies 13
Post grad students 12
46 Text extract from EA Questionnaire.
167

Chapter 5: Evaluation of ecotourism enterprises (Research Component 2)
Contributions to knowledge were reported by 6 sites (7%) through publication outputs and the
dissemination of information beyond staff and visitors. The number of outputs per site varied
from a few publications to over 150 academic papers, books, book chapters and reports for Site
21.
5.4.2.5 Purchasing power As discussed in Section 4.2.5.4, purchasing environmentally friendly products is predominantly
a sustainability issue but can also produce conservation benefits. Although not a key focus of
the NCA, the responsible purchasing of goods and services is touched on by both the ABC
Strategy and the Weeds Strategy. It may therefore be of conservation significance that all 86
sites used their purchasing power to support sustainable products and services, with 55 sites
(64%) having purchasing guidelines or policies that outlined a preference for both goods and
services that have “lower energy, waste and emissions associated with the product purchase and
use”47. This included, for example, using companies with environmental policies and/or “green”
certification (88%); energy providers that offered “green” accredited products or renewable
energy (65%); and environmentally friendly products such as biodegradable or Fairtrade
products (37%).
5.4.2.6 Economic development, employment, and community contributions The NCA highlights the need to provide incentives and increase the capacity of Australian
residents and the broader public to engage with conservation activities. Section 4.2.4 highlights
that in addition to direct links, this can also occur through aspects such as employment and
social benefits that increase the shared value of the natural environment and facilitate the
transition of workers into more sustainable employment options. It may therefore be of
conservation significance that all sites were involved with actions that contributed to the
economic development and growth of the area. This included local sourcing of products (99%),
services (98%), and construction materials (91%); highlighting regional food or wine as part of
the tourist experience (67%); and incorporating regional and destination marketing into their
promotional materials (24%).
All but one site48 employed members of their local community, varying from a single employee
through to 100% of staff. Furthermore, to “respect and maintain traditional ecological
knowledge and stewardship of nature” is one of the 12 key objectives of the Nature Strategy
(DEE, 2017, p. 9). It is therefore of conservation significance that 21 sites employed Indigenous
47 Text extract from EA Questionnaire. 48 There was not enough information available to confirm this for the remaining site.
168

Chapter 5: Evaluation of ecotourism enterprises (Research Component 2)
people with “an understanding and knowledge of local Indigenous heritage”49 as interpreters,
trainers, or guides.
Additional community contributions and support were provided by 83 sites (97%). This
included, for example, submissions to local governments or media outlets on local community
issues (70%); financial or in-kind support for local events and associations (24%); and donation
of prizes for community fundraising efforts (26%). Furthermore, four sites reported their
involvement with local emergency services including acting as a drop off point for goods after
natural disasters (Site 19), volunteering in the rural fire brigade (Site 20), and assisting with
search and rescue operations (Site 2 and Site 14).
Finally, 72 sites provided training and upskilling opportunities for local community members
such as work experience (65%), access to free jobs and skills training (59%), career
development mentoring (57%), tourism and business management training for Aboriginal and
Torres Strait Islander peoples (27%); and mentorship and operating assistance to local
businesses (13%).
5.5 Conservation challenges and innovations
Some sites commented on the challenges they faced when engaging with these conservation
activities. Although not specifically included in the CE Framework, the value of this
information is demonstrated by the lack of relevant questions to include these details in the EA
Questionnaire.
5.5.1 Resources, staff and costs The most common challenges reported by sites were time, funding and resources. Costings were
generally not provided; however, they were reported to be as high as $30,000 per year for a
single pest removal project (Site 25) and $6,000 per year for a single weed removal project (Site
22). The cost and effort of the necessary ongoing monitoring following conservation activities
such as weed removal also proved problematic for some sites. Low staff numbers were a
common issue exacerbating this, with 15 sites (17%) employing less than five staff.
Tactics to overcome these issues included obtaining external funding such as government grants
and conservation donations (12 sites). A comment from Site 4 highlights the importance of this,
stating that “government funding cutbacks in environmental and rainforest studies have
49 Text extract from EA Questionnaire.
169

Chapter 5: Evaluation of ecotourism enterprises (Research Component 2)
prohibited much fieldwork”. Additionally, some sites used volunteers in the form of guests or
locals to assist with conservation activities. However, the proximity to local community
volunteers posed a challenge for some sites situated in regional towns, remote areas, on islands,
or on very large properties.
Additionally, many sites mentioned that some components of the EA Questionnaire that focused
on environmental education for staff “lacked relevance” because of (1) low staff numbers, and
(2) the environmental qualifications staff were required to obtain prior to being hired.
Furthermore, Site 15 commented that “all staff have grown up in the area so little induction
regarding the region's environment and values is required”. Although not identified by sites as a
challenge, this highlights a potential barrier for sites to undertake and expand their staff
environmental education activities.
5.5.2 Landscape and climatic conditions Arid climatic conditions, rocky landscapes and large property sizes in Australia provide
challenges to many aspects of ecological restoration projects. As such, many sites used fast
growing or drought tolerant plants to address watering issues and allow native vegetation to
outcompete with weeds after a site had been cleared. Dripper irrigation, wastewater, water
saving crystals and mulch were also used to maximise water retention, with some sites
undertaking extra watering activities during prolonged drought periods. Several sites also
reported continued weed management for the first few years in cleared and revegetated areas
until the newly planted natives had established themselves. Chemical rather than mechanical
weed removal was used by some large properties to reduce costs and improve efficiency in
rocky and difficult to access areas.
5.5.3 Neighbouring properties and community A major issue highlighted by several sites across many conservation actions was the need for
collaboration on a wider landscape-scale. Due to their generalist nature, invasive fauna and flora
species were difficult to keep at bay even after eradication or reduction programs had been
completed if they persisted on surrounding properties. To address this difficulty, six sites were
part of larger, external pest removal programs with government departments or NGOs, and
twelve sites worked with partners including government departments, NGOs, and neighbouring
landowners. For example, Site 15 was a founder of the local Landcare group and had
established a seven-year regional program to eradicate rabbits, and Site 10 ran community
workshops on humane fox and cat trapping to reduce numbers across the region. Many sites
also utilised fences to protect specific sections of their properties, prevent non-native access
170

Chapter 5: Evaluation of ecotourism enterprises (Research Component 2)
from some sides of the property, or entirely close off the property. For example, Site 23 used
electric fences with a ‘spear’ gate that “permits goats to leave the Reserve but prevents their
return”.
Landscape level projects were also used to address conservation goals more broadly. For
example, Site 36 was a founding member of a local ‘Friends Of’ conservation group and were
integral in coordinating conservation projects across 13 adjoining properties spanning over
230ha. Their five-year implementation plan addressed (1) invasive weeds, invasive fauna and
habitat restoration; (2) monitoring and protection of “two nationally listed endangered species
and 38 species of regional or state significance”; and (3) targets to “greatly improve the
condition of three vegetation associations of state or national significance”. Furthermore, Site
36 commented on the benefit of “managing these properties as a single entity” to overcome “the
sometimes disparate and short-term management of threats”.
Two sites raised additional community challenges of a different nature. Site 18 reported
difficulties with the handful of nearby properties in their sparsely populated area, stating that
these neighbours had carried out acts of vandalism and theft on their property and had “illegally
fallen some of our mature trees on our property boundary”. Site 1 reported that insurance
complications prevented them from sharing tourism revenue with their close neighbours whose
properties are utilised as part of their wildlife tours. Therefore, they use the properties with
permission but highlighted that they are unable to provide a financial incentive to the
landowners to keep areas of habitat intact.
5.5.4 Conversion to tourism The process of converting a property to ecotourism after it had been previously used for other
commercial operations came with additional challenges. Some sites mentioned the need for
extensive research and consultation to determine appropriate flora for the site and existing
wildlife populations, as they had been cleared of all or most native vegetation by previous
owners. Site 38 faced challenges of addressing the impacts of goats on their island location that
had been intentionally introduced by workers in the past when it was a mining operation. Site 15
found that transitioning from sheep grazing to tourism had opened the property to feral goats by
removing the sheep as competitors, causing unexpected challenges.
5.5.5 Monitoring Challenges regarding the cost and time required for monitoring activities were compounded for
many sites by the large size of properties and the cryptic nature of target species. Many sites
171

Chapter 5: Evaluation of ecotourism enterprises (Research Component 2)
therefore worked in conjunction with partners, hired consultancies to carry out the work, or
utilised volunteers from universities or community groups. For example, Site 10 established a
community reporting hotline for local residents to report sightings of threatened species. Several
sites also encouraged guests to report specific wildlife seen while on site. For example, Site 38
utilised photos taken by guests while scuba diving for photographic monitoring of manta ray
populations, and supported guests to help with the identification process.
Technology also played an important role in reducing the effort required by sites for their
monitoring activities. For example, Site 23 used camera traps and drones to conduct wider
searches of their large property over longer monitoring periods. This strategy also enabled them
to identify localised areas of high activity where manual monitoring efforts should be
intensified. Additionally, Site 10 had trained tracking dogs to locate tiger quoll scats to address
the challenge of locating this small, nocturnal and solitary marsupial.
172

173

Chapter 6: Ecotourism-conservation gaps and overlaps in Australia (Research Component 3)
6.1 Introduction
6.1.1 Context The previous chapter utilised the Conservation Activities Matrix (‘CA Matrix’) and the broader
Conservation Evaluation Framework (‘CE Framework’) developed in Chapter 4 to evaluate the
contributions of a set of Australian ecotourism enterprises to national conservation goals in
Australia. As the final research component (Figure 6.1), this chapter incorporates these findings
from both previous chapters to address Research Objective 5:
Document and explore the overlaps and gaps between the EA certification criteria,
conservation practices of ecotourism enterprises, and the national conservation policy
landscape in Australia.
Figure 6.1 Conceptual depiction of the three interlinked research components highlighting the location and function of this chapter within the thesis (modified from Figure 3.1 in Chapter 3).
6.1.2 Chapter structure The chapter begins by evaluating the conservation coverage of the EA Questionnaire, as guided
by the CA Matrix (Section 6.2). This is followed by a thematic exploration of the National
Conservation Agenda (NCA) in Section 6.3 which includes an evaluation of the tourism
174

Chapter 6: Conservation gaps and overlaps (Research Component 3)
coverage of the NCA (Section 6.3.1) and a review of key aspects underlying effective
conservation practices in Australia that need improving (Sections 6.3.2 and 6.3.3). Finally, these
findings are amalgamated in Section 6.4 to reveal key conservation ‘gaps and overlaps’ across
national policy, ecotourism site practices, and eco-certification in Australia (i.e. areas identified
for improvement or for collaboration).
6.2 Eco-certification: conservation coverage and gaps
The EA Questionnaire was updated and streamlined in 201550; however, most sites evaluated in
Chapter 5 were certified under the previous version. As such, both the Pre-2015 and Post-2015
versions of the EA Questionnaire are examined here.
6.2.1 Coverage levels Nine of the 57 Conservation Items from the CA Matrix51 had an extensive level of coverage in
the Pre-2015 version of the EA Questionnaire, which reduced to only five Conservation Items in
the Post-2015 version (Table 6.1). The number of Conservation Items with a moderate level of
coverage also decreased in the Post-2015 EA Questionnaire, while the number of Conservation
Items with minimal or no coverage increased marginally.
Table 6.1 Number of Conservation Items from CA Matrix (Chapter 4) within each level of coverage in the EA Questionnaire
EA
Questionnaire
Extensive Moderate Minimum None
# Proportion # Proportion # Proportion # Proportion
Pre-2015 9 16% 13 23% 3 5% 32 56%
Post-2015 5 9% 10 18% 9 16% 33 58%
6.2.2 Conservation Items and site practices The proportion of sites undertaking the 32 Conservation Items that had no coverage in the Pre-
2015 version of the EA Questionnaire ranged from 0% to 17% (Table 6.2 and Table 6.3). The
five Conservation Items covered extensively by both versions of the EA Questionnaire were all
socio-political conservation actions and were undertaken by 95-100% of sites: environmental
interpretation for visitors, environmental education for staff, economic stimulation and linkages,
research, and environmentally-friendly purchasing (Table 6.2). The four Conservation Items
covered extensively by the Pre-2015 version of the EA Questionnaire but not the Post-2015
50 Details are included in Section 3.5.1. 51 Using an earlier CA Matrix version with 57 Conservation Items (as detailed in Section 3.5.1.1).
175

Chapter 6: Conservation gaps and overlaps (Research Component 3)
version were also socio-political actions and were undertaken by 84-100% of sites: support for
conservation projects, employment of locals, support to protected area agencies, and capacity
building for locals.
Table 6.2 EA Questionnaire coverage of ecological actions and outcomes with site frequencies (from Chapter 5) for comparison
Category Conservation Items %1 EA cov2
(≤2015)
EA cov2
(>2015)
Actions
Biophysical Actions to remove non-native flora species 100 Mod Min
Revegetation 100 Mod Mod
Pollution/rubbish clean-up 98 Mod N
Established a protected area 63 Mod Mod
Converted degraded land to ecotourism site 52 Mod Min
Actions to control erosion 49 Min Min
Ecological fire management 8 N N
Propagation of a threatened species 3 N N
Fauna Actions to control non-native fauna species 77 Mod Min
Monitoring 69 Mod Mod
Increased wildlife resources/nest sites 47 Mod Mod
Veterinary services and wildlife care3 15 N N
Translocation 5 N N
Breeding programs 3 N N
Outcomes
Biophysical Increased ecological connectivity and corridors 70 Mod Mod
Increased extent and quality of habitat 64 Mod Mod
Increased rates of carbon capture 17 N N
Reduction in extent of non-native flora species 13 N N
Eradication of non-native flora species 7 N N
Increased ecological integrity and resilience4 5 N N
Reduced erosion 5 N N
Improved floral genetic and species diversity 3 N N
Decreased habitat loss and fragmentation 0 N N
Fauna Reduced non-native faunal species 15 N N
Improved wildlife numbers 12 N N
Reduced unnatural competition or predation 7 N N
Eradicated non-native fauna species 6 N N
Increased faunal genetic diversity 5 N N
Increased faunal health and population resilience 0 N N 1Proportion of sites undertaking Conservation Items (from Chapter 5); 2Level of coverage in Pre- and Post-2015 EA Questionnaires (no, minimal and moderate); 3Includes disease control activities; and 4Includes ecosystem health.
176

Chapter 6: Conservation gaps and overlaps (Research Component 3)
Table 6.3 EA Questionnaire coverage of socio-political actions and outcomes with site frequencies (from Chapter 5) for comparison
Category Conservation Items %1 EA cov2
(≤2015)
EA cov2
(>2015)
Actions
Visitors Environmental interpretation/inspiration 100 E E
Community Staff environmental education/interpretation 100 E E
Economic development and stimulation 100 E E
Employment 99 E Mod
Community contributions 97 Mod Mod
Professional training and capacity building3 84 E Min
Actions to reduce illegal activities 69 Mod Min
Environmental education/interpretation for locals 40 Min Min
Community development/support donations 1 N N
Actions to reduce human-wildlife conflict 0 N N
Organisational/ Political
Support for conservation projects and organisations 100 E Mod
Environmentally friendly purchasing 100 E E
Research 95 E E
Support to protected area agencies and governments 94 E Mod
Lobbying and advocacy 41 Min Mod
Investment in conservation related technologies 1 N N
Outcomes
Visitors Improved environmental behaviours of visitors 9 N N
Increased environmental awareness and knowledge 3 N N
Community Increased staff environmental awareness and knowledge 70 Min Min
Increased pro-environmental behaviours of locals 17 N N
Increased local environmental awareness and knowledge 6 N N
Decreased consumptive or land-intensive practices 0 N N
Improved local natural resource management 0 N N
Reduced illegal activities 0 N N
Reduced human-wildlife conflict 0 N N
Organisational/ Political
Improved environmental legislation, policies & regulations 7 N N
Increased knowledge base 7 N N
Recognition of environment, land and community rights 6 N N 1Proportion of sites undertaking the Conservation Items sourced from Chapter 5; 2Level of coverage in Pre- and Post-2015 versions of the EA Questionnaire (no, minimal, moderate and extensive coverage); and 3Includes activities targeted towards the local community broadly as well as individual community members.
177

Chapter 6: Conservation gaps and overlaps (Research Component 3)
The coverage level of Conservation Items in the Pre-2015 EA Questionnaire is a very strong
predictor of the number of sites reporting efforts to address these items (R2 = 0.92) (Figure 6.2),
despite the range of data sources used to evaluate site frequencies52. All Conservation Items
with an extensive coverage level were addressed by more than 80% of sites; and all items with
no coverage were addressed by less than 20% of sites. Patterns for minimal and moderate levels
of coverage are less absolute; however over 90% of the Conservation Items with a moderate
level of coverage were addressed by more than 50% of sites, and 75% of the Conservation Items
with a minimal level of coverage were addressed by less than 50% of sites.
Figure 6.2 Comparison of coverage levels in the Pre-2015 EA Questionnaire and the number of sites reporting each Conservation Item.
The relationship weakens (R2 = 0.75) when using the coverage levels of the Post-2015 EA
Questionnaire (Figure 6.3). Over 70% of this change in model performance between Pre-2015
and Post-2015 is influenced by only two Conservation Items: the coverage of rubbish clean-up
activities (addressed by 98% of sites) reduced from moderate to none; and the coverage of
actions to remove non-native flora (addressed by 100% of sites) reduced from moderate to
minimal. Furthermore, all Conservation Items with an extensive coverage level in the Post-2015
EA Questionnaire were addressed by more than 90% of sites; and all except one of the 33
Conservation Items with no coverage were addressed by less than 20% of sites.
52 Detailed in Section 3.2.3.4 and 3.4.2.
y = 27.328x + 6.2658R² = 0.9235
0
20
40
60
80
0 1 2 3
# si
tes
Coverage level (Pre-2015 EA Questionnaire)
None Min Mod Max
178

Chapter 6: Conservation gaps and overlaps (Research Component 3)
Figure 6.3 Comparison of coverage levels in the Post-2015 EA Questionnaire and the number of sites reporting each Conservation Item.
6.2.3 Coverage of Conservation Categories Separating ecological items from socio-political items, as well as actions from outcomes,
provides further insights into the conservation coverage of the EA Questionnaire. Although
conservation actions were spread across all four coverage levels in the Pre-2015 EA
Questionnaire, almost two-thirds received a moderate or extensive level of coverage (Figure
6.4). However, only 7% of outcomes received enough coverage to determine if the outcome
occurred, and nearly 90% of outcomes received no coverage at all. Socio-political items
received more coverage than those in the ecological categories; however, over 60% of
Conservation Items in both categories received no or minimal coverage, meaning that it would
not be possible to determine through the EA Questionnaire alone if these items are addressed by
sites.
Figure 6.4 Proportion of Conservation Item meta-categories within each of the Pre-2015 EA Questionnaire coverage levels.
y = 28.018x + 10.495R² = 0.7487
0
20
40
60
80
0 1 2 3
# si
tes
Coverage level (Post-2015 EA Questionnaire)
27%
89%
62%
50%
10%
4%
3%
11%
33%
7%
34%
7%
30%
32%
0% 20% 40% 60% 80% 100%
Actions
Outcomes
Ecological
Socio-political
None Minimal Moderate Extensive
None Min Mod Max
179

Chapter 6: Conservation gaps and overlaps (Research Component 3)
Conservation coverage declines in the Post-2015 EA Questionnaire as shown by the increased
proportion of Conservation Items in the lower coverage levels (Figure 6.5). This shift is caused
by the coverage of conservation actions rather than outcomes, with seven actions moving down
one level of coverage and two actions moving down two levels of coverage, resulting in the
total proportion of actions receiving a moderate or extensive level of coverage falling to less
than 50%. Five of these were socio-political actions and four were ecological actions. However,
one socio-political action also moved up one coverage level in the Pre- to Post-2015 EA
Questionnaires53. As such, the proportion of Conservation Items within the socio-political and
ecological categories receiving minimal or no coverage increased from 61% to 64% and 65% to
80%, respectively.
Figure 6.5 Proportion of Conservation Item meta-categories within each of the Post-2015 EA Questionnaire coverage levels.
6.3 National Conservation Agenda (NCA): ecotourism and conservation
management
6.3.1 NCA and tourism Tourism is not a common topic in the NCA; however, three themes for the tourism-related
content were identified:
(1) tourism as a reason for promoting conservation activities because of the high value
tourists place on the natural environment and the high value of tourism to the Australian
economy;
53 Coverage of the organisational/political action ‘lobbying and advocacy’ increased from minimal in the Pre-2015 EA Questionnaire to moderate in the Post-2015 EA Questionnaire.
30%
89%
66%
50%
23%
4%
14%
14%
30%
7%
21%
18%
17%
18%
0% 20% 40% 60% 80% 100%
Actions
Outcomes
Ecological
Socio-political
None Minimal Moderate Extensive
180

Chapter 6: Conservation gaps and overlaps (Research Component 3)
(2) tourism as an activity that may result in negative environmental impacts and therefore
requires management; and
(3) tourism as an activity or sector that can contribute to conservation goals.
The first two themes are the most prominent, and only three of the eight NCA policies
incorporate the third theme (Table 6.4), as discussed below.
Table 6.4 NCA coverage of the three tourism themes
NCA policies1
Conservation
mechanism2
Potential impact
to manage2
Broad incentive
for action2
TOPs3
Content TOPs3
Content TOPs3
Content
ABC Strategy N N Min Min N Mod
Nature Strategy Min N N N N E
Pests Strategy N N N N N N
Weeds Strategy N Min N Min N N
Reserve Strategy N N N Mod N Mod
Vegetation Strategy N N N Min N Min
Heritage Strategy Min Min N Mod N E
Species Strategy N N N N N Min 1Full details of these eight policies are provided in Section 3.2.3.2; 2Coverage levels (no, minimal, moderate and extensive coverage); and 3TOPs refers to the Targets, Objectives and Priorities of the NCA policies while ‘content’ refers to their general content (details in Section 3.2.3.2).
The Heritage Strategy has the strongest and most positive coverage of tourism, with one of the
11 strategy objectives to “foster greater collaboration between the heritage and tourism sectors”
(Commonwealth of Australia, 2015, p. 4). This strategy also mentions the important role that
tourism businesses play in managing and preserving heritage, “demonstrating commitment to
heritage values”, “contributing significant expenditure”, and making positive contributions to
local areas (p. 9). Additionally, when acknowledging the negative impacts tourism can have on
heritage values, this strategy highlights that these can be managed through cooperative
partnerships and the “provision of infrastructure and professional services to support visitation
[and] provide tourists with both an enjoyable and sustainable heritage experience” (p. 39).
However, as the Heritage Strategy also incorporates built and cultural heritage, these quotes do
not refer only to natural heritage.
Both the ABC Strategy54 and its draft replacement, the Nature Strategy, strongly emphasise the
need to engage all Australians in biodiversity conservation. However, some subtle changes in
54 Australia’s overarching national conservation policy.
181

Chapter 6: Conservation gaps and overlaps (Research Component 3)
the Nature Strategy, drafted nearly a decade later, shift this focus to first fostering a public
appreciation of nature. For example, the first of the three priorities in the ABC Strategy is to
“engage all Australians in biodiversity conservation” (NRMMC, 2010, p. 71), which has been
changed in the Nature Strategy to “connect all Australians with nature” (DEE, 2017, p. 9).
Additionally, goals such as “mainstreaming biodiversity” and “increasing public awareness of
biodiversity” in the ABC Strategy (NRMMC, 2010, p. 71) have been replaced with objectives to
“encourage Australians to get out into nature” and “increase Australians’ understanding of the
value of nature” in the Nature Strategy (DEE, 2017, p. 9). Although tourism is not specifically
mentioned by these objectives, their explanatory content makes it clear that they include
recreational interactions with nature and refers to the potential for nature-based tourism to
contribute to achieving these objectives.
The Weed Strategy mentions tourism in relation to conservation activities through a case study
on mouse-ear hawkweed. A small infestation of the invasive plant was found by a bushwalker
in Kosciusko National Park who immediately reported it to the parks agency. The NSW
National Parks and Wildlife Service were able to quarantine the site, remove the extremely
problematic weed, and begin high priority surveillance of the surrounding area within six days,
preventing “severe conservation and agricultural consequences” due to the early detection by
the bushwalker (IPAC, 2016b, p. 22). However, the case study also states that the incursion was
believed to be the result of seeds accidentally taken into the national park on camping or hiking
equipment. This strategy therefore highlights tourism as an activity that both needs managing
and can contribute to conservation goals.
6.3.2 NCA and conservation themes Document and thematic analyses revealed that there are eleven ecological themes (Table 6.5)
and six socio-political themes (Table 6.6) of high importance across the NCA and NCTs,
indicating key conservation management gaps in Australia that need to be addressed55. Many of
these themes are the focus of individual NCA policies, indicated in the tables by the symbol ~.
As this analysis was guided by the CA Matrix, these tables also include Conservation Items that
were only of moderate or low importance in the NCA to provide a comprehensive exploration
of these themes in preparation for the analysis that follows in Section 6.4. Additionally, some
themes incorporate multiple Conservation Items where relevant56.
55 As explained in Section 3.5.2.2, this approach used the NCA to identify gaps in conservation management, rather than identifying conservation gaps within the NCA. 56 For example, the actions and outcomes of ‘weed removal’, ‘reducing weeds’ and ‘eradicating weeds’ were grouped as a single theme. Tables 3.10 and 3.11 in Section 3.5.2.2 detail the Conservation Items included within each theme.
182

Chapter 6: Conservation gaps and overlaps (Research Component 3)
Table 6.5 Ecological conservation themes covered by the NCA and NCTs
Conservation themes1
NC
A &
NC
Ts
Individual NCA Policies2
AB
C
Na
ture
Pes
t
Wee
d
Her
ita
ge
Res
erv
e
Sp
ecie
s
Veg
eta
tio
n
Habitat extent and quality H~ ✓* ✓ ⁄ ⁄ ✓ ✓ ✓ ✓*
Ecological connectivity and corridors H~ ✓* ✓ ⁄ ✓ ✓ ✓* ✓ ✓*
Control of non-native flora H~ ✓* ✓ ✓ ✓* ✓ ✓ ✓ ✓
Control of non-native fauna H~ ✓* ✓ ✓* ✓ ⁄ ✓ ✓* ✓
Land-use change, clearing and PPAs3 H~ ✓* ✓ ✓ ✓ ✓ ✓* ✓* ✓*
Pollution and rubbish clean-up H~ ✓ ✓ ⁄ ⁄ ✓ ⁄ ✓ ⁄
Erosion M ✓ ✓ ✓ ✓ ⁄ ⁄ ✓ ✓
Ecological fire management M ✓* ✓ ⁄ ✓ ⁄ ✓* ✓ ✓*
Ecological integrity, resilience & health H ✓* ✓* ✓ ✓ ✓ ✓* ✓ ✓*
Genetic and species diversity H ✓* ✓* ⁄ ⁄ ✓ ✓* ✓ ✓*
Carbon capture H~ ✓ ✓ ⁄ ⁄ ⁄ ✓ ✓ ✓*
Monitoring H ✓* ✓ ✓* ✓* ✓ ✓* ✓ ✓*
Wildlife resources and nest management L ⁄ ✓ ✓ ⁄ ⁄ ✓ ✓ ✓
Veterinary services and wildlife care L ✓ ✓ ✓ ✓ ⁄ ⁄ ✓ ⁄
Translocation and breeding programs L ✓ ✓ ⁄ ⁄ ⁄ ⁄ ✓ ✓
Wildlife numbers and threat status H~ ✓* ✓* ✓ ⁄ ✓ ⁄ ✓* ✓ Key: H = high importance, M = moderate importance, L = lesser importance, N = not covered (details in
Section 3.5.2.2); H~ = high importance as the theme is addressed individually by an NCA policy or NCT item (details in Sections 3.2.3.2 and 3.2.3.3) ✓ covered in content; ✓* covered in TOPs57; ⁄ = not covered
Footnotes: 1Details regarding the conservation themes and the groupings of Conservation Items within these themes are in Section 3.5.2, Tables 3.10 and 3.11; 2Full details of these eight policies are provided in Section 3.2.3.2; and 3PPAs = private protected areas.
Visitor and local community items have been combined in Table 6.6 to align with the broader
concept of ‘the public’ as covered in the NCA including landholders, farmers, private citizens,
Indigenous peoples, community groups, businesses, and the industry sector.
57 TOPs refers to the Targets, Objectives and Priorities of the NCA policies while ‘content’ refers to their general content (details in Section 3.2.3.2).
183

Chapter 6: Conservation gaps and overlaps (Research Component 3)
Table 6.6 Socio-political conservation themes covered by the NCA and NCTs
Themes and Conservation Items1
NC
A &
NC
Ts Individual NCA Policies
2
AB
C
Na
ture
Pes
t
Wee
d
Her
ita
ge
Res
erv
e
Sp
ecie
s
Veg
eta
tio
n
Conservation awareness and capacity H ✓* ✓* ✓* ✓* ✓* ✓* ✓ ✓*
Conservation incentives and deterrents H ✓* ✓ ✓ ✓ ✓ ✓* ✓ ✓*
Conservation behaviours H ✓* ✓* ✓* ✓* ✓ ✓* ✓ ✓*
Human-wildlife conflict L ⁄ ⁄ ✓ ⁄ ⁄ ⁄ ⁄ ⁄
Conservation support M ✓ ✓ ✓ ✓ ⁄ ✓ ✓ ✓
Environmentally friendly purchasing L ✓ ⁄ ⁄ ✓ ⁄ ⁄ ⁄ ✓
Research and knowledge H ✓* ✓* ✓* ✓* ✓* ✓* ✓ ✓*
Conservation technologies M ✓ ✓ ✓ ✓ ⁄ ✓ ✓ ✓
Governance and environment regulations H ✓* ✓* ✓* ✓* ✓* ✓* ✓ ✓*
Support to protected area agencies H ✓* ✓ ✓* ✓* ✓* ✓* ✓ ✓*
Key: H = high importance, M = moderate importance, L = lesser importance, N = not covered (details in Section 3.5.2.2) ✓ covered in content; ✓* covered in TOPs58; ⁄ = not covered
Footnotes: 1Details regarding the conservation themes and the groupings of Conservation Items within these themes are in Section 3.5.2, Tables 3.10 and 3.11; and 2Full details of these eight policies are provided in Section 3.2.3.2.
The NCA was also utilised in the development of the CA Matrix59 and, as such, there is much
overlap between them: the NCA themes cover all but two of the 53 Conservation Items in the
CA Matrix60. The two items not included are ‘converting degraded land to ecotourism’ and
‘lobbying and advocacy’. However, both items are captured when considering the themes in the
NCA more broadly. For example, ‘converting degraded land to ecotourism’ is just a specific
type of land-use change (row 5, Table 6.5). Additionally, the NCA discusses the need for
improved conservation management and governance arrangements (as described in Section
6.3.3 below), which may be considered a form of advocacy and political activism of an internal
nature with a similar goal of improving conservation efforts (row 9, Table 6.6).
58 TOPs refers to the Targets, Objectives and Priorities of the NCA policies while ‘content’ refers to their general content (details in Section 3.2.3.2). 59 This iterative two-way process is described in Section 3.5.2 and 3.5.2.2. 60 57 Conservation Items if using an earlier version of the CA Matrix as in Chapter 5 and Section 6.2.
184

Chapter 6: Conservation gaps and overlaps (Research Component 3)
6.3.3 NCA and the broader conservation context Thematic analysis of the NCA revealed three overarching concepts that underlie effective
conservation practices across the themes: (1) governance, (2) knowledge, and (3) engagement
and strategic partnerships. This section provides a synthesis of these concepts as the underlying
context for the themes explored in the previous section.
6.3.3.1 Governance The importance of effective governance and leadership for successful biodiversity conservation
(and the need to improve this) is a prominent concept in the NCA. Specifically, the NCA
highlights a need for structured systems and nationally accepted standards to ensure alignment
and consistency in conservation policies and management practices across all jurisdictions and
relevant sectors. For example, the Heritage Strategy suggests the implementation of a “One-
Stop Shop policy through bilateral agreements between the Australian Government and states
and territories in order to make it easier to navigate heritage regulations” (Commonwealth of
Australia, 2015, p. 31).
Effective governance is highlighted throughout the NCA as essential for providing policies and
institutional arrangements that:
• Enhance strategic investments and partnerships;
• Facilitate, coordinate and incentivise stakeholder engagement in conservation activities, effective management practices, capacity building, and two-way knowledge transfer;
• Improve access to “information about Australia’s environment and biodiversity” and ensure relevant “information assets” (e.g. databases) are “properly maintained, supported and appropriately and effectively shared” (DEE, 2017, p. 15); and
• “Maintain and enhance long-term research, development and extension capacity and capability” (IPAC, 2016a, p. 6).
6.3.3.2 Knowledge All NCA policies emphasise the need to build and expand on existing knowledge across nearly
all aspects of biodiversity management. This includes conservation research and assessments of
ecological conditions as well as the need for “increased use of monitoring and reporting in the
evaluation and improvement of biodiversity conservation projects, programs and strategies”
(NRMMC, 2010, p. 50). Knowledge building and knowledge sharing are discussed throughout
the NCA as being essential for:
• Evidence-informed decision-making and priority setting;
• Providing information on the costs, benefits, and likely investment of potential management strategies;
185

Chapter 6: Conservation gaps and overlaps (Research Component 3)
• Improving management strategies and enhancing the conservation capacity of stakeholders; and
• Increasing understanding of “community awareness of the need for biodiversity conservation [and] associated behavioural change” (NRMMC, 2010, p. 61), and of “landholder behaviour (barriers, attitudes, ways to better work with stakeholders to encourage improved [conservation management]) and their related economic drivers” (IPAC, 2016b, p. 26).
Furthermore, the NCA highlights that best practice management is continually evolving and that
“ongoing investments in research and development are required to ensure that the available
management techniques and tools continue to meet operational needs and community
expectations” (IPAC, 2016a, p. 27).
6.3.3.3 Engagement and strategic partnerships Engaging and working with stakeholders is a recurring theme throughout the NCA, with
frequent mentions of the need to improve collaboration and partnerships across property
borders, sectors and jurisdictions. This includes a spectrum of engagement activities from
“increase[ing] Australians’ understanding of the value of nature” (DEE, 2017, p. 9); to
“develop[ing] the knowledge, capacity and commitment of key stakeholders” (IPAC, 2016b, p.
5) and “increas[ing] participation in coordinated management approaches across a range of
scales and land tenures” (IPAC, 2016a, p. 6); and to “empower[ing] Australians to be active
stewards of nature” (DEE, 2017, p. 9). Additionally, there is a clear emphasis on the need for
strategic investments, incentives, partnerships and stakeholder engagement for increasing
conservation funds and resources from non-government sources including private landholders
and primary industries.
Key advantages of coordinated efforts highlighted within the NCA include “the effective use of
local expertise and resources, decreased [management] costs, and encouraging ownership of
[conservation issues] through group cohesiveness” (IPAC, 2016a, p. 29). Furthermore, there are
numerous references across the NCA to the need for improved two-way knowledge-sharing
among all stakeholders to disseminate and build upon best-practice management. For example,
the ABC Strategy highlights the importance of improved consultation with community and
industry stakeholders “to develop national guidelines for adaptive management” (NRMMC,
2010, p. 61). The importance of local-level data is also strongly emphasised across the NCA
including the surveillance and reporting of environmental conditions (such as pest sightings), as
well as detailed knowledge of the local area and context. For example, the Pest Strategy
recognises that “farmers develop important knowledge about their property over time, and
understand how their land adapts to changing conditions” (IPAC, 2016a, p. 29). However,
186

Chapter 6: Conservation gaps and overlaps (Research Component 3)
inadequacies in current engagement practices are clear, with all NCA policies emphasising (1)
the importance of increasing both the number and the effectiveness of such practices; and (2)
the need for additional arrangements and resources to facilitate this.
6.4 Policy, practice, and eco-certification: overlaps and gaps
Table 6.7 highlights key gaps and overlaps in the ecotourism-conservation relationship in
Australia by using star ratings to compare the following three groups:
(1) NCA rating – the importance of key conservation themes in the NCA/NCTs (from Section 6.3.2);
(2) Site prevalence rating (‘site rating’) – the prevalence of ecotourism sites undertaking activities that address these themes i.e. how widespread these practices are across certified ecotourism sites (modified from Section 5.3.1)61; and
(3) EAQ coverage rating (‘EAQ rating’) – coverage level of these themes in the Post-2015 EA Questionnaire (modified from Section 6.2)61.
Themes with lower site or EAQ ratings indicate a conservation gap and, conversely, themes
with higher site or EAQ ratings indicate conservation areas that are addressed by a high
proportion of ecotourism sites or receive a high level of coverage in the Post-2015 EA
Questionnaire.
Additionally, a potential site prevalence rating was also calculated for themes in which the
overall rating for the theme was skewed by large disparities in site prevalence across the
combined conservation actions and outcomes and therefore did not accurately reflect the large
number of sites engaging with the conservation activity. This potential site prevalence is
indicated in Table 6.7 by the addition of a star in brackets next to the site prevalence rating (*).
For example, the site rating of **(*) for the theme ‘control of non-native flora’ indicates a 2-star
site rating and a 3-star potential site rating62.
Comparisons of the NCA ratings with the site and EAQ ratings were used to calculate the
following two rankings for each theme.
61 Details regarding the merging of Conservation Items into themes and the calculations to obtain a single site prevalence rating and EA Coverage rating per theme can be found in Section 3.5.3.2. 62 Details regarding the calculations of potential site prevalence ratings can be found in Section 3.5.3.2.
187

Chapter 6: Conservation gaps and overlaps (Research Component 3)
Gap rankings
A ranking of the conservation gaps for sites or EA to improve upon based on a combination of (1) the size of the gap; and (2) the importance of the theme within the NCA. These rankings are
indicated in Table 6.7 by ‘traffic light’ colouring of the symbol .
Themes of high NCA importance with low site prevalence have important practical implications as
key areas for sites to target to increase their eligibility and attractiveness as an investment option for
government grants and programs.
Similarly, themes of high NCA importance and low EAQ ratings have strong eco-certification
implications as key areas for EA to include in their certification criteria.
Overlap rankings
A ranking of the potential opportunities for conservation-ecotourism collaborations based on a combination of (1) the importance of the theme within the NCA; and (2) the prevalence of sites addressing the theme or the EAQ coverage of the theme. These rankings are indicated in Table 6.7 by the number of exclamation marks (from zero to three).
Themes of high NCA importance that overlap with high site or EAQ ratings have strong policy
implications as key areas for strategic investments and partnerships with ecotourism sites and/or
Ecotourism Australia, as indicated by the symbol [!!!] in the overlap ranking columns.
188

Chapter 6: Conservation gaps and overlaps (Research Component 3)
Table 6.7 Comparisons and implications of NCA focus, site practices and the EA Questionnaire (‘EAQ’) across key conservation themes
Conservation themes1
Rating
NCA-Site
ranking
NCA-EAQ
ranking
NCA Sites EAQ Gap Overlap Gap Overlap
Ecological Habitat extent and quality *** *** ** !!! !! Ecological connectivity and corridors *** *** ** !!! !! Control of non-native flora *** **(*) * !!! !! Control of non-native fauna *** **(*) * !!! !! Land-use change, clearing and PPAs *** ** ** !! !! Pollution and rubbish clean-up *** *** × !!! ⁄ Erosion ** *(*) * !! ! Ecological fire management ** * × ! ⁄ Ecological integrity, resilience & health *** * × !! ⁄ Genetic and species diversity *** * × !! ⁄ Carbon capture *** * × !! ⁄ Monitoring *** *** ** !!! !! Wildlife resources and nest management * ** ** ! ! Veterinary services and wildlife care * * × ! ⁄ Translocation and breeding programs * * × ! ⁄ Wildlife numbers and threat status *** * × !! ⁄
Social
Conservation awareness and capacity *** **(*) ** !!! !! Conservation incentives and deterrents *** *** *** !!! !!! Conservation behaviours *** *(**) × !! ⁄
Organisational/political
Conservation support * *** ** !! ! Conservation technologies ** * × ! ⁄ Environmentally friendly purchasing * *** *** !! !! Research and knowledge *** **(*) ** !!! !! Support to protected area agencies *** *** *** !!! !!! Governance and environment regulations *** ** * !! !!
Rating: *** = high; ** = moderate; * = low; × = none (for NCA importance, site prevalence and EAQ coverage) Gap ranking: = very important; = important; = somewhat important; = low importance; / = not important
Overlap ranking: !!! = very important; !! = moderately important; ! = low importance; / = not important Footnotes: 1Details regarding the conservation themes and the grouping and calculations of Conservation Items within
these themes are in Section 3.5.3.
189

190

Chapter 7: Discussion
7.1 Introduction
Ecotourism is often promoted for its potential to combine social and commercial benefits with
conservation goals, and has been adopted widely in community development and conservation
policies in developing nations, and in practical conservation approaches globally (Butcher,
2006; Lamers et al., 2014; Romero-Brito et al., 2016). However, evaluations of this relationship
in practice are a relatively recent trend and the conservation impact of ecotourism enterprises on
a larger scale remains unclear (Wardle et al., 2018). This thesis therefore used a
multidisciplinary mixed methods approach to explore the demonstrated and potential
conservation practices of ecotourism enterprises at a broad global scale, and to evaluate the
conservation contributions of private ecotourism enterprises at the national scale in Australia.
Core themes from this research demonstrate a raft of ecological and social relationships between
ecotourism and conservation practice, and this chapter presents a discussion of each of these
components.
The chapter begins by discussing the significance and contribution of this thesis to knowledge
through the Research Objectives in Section 7.2. Next, an evidence-based interpretation and
contextualisation of the thesis findings in relation to the academic literature is presented in
Sections 7.3 and 7.4. This is followed by the practical implications of this research in Section
7.5, the key limitations of this study and suggestions for future research directions in Section
7.6, and concluding remarks in Section 7.7.
7.2 Thesis significance and contributions
7.2.1 Research Objective 1 Identify and synthesise existing evaluations of the conservation activities of
ecotourism enterprises in the academic literature to quantify the gaps and biases
that exist within this research.
Chapter 2 used a published systematic quantitative literature review to (1) demonstrate the gaps
in conservation evaluations of ecotourism enterprises; and (2) develop conceptual models of the
ecotourism-conservation pathways that have been demonstrated in the academic literature. This
is the most comprehensive review currently available of the conservation actions and outcomes
of ecotourism enterprises (Wardle et al., 2018). It highlights that although existing evaluations
in the academic literature do indicate that ecotourism enterprises can achieve positive
conservation outcomes, the indiscriminate and variable nature of this research undermines its
191

Chapter 7: Discussion
reliability as an evidence base (Kleiman et al., 2000; Tear et al., 2005; Ferraro and Pattanayak,
2006). This necessitates more robust standardised measures to quantify ecotourism
contributions and facilitate more detailed comparative analyses.
7.2.2 Research Objective 2 Identify the potential conservation activities that ecotourism enterprises may
undertake and construct an evaluation framework based on an exploration of the
actions, outcomes and relationships of these conservation activities.
Chapter 4 built on the conservation pathways identified in Chapter 2 and established the first
comprehensive list of conservation actions, outcomes and the interconnected relationships
between them. Constructed into a Conservation Activities Matrix, this provides the foundation
of a novel Conservation Evaluation Framework to guide systematic evaluations of the
conservation contributions of the ecotourism industry at an individual enterprise level or
accumulative scale. It addresses vital aspects of threatened species management by allowing for
both spatial and temporal comparisons, and facilitating repeatability and reproducibility of
evaluations (Kleiman et al., 2000; Tear et al., 2005; Morrison, Wardle and Castley, 2016).
Furthermore, by incorporating the ecological, social and political dimensions of conservation
practices, the Conservation Activities Matrix addresses key gaps in the academic literature
identified in Chapter 2 (Wardle et al., 2018). This framework provided a platform for the
subsequent assessment of conservation actions and outcomes by Australian ecotourism
operators in Chapter 5.
7.2.3 Research Objectives 3 and 4 (3) Evaluate the conservation activities of a set of Australian ecotourism
enterprises certified with Ecotourism Australia (‘EA’).
(4) Explore the patterns that may exist between the conservation practices of
Australian ecotourism enterprises and their enterprise characteristics such as
the size of the property and age of the business.
Under the guidance of the Conservation Evaluation Framework, Chapter 5 provides the first
national scale systematic evaluation of the conservation contributions of multiple privately
owned and operated ecotourism enterprises in Australia. This research reveals that although
ecotourism operations generate a myriad of conservation gains through social and ecological
actions, not all eco-certified sites contribute to conservation goals. Many of the findings
presented in Chapter 5 reflect previously reported patterns for individual private land
192

Chapter 7: Discussion
conservation63 (e.g. Brightsmith et al., 2008; Halliday et al., 2012; Mossaz et al., 2015).
However, this thesis is the first to use a predetermined comprehensive list of ecological and
socio-political items, providing an important step for the systematic use and evaluation of
ecotourism for conservation purposes. It helps to satisfy the need for evidence-based
conservation measures, and therefore has practical implications for operators, researchers, and
eco-certification bodies for introducing or enhancing the use of ecotourism in conservation
strategies (Kleiman et al., 2000; Tear et al., 2005; Walsh et al., 2012). Furthermore, this static
assessment provides a baseline for future evaluations of Australian ecotourism enterprises.
7.2.4 Research Objective 5 Document and explore the overlaps and gaps between the EA certification criteria,
conservation practices of ecotourism enterprises, and the national conservation
policy landscape in Australia.
Chapter 6 provides a novel comparison of the criteria from an eco-certification program, the
conservation practices of their certified members, and the key themes and priorities of national
conservation policy. By exploring overlaps and gaps across these three groups, this chapter
identified (1) priority areas for Australian ecotourism sites and EA to improve their
contributions to national conservation goals, such as assessments of both social and ecological
outcomes of conservation activities; and (2) key opportunities for conservation-ecotourism
collaborations and strategic investments for conservation activities.
7.3 Ecotourism and ecological conservation practices
The significance of the conservation achievements identified in this study varied greatly, with
some sites making important contributions to threatened species or ecosystems, and others
simply listing actions with little focus on their extent or outcomes. As the available information
for these results was strongly influenced by the certification program and reporting process, it is
possible that these patterns may differ slightly in practice. However, both the types of actions
reported and the large difference in frequencies between actions and outcomes reflect trends in
the academic literature (Wardle et al., 2018).
63 Discussed further in Sections 7.3 and 7.4.
193

Chapter 7: Discussion
7.3.1 Frequencies and patterns Findings from Chapter 5 demonstrate that there are some Conservation Items addressed by
many sites, many Conservation Items that are addressed by no or few sites, and a handful of
sites that undertake many Conservation Items. Over 85% of ecological outcomes were reported
by less than 20% of sites, which may reflect critical limitations in how such outcomes are
reported or evaluated on private properties more broadly. The challenge of evaluating
conservation outcomes has been highlighted previously (Adams, Game and Bode, 2014), and
this may be particularly pertinent in the private land context where conservation objectives,
evaluation methods and reporting are highly variable (Fitzsimons and Carr, 2014), and the poor
exchange of information (e.g. Sunderland et al., 2009) may further limit evaluations.
The most commonly reported conservation actions from ecotourism operations were similar to,
but more prevalent than, those of the broader population of private landholders in Australia with
conservation agreements (both legally binding and non-legally binding) (Halliday et al., 2012).
For example, the two most frequent activities identified in Halliday et al. (2012) were weed
control (89%) and revegetation (54%), which were both carried out by 100% of the ecotourism
sites examined in this study. This may be because these and other commonly reported activities
in this study such as rubbish clean-up are (1) relatively cheap and easy to undertake at a basic
level (which is all that is required to meet the criteria of the certification program), and (2) likely
to enhance site aesthetics. Similarly, the most frequently reported conservation outcomes were
those that are the most visible and easily detected such as increased habitat, in contrast to the
infrequently reported actions and outcomes which tend to require specialised equipment or
technical measurements (Fitzsimons and Carr, 2014). However, the cost and convenience of an
activity does not necessarily correlate with its importance. For example, rubbish clean-up
requires minimal effort or expertise yet can be extremely important in coastal areas due to the
risk that discarded material presents to marine wildlife (Jackson et al., 2017), as demonstrated
by the creation of a Threat Abatement Plan in 2018 for this issue (Commonwealth of Australia,
2018). Furthermore, despite the low frequencies of reported outcomes, the high frequencies of
conservation actions indicate a high level of enthusiasm for conservation practices among
private Australian ecotourism enterprises, reflecting previous findings that tourism operators in
natural areas have a high conservation ethic and often see themselves in a ‘steward’ role to both
use and protect the natural environment (Besio, Johnston and Longhurst, 2008; Liburd and
Becken, 2017).
The highly associated relationships between Conservation Items reflect similarly high
frequencies: there were no pairs of Conservation Items with low frequencies but high
association. This means that Conservation Items which are uncommon overall are scattered
across sites in various patterns rather than clumped together at particular sites. Again, this could
194

Chapter 7: Discussion
be related to the cost and effort required for most of these low-frequency items: many of the
sites in this study are small businesses, and it is of greater value to use their limited resources
efficiently on a small number of targeted actions to maximise their outcomes (Naidoo et al.,
2006; Frankham, 2008).
There were also few significant patterns across the sites relating to site characteristics, meaning
there are similar opportunities for most sites to undertake most Conservation Items. Within the
Australian context this may be because (1) both threats and threatened species are widely
distributed across Australia (Allek et al., 2018), and (2) there is relatively equal access to
nationwide programs such as federal grants, Landcare, and Land for Wildlife (Prado et al.,
2018; Robins, 2018). However, the results highlight some patterns relating to property size and
enterprise age.
Sites with larger properties were more likely to obtain some level of formal protection, reduce
invasive fauna, and undertake wildlife rehabilitation and veterinary activities. This is likely
related to factors that increase the feasibility and value of these actions in this context. For
example, larger properties tend to contain higher numbers of wildlife, larger and less
fragmented forested areas, and a higher area-to-perimeter ratio that reduces edge effects of
neighbouring properties (Hobbs, 2001; Ries et al., 2004; Fischer and Lindenmayer, 2007).
Younger enterprises were more likely to manage resources and nest sites for wildlife, indicating
a lack of old growth forest (and associated undergrowth and nesting hollows) that would
otherwise be present on properties that had been under protective arrangements for a longer
period of time (Lindenmayer et al., 2000; Vesk and Mac Nally, 2006; Boyle et al., 2008;
Lindenmayer et al., 2009). It is also likely that this is linked to the non-significant association
that enterprises less than five years old were more likely to have converted degraded land to
ecotourism.
However, care must be taken in the interpretation of this data: these patterns are a reflection of
the number of Conservation Items reported and do not incorporate their extent, scale, or impact
on threatened species. Furthermore, the importance of these conservation activities is dependent
on the individual context.
7.3.2 Private land and protected areas This study demonstrates that ecotourism enterprises are already contributing to a key
conservation strategy in Australia to increase private protected areas (PPAs) (Fitzsimons, 2015;
England, 2016; Mitchell et al., 2018). Nearly two-thirds of the 86 sites had established legally-
195

Chapter 7: Discussion
binding PPAs, with an additional 12 sites (14%) demonstrating their conservation commitment
through non-legally binding mechanisms such as the Land for Wildlife program64. This
proportion is far higher than that of other segments of commercial or private landholders in
Australia (Fitzsimons, 2015). Furthermore, the 54 sites with formal PPAs together make up 3%
of the 8,702,600ha of land under PPAs in Australia (DEE, 2016), with the remainder made up
of approximately 5,000 properties (Fitzsimons, 2015). However, as noted in Chapter 5, just
three sites made up 75% of the total area protected in this study. Furthermore, private protected
areas also face funding challenges, and landowner concerns about the loss of potential future
land-use options and productivity (Greiner and Gregg, 2011; Moon and Cocklin, 2011; Adams
and Moon, 2013; Addison and Pavey, 2017) will remain important discussion points.
Nevertheless, over half of the 86 sites in this study were situated on previously degraded land
that they had restored and converted to ecotourism use. The majority65 of these properties had
previously been used for agriculture, and half66 had shifted to ecotourism due to the financial
difficulties and uncertainty of the previous agricultural operations. A further three sites were in
the process of transitioning by combining both ecotourism and agricultural activities. This
reflects similar findings from previous studies that revenue from nature-based or wildlife
recreational operations such as ecotourism may provide financial stability for landholders
during times of droughts or market fluctuations (Kerley, Knight and Kock, 1995; Macaulay,
2016) while also stimulating economic growth and employment (Sims-Castley et al., 2005).
Furthermore, the use of ecotourism as a commercial operation that contributes to environmental
protection helps refute the “land sparing or land sharing” debate regarding conservation versus
consumptive land uses (Addison and Pavey, 2017). Additionally, the range of threatened species
protected across the sites, including several small, nocturnal and cryptic species (Chapter 5)
suggests that the conservation efforts of ecotourism enterprises may not be driven solely by
visitor viewing preferences for charismatic species (Kerley, Geach and Vial, 2003; Lindsey et
al., 2007a; Castley, Bennett and Pickering, 2013).
7.3.3 Landscape management Findings demonstrate that many of the ecotourism enterprises were engaging in practices
relating to vegetation and habitat quality including revegetation activities (100%); establishing
wildlife corridors and enhancing ecological connectivity (70%); and increasing habitat quality
and/or extent (64%). This likely reflects widespread concern over the extensive land clearing in
Australia (Bradshaw, 2012; Ritchie et al., 2013), with habitat loss and fragmentation affecting
64 Details on PPA arrangements in Australia and the Land for Wildlife program are in Section 2.6.4. 65 18 of the 23 sites that gave information on previous land uses. 66 Three of the six sites that gave information on motivation for transitioning to ecotourism.
196

Chapter 7: Discussion
half of all threatened species in Australia including 34 threatened mammal species (Woinarski,
Burbidge and Harrison, 2014; Jackson et al., 2017). However, the revegetation efforts were
classified as minimal for over a third of the 26 sites that provided relevant information on these
activities (Chapter 5). Even so, many sites also shared borders with important natural areas such
as national parks and landscape-level corridors, and therefore extend the reach of the protected
area network and assist in reducing edge effects (Fitzsimons, 2015). More broadly, private lands
provide important areas for retaining native vegetation communities (Pressey et al., 2000;
Ritchie et al., 2013), and there are opportunities here to incentivise landowners to protect rather
than clear this habitat.
Restoring or mimicking ecological fire regimes is another important aspect of landscape
management, as discussed in Chapter 4. However, just seven sites (8%) reported engaging in
ecological fire management for targeted conservation purposes. This number was not large
enough to investigate statistically; nor was it possible to identify the need for ecological fire
management, or lack thereof, for most properties. However, it is slightly less than that of the
broader population of private landholders in Australia with conservation agreements (Halliday
et al., 2012). This may reflect the widespread lack of understanding among the general public of
the importance of ecological fire regimes (Dombeck, Williams and Wood, 2004), which has
been found even among private landholders with conservation agreements (Halliday et al.,
2012), and may be exacerbated by enterprise concerns of backlash from visitors and local
communities. Additionally, the low participation rate of ecological fire management across both
studies may be due to the perception that they are difficult, “time consuming and bureaucratic”
(Fitzsimons and Carr, 2014, p. 611). This is particularly problematic for biodiversity
conservation in Australia as changed fire regimes are recognised as a threat to 60% of
Australia’s at-risk species (Jackson et al., 2017).
Finally, this study revealed a strong interest in invasive species management among ecotourism
enterprises, with 100% and 75% of sites addressing introduced flora and fauna, respectively.
Feral cats and foxes were the primary invasive fauna species targeted by sites, likely reflecting
their severe environmental impact: these two species have been the primary cause of mammal
extinction in Australia, with cats currently threatening over 140 native species including over a
third of Australia’s threatened mammals, reptiles, frogs and birds (Woinarski et al., 2014; IPAC,
2016a; Jackson et al., 2017). Although outcomes on these activities were not well reported, even
a few individuals of a predatory invasive species such as cats can wreak devastating impacts on
native wildlife in a short time (Burbidge and Manly, 2002; Kinnear, Sumner and Onus, 2002;
Algar et al., 2010). However, as highlighted by the Pest Strategy, a key principle of effective
pest management is that it must be “based on actual rather than perceived impacts and should be
supported by monitoring to measure whether impact reduction targets are being achieved”
197

Chapter 7: Discussion
(IPAC, 2016a, p. 5). Ecotourism sites will therefore need to enhance their monitoring and/or
reporting practices in order to assess and demonstrate the impact of their efforts to control
invasive fauna.
7.4 Ecotourism as a social driver for conservation
7.4.1 Frequencies and patterns This study demonstrates a high level of engagement with socio-political activities among
ecotourism sites, with nearly two-thirds of these actions undertaken by more than 85% of
enterprises. This is likely a reflection of the benefits these actions may bring to businesses such
as reducing costs through purchasing locally (John et al., 2006; Kang and Rajagopal, 2014);
enhancing the visitor experience through environmental training for staff (Christie and Mason,
2003); enhancing their public image through supporting conservation organisations
(Cetindamar, 2007; Heikkurinen, 2010); gaining local support through community contributions
(Andereck et al., 2005; Lapeyre, 2011); and mutually beneficial actions with protected area
agencies such as track maintenance on shared land. However, many enterprises do demonstrate
a genuine conservation ethic and desire to aid local communities at the expense of business
resources (Kabii and Horwitz, 2006). For example, some sites gave career development support
for local residents who weren’t employed by the site and who were actively seeking work
elsewhere. It is also likely that frequency patterns are related to the context-specific nature of
socio-political conservation activities. For example, it is expected that most enterprises will only
engage in advocacy and lobbying activities if there are political issues threatening their local
area or operations, and will only persevere in these activities until a resolution is achieved
(Miller and Krosnick, 2004). Additionally, the three actions undertaken by 1% of enterprises or
less have little relevance in the Australian context. For example, human-wildlife conflict is only
mentioned by a single policy in the NCA and this is only in reference to managing native pests
“in accordance with state and territory legislation” (IPAC, 2016a, p. 4).
Most outcomes (83%) were reported by less than 10% of enterprises, which is likely related to a
lack of prompts in the EA Questionnaire (Rooney, Steinberg and Schervish, 2004).
Furthermore, many of these outcomes would be difficult for enterprises to gauge and impossible
to quantify without establishing specific mechanisms with which to measure changes (e.g.
Hughes, 2013). To do so would be time consuming and unlikely to provide much commercial
benefit for operators. As with the ecological outcomes, this may also be reflective of the
challenges in measuring conservation outcomes more broadly (Fitzsimons and Carr, 2007;
Sunderland et al., 2009; Adams et al., 2014). It is therefore possible that the outcomes examined
in this study may be more prevalent in practice among Australian ecotourism enterprises than
198

Chapter 7: Discussion
the results suggest. For example, given the extensive visitor environmental interpretation
activities reported by sites, it is likely that the outcome of increased visitor environmental
awareness is higher than the three enterprises that mentioned this, even after accounting for the
ceiling effect (Beaumont, 2001; Sander, 2012).
As with the ecological items, the associations between the socio-political items reflect similarly
high frequencies, and no pair of Conservation Items had low frequencies but a high association.
Again, this indicates that uncommon items are scattered across the group rather than a small
number of sites undertaking multiple low-frequency items. As with the ecological indices, few
significant patterns were found between the Conservation Items and enterprise characteristics,
indicating that there are similar opportunities and social needs for most enterprises to undertake
most items. Furthermore, all enterprises in this study operate within similar community
structures and cultural contexts with equal access to government grants and tourism
associations.
7.4.2 Public engagement and social capital Chapter 4 highlights that the ability of ecotourism enterprises to increase the environmental
knowledge and pro-environmental behavioural intentions of both visitors and local community
members has been well documented (Hughes, 2011; Wheaton et al., 2016). However, there is
limited data available on if, and how, this translates into actual behavioural changes (Nye and
Hargreaves, 2010; Hofman and Hughes, 2018). This study demonstrates that the ecotourism and
eco-certification sectors in Australia are subject to the same data inadequacies that prevent the
demonstration of this conservation pathway. Nevertheless, findings in Chapter 5 indicate that in
some instances ecotourism enterprises in Australia can empower and motivate people to make
positive behavioural changes such as reducing waste, contributing to revegetation programs, and
donating money to conservation projects. Furthermore, many of the ecotourism enterprises were
also providing the necessary access and opportunities for ensuring enthusiasm was turned into
action (Hughes, 2013). For example, three sites supplied native seedlings free of charge to local
landowners. Furthermore, the example of a visitor purchasing and restoring the adjoining block
of land to Site 4 (Chapter 5) demonstrates the scale of conservation outcomes that ecotourism
experiences could potentially generate. Of course, large-scale environmental improvements
won’t result from every interaction with visitors or the local community; however, even small
changes such as substituting introduced plants with local natives in residential gardens can have
significant ecological impacts when replicated on a number of properties (Goddard, Dougill and
Benton, 2010).
199

Chapter 7: Discussion
Furthermore, the findings of this study also indicate that ecotourism enterprises can contribute
to social capital in a developed country, which is a critical component of effective social
movements (Sobels, Curtis and Lockie, 2001; Mbaiwa, 2011; Thoyre, 2011). For example,
supporting community and environmental associations may increase bonding social capital;
participating in local events and engaging with a range of community groups may increase
linking social capital; and facilitating engagement between the local community and visitors
(i.e. external groups) may increase bridging social capital (Pretty, 2003; Woodhouse, 2006).
Studies have shown that individuals are more likely to engage in pro-environmental behaviours
when social capital is improved due to the increased value of the collective interest and
associated community expectations (Mbaiwa, 2011; Thoyre, 2011). This also helps ensure that
individuals don’t revert back to environmentally damaging behaviours if incentives end or
regulations aren’t enforced as strictly (Pretty, 2003; Nye and Hargreaves, 2010). Additionally,
as highlighted in Chapter 4, the increased vigilance and reporting of illegal activities may
provide deterrents for harmful behaviours, which can be particularly important in regional and
sparsely populated areas (Henriques and Sadorsky, 1996; Dong et al., 2011). The example in
this study of the illegally buried 38 tonnes of rubbish found by Site 2 (Chapter 5) highlights that
this type of issue isn’t confined only to countries with weaker governance structures or
supporting legal systems. Finally, social capital is linked with higher quality of life and
economic development, placing communities in better positions to face new economic and
social challenges (Woodhouse, 2006).
7.4.3 Economic priorities and political pressure There has long been competing priorities in Australia between environmental protection and the
demand for jobs and economic development (Hollander, 2006; Buckeridge, 2014), often
resulting in substantial wildlife losses and environmental degradation (Kingsford et al., 2009;
Lindenmayer et al., 2010; Watson et al., 2011). However, tourism, and to a smaller extent
ecotourism, has the potential to help bridge this gap (Sims-Castley et al., 2005; Liburd and
Becken, 2017). Chapter 5 revealed that all sites undertook actions that contributed to the
economic development and growth of their local area, and all except one site employed
members of the local community. This is particularly important given the decline in resource
sector jobs and the growth of the tourism industry in Australia in recent years (Australian
Bureau of Statistics, 2016; 2017; Liburd and Becken, 2017). The provision of jobs and the
sustainable use-value of the natural environment through tourism can also help level the playing
field against other powerful bodies (Buckley, 2009). For example, in 2012 the Great Barrier
Reef in North Queensland was nearly placed on the endangered list of World Heritage Sites
after severe environmental degradation from increased resource extraction and shipping
200

Chapter 7: Discussion
activities. The contribution of the AU$6.4 billion/year tourism industry voices to those of
environmental groups in opposition to the resource sector was instrumental in bringing about
extensive government and public action to better protect the area67, including bank refusal to
finance developments in the adjacent Galilee Basin (Hamman, 2016; Liburd and Becken, 2017).
However, despite the significance of the Great Barrier Reef situation and the handful of notable
examples highlighted in Chapter 5, this study illustrates that many of the political activities at an
individual site level were largely those that involve little effort or commitment, such as writing
letters to politicians. Furthermore, given the style of the certification application, few sites
reported information on the extent of these activities such as, for example, the number of letters
written to politicians, the frequency with which they attended meetings or forums, or indeed
whether any of these actions resulted in any change in practice or policy.
7.5 Implications of this research
7.5.1 Ecotourism-conservation evaluations The CA Matrix and CE Framework established in Chapter 4 provide a guide for evaluations of
the conservation contributions of ecotourism sites, businesses and programs. Furthermore, the
systematic and comprehensive nature of this framework has the potential to enable comparisons
across locations, sectors and time scales (Ferraro and Pattanayak, 2006; Fitzsimons and Carr,
2014). This work therefore has practical implications for conservation and ecotourism research,
practitioners in conservation management, ecotourism certification bodies, and the wider
ecotourism industry.
As highlighted by this study, conservation activities do not exist in isolation and much overlap
exists between actions and outcomes and across the ecological and socio-political categories. By
(1) incorporating the ecological, social and political dimensions of conservation practices into a
single framework, and (2) highlighting the links between conservation actions and outcomes,
this research addresses key gaps in the academic literature as identified in Chapter 2 (Wardle et
al., 2018), and elsewhere (Rissman and Sayre, 2012; Adams et al., 2014; Fitzsimons and Carr,
2014). Ecotourism is often proclaimed as a commercial land use that can generate real-world
conservation outcomes through the pro-environmental values and behaviours of visitors and
local community members (e.g. Almeyda Zambrano et al., 2010; Sander, 2012; Skibins et al.,
67 However, the controversial Adani coal and rail project received government approval to begin construction in June 2019, suggesting resource extraction still trumps tourism in the eyes of the government. Even so, the extensive efforts of concerned stakeholders delayed construction by four years and halved the size of the mine by forcing Adani to self-fund the project (reducing the project cost from an original $16.5 billion over its lifetime to $2 billion (ABC News, 13 June, 2019)).
201

Chapter 7: Discussion
2013). The CE Framework gets to the crux of this relationship: environmental understanding
and conservation values are indeed important aspects of the ecotourism-conservation
relationship; however, if they do not manifest as pro-environmental behavioural changes, then
there are no real-world conservation outcomes.
The usefulness of framework applications will depend on the data available for the CA Matrix.
Wherever possible, evaluations should incorporate qualitative and quantitative data to ensure
both depth and breadth (Thomas and Magilvy, 2011; Yilmaz, 2013). Although a variety of tools
and techniques exist for each Conservation Item, both access to, and quality of, relevant data
will be highly variable across items, sites and contexts. However, at its most basic this
framework can be used with presence/absence data for each Conservation Item and
supplemented with qualitative data where available (as illustrated through Chapter 5), with the
potential to convert this to Likert scales when greater detail allows.
The CA Matrix is the most comprehensive model of conservation pathways to date; however, it
is not exhaustive. For example, it does not specifically include aquatic environments or
hydrological flows. Furthermore, the arrangement of the CA Matrix is not static or absolute. For
example, it could be argued that ‘establishing a protected area’ should be divided into two
conservation actions to distinguish between legal protection (such as properties protected by
conservation covenants) and physical protection regardless of the presence of legal mechanisms
(such as predator-proof properties), as one does not necessarily follow the other (Watson et al.,
2014). It is likely that incorporating the knowledge and perspectives of additional stakeholders
such as conservation practitioners and researchers of behavioural economics could identify
further additions or modifications.
7.5.2 Eco-certification and conservation in Australia
7.5.2.1 Program content and style The gaps and overlaps analysis in Chapter 6 demonstrates that the EA Questionnaire includes
items across environmental, social and economic areas, something few certification programs
cover (Esparon, Stoeckl and Gyuris, 2013). However, although the EA Questionnaire content
addresses key conservation issues such as deforestation and invasive species which provide
some of the greatest threats to biodiversity in Australia (Jackson et al., 2017), this study also
demonstrates that 88% of the Conservation Items are not covered adequately or at all,
highlighting key conservation gaps within the ECO Certification Program. Furthermore, the EA
Questionnaire consists predominantly of check-list items requiring only yes/no answers with
some spaces for applicants to provide additional information if they wish. Without prompts or
202

Chapter 7: Discussion
specific questions to obtain relevant information from applicants (Rooney et al., 2004), there is
often a glaring absence of appropriate detail and no consistency in the information provided
across applications (Boreux, Born and Lawes, 2009; Sunderland et al., 2009).
Although process-based systems are common for eco-certification programs and are noted for
their apparent recognition of the efforts of certified members, these approaches have been
widely criticised in the academic literature in comparison to performance-based programs
(Jamal et al., 2006; Tscharntke et al., 2015). By focusing solely on whether certain activities are
undertaken, the EA Questionnaire provides no indication of the effort exerted by sites. For
example, in its current form the ECO Certification Program does not distinguish between (1)
sites that devote over 4,000 person-hours annually on weed removal activities; and (2) sites that
sporadically remove a small number of weeds: under the current system both sites ‘remove
weeds’. Additionally, the EA Questionnaire disregards the extent of conservation outcomes,
meaning sites that remove weeds from an area of 5m2 are treated as equal to sites that have
cleared 10,000ha of weeds. Furthermore, it doesn’t consider the scale and frequency of activities
undertaken or the need for these activities within the specific context of individual sites,
exacerbating the content issues outlined above.
This research shows that many certified ecotourism enterprises are enthusiastic about
conservation, but the depth of analysis is severely limited by a lack of quantitative data.
Improving information exchange among all stakeholders in conservation practice is an
important intervention to strengthen on-ground implementation, and collaboration with
independent researchers with experience in conservation mechanisms and indicators could
enhance the conservation coverage and quality of the ECO Certification Program (Boreux et al.,
2009; Sunderland et al., 2009; Haaland and Aas, 2010; Laurance et al., 2012). Key areas
highlighted for improvement in Chapter 6 include conservation outcomes regarding invasive
species, wildlife numbers and threat status, and conservation behaviours. Substantially more
detailed evidence will be required if eco-certification is to gain recognition and support for its
contributions to conservation.
7.5.2.2 Program tiers As covered in Section 2.3.2, the ECO Certification Program includes basic, intermediate, and
advanced levels of certification. It is theoretically possible for this tiered system to encourage
members in lower certification levels to improve their practices to advance to higher levels.
Indeed, discussions with EA staff indicate that this is their primary justification for having such
a low entry-level tier, and they offer discounts for existing members to upgrade to a higher level
203

Chapter 7: Discussion
of certification or to obtain additional certifications through their Respecting Our Culture
(ROC) and Climate Action (CA) programs.
However, this approach is contingent on the benefits of upgrading outweighing the costs. Other
than the possibility of extended operating permits with the Great Barrier Reef Marine Park
Authority, and eligibility to use the GSTC logo in promotional materials, there appear to be few
incentives for operators to move beyond the basic level of certification. Furthermore, consumers
already struggle to differentiate between many of the eco-labels that have flooded the tourism
market (Haaland and Aas, 2010; Lebe and Vrečko, 2015), and the similarity of the logos for the
ECO Certification Program’s three tiers of certification (Figure 7.6) mean a marketing
advantage is a questionable incentive (Mihalič, 2000; Esparon et al., 2013).
Figure 7.6 The almost identical logos for the three tiers of EA’s ECO Certification Program
Given that financial constraints have been identified as a primary barrier for ecotourism
enterprises to become certified (Blackman et al., 2014; Fogle and Duffy, 2018), it is also
possible that the upgrade fee may actively deter enterprises from upgrading, especially if
gaining extended operating permits is not relevant to their operating context. As such, it remains
unclear whether EA can successfully foster improved environmental practices of their members
or whether they are effectively “providing a logo for those who would have ‘done the right
thing’ anyway” (Esparon et al., 2013, p. 847). Furthermore, upgrading from the intermediate
certification level to the advanced level only requires more boxes to be ‘ticked’ rather than
generating or demonstrating an improved environmental impact.
The addition of a fourth tier ‘conservation’ level within the ECO Certification Program could
distinguish sites that are making genuine contributions to conservation goals in Australia.
However, for such a certification to be successful, the current checklist-based system will need
supplementation with quantitative and ecologically meaningful measurements.
204

Chapter 7: Discussion
7.5.3 Policy and practice It has long been acknowledged that the financial resources required to conserve global
biodiversity far exceed the resources available for conservation practices (James, Gaston and
Balmford, 1999; Waldron et al., 2013), and a lack of financial resources was consistently
reported by CBD parties as one of the main reasons for failing to meet the CBD goal of
reducing rates of biodiversity loss by 2010 (Waldron et al., 2013). However, this divide between
required and available funds continues to widen and is likely to be a key factor in the predicted
failure to meet the Aichi Targets by 2020 (Waldron et al., 2017). Alternative conservation
strategies incorporating socio-ecological systems alongside more traditional approaches are
therefore critical for meeting the goals of international agreements and substantially reducing
the rate of biodiversity loss (Waldron et al., 2013; Butchart et al., 2015; Hill et al., 2015).
This is particularly pertinent in Australia where conservation funding has actually decreased,
even after being ranked as one of a handful of developed nations in the top 40 underfunded
countries for biodiversity conservation for the period 2001-2008 (Waldron et al., 2013;
Woinarski et al., 2017; Scheele et al., 2018). This decline in government resources is
highlighted in the Pest Strategy as triggering “increased interest in ways to maximise return on
investment of public funds” (IPAC, 2016a, p. 41), and all policies across the NCA have a strong
focus on strategic partnerships and investment options to increase cross-sectoral contributions of
conservation funding and resources (Chapter 6).
Findings from this study demonstrate the potential for ecotourism enterprises to address national
conservation goals, including eight of the 13 Threat Abatement Plans and 12 of the 21 Key
Threatening Processes under the EPBC Act 1999 (Chapter 5). Additionally, findings from
Chapter 6 demonstrate a number of areas where the conservation activities of a large proportion
of ecotourism sites overlap with conservation themes of high importance for national policy.
However, this study shows that tourism is predominantly acknowledged by national
conservation policy in Australia as a driver for environmental protection as well as an impact
that must be managed, and is not yet widely acknowledged as an industry that can contribute to
conservation goals (Chapter 6). Combining the findings from Chapters 5 and 6 highlights key
opportunities for strategic investments and collaborations with ecotourism sites across the
following three themes.
7.5.3.1 Protected areas and land-use change Increasing the amount of private land under protective arrangements is well recognised as an
important step in meeting the protected area targets of international agreements, such as the
205

Chapter 7: Discussion
Convention on Biological Diversity’s Aichi Target 11 (Bingham et al., 2017). Given that over
three-quarters of Australian land is freehold, leasehold, or under community management
(Jackson et al., 2017), increasing PPAs is a particularly important strategy for Australia that has
been actively pursued for over 25 years (Fitzsimons, 2015; England, 2016; Mitchell et al.,
2018). Furthermore, this high level of private control of Australia’s land meant that much of the
existing national reserve system (NRS) was originally pieced together from ‘left over’ public
land that was unsuitable for agricultural purposes (Fitzsimons, 2015). Consequently, much of it
is nutrient poor and elevated, and it does not provide an adequate representation of Australia’s
biomes and wildlife (Kingsford et al., 2009). For example, Watson et al. (2011) identified that
more than 12% of threatened species and 20% of critically endangered species occur entirely
outside of the NRS, and Fuller et al. (2010) suggest that replacing some existing protected areas
could achieve better conservation outcomes. Similarly, the 2016 State of the Environment
Report highlights that nearly a third of all endangered communities and half of all critically
endangered communities have less than 5% of their extent represented in the NRS (Jackson et
al., 2017).
As such, the importance of protecting private properties of high conservation value cannot be
understated. This study showed that in addition to the 63% of sites with formal PPAs, over half
of the sites without formal PPA arrangements had demonstrated their conservation commitment
through non-legally binding mechanisms such as Land for Wildlife, highlighting the important
role that ecotourism enterprises can play in protecting at-risk species outside of the protected
area network. This also highlights that some ecotourism enterprises may provide a tangible
opportunity through targeted initiatives to increase the protection on their land through binding
conservation covenants. Furthermore, providing other private landholders with support to
diversify their revenue streams through additional ventures such as ecotourism may reduce
some of the current barriers to private landholders undertaking conservation activities,
including: a lack of practical conservation programs to participate in, mistrust of government,
the required commitment, lack of time, and a fear of losing productivity and profitability
(Greiner and Gregg, 2011; Moon and Cocklin, 2011; Adams and Moon, 2013; Addison and
Pavey, 2017)
7.5.3.2 Invasive fauna Invasive species are the most pervasive threat for at-risk native species in Australia (Allek et al.,
2018), and this study demonstrates a very high proportion of sites that address this issue.
Furthermore, an Australian survey of 32 land conservation professionals and researchers
identified the control of invasive flora and fauna as the first and third, respectively, most
important conservation actions for private landholders to undertake (Halliday et al., 2012).
206

Chapter 7: Discussion
Feral cats and foxes have been the primary cause of mammal extinction in Australia (Allek et
al., 2018), and these were the two main invasive fauna species targeted by sites in this study.
Rabbits were the third most frequently targeted species, which threaten over 300 nationally
threatened plant and animal species and are described as the “single worst, most widespread,
destructive and costly environmental and agricultural vertebrate pest animal” in the Pest
Strategy (IPAC, 2016a, p. 36). Other invasive species targeted by sites in this study included
large introduced herbivores such as goats and pigs, which contribute to habitat degradation and
compete with at-risk native herbivores; rats, which have contributed to the extinction of a
number of mammal species and currently threaten several others; and cane toads, which pose a
significant threat for four at-risk mammal species (DEE, 2015; Jackson et al., 2017).
Furthermore, by emphasising the importance of shared responsibility for pest management
through visitor interpretation and increasing the capacity for the wider public to engage with
pest management such as through community workshops and pest ‘hotlines’, these sites address
key barriers identified in the Pest Strategy (IPAC, 2016a).
7.5.3.3 Knowledge and research Knowledge of ecosystem processes that support biodiversity in Australia is currently
insufficient for 99% of species, and reports across all jurisdictions have raised the lack of long-
term monitoring and adequate reporting as a major barrier to effective environmental
management (Jackson et al., 2017). Over two-thirds of ecotourism sites reported monitoring
their properties and wildlife populations, and 95% undertook or participated in environmental
research projects (Chapter 5). This is a key theme in the NCA and has the potential to provide
much needed data for governments and conservation organisations (Chapter 6). Research can
contribute to both a reduction in negative environmental impacts and the creation or
magnification of positive impacts through, for example, an increased understanding of
ecological processes and impacts, and by providing data on optimal conservation processes for
practitioners and decision-makers (Sutherland et al., 2004; Cardinale et al., 2012; Balme et al.,
2013). Furthermore, ecotourism operators focus on long-term viability and can provide
extensive monitoring data and much needed funds and support for long-term research projects,
while also allowing for population recovery times (Brightsmith et al., 2008; Balme et al., 2013;
Marnewick et al., 2014; Young et al., 2014; Vinding et al., 2015), as illustrated by the 40 years
of data collected by Site 21 on the vulnerable hooded plover (Chapter 5). In addition to building
knowledge, some sites have also developed new and innovative monitoring techniques to
address the challenges of large properties, rough terrain, and limited resources (Chapter 5).
However, site development of these monitoring and research activities has been ad hoc and are
dependent on the ability of individual sites to connect with researchers. Greater guidance and
207

Chapter 7: Discussion
facilitation are needed to increase the number of these connections and enhance their
contribution to conservation knowledge.
7.6 Limitations and future research directions
7.6.1 Framework development The development of the CA Matrix and CE Framework were limited to papers published in
English language journals and publicly available eco-certification criteria from English-
speaking countries. Although previous research has estimated that over 90% and 75% of articles
published in natural science and social science journals, respectively, are printed in English
(Hamel, 2007), future research incorporating a multi-language review could investigate this
topic further. Additionally, as highlighted previously in this chapter, the framework is not
exhaustive in its coverage of conservation issues or pathways. The strength of the framework as
an evaluation tool and the breadth of its applicability could be enhanced by (1) incorporating the
knowledge and perspectives of additional stakeholders such as conservation practitioners, and
(2) testing its applicability across a range of enterprise types, scales, and data sources. It is also
recommended that future applications of this framework be conducted in partnership with the
ecotourism enterprises in question to ensure greater access to rich, high quality data.
7.6.2 Site evaluations The decision to omit field evaluations in this study and use the EA Questionnaire as the primary
data source allowed for the application of all Conservation Items in the CA Matrix across a
much larger number of sites than would otherwise be possible. Furthermore, use of these pre-
existing information sources meant there was a 100% response rate with considerable cross
validation inherent in the questions that minimised positive response biases. However, this
resulted in two key limitations.
Firstly, this limited much of the data to self-reported information provided by the enterprises,
which may be influenced by their priorities, knowledge, and marketing objectives. However, all
certification documentation supplied by the sites had previously been independently audited and
verified by EA, and was checked against independent third-party sources where available.
Nevertheless, the information provided by sites was at times too obscure to be used for detailed
analyses. For example, many sites used incorrect species names or incorrect spellings;
colloquial, genus or family names (e.g. ‘thistles’); or broad categories such as “the worst grassy
weeds”.
208

Chapter 7: Discussion
Secondly, the data were heavily influenced by the limited content and restrictive questions of
the EA Questionnaire which relies predominantly on check-lists requiring only yes/no answers
without further detail. As a result, it is impossible to determine if enterprises have not discussed
some types of conservation activities because they do not undertake these, or because they were
not prompted to report on them (Rooney et al., 2004). Furthermore, without adequate data and
consistent reporting practices by all sites regarding the extent of the Conservation Items, it is not
possible to distinguish sites with high versus low efforts or minor versus important outcomes
across the group.
Additionally, sites may have begun further conservation activities after becoming certified,
meaning that information regarding these would not have been captured in the application
process. This was accounted for by using publicly available sources such as company websites
and brochures to collect information regarding recent conservation practices on the premise that
ecotourism sites would incorporate important conservation practices in their promotional
material and websites. However, it is possible that some conservation contributions have not
been captured. As such, the results of this research should be assumed to highlight only the
minimum achievements of the study group.
Greater coverage of these Conservation Items by the certification program and greater detail and
consistency of information provided by the sites would allow the quantification of each item, or
at least the creation of Likert scales, increasing the depth of this research. Furthermore,
collaborations between EA and researchers could provide additional support to enable
enterprises to better measure and evaluate their conservation contributions.
7.6.3 Conservation significance Only national policies and directives (supplemented with state-level threatened species lists)
were used to evaluate the conservation significance of site activities due to time constraints.
However, conservation requirements can be very context specific, and this level of detail was
difficult to capture from such a top-down approach. It is therefore possible that some of the
conservation activities of the sites are of greater significance for conservation at a local level
than identified in this project. Future research using conservation policies and priorities at a
state and/or local level could investigate this further. Additionally, this information could allow
the Conservation Items from the CA Matrix to be weighted based on their importance in each
given context.
209

Chapter 7: Discussion
7.6.4 Research scope The sites sampled in this study had the highest level of eco-certification available in Australia
and may represent the highest performing sites. Therefore, it would not be prudent to assume
that the same frequencies and extent of conservation activities will extend to ecotourism
operators across all certification levels. Furthermore, this research provided a static assessment
of sites that ranged in age from 6 to 90 years with an average age of 22, meaning that most sites
had a lengthy period in which to carry out their conservation activities. Expanding this research
to (1) cover multiple time periods to explore temporal trends, and (2) include all EA certified
ecotourism enterprises rather than only fixed-site enterprises with advanced certification would
provide a more accurate reflection of the conservation achievements of the ecotourism sector.
Furthermore, evaluations incorporating ecotourism enterprises without eco-certification as well
as nature-based tourism operations more broadly would allow for comparisons of the
conservation achievements of the ecotourism subset with the larger nature tourism sector.
Additionally, future research could explore the potential influence of high-profile early-adopters
on the sustainability and conservation practices of other ecotourism operations.
7.7 Conclusion
Ecotourism is often promoted as a conservation mechanism; however, the lack of an adequate
evidence base means the legitimacy and extent of this relationship is unclear. This thesis
contributes to the growing body of research in this area by (1) exploring the demonstrated and
potential conservation practices of ecotourism enterprises at a global scale and consolidating
these into a conservation framework to guide future evaluations; (2) evaluating the conservation
practices of a set of certified ecotourism enterprises in Australia and identifying their
contributions to national conservation goals; and (3) revealing key gaps and areas of overlap
between the practices of these sites, the national eco-certification program, and national
conservation priorities in Australia.
This research reveals that some individual enterprises are indeed making substantial
conservation contributions, commensurate with their relatively small scale. However, findings
illustrate a substantial lack of attention given to conservation outcomes from both the ECO
Certification Program and site reporting practices. One reason for this is that the EA
Questionnaire relies only on a check-list of actions rather than a set of quantified, monitored,
and ecologically significant conservation outcomes. Consequently, the conservation
contributions of individual sites or groups of sites may demonstrate the potential conservation
impact of ecotourism enterprises, but the aggregate performance of this sector is limited to
presence/absence data for a narrow set of conservation practices. In order to provide meaningful
210

Chapter 7: Discussion
assessments of ecotourism contributions to conservation, the ECO Certification Program will
need substantial modifications to shift its focus beyond minimal impact operations.
This research also identified a number of areas where the conservation activities of ecotourism
sites overlap with national conservation priorities. Furthermore, the high frequencies of
conservation actions contrasted with the low frequencies of reported outcomes (1) demonstrate a
high level of enthusiasm for conservation practices among private Australian ecotourism
enterprises; and (2) indicate a tangible opportunity for governments in Australia to improve
conservation gains and meet international obligations through targeted initiatives for private
ecotourism enterprises, particularly with regards to private protected areas and public
engagement with conservation activities. However, findings reveal that tourism is
predominantly acknowledged by national conservation policy in Australia as a driver for
environmental protection as well as an impact that must be managed, and is not yet widely
acknowledged as an industry that can contribute to conservation goals.
This thesis does not suggest that ecotourism can provide a conservation solution in all contexts
or that it should be pursued at the expense of other conservation programs. The use of
ecotourism as a conservation strategy is neither a panacea or Pandora’s box. Like any other
strategy, its success is dependent on the particular context, individual players involved, and
underlying systems. However, one thing is certain: current levels of conservation funding are
insufficient to reduce existing rates of biodiversity loss and environmental degradation, both
within Australia and around the world. Alternative conservation strategies incorporating socio-
ecological systems alongside more traditional approaches are therefore critical for meeting the
goals of international agreements and substantially reducing the rate of biodiversity loss.
211

References
&Beyond. (2019a). The Phinda story. &Beyond; retrieved March 2019 from: https://www.andbeyond.com/small-group-journeys/phinda-impact/the-phinda-story/.
&Beyond. (2019b). Why visit &Beyond Phinda private game reserve? &Beyond; retrieved March 2019 from: https://www.andbeyond.com/advice/africa/south-africa/kwazulu-natal/phinda-private-game-reserve/why-visit-andbeyond-phinda-private-game-reserve/.
ABC News (13 June, 2019). What we know about adani's carmichael coal mine project, from: https://www.abc.net.au/news/2019-04-26/what-we-know-about-adanis-carmichael-coal-mine-project/11049938.
Adams, R.J., Smart, P. and Huff, A.S. (2017). Shades of grey: Guidelines for working with the grey literature in systematic reviews for management and organizational studies. International Journal of Management Reviews 19(4): 432-454.
Adams, V.M., Game, E.T. and Bode, M. (2014). Synthesis and review: Delivering on conservation promises: The challenges of managing and measuring conservation outcomes. Environmental Research Letters 9(8): 085002, doi:10.1088/1748-9326/9/8/085002.
Adams, V.M. and Moon, K. (2013). Security and equity of conservation covenants: Contradictions of private protected area policies in Australia. Land Use Policy 30(1): 114-119.
Adams, W.M. and Infield, M. (2003). Who is on the gorilla’s payroll? Claims on tourist revenue from a Ugandan national park. World Development 31(1): 177-190.
Addison, J. and Pavey, C.R. (2017). Alignment between values of dryland pastoralists and conservation needs for small mammals. Conservation Biology 31(2): 331-342.
Adimassu, Z., Mekonnen, K., Yirga, C. and Kessler, A. (2014). Effect of soil bunds on runoff, soil and nutrient losses, and crop yield in the central highlands of Ethiopia. Land Degradation & Development 25(6): 554-564.
Aerts, R., Nyssen, J. and Haile, M. (2009). On the difference between “exclosures” and “enclosures” in ecology and the environment. Journal of Arid Environments 73(8): 762-763.
Ahebwa, W.M., van der Duim, V.R. and Sandbrook, C.G. (2012). Tourism revenue sharing policy at Bwindi Impenetrable National Park, Uganda: A policy arrangements approach. Journal of Sustainable Tourism 20(3): 377-394.
Algar, D., Angus, G.J., Brazell, R.I., Gilbert, C. and Withnell, G.B. (2010). Eradication of feral cats on Faure Island, Western Australia. Journal of the Royal Society of Western Australia 93(3): 133-140.
Allek, A., Assis, A.S., Eiras, N., Amaral, T.P., Williams, B., Butt, N., Renwick, A.R., Bennett, J.R. and Beyer, H.L. (2018). The threats endangering Australia's at-risk fauna. Biological Conservation 222: 172-179.
Almeyda, A.M., Broadbent, E.N., Wyman, M.S. and Durham, W.H. (2010). Ecotourism impacts in the Nicoya Peninsula, Costa Rica. International Journal of Tourism Research 12(6): 803-819.
212

Almeyda Zambrano, A.M., Broadbent, E.N. and Durham, W.H. (2010). Social and environmental effects of ecotourism in the Osa Peninsula of Costa Rica: The Lapa Rios case. Journal of Ecotourism 9(1): 62-83.
Anand, A., Chandan, P. and Singh, R.B. (2012). Homestays at Korzok: Supplementing rural livelihoods and supporting green tourism in the Indian Himalayas. Mountain Research and Development 32(2): 126-136.
Andereck, K.L., Valentine, K.M., Knopf, R.C. and Vogt, C.A. (2005). Residents’ perceptions of community tourism impacts. Annals of Tourism Research 32(4): 1056-1076.
Andersen, A.N., Cook, G.D., Corbett, L.K., Douglas, M.M., Eager, R.W., Russell-Smith, J., Setterfield, S.A., Williams, R.J. and Woinarski, J.C.Z. (2005). Fire frequency and biodiversity conservation in Australian tropical savannas: Implications from the Kapalga fire experiment. Austral Ecology 30(2): 155-167.
Andréassian, V. (2004). Waters and forests: From historical controversy to scientific debate. Journal of Hydrology 291(1): 1-27.
Ansong, M. and Pickering, C. (2013). Are weeds hitchhiking a ride on your car? A systematic review of seed dispersal on cars. PLoS ONE 8(11): 1-11.
Appiah-Opoku, S. (2011). Using protected areas as a tool for biodiversity conservation and ecotourism: A case study of Kakum National Park in Ghana. Society and Natural Resources 24(5): 500-510.
Ardoin, N.M., Wheaton, M., Bowers, A.W., Hunt, C.A. and Durham, W.H. (2015). Nature-based tourism's impact on environmental knowledge, attitudes, and behavior: A review and analysis of the literature and potential future research. Journal of Sustainable Tourism 23(6): 838-858.
Ardoin, N.M., Wheaton, M., Hunt, C.A., Schuh, J.S. and Durham, W.H. (2016). Post-trip philanthropic intentions of nature-based tourists in Galapagos. Journal of Ecotourism 15(1): 21-35.
Armstrong, E.K. and Weiler, B.V. (2002). Getting the message across: An analysis of messages delivered by tour operators in protected areas. Journal of Ecotourism 1(2/3): 104-121.
Armstrong, R.A. (2014). When to use the Bonferroni correction. Ophthalmic and Physiological Optics 34(5): 502-508.
Australian Bureau of Statistics (2016). Australian national accounts: Tourism satellite account, 2015-16. Australian Bureau of Statistics; Canberra.
Australian Bureau of Statistics (2017). Australian industry, 2015-16: Australian industry by division. Australian Bureau of Statistics; Canberra.
Avery-Gomm, S., Borrelle, S.B. and Provencher, J.F. (2018). Linking plastic ingestion research with marine wildlife conservation. Science of the Total Environment 637-638: 1492-1495.
Baguette, M., Blanchet, S., Legrand, D., Stevens, V.M. and Turlure, C. (2013). Individual dispersal, landscape connectivity and ecological networks. Biological Reviews 88(2): 310-326.
213

Ballantyne, R., Packer, J. and Hughes, K. (2008). Environmental awareness, interests and motives of botanic gardens visitors: Implications for interpretive practice. Tourism Management 29(3): 439-444.
Ballantyne, R., Packer, J. and Sutherland, L.A. (2011). Visitors' memories of wildlife tourism: Implications for the design of powerful interpretive experiences. Tourism Management 32(4): 770-779.
Balme, G.A., Batchelor, A., De Woronin Britz, N., Seymour, G., Grover, M., Hes, L., Macdonald, D.W. and Hunter, L.T.B. (2013). Reproductive success of female leopards Panthera pardus: The importance of top-down processes. Mammal Review 43(3): 221-237.
Balmford, A., Beresford, J., Green, J., Naidoo, R., Walpole, M. and Manica, A. (2009). A global perspective on trends in nature-based tourism. PLoS Biology 7(6): e1000144, DOI: 10.1371/journal.pbio.1000144.
Barnes, J., Schier, G. and Van Rooy, G. (1999). Tourists' willingness to pay for wildlife viewing and wildlife conservation in Namibia. South African Journal of Wildlife Research 29(4): 101-111.
Bazeley, P. (2009). Analysing qualitative data: More than ‘identifying themes’. Malaysian Journal of Qualitative Research 2(2): 6-22.
Beaumont, N. (2001). Ecotourism and the conservation ethic: Recruiting the uninitiated or preaching to the converted? Journal of Sustainable Tourism 9(4): 317-341.
Becker, C.D., Agreda, A., Astudillo, E., Costantino, M. and Torres, P. (2005). Community-based monitoring of fog capture and biodiversity at Loma Alta, Ecuador enhance social capital and institutional cooperation. Biodiversity and Conservation 14(11): 2695-2707.
Bernard, H.R. (2013). Social research methods: Qualitative and quantitative approaches. SAGE Publications, Inc.; London, UK.
Besio, K., Johnston, L. and Longhurst, R. (2008). Sexy beasts and devoted mums: Narrating nature through dolphin tourism. Environment and Planning A 40(5): 1219-1234.
Beyene, A., Legesse, W., Triest, L. and Kloos, H. (2008). Urban impact on ecological integrity of nearby rivers in developing countries: The Borkena River in highland Ethiopia. Environmental Monitoring and Assessment 153(1): 461.
Biddle, N. and Swee, H. (2012). The relationship between wellbeing and indigenous land, language and culture in Australia. Australian Geographer 43(3): 215-232.
Bingham, H., Fitzsimons, J.A., Redford, K.H., Mitchell, B.A., Bezaury-Creel, J. and Cumming, T.L. (2017). Privately protected areas: Advances and challenges in guidance, policy and documentation. PARKS 23.1: 13-28.
Blackburn, T.M., Cassey, P., Duncan, R.P., Evans, K.L. and Gaston, K.J. (2004). Avian extinction and mammalian introductions on oceanic islands. Science 305(5692): 1955-1958.
Blackman, A., Naranjo, M.A., Robalino, J., Alpízar, F. and Rivera, J. (2014). Does tourism eco-certification pay? Costa Rica’s Blue Flag Program. World Development 58: 41-52.
Blamey, R.K. (1997). Ecotourism: The search for an operational definition. Journal of Sustainable Tourism 5(2): 109-130.
214

Blangy, S. and Mehta, H. (2006). Ecotourism and ecological restoration. Journal for Nature Conservation 14(3-4): 233-236.
Block, W.M., Franklin, A.B., Ward, J.P., Ganey, J.L. and White, G.C. (2001). Design and implementation of monitoring studies to evaluate the success of ecological restoration on wildlife. Restoration Ecology 9(3): 293-303.
Bond, W.J. and Keeley, J.E. (2005). Fire as a global ‘herbivore’: The ecology and evolution of flammable ecosystems. Trends in Ecology & Evolution 20(7): 387-394.
Boreux, V., Born, J. and Lawes, M.J. (2009). Sharing ecological knowledge: Opportunities and barriers to uptake. Biotropica 41(5): 532-534.
Borrelli, P., Robinson, D.A., Fleischer, L.R., Lugato, E., Ballabio, C., Alewell, C., Meusburger, K., Modugno, S., Schütt, B., Ferro, V., Bagarello, V., Oost, K.V., Montanarella, L. and Panagos, P. (2017). An assessment of the global impact of 21st century land use change on soil erosion. Nature Communications 8(1): 2013.
Bowen, G.A. (2009). Document analysis as a qualitative research method. Qualitative research journal 9(2): 27-40.
Boyle, W.A., Ganong, C.N., Clark, D.B. and Hast, M.A. (2008). Density, distribution, and attributes of tree cavities in an old-growth tropical rain forest. Biotropica 40(2): 241-245.
Braat, L.C. and de Groot, R. (2012). The ecosystem services agenda: Bridging the worlds of natural science and economics, conservation and development, and public and private policy. Ecosystem Services 1(1): 4-15.
Bradshaw, C.J.A. (2012). Little left to lose: Deforestation and forest degradation in Australia since European colonization. Journal of Plant Ecology 5(1): 109-120.
Brandt, J.S. and Buckley, R.C. (2018). A global systematic review of empirical evidence of ecotourism impacts on forests in biodiversity hotspots. Current Opinion in Environmental Sustainability 32: 112-118.
Brightsmith, D.J., Stronza, A.L. and Holle, K. (2008). Ecotourism, conservation biology, and volunteer tourism: A mutually beneficial triumvirate. Biological Conservation 141(11): 2832-2842.
Brockway, D.G., Gatewood, R.G. and Paris, R.B. (2002). Restoring fire as an ecological process in shortgrass prairie ecosystems: Initial effects of prescribed burning during the dormant and growing seasons. Journal of Environmental Management 65(2): 135-152.
Brooks, M.L., D'Antonio, C.M., Richardson, D.M., Grace, J.B., Keeley, J.E., DiTomaso, J.M., Hobbs, R.J., Pellant, M. and Pyke, D. (2004). Effects of invasive alien plants on fire regimes. BioScience 54(7): 677-688.
Bryman, A. (2016). Social research methods. Oxford University Press; Oxford, UK.
Buckeridge, J. (2014). Environmental ethics: An overview, assessing the place of bioscientists in society, supplemented with selected Australian perspectives. Integrative Zoology 9(1): 14-23.
Buckley, R. (2004). Partnerships in ecotourism: Australian political frameworks. International Journal of Tourism Research 6(2): 75-83.
215

Buckley, R. (2009). Evaluating the net effects of ecotourism on the environment: A framework, first assessment and future research. Journal of Sustainable Tourism 17(6): 643-672.
Buckley, R. (2010). Conservation tourism. CAB International; Wallingford, UK.
Buckley, R. (2011). Tourism and environment. Annual Review of Environment and Resources 36(2011): 397-416.
Buckley, R. (2012). Sustainable tourism: Research and reality. Annals of Tourism Research 39(2): 528-546.
Buckley, R. (2016). Triage approaches send adverse political signals for conservation. Frontiers in Ecology and Evolution 4: 39.
Buckley, R. and Brough, P. (2017). Economic value of parks via human mental health: An analytical framework. Frontiers in Ecology and Evolution 5(16), DOI: 10.3389/fevo.2017.00016.
Buckley, R., Castley, J.G., Pegas, F.d.V., Mossaz, A.C. and Steven, R. (2012). A population accounting approach to assess tourism contributions to conservation of IUCN-redlisted mammal species. PLoS ONE 7(9): e44134, https://doi.org/10.1371/journal.pone.0044134.
Burbidge, A.A. and Manly, B.F.J. (2002). Mammal extinctions on Australian islands: Causes and conservation implications. Journal of Biogeography 29(4): 465-473.
Burrows, N. (2008). Linking fire ecology and fire management in south-west Australian forest landscapes. Forest Ecology and Management 255(7): 2394-2406.
Butchart, S.H.M., Clarke, M., Smith, R.J., Sykes, R.E., Scharlemann, J.P.W., Harfoot, M., Buchanan, G.M., Angulo, A., Balmford, A., Bertzky, B., Brooks, T.M., Carpenter, K.E., Comeros-Raynal, M.T., Cornell, J., Ficetola, G.F., Fishpool, L.D.C., Fuller, R.A., Geldmann, J., Harwell, H., Hilton-Taylor, C., Hoffmann, M., Joolia, A., Joppa, L., Kingston, N., May, I., Milam, A., Polidoro, B., Ralph, G., Richman, N., Rondinini, C., Segan, D.B., Skolnik, B., Spalding, M.D., Stuart, S.N., Symes, A., Taylor, J., Visconti, P., Watson, J.E.M., Wood, L. and Burgess, N.D. (2015). Shortfalls and solutions for meeting national and global conservation area targets. Conservation Letters 8(5): 329-337.
Butchart, S.H.M., Walpole, M., Collen, B., van Strien, A., Scharlemann, J.P.W., Almond, R.E.A., Baillie, J.E.M., Bomhard, B., Brown, C., Bruno, J., Carpenter, K.E., Carr, G.M., Chanson, J., Chenery, A.M., Csirke, J., Davidson, N.C., Dentener, F., Foster, M., Galli, A., Galloway, J.N., Genovesi, P., Gregory, R.D., Hockings, M., Kapos, V., Lamarque, J.-F., Leverington, F., Loh, J., McGeoch, M.A., McRae, L., Minasyan, A., Morcillo, M.H., Oldfield, T.E.E., Pauly, D., Quader, S., Revenga, C., Sauer, J.R., Skolnik, B., Spear, D., Stanwell-Smith, D., Stuart, S.N., Symes, A., Tierney, M., Tyrrell, T.D., Vié, J.-C. and Watson, R. (2010). Global biodiversity: Indicators of recent declines. Science 328(5982): 1164-1168.
Butcher, J. (2006). Natural capital and the advocacy of ecotourism as sustainable development. Journal of Sustainable Tourism 14(6): 629-644.
Campbell, L.M. and Smith, C. (2006). What makes them pay? Values of volunteer tourists working for sea turtle conservation. Environmental Management 38(1): 84-98.
216

Canesi, L. and Corsi, I. (2016). Effects of nanomaterials on marine invertebrates. Science of the Total Environment 565: 933-940.
Cardinale, B.J., Duffy, J.E., Gonzalez, A., Hooper, D.U., Perrings, C., Venail, P., Narwani, A., Mace, G.M., Tilman, D. and Wardle, D.A. (2012). Biodiversity loss and its impact on humanity. Nature 486(7401): 59.
Castley, J.G., Bennett, A. and Pickering, C.M. (2013). Wildlife visual imagery: Do pictures used to promote destinations online match on-site species visibility at two geographic destinations? Geographical Research 51(1): 59-70.
Castley, J.G., Boshoff, A.F. and Kerley, G.I.H. (2001). Compromising South Africa's natural biodiversity-inappropriate herbivore introductions. South African Journal of Science 97(9): 344-348.
Catibog-Sinha, C. (2008). Zoo tourism: Biodiversity conservation through tourism. Journal of Ecotourism 7(2-3): 160-178.
CBD (1992). Convention on Biological Diversity. Secretariat of the Convention on Biological Diversity; retrieved September 2018 from: https://www.cbd.int/doc/legal/cbd-en.pdf.
CBD (2002). Decision vi/26: Strategic plan for the Convention on Biological Diversity 2002-2010. Secretariat of the Convention on Biological Diversity; Montreal.
CBD (2016). Biodiversity and the 2030 Agenda for Sustainable Development technical note. Secretariat of the Convention on Biological Diversity; retrieved September 2018 from: https://www.undp.org/content/undp/en/home/librarypage/environment-energy/ecosystems_and_biodiversity/biodiversity-and-the-2030-agenda-for-sustainable-development---p.html.
CBD, SCBD, UNDP, UNEP, FAO and World Bank (2016). Biodiversity and the 2030 Agenda for Sustainable Development. Secretariat of the Convention on Biological Diversity; Quebec, Canada.
Ceballos-Lascurain, H. (1987). The future of ecotourism. Mexico Journal 1(987): 1.
Ceballos-Lascurain, H. (2008). Ecotourism and ecolodge development in the 21st century. Ecotourism and conservation in the Americas. A. Stronza and W. Durham. CABI; Wallingford.
Ceballos, G., Ehrlich, P.R., Barnosky, A.D., García, A., Pringle, R.M. and Palmer, T.M. (2015). Accelerated modern human–induced species losses: Entering the sixth mass extinction. Science advances 1(5): 1-5.
Cetindamar, D. (2007). Corporate social responsibility practices and environmentally responsible behavior: The case of the United Nations global compact. Journal of Business Ethics 76(2): 163-176.
Chandel, A. and Mishra, S. (2016). Ecotourism revisited: Last twenty-five years. Czech Journal of Tourism 5(2): 135-143.
Charmaz, K. (2006). Constructing grounded theory: A practical guide through qualitative analysis. SAGE Publications, Inc.; Thousand Oaks, CA.
Christie, M.F. and Mason, P.A. (2003). Transformative tour guiding: Training tour guides to be critically reflective practitioners. Journal of Ecotourism 2(1): 1-16.
217
Clarke, A.E. (2005). Situational analysis: Grounded theory after the postmodern turn. SAGE Publications; Thousand Oaks, California.
Cobbinah, P.B. (2015). Contextualising the meaning of ecotourism. Tourism Management Perspectives 16: 179-189.
Collins, S.L., Carpenter, S.R., Swinton, S.M., Orenstein, D.E., Childers, D.L., Gragson, T.L., Grimm, N.B., Grove, J.M., Harlan, S.L., Kaye, J.P., Knapp, A.K., Kofinas, G.P., Magnuson, J.J., McDowell, W.H., Melack, J.M., Ogden, L.A., Robertson, G.P., Smith, M.D. and Whitmer, A.C. (2011). An integrated conceptual framework for long-term social–ecological research. Frontiers in Ecology and the Environment 9(6): 351-357.
Commonwealth of Australia (2015). Australian Heritage Strategy. Commonwealth of Australia; Canberra.
Commonwealth of Australia (2018). Threat Abatement Plan for the impacts of marine debris on the vertebrate wildlife of Australia’s coasts and oceans. Commonwealth of Australia; Canberra.
Costanza, R., d'Arge, R., de Groot, R., Farber, S., Grasso, M., Hannon, B., Limburg, K., Naeem, S., O'Neill, R.V., Paruelo, J., Raskin, R.G., Sutton, P. and Van den Belt, M. (1997). The value of the world's ecosystem services and natural capital. Nature 387: 253-260.
Costanza, R., de Groot, R., Braat, L., Kubiszewski, I., Fioramonti, L., Sutton, P., Farber, S. and Grasso, M. (2017). Twenty years of ecosystem services: How far have we come and how far do we still need to go? Ecosystem Services 28: 1-16.
Creswell, J.W. (2014). Research design: Qualitative, quantitative, and mixed method approaches. SAGE Publications, Inc.; Thousand Oaks, CA.
Crowe, S., Cresswell, K., Robertson, A., Huby, G., Avery, A. and Sheikh, A. (2011). The case study approach. BMC Medical Research Methodology 11(1): 100.
Crowther, T.W., Glick, H., Covey, K., Bettigole, C., Maynard, D., Thomas, S., Smith, J., Hintler, G., Duguid, M. and Amatulli, G. (2015). Mapping tree density at a global scale. Nature 525(7568): 201.
Daily, G.R. (1998). Nature's services: Societal dependence on natural ecosystems. Environmental Values 7(3): 365-367.
Daly, C.A.K., Fraser, G. and Snowball, J.D. (2015). Willingness to pay for marine-based tourism in the Ponta do Ouro Partial Marine Reserve, Mozambique. African Journal of Marine Science 37(1): 33-40.
Das, N. and Syiemlieh, H. (2009). Ecotourism in wetland ecology. Anatolia 20(2): 445-450.
Davies, T.K., Stevens, G., Meekan, M.G., Struve, J. and Rowcliffe, J.M. (2012). Can citizen science monitor whale-shark aggregations? Investigating bias in mark-recapture modelling using identification photographs sourced from the public. Wildlife Research 39(8): 696-704.
de Boer, W.F., Stigter, J.D. and Ntumi, C.P. (2007). Optimising investments from elephant tourist revenues in the Maputo Elephant Reserve, Mozambique. Journal for Nature Conservation 15(4): 225-236.
De Luca, V., Salim, V., Atsumi, S.M. and Yu, F. (2012). Mining the biodiversity of plants: A revolution in the making. Science 336(6089): 1658-1661.
218
De, U.K. and Devi, A. (2011). Valuing recreational and conservational benefits of a natural tourist site: Case of Cherrapunjee. Journal of Quantitative Economics 9(2): 154-172.
DEE (2015). Threatened Species Strategy. Commonwealth of Australia; Canberra.
DEE (2016). Collaborative Australian Protected Area Database. Commonwealth of Australia; retrieved March 2019 from: http://www.environment.gov.au/land/nrs/science/capad/2016.
DEE (2017). Australia’s Strategy for Nature (draft) 2018-2030. Commonwealth of Australia; Canberra.
DEE. (2019a). National Environmental Science Program. Commonwealth of Australia; retrieved May 2019 from: https://www.environment.gov.au/science/nesp.
DEE. (2019b). Species Profile and Threats Database. Commonwealth of Australia; retrieved May 2019 from: http://www.environment.gov.au/cgi-bin/sprat/public/publicthreatenedlist.pl.
DEHP (2017a). 2017 koala expert panel interim report. Queensland Government; retrieved November 2017 from: http://www.ehp.qld.gov.au/wildlife/koalas/pdf/koala-expert-panel-interim-report.pdf
DEHP (2017b). Tectaria devexa. Queensland Government; retrieved November 2017 from: https://www.ehp.qld.gov.au/wildlife/threatened-species/endangered/endangered-plants/cave_fern.html.
Department of Environment (2014). Australia’s fifth national report to the Convention on Biological Diversity. Commonwealth of Australia; Canberra.
Department of Environment (2016). Report on the review of the first five years of Australia’s Biodiversity Conservation Strategy 2010–2030. Commonwealth of Australia; Canberra.
Derhé, M.A., Murphy, H., Monteith, G. and Menéndez, R. (2016). Measuring the success of reforestation for restoring biodiversity and ecosystem functioning. Journal of Applied Ecology 53(6): 1714-1724.
Di Minin, E., Macmillan, D.C., Goodman, P.S., Escott, B., Slotow, R. and Moilanen, A. (2013). Conservation businesses and conservation planning in a biological diversity hotspot. Conservation Biology 27(4): 808-820.
Director of National Parks (2011). Sustainable tourism overview 2011-2016. Commonwealth of Australia; Canberra.
Doan, T.M. (2000). The effects of ecotourism in developing nations: An analysis of case studies. Journal of Sustainable Tourism 8(4): 288-304.
Dombeck, M.P., Williams, J.E. and Wood, C.A. (2004). Wildfire policy and public lands: Integrating scientific understanding with social concerns across landscapes. Conservation Biology 18(4): 883-889.
Dong, Y., Ishikawa, M., Liu, X. and Hamori, S. (2011). The determinants of citizen complaints on environmental pollution: An empirical study from China. Journal of Cleaner Production 19(12): 1306-1314.
Donohoe, H.M. and Needham, R.D. (2006). Ecotourism: The evolving contemporary definition. Journal of Ecotourism 5(3): 192-210.
219

Dowling, R. (2013). The history of ecotourism. International handbook on ecotourism. R. Ballantyne and J. Packer. Edward Elgar Publishing Inc.; Glos, United Kingdom.
Ecotourism Australia (2017). Nature Based Tourism in Australia Manifesto. Ecotourism Australia; retrieved November 2018 from: https://www.ecotourism.org.au/assets/Uploads/Manifesto-v5.0.pdf.
Ecotourism Australia (2018a). Annual report 2017/18. Ecotourism Australia; Brisbane, Australia.
Ecotourism Australia. (2018b). A brief history of Ecotourism Australia. Ecotourism Australia; retrieved October 2018 from: http://www.ecotourism.org.au/about/history/.
Elo, S. and Kyngäs, H. (2008). The qualitative content analysis process. Journal of advanced nursing 62(1): 107-115.
England, P. (2016). Between regulation and markets: Ironies and anomalies in the regulatory governance of biodiversity conservation in Australia. Australian Journal of Environmental Law 2016: 44-85.
Epaphras, A.M., Gereta, E., Lejora, I.A., Ole Meing’ataki, G.E., Ng’umbi, G., Kiwango, Y., Mwangomo, E., Semanini, F., Vitalis, L., Balozi, J. and Mtahiko, M.G.G. (2008). Wildlife water utilization and importance of artificial waterholes during dry season at Ruaha National Park, Tanzania. Wetlands Ecology and Management 16(3): 183-188.
Erdem, B. and Tetik, N. (2013). An environmentally-sensitive approach in the hotel industry: Ecolodges. International Journal for Responsible Tourism 2(2): 22-40.
Esparon, M., Stoeckl, N. and Gyuris, E. (2013). Eco certification in Queensland's Wet Tropics World Heritage Area: Is it good for business? Handbook of tourism economics: Analysis, new applications and case studies. C. Tisdell. World Scientific; Singapore.
Evans, M.C. (2016). Deforestation in Australia: Drivers, trends and policy responses. Pacific Conservation Biology 22(2): 130-150.
Evans, M.C. (2018). Effective incentives for reforestation: Lessons from Australia's carbon farming policies. Current Opinion in Environmental Sustainability 32: 38-45.
Feilzer, M.Y. (2009). Doing mixed methods research pragmatically: Implications for the rediscovery of pragmatism as a research paradigm. Journal of Mixed Methods Research 4(1): 6-16.
Fennell, D.A. (2001). A content analysis of ecotourism definitions. Current Issues in Tourism 4(5): 403-421.
Fennell, D.A. (2013). Contesting the zoo as a setting for ecotourism, and the design of a first principle. Journal of Ecotourism 12(1): 1-14.
Ferraro, P.J. and Pattanayak, S.K. (2006). Money for nothing? A call for empirical evaluation of biodiversity conservation investments. PLoS Biol 4(4): e105, https://doi.org/10.1371/journal.pbio.0040105.
Fischer, J. and Lindenmayer, D.B. (2007). Landscape modification and habitat fragmentation: A synthesis. Global Ecology and Biogeography 16(3): 265-280.
Fitzgerald, L.A. and Stronza, A.L. (2016). In defense of the ecotourism shield: A response to Geffroy et al. Trends in Ecology & Evolution 31(2): 94-95.
220
Fitzsimons, J. and Carr, B. (2007). Evaluation of the effectiveness of conservation covenanting programs in delivering biodiversity conservation outcomes. Report to the Biodiversity Conservation Branch, Department of Environment and Water Resources. Bush Heritage Australia; Melbourne.
Fitzsimons, J.A. (2015). Private protected areas in Australia: Current status and future directions. Nature Conservation 10: 1-23.
Fitzsimons, J.A. and Carr, C.B. (2014). Conservation covenants on private land: Issues with measuring and achieving biodiversity outcomes in Australia. Environmental Management 54(3): 606-616.
Fletcher, R. (2009). Ecotourism discourse: Challenging the stakeholders theory. Journal of Ecotourism 8(3): 269-285.
Fletcher, R. (2011). Sustaining tourism, sustaining capitalism? The tourism industry's role in global capitalist expansion. Tourism Geographies 13(3): 443-461.
Fletcher, R. and Neves, K. (2012). Contradictions in tourism: The promise and pitfalls of ecotourism as a manifold capitalist fix. Environment and Society 3(1): 60-77.
Fogle, E.L.V. and Duffy, L.N. (2018). Guiding practices for implementing an eco-certification program: A case study of Ecotourism Australia. E-review of Tourism Research 15(2/3).
Fowler, F.J.J. (2014). Survey research methods. SAGE Publications; London, UK.
Frankham, R. (2008). Genetic adaptation to captivity in species conservation programs. Molecular Ecology 17(1): 325-333.
Fuerst, F. and McAllister, P. (2011). Green noise or green value? Measuring the effects of environmental certification on office values. Real Estate Economics 39(1): 45-69.
Fuller, R.A., McDonald-Madden, E., Wilson, K.A., Carwardine, J., Grantham, H.S., Watson, J.E.M., Klein, C.J., Green, D.C. and Possingham, H.P. (2010). Replacing underperforming protected areas achieves better conservation outcomes. Nature 466(7304): 365-367.
Gaba, J.M. (1999). Environmental ethics and our moral relationship to future generations: Future rights and present virtue. Columbia Journal of Environmental Law 24: 249.
Galley, G. and Clifton, J. (2004). The motivational and demographic characteristics of research ecotourists: Operation Wallacea volunteers in Southeast Sulawesi, Indonesia. Journal of Ecotourism 3(1): 69-82.
García-Ruiz, J.M., Beguería, S., Lana-Renault, N., Nadal-Romero, E. and Cerdà, A. (2017). Ongoing and emerging questions in water erosion studies. Land Degradation & Development 28(1): 5-21.
Gardener, M. (2014). Community ecology: Analytical methods using R and Excel. Pelagic Publishing Ltd.; Exeter, UK.
Gaston, K.J., Jackson, S.F., Cantú-Salazar, L. and Cruz-Piñón, G. (2008). The ecological performance of protected areas. Annual Review of Ecology, Evolution, and Systematics 39(1): 93-113.
221

Geffroy, B., Samia, D.S., Bessa, E. and Blumstein, D.T. (2015). How nature-based tourism might increase prey vulnerability to predators. Trends in Ecology & Evolution 30(12): 755-765.
Geist, J. and Hawkins, S.J. (2016). Habitat recovery and restoration in aquatic ecosystems: Current progress and future challenges. Aquatic Conservation: Marine and Freshwater Ecosystems 26(5): 942-962.
Genet, M., Kokutse, N., Stokes, A., Fourcaud, T., Cai, X., Ji, J. and Mickovski, S. (2008). Root reinforcement in plantations of Cryptomeria japonica D. Don: Effect of tree age and stand structure on slope stability. Forest Ecology and Management 256(8): 1517-1526.
Glasgow, R.E. (2013). What does it mean to be pragmatic? Pragmatic methods, measures, and models to facilitate research translation. Health Education & Behavior 40(3): 257-265.
Goddard, M.A., Dougill, A.J. and Benton, T.G. (2010). Scaling up from gardens: Biodiversity conservation in urban environments. Trends in Ecology & Evolution 25(2): 90-98.
Gómez-Baggethun, E., de Groot, R., Lomas, P.L. and Montes, C. (2010). The history of ecosystem services in economic theory and practice: From early notions to markets and payment schemes. Ecological Economics 69(6): 1209-1218.
Good, R. and Johnston, S. (2019). Rehabilitation and revegetation of the Kosciuszko summit area, following the removal of grazing – an historic review. Ecological Management & Restoration 20(1): 13-20.
Goossens, B., Sharma, R., Othman, N., Kun-Rodrigues, C., Sakong, R., Ancrenaz, M., Ambu, L.N., Jue, N.K., O'Neill, R.J. and Bruford, M.W. (2016). Habitat fragmentation and genetic diversity in natural populations of the Bornean elephant: Implications for conservation. Biological Conservation 196(2016): 80-92.
Gosper, C.R. and Vivian-Smith, G. (2006). Selecting replacements for invasive plants to support frugivores in highly modified sites: A case study focusing on Lantana camara. Ecological Management & Restoration 7(3): 197-203.
Gössling, S. and Buckley, R. (2016). Carbon labels in tourism: Persuasive communication? Journal of Cleaner Production 111: 358-369.
Graci, S. and Dodds, R. (2015). Certification and labeling. The Routledge handbook of tourism and sustainability. S. Gössling, C.M. Hall and D. Scott. Routledge; New York, NY.
Greene, J.C. and Hall, J. (2010). Dialectics and pragmatism: Being of consequence. Sage handbook of mixed methods in social & behavioral research. A. Tashakkori and C. Teddlie. SAGE Publications; Thousand Oaks, CA.
Greiner, R. and Gregg, D. (2011). Farmers’ intrinsic motivations, barriers to the adoption of conservation practices and effectiveness of policy instruments: Empirical evidence from northern Australia. Land Use Policy 28(1): 257-265.
Gressier, C. (2014). An elephant in the room: Okavango safari hunting as ecotourism? Ethnos 79(2): 193-214.
Haaland, H. and Aas, Ø. (2010). Eco‐tourism certification – does it make a difference? A comparison of systems from Australia, Costa Rica and Sweden. Scandinavian Journal of Hospitality and Tourism 10(3): 375-385.
222

Haddaway, N.R. and Bayliss, H.R. (2015). Shades of grey: Two forms of grey literature important for reviews in conservation. Biological Conservation 191: 827-829.
Hall, C.M. (2011). Seeing the forest for the trees: Tourism and the international year of forests. Journal of Heritage Tourism 6(4): 271-283.
Hall, C.M. (2013). Ecotourism and global environmental change. International handbook on ecotourism. R. Ballantyne and J. Packer. Edward Elgar Pub. Limited; Glos, UK.
Halliday, L.G., Castley, J.G., Fitzsimons, J.A., Tran, C. and Warnken, J. (2012). Fire management on private conservation lands: Knowledge, perceptions and actions of landholders in eastern Australia. International Journal of Wildland Fire 21(3): 197-209.
Hamel, E. (2007). The dominance of English in the international scientific periodical literature and the future of language use in science. AILA Review 20(1): 53-71.
Hamman, E. (2016). The influence of environmental NGOs on project finance: A case study of activism, development and Australia’s Great Barrier Reef. Journal of Sustainable Finance & Investment 6(1): 51-66.
Hancock, D.R. and Algozzine, R. (2011). Doing case study research: A practical guide for beginning researchers. Teachers College Press; New York, NY.
Hanly, C. (2014). The interplay of deductive and inductive reasoning in psychoanalytic theorizing. The Psychoanalytic Quarterly 83(4): 897-915.
Hansen, U. and Schrader, U. (1997). A modern model of consumption for a sustainable society. Journal of Consumer Policy 20(4): 443-468.
Hardy, M.J., Fitzsimons, J.A., Bekessy, S.A. and Gordon, A. (2017). Exploring the permanence of conservation covenants. Conservation Letters 10(2): 221-230.
Harris, R.B., Wall, W.A. and Allendorf, F.W. (2002). Genetic consequences of hunting: What do we know and what should we do? Wildlife Society Bulletin (1973-2006) 30(2): 634-643.
Hayward, M.W., Kerley, G.I.H., Adendorff, J., Moolman, L.C., O'Brien, J., Sholto-Douglas, A., Bissett, C., Bean, P., Fogarty, A., Howarth, D. and Slater, R. (2007). The reintroduction of large carnivores to the Eastern Cape, South Africa: An assessment. Oryx 41(2): 205-214.
Hedrick, P.W. and Fredrickson, R.J. (2008). Captive breeding and the reintroduction of Mexican and red wolves. Molecular Ecology 17(1): 344-350.
Heikkurinen, P. (2010). Image differentiation with corporate environmental responsibility. Corporate Social Responsibility and Environmental Management 17(3): 142-152.
Henriques, I. and Sadorsky, P. (1996). The determinants of an environmentally responsive firm: An empirical approach. Journal of Environmental Economics and Management 30(3): 381-395.
Hermoso, V. and Clavero, M. (2013). Revisiting ecological integrity 30 years later: Non-native species and the misdiagnosis of freshwater ecosystem health. Fish and Fisheries 14(3): 416-423.
Hess, S.C. (2016). A Tour de Force by Hawaii’s invasive mammals: Establishment, takeover, and ecosystem restoration through eradication. Mammal Study 41(2): 47-60.
223

Higginbottom, K. and Buckley, R. (2003). Terrestrial wildlife viewing in Australia. CRC for Sustainable Tourism Gold Coast, Queensland; Gold Coast, Australia.
Hill, R., Dyer, G.A., Lozada-Ellison, L.M., Gimona, A., Martin-Ortega, J., Munoz-Rojas, J. and Gordon, I.J. (2015). A social–ecological systems analysis of impediments to delivery of the Aichi 2020 targets and potentially more effective pathways to the conservation of biodiversity. Global Environmental Change 34: 22-34.
Hoban, S.M., Hauffe, H.C., Pérez-Espona, S., Arntzen, J.W., Bertorelle, G., Bryja, J., Frith, K., Gaggiotti, O.E., Galbusera, P. and Godoy, J.A. (2013). Bringing genetic diversity to the forefront of conservation policy and management. Conservation Genetics Resources 5(2): 593-598.
Hobbs, R.J. (2001). Synergisms among habitat fragmentation, livestock grazing, and biotic invasions in southwestern Australia. Conservation Biology 15(6): 1522-1528.
Hofman, K. and Hughes, K. (2018). Protecting the Great Barrier Reef: Analysing the impact of a conservation documentary and post-viewing strategies on long-term conservation behaviour. Environmental Education Research 24(4): 521-536.
Hollander, R. (2006). Elections, policy and the media: Tasmania's forests and the 2004 federal election. Australian Journal of Political Science 41(4): 569-584.
Honey, M.S. (1999). Treading lightly? Ecotourism's impact on the environment. Environment: Science and Policy for Sustainable Development 41(5): 4-9.
Honey, M.S. (2011). Travelers’ philanthropy handbook. Center for Responsible Travel (CREST).
Hovardas, T. and Poirazidis, K. (2006). Evaluation of the environmentalist dimension of ecotourism at the Dadia Forest Reserve (Greece). Environmental Management 38(5): 810-822.
Howard, J. (2000). Research in progress: Does environmental interpretation influence behaviour through knowledge or affect? Australian Journal of Environmental Education 15(1999): 153-156.
Hughes, K. (2011). Designing post-visit action resources for families visiting wildlife tourism sites. Visitor Studies 14(1): 66-83.
Hughes, K. (2013). Measuring the impact of viewing wildlife: Do positive intentions equate to long-term changes in conservation behaviour? Journal of Sustainable Tourism 21(1): 42-59.
Hughes, K., Packer, J. and Ballantyne, R. (2011). Using post-visit action resources to support family conservation learning following a wildlife tourism experience. Environmental Education Research 17(3): 307-328.
Hughes, M. and Morrison-Saunders, A. (2005). Influence of on-site interpretation intensity on visitors to natural areas. Journal of Ecotourism 4(3): 161-177.
Hunt, C.A., Durham, W.H., Driscoll, L. and Honey, M. (2015). Can ecotourism deliver real economic, social, and environmental benefits? A study of the Osa Peninsula, Costa Rica. Journal of Sustainable Tourism 23(3): 339-357.
IPAC (2016a). Australian Pest Animal Strategy 2017 to 2027. Australian Government Department of Agriculture and Water Resources; Canberra.
224

IPAC (2016b). Australian Weeds Strategy 2017 to 2027. Australian Government Department of Agriculture and Water Resources; Canberra.
IPBES (2019). The IPBES global assessment report on biodiversity and ecosystem services Secretariat of the Intergovernmental Science-Policy Platform on Biodiversity and Ecosystem Services; Bonn, Germany.
IUCN (1980). World Conservation Strategy. IUCN; Gland, Switzerland.
Jackson, W., Argent, R., Bax, N., Clark, G., Coleman, S., Cresswell, I., Emmerson, K., Evans, K., Hibberd, M., Johnston, E., Keywood, M., Klekociuk, A., Mackay, R., Metcalfe, D., Murphy, H., Rankin, A., Smith, D. and Wienecke, B. (2017). Australia State of the Environment 2016: Overview, independent report to the Australian Government Minister for the Environment And Energy. Australian Government Department of the Environment and Energy; Canberra, Australia.
Jalonen, R., Valette, M., Boshier, D., Duminil, J. and Thomas, E. (2018). Forest and landscape restoration severely constrained by a lack of attention to the quantity and quality of tree seed: Insights from a global survey. Conservation Letters 11(4): e12424, DOI: 10.1111/conl.12424.
Jamal, T., Borges, M. and Stronza, A.L. (2006). The institutionalisation of ecotourism: Certification, cultural equity and praxis. Journal of Ecotourism 5(3): 145-175.
James, A.N., Gaston, K.J. and Balmford, A. (1999). Balancing the earth's accounts. Nature 401(6751): 323-324.
John, G., Anna, G., Rob, L. and Alan, C. (2006). Farmers' markets: The small business counter‐revolution in food production and retailing. British Food Journal 108(7): 560-573.
Justus, J., Colyvan, M., Regan, H. and Maguire, L. (2009). Buying into conservation: Intrinsic versus instrumental value. Trends in Ecology & Evolution 24(4): 187-191.
Kabii, T. and Horwitz, P. (2006). A review of landholder motivations and determinants for participation in conservation covenanting programmes. Environmental Conservation 33(1): 11-20.
Kagabo, D.M., Stroosnijder, L., Visser, S.M. and Moore, D. (2013). Soil erosion, soil fertility and crop yield on slow-forming terraces in the highlands of Buberuka, Rwanda. Soil and Tillage Research 128: 23-29.
Kang, S. and Rajagopal, L. (2014). Perceptions of benefits and challenges of purchasing local foods among hotel industry decision makers. Journal of Foodservice Business Research 17(4): 301-322.
Karlsson, L. and Dolnicar, S. (2016). Does eco certification sell tourism services? Evidence from a quasi-experimental observation study in Iceland. Journal of Sustainable Tourism 24(5): 694-714.
Karppinen, K. and Moe, H. (2012). What we talk about when we talk about document analysis. Trends in Communication Policy Research: New Theories, Methods and Subjects. Bristol: Intellect: 177-193.
Katić, A., Stanković, J., Kovačević, J. and Muhi, B. (2011). Green trends in tourism industry. 1st Climate Change, Economic Development, Environment and People Conference, Novi Sad, Serbia, 14-15 September 2011 (pp. 215-226), Educons University.
225

Keating, P.J. (1995). Speech by the Prime Minister, the Hon P.J. Keating, MP, National Press Club Canberra Thursday 24 August 1995. Department of the Prime Minister and Cabinet; retrieved January 2018 from: http://pmtranscripts.pmc.gov.au/release/transcript-9727.
Kelly, J., Haider, W., Williams, P.W. and Englund, K. (2007). Stated preferences of tourists for eco-efficient destination planning options. Tourism Management 28(2): 377-390.
Keppel, G., Mokany, K., Wardell-Johnson, G.W., Phillips, B.L., Welbergen, J.A. and Reside, A.E. (2015). The capacity of refugia for conservation planning under climate change. Frontiers in Ecology and the Environment 13(2): 106-112.
Kerley, G.I., Geach, B.G. and Vial, C. (2003). Jumbos or bust: Do tourists' perceptions lead to an under-appreciation of biodiversity? South African Journal of Wildlife Research-24-month delayed open access 33(1): 13-21.
Kerley, G.I.H., Knight, M.H. and Kock, M. (1995). Desertification of subtropical thicket in the Eastern Cape, South Africa: Are there alternatives? Environmental Monitoring and Assessment 37(1): 211-230.
Kettenring, K.M., Mercer, K.L., Reinhardt Adams, C. and Hines, J. (2014). Application of genetic diversity–ecosystem function research to ecological restoration. Journal of Applied Ecology 51(2): 339-348.
Kingsford, R.T., Watson, J.E.M., Lundquist, C.J., Venter, O., Hughes, L., Johnston, E.L., Atherton, J., Gawel, M., Keith, D.A., Mackey, B.G., Morley, C., Possingham, H.P., Raynor, B., Recher, H.F. and Wilson, K.A. (2009). Major conservation policy issues for biodiversity in Oceania. Conservation Biology 23(4): 834-840.
Kingsley, J., Townsend, M., Phillips, R. and Aldous, D. (2009). “If the land is healthy … it makes the people healthy”: The relationship between caring for Country and health for the Yorta Yorta Nation, Boonwurrung and Bangerang Tribes. Health & Place 15(1): 291-299.
Kinnear, J.E., Sumner, N.R. and Onus, M.L. (2002). The red fox in Australia—an exotic predator turned biocontrol agent. Biological Conservation 108(3): 335-359.
Kirillova, K., Fu, X., Lehto, X. and Cai, L. (2014). What makes a destination beautiful? Dimensions of tourist aesthetic judgment. Tourism Management 42: 282-293.
Kirkby, C.A., Giudice, R., Day, B., Turner, K., Soares-Filho, B.S., Oliveira-Rodrigues, H. and Yu, D.W. (2011). Closing the ecotourism-conservation loop in the Peruvian Amazon. Environmental Conservation 38(01): 6-17.
Kleiman, D.G., Reading, R.P., Miller, B.J., Clark, T.W., Scott, J.M., Robinson, J., Wallace, R.L., Cabin, R.J. and Felleman, F. (2000). Improving the evaluation of conservation programs. Conservation Biology 14(2): 356-365.
Koester, V. (2002). The five global biodiversity‐related conventions: A stocktaking. Review of European Community & International Environmental Law 11(1): 96-103.
Kohli, R.K., Batish, D.R., Singh, H.P. and Dogra, K.S. (2006). Status, invasiveness and environmental threats of three tropical American invasive weeds (Parthenium hysterophorus l., Ageratum conyzoides l., Lantana camara l.) in India. Biological Invasions 8(7): 1501-1510.
226

Kolk, A. and Levy, D. (2001). Winds of change. European Management Journal 19(5): 501-509.
Kramer, A.T. and Havens, K. (2009). Plant conservation genetics in a changing world. Trends in Plant Science 14(11): 599-607.
Krüger, O. (2005). The role of ecotourism in conservation: Panacea or Pandora’s box? Biodiversity and Conservation 14(3): 579-600.
Kubiszewski, I., Costanza, R., Anderson, S. and Sutton, P. (2017). The future value of ecosystem services: Global scenarios and national implications. Ecosystem Services 26: 289-301.
Lamers, M., Nthiga, R., van der Duim, V.R. and van Wijk, J. (2014). Tourism-conservation enterprises as a land-use strategy in Kenya. Tourism Geographies 16(3): 474-489.
Lapeyre, R. (2010). Community-based tourism as a sustainable solution to maximise impacts locally? The Tsiseb Conservancy case, Namibia. Development Southern Africa 27(5): 757-772.
Lapeyre, R. (2011). The Grootberg Lodge partnership in Namibia: Towards poverty alleviation and empowerment for long-term sustainability? Current Issues in Tourism 14(3): 221-234.
Laurance, W.F., Koster, H., Grooten, M., Anderson, A.B., Zuidema, P.A., Zwick, S., Zagt, R.J., Lynam, A.J., Linkie, M. and Anten, N.P.R. (2012). Making conservation research more relevant for conservation practitioners. Biological Conservation 153(2012): 164-168.
Lebe, S.S. and Vrečko, I. (2015). Eco-labels and schemes: A requisitely holistic proof of tourism's social responsibility? Systems Research and Behavioral Science 32(2): 247-255.
Leech, N.L. (2007). An array of qualitative data analysis tools: A call for data analysis triangulation. School psychology quarterly 22(4): 557-584.
Leung, Y.-F., Spenceley, A., Hvenegaard, G. and Buckley, R. (2014). Tourism and visitor management in protected areas: Guidelines for sustainability. Best practice protected area guidelines series no. 27. IUCN; Gland, Switzerland.
Li, W., Zhang, Q., Liu, C. and Xue, Q. (2006). Tourism's impacts on natural resources: A positive case from China. Environmental Management 38(4): 572-579.
Libois, E., Gimenez, O., Oro, D., Mínguez, E., Pradel, R. and Sanz-Aguilar, A. (2012). Nest boxes: A successful management tool for the conservation of an endangered seabird. Biological Conservation 155: 39-43.
Liburd, J.J. and Becken, S. (2017). Values in nature conservation, tourism and UNESCO World Heritage Site stewardship. Journal of Sustainable Tourism 25(12): 1719-1735.
Lin, T.T.C. (2012). Cross-platform framing and cross-cultural adaptation: Examining elephant conservation in Thailand. Environmental Communication 6(2): 193-211.
Lindberg, K. (1991). Policies for maximizing nature tourism’s ecological and economic benefits. World Resources Institute; USA.
227

Lindenmayer, D.B., Cunningham, R.B., Donnelly, C.F. and Franklin, J.F. (2000). Structural features of old-growth Australian montane ash forests. Forest Ecology and Management 134(1): 189-204.
Lindenmayer, D.B., Hulvey, K.B., Hobbs, R.J., Colyvan, M., Felton, A., Possingham, H., Steffen, W., Wilson, K., Youngentob, K. and Gibbons, P. (2012). Avoiding bio-perversity from carbon sequestration solutions. Conservation Letters 5(1): 28-36.
Lindenmayer, D.B., Steffen, W., Burbidge, A.A., Hughes, L., Kitching, R.L., Musgrave, W., Stafford Smith, M. and Werner, P.A. (2010). Conservation strategies in response to rapid climate change: Australia as a case study. Biological Conservation 143(7): 1587-1593.
Lindenmayer, D.B., Welsh, A., Donnelly, C., Crane, M., Michael, D., Macgregor, C., McBurney, L., Montague-Drake, R. and Gibbons, P. (2009). Are nest boxes a viable alternative source of cavities for hollow-dependent animals? Long-term monitoring of nest box occupancy, pest use and attrition. Biological Conservation 142(1): 33-42.
Lindsey, P.A., Alexander, R.R., Mills, M.G.L., Romañach, S.S. and Woodroffe, R. (2007a). Wildlife viewing preferences of visitors to protected areas in South Africa: Implications for the role of ecotourism in conservation. Journal of Ecotourism 6(1): 19-33.
Lindsey, P.A., Roulet, P.A. and Romañach, S.S. (2007b). Economic and conservation significance of the trophy hunting industry in sub-Saharan Africa. Biological Conservation 134(4): 455-469.
Liu, J., Dietz, T., Carpenter, S.R., Alberti, M., Folke, C., Moran, E., Pell, A.N., Deadman, P., Kratz, T., Lubchenco, J., Ostrom, E., Ouyang, Z., Provencher, W., Redman, C.L., Schneider, S.H. and Taylor, W.W. (2007). Complexity of coupled human and natural systems. Science 317(5844): 1513-1516.
Macaulay, L. (2016). The role of wildlife-associated recreation in private land use and conservation: Providing the missing baseline. Land Use Policy 58: 218-233.
Mackey, B.G., Watson, J.E.M., Hope, G. and Gilmore, S. (2008). Climate change, biodiversity conservation, and the role of protected areas: An Australian perspective. Biodiversity 9(3-4): 11-18.
Maes, J., Egoh, B., Willemen, L., Liquete, C., Vihervaara, P., Schägner, J.P., Grizzetti, B., Drakou, E.G., Notte, A.L., Zulian, G., Bouraoui, F., Luisa Paracchini, M., Braat, L. and Bidoglio, G. (2012). Mapping ecosystem services for policy support and decision making in the European Union. Ecosystem Services 1(1): 31-39.
Mallari, N.A.D., Collar, N.J., McGowan, P.J.K. and Marsden, S.J. (2016). Philippine protected areas are not meeting the biodiversity coverage and management effectiveness requirements of Aichi Target 11. Ambio 45(3): 313-322.
Marcovaldi, M.A. and Dei Marcovaldi, G.G. (1999). Marine turtles of Brazil: The history and structure of Projeto Tamar-Ibama. Biological Conservation 91(1): 35-41.
Marino, J., Sillero‐Zubiri, C. and Macdonald, D.W. (2006). Trends, dynamics and resilience of an Ethiopian wolf population. Animal Conservation 9(1): 49-58.
Marnewick, K., Ferreira, S.M., Grange, S., Watermeyer, J., Maputla, N. and Davies-Mostert, H.T. (2014). Evaluating the status of and African wild dogs Lycaon pictus and cheetahs
228

Acinonyx jubatus through tourist-based photographic surveys in the Kruger National Park. PLoS ONE 9(1): e86265, DOI: 10.1371/journal.pone.0086265.
Martin, T.E., Lurbiecki, H., Joy, J.B. and Mooers, A.O. (2014). Mammal and bird species held in zoos are less endemic and less threatened than their close relatives not held in zoos. Animal Conservation 17(2): 89-96.
Mason, P. (2000). Zoo tourism: The need for more research. Journal of Sustainable Tourism 8(4): 333-339.
Mbaiwa, J.E. (2011). The effects of tourism development on the sustainable utilisation of natural resources in the Okavango Delta, Botswana. Current Issues in Tourism 14(3): 251-273.
Mbaiwa, J.E. and Kolawole, O.D. (2013). Tourism and biodiversity conservation: The case of community-based natural resource management in southern Africa. CAB Reviews 8(010): 1-10.
McCallum, H. (2008). Tasmanian devil facial tumour disease: Lessons for conservation biology. Trends in Ecology & Evolution 23(11): 631-637.
McCauley, D.J., Power, E.A., Bird, D.W., McInturff, A., Dunbar, R.B., Durham, W.H., Micheli, F. and Young, H.S. (2013). Conservation at the edges of the world. Biological Conservation 165(2013): 139-145.
McDonough, K., Hutchinson, S., Moore, T. and Hutchinson, J.M.S. (2017). Analysis of publication trends in ecosystem services research. Ecosystem Services 25: 82-88.
Mihalič, T. (2000). Environmental management of a tourist destination: A factor of tourism competitiveness. Tourism Management 21(1): 65-78.
Millennium Ecosystem Assessment (2005). Ecosystems and human well‐being: Synthesis. Island Press; Washington, D.C.
Miller, J.M. and Krosnick, J.A. (2004). Threat as a motivator of political activism: A field experiment. Political Psychology 25(4): 507-523.
Mitchell, B.A., Fitzsimons, J.A., Stevens, C.M. and Wright, D.R. (2018). PPA or OECM? Differentiating between privately protected areas and other effective area‐based conservation measures on private land. PARKS 24: 49.
Moncrieff, D. (2000). Managing tourism and recreation on wheatbelt granite outcrops. Journal of the Royal Society of Western Australia 83: 187-196.
Moon, K. and Cocklin, C. (2011). Participation in biodiversity conservation: Motivations and barriers of Australian landholders. Journal of Rural Studies 27(3): 331-342.
Moran, M.D. (2003). Arguments for rejecting the sequential Bonferroni in ecological studies. Oikos 100(2): 403-405.
Morelli, T.L., Daly, C., Dobrowski, S.Z., Dulen, D.M., Ebersole, J.L., Jackson, S.T., Lundquist, J.D., Millar, C.I., Maher, S.P., Monahan, W.B., Nydick, K.R., Redmond, K.T., Sawyer, S.C., Stock, S. and Beissinger, S.R. (2016). Managing climate change refugia for climate adaptation. PLoS ONE 11(8): e0159909, DOI: 10.1371/journal.pone.0159909.
Morgan, D.L. (2014). Pragmatism as a paradigm for social research. Qualitative Inquiry 20(8): 1045-1053.
229

Morrison, C., Wardle, C. and Castley, J.G. (2016). Repeatability and reproducibility of Population Viability Analysis (PVA) and the implications for threatened species management. Frontiers in Ecology and Evolution 4(98): 1-7.
Mossaz, A., Buckley, R.C. and Castley, J.G. (2015). Ecotourism contributions to conservation of African big cats. Journal for Nature Conservation 28(2015): 112-118.
Mukhambetov, T., Janguttina, G. and Еsaidar, U. (2016). Entrepreneurial aspects of eco‐tourism. ICIE 2016 Proceedings of the 4th International Conference on Innovation and Entrepreneurship, Toronto, Canada, Academic Conferences and Publishing International Limited.
Naidoo, R., Balmford, A., Ferraro, P.J., Polasky, S., Ricketts, T.H. and Rouget, M. (2006). Integrating economic costs into conservation planning. Trends in Ecology & Evolution 21(12): 681-687.
Navrátil, J., Knotek, J., Hanzelková, E. and Pícha, K. (2016). Tourists' knowledge of a visited environment and the immediate influence on this knowledge of completing an interpretive nature trail: Beskydy Protected Landscape Area, West Carpathians. GeoJournal of Tourism and Geosites 18(2): 145-151.
Navrud, S. and Mungatana, E.D. (1994). Environmental valuation in developing countries: The recreational value of wildlife viewing. Ecological Economics 11(2): 135-151.
Nekuda Malik, J.A. (2019). US Academies call for research agenda on negative emissions technologies and reliable sequestration. MRS Bulletin 44(1): 13-15.
Neldner, V.J., Niehus, R.E., Wilson, B.A., McDonald, W.J.F., Ford, A.J. and Accad, A. (2017). The vegetation of Queensland. Descriptions of broad vegetation groups. Version 3.0. Queensland Herbarium, Department of Science, Information Technology and Innovation; retrieved November 2017 from: https://publications.qld.gov.au/dataset/redd/resource/78209e74-c7f2-4589-90c1-c33188359086.
Nelson, F., Foley, C., Foley, L.S., Leposo, A., Loure, E., Peterson, D., Peterson, M., Peterson, T., Sachedina, H. and Williams, A. (2010). Payments for ecosystem services as a framework for community-based conservation in northern Tanzania. Conservation Biology 24(1): 78-85.
New, T.R. (2010). Butterfly conservation in Australia: The importance of community participation. Journal of Insect Conservation 14(3): 305-311.
Newbold, T., Hudson, L.N., Hill, S.L.L., Contu, S., Lysenko, I., Senior, R.A., Borger, L., Bennett, D.J., Choimes, A., Collen, B., Day, J., De Palma, A., Diaz, S., Echeverria-Londono, S., Edgar, M.J., Feldman, A., Garon, M., Harrison, M.L.K., Alhusseini, T., Ingram, D.J., Itescu, Y., Kattge, J., Kemp, V., Kirkpatrick, L., Kleyer, M., Correia, D.L.P., Martin, C.D., Meiri, S., Novosolov, M., Pan, Y., Phillips, H.R.P., Purves, D.W., Robinson, A., Simpson, J., Tuck, S.L., Weiher, E., White, H.J., Ewers, R.M., Mace, G.M., Scharlemann, J.P.W. and Purvis, A. (2015). Global effects of land use on local terrestrial biodiversity. Nature 520(7545): 45-50.
Newmark, W.D., Jenkins, C.N., Pimm, S.L., McNeally, P.B. and Halley, J.M. (2017). Targeted habitat restoration can reduce extinction rates in fragmented forests. Proceedings of the National Academy of Sciences 114(36): 9635.
230

Nogales, M., MartÍN, A., Tershy, B.R., Donlan, C.J., Veitch, D., Puerta, N., Wood, B. and Alonso, J. (2004). A review of feral cat eradication on islands. Conservation Biology 18(2): 310-319.
Novelli, M., Barnes, J.I. and Humavindu, M. (2006). The other side of the ecotourism coin: Consumptive tourism in southern Africa. Journal of Ecotourism 5(1-2): 62-69.
NRMMC (2010). Australia’s Biodiversity Conservation Strategy 2010-2030. Australian Government, Department of Sustainability, Environment, Water, Population and Communities; Canberra.
Nunes, P.A.L.D. and van den Bergh, J.C.J.M. (2001). Economic valuation of biodiversity: Sense or nonsense? Ecological Economics 39(2): 203-222.
Nye, M. and Hargreaves, T. (2010). Exploring the social dynamics of proenvironmental behavior change. Journal of Industrial Ecology 14(1): 137-149.
O'Malley, M.P., Lee-Brooks, K. and Medd, H.B. (2013). The global economic impact of manta ray watching tourism. PLoS ONE 8(5), DOI: 10.1371/journal.pone.0065051.
Ogutu, Z.A. (2002). The impact of ecotourism on livelihood and natural resource management in Eselenkei, Amboseli Ecosystem, Kenya. Land Degradation & Development 13(3): 251-256.
Okereke, C. (2007). An exploration of motivations, drivers and barriers to carbon management. European Management Journal 25(6): 475-486.
Oldekop, J.A., Holmes, G., Harris, W.E. and Evans, K.L. (2015). A global assessment of the social and conservation outcomes of protected areas. Conservation Biology 30(1): 133-141.
Oliver, T.H., Brereton, T. and Roy, D.B. (2013). Population resilience to an extreme drought is influenced by habitat area and fragmentation in the local landscape. Ecography 36(5): 579-586.
Onwuegbuzie, A.J., Johnson, R.B. and Collins, K.M. (2009). Call for mixed analysis: A philosophical framework for combining qualitative and quantitative approaches. International Journal of Multiple Research Approaches 3(2): 114-139.
Onwuegbuzie, A.J. and Leech, N.L. (2005). On becoming a pragmatic researcher: The importance of combining quantitative and qualitative research methodologies. International Journal of Social Research Methodology 8(5): 375-387.
Osano, P.M., Said, M.Y., de Leeuw, J., Ndiwa, N., Kaelo, D., Schomers, S., Birner, R. and Ogutu, J.O. (2013). Why keep lions instead of livestock? Assessing wildlife tourism-based payment for ecosystem services involving herders in the Maasai Mara, Kenya. Natural Resources Forum 37(4): 242-256.
Parrish, J.D., Braun, D.P. and Unnasch, R.S. (2003). Are we conserving what we say we are? Measuring ecological integrity within protected areas. BioScience 53(9): 851-860.
Pegas, F.d.V. and Castley, J.G. (2014). Ecotourism as a conservation tool and its adoption by private protected areas in Brazil. Journal of Sustainable Tourism 22(4): 604-625.
Perkins, H. and Grace, D.A. (2009). Ecotourism: Supply of nature or tourist demand? Journal of Ecotourism 8(3): 223-236.
231

Perrings, C., Naeem, S., Ahrestani, F.S., Bunker, D.E., Burkill, P., Canziani, G., Elmqvist, T., Fuhrman, J.A., Jaksic, F.M., Kawabata, Z.i., Kinzig, A., Mace, G.M., Mooney, H., Prieur-Richard, A.-H., Tschirhart, J. and Weisser, W. (2011). Ecosystem services, targets, and indicators for the conservation and sustainable use of biodiversity. Frontiers in Ecology and the Environment 9(9): 512-520.
Piccolo, J.J. (2017). Intrinsic values in nature: Objective good or simply half of an unhelpful dichotomy? Journal for Nature Conservation 37: 8-11.
Pickering, C., Harrington, J. and Worboys, G. (2003). Environmental impacts of tourism on the Australian alps protected areas. Mountain Research and Development 23(3): 247-254.
Pimm, S.L., Jenkins, C.N., Abell, R., Brooks, T.M., Gittleman, J.L., Joppa, L.N., Raven, P.H., Roberts, C.M. and Sexton, J.O. (2014). The biodiversity of species and their rates of extinction, distribution, and protection. Science 344(6187): 987-997.
Polkinghorne, A., Hanger, J. and Timms, P. (2013). Recent advances in understanding the biology, epidemiology and control of chlamydial infections in koalas. Veterinary Microbiology 165(3–4): 214-223.
Powell, R.B. and Ham, S.H. (2008). Can ecotourism interpretation really lead to pro-conservation knowledge, attitudes and behaviour? Evidence from the Galapagos Islands. Journal of Sustainable Tourism 16(4): 467-489.
Prado, J.A., Puszka, H., Forman, A., Cooke, B. and Fitzsimons, J.A. (2018). Trends and values of ‘Land for Wildlife’ programs for private land conservation. Ecological Management & Restoration 19(2): 136-146.
Pressey, R.L., Hager, T.C., Ryan, K.M., Schwarz, J., Wall, S., Ferrier, S. and Creaser, P.M. (2000). Using abiotic data for conservation assessments over extensive regions: Quantitative methods applied across New South Wales, Australia. Biological Conservation 96(1): 55-82.
Pretty, J. (2003). Social capital and the collective management of resources. Science 302(5652): 1912-1914.
Productivity Commission (2015). Australia’s international tourism industry. Productivity Commission; Canberra.
Pullin, A.S. and Stewart, G.B. (2006). Guidelines for systematic review in conservation and environmental management. Conservation Biology 20(6): 1647-1656.
Pyke, G.H. and Szabo, J.K. (2018). Conservation and the 4 Rs, which are rescue, rehabilitation, release, and research. Conservation Biology 32(1): 50-59.
Queensland Government (2013). Queensland Ecotourism Plan 2013–2020. Queensland Government; Brisbane, Australia.
Queensland Herbarium (2015). Regional Ecosystems Map. Lot: 4; plan: W311633. Department of Science, Information Technology and Innovation, Queensland Government; Brisbane, Australia.
Queensland Parks and Wildlife Service (2016). Queensland Ecotourism Plan 2016–2020. Queensland Government; Brisbane, Australia.
Radford, J.Q., Woinarski, J.C., Legge, S., Baseler, M., Bentley, J., Burbidge, A.A., Bode, M., Copley, P., Dexter, N. and Dickman, C.R. (2018). Degrees of population-level
232
susceptibility of Australian terrestrial non-volant mammal species to predation by the introduced red fox (Vulpes vulpes) and feral cat (Felis catus). Wildlife Research 45(7): 645-657.
Ran, L., Lu, X., Fang, N. and Yang, X. (2018). Effective soil erosion control represents a significant net carbon sequestration. Scientific Reports 8(1): 12018.
Reed, D.H. and Frankham, R. (2003). Correlation between fitness and genetic diversity. Conservation Biology 17(1): 230-237.
Reside, A.E., Beher, J., Cosgrove, A.J., Evans, M.C., Seabrook, L., Silcock, J.L., Wenger, A.S. and Maron, M. (2017). Ecological consequences of land clearing and policy reform in Queensland. Pacific Conservation Biology 23(3): 219-230.
Ries, L., Fletcher Jr, R.J., Battin, J. and Sisk, T.D. (2004). Ecological responses to habitat edges: Mechanisms, models, and variability explained. Annu. Rev. Ecol. Evol. Syst. 35: 491-522.
Rissman, A.R. and Sayre, N.F. (2012). Conservation outcomes and social relations: A comparative study of private ranchland conservation easements. Society & Natural Resources 25(6): 523-538.
Ritchie, E.G., Bradshaw, C.J.A., Dickman, C.R., Hobbs, R., Johnson, C.N., Johnston, E.L., Laurance, W.F., Lindenmayer, D., McCarthy, M.A., Nimmo, D.G., Possingham, H.H., Pressey, R.L., Watson, D.M. and Woinarski, J. (2013). Continental-scale governance and the hastening of loss of Australia's biodiversity. Conservation Biology 27(6): 1133-1135.
Robbins, A., Loader, J., Timms, P. and Hanger, J. (2018). Optimising the short and long-term clinical outcomes for koalas (Phascolarctos cinereus) during treatment for chlamydial infection and disease. PLoS ONE 13(12): e0209679, DOI: 10.1371/journal.pone.0209679.
Robins, L. (2018). More than 30 years of ‘Landcare’ in Australia: Five phases of development from ‘childhood’ to ‘mid-life’ (crisis or renewal?). Australasian Journal of Environmental Management 25(4): 385-397.
Rodger, K., Moore, S.A. and Newsome, D. (2007). Wildlife tours in Australia: Characteristics, the place of science and sustainable futures. Journal of Sustainable Tourism 15(2): 160-179.
Rodrigues, A.S.L., Andelman, S.J., Bakarr, M.I., Boitani, L., Brooks, T.M., Cowling, R.M., Fishpool, L.D.C., da Fonseca, G.A.B., Gaston, K.J., Hoffmann, M., Long, J.S., Marquet, P.A., Pilgrim, J.D., Pressey, R.L., Schipper, J., Sechrest, W., Stuart, S.N., Underhill, L.G., Waller, R.W., Watts, M.E.J. and Yan, X. (2004). Effectiveness of the global protected area network in representing species diversity. Nature 428(6983): 640-643.
Romanin, L.M., Prior, L.D., Williamson, G.J. and Bowman, D.M.J.S. (2015). Trajectory of change in land cover and carbon stocks following European settlement in Tasmania, Australia. Anthropocene 9: 33-40.
Romero-Brito, T.P., Buckley, R.C. and Byrne, J. (2016). NGO partnerships in using ecotourism for conservation: Systematic review and meta-analysis. PLoS ONE 11(11): 1-19.
233
Rooney, P., Steinberg, K. and Schervish, P.G. (2004). Methodology is destiny: The effect of survey prompts on reported levels of giving and volunteering. Nonprofit and Voluntary Sector Quarterly 33(4): 628-654.
Ross, S. and Wall, G. (1999). Ecotourism: Towards congruence between theory and practice. Tourism Management 20(1): 123-132.
Rossi, P.H., Wright, J.D. and Anderson, A.B. (2013). Handbook of survey research. Academic Press; New York, NY.
Ruhanen, L., Weiler, B., Moyle, B.D. and McLennan, C.-l.J. (2015). Trends and patterns in sustainable tourism research: A 25-year bibliometric analysis. Journal of Sustainable Tourism 23(4): 517-535.
Sakata, H. and Prideaux, B. (2013). An alternative approach to community-based ecotourism: A bottom-up locally initiated non-monetised project in Papua New Guinea. Journal of Sustainable Tourism 21(6): 880-899.
Salafsky, N., Cauley, H., Balachander, G., Cordes, B., Parks, J., Margoluis, C., Bhatt, S., Encarnacion, C., Russell, D. and Margoluis, R. (2001). A systematic test of an enterprise strategy for community-based biodiversity conservation. Conservation Biology 15(6): 1585-1595.
Salafsky, N., Salzer, D., Stattersfield, A.J., Hilton-Taylor, C., Neugarten, R., Butchart, S.H.M., Collen, B.E.N., Cox, N., Master, L.L., O'Connor, S. and Wilkie, D. (2008). A standard lexicon for biodiversity conservation: Unified classifications of threats and actions. Conservation Biology 22(4): 897-911.
Saldana, J. (2013). The coding manual for qualitative researchers Sage Publishing, Ltd.; Thousand Oaks California, CA.
Salum, L.A. (2009). Ecotourism and biodiversity conservation in Jozani-Chwaka Bay National Park, Zanzibar. African Journal of Ecology 47(2009): 166-170.
Samways, M.J., Hitchins, P.M., Bourquin, O. and Henwood, J. (2010). Restoration of a tropical island: Cousine Island, Seychelles. Biodiversity and Conservation 19(2): 425-434.
Sanchez, D.L., Amador, G., Funk, J. and Mach, K.J. (2018). Federal research, development, and demonstration priorities for carbon dioxide removal in the United States. Environmental Research Letters 13(1): 015005, DOI: 10.1088/1748-9326/aaa08f.
Sandbrook, C.G. (2015). What is conservation? Oryx 49(4): 565-566.
Sander, B. (2012). The importance of education in ecotourism ventures: Lessons from Rara Avis Ecolodge, Costa Rica. International Journal of Sustainable Society 4(4): 389-404.
Sandy, Q.Q. and John, D. (2011). The qualitative research interview. Qualitative Research in Accounting & Management 8(3): 238-264.
Santos Junior, P.C.A., Marques, F.C., Lima, M.R. and dos Anjos, L. (2016). The importance of restoration areas to conserve bird species in a highly fragmented Atlantic forest landscape. Natureza & Conservação 14(1): 1-7.
Scheele, B.C., Legge, S., Armstrong, D.P., Copley, P., Robinson, N., Southwell, D., Westgate, M.J. and Lindenmayer, D.B. (2018). How to improve threatened species management: An Australian perspective. Journal of Environmental Management 223: 668-675.
234

Schoneveld-de Lange, N., Meijaard, E. and Löhr, A. (2016). South to south learning in great ape conservation. American Journal of Primatology 78(6): 669-678.
Sgalitzer, H.A., Brownlee, M.T.J., Zajchowski, C., Bricker, K.S. and Powell, R.B. (2016). Modelling travellers philanthropy: Tourists motivations to donate at Sweetwater Chimpanzee Sanctuary. Journal of Ecotourism 15(1): 1-20.
Shahidul Islam, M. and Tanaka, M. (2004). Impacts of pollution on coastal and marine ecosystems including coastal and marine fisheries and approach for management: A review and synthesis. Marine Pollution Bulletin 48(7): 624-649.
Shaw, D., Newholm, T. and Dickinson, R. (2006). Consumption as voting: An exploration of consumer empowerment. European Journal of Marketing 40(9/10): 1049-1067.
Sims-Castley, R., Kerley, G.I., Geach, B. and Langholz, J. (2005). Socio-economic significance of ecotourism-based private game reserves in South Africa’s Eastern Cape province. PARKS 15(2): 6-18.
Sirakaya, E., Sasidharan, V. and Sönmez, S. (1999). Redefining ecotourism: The need for a supply-side view. Journal of Travel Research 38(2): 168-172.
Skibins, J.C., Powell, R.B. and Hallo, J.C. (2013). Charisma and conservation: Charismatic megafauna’s influence on safari and zoo tourists’ pro-conservation behaviors. Biodiversity and Conservation 22(4): 959-982.
Smallwood, K.S. (2001). Linking habitat restoration to meaningful units of animal demography. Restoration Ecology 9(3): 253-261.
Smith, D.W., White, P.J., Stahler, D.R., Wydeven, A. and Hallac, D.E. (2016). Managing wolves in the Yellowstone area: Balancing goals across jurisdictional boundaries. Wildlife Society Bulletin 40(3): 436-445.
Smith, L.D.G., Broad, S. and Weiler, B.V. (2008). A closer examination of the impact of zoo visits on visitor behaviour. Journal of Sustainable Tourism 16(5): 544-562.
Snyman, S. (2016). The role of private sector ecotourism in local socio-economic development in southern Africa. Journal of Ecotourism 16(3): 247-268.
Sobels, J., Curtis, A. and Lockie, S. (2001). The role of Landcare group networks in rural Australia: Exploring the contribution of social capital. Journal of Rural Studies 17(3): 265-276.
Sommer, S., McDevitt, A.D. and Balkenhol, N. (2013). Landscape genetic approaches in conservation biology and management. Conservation Genetics 14(2): 249-251.
Stake, R.E. (2006). Multiple case study analysis. Guilford Publications, Inc.; New York, NY.
State of New South Wales and Office of Environment and Heritage (2018). Biodiversity Conservation Investment Strategy 2018. Office of Environment and Heritage; Sydney.
Stavrakas, V., Spyridaki, N.-A. and Flamos, A. (2018). Striving towards the deployment of bio-energy with carbon capture and storage (BECCS): A review of research priorities and assessment needs. Sustainability 10(7): 2206.
Stem, C.J., Lassoie, J.P., Lee, D.R. and Deshler, D.J. (2003). How 'eco' is ecotourism? A comparative case study of ecotourism in Costa Rica. Journal of Sustainable Tourism 11(4): 322-347.
235

Steven, R., Castley, J.G. and Buckley, R. (2013). Tourism revenue as a conservation tool for threatened birds in protected areas. PLoS ONE 8(5): e62598, https://doi.org/10.1371/journal.pone.0062598.
Steven, R., Pickering, C. and Castley, J.G. (2011). A review of the impacts of nature based recreation on birds. Journal of Environmental Management 92(10): 2287-2294.
Stevenson, A. (2010). Oxford dictionary of English. Oxford University Press; Oxford, UK.
Stronza, A.L. and Gordillo, J. (2008). Community views of ecotourism. Annals of Tourism Research 35(2): 448-468.
Sunderland, T., Sunderland-Groves, J., Shanley, P. and Campbell, B. (2009). Bridging the gap: How can information access and exchange between conservation biologists and field practitioners be improved for better conservation outcomes? Biotropica 41(5): 549-554.
Sutherland, W.J., Pullin, A.S., Dolman, P.M. and Knight, T.M. (2004). The need for evidence-based conservation. Trends in Ecology & Evolution 19(6): 305-308.
Svoronou, E. and Holden, A. (2005). Ecotourism as a tool for nature conservation: The role of WWF Greece in the Dadia-Lefkimi-Soufli Forest Reserve in Greece. Journal of Sustainable Tourism 13(5): 456-467.
Tear, T.H., Kareiva, P., Angermeier, P.L., Comer, P., Czech, B., Kautz, R., Landon, L., Mehlman, D., Murphy, K., Ruckelshaus, M., Scott, J.M. and Wilhere, G. (2005). How much is enough? The recurrent problem of setting measurable objectives in conservation. BioScience 55(10): 835-849.
TEEB (2012). The Economics of Ecosystems and Biodiversity (TEEB) in business and enterprise. Earthscan; London.
TEEB (2015). TEEB for agriculture & food: An interim report. United Nations Environment Programme; Geneva, Switzerland.
Thakadu, O., Mangadi, K., Bernard, F. and Mbaiwa, J. (2005). The economic contribution of safari hunting to rural livelihoods in the Okavango: The case of Sankuyo Village. Botswana Notes and Records 37(1): 22-39.
Theobald, D.M. (2013). A general model to quantify ecological integrity for landscape assessments and US application. Landscape Ecology 28(10): 1859-1874.
Thomas, E. and Magilvy, J.K. (2011). Qualitative rigor or research validity in qualitative research. Journal for Specialists in Pediatric Nursing 16(2): 151-155.
Thoyre, A. (2011). Social capital as a facilitator of pro-environmental actions in the USA: A preliminary examination of mechanisms. Local Environment 16(1): 37-49.
Tisdell, C. (2007). Valuing the Otago Peninsula: The economic benefits of conservation. Working Papers on Economics, Ecology and the Environment. University of Queensland; Brisbane, Australia.
Tisdell, C. and Wilson, C. (2005). Perceived impacts of ecotourism on environmental learning and conservation: Turtle watching as a case study. Environment, Development and Sustainability 7(3): 291-302.
Tisdell, C. and Wilson, C. (2012). Nature-based tourism and conservation: New economic insights and case studies. Edward Elgar Publishing; Massachusetts, US.
236

Tisdell, C.A., Preece, H.J., Abdullah, S. and Beyer, H.L. (2017). Strategies to conserve the koala: Cost-effectiveness considerations. Australasian Journal of Environmental Management 24(3): 302-318.
Tittensor, D.P., Walpole, M., Hill, S.L.L., Boyce, D.G., Britten, G.L., Burgess, N.D., Butchart, S.H.M., Leadley, P.W., Regan, E.C., Alkemade, R., Baumung, R., Bellard, C., Bouwman, L., Bowles-Newark, N.J., Chenery, A.M., Cheung, W.W.L., Christensen, V., Cooper, H.D., Crowther, A.R., Dixon, M.J.R., Galli, A., Gaveau, V., Gregory, R.D., Gutierrez, N.L., Hirsch, T.L., Höft, R., Januchowski-Hartley, S.R., Karmann, M., Krug, C.B., Leverington, F.J., Loh, J., Lojenga, R.K., Malsch, K., Marques, A., Morgan, D.H.W., Mumby, P.J., Newbold, T., Noonan-Mooney, K., Pagad, S.N., Parks, B.C., Pereira, H.M., Robertson, T., Rondinini, C., Santini, L., Scharlemann, J.P.W., Schindler, S., Sumaila, U.R., Teh, L.S.L., van Kolck, J., Visconti, P. and Ye, Y. (2014). A mid-term analysis of progress toward international biodiversity targets. Science 346(6206): 241-244.
Tourism Research Australia (2009). Snapshots 2009 nature tourism in Australia. Department of Resources, Energy and Tourism, Australian Government; Canberra.
Tourism Research Australia (2017). Consumer demand project fact sheets: Understanding the markets. Tourism Research Australia; Sydney.
Tourism Research Australia (2018). Travel by Australians: Year ending March 2018. Austrade, Australian Government; Canberra.
Tovar, C., Pye, R.J., Kreiss, A., Cheng, Y., Brown, G.K., Darby, J., Malley, R.C., Siddle, H.V.T., Skjødt, K., Kaufman, J., Silva, A., Baz Morelli, A., Papenfuss, A.T., Corcoran, L.M., Murphy, J.M., Pearse, M.J., Belov, K., Lyons, A.B. and Woods, G.M. (2017). Regression of devil facial tumour disease following immunotherapy in immunised Tasmanian devils. Scientific Reports 7: 43827.
Townsend, M., Henderson-Wilson, C., Warner, E. and Weiss, L. (2015). Healthy parks healthy people: The state of the evidence, 2015. Parks Victoria; Melbourne.
Tracy, S.J. (2013). Qualitative research methods: Collecting evidence, crafting analysis, communicating impact. John Wiley & Sons, Ltd.; West Sussex, UK.
Trinkel, M., Ferguson, N., Reid, A., Reid, C., Somers, M., Turelli, L., Graf, J., Szykman, M., Cooper, D. and Haverman, P. (2008). Translocating lions into an inbred lion population in the Hluhluwe‐iMfolozi Park, South Africa. Animal Conservation 11(2): 138-143.
Tscharntke, T., Milder, J.C., Schroth, G., Clough, Y., DeClerck, F., Waldron, A., Rice, R. and Ghazoul, J. (2015). Conserving biodiversity through certification of tropical agroforestry crops at local and landscape scales. Conservation Letters 8(1): 14-23.
TTF (2017). Unlocking our great outdoors - June 2017. Tourism & Transport Forum; Sydney.
U.S. Fish and Wildlife Service (2018). 2016 National survey of fishing, hunting, and wildlife-associated recreation. U.S. Fish and Wildlife Service and U.S. Census Bureau; Washington.
UN General Assembly (2000). United Nations Millennium Declaration, a/res/55/2. UN General Assembly; New York.
UNEP-WCMC, IUCN and NGS (2018). Protected Planet Report 2018. UNEP-WCMC, IUCN and NGS; Gland, Switzerland.
237

United Nations (2015). 2030 Agenda for Sustainable Development a/res/70/1. United Nations; New York.
United Nations (2018). The Sustainable Development Goals Report 2018. United Nations; New York.
Vaismoradi, M., Turunen, H. and Bondas, T. (2013). Content analysis and thematic analysis: Implications for conducting a qualitative descriptive study. Nursing & Health Sciences 15(3): 398-405.
Vaughan, D. (2000). Tourism and biodiversity: A convergence of interests? International Affairs 76(2): 283-297.
Vesk, P.A. and Mac Nally, R. (2006). The clock is ticking—revegetation and habitat for birds and arboreal mammals in rural landscapes of southern Australia. Agriculture, Ecosystems & Environment 112(4): 356-366.
Vesk, P.A., Nolan, R., Thomson, J.R., Dorrough, J.W. and Nally, R.M. (2008). Time lags in provision of habitat resources through revegetation. Biological Conservation 141(1): 174-186.
Vinding, K., Bester, M., Kirkman, S.P., Chivell, W. and Elwen, S.H. (2015). The use of data from a platform of opportunity (whale watching) to study coastal cetaceans on the southwest coast of South Africa. Tourism in Marine Environments 11(1): 33-54.
Vucetich, J.A., Bruskotter, J.T. and Nelson, M.P. (2015). Evaluating whether nature's intrinsic value is an axiom of or anathema to conservation. Conservation Biology 29(2): 321-332.
Waldron, A., Miller, D.C., Redding, D., Mooers, A., Kuhn, T.S., Nibbelink, N., Roberts, J.T., Tobias, J.A. and Gittleman, J.L. (2017). Reductions in global biodiversity loss predicted from conservation spending. Nature 551: 364.
Waldron, A., Mooers, A.O., Miller, D.C., Nibbelink, N., Redding, D., Kuhn, T.S., Roberts, J.T. and Gittleman, J.L. (2013). Targeting global conservation funding to limit immediate biodiversity declines. Proceedings of the National Academy of Sciences 110(29): 12144-12148.
Walsh, J.C., Wilson, K.A., Benshemesh, J. and Possingham, H.P. (2012). Unexpected outcomes of invasive predator control: The importance of evaluating conservation management actions. Animal Conservation 15(4): 319-328.
Wardle, C., Buckley, R., Shakeela, A. and Castley, J.G. (2018). Ecotourism’s contributions to conservation: Analysing patterns in published studies. Journal of Ecotourism, 10.1080/14724049.2018.1424173.
Watson, J.E.M., Dudley, N., Segan, D.B. and Hockings, M. (2014). The performance and potential of protected areas. Nature 515: 67-73.
Watson, J.E.M., Evans, M.C., Carwardine, J., Fuller, R.A., Joseph, L.N., Segan, D.B., Taylor, M.F.J., Fensham, R.J. and Possingham, H.P. (2011). The capacity of Australia's protected-area system to represent threatened species. Conservation Biology 25(2): 324-332.
238

Waylen, K.A., McGowan, P.J.K., Pawi Study Group and Milner-Gulland, E.J. (2009). Ecotourism positively affects awareness and attitudes but not conservation behaviours: A case study at Grande Riviere, Trinidad. Oryx 43(3): 343-351.
Weaver, D.B. (1999). Magnitude of ecotourism in Costa Rica and Kenya. Annals of Tourism Research 26(4): 792-816.
Weaver, D.B. (2001). Ecotourism as mass tourism: Contradiction or reality? The Cornell Hotel and Restaurant Administration Quarterly 42(2): 104-112.
Weaver, D.B. (2002). Hard-core ecotourists in Lamington National Park, Australia. Journal of Ecotourism 1(1): 19-35.
Weaver, D.B. (2012). Protected area visitor willingness to participate in site enhancement activities. Journal of Travel Research 52(3): 377-391.
Weaver, D.B. and Lawton, L.J. (2002). Overnight ecotourist market segmentation in the Gold Coast hinterland of Australia. Journal of Travel Research 40(3): 270-280.
Weaver, D.B. and Lawton, L.J. (2007). Twenty years on: The state of contemporary ecotourism research. Tourism Management 28(5): 1168-1179.
West, P. and Carrier, James G. (2004). Ecotourism and authenticity: Getting away from it all? Current Anthropology 45(4): 483-498.
Weston, B.H. (2012). The theoretical foundations of intergenerational ecological justice: An overview. Human Rights Quarterly 34(1): 251-266.
Weston, C., Gandell, T., Beauchamp, J., McAlpine, L., Wiseman, C. and Beauchamp, C. (2001). Analyzing interview data: The development and evolution of a coding system. Qualitative sociology 24(3): 381-400.
Wheaton, M., Ardoin, N.M., Hunt, C., Schuh, J.S., Kresse, M., Menke, C. and Durham, W. (2016). Using web and mobile technology to motivate pro-environmental action after a nature-based tourism experience. Journal of Sustainable Tourism 24(4): 594-615.
Whitelaw, P.A., King, B.E.M. and Tolkach, D. (2014). Protected areas, conservation and tourism – financing the sustainable dream. Journal of Sustainable Tourism 22(4): 584-603.
Wight, P.A. (2001). Ecotourists: Not a homogeneous market segment. The encyclopedia of ecotourism. D.B. Weaver. CAB International; Oxon, UK.
Witmer, G.W. (2005). Wildlife population monitoring: Some practical considerations. Wildlife Research 32(3): 259-263.
Witzenberger, K.A. and Hochkirch, A. (2011). Ex situ conservation genetics: A review of molecular studies on the genetic consequences of captive breeding programmes for endangered animal species. Biodiversity and Conservation 20(9): 1843-1861.
Woinarski, J.C., Garnett, S.T., Legge, S.M. and Lindenmayer, D.B. (2017). The contribution of policy, law, management, research, and advocacy failings to the recent extinctions of three Australian vertebrate species. Conservation Biology 31(1): 13-23.
Woinarski, J.C.Z., Burbidge, A.A. and Harrison, P.L. (2014). The action plan for Australian mammals 2012. CSIRO Publishing; Melbourne.
239

Woinarski, J.C.Z., Burbidge, A.A. and Harrison, P.L. (2015). Ongoing unraveling of a continental fauna: Decline and extinction of Australian mammals since European settlement. Proceedings of the National Academy of Sciences 112(15): 4531-4540.
Woodhouse, A. (2006). Social capital and economic development in regional Australia: A case study. Journal of Rural Studies 22(1): 83-94.
WTO (2018). UNWTO annual report 2017. UN World Tourism Organization; Madrid.
WTO and UNEP (2012). Tourism in the green economy – background report. UN World Tourism Organization; Madrid.
Xiang, Z., Yu, Y., Yang, M., Yang, J., Niao, M. and Li, M. (2011). Does flagship species tourism benefit conservation? A case study of the golden snub-nosed monkey in Shennongjia National Nature Reserve. Chinese Science Bulletin 56(24): 2553-2558.
Xiong, M., Sun, R. and Chen, L. (2018). Effects of soil conservation techniques on water erosion control: A global analysis. Science of the Total Environment 645: 753-760.
Yilmaz, K. (2013). Comparison of quantitative and qualitative research traditions: Epistemological, theoretical, and methodological differences. European Journal of Education 48(2): 311-325.
Young, R.P., Hudson, M.A., Terry, A.M.R., Jones, C.G., Lewis, R.E., Tatayah, V., Zuël, N. and Butchart, S.H.M. (2014). Accounting for conservation: Using the IUCN Red List index to evaluate the impact of a conservation organization. Biological Conservation 180(2014): 84-96.
Zeppel, H. (2006). Indigenous ecotourism: Sustainable development and management. CAB International; Wallingford.
Zeppel, H. (2008). Education and conservation benefits of marine wildlife tours: Developing free-choice learning experiences. Journal of Environmental Education 39(3): 3-18.
240

Appendices
241

Appendix A: Example of CA Matrix data template used for Research Component 2
Due to the length of this template, a detailed version has been provided for the actions in the Biophysical Landscape category only. Note that the text excerpts included in this example come from a range of sites for confidentiality reasons.
Data sources Code Date accessed
EA Questionnaire EAQ May 2016 Environmental Management Plan EMP May 2016
Text extracts for biophysical actions Sources
Actions to remove non-native floral species
All vegetation on [site] that is exotic or not local is being systematically removed. Weeding and clearing of unwanted weeds is an ongoing task, and the existing gardeners do well with the resources that they have had available to them. We have a weed identification and control program in place. The weed invasion from the initial clearing and mismanagement of the area is still a major management issue with Lantana being very invasive along with halk weed and numerous other species.
EAQ
Revegetation (including propagation)
We use natives for all vegetation planted on the property, and much of the former grazing land is now re-planted with locally native species Sheoaks are planted in degraded area to provide food trees for the glossy blacks
EAQ
Pollution/rubbish clean-up
We organise community events for Clean Up Australia Day each year
Established a protected area
Our property is protected by a conservation covenant that recognises the ecological significance of the area. All aspects of the site are reviewed annually, and no changes in the structures or use can take place without a review.
EAQ
Is this because the ongoing task is so challenging, or because they don’t allocate enough resources to their gardening staff?
The two last points don’t actually indicate if weed removal activities are occurring…
There is no weed called ‘halk weed’. It’s possible they mean ‘hawkweed’ which is prevalent in their region, but I’ll need more information or images of weed removal activities to confirm this.
Duplicate in ‘converted degraded land’ item
Duplicate in ‘converted degraded land’ item
Common name Casuarinaceae family, usually referring to the Allocasuarina genus (which has 61 species) - likely to be drooping sheoak (Allocasuarina verticillata) - might be able to confirm by site location
Glossy Black Cockatoo
Duplicate in ‘providing resources for wildlife’
This is enough information to know that it is legally binding but not enough to identify the specific type of agreement, the administering body, if it is in-perpetuity, etc.
242

Appendix A: Example of CA Matrix data template used for Research Component 2
Converted degraded land to ecotourism site
Much of the former grazing land is now re-planted with locally native species The weed invasion from the initial clearing and mismanagement of the area is still a major management issue…
EAQ
Actions to reduce/control erosion
Continuous monitoring of the property is conducted by our tour guides and relevant professional staff. Any erosion, rock fall or other damage is rehabilitated as part of the ongoing management plan.
EAQ
Fire management
[Naturally occurring bush fires are a regular occurrence in the area. A control burn is conducted jointly by the National Parks staff and our staff approximately every three years. This is done as form of prevention, to reduce fuel in case of an unmanageable wildfire occurrence.] [Additionally, we use fire as an environmental management tool with low to moderate intensity burns able to affect germination in some native plant species but won’t reduce soil nutrient levels as a high intensity fire would.]
EAQ
Fire can be adopted as a weed control mechanism as many introduced species do not have the level of fire tolerance that most Australian native species have developed. Fire tolerant species will expand their range at the expense of the more fire sensitive species (Protected area management and operations, 1999). This management technique depends greatly on the native species in the area and their natural fire tolerance. If their tolerance is low, using fire as a management tool may only assist the invading species to extend their range. Fire may also be used in conjunction with other techniques as a way of destroying plants that may have already been removed so as to stop seed dispersal.
EMP
Is this enough to distinguish a proactive conservation action from a minimal impact one? Is the erosion or ‘other damage’ a result of the previous land use, or is this from their own activities? s
This is about bushfires rather than ecological fire management
This is relevant for ecological fire management
This level of detail is a good indicator of ecological fire management, but none of this actually specifies that they do these things…
243

Appendix B: Sources used for each category of the CA Matrix
Table B1 Sources for the biophysical landscape actions and outcomes
(&Beyond, 2019a, 2019b; V. M. Adams & Moon, 2013; Adimassu, Mekonnen, Yirga, & Kessler, 2014; Aerts, Nyssen, & Haile, 2009; Ahebwa, van der Duim, & Sandbrook, 2012b; Albaladejo Montoro, Alvarez Rogel, Querejeta, Diaz, & Castillo, 2000; Alder, Zeller, Pitcher, & Sumaila, 2002; Allen, 2015; Almany, 2004; Almeyda, Broadbent, Wyman, & Durham, 2010; Almeyda Zambrano, Broadbent, & Durham, 2010; Andersen et al., 2005; Avery-Gomm, Borrelle, & Provencher, 2018; Baguette, Blanchet, Legrand, Stevens, & Turlure, 2013; Beier, Majka, & Spencer, 2008; Beyene, Legesse, Triest, & Kloos, 2008; Bingham et al., 2017; Blangy & Mehta, 2006; Bond & Keeley, 2005; Borja, Dauer, Elliott, & Simenstad, 2010; Borrelli et al., 2017; Breed, Stead, Ottewell, Gardner, & Lowe, 2013; Brockway, Gatewood, & Paris, 2002; Brooks et al., 2004; Burrows, 2008; Canesi & Corsi, 2016; Chape, Harrison, Spalding, & Lysenko, 2005; Cousins, Sadler, & Evans, 2008; Covington & Moore, 1994; Derhé, Murphy, Monteith, & Menéndez, 2016; García-Barcina, González-Oreja, & De la Sota, 2006; García-Ruiz, Beguería, Lana-Renault, Nadal-Romero, & Cerdà, 2017; Gaston, Jackson, Cantú-Salazar, & Cruz-Piñón, 2008; Genet et al., 2008; Good & Johnston, 2019; Goossens et al., 2016; Gosper & Vivian-Smith, 2006; Grismer & Hogan, 2005; Hardy, Fitzsimons, Bekessy, & Gordon, 2017; Hermoso & Clavero, 2013; Hess, 2016; Hoban et al., 2013; Jalonen, Valette, Boshier, Duminil, & Thomas, 2018; Kagabo, Stroosnijder, Visser, & Moore, 2013; Keppel et al., 2015; Kettenring, Mercer, Reinhardt Adams, & Hines, 2014; Kohli, Batish, Singh, & Dogra, 2006; Kramer & Havens, 2009; Li, Zhang, Liu, & Xue, 2006; Lin, 2012; Lindenmayer et al., 2012; Lindenmayer et al., 2010; Mackey, Watson, Hope, & Gilmore, 2008; Miteva, Pattanayak, & Ferraro, 2012; Moncrieff, 2000; Morelli et al., 2016; Mossaz, Buckley, & Castley, 2015; Nekuda Malik, 2019; Newmark, Jenkins, Pimm, McNeally, & Halley, 2017; Ogutu, 2002; Parrish, Braun, & Unnasch, 2003; Pasquini, Fitzsimons, Cowell, Brandon, & Wescott, 2011; Pegas & Castley, 2014; Ran, Lu, Fang, & Yang, 2018; Reed & Frankham, 2003; Rice & Toney, 1998; Romanin, Prior, Williamson, & Bowman, 2015; Samways, Hitchins, Bourquin, & Henwood, 2010; Sanchez, Amador, Funk, & Mach, 2018; Santos Junior, Marques, Lima, & dos Anjos, 2016; Shahidul Islam & Tanaka, 2004; Sheppard, Moehrenschlager, McPherson, & Mason, 2010; Silver, Kueppers, Lugo, Ostertag, & Matzek, 2004; Silver, Ostertag, & Lugo, 2000; Sommer, McDevitt, & Balkenhol, 2013; Stavrakas, Spyridaki, & Flamos, 2018; Taylor, 2000; Theobald, 2013; Vesk, Nolan, Thomson, Dorrough, & Nally, 2008; Wardle, Buckley, Shakeela, & Castley, 2018; Xiong, Sun, & Chen, 2018; Young et al., 2014)
244

Appendix B: Sources used for each category of the CA Matrix
Table B2 Sources for the fauna actions and outcomes
(Algar, Angus, Brazell, Gilbert, & Withnell, 2010; Allek et al., 2018; Baguette et al., 2013; Balme et al., 2013; Blackburn, Cassey, Duncan, Evans, & Gaston, 2004; Block, Franklin, Ward, Ganey, & White, 2001; Castley, Boshoff, & Kerley, 2001; Charbonnel, Serre, Ruitton, Harmelin, & Jensen, 2002; Cross, Buddle, & Aldwell, 2007; Davies, Stevens, Meekan, Struve, & Rowcliffe, 2012; Epaphras et al., 2008; Fargallo, Blanco, Potti, & Viñuela, 2001; Good & Johnston, 2019; Goossens et al., 2016; Gosper & Vivian-Smith, 2006; Hayward et al., 2007; Hedrick & Fredrickson, 2008; Hess, 2016; Hughes, Packer, & Ballantyne, 2011; Kingsford et al., 2009; Lacy, 1997, 2013; Laikre, Schwartz, Waples, & Ryman, 2010; Lapeyre, 2011; Libois et al., 2012; Marino, Sillero‐Zubiri, & Macdonald, 2006; Mbaiwa, 2011; McCallum, 2008; Nelson et al., 2010; Nogales et al., 2004; Norbury et al., 2013; Ogutu, 2002; Oliver, Brereton, & Roy, 2013; Polkinghorne, Hanger, & Timms, 2013; Potapov, Merrill, & Lewis, 2012; Pyke & Szabo, 2018; Pyšek & Richardson, 2010; Radford et al., 2018; Robbins, Loader, Timms, & Hanger, 2018; Salafsky et al., 2008; Samways et al., 2010; Smallwood, 2001; Smith, White, Stahler, Wydeven, & Hallac, 2016; Sommer et al., 2013; Sullivan et al., 2009; Svoronou & Holden, 2005; Tovar et al., 2017; Trinkel et al., 2008; Witmer, 2005; Witzenberger & Hochkirch, 2011; Xiang et al., 2011; Young et al., 2014)
Table B3 Sources for the visitor actions and outcomes
(Ardoin, Wheaton, Hunt, Schuh, & Durham, 2016; Armstrong & Weiler, 2002; Ballantyne & Packer, 2011; Ballantyne, Packer, & Hughes, 2008; Ballantyne, Packer, & Sutherland, 2011; Barnes & Eagles, 2004; Batta, 2006; Beaumont, 2001; Bottema & Bush, 2012; Briedenhann, 2011; Feck & Hamann, 2013; Hofman & Hughes, 2018; Hovardas & Poirazidis, 2006; Howard, 2000; Hughes, 2011, 2013; Hughes et al., 2011; Lee & Moscardo, 2005; Lin, 2012; Marcovaldi & Dei Marcovaldi, 1999; Mony & Heimlich, 2008; Navrátil, Knotek, Hanzelková, & Pícha, 2016; Powell & Ham, 2008; Powell, Kellert, & Ham, 2009; Roberts, Mearns, & Edwards, 2014; Sander, 2012; Scheyvens, 2009; Sgalitzer, Brownlee, Zajchowski, Bricker, & Powell, 2016; Sinha, Qureshi, Uniyal, & Sen, 2012; Skibins, Powell, & Hallo, 2013; Stamation, Croft, Shaughnessy, Waples, & Briggs, 2007; Tisdell & Wilson, 2002, 2005; Tsang, Yeung, & Cheung, 2011; Weaver, 2001, 2012; Weaver & Lawton, 2002, 2007; Wheaton et al., 2016; Zanotti & Chernela, 2008; Zeppel, 2008; Zeppel & Muloin, 2008)
245
Appendix B: Sources used for each category of the CA Matrix
Table B4 Sources for the community actions and outcomes
(W. M. Adams & Infield, 2003; Ahebwa, van der Duim, & Sandbrook, 2012a; Ahebwa et al., 2012b; Aipanjiguly, Jacobson, & Flamm, 2003; Almeyda et al., 2010; Almeyda Zambrano et al., 2010; Anand, Chandan, & Singh, 2012; Appiah-Opoku, 2011; Ballantyne et al., 2011; Batta, 2006; Blangy & Mehta, 2006; Bottema & Bush, 2012; Brightsmith, Stronza, & Holle, 2008; Brockelman & Dearden, 1990; Butcher, 2006; Campbell & Smith, 2006; Chandel & Mishra, 2016; de Boer, Stigter, & Ntumi, 2007; Dong, Ishikawa, Liu, & Hamori, 2011; Fennell, 2001; Henriques & Sadorsky, 1996; Horwich & Lyon, 2007; Hunt, Durham, Driscoll, & Honey, 2015; Jackson & Wangchuk, 2001; Justus, Colyvan, Regan, & Maguire, 2009; Krüger, 2005; Lamers, Nthiga, van der Duim, & van Wijk, 2014; Lapeyre, 2010, 2011; Lewis, Kaweche, & Mwenya, 1990; Li et al., 2006; Lin, 2012; Lowman & Schowalter, 2012; Marcovaldi & Dei Marcovaldi, 1999; Mbaiwa, 2011; Mbaiwa & Kolawole, 2013; Nelson et al., 2010; New, 2010; Ogutu, 2002; Oldekop, Holmes, Harris, & Evans, 2015; Ormsby & Mannle, 2006; Osano et al., 2013; Pretty, 2003; Romero-Brito, Buckley, & Byrne, 2016; Ross & Wall, 1999; Sakata & Prideaux, 2013; Salafsky et al., 2008; Salum, 2009; Samways et al., 2010; Schoneveld-de Lange, Meijaard, & Löhr, 2016; Sheppard et al., 2010; Sinha et al., 2012; Snyman, 2016; Stem, Lassoie, Lee, Deshler, & Schelhas, 2003; Stem, Lassoie, Lee, & Deshler, 2003; Stone & Nyaupane, 2016; Svoronou & Holden, 2005; Thoyre, 2011; Trapasso, 1994; Walter, 2009; Waylen, McGowan, Pawi Study Group, & Milner-Gulland, 2009; Zanotti & Chernela, 2008)
Table B5 Sources for the organisational/political actions and outcomes
(Balme et al., 2013; Biliouri, 1999; Brechin, Wilshusen, Fortwangler, & West, 2002; Brightsmith et al., 2008; Bruner, Gullison, & Balmford, 2004; Bruner, Gullison, Rice, & da Fonseca, 2001; Buckley, 2004, 2009, 2010, 2011, 2016; Buckley, Castley, Pegas, Mossaz, & Steven, 2012; Butts & Sukhdeo-Singh, 2010; Cardinale et al., 2012; Carlisle, 2007; Damania, 2001; Davies et al., 2012; Hansen & Schrader, 1997; Holmberg, Norman, & Arzoumanian, 2008; Hughes et al., 2011; Kolk & Levy, 2001; Krüger, 2005; Leverington, Costa, Pavese, Lisle, & Hockings, 2010; Marnewick et al., 2014; Martínez Pastur et al., 2007; Mbaiwa, 2011; McCauley et al., 2013; Morrison, Simpkins, Castley, & Buckley, 2012; Nelson et al., 2010; Okereke, 2007; Pasquini et al., 2011; Romero-Brito et al., 2016; Samways et al., 2010; Shaw, Newholm, & Dickinson, 2006; Steven, Castley, & Buckley, 2013; Sullivan et al., 2009; Sutherland, Pullin, Dolman, & Knight, 2004; Svoronou & Holden, 2005; Varty & Buchanan, 1999; Vinding, Bester, Kirkman, Chivell, & Elwen, 2015; Waylen et al., 2009; Xiang et al., 2011; Young et al., 2014; Zeppel, 2008)
246

Appendix B: Sources used for each category of the CA Matrix
Reference list for Tables B1-B5
&Beyond. (2019a). The Phinda story. &Beyond; retrieved March 2019 from: https://www.andbeyond.com/small-group-journeys/phinda-impact/the-phinda-story/.
&Beyond. (2019b). Why visit &beyond Phinda private game reserve? &Beyond; retrieved March 2019 from: https://www.andbeyond.com/advice/africa/south-africa/kwazulu-natal/phinda-private-game-reserve/why-visit-andbeyond-phinda-private-game-reserve/.
Adams, V.M. and Moon, K. (2013). Security and equity of conservation covenants: Contradictions of private protected area policies in Australia. Land Use Policy 30(1): 114-119.
Adams, W.M. and Infield, M. (2003). Who is on the gorilla’s payroll? Claims on tourist revenue from a Ugandan national park. World Development 31(1): 177-190.
Adimassu, Z., Mekonnen, K., Yirga, C. and Kessler, A. (2014). Effect of soil bunds on runoff, soil and nutrient losses, and crop yield in the central highlands of Ethiopia. Land Degradation & Development 25(6): 554-564.
Aerts, R., Nyssen, J. and Haile, M. (2009). On the difference between “exclosures” and “enclosures” in ecology and the environment. Journal of Arid Environments 73(8): 762-763.
Ahebwa, W.M., van der Duim, V.R. and Sandbrook, C.G. (2012a). Private-community partnerships: Investigating a new approach to conservation and development in Uganda. Conservation and Society 10(4): 305-317.
Ahebwa, W.M., van der Duim, V.R. and Sandbrook, C.G. (2012b). Tourism revenue sharing policy at Bwindi Impenetrable National Park, Uganda: A policy arrangements approach. Journal of Sustainable Tourism 20(3): 377-394.
Aipanjiguly, S., Jacobson, S.K. and Flamm, R. (2003). Conserving manatees: Knowledge, attitudes, and intentions of boaters in Tampa Bay, Florida. Conservation Biology 17(4): 1098-1105.
Albaladejo Montoro, J., Alvarez Rogel, J., Querejeta, J., Diaz, E. and Castillo, V. (2000). Three hydro‐seeding revegetation techniques for soil erosion control on anthropic steep slopes. Land Degradation & Development 11(4): 315-325.
Alder, J., Zeller, D., Pitcher, T. and Sumaila, R. (2002). A method for evaluating marine protected area management. Coastal Management 30(2): 121-131.
Algar, D., Angus, G.J., Brazell, R.I., Gilbert, C. and Withnell, G.B. (2010). Eradication of feral cats on Faure Island, Western Australia. Journal of the Royal Society of Western Australia 93(3): 133-140.
Allek, A., Assis, A.S., Eiras, N., Amaral, T.P., Williams, B., Butt, N., Renwick, A.R., Bennett, J.R. and Beyer, H.L. (2018). The threats endangering Australia's at-risk fauna. Biological Conservation 222: 172-179.
Allen, K.E. (2015). Trade-offs in nature tourism: Contrasting parcel-level decisions with landscape conservation planning. Ecology and Society 20(1): 21-30.
Almany, G.R. (2004). Does increased habitat complexity reduce predation and competition in coral reef fish assemblages? Oikos 106(2): 275-284.
Almeyda, A.M., Broadbent, E.N., Wyman, M.S. and Durham, W.H. (2010). Ecotourism impacts in the Nicoya Peninsula, Costa Rica. International Journal of Tourism Research 12(6): 803-819.
247

Appendix B: Sources used for each category of the CA Matrix
Almeyda Zambrano, A.M., Broadbent, E.N. and Durham, W.H. (2010). Social and environmental effects of ecotourism in the Osa Peninsula of Costa Rica: The Lapa Rios case. Journal of Ecotourism 9(1): 62-83.
Anand, A., Chandan, P. and Singh, R.B. (2012). Homestays at Korzok: Supplementing rural livelihoods and supporting green tourism in the Indian Himalayas. Mountain Research and Development 32(2): 126-136.
Andersen, A.N., Cook, G.D., Corbett, L.K., Douglas, M.M., Eager, R.W., Russell-Smith, J., Setterfield, S.A., Williams, R.J. and Woinarski, J.C.Z. (2005). Fire frequency and biodiversity conservation in Australian tropical savannas: Implications from the Kapalga fire experiment. Austral Ecology 30(2): 155-167.
Appiah-Opoku, S. (2011). Using protected areas as a tool for biodiversity conservation and ecotourism: A case study of Kakum National Park in Ghana. Society and Natural Resources 24(5): 500-510.
Ardoin, N.M., Wheaton, M., Hunt, C.A., Schuh, J.S. and Durham, W.H. (2016). Post-trip philanthropic intentions of nature-based tourists in Galapagos. Journal of Ecotourism 15(1): 21-35.
Armstrong, E.K. and Weiler, B.V. (2002). Getting the message across: An analysis of messages delivered by tour operators in protected areas. Journal of Ecotourism 1(2/3): 104-121.
Avery-Gomm, S., Borrelle, S.B. and Provencher, J.F. (2018). Linking plastic ingestion research with marine wildlife conservation. Science of the Total Environment 637-638: 1492-1495.
Baguette, M., Blanchet, S., Legrand, D., Stevens, V.M. and Turlure, C. (2013). Individual dispersal, landscape connectivity and ecological networks. Biological Reviews 88(2): 310-326.
Ballantyne, R. and Packer, J. (2011). Using tourism free-choice learning experiences to promote environmentally sustainable behaviour: The role of post-visit 'action resources'. Environmental Education Research 17(2): 201-215.
Ballantyne, R., Packer, J. and Hughes, K. (2008). Environmental awareness, interests and motives of botanic gardens visitors: Implications for interpretive practice. Tourism Management 29(3): 439-444.
Ballantyne, R., Packer, J. and Sutherland, L.A. (2011). Visitors' memories of wildlife tourism: Implications for the design of powerful interpretive experiences. Tourism Management 32(4): 770-779.
Balme, G.A., Batchelor, A., De Woronin Britz, N., Seymour, G., Grover, M., Hes, L., Macdonald, D.W. and Hunter, L.T.B. (2013). Reproductive success of female leopards Panthera pardus: The importance of top-down processes. Mammal Review 43(3): 221-237.
Barnes, M.L. and Eagles, P. (2004). Examining the relationship between ecotourists and philanthropic behaviour. Tourism Recreation Research 29(3): 35-38.
Batta, R.N. (2006). Evaluating ecotourism in mountain areas: A study of three Himalayan destinations. International Review for Environmental Strategies 6(1): 41-61.
Beaumont, N. (2001). Ecotourism and the conservation ethic: Recruiting the uninitiated or preaching to the converted? Journal of Sustainable Tourism 9(4): 317-341.
248

Appendix B: Sources used for each category of the CA Matrix
Beier, P., Majka, D.R. and Spencer, W.D. (2008). Forks in the road: Choices in procedures for designing wildland linkages. Conservation Biology 22(4): 836-851.
Beyene, A., Legesse, W., Triest, L. and Kloos, H. (2008). Urban impact on ecological integrity of nearby rivers in developing countries: The Borkena River in highland Ethiopia. Environmental Monitoring and Assessment 153(1): 461.
Biliouri, D. (1999). Environmental NGOs in Brussels: How powerful are their lobbying activities? Environmental Politics 8(2): 173-182.
Bingham, H., Fitzsimons, J.A., Redford, K.H., Mitchell, B.A., Bezaury-Creel, J. and Cumming, T.L. (2017). Privately protected areas: Advances and challenges in guidance, policy and documentation. PARKS 23.1: 13-28.
Blackburn, T.M., Cassey, P., Duncan, R.P., Evans, K.L. and Gaston, K.J. (2004). Avian extinction and mammalian introductions on oceanic islands. Science 305(5692): 1955-1958.
Blangy, S. and Mehta, H. (2006). Ecotourism and ecological restoration. Journal for Nature Conservation 14(3-4): 233-236.
Block, W.M., Franklin, A.B., Ward, J.P., Ganey, J.L. and White, G.C. (2001). Design and implementation of monitoring studies to evaluate the success of ecological restoration on wildlife. Restoration Ecology 9(3): 293-303.
Bond, W.J. and Keeley, J.E. (2005). Fire as a global ‘herbivore’: The ecology and evolution of flammable ecosystems. Trends in Ecology & Evolution 20(7): 387-394.
Borja, Á., Dauer, D.M., Elliott, M. and Simenstad, C.A. (2010). Medium- and long-term recovery of estuarine and coastal ecosystems: Patterns, rates and restoration effectiveness. Estuaries and Coasts 33(6): 1249-1260.
Borrelli, P., Robinson, D.A., Fleischer, L.R., Lugato, E., Ballabio, C., Alewell, C., Meusburger, K., Modugno, S., Schütt, B., Ferro, V., Bagarello, V., Oost, K.V., Montanarella, L. and Panagos, P. (2017). An assessment of the global impact of 21st century land use change on soil erosion. Nature Communications 8(1): 2013.
Bottema, M.J.M. and Bush, S.R. (2012). The durability of private sector-led marine conservation: A case study of two entrepreneurial marine protected areas in Indonesia. Ocean and Coastal Management 61(2012): 38-48.
Brechin, S.R., Wilshusen, P.R., Fortwangler, C.L. and West, P.C. (2002). Beyond the square wheel: Toward a more comprehensive understanding of biodiversity conservation as social and political process. Society & Natural Resources 15(1): 41-64.
Breed, M.F., Stead, M.G., Ottewell, K.M., Gardner, M.G. and Lowe, A.J. (2013). Which provenance and where? Seed sourcing strategies for revegetation in a changing environment. Conservation Genetics 14(1): 1-10.
Briedenhann, J. (2011). The potential of small tourism operators in the promotion of pro-poor tourism. Journal of Hospitality Marketing & Management 20(3-4): 484-500.
Brightsmith, D.J., Stronza, A.L. and Holle, K. (2008). Ecotourism, conservation biology, and volunteer tourism: A mutually beneficial triumvirate. Biological Conservation 141(11): 2832-2842.
Brockelman, W.Y. and Dearden, P. (1990). The role of nature trekking in conservation: A case-study in Thailand. Environmental Conservation 17(2): 141-148.
249

Appendix B: Sources used for each category of the CA Matrix
Brockway, D.G., Gatewood, R.G. and Paris, R.B. (2002). Restoring fire as an ecological process in shortgrass prairie ecosystems: Initial effects of prescribed burning during the dormant and growing seasons. Journal of Environmental Management 65(2): 135-152.
Brooks, M.L., D'Antonio, C.M., Richardson, D.M., Grace, J.B., Keeley, J.E., DiTomaso, J.M., Hobbs, R.J., Pellant, M. and Pyke, D. (2004). Effects of invasive alien plants on fire regimes. BioScience 54(7): 677-688.
Bruner, A.G., Gullison, R.E. and Balmford, A. (2004). Financial costs and shortfalls of managing and expanding protected-area systems in developing countries. BioScience 54(12): 1119-1126.
Bruner, A.G., Gullison, R.E., Rice, R.E. and da Fonseca, G.A.B. (2001). Effectiveness of parks in protecting tropical biodiversity. Science 291(5501): 125-128.
Buckley, R. (2004). Partnerships in ecotourism: Australian political frameworks. International Journal of Tourism Research 6(2): 75-83.
Buckley, R. (2009). Evaluating the net effects of ecotourism on the environment: A framework, first assessment and future research. Journal of Sustainable Tourism 17(6): 643-672.
Buckley, R. (2010). Conservation tourism. CAB International; Wallingford, UK. Buckley, R. (2011). Tourism and environment. Annual Review of Environment and Resources
36(2011): 397-416. Buckley, R. (2016). Triage approaches send adverse political signals for conservation. Frontiers
in Ecology and Evolution 4: 39. Buckley, R., Castley, J.G., Pegas, F.d.V., Mossaz, A.C. and Steven, R. (2012). A population
accounting approach to assess tourism contributions to conservation of IUCN-redlisted mammal species. PLoS ONE 7(9): e44134, https://doi.org/10.1371/journal.pone.0044134.
Burrows, N. (2008). Linking fire ecology and fire management in south-west Australian forest landscapes. Forest Ecology and Management 255(7): 2394-2406.
Butcher, J. (2006). Natural capital and the advocacy of ecotourism as sustainable development. Journal of Sustainable Tourism 14(6): 629-644.
Butts, T. and Sukhdeo-Singh, T. (2010). Sustainable tourism as a tool for conservation and protection of the Amazon rainforest in Guyana? Worldwide Hospitality and Tourism Themes 2(2): 173-185.
Campbell, L.M. and Smith, C. (2006). What makes them pay? Values of volunteer tourists working for sea turtle conservation. Environmental Management 38(1): 84-98.
Canesi, L. and Corsi, I. (2016). Effects of nanomaterials on marine invertebrates. Science of the Total Environment 565: 933-940.
Cardinale, B.J., Duffy, J.E., Gonzalez, A., Hooper, D.U., Perrings, C., Venail, P., Narwani, A., Mace, G.M., Tilman, D. and Wardle, D.A. (2012). Biodiversity loss and its impact on humanity. Nature 486(7401): 59.
Carlisle, L. (2007). Conservation and community development: The Conservation Corporation Africa model. Tourism and protected areas: Benefit beyond boundaries R. Bushell and P.F.J. Eagles. CABI; Wallingford: 244-263.
Castley, J.G., Boshoff, A.F. and Kerley, G.I.H. (2001). Compromising South Africa's natural biodiversity-inappropriate herbivore introductions. South African Journal of Science 97(9): 344-348.
250

Appendix B: Sources used for each category of the CA Matrix
Chandel, A. and Mishra, S. (2016). Ecotourism revisited: Last twenty-five years. Czech Journal of Tourism 5(2): 135-143.
Chape, S., Harrison, J., Spalding, M. and Lysenko, I. (2005). Measuring the extent and effectiveness of protected areas as an indicator for meeting global biodiversity targets. Philosophical Transactions of the Royal Society of London B: Biological Sciences 360(1454): 443-455.
Charbonnel, E., Serre, C., Ruitton, S., Harmelin, J.-G. and Jensen, A. (2002). Effects of increased habitat complexity on fish assemblages associated with large artificial reef units (French Mediterranean coast). ICES Journal of Marine Science 59(2002): 208-213.
Cousins, J.A., Sadler, J.P. and Evans, J. (2008). Exploring the role of private wildlife ranching as a conservation tool in South Africa: Stakeholder perspectives. Ecology and Society 13(2): 43-60.
Covington, W.W. and Moore, M.M. (1994). Postsettlement changes in natural fire regimes and forest structure. Journal of Sustainable Forestry 2(1-2): 153-181.
Cross, M.L., Buddle, B.M. and Aldwell, F.E. (2007). The potential of oral vaccines for disease control in wildlife species. The Veterinary Journal 174(3): 472-480.
Damania, R. (2001). When the weak win: The role of investment in environmental lobbying. Journal of Environmental Economics and Management 42(1): 1-22.
Davies, T.K., Stevens, G., Meekan, M.G., Struve, J. and Rowcliffe, J.M. (2012). Can citizen science monitor whale-shark aggregations? Investigating bias in mark-recapture modelling using identification photographs sourced from the public. Wildlife Research 39(8): 696-704.
de Boer, W.F., Stigter, J.D. and Ntumi, C.P. (2007). Optimising investments from elephant tourist revenues in the Maputo Elephant Reserve, Mozambique. Journal for Nature Conservation 15(4): 225-236.
Derhé, M.A., Murphy, H., Monteith, G. and Menéndez, R. (2016). Measuring the success of reforestation for restoring biodiversity and ecosystem functioning. Journal of Applied Ecology 53(6): 1714-1724.
Dong, Y., Ishikawa, M., Liu, X. and Hamori, S. (2011). The determinants of citizen complaints on environmental pollution: An empirical study from China. Journal of Cleaner Production 19(12): 1306-1314.
Epaphras, A.M., Gereta, E., Lejora, I.A., Ole Meing’ataki, G.E., Ng’umbi, G., Kiwango, Y., Mwangomo, E., Semanini, F., Vitalis, L., Balozi, J. and Mtahiko, M.G.G. (2008). Wildlife water utilization and importance of artificial waterholes during dry season at Ruaha National Park, Tanzania. Wetlands Ecology and Management 16(3): 183-188.
Fargallo, J.A., Blanco, G., Potti, J. and Viñuela, J. (2001). Nestbox provisioning in a rural population of Eurasian kestrels: Breeding performance, nest predation and parasitism. Bird Study 48(2): 236-244.
Feck, A.D. and Hamann, M. (2013). Effect of sea turtle rehabilitation centres in Queensland, Australia, on people's perceptions of conservation. Endangered Species Research 20(2): 153-165.
Fennell, D.A. (2001). A content analysis of ecotourism definitions. Current Issues in Tourism 4(5): 403-421.
251

Appendix B: Sources used for each category of the CA Matrix
García-Barcina, J.M., González-Oreja, J.A. and De la Sota, A. (2006). Assessing the improvement of the Bilbao Estuary water quality in response to pollution abatement measures. Water Research 40(5): 951-960.
García-Ruiz, J.M., Beguería, S., Lana-Renault, N., Nadal-Romero, E. and Cerdà, A. (2017). Ongoing and emerging questions in water erosion studies. Land Degradation & Development 28(1): 5-21.
Gaston, K.J., Jackson, S.F., Cantú-Salazar, L. and Cruz-Piñón, G. (2008). The ecological performance of protected areas. Annual Review of Ecology, Evolution, and Systematics 39(1): 93-113.
Genet, M., Kokutse, N., Stokes, A., Fourcaud, T., Cai, X., Ji, J. and Mickovski, S. (2008). Root reinforcement in plantations of Cryptomeria japonica D. Don: Effect of tree age and stand structure on slope stability. Forest Ecology and Management 256(8): 1517-1526.
Good, R. and Johnston, S. (2019). Rehabilitation and revegetation of the Kosciuszko summit area, following the removal of grazing – an historic review. Ecological Management & Restoration 20(1): 13-20.
Goossens, B., Sharma, R., Othman, N., Kun-Rodrigues, C., Sakong, R., Ancrenaz, M., Ambu, L.N., Jue, N.K., O'Neill, R.J. and Bruford, M.W. (2016). Habitat fragmentation and genetic diversity in natural populations of the Bornean elephant: Implications for conservation. Biological Conservation 196(2016): 80-92.
Gosper, C.R. and Vivian-Smith, G. (2006). Selecting replacements for invasive plants to support frugivores in highly modified sites: A case study focusing on Lantana camara. Ecological Management & Restoration 7(3): 197-203.
Grismer, M.E. and Hogan, M.P. (2005). Simulated rainfall evaluation of revegetation/mulch erosion control in the Lake Tahoe Basin—3: Soil treatment effects. Land Degradation & Development 16(5): 489-501.
Hansen, U. and Schrader, U. (1997). A modern model of consumption for a sustainable society. Journal of Consumer Policy 20(4): 443-468.
Hardy, M.J., Fitzsimons, J.A., Bekessy, S.A. and Gordon, A. (2017). Exploring the permanence of conservation covenants. Conservation Letters 10(2): 221-230.
Hayward, M.W., Kerley, G.I.H., Adendorff, J., Moolman, L.C., O'Brien, J., Sholto-Douglas, A., Bissett, C., Bean, P., Fogarty, A., Howarth, D. and Slater, R. (2007). The reintroduction of large carnivores to the Eastern Cape, South Africa: An assessment. Oryx 41(2): 205-214.
Hedrick, P.W. and Fredrickson, R.J. (2008). Captive breeding and the reintroduction of Mexican and red wolves. Molecular Ecology 17(1): 344-350.
Henriques, I. and Sadorsky, P. (1996). The determinants of an environmentally responsive firm: An empirical approach. Journal of Environmental Economics and Management 30(3): 381-395.
Hermoso, V. and Clavero, M. (2013). Revisiting ecological integrity 30 years later: Non-native species and the misdiagnosis of freshwater ecosystem health. Fish and Fisheries 14(3): 416-423.
Hess, S.C. (2016). A Tour de Force by Hawaii’s invasive mammals: Establishment, takeover, and ecosystem restoration through eradication. Mammal Study 41(2): 47-60.
252
Appendix B: Sources used for each category of the CA Matrix
Hoban, S.M., Hauffe, H.C., Pérez-Espona, S., Arntzen, J.W., Bertorelle, G., Bryja, J., Frith, K., Gaggiotti, O.E., Galbusera, P. and Godoy, J.A. (2013). Bringing genetic diversity to the forefront of conservation policy and management. Conservation Genetics Resources 5(2): 593-598.
Hofman, K. and Hughes, K. (2018). Protecting the Great Barrier Reef: Analysing the impact of a conservation documentary and post-viewing strategies on long-term conservation behaviour. Environmental Education Research 24(4): 521-536.
Holmberg, J., Norman, B. and Arzoumanian, Z. (2008). Robust, comparable population metrics through collaborative photo-monitoring of whale sharks Rhincodon typus. Ecological Applications 18(1): 222-233.
Horwich, R.H. and Lyon, J. (2007). Community conservation: Practitioners’ answer to critics. Oryx 41(3): 376-385.
Hovardas, T. and Poirazidis, K. (2006). Evaluation of the environmentalist dimension of ecotourism at the Dadia Forest Reserve (Greece). Environmental Management 38(5): 810-822.
Howard, J. (2000). Research in progress: Does environmental interpretation influence behaviour through knowledge or affect? Australian Journal of Environmental Education 15(1999): 153-156.
Hughes, K. (2011). Designing post-visit action resources for families visiting wildlife tourism sites. Visitor Studies 14(1): 66-83.
Hughes, K. (2013). Measuring the impact of viewing wildlife: Do positive intentions equate to long-term changes in conservation behaviour? Journal of Sustainable Tourism 21(1): 42-59.
Hughes, K., Packer, J. and Ballantyne, R. (2011). Using post-visit action resources to support family conservation learning following a wildlife tourism experience. Environmental Education Research 17(3): 307-328.
Hunt, C.A., Durham, W.H., Driscoll, L. and Honey, M. (2015). Can ecotourism deliver real economic, social, and environmental benefits? A study of the Osa Peninsula, Costa Rica. Journal of Sustainable Tourism 23(3): 339-357.
Jackson, R. and Wangchuk, R. (2001). Linking snow leopard conservation and people-wildlife conflict resolution: Grassroots measures to protect the endangered snow leopard from herder retribution. Endangered Species Update 18(4): 138-141.
Jalonen, R., Valette, M., Boshier, D., Duminil, J. and Thomas, E. (2018). Forest and landscape restoration severely constrained by a lack of attention to the quantity and quality of tree seed: Insights from a global survey. Conservation Letters 11(4): e12424, DOI: 10.1111/conl.12424.
Justus, J., Colyvan, M., Regan, H. and Maguire, L. (2009). Buying into conservation: Intrinsic versus instrumental value. Trends in Ecology & Evolution 24(4): 187-191.
Kagabo, D.M., Stroosnijder, L., Visser, S.M. and Moore, D. (2013). Soil erosion, soil fertility and crop yield on slow-forming terraces in the highlands of Buberuka, Rwanda. Soil and Tillage Research 128: 23-29.
Keppel, G., Mokany, K., Wardell-Johnson, G.W., Phillips, B.L., Welbergen, J.A. and Reside, A.E. (2015). The capacity of refugia for conservation planning under climate change. Frontiers in Ecology and the Environment 13(2): 106-112.
253

Appendix B: Sources used for each category of the CA Matrix
Kettenring, K.M., Mercer, K.L., Reinhardt Adams, C. and Hines, J. (2014). Application of genetic diversity–ecosystem function research to ecological restoration. Journal of Applied Ecology 51(2): 339-348.
Kingsford, R.T., Watson, J.E.M., Lundquist, C.J., Venter, O., Hughes, L., Johnston, E.L., Atherton, J., Gawel, M., Keith, D.A., Mackey, B.G., Morley, C., Possingham, H.P., Raynor, B., Recher, H.F. and Wilson, K.A. (2009). Major conservation policy issues for biodiversity in Oceania. Conservation Biology 23(4): 834-840.
Kohli, R.K., Batish, D.R., Singh, H.P. and Dogra, K.S. (2006). Status, invasiveness and environmental threats of three tropical American invasive weeds (Parthenium hysterophorus l., Ageratum conyzoides l., Lantana camara l.) in India. Biological Invasions 8(7): 1501-1510.
Kolk, A. and Levy, D. (2001). Winds of change. European Management Journal 19(5): 501-509.
Kramer, A.T. and Havens, K. (2009). Plant conservation genetics in a changing world. Trends in Plant Science 14(11): 599-607.
Krüger, O. (2005). The role of ecotourism in conservation: Panacea or Pandora’s box? Biodiversity and Conservation 14(3): 579-600.
Lacy, R.C. (1997). Importance of genetic variation to the viability of mammalian populations. Journal of Mammalogy 78(2): 320-335.
Lacy, R.C. (2013). Achieving true sustainability of zoo populations. Zoo Biology 32(1): 19-26.
Laikre, L., Schwartz, M.K., Waples, R.S. and Ryman, N. (2010). Compromising genetic diversity in the wild: Unmonitored large-scale release of plants and animals. Trends in Ecology & Evolution 25(9): 520-529.
Lamers, M., Nthiga, R., van der Duim, V.R. and van Wijk, J. (2014). Tourism-conservation enterprises as a land-use strategy in Kenya. Tourism Geographies 16(3): 474-489.
Lapeyre, R. (2010). Community-based tourism as a sustainable solution to maximise impacts locally? The Tsiseb Conservancy case, Namibia. Development Southern Africa 27(5): 757-772.
Lapeyre, R. (2011). The grootberg lodge partnership in Namibia: Towards poverty alleviation and empowerment for long-term sustainability? Current Issues in Tourism 14(3): 221-234.
Lee, W.H. and Moscardo, G. (2005). Understanding the impact of ecotourism resort experiences on tourists' environmental attitudes and behavioural intentions. Journal of Sustainable Tourism 13(6): 546-565.
Leverington, F., Costa, K.L., Pavese, H., Lisle, A. and Hockings, M. (2010). A global analysis of protected area management effectiveness. Environmental Management 46(5): 685-698.
Lewis, D., Kaweche, G.B. and Mwenya, A. (1990). Wildlife conservation outside protected areas-lessons from an experiment in Zambia. Conservation Biology 4(2): 171-180.
Li, W., Zhang, Q., Liu, C. and Xue, Q. (2006). Tourism's impacts on natural resources: A positive case from China. Environmental Management 38(4): 572-579.
Libois, E., Gimenez, O., Oro, D., Mínguez, E., Pradel, R. and Sanz-Aguilar, A. (2012). Nest boxes: A successful management tool for the conservation of an endangered seabird. Biological Conservation 155: 39-43.
254

Appendix B: Sources used for each category of the CA Matrix
Lin, T.T.C. (2012). Cross-platform framing and cross-cultural adaptation: Examining elephant conservation in Thailand. Environmental Communication 6(2): 193-211.
Lindenmayer, D.B., Hulvey, K.B., Hobbs, R.J., Colyvan, M., Felton, A., Possingham, H., Steffen, W., Wilson, K., Youngentob, K. and Gibbons, P. (2012). Avoiding bio-perversity from carbon sequestration solutions. Conservation Letters 5(1): 28-36.
Lindenmayer, D.B., Steffen, W., Burbidge, A.A., Hughes, L., Kitching, R.L., Musgrave, W., Stafford Smith, M. and Werner, P.A. (2010). Conservation strategies in response to rapid climate change: Australia as a case study. Biological Conservation 143(7): 1587-1593.
Lowman, M.D. and Schowalter, T.D. (2012). Plant science in forest canopies – the first 30 years of advances and challenges (1980–2010). New Phytologist 194(1): 12-27.
Mackey, B.G., Watson, J.E.M., Hope, G. and Gilmore, S. (2008). Climate change, biodiversity conservation, and the role of protected areas: An Australian perspective. Biodiversity 9(3-4): 11-18.
Marcovaldi, M.A. and Dei Marcovaldi, G.G. (1999). Marine turtles of Brazil: The history and structure of Projeto Tamar-Ibama. Biological Conservation 91(1): 35-41.
Marino, J., Sillero‐Zubiri, C. and Macdonald, D.W. (2006). Trends, dynamics and resilience of an Ethiopian wolf population. Animal Conservation 9(1): 49-58.
Marnewick, K., Ferreira, S.M., Grange, S., Watermeyer, J., Maputla, N. and Davies-Mostert, H.T. (2014). Evaluating the status of and African wild dogs Lycaon pictus and cheetahs Acinonyx jubatus through tourist-based photographic surveys in the Kruger National Park. PLoS ONE 9(1): e86265, DOI: 10.1371/journal.pone.0086265.
Martínez Pastur, G.J., Lencinas, M.V., Peri, P., Moretto, A., Cellini, J.M., Mormeneo, I. and Vukasovic, R. (2007). Harvesting adaptation to biodiversity conservation in sawmill industry: Technology innovation and monitoring program. Journal of Technology Management & Innovation 2(3): 58-70.
Mbaiwa, J.E. (2011). The effects of tourism development on the sustainable utilisation of natural resources in the Okavango Delta, Botswana. Current Issues in Tourism 14(3): 251-273.
Mbaiwa, J.E. and Kolawole, O.D. (2013). Tourism and biodiversity conservation: The case of community-based natural resource management in southern Africa. CAB Reviews 8(010): 1-10.
McCallum, H. (2008). Tasmanian devil facial tumour disease: Lessons for conservation biology. Trends in Ecology & Evolution 23(11): 631-637.
McCauley, D.J., Power, E.A., Bird, D.W., McInturff, A., Dunbar, R.B., Durham, W.H., Micheli, F. and Young, H.S. (2013). Conservation at the edges of the world. Biological Conservation 165(2013): 139-145.
Miteva, D.A., Pattanayak, S.K. and Ferraro, P.J. (2012). Evaluation of biodiversity policy instruments: What works and what doesn’t? Oxford Review of Economic Policy 28(1): 69-92.
Moncrieff, D. (2000). Managing tourism and recreation on wheatbelt granite outcrops. Journal of the Royal Society of Western Australia 83: 187-196.
255
Appendix B: Sources used for each category of the CA Matrix
Mony, P.R.S. and Heimlich, J.E. (2008). Talking to visitors about conservation: Exploring message communication through docent-visitor interactions at zoos. Visitor Studies 11(2): 151-162.
Morelli, T.L., Daly, C., Dobrowski, S.Z., Dulen, D.M., Ebersole, J.L., Jackson, S.T., Lundquist, J.D., Millar, C.I., Maher, S.P., Monahan, W.B., Nydick, K.R., Redmond, K.T., Sawyer, S.C., Stock, S. and Beissinger, S.R. (2016). Managing climate change refugia for climate adaptation. PLoS ONE 11(8): e0159909, DOI: 10.1371/journal.pone.0159909.
Morrison, C., Simpkins, C., Castley, J.G. and Buckley, R. (2012). Tourism and the conservation of critically endangered frogs. PLoS ONE 7(9): e43757, https://doi.org/10.1371/journal.pone.0043757.
Mossaz, A., Buckley, R.C. and Castley, J.G. (2015). Ecotourism contributions to conservation of African big cats. Journal for Nature Conservation 28(2015): 112-118.
Navrátil, J., Knotek, J., Hanzelková, E. and Pícha, K. (2016). Tourists' knowledge of a visited environment and the immediate influence on this knowledge of completing an interpretive nature trail: Beskydy Protected Landscape Area, West Carpathians. GeoJournal of Tourism and Geosites 18(2): 145-151.
Nekuda Malik, J.A. (2019). US Academies call for research agenda on negative emissions technologies and reliable sequestration. MRS Bulletin 44(1): 13-15.
Nelson, F., Foley, C., Foley, L.S., Leposo, A., Loure, E., Peterson, D., Peterson, M., Peterson, T., Sachedina, H. and Williams, A. (2010). Payments for ecosystem services as a framework for community-based conservation in northern Tanzania. Conservation Biology 24(1): 78-85.
New, T.R. (2010). Butterfly conservation in Australia: The importance of community participation. Journal of Insect Conservation 14(3): 305-311.
Newmark, W.D., Jenkins, C.N., Pimm, S.L., McNeally, P.B. and Halley, J.M. (2017). Targeted habitat restoration can reduce extinction rates in fragmented forests. Proceedings of the National Academy of Sciences 114(36): 9635.
Nogales, M., MartÍN, A., Tershy, B.R., Donlan, C.J., Veitch, D., Puerta, N., Wood, B. and Alonso, J. (2004). A review of feral cat eradication on islands. Conservation Biology 18(2): 310-319.
Norbury, G., Byrom, A., Pech, R., Smith, J., Clarke, D., Anderson, D. and Forrester, G. (2013). Invasive mammals and habitat modification interact to generate unforeseen outcomes for indigenous fauna. Ecological Applications 23(7): 1707-1721.
Ogutu, Z.A. (2002). The impact of ecotourism on livelihood and natural resource management in Eselenkei, Amboseli Ecosystem, Kenya. Land Degradation & Development 13(3): 251-256.
Okereke, C. (2007). An exploration of motivations, drivers and barriers to carbon management. European Management Journal 25(6): 475-486.
Oldekop, J.A., Holmes, G., Harris, W.E. and Evans, K.L. (2015). A global assessment of the social and conservation outcomes of protected areas. Conservation Biology 30(1): 133-141.
Oliver, T.H., Brereton, T. and Roy, D.B. (2013). Population resilience to an extreme drought is influenced by habitat area and fragmentation in the local landscape. Ecography 36(5): 579-586.
256

Appendix B: Sources used for each category of the CA Matrix
Ormsby, A. and Mannle, K. (2006). Ecotourism benefits and the role of local guides at Masoala National Park, Madagascar. Journal of Sustainable Tourism 14(3): 271-287.
Osano, P.M., Said, M.Y., de Leeuw, J., Ndiwa, N., Kaelo, D., Schomers, S., Birner, R. and Ogutu, J.O. (2013). Why keep lions instead of livestock? Assessing wildlife tourism-based payment for ecosystem services involving herders in the Maasai Mara, Kenya. Natural Resources Forum 37(4): 242-256.
Parrish, J.D., Braun, D.P. and Unnasch, R.S. (2003). Are we conserving what we say we are? Measuring ecological integrity within protected areas. BioScience 53(9): 851-860.
Pasquini, L., Fitzsimons, J.A., Cowell, S., Brandon, K. and Wescott, G. (2011). The establishment of large private nature reserves by conservation NGOs: Key factors for successful implementation. Oryx 45(3): 373-380.
Pegas, F.d.V. and Castley, J.G. (2014). Ecotourism as a conservation tool and its adoption by private protected areas in Brazil. Journal of Sustainable Tourism 22(4): 604-625.
Polkinghorne, A., Hanger, J. and Timms, P. (2013). Recent advances in understanding the biology, epidemiology and control of chlamydial infections in koalas. Veterinary Microbiology 165(3–4): 214-223.
Potapov, A., Merrill, E. and Lewis, M.A. (2012). Wildlife disease elimination and density dependence. Proceedings of the Royal Society B: Biological Sciences 279(1741): 3139-3145.
Powell, R.B. and Ham, S.H. (2008). Can ecotourism interpretation really lead to pro-conservation knowledge, attitudes and behaviour? Evidence from the Galapagos Islands. Journal of Sustainable Tourism 16(4): 467-489.
Powell, R.B., Kellert, S.R. and Ham, S.H. (2009). Interactional theory and the sustainable nature-based tourism experience. Society & Natural Resources 22(8): 761-776.
Pretty, J. (2003). Social capital and the collective management of resources. Science 302(5652): 1912-1914.
Pyke, G.H. and Szabo, J.K. (2018). Conservation and the 4 Rs, which are rescue, rehabilitation, release, and research. Conservation Biology 32(1): 50-59.
Pyšek, P. and Richardson, D.M. (2010). Invasive species, environmental change and management, and health. Annual Review of Environment and Resources 35(2010): 25-55.
Radford, J.Q., Woinarski, J.C., Legge, S., Baseler, M., Bentley, J., Burbidge, A.A., Bode, M., Copley, P., Dexter, N. and Dickman, C.R. (2018). Degrees of population-level susceptibility of Australian terrestrial non-volant mammal species to predation by the introduced red fox (Vulpes vulpes) and feral cat (Felis catus). Wildlife Research 45(7): 645-657.
Ran, L., Lu, X., Fang, N. and Yang, X. (2018). Effective soil erosion control represents a significant net carbon sequestration. Scientific Reports 8(1): 12018.
Reed, D.H. and Frankham, R. (2003). Correlation between fitness and genetic diversity. Conservation Biology 17(1): 230-237.
Rice, P.M. and Toney, J.C. (1998). Exotic weed control treatments for conservation of fescue grassland in Montana. Biological Conservation 85(1–2): 83-95, 1998/8//.
Robbins, A., Loader, J., Timms, P. and Hanger, J. (2018). Optimising the short and long-term clinical outcomes for koalas (Phascolarctos cinereus) during treatment for chlamydial
257

Appendix B: Sources used for each category of the CA Matrix
infection and disease. PLoS ONE 13(12): e0209679, DOI: 10.1371/journal.pone.0209679.
Roberts, M., Mearns, K. and Edwards, V. (2014). Evaluating the effectiveness of guided versus non-guided interpretation in the Kruger National Park, South Africa. Koedoe 56(2): 1-8.
Romanin, L.M., Prior, L.D., Williamson, G.J. and Bowman, D.M.J.S. (2015). Trajectory of change in land cover and carbon stocks following European settlement in Tasmania, Australia. Anthropocene 9: 33-40.
Romero-Brito, T.P., Buckley, R.C. and Byrne, J. (2016). NGO partnerships in using ecotourism for conservation: Systematic review and meta-analysis. PLoS ONE 11(11): 1-19.
Ross, S. and Wall, G. (1999). Ecotourism: Towards congruence between theory and practice. Tourism Management 20(1): 123-132.
Sakata, H. and Prideaux, B. (2013). An alternative approach to community-based ecotourism: A bottom-up locally initiated non-monetised project in Papua New Guinea. Journal of Sustainable Tourism 21(6): 880-899.
Salafsky, N., Salzer, D., Stattersfield, A.J., Hilton-Taylor, C., Neugarten, R., Butchart, S.H.M., Collen, B.E.N., Cox, N., Master, L.L., O'Connor, S. and Wilkie, D. (2008). A standard lexicon for biodiversity conservation: Unified classifications of threats and actions. Conservation Biology 22(4): 897-911.
Salum, L.A. (2009). Ecotourism and biodiversity conservation in Jozani-Chwaka Bay National Park, Zanzibar. African Journal of Ecology 47(2009): 166-170.
Samways, M.J., Hitchins, P.M., Bourquin, O. and Henwood, J. (2010). Restoration of a tropical island: Cousine Island, Seychelles. Biodiversity and Conservation 19(2): 425-434.
Sanchez, D.L., Amador, G., Funk, J. and Mach, K.J. (2018). Federal research, development, and demonstration priorities for carbon dioxide removal in the United States. Environmental Research Letters 13(1): 015005, DOI: 10.1088/1748-9326/aaa08f.
Sander, B. (2012). The importance of education in ecotourism ventures: Lessons from Rara Avis Ecolodge, Costa Rica. International Journal of Sustainable Society 4(4): 389-404.
Santos Junior, P.C.A., Marques, F.C., Lima, M.R. and dos Anjos, L. (2016). The importance of restoration areas to conserve bird species in a highly fragmented Atlantic Forest landscape. Natureza & Conservação 14(1): 1-7.
Scheyvens, R. (2009). Pro-poor tourism: Is there value beyond the rhetoric? Tourism Recreation Research 34(2): 191-196.
Schoneveld-de Lange, N., Meijaard, E. and Löhr, A. (2016). South to south learning in great ape conservation. American Journal of Primatology 78(6): 669-678.
Sgalitzer, H.A., Brownlee, M.T.J., Zajchowski, C., Bricker, K.S. and Powell, R.B. (2016). Modelling travellers philanthropy: Tourists motivations to donate at Sweetwater Chimpanzee Sanctuary. Journal of Ecotourism 15(1): 1-20.
Shahidul Islam, M. and Tanaka, M. (2004). Impacts of pollution on coastal and marine ecosystems including coastal and marine fisheries and approach for management: A review and synthesis. Marine Pollution Bulletin 48(7): 624-649.
Shaw, D., Newholm, T. and Dickinson, R. (2006). Consumption as voting: An exploration of consumer empowerment. European Journal of Marketing 40(9/10): 1049-1067.
Sheppard, D.J., Moehrenschlager, A., McPherson, J.M. and Mason, J.J. (2010). Ten years of adaptive community-governed conservation: Evaluating biodiversity protection and
258

Appendix B: Sources used for each category of the CA Matrix
poverty alleviation in a West African hippopotamus reserve. Environmental Conservation 37(3): 270-282.
Silver, W.L., Kueppers, L.M., Lugo, A.E., Ostertag, R. and Matzek, V. (2004). Carbon sequestration and plant community dynamics following reforestation of tropical pasture. Ecological Applications 14(4): 1115-1127, 2015/05/18.
Silver, W.L., Ostertag, R. and Lugo, A.E. (2000). The potential for carbon sequestration through reforestation of abandoned tropical agricultural and pasture lands. Restoration Ecology 8(4): 394-407.
Sinha, B.C., Qureshi, Q., Uniyal, V.K. and Sen, S. (2012). Economics of wildlife tourism-contribution to livelihoods of communities around Kanha Tiger Reserve, India. Journal of Ecotourism 11(3): 207-218.
Skibins, J.C., Powell, R.B. and Hallo, J.C. (2013). Charisma and conservation: Charismatic megafauna’s influence on safari and zoo tourists’ pro-conservation behaviors. Biodiversity and Conservation 22(4): 959-982.
Smallwood, K.S. (2001). Linking habitat restoration to meaningful units of animal demography. Restoration Ecology 9(3): 253-261.
Smith, D.W., White, P.J., Stahler, D.R., Wydeven, A. and Hallac, D.E. (2016). Managing wolves in the Yellowstone area: Balancing goals across jurisdictional boundaries. Wildlife Society Bulletin 40(3): 436-445.
Snyman, S. (2016). The role of private sector ecotourism in local socio-economic development in southern Africa. Journal of Ecotourism 16(3): 247-268.
Sommer, S., McDevitt, A.D. and Balkenhol, N. (2013). Landscape genetic approaches in conservation biology and management. Conservation Genetics 14(2): 249-251.
Stamation, K.A., Croft, D.B., Shaughnessy, P.D., Waples, K.A. and Briggs, S.V. (2007). Educational and conservation value of whale watching. Tourism in Marine Environments 4(1): 41-55.
Stavrakas, V., Spyridaki, N.-A. and Flamos, A. (2018). Striving towards the deployment of bio-energy with carbon capture and storage (BECCS): A review of research priorities and assessment needs. Sustainability 10(7): 2206.
Stem, C.J., Lassoie, J.P., Lee, D.R., Deshler, D.D. and Schelhas, J.W. (2003a). Community participation in ecotourism benefits: The link to conservation practices and perspectives. Society and Natural Resources 16(5): 387-413.
Stem, C.J., Lassoie, J.P., Lee, D.R. and Deshler, D.J. (2003b). How 'eco' is ecotourism? A comparative case study of ecotourism in Costa Rica. Journal of Sustainable Tourism 11(4): 322-347.
Steven, R., Castley, J.G. and Buckley, R. (2013). Tourism revenue as a conservation tool for threatened birds in protected areas. PLoS ONE 8(5): e62598, https://doi.org/10.1371/journal.pone.0062598.
Stone, M.T. and Nyaupane, G.P. (2016). Protected areas, tourism and community livelihoods linkages: A comprehensive analysis approach. Journal of Sustainable Tourism 24(5): 673-693.
Sullivan, B.L., Wood, C.L., Iliff, M.J., Bonney, R.E., Fink, D. and Kelling, S. (2009). Ebird: A citizen-based bird observation network in the biological sciences. Biological Conservation 142(10): 2282-2292.
259

Appendix B: Sources used for each category of the CA Matrix
Sutherland, W.J., Pullin, A.S., Dolman, P.M. and Knight, T.M. (2004). The need for evidence-based conservation. Trends in Ecology & Evolution 19(6): 305-308.
Svoronou, E. and Holden, A. (2005). Ecotourism as a tool for nature conservation: The role of WWF Greece in the Dadia-Lefkimi-Soufli Forest Reserve in Greece. Journal of Sustainable Tourism 13(5): 456-467.
Taylor, A.H. (2000). Fire regimes and forest changes in mid and upper montane forests of the southern Cascades, Lassen Volcanic National Park, California, U.S.A. Journal of Biogeography 27(1): 87-104.
Theobald, D.M. (2013). A general model to quantify ecological integrity for landscape assessments and US application. Landscape Ecology 28(10): 1859-1874.
Thoyre, A. (2011). Social capital as a facilitator of pro-environmental actions in the USA: A preliminary examination of mechanisms. Local Environment 16(1): 37-49.
Tisdell, C. and Wilson, C. (2002). Ecotourism for the survival of sea turtles and other wildlife. Biodiversity and Conservation 11(9): 1521-1538.
Tisdell, C. and Wilson, C. (2005). Perceived impacts of ecotourism on environmental learning and conservation: Turtle watching as a case study. Environment, Development and Sustainability 7(3): 291-302.
Tovar, C., Pye, R.J., Kreiss, A., Cheng, Y., Brown, G.K., Darby, J., Malley, R.C., Siddle, H.V.T., Skjødt, K., Kaufman, J., Silva, A., Baz Morelli, A., Papenfuss, A.T., Corcoran, L.M., Murphy, J.M., Pearse, M.J., Belov, K., Lyons, A.B. and Woods, G.M. (2017). Regression of devil facial tumour disease following immunotherapy in immunised Tasmanian devils. Scientific Reports 7: 43827.
Trapasso, L.M. (1994). Indigenous attitudes, ecotourism, and mennonites: Recent examples in rainforest destruction/preservation. GeoJournal 33(4): 449-452.
Trinkel, M., Ferguson, N., Reid, A., Reid, C., Somers, M., Turelli, L., Graf, J., Szykman, M., Cooper, D. and Haverman, P. (2008). Translocating lions into an inbred lion population in the Hluhluwe‐iMfolozi Park, South Africa. Animal Conservation 11(2): 138-143.
Tsang, N.K.F., Yeung, S. and Cheung, C. (2011). A critical investigation of the use and effectiveness of interpretive services. Asia Pacific Journal of Tourism Research 16(2): 123-137.
Varty, S. and Buchanan, M. (1999). The return: The story of Phinda Game Reserve. Londolozi Publishers; Rivonia.
Vesk, P.A., Nolan, R., Thomson, J.R., Dorrough, J.W. and Nally, R.M. (2008). Time lags in provision of habitat resources through revegetation. Biological Conservation 141(1): 174-186.
Vinding, K., Bester, M., Kirkman, S.P., Chivell, W. and Elwen, S.H. (2015). The use of data from a platform of opportunity (whale watching) to study coastal cetaceans on the southwest coast of South Africa. Tourism in Marine Environments 11(1): 33-54.
Walter, P. (2009). Local knowledge and adult learning in environmental adult education: Community-based ecotourism in southern Thailand. International Journal of Lifelong Education 28(4): 513-532.
Wardle, C., Buckley, R., Shakeela, A. and Castley, J.G. (2018). Ecotourism’s contributions to conservation: Analysing patterns in published studies. Journal of Ecotourism, 10.1080/14724049.2018.1424173.
260

Appendix B: Sources used for each category of the CA Matrix
Waylen, K.A., McGowan, P.J.K., Pawi Study Group and Milner-Gulland, E.J. (2009). Ecotourism positively affects awareness and attitudes but not conservation behaviours: A case study at Grande Riviere, Trinidad. Oryx 43(3): 343-351.
Weaver, D.B. (2001). Ecotourism as mass tourism: Contradiction or reality? The Cornell Hotel and Restaurant Administration Quarterly 42(2): 104-112.
Weaver, D.B. (2012). Protected area visitor willingness to participate in site enhancement activities. Journal of Travel Research 52(3): 377-391.
Weaver, D.B. and Lawton, L.J. (2002). Overnight ecotourist market segmentation in the Gold Coast hinterland of Australia. Journal of Travel Research 40(3): 270-280.
Weaver, D.B. and Lawton, L.J. (2007). Twenty years on: The state of contemporary ecotourism research. Tourism Management 28(5): 1168-1179.
Wheaton, M., Ardoin, N.M., Hunt, C., Schuh, J.S., Kresse, M., Menke, C. and Durham, W. (2016). Using web and mobile technology to motivate pro-environmental action after a nature-based tourism experience. Journal of Sustainable Tourism 24(4): 594-615.
Witmer, G.W. (2005). Wildlife population monitoring: Some practical considerations. Wildlife Research 32(3): 259-263.
Witzenberger, K.A. and Hochkirch, A. (2011). Ex situ conservation genetics: A review of molecular studies on the genetic consequences of captive breeding programmes for endangered animal species. Biodiversity and Conservation 20(9): 1843-1861.
Xiang, Z., Yu, Y., Yang, M., Yang, J., Niao, M. and Li, M. (2011). Does flagship species tourism benefit conservation? A case study of the golden snub-nosed monkey in Shennongjia National Nature Reserve. Chinese Science Bulletin 56(24): 2553-2558.
Xiong, M., Sun, R. and Chen, L. (2018). Effects of soil conservation techniques on water erosion control: A global analysis. Science of the Total Environment 645: 753-760.
Young, R.P., Hudson, M.A., Terry, A.M.R., Jones, C.G., Lewis, R.E., Tatayah, V., Zuël, N. and Butchart, S.H.M. (2014). Accounting for conservation: Using the IUCN Red List index to evaluate the impact of a conservation organization. Biological Conservation 180(2014): 84-96.
Zanotti, L. and Chernela, J. (2008). Conflicting cultures of nature: Ecotourism, education and the Kayapo of the Brazilian Amazon. Tourism Geographies 10(4): 495-521.
Zeppel, H. (2008). Education and conservation benefits of marine wildlife tours: Developing free-choice learning experiences. Journal of Environmental Education 39(3): 3-18.
Zeppel, H. and Muloin, S. (2008). Conservation benefits of interpretation on marine wildlife tours. Human Dimensions of Wildlife 13(4): 280-294.
261

Appendix C: Amalgamation of site data for ecological Conservation Items
This appendix provides a summary of the relevant aggregate information collected for each of
the ecological Conservation Items across the 86 ecotourism enterprises. These summaries are
condensed from 176 pages of text extracts. All percentages refer to that of the total number of
sites (n = 86) unless otherwise specified.
C1 Biophysical landscape actions
C1.1 Establishment of a protected area The active establishment of a protected area was undertaken by 54 sites (63%). These varied
from 1ha to 70,000ha and covered a total of 241,750ha (Table C1.1). Sites without formal
protection arrangements covered an additional 21,215ha. Furthermore, there were 35 sites that
shared a border with a public protected area, effectively extending the public protected area
network by an additional 65,300ha, 98% of which is under legally binding, in-perpetuity
conservation agreements. However, a single property accounts for 83% of this total. Of the 32
sites that did not have formal protection arrangements, 60% were less than 10ha compared with
31% of the sites with formal protection.
Table C1.1 Number and size of sites within each protection level category
Type PR1
Level Details
#
sites
Total
area (ha)
Formal PA
1 Legally binding in-perpetuity conservation covenant 25 151,894
2 (a) Exact nature of covenant could not be determined; however, sites gave additional details such as “the whole property is managed for nature conservation”.
12 88,128
(b) Exact nature of protection arrangement could not be determined, and sites did not provide any other information on protection measures.
17 1,728
No formal PA
3 (a) Conservation commitment e.g. property registered with a non-legally binding mechanism such as Land for Wildlife.
12 4,597
(b) No information was provided about any protection measures.
20 16,618
1PR Level = Protection level assigned to each site based on the details provided. Where properties had multiple conservation agreements, the more legally binding agreement was used to assign the protection level.
262

Appendix C: Amalgamation of site data for ecological Conservation Items
C1.1.1 Motivation for protection Motivations for establishing formal protected areas included: to provide formal protection for
the land against logging or mining; to protect a specific species; to ensure that these protections
remained into the future; to provide a better framework for rehabilitating degraded land; to link
with other protected areas and form corridors; and to establish catchment linkages. Several
studies mentioned their strong commitment to conservation, but only Site 39 linked this with
advertising and promotion opportunities. Site 5 stated that part of their motivation came from an
Australian study that found private reserves were key to battling climate change effects. In some
instances, private protection was attained because government protection was unavailable due
to, for example, a lack of funds to purchase the land or lack of government willpower.
When relationships with governments were mentioned it was usually in a positive way, often as
a partnership or as a participant in a government program. However, Site 2 had difficulties with
the State Government in the 1970s after the government “withdrew [their] official Sanctuary
and Reserve status for no apparent reason”. It is difficult to determine how this situation
unfolded; however, it does not appear to be linked to poor stewardship and was likely politically
motivated. The enterprise continued their conservation programs, invested substantially in
protection efforts, and lobbied for increased protection measures. It took nearly ten years for this
site to again obtain legal protections and another 15 years to achieve their Sanctuary Status
again.
C1.1.2 Protected species and communities Sites with protection arrangements covered a variety of habitats and areas of significance
including a Biosphere Reserve (Site 23), part of the East Asian-Australasian Flyway (Site 24), a
biodiversity hotspot (Site 15), and Ramsar listed wetlands (Site 33). There were various
additional mentions of habitat that is endangered, of concern, or vulnerable. For example, Site
23 covers over 50,000ha and forms “part of the largest block of intact mallee left within
Australia”, and is one of just five areas on the national Register of Critical Habitat under the
EPBC Act 1999. Many sites also reported the presence of old growth or virgin forest, with some
properties containing trees that were several hundred years old. This provides important habitat
for wildlife through, for example, an increased number of nesting hollows.
Many sites had conducted fauna and flora surveys and were therefore aware of the threatened
species on their properties (Table 5.9, Chapter 5)68. Few sites provided quantification of
threatened or native species; however, Site 11 reported that 20% of the vegetation on-site was
made up of locally endangered species, the highest reported proportion. Furthermore, several
68 Due to its length, this table is not repeated here.
263

Appendix C: Amalgamation of site data for ecological Conservation Items
sites reported vegetation counts of over 100 native species, and Sites 30 and 36 both reported
over 150 native species, although the species lists were not provided and could not be checked
for threatened species. Additionally, Site 23 reports protecting breeding populations of 18
threatened species of birds and “many other nationally threatened species”, claiming that “there
are few areas of the world that support such a concentration of threatened species”.
C1.2 Effort to reduce non-native flora All 86 sites were involved with weed removal activities. In many instances these were an
intensive process upon first taking ownership of the land or first converting it to ecotourism.
However, weed removal appeared to be an ongoing process for all sites, and many weed
programs had spanned several decades.
C1.2.1 Extent Detailed information on the extent of weed removal was not provided by most sites and cannot
be assumed to always have conservation significance. However, Site 21 devoted more than
4,000 person-hours annually to weed removal, demonstrating the extensive effort that weed
control may entail. Additionally, Site 2 reported spraying over 7,000 non-native plants on their
property over five years and had noted that the weed composition was increasingly made up of
young plants, indicating management success. Furthermore, several enterprises engage with
weed removal actions away from their own properties. This was often in conjunction with parks
agencies, non-government groups, and community organisations, with many sites also reporting
clearing weeds from roadsides near their properties. Landcare and Conservation Volunteers
Australia were the two most commonly mentioned groups, with owners of some enterprises
holding positions within local Landcare Groups. Three sites also reported working with
neighbouring properties: Site 44 worked with the protected area agency responsible for the land
that borders their property; Site 32 liaised with neighbouring landholders to “ensure consistency
and maximise the efficiency of pest control efforts”; and Site 25 reported weeding their
neighbour's property because “they don’t do it themselves”.
C1.2.2 Species A total of 46 non-native species were listed across the nineteen sites that reported weeds by a
recognisable name, with lantana being the most commonly mentioned (Table C1.2)
264

Appendix C: Amalgamation of site data for ecological Conservation Items
Table C1.2 Non-native flora species targeted by Australian ecotourism sites
Species Number of sites WoNS1
African boxthorn (Lycium ferocissimum) 1 ✓
African love grass (Eragrostis curvula) 1
Apple of Sodom (Calotropis procera) 1
Asparagus fern (Asparagus aethiopicus) 2 ✓
Belladonna lily (Amaryllis belladonn) 1
Bitou bush (Chrysanthemoides monilifera ssp. monilifera) 1 ✓
Blackberry (Rubus laudatus) 3 ✓
Boneseed (Chrysanthemoides monilifera ssp. rotundata) 1 ✓
Buffalo grass (Stenotaphrum secundatum) 1
Cane cholla (Cylindropuntia spinosior) 1 ✓
Cape ivy (Delairea odorata) 1
Capeweed (Arctotheca calendula) 1
Coffee trees (Coffea arabica) 1
Coral berry (Symphoricarpos orbiculatus) 1
Cretan trefoil (Lotus creticus) 1
Crofton weed (Eupatorium adenophorum syn Ageratina adenophora) 1
English broom (Cytisus scoparius) 1 ✓
Formocea lily (Lilium formosanum) 1
Foxglove (Digitalis purpurea) 1
Giant bramble (Rubus alceifolius poir) 1
Glycine (Neonotonia wightii) 1
Gorse (Ulex europaeus) 1 ✓
Hawkweed (Pilosella or Hieracium spp.) 1
Horehound (Marrubium vulgare) 2
Jumping cholla (Cylindropuntia prolifera) 1 ✓
Khaki burr (Alternanthera pungens) 1
Kikuyu (Pennisetum clandestinum) 1
Lantana (Lantana camara) 5 ✓
Madeira vine (Anredera cordifolia) 1 ✓
Myrtle-leaf milkwort (Polygala myrtifolia) 1
Oleander (Nerium oleander) 1
Phalaris (Phalaris arundinacea) 1
265

Appendix C: Amalgamation of site data for ecological Conservation Items
Species Number of sites WoNS1
Red hot pokers (Kniphofia uvaria) 1
Rosy dock (Acetosa vesicaria) 1
Rubber vine (Cryptostegia grandiflora) 1 ✓
Scotch thistle (Onopordum acanthium) 1
Sea-spurge (Euphorbia paralias) 1
Serrated tussock (Nassella trichotoma) 1 ✓
Sicilian sea lavender (Limonium hyblaeum) 1
Snakeweed (Stachytarpheta spp.) 1
Stinkwort (Dittrichia graveolens) 2
Sweet pittosporum (Pittosporum undulatum) 1
Tall wheat grass (Lophopyrum ponticum) 1
Tobacco bush (Solanum mauritianum) 1
Ward’s weed (carrichtera annua) 1
Wild passion fruit (Passiflora foetida) 1 1WoNS = Weeds of National Significance (details in Section 3.2.3.3).
C1.2.3 Reasons for weed removal Reasons given for weed removal activities include: to return the habitat to its natural state; to
make way for natives; and to give a competitive edge to the existing native plants until they take
hold, sometimes following a destructive event such as a flood. Weed removal was included in
all overarching site management plans and predominantly formed part of site rehabilitation and
habitat restoration activities, especially after land had been converted to ecotourism. Some sites
also reported implementing intensive and targeted weed projects to tackle certain weeds or areas
of their property.
C1.2.4 Methods of weed removal Chemical and mechanical weed removal methods were the most frequently mentioned
approaches and were often used in combination. In some instances, such as densely vegetated
areas or near waterways, the use of chemicals was considered risky and only mechanical
methods were used to protect the surrounding environment. Conversely, herbicides were
sometimes found to be the only effective method, especially in arid areas where rocky soils
made mechanical removal difficult. Additionally, Sites 2 and 45 utilised biocontrol methods,
and Site 43 used a rigid fire regime that favoured natives and burnt weeds.
Several sites undertook weed mapping and vegetation assessments, with some recording all
identified weed species and GPS locations of weed infestations in databases. This information
266

Appendix C: Amalgamation of site data for ecological Conservation Items
was reported to be useful for sites to strategically address weed management into the future and
identify correlations between activities and weed outbreaks. Furthermore, Site 2 was able to
share their data with the neighbouring protected area agency and adopt a cross-boundary
approach to weed management.
C1.2.5 Challenges and strategies The most commonly mentioned challenge was the classic trait of weeds to persist, return and
spread even in times of extreme weather conditions. Several sites reported finding new weed
populations even after initial weed removal activities had been successful. Continued
monitoring was therefore an important component of weed management to maintain the
environmental value of the site and ensure any new outbreaks were immediately addressed.
Another significant challenge was the number of weed species, with Site 21 recording over 200
weed species including “five of National Significance and 26 state declared noxious weeds”.
Funding was another significant challenge. The labour, chemicals, and equipment required for
weed removal and the additional revegetation and monitoring that followed were often costly.
For example, Site 22 reported spending $6,000 on a single weed removal project in a single
year. Some sites had received external funding for weed removal activities including grants
from governments and environmental organisations. Dollar values for grants were only reported
by two enterprises: Site 2 received a grant for nearly $19,000 for a weed removal project
targeting a single problematic species. Site 15 also described a situation in which their work
with a community group was “so successful in the complete eradication of rabbits and a large
reduction in the number of boxthorns over a 7-year period” that it was emulated by other
groups. This was then the basis on which a $400,000 state government grant was given to a
community environmental group to continue the project over a larger region. Only a single
enterprise, Site 40, reported that the profits from tourism covered the full cost of both fauna and
flora invasive species programs.
Guest and local volunteers were an important resource for weed removal programs as well as in-
kind support from community groups and non-government organisations. For example, Site 30
offers a Working Holiday Program in which guests visit the retreat to be “involved in landscape
management procedures”; and Site 46 runs an annual program in which guests and community
members can participate in habitat restoration and management including “the identification and
removal of noxious weeds”. Site 22 utilised a student ambassador program with 600 students
from the USA who undertook an on-site conservation project for two months in 2012.
267

Appendix C: Amalgamation of site data for ecological Conservation Items
Other challenges mentioned by sites related to the removal process. Several sites were situated
on very large properties covering steep and rocky terrain or dense bushland, making access to
some areas for weed removal difficult. The prolific dispersal methods of some weed species
also increased the challenge of removal activities. For example, Site 2 had spent years battling
jumping cholla, an invasive cactus that regrows from dislodged fragments that “spread far and
fast during rain events”, meaning that extreme care was required during the removal and
disposal process. Site 2 also highlighted the potential threat that some weeds posed to staff due
to, for example, large spikes. Finally, weed removal could be time consuming and was
perceived by Site 32 to be unappealing or unattractive to guests. Therefore, some businesses
chose to conduct these activities in stages to minimise any impacts on business operations.
C1.3 Revegetation (includes propagation) All 86 sites were involved with revegetation activities using native flora. Of the 26 sites that
reported information on the extent of their revegetation programs, just over a third (10 sites)
were classified as small scale, meaning that revegetation activities covered less than 1ha or less
than 1,000 individual plants. However, the conservation significance of this action is not limited
to only quantity. For example, Site 30 planted 60 drooping she-oaks over a year, which are vital
for the glossy black-cockatoo (South Australian subspecies EN).
C1.3.1 Reasons for revegetation and plant selection Six sites provided reasons for their revegetation activities other than those covered by other
conservation actions (e.g. weed removal): Site 80 rehabilitated an area following damage by a
cyclone; Site 71 rehabilitated an area after a bushfire; Site 1 created experimental plots to
monitor their restoration efforts and any changes in plants and wildlife; Site 26 was complying
with their covenant agreement; Site 78 wanted to increase shade and privacy; and Site 5 wanted
to improve aesthetics and beautification.
The plants used for revegetation activities were selected for a variety of reasons. Four sites
targeted threatened or important ecosystems including manna gum woodlands (Site 10),
threatened vine thickets (Site 24), the candlebark ecosystem (Site 36), and a RAMSAR listed
wetland (Site 33). Eight sites targeted threatened or rare floral species and three sites propagated
at-risk species. For example, Site 22 contains the last existing Australian population of the cave
fern Tectaria devexa var. devexa and had propagated and “strategically planted” 800 of these
ferns on their property. Site 11 specified that 30% of species used for revegetation must be rare
in the area and 20% must be locally endangered, with the remaining 50% being other natives,
especially those that encourage birds and key insect pollinators. Ten sites targeted their
revegetation activities to threatened wildlife species including the koala (V), glossy black-
268

Appendix C: Amalgamation of site data for ecological Conservation Items
cockatoo (EN), Gouldian finch (EN), and the Richmond birdwing butterfly (V). For example,
Site 30 planted over “70 tubes of the near threatened Richmond birdwing vine (Pararistolochia
praevenosa) for the vulnerable Richmond birdwing butterfly”.
Only 25 sites reported the species that were planted, providing a combined list of 26 individual
species and 6 broad groups (e.g. orchids and epiphytes). At 44% of the 25 sites, Eucalypts were
the most commonly mentioned genus followed by Casuarinas (16%), reflecting the number of
sites targeting their revegetation activities to koalas (V) and glossy black-cockatoos (EN).
Species diversity was also important for a small number of sites. For example, Site 37 planted
over 100 different native species in a single revegetation project.
C1.3.2 Methods of revegetation Revegetation occurred both as an intensive project and as an ongoing process that had been
carried out since an enterprise was established, continuing for up to 30 years in some cases.
Revegetation was part of internal management plans and strategies for 24% of sites, and an
additional 7% of sites were part of external programs such as National Parks South Australia’s
ecological restoration Bounceback Program. Guests were encouraged to assist in revegetation
programs or to plant a tree as part of their stay at 14% of sites. Although predominantly focused
on the visitor experience and education, guests also proved to be a useful planting strategy, with
Site 28 using this approach to plant more than 3,000 trees over 10 years and another 800 trees
over the eight years that followed. Additionally, enterprises were sometimes assisted by, or
provided off-site assistance to, both government (10%) and non-government (11%) groups for
revegetation activities.
Revegetation and community engagement overlapped for 22 sites, with 15% of all sites using
community volunteers in their on-site revegetation programs, 7% of sites working with
neighbouring properties or community revegetation programs, and 6% of sites working with
schools or scouts. Community involvement was demonstrated in some instances to have a
considerable impact. For example, more than 2000 volunteers planted 400,000 seedlings over
150ha through five separate planting “festivals” with Site 37; and more than 100 volunteers
planted 25,000 trees over two days with Site 10. Additionally, 3% of sites provided native
seedlings and plants for community members free of charge.
Favourable growth conditions were also provided by 15% of sites to increase natural
regeneration rates. For example, Site 33 had provided “artificial watering [for] severely stressed
River Red Gums [over] approximately 50ha over 10 years” and restored a natural wetting and
drying cycle for a wetland area “following almost a century of permanent inundation due to
269

Appendix C: Amalgamation of site data for ecological Conservation Items
river regulation”. Additionally, Site 22 recorded the planting locations of their endangered fern
and used six-monthly photographs to monitor their progress.
C1.3.3 Challenges and innovations Revegetation can be a costly and resource intensive process, with many sites reporting the need
for weed removal and/or ground preparation of compacted soil prior to any planting taking
place. Additionally, several sites mentioned the need for extensive research and consultation to
determine appropriate flora for the property and existing wildlife populations as previous
owners had cleared much of the land. Monitoring, weed management, and additional support
were also highlighted as important post-planting practices by several sites. For example, Site 17
carried out weed control every weekend for five years following a revegetation project, and
several sites used chicken wire or other coverings to protect young plants from herbivores. As
such, funding was the most commonly mentioned challenge, and 7 sites (8%) obtained external
funding from council grants, federal government grants, state government grants, and donations.
Volunteers were also crucial for some sites. For example, Site 21 reported spending over 4,000
volunteer-hours on revegetation projects each year.
Other challenges included dry climates, wildlife damage, and the persistence of weeds. Many
sites therefore used fast growing or drought tolerant plants to address watering issues and
outcompete with weeds after a site had been cleared. Some sites reported balancing these with a
range of other natives that did not grow as fast but were essential to maintain and improve
habitat and increase diversity. Dripper irrigation, wastewater, water saving crystals, and mulch
were also used to maximise water retention, with some sites undertaking additional watering
activities during prolonged drought periods.
C1.4 Conversion of degraded land to ecotourism Forty-five sites (52%) reported converting properties to ecotourism following previous land
uses. Of the 23 sites that gave information on the previous land uses, agriculture was the most
common (18 sites) including cattle grazing, sheep stations, pastoral leases, and crops.
Additional and sometimes simultaneous previous land uses included mining (3 sites), logging (1
site), a nursery (1 site), an abandoned building site (1 site), and an army barracks (1 site). Weeds
were the most common issue due to a combination of previous land uses involving non-native
species such as crops or landscaping, and the unintentional promotion of weeds through land
clearing practices. Many sites were still battling with weed problems years after converting the
land to ecotourism. Although some sites allowed natural regeneration, most sites actively
planted native species to fill clearings left by previous land uses or weed removal.
270

Appendix C: Amalgamation of site data for ecological Conservation Items
C1.4.1 Motivation Six sites gave reasons for the purchase and/or conversion of land to ecotourism, four of which
involved economic motives: Site 17 cited previous financial hardships due to bad topography
for dairy herds; Site 55 cited a dramatic decline in the price of wool; and Site 2 cited failing
pastoral returns due to drought. The fourth, Site 57, destocked as they were making enough
money from tourism and associated activities; however, it is unclear what caused them to turn to
tourism in the first place. Additionally, Site 74 stopped grazing due to their environmental
concerns over their proximity to a national park, and Site 31 wanted to convert the land to a
retreat for travellers.
Three sites continued with the previous land use of grazing at the time of data collection;
however, stock numbers had been greatly reduced and were contained to specific areas of the
properties. For example, Site 78 reported that tourism “is by far the bulk and main focus of the
business now”. They reported that this had reduced pressure on waterways and riparian
vegetation, allowed for reforestation, and assisted with erosion management.
C1.5 Ecological fire management Seven sites (8%) engaged in fire management for conservation purposes such as weed removal,
promoting the regeneration and proliferation of fire tolerant native flora, and returning nutrients
to the soil. The frequency of burning activities were provided by four sites and ranged from
annual to five-yearly, and were generally carried out on a mosaic or rotational basis. Site 25 also
highlighted the importance of using fire management in conjunction with other ecological
restoration processes. For example, this site reintroduced “small digging and burrowing fauna”
prior to their burning activities to assist in trapping seeds underground at an optimal distance
from the surface during fire events.
An additional 10 sites also carried out other fire management practices such as back burning,
controlled burns, reducing fuel loads, and creating fire breaks. These were sometimes carried
out in cooperation with parks agencies, local rangers, and rural fire services. However, these
activities aim to reduce bushfire risk and protect properties rather than contribute to
conservation goals, and were therefore not included as ecological fire management.
C1.6 Rubbish clean-up Some form of clean-up program beyond their own standard waste removal and management
was undertaken by 98% of sites. The most common areas mentioned for clean-up activities
included protected areas, roads, tracks, and beaches. Some enterprises organised or participated
271

Appendix C: Amalgamation of site data for ecological Conservation Items
in clean-up events and encouraged guests and local community members to join. These included
Clean Up Australia Day, National Recycling Week, and the Adopt A Road program which
allocates road portions to local businesses to keep clean. Sites 16 and 34 also collected and
deposited cans to a ‘Cash for Cans’ program as part of their clean-up activities to raise money
for two local groups: a branch of the local Wildlife Information, Rescue and Education Service,
and a local Scouts group.
C1.7 Effort to reduce erosion Activities to reduce erosion rates were undertaken by 42 sites (49%). This was predominantly
through ground stabilisation techniques using vegetation or rocks, with some sites also fencing
off areas or using wind breaks to encourage reforestation and prevent soil disturbance. The scale
of these efforts was not provided by most sites; however, the available data showed a range
between “a section” of a 1ha property to thousands of trees planted for this purpose. Actions to
reduce erosion were reported solely by sites that had previously been used for other commercial
purposes such as agriculture.
C2 Wildlife actions
C2.1 Monitoring Monitoring was reported by 59 sites (68%).
C2.1.1 Motivations Across the 38 sites that reported their motivations, the most common reasons were to monitor
fauna populations (79%); detect changes in fauna or flora populations (39%); assess habitat
health (34%); monitor flora populations (29%); collect wildlife data such as movements,
breeding habits, or breeding success (29%); compile species lists for the property (13%); fulfil
the requirements of conservation covenants or other agreements (8%); plot the location of trees
(5%); look for injured or diseased wildlife (5%); determine vegetation density (3%); and
establish baseline data (3%). Some monitoring programs were targeted at specific wildlife
species including the glossy black-cockatoo (EN) (5 sites), southern cassowary (EN) (3 sites),
koala (V) (3 sites), and Tasmanian devil (EN) (3 sites).
C2.1.2 Mechanisms and methods Monitoring activities incorporated a range of methods including fauna and flora surveys;
physical traps; camera traps; tagging and the use of GPS for tracking or mapping; drones and
aerial surveys; the use of photo points to determine physical changes over time, monitoring
272

Appendix C: Amalgamation of site data for ecological Conservation Items
through daily activities of staff; log books; and the use of tracking dogs to locate animal scats.
Fauna and flora surveys ranged from simple walking surveys to intensive ‘survey weeks’
covering multiple quadrants and monitoring points. The level and types of data collected ranged
from general fauna sightings to detailed data on animal behaviours, vegetation health, and
weather patterns. For example, Site 23 had 90 monitoring points covering all vegetation types
across their property. Additionally, the frequency of monitoring activities varied greatly, from
“continuous monitoring” and “daily observations” to property assessments every five years.
Over half of the 59 sites were part of larger monitoring programs and gave their monitoring data
to NGOs, research organisations, government bodies, and databases. Many sites also worked in
conjunction with government bodies, NGOs, conservation groups, and universities.
C2.1.3 Challenges and innovations Monitoring challenges reported by sites included the cost of equipment and staff hours; the time
required for locating, identifying, and recording specimens; the physical effort required for sites
with large properties or challenging topography; and difficulties in detecting small, cryptic
animals and low-density populations. Strategies to overcome these challenges included hiring
consultancies to carry out monitoring work, working with community groups, and using
volunteers. For example, Site 10 established a community hotline for community members to
report wildlife sightings, and Site 27 encouraged a local birding group to use the property for
birding activities and record their sightings. Additionally, six sites used their guests to assist
with monitoring efforts, record wildlife sightings in a log book, or participate in surveys. For
example, Site 38 encouraged guests to photograph any manta rays seen while scuba diving and
compare these to a series of manta ray photos, allowing guests to check which manta ray they
saw or “if they have found a new individual”.
Technology and innovation also allowed sites to improve monitoring activities while reducing
the person-hours required. For example, Site 23 used drones to locate active mounds of a
threatened bird species rather than traversing the 54,000ha property to locate them manually.
Cameras were then placed on the active mounds to “record movement on the ground 24/7”
including laying, hatching, breeding success, and predator activity. Solar panels and large
memory cards were also used to increase the length of device operating time without
intervention. Site 10 worked in partnership with a dog organisation to train community
volunteers and their dogs to detect spotted-tailed quoll (EN) scats. This circumvents the
monitoring challenge posed by the small, nocturnal, and cryptic species. However, the uptake of
technological and innovative methods was generally low across the 86 sites, and physically
intensive methods of surveying were still the most popular.
273

Appendix C: Amalgamation of site data for ecological Conservation Items
C2.2 Breeding programs Three sites were involved with breeding programs for three endangered species: spotted-tailed
quoll (Site 10), Gouldian finch (Site 24), and woylie (Site 25). All three sites had prepared an
area on their property for soft release. For example, Site 24 had planted part of the property with
specific trees to “provide increased breeding hollows” and replaced exotic grasses “with native
grasses to provide increased food” with the hope of re-establishing a wild breeding population.
Two of the sites were part of larger programs: Site 10 was part of a Captive Breeding Network
and Site 25 worked with a zoo. All three sites also utilised the breeding programs for research
purposes.
C2.3 Translocation Translocation and reintroduction activities were undertaken by four sites in this study (5%). Site
21 managed a reintroduction project for the Eastern Barred Bandicoot, which has been
“considered extinct in the wild on the mainland since 1991”; Site 23 translocated black-eared
miner colonies (EN) from a large population situated on a local network of properties to
genetically isolated populations elsewhere in the state; Site 24 tagged and released 100
Gouldian finches (EN) annually from their breeding program, and Site 25 had successfully bred
and released 20 woylies at the time of data collection. Habitat restoration and invasive fauna
control were two additional actions required in conjunction with translocations and
reintroductions. Site 21 established a predator free zone by removing all predators from a small
island; Site 23 used electric fencing to reduce predation rates from ground dwelling predators;
and Site 25 built a predator free zone on their property.
C2.4 Provision of veterinary services, disease control and wildlife rehabilitation
Veterinary and rehabilitation services were carried out by 13 sites (15%). This included
rescuing, treating, and rehabilitating sick or injured wildlife; moving wildlife away from threats
such as roads; and hand-raising orphaned infants. Additionally, Site 23 maintained a captive
population of black-eared miners (EN) in case of fire or other dangers to the wild population.
Situations most commonly reported by sites as requiring intervention included road trauma,
attacks by pets and feral animals, boat injuries, starvation, drought, discarded debris such as
trawl net and fishing line, and wildlife orphaned as a result of vehicle accidents or shootings.
Site 10 stated that “motor vehicle collisions account for 57% of all injured or orphaned wildlife
in the rehabilitation program”.
274
Appendix C: Amalgamation of site data for ecological Conservation Items
The number of individuals treated and released varied greatly across sites from one or two every
few months to several hundred per year. For example, Site 21 reported treating “150 little
penguins and 300 to 400 other native animals, including short-tailed shearwaters, southern giant
petrels, possums and koalas” every year. This site could also cater “for up to 500 little penguins
in the event of an oil spill”, which was required in 2001 when they took in 438 penguins, 95%
of which were able to be released. Furthermore, over the previous 10 years they had rescued
over 150 seals tangled in fishing line and debris. Additionally, Site 10 had “admitted 96 injured
and orphaned animals” over a two-year period, with over a third of animals admitted being
“pouch young or dependent juveniles requiring long term care”.
Treated mammal species across the sites included koalas (V), Tasmanian devils (EN), swamp
wallabies, red-shouldered wallabies, eastern grey kangaroos, unspecified kangaroos and
wallabies, wombats, echidnas, eastern pigmy possums, brush-tail and ringtail possums,
unspecified possums, unspecified seals, and microbats. Treated bird species included little
penguins (regionally EN), fairy prions (V), wattlebirds, emus, cape barren geese, magpies,
rainbow lorikeets, silver gulls, kookaburras, short-tailed and fluttering shearwaters, masked
lapwings, ibis, purple swamphens, crested terns, pacific gulls, New Holland honeyeaters,
yellow-tailed black cockatoos, sulphur-crested cockatoos, and galahs. Treated reptiles included
carpet pythons, long-necked tortoises, and blue-tongued lizards.
Six sites had wildlife carers on site or were themselves registered as wildlife care centres. Sites
18 and 24 offered their properties as release sites for rehabilitated wildlife from other carers, and
Sites 10 and 21 held wildlife first-aid training workshops for their local community. Sites 14
and 25 had worked with external partners for wildlife rehabilitation including wildlife care
groups and a government department.
C2.5 Effort to reduce non-native fauna Efforts to reduce the number of non-native fauna species were undertaken by 66 sites (77%).
C2.5.1 Species Of the 34 sites that specified their target species, the majority targeted cats (17 sites), followed
closely by foxes (13 sites). Other species include rabbits (8 sites), goats (6 sites), rodents (4
sites), wild boars (3 sites), cane toads (2 sites), European wasps (1 site), non-native bees (1 site),
and drupella snails (1 site).
Native species that were targeted for protection by the feral animal removal activities varied
greatly across sites and included the yellow-footed rock wallaby (V), southern brown bandicoot
275

Appendix C: Amalgamation of site data for ecological Conservation Items
(EN), woylie (EN), swamp antechinus (V), spotted-tailed quoll (EN), black-eared miner (EN),
chestnut-rumped heathwren (EN), little penguin (regionally EN), hooded plover (V), and short-
tailed shearwater (migratory species), as well as native species not at risk such as dunnarts,
pygmy possums, bandicoots, and oyster catchers. However, details regarding outcomes for these
species were not reported.
C2.5.2 Methods of removal A variety of methods were used across sites for the removal of non-native species. Of the 19
sites that provided information on methods, 58% used trapping; 32% used baits; 26% used
shooting; 26% destroyed dens, burrows, and hives; and 11% used biological control methods
such as a virus to reduce rabbit numbers and green ants to control wasps. Four sites also used
fencing to keep non-native animals out. Two of these had entirely enclosed predator-proof areas
covering 40ha (Site 25) and 1,600ha (Site 33), and a third (Site 23) had installed 50km of
electric fencing along part of the property’s perimeter.
Various lengths of time were provided by sites for their feral animal control programs ranging
from continuous to quarterly or annually. Eleven sites undertook monitoring activities using
surveys, camera traps, detection dogs, and monitoring points to determine the success of their
feral animal programs. Three sites included guests in their feral animal programs, with Site 31
allowing gests to help catch toads; Site 85 educating guests on the management of non-native
insects; and Site 45 encouraging guests to “participate in the community fox watch by reporting
fox sightings during their visit”.
C2.5.3 Challenges and strategies The most common challenge reported was the presence of non-native animals remaining on
surrounding properties and the need for landscape level collaboration to keep numbers down.
Six sites were part of larger, external programs run by government departments or NGOs, and
twelve sites worked with partners including government departments, NGOs, and neighbouring
landowners. Site 15 was a founder of the local Landcare group and established a seven-year
program to eradicate rabbits. Site 10 created fox management workshops for local landowners
to “engage and provide skills” in the hope that this would “lead to a coordinated approach
which is vital for effective feral predator management and will significantly contribute to
landscape conservation”. Site 45 was part of a community fox control program covering a
“coastal strip of approximately 50km” as a partnership between various local conservation
groups, private landowners, and government departments. Fences were also used by sites to
address the spatial issue. For example, Site 23 placed fences around their “dams to discourage
276
Appendix C: Amalgamation of site data for ecological Conservation Items
feral animals” and used electric fences “along the northern and western boundaries” of the
property with a ‘spear’ gate that “permits goats to leave the Reserve but prevents their return”.
Funding was another challenge, with sites listing time requirements and the high cost of
specialised equipment as key problems. However, sites that raised these issues were not deterred
from this action, and it seems that the sites perceived the cost of not acting as higher.
Furthermore, at least five sites received external funding from government and NGO bodies to
aid in the removal of non-native species, with one grant as high as $400,000 for a program
targeting feral goats and the invasive boxthorn over several properties (Site 15). Other
challenges included the fear of accidentally killing native wildlife with baits; the difficulty of
ensuring predator proof fences were of an adequate height and depth to prevent access by cats
and burrowing animals; and climatic conditions. For example, Site 2 reported that occasional
high rainfall in the arid area could provide optimal conditions for feral goats. And finally, Site
15 mentioned that moving their business from sheep grazing to tourism had opened the property
to feral goats.
C2.6 Increased resources for wildlife and provision/management of nest sites Although all sites undertook revegetation activities, this cannot be assumed to automatically
increase resources for wildlife, and this action was therefore only attributed to the 40 sites
(47%) that reported an increase in resources targeted to wildlife needs. Across these sites,
increased habitat and shelter were the most commonly provided resources (20 sites), including
the creation of frog ponds, improvement of wetlands, and provision of old logs for reptiles in
cleared areas. This was followed by food sources (13 sites) including food trees such as
eucalypts for koalas (V), and plants with nectar flowers for insects and birds. Water sources
were created or enhanced by four sites. For example, Site 23 used “elevated bird watering
troughs to exclude goats”.
Nest provision/management was able to be determined for 34 of the 40 sites and included
nesting boxes, vegetation mounds, burrows, and hollows in trees. Two reasons were provided
for this action: to support a threatened wildlife population or to compensate for a lack of natural
nesting opportunities. For example, Site 1 increased the number of nesting boxes on their
property after many trees in a riparian strip were lost in a flood. Additionally, Site 45 used
nesting boxes to encourage possums to nest outside of buildings. Five sites specified the target
species: Gouldian finch (EN), glossy black-cockatoo (EN), sugar glider, Richmond birdwing
butterfly (V), little penguin (regionally EN), and brush-tail possum (LC).
277

Appendix C: Amalgamation of site data for ecological Conservation Items
Four sites stated that nesting boxes were not needed due to “the scale of the natural environment
which offers more than sufficient nesting” (Site 2); because “there are many trees, cliffs and
bushy areas for birds to nest” (Site 76); because “this is a natural environment with plenty of
trees, fallen logs, etc.” (Site 15); and because they “retain dead trees specifically for nesting and
perching purposes” (Site 26).
C3 Physical natural environment outcomes
C3.1 Decreased habitat loss and fragmentation This outcome was not addressed by any site.
C3.2 Increased ecological integrity, resilience and health Although all 86 sites reported habitat restoration activities including weed removal and
revegetation, it cannot be assumed that this automatically improved ecological integrity or
health. Appropriate evaluations using established measurements, scales, and parameters are
required to determine this outcome. This is generally an unreasonable expectation of small
businesses; however, four sites (5%) provided information that demonstrated this outcome. Site
2 received a high score for their Land Condition Index as part of an external Pastoral
Assessment. Site 4 reported results from a research study that found the rainforest on their
property consistently produced “four to seven times more fruit than any of the other rainforest
[in the area] that has been studied”. Site 28 stated that using different species in their
revegetation program and increasing genetic diversity had helped to “prevent the spread of plant
diseases among the trees”. Site 32 stated that they had increased ecosystem resilience and
promoted “natural ecological restoration”; however, it was not clear how they had determined
this.
C3.3 Increased ecological connectivity and corridors Sixty sites (70%) reported creating corridors and improving habitat connectivity. Additionally,
35 sites bordered a public protected area; 16 sites bordered a World Heritage Site; 7 sites were
part of regional landscape-level corridors; Site 23 bordered a biosphere reserve and assisted in
extending “the largest block of intact mallee left in Australia”; and Site 24 was “situated on the
East Asian-Australasian flyway”.
At-risk species targeted by the corridors included koalas (V) (Sites 10, 26, 28, and 29); spotted-
tailed quolls (EN) (Site 10); southern cassowaries (EN) (Site 54); and the Richmond birdwing
butterfly (V) (Site 31). Additionally, Site 27 reported corridor use by “most terrestrial fauna
groups” without providing the name of any species. However, only two sites (Sites 27 and 31)
reported that their corridors had resulted in an increase in animals traversing their properties.
278

Appendix C: Amalgamation of site data for ecological Conservation Items
Eight sites worked with neighbouring properties to enhance their impact, four of which were
involved with larger programs including the NatureLinks Program (Site 2), the Great Eastern
Ranges Initiative (Site 6), the Urban Forest Biodiversity Program (Site 36), and a Land for
Wildlife program (Site 59). These programs cover multiple properties and therefore allow for
the creation of a larger corridor and extended habitat connectivity.
C3.4 Improved floral genetic and species diversity Although 10% of sites stated that increased genetic diversity was an aim of their revegetation
programs, only three specified that this had been successfully achieved: Sites 18, 28, and 32.
Furthermore, Sites 28 and 32 highlighted the need for research prior to establishing their
revegetation programs to ensure the selected combination of plants would maintain or enhance
the “genetic makeup of species found on site” (Site 32).
C3.5 Reforestation, improved vegetation density, and increased habitat Increased vegetation density, reforestation, and habitat quality were reported by 55 sites (64%).
However, only three sites gave detailed information on this outcome. Site 40 reported that their
rainforest had expanded by more than 2ha over 16 years through seed dispersal by wildlife,
which they claimed was “equivalent to planting 2 million trees”. Site 10 reported that planting
and dispersing seeds on the property had resulted “in the germination of around 100,000 new
trees” which had “dramatically improved the habitat quality and enabled recolonisation of the
property by numerous species including endemic and endangered plants and animals”. Site 17
reported that 21ha of their property had undergone reforestation and 34ha had acacia regrowth.
Seven sites provided some level of information regarding how this outcome was determined:
Sites 9 and 40 used pegs and other markings to measure forest expansion over the years; Sites
16, 31, and 85 noted growing and expanding wildlife populations in relation to increased
habitat; Site 55 used annual inspections by the Department of Agriculture; and Site 25 used
photographic records over several decades.
C3.6 Increased rates of carbon capture As covered in Section 4.2.1.7, increased rates of carbon capture will not necessarily follow
revegetation. Therefore, even though all sites had undertaken revegetation activities, this
outcome was only attributed to the 15 sites (17%) who specifically stated that it had been
achieved. For example, Site 33 used a proportion of their sales to fund a carbon sink project on
degraded land offsite; Site 37 planted more than the required number of trees for offsetting their
279

Appendix C: Amalgamation of site data for ecological Conservation Items
emissions in order to have a net positive impact; and Site 54 participated in community carbon
sequestration projects.
C3.7 Reduced or eradicated non-native flora Although 100% of sites in this study undertook weed removal activities, only 11 sites (13%)
reported successfully reducing the number or spread of a specified weed, and just 6 sites (7%)
eradicated a weed species completely. However, this includes nine Weeds of National
Significance69 (WoNS) (Table C3.1). Five sites reported a reduction in the extent of unspecified
species and two sites reported eradicating unspecified species. For example, Site 2 reported the
eradication of “non-native cacti” and other “exotic species”.
Table C3.1 Non-native flora species reduced or eradicated by Australian ecotourism sites
Non-native species Number of sites
WoNS Reduced Eradicated
Lantana (Lantana camara) 1 1 ✓
Blackberry (Rubus laudatus) 1 0 ✓
Bitou bush (Chrysanthemoides monilifera ssp. monilifera)
0 1 ✓
Buffalo grass (Stenotaphrum secundatum) 0 1
Gorse (Ulex europaeus) 0 1 ✓
Tobacco bush (Solanum mauritianum) 0 1
Glycine (Neonotonia wightii) 0 1
African boxthorn (Lycium ferocissimum) 1 0 ✓
Cane cholla (Cylindropuntia spinosior) 1 0 ✓
Scotch thistle (Onopordum acanthium) 1 0
English broom (Cytisus scoparius) 1 0 ✓
Madeira vine (Anredera cordifolia) 1 0 ✓
Oleander (Nerium oleander) 1 0
Rosy dock (Acetosa vesicaria) 1 0
Rubber vine (Cryptostegia grandiflora) 1 0 ✓
Snakeweed (Stachytarpheta spp.) 1 0 1WoNS = Weeds of National Significance (details in Section 3.2.3.2).
Only four sites provided data on the extent of weed reduction as an outcome: Site 35 had
removed weeds along 4km of riparian zone; Site 17 had removed weeds from over a third of
69 Details in Section 3.2.3.2.
280

Appendix C: Amalgamation of site data for ecological Conservation Items
their 90ha property; Site 36 had cleared weeds from over 3ha; and Site 18 had reduced weed
cover in one of their assessment areas to just 1% (although the size of this area was not
provided).
Challenges reported by sites as preventing eradication include difficulties accessing certain
areas of their properties due to rough or steep terrain, and the continued presence of weeds on
neighbouring properties combined with their generalist nature allowing easy dispersal and re-
establishment.
C3.8 Reduced erosion Erosion control can be complicated and the mechanisms involved, such as planting trees, can
take a long time to adequately stabilise soil movements. Therefore, undertaking activities to
reduce erosion should not automatically be assumed to achieve a positive outcome. Although 42
sites reported utilising erosion control methods, just 4 sites stated that these efforts had been
successful. All four sites achieved this outcome through revegetation.
C4 Fauna outcomes
C4.1 Increased faunal health and population resilience This outcome was not addressed by any site. Resilience and health apply to whole populations
rather than individual animals, and therefore the veterinary and rehabilitation actions undertaken
by sites in this study cannot be assumed to have achieved this outcome.
C4.2 Increased faunal genetic diversity Four sites reported enhancing the genetic diversity of a wildlife population. Site 23 translocated
eight colonies of black-eared miners (EN) to “supplement tiny, genetically isolated colonies”
elsewhere in the state. Site 85 reported enhancing the genetic flow between two undisturbed
habitats by creating a corridor, although no details were provided on the species involved or
how this was determined. Site 10 was “part of a Captive Breeding Network” for spotted-tailed
quolls (EN) that aimed to maintain “the genetic health of the captive population as an insurance
population”. Site 21 was part of a wider program for the eastern barred bandicoot (EN) that
involved:
“…a $146,800 gene pool widening project that will mix captive-bred eastern barred
bandicoots from Victoria with individuals from the Tasmanian sub-species to increase
genetic diversity amongst the Victorian population, which has suffered due to their
critically low population size”.
281

Appendix C: Amalgamation of site data for ecological Conservation Items
C4.3 Improved wildlife numbers/distribution/range Increased wildlife populations were reported by 10 sites (12%). Specific species reported by
these sites include the yellow-footed rock wallaby (V), western pygmy possum (regionally
rare), northern quoll (EN), swamp antechinus (V), dusky and agile antechinus, broad-toothed rat
(V), yellow bellied glider (NT), feather-tailed glider, gang-gang cockatoo (V), powerful owl
(V), hooded plover (V), southern cassowary (EN), and black-eared miner (EN).
Four sites (10, 12, 17, 43) had also seen the return of native fauna species which had not been
present on the properties since before the conversion of the land to ecotourism including the
southern cassowary (Site 17), several species of antechinus (Site 10), and the northern quoll
(Site 43). Site 12 did not name a specific species; however, they reported “continuously seeing
new fauna species on the property, which can only be a result of the increase in native food
plants that have been planted over the past 15 years”. Additionally, Site 6 had reported that the
number of bird species had grown from “just 20 in 2004 to over 50 now”.
Five sites stated that they used surveys and live trapping to determine the increases in wildlife
populations. However, increases were more often mentioned as a general statement by sites
rather than as a quantified outcome. For example, Site 31 reported that their restoration work
had “resulted in the increase in numbers of reptiles spotted on and near the property”, a “large
increase in birdlife” and “increases in native frog populations”; and Site 10 reported that their
revegetation work had “enabled [the] recolonisation of the property by numerous species
including endemic and endangered species of plants and animals”.
C4.4 Reduced unnatural competition or predation Although 77% of sites reported actions to reduce the number of non-native species, it cannot be
assumed that these actions successfully reduced unnatural rates of competition or predation.
This outcome was therefore only attributed to the six sites (7%) that specifically stated it had
been achieved. Site 2 reduced goat and fox numbers to reduce competition and predation rates,
reporting that their property had become “home to one of the most secure yellow-footed rock
wallaby (V) populations in the Flinders Ranges”. Site 10 noted that reducing fox and feral cat
numbers had reduced both competition with and predation on spotted-tailed quolls (EN). Site 21
reported two years running with no fox predation of penguins. Site 25 had seen a complete
reduction in predation of and competition with native fauna after establishing a predator proof
fence and removing foxes, cats, and rabbits. Site 45 reported reduced predation on small
marsupials and threatened nesting birds from reduced numbers of foxes and feral cats. Finally,
Site 28 had noticed a different cause and effect relationship, with their revegetation program
282

Appendix C: Amalgamation of site data for ecological Conservation Items
providing an understory of native shrubs that gave “ground dwelling native animals a safe cover
from predators”.
C4.5 Reduced or eradicated non-native fauna A reduction in non-native fauna was reported by 13 sites (15%) and a complete eradication by
just 5 sites (6%). Non-native species specified by sites as being reduced include goats (Sites 2,
23, and 55), foxes (Sites 2 and 45), rabbits (Sites 15 and 21), feral cats (Sites 21 and 45), wild
boars (Sites 24 and 43), European Wasp (Site 34). Additionally, Site 64 reported reduced
numbers of non-native bees, although specific species weren’t provided. The extent of reduction
was often not quantified; however, Site 15 reported removing 99% of a rabbit population over
seven years, Site 34 reported removing 80% of the European wasp population on their 1ha
property, and Site 43 reported removing hundreds of wild boars every year. Reduction success
was determined through camera traps, monitoring, and noting a decrease in the number of
individuals killed each year.
Non-native species that were eradicated include foxes (Sites 21, 25, and 27), rabbits (Sites 15
and 25), and feral cats (Sites 21 and 25). Four of the five sites achieved eradication by
preventing or minimising the ability of new individuals to enter their properties. For example,
Site 21 eradicated foxes and cats from an island; Site 25 established a predator proof area; and
Sites 15 and 27 worked with neighbouring properties to reduce fox and rabbit numbers in the
region. Site 2 is situated on a very large property (>61,000ha), which appears to have overcome
the lack of support from neighbours.
283

Appendix D: Amalgamation of site data for socio-political Conservation Items
This appendix provides a summary of the relevant aggregate information collected for each of
the socio-political Conservation Items across the 86 sites. These summaries are condensed from
580 pages of text extracts. All percentages refer to that of the total number of sites (n = 86)
unless otherwise specified.
D1 Visitor actions
D1.1 Environmental interpretation and conservation awareness for visitors All 86 sites incorporated environmental interpretation into the visitor experience. Eighty-two
sites (95%) linked the interpretation material to environmental practices in everyday life and
how visitors can care for the environment, local cultures, and reduce their emissions both at
home and while travelling.
D1.1.1 Interpretation methods
Methods of interpretation include the provision of: reference materials such as a library of books
(85%), informative interaction with a guide (78%), interpretive brochures (74%), pre-tour
materials such as a briefing sheet (71%), displays or interpretive signage (71%), talks or lectures
by specialists (64%), audio-visuals (60%), self-guiding trails (50%), other interpretive activities
such as quizzes or games (34%), and theatre performances (7%). Additionally, information on
the natural local environment was offered to past or potential customers by 65 sites (76%)
through newsletters, blogs, websites and brochures.
D1.1.2 Interpretation themes
The most common focus of interpretation was on the local natural and cultural heritage (83%)
and the conservation significance of the area (79%). The principles of ecotourism and the role of
eco-certification were covered by 63 sites (73%), as well as information and tips for identifying
certified products (62%). Climate change was also a major theme (71%) with sites providing
general information on the topic (48%), the impacts on the region (43%), links to external
resources regarding climate change action (38%), how the tourism industry can reduce impacts
(24%), and the impacts of tourism and travel in climate change (24%).
D1.1.3 Accuracy of information
Verification of the accuracy of their interpretation information was achieved through: reference
books or scientific journals (79%), professional persons such as scientists or academics (79%),
284
Appendix D: Amalgamation of site data for socio-political Conservation Items
“knowledgeable local people” (73%)70, recognised bodies or interest groups such as industry
associations (51%), scholarly film and television documentaries (42%), recognised training
courses or materials such as operator workbooks (41%), scholarly oral history (38%), traditional
custodians (36%), and museums or zoos (24%).
D2 Community Actions
D2.1 Environmental education/awareness for staff Staff training and education regarding conservation and environmental issues was undertaken
by all sites. This occurred as part of the induction of new staff and volunteers, as well as being
part of ongoing training programs. Training for environmental emergencies was undertaken by
55 sites (64%) and training on conservation practices was provided by 59 sites (69%).
D2.1.1 Delivery and topics
Environmental training or approaches to increase the environmental awareness of staff included:
the provision of “access to relevant research journals and websites” (70%)70; environmental
resources such as books, fact sheets, and reports from government, tourism associations and
conservation organisations (69%); specialised talks (64%); “customised delivery material”
(60%)70; updates from scientific research programs (56%); wildlife sighting registers (49%); “an
interpretation operations manual” (48%)70; and “an interpretative newsletter” (43%)70. Topics
covered by these training and educational materials included: the natural and cultural values of
the area (83%), environmental management issues (79%), ecotourism principles (79%), minimal
impact practices (78%), and climate change (64%). Additionally, 34% of sites reported that staff
had attended conferences, workshops or seminars on environmental and conservation issues.
D2.1.2 Challenges
Comments from many sites indicate that they may question the relevance of formal education
activities. This is predominantly due to low staff numbers, with 15 sites having less than five
staff in total. For example, Site 50 commented that as there are only two people in the business
“we draw from our life experiences” and “research and educate ourselves”. Similarly, Site 31
commented that as they are a very small team, “it [environmental training] is handled on site on
a one to one basis as needed”. Furthermore, Site 15 commented that “all staff have grown up in
the area so little induction regarding the region's environment and values is required”.
70 Text extract from EA Questionnaire.
285

Appendix D: Amalgamation of site data for socio-political Conservation Items
D2.2 Environmental education and awareness for local communities Thirty-four sites (40%) undertook additional environmental education and engagement activities
with local schools (22%) and tertiary institutes (15%), and within their local communities more
broadly (38%).
D2.2.1 Community
Engagement with the wider community on conservation and environmental issues was
undertaken by 33 sites (38%). Eighteen sites (21%) allowed locals to utilise part of their
ecotourism product such as interpretative trails free of charge or for discounted rates; 13%
assisted local groups and associations with conservation activities and programs; 9% gave
public talks and presentations; 8% conducted community workshops on conservation issues
such as humane fox management; 6% provided conservation materials for the general public
such as fact sheets; 6% participated in local environmental events such as a local council’s
Conservation Week; and 6% ran community days or weekends for locals to participate in
conservation activities.
D2.2.2 Schools and tertiary institutes
Several sites hosted schools (19%) and tertiary institutes (8%) for environmental education
and/or conservation activities. Six sites provided materials for schools such as worksheets and
information packs. This also included the donation of a “stream watch kit to allow local students
to monitor the environmental quality of a hanging swamp” (Site 16). Three sites visited schools
to conduct presentations or workshops. For example, Site 14 had created an educational van
featuring hands-on material, sustainable practices and conservation information, with
participation already surpassing 800 students in 2012. Additionally, Site 39 provided workshops
for tertiary students; and Site 10 provided a research scholarship and co-supervision for students
undertaking Honours or Masters level conservation research, although it is not clear how many
students this was for. Additionally, 66% of sites reported providing “concession rates to schools
and other institutions studying the conservation of the environment”71; however, this alone was
not considered strong enough to obtain a ‘presence’ score for this action.
D2.3 Professional training and capacity building for locals Seventy-two sites (84%) provided training and upskilling opportunities for local community
members. This included access to free jobs and skills training for local residents (59%); career
development mentoring (57%); advice for job applications and interviews (53%); access to
office equipment to assist local residents with job applications (38%); tourism and business
71 Text extract from EA Questionnaire.
286
Appendix D: Amalgamation of site data for socio-political Conservation Items
management training for Aboriginal and Torres Strait Islander peoples (27%); and mentorship
and operating assistance to local businesses (13%). Work experience for students was provided
by 56 sites (65%), with 13 sites specifying they work with local schools and 12 with tertiary
institutes, mostly in relation to tourism and hospitality but also for maintenance work. This also
extended to existing staff, with 66% of sites reporting encouraging their staff to undertake
regular professional development including in-house training courses, access to seminars, first-
aid training, and paid leave to attend courses or conferences. Additionally, Sites 4 and 27
reported hiring people with disabilities to provide them with training and employment, and Site
2 reported hiring long-term unemployed people to give them “work experience and career
mentoring”.
D2.4 Economic development, stimulation and linkages All sites were involved with actions that contributed to the economic development and growth
of the area. This included local sourcing of products such as food (99%), services such as
maintenance (98%), and construction materials (91%). Many sites also contributed to the
marketing of the region more broadly: 36% were active members of regional tourism
associations or programs; 67% highlighted regional food or wine as part of their tourist
experience; 26% encouraged guests to visit other local attractions; and 24% incorporated
regional and destination marketing into their promotional materials or were part of region wide
marketing campaigns. Additionally, Site 20 stated that the region’s two traditional industries of
timber-cutting and tin-mining were no longer viable, and tourism had therefore become “a key
industry for rejuvenating the region”.
Many sites also reported supporting individual local businesses. For example, 69% of sites gave
their customers the opportunity to purchase locally produced mementos; 20% engaged in
partnerships with local businesses; 14% had formal agreements in place for the purchase,
distribution and/or support of emerging Indigenous artists; and 6% incorporated other local
tourism businesses in the experience they provided for guests. Additionally, 13% of sites
mentored and gave substantial operating assistance and advice to local businesses. For example,
Site 8 allowed a new chocolate start-up business to use the site’s commercial sized kitchen to
produce their goods.
D2.5 Employment All but one site72 employed members of their local community “in some aspect of the
operation”. The proportion of locals making up total employment was generally not provided
72 There was not enough information available to confirm this for the remaining site.
287

Appendix D: Amalgamation of site data for socio-political Conservation Items
but varied from a single individual staff member through to 100% of staff. This included
employing local guides “to present local attractions or sites, or to provide training to guides”
(56%)73; however, positions held by locals covered a wide range of roles including: landscaping,
housekeeping, guides, chefs, management, board members, IT, and entertainment. Additionally,
local Aboriginal and Torres Strait Islander peoples with “an understanding and knowledge of
local Indigenous heritage are employed to act as interpreters and/or trainers of guides”73 by 24%
of sites; and 23% of sites employed Aboriginal and Torres Strait Islander peoples “in tourism
business positions within the operation, not just as guides”73. The intent behind the phrasing in
these two questions from the EA Questionnaire is unclear.
Two main challenges were reported across the sites for employing locals: (1) low staff numbers,
with 15 sites having under five staff in total; and (2) the distance of the site to a local
community, as some sites were situated on very large properties, in remote areas, or on islands.
Site 18 also reported having difficulties with the handful of nearby properties in their sparsely
populated area, stating that these neighbours had carried out acts of vandalism and theft on their
property and had “illegally fallen some of our mature trees on our property boundary”.
D2.6 Community contributions Community contributions were undertaken by 83 sites (97%).
D2.6.1 Support for community issues
Seventy-six sites had “attended a meeting in relation to a local community issue”73 such as new
community developments, council meetings and tourism association meetings; 85% had
“attended a workshop or seminar in relation to a local community issue”73 such as those run by
tourism associations, local governments, and community groups; and 70% had “written a letter
or submission in relation to a local community issue”73 such as submissions to local
governments, submissions on tourism plans, and letters to newspapers. Additionally, the owners
or operators of 21% of sites were members of local associations and conservation organisations,
sometimes holding positions such as the Chair or Treasurer.
D2.6.2 Community support
Twenty-one sites gave financial or in-kind support to local events and associations including
sporting groups, health associations, aged care, and Scouts groups, in addition to groups focused
on community development, environmental protection and tourism. Although financial support
was generally small to moderate (if disclosed at all), some sites made valuable contributions.
73 Text extract from EA Questionnaire.
288

Appendix D: Amalgamation of site data for socio-political Conservation Items
For example, in 2015 Site 5 “provided over $75,000 of in kind support for familiarisations,
media, local residents and local community groups”, and in 2011 Site 9 gave over $40,000 of
in-kind support for local organisations. Furthermore, 26% of sites donated prizes for community
fundraising efforts, with several sites providing the same prize for many years running.
Additionally, “tangible support or participation” had “recently been offered to at least one not-
for-profit organisation or event that contributed to the welfare of the local community”74 by
91% of sites, although it is not clear what this entailed.
D2.6.3 Community good-will
Twenty-four sites allowed local community members, groups, schools, and not-for-profit
organisations to participate in their activities or stay at their accommodation for discounted
rates; and an additional 6% allowed locals to access their facilities, such as gardens or picnic
areas, free of charge. For example, Site 11 reported providing over 350 tours “free of charge to
locals and families” in a single year. Additionally, 17% of sites were involved with local
Indigenous communities and reported actively pursuing a positive relationship. This was
achieved through frequent meetings with elders and representatives; consultations on relevant
components of the tourism experience; involving the Indigenous communities in visitor
interpretation; gaining their feedback and approval on interpretation resources; and sharing
information provided by the Indigenous community with visitors.
D2.6.4 Community aid
Nineteen sites (22%) reported charity donations of a local, national and global scale, with the
most commonly mentioned charities being the Royal Flying Doctors Service, Make a Wish
Foundation, Starlight Children’s Foundation, and various hospitals and cancer foundations. Four
sites (5%) also reported their involvement with local emergency services including acting as a
drop off point for goods after natural disasters (Site 19), volunteering in the rural fire brigade
(Site 20), and assisting with search and rescue operations (Site 2 and Site 14). Furthermore, Site
14 had several staff members who were active paramedics who “spend many hours each week”
working within community camps “which are known to have some of the highest trauma and
violence rates in the world”. This site also reports being “the primary sponsor to Global Rescue
Inc. which develops adequate and suitable housing for Indigenous communities” and “focuses
on delivering life skills and emergency management training to members of the community”.
74 Text extract from EA Questionnaire.
289

Appendix D: Amalgamation of site data for socio-political Conservation Items
D2.7 Actions to reduce human-wildlife conflict No sites were found to be undertaking any actions to reduce human-wildlife conflict within their
community. Site 45 reported using nesting boxes in trees near their lodge to encourage possums
to nest in these trees rather than in their roof. However, this action is not targeted towards the
local community and was therefore not assigned a ‘presence’ score.
D2.8 Actions to reduce illegal activities Fifty-nine sites (69%) reported “suspected infringements, incidents and pollution” to protected
area managers, and 63 sites (73%) also confirmed that they “shall actively provide feedback to
protected area managers on events or practices which are harmful to wildlife and the
environment” such as whale strandings or oil spills. For example, the owners of Site 2 were
actively vigilant following mining exploration in their region and discovered 38 tonnes of drill
samples, plastics, mineral waste and discarded operational material illegally buried in a
sanctuary.
Due to the phrasing of these EA Questions, this Conservation Item shares similarities with
‘providing support to PA agencies’.
D2.9 Financial donations for community development Only one site reported this action: Site 1 includes an Indigenous museum as part of their tour
offerings, which provides an avenue to direct donations to support the local community.
D3 Organisational/political actions
D3.1 Research Eighty-two sites (95%) undertook or participated in environmental research projects. The types
of research projects varied from static data points to broad, longitudinal studies spanning
decades. For example, Site 21 had been monitoring the vulnerable hooded plover since the
1980s through nest records and tagging chicks. Additionally, this site had been involved with
research on the little penguin for over 45 years, “one of the longest continuous seabird studies in
the world”.
D3.1.1 Research focus
Research on the local flora and fauna was conducted by 33% of sites and focused on breeding
and nesting (10%); health or population condition (10%); relationships between flora and fauna
(9%); movements and behaviours (7%); feral animals (7%); and physiological studies e.g. DNA
290

Appendix D: Amalgamation of site data for socio-political Conservation Items
analyses (6%). Studies focusing on the biophysical landscape were conducted by 26% of sites
and looked at geology, temperature and currents (10%); management practices such as burning
or watering techniques (7%); and resource mapping (2%). For example, Site 10 reported
“assessing the effects of small patch burns to stimulate regeneration of manna gum (Eucalyptus
viminalis), and mosaic burning to maintain biodiversity in declining woodlands”. Furthermore,
several sites conducted monitoring and research activities for a number of species with National
Recovery Plans that highlight a critical need for research, data collection and data sharing,
including the spotted-tailed quoll (Site 10); buff-breasted button-quail and Gouldian finch (Site
24); black-eared miner, malleefowl and red-lored whistler (Site 23); chestnut-rumped heathwren
(Site 36); Coxen’s fig parrot (Site 74); and southern cassowary (Sites 4, 8, 40 and 54).
D3.1.2 Research support and collaborations
Sixty-two sites (72%) reported aiding research projects including the provision of: “tangible
support” (66%), data for researchers (42%), in-kind support such as accommodation for
researchers (17%), property access for researchers to conduct projects (15%), data collected
specifically for external research projects (14%), financial support to external research projects
(8%), staff assistance (3%), and assistance with networking between researchers and other land
owners (1 site). Additionally, 64% of sites were involved in regional tourism impact studies,
and 14 sites (16%) were involved with climate change studies in association with an external
research organisation or agency.
Nearly half of all sites (44%) collaborated with external researchers including universities
(24%), NGOs (15%), government bodies (13%), and post-grad students (12%), with some sites
working with multiple external partners. For example, Site 21 reported “partnerships with over
50 collaborators in all continents”, and Site 23 reported working with “fourteen universities and
research institutes”. Five sites received external funding to help with their research projects, and
one site stated that “government funding cutbacks in environmental and rainforest studies have
prohibited much fieldwork”.
D3.2 Lobbying and advocacy Lobbying and advocacy activities were reported by 41% of sites.
D3.2.1 Topics
These actions focused on a range of topics including climate change (28%), establishing
protected areas (9%), general conservation issues (7%), establishing a local recycling program
(2%), and sustainable tourism (2%). Other issues addressed by single sites included: water
291

Appendix D: Amalgamation of site data for socio-political Conservation Items
quality, vandalism, erosion, wetland infringements, sand mining, population expansion,
rainforest logging, coal mining, coal seam gas (CSG), quarries, vegetation protection,
dredging/dumping in the Great Barrier Reef Marine Park, and minimising “the use of motorised
recreational craft” to reduce wildlife stress and environmental degradation.
D3.2.2 Activities
A variety of actions were undertaken including writing letters to politicians (7%), participation
in industry forums on climate change action (6%), submissions to the government (6%), general
lobbying (3%), attending protests (3%), and arranging site visits for politicians (2%). Other
actions undertaken by single sites included: giving presentations to government ministers,
attending political meetings, “voting for and supporting political candidates” with
environmentally friendly policies, and “encouraging the development of legislation” to better
protect the environment. All levels of government were targeted, with local and regional levels
being the most common (9%) followed by the state government (7%) and the federal
government (6%) as well as conservation organisations and NGOs (3%).
Actions by three sites were particularly noteworthy. Site 12 founded a community group and
organised protests of 1,000 people against the CSG industry including a 10-day blockade of a
“CSG exploration drill rig that had no social licence or council approvals”. Site 2 spent years
trying to gain legal protection for an area by protesting, “lobbying and lamenting”, and
developing “posters and press releases, T-shirts and bumper stickers, and street theatre” to gain
public support and media coverage. Site 13 gave their land to the government to be incorporated
into a national park under the condition that they be given sole commercial tour operating
rights.
D3.3 Support for conservation organisations and projects All sites reported providing support for conservation organisations and projects. Due to the style
of questions in the EA Questionnaire, it was not always possible to distinguish individual items.
As such, there is much overlap in the following groupings taken from the questionnaire.
Financial support was provided by 72 sites (84%) through direct donations from the site,
donations included as a voluntary add-on for guests, and through fundraising assistance such as
placing a donations box on-site. The amount of money was generally not disclosed and varied
from one off donations or monthly membership fees to $60,000 per year “to financially support
conservation and the local community” (Site 74). Seventy-six sites (88%) provided physical,
financial or in-kind assistance, such as free accommodation for conservation researchers; 77%
“promoted conservation” as a general statement; 73% “promoted a conservation group or its
292

Appendix D: Amalgamation of site data for socio-political Conservation Items
initiatives in promotional material”; 73% “promoted conservation programs/initiatives”; and
70% supported a conservation project. Furthermore, 63% of sites had “entered into partnership
with a conservation group that provided mutual tangible benefits”; 51% participated in a
conservation project or program; and 40% worked with, assisted or collaborated with
conservation organisations. Additionally, 63% of sites were members of a conservation
organisation; 9% reported that they had established or been instrumental in the establishment of
a conservation organisation; and the owners and/or operators of four sites held positions within
conservation organisations, such as the Treasurer. An additional 45 sites (52%) undertook
“physical, financial or in-kind conservation work in a natural area not directly used by the
operator”.
D3.4 Support for protected area agencies, councils and governments Support for protected area agencies was reported by 81 sites (94%) and included a variety of
actions. Collaborating, assisting or partnering with a protected area agency or government
department was reported by 42% of sites. This included cross-boundary issues such as feral
animal and weed control, wildlife counts and monitoring, in addition to general statements such
as “working closely with National Parks on local environmental issues”. Twenty sites
participated in government programs such as the Great Barrier Reef Marine Park Authority’s
Eye on the Reef Program. Furthermore, “regular scientifically recorded data” on animal
sightings and the results of “regular wildlife research” was provided to protected area agencies
by 64% of sites. This included monitoring wildlife populations and feral animals, providing
weather and bushfire data, and assisting protected area agencies in wildlife counts and other
research projects. Additionally, 44% of sites provided “input into the development of relevant
planning and policy initiatives for managing the natural area” including written submissions,
attending meetings and reviewing management plans.
Financial support through fees, permits and licencing was only specified by 6% of sites.
However, this is likely due to the focus of this study on fixed-site enterprises rather than tour
companies that operate in national parks. Nevertheless, assistance with park and facilities
management was undertaken by 10% of sites and included removing rubbish, cleaning public
facilities, and maintaining tracks. As stated by one site, “this gives the rangers time to apply
their specialist knowledge and conduct research within the National Park”. Additionally, in-kind
support was provided to protected area agencies by 6% of sites. This included the provision of
services such as power generation, production of potable water and wastewater treatment, and
donating “facilities for events”.
293
Appendix D: Amalgamation of site data for socio-political Conservation Items
The most commonly reported theme of support was climate change, with 12 sites participating
in climate change research or monitoring projects. This was followed by invasive fauna, with 11
sites assisting in feral animal control or reporting sightings of feral animals. The remaining
themes included threatened and native species management (10 sites), weed control or
notification of weed presence (8 sites), general conservation management (7 sites), fire
management (4 sites) and world heritage nomination (1 site).
D3.5 Investment in conservation related technologies Only one site reported this action: Site 14 stated that they are “committed to channelling a
significant proportion of future income into developing and growing sustainable technologies
and facilities”.
D3.6 Environmentally friendly purchasing All 86 sites used their purchasing power to support sustainable products and services, with 64%
of sites having purchasing guidelines or policies that outlined a preference for both goods and
services that have “lower energy, waste and emissions associated with the product purchase and
use”. This was predominantly achieved through three main avenues: services utilised, products
purchased and electricity providers. Seventy-six sites (88%) specified that they utilised the
services of, or have partnered with, companies with environmentally friendly and sustainable
policies who have attained “green” certification or who can demonstrate a commitment to
climate change action. Thirty-two sites (37%) specified that they purchased environmentally
friendly products, with 15% specifying the use of biodegradable products, 10% specifying
recyclable or recycled products, 5% specifying fair trade certified products, 5% specifying
products with reduced packaging, and 3% specifying energy efficient products. Additionally,
22% of sites specified that they purchased local products to reduce transportation impacts. Fifty-
six sites (65%) were powered by an energy provider that “offers Green Power accredited
products” or uses renewable energy sources. It would be useful to know if these sites are
utilising the Green Power accredited products offered by these companies; however, only one
site commented on this, stating that the option was currently too expensive. Additionally, three
sites reported that they are not connected to the grid.
D4 Visitor outcomes
D4.1 Increased environmental awareness of visitors Although 75% of sites monitored feedback from visitor participation in interpretation activities
and 62% recorded visitor participation rates, just three sites (3%) gave enough information to
demonstrate that this outcome had been achieved.
294

Appendix D: Amalgamation of site data for socio-political Conservation Items
D4.2 Improved pro-environmental behaviours of visitors Eight sites (9%) reported increased pro-environmental visitor behaviours. Four sites reported
donations for conservation purposes. For example, Site 6 reported that 5% of all guests made
conservation donations online when booking and “a further 5% make donations while on site”.
Three sites reported that visitors volunteered for conservation purposes (3%). For example, Site
4 reported that a visitor was “so touched by his experience” that he purchased and revegetated
“the adjoining farm/rainforest block”. Additionally, Site 15 reported that a group of tertiary
students had become “passionate advocators” for the region following their visit to the site.
D5 Community outcomes
D5.1 Increased environmental awareness and knowledge of staff This outcome was reported by 60 sites (70%) who confirmed that their staff were “aware of
monitoring, research, and conservation programs carried out within or involving the operation”.
Several sites stated that they hired staff already trained in environmental and conservation
practices, and for these cases it is likely that they are “preaching to the converted” and not
contributing to an increase in this outcome. However, this was not taken into consideration
when applying a presence/absence score.
D5.2 Increased environmental awareness and knowledge of locals Although a moderate number of sites were involved with community environmental activities, a
‘presence’ score for this outcome was only given to the five sites (6%) that specifically reported
it had occurred. Examples of this include reports of an increasing number of schools
participating in their programs (Site 14), past students becoming “passionate advocators” of the
area (Site 15), and phone calls from the wider community inquiring about environmental
practices they had heard the site carried out (Site 16).
D5.3 Increased pro-environmental behaviours of locals Increased pro-environmental behaviours of local community members were reported by 15 sites
(17%), as identified through information provided by sites on community engagement with site-
run conservation activities. This was predominantly through on-site conservation work carried
out by community volunteers, which could sometimes be of a considerable scale. For example,
Site 37 reported more than 2000 volunteers planting 400,000 seedlings over 150ha through five
separate planting “festivals”; and Site 10 reported more than 100 volunteers planting 25,000
trees over two days. Additionally, three sites had been providing native seedlings free of charge
for local landowners to plant (Site 10, Site 11 and Site 17); Site 4 reported that their
295
Appendix D: Amalgamation of site data for socio-political Conservation Items
encouragement of neighbouring properties to undertake revegetation projects had resulted in
“all neighbours, without exception… replanting to extend habitat”; and Site 6 assisted in the
development of an online tool to calculate and help offset emissions, which they report had been
used by over 20 local and regional businesses.
D5.4 Decreased consumptive and land-intensive practices No sites reported a reduction of consumptive practices by local community members. Two sites
mentioned this outcome in their application material; however, it was not clear if they had
contributed to the outcome. Site 20 stated that the region’s two traditional industries of timber-
cutting and tin-mining were no longer viable, and tourism had therefore become “a key industry
for rejuvenating the region”. Site 1 stated that while they occasionally took visitors on tours
across other privately-owned properties, they were unable to pay the landowners due to the
complications this raises with insurance issues. Therefore, they do this with permission, but are
unable to provide a financial incentive to the landowners to keep areas of habitat intact.
D5.5 Improved community based natural resource management This outcome was not reported by any site.
D5.6 Reduced illegal activities This outcome was not reported by any site.
D5.7 Reduced human-wildlife conflict This outcome was not reported by any site.
D6 Organisational/political outcomes
D6.1 Improved environmental legislation, policies and regulations Improvements in environmental regulations were reported by six sites (7%). For example, Site 2
obtained “secure long-term protection from mining” through the legislation of a new State Act
in 2012 after spending years in political and legal battles. Additional outcomes sites report to
have contributed to include “a speed limit being implemented on the Daintree River” to
minimise erosion and the impact on wildlife (Site 7); the establishment of a no anchor zone
around an island on the Great Barrier Reef (Site 38); a local council adjusting their roadside
native vegetation clearance and management plan to protect endangered species (Site 36);
296

Appendix D: Amalgamation of site data for socio-political Conservation Items
improved federal government policy regarding carbon offsets (claimed by Site 6); and improved
“wildlife guidelines for Ecotourism Australia’s eco-accreditation process” (Site 1).
D6.2 Recognition of environment, land and community rights Formal recognition and support for environment and land rights were achieved by 5 sites (6%).
For example, Site 2 obtained “secure long-term protection from mining” through the legislation
of a new State Act in 2012 after spending years in political and legal battles. In another
example, Site 12 blocked a “CSG exploration drill rig that had no social licence or council
approvals, resulting in the cessation of any further CSG exploration and elicited a promise from
[the State Premier] to protect the area”. Additional outcomes reported by the sites include the
termination of logging in a State Forest (Site 42); the designation of an island and its
surrounding waters in the Great Barrier Reef as a ‘Green Zone’, which is “the highest category
of protection available” (Site 38); and the extension of a national park after Site 13 donated their
land that bordered the national park to the state government in return for exclusive operating
rights.
D6.3 Increased knowledge base Publication output was the only feasible measure that could be utilised in this study to determine
site contributions to the broader knowledge base. Despite the high proportion of sites involved
with research and monitoring activities, just six sites (7%) provided enough information to
obtain a ‘presence’ score for this item. The most common research outputs were academic
papers (4 sites), followed by books and book chapters (3 sites), reports and other grey literature
(3 sites), blogs (2 sites), an honours thesis (1 site), a conference (1 site) and a regional database
(1 site). The number of publications per site varied from a couple of publications to over 150
academic papers, books, book chapters and reports (Site 21). The topics addressed in these
outputs were predominantly of a biological or ecological nature, followed by general wildlife,
general conservation, impacts of tourism on wildlife, scientific methodologies, and threatened
species.
297