INVESTMENT IN PUBLIC ENTERPRISES
113
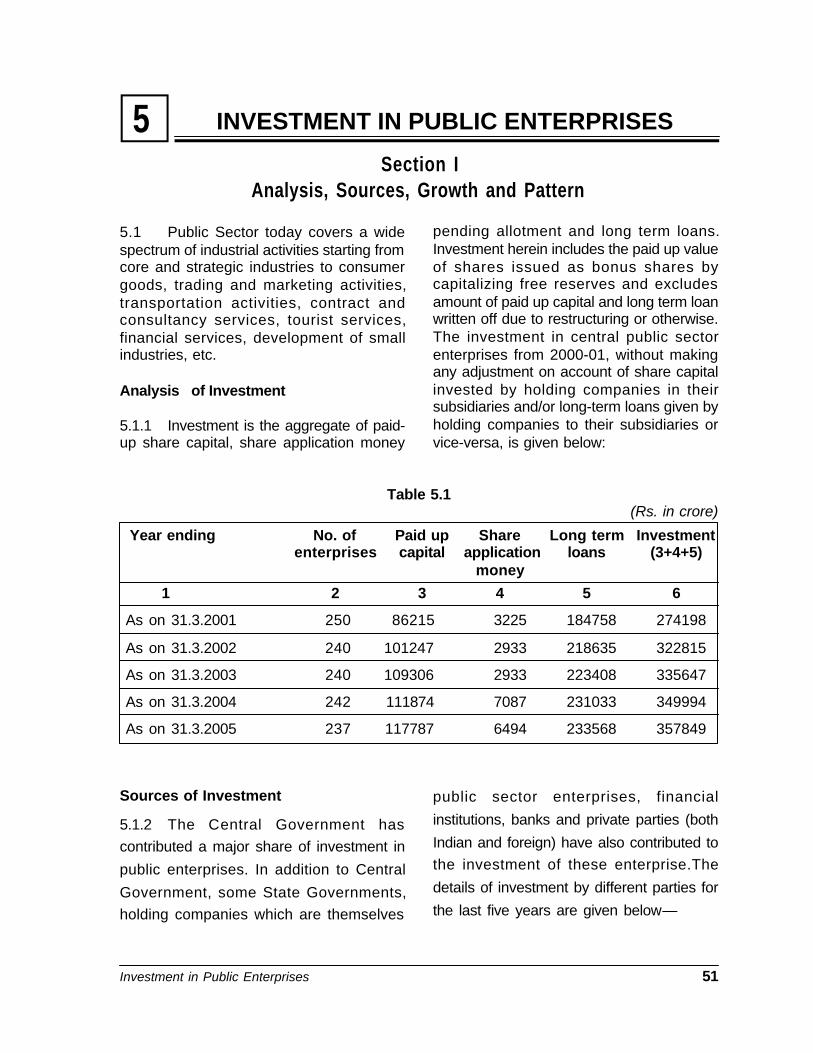
Investment in Public Enterprises 51 5 Section I Analysis, Sources, Growth and Pattern INVESTMENT IN PUBLIC ENTERPRISES pending allotment and long term loans. Investment herein includes the paid up value of shares issued as bonus shares by capitalizing free reserves and excludes amount of paid up capital and long term loan written off due to restructuring or otherwise. The investment in central public sector enterprises from 2000-01, without making any adjustment on account of share capital invested by holding companies in their subsidiaries and/or long-term loans given by holding companies to their subsidiaries or vice-versa, is given below: Table 5.1 (Rs. in crore) Year ending No. of Paid up Share Long term Investment enterprises capital application loans (3+4+5) money 1 2 3 4 5 6 As on 31.3.2001 250 86215 3225 184758 274198 As on 31.3.2002 240 101247 2933 218635 322815 As on 31.3.2003 240 109306 2933 223408 335647 As on 31.3.2004 242 111874 7087 231033 349994 As on 31.3.2005 237 117787 6494 233568 357849 Sources of Investment 5.1.2 The Central Government has contributed a major share of investment in public enterprises. In addition to Central Government, some State Governments, holding companies which are themselves public sector enterprises, financial institutions, banks and private parties (both Indian and foreign) have also contributed to the investment of these enterprise.The details of investment by different parties for the last five years are given below— 5.1 Public Sector today covers a wide spectrum of industrial activities starting from core and strategic industries to consumer goods, trading and marketing activities, transportation activities, contract and consultancy services, tourist services, financial services, development of small industries, etc. Analysis of Investment 5.1.1 Investment is the aggregate of paid- up share capital, share application money
-
Upload
khangminh22 -
Category
Documents
-
view
0 -
download
0
Transcript of INVESTMENT IN PUBLIC ENTERPRISES
Investment in Public Enterprises 51
5Section I
Analysis, Sources, Growth and Pattern
INVESTMENT IN PUBLIC ENTERPRISES
pending allotment and long term loans.Investment herein includes the paid up valueof shares issued as bonus shares bycapitalizing free reserves and excludesamount of paid up capital and long term loanwritten off due to restructuring or otherwise.The investment in central public sectorenterprises from 2000-01, without makingany adjustment on account of share capitalinvested by holding companies in theirsubsidiaries and/or long-term loans given byholding companies to their subsidiaries orvice-versa, is given below:
Table 5.1(Rs. in crore)
Year ending No. of Paid up Share Long term Investmententerprises capital application loans (3+4+5)
money
1 2 3 4 5 6
As on 31.3.2001 250 86215 3225 184758 274198
As on 31.3.2002 240 101247 2933 218635 322815
As on 31.3.2003 240 109306 2933 223408 335647
As on 31.3.2004 242 111874 7087 231033 349994
As on 31.3.2005 237 117787 6494 233568 357849
Sources of Investment
5.1.2 The Central Government hascontributed a major share of investment in
public enterprises. In addition to Central
Government, some State Governments,holding companies which are themselves
public sector enterprises, financial
institutions, banks and private parties (both
Indian and foreign) have also contributed tothe investment of these enterprise.The
details of investment by different parties for
the last five years are given below—
5.1 Public Sector today covers a widespectrum of industrial activities starting fromcore and strategic industries to consumergoods, trading and marketing activities,transportation activities, contract andconsultancy services, tourist services,financial services, development of smallindustries, etc.
Analysis of Investment
5.1.1 Investment is the aggregate of paid-up share capital, share application money

52 Public Enterprises Survey 2004-05 : Vol.-I
Table 5.2
SOURCES OF INVESTMENT(Rs. in crore)
Particulars Central State Holding Foreign FI/Banks Total Share TotalGovt. Govt. Company Parties & Others Application Investment
moneypending
allotment
(1) (2) (3) (4) (5) (6) (7) (8) (9)(2 to 6) (7+8)
As on 31.3.2001
Equity 71771 1368 9866 756 2454 86215
Loan 49068 21 13183 4657 117829 184758
Total 120839 1389 23049 5413 120283 270973 3225 274198
As on 31.3.2002
Equity 86444 1468 10329 575 2431 101247
Loan 56710 26 16018 33261 112620 218635
Total 143154 1494 26347 33836 115051 319882 4732 324614
As on 31.3.2003
Equity 91368 2542 11453 545 3398 109306
Loan 56699 10 21808 29835 115056 223408
Total 148067 2552 33261 30380 118454 332714 2933 335647
As on 31.3.2004
Equity 93415 3200 11154 767 3338 111874
Loan 50864 262 23675 27394 128838 231033
Total 144279 3462 34829 28161 132176 342907 7087 349994
As on 31.3.2005
Equity 98313 3113 11391 1421 3549 117787
Loan 36453 266 28722 28550 139577 233568
Total 134766 3379 40113 29971 143126 351355 6494 357849
Growth of Investment
5.1.3 The investment in public sectorenterprises has grown from Rs. 29 crore ason 1.4.1951 to Rs. 357849 crore as on
31.3.2005. The growth of investment in publicsector enterprises, including enterprisesunder construction, over the years is givenbelow—

Investment in Public Enterprises 53
Table 5.3
Growth in Investment
Particulars Total EnterprisesInvestment (Numbers)(Rs. crore)
At the commencement of the 1st Five Year Plan (1.4.1951) 29 5
At the commencement of the 2nd Five Year Plan (1.4.1956) 81 21
At the commencement of the 3rd Five Year Plan (1.4.1961) 948 47
At the end of 3rd Five Year Plan (31.3.1966) 2410 73
At the commencement of the 4th Five Year Plan (1.4.1969) 3897 84
At the commencement of the 5th Five Year Plan (1.4.1974) 6237 122
At the end of 5th Five Year Plan (31.3.1979) 15534 169
At the commencement of the 6th Five Year Plan (1.4.1980) 18150 179
At the commencement of the 7th Five Year Plan (1.4.1985) 42673 215
At the end of 7th Five Year Plan (31.3.1990) 99329 244
At the commencement of the 8th Five Year Plan (1.4.1992) 135445 246
At the end of 8th Five Year Plan (31.3.1997) 213610 242
At the end of 9th Five Year Plan (31.3.2002) 324614 240
As on 31.3.2003 335647 240
As on 31.3.2004 349994 242
As on 31.3.2005 357849 237
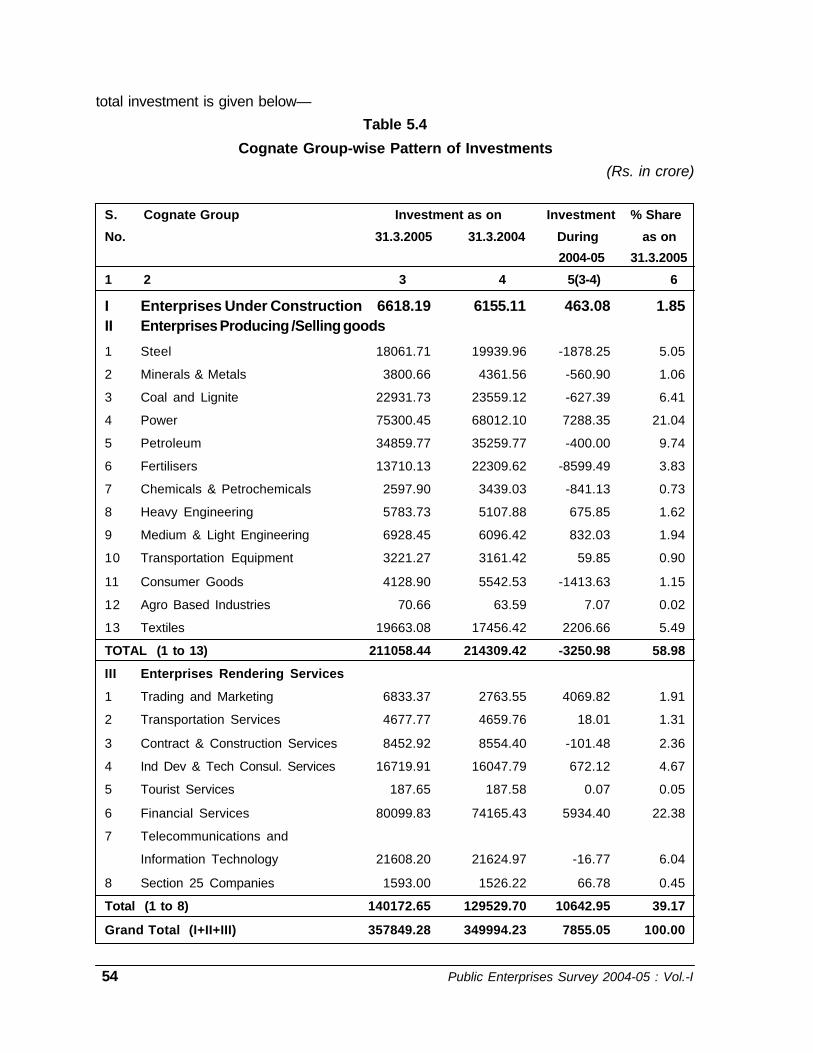
Pattern of Investment
5.1.4 The statement showing the totalinvestment for the last two years in various
cognate groups, changes in investmentduring the year and percentange share ofinvestment in each cognate group to the
54 Public Enterprises Survey 2004-05 : Vol.-I
total investment is given below—
Table 5.4
Cognate Group-wise Pattern of Investments
(Rs. in crore)
S. Cognate Group Investment as on Investment % Share
No. 31.3.2005 31.3.2004 During as on
2004-05 31.3.2005
1 2 3 4 5(3-4) 6
I Enterprises Under Construction 6618.19 6155.11 463.08 1.85II Enterprises Producing /Selling goods
1 Steel 18061.71 19939.96 -1878.25 5.05
2 Minerals & Metals 3800.66 4361.56 -560.90 1.06
3 Coal and Lignite 22931.73 23559.12 -627.39 6.41
4 Power 75300.45 68012.10 7288.35 21.04
5 Petroleum 34859.77 35259.77 -400.00 9.74
6 Fertilisers 13710.13 22309.62 -8599.49 3.83
7 Chemicals & Petrochemicals 2597.90 3439.03 -841.13 0.73
8 Heavy Engineering 5783.73 5107.88 675.85 1.62
9 Medium & Light Engineering 6928.45 6096.42 832.03 1.94
10 Transportation Equipment 3221.27 3161.42 59.85 0.90
11 Consumer Goods 4128.90 5542.53 -1413.63 1.15
12 Agro Based Industries 70.66 63.59 7.07 0.02
13 Textiles 19663.08 17456.42 2206.66 5.49
TOTAL (1 to 13) 211058.44 214309.42 -3250.98 58.98
III Enterprises Rendering Services
1 Trading and Marketing 6833.37 2763.55 4069.82 1.91
2 Transportation Services 4677.77 4659.76 18.01 1.31
3 Contract & Construction Services 8452.92 8554.40 -101.48 2.36
4 Ind Dev & Tech Consul. Services 16719.91 16047.79 672.12 4.67
5 Tourist Services 187.65 187.58 0.07 0.05
6 Financial Services 80099.83 74165.43 5934.40 22.38
7 Telecommunications and
Information Technology 21608.20 21624.97 -16.77 6.04
8 Section 25 Companies 1593.00 1526.22 66.78 0.45
Total (1 to 8) 140172.65 129529.70 10642.95 39.17
Grand Total (I+II+III) 357849.28 349994.23 7855.05 100.00
Investment in Public Enterprises 55
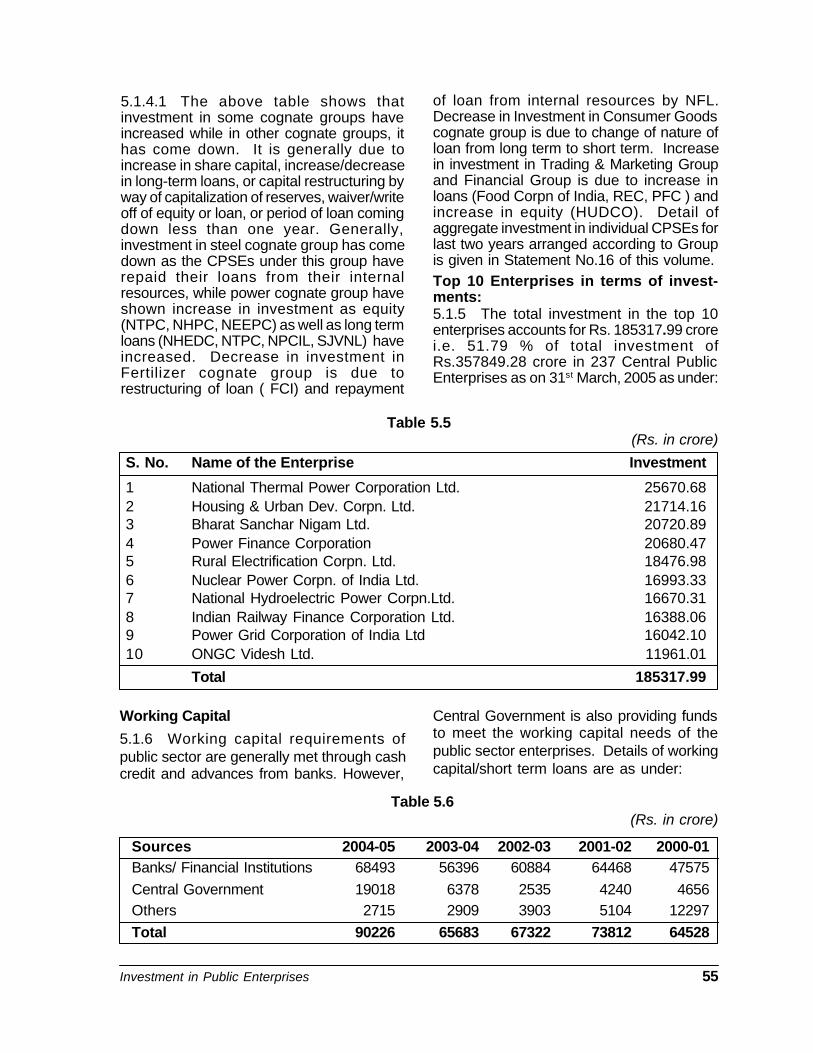
Table 5.5(Rs. in crore)
S. No. Name of the Enterprise Investment
1 National Thermal Power Corporation Ltd. 25670.682 Housing & Urban Dev. Corpn. Ltd. 21714.163 Bharat Sanchar Nigam Ltd. 20720.894 Power Finance Corporation 20680.475 Rural Electrification Corpn. Ltd. 18476.986 Nuclear Power Corpn. of India Ltd. 16993.337 National Hydroelectric Power Corpn.Ltd. 16670.318 Indian Railway Finance Corporation Ltd. 16388.069 Power Grid Corporation of India Ltd 16042.1010 ONGC Videsh Ltd. 11961.01
Total 185317.99
5.1.4.1 The above table shows thatinvestment in some cognate groups haveincreased while in other cognate groups, ithas come down. It is generally due toincrease in share capital, increase/decreasein long-term loans, or capital restructuring byway of capitalization of reserves, waiver/writeoff of equity or loan, or period of loan comingdown less than one year. Generally,investment in steel cognate group has comedown as the CPSEs under this group haverepaid their loans from their internalresources, while power cognate group haveshown increase in investment as equity(NTPC, NHPC, NEEPC) as well as long termloans (NHEDC, NTPC, NPCIL, SJVNL) haveincreased. Decrease in investment inFertilizer cognate group is due torestructuring of loan ( FCI) and repayment
of loan from internal resources by NFL.Decrease in Investment in Consumer Goodscognate group is due to change of nature ofloan from long term to short term. Increasein investment in Trading & Marketing Groupand Financial Group is due to increase inloans (Food Corpn of India, REC, PFC ) andincrease in equity (HUDCO). Detail ofaggregate investment in individual CPSEs forlast two years arranged according to Groupis given in Statement No.16 of this volume.Top 10 Enterprises in terms of invest-ments:5.1.5 The total investment in the top 10enterprises accounts for Rs. 185317.99 crorei.e. 51.79 % of total investment ofRs.357849.28 crore in 237 Central PublicEnterprises as on 31st March, 2005 as under:
Table 5.6(Rs. in crore)
Sources 2004-05 2003-04 2002-03 2001-02 2000-01Banks/ Financial Institutions 68493 56396 60884 64468 47575Central Government 19018 6378 2535 4240 4656Others 2715 2909 3903 5104 12297Total 90226 65683 67322 73812 64528
Working Capital
5.1.6 Working capital requirements ofpublic sector are generally met through cashcredit and advances from banks. However,
Central Government is also providing fundsto meet the working capital needs of thepublic sector enterprises. Details of workingcapital/short term loans are as under:
56 Public Enterprises Survey 2004-05 : Vol.-I
5.2 Under the Articles of Association, theBoard of Directors of PSEs enjoy certainamount of financial powers and autonomy inrespect of recruitment, promotion and otherservice conditions of below Board levelemployees. The Board of Directors of a PSEexercises the delegated powers subject tobroad policy guidelines issued byGovernment from time to time. TheGovernment have granted enhanced powersto the Boards of profit making enterprisesunder various schemes like Navratna andMiniratna.
5.2.1 Keeping in view the pledge made inthe National Common Minimum Programme(NCMP) that full managerial and commercialautonomy will be devolved to successful profitmaking companies operating in a competitiveenvironment, the Government have reviewedthe powers delegated to the Board ofDirectors of Navratna, Miniratna and otherprofit making PSEs and have decided inAugust, 2005 to enhance the powers.
Navratna scheme
5.2.2 Under this scheme, the Governmenthas delegated higher powers to PSEs havingcomparative advantage and the potential tobecome global players. The Navratna PSEsare:
(i) Bharat Heavy Electricals Ltd.
(ii) Bharat Petroleum Corporation Ltd.
(iii) GAIL (India) Ltd.
(iv) Hindustan Petroleum CorporationLtd.
(v) Indian Oil Corporation Ltd.
(vi) Mahanagar Telephone Nigam Ltd.
(vii) National Thermal Power CorporationLtd.
(viii) Oil & Natural Gas Corporation Ltd.
(ix) Steel Authority of India Ltd.
5.2.2.1 The powers presently delegated tothe Boards of Navratna PSEs are as under: -
(a) To incur capital expenditure on purchaseof new items or for replacement, withoutany monetary ceiling.
(b) To enter into technology joint ventures orstrategic alliances.
(c) To obtain by purchase or otherarrangements, technology and know-how.
(d) To effect organisational restructuringincluding establishment of profit centres,opening of offices in India and abroad,creating new activity centres, etc.
(e) Creation and winding up of all postsincluding and upto those of non-Boardlevel Directors, i.e., Functional Directorswho may have the same pay-scales asthat of Board level Directors, but whowould not be members of the Board. Allappointments upto this level would alsobe in the powers of the Boards andwould include the power to effect internaltransfers and re-designation of posts.
(f) The Board of Directors of these PSEshave the power to further delegate thepowers relating to Human ResourceManagement (appointments, transfer,posting, etc.) of below Board levelexecutives to sub-committees of theBoard or to executives of the PSE, asmay be decided by the Board of thePSE.
(g) To raise debt from the domestic capitalmarkets and for borrowings frominternational market, which would besubject to the approval of RBI/Department of Economic Affairs as maybe required and should be obtainedthrough the administrative Ministry.
(h) To establish financial joint ventures andwholly owned subsidiaries in India or
Section-II
DELEGATION OF ENHANCED FINANCIAL POWERS TO CPSEs

Investment in Public Enterprises 57
abroad with the stipulation that the equityinvestment of the PSE should be limitedto the following: -
i. Rs. 1000 crore in any one project,
ii. 15% of the networth of the PSEin one project,
iii. 30% of the networth of the PSEin all joint ventures/ subsidiariesput together.
(i) Mergers and acquisitions, subject to theconditions that (i) it should be as per thegrowth plan and in the core area offunctioning of the PSE, (ii) conditions/limits would be as in the case ofestablishing joint ventures/subsidiaries,and (iii) the Cabinet Committee onEconomic Affairs would be keptinformed in case of investments abroad.
(j) To approve business tours abroad offunctional directors up to 5 days’duration (other than study tours,seminars, etc.) in emergency, by theChief Executive of the PSE underintimation to the Secretary of theadministrative Ministry. In all other casesincluding those of Chief Executive, toursabroad would continue to require theprior approval of the Minister of theAdministrative Ministry/ Department
5.2.2.2 The above mentioned delegation issubject to the following conditions andguidelines:-
a) The proposals must be presented to theBoard of Directors in writing andreasonably well in advance, with ananalysis of relevant factors andquantification of the anticipated resultsand benefits. Risk factors, if any, mustbe clearly brought out.
b) The Government Directors, the FinancialDirectors and the concerned FunctionalDirector(s) must be present when majordecisions are taken, especially whenthey pertain to investments, expenditureor organizational/ capital restructuring.
c) The decisions on such proposals shouldpreferably be unanimous.
d) In the event of any decision on importantmatters not being unanimous, a majoritydecision may be taken, but at least twothirds of the Directors should be present,including those mentioned above, whensuch a decision is taken. The objections,dissents, the reasons for over-rulingthem and those for taking the decisionshould be recorded in writing andminuted.
e) No financial support or contingent liabilityon the part of the Government shouldbe involved.
f) These PSEs will establish transparentand effective systems of internalmonitoring, including the establishmentof an Audit Committee of the Board withmembership of non-official Directors.
g) All the proposals, where they pertain tocapital expenditure, investment or othermatters involving substantial financial ormanagerial commitments or where theywould have a long term impact on thestructure and functioning of the PSE,should be prepared by or with theassistance of professionals and expertsand should be appraised, in suitablecases, by financial institutions or reputedprofessional organizations withexpertise in the areas. The financialappraisal should also preferably bebacked by an involvement of theappraising institutions through loans orequity participation.
h) The exercise of authority to enter intotechnology joint ventures and strategicalliances shall be in accordance with theGovernment guidelines as may beissued from time to time.
i) The Boards of these PSEs should berestructured by inducting at least fournon-official Directors as the first stepbefore the exercise of the enhanceddelegation of authority.
j) These public sector enterprises shall not

58 Public Enterprises Survey 2004-05 : Vol.-I
depend upon budgetary support orGovernment guarantees. The resourcesfor implementing their programmesshould come from their internalresources or through other sources,including the capital markets.
Miniratna scheme
5.2.3 In October 1997, the Governmenthad also decided to grant enhancedautonomy and delegation of financial powersto some other profit making companiessubject to certain eligibility conditions andguidelines to make them efficient andcompetitive. These companies, calledMiniratnas, are in two categories, namely,Category- I and Category-II. The eligibilityconditions and criteria are:
(i) Category-I PSEs should have madeprofit in the last three years continuously,the pre-tax profit should have beenRs.30 crores or more in at least one ofthe three years and should have apositive net worth.
(ii) Category-II PSEs should have madeprofit for the last three yearscontinuously and should have a positivenet worth.
(iii) These PSEs shall be eligible for theenhanced delegated powers providedthey have not defaulted in therepayment of loans/interest payment onany loans due to the Government.
(iv) These public sector enterprises shall notdepend upon budgetary support orGovernment guarantees.
(v) The Boards of these PSEs should berestructured by inducting at least threenon-official Directors as the first stepbefore the exercise of enhanceddelegation of authority.
(vi) The administrative Ministry concernedshall decide whether a Public SectorEnterprise fulfilled the requirements ofa Category-I/Category-II companybefore the exercise of enhancedpowers.
5.2. 3.1 Presently there are 44 MiniratnaPSEs. Their names are as under:
Category-I
1. Bharat Dynamics Ltd.
2. Bharat Electronics Ltd.
3. Bongaigaon Refinery & PetrochemicalsLtd.
4. Central Warehousing Corporation
5. Chennai Petroleum Corporation Ltd.
6. Container Corporation of India Ltd.
7. Dredging Corporation of India Ltd.
8. Engineers India Ltd.
9. Hindustan Aeronautics Ltd.
10. Hindustan Newsprint Ltd.
11. Housing & Urban DevelopmentCorporation Ltd.
12. India Tourism Development CorporationLtd.
13. IRCON (International) Ltd.
14. Kochi Refineries Ltd.
15. Kudremukh Iron Ore Company Ltd.
16. M M T C Ltd.
17. National Aluminium Company Ltd.
18. National Fertilizers Ltd.
19. National Mineral DevelopmentCorporation Ltd.
20. Neyveli Lignite Corporation Ltd.
21. Numaligarh Refinery Ltd.
22. Oil India Ltd.
23. Power Finance Corporation Ltd.
24. Power Grid Corporation Ltd.
25. Rashtriya Chemicals & Fertilizers Ltd.
26. Rural Electrification Corporation Ltd.
27. Shipping Corporation of India Ltd.
28. State Trading Corporation of India Ltd.
29. Telecommunications Consultants (India)Ltd.
Investment in Public Enterprises 59
Category-II1. Balmer Lawrie & Co. Ltd.
2. Educational Consultants (India) Ltd.3. Ferro Scrap Nigam Ltd.
4. HMT (International) Ltd.5. Hospital Services Consultancy
Corporation (I) Ltd.6. India Trade Promotion Organisation.7. Indian Medicines Pharmaceuticals
Corporation Ltd.8. M S T C Ltd.
9. Manganese Ore India Ltd.10. M E C O N Ltd.
11. National Film Development CorporationLtd.
12. P E C Ltd.13. Rajasthan Electronics & Instruments Ltd.14. R I T E S Ltd.
15. Water & Power Consultancy Services(India) Ltd.
5.2.3.2 The delegation of decision-makingauthority available at present to the Boardsof these PSEs is as follows:
(i) Capital Expenditure
(a) For PSEs in category I: The powerto incur capital expenditure on newprojects, modernization, purchaseof equipment, etc., withoutGovernment approval upto Rs. 500crore or equal to net worth,whichever is less.
(b) For PSEs in category II: The powerto incur capital expenditure on newprojects, modernization, purchaseof equipment, etc., withoutGovernment approval upto Rs. 250crore or equal to 50% of the Networth, whichever is less.
(ii) Joint ventures and subsidiaries:
(a) Category I PSEs: To establish jointventures and subsidiaries in Indiawith the stipulation that the equity
investment of the PSE in any oneproject should be limited to 15% ofthe networth of the PSE or Rs. 500crore, whichever is less. The overallceiling on such investment in allprojects put together is 30% of thenetworth of the PSE.
(b) Category II PSEs: To establish jointventures and subsidiaries in Indiawith the stipulation that the equityinvestment of the PSE in any oneproject should be 15% of thenetworth of the PSE or Rs. 250crore, whichever is less. The overallceiling on such investment in allprojects put together is 30% of thenetworth of the PSE.
(iii) Mergers and acquisitions
The Board of Directors of these PSEshave the powers for mergers andacquisitions, subject to the conditionsthat (i) it should be as per the growthplan and in the core area of functioningof the PSE, (ii) conditions/limits wouldbe as in the case of establishing jointventures/subsidiaries, and (iii) theCabinet Committee on Economic Affairswould be kept informed in case ofinvestments abroad.
(iv) Scheme for HRD
To structure and implement schemesrelating to personnel and humanresource management, training,voluntary or compulsory retirementschemes, etc. The Board of Directors ofthese PSEs have the power to furtherdelegate the powers relating to HumanResource Management (appointments,transfer, posting, etc.) of below Boardlevel executives to sub-committees ofthe Board or to executives of the PSE,as may be decided by the Board of thePSE.
(v) Tour abroad of functional Directors
The Chief Executive of the PSE havethe power to approve business tours

60 Public Enterprises Survey 2004-05 : Vol.-I
abroad of functional directors up to 5days’ duration (other than study tours,seminars, etc.) in emergency, underintimation to the Secretary of theadministrative Ministry. In all other casesincluding those of Chief Executive, toursabroad would continue to require theprior approval of the Minister of theAdministrative Ministry/ Department.
(vi) Technology Joint Ventures andStrategic Alliances
To enter into technology jointventures, strategic alliances and to obtaintechnology and know-how by purchase orother arrangements, subject to Governmentguidelines as may be issued from time totime.
5.2.3.3 The above delegation of powers issubject to similar conditions as are applicableto Navratna PSEs.
Other profit making PSEs
5.2.4 Those PSEs which have shown aprofit in each of the 3 preceding accountingyears and have a positive net worth arecategorized as ‘other profit making PSEs’ andhave been delegated enhanced powers asunder:-
(i) The power to incur capital expenditurewithout Government approval standsrevised to Rs. 150 crore or equal to 50%of the Net worth, whichever is less.
(ii) The Chief Executive of the PSE shallhave the power to approve businesstours abroad of functional directors upto 5 days’ duration (other than studytours, seminars, etc.) in emergency,under intimation to the Secretary of theadministrative Ministry. In all other casesincluding those of Chief Executive, toursabroad would continue to require theprior approval of the Minister of theAdministrative Ministry/ Department.
5.2.4.1 The delegation is subject to thefollowing conditions:
(a) inclusion of the project in theapproved Five Year and AnnualPlans and outlays provided for.
(b) The required funds can be foundfrom the internal resources of thecompany and extra budgetaryresources (EIBR) and theexpenditure is incurred on schemesincluded in the capital budgetapproved by the Government.

Disinvestment 61
DISINVESTMENT66.1 The policy of the Government onDisinvestment has evolved over a period oftime.The National Common MinimumProgramme (NCMP) outlines the presentpolicy of the Government with respect to thePublic Sector, including disinvestment ofGovernment's equity in Central Public SectorEnterprises (CPSEs). The salient features ofthe policy as laid down in NCMP are asfollows:-
• “The Government is committed to astrong and effective public sectorwhose social objectives are met by itscommercial functioning.
• The Government is pledged to devolvefull managerial and commercialautonomy to successful, profit-makingcompanies operating in a competitiveenvironment.
• Generally profit making companies willnot be privatised.
• All privatisations will be considered ona transparent and consultative case-by-case basis.
• The Government will retain existing“navaratna” companines in the publicsector while these companies raiseresources from the capital market.
• While every effort will be made tomodernize and restructure sick publicsector comapnies and revive sickindustry, chronically loss-makingcompanies will either be sold-off, orclosed, after all workers have got theirlegitimate dues and compensation.
• The Government will induct privateindustry to turn around companies thathave potential for revival.
• The Governement believes thatprivatisation should increasecompetition, not decrease it. It will notsupport the emergence of anymonopoly that only restrictscompetition. It also believes that theremust be a direct link betweenprivatisation and social needs—like, forexample, the use of privatisationrevenues for designated socialschemes. Public sector companies andnationalised banks will be encouragedto enter the capital market to raiseresources and offer new investmentavenues to retail investors.”
6.2 The chronology of evolution of policyon disinvestment since 1991-1992 is givenin Annexure-I. Disinvestment ofGovernment equity in Public Sector beganin 1991-92.Till 1999-2000, it was primarilythrough sale of minority shares in small lots.From 1999-2000 till 2003-2004, theemphasis of disinvestment changed infavour of Strategic Sale. At present, theemphasis is to list, large, profitable CPSEson domestic stock exchanges and toselectively sell small portions of equity inlisted, profitable CPSEs (other than thenavratnas).
6.3 The proceeds from disinvestmentfrom April, 1991 to November, 2005amounted to Rs.47,671.62 crore. Details ofthe annual realisation and themethodologies adopted are given inAnnexure-II.

62 Public Enterprises Survey 2004-05 : Vol.-I
6.4 The Ministry of Industry (Department
of Public Enterprises) vide a resolution dated23rd August,1996, constituted a Public
Sector Disinvestment Commission for a
period of three years. The term was furtherextended till 30th November,1999. The
Commission submitted its reports on 58
PSEs. The Commission was reconstituted inJuly, 2001 for a period of two years. The
term of this Commission was subsequently
extended till October,2004. Thereconstituted Commission submitted its
Reports on 41 PSEs, including review cases
of earlier Commission’s recommendationson 4 PSEs. The term of the Commission
expired on 31st October, 2004 and it has
been wound up.

Disinvestment 63
Annexure-1
Chronology of the evolution of the policy on disinvestment since 1991-92
Date Event
1991-92 Interim Budget Government announced its intention to divest upto 20%of Government equity in slected PSEs in favour of publicsector institutional investos.
Industrial Policy Statement In the case of selected enterprises, part of Governmentdated 24.7.1991 holdings in the equity share capital of the enterprises
will be disinvested in order to provide further marketdiscipline to the performance of public enterprises.
Rangarajan Committee-April,1993 It emphasized the need for substantial disinvestmentand stated that while the percentage of equity to bedivested should be not more than 49% for industiresexplicity reserved for the public sector, it should beeither 74% or 100% for others.
Budget speech-1998-1999 “Government have also decided that in the generalityof cases, the Government shareholding in public sectorenterprises will be brought down to 26 per cent. In casesof public sector enterprises involving strategicconsiderations, Government will continue to retainmajority holding. The interest of workers shall beprotected in all cases.”
Budget speech-1999-2000 “Government strategy towards public sector enterpriseswill continue to encompass a judicious mix ofstrengthening strategic units, privatising non-strategicones through gradual disinvestment of strategic saleand devising viable rehabilitation strategies for weakunits.”
Cabinet decision dated 16.3.1999 Public Sector Enterprises (PSEs) have been classifiedinto strategic and non-strategic areas for the purposeof disinvestment.
Strategic PSEs would be those in the areas of:
(a) Arms and ammunitions and the allied items ofdefence equipment, defence air-crafts and warships;
(b) Atomic engery (except in the areas related to theoperation of nuclear power and applications of radiationand radio-isotopes to agriculture medicine and non-strategic industries);

64 Public Enterprises Survey 2004-05 : Vol.-I
(c) Railway transport
All other PSEs were to be considered as non-strategic.For the non-strategic PSEs, it was decided that thereduction of Government stake to 26% would not beautomatic.
Decision in regard to the percentage of disinvestmenti.e., Goverment’s stake going down to less than 51%or to 26% would be taken on the followingconsiderations :
a) Whether the industrial sector requires the presenceof the public sector as a countervailing force to preventconcentration of power in private hands; and
b) Whether the industrial sector requires a properregulatory mechanism to protect the cosumer interestbefore Public Sector Enterprises are privatised.
Budget speech 2000-2001 Government announced its decision to reduce its stakein the non-strategic PSEs even below 26%, ifnecessary. There would be increasing emphasis onstrategic sale and the entire proceeds fromdisinvestment/privatisation would be deployed in socialsector, restructuring of PSEs and retirement of publicdebts.
Decision dated 23.6.2000 In order to secure the presence of the public sector asa Countervailing force, the Government took thedecision of not going for disinvestment of GAIL, IOC andONGC, and retaining them as flagship companies.
Decision dated 7.9.2002 Central Public Sector Enterprises (PSEs), CentralGovernment owned Cooperative Societies (whereGovernment’s ownership is 51% or more) should not bepermitted to participate in the disinvestment of otherPSEs as bidder. If in some specific cases any deviationfrom these restrictions is considered desirable in publicinterest. the Ministry/Department may bring anappropriate proposal for consideration of the CoreGroup of Secretaries on Disinvestment.
Budget Speech 2003-04 Details about the already announced DisinvestmentFund and Asset Management company, to hold residualshares post disinvestment, shall be finalised early in2003-04.
Disinvestment 65
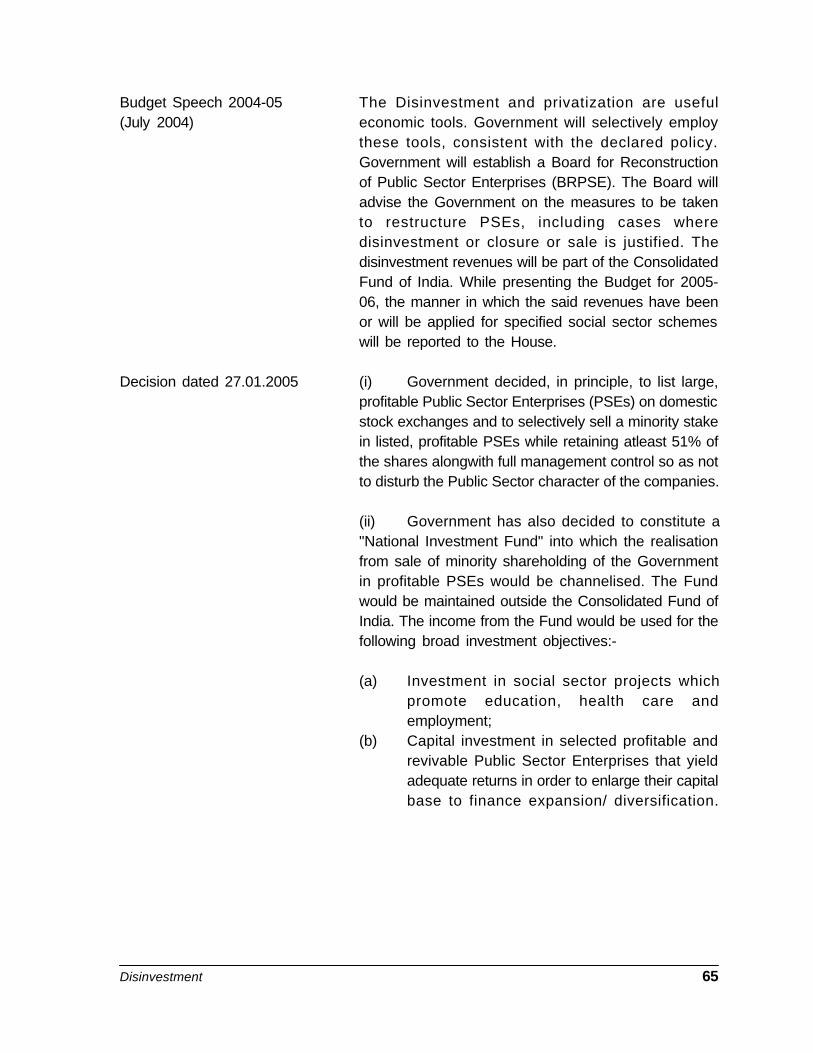
Budget Speech 2004-05 The Disinvestment and privatization are useful(July 2004) economic tools. Government will selectively employ
these tools, consistent with the declared policy.Government will establish a Board for Reconstructionof Public Sector Enterprises (BRPSE). The Board willadvise the Government on the measures to be takento restructure PSEs, including cases wheredisinvestment or closure or sale is justified. Thedisinvestment revenues will be part of the ConsolidatedFund of India. While presenting the Budget for 2005-06, the manner in which the said revenues have beenor will be applied for specified social sector schemeswill be reported to the House.
Decision dated 27.01.2005 (i) Government decided, in principle, to list large,profitable Public Sector Enterprises (PSEs) on domesticstock exchanges and to selectively sell a minority stakein listed, profitable PSEs while retaining atleast 51% ofthe shares alongwith full management control so as notto disturb the Public Sector character of the companies.
(ii) Government has also decided to constitute a"National Investment Fund" into which the realisationfrom sale of minority shareholding of the Governmentin profitable PSEs would be channelised. The Fundwould be maintained outside the Consolidated Fund ofIndia. The income from the Fund would be used for thefollowing broad investment objectives:-
(a) Investment in social sector projects whichpromote education, health care andemployment;
(b) Capital investment in selected profitable andrevivable Public Sector Enterprises that yieldadequate returns in order to enlarge their capitalbase to finance expansion/ diversification.

66 Public Enterprises Survey 2004-05 : Vol.-I
Annexure-IISummary of disinvestment target and realisation since 1991-92 and the methodologies adopted
Year No. of Budgeted Receipts Receipts Receipts Total Main transactionstransa- receipt through sale through sale through receiptsctions (Rs. crore) of residual/ of shares Strategic (Rs.
minority shares to CPSEs sale crore)(Rs. crore) (Rs. crore) (Rs. crore)
1991-92 47 2500 3037.74 0.00 0.00 3037.74 Minority shares sold in Dec 1991 andFeb 1992 by auction method in bundlesof “very good”, “good” and “average”companies
1992-93 29 2500 1912.42 0.00 0.00 1912.42 Shares sold separately for eachcompany by auction method.
1993-94 - 3500 0.00 0.00 0.00 0.00 Equity of 6 companies sold by openauction but proceeds received in 94-95.
1994-95 17 4000 4843.10 0.00 0.00 4843.10 Shares sold by auction method.1995-96 4 7000 168.48 0.00 0.00 168.48 Shares sold by auction method.1996-97 1 5000 379.67 0.00 0.00 379.67 GDR -VSNL in international market.1997-98 1 4800 910.00 0.00 0.00 910.00 GDR -MTNL in international market.1998-99 5 5000 5371.11 0.00 0.00 5371.11 GDR-VSNL; Domestic offerings of
CONCOR and GAIL; Cross purchase by3 Oil sector companies i.e. GAIL, ONGCand IOC.
1999-00 5 10000 1479.27 0.00 380.87 1860.14 GDR-GAIL; Domestic offering of VSNL;capital restructuring of BALCO; Strategicsale of MFIL.
2000-01 5 10000 0.00 1317.23 554.03 1871.26 Strategic sale of BALCO and LJMC;Sale of KRL, CPCL and BRPL toCPSEs.
2001-02 8 12,000 0.00 0.00 5657.44 5657.44 Strategic sale of CMC, HTL, VSNL, IBP,PPL and sale of hotel properties of ITDC& HCI; Special dividend from STC andMMTC; sale of shares to VSNLemployees.
2002-03 8 12,000 0.00 0.00 3347.98 3347.98 Strategic sale of HZL, IPCL, and sale ofhotel properties of HCI & ITDC; Controlpremium from renunciation of rightsissue from MUL; Put Option of MFIL;sale of shares to employees of HZL andCMC.
2003-04 2 14,500 15205.35 0.00 342.06 15547.41 Strategic sale of JCL; Call Option of HZL;IPO / Offer for Sale of MUL, IBP IPCL,CMC, DCI, GAIL and ONGC; Sale ofshares of ICI Ltd.
2004-05 3 4,000 2700.06 0.00 64.81 2764.87 Offer for Sale of NTPC; sale of sharesto IPCL employees etc.
Total 96800 36007.20 1317.23 10347.19 47671.62
Generation of Internal Resources by Public Enterprises 67
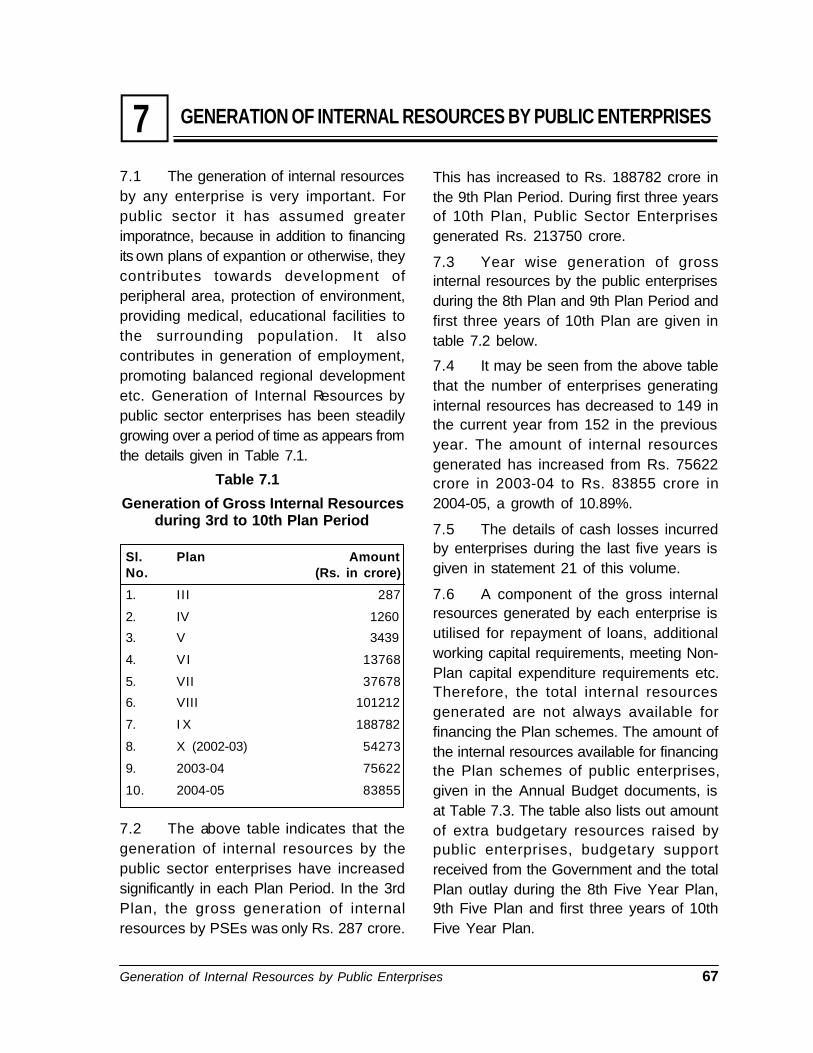
GENERATION OF INTERNAL RESOURCES BY PUBLIC ENTERPRISES77.1 The generation of internal resourcesby any enterprise is very important. Forpublic sector it has assumed greaterimporatnce, because in addition to financingits own plans of expantion or otherwise, theycontributes towards development ofperipheral area, protection of environment,providing medical, educational facilities tothe surrounding population. It alsocontributes in generation of employment,promoting balanced regional developmentetc. Generation of Internal Resources bypublic sector enterprises has been steadilygrowing over a period of time as appears fromthe details given in Table 7.1.
Table 7.1
Generation of Gross Internal Resourcesduring 3rd to 10th Plan Period
Sl. Plan AmountNo. (Rs. in crore)
1. III 287
2. IV 1260
3. V 3439
4. VI 13768
5. VII 37678
6. VIII 101212
7. I X 188782
8. X (2002-03) 54273
9. 2003-04 75622
10. 2004-05 83855
7.2 The above table indicates that thegeneration of internal resources by thepublic sector enterprises have increasedsignificantly in each Plan Period. In the 3rdPlan, the gross generation of internalresources by PSEs was only Rs. 287 crore.
This has increased to Rs. 188782 crore inthe 9th Plan Period. During first three yearsof 10th Plan, Public Sector Enterprisesgenerated Rs. 213750 crore.
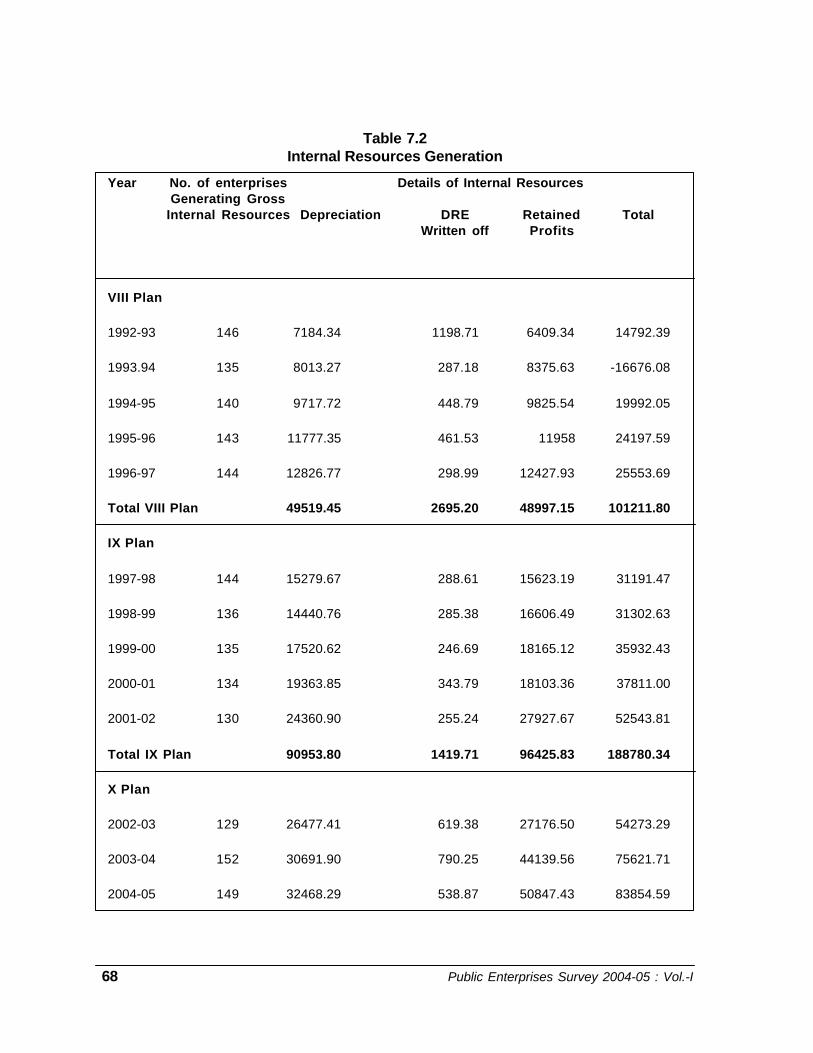
7.3 Year wise generation of grossinternal resources by the public enterprisesduring the 8th Plan and 9th Plan Period andfirst three years of 10th Plan are given intable 7.2 below.
7.4 It may be seen from the above tablethat the number of enterprises generatinginternal resources has decreased to 149 inthe current year from 152 in the previousyear. The amount of internal resourcesgenerated has increased from Rs. 75622crore in 2003-04 to Rs. 83855 crore in2004-05, a growth of 10.89%.
7.5 The details of cash losses incurredby enterprises during the last five years isgiven in statement 21 of this volume.
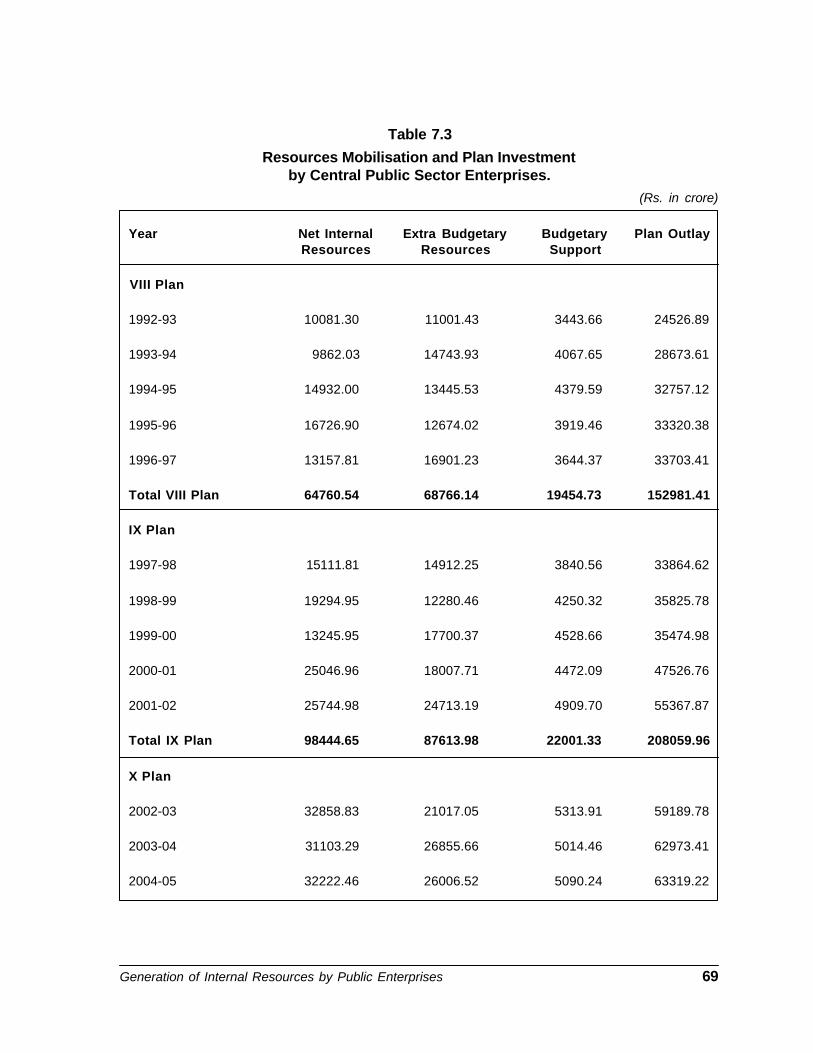
7.6 A component of the gross internalresources generated by each enterprise isutilised for repayment of loans, additionalworking capital requirements, meeting Non-Plan capital expenditure requirements etc.Therefore, the total internal resourcesgenerated are not always available forfinancing the Plan schemes. The amount ofthe internal resources available for financingthe Plan schemes of public enterprises,given in the Annual Budget documents, isat Table 7.3. The table also lists out amountof extra budgetary resources raised bypublic enterprises, budgetary supportreceived from the Government and the totalPlan outlay during the 8th Five Year Plan,9th Five Plan and first three years of 10thFive Year Plan.
68 Public Enterprises Survey 2004-05 : Vol.-I
Table 7.2Internal Resources Generation
Year No. of enterprises Details of Internal ResourcesGenerating Gross
Internal Resources Depreciation DRE Retained TotalWritten off Profits
VIII Plan
1992-93 146 7184.34 1198.71 6409.34 14792.39
1993.94 135 8013.27 287.18 8375.63 -16676.08
1994-95 140 9717.72 448.79 9825.54 19992.05
1995-96 143 11777.35 461.53 11958 24197.59
1996-97 144 12826.77 298.99 12427.93 25553.69
Total VIII Plan 49519.45 2695.20 48997.15 101211.80
IX Plan
1997-98 144 15279.67 288.61 15623.19 31191.47
1998-99 136 14440.76 285.38 16606.49 31302.63
1999-00 135 17520.62 246.69 18165.12 35932.43
2000-01 134 19363.85 343.79 18103.36 37811.00
2001-02 130 24360.90 255.24 27927.67 52543.81
Total IX Plan 90953.80 1419.71 96425.83 188780.34
X Plan
2002-03 129 26477.41 619.38 27176.50 54273.29
2003-04 152 30691.90 790.25 44139.56 75621.71
2004-05 149 32468.29 538.87 50847.43 83854.59
Generation of Internal Resources by Public Enterprises 69
Table 7.3
Resources Mobilisation and Plan Investmentby Central Public Sector Enterprises.
(Rs. in crore)
Year Net Internal Extra Budgetary Budgetary Plan OutlayResources Resources Support
VIII Plan
1992-93 10081.30 11001.43 3443.66 24526.89
1993-94 9862.03 14743.93 4067.65 28673.61
1994-95 14932.00 13445.53 4379.59 32757.12
1995-96 16726.90 12674.02 3919.46 33320.38
1996-97 13157.81 16901.23 3644.37 33703.41
Total VIII Plan 64760.54 68766.14 19454.73 152981.41
IX Plan
1997-98 15111.81 14912.25 3840.56 33864.62
1998-99 19294.95 12280.46 4250.32 35825.78
1999-00 13245.95 17700.37 4528.66 35474.98
2000-01 25046.96 18007.71 4472.09 47526.76
2001-02 25744.98 24713.19 4909.70 55367.87
Total IX Plan 98444.65 87613.98 22001.33 208059.96
X Plan
2002-03 32858.83 21017.05 5313.91 59189.78
2003-04 31103.29 26855.66 5014.46 62973.41
2004-05 32222.46 26006.52 5090.24 63319.22

70 Public Enterprises Survey 2004-05 : Vol.-I
PRICING POLICY IN PUBLIC ENERPRISES8A. PRICING POLICY
8.1 The investment policy of theGovernment aims at channelising publicinvestment in basic and infrastructural sectorand for continuing with the provisions ofessential commodities. The pricing policiesin the Central Public Sector Enterprises(CPSEs) are therefore, interlinked with theinvestment policies. Another dimension ofthe pricing policy is to create a balancebetween the social obectives of theseenterprises and their commercial viabilityand also the overall economic policies of theGovernment.
8.2. It has been accepted principle thatprices of products produced and servicesrendered by public enterprises should be sodetermined that at a satisfactory level ofcapacity utilization these enterprises not onlycover their costs of production, but alsogenerate a reasonable amount of surplus.This will assist in capital formation andenable redeployment of the capital forfurther strengthening of economic and socialinfrastructure. In this sense, product makingin public enterprises is not quite inconsistentwith the public purpose. It is theGovernment’s expectation that with themassive investment in the public sectorenterprises, these enterprises do not at anystage erode the resources base, butstrengthen it. It is therefore, recognized thatsubect to the total overall impact of certainproduct prices on the economy, theproducers in the public sector shouldgenerally have proper control in determiningthe prices of their commodities.
8.3. However with the dismantling ofadministered price mechanism, opening up
various sectors for private partipation andglobalisation of Indian economy, prices ofproducts and service in public sector alsoare generally determined by market forcesThe CPSEs have to compete with othercompanies in India as well as abroad.Indiviual CPSE, are generally fix price fortheir products & services on their ownexcept for certain sectors details of whichare given in subsequent para's.
8.4 Govt. of India has evolved pricingpolicies in respect of certain sectors. Thesepolicies are applicable to public sector aswell as private sector and are discussedbelow:
(i) AGRICULTURE
8.4.1 Agriculutural products comprise bothfood grains and industrial raw materials. Thestress is on adoption of a pricing policywhich will provide a minimum fair return tothe producers, reduce fluctuations in pricesand achieve an equitable distribution ofessential consumer goods. An efficientpublic distribution system is an essentialingredient to ensure that this pricing strategyworks equitably. Under this policy, Govt. ofIndia fixes Minimum Support Prices (MSP)in respect of major food grains and industrialraw materials on the recommendation of theCommission on Agricultural Costs Prices(CACP). At the same time, Governmentensures supply of major food grains toweaker sections of society at reasonablerates through public distribuition system.Food Corporation of India implementprocurement and public distributution policyfor food grains while jute Corporation ofIndia and Cotton Corporation Indiaimplement MSP policy for jute and cottonrespectively.
Socio-Economic and Welfare Measures 71
ii) COAL
8.4.2 The pricing of coal has beencompletely deregulated after Colliery ControlOrder, 1945. Under the Colliery ControlOrder, 2000, the Central Government has nopower to fix the prices of coal and the coalcompanies themselves are competent to fixgrade-wise prices for coal produced by thembased on marketing economics.
(iii) FERTILIZERS
8.4.3 At present, only urea, which is themain nitrogenous fertilizer constituting about60% of the total fertilizer consumption in thecountry, is under statutory price and partialdistribution control. Urea is sold/madeavailable to the farmers at statutory notifiedsale price. All other varieties of fertilizerswere removed from price and distributioncontrol between August '92 and June '94.However, Government of India still indicatesthe MRP in respect of major phosphatic andcomplex fertilizers, namely Di-AmmoniumPhosphate (DAP), Muriate of Potash (MOP)and Complex Fertilizers. The MRP for SingleSupper Phosphates (SSP) are indicated bythe respective State Government. Thestatutorily notified sale price and indicativeMRP is generally kept less than the cost ofproduction of the respective manufacturingunit. The difference between the cost ofproduction and the selling price/MRP is paidas subsidy/concession to manufacturers. Asthe consumer prices of both indigenous andimported fertilizers are fixed uniformly,financial support is also given on importedurea and decontrolled phosphatic andpotassic fertilizers.
(iv) STEEL
8.4.4 Prices of steel products have beenfully decontrolled and the Central PublicSector Enterprises (CPSEs) are free to8determine prices of their products/servicesbased on free interplay to market forces.
However, the Government, through its policyinnitiatives attempts to ensure adequateavailability of Steel in the domestic marketand a stable price regime.
(v) PETROLEUM PRODUCTS
8.4.5 Effective from 1/4/02, pricing ofpetroleum products except for PDSKerosene and domestic LPG, has becomemarket determined. As per the decisiontaken at the time of announcement of APMdismantling, post APM Governmentsubsidies on PDS Kerosene and DomesticLPG were to be on flat rates basis to beprovided from the fiscal budget and afterproviding for this subsidy, the retail priceswere to vary as per changes in theinternational prices. These subsidies were tobe phased out in three to five years effectivefrom 1/4/2002. The subsidies from fiscalbudget were based on international pricesof Kerosene and LPG prevailing in Arab Gulfmarket during the month of March, 2002, i.e.$23.65 per barrel and $194 per MTrespectively. At present subsidy is beingallowed at the rate of Rs. 22.58 per cylinderand Rs. 0.82 per litre in respect of LPG(Domestic) and SKO(PDS) respectively.
8.4.5.1 The financial year 2004-05 witnessedsharp and spiraling increase in internationalprices of Crude Oil and petroleum products.There was a severe escalation in prices ofCrude Oil and Petroleum products during2004-05 vis-a-vis March, 2002.
8.4.5.2 The impact of such phenomenal priceincrease in the international market is boundto have major impact on Oil Industry whichis heavily dependent on imports for crudeprocurement. However, if Import ParityPricing (IPP) mechanism had been allowedfull play that would have caused severehardship to the end consumers. To insulatethe end consumers it was decided that theshare of burden has been divided between
72 Public Enterprises Survey 2004-05 : Vol.-I
various stakeholders i.e. Government, Oilcompanies and consumers. Hence, series ofduty structuring and some price revisionswere carried out to distribute the burden ofprice hike in an equitable manner.
8.4.5.3 Moderate imcreases to the extent ofRs.2 per litre on petrol, Re.1 per litre on dieseland Rs.20 per LPG Cyllinder were effectedon 16-6-2004, coupled with excise dutyreductions of 4% on Petrol, 3% on diesel andand 8% on LPG (Domestic).
8.4.5.4 In order to mitigate the hardships ofoil companies, Government had worked outa new methodology with effect from 1s t
August, 2004 allowing OMCs limited freedomto revise the prices of MS/HSD within a priceband. The concept of price band is basedon the principles of rolling average prices ofthese products in the international markets.Accordingly, oil companies are permitted dtocarry out autonomous adjustments in priceswithin a band of +/- 10% of the mean of rollingaverage C&F prices of last 12 months andlast quarter, i.e. three months.
8.4.5.5 In case of breach of this band, theOMCs have to approach the Ministry ofFinance through MOP&NG to modulate theexcise duty rates so that the spiraling pricesprevailing in the international markets do notcause undue hardships to the consumers.Further on 19/08/2004 the Governmentreduced Customs duty by 5% in respect ofPetrol, Diesel. SKO (PDS) and LPG(Domestic) and Excise Duty by 3% on Petroland Diesel and by 4% in respect of SKO(PDS).
8.4.5.6 However, the international prices wentup further during the month of October, 2004.With the under-recoveries on petrol and dieselmounting, further increases were announcedeffective 5-11-2004. Retail selling price of
petrol was fixed in line with the import parityprice. The retail price of petrol was furtherrevised downwards in line with internationalprices effective 16-11-04. However, theincrease in the diesel retail price was peggedat 50% of the level of increase required onthe basis of import parity and no furtherincrease wsa made in the diesel price on 16-11-2004.
8.4.5.7 The retai selling price of LPG (PackedDomestic) was revised again by the oilmarketing companies effective 5 th November,2004 by Rs.20 per cylinder in view of theabnormally high prices of crude oil andpetroleum products in the international market.However, there was no hike in retail sellingprice of PDS Kerosene which has remainedunchanged (except minor correction indealers’ commission / VAT by StateGovernment since March, 2002.
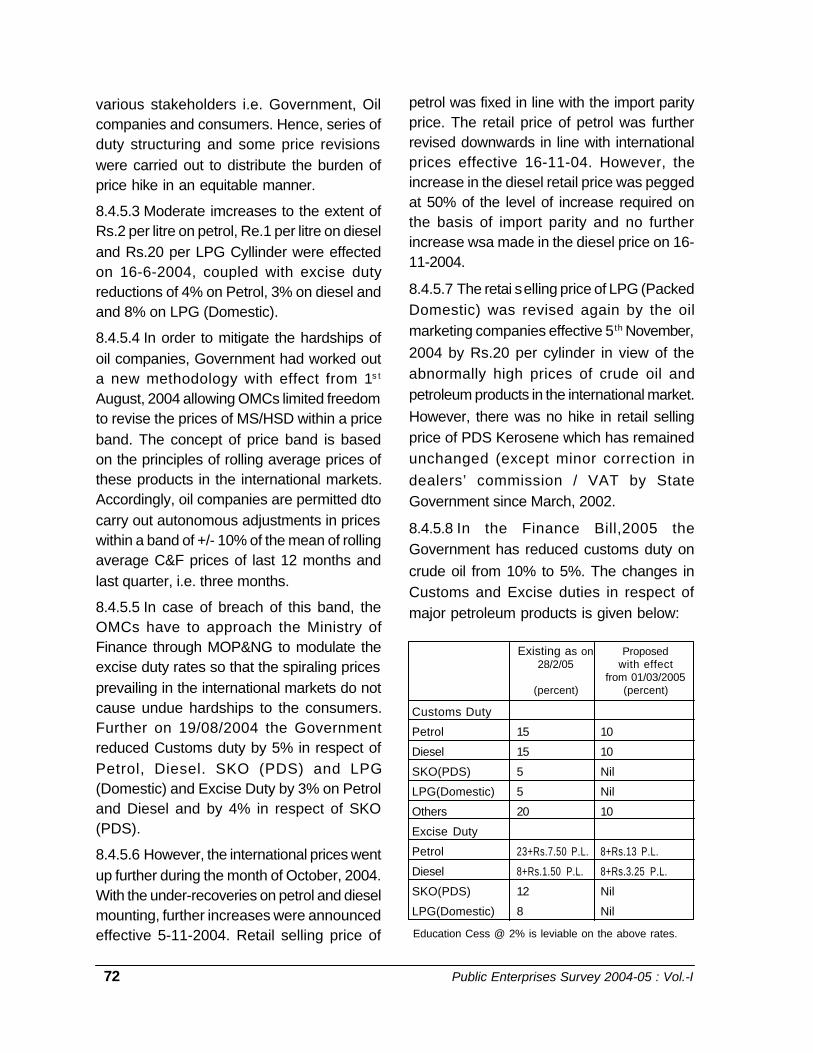
8.4.5.8 In the Finance Bill,2005 theGovernment has reduced customs duty oncrude oil from 10% to 5%. The changes inCustoms and Excise duties in respect ofmajor petroleum products is given below:
Existing as on Proposed28/2/05 with effect
from 01/03/2005(percent) (percent)
Customs Duty
Petrol 15 10
Diesel 15 10
SKO(PDS) 5 Nil
LPG(Domestic) 5 Nil
Others 20 10
Excise Duty
Petrol 23+Rs.7.50 P.L. 8+Rs.13 P.L.
Diesel 8+Rs.1.50 P.L. 8+Rs.3.25 P.L.
SKO(PDS) 12 Nil
LPG(Domestic) 8 Nil
Education Cess @ 2% is leviable on the above rates.
Socio-Economic and Welfare Measures 73
(vi) POWER
8.4.6 The power tariff for the sale of powerby the generation company to thedistribution company and to other personsis determined/regulated as per the termsand conditions notified by the Governmentof India vide its notification dated 30th March,1992 and subsequent amendments madetherein from time to time.
8.4.6.1 In 1998, the Electricity RegulatoryCommission Act was enacted for creation ofRegulatory Commissions at the Centre andin the States with powers inter-alia toregulate/determine traiff. Under theprovisions of the Act, the CentralGovernment created Central ElectricityRegulatory Commission (CERC) whichregulate/determine traiff of the CentralGovernment owned companies engaged ingeneration and inter-state transmission.CERC also issued order on availabilityBased Tariff for ensuring grid discipline.
8.4.6.2 The power sector reforms effected inrecent years necessitated the enactment ofthe Electricity Act, 2003 and repeal of theERC Act, 1998. The provisions of theElectricity Act, 2003 serve to consolidate thelaws relating to generation, transmission,distribution, trading and use of electricity.The Act is aimed at taking measuresconducive to development of electricityindustry, promoting competition therein,protecting interest of the consumers andsupply of electricity to all areas,rationalization of electricity tariff, ensuringtransparent policies regarding subsidies,promotion of efficient and environmentallybenign policies, constitution of CentralElectricity Authority, RegulatoryCommissions and establishment ofAppellate Tribunal and for matters
connected therewith or incidental thereto.However, at present the CERC constitutedunder the ERC Act, 1998 as also its powersin terms of regulation/ determination of Statetariff of the Central Government ownedcompanies involved in generation and inter-transmission have been retained.
8.4.6.3 As per the Electricity Act, 2003, theRegulatory Commission shall be guided byElectricity Tariff Policy to be notified by theCentral Government in near future.
(vii) PHARMACEUTICALS
8.4.7 For fixations of prices ofpharmaceutical products in Central PublicSector Enterprises (CPSEs), the Drugs PriceControl Order (DPCO), 1995 is followed. Asper DPCO, the pharmaceutical products arecategorized as Scheduled and Non-Scheduled formulations. The prices ofScheduled products are fixed by theNational Pharmaceutical Pricing Authority(NPPA) under the provisions of DPCO. TheMaximum Retail Prices (MRP) of Scheduledformulations are fixed and revised as perannouncement/notification by theGovernment of India.
8.4.7.1 In case of Non-scheduledformulations the prices are fixed by theCPSEs on cost plus basis.
B. PURCHASE PREFRENCE POLICY
8.5 The policy of purchase preference forproducts and services of Central PublicSector Enterprises (CPSEs) by GovernmentDepartments/Organisations and otherCPSEs was introduced in 1992 by replacingthe earlier policy of both price and purchasepreference operating since 1971. Theunderlying objective of this policy is to enableCPSEs to adjust to the new environment ofcompetitiveness and market mechanism in

74 Public Enterprises Survey 2004-05 : Vol.-I
the wake of liberalization/globalization and toassist these enterprises in improving theirprofitability by better utilization of theirinstalled capacities.
8.5.1 The purchase preference policy (PPP)was initially made applicable for a period ofthree years. However, over the period of timeit has been reviewed and extended from timeto time with or with out certain modifications.The policy was last reviewed by theGovernment in June, 2005 and extended videO.M. dated 18.07.2005 it with certainmodifications for a period of three yearsbeyond 31.3.2005 with clear stipulation thatthe policy will be terminated with effect from31.3.2008.
8.5.2 As per PPP if the price quoted by aCPSE/subsidiary company is within 10% ofthe evaluated valid price bid (L 1), purchasepreference will be granted to the enterpriseconcerned at L 1 price. Joint ventures withprivate partners are not eligible for availingof purchase preference.Provisions forpurchase preference will be made in tendersincluding civil works and turnkey contractsof Rs. 5 crore and above but not exceedingRs. 100 crore. A minimum value addition of20% will be ensured by the CPSEs foravailing of purchase preference.
8.5.3 PSEs should be subject to the samequalification process as any other bidder. Ifthe PSE does not meet the minimumqualifications, it should be subject todisqualification. However, in suitable cases,the purchasers / clients may relax thecondition of “net worth” from the list ofminimum qualifications. If the PSE, which hashad the benefit of the Purchase Preference
Policy, fails to perform, it should also besubject to payment of liquidated damages orany other penalty included in the contract.
8.5.4 Each Ministry shall make a list ofCPSEs that would require PPP support andif there is no possibility of making a positivelist, they may attempt a negative list of CPSEswhich may not require PPP support.
8.5.5 Ministry of Power will be grantedexemption from the PPP, subject to thecondition that they will place certain ordersupon BHEL on a negotiated basis pricebenchmarked through competitively bidprojects every year. Ministry of Power andDepartment of Heavy Industry will work out,at the beginning of the year, the number andvalue of the orders to be placed upon BHELduring the financial year.
8.5.6 All Ministries /Departments/ CPSEs /Autonomous Bodies except Ministry of Powerwill continue to grant purchase preferenceto CPSEs/subsidiary companies. RespectiveMinistries /Departments / CPSEs /Autonomous Bodies will be responsible forimplementing the Purchase PreferencePolicy in letter and in spirit. For any deviationincluding exclusion of the purchasepreference clause from NIT, it will beobligatory on the concerned Ministry/Department / CPSE / Autonomous Body toobtain prior exemption from the Cabinet inconsultation with the Department of PublicEnterprises.
8.5.7 The cases which were underconsideration from 1.4.2005 till the date ofissue of the order extending the policy wouldstand covered under the policy except thosewhich have already been decided otherwise.
Productivity in Public Enterprises 75
PRODUCTIVITY IN PUBLIC ENTERPRISES99.1 Productivity is a measure ofefficiency with which an enterprise ismanaged. It is the relationship between theoutput generated by a production unit andthe input provided for the purpose. It is ameasure of efficient use of resources in theproduction of various goods. Among severalmeasures, capacity utilization is one of thesound indicators for measuring the efficiencyof manufacturing units. There are variousfactors like technology employed, state ofthe plant and machinery, inventorymanagement, work methods, managementpractice and work ethics which affectcapacity utilization.
9.2. For the purpose of the Survey, theratio of utilization has been derived on thebasis of installed/rated capacity. However, insome cases where for various reasons theinstalled/rated capacity is not available, the
assessment of the management of theenterprises has been used. In the case ofmultiple-product units, the capacity figureshave been adopted with reference to majorproducts.
9.3 A detailed enterprise-wise statement(Statement No.23) indicating the majorproducts in the manufacturing profile, outputof such products and the capacity utilizationfor the last three years is given in Part-IV ofthis Volume. Cognate group-wise analysis ofthe enterprises/units and extent of utilisationare given in the following paragraphs.
STEEL
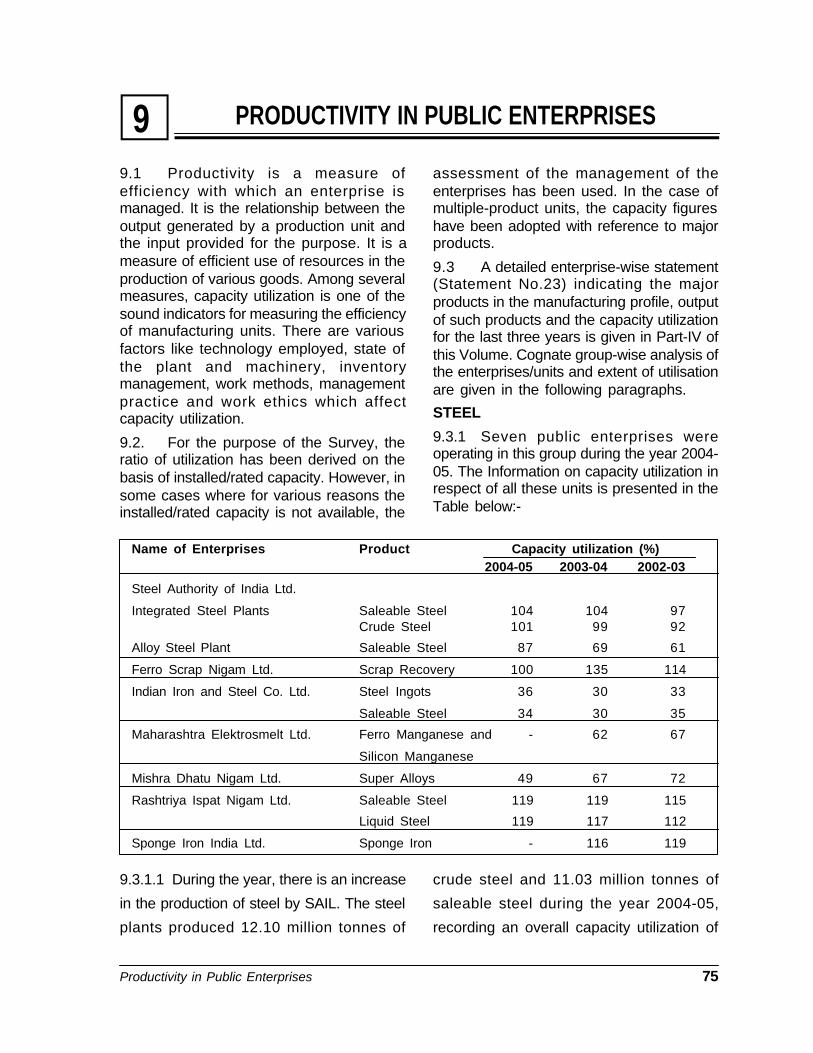
9.3.1 Seven public enterprises wereoperating in this group during the year 2004-05. The Information on capacity utilization inrespect of all these units is presented in theTable below:-
Name of Enterprises Product Capacity utilization (%)2004-05 2003-04 2002-03
Steel Authority of India Ltd.
Integrated Steel Plants Saleable Steel 104 104 97Crude Steel 101 99 92
Alloy Steel Plant Saleable Steel 87 69 61
Ferro Scrap Nigam Ltd. Scrap Recovery 100 135 114
Indian Iron and Steel Co. Ltd. Steel Ingots 36 30 33
Saleable Steel 34 30 35
Maharashtra Elektrosmelt Ltd. Ferro Manganese and - 62 67
Silicon Manganese
Mishra Dhatu Nigam Ltd. Super Alloys 49 67 72
Rashtriya Ispat Nigam Ltd. Saleable Steel 119 119 115
Liquid Steel 119 117 112
Sponge Iron India Ltd. Sponge Iron - 116 119
9.3.1.1 During the year, there is an increase
in the production of steel by SAIL. The steel
plants produced 12.10 million tonnes of
crude steel and 11.03 million tonnes of
saleable steel during the year 2004-05,
recording an overall capacity utilization of

76 Public Enterprises Survey 2004-05 : Vol.-I
101% and 104% respectively. The
corresponding figures for the previous year
were 11.83 million tonnes of crude steel and
11.026 million tonnes of saleable steel with
capacity utilization of 99% and 104%
respectively.
9.3.2 The Alloy Steel plant at Durgapur
and the Salem Steel Plant together
produced 3.79 lakh tonnes of saleable steel
as compared to the previous year's
production of 2.98 lakh tonnes.
9.3.3 The Indian Iron and Steel Co. Ltd.
produced 3.57 lakh tonnes of crude steel
and 2.74 lakh tonnes of saleable steel
during 2004-05 as compared to 3.01 lakh
tonnes of crude steel and 2.58 lakh tonnes
of saleable steel during the previous year.
9.3.1.4 The Mishra Dhatu Nigam Ltd.
produced 1337 MT of alloys during 2004-05
with 49 per cent utilization of the capacity
as against a production of 1819 MT in the
previous year at 67 percent of the capacity.
9.3.1.5 The Rashtriya Ispat Nigam Ltd.
produced 3.56 lakh tonnes of liquid steel
and 3.17 lakh tonnes of saleable steel
during 2004-05 as against a production of
3.51 lakh tonnes of liquid steel and 3.17 lakh
tonnes of saleable steel during the previous
year.
Minerals and Metals
9.4.1 Nine public enterprises were operating
in the Minerals and Metals group during the
year 2004-05. The information in respect of
two are not available and the information in
respect of the remaining seven enterprises is
presented in the Table below: -
Name of Enterprise Product Capacity utilization (%)2004-05 2003-04 2002-03
Bharat Refractories Ltd. Bricks and Masses 48 39 26
Hindustan Copper Ltd. KCC-Cathodes 51 64 77
Wire Rod 46 47 51
Indian Rare Earths Ltd. Limenite 90 89 74
Rutile 68 66 56
Zircon 102 103 98
Kudremukh Iron Ore Ltd. Iron Ore Concen. 65 76 83
Iron Ore Pellets 95 92 86
Manganese Ore (India) Ltd. Manganese Ore 100 118 106
Elect. Mon Diox 112 97 93
Ferro Manganese 103 109 60
National Aluminium Co. Ltd. Bauxite 101 100 100
Calcined Alumina 100 98 94
Aluminium Metal 98 104 8
Power (Net) 101 105 88
National Mineral Dev. Iron Ore 110 103 109
Corporation Ltd. Diamonds 93 85 100

Productivity in Public Enterprises 77
9.4.1.1 National Aluminium Company Ltd.produced 3.385 lakh tonnes of aluminiummetal during the year 2004-05 as against2.982 lakh tonnes during the previous year.The production of calcined alumina andbauxite was 15.667 lakh tonnes and 48.52lakh tonnes with capacity utilization at 100%and 101% respectively.
9.4.1.2 The National Mineral DevelopmentCorporation Ltd. produced 207.43 lakh MTof iron ore during the year 2004-05 ascompared to 179.59 lakh MT in the previousyear. The production of diamonds at Pannaunit was 78217 carats as against 71163carats of previous year.
9.4.1.3 The Hindustan Copper Ltd.produced 24186 tonnes of cathode and27423 tonnes of wire rod during 2004-05 ascompared to 30598 tonnes of cathode and28003 tonnes of wire rod during the previousyear respectively.
9.4.1.4 The Manganese Ore India Ltd.produced 9.43 lakh tonnes of manganese
Name of Enterprise Product Capacity utilization (%)2004-05 2003-03 2002-03
Bharat Coking Coal Ltd. Raw Coal 64 64 74
Central Coalfields Ltd. Raw Coal 74 99 90
Eastern Coalfields Ltd. Raw Coal 82 85 83
Mahanadi Coalfields Ltd. Coal 100 102 101
Northern Coalfields Ltd. Coal - 112 106
South Eastern Coalfields Ltd. Coal 115 105 97
Western Coalfields Ltd. Coal 113 105 104
Coal India Ltd. (Total) Coal - 90 89
Neyveli Lignite Corpn. Ltd. Lignite 90 86 78
ore during 2004-05 against the productionof 7.99 lakh tonnes during the previous year.The production of bricks and masses by theBharat Refractories Ltd. during the year2004-05 was 65485 MT with capacityutilization of 48% as compared to 53116 MTwith capacity utilization of 39% during theprevious year. There is an improvement inthe capacity utilization as compared to theprevious year.
9.4.1.5 The Indian Rare Earths Ltd.produced 417275 MT ilmenite, 16317 MTrutile and 23376 MT zircon during the year2004-05. The corresponding figures for theprevious year were 414631, 15753 and23634 MT respectively.
Coal and Lignite
9.5.1 Nine public enterprises wereoperating in the Coal and Lignite groupduring the year 2004-05. The information oncapacity utilization in respect of all theseunits is presented in the Table below:-
9.5.1.1 The total production of raw coal byCoal India Ltd. including its seven coalproducing subsidiaries during the year 2004-05 was 323.58 million tonnes as comparedto 306 million tonnes in the previous year.
9.5.1.2 The Neyveli Lignite Corporation Ltd.produced 21.57 MT of lignite during 2004-
05 as compared to 20.56 MT during theprevious year.
Power
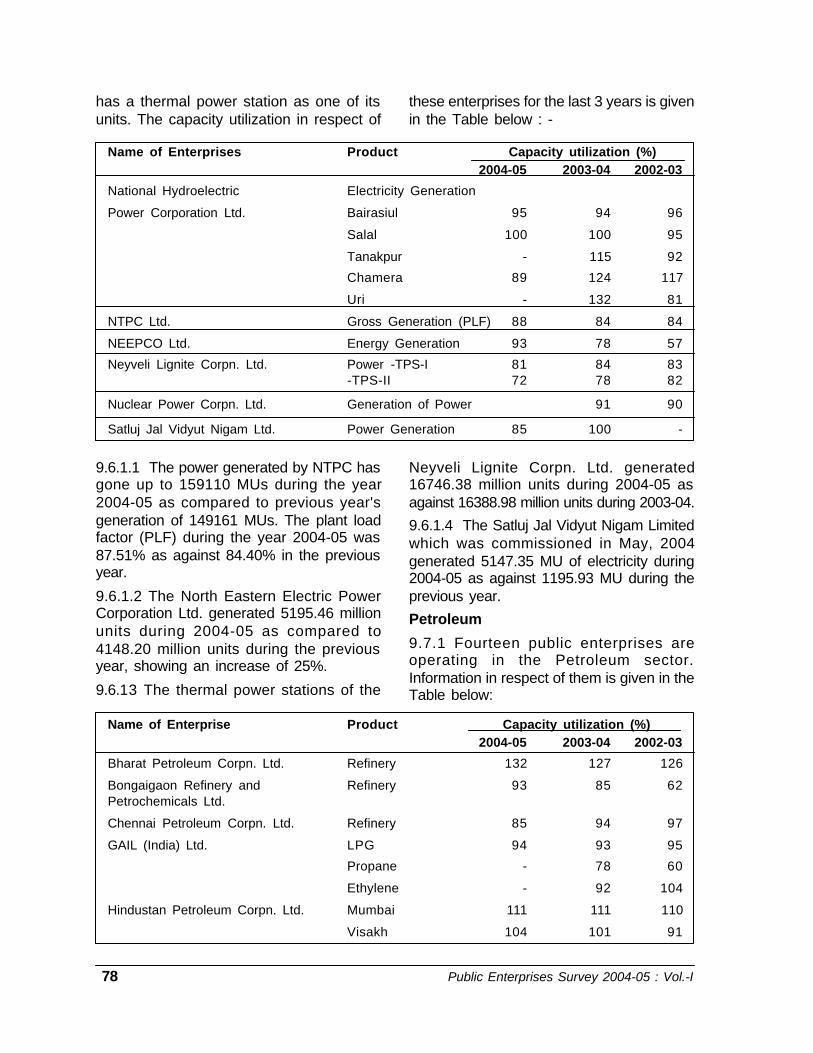
9.6.1 Six public enterprises are engaged inthe generation of power. The information inrespect of one of them is not received. Inaddition, the Neyveli Lignite Corporation Ltd.
78 Public Enterprises Survey 2004-05 : Vol.-I
has a thermal power station as one of itsunits. The capacity utilization in respect of
these enterprises for the last 3 years is givenin the Table below : -
Name of Enterprises Product Capacity utilization (%)2004-05 2003-04 2002-03
National Hydroelectric Electricity Generation
Power Corporation Ltd. Bairasiul 95 94 96
Salal 100 100 95
Tanakpur - 115 92
Chamera 89 124 117
Uri - 132 81
NTPC Ltd. Gross Generation (PLF) 88 84 84
NEEPCO Ltd. Energy Generation 93 78 57
Neyveli Lignite Corpn. Ltd. Power -TPS-I 81 84 83-TPS-II 72 78 82
Nuclear Power Corpn. Ltd. Generation of Power 91 90
Satluj Jal Vidyut Nigam Ltd. Power Generation 85 100 -
Name of Enterprise Product Capacity utilization (%)2004-05 2003-04 2002-03
Bharat Petroleum Corpn. Ltd. Refinery 132 127 126
Bongaigaon Refinery and Refinery 93 85 62Petrochemicals Ltd.
Chennai Petroleum Corpn. Ltd. Refinery 85 94 97
GAIL (India) Ltd. LPG 94 93 95
Propane - 78 60
Ethylene - 92 104
Hindustan Petroleum Corpn. Ltd. Mumbai 111 111 110
Visakh 104 101 91
9.6.1.1 The power generated by NTPC hasgone up to 159110 MUs during the year2004-05 as compared to previous year'sgeneration of 149161 MUs. The plant loadfactor (PLF) during the year 2004-05 was87.51% as against 84.40% in the previousyear.
9.6.1.2 The North Eastern Electric PowerCorporation Ltd. generated 5195.46 millionunits during 2004-05 as compared to4148.20 million units during the previousyear, showing an increase of 25%.
9.6.13 The thermal power stations of the
Neyveli Lignite Corpn. Ltd. generated16746.38 million units during 2004-05 asagainst 16388.98 million units during 2003-04.
9.6.1.4 The Satluj Jal Vidyut Nigam Limitedwhich was commissioned in May, 2004generated 5147.35 MU of electricity during2004-05 as against 1195.93 MU during theprevious year.
Petroleum
9.7.1 Fourteen public enterprises areoperating in the Petroleum sector.Information in respect of them is given in theTable below:

Productivity in Public Enterprises 79
Name of Enterprise Product Capacity utilization (%)2004-05 2003-04 2002-03
Indian Oil Blending Ltd. Lubricating Oil 88 94 98
Greases 93 90 87Indian Oil Corpn. Ltd. Barauni 85 72 71
Gujarat 85 93 91Guwahati 100 89 46Haldia 90 75 98
Mathura 80 103 103Panipat 106 106 102
Digboi 100 92 89IBP Co. Ltd. Explosives 43 61 65
Cryo-containers 63 45 64
Kochi Refineries Ltd. Refinery 106 105 101MRPL Refinery 122 104 75
Numaligarh Refinery Ltd. Refinery 68 73 63Oil and Natural Gas Corpn. Crude Oil NA NA NA
Natural Gas NA NA NA
VAP 99 104 108Oil India Ltd. Crude Oil 94 88 86
LPG 99 101 106Natural Gas 124 117 107
9.7.1.1 The Bharat Petroleum CorporationLtd. processed 9.14 million tonnes of crudeduring 2004-05 as aganist 8.76 milliontonnes during 2003-04.
9.7.1.2 The crude throughput for theBongaigaon Refinery and PetrochemicalsLtd. during 2004-05 was 2.18 million MT asagainst 2.00 million MT during the previousyear.
9.7.1.3 The Chennai Petroleum Corpn. Ltd.processed 8.923 million MT crude during theyear 2004-05 as against 7.039 million MTprocessed during the previous year.
9.7.1.4 The GAIL (India) Ltd. produced10.94 lakh MT of LPG during 2004-05 asagainst a production of 10.89 lakh MT duringthe previous year.
9.7.1.5 The Mumbai refinery of HindustanPetroleum Corporation Ltd. processed 6.12MMT of crude oil during the year 2004-05and Visakh refinery processed 7.82 MMT as
compared to 6.11 MMT and 7.59 MMTrespectively during the previous year
9.7.1.6 The IBP Co. Ltd. produced 51204MT of industrial explosives and 10381cryocontainers during 2004-05 as comparedto 52266 MT of industrial explosives and7496 cryocontainers during the previousyear.
9.7.1.7 The Indian Oil Blending Ltd.produced 1.98 lakh KL lubricating oil during2004-05 at 88% capacity utilization asagainst a production of 2.11 lakh KL during2003-04 a capacity utilization of 94%. Theproduction of greases was 12959 MT during2004-05 as compared to 12607 MT in theprevious year.
9.7.1.8 The combined throughput by theseven refineries of the Indian Oil CorporationLtd. during the year 2004-05 was 36.63million tonnes as against the previous year'sthroughput of 37.66 million tonnes. The
80 Public Enterprises Survey 2004-05 : Vol.-I
overall capacity utilization during 2004-05was 88.59% as compared to 91% during theprevious year. Capacity utilization was lowerdue to extended shut down maintenance ofMathura Refinery and closure of catalyticunit at Gujarat refinery.
9.7.1.9 The Kochi Refineries Ltd. processed7.924 million MT of crude oil during 2004-05 as against 7.853 million MT during theprevious year. The capacity utilization duringthe year was 105.65% as compared to theprevious year's figure of 105%.
9.7.1.10 During the year 2004-05, theNumaligarh refinery processed 2.04 MMT ofcrude as compared to 2.20 MMT in theprevious year. The capacity utilization hasdeclined from 73% in the previous year to68% during 2004-05.
9.7.1.11 The crude oil production by the Oiland Natural Gas Corporation Ltd. (incl. JVs)during the year 2004-05 was 28.13 millionMT as against a production of 27.72 millionMT during the previous year. Natural gasproduction during 2004-05 was 25.23 billioncubic meters as against 25.70 billion cubic
meters during the previous year.
9.8.1.12 Oil India Ltd. produced 3.20 MMTcrude oil during 2004-05 as against 3.00MMT of the previous year. The productionof LPG was 49.5 KMT as against 51.51 KMTduring the previous year. The production ofnatural gas was 2.01 BCM during 2004-05as against 1.89 BCM during the previousyear.9.7.1.13 The production of gas andcondensate by ONGC (Videsh) Limited was1349038 M and 39104 MT during 2004-05as against production of Gas 523383 M andcondensate 21822 MT during the previousyear.
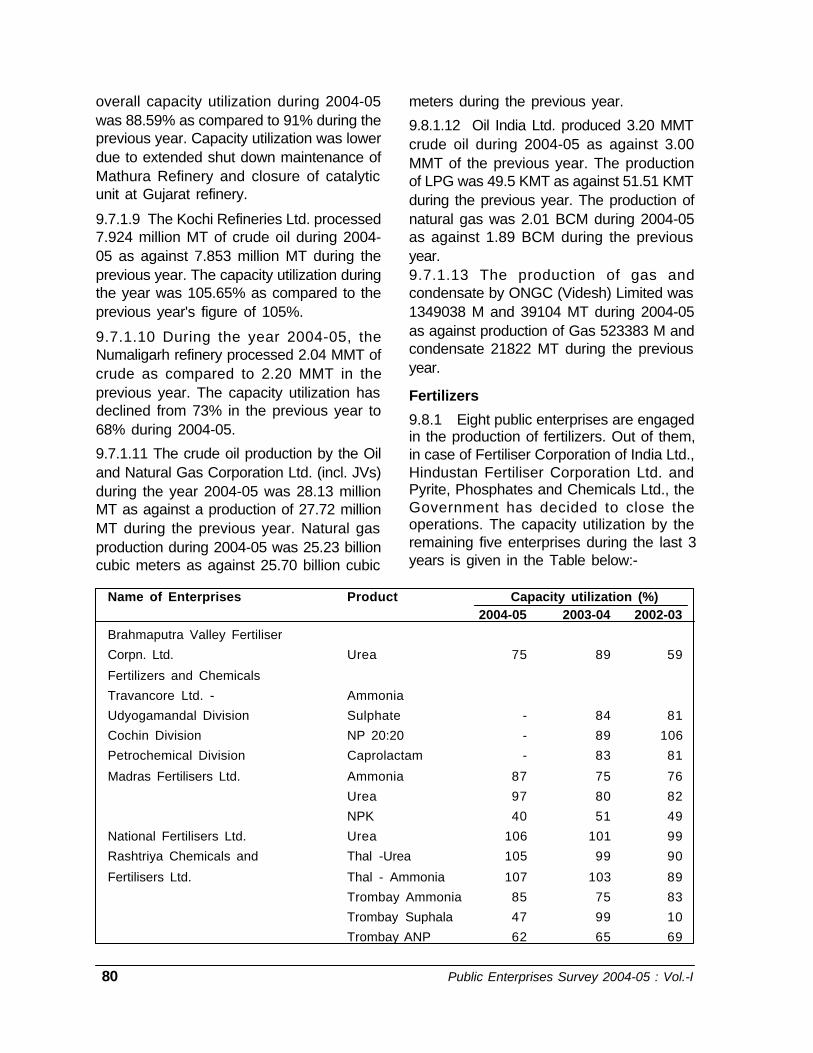
Fertilizers
9.8.1 Eight public enterprises are engagedin the production of fertilizers. Out of them,in case of Fertiliser Corporation of India Ltd.,Hindustan Fertiliser Corporation Ltd. andPyrite, Phosphates and Chemicals Ltd., theGovernment has decided to close theoperations. The capacity utilization by theremaining five enterprises during the last 3years is given in the Table below:-
Name of Enterprises Product Capacity utilization (%)2004-05 2003-04 2002-03
Brahmaputra Valley Fertiliser
Corpn. Ltd. Urea 75 89 59
Fertilizers and Chemicals
Travancore Ltd. - Ammonia
Udyogamandal Division Sulphate - 84 81
Cochin Division NP 20:20 - 89 106
Petrochemical Division Caprolactam - 83 81
Madras Fertilisers Ltd. Ammonia 87 75 76
Urea 97 80 82
NPK 40 51 49
National Fertilisers Ltd. Urea 106 101 99
Rashtriya Chemicals and Thal -Urea 105 99 90
Fertilisers Ltd. Thal - Ammonia 107 103 89
Trombay Ammonia 85 75 83
Trombay Suphala 47 99 10
Trombay ANP 62 65 69
Productivity in Public Enterprises 81
9.8.1.1 The Brahmaputra Valley FertiliserCorpn. Ltd. produced 2.03 lakh MT urea dur-ing 2004-05 as compared to 2.41 lakh MTduring the previous year.
9.8.1.2 The Madras Fertilizers Ltd. produced3.01 lakh tonnes ammonia, 4.73 lakh tonnesurea and 3.33 lakh tonnes NPK during 2004-05 with capacity utilization of 87%, 91% and40% respectively. The corresponding produc-tion figures for the previous year were 2.60lakh tonnes ammonia, 3.88 lakh tonnes ureaand 4.29 lakh tones NPK with capacity utili-zation of 75%, 80% and 51% respectively.
9.8.1.3 The National Fertilisers Ltd. produced34.32 lakh MT of urea during 2004-05 asagainst the production of 32.50 lakh MT dur-
ing the previous year.
9.8.1.4 The Thal unit of Rashtriya Chemicalsand Fertilizers Ltd. produced 17.90 lakh MT ureaand 10.59 lakh MT ammonia during the year2004-05 as against 16.87 lakh MT Urea and10.15 lakh MT ammonia during the previousyear. The Trombay unit produced 2.53 lakh tonesof ammonia, 3.50 lakh tones Suphala and 2.23lakh MT ANP during the year.
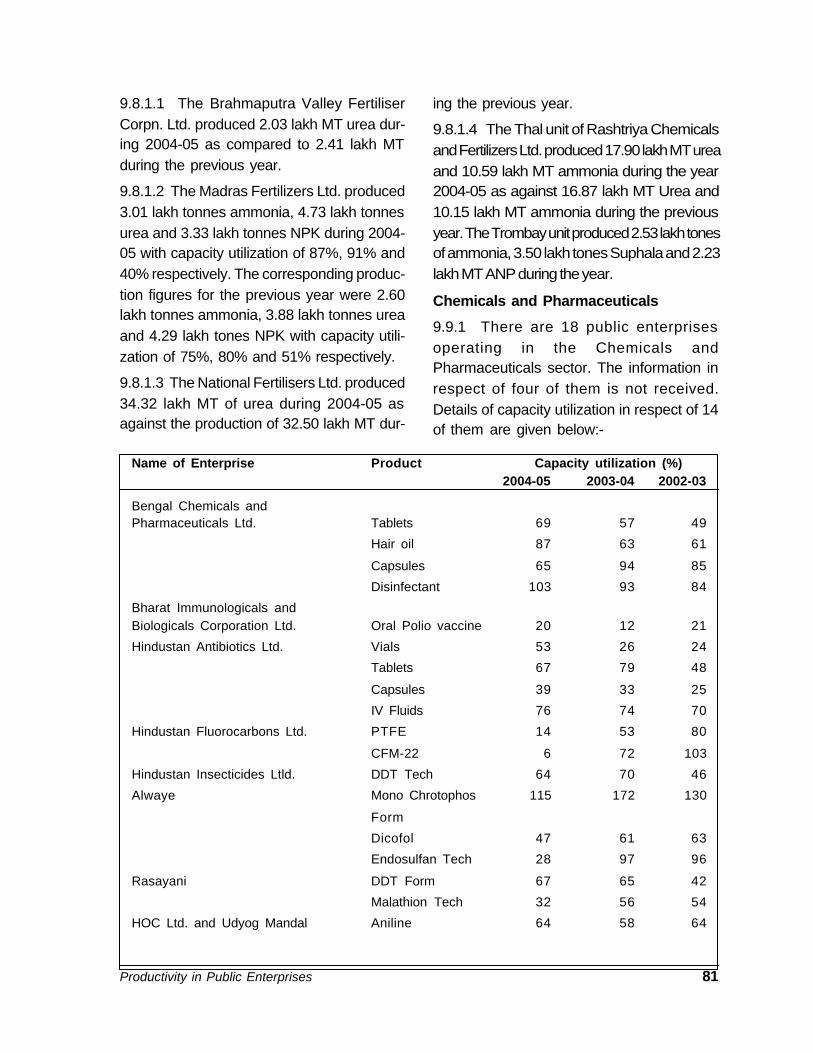
Chemicals and Pharmaceuticals
9.9.1 There are 18 public enterprisesoperating in the Chemicals andPharmaceuticals sector. The information inrespect of four of them is not received.Details of capacity utilization in respect of 14of them are given below:-
Name of Enterprise Product Capacity utilization (%)2004-05 2003-04 2002-03
Bengal Chemicals andPharmaceuticals Ltd. Tablets 69 57 49
Hair oil 87 63 61
Capsules 65 94 85
Disinfectant 103 93 84
Bharat Immunologicals andBiologicals Corporation Ltd. Oral Polio vaccine 20 12 21
Hindustan Antibiotics Ltd. Vials 53 26 24
Tablets 67 79 48
Capsules 39 33 25
IV Fluids 76 74 70
Hindustan Fluorocarbons Ltd. PTFE 14 53 80
CFM-22 6 72 103
Hindustan Insecticides Ltld. DDT Tech 64 70 46
Alwaye Mono Chrotophos 115 172 130
Form
Dicofol 47 61 63
Endosulfan Tech 28 97 96
Rasayani DDT Form 67 65 42
Malathion Tech 32 56 54
HOC Ltd. and Udyog Mandal Aniline 64 58 64
82 Public Enterprises Survey 2004-05 : Vol.-I
Name of Enterprise Product Capacity utilization (%)2004-05 2003-04 2002-03
Formal dehyde 99 104 63Phenol 121 100 106Acetone 123 102 108Acids 79 83 82Nitro products 47 51 49
Indian Drugs and Pharmaceuticals Ltd. Tablets - 7 6Capsules - 1 3Syrup - 2 1
Indian Medicines and Pharmaceuticals Ayurvedic andCorpn. Ltd. Unani 40 40 34Karnatak Antibiotics andPharmaceuticals Ltd. Capsules 132 149 152
Liquids/Parenterals 87 88 104Tablets 57 63 57Dry Syrup/Vails - 46 40Dry Powder Vails 103 94 76
Orissa Drugs and Pharm. Ltd. Tablets NA - - 32Capsules - - 80Ampoules - - 10
Projects and Development India Ltd. Catalyst 29 80 37Rajasthan Drugs and Pharmaceuticals Tablets 126 116 137Ltd. Capsules 73 60 146
Powder 61 134 132Liquids 82 67 80Vials 39 42 40
Sambhar Salts Ltd. Processed Salt 31 32 56U.P. Drugs and Pharm. Ltd. Liquids 77 23 22
Tablects 58 40 50Capsules 66 100 125
Powder 57 28 5
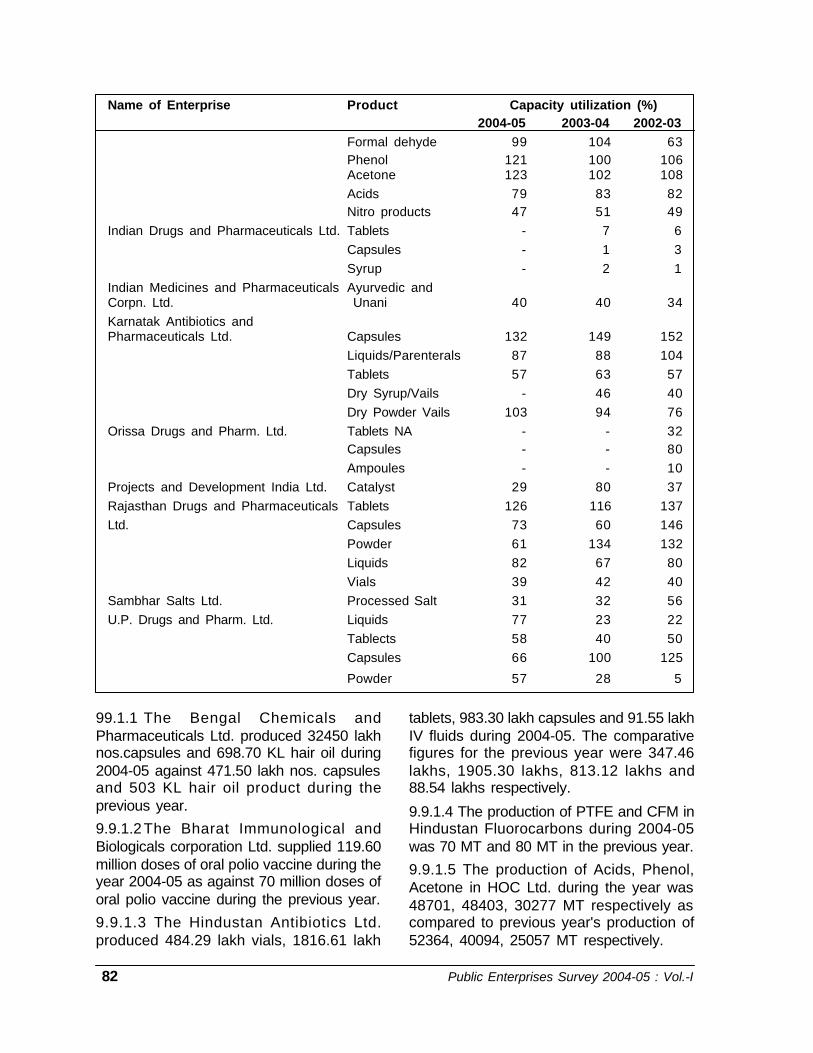
99.1.1 The Bengal Chemicals andPharmaceuticals Ltd. produced 32450 lakhnos.capsules and 698.70 KL hair oil during2004-05 against 471.50 lakh nos. capsulesand 503 KL hair oil product during theprevious year.
9.9.1.2The Bharat Immunological andBiologicals corporation Ltd. supplied 119.60million doses of oral polio vaccine during theyear 2004-05 as against 70 million doses oforal polio vaccine during the previous year.
9.9.1.3 The Hindustan Antibiotics Ltd.produced 484.29 lakh vials, 1816.61 lakh
tablets, 983.30 lakh capsules and 91.55 lakhIV fluids during 2004-05. The comparativefigures for the previous year were 347.46lakhs, 1905.30 lakhs, 813.12 lakhs and88.54 lakhs respectively.
9.9.1.4 The production of PTFE and CFM inHindustan Fluorocarbons during 2004-05was 70 MT and 80 MT in the previous year.
9.9.1.5 The production of Acids, Phenol,Acetone in HOC Ltd. during the year was48701, 48403, 30277 MT respectively ascompared to previous year's production of52364, 40094, 25057 MT respectively.
Productivity in Public Enterprises 83
9.9.1.6 The Hindustan Insecticides Ltd.produced 4087 MT of DDT (Tech) and 8500MT of DDT (Form) during the year 2004-05as compared to 4471 MT of DDT (Tech) and8223 MT of DDT (Form) in the previous year.
9.9.1.7 Hindustan Salts Ltd. produced 0.32lakh MT common salt during the year 2004-05 as against 0.57 lakh MT during theprevious year. The Sambhar Salts Limitedproduced 3738 MT processed salt duringthe year 2004-05 as against 3941 MT in theprevious year.
9.9.1.8 Indian Medicines and PharmaceuticalsCorporation Ltd. produced 260 items ofAyurvedic and Unani medicines during2004-05 as against 259 items duringprevious year.
9.9.1.9 Karnataka Anitbiotics andPharmaceuticals Ltd. produced 765 lakhtablets and 500 lakh capsules during 2004-05 as compared to 845 lakh and 564 lakhrespectively during the previous year.
9.9.1.10 Projects and Development IndiaLtd. has produced 362 MT catalyst during2004-05 as against 982 MT of previous year.
9.9.1.11 Rajasthan Drugs andPharmaceuticals Ltd. produced 378.14million tablets during 2004-05 as comparedto 347.68 million tablets of previous year.The production of liquid orals has increasedto 328.38 KL during 2004-05 from 269.53KL of previous year.
9.9.1.12 U.P. Drugs and PharmaceuticalsLtd. produced 79.73 million capsules and269.23 KL of liquids during 2004-05 against120.42 million capsules and 102.89 KL ofliquids of previous year. The variation is dueto working capital constraints.
Heavy Engineering
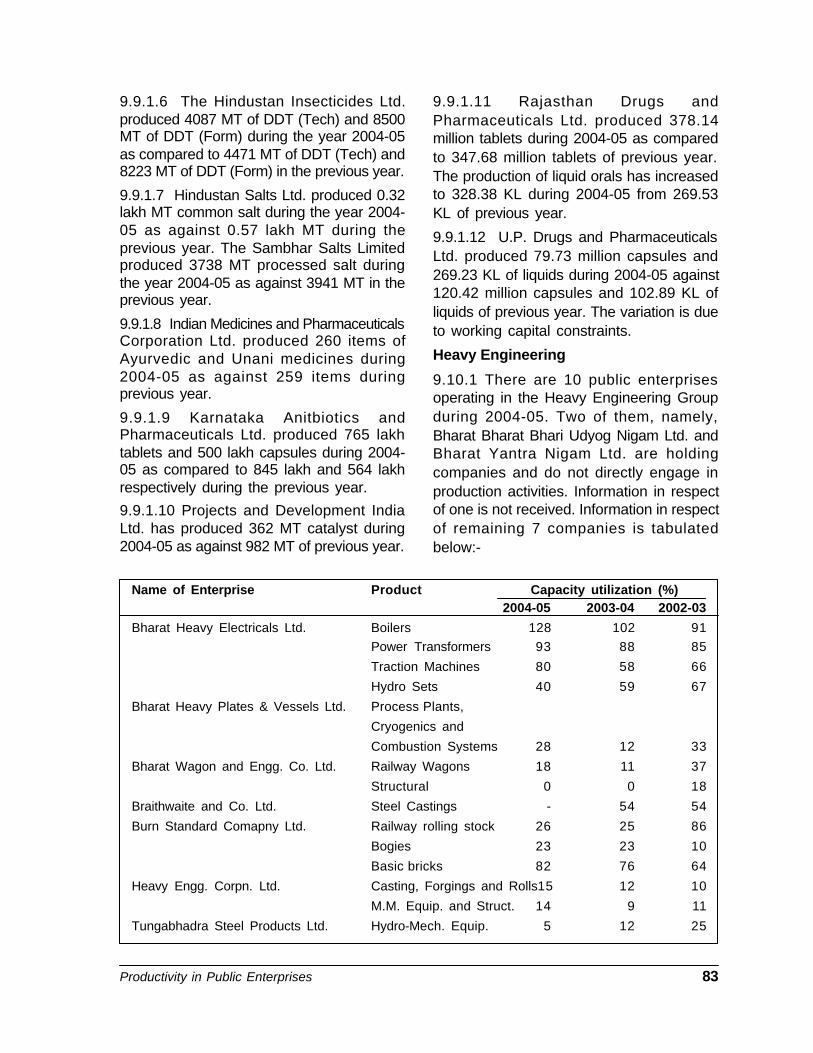
9.10.1 There are 10 public enterprisesoperating in the Heavy Engineering Groupduring 2004-05. Two of them, namely,Bharat Bharat Bhari Udyog Nigam Ltd. andBharat Yantra Nigam Ltd. are holdingcompanies and do not directly engage inproduction activities. Information in respectof one is not received. Information in respectof remaining 7 companies is tabulatedbelow:-
Name of Enterprise Product Capacity utilization (%)2004-05 2003-04 2002-03
Bharat Heavy Electricals Ltd. Boilers 128 102 91Power Transformers 93 88 85
Traction Machines 80 58 66
Hydro Sets 40 59 67
Bharat Heavy Plates & Vessels Ltd. Process Plants,
Cryogenics and
Combustion Systems 28 12 33
Bharat Wagon and Engg. Co. Ltd. Railway Wagons 18 11 37
Structural 0 0 18
Braithwaite and Co. Ltd. Steel Castings - 54 54
Burn Standard Comapny Ltd. Railway rolling stock 26 25 86
Bogies 23 23 10
Basic bricks 82 76 64
Heavy Engg. Corpn. Ltd. Casting, Forgings and Rolls15 12 10
M.M. Equip. and Struct. 14 9 11
Tungabhadra Steel Products Ltd. Hydro-Mech. Equip. 5 12 25
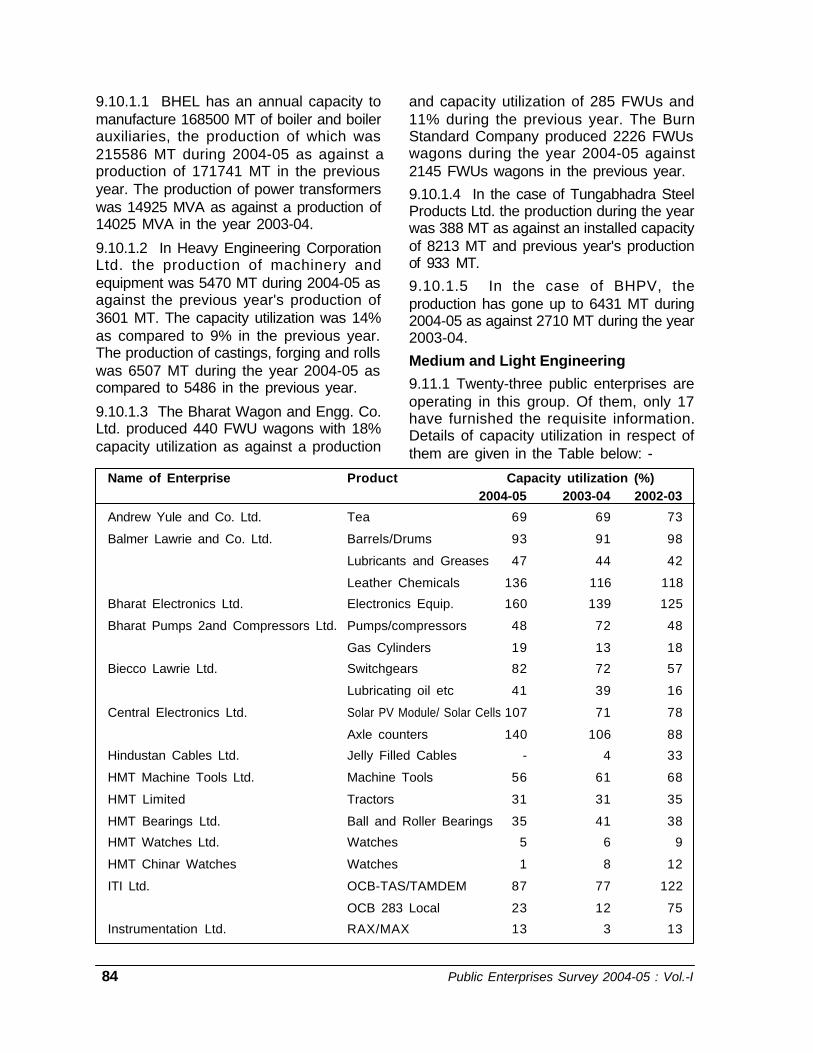
84 Public Enterprises Survey 2004-05 : Vol.-I
9.10.1.1 BHEL has an annual capacity tomanufacture 168500 MT of boiler and boilerauxiliaries, the production of which was215586 MT during 2004-05 as against aproduction of 171741 MT in the previousyear. The production of power transformerswas 14925 MVA as against a production of14025 MVA in the year 2003-04.
9.10.1.2 In Heavy Engineering CorporationLtd. the production of machinery andequipment was 5470 MT during 2004-05 asagainst the previous year's production of3601 MT. The capacity utilization was 14%as compared to 9% in the previous year.The production of castings, forging and rollswas 6507 MT during the year 2004-05 ascompared to 5486 in the previous year.
9.10.1.3 The Bharat Wagon and Engg. Co.Ltd. produced 440 FWU wagons with 18%capacity utilization as against a production
and capacity utilization of 285 FWUs and11% during the previous year. The BurnStandard Company produced 2226 FWUswagons during the year 2004-05 against2145 FWUs wagons in the previous year.
9.10.1.4 In the case of Tungabhadra SteelProducts Ltd. the production during the yearwas 388 MT as against an installed capacityof 8213 MT and previous year's productionof 933 MT.
9.10.1.5 In the case of BHPV, theproduction has gone up to 6431 MT during2004-05 as against 2710 MT during the year2003-04.
Medium and Light Engineering
9.11.1 Twenty-three public enterprises areoperating in this group. Of them, only 17have furnished the requisite information.Details of capacity utilization in respect ofthem are given in the Table below: -
Name of Enterprise Product Capacity utilization (%)2004-05 2003-04 2002-03
Andrew Yule and Co. Ltd. Tea 69 69 73
Balmer Lawrie and Co. Ltd. Barrels/Drums 93 91 98
Lubricants and Greases 47 44 42
Leather Chemicals 136 116 118
Bharat Electronics Ltd. Electronics Equip. 160 139 125
Bharat Pumps 2and Compressors Ltd. Pumps/compressors 48 72 48
Gas Cylinders 19 13 18
Biecco Lawrie Ltd. Switchgears 82 72 57
Lubricating oil etc 41 39 16
Central Electronics Ltd. Solar PV Module/ Solar Cells 107 71 78
Axle counters 140 106 88
Hindustan Cables Ltd. Jelly Filled Cables - 4 33
HMT Machine Tools Ltd. Machine Tools 56 61 68
HMT Limited Tractors 31 31 35
HMT Bearings Ltd. Ball and Roller Bearings 35 41 38
HMT Watches Ltd. Watches 5 6 9
HMT Chinar Watches Watches 1 8 12
ITI Ltd. OCB-TAS/TAMDEM 87 77 122
OCB 283 Local 23 12 75
Instrumentation Ltd. RAX/MAX 13 3 13
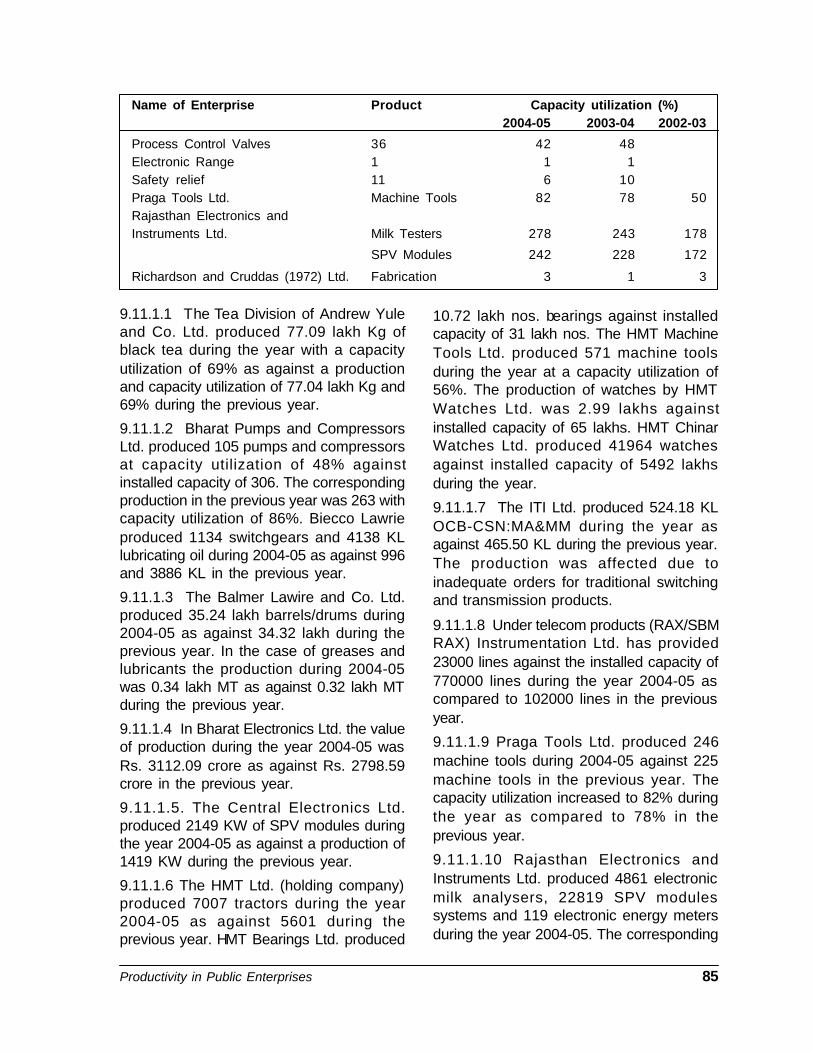
Productivity in Public Enterprises 85
Name of Enterprise Product Capacity utilization (%)2004-05 2003-04 2002-03
Process Control Valves 36 42 48Electronic Range 1 1 1Safety relief 11 6 10Praga Tools Ltd. Machine Tools 82 78 50Rajasthan Electronics andInstruments Ltd. Milk Testers 278 243 178
SPV Modules 242 228 172
Richardson and Cruddas (1972) Ltd. Fabrication 3 1 3
9.11.1.1 The Tea Division of Andrew Yuleand Co. Ltd. produced 77.09 lakh Kg ofblack tea during the year with a capacityutilization of 69% as against a productionand capacity utilization of 77.04 lakh Kg and69% during the previous year.
9.11.1.2 Bharat Pumps and CompressorsLtd. produced 105 pumps and compressorsat capacity utilization of 48% againstinstalled capacity of 306. The correspondingproduction in the previous year was 263 withcapacity utilization of 86%. Biecco Lawrieproduced 1134 switchgears and 4138 KLlubricating oil during 2004-05 as against 996and 3886 KL in the previous year.
9.11.1.3 The Balmer Lawire and Co. Ltd.produced 35.24 lakh barrels/drums during2004-05 as against 34.32 lakh during theprevious year. In the case of greases andlubricants the production during 2004-05was 0.34 lakh MT as against 0.32 lakh MTduring the previous year.
9.11.1.4 In Bharat Electronics Ltd. the valueof production during the year 2004-05 wasRs. 3112.09 crore as against Rs. 2798.59crore in the previous year.
9.11.1.5. The Central Electronics Ltd.produced 2149 KW of SPV modules duringthe year 2004-05 as against a production of1419 KW during the previous year.
9.11.1.6 The HMT Ltd. (holding company)produced 7007 tractors during the year2004-05 as against 5601 during theprevious year. HMT Bearings Ltd. produced
10.72 lakh nos. bearings against installedcapacity of 31 lakh nos. The HMT MachineTools Ltd. produced 571 machine toolsduring the year at a capacity utilization of56%. The production of watches by HMTWatches Ltd. was 2.99 lakhs againstinstalled capacity of 65 lakhs. HMT ChinarWatches Ltd. produced 41964 watchesagainst installed capacity of 5492 lakhsduring the year.
9.11.1.7 The ITI Ltd. produced 524.18 KLOCB-CSN:MA&MM during the year asagainst 465.50 KL during the previous year.The production was affected due toinadequate orders for traditional switchingand transmission products.
9.11.1.8 Under telecom products (RAX/SBMRAX) Instrumentation Ltd. has provided23000 lines against the installed capacity of770000 lines during the year 2004-05 ascompared to 102000 lines in the previousyear.
9.11.1.9 Praga Tools Ltd. produced 246machine tools during 2004-05 against 225machine tools in the previous year. Thecapacity utilization increased to 82% duringthe year as compared to 78% in theprevious year.
9.11.1.10 Rajasthan Electronics andInstruments Ltd. produced 4861 electronicmilk analysers, 22819 SPV modulessystems and 119 electronic energy metersduring the year 2004-05. The corresponding
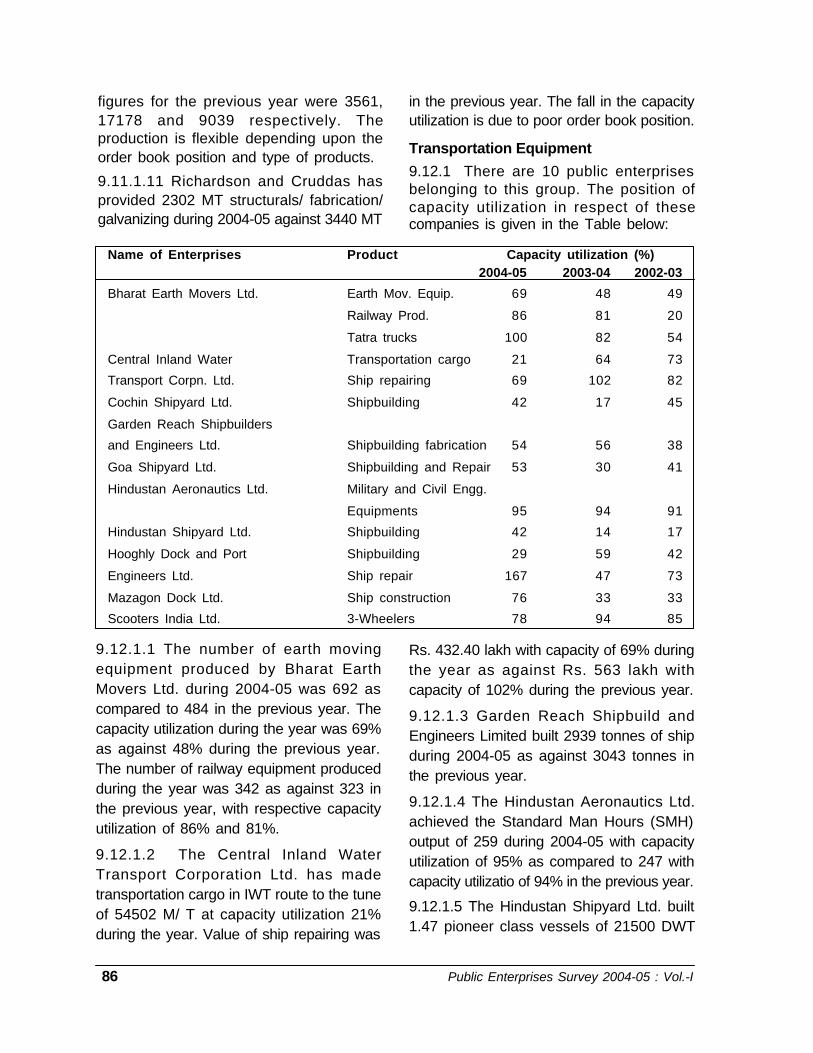
86 Public Enterprises Survey 2004-05 : Vol.-I
figures for the previous year were 3561,17178 and 9039 respectively. Theproduction is flexible depending upon theorder book position and type of products.
9.11.1.11 Richardson and Cruddas hasprovided 2302 MT structurals/ fabrication/galvanizing during 2004-05 against 3440 MT
in the previous year. The fall in the capacityutilization is due to poor order book position.
Transportation Equipment
9.12.1 There are 10 public enterprisesbelonging to this group. The position ofcapacity utilization in respect of thesecompanies is given in the Table below:
Name of Enterprises Product Capacity utilization (%)2004-05 2003-04 2002-03
Bharat Earth Movers Ltd. Earth Mov. Equip. 69 48 49
Railway Prod. 86 81 20
Tatra trucks 100 82 54
Central Inland Water Transportation cargo 21 64 73
Transport Corpn. Ltd. Ship repairing 69 102 82
Cochin Shipyard Ltd. Shipbuilding 42 17 45
Garden Reach Shipbuilders
and Engineers Ltd. Shipbuilding fabrication 54 56 38
Goa Shipyard Ltd. Shipbuilding and Repair 53 30 41
Hindustan Aeronautics Ltd. Military and Civil Engg.
Equipments 95 94 91
Hindustan Shipyard Ltd. Shipbuilding 42 14 17
Hooghly Dock and Port Shipbuilding 29 59 42
Engineers Ltd. Ship repair 167 47 73
Mazagon Dock Ltd. Ship construction 76 33 33
Scooters India Ltd. 3-Wheelers 78 94 85
9.12.1.1 The number of earth movingequipment produced by Bharat EarthMovers Ltd. during 2004-05 was 692 ascompared to 484 in the previous year. Thecapacity utilization during the year was 69%as against 48% during the previous year.The number of railway equipment producedduring the year was 342 as against 323 inthe previous year, with respective capacityutilization of 86% and 81%.
9.12.1.2 The Central Inland WaterTransport Corporation Ltd. has madetransportation cargo in IWT route to the tuneof 54502 M/ T at capacity utilization 21%during the year. Value of ship repairing was
Rs. 432.40 lakh with capacity of 69% duringthe year as against Rs. 563 lakh withcapacity of 102% during the previous year.
9.12.1.3 Garden Reach Shipbuild andEngineers Limited built 2939 tonnes of shipduring 2004-05 as against 3043 tonnes inthe previous year.
9.12.1.4 The Hindustan Aeronautics Ltd.achieved the Standard Man Hours (SMH)output of 259 during 2004-05 with capacityutilization of 95% as compared to 247 withcapacity utilizatio of 94% in the previous year.
9.12.1.5 The Hindustan Shipyard Ltd. built1.47 pioneer class vessels of 21500 DWT

Productivity in Public Enterprises 87
each during the year 2004-05 as against0.49 in the previous year and against aninstalled capacity of 3.5 pioneer classvessels of 21500 DWT.
9.12.1.6 The shipbuilding in Hooghly Dockand Port Engineers Ltd. during the year2004-05 was 321 tonnes as against 653tonnes in the previous year. It repaired 25ships during 2004-05 as against 7 in theprevious year.
9.12.1.7 The Mazagon Dock Ltd.constructed 8.92 ship units during the year
2004-05 with capacity utilization of 76% asagainst 3.16 ship units with capacityutilization of 33% during the previous year.
9.12.1.8 The Scooters India Ltd. produced12863 three-wheeler scooters during 2004-05 as against 15494 in the previous year.
Consumer Goods
9.13.1 There are 11 enterprises producingconsumer goods. Information relating tocapacity utilization is available in respect of7 enterprises only. The position is given inthe Table below:-
Name of Enterprises Product Capacity utilization (%)2004-05 2003-04 2002-03
Cement Corpn. of India Ltd. Cement 21 15 14
Hindustan Latex Ltd. Contraceptive/ Condoms 138 128 121
Steroidal OCP 193 183 167
Hindustan Newsprint Ltd. Newsprint 112 113 101
Hindustan Paper Corpn. NPM-Paper of Newspaper 106 113 106
CPM-Paper/Newsprint 91 97 94
Hindustan Photofilms Mfg.
Co. Ltd. Cine Products, X-Ray
Films, Paper products etc. 2 5 4
NEPA Ltd. Newsprint 25 26 23
Tyre Corporation of India Ltd. Automotive Tyre 26 73 55
9.13.1.1 The Cement Corporation of IndiaLtd. produced 8.06 lakh MT cement duringthe year 2004-05 recording 21% capacityutilization as compared to a production andcapacity utilization of 5.85 lakh MT and 15%respectively during the previous year.
9.13.12 The Hindustan Latex Limitedproduced 925.97 million pieces of condomsduring the year 2004-05 as compared to856.18 million pieces in the previous year.The production of copper-T, steroidal OCPand blood bags have also recorded increaseduring the year.
9.13.1.3 The combined production of paperand newsprint by the Nagaon and CacharMills of Hindustan Paper Corporation Ltd.
during the year 2004-05 was 197312 MT ascompared to 210015 MT during the previousyear.
9.13.1.4 The Hindustan Newsprint Ltd.produced 112200 MT newsprint during2004-05 as against 112555 MT during theprevious year against the installed capacityof 1 lakh MT.
9.13.1.5 In Hindustan PhotofilmsManufacturing Co. Ltd. production during theyear 2004-05 was 0.81 M. Sq. M as against1.70 M.Sq. M during the previous year.
9.13.1.6 The NEPA Ltd. produced 21680MT newsprint during 2004-05 as against22450 MT during the previous year.

88 Public Enterprises Survey 2004-05 : Vol.-I
9.13.1.7 Tyre Corporation of India produced6171 MT automotive tyres as compared to17006 MT during the previous year.
Macro Picture of Capacity Utilisation
9.14.1 The consolidated position of capacityutilization for the year under review alongwith that for the previous two years ispresented in the Table below: -
Description 2004-05 2003-04 2002-03
Units which have recorded 75% or more 98(58) 87(53) 84(54)
capacity utilization
Units which have recorded 50% or more but 28(17) 32(19) 29(19)
less than 75% capacities utilization
Units which have recorded less than 50% 42(25) 47(28) 41(27)
capacity utilization
Total 168(100) 165(100) 154(100)
(Figures in brackets show percentages.)
9.14.2 Ninety eight units, i.e. 58% of theoperating units in respect of whichinformation is available, achieved 75% ormore capacity utilization during the year2004-05 as against 53% during the previousyear. The number of units operating at 50%or more but less than 75% was 28 ascompared to 32 in the previous year. Twentyfive percent of the units operated at below50% of their capacity during 2004-05. Whilemost of the units belonging to the mineralsand metals, coal, power, petroleum andfertilisers sectors have achieved 75% ormore capacity utilization during the year,many units belonging to the chemicals andpetrochemicals, engineering, transportationequipments and consumer goods sectorsoperated at lower capacity.
Steps Taken for PerformanceImprovement
9.15.1 Some of the measures taken by theGovernment and the management of the publicenterprises to improve the performance ofpublic enterprises are as under:
• Strengthening of MOU system• Periodic performance review by the
administrative Ministries and InterMinisterial Committee.
• Delegation of enhanced powers toBoard of Directors of Navratna,Miniratna PSEs and profit makingPSEs.
• Professionalisation of Board ofDirectors and induction of eminentpersons as Independent Directors.
• Setting up of Board forReconstruction of Public SectorEnterprises (BRPSE) to considerrevival/restructuring of sick and lossmaking CPSEs
• Training and human resourcedevelopment.
• Diversification of product-mix.• Technology upgradation, research
and development.• Better house keeping and improved
maintenance management practices• Greater emphasis on energy
conservation.• Export promotion.
• Improved inventory control.

Energy Conservation in Public Sector 89
ENERGY CONSERVATION IN PUBLIC SECTOR1010.1 Energy is an essential input in theproduction activities. Rapid increase inenergy demand and consumption in theindustrial and service sectors have resultedin the gradual depletion of the reserves.Thus energy conservation has assumedconsiderable importance. Setting up ofadditional capacity is not only capitalintensive but also time consuming. On theother hand, the additional investments thatmay be required for energy conservationmeasures would be much less and theresults would be available within a shortperiod.
10.2 Industrial sector has a major role to
play in this area because it is the majorconsumer of commercial energy. Themanufacturing sector can achieve substantialsaving in the consumption of energy byadopting energy efficient methods. The mainreasons for higher consumption of energy areobsolete technology, lower capacity utilization,casual monitoring of energy consumption,lower automation, low quality of raw materialand poor operating and maintenancepractices.
10.3 The following table gives the patternof energy consumption by manufacturing unitsbelonging to different cognate groups duringthe last 2 years.
Cognate Group Consumption of energy Energy cost as % age(Rs. in crore) of cost of production
2004-05 2003-04 2004-05 2003-04
Steel 2613.40 2545.39 9.20 10.37
Mineral & Metals 1274.62 1164.54 22.41 22.85
Coal & Lignite 1616.43 1498.67 6.27 6.62
Power 13929.46 12400.20 56.19 49.88
Petroleum 1129.20 1029.56 0.31 0.37
Fertilizer 2198.81 1941.72 20.19 19.52
Chemicals & Pharmaceuticals 100.91 123.93 6.78 8.31
Heavy Engineering 271.96 251.05 2.66 3.06
Medium & Light Engineering 123.27 129.42 1.35 1.56
Transportation Equipment 143.57 141.88 1.80 2.08
Consumer Goods 238.18 226.81 11.64 11.16
Agro based Industries 5.66 5.07 3.16 2.73
Textiles 104.62 108.19 3.53 3.66

90 Public Enterprises Survey 2004-05 : Vol.-I
10.4 Energy conservation measures takenby some of the major public sectorenterprises during the year 2004-05 and theresults achieved thereof are given in thefollowing paragraphs.
STEEL
10.4.1 The overall specific energy
consumption in Steel Authority of India Ltd.(four integrated steel plants) during 2004-05was 7.29 Gcal per tonne of crude steel ascompared to 7.46 Gcal per tonne of crudesteel during 2003-04.
10.4.1.1 Details of energy consumption pertonne of production are as under :
Description Steel Alloy & Spl. Steel
2004-05 2003-04 2004-05 2003-04
Purchased electricity (KWH) 495 498 1023 1225
Fuel Oil (Litres) 2 2 68 84
Coking Coal (Kgs) 1080 1130 — —
Coke (Kgs) 46 7 328 419
Non-Coking Coal (Kgs) 86 77 — —
10.4.1.2 Some of the important energyconservation schemes undertaken by thecompany are :
Bhilai Steel Plant
- Propane gas for scarfing to replaceacetylene gas.
- Installation of blast furnace gas burnersin Boiler-6 of PBS to replace coal.
Bokaro Steel Plant
- Commissioning of multi-slit burners inSinter band No.2 and No.3.
- Installation of stainless steel sheet in thecombustion chamber wall of stove No.4of blast No.3.
- Provision of duplex burners in Kin No.5to fire tar along with gas.
- Coal dust injection system in BF 5.
Durgapur Steel Plant
- Automation and implementation ofprocess heating model for reheatingfurnace of Section mill.
- Implementation of on-line delay strategymodel in ‘A’-Furnace of wheel and axleplant.
Rourkela Steel Plant
- Replacement of recuperators of furnaceNo.6.
10.4.2 The Rashtriya Ispat Nigam Ltd. hastaken various measures towards energyconservation, but due to the problems facedwith the availability of major raw materialsnamely Coke and Iron ore, the specific energyconsumption increased from 6.27 Gcal pertonne of liquid steel in 2003-04 to 6.33 Gcal pertonne of liquid steel in 2004-05.
10.4.2.1 Details of energy consumption pertonne of production are as under :
Description 2004-05 2003-04
Coking Coal (Kgs) 893.55 942.00
Coke (Kgs) 130.89 82.80
Boiler Coal (Kgs) 400.68 405.97
Furnace Oil (litres) 0.19 0.29
Electricity (Kwh) 22.96 26.60
Minerals and Metals
10.5.1 In Kudremukh Iron Ore Company Ltdthe consumption of electricity per tonne of
Energy Conservation in Public Sector 91
pellets during 2004-05 was 32.11 kwh asagainst 31.89 kwh in the previous year. Inthe case of concentrate the energyconsumption was higher at 94.84 kwh/T in2004-05 as against 79.13 kwh/T in 2003-04.This was due to lower productivity, hard oreand also due to restriction on mining in thealready broken up area.
10.5.2 The National Aluminum CompanyLtd. continues to give importance to energyconservation measures for all its operations.Accordingly, the Company has gone for thelatest technology with installation of energyefficient equipment for expansion project ofall units. Periodical review and monitoring ofenergy consumption took place at regularintervals at all units. Some of the importantenergy conservation measures undertakenby the company during the year are givenbelow:
Alumina Refinery
i) Specific Coal consumption with respectto Alumina as well as Hydrate reducedthrough the following measures –
• Optimal control of secondary air toachieve efficient and completecombustion inside the furnace.
• Improvement in Milling system output byregular classifier cleaning and otherproactive maintenance and time basedreplacement of critical spare parts likegearbox.
• Replacement of inefficient impellers of PAfans in each overhauling.
• Time based replacement of AH baskets,which resulted in effective heat transferfrom fuel gas to Air, and thereby reductionin coal consumption.
ii) Reduction in total number of Boilertripping in the year 2004-05 has reducedby 17.46% over the previous year whichwas achieved through –
• Optimal control of mill level, mill outlettemperature etc., which contributed to thestability of furnace and reduction in Boilertrip outs.
• Suitable modification in SecondaryAuxiliary air damper control circuit whichreduced the secondary air fluctuationduring a mill trip.
iii) Operation of Condensate Polishing Unitresulted in the following advantages –
• Filter water consumption has reduced;burden on DM plant and water intake wastherefore less.
• Higher DM water temperature from CPUenhanced the Boiler Cycle efficiency andthere is reduction in coal consumption.
Smelter:
i) Variable frequency drive has beeninstalled in Anode Handling De-dustingunit to optimize the speed. Energy savinghas been achieved.
ii) In Strip Casting Plant, atomizingcompressed air pressure has beenoptimized by reducing RPM by resizingmotor and changing pulley.
iii) Automatic control of Cooling tower fanmotors has been done throughtemperature controller.
iv) Reduction in lighting power consumptionhas been done in Cast House – B byvoltage control of lighting transformer.
Captive Power Plant
i) Cooling Tower –3 Fan, fan bladesreplaced with energy efficient ENCONmake blades.
ii) U#6 Auxiliary Oil Pump-1 replaced withenergy efficient KSB, Germany makepump.
iii) With optimization of process parameters

92 Public Enterprises Survey 2004-05 : Vol.-I
it has been possible to generate full loadby running 3 Mills instead of 4.
iv) Power has been saved by installing 2x300TR VAM in place of ChillerCompressor.
V) Making the functioning of oil waterseparator pit effective to reclaim andreuse fuel oil in the boilers resulting indirect saving of fuel oil.
Coal and Lignite
10.6.1 The energy conservation measurestaken by the Neyveli Lignite Corporation Ltdduring the year are as under:
Mines sector
(i) Variable speed drive has been introducedin the Main Slewing and major frictionalmechanical elements of the BWE 1355to avoid frictional loss and thereby saveenergy;
(ii) Computerised energy managementsystem has been introduced in 230 KV/11 KV sub station from 17.12.2004.
Power sector
(i) Dyno Drives in the raw coal feeders forspeed control were replaced with Variablefrequency drives in few boilers, CoolingTower Fan Motors with 243 KW werereplaced with 200 KW high efficiencymotors.
(ii) Energy efficient lighting system timershave been provided for all criticallocations.
(iii) Auxiliary power consumption wascontained to 11.41% in Station-I and9.78% in Station-II against the norm of12% by taking up various energyconservation measures.
Petroleum
10.7.1 The Bharat Petroleum CorporationLtd. continued its efforts for energyconservation both in terms of improvementin operations/ maintenance as well asdevelopment of new projects. Continuousmonitoring of fuel consumption andhydrocarbon loss is undertaken usingsophisticated instruments and dataacquisition system. An elaborate energyaccounting system and managementinformation system are important features inBPCL refinery. Commissioning of highlyenergy efficient integrated crude andvacuum units, provision of 25 fibrereinforced plastic blades in lieu of existingaluminium blades in air-fin coolers in thecatalytic cracking unit and high vacuum unit,de-coking of furnaces in heavy crude unit,replacement of leaky steam traps, etc aresome of the energy conservation measurestaken during the year.
10.7.2 The Bongaigaon Refinery &Petrochemicals Corporation Ltd. hasadopted various energy conservationmeasures in the plant/processing complex tomake the operations more efficient. Theimportant schemes undertaken during theyear are (i) destaging of two numbers ofwash water pump from 12 to 9 stage inCDU-II was done in October,2004 &December, 2004 respectively resulted in dropof current by 12 ampere; (ii) diversion of REPdrinking water reservoir overflow to coolingwater sump resulted in the water saving of30 M3/hr which was implemented in August,2004; (iii) reinsulation of 400 m processsteam line with better insulation material –Perlite and calcium silicate; (iv) replacementof metallic fin fan cooler blades with FRPblades of 14-E-29-B1 and 14-E-32A in DCU-I resulted in drop of current by 5.0 & 8.0ampere respectively.
Energy Conservation in Public Sector 93
10.7.3 Important energy conservationschemes undertaken by Chennai PetroleumCorporation Ltd. during the year include (i)the Refinery Linear Programming model isextensively utilized to optimize variousprocess units, to maximize profit with energyconservation as focus; (ii) as part of the long-term efforts to plan and implement energyconservation techniques in a sustainablemanner, CPCL is participating in thebenchmarking exercise by M/s. Shell GlobalSolutions Inc., for Manali Refinery to identifythe gaps in each area for further correctiveaction; (iii) CPCL is also embarking on plansto use Natural Gas as fuel in place of Fueloil, as it offers the advantages of being aclean environment friendly fuel; and (iv) acomprehensive plan of action to reduce thefuel and loss levels gradually in the next five-year period is being worked out.
10.7.4 Mumbai and Visakh refineries of theHindustan Petroleum Corporation Ltd. haveaccorded highest priority to energyconservation and have undertaken severalenergy conservation measures byoperational improvements and implementingenergy conservation projects. These include:
Mumbai Refinery
(i) Optimization of GTG load and reducedspecific energy consumption from0.373 to 0.365 kg of fuel per unit ofpower generation in CPP.
(ii) Modified PDU steam condensaterecovery system and reduced processsteam consumption by 2 tons/hr.
(iii) Organised oil conservation fortnightduring January, 2005 to generate massawareness in public for conservation ofpetroleum products.
Visakh Refinery:
(i) Carried out refinery’s comprehensive
compressed oil survey and remedialmeasures taken to arrest air leaks.
(ii) Reduced specific stem consumption to292 MT/TMT during the year 2004-05as compared to 305 MT/TMT during theprevious year.
(iii) Steam leak joint survey was carried outduring the oil conservation fortnight inJanuary, 2005.
10.7.5 Kochi Refineries Ltd. continues tobestow utmost importance to conservation ofenergy by regular monitoring and analysis offuel and utilities consumption, optimizing plantoperations and proper upkeep of plant andmachinery. During the year 2004-05, thepurchased power is more as compared to theprevious year due to the shut down of GT forrepairs. The major energy conservationmeasures undertaken during the year 2004-05 are:
• Replacement of metallic blade with FibreReinforced Plastic blade in CE7A/B airfin fans on a trial basis, at an investmentof Rs.0.11 Million with an expectedsavings of Rs.0.26 Million per annum.
• Using hot condensate for production ofbitumen emulsion as part of BitumenEmulsion project with an expectedsavings of Rs.0.15 Million per annum.
• Replacement of conventional burnersin EH1 heater with low Nox burners.
• Additional investments are beingimplemented for reduction of energyconsumption viz., insulation of plant fueltank, condensate recovery fromVacuum Residue/Plant fuel tank farmand internal coating of cooling waterpump to improve pump efficiency etc.
94 Public Enterprises Survey 2004-05 : Vol.-I
10.7.6 The Indian Oil Corporation continuedits efforts in energy conservation andimplemented a number of energy conservationschemes during the year. Major schemesimplemented are: –
• Yield and energy optimization revamp ofCDU at Mathura refinery;
• Installation of new 2x50 TPH boilers atGuwahati Refinery; and
• Recovery of Hydrogen from lowpressure off gases of OHCU at PanipatRefinery
These measures have resulted in fuelsavings of about 24,000 tonnes per year.
10.7.7 As a part of Numaligarh RefineriesLtd.’s continual efforts towards energyconservation and loss control, the followingnew Encon schemes have been taken up forimplementation during the year 2004-05:-
• Implementation of Advanced ProcessControl (APC) in CDU/VDU to optimizeProduct recovery and improve Productyields.
• Providing special type of TelescopicInsulation for all the 150 numbers ofCatalyst Tubes, which is expected tosave around 600 MT of fuel per year.
• Installation of 12 MW Steam TurboGenerator (STG) for utilizing surplussteam and recovering power fromPRDS. The project is expected torecover around 14000 MWH of energythrough PRDS as well as utilize the totalsurplus steam of the refinery.
• During the Oil & Gas ConservationFortnight in the month of January, 2005,a joint team of CHT conducted SteamLeak survey. Remedial actions havebeen taken for all the identified leaks.
Fertilizers and Chemicals
10.8.1 The Fertilizers & ChemicalsTravancore Ltd. has modified the steamnetwork system of Udyogamandal Divisionwhich resulted in steam saving at the rate of2-4 MT/hr of 14 ATA steam. Steamrequirements of ammonium sulphate plantwas partially met by re-using 8 ATA steamwhich would have been vented otherwise.
10.8.2 The consumption of energy (Gcals)per tonne of production of urea by differentplants of National Fertilizers Ltd. was asunder:
10.8.2.1 The energy conservation schemesimplemented in Nangal, Panipat and Bathindaplants are replacement of governors,provision of variable speed coupling for majorpumps/fans, and upgradation ofinstrumentation. Replacement of condensingsteam turbine with motor for CW pumps,installation of additional trays, installation ofvacuum pre-concentrator in Urea plant, etc.are some of the measures taken in the Vijaipurplant.
10.8.3 The Rashtriya Chemicals andFertilizers Ltd. has undertaken various energysavings schemes due to which energy costas percentage of total cost of production hasreduced. These include use of extractionsteam for atomization of naphtha burners,installation of Magnetic resonator for steamgeneration, revamping of Old HP Nitric Acid
2004-05 2003-04
Nangal 9.639 9.580
Panipat 9.955 9.705
Bathinda 9.720 9.758
Vijaipur-I 6.043 5.815
Vijaipur-II 5.629 5.469
Energy Conservation in Public Sector 95
Plant for reduction of Electrical Energy, useof energy efficient lamps, improvement ofpower factor and monitoring of maximumdemand, installing micro processor basedenergy meters for all feeders and majorelectrical drives for close monitoring, etc.
10.8.3.1 The consumption of energy per unitof production was 6.477Gcal during 2004-05as compared to 6.574 Gcal during theprevious year.
10.8.4 The Madras Fertilizers Ltd. hastaken extensive turnaround and preventivemaintenance measures during the year. Theoverall energy consumption level per unit ofproduction was as under:-
Engineering
10.9.1 Bharat Heavy Electricals Ltd. hasworked out a 5 years plan for energyconservation and its efficient use aiming at30% reduction in energy consumption asrelated to turnover. Containing energy coston a continuous basis, optimal utilization ofresources, general awareness of importanceof energy conservation, improved housekeeping and improved operational practicesare some of the steps towards energyconservation. Energy audits in various unitsare regularly being conducted. The energycost as a percentage of turnover (net ofexcise) has improved to 2.62 as against 2.86in the previous year.
Product 2004-05 2003-04
Ammonia
Electricity (KWH) 123.942 122.833
Fuel oil+LSHS (MT) 0.2095 0.2127
Naptha (MT) 0.7575 0.7784
Urea
Electricity (KWH) 171.494 177.553
Fuel oil+LSHS (MT) 0.1177 0.1324
10.9.2 The energy conservation measurestaken by Bharat Electronics Ltd. during theyear 2004-05 are:
• Automation of air compressor system;
• Extensive replacement of conventionalfittings by energy efficient lightingfixtures;
• Installation of additional automaticpower factor improvement controllers;
• Energy audit by TERI andimplementation of the recommendations;
• Incorporation of energy savers fordischarge lamps.
As a result of these measures, theconsumption of electricity per each lakhrupee of production is reduced to 198 kwhrsduring 2004-05 as compared to 217 kwhrsduring the previous year.
10.9.3 The Bharat Earth Movers Ltd. hastaken the following measures during 2004-05for energy conservation:
• Round the clock monitoring of thehanger lights and controlling them tobarest necessity;
• Decentralisation of compressed airsystem by providing portablecompressors, wherever possible;
• Shutting of electrical machinery/alliances during unproductive hours;
• Improving the efficiency of DG sets byproper tuning and adjusting the fuelsystem and eliminating the overheatingof DG engines by proper coolingarrangements.
10.9.4 The ITI Ltd. has taken energyconservation measures like creatingawareness among staff to conserve energy,use of energy saving equipments, etc.
96 Public Enterprises Survey 2004-05 : Vol.-I
CONSUMER GOODS
10.10.1 The Hindustan Paper CorporationLtd. has implemented the measuressuggested by M/s DSCL Energy Services Ltd.In-house energy conservation task forces haveidentified schemes for conservation of power,water and steam. Energy managers areappointed at both Nagaon Paper Mill andCachar Paper Mill. The schemesimplemented during the year are (i) wet fly ashhandling system to dry type, (ii) oxygentrimming control mechanism to reduce dryflue gas loss of C&C flaker heater and (iii) twostage heating at recovery boiler.
10.10.2 The Hindustan Newsprint Ltd. hasconducted a detailed energy conservationstudy in the mill, focusing on pumps and fansand identifying energy saving potential byinstalling electronic variable frequency drivesfor speed control of motors, driving pumps
and fans. The consumption of electricity perMT of production during 2004-05 was 1859Kwh as against 2073 Kwh in the previous year.
CONCLUSION
10.11 As could be seen from the aboveanalysis the central public sector enterprisesare conscious of the need to conserve energyand have taken various steps for efficient useof energy for various operational and auxiliarypurposes. Regular maintenance of plant &machinery, replacement of energy inefficientequipment by better ones, effective recoveryof waste-heat, prevention of leakage,modifications in the design of plant/machinery and other equipment, energy auditand creation of awareness amongemployees and general public are theimportant areas which should receiveadequate attention
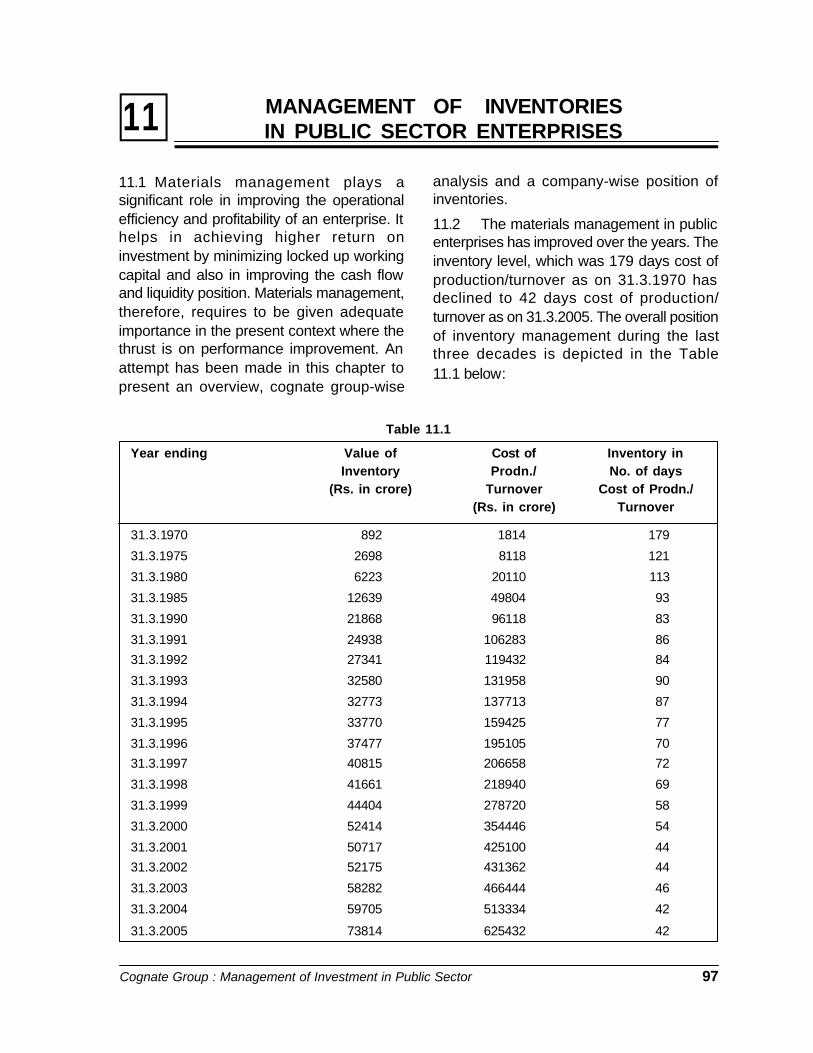
Cognate Group : Management of Investment in Public Sector 97
MANAGEMENT OF INVENTORIESIN PUBLIC SECTOR ENTERPRISES11
11.1 Materials management plays asignificant role in improving the operationalefficiency and profitability of an enterprise. Ithelps in achieving higher return oninvestment by minimizing locked up workingcapital and also in improving the cash flowand liquidity position. Materials management,therefore, requires to be given adequateimportance in the present context where thethrust is on performance improvement. Anattempt has been made in this chapter topresent an overview, cognate group-wise
Table 11.1
Year ending Value of Cost of Inventory inInventory Prodn./ No. of days
(Rs. in crore) Turnover Cost of Prodn./(Rs. in crore) Turnover
31.3.1970 892 1814 179
31.3.1975 2698 8118 121
31.3.1980 6223 20110 113
31.3.1985 12639 49804 93
31.3.1990 21868 96118 83
31.3.1991 24938 106283 86
31.3.1992 27341 119432 84
31.3.1993 32580 131958 90
31.3.1994 32773 137713 87
31.3.1995 33770 159425 77
31.3.1996 37477 195105 70
31.3.1997 40815 206658 72
31.3.1998 41661 218940 69
31.3.1999 44404 278720 58
31.3.2000 52414 354446 54
31.3.2001 50717 425100 44
31.3.2002 52175 431362 44
31.3.2003 58282 466444 46
31.3.2004 59705 513334 42
31.3.2005 73814 625432 42
analysis and a company-wise position ofinventories.
11.2 The materials management in publicenterprises has improved over the years. Theinventory level, which was 179 days cost ofproduction/turnover as on 31.3.1970 hasdeclined to 42 days cost of production/turnover as on 31.3.2005. The overall positionof inventory management during the lastthree decades is depicted in the Table11.1 below:
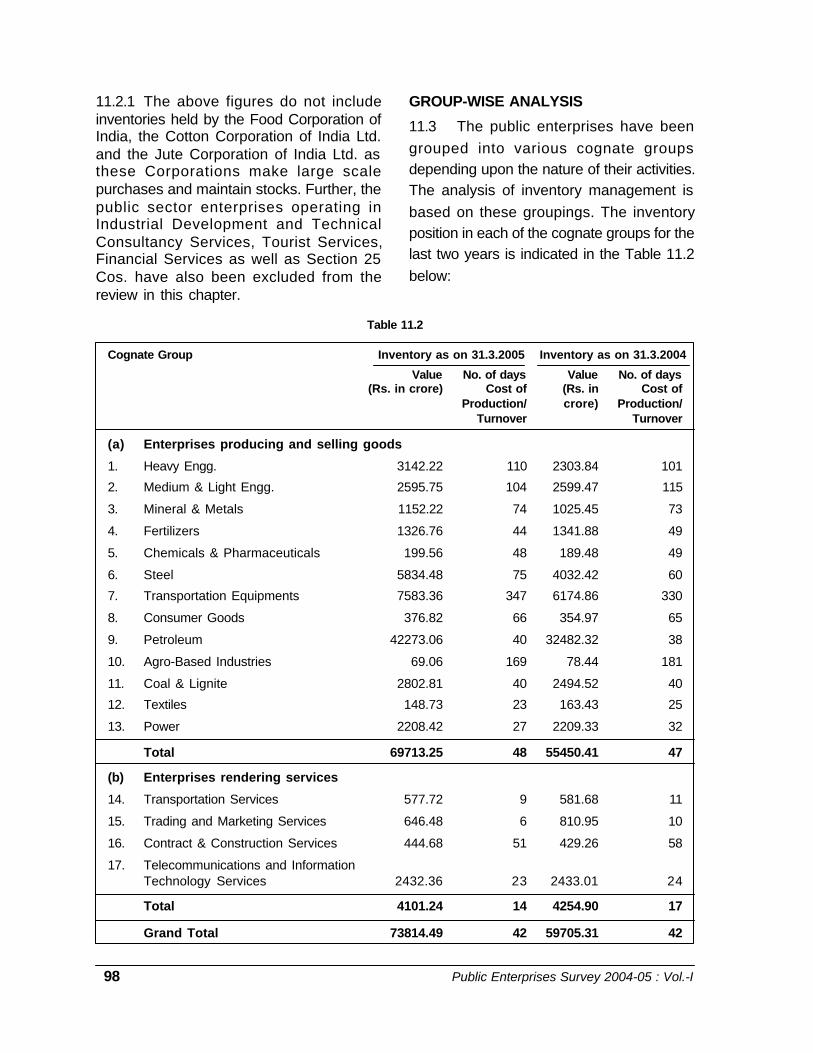
98 Public Enterprises Survey 2004-05 : Vol.-I
11.2.1 The above figures do not includeinventories held by the Food Corporation ofIndia, the Cotton Corporation of India Ltd.and the Jute Corporation of India Ltd. asthese Corporations make large scalepurchases and maintain stocks. Further, thepublic sector enterprises operating inIndustrial Development and TechnicalConsultancy Services, Tourist Services,Financial Services as well as Section 25Cos. have also been excluded from thereview in this chapter.
GROUP-WISE ANALYSIS
11.3 The public enterprises have beengrouped into various cognate groupsdepending upon the nature of their activities.The analysis of inventory management isbased on these groupings. The inventoryposition in each of the cognate groups for thelast two years is indicated in the Table 11.2below:
Table 11.2
Cognate Group Inventory as on 31.3.2005 Inventory as on 31.3.2004
Value No. of days Value No. of days(Rs. in crore) Cost of (Rs. in Cost of
Production/ crore) Production/Turnover Turnover
(a) Enterprises producing and selling goods
1. Heavy Engg. 3142.22 110 2303.84 101
2. Medium & Light Engg. 2595.75 104 2599.47 115
3. Mineral & Metals 1152.22 74 1025.45 73
4. Fertilizers 1326.76 44 1341.88 49
5. Chemicals & Pharmaceuticals 199.56 48 189.48 49
6. Steel 5834.48 75 4032.42 60
7. Transportation Equipments 7583.36 347 6174.86 330
8. Consumer Goods 376.82 66 354.97 65
9. Petroleum 42273.06 40 32482.32 38
10. Agro-Based Industries 69.06 169 78.44 181
11. Coal & Lignite 2802.81 40 2494.52 40
12. Textiles 148.73 23 163.43 25
13. Power 2208.42 27 2209.33 32
Total 69713.25 48 55450.41 47
(b) Enterprises rendering services
14. Transportation Services 577.72 9 581.68 11
15. Trading and Marketing Services 646.48 6 810.95 10
16. Contract & Construction Services 444.68 51 429.26 58
17. Telecommunications and InformationTechnology Services 2432.36 23 2433.01 24
Total 4101.24 14 4254.90 17
Grand Total 73814.49 42 59705.31 42
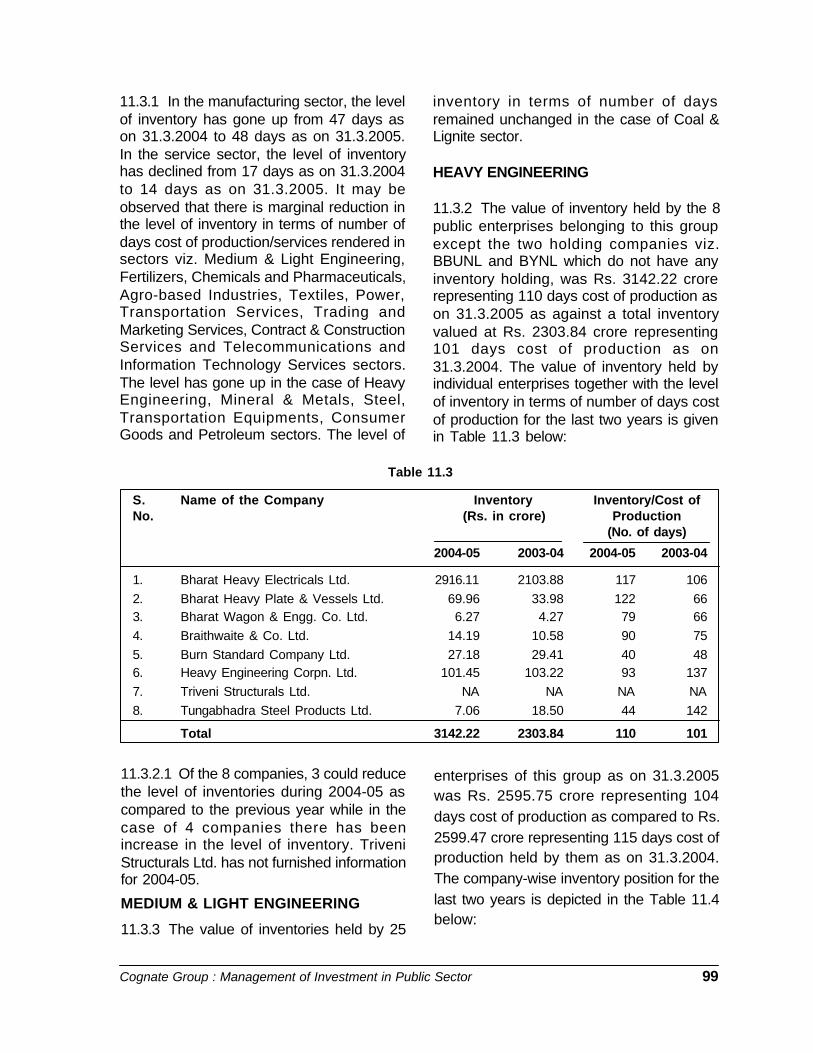
Cognate Group : Management of Investment in Public Sector 99
11.3.1 In the manufacturing sector, the levelof inventory has gone up from 47 days ason 31.3.2004 to 48 days as on 31.3.2005.In the service sector, the level of inventoryhas declined from 17 days as on 31.3.2004to 14 days as on 31.3.2005. It may beobserved that there is marginal reduction inthe level of inventory in terms of number ofdays cost of production/services rendered insectors viz. Medium & Light Engineering,Fertilizers, Chemicals and Pharmaceuticals,Agro-based Industries, Textiles, Power,Transportation Services, Trading andMarketing Services, Contract & ConstructionServices and Telecommunications andInformation Technology Services sectors.The level has gone up in the case of HeavyEngineering, Mineral & Metals, Steel,Transportation Equipments, ConsumerGoods and Petroleum sectors. The level of
inventory in terms of number of daysremained unchanged in the case of Coal &Lignite sector.
HEAVY ENGINEERING
11.3.2 The value of inventory held by the 8public enterprises belonging to this groupexcept the two holding companies viz.BBUNL and BYNL which do not have anyinventory holding, was Rs. 3142.22 crorerepresenting 110 days cost of production ason 31.3.2005 as against a total inventoryvalued at Rs. 2303.84 crore representing101 days cost of production as on31.3.2004. The value of inventory held byindividual enterprises together with the levelof inventory in terms of number of days costof production for the last two years is givenin Table 11.3 below:
Table 11.3
S. Name of the Company Inventory Inventory/Cost ofNo. (Rs. in crore) Production
(No. of days)
2004-05 2003-04 2004-05 2003-04
1. Bharat Heavy Electricals Ltd. 2916.11 2103.88 117 1062. Bharat Heavy Plate & Vessels Ltd. 69.96 33.98 122 663. Bharat Wagon & Engg. Co. Ltd. 6.27 4.27 79 664. Braithwaite & Co. Ltd. 14.19 10.58 90 755. Burn Standard Company Ltd. 27.18 29.41 40 486. Heavy Engineering Corpn. Ltd. 101.45 103.22 93 1377. Triveni Structurals Ltd. NA NA NA NA8. Tungabhadra Steel Products Ltd. 7.06 18.50 44 142
Total 3142.22 2303.84 110 101
11.3.2.1 Of the 8 companies, 3 could reducethe level of inventories during 2004-05 ascompared to the previous year while in thecase of 4 companies there has beenincrease in the level of inventory. TriveniStructurals Ltd. has not furnished informationfor 2004-05.
MEDIUM & LIGHT ENGINEERING
11.3.3 The value of inventories held by 25
enterprises of this group as on 31.3.2005was Rs. 2595.75 crore representing 104days cost of production as compared to Rs.2599.47 crore representing 115 days cost ofproduction held by them as on 31.3.2004.The company-wise inventory position for thelast two years is depicted in the Table 11.4below:
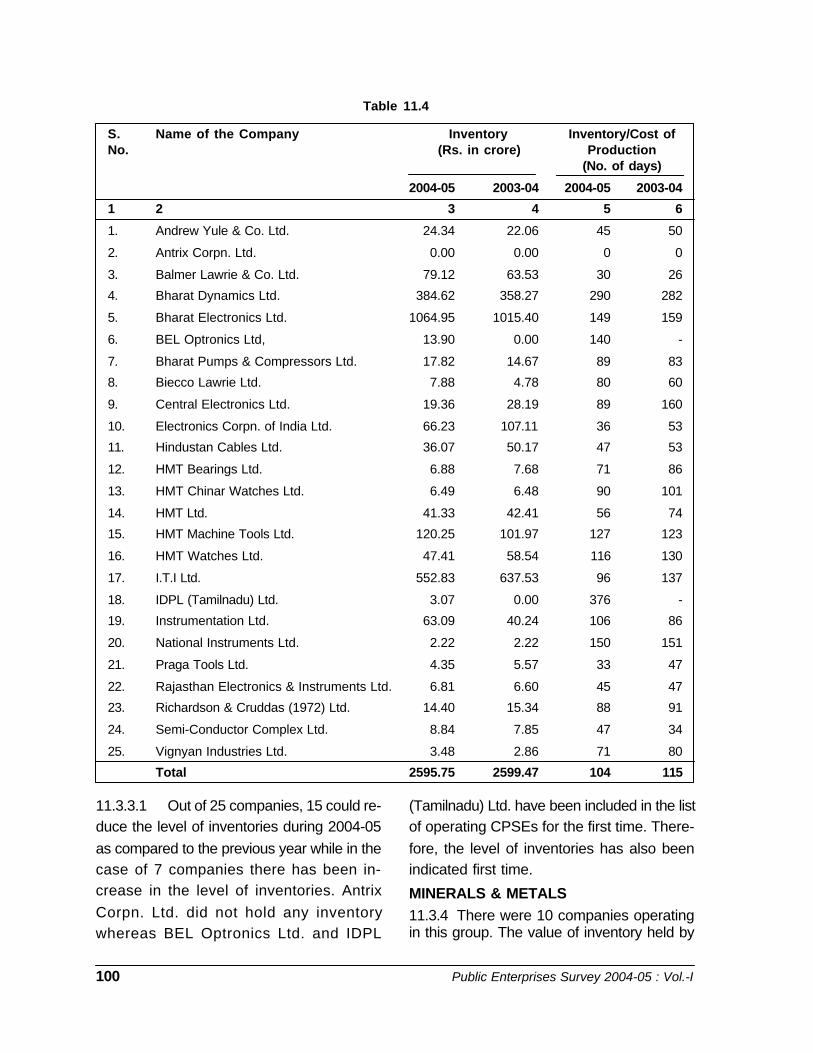
100 Public Enterprises Survey 2004-05 : Vol.-I
Table 11.4
S. Name of the Company Inventory Inventory/Cost ofNo. (Rs. in crore) Production
(No. of days)
2004-05 2003-04 2004-05 2003-04
1 2 3 4 5 6
1. Andrew Yule & Co. Ltd. 24.34 22.06 45 50
2. Antrix Corpn. Ltd. 0.00 0.00 0 0
3. Balmer Lawrie & Co. Ltd. 79.12 63.53 30 26
4. Bharat Dynamics Ltd. 384.62 358.27 290 282
5. Bharat Electronics Ltd. 1064.95 1015.40 149 159
6. BEL Optronics Ltd, 13.90 0.00 140 -
7. Bharat Pumps & Compressors Ltd. 17.82 14.67 89 83
8. Biecco Lawrie Ltd. 7.88 4.78 80 60
9. Central Electronics Ltd. 19.36 28.19 89 160
10. Electronics Corpn. of India Ltd. 66.23 107.11 36 53
11. Hindustan Cables Ltd. 36.07 50.17 47 53
12. HMT Bearings Ltd. 6.88 7.68 71 86
13. HMT Chinar Watches Ltd. 6.49 6.48 90 101
14. HMT Ltd. 41.33 42.41 56 74
15. HMT Machine Tools Ltd. 120.25 101.97 127 123
16. HMT Watches Ltd. 47.41 58.54 116 130
17. I.T.I Ltd. 552.83 637.53 96 137
18. IDPL (Tamilnadu) Ltd. 3.07 0.00 376 -
19. Instrumentation Ltd. 63.09 40.24 106 86
20. National Instruments Ltd. 2.22 2.22 150 151
21. Praga Tools Ltd. 4.35 5.57 33 47
22. Rajasthan Electronics & Instruments Ltd. 6.81 6.60 45 47
23. Richardson & Cruddas (1972) Ltd. 14.40 15.34 88 91
24. Semi-Conductor Complex Ltd. 8.84 7.85 47 34
25. Vignyan Industries Ltd. 3.48 2.86 71 80
Total 2595.75 2599.47 104 115
11.3.3.1 Out of 25 companies, 15 could re-duce the level of inventories during 2004-05as compared to the previous year while in thecase of 7 companies there has been in-crease in the level of inventories. AntrixCorpn. Ltd. did not hold any inventorywhereas BEL Optronics Ltd. and IDPL
(Tamilnadu) Ltd. have been included in the listof operating CPSEs for the first time. There-fore, the level of inventories has also beenindicated first time.
MINERALS & METALS11.3.4 There were 10 companies operatingin this group. The value of inventory held by
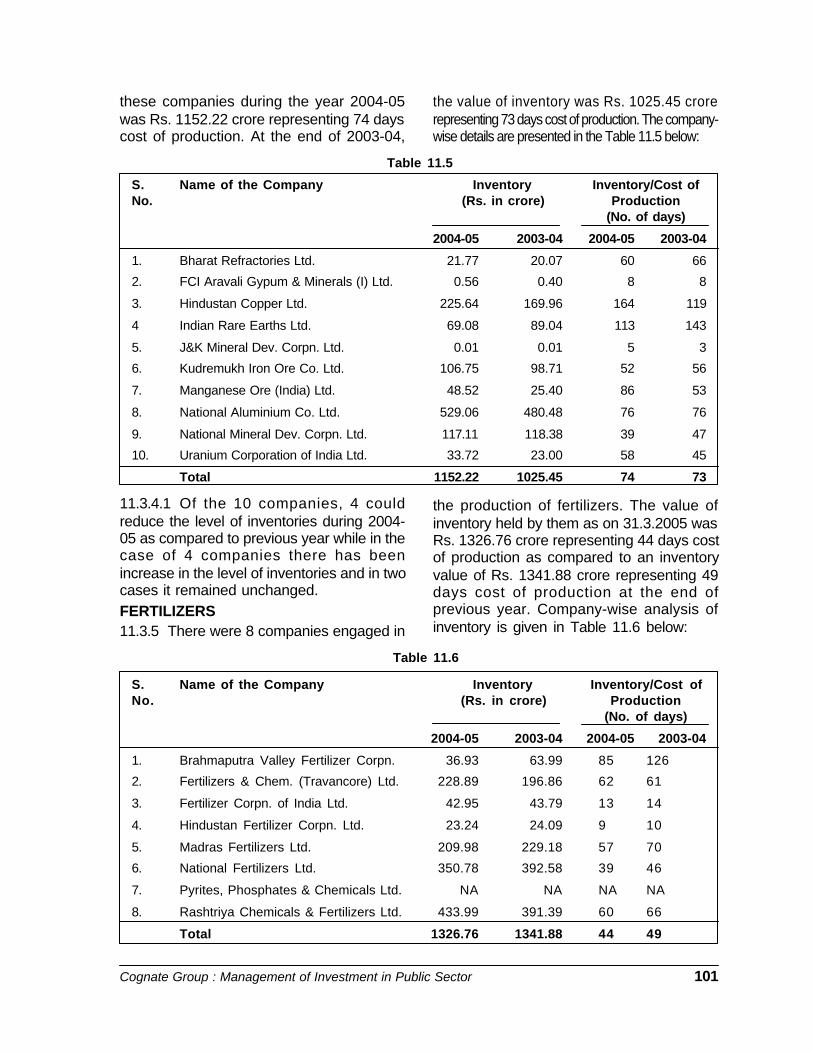
Cognate Group : Management of Investment in Public Sector 101
these companies during the year 2004-05was Rs. 1152.22 crore representing 74 dayscost of production. At the end of 2003-04,
Table 11.5
S. Name of the Company Inventory Inventory/Cost ofNo. (Rs. in crore) Production
(No. of days)
2004-05 2003-04 2004-05 2003-04
1. Bharat Refractories Ltd. 21.77 20.07 60 66
2. FCI Aravali Gypum & Minerals (I) Ltd. 0.56 0.40 8 8
3. Hindustan Copper Ltd. 225.64 169.96 164 119
4 Indian Rare Earths Ltd. 69.08 89.04 113 143
5. J&K Mineral Dev. Corpn. Ltd. 0.01 0.01 5 3
6. Kudremukh Iron Ore Co. Ltd. 106.75 98.71 52 56
7. Manganese Ore (India) Ltd. 48.52 25.40 86 53
8. National Aluminium Co. Ltd. 529.06 480.48 76 76
9. National Mineral Dev. Corpn. Ltd. 117.11 118.38 39 47
10. Uranium Corporation of India Ltd. 33.72 23.00 58 45
Total 1152.22 1025.45 74 73
the value of inventory was Rs. 1025.45 crorerepresenting 73 days cost of production. The company-wise details are presented in the Table 11.5 below:
11.3.4.1 Of the 10 companies, 4 couldreduce the level of inventories during 2004-05 as compared to previous year while in thecase of 4 companies there has beenincrease in the level of inventories and in twocases it remained unchanged.FERTILIZERS11.3.5 There were 8 companies engaged in
the production of fertilizers. The value ofinventory held by them as on 31.3.2005 wasRs. 1326.76 crore representing 44 days costof production as compared to an inventoryvalue of Rs. 1341.88 crore representing 49days cost of production at the end ofprevious year. Company-wise analysis ofinventory is given in Table 11.6 below:
Table 11.6
S. Name of the Company Inventory Inventory/Cost ofNo. (Rs. in crore) Production
(No. of days)
2004-05 2003-04 2004-05 2003-04
1. Brahmaputra Valley Fertilizer Corpn. 36.93 63.99 85 126
2. Fertilizers & Chem. (Travancore) Ltd. 228.89 196.86 62 61
3. Fertilizer Corpn. of India Ltd. 42.95 43.79 13 14
4. Hindustan Fertilizer Corpn. Ltd. 23.24 24.09 9 10
5. Madras Fertilizers Ltd. 209.98 229.18 57 70
6. National Fertilizers Ltd. 350.78 392.58 39 46
7. Pyrites, Phosphates & Chemicals Ltd. NA NA NA NA
8. Rashtriya Chemicals & Fertilizers Ltd. 433.99 391.39 60 66
Total 1326.76 1341.88 44 49

102 Public Enterprises Survey 2004-05 : Vol.-I
11.3.5.1 The value of inventories hasdecreased in 6 public enterprises andincreased in case of 1 enterprise. Pyrites,Phosphates and Chemicals Ltd. did notfurnish information for 2004-05.
CHEMICALS & PHARMACEUTICALS
11.3.6 The value of inventories held by 19
companies in the group as on 31.3.2005amounted to Rs. 199.56 crore representing48 days cost of production as compared toRs. 189.48 crore representing 49 days costof production at the end of 2003-04. Anenterprise-wise analysis of the inventoryposition is given in the Table 11.7 below:
Table 11.7
S. Name of the Company Inventory Inventory/Cost ofNo. (Rs. in crore) Production
(No. of days)
2004-05 2003-04 2004-05 2003-04
1. Bengal Chem. & Pharmaceuticals Ltd. 17.75 10.49 118 82
2. Bengal Immunity Ltd. - - - -
3. Bharat Immunologicals & Biologicals Ltd. 1.06 10.60 9 127
4. Hindustan Antibiotics Ltd. 16.79 16.69 57 47
5. Hindustan Insecticides Ltd. 46.79 51.72 94 103
6. Hindustan Flurocarbons Ltd. 7.34 7.55 102 109
7. Hindustan Organic Chemicals Ltd. 69.59 55.47 39 36
8. Hindustan Salts Ltd. 0.98 2.66 50 97
9. Indian Drugs & Pharmaceuticals Ltd. 9.45 10.90 13 14
10. Indian Medicines & Pharmaceuticals
Corp. Ltd. 1.23 1.25 80 100
11. Karnataka Antibiotics & Pharma. Ltd. 15.75 10.54 69 54
12. Maharashtra Antibiotics & Pharma. Ltd. - - - -
13. Manipur State Drugs & Pharma. Ltd. - - - -
14. Orissa Drugs & Chemicals Ltd. NA NA NA NA
15. Projects & Development India Ltd. 8.28 6.86 85 64
16. Rajasthan Drugs & Pharm. Ltd. 2.82 2.73 69 63
17. Sambhar Salts Ltd. 1.73 2.02 74 85
18. Smith Stanistreet & Pharma. Ltd. - - - -
19. U.P. Drugs & Pharmaceuticals Ltd. - - - -
Total 199.56 189.48 48 49
11.3.6.1 The level of inventory has increasedin case of 6 companies and decreased incase of 7 companies during the year 2004-05. Bengal Immunity Ltd., MaharashtraAntibiotics & Pharmaceuticals Ltd., ManipurDrugs & Pharmaceuticals Ltd. and SmithStanistreet & Pharmaceuticals Ltd. have
been closed and U.P. Drugs &Pharmaceuticals has been transferred toU.P. Govt. Hence, the level of inventoriesrelating to these companies has not beenfurnished. As regard, Orissa Drugs &Chemicals Ltd., the Company has notfurnished information for 2004-05.
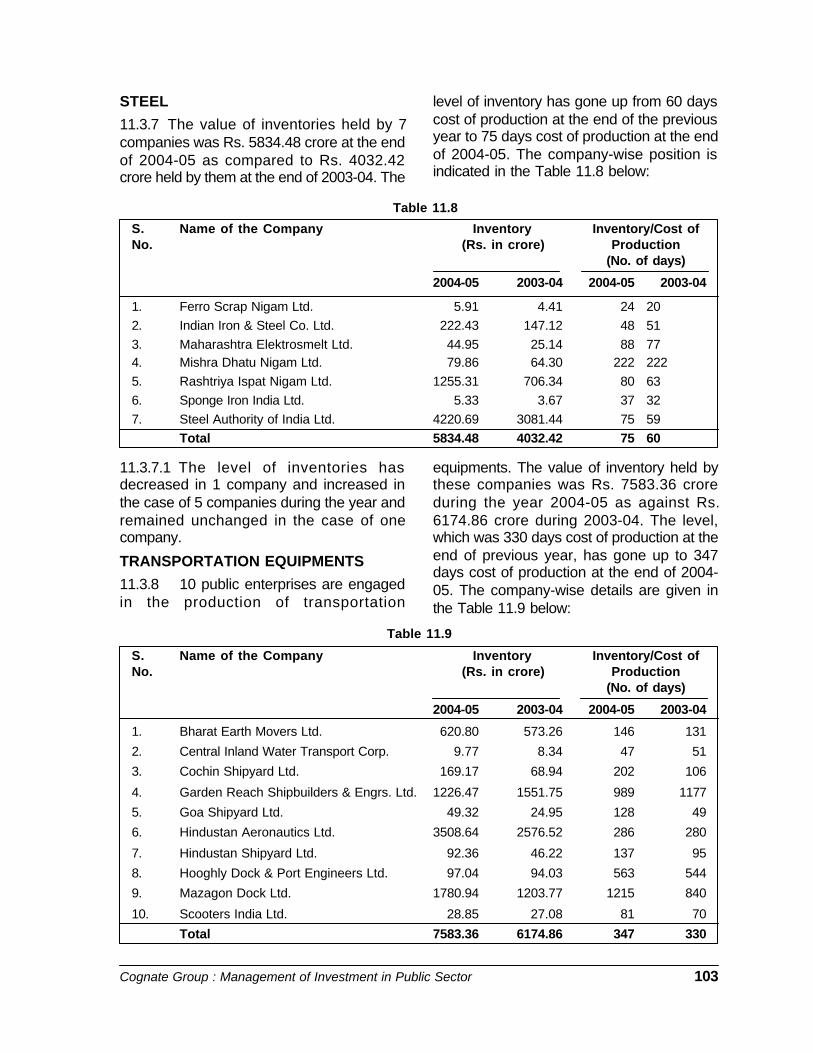
Cognate Group : Management of Investment in Public Sector 103
STEEL
11.3.7 The value of inventories held by 7companies was Rs. 5834.48 crore at the endof 2004-05 as compared to Rs. 4032.42crore held by them at the end of 2003-04. The
level of inventory has gone up from 60 dayscost of production at the end of the previousyear to 75 days cost of production at the endof 2004-05. The company-wise position isindicated in the Table 11.8 below:
Table 11.8
S. Name of the Company Inventory Inventory/Cost ofNo. (Rs. in crore) Production
(No. of days)
2004-05 2003-04 2004-05 2003-04
1. Ferro Scrap Nigam Ltd. 5.91 4.41 24 202. Indian Iron & Steel Co. Ltd. 222.43 147.12 48 513. Maharashtra Elektrosmelt Ltd. 44.95 25.14 88 774. Mishra Dhatu Nigam Ltd. 79.86 64.30 222 2225. Rashtriya Ispat Nigam Ltd. 1255.31 706.34 80 636. Sponge Iron India Ltd. 5.33 3.67 37 327. Steel Authority of India Ltd. 4220.69 3081.44 75 59
Total 5834.48 4032.42 75 60
11.3.7.1 The level of inventories hasdecreased in 1 company and increased inthe case of 5 companies during the year andremained unchanged in the case of onecompany.
TRANSPORTATION EQUIPMENTS
11.3.8 10 public enterprises are engagedin the production of transportation
equipments. The value of inventory held bythese companies was Rs. 7583.36 croreduring the year 2004-05 as against Rs.6174.86 crore during 2003-04. The level,which was 330 days cost of production at theend of previous year, has gone up to 347days cost of production at the end of 2004-05. The company-wise details are given inthe Table 11.9 below:
Table 11.9
S. Name of the Company Inventory Inventory/Cost ofNo. (Rs. in crore) Production
(No. of days)
2004-05 2003-04 2004-05 2003-04
1. Bharat Earth Movers Ltd. 620.80 573.26 146 131
2. Central Inland Water Transport Corp. 9.77 8.34 47 51
3. Cochin Shipyard Ltd. 169.17 68.94 202 106
4. Garden Reach Shipbuilders & Engrs. Ltd. 1226.47 1551.75 989 1177
5. Goa Shipyard Ltd. 49.32 24.95 128 49
6. Hindustan Aeronautics Ltd. 3508.64 2576.52 286 280
7. Hindustan Shipyard Ltd. 92.36 46.22 137 95
8. Hooghly Dock & Port Engineers Ltd. 97.04 94.03 563 544
9. Mazagon Dock Ltd. 1780.94 1203.77 1215 840
10. Scooters India Ltd. 28.85 27.08 81 70
Total 7583.36 6174.86 347 330
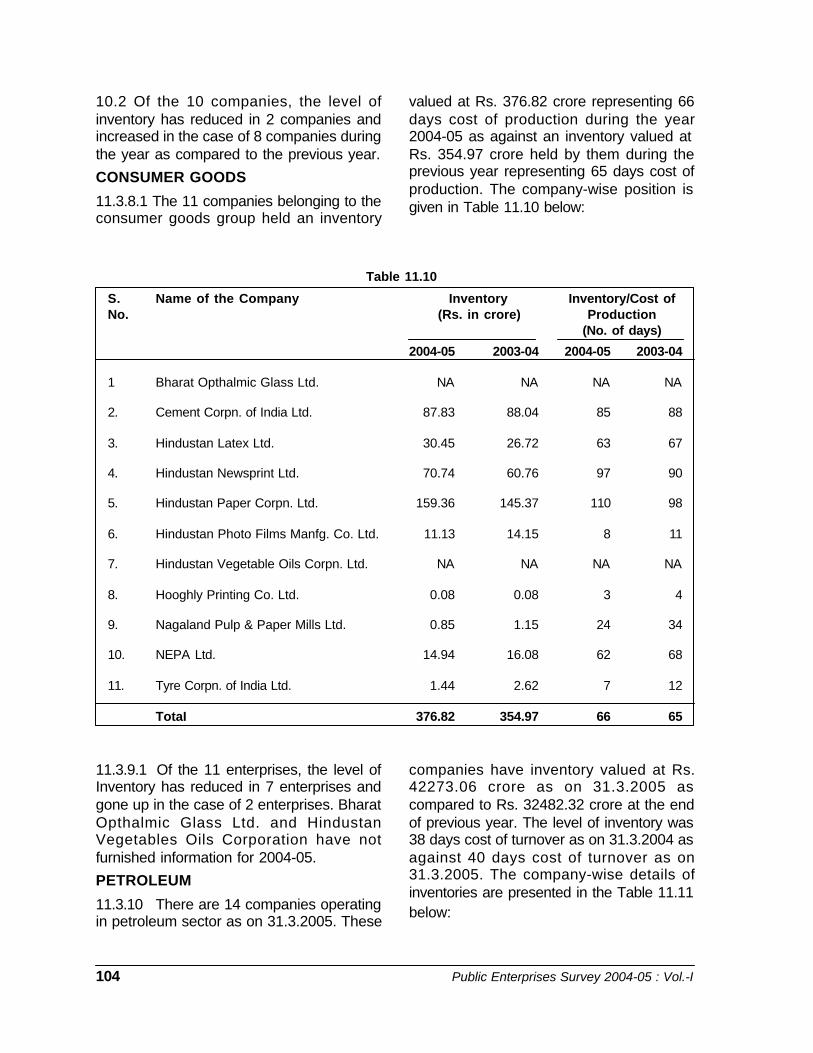
104 Public Enterprises Survey 2004-05 : Vol.-I
10.2 Of the 10 companies, the level ofinventory has reduced in 2 companies andincreased in the case of 8 companies duringthe year as compared to the previous year.
CONSUMER GOODS
11.3.8.1 The 11 companies belonging to theconsumer goods group held an inventory
valued at Rs. 376.82 crore representing 66days cost of production during the year2004-05 as against an inventory valued atRs. 354.97 crore held by them during theprevious year representing 65 days cost ofproduction. The company-wise position isgiven in Table 11.10 below:
Table 11.10
S. Name of the Company Inventory Inventory/Cost ofNo. (Rs. in crore) Production
(No. of days)
2004-05 2003-04 2004-05 2003-04
1 Bharat Opthalmic Glass Ltd. NA NA NA NA
2. Cement Corpn. of India Ltd. 87.83 88.04 85 88
3. Hindustan Latex Ltd. 30.45 26.72 63 67
4. Hindustan Newsprint Ltd. 70.74 60.76 97 90
5. Hindustan Paper Corpn. Ltd. 159.36 145.37 110 98
6. Hindustan Photo Films Manfg. Co. Ltd. 11.13 14.15 8 11
7. Hindustan Vegetable Oils Corpn. Ltd. NA NA NA NA
8. Hooghly Printing Co. Ltd. 0.08 0.08 3 4
9. Nagaland Pulp & Paper Mills Ltd. 0.85 1.15 24 34
10. NEPA Ltd. 14.94 16.08 62 68
11. Tyre Corpn. of India Ltd. 1.44 2.62 7 12
TotaI 376.82 354.97 66 65
11.3.9.1 Of the 11 enterprises, the level ofInventory has reduced in 7 enterprises andgone up in the case of 2 enterprises. BharatOpthalmic Glass Ltd. and HindustanVegetables Oils Corporation have notfurnished information for 2004-05.
PETROLEUM
11.3.10 There are 14 companies operatingin petroleum sector as on 31.3.2005. These
companies have inventory valued at Rs.42273.06 crore as on 31.3.2005 ascompared to Rs. 32482.32 crore at the endof previous year. The level of inventory was38 days cost of turnover as on 31.3.2004 asagainst 40 days cost of turnover as on31.3.2005. The company-wise details ofinventories are presented in the Table 11.11below:

Cognate Group : Management of Investment in Public Sector 105
Table 11.11
S. Name of the Company Inventory Inventory/Cost ofNo. (Rs. in crore) Turnover
(No. of days)
2004-05 2003-04 2004-05 2003-04
1 Bharat Petroleum Copn. Ltd. 6258.56 4286.02 39 32
2. Bongaigaon Refinery & Petrochemicals 724.26 471.26 58 59
3. Chennai Petroleum Corpn. Ltd. 2416.15 1203.14 62 50
4. Gas Authority of India Ltd. 481.44 474.91 13 15
5. Hindustan Petroleum Corpn. Ltd. 5682.21 5402.53 35 39
6. Indian Oil Blending Ltd. 0.15 0.14 2 2
7. Indian Oil Corpn. Ltd. 19504.82 14951.08 52 47
8. I.B.P. Co. Ltd. 328.31 385.19 9 14
9. Kochi Refineries Ltd. 1383.08 871.02 38 32
10. Mangalore Refinery & Petrochemicals Ltd. 1911.62 1189.35 38 38
11. Numaligarh Refinery Ltd. 717.44 595.22 67 75
12. Oil & Natural Gas Corpn. Ltd. 2569.19 2405.69 20 27
13. Oil India Ltd. 260.78 221.50 24 26
14. ONGC Videsh Ltd. 34.95 25.27 12 59
Total 42273.06 32482.32 40 38
11.3.10.1 The level of inventory has comedown in 8 enterprises and gone up in thecase of 4 enterprises and remainedunchanged in 2 public enterprises.
AGRO-BASED INDUSTRIES
11.3.11 The value of inventories held by 4companies belonging to this group was Rs.69.06 crore at the end of 2004-05 as
Table 11.12
S. Name of the Company Inventory Inventory/Cost ofNo. (Rs. in crore) Turnover
(No. of days)
2004-05 2003-04 2004-05 2003-04
1. Andaman & Nicobar lsI. Forest & Plantation 0.90 1.67 61 89
2. National Seeds Corpn. Ltd. 13.28 11.39 61 47
3. North Eastern Regn. Agri. Mktg. Corpn. Ltd. 0.22 0.81 12 35
4. State Farms Corpn. of India Ltd. 54.66 64.57 347 437
Total 69.06 78.44 169 181
11.3.11.1 The level of inventory hascome down in 3 public enterprises and hasgone up in the case of 1 public enterprise.
COAL & LIGNITE
11.3.12 The value of inventories held by 9public enterprises belonging to this group as
compared to Rs. 78.44 crore at the end ofthe previous year. The level of inventories hasdecreased to the level of 169 days cost ofturnover at the end of 2004-05 as comparedto 181 days cost of turnover at the end ofprevious year. Details of inventory held bythese enterprises are given in the Table 11.12below:
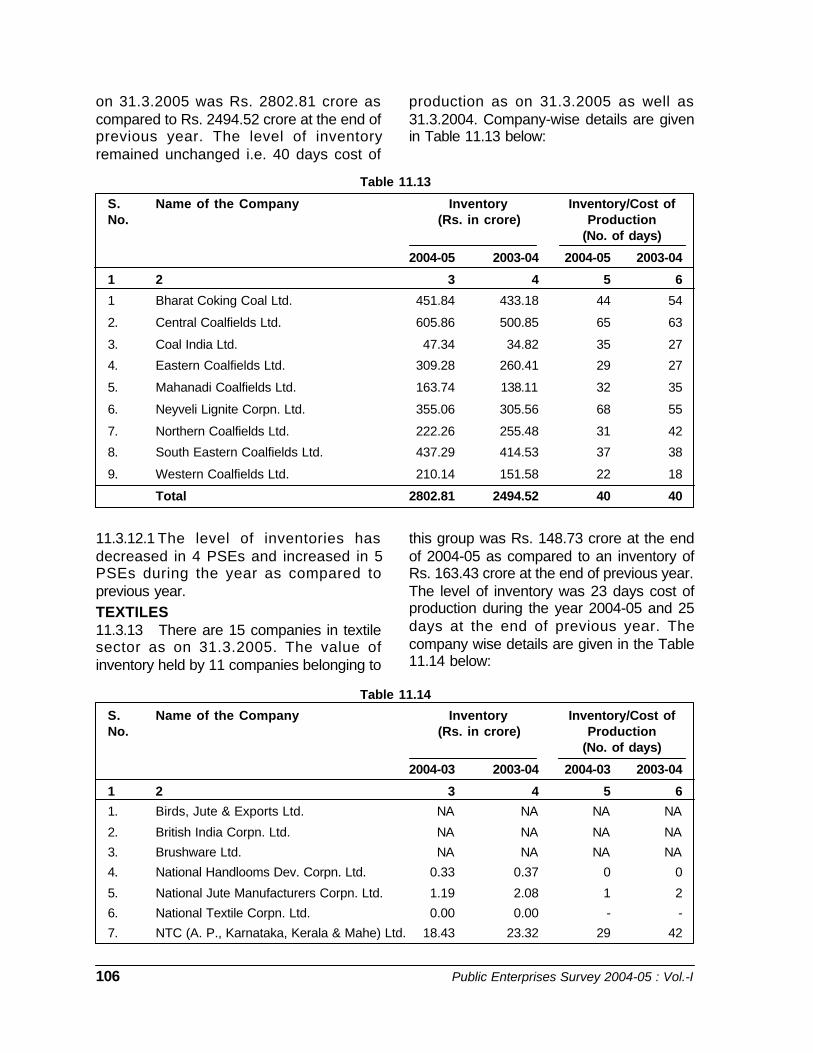
106 Public Enterprises Survey 2004-05 : Vol.-I
on 31.3.2005 was Rs. 2802.81 crore ascompared to Rs. 2494.52 crore at the end ofprevious year. The level of inventoryremained unchanged i.e. 40 days cost of
production as on 31.3.2005 as well as31.3.2004. Company-wise details are givenin Table 11.13 below:
Table 11.13
S. Name of the Company Inventory Inventory/Cost ofNo. (Rs. in crore) Production
(No. of days)
2004-05 2003-04 2004-05 2003-04
1 2 3 4 5 6
1 Bharat Coking Coal Ltd. 451.84 433.18 44 54
2. Central Coalfields Ltd. 605.86 500.85 65 63
3. Coal India Ltd. 47.34 34.82 35 27
4. Eastern Coalfields Ltd. 309.28 260.41 29 27
5. Mahanadi Coalfields Ltd. 163.74 138.11 32 35
6. Neyveli Lignite Corpn. Ltd. 355.06 305.56 68 55
7. Northern Coalfields Ltd. 222.26 255.48 31 42
8. South Eastern Coalfields Ltd. 437.29 414.53 37 38
9. Western Coalfields Ltd. 210.14 151.58 22 18
Total 2802.81 2494.52 40 40
11.3.12.1 The level of inventories hasdecreased in 4 PSEs and increased in 5PSEs during the year as compared toprevious year.TEXTILES11.3.13 There are 15 companies in textilesector as on 31.3.2005. The value ofinventory held by 11 companies belonging to
this group was Rs. 148.73 crore at the endof 2004-05 as compared to an inventory ofRs. 163.43 crore at the end of previous year.The level of inventory was 23 days cost ofproduction during the year 2004-05 and 25days at the end of previous year. Thecompany wise details are given in the Table11.14 below:
Table 11.14
S. Name of the Company Inventory Inventory/Cost ofNo. (Rs. in crore) Production
(No. of days)
2004-03 2003-04 2004-03 2003-04
1 2 3 4 5 6
1. Birds, Jute & Exports Ltd. NA NA NA NA
2. British India Corpn. Ltd. NA NA NA NA
3. Brushware Ltd. NA NA NA NA
4. National Handlooms Dev. Corpn. Ltd. 0.33 0.37 0 0
5. National Jute Manufacturers Corpn. Ltd. 1.19 2.08 1 2
6. National Textile Corpn. Ltd. 0.00 0.00 - -
7. NTC (A. P., Karnataka, Kerala & Mahe) Ltd. 18.43 23.32 29 42
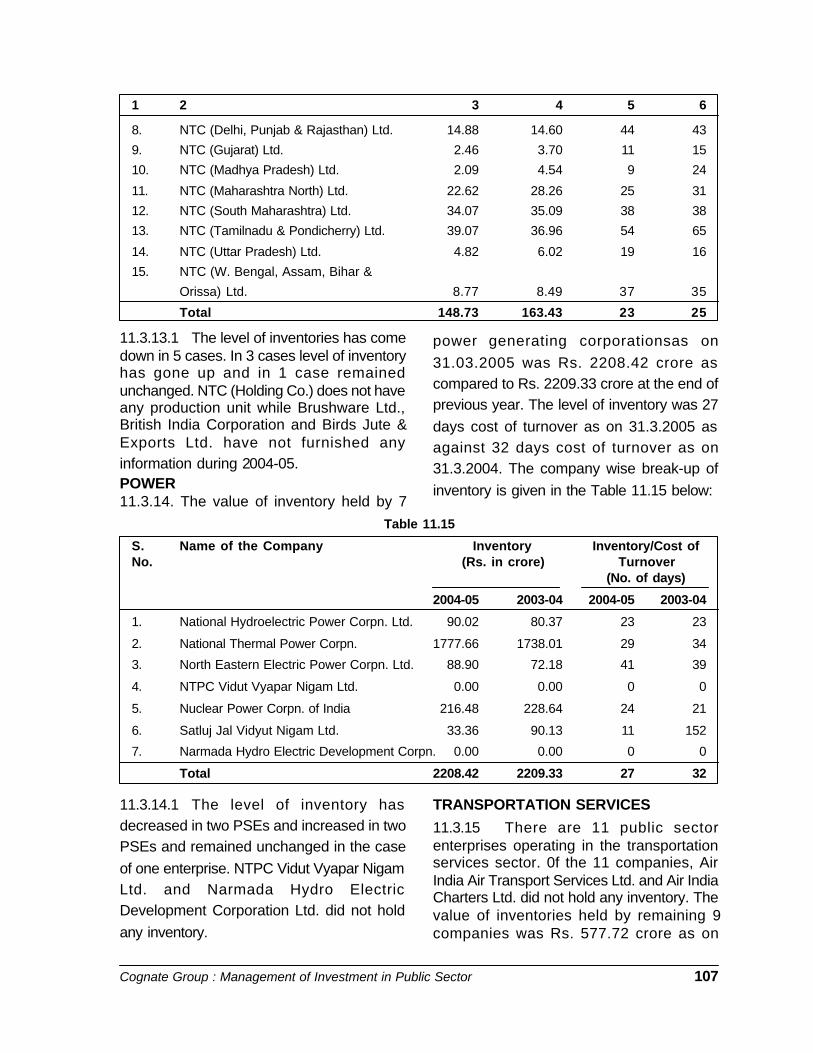
Cognate Group : Management of Investment in Public Sector 107
8. NTC (Delhi, Punjab & Rajasthan) Ltd. 14.88 14.60 44 43
9. NTC (Gujarat) Ltd. 2.46 3.70 11 15
10. NTC (Madhya Pradesh) Ltd. 2.09 4.54 9 24
11. NTC (Maharashtra North) Ltd. 22.62 28.26 25 31
12. NTC (South Maharashtra) Ltd. 34.07 35.09 38 38
13. NTC (Tamilnadu & Pondicherry) Ltd. 39.07 36.96 54 65
14. NTC (Uttar Pradesh) Ltd. 4.82 6.02 19 16
15. NTC (W. Bengal, Assam, Bihar &
Orissa) Ltd. 8.77 8.49 37 35
Total 148.73 163.43 23 25
1 2 3 4 5 6
11.3.13.1 The level of inventories has comedown in 5 cases. In 3 cases level of inventoryhas gone up and in 1 case remainedunchanged. NTC (Holding Co.) does not haveany production unit while Brushware Ltd.,British India Corporation and Birds Jute &Exports Ltd. have not furnished anyinformation during 2004-05.POWER11.3.14. The value of inventory held by 7
power generating corporationsas on31.03.2005 was Rs. 2208.42 crore ascompared to Rs. 2209.33 crore at the end ofprevious year. The level of inventory was 27days cost of turnover as on 31.3.2005 asagainst 32 days cost of turnover as on31.3.2004. The company wise break-up ofinventory is given in the Table 11.15 below:
Table 11.15
S. Name of the Company Inventory Inventory/Cost ofNo. (Rs. in crore) Turnover
(No. of days)
2004-05 2003-04 2004-05 2003-04
1. National Hydroelectric Power Corpn. Ltd. 90.02 80.37 23 23
2. National Thermal Power Corpn. 1777.66 1738.01 29 34
3. North Eastern Electric Power Corpn. Ltd. 88.90 72.18 41 39
4. NTPC Vidut Vyapar Nigam Ltd. 0.00 0.00 0 0
5. Nuclear Power Corpn. of India 216.48 228.64 24 21
6. Satluj Jal Vidyut Nigam Ltd. 33.36 90.13 11 152
7. Narmada Hydro Electric Development Corpn. 0.00 0.00 0 0
Total 2208.42 2209.33 27 32
11.3.14.1 The level of inventory hasdecreased in two PSEs and increased in twoPSEs and remained unchanged in the caseof one enterprise. NTPC Vidut Vyapar NigamLtd. and Narmada Hydro ElectricDevelopment Corporation Ltd. did not holdany inventory.
TRANSPORTATION SERVICES
11.3.15 There are 11 public sectorenterprises operating in the transportationservices sector. 0f the 11 companies, AirIndia Air Transport Services Ltd. and Air IndiaCharters Ltd. did not hold any inventory. Thevalue of inventories held by remaining 9companies was Rs. 577.72 crore as on

108 Public Enterprises Survey 2004-05 : Vol.-I
31.3.2005 as compared to an inventoryvalued at Rs. 581.68 crore at the end ofprevious year. The level of inventory has
reduced from 11 days cost of turnover duringthe previous year to 9 days cost of turnoverin the current year. The company-wisedetails are given in the Table 11.16 below:
11.3.15.1 The level of inventories hasdeclined in 3 cases and increased in 2 cases.The inventory level remained unchanged incase of 4 PSEs.
TRADING & MARKETING SERVICES
11.3.16 There were 14 companies in theTrading & Marketing Services group duringthe year 2004-05. Three companies namelyFood Corpn. of India, Cotton Corpn. of Indiaand Jute Corpn. of India have been excludedfor the purpose of analysis as these
corporations keep stocks as deliberatepolicy. The ET&T Ltd. and Tea TradingCorporation of India Ltd. are under theprocess of winding up. As such, the analysiscovers the remaining 11 companies only. The11 companies held inventory valued at Rs.646.48 crore representing 6 days cost ofturnover at the end of 2004-05 as comparedto an inventory of Rs. 810.95 crorerepresenting 10 days cost of turnover at theend of previous year. The company-wisedetails are given in the Table 11.17 below:
Table 11.16
S. Name of the Company Inventory Inventory/Cost ofNo. (Rs. in crore) Turnover
(No. of days)
2004-05 2003-04 2004-05 2003-04
1 2 3 4 5 6
1. Air India Ltd. 353.43 346.95 17 21
2. Air India Air Transport Services Ltd. 0.00 0.00 0 0
3. Air India Charters Ltd. 0.00 0.00 0 0
4. Airline Allied Services Ltd. 6.77 7.24 4 4
5. Airports Authority of India 3.90 4.08 1 1
6. Container Corpn. of India Ltd. 3.38 2.95 1 1
7. Dredging Corpn. of India Ltd. 13.54 9.18 9 6
8. Ennore Port Ltd. 4.79 4.79 19 20
9. Indian Airlines Ltd. 116.47 144.62 8 11
10. Pawan Hans Helicopters Ltd. 25.01 20.01 45 40
11. Shipping Corpn. of India Ltd. 50.41 41.86 5 5
Total 577.72 581.68 9 11

Cognate Group : Management of Investment in Public Sector 109
Table 11.17
S. Name of the Company Inventory Inventory/Cost ofNo. (Rs. in crore) Turnover
(No. of days)
2004-05 2003-04 2004-05 2003-04
1. Bharat Leather Corpn. Ltd. NA NA NA NA
2. Central Cottage Industries Corpn. 6.28 7.42 37 463. Central Warehousing Corpn. 3.92 5.46 3 5
4. Handicrafts & Handlooms Exports Corpn. 6.47 3.03 2 1
5. H.M.T. (International) Ltd. 0.57 0.18 7 2
6. MMTC Ltd. 110.89 162.55 3 6
7. MSTC Ltd. 72.18 149.27 5 16
8. North Eastern Handicrafts &
Handlooms Corpn. Ltd. 0.98 0.77 44 48
9. PEC Ltd. 199.59 345.17 12 2210. Spices Trading Corpn. Ltd. 5.66 1.17 5 1
11. State Trading Corpn. Ltd. 239.94 135.93 9 6
Total 646.48 810.95 6 10
Table 11.18
S. Name of the Company Inventory Inventory/Cost ofNo. (Rs. in crore) Turnover
(No. of days)
2004-05 2003-04 2004-05 2003-04
1. BBJ Construction Co. Ltd. 13.14 10.02 113 1292. Bridge & Roof Co. (India) Ltd. 216.54 223.06 178 2213. Hindustan Prefab Ltd. 0.48 1.25 18 604. Hindustan Steelworks Constn. Ltd. 6.54 7.69 8 95. IRCON (International) Ltd. 41.37 58.94 16 296. Konkan Railway Corpn. Ltd. 61.27 25.85 82 407. Mineral Exploration Corpn. Ltd. 9.17 9.15 46 538. Mumbai Railway Vikas Corpn. Ltd. 0.00 0.00 0 09. National Bldg. Constn. Corpn. Ltd. 87.83 85.06 41 4710. National Projects Constn. Corpn. Ltd. 8.34 8.24 10 10
Total 444.68 429.26 51 58
11.3.16.1 While 6 companies could reducethe level of inventory, there has been anincrease in the case of 4 companies. BharatLeather Corporation Ltd. has not furnishedinformation for the year.
CONTRACT & CONSTRUCTION SERVICES11.3.17 There were 10 public sectorenterprises operating in the Contract &Construction Services group. Of the 10
companies, Mumbai Railway Vikas Corpn.Ltd. did not hold any inventory. The value ofinventories held by 9 companies in this groupwas Rs. 444.68 crore as on 31.3.2005 ascompared to Rs. 429.26 crore held by themat the end of previous year. The level ofinventory has decreased from 58 days costof turnover to 51 days cost of turnover. Thecompany-wise details are given in the Table11.18 below:
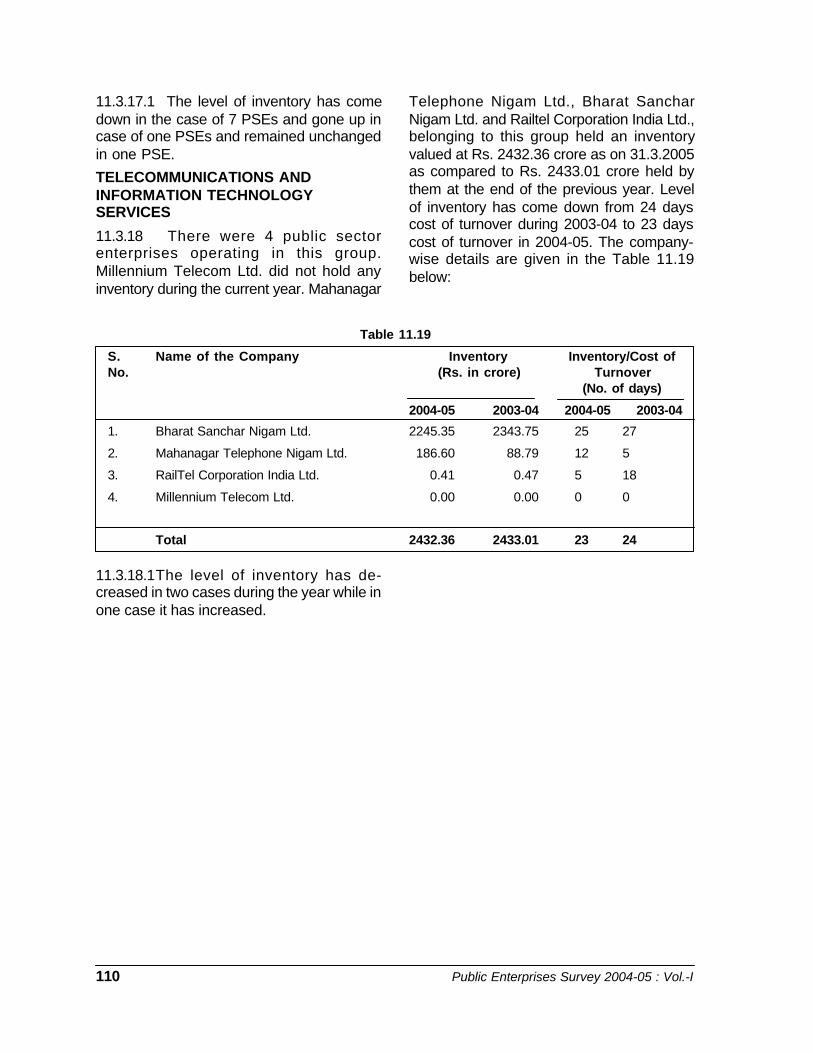
110 Public Enterprises Survey 2004-05 : Vol.-I
11.3.17.1 The level of inventory has comedown in the case of 7 PSEs and gone up incase of one PSEs and remained unchangedin one PSE.
TELECOMMUNICATIONS ANDINFORMATION TECHNOLOGYSERVICES
11.3.18 There were 4 public sectorenterprises operating in this group.Millennium Telecom Ltd. did not hold anyinventory during the current year. Mahanagar
Telephone Nigam Ltd., Bharat SancharNigam Ltd. and Railtel Corporation India Ltd.,belonging to this group held an inventoryvalued at Rs. 2432.36 crore as on 31.3.2005as compared to Rs. 2433.01 crore held bythem at the end of the previous year. Levelof inventory has come down from 24 dayscost of turnover during 2003-04 to 23 dayscost of turnover in 2004-05. The company-wise details are given in the Table 11.19below:
Table 11.19
S. Name of the Company Inventory Inventory/Cost ofNo. (Rs. in crore) Turnover
(No. of days)
2004-05 2003-04 2004-05 2003-04
1. Bharat Sanchar Nigam Ltd. 2245.35 2343.75 25 27
2. Mahanagar Telephone Nigam Ltd. 186.60 88.79 12 5
3. RailTel Corporation India Ltd. 0.41 0.47 5 18
4. Millennium Telecom Ltd. 0.00 0.00 0 0
Total 2432.36 2433.01 23 24
11.3.18.1The level of inventory has de-creased in two cases during the year while inone case it has increased.
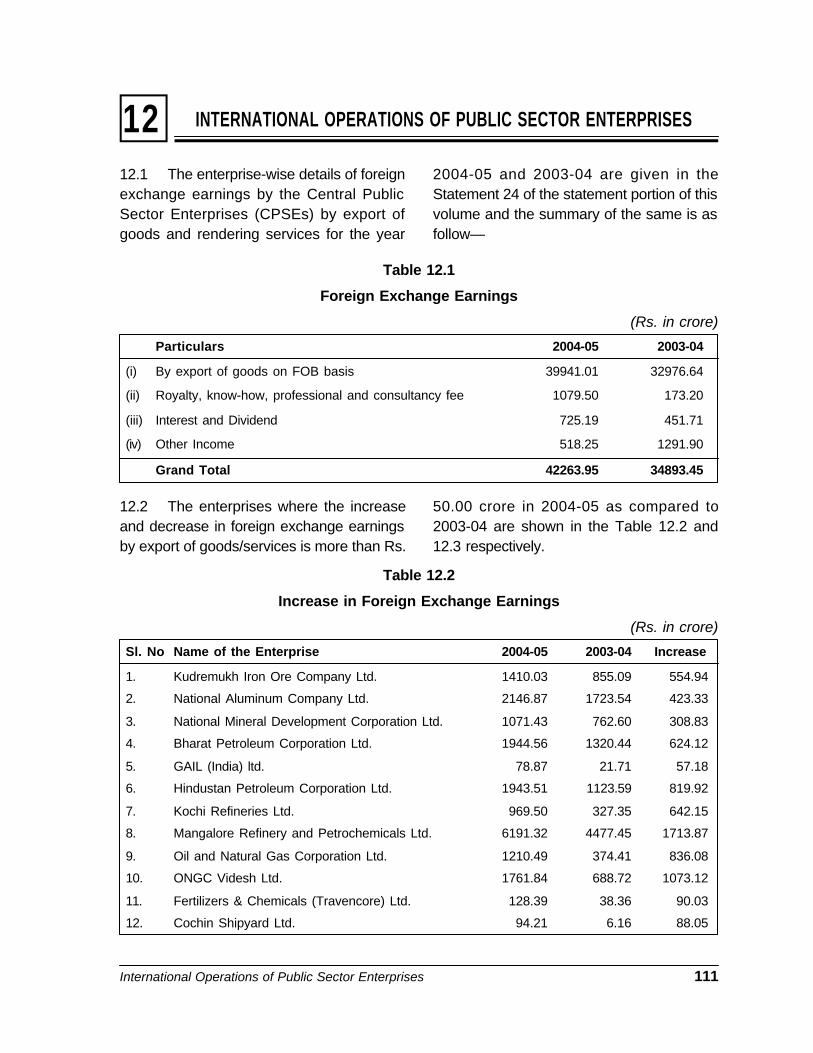
International Operations of Public Sector Enterprises 111
Table 12.1
Foreign Exchange Earnings
(Rs. in crore)
Particulars 2004-05 2003-04
(i) By export of goods on FOB basis 39941.01 32976.64
(ii) Royalty, know-how, professional and consultancy fee 1079.50 173.20
(iii) Interest and Dividend 725.19 451.71
(iv) Other Income 518.25 1291.90
Grand Total 42263.95 34893.45
INTERNATIONAL OPERATIONS OF PUBLIC SECTOR ENTERPRISES1212.1 The enterprise-wise details of foreignexchange earnings by the Central PublicSector Enterprises (CPSEs) by export ofgoods and rendering services for the year
2004-05 and 2003-04 are given in theStatement 24 of the statement portion of thisvolume and the summary of the same is asfollow—
12.2 The enterprises where the increaseand decrease in foreign exchange earningsby export of goods/services is more than Rs.
50.00 crore in 2004-05 as compared to2003-04 are shown in the Table 12.2 and12.3 respectively.
Table 12.2
Increase in Foreign Exchange Earnings
(Rs. in crore)
Sl. No Name of the Enterprise 2004-05 2003-04 Increase
1. Kudremukh Iron Ore Company Ltd. 1410.03 855.09 554.94
2. National Aluminum Company Ltd. 2146.87 1723.54 423.33
3. National Mineral Development Corporation Ltd. 1071.43 762.60 308.83
4. Bharat Petroleum Corporation Ltd. 1944.56 1320.44 624.12
5. GAIL (India) ltd. 78.87 21.71 57.18
6. Hindustan Petroleum Corporation Ltd. 1943.51 1123.59 819.92
7. Kochi Refineries Ltd. 969.50 327.35 642.15
8. Mangalore Refinery and Petrochemicals Ltd. 6191.32 4477.45 1713.87
9. Oil and Natural Gas Corporation Ltd. 1210.49 374.41 836.08
10. ONGC Videsh Ltd. 1761.84 688.72 1073.12
11. Fertilizers & Chemicals (Travencore) Ltd. 128.39 38.36 90.03
12. Cochin Shipyard Ltd. 94.21 6.16 88.05
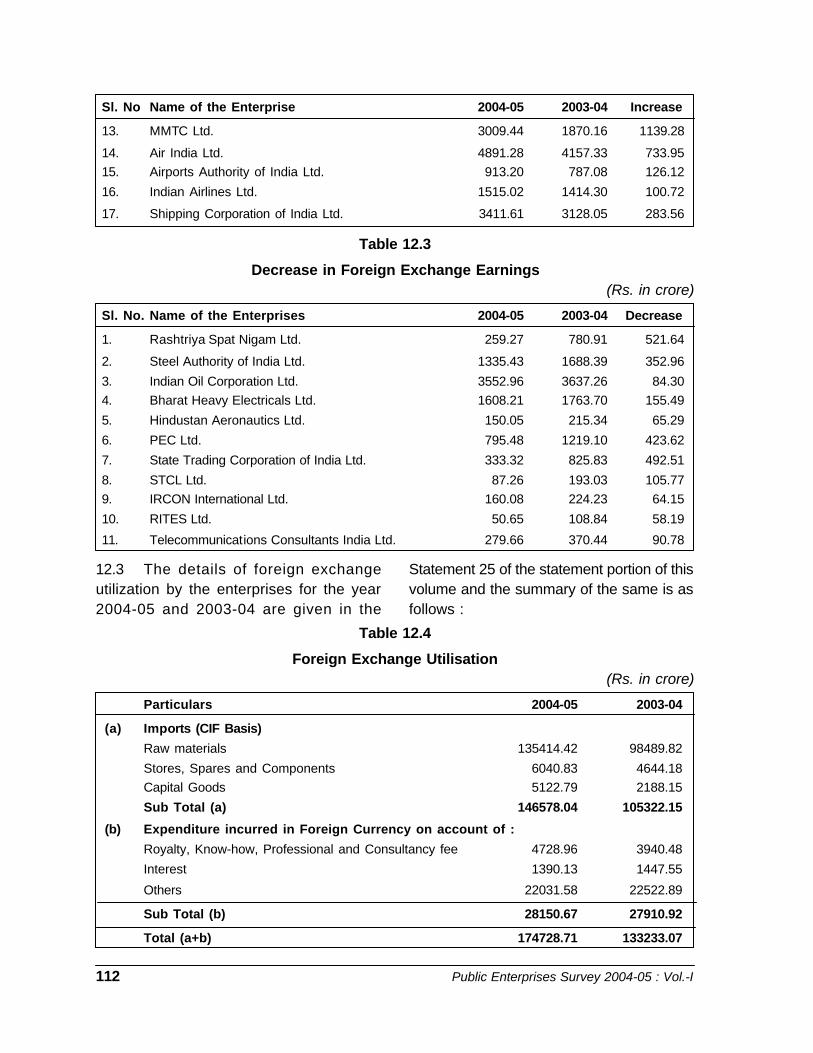
112 Public Enterprises Survey 2004-05 : Vol.-I
13. MMTC Ltd. 3009.44 1870.16 1139.28
14. Air India Ltd. 4891.28 4157.33 733.9515. Airports Authority of India Ltd. 913.20 787.08 126.12
16. Indian Airlines Ltd. 1515.02 1414.30 100.72
17. Shipping Corporation of India Ltd. 3411.61 3128.05 283.56
Table 12.3
Decrease in Foreign Exchange Earnings(Rs. in crore)
Sl. No. Name of the Enterprises 2004-05 2003-04 Decrease
1. Rashtriya Spat Nigam Ltd. 259.27 780.91 521.64
2. Steel Authority of India Ltd. 1335.43 1688.39 352.96
3. Indian Oil Corporation Ltd. 3552.96 3637.26 84.304. Bharat Heavy Electricals Ltd. 1608.21 1763.70 155.49
5. Hindustan Aeronautics Ltd. 150.05 215.34 65.29
6. PEC Ltd. 795.48 1219.10 423.62
7. State Trading Corporation of India Ltd. 333.32 825.83 492.51
8. STCL Ltd. 87.26 193.03 105.779. IRCON International Ltd. 160.08 224.23 64.15
10. RITES Ltd. 50.65 108.84 58.19
11. Telecommunications Consultants India Ltd. 279.66 370.44 90.78
Sl. No Name of the Enterprise 2004-05 2003-04 Increase
12.3 The details of foreign exchangeutilization by the enterprises for the year2004-05 and 2003-04 are given in the
Statement 25 of the statement portion of thisvolume and the summary of the same is asfollows :
Table 12.4
Foreign Exchange Utilisation(Rs. in crore)
Particulars 2004-05 2003-04
(a) Imports (CIF Basis)
Raw materials 135414.42 98489.82
Stores, Spares and Components 6040.83 4644.18Capital Goods 5122.79 2188.15
Sub Total (a) 146578.04 105322.15
(b) Expenditure incurred in Foreign Currency on account of :
Royalty, Know-how, Professional and Consultancy fee 4728.96 3940.48
Interest 1390.13 1447.55
Others 22031.58 22522.89
Sub Total (b) 28150.67 27910.92
Total (a+b) 174728.71 133233.07

International Operations of Public Sector Enterprises 113
12.4 The enterprises where the increaseand decrease in foreign exhange utilization ismore than Rs.50.00 crore in 2004-05 as
Table 12.5
Increase in Foreign Exchange Utilisation
(Rs. in crore)Sl. No Name of the Enterprise 2004-05 2003-04 Increase
1. Indian Iron & Steel Company Ltd. 77.82 22.06 55.76
2. Rashtriya Ispat Nigam Ltd. 1747.45 993.18 754.27
3. Steel Authority of India Ltd. 4711.99 2555.58 2156.41
4. Narmada Hydro Electric DevelopmentCorporation Ltd. 160.56 74.60 85.96
5. National Thermal Power Corporation Ltd. 1551.87 1459.20 92.67
6. Nuclear Power Corporation of India Ltd. 924.10 548.05 376.05
7. Bharat Petroleum Corporation Ltd. 7425.42 4952.67 2472.75
8. Bongaigaon Refinery & Petrochemicals Ltd. 721.88 536.81 185.07
9. Chennai Petroleum Corporation Ltd. 9902.10 5326.77 4575.33
10. Indian Oil Corporation Ltd. 54467.71 39011.09 15456.62
11. Kochi Refineries Ltd. 7704.98 6158.71 1546.27
12. Mangalore Refinery & Petrochemicals Ltd. 10414.84 7695.74 2719.10
13. Numaligarh Refinery Ltd. 111.72 24.15 87.57
14. ONGC Ltd. 7124.48 4116.52 3007.96
15. Oil India Ltd, 262.53 140.58 121.95
16. ONGC Videsh Ltd. 2515.24 1138.06 1377.18
17. Fertilizers & Chemicals (Travencore) Ltd. 193.40 143.19 50.21
18. Rashtriya Chemicals & Fertilizers Ltd. 179.26 103.02 76.24
19. Bharat Heavy Electricals Ltd. 1772.11 1257.73 514.38
20. Bharat Dynamics Ltd. 149.17 76.51 72.66
21. I T I Ltd. 677.05 360.87 316.18
22. Cochin Shipyard Ltd. 260.69 71.14 189.55
23. Garden Reach Shipbuilders & Engineers Ltd. 146.20 58.45 87.75
24. Hindustan Aeronautics Ltd. 3647.28 2265.55 1381.73
25. Hindustan Shipyard Ltd. 140.56 26.68 113.88
26. Mazagon Dock Ltd. 167.98 88.28 79.70
27 MMTC Ltd. 11119.02 6759.65 4359.37
compared to 2003-04 are shown in the Table12.5 and 12.6 respectively.
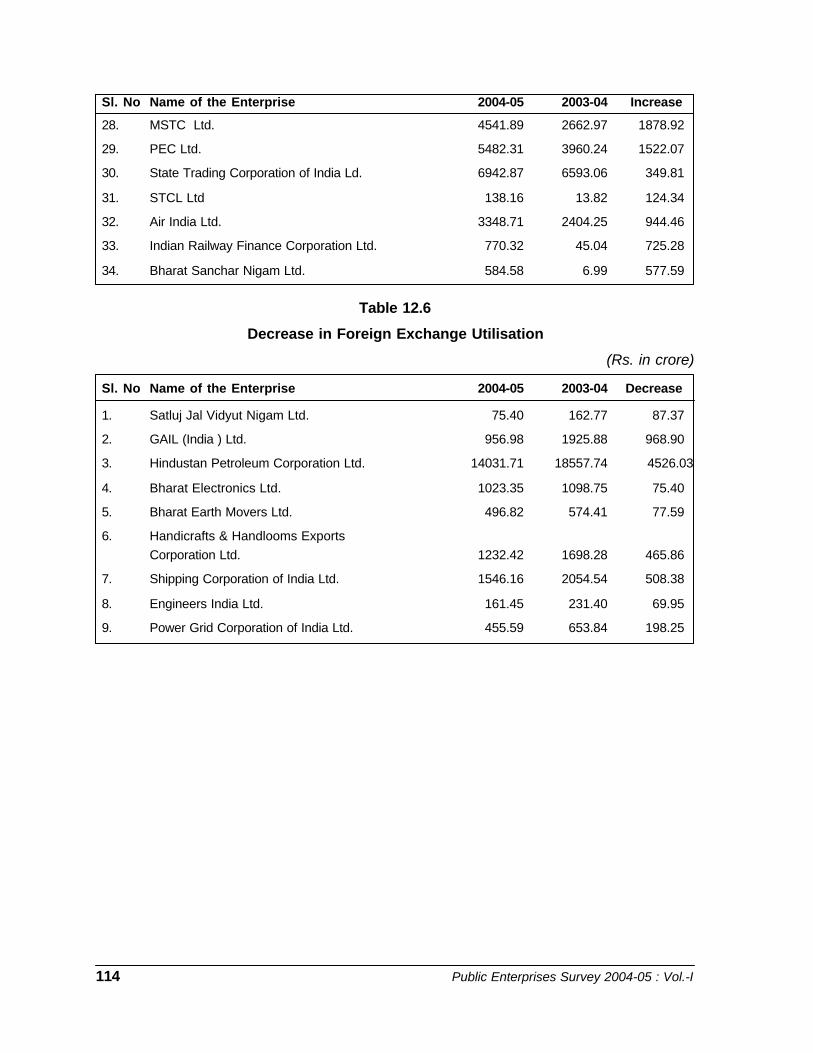
114 Public Enterprises Survey 2004-05 : Vol.-I
28. MSTC Ltd. 4541.89 2662.97 1878.92
29. PEC Ltd. 5482.31 3960.24 1522.07
30. State Trading Corporation of India Ld. 6942.87 6593.06 349.81
31. STCL Ltd 138.16 13.82 124.34
32. Air India Ltd. 3348.71 2404.25 944.46
33. Indian Railway Finance Corporation Ltd. 770.32 45.04 725.28
34. Bharat Sanchar Nigam Ltd. 584.58 6.99 577.59
Table 12.6
Decrease in Foreign Exchange Utilisation
(Rs. in crore)
Sl. No Name of the Enterprise 2004-05 2003-04 Decrease
1. Satluj Jal Vidyut Nigam Ltd. 75.40 162.77 87.37
2. GAIL (India ) Ltd. 956.98 1925.88 968.90
3. Hindustan Petroleum Corporation Ltd. 14031.71 18557.74 4526.03
4. Bharat Electronics Ltd. 1023.35 1098.75 75.40
5. Bharat Earth Movers Ltd. 496.82 574.41 77.59
6. Handicrafts & Handlooms ExportsCorporation Ltd. 1232.42 1698.28 465.86
7. Shipping Corporation of India Ltd. 1546.16 2054.54 508.38
8. Engineers India Ltd. 161.45 231.40 69.95
9. Power Grid Corporation of India Ltd. 455.59 653.84 198.25
Sl. No Name of the Enterprise 2004-05 2003-04 Increase
Human Resource Development in Public Enterprises 115
HUMAN RESOURCES DEVELOPMENT IN PUBLIC ENTERPRISES13Section - I
Personnel Policy and Human Resources Developmenttraining programmes in collaboration withpremier Management/Training Institutes inthe country as well as International agencieslike the Commonwealth Secretariat. Thedetails in this regard are as under:
(i) Executive DevelopmentProgramme (EDP)
In order to upgrade the skills andknowledge of middle and senior levelexecutives in PSEs, Department of PublicEnterprises has been conducting EDPs forduration of 2-5 days in collaboration withpremier Management/Training Institutes.
During 2004-05, 44 such programmeswere conducted in collaboration with IIMLucknow, IIM Kozhikode, Institute of PublicEnterprise, Hyderabad; National Institute ofFinancial Management, Faridabad; IndianInstitute of Public Administration, Delhi;Institute of Chartered Accountants of India;International Management Institute, Delhi;Indian Society for Training and Development;Institute of Cost and Works Accountants ofIndia; Institute of Company Secretaries ofIndia; V.V. Giri National Labour Institute,Noida; Management Development Institute,Gurgaon; Administrative Staff College ofIndia, Hyderabad; National ProductivityCouncil, New Delhi, etc.
(ii) Overseas Training Programmes
The Department of Public Enterprisesco-ordinates training programmes abroadbeing offered under various aided schemes.During 2004-05, 34 Public Sector executiveshave been sponsored for training
13.1.1 The Human Resources Developmentassumes a special significance in themanagement of public sector enterprisesparticularly for their efficient and profitablefunctioning. PSEs employ a large number ofworkforce in different disciplines and thesuccessful operation of these enterprises toa large extent depends on the skills andcapabilities of the workforce. Since therehave been widespread changes in thefinancial and production managementmethods, techniques and technologies, etc.due to globalisation and liberalization, thereis a need to improve every sphere of publicsector activity including quality of manpower.Human Resources Development isconsidered to be one of the most importantinputs for the public sector reforms.
13.1.2 Out of around 16.93 lakhs manpowerdeployed presently in PSEs about 3.63 lakhsare in the supervisory and managerial cadreswhich represents about 21.44% of totalmanpower. To improve the quality of themanpower and to upgrade their knowledgeand skills various steps like organizing in-house training programmes have been takenby the PSEs. Apart from this, the PSEsdepute their executives for various trainingprogrammes being organized by the premierManagement/Training Institutes in India andabroad.
Human Resources Development
13.1.3 The Department of Public Enterprises,which is the nodal Department for PSEs, hasbeen supplementing the efforts of the publicenterprises in this regard by organizing
116 Public Enterprises Survey 2004-05 : Vol.-I
programmes under different aided schemesin countries like Singapore, Malaysia,Sweden, Thailand, New Zealand, Japan, UKand US. These programmes coveredsubjects like e-commerce, e-businessstrategies, budgeting & financemanagement, challenges of privatization,promotion of small & medium enterprises,public sector reforms, women inmanagement, corporate management, etc.
Board Structure of PSEs
13.1.4 The Department of Public Enterprisesformulates policy guidelines on the Boardstructure of public enterprises and adviseson the shape and size of organizationalstructure of PSEs. The public enterprises arecategorized in four Schedules namely ‘A’, ‘B’,‘C’ and ‘D’ based on various quantitative,qualitative and other factors. The quantitativefactors are: investment, capital employed, netsales, profit before tax, number ofemployees, number of units and value addedper employee. Qualitative factors are :national importance, complexities ofproblems, level of technology, prospects forexpansion and diversification of activities andcompetition from other sectors, etc. while theother relates to the strategic importance ofthe corporation. The pay scales of ChiefExecutives and full time Functional Directorsin PSEs are determined as per the scheduleof the concerned enterprise.
13.1.4.1 Proposals received from theadministrative Ministries/Departments forcategorization /upgradation of PSEs areconsidered in DPE in consultation with PESB.During 2004-05, DPE examined 17 proposalsrelating to categorization of PSEs inappropriate schedule, creation of posts, etc.As a result, 3 PSEs were categorized inappropriate schedule, 2 PSEs wereupgraded to the next higher schedule and 6posts of Functional Directors created.
13.1.4.2 As on 31.3.2005, there were 52Schedule ‘A’, 87 Schedule ‘B’, 55 Schedule‘C’ and 07 Schedule ‘D’ enterprises. Thedetails of the Board level posts (whole time)are given in the table below:
Schedule Chief Executive Whole TimeDirectors
2004 2005 2004 2005
Schedule A 51 52 — —
Schedule B 87 87 185 194
Schedule C 54 55 211 207
Schedule D 09 07 67 68
Total 201 201 463 469
Professionalisation of Boards
13.1.5 In pursuance of the public sectorpolicy being followed since 1991 severalmeasures have been taken by theDepartment of Public Enterprises toprofessionalize the Boards of publicenterprises. The guidelines issued in 1992provide that outside professionals should beinducted on the Boards of PSEs in the formof part-time non-official Directors and that thenumber of such Directors should be at least1/3rd of the actual strength of the Board. Theguidelines also provide that the number ofGovernment Directors on the Boards shouldbe not more than one-sixth of the actualstrength of the Board subject to a maximumof two. Apart from this there should be somefunctional Directors on each Board whosenumber should not exceed 50% of the actualstrength of the Board In the case of listedPSEs headed by executive Chairman thenumber of non-official Directors (IndependentDirectors) should be at least half of thestrength of the Board.
13.1.5.1 Appointments of part-time non-official Directors on the Boards of PSEs are

Human Resource Development in Public Enterprises 117
made by the administrative Ministries/Departments from the panel prepared inconsultation with the Department of PublicEnterprises. In so far as Navratna/MiniratnaPSEs are concerned, the panel of non-officialDirectors is prepared by the SearchCommittee consisting of Chairman (PESB),Secretary (DPE), Secretary of theadministrative Ministry/Department of thePSE, and four other non-official Members.According to the Navratna/Miniratna scheme,the Boards of these companies should beprofessionalised by inducting a minimum of
4 non-official Directors in the case ofNavratna and 3 non-official Directors in thecase of Miniratnas before the Boardsexercise the enhanced powers. During 2004-05 the Search Committee held 5 meetingsand selected 65 persons for appointment asnon-official Directors in 7 Navratna and 12Miniratna PSEs. In the case of PSEs other thanNavratna and Miniratna, 27 proposals wereexamined/considered and 21 persons wererecommended for appointment as non-officialpart-time Directors on the Boards of variousPSEs.
118 Public Enterprises Survey 2004-05 : Vol.-I
13.2 The Department of PublicEnterprises, Ministry of Heavy Industries &Public Enterprises inter alia function as anodal agency for evolution of policy relatingto wage settlements of unionized employees/pay revision of non-unionized supervisorsand executives holding posts below theBoard level as well as at the Board level. TheDepartment provides clarifications andrender advice to the administrative Ministries/Departments and the CPSEs in mattersrelating to the wage policy and revision inthe scales of pay of the executives. TheCPSEs are following Industrial DearnessAllowance (IDA) pattern scales of pay andCentral Dearness Allowance (CDA) patternscales of pay.
Industrial Dearness Allowance (IDA)pattern and related Scales of Pay in CPSEs
13.2.1 Government policy relating to payscales and pay pattern is that all employeesof the CPSEs should be on IDA pattern andrelated scales of pay. Instructions had beenissued by the DPE in July, 1981 and July,1984 to all the administrative Ministries thatas and when a new CPSE is created orestablished, IDA pattern and related scalesof pay should be adopted ab-initio. There are237 CPSEs (excluding Banks, InsuranceCompanies and Financial Institutions) underthe administrative control of the CentralGovernment. They employ approximately16.93 lakhs workers, clerical staff andexecutives. Out of this 86.86 % of the workersand executives are on IDA pattern andrelated scales of pay.
Procedure adopted for revision of pay inIDA pattern of scales w.e.f. 1.1.1997
(i) CPSEs which have been consistentlymaking profit are allowed to adoptrevised scales of pay in the IDA patternin accordance with DPE’s guidelines.
(ii) CPSEs which had incurred loss duringany of the three financial yearspreceding to pay revision would alsobe allowed to revise the scales with theapproval of the Government i.e. theadministrative Ministry acting inconsultation with DPE, provided theygive an estimate as to how theresources would be generated by themto meet the extra expenditure.
(iii) In respect of sick enterprises referredto BIFR, revision of pay scales for allemployees following IDA pattern wouldbe strictly in accordance with therehabilitation packages approved or tobe approved by the BIFR and afterproviding for the additional expenditureon account of pay revision in thispackage
(iv) CPSEs under construction or newCPSEs would submit their proposals foradoption of revised scales of pay totheir administrative Ministries forapproval in consultation with the DPE.
Landmark Judgement of Supreme Courton pay revision.
13.2.2 The Supreme Court in Transferpetition No. 8 of 2000 in A.K. Bindal and othervs Union of India has passed the landmarkJudgement on 25.4.2003 in case of pay
Section-II
Wage & Salary Policies
Human Resource Development in Public Enterprises 119
revision of sick PSEs referred to BIFR. TheA.K. Bindal case was dealing with the claimof employees of Fertilizer Corporation of Indiaand Hindustan Fertilizers Corporation Ltd. forrevision of IDA pay scale of 1992. Both thesewere sick PSEs referred to BIFR. Thepetitions prayed for quashing the conditionlinking revision of pay scales of employeesof sick enterprises to the revival packagesbeing formulated by BIFR.
13.2.2.1 The Supreme Court, however, heldthat economic viability or financial capacityof the employer Company should be takeninto consideration in the matter of revision ofthe pay scales of the employees.
CDA Pattern in CPSEs
13.2.3 CDA pattern pay scales are applicableto some of the clerical staff, unionized cadresand executives of the 69 CPSEs who wereon the rolls of these companies as on1.1.1986 and upto 31.12.1988 and were inreceipt of CDA pattern pay scales during thattime. A High Power Pay Committee (HPPC)was appointed by the Government inpursuance of the Supreme Court directionsdated 12.3.1986 which submitted its Reportto the Government on 24.11.1988. Itsrecommendations have been implementedin these CPSEs. In pursuance of theSupreme Court direction dated 3.5.1990 readwith the subsequent directions dated28.8.1991, IDA pattern and related scales ofpay have been introduced in these CPSEswith effect from 1.1.1989. All appointmentsmade in CPSEs on or after 1.1.1989 are onIDA pay structure only. Out of 69 CPSEs(covered under HPPC), at present there areonly 61 CPSEs, which are following bothCDA and IDA pattern scales of pay.Approximately 4% of the total workforce inall CPSEs taken together is presently underCDA pattern of scales. The recommendationof 5th Pay Commission w.e.f. 1.1.1996 has
also been extended to the employees ofCPSEs following CDA pattern of scales. Theemployees of CPSEs following CDA patternhas also been allowed the benefit of mergerof 50% of DA with basic pay w.e.f 1.4.2004.This benefit has been allowed to theemployees of those CPSEs that are not lossmaking and are in a position to absorb theadditional expenditure on account of mergerof DA with basic pay from their own resourceswithout any budgetary support from the Govt.
WAGE POLICY
(i) Pay Revision for Workmen
13.2.4 In respect of workmen following IDApattern scales of pay, autonomy has beenallowed to the managements of CPSEs tonegotiate revision of pay scales for theworkmen within certain stipulated conditions.The latest wage negotiation to be enteredbetween managements and the workers’unions, was to come to effect from 1.1.1997for 10 year periodicity and 1.1.2002 for fiveyear periodicity. The Government orderswere issued on 14.1.1999, 26.7.2000 and11.2.2004 to this effect as under:
13.2.4.1 For the unionized employeescovered by the IDA pattern pay scales in theCentral Public Enterprises, the Governmenthave decided to allow the option to opt foreither: -
i. A ten year periodicity of pay revisionwith 100% neutralization of DA as setout in the guidelines issued on 14.1.99OR
ii. A five year periodicity on the basis ofgraded neutralization as did existpreviously i.e. from 1.1.1992 to31.12.1996
13.2.4.2 The CPSEs who had opted earlierfor five year wage negotiation for workmenhave been allowed wage negotiation for a

120 Public Enterprises Survey 2004-05 : Vol.-I
period of five years with effect from 1.1.2002.Some of the CPSEs have alreadyimplemented this negotiated wagesettlements.
The pay scales in respect of workmenfollowing CDA pattern scales of pay arerevised as per the recommendations of theCentral Pay Commission and Governmentdecision thereon for the Central Governmentemployees.
(ii) Pay Revision for Executives
13.2.5 The last pay revision for the IDAexecutives and non-unionized supervisorswas done w.e.f 1.1.97 for a period of tenyears based on the recommendations ofJustice Mohan Committee and consequentDPE O.M dated 25.6.99. For the employeesfollowing CDA pattern pay, their pay scalesare governed by the recommendations of theCentral Pay Commission and Governmentdecisions thereon for the Governmentemployees. The benefits allowed toGovernment employees are also extendedto them as per the Supreme Court directions.
13.2.5.1 As per the recommendations ofthe High Power Pay Committee and SupremeCourt directive thereon, the employeesfollowing CDA pattern of scales of the CentralPublic Sector Enterprises would get payrevision only as and when similar changesare effected for the Central Governmentemployees.
VOLUNTARY RETIREMENT SCHEME(VRS)
13.2.6 In the present market scenario, inview of the ongoing restructuring in theindustries including CPSEs, severalmeasures for reforms and restructuring ofCPSEs have been taken up by Government.Right sizing of manpower in the CPSEs is
one of the measures adopted. Restructuringof manpower may lead to redundancy. In thiscontext, it has been the constant endeavourof the Government to safeguard the interestof the employees in CPSEs.
13.2.6.1 In the process, the VoluntaryRetirement Scheme, which was initiallyannounced in October, 1988 for the first timewas further liberalized and a comprehensivepackage was notified vide DPE’s O.M dated5th May, 2000 so as to cater to the need ofthe CPSEs to meet their objectives and alsoto protect the interest of the workers affecteddue to various forms of restructuring.
13.2.6.2 Difficulties were being faced by theenterprises where the wage revision effectivefrom 1st January, 1992 or 1997, as the casemay be, could not be effected. This lead tohardships to the employees involved in theseenterprises. The Voluntary RetirementScheme was further modified by issuance ofsubsequent notification of 6th November,2001, which inter alia provides for 100%additional compensation for the employeeswhere wage revision of 1992 could not beeffected and similarly 50% additionalcompensation for employees where the wagerevision of 1997 could not be made effective.These increases in VR compensation are tobe computed based on the existing pay ofthe employees. The VRS/VSS ex-gratia inrespect of CDA pattern employees at 1986scales of pay has been enhanced by 50%vide DPE’s OM dated 26.10.2004. Theseliberalizations in the compensation packagewould help the sick and loss makingenterprises in downsizing their manpower.
13.2.6.3 Beginning from the introduction ofthe Voluntary Retirement Scheme in October1988 till March, 2005, aout 5.33 lakhs2employees have been released under VRS.
Human Resource Development in Public Enterprises 121
VRS IN CPSEs THAT CAN SUSTAIN A VRSON THEIR OWN SURPLUS RESOURCES
13.2.7 Financially sound enterprises whohave to reduce their workforce in order toremain competitive may frame their ownschemes of VRS and make it attractiveenough for employees to opt for it. They mayoffer as compensation upto 60 days salaryfor every completed year of service. However,such compensation will not exceed the salaryfor the balance period of service left.
VRS IN MARGINALLY PROFIT OR LOSSMAKING AND SICK AND UNVIABLE PSEs
13.2.8 Marginally profit making or lossmaking PSEs have been permitted tointroduce an improved VRS based on Gujaratmodel. Under this model an employee willreceive compensation as follows :
(i) 35 days salary for each completed yearof service; and
(ii) 25 days salary per year of service forthe balance of service left untilsuperannuation subject to someconditions.
13.2.8.1 The model, known as DHI(Department of Heavy Industry) model,available to employees of sick and unviablePSEs is to allow ex-gratia payment equivalentto 45 days salary for each completed year ofservice or the salary for the remaining monthsof service left, whichever is less. However,all those who have completed not less than30 years of service, are eligible for amaximum of 60 (sixty) months salary ascompensation subject to the amount notexceeding the salary for the balance periodof service left.
13.2.8.2 The VRS optees in PSEs whichare marginally profit/loss making or sick/unviable can opt for either of the Gujaratmodel or DHI model.

122 Public Enterprises Survey 2004-05 : Vol.-I
Section-III
Scheme for Counselling, Retraining and Redeployment
13.3.1 Restructuring of enterprises is aglobal phenomenon, particularly in thecontext of liberalized economy. There hasbeen thrust on restructuring the CentralPublic Sector Enterprises (CPSEs) both atmacro as well as micro level. In the process,rationlization of manpower has also becomea necessity. But this affects in some casesthe interest of the workers. As such, thepolicy of the Government has been toimplement reforms with a humane face andprovide adequate safety net for the affectedworkers.
13.3.2. Considering the emerging need tohave safety net, Government had establishedNational Renewal Fund (NRF) in February,1992 broadly to cover the expenses of VRSand to provide retraining to the workers inthe organized sector. However, in thebackdrop of on going restructuring exercisesin the central enterprises, focus was givenon the need of CPSEs. The NRF wasabolished in February, 2000. The retrainingactivity was administered by Department ofIndustrial Policy & Promotion till 31st March,2001. The scheme for Counselling,Retraining and Redeployment (CRR) ofrationalized employees of CPSEs has beenunder the charge of Department of PublicEnterprises since 2001-02.
13.3.3 The scheme for Counselling,Retraining and Redeployment (CRR) inter-alia aims at:
- to provide opportunity for self-employment.
- to reorient rationalized employeesthrough short duration programmes.
- to equip them for new avocations,
- to engage them in income generatingself-employment.
- to help them rejoin the productiveprocess.
13.3.4 The main elements of the CRRprogramme are Counselling, Retraining andRedeployment. Besides, a new element ofsensitization programme has also beenincluded under the CRR programme.
13.3.5 Counselling helps the rationalizedemployees to absorb the trauma of leavingthe organization, to properly manage theirfunds including compensation and tomotivate them to face the challenges and tore-join the productive process. Similarly,retraining strengthens their skill/expertise.Selected training institutes impart need-based training of 20 days / 30 days / 40 daysmodules. The faculty support is both internaland external, and the approach is to provideclassroom lectures as well as fieldexperience. In the process, trainees interactwith experts from various fields and are beinghelped in preparation/finalization of projectreports. The retraining should lead toredeployment mostly through self-employment. In the present scheme, theobjective is to maximize the rate of self-employment. The Nodal Agencies, therefore,provide need-based support, linkage withcredit institutions and continuously follow upwith the retrained personnel.
13.3.6 The 3 days’ sensitization programmein the premises of the CPSEs aims atproviding capsule course, literature forguidance, motivation cum awareness,information on market opportunities etc. prior

Human Resource Development in Public Enterprises 123
to the release of the employees so that theycan leave the organization with confidenceto meet the challenges of their earlyretirement.
13.3.7 For monitoring the CRR programmethe in-built mechanism involves field visitsand inspections by the concerned officers ofDPE. Coordination Committees at local levelhave also been formed. The Scheme alsoprovides for inter-ministerial ReviewCommittee under Secretary (PE) withmembers from selected concernedGovernment Departments/Agencies/CPSEs.
13.3.8 The Nodal Training Agencies arerequired to counsel VRS optees, imparttraining and reorientation, developcurriculum/materials, prepare feasibilityreport market surveys, post training follow up,interface with credit institutions, support inself employment, regular liaison with CPSEs,convening meeting of Co-ordinationCommittee etc.
13.3.9 CPSEs are the key to the successof the scheme. They are supposed to extendall possible support for the welfare of theseparated employees by clearing theircompensation/dues before release. Longassociation with employees puts CPSEs in abetter position to identify their retraining needs.
13.3.10 A Plan Fund of Rs. 8 crore wasallocated initially during 2001-02, which wasenhanced to Rs.10 crore during 2002-03 and2003-04. The plan fund was substantiallyincreased to Rs. 30 crore during 2004-05.For imparting training to the rationalizedemployees, 35 selected nodal agencies areoperational with around 103 EmployeesAssistance Centres (EACs). During the year2001-02, 2002-03, 2003-04 and 2004-05, thenumber of persons retrained was 8064,12066, 12134 and 28003 respectively. Theaverage rate of redeployment is around 45%.A list of nodal agencies is given at Annexure.
13.3.11 In order to evaluate theimplementation of CRR Scheme, an efficacystudy was conducted by V. V. Giri NationalLabour Institute, an autonomous body underMinistry of Labour. The study covers valuablesuggestions/findings on numerous areas.Bringing improvement in the CRR Schemeon continuous basis has been primary mottoof this Department. In view of countrywidenetwork of the CRR Scheme, a web-basedsystem to benefit all the stakeholders is beingdeveloped.
LIST OF SELECTED NODAL TRAINING AGENCIES
1. Associated Chamber of Commerce &Industry of India (ASSOCHAM), NewDelhi
2. Central Institute of Plastic Engg. andTechnology (CIPET), Channai
3. CIPET, Bhubaneshwar
4. CIPET, Hajipur
5. Central Leather Research Insititue,Chennai
6. Centre for Dvelopment of AdvancedComputing, Mohali (Chandigarh)
7. CMC
8. Centre for Management DevelopmentTrivendrum
9. Director Genral of Employment &Training, M/o Labour
10. Electronics Service & Training Centre,Kaniya, Ramnagar
11. Indian Council of Small Industries,Kolkata

124 Public Enterprises Survey 2004-05 : Vol.-I
12. Indian Institute of Entrepreneurship,Guwahati
13. Institute of EntrepreneurshipDevelopment, Patna
14. Institute of Labour Development,Jaipur
15. Kalinga Institute of IndustrialTechnology (KIIT), Bhubaneswar
16. Madhya Pradesh ConsultancyOrganisation, Bhopal
17. MITCON, Pune
18. National Institute of Small IndustryExtension Training (NISIET),Hyderabad
19. National Productivity Council, NewDelhi
20. National Small Industries Corpn. Ltd.,New Delhi
21. NIESBUD, NOIDA
22. NITRA, Ghaziabad
23. Small Industries Service Institute,Bangalore
24. Small Industries Service Institute,Chennai
25. Small Industries Service Institute,Coimbatore
26. Small Industries Service Institute,Indore
27. Small Industries Service Institute,Kanpur
28. Small Industries Service Institute,Karnal
29. Small Industries Service Institute,Koklata
30. Small Industries Service Institute,Mumbai
31. Small Industries Service Institute, NewDelhi
32. Small Industries Service Institute,Patna
33. Small Industries Service Institute,Raipur
34. Small Industries Service Institute,Thrissur
35. U.P. Industrial Consultants Ltd.,Kanpur
Human Resource Development in Public Enterprises 125
Section - IVEMPLOYMENT UNDER RESERVED CATEGORIES
Second Backward Classes Commission(Mandal Commission) and in accordance withthe Supreme Court Judgement in the IndiraSawhney case, instructions were issuedproviding reservation of 27% of vacancies infavour of Other Backward Classes (OBCs)in Civil Posts and Services under theGovernment of India. Department ofPersonnel & Training (DOPT) who formulatethe policy in respect of reservation inservices, have been issuing instructions fromtime to time on various aspects of reservationin favour of OBCs. Reservation for OBCs wasmade effective w.e.f. 8.9.1993. Departmentof Public Enterprises (DPE) have beenextending these instructions to the PublicSector Enterprises through theiradministrative Ministries for compliance. Acomprehensive Presidential Directiveincorporating all instructions was preparedby the Department of Public Enterprises andissued to all administrative Ministries videDPE’s OM dated 27th July, 1995 for formalissuance to the PSEs under their control,under the relevant Article of the Articles ofAssociation/Section of the relevant Act.
4. Although the administrativeMinistries/Departments concerned havebeen made formally responsible forimplementation of these Directives, theDepartment of Public Enterprises also takefollow-up action on the recommendationsmade by the Parliamentary Committee onWelfare of Scheduled Castes and ScheduledTribes and National Commission for SCs/STs/OBCs. The PSEs have been advised by thisDepartment to make vigorous efforts to wipeout the backlog vacancies so as to improvethe representation of Scheduled Castes/
The Personnel and RecruitmentPolicies of the Public Enterprises areformulated by the management ofrespective Public Sector Enterprises.However, on the matters of generalimportance, policy guidelines are issued bythe Government to the enterprises which areto be kept in view by the latter while framingtheir individual corporate policies.
2. Apart from having formal PresidentialDirectives issued to Public Sector Enterprisesby the concerned administrative Ministries soas to ensure reservation in regard toemployment for Scheduled Castes,Scheduled Tribes and Other BackwardClasses (OBCs), on the same lines asapplicable to the Central GovernmentMinistries/Departments, the Department ofPublic Enterprises also keep a watch on thereservation policies in the recruitment bycalling for Annual Reports from the PSEs andalso by taking necessary follow-up actionafter scrutinizing these reports. However, inthe case of details of implementation, thePublic Enterprises generally follow theinstructions from Department of Personnel& Training. A comprehensive PresidentialDirective incorporating all importantinstructions on reservation for SCs and STs,was issued on 25 th April, 1991 to alladministrative Ministries/Departmentsconcerned for formal issuance to the PublicEnterprises. Subsequently, changes andmodifications are circulated to PSEs throughtheir administrative Ministries/ Departmentsfor information and compliance.
3. Based on the recommendation of the
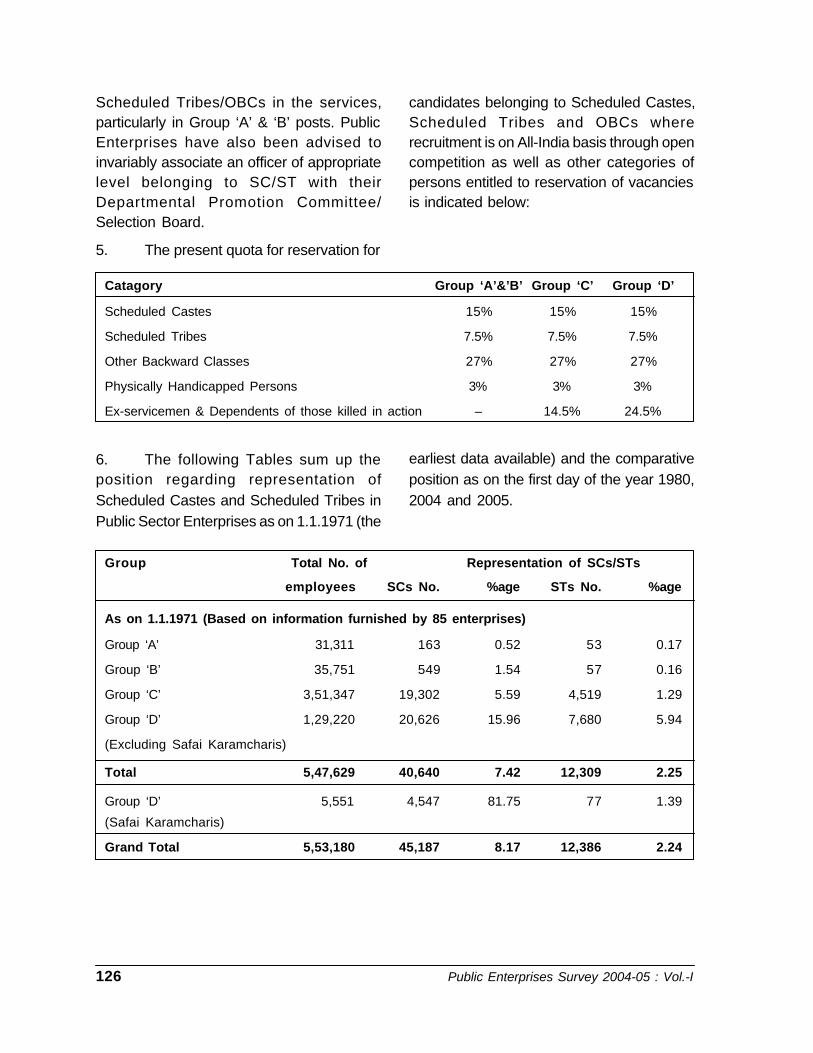
126 Public Enterprises Survey 2004-05 : Vol.-I
candidates belonging to Scheduled Castes,Scheduled Tribes and OBCs whererecruitment is on All-India basis through opencompetition as well as other categories ofpersons entitled to reservation of vacanciesis indicated below:
Catagory Group ‘A’&’B’ Group ‘C’ Group ‘D’
Scheduled Castes 15% 15% 15%
Scheduled Tribes 7.5% 7.5% 7.5%
Other Backward Classes 27% 27% 27%
Physically Handicapped Persons 3% 3% 3%
Ex-servicemen & Dependents of those killed in action – 14.5% 24.5%
6. The following Tables sum up theposition regarding representation ofScheduled Castes and Scheduled Tribes inPublic Sector Enterprises as on 1.1.1971 (the
earliest data available) and the comparativeposition as on the first day of the year 1980,2004 and 2005.
Group Total No. of Representation of SCs/STs
employees SCs No. %age STs No. %age
As on 1.1.1971 (Based on information furnished by 85 enterprises)
Group ‘A’ 31,311 163 0.52 53 0.17
Group ‘B’ 35,751 549 1.54 57 0.16
Group ‘C’ 3,51,347 19,302 5.59 4,519 1.29
Group ‘D’ 1,29,220 20,626 15.96 7,680 5.94
(Excluding Safai Karamcharis)
Total 5,47,629 40,640 7.42 12,309 2.25
Group ‘D’ 5,551 4,547 81.75 77 1.39
(Safai Karamcharis)
Grand Total 5,53,180 45,187 8.17 12,386 2.24
Scheduled Tribes/OBCs in the services,particularly in Group ‘A’ & ‘B’ posts. PublicEnterprises have also been advised toinvariably associate an officer of appropriatelevel belonging to SC/ST with theirDepartmental Promotion Committee/Selection Board.
5. The present quota for reservation for
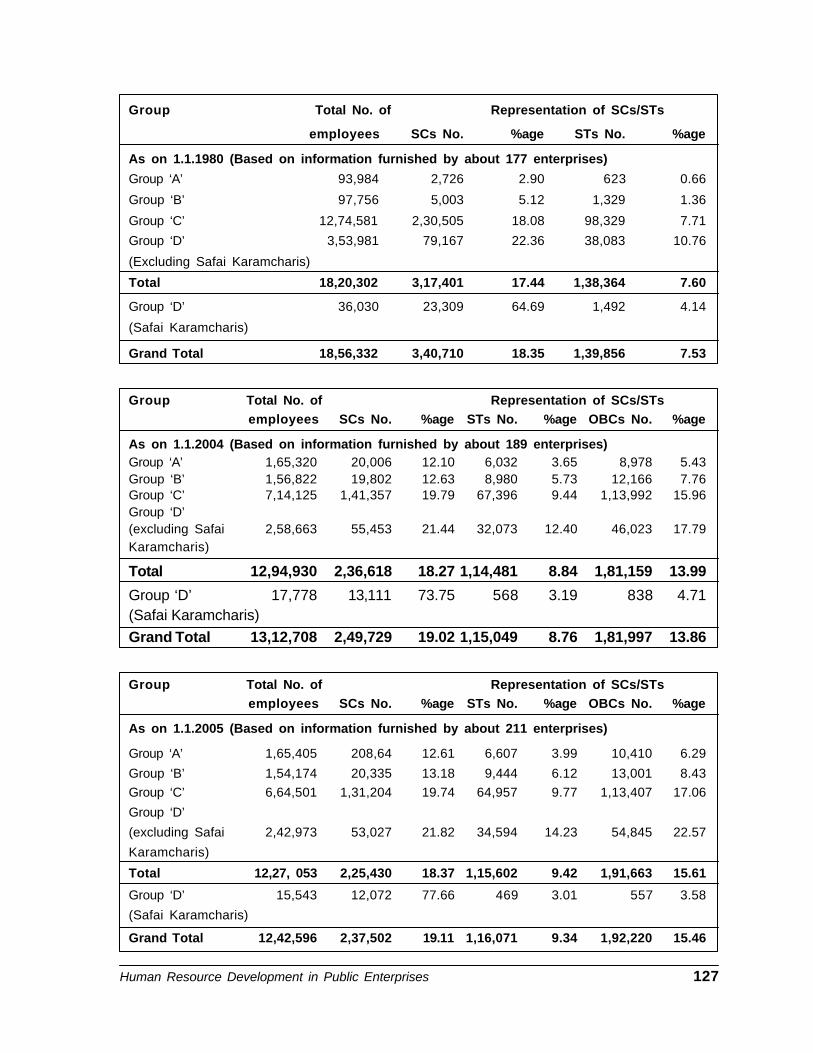
Human Resource Development in Public Enterprises 127
Group Total No. of Representation of SCs/STs
employees SCs No. %age STs No. %age
As on 1.1.1980 (Based on information furnished by about 177 enterprises)
Group ‘A’ 93,984 2,726 2.90 623 0.66
Group ‘B’ 97,756 5,003 5.12 1,329 1.36
Group ‘C’ 12,74,581 2,30,505 18.08 98,329 7.71
Group ‘D’ 3,53,981 79,167 22.36 38,083 10.76
(Excluding Safai Karamcharis)
Total 18,20,302 3,17,401 17.44 1,38,364 7.60
Group ‘D’ 36,030 23,309 64.69 1,492 4.14
(Safai Karamcharis)
Grand Total 18,56,332 3,40,710 18.35 1,39,856 7.53
Group Total No. of Representation of SCs/STsemployees SCs No. %age STs No. %age OBCs No. %age
As on 1.1.2004 (Based on information furnished by about 189 enterprises)Group ‘A’ 1,65,320 20,006 12.10 6,032 3.65 8,978 5.43Group ‘B’ 1,56,822 19,802 12.63 8,980 5.73 12,166 7.76Group ‘C’ 7,14,125 1,41,357 19.79 67,396 9.44 1,13,992 15.96Group ‘D’(excluding Safai 2,58,663 55,453 21.44 32,073 12.40 46,023 17.79Karamcharis)
Total 12,94,930 2,36,618 18.27 1,14,481 8.84 1,81,159 13.99
Group ‘D’ 17,778 13,111 73.75 568 3.19 838 4.71(Safai Karamcharis)Grand Total 13,12,708 2,49,729 19.02 1,15,049 8.76 1,81,997 13.86
Group Total No. of Representation of SCs/STsemployees SCs No. %age STs No. %age OBCs No. %age
As on 1.1.2005 (Based on information furnished by about 211 enterprises)
Group ‘A’ 1,65,405 208,64 12.61 6,607 3.99 10,410 6.29
Group ‘B’ 1,54,174 20,335 13.18 9,444 6.12 13,001 8.43Group ‘C’ 6,64,501 1,31,204 19.74 64,957 9.77 1,13,407 17.06
Group ‘D’
(excluding Safai 2,42,973 53,027 21.82 34,594 14.23 54,845 22.57
Karamcharis)
Total 12,27, 053 2,25,430 18.37 1,15,602 9.42 1,91,663 15.61
Group ‘D’ 15,543 12,072 77.66 469 3.01 557 3.58
(Safai Karamcharis)
Grand Total 12,42,596 2,37,502 19.11 1,16,071 9.34 1,92,220 15.46
128 Public Enterprises Survey 2004-05 : Vol.-I
7. It may, however, be noted from theabove Tables that as on 1.1.2005 there hasbeen improvement in the representation ofboth Scheduled Castes and ScheduledTribes in Group ‘A’ and Group ‘B’ posts overthe years. The representation of SCs/STs inGroup ‘A’ posts has been rising steadily andhas increased from 2.90% and 0.66% as on1.1.1980 to 12.61% and 3.99% respectivelyas on 1.1.2005. Similarly, in regard to Group‘B’ posts the representation of SCs/STs hasrisen from 5.12% and 1.36% as on 1.1.1980to 13.18% and 6.12% respectively as on1.1.2005. Though the overall percentage ofrepresentation of SC/ST in services isadequate, the representation in Group ‘A’ andGroup ‘B’ is not yet satisfactory. This is forthe reasons that the private sector companiestaken over by the Government, whichaccount for a significant percentage of totalemployment in the public sector at present,did not necessarily have any scheme ofreservation for Scheduled Castes/ScheduledTribes till these were nationalized. Theshortfall in the representation of ScheduledCastes/Schedule Tribes in Group ‘A’ andGroup ‘B’ posts in Public Enterprises is alsoon account of non-availability of suitableScheduled Castes and Scheduled Tribescandidates in technical disciplines. Most ofthe Public Enterprises being in themanufacturing/production sector, havepreponderance of technical posts in Group‘A’ and ‘B’ services. The representation ofOBCs in Group ‘A’ and ‘B’ posts as on1.1.2005 is 6.29% and 8.43% respectively.Though the representation of OBCs in allGroups ‘A’, ’B’, ‘C’ and ‘D’ posts hasimproved, the overall percentage of OBCsin services is not satisfactory.
8. The need to ensure timely filling upof reserved posts and the backlog has beenstressed in various instructions issued fromtime to time. All administrative Ministries/Departments have been requested to advisethe PSEs under their administrative control
to take effective steps to fill up the unfilledreserved posts in Direct Recruitment as wellas in promotion in accordance with theexisting instructions. One of the agendaenunciated in National Common MinimumProgramme (NCMP) is to launch a SpecialRecruitment Drive to fill up backlog ofreserved vacancies for SC and ST in CPSEs.DPE has issued instructions to alladministrative Ministries/ Departmentsdealing with CPSEs to fill up these vacanciesby December, 2005.
9. Department of Public Enterpriseshave extended the scheme for reservationfor Ex-servicemen to the Public Enterprisesthrough the administrative Ministries/Departments, and instructions streamliningthe procedure for recruitment of Ex-servicemen have been issued so as toaugment the in-take in the services of publicenterprises. Such PSEs, which are in aposition to offer agencies/dealerships havebeen advised to reserve quota of suchagencies/dealership for allotment to Ex-servicemen.
10. DPE have also issued draftPresidential Directive to all the administrativeMinistries/Departments concerned with thePSEs for employment of physicallyhandicapped persons in PSEs on 22.4.1991incorporating all instructions issued on thesubject. With the enactment of the Personswith Disabilities (Equal Opportunities,Protection of Rights and Full Participation)Act, 1995, the reservation to physicallyhandicapped persons stood extended toidentified Group ‘A’ and ‘B’ posts filledthrough Direct Recruitment. As per the Act,not less than 3% shall be reserved forPersons with Disabilities of which 1% eachshall be reserved for persons suffering from(i) blindness or low vision (ii) hearingimpairment and (iii) locomotor disability orcerebral palsy. All PSEs have been advisedto comply with the provisions of the Act.
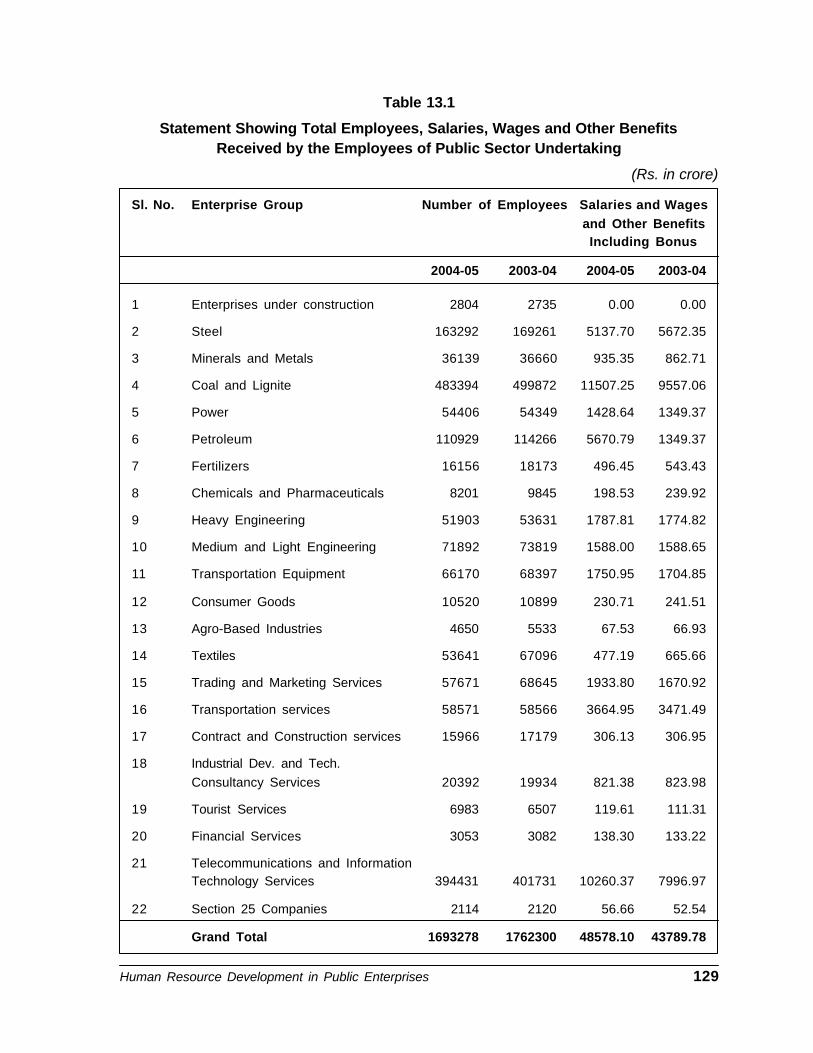
Human Resource Development in Public Enterprises 129
Table 13.1
Statement Showing Total Employees, Salaries, Wages and Other BenefitsReceived by the Employees of Public Sector Undertaking
(Rs. in crore)
Sl. No. Enterprise Group Number of Employees Salaries and Wagesand Other BenefitsIncluding Bonus
2004-05 2003-04 2004-05 2003-04
1 Enterprises under construction 2804 2735 0.00 0.00
2 Steel 163292 169261 5137.70 5672.35
3 Minerals and Metals 36139 36660 935.35 862.71
4 Coal and Lignite 483394 499872 11507.25 9557.06
5 Power 54406 54349 1428.64 1349.37
6 Petroleum 110929 114266 5670.79 1349.37
7 Fertilizers 16156 18173 496.45 543.43
8 Chemicals and Pharmaceuticals 8201 9845 198.53 239.92
9 Heavy Engineering 51903 53631 1787.81 1774.82
10 Medium and Light Engineering 71892 73819 1588.00 1588.65
11 Transportation Equipment 66170 68397 1750.95 1704.85
12 Consumer Goods 10520 10899 230.71 241.51
13 Agro-Based Industries 4650 5533 67.53 66.93
14 Textiles 53641 67096 477.19 665.66
15 Trading and Marketing Services 57671 68645 1933.80 1670.92
16 Transportation services 58571 58566 3664.95 3471.49
17 Contract and Construction services 15966 17179 306.13 306.95
18 Industrial Dev. and Tech.Consultancy Services 20392 19934 821.38 823.98
19 Tourist Services 6983 6507 119.61 111.31
20 Financial Services 3053 3082 138.30 133.22
21 Telecommunications and InformationTechnology Services 394431 401731 10260.37 7996.97
22 Section 25 Companies 2114 2120 56.66 52.54
Grand Total 1693278 1762300 48578.10 43789.78

130 Public Enterprises Survey 2004-05 : Vol.-I
Table 13.2
Statement Showing Employment, Gross Block, Cost of Production and LabourContent in Some of The Commodity Groups during 2004-05
(Rs. in crore)Sl. Commodity Group No. of Gross Gross Cost of Labour LabourNo. Employees Block Block Production Content Content
(Rs. in (Per- (Rs. in (Rs. in as % ofCrore Employee Crores) Crore) Cost of
(Rs. in ProductionThousand)
1. Enterprises UnderConstruction 2804 559.40 1995.01 0.00 0.00 **********
2. Steel 163292 38034.91 2329.26 28406.78 5137.70 18.09
3. Minerals and Metals 36139 12918.56 3574.69 5688.71 935.35 16.44
4. Coal and Lignite 483394 37109.21 767.68 25798.53 11507.25 44.60
5. Power 54406 79079.30 14535.03 24788.06 1428.64 5.76
6. Petroleum 110929 196147.57 17682.26 360593.36 5670.79 1.57
7. Fertilizers 16156 9680.97 5992.18 10889.02 496.45 4.56
8. Chemicals andPharmaceutical 8201 1298.54 1583.39 1487.56 198.53 13.35
9. Heavy Engineering 51903 4241.31 817.16 10240.80 1787.81 17.46
10. Medium and LightEngineering 71892 4716.94 656.11 9133.24 1588.00 17.39
11. Trasportation Equipment 66170 4355.84 658.28 7974.75 1750.95 21.96
12. Consumer Goods 10520 3005.20 2856.65 2046.65 230.71 11.27
13. Agro - Based Industries 4650 86.93 186.95 179.22 67.53 37.68
14. Textiles 53641 693.73 129.33 2963.50 477.19 16.10
15. Trading and MarketingServices 57671 2357.56 408.79 87560.23 1933.80 2.21
16. Transportaion Services 58571 27821.47 4750.04 20467.90 3664.95 17.91
17. Contract and
Construction Services 15966 4275.04 2677.59 3715.50 306.13 8.24
18. Industrial Dev. And
Tech. Consutancy Sercices 20392 22592.76 11079.23 4809.94 821.38 17.08
19. Tourist Services 6983 214.57 307.27 519.00 119.61 23.05
20. Financial Servies 3053 623.10 2040.94 7147.62 138.30 1.93
21. Telecommunications and
Information Technology
Services 394431 119204.84 3022.20 34322.94 10260.37 29.89
22. Section 25 Compaines 2114 139.86 661.59 164.54 56.66 34.44
Grand Total : 1693278 569157.61 3361.28 648897.85 48578.10
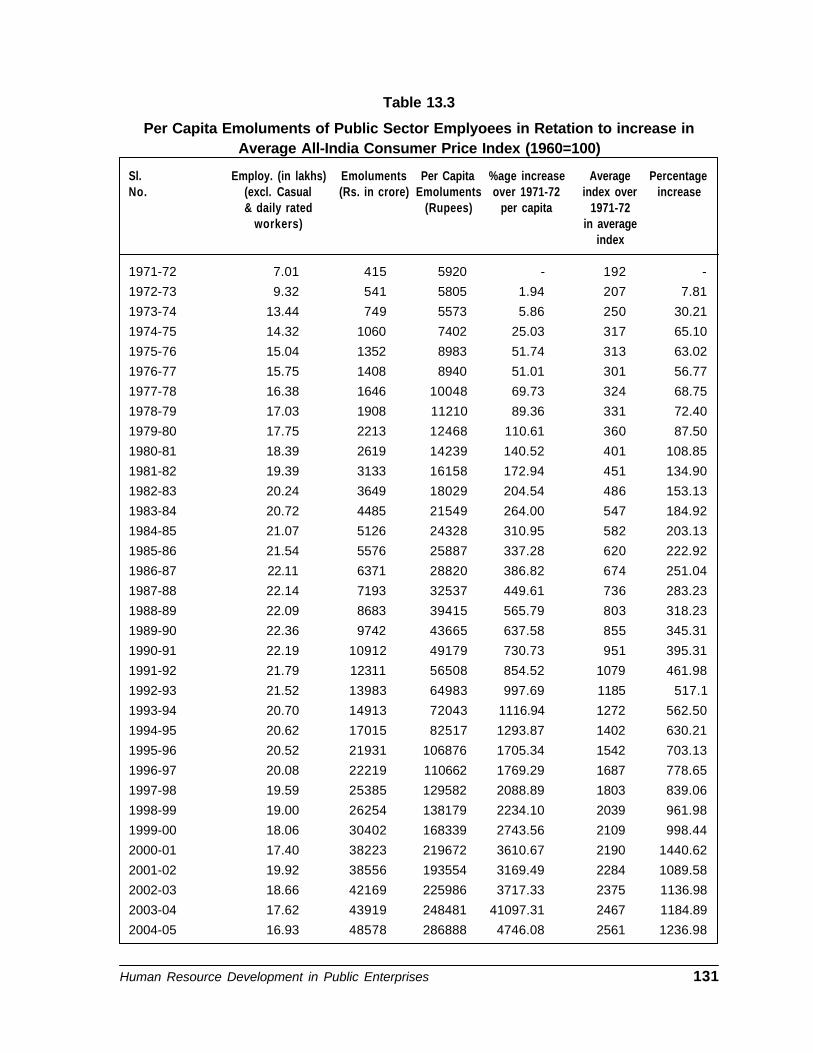
Human Resource Development in Public Enterprises 131
Table 13.3
Per Capita Emoluments of Public Sector Emplyoees in Retation to increase inAverage All-India Consumer Price Index (1960=100)
Sl. Employ. (in lakhs) Emoluments Per Capita %age increase Average PercentageNo. (excl. Casual (Rs. in crore) Emoluments over 1971-72 index over increase
& daily rated (Rupees) per capita 1971-72workers) in average
index
1971-72 7.01 415 5920 - 192 -
1972-73 9.32 541 5805 1.94 207 7.81
1973-74 13.44 749 5573 5.86 250 30.21
1974-75 14.32 1060 7402 25.03 317 65.10
1975-76 15.04 1352 8983 51.74 313 63.02
1976-77 15.75 1408 8940 51.01 301 56.77
1977-78 16.38 1646 10048 69.73 324 68.75
1978-79 17.03 1908 11210 89.36 331 72.40
1979-80 17.75 2213 12468 110.61 360 87.50
1980-81 18.39 2619 14239 140.52 401 108.85
1981-82 19.39 3133 16158 172.94 451 134.90
1982-83 20.24 3649 18029 204.54 486 153.13
1983-84 20.72 4485 21549 264.00 547 184.92
1984-85 21.07 5126 24328 310.95 582 203.13
1985-86 21.54 5576 25887 337.28 620 222.92
1986-87 22.11 6371 28820 386.82 674 251.04
1987-88 22.14 7193 32537 449.61 736 283.23
1988-89 22.09 8683 39415 565.79 803 318.23
1989-90 22.36 9742 43665 637.58 855 345.31
1990-91 22.19 10912 49179 730.73 951 395.31
1991-92 21.79 12311 56508 854.52 1079 461.98
1992-93 21.52 13983 64983 997.69 1185 517.1
1993-94 20.70 14913 72043 1116.94 1272 562.50
1994-95 20.62 17015 82517 1293.87 1402 630.21
1995-96 20.52 21931 106876 1705.34 1542 703.13
1996-97 20.08 22219 110662 1769.29 1687 778.65
1997-98 19.59 25385 129582 2088.89 1803 839.06
1998-99 19.00 26254 138179 2234.10 2039 961.98
1999-00 18.06 30402 168339 2743.56 2109 998.44
2000-01 17.40 38223 219672 3610.67 2190 1440.62
2001-02 19.92 38556 193554 3169.49 2284 1089.58
2002-03 18.66 42169 225986 3717.33 2375 1136.98
2003-04 17.62 43919 248481 41097.31 2467 1184.89
2004-05 16.93 48578 286888 4746.08 2561 1236.98
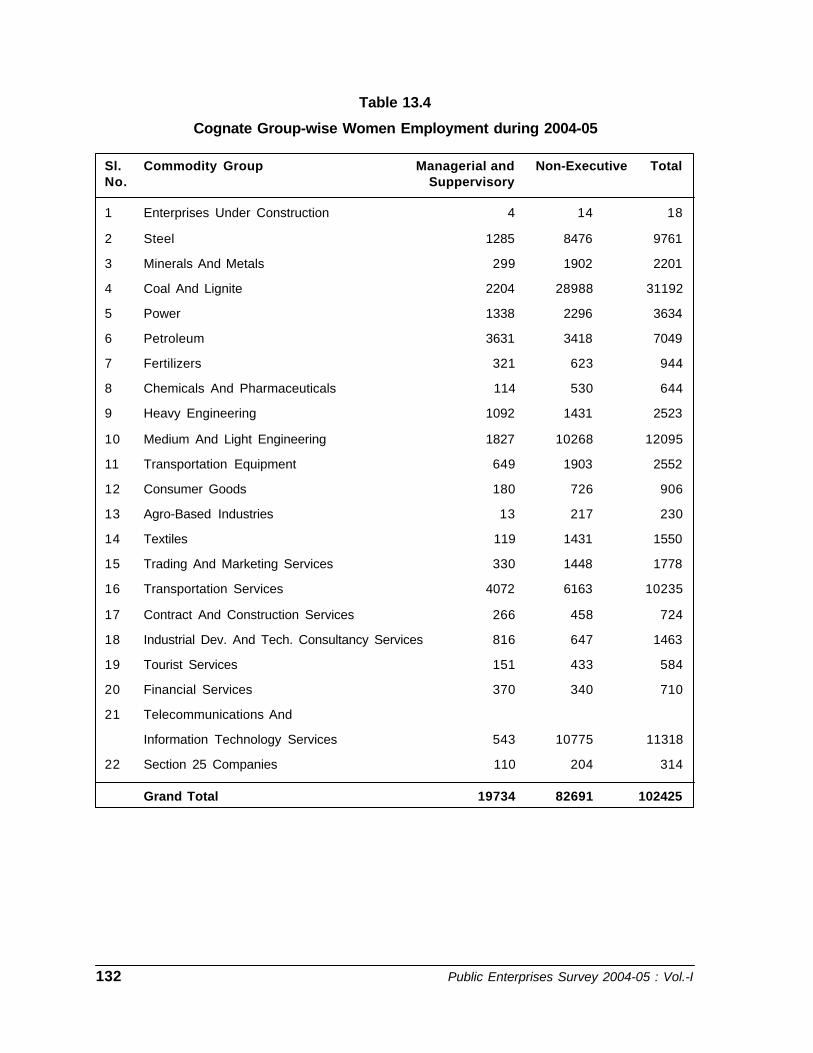
132 Public Enterprises Survey 2004-05 : Vol.-I
Table 13.4
Cognate Group-wise Women Employment during 2004-05
Sl. Commodity Group Managerial and Non-Executive TotalNo. Suppervisory
1 Enterprises Under Construction 4 14 18
2 Steel 1285 8476 9761
3 Minerals And Metals 299 1902 2201
4 Coal And Lignite 2204 28988 31192
5 Power 1338 2296 3634
6 Petroleum 3631 3418 7049
7 Fertilizers 321 623 944
8 Chemicals And Pharmaceuticals 114 530 644
9 Heavy Engineering 1092 1431 2523
10 Medium And Light Engineering 1827 10268 12095
11 Transportation Equipment 649 1903 2552
12 Consumer Goods 180 726 906
13 Agro-Based Industries 13 217 230
14 Textiles 119 1431 1550
15 Trading And Marketing Services 330 1448 1778
16 Transportation Services 4072 6163 10235
17 Contract And Construction Services 266 458 724
18 Industrial Dev. And Tech. Consultancy Services 816 647 1463
19 Tourist Services 151 433 584
20 Financial Services 370 340 710
21 Telecommunications And
Information Technology Services 543 10775 11318
22 Section 25 Companies 110 204 314
Grand Total 19734 82691 102425
MOU System in Central Public Sector Enterprises 133
MOU SYSTEM IN CENTRAL PUBLIC SECTOR ENTERPRISES14BACKGROUND
14.1 The investment decisions to createpublic sector units were based on social costbenefit analysis. A number of public sectorenterprises came to be set up because thesocial internal rate of return and social costbenefit ratio were positive, even when theirprivate profitability was negative. Moreovermost of the public sector enterprises were notexpected to maximize profits. Theseinvestment decisions by themselves do notcreate any problem for evaluation ofperformance. However, the instrument (i.e.the accounting system) that was chosen toevaluate the performance was borrowed fromthe private sector, and this accounting systemjudges performance on a single criteria, whichis, profit. The public sector enterprisesperformance, therefore, came to be evaluatedbased on their financial profit. There wasclearly a lack of an instrument that couldmeasure the performance of PSEs taking intoaccount the complexity of fusing social andfinancial objectives and translating them intomeasurable parameters.
14.2 Though the importance of the need forboth autonomy as well as accountability waswell understood, putting it into practice provedto be difficult. For ensuring autonomy as wellas accountability, greater reliance was placedon setting out rules and procedures, throughgovernment directives, circulars,memorandum etc. These directives would befollowed up by prescribing elaborate formsand returns that the enterprises must submitperiodically to the line ministry so that the lineministry could monitor compliance of thesedirectives. With the passage of time the
number of these forms and returns increasedmanifold and ultimately the line ministry endsup controlling more and more of day-to-dayfunctions of the enterprises. The manager,hence, finds that most of the decisions forrunning the enterprises are taken by otherpeople and therefore, he sees no reason whyhe should be held accountable for results.
14.3 With the above background, theGovernment policy towards PSEs has beenreviewed from time to time and in 1984, theGovernment appointed Arjun SenguptaCommittee to review the policy in respect ofPublic Sector Enterprises. Following therecommendations of the committee report,the Government of India introduced theconcept of the Memorandum ofUnderstanding in 1988 to improve theperformance of the PSEs and to introduce anobjective system of evaluation of theperformance of the managements of thePSEs.
THE CONCEPT OF MOU
14.4 The concept of Memorandum ofUnderstanding is very simple. It is supposedto be a freely negotiated document betweenthe Government, acting as the owner of PublicSector Enterprise (PSE) and a specific PSE.Second, it is supposed to clearly specify theintentions, obligations and mutualresponsibilities of both parties to theMemorandum of Understanding (MOU). Ifeither of the above two conditions is violated,the effectiveness of the MOU as an instrumentof performance improvement is bound to beaffected. Further, MOU makes an attempt tomove the management of PSEs frommanagement by controls and procedures to
134 Public Enterprises Survey 2004-05 : Vol.-I
management by results and objectives.Another way of saying the same thing is thatMOU makes an attempt to move themanagement of PSEs from reliance on ex-ante controls to a system of ex-post controls.
THE OBJECTIVES OF MOU SYSTEM
14.5 The objectives of the MOU system areto:
• Measure the performance of PSEs takinginto account the complexity of fusingsocial and financial objectives andtranslating them into measurableparameters;
• Ensure simultaneous increase inautonomy as well as accountability;
• Set up new institutions and administrative& personnel systems;
• Replace ‘multiple principles with multipleobjectives’ with clarity in goals andobjectives.
STRUCTURE OF MOU
14.6 The MOU is not merely a document,it is a way of life or a management system.This tool for performance improvementincorporates within its fold three sub-system,namely, performance information system,performance evaluation system andperformance incentive system.
14.6.1 Performance evaluation in MOUinvolves five steps. First three steps are takenat the beginning of the year and the last twosteps are taken at the end of the year.
BEGINNING OF THE YEAR
STEP 1: CRITERIA SELECTIONSTEP 2: CRITERIA WEIGHT SELECTIONSTEP 3: CRITERIA VALUE SELCTION AT
THE END OF THE YEAR
STEP 4: PERFORMANCE EV ALUA TION
STEP 5: PERFORMANCE REWARD
STEP 1 - CRITERIA SELECTION14.6.1.1 In the first step, one has to choosean appropriate set of criteria to be included inthe MOU. This raises the question: whatconstitutes an appropriate set of criteria?According to the MOU philosophy only thosecriteria. should be included in the MOU whichare “fair” to the manager, as well as “fair” tothe country and have been negotiated freely.Fairness to managers implies that the criteriaincluded in the MOU should measure onlythose aspects of managerial performancewhich are under manager’s control.Performance criteria must be selectedcarefully and not arbitrarily. These should bebased on the enterprises’ corporate plan thatlooks at three to five years in the future. Theymust also be consistent with plan andbudgetary goals of the government.Therefore, the MOU target and budgetarygoals are kept identical In the MOUs for thecentral public sector enterprises. Very often,no distinction is made between managerialperformance and enterprises performance.MOU is an instrument that measures theperformance of the manager and not that ofthe enterprise. While selecting performancecriteria this must he kept in mind and only thoseparameters that judge managerialperformance should be selected.
STEP 2 - CRITERIA WEIGHT SELECTION
14.6.1.2 Next step deals with criteria weightselection. For running an enterprisesuccessfully a chief executive has toundertake a number of tasks. However, notall the tasks are of equal importance. A smartchief executive therefore, priorities his tasksbased on his perception of the relativeimportance of different activities in hand. Theperception of the chief executive and that ofthe owner may not coincide in this case. Inthe interest of clarity of purpose it is necessary
MOU System in Central Public Sector Enterprises 135
that from the long list of things to do, themanager must be told what are the relativepriorities so that he can allocate his time moreeffectively in achieving those priorities. Thisis not an academic issue. Rather, it representsa key difference between the Action Plan typeof monitoring instrument and the MOUsystem. At the end of 1989-90, theGovernment of India found it difficult to evaluatethe performance of PSEs based on their MOUcommitments. Thus, after a carefulexamination of how this problem had beenovercome in other countries, it was decidedto introduce this system of relative weights.
STEP 3 - CRITERIA VALUE SELECTION
14.6.1.3 The third step in the performanceevaluation system relates to criteria valueselection. To understand one needs todistinguish between “criteria” and “criteriavalue.” Now, kilometers per litre is a criterionto measure efficiency of all types of motorvehicles. For example, cars, scooters, trucksand so on. However, 10 kilometers/litre maybe excellent for a truck but it is terrible for ascooter. This value of 10 kilometers/litre is thecriteria value. It is a value, which distinguishesvarious levels of performance. In MOU wehave a 5-point scale, where “1” represents“excellent” performance and “5” represents“poor” performance. Once decided on therelevant set of criteria to be included in theMOU, their relative priorities and the criteriavalues, there is nothing to be done till the endof the year. This, indeed, is the very heart ofthe MOU philosophy: Once you have specifiedthe objectives for the mangers you should notinterfere in the operation and wait till the endof the year for them to deliver the goods. Inselecting these criterion values (targets), thefollowing points may be kept in mind.
- This exercise should be carried out
through a participative process. Experiencesuggests that without a participative approach,targets tend to take the form of formaldirectives which are often overtly acceptedand covertly resisted.
- These targets should be easy tounderstand and well defined. It is desirable atthis stage to also agree upon definitions ofvarious criteria and methodology formeasuring them.
- The sources of information whichcould assist in setting criterion values include:
• The original objectives at the projectformulation stage;
• Comparisons with similar firms in thepublic or private sector;
• Standards achieved by similarundertakings in other selected developedand developing countries;
• Comparisons with the performance of thesame firm in the previous years;
• Professional judgment by third parties;• Professional judgment at the ministry
level;• Professional judgment at the enterprise
level.
STEP 4 - PERFORMANCE EVALUATION
14.6.1.4 The fourth step is taken at the endof year, when we look at the achievements ofthe PSEs and compare them with the criteriavalues and determine the scores. The valueof the composite score will also lie between“1” and “5”. If the management has doneexcellent in all fronts included in the MOU, theywill get a score of “1”. But, suppose, they havedone terrible job on all fronts included in theMOU, they will get a score of “5”. A mixedperformance will get them a scoresomewhere between” 1" and” 5".This concept of composite score is a very keyconcept in the MOU exercise. It measures the

136 Public Enterprises Survey 2004-05 : Vol.-I
ability of the enterprise to meet its owncommitments. It also allows us to compareand rank various enterprises, according to thecomposite scores, while the commitment ofthe enterprises may be different. For example,the commitments of Air India and SteelAuthroity of India are very different. Yet,through this exercise we are able to comparetheir ability to meet their respectivecommitments.
This final step in the performance evaluationexercise cannot be a mechanical procedure.Everything in life does not always go accordingto plans and, hence, there has to be someopportunity to deal with such exigencies in anycredible system. In the MOU system thereview meeting at the end of the year providesanother opportunity to adjust the criterionvalues for factors which were genuinelyunanticipated by both parties to the MOU i.e.,factors which were not predicted and couldnot have been predicted by either party, suchnatural disasters, wars, etc. This is essentialto keep the system “fair”.
STEP 5 - PERFORMANCE REWARD
14.6.1.5 While performance evaluation ofPSEs provides a measure of the degree ofachievement of the objectives set out,evaluation by itself does not lead toimprovement of performance. Unlessperformance evaluation is coupled with asystem of rewards and penalties ( for goodand bad performance) and utilized as a meansfor that purpose, it provides no motivation tothe PSEs for improving their performance. Atransparent system of rewards andpunishment is thus a corollary to theintroduction of an objective performanceevaluation system of the PSEs. Thus aperformance reward scheme constitutes anessential complement of the MOU system.
INSTITUTIONAL ARRANGEMENTS FORIMPLEMENTING MOU POLICY
14.7 The basic drive for designing theinstitutional arrangement for the MOU exerciseis in response to the two major criticismlevelled against the MOU system in its earlieryears. First criticism by many PSE chiefexecutives was that the MOU was a contractbetween “unequals”. They claimed that howcan one party to the contract be also the judgeto that contract. They were referring to thefact that in the past the onus of evaluating theperformance of PSEs against thecommitments made in the MOUs restedprimarily with the administrative Ministries.Second major concern expressed by someobservers of the MOU exercise was relatedto the imbalance in technical expertiseavailable between the Government and thePSEs. It was argued that, perhaps,Government was not technically equipped tomake a proper assessment of PSEs . Inresponse to these concerns, the Governmentof India decided on this institutionalarrangement. The details of this institutionalarrangement and their inter-linkages are asfollows.
1. HIGH POWER COMMITTEE (HPC)
14.7.1 At the apex of this institutionalarrangement is the High Power Committee(HPC) consisting of following members:
1. Cabinet Secretary, Chairman2. Finance Secretary, Member3. Secretary (Expenditure), Member4. Secretary (Planning Commission),
Member5. Secretary (Statistics & Programme
Implementation), Member6. Chairman (Public Enterprises Selection
Board), Member7. Chairman, Tariff Commission

MOU System in Central Public Sector Enterprises 137
8. Chief Economic Adviser, Member9. Secretary (Public Enterprises),
Member-Secretary
14.7.1.1 The functions of this committee areto assess the performance of MOU signingenterprises with reference to thecommitments made in the MOU. It alsoassesses how far the administrativeministries have been able to provide thenecessary administrative and financial supportcommitted by them in the MOU. It overseesthe functioning of the MOU system, providesguidelines and gives directions to strengthenand improve the system besides takinggeneral decisions on broader issuespertaining to the improvement of theperformance of public enterprises.
14.7.1.2 Now, the power to approve the finalMOUs has been delegated to TF/DPE and onlyin those cases where TF is not able to take adecision are referred to HPC.
2. TASK FORCE (TF)
14.7.2 The main objective behind the creationof an TF was to take care of the concernregarding the imbalance in technical expertiseavailable between the Government andPSEs. The main functions of the TF are:
(a) to examine the design of MOU at thebeginning of the year. For this purpose thedraft MOU agreed upon by the PSE andthe relevant administrative Ministry isexamined by the Task Force (TF). If TFhas any comments or questions regardingthe draft MOUs, they seek clarificationsvia MOU Division. Once the signatoriesto MOUs have responded to the concernsexpressed by the TF on their draft MOUs,the MOU negotiation meetings areorganized. These meetings are attendedby the executives of PSEs, senior officialsof the concerned Administrative Ministry
and the representatives from the nodalagencies such as Planning Commission,Ministry of Statistics & ProgrammeImplementation, Ministry of Finance, etc.The draft MOUs are discussed andfinalized during these meetings.
(b) Once the MOUs have been signed, thenext step by the TF is undertaken at theend of the year. It is the primaryresponsibility of the Task Force to do thisevaluation and determine the compositescore for each enterprise. In this work theyare assisted by MOU Division.
14.7.2.1 This Task Force membersconsists of management professionals andindependent members with considerableexperience in managing PSEs from bothsides of the fence - PSEs and administrativeministries. It was decided by the High PowerCommittee that no one belonging to theGovernment should be a member of this TaskForce. This was considered essential tomaintain objectivity and credibility of this TaskForce.
3. MOU DIVISION
14.7.3 The HPC and TF are assisted by theMOU Division in the Department of PublicEnterprises. It acts as a permanentsecretariat to this HPC and TF. The mainfunctions of this Division are:a. To re-constitute Task Force each year and
provide logistical support to the TaskForce. It is expected to provide not onlyadministrative support but also technicalsupport to the Task Force.
b. To short list PSEs for signing MOU.c. To prepare MOU guidelines on the basis of which
MOU signing PSEs draft their MOU.d. To act as buffer between the Task Force
members and the two signatories to theMOUs - PSEs and AdministrativeMinistries. It is expected that TF members
138 Public Enterprises Survey 2004-05 : Vol.-I
will have contacts with signatories to MOUvia MOU Division only.
e. To develop information and data base onMOU signing PSEs.
f. To prepare agenda and backgroundpapers for the High Power Committee.
g. To monitor the progress of MOUs. ThisDivision keeps a tab on various stagesinvolved in the preparation of MOUs toensure that all parties involved in theprocess adhere to the relevant deadlines.
h. To provide advice and counsel to the MOUsignatories on methodological andconceptual aspects of the MOU policy.
i. To coordinate research and training onvarious aspects of MOU policy.
JUSTIFICATION FOR THEINSTITUTIONAL ARRANGEMENT
14.8 While describing various elements ofthe current institutional arrangement we putforward the rationale for their existence. Thepurpose of this section is to bring togetherthese justifications at one place to present aunified picture. Therefore, in what follows welist the reasons why this arrangement makessense in the Indian context.
(i) It ensures commitment from the higherlevels of the Government.
(ii) It enables objective, third party evaluation.(iii) Task Force ensures professionalism and
prevents bureaucratization.(iv) High Power Committee can demand
recommendations information and makebinding
(v) Ensures “fairness” and “equality” in theprocess of negotiation of MOUs.
WORKING OF MOU SYSTEM
14.9 Issue of guidelines
14.9.1 The process of signing of MOU isinitiated by the MOU Division with the issue ofGuidelines for drafting of MOUs. These
guidelines indicate the broad structure and theaspects to be covered in the draft MOUincluding the weights to be given to thefinancial parameters. These guidelines reflectthe concerns of the Government and give thegeneral direction to the PSEs.
Drafting of MOUs
14.9.2 On the basis of these Guidelines, thedraft MOUs are prepared by PSEs andsubmitted to DPE after due discussions inBoard and the concerned AdministrativeMinistry/Department in the month ofDecember. The draft MOUs received in DPEare examined in MOU division in consultationwith members Task Force.If required,additional information to ensure that thetargets proposed in the draft MOUs arerealistic and challenging is sought from PSEs/Ministries.
MOU negotiation Meetings
14.9.3 MOU negotiation meetings are held inthe month of February/March. Before themeetings critiques/background papers areprepared by MOU division on the draft MOUof each PSE. These meetings are attendedby TF members, senior officials ofadministrative ministry, top executives ofPSEs and representatives from nodalagencies of Government of India such asPlanning Commission, Ministry of Finance &Ministry of Statistics & ProgrammeImplementation. The targets under variousparameters are discussed and finalised duringthese meetings.
Signing of MOU
14.9.4 After approval of DPE/TF, MOU issigned by Chief Executive of the PSE &Secretary of the concerned Ministry by 31st
March.

MOU System in Central Public Sector Enterprises 139
Evaluation of MOU
14.9.5 Performance of MOU signing PSEs
is evaluated with reference to their MOUtargets in May/June on the basis of provisional
results and in October/November on the basis
of audited data. On the basis of theirperformance, the PSEs are graded as
“EXCELLENT”, “VERY GOOD”, “GOOD”,
“FAIR” & “POOR”.
COVERAGE OF PSEs UNDER THE MOU
SYSTEM
14.10 The MOU system has grown at a
steady rate and from 4 MOUs signed in theyear 1987-88, 101 MOUs were signed/
finalised for the year 2005-06. Many of these
101 PSEs (Annexure-I) are the holding PSE’sand if their subsidiaries are also included then
the total no. of PSE’s covered under MOU
system works out to be much more. Thenumber of MOUs signed/finalised since the
inception of the MOU system are as follows:
Year No. of MOU’s Year No. of MOU’ssigned signed
1987-88 4 1997-1998 108
1988-89 11 1998-1999 108
1989-90 18 1999-2000 108
1990-91 23 2000-2001 107
1991-92 72 2001-2002 104
1992-93 98 2002-2003 100
1993-94 101 2003-2004 96
1994-95 100 2004-2005 103
1995-96 104 2005-2006 101
1996-97 110
Achievements of the MOU system
14.11 Viewed in the light of the objectives the
effectiveness of the MOU system can besummarised as follows:
* Since the focus, under the MOU system,
has shifted to achievements of results,Ministries have begun to withdraw from
their tendency to control by procedures.
MOU has thus increased the operationalautonomy of the enterprises.
* Operational autonomy has also beenincreased by delegating more financial and
administrative powers to the MOU signing
PSEs.
* By laying stress on marketing effort andcomparing with private sector enterprises
MOU are helping PSEs to face
competition.
* The quarterly performance review (QPR)
meetings have become more focussedsince the introduction of MOUs.
Discussion is confined to overall
achievement as outlined in the MOUs.This has lead to higher quality of debate
about PSE’s performance.
* By making a distinction between
enterprise performance and managerial
performance, MOU’s have improved thequality of debate and made the
judgements on PSE managements much
more fair. This has been very good for themorale of the employees who know that
gross generalisation about public sector
is unfair.
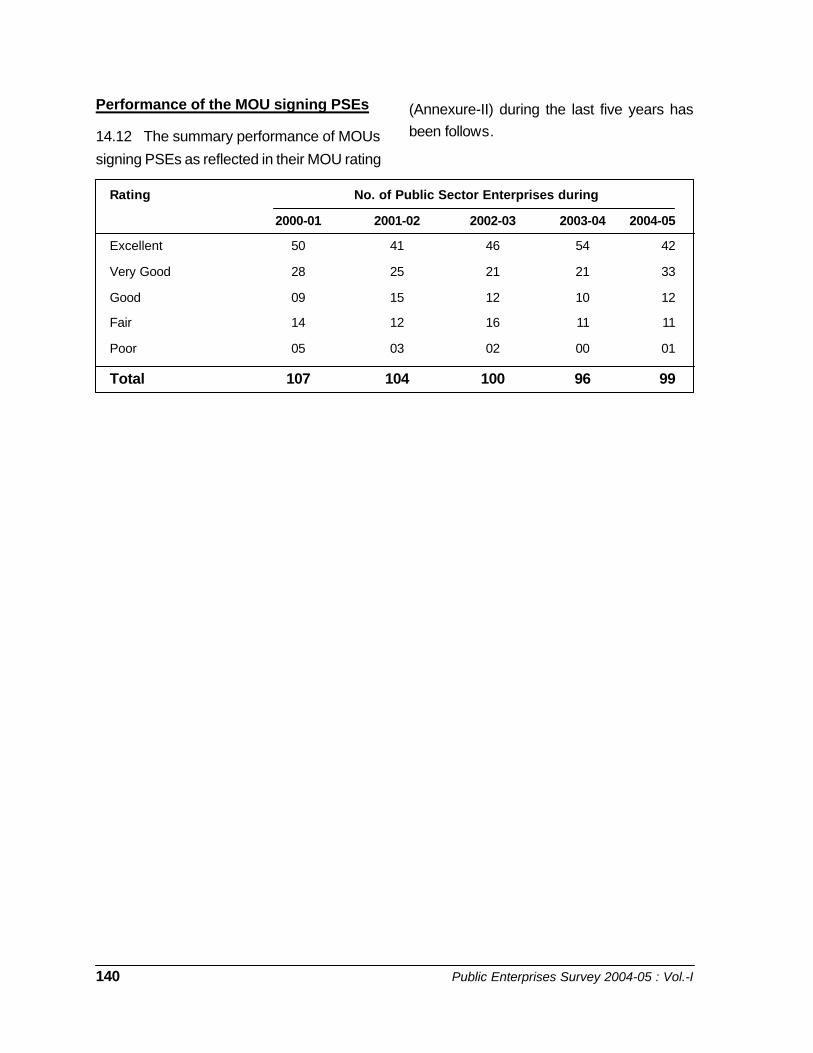
140 Public Enterprises Survey 2004-05 : Vol.-I
Rating No. of Public Sector Enterprises during
2000-01 2001-02 2002-03 2003-04 2004-05
Excellent 50 41 46 54 42
Very Good 28 25 21 21 33
Good 09 15 12 10 12
Fair 14 12 16 11 11
Poor 05 03 02 00 01
Total 107 104 100 96 99
Performance of the MOU signing PSEs
14.12 The summary performance of MOUs
signing PSEs as reflected in their MOU rating
(Annexure-II) during the last five years hasbeen follows.
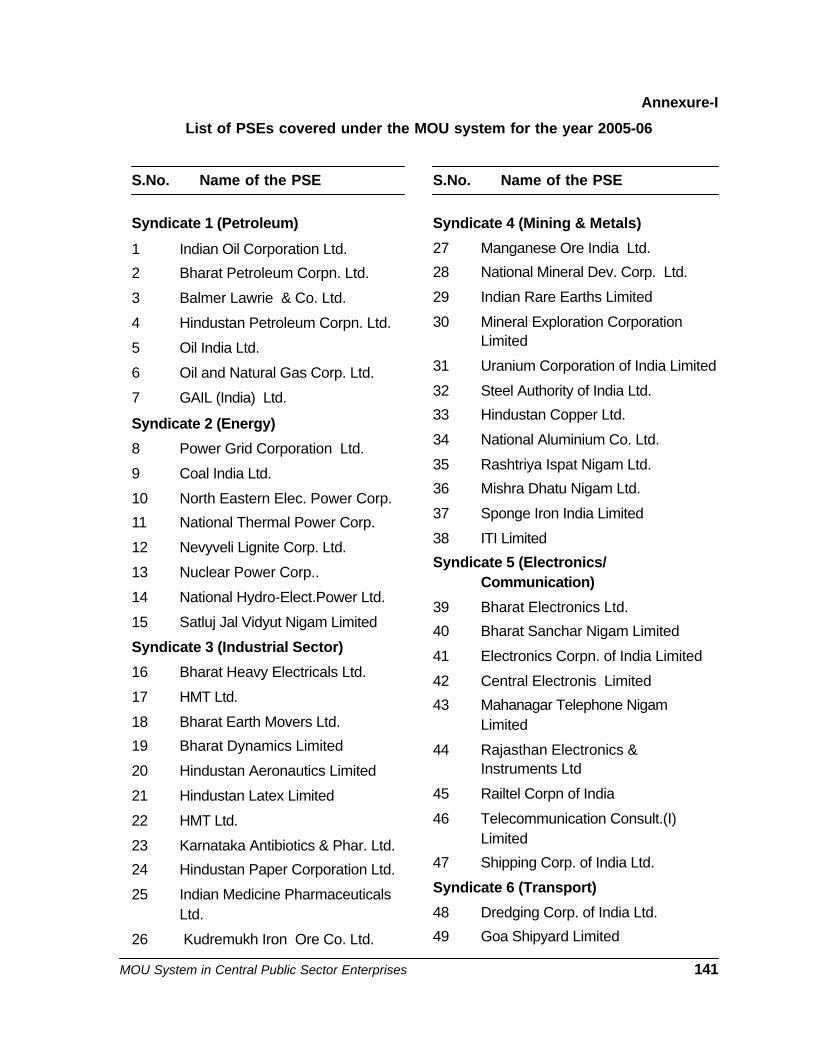
MOU System in Central Public Sector Enterprises 141
S.No. Name of the PSE
Syndicate 1 (Petroleum)
1 Indian Oil Corporation Ltd.
2 Bharat Petroleum Corpn. Ltd.
3 Balmer Lawrie & Co. Ltd.
4 Hindustan Petroleum Corpn. Ltd.
5 Oil India Ltd.
6 Oil and Natural Gas Corp. Ltd.
7 GAIL (India) Ltd.
Syndicate 2 (Energy)
8 Power Grid Corporation Ltd.
9 Coal India Ltd.
10 North Eastern Elec. Power Corp.
11 National Thermal Power Corp.
12 Nevyveli Lignite Corp. Ltd.
13 Nuclear Power Corp..
14 National Hydro-Elect.Power Ltd.
15 Satluj Jal Vidyut Nigam Limited
Syndicate 3 (Industrial Sector)
16 Bharat Heavy Electricals Ltd.
17 HMT Ltd.
18 Bharat Earth Movers Ltd.
19 Bharat Dynamics Limited
20 Hindustan Aeronautics Limited
21 Hindustan Latex Limited
22 HMT Ltd.
23 Karnataka Antibiotics & Phar. Ltd.
24 Hindustan Paper Corporation Ltd.
25 Indian Medicine PharmaceuticalsLtd.
26 Kudremukh Iron Ore Co. Ltd.
S.No. Name of the PSE
Syndicate 4 (Mining & Metals)
27 Manganese Ore India Ltd.
28 National Mineral Dev. Corp. Ltd.
29 Indian Rare Earths Limited
30 Mineral Exploration CorporationLimited
31 Uranium Corporation of India Limited
32 Steel Authority of India Ltd.
33 Hindustan Copper Ltd.
34 National Aluminium Co. Ltd.
35 Rashtriya Ispat Nigam Ltd.
36 Mishra Dhatu Nigam Ltd.
37 Sponge Iron India Limited
38 ITI Limited
Syndicate 5 (Electronics/Communication)
39 Bharat Electronics Ltd.
40 Bharat Sanchar Nigam Limited
41 Electronics Corpn. of India Limited
42 Central Electronis Limited
43 Mahanagar Telephone NigamLimited
44 Rajasthan Electronics &Instruments Ltd
45 Railtel Corpn of India
46 Telecommunication Consult.(I)Limited
47 Shipping Corp. of India Ltd.
Syndicate 6 (Transport)
48 Dredging Corp. of India Ltd.
49 Goa Shipyard Limited
Annexure-I
List of PSEs covered under the MOU system for the year 2005-06
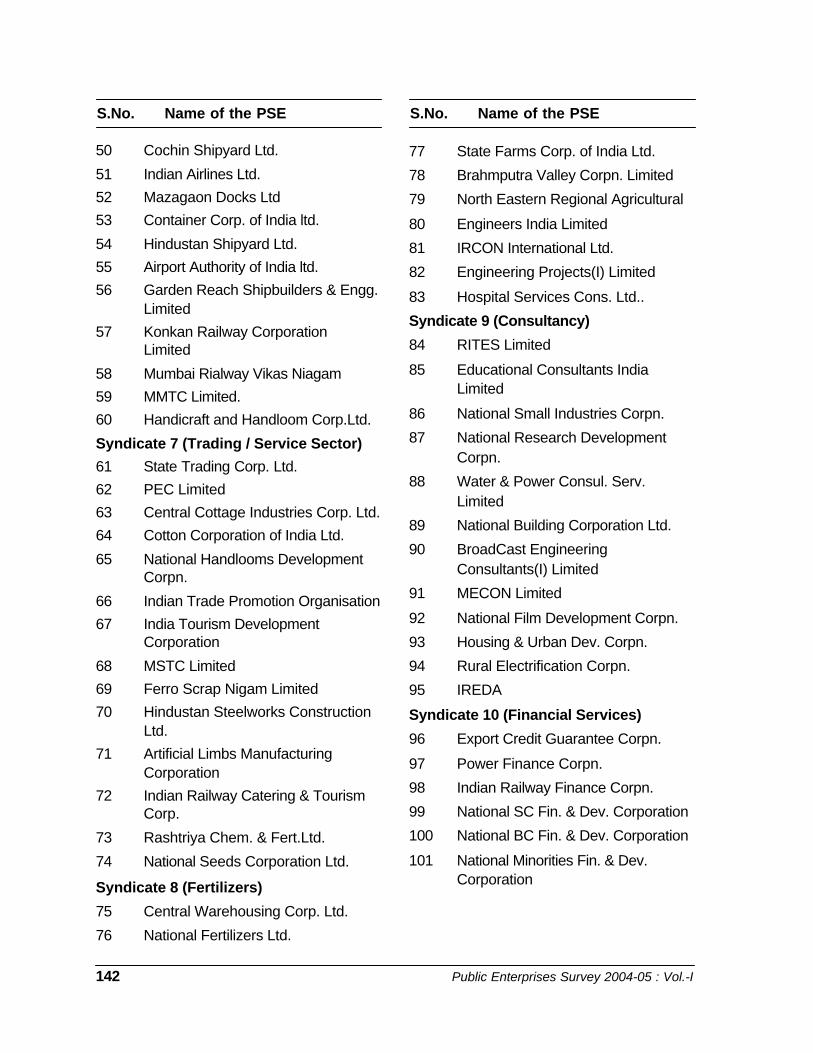
142 Public Enterprises Survey 2004-05 : Vol.-I
50 Cochin Shipyard Ltd.
51 Indian Airlines Ltd.
52 Mazagaon Docks Ltd
53 Container Corp. of India ltd.
54 Hindustan Shipyard Ltd.
55 Airport Authority of India ltd.
56 Garden Reach Shipbuilders & Engg.Limited
57 Konkan Railway CorporationLimited
58 Mumbai Rialway Vikas Niagam
59 MMTC Limited.
60 Handicraft and Handloom Corp.Ltd.
Syndicate 7 (Trading / Service Sector)
61 State Trading Corp. Ltd.
62 PEC Limited
63 Central Cottage Industries Corp. Ltd.
64 Cotton Corporation of India Ltd.
65 National Handlooms DevelopmentCorpn.
66 Indian Trade Promotion Organisation
67 India Tourism DevelopmentCorporation
68 MSTC Limited
69 Ferro Scrap Nigam Limited
70 Hindustan Steelworks ConstructionLtd.
71 Artificial Limbs ManufacturingCorporation
72 Indian Railway Catering & TourismCorp.
73 Rashtriya Chem. & Fert.Ltd.
74 National Seeds Corporation Ltd.
Syndicate 8 (Fertilizers)
75 Central Warehousing Corp. Ltd.
76 National Fertilizers Ltd.
77 State Farms Corp. of India Ltd.
78 Brahmputra Valley Corpn. Limited
79 North Eastern Regional Agricultural
80 Engineers India Limited
81 IRCON International Ltd.
82 Engineering Projects(I) Limited
83 Hospital Services Cons. Ltd..
Syndicate 9 (Consultancy)
84 RITES Limited
85 Educational Consultants IndiaLimited
86 National Small Industries Corpn.
87 National Research DevelopmentCorpn.
88 Water & Power Consul. Serv.Limited
89 National Building Corporation Ltd.
90 BroadCast EngineeringConsultants(I) Limited
91 MECON Limited
92 National Film Development Corpn.
93 Housing & Urban Dev. Corpn.
94 Rural Electrification Corpn.
95 IREDA
Syndicate 10 (Financial Services)
96 Export Credit Guarantee Corpn.
97 Power Finance Corpn.
98 Indian Railway Finance Corpn.
99 National SC Fin. & Dev. Corporation
100 National BC Fin. & Dev. Corporation
101 National Minorities Fin. & Dev.Corporation
S.No. Name of the PSES.No. Name of the PSE

MOU System in Central Public Sector Enterprises 143
Annexure-II
LIST OF CPSES ALONGWITH THEIR MOU COMPOSITE SCORES DURING 2004-05
1. Air India 3.69 3.69 Fair
2. Airports Authority of India 1.48 1.54 Very Good
3. Artificial Limbs Manufacturing Corporation of India * 1.80 1.71 Very Good
4. Balmer Lawrie & Co. Ltd. 1.16 1.26 Excellent
5. Bharat Dynamics Ltd. 2.83 4.32 Fair
6. Broadcast Engineering Consultants India Limited - 1.88 Very Good
7. Bharat Earth Movers Limited 1.99 1.99 Very Good
8. Bharat Heavy Electricals Limited * 1.11 1.25 Excellent
9. Bharat Electronics Limited 1.12 1.29 Excellent
10. Bharat Petroleum Corporation Ltd. 1.48 1.48 Excellent
11. Bharat Sanchar Nigam Ltd, 1.19 1.19 Excellent
12. Brahmaputra Valley Fertilisers Corp Ltd, 2.86 2.86 Good
13. Central Warehousing Corporation - 1.36 Excellent
14. Central Electronics Ltd.* 1.43 2.06 Very Good
15. Central Cottage Industries Corp. of India 2.21 2.24 Very Good
16. Coal India Limited 1.46 1.50 Excellent
17. Cochin Shipyard Limited - 3.76
18. Cotton Corporation of India Ltd. 1.48 1.46 Excellent
19. Container Corporation of India 1.05 1.05 Excellent
20. Dredging Corporation of India 2.12 2.12 Very Good
21. Educational Consultants India Ltd. 4.44 4.44 Fair
22. Electronics Corp. Of India Ltd. 3.32 3.32 Good
23. Engineering Projects (India) Ltd. 2.84 2.92 Good
24. Engineers India Ltd.* 1.53 2.38 Very Good
25. Export Credit Guarantee Corp. 1.56 1.56 Very Good
26. Ferro Scrap Nigam Ltd. 1.83 1.83 Very Good
27. Fertilizers and Chemicals (T) Ltd. 2.10 2.09 Very Good
28. Goa Shipyard Ltd. 1.91 1.89 Very Good
29. Garden Reach Shipbuilders &Eng. Ltd. 2.01 2.10 Very Good
30. Gas Authority of India Ltd.* 1.00 1.24 Excellent
31. Hindustan Paper Corporation 1.42 1.43 Excellent
32. Hindustan Petroleum Corp. Ltd 1.42 1.42 Excellent
33. Hindustan Shipyard Limited * 4.04 4.10 Fair
34. Handicrafts & Handlooms Export Corpn. 2.60 2.57 Good
S.No. Name of PSE MOU Score MOU Score Rating
(as per PSE) (as per DPE)

144 Public Enterprises Survey 2004-05 : Vol.-I
35. Hindustan Aeronautics Ltd. 1.00 1.00 Excellent
36. Hindustan Latex Ltd.* 1.17 1.28 Excellent37. Hindustan Copper Ltd. 2.31 2.17 Very Good
38. HMT Ltd. 4.65 4.65 Poor
39. Hospital Services Consultancy Corp. 3.29 3.29 Good
40. Housing & Urban Dev. Corp.* 1.22 1.22 Excellent
41. Hindustan Steelworks Construction Ltd. 3.19 3.40 Good
42. Indian Medicines Pharmaceuticals Corporation Ltd, 3.79 Fair
43. India Trade Promotion Organisation * 1.51 1.58 Very Good
44. India Tourism Development Corp. 1.95 1.75 Very Good
45. Indian Airlines 2.15 2.15 Very Good
46. Indian Oil Corporation Ltd. 1.13 1.13 Excellent
47. Indian Renewable Energy Dev. Agency 2.74 2.74 Good
48. Indian Rare Earth Ltd. 1.70 1.70 Very Good
49. Indian Railway Finance Corp. 1.00 1.05 Excellent
50. IRCON International Ltd. 1.31 1.31 Excellent
51. ITI Ltd.* 2.42 3.48 Good
52. Karnataka Antibiotics & Pham.Ltd. 1.21 1.21 Excellent
53. Kudremukh Iron Ore Co. Ltd.* 1.43 1.43 Excellent
54. Konkan Railway Corporation Ltd. 4.12 4.28 Fair
55. Madras Fertilizers Ltd. 4.06 4.06 Fair
56. Manganese Ore (India) Ltd.* 1.27 1.47 Excellent
57. Mazagoan Dock Ltd. 2.25 2.25 Very Good
58. MECON Ltd. 2.10 2.10 Very Good
59. Mineral Exploration Corporation Ltd. 1.50 1.54 Very Good
60. Mishra Dhatu Nigam Ltd. 1.08 1.08 Excellent
61. MMTC Ltd. 1.08 1.08 Excellent
62. Mahanagar Telephone Nigam Ltd. 2.35 2.36 Very Good
63. MSTC Ltd. 1.04 1.04 Excellent
64. National Hydroelectric Power Corp.* 1.37 1.44 Excellent
65. National Thermal Power Corpn.* 1.00 1.11 Excellent
66. National Aluminium Co. Limited 1.26 1.27 Excellent
67. National Small Industries Corpn. 3.39 3.41 Good
68. National Building Const. Corp.* 1.18 1.19 Excellent
69. National Seeds. Corpn. 3.27 3.18 Good
70. National Backward Classes Fin. & Development Corpn. 1.00 1.00 Excellent
71. National Mineral Dev. Corp. 1.19 1.19 Excellent
72. National Film Development Corp. 4.30 4.28 Fair
73. National Fertilizes Ltd. 1.28 1.28 Excellent

MOU System in Central Public Sector Enterprises 145
74. National Handloom Dev. Corp. 2.23 2.23 Very Good
75. National Minorities Fin. & Dev. Corp. 1.41 1.41 Excellent76. National Research Dev. Corpn. 2.19 2.47 Very good
77. Neyveli Lignite Corpn.* 1.29 1.32 Excellent
78. North Eastern Electric Power Corp.* 1.27 1.75 Very Good
79. Nuclear Power Corpn. Ltd. 1.45 1.45 Excellent
80. Oil India Limited* 1.33 1.69 Very Good
81. Oil & Natural Gas Co. Ltd. 1.77 1.61 Very Good
82. Power Finance Corpn. Ltd.* 1.02 2.39 Very Good
83. Power Grid Corpn. of India Ltd. 1.00 1.01 Excellent
84. PEC Limited 1.44 1.44 Excellent
85. RITES Limited 2.20 2.28 Very Good
86. Rashtriya Chemicals & Fertilizers Ltd. 1.14 1.14 Excellent
87. Rashtriya Ispat Nigam Ltd.* 1.32 1.32 Excellent
88. Rural Electrification Corpn. 1.00 1.00 Excellent
89. Rajasthan Electronics & Instrumentation Ltd, * 1.40 1.52 Very Good
90. Satluj Jal Vidyut Nigam Ltd,* - 2.59 Good
91. Scooters India Ltd - 3.13 Good
92. Shipping Corpn. of India Ltd. 1.28 1.28 Excellent
93. Sponge Iron India Ltd.. 2.13 2.13 Very Good
94. State Trading Corpn. of India Ltd,* 1.00 1.66 Very Good
95. State Farms Corporation of India Ltd. - 4.06 Fair
96. Steel Authority of India Ltd.* 1.09 1.32 Excellent
97. Telecommunication Consultant of (I) Ltd.* 1.43 1.50 Fair
98. Uranium Corporation of India Ltd.* 1.46 1.97 Very Good
99. Water & Power Consultancy Ser. (I) Ltd. 1.30 1.31
MOU Composite Score MOU Rating
1.00 – 1.50 Excellent
1.51 – 2.50 Very Good
2.51 – 3.50 Good
3.51 – 4.50 Fair
4.51 – 5.00 Poor
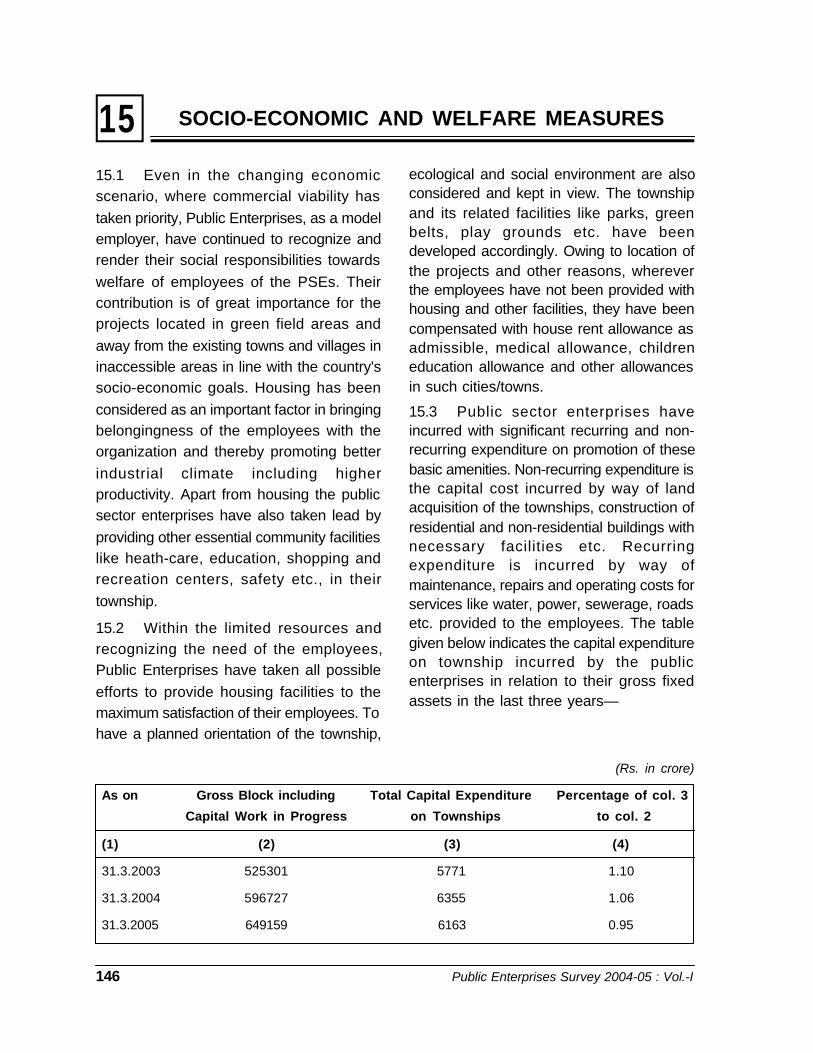
146 Public Enterprises Survey 2004-05 : Vol.-I
SOCIO-ECONOMIC AND WELFARE MEASURES1515.1 Even in the changing economicscenario, where commercial viability hastaken priority, Public Enterprises, as a modelemployer, have continued to recognize andrender their social responsibilities towardswelfare of employees of the PSEs. Theircontribution is of great importance for theprojects located in green field areas andaway from the existing towns and villages ininaccessible areas in line with the country'ssocio-economic goals. Housing has beenconsidered as an important factor in bringingbelongingness of the employees with theorganization and thereby promoting betterindustrial climate including higherproductivity. Apart from housing the publicsector enterprises have also taken lead byproviding other essential community facilitieslike heath-care, education, shopping andrecreation centers, safety etc., in theirtownship.
15.2 Within the limited resources andrecognizing the need of the employees,Public Enterprises have taken all possibleefforts to provide housing facilities to themaximum satisfaction of their employees. Tohave a planned orientation of the township,
ecological and social environment are alsoconsidered and kept in view. The townshipand its related facilities like parks, greenbelts, play grounds etc. have beendeveloped accordingly. Owing to location ofthe projects and other reasons, whereverthe employees have not been provided withhousing and other facilities, they have beencompensated with house rent allowance asadmissible, medical allowance, childreneducation allowance and other allowancesin such cities/towns.
15.3 Public sector enterprises haveincurred with significant recurring and non-recurring expenditure on promotion of thesebasic amenities. Non-recurring expenditure isthe capital cost incurred by way of landacquisition of the townships, construction ofresidential and non-residential buildings withnecessary facilities etc. Recurringexpenditure is incurred by way ofmaintenance, repairs and operating costs forservices like water, power, sewerage, roadsetc. provided to the employees. The tablegiven below indicates the capital expenditureon township incurred by the publicenterprises in relation to their gross fixedassets in the last three years—
(Rs. in crore)
As on Gross Block including Total Capital Expenditure Percentage of col. 3
Capital Work in Progress on Townships to col. 2
(1) (2) (3) (4)
31.3.2003 525301 5771 1.10
31.3.2004 596727 6355 1.06
31.3.2005 649159 6163 0.95

Socio-Economic and Welfare Measures 147
15.4 The capital expenditure made during the last two years under different Sectoral groupsof enterprises are as under—
(Rs. in crore)
Sl. No. Cognate Group Capital Expenditure on Township
2004-05 2003-04
(1) (2) (3) (4)
I. Enterprises under construction 2.65 39.61
II. Manufacturing and Service Enterprises
1. Steel 312.59 309.58
2. Minerals and Metals 524.07 497.47
3. Coal and Lignite 2544.77 2486.51
4. Power 613.52 1025.30
5. Petroleum 762.26 1078.03
6. Fertilizer 108.70 140.99
7. Chemicals and Pharmaceutical 7.85 5.38
8. Heavy Engineering 201.60 222.93
9. Medium and Light Engineering 146.61 109.48
10. Transportation Equipments 184.72 38.08
11. Consumer Goods 81.91 81.68
12. Agro-based Industries 0.00 0.00
13. Textiles 1.41 1.76
14. Trading and Marketing Services 27.82 28.13
15. Transportation Services 213.90 194.27
16. Contract and Construction Services 63.70 26.20
17. Industrial Dev. and Tech. Consultancy Services 365.04 68.78
18. Tourist Services 0.00 0.00
19. Financial Services 0.00 0.00
20. Telecommunications and Information Technology 0.00 0.00
21. Section 25 Companies 0.34 0.34
Total 6163.46 6354.52
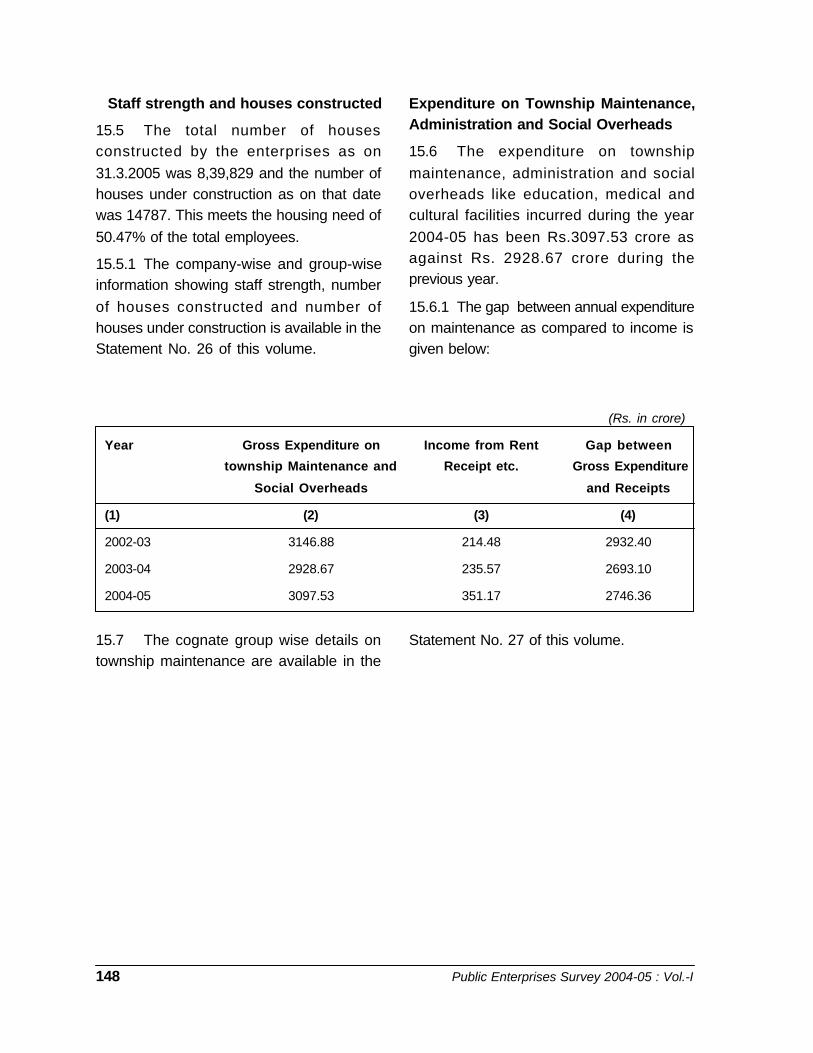
148 Public Enterprises Survey 2004-05 : Vol.-I
(Rs. in crore)
Year Gross Expenditure on Income from Rent Gap between
township Maintenance and Receipt etc. Gross Expenditure
Social Overheads and Receipts
(1) (2) (3) (4)
2002-03 3146.88 214.48 2932.40
2003-04 2928.67 235.57 2693.10
2004-05 3097.53 351.17 2746.36
Staff strength and houses constructed
15.5 The total number of housesconstructed by the enterprises as on31.3.2005 was 8,39,829 and the number ofhouses under construction as on that datewas 14787. This meets the housing need of50.47% of the total employees.
15.5.1 The company-wise and group-wiseinformation showing staff strength, numberof houses constructed and number ofhouses under construction is available in theStatement No. 26 of this volume.
Expenditure on Township Maintenance,Administration and Social Overheads
15.6 The expenditure on townshipmaintenance, administration and socialoverheads like education, medical andcultural facilities incurred during the year2004-05 has been Rs.3097.53 crore asagainst Rs. 2928.67 crore during theprevious year.
15.6.1 The gap between annual expenditureon maintenance as compared to income isgiven below:
15.7 The cognate group wise details ontownship maintenance are available in the
Statement No. 27 of this volume.

Promotion of Balanced Regional Development 149
PROMOTION OF BALANCED REGIONAL DEVELOPMENT1616.1 One of the objectives of setting up ofpublic enterprises was to promote balancedregional development. In order thatindustrialization may benefit the economy ofthe country as a whole, it is important thatdisparities in levels of development betweendifferent regions are progressively reduced.The pace of economic development ofdifferent States and Regions in the countryhas not been uniform over the years owingto historic reasons and a number of otherfactors. Even the States which are fairly welldeveloped, have pockets and areas whichhave not been able to keep pace with theprogress achieved elsewhere. The lack ofindustries in different parts of the country areoften due to the factors such as non-availability of the raw material or other naturalresources, non-availability of power, watersupply and transport facilities which have notbeen developed there. Therefore oneof theaims of the national planning is to ensurethat these facilities are steadily madeavailable to areas which are at presentlagging behind. Recognising the existence ofthese disparities in economic development ofdifferent States/Regions, the Industrial PolicyResolution adopted by the Parliament in 1956and subsequent Resolutions, emphasizedthe need of accelerated rate of economicgrowth and speedy industrialization andremoval of imbalances in the levels ofdevelopment between different regions/areas.
16.2 The States in which the public sectorenterprises have been set up by the Central
Government became the direct beneficiariesand stand to gain manifold in terms ofremoval of regional imbalances, increasedemployment opportunities, balanced growthof small scale and ancillary industries,resource mobilization etc. Any study of thebenefits flowing from the central public sectorenterprises to the economy will remainincomplete if these contributions to the Stateeconomies are not taken into account.
16.3 Industrialisation plays an importantrole in correcting the regional imbalancesand accelerating the industrial growth. Inorder to remove regional inequalities andencourage balanced industrial growth ofdifferent States/Regions, subsidies toindustries set up in backward districts/non-industry districts are given. While deciding onthe locations of central public sectorenterprises, due consideration is also givento backwardness of the regions.
16.4 Another dimension of the balancedregional development through setting uppublic enterprises is the expansion of theemployment opportunities in the backwardregions. The establishment of central publicsector enterprises has resulted in generationof substantial employment, both direct andindirect in the States where the units arelocated. The work force recruited locally inthese enterprises, constitute a substantialportion of the total employment. State-wisedistribution of gross block and employmentfor the year 2004-05 and 2003-04 is given inTable No. 16.1.

150 Public Enterprises Survey 2004-05 : Vol.-I
Table 16.1
Statewise Distribution of Gross Block and Employment
(Gross Block-Rs. in Crore)(Employment-No.in Lakh)
S. State/Union Territory As on 31.3.2005 As on 31.3.2004 %age share as on Ranking as on No. 31.3.2005 31.3.2005
Gross Employ- Gross Employ- Gross Employ- Gross Employ-
Block ment Block ment Block ment Block ment
1. Andhra Pradesh 44545.73 0.99 42433.22 1.01 6.86 5.85 3 7
2. Arunachal Pradesh 2961.14 0.02 2183.15 0.02 0.46 0.12 23 25
3. Assam 28153.81 0.51 26334.44 0.53 4.34 3.01 10 12
4. Bihar 12086.79 0.18 10403.24 0.19 1.86 1.06 19 19
5. Chhattisgarh 16072.47 1.00 12089.73 1.04 2.48 5.91 17 6
6. Delhi 21713.24 0.79 20249.20 0.76 3.34 4.67 12 10
7. Goa 436.65 0.03 395.93 0.02 0.06 0.18 27 23
8. Gujarat 42295.53 0.50 39156.40 0.53 6.51 2.95 5 13
9. Haryana 16541.77 0.21 13016.90 0.20 2.55 1.24 16 18
10. Himachal Pradesh 17390.10 0.10 16301.70 0.11 2.68 0.59 14 21
11. Jammu & Kashmir 11764.22 0.09 11002.75 0.09 1.81 0.53 21 22
12. Jharkhand 20654.82 2.31 22869.12 2.49 3.18 13.64 13 1
13. Karnataka 28543.88 0.81 29572.93 0.83 4.40 4.78 9 9
14. Kerala 16828.32 0.42 15300.80 0.45 2.59 2.48 15 15
15. Madhya Pradesh 29830.52 1.09 27655.11 1.10 4.60 6.44 8 4
16. Maharashtra 122899.24 2.01 107826.07 2.08 18.93 11.87 1 2
17. Manipur 261.48 0.01 242.11 0.01 0.04 0.06 28 29
18. Meghalaya 224.17 0.01 186.36 0.02 0.03 0.06 29 30
19. Nagaland 1075.43 0.01 1054.59 0.01 0.17 0.06 26 28
20. Orissa 33354.47 0.69 31415.45 0.68 5.14 4.08 6 11
21. Punjab 9288.04 0.27 8704.52 0.28 1.43 1.59 22 17
22. Rajasthan 13900.88 0.30 15399.46 0.31 2.14 1.77 18 16
23. Sikkim 1990.52 0.01 1566.39 0.01 0.31 0.06 24 32
24. Tamilnadu 43475.42 1.09 38517.46 0.88 6.70 6.44 4 5
25. Tripura 1659.58 0.02 1488.25 0.02 0.26 0.12 25 27
26. Uttar Pradesh 45738.01 0.90 39933.27 0.89 7.04 5.32 2 8
27. Uttaranchal 11767.38 0.16 11526.08 0.20 1.81 0.95 20 20
28. West Bengal 31397.67 1.92 29377.57 2.19 4.84 11.34 7 3
29. Andaman & Nicobar Islands 199.93 0.02 199.10 0.02 0.03 0.12 30 26
30. Chandigarh 99.83 0.01 99.67 0.01 0.02 0.06 31 31
31. Pondicherry 123.06 0.02 85.65 0.02 0.01 0.12 32 24
32. Others and Unallocated 21884.90 0.43 19803.79 0.61 3.37 2.54 11 14
Total : 649159.00 16.93 596726.65 17.62 100.00 100.00 - -
Department of Public Enterprises and Its Role in Management of Public Enterprises 151
DEPARTMENT OF PUBLIC ENTERPRISES AND ITSROLE IN MANAGEMENT OF PUBLIC ENTERPRISES.17
INTRODUCTION
17.1 Department of Public Enterprises(DPE) is an outcome of the recommendationsof the Estimates Committee of 3rd Lok Sabhamade in their 52nd Report stressing a needfor setting up a centralized coordinating unitwhich could also make continuous appraisalof the performance of Public Enterprises.This led to the setting up of the Bureau ofPublic Enterprises (BPE) in 1965. BPE waslater constituted as an independentadministrative unit within the Ministry ofFinance, Department of Expenditure in 1969.As a result of the reorganization of theMinistries/Departments of the CentralGovernment in September, 1985, BPE wasmade as part of Ministry of Industry. In May,1990, BPE was conferred the status of a full-fledged Department and is now known as theDepartment of Public Enterprises (DPE) inthe Ministry of Heavy Industries & PublicEnterprises.
17.2 DPE acts as a nodal agency for allCentral Public Sector Enterprises (CPSEs)and assists in policy formulation pertainingto the role of PSEs in the economy. DPEissues policy guidelines on performanceimprovement, evaluation, financialaccounting, personnel management and inrelated areas concerning the managementof CPSEs. It collects, evaluates andmaintains information on several areas inrespect of PSEs. In fulfilling its role, itassociates itself with other ministries andorganizations as well as premiermanagement and accounting institutes in thecountry.
ROLE AND TASKS
17.3 The important role and tasks of theDepartment of Public Enterprises are listedbelow:-
i) To coordinate matters of general policyof non-financial nature relating to publicsector enterprises.
ii) Matters relating to issue of PresidentialDirectives and guidelines to PublicSector Enterprises.
iii) Formulation of Policy guidelinespertaining to Public Sector Enterprisesin areas like, board structures,personnel management, performanceimprovement and evaluation, financialmanagement, wage settlement,vigilance management, performanceappraisal etc.
iv) Matters relating to reservation of postsin the Public Sector Enterprises forcertain classes of citizens.
v) Matters relating to Memorandum ofUnderstanding between the PublicSector Enterprises and theadministrative Ministries/Departments.
vi) Matters relating to delegation of powersto Board of Directors.
vii) To undertake studies in respect ofsignificant areas of functioning ofCentral PSEs.
viii) Matters relating to International Centrefor Promotion of Enterprises (ICPE).
ix) Matters relating to StandingConference of Public Enterprises(SCOPE)

152 Public Enterprises Survey 2004-05 : Vol.-I
x) To act as a repository of data and tobring out an annual survey of PSEsknown as Public Enterprises Survey.
xi) Settlement of disputes throughPermanent Machinery of Arbitration(PMA) among Public Sector Enterprisesand between Public Sector Enterprisesand government departments exceptdisputes relating to tax matters.
xii) Advise on establishing new CentralPSEs including their capital andorganizational structure andMemorandum and Articles ofAssociation.
xiii) Policy matters relating to compositionof Board of Directors of PSEs,categorization of top posts, schedulingof PSEs.
xiv) Notification of pay scales of Board levelexecutives as well as below Board levelpersonnel and unionized workers andthe DA admissible thereon at periodicintervals.
xv) Co-ordination of training programmesfor managerial personnel in PublicSector Enterprises.
xvi) Policy relating to deputation ofGovernment Officers to Public SectorEnterprises.
xvii) To consider matters relating to Boardfor Reconstruction of Public SectorEnterprises (BRPSE).
xviii) To advise in respect of proposals onrestructuring, joint ventures,disinvestments, issue of fresh capitaletc. of PSEs received fromadministrative Ministries/Departments.
xix) Voluntary Retirement Scheme inCPSEs.
xx) Matters relating to Counseling,
Retraining and Redeployment Scheme(CRR) for rationalized employees ofCPSEs.
ORGANIZATIONAL STRUCTURE
17.4 DPE is under the charge of theMinister of State (Independent charge) in theMinistry of Heavy Industries and PublicEnterprises. The Department is headed bya Secretary, assisted by an establishmentwith an overall sanctioned strength of 128officers/personnel.
17.4.1 The Department has 5 constituentdivisions namely the Financial Policy Division,the Management Policy Division, the MOUDivision, the Administration & Co-ordinationDivision and the Permanent Machinery ofArbitration. The organizational structure ofthe Department is given at page___. TheFinancial Policy Division deals with mattersrelating to Restructuring/Revival of CPSEs,Policy on financial management of the PSEs,compilation of performance data in the formof Public Enterprises Survey, PurchasePreference Policy, Salary and Wage Policiesfor employees/workers of CPSEs, finalisationof terms and conditions and determinationof pay of Board level executives, finalisationof terms and conditions of civil servantsdeputed to CPSEs, Voluntary retirementschemes and the CRR Scheme. TheManagement Policy Division handles mattersrelating to Human Resource Development,Organizational structuring/restructuring andcreation of Board level posts in PSEs,personnel and general management policies,Search Committee for selection of non-officialpt. Time directors, Discipline, Conduct &Appeal Rules and Vigilance policies,Navratna and Miniratna etc. The mainfunctions of MOU Division include providinglogistical, technical and administrative

Department of Public Enterprises and Its Role in Management of Public Enterprises 153
support to the Task Force, act as bufferbetween the Task Force members and thesignatories to the MOUs, develop informationand data base on MOU signing PSEs, toassist the High Power Committee, monitorthe progress of MOUs, to advise and counselthe MOU signatories and coordinate researchand Training etc. The Permanent Machineryof Arbitration has been set up to resolvedisputes between PSEs inter-se as well asbetween a PSE and a Central GovernmentDepartment/Ministry.
17.4.2 A Board for Reconstruction of PublicSector Enterprises has been set up to advisethe Government on ways and means forstrengthening Public Sector Enterprises ingeneral and making them more autonomousand professional; to consider restructuring ofCPSEs and suggest ways and means forfunding such restructuring schemes; toexamine the revival/restructuring proposals
of sick/loss making CPSEs for their turnaround and to make suitablerecommendations related thereto; to advisethe Government on disinvestment/closure/sale of chronically loss making companieswhich can not be revived and advise theGovernment about sources of fund for thepayment of all legitimate dues andcompensation to workers and other costs ofclosure; to monitor incipient sickness inCPSEs and advise the Government on suchother matters as may be assigned to it. TheBoard consists of a part-time Chairman andthree non-official part time members.Secretary (Expenditure), Secretary(Disinvestment) are official members withSecretary (PE) as Member Secretary.Chairman, PESB, Chairman, SCOPE andCMD, ONGC are the permanent invitees.Secretary of the concerned administrativeMinistry is the special invitee.
Financial Policy Division Public Enterprises Survey UnitPolicy Planning UnitCRR UnitWage policy Unit
Management Division Personnel Policy UnitTraining UnitPerformance Indicator andwork Norms Unit (PIWN Unit)SC & ST Cell
DPE MOU Division MOU Unit,Data Bank
Administration & Coordination AdministrationDivision Library
ParliamentCoordinationHindi Cell
PMA PMA Unit
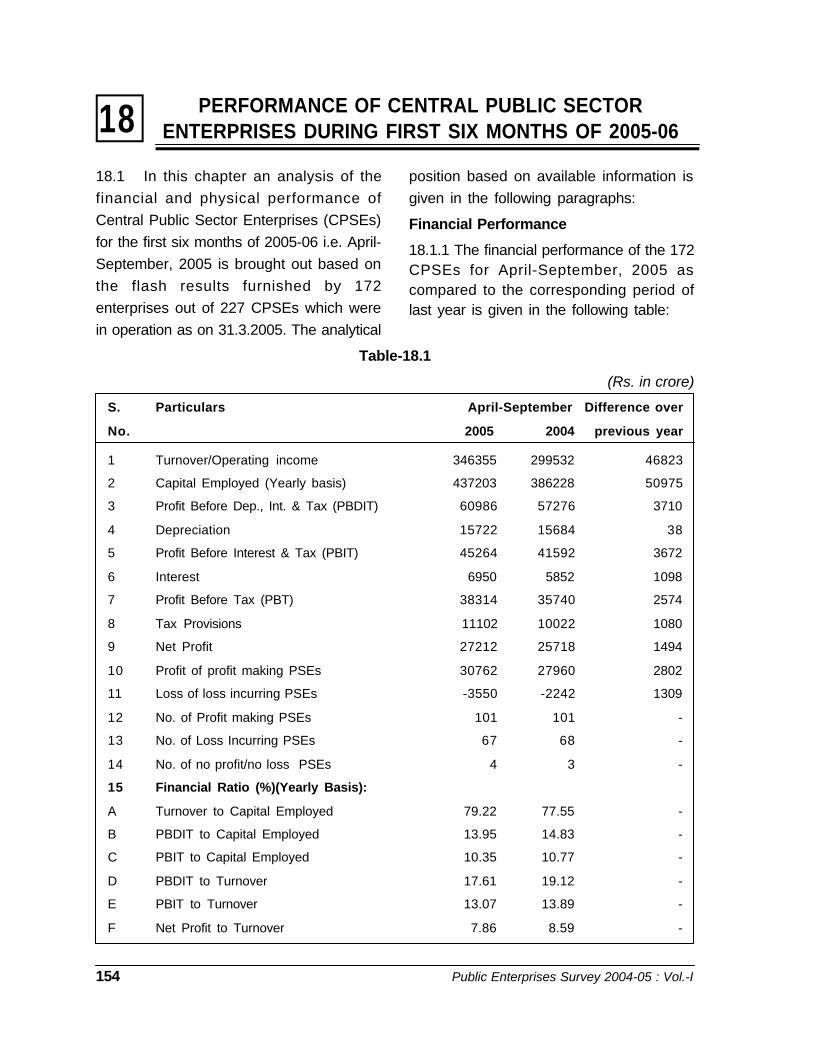
154 Public Enterprises Survey 2004-05 : Vol.-I
PERFORMANCE OF CENTRAL PUBLIC SECTORENTERPRISES DURING FIRST SIX MONTHS OF 2005-0618
18.1 In this chapter an analysis of thefinancial and physical performance ofCentral Public Sector Enterprises (CPSEs)for the first six months of 2005-06 i.e. April-September, 2005 is brought out based onthe flash results furnished by 172enterprises out of 227 CPSEs which werein operation as on 31.3.2005. The analytical
position based on available information isgiven in the following paragraphs:
Financial Performance
18.1.1 The financial performance of the 172CPSEs for April-September, 2005 ascompared to the corresponding period oflast year is given in the following table:
Table-18.1
(Rs. in crore)
S. Particulars April-September Difference over
No. 2005 2004 previous year
1 Turnover/Operating income 346355 299532 46823
2 Capital Employed (Yearly basis) 437203 386228 50975
3 Profit Before Dep., Int. & Tax (PBDIT) 60986 57276 3710
4 Depreciation 15722 15684 38
5 Profit Before Interest & Tax (PBIT) 45264 41592 3672
6 Interest 6950 5852 1098
7 Profit Before Tax (PBT) 38314 35740 2574
8 Tax Provisions 11102 10022 1080
9 Net Profit 27212 25718 1494
10 Profit of profit making PSEs 30762 27960 2802
11 Loss of loss incurring PSEs -3550 -2242 1309
12 No. of Profit making PSEs 101 101 -
13 No. of Loss Incurring PSEs 67 68 -
14 No. of no profit/no loss PSEs 4 3 -
15 Financial Ratio (%)(Yearly Basis):
A Turnover to Capital Employed 79.22 77.55 -
B PBDIT to Capital Employed 13.95 14.83 -
C PBIT to Capital Employed 10.35 10.77 -
D PBDIT to Turnover 17.61 19.12 -
E PBIT to Turnover 13.07 13.89 -
F Net Profit to Turnover 7.86 8.59 -
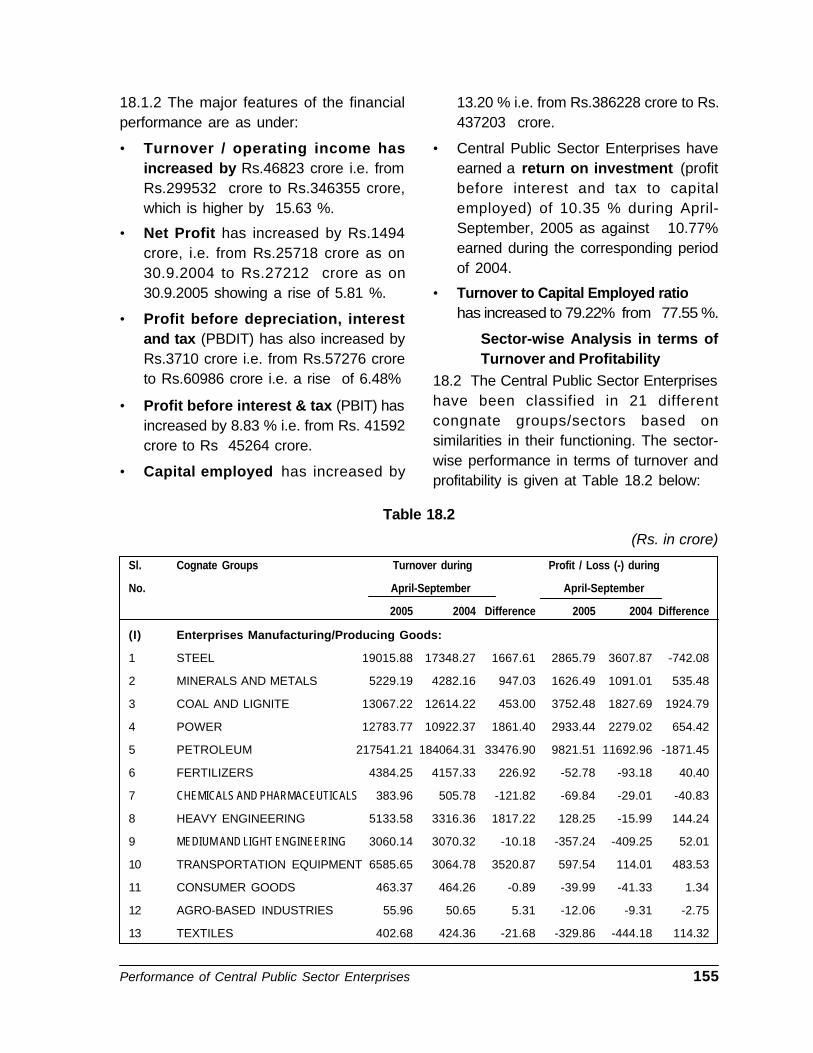
Performance of Central Public Sector Enterprises 155
18.1.2 The major features of the financialperformance are as under:
• Turnover / operating income hasincreased by Rs.46823 crore i.e. fromRs.299532 crore to Rs.346355 crore,which is higher by 15.63 %.
• Net Profit has increased by Rs.1494crore, i.e. from Rs.25718 crore as on30.9.2004 to Rs.27212 crore as on30.9.2005 showing a rise of 5.81 %.
• Profit before depreciation, interestand tax (PBDIT) has also increased byRs.3710 crore i.e. from Rs.57276 croreto Rs.60986 crore i.e. a rise of 6.48%
• Profit before interest & tax (PBIT) hasincreased by 8.83 % i.e. from Rs. 41592crore to Rs 45264 crore.
• Capital employed has increased by
13.20 % i.e. from Rs.386228 crore to Rs.437203 crore.
• Central Public Sector Enterprises haveearned a return on investment (profitbefore interest and tax to capitalemployed) of 10.35 % during April-September, 2005 as against 10.77%earned during the corresponding periodof 2004.
• Turnover to Capital Employed ratiohas increased to 79.22% from 77.55 %.
Sector-wise Analysis in terms ofTurnover and Profitability
18.2 The Central Public Sector Enterpriseshave been classified in 21 differentcongnate groups/sectors based onsimilarities in their functioning. The sector-wise performance in terms of turnover andprofitability is given at Table 18.2 below:
Table 18.2
(Rs. in crore)
Sl. Cognate Groups Turnover during Profit / Loss (-) during
No. April-September April-September
2005 2004 Difference 2005 2004 Difference
(I) Enterprises Manufacturing/Producing Goods:
1 STEEL 19015.88 17348.27 1667.61 2865.79 3607.87 -742.08
2 MINERALS AND METALS 5229.19 4282.16 947.03 1626.49 1091.01 535.48
3 COAL AND LIGNITE 13067.22 12614.22 453.00 3752.48 1827.69 1924.79
4 POWER 12783.77 10922.37 1861.40 2933.44 2279.02 654.42
5 PETROLEUM 217541.21 184064.31 33476.90 9821.51 11692.96 -1871.45
6 FERTILIZERS 4384.25 4157.33 226.92 -52.78 -93.18 40.40
7 CHEMICALS AND PHARMACEUTICALS 383.96 505.78 -121.82 -69.84 -29.01 -40.83
8 HEAVY ENGINEERING 5133.58 3316.36 1817.22 128.25 -15.99 144.24
9 MEDIUM AND LIGHT ENGINEERING 3060.14 3070.32 -10.18 -357.24 -409.25 52.01
10 TRANSPORTATION EQUIPMENT 6585.65 3064.78 3520.87 597.54 114.01 483.53
11 CONSUMER GOODS 463.37 464.26 -0.89 -39.99 -41.33 1.34
12 AGRO-BASED INDUSTRIES 55.96 50.65 5.31 -12.06 -9.31 -2.75
13 TEXTILES 402.68 424.36 -21.68 -329.86 -444.18 114.32

156 Public Enterprises Survey 2004-05 : Vol.-I
TOTAL A : 288106.86 244285.17 43821.69 20863.73 19570.31 1293.42
(II) Enterprises Rendering Services:
14. TRADING AND MARKETING SERVICES 17869.88 19871.97 -2002.09 392.98 383.35 9.63
15. TRANSPORTATION SERVICES 10333.30 6776.00 3557.30 728.94 797.57 -68.63
16. CONTRACT AND
CONSTRUCTION SERVICES 1655.12 1180.97 474.15 -149.69 -182.89 33.20
17. INDUSTRIAL DEV. AND TECH.
CONSULTANCY SERVICES 2740.58 2288.98 451.60 559.42 358.58 200.84
18. TOURIST SERVICES 284.38 232.06 52.32 1.12 -7.49 8.61
19. FINANCIAL SERVICES 5463.07 5897.04 -433.97 1622.13 2043.56 -421.43
20. TELECOMMUNICATIONS
AND INFORMATION TECH 19814.99 18938.44 876.55 3189.30 2746.85 442.45
21. SECTION 25 COMPANIES 87.05 61.59 25.46 4.17 8.65 -4.48
TOTAL B : 58248.37 55247.05 3001.32 6348.37 6148.18 200.19
GRAND TOTAL (A+B ) : 346355.23 299532.22 46823.01 27212.10 25718.49 1493.61
(Rs. in crore)
Sl. Cognate Groups Turnover during Profit / Loss (-) during
April-September April-September
2005 2004 Difference 2005 2004 Difference
18.2.1. It is observed that the CPSEs as awhole have registered a growth of 15.63 %in turnover during first six months of 2005-06 as compared to the corresponding periodof last year. The manufacturing sector hasindicated better growth of about 17.94% inturnover than the performance of servicesector, which is 5.43%. 6 sectors, out of 21sectors, namely Chemicals &Pharmaceuticals, Medium & LightEngineering, Consumer goods, Textiles,Trading and Marketing Services andFinancial services have recorded negativetrend of growth in turnover.
18.2.2 As regards profitability, the CPSEs asa whole have registered a rise of 5.81 % in netprofit during first six months of 2005-06 ascompared to the corresponding period of last
year. The manufacturing sector has indicateda rise of about 6.61% in net profit than theperformance of services sector, which hasshown increase of 3.26%. 14 out of 21 sectorshave improved their profitability. The major fallis in Petroleum, Steel, Financial Services,Transportation Services, Chemicals &Pharmaceuticals, Section 21 Companies andAgro Based Industries. The main CPSEs thathave shown fall in profitability are BharatPetroleum Cop. Ltd. (BPCL), HindustanPetroleum Corp. Ltd. (HPCL) and Indian oilCorporation (IOC) in petroleum sector, RINLand SAIL in Steel sector, Air India (AI) andShipping Corporation of India in Transportationservices sector and power finance corporationin sivialicial (SCI) in Transportation servicessector and Power Finance Corporation in
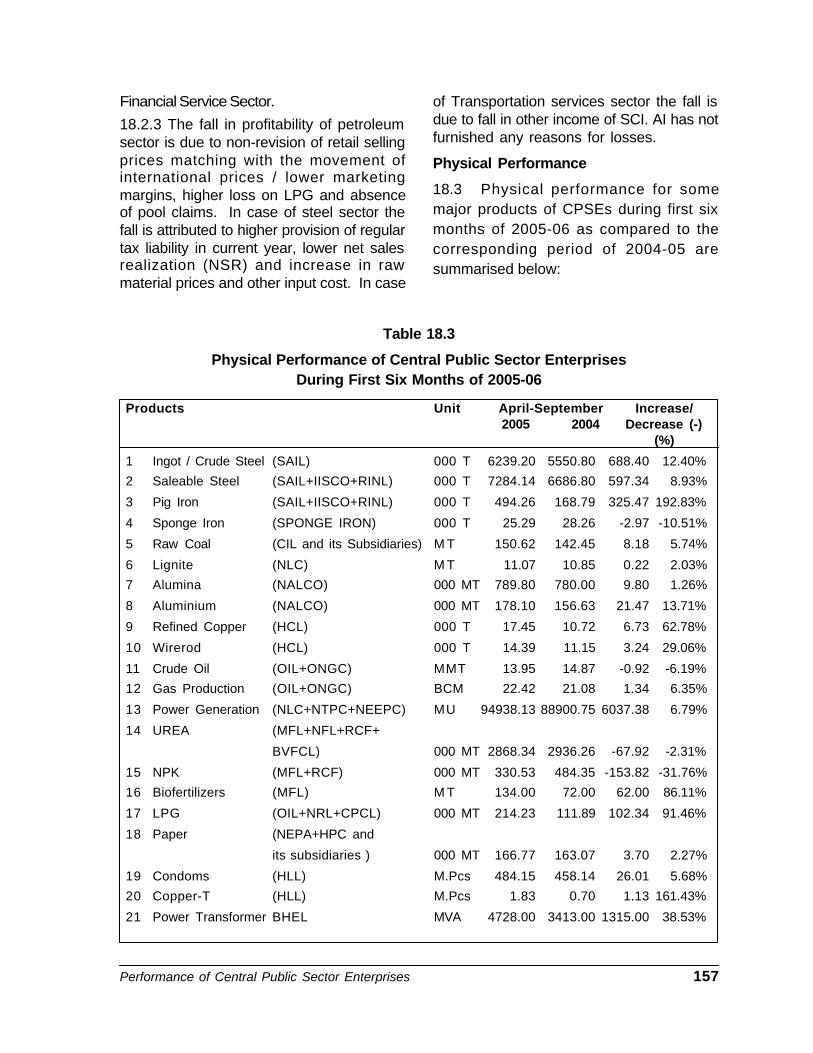
Performance of Central Public Sector Enterprises 157
Financial Service Sector.
18.2.3 The fall in profitability of petroleumsector is due to non-revision of retail sellingprices matching with the movement ofinternational prices / lower marketingmargins, higher loss on LPG and absenceof pool claims. In case of steel sector thefall is attributed to higher provision of regulartax liability in current year, lower net salesrealization (NSR) and increase in rawmaterial prices and other input cost. In case
of Transportation services sector the fall isdue to fall in other income of SCI. AI has notfurnished any reasons for losses.
Physical Performance
18.3 Physical performance for somemajor products of CPSEs during first sixmonths of 2005-06 as compared to thecorresponding period of 2004-05 aresummarised below:
Table 18.3
Physical Performance of Central Public Sector EnterprisesDuring First Six Months of 2005-06
Products Unit April-September Increase/2005 2004 Decrease (-)
(%)
1 Ingot / Crude Steel (SAIL) 000 T 6239.20 5550.80 688.40 12.40%
2 Saleable Steel (SAIL+IISCO+RINL) 000 T 7284.14 6686.80 597.34 8.93%
3 Pig Iron (SAIL+IISCO+RINL) 000 T 494.26 168.79 325.47 192.83%
4 Sponge Iron (SPONGE IRON) 000 T 25.29 28.26 -2.97 -10.51%
5 Raw Coal (CIL and its Subsidiaries) M T 150.62 142.45 8.18 5.74%
6 Lignite (NLC) M T 11.07 10.85 0.22 2.03%
7 Alumina (NALCO) 000 MT 789.80 780.00 9.80 1.26%
8 Aluminium (NALCO) 000 MT 178.10 156.63 21.47 13.71%
9 Refined Copper (HCL) 000 T 17.45 10.72 6.73 62.78%
10 Wirerod (HCL) 000 T 14.39 11.15 3.24 29.06%
11 Crude Oil (OIL+ONGC) MMT 13.95 14.87 -0.92 -6.19%
12 Gas Production (OIL+ONGC) BCM 22.42 21.08 1.34 6.35%
13 Power Generation (NLC+NTPC+NEEPC) MU 94938.13 88900.75 6037.38 6.79%
14 UREA (MFL+NFL+RCF+
BVFCL) 000 MT 2868.34 2936.26 -67.92 -2.31%
15 NPK (MFL+RCF) 000 MT 330.53 484.35 -153.82 -31.76%
16 Biofertilizers (MFL) M T 134.00 72.00 62.00 86.11%
17 LPG (OIL+NRL+CPCL) 000 MT 214.23 111.89 102.34 91.46%
18 Paper (NEPA+HPC and
its subsidiaries ) 000 MT 166.77 163.07 3.70 2.27%
19 Condoms (HLL) M.Pcs 484.15 458.14 26.01 5.68%
20 Copper-T (HLL) M.Pcs 1.83 0.70 1.13 161.43%
21 Power Transformer BHEL MVA 4728.00 3413.00 1315.00 38.53%
158 Public Enterprises Survey 2004-05 : Vol.-I
18.3.1 It is observed that the physicalperformance has generally increased duringfirst six months of 2005-06 as compared tothe corresponding period of 2004-05. Thereis fall in the production of 4 productscovered in analysis out of 21 productsnamely sponge iron, Crude oil, UREA andNPK Products. The reasons for decrease inproduction include maintenance worksundertaken and shortage of availability of
qualitative raw materials due to heavy rainsin case of Sponge Iron India Ltd. The fallin natural gas production is due to fire atBHN platform of ONGC causing shutdownof all wells connected to BHN. Theproduction of UREA at Trombay unit of RCFplant is affected due to flood / gas shortage.The reduction in NPK production is due toImported Phosphoric Acid limitation.
Revival and Restructuring of Sick/ Loss making CPSEs 159
19.1 The National Common MinimumProgramme (NCMP) stipulates that theGovernment is committed for a strong andefficient Public Sector whose social objectivesare met by its commercial functioning. Whileevery effort will be made to modernize andrestructure sick public sector companies andrevive sick industry, chronically loss-makingcompanies will either be sold-off, or closed,after all workers have got their legitimate duesand compensation. The private industry willbe inducted to turn-around companies thathave potential for revival.
19.2 Sickness in CPSEs has been thesubject matter of concern in the Governmentfor quite some time particularly in the changedeconomic environment wherein resourcegeneration through commercial functioning ofenterprises is of paramount importance.There are certain enterprises, which havebeen incurring losses continuously for the lastseveral years and in a number of cases theiraccumulated losses have surpassed thenetworth making the enterprises financiallyweak. Out of 217 operating CPSEs whichhave furnished information as on 31.3.2005,73 had incurred a loss of Rs. 9003 croreduring 2004-05. Accumulated losses inrespect 81CPSEs have exceeded theirrespective net worth over the years althoughsome of them have recorded profit during lastone or two years. Under the provisions of SickIndustrial Companies (Special Provisions)Act, 1985 (SICA) the industrial CPSEs whoseaccumulated losses have exceeded their networth are referred to the Board for Industrialand Financial Reconstruction(BIFR) whichapproves suitable revival/rehabilitation
schemes in case of enterprises found viableand recommend winding up/closure in respectof enterprises found non-viable. In respect ofother CPSEs the concerned administrativeMinistries/Departments take suitable action.
19.3 Reasons for losses/sickness aremanifold and may vary from unit to unit.However, some common problems faced/being faced by sick and loss making CPSEsinclude old and obsolete plant and machinery,outdated technology, resource crunch, lowcapacity utilization, excess manpower, heavyinterest burden, weak marketing strategies,stiff competition, reluctance of financialinstitutions to provide funds for revival/rehabilitation, high input cost, erosion of net-worth due to continuous losses and inherentproblems of sick taken over enterprises, etc.
19.4 Recognizing the socio-economic rolebeing played by CPSEs in the developmentof the country, Government has evolvedstrategies from time to time for strengtheningCPSEs. Some of the strategies forrestructuring/revival of CPSEs including sickunits on long-term basis include:
- Revival of PSEs through the process ofBIFR;
- Financial restructuring whereverappropriate;
- Formation of joint ventures by inductionof partners capable of providing technical,financial and marketing inputs;
- Infusion of fresh funds;
- Organizational and businessrestructuring;
- Manpower rationalization throughapproved Voluntary Retirement Scheme(VRS);
REVIVAL AND RESTRUCTURING OF SICK/LOSS MAKING CPSE S19

160 Public Enterprises Survey 2004-05 : Vol.-I
- Improved marketing strategies;
- Cost control measures, etc.
19.5 The major strategies for restructuringof CPSEs including sick units on long termbasis may include:-
(i) Financial restructuring: Investmentis made in the form of equity participation,loan, non-plan assistance or through therevival packages which involve sustainableoutgo from Government or write-off of pastlosses and infusion of fresh capital, etc.Measures such as waiver of loan/interest/penal interest, conversion of loan into equity,conversion of interest including penal interestinto loan, moratorium on payment of loan/interest, Government guarantee, etc. are alsotaken to improve financial strength of thecompany.
(ii) Business restructuring: Change ofmanagement, organizational restructuring,hiving off viable units from CPSEs forformation of separate company, closure ofunviable units, formation of joint ventures byinduction of partners capable of providingtechnical, financial and marketing inputs,change in product mix, improving marketingstrategy, etc. may be involved.
(iii) Manpower rationalization: throughapproved Voluntary RetirementScheme(VRS).
19.6 Government has set up a Board forReconstruction of Public Sector Enterprises(BRPSE) to advise the Government on themeasures to be taken to restructure PSEs.The Board comprises a part- time Chairman,three part-time Non-Official Members andthree part-time Official Members includingSecretary, Department of Public Enterprisesas Member Secretary. The Board is servicedby DPE. For the purpose of making referenceto BRPSE, a company will be considered
‘sick’ if it has accumulated losses in anyfinancial year equal to 50% or more of itsaverage net worth during 4 years immediatelypreceding such financial year and / or acompany which is a sick company within themeaning of Sick Industrial Companies(Special Provisions) Act, 1985 (SICA). Theconcerned administrative Ministries havebeen advised to send proposals of theirCPSEs identified as ‘sick’ for considerationof the BRPSE. BRPSE has maderecommendation in respect of 28 CPSEs till08.02.2006.
19.7 Government has been extending needbased budgetary support to the PSEs fromtime to time in the form of Plan as well asNon-Plan assistance, latter generally being forsick and loss making enterprises. For profitmaking CPSEs the emphasis is on generationof more internal resources and lesserdependency on Government support. In linewith the above policy, PSEs are enhancingtheir internal resources and only need basedBudgetary support is provided. Enterprise-wise details of Plan and Non-Plan assistancerendered by the Government to CPSEs isgiven in Volume I of the Expenditure Budgetof the Ministry of Finance. There are separatechapters on Internal Resource Generation ofCPSEs and disinvestments in this volume.However, sick/loss making enterprisesgenerally face the reluctance of the StateGovernments and Financial Institutions tocome forward for/with concessions/reliefs orsupport for working capital etc.
19.8 As a result of revival efforts made bythe BIFR, 3 CPSEs namely North EasternRegional Agricultural Marketing CorporationLimited, Scooters India Limited and VignyanIndustries Limited have been declared ‘NoLonger Sick’ by the Board. In addition, BharatImmunologicals and Biologicals Corporation
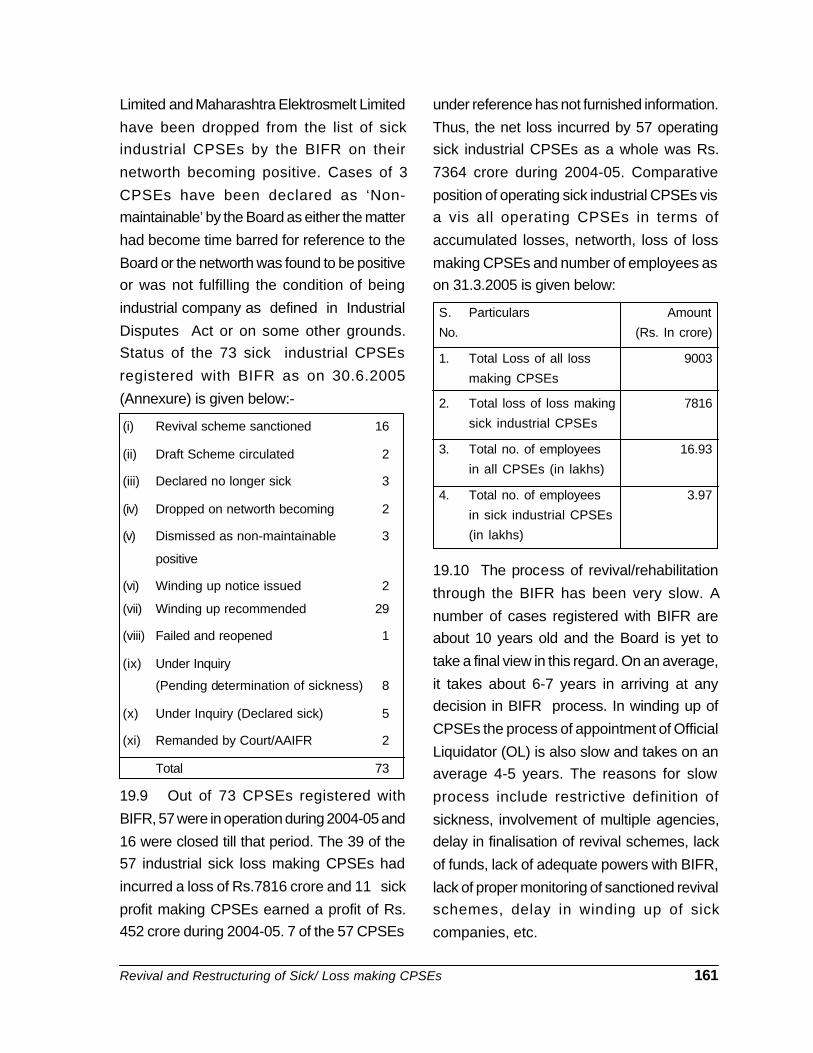
Revival and Restructuring of Sick/ Loss making CPSEs 161
Limited and Maharashtra Elektrosmelt Limited
have been dropped from the list of sickindustrial CPSEs by the BIFR on their
networth becoming positive. Cases of 3
CPSEs have been declared as ‘Non-maintainable’ by the Board as either the matter
had become time barred for reference to the
Board or the networth was found to be positiveor was not fulfilling the condition of being
industrial company as defined in Industrial
Disputes Act or on some other grounds.Status of the 73 sick industrial CPSEs
registered with BIFR as on 30.6.2005
(Annexure) is given below:-
(i) Revival scheme sanctioned 16
(ii) Draft Scheme circulated 2
(iii) Declared no longer sick 3
(iv) Dropped on networth becoming 2
(v) Dismissed as non-maintainable 3
positive
(vi) Winding up notice issued 2
(vii) Winding up recommended 29
(viii) Failed and reopened 1
(ix) Under Inquiry
(Pending determination of sickness) 8
(x) Under Inquiry (Declared sick) 5
(xi) Remanded by Court/AAIFR 2
Total 73
19.9 Out of 73 CPSEs registered with
BIFR, 57 were in operation during 2004-05 and
16 were closed till that period. The 39 of the57 industrial sick loss making CPSEs had
incurred a loss of Rs.7816 crore and 11 sick
profit making CPSEs earned a profit of Rs.452 crore during 2004-05. 7 of the 57 CPSEs
under reference has not furnished information.
Thus, the net loss incurred by 57 operatingsick industrial CPSEs as a whole was Rs.
7364 crore during 2004-05. Comparative
position of operating sick industrial CPSEs visa vis all operating CPSEs in terms of
accumulated losses, networth, loss of loss
making CPSEs and number of employees ason 31.3.2005 is given below:
S. Particulars Amount
No. (Rs. In crore)
1. Total Loss of all loss 9003
making CPSEs
2. Total loss of loss making 7816
sick industrial CPSEs
3. Total no. of employees 16.93
in all CPSEs (in lakhs)
4. Total no. of employees 3.97
in sick industrial CPSEs
(in lakhs)
19.10 The process of revival/rehabilitation
through the BIFR has been very slow. A
number of cases registered with BIFR areabout 10 years old and the Board is yet to
take a final view in this regard. On an average,
it takes about 6-7 years in arriving at anydecision in BIFR process. In winding up of
CPSEs the process of appointment of Official
Liquidator (OL) is also slow and takes on anaverage 4-5 years. The reasons for slow
process include restrictive definition of
sickness, involvement of multiple agencies,delay in finalisation of revival schemes, lack
of funds, lack of adequate powers with BIFR,
lack of proper monitoring of sanctioned revivalschemes, delay in winding up of sick
companies, etc.

162 Public Enterprises Survey 2004-05 : Vol.-I
Annexure
STATUS REPORT OF CPSES REGISTERED WITH BIFR AS ON 30.6.2005
S. Case No. and year Name of CPSE Date of orderNo. of reference1 2 3 4
A. Revival Scheme sanctioned1. 518/1992 The British India Corpn. Ltd. @ 17.12.20022. 528/1992 Braithwaite & Co. Ltd. @ 17.10.19953. 533/1992 Bengal Chemicals & Pharmaceuticals Ltd. @ 31.3.19954. 534/1992 NTC (APKK& Mahe) Ltd. @ 7.2.2002 *5. 535/1992 NTC (Gujarat) Ltd. @ 10.2.20026. 536/1992 NTC (Maharashtra North) Ltd. @ 1.10.20027. 501/1993 NTC (MP) Ltd. @ 12.2.20028. 503/1993 NTC (WB A B & O) Ltd. @ 15.2.20029. 504/1993 NTC (UP) Ltd. @ 5.2.200210. 505/1993 NTC (South Maharashtra) Ltd. @ 1.10.200211. 509/1993 Instrumentation Ltd. 23.12.199812. 501/1994 NTC (DPR) Ltd. @ 22.2.200213. 505/1994 The Indian Iron & Steel Co. Ltd. @ 20.11.2003 *14. 507/1994 Hindustan Flurocarbons Ltd. 24.7.200315. 521/1992 Projects and Development India Ltd. 26.3.2004 *16. 501/1998/501/2000 Eastern Coalfields Limited 2.11.2004B. Winding Up Notice Issued17. 501/1992 Bharat Pumps & Compressors Ltd. 15.11.200118. 501/1997 Hindustan Antibiotics Limited 4.9.2003C. Winding up Recommended19. 503/1992 Indian Drugs and Pharmaceuticals Ltd. 4.12.200320. 531/1992 National Instruments Ltd. 1.10.200221. 511/1992 Heavy Engineering Corpn. Ltd. 6.7.200422. 506/1993 National Jute Manufacturers Corporation Ltd. 8.7.200423. 503/1995 Hindustan Photofilms Mfg. Co. Ltd. 30.1.200324. 502/1999 Hindustan Vegetable Oils Corpn. Ltd. @ 7.12.200125. 507/1992 Triveni Structurals Ltd. 5.6.200326. 514/1992 Orissa Drugs & Chemicals Ltd. 8.4.200327. 532/1992 Bharat Ophthalmic Glass Ltd. 19.6.200328. 509/1992 Richardson & Crudass (1972) Ltd. @ 25.7.200329. 502/1992/601/1998 Nagaland Pulp & Paper Co. Ltd. 4.3.200230. 515/1992 Fertilizers Corpn. of India Ltd. 2.4.200431. 501/1999 Birds Jute and Exports Ltd. @ 24.6.2004CPSEs recommended for winding up and have been closed32. 526/1992 Bharat Brakes & Valves Ltd. @ 27.9.200233. 520/1992 Bharat Process and Mechanical Engineers Ltd. @ 22.7.1996
34. 508/1992 Cycle Corporation of India Limited @ 10.7.200035. 510/1992 Mining and Allied Machinery Corporation Ltd. 29.6.200136. 513/1992 National Bicycle Corporation of India Ltd. @ 20.12.1993
37. 506/1994 Rayrolle Burn Ltd. @ 13.7.200138. 506/1992 Tannery and Footwear Corporation of India Ltd. 14.2.199539. 524/1992 Weighbird India Limited @ 17.2.199740. 504/1994 Southern Pesticides Corporation Limited 1.11.2001
41. 505/1992 Bharat Gold Mines Ltd. 12.6.2000
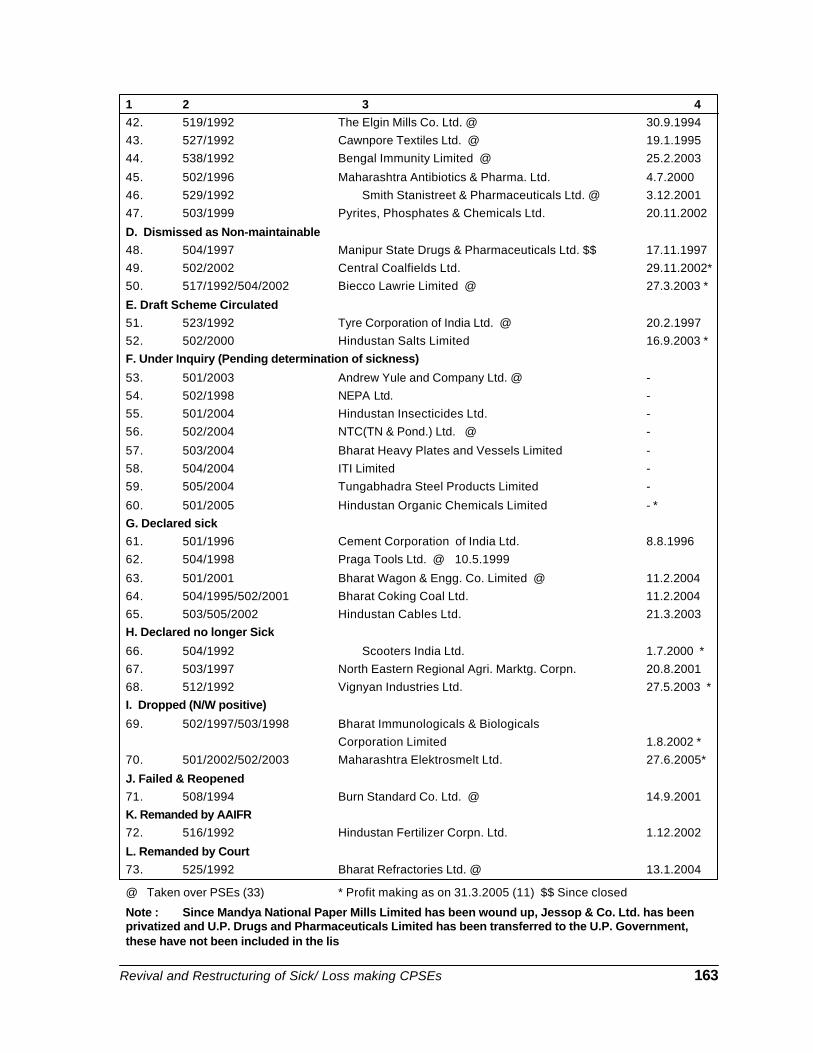
Revival and Restructuring of Sick/ Loss making CPSEs 163
1 2 3 442. 519/1992 The Elgin Mills Co. Ltd. @ 30.9.199443. 527/1992 Cawnpore Textiles Ltd. @ 19.1.199544. 538/1992 Bengal Immunity Limited @ 25.2.2003
45. 502/1996 Maharashtra Antibiotics & Pharma. Ltd. 4.7.200046. 529/1992 Smith Stanistreet & Pharmaceuticals Ltd. @ 3.12.200147. 503/1999 Pyrites, Phosphates & Chemicals Ltd. 20.11.2002
D. Dismissed as Non-maintainable48. 504/1997 Manipur State Drugs & Pharmaceuticals Ltd. $$ 17.11.199749. 502/2002 Central Coalfields Ltd. 29.11.2002*50. 517/1992/504/2002 Biecco Lawrie Limited @ 27.3.2003 *
E. Draft Scheme Circulated51. 523/1992 Tyre Corporation of India Ltd. @ 20.2.199752. 502/2000 Hindustan Salts Limited 16.9.2003 *F. Under Inquiry (Pending determination of sickness)
53. 501/2003 Andrew Yule and Company Ltd. @ -54. 502/1998 NEPA Ltd. -55. 501/2004 Hindustan Insecticides Ltd. -56. 502/2004 NTC(TN & Pond.) Ltd. @ -
57. 503/2004 Bharat Heavy Plates and Vessels Limited -58. 504/2004 ITI Limited -59. 505/2004 Tungabhadra Steel Products Limited -
60. 501/2005 Hindustan Organic Chemicals Limited - *G. Declared sick61. 501/1996 Cement Corporation of India Ltd. 8.8.199662. 504/1998 Praga Tools Ltd. @ 10.5.1999
63. 501/2001 Bharat Wagon & Engg. Co. Limited @ 11.2.200464. 504/1995/502/2001 Bharat Coking Coal Ltd. 11.2.200465. 503/505/2002 Hindustan Cables Ltd. 21.3.2003H. Declared no longer Sick
66. 504/1992 Scooters India Ltd. 1.7.2000 *67. 503/1997 North Eastern Regional Agri. Marktg. Corpn. 20.8.200168. 512/1992 Vignyan Industries Ltd. 27.5.2003 *I. Dropped (N/W positive)
69. 502/1997/503/1998 Bharat Immunologicals & BiologicalsCorporation Limited 1.8.2002 *
70. 501/2002/502/2003 Maharashtra Elektrosmelt Ltd. 27.6.2005*
J. Failed & Reopened71. 508/1994 Burn Standard Co. Ltd. @ 14.9.2001K. Remanded by AAIFR72. 516/1992 Hindustan Fertilizer Corpn. Ltd. 1.12.2002
L. Remanded by Court73. 525/1992 Bharat Refractories Ltd. @ 13.1.2004
@ Taken over PSEs (33) * Profit making as on 31.3.2005 (11) $$ Since closed
Note : Since Mandya National Paper Mills Limited has been wound up, Jessop & Co. Ltd. has beenprivatized and U.P. Drugs and Pharmaceuticals Limited has been transferred to the U.P. Government,these have not been included in the lis