Public Enterprises Surve y 2011-2012 - DPE
405
Public Enterprises Survey 2011-2012: Vol-II 363 Services Public Enterprises Survey 2011-2012
-
Upload
khangminh22 -
Category
Documents
-
view
0 -
download
0
Transcript of Public Enterprises Surve y 2011-2012 - DPE

Public Enterprises Survey 2011-2012: Vol-II 363
Services
Public E
nte
rpri
ses
Surv
ey
2011-2
012

Trading & Marketing Services364

Public Enterprises Survey 2011-2012: Vol-II 365
TRADING AND MARKETINGSERVICES

Trading & Marketing Services366

Public Enterprises Survey 2011-2012: Vol-II 367
16. Trading & Marketing Services
As on 31.03.2012, there were 21 Central Public SectorEnterprises in the Trading & Marketing Services group. The nameof these enterprises along with their year of incorporation inchronological order are given below:—
Sl. Enterprise Year ofNo. Incorporation
1 State Trading Corpn. of India Ltd. 1956
2 Central Warehousing Corpn. 1957
3 Handicrafts & Handloom ExportsCorp. of India Ltd.1962
4 MMTC Ltd. 1963
5 MSTC Ltd. 1964
6 Food Corpn. of India 1965
7 Cotton Corpn.of India Ltd. 1970
8 Jute Corpn. of India Ltd. 1971
9 PEC Ltd. 1971
10 Hmt (International) Ltd. 1975
11 Central Cottage Industries Corpn. 1976of India Ltd.
12 India Trade Promotion Organisation 1976
13 North Eastern Handicrafts & 1977Handloom Dev.corpn. Ltd.
14 North Eastern Regional Agri. 1982Marketing Corp. Ltd.
15 STCL Ltd. 1982
16 National Handloom Development 1983Corporation Ltd.
17 Antrix Corporation Ltd. 1993
18 Karnataka Trade Promotion Organisation 2000
19 Tamil Nadu Trade Promotion Organisation 2000
20 Ntpc Vidyut Vyapar Nigam Ltd. 2003
21 Central Railside Warehousing Co. Ltd. 2007
2. The enterprises falling in this group are mainly engaged infollowing activities:—
(i) To regulate trade in certain sensitive products.(ii) To control and eliminate to the extend possible speculative
activity in the trade of certain products vital to thecommunity.
(iii) To provide support prices to agricultural products ofcertain cash crops.
(iv) To ensure availability of essential consumer products toall sections of the community;
(v) To arrange import of certain industries in the small sectorswith or without high export potential;
(vi) To provide adequate scientific storage facilities foragricultural products etc.
3. The consolidated financial position the working resultsand the important management ratios of these enterprises areappended.
4. Turnover : The details of turnover of individualenterprises are given below:
(` in Crores)Sl. Enterprise TurnoverNo. 2011-12 2010-11
1 Food Corpn. of India 94951.33 82245.052 MMTC Ltd. 66325.2 690563 State Trading Corpn. of India Ltd. 30773.1 20475.654 Handicrafts & Handloom Exports
Corp. of India Ltd. 12128.21 5008.195 PEC Ltd. 11498.32 10524.696 MST C Ltd. 2625.31 1880.287 Cotton Corpn. of India Ltd. 1765.6 2767.928 National Handloom Development 1153.32 1282.55
Corporation Ltd.9 Central Warehousing Corpn. 1152.04 979.7910 Antrix Corporation Ltd. 1050.78 1035.1611 India Trade Promotion Organisation 273.18 187.9612 STCL Ltd. 132.62 63.1813 Jute Corpn. Of India Ltd. 131.92 60.1714 North Eastern Regional Agri. 96.04 100.02
Marketing Corp.Ltd.15 Central Railside Warehousing Co. Ltd. 73.88 50.8116 Central Cottage Industries Corpn. 72.25 63.09
of India Ltd.17 NTPC Vidyut Vyapar Nigam Ltd. 48.6 33.9618 HMT (International) Ltd. 32.4 27.8919 Tamil Nadu Trade Promotion 24.12 21.58
Organisation20 North Eastern Handicrafts & 16.82 17.27
Handloom Dev. Cofpn. Ltd.21 Kartnataka Trade Promotion 5.64 3.09
OrganisationSub Total : 224330.68 95884.30

Trading & Marketing Services368
5. Net Profit / Loss : The details of enterprises , whichearned net profit or sustained net loss (-) are given below:
(` in Crores)Sl. Enterprise Adjusted NetNo. Profit / Net Loss
2011-12 2010-11
1 State Farms Corporation of India Ltd. 38.96 29.87
1 India Trade Promotion Organisation 183.03 70.87
2 Antrix Corporation Ltd. 170.98 138.87
3 MSTC Ltd. 118.39 99.17
4 NTPC Vidyut Vyapar Nigam Ltd. 111.93 30.06
5 Central Warehousing Corpn. 100.46 136.17
6 PEC Ltd. 79.55 70.92
7 MMTC Ltd. 70.72 121.64
8 Tamil Nadu Trade Promotion 18.86 14.32Organisation
9 State Trading Corpn. of India Ltd. 16.47 56.44
10 Central Railside Warehousing Co. Ltd. 13.31 7.22
11 Jute Corpn. of India Ltd. 10.22 -11.47
12 Karnataka Trade Promotion 2.84 1.49Organisation
13 National Handloom Development 2.82 4.32Corporation Ltd.
14 Handicrafts & Handloom Exports 2.16 0.92Corp. of India Ltd.
15 Hmt (International) Ltd. 1.35 0.21
16 North Eastern Regional Agri. 1.00 1.47Marketing Corp.Ltd.
17 Central Cottage Industries Corpn. 0.49 -0.88of India Ltd.
18 Food Corpn. of India 0.00 -5.80
19 North Eastern Handicrafts & -1.51 -1.74Handloom Dev.Corpn. Ltd.
20 Cotton Corpn. of India Ltd. -179.89 -0.96
21 STCL Ltd. -284.66 -178.02
Sub Total : 438.52 555.22
6. Dividend : The details of dividend declared by theindividual enterprises are given below:
(` in Crores)
Sl. Enterprise DividendNo. 2011-12 2010-11
1 Central Warehousing Corpn. 27.19 27.19
2 MMTC Ltd. 25.00 25.00
3 MSTC Ltd. 23.69 2.20
4 NTPC Vidyut Vyapar Nigam Ltd. 20.00 15.00
5 PEC Ltd. 15.00 15.00
6 State Trading Corpn. of India Ltd. 12.00 18.00
7 Central Railside Warehousing Co. Ltd. 2.03 1.22
8 National Handloom Development 0.57 0.87Corporation Ltd.
9 HMT (International) Ltd. 0.15 0.14
10 Central Cottage Industries Corpn. 0.1 0.00of India Ltd.
11 Antrix Corporation Ltd. 0.00 27.78
Group Total : 125.73 132.40
7. Social Overhead and Township : The total number ofpersons employed and the expenditure incurred on social overheadsand townships are given below:
(` in Crores)Sl. Enterprise Township andNo. Social Overheads
2011-12 2010-11
1 No. of employees (in number) 42004 43767
2 Social overheads: (Rupees in Crore)
(i) Educational 47.75 40.62
(ii) Medical Facilities 56.59 47.35
(iii) Others 4.88 5.15
3 Capital cost of township 28.01 30.26(Rupees in Crore)
4 No. of houses constructed 828 828(in numbers)
8. Company wise details in respect of Balance Sheet, Profitand Loss account, Important Indicators and Financial Ratios alongwith the write up of individual company are given in the pagesbelow.

Public Enterprises Survey 2011-2012: Vol-II 369
TRADING & MARKETING
BALANCE SHEET (`̀̀̀̀ in Lakhs)PARTICULARS 2011-12 2010-11I. EQUITY & LIABILITIESAUTHORISED CAPITAL 428800 428450(1) Shareholders’ Funds (a) Share Capital (i) Central Govt 294755 288561 (ii) Others 10022 10022 (b) Reserves & Surplus 431332 398827 (c) Money received against share warrants 0 0 Total Shareholders’ Funds (1(a)+1(b)+1(c) 736109 697410(2) Share application money pending allotment 995 995(3) Non-current Liabilities (a) Long Term Borrowings 409163 446439 (b) Deferred tax liabilities (Net) 5018 5935 (c) Other Long-term liabilities 238392 220431 (d) Long-term provisions 75536 63140 Total Non-Current Liabilities 3(a) to 3(d) 728109 735945(4) Current Liabilities (a) Short Term Borrowings 6559399 5409215 (b) Trade Payables 2885042 2963573 (c) Other current liabilities 1124278 1342240 (d) Short-term provisions 81564 81605 Total Current Liabilities 4(a) to 4(d) 10650283 9796633TOTAL EQUITY & LIABILITIES (1+2+3+4) 12115496 11230983II. ASSETS(1) Non-Current Assets (a) Total Gross Fixed Assets 357964 341673 (ai) Accumulated Depreciation, Depletion & Amortisation 162302 154568 (aii) Accumulated Impairment 0 0 (b) Total Net Fixed Assets ((a)-(ai)-(aii) 195662 187105 (c) Capital work in progress 14233 7595 (d) Intangible assets under developmet 0 28 (e) Non-Current Investments 60622 65133 (f) Deferred Tax Assets (Net) 21468 15479 (g) Long Term Loans and Advances 312539 186852 (h) Other Non-Current Assets 188792 322966 Total Non-Current Assets (b+c+d+e+f+g+h) 793316 785158(2) Current Assets (a) Current Investments 23717 17526 (b) Inventories 5237203 4546436 (c) Trade Recievables 4049234 2958056 (d) Cash & Bank Balance 747654 1560049 (e) Short-term Loans & Advances 591461 759478 (f) Other Current Assets 672911 604280 Total Current Assets (a+b+c+d+e+f) 11322180 10445825TOTAL ASSETS (1+2) 12115496 11230983Important Indicators (i) Investment 714935 746017 (ii) Capital Employed 1146267 1144844 (iii) Net Worth 737104 698405 (iv) Net Current Assets 671897 649192 (v) Cost of Sales 21916307 19229671 (vi) Net Value Added (at market price) 1505155 1306386 (vii) Total Regular Employees (Nos.) 42004 43767(viii) Avg. Monthly Emoluments per Employee(`) 65851 63706
PROFIT & LOSS ACCOUNT ( `̀̀̀̀ in Lakhs)PARTICULARS 2011-12 2010-11(I) Revenue from Operations (Gross) 22433068 19588430 Less : Excise Duty 62 4 Revenue from Operations (Net) 22433006 19588426(II) Other Income 229338 158079(III) Total Revenue (I+II) 22662344 19746505(IV) Expenditure on: (a) Cost of materials consumed 146087 530216 (b) Purchase of stock-in-trade 20881980 17639862 (c) Changes in inventories of finished goods, -690371 -549164 work-in-progress and stock in trade (d) Stores & Spares 1547 1319 (e) Power & Fuel 5470 5134 (f) Salary, Wages & Benefits/Employees Expense 331919 334585 (g) Other Operating/direct/manufacturing Expenses 923270 947914 (h) Rent, Royalty & Cess 118169 97142 (i) Loss on sale of Assets/Investments 14 47 (j) Other Expenses 189033 213199Total Expenditure (IV (a to j)) 21907118 19220254(V) PROFIT BEFORE DEPRECIATION, & IMPAIRMENT, 755226 526251FINANCE CHARGES/INTEREST, EXCEPTIONAL &EXTRAORDINARY ITEMS & TAXES (PBDIEET)(III-IV)(VI) Depreciation, Depletion & Amortisation 9203 9463(VII) Impairment 0 1(VIII) PROFIT BEFORE FINANCE COST/INTEREST, 746023 516787EXCEPTIONAL, EXTRA-ORDINARY ITEMS & TAXES(PBIEET)(V-VI-VII)(IX) Finance Cost (a) On Central Government Loans 144164 0 (b) On Foreign Loans 0 0 (c) Others 512568 425563 (d) Less Finance Cost Capitalised 0 0 (e) Charged to P & L Account (a+b+c+d) 656732 425563(X) PROFIT BEFORE EXCEPTIONAL & EXTRA- 89291 91224ORDINARY ITEMS & TAX (PBEET)(VIII-IXe)(XI) Exceptional Items -5044 1603(XII) PROFIT BEFORE EXTRA-ORDINARY ITEMS & TAX 94335 89621 (PBET)(X-XI)(XIII) Extra-Ordinary Items 21187 272(XIV) PROFIT BEFORE TAX (PBT)(XII-XIII) 73148 89349(XV) TAX PROVISIONS 29296 33827(XVI) NET PROFIT / LOSS FOR THE PERIOD FROM 43852 55522CONTINUING OPERATIONS AFTER TAX(XIV-XV)(XVII) Profit/Loss from discontinuing operations 0 0(XVIII) Tax expenses of discontinuing operations 0 0(XIX) Profit/Loss from discontinuing operations 0 0 (after Tax)(XVII-XVIII)(XX) Profit/Loss for the period (XVI+XIX) 43852 55522Financial Ratios (i) Sales : Capital Employed 1957.05 1711.01 (ii) Cost of Sales : Sales 97.7 98.17 (iii) Salary/Wages : Sales 1.48 1.71 (iv) Net Profit : Net Worth 5.95 7.95 (v) Debt : Equity 1.34 1.49 (vi) Current Ratio 1.06 1.07 (vii) Trade Recievables : Sales 18.05 15.1 (viii) Total Inventory : Sales 23.35 23.21

Trading & Marketing Services370
Antrix Corporation Limited
The CompanyAntrix Corporation Limited (ACL) was incorporated on
28.09.1992 as the commercial marketing arm / corporate front ofIndian Space Research Organization (ISRO).
ACL is a schedule - 'B' Miniratna CPSE in the Trading &Marketing sector under the administrative control of theDepartment of Space with 100% shareholding by Government ofIndia. The company employed 17 regular employees (Executives14 and Non-executives 3) as on 31.3.2012. It's registered andCorporate Office are at Bangalore, Karnataka
Vision/MissionThe Vision of Antrix is to emerge as a globally significant
space company, fully utilizing the strength of ISRO and otherIndian entities in the field of space.
The Mission of Antrix is to enhance & generate commercialspin-offs from ISRO's programme in the global space markets &establish a commercially viable space industry in India.
Industrial / Business OperationsThe Company is engaged in providing Space Products and
services to national & international customers. ANTRIX's Businessportfolio consists of:
(i) Remote Sensing Services (ii) Spacecraft Systems &Subsystems
(iii) Transponder Leasing Services(iv) Launch Services(v) Mission Support Services (vi) Ground System Services
(vii) Spacecraft Testing (viii) Training & ConsultancyFacilities Services
Performance HighlightsThe company has not provided any details of its performance
during last two years. The Company registered an increase of ̀̀̀̀̀ 67.03crore in total income during 2011-12 which went up to `̀̀̀̀ 1180.61crore in 2011-12 from `̀̀̀̀ 1113.58 crore during 2010-11. The netprofit of the company correspondingly increased to `̀̀̀̀ 170.98 crorein 2011-12, an increase of `̀̀̀̀ 32.11 crore over the previous year'sprofit of `̀̀̀̀ 138.87 crore due to increase in operating income andother income.
Export of Hylas satellite has contributed to the increase inturnover and profit of the company. INSAT capacity is exhaustedhence foreign satellite capacity is being procured which is keepingconstant pressure on the profit margin.
The current ratio of company is at 3.58:1 during 2011-12 asagainst 3.06:1 in the previous year (Fig.2). Balance Sheet and Profit& Loss Account of the company and selected financial ratios duringthe period 2010-11 to 2011-12 can be seen on the adjoining page.
www.antrix.gov.in
Strategic issuesThe Company intended to provide cost effective & flight
proven space products & services in International markets, to playa substantial role in development of Space Industry in India,monitoring trends in satellite industry (including launch vehicle &ground segment) & to provide inputs to the management of ISROetc.
EBIT
DA
& P
AT (
Rs.
cro
re)
TOTAL R
EVENU
E (Rs. crore)
Fig. 1
PRO
FITA
BIL
ITY
RAT
IOS
(%)
CU
RR
ENT R
ATIO
Fig. 2

Public Enterprises Survey 2011-2012: Vol-II 371
Antrix Corporation LimitedAntriksh Bhavan, New BEL Road, Bangalore, Karnataka -560231
PROFIT & LOSS ACCOUNT (` in Lakhs)PARTICULARS 2011-12 2010-11(I) Revenue from Operations (Gross) 105078 103516Less : Excise Duty 0 0Revenue from Operations (Net) 105078 103516(II) Other Income 12983 7842(III) Total Revenue (I+II) 118061 111358(IV) Expenditure on:(a) Cost of materials consumed 92644 89148(b) Purchase of stock-in-trade 0 0(c) Changes in inventories of finished goods,work-in-progress and stock in trade 0 0(d) Stores & Spares 0 0(e) Power & Fuel 0 0(f) Salary, Wages & Benefits/Employees Expense 183 169(g) Other Operating/direct/manufacturing Expenses 0 0(h) Rent, Royalty & Cess 0 0(i) Loss on sale of Assets/Investments 0 0(j) Other Expenses 743 641Total Expenditure (IV (a to j)) 93570 89958(V) PROFIT BEFORE DEPRECIATION, & IMPAIRMENT,FINANCE CHARGES/INTEREST, EXCEPTIONAL &EXTRAORDINARY ITEMS & TAXES (PBDIEET)(III-IV) 24491 21400(VI) Depreciation, Depletion & Amortisation 10 12(VII) Impairment 0 0(VIII) PROFIT BEFORE FINANCE COST/INTEREST,EXCEPTIONAL, EXTRA-ORDINARY ITEMS & TAXES(PBIEET)(V-VI-VII) 24481 21388(IX) Finance Cost(a) On Central Government Loans 0 0(b) On Foreign Loans
0 0(c) Others 0 0(d) Less Finance Cost Capitalised 0 0(e) Charged to P & L Account (a+b+c+d) 0 0(X) PROFIT BEFORE EXCEPTIONAL & EXTRA-ORDINARYITEMS & TAX (PBEET)(VIII-IXe) 24481 21388(XI) Exceptional Items 0 0(XII) PROFIT BEFORE EXTRA-ORDINARY ITEMS & TAX(PBET)(X-XI) 24481 21388(XIII) Extra-Ordinary Items 0 -14(XIV) PROFIT BEFORE TAX (PBT)(XII-XIII) 24481 21402(XV) TAX PROVISIONS 7383 7515(XVI) NET PROFIT / LOSS FOR THE PERIOD FROMCONTINUING OPERATIONS AFTER TAX(XIV-XV) 17098 13887(XVII) Profit/Loss from discontinuing operations 0 0(XVIII) Tax expenses of discontinuing operations 0 0(XIX) Profit/Loss from discontinuing operations(after Tax)(XVII-XVIII) 0 0(XX) Profit/Loss for the period (XVI+XIX) 17098 13887Financial Ratios(i) Sales : Capital Employed 131.12 154.47(ii) Cost of Sales : Sales 89.06 86.91(iii) Salary/Wages : Sales 0.17 0.16(iv) Net Profit : Net Worth 21.34 20.72(v) Debt : Equity 0 0(vi) Current Ratio 3.58 3.05(vii) Trade Recievables : Sales 40.46 29.74(viii) Total Inventory : Sales 0 0
BALANCE SHEET ( `̀̀̀̀ in Lakhs)PARTICULARS 2011-12 2010-11I. EQUITY & LIABILITIESAUTHORISED CAPITAL 500 500(1) Shareholders’ Funds(a) Share Capital(i) Central Govt 100 100(ii) Others 0 0(b) Reserves & Surplus 80038 66915(c) Money received against share warrants 0 0Total Shareholders’ Funds (1(a)+1(b)+1(c) 80138 67015(2) Share application money pending allotment 0 0(3) Non-current Liabilities(a) Long Term Borrowings 0 0(b) Deferred tax liabilities (Net) 0 0(c) Other Long-term liabilities 118013 100840(d) Long-term provisions 17 11Total Non-Current Liabilities 3(a) to 3(d) 118030 100851(4) Current Liabilities(a) Short Term Borrowings 0 0(b) Trade Payables 22843 16587(c) Other current liabilities 22892 31057(d) Short-term provisions 3976 3239Total Current Liabilities 4(a) to 4(d) 49711 50883TOTAL EQUITY & LIABILITIES (1+2+3+4) 247879 218749II. ASSETS(1) Non-Current Assets(a) Total Gross Fixed Assets 161 153(ai) Accumulated Depreciation, Depletion & Amortisation 123 114(aii) Accumulated Impairment 0 0(b) Total Net Fixed Assets ((a)-(ai)-(aii) 38 39(c) Capital work in progress 1382 650(d) Intangible assets under developmet 0 0(e) Non-Current Investments 0 2500(f) Deferred Tax Assets (Net) 1022 903(g) Long Term Loans and Advances 67333 59313(h) Other Non-Current Assets 0 0Total Non-Current Assets (b+c+d+e+f+g+h) 69775 63405(2) Current Assets(a) Current Investments 23695 17505(b) Inventories 0 0(c) Trade Recievables 42518 30790(d) Cash & Bank Balance 98903 96766(e) Short-term Loans & Advances 5275 5771(f) Other Current Assets 7713 4512Total Current Assets (a+b+c+d+e+f) 178104 155344TOTAL ASSETS (1+2) 247879 218749Important Indicators(i) Investment 100 100(ii) Capital Employed 80138 67015(iii) Net Worth 80138 67015(iv) Net Current Assets 128393 104461(v) Cost of Sales 93580 89970(vi) Net Value Added (at market price) 35155 31190(vii) Total Regular Employees (Nos.) 17 57(viii) Avg. Monthly Emoluments per Employee(`) 89706 24708
2011-12 Provisional

Trading & Marketing Services372
Central Cottage Industries Corporation of India Limited
The CompanyCentral Cottage Industries Corporations of India Limited
(CCICI) was incorporated on 04-02-1976 with the objective topromote, develop, aid, and assist Cottage Industries by organizingtheir sales in India and abroad.
CCICI is a Schedule-'C' CPSE in Trading & Marketing sectorunder the administrative control of M/o Textiles with 100%shareholding by the Government of India. The company employed321 regular employees (Executives 145, Non-executives 176) as on31.3.2012. Its Registered and Corporate offices are in New Delhi.
Vision / MissionThe Vision and Mission of the Company is to promote,
develop, aid, counsel and assist cottage industries by organisingtheir sale in India and abroad.
Industrial / Business OperationsCCICI is engaged in trading of handicrafts and handloom and
other related services in India and abroad. The operating units ofthe corporation are situated at Kolkata (West Bengal), Bangaluru(Karnataka), Chennai (Tamilnadu), Mumbai (Maharashtra) andDelhi.
Performance Highlights
www.cottageemporium.in
Strategic issueSteps were taken towards strengthening operations in emporia,
improvements in merchandise cost control, setting up of newshowrooms and booking of bulk/ institutional orders.
CCICI procures merchandise from handicraft and handloomclusters and from a large number of artisans, craftsmen, weavers,etc. spread throughout the country and also from National Awardees,State Awardees, women organizations, minority and from weakersections, etc. The retails prices and quality of products of CCICIare considered a benchmark in the trade.
Main Products Unit Performance during
2011-12 2010-11
Trading (Handicrafts & ` in Crore 72.49 63.34Handlooms)
The physical performance of the company during the previoustwo years is mentioned below:
The Company registered a growth of `̀̀̀̀ 9.59 crore in totalrevenue during 2011-12 which went up to ̀̀̀̀̀ 76.91 crore in 2011-12from `̀̀̀̀ 67.32 crore during 2010-11. The net profit of the companywas `̀̀̀̀ 0.49 crore during 2011-12, an increase of `̀̀̀̀ 1.37 crore overthe previous year's loss of `̀̀̀̀ 0.88 core due to increase in operatingincome.
The current ratio of company is at 1.65:1 during 2011-12 asagainst 1.59:1 in the previous year (Fig.2). Balance Sheet and Profit& Loss Account of the company and selected financial ratios duringthe period 2010-11 to 2011-12 can be seen on the adjoining page.
EBIT
DA
& P
AT (
Rs.
cro
re)
TOTAL R
EVENU
E (Rs. crore)
Fig. 1
Fig. 2
PRO
FITA
BIL
ITY
RAT
IOS
(%)
CU
RR
ENT R
ATIO

Public Enterprises Survey 2011-2012: Vol-II 373
Central Cottage Industries Corporation of India LimitedJawahar Vyapar Bhawan, Janpath, New Delhi- 110001
PROFIT & LOSS ACCOUNT (` in Lakhs)PARTICULARS 2011-12 2010-11(I) Revenue from Operations (Gross) 7225 6309Less : Excise Duty 27 4Revenue from Operations (Net) 7198 6305(II) Other Income 493 427(III) Total Revenue (I+II) 7691 6732(IV) Expenditure on:(a) Cost of materials consumed 121 100(b) Purchase of stock-in-trade 4019 3487(c) Changes in inventories of finished goods,work-in-progress and stock in trade -150 -13(d) Stores & Spares 0 0(e) Power & Fuel 129 106(f) Salary, Wages & Benefits/Employees Expense 2340 2060(g) Other Operating/direct/manufacturing Expenses 147 183(h) Rent, Royalty & Cess 378 383(i) Loss on sale of Assets/Investments 0 0(j) Other Expenses 680 505Total Expenditure (IV (a to j)) 7664 6811(V) PROFIT BEFORE DEPRECIATION, & IMPAIRMENT,FINANCE CHARGES/INTEREST, EXCEPTIONAL &EXTRAORDINARY ITEMS & TAXES (PBDIEET)(III-IV) 27 -79(VI) Depreciation, Depletion & Amortisation 61 57(VII) Impairment 0 0(VIII) PROFIT BEFORE FINANCE COST/INTEREST,EXCEPTIONAL, EXTRA-ORDINARY ITEMS & TAXES(PBIEET)(V-VI-VII) -34 -136(IX) Finance Cost(a) On Central Government Loans 0 0(b) On Foreign Loans
0 0(c) Others 1 1(d) Less Finance Cost Capitalised 0 0(e) Charged to P & L Account (a+b+c+d) 1 1(X) PROFIT BEFORE EXCEPTIONAL & EXTRA-ORDINARYITEMS & TAX (PBEET)(VIII-IXe) -35 -137(XI) Exceptional Items -102 -38(XII) PROFIT BEFORE EXTRA-ORDINARY ITEMS & TAX(PBET)(X-XI) 67 -99(XIII) Extra-Ordinary Items 0 0(XIV) PROFIT BEFORE TAX (PBT)(XII-XIII) 67 -99(XV) TAX PROVISIONS 18 -11(XVI) NET PROFIT / LOSS FOR THE PERIOD FROMCONTINUING OPERATIONS AFTER TAX(XIV-XV) 49 -88(XVII) Profit/Loss from discontinuing operations 0 0(XVIII) Tax expenses of discontinuing operations 0 0(XIX) Profit/Loss from discontinuing operations (after Tax)(XVII-XVIII) 0 0(XX) Profit/Loss for the period (XVI+XIX) 49 -88Financial Ratios(i) Sales : Capital Employed 331.55 293.94(ii) Cost of Sales : Sales 107.32 108.93(iii) Salary/Wages : Sales 32.51 32.67(iv) Net Profit : Net Worth 2.26 -4.1(v) Debt : Equity 0 0(vi) Current Ratio 1.65 1.59(vii) Trade Recievables : Sales 1.61 4.46(viii) Total Inventory : Sales 9.84 8.64
BALANCE SHEET ( `̀̀̀̀ in Lakhs)PARTICULARS 2011-12 2010-11I. EQUITY & LIABILITIESAUTHORISED CAPITAL 1200 1200(1) Shareholders’ Funds(a) Share Capital(i) Central Govt 1085 1085(ii) Others 0 0(b) Reserves & Surplus 1086 1060(c) Money received against share warrants 0 0Total Shareholders’ Funds (1(a)+1(b)+1(c) 2171 2145(2) Share application money pending allotment 0 0(3) Non-current Liabilities(a) Long Term Borrowings 0 0(b) Deferred tax liabilities (Net) 0 0(c) Other Long-term liabilities 94 42(d) Long-term provisions 2483 2289Total Non-Current Liabilities 3(a) to 3(d) 2577 2331(4) Current Liabilities(a) Short Term Borrowings 32 0(b) Trade Payables 983 999(c) Other current liabilities 677 826(d) Short-term provisions 1878 1679Total Current Liabilities 4(a) to 4(d) 3570 3504TOTAL EQUITY & LIABILITIES (1+2+3+4) 8318 7980II. ASSETS(1) Non-Current Assets(a) Total Gross Fixed Assets 2179 2155(ai) Accumulated Depreciation, Depletion & Amortisation 958 929(aii) Accumulated Impairment 0 0(b) Total Net Fixed Assets ((a)-(ai)-(aii) 1221 1226(c) Capital work in progress 1 0(d) Intangible assets under developmet 0 0(e) Non-Current Investments 0 0(f) Deferred Tax Assets (Net) 1126 1052(g) Long Term Loans and Advances 86 123(h) Other Non-Current Assets 9 10Total Non-Current Assets (b+c+d+e+f+g+h) 2443 2411(2) Current Assets(a) Current Investments 0 0(b) Inventories 708 545(c) Trade Recievables 116 281(d) Cash & Bank Balance 4532 4143(e) Short-term Loans & Advances 444 537(f) Other Current Assets 75 63Total Current Assets (a+b+c+d+e+f) 5875 5569TOTAL ASSETS (1+2) 8318 7980Important Indicators(i) Investment 1085 1085(ii) Capital Employed 2171 2145(iii) Net Worth 2171 2145(iv) Net Current Assets 2305 2065(v) Cost of Sales 7725 6868(vi) Net Value Added (at market price) 3120 2451(vii) Total Regular Employees (Nos.) 321 325(viii) Avg. Monthly Emoluments per Employee(`) 60748 52821

Trading & Marketing Services374
The Cotton Corporation of India Ltd.
The CompanyCotton Corporation of India Ltd. (CCIL) was incorporated on
31.07.1970 under the Companies Act, 1956 with an objective to act asa canalizing agency for import of cotton particularly for long and extralong staple varieties. Subsequently, the role of the Corporationunderwent changes on several occasions and currently the broadobjectives are to ensure remunerative and competitive prices to thecotton farmers; to supply cotton to textile industry on reasonableprices; domestic sales operations at negligible margin in order to passon larger benefit to cotton growers; increasing supplies of contaminationfree cotton to meet growing demand of textile mills etc.
CCI is a Schedule 'B' CPSE in Trading and Marketing Servicessector under the administrative control of M/o Textiles with 100%shareholding by the Government of India. The company employed1113 regular employees (Executives 124 & Non-Executives 989) ason 31.3.2012. Its Registered and Corporate office is at Navi Mumbai,Maharashtra.Vision/Mission
The Vision / Mission of the company is to rendering help tothe cotton farmers by way of social services and endeavouring toattain commercial gain by sustained growth of the corporation.Industrial / Business Operations
CCI is engaged in providing services in carrying out pricesupport operations, whenever the market prices of kapas touch thesupport prices announced by the Government without anyquantitative limit and commercial operations at the Company'sown risk; undertaking developmental activities related toproductivity and quality of cotton through its 18 branch offices(including Corporate Office) to cover 83 districts and 303procurement centers in various cotton growing states. The servicesegment of the company comprises of Sale and Purchase of Kapas.Performance Highlights
The performance details of domestic cotton processing duringlast two years are as follows:—
www.cotcorp.com
Main Products Unit Performance during
2011-12 2010-11
Domestic Sales Lakh bales 8.02 12.68
Export sales Lakh bales 0.19 0.17
Strategic IssuesAs a Nodal Agency of Government of India to undertake price
support operations, Corporation keeps itself in preparedness tomeet the eventualities of price support operations. As and whenkapas prices touch the level of Minimum Support Price (MSP),kapas purchases are made under MSP operations without anyquantitative limits. Under these MSP operations, cotton farmersare free to offer their kapas produce to CCI and Corporationcontinues purchases of such kapas till the prices rule at MSP level.
In the event of kapas prices ruling above MSP level,Corporation undertakes commercial operations at its own cost forsupply of cotton to mills in the State sector as well as privatesector. All these operations are dovetailed to benefit the cottongrowers on the one hand and supply of quality cotton to the textilemills on the other hand.
EBIT
DA
& P
AT (
Rs.
cro
re) TO
TAL REVEN
UE (R
s. crore)
Fig. 1
PRO
FITA
BIL
ITY
RAT
IOS
(%)
CU
RR
ENT R
ATIO
Fig. 2
Total Revenue of the company registered a reduction of`̀̀̀̀ 983.45 crore during 2011-12, which went down from ̀̀̀̀̀ 2785.27crorein 2010-11 to ̀̀̀̀̀ 1801.82 crore in 2011-12. The losses of the companyhas also gone up by `̀̀̀̀ 178.85 crore to `̀̀̀̀ 179.89 crore in 2011-12,from `̀̀̀̀ 1.04.crore in previous year due to reduction in operation ofcompany as a result of downfall in sale rates. The sale realizationcould not match the cost and the value of closing stock lying with theCorporation has reduced, resulting in loss during the FY 2011-12.
The current ratio of company is at 1.56:1 during 2011-12 asagainst 1.15:1 in the pervious year (Fig.2). Balance Sheet and Profit& Loss Account of the company and selected financial ratios duringthe period 2010-11 to 2011-12 can be seen on the adjoining page.

Public Enterprises Survey 2011-2012: Vol-II 375
The Cotton Corporation of India Ltd.Kapas Bhavan, Sector 10, Plot No.3A, CBD-Belapur, Navi Mumbai 400 614
PROFIT & LOSS ACCOUNT (` in Lakhs)PARTICULARS 2011-12 2010-11(I) Revenue from Operations (Gross) 176560 276792Less : Excise Duty 0 0Revenue from Operations (Net) 176560 276792(II) Other Income 3622 1735(III) Total Revenue (I+II) 180182 278527(IV) Expenditure on:(a) Cost of materials consumed 44870 312651(b) Purchase of stock-in-trade 21 349(c) Changes in inventories of finished goods,work-in-progress and stock in trade 135866 -63530(d) Stores & Spares 0 0(e) Power & Fuel 107 66(f) Salary, Wages & Benefits/Employees Expense 7780 6793(g) Other Operating/direct/manufacturing Expenses 2584 10895(h) Rent, Royalty & Cess 63 92(i) Loss on sale of Assets/Investments 3 8(j) Other Expenses 1172 2631Total Expenditure (IV (a to j)) 192466 269955(V) PROFIT BEFORE DEPRECIATION, & IMPAIRMENT,FINANCE CHARGES/INTEREST, EXCEPTIONAL &EXTRAORDINARY ITEMS & TAXES (PBDIEET)(III-IV) -12284 8572(VI) Depreciation, Depletion & Amortisation 343 238(VII) Impairment 0 0(VIII) PROFIT BEFORE FINANCE COST/INTEREST,EXCEPTIONAL, EXTRA-ORDINARY ITEMS & TAXES(PBIEET)(V-VI-VII) -12627 8334(IX) Finance Cost(a) On Central Government Loans 0 0(b) On Foreign Loans 0 0(c) Others 5823 8673(d) Less Finance Cost Capitalised 0 0(e) Charged to P & L Account (a+b+c+d) 5823 8673(X) PROFIT BEFORE EXCEPTIONAL & EXTRA-ORDINARYITEMS & TAX (PBEET)(VIII-IXe) -18450 -339(XI) Exceptional Items 0 0(XII) PROFIT BEFORE EXTRA-ORDINARY ITEMS & TAX(PBET)(X-XI) -18450 -339(XIII) Extra-Ordinary Items 0 0(XIV) PROFIT BEFORE TAX (PBT)(XII-XIII) -18450 -339(XV) TAX PROVISIONS -461 -243(XVI) NET PROFIT / LOSS FOR THE PERIOD FROMCONTINUING OPERATIONS AFTER TAX(XIV-XV) -17989 -96(XVII) Profit/Loss from discontinuing operations 0 0(XVIII) Tax expenses of discontinuing operations 0 0(XIX) Profit/Loss from discontinuing operations (after Tax)(XVII-XVIII) 0 0(XX) Profit/Loss for the period (XVI+XIX) -17989 -96Financial Ratios(i) Sales : Capital Employed 1010.18 780.42(ii) Cost of Sales : Sales 109.2 97.61(iii) Salary/Wages : Sales 4.41 2.45(iv) Net Profit : Net Worth -102.92 -0.27(v) Debt : Equity 0 0(vi) Current Ratio 1.56 1.15(vii) Trade Recievables : Sales 4.12 6.83(viii) Total Inventory : Sales 12.35 56.77
BALANCE SHEET ( `̀̀̀̀ in Lakhs)PARTICULARS 2011-12 2010-11I. EQUITY & LIABILITIES
AUTHORISED CAPITAL 7500 7500(1) Shareholders’ Funds(a) Share Capital(i) Central Govt 2500 2500(ii) Others 0 0(b) Reserves & Surplus 14978 32967(c) Money received against share warrants 0 0Total Shareholders’ Funds (1(a)+1(b)+1(c) 17478 35467(2) Share application money pending allotment 0 0(3) Non-current Liabilities(a) Long Term Borrowings 0 0(b) Deferred tax liabilities (Net) 0 0(c) Other Long-term liabilities 370 441(d) Long-term provisions 2651 1819Total Non-Current Liabilities 3(a) to 3(d) 3021 2260(4) Current Liabilities(a) Short Term Borrowings 6575 178500(b) Trade Payables 3366 1735(c) Other current liabilities 9592 21542(d) Short-term provisions 1655 1571Total Current Liabilities 4(a) to 4(d) 21188 203348TOTAL EQUITY & LIABILITIES (1+2+3+4) 41687 241075II. ASSETS(1) Non-Current Assets(a) Total Gross Fixed Assets 8315 7663(ai) Accumulated Depreciation, Depletion & Amortisation 2849 2530(aii) Accumulated Impairment 0 0(b) Total Net Fixed Assets ((a)-(ai)-(aii) 5466 5133(c) Capital work in progress 276 246(d) Intangible assets under developmet 0 28(e) Non-Current Investments 0 0(f) Deferred Tax Assets (Net) 1672 1383(g) Long Term Loans and Advances 949 874(h) Other Non-Current Assets 190 187Total Non-Current Assets (b+c+d+e+f+g+h) 8553 7851(2) Current Assets(a) Current Investments 0 0(b) Inventories 21813 157125(c) Trade Recievables 7269 18907(d) Cash & Bank Balance 368 50560(e) Short-term Loans & Advances 2408 3036(f) Other Current Assets 1276 3596Total Current Assets (a+b+c+d+e+f) 33134 233224TOTAL ASSETS (1+2) 41687 241075Important Indicators(i) Investment 2500 2500(ii) Capital Employed 17478 35467(iii) Net Worth 17478 35467(iv) Net Current Assets 11946 29876(v) Cost of Sales 192806 270185(vi) Net Value Added (at market price) -226 23526(vii) Total Regular Employees (Nos.) 1113 1181(viii) Avg. Monthly Emoluments per Employee(`) 58251 47933

Trading & Marketing Services376
Central Railside Warehouse Company Limited
The CompanyCentral Railside Warehouse Company Limited (CRWC) was
incorporated on 10.07.2007 with the broad objectives of providingquality storage facility at transit nodes and to maximize the use ofRailways assets so as to bring the economy of scales for customers,Railways and the company itself.
It is a Schedule-'C' CPSE in Trading & Marketing sector underthe administrative control of M/o Consumer Affairs, Food andPublic Distribution, Department of Food and Public Distribution.CRWCL is a subsidiary of Central Warehousing Corporation (CWC).The Company employed 43 regular employees (Executives 38 &Non-Executives 5) as on 31.03.2012. Its Registered and Corporateoffices are at New Delhi.
Vision / MissionThe Vision of the Company is to provide Multimodal Logistics
to the trade and support Indian Economy in reducing logistics cost.The Mission of the Company is to provide quality storage
facility at transit nodes, maximize the use of Railways assets; bringeconomy of scales for customers, Railways and CRWC.
Industrial / Business OperationsCRWC is engaged in promotion and development of Railside
Warehousing Complexes (RWCs) / Terminals / Multimodal LogisticsHub and providing seamless supply chain management system bybetter utilization of existing good-sheds of Railways. The companyhas 17 Railside Warehouse Complexes all over India as on 31.3.2012.
Performance HighlightsThe physical performances of the company for last two years
are given below:
www.crwc.in
Strategic IssuesThe other strategic objectives of the company are to plan,
develop, promote, acquire and operate Railside WarehousingComplexes / Terminals / Multi-modal Logistics Hub on land leasedfrom Railways or acquired otherwise; to promote and provideseamless supply chain management systems rail based logistics inIndia and abroad; to carry on the business of Multimodal transportoperations and aggregation / disaggregation of cargo both for domestic/ impex movement in India and abroad and to provide state-of-artwarehousing facilities and competitive modes of handling &transportation facilities of Cargo.
Main Products Unit Performance during
2011-12 2010-11
Operating RWCs No. 17 16
Wagons Handled No. 110580 96134
Quantity Handled Lakh MT 81.59 69.21
Warehousing Logistics ` in Crore 70.54 48.36
The Company registered an increase of ` 23.12 crore in totalrevenue during 2011-12 which went up to ̀̀̀̀̀ 74.20 crore in 2011-12from `̀̀̀̀ 51.08 crore during 2010-11. The net profit of the companyincreased to `̀̀̀̀ 13.31 crore, an increase of `̀̀̀̀ 6.09 crore over theprevious year profit of `̀̀̀̀ 7.22 crore due to increase in turnover.
The current ratio of company is at 0.8:1 during 2011-12 asagainst 0.67:1 in the previous year (Fig.2). Balance Sheet and Profit& Loss Account of the company and selected financial ratios duringthe period 2010-11 to 2011-12 can be seen on the adjoining page.
EBIT
DA
& P
AT (
Rs.
cro
re) TO
TAL REVEN
UE (R
s. crore)
Fig. 1
PRO
FITA
BIL
ITY
RAT
IOS
(%)
CU
RR
ENT R
ATIO
Fig. 2

Public Enterprises Survey 2011-2012: Vol-II 377
Central Railside Warehouse Company LimitedWarehousing Bhawan, 4/1, Siri Fort Institutiona Area, Hauz Khas, New Delhi 110 016
PROFIT & LOSS ACCOUNT (` in Lakhs)PARTICULARS 2011-12 2010-11(I) Revenue from Operations (Gross) 7388 5081 Less : Excise Duty 0 0 Revenue from Operations (Net) 7388 5081(II) Other Income 32 27(III) Total Revenue (I+II) 7420 5108(IV) Expenditure on: (a) Cost of materials consumed 0 0 (b) Purchase of stock-in-trade 0 0 (c) Changes in inventories of finished goods, work-in- 0 0
progress and stock in trade (d) Stores & Spares 0 0 (e) Power & Fuel 55 48 (f) Salary, Wages & Benefits/Employees Expense 380 334 (g) Other Operating/direct/manufacturing Expenses 3366 2183 (h) Rent, Royalty & Cess 0 0 (i) Loss on sale of Assets/Investments 0 0 (j) Other Expenses 678 530Total Expenditure (IV (a to j)) 4479 3095(V)PROFIT BEFORE DEPRECIATION, & IMPAIRMENT, 2941 2013
FINANCE CHARGES/INTEREST, EXCEPTIONAL &EXTRAORDINARY ITEMS & TAXES (PBDIEET)(III-IV)
(VI) Depreciation, Depletion & Amortisation 301 268(VII) Impairment 0 0(VIII) PROFIT BEFORE FINANCE COST/INTEREST, 2640 1745
EXCEPTIONAL, EXTRA-ORDINARY ITEMS & TAXES(PBIEET)(V-VI-VII)
(IX) Finance Cost (a) On Central Government Loans 0 0 (b) On Foreign Loans 0 0 (c) Others 708 611 (d) Less Finance Cost Capitalised 0 0 (e) Charged to P & L Account (a+b+c+d) 708 611(X)PROFIT BEFORE EXCEPTIONAL & EXTRA-ORDINARY 1932 1134
ITEMS & TAX (PBEET)(VIII-IXe)(XI) Exceptional Items 0 0(XII) PROFIT BEFORE EXTRA-ORDINARY ITEMS & TAX 1932 1134
(PBET)(X-XI)(XIII) Extra-Ordinary Items 0 0(XIV) PROFIT BEFORE TAX (PBT)(XII-XIII) 1932 1134(XV) TAX PROVISIONS 601 412(XVI) NET PROFIT / LOSS FOR THE PERIOD FROM 1331 722
CONTINUING OPERATIONS AFTER TAX(XIV-XV)(XVII) Profit/Loss from discontinuing operations 0 0(XVIII) Tax expenses of discontinuing operations 0 0(XIX) Profit/Loss from discontinuing operations (after Tax) 0 0
(XVII-XVIII)(XX) Profit/Loss for the period (XVI+XIX) 1331 722Financial Ratios (i) Sales : Capital Employed 49.4 35.3 (ii) Cost of Sales : Sales 64.7 66.19 (iii) Salary/Wages : Sales 5.14 6.57 (iv) Net Profit : Net Worth 18.72 12 (v) Debt : Equity 1.93 2.07 (vi) Current Ratio 0.80 0.67 (vii) Trade Recievables : Sales 8.38 8.36 (viii) Total Inventory : Sales 0 0
BALANCE SHEET ( `̀̀̀̀ in Lakhs)PARTICULARS 2011-12 2010-11I. EQUITY & LIABILITIESAUTHORISED CAPITAL 15000 15000(1) Shareholders’ Funds (a) Share Capital (i) Central Govt 0 0 (ii) Others 4056 4056 (b) Reserves & Surplus 3055 1961 (c) Money received against share warrants 0 0 Total Shareholders’ Funds (1(a)+1(b)+1(c) 7111 6017(2) Share application money pending allotment 0 0(3) Non-current Liabilities (a) Long Term Borrowings 7843 8378 (b) Deferred tax liabilities (Net) 1290 1004 (c) Other Long-term liabilities 0 0 (d) Long-term provisions 0 0 Total Non-Current Liabilities 3(a) to 3(d) 9133 9382(4) Current Liabilities (a) Short Term Borrowings 0 0 (b) Trade Payables 556 524 (c) Other current liabilities 1304 1238 (d) Short-term provisions 1138 657 Total Current Liabilities 4(a) to 4(d) 2998 2419TOTAL EQUITY & LIABILITIES (1+2+3+4) 19242 17818II. ASSETS(1) Non-Current Assets (a) Total Gross Fixed Assets 15743 14957 (ai) Accumulated Depreciation, Depletion & Amortisation 301 268 (aii) Accumulated Impairment 0 0 (b) Total Net Fixed Assets ((a)-(ai)-(aii) 15442 14689 (c) Capital work in progress 614 876 (d) Intangible assets under developmet 0 0 (e) Non-Current Investments 0 0 (f) Deferred Tax Assets (Net) 0 0 (g) Long Term Loans and Advances 438 632 (h) Other Non-Current Assets 344 0 Total Non-Current Assets (b+c+d+e+f+g+h) 16838 16197(2) Current Assets (a) Current Investments 0 0 (b) Inventories 0 0 (c) Trade Recievables 619 425 (d) Cash & Bank Balance 660 330 (e) Short-term Loans & Advances 1125 863 (f) Other Current Assets 0 3 Total Current Assets (a+b+c+d+e+f) 2404 1621TOTAL ASSETS (1+2) 19242 17818Important Indicators (i) Investment 11899 12434 (ii) Capital Employed 14954 14395 (iii) Net Worth 7111 6017 (iv) Net Current Assets -594 -798 (v) Cost of Sales 4780 3363 (vi) Net Value Added (at market price) 3957 2660 (vii) Total Regular Employees (Nos.) 43 42(viii) Avg. Monthly Emoluments per Employee(`) 73643 66270

Trading & Marketing Services378
Central Warehousing Corporation
The CompanyCentral Warehousing Corporation (CWC) was incorporated in
1957 under the Agricultural Produce (Development & Warehousing)Corporations Act 1956, which was subsequently repealed andreplaced by the Warehousing Corporations Act, 1962 with theobjective to meet the changing needs of agriculture, trade, industryand other sectors by providing scientific warehousing, logisticservices and related infrastructural facilities.
CWC is a Schedule-'A' Mini-ratna CPSE in Trading &Marketing sector under the administrative control of the M/oConsumer Affairs, Food & Public Distribution D/o Food & PublicDistribution with 55.1% shareholding by the Government of India.The rest of the holding is with SBI, 35 other scheduled banks, 7insurance companies, 6 other recognized associations / companiesdealing in agricultural produce and 400 cooperative societies. Thecompany employed 5492 regular employees (Executives 1365 &Non-Executives 4127) as on 31.3.2012. Its Registered and Corporateoffices are at New Delhi.
Vision / MissionThe Vision of the Company is to emerge as the leading global
market facilitator by providing integrated warehousing infrastructureand logistic services, as a support to India's economy, with emphasison customer's delight.
The Mission of the Company is to provide reliable, costeffective, value added and integrated warehousing and logisticssolutions in a socially responsible and environment friendly manner.
Industrial / Business OperationsCWC is engaged in providing services in the field of storage of
agricultural produce and inputs and industrial trade through its 468warehouses with a total storage capacity of 100.85 lakh MT as on31.3.2012. This included 66 Custom Bonded Warehouses, 4 AirCargo Complexes, 36 Container Freight Stations (CFSs) / InlandClearance Depots (ICDs) and 4 temperature controlled warehouses.CWC also runs 17 Railside Warehousing Complexes (RWCs)through its wholly owned subsidiary namely Central RailsideWarehouse Company Limited.
It has also subscribed to the 50% equity of 17 StateWarehousing Corporations (SWCs) with the respective StateGovernments holding the remaining 50%. The company has onefinancial joint venture namely National Multi Commodity Exchangeof India Ltd. (NMCE) with a shareholding of 29.70%.
Performance HighlightsThe average capacity utilization for all the products / services
of the company was 85% during 2011-12 as against 88% duringprevious year. The physical performances of the company for lasttwo years are given below:
www.cewacor.nic.in
`̀̀̀̀ 35.71 crore to `̀̀̀̀ 100.46 crore in 2011-12, from `̀̀̀̀ 136.17 crore inprevious year due to Extra-Ordinary Item namely provision of`̀̀̀̀100.13 crore for contribution towards employees' pension fundwith effect from 01.01.2007.
The current ratio of company is at 2.23:1 during 2011-12 asagainst 2.19:1 in the previous year (Fig.2). Balance Sheet and Profit& Loss Account of the company and selected financial ratios duringthe period 2010-11 to 2011-12 can be seen on the adjoining page.
Main Products Unit Performance during
2011-12 2010-11
Warehousing Lakh M.T. 91.87 90.77
Total Revenue of the company registered an increase of`̀̀̀̀ 189.10 crore during 2011-12, which went up from `̀̀̀̀ 1029.55crore in 2010-11 to `̀̀̀̀ 1218.65 crore in 2011-12 due to increase inoperating income. The profit of the company has gone down by
EBIT
DA
& P
AT (
Rs.
cro
re)
TOTAL R
EVENU
E (Rs. crore)
Fig. 1
PRO
FITA
BIL
ITY
RAT
IOS
(%)
CU
RR
ENT R
ATIO
Fig. 2
Strategic issuesAs a diversified activity, CWC has been running container
trains since 2007. It holds a Category-I license to operate containertrains on Pan India basis.
2010-11 2011-12
2010-11 2011-12

Public Enterprises Survey 2011-2012: Vol-II 379
Central Warehousing Corporation4/1, Siri Institutional Area, August Kranti Marg, Hauz Khas, New Delhi - 110 016
PROFIT & LOSS ACCOUNT (` in Lakhs)PARTICULARS 2011-12 2010-11(I) Revenue from Operations (Gross) 115204 97979Less : Excise Duty 0 0Revenue from Operations (Net) 115204 97979(II) Other Income 6661 4976(III) Total Revenue (I+II) 121865 102955(IV) Expenditure on:(a) Cost of materials consumed 0 0(b) Purchase of stock-in-trade 0 0(c) Changes in inventories of finished goods, work-in-progressand stock in trade 0 0(d) Stores & Spares 1546 1311(e) Power & Fuel 848 775(f) Salary, Wages & Benefits/Employees Expense 41627 36980(g) Other Operating/direct/manufacturing Expenses 35923 29993(h) Rent, Royalty & Cess 3770 3657(i) Loss on sale of Assets/Investments 0 34(j) Other Expenses 9072 7100Total Expenditure (IV (a to j)) 92786 79850(V) PROFIT BEFORE DEPRECIATION, & IMPAIRMENT, FINANCECHARGES/INTEREST, EXCEPTIONAL & EXTRAORDINARYITEMS & TAXES (PBDIEET)(III-IV) 29079 23105(VI) Depreciation, Depletion & Amortisation 2520 2507(VII) Impairment 0 1(VIII) PROFIT BEFORE FINANCE COST/INTEREST,EXCEPTIONAL, EXTRA-ORDINARY ITEMS & TAXES (PBIEET)(V-VI-VII) 26559 20597(IX) Finance Cost(a) On Central Government Loans 0 0(b) On Foreign Loans 0 0(c) Others 634 224(d) Less Finance Cost Capitalised 0 0(e) Charged to P & L Account (a+b+c+d) 634 224(X) PROFIT BEFORE EXCEPTIONAL & EXTRA-ORDINARYITEMS & TAX (PBEET)(VIII-IXe) 25925 20373(XI) Exceptional Items 0 0(XII) PROFIT BEFORE EXTRA-ORDINARY ITEMS & TAX(PBET)(X-XI) 25925 20373(XIII) Extra-Ordinary Items 10013 0(XIV) PROFIT BEFORE TAX (PBT)(XII-XIII) 15912 20373(XV) TAX PROVISIONS 5866 6756(XVI) NET PROFIT / LOSS FOR THE PERIOD FROMCONTINUING OPERATIONS AFTER TAX(XIV-XV) 10046 13617(XVII) Profit/Loss from discontinuing operations 0 0(XVIII) Tax expenses of discontinuing operations 0 0(XIX) Profit/Loss from discontinuing operations (after Tax)(XVII-XVIII) 0 0(XX) Profit/Loss for the period (XVI+XIX) 10046 13617Financial Ratios(i) Sales : Capital Employed 86.24 77.67(ii) Cost of Sales : Sales 82.73 84.02(iii) Salary/Wages : Sales 36.13 37.74(iv) Net Profit : Net Worth 7.52 10.79(v) Debt : Equity 0 0(vi) Current Ratio 2.23 2.19(vii) Trade Recievables : Sales 20.15 23.69(viii) Total Inventory : Sales 0.57 0.74
BALANCE SHEET (` in Lakhs)PARTICULARS 2011-12 2010-11I. EQUITY & LIABILITIESAUTHORISED CAPITAL 10000 10000(1) Shareholders’ Funds(a) Share Capital(i) Central Govt 3742 3742(ii) Others 3060 3060(b) Reserves & Surplus 126778 119349(c) Money received against share warrants 0 0Total Shareholders’ Funds (1(a)+1(b)+1(c) 133580 126151(2) Share application money pending allotment 0 0(3) Non-current Liabilities(a) Long Term Borrowings 0 0(b) Deferred tax liabilities (Net) 3483 4816(c) Other Long-term liabilities 0 0(d) Long-term provisions 44447 36005Total Non-Current Liabilities 3(a) to 3(d) 47930 40821(4) Current Liabilities(a) Short Term Borrowings 0 0(b) Trade Payables 5822 4767(c) Other current liabilities 20468 18039(d) Short-term provisions 19924 20487Total Current Liabilities 4(a) to 4(d) 46214 43293TOTAL EQUITY & LIABILITIES (1+2+3+4) 227724 210265II. ASSETS(1) Non-Current Assets(a) Total Gross Fixed Assets 136008 125400(ai) Accumulated Depreciation, Depletion & Amortisation 32131 29664(aii) Accumulated Impairment 0 0(b) Total Net Fixed Assets ((a)-(ai)-(aii) 103877 95736(c) Capital work in progress 3158 2250(d) Intangible assets under developmet 0 0(e) Non-Current Investments 11001 10926(f) Deferred Tax Assets (Net) 0 0(g) Long Term Loans and Advances 6686 6494(h) Other Non-Current Assets 0 0Total Non-Current Assets (b+c+d+e+f+g+h) 124722 115406(2) Current Assets(a) Current Investments 0 0(b) Inventories 657 723(c) Trade Recievables 23218 23213(d) Cash & Bank Balance 49148 38082(e) Short-term Loans & Advances 332 224(f) Other Current Assets 29647 32617Total Current Assets (a+b+c+d+e+f) 103002 94859TOTAL ASSETS (1+2) 227724 210265Important Indicators(i) Investment 6802 6802(ii) Capital Employed 133580 126151(iii) Net Worth 133580 126151(iv) Net Current Assets 56788 51566(v) Cost of Sales 95306 82324(vi) Net Value Added (at market price) 67205 66087(vii) Total Regular Employees (Nos.) 5492 5667(viii) Avg. Monthly Emoluments per Employee(`) 63163 54379

Trading & Marketing Services380
Food Corporation of India
The CompanyFood Corporation of India (FCI) was incorporated in 1965 as
No-Profit No-Loss making company under Food Corporation Act,1964 with the objectives of providing minimum price support tofarmers and supplying food-grains to the general public under thePublic Distribution System. Through maintaining a buffer stock offood grains, it also ensures national food security.
FCI is a Schedule-'A' CPSE in Trading & Marketing sectorunder the administrative control of M/o Consumer Affairs, Foodand Public Distribution, D/o Food and Public Distribution with100% shareholding by the Government of India. The companyemployed 29434 Regular employees (Executives 5617 & Non-Executives 23817) as on 31.3.2012. Its registered office is at NewDelhi.
Vision / MissionThe Vision of the Corporation is to initiate procurement of
non-MSP governed commodities on commercial principles and toensure adequate buffer for meeting requirements under TPDS &Other Welfare Schemes.
The Mission of the Corporation is to introduce State of ArtFinancial Management in order to reduce the dependency on thepresent banking system in the country.
Industrial / Business OperationsFCI is the main agency of the Central Government for
procurement, storage and distribution of food grains through its165 district offices spread all over the country to ensure steadyfood grain supplies to 5 lakhs Fair Price Shops (FPS) under PublicDistribution System (PDS). The FCI has State-of-the-ArtTechnology on food grain preservation, warehousing, transportationand management.
Performance Highlights The company has not provided any details of its physical
performance during last two years. As per provisional informationreceived, the total Revenue of the company registered an increaseof `̀̀̀̀ 12981.10 crore during 2011-12 which went up to `̀̀̀̀ 95559.51crore in 2011-12 from `̀̀̀̀ 82578.41 crore during 2010-11. Thecompany has shown No-Profit-No-Loss for the year 2011-12 asagainst a loss of `̀̀̀̀ 5.80 crore during previous year due to adjustmentof income pertaining to prior years (Net).
The current ratio of company is at 1.03:1 during 2011-12 asagainst 1.07:1 in the previous year (Fig.2). Balance Sheet and Profit& Loss Account of the company and selected financial ratios duringthe period 2010-11 to 2011-12 can be seen on the adjoining page.
Strategic issuesThe procurement and issue price of food grains is fixed by the
Government of India and the difference between the economic costand rates realization is reimbursed by the Government as subsidy.The Government of India also provides budgetary support to theCorporation for meeting capital expenditure such as construction www.fciweb.nic.in
of storage, godowns etc. During the year 2011-12, FCI received asubsidy of ` 67934.16 crore as against ` 56394.42 crore duringprevious year.
As a major player in food grain management within the country,FCI is now endeavoring to reduce burden on food subsidy throughbetter financial Management, improved stock / inventorymanagement and real time on-line system. It has recently launchedthe IISFM (Integrated Information System for Food GrainsManagement) in collaboration with NIC.
TOTAL R
EVENU
E (Rs. crore)
Fig. 1
PRO
FITA
BIL
ITY
RAT
IOS
(%)
CU
RR
ENT R
ATIO
Fig. 2
EBIT
DA
& P
AT (
Rs.
cro
re)

Public Enterprises Survey 2011-2012: Vol-II 381
Food Corporation of India16-20, Barakhamba Lane,New Delhi-110 001
PROFIT & LOSS ACCOUNT (` in Lakhs)PARTICULARS 2011-12 2010-11(I) Revenue from Operations (Gross) 9495133 8224505Less : Excise Duty 0 0Revenue from Operations (Net) 9495133 8224505(II) Other Income 60818 33336(III) Total Revenue (I+II) 9555951 8257841(IV) Expenditure on:(a) Cost of materials consumed 0 0(b) Purchase of stock-in-trade 8766942 7332471(c) Changes in inventories of finished goods,work-in-progress and stock in trade -935866 -495028(d) Stores & Spares 0 0(e) Power & Fuel 1926 1826(f) Salary, Wages & Benefits/Employees Expense 224770 234597(g) Other Operating/direct/manufacturing Expenses 830614 743893(h) Rent, Royalty & Cess 111807 90670(i) Loss on sale of Assets/Investments 0 0(j) Other Expenses 29008 25889Total Expenditure (IV (a to j)) 9029201 7934318(V) PROFIT BEFORE DEPRECIATION, & IMPAIRMENT,FINANCE CHARGES/INTEREST, EXCEPTIONAL &EXTRAORDINARY ITEMS & TAXES (PBDIEET)(III-IV) 526750 323523(VI) Depreciation, Depletion & Amortisation 3224 3712(VII) Impairment 0 0(VIII) PROFIT BEFORE FINANCE COST/INTEREST,EXCEPTIONAL, EXTRA-ORDINARY ITEMS & TAXES(PBIEET)(V-VI-VII) 523526 319811(IX) Finance Cost(a) On Central Government Loans 144164 0(b) On Foreign Loans
0 0(c) Others 378492 320434(d) Less Finance Cost Capitalised 0 0(e) Charged to P & L Account (a+b+c+d) 522656 320434(X) PROFIT BEFORE EXCEPTIONAL & EXTRA-ORDINARYITEMS & TAX (PBEET)(VIII-IXe) 870 -623(XI) Exceptional Items 0 0(XII) PROFIT BEFORE EXTRA-ORDINARY ITEMS & TAX(PBET)(X-XI) 870 -623(XIII) Extra-Ordinary Items 870 -43(XIV) PROFIT BEFORE TAX (PBT)(XII-XIII) 0 -580(XV) TAX PROVISIONS 0 0(XVI) NET PROFIT / LOSS FOR THE PERIOD FROMCONTINUING OPERATIONS AFTER TAX(XIV-XV) 0 -580(XVII) Profit/Loss from discontinuing operations 0 0(XVIII) Tax expenses of discontinuing operations 0 0(XIX) Profit/Loss from discontinuing operations(after Tax)(XVII-XVIII) 0 0(XX) Profit/Loss for the period (XVI+XIX) 0 -580Financial Ratios(i) Sales : Capital Employed 1543.91 1351.21(ii) Cost of Sales : Sales 95.13 96.52(iii) Salary/Wages : Sales 2.37 2.85(iv) Net Profit : Net Worth 0 -0.27(v) Debt : Equity 1.48 1.52(vi) Current Ratio 1.03 1.07(vii) Trade Recievables : Sales 26.88 22.09(viii) Total Inventory : Sales 52.37 49.09
BALANCE SHEET ( `̀̀̀̀ in Lakhs)PARTICULARS 2011-12 2010-11I. EQUITY & LIABILITIES
AUTHORISED CAPITAL 350000 350000(1) Shareholders’ Funds(a) Share Capital(i) Central Govt 264967 258773(ii) Others 0 0(b) Reserves & Surplus -43040 -43063(c) Money received against share warrants 0 0Total Shareholders’ Funds (1(a)+1(b)+1(c) 221927 215710(2) Share application money pending allotment 0 0(3) Non-current Liabilities(a) Long Term Borrowings 393077 392965(b) Deferred tax liabilities (Net) 0 0(c) Other Long-term liabilities 0 0(d) Long-term provisions 0 0Total Non-Current Liabilities 3(a) to 3(d) 393077 392965(4) Current Liabilities(a) Short Term Borrowings 5751708 4215954(b) Trade Payables 1525187 1626491(c) Other current liabilities 126731 53040(d) Short-term provisions 0 0Total Current Liabilities 4(a) to 4(d) 7403626 5895485TOTAL EQUITY & LIABILITIES (1+2+3+4) 8018630 6504160II. ASSETS(1) Non-Current Assets(a) Total Gross Fixed Assets 137857 133638(ai) Accumulated Depreciation, Depletion & Amortisation 100213 97077(aii) Accumulated Impairment 0 0(b) Total Net Fixed Assets ((a)-(ai)-(aii) 37644 36561(c) Capital work in progress 7361 2774(d) Intangible assets under developmet 0 0(e) Non-Current Investments 0 0(f) Deferred Tax Assets (Net) 0 0(g) Long Term Loans and Advances 218840 102986(h) Other Non-Current Assets 109641 68477Total Non-Current Assets (b+c+d+e+f+g+h) 373486 210798(2) Current Assets(a) Current Investments 0 0(b) Inventories 4972914 4037047(c) Trade Recievables 2552679 1817003(d) Cash & Bank Balance 355 380622(e) Short-term Loans & Advances 0 0(f) Other Current Assets 119196 58690Total Current Assets (a+b+c+d+e+f) 7645144 6293362TOTAL ASSETS (1+2) 8018630 6504160Important Indicators(i) Investment 658044 651738(ii) Capital Employed 615004 608675(iii) Net Worth 221927 215710(iv) Net Current Assets 241518 397877(v) Cost of Sales 9032425 7938030(vi) Net Value Added (at market price) 859233 645121(vii) Total Regular Employees (Nos.) 29434 30656(viii) Avg. Monthly Emoluments per Employee(`) 63637 63771
2011-12 Provisional

Trading & Marketing Services382
Handicrafts and Handlooms Exports Corporations of India Limited
The CompanyHandicrafts and Handlooms Exports Corporations of India
Limited (HHEC) was incorporated on 11.4.1958 with the objectiveof export promotion and developing trade of handicrafts andhandlooms products, and products of village industries. Since thenthe product range has spread from handicraft and handloom fabricsto hand-knitted carpets, fashion garments, gold and silver jewellery/articles.
HHEC is a Schedule-'B' CPSE in Trading & Marketing sectorunder the administrative control of M/o Textiles with 100%shareholding by the Government of India.The company employed134 regular employees (Executives 61, Non-executives 73) as on31.3.2012. Its Registered at New Delhi & and Corporate office is atNOIDA, UP
Vision / MissionThe Vision of the company is to keep India alive on the world
map for demand of craftsmanship products by continuouslyadapting supply of Indian craftsmanship products to the changingconsumer habits on a continuous basis, to develop and supply newproducts of high quality at the right price, to provide a sustainablelivelihood to Indian craft persons and weavers.
The Mission of the company is to develop, promote andaggressively market the products of Indian crafts and skills abroadthereby providing a marketing channel for craftsmen and artisansand to continuously create demand for Indian crafts and skills inorder to enhance the income and profitability of Indian craftsmenand weavers.
Industrial / Business OperationsHHEC is engaged in export & domestic sales of handicrafts,
handlooms products, ready-to-wear garments (includingmanufacturing), carpets, sales of gold and silver jewellery / articlesand import & domestic sale of bullion. The company has fiveregional offices at Noida in UP, Chennai in Tamil Nadu, Mumbai inMaharashtra, Ahmedabad in Gujarat and Kolkata in West Bengal.
Performance HighlightsThe physical performances of the company for last two years
are given below:
www.hhecworld.in
`̀̀̀̀ 0.93 crore due to increase in turnover of all three segments ofoperation namely core group exports, bullion imports, retail salesand optimum utilization of the idle assets etc.
The current ratio of company is at 1:1 during 2011-12 &2010-11 (Fig.2). Balance Sheet and Profit & Loss Account of thecompany and selected financial ratios during the period 2010-11 to2011-12 can be seen on the adjoining page.
Main Products Unit Performance during
2011-12 2010-11
Manufactured Goods ` in Crore 31.33 28.45
Traded Goods ` in Crore 12094.95 4978.18
The Company registered an increase of ̀̀̀̀̀ 7121.34crore in netrevenue during 2011-12 which went up to ̀̀̀̀̀ 12135.64crore in 2011-12 from `̀̀̀̀ 5014.30crore during 2010-11 due to increase in Bullionimports. The net profit of the company increased to `̀̀̀̀ 2.16 crore,an increase of `̀̀̀̀ 1.23 crore over the previous year's profit of
Strategic issueThe corporation has been exploring new market opportunities.
HHEC has positioned itself for retail outlets in leading museum inIndia with view to showcase the museum objects on themerchandise.HHEC has developed a lot of new product series likeeco friendly products in banana fiber, istra grass, sabaii grass etc.
TOTAL R
EVENU
E (Rs. crore)
Fig. 1
Fig. 2
EBIT
DA
& P
AT (
Rs.
cro
re)
PRO
FITA
BIL
ITY
RAT
IOS
(%)
CU
RR
ENT R
ATIO

Public Enterprises Survey 2011-2012: Vol-II 383
Handicrafts and Handlooms Exports Corporations of India LimitedJawaharVyaparBhawanAnnexe, 1, Tolstoy Marg New Delhi - 110 001
PROFIT & LOSS ACCOUNT (` in Lakhs)PARTICULARS 2011-12 2010-11(I) Revenue from Operations (Gross) 1212821 500819Less : Excise Duty 4 0Revenue from Operations (Net) 1212817 500819(II) Other Income 747 611(III) Total Revenue (I+II) 1213564 501430(IV) Expenditure on:(a) Cost of materials consumed 2435 2351(b) Purchase of stock-in-trade
1214911 498472(c) Changes in inventories of finished goods,work-in-progress and stock in trade -6423 -1137(d) Stores & Spares 0 0(e) Power & Fuel 51 48(f) Salary, Wages & Benefits/Employees Expense 721 646(g) Other Operating/direct/manufacturing Expenses 182 179(h) Rent, Royalty & Cess 0 0(i) Loss on sale of Assets/Investments 1 1(j) Other Expenses 784 746Total Expenditure (IV (a to j)) 1212662 501306(V) PROFIT BEFORE DEPRECIATION, & IMPAIRMENT,FINANCE CHARGES/INTEREST, EXCEPTIONAL &EXTRAORDINARY ITEMS & TAXES (PBDIEET)(III-IV) 902 124(VI) Depreciation, Depletion & Amortisation 53 50(VII) Impairment 0 0(VIII) PROFIT BEFORE FINANCE COST/INTEREST,EXCEPTIONAL, EXTRA-ORDINARY ITEMS & TAXES(PBIEET)(V-VI-VII) 849 74(IX) Finance Cost(a) On Central Government Loans 0 0(b) On Foreign Loans 0 0(c) Others 2 7(d) Less Finance Cost Capitalised 0 0(e) Charged to P & L Account (a+b+c+d) 2 7(X) PROFIT BEFORE EXCEPTIONAL & EXTRA-ORDINARYITEMS & TAX (PBEET)(VIII-IXe) 847 67(XI) Exceptional Items 1157 -38(XII) PROFIT BEFORE EXTRA-ORDINARY ITEMS & TAX(PBET)(X-XI) -310 105(XIII) Extra-Ordinary Items 0 0(XIV) PROFIT BEFORE TAX (PBT)(XII-XIII) -310 105(XV) TAX PROVISIONS -526 13(XVI) NET PROFIT / LOSS FOR THE PERIOD FROMCONTINUING OPERATIONS AFTER TAX(XIV-XV) 216 92(XVII) Profit/Loss from discontinuing operations 0 0(XVIII) Tax expenses of discontinuing operations 0 0(XIX) Profit/Loss from discontinuing operations (after Tax)(XVII-XVIII) 0 0(XX) Profit/Loss for the period (XVI+XIX) 216 92Financial Ratios(i) Sales : Capital Employed 76086.39 36343.9(ii) Cost of Sales : Sales 99.99 100.11(iii) Salary/Wages : Sales 0.06 0.13(iv) Net Profit : Net Worth 13.55 6.68(v) Debt : Equity 0 0(vi) Current Ratio 1 1(vii) Trade Recievables : Sales 0.27 0.4(viii) Total Inventory : Sales 0.82 0.71
BALANCE SHEET ( `̀̀̀̀ in Lakhs)PARTICULARS 2011-12 2010-11I. EQUITY & LIABILITIESAUTHORISED CAPITAL 2000 2000(1) Shareholders’ Funds(a) Share Capital(i) Central Govt 1382 1382(ii) Others 0 0(b) Reserves & Surplus 212 -4(c) Money received against share warrants 0 0Total Shareholders’ Funds (1(a)+1(b)+1(c) 1594 1378(2) Share application money pending allotment 0 0(3) Non-current Liabilities(a) Long Term Borrowings 0 0(b) Deferred tax liabilities (Net) 129 0(c) Other Long-term liabilities 448 535(d) Long-term provisions 610 583Total Non-Current Liabilities 3(a) to 3(d) 1187 1118(4) Current Liabilities(a) Short Term Borrowings 167 86(b) Trade Payables 8255 12401(c) Other current liabilities 362272 251374(d) Short-term provisions 1176 9Total Current Liabilities 4(a) to 4(d) 371870 263870TOTAL EQUITY & LIABILITIES (1+2+3+4) 374651 266366II. ASSETS(1) Non-Current Assets(a) Total Gross Fixed Assets 1617 1593(ai) Accumulated Depreciation, Depletion & Amortisation 670 629(aii) Accumulated Impairment 0 0(b) Total Net Fixed Assets ((a)-(ai)-(aii) 947 964(c) Capital work in progress 0 0(d) Intangible assets under developmet 0 0(e) Non-Current Investments 0 0(f) Deferred Tax Assets (Net) 691 0(g) Long Term Loans and Advances 576 550(h) Other Non-Current Assets 501 320Total Non-Current Assets (b+c+d+e+f+g+h) 2715 1834(2) Current Assets(a) Current Investments 0 0(b) Inventories 9958 3535(c) Trade Recievables 3229 1987(d) Cash & Bank Balance 5759 6103(e) Short-term Loans & Advances 452 341(f) Other Current Assets 352538 252566Total Current Assets (a+b+c+d+e+f) 371936 264532TOTAL ASSETS (1+2) 374651 266366Important Indicators(i) Investment 1382 1382(ii) Capital Employed 1594 1378(iii) Net Worth 1594 1378(iv) Net Current Assets 66 662(v) Cost of Sales 1212714 501355(vi) Net Value Added (at market price) 28530 12234(vii) Total Regular Employees (Nos.) 134 146(viii) Avg. Monthly Emoluments per Employee(`) 44838 36872

Trading & Marketing Services384
HMT (International) Ltd.
The CompanyHMT (International) Ltd. (HMT (I)) was incorporated in
1975 with the objective to carry on business in India andabroad. It is a wholly owned subsidiary of HMT Limited andis a Schedule-'B' / Mini-ratna CPSE in Trading and MarketingServices sector under the administrative control of M/o HeavyIndustries and Public Enterprises, D/o Heavy Industry. Thecompany employed 60 regular employees (Executives 54 &Non-Executives 6) as on 31.3.2012. Its Registered andCorporate offices are at Bangalore, Karnataka.
Vision / MissionThe Vision / Mission of the company is to carry on
business in India and abroad as exporters, importers andconsultants and to undertake project works and technicalservices abroad, sale of HMT products and other engineeringproducts.
Industrial / Business OperationsHMT(I) is involved in the export of HMT products,
associate products as well as setting up projects abroad forgroup companies for machines / watches.
Performance Highlight The physical performances of the company for last two years
are given below:
Total Revenue of the company registered an increase of`̀̀̀̀ 6.74 crore during 2011-12, which went up from ̀̀̀̀̀ 32.97 crorein 2010-11 to ̀̀̀̀̀ 39.71 crore in 2011-12. However, the profit ofthe company has gone up by `̀̀̀̀ 1.14 crore to `̀̀̀̀ 1.35 crore in2011-12, from ̀ ` ` ` ` 0.21 crore in previous year due to increasein operating income.
The current ratio of company is at 1.93:1 during 2011-12as against 2.39:1 in the previous year (Fig.2). Balance Sheetand Profit & Loss Account of the company and selectedfinancial ratios during the period 2010-11 to 2011-12 can beseen on the adjoining page.
www.hmti.com
Main Products Unit Performance during
2011-12 2010-11
HMT Products &
Technical Services ` in Cr. 3.41 8.52
Agency & Others ` in Cr. 1.18 1.03
Projects & Services ` in Cr. 23.71 15.04
Sale of Imports ` in Cr. 4.10 3.24
Strategic issuesThe strategic and action plans for 2012-13 broadly focus
on high technology Machine Tools in the target markets,focus on Re-manufacturing & retrofitting of Machine Tools,aggressive marketing, trading & imports for other CPSEs andpurse with M/o External Affairs for grant in aid projects todifferent countries.
TOTAL R
EVENU
E (Rs. crore)
Fig. 1
Fig. 2
EBIT
DA
& P
AT (
Rs.
cro
re)
PRO
FITA
BIL
ITY
RAT
IOS
(%)
CU
RR
ENT R
ATIO

Public Enterprises Survey 2011-2012: Vol-II 385
HMT (International) Ltd.HMT Bhawan 59, Bellary Road, Bangalore-560 032.
BALANCE SHEET (` in Lakhs)PARTICULARS 2011-12 2010-11I. EQUITY & LIABILITIESAUTHORISED CAPITAL 800 800(1) Shareholders’ Funds(a) Share Capital(i) Central Govt 0 0(ii) Others 72 72(b) Reserves & Surplus 2598 2481(c) Money received against share warrants 0 0Total Shareholders’ Funds (1(a)+1(b)+1(c) 2670 2553(2) Share application money pending allotment 0 0(3) Non-current Liabilities(a) Long Term Borrowings 0 0(b) Deferred tax liabilities (Net) 115 114(c) Other Long-term liabilities 0 0(d) Long-term provisions 49 53Total Non-Current Liabilities 3(a) to 3(d) 164 167(4) Current Liabilities(a) Short Term Borrowings 0 0(b) Trade Payables 703 196(c) Other current liabilities 1156 751(d) Short-term provisions 679 649Total Current Liabilities 4(a) to 4(d) 2538 1596TOTAL EQUITY & LIABILITIES (1+2+3+4) 5372 4316II. ASSETS(1) Non-Current Assets(a) Total Gross Fixed Assets 739 735(ai) Accumulated Depreciation, Depletion & Amortisation 255 238(aii) Accumulated Impairment 0 0(b) Total Net Fixed Assets ((a)-(ai)-(aii) 484 497(c) Capital work in progress 0 0(d) Intangible assets under developmet 0 0(e) Non-Current Investments 0 0(f) Deferred Tax Assets (Net) 0 0(g) Long Term Loans and Advances 0 0(h) Other Non-Current Assets 0 0Total Non-Current Assets (b+c+d+e+f+g+h) 484 497(2) Current Assets(a) Current Investments 0 0(b) Inventories 41 0(c) Trade Recievables 1641 514(d) Cash & Bank Balance 2097 2298(e) Short-term Loans & Advances 1109 1007(f) Other Current Assets 0 0Total Current Assets (a+b+c+d+e+f) 4888 3819TOTAL ASSETS (1+2) 5372 4316Important Indicators(i) Investment 72 72(ii) Capital Employed 2670 2553(iii) Net Worth 2670 2553(iv) Net Current Assets 2350 2223(v) Cost of Sales 3512 2934(vi) Net Value Added (at market price) 684 400(vii) Total Regular Employees (Nos.) 60 59(viii) Avg. Monthly Emoluments per Employee(`) 67639 49718
PROFIT & LOSS ACCOUNT (` in Lakhs)PARTICULARS 2011-12 2010-11(I) Revenue from Operations (Gross) 3240 2789Less : Excise Duty 0 0Revenue from Operations (Net) 3240 2789(II) Other Income 731 508(III) Total Revenue (I+II) 3971 3297(IV) Expenditure on:(a) Cost of materials consumed 0 0(b) Purchase of stock-in-trade 2096 1757(c) Changes in inventories of finished goods,work-in-progress and stock in trade -24 52(d) Stores & Spares 0 0(e) Power & Fuel 0 0(f) Salary, Wages & Benefits/Employees Expense 487 352(g) Other Operating/direct/manufacturing Expenses 773 592(h) Rent, Royalty & Cess 21 16(i) Loss on sale of Assets/Investments 0 2(j) Other Expenses 140 147Total Expenditure (IV (a to j)) 3493 2918(V) PROFIT BEFORE DEPRECIATION, & IMPAIRMENT,FINANCE CHARGES/INTEREST, EXCEPTIONAL &EXTRAORDINARY ITEMS & TAXES (PBDIEET)(III-IV) 478 379(VI) Depreciation, Depletion & Amortisation 19 18(VII) Impairment 0 0(VIII) PROFIT BEFORE FINANCE COST/INTEREST,EXCEPTIONAL, EXTRA-ORDINARY ITEMS &TAXES (PBIEET)(V-VI-VII) 459 361(IX) Finance Cost(a) On Central Government Loans 0 0(b) On Foreign Loans
0 0(c) Others 2 1(d) Less Finance Cost Capitalised 0 0(e) Charged to P & L Account (a+b+c+d) 2 1(X) PROFIT BEFORE EXCEPTIONAL & EXTRA-ORDINARYITEMS & TAX (PBEET)(VIII-IXe) 457 360(XI) Exceptional Items 0 0(XII) PROFIT BEFORE EXTRA-ORDINARY ITEMS &TAX (PBET)(X-XI) 457 360(XIII) Extra-Ordinary Items 283 329(XIV) PROFIT BEFORE TAX (PBT)(XII-XIII) 174 31(XV) TAX PROVISIONS 39 10(XVI) NET PROFIT / LOSS FOR THE PERIOD FROMCONTINUING OPERATIONS AFTER TAX(XIV-XV) 135 21(XVII) Profit/Loss from discontinuing operations 0 0(XVIII) Tax expenses of discontinuing operations 0 0(XIX) Profit/Loss from discontinuing operations(after Tax)(XVII-XVIII) 0 0(XX) Profit/Loss for the period (XVI+XIX) 135 21Financial Ratios(i) Sales : Capital Employed 121.35 109.24(ii) Cost of Sales : Sales 108.4 105.2(iii) Salary/Wages : Sales 15.03 12.62(iv) Net Profit : Net Worth 5.06 0.82(v) Debt : Equity 0 0(vi) Current Ratio 1.93 2.39(vii) Trade Recievables : Sales 50.65 18.43(viii) Total Inventory : Sales 1.27 0
Trading & Marketing Services386
India Trade Promotion Organisation
The CompanyIndia Trade Promotion Organisation (ITPO) was incorporated
on 30.12.1976 with the objective to merge Trade DevelopmentAuthority (TDA), a Registered Society, under the administrativecontrol of the Ministry of Commerce & Industry with The TradeFair Authority of India (TFAI) with effect from 1st January, 1992.TFAI was earlier incorporated, under Section 25 of the IndianCompanies Act, 1956, on 30th December, 1976 by amalgamatingthree organizations of the Government of India viz. India InternationalTrade Fair Organization, Directorate of Exhibitions and CommercialPublicity and Indian Council of Trade Fairs and Exhibitions andcommenced operations with effect from 1st March, 1977.
ITPO is a Schedule-'B' Miniratna CPSE under theadministrative control of M/o Commerce and Industry, D/oCommerce with 100% shareholding by the Government of India.The company employed 1054 regular employees (Executives 111,Non-executives 943) as on 31.3.2012. Its Registered and Corporateoffices are at New Delhi. The four Regional Offices of ITPO arelocated in Mumbai, Kolkata, Chennai and Bangalore.
Vision/MissionThe Vision of the company is to be a leader amongst world
class trade promotion organizations leveraging India's strengthsinternationally.
The Mission of the company is to promote, facilitate,encourage and coordinate various activities and programmes toenhance India's share of export through trade in goods.
Industrial / Business OperationsITPO is engaged in providing services in promotion / facilitation
of trade through organizing / participating in trade fairs in India andabroad thereby increasing India's exports.
The company has two subsidiaries namely Karnataka TradePromotion Organisation and Tamil Nadu Trade Promotion Organisationwith share holding of 51% in each of them. ITPO also has a 50:50 JointVenture namely 'National Centre for Trade Information' (NCTI) alongwith the National Informatics Centre (NIC).
The service range of the company comprises of letting out theexhibition halls and convention centre to organize exhibitions, tradefairs and trade development and promotion through specializedprogrammes such as Buyers-Seller Meets and coordination ofbusiness delegations etc.
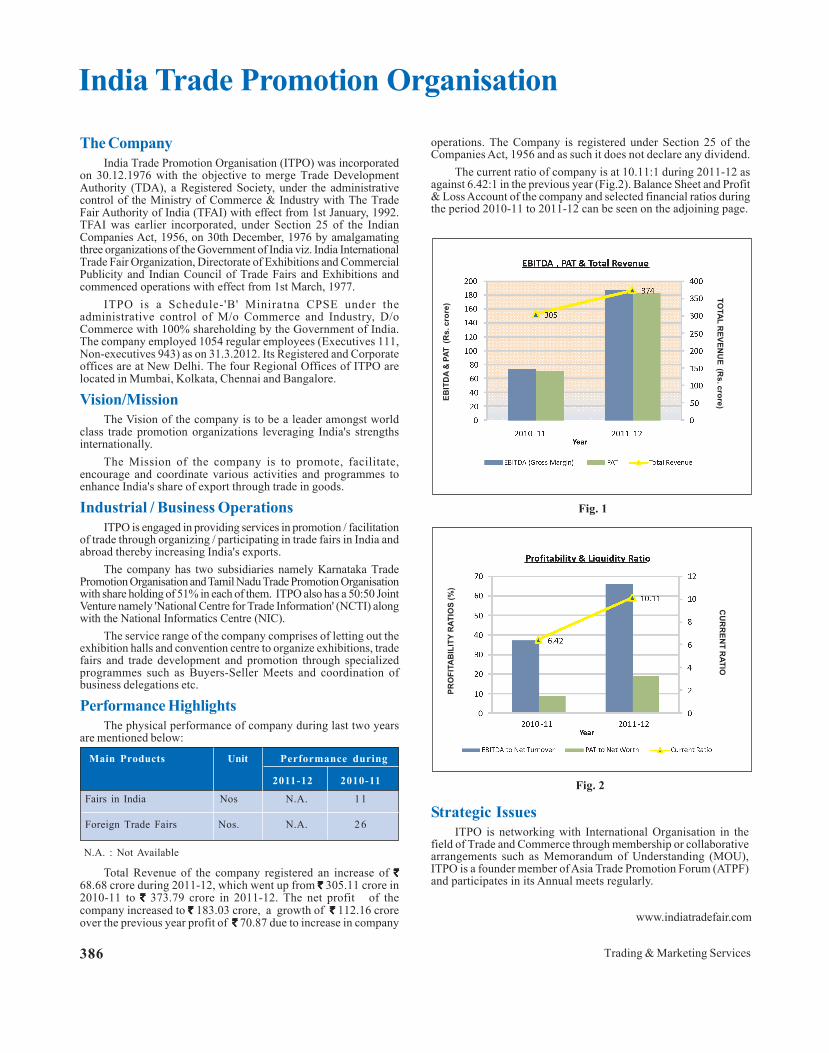
Performance HighlightsThe physical performance of company during last two years
are mentioned below:
operations. The Company is registered under Section 25 of theCompanies Act, 1956 and as such it does not declare any dividend.
The current ratio of company is at 10.11:1 during 2011-12 asagainst 6.42:1 in the previous year (Fig.2). Balance Sheet and Profit& Loss Account of the company and selected financial ratios duringthe period 2010-11 to 2011-12 can be seen on the adjoining page.
www.indiatradefair.com
Main Products Unit Performance during
2011-12 2010-11
Fairs in India Nos N.A. 11
Foreign Trade Fairs Nos. N.A. 26
N.A. : Not Available
EBIT
DA
& P
AT (
Rs.
cro
re)
TOTAL R
EVENU
E (Rs. crore)
Fig. 1
CU
RR
ENT R
ATIO
Fig. 2
PRO
FITA
BIL
ITY
RAT
IOS
(%)
Total Revenue of the company registered an increase of `̀̀̀̀68.68 crore during 2011-12, which went up from `̀̀̀̀ 305.11 crore in2010-11 to `̀̀̀̀ 373.79 crore in 2011-12. The net profit of thecompany increased to `̀̀̀̀ 183.03 crore, a growth of ` ̀` ̀` 112.16 croreover the previous year profit of `̀̀̀̀ 70.87 due to increase in company
Strategic IssuesITPO is networking with International Organisation in the
field of Trade and Commerce through membership or collaborativearrangements such as Memorandum of Understanding (MOU),ITPO is a founder member of Asia Trade Promotion Forum (ATPF)and participates in its Annual meets regularly.

Public Enterprises Survey 2011-2012: Vol-II 387
India Trade Promotion OrganisationPragati Bhawan, Pragati Maidan, New Delhi-110 001.
BALANCE SHEET (` in Lakhs)PARTICULARS 2011-12 2010-11I. EQUITY & LIABILITIESAUTHORISED CAPITAL 50 50(1) Shareholders’ Funds(a) Share Capital(i) Central Govt 25 25(ii) Others 0 0(b) Reserves & Surplus 96037 77734(c) Money received against share warrants 0 0Total Shareholders’ Funds (1(a)+1(b)+1(c) 96062 77759(2) Share application money pending allotment 0 0(3) Non-current Liabilities(a) Long Term Borrowings 0 0(b) Deferred tax liabilities (Net) 0 0(c) Other Long-term liabilities 501 155(d) Long-term provisions 4821 4206Total Non-Current Liabilities 3(a) to 3(d) 5322 4361(4) Current Liabilities(a) Short Term Borrowings 0 0(b) Trade Payables 1555 5489(c) Other current liabilities 5843 5787(d) Short-term provisions 2715 2152Total Current Liabilities 4(a) to 4(d) 10113 13428TOTAL EQUITY & LIABILITIES (1+2+3+4) 111497 95548II. ASSETS(1) Non-Current Assets(a) Total Gross Fixed Assets 10695 10635(ai) Accumulated Depreciation, Depletion & Amortisation 4895 4472(aii) Accumulated Impairment 0 0(b) Total Net Fixed Assets ((a)-(ai)-(aii) 5800 6163(c) Capital work in progress 84 156(d) Intangible assets under developmet 0 0(e) Non-Current Investments 1220 1220(f) Deferred Tax Assets (Net) 0 0(g) Long Term Loans and Advances 1697 1383(h) Other Non-Current Assets 406 392Total Non-Current Assets (b+c+d+e+f+g+h) 9207 9314(2) Current Assets(a) Current Investments 22 21(b) Inventories 0 0(c) Trade Recievables 1106 1020(d) Cash & Bank Balance 83000 73401(e) Short-term Loans & Advances 13610 7172(f) Other Current Assets 4552 4620Total Current Assets (a+b+c+d+e+f) 102290 86234TOTAL ASSETS (1+2) 111497 95548Important Indicators(i) Investment 25 25(ii) Capital Employed 96062 77759(iii) Net Worth 96062 77759(iv) Net Current Assets 92177 72806(v) Cost of Sales 19076 23424(vi) Net Value Added (at market price) 27692 11163(vii) Total Regular Employees (Nos.) 1054 1104(viii) Avg. Monthly Emoluments per Employee(`) 79491 71905
PROFIT & LOSS ACCOUNT (` in Lakhs)PARTICULARS 2011-12 2010-11(I) Revenue from Operations (Gross) 27318 18796Less : Excise Duty 0 0Revenue from Operations (Net) 27318 18796(II) Other Income 10061 11715(III) Total Revenue (I+II) 37379 30511(IV) Expenditure on:(a) Cost of materials consumed 0 0(b) Purchase of stock-in-trade 0 0(c) Changes in inventories of finished goods,work-in-progress and stock in trade 0 0(d) Stores & Spares 0 0(e) Power & Fuel 1982 1955(f) Salary, Wages & Benefits/Employees Expense 10054 9526(g) Other Operating/direct/manufacturing Expenses 2007 5732(h) Rent, Royalty & Cess 0 0(i) Loss on sale of Assets/Investments 0 0(j) Other Expenses 4595 5863Total Expenditure (IV (a to j)) 18638 23076(V) PROFIT BEFORE DEPRECIATION, & IMPAIRMENT,FINANCE CHARGES/INTEREST, EXCEPTIONAL &EXTRAORDINARY ITEMS & TAXES (PBDIEET)(III-IV) 18741 7435(VI) Depreciation, Depletion & Amortisation 438 348(VII) Impairment 0 0(VIII) PROFIT BEFORE FINANCE COST/INTEREST,EXCEPTIONAL, EXTRA-ORDINARY ITEMS &TAXES (PBIEET)(V-VI-VII) 18303 7087(IX) Finance Cost(a) On Central Government Loans 0 0(b) On Foreign Loans 0 0(c) Others 0 0(d) Less Finance Cost Capitalised 0 0(e) Charged to P & L Account (a+b+c+d) 0 0(X) PROFIT BEFORE EXCEPTIONAL &EXTRA-ORDINARY ITEMS & TAX (PBEET)(VIII-IXe) 18303 7087(XI) Exceptional Items 0 0(XII) PROFIT BEFORE EXTRA-ORDINARY ITEMS &TAX (PBET)(X-XI) 18303 7087(XIII) Extra-Ordinary Items 0 0(XIV) PROFIT BEFORE TAX (PBT)(XII-XIII) 18303 7087(XV) TAX PROVISIONS 0 0(XVI) NET PROFIT / LOSS FOR THE PERIOD FROMCONTINUING OPERATIONS AFTER TAX(XIV-XV) 18303 7087(XVII) Profit/Loss from discontinuing operations 0 0(XVIII) Tax expenses of discontinuing operations 0 0(XIX) Profit/Loss from discontinuing operations(after Tax)(XVII-XVIII) 0 0(XX) Profit/Loss for the period (XVI+XIX) 18303 7087Financial Ratios(i) Sales : Capital Employed 28.44 24.17(ii) Cost of Sales : Sales 69.83 124.62(iii) Salary/Wages : Sales 36.8 50.68(iv) Net Profit : Net Worth 19.05 9.11(v) Debt : Equity 0 0(vi) Current Ratio 10.11 6.42(vii) Trade Recievables : Sales 4.05 5.43(viii) Total Inventory : Sales 0 0

Trading & Marketing Services388
Jute Corporation of India Ltd.
The CompanyJute Corporation of India Ltd. (JCI) was incorporated in 1971
with the objective to work as on official agency by the Govt. of Indiawith the aim to provide minimum support price (MSP) to the jutecultivators and also work as a helping hand in the raw jute sector.
JCI is a Schedule-'C' CPSE in Trading & Marketing sectorunder the administrative control of M/o Textiles with 100%shareholding by the Government of India. The company employed848 regular employees (Executives 105 & Non-Executives 743) ason 31.3.2012. Its Registered and Corporate offices are at Kolkata,West Bengal.Vision / Mission
The Vision of the Company is to promote genuine interest ofjute growers in particular and jute economy at large through pricestabilization effort and as a quality leader in the jute trade.
The Mission of the Company is to implement the policy ofGOI for providing MSP to the jute growers of the country andundertake various extensive measures for implementation ofdifferent jute related projects.Industrial / Business Operations
The Jute Corporation of India with a wide network of 143Departmental Purchase Centre, 28 Sub Centers in Six (6) jutegrowing states namely West Bengal, Bihar, Assam, Tripura, Orissaand Andhra Pradesh undertook Raw Jute procurement activitiesfor the benefit of the jute farmers.
Since the corporation has been involved in price supportmechanism for jute growers, no operational data is available.Performance Highlights
Total Revenue of the company registered an increase of`̀̀̀̀ 71.75 crore during 2011-12, which went up from `̀̀̀̀ 60.17 crorein 2010-11 to `̀̀̀̀ 131.92 crore in 2011-12. The profit of the companyhas gone up by `̀̀̀̀ 25.66 crore to `̀̀̀̀ 14.18 crore, from a loss of `̀̀̀̀11.48 crore in previous year due to increase in operating income asa result of subsidy amount of (`̀̀̀̀ 55.00 crore per annum) to theCorporation for maintenance of Minimum Support Price (MSP)infrastructure along with operational efficiency and strict costcontrol.
The current ratio of company is at 2.77:1 during 2011-12 asagainst 2.72:1 in the pervious year (Fig.2). Balance Sheet and Profit& Loss Account of the company and selected financial ratios duringthe period 2010-11 to 2011-12 can be seen on the adjoining page.
Strategic IssuesThe corporation receives subsidy in reimbursement of losses
on price support account. While approving the financialrestructuring of JCI, the Government (Ministry of Textiles) on2.6.2005 decided to provide subsidy to JCI on a continuous basisfrom the year 2003-04 to set-off losses on account of MinimumSupport Price (MSP) operation by the company. The quantum ofsubsidy is the difference between the purchase and sale prices ofraw jute by JCI. While calculating the MSP losses, the www.jutecorp.com
reimbursement of overhead costs to JCI does not exceed 10% of thevalue of purchases under MSP in a particular financial year.
The volume of procurement of raw jute / turnover of thecompany solely depends on the market behaviour as procurementis conducted when ruling price touches the MSP as declared byGOI.
The Jute Corporation of India Limited was authorized to actas the Implementing Agency for execution of Mini Mission-III andalso provide necessary support on activities of Mini Mission IVand other Mini Missions of the Jute Technology Mission.
EBIT
DA
& P
AT (
Rs.
cro
re)
TOTAL R
EVENU
E (Rs. crore)
Fig. 1
Fig. 2
CU
RR
ENT R
ATIO
PRO
FITA
BIL
ITY
RAT
IOS
(%)

Public Enterprises Survey 2011-2012: Vol-II 389
Jute Corporation of India Ltd.15N, Nellie Sengupta Sarani, 7th Floor, Kolkata, West Bengal-700 087.
BALANCE SHEET (` in Lakhs)PARTICULARS 2011-12 2010-11I. EQUITY & LIABILITIESAUTHORISED CAPITAL 500 500(1) Shareholders’ Funds(a) Share Capital(i) Central Govt 500 500(ii) Others 0 0(b) Reserves & Surplus 5813 4791(c) Money received against share warrants 0 0Total Shareholders’ Funds (1(a)+1(b)+1(c) 6313 5291(2) Share application money pending allotment 0 0(3) Non-current Liabilities(a) Long Term Borrowings 0 0(b) Deferred tax liabilities (Net) 0 0(c) Other Long-term liabilities 2957 3535(d) Long-term provisions 0 0Total Non-Current Liabilities 3(a) to 3(d) 2957 3535(4) Current Liabilities(a) Short Term Borrowings 0 0(b) Trade Payables 4217 4066(c) Other current liabilities 582 797(d) Short-term provisions 292 120Total Current Liabilities 4(a) to 4(d) 5091 4983TOTAL EQUITY & LIABILITIES (1+2+3+4) 14361 13809II. ASSETS(1) Non-Current Assets(a) Total Gross Fixed Assets 371 370(ai) Accumulated Depreciation, Depletion & Amortisation 123 117(aii) Accumulated Impairment 0 0(b) Total Net Fixed Assets ((a)-(ai)-(aii) 248 253(c) Capital work in progress 0 0(d) Intangible assets under developmet 0 0(e) Non-Current Investments 0 0(f) Deferred Tax Assets (Net) 0 0(g) Long Term Loans and Advances 15 6(h) Other Non-Current Assets 0 0Total Non-Current Assets (b+c+d+e+f+g+h) 263 259(2) Current Assets(a) Current Investments 0 0(b) Inventories 1553 1872(c) Trade Recievables 547 10(d) Cash & Bank Balance 9356 11253(e) Short-term Loans & Advances 2474 144(f) Other Current Assets 168 271Total Current Assets (a+b+c+d+e+f) 14098 13550TOTAL ASSETS (1+2) 14361 13809Important Indicators(i) Investment 500 500(ii) Capital Employed 6313 5291(iii) Net Worth 6313 5291(iv) Net Current Assets 9007 8567(v) Cost of Sales 11777 7154(vi) Net Value Added (at market price) 6589 4211(vii) Total Regular Employees (Nos.) 848 922(viii) Avg. Monthly Emoluments per Employee(`) 50737 48427
PROFIT & LOSS ACCOUNT (` in Lakhs)PARTICULARS 2011-12 2010-11(I) Revenue from Operations (Gross) 13192 6017Less : Excise Duty 0 0Revenue from Operations (Net) 13192 6017(II) Other Income 0 0(III) Total Revenue (I+II) 13192 6017(IV) Expenditure on:(a) Cost of materials consumed 5863 3245(b) Purchase of stock-in-trade 0 0(c) Changes in inventories of finished goods, work-in-progress and stock in trade 318 -1791(d) Stores & Spares 0 0(e) Power & Fuel 0 0(f) Salary, Wages & Benefits/Employees Expense 5163 5358(g) Other Operating/direct/manufacturing Expenses 0 0(h) Rent, Royalty & Cess 0 0(i) Loss on sale of Assets/Investments 0 0(j) Other Expenses 426 349Total Expenditure (IV (a to j)) 11770 7161(V) PROFIT BEFORE DEPRECIATION, & IMPAIRMENT,FINANCE CHARGES/INTEREST, EXCEPTIONAL &EXTRAORDINARY ITEMS & TAXES (PBDIEET)(III-IV) 1422 -1144(VI) Depreciation, Depletion & Amortisation 7 -7(VII) Impairment 0 0(VIII) PROFIT BEFORE FINANCE COST/INTEREST,EXCEPTIONAL, EXTRA-ORDINARY ITEMS &TAXES (PBIEET)(V-VI-VII) 1415 -1137(IX) Finance Cost(a) On Central Government Loans 0 0(b) On Foreign Loans 0 0(c) Others 4 0(d) Less Finance Cost Capitalised 0 0(e) Charged to P & L Account (a+b+c+d) 4 0(X) PROFIT BEFORE EXCEPTIONAL & EXTRA-ORDINARY ITEMS & TAX (PBEET)(VIII-IXe) 1411 -1137(XI) Exceptional Items -11 10(XII) PROFIT BEFORE EXTRA-ORDINARY ITEMS &TAX (PBET)(X-XI) 1422 -1147(XIII) Extra-Ordinary Items 0 0(XIV) PROFIT BEFORE TAX (PBT)(XII-XIII) 1422 -1147(XV) TAX PROVISIONS 400 0(XVI) NET PROFIT / LOSS FOR THE PERIOD FROMCONTINUING OPERATIONS AFTER TAX(XIV-XV) 1022 -1147(XVII) Profit/Loss from discontinuing operations 0 0(XVIII) Tax expenses of discontinuing operations 0 0(XIX) Profit/Loss from discontinuing operations(after Tax)(XVII-XVIII) 0 0(XX) Profit/Loss for the period (XVI+XIX) 1022 -1147Financial Ratios(i) Sales : Capital Employed 208.97 113.72(ii) Cost of Sales : Sales 89.27 118.9(iii) Salary/Wages : Sales 39.14 89.05(iv) Net Profit : Net Worth 16.19 -21.68(v) Debt : Equity 0 0(vi) Current Ratio 2.77 2.72(vii) Trade Recievables : Sales 4.15 0.17(viii) Total Inventory : Sales 11.77 31.11

Trading & Marketing Services390
Karnataka Trade Promotion Organisation
The CompanyKarnataka Trade Promotion Organisation(KTPO) was
incorporated on 6.12.2000 under section 25 of the Companies Act,1956 with the objective to set up an exhibition complex at Bangalore,Karnataka. It was incorporated as a joint venture between IndiaTrade Promotion Organization (ITPO) and Karnataka IndustrialArea Development Board (KIADB), a Government of Karnatakaundertaking. The company came into operation on 23.9.2004.
KTPO is an uncategorized CPSE in Trading & Marketingsector under the administrative control of M/o Commerce andIndustry, D/o Commerce. The company employed 2 regularemployees as on 31.3.2012. Its Registered and Corporate officesare at Bangalore. KTPO is a subsidiary of ITPO which holds 51%of its equity.
Vision / MissionThe Vision of the company is to be a leading service provider
with wide spectrum of services to trade and industry and acts as acatalyst for growth of business industry trade & commerce community.
The Mission of the company is to promote, organize andparticipate in industrial trade, other fairs and exhibitions in Indiaand abroad and to take all measures incidental thereto for promotingIndian Industry, trade and enhance its global competitiveness.
Industrial / Business OperationsKTPO is engaged in providing services in the field of trade
promotion through organizing trade fairs and exhibitions as also toprovide covered air-conditioned exhibition space on rental basis toexhibitors for organizing trade and industry related exhibitions / events.
The service range of the company comprises of letting out theexhibition halls and convention centre to organize IndustrialExhibitions, Trade fairs etc.
Performance HighlightsThe physical performances of the company for last two years
are given below:
The Company registered an increase of ` 3.08 crore in totalrevenue during 2011-12 which went up to ` 7.07 crore in 2011-12from ` 3.99 crore during 2010-11. The net profit of the companycorrespondingly increased to ` 2.84 crore in 2011-12, an increaseof ` 1.35 croreover the previous yearprofit of ` 1.49 croredue toincrease in operating income as a result of increase in occupancyrate of the center.
The current ratio of company is at 8.37:1 during 2011-12 asagainst 8.3:1 in the previous year (Fig.2). Balance Sheet and Profit& Loss Account of the company and selected financial ratios duringthe period 2010-11 to 2011-12 can be seen on the adjoining page.
www.ktpo.org
Main Service Unit Performance during
2011-12 2010-11
Renting OutExhibition Complex ` in Crores 4.66 2.61
Events/Exhibitions Nos. 32 30Strategic issue
The company has been exempted from payment of income taxunder Section 12 (a) and under 10(23C) (iv) upto accounting year2008-09. The company has made an application for extension ofexemption for further periods and hence has not provided for anyincome tax liability. The land title deed is also yet to be executed infavour of KTPO.
EBIT
DA
& P
AT (
Rs.
cro
re)
TOTAL R
EVENU
E (Rs. crore)
Fig. 1PR
OFI
TAB
ILIT
Y R
ATIO
S (%
)
CU
RR
ENT R
ATIO
Fig. 2

Public Enterprises Survey 2011-2012: Vol-II 391
Karnataka Trade Promotion OrganisationPlot No. 121, EPIP Industrial Area, Whitefield, Bangalore, Karnataka-560 066.
BALANCE SHEET (` in Lakhs)PARTICULARS 2011-12 2010-11I. EQUITY & LIABILITIESAUTHORISED CAPITAL 2000 2000(1) Shareholders’ Funds(a) Share Capital(i) Central Govt 0 0(ii) Others 50 50(b) Reserves & Surplus 884 600(c) Money received against share warrants 0 0Total Shareholders’ Funds (1(a)+1(b)+1(c) 934 650(2) Share application money pending allotment 995 995(3) Non-current Liabilities(a) Long Term Borrowings 774 747(b) Deferred tax liabilities (Net) 0 0(c) Other Long-term liabilities 0 0(d) Long-term provisions 0 0Total Non-Current Liabilities 3(a) to 3(d) 774 747(4) Current Liabilities(a) Short Term Borrowings 0 0(b) Trade Payables 0 0(c) Other current liabilities 237 186(d) Short-term provisions 1 1Total Current Liabilities 4(a) to 4(d) 238 187TOTAL EQUITY & LIABILITIES (1+2+3+4) 2941 2579II. ASSETS(1) Non-Current Assets(a) Total Gross Fixed Assets 1910 1878(ai) Accumulated Depreciation, Depletion & Amortisation 961 851(aii) Accumulated Impairment 0 0(b) Total Net Fixed Assets ((a)-(ai)-(aii) 949 1027(c) Capital work in progress 0 0(d) Intangible assets under developmet 0 0(e) Non-Current Investments 0 0(f) Deferred Tax Assets (Net) 0 0(g) Long Term Loans and Advances 0 0(h) Other Non-Current Assets 0 0Total Non-Current Assets (b+c+d+e+f+g+h) 949 1027(2) Current Assets(a) Current Investments 0 0(b) Inventories 0 0(c) Trade Recievables 0 0(d) Cash & Bank Balance 1790 1315(e) Short-term Loans & Advances 113 191(f) Other Current Assets 89 46Total Current Assets (a+b+c+d+e+f) 1992 1552TOTAL ASSETS (1+2) 2941 2579Important Indicators(i) Investment 1819 1792(ii) Capital Employed 2703 2392(iii) Net Worth 1929 1645(iv) Net Current Assets 1754 1365(v) Cost of Sales 423 250(vi) Net Value Added (at market price) 299 159(vii) Total Regular Employees (Nos.) 2(viii) Avg. Monthly Emoluments per Employee(`) 0 41667
PROFIT & LOSS ACCOUNT (` in Lakhs)PARTICULARS 2011-12 2010-11(I) Revenue from Operations (Gross) 564 309Less : Excise Duty 0 0Revenue from Operations (Net) 564 309(II) Other Income 143 90(III) Total Revenue (I+II) 707 399(IV) Expenditure on:(a) Cost of materials consumed 0 0(b) Purchase of stock-in-trade 0 0(c) Changes in inventories of finished goods,work-in-progress and stock in trade 0 0(d) Stores & Spares 0 0(e) Power & Fuel 49 29(f) Salary, Wages & Benefits/Employees Expense 15 10(g) Other Operating/direct/manufacturing Expenses 51 27(h) Rent, Royalty & Cess 0 0(i) Loss on sale of Assets/Investments 0 0(j) Other Expenses 198 66Total Expenditure (IV (a to j)) 313 132(V) PROFIT BEFORE DEPRECIATION, & IMPAIRMENT,FINANCE CHARGES/INTEREST, EXCEPTIONAL &EXTRAORDINARY ITEMS & TAXES (PBDIEET)(III-IV) 394 267(VI) Depreciation, Depletion & Amortisation 110 118(VII) Impairment 0 0(VIII) PROFIT BEFORE FINANCE COST/INTEREST,EXCEPTIONAL, EXTRA-ORDINARY ITEMS &TAXES (PBIEET)(V-VI-VII) 284 149(IX) Finance Cost(a) On Central Government Loans 0 0(b) On Foreign Loans 0 0(c) Others 0 0(d) Less Finance Cost Capitalised 0 0(e) Charged to P & L Account (a+b+c+d) 0 0(X) PROFIT BEFORE EXCEPTIONAL & EXTRA-ORDINARY ITEMS & TAX (PBEET)(VIII-IXe) 284 149(XI) Exceptional Items 0 0(XII) PROFIT BEFORE EXTRA-ORDINARY ITEMS &TAX (PBET)(X-XI) 284 149(XIII) Extra-Ordinary Items 0 0(XIV) PROFIT BEFORE TAX (PBT)(XII-XIII) 284 149(XV) TAX PROVISIONS 0 0(XVI) NET PROFIT / LOSS FOR THE PERIOD FROMCONTINUING OPERATIONS AFTER TAX(XIV-XV) 284 149(XVII) Profit/Loss from discontinuing operations 0 0(XVIII) Tax expenses of discontinuing operations 0 0(XIX) Profit/Loss from discontinuing operations (after Tax)(XVII-XVIII) 0 0(XX) Profit/Loss for the period (XVI+XIX) 284 149Financial Ratios(i) Sales : Capital Employed 20.87 12.92(ii) Cost of Sales : Sales 75 80.91(iii) Salary/Wages : Sales 2.66 3.24(iv) Net Profit : Net Worth 14.72 9.06(v) Debt : Equity 0.74 0.71(vi) Current Ratio 8.37 8.3(vii) Trade Recievables : Sales 0 0(viii) Total Inventory : Sales 0 0

Trading & Marketing Services392
MMTC Limited
The CompanyMMTC Limited (till 1993 known as Minerals and Metals
Trading Corporation of India Ltd) was set up by Government ofIndia in the year 1963 primarily to regulate the International trade ofMinerals and Metals. Over the years new product lines like AgroCommodities, Fertilizers, Precious Metals, and Coal & Hydrocarbonswere added to the product profile of MMTC.
MMTC is a schedule 'A' / Mini-Ratna listed CPSE in Tradingand Marketing Services sector under the administrative control ofMinistry of Commerce & Industry with 99.33% of equityshareholding held by Govt. of India. The company employed 1673regular employees (Executives 607 & Non-executives 1066) as on31.3.2012. MMTC's Registered and Corporate office are at NewDelhi.
Vision/MissionThe Vision and Mission is to be the largest trading company
of India and a major trading company of Asia.
Industrial / Business OperationsMMTC is India's largest International Trading Company and
exporter of Mineral, leading exporter / importer of Agrocommodities, single largest importer / supplier of Metals includingGold & Silver and a major player in the Coal and Hydrocarbonsimports by the country. The company commands extensive marketcoverage in over 65 countries in Asia, Europe, Africa, Oceania andAmerica etc. and the domestic network of MMTC in India spreadsacross 76 offices, warehouses and retail outlets.
The company has one wholly owned subsidiary companynamely MMTC Transnational Pte. Ltd., Singapore (MTPL)(incorporated under the laws of Singapore with a share capital ofUS$ 1 million) and nine Joint Venture companies. MMTC has alsoset up Neelachal Ispat Nigam Limited (NINL) - an Iron & Steel plantjointly with Govt. of Orissa.
MMTC has also diversified into the area of clean, non-conventional and renewable energy sources by setting up a 15MWWind Energy Farm in the state of Karnataka.Performance Highlights
The physical performance of the company for last two yearsis given below:
Total Revenue of the company registered a reduction of` 2511.85 crore during 2011-12, which went down from ̀ 69563.75crore in 2010-11 to ` 67051.9 crore in 2011-12.The net profit ofthe company also reduced to ` 70.73 crore, a reduction of ̀ 50.90crore over the previous year profit of ̀ 121.63 crore due to decreasein margins due to intense competition in all its trade activities.
The current ratio of company is at 1.07:1 during 2011-12 asagainst 1.04 in the previous year (Fig.2). Balance Sheet and Profit& Loss Account of the company and selected financial ratios duringthe period 2010-11 to 2011-12 can be seen on the adjoining page. www.mmtclimited.co.in
Main Products Unit Performance during
2011-12 2010-11
EXPORTS ` in Crore 2045 3693
IMPORTS ` in Crore 61042 63301
DOMESTIC ` in Crore 2842 1860
Strategic IssuesBesides keeping its position intact in its core areas of activities,
MMTC also associates itself in promotion and development oftrade related infrastructure like setting up of a Commodity Exchange(which has commenced its operation in November, 2009) and aCurrency Exchange (which has commenced its operation inSeptember, 2010).
As a measure of investing in mining infrastructure, MMTC ispromoting a Joint Venture Company for exploration anddevelopment of mines for Minerals, Ferrous and Non-Ferrous ores,Precious Metals, Diamonds and Coal etc. MMTC has also beenallotted a coal mine in Jharkhand having estimated reserves ofabout 287 million tonnes. MMTC is a member of a consortium,which has constructed permanent Iron Ore Loading berth at Ennore.MMTC is also partner in another consortium, which has beenawarded the project for construction of a deep draft iron ore berthat Paradip port.
EBIT
DA
& P
AT (
Rs.
cro
re)
TOTAL R
EVENU
E (Rs. crore)
Fig. 1
PRO
FITA
BIL
ITY
RAT
IOS
(%)
CU
RR
ENT R
ATIO
Fig. 2

Public Enterprises Survey 2011-2012: Vol-II 393
MMTC Limited7, Scope Complex Lodi Road, New Delhi-110 003.
BALANCE SHEET (` in Lakhs)PARTICULARS 2011-12 2010-11I. EQUITY & LIABILITIESAUTHORISED CAPITAL 10000 10000(1) Shareholders’ Funds(a) Share Capital(i) Central Govt 9933 9933(ii) Others 67 67(b) Reserves & Surplus 132140 127973(c) Money received against share warrants 0 0Total Shareholders’ Funds (1(a)+1(b)+1(c) 142140 137973(2) Share application money pending allotment 0 0(3) Non-current Liabilities(a) Long Term Borrowings 0 0(b) Deferred tax liabilities (Net) 0 0(c) Other Long-term liabilities 448 439(d) Long-term provisions 13737 12524Total Non-Current Liabilities 3(a) to 3(d) 14185 12963(4) Current Liabilities(a) Short Term Borrowings 342987 608347(b) Trade Payables 329961 349027(c) Other current liabilities 423766 807167(d) Short-term provisions 21235 27475Total Current Liabilities 4(a) to 4(d) 1117949 1792016TOTAL EQUITY & LIABILITIES (1+2+3+4) 1274274 1942952II. ASSETS(1) Non-Current Assets(a) Total Gross Fixed Assets 20241 20245(ai) Accumulated Depreciation, Depletion & Amortisation 10514 9524(aii) Accumulated Impairment 0 0(b) Total Net Fixed Assets ((a)-(ai)-(aii) 9727 10721(c) Capital work in progress 0 51(d) Intangible assets under developmet 0 0(e) Non-Current Investments 46729 48528(f) Deferred Tax Assets (Net) 7150 3355(g) Long Term Loans and Advances 10951 9649(h) Other Non-Current Assets 229 282Total Non-Current Assets (b+c+d+e+f+g+h) 74786 72586(2) Current Assets(a) Current Investments 0 0(b) Inventories 92438 64798(c) Trade Recievables 277061 253692(d) Cash & Bank Balance 285312 674824(e) Short-term Loans & Advances 441919 653957(f) Other Current Assets 102758 223095Total Current Assets (a+b+c+d+e+f) 1199488 1870366TOTAL ASSETS (1+2) 1274274 1942952Important Indicators(i) Investment 10000 10000(ii) Capital Employed 142140 137973(iii) Net Worth 142140 137973(iv) Net Current Assets 81539 78350(v) Cost of Sales 6629938 6897427(vi) Net Value Added (at market price) 230799 357289(vii) Total Regular Employees (Nos.) 1673 1762(viii) Avg. Monthly Emoluments per Employee(`) 91831 86909
PROFIT & LOSS ACCOUNT (` in Lakhs)PARTICULARS 2011-12 2010-11(I) Revenue from Operations (Gross) 6632520 6905600Less : Excise Duty 31 0Revenue from Operations (Net) 6632489 6905600(II) Other Income 72701 50775(III) Total Revenue (I+II) 6705190 6956375(IV) Expenditure on:(a) Cost of materials consumed 0 0(b) Purchase of stock-in-trade 6516557 6458702(c) Changes in inventories of finished goods,work-in-progress and stock in trade -27764 147307(d) Stores & Spares 0 0(e) Power & Fuel 0 0(f) Salary, Wages & Benefits/Employees Expense 18436 18376(g) Other Operating/direct/manufacturing Expenses 25082 142583(h) Rent, Royalty & Cess 224 414(i) Loss on sale of Assets/Investments 0 0(j) Other Expenses 96203 128810Total Expenditure (IV (a to j)) 6628738 6896192(V) PROFIT BEFORE DEPRECIATION, & IMPAIRMENT,FINANCE CHARGES/INTEREST, EXCEPTIONAL &EXTRAORDINARY ITEMS & TAXES (PBDIEET)(III-IV) 76452 60183(VI) Depreciation, Depletion & Amortisation 1200 1235(VII) Impairment 0 0(VIII) PROFIT BEFORE FINANCE COST/INTEREST,EXCEPTIONAL, EXTRA-ORDINARY ITEMS &TAXES (PBIEET)(V-VI-VII) 75252 58948(IX) Finance Cost(a) On Central Government Loans 0 0(b) On Foreign Loans 0 0(c) Others 57643 39285(d) Less Finance Cost Capitalised 0 0(e) Charged to P & L Account (a+b+c+d) 57643 39285(X) PROFIT BEFORE EXCEPTIONAL & EXTRA-ORDINARY ITEMS & TAX (PBEET)(VIII-IXe) 17609 19663(XI) Exceptional Items -13 673(XII) PROFIT BEFORE EXTRA-ORDINARY ITEMS &TAX (PBET)(X-XI) 17622 18990(XIII) Extra-Ordinary Items 10021 0(XIV) PROFIT BEFORE TAX (PBT)(XII-XIII) 7601 18990(XV) TAX PROVISIONS 529 6826(XVI) NET PROFIT / LOSS FOR THE PERIOD FROMCONTINUING OPERATIONS AFTER TAX(XIV-XV) 7072 12164(XVII) Profit/Loss from discontinuing operations 0 0(XVIII) Tax expenses of discontinuing operations 0 0(XIX) Profit/Loss from discontinuing operations (after Tax)(XVII-XVIII) 0 0(XX) Profit/Loss for the period (XVI+XIX) 7072 12164Financial Ratios(i) Sales : Capital Employed 4666.17 5005.04(ii) Cost of Sales : Sales 99.96 99.88(iii) Salary/Wages : Sales 0.28 0.27(iv) Net Profit : Net Worth 4.98 8.82(v) Debt : Equity 0 0(vi) Current Ratio 1.07 1.04(vii) Trade Recievables : Sales 4.18 3.67(viii) Total Inventory : Sales 1.39 0.94

Trading & Marketing Services394
MSTC Ltd.
The CompanyM S T C LTD. (MSTC) was incorporated on 9.9.1964 as Metal
Scrap Trade Corp. Ltd. with the objective of working as diversifiedtrading house with particular emphasis on bulk raw materials for steelindustry and to gradually build up tie- ups with international tradinghouses, develop warehousing system and logistics and to undertakedisposal of scrap and secondary arising etc. of organizations, both inpublic and private sector. MSTC today facilities in recycling of scrapfor industrial use of raw materials and thereby reduce input cost,conserve natural resources and ultimately protect the environment.
MSTC is a Schedule-'B' Mini-ratna CPSE in Trading & Marketingsector under the administrative control of M/o Steel with 90%shareholding by the Government of India and balance 10% by themembers of Steel Furnace Association of India and Ispat IndustriesLimited. The company employed 308 regular employees (Executives156, Non-executives 152) as on 31.3.2012. Its Registered andCorporate offices are at Kolkata, West Bengal.
Vision / MissionThe Vision of the Company is to emerge as a dominant B2B
player in the area of trading with particular emphasis on Steel Industry.The Mission of the Company is to organize and expand a market
for the various commodities handled by it by making transactions astransparent as possible through extensive use of e-commerce.
Industrial / Business OperationsMSTC undertakes disposal of ferrous / non-ferrous scrap and
other secondary arising from integrated steel plants under SAIL, RINLetc. and for disposal of scrap and obsolete / surplus stores from otherPSUs and Government Department including M/o Defence. It is alsoinvolved in import of steel melting scrap for the use of secondarysteel industry and finished iron and steel items like HR Coils, Billets,Pig Iron, DR Pellets, Coke, Coal and other inputs and Petroleumproducts like Naphtha, Super Kerosene Oil, Furnace Oil etc.
The company functions through its 4 Regional Offices at Delhi,Mumbai, Kolkata and Chennai and 3 Branch Offices at Bangalore,Vishakhapatnam and Vadodara. It has one subsidiary namely FerroScrap Nigam Ltd. (FSNL). The main segment of the companyservices are classified as Selling Agency, E-auction tender, marketingand E-Procurement.
Performance HighlightsThe total volume of business recorded through
e-commerce during 2011-12 was Rs.16,005.03 crore. The physicalperformances of the company for last two years are givenbelow:
www.mstcindia.co.in
EBIT
DA
& P
AT (
Rs.
cro
re)
TOTAL R
EVENU
E (Rs. crore)
Fig. 1
PRO
FITA
BIL
ITY
RAT
IOS
(%)
CU
RR
ENT R
ATIO
Fig. 2
Main Business Unit Performance during
segment 2011-12 2010-11Imported material ` in Crore 2076.00 2580.77
Indigenous Material ` in Crore 3670.15 3352.25
Sale of scrap and ` in Crore 3147.68 2568.08Manganese
Sale of coal ` in Crore 8560.05 5565.48
Total volume of business ` in Crore 21751.18 14100.77
The Company registered a growth of ` 748.59 crore in totalrevenue during 2011-12 which went upto ` 2695.92 crore in 2011-12from ` 1947.33 crore during 2010-11. The net profit of the company
increased to ` 118.39 crore, an increase of ` 270.68 crore over theprevious year's loss of ̀ 152.29 crore due to higher business and sale.
The current ratio of company is at 1.15:1 during 2011-12 asagainst 1.17:1 in the previous year (Fig.2). Balance Sheet and Profit& Loss Account of the company and selected financial ratios duringthe period 2010-11 to 2011-12 can be seen on the adjoining page.
Strategic issueMSTC is one of the largest e-commerce service providers in the
country and aims to remain so. Ferrous/ non ferrous scrap is beingimported from Europe & USA. MSTC is setting up a shredding plantfor shredding of Auto & miscellaneous steel scrap. Shredded Ferrousscrap is utilized as raw material for induction and arc furnaces toproduce steel by recycling. The project will save huge amount ofprecious foreign exchange for the country. The company has startedstockyard in Haldia and plans to convert it into Container freightstation.

Public Enterprises Survey 2011-2012: Vol-II 395
MSTC Ltd.225-C A.J.C. Bose Road, Kolkata, West Bengal-700 020.
BALANCE SHEET (` in Lakhs)PARTICULARS 2011-12 2010-11I. EQUITY & LIABILITIESAUTHORISED CAPITAL 500 500(1) Shareholders’ Funds(a) Share Capital(i) Central Govt 198 198(ii) Others 22 22(b) Reserves & Surplus 59386 50301(c) Money received against share warrants 0 0Total Shareholders’ Funds (1(a)+1(b)+1(c) 59606 50521(2) Share application money pending allotment 0 0(3) Non-current Liabilities(a) Long Term Borrowings 0 0(b) Deferred tax liabilities (Net) 0 0(c) Other Long-term liabilities 921 871(d) Long-term provisions 0 0Total Non-Current Liabilities 3(a) to 3(d) 921 871(4) Current Liabilities(a) Short Term Borrowings 73260 116369(b) Trade Payables 221941 116116(c) Other current liabilities 51480 36004(d) Short-term provisions 1138 623Total Current Liabilities 4(a) to 4(d) 347819 269112TOTAL EQUITY & LIABILITIES (1+2+3+4) 408346 320504II. ASSETS(1) Non-Current Assets(a) Total Gross Fixed Assets 2978 3152(ai) Accumulated Depreciation, Depletion & Amortisation 1062 1414(aii) Accumulated Impairment 0 0(b) Total Net Fixed Assets ((a)-(ai)-(aii) 1916 1738(c) Capital work in progress 0 0(d) Intangible assets under developmet 0 0(e) Non-Current Investments 1581 1581(f) Deferred Tax Assets (Net) 1301 1065(g) Long Term Loans and Advances 2048 2323(h) Other Non-Current Assets 23 34Total Non-Current Assets (b+c+d+e+f+g+h) 6869 6741(2) Current Assets(a) Current Investments 0 0(b) Inventories 0 1618(c) Trade Recievables 307664 221559(d) Cash & Bank Balance 91428 88447(e) Short-term Loans & Advances 1495 430(f) Other Current Assets 890 1709Total Current Assets (a+b+c+d+e+f) 401477 313763TOTAL ASSETS (1+2) 408346 320504Important Indicators(i) Investment 220 220(ii) Capital Employed 59606 50521(iii) Net Worth 59606 50521(iv) Net Current Assets 53658 44651(v) Cost of Sales 241812 169585(vi) Net Value Added (at market price) 37913 33963(vii) Total Regular Employees (Nos.) 308 316(viii) Avg. Monthly Emoluments per Employee(`) 111715 91060
PROFIT & LOSS ACCOUNT (` in Lakhs)PARTICULARS 2011-12 2010-11(I) Revenue from Operations (Gross) 262531 188028Less : Excise Duty 0 0Revenue from Operations (Net) 262531 188028(II) Other Income 7061 6705(III) Total Revenue (I+II) 269592 194733(IV) Expenditure on:(a) Cost of materials consumed 0 0(b) Purchase of stock-in-trade 232667 165836(c) Changes in inventories of finished goods,work-in-progress and stock in trade 1618 -1618(d) Stores & Spares 0 0(e) Power & Fuel 83 73(f) Salary, Wages & Benefits/Employees Expense 4129 3453(g) Other Operating/direct/manufacturing Expenses 482 419(h) Rent, Royalty & Cess 253 270(i) Loss on sale of Assets/Investments 10 2(j) Other Expenses 2372 1022Total Expenditure (IV (a to j)) 241614 169457(V) PROFIT BEFORE DEPRECIATION, & IMPAIRMENT,FINANCE CHARGES/INTEREST, EXCEPTIONAL &EXTRAORDINARY ITEMS & TAXES (PBDIEET)(III-IV) 27978 25276(VI) Depreciation, Depletion & Amortisation 208 130(VII) Impairment 0 0(VIII) PROFIT BEFORE FINANCE COST/INTEREST,EXCEPTIONAL, EXTRA-ORDINARY ITEMS &TAXES (PBIEET)(V-VI-VII) 27770 25146(IX) Finance Cost(a) On Central Government Loans 0 0(b) On Foreign Loans 0 0(c) Others 10155 10206(d) Less Finance Cost Capitalised 0 0(e) Charged to P & L Account (a+b+c+d) 10155 10206(X) PROFIT BEFORE EXCEPTIONAL & EXTRA-ORDINARY ITEMS & TAX (PBEET)(VIII-IXe) 17615 14940(XI) Exceptional Items 0 0(XII) PROFIT BEFORE EXTRA-ORDINARY ITEMS &TAX (PBET)(X-XI) 17615 14940(XIII) Extra-Ordinary Items 0 0(XIV) PROFIT BEFORE TAX (PBT)(XII-XIII) 17615 14940(XV) TAX PROVISIONS 5776 5023(XVI) NET PROFIT / LOSS FOR THE PERIOD FROMCONTINUING OPERATIONS AFTER TAX(XIV-XV) 11839 9917(XVII) Profit/Loss from discontinuing operations 0 0(XVIII) Tax expenses of discontinuing operations 0 0(XIX) Profit/Loss from discontinuing operations(after Tax)(XVII-XVIII) 0 0(XX) Profit/Loss for the period (XVI+XIX) 11839 9917Financial Ratios(i) Sales : Capital Employed 440.44 372.18(ii) Cost of Sales : Sales 92.11 90.19(iii) Salary/Wages : Sales 1.57 1.84(iv) Net Profit : Net Worth 19.86 19.63(v) Debt : Equity 0 0(vi) Current Ratio 1.15 1.17(vii) Trade Recievables : Sales 117.19 117.83(viii) Total Inventory : Sales 0 0.86

Trading & Marketing Services396
National Handloom Development Corporation Ltd.
The Company National Handloom Development Corporation Ltd. (NHDC)
was incorporated on 22.02.1983 with the objective to serve as anational level agency for promotion and development of theHandloom sector.
NHDC is a Schedule-'B' CPSE under the administrative controlof the M/o Textiles with 100% shareholding by the Government ofIndia. The Company employed 203 regular employees (Executives106 & Non-Executives 97) as on 31.03.2012. Its Registered andCorporate Office are at Lucknow (U.P.).
Vision/MissionThe Vision of the company is to be a leading player in supplying
the quality raw material to the handloom sector. The Mission ofthe company is to serve as a National level agency for the promotionand development of the handloom sector.
Industrial / Business OperationsThe main activity of the company is to ensure the availability
of Raw Material like yarn and Dyes & Chemicals to Handloomweavers & supply of Handloom fabrics. The activities of thecorporation are divided into three categories (i) Arranging supplyof Raw Materials (Yarn and Dyes & Chemicals) (ii) DevelopmentalActivities like Organisation of Appropriate Technology Exhibitions,Organisation of Quality Dyeing Training programme, Organisationof workshop on awareness / senstisation (iii) Marketing Supportlike Organisation of Expos- Silk Fab, Wool Fab and Establishmentof marketing complexes etc.
The Company is engaged in Supply of Yarn, Dyes Chemicaland Fabrics from its 32 operating units.
Performance HighlightsThe physical performance of Company for last two years is
given below:
The Company registered a reduction of ̀ 128.58 crore in totalrevenue during 2011-12 which went down to ` 1156.67 crore in2011-12 from ̀ 1285.25 crore during 2010-11 due to fall in turnover.The net profit of the company correspondingly reduced to ` 2.82crore, a decline of ̀ 1.50 crore from previous year's profit of ̀ 4.32crore due to higher yarn prices, reduction in off take and generalslowdown in the textile sector.
The current ratio of company is at 1.19:1 during 2011-12 asagainst 1.25:1 in the previous year (Fig.2). Balance Sheet and Profit& Loss Account of the company and selected financial ratios duringthe period 2011-12 to 2011-12 can be seen on the adjoining page.
Main Products Unit Performance during
2011-12 2010-11
Yarn Rs crores 1081.12 1201.67
Dyes & chemical Rs crores 18.33 24.62
Fabrics Rs crores 1.62 0.46
www.nhdcltd.com
Strategic IssuesThe other main objectives of the company are to enlarge input
supplies so as to meet up to 20% of Yarn requirement of Handloomsector; to enhance its competitive edge in providing quality rawmaterials i.e. Yarn, Dyes & Chemicals through improved supplychain management; to maintain viability of operations througheffective utilization of available resources, to take up developmentprograms so as to contribute to increasing the awareness of schemes/products/appropriate technology and marketing avenues etc., tocontinue to act as a channel for routing Central Government funds,loans and grants to Handloom agencies; to aid in speedyimplementation of programmes for development of the sector, toensure enhanced contribution from personal through training/counseling and to ensure career progression opportunities.
A new component of 10% subsidy on hank yarn under MillGate price Scheme (MGPS) scheme has been introduced w.e.f.06.01.2012. This will help the handloom sector to survive and tobecome self-sustainable in the long run and enable them to competewith power loom products. The Government of India has beenimplementing the MGPS through NHDC.
EBIT
DA
& P
AT (
Rs.
cro
re) TO
TAL REVEN
UE (R
s. crore)
Fig. 1
PRO
FITA
BIL
ITY
RAT
IOS
(%)
CU
RR
ENT R
ATIO
Fig. 2

Public Enterprises Survey 2011-2012: Vol-II 397
National Handloom Development Corporation Ltd.10-11th Floor Vikas Deep 22, Station Road, Lucknow-226019 Uttar Pradesh
BALANCE SHEET (` in Lakhs)PARTICULARS 2011-12 2010-11I. EQUITY & LIABILITIESAUTHORISED CAPITAL 2000 2000(1) Shareholders’ Funds(a) Share Capital(i) Central Govt 1900 1900(ii) Others 0 0(b) Reserves & Surplus 1647 1446(c) Money received against share warrants 0 0Total Shareholders’ Funds (1(a)+1(b)+1(c) 3547 3346(2) Share application money pending allotment 0 0(3) Non-current Liabilities(a) Long Term Borrowings 0 0(b) Deferred tax liabilities (Net) 0 0(c) Other Long-term liabilities 1905 1762(d) Long-term provisions 0 0Total Non-Current Liabilities 3(a) to 3(d) 1905 1762(4) Current Liabilities(a) Short Term Borrowings 0 0(b) Trade Payables 11920 8467(c) Other current liabilities 3326 2657(d) Short-term provisions 872 997Total Current Liabilities 4(a) to 4(d) 16118 12121TOTAL EQUITY & LIABILITIES (1+2+3+4) 21570 17229II. ASSETS(1) Non-Current Assets(a) Total Gross Fixed Assets 476 456(ai) Accumulated Depreciation, Depletion & Amortisation 219 208(aii) Accumulated Impairment 0 0(b) Total Net Fixed Assets ((a)-(ai)-(aii) 257 248(c) Capital work in progress 161 54(d) Intangible assets under developmet 0 0(e) Non-Current Investments 0 0(f) Deferred Tax Assets (Net) 54 40(g) Long Term Loans and Advances 3 2(h) Other Non-Current Assets 1905 1762Total Non-Current Assets (b+c+d+e+f+g+h) 2380 2106(2) Current Assets(a) Current Investments 0 0(b) Inventories 175 177(c) Trade Recievables 11440 8043(d) Cash & Bank Balance 4559 4197(e) Short-term Loans & Advances 2911 2653(f) Other Current Assets 105 53Total Current Assets (a+b+c+d+e+f) 19190 15123TOTAL ASSETS (1+2) 21570 17229Important Indicators(i) Investment 1900 1900(ii) Capital Employed 3547 3346(iii) Net Worth 3547 3346(iv) Net Current Assets 3072 3002(v) Cost of Sales 115239 127828(vi) Net Value Added (at market price) 1810 1988(vii) Total Regular Employees (Nos.) 203 201(viii) Avg. Monthly Emoluments per Employee(`) 55008 53109
PROFIT & LOSS ACCOUNT (` in Lakhs)PARTICULARS 2011-12 2010-11(I) Revenue from Operations (Gross) 115332 128255Less : Excise Duty 0 0Revenue from Operations (Net) 115332 128255(II) Other Income 335 270(III) Total Revenue (I+II) 115667 128525(IV) Expenditure on:(a) Cost of materials consumed 0 122481(b) Purchase of stock-in-trade 109962 0(c) Changes in inventories of finished goods,work-in-progress and stock in trade 7 11(d) Stores & Spares 0 0(e) Power & Fuel 13 13(f) Salary, Wages & Benefits/Employees Expense 1340 1281(g) Other Operating/direct/manufacturing Expenses 3654 3820(h) Rent, Royalty & Cess 0 0(i) Loss on sale of Assets/Investments 0 0(j) Other Expenses 247 207Total Expenditure (IV (a to j)) 115223 127813(V) PROFIT BEFORE DEPRECIATION, & IMPAIRMENT,FINANCE CHARGES/INTEREST, EXCEPTIONAL &EXTRAORDINARY ITEMS & TAXES (PBDIEET)(III-IV) 444 712(VI) Depreciation, Depletion & Amortisation 16 15(VII) Impairment 0 0(VIII) PROFIT BEFORE FINANCE COST/INTEREST,EXCEPTIONAL, EXTRA-ORDINARY ITEMS &TAXES (PBIEET)(V-VI-VII) 428 697(IX) Finance Cost(a) On Central Government Loans 0 0(b) On Foreign Loans 0 0(c) Others 0 0(d) Less Finance Cost Capitalised 0 0(e) Charged to P & L Account (a+b+c+d) 0 0(X) PROFIT BEFORE EXCEPTIONAL & EXTRA-ORDINARY ITEMS & TAX (PBEET)(VIII-IXe) 428 697(XI) Exceptional Items 16 56(XII) PROFIT BEFORE EXTRA-ORDINARY ITEMS &TAX (PBET)(X-XI) 412 641(XIII) Extra-Ordinary Items 0 0(XIV) PROFIT BEFORE TAX (PBT)(XII-XIII) 412 641(XV) TAX PROVISIONS 130 209(XVI) NET PROFIT / LOSS FOR THE PERIOD FROMCONTINUING OPERATIONS AFTER TAX(XIV-XV) 282 432(XVII) Profit/Loss from discontinuing operations 0 0(XVIII) Tax expenses of discontinuing operations 0 0(XIX) Profit/Loss from discontinuing operations (after Tax)(XVII-XVIII) 0 0(XX) Profit/Loss for the period (XVI+XIX) 282 432Financial Ratios(i) Sales : Capital Employed 3251.54 3833.08(ii) Cost of Sales : Sales 99.92 99.67(iii) Salary/Wages : Sales 1.16 1(iv) Net Profit : Net Worth 7.95 12.91(v) Debt : Equity 0 0(vi) Current Ratio 1.19 1.25(vii) Trade Recievables : Sales 9.92 6.27(viii) Total Inventory : Sales 0.15 0.14

Trading & Marketing Services398
North Eastern Handicrafts and HandloomsDevelopment Corporation Ltd.The Company
North Eastern Handicrafts and Handlooms DevelopmentCorporation Ltd. (NEHHDC) was incorporated on 31.3.1977 underthe companies Act, 1956 with an objective to promote and develophandicrafts and hondlooms in the North Eastern Region.
NEHHDC is a Schedule 'C' CPSE in Trading and Marketingservices sector under the administrative control of Ministry ofDevelopment of North Eastern Region (DONER), with 100%shareholding by the Government of India. The company employed105 regular employees (Executives 9 & Non-Executives 96) as on31.3.2012. Its Registered Office is at Shillong, Meghalaya.
Vision / MissionThe Vision and Mission of the Company is to promote develop
and market the Handloom & Handicraft products of North EasternRegion both within and outside India and provide necessaryassistance to artisans & craftsmen of the region in terms of loantechnology and training etc.
Industrial / Business OperationsNEHHDC is providing services in the field of Marketing of
handicrafts and handlooms products through its 5 Emporia locatedat Kolkata, Bangalore, Guwahati, Shillong, New Delhi and salespromotion office at Chennai. The Corporation also conducts NorthEast craft Fairs and exhibitions to promote sales. It also providestraining facilities under sponsored programme of the Office of theDevelopment Commissioner (Handicrafts), Government of India,M/o Textiles etc.
Performance Highlights The physical performances of the company for last two years
are given below:
Account of the company and selected financial ratios during theperiod 2010-11 to 2011-12 can be seen on the adjoining page.
Main Products Unit Performance during
2011-12 2010-11
Purchases
Handicrafts ` in Crore 7.73 7.63
Handlooms ` in Crore 5.85 5.94
Sales :
Handicrafts ` in Crore 10.07 10.17
Handlooms ` in Crore 6.73 7.04
www.nehhde.com
Strategic issuesThe Handicraft Design Bank has been set up at Guwahati,
where Artisans / Craft person / Entrepreneurs / Exporters can seekinformation, advice and guidance on design & product development& innovation at nominal fees. The corporation has also set up aMuseum at Guwahati showcasing handicrafts of all the 8 NorthEastern states.
Total Revenue of the company registered a reduction of` 0.43.crore during 2011-12, which went down from ` 17.35 crorein 2010-11 to ̀ 16.92 crore in 2011-12. The losses of the companyhowever come down to ` 1.51 crore in 2011-12 from ̀ 1.74 crorein previous year due to lower cost of production / fall in totaloperating expenses during the year.
The current ratio of company is at 5.89:1 during 2011-12 asagainst 9.18:1 in the previous year. Balance Sheet and Profit & Loss
EBIT
DA
& P
AT (
Rs.
cro
re)
TOTAL R
EVENU
E (Rs. crore)
Fig. 1

Public Enterprises Survey 2011-2012: Vol-II 399
North Eastern Handicrafts & Handloom Dev.corpn. Ltd.C/o Purbashree Emporium, Police Bazar Shillong, Meghalaya - 793001
BALANCE SHEET (` in Lakhs)PARTICULARS 2011-12 2010-11I. EQUITY & LIABILITIESAUTHORISED CAPITAL 200 200(1) Shareholders’ Funds(a) Share Capital(i) Central Govt 200 200(ii) Others 0 0(b) Reserves & Surplus -3236 -3085(c) Money received against share warrants 0 0Total Shareholders’ Funds (1(a)+1(b)+1(c) -3036 -2885(2) Share application money pending allotment 0 0(3) Non-current Liabilities(a) Long Term Borrowings 3696 3521(b) Deferred tax liabilities (Net) 0 0(c) Other Long-term liabilities 85 21(d) Long-term provisions 0 0Total Non-Current Liabilities 3(a) to 3(d) 3781 3542(4) Current Liabilities(a) Short Term Borrowings 0 0(b) Trade Payables 38 34(c) Other current liabilities 102 39(d) Short-term provisions 0 0Total Current Liabilities 4(a) to 4(d) 140 73TOTAL EQUITY & LIABILITIES (1+2+3+4) 885 730II. ASSETS(1) Non-Current Assets(a) Total Gross Fixed Assets 128 125(ai) Accumulated Depreciation, Depletion & Amortisation 79 76(aii) Accumulated Impairment 0 0(b) Total Net Fixed Assets ((a)-(ai)-(aii) 49 49(c) Capital work in progress 0 0(d) Intangible assets under developmet 0 0(e) Non-Current Investments 0 0(f) Deferred Tax Assets (Net) 0 0(g) Long Term Loans and Advances 2 2(h) Other Non-Current Assets 9 9Total Non-Current Assets (b+c+d+e+f+g+h) 60 60(2) Current Assets(a) Current Investments 0 0(b) Inventories 131 145(c) Trade Recievables 35 0(d) Cash & Bank Balance 32 43(e) Short-term Loans & Advances 622 477(f) Other Current Assets 5 5Total Current Assets (a+b+c+d+e+f) 825 670TOTAL ASSETS (1+2) 885 730Important Indicators(i) Investment 3896 3721(ii) Capital Employed 660 636(iii) Net Worth -3036 -2885(iv) Net Current Assets 685 597(v) Cost of Sales 1839 1903(vi) Net Value Added (at market price) 167 140(vii) Total Regular Employees (Nos.) 105 110(viii) Avg. Monthly Emoluments per Employee(`) 21429 20379
PROFIT & LOSS ACCOUNT (` in Lakhs)PARTICULARS 2011-12 2010-11(I) Revenue from Operations (Gross) 1682 1727Less : Excise Duty 0 0Revenue from Operations (Net) 1682 1727(II) Other Income 10 8(III) Total Revenue (I+II) 1692 1735(IV) Expenditure on:(a) Cost of materials consumed 0 0(b) Purchase of stock-in-trade 1359 1362(c) Changes in inventories of finished goods, 12 -12
work-in-progress and stock in trade(d) Stores & Spares 0 0(e) Power & Fuel 7 7(f) Salary, Wages & Benefits/Employees Expense 270 269(g) Other Operating/direct/manufacturing Expenses 25 156(h) Rent, Royalty & Cess 44 39(i) Loss on sale of Assets/Investments 0 0(j) Other Expenses 115 77Total Expenditure (IV (a to j)) 1832 1898(V) PROFIT BEFORE DEPRECIATION, & -140 -163
IMPAIRMENT, FINANCE CHARGES/INTEREST, EXCEPTIONAL & EXTRAORDINARYITEMS & TAXES (PBDIEET)(III-IV)
(VI) Depreciation, Depletion & Amortisation 7 5(VII) Impairment 0 0(VIII) PROFIT BEFORE FINANCE COST/
INTEREST, EXCEPTIONAL, EXTRA-ORDINARYITEMS & TAXES (PBIEET)(V-VI-VII) -147 -168
(IX) Finance Cost(a) On Central Government Loans 0 0(b) On Foreign Loans 0 0(c) Others 4 6(d) Less Finance Cost Capitalised 0 0(e) Charged to P & L Account (a+b+c+d) 4 6(X) PROFIT BEFORE EXCEPTIONAL & EXTRA-ORDINARY -151 -174
ITEMS & TAX (PBEET)(VIII-IXe)(XI) Exceptional Items 0 0(XII) PROFIT BEFORE EXTRA-ORDINARY ITEMS & TAX -151 -174
(PBET)(X-XI)(XIII) Extra-Ordinary Items 0 0(XIV) PROFIT BEFORE TAX (PBT)(XII-XIII) -151 -174(XV) TAX PROVISIONS 0 0(XVI) NET PROFIT / LOSS FOR THE PERIOD FROM -151 -174
CONTINUING OPERATIONS AFTER TAX(XIV-XV)(XVII) Profit/Loss from discontinuing operations 0 0(XVIII) Tax expenses of discontinuing operations 0 0(XIX) Profit/Loss from discontinuing operations 0 0
(after Tax)(XVII-XVIII)(XX) Profit/Loss for the period (XVI+XIX) -151 -174Financial Ratios(i) Sales : Capital Employed 254.85 271.54(ii) Cost of Sales : Sales 109.33 110.19(iii) Salary/Wages : Sales 16.05 15.58(iv) Net Profit : Net Worth - -(v) Debt : Equity 18.48 17.6(vi) Current Ratio 5.89 9.18(vii) Trade Recievables : Sales 2.08 0(viii) Total Inventory : Sales 7.79 8.4

Trading & Marketing Services400
North-Eastern Regional Agricultural MarketingCorporation LimitedThe Company
North-Eastern Regional Agricultural Marketing CorporationLimited (NERAMAC) was incorporated on 31.03.1982 with theobjective to purchase the marketable surplus of fruit and vegetablein the North Eastern Region to the maximum possible extent througha network of centers and to make necessary arrangement for itsprocessing and marketing.
NERAMAC is a Schedule 'C'BIFR referred CPSE in Trading& Marketing sector under the administrative control of Ministry ofDevelopment of North Eastern Region with 100% shareholding bythe Government of India. BIFR declared the company 'no longersick' after its net worth become positive. The company employed45 regular employees (Executives 8 & Non-Executives 37) as on31.3.2012. Its Registered and Corporate Offices are at Guwahati,Assam.
Vision / MissionThe Mission / Vision of the company is to contribute
significantly for the agro-horticultural development of the regionby procuring, processing and marketing of at least 50% of thesurplus production of agro-horticultural produces that farmers finddifficult to market like Ginger, Pineapple, Orange, Apple, Kiwi etc.
Industrial / Business OperationsNERAMAC is mainly involved in trading and marketing of
fresh agro-horticulture produce along with processing of pineappleand cashew and retail vending of processed food items through its3 operating units at Nalkata, Agartala (Tripura) and Byrnihat(Meghalaya). Besides Registered / Head Office, it has 8 procurement& marketing Offices in Assam, Tripura, Meghalaya, Nagaland,Mizoram, Manipur, Arunachal Pradesh and Sikkim.
Performance Highlights The physical performances of the company for last two years
are given below:
www.neramac.com
Total Revenue of the company registered a reduction of ̀ 1.48crore during 2011-12, which went down from ` 102.43 crore in2010-11 to ` 100.95 crore in 2011-12. The profit of the companyhas also gone down by `. 0.47 crore to ` 1.00 crore in 2011-12,from ` 1.47 crore in previous year due to fall in turnover andincrease in other expenses.
The current ratio of company is at 1.68:1 during 2011-12 asagainst 1.78:1 in the previous year (Fig.2). Balance Sheet and Profit& Loss Account of the company and selected financial ratios duringthe period 2010-11 to 2011-12 can be seen on the adjoining page.
Fig. 2
Main Products Unit Performance during
2011-12 2010-11
Cashew Nut M T 1.03 11.25
Fruit Juice M T 0.00 18.53Concentration
Ginger Oil KG 18.90 40.37
Ginger Powder KG 2413 305 Strategic issuesThe new imitative taken by company includes setting up of
Cashew Processing unit at Mankachar, Assam, Restructuring &Modernization of the Pineapple Juice Concentration Plant, Nalkata,Tripura and Establishment of Quality Assurance & CentralPackaging Centre at Chaygaon, Assam.
The company is putting its efforts to generate employmentby way of appointing franchisees for marketing and sale of differentproducts produced by tiny / small producers of North EasternRegion. NERAMAC aims to set up minimum 100 outlets in thenext five years.
EBIT
DA
& P
AT (
Rs.
cro
re)
TOTAL R
EVENU
E (Rs. crore)
Fig. 1PR
OFI
TAB
ILIT
Y R
ATIO
S (%
)
CU
RR
ENT R
ATIO

Public Enterprises Survey 2011-2012: Vol-II 401
North Eastern Regional Agri. Marketing Corp.ltd.9, Rajbari Path, G.S. Road, Ganeshguri, Guwahti, Assam -781005
BALANCE SHEET (` in Lakhs)PARTICULARS 2011-12 2010-11I. EQUITY & LIABILITIESAUTHORISED CAPITAL 1000 1000(1) Shareholders’ Funds(a) Share Capital(i) Central Govt 762 762(ii) Others 0 0(b) Reserves & Surplus -381 -481(c) Money received against share warrants 0 0Total Shareholders’ Funds (1(a)+1(b)+1(c) 381 281(2) Share application money pending allotment 0 0(3) Non-current Liabilities(a) Long Term Borrowings 1513 1313(b) Deferred tax liabilities (Net) 0 0(c) Other Long-term liabilities 306 504(d) Long-term provisions 9 9Total Non-Current Liabilities 3(a) to 3(d) 1828 1826(4) Current Liabilities(a) Short Term Borrowings 0 0(b) Trade Payables 1719 1658(c) Other current liabilities 930 588(d) Short-term provisions 0 0Total Current Liabilities 4(a) to 4(d) 2649 2246TOTAL EQUITY & LIABILITIES (1+2+3+4) 4858 4353II. ASSETS(1) Non-Current Assets(a) Total Gross Fixed Assets 704 677(ai) Accumulated Depreciation, Depletion & Amortisation 516 500(aii) Accumulated Impairment 0 0(b) Total Net Fixed Assets ((a)-(ai)-(aii) 188 177(c) Capital work in progress 209 175(d) Intangible assets under developmet 0 0(e) Non-Current Investments 0 0(f) Deferred Tax Assets (Net) 0 0(g) Long Term Loans and Advances 0 0(h) Other Non-Current Assets 0 0Total Non-Current Assets (b+c+d+e+f+g+h) 397 352(2) Current Assets(a) Current Investments 0 0(b) Inventories 82 40(c) Trade Recievables 2009 1438(d) Cash & Bank Balance 592 548(e) Short-term Loans & Advances 1743 1927(f) Other Current Assets 35 48Total Current Assets (a+b+c+d+e+f) 4461 4001TOTAL ASSETS (1+2) 4858 4353Important Indicators(i) Investment 2275 2075(ii) Capital Employed 1894 1594(iii) Net Worth 381 281(iv) Net Current Assets 1812 1755(v) Cost of Sales 9946 10036(vi) Net Value Added (at market price) 388 427(vii) Total Regular Employees (Nos.) 45 44(viii) Avg. Monthly Emoluments per Employee(`) 40556 39394
PROFIT & LOSS ACCOUNT (` in Lakhs)PARTICULARS 2011-12 2010-11(I) Revenue from Operations (Gross) 9604 10002Less : Excise Duty 0 0Revenue from Operations (Net) 9604 10002(II) Other Income 491 241(III) Total Revenue (I+II) 10095 10243(IV) Expenditure on:(a) Cost of materials consumed 20 35(b) Purchase of stock-in-trade 9336 9641(c) Changes in inventories of finished goods, -58 15
work-in-progress and stock in trade(d) Stores & Spares 1 8(e) Power & Fuel 0 0(f) Salary, Wages & Benefits/Employees Expense 219 208(g) Other Operating/direct/manufacturing Expenses 54 73(h) Rent, Royalty & Cess 20 12(i) Loss on sale of Assets/Investments 0 0(j) Other Expenses 338 23Total Expenditure (IV (a to j)) 9930 10015(V) PROFIT BEFORE DEPRECIATION, & 165 228
IMPAIRMENT, FINANCE CHARGES/INTEREST, EXCEPTIONAL & EXTRAORDINARYITEMS & TAXES (PBDIEET)(III-IV)
(VI) Depreciation, Depletion & Amortisation 16 21(VII) Impairment 0 0(VIII) PROFIT BEFORE FINANCE COST/
INTEREST, EXCEPTIONAL, EXTRA-ORDINARYITEMS & TAXES (PBIEET)(V-VI-VII) 149 207
(IX) Finance Cost(a) On Central Government Loans 0 0(b) On Foreign Loans 0 0(c) Others 0 0(d) Less Finance Cost Capitalised 0 0(e) Charged to P & L Account (a+b+c+d) 0 0(X) PROFIT BEFORE EXCEPTIONAL & EXTRA-ORDINARY 149 207
ITEMS & TAX (PBEET)(VIII-IXe)(XI) Exceptional Items 0 0(XII) PROFIT BEFORE EXTRA-ORDINARY ITEMS & TAX 149 207
(PBET)(X-XI)(XIII) Extra-Ordinary Items 0 0(XIV) PROFIT BEFORE TAX (PBT)(XII-XIII) 149 207(XV) TAX PROVISIONS 49 60(XVI) NET PROFIT / LOSS FOR THE PERIOD FROM 100 147
CONTINUING OPERATIONS AFTER TAX(XIV-XV)(XVII) Profit/Loss from discontinuing operations 0 0(XVIII) Tax expenses of discontinuing operations 0 0(XIX) Profit/Loss from discontinuing operations
(after Tax)(XVII-XVIII) 0 0(XX) Profit/Loss for the period (XVI+XIX) 100 147Financial Ratios(i) Sales : Capital Employed 507.07 627.48(ii) Cost of Sales : Sales 103.56 100.34(iii) Salary/Wages : Sales 2.28 2.08(iv) Net Profit : Net Worth 26.25 52.31(v) Debt : Equity 1.99 1.72(vi) Current Ratio 1.68 1.78(vii) Trade Recievables : Sales 20.92 14.38(viii) Total Inventory : Sales 0.85 0.4

Trading & Marketing Services402
NTPC Vidyut Vyapar Nigam Ltd.
The CompanyNTPC Vidyut Vyapar Nigam Ltd. (NVVN) was incorporated
on 1.11.2002 as a wholly owned subsidiary of NTPC Ltd. with theobjective to undertake business of sale and purchase of electricpower, to effectively utilise installed capacity and thus enablereduction in the cost of power. The company was granted category'I' Trading License by Central Electricity Regulatory Commission(CERC), the highest category of license.
NVVN is an un-categarised CPSE in Trading & Marketingsector under the administrative control of M/o Power. The companyemployed 53 regular employees (Executives 52, Non-executives 1)as on 31.3.2012. Its Registered and Corporate offices are at NewDelhi.
Vision/MissionThe Vision of the company is to be a catalyst in development
of wholesale power market in India enabling trading of surpluspower.
The Mission of the company is to provide good value topotential sellers and develop commercial arrangement for theirsurplus power, provide viable alternative to buyers and enableNTPC to maintain optimal generation level through mutuallybeneficial trading transactions.
Industrial / Business OperationsNVVN is involved in the business of power trading and ash
trading. NVVN is actively involved in facilitating the developmentof a wholesale electricity market in India.
Performance Highlights
www.ntpc.co.in
Strategic issuesThe Government has approved the Jawaharlal Nehru National
Solar Mission (JNNSM) in November, 2009, with an aim to havecapacity of 20000 MW of solar power by 2022, with immediatetarget for 1000 MW by 2013 for phase-I. Government has designatedNVVN as a Nodal Agency for first phase of the National SolarMission for 2009-13.
Under the migration projects scheme of JNNSM solar PVprojects of 48 MW capacity out of 54 MW contracted has beencommissioned and solar thermal projects 30 MW capacity are tobe commissioned in 2013. A solar capacity (migration + batch1) of178 MW has been commissioned & corresponding allocation ofNTPC coal power has been made by M/o Power.
The physical performance of company during last 2 years ismentioned below:
The Company registered an increase of ` 15.50 crore in totalincome during 2011-12 which went up to ` 69.98 crore in 2011-12from ̀ 54.48 crore during 2010-11 due to overall increase in volumeof energy traded. The net profit of the company however increasedto ` 111.93 crore 2011-12, an increase of ` 81.87 crore over theprevious year's profit of ` 30.06 crore mainly due to ExceptionalItems on account of liquidated damages and encashment of bankguarantees aggregating to ̀ 107.18 crore.
The current ratio of company is at 1.87:1 during 2011-12 asagainst 2.65:1 in the previous year (Fig.2). Balance Sheet and Profit& Loss Account of the company and selected financial ratios duringthe period 2010-11 to 2011-12 can be seen on the adjoining page.
Main Products Unit Performance during
2011-12 2010-11
Power Trading MUs 8529 6933
Fly Ash M T 3782470 2337115
TOTAL R
EVENU
E (Rs. crore)
Fig. 1
Fig. 2
EBIT
DA
& P
AT (
Rs.
cro
re)
PRO
FITA
BIL
ITY
RAT
IOS
(%)
CU
RR
ENT R
ATIO

Public Enterprises Survey 2011-2012: Vol-II 403
NTPC Vidyut Vyapar Nigam Ltd.NTPC Bhawan, SCOPE Complex, 7, Institutional Area, Lodhi Road New Delhi-110003
BALANCE SHEET (` in Lakhs)PARTICULARS 2011-12 2010-11I. EQUITY & LIABILITIESAUTHORISED CAPITAL 2000 2000(1) Shareholders’ Funds(a) Share Capital(i) Central Govt 0 0(ii) Others 2000 2000(b) Reserves & Surplus 30457 14787(c) Money received against share warrants 0 0Total Shareholders’ Funds (1(a)+1(b)+1(c) 32457 16787(2) Share application money pending allotment 0 0(3) Non-current Liabilities(a) Long Term Borrowings 0 0(b) Deferred tax liabilities (Net) 1 1(c) Other Long-term liabilities 86 28(d) Long-term provisions 0 0Total Non-Current Liabilities 3(a) to 3(d) 87 29(4) Current Liabilities(a) Short Term Borrowings 0 0(b) Trade Payables 32380 7377(c) Other current liabilities 1908 1052(d) Short-term provisions 2959 1756Total Current Liabilities 4(a) to 4(d) 37247 10185TOTAL EQUITY & LIABILITIES (1+2+3+4) 69791 27001II. ASSETS(1) Non-Current Assets(a) Total Gross Fixed Assets 65 66(ai) Accumulated Depreciation, Depletion & Amortisation 40 37(aii) Accumulated Impairment 0 0(b) Total Net Fixed Assets ((a)-(ai)-(aii) 25 29(c) Capital work in progress 0 0(d) Intangible assets under developmet 0 0(e) Non-Current Investments 0 0(f) Deferred Tax Assets (Net) 0 0(g) Long Term Loans and Advances 0 15(h) Other Non-Current Assets 0 0Total Non-Current Assets (b+c+d+e+f+g+h) 25 44(2) Current Assets(a) Current Investments 0 0(b) Inventories 2 2(c) Trade Recievables 16207 5650(d) Cash & Bank Balance 33955 14470(e) Short-term Loans & Advances 0 178(f) Other Current Assets 19602 6657Total Current Assets (a+b+c+d+e+f) 69766 26957TOTAL ASSETS (1+2) 69791 27001Important Indicators(i) Investment 2000 2000(ii) Capital Employed 32457 16787(iii) Net Worth 32457 16787(iv) Net Current Assets 32519 16772(v) Cost of Sales 915 918(vi) Net Value Added (at market price) 17803 5395(vii) Total Regular Employees (Nos.) 53 53(viii) Avg. Monthly Emoluments per Employee(`) 108648 90252
PROFIT & LOSS ACCOUNT (` in Lakhs)PARTICULARS 2011-12 2010-11(I) Revenue from Operations (Gross) 4860 3396Less : Excise Duty 0 0Revenue from Operations (Net) 4860 3396(II) Other Income 2138 2052(III) Total Revenue (I+II) 6998 5448(IV) Expenditure on:(a) Cost of materials consumed 0 0(b) Purchase of stock-in-trade 0 0(c) Changes in inventories of finished goods, 0 0
work-in-progress and stock in trade(d) Stores & Spares 0 0(e) Power & Fuel 12 15(f) Salary, Wages & Benefits/Employees Expense 691 574(g) Other Operating/direct/manufacturing Expenses 354 114(h) Rent, Royalty & Cess 311 291(i) Loss on sale of Assets/Investments 0 0(j) Other Expenses -457 -82Total Expenditure (IV (a to j)) 911 912(V) PROFIT BEFORE DEPRECIATION, & 6087 4536
IMPAIRMENT, FINANCE CHARGES/INTEREST, EXCEPTIONAL & EXTRAORDINARYITEMS & TAXES (PBDIEET)(III-IV)
(VI) Depreciation, Depletion & Amortisation 4 6(VII) Impairment 0 0(VIII) PROFIT BEFORE FINANCE COST/
INTEREST, EXCEPTIONAL, EXTRA-ORDINARYITEMS & TAXES (PBIEET)(V-VI-VII) 6083 4530
(IX) Finance Cost(a) On Central Government Loans 0 0(b) On Foreign Loans 0 0(c) Others 157 17(d) Less Finance Cost Capitalised 0 0(e) Charged to P & L Account (a+b+c+d) 157 17(X) PROFIT BEFORE EXCEPTIONAL & EXTRA-ORDINARY 5926 4513
ITEMS & TAX (PBEET)(VIII-IXe)(XI) Exceptional Items -10718 0(XII) PROFIT BEFORE EXTRA-ORDINARY ITEMS & TAX 16644 4513
(PBET)(X-XI)(XIII) Extra-Ordinary Items 0 0(XIV) PROFIT BEFORE TAX (PBT)(XII-XIII) 16644 4513(XV) TAX PROVISIONS 5451 1507(XVI) NET PROFIT / LOSS FOR THE PERIOD FROM 11193 3006
CONTINUING OPERATIONS AFTER TAX(XIV-XV)(XVII) Profit/Loss from discontinuing operations 0 0(XVIII) Tax expenses of discontinuing operations 0 0(XIX) Profit/Loss from discontinuing operations
(after Tax)(XVII-XVIII) 0 0(XX) Profit/Loss for the period (XVI+XIX) 11193 3006Financial Ratios(i) Sales : Capital Employed 14.97 20.23(ii) Cost of Sales : Sales 18.83 27.03(iii) Salary/Wages : Sales 14.22 16.9(iv) Net Profit : Net Worth 34.49 17.91(v) Debt : Equity 0 0(vi) Current Ratio 1.87 2.65(vii) Trade Recievables : Sales 333.48 166.37(viii) Total Inventory : Sales 0.04 0.06

Trading & Marketing Services404
PEC Ltd.
The CompanyPEC Ltd. was incorporated in April 1971 as Public Sector
Undertaking under Ministry of Commerce & Industry, Govt. ofIndia. The company is engaged in export of engineering equipmentand projects specially from small and medium enterprises, besidesexport and import of bulk items viz. agro commodities, bullion,industrial raw materials, domestic trade, export of engineeringequipment, projects etc.
PEC is a Schedule - B / Miniratna CPSE in Trading andMarketing Services under Ministry of Commerce & Industry with100% shareholding by the Government. The company employed197 regular employees (Executives 170 & Non-Executives 27) ason 31.3.2012. The Registered Office of the Company is located atNew Delhi.
Vision / MissionThe Vision of the company is to be highly focused company,
engaged in international and domestic trade.The Mission of the Company are to trade in the international
and domestic market in a manner to create an image of quality,reliability, ethical values and sustained long term relationship withthe customers and other business partners.
Industrial / Business OperationsPEC is one of the pioneering enterprises providing services in
the field of export and import of bulk items viz. agriculturalcommodities, industrial raw materials, bullion and domestic tradeand export of engineering equipment, projects etc. from its 14 branchoffices in all major cities and ports of India.
PEC over last three decades has expanded its role to becomean international business organization and a provider of integratedtrade facilitating services.
Performance HighlightsThe physical performances of the company for last two years
are given below:
www.peclimited.com
Strategic issuePEC continues with its commitment to promote export of
engineering and manufactured goods. Over the years, business ofPEC has changed with industrial raw materials, commodities andbullion constituting major part of its turnover and profit. Some ofthe key initiatives have been consolidation of existing line ofbusiness and selective diversification into sustainable business areas,improving operational efficiency and cost effectiveness. PECcontinues to strive in its efforts to capture new opportunities ininternational as well as domestic trade to sustain. PEC looks forwardoptimistically to achieve higher targets in future.
Main Products Unit Performance during
2011-12 2010-11
Export ` in crore 1254.91 1136.25
Import ` in crore 8881.57 7906.80
Domestic ` in crore 889.46 926.89
TOTAL ` in crore 11025.94 9969.94
The Company registered a growth of ` 1019.41 crore in totalincome during 2011-12 which went up to ` 11682.22 crore in2011-12 from ` 10662.81 crore during 2010-11. The net profit ofthe company increased to ̀ 79.55 crore during 2011-12, an increaseof ` 8.63 crore over the previous year profit of ` 70.92 crore dueto increase in export, import and domestic sales turnover and bettermargins.
The current ratio of company is at 1.05:1 during 2011-12 asagainst 1.04:1 in the previous year (Fig.2). Balance Sheet & Profit& Loss Account of the company and selected financial ratios duringthe period 2010-11 to 2011-12 can be seen on the adjoining page.
EBIT
DA
& P
AT (
Rs.
cro
re)
TOTAL R
EVENU
E (Rs. crore)
Fig. 1
PRO
FITA
BIL
ITY
RAT
IOS
(%)
CU
RR
ENT R
ATIO
Fig. 2

Public Enterprises Survey 2011-2012: Vol-II 405
P E C LTD.Hansalaya, 15 Barakhamba Road, New Delhi
BALANCE SHEET (` in Lakhs)PARTICULARS 2011-12 2010-11I. EQUITY & LIABILITIESAUTHORISED CAPITAL 3000 3000(1) Shareholders’ Funds(a) Share Capital(i) Central Govt 2000 2000(ii) Others 0 0(b) Reserves & Surplus 32763 26551(c) Money received against share warrants 0 0Total Shareholders’ Funds (1(a)+1(b)+1(c) 34763 28551(2) Share application money pending allotment 0 0(3) Non-current Liabilities(a) Long Term Borrowings 0 0(b) Deferred tax liabilities (Net) 0 0(c) Other Long-term liabilities 0 0(d) Long-term provisions 0 0Total Non-Current Liabilities 3(a) to 3(d) 0 0(4) Current Liabilities(a) Short Term Borrowings 0 19400(b) Trade Payables 487624 482713(c) Other current liabilities 59988 60976(d) Short-term provisions 17191 13278Total Current Liabilities 4(a) to 4(d) 564803 576367TOTAL EQUITY & LIABILITIES (1+2+3+4) 599566 604918II. ASSETS(1) Non-Current Assets(a) Total Gross Fixed Assets 604 596(ai) Accumulated Depreciation, Depletion & Amortisation 522 511(aii) Accumulated Impairment 0 0(b) Total Net Fixed Assets ((a)-(ai)-(aii) 82 85(c) Capital work in progress 0 0(d) Intangible assets under developmet 0 0(e) Non-Current Investments 40 40(f) Deferred Tax Assets (Net) 1151 1099(g) Long Term Loans and Advances 123 112(h) Other Non-Current Assets 3215 1293Total Non-Current Assets (b+c+d+e+f+g+h) 4611 2629(2) Current Assets(a) Current Investments 0 0(b) Inventories 80879 147429(c) Trade Recievables 381026 356851(d) Cash & Bank Balance 46567 31200(e) Short-term Loans & Advances 84505 64085(f) Other Current Assets 1978 2724Total Current Assets (a+b+c+d+e+f) 594955 602289TOTAL ASSETS (1+2) 599566 604918Important Indicators(i) Investment 2000 2000(ii) Capital Employed 34763 28551(iii) Net Worth 34763 28551(iv) Net Current Assets 30152 25922(v) Cost of Sales 1141552 1045787(vi) Net Value Added (at market price) 42145 30641(vii) Total Regular Employees (Nos.) 197 193(viii) Avg. Monthly Emoluments per Employee(`) 120474 116451
PROFIT & LOSS ACCOUNT (` in Lakhs)PARTICULARS 2011-12 2010-11(I) Revenue from Operations (Gross) 1149832 1052469Less : Excise Duty 0 0Revenue from Operations (Net) 1149832 1052469(II) Other Income 18390 13812(III) Total Revenue (I+II) 1168222 1066281(IV) Expenditure on:(a) Cost of materials consumed 0 0(b) Purchase of stock-in-trade 1021421 1059868(c) Changes in inventories of finished goods, 66550 -58692
work-in-progress and stock in trade(d) Stores & Spares 0 0(e) Power & Fuel 29 29(f) Salary, Wages & Benefits/Employees Expense 2848 2697(g) Other Operating/direct/manufacturing Expenses 15726 4704(h) Rent, Royalty & Cess 262 244(i) Loss on sale of Assets/Investments 0 0(j) Other Expenses 34669 36881Total Expenditure (IV (a to j)) 1141505 1045731(V) PROFIT BEFORE DEPRECIATION, & 26717 20550
IMPAIRMENT, FINANCE CHARGES/INTEREST, EXCEPTIONAL & EXTRAORDINARYITEMS & TAXES (PBDIEET)(III-IV)
(VI) Depreciation, Depletion & Amortisation 47 56(VII) Impairment 0 0(VIII) PROFIT BEFORE FINANCE COST/
INTEREST, EXCEPTIONAL, EXTRA-ORDINARYITEMS & TAXES (PBIEET)(V-VI-VII) 26670 20494
(IX) Finance Cost(a) On Central Government Loans 0 0(b) On Foreign Loans 0 0(c) Others 14817 9838(d) Less Finance Cost Capitalised 0 0(e) Charged to P & L Account (a+b+c+d) 14817 9838(X) PROFIT BEFORE EXCEPTIONAL & EXTRA-ORDINARY 11853 10656
ITEMS & TAX (PBEET)(VIII-IXe)(XI) Exceptional Items 0 0(XII) PROFIT BEFORE EXTRA-ORDINARY ITEMS & TAX 11853 10656
(PBET)(X-XI)(XIII) Extra-Ordinary Items 0 0(XIV) PROFIT BEFORE TAX (PBT)(XII-XIII) 11853 10656(XV) TAX PROVISIONS 3898 3564(XVI) NET PROFIT / LOSS FOR THE PERIOD FROM 7955 7092
CONTINUING OPERATIONS AFTER TAX(XIV-XV)(XVII) Profit/Loss from discontinuing operations 0 0(XVIII) Tax expenses of discontinuing operations 0 0(XIX) Profit/Loss from discontinuing operations 0 0
(after Tax)(XVII-XVIII)(XX) Profit/Loss for the period (XVI+XIX) 7955 7092Financial Ratios(i) Sales : Capital Employed 3307.63 3686.28(ii) Cost of Sales : Sales 99.28 99.37(iii) Salary/Wages : Sales 0.25 0.26(iv) Net Profit : Net Worth 22.88 24.84(v) Debt : Equity 0 0(vi) Current Ratio 1.05 1.04(vii) Trade Recievables : Sales 33.14 33.91(viii) Total Inventory : Sales 7.03 14.01

Trading & Marketing Services406
The State Trading Corporation of India Ltd.
The CompanyThe State Trading Corporation of India Ltd. (STC) was
incorporated in 1956 under the Companies Act, 1956 with primaryobjective to trade with East European countries and to supplementthe efforts of private trade and industry in developing exports fromthe country.
It is a Schedule -'A', Mini-ratna listed CPSE in Trading andMarketing Syndicate under the administrative control of Ministryof Commerce and Industry, Department of Commerce with 91.023%shareholding by the Government of India. The company employed844 regular employees (Executives 554 & Non-Executives 290) ason 31.3.2012. It's registered and corporate office is at New DelhiVision / Mission
The Vision/Mission of the company is to emerge as one of thelargest global trading companies with international standards ofexcellence nurturing a blend of quality, business ethics and proactiveenthusiasm to enhance stakeholders' value. To develop corecompetencies in selected areas and exploit the market opportunitiesin these areas to its best advantage is one of the major objectives ofSTC.Industrial / Business Operations
STC is involved in exports, imports and domestic tradingactivities in a large basket of items through its 13 branch offices,mostly located at major port towns of the country. It has onewholly owned subsidiary, namely, STCL Ltd. situated at Bangalore.The company has also formed a Joint Venture namely NSS SatpuraAgro Development Co. with NAFED and STCL with a share holdingof 25%, 50% and 25% respectively.
The exports of the company include agricultural commoditiessuch as rice, tea, cashew, castor oil, sugar, maize and manufacturedproducts like pharmaceuticals, construction materials, consumergoods, steel raw materials, iron ore, gold jewellery, etc. The Companyundertakes imports of bullion, hydrocarbons, minerals, metals,fertilizers, petro-chemicals, edible oils, etc. It also arranges importsof essential items of mass consumption such as wheat, pulses andedible oils to meet domestic shortages as and when called upon bythe Govt. of India to do so. It imports crucial raw materials as andwhen needed by the Indian Industry. It also undertakes import oftechnical and security equipment on behalf of Forensic ScienceLaboratories, State Police and Intelligence Departments andParamilitary Organizations. STC also undertakes counter trade andoffset operations against purchases by the Government of India asalso third county trading. Besides, exports and imports, STC alsoundertakes domestic sales of hydrocarbons, metals, tea, pulses,jute, etc.Financial Highlights
The physical performances of the company for last two yearsare given below:
Total Revenue from of the company registered an increase of10387.18crore during 2011-12, which went up from ` 20695.91crore in 2010-11 to ` 31083.09 crore in 2011-12 due to increase inturnover. The profit of the company has gone down by ` 39.97crore to ` 16.47 crore in 2011-12, from ` 56.44 crore in previousyear due to increase in finance cost and other operating expenses.
The current ratio of company is at 1.22:1 during 2011-12 asagainst 0.91:1 in the previous year (Fig.2). Balance Sheet and Profit& Loss Account of the company and selected financial ratios duringthe period 2010-11 to 2011-12 can be seen on the adjoining page.
Main Products Unit Performance during
2011-12 2010-11
Imports ` in Crore 29961 18938
Exports ` in Crore 344 492
Domestic Sale ` in Crore 139 555
EBIT
DA
& P
AT (
Rs.
cro
re)
TOTAL R
EVENU
E (Rs. crore)
Fig. 1
PRO
FITA
BIL
ITY
RAT
IOS
(%)
CU
RR
ENT R
ATIO
Fig. 2Strategic issues
With a view to increase its turnover and profitability, theCorporation has undertaken a number of new initiatives like stock& sale of retail items, developing greater liaison with stategovernments for enhanced procurements on their behalf, registrationof grain traders etc. STC has identified Latin America, Africa andAsia as focus markets.
www.stc.gov.in

Public Enterprises Survey 2011-2012: Vol-II 407
State Trading Corpn. of India Ltd.Jawahar Vyapar Bhavan Tolstoy Marg New Delhi 110001
BALANCE SHEET (` in Lakhs)PARTICULARS 2011-12 2010-11I. EQUITY & LIABILITIESAUTHORISED CAPITAL 20000 20000(1) Shareholders’ Funds(a) Share Capital(i) Central Govt 5461 5461(ii) Others 539 539(b) Reserves & Surplus 62198 61947(c) Money received against share warrants 0 0Total Shareholders’ Funds (1(a)+1(b)+1(c) 68198 67947(2) Share application money pending allotment 0 0(3) Non-current Liabilities(a) Long Term Borrowings 0 37255(b) Deferred tax liabilities (Net) 0 0(c) Other Long-term liabilities 112258 111258(d) Long-term provisions 6603 5524Total Non-Current Liabilities 3(a) to 3(d) 118861 154037(4) Current Liabilities(a) Short Term Borrowings 203032 117654(b) Trade Payables 222336 320685(c) Other current liabilities 29248 47425(d) Short-term provisions 3745 5931Total Current Liabilities 4(a) to 4(d) 458361 491695TOTAL EQUITY & LIABILITIES (1+2+3+4) 645420 713679II. ASSETS(1) Non-Current Assets(a) Total Gross Fixed Assets 9117 8980(ai) Accumulated Depreciation, Depletion & Amortisation 3938 3673(aii) Accumulated Impairment 0 0(b) Total Net Fixed Assets ((a)-(ai)-(aii) 5179 5307(c) Capital work in progress 987 337(d) Intangible assets under developmet 0 0(e) Non-Current Investments 31 303(f) Deferred Tax Assets (Net) 7301 6582(g) Long Term Loans and Advances 2792 2388(h) Other Non-Current Assets 70888 249129Total Non-Current Assets (b+c+d+e+f+g+h) 87178 264046(2) Current Assets(a) Current Investments 0 0(b) Inventories 54371 131374(c) Trade Recievables 420407 216380(d) Cash & Bank Balance 22634 73704(e) Short-term Loans & Advances 28552 15173(f) Other Current Assets 32278 13002Total Current Assets (a+b+c+d+e+f) 558242 449633TOTAL ASSETS (1+2) 645420 713679Important Indicators(i) Investment 6000 43255(ii) Capital Employed 68198 105202(iii) Net Worth 68198 67947(iv) Net Current Assets 99881 -42062(v) Cost of Sales 3081589 2042932(vi) Net Value Added (at market price) 143981 74708(vii) Total Regular Employees (Nos.) 844 864(viii) Avg. Monthly Emoluments per Employee(`) 99259 101466
PROFIT & LOSS ACCOUNT (` in Lakhs)PARTICULARS 2011-12 2010-11(I) Revenue from Operations (Gross) 3077310 2047565Less : Excise Duty 0 0Revenue from Operations (Net) 3077310 2047565(II) Other Income 30999 22026(III) Total Revenue (I+II) 3108309 2069591(IV) Expenditure on:(a) Cost of materials consumed 134 205(b) Purchase of stock-in-trade 2988583 2102134(c) Changes in inventories of finished goods, 77018 -74732
work-in-progress and stock in trade(d) Stores & Spares 0 0(e) Power & Fuel 158 136(f) Salary, Wages & Benefits/Employees Expense 10053 10520(g) Other Operating/direct/manufacturing Expenses 1617 1758(h) Rent, Royalty & Cess 990 1041(i) Loss on sale of Assets/Investments 0 0(j) Other Expenses 2729 1563Total Expenditure (IV (a to j)) 3081282 2042625(V) PROFIT BEFORE DEPRECIATION, & 27027 26966
IMPAIRMENT, FINANCE CHARGES/INTEREST, EXCEPTIONAL & EXTRAORDINARYITEMS & TAXES (PBDIEET)(III-IV)
(VI) Depreciation, Depletion & Amortisation 307 307(VII) Impairment 0 0(VIII) PROFIT BEFORE FINANCE COST/INTEREST,
EXCEPTIONAL, EXTRA-ORDINARYITEMS & TAXES (PBIEET)(V-VI-VII) 26720 26659
(IX) Finance Cost(a) On Central Government Loans 0 0(b) On Foreign Loans 0 0(c) Others 20347 17753(d) Less Finance Cost Capitalised 0 0(e) Charged to P & L Account (a+b+c+d) 20347 17753(X) PROFIT BEFORE EXCEPTIONAL & EXTRA-ORDINARY 6373 8906
ITEMS & TAX (PBEET)(VIII-IXe)(XI) Exceptional Items 4593 942(XII) PROFIT BEFORE EXTRA-ORDINARY ITEMS & TAX 1780 7964
(PBET)(X-XI)(XIII) Extra-Ordinary Items 0 0(XIV) PROFIT BEFORE TAX (PBT)(XII-XIII) 1780 7964(XV) TAX PROVISIONS 133 2320(XVI) NET PROFIT / LOSS FOR THE PERIOD FROM 1647 5644
CONTINUING OPERATIONS AFTER TAX(XIV-XV)(XVII) Profit/Loss from discontinuing operations 0 0(XVIII) Tax expenses of discontinuing operations 0 0(XIX) Profit/Loss from discontinuing operations 0 0
(after Tax)(XVII-XVIII)(XX) Profit/Loss for the period (XVI+XIX) 1647 5644Financial Ratios(i) Sales : Capital Employed 4512.32 1946.32(ii) Cost of Sales : Sales 100.14 99.77(iii) Salary/Wages : Sales 0.33 0.51(iv) Net Profit : Net Worth 2.42 8.31(v) Debt : Equity 0 6.21(vi) Current Ratio 1.22 0.91(vii) Trade Recievables : Sales 13.66 10.57(viii) Total Inventory : Sales 1.77 6.42

Trading & Marketing Services408
STCL Ltd.
The CompanySTCL Ltd. (STCL) was incorporated on 23.10.1982 (as
'Cardamom Trading Corporation Ltd.', which was renamed as 'SpicesTrading Corporation Ltd.' in 1987 and further renamed as 'STCLLtd.', in 2004) with the objective to trade in spices and agriculturalproducts in domestic and international markets, to process andcure spices and to manufacture spice products and agriculturalproducts of international standards and to carry on domestic andinternational trade in all kinds of industrial goods, iron ore, bullion,precious metals, limestone, met-coke, other minerals, polymer,polyester yarn, cotton yarn and such other textile products, PVCresins, HMS Scraps and other metal scrap.
STCL is a Schedule 'C' CPSE in Trading & Marketing sectorunder the administrative control of Ministry of Commerce andIndustry, Department of Commerce. The Company employed 54regular employees (Executives 19 & Non-Executives 35) as on31.03.2012. Its Registered and Corporate offices are at Bangalore,Karnataka. STCL is a 100% subsidiary of The State TradingCorporation of India Ltd.
Vision / MissionThe Vision / Mission of the Company is to emerge as global
trading company with international standards of excellence nurturinga blend of quality, business ethics and proactive enthusiasm toenhance stakeholders value.
Industrial / Business OperationsSTCL is engaged in trading of spices, agricultural commodities
and supply of agriculture inputs to growers; to conduct Cardamomauctions; to import and export spices, agriculture commodities andother commodities through its two (2) operating manufacturingunits and 10 branch offices. The company has one Joint Venture(JV) namely NSS Satpura Agro Development Corp. Ltd. with equityparticipation's from STC (holding company) and NAFED.
Performance HighlightsThe company has not provided any information on physical
performance for last two years.
Total Revenue of the company registered an increase of` 66.99 crore during 2011-12, which went up from ̀ 68.91 crore in2010-11 to ` 135.90 crore in 2011-12. However, the companyincurred a loss of ` 284.66 crores during the year 2011-12 ascompared to a loss of ` 178.02 crore during the year 2010-11showing an increase in loss of ` 106.64 crore. The turnover andprofitability of the company during the last two years is affectedon account of Bank default by business associates as result ofwhich the principal and interest liability could not be paid by thecompany.
The current ratio of company is at 0.02:1 during 2011-12 asagainst 0.03:1 in the previous year. Balance Sheet and Profit & LossAccount of the company and selected financial ratios during theperiod 2010-11 to 2011-12 can be seen on the adjoining page.
www.stclindia.com
Strategic issuesSTCL has taken all necessary steps for its Non-performing
assets of ̀ 1806 crore through appropriate legal action / complaintfiled. STCL has a negative net worth of ` 1800 crore due toprovisions made towards recoveries outstanding from its businessassociates and the accumulated interest thereon in merchantingtrade transactions undertaken during 2007-08 and earlier. STC theholding company has not given any corporate guarantee to / onbehalf of STCL as such STC liability is limited to its investment inthe equity (` 2.82 core) of STCL.
EBIT
DA
& P
AT (
Rs.
cro
re)
TOTAL R
EVENU
E (Rs. crore)
Fig. 1

Public Enterprises Survey 2011-2012: Vol-II 409
STCL Ltd.166/2, 13th Main Road, Vasanthnagar, Bangalore, Karnataka 560 052
BALANCE SHEET (` in Lakhs)PARTICULARS 2011-12 2010-11I. EQUITY & LIABILITIESAUTHORISED CAPITAL 500 150(1) Shareholders’ Funds(a) Share Capital(i) Central Govt 0 0(ii) Others 150 150(b) Reserves & Surplus -180055 -151537(c) Money received against share warrants 0 0Total Shareholders’ Funds (1(a)+1(b)+1(c) -179905 -151387(2) Share application money pending allotment 0 0(3) Non-current Liabilities(a) Long Term Borrowings 0 0(b) Deferred tax liabilities (Net) 0 0(c) Other Long-term liabilities 0 0(d) Long-term provisions 99 109Total Non-Current Liabilities 3(a) to 3(d) 99 109(4) Current Liabilities(a) Short Term Borrowings 181638 152905(b) Trade Payables 3610 4214(c) Other current liabilities 268 278(d) Short-term provisions 989 980Total Current Liabilities 4(a) to 4(d) 186505 158377TOTAL EQUITY & LIABILITIES (1+2+3+4) 6699 7099II. ASSETS(1) Non-Current Assets(a) Total Gross Fixed Assets 1215 1381(ai) Accumulated Depreciation, Depletion & Amortisation 388 406(aii) Accumulated Impairment 0 0(b) Total Net Fixed Assets ((a)-(ai)-(aii) 827 975(c) Capital work in progress 0 26(d) Intangible assets under developmet 0 0(e) Non-Current Investments 10 10(f) Deferred Tax Assets (Net) 0 0(g) Long Term Loans and Advances 0 0(h) Other Non-Current Assets 1432 1071Total Non-Current Assets (b+c+d+e+f+g+h) 2269 2082(2) Current Assets(a) Current Investments 0 0(b) Inventories 1481 6(c) Trade Recievables 330 181(d) Cash & Bank Balance 741 3835(e) Short-term Loans & Advances 1872 992(f) Other Current Assets 6 3Total Current Assets (a+b+c+d+e+f) 4430 5017TOTAL ASSETS (1+2) 6699 7099Important Indicators(i) Investment 150 150(ii) Capital Employed -179905 -151387(iii) Net Worth -179905 -151387(iv) Net Current Assets -182075 -153360(v) Cost of Sales 18228 6316(vi) Net Value Added (at market price) -4318 911(vii) Total Regular Employees (Nos.) 54 56(viii) Avg. Monthly Emoluments per Employee(`) 50617 48661
PROFIT & LOSS ACCOUNT (` in Lakhs)PARTICULARS 2011-12 2010-11(I) Revenue from Operations (Gross) 13262 6318Less : Excise Duty 0 0Revenue from Operations (Net) 13262 6318(II) Other Income 328 573(III) Total Revenue (I+II) 13590 6891(IV) Expenditure on:(a) Cost of materials consumed 0 0(b) Purchase of stock-in-trade 14106 5783(c) Changes in inventories of finished goods, -1475 4
work-in-progress and stock in trade(d) Stores & Spares 0 0(e) Power & Fuel 21 8(f) Salary, Wages & Benefits/Employees Expense 328 327(g) Other Operating/direct/manufacturing Expenses 59 34(h) Rent, Royalty & Cess 26 13(i) Loss on sale of Assets/Investments 0 0(j) Other Expenses 5071 -14Total Expenditure (IV (a to j)) 18136 6155(V) PROFIT BEFORE DEPRECIATION, & -4546 736
IMPAIRMENT, FINANCE CHARGES/INTEREST, EXCEPTIONAL & EXTRAORDINARYITEMS & TAXES (PBDIEET)(III-IV)
(VI) Depreciation, Depletion & Amortisation 92 161(VII) Impairment 0 0(VIII) PROFIT BEFORE FINANCE COST/INTEREST,
EXCEPTIONAL, EXTRA-ORDINARYITEMS & TAXES (PBIEET)(V-VI-VII) -4638 575
(IX) Finance Cost(a) On Central Government Loans 0 0(b) On Foreign Loans 0 0(c) Others 23779 18507(d) Less Finance Cost Capitalised 0 0(e) Charged to P & L Account (a+b+c+d) 23779 18507(X) PROFIT BEFORE EXCEPTIONAL & EXTRA-ORDINARY -28417 -17932
ITEMS & TAX (PBEET)(VIII-IXe)(XI) Exceptional Items 39 4(XII) PROFIT BEFORE EXTRA-ORDINARY ITEMS & TAX -28456 -17936
(PBET)(X-XI)(XIII) Extra-Ordinary Items 0 0(XIV) PROFIT BEFORE TAX (PBT)(XII-XIII) -28456 -17936(XV) TAX PROVISIONS 10 -134(XVI) NET PROFIT / LOSS FOR THE PERIOD FROM -28466 -17802
CONTINUING OPERATIONS AFTER TAX(XIV-XV)(XVII) Profit/Loss from discontinuing operations 0 0(XVIII) Tax expenses of discontinuing operations 0 0(XIX) Profit/Loss from discontinuing operations 0 0
(after Tax)(XVII-XVIII)(XX) Profit/Loss for the period (XVI+XIX) -28466 -17802Financial Ratios(i) Sales : Capital Employed -7.37 -4.17(ii) Cost of Sales : Sales 137.45 99.97(iii) Salary/Wages : Sales 2.47 5.18(iv) Net Profit : Net Worth - -(v) Debt : Equity 0 0(vi) Current Ratio 0.02 0.03(vii) Trade Recievables : Sales 2.49 2.86(viii) Total Inventory : Sales 11.17 0.09

Trading & Marketing Services410
Tamil Nadu Trade Promotion Organization
The CompanyTamil Nadu Trade Promotion Organization (TNTPO) was
incorporated on 17.11.2000 as a joint venture between India TradePromotion Organization (ITPO) and Tamilnadu IndustrialDevelopment Corporation Limited (TIDCO) under section 25 ofthe Companies Act, 1956 with a shareholding pattern of 51% and49 % respectively making it a subsidiary of ITPO. The objectivewas to promote, organize and participate in industrial trade andother fairs / exhibitions in India and abroad and to take all measuresincidental thereto for promoting Indian industry and trade andenhance its global competitiveness and to organize trade fairs andexhibitions and invite wider participation in export promotionactivities like Buyers Sellers Meet, Contact Promotion Programsand India Promotions with Departmental stores.
TNTPO is a Schedule 'C' CPSE in Trading & Marketing sectorunder the Ministry of Commerce and Industry, Department ofCommerce. The company employed 6regularexecutives' employeesas on 31.3.2012. The company is having its registered office atChennai.
Industrial / Business OperationsTNTPO is engaged in promotion of trade and industry by
letting out the exhibition halls and convention centers for IndustrialExhibitions, trade fairs, annual day functions, Award functions,Product launch, Seminars, Conferences and other business functionsetc. and also to organize trade fairs and exhibitions in India andabroad and invite wider participation in export promotion activitieslike Buyer Seller meets; Contact Promotion Programmes; IndiaPromotions with Departments stores such as Product - SpecificPromotions, Product Development & Adaptation and undertakemarket studies to determine the market potential and exportpromotion measures to tap export opportunities.
TNTPO has a convention centre with facilities of internationalstandards. The Convention Centre at Chennai is a multi-purposehall with 10560 sq.mtrs of air conditioned space and offers a varietyof conferencing and banquet rooms for 250 to 1500 delegates. It hasbeen designed with ultra-modern facilities like Infrared DigitalInterpretation system, theatrical lighting system, digital audio-videosystem, modern fire protection and security system etc.
Performance HighlightsThe company has not provided any information on its physical
performance. The Company registered an increase of ̀ 4.98crore intotal income during 2011-12 which went up to ` 30.06 crore in2011-12 from ` 25.08crore during 2010-11. The net profit of thecompany correspondingly increased to ̀ 18.86crore in 2011-12, anincrease of ` 4.54 crore over the previous year's profit of ` 14.32crore due to increase in operating income as well as other income.
The current ratio of company is at 4.22:1 during 2011-12 asagainst 3.00:1 in the previous year (Fig.2). Balance Sheet and Profit&Loss Account of the company and selected financial ratios duringthe period 2010-11 to 2011-12 can be seen on the adjoining page.
www.chennaitradecentre.org
EBIT
DA
& P
AT (
Rs.
cro
re)
TOTAL R
EVENU
E (Rs. crore)
Fig. 1
PRO
FITA
BIL
ITY
RAT
IOS
(%)
CU
RR
ENT R
ATIO
Fig. 2

Public Enterprises Survey 2011-2012: Vol-II 411
Tamil Nadu Trade Promotion OrganisationChennai Trade Centre Complex, Mount Poonamalle Road, Nandamabkkam, Chennai, Tamil Nadu-600089
BALANCE SHEET (` in Lakhs)PARTICULARS 2011-12 2010-11I. EQUITY & LIABILITIESAUTHORISED CAPITAL 50 50(1) Shareholders’ Funds(a) Share Capital(i) Central Govt 0 0(ii) Others 6 6(b) Reserves & Surplus 7974 6134(c) Money received against share warrants 0 0Total Shareholders’ Funds (1(a)+1(b)+1(c) 7980 6140(2) Share application money pending allotment 0 0(3) Non-current Liabilities(a) Long Term Borrowings 2260 2260(b) Deferred tax liabilities (Net) 0 0(c) Other Long-term liabilities 0 0(d) Long-term provisions 10 8Total Non-Current Liabilities 3(a) to 3(d) 2270 2268(4) Current Liabilities(a) Short Term Borrowings 0 0(b) Trade Payables 26 27(c) Other current liabilities 1508 1417(d) Short-term provisions 1 1Total Current Liabilities 4(a) to 4(d) 1535 1445TOTAL EQUITY & LIABILITIES (1+2+3+4) 11785 9853II. ASSETS(1) Non-Current Assets(a) Total Gross Fixed Assets 6841 6818(ai) Accumulated Depreciation, Depletion & Amortisation 1545 1330(aii) Accumulated Impairment 0 0(b) Total Net Fixed Assets ((a)-(ai)-(aii) 5296 5488(c) Capital work in progress 0 0(d) Intangible assets under developmet 0 0(e) Non-Current Investments 10 25(f) Deferred Tax Assets (Net) 0 0(g) Long Term Loans and Advances 0 0(h) Other Non-Current Assets 0 0Total Non-Current Assets (b+c+d+e+f+g+h) 5306 5513(2) Current Assets(a) Current Investments 0 0(b) Inventories 0 0(c) Trade Recievables 113 112(d) Cash & Bank Balance 5866 3908(e) Short-term Loans & Advances 500 320(f) Other Current Assets 0 0Total Current Assets (a+b+c+d+e+f) 6479 4340TOTAL ASSETS (1+2) 11785 9853Important Indicators(i) Investment 2266 2266(ii) Capital Employed 10240 8400(iii) Net Worth 7980 6140(iv) Net Current Assets 4944 2895(v) Cost of Sales 1125 1082(vi) Net Value Added (at market price) 2229 1722(vii) Total Regular Employees (Nos.) 6 7(viii) Avg. Monthly Emoluments per Employee(`) 118056 65476
PROFIT & LOSS ACCOUNT (` in Lakhs)PARTICULARS 2011-12 2010-11(I) Revenue from Operations (Gross) 2412 2158Less : Excise Duty 0 0Revenue from Operations (Net) 2412 2158(II) Other Income 594 350(III) Total Revenue (I+II) 3006 2508(IV) Expenditure on:(a) Cost of materials consumed 0 0(b) Purchase of stock-in-trade 0 0(c) Changes in inventories of finished goods, 0 0
work-in-progress and stock in trade(d) Stores & Spares 0 0(e) Power & Fuel 0 0(f) Salary, Wages & Benefits/Employees Expense 85 55(g) Other Operating/direct/manufacturing Expenses 570 576(h) Rent, Royalty & Cess 0 0(i) Loss on sale of Assets/Investments 0 0(j) Other Expenses 250 245Total Expenditure (IV (a to j)) 905 876(V) PROFIT BEFORE DEPRECIATION, & 2101 1632
IMPAIRMENT, FINANCE CHARGES/INTEREST, EXCEPTIONAL & EXTRAORDINARYITEMS & TAXES (PBDIEET)(III-IV)
(VI) Depreciation, Depletion & Amortisation 220 206(VII) Impairment 0 0(VIII) PROFIT BEFORE FINANCE COST/ 1881 1426
INTEREST, EXCEPTIONAL, EXTRA-ORDINARYITEMS & TAXES (PBIEET)(V-VI-VII)
(IX) Finance Cost(a) On Central Government Loans 0 0(b) On Foreign Loans 0 0(c) Others 0 0(d) Less Finance Cost Capitalised 0 0(e) Charged to P & L Account (a+b+c+d) 0 0(X) PROFIT BEFORE EXCEPTIONAL & EXTRA-ORDINARY 1881 1426
ITEMS & TAX (PBEET)(VIII-IXe)(XI) Exceptional Items -5 -6(XII) PROFIT BEFORE EXTRA-ORDINARY ITEMS & TAX 1886 1432
(PBET)(X-XI)(XIII) Extra-Ordinary Items 0 0(XIV) PROFIT BEFORE TAX (PBT)(XII-XIII) 1886 1432(XV) TAX PROVISIONS 0 0(XVI) NET PROFIT / LOSS FOR THE PERIOD FROM 1886 1432
CONTINUING OPERATIONS AFTER TAX(XIV-XV)(XVII) Profit/Loss from discontinuing operations 0 0(XVIII) Tax expenses of discontinuing operations 0 0(XIX) Profit/Loss from discontinuing operations 0 0
(after Tax)(XVII-XVIII)(XX) Profit/Loss for the period (XVI+XIX) 1886 1432Financial Ratios(i) Sales : Capital Employed 23.55 25.69(ii) Cost of Sales : Sales 46.64 50.14(iii) Salary/Wages : Sales 3.52 2.55(iv) Net Profit : Net Worth 23.63 23.32(v) Debt : Equity 376.67 376.67(vi) Current Ratio 4.22 3(vii) Trade Recievables : Sales 4.68 5.19(viii) Total Inventory : Sales 0 0
2011-12 Provisional

Trading & Marketing Services370
Antrix Corporation Limited
The CompanyAntrix Corporation Limited (ACL) was incorporated on
28.09.1992 as the commercial marketing arm / corporate front ofIndian Space Research Organization (ISRO).
ACL is a schedule - 'B' Miniratna CPSE in the Trading &Marketing sector under the administrative control of theDepartment of Space with 100% shareholding by Government ofIndia. The company employed 17 regular employees (Executives14 and Non-executives 3) as on 31.3.2012. It's registered andCorporate Office are at Bangalore, Karnataka
Vision/MissionThe Vision of Antrix is to emerge as a globally significant
space company, fully utilizing the strength of ISRO and otherIndian entities in the field of space.
The Mission of Antrix is to enhance & generate commercialspin-offs from ISRO's programme in the global space markets &establish a commercially viable space industry in India.
Industrial / Business OperationsThe Company is engaged in providing Space Products and
services to national & international customers. ANTRIX's Businessportfolio consists of:
(i) Remote Sensing Services (ii) Spacecraft Systems &Subsystems
(iii) Transponder Leasing Services(iv) Launch Services(v) Mission Support Services (vi) Ground System Services
(vii) Spacecraft Testing (viii) Training & ConsultancyFacilities Services
Performance HighlightsThe company has not provided any details of its performance
during last two years. The Company registered an increase of ̀̀̀̀̀ 67.03crore in total income during 2011-12 which went up to `̀̀̀̀ 1180.61crore in 2011-12 from `̀̀̀̀ 1113.58 crore during 2010-11. The netprofit of the company correspondingly increased to `̀̀̀̀ 170.98 crorein 2011-12, an increase of `̀̀̀̀ 32.11 crore over the previous year'sprofit of `̀̀̀̀ 138.87 crore due to increase in operating income andother income.
Export of Hylas satellite has contributed to the increase inturnover and profit of the company. INSAT capacity is exhaustedhence foreign satellite capacity is being procured which is keepingconstant pressure on the profit margin.
The current ratio of company is at 3.58:1 during 2011-12 asagainst 3.06:1 in the previous year (Fig.2). Balance Sheet and Profit& Loss Account of the company and selected financial ratios duringthe period 2010-11 to 2011-12 can be seen on the adjoining page.
www.antrix.gov.in
Strategic issuesThe Company intended to provide cost effective & flight
proven space products & services in International markets, to playa substantial role in development of Space Industry in India,monitoring trends in satellite industry (including launch vehicle &ground segment) & to provide inputs to the management of ISROetc.
EBIT
DA
& P
AT (
Rs.
cro
re)
TOTAL R
EVENU
E (Rs. crore)
Fig. 1
PRO
FITA
BIL
ITY
RAT
IOS
(%)
CU
RR
ENT R
ATIO
Fig. 2

Public Enterprises Survey 2011-2012: Vol-II 371
Antrix Corporation LimitedAntriksh Bhavan, New BEL Road, Bangalore, Karnataka -560231
PROFIT & LOSS ACCOUNT (` in Lakhs)PARTICULARS 2011-12 2010-11(I) Revenue from Operations (Gross) 105078 103516Less : Excise Duty 0 0Revenue from Operations (Net) 105078 103516(II) Other Income 12983 7842(III) Total Revenue (I+II) 118061 111358(IV) Expenditure on:(a) Cost of materials consumed 92644 89148(b) Purchase of stock-in-trade 0 0(c) Changes in inventories of finished goods,work-in-progress and stock in trade 0 0(d) Stores & Spares 0 0(e) Power & Fuel 0 0(f) Salary, Wages & Benefits/Employees Expense 183 169(g) Other Operating/direct/manufacturing Expenses 0 0(h) Rent, Royalty & Cess 0 0(i) Loss on sale of Assets/Investments 0 0(j) Other Expenses 743 641Total Expenditure (IV (a to j)) 93570 89958(V) PROFIT BEFORE DEPRECIATION, & IMPAIRMENT,FINANCE CHARGES/INTEREST, EXCEPTIONAL &EXTRAORDINARY ITEMS & TAXES (PBDIEET)(III-IV) 24491 21400(VI) Depreciation, Depletion & Amortisation 10 12(VII) Impairment 0 0(VIII) PROFIT BEFORE FINANCE COST/INTEREST,EXCEPTIONAL, EXTRA-ORDINARY ITEMS & TAXES(PBIEET)(V-VI-VII) 24481 21388(IX) Finance Cost(a) On Central Government Loans 0 0(b) On Foreign Loans
0 0(c) Others 0 0(d) Less Finance Cost Capitalised 0 0(e) Charged to P & L Account (a+b+c+d) 0 0(X) PROFIT BEFORE EXCEPTIONAL & EXTRA-ORDINARYITEMS & TAX (PBEET)(VIII-IXe) 24481 21388(XI) Exceptional Items 0 0(XII) PROFIT BEFORE EXTRA-ORDINARY ITEMS & TAX(PBET)(X-XI) 24481 21388(XIII) Extra-Ordinary Items 0 -14(XIV) PROFIT BEFORE TAX (PBT)(XII-XIII) 24481 21402(XV) TAX PROVISIONS 7383 7515(XVI) NET PROFIT / LOSS FOR THE PERIOD FROMCONTINUING OPERATIONS AFTER TAX(XIV-XV) 17098 13887(XVII) Profit/Loss from discontinuing operations 0 0(XVIII) Tax expenses of discontinuing operations 0 0(XIX) Profit/Loss from discontinuing operations(after Tax)(XVII-XVIII) 0 0(XX) Profit/Loss for the period (XVI+XIX) 17098 13887Financial Ratios(i) Sales : Capital Employed 131.12 154.47(ii) Cost of Sales : Sales 89.06 86.91(iii) Salary/Wages : Sales 0.17 0.16(iv) Net Profit : Net Worth 21.34 20.72(v) Debt : Equity 0 0(vi) Current Ratio 3.58 3.05(vii) Trade Recievables : Sales 40.46 29.74(viii) Total Inventory : Sales 0 0
BALANCE SHEET ( `̀̀̀̀ in Lakhs)PARTICULARS 2011-12 2010-11I. EQUITY & LIABILITIESAUTHORISED CAPITAL 500 500(1) Shareholders’ Funds(a) Share Capital(i) Central Govt 100 100(ii) Others 0 0(b) Reserves & Surplus 80038 66915(c) Money received against share warrants 0 0Total Shareholders’ Funds (1(a)+1(b)+1(c) 80138 67015(2) Share application money pending allotment 0 0(3) Non-current Liabilities(a) Long Term Borrowings 0 0(b) Deferred tax liabilities (Net) 0 0(c) Other Long-term liabilities 118013 100840(d) Long-term provisions 17 11Total Non-Current Liabilities 3(a) to 3(d) 118030 100851(4) Current Liabilities(a) Short Term Borrowings 0 0(b) Trade Payables 22843 16587(c) Other current liabilities 22892 31057(d) Short-term provisions 3976 3239Total Current Liabilities 4(a) to 4(d) 49711 50883TOTAL EQUITY & LIABILITIES (1+2+3+4) 247879 218749II. ASSETS(1) Non-Current Assets(a) Total Gross Fixed Assets 161 153(ai) Accumulated Depreciation, Depletion & Amortisation 123 114(aii) Accumulated Impairment 0 0(b) Total Net Fixed Assets ((a)-(ai)-(aii) 38 39(c) Capital work in progress 1382 650(d) Intangible assets under developmet 0 0(e) Non-Current Investments 0 2500(f) Deferred Tax Assets (Net) 1022 903(g) Long Term Loans and Advances 67333 59313(h) Other Non-Current Assets 0 0Total Non-Current Assets (b+c+d+e+f+g+h) 69775 63405(2) Current Assets(a) Current Investments 23695 17505(b) Inventories 0 0(c) Trade Recievables 42518 30790(d) Cash & Bank Balance 98903 96766(e) Short-term Loans & Advances 5275 5771(f) Other Current Assets 7713 4512Total Current Assets (a+b+c+d+e+f) 178104 155344TOTAL ASSETS (1+2) 247879 218749Important Indicators(i) Investment 100 100(ii) Capital Employed 80138 67015(iii) Net Worth 80138 67015(iv) Net Current Assets 128393 104461(v) Cost of Sales 93580 89970(vi) Net Value Added (at market price) 35155 31190(vii) Total Regular Employees (Nos.) 17 57(viii) Avg. Monthly Emoluments per Employee(`) 89706 24708
2011-12 Provisional

Trading & Marketing Services372
Central Cottage Industries Corporation of India Limited
The CompanyCentral Cottage Industries Corporations of India Limited
(CCICI) was incorporated on 04-02-1976 with the objective topromote, develop, aid, and assist Cottage Industries by organizingtheir sales in India and abroad.
CCICI is a Schedule-'C' CPSE in Trading & Marketing sectorunder the administrative control of M/o Textiles with 100%shareholding by the Government of India. The company employed321 regular employees (Executives 145, Non-executives 176) as on31.3.2012. Its Registered and Corporate offices are in New Delhi.
Vision / MissionThe Vision and Mission of the Company is to promote,
develop, aid, counsel and assist cottage industries by organisingtheir sale in India and abroad.
Industrial / Business OperationsCCICI is engaged in trading of handicrafts and handloom and
other related services in India and abroad. The operating units ofthe corporation are situated at Kolkata (West Bengal), Bangaluru(Karnataka), Chennai (Tamilnadu), Mumbai (Maharashtra) andDelhi.
Performance Highlights
www.cottageemporium.in
Strategic issueSteps were taken towards strengthening operations in emporia,
improvements in merchandise cost control, setting up of newshowrooms and booking of bulk/ institutional orders.
CCICI procures merchandise from handicraft and handloomclusters and from a large number of artisans, craftsmen, weavers,etc. spread throughout the country and also from National Awardees,State Awardees, women organizations, minority and from weakersections, etc. The retails prices and quality of products of CCICIare considered a benchmark in the trade.
Main Products Unit Performance during
2011-12 2010-11
Trading (Handicrafts & ` in Crore 72.49 63.34Handlooms)
The physical performance of the company during the previoustwo years is mentioned below:
The Company registered a growth of `̀̀̀̀ 9.59 crore in totalrevenue during 2011-12 which went up to ̀̀̀̀̀ 76.91 crore in 2011-12from `̀̀̀̀ 67.32 crore during 2010-11. The net profit of the companywas `̀̀̀̀ 0.49 crore during 2011-12, an increase of `̀̀̀̀ 1.37 crore overthe previous year's loss of `̀̀̀̀ 0.88 core due to increase in operatingincome.
The current ratio of company is at 1.65:1 during 2011-12 asagainst 1.59:1 in the previous year (Fig.2). Balance Sheet and Profit& Loss Account of the company and selected financial ratios duringthe period 2010-11 to 2011-12 can be seen on the adjoining page.
EBIT
DA
& P
AT (
Rs.
cro
re)
TOTAL R
EVENU
E (Rs. crore)
Fig. 1
Fig. 2
PRO
FITA
BIL
ITY
RAT
IOS
(%)
CU
RR
ENT R
ATIO

Public Enterprises Survey 2011-2012: Vol-II 373
Central Cottage Industries Corporation of India LimitedJawahar Vyapar Bhawan, Janpath, New Delhi- 110001
PROFIT & LOSS ACCOUNT (` in Lakhs)PARTICULARS 2011-12 2010-11(I) Revenue from Operations (Gross) 7225 6309Less : Excise Duty 27 4Revenue from Operations (Net) 7198 6305(II) Other Income 493 427(III) Total Revenue (I+II) 7691 6732(IV) Expenditure on:(a) Cost of materials consumed 121 100(b) Purchase of stock-in-trade 4019 3487(c) Changes in inventories of finished goods,work-in-progress and stock in trade -150 -13(d) Stores & Spares 0 0(e) Power & Fuel 129 106(f) Salary, Wages & Benefits/Employees Expense 2340 2060(g) Other Operating/direct/manufacturing Expenses 147 183(h) Rent, Royalty & Cess 378 383(i) Loss on sale of Assets/Investments 0 0(j) Other Expenses 680 505Total Expenditure (IV (a to j)) 7664 6811(V) PROFIT BEFORE DEPRECIATION, & IMPAIRMENT,FINANCE CHARGES/INTEREST, EXCEPTIONAL &EXTRAORDINARY ITEMS & TAXES (PBDIEET)(III-IV) 27 -79(VI) Depreciation, Depletion & Amortisation 61 57(VII) Impairment 0 0(VIII) PROFIT BEFORE FINANCE COST/INTEREST,EXCEPTIONAL, EXTRA-ORDINARY ITEMS & TAXES(PBIEET)(V-VI-VII) -34 -136(IX) Finance Cost(a) On Central Government Loans 0 0(b) On Foreign Loans
0 0(c) Others 1 1(d) Less Finance Cost Capitalised 0 0(e) Charged to P & L Account (a+b+c+d) 1 1(X) PROFIT BEFORE EXCEPTIONAL & EXTRA-ORDINARYITEMS & TAX (PBEET)(VIII-IXe) -35 -137(XI) Exceptional Items -102 -38(XII) PROFIT BEFORE EXTRA-ORDINARY ITEMS & TAX(PBET)(X-XI) 67 -99(XIII) Extra-Ordinary Items 0 0(XIV) PROFIT BEFORE TAX (PBT)(XII-XIII) 67 -99(XV) TAX PROVISIONS 18 -11(XVI) NET PROFIT / LOSS FOR THE PERIOD FROMCONTINUING OPERATIONS AFTER TAX(XIV-XV) 49 -88(XVII) Profit/Loss from discontinuing operations 0 0(XVIII) Tax expenses of discontinuing operations 0 0(XIX) Profit/Loss from discontinuing operations (after Tax)(XVII-XVIII) 0 0(XX) Profit/Loss for the period (XVI+XIX) 49 -88Financial Ratios(i) Sales : Capital Employed 331.55 293.94(ii) Cost of Sales : Sales 107.32 108.93(iii) Salary/Wages : Sales 32.51 32.67(iv) Net Profit : Net Worth 2.26 -4.1(v) Debt : Equity 0 0(vi) Current Ratio 1.65 1.59(vii) Trade Recievables : Sales 1.61 4.46(viii) Total Inventory : Sales 9.84 8.64
BALANCE SHEET ( `̀̀̀̀ in Lakhs)PARTICULARS 2011-12 2010-11I. EQUITY & LIABILITIESAUTHORISED CAPITAL 1200 1200(1) Shareholders’ Funds(a) Share Capital(i) Central Govt 1085 1085(ii) Others 0 0(b) Reserves & Surplus 1086 1060(c) Money received against share warrants 0 0Total Shareholders’ Funds (1(a)+1(b)+1(c) 2171 2145(2) Share application money pending allotment 0 0(3) Non-current Liabilities(a) Long Term Borrowings 0 0(b) Deferred tax liabilities (Net) 0 0(c) Other Long-term liabilities 94 42(d) Long-term provisions 2483 2289Total Non-Current Liabilities 3(a) to 3(d) 2577 2331(4) Current Liabilities(a) Short Term Borrowings 32 0(b) Trade Payables 983 999(c) Other current liabilities 677 826(d) Short-term provisions 1878 1679Total Current Liabilities 4(a) to 4(d) 3570 3504TOTAL EQUITY & LIABILITIES (1+2+3+4) 8318 7980II. ASSETS(1) Non-Current Assets(a) Total Gross Fixed Assets 2179 2155(ai) Accumulated Depreciation, Depletion & Amortisation 958 929(aii) Accumulated Impairment 0 0(b) Total Net Fixed Assets ((a)-(ai)-(aii) 1221 1226(c) Capital work in progress 1 0(d) Intangible assets under developmet 0 0(e) Non-Current Investments 0 0(f) Deferred Tax Assets (Net) 1126 1052(g) Long Term Loans and Advances 86 123(h) Other Non-Current Assets 9 10Total Non-Current Assets (b+c+d+e+f+g+h) 2443 2411(2) Current Assets(a) Current Investments 0 0(b) Inventories 708 545(c) Trade Recievables 116 281(d) Cash & Bank Balance 4532 4143(e) Short-term Loans & Advances 444 537(f) Other Current Assets 75 63Total Current Assets (a+b+c+d+e+f) 5875 5569TOTAL ASSETS (1+2) 8318 7980Important Indicators(i) Investment 1085 1085(ii) Capital Employed 2171 2145(iii) Net Worth 2171 2145(iv) Net Current Assets 2305 2065(v) Cost of Sales 7725 6868(vi) Net Value Added (at market price) 3120 2451(vii) Total Regular Employees (Nos.) 321 325(viii) Avg. Monthly Emoluments per Employee(`) 60748 52821

Trading & Marketing Services376
Central Railside Warehouse Company Limited
The CompanyCentral Railside Warehouse Company Limited (CRWC) was
incorporated on 10.07.2007 with the broad objectives of providingquality storage facility at transit nodes and to maximize the use ofRailways assets so as to bring the economy of scales for customers,Railways and the company itself.
It is a Schedule-'C' CPSE in Trading & Marketing sector underthe administrative control of M/o Consumer Affairs, Food andPublic Distribution, Department of Food and Public Distribution.CRWCL is a subsidiary of Central Warehousing Corporation (CWC).The Company employed 43 regular employees (Executives 38 &Non-Executives 5) as on 31.03.2012. Its Registered and Corporateoffices are at New Delhi.
Vision / MissionThe Vision of the Company is to provide Multimodal Logistics
to the trade and support Indian Economy in reducing logistics cost.The Mission of the Company is to provide quality storage
facility at transit nodes, maximize the use of Railways assets; bringeconomy of scales for customers, Railways and CRWC.
Industrial / Business OperationsCRWC is engaged in promotion and development of Railside
Warehousing Complexes (RWCs) / Terminals / Multimodal LogisticsHub and providing seamless supply chain management system bybetter utilization of existing good-sheds of Railways. The companyhas 17 Railside Warehouse Complexes all over India as on 31.3.2012.
Performance HighlightsThe physical performances of the company for last two years
are given below:
www.crwc.in
Strategic IssuesThe other strategic objectives of the company are to plan,
develop, promote, acquire and operate Railside WarehousingComplexes / Terminals / Multi-modal Logistics Hub on land leasedfrom Railways or acquired otherwise; to promote and provideseamless supply chain management systems rail based logistics inIndia and abroad; to carry on the business of Multimodal transportoperations and aggregation / disaggregation of cargo both for domestic/ impex movement in India and abroad and to provide state-of-artwarehousing facilities and competitive modes of handling &transportation facilities of Cargo.
Main Products Unit Performance during
2011-12 2010-11
Operating RWCs No. 17 16
Wagons Handled No. 110580 96134
Quantity Handled Lakh MT 81.59 69.21
Warehousing Logistics ` in Crore 70.54 48.36
The Company registered an increase of ` 23.12 crore in totalrevenue during 2011-12 which went up to ̀̀̀̀̀ 74.20 crore in 2011-12from `̀̀̀̀ 51.08 crore during 2010-11. The net profit of the companyincreased to `̀̀̀̀ 13.31 crore, an increase of `̀̀̀̀ 6.09 crore over theprevious year profit of `̀̀̀̀ 7.22 crore due to increase in turnover.
The current ratio of company is at 0.8:1 during 2011-12 asagainst 0.67:1 in the previous year (Fig.2). Balance Sheet and Profit& Loss Account of the company and selected financial ratios duringthe period 2010-11 to 2011-12 can be seen on the adjoining page.
EBIT
DA
& P
AT (
Rs.
cro
re) TO
TAL REVEN
UE (R
s. crore)
Fig. 1
PRO
FITA
BIL
ITY
RAT
IOS
(%)
CU
RR
ENT R
ATIO
Fig. 2

Public Enterprises Survey 2011-2012: Vol-II 377
Central Railside Warehouse Company LimitedWarehousing Bhawan, 4/1, Siri Fort Institutiona Area, Hauz Khas, New Delhi 110 016
PROFIT & LOSS ACCOUNT (` in Lakhs)PARTICULARS 2011-12 2010-11(I) Revenue from Operations (Gross) 7388 5081 Less : Excise Duty 0 0 Revenue from Operations (Net) 7388 5081(II) Other Income 32 27(III) Total Revenue (I+II) 7420 5108(IV) Expenditure on: (a) Cost of materials consumed 0 0 (b) Purchase of stock-in-trade 0 0 (c) Changes in inventories of finished goods, work-in- 0 0
progress and stock in trade (d) Stores & Spares 0 0 (e) Power & Fuel 55 48 (f) Salary, Wages & Benefits/Employees Expense 380 334 (g) Other Operating/direct/manufacturing Expenses 3366 2183 (h) Rent, Royalty & Cess 0 0 (i) Loss on sale of Assets/Investments 0 0 (j) Other Expenses 678 530Total Expenditure (IV (a to j)) 4479 3095(V)PROFIT BEFORE DEPRECIATION, & IMPAIRMENT, 2941 2013
FINANCE CHARGES/INTEREST, EXCEPTIONAL &EXTRAORDINARY ITEMS & TAXES (PBDIEET)(III-IV)
(VI) Depreciation, Depletion & Amortisation 301 268(VII) Impairment 0 0(VIII) PROFIT BEFORE FINANCE COST/INTEREST, 2640 1745
EXCEPTIONAL, EXTRA-ORDINARY ITEMS & TAXES(PBIEET)(V-VI-VII)
(IX) Finance Cost (a) On Central Government Loans 0 0 (b) On Foreign Loans 0 0 (c) Others 708 611 (d) Less Finance Cost Capitalised 0 0 (e) Charged to P & L Account (a+b+c+d) 708 611(X)PROFIT BEFORE EXCEPTIONAL & EXTRA-ORDINARY 1932 1134
ITEMS & TAX (PBEET)(VIII-IXe)(XI) Exceptional Items 0 0(XII) PROFIT BEFORE EXTRA-ORDINARY ITEMS & TAX 1932 1134
(PBET)(X-XI)(XIII) Extra-Ordinary Items 0 0(XIV) PROFIT BEFORE TAX (PBT)(XII-XIII) 1932 1134(XV) TAX PROVISIONS 601 412(XVI) NET PROFIT / LOSS FOR THE PERIOD FROM 1331 722
CONTINUING OPERATIONS AFTER TAX(XIV-XV)(XVII) Profit/Loss from discontinuing operations 0 0(XVIII) Tax expenses of discontinuing operations 0 0(XIX) Profit/Loss from discontinuing operations (after Tax) 0 0
(XVII-XVIII)(XX) Profit/Loss for the period (XVI+XIX) 1331 722Financial Ratios (i) Sales : Capital Employed 49.4 35.3 (ii) Cost of Sales : Sales 64.7 66.19 (iii) Salary/Wages : Sales 5.14 6.57 (iv) Net Profit : Net Worth 18.72 12 (v) Debt : Equity 1.93 2.07 (vi) Current Ratio 0.80 0.67 (vii) Trade Recievables : Sales 8.38 8.36 (viii) Total Inventory : Sales 0 0
BALANCE SHEET ( `̀̀̀̀ in Lakhs)PARTICULARS 2011-12 2010-11I. EQUITY & LIABILITIESAUTHORISED CAPITAL 15000 15000(1) Shareholders’ Funds (a) Share Capital (i) Central Govt 0 0 (ii) Others 4056 4056 (b) Reserves & Surplus 3055 1961 (c) Money received against share warrants 0 0 Total Shareholders’ Funds (1(a)+1(b)+1(c) 7111 6017(2) Share application money pending allotment 0 0(3) Non-current Liabilities (a) Long Term Borrowings 7843 8378 (b) Deferred tax liabilities (Net) 1290 1004 (c) Other Long-term liabilities 0 0 (d) Long-term provisions 0 0 Total Non-Current Liabilities 3(a) to 3(d) 9133 9382(4) Current Liabilities (a) Short Term Borrowings 0 0 (b) Trade Payables 556 524 (c) Other current liabilities 1304 1238 (d) Short-term provisions 1138 657 Total Current Liabilities 4(a) to 4(d) 2998 2419TOTAL EQUITY & LIABILITIES (1+2+3+4) 19242 17818II. ASSETS(1) Non-Current Assets (a) Total Gross Fixed Assets 15743 14957 (ai) Accumulated Depreciation, Depletion & Amortisation 301 268 (aii) Accumulated Impairment 0 0 (b) Total Net Fixed Assets ((a)-(ai)-(aii) 15442 14689 (c) Capital work in progress 614 876 (d) Intangible assets under developmet 0 0 (e) Non-Current Investments 0 0 (f) Deferred Tax Assets (Net) 0 0 (g) Long Term Loans and Advances 438 632 (h) Other Non-Current Assets 344 0 Total Non-Current Assets (b+c+d+e+f+g+h) 16838 16197(2) Current Assets (a) Current Investments 0 0 (b) Inventories 0 0 (c) Trade Recievables 619 425 (d) Cash & Bank Balance 660 330 (e) Short-term Loans & Advances 1125 863 (f) Other Current Assets 0 3 Total Current Assets (a+b+c+d+e+f) 2404 1621TOTAL ASSETS (1+2) 19242 17818Important Indicators (i) Investment 11899 12434 (ii) Capital Employed 14954 14395 (iii) Net Worth 7111 6017 (iv) Net Current Assets -594 -798 (v) Cost of Sales 4780 3363 (vi) Net Value Added (at market price) 3957 2660 (vii) Total Regular Employees (Nos.) 43 42(viii) Avg. Monthly Emoluments per Employee(`) 73643 66270

Trading & Marketing Services378
Central Warehousing Corporation
The CompanyCentral Warehousing Corporation (CWC) was incorporated in
1957 under the Agricultural Produce (Development & Warehousing)Corporations Act 1956, which was subsequently repealed andreplaced by the Warehousing Corporations Act, 1962 with theobjective to meet the changing needs of agriculture, trade, industryand other sectors by providing scientific warehousing, logisticservices and related infrastructural facilities.
CWC is a Schedule-'A' Mini-ratna CPSE in Trading &Marketing sector under the administrative control of the M/oConsumer Affairs, Food & Public Distribution D/o Food & PublicDistribution with 55.1% shareholding by the Government of India.The rest of the holding is with SBI, 35 other scheduled banks, 7insurance companies, 6 other recognized associations / companiesdealing in agricultural produce and 400 cooperative societies. Thecompany employed 5492 regular employees (Executives 1365 &Non-Executives 4127) as on 31.3.2012. Its Registered and Corporateoffices are at New Delhi.
Vision / MissionThe Vision of the Company is to emerge as the leading global
market facilitator by providing integrated warehousing infrastructureand logistic services, as a support to India's economy, with emphasison customer's delight.
The Mission of the Company is to provide reliable, costeffective, value added and integrated warehousing and logisticssolutions in a socially responsible and environment friendly manner.
Industrial / Business OperationsCWC is engaged in providing services in the field of storage of
agricultural produce and inputs and industrial trade through its 468warehouses with a total storage capacity of 100.85 lakh MT as on31.3.2012. This included 66 Custom Bonded Warehouses, 4 AirCargo Complexes, 36 Container Freight Stations (CFSs) / InlandClearance Depots (ICDs) and 4 temperature controlled warehouses.CWC also runs 17 Railside Warehousing Complexes (RWCs)through its wholly owned subsidiary namely Central RailsideWarehouse Company Limited.
It has also subscribed to the 50% equity of 17 StateWarehousing Corporations (SWCs) with the respective StateGovernments holding the remaining 50%. The company has onefinancial joint venture namely National Multi Commodity Exchangeof India Ltd. (NMCE) with a shareholding of 29.70%.
Performance HighlightsThe average capacity utilization for all the products / services
of the company was 85% during 2011-12 as against 88% duringprevious year. The physical performances of the company for lasttwo years are given below:
www.cewacor.nic.in
`̀̀̀̀ 35.71 crore to `̀̀̀̀ 100.46 crore in 2011-12, from `̀̀̀̀ 136.17 crore inprevious year due to Extra-Ordinary Item namely provision of`̀̀̀̀100.13 crore for contribution towards employees' pension fundwith effect from 01.01.2007.
The current ratio of company is at 2.23:1 during 2011-12 asagainst 2.19:1 in the previous year (Fig.2). Balance Sheet and Profit& Loss Account of the company and selected financial ratios duringthe period 2010-11 to 2011-12 can be seen on the adjoining page.
Main Products Unit Performance during
2011-12 2010-11
Warehousing Lakh M.T. 91.87 90.77
Total Revenue of the company registered an increase of`̀̀̀̀ 189.10 crore during 2011-12, which went up from `̀̀̀̀ 1029.55crore in 2010-11 to `̀̀̀̀ 1218.65 crore in 2011-12 due to increase inoperating income. The profit of the company has gone down by
EBIT
DA
& P
AT (
Rs.
cro
re)
TOTAL R
EVENU
E (Rs. crore)
Fig. 1
PRO
FITA
BIL
ITY
RAT
IOS
(%)
CU
RR
ENT R
ATIO
Fig. 2
Strategic issuesAs a diversified activity, CWC has been running container
trains since 2007. It holds a Category-I license to operate containertrains on Pan India basis.
2010-11 2011-12
2010-11 2011-12

Public Enterprises Survey 2011-2012: Vol-II 379
Central Warehousing Corporation4/1, Siri Institutional Area, August Kranti Marg, Hauz Khas, New Delhi - 110 016
PROFIT & LOSS ACCOUNT (` in Lakhs)PARTICULARS 2011-12 2010-11(I) Revenue from Operations (Gross) 115204 97979Less : Excise Duty 0 0Revenue from Operations (Net) 115204 97979(II) Other Income 6661 4976(III) Total Revenue (I+II) 121865 102955(IV) Expenditure on:(a) Cost of materials consumed 0 0(b) Purchase of stock-in-trade 0 0(c) Changes in inventories of finished goods, work-in-progressand stock in trade 0 0(d) Stores & Spares 1546 1311(e) Power & Fuel 848 775(f) Salary, Wages & Benefits/Employees Expense 41627 36980(g) Other Operating/direct/manufacturing Expenses 35923 29993(h) Rent, Royalty & Cess 3770 3657(i) Loss on sale of Assets/Investments 0 34(j) Other Expenses 9072 7100Total Expenditure (IV (a to j)) 92786 79850(V) PROFIT BEFORE DEPRECIATION, & IMPAIRMENT, FINANCECHARGES/INTEREST, EXCEPTIONAL & EXTRAORDINARYITEMS & TAXES (PBDIEET)(III-IV) 29079 23105(VI) Depreciation, Depletion & Amortisation 2520 2507(VII) Impairment 0 1(VIII) PROFIT BEFORE FINANCE COST/INTEREST,EXCEPTIONAL, EXTRA-ORDINARY ITEMS & TAXES (PBIEET)(V-VI-VII) 26559 20597(IX) Finance Cost(a) On Central Government Loans 0 0(b) On Foreign Loans 0 0(c) Others 634 224(d) Less Finance Cost Capitalised 0 0(e) Charged to P & L Account (a+b+c+d) 634 224(X) PROFIT BEFORE EXCEPTIONAL & EXTRA-ORDINARYITEMS & TAX (PBEET)(VIII-IXe) 25925 20373(XI) Exceptional Items 0 0(XII) PROFIT BEFORE EXTRA-ORDINARY ITEMS & TAX(PBET)(X-XI) 25925 20373(XIII) Extra-Ordinary Items 10013 0(XIV) PROFIT BEFORE TAX (PBT)(XII-XIII) 15912 20373(XV) TAX PROVISIONS 5866 6756(XVI) NET PROFIT / LOSS FOR THE PERIOD FROMCONTINUING OPERATIONS AFTER TAX(XIV-XV) 10046 13617(XVII) Profit/Loss from discontinuing operations 0 0(XVIII) Tax expenses of discontinuing operations 0 0(XIX) Profit/Loss from discontinuing operations (after Tax)(XVII-XVIII) 0 0(XX) Profit/Loss for the period (XVI+XIX) 10046 13617Financial Ratios(i) Sales : Capital Employed 86.24 77.67(ii) Cost of Sales : Sales 82.73 84.02(iii) Salary/Wages : Sales 36.13 37.74(iv) Net Profit : Net Worth 7.52 10.79(v) Debt : Equity 0 0(vi) Current Ratio 2.23 2.19(vii) Trade Recievables : Sales 20.15 23.69(viii) Total Inventory : Sales 0.57 0.74
BALANCE SHEET (` in Lakhs)PARTICULARS 2011-12 2010-11I. EQUITY & LIABILITIESAUTHORISED CAPITAL 10000 10000(1) Shareholders’ Funds(a) Share Capital(i) Central Govt 3742 3742(ii) Others 3060 3060(b) Reserves & Surplus 126778 119349(c) Money received against share warrants 0 0Total Shareholders’ Funds (1(a)+1(b)+1(c) 133580 126151(2) Share application money pending allotment 0 0(3) Non-current Liabilities(a) Long Term Borrowings 0 0(b) Deferred tax liabilities (Net) 3483 4816(c) Other Long-term liabilities 0 0(d) Long-term provisions 44447 36005Total Non-Current Liabilities 3(a) to 3(d) 47930 40821(4) Current Liabilities(a) Short Term Borrowings 0 0(b) Trade Payables 5822 4767(c) Other current liabilities 20468 18039(d) Short-term provisions 19924 20487Total Current Liabilities 4(a) to 4(d) 46214 43293TOTAL EQUITY & LIABILITIES (1+2+3+4) 227724 210265II. ASSETS(1) Non-Current Assets(a) Total Gross Fixed Assets 136008 125400(ai) Accumulated Depreciation, Depletion & Amortisation 32131 29664(aii) Accumulated Impairment 0 0(b) Total Net Fixed Assets ((a)-(ai)-(aii) 103877 95736(c) Capital work in progress 3158 2250(d) Intangible assets under developmet 0 0(e) Non-Current Investments 11001 10926(f) Deferred Tax Assets (Net) 0 0(g) Long Term Loans and Advances 6686 6494(h) Other Non-Current Assets 0 0Total Non-Current Assets (b+c+d+e+f+g+h) 124722 115406(2) Current Assets(a) Current Investments 0 0(b) Inventories 657 723(c) Trade Recievables 23218 23213(d) Cash & Bank Balance 49148 38082(e) Short-term Loans & Advances 332 224(f) Other Current Assets 29647 32617Total Current Assets (a+b+c+d+e+f) 103002 94859TOTAL ASSETS (1+2) 227724 210265Important Indicators(i) Investment 6802 6802(ii) Capital Employed 133580 126151(iii) Net Worth 133580 126151(iv) Net Current Assets 56788 51566(v) Cost of Sales 95306 82324(vi) Net Value Added (at market price) 67205 66087(vii) Total Regular Employees (Nos.) 5492 5667(viii) Avg. Monthly Emoluments per Employee(`) 63163 54379

Trading & Marketing Services374
The Cotton Corporation of India Ltd.
The CompanyCotton Corporation of India Ltd. (CCIL) was incorporated on
31.07.1970 under the Companies Act, 1956 with an objective to act asa canalizing agency for import of cotton particularly for long and extralong staple varieties. Subsequently, the role of the Corporationunderwent changes on several occasions and currently the broadobjectives are to ensure remunerative and competitive prices to thecotton farmers; to supply cotton to textile industry on reasonableprices; domestic sales operations at negligible margin in order to passon larger benefit to cotton growers; increasing supplies of contaminationfree cotton to meet growing demand of textile mills etc.
CCI is a Schedule 'B' CPSE in Trading and Marketing Servicessector under the administrative control of M/o Textiles with 100%shareholding by the Government of India. The company employed1113 regular employees (Executives 124 & Non-Executives 989) ason 31.3.2012. Its Registered and Corporate office is at Navi Mumbai,Maharashtra.Vision/Mission
The Vision / Mission of the company is to rendering help tothe cotton farmers by way of social services and endeavouring toattain commercial gain by sustained growth of the corporation.Industrial / Business Operations
CCI is engaged in providing services in carrying out pricesupport operations, whenever the market prices of kapas touch thesupport prices announced by the Government without anyquantitative limit and commercial operations at the Company'sown risk; undertaking developmental activities related toproductivity and quality of cotton through its 18 branch offices(including Corporate Office) to cover 83 districts and 303procurement centers in various cotton growing states. The servicesegment of the company comprises of Sale and Purchase of Kapas.Performance Highlights
The performance details of domestic cotton processing duringlast two years are as follows:—
www.cotcorp.com
Main Products Unit Performance during
2011-12 2010-11
Domestic Sales Lakh bales 8.02 12.68
Export sales Lakh bales 0.19 0.17
Strategic IssuesAs a Nodal Agency of Government of India to undertake price
support operations, Corporation keeps itself in preparedness tomeet the eventualities of price support operations. As and whenkapas prices touch the level of Minimum Support Price (MSP),kapas purchases are made under MSP operations without anyquantitative limits. Under these MSP operations, cotton farmersare free to offer their kapas produce to CCI and Corporationcontinues purchases of such kapas till the prices rule at MSP level.
In the event of kapas prices ruling above MSP level,Corporation undertakes commercial operations at its own cost forsupply of cotton to mills in the State sector as well as privatesector. All these operations are dovetailed to benefit the cottongrowers on the one hand and supply of quality cotton to the textilemills on the other hand.
EBIT
DA
& P
AT (
Rs.
cro
re) TO
TAL REVEN
UE (R
s. crore)
Fig. 1
PRO
FITA
BIL
ITY
RAT
IOS
(%)
CU
RR
ENT R
ATIO
Fig. 2
Total Revenue of the company registered a reduction of`̀̀̀̀ 983.45 crore during 2011-12, which went down from ̀̀̀̀̀ 2785.27crorein 2010-11 to ̀̀̀̀̀ 1801.82 crore in 2011-12. The losses of the companyhas also gone up by `̀̀̀̀ 178.85 crore to `̀̀̀̀ 179.89 crore in 2011-12,from `̀̀̀̀ 1.04.crore in previous year due to reduction in operation ofcompany as a result of downfall in sale rates. The sale realizationcould not match the cost and the value of closing stock lying with theCorporation has reduced, resulting in loss during the FY 2011-12.
The current ratio of company is at 1.56:1 during 2011-12 asagainst 1.15:1 in the pervious year (Fig.2). Balance Sheet and Profit& Loss Account of the company and selected financial ratios duringthe period 2010-11 to 2011-12 can be seen on the adjoining page.

Public Enterprises Survey 2011-2012: Vol-II 375
The Cotton Corporation of India Ltd.Kapas Bhavan, Sector 10, Plot No.3A, CBD-Belapur, Navi Mumbai 400 614
PROFIT & LOSS ACCOUNT (` in Lakhs)PARTICULARS 2011-12 2010-11(I) Revenue from Operations (Gross) 176560 276792Less : Excise Duty 0 0Revenue from Operations (Net) 176560 276792(II) Other Income 3622 1735(III) Total Revenue (I+II) 180182 278527(IV) Expenditure on:(a) Cost of materials consumed 44870 312651(b) Purchase of stock-in-trade 21 349(c) Changes in inventories of finished goods,work-in-progress and stock in trade 135866 -63530(d) Stores & Spares 0 0(e) Power & Fuel 107 66(f) Salary, Wages & Benefits/Employees Expense 7780 6793(g) Other Operating/direct/manufacturing Expenses 2584 10895(h) Rent, Royalty & Cess 63 92(i) Loss on sale of Assets/Investments 3 8(j) Other Expenses 1172 2631Total Expenditure (IV (a to j)) 192466 269955(V) PROFIT BEFORE DEPRECIATION, & IMPAIRMENT,FINANCE CHARGES/INTEREST, EXCEPTIONAL &EXTRAORDINARY ITEMS & TAXES (PBDIEET)(III-IV) -12284 8572(VI) Depreciation, Depletion & Amortisation 343 238(VII) Impairment 0 0(VIII) PROFIT BEFORE FINANCE COST/INTEREST,EXCEPTIONAL, EXTRA-ORDINARY ITEMS & TAXES(PBIEET)(V-VI-VII) -12627 8334(IX) Finance Cost(a) On Central Government Loans 0 0(b) On Foreign Loans 0 0(c) Others 5823 8673(d) Less Finance Cost Capitalised 0 0(e) Charged to P & L Account (a+b+c+d) 5823 8673(X) PROFIT BEFORE EXCEPTIONAL & EXTRA-ORDINARYITEMS & TAX (PBEET)(VIII-IXe) -18450 -339(XI) Exceptional Items 0 0(XII) PROFIT BEFORE EXTRA-ORDINARY ITEMS & TAX(PBET)(X-XI) -18450 -339(XIII) Extra-Ordinary Items 0 0(XIV) PROFIT BEFORE TAX (PBT)(XII-XIII) -18450 -339(XV) TAX PROVISIONS -461 -243(XVI) NET PROFIT / LOSS FOR THE PERIOD FROMCONTINUING OPERATIONS AFTER TAX(XIV-XV) -17989 -96(XVII) Profit/Loss from discontinuing operations 0 0(XVIII) Tax expenses of discontinuing operations 0 0(XIX) Profit/Loss from discontinuing operations (after Tax)(XVII-XVIII) 0 0(XX) Profit/Loss for the period (XVI+XIX) -17989 -96Financial Ratios(i) Sales : Capital Employed 1010.18 780.42(ii) Cost of Sales : Sales 109.2 97.61(iii) Salary/Wages : Sales 4.41 2.45(iv) Net Profit : Net Worth -102.92 -0.27(v) Debt : Equity 0 0(vi) Current Ratio 1.56 1.15(vii) Trade Recievables : Sales 4.12 6.83(viii) Total Inventory : Sales 12.35 56.77
BALANCE SHEET ( `̀̀̀̀ in Lakhs)PARTICULARS 2011-12 2010-11I. EQUITY & LIABILITIES
AUTHORISED CAPITAL 7500 7500(1) Shareholders’ Funds(a) Share Capital(i) Central Govt 2500 2500(ii) Others 0 0(b) Reserves & Surplus 14978 32967(c) Money received against share warrants 0 0Total Shareholders’ Funds (1(a)+1(b)+1(c) 17478 35467(2) Share application money pending allotment 0 0(3) Non-current Liabilities(a) Long Term Borrowings 0 0(b) Deferred tax liabilities (Net) 0 0(c) Other Long-term liabilities 370 441(d) Long-term provisions 2651 1819Total Non-Current Liabilities 3(a) to 3(d) 3021 2260(4) Current Liabilities(a) Short Term Borrowings 6575 178500(b) Trade Payables 3366 1735(c) Other current liabilities 9592 21542(d) Short-term provisions 1655 1571Total Current Liabilities 4(a) to 4(d) 21188 203348TOTAL EQUITY & LIABILITIES (1+2+3+4) 41687 241075II. ASSETS(1) Non-Current Assets(a) Total Gross Fixed Assets 8315 7663(ai) Accumulated Depreciation, Depletion & Amortisation 2849 2530(aii) Accumulated Impairment 0 0(b) Total Net Fixed Assets ((a)-(ai)-(aii) 5466 5133(c) Capital work in progress 276 246(d) Intangible assets under developmet 0 28(e) Non-Current Investments 0 0(f) Deferred Tax Assets (Net) 1672 1383(g) Long Term Loans and Advances 949 874(h) Other Non-Current Assets 190 187Total Non-Current Assets (b+c+d+e+f+g+h) 8553 7851(2) Current Assets(a) Current Investments 0 0(b) Inventories 21813 157125(c) Trade Recievables 7269 18907(d) Cash & Bank Balance 368 50560(e) Short-term Loans & Advances 2408 3036(f) Other Current Assets 1276 3596Total Current Assets (a+b+c+d+e+f) 33134 233224TOTAL ASSETS (1+2) 41687 241075Important Indicators(i) Investment 2500 2500(ii) Capital Employed 17478 35467(iii) Net Worth 17478 35467(iv) Net Current Assets 11946 29876(v) Cost of Sales 192806 270185(vi) Net Value Added (at market price) -226 23526(vii) Total Regular Employees (Nos.) 1113 1181(viii) Avg. Monthly Emoluments per Employee(`) 58251 47933

Trading & Marketing Services380
Food Corporation of India
The CompanyFood Corporation of India (FCI) was incorporated in 1965 as
No-Profit No-Loss making company under Food Corporation Act,1964 with the objectives of providing minimum price support tofarmers and supplying food-grains to the general public under thePublic Distribution System. Through maintaining a buffer stock offood grains, it also ensures national food security.
FCI is a Schedule-'A' CPSE in Trading & Marketing sectorunder the administrative control of M/o Consumer Affairs, Foodand Public Distribution, D/o Food and Public Distribution with100% shareholding by the Government of India. The companyemployed 29434 Regular employees (Executives 5617 & Non-Executives 23817) as on 31.3.2012. Its registered office is at NewDelhi.
Vision / MissionThe Vision of the Corporation is to initiate procurement of
non-MSP governed commodities on commercial principles and toensure adequate buffer for meeting requirements under TPDS &Other Welfare Schemes.
The Mission of the Corporation is to introduce State of ArtFinancial Management in order to reduce the dependency on thepresent banking system in the country.
Industrial / Business OperationsFCI is the main agency of the Central Government for
procurement, storage and distribution of food grains through its165 district offices spread all over the country to ensure steadyfood grain supplies to 5 lakhs Fair Price Shops (FPS) under PublicDistribution System (PDS). The FCI has State-of-the-ArtTechnology on food grain preservation, warehousing, transportationand management.
Performance Highlights The company has not provided any details of its physical
performance during last two years. As per provisional informationreceived, the total Revenue of the company registered an increaseof `̀̀̀̀ 12981.10 crore during 2011-12 which went up to `̀̀̀̀ 95559.51crore in 2011-12 from `̀̀̀̀ 82578.41 crore during 2010-11. Thecompany has shown No-Profit-No-Loss for the year 2011-12 asagainst a loss of `̀̀̀̀ 5.80 crore during previous year due to adjustmentof income pertaining to prior years (Net).
The current ratio of company is at 1.03:1 during 2011-12 asagainst 1.07:1 in the previous year (Fig.2). Balance Sheet and Profit& Loss Account of the company and selected financial ratios duringthe period 2010-11 to 2011-12 can be seen on the adjoining page.
Strategic issuesThe procurement and issue price of food grains is fixed by the
Government of India and the difference between the economic costand rates realization is reimbursed by the Government as subsidy.The Government of India also provides budgetary support to theCorporation for meeting capital expenditure such as construction www.fciweb.nic.in
of storage, godowns etc. During the year 2011-12, FCI received asubsidy of ` 67934.16 crore as against ` 56394.42 crore duringprevious year.
As a major player in food grain management within the country,FCI is now endeavoring to reduce burden on food subsidy throughbetter financial Management, improved stock / inventorymanagement and real time on-line system. It has recently launchedthe IISFM (Integrated Information System for Food GrainsManagement) in collaboration with NIC.
TOTAL R
EVENU
E (Rs. crore)
Fig. 1
PRO
FITA
BIL
ITY
RAT
IOS
(%)
CU
RR
ENT R
ATIO
Fig. 2
EBIT
DA
& P
AT (
Rs.
cro
re)

Public Enterprises Survey 2011-2012: Vol-II 381
Food Corporation of India16-20, Barakhamba Lane,New Delhi-110 001
PROFIT & LOSS ACCOUNT (` in Lakhs)PARTICULARS 2011-12 2010-11(I) Revenue from Operations (Gross) 9495133 8224505Less : Excise Duty 0 0Revenue from Operations (Net) 9495133 8224505(II) Other Income 60818 33336(III) Total Revenue (I+II) 9555951 8257841(IV) Expenditure on:(a) Cost of materials consumed 0 0(b) Purchase of stock-in-trade 8766942 7332471(c) Changes in inventories of finished goods,work-in-progress and stock in trade -935866 -495028(d) Stores & Spares 0 0(e) Power & Fuel 1926 1826(f) Salary, Wages & Benefits/Employees Expense 224770 234597(g) Other Operating/direct/manufacturing Expenses 830614 743893(h) Rent, Royalty & Cess 111807 90670(i) Loss on sale of Assets/Investments 0 0(j) Other Expenses 29008 25889Total Expenditure (IV (a to j)) 9029201 7934318(V) PROFIT BEFORE DEPRECIATION, & IMPAIRMENT,FINANCE CHARGES/INTEREST, EXCEPTIONAL &EXTRAORDINARY ITEMS & TAXES (PBDIEET)(III-IV) 526750 323523(VI) Depreciation, Depletion & Amortisation 3224 3712(VII) Impairment 0 0(VIII) PROFIT BEFORE FINANCE COST/INTEREST,EXCEPTIONAL, EXTRA-ORDINARY ITEMS & TAXES(PBIEET)(V-VI-VII) 523526 319811(IX) Finance Cost(a) On Central Government Loans 144164 0(b) On Foreign Loans
0 0(c) Others 378492 320434(d) Less Finance Cost Capitalised 0 0(e) Charged to P & L Account (a+b+c+d) 522656 320434(X) PROFIT BEFORE EXCEPTIONAL & EXTRA-ORDINARYITEMS & TAX (PBEET)(VIII-IXe) 870 -623(XI) Exceptional Items 0 0(XII) PROFIT BEFORE EXTRA-ORDINARY ITEMS & TAX(PBET)(X-XI) 870 -623(XIII) Extra-Ordinary Items 870 -43(XIV) PROFIT BEFORE TAX (PBT)(XII-XIII) 0 -580(XV) TAX PROVISIONS 0 0(XVI) NET PROFIT / LOSS FOR THE PERIOD FROMCONTINUING OPERATIONS AFTER TAX(XIV-XV) 0 -580(XVII) Profit/Loss from discontinuing operations 0 0(XVIII) Tax expenses of discontinuing operations 0 0(XIX) Profit/Loss from discontinuing operations(after Tax)(XVII-XVIII) 0 0(XX) Profit/Loss for the period (XVI+XIX) 0 -580Financial Ratios(i) Sales : Capital Employed 1543.91 1351.21(ii) Cost of Sales : Sales 95.13 96.52(iii) Salary/Wages : Sales 2.37 2.85(iv) Net Profit : Net Worth 0 -0.27(v) Debt : Equity 1.48 1.52(vi) Current Ratio 1.03 1.07(vii) Trade Recievables : Sales 26.88 22.09(viii) Total Inventory : Sales 52.37 49.09
BALANCE SHEET ( `̀̀̀̀ in Lakhs)PARTICULARS 2011-12 2010-11I. EQUITY & LIABILITIES
AUTHORISED CAPITAL 350000 350000(1) Shareholders’ Funds(a) Share Capital(i) Central Govt 264967 258773(ii) Others 0 0(b) Reserves & Surplus -43040 -43063(c) Money received against share warrants 0 0Total Shareholders’ Funds (1(a)+1(b)+1(c) 221927 215710(2) Share application money pending allotment 0 0(3) Non-current Liabilities(a) Long Term Borrowings 393077 392965(b) Deferred tax liabilities (Net) 0 0(c) Other Long-term liabilities 0 0(d) Long-term provisions 0 0Total Non-Current Liabilities 3(a) to 3(d) 393077 392965(4) Current Liabilities(a) Short Term Borrowings 5751708 4215954(b) Trade Payables 1525187 1626491(c) Other current liabilities 126731 53040(d) Short-term provisions 0 0Total Current Liabilities 4(a) to 4(d) 7403626 5895485TOTAL EQUITY & LIABILITIES (1+2+3+4) 8018630 6504160II. ASSETS(1) Non-Current Assets(a) Total Gross Fixed Assets 137857 133638(ai) Accumulated Depreciation, Depletion & Amortisation 100213 97077(aii) Accumulated Impairment 0 0(b) Total Net Fixed Assets ((a)-(ai)-(aii) 37644 36561(c) Capital work in progress 7361 2774(d) Intangible assets under developmet 0 0(e) Non-Current Investments 0 0(f) Deferred Tax Assets (Net) 0 0(g) Long Term Loans and Advances 218840 102986(h) Other Non-Current Assets 109641 68477Total Non-Current Assets (b+c+d+e+f+g+h) 373486 210798(2) Current Assets(a) Current Investments 0 0(b) Inventories 4972914 4037047(c) Trade Recievables 2552679 1817003(d) Cash & Bank Balance 355 380622(e) Short-term Loans & Advances 0 0(f) Other Current Assets 119196 58690Total Current Assets (a+b+c+d+e+f) 7645144 6293362TOTAL ASSETS (1+2) 8018630 6504160Important Indicators(i) Investment 658044 651738(ii) Capital Employed 615004 608675(iii) Net Worth 221927 215710(iv) Net Current Assets 241518 397877(v) Cost of Sales 9032425 7938030(vi) Net Value Added (at market price) 859233 645121(vii) Total Regular Employees (Nos.) 29434 30656(viii) Avg. Monthly Emoluments per Employee(`) 63637 63771
2011-12 Provisional

Trading & Marketing Services382
Handicrafts and Handlooms Exports Corporations of India Limited
The CompanyHandicrafts and Handlooms Exports Corporations of India
Limited (HHEC) was incorporated on 11.4.1958 with the objectiveof export promotion and developing trade of handicrafts andhandlooms products, and products of village industries. Since thenthe product range has spread from handicraft and handloom fabricsto hand-knitted carpets, fashion garments, gold and silver jewellery/articles.
HHEC is a Schedule-'B' CPSE in Trading & Marketing sectorunder the administrative control of M/o Textiles with 100%shareholding by the Government of India.The company employed134 regular employees (Executives 61, Non-executives 73) as on31.3.2012. Its Registered at New Delhi & and Corporate office is atNOIDA, UP
Vision / MissionThe Vision of the company is to keep India alive on the world
map for demand of craftsmanship products by continuouslyadapting supply of Indian craftsmanship products to the changingconsumer habits on a continuous basis, to develop and supply newproducts of high quality at the right price, to provide a sustainablelivelihood to Indian craft persons and weavers.
The Mission of the company is to develop, promote andaggressively market the products of Indian crafts and skills abroadthereby providing a marketing channel for craftsmen and artisansand to continuously create demand for Indian crafts and skills inorder to enhance the income and profitability of Indian craftsmenand weavers.
Industrial / Business OperationsHHEC is engaged in export & domestic sales of handicrafts,
handlooms products, ready-to-wear garments (includingmanufacturing), carpets, sales of gold and silver jewellery / articlesand import & domestic sale of bullion. The company has fiveregional offices at Noida in UP, Chennai in Tamil Nadu, Mumbai inMaharashtra, Ahmedabad in Gujarat and Kolkata in West Bengal.
Performance HighlightsThe physical performances of the company for last two years
are given below:
www.hhecworld.in
`̀̀̀̀ 0.93 crore due to increase in turnover of all three segments ofoperation namely core group exports, bullion imports, retail salesand optimum utilization of the idle assets etc.
The current ratio of company is at 1:1 during 2011-12 &2010-11 (Fig.2). Balance Sheet and Profit & Loss Account of thecompany and selected financial ratios during the period 2010-11 to2011-12 can be seen on the adjoining page.
Main Products Unit Performance during
2011-12 2010-11
Manufactured Goods ` in Crore 31.33 28.45
Traded Goods ` in Crore 12094.95 4978.18
The Company registered an increase of ̀̀̀̀̀ 7121.34crore in netrevenue during 2011-12 which went up to ̀̀̀̀̀ 12135.64crore in 2011-12 from `̀̀̀̀ 5014.30crore during 2010-11 due to increase in Bullionimports. The net profit of the company increased to `̀̀̀̀ 2.16 crore,an increase of `̀̀̀̀ 1.23 crore over the previous year's profit of
Strategic issueThe corporation has been exploring new market opportunities.
HHEC has positioned itself for retail outlets in leading museum inIndia with view to showcase the museum objects on themerchandise.HHEC has developed a lot of new product series likeeco friendly products in banana fiber, istra grass, sabaii grass etc.
TOTAL R
EVENU
E (Rs. crore)
Fig. 1
Fig. 2
EBIT
DA
& P
AT (
Rs.
cro
re)
PRO
FITA
BIL
ITY
RAT
IOS
(%)
CU
RR
ENT R
ATIO

Public Enterprises Survey 2011-2012: Vol-II 383
Handicrafts and Handlooms Exports Corporations of India LimitedJawaharVyaparBhawanAnnexe, 1, Tolstoy Marg New Delhi - 110 001
PROFIT & LOSS ACCOUNT (` in Lakhs)PARTICULARS 2011-12 2010-11(I) Revenue from Operations (Gross) 1212821 500819Less : Excise Duty 4 0Revenue from Operations (Net) 1212817 500819(II) Other Income 747 611(III) Total Revenue (I+II) 1213564 501430(IV) Expenditure on:(a) Cost of materials consumed 2435 2351(b) Purchase of stock-in-trade
1214911 498472(c) Changes in inventories of finished goods,work-in-progress and stock in trade -6423 -1137(d) Stores & Spares 0 0(e) Power & Fuel 51 48(f) Salary, Wages & Benefits/Employees Expense 721 646(g) Other Operating/direct/manufacturing Expenses 182 179(h) Rent, Royalty & Cess 0 0(i) Loss on sale of Assets/Investments 1 1(j) Other Expenses 784 746Total Expenditure (IV (a to j)) 1212662 501306(V) PROFIT BEFORE DEPRECIATION, & IMPAIRMENT,FINANCE CHARGES/INTEREST, EXCEPTIONAL &EXTRAORDINARY ITEMS & TAXES (PBDIEET)(III-IV) 902 124(VI) Depreciation, Depletion & Amortisation 53 50(VII) Impairment 0 0(VIII) PROFIT BEFORE FINANCE COST/INTEREST,EXCEPTIONAL, EXTRA-ORDINARY ITEMS & TAXES(PBIEET)(V-VI-VII) 849 74(IX) Finance Cost(a) On Central Government Loans 0 0(b) On Foreign Loans 0 0(c) Others 2 7(d) Less Finance Cost Capitalised 0 0(e) Charged to P & L Account (a+b+c+d) 2 7(X) PROFIT BEFORE EXCEPTIONAL & EXTRA-ORDINARYITEMS & TAX (PBEET)(VIII-IXe) 847 67(XI) Exceptional Items 1157 -38(XII) PROFIT BEFORE EXTRA-ORDINARY ITEMS & TAX(PBET)(X-XI) -310 105(XIII) Extra-Ordinary Items 0 0(XIV) PROFIT BEFORE TAX (PBT)(XII-XIII) -310 105(XV) TAX PROVISIONS -526 13(XVI) NET PROFIT / LOSS FOR THE PERIOD FROMCONTINUING OPERATIONS AFTER TAX(XIV-XV) 216 92(XVII) Profit/Loss from discontinuing operations 0 0(XVIII) Tax expenses of discontinuing operations 0 0(XIX) Profit/Loss from discontinuing operations (after Tax)(XVII-XVIII) 0 0(XX) Profit/Loss for the period (XVI+XIX) 216 92Financial Ratios(i) Sales : Capital Employed 76086.39 36343.9(ii) Cost of Sales : Sales 99.99 100.11(iii) Salary/Wages : Sales 0.06 0.13(iv) Net Profit : Net Worth 13.55 6.68(v) Debt : Equity 0 0(vi) Current Ratio 1 1(vii) Trade Recievables : Sales 0.27 0.4(viii) Total Inventory : Sales 0.82 0.71
BALANCE SHEET ( `̀̀̀̀ in Lakhs)PARTICULARS 2011-12 2010-11I. EQUITY & LIABILITIESAUTHORISED CAPITAL 2000 2000(1) Shareholders’ Funds(a) Share Capital(i) Central Govt 1382 1382(ii) Others 0 0(b) Reserves & Surplus 212 -4(c) Money received against share warrants 0 0Total Shareholders’ Funds (1(a)+1(b)+1(c) 1594 1378(2) Share application money pending allotment 0 0(3) Non-current Liabilities(a) Long Term Borrowings 0 0(b) Deferred tax liabilities (Net) 129 0(c) Other Long-term liabilities 448 535(d) Long-term provisions 610 583Total Non-Current Liabilities 3(a) to 3(d) 1187 1118(4) Current Liabilities(a) Short Term Borrowings 167 86(b) Trade Payables 8255 12401(c) Other current liabilities 362272 251374(d) Short-term provisions 1176 9Total Current Liabilities 4(a) to 4(d) 371870 263870TOTAL EQUITY & LIABILITIES (1+2+3+4) 374651 266366II. ASSETS(1) Non-Current Assets(a) Total Gross Fixed Assets 1617 1593(ai) Accumulated Depreciation, Depletion & Amortisation 670 629(aii) Accumulated Impairment 0 0(b) Total Net Fixed Assets ((a)-(ai)-(aii) 947 964(c) Capital work in progress 0 0(d) Intangible assets under developmet 0 0(e) Non-Current Investments 0 0(f) Deferred Tax Assets (Net) 691 0(g) Long Term Loans and Advances 576 550(h) Other Non-Current Assets 501 320Total Non-Current Assets (b+c+d+e+f+g+h) 2715 1834(2) Current Assets(a) Current Investments 0 0(b) Inventories 9958 3535(c) Trade Recievables 3229 1987(d) Cash & Bank Balance 5759 6103(e) Short-term Loans & Advances 452 341(f) Other Current Assets 352538 252566Total Current Assets (a+b+c+d+e+f) 371936 264532TOTAL ASSETS (1+2) 374651 266366Important Indicators(i) Investment 1382 1382(ii) Capital Employed 1594 1378(iii) Net Worth 1594 1378(iv) Net Current Assets 66 662(v) Cost of Sales 1212714 501355(vi) Net Value Added (at market price) 28530 12234(vii) Total Regular Employees (Nos.) 134 146(viii) Avg. Monthly Emoluments per Employee(`) 44838 36872

Trading & Marketing Services384
HMT (International) Ltd.
The CompanyHMT (International) Ltd. (HMT (I)) was incorporated in
1975 with the objective to carry on business in India andabroad. It is a wholly owned subsidiary of HMT Limited andis a Schedule-'B' / Mini-ratna CPSE in Trading and MarketingServices sector under the administrative control of M/o HeavyIndustries and Public Enterprises, D/o Heavy Industry. Thecompany employed 60 regular employees (Executives 54 &Non-Executives 6) as on 31.3.2012. Its Registered andCorporate offices are at Bangalore, Karnataka.
Vision / MissionThe Vision / Mission of the company is to carry on
business in India and abroad as exporters, importers andconsultants and to undertake project works and technicalservices abroad, sale of HMT products and other engineeringproducts.
Industrial / Business OperationsHMT(I) is involved in the export of HMT products,
associate products as well as setting up projects abroad forgroup companies for machines / watches.
Performance Highlight The physical performances of the company for last two years
are given below:
Total Revenue of the company registered an increase of`̀̀̀̀ 6.74 crore during 2011-12, which went up from ̀̀̀̀̀ 32.97 crorein 2010-11 to ̀̀̀̀̀ 39.71 crore in 2011-12. However, the profit ofthe company has gone up by `̀̀̀̀ 1.14 crore to `̀̀̀̀ 1.35 crore in2011-12, from ̀ ` ` ` ` 0.21 crore in previous year due to increasein operating income.
The current ratio of company is at 1.93:1 during 2011-12as against 2.39:1 in the previous year (Fig.2). Balance Sheetand Profit & Loss Account of the company and selectedfinancial ratios during the period 2010-11 to 2011-12 can beseen on the adjoining page.
www.hmti.com
Main Products Unit Performance during
2011-12 2010-11
HMT Products &
Technical Services ` in Cr. 3.41 8.52
Agency & Others ` in Cr. 1.18 1.03
Projects & Services ` in Cr. 23.71 15.04
Sale of Imports ` in Cr. 4.10 3.24
Strategic issuesThe strategic and action plans for 2012-13 broadly focus
on high technology Machine Tools in the target markets,focus on Re-manufacturing & retrofitting of Machine Tools,aggressive marketing, trading & imports for other CPSEs andpurse with M/o External Affairs for grant in aid projects todifferent countries.
TOTAL R
EVENU
E (Rs. crore)
Fig. 1
Fig. 2
EBIT
DA
& P
AT (
Rs.
cro
re)
PRO
FITA
BIL
ITY
RAT
IOS
(%)
CU
RR
ENT R
ATIO

Public Enterprises Survey 2011-2012: Vol-II 385
HMT (International) Ltd.HMT Bhawan 59, Bellary Road, Bangalore-560 032.
BALANCE SHEET (` in Lakhs)PARTICULARS 2011-12 2010-11I. EQUITY & LIABILITIESAUTHORISED CAPITAL 800 800(1) Shareholders’ Funds(a) Share Capital(i) Central Govt 0 0(ii) Others 72 72(b) Reserves & Surplus 2598 2481(c) Money received against share warrants 0 0Total Shareholders’ Funds (1(a)+1(b)+1(c) 2670 2553(2) Share application money pending allotment 0 0(3) Non-current Liabilities(a) Long Term Borrowings 0 0(b) Deferred tax liabilities (Net) 115 114(c) Other Long-term liabilities 0 0(d) Long-term provisions 49 53Total Non-Current Liabilities 3(a) to 3(d) 164 167(4) Current Liabilities(a) Short Term Borrowings 0 0(b) Trade Payables 703 196(c) Other current liabilities 1156 751(d) Short-term provisions 679 649Total Current Liabilities 4(a) to 4(d) 2538 1596TOTAL EQUITY & LIABILITIES (1+2+3+4) 5372 4316II. ASSETS(1) Non-Current Assets(a) Total Gross Fixed Assets 739 735(ai) Accumulated Depreciation, Depletion & Amortisation 255 238(aii) Accumulated Impairment 0 0(b) Total Net Fixed Assets ((a)-(ai)-(aii) 484 497(c) Capital work in progress 0 0(d) Intangible assets under developmet 0 0(e) Non-Current Investments 0 0(f) Deferred Tax Assets (Net) 0 0(g) Long Term Loans and Advances 0 0(h) Other Non-Current Assets 0 0Total Non-Current Assets (b+c+d+e+f+g+h) 484 497(2) Current Assets(a) Current Investments 0 0(b) Inventories 41 0(c) Trade Recievables 1641 514(d) Cash & Bank Balance 2097 2298(e) Short-term Loans & Advances 1109 1007(f) Other Current Assets 0 0Total Current Assets (a+b+c+d+e+f) 4888 3819TOTAL ASSETS (1+2) 5372 4316Important Indicators(i) Investment 72 72(ii) Capital Employed 2670 2553(iii) Net Worth 2670 2553(iv) Net Current Assets 2350 2223(v) Cost of Sales 3512 2934(vi) Net Value Added (at market price) 684 400(vii) Total Regular Employees (Nos.) 60 59(viii) Avg. Monthly Emoluments per Employee(`) 67639 49718
PROFIT & LOSS ACCOUNT (` in Lakhs)PARTICULARS 2011-12 2010-11(I) Revenue from Operations (Gross) 3240 2789Less : Excise Duty 0 0Revenue from Operations (Net) 3240 2789(II) Other Income 731 508(III) Total Revenue (I+II) 3971 3297(IV) Expenditure on:(a) Cost of materials consumed 0 0(b) Purchase of stock-in-trade 2096 1757(c) Changes in inventories of finished goods,work-in-progress and stock in trade -24 52(d) Stores & Spares 0 0(e) Power & Fuel 0 0(f) Salary, Wages & Benefits/Employees Expense 487 352(g) Other Operating/direct/manufacturing Expenses 773 592(h) Rent, Royalty & Cess 21 16(i) Loss on sale of Assets/Investments 0 2(j) Other Expenses 140 147Total Expenditure (IV (a to j)) 3493 2918(V) PROFIT BEFORE DEPRECIATION, & IMPAIRMENT,FINANCE CHARGES/INTEREST, EXCEPTIONAL &EXTRAORDINARY ITEMS & TAXES (PBDIEET)(III-IV) 478 379(VI) Depreciation, Depletion & Amortisation 19 18(VII) Impairment 0 0(VIII) PROFIT BEFORE FINANCE COST/INTEREST,EXCEPTIONAL, EXTRA-ORDINARY ITEMS &TAXES (PBIEET)(V-VI-VII) 459 361(IX) Finance Cost(a) On Central Government Loans 0 0(b) On Foreign Loans
0 0(c) Others 2 1(d) Less Finance Cost Capitalised 0 0(e) Charged to P & L Account (a+b+c+d) 2 1(X) PROFIT BEFORE EXCEPTIONAL & EXTRA-ORDINARYITEMS & TAX (PBEET)(VIII-IXe) 457 360(XI) Exceptional Items 0 0(XII) PROFIT BEFORE EXTRA-ORDINARY ITEMS &TAX (PBET)(X-XI) 457 360(XIII) Extra-Ordinary Items 283 329(XIV) PROFIT BEFORE TAX (PBT)(XII-XIII) 174 31(XV) TAX PROVISIONS 39 10(XVI) NET PROFIT / LOSS FOR THE PERIOD FROMCONTINUING OPERATIONS AFTER TAX(XIV-XV) 135 21(XVII) Profit/Loss from discontinuing operations 0 0(XVIII) Tax expenses of discontinuing operations 0 0(XIX) Profit/Loss from discontinuing operations(after Tax)(XVII-XVIII) 0 0(XX) Profit/Loss for the period (XVI+XIX) 135 21Financial Ratios(i) Sales : Capital Employed 121.35 109.24(ii) Cost of Sales : Sales 108.4 105.2(iii) Salary/Wages : Sales 15.03 12.62(iv) Net Profit : Net Worth 5.06 0.82(v) Debt : Equity 0 0(vi) Current Ratio 1.93 2.39(vii) Trade Recievables : Sales 50.65 18.43(viii) Total Inventory : Sales 1.27 0

Trading & Marketing Services386
India Trade Promotion Organisation
The CompanyIndia Trade Promotion Organisation (ITPO) was incorporated
on 30.12.1976 with the objective to merge Trade DevelopmentAuthority (TDA), a Registered Society, under the administrativecontrol of the Ministry of Commerce & Industry with The TradeFair Authority of India (TFAI) with effect from 1st January, 1992.TFAI was earlier incorporated, under Section 25 of the IndianCompanies Act, 1956, on 30th December, 1976 by amalgamatingthree organizations of the Government of India viz. India InternationalTrade Fair Organization, Directorate of Exhibitions and CommercialPublicity and Indian Council of Trade Fairs and Exhibitions andcommenced operations with effect from 1st March, 1977.
ITPO is a Schedule-'B' Miniratna CPSE under theadministrative control of M/o Commerce and Industry, D/oCommerce with 100% shareholding by the Government of India.The company employed 1054 regular employees (Executives 111,Non-executives 943) as on 31.3.2012. Its Registered and Corporateoffices are at New Delhi. The four Regional Offices of ITPO arelocated in Mumbai, Kolkata, Chennai and Bangalore.
Vision/MissionThe Vision of the company is to be a leader amongst world
class trade promotion organizations leveraging India's strengthsinternationally.
The Mission of the company is to promote, facilitate,encourage and coordinate various activities and programmes toenhance India's share of export through trade in goods.
Industrial / Business OperationsITPO is engaged in providing services in promotion / facilitation
of trade through organizing / participating in trade fairs in India andabroad thereby increasing India's exports.
The company has two subsidiaries namely Karnataka TradePromotion Organisation and Tamil Nadu Trade Promotion Organisationwith share holding of 51% in each of them. ITPO also has a 50:50 JointVenture namely 'National Centre for Trade Information' (NCTI) alongwith the National Informatics Centre (NIC).
The service range of the company comprises of letting out theexhibition halls and convention centre to organize exhibitions, tradefairs and trade development and promotion through specializedprogrammes such as Buyers-Seller Meets and coordination ofbusiness delegations etc.
Performance HighlightsThe physical performance of company during last two years
are mentioned below:
operations. The Company is registered under Section 25 of theCompanies Act, 1956 and as such it does not declare any dividend.
The current ratio of company is at 10.11:1 during 2011-12 asagainst 6.42:1 in the previous year (Fig.2). Balance Sheet and Profit& Loss Account of the company and selected financial ratios duringthe period 2010-11 to 2011-12 can be seen on the adjoining page.
www.indiatradefair.com
Main Products Unit Performance during
2011-12 2010-11
Fairs in India Nos N.A. 11
Foreign Trade Fairs Nos. N.A. 26
N.A. : Not Available
EBIT
DA
& P
AT (
Rs.
cro
re)
TOTAL R
EVENU
E (Rs. crore)
Fig. 1
CU
RR
ENT R
ATIO
Fig. 2
PRO
FITA
BIL
ITY
RAT
IOS
(%)
Total Revenue of the company registered an increase of `̀̀̀̀68.68 crore during 2011-12, which went up from `̀̀̀̀ 305.11 crore in2010-11 to `̀̀̀̀ 373.79 crore in 2011-12. The net profit of thecompany increased to `̀̀̀̀ 183.03 crore, a growth of ` ̀` ̀` 112.16 croreover the previous year profit of `̀̀̀̀ 70.87 due to increase in company
Strategic IssuesITPO is networking with International Organisation in the
field of Trade and Commerce through membership or collaborativearrangements such as Memorandum of Understanding (MOU),ITPO is a founder member of Asia Trade Promotion Forum (ATPF)and participates in its Annual meets regularly.

Public Enterprises Survey 2011-2012: Vol-II 387
India Trade Promotion OrganisationPragati Bhawan, Pragati Maidan, New Delhi-110 001.
BALANCE SHEET (` in Lakhs)PARTICULARS 2011-12 2010-11I. EQUITY & LIABILITIESAUTHORISED CAPITAL 50 50(1) Shareholders’ Funds(a) Share Capital(i) Central Govt 25 25(ii) Others 0 0(b) Reserves & Surplus 96037 77734(c) Money received against share warrants 0 0Total Shareholders’ Funds (1(a)+1(b)+1(c) 96062 77759(2) Share application money pending allotment 0 0(3) Non-current Liabilities(a) Long Term Borrowings 0 0(b) Deferred tax liabilities (Net) 0 0(c) Other Long-term liabilities 501 155(d) Long-term provisions 4821 4206Total Non-Current Liabilities 3(a) to 3(d) 5322 4361(4) Current Liabilities(a) Short Term Borrowings 0 0(b) Trade Payables 1555 5489(c) Other current liabilities 5843 5787(d) Short-term provisions 2715 2152Total Current Liabilities 4(a) to 4(d) 10113 13428TOTAL EQUITY & LIABILITIES (1+2+3+4) 111497 95548II. ASSETS(1) Non-Current Assets(a) Total Gross Fixed Assets 10695 10635(ai) Accumulated Depreciation, Depletion & Amortisation 4895 4472(aii) Accumulated Impairment 0 0(b) Total Net Fixed Assets ((a)-(ai)-(aii) 5800 6163(c) Capital work in progress 84 156(d) Intangible assets under developmet 0 0(e) Non-Current Investments 1220 1220(f) Deferred Tax Assets (Net) 0 0(g) Long Term Loans and Advances 1697 1383(h) Other Non-Current Assets 406 392Total Non-Current Assets (b+c+d+e+f+g+h) 9207 9314(2) Current Assets(a) Current Investments 22 21(b) Inventories 0 0(c) Trade Recievables 1106 1020(d) Cash & Bank Balance 83000 73401(e) Short-term Loans & Advances 13610 7172(f) Other Current Assets 4552 4620Total Current Assets (a+b+c+d+e+f) 102290 86234TOTAL ASSETS (1+2) 111497 95548Important Indicators(i) Investment 25 25(ii) Capital Employed 96062 77759(iii) Net Worth 96062 77759(iv) Net Current Assets 92177 72806(v) Cost of Sales 19076 23424(vi) Net Value Added (at market price) 27692 11163(vii) Total Regular Employees (Nos.) 1054 1104(viii) Avg. Monthly Emoluments per Employee(`) 79491 71905
PROFIT & LOSS ACCOUNT (` in Lakhs)PARTICULARS 2011-12 2010-11(I) Revenue from Operations (Gross) 27318 18796Less : Excise Duty 0 0Revenue from Operations (Net) 27318 18796(II) Other Income 10061 11715(III) Total Revenue (I+II) 37379 30511(IV) Expenditure on:(a) Cost of materials consumed 0 0(b) Purchase of stock-in-trade 0 0(c) Changes in inventories of finished goods,work-in-progress and stock in trade 0 0(d) Stores & Spares 0 0(e) Power & Fuel 1982 1955(f) Salary, Wages & Benefits/Employees Expense 10054 9526(g) Other Operating/direct/manufacturing Expenses 2007 5732(h) Rent, Royalty & Cess 0 0(i) Loss on sale of Assets/Investments 0 0(j) Other Expenses 4595 5863Total Expenditure (IV (a to j)) 18638 23076(V) PROFIT BEFORE DEPRECIATION, & IMPAIRMENT,FINANCE CHARGES/INTEREST, EXCEPTIONAL &EXTRAORDINARY ITEMS & TAXES (PBDIEET)(III-IV) 18741 7435(VI) Depreciation, Depletion & Amortisation 438 348(VII) Impairment 0 0(VIII) PROFIT BEFORE FINANCE COST/INTEREST,EXCEPTIONAL, EXTRA-ORDINARY ITEMS &TAXES (PBIEET)(V-VI-VII) 18303 7087(IX) Finance Cost(a) On Central Government Loans 0 0(b) On Foreign Loans 0 0(c) Others 0 0(d) Less Finance Cost Capitalised 0 0(e) Charged to P & L Account (a+b+c+d) 0 0(X) PROFIT BEFORE EXCEPTIONAL &EXTRA-ORDINARY ITEMS & TAX (PBEET)(VIII-IXe) 18303 7087(XI) Exceptional Items 0 0(XII) PROFIT BEFORE EXTRA-ORDINARY ITEMS &TAX (PBET)(X-XI) 18303 7087(XIII) Extra-Ordinary Items 0 0(XIV) PROFIT BEFORE TAX (PBT)(XII-XIII) 18303 7087(XV) TAX PROVISIONS 0 0(XVI) NET PROFIT / LOSS FOR THE PERIOD FROMCONTINUING OPERATIONS AFTER TAX(XIV-XV) 18303 7087(XVII) Profit/Loss from discontinuing operations 0 0(XVIII) Tax expenses of discontinuing operations 0 0(XIX) Profit/Loss from discontinuing operations(after Tax)(XVII-XVIII) 0 0(XX) Profit/Loss for the period (XVI+XIX) 18303 7087Financial Ratios(i) Sales : Capital Employed 28.44 24.17(ii) Cost of Sales : Sales 69.83 124.62(iii) Salary/Wages : Sales 36.8 50.68(iv) Net Profit : Net Worth 19.05 9.11(v) Debt : Equity 0 0(vi) Current Ratio 10.11 6.42(vii) Trade Recievables : Sales 4.05 5.43(viii) Total Inventory : Sales 0 0

Trading & Marketing Services388
Jute Corporation of India Ltd.
The CompanyJute Corporation of India Ltd. (JCI) was incorporated in 1971
with the objective to work as on official agency by the Govt. of Indiawith the aim to provide minimum support price (MSP) to the jutecultivators and also work as a helping hand in the raw jute sector.
JCI is a Schedule-'C' CPSE in Trading & Marketing sectorunder the administrative control of M/o Textiles with 100%shareholding by the Government of India. The company employed848 regular employees (Executives 105 & Non-Executives 743) ason 31.3.2012. Its Registered and Corporate offices are at Kolkata,West Bengal.Vision / Mission
The Vision of the Company is to promote genuine interest ofjute growers in particular and jute economy at large through pricestabilization effort and as a quality leader in the jute trade.
The Mission of the Company is to implement the policy ofGOI for providing MSP to the jute growers of the country andundertake various extensive measures for implementation ofdifferent jute related projects.Industrial / Business Operations
The Jute Corporation of India with a wide network of 143Departmental Purchase Centre, 28 Sub Centers in Six (6) jutegrowing states namely West Bengal, Bihar, Assam, Tripura, Orissaand Andhra Pradesh undertook Raw Jute procurement activitiesfor the benefit of the jute farmers.
Since the corporation has been involved in price supportmechanism for jute growers, no operational data is available.Performance Highlights
Total Revenue of the company registered an increase of`̀̀̀̀ 71.75 crore during 2011-12, which went up from `̀̀̀̀ 60.17 crorein 2010-11 to `̀̀̀̀ 131.92 crore in 2011-12. The profit of the companyhas gone up by `̀̀̀̀ 25.66 crore to `̀̀̀̀ 14.18 crore, from a loss of `̀̀̀̀11.48 crore in previous year due to increase in operating income asa result of subsidy amount of (`̀̀̀̀ 55.00 crore per annum) to theCorporation for maintenance of Minimum Support Price (MSP)infrastructure along with operational efficiency and strict costcontrol.
The current ratio of company is at 2.77:1 during 2011-12 asagainst 2.72:1 in the pervious year (Fig.2). Balance Sheet and Profit& Loss Account of the company and selected financial ratios duringthe period 2010-11 to 2011-12 can be seen on the adjoining page.
Strategic IssuesThe corporation receives subsidy in reimbursement of losses
on price support account. While approving the financialrestructuring of JCI, the Government (Ministry of Textiles) on2.6.2005 decided to provide subsidy to JCI on a continuous basisfrom the year 2003-04 to set-off losses on account of MinimumSupport Price (MSP) operation by the company. The quantum ofsubsidy is the difference between the purchase and sale prices ofraw jute by JCI. While calculating the MSP losses, the www.jutecorp.com
reimbursement of overhead costs to JCI does not exceed 10% of thevalue of purchases under MSP in a particular financial year.
The volume of procurement of raw jute / turnover of thecompany solely depends on the market behaviour as procurementis conducted when ruling price touches the MSP as declared byGOI.
The Jute Corporation of India Limited was authorized to actas the Implementing Agency for execution of Mini Mission-III andalso provide necessary support on activities of Mini Mission IVand other Mini Missions of the Jute Technology Mission.
EBIT
DA
& P
AT (
Rs.
cro
re)
TOTAL R
EVENU
E (Rs. crore)
Fig. 1
Fig. 2
CU
RR
ENT R
ATIO
PRO
FITA
BIL
ITY
RAT
IOS
(%)

Public Enterprises Survey 2011-2012: Vol-II 389
Jute Corporation of India Ltd.15N, Nellie Sengupta Sarani, 7th Floor, Kolkata, West Bengal-700 087.
BALANCE SHEET (` in Lakhs)PARTICULARS 2011-12 2010-11I. EQUITY & LIABILITIESAUTHORISED CAPITAL 500 500(1) Shareholders’ Funds(a) Share Capital(i) Central Govt 500 500(ii) Others 0 0(b) Reserves & Surplus 5813 4791(c) Money received against share warrants 0 0Total Shareholders’ Funds (1(a)+1(b)+1(c) 6313 5291(2) Share application money pending allotment 0 0(3) Non-current Liabilities(a) Long Term Borrowings 0 0(b) Deferred tax liabilities (Net) 0 0(c) Other Long-term liabilities 2957 3535(d) Long-term provisions 0 0Total Non-Current Liabilities 3(a) to 3(d) 2957 3535(4) Current Liabilities(a) Short Term Borrowings 0 0(b) Trade Payables 4217 4066(c) Other current liabilities 582 797(d) Short-term provisions 292 120Total Current Liabilities 4(a) to 4(d) 5091 4983TOTAL EQUITY & LIABILITIES (1+2+3+4) 14361 13809II. ASSETS(1) Non-Current Assets(a) Total Gross Fixed Assets 371 370(ai) Accumulated Depreciation, Depletion & Amortisation 123 117(aii) Accumulated Impairment 0 0(b) Total Net Fixed Assets ((a)-(ai)-(aii) 248 253(c) Capital work in progress 0 0(d) Intangible assets under developmet 0 0(e) Non-Current Investments 0 0(f) Deferred Tax Assets (Net) 0 0(g) Long Term Loans and Advances 15 6(h) Other Non-Current Assets 0 0Total Non-Current Assets (b+c+d+e+f+g+h) 263 259(2) Current Assets(a) Current Investments 0 0(b) Inventories 1553 1872(c) Trade Recievables 547 10(d) Cash & Bank Balance 9356 11253(e) Short-term Loans & Advances 2474 144(f) Other Current Assets 168 271Total Current Assets (a+b+c+d+e+f) 14098 13550TOTAL ASSETS (1+2) 14361 13809Important Indicators(i) Investment 500 500(ii) Capital Employed 6313 5291(iii) Net Worth 6313 5291(iv) Net Current Assets 9007 8567(v) Cost of Sales 11777 7154(vi) Net Value Added (at market price) 6589 4211(vii) Total Regular Employees (Nos.) 848 922(viii) Avg. Monthly Emoluments per Employee(`) 50737 48427
PROFIT & LOSS ACCOUNT (` in Lakhs)PARTICULARS 2011-12 2010-11(I) Revenue from Operations (Gross) 13192 6017Less : Excise Duty 0 0Revenue from Operations (Net) 13192 6017(II) Other Income 0 0(III) Total Revenue (I+II) 13192 6017(IV) Expenditure on:(a) Cost of materials consumed 5863 3245(b) Purchase of stock-in-trade 0 0(c) Changes in inventories of finished goods, work-in-progress and stock in trade 318 -1791(d) Stores & Spares 0 0(e) Power & Fuel 0 0(f) Salary, Wages & Benefits/Employees Expense 5163 5358(g) Other Operating/direct/manufacturing Expenses 0 0(h) Rent, Royalty & Cess 0 0(i) Loss on sale of Assets/Investments 0 0(j) Other Expenses 426 349Total Expenditure (IV (a to j)) 11770 7161(V) PROFIT BEFORE DEPRECIATION, & IMPAIRMENT,FINANCE CHARGES/INTEREST, EXCEPTIONAL &EXTRAORDINARY ITEMS & TAXES (PBDIEET)(III-IV) 1422 -1144(VI) Depreciation, Depletion & Amortisation 7 -7(VII) Impairment 0 0(VIII) PROFIT BEFORE FINANCE COST/INTEREST,EXCEPTIONAL, EXTRA-ORDINARY ITEMS &TAXES (PBIEET)(V-VI-VII) 1415 -1137(IX) Finance Cost(a) On Central Government Loans 0 0(b) On Foreign Loans 0 0(c) Others 4 0(d) Less Finance Cost Capitalised 0 0(e) Charged to P & L Account (a+b+c+d) 4 0(X) PROFIT BEFORE EXCEPTIONAL & EXTRA-ORDINARY ITEMS & TAX (PBEET)(VIII-IXe) 1411 -1137(XI) Exceptional Items -11 10(XII) PROFIT BEFORE EXTRA-ORDINARY ITEMS &TAX (PBET)(X-XI) 1422 -1147(XIII) Extra-Ordinary Items 0 0(XIV) PROFIT BEFORE TAX (PBT)(XII-XIII) 1422 -1147(XV) TAX PROVISIONS 400 0(XVI) NET PROFIT / LOSS FOR THE PERIOD FROMCONTINUING OPERATIONS AFTER TAX(XIV-XV) 1022 -1147(XVII) Profit/Loss from discontinuing operations 0 0(XVIII) Tax expenses of discontinuing operations 0 0(XIX) Profit/Loss from discontinuing operations(after Tax)(XVII-XVIII) 0 0(XX) Profit/Loss for the period (XVI+XIX) 1022 -1147Financial Ratios(i) Sales : Capital Employed 208.97 113.72(ii) Cost of Sales : Sales 89.27 118.9(iii) Salary/Wages : Sales 39.14 89.05(iv) Net Profit : Net Worth 16.19 -21.68(v) Debt : Equity 0 0(vi) Current Ratio 2.77 2.72(vii) Trade Recievables : Sales 4.15 0.17(viii) Total Inventory : Sales 11.77 31.11

Trading & Marketing Services390
Karnataka Trade Promotion Organisation
The CompanyKarnataka Trade Promotion Organisation(KTPO) was
incorporated on 6.12.2000 under section 25 of the Companies Act,1956 with the objective to set up an exhibition complex at Bangalore,Karnataka. It was incorporated as a joint venture between IndiaTrade Promotion Organization (ITPO) and Karnataka IndustrialArea Development Board (KIADB), a Government of Karnatakaundertaking. The company came into operation on 23.9.2004.
KTPO is an uncategorized CPSE in Trading & Marketingsector under the administrative control of M/o Commerce andIndustry, D/o Commerce. The company employed 2 regularemployees as on 31.3.2012. Its Registered and Corporate officesare at Bangalore. KTPO is a subsidiary of ITPO which holds 51%of its equity.
Vision / MissionThe Vision of the company is to be a leading service provider
with wide spectrum of services to trade and industry and acts as acatalyst for growth of business industry trade & commerce community.
The Mission of the company is to promote, organize andparticipate in industrial trade, other fairs and exhibitions in Indiaand abroad and to take all measures incidental thereto for promotingIndian Industry, trade and enhance its global competitiveness.
Industrial / Business OperationsKTPO is engaged in providing services in the field of trade
promotion through organizing trade fairs and exhibitions as also toprovide covered air-conditioned exhibition space on rental basis toexhibitors for organizing trade and industry related exhibitions / events.
The service range of the company comprises of letting out theexhibition halls and convention centre to organize IndustrialExhibitions, Trade fairs etc.
Performance HighlightsThe physical performances of the company for last two years
are given below:
The Company registered an increase of ` 3.08 crore in totalrevenue during 2011-12 which went up to ` 7.07 crore in 2011-12from ` 3.99 crore during 2010-11. The net profit of the companycorrespondingly increased to ` 2.84 crore in 2011-12, an increaseof ` 1.35 croreover the previous yearprofit of ` 1.49 croredue toincrease in operating income as a result of increase in occupancyrate of the center.
The current ratio of company is at 8.37:1 during 2011-12 asagainst 8.3:1 in the previous year (Fig.2). Balance Sheet and Profit& Loss Account of the company and selected financial ratios duringthe period 2010-11 to 2011-12 can be seen on the adjoining page.
www.ktpo.org
Main Service Unit Performance during
2011-12 2010-11
Renting OutExhibition Complex ` in Crores 4.66 2.61
Events/Exhibitions Nos. 32 30Strategic issue
The company has been exempted from payment of income taxunder Section 12 (a) and under 10(23C) (iv) upto accounting year2008-09. The company has made an application for extension ofexemption for further periods and hence has not provided for anyincome tax liability. The land title deed is also yet to be executed infavour of KTPO.
EBIT
DA
& P
AT (
Rs.
cro
re)
TOTAL R
EVENU
E (Rs. crore)
Fig. 1PR
OFI
TAB
ILIT
Y R
ATIO
S (%
)
CU
RR
ENT R
ATIO
Fig. 2

Public Enterprises Survey 2011-2012: Vol-II 391
Karnataka Trade Promotion OrganisationPlot No. 121, EPIP Industrial Area, Whitefield, Bangalore, Karnataka-560 066.
BALANCE SHEET (` in Lakhs)PARTICULARS 2011-12 2010-11I. EQUITY & LIABILITIESAUTHORISED CAPITAL 2000 2000(1) Shareholders’ Funds(a) Share Capital(i) Central Govt 0 0(ii) Others 50 50(b) Reserves & Surplus 884 600(c) Money received against share warrants 0 0Total Shareholders’ Funds (1(a)+1(b)+1(c) 934 650(2) Share application money pending allotment 995 995(3) Non-current Liabilities(a) Long Term Borrowings 774 747(b) Deferred tax liabilities (Net) 0 0(c) Other Long-term liabilities 0 0(d) Long-term provisions 0 0Total Non-Current Liabilities 3(a) to 3(d) 774 747(4) Current Liabilities(a) Short Term Borrowings 0 0(b) Trade Payables 0 0(c) Other current liabilities 237 186(d) Short-term provisions 1 1Total Current Liabilities 4(a) to 4(d) 238 187TOTAL EQUITY & LIABILITIES (1+2+3+4) 2941 2579II. ASSETS(1) Non-Current Assets(a) Total Gross Fixed Assets 1910 1878(ai) Accumulated Depreciation, Depletion & Amortisation 961 851(aii) Accumulated Impairment 0 0(b) Total Net Fixed Assets ((a)-(ai)-(aii) 949 1027(c) Capital work in progress 0 0(d) Intangible assets under developmet 0 0(e) Non-Current Investments 0 0(f) Deferred Tax Assets (Net) 0 0(g) Long Term Loans and Advances 0 0(h) Other Non-Current Assets 0 0Total Non-Current Assets (b+c+d+e+f+g+h) 949 1027(2) Current Assets(a) Current Investments 0 0(b) Inventories 0 0(c) Trade Recievables 0 0(d) Cash & Bank Balance 1790 1315(e) Short-term Loans & Advances 113 191(f) Other Current Assets 89 46Total Current Assets (a+b+c+d+e+f) 1992 1552TOTAL ASSETS (1+2) 2941 2579Important Indicators(i) Investment 1819 1792(ii) Capital Employed 2703 2392(iii) Net Worth 1929 1645(iv) Net Current Assets 1754 1365(v) Cost of Sales 423 250(vi) Net Value Added (at market price) 299 159(vii) Total Regular Employees (Nos.) 2(viii) Avg. Monthly Emoluments per Employee(`) 0 41667
PROFIT & LOSS ACCOUNT (` in Lakhs)PARTICULARS 2011-12 2010-11(I) Revenue from Operations (Gross) 564 309Less : Excise Duty 0 0Revenue from Operations (Net) 564 309(II) Other Income 143 90(III) Total Revenue (I+II) 707 399(IV) Expenditure on:(a) Cost of materials consumed 0 0(b) Purchase of stock-in-trade 0 0(c) Changes in inventories of finished goods,work-in-progress and stock in trade 0 0(d) Stores & Spares 0 0(e) Power & Fuel 49 29(f) Salary, Wages & Benefits/Employees Expense 15 10(g) Other Operating/direct/manufacturing Expenses 51 27(h) Rent, Royalty & Cess 0 0(i) Loss on sale of Assets/Investments 0 0(j) Other Expenses 198 66Total Expenditure (IV (a to j)) 313 132(V) PROFIT BEFORE DEPRECIATION, & IMPAIRMENT,FINANCE CHARGES/INTEREST, EXCEPTIONAL &EXTRAORDINARY ITEMS & TAXES (PBDIEET)(III-IV) 394 267(VI) Depreciation, Depletion & Amortisation 110 118(VII) Impairment 0 0(VIII) PROFIT BEFORE FINANCE COST/INTEREST,EXCEPTIONAL, EXTRA-ORDINARY ITEMS &TAXES (PBIEET)(V-VI-VII) 284 149(IX) Finance Cost(a) On Central Government Loans 0 0(b) On Foreign Loans 0 0(c) Others 0 0(d) Less Finance Cost Capitalised 0 0(e) Charged to P & L Account (a+b+c+d) 0 0(X) PROFIT BEFORE EXCEPTIONAL & EXTRA-ORDINARY ITEMS & TAX (PBEET)(VIII-IXe) 284 149(XI) Exceptional Items 0 0(XII) PROFIT BEFORE EXTRA-ORDINARY ITEMS &TAX (PBET)(X-XI) 284 149(XIII) Extra-Ordinary Items 0 0(XIV) PROFIT BEFORE TAX (PBT)(XII-XIII) 284 149(XV) TAX PROVISIONS 0 0(XVI) NET PROFIT / LOSS FOR THE PERIOD FROMCONTINUING OPERATIONS AFTER TAX(XIV-XV) 284 149(XVII) Profit/Loss from discontinuing operations 0 0(XVIII) Tax expenses of discontinuing operations 0 0(XIX) Profit/Loss from discontinuing operations (after Tax)(XVII-XVIII) 0 0(XX) Profit/Loss for the period (XVI+XIX) 284 149Financial Ratios(i) Sales : Capital Employed 20.87 12.92(ii) Cost of Sales : Sales 75 80.91(iii) Salary/Wages : Sales 2.66 3.24(iv) Net Profit : Net Worth 14.72 9.06(v) Debt : Equity 0.74 0.71(vi) Current Ratio 8.37 8.3(vii) Trade Recievables : Sales 0 0(viii) Total Inventory : Sales 0 0

Trading & Marketing Services392
MMTC Limited
The CompanyMMTC Limited (till 1993 known as Minerals and Metals
Trading Corporation of India Ltd) was set up by Government ofIndia in the year 1963 primarily to regulate the International trade ofMinerals and Metals. Over the years new product lines like AgroCommodities, Fertilizers, Precious Metals, and Coal & Hydrocarbonswere added to the product profile of MMTC.
MMTC is a schedule 'A' / Mini-Ratna listed CPSE in Tradingand Marketing Services sector under the administrative control ofMinistry of Commerce & Industry with 99.33% of equityshareholding held by Govt. of India. The company employed 1673regular employees (Executives 607 & Non-executives 1066) as on31.3.2012. MMTC's Registered and Corporate office are at NewDelhi.
Vision/MissionThe Vision and Mission is to be the largest trading company
of India and a major trading company of Asia.
Industrial / Business OperationsMMTC is India's largest International Trading Company and
exporter of Mineral, leading exporter / importer of Agrocommodities, single largest importer / supplier of Metals includingGold & Silver and a major player in the Coal and Hydrocarbonsimports by the country. The company commands extensive marketcoverage in over 65 countries in Asia, Europe, Africa, Oceania andAmerica etc. and the domestic network of MMTC in India spreadsacross 76 offices, warehouses and retail outlets.
The company has one wholly owned subsidiary companynamely MMTC Transnational Pte. Ltd., Singapore (MTPL)(incorporated under the laws of Singapore with a share capital ofUS$ 1 million) and nine Joint Venture companies. MMTC has alsoset up Neelachal Ispat Nigam Limited (NINL) - an Iron & Steel plantjointly with Govt. of Orissa.
MMTC has also diversified into the area of clean, non-conventional and renewable energy sources by setting up a 15MWWind Energy Farm in the state of Karnataka.Performance Highlights
The physical performance of the company for last two yearsis given below:
Total Revenue of the company registered a reduction of` 2511.85 crore during 2011-12, which went down from ̀ 69563.75crore in 2010-11 to ` 67051.9 crore in 2011-12.The net profit ofthe company also reduced to ` 70.73 crore, a reduction of ̀ 50.90crore over the previous year profit of ̀ 121.63 crore due to decreasein margins due to intense competition in all its trade activities.
The current ratio of company is at 1.07:1 during 2011-12 asagainst 1.04 in the previous year (Fig.2). Balance Sheet and Profit& Loss Account of the company and selected financial ratios duringthe period 2010-11 to 2011-12 can be seen on the adjoining page. www.mmtclimited.co.in
Main Products Unit Performance during
2011-12 2010-11
EXPORTS ` in Crore 2045 3693
IMPORTS ` in Crore 61042 63301
DOMESTIC ` in Crore 2842 1860
Strategic IssuesBesides keeping its position intact in its core areas of activities,
MMTC also associates itself in promotion and development oftrade related infrastructure like setting up of a Commodity Exchange(which has commenced its operation in November, 2009) and aCurrency Exchange (which has commenced its operation inSeptember, 2010).
As a measure of investing in mining infrastructure, MMTC ispromoting a Joint Venture Company for exploration anddevelopment of mines for Minerals, Ferrous and Non-Ferrous ores,Precious Metals, Diamonds and Coal etc. MMTC has also beenallotted a coal mine in Jharkhand having estimated reserves ofabout 287 million tonnes. MMTC is a member of a consortium,which has constructed permanent Iron Ore Loading berth at Ennore.MMTC is also partner in another consortium, which has beenawarded the project for construction of a deep draft iron ore berthat Paradip port.
EBIT
DA
& P
AT (
Rs.
cro
re)
TOTAL R
EVENU
E (Rs. crore)
Fig. 1
PRO
FITA
BIL
ITY
RAT
IOS
(%)
CU
RR
ENT R
ATIO
Fig. 2

Public Enterprises Survey 2011-2012: Vol-II 393
MMTC Limited7, Scope Complex Lodi Road, New Delhi-110 003.
BALANCE SHEET (` in Lakhs)PARTICULARS 2011-12 2010-11I. EQUITY & LIABILITIESAUTHORISED CAPITAL 10000 10000(1) Shareholders’ Funds(a) Share Capital(i) Central Govt 9933 9933(ii) Others 67 67(b) Reserves & Surplus 132140 127973(c) Money received against share warrants 0 0Total Shareholders’ Funds (1(a)+1(b)+1(c) 142140 137973(2) Share application money pending allotment 0 0(3) Non-current Liabilities(a) Long Term Borrowings 0 0(b) Deferred tax liabilities (Net) 0 0(c) Other Long-term liabilities 448 439(d) Long-term provisions 13737 12524Total Non-Current Liabilities 3(a) to 3(d) 14185 12963(4) Current Liabilities(a) Short Term Borrowings 342987 608347(b) Trade Payables 329961 349027(c) Other current liabilities 423766 807167(d) Short-term provisions 21235 27475Total Current Liabilities 4(a) to 4(d) 1117949 1792016TOTAL EQUITY & LIABILITIES (1+2+3+4) 1274274 1942952II. ASSETS(1) Non-Current Assets(a) Total Gross Fixed Assets 20241 20245(ai) Accumulated Depreciation, Depletion & Amortisation 10514 9524(aii) Accumulated Impairment 0 0(b) Total Net Fixed Assets ((a)-(ai)-(aii) 9727 10721(c) Capital work in progress 0 51(d) Intangible assets under developmet 0 0(e) Non-Current Investments 46729 48528(f) Deferred Tax Assets (Net) 7150 3355(g) Long Term Loans and Advances 10951 9649(h) Other Non-Current Assets 229 282Total Non-Current Assets (b+c+d+e+f+g+h) 74786 72586(2) Current Assets(a) Current Investments 0 0(b) Inventories 92438 64798(c) Trade Recievables 277061 253692(d) Cash & Bank Balance 285312 674824(e) Short-term Loans & Advances 441919 653957(f) Other Current Assets 102758 223095Total Current Assets (a+b+c+d+e+f) 1199488 1870366TOTAL ASSETS (1+2) 1274274 1942952Important Indicators(i) Investment 10000 10000(ii) Capital Employed 142140 137973(iii) Net Worth 142140 137973(iv) Net Current Assets 81539 78350(v) Cost of Sales 6629938 6897427(vi) Net Value Added (at market price) 230799 357289(vii) Total Regular Employees (Nos.) 1673 1762(viii) Avg. Monthly Emoluments per Employee(`) 91831 86909
PROFIT & LOSS ACCOUNT (` in Lakhs)PARTICULARS 2011-12 2010-11(I) Revenue from Operations (Gross) 6632520 6905600Less : Excise Duty 31 0Revenue from Operations (Net) 6632489 6905600(II) Other Income 72701 50775(III) Total Revenue (I+II) 6705190 6956375(IV) Expenditure on:(a) Cost of materials consumed 0 0(b) Purchase of stock-in-trade 6516557 6458702(c) Changes in inventories of finished goods,work-in-progress and stock in trade -27764 147307(d) Stores & Spares 0 0(e) Power & Fuel 0 0(f) Salary, Wages & Benefits/Employees Expense 18436 18376(g) Other Operating/direct/manufacturing Expenses 25082 142583(h) Rent, Royalty & Cess 224 414(i) Loss on sale of Assets/Investments 0 0(j) Other Expenses 96203 128810Total Expenditure (IV (a to j)) 6628738 6896192(V) PROFIT BEFORE DEPRECIATION, & IMPAIRMENT,FINANCE CHARGES/INTEREST, EXCEPTIONAL &EXTRAORDINARY ITEMS & TAXES (PBDIEET)(III-IV) 76452 60183(VI) Depreciation, Depletion & Amortisation 1200 1235(VII) Impairment 0 0(VIII) PROFIT BEFORE FINANCE COST/INTEREST,EXCEPTIONAL, EXTRA-ORDINARY ITEMS &TAXES (PBIEET)(V-VI-VII) 75252 58948(IX) Finance Cost(a) On Central Government Loans 0 0(b) On Foreign Loans 0 0(c) Others 57643 39285(d) Less Finance Cost Capitalised 0 0(e) Charged to P & L Account (a+b+c+d) 57643 39285(X) PROFIT BEFORE EXCEPTIONAL & EXTRA-ORDINARY ITEMS & TAX (PBEET)(VIII-IXe) 17609 19663(XI) Exceptional Items -13 673(XII) PROFIT BEFORE EXTRA-ORDINARY ITEMS &TAX (PBET)(X-XI) 17622 18990(XIII) Extra-Ordinary Items 10021 0(XIV) PROFIT BEFORE TAX (PBT)(XII-XIII) 7601 18990(XV) TAX PROVISIONS 529 6826(XVI) NET PROFIT / LOSS FOR THE PERIOD FROMCONTINUING OPERATIONS AFTER TAX(XIV-XV) 7072 12164(XVII) Profit/Loss from discontinuing operations 0 0(XVIII) Tax expenses of discontinuing operations 0 0(XIX) Profit/Loss from discontinuing operations (after Tax)(XVII-XVIII) 0 0(XX) Profit/Loss for the period (XVI+XIX) 7072 12164Financial Ratios(i) Sales : Capital Employed 4666.17 5005.04(ii) Cost of Sales : Sales 99.96 99.88(iii) Salary/Wages : Sales 0.28 0.27(iv) Net Profit : Net Worth 4.98 8.82(v) Debt : Equity 0 0(vi) Current Ratio 1.07 1.04(vii) Trade Recievables : Sales 4.18 3.67(viii) Total Inventory : Sales 1.39 0.94

Trading & Marketing Services394
MSTC Ltd.
The CompanyM S T C LTD. (MSTC) was incorporated on 9.9.1964 as Metal
Scrap Trade Corp. Ltd. with the objective of working as diversifiedtrading house with particular emphasis on bulk raw materials for steelindustry and to gradually build up tie- ups with international tradinghouses, develop warehousing system and logistics and to undertakedisposal of scrap and secondary arising etc. of organizations, both inpublic and private sector. MSTC today facilities in recycling of scrapfor industrial use of raw materials and thereby reduce input cost,conserve natural resources and ultimately protect the environment.
MSTC is a Schedule-'B' Mini-ratna CPSE in Trading & Marketingsector under the administrative control of M/o Steel with 90%shareholding by the Government of India and balance 10% by themembers of Steel Furnace Association of India and Ispat IndustriesLimited. The company employed 308 regular employees (Executives156, Non-executives 152) as on 31.3.2012. Its Registered andCorporate offices are at Kolkata, West Bengal.
Vision / MissionThe Vision of the Company is to emerge as a dominant B2B
player in the area of trading with particular emphasis on Steel Industry.The Mission of the Company is to organize and expand a market
for the various commodities handled by it by making transactions astransparent as possible through extensive use of e-commerce.
Industrial / Business OperationsMSTC undertakes disposal of ferrous / non-ferrous scrap and
other secondary arising from integrated steel plants under SAIL, RINLetc. and for disposal of scrap and obsolete / surplus stores from otherPSUs and Government Department including M/o Defence. It is alsoinvolved in import of steel melting scrap for the use of secondarysteel industry and finished iron and steel items like HR Coils, Billets,Pig Iron, DR Pellets, Coke, Coal and other inputs and Petroleumproducts like Naphtha, Super Kerosene Oil, Furnace Oil etc.
The company functions through its 4 Regional Offices at Delhi,Mumbai, Kolkata and Chennai and 3 Branch Offices at Bangalore,Vishakhapatnam and Vadodara. It has one subsidiary namely FerroScrap Nigam Ltd. (FSNL). The main segment of the companyservices are classified as Selling Agency, E-auction tender, marketingand E-Procurement.
Performance HighlightsThe total volume of business recorded through
e-commerce during 2011-12 was Rs.16,005.03 crore. The physicalperformances of the company for last two years are givenbelow:
www.mstcindia.co.in
EBIT
DA
& P
AT (
Rs.
cro
re)
TOTAL R
EVENU
E (Rs. crore)
Fig. 1
PRO
FITA
BIL
ITY
RAT
IOS
(%)
CU
RR
ENT R
ATIO
Fig. 2
Main Business Unit Performance during
segment 2011-12 2010-11Imported material ` in Crore 2076.00 2580.77
Indigenous Material ` in Crore 3670.15 3352.25
Sale of scrap and ` in Crore 3147.68 2568.08Manganese
Sale of coal ` in Crore 8560.05 5565.48
Total volume of business ` in Crore 21751.18 14100.77
The Company registered a growth of ` 748.59 crore in totalrevenue during 2011-12 which went upto ` 2695.92 crore in 2011-12from ` 1947.33 crore during 2010-11. The net profit of the company
increased to ` 118.39 crore, an increase of ` 270.68 crore over theprevious year's loss of ̀ 152.29 crore due to higher business and sale.
The current ratio of company is at 1.15:1 during 2011-12 asagainst 1.17:1 in the previous year (Fig.2). Balance Sheet and Profit& Loss Account of the company and selected financial ratios duringthe period 2010-11 to 2011-12 can be seen on the adjoining page.
Strategic issueMSTC is one of the largest e-commerce service providers in the
country and aims to remain so. Ferrous/ non ferrous scrap is beingimported from Europe & USA. MSTC is setting up a shredding plantfor shredding of Auto & miscellaneous steel scrap. Shredded Ferrousscrap is utilized as raw material for induction and arc furnaces toproduce steel by recycling. The project will save huge amount ofprecious foreign exchange for the country. The company has startedstockyard in Haldia and plans to convert it into Container freightstation.

Public Enterprises Survey 2011-2012: Vol-II 395
MSTC Ltd.225-C A.J.C. Bose Road, Kolkata, West Bengal-700 020.
BALANCE SHEET (` in Lakhs)PARTICULARS 2011-12 2010-11I. EQUITY & LIABILITIESAUTHORISED CAPITAL 500 500(1) Shareholders’ Funds(a) Share Capital(i) Central Govt 198 198(ii) Others 22 22(b) Reserves & Surplus 59386 50301(c) Money received against share warrants 0 0Total Shareholders’ Funds (1(a)+1(b)+1(c) 59606 50521(2) Share application money pending allotment 0 0(3) Non-current Liabilities(a) Long Term Borrowings 0 0(b) Deferred tax liabilities (Net) 0 0(c) Other Long-term liabilities 921 871(d) Long-term provisions 0 0Total Non-Current Liabilities 3(a) to 3(d) 921 871(4) Current Liabilities(a) Short Term Borrowings 73260 116369(b) Trade Payables 221941 116116(c) Other current liabilities 51480 36004(d) Short-term provisions 1138 623Total Current Liabilities 4(a) to 4(d) 347819 269112TOTAL EQUITY & LIABILITIES (1+2+3+4) 408346 320504II. ASSETS(1) Non-Current Assets(a) Total Gross Fixed Assets 2978 3152(ai) Accumulated Depreciation, Depletion & Amortisation 1062 1414(aii) Accumulated Impairment 0 0(b) Total Net Fixed Assets ((a)-(ai)-(aii) 1916 1738(c) Capital work in progress 0 0(d) Intangible assets under developmet 0 0(e) Non-Current Investments 1581 1581(f) Deferred Tax Assets (Net) 1301 1065(g) Long Term Loans and Advances 2048 2323(h) Other Non-Current Assets 23 34Total Non-Current Assets (b+c+d+e+f+g+h) 6869 6741(2) Current Assets(a) Current Investments 0 0(b) Inventories 0 1618(c) Trade Recievables 307664 221559(d) Cash & Bank Balance 91428 88447(e) Short-term Loans & Advances 1495 430(f) Other Current Assets 890 1709Total Current Assets (a+b+c+d+e+f) 401477 313763TOTAL ASSETS (1+2) 408346 320504Important Indicators(i) Investment 220 220(ii) Capital Employed 59606 50521(iii) Net Worth 59606 50521(iv) Net Current Assets 53658 44651(v) Cost of Sales 241812 169585(vi) Net Value Added (at market price) 37913 33963(vii) Total Regular Employees (Nos.) 308 316(viii) Avg. Monthly Emoluments per Employee(`) 111715 91060
PROFIT & LOSS ACCOUNT (` in Lakhs)PARTICULARS 2011-12 2010-11(I) Revenue from Operations (Gross) 262531 188028Less : Excise Duty 0 0Revenue from Operations (Net) 262531 188028(II) Other Income 7061 6705(III) Total Revenue (I+II) 269592 194733(IV) Expenditure on:(a) Cost of materials consumed 0 0(b) Purchase of stock-in-trade 232667 165836(c) Changes in inventories of finished goods,work-in-progress and stock in trade 1618 -1618(d) Stores & Spares 0 0(e) Power & Fuel 83 73(f) Salary, Wages & Benefits/Employees Expense 4129 3453(g) Other Operating/direct/manufacturing Expenses 482 419(h) Rent, Royalty & Cess 253 270(i) Loss on sale of Assets/Investments 10 2(j) Other Expenses 2372 1022Total Expenditure (IV (a to j)) 241614 169457(V) PROFIT BEFORE DEPRECIATION, & IMPAIRMENT,FINANCE CHARGES/INTEREST, EXCEPTIONAL &EXTRAORDINARY ITEMS & TAXES (PBDIEET)(III-IV) 27978 25276(VI) Depreciation, Depletion & Amortisation 208 130(VII) Impairment 0 0(VIII) PROFIT BEFORE FINANCE COST/INTEREST,EXCEPTIONAL, EXTRA-ORDINARY ITEMS &TAXES (PBIEET)(V-VI-VII) 27770 25146(IX) Finance Cost(a) On Central Government Loans 0 0(b) On Foreign Loans 0 0(c) Others 10155 10206(d) Less Finance Cost Capitalised 0 0(e) Charged to P & L Account (a+b+c+d) 10155 10206(X) PROFIT BEFORE EXCEPTIONAL & EXTRA-ORDINARY ITEMS & TAX (PBEET)(VIII-IXe) 17615 14940(XI) Exceptional Items 0 0(XII) PROFIT BEFORE EXTRA-ORDINARY ITEMS &TAX (PBET)(X-XI) 17615 14940(XIII) Extra-Ordinary Items 0 0(XIV) PROFIT BEFORE TAX (PBT)(XII-XIII) 17615 14940(XV) TAX PROVISIONS 5776 5023(XVI) NET PROFIT / LOSS FOR THE PERIOD FROMCONTINUING OPERATIONS AFTER TAX(XIV-XV) 11839 9917(XVII) Profit/Loss from discontinuing operations 0 0(XVIII) Tax expenses of discontinuing operations 0 0(XIX) Profit/Loss from discontinuing operations(after Tax)(XVII-XVIII) 0 0(XX) Profit/Loss for the period (XVI+XIX) 11839 9917Financial Ratios(i) Sales : Capital Employed 440.44 372.18(ii) Cost of Sales : Sales 92.11 90.19(iii) Salary/Wages : Sales 1.57 1.84(iv) Net Profit : Net Worth 19.86 19.63(v) Debt : Equity 0 0(vi) Current Ratio 1.15 1.17(vii) Trade Recievables : Sales 117.19 117.83(viii) Total Inventory : Sales 0 0.86

Trading & Marketing Services396
National Handloom Development Corporation Ltd.
The Company National Handloom Development Corporation Ltd. (NHDC)
was incorporated on 22.02.1983 with the objective to serve as anational level agency for promotion and development of theHandloom sector.
NHDC is a Schedule-'B' CPSE under the administrative controlof the M/o Textiles with 100% shareholding by the Government ofIndia. The Company employed 203 regular employees (Executives106 & Non-Executives 97) as on 31.03.2012. Its Registered andCorporate Office are at Lucknow (U.P.).
Vision/MissionThe Vision of the company is to be a leading player in supplying
the quality raw material to the handloom sector. The Mission ofthe company is to serve as a National level agency for the promotionand development of the handloom sector.
Industrial / Business OperationsThe main activity of the company is to ensure the availability
of Raw Material like yarn and Dyes & Chemicals to Handloomweavers & supply of Handloom fabrics. The activities of thecorporation are divided into three categories (i) Arranging supplyof Raw Materials (Yarn and Dyes & Chemicals) (ii) DevelopmentalActivities like Organisation of Appropriate Technology Exhibitions,Organisation of Quality Dyeing Training programme, Organisationof workshop on awareness / senstisation (iii) Marketing Supportlike Organisation of Expos- Silk Fab, Wool Fab and Establishmentof marketing complexes etc.
The Company is engaged in Supply of Yarn, Dyes Chemicaland Fabrics from its 32 operating units.
Performance HighlightsThe physical performance of Company for last two years is
given below:
The Company registered a reduction of ̀ 128.58 crore in totalrevenue during 2011-12 which went down to ` 1156.67 crore in2011-12 from ̀ 1285.25 crore during 2010-11 due to fall in turnover.The net profit of the company correspondingly reduced to ` 2.82crore, a decline of ̀ 1.50 crore from previous year's profit of ̀ 4.32crore due to higher yarn prices, reduction in off take and generalslowdown in the textile sector.
The current ratio of company is at 1.19:1 during 2011-12 asagainst 1.25:1 in the previous year (Fig.2). Balance Sheet and Profit& Loss Account of the company and selected financial ratios duringthe period 2011-12 to 2011-12 can be seen on the adjoining page.
Main Products Unit Performance during
2011-12 2010-11
Yarn Rs crores 1081.12 1201.67
Dyes & chemical Rs crores 18.33 24.62
Fabrics Rs crores 1.62 0.46
www.nhdcltd.com
Strategic IssuesThe other main objectives of the company are to enlarge input
supplies so as to meet up to 20% of Yarn requirement of Handloomsector; to enhance its competitive edge in providing quality rawmaterials i.e. Yarn, Dyes & Chemicals through improved supplychain management; to maintain viability of operations througheffective utilization of available resources, to take up developmentprograms so as to contribute to increasing the awareness of schemes/products/appropriate technology and marketing avenues etc., tocontinue to act as a channel for routing Central Government funds,loans and grants to Handloom agencies; to aid in speedyimplementation of programmes for development of the sector, toensure enhanced contribution from personal through training/counseling and to ensure career progression opportunities.
A new component of 10% subsidy on hank yarn under MillGate price Scheme (MGPS) scheme has been introduced w.e.f.06.01.2012. This will help the handloom sector to survive and tobecome self-sustainable in the long run and enable them to competewith power loom products. The Government of India has beenimplementing the MGPS through NHDC.
EBIT
DA
& P
AT (
Rs.
cro
re) TO
TAL REVEN
UE (R
s. crore)
Fig. 1
PRO
FITA
BIL
ITY
RAT
IOS
(%)
CU
RR
ENT R
ATIO
Fig. 2

Public Enterprises Survey 2011-2012: Vol-II 397
National Handloom Development Corporation Ltd.10-11th Floor Vikas Deep 22, Station Road, Lucknow-226019 Uttar Pradesh
BALANCE SHEET (` in Lakhs)PARTICULARS 2011-12 2010-11I. EQUITY & LIABILITIESAUTHORISED CAPITAL 2000 2000(1) Shareholders’ Funds(a) Share Capital(i) Central Govt 1900 1900(ii) Others 0 0(b) Reserves & Surplus 1647 1446(c) Money received against share warrants 0 0Total Shareholders’ Funds (1(a)+1(b)+1(c) 3547 3346(2) Share application money pending allotment 0 0(3) Non-current Liabilities(a) Long Term Borrowings 0 0(b) Deferred tax liabilities (Net) 0 0(c) Other Long-term liabilities 1905 1762(d) Long-term provisions 0 0Total Non-Current Liabilities 3(a) to 3(d) 1905 1762(4) Current Liabilities(a) Short Term Borrowings 0 0(b) Trade Payables 11920 8467(c) Other current liabilities 3326 2657(d) Short-term provisions 872 997Total Current Liabilities 4(a) to 4(d) 16118 12121TOTAL EQUITY & LIABILITIES (1+2+3+4) 21570 17229II. ASSETS(1) Non-Current Assets(a) Total Gross Fixed Assets 476 456(ai) Accumulated Depreciation, Depletion & Amortisation 219 208(aii) Accumulated Impairment 0 0(b) Total Net Fixed Assets ((a)-(ai)-(aii) 257 248(c) Capital work in progress 161 54(d) Intangible assets under developmet 0 0(e) Non-Current Investments 0 0(f) Deferred Tax Assets (Net) 54 40(g) Long Term Loans and Advances 3 2(h) Other Non-Current Assets 1905 1762Total Non-Current Assets (b+c+d+e+f+g+h) 2380 2106(2) Current Assets(a) Current Investments 0 0(b) Inventories 175 177(c) Trade Recievables 11440 8043(d) Cash & Bank Balance 4559 4197(e) Short-term Loans & Advances 2911 2653(f) Other Current Assets 105 53Total Current Assets (a+b+c+d+e+f) 19190 15123TOTAL ASSETS (1+2) 21570 17229Important Indicators(i) Investment 1900 1900(ii) Capital Employed 3547 3346(iii) Net Worth 3547 3346(iv) Net Current Assets 3072 3002(v) Cost of Sales 115239 127828(vi) Net Value Added (at market price) 1810 1988(vii) Total Regular Employees (Nos.) 203 201(viii) Avg. Monthly Emoluments per Employee(`) 55008 53109
PROFIT & LOSS ACCOUNT (` in Lakhs)PARTICULARS 2011-12 2010-11(I) Revenue from Operations (Gross) 115332 128255Less : Excise Duty 0 0Revenue from Operations (Net) 115332 128255(II) Other Income 335 270(III) Total Revenue (I+II) 115667 128525(IV) Expenditure on:(a) Cost of materials consumed 0 122481(b) Purchase of stock-in-trade 109962 0(c) Changes in inventories of finished goods,work-in-progress and stock in trade 7 11(d) Stores & Spares 0 0(e) Power & Fuel 13 13(f) Salary, Wages & Benefits/Employees Expense 1340 1281(g) Other Operating/direct/manufacturing Expenses 3654 3820(h) Rent, Royalty & Cess 0 0(i) Loss on sale of Assets/Investments 0 0(j) Other Expenses 247 207Total Expenditure (IV (a to j)) 115223 127813(V) PROFIT BEFORE DEPRECIATION, & IMPAIRMENT,FINANCE CHARGES/INTEREST, EXCEPTIONAL &EXTRAORDINARY ITEMS & TAXES (PBDIEET)(III-IV) 444 712(VI) Depreciation, Depletion & Amortisation 16 15(VII) Impairment 0 0(VIII) PROFIT BEFORE FINANCE COST/INTEREST,EXCEPTIONAL, EXTRA-ORDINARY ITEMS &TAXES (PBIEET)(V-VI-VII) 428 697(IX) Finance Cost(a) On Central Government Loans 0 0(b) On Foreign Loans 0 0(c) Others 0 0(d) Less Finance Cost Capitalised 0 0(e) Charged to P & L Account (a+b+c+d) 0 0(X) PROFIT BEFORE EXCEPTIONAL & EXTRA-ORDINARY ITEMS & TAX (PBEET)(VIII-IXe) 428 697(XI) Exceptional Items 16 56(XII) PROFIT BEFORE EXTRA-ORDINARY ITEMS &TAX (PBET)(X-XI) 412 641(XIII) Extra-Ordinary Items 0 0(XIV) PROFIT BEFORE TAX (PBT)(XII-XIII) 412 641(XV) TAX PROVISIONS 130 209(XVI) NET PROFIT / LOSS FOR THE PERIOD FROMCONTINUING OPERATIONS AFTER TAX(XIV-XV) 282 432(XVII) Profit/Loss from discontinuing operations 0 0(XVIII) Tax expenses of discontinuing operations 0 0(XIX) Profit/Loss from discontinuing operations (after Tax)(XVII-XVIII) 0 0(XX) Profit/Loss for the period (XVI+XIX) 282 432Financial Ratios(i) Sales : Capital Employed 3251.54 3833.08(ii) Cost of Sales : Sales 99.92 99.67(iii) Salary/Wages : Sales 1.16 1(iv) Net Profit : Net Worth 7.95 12.91(v) Debt : Equity 0 0(vi) Current Ratio 1.19 1.25(vii) Trade Recievables : Sales 9.92 6.27(viii) Total Inventory : Sales 0.15 0.14

Trading & Marketing Services398
North Eastern Handicrafts and HandloomsDevelopment Corporation Ltd.The Company
North Eastern Handicrafts and Handlooms DevelopmentCorporation Ltd. (NEHHDC) was incorporated on 31.3.1977 underthe companies Act, 1956 with an objective to promote and develophandicrafts and hondlooms in the North Eastern Region.
NEHHDC is a Schedule 'C' CPSE in Trading and Marketingservices sector under the administrative control of Ministry ofDevelopment of North Eastern Region (DONER), with 100%shareholding by the Government of India. The company employed105 regular employees (Executives 9 & Non-Executives 96) as on31.3.2012. Its Registered Office is at Shillong, Meghalaya.
Vision / MissionThe Vision and Mission of the Company is to promote develop
and market the Handloom & Handicraft products of North EasternRegion both within and outside India and provide necessaryassistance to artisans & craftsmen of the region in terms of loantechnology and training etc.
Industrial / Business OperationsNEHHDC is providing services in the field of Marketing of
handicrafts and handlooms products through its 5 Emporia locatedat Kolkata, Bangalore, Guwahati, Shillong, New Delhi and salespromotion office at Chennai. The Corporation also conducts NorthEast craft Fairs and exhibitions to promote sales. It also providestraining facilities under sponsored programme of the Office of theDevelopment Commissioner (Handicrafts), Government of India,M/o Textiles etc.
Performance Highlights The physical performances of the company for last two years
are given below:
Account of the company and selected financial ratios during theperiod 2010-11 to 2011-12 can be seen on the adjoining page.
Main Products Unit Performance during
2011-12 2010-11
Purchases
Handicrafts ` in Crore 7.73 7.63
Handlooms ` in Crore 5.85 5.94
Sales :
Handicrafts ` in Crore 10.07 10.17
Handlooms ` in Crore 6.73 7.04
www.nehhde.com
Strategic issuesThe Handicraft Design Bank has been set up at Guwahati,
where Artisans / Craft person / Entrepreneurs / Exporters can seekinformation, advice and guidance on design & product development& innovation at nominal fees. The corporation has also set up aMuseum at Guwahati showcasing handicrafts of all the 8 NorthEastern states.
Total Revenue of the company registered a reduction of` 0.43.crore during 2011-12, which went down from ` 17.35 crorein 2010-11 to ̀ 16.92 crore in 2011-12. The losses of the companyhowever come down to ` 1.51 crore in 2011-12 from ̀ 1.74 crorein previous year due to lower cost of production / fall in totaloperating expenses during the year.
The current ratio of company is at 5.89:1 during 2011-12 asagainst 9.18:1 in the previous year. Balance Sheet and Profit & Loss
EBIT
DA
& P
AT (
Rs.
cro
re)
TOTAL R
EVENU
E (Rs. crore)
Fig. 1

Public Enterprises Survey 2011-2012: Vol-II 399
North Eastern Handicrafts & Handloom Dev.corpn. Ltd.C/o Purbashree Emporium, Police Bazar Shillong, Meghalaya - 793001
BALANCE SHEET (` in Lakhs)PARTICULARS 2011-12 2010-11I. EQUITY & LIABILITIESAUTHORISED CAPITAL 200 200(1) Shareholders’ Funds(a) Share Capital(i) Central Govt 200 200(ii) Others 0 0(b) Reserves & Surplus -3236 -3085(c) Money received against share warrants 0 0Total Shareholders’ Funds (1(a)+1(b)+1(c) -3036 -2885(2) Share application money pending allotment 0 0(3) Non-current Liabilities(a) Long Term Borrowings 3696 3521(b) Deferred tax liabilities (Net) 0 0(c) Other Long-term liabilities 85 21(d) Long-term provisions 0 0Total Non-Current Liabilities 3(a) to 3(d) 3781 3542(4) Current Liabilities(a) Short Term Borrowings 0 0(b) Trade Payables 38 34(c) Other current liabilities 102 39(d) Short-term provisions 0 0Total Current Liabilities 4(a) to 4(d) 140 73TOTAL EQUITY & LIABILITIES (1+2+3+4) 885 730II. ASSETS(1) Non-Current Assets(a) Total Gross Fixed Assets 128 125(ai) Accumulated Depreciation, Depletion & Amortisation 79 76(aii) Accumulated Impairment 0 0(b) Total Net Fixed Assets ((a)-(ai)-(aii) 49 49(c) Capital work in progress 0 0(d) Intangible assets under developmet 0 0(e) Non-Current Investments 0 0(f) Deferred Tax Assets (Net) 0 0(g) Long Term Loans and Advances 2 2(h) Other Non-Current Assets 9 9Total Non-Current Assets (b+c+d+e+f+g+h) 60 60(2) Current Assets(a) Current Investments 0 0(b) Inventories 131 145(c) Trade Recievables 35 0(d) Cash & Bank Balance 32 43(e) Short-term Loans & Advances 622 477(f) Other Current Assets 5 5Total Current Assets (a+b+c+d+e+f) 825 670TOTAL ASSETS (1+2) 885 730Important Indicators(i) Investment 3896 3721(ii) Capital Employed 660 636(iii) Net Worth -3036 -2885(iv) Net Current Assets 685 597(v) Cost of Sales 1839 1903(vi) Net Value Added (at market price) 167 140(vii) Total Regular Employees (Nos.) 105 110(viii) Avg. Monthly Emoluments per Employee(`) 21429 20379
PROFIT & LOSS ACCOUNT (` in Lakhs)PARTICULARS 2011-12 2010-11(I) Revenue from Operations (Gross) 1682 1727Less : Excise Duty 0 0Revenue from Operations (Net) 1682 1727(II) Other Income 10 8(III) Total Revenue (I+II) 1692 1735(IV) Expenditure on:(a) Cost of materials consumed 0 0(b) Purchase of stock-in-trade 1359 1362(c) Changes in inventories of finished goods, 12 -12
work-in-progress and stock in trade(d) Stores & Spares 0 0(e) Power & Fuel 7 7(f) Salary, Wages & Benefits/Employees Expense 270 269(g) Other Operating/direct/manufacturing Expenses 25 156(h) Rent, Royalty & Cess 44 39(i) Loss on sale of Assets/Investments 0 0(j) Other Expenses 115 77Total Expenditure (IV (a to j)) 1832 1898(V) PROFIT BEFORE DEPRECIATION, & -140 -163
IMPAIRMENT, FINANCE CHARGES/INTEREST, EXCEPTIONAL & EXTRAORDINARYITEMS & TAXES (PBDIEET)(III-IV)
(VI) Depreciation, Depletion & Amortisation 7 5(VII) Impairment 0 0(VIII) PROFIT BEFORE FINANCE COST/
INTEREST, EXCEPTIONAL, EXTRA-ORDINARYITEMS & TAXES (PBIEET)(V-VI-VII) -147 -168
(IX) Finance Cost(a) On Central Government Loans 0 0(b) On Foreign Loans 0 0(c) Others 4 6(d) Less Finance Cost Capitalised 0 0(e) Charged to P & L Account (a+b+c+d) 4 6(X) PROFIT BEFORE EXCEPTIONAL & EXTRA-ORDINARY -151 -174
ITEMS & TAX (PBEET)(VIII-IXe)(XI) Exceptional Items 0 0(XII) PROFIT BEFORE EXTRA-ORDINARY ITEMS & TAX -151 -174
(PBET)(X-XI)(XIII) Extra-Ordinary Items 0 0(XIV) PROFIT BEFORE TAX (PBT)(XII-XIII) -151 -174(XV) TAX PROVISIONS 0 0(XVI) NET PROFIT / LOSS FOR THE PERIOD FROM -151 -174
CONTINUING OPERATIONS AFTER TAX(XIV-XV)(XVII) Profit/Loss from discontinuing operations 0 0(XVIII) Tax expenses of discontinuing operations 0 0(XIX) Profit/Loss from discontinuing operations 0 0
(after Tax)(XVII-XVIII)(XX) Profit/Loss for the period (XVI+XIX) -151 -174Financial Ratios(i) Sales : Capital Employed 254.85 271.54(ii) Cost of Sales : Sales 109.33 110.19(iii) Salary/Wages : Sales 16.05 15.58(iv) Net Profit : Net Worth - -(v) Debt : Equity 18.48 17.6(vi) Current Ratio 5.89 9.18(vii) Trade Recievables : Sales 2.08 0(viii) Total Inventory : Sales 7.79 8.4

Trading & Marketing Services400
North-Eastern Regional Agricultural MarketingCorporation LimitedThe Company
North-Eastern Regional Agricultural Marketing CorporationLimited (NERAMAC) was incorporated on 31.03.1982 with theobjective to purchase the marketable surplus of fruit and vegetablein the North Eastern Region to the maximum possible extent througha network of centers and to make necessary arrangement for itsprocessing and marketing.
NERAMAC is a Schedule 'C'BIFR referred CPSE in Trading& Marketing sector under the administrative control of Ministry ofDevelopment of North Eastern Region with 100% shareholding bythe Government of India. BIFR declared the company 'no longersick' after its net worth become positive. The company employed45 regular employees (Executives 8 & Non-Executives 37) as on31.3.2012. Its Registered and Corporate Offices are at Guwahati,Assam.
Vision / MissionThe Mission / Vision of the company is to contribute
significantly for the agro-horticultural development of the regionby procuring, processing and marketing of at least 50% of thesurplus production of agro-horticultural produces that farmers finddifficult to market like Ginger, Pineapple, Orange, Apple, Kiwi etc.
Industrial / Business OperationsNERAMAC is mainly involved in trading and marketing of
fresh agro-horticulture produce along with processing of pineappleand cashew and retail vending of processed food items through its3 operating units at Nalkata, Agartala (Tripura) and Byrnihat(Meghalaya). Besides Registered / Head Office, it has 8 procurement& marketing Offices in Assam, Tripura, Meghalaya, Nagaland,Mizoram, Manipur, Arunachal Pradesh and Sikkim.
Performance Highlights The physical performances of the company for last two years
are given below:
www.neramac.com
Total Revenue of the company registered a reduction of ̀ 1.48crore during 2011-12, which went down from ` 102.43 crore in2010-11 to ` 100.95 crore in 2011-12. The profit of the companyhas also gone down by `. 0.47 crore to ` 1.00 crore in 2011-12,from ` 1.47 crore in previous year due to fall in turnover andincrease in other expenses.
The current ratio of company is at 1.68:1 during 2011-12 asagainst 1.78:1 in the previous year (Fig.2). Balance Sheet and Profit& Loss Account of the company and selected financial ratios duringthe period 2010-11 to 2011-12 can be seen on the adjoining page.
Fig. 2
Main Products Unit Performance during
2011-12 2010-11
Cashew Nut M T 1.03 11.25
Fruit Juice M T 0.00 18.53Concentration
Ginger Oil KG 18.90 40.37
Ginger Powder KG 2413 305 Strategic issuesThe new imitative taken by company includes setting up of
Cashew Processing unit at Mankachar, Assam, Restructuring &Modernization of the Pineapple Juice Concentration Plant, Nalkata,Tripura and Establishment of Quality Assurance & CentralPackaging Centre at Chaygaon, Assam.
The company is putting its efforts to generate employmentby way of appointing franchisees for marketing and sale of differentproducts produced by tiny / small producers of North EasternRegion. NERAMAC aims to set up minimum 100 outlets in thenext five years.
EBIT
DA
& P
AT (
Rs.
cro
re)
TOTAL R
EVENU
E (Rs. crore)
Fig. 1PR
OFI
TAB
ILIT
Y R
ATIO
S (%
)
CU
RR
ENT R
ATIO

Public Enterprises Survey 2011-2012: Vol-II 401
North Eastern Regional Agri. Marketing Corp.ltd.9, Rajbari Path, G.S. Road, Ganeshguri, Guwahti, Assam -781005
BALANCE SHEET (` in Lakhs)PARTICULARS 2011-12 2010-11I. EQUITY & LIABILITIESAUTHORISED CAPITAL 1000 1000(1) Shareholders’ Funds(a) Share Capital(i) Central Govt 762 762(ii) Others 0 0(b) Reserves & Surplus -381 -481(c) Money received against share warrants 0 0Total Shareholders’ Funds (1(a)+1(b)+1(c) 381 281(2) Share application money pending allotment 0 0(3) Non-current Liabilities(a) Long Term Borrowings 1513 1313(b) Deferred tax liabilities (Net) 0 0(c) Other Long-term liabilities 306 504(d) Long-term provisions 9 9Total Non-Current Liabilities 3(a) to 3(d) 1828 1826(4) Current Liabilities(a) Short Term Borrowings 0 0(b) Trade Payables 1719 1658(c) Other current liabilities 930 588(d) Short-term provisions 0 0Total Current Liabilities 4(a) to 4(d) 2649 2246TOTAL EQUITY & LIABILITIES (1+2+3+4) 4858 4353II. ASSETS(1) Non-Current Assets(a) Total Gross Fixed Assets 704 677(ai) Accumulated Depreciation, Depletion & Amortisation 516 500(aii) Accumulated Impairment 0 0(b) Total Net Fixed Assets ((a)-(ai)-(aii) 188 177(c) Capital work in progress 209 175(d) Intangible assets under developmet 0 0(e) Non-Current Investments 0 0(f) Deferred Tax Assets (Net) 0 0(g) Long Term Loans and Advances 0 0(h) Other Non-Current Assets 0 0Total Non-Current Assets (b+c+d+e+f+g+h) 397 352(2) Current Assets(a) Current Investments 0 0(b) Inventories 82 40(c) Trade Recievables 2009 1438(d) Cash & Bank Balance 592 548(e) Short-term Loans & Advances 1743 1927(f) Other Current Assets 35 48Total Current Assets (a+b+c+d+e+f) 4461 4001TOTAL ASSETS (1+2) 4858 4353Important Indicators(i) Investment 2275 2075(ii) Capital Employed 1894 1594(iii) Net Worth 381 281(iv) Net Current Assets 1812 1755(v) Cost of Sales 9946 10036(vi) Net Value Added (at market price) 388 427(vii) Total Regular Employees (Nos.) 45 44(viii) Avg. Monthly Emoluments per Employee(`) 40556 39394
PROFIT & LOSS ACCOUNT (` in Lakhs)PARTICULARS 2011-12 2010-11(I) Revenue from Operations (Gross) 9604 10002Less : Excise Duty 0 0Revenue from Operations (Net) 9604 10002(II) Other Income 491 241(III) Total Revenue (I+II) 10095 10243(IV) Expenditure on:(a) Cost of materials consumed 20 35(b) Purchase of stock-in-trade 9336 9641(c) Changes in inventories of finished goods, -58 15
work-in-progress and stock in trade(d) Stores & Spares 1 8(e) Power & Fuel 0 0(f) Salary, Wages & Benefits/Employees Expense 219 208(g) Other Operating/direct/manufacturing Expenses 54 73(h) Rent, Royalty & Cess 20 12(i) Loss on sale of Assets/Investments 0 0(j) Other Expenses 338 23Total Expenditure (IV (a to j)) 9930 10015(V) PROFIT BEFORE DEPRECIATION, & 165 228
IMPAIRMENT, FINANCE CHARGES/INTEREST, EXCEPTIONAL & EXTRAORDINARYITEMS & TAXES (PBDIEET)(III-IV)
(VI) Depreciation, Depletion & Amortisation 16 21(VII) Impairment 0 0(VIII) PROFIT BEFORE FINANCE COST/
INTEREST, EXCEPTIONAL, EXTRA-ORDINARYITEMS & TAXES (PBIEET)(V-VI-VII) 149 207
(IX) Finance Cost(a) On Central Government Loans 0 0(b) On Foreign Loans 0 0(c) Others 0 0(d) Less Finance Cost Capitalised 0 0(e) Charged to P & L Account (a+b+c+d) 0 0(X) PROFIT BEFORE EXCEPTIONAL & EXTRA-ORDINARY 149 207
ITEMS & TAX (PBEET)(VIII-IXe)(XI) Exceptional Items 0 0(XII) PROFIT BEFORE EXTRA-ORDINARY ITEMS & TAX 149 207
(PBET)(X-XI)(XIII) Extra-Ordinary Items 0 0(XIV) PROFIT BEFORE TAX (PBT)(XII-XIII) 149 207(XV) TAX PROVISIONS 49 60(XVI) NET PROFIT / LOSS FOR THE PERIOD FROM 100 147
CONTINUING OPERATIONS AFTER TAX(XIV-XV)(XVII) Profit/Loss from discontinuing operations 0 0(XVIII) Tax expenses of discontinuing operations 0 0(XIX) Profit/Loss from discontinuing operations
(after Tax)(XVII-XVIII) 0 0(XX) Profit/Loss for the period (XVI+XIX) 100 147Financial Ratios(i) Sales : Capital Employed 507.07 627.48(ii) Cost of Sales : Sales 103.56 100.34(iii) Salary/Wages : Sales 2.28 2.08(iv) Net Profit : Net Worth 26.25 52.31(v) Debt : Equity 1.99 1.72(vi) Current Ratio 1.68 1.78(vii) Trade Recievables : Sales 20.92 14.38(viii) Total Inventory : Sales 0.85 0.4

Trading & Marketing Services402
NTPC Vidyut Vyapar Nigam Ltd.
The CompanyNTPC Vidyut Vyapar Nigam Ltd. (NVVN) was incorporated
on 1.11.2002 as a wholly owned subsidiary of NTPC Ltd. with theobjective to undertake business of sale and purchase of electricpower, to effectively utilise installed capacity and thus enablereduction in the cost of power. The company was granted category'I' Trading License by Central Electricity Regulatory Commission(CERC), the highest category of license.
NVVN is an un-categarised CPSE in Trading & Marketingsector under the administrative control of M/o Power. The companyemployed 53 regular employees (Executives 52, Non-executives 1)as on 31.3.2012. Its Registered and Corporate offices are at NewDelhi.
Vision/MissionThe Vision of the company is to be a catalyst in development
of wholesale power market in India enabling trading of surpluspower.
The Mission of the company is to provide good value topotential sellers and develop commercial arrangement for theirsurplus power, provide viable alternative to buyers and enableNTPC to maintain optimal generation level through mutuallybeneficial trading transactions.
Industrial / Business OperationsNVVN is involved in the business of power trading and ash
trading. NVVN is actively involved in facilitating the developmentof a wholesale electricity market in India.
Performance Highlights
www.ntpc.co.in
Strategic issuesThe Government has approved the Jawaharlal Nehru National
Solar Mission (JNNSM) in November, 2009, with an aim to havecapacity of 20000 MW of solar power by 2022, with immediatetarget for 1000 MW by 2013 for phase-I. Government has designatedNVVN as a Nodal Agency for first phase of the National SolarMission for 2009-13.
Under the migration projects scheme of JNNSM solar PVprojects of 48 MW capacity out of 54 MW contracted has beencommissioned and solar thermal projects 30 MW capacity are tobe commissioned in 2013. A solar capacity (migration + batch1) of178 MW has been commissioned & corresponding allocation ofNTPC coal power has been made by M/o Power.
The physical performance of company during last 2 years ismentioned below:
The Company registered an increase of ` 15.50 crore in totalincome during 2011-12 which went up to ` 69.98 crore in 2011-12from ̀ 54.48 crore during 2010-11 due to overall increase in volumeof energy traded. The net profit of the company however increasedto ` 111.93 crore 2011-12, an increase of ` 81.87 crore over theprevious year's profit of ` 30.06 crore mainly due to ExceptionalItems on account of liquidated damages and encashment of bankguarantees aggregating to ̀ 107.18 crore.
The current ratio of company is at 1.87:1 during 2011-12 asagainst 2.65:1 in the previous year (Fig.2). Balance Sheet and Profit& Loss Account of the company and selected financial ratios duringthe period 2010-11 to 2011-12 can be seen on the adjoining page.
Main Products Unit Performance during
2011-12 2010-11
Power Trading MUs 8529 6933
Fly Ash M T 3782470 2337115
TOTAL R
EVENU
E (Rs. crore)
Fig. 1
Fig. 2
EBIT
DA
& P
AT (
Rs.
cro
re)
PRO
FITA
BIL
ITY
RAT
IOS
(%)
CU
RR
ENT R
ATIO

Public Enterprises Survey 2011-2012: Vol-II 403
NTPC Vidyut Vyapar Nigam Ltd.NTPC Bhawan, SCOPE Complex, 7, Institutional Area, Lodhi Road New Delhi-110003
BALANCE SHEET (` in Lakhs)PARTICULARS 2011-12 2010-11I. EQUITY & LIABILITIESAUTHORISED CAPITAL 2000 2000(1) Shareholders’ Funds(a) Share Capital(i) Central Govt 0 0(ii) Others 2000 2000(b) Reserves & Surplus 30457 14787(c) Money received against share warrants 0 0Total Shareholders’ Funds (1(a)+1(b)+1(c) 32457 16787(2) Share application money pending allotment 0 0(3) Non-current Liabilities(a) Long Term Borrowings 0 0(b) Deferred tax liabilities (Net) 1 1(c) Other Long-term liabilities 86 28(d) Long-term provisions 0 0Total Non-Current Liabilities 3(a) to 3(d) 87 29(4) Current Liabilities(a) Short Term Borrowings 0 0(b) Trade Payables 32380 7377(c) Other current liabilities 1908 1052(d) Short-term provisions 2959 1756Total Current Liabilities 4(a) to 4(d) 37247 10185TOTAL EQUITY & LIABILITIES (1+2+3+4) 69791 27001II. ASSETS(1) Non-Current Assets(a) Total Gross Fixed Assets 65 66(ai) Accumulated Depreciation, Depletion & Amortisation 40 37(aii) Accumulated Impairment 0 0(b) Total Net Fixed Assets ((a)-(ai)-(aii) 25 29(c) Capital work in progress 0 0(d) Intangible assets under developmet 0 0(e) Non-Current Investments 0 0(f) Deferred Tax Assets (Net) 0 0(g) Long Term Loans and Advances 0 15(h) Other Non-Current Assets 0 0Total Non-Current Assets (b+c+d+e+f+g+h) 25 44(2) Current Assets(a) Current Investments 0 0(b) Inventories 2 2(c) Trade Recievables 16207 5650(d) Cash & Bank Balance 33955 14470(e) Short-term Loans & Advances 0 178(f) Other Current Assets 19602 6657Total Current Assets (a+b+c+d+e+f) 69766 26957TOTAL ASSETS (1+2) 69791 27001Important Indicators(i) Investment 2000 2000(ii) Capital Employed 32457 16787(iii) Net Worth 32457 16787(iv) Net Current Assets 32519 16772(v) Cost of Sales 915 918(vi) Net Value Added (at market price) 17803 5395(vii) Total Regular Employees (Nos.) 53 53(viii) Avg. Monthly Emoluments per Employee(`) 108648 90252
PROFIT & LOSS ACCOUNT (` in Lakhs)PARTICULARS 2011-12 2010-11(I) Revenue from Operations (Gross) 4860 3396Less : Excise Duty 0 0Revenue from Operations (Net) 4860 3396(II) Other Income 2138 2052(III) Total Revenue (I+II) 6998 5448(IV) Expenditure on:(a) Cost of materials consumed 0 0(b) Purchase of stock-in-trade 0 0(c) Changes in inventories of finished goods, 0 0
work-in-progress and stock in trade(d) Stores & Spares 0 0(e) Power & Fuel 12 15(f) Salary, Wages & Benefits/Employees Expense 691 574(g) Other Operating/direct/manufacturing Expenses 354 114(h) Rent, Royalty & Cess 311 291(i) Loss on sale of Assets/Investments 0 0(j) Other Expenses -457 -82Total Expenditure (IV (a to j)) 911 912(V) PROFIT BEFORE DEPRECIATION, & 6087 4536
IMPAIRMENT, FINANCE CHARGES/INTEREST, EXCEPTIONAL & EXTRAORDINARYITEMS & TAXES (PBDIEET)(III-IV)
(VI) Depreciation, Depletion & Amortisation 4 6(VII) Impairment 0 0(VIII) PROFIT BEFORE FINANCE COST/
INTEREST, EXCEPTIONAL, EXTRA-ORDINARYITEMS & TAXES (PBIEET)(V-VI-VII) 6083 4530
(IX) Finance Cost(a) On Central Government Loans 0 0(b) On Foreign Loans 0 0(c) Others 157 17(d) Less Finance Cost Capitalised 0 0(e) Charged to P & L Account (a+b+c+d) 157 17(X) PROFIT BEFORE EXCEPTIONAL & EXTRA-ORDINARY 5926 4513
ITEMS & TAX (PBEET)(VIII-IXe)(XI) Exceptional Items -10718 0(XII) PROFIT BEFORE EXTRA-ORDINARY ITEMS & TAX 16644 4513
(PBET)(X-XI)(XIII) Extra-Ordinary Items 0 0(XIV) PROFIT BEFORE TAX (PBT)(XII-XIII) 16644 4513(XV) TAX PROVISIONS 5451 1507(XVI) NET PROFIT / LOSS FOR THE PERIOD FROM 11193 3006
CONTINUING OPERATIONS AFTER TAX(XIV-XV)(XVII) Profit/Loss from discontinuing operations 0 0(XVIII) Tax expenses of discontinuing operations 0 0(XIX) Profit/Loss from discontinuing operations
(after Tax)(XVII-XVIII) 0 0(XX) Profit/Loss for the period (XVI+XIX) 11193 3006Financial Ratios(i) Sales : Capital Employed 14.97 20.23(ii) Cost of Sales : Sales 18.83 27.03(iii) Salary/Wages : Sales 14.22 16.9(iv) Net Profit : Net Worth 34.49 17.91(v) Debt : Equity 0 0(vi) Current Ratio 1.87 2.65(vii) Trade Recievables : Sales 333.48 166.37(viii) Total Inventory : Sales 0.04 0.06

Trading & Marketing Services404
PEC Ltd.
The CompanyPEC Ltd. was incorporated in April 1971 as Public Sector
Undertaking under Ministry of Commerce & Industry, Govt. ofIndia. The company is engaged in export of engineering equipmentand projects specially from small and medium enterprises, besidesexport and import of bulk items viz. agro commodities, bullion,industrial raw materials, domestic trade, export of engineeringequipment, projects etc.
PEC is a Schedule - B / Miniratna CPSE in Trading andMarketing Services under Ministry of Commerce & Industry with100% shareholding by the Government. The company employed197 regular employees (Executives 170 & Non-Executives 27) ason 31.3.2012. The Registered Office of the Company is located atNew Delhi.
Vision / MissionThe Vision of the company is to be highly focused company,
engaged in international and domestic trade.The Mission of the Company are to trade in the international
and domestic market in a manner to create an image of quality,reliability, ethical values and sustained long term relationship withthe customers and other business partners.
Industrial / Business OperationsPEC is one of the pioneering enterprises providing services in
the field of export and import of bulk items viz. agriculturalcommodities, industrial raw materials, bullion and domestic tradeand export of engineering equipment, projects etc. from its 14 branchoffices in all major cities and ports of India.
PEC over last three decades has expanded its role to becomean international business organization and a provider of integratedtrade facilitating services.
Performance HighlightsThe physical performances of the company for last two years
are given below:
www.peclimited.com
Strategic issuePEC continues with its commitment to promote export of
engineering and manufactured goods. Over the years, business ofPEC has changed with industrial raw materials, commodities andbullion constituting major part of its turnover and profit. Some ofthe key initiatives have been consolidation of existing line ofbusiness and selective diversification into sustainable business areas,improving operational efficiency and cost effectiveness. PECcontinues to strive in its efforts to capture new opportunities ininternational as well as domestic trade to sustain. PEC looks forwardoptimistically to achieve higher targets in future.
Main Products Unit Performance during
2011-12 2010-11
Export ` in crore 1254.91 1136.25
Import ` in crore 8881.57 7906.80
Domestic ` in crore 889.46 926.89
TOTAL ` in crore 11025.94 9969.94
The Company registered a growth of ` 1019.41 crore in totalincome during 2011-12 which went up to ` 11682.22 crore in2011-12 from ` 10662.81 crore during 2010-11. The net profit ofthe company increased to ̀ 79.55 crore during 2011-12, an increaseof ` 8.63 crore over the previous year profit of ` 70.92 crore dueto increase in export, import and domestic sales turnover and bettermargins.
The current ratio of company is at 1.05:1 during 2011-12 asagainst 1.04:1 in the previous year (Fig.2). Balance Sheet & Profit& Loss Account of the company and selected financial ratios duringthe period 2010-11 to 2011-12 can be seen on the adjoining page.
EBIT
DA
& P
AT (
Rs.
cro
re)
TOTAL R
EVENU
E (Rs. crore)
Fig. 1
PRO
FITA
BIL
ITY
RAT
IOS
(%)
CU
RR
ENT R
ATIO
Fig. 2

Public Enterprises Survey 2011-2012: Vol-II 405
P E C LTD.Hansalaya, 15 Barakhamba Road, New Delhi
BALANCE SHEET (` in Lakhs)PARTICULARS 2011-12 2010-11I. EQUITY & LIABILITIESAUTHORISED CAPITAL 3000 3000(1) Shareholders’ Funds(a) Share Capital(i) Central Govt 2000 2000(ii) Others 0 0(b) Reserves & Surplus 32763 26551(c) Money received against share warrants 0 0Total Shareholders’ Funds (1(a)+1(b)+1(c) 34763 28551(2) Share application money pending allotment 0 0(3) Non-current Liabilities(a) Long Term Borrowings 0 0(b) Deferred tax liabilities (Net) 0 0(c) Other Long-term liabilities 0 0(d) Long-term provisions 0 0Total Non-Current Liabilities 3(a) to 3(d) 0 0(4) Current Liabilities(a) Short Term Borrowings 0 19400(b) Trade Payables 487624 482713(c) Other current liabilities 59988 60976(d) Short-term provisions 17191 13278Total Current Liabilities 4(a) to 4(d) 564803 576367TOTAL EQUITY & LIABILITIES (1+2+3+4) 599566 604918II. ASSETS(1) Non-Current Assets(a) Total Gross Fixed Assets 604 596(ai) Accumulated Depreciation, Depletion & Amortisation 522 511(aii) Accumulated Impairment 0 0(b) Total Net Fixed Assets ((a)-(ai)-(aii) 82 85(c) Capital work in progress 0 0(d) Intangible assets under developmet 0 0(e) Non-Current Investments 40 40(f) Deferred Tax Assets (Net) 1151 1099(g) Long Term Loans and Advances 123 112(h) Other Non-Current Assets 3215 1293Total Non-Current Assets (b+c+d+e+f+g+h) 4611 2629(2) Current Assets(a) Current Investments 0 0(b) Inventories 80879 147429(c) Trade Recievables 381026 356851(d) Cash & Bank Balance 46567 31200(e) Short-term Loans & Advances 84505 64085(f) Other Current Assets 1978 2724Total Current Assets (a+b+c+d+e+f) 594955 602289TOTAL ASSETS (1+2) 599566 604918Important Indicators(i) Investment 2000 2000(ii) Capital Employed 34763 28551(iii) Net Worth 34763 28551(iv) Net Current Assets 30152 25922(v) Cost of Sales 1141552 1045787(vi) Net Value Added (at market price) 42145 30641(vii) Total Regular Employees (Nos.) 197 193(viii) Avg. Monthly Emoluments per Employee(`) 120474 116451
PROFIT & LOSS ACCOUNT (` in Lakhs)PARTICULARS 2011-12 2010-11(I) Revenue from Operations (Gross) 1149832 1052469Less : Excise Duty 0 0Revenue from Operations (Net) 1149832 1052469(II) Other Income 18390 13812(III) Total Revenue (I+II) 1168222 1066281(IV) Expenditure on:(a) Cost of materials consumed 0 0(b) Purchase of stock-in-trade 1021421 1059868(c) Changes in inventories of finished goods, 66550 -58692
work-in-progress and stock in trade(d) Stores & Spares 0 0(e) Power & Fuel 29 29(f) Salary, Wages & Benefits/Employees Expense 2848 2697(g) Other Operating/direct/manufacturing Expenses 15726 4704(h) Rent, Royalty & Cess 262 244(i) Loss on sale of Assets/Investments 0 0(j) Other Expenses 34669 36881Total Expenditure (IV (a to j)) 1141505 1045731(V) PROFIT BEFORE DEPRECIATION, & 26717 20550
IMPAIRMENT, FINANCE CHARGES/INTEREST, EXCEPTIONAL & EXTRAORDINARYITEMS & TAXES (PBDIEET)(III-IV)
(VI) Depreciation, Depletion & Amortisation 47 56(VII) Impairment 0 0(VIII) PROFIT BEFORE FINANCE COST/
INTEREST, EXCEPTIONAL, EXTRA-ORDINARYITEMS & TAXES (PBIEET)(V-VI-VII) 26670 20494
(IX) Finance Cost(a) On Central Government Loans 0 0(b) On Foreign Loans 0 0(c) Others 14817 9838(d) Less Finance Cost Capitalised 0 0(e) Charged to P & L Account (a+b+c+d) 14817 9838(X) PROFIT BEFORE EXCEPTIONAL & EXTRA-ORDINARY 11853 10656
ITEMS & TAX (PBEET)(VIII-IXe)(XI) Exceptional Items 0 0(XII) PROFIT BEFORE EXTRA-ORDINARY ITEMS & TAX 11853 10656
(PBET)(X-XI)(XIII) Extra-Ordinary Items 0 0(XIV) PROFIT BEFORE TAX (PBT)(XII-XIII) 11853 10656(XV) TAX PROVISIONS 3898 3564(XVI) NET PROFIT / LOSS FOR THE PERIOD FROM 7955 7092
CONTINUING OPERATIONS AFTER TAX(XIV-XV)(XVII) Profit/Loss from discontinuing operations 0 0(XVIII) Tax expenses of discontinuing operations 0 0(XIX) Profit/Loss from discontinuing operations 0 0
(after Tax)(XVII-XVIII)(XX) Profit/Loss for the period (XVI+XIX) 7955 7092Financial Ratios(i) Sales : Capital Employed 3307.63 3686.28(ii) Cost of Sales : Sales 99.28 99.37(iii) Salary/Wages : Sales 0.25 0.26(iv) Net Profit : Net Worth 22.88 24.84(v) Debt : Equity 0 0(vi) Current Ratio 1.05 1.04(vii) Trade Recievables : Sales 33.14 33.91(viii) Total Inventory : Sales 7.03 14.01

Trading & Marketing Services406
The State Trading Corporation of India Ltd.
The CompanyThe State Trading Corporation of India Ltd. (STC) was
incorporated in 1956 under the Companies Act, 1956 with primaryobjective to trade with East European countries and to supplementthe efforts of private trade and industry in developing exports fromthe country.
It is a Schedule -'A', Mini-ratna listed CPSE in Trading andMarketing Syndicate under the administrative control of Ministryof Commerce and Industry, Department of Commerce with 91.023%shareholding by the Government of India. The company employed844 regular employees (Executives 554 & Non-Executives 290) ason 31.3.2012. It's registered and corporate office is at New DelhiVision / Mission
The Vision/Mission of the company is to emerge as one of thelargest global trading companies with international standards ofexcellence nurturing a blend of quality, business ethics and proactiveenthusiasm to enhance stakeholders' value. To develop corecompetencies in selected areas and exploit the market opportunitiesin these areas to its best advantage is one of the major objectives ofSTC.Industrial / Business Operations
STC is involved in exports, imports and domestic tradingactivities in a large basket of items through its 13 branch offices,mostly located at major port towns of the country. It has onewholly owned subsidiary, namely, STCL Ltd. situated at Bangalore.The company has also formed a Joint Venture namely NSS SatpuraAgro Development Co. with NAFED and STCL with a share holdingof 25%, 50% and 25% respectively.
The exports of the company include agricultural commoditiessuch as rice, tea, cashew, castor oil, sugar, maize and manufacturedproducts like pharmaceuticals, construction materials, consumergoods, steel raw materials, iron ore, gold jewellery, etc. The Companyundertakes imports of bullion, hydrocarbons, minerals, metals,fertilizers, petro-chemicals, edible oils, etc. It also arranges importsof essential items of mass consumption such as wheat, pulses andedible oils to meet domestic shortages as and when called upon bythe Govt. of India to do so. It imports crucial raw materials as andwhen needed by the Indian Industry. It also undertakes import oftechnical and security equipment on behalf of Forensic ScienceLaboratories, State Police and Intelligence Departments andParamilitary Organizations. STC also undertakes counter trade andoffset operations against purchases by the Government of India asalso third county trading. Besides, exports and imports, STC alsoundertakes domestic sales of hydrocarbons, metals, tea, pulses,jute, etc.Financial Highlights
The physical performances of the company for last two yearsare given below:
Total Revenue from of the company registered an increase of10387.18crore during 2011-12, which went up from ` 20695.91crore in 2010-11 to ` 31083.09 crore in 2011-12 due to increase inturnover. The profit of the company has gone down by ` 39.97crore to ` 16.47 crore in 2011-12, from ` 56.44 crore in previousyear due to increase in finance cost and other operating expenses.
The current ratio of company is at 1.22:1 during 2011-12 asagainst 0.91:1 in the previous year (Fig.2). Balance Sheet and Profit& Loss Account of the company and selected financial ratios duringthe period 2010-11 to 2011-12 can be seen on the adjoining page.
Main Products Unit Performance during
2011-12 2010-11
Imports ` in Crore 29961 18938
Exports ` in Crore 344 492
Domestic Sale ` in Crore 139 555
EBIT
DA
& P
AT (
Rs.
cro
re)
TOTAL R
EVENU
E (Rs. crore)
Fig. 1
PRO
FITA
BIL
ITY
RAT
IOS
(%)
CU
RR
ENT R
ATIO
Fig. 2Strategic issues
With a view to increase its turnover and profitability, theCorporation has undertaken a number of new initiatives like stock& sale of retail items, developing greater liaison with stategovernments for enhanced procurements on their behalf, registrationof grain traders etc. STC has identified Latin America, Africa andAsia as focus markets.
www.stc.gov.in

Public Enterprises Survey 2011-2012: Vol-II 407
State Trading Corpn. of India Ltd.Jawahar Vyapar Bhavan Tolstoy Marg New Delhi 110001
BALANCE SHEET (` in Lakhs)PARTICULARS 2011-12 2010-11I. EQUITY & LIABILITIESAUTHORISED CAPITAL 20000 20000(1) Shareholders’ Funds(a) Share Capital(i) Central Govt 5461 5461(ii) Others 539 539(b) Reserves & Surplus 62198 61947(c) Money received against share warrants 0 0Total Shareholders’ Funds (1(a)+1(b)+1(c) 68198 67947(2) Share application money pending allotment 0 0(3) Non-current Liabilities(a) Long Term Borrowings 0 37255(b) Deferred tax liabilities (Net) 0 0(c) Other Long-term liabilities 112258 111258(d) Long-term provisions 6603 5524Total Non-Current Liabilities 3(a) to 3(d) 118861 154037(4) Current Liabilities(a) Short Term Borrowings 203032 117654(b) Trade Payables 222336 320685(c) Other current liabilities 29248 47425(d) Short-term provisions 3745 5931Total Current Liabilities 4(a) to 4(d) 458361 491695TOTAL EQUITY & LIABILITIES (1+2+3+4) 645420 713679II. ASSETS(1) Non-Current Assets(a) Total Gross Fixed Assets 9117 8980(ai) Accumulated Depreciation, Depletion & Amortisation 3938 3673(aii) Accumulated Impairment 0 0(b) Total Net Fixed Assets ((a)-(ai)-(aii) 5179 5307(c) Capital work in progress 987 337(d) Intangible assets under developmet 0 0(e) Non-Current Investments 31 303(f) Deferred Tax Assets (Net) 7301 6582(g) Long Term Loans and Advances 2792 2388(h) Other Non-Current Assets 70888 249129Total Non-Current Assets (b+c+d+e+f+g+h) 87178 264046(2) Current Assets(a) Current Investments 0 0(b) Inventories 54371 131374(c) Trade Recievables 420407 216380(d) Cash & Bank Balance 22634 73704(e) Short-term Loans & Advances 28552 15173(f) Other Current Assets 32278 13002Total Current Assets (a+b+c+d+e+f) 558242 449633TOTAL ASSETS (1+2) 645420 713679Important Indicators(i) Investment 6000 43255(ii) Capital Employed 68198 105202(iii) Net Worth 68198 67947(iv) Net Current Assets 99881 -42062(v) Cost of Sales 3081589 2042932(vi) Net Value Added (at market price) 143981 74708(vii) Total Regular Employees (Nos.) 844 864(viii) Avg. Monthly Emoluments per Employee(`) 99259 101466
PROFIT & LOSS ACCOUNT (` in Lakhs)PARTICULARS 2011-12 2010-11(I) Revenue from Operations (Gross) 3077310 2047565Less : Excise Duty 0 0Revenue from Operations (Net) 3077310 2047565(II) Other Income 30999 22026(III) Total Revenue (I+II) 3108309 2069591(IV) Expenditure on:(a) Cost of materials consumed 134 205(b) Purchase of stock-in-trade 2988583 2102134(c) Changes in inventories of finished goods, 77018 -74732
work-in-progress and stock in trade(d) Stores & Spares 0 0(e) Power & Fuel 158 136(f) Salary, Wages & Benefits/Employees Expense 10053 10520(g) Other Operating/direct/manufacturing Expenses 1617 1758(h) Rent, Royalty & Cess 990 1041(i) Loss on sale of Assets/Investments 0 0(j) Other Expenses 2729 1563Total Expenditure (IV (a to j)) 3081282 2042625(V) PROFIT BEFORE DEPRECIATION, & 27027 26966
IMPAIRMENT, FINANCE CHARGES/INTEREST, EXCEPTIONAL & EXTRAORDINARYITEMS & TAXES (PBDIEET)(III-IV)
(VI) Depreciation, Depletion & Amortisation 307 307(VII) Impairment 0 0(VIII) PROFIT BEFORE FINANCE COST/INTEREST,
EXCEPTIONAL, EXTRA-ORDINARYITEMS & TAXES (PBIEET)(V-VI-VII) 26720 26659
(IX) Finance Cost(a) On Central Government Loans 0 0(b) On Foreign Loans 0 0(c) Others 20347 17753(d) Less Finance Cost Capitalised 0 0(e) Charged to P & L Account (a+b+c+d) 20347 17753(X) PROFIT BEFORE EXCEPTIONAL & EXTRA-ORDINARY 6373 8906
ITEMS & TAX (PBEET)(VIII-IXe)(XI) Exceptional Items 4593 942(XII) PROFIT BEFORE EXTRA-ORDINARY ITEMS & TAX 1780 7964
(PBET)(X-XI)(XIII) Extra-Ordinary Items 0 0(XIV) PROFIT BEFORE TAX (PBT)(XII-XIII) 1780 7964(XV) TAX PROVISIONS 133 2320(XVI) NET PROFIT / LOSS FOR THE PERIOD FROM 1647 5644
CONTINUING OPERATIONS AFTER TAX(XIV-XV)(XVII) Profit/Loss from discontinuing operations 0 0(XVIII) Tax expenses of discontinuing operations 0 0(XIX) Profit/Loss from discontinuing operations 0 0
(after Tax)(XVII-XVIII)(XX) Profit/Loss for the period (XVI+XIX) 1647 5644Financial Ratios(i) Sales : Capital Employed 4512.32 1946.32(ii) Cost of Sales : Sales 100.14 99.77(iii) Salary/Wages : Sales 0.33 0.51(iv) Net Profit : Net Worth 2.42 8.31(v) Debt : Equity 0 6.21(vi) Current Ratio 1.22 0.91(vii) Trade Recievables : Sales 13.66 10.57(viii) Total Inventory : Sales 1.77 6.42

Trading & Marketing Services408
STCL Ltd.
The CompanySTCL Ltd. (STCL) was incorporated on 23.10.1982 (as
'Cardamom Trading Corporation Ltd.', which was renamed as 'SpicesTrading Corporation Ltd.' in 1987 and further renamed as 'STCLLtd.', in 2004) with the objective to trade in spices and agriculturalproducts in domestic and international markets, to process andcure spices and to manufacture spice products and agriculturalproducts of international standards and to carry on domestic andinternational trade in all kinds of industrial goods, iron ore, bullion,precious metals, limestone, met-coke, other minerals, polymer,polyester yarn, cotton yarn and such other textile products, PVCresins, HMS Scraps and other metal scrap.
STCL is a Schedule 'C' CPSE in Trading & Marketing sectorunder the administrative control of Ministry of Commerce andIndustry, Department of Commerce. The Company employed 54regular employees (Executives 19 & Non-Executives 35) as on31.03.2012. Its Registered and Corporate offices are at Bangalore,Karnataka. STCL is a 100% subsidiary of The State TradingCorporation of India Ltd.
Vision / MissionThe Vision / Mission of the Company is to emerge as global
trading company with international standards of excellence nurturinga blend of quality, business ethics and proactive enthusiasm toenhance stakeholders value.
Industrial / Business OperationsSTCL is engaged in trading of spices, agricultural commodities
and supply of agriculture inputs to growers; to conduct Cardamomauctions; to import and export spices, agriculture commodities andother commodities through its two (2) operating manufacturingunits and 10 branch offices. The company has one Joint Venture(JV) namely NSS Satpura Agro Development Corp. Ltd. with equityparticipation's from STC (holding company) and NAFED.
Performance HighlightsThe company has not provided any information on physical
performance for last two years.
Total Revenue of the company registered an increase of` 66.99 crore during 2011-12, which went up from ̀ 68.91 crore in2010-11 to ` 135.90 crore in 2011-12. However, the companyincurred a loss of ` 284.66 crores during the year 2011-12 ascompared to a loss of ` 178.02 crore during the year 2010-11showing an increase in loss of ` 106.64 crore. The turnover andprofitability of the company during the last two years is affectedon account of Bank default by business associates as result ofwhich the principal and interest liability could not be paid by thecompany.
The current ratio of company is at 0.02:1 during 2011-12 asagainst 0.03:1 in the previous year. Balance Sheet and Profit & LossAccount of the company and selected financial ratios during theperiod 2010-11 to 2011-12 can be seen on the adjoining page.
www.stclindia.com
Strategic issuesSTCL has taken all necessary steps for its Non-performing
assets of ̀ 1806 crore through appropriate legal action / complaintfiled. STCL has a negative net worth of ` 1800 crore due toprovisions made towards recoveries outstanding from its businessassociates and the accumulated interest thereon in merchantingtrade transactions undertaken during 2007-08 and earlier. STC theholding company has not given any corporate guarantee to / onbehalf of STCL as such STC liability is limited to its investment inthe equity (` 2.82 core) of STCL.
EBIT
DA
& P
AT (
Rs.
cro
re)
TOTAL R
EVENU
E (Rs. crore)
Fig. 1

Public Enterprises Survey 2011-2012: Vol-II 409
STCL Ltd.166/2, 13th Main Road, Vasanthnagar, Bangalore, Karnataka 560 052
BALANCE SHEET (` in Lakhs)PARTICULARS 2011-12 2010-11I. EQUITY & LIABILITIESAUTHORISED CAPITAL 500 150(1) Shareholders’ Funds(a) Share Capital(i) Central Govt 0 0(ii) Others 150 150(b) Reserves & Surplus -180055 -151537(c) Money received against share warrants 0 0Total Shareholders’ Funds (1(a)+1(b)+1(c) -179905 -151387(2) Share application money pending allotment 0 0(3) Non-current Liabilities(a) Long Term Borrowings 0 0(b) Deferred tax liabilities (Net) 0 0(c) Other Long-term liabilities 0 0(d) Long-term provisions 99 109Total Non-Current Liabilities 3(a) to 3(d) 99 109(4) Current Liabilities(a) Short Term Borrowings 181638 152905(b) Trade Payables 3610 4214(c) Other current liabilities 268 278(d) Short-term provisions 989 980Total Current Liabilities 4(a) to 4(d) 186505 158377TOTAL EQUITY & LIABILITIES (1+2+3+4) 6699 7099II. ASSETS(1) Non-Current Assets(a) Total Gross Fixed Assets 1215 1381(ai) Accumulated Depreciation, Depletion & Amortisation 388 406(aii) Accumulated Impairment 0 0(b) Total Net Fixed Assets ((a)-(ai)-(aii) 827 975(c) Capital work in progress 0 26(d) Intangible assets under developmet 0 0(e) Non-Current Investments 10 10(f) Deferred Tax Assets (Net) 0 0(g) Long Term Loans and Advances 0 0(h) Other Non-Current Assets 1432 1071Total Non-Current Assets (b+c+d+e+f+g+h) 2269 2082(2) Current Assets(a) Current Investments 0 0(b) Inventories 1481 6(c) Trade Recievables 330 181(d) Cash & Bank Balance 741 3835(e) Short-term Loans & Advances 1872 992(f) Other Current Assets 6 3Total Current Assets (a+b+c+d+e+f) 4430 5017TOTAL ASSETS (1+2) 6699 7099Important Indicators(i) Investment 150 150(ii) Capital Employed -179905 -151387(iii) Net Worth -179905 -151387(iv) Net Current Assets -182075 -153360(v) Cost of Sales 18228 6316(vi) Net Value Added (at market price) -4318 911(vii) Total Regular Employees (Nos.) 54 56(viii) Avg. Monthly Emoluments per Employee(`) 50617 48661
PROFIT & LOSS ACCOUNT (` in Lakhs)PARTICULARS 2011-12 2010-11(I) Revenue from Operations (Gross) 13262 6318Less : Excise Duty 0 0Revenue from Operations (Net) 13262 6318(II) Other Income 328 573(III) Total Revenue (I+II) 13590 6891(IV) Expenditure on:(a) Cost of materials consumed 0 0(b) Purchase of stock-in-trade 14106 5783(c) Changes in inventories of finished goods, -1475 4
work-in-progress and stock in trade(d) Stores & Spares 0 0(e) Power & Fuel 21 8(f) Salary, Wages & Benefits/Employees Expense 328 327(g) Other Operating/direct/manufacturing Expenses 59 34(h) Rent, Royalty & Cess 26 13(i) Loss on sale of Assets/Investments 0 0(j) Other Expenses 5071 -14Total Expenditure (IV (a to j)) 18136 6155(V) PROFIT BEFORE DEPRECIATION, & -4546 736
IMPAIRMENT, FINANCE CHARGES/INTEREST, EXCEPTIONAL & EXTRAORDINARYITEMS & TAXES (PBDIEET)(III-IV)
(VI) Depreciation, Depletion & Amortisation 92 161(VII) Impairment 0 0(VIII) PROFIT BEFORE FINANCE COST/INTEREST,
EXCEPTIONAL, EXTRA-ORDINARYITEMS & TAXES (PBIEET)(V-VI-VII) -4638 575
(IX) Finance Cost(a) On Central Government Loans 0 0(b) On Foreign Loans 0 0(c) Others 23779 18507(d) Less Finance Cost Capitalised 0 0(e) Charged to P & L Account (a+b+c+d) 23779 18507(X) PROFIT BEFORE EXCEPTIONAL & EXTRA-ORDINARY -28417 -17932
ITEMS & TAX (PBEET)(VIII-IXe)(XI) Exceptional Items 39 4(XII) PROFIT BEFORE EXTRA-ORDINARY ITEMS & TAX -28456 -17936
(PBET)(X-XI)(XIII) Extra-Ordinary Items 0 0(XIV) PROFIT BEFORE TAX (PBT)(XII-XIII) -28456 -17936(XV) TAX PROVISIONS 10 -134(XVI) NET PROFIT / LOSS FOR THE PERIOD FROM -28466 -17802
CONTINUING OPERATIONS AFTER TAX(XIV-XV)(XVII) Profit/Loss from discontinuing operations 0 0(XVIII) Tax expenses of discontinuing operations 0 0(XIX) Profit/Loss from discontinuing operations 0 0
(after Tax)(XVII-XVIII)(XX) Profit/Loss for the period (XVI+XIX) -28466 -17802Financial Ratios(i) Sales : Capital Employed -7.37 -4.17(ii) Cost of Sales : Sales 137.45 99.97(iii) Salary/Wages : Sales 2.47 5.18(iv) Net Profit : Net Worth - -(v) Debt : Equity 0 0(vi) Current Ratio 0.02 0.03(vii) Trade Recievables : Sales 2.49 2.86(viii) Total Inventory : Sales 11.17 0.09

Trading & Marketing Services410
Tamil Nadu Trade Promotion Organization
The CompanyTamil Nadu Trade Promotion Organization (TNTPO) was
incorporated on 17.11.2000 as a joint venture between India TradePromotion Organization (ITPO) and Tamilnadu IndustrialDevelopment Corporation Limited (TIDCO) under section 25 ofthe Companies Act, 1956 with a shareholding pattern of 51% and49 % respectively making it a subsidiary of ITPO. The objectivewas to promote, organize and participate in industrial trade andother fairs / exhibitions in India and abroad and to take all measuresincidental thereto for promoting Indian industry and trade andenhance its global competitiveness and to organize trade fairs andexhibitions and invite wider participation in export promotionactivities like Buyers Sellers Meet, Contact Promotion Programsand India Promotions with Departmental stores.
TNTPO is a Schedule 'C' CPSE in Trading & Marketing sectorunder the Ministry of Commerce and Industry, Department ofCommerce. The company employed 6regularexecutives' employeesas on 31.3.2012. The company is having its registered office atChennai.
Industrial / Business OperationsTNTPO is engaged in promotion of trade and industry by
letting out the exhibition halls and convention centers for IndustrialExhibitions, trade fairs, annual day functions, Award functions,Product launch, Seminars, Conferences and other business functionsetc. and also to organize trade fairs and exhibitions in India andabroad and invite wider participation in export promotion activitieslike Buyer Seller meets; Contact Promotion Programmes; IndiaPromotions with Departments stores such as Product - SpecificPromotions, Product Development & Adaptation and undertakemarket studies to determine the market potential and exportpromotion measures to tap export opportunities.
TNTPO has a convention centre with facilities of internationalstandards. The Convention Centre at Chennai is a multi-purposehall with 10560 sq.mtrs of air conditioned space and offers a varietyof conferencing and banquet rooms for 250 to 1500 delegates. It hasbeen designed with ultra-modern facilities like Infrared DigitalInterpretation system, theatrical lighting system, digital audio-videosystem, modern fire protection and security system etc.
Performance HighlightsThe company has not provided any information on its physical
performance. The Company registered an increase of ̀ 4.98crore intotal income during 2011-12 which went up to ` 30.06 crore in2011-12 from ` 25.08crore during 2010-11. The net profit of thecompany correspondingly increased to ̀ 18.86crore in 2011-12, anincrease of ` 4.54 crore over the previous year's profit of ` 14.32crore due to increase in operating income as well as other income.
The current ratio of company is at 4.22:1 during 2011-12 asagainst 3.00:1 in the previous year (Fig.2). Balance Sheet and Profit&Loss Account of the company and selected financial ratios duringthe period 2010-11 to 2011-12 can be seen on the adjoining page.
www.chennaitradecentre.org
EBIT
DA
& P
AT (
Rs.
cro
re)
TOTAL R
EVENU
E (Rs. crore)
Fig. 1
PRO
FITA
BIL
ITY
RAT
IOS
(%)
CU
RR
ENT R
ATIO
Fig. 2

Public Enterprises Survey 2011-2012: Vol-II 411
Tamil Nadu Trade Promotion OrganisationChennai Trade Centre Complex, Mount Poonamalle Road, Nandamabkkam, Chennai, Tamil Nadu-600089
BALANCE SHEET (` in Lakhs)PARTICULARS 2011-12 2010-11I. EQUITY & LIABILITIESAUTHORISED CAPITAL 50 50(1) Shareholders’ Funds(a) Share Capital(i) Central Govt 0 0(ii) Others 6 6(b) Reserves & Surplus 7974 6134(c) Money received against share warrants 0 0Total Shareholders’ Funds (1(a)+1(b)+1(c) 7980 6140(2) Share application money pending allotment 0 0(3) Non-current Liabilities(a) Long Term Borrowings 2260 2260(b) Deferred tax liabilities (Net) 0 0(c) Other Long-term liabilities 0 0(d) Long-term provisions 10 8Total Non-Current Liabilities 3(a) to 3(d) 2270 2268(4) Current Liabilities(a) Short Term Borrowings 0 0(b) Trade Payables 26 27(c) Other current liabilities 1508 1417(d) Short-term provisions 1 1Total Current Liabilities 4(a) to 4(d) 1535 1445TOTAL EQUITY & LIABILITIES (1+2+3+4) 11785 9853II. ASSETS(1) Non-Current Assets(a) Total Gross Fixed Assets 6841 6818(ai) Accumulated Depreciation, Depletion & Amortisation 1545 1330(aii) Accumulated Impairment 0 0(b) Total Net Fixed Assets ((a)-(ai)-(aii) 5296 5488(c) Capital work in progress 0 0(d) Intangible assets under developmet 0 0(e) Non-Current Investments 10 25(f) Deferred Tax Assets (Net) 0 0(g) Long Term Loans and Advances 0 0(h) Other Non-Current Assets 0 0Total Non-Current Assets (b+c+d+e+f+g+h) 5306 5513(2) Current Assets(a) Current Investments 0 0(b) Inventories 0 0(c) Trade Recievables 113 112(d) Cash & Bank Balance 5866 3908(e) Short-term Loans & Advances 500 320(f) Other Current Assets 0 0Total Current Assets (a+b+c+d+e+f) 6479 4340TOTAL ASSETS (1+2) 11785 9853Important Indicators(i) Investment 2266 2266(ii) Capital Employed 10240 8400(iii) Net Worth 7980 6140(iv) Net Current Assets 4944 2895(v) Cost of Sales 1125 1082(vi) Net Value Added (at market price) 2229 1722(vii) Total Regular Employees (Nos.) 6 7(viii) Avg. Monthly Emoluments per Employee(`) 118056 65476
PROFIT & LOSS ACCOUNT (` in Lakhs)PARTICULARS 2011-12 2010-11(I) Revenue from Operations (Gross) 2412 2158Less : Excise Duty 0 0Revenue from Operations (Net) 2412 2158(II) Other Income 594 350(III) Total Revenue (I+II) 3006 2508(IV) Expenditure on:(a) Cost of materials consumed 0 0(b) Purchase of stock-in-trade 0 0(c) Changes in inventories of finished goods, 0 0
work-in-progress and stock in trade(d) Stores & Spares 0 0(e) Power & Fuel 0 0(f) Salary, Wages & Benefits/Employees Expense 85 55(g) Other Operating/direct/manufacturing Expenses 570 576(h) Rent, Royalty & Cess 0 0(i) Loss on sale of Assets/Investments 0 0(j) Other Expenses 250 245Total Expenditure (IV (a to j)) 905 876(V) PROFIT BEFORE DEPRECIATION, & 2101 1632
IMPAIRMENT, FINANCE CHARGES/INTEREST, EXCEPTIONAL & EXTRAORDINARYITEMS & TAXES (PBDIEET)(III-IV)
(VI) Depreciation, Depletion & Amortisation 220 206(VII) Impairment 0 0(VIII) PROFIT BEFORE FINANCE COST/ 1881 1426
INTEREST, EXCEPTIONAL, EXTRA-ORDINARYITEMS & TAXES (PBIEET)(V-VI-VII)
(IX) Finance Cost(a) On Central Government Loans 0 0(b) On Foreign Loans 0 0(c) Others 0 0(d) Less Finance Cost Capitalised 0 0(e) Charged to P & L Account (a+b+c+d) 0 0(X) PROFIT BEFORE EXCEPTIONAL & EXTRA-ORDINARY 1881 1426
ITEMS & TAX (PBEET)(VIII-IXe)(XI) Exceptional Items -5 -6(XII) PROFIT BEFORE EXTRA-ORDINARY ITEMS & TAX 1886 1432
(PBET)(X-XI)(XIII) Extra-Ordinary Items 0 0(XIV) PROFIT BEFORE TAX (PBT)(XII-XIII) 1886 1432(XV) TAX PROVISIONS 0 0(XVI) NET PROFIT / LOSS FOR THE PERIOD FROM 1886 1432
CONTINUING OPERATIONS AFTER TAX(XIV-XV)(XVII) Profit/Loss from discontinuing operations 0 0(XVIII) Tax expenses of discontinuing operations 0 0(XIX) Profit/Loss from discontinuing operations 0 0
(after Tax)(XVII-XVIII)(XX) Profit/Loss for the period (XVI+XIX) 1886 1432Financial Ratios(i) Sales : Capital Employed 23.55 25.69(ii) Cost of Sales : Sales 46.64 50.14(iii) Salary/Wages : Sales 3.52 2.55(iv) Net Profit : Net Worth 23.63 23.32(v) Debt : Equity 376.67 376.67(vi) Current Ratio 4.22 3(vii) Trade Recievables : Sales 4.68 5.19(viii) Total Inventory : Sales 0 0
2011-12 Provisional

Public Enterprises Survey 2011-2012: Vol-II 413
TRANSPORTATIONSERVICES

Transportation Services414

Public Enterprises Survey 2011-2012: Vol-II 415
17. Transportation Services
As on 31.03.2012, there were 12 Central Public SectorEnterprises in the Transportation Services group. The name ofthese enterprises along with their year of incorporation inchronological order are given below:-
Sl. Enterprise Year ofNo. Incorporation
1 Shipping Corporation of India Ltd. 1961
2 Central Inland Water Transport Corpn. Ltd. 1967
3 Air India Charters Ltd. 1972
4 Dredging Corpn. of India Ltd. 1977
5 Airline Allied Services Ltd. 1983
6 Pawan Hans Helicopters Ltd. 1985
7 Container Corporation of India Ltd. 1988
8 Airports Authority of India Ltd. 1996
9 Ennore Port Ltd. 1999
10 Air India Air Transport Services Ltd. 2003
11 Fresh & Healthy Enterprises Ltd. 2006
12 Air India Ltd. 2007
2. The enterprises falling in this group are mainly engagedin providing transport by Air, Road and Sea, management of nationalas well as international airports, creating and maintaining requireddepth in ports and rivers, providing helicopter services etc.
3. The consolidated financial position the working resultsand the important management ratios of these enterprises areappended.
4. Turnover : The details of turnover of individualenterprises are given below:
(` in Crores)Sl. Enterprise TurnoverNo. 2011-12 2010-11
1 Air India Ltd. 14675.30 13976.032 Airports Authority of India Ltd. 5690.55 5027.713 Container Corporation of India Ltd. 4060.95 3834.854 Shipping Corporation of India Ltd. 3867.55 3594.645 Air India Charters Ltd. 1377.81 1311.426 Dredging Corpn. of India Ltd. 491.66 507.147 Pawan Hans Helicopters Ltd. 413.54 413.038 Airline Allied Services Ltd. 272.41 336.399 Ennore Port Ltd. 248.65 167.3110 Air India Air Transport Services Ltd. 60.90 48.6011 Fresh & Healthy Enterprises Ltd. 39.89 64.3512 Central Inland Water Transport Corpn. 1.31 1.51
Ltd.Sub Total : 31200.52 29282.98
5. Net Profit / Loss : The details of enterprises , whichearned net profit or sustained net loss (-) are given below:
(` in Crores)Sl. Enterprise Adjusted NetNo. Profit / Net Loss
2011-12 2010-11
1 Container Corporation of India Ltd. 877.88 875.952 Airports Authority of India Ltd. 859.01 846.393 Ennore Port Ltd. 96.72 55.584 Dredging Corpn. of India Ltd. 13.18 39.515 Air India Air Transport Services Ltd. -0.26 -0.186 Pawan Hans Helicopters Ltd. -10.35 18.507 Fresh & Healthy Enterprises Ltd. -12.22 0.428 Central Inland Water Transport -13.09 -4.93
Corpn. Ltd.9 Airline Allied Services Ltd. -114.74 -29.1210 Shipping Corporation of India Ltd. -428.21 567.3511 Air India Charters Ltd. -602.50 -391.2212 Air India Ltd. -7559.74 -6865.17
Sub Total : -6894.32 -4886.92
6. Dividend : The details of dividend declared by theindividual enterprises are given below:Sl. Enterprise DividendNo. 2011-12 2010-11
1 Container Corporation of India Ltd. 214.47 201.472 Airports Authority of India Ltd. 171.90 169.303 Ennore Port Ltd. 19.34 11.124 Shipping Corporation of India Ltd. 0.00 275.08
Group Total : 405.71 656.97
7. Social Overhead and Township : The total number ofpersons employed and the expenditure incurred on social overheadsand townships are given below:
(` in Crores)Sl. Enterprise Township andNo. Social Overheads
2011-12 2010-11
1 No. of employees (in number) 52906 525452 Social overheads: (Rupees in Crore)
(i) Educational 11.12 18.07(ii) Medical Facilities 9.70 8.99(iii) Others 162.61 127.60
3 Capital cost of township 64.45 59.08(Rupees in Crore)
4 No. of houses constructed (in numbers) 422 404

Transportation Services416
8. Company wise details in respect of Balance Sheet, Profitand Loss account, Important Indicators and Financial Ratios alongwith the write up of individual company are given in the pagesbelow.

Public Enterprises Survey 2011-2012: Vol-II 417
TRANSPORTATION SERVICES
BALANCE SHEET (`̀̀̀̀ in Lakhs)PARTICULARS 2011-12 2010-11I. EQUITY & LIABILITIESAUTHORISED CAPITAL 1407256 807166(1) Shareholders’ Funds (a) Share Capital (i) Central Govt 485811 365716 (ii) Others 52391 52391 (b) Reserves & Surplus -66175 656904 (c) Money received against share warrants 0 0 Total Shareholders’ Funds (1(a)+1(b)+1(c) 472027 1075011(2) Share application money pending allotment 0 0(3) Non-current Liabilities (a) Long Term Borrowings 4080207 2513523 (b) Deferred tax liabilities (Net) 37031 32638 (c) Other Long-term liabilities 130921 134349 (d) Long-term provisions 199436 188638 Total Non-Current Liabilities 3(a) to 3(d) 4447595 2869148(4) Current Liabilities (a) Short Term Borrowings 1462379 2517872 (b) Trade Payables 906780 552009 (c) Other current liabilities 1167404 871138 (d) Short-term provisions 490777 547482 Total Current Liabilities 4(a) to 4(d) 4027340 4488501TOTAL EQUITY & LIABILITIES (1+2+3+4) 8946962 8432660II. ASSETS(1) Non-Current Assets (a) Total Gross Fixed Assets 7022214 6547562 (ai) Accumulated Depreciation, Depletion & Amortisation 1580446 1427627 (aii) Accumulated Impairment 953 954 (b) Total Net Fixed Assets ((a)-(ai)-(aii) 5440815 5118981 (c) Capital work in progress 692713 615487 (d) Intangible assets under developmet 14942 5483 (e) Non-Current Investments 178648 162369 (f) Deferred Tax Assets (Net) 366272 351024 (g) Long Term Loans and Advances 820706 798986 (h) Other Non-Current Assets 15130 9379 Total Non-Current Assets (b+c+d+e+f+g+h) 7529226 7061709(2) Current Assets (a) Current Investments 8231 10031 (b) Inventories 145333 115238 (c) Trade Recievables 489540 429866 (d) Cash & Bank Balance 516438 580139 (e) Short-term Loans & Advances 104445 94752 (f) Other Current Assets 153749 140925 Total Current Assets (a+b+c+d+e+f) 1417736 1370951TOTAL ASSETS (1+2) 8946962 8432660Important Indicators (i) Investment 4618409 2931630 (ii) Capital Employed 4552234 3588534 (iii) Net Worth 472027 1075011 (iv) Net Current Assets -2609604 -3117550 (v) Cost of Sales 3504144 3102599 (vi) Net Value Added (at market price) 672831 705440 (vii) Total Regular Employees (Nos.) 52906 52545(viii) Avg. Monthly Emoluments per Employee(`) 102494 99985
PROFIT & LOSS ACCOUNT ( `̀̀̀̀ in Lakhs)PARTICULARS 2011-12 2010-11(I) Revenue from Operations (Gross) 3120052 2928298 Less : Excise Duty 0 0 Revenue from Operations (Net) 3120052 2928298(II) Other Income 122754 90362(III) Total Revenue (I+II) 3242806 3018660(IV) Expenditure on: (a) Cost of materials consumed 113298 104548 (b) Purchase of stock-in-trade 4762 3542 (c) Changes in inventories of finished goods, work-in- -2181 262
progress and stock in trade (d) Stores & Spares 60708 87013 (e) Power & Fuel 904507 662005 (f) Salary, Wages & Benefits/Employees Expense 650706 630445 (g) Other Operating/direct/manufacturing Expenses 1178135 1043743 (h) Rent, Royalty & Cess 14702 11024 (i) Loss on sale of Assets/Investments 6896 2098 (j) Other Expenses 193780 207921Total Expenditure (IV (a to j)) 3125313 2752601(V) PROFIT BEFORE DEPRECIATION, & IMPAIRMENT, 117493 266059FINANCE CHARGES/INTEREST, EXCEPTIONAL &EXTRAORDINARY ITEMS & TAXES (PBDIEET)(III-IV)(VI) Depreciation, Depletion & Amortisation 385727 352096(VII) Impairment 0 0(VIII) PROFIT BEFORE FINANCE COST/INTEREST, -268234 -86037EXCEPTIONAL, EXTRA-ORDINARY ITEMS & TAXES(PBIEET)(V-VI-VII)(IX) Finance Cost (a) On Central Government Loans 10 224 (b) On Foreign Loans 79341 106916 (c) Others 365874 251568 (d) Less Finance Cost Capitalised 77 0 (e) Charged to P & L Account (a+b+c+d) 445148 358708(X) PROFIT BEFORE EXCEPTIONAL & EXTRA-ORDINARY -713382 -444745ITEMS & TAX (PBEET)(VIII-IXe)(XI) Exceptional Items -91653 -18562(XII) PROFIT BEFORE EXTRA-ORDINARY ITEMS & TAX -621729 -426183(PBET)(X-XI)(XIII) Extra-Ordinary Items -28714 -19983(XIV) PROFIT BEFORE TAX (PBT)(XII-XIII) -593015 -406200(XV) TAX PROVISIONS 96417 82492(XVI) NET PROFIT / LOSS FOR THE PERIOD FROM -689432 -488692CONTINUING OPERATIONS AFTER TAX(XIV-XV)(XVII) Profit/Loss from discontinuing operations 0 0(XVIII) Tax expenses of discontinuing operations 0 0(XIX) Profit/Loss from discontinuing operations 0 0(after Tax)(XVII-XVIII)(XX) Profit/Loss for the period (XVI+XIX) -689432 -488692Financial Ratios (i) Sales : Capital Employed 68.54 81.6 (ii) Cost of Sales : Sales 112.31 105.95 (iii) Salary/Wages : Sales 20.86 21.53 (iv) Net Profit : Net Worth -146.06 -45.46 (v) Debt : Equity 7.58 6.01 (vi) Current Ratio 0.35 0.31 (vii) Trade Recievables : Sales 15.69 14.68 (viii) Total Inventory : Sales 4.66 3.94

Transportation Services418
Airport Authority of India
The CompanyAirport Authority of India (AAI)was incorporated on
01.04.1995 through the Act of Parliament, namely The AirportAuthority of India Act, 1994 by merger of International AirportsAuthority of India and National Airports Authority with theobjective to have an integrated development and modernization ofthe airports in India to international standards.
AAI is a Schedule-'A' Miniratna CPSE in Transport Servicessector under the administrative control of M/o Civil Aviation with100% shareholding by the Government of India. The companyemployed 18781regular employees (Executives 7010, Non-executives 11771) as on 31.3.2012. Its Registered and Corporateoffice is at New Delhi.Vision / Mission
The Vision of the Company is to be a world class Organizationproviding leadership in Air Traffic Services and Airport Management& making a major hub in Asia Pacific Region by 2016.
The Mission of the Company is to achieve highest standardsof safety and quality in Air Traffic Services and AirportManagement.Industrial / Business Operations
AAI is involved in development and modernization of airportsand providing Air Traffic services in the designated air space in theentire Indian air space. Currently it manages 125 airports consisting68 operational airports(11 International Airports, 8 customs, 49domestic), 26 civil enclaves (3 International Airports, 4 customs,19 domestic) and 31 non operational domestic airports. In addition,AAI also provides CNS-ATM facilities at 09 other airports.
AAI have 7 JVs for airports at Delhi, Mumbai, Bengaluru,Hyderabad & Chandigarh which are handed over to Joint VentureCompanies (JVCs).
The major sources of revenue of AAI are Route / TerminalNavigational Facilities, Landing & Parking, Cargo Handling andPassenger Services.Performance Highlights
The physical performances of the company for last two yearsare given below:
Profit & Loss Account of the company and selected financial ratiosduring the period 2010-11 to 2011-12 can be seen on the adjoiningpage.Strategic issue
With new Terminals being commissioned in Tier 2 and Tier 3cities in the country, the focus of the expansion of Civil Aviationhas now shifted from the metro cities to these Tier 2 and Tier 3cities in the country. AAI has plans to construct airports in theremote corners of the country and strive to upgrade the existing
Main Services Unit Performance during
2011-12 2010-11
Aircraft Movements Nos. in 000 1545 1393
Cargo 000' Tonne 2280 2348
Passengers Handled No. in lacs 1623 1434
ones to international standards. AAI has brought in state of the arttechnology viz Satellite Based Navigation in the area of CNS -ATM.
The civil aviation sector in general is passing throughchallenging times and airlines are reporting losses due to which theairport operators are notable to get their payments. AAI has toresort to borrowing in order to finance its capital expenditurerequirement over and above the surplus generated by it.
www.aai.aero
EBIT
DA
& P
AT (
Rs.
cro
re)
TOTAL R
EVENU
E (Rs. crore)
Fig. 1
PRO
FITA
BIL
ITY
RAT
IOS
(%)
CU
RR
ENT R
ATIO
Fig. 2
The total revenue of the company registered an increase of` 739.45crore in total income during 2011-12 which went up to` 5878.66 crore in 2011-12 from ` 5139.21 crore during 2010-11due to growth in aircraft movement and passengers handled. Thenet profit of the company increased to ` 859.01crore in 2011-12,an increase of ` 12.62croreover previousyear'sprofit of ` 846.39due to increase in operating income.
The current ratio of company is at 0.31 : 1 during 2011-12 asagainst 0.21 : 1 in the previous year (Fig.2). Balance Sheet and

Public Enterprises Survey 2011-2012: Vol-II 419
Airports Authority of IndiaRajiv Gandhi Bhawan, Safdarjung Airport, New Delhi - 110 003
BALANCE SHEET ( ` in Lakhs)PARTICULARS 2011-12 2010-11I. EQUITY & LIABILITIESAUTHORISED CAPITAL 65656 65561(1) Shareholders’ Funds(a) Share Capital(i) Central Govt 65656 65561(ii) Others 0 0(b) Reserves & Surplus 815755 740177(c) Money received against share warrants 0 0Total Shareholders’ Funds (1(a)+1(b)+1(c) 881411 805738(2) Share application money pending allotment 0 0(3) Non-current Liabilities(a) Long Term Borrowings 146223 67524(b) Deferred tax liabilities (Net) 0 0(c) Other Long-term liabilities 70819 71366(d) Long-term provisions 44767 44664Total Non-Current Liabilities 3(a) to 3(d) 261809 183554(4) Current Liabilities(a) Short Term Borrowings 68000 55000(b) Trade Payables 0 0(c) Other current liabilities 139005 153955(d) Short-term provisions 411340 470994Total Current Liabilities 4(a) to 4(d) 618345 679949TOTAL EQUITY & LIABILITIES (1+2+3+4) 1761565 1669241II. ASSETS(1) Non-Current Assets(a) Total Gross Fixed Assets 1385717 1223869(ai) Accumulated Depreciation, Depletion & Amortisation 794774 687854(aii) Accumulated Impairment 0 0(b) Total Net Fixed Assets ((a)-(ai)-(aii) 590943 536015(c) Capital work in progress 439168 374752(d) Intangible assets under developmet 0 0(e) Non-Current Investments 108631 97865(f) Deferred Tax Assets (Net) 82018 66736(g) Long Term Loans and Advances 348897 449760(h) Other Non-Current Assets 0 0Total Non-Current Assets (b+c+d+e+f+g+h) 1569657 1525128(2) Current Assets(a) Current Investments 0 0(b) Inventories 9027 9263(c) Trade Recievables 151651 102199(d) Cash & Bank Balance 11374 10621(e) Short-term Loans & Advances 0 0(f) Other Current Assets 19856 22030Total Current Assets (a+b+c+d+e+f) 191908 144113TOTAL ASSETS (1+2) 1761565 1669241Important Indicators(i) Investment 211879 133085(ii) Capital Employed 1027634 873262(iii) Net Worth 881411 805738(iv) Net Current Assets -426437 -535836(v) Cost of Sales 446901 378177(vi) Net Value Added (at market price) 375698 312627(vii) Total Regular Employees (Nos.) 18781 18243(viii) Avg. Monthly Emoluments per Employee(`) 88721 75604
PROFIT & LOSS ACCOUNT (` in Lakhs)PARTICULARS 2011-12 2010-11(I) Revenue from Operations (Gross) 569055 502771Less : Excise Duty 0 0Revenue from Operations (Net) 569055 502771(II) Other Income 18811 11150(III) Total Revenue (I+II) 587866 513921(IV) Expenditure on:(a) Cost of materials consumed 0 0(b) Purchase of stock-in-trade 0 0(c) Changes in inventories of finished goods,
work-in-progress and stock in trade 0 0(d) Stores & Spares 3871 2640(e) Power & Fuel 18049 15006(f) Salary, Wages & Benefits/Employees Expense 199952 165509(g) Other Operating/direct/manufacturing Expenses 93392 79390(h) Rent, Royalty & Cess 0 0(i) Loss on sale of Assets/Investments 0 0(j) Other Expenses 30628 26296Total Expenditure (IV (a to j)) 345892 288841(V) PROFIT BEFORE DEPRECIATION, & IMPAIRMENT, 241974 225080
FINANCE CHARGES/INTEREST, EXCEPTIONAL &EXTRAORDINARY ITEMS & TAXES (PBDIEET)(III-IV)
(VI) Depreciation, Depletion & Amortisation 101009 89336(VII) Impairment 0 0(VIII) PROFIT BEFORE FINANCE COST/INTEREST, 140965 135744
EXCEPTIONAL, EXTRA-ORDINARY ITEMS &TAXES (PBIEET)(V-VI-VII)
(IX) Finance Cost(a) On Central Government Loans 10 224(b) On Foreign Loans 0 3(c) Others 4461 888(d) Less Finance Cost Capitalised 0 0(e) Charged to P & L Account (a+b+c+d) 4471 1115(X) PROFIT BEFORE EXCEPTIONAL & EXTRA- 136494 134629
ORDINARY ITEMS & TAX (PBEET)(VIII-IXe)(XI) Exceptional Items 0 0(XII) PROFIT BEFORE EXTRA-ORDINARY ITEMS & 136494 134629
TAX (PBET)(X-XI)(XIII) Extra-Ordinary Items 0 0(XIV) PROFIT BEFORE TAX (PBT)(XII-XIII) 136494 134629(XV) TAX PROVISIONS 50593 49990(XVI) NET PROFIT / LOSS FOR THE PERIOD FROM 85901 84639
CONTINUING OPERATIONS AFTER TAX(XIV-XV)(XVII) Profit/Loss from discontinuing operations 0 0(XVIII) Tax expenses of discontinuing operations 0 0(XIX) Profit/Loss from discontinuing operations 0 0
(after Tax)(XVII-XVIII)(XX) Profit/Loss for the period (XVI+XIX) 85901 84639Financial Ratios(i) Sales : Capital Employed 55.38 57.57(ii) Cost of Sales : Sales 78.53 75.22(iii) Salary/Wages : Sales 35.14 32.92(iv) Net Profit : Net Worth 9.75 10.5(v) Debt : Equity 2.23 1.03(vi) Current Ratio 0.31 0.21(vii) Trade Recievables : Sales 26.65 20.33(viii) Total Inventory : Sales 1.59 1.84
2011-12 Provisional

Transportation Services420
The CompanyAirline Allied Services Limited (AASL) was incorporated on
13.09.1983 with the objective of creating a profit center under thesubsidiary company structure for speedy and flexible decision-making and also to utilize the fleet effectively. The company wasrevitalized as scheduled airline in 1996 and named as Alliance Air.
AASL is a Schedule-'C' CPSE in Transport Services sectorunder the administrative control of M/o Civil Aviation. It is a 100%subsidiary of Air India Limited. Its Registered and Corporate officesare at New Delhi.
Industrial / Business OperationsAASL undertook freighter charter operations with freighter
B737 aircraft on lease from Air India Ltd. under the agreements forthe freighter charters exclusively between Air India Ltd. andconcerned parties. It also operates other aircraft directly leasedfrom other lessors. Air India Ltd. provides handling, marketing,sales and reservations and other support services for Alliance Airflights.
Performance HighlightsThe physical performances of the company for last two years
are given below:
Total Revenue of the company registered a reduction of` 63.05 crore during 2011-12 which went down to ̀ 295.21 crorein 2011-12 from ` 358.26 crore during 2010-11. The losses of thecompany has gone up by ` 85.62 crore to ` 114.74 crore in 2011-12, from ` 29.12 crore in previous year due to fall in operatingincome and increase in operating expenses.
The current ratio of company is at 0.12:1 during 2011-12 asagainst 0.16:1 in the previous year. Balance Sheet and Profit & LossAccount of the company and selected financial ratios during theperiod 2010-11 to 2011-12 can be seen on the adjoining page.
Airline Allied Services Limited
www.airindia.in
Main Services Unit Performance during
2011-12 2010-11
Passenger Revenue Rs. in Crore 220.33 227.98
Charter Revenue Rs. in Crore 3.22 48.19
Cargo Revenue Rs. in Crore 2.33 2.59
Mail Revenue Rs. in Crore 0.46 10.08
EBIT
DA
& P
AT (
Rs.
cro
re)
TOTAL R
EVENU
E (Rs. crore)
Fig. 1
Strategic issuesThe lease payment to Air India Ltd. for Boeing-737 aircraft
taken on lease are mutually agreed on a year-to-year basis.

Public Enterprises Survey 2011-2012: Vol-II 421
Airline Allied Services Ltd.Domestic Arrival Terminal-I, 1st Floor, I.G.I Airport, Palam, New Delhi-110 037
BALANCE SHEET ( ` in Lakhs)PARTICULARS 2011-12 2010-11I. EQUITY & LIABILITIESAUTHORISED CAPITAL 500 500(1) Shareholders’ Funds(a) Share Capital(i) Central Govt 0 0(ii) Others 225 225(b) Reserves & Surplus -69763 -58289(c) Money received against share warrants 0 0Total Shareholders’ Funds (1(a)+1(b)+1(c) -69538 -58064(2) Share application money pending allotment 0 0(3) Non-current Liabilities(a) Long Term Borrowings 0 0(b) Deferred tax liabilities (Net) 0 0(c) Other Long-term liabilities 3225 3194(d) Long-term provisions 4776 3544Total Non-Current Liabilities 3(a) to 3(d) 8001 6738(4) Current Liabilities(a) Short Term Borrowings 0 0(b) Trade Payables 20418 12670(c) Other current liabilities 45246 47240(d) Short-term provisions 5686 2121Total Current Liabilities 4(a) to 4(d) 71350 62031TOTAL EQUITY & LIABILITIES (1+2+3+4) 9813 10705II. ASSETS(1) Non-Current Assets(a) Total Gross Fixed Assets 607 609(ai) Accumulated Depreciation, Depletion & Amortisation 496 463(aii) Accumulated Impairment 0 0(b) Total Net Fixed Assets ((a)-(ai)-(aii) 111 146(c) Capital work in progress 0 0(d) Intangible assets under developmet 0 0(e) Non-Current Investments 0 0(f) Deferred Tax Assets (Net) 0 0(g) Long Term Loans and Advances 843 731(h) Other Non-Current Assets 0 0Total Non-Current Assets (b+c+d+e+f+g+h) 954 877(2) Current Assets(a) Current Investments 0 0(b) Inventories 1102 1360(c) Trade Recievables 6317 7801(d) Cash & Bank Balance 130 38(e) Short-term Loans & Advances 1310 629(f) Other Current Assets 0 0Total Current Assets (a+b+c+d+e+f) 8859 9828TOTAL ASSETS (1+2) 9813 10705Important Indicators(i) Investment 225 225(ii) Capital Employed -69538 -58064(iii) Net Worth -69538 -58064(iv) Net Current Assets -62491 -52203(v) Cost of Sales 40879 38713(vi) Net Value Added (at market price) -6205 2799(vii) Total Regular Employees (Nos.) 0(viii) Avg. Monthly Emoluments per Employee(`) 0 0
PROFIT & LOSS ACCOUNT (` in Lakhs)PARTICULARS 2011-12 2010-11(I) Revenue from Operations (Gross) 27241 33639Less : Excise Duty 0 0Revenue from Operations (Net) 27241 33639(II) Other Income 2280 2187(III) Total Revenue (I+II) 29521 35826(IV) Expenditure on:(a) Cost of materials consumed 0 0(b) Purchase of stock-in-trade 0 0(c) Changes in inventories of finished goods, 0 0
work-in-progress and stock in trade(d) Stores & Spares 760 777(e) Power & Fuel 13883 11204(f) Salary, Wages & Benefits/Employees Expense 4387 4786(g) Other Operating/direct/manufacturing Expenses 19221 19779(h) Rent, Royalty & Cess 170 168(i) Loss on sale of Assets/Investments 0 0(j) Other Expenses 2417 1959Total Expenditure (IV (a to j)) 40838 38673(V) PROFIT BEFORE DEPRECIATION, & IMPAIRMENT, -11317 -2847
FINANCE CHARGES/INTEREST, EXCEPTIONAL &EXTRAORDINARY ITEMS & TAXES (PBDIEET)(III-IV)
(VI) Depreciation, Depletion & Amortisation 41 40(VII) Impairment 0 0(VIII) PROFIT BEFORE FINANCE COST/INTEREST, -11358 -2887
EXCEPTIONAL, EXTRA-ORDINARY ITEMS &TAXES (PBIEET)(V-VI-VII)
(IX) Finance Cost(a) On Central Government Loans 0 0(b) On Foreign Loans 0 0(c) Others 109 25(d) Less Finance Cost Capitalised 0 0(e) Charged to P & L Account (a+b+c+d) 109 25(X) PROFIT BEFORE EXCEPTIONAL & EXTRA- -11467 -2912
ORDINARY ITEMS & TAX (PBEET)(VIII-IXe)(XI) Exceptional Items 0 0(XII) PROFIT BEFORE EXTRA-ORDINARY ITEMS & -11467 -2912
TAX (PBET)(X-XI)(XIII) Extra-Ordinary Items 0 0(XIV) PROFIT BEFORE TAX (PBT)(XII-XIII) -11467 -2912(XV) TAX PROVISIONS 7 0(XVI) NET PROFIT / LOSS FOR THE PERIOD FROM -11474 -2912
CONTINUING OPERATIONS AFTER TAX(XIV-XV)(XVII) Profit/Loss from discontinuing operations 0 0(XVIII) Tax expenses of discontinuing operations 0 0(XIX) Profit/Loss from discontinuing operations 0 0
(after Tax)(XVII-XVIII)(XX) Profit/Loss for the period (XVI+XIX) -11474 -2912Financial Ratios(i) Sales : Capital Employed -39.17 -57.93(ii) Cost of Sales : Sales 150.06 115.08(iii) Salary/Wages : Sales 16.1 14.23(iv) Net Profit : Net Worth - -(v) Debt : Equity 0 0(vi) Current Ratio 0.12 0.16(vii) Trade Recievables : Sales 23.19 23.19(viii) Total Inventory : Sales 4.05 4.04
2011-12 Provisional

Transportation Services422
Air India Air Transport Services Limited
The CompanyAir India Air Transport Services Limited (AIATS) was
incorporated on 09.06.2003 with the objective of carrying on thebusiness of providing all types of services at airport.
AIATS is an un-categorized CPSE in Transport Services sectorunder the administrative control of M/o Civil Aviation. AIATS is100% subsidiary of Air India Limited. The company employed1683 Regular employees (Executives 11 & Non-Executives 1672)as on 31.3.2012. Its registered office is at New Delhi and Corporateoffice at Mumbai, Maharashtra.
Vision / MissionThe Vision / Mission / Objectives of the company are to carry
on the business of repairing, maintaining, servicing, refurbishingproviding engineering services of and for aircraft, flying machines,aerial conveyances, engines, auxiliary power units and allcomponents and parts thereof.
Industrial / Business OperationsAIATS is rendering Airport Ground Handling Services including
Passenger Handling, Ramp handling, Security Handling and CargoHandling for Air India and Associate Company / Joint VentureCompany i.e. AI SAT, Bangalore.
Performance Highlights The physical performances of the company for last two years
are given below:
Total Revenue of the company registered an increase of` 12.30 crore during 2011-12 which went up to ` 60.90 crore in2011-12 from ` 48.60 crore during 2010-11. The losses of thecompany has gone up by ` 0.08 crore to ` 0.26 crore in 2011-12,from ` 0.18 crore in previous year due to increase in operatingexpenses and prior period adjustments.
The current ratio of company is at 0.49:1 during 2011-12 asagainst 0.38:1 in the previous year. Balance Sheet and Profit & LossAccount of the company and selected financial ratios during theperiod 2010-11 to 2011-12 can be seen on the adjoining page.
www.airindia.in
Main Services Unit Performance during
2011-12 2010-11
Handling Services ` in Crore 60.36 48.36
EBIT
DA
& P
AT (
Rs.
cro
re) TO
TAL REVEN
UE (R
s. crore)
Fig. 1

Public Enterprises Survey 2011-2012: Vol-II 423
Air India Transport Services Ltd.Airlines House, 113, Gurudwara Rakabgunj Road, New Delhi - 110003
BALANCE SHEET ( ` in Lakhs)PARTICULARS 2011-12 2010-11I. EQUITY & LIABILITIES
AUTHORISED CAPITAL 10000 10000(1) Shareholders’ Funds(a) Share Capital(i) Central Govt 0 0(ii) Others 5 5(b) Reserves & Surplus -270 -270(c) Money received against share warrants 0 0Total Shareholders’ Funds (1(a)+1(b)+1(c) -265 -265(2) Share application money pending allotment 0 0(3) Non-current Liabilities(a) Long Term Borrowings 0 0(b) Deferred tax liabilities (Net) 0 0(c) Other Long-term liabilities 0 0(d) Long-term provisions 90 63Total Non-Current Liabilities 3(a) to 3(d) 90 63(4) Current Liabilities(a) Short Term Borrowings 0 0(b) Trade Payables 658 728(c) Other current liabilities 876 460(d) Short-term provisions 2 0Total Current Liabilities 4(a) to 4(d) 1536 1188TOTAL EQUITY & LIABILITIES (1+2+3+4) 1361 986II. ASSETS(1) Non-Current Assets(a) Total Gross Fixed Assets 1 1(ai) Accumulated Depreciation, Depletion & Amortisation 0 0(aii) Accumulated Impairment 0 0(b) Total Net Fixed Assets ((a)-(ai)-(aii) 1 1(c) Capital work in progress 0 0(d) Intangible assets under developmet 0 0(e) Non-Current Investments 0 0(f) Deferred Tax Assets (Net) 2 36(g) Long Term Loans and Advances 599 489(h) Other Non-Current Assets 6 6Total Non-Current Assets (b+c+d+e+f+g+h) 608 532(2) Current Assets(a) Current Investments 0 0(b) Inventories 0 0(c) Trade Recievables 701 431(d) Cash & Bank Balance 36 9(e) Short-term Loans & Advances 0 0(f) Other Current Assets 16 14Total Current Assets (a+b+c+d+e+f) 753 454TOTAL ASSETS (1+2) 1361 986Important Indicators(i) Investment 5 5(ii) Capital Employed -265 -265(iii) Net Worth -265 -265(iv) Net Current Assets -783 -734(v) Cost of Sales 6058 4947(vi) Net Value Added (at market price) 4881 3136(vii) Total Regular Employees (Nos.) 1683 1683(viii) Avg. Monthly Emoluments per Employee(`) 21237 14320
PROFIT & LOSS ACCOUNT (` in Lakhs)PARTICULARS 2011-12 2010-11(I) Revenue from Operations (Gross) 6090 4860Less : Excise Duty 0 0Revenue from Operations (Net) 6090 4860(II) Other Income 0 0(III) Total Revenue (I+II) 6090 4860(IV) Expenditure on:(a) Cost of materials consumed 0 0(b) Purchase of stock-in-trade 0 0(c) Changes in inventories of finished goods, 0 0
work-in-progress and stock in trade(d) Stores & Spares 0 0(e) Power & Fuel 0 0(f) Salary, Wages & Benefits/Employees Expense 4289 2892(g) Other Operating/direct/manufacturing Expenses 0 0(h) Rent, Royalty & Cess 0 0(i) Loss on sale of Assets/Investments 0 0(j) Other Expenses 1769 2055Total Expenditure (IV (a to j)) 6058 4947(V) PROFIT BEFORE DEPRECIATION, & IMPAIRMENT, 32 -87
FINANCE CHARGES/INTEREST, EXCEPTIONAL &EXTRAORDINARY ITEMS & TAXES (PBDIEET)(III-IV)
(VI) Depreciation, Depletion & Amortisation 0 0(VII) Impairment 0 0(VIII) PROFIT BEFORE FINANCE COST/INTEREST, 32 -87
EXCEPTIONAL, EXTRA-ORDINARY ITEMS &TAXES (PBIEET)(V-VI-VII)
(IX) Finance Cost(a) On Central Government Loans 0 0(b) On Foreign Loans 0 0(c) Others 0 0(d) Less Finance Cost Capitalised 0 0(e) Charged to P & L Account (a+b+c+d) 0 0(X) PROFIT BEFORE EXCEPTIONAL & EXTRA- 32 -87
ORDINARY ITEMS & TAX (PBEET)(VIII-IXe)(XI) Exceptional Items 22 -33(XII) PROFIT BEFORE EXTRA-ORDINARY ITEMS & 10 -54
TAX (PBET)(X-XI)(XIII) Extra-Ordinary Items 0 0(XIV) PROFIT BEFORE TAX (PBT)(XII-XIII) 10 -54(XV) TAX PROVISIONS 36 -36(XVI) NET PROFIT / LOSS FOR THE PERIOD FROM -26 -18
CONTINUING OPERATIONS AFTER TAX(XIV-XV)(XVII) Profit/Loss from discontinuing operations 0 0(XVIII) Tax expenses of discontinuing operations 0 0(XIX) Profit/Loss from discontinuing operations 0 0
(after Tax)(XVII-XVIII)(XX) Profit/Loss for the period (XVI+XIX) -26 -18Financial Ratios(i) Sales : Capital Employed -2298.11 -1833.96(ii) Cost of Sales : Sales 99.47 101.79(iii) Salary/Wages : Sales 70.43 59.51(iv) Net Profit : Net Worth - -(v) Debt : Equity 0 0(vi) Current Ratio 0.49 0.38(vii) Trade Recievables : Sales 11.51 8.87(viii) Total Inventory : Sales 0 0
2011-12 Provisional

Transportation Services424
Air India Ltd.
The CompanyNational Aviation Company of India Ltd. (NACIL) (now Air
India Ltd.) was incorporated on 30.3.2007 and commenced itsbusiness from 14.05.2007 with the objective of synergizing theactivities of merged airlines (Air India and Indian Airlines) so as totake on the growing competition from the private airlines and largeinternational carriers. The merger was done under section 391-394of the Companies Act, 1956. During the year 2010-11, the name ofcompany changed to Air India Ltd. (AI).
Air India is a Schedule-'A' CPSE in Transport Services sectorunder the administrative control of the M/o Civil Aviation with100% shareholding by the Government of India. The companyemployed 28005 regular employees (Executives 6379 & Non-Executives 21626) as on 31.3.2012. Its registered office is at NewDelhi and corporate office is at Mumbai, Maharashtra.Industrial / Business Operations
The company provides domestic and international air transportservices within India as also across the globe. The aircraft fleet ofthe company consists of Airbus and Boeing aircraft such as A-319,A-320, A-321, B-777 and B-787. Air India comprises six StrategicBusiness Units (SBUs) comprising Passenger; Cargo; GroundHandling Services; Low Cost Carrier (LCCs); MRO (Airframesand Engines / Components); and Related Business. The mergedentity also has a Corporate Services Group. The company operatesfrom 5 regional and 4 offices abroad.
The company has five wholly owned subsidiaries namely HotelCorporation of India, Air-India Charters Ltd., Air India Air TransportServices Ltd., Air India Engineering Services Ltd., and Airlines AlliedServices Ltd. The company also has one 50:50 Joint Venture namelyAir India SATS Airport Services Private Ltd.Performance Highlights
The physical performances of the company for last two yearsare given below:
Total Revenue of the company registered an increaseof ` 651.80 crore during 2011-12, which went up from` 14062.01 crore in 2010-11 to ̀ 14713.81 crore in 2011-12 due toincrease in operational revenue. However, the loss of the companyhas gone up by ` 694.57 crore to ` 7559.74 crore in 2011-12, from` 6865.17 crore in previous year due to increase in cost of operationmainly on account of increase in Aircraft Fuel & Oil expenses andprior period adjustments.
The current ratio of company is at 0.16:1 during 2011-12 asagainst 0.13:1 in the previous year. Balance Sheet and Profit & LossAccount of the company and selected financial ratios during theperiod 2010-11 to 2011-12 can be seen on the adjoining page. www.airindia.in
Main Services Unit Performance during
2011-12 2010-11
Scheduled Traffic ` in Crore 12364.18 11457.00
Non Scheduled Traffic ` in Crore 1189.75 1239.48
Handling, Servicing & ` in Crore 1121.37 1279.55Incidental Revenue
EBIT
DA
& P
AT (
Rs.
cro
re) TO
TAL REVEN
UE (R
s. crore)
Fig. 1
Strategic issuesIn view of consolidation of the global aviation environment,
wherein critical / mass size is a key success factor, the Air India andIndian Airlines were merged in a single company. The merger wasexpected to provide an opportunity to leverage combined assetsand capital. Post merger, the new entity was expected to retainBrand Name "Air India" with "Maharaja" as its mascot. Along withsize, the new entity was expected to create considerable synergy,since the two airlines could feed traffic to each other. The synergybenefits were in the areas of route rationalization; fuel procurement;stores and inventory purchase both aircraft and non-aircraft;insurance benefits; handling of flights; and employee productivity.Besides, it was to result in redeployment of aircraft since Air Indiaand Indian Airlines were flying on some common routes in the Gulfand South East Asia.
Currently the Airline Industry has generally been affected byeconomic slowdown coupled with high fuel cost. The company hasduring the year adopted / implemented a Turnaround Plan (TAP)and a Financial Restructuring Plan (FRP) to improve its operationaland financial performance.

Public Enterprises Survey 2011-2012: Vol-II 425
Air India Ltd.Airlines House, 113, GurudwaraRakabgn Road, New Delhi - 110 001
BALANCE SHEET ( ` in Lakhs)PARTICULARS 2011-12 2010-11I. EQUITY & LIABILITIES
AUTHORISED CAPITAL 1100000 500005(1) Shareholders’ Funds(a) Share Capital(i) Central Govt 334500 214500(ii) Others 0 0(b) Reserves & Surplus -1978817 -1227379(c) Money received against share warrants 0 0Total Shareholders’ Funds (1(a)+1(b)+1(c) -1644317 -1012879(2) Share application money pending allotment 0 0(3) Non-current Liabilities(a) Long Term Borrowings 3062205 1758121(b) Deferred tax liabilities (Net) 0 0(c) Other Long-term liabilities 5815 5610(d) Long-term provisions 134592 126844Total Non-Current Liabilities 3(a) to 3(d) 3202612 1890575(4) Current Liabilities(a) Short Term Borrowings 1281951 2354901(b) Trade Payables 750468 416729(c) Other current liabilities 653101 422965(d) Short-term provisions 23346 17838Total Current Liabilities 4(a) to 4(d) 2708866 3212433TOTAL EQUITY & LIABILITIES (1+2+3+4) 4267161 4090129II. ASSETS(1) Non-Current Assets(a) Total Gross Fixed Assets 3128813 3071264(ai) Accumulated Depreciation, Depletion & Amortisation 0 0(aii) Accumulated Impairment 0 0(b) Total Net Fixed Assets ((a)-(ai)-(aii) 3128813 3071264(c) Capital work in progress 196441 184161(d) Intangible assets under developmet 10096 5442(e) Non-Current Investments 13430 13205(f) Deferred Tax Assets (Net) 284252 284252(g) Long Term Loans and Advances 198190 110924(h) Other Non-Current Assets 4156 936Total Non-Current Assets (b+c+d+e+f+g+h) 3835378 3670184(2) Current Assets(a) Current Investments 0 0(b) Inventories 90726 67596(c) Trade Recievables 184913 215151(d) Cash & Bank Balance 43101 41544(e) Short-term Loans & Advances 33647 23577(f) Other Current Assets 79396 72077Total Current Assets (a+b+c+d+e+f) 431783 419945TOTAL ASSETS (1+2) 4267161 4090129Important Indicators(i) Investment 3396705 1972621(ii) Capital Employed 1417888 745242(iii) Net Worth -1644317 -1012879(iv) Net Current Assets -2277083 -2792488(v) Cost of Sales 1974504 1805987(vi) Net Value Added (at market price) 49331 76794(vii) Total Regular Employees (Nos.) 28005 28085(viii) Avg. Monthly Emoluments per Employee(`) 106131 111314
PROFIT & LOSS ACCOUNT (` in Lakhs)PARTICULARS 2011-12 2010-11(I) Revenue from Operations (Gross) 1467530 1397603Less : Excise Duty 0 0Revenue from Operations (Net) 1467530 1397603(II) Other Income 3851 8598(III) Total Revenue (I+II) 1471381 1406201(IV) Expenditure on:(a) Cost of materials consumed 18365 32115(b) Purchase of stock-in-trade 0 0(c) Changes in inventories of finished goods, 0 0
work-in-progress and stock in trade(d) Stores & Spares 29758 59091(e) Power & Fuel 851167 611206(f) Salary, Wages & Benefits/Employees Expense 356665 375149(g) Other Operating/direct/manufacturing Expenses 415338 428134(h) Rent, Royalty & Cess 13102 9693(i) Loss on sale of Assets/Investments 6895 2093(j) Other Expenses 130426 121589Total Expenditure (IV (a to j)) 1821716 1639070(V) PROFIT BEFORE DEPRECIATION, & IMPAIRMENT, -350335 -232869
FINANCE CHARGES/INTEREST, EXCEPTIONAL &EXTRAORDINARY ITEMS & TAXES (PBDIEET)(III-IV)
(VI) Depreciation, Depletion & Amortisation 159683 169010(VII) Impairment 0 0(VIII) PROFIT BEFORE FINANCE COST/INTEREST, -510018 -401879
EXCEPTIONAL, EXTRA-ORDINARY ITEMS &TAXES (PBIEET)(V-VI-VII)
(IX) Finance Cost(a) On Central Government Loans 0 0(b) On Foreign Loans 71595 102750(c) Others 292954 221329(d) Less Finance Cost Capitalised 0 0(e) Charged to P & L Account (a+b+c+d) 364549 324079(X) PROFIT BEFORE EXCEPTIONAL & EXTRA- -874567 -725958
ORDINARY ITEMS & TAX (PBEET)(VIII-IXe)(XI) Exceptional Items -92241 -19474(XII) PROFIT BEFORE EXTRA-ORDINARY ITEMS & -782326 -706484
TAX (PBET)(X-XI)(XIII) Extra-Ordinary Items -26557 -20087(XIV) PROFIT BEFORE TAX (PBT)(XII-XIII) -755769 -686397(XV) TAX PROVISIONS 205 120(XVI) NET PROFIT / LOSS FOR THE PERIOD FROM -755974 -686517
CONTINUING OPERATIONS AFTER TAX(XIV-XV)(XVII) Profit/Loss from discontinuing operations 0 0(XVIII) Tax expenses of discontinuing operations 0 0(XIX) Profit/Loss from discontinuing operations 0 0
(after Tax)(XVII-XVIII)(XX) Profit/Loss for the period (XVI+XIX) -755974 -686517Financial Ratios(i) Sales : Capital Employed 103.5 187.54(ii) Cost of Sales : Sales 134.55 129.22(iii) Salary/Wages : Sales 24.3 26.84(iv) Net Profit : Net Worth - -(v) Debt : Equity 9.15 8.2(vi) Current Ratio 0.16 0.13(vii) Trade Recievables : Sales 12.6 15.39(viii) Total Inventory : Sales 6.18 4.84
2011-12 Provisional

Transportation Services426
Air India Charters Limited
The CompanyAir India Charters Limited (AICL) was incorporated on
9.09.1971 with the objective of undertaking Chartered operations /Flights and overcoming the situation created by discounting offares by Arab carriers and other non-scheduled operators. However,in 1988 through an amendment, the objective of the companychanged to provideing quality services to the client airlines. In2004-05, the company saw metamorphosis in its role from merelya service provider of ground handling and security to the firstinternational low cost, no frill budget airline from India
AICL is an un-categorised CPSE in Transport Services sectorunder the administrative control of M/o Civil Aviation. The companyemployed 277 regular employees (Executives 65 & Non-Executives212) as on 31.3.2012. Its Registered and Corporate offices are atMumbai, Maharashtra. AICL is a wholly owned subsidiary of AirIndia Ltd.
Industrial / Business OperationsAICL is engaged in providing various ground handling services.
The company took a new dimension in setting up a low cost servicenamely 'Air India Express' under its management from Kerala tocertain points in the Gulf which is considered to be advantageous tomillions of people working abroad especially in the Gulf & MiddleEast and South East Asia.
Company is engaged in providing three main services i.e.Passenger Carrier, Cargo Carrier, and Handling Services.
Performance Highlights The physical performances of the company for last two years
are given below:
Total Revenue of the company registered an increase of `29.80 crore during 2011-12, which went up from ̀ 1351.13 crorein 2010-11 to ̀ 1380.93 crore in 2011-12. However, the losses ofthe company has gone up by ` 211.28 crore to ` 602.50 crore in2011-12, from ` 391.22 crore in previous year due to increase inoperating expenses.
The current ratio of company is at 0.04:1 during 2011-12 asagainst 0.06:1 in the previous year. Balance Sheet and Profit &Loss Account of the company and selected financial ratios duringthe period 2010-11 to 2011-12 can be seen on the adjoining page.
www.airindia.in
Strategic issuesAs per the resolution passed by the Board of Directors and as
per the terms of amended MoU between National AviationCompany of India Limited (NACIL) and AICL, the revenue earnedby AICL will be shared in the ratio of 25% and 75% respectively,retrospectively, from 1st April, 2005. The company has madechanges in respect of providing deprecation on aircrafts and airframesequipments.
Main Services Unit Performance during
2011-12 2010-11
Passenger Revenue Rs. in Crore 1773.12 1673.04
Cargo Revenue Rs. in Crore 19.25 17.29
Mail Revenue Rs. in Crore 0.22 0.31
EBIT
DA
& P
AT (
Rs.
cro
re) TO
TAL REVEN
UE (R
s. crore)
Fig. 1

Public Enterprises Survey 2011-2012: Vol-II 427
Air India Charters Ltd.21st Floor, Air India Building, Nariman Point, Mumbai, Maharashtra-400 021
BALANCE SHEET ( ` in Lakhs)PARTICULARS 2011-12 2010-11I. EQUITY & LIABILITIES
AUTHORISED CAPITAL 3000 3000(1) Shareholders’ Funds(a) Share Capital(i) Central Govt 0 0(ii) Others 3000 3000(b) Reserves & Surplus -166988 -106529(c) Money received against share warrants 0 0Total Shareholders’ Funds (1(a)+1(b)+1(c) -163988 -103529(2) Share application money pending allotment 0 0(3) Non-current Liabilities(a) Long Term Borrowings 230579 232500(b) Deferred tax liabilities (Net) 0 0(c) Other Long-term liabilities 0 0(d) Long-term provisions 378 324Total Non-Current Liabilities 3(a) to 3(d) 230957 232824(4) Current Liabilities(a) Short Term Borrowings 105175 103919(b) Trade Payables 51770 32859(c) Other current liabilities 149309 94602(d) Short-term provisions 15 5Total Current Liabilities 4(a) to 4(d) 306269 231385TOTAL EQUITY & LIABILITIES (1+2+3+4) 373238 360680II. ASSETS(1) Non-Current Assets(a) Total Gross Fixed Assets 428982 398192(ai) Accumulated Depreciation, Depletion & Amortisation 81302 60646(aii) Accumulated Impairment 0 0(b) Total Net Fixed Assets ((a)-(ai)-(aii) 347680 337546(c) Capital work in progress 0 30(d) Intangible assets under developmet 0 0(e) Non-Current Investments 0 0(f) Deferred Tax Assets (Net) 0 0(g) Long Term Loans and Advances 2594 2282(h) Other Non-Current Assets 9214 7032Total Non-Current Assets (b+c+d+e+f+g+h) 359488 346890(2) Current Assets(a) Current Investments 0 0(b) Inventories 5353 4354(c) Trade Recievables 4759 3853(d) Cash & Bank Balance 2919 4990(e) Short-term Loans & Advances 715 590(f) Other Current Assets 4 3Total Current Assets (a+b+c+d+e+f) 13750 13790TOTAL ASSETS (1+2) 373238 360680Important Indicators(i) Investment 233579 235500(ii) Capital Employed 66591 128971(iii) Net Worth -163988 -103529(iv) Net Current Assets -292519 -217595(v) Cost of Sales 171569 152929(vi) Net Value Added (at market price) -24169 -8119(vii) Total Regular Employees (Nos.) 277 277(viii) Avg. Monthly Emoluments per Employee(`) 279994 291727
PROFIT & LOSS ACCOUNT (` in Lakhs)PARTICULARS 2011-12 2010-11(I) Revenue from Operations (Gross) 137781 131142Less : Excise Duty 0 0Revenue from Operations (Net) 137781 131142(II) Other Income 312 3971(III) Total Revenue (I+II) 138093 135113(IV) Expenditure on:(a) Cost of materials consumed 94730 72041(b) Purchase of stock-in-trade 0 0(c) Changes in inventories of finished goods, 0 0
work-in-progress and stock in trade(d) Stores & Spares 2940 0(e) Power & Fuel 20 21(f) Salary, Wages & Benefits/Employees Expense 9307 9697(g) Other Operating/direct/manufacturing Expenses 33078 34100(h) Rent, Royalty & Cess 0 0(i) Loss on sale of Assets/Investments 0 0(j) Other Expenses 67 18091Total Expenditure (IV (a to j)) 140142 133950(V) PROFIT BEFORE DEPRECIATION, & IMPAIRMENT, -2049 1163
FINANCE CHARGES/INTEREST, EXCEPTIONAL &EXTRAORDINARY ITEMS & TAXES (PBDIEET)(III-IV)
(VI) Depreciation, Depletion & Amortisation 31427 18979(VII) Impairment 0 0(VIII) PROFIT BEFORE FINANCE COST/INTEREST, -33476 -17816
EXCEPTIONAL, EXTRA-ORDINARY ITEMS &TAXES (PBIEET)(V-VI-VII)
(IX) Finance Cost(a) On Central Government Loans 0 0(b) On Foreign Loans 0 0(c) Others 26774 21353(d) Less Finance Cost Capitalised 0 0(e) Charged to P & L Account (a+b+c+d) 26774 21353(X) PROFIT BEFORE EXCEPTIONAL & EXTRA- -60250 -39169
ORDINARY ITEMS & TAX (PBEET)(VIII-IXe)(XI) Exceptional Items 0 0(XII) PROFIT BEFORE EXTRA-ORDINARY ITEMS & -60250 -39169
TAX (PBET)(X-XI)(XIII) Extra-Ordinary Items 0 0(XIV) PROFIT BEFORE TAX (PBT)(XII-XIII) -60250 -39169(XV) TAX PROVISIONS 0 -47(XVI) NET PROFIT / LOSS FOR THE PERIOD FROM -60250 -39122
CONTINUING OPERATIONS AFTER TAX(XIV-XV)(XVII) Profit/Loss from discontinuing operations 0 0(XVIII) Tax expenses of discontinuing operations 0 0(XIX) Profit/Loss from discontinuing operations 0 0
(after Tax)(XVII-XVIII)(XX) Profit/Loss for the period (XVI+XIX) -60250 -39122Financial Ratios(i) Sales : Capital Employed 206.91 101.68(ii) Cost of Sales : Sales 124.52 116.61(iii) Salary/Wages : Sales 6.75 7.39(iv) Net Profit : Net Worth - -(v) Debt : Equity 76.86 77.5(vi) Current Ratio 0.04 0.06(vii) Trade Recievables : Sales 3.45 2.94(viii) Total Inventory : Sales 3.89 3.32
2011-12 Provisional

Transportation Services428
Central Inland Water Transport Corp. Ltd.
The CompanyCentral Inland Water Transport Corp. Ltd. (CIWTC) was
incorporated on 22.2.1967 to take over the assets of the erstwhileRivers Steams Navigation Company Ltd. with an objective to utilizethe Inland Water Transport (IWT) mode of transportation as anoperator.
CIWTC is a Schedule-'C' BRPSE referred sick taken over CPSEin Transport Services Sector under the administrative control of M/o Shipping, Road Transport and Highways, Department of Shippingwith 99.78% shareholding by the Government of India. Thecompany employed 370 regular employees (Executives 21, Non-executives 349) as on 31.3.2011. Its Registered and Corporate officesare at Kolkata, West Bengal.
Vision / MissionThe Vision of the Company is to see that IWT sector prosper
competitively at par with the rest of the transportation modes viz.road, rail and air.
The Mission of the Company is to operate IWT services andto strive for achieving the break even in the shortest possible timeby continuously reducing the operational cost and losses.
Industrial / Business OperationsCIWTC is engaged in transportation of Cargo on the route of
N.W.-I, N.W.-II, Bangladesh, Sector and lighterage operation inriver Hooghly through its single operating unit namely River ServiceDivision Kolkata, West Bengal.
Performance HighlightsThe physical performances of the company for last two years
are given below:
Total Revenue of the company registered an increase of` 1.39 crore during 2011-12, which went up from ` 19.21 crore in2010-11 to ` 20.60 crore in 2011-12 due to increase in otherincome.The net loss of the companyhowever increased to` 13.08 crore in 2011-12 from ̀ 5.06 crorein previous year showingan increase in loss of ` 8.02 crore due to fall in turnover andaccounting of interest of ` 16.27 crore on income tax dues for theearlier years.During the year 2011-12, company got a budget supportof ` 10.29 crore from Government of India for wages & salary asgrant.
The current ratio of company is at 0.66:1 during 2011-12 asagainst 0.69:1 in the previous year. Balance Sheet and Profit &Loss Account of the company and selected financial ratios duringthe period 2010-11 to 2011-12 can be seen on the adjoining page.
www.ciwtcltd.com
Strategic issueRevival scheme for the company was sanctioned by the
Government of India in 2001 and a new revival scheme wassanctioned in 2005 on the basis of the recommendations of BRPSE.As per the revival plan, one unit for ship building and ship repairingviz. Rajabagan Dockyard (RBD) was to be handed over to GardenReach Shipbuilders & Engineers Limited (GRSE) or to any PSE onoutright purchase/ long term lease/ management contract basis, write-off of interest and conversion of outstanding principal into equityand reducing the same against losses, and introduction of VRS tobring down manpower level to 43. Disinvestment of the company(minus RBD) is to be taken up in favor of private parties afterimplantation of the above proposal.
Main Product / Unit Performance duringServices
2011-12 2010-11
I.W.T Transportation M T 30693 42882of Cargo
EBIT
DA
& P
AT (
Rs.
cro
re) TO
TAL REVEN
UE (R
s. crore)
Fig. 1

Public Enterprises Survey 2011-2012: Vol-II 429
Central Inland Water Transport Corpn. Ltd.4, Fairlie Place, Kolkata, West Bengal- 700001
BALANCE SHEET ( ` in Lakhs)PARTICULARS 2011-12 2010-11I. EQUITY & LIABILITIES
AUTHORISED CAPITAL 25100 25100(1) Shareholders’ Funds(a) Share Capital(i) Central Govt 13034 13034(ii) Others 15 15(b) Reserves & Surplus -17649 -16341(c) Money received against share warrants 0 0Total Shareholders’ Funds (1(a)+1(b)+1(c) -4600 -3292(2) Share application money pending allotment 0 0(3) Non-current Liabilities(a) Long Term Borrowings 0 0(b) Deferred tax liabilities (Net) 0 0(c) Other Long-term liabilities 0 0(d) Long-term provisions 762 1023Total Non-Current Liabilities 3(a) to 3(d) 762 1023(4) Current Liabilities(a) Short Term Borrowings 0 0(b) Trade Payables 2853 2764(c) Other current liabilities 925 1043(d) Short-term provisions 17374 15490Total Current Liabilities 4(a) to 4(d) 21152 19297TOTAL EQUITY & LIABILITIES (1+2+3+4) 17314 17028II. ASSETS(1) Non-Current Assets(a) Total Gross Fixed Assets 11119 11119(ai) Accumulated Depreciation, Depletion & Amortisation 7838 7505(aii) Accumulated Impairment 0 0(b) Total Net Fixed Assets ((a)-(ai)-(aii) 3281 3614(c) Capital work in progress 38 0(d) Intangible assets under developmet 0 0(e) Non-Current Investments 0 0(f) Deferred Tax Assets (Net) 0 0(g) Long Term Loans and Advances 0 0(h) Other Non-Current Assets 65 58Total Non-Current Assets (b+c+d+e+f+g+h) 3384 3672(2) Current Assets(a) Current Investments 0 0(b) Inventories 66 64(c) Trade Recievables 1760 1730(d) Cash & Bank Balance 12034 11464(e) Short-term Loans & Advances 0 0(f) Other Current Assets 70 98Total Current Assets (a+b+c+d+e+f) 13930 13356TOTAL ASSETS (1+2) 17314 17028Important Indicators(i) Investment 13049 13049(ii) Capital Employed -4600 -3292(iii) Net Worth -4600 -3292(iv) Net Current Assets -7222 -5941(v) Cost of Sales 1519 1910(vi) Net Value Added (at market price) 582 -132(vii) Total Regular Employees (Nos.) 370 390(viii) Avg. Monthly Emoluments per Employee(`) 19662 22842
PROFIT & LOSS ACCOUNT (` in Lakhs)PARTICULARS 2011-12 2010-11(I) Revenue from Operations (Gross) 131 151Less : Excise Duty 0 0Revenue from Operations (Net) 131 151(II) Other Income 1929 1783(III) Total Revenue (I+II) 2060 1934(IV) Expenditure on:(a) Cost of materials consumed 33 15(b) Purchase of stock-in-trade 0 0(c) Changes in inventories of finished goods, -38 0
work-in-progress and stock in trade(d) Stores & Spares 0 0(e) Power & Fuel 46 57(f) Salary, Wages & Benefits/Employees Expense 873 1069(g) Other Operating/direct/manufacturing Expenses 57 34(h) Rent, Royalty & Cess 0 0(i) Loss on sale of Assets/Investments 0 0(j) Other Expenses 215 379Total Expenditure (IV (a to j)) 1186 1554(V) PROFIT BEFORE DEPRECIATION, & IMPAIRMENT, 874 380
FINANCE CHARGES/INTEREST, EXCEPTIONAL &EXTRAORDINARY ITEMS & TAXES (PBDIEET)(III-IV)
(VI) Depreciation, Depletion & Amortisation 333 356(VII) Impairment 0 0(VIII) PROFIT BEFORE FINANCE COST/INTEREST, 541 24
EXCEPTIONAL, EXTRA-ORDINARY ITEMS &TAXES (PBIEET)(V-VI-VII)
(IX) Finance Cost(a) On Central Government Loans 0 0(b) On Foreign Loans 0 0(c) Others 1627 0(d) Less Finance Cost Capitalised 0 0(e) Charged to P & L Account (a+b+c+d) 1627 0(X) PROFIT BEFORE EXCEPTIONAL & EXTRA- -1086 24
ORDINARY ITEMS & TAX (PBEET)(VIII-IXe)(XI) Exceptional Items 0 0(XII) PROFIT BEFORE EXTRA-ORDINARY ITEMS & -1086 24
TAX (PBET)(X-XI)(XIII) Extra-Ordinary Items -41 289(XIV) PROFIT BEFORE TAX (PBT)(XII-XIII) -1045 -265(XV) TAX PROVISIONS 264 228(XVI) NET PROFIT / LOSS FOR THE PERIOD FROM -1309 -493
CONTINUING OPERATIONS AFTER TAX(XIV-XV)(XVII) Profit/Loss from discontinuing operations 0 0(XVIII) Tax expenses of discontinuing operations 0 0(XIX) Profit/Loss from discontinuing operations 0 0
(after Tax)(XVII-XVIII)(XX) Profit/Loss for the period (XVI+XIX) -1309 -493Financial Ratios(i) Sales : Capital Employed -2.85 -4.59(ii) Cost of Sales : Sales 1159.54 1264.9(iii) Salary/Wages : Sales 666.41 707.95(iv) Net Profit : Net Worth - -(v) Debt : Equity 0 0(vi) Current Ratio 0.66 0.69(vii) Trade Recievables : Sales 1343.51 1145.7(viii) Total Inventory : Sales 50.38 42.38
2011-12 Provisional

Transportation Services430
Container Corporation of India Limited
The CompanyContainer Corporation of India Limited (CONCOR) was
incorporated on 10.03.1988 and began its operation in November1989 by taking over seven ICDs from the Indian Railways and toserve as a catalyst for boosting India's EXIM and Domestic tradeand commerce by providing efficient and reliable multimodal logisticsupport and to ensure growing stakeholder value.
CONCOR is a Schedule 'A', listed Miniratna CPSE intransportation services sector under the administrative control ofMinistry of Railways with 63.09% shareholding by the Governmentof India. The company employed 1164 regular employees(Executives 421, Non-executives 743) as on 31.3.2012. It'sRegistered and Corporate Offices are at New Delhi.Vision / Mission
The Vision of the company is to provide responsive, costeffective, efficient and reliable logistics solutions to its customersthrough synergy with community partners and ensuring profitabilityand growth.
The Mission of the company is to join its community partnersand stake holders to make CONCOR a company of outstandingquality.Industrial / Business Operations
The company operates as a carrier, Inland port operator andterminal services provider. The Company's main function is toprovide cost effective and reliable logistics support services to itscustomers. The bouquet of logistics services that are offered totrade comprises of operation of Inland Ports and DomesticContainer Terminals transportation by rail, road, warehousing,storage, end-to-end logistics solutions, movement of refrigeratedcargo in containers and providing other value added solutions.The Company has established itself as the leading logisticscompany in the country.
At present, CONCOR has one subsidiary, 12 joint ventures, 8regional offices along with 62 terminals of which 48 are EXIMterminals and 14 exclusive Domestic terminals. These terminals areconnected by rail/road across the length and breadth of the country.
During the last fiscal year 270 BLC wagons were added to theexisting fleet of owned wagons; increasing the holding of high speedwagon to 9,631 units. With these, the total wagon holding is now10,988 numbers as at the end of the fiscal.Performance Highlights
CONCOR core business is characterized by three distinctactivities transportation, terminal operator and CFS/ Warehouseoperator. 57 business units have been ISO certified. The physicalperformances of the company for last two years are given below:
Main Product / Unit Performance duringServices
2011-12 2010-11
International Handling TEUs 21,36,000 20,18,551 (EXIM)
Domestic Handling TEUs 4,68,311 5,43,746
Total Handling TEUs 26,04,311 25,62,297(EXIM + Domestic)
Fig. 2
Total Revenue of the company registered an increaseof ` 345.38 crore during 2011-12, which went up fromRs. 4032.11 crore in 2010-11 to ` 4377.49 crore in 2011-12.
The net profit of the company however increased by` 1.93 crore only to ` 877.88 crore during 2011-12 from` 875.95 crore during previous year due to increase in operatingexpenses along with growth in the operating turnover and increasein other income.
The current ratio of company is at 5.48:1 during 2011-12 asagainst 5.88:1 in the previous year (Fig.2). Balance Sheet and Profit& Loss Account of the company and selected financial ratios duringthe period 2010-11 to 2011-12 can be seen on the adjoining page.
EBIT
DA
& P
AT (
Rs.
cro
re)
TOTAL R
EVENU
E (Rs. crore)
Fig. 1
PRO
FITA
BIL
ITY
RAT
IOS
(%)
CU
RR
ENT R
ATIO
Fig. 2
Strategic issueCONCOR is competing with not only the other Container
Train Operators but also with road transporter to bring back asmuch traffic to its fold as possible, keeping the overall objective ofimproving the rail share traffic.

Public Enterprises Survey 2011-2012: Vol-II 431
Container Corporation of India Ltd.CONCOR Bhawan, C-3 Mathura Road, Opposite Apollo Hospital, New Delhi-110 076
BALANCE SHEET ( ` in Lakhs)PARTICULARS 2011-12 2010-11I. EQUITY & LIABILITIES
AUTHORISED CAPITAL 20000 20000(1) Shareholders’ Funds(a) Share Capital(i) Central Govt 8200 8200(ii) Others 4798 4798(b) Reserves & Surplus 547645 484783(c) Money received against share warrants 0 0Total Shareholders’ Funds (1(a)+1(b)+1(c) 560643 497781(2) Share application money pending allotment 0 0(3) Non-current Liabilities(a) Long Term Borrowings 0 0(b) Deferred tax liabilities (Net) 24378 22856(c) Other Long-term liabilities 2164 5132(d) Long-term provisions 2281 1794Total Non-Current Liabilities 3(a) to 3(d) 28823 29782(4) Current Liabilities(a) Short Term Borrowings 0 0(b) Trade Payables 13189 11636(c) Other current liabilities 31706 22929(d) Short-term provisions 15397 13613Total Current Liabilities 4(a) to 4(d) 60292 48178TOTAL EQUITY & LIABILITIES (1+2+3+4) 649758 575741II. ASSETS(1) Non-Current Assets(a) Total Gross Fixed Assets 350378 328615(ai) Accumulated Depreciation, Depletion & Amortisation 111008 95913(aii) Accumulated Impairment 0 0(b) Total Net Fixed Assets ((a)-(ai)-(aii) 239370 232702(c) Capital work in progress 11512 10690(d) Intangible assets under developmet 5 41(e) Non-Current Investments 29310 24396(f) Deferred Tax Assets (Net) 0 0(g) Long Term Loans and Advances 38187 24273(h) Other Non-Current Assets 792 425Total Non-Current Assets (b+c+d+e+f+g+h) 319176 292527(2) Current Assets(a) Current Investments 0 0(b) Inventories 817 626(c) Trade Recievables 1959 1727(d) Cash & Bank Balance 276150 229568(e) Short-term Loans & Advances 40855 44370(f) Other Current Assets 10801 6923Total Current Assets (a+b+c+d+e+f) 330582 283214TOTAL ASSETS (1+2) 649758 575741Important Indicators(i) Investment 12998 12998(ii) Capital Employed 560643 497781(iii) Net Worth 560643 497781(iv) Net Current Assets 270290 235036(v) Cost of Sales 319571 297383(vi) Net Value Added (at market price) 147309 133988(vii) Total Regular Employees (Nos.) 1164 1147(viii) Avg. Monthly Emoluments per Employee(`) 71528 63521
PROFIT & LOSS ACCOUNT (` in Lakhs)PARTICULARS 2011-12 2010-11(I) Revenue from Operations (Gross) 406095 383485Less : Excise Duty 0 0Revenue from Operations (Net) 406095 383485(II) Other Income 31654 19726(III) Total Revenue (I+II) 437749 403211(IV) Expenditure on:(a) Cost of materials consumed 0 0(b) Purchase of stock-in-trade 0 0(c) Changes in inventories of finished goods, 0 0
work-in-progress and stock in trade(d) Stores & Spares 504 267(e) Power & Fuel 2300 1403(f) Salary, Wages & Benefits/Employees Expense 9991 8743(g) Other Operating/direct/manufacturing Expenses 271901 255740(h) Rent, Royalty & Cess 199 167(i) Loss on sale of Assets/Investments 0 0(j) Other Expenses 18827 16540Total Expenditure (IV (a to j)) 303722 282860(V) PROFIT BEFORE DEPRECIATION, & IMPAIRMENT, 134027 120351
FINANCE CHARGES/INTEREST, EXCEPTIONAL &EXTRAORDINARY ITEMS & TAXES (PBDIEET)(III-IV)
(VI) Depreciation, Depletion & Amortisation 15849 14523(VII) Impairment 0 0(VIII) PROFIT BEFORE FINANCE COST/INTEREST, 118178 105828
EXCEPTIONAL, EXTRA-ORDINARY ITEMS &TAXES (PBIEET)(V-VI-VII)
(IX) Finance Cost(a) On Central Government Loans 0 0(b) On Foreign Loans 0 0(c) Others 0 0(d) Less Finance Cost Capitalised 0 0(e) Charged to P & L Account (a+b+c+d) 0 0(X) PROFIT BEFORE EXCEPTIONAL & EXTRA- 118178 105828
ORDINARY ITEMS & TAX (PBEET)(VIII-IXe)(XI) Exceptional Items 0 0(XII) PROFIT BEFORE EXTRA-ORDINARY ITEMS & 118178 105828
TAX (PBET)(X-XI)(XIII) Extra-Ordinary Items 0 0(XIV) PROFIT BEFORE TAX (PBT)(XII-XIII) 118178 105828(XV) TAX PROVISIONS 30390 18233(XVI) NET PROFIT / LOSS FOR THE PERIOD FROM 87788 87595
CONTINUING OPERATIONS AFTER TAX(XIV-XV)(XVII) Profit/Loss from discontinuing operations 0 0(XVIII) Tax expenses of discontinuing operations 0 0(XIX) Profit/Loss from discontinuing operations 0 0
(after Tax)(XVII-XVIII)(XX) Profit/Loss for the period (XVI+XIX) 87788 87595Financial Ratios(i) Sales : Capital Employed 72.43 77.04(ii) Cost of Sales : Sales 78.69 77.55(iii) Salary/Wages : Sales 2.46 2.28(iv) Net Profit : Net Worth 15.66 17.6(v) Debt : Equity 0 0(vi) Current Ratio 5.48 5.88(vii) Trade Recievables : Sales 0.48 0.45(viii) Total Inventory : Sales 0.2 0.16

Transportation Services432
The CompanyDredging Corporation of India Limited (DCI) was incorporated
on 29-3-1976 under the Companies Act, 1956 with an objective toprovide integrated dredging and related marine services for promotingthe national and international maritime trade, beach nourishment,reclamation, inland dredging, environmental protection, etc. and tobecome a global player in the field of dredging.
DCI is a schedule -'B' / Miniratna listed CPSE in TransportationServices Sector under the administrative control of M/o Shipping,D/o Shipping, with 78.56% shareholding by the Government. Thecompany employed 631 regular employees (Executives 303, Non-Executives 328) as on 31.3.2012. Its Registered Office is at Delhiand Corporate office at Visakhapatnam, Andhra Pradesh.
Vision / MissionThe Vision / Mission of the Company is to provide integrated
dredging and related marine services for promoting the national andinternational maritime trade beach nourishment reclamation inlanddredging environmental protection and to become a global player inthe field of dredging.
Industrial / Business OperationsDCI is engaged in providing services in the field of maintenance
dredging, capital dredging, beach nourishment, reclamation andenvironmental protection through its different Project Offices outof which one each are located in the states of Andhra Pradesh,Karnataka, Orissa, Tamilnadu and two in West Bengal. As on31.3.2012, the company has among others, 10 Trailer SuctionHopper Dredgers (TSHD), 3 Cutter Suction Dredgers (CSD) andone Back Hoe Dredger apart from other ancillary crafts. DCI'scustomers include Major Ports under M/o Shipping, Non-MajorPorts under Government of India and State Governments, privateports, the Indian Navy and shipyards.
Performance HighlightsThe physical performances of the company for last two years
are given below:
Total Revenue of the company registered a reduction of` 18.14 crore during 2011-12, which went down from` 522.72 crore in 2010-11 to ` 504.58 crore in 2011-12 due toreduction in operational income as result of differential costadjustment (cost plus contract) for the year 2010-11 and shortfallin available dredging days due to non-availability of vessels andageing dredgers and their prolonged lay-ups.
The net profit of the company however increased to` 13.18 crore, a growth of ` 18.54 crore over the previous year'sloss of ` 5.36 core due to reduction in other expenses.
Dredging Corporation of India Limited
The current ratio of company is at 3.41:1 during 2011-12 asagainst 3.50:1 in the previous year (Fig.2). Balance Sheet and Profit& Loss Account of the company and selected financial ratios duringthe period 2010-11 to 2011-12 can be seen on the adjoining page.
www.dci.gov.in
Main Services Unit Performance during
2011-12 2010-11
Dredging DAYS 2200 2878
% capacity utilization %. 61 79
EBIT
DA
& P
AT (
Rs.
cro
re) TO
TAL REVEN
UE (R
s. crore)
Fig. 1PR
OFI
TAB
ILIT
Y R
ATIO
S (%
)
CU
RR
ENT R
ATIO
Fig. 2
Strategic issueThe Indian dredging market is primarily maintenance dredging
oriented. However, some capital dredging projects are also in theoffing. DCI has already secured the Ennore Capital dredging projecton tender basis.
In the future, increased private sector participation in portdevelopment and related capital dredging activity is expected.Accordingly, the customer profile of DCI's is expected to change.Other developments include deeper draught requirements of Indianports, tourism development, increasing need for beach nourishment,land reclamation for low lying area.

Public Enterprises Survey 2011-2012: Vol-II 433
Dredging Corporation of India Ltd.Core2, 1st Floor, Scope Minar, Plot No. 2A&2B, Laxmi Nagar, District Centre, Delhi-110091
BALANCE SHEET ( ` in Lakhs)PARTICULARS 2011-12 2010-11I. EQUITY & LIABILITIES
AUTHORISED CAPITAL 3000 3000(1) Shareholders’ Funds(a) Share Capital(i) Central Govt 2200 2200(ii) Others 600 600(b) Reserves & Surplus 135373 134055(c) Money received against share warrants 0 0Total Shareholders’ Funds (1(a)+1(b)+1(c) 138173 136855(2) Share application money pending allotment 0 0(3) Non-current Liabilities(a) Long Term Borrowings 25995 0(b) Deferred tax liabilities (Net) 0 0(c) Other Long-term liabilities 120 156(d) Long-term provisions 516 577Total Non-Current Liabilities 3(a) to 3(d) 26631 733(4) Current Liabilities(a) Short Term Borrowings 94 120(b) Trade Payables 3080 8466(c) Other current liabilities 19882 18330(d) Short-term provisions 521 146Total Current Liabilities 4(a) to 4(d) 23577 27062TOTAL EQUITY & LIABILITIES (1+2+3+4) 188381 164650II. ASSETS(1) Non-Current Assets(a) Total Gross Fixed Assets 140085 126735(ai) Accumulated Depreciation, Depletion & Amortisation 86763 78011(aii) Accumulated Impairment 0 0(b) Total Net Fixed Assets ((a)-(ai)-(aii) 53322 48724(c) Capital work in progress 49 20(d) Intangible assets under developmet 4841 0(e) Non-Current Investments 3000 3000(f) Deferred Tax Assets (Net) 0 0(g) Long Term Loans and Advances 46771 18308(h) Other Non-Current Assets 0 0Total Non-Current Assets (b+c+d+e+f+g+h) 107983 70052(2) Current Assets(a) Current Investments 0 0(b) Inventories 9766 9187(c) Trade Recievables 38880 38238(d) Cash & Bank Balance 7832 23527(e) Short-term Loans & Advances 1360 6229(f) Other Current Assets 22560 17417Total Current Assets (a+b+c+d+e+f) 80398 94598TOTAL ASSETS (1+2) 188381 164650Important Indicators(i) Investment 28795 2800(ii) Capital Employed 164168 136855(iii) Net Worth 138173 136855(iv) Net Current Assets 56821 67536(v) Cost of Sales 48702 47785(vi) Net Value Added (at market price) 17210 16847(vii) Total Regular Employees (Nos.) 631 684(viii) Avg. Monthly Emoluments per Employee(`) 122636 81299
PROFIT & LOSS ACCOUNT (` in Lakhs)PARTICULARS 2011-12 2010-11(I) Revenue from Operations (Gross) 49166 50714Less : Excise Duty 0 0Revenue from Operations (Net) 49166 50714(II) Other Income 1292 1558(III) Total Revenue (I+II) 50458 52272(IV) Expenditure on:(a) Cost of materials consumed 0 0(b) Purchase of stock-in-trade 0 0(c) Changes in inventories of finished goods, 0 0
work-in-progress and stock in trade(d) Stores & Spares 4372 4161(e) Power & Fuel 16053 19948(f) Salary, Wages & Benefits/Employees Expense 9286 6673(g) Other Operating/direct/manufacturing Expenses 7879 3657(h) Rent, Royalty & Cess 100 40(i) Loss on sale of Assets/Investments 0 0(j) Other Expenses 2217 6274Total Expenditure (IV (a to j)) 39907 40753(V) PROFIT BEFORE DEPRECIATION, & IMPAIRMENT, 10551 11519
FINANCE CHARGES/INTEREST, EXCEPTIONAL &EXTRAORDINARY ITEMS & TAXES (PBDIEET)(III-IV)
(VI) Depreciation, Depletion & Amortisation 8795 7032(VII) Impairment 0 0(VIII) PROFIT BEFORE FINANCE COST/INTEREST, 1756 4487
EXCEPTIONAL, EXTRA-ORDINARY ITEMS &TAXES (PBIEET)(V-VI-VII)
(IX) Finance Cost(a) On Central Government Loans 0 0(b) On Foreign Loans 0 0(c) Others 0 0(d) Less Finance Cost Capitalised 0 0(e) Charged to P & L Account (a+b+c+d) 0 0(X) PROFIT BEFORE EXCEPTIONAL & EXTRA- 1756 4487
ORDINARY ITEMS & TAX (PBEET)(VIII-IXe)(XI) Exceptional Items 0 0(XII) PROFIT BEFORE EXTRA-ORDINARY ITEMS & 1756 4487
TAX (PBET)(X-XI)(XIII) Extra-Ordinary Items 0 0(XIV) PROFIT BEFORE TAX (PBT)(XII-XIII) 1756 4487(XV) TAX PROVISIONS 438 536(XVI) NET PROFIT / LOSS FOR THE PERIOD FROM 1318 3951
CONTINUING OPERATIONS AFTER TAX(XIV-XV)(XVII) Profit/Loss from discontinuing operations 0 0(XVIII) Tax expenses of discontinuing operations 0 0(XIX) Profit/Loss from discontinuing operations 0 0
(after Tax)(XVII-XVIII)(XX) Profit/Loss for the period (XVI+XIX) 1318 3951Financial Ratios(i) Sales : Capital Employed 29.95 37.06(ii) Cost of Sales : Sales 99.06 94.22(iii) Salary/Wages : Sales 18.89 13.16(iv) Net Profit : Net Worth 0.95 2.89(v) Debt : Equity 9.28 0(vi) Current Ratio 3.41 3.5(vii) Trade Recievables : Sales 79.08 75.4(viii) Total Inventory : Sales 19.86 18.12

Transportation Services434
Ennore Port Ltd.
The CompanyEnnore Port Ltd. (EPL) was developed near Chennai on the
East Coast of India. The Port was declared as Major Port under theIndian Port Act, 1908, in October 1999 and incorporated as acompany. Ennore Port was formally declared open in February2001 and commercial operation commenced in June 2001 with twocoal berths to handle coal needed for the Thermal Power Station ofTNEB in Tamil Nadu. Modern unloading equipment and conveyorshave been installed on the coal berths by TNEB. The capacity ofcoal handling facility is 12 MTPA.
It is a Schedule-'B' / Miniratna CPSE in Transport Servicessector under the administrative control of M/o Shipping with66.67% shareholding by the Government of India and the remainingby Chennai Port Trust. The company employed 94 regularemployees (Executives 51 & Non-Executives 43) as on 31.3.2012.Its Registered and Corporate offices are at Chennai, Tamilnadu.
Vision / MissionThe Vision of the Company is to provide Port Services of
International Standards. Mission of the Company is to develop Ennore Port as a mega
port with world class facilities to become the Eastern gateway Portof India.
Industrial / Business OperationsEPL is functioning on a Landlord Management Model. All the
cargo handling facilities are being developed mainly through privatesector on BOT basis. The common facilities such as creation ofnecessary depths in the harbor and in the channel by dredging, aidsto navigation, road / rail connectivity, etc. are funded and developedby EPL
Performance Highlights The physical performances of the company for last two years
are given below:
Total Revenue from of the company registered a increase of` 82.15 crore during 2011-12, which went up from ̀ 168.11 crorein 2010-11 to ̀ 250.26 crore in 2011-12. The profit of the companyhas gone up by ` 41.13 crore to ` 96.72 crore in 2011-12, from` 55.59 crore in previous year due increase in operating income asa result of increase in export of cars and increase in income fromhandling of Common User coal towards BOT Operations.
The current ratio of company is at 0.47:1 during 2011-12 asagainst 0.29:1 in the previous year (Fig.2). Balance Sheet and Profit
& Loss Account of the company and selected financial ratios duringthe period 2010-11 to 2011-12 can be seen on the adjoining page.
www. ennoreport.gov.in
Services Units Unit Performance during
2011-12 2010-11
Port Services # Million M.T. 14.96 11.50
# Coal, Iron Ore , POL,& other cargo etc.
Fig. 2
EBIT
DA
& P
AT (
Rs.
cro
re)
TOTAL R
EVENU
E (Rs. crore)
PRO
FITA
BIL
ITY
RAT
IOS
(%)
CU
RR
ENT R
ATIO
Fig. 1
Strategic issuesThe other objective of the company is to increase cargo handling
capacity from the present 24.5 MMTPA to 61.5 MMTPA by2014-15 through development of state of art new terminals withPublic Private Partnership and internal and Extra BudgetaryResources. The company has drawn proposal to the extent of ̀ 1852crores during 12th Five Year Plan period. Further, the company hasplanned to attract ` 6000 crore investment from Private / CaptivePort Operator through PPP model during 12th Five Year Plan. Theongoing expansion projects will result in enhancing the capacity ofEnnore Port from 30 MTPA to 66 MTPA by the end of the 12thFive year plan.

Public Enterprises Survey 2011-2012: Vol-II 435
Ennore Port Ltd.P.T. Lee Chengalvaraya Naicker Maaligai, 23, Rajaji Salai, Chennai, Tamilnadu-600001
BALANCE SHEET ( ` in Lakhs)PARTICULARS 2011-12 2010-11I. EQUITY & LIABILITIES
AUTHORISED CAPITAL 50000 50000(1) Shareholders’ Funds(a) Share Capital(i) Central Govt 20000 20000(ii) Others 10000 10000(b) Reserves & Surplus 23805 16381(c) Money received against share warrants 0 0Total Shareholders’ Funds (1(a)+1(b)+1(c) 53805 46381(2) Share application money pending allotment 0 0(3) Non-current Liabilities(a) Long Term Borrowings 37004 40374(b) Deferred tax liabilities (Net) 0 0(c) Other Long-term liabilities 716 385(d) Long-term provisions 0 0Total Non-Current Liabilities 3(a) to 3(d) 37720 40759(4) Current Liabilities(a) Short Term Borrowings 0 0(b) Trade Payables 418 94(c) Other current liabilities 17512 14082(d) Short-term provisions 7725 4927Total Current Liabilities 4(a) to 4(d) 25655 19103TOTAL EQUITY & LIABILITIES (1+2+3+4) 117180 106243II. ASSETS(1) Non-Current Assets(a) Total Gross Fixed Assets 99918 86389(ai) Accumulated Depreciation, Depletion & Amortisation 11605 10287(aii) Accumulated Impairment 0 0(b) Total Net Fixed Assets ((a)-(ai)-(aii) 88313 76102(c) Capital work in progress 7003 9994(d) Intangible assets under developmet 0 0(e) Non-Current Investments 4752 4378(f) Deferred Tax Assets (Net) 0 0(g) Long Term Loans and Advances 5008 10316(h) Other Non-Current Assets 0 0Total Non-Current Assets (b+c+d+e+f+g+h) 105076 100790(2) Current Assets(a) Current Investments 0 0(b) Inventories 0 479(c) Trade Recievables 2091 994(d) Cash & Bank Balance 5047 531(e) Short-term Loans & Advances 4894 3439(f) Other Current Assets 72 10Total Current Assets (a+b+c+d+e+f) 12104 5453TOTAL ASSETS (1+2) 117180 106243Important Indicators(i) Investment 67004 70374(ii) Capital Employed 90809 86755(iii) Net Worth 53805 46381(iv) Net Current Assets -13551 -13650(v) Cost of Sales 5748 4558(vi) Net Value Added (at market price) 21448 13775(vii) Total Regular Employees (Nos.) 94 88(viii) Avg. Monthly Emoluments per Employee(`) 67819 56534
PROFIT & LOSS ACCOUNT (` in Lakhs)PARTICULARS 2011-12 2010-11(I) Revenue from Operations (Gross) 24865 16731Less : Excise Duty 0 0Revenue from Operations (Net) 24865 16731(II) Other Income 161 80(III) Total Revenue (I+II) 25026 16811(IV) Expenditure on:(a) Cost of materials consumed 0 0(b) Purchase of stock-in-trade 0 0(c) Changes in inventories of finished goods, 0 0
work-in-progress and stock in trade(d) Stores & Spares 0 0(e) Power & Fuel 212 143(f) Salary, Wages & Benefits/Employees Expense 765 597(g) Other Operating/direct/manufacturing Expenses 2494 1670(h) Rent, Royalty & Cess 23 28(i) Loss on sale of Assets/Investments 0 0(j) Other Expenses 929 827Total Expenditure (IV (a to j)) 4423 3265(V) PROFIT BEFORE DEPRECIATION, & IMPAIRMENT, 20603 13546
FINANCE CHARGES/INTEREST, EXCEPTIONAL &EXTRAORDINARY ITEMS & TAXES (PBDIEET)(III-IV)
(VI) Depreciation, Depletion & Amortisation 1325 1293(VII) Impairment 0 0(VIII) PROFIT BEFORE FINANCE COST/INTEREST, 19278 12253
EXCEPTIONAL, EXTRA-ORDINARY ITEMS &TAXES (PBIEET)(V-VI-VII)
(IX) Finance Cost(a) On Central Government Loans 0 0(b) On Foreign Loans 0 0(c) Others 6616 4322(d) Less Finance Cost Capitalised 0 0(e) Charged to P & L Account (a+b+c+d) 6616 4322(X) PROFIT BEFORE EXCEPTIONAL & EXTRA- 12662 7931
ORDINARY ITEMS & TAX (PBEET)(VIII-IXe)(XI) Exceptional Items 566 945(XII) PROFIT BEFORE EXTRA-ORDINARY ITEMS & 12096 6986
TAX (PBET)(X-XI)(XIII) Extra-Ordinary Items 18 0(XIV) PROFIT BEFORE TAX (PBT)(XII-XIII) 12078 6986(XV) TAX PROVISIONS 2406 1428(XVI) NET PROFIT / LOSS FOR THE PERIOD FROM 9672 5558
CONTINUING OPERATIONS AFTER TAX(XIV-XV)(XVII) Profit/Loss from discontinuing operations 0 0(XVIII) Tax expenses of discontinuing operations 0 0(XIX) Profit/Loss from discontinuing operations 0 0
(after Tax)(XVII-XVIII)(XX) Profit/Loss for the period (XVI+XIX) 9672 5558Financial Ratios(i) Sales : Capital Employed 27.38 19.29(ii) Cost of Sales : Sales 23.12 27.24(iii) Salary/Wages : Sales 3.08 3.57(iv) Net Profit : Net Worth 17.98 11.98(v) Debt : Equity 1.23 1.35(vi) Current Ratio 0.47 0.29(vii) Trade Recievables : Sales 8.41 5.94(viii) Total Inventory : Sales 0 2.86

Transportation Services436
Fresh and Healthy Enterprises Ltd.
The CompanyFresh & Healthy Enterprises Limited (FHEL) is a wholly
owned subsidiary of Container Corporation of India (CONCOR).It was incorporated on 1.2.2006 with the objective to set up aworld class cold chain infrastructure in India, and to providecomplete cold chain logistics solutions to the various stakeholdersin this area.
FHEL is an un-categorized CPSE in transportation servicessector under Ministry of Railways. The company employed 33employees (Executives 16 & Non-Executives 17) as on 31.3.2012.Its Registered Office is in New Delhi and corporate office is atSonepat, Haryana.
Vision / MissionThe Vision / Mission of the Company is to develop into a
world class organization using state-of-the-art technologies forprocurement, transportation, storage, and distribution of fruits andvegetables in the country. This is to be achieved through setting upmodern controlled atmosphere storage facilities and by developingstrong long term linkages with farmers, agricultural institutes,logistics, operations and governmental agencies with emphasis oninformation technology solutions for all activities. The Companywill strive to provide value for money to its customers throughproviding qualitative and efficient services.
Industrial / Business OperationsFHEL is involved in the procurement, transportation, storage
and distribution of fruits and vegetables through integratedcontrolled atmosphere storage, operation & logistics through itsregional and works office at Shimla (H.P.) and Sonepat (Haryana)respectively.
Performance HighlightsThe Company started its operation in the year 2006-07 by
procuring apples from Shimla and Kinnaur districts of HimachalPradesh for which it commissioned 12000 MT State-of-art- CAStore, currently the largest in the country. The physical performancesof the company for last two years are given below:
Total Revenue of the company registered a reduction of ̀ 24.36crore during 2011-12, which went down from ̀ 64.65 crore in 2010-11 to ` 40.29 crore in 2011-12.
Accordingly as against a profit of ̀ 0.42 crore during 2010-11the company suffered a net loss of ` 12.22 crore during 2011-12mainly on account of high procurement cost. Income from operationwas low because of bad apple crop.
The current ratio of company is at 0.47 : 1 during 2011-12 asagainst 0.40 : 1 in the previous year. Balance Sheet and Profit &Loss Account of the company and selected financial ratios duringthe period 2010-11 to 2011-12 can be seen on the adjoining page.
www.fhel.co.in
Main Product / Unit Performance duringServices
2011-12 2010-11
Apple procured M T 6898 9361
Apple marketed M T 4805 9539
Strategic issueThe Company aims to establish standards of quality for fruits
and vegetables procured and marketed by the company. The broadapproach of FHEL is to source fresh produce directly from farmers,and then sell directly to retail chains. FHEL is also working withfarmers to adopt modern scientific orchard management techniquesto improve quality and yield.
EBIT
DA
& P
AT (
Rs.
cro
re)
TOTAL R
EVENU
E (Rs. crore)
Fig. 1

Public Enterprises Survey 2011-2012: Vol-II 437
Fresh and Healthy Enterprises Ltd.CONCOR Bhawan, C-3, Mathura Road, Opp. Apollo Hospital, New Delhi-110076
BALANCE SHEET ( ` in Lakhs)PARTICULARS 2011-12 2010-11I. EQUITY & LIABILITIES
AUTHORISED CAPITAL 5000 5000(1) Shareholders’ Funds(a) Share Capital(i) Central Govt 0 0(ii) Others 4827 4827(b) Reserves & Surplus -5113 -3891(c) Money received against share warrants 0 0Total Shareholders’ Funds (1(a)+1(b)+1(c) -286 936(2) Share application money pending allotment 0 0(3) Non-current Liabilities(a) Long Term Borrowings 2340 2964(b) Deferred tax liabilities (Net) 0 19(c) Other Long-term liabilities 0 0(d) Long-term provisions 45 28Total Non-Current Liabilities 3(a) to 3(d) 2385 3011(4) Current Liabilities(a) Short Term Borrowings 7159 3932(b) Trade Payables 83 98(c) Other current liabilities 1110 882(d) Short-term provisions 6 1Total Current Liabilities 4(a) to 4(d) 8358 4913TOTAL EQUITY & LIABILITIES (1+2+3+4) 10457 8860II. ASSETS(1) Non-Current Assets(a) Total Gross Fixed Assets 8177 8169(ai) Accumulated Depreciation, Depletion & Amortisation 1668 1307(aii) Accumulated Impairment 0 0(b) Total Net Fixed Assets ((a)-(ai)-(aii) 6509 6862(c) Capital work in progress 0 0(d) Intangible assets under developmet 0 0(e) Non-Current Investments 0 0(f) Deferred Tax Assets (Net) 0 0(g) Long Term Loans and Advances 47 46(h) Other Non-Current Assets 4 6Total Non-Current Assets (b+c+d+e+f+g+h) 6560 6914(2) Current Assets(a) Current Investments 0 0(b) Inventories 2782 622(c) Trade Recievables 1069 1237(d) Cash & Bank Balance 13 40(e) Short-term Loans & Advances 29 40(f) Other Current Assets 4 7Total Current Assets (a+b+c+d+e+f) 3897 1946TOTAL ASSETS (1+2) 10457 8860Important Indicators(i) Investment 7167 7791(ii) Capital Employed 2054 3900(iii) Net Worth -286 936(iv) Net Current Assets -4461 -2967(v) Cost of Sales 4444 5896(vi) Net Value Added (at market price) -126 788(vii) Total Regular Employees (Nos.) 33 33(viii) Avg. Monthly Emoluments per Employee(`) 46717 36111
PROFIT & LOSS ACCOUNT (` in Lakhs)PARTICULARS 2011-12 2010-11(I) Revenue from Operations (Gross) 3989 6435Less : Excise Duty 0 0Revenue from Operations (Net) 3989 6435(II) Other Income 40 30(III) Total Revenue (I+II) 4029 6465(IV) Expenditure on:(a) Cost of materials consumed 170 377(b) Purchase of stock-in-trade 4762 3542(c) Changes in inventories of finished goods, -2143 262
work-in-progress and stock in trade(d) Stores & Spares -20 0(e) Power & Fuel 228 186(f) Salary, Wages & Benefits/Employees Expense 185 143(g) Other Operating/direct/manufacturing Expenses 592 775(h) Rent, Royalty & Cess 24 24(i) Loss on sale of Assets/Investments 0 0(j) Other Expenses 284 223Total Expenditure (IV (a to j)) 4082 5532(V) PROFIT BEFORE DEPRECIATION, & IMPAIRMENT, -53 933
FINANCE CHARGES/INTEREST, EXCEPTIONAL &EXTRAORDINARY ITEMS & TAXES (PBDIEET)(III-IV)
(VI) Depreciation, Depletion & Amortisation 362 364(VII) Impairment 0 0(VIII) PROFIT BEFORE FINANCE COST/INTEREST, -415 569
EXCEPTIONAL, EXTRA-ORDINARY ITEMS &TAXES (PBIEET)(V-VI-VII)
(IX) Finance Cost(a) On Central Government Loans 0 0(b) On Foreign Loans 0 0(c) Others 826 508(d) Less Finance Cost Capitalised 0 0(e) Charged to P & L Account (a+b+c+d) 826 508(X) PROFIT BEFORE EXCEPTIONAL & EXTRA- -1241 61
ORDINARY ITEMS & TAX (PBEET)(VIII-IXe)(XI) Exceptional Items 0 0(XII) PROFIT BEFORE EXTRA-ORDINARY ITEMS & -1241 61
TAX (PBET)(X-XI)(XIII) Extra-Ordinary Items 0 0(XIV) PROFIT BEFORE TAX (PBT)(XII-XIII) -1241 61(XV) TAX PROVISIONS -19 19(XVI) NET PROFIT / LOSS FOR THE PERIOD FROM -1222 42
CONTINUING OPERATIONS AFTER TAX(XIV-XV)(XVII) Profit/Loss from discontinuing operations 0 0(XVIII) Tax expenses of discontinuing operations 0 0(XIX) Profit/Loss from discontinuing operations 0 0
(after Tax)(XVII-XVIII)(XX) Profit/Loss for the period (XVI+XIX) -1222 42Financial Ratios(i) Sales : Capital Employed 194.21 165(ii) Cost of Sales : Sales 111.41 91.62(iii) Salary/Wages : Sales 4.64 2.22(iv) Net Profit : Net Worth - 4.49(v) Debt : Equity 0.48 0.61(vi) Current Ratio 0.47 0.4(vii) Trade Recievables : Sales 26.8 19.22(viii) Total Inventory : Sales 69.74 9.67

Transportation Services438
Pawan Hans Helicopters Limited
The CompanyPawan Hans Helicopters Limited (PHHL) was incorporated
on 15-10-1985 with the objective to provide helicopter supportservices to meet the requirement of oil & non-oil sector, otherremote areas and to provide charter service to promote tourism.
PHHL is a Schedule-'B' CPSE in Transportation Services sectorunder the administrative control of M/o Civil Aviation with 51%shareholding by the Government of India and 49% is with ONGCLtd., a Navratna CPSE. The company employed 967 regular employees(Executives 200 & Non-Executives 767) as on 31.3.2012. Its registeredoffice is in New Delhi and corporate office is at Noida (U.P.).
Vision / MissionThe Vision of the company is to meet customer's expectations.
The Mission of the Company is to become a market leader in Asia inhelicopter operations and provide repair / overhaul services ofhelicopter components / assemblies at par with international standard.
Industrial / Business OperationsPHHL is engaged in providing Helicopter services in exploration
& production sector, connecting inaccessible & hilly areas in northeast, inter-island connectivity, pipeline surveillance, pilgrimageservices, hot line insulator washing for Power grid through its fleet of45 helicopters consisting of Dauphin, Bell and Mi-172 etc. Thecompany is also maintaining & operating helicopters owned by othercustomers such as Govt. of Bihar and Gujarat, BSF and ONGC.
Performance Highlights The physical performances of the company for last two years
are given below:
The current ratio of company is at 3.27:1 during 2011-12 asagainst 3.19:1 in the previous year (Fig.2). Balance Sheet and Profit& Loss Account of the company and selected financial ratios duringthe period 2010-11 to 2011-12 can be seen on the adjoining page.
www.pawanhans.co.in
Main Services Unit Performance during
2011-12 2010-11
Helicopter Flying Hrs. 31240 33670
Capacity Utiliation % 81% 83%
Total Revenue from of the company registered an increase of` 7.68 crore during 2011-12, which went up from ` 430.47 crorein 2010-11 to ` 438.15 crore in 2011-12. However, the companyhas shown a loss of ` 10.35 crore in 2011-12 as against a profit of` 18.51 crore in previous year due to reduction in total flyinghours, reduction in average fleet serviceability, reduction in averagemonthly deployment of helicopters and there were increase indepreciation charges (due to induction of 5 new helicopters) , higherliquidated damages , higher helicopter maintenance expenditure andincrease in interest charges paid on enhanced borrowings.
The main reason for lower flying hours was that helicopteroperation in North-East Region was suspended by DGCA fromMay 2011 to June 2011 in Sikkim, from May to July 2011 in Tripuraand MHA from May to Sep. 2011 after fatal accident of one Mi-172helicopter on 19.04.2011 and one B3 helicopter on 30.04.2011. Govt.of Meghahlya and Arunachal Pradesh cancelled the contract.
Strategic issuesThe company aims at to enhance its fleet of Helicopters in the
next few years. It is also considering adding Ultra Light and LightDouble Engine helicopters to its fleet in the near future. PHHL has alsolaunched an Aircraft Maintenance Engineering (AME) training instituteat Mumbai.
PHHL has signed an MOU with DGCA for development ofHadaspar Gliding Centre as a training institute and plans are underwayto operationalize it shortly. PHHL has given order for 2 Mi-172helicopters and delivery of which is expected in June 2012. PHHL is inthe process of acquiring Ultra Light in its fleet in the near future.
EBIT
DA
& P
AT (
Rs.
cro
re)
TOTAL R
EVENU
E (Rs. crore)
Fig. 1PR
OFI
TAB
ILIT
Y R
ATIO
S (%
)
CU
RR
ENT R
ATIO
Fig. 2

Public Enterprises Survey 2011-2012: Vol-II 439
Pawan Hans Helicopters Ltd.Safdarjung Airport, New Delhi-110003
BALANCE SHEET ( ` in Lakhs)PARTICULARS 2011-12 2010-11I. EQUITY & LIABILITIES
AUTHORISED CAPITAL 25000 25000(1) Shareholders’ Funds(a) Share Capital(i) Central Govt 12527 12527(ii) Others 12035 12035(b) Reserves & Surplus 22995 23976(c) Money received against share warrants 0 0Total Shareholders’ Funds (1(a)+1(b)+1(c) 47557 48538(2) Share application money pending allotment 0 0(3) Non-current Liabilities(a) Long Term Borrowings 23283 6410(b) Deferred tax liabilities (Net) 12653 9763(c) Other Long-term liabilities 47060 47069(d) Long-term provisions 3485 1962Total Non-Current Liabilities 3(a) to 3(d) 86481 65204(4) Current Liabilities(a) Short Term Borrowings 0 0(b) Trade Payables 3467 2391(c) Other current liabilities 7394 6807(d) Short-term provisions 2685 3451Total Current Liabilities 4(a) to 4(d) 13546 12649TOTAL EQUITY & LIABILITIES (1+2+3+4) 147584 126391II. ASSETS(1) Non-Current Assets(a) Total Gross Fixed Assets 134983 108470(ai) Accumulated Depreciation, Depletion & Amortisation 42833 38431(aii) Accumulated Impairment 953 954(b) Total Net Fixed Assets ((a)-(ai)-(aii) 91197 69085(c) Capital work in progress 2303 2935(d) Intangible assets under developmet 0 0(e) Non-Current Investments 289 289(f) Deferred Tax Assets (Net) 0 0(g) Long Term Loans and Advances 9069 13262(h) Other Non-Current Assets 393 408Total Non-Current Assets (b+c+d+e+f+g+h) 103251 85979(2) Current Assets(a) Current Investments 0 0(b) Inventories 7949 7037(c) Trade Recievables 16847 18432(d) Cash & Bank Balance 13561 11135(e) Short-term Loans & Advances 2597 2430(f) Other Current Assets 3379 1378Total Current Assets (a+b+c+d+e+f) 44333 40412TOTAL ASSETS (1+2) 147584 126391Important Indicators(i) Investment 47845 30972(ii) Capital Employed 70840 54948(iii) Net Worth 47557 48538(iv) Net Current Assets 30787 27763(v) Cost of Sales 42259 37668(vi) Net Value Added (at market price) 23244 21507(vii) Total Regular Employees (Nos.) 967 989(viii) Avg. Monthly Emoluments per Employee(`) 117141 102351
PROFIT & LOSS ACCOUNT (` in Lakhs)PARTICULARS 2011-12 2010-11(I) Revenue from Operations (Gross) 41354 41303Less : Excise Duty 0 0Revenue from Operations (Net) 41354 41303(II) Other Income 2461 1744(III) Total Revenue (I+II) 43815 43047(IV) Expenditure on:(a) Cost of materials consumed 0 0(b) Purchase of stock-in-trade 0 0(c) Changes in inventories of finished goods, 0 0
work-in-progress and stock in trade(d) Stores & Spares 0 0(e) Power & Fuel 2118 2340(f) Salary, Wages & Benefits/Employees Expense 13593 12147(g) Other Operating/direct/manufacturing Expenses 17128 13195(h) Rent, Royalty & Cess 444 509(i) Loss on sale of Assets/Investments 1 5(j) Other Expenses 2945 4824Total Expenditure (IV (a to j)) 36229 33020(V) PROFIT BEFORE DEPRECIATION, & IMPAIRMENT, 7586 10027
FINANCE CHARGES/INTEREST, EXCEPTIONAL &EXTRAORDINARY ITEMS & TAXES (PBDIEET)(III-IV)
(VI) Depreciation, Depletion & Amortisation 6031 4653(VII) Impairment 0 0(VIII) PROFIT BEFORE FINANCE COST/INTEREST, 1555 5374
EXCEPTIONAL, EXTRA-ORDINARY ITEMS &TAXES (PBIEET)(V-VI-VII)
(IX) Finance Cost(a) On Central Government Loans 0 0(b) On Foreign Loans 0 0(c) Others 1523 617(d) Less Finance Cost Capitalised 77 0(e) Charged to P & L Account (a+b+c+d) 1446 617(X) PROFIT BEFORE EXCEPTIONAL & EXTRA- 109 4757
ORDINARY ITEMS & TAX (PBEET)(VIII-IXe)(XI) Exceptional Items 0 0(XII) PROFIT BEFORE EXTRA-ORDINARY ITEMS & 109 4757
TAX (PBET)(X-XI)(XIII) Extra-Ordinary Items -2134 -185(XIV) PROFIT BEFORE TAX (PBT)(XII-XIII) 2243 4942(XV) TAX PROVISIONS 3278 3092(XVI) NET PROFIT / LOSS FOR THE PERIOD FROM -1035 1850
CONTINUING OPERATIONS AFTER TAX(XIV-XV)(XVII) Profit/Loss from discontinuing operations 0 0(XVIII) Tax expenses of discontinuing operations 0 0(XIX) Profit/Loss from discontinuing operations 0 0
(after Tax)(XVII-XVIII)(XX) Profit/Loss for the period (XVI+XIX) -1035 1850Financial Ratios(i) Sales : Capital Employed 58.38 75.17(ii) Cost of Sales : Sales 102.19 91.2(iii) Salary/Wages : Sales 32.87 29.41(iv) Net Profit : Net Worth -2.18 3.81(v) Debt : Equity 0.95 0.26(vi) Current Ratio 3.27 3.19(vii) Trade Recievables : Sales 40.74 44.63(viii) Total Inventory : Sales 19.22 17.04

Transportation Services440
Shipping Corporation of India Ltd.
The CompanyShipping Corporation of India Ltd. (SCI) was incorporated on
24.03.1950 under the Company Act 1913 with the objective toserve India's overseas and costal sea born trades as its primary flagcarrier and be an important player in the field of global maritimetransportation as also in diverse fields like offshore and other marinetransport infrastructure.
SCI was incorporated by amalgamation of Eastern ShippingCorporation and Western Shipping Corporation. Subsequently twomore Shipping Companies viz. M/s Jayanti Shipping Companyand M/s Mogul Line Ltd. were merged with the SCI in 1973 and1986 respectively. The SCI has undergone change from PrivateLimited Company to Public Limited Company with effect from18.09.1992.
SCI is a Schedule 'A' listed Navratna CPSE under theadministrative control of M/o Shipping, D/o Shipping with 80.12%shareholding by the Government of India. The company employed901 regular employees (Executives 729, Non-executives 172) as on31.3.2012. Its Registered and Corporate offices are at Mumbai,Maharashtra.Vision / Mission
The Vision of the Company is to emerge as a team of inspiredperformers in the field of Maritime Transportation serving Indianand Global trades.
The Mission of the company is to serve India's overseas andcoastal seaborne trades as it is a primary flag carrier.Industrial / Business Operations
The main activities of the SCI comprises of operating shippingservices in practically all areas of shipping business, catering to therequirements of the country's EXIM trade and coastal trade andInternational cross trades. The company is operating 76 vessels ason 31.3.2012 under five major fleet profiles namely Tankers (42),Liner Ships (5), Bulk Carriers (14), Offshore Supply Vessels (13)and Passenger-cum-Cargo Vessels (2). Besides its Head Office atMumbai, it operates through its Regional offices at New Delhi,Kolkata, Chennai, London and Branch offices at Haldia and PortBlair. The company has six joint ventures.Performance Highlights
The physical performances of the company for last two yearsare given below:
www.shipindia.com
Main Product / Unit Performance duringServices
2011-12 2010-11
Freight ` in Crore 2935.05 2261.40
Charter Hire ` in Crore 712.72 1109.77
Although, there was an increase in the operating revenue, thesame has been offset primarily by increase in bunker costs andrevaluation of foreign currency loans which led to increase in theinterest costs. Due to depreciation of the Indian rupee vis a vis USdollar, the exchange loss on foreign currency loans also increased.Although there is no cash loss, the exchange loss had to be consideredas the finance cost as per the requirement of the new AccountingStandards.
The current ratio of company is at 1.70:1 during 2011-12 asagainst 2.02:1 in the previous year (Fig.2). Balance Sheet and Profit& Loss Account of the company and selected financial ratios duringthe period 2010-11 to 2011-12 can be seen on the adjoining page.
Strategic issueThe SCI had proposed acquisition of 62 vessels in different
categories during the 11th Five Year Plan period (2007-12), ofwhich by the end of 2011-12, SCI had placed orders of 42 vessels,and acquired 3 vessels. In the last financial year, company hadplaced order for 2 resale bulk carriers. In 2011-12, 14 vessels weredisposed and 11 vessels were delivered. As on 31.3.2012, thecompany had an orderbook of 27 different types of vessels withtotal tonnage of 1,667,850 dwt.
The Company registered an increase of ` 477.19 crore in totalincome during 2011-12 which went up to ̀ 4467.18 crore in 2011-12 from ` 3989.99 crore during 2010-11. The company howeversuffered a loss of ` 428.21 crore as against a profit of ` 567.31crore in 2010-11, thereon showing a total decline of ` 995.56 croremainly due to increase in operating expenses along with financecost.
PRO
FITA
BIL
ITY
RAT
IOS
(%)
CU
RR
ENT R
ATIO
Fig. 2
EBIT
DA
& P
AT (
Rs.
cro
re)
TOTAL R
EVENU
E (Rs. crore)
Fig. 1

Public Enterprises Survey 2011-2012: Vol-II 441
Shipping Corporation of India Ltd.Shipping House, 245, Madame Cama Road, Mumbai-400021
BALANCE SHEET ( ` in Lakhs)PARTICULARS 2011-12 2010-11I. EQUITY & LIABILITIES
AUTHORISED CAPITAL 100000 100000(1) Shareholders’ Funds(a) Share Capital(i) Central Govt 29694 29694(ii) Others 16886 16886(b) Reserves & Surplus 626852 670231(c) Money received against share warrants 0 0Total Shareholders’ Funds (1(a)+1(b)+1(c) 673432 716811(2) Share application money pending allotment 0 0(3) Non-current Liabilities(a) Long Term Borrowings 552578 405630(b) Deferred tax liabilities (Net) 0 0(c) Other Long-term liabilities 1002 1437(d) Long-term provisions 7744 7815Total Non-Current Liabilities 3(a) to 3(d) 561324 414882(4) Current Liabilities(a) Short Term Borrowings 0 0(b) Trade Payables 60376 63574(c) Other current liabilities 101338 87843(d) Short-term provisions 6680 18896Total Current Liabilities 4(a) to 4(d) 168394 170313TOTAL EQUITY & LIABILITIES (1+2+3+4) 1403150 1302006II. ASSETS(1) Non-Current Assets(a) Total Gross Fixed Assets 1333434 1184130(ai) Accumulated Depreciation, Depletion & Amortisation 442159 447210(aii) Accumulated Impairment 0 0(b) Total Net Fixed Assets ((a)-(ai)-(aii) 891275 736920(c) Capital work in progress 36199 32905(d) Intangible assets under developmet 0 0(e) Non-Current Investments 19236 19236(f) Deferred Tax Assets (Net) 0 0(g) Long Term Loans and Advances 170501 168595(h) Other Non-Current Assets 500 508Total Non-Current Assets (b+c+d+e+f+g+h) 1117711 958164(2) Current Assets(a) Current Investments 8231 10031(b) Inventories 17745 14650(c) Trade Recievables 78593 38073(d) Cash & Bank Balance 144241 246672(e) Short-term Loans & Advances 19038 13448(f) Other Current Assets 17591 20968Total Current Assets (a+b+c+d+e+f) 285439 343842TOTAL ASSETS (1+2) 1403150 1302006Important Indicators(i) Investment 599158 452210(ii) Capital Employed 1226010 1122441(iii) Net Worth 673432 716811(iv) Net Current Assets 117045 173529(v) Cost of Sales 441990 326646(vi) Net Value Added (at market price) 63628 131430(vii) Total Regular Employees (Nos.) 901 926(viii) Avg. Monthly Emoluments per Employee(`) 383028 387329
PROFIT & LOSS ACCOUNT (` in Lakhs)PARTICULARS 2011-12 2010-11(I) Revenue from Operations (Gross) 386755 359464Less : Excise Duty 0 0Revenue from Operations (Net) 386755 359464(II) Other Income 59963 39535(III) Total Revenue (I+II) 446718 398999(IV) Expenditure on:(a) Cost of materials consumed 0 0(b) Purchase of stock-in-trade 0 0(c) Changes in inventories of finished goods, 0 0
work-in-progress and stock in trade(d) Stores & Spares 18523 20077(e) Power & Fuel 431 491(f) Salary, Wages & Benefits/Employees Expense 41413 43040(g) Other Operating/direct/manufacturing Expenses 317055 207269(h) Rent, Royalty & Cess 640 395(i) Loss on sale of Assets/Investments 0 0(j) Other Expenses 3056 8864Total Expenditure (IV (a to j)) 381118 280136(V) PROFIT BEFORE DEPRECIATION, & IMPAIRMENT, 65600 118863
FINANCE CHARGES/INTEREST, EXCEPTIONAL &EXTRAORDINARY ITEMS & TAXES (PBDIEET)(III-IV)
(VI) Depreciation, Depletion & Amortisation 60872 46510(VII) Impairment 0 0(VIII) PROFIT BEFORE FINANCE COST/INTEREST, 4728 72353
EXCEPTIONAL, EXTRA-ORDINARY ITEMS &TAXES (PBIEET)(V-VI-VII)
(IX) Finance Cost(a) On Central Government Loans 0 0(b) On Foreign Loans 7746 4163(c) Others 30984 2526(d) Less Finance Cost Capitalised 0 0(e) Charged to P & L Account (a+b+c+d) 38730 6689(X) PROFIT BEFORE EXCEPTIONAL & EXTRA- -34002 65664
ORDINARY ITEMS & TAX (PBEET)(VIII-IXe)(XI) Exceptional Items 0 0(XII) PROFIT BEFORE EXTRA-ORDINARY ITEMS & -34002 65664
TAX (PBET)(X-XI)(XIII) Extra-Ordinary Items 0 0(XIV) PROFIT BEFORE TAX (PBT)(XII-XIII) -34002 65664(XV) TAX PROVISIONS 8819 8929(XVI) NET PROFIT / LOSS FOR THE PERIOD FROM -42821 56735
CONTINUING OPERATIONS AFTER TAX(XIV-XV)(XVII) Profit/Loss from discontinuing operations 0 0(XVIII) Tax expenses of discontinuing operations 0 0(XIX) Profit/Loss from discontinuing operations 0 0
(after Tax)(XVII-XVIII)(XX) Profit/Loss for the period (XVI+XIX) -42821 56735Financial Ratios(i) Sales : Capital Employed 31.55 32.03(ii) Cost of Sales : Sales 114.28 90.87(iii) Salary/Wages : Sales 10.71 11.97(iv) Net Profit : Net Worth -6.36 7.91(v) Debt : Equity 11.86 8.71(vi) Current Ratio 1.7 2.02(vii) Trade Recievables : Sales 20.32 10.59(viii) Total Inventory : Sales 4.59 4.08

Transportation Services422
Air India Air Transport Services Limited
The CompanyAir India Air Transport Services Limited (AIATS) was
incorporated on 09.06.2003 with the objective of carrying on thebusiness of providing all types of services at airport.
AIATS is an un-categorized CPSE in Transport Services sectorunder the administrative control of M/o Civil Aviation. AIATS is100% subsidiary of Air India Limited. The company employed1683 Regular employees (Executives 11 & Non-Executives 1672)as on 31.3.2012. Its registered office is at New Delhi and Corporateoffice at Mumbai, Maharashtra.
Vision / MissionThe Vision / Mission / Objectives of the company are to carry
on the business of repairing, maintaining, servicing, refurbishingproviding engineering services of and for aircraft, flying machines,aerial conveyances, engines, auxiliary power units and allcomponents and parts thereof.
Industrial / Business OperationsAIATS is rendering Airport Ground Handling Services including
Passenger Handling, Ramp handling, Security Handling and CargoHandling for Air India and Associate Company / Joint VentureCompany i.e. AI SAT, Bangalore.
Performance Highlights The physical performances of the company for last two years
are given below:
Total Revenue of the company registered an increase of` 12.30 crore during 2011-12 which went up to ` 60.90 crore in2011-12 from ` 48.60 crore during 2010-11. The losses of thecompany has gone up by ` 0.08 crore to ` 0.26 crore in 2011-12,from ` 0.18 crore in previous year due to increase in operatingexpenses and prior period adjustments.
The current ratio of company is at 0.49:1 during 2011-12 asagainst 0.38:1 in the previous year. Balance Sheet and Profit & LossAccount of the company and selected financial ratios during theperiod 2010-11 to 2011-12 can be seen on the adjoining page.
www.airindia.in
Main Services Unit Performance during
2011-12 2010-11
Handling Services ` in Crore 60.36 48.36
EBIT
DA
& P
AT (
Rs.
cro
re) TO
TAL REVEN
UE (R
s. crore)
Fig. 1

Public Enterprises Survey 2011-2012: Vol-II 423
Air India Transport Services Ltd.Airlines House, 113, Gurudwara Rakabgunj Road, New Delhi - 110003
BALANCE SHEET ( ` in Lakhs)PARTICULARS 2011-12 2010-11I. EQUITY & LIABILITIES
AUTHORISED CAPITAL 10000 10000(1) Shareholders’ Funds(a) Share Capital(i) Central Govt 0 0(ii) Others 5 5(b) Reserves & Surplus -270 -270(c) Money received against share warrants 0 0Total Shareholders’ Funds (1(a)+1(b)+1(c) -265 -265(2) Share application money pending allotment 0 0(3) Non-current Liabilities(a) Long Term Borrowings 0 0(b) Deferred tax liabilities (Net) 0 0(c) Other Long-term liabilities 0 0(d) Long-term provisions 90 63Total Non-Current Liabilities 3(a) to 3(d) 90 63(4) Current Liabilities(a) Short Term Borrowings 0 0(b) Trade Payables 658 728(c) Other current liabilities 876 460(d) Short-term provisions 2 0Total Current Liabilities 4(a) to 4(d) 1536 1188TOTAL EQUITY & LIABILITIES (1+2+3+4) 1361 986II. ASSETS(1) Non-Current Assets(a) Total Gross Fixed Assets 1 1(ai) Accumulated Depreciation, Depletion & Amortisation 0 0(aii) Accumulated Impairment 0 0(b) Total Net Fixed Assets ((a)-(ai)-(aii) 1 1(c) Capital work in progress 0 0(d) Intangible assets under developmet 0 0(e) Non-Current Investments 0 0(f) Deferred Tax Assets (Net) 2 36(g) Long Term Loans and Advances 599 489(h) Other Non-Current Assets 6 6Total Non-Current Assets (b+c+d+e+f+g+h) 608 532(2) Current Assets(a) Current Investments 0 0(b) Inventories 0 0(c) Trade Recievables 701 431(d) Cash & Bank Balance 36 9(e) Short-term Loans & Advances 0 0(f) Other Current Assets 16 14Total Current Assets (a+b+c+d+e+f) 753 454TOTAL ASSETS (1+2) 1361 986Important Indicators(i) Investment 5 5(ii) Capital Employed -265 -265(iii) Net Worth -265 -265(iv) Net Current Assets -783 -734(v) Cost of Sales 6058 4947(vi) Net Value Added (at market price) 4881 3136(vii) Total Regular Employees (Nos.) 1683 1683(viii) Avg. Monthly Emoluments per Employee(`) 21237 14320
PROFIT & LOSS ACCOUNT (` in Lakhs)PARTICULARS 2011-12 2010-11(I) Revenue from Operations (Gross) 6090 4860Less : Excise Duty 0 0Revenue from Operations (Net) 6090 4860(II) Other Income 0 0(III) Total Revenue (I+II) 6090 4860(IV) Expenditure on:(a) Cost of materials consumed 0 0(b) Purchase of stock-in-trade 0 0(c) Changes in inventories of finished goods, 0 0
work-in-progress and stock in trade(d) Stores & Spares 0 0(e) Power & Fuel 0 0(f) Salary, Wages & Benefits/Employees Expense 4289 2892(g) Other Operating/direct/manufacturing Expenses 0 0(h) Rent, Royalty & Cess 0 0(i) Loss on sale of Assets/Investments 0 0(j) Other Expenses 1769 2055Total Expenditure (IV (a to j)) 6058 4947(V) PROFIT BEFORE DEPRECIATION, & IMPAIRMENT, 32 -87
FINANCE CHARGES/INTEREST, EXCEPTIONAL &EXTRAORDINARY ITEMS & TAXES (PBDIEET)(III-IV)
(VI) Depreciation, Depletion & Amortisation 0 0(VII) Impairment 0 0(VIII) PROFIT BEFORE FINANCE COST/INTEREST, 32 -87
EXCEPTIONAL, EXTRA-ORDINARY ITEMS &TAXES (PBIEET)(V-VI-VII)
(IX) Finance Cost(a) On Central Government Loans 0 0(b) On Foreign Loans 0 0(c) Others 0 0(d) Less Finance Cost Capitalised 0 0(e) Charged to P & L Account (a+b+c+d) 0 0(X) PROFIT BEFORE EXCEPTIONAL & EXTRA- 32 -87
ORDINARY ITEMS & TAX (PBEET)(VIII-IXe)(XI) Exceptional Items 22 -33(XII) PROFIT BEFORE EXTRA-ORDINARY ITEMS & 10 -54
TAX (PBET)(X-XI)(XIII) Extra-Ordinary Items 0 0(XIV) PROFIT BEFORE TAX (PBT)(XII-XIII) 10 -54(XV) TAX PROVISIONS 36 -36(XVI) NET PROFIT / LOSS FOR THE PERIOD FROM -26 -18
CONTINUING OPERATIONS AFTER TAX(XIV-XV)(XVII) Profit/Loss from discontinuing operations 0 0(XVIII) Tax expenses of discontinuing operations 0 0(XIX) Profit/Loss from discontinuing operations 0 0
(after Tax)(XVII-XVIII)(XX) Profit/Loss for the period (XVI+XIX) -26 -18Financial Ratios(i) Sales : Capital Employed -2298.11 -1833.96(ii) Cost of Sales : Sales 99.47 101.79(iii) Salary/Wages : Sales 70.43 59.51(iv) Net Profit : Net Worth - -(v) Debt : Equity 0 0(vi) Current Ratio 0.49 0.38(vii) Trade Recievables : Sales 11.51 8.87(viii) Total Inventory : Sales 0 0
2011-12 Provisional

Transportation Services426
Air India Charters Limited
The CompanyAir India Charters Limited (AICL) was incorporated on
9.09.1971 with the objective of undertaking Chartered operations /Flights and overcoming the situation created by discounting offares by Arab carriers and other non-scheduled operators. However,in 1988 through an amendment, the objective of the companychanged to provideing quality services to the client airlines. In2004-05, the company saw metamorphosis in its role from merelya service provider of ground handling and security to the firstinternational low cost, no frill budget airline from India
AICL is an un-categorised CPSE in Transport Services sectorunder the administrative control of M/o Civil Aviation. The companyemployed 277 regular employees (Executives 65 & Non-Executives212) as on 31.3.2012. Its Registered and Corporate offices are atMumbai, Maharashtra. AICL is a wholly owned subsidiary of AirIndia Ltd.
Industrial / Business OperationsAICL is engaged in providing various ground handling services.
The company took a new dimension in setting up a low cost servicenamely 'Air India Express' under its management from Kerala tocertain points in the Gulf which is considered to be advantageous tomillions of people working abroad especially in the Gulf & MiddleEast and South East Asia.
Company is engaged in providing three main services i.e.Passenger Carrier, Cargo Carrier, and Handling Services.
Performance Highlights The physical performances of the company for last two years
are given below:
Total Revenue of the company registered an increase of `29.80 crore during 2011-12, which went up from ̀ 1351.13 crorein 2010-11 to ̀ 1380.93 crore in 2011-12. However, the losses ofthe company has gone up by ` 211.28 crore to ` 602.50 crore in2011-12, from ` 391.22 crore in previous year due to increase inoperating expenses.
The current ratio of company is at 0.04:1 during 2011-12 asagainst 0.06:1 in the previous year. Balance Sheet and Profit &Loss Account of the company and selected financial ratios duringthe period 2010-11 to 2011-12 can be seen on the adjoining page.
www.airindia.in
Strategic issuesAs per the resolution passed by the Board of Directors and as
per the terms of amended MoU between National AviationCompany of India Limited (NACIL) and AICL, the revenue earnedby AICL will be shared in the ratio of 25% and 75% respectively,retrospectively, from 1st April, 2005. The company has madechanges in respect of providing deprecation on aircrafts and airframesequipments.
Main Services Unit Performance during
2011-12 2010-11
Passenger Revenue Rs. in Crore 1773.12 1673.04
Cargo Revenue Rs. in Crore 19.25 17.29
Mail Revenue Rs. in Crore 0.22 0.31
EBIT
DA
& P
AT (
Rs.
cro
re) TO
TAL REVEN
UE (R
s. crore)
Fig. 1

Public Enterprises Survey 2011-2012: Vol-II 427
Air India Charters Ltd.21st Floor, Air India Building, Nariman Point, Mumbai, Maharashtra-400 021
BALANCE SHEET ( ` in Lakhs)PARTICULARS 2011-12 2010-11I. EQUITY & LIABILITIES
AUTHORISED CAPITAL 3000 3000(1) Shareholders’ Funds(a) Share Capital(i) Central Govt 0 0(ii) Others 3000 3000(b) Reserves & Surplus -166988 -106529(c) Money received against share warrants 0 0Total Shareholders’ Funds (1(a)+1(b)+1(c) -163988 -103529(2) Share application money pending allotment 0 0(3) Non-current Liabilities(a) Long Term Borrowings 230579 232500(b) Deferred tax liabilities (Net) 0 0(c) Other Long-term liabilities 0 0(d) Long-term provisions 378 324Total Non-Current Liabilities 3(a) to 3(d) 230957 232824(4) Current Liabilities(a) Short Term Borrowings 105175 103919(b) Trade Payables 51770 32859(c) Other current liabilities 149309 94602(d) Short-term provisions 15 5Total Current Liabilities 4(a) to 4(d) 306269 231385TOTAL EQUITY & LIABILITIES (1+2+3+4) 373238 360680II. ASSETS(1) Non-Current Assets(a) Total Gross Fixed Assets 428982 398192(ai) Accumulated Depreciation, Depletion & Amortisation 81302 60646(aii) Accumulated Impairment 0 0(b) Total Net Fixed Assets ((a)-(ai)-(aii) 347680 337546(c) Capital work in progress 0 30(d) Intangible assets under developmet 0 0(e) Non-Current Investments 0 0(f) Deferred Tax Assets (Net) 0 0(g) Long Term Loans and Advances 2594 2282(h) Other Non-Current Assets 9214 7032Total Non-Current Assets (b+c+d+e+f+g+h) 359488 346890(2) Current Assets(a) Current Investments 0 0(b) Inventories 5353 4354(c) Trade Recievables 4759 3853(d) Cash & Bank Balance 2919 4990(e) Short-term Loans & Advances 715 590(f) Other Current Assets 4 3Total Current Assets (a+b+c+d+e+f) 13750 13790TOTAL ASSETS (1+2) 373238 360680Important Indicators(i) Investment 233579 235500(ii) Capital Employed 66591 128971(iii) Net Worth -163988 -103529(iv) Net Current Assets -292519 -217595(v) Cost of Sales 171569 152929(vi) Net Value Added (at market price) -24169 -8119(vii) Total Regular Employees (Nos.) 277 277(viii) Avg. Monthly Emoluments per Employee(`) 279994 291727
PROFIT & LOSS ACCOUNT (` in Lakhs)PARTICULARS 2011-12 2010-11(I) Revenue from Operations (Gross) 137781 131142Less : Excise Duty 0 0Revenue from Operations (Net) 137781 131142(II) Other Income 312 3971(III) Total Revenue (I+II) 138093 135113(IV) Expenditure on:(a) Cost of materials consumed 94730 72041(b) Purchase of stock-in-trade 0 0(c) Changes in inventories of finished goods, 0 0
work-in-progress and stock in trade(d) Stores & Spares 2940 0(e) Power & Fuel 20 21(f) Salary, Wages & Benefits/Employees Expense 9307 9697(g) Other Operating/direct/manufacturing Expenses 33078 34100(h) Rent, Royalty & Cess 0 0(i) Loss on sale of Assets/Investments 0 0(j) Other Expenses 67 18091Total Expenditure (IV (a to j)) 140142 133950(V) PROFIT BEFORE DEPRECIATION, & IMPAIRMENT, -2049 1163
FINANCE CHARGES/INTEREST, EXCEPTIONAL &EXTRAORDINARY ITEMS & TAXES (PBDIEET)(III-IV)
(VI) Depreciation, Depletion & Amortisation 31427 18979(VII) Impairment 0 0(VIII) PROFIT BEFORE FINANCE COST/INTEREST, -33476 -17816
EXCEPTIONAL, EXTRA-ORDINARY ITEMS &TAXES (PBIEET)(V-VI-VII)
(IX) Finance Cost(a) On Central Government Loans 0 0(b) On Foreign Loans 0 0(c) Others 26774 21353(d) Less Finance Cost Capitalised 0 0(e) Charged to P & L Account (a+b+c+d) 26774 21353(X) PROFIT BEFORE EXCEPTIONAL & EXTRA- -60250 -39169
ORDINARY ITEMS & TAX (PBEET)(VIII-IXe)(XI) Exceptional Items 0 0(XII) PROFIT BEFORE EXTRA-ORDINARY ITEMS & -60250 -39169
TAX (PBET)(X-XI)(XIII) Extra-Ordinary Items 0 0(XIV) PROFIT BEFORE TAX (PBT)(XII-XIII) -60250 -39169(XV) TAX PROVISIONS 0 -47(XVI) NET PROFIT / LOSS FOR THE PERIOD FROM -60250 -39122
CONTINUING OPERATIONS AFTER TAX(XIV-XV)(XVII) Profit/Loss from discontinuing operations 0 0(XVIII) Tax expenses of discontinuing operations 0 0(XIX) Profit/Loss from discontinuing operations 0 0
(after Tax)(XVII-XVIII)(XX) Profit/Loss for the period (XVI+XIX) -60250 -39122Financial Ratios(i) Sales : Capital Employed 206.91 101.68(ii) Cost of Sales : Sales 124.52 116.61(iii) Salary/Wages : Sales 6.75 7.39(iv) Net Profit : Net Worth - -(v) Debt : Equity 76.86 77.5(vi) Current Ratio 0.04 0.06(vii) Trade Recievables : Sales 3.45 2.94(viii) Total Inventory : Sales 3.89 3.32
2011-12 Provisional

Transportation Services424
Air India Ltd.
The CompanyNational Aviation Company of India Ltd. (NACIL) (now Air
India Ltd.) was incorporated on 30.3.2007 and commenced itsbusiness from 14.05.2007 with the objective of synergizing theactivities of merged airlines (Air India and Indian Airlines) so as totake on the growing competition from the private airlines and largeinternational carriers. The merger was done under section 391-394of the Companies Act, 1956. During the year 2010-11, the name ofcompany changed to Air India Ltd. (AI).
Air India is a Schedule-'A' CPSE in Transport Services sectorunder the administrative control of the M/o Civil Aviation with100% shareholding by the Government of India. The companyemployed 28005 regular employees (Executives 6379 & Non-Executives 21626) as on 31.3.2012. Its registered office is at NewDelhi and corporate office is at Mumbai, Maharashtra.Industrial / Business Operations
The company provides domestic and international air transportservices within India as also across the globe. The aircraft fleet ofthe company consists of Airbus and Boeing aircraft such as A-319,A-320, A-321, B-777 and B-787. Air India comprises six StrategicBusiness Units (SBUs) comprising Passenger; Cargo; GroundHandling Services; Low Cost Carrier (LCCs); MRO (Airframesand Engines / Components); and Related Business. The mergedentity also has a Corporate Services Group. The company operatesfrom 5 regional and 4 offices abroad.
The company has five wholly owned subsidiaries namely HotelCorporation of India, Air-India Charters Ltd., Air India Air TransportServices Ltd., Air India Engineering Services Ltd., and Airlines AlliedServices Ltd. The company also has one 50:50 Joint Venture namelyAir India SATS Airport Services Private Ltd.Performance Highlights
The physical performances of the company for last two yearsare given below:
Total Revenue of the company registered an increaseof ` 651.80 crore during 2011-12, which went up from` 14062.01 crore in 2010-11 to ̀ 14713.81 crore in 2011-12 due toincrease in operational revenue. However, the loss of the companyhas gone up by ` 694.57 crore to ` 7559.74 crore in 2011-12, from` 6865.17 crore in previous year due to increase in cost of operationmainly on account of increase in Aircraft Fuel & Oil expenses andprior period adjustments.
The current ratio of company is at 0.16:1 during 2011-12 asagainst 0.13:1 in the previous year. Balance Sheet and Profit & LossAccount of the company and selected financial ratios during theperiod 2010-11 to 2011-12 can be seen on the adjoining page. www.airindia.in
Main Services Unit Performance during
2011-12 2010-11
Scheduled Traffic ` in Crore 12364.18 11457.00
Non Scheduled Traffic ` in Crore 1189.75 1239.48
Handling, Servicing & ` in Crore 1121.37 1279.55Incidental Revenue
EBIT
DA
& P
AT (
Rs.
cro
re) TO
TAL REVEN
UE (R
s. crore)
Fig. 1
Strategic issuesIn view of consolidation of the global aviation environment,
wherein critical / mass size is a key success factor, the Air India andIndian Airlines were merged in a single company. The merger wasexpected to provide an opportunity to leverage combined assetsand capital. Post merger, the new entity was expected to retainBrand Name "Air India" with "Maharaja" as its mascot. Along withsize, the new entity was expected to create considerable synergy,since the two airlines could feed traffic to each other. The synergybenefits were in the areas of route rationalization; fuel procurement;stores and inventory purchase both aircraft and non-aircraft;insurance benefits; handling of flights; and employee productivity.Besides, it was to result in redeployment of aircraft since Air Indiaand Indian Airlines were flying on some common routes in the Gulfand South East Asia.
Currently the Airline Industry has generally been affected byeconomic slowdown coupled with high fuel cost. The company hasduring the year adopted / implemented a Turnaround Plan (TAP)and a Financial Restructuring Plan (FRP) to improve its operationaland financial performance.

Public Enterprises Survey 2011-2012: Vol-II 425
Air India Ltd.Airlines House, 113, GurudwaraRakabgn Road, New Delhi - 110 001
BALANCE SHEET ( ` in Lakhs)PARTICULARS 2011-12 2010-11I. EQUITY & LIABILITIES
AUTHORISED CAPITAL 1100000 500005(1) Shareholders’ Funds(a) Share Capital(i) Central Govt 334500 214500(ii) Others 0 0(b) Reserves & Surplus -1978817 -1227379(c) Money received against share warrants 0 0Total Shareholders’ Funds (1(a)+1(b)+1(c) -1644317 -1012879(2) Share application money pending allotment 0 0(3) Non-current Liabilities(a) Long Term Borrowings 3062205 1758121(b) Deferred tax liabilities (Net) 0 0(c) Other Long-term liabilities 5815 5610(d) Long-term provisions 134592 126844Total Non-Current Liabilities 3(a) to 3(d) 3202612 1890575(4) Current Liabilities(a) Short Term Borrowings 1281951 2354901(b) Trade Payables 750468 416729(c) Other current liabilities 653101 422965(d) Short-term provisions 23346 17838Total Current Liabilities 4(a) to 4(d) 2708866 3212433TOTAL EQUITY & LIABILITIES (1+2+3+4) 4267161 4090129II. ASSETS(1) Non-Current Assets(a) Total Gross Fixed Assets 3128813 3071264(ai) Accumulated Depreciation, Depletion & Amortisation 0 0(aii) Accumulated Impairment 0 0(b) Total Net Fixed Assets ((a)-(ai)-(aii) 3128813 3071264(c) Capital work in progress 196441 184161(d) Intangible assets under developmet 10096 5442(e) Non-Current Investments 13430 13205(f) Deferred Tax Assets (Net) 284252 284252(g) Long Term Loans and Advances 198190 110924(h) Other Non-Current Assets 4156 936Total Non-Current Assets (b+c+d+e+f+g+h) 3835378 3670184(2) Current Assets(a) Current Investments 0 0(b) Inventories 90726 67596(c) Trade Recievables 184913 215151(d) Cash & Bank Balance 43101 41544(e) Short-term Loans & Advances 33647 23577(f) Other Current Assets 79396 72077Total Current Assets (a+b+c+d+e+f) 431783 419945TOTAL ASSETS (1+2) 4267161 4090129Important Indicators(i) Investment 3396705 1972621(ii) Capital Employed 1417888 745242(iii) Net Worth -1644317 -1012879(iv) Net Current Assets -2277083 -2792488(v) Cost of Sales 1974504 1805987(vi) Net Value Added (at market price) 49331 76794(vii) Total Regular Employees (Nos.) 28005 28085(viii) Avg. Monthly Emoluments per Employee(`) 106131 111314
PROFIT & LOSS ACCOUNT (` in Lakhs)PARTICULARS 2011-12 2010-11(I) Revenue from Operations (Gross) 1467530 1397603Less : Excise Duty 0 0Revenue from Operations (Net) 1467530 1397603(II) Other Income 3851 8598(III) Total Revenue (I+II) 1471381 1406201(IV) Expenditure on:(a) Cost of materials consumed 18365 32115(b) Purchase of stock-in-trade 0 0(c) Changes in inventories of finished goods, 0 0
work-in-progress and stock in trade(d) Stores & Spares 29758 59091(e) Power & Fuel 851167 611206(f) Salary, Wages & Benefits/Employees Expense 356665 375149(g) Other Operating/direct/manufacturing Expenses 415338 428134(h) Rent, Royalty & Cess 13102 9693(i) Loss on sale of Assets/Investments 6895 2093(j) Other Expenses 130426 121589Total Expenditure (IV (a to j)) 1821716 1639070(V) PROFIT BEFORE DEPRECIATION, & IMPAIRMENT, -350335 -232869
FINANCE CHARGES/INTEREST, EXCEPTIONAL &EXTRAORDINARY ITEMS & TAXES (PBDIEET)(III-IV)
(VI) Depreciation, Depletion & Amortisation 159683 169010(VII) Impairment 0 0(VIII) PROFIT BEFORE FINANCE COST/INTEREST, -510018 -401879
EXCEPTIONAL, EXTRA-ORDINARY ITEMS &TAXES (PBIEET)(V-VI-VII)
(IX) Finance Cost(a) On Central Government Loans 0 0(b) On Foreign Loans 71595 102750(c) Others 292954 221329(d) Less Finance Cost Capitalised 0 0(e) Charged to P & L Account (a+b+c+d) 364549 324079(X) PROFIT BEFORE EXCEPTIONAL & EXTRA- -874567 -725958
ORDINARY ITEMS & TAX (PBEET)(VIII-IXe)(XI) Exceptional Items -92241 -19474(XII) PROFIT BEFORE EXTRA-ORDINARY ITEMS & -782326 -706484
TAX (PBET)(X-XI)(XIII) Extra-Ordinary Items -26557 -20087(XIV) PROFIT BEFORE TAX (PBT)(XII-XIII) -755769 -686397(XV) TAX PROVISIONS 205 120(XVI) NET PROFIT / LOSS FOR THE PERIOD FROM -755974 -686517
CONTINUING OPERATIONS AFTER TAX(XIV-XV)(XVII) Profit/Loss from discontinuing operations 0 0(XVIII) Tax expenses of discontinuing operations 0 0(XIX) Profit/Loss from discontinuing operations 0 0
(after Tax)(XVII-XVIII)(XX) Profit/Loss for the period (XVI+XIX) -755974 -686517Financial Ratios(i) Sales : Capital Employed 103.5 187.54(ii) Cost of Sales : Sales 134.55 129.22(iii) Salary/Wages : Sales 24.3 26.84(iv) Net Profit : Net Worth - -(v) Debt : Equity 9.15 8.2(vi) Current Ratio 0.16 0.13(vii) Trade Recievables : Sales 12.6 15.39(viii) Total Inventory : Sales 6.18 4.84
2011-12 Provisional

Transportation Services420
The CompanyAirline Allied Services Limited (AASL) was incorporated on
13.09.1983 with the objective of creating a profit center under thesubsidiary company structure for speedy and flexible decision-making and also to utilize the fleet effectively. The company wasrevitalized as scheduled airline in 1996 and named as Alliance Air.
AASL is a Schedule-'C' CPSE in Transport Services sectorunder the administrative control of M/o Civil Aviation. It is a 100%subsidiary of Air India Limited. Its Registered and Corporate officesare at New Delhi.
Industrial / Business OperationsAASL undertook freighter charter operations with freighter
B737 aircraft on lease from Air India Ltd. under the agreements forthe freighter charters exclusively between Air India Ltd. andconcerned parties. It also operates other aircraft directly leasedfrom other lessors. Air India Ltd. provides handling, marketing,sales and reservations and other support services for Alliance Airflights.
Performance HighlightsThe physical performances of the company for last two years
are given below:
Total Revenue of the company registered a reduction of` 63.05 crore during 2011-12 which went down to ` 295.21 crorein 2011-12 from ` 358.26 crore during 2010-11. The losses of thecompany has gone up by ` 85.62 crore to ` 114.74 crore in 2011-12, from ` 29.12 crore in previous year due to fall in operatingincome and increase in operating expenses.
The current ratio of company is at 0.12:1 during 2011-12 asagainst 0.16:1 in the previous year. Balance Sheet and Profit & LossAccount of the company and selected financial ratios during theperiod 2010-11 to 2011-12 can be seen on the adjoining page.
Airline Allied Services Limited
www.airindia.in
Main Services Unit Performance during
2011-12 2010-11
Passenger Revenue Rs. in Crore 220.33 227.98
Charter Revenue Rs. in Crore 3.22 48.19
Cargo Revenue Rs. in Crore 2.33 2.59
Mail Revenue Rs. in Crore 0.46 10.08
EBIT
DA
& P
AT (
Rs.
cro
re)
TOTAL R
EVENU
E (Rs. crore)
Fig. 1
Strategic issuesThe lease payment to Air India Ltd. for Boeing-737 aircraft
taken on lease are mutually agreed on a year-to-year basis.

Public Enterprises Survey 2011-2012: Vol-II 421
Airline Allied Services Ltd.Domestic Arrival Terminal-I, 1st Floor, I.G.I Airport, Palam, New Delhi-110 037
BALANCE SHEET ( ` in Lakhs)PARTICULARS 2011-12 2010-11I. EQUITY & LIABILITIESAUTHORISED CAPITAL 500 500(1) Shareholders’ Funds(a) Share Capital(i) Central Govt 0 0(ii) Others 225 225(b) Reserves & Surplus -69763 -58289(c) Money received against share warrants 0 0Total Shareholders’ Funds (1(a)+1(b)+1(c) -69538 -58064(2) Share application money pending allotment 0 0(3) Non-current Liabilities(a) Long Term Borrowings 0 0(b) Deferred tax liabilities (Net) 0 0(c) Other Long-term liabilities 3225 3194(d) Long-term provisions 4776 3544Total Non-Current Liabilities 3(a) to 3(d) 8001 6738(4) Current Liabilities(a) Short Term Borrowings 0 0(b) Trade Payables 20418 12670(c) Other current liabilities 45246 47240(d) Short-term provisions 5686 2121Total Current Liabilities 4(a) to 4(d) 71350 62031TOTAL EQUITY & LIABILITIES (1+2+3+4) 9813 10705II. ASSETS(1) Non-Current Assets(a) Total Gross Fixed Assets 607 609(ai) Accumulated Depreciation, Depletion & Amortisation 496 463(aii) Accumulated Impairment 0 0(b) Total Net Fixed Assets ((a)-(ai)-(aii) 111 146(c) Capital work in progress 0 0(d) Intangible assets under developmet 0 0(e) Non-Current Investments 0 0(f) Deferred Tax Assets (Net) 0 0(g) Long Term Loans and Advances 843 731(h) Other Non-Current Assets 0 0Total Non-Current Assets (b+c+d+e+f+g+h) 954 877(2) Current Assets(a) Current Investments 0 0(b) Inventories 1102 1360(c) Trade Recievables 6317 7801(d) Cash & Bank Balance 130 38(e) Short-term Loans & Advances 1310 629(f) Other Current Assets 0 0Total Current Assets (a+b+c+d+e+f) 8859 9828TOTAL ASSETS (1+2) 9813 10705Important Indicators(i) Investment 225 225(ii) Capital Employed -69538 -58064(iii) Net Worth -69538 -58064(iv) Net Current Assets -62491 -52203(v) Cost of Sales 40879 38713(vi) Net Value Added (at market price) -6205 2799(vii) Total Regular Employees (Nos.) 0(viii) Avg. Monthly Emoluments per Employee(`) 0 0
PROFIT & LOSS ACCOUNT (` in Lakhs)PARTICULARS 2011-12 2010-11(I) Revenue from Operations (Gross) 27241 33639Less : Excise Duty 0 0Revenue from Operations (Net) 27241 33639(II) Other Income 2280 2187(III) Total Revenue (I+II) 29521 35826(IV) Expenditure on:(a) Cost of materials consumed 0 0(b) Purchase of stock-in-trade 0 0(c) Changes in inventories of finished goods, 0 0
work-in-progress and stock in trade(d) Stores & Spares 760 777(e) Power & Fuel 13883 11204(f) Salary, Wages & Benefits/Employees Expense 4387 4786(g) Other Operating/direct/manufacturing Expenses 19221 19779(h) Rent, Royalty & Cess 170 168(i) Loss on sale of Assets/Investments 0 0(j) Other Expenses 2417 1959Total Expenditure (IV (a to j)) 40838 38673(V) PROFIT BEFORE DEPRECIATION, & IMPAIRMENT, -11317 -2847
FINANCE CHARGES/INTEREST, EXCEPTIONAL &EXTRAORDINARY ITEMS & TAXES (PBDIEET)(III-IV)
(VI) Depreciation, Depletion & Amortisation 41 40(VII) Impairment 0 0(VIII) PROFIT BEFORE FINANCE COST/INTEREST, -11358 -2887
EXCEPTIONAL, EXTRA-ORDINARY ITEMS &TAXES (PBIEET)(V-VI-VII)
(IX) Finance Cost(a) On Central Government Loans 0 0(b) On Foreign Loans 0 0(c) Others 109 25(d) Less Finance Cost Capitalised 0 0(e) Charged to P & L Account (a+b+c+d) 109 25(X) PROFIT BEFORE EXCEPTIONAL & EXTRA- -11467 -2912
ORDINARY ITEMS & TAX (PBEET)(VIII-IXe)(XI) Exceptional Items 0 0(XII) PROFIT BEFORE EXTRA-ORDINARY ITEMS & -11467 -2912
TAX (PBET)(X-XI)(XIII) Extra-Ordinary Items 0 0(XIV) PROFIT BEFORE TAX (PBT)(XII-XIII) -11467 -2912(XV) TAX PROVISIONS 7 0(XVI) NET PROFIT / LOSS FOR THE PERIOD FROM -11474 -2912
CONTINUING OPERATIONS AFTER TAX(XIV-XV)(XVII) Profit/Loss from discontinuing operations 0 0(XVIII) Tax expenses of discontinuing operations 0 0(XIX) Profit/Loss from discontinuing operations 0 0
(after Tax)(XVII-XVIII)(XX) Profit/Loss for the period (XVI+XIX) -11474 -2912Financial Ratios(i) Sales : Capital Employed -39.17 -57.93(ii) Cost of Sales : Sales 150.06 115.08(iii) Salary/Wages : Sales 16.1 14.23(iv) Net Profit : Net Worth - -(v) Debt : Equity 0 0(vi) Current Ratio 0.12 0.16(vii) Trade Recievables : Sales 23.19 23.19(viii) Total Inventory : Sales 4.05 4.04
2011-12 Provisional

Transportation Services418
Airport Authority of India
The CompanyAirport Authority of India (AAI)was incorporated on
01.04.1995 through the Act of Parliament, namely The AirportAuthority of India Act, 1994 by merger of International AirportsAuthority of India and National Airports Authority with theobjective to have an integrated development and modernization ofthe airports in India to international standards.
AAI is a Schedule-'A' Miniratna CPSE in Transport Servicessector under the administrative control of M/o Civil Aviation with100% shareholding by the Government of India. The companyemployed 18781regular employees (Executives 7010, Non-executives 11771) as on 31.3.2012. Its Registered and Corporateoffice is at New Delhi.Vision / Mission
The Vision of the Company is to be a world class Organizationproviding leadership in Air Traffic Services and Airport Management& making a major hub in Asia Pacific Region by 2016.
The Mission of the Company is to achieve highest standardsof safety and quality in Air Traffic Services and AirportManagement.Industrial / Business Operations
AAI is involved in development and modernization of airportsand providing Air Traffic services in the designated air space in theentire Indian air space. Currently it manages 125 airports consisting68 operational airports(11 International Airports, 8 customs, 49domestic), 26 civil enclaves (3 International Airports, 4 customs,19 domestic) and 31 non operational domestic airports. In addition,AAI also provides CNS-ATM facilities at 09 other airports.
AAI have 7 JVs for airports at Delhi, Mumbai, Bengaluru,Hyderabad & Chandigarh which are handed over to Joint VentureCompanies (JVCs).
The major sources of revenue of AAI are Route / TerminalNavigational Facilities, Landing & Parking, Cargo Handling andPassenger Services.Performance Highlights
The physical performances of the company for last two yearsare given below:
Profit & Loss Account of the company and selected financial ratiosduring the period 2010-11 to 2011-12 can be seen on the adjoiningpage.Strategic issue
With new Terminals being commissioned in Tier 2 and Tier 3cities in the country, the focus of the expansion of Civil Aviationhas now shifted from the metro cities to these Tier 2 and Tier 3cities in the country. AAI has plans to construct airports in theremote corners of the country and strive to upgrade the existing
Main Services Unit Performance during
2011-12 2010-11
Aircraft Movements Nos. in 000 1545 1393
Cargo 000' Tonne 2280 2348
Passengers Handled No. in lacs 1623 1434
ones to international standards. AAI has brought in state of the arttechnology viz Satellite Based Navigation in the area of CNS -ATM.
The civil aviation sector in general is passing throughchallenging times and airlines are reporting losses due to which theairport operators are notable to get their payments. AAI has toresort to borrowing in order to finance its capital expenditurerequirement over and above the surplus generated by it.
www.aai.aero
EBIT
DA
& P
AT (
Rs.
cro
re)
TOTAL R
EVENU
E (Rs. crore)
Fig. 1
PRO
FITA
BIL
ITY
RAT
IOS
(%)
CU
RR
ENT R
ATIO
Fig. 2
The total revenue of the company registered an increase of` 739.45crore in total income during 2011-12 which went up to` 5878.66 crore in 2011-12 from ` 5139.21 crore during 2010-11due to growth in aircraft movement and passengers handled. Thenet profit of the company increased to ` 859.01crore in 2011-12,an increase of ` 12.62croreover previousyear'sprofit of ` 846.39due to increase in operating income.
The current ratio of company is at 0.31 : 1 during 2011-12 asagainst 0.21 : 1 in the previous year (Fig.2). Balance Sheet and

Public Enterprises Survey 2011-2012: Vol-II 419
Airports Authority of IndiaRajiv Gandhi Bhawan, Safdarjung Airport, New Delhi - 110 003
BALANCE SHEET ( ` in Lakhs)PARTICULARS 2011-12 2010-11I. EQUITY & LIABILITIESAUTHORISED CAPITAL 65656 65561(1) Shareholders’ Funds(a) Share Capital(i) Central Govt 65656 65561(ii) Others 0 0(b) Reserves & Surplus 815755 740177(c) Money received against share warrants 0 0Total Shareholders’ Funds (1(a)+1(b)+1(c) 881411 805738(2) Share application money pending allotment 0 0(3) Non-current Liabilities(a) Long Term Borrowings 146223 67524(b) Deferred tax liabilities (Net) 0 0(c) Other Long-term liabilities 70819 71366(d) Long-term provisions 44767 44664Total Non-Current Liabilities 3(a) to 3(d) 261809 183554(4) Current Liabilities(a) Short Term Borrowings 68000 55000(b) Trade Payables 0 0(c) Other current liabilities 139005 153955(d) Short-term provisions 411340 470994Total Current Liabilities 4(a) to 4(d) 618345 679949TOTAL EQUITY & LIABILITIES (1+2+3+4) 1761565 1669241II. ASSETS(1) Non-Current Assets(a) Total Gross Fixed Assets 1385717 1223869(ai) Accumulated Depreciation, Depletion & Amortisation 794774 687854(aii) Accumulated Impairment 0 0(b) Total Net Fixed Assets ((a)-(ai)-(aii) 590943 536015(c) Capital work in progress 439168 374752(d) Intangible assets under developmet 0 0(e) Non-Current Investments 108631 97865(f) Deferred Tax Assets (Net) 82018 66736(g) Long Term Loans and Advances 348897 449760(h) Other Non-Current Assets 0 0Total Non-Current Assets (b+c+d+e+f+g+h) 1569657 1525128(2) Current Assets(a) Current Investments 0 0(b) Inventories 9027 9263(c) Trade Recievables 151651 102199(d) Cash & Bank Balance 11374 10621(e) Short-term Loans & Advances 0 0(f) Other Current Assets 19856 22030Total Current Assets (a+b+c+d+e+f) 191908 144113TOTAL ASSETS (1+2) 1761565 1669241Important Indicators(i) Investment 211879 133085(ii) Capital Employed 1027634 873262(iii) Net Worth 881411 805738(iv) Net Current Assets -426437 -535836(v) Cost of Sales 446901 378177(vi) Net Value Added (at market price) 375698 312627(vii) Total Regular Employees (Nos.) 18781 18243(viii) Avg. Monthly Emoluments per Employee(`) 88721 75604
PROFIT & LOSS ACCOUNT (` in Lakhs)PARTICULARS 2011-12 2010-11(I) Revenue from Operations (Gross) 569055 502771Less : Excise Duty 0 0Revenue from Operations (Net) 569055 502771(II) Other Income 18811 11150(III) Total Revenue (I+II) 587866 513921(IV) Expenditure on:(a) Cost of materials consumed 0 0(b) Purchase of stock-in-trade 0 0(c) Changes in inventories of finished goods,
work-in-progress and stock in trade 0 0(d) Stores & Spares 3871 2640(e) Power & Fuel 18049 15006(f) Salary, Wages & Benefits/Employees Expense 199952 165509(g) Other Operating/direct/manufacturing Expenses 93392 79390(h) Rent, Royalty & Cess 0 0(i) Loss on sale of Assets/Investments 0 0(j) Other Expenses 30628 26296Total Expenditure (IV (a to j)) 345892 288841(V) PROFIT BEFORE DEPRECIATION, & IMPAIRMENT, 241974 225080
FINANCE CHARGES/INTEREST, EXCEPTIONAL &EXTRAORDINARY ITEMS & TAXES (PBDIEET)(III-IV)
(VI) Depreciation, Depletion & Amortisation 101009 89336(VII) Impairment 0 0(VIII) PROFIT BEFORE FINANCE COST/INTEREST, 140965 135744
EXCEPTIONAL, EXTRA-ORDINARY ITEMS &TAXES (PBIEET)(V-VI-VII)
(IX) Finance Cost(a) On Central Government Loans 10 224(b) On Foreign Loans 0 3(c) Others 4461 888(d) Less Finance Cost Capitalised 0 0(e) Charged to P & L Account (a+b+c+d) 4471 1115(X) PROFIT BEFORE EXCEPTIONAL & EXTRA- 136494 134629
ORDINARY ITEMS & TAX (PBEET)(VIII-IXe)(XI) Exceptional Items 0 0(XII) PROFIT BEFORE EXTRA-ORDINARY ITEMS & 136494 134629
TAX (PBET)(X-XI)(XIII) Extra-Ordinary Items 0 0(XIV) PROFIT BEFORE TAX (PBT)(XII-XIII) 136494 134629(XV) TAX PROVISIONS 50593 49990(XVI) NET PROFIT / LOSS FOR THE PERIOD FROM 85901 84639
CONTINUING OPERATIONS AFTER TAX(XIV-XV)(XVII) Profit/Loss from discontinuing operations 0 0(XVIII) Tax expenses of discontinuing operations 0 0(XIX) Profit/Loss from discontinuing operations 0 0
(after Tax)(XVII-XVIII)(XX) Profit/Loss for the period (XVI+XIX) 85901 84639Financial Ratios(i) Sales : Capital Employed 55.38 57.57(ii) Cost of Sales : Sales 78.53 75.22(iii) Salary/Wages : Sales 35.14 32.92(iv) Net Profit : Net Worth 9.75 10.5(v) Debt : Equity 2.23 1.03(vi) Current Ratio 0.31 0.21(vii) Trade Recievables : Sales 26.65 20.33(viii) Total Inventory : Sales 1.59 1.84
2011-12 Provisional

Transportation Services428
Central Inland Water Transport Corp. Ltd.
The CompanyCentral Inland Water Transport Corp. Ltd. (CIWTC) was
incorporated on 22.2.1967 to take over the assets of the erstwhileRivers Steams Navigation Company Ltd. with an objective to utilizethe Inland Water Transport (IWT) mode of transportation as anoperator.
CIWTC is a Schedule-'C' BRPSE referred sick taken over CPSEin Transport Services Sector under the administrative control of M/o Shipping, Road Transport and Highways, Department of Shippingwith 99.78% shareholding by the Government of India. Thecompany employed 370 regular employees (Executives 21, Non-executives 349) as on 31.3.2011. Its Registered and Corporate officesare at Kolkata, West Bengal.
Vision / MissionThe Vision of the Company is to see that IWT sector prosper
competitively at par with the rest of the transportation modes viz.road, rail and air.
The Mission of the Company is to operate IWT services andto strive for achieving the break even in the shortest possible timeby continuously reducing the operational cost and losses.
Industrial / Business OperationsCIWTC is engaged in transportation of Cargo on the route of
N.W.-I, N.W.-II, Bangladesh, Sector and lighterage operation inriver Hooghly through its single operating unit namely River ServiceDivision Kolkata, West Bengal.
Performance HighlightsThe physical performances of the company for last two years
are given below:
Total Revenue of the company registered an increase of` 1.39 crore during 2011-12, which went up from ` 19.21 crore in2010-11 to ` 20.60 crore in 2011-12 due to increase in otherincome.The net loss of the companyhowever increased to` 13.08 crore in 2011-12 from ̀ 5.06 crorein previous year showingan increase in loss of ` 8.02 crore due to fall in turnover andaccounting of interest of ` 16.27 crore on income tax dues for theearlier years.During the year 2011-12, company got a budget supportof ` 10.29 crore from Government of India for wages & salary asgrant.
The current ratio of company is at 0.66:1 during 2011-12 asagainst 0.69:1 in the previous year. Balance Sheet and Profit &Loss Account of the company and selected financial ratios duringthe period 2010-11 to 2011-12 can be seen on the adjoining page.
www.ciwtcltd.com
Strategic issueRevival scheme for the company was sanctioned by the
Government of India in 2001 and a new revival scheme wassanctioned in 2005 on the basis of the recommendations of BRPSE.As per the revival plan, one unit for ship building and ship repairingviz. Rajabagan Dockyard (RBD) was to be handed over to GardenReach Shipbuilders & Engineers Limited (GRSE) or to any PSE onoutright purchase/ long term lease/ management contract basis, write-off of interest and conversion of outstanding principal into equityand reducing the same against losses, and introduction of VRS tobring down manpower level to 43. Disinvestment of the company(minus RBD) is to be taken up in favor of private parties afterimplantation of the above proposal.
Main Product / Unit Performance duringServices
2011-12 2010-11
I.W.T Transportation M T 30693 42882of Cargo
EBIT
DA
& P
AT (
Rs.
cro
re) TO
TAL REVEN
UE (R
s. crore)
Fig. 1

Public Enterprises Survey 2011-2012: Vol-II 429
Central Inland Water Transport Corpn. Ltd.4, Fairlie Place, Kolkata, West Bengal- 700001
BALANCE SHEET ( ` in Lakhs)PARTICULARS 2011-12 2010-11I. EQUITY & LIABILITIES
AUTHORISED CAPITAL 25100 25100(1) Shareholders’ Funds(a) Share Capital(i) Central Govt 13034 13034(ii) Others 15 15(b) Reserves & Surplus -17649 -16341(c) Money received against share warrants 0 0Total Shareholders’ Funds (1(a)+1(b)+1(c) -4600 -3292(2) Share application money pending allotment 0 0(3) Non-current Liabilities(a) Long Term Borrowings 0 0(b) Deferred tax liabilities (Net) 0 0(c) Other Long-term liabilities 0 0(d) Long-term provisions 762 1023Total Non-Current Liabilities 3(a) to 3(d) 762 1023(4) Current Liabilities(a) Short Term Borrowings 0 0(b) Trade Payables 2853 2764(c) Other current liabilities 925 1043(d) Short-term provisions 17374 15490Total Current Liabilities 4(a) to 4(d) 21152 19297TOTAL EQUITY & LIABILITIES (1+2+3+4) 17314 17028II. ASSETS(1) Non-Current Assets(a) Total Gross Fixed Assets 11119 11119(ai) Accumulated Depreciation, Depletion & Amortisation 7838 7505(aii) Accumulated Impairment 0 0(b) Total Net Fixed Assets ((a)-(ai)-(aii) 3281 3614(c) Capital work in progress 38 0(d) Intangible assets under developmet 0 0(e) Non-Current Investments 0 0(f) Deferred Tax Assets (Net) 0 0(g) Long Term Loans and Advances 0 0(h) Other Non-Current Assets 65 58Total Non-Current Assets (b+c+d+e+f+g+h) 3384 3672(2) Current Assets(a) Current Investments 0 0(b) Inventories 66 64(c) Trade Recievables 1760 1730(d) Cash & Bank Balance 12034 11464(e) Short-term Loans & Advances 0 0(f) Other Current Assets 70 98Total Current Assets (a+b+c+d+e+f) 13930 13356TOTAL ASSETS (1+2) 17314 17028Important Indicators(i) Investment 13049 13049(ii) Capital Employed -4600 -3292(iii) Net Worth -4600 -3292(iv) Net Current Assets -7222 -5941(v) Cost of Sales 1519 1910(vi) Net Value Added (at market price) 582 -132(vii) Total Regular Employees (Nos.) 370 390(viii) Avg. Monthly Emoluments per Employee(`) 19662 22842
PROFIT & LOSS ACCOUNT (` in Lakhs)PARTICULARS 2011-12 2010-11(I) Revenue from Operations (Gross) 131 151Less : Excise Duty 0 0Revenue from Operations (Net) 131 151(II) Other Income 1929 1783(III) Total Revenue (I+II) 2060 1934(IV) Expenditure on:(a) Cost of materials consumed 33 15(b) Purchase of stock-in-trade 0 0(c) Changes in inventories of finished goods, -38 0
work-in-progress and stock in trade(d) Stores & Spares 0 0(e) Power & Fuel 46 57(f) Salary, Wages & Benefits/Employees Expense 873 1069(g) Other Operating/direct/manufacturing Expenses 57 34(h) Rent, Royalty & Cess 0 0(i) Loss on sale of Assets/Investments 0 0(j) Other Expenses 215 379Total Expenditure (IV (a to j)) 1186 1554(V) PROFIT BEFORE DEPRECIATION, & IMPAIRMENT, 874 380
FINANCE CHARGES/INTEREST, EXCEPTIONAL &EXTRAORDINARY ITEMS & TAXES (PBDIEET)(III-IV)
(VI) Depreciation, Depletion & Amortisation 333 356(VII) Impairment 0 0(VIII) PROFIT BEFORE FINANCE COST/INTEREST, 541 24
EXCEPTIONAL, EXTRA-ORDINARY ITEMS &TAXES (PBIEET)(V-VI-VII)
(IX) Finance Cost(a) On Central Government Loans 0 0(b) On Foreign Loans 0 0(c) Others 1627 0(d) Less Finance Cost Capitalised 0 0(e) Charged to P & L Account (a+b+c+d) 1627 0(X) PROFIT BEFORE EXCEPTIONAL & EXTRA- -1086 24
ORDINARY ITEMS & TAX (PBEET)(VIII-IXe)(XI) Exceptional Items 0 0(XII) PROFIT BEFORE EXTRA-ORDINARY ITEMS & -1086 24
TAX (PBET)(X-XI)(XIII) Extra-Ordinary Items -41 289(XIV) PROFIT BEFORE TAX (PBT)(XII-XIII) -1045 -265(XV) TAX PROVISIONS 264 228(XVI) NET PROFIT / LOSS FOR THE PERIOD FROM -1309 -493
CONTINUING OPERATIONS AFTER TAX(XIV-XV)(XVII) Profit/Loss from discontinuing operations 0 0(XVIII) Tax expenses of discontinuing operations 0 0(XIX) Profit/Loss from discontinuing operations 0 0
(after Tax)(XVII-XVIII)(XX) Profit/Loss for the period (XVI+XIX) -1309 -493Financial Ratios(i) Sales : Capital Employed -2.85 -4.59(ii) Cost of Sales : Sales 1159.54 1264.9(iii) Salary/Wages : Sales 666.41 707.95(iv) Net Profit : Net Worth - -(v) Debt : Equity 0 0(vi) Current Ratio 0.66 0.69(vii) Trade Recievables : Sales 1343.51 1145.7(viii) Total Inventory : Sales 50.38 42.38
2011-12 Provisional

Transportation Services430
Container Corporation of India Limited
The CompanyContainer Corporation of India Limited (CONCOR) was
incorporated on 10.03.1988 and began its operation in November1989 by taking over seven ICDs from the Indian Railways and toserve as a catalyst for boosting India's EXIM and Domestic tradeand commerce by providing efficient and reliable multimodal logisticsupport and to ensure growing stakeholder value.
CONCOR is a Schedule 'A', listed Miniratna CPSE intransportation services sector under the administrative control ofMinistry of Railways with 63.09% shareholding by the Governmentof India. The company employed 1164 regular employees(Executives 421, Non-executives 743) as on 31.3.2012. It'sRegistered and Corporate Offices are at New Delhi.Vision / Mission
The Vision of the company is to provide responsive, costeffective, efficient and reliable logistics solutions to its customersthrough synergy with community partners and ensuring profitabilityand growth.
The Mission of the company is to join its community partnersand stake holders to make CONCOR a company of outstandingquality.Industrial / Business Operations
The company operates as a carrier, Inland port operator andterminal services provider. The Company's main function is toprovide cost effective and reliable logistics support services to itscustomers. The bouquet of logistics services that are offered totrade comprises of operation of Inland Ports and DomesticContainer Terminals transportation by rail, road, warehousing,storage, end-to-end logistics solutions, movement of refrigeratedcargo in containers and providing other value added solutions.The Company has established itself as the leading logisticscompany in the country.
At present, CONCOR has one subsidiary, 12 joint ventures, 8regional offices along with 62 terminals of which 48 are EXIMterminals and 14 exclusive Domestic terminals. These terminals areconnected by rail/road across the length and breadth of the country.
During the last fiscal year 270 BLC wagons were added to theexisting fleet of owned wagons; increasing the holding of high speedwagon to 9,631 units. With these, the total wagon holding is now10,988 numbers as at the end of the fiscal.Performance Highlights
CONCOR core business is characterized by three distinctactivities transportation, terminal operator and CFS/ Warehouseoperator. 57 business units have been ISO certified. The physicalperformances of the company for last two years are given below:
Main Product / Unit Performance duringServices
2011-12 2010-11
International Handling TEUs 21,36,000 20,18,551 (EXIM)
Domestic Handling TEUs 4,68,311 5,43,746
Total Handling TEUs 26,04,311 25,62,297(EXIM + Domestic)
Fig. 2
Total Revenue of the company registered an increaseof ` 345.38 crore during 2011-12, which went up fromRs. 4032.11 crore in 2010-11 to ` 4377.49 crore in 2011-12.
The net profit of the company however increased by` 1.93 crore only to ` 877.88 crore during 2011-12 from` 875.95 crore during previous year due to increase in operatingexpenses along with growth in the operating turnover and increasein other income.
The current ratio of company is at 5.48:1 during 2011-12 asagainst 5.88:1 in the previous year (Fig.2). Balance Sheet and Profit& Loss Account of the company and selected financial ratios duringthe period 2010-11 to 2011-12 can be seen on the adjoining page.
EBIT
DA
& P
AT (
Rs.
cro
re)
TOTAL R
EVENU
E (Rs. crore)
Fig. 1
PRO
FITA
BIL
ITY
RAT
IOS
(%)
CU
RR
ENT R
ATIO
Fig. 2
Strategic issueCONCOR is competing with not only the other Container
Train Operators but also with road transporter to bring back asmuch traffic to its fold as possible, keeping the overall objective ofimproving the rail share traffic.

Public Enterprises Survey 2011-2012: Vol-II 431
Container Corporation of India Ltd.CONCOR Bhawan, C-3 Mathura Road, Opposite Apollo Hospital, New Delhi-110 076
BALANCE SHEET ( ` in Lakhs)PARTICULARS 2011-12 2010-11I. EQUITY & LIABILITIES
AUTHORISED CAPITAL 20000 20000(1) Shareholders’ Funds(a) Share Capital(i) Central Govt 8200 8200(ii) Others 4798 4798(b) Reserves & Surplus 547645 484783(c) Money received against share warrants 0 0Total Shareholders’ Funds (1(a)+1(b)+1(c) 560643 497781(2) Share application money pending allotment 0 0(3) Non-current Liabilities(a) Long Term Borrowings 0 0(b) Deferred tax liabilities (Net) 24378 22856(c) Other Long-term liabilities 2164 5132(d) Long-term provisions 2281 1794Total Non-Current Liabilities 3(a) to 3(d) 28823 29782(4) Current Liabilities(a) Short Term Borrowings 0 0(b) Trade Payables 13189 11636(c) Other current liabilities 31706 22929(d) Short-term provisions 15397 13613Total Current Liabilities 4(a) to 4(d) 60292 48178TOTAL EQUITY & LIABILITIES (1+2+3+4) 649758 575741II. ASSETS(1) Non-Current Assets(a) Total Gross Fixed Assets 350378 328615(ai) Accumulated Depreciation, Depletion & Amortisation 111008 95913(aii) Accumulated Impairment 0 0(b) Total Net Fixed Assets ((a)-(ai)-(aii) 239370 232702(c) Capital work in progress 11512 10690(d) Intangible assets under developmet 5 41(e) Non-Current Investments 29310 24396(f) Deferred Tax Assets (Net) 0 0(g) Long Term Loans and Advances 38187 24273(h) Other Non-Current Assets 792 425Total Non-Current Assets (b+c+d+e+f+g+h) 319176 292527(2) Current Assets(a) Current Investments 0 0(b) Inventories 817 626(c) Trade Recievables 1959 1727(d) Cash & Bank Balance 276150 229568(e) Short-term Loans & Advances 40855 44370(f) Other Current Assets 10801 6923Total Current Assets (a+b+c+d+e+f) 330582 283214TOTAL ASSETS (1+2) 649758 575741Important Indicators(i) Investment 12998 12998(ii) Capital Employed 560643 497781(iii) Net Worth 560643 497781(iv) Net Current Assets 270290 235036(v) Cost of Sales 319571 297383(vi) Net Value Added (at market price) 147309 133988(vii) Total Regular Employees (Nos.) 1164 1147(viii) Avg. Monthly Emoluments per Employee(`) 71528 63521
PROFIT & LOSS ACCOUNT (` in Lakhs)PARTICULARS 2011-12 2010-11(I) Revenue from Operations (Gross) 406095 383485Less : Excise Duty 0 0Revenue from Operations (Net) 406095 383485(II) Other Income 31654 19726(III) Total Revenue (I+II) 437749 403211(IV) Expenditure on:(a) Cost of materials consumed 0 0(b) Purchase of stock-in-trade 0 0(c) Changes in inventories of finished goods, 0 0
work-in-progress and stock in trade(d) Stores & Spares 504 267(e) Power & Fuel 2300 1403(f) Salary, Wages & Benefits/Employees Expense 9991 8743(g) Other Operating/direct/manufacturing Expenses 271901 255740(h) Rent, Royalty & Cess 199 167(i) Loss on sale of Assets/Investments 0 0(j) Other Expenses 18827 16540Total Expenditure (IV (a to j)) 303722 282860(V) PROFIT BEFORE DEPRECIATION, & IMPAIRMENT, 134027 120351
FINANCE CHARGES/INTEREST, EXCEPTIONAL &EXTRAORDINARY ITEMS & TAXES (PBDIEET)(III-IV)
(VI) Depreciation, Depletion & Amortisation 15849 14523(VII) Impairment 0 0(VIII) PROFIT BEFORE FINANCE COST/INTEREST, 118178 105828
EXCEPTIONAL, EXTRA-ORDINARY ITEMS &TAXES (PBIEET)(V-VI-VII)
(IX) Finance Cost(a) On Central Government Loans 0 0(b) On Foreign Loans 0 0(c) Others 0 0(d) Less Finance Cost Capitalised 0 0(e) Charged to P & L Account (a+b+c+d) 0 0(X) PROFIT BEFORE EXCEPTIONAL & EXTRA- 118178 105828
ORDINARY ITEMS & TAX (PBEET)(VIII-IXe)(XI) Exceptional Items 0 0(XII) PROFIT BEFORE EXTRA-ORDINARY ITEMS & 118178 105828
TAX (PBET)(X-XI)(XIII) Extra-Ordinary Items 0 0(XIV) PROFIT BEFORE TAX (PBT)(XII-XIII) 118178 105828(XV) TAX PROVISIONS 30390 18233(XVI) NET PROFIT / LOSS FOR THE PERIOD FROM 87788 87595
CONTINUING OPERATIONS AFTER TAX(XIV-XV)(XVII) Profit/Loss from discontinuing operations 0 0(XVIII) Tax expenses of discontinuing operations 0 0(XIX) Profit/Loss from discontinuing operations 0 0
(after Tax)(XVII-XVIII)(XX) Profit/Loss for the period (XVI+XIX) 87788 87595Financial Ratios(i) Sales : Capital Employed 72.43 77.04(ii) Cost of Sales : Sales 78.69 77.55(iii) Salary/Wages : Sales 2.46 2.28(iv) Net Profit : Net Worth 15.66 17.6(v) Debt : Equity 0 0(vi) Current Ratio 5.48 5.88(vii) Trade Recievables : Sales 0.48 0.45(viii) Total Inventory : Sales 0.2 0.16

Transportation Services432
The CompanyDredging Corporation of India Limited (DCI) was incorporated
on 29-3-1976 under the Companies Act, 1956 with an objective toprovide integrated dredging and related marine services for promotingthe national and international maritime trade, beach nourishment,reclamation, inland dredging, environmental protection, etc. and tobecome a global player in the field of dredging.
DCI is a schedule -'B' / Miniratna listed CPSE in TransportationServices Sector under the administrative control of M/o Shipping,D/o Shipping, with 78.56% shareholding by the Government. Thecompany employed 631 regular employees (Executives 303, Non-Executives 328) as on 31.3.2012. Its Registered Office is at Delhiand Corporate office at Visakhapatnam, Andhra Pradesh.
Vision / MissionThe Vision / Mission of the Company is to provide integrated
dredging and related marine services for promoting the national andinternational maritime trade beach nourishment reclamation inlanddredging environmental protection and to become a global player inthe field of dredging.
Industrial / Business OperationsDCI is engaged in providing services in the field of maintenance
dredging, capital dredging, beach nourishment, reclamation andenvironmental protection through its different Project Offices outof which one each are located in the states of Andhra Pradesh,Karnataka, Orissa, Tamilnadu and two in West Bengal. As on31.3.2012, the company has among others, 10 Trailer SuctionHopper Dredgers (TSHD), 3 Cutter Suction Dredgers (CSD) andone Back Hoe Dredger apart from other ancillary crafts. DCI'scustomers include Major Ports under M/o Shipping, Non-MajorPorts under Government of India and State Governments, privateports, the Indian Navy and shipyards.
Performance HighlightsThe physical performances of the company for last two years
are given below:
Total Revenue of the company registered a reduction of` 18.14 crore during 2011-12, which went down from` 522.72 crore in 2010-11 to ` 504.58 crore in 2011-12 due toreduction in operational income as result of differential costadjustment (cost plus contract) for the year 2010-11 and shortfallin available dredging days due to non-availability of vessels andageing dredgers and their prolonged lay-ups.
The net profit of the company however increased to` 13.18 crore, a growth of ` 18.54 crore over the previous year'sloss of ` 5.36 core due to reduction in other expenses.
Dredging Corporation of India Limited
The current ratio of company is at 3.41:1 during 2011-12 asagainst 3.50:1 in the previous year (Fig.2). Balance Sheet and Profit& Loss Account of the company and selected financial ratios duringthe period 2010-11 to 2011-12 can be seen on the adjoining page.
www.dci.gov.in
Main Services Unit Performance during
2011-12 2010-11
Dredging DAYS 2200 2878
% capacity utilization %. 61 79
EBIT
DA
& P
AT (
Rs.
cro
re) TO
TAL REVEN
UE (R
s. crore)
Fig. 1PR
OFI
TAB
ILIT
Y R
ATIO
S (%
)
CU
RR
ENT R
ATIO
Fig. 2
Strategic issueThe Indian dredging market is primarily maintenance dredging
oriented. However, some capital dredging projects are also in theoffing. DCI has already secured the Ennore Capital dredging projecton tender basis.
In the future, increased private sector participation in portdevelopment and related capital dredging activity is expected.Accordingly, the customer profile of DCI's is expected to change.Other developments include deeper draught requirements of Indianports, tourism development, increasing need for beach nourishment,land reclamation for low lying area.

Public Enterprises Survey 2011-2012: Vol-II 433
Dredging Corporation of India Ltd.Core2, 1st Floor, Scope Minar, Plot No. 2A&2B, Laxmi Nagar, District Centre, Delhi-110091
BALANCE SHEET ( ` in Lakhs)PARTICULARS 2011-12 2010-11I. EQUITY & LIABILITIES
AUTHORISED CAPITAL 3000 3000(1) Shareholders’ Funds(a) Share Capital(i) Central Govt 2200 2200(ii) Others 600 600(b) Reserves & Surplus 135373 134055(c) Money received against share warrants 0 0Total Shareholders’ Funds (1(a)+1(b)+1(c) 138173 136855(2) Share application money pending allotment 0 0(3) Non-current Liabilities(a) Long Term Borrowings 25995 0(b) Deferred tax liabilities (Net) 0 0(c) Other Long-term liabilities 120 156(d) Long-term provisions 516 577Total Non-Current Liabilities 3(a) to 3(d) 26631 733(4) Current Liabilities(a) Short Term Borrowings 94 120(b) Trade Payables 3080 8466(c) Other current liabilities 19882 18330(d) Short-term provisions 521 146Total Current Liabilities 4(a) to 4(d) 23577 27062TOTAL EQUITY & LIABILITIES (1+2+3+4) 188381 164650II. ASSETS(1) Non-Current Assets(a) Total Gross Fixed Assets 140085 126735(ai) Accumulated Depreciation, Depletion & Amortisation 86763 78011(aii) Accumulated Impairment 0 0(b) Total Net Fixed Assets ((a)-(ai)-(aii) 53322 48724(c) Capital work in progress 49 20(d) Intangible assets under developmet 4841 0(e) Non-Current Investments 3000 3000(f) Deferred Tax Assets (Net) 0 0(g) Long Term Loans and Advances 46771 18308(h) Other Non-Current Assets 0 0Total Non-Current Assets (b+c+d+e+f+g+h) 107983 70052(2) Current Assets(a) Current Investments 0 0(b) Inventories 9766 9187(c) Trade Recievables 38880 38238(d) Cash & Bank Balance 7832 23527(e) Short-term Loans & Advances 1360 6229(f) Other Current Assets 22560 17417Total Current Assets (a+b+c+d+e+f) 80398 94598TOTAL ASSETS (1+2) 188381 164650Important Indicators(i) Investment 28795 2800(ii) Capital Employed 164168 136855(iii) Net Worth 138173 136855(iv) Net Current Assets 56821 67536(v) Cost of Sales 48702 47785(vi) Net Value Added (at market price) 17210 16847(vii) Total Regular Employees (Nos.) 631 684(viii) Avg. Monthly Emoluments per Employee(`) 122636 81299
PROFIT & LOSS ACCOUNT (` in Lakhs)PARTICULARS 2011-12 2010-11(I) Revenue from Operations (Gross) 49166 50714Less : Excise Duty 0 0Revenue from Operations (Net) 49166 50714(II) Other Income 1292 1558(III) Total Revenue (I+II) 50458 52272(IV) Expenditure on:(a) Cost of materials consumed 0 0(b) Purchase of stock-in-trade 0 0(c) Changes in inventories of finished goods, 0 0
work-in-progress and stock in trade(d) Stores & Spares 4372 4161(e) Power & Fuel 16053 19948(f) Salary, Wages & Benefits/Employees Expense 9286 6673(g) Other Operating/direct/manufacturing Expenses 7879 3657(h) Rent, Royalty & Cess 100 40(i) Loss on sale of Assets/Investments 0 0(j) Other Expenses 2217 6274Total Expenditure (IV (a to j)) 39907 40753(V) PROFIT BEFORE DEPRECIATION, & IMPAIRMENT, 10551 11519
FINANCE CHARGES/INTEREST, EXCEPTIONAL &EXTRAORDINARY ITEMS & TAXES (PBDIEET)(III-IV)
(VI) Depreciation, Depletion & Amortisation 8795 7032(VII) Impairment 0 0(VIII) PROFIT BEFORE FINANCE COST/INTEREST, 1756 4487
EXCEPTIONAL, EXTRA-ORDINARY ITEMS &TAXES (PBIEET)(V-VI-VII)
(IX) Finance Cost(a) On Central Government Loans 0 0(b) On Foreign Loans 0 0(c) Others 0 0(d) Less Finance Cost Capitalised 0 0(e) Charged to P & L Account (a+b+c+d) 0 0(X) PROFIT BEFORE EXCEPTIONAL & EXTRA- 1756 4487
ORDINARY ITEMS & TAX (PBEET)(VIII-IXe)(XI) Exceptional Items 0 0(XII) PROFIT BEFORE EXTRA-ORDINARY ITEMS & 1756 4487
TAX (PBET)(X-XI)(XIII) Extra-Ordinary Items 0 0(XIV) PROFIT BEFORE TAX (PBT)(XII-XIII) 1756 4487(XV) TAX PROVISIONS 438 536(XVI) NET PROFIT / LOSS FOR THE PERIOD FROM 1318 3951
CONTINUING OPERATIONS AFTER TAX(XIV-XV)(XVII) Profit/Loss from discontinuing operations 0 0(XVIII) Tax expenses of discontinuing operations 0 0(XIX) Profit/Loss from discontinuing operations 0 0
(after Tax)(XVII-XVIII)(XX) Profit/Loss for the period (XVI+XIX) 1318 3951Financial Ratios(i) Sales : Capital Employed 29.95 37.06(ii) Cost of Sales : Sales 99.06 94.22(iii) Salary/Wages : Sales 18.89 13.16(iv) Net Profit : Net Worth 0.95 2.89(v) Debt : Equity 9.28 0(vi) Current Ratio 3.41 3.5(vii) Trade Recievables : Sales 79.08 75.4(viii) Total Inventory : Sales 19.86 18.12

Transportation Services434
Ennore Port Ltd.
The CompanyEnnore Port Ltd. (EPL) was developed near Chennai on the
East Coast of India. The Port was declared as Major Port under theIndian Port Act, 1908, in October 1999 and incorporated as acompany. Ennore Port was formally declared open in February2001 and commercial operation commenced in June 2001 with twocoal berths to handle coal needed for the Thermal Power Station ofTNEB in Tamil Nadu. Modern unloading equipment and conveyorshave been installed on the coal berths by TNEB. The capacity ofcoal handling facility is 12 MTPA.
It is a Schedule-'B' / Miniratna CPSE in Transport Servicessector under the administrative control of M/o Shipping with66.67% shareholding by the Government of India and the remainingby Chennai Port Trust. The company employed 94 regularemployees (Executives 51 & Non-Executives 43) as on 31.3.2012.Its Registered and Corporate offices are at Chennai, Tamilnadu.
Vision / MissionThe Vision of the Company is to provide Port Services of
International Standards. Mission of the Company is to develop Ennore Port as a mega
port with world class facilities to become the Eastern gateway Portof India.
Industrial / Business OperationsEPL is functioning on a Landlord Management Model. All the
cargo handling facilities are being developed mainly through privatesector on BOT basis. The common facilities such as creation ofnecessary depths in the harbor and in the channel by dredging, aidsto navigation, road / rail connectivity, etc. are funded and developedby EPL
Performance Highlights The physical performances of the company for last two years
are given below:
Total Revenue from of the company registered a increase of` 82.15 crore during 2011-12, which went up from ̀ 168.11 crorein 2010-11 to ̀ 250.26 crore in 2011-12. The profit of the companyhas gone up by ` 41.13 crore to ` 96.72 crore in 2011-12, from` 55.59 crore in previous year due increase in operating income asa result of increase in export of cars and increase in income fromhandling of Common User coal towards BOT Operations.
The current ratio of company is at 0.47:1 during 2011-12 asagainst 0.29:1 in the previous year (Fig.2). Balance Sheet and Profit
& Loss Account of the company and selected financial ratios duringthe period 2010-11 to 2011-12 can be seen on the adjoining page.
www. ennoreport.gov.in
Services Units Unit Performance during
2011-12 2010-11
Port Services # Million M.T. 14.96 11.50
# Coal, Iron Ore , POL,& other cargo etc.
Fig. 2
EBIT
DA
& P
AT (
Rs.
cro
re)
TOTAL R
EVENU
E (Rs. crore)
PRO
FITA
BIL
ITY
RAT
IOS
(%)
CU
RR
ENT R
ATIO
Fig. 1
Strategic issuesThe other objective of the company is to increase cargo handling
capacity from the present 24.5 MMTPA to 61.5 MMTPA by2014-15 through development of state of art new terminals withPublic Private Partnership and internal and Extra BudgetaryResources. The company has drawn proposal to the extent of ̀ 1852crores during 12th Five Year Plan period. Further, the company hasplanned to attract ` 6000 crore investment from Private / CaptivePort Operator through PPP model during 12th Five Year Plan. Theongoing expansion projects will result in enhancing the capacity ofEnnore Port from 30 MTPA to 66 MTPA by the end of the 12thFive year plan.

Public Enterprises Survey 2011-2012: Vol-II 435
Ennore Port Ltd.P.T. Lee Chengalvaraya Naicker Maaligai, 23, Rajaji Salai, Chennai, Tamilnadu-600001
BALANCE SHEET ( ` in Lakhs)PARTICULARS 2011-12 2010-11I. EQUITY & LIABILITIES
AUTHORISED CAPITAL 50000 50000(1) Shareholders’ Funds(a) Share Capital(i) Central Govt 20000 20000(ii) Others 10000 10000(b) Reserves & Surplus 23805 16381(c) Money received against share warrants 0 0Total Shareholders’ Funds (1(a)+1(b)+1(c) 53805 46381(2) Share application money pending allotment 0 0(3) Non-current Liabilities(a) Long Term Borrowings 37004 40374(b) Deferred tax liabilities (Net) 0 0(c) Other Long-term liabilities 716 385(d) Long-term provisions 0 0Total Non-Current Liabilities 3(a) to 3(d) 37720 40759(4) Current Liabilities(a) Short Term Borrowings 0 0(b) Trade Payables 418 94(c) Other current liabilities 17512 14082(d) Short-term provisions 7725 4927Total Current Liabilities 4(a) to 4(d) 25655 19103TOTAL EQUITY & LIABILITIES (1+2+3+4) 117180 106243II. ASSETS(1) Non-Current Assets(a) Total Gross Fixed Assets 99918 86389(ai) Accumulated Depreciation, Depletion & Amortisation 11605 10287(aii) Accumulated Impairment 0 0(b) Total Net Fixed Assets ((a)-(ai)-(aii) 88313 76102(c) Capital work in progress 7003 9994(d) Intangible assets under developmet 0 0(e) Non-Current Investments 4752 4378(f) Deferred Tax Assets (Net) 0 0(g) Long Term Loans and Advances 5008 10316(h) Other Non-Current Assets 0 0Total Non-Current Assets (b+c+d+e+f+g+h) 105076 100790(2) Current Assets(a) Current Investments 0 0(b) Inventories 0 479(c) Trade Recievables 2091 994(d) Cash & Bank Balance 5047 531(e) Short-term Loans & Advances 4894 3439(f) Other Current Assets 72 10Total Current Assets (a+b+c+d+e+f) 12104 5453TOTAL ASSETS (1+2) 117180 106243Important Indicators(i) Investment 67004 70374(ii) Capital Employed 90809 86755(iii) Net Worth 53805 46381(iv) Net Current Assets -13551 -13650(v) Cost of Sales 5748 4558(vi) Net Value Added (at market price) 21448 13775(vii) Total Regular Employees (Nos.) 94 88(viii) Avg. Monthly Emoluments per Employee(`) 67819 56534
PROFIT & LOSS ACCOUNT (` in Lakhs)PARTICULARS 2011-12 2010-11(I) Revenue from Operations (Gross) 24865 16731Less : Excise Duty 0 0Revenue from Operations (Net) 24865 16731(II) Other Income 161 80(III) Total Revenue (I+II) 25026 16811(IV) Expenditure on:(a) Cost of materials consumed 0 0(b) Purchase of stock-in-trade 0 0(c) Changes in inventories of finished goods, 0 0
work-in-progress and stock in trade(d) Stores & Spares 0 0(e) Power & Fuel 212 143(f) Salary, Wages & Benefits/Employees Expense 765 597(g) Other Operating/direct/manufacturing Expenses 2494 1670(h) Rent, Royalty & Cess 23 28(i) Loss on sale of Assets/Investments 0 0(j) Other Expenses 929 827Total Expenditure (IV (a to j)) 4423 3265(V) PROFIT BEFORE DEPRECIATION, & IMPAIRMENT, 20603 13546
FINANCE CHARGES/INTEREST, EXCEPTIONAL &EXTRAORDINARY ITEMS & TAXES (PBDIEET)(III-IV)
(VI) Depreciation, Depletion & Amortisation 1325 1293(VII) Impairment 0 0(VIII) PROFIT BEFORE FINANCE COST/INTEREST, 19278 12253
EXCEPTIONAL, EXTRA-ORDINARY ITEMS &TAXES (PBIEET)(V-VI-VII)
(IX) Finance Cost(a) On Central Government Loans 0 0(b) On Foreign Loans 0 0(c) Others 6616 4322(d) Less Finance Cost Capitalised 0 0(e) Charged to P & L Account (a+b+c+d) 6616 4322(X) PROFIT BEFORE EXCEPTIONAL & EXTRA- 12662 7931
ORDINARY ITEMS & TAX (PBEET)(VIII-IXe)(XI) Exceptional Items 566 945(XII) PROFIT BEFORE EXTRA-ORDINARY ITEMS & 12096 6986
TAX (PBET)(X-XI)(XIII) Extra-Ordinary Items 18 0(XIV) PROFIT BEFORE TAX (PBT)(XII-XIII) 12078 6986(XV) TAX PROVISIONS 2406 1428(XVI) NET PROFIT / LOSS FOR THE PERIOD FROM 9672 5558
CONTINUING OPERATIONS AFTER TAX(XIV-XV)(XVII) Profit/Loss from discontinuing operations 0 0(XVIII) Tax expenses of discontinuing operations 0 0(XIX) Profit/Loss from discontinuing operations 0 0
(after Tax)(XVII-XVIII)(XX) Profit/Loss for the period (XVI+XIX) 9672 5558Financial Ratios(i) Sales : Capital Employed 27.38 19.29(ii) Cost of Sales : Sales 23.12 27.24(iii) Salary/Wages : Sales 3.08 3.57(iv) Net Profit : Net Worth 17.98 11.98(v) Debt : Equity 1.23 1.35(vi) Current Ratio 0.47 0.29(vii) Trade Recievables : Sales 8.41 5.94(viii) Total Inventory : Sales 0 2.86

Transportation Services436
Fresh and Healthy Enterprises Ltd.
The CompanyFresh & Healthy Enterprises Limited (FHEL) is a wholly
owned subsidiary of Container Corporation of India (CONCOR).It was incorporated on 1.2.2006 with the objective to set up aworld class cold chain infrastructure in India, and to providecomplete cold chain logistics solutions to the various stakeholdersin this area.
FHEL is an un-categorized CPSE in transportation servicessector under Ministry of Railways. The company employed 33employees (Executives 16 & Non-Executives 17) as on 31.3.2012.Its Registered Office is in New Delhi and corporate office is atSonepat, Haryana.
Vision / MissionThe Vision / Mission of the Company is to develop into a
world class organization using state-of-the-art technologies forprocurement, transportation, storage, and distribution of fruits andvegetables in the country. This is to be achieved through setting upmodern controlled atmosphere storage facilities and by developingstrong long term linkages with farmers, agricultural institutes,logistics, operations and governmental agencies with emphasis oninformation technology solutions for all activities. The Companywill strive to provide value for money to its customers throughproviding qualitative and efficient services.
Industrial / Business OperationsFHEL is involved in the procurement, transportation, storage
and distribution of fruits and vegetables through integratedcontrolled atmosphere storage, operation & logistics through itsregional and works office at Shimla (H.P.) and Sonepat (Haryana)respectively.
Performance HighlightsThe Company started its operation in the year 2006-07 by
procuring apples from Shimla and Kinnaur districts of HimachalPradesh for which it commissioned 12000 MT State-of-art- CAStore, currently the largest in the country. The physical performancesof the company for last two years are given below:
Total Revenue of the company registered a reduction of ̀ 24.36crore during 2011-12, which went down from ̀ 64.65 crore in 2010-11 to ` 40.29 crore in 2011-12.
Accordingly as against a profit of ̀ 0.42 crore during 2010-11the company suffered a net loss of ` 12.22 crore during 2011-12mainly on account of high procurement cost. Income from operationwas low because of bad apple crop.
The current ratio of company is at 0.47 : 1 during 2011-12 asagainst 0.40 : 1 in the previous year. Balance Sheet and Profit &Loss Account of the company and selected financial ratios duringthe period 2010-11 to 2011-12 can be seen on the adjoining page.
www.fhel.co.in
Main Product / Unit Performance duringServices
2011-12 2010-11
Apple procured M T 6898 9361
Apple marketed M T 4805 9539
Strategic issueThe Company aims to establish standards of quality for fruits
and vegetables procured and marketed by the company. The broadapproach of FHEL is to source fresh produce directly from farmers,and then sell directly to retail chains. FHEL is also working withfarmers to adopt modern scientific orchard management techniquesto improve quality and yield.
EBIT
DA
& P
AT (
Rs.
cro
re)
TOTAL R
EVENU
E (Rs. crore)
Fig. 1

Public Enterprises Survey 2011-2012: Vol-II 437
Fresh and Healthy Enterprises Ltd.CONCOR Bhawan, C-3, Mathura Road, Opp. Apollo Hospital, New Delhi-110076
BALANCE SHEET ( ` in Lakhs)PARTICULARS 2011-12 2010-11I. EQUITY & LIABILITIES
AUTHORISED CAPITAL 5000 5000(1) Shareholders’ Funds(a) Share Capital(i) Central Govt 0 0(ii) Others 4827 4827(b) Reserves & Surplus -5113 -3891(c) Money received against share warrants 0 0Total Shareholders’ Funds (1(a)+1(b)+1(c) -286 936(2) Share application money pending allotment 0 0(3) Non-current Liabilities(a) Long Term Borrowings 2340 2964(b) Deferred tax liabilities (Net) 0 19(c) Other Long-term liabilities 0 0(d) Long-term provisions 45 28Total Non-Current Liabilities 3(a) to 3(d) 2385 3011(4) Current Liabilities(a) Short Term Borrowings 7159 3932(b) Trade Payables 83 98(c) Other current liabilities 1110 882(d) Short-term provisions 6 1Total Current Liabilities 4(a) to 4(d) 8358 4913TOTAL EQUITY & LIABILITIES (1+2+3+4) 10457 8860II. ASSETS(1) Non-Current Assets(a) Total Gross Fixed Assets 8177 8169(ai) Accumulated Depreciation, Depletion & Amortisation 1668 1307(aii) Accumulated Impairment 0 0(b) Total Net Fixed Assets ((a)-(ai)-(aii) 6509 6862(c) Capital work in progress 0 0(d) Intangible assets under developmet 0 0(e) Non-Current Investments 0 0(f) Deferred Tax Assets (Net) 0 0(g) Long Term Loans and Advances 47 46(h) Other Non-Current Assets 4 6Total Non-Current Assets (b+c+d+e+f+g+h) 6560 6914(2) Current Assets(a) Current Investments 0 0(b) Inventories 2782 622(c) Trade Recievables 1069 1237(d) Cash & Bank Balance 13 40(e) Short-term Loans & Advances 29 40(f) Other Current Assets 4 7Total Current Assets (a+b+c+d+e+f) 3897 1946TOTAL ASSETS (1+2) 10457 8860Important Indicators(i) Investment 7167 7791(ii) Capital Employed 2054 3900(iii) Net Worth -286 936(iv) Net Current Assets -4461 -2967(v) Cost of Sales 4444 5896(vi) Net Value Added (at market price) -126 788(vii) Total Regular Employees (Nos.) 33 33(viii) Avg. Monthly Emoluments per Employee(`) 46717 36111
PROFIT & LOSS ACCOUNT (` in Lakhs)PARTICULARS 2011-12 2010-11(I) Revenue from Operations (Gross) 3989 6435Less : Excise Duty 0 0Revenue from Operations (Net) 3989 6435(II) Other Income 40 30(III) Total Revenue (I+II) 4029 6465(IV) Expenditure on:(a) Cost of materials consumed 170 377(b) Purchase of stock-in-trade 4762 3542(c) Changes in inventories of finished goods, -2143 262
work-in-progress and stock in trade(d) Stores & Spares -20 0(e) Power & Fuel 228 186(f) Salary, Wages & Benefits/Employees Expense 185 143(g) Other Operating/direct/manufacturing Expenses 592 775(h) Rent, Royalty & Cess 24 24(i) Loss on sale of Assets/Investments 0 0(j) Other Expenses 284 223Total Expenditure (IV (a to j)) 4082 5532(V) PROFIT BEFORE DEPRECIATION, & IMPAIRMENT, -53 933
FINANCE CHARGES/INTEREST, EXCEPTIONAL &EXTRAORDINARY ITEMS & TAXES (PBDIEET)(III-IV)
(VI) Depreciation, Depletion & Amortisation 362 364(VII) Impairment 0 0(VIII) PROFIT BEFORE FINANCE COST/INTEREST, -415 569
EXCEPTIONAL, EXTRA-ORDINARY ITEMS &TAXES (PBIEET)(V-VI-VII)
(IX) Finance Cost(a) On Central Government Loans 0 0(b) On Foreign Loans 0 0(c) Others 826 508(d) Less Finance Cost Capitalised 0 0(e) Charged to P & L Account (a+b+c+d) 826 508(X) PROFIT BEFORE EXCEPTIONAL & EXTRA- -1241 61
ORDINARY ITEMS & TAX (PBEET)(VIII-IXe)(XI) Exceptional Items 0 0(XII) PROFIT BEFORE EXTRA-ORDINARY ITEMS & -1241 61
TAX (PBET)(X-XI)(XIII) Extra-Ordinary Items 0 0(XIV) PROFIT BEFORE TAX (PBT)(XII-XIII) -1241 61(XV) TAX PROVISIONS -19 19(XVI) NET PROFIT / LOSS FOR THE PERIOD FROM -1222 42
CONTINUING OPERATIONS AFTER TAX(XIV-XV)(XVII) Profit/Loss from discontinuing operations 0 0(XVIII) Tax expenses of discontinuing operations 0 0(XIX) Profit/Loss from discontinuing operations 0 0
(after Tax)(XVII-XVIII)(XX) Profit/Loss for the period (XVI+XIX) -1222 42Financial Ratios(i) Sales : Capital Employed 194.21 165(ii) Cost of Sales : Sales 111.41 91.62(iii) Salary/Wages : Sales 4.64 2.22(iv) Net Profit : Net Worth - 4.49(v) Debt : Equity 0.48 0.61(vi) Current Ratio 0.47 0.4(vii) Trade Recievables : Sales 26.8 19.22(viii) Total Inventory : Sales 69.74 9.67

Transportation Services438
Pawan Hans Helicopters Limited
The CompanyPawan Hans Helicopters Limited (PHHL) was incorporated
on 15-10-1985 with the objective to provide helicopter supportservices to meet the requirement of oil & non-oil sector, otherremote areas and to provide charter service to promote tourism.
PHHL is a Schedule-'B' CPSE in Transportation Services sectorunder the administrative control of M/o Civil Aviation with 51%shareholding by the Government of India and 49% is with ONGCLtd., a Navratna CPSE. The company employed 967 regular employees(Executives 200 & Non-Executives 767) as on 31.3.2012. Its registeredoffice is in New Delhi and corporate office is at Noida (U.P.).
Vision / MissionThe Vision of the company is to meet customer's expectations.
The Mission of the Company is to become a market leader in Asia inhelicopter operations and provide repair / overhaul services ofhelicopter components / assemblies at par with international standard.
Industrial / Business OperationsPHHL is engaged in providing Helicopter services in exploration
& production sector, connecting inaccessible & hilly areas in northeast, inter-island connectivity, pipeline surveillance, pilgrimageservices, hot line insulator washing for Power grid through its fleet of45 helicopters consisting of Dauphin, Bell and Mi-172 etc. Thecompany is also maintaining & operating helicopters owned by othercustomers such as Govt. of Bihar and Gujarat, BSF and ONGC.
Performance Highlights The physical performances of the company for last two years
are given below:
The current ratio of company is at 3.27:1 during 2011-12 asagainst 3.19:1 in the previous year (Fig.2). Balance Sheet and Profit& Loss Account of the company and selected financial ratios duringthe period 2010-11 to 2011-12 can be seen on the adjoining page.
www.pawanhans.co.in
Main Services Unit Performance during
2011-12 2010-11
Helicopter Flying Hrs. 31240 33670
Capacity Utiliation % 81% 83%
Total Revenue from of the company registered an increase of` 7.68 crore during 2011-12, which went up from ` 430.47 crorein 2010-11 to ` 438.15 crore in 2011-12. However, the companyhas shown a loss of ` 10.35 crore in 2011-12 as against a profit of` 18.51 crore in previous year due to reduction in total flyinghours, reduction in average fleet serviceability, reduction in averagemonthly deployment of helicopters and there were increase indepreciation charges (due to induction of 5 new helicopters) , higherliquidated damages , higher helicopter maintenance expenditure andincrease in interest charges paid on enhanced borrowings.
The main reason for lower flying hours was that helicopteroperation in North-East Region was suspended by DGCA fromMay 2011 to June 2011 in Sikkim, from May to July 2011 in Tripuraand MHA from May to Sep. 2011 after fatal accident of one Mi-172helicopter on 19.04.2011 and one B3 helicopter on 30.04.2011. Govt.of Meghahlya and Arunachal Pradesh cancelled the contract.
Strategic issuesThe company aims at to enhance its fleet of Helicopters in the
next few years. It is also considering adding Ultra Light and LightDouble Engine helicopters to its fleet in the near future. PHHL has alsolaunched an Aircraft Maintenance Engineering (AME) training instituteat Mumbai.
PHHL has signed an MOU with DGCA for development ofHadaspar Gliding Centre as a training institute and plans are underwayto operationalize it shortly. PHHL has given order for 2 Mi-172helicopters and delivery of which is expected in June 2012. PHHL is inthe process of acquiring Ultra Light in its fleet in the near future.
EBIT
DA
& P
AT (
Rs.
cro
re)
TOTAL R
EVENU
E (Rs. crore)
Fig. 1PR
OFI
TAB
ILIT
Y R
ATIO
S (%
)
CU
RR
ENT R
ATIO
Fig. 2

Public Enterprises Survey 2011-2012: Vol-II 439
Pawan Hans Helicopters Ltd.Safdarjung Airport, New Delhi-110003
BALANCE SHEET ( ` in Lakhs)PARTICULARS 2011-12 2010-11I. EQUITY & LIABILITIES
AUTHORISED CAPITAL 25000 25000(1) Shareholders’ Funds(a) Share Capital(i) Central Govt 12527 12527(ii) Others 12035 12035(b) Reserves & Surplus 22995 23976(c) Money received against share warrants 0 0Total Shareholders’ Funds (1(a)+1(b)+1(c) 47557 48538(2) Share application money pending allotment 0 0(3) Non-current Liabilities(a) Long Term Borrowings 23283 6410(b) Deferred tax liabilities (Net) 12653 9763(c) Other Long-term liabilities 47060 47069(d) Long-term provisions 3485 1962Total Non-Current Liabilities 3(a) to 3(d) 86481 65204(4) Current Liabilities(a) Short Term Borrowings 0 0(b) Trade Payables 3467 2391(c) Other current liabilities 7394 6807(d) Short-term provisions 2685 3451Total Current Liabilities 4(a) to 4(d) 13546 12649TOTAL EQUITY & LIABILITIES (1+2+3+4) 147584 126391II. ASSETS(1) Non-Current Assets(a) Total Gross Fixed Assets 134983 108470(ai) Accumulated Depreciation, Depletion & Amortisation 42833 38431(aii) Accumulated Impairment 953 954(b) Total Net Fixed Assets ((a)-(ai)-(aii) 91197 69085(c) Capital work in progress 2303 2935(d) Intangible assets under developmet 0 0(e) Non-Current Investments 289 289(f) Deferred Tax Assets (Net) 0 0(g) Long Term Loans and Advances 9069 13262(h) Other Non-Current Assets 393 408Total Non-Current Assets (b+c+d+e+f+g+h) 103251 85979(2) Current Assets(a) Current Investments 0 0(b) Inventories 7949 7037(c) Trade Recievables 16847 18432(d) Cash & Bank Balance 13561 11135(e) Short-term Loans & Advances 2597 2430(f) Other Current Assets 3379 1378Total Current Assets (a+b+c+d+e+f) 44333 40412TOTAL ASSETS (1+2) 147584 126391Important Indicators(i) Investment 47845 30972(ii) Capital Employed 70840 54948(iii) Net Worth 47557 48538(iv) Net Current Assets 30787 27763(v) Cost of Sales 42259 37668(vi) Net Value Added (at market price) 23244 21507(vii) Total Regular Employees (Nos.) 967 989(viii) Avg. Monthly Emoluments per Employee(`) 117141 102351
PROFIT & LOSS ACCOUNT (` in Lakhs)PARTICULARS 2011-12 2010-11(I) Revenue from Operations (Gross) 41354 41303Less : Excise Duty 0 0Revenue from Operations (Net) 41354 41303(II) Other Income 2461 1744(III) Total Revenue (I+II) 43815 43047(IV) Expenditure on:(a) Cost of materials consumed 0 0(b) Purchase of stock-in-trade 0 0(c) Changes in inventories of finished goods, 0 0
work-in-progress and stock in trade(d) Stores & Spares 0 0(e) Power & Fuel 2118 2340(f) Salary, Wages & Benefits/Employees Expense 13593 12147(g) Other Operating/direct/manufacturing Expenses 17128 13195(h) Rent, Royalty & Cess 444 509(i) Loss on sale of Assets/Investments 1 5(j) Other Expenses 2945 4824Total Expenditure (IV (a to j)) 36229 33020(V) PROFIT BEFORE DEPRECIATION, & IMPAIRMENT, 7586 10027
FINANCE CHARGES/INTEREST, EXCEPTIONAL &EXTRAORDINARY ITEMS & TAXES (PBDIEET)(III-IV)
(VI) Depreciation, Depletion & Amortisation 6031 4653(VII) Impairment 0 0(VIII) PROFIT BEFORE FINANCE COST/INTEREST, 1555 5374
EXCEPTIONAL, EXTRA-ORDINARY ITEMS &TAXES (PBIEET)(V-VI-VII)
(IX) Finance Cost(a) On Central Government Loans 0 0(b) On Foreign Loans 0 0(c) Others 1523 617(d) Less Finance Cost Capitalised 77 0(e) Charged to P & L Account (a+b+c+d) 1446 617(X) PROFIT BEFORE EXCEPTIONAL & EXTRA- 109 4757
ORDINARY ITEMS & TAX (PBEET)(VIII-IXe)(XI) Exceptional Items 0 0(XII) PROFIT BEFORE EXTRA-ORDINARY ITEMS & 109 4757
TAX (PBET)(X-XI)(XIII) Extra-Ordinary Items -2134 -185(XIV) PROFIT BEFORE TAX (PBT)(XII-XIII) 2243 4942(XV) TAX PROVISIONS 3278 3092(XVI) NET PROFIT / LOSS FOR THE PERIOD FROM -1035 1850
CONTINUING OPERATIONS AFTER TAX(XIV-XV)(XVII) Profit/Loss from discontinuing operations 0 0(XVIII) Tax expenses of discontinuing operations 0 0(XIX) Profit/Loss from discontinuing operations 0 0
(after Tax)(XVII-XVIII)(XX) Profit/Loss for the period (XVI+XIX) -1035 1850Financial Ratios(i) Sales : Capital Employed 58.38 75.17(ii) Cost of Sales : Sales 102.19 91.2(iii) Salary/Wages : Sales 32.87 29.41(iv) Net Profit : Net Worth -2.18 3.81(v) Debt : Equity 0.95 0.26(vi) Current Ratio 3.27 3.19(vii) Trade Recievables : Sales 40.74 44.63(viii) Total Inventory : Sales 19.22 17.04

Transportation Services440
Shipping Corporation of India Ltd.
The CompanyShipping Corporation of India Ltd. (SCI) was incorporated on
24.03.1950 under the Company Act 1913 with the objective toserve India's overseas and costal sea born trades as its primary flagcarrier and be an important player in the field of global maritimetransportation as also in diverse fields like offshore and other marinetransport infrastructure.
SCI was incorporated by amalgamation of Eastern ShippingCorporation and Western Shipping Corporation. Subsequently twomore Shipping Companies viz. M/s Jayanti Shipping Companyand M/s Mogul Line Ltd. were merged with the SCI in 1973 and1986 respectively. The SCI has undergone change from PrivateLimited Company to Public Limited Company with effect from18.09.1992.
SCI is a Schedule 'A' listed Navratna CPSE under theadministrative control of M/o Shipping, D/o Shipping with 80.12%shareholding by the Government of India. The company employed901 regular employees (Executives 729, Non-executives 172) as on31.3.2012. Its Registered and Corporate offices are at Mumbai,Maharashtra.Vision / Mission
The Vision of the Company is to emerge as a team of inspiredperformers in the field of Maritime Transportation serving Indianand Global trades.
The Mission of the company is to serve India's overseas andcoastal seaborne trades as it is a primary flag carrier.Industrial / Business Operations
The main activities of the SCI comprises of operating shippingservices in practically all areas of shipping business, catering to therequirements of the country's EXIM trade and coastal trade andInternational cross trades. The company is operating 76 vessels ason 31.3.2012 under five major fleet profiles namely Tankers (42),Liner Ships (5), Bulk Carriers (14), Offshore Supply Vessels (13)and Passenger-cum-Cargo Vessels (2). Besides its Head Office atMumbai, it operates through its Regional offices at New Delhi,Kolkata, Chennai, London and Branch offices at Haldia and PortBlair. The company has six joint ventures.Performance Highlights
The physical performances of the company for last two yearsare given below:
www.shipindia.com
Main Product / Unit Performance duringServices
2011-12 2010-11
Freight ` in Crore 2935.05 2261.40
Charter Hire ` in Crore 712.72 1109.77
Although, there was an increase in the operating revenue, thesame has been offset primarily by increase in bunker costs andrevaluation of foreign currency loans which led to increase in theinterest costs. Due to depreciation of the Indian rupee vis a vis USdollar, the exchange loss on foreign currency loans also increased.Although there is no cash loss, the exchange loss had to be consideredas the finance cost as per the requirement of the new AccountingStandards.
The current ratio of company is at 1.70:1 during 2011-12 asagainst 2.02:1 in the previous year (Fig.2). Balance Sheet and Profit& Loss Account of the company and selected financial ratios duringthe period 2010-11 to 2011-12 can be seen on the adjoining page.
Strategic issueThe SCI had proposed acquisition of 62 vessels in different
categories during the 11th Five Year Plan period (2007-12), ofwhich by the end of 2011-12, SCI had placed orders of 42 vessels,and acquired 3 vessels. In the last financial year, company hadplaced order for 2 resale bulk carriers. In 2011-12, 14 vessels weredisposed and 11 vessels were delivered. As on 31.3.2012, thecompany had an orderbook of 27 different types of vessels withtotal tonnage of 1,667,850 dwt.
The Company registered an increase of ` 477.19 crore in totalincome during 2011-12 which went up to ̀ 4467.18 crore in 2011-12 from ` 3989.99 crore during 2010-11. The company howeversuffered a loss of ` 428.21 crore as against a profit of ` 567.31crore in 2010-11, thereon showing a total decline of ` 995.56 croremainly due to increase in operating expenses along with financecost.
PRO
FITA
BIL
ITY
RAT
IOS
(%)
CU
RR
ENT R
ATIO
Fig. 2
EBIT
DA
& P
AT (
Rs.
cro
re)
TOTAL R
EVENU
E (Rs. crore)
Fig. 1

Public Enterprises Survey 2011-2012: Vol-II 441
Shipping Corporation of India Ltd.Shipping House, 245, Madame Cama Road, Mumbai-400021
BALANCE SHEET ( ` in Lakhs)PARTICULARS 2011-12 2010-11I. EQUITY & LIABILITIES
AUTHORISED CAPITAL 100000 100000(1) Shareholders’ Funds(a) Share Capital(i) Central Govt 29694 29694(ii) Others 16886 16886(b) Reserves & Surplus 626852 670231(c) Money received against share warrants 0 0Total Shareholders’ Funds (1(a)+1(b)+1(c) 673432 716811(2) Share application money pending allotment 0 0(3) Non-current Liabilities(a) Long Term Borrowings 552578 405630(b) Deferred tax liabilities (Net) 0 0(c) Other Long-term liabilities 1002 1437(d) Long-term provisions 7744 7815Total Non-Current Liabilities 3(a) to 3(d) 561324 414882(4) Current Liabilities(a) Short Term Borrowings 0 0(b) Trade Payables 60376 63574(c) Other current liabilities 101338 87843(d) Short-term provisions 6680 18896Total Current Liabilities 4(a) to 4(d) 168394 170313TOTAL EQUITY & LIABILITIES (1+2+3+4) 1403150 1302006II. ASSETS(1) Non-Current Assets(a) Total Gross Fixed Assets 1333434 1184130(ai) Accumulated Depreciation, Depletion & Amortisation 442159 447210(aii) Accumulated Impairment 0 0(b) Total Net Fixed Assets ((a)-(ai)-(aii) 891275 736920(c) Capital work in progress 36199 32905(d) Intangible assets under developmet 0 0(e) Non-Current Investments 19236 19236(f) Deferred Tax Assets (Net) 0 0(g) Long Term Loans and Advances 170501 168595(h) Other Non-Current Assets 500 508Total Non-Current Assets (b+c+d+e+f+g+h) 1117711 958164(2) Current Assets(a) Current Investments 8231 10031(b) Inventories 17745 14650(c) Trade Recievables 78593 38073(d) Cash & Bank Balance 144241 246672(e) Short-term Loans & Advances 19038 13448(f) Other Current Assets 17591 20968Total Current Assets (a+b+c+d+e+f) 285439 343842TOTAL ASSETS (1+2) 1403150 1302006Important Indicators(i) Investment 599158 452210(ii) Capital Employed 1226010 1122441(iii) Net Worth 673432 716811(iv) Net Current Assets 117045 173529(v) Cost of Sales 441990 326646(vi) Net Value Added (at market price) 63628 131430(vii) Total Regular Employees (Nos.) 901 926(viii) Avg. Monthly Emoluments per Employee(`) 383028 387329
PROFIT & LOSS ACCOUNT (` in Lakhs)PARTICULARS 2011-12 2010-11(I) Revenue from Operations (Gross) 386755 359464Less : Excise Duty 0 0Revenue from Operations (Net) 386755 359464(II) Other Income 59963 39535(III) Total Revenue (I+II) 446718 398999(IV) Expenditure on:(a) Cost of materials consumed 0 0(b) Purchase of stock-in-trade 0 0(c) Changes in inventories of finished goods, 0 0
work-in-progress and stock in trade(d) Stores & Spares 18523 20077(e) Power & Fuel 431 491(f) Salary, Wages & Benefits/Employees Expense 41413 43040(g) Other Operating/direct/manufacturing Expenses 317055 207269(h) Rent, Royalty & Cess 640 395(i) Loss on sale of Assets/Investments 0 0(j) Other Expenses 3056 8864Total Expenditure (IV (a to j)) 381118 280136(V) PROFIT BEFORE DEPRECIATION, & IMPAIRMENT, 65600 118863
FINANCE CHARGES/INTEREST, EXCEPTIONAL &EXTRAORDINARY ITEMS & TAXES (PBDIEET)(III-IV)
(VI) Depreciation, Depletion & Amortisation 60872 46510(VII) Impairment 0 0(VIII) PROFIT BEFORE FINANCE COST/INTEREST, 4728 72353
EXCEPTIONAL, EXTRA-ORDINARY ITEMS &TAXES (PBIEET)(V-VI-VII)
(IX) Finance Cost(a) On Central Government Loans 0 0(b) On Foreign Loans 7746 4163(c) Others 30984 2526(d) Less Finance Cost Capitalised 0 0(e) Charged to P & L Account (a+b+c+d) 38730 6689(X) PROFIT BEFORE EXCEPTIONAL & EXTRA- -34002 65664
ORDINARY ITEMS & TAX (PBEET)(VIII-IXe)(XI) Exceptional Items 0 0(XII) PROFIT BEFORE EXTRA-ORDINARY ITEMS & -34002 65664
TAX (PBET)(X-XI)(XIII) Extra-Ordinary Items 0 0(XIV) PROFIT BEFORE TAX (PBT)(XII-XIII) -34002 65664(XV) TAX PROVISIONS 8819 8929(XVI) NET PROFIT / LOSS FOR THE PERIOD FROM -42821 56735
CONTINUING OPERATIONS AFTER TAX(XIV-XV)(XVII) Profit/Loss from discontinuing operations 0 0(XVIII) Tax expenses of discontinuing operations 0 0(XIX) Profit/Loss from discontinuing operations 0 0
(after Tax)(XVII-XVIII)(XX) Profit/Loss for the period (XVI+XIX) -42821 56735Financial Ratios(i) Sales : Capital Employed 31.55 32.03(ii) Cost of Sales : Sales 114.28 90.87(iii) Salary/Wages : Sales 10.71 11.97(iv) Net Profit : Net Worth -6.36 7.91(v) Debt : Equity 11.86 8.71(vi) Current Ratio 1.7 2.02(vii) Trade Recievables : Sales 20.32 10.59(viii) Total Inventory : Sales 4.59 4.08

Public Enterprises Survey 2011-2012: Vol-II 443
CONTRACTAND
CONSTRUCTIONSERVICES

Contract & Construction Services444
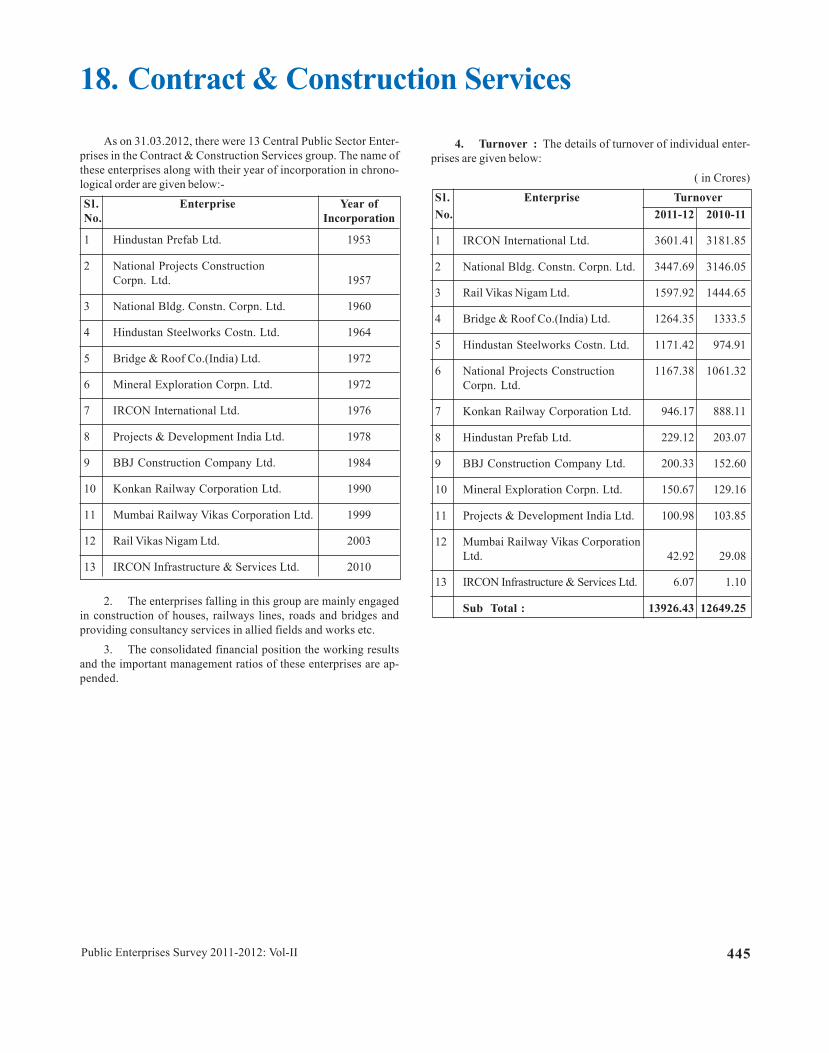
Public Enterprises Survey 2011-2012: Vol-II 445
18. Contract & Construction Services
As on 31.03.2012, there were 13 Central Public Sector Enter-prises in the Contract & Construction Services group. The name ofthese enterprises along with their year of incorporation in chrono-logical order are given below:-Sl. Enterprise Year ofNo. Incorporation
1 Hindustan Prefab Ltd. 1953
2 National Projects ConstructionCorpn. Ltd. 1957
3 National Bldg. Constn. Corpn. Ltd. 1960
4 Hindustan Steelworks Costn. Ltd. 1964
5 Bridge & Roof Co.(India) Ltd. 1972
6 Mineral Exploration Corpn. Ltd. 1972
7 IRCON International Ltd. 1976
8 Projects & Development India Ltd. 1978
9 BBJ Construction Company Ltd. 1984
10 Konkan Railway Corporation Ltd. 1990
11 Mumbai Railway Vikas Corporation Ltd. 1999
12 Rail Vikas Nigam Ltd. 2003
13 IRCON Infrastructure & Services Ltd. 2010
2. The enterprises falling in this group are mainly engagedin construction of houses, railways lines, roads and bridges andproviding consultancy services in allied fields and works etc.
3. The consolidated financial position the working resultsand the important management ratios of these enterprises are ap-pended.
4. Turnover : The details of turnover of individual enter-prises are given below:
( in Crores)Sl. Enterprise TurnoverNo. 2011-12 2010-11
1 IRCON International Ltd. 3601.41 3181.85
2 National Bldg. Constn. Corpn. Ltd. 3447.69 3146.05
3 Rail Vikas Nigam Ltd. 1597.92 1444.65
4 Bridge & Roof Co.(India) Ltd. 1264.35 1333.5
5 Hindustan Steelworks Costn. Ltd. 1171.42 974.91
6 National Projects Construction 1167.38 1061.32Corpn. Ltd.
7 Konkan Railway Corporation Ltd. 946.17 888.11
8 Hindustan Prefab Ltd. 229.12 203.07
9 BBJ Construction Company Ltd. 200.33 152.60
10 Mineral Exploration Corpn. Ltd. 150.67 129.16
11 Projects & Development India Ltd. 100.98 103.85
12 Mumbai Railway Vikas CorporationLtd. 42.92 29.08
13 IRCON Infrastructure & Services Ltd. 6.07 1.10
Sub Total : 13926.43 12649.25

Contract & Construction Services446
5. Net Profit / Loss : The details of enterprises , whichearned net profit or sustained net loss (-) are given below:
( in Crores)
Sl. Enterprise Adjusted Net No. Profit /Net Loss
2011-12 2010-11
1 National Bldg. Constn. Corpn. Ltd. 190.17 140.34
2 Rail Vikas Nigam Ltd. 98.38 61.09
3 Bridge & Roof Co.(India) Ltd. 45.8 57.68
4 National Projects Construction 42.18 72.74Corpn. Ltd.
5 Projects & Development India Ltd. 26.08 21.02
6 Mumbai Railway Vikas 22.71 10.37Corporation Ltd.
7 Konkan Railway Corporation Ltd. 18.74 1.83
8 Mineral Exploration Corpn. Ltd. 17.32 11.96
9 BBJ Construction Company Ltd. 4.77 3.6
10 Ircon Infrastructure & Services Ltd. 2.56 0.07
11 Hindustan Prefab Ltd. 2.47 4.61
12 Hindustan Steelworks Costn. Ltd. -28.08 -38.09
13 IRCON International Ltd. 469.92 240.51
Sub Total : 913.02 587.73
6. Dividend : The details of dividend declared by theindividual enterprises are given below:
(in Crores)
Sl. Enterprise Township andNo. Social Overheads
2011-12 2010-11
1 Ircon International Ltd. 94.03 49.49
2 National Bldg. Constn. Corpn. Ltd. 42.00 28.07
3 Rail Vikas Nigam Ltd. 20.00 12.50
4 Projects & Development India Ltd. 3.81 3.81
5 Bridge & Roof Co.(India) Ltd. 2.75 1.65
6 BBJ Construction Company Ltd. 0.1 0.05
Group Total : 162.69 95.57
7. Social Overhead and Township : The total number ofpersons employed and the expenditure incurred on social overheadsand townships are given below:
( in Crores)Sl. Enterprise Township andNo. Social Overheads
2011-12 2010-11
1 No. of employees (in number) 15430 15679
2 Social overheads: (Rupees in Crore) (i) Educational 6.23 5.56(ii) Medical Facilities 7.16 6.92
(iii) Others 21.44 19.23
3 Capital cost of township(Rs. in Crore) 11.56 81.12
4 No. of houses constructed(in numbers) 5842 5827
8. Company wise details in respect of Balance Sheet, Profitand Loss account, Important Indicators and Financial Ratios alongwith the write up of individual company are given in the pagesbelow.

Public Enterprises Survey 2011-2012: Vol-II 447
BALANCE SHEET (` in Lakhs)PARTICULARS 2011-12 2010-11I. EQUITY & LIABILITIESAUTHORISED CAPITAL 932898 932898(1) Shareholders’ Funds (a) Share Capital (i) Central Govt 725527 722527 (ii) Others 43403 43403 (b) Reserves & Surplus -188153 -257316 (c) Money received against share warrants 0 0 Total Shareholders’ Funds (1(a)+1(b)+1(c) 580777 508614(2) Share application money pending allotment 0 0(3) Non-current Liabilities (a) Long Term Borrowings 760880 626130 (b) Deferred tax liabilities (Net) 158 28 (c) Other Long-term liabilities 121575 161448 (d) Long-term provisions 54836 43733 Total Non-Current Liabilities 3(a) to 3(d) 937449 831339(4) Current Liabilities (a) Short Term Borrowings 127273 98973 (b) Trade Payables 383448 336716 (c) Other current liabilities 668091 610154 (d) Short-term provisions 97783 94525 Total Current Liabilities 4(a) to 4(d) 1276595 1140368TOTAL EQUITY & LIABILITIES (1+2+3+4) 2794821 2480321II. ASSETS(1) Non-Current Assets (a) Total Gross Fixed Assets 521102 503720 (ai) Accumulated Depreciation, Depletion & Amortisation 176995 163068 (aii) Accumulated Impairment 227 69 (b) Total Net Fixed Assets ((a)-(ai)-(aii) 343880 340583 (c) Capital work in progress 12701 13970 (d) Intangible assets under developmet 417 284 (e) Non-Current Investments 64855 61130 (f) Deferred Tax Assets (Net) 24440 19253 (g) Long Term Loans and Advances 102068 103441 (h) Other Non-Current Assets 31816 45031 Total Non-Current Assets (b+c+d+e+f+g+h) 580177 583692(2) Current Assets (a) Current Investments 34128 21894 (b) Inventories 868692 721591 (c) Trade Recievables 381897 314879 (d) Cash & Bank Balance 649491 563678 (e) Short-term Loans & Advances 223355 223762 (f) Other Current Assets 57081 50825 Total Current Assets (a+b+c+d+e+f) 2214644 1896629TOTAL ASSETS (1+2) 2794821 2480321Important Indicators (i) Investment 1529810 1392060 (ii) Capital Employed 1341657 1134744 (iii) Net Worth 580777 508614 (iv) Net Current Assets 938049 756261 (v) Cost of Sales 1301798 1186642 (vi) Net Value Added (at market price) 262692 210680 (vii) Total Regular Employees (Nos.) 15430 15679(viii) Avg. Monthly Emoluments per Employee(`) 50095 42646
PROFIT & LOSS ACCOUNT (` in Lakhs)PARTICULARS 2011-12 2010-11(I) Revenue from Operations (Gross) 1392643 1264925 Less : Excise Duty 649 444 Revenue from Operations (Net) 1391994 1264481(II) Other Income 57302 32667(III) Total Revenue (I+II) 1449296 1297148(IV) Expenditure on: (a) Cost of materials consumed 88376 102846 (b) Purchase of stock-in-trade 0 0 (c) Changes in inventories of finished goods, work-in- 154682 139340
progress and stock in trade (d) Stores & Spares 1194 1199 (e) Power & Fuel 11168 5262 (f) Salary, Wages & Benefits/Employees Expense 92755 80237 (g) Other Operating/direct/manufacturing Expenses 860497 776152 (h) Rent, Royalty & Cess 725 634 (i) Loss on sale of Assets/Investments 15 18 (j) Other Expenses 74045 65872Total Expenditure (IV (a to j)) 1283457 1171560(V)PROFIT BEFORE DEPRECIATION, & IMPAIRMENT, 165839 125588
FINANCE CHARGES/INTEREST, EXCEPTIONAL &EXTRAORDINARY ITEMS & TAXES (PBDIEET)(III-IV)
(VI) Depreciation, Depletion & Amortisation 18160 15100(VII) Impairment 196 0(VIII) PROFIT BEFORE FINANCE COST/INTEREST, 147483 110488
EXCEPTIONAL, EXTRA-ORDINARY ITEMS & TAXES(PBIEET)(V-VI-VII)
(IX) Finance Cost (a) On Central Government Loans 10191 10453 (b) On Foreign Loans 0 0 (c) Others 15182 15537 (d) Less Finance Cost Capitalised 0 0 (e) Charged to P & L Account (a+b+c+d) 25373 25990(X)PROFIT BEFORE EXCEPTIONAL & EXTRA-ORDINARY 122110 84498
ITEMS & TAX (PBEET)(VIII-IXe)(XI) Exceptional Items 1200 530(XII) PROFIT BEFORE EXTRA-ORDINARY ITEMS & TAX 120910 83968
(PBET)(X-XI)(XIII) Extra-Ordinary Items -1345 99(XIV) PROFIT BEFORE TAX (PBT)(XII-XIII) 122255 83869(XV) TAX PROVISIONS 30953 25096(XVI) NET PROFIT / LOSS FOR THE PERIOD FROM 91302 58773
CONTINUING OPERATIONS AFTER TAX(XIV-XV)(XVII) Profit/Loss from discontinuing operations 0 0(XVIII) Tax expenses of discontinuing operations 0 0(XIX) Profit/Loss from discontinuing operations (after Tax) 0 0
(XVII-XVIII)(XX) Profit/Loss for the period (XVI+XIX) 91302 58773Financial Ratios (i) Sales : Capital Employed 103.75 111.43 (ii) Cost of Sales : Sales 93.52 93.84 (iii) Salary/Wages : Sales 6.66 6.35 (iv) Net Profit : Net Worth 15.72 11.56 (v) Debt : Equity 0.99 0.82 (vi) Current Ratio 1.73 1.66 (vii) Trade Recievables : Sales 27.44 24.9 (viii) Total Inventory : Sales 62.41 57.07
CONTRACT & CONSTRUCTION SERVICES

Contract & Construction Services448
Braithwaite Burn and Jessop ConstructionCompany Limited
www.bbjconst.com
The CompanyBraithwaite Burn and Jessop (BBJ) Construction Company
Limited (BBJCC) setup in 1935 was incorporated as CPSE on13.09.1987 after it was taken over from the private sector on13.08.1987. The current objective of the company is to maintainmarket leadership in the field of design, fabrication and erection ofsteel bridges in India and selected foreign markets.
It is a Schedule-’B’ BRPSE referred taken over CPSE inContract & Construction Services sector under the administrativecontrol of M/o Heavy Industries and Public Enterprises, D/o HeavyIndustry with its Registered and Corporate offices at Kolkata,West Bengal. The company employed 101 regular employees(Executives 52, Non-executives 49) as on 31.3.2012. BBJCC is a100% subsidiary of Bharat Bhari Udyog Nigam Ltd. (BBUNL).
Vision / MissionThe Vision of the Company is to be a leader in the field of
infrastructure development and all types of steel bridges. The Mission of the Company is to enhance the turnover five
times in next five years.
Industrial / Business OperationsBBJCC is engaged in providing services in the field of
construction of Steel bridges, rehabilitation / restoration andreplacement of early Steel Bridges, construction of PSC GirderBridges, and fabrication of Steel Structure, civil construction includingHeavy foundations and piling work.
The steel girder bridge fabrication units viz. Heavy Plant Yardand Angus Works are located at Kolkata and Hooghly districts ofWest Bengal. Project construction sites are located all over India.
Performance HighlightsThe physical performance of company during the last three
year is mentioned below:
Strategic IssuesThe financial restructuring was approved by GOI on
31.03.2005 as per the recommendation of BRPSE. BraithwaiteBurn and Jessop (BBJ) Construction Company Limited (BBJCC)is one of the Turnaround CPSE as per the guidelines issued by theGovernment of India for declaring a sick CPSE as “TurnaroundCPSE”. It has made a profit before tax in each of three precedingyears & has a positive net worth after implementation of revivalpackage.
BBJ is planning for development of required resources forentering into job of replacement of old bridges with new bridgewithin specified block period.
Main Services U n i t Performance during
2011-12 2010-11
Bridge Project, Civil ` in Crore 199.14 146.51Construction etc.
The Company registered an increase of ̀ 47.18 crore in totalrevenue which went up to ̀ 199.86 crore in 2011-12 from ̀ 152.68crore during 2010-11. The net profit of the companycorrespondingly increased to ` 4.77 crore, an increase of ` 1.17crore over the previous year due to increase in orders execution andincrease in efficiency.
The current ratio of company is at 1.49:1 during 2011-12 asagainst 1.31:1 in the previous year (Fig.2). Balance Sheet and Profit& Loss Account of the company and selected financial ratios duringthe period 2010-11 to 2011-12 can be seen on the adjoining page.
EBIT
DA
& P
AT (
Rs.
cro
re) TO
TAL REVEN
UE (R
s. crore)
Fig. 1
PRO
FITA
BIL
ITY
RAT
IOS
(%)
CU
RR
ENT R
ATIO
Fig. 2

Public Enterprises Survey 2011-2012: Vol-II 449
Braithwaite Burn and Jessop Construction Company Limited27, Rajendra Nath Mukherjee Road, P.O. Box No-264, Kolkata-700001
BALANCE SHEET (` in Lakhs)PARTICULARS 2011-12 2010-11I. EQUITY & LIABILITIESAUTHORISED CAPITAL 3000 3000(1) Shareholders’ Funds (a) Share Capital (i) Central Govt 0 0 (ii) Others 2027 2027 (b) Reserves & Surplus 985 520 (c) Money received against share warrants 0 0 Total Shareholders’ Funds (1(a)+1(b)+1(c) 3012 2547(2) Share application money pending allotment 0 0(3) Non-current Liabilities (a) Long Term Borrowings 1035 1120 (b) Deferred tax liabilities (Net) 0 0 (c) Other Long-term liabilities 16 13 (d) Long-term provisions 25 28 Total Non-Current Liabilities 3(a) to 3(d) 1076 1161(4) Current Liabilities (a) Short Term Borrowings 625 1585 (b) Trade Payables 5414 7008 (c) Other current liabilities 424 716 (d) Short-term provisions 137 117 Total Current Liabilities 4(a) to 4(d) 6600 9426TOTAL EQUITY & LIABILITIES (1+2+3+4) 10688 13134II. ASSETS(1) Non-Current Assets (a) Total Gross Fixed Assets 1707 1543 (ai) Accumulated Depreciation, Depletion 845 727
& Amortisation (aii) Accumulated Impairment 0 0 (b) Total Net Fixed Assets ((a)-(ai)-(aii) 862 816 (c) Capital work in progress 0 0 (d) Intangible assets under developmet 0 0 (e) Non-Current Investments 0 1 (f) Deferred Tax Assets (Net) 0 0 (g) Long Term Loans and Advances 0 0 (h) Other Non-Current Assets 0 0 Total Non-Current Assets (b+c+d+e+f+g+h) 862 817(2) Current Assets (a) Current Investments 0 0 (b) Inventories 2098 3444 (c) Trade Recievables 1218 4082 (d) Cash & Bank Balance 3504 2105 (e) Short-term Loans & Advances 1585 1331 (f) Other Current Assets 1421 1355 Total Current Assets (a+b+c+d+e+f) 9826 12317TOTAL ASSETS (1+2) 10688 13134Important Indicators (i) Investment 3062 3147 (ii) Capital Employed 4047 3667 (iii) Net Worth 3012 2547 (iv) Net Current Assets 3226 2891 (v) Cost of Sales 19296 14642 (vi) Net Value Added (at market price) 3272 2235 (vii) Total Regular Employees (Nos.) 101 98(viii) Avg. Monthly Emoluments per Employee(`) 130693 89116
PROFIT & LOSS ACCOUNT (` in Lakhs)PARTICULARS 2011-12 2010-11(I) Revenue from Operations (Gross) 20033 15260 Less : Excise Duty 364 72 Revenue from Operations (Net) 19669 15188(II) Other Income 317 80(III) Total Revenue (I+II) 19986 15268(IV) Expenditure on: (a) Cost of materials consumed 6538 4656 (b) Purchase of stock-in-trade 0 0 (c) Changes in inventories of finished goods, 118 610 work-in-progress and stock in trade (d) Stores & Spares 440 398 (e) Power & Fuel 205 110 (f) Salary, Wages & Benefits/Employees 1584 1048 Expense (g) Other Operating/direct/manufacturing 9006 7048 Expenses (h) Rent, Royalty & Cess 55 19 (i) Loss on sale of Assets/Investments 0 0 (j) Other Expenses 1232 645Total Expenditure (IV (a to j)) 19178 14534(V) PROFIT BEFORE DEPRECIATION, & 808 734IMPAIRMENT, FINANCE CHARGES/INTEREST,EXCEPTIONAL & EXTRAORDINARY ITEMS &TAXES (PBDIEET)(III-IV)(VI) Depreciation, Depletion & Amortisation 118 108(VII) Impairment 0 0(VIII) PROFIT BEFORE FINANCE COST/INTEREST, 690 626EXCEPTIONAL, EXTRA-ORDINARY ITEMS &TAXES (PBIEET)(V-VI-VII)(IX) Finance Cost (a) On Central Government Loans 48 44 (b) On Foreign Loans 0 0 (c) Others 46 46 (d) Less Finance Cost Capitalised 0 0 (e) Charged to P & L Account (a+b+c+d) 94 90(X) PROFIT BEFORE EXCEPTIONAL & EXTRA-ORDINARY ITEMS & TAX (PBEET)(VIII-IXe) 596 536(XI) Exceptional Items 0 0(XII) PROFIT BEFORE EXTRA-ORDINARY 596 536ITEMS & TAX (PBET)(X-XI)(XIII) Extra-Ordinary Items 0 87(XIV) PROFIT BEFORE TAX (PBT)(XII-XIII) 596 449(XV) TAX PROVISIONS 119 89(XVI) NET PROFIT / LOSS FOR THE PERIOD 477 360FROM CONTINUING OPERATIONS AFTERTAX(XIV-XV)(XVII) Profit/Loss from discontinuing operations 0 0(XVIII) Tax expenses of discontinuing operations 0 0(XIX) Profit/Loss from discontinuing operations 0 0(after Tax)(XVII-XVIII)(XX) Profit/Loss for the period (XVI+XIX) 477 360Financial Ratios (i) Sales : Capital Employed 486.01 414.18 (ii) Cost of Sales : Sales 98.1 96.41 (iii) Salary/Wages : Sales 8.05 6.9 (iv) Net Profit : Net Worth 15.84 14.13 (v) Debt : Equity 0.51 0.55 (vi) Current Ratio 1.49 1.31 (vii) Trade Recievables : Sales 6.19 26.88 (viii) Total Inventory : Sales 10.67 22.68

Contract & Construction Services450
The CompanyBridge & Roof Company (India) Ltd (B&R) is a one source
multidisciplinary engineering construction company incorporatedin 1920 and nationalized in 1972.
It is a Schedule-’ B’, BRPSE referred, Profit Making CPSE inContract & Construction Services sector under the administrativecontrol of Ministry of Heavy Industries & Public Enterprises. Thecompany employed 1557 regular employees (Executives 805 &Non-Executives 752) as on 31.3.2011. Its Registered and Corporateoffices are at Kolkata, West Bengal.
Vision / MissionThe Vision of the Company is to be the leader in construction
field and project management services with customer satisfactionin all respects in India and abroad.
The Mission of the Company is to thrive in the competitiveIndian Construction Industry and to transform itself from being amere construction company to an integrated project managementcompany
Industrial / Business OperationsThe Company is a versatile construction Company having
presence all over India. It has two Strategic Business Units vizProject Division at Kolkata and Howrah Works. Howrah Works isengaged in Structural Fabrication production of Bailey Bridges BunkHouses, Containers, Pot Shells etc. The Zonal Offices are at Mumbaiand Chennai with Liaison office at Delhi, with 55 project locations.
B&R has been playing an important role in the infrastructuraldevelopment of the country Its range of activities cover Civil,Mechanical , Tankage, Piling , Roads and Highways, EPC/LSTK/and Turnkey Jobs etc. Company has executed projects in Iraq,Abu Dhabi, Nepal and Maldives and at present executing a coupleof international projects in Kuwait. It has high credibility of qualityand timely execution of projects of national importance.
Performance HighlightsThe Construction activities comprise around 96% of the total
activities of the company and are not quantifiable in physical terms.Total Revenue of the company registered a reduction of` 68.91 crore during 2011-12, which went down from ` 1334.02crore in 2010-11 to ` 1265.11 crore in 2011-12. The net profit ofthe company correspondingly reduced by `11.88 creore from` 57.67 crore in 2010-11 to ` 45.79 crore in 2011-12 due toreduction in turnover.
The current ratio of company is at 1.24:1 during 2011-12 asagainst 1.20:1 in the previous year (Fig.2). Balance Sheet and Profit& Loss Account of the company and selected financial ratiosduring the period 2010-11 to 2011-12 can be seen on the adjoiningpage.
www.bridgeroof.co.in
Bridge & Roof Co.(India) Ltd.
Strategic issueIn order to increase its business volume and profitability and
stability of operation, the company is planning for formulation ofjoint ventures / consortiums/ associates on job to job basis. Stepsare also being formulated for the tie up with other CPSEs.
Bridge & Roof Company (India) Ltd (B&R) is one of theTurnaround CPSE” as per the guidelines issued by the Governmentof India for declaring a sick CPSE as “Turnaround CPSE”. It hasmade a profit before tax in each of three preceding years & has apositive net worth after implementation of revival package.
EBIT
DA
& P
AT (
Rs.
cro
re)
TOTAL R
EVENU
E (Rs. crore)
Fig. 1
PRO
FITA
BIL
ITY
RAT
IOS
(%)
CU
RR
ENT R
ATIO
Fig. 2

Public Enterprises Survey 2011-2012: Vol-II 451
Bridge & Roof Co.(India) Ltd.Kankaria Centre (5th Floor), 2/1, Russel Street Kolkata, West Bengal - 700 071
BALANCE SHEET (` in Lakhs)
PARTICULARS 2011-12 2010-11I. EQUITY & LIABILITIESAUTHORISED CAPITAL 6000 6000(1) Shareholders’ Funds (a) Share Capital (i) Central Govt 5463 5463 (ii) Others 36 36 (b) Reserves & Surplus 20222 15962 (c) Money received against share warrants 0 0 Total Shareholders’ Funds (1(a)+1(b)+1(c) 25721 21461(2) Share application money pending allotment 0 0(3) Non-current Liabilities (a) Long Term Borrowings 2377 2414 (b) Deferred tax liabilities (Net) 0 0 (c) Other Long-term liabilities 0 0 (d) Long-term provisions 1659 1092 Total Non-Current Liabilities 3(a) to 3(d) 4036 3506(4) Current Liabilities (a) Short Term Borrowings 4525 4990 (b) Trade Payables 62912 59855 (c) Other current liabilities 22368 21470 (d) Short-term provisions 2996 8304 Total Current Liabilities 4(a) to 4(d) 92801 94619TOTAL EQUITY & LIABILITIES (1+2+3+4) 122558 119586II. ASSETS(1) Non-Current Assets (a) Total Gross Fixed Assets 23046 19970 (ai) Accumulated Depreciation, Depletion 16572 15060 & Amortisation (aii) Accumulated Impairment 0 0 (b) Total Net Fixed Assets ((a)-(ai)-(aii) 6474 4910 (c) Capital work in progress 0 0 (d) Intangible assets under developmet 0 0 (e) Non-Current Investments 0 0 (f) Deferred Tax Assets (Net) 963 841 (g) Long Term Loans and Advances 127 387 (h) Other Non-Current Assets 0 0 Total Non-Current Assets (b+c+d+e+f+g+h) 7564 6138(2) Current Assets (a) Current Investments 0 0 (b) Inventories 69583 58453 (c) Trade Recievables 703 1039 (d) Cash & Bank Balance 2303 8196 (e) Short-term Loans & Advances 39216 36699 (f) Other Current Assets 3189 9061 Total Current Assets (a+b+c+d+e+f) 114994 113448TOTAL ASSETS (1+2) 122558 119586Important Indicators (i) Investment 7876 7913 (ii) Capital Employed 28098 23875 (iii) Net Worth 25721 21461 (iv) Net Current Assets 22193 18829 (v) Cost of Sales 118078 123268 (vi) Net Value Added (at market price) 24503 26544 (vii) Total Regular Employees (Nos.) 1585 1557(viii) Avg. Monthly Emoluments per Employee(`) 52135 46724
PROFIT & LOSS ACCOUNT (` in Lakhs)
PARTICULARS 2011-12 2010-11(I) Revenue from Operations (Gross) 126435 133350 Less : Excise Duty 244 251 Revenue from Operations (Net) 126191 133099(II) Other Income 320 303(III) Total Revenue (I+II) 126511 133402(IV) Expenditure on: (a) Cost of materials consumed 27465 30949 (b) Purchase of stock-in-trade 0 0 (c) Changes in inventories of finished goods, 0 0 work-in-progress and stock in trade (d) Stores & Spares 0 0 (e) Power & Fuel 2608 2772 (f) Salary, Wages & Benefits/Employees 9916 8730 Expense (g) Other Operating/direct/manufacturing 69383 69612 Expenses (h) Rent, Royalty & Cess 0 0 (i) Loss on sale of Assets/Investments 0 0 (j) Other Expenses 7172 9821Total Expenditure (IV (a to j)) 116544 121884(V) PROFIT BEFORE DEPRECIATION, & 9967 11518IMPAIRMENT, FINANCE CHARGES/INTEREST,EXCEPTIONAL & EXTRAORDINARY ITEMS &TAXES (PBDIEET)(III-IV)(VI) Depreciation, Depletion & Amortisation 1534 1384(VII) Impairment 0 0(VIII) PROFIT BEFORE FINANCE COST/INTE 8433 10134REST, EXCEPTIONAL, EXTRA-ORDINARYITEMS & TAXES (PBIEET)(V-VI-VII)(IX) Finance Cost (a) On Central Government Loans 0 71 (b) On Foreign Loans 0 0 (c) Others 1604 1354 (d) Less Finance Cost Capitalised 0 0 (e) Charged to P & L Account (a+b+c+d) 1604 1425(X) PROFIT BEFORE EXCEPTIONAL & EXTRA- 6829 8709ORDINARY ITEMS & TAX (PBEET)(VIII-IXe)(XI) Exceptional Items 0 0(XII) PROFIT BEFORE EXTRA-ORDINARY 6829 8709ITEMS & TAX (PBET)(X-XI)(XIII) Extra-Ordinary Items 0 0(XIV) PROFIT BEFORE TAX (PBT)(XII-XIII) 6829 8709(XV) TAX PROVISIONS 2249 2941(XVI) NET PROFIT / LOSS FOR THE PERIOD 4580 5768FROM CONTINUING OPERATIONS AFTERTAX(XIV-XV)(XVII) Profit/Loss from discontinuing operations 0 0(XVIII) Tax expenses of discontinuing operations 0 0(XIX) Profit/Loss from discontinuing operations 0 0(after Tax)(XVII-XVIII)(XX) Profit/Loss for the period (XVI+XIX) 4580 5768Financial Ratios (i) Sales : Capital Employed 449.11 557.48 (ii) Cost of Sales : Sales 93.57 92.61 (iii) Salary/Wages : Sales 7.86 6.56 (iv) Net Profit : Net Worth 17.81 26.88 (v) Debt : Equity 0.43 0.44 (vi) Current Ratio 1.24 1.2 (vii) Trade Recievables : Sales 0.56 0.78 (viii) Total Inventory : Sales 55.14 43.92

Contract & Construction Services452
The CompanyHindustan Prefab Limited (HPL) was incorporated on
27.1.1953 and commenced its business on 16.8.1955. It was earlierfounded as Hindustan Housing Factory Ltd. (in 1950). As yearsrolled by, the company came to be known as HPL, the change inname being necessitated by diversification of its operations. Itsname was changed as HPL w.e.f. 09.03.1978.
HPL is a Schedule-‘C’BRPSE referred CPSE in Contract &Construction Services sector under the administrative control ofM/o Urban Development with 100% shareholding by theGovernment of India. The company employed 286 regularemployees (Executives 16 & Non-executives 270) as on 31.3.2012.Its Registered and Corporate offices are at New Delhi.Vision / Mission
The Vision of the Company is to be a premier organization inthe field of Civil construction and infrastructure industry byembracing state of art and cost effective technology in Prefab /Precast as well as conventional methods committed to total customersatisfaction.
The Mission of the Company is to pioneer Pre-fabricationmethods and technology whereby ensuring optimum Quality andeffortless Construction Techniques within one’s means;Industrial / Business Operations
HPL is now engaged in execution of projects on turnkey basisi.e. from concept to completion on Project Management basis inareas of mass housing & infrastructure works for slum dwellers andurban poor, Institutional buildings and residential complexes,hospital buildings, sewerage treatment plant etcall over the Country.
It has also undertaken projects under JnNURM, for M/oHousing & Urban Poverty Alleviation for execution of its projectsin State of Bihar, Meghalaya, Arunachal Pradesh, Chhattisgarh,Mizoram etc. & Kerala Govt. (NRHM) and is executing a largenumber of projects for paramilitary forces, National LawUniversity, Food Corporation of India, ESIC etc.Performance Highlights
The physical performances of the company for last two yearsare given below:
Hindustan Prefab Ltd.
www.hindprefab.com
Fig. 2
Main Services Unit Performance during
2011-12 2010-11
Project Management Services ` in crore 229.12 203.07
Strategic IssuesHPL was referred to BRPSE and Government had approved
the financial restructuring of HPL as per the recommendations ofBRPSE on16.09.2009. HPL is one of the Turnaround CPSE as perthe guidelines issued by the Government of India for declaring asick CPSE as “Turnaround CPSE”.
The core business of HPL i.e. prefabrication operation havebecome un-economical for about last 6 years due to obsolete Plant& Machinery necessitating the company to take up projectManagement Services for its survival. After financial restructuring,HPL desires to revamp its core business of prefab and to focusmore on execution of turnkey contracts which allow use of prefabconstruction method. Accordingly HPL has undertakenmodernization of its Prefab Plant in Delhi and has setup two newplants at Vishakhapatam in Andhra Pradesh and Pinjore in Haryana.
The Company registered an increase of ` 26.71 crore in totalincome during 2011-12 which went up to `235.61 crore in2011-12 from `208.90crore during 2010-11. The net profit of thecompany however reduced to `2.47crore in 2011-12, a reductionof `2.14 crorefrom the previous year’s profit of ̀ 4.61 crore dueto increase in operating expenses.
The current ratio of company is at 1.03:1 during 2011-12 asagainst 1.02:1 in the previous year (Fig.2). Balance Sheet and Profit& Loss Account of the company and selected financial ratios duringthe period 2010-11 to 2011-12 can be seen on the adjoining page.
EBIT
DA
& P
AT (
Rs.
cro
re)
TOTAL R
EVENU
E (Rs. crore)
Fig. 1
PRO
FITA
BIL
ITY
RAT
IOS
(%)
CU
RR
ENT R
ATIO

Public Enterprises Survey 2011-2012: Vol-II 453
Hindustan Prefab Ltd.Jangpura, New Delhi 110 014
BALANCE SHEET (` in Lakhs)
PARTICULARS 2011-12 2010-11I. EQUITY & LIABILITIESAUTHORISED CAPITAL 13800 13800(1) Shareholders’ Funds (a) Share Capital (i) Central Govt 13477 13477 (ii) Others 0 0 (b) Reserves & Surplus -12216 -12463 (c) Money received against share warrants 0 0 Total Shareholders’ Funds (1(a)+1(b)+1(c) 1261 1014(2) Share application money pending allotment 0 0(3) Non-current Liabilities (a) Long Term Borrowings 0 0 (b) Deferred tax liabilities (Net) 0 0 (c) Other Long-term liabilities 0 0 (d) Long-term provisions 0 0 Total Non-Current Liabilities 3(a) to 3(d) 0 0(4) Current Liabilities (a) Short Term Borrowings 0 0 (b) Trade Payables 10583 9892 (c) Other current liabilities 12013 8860 (d) Short-term provisions 1081 874 Total Current Liabilities 4(a) to 4(d) 23677 19626TOTAL EQUITY & LIABILITIES (1+2+3+4) 24938 20640II. ASSETS(1) Non-Current Assets (a) Total Gross Fixed Assets 819 790 (ai) Accumulated Depreciation, Depletion 469 453 & Amortisation (aii) Accumulated Impairment 0 0 (b) Total Net Fixed Assets ((a)-(ai)-(aii) 350 337 (c) Capital work in progress 0 0 (d) Intangible assets under developmet 0 0 (e) Non-Current Investments 0 0 (f) Deferred Tax Assets (Net) 0 0 (g) Long Term Loans and Advances 0 0 (h) Other Non-Current Assets 184 250 Total Non-Current Assets (b+c+d+e+f+g+h) 534 587(2) Current Assets (a) Current Investments 0 0 (b) Inventories 21 34 (c) Trade Recievables 9888 7184 (d) Cash & Bank Balance 11945 9978 (e) Short-term Loans & Advances 2550 2857 (f) Other Current Assets 0 0 Total Current Assets (a+b+c+d+e+f) 24404 20053TOTAL ASSETS (1+2) 24938 20640Important Indicators (i) Investment 13477 13477 (ii) Capital Employed 1261 1014 (iii) Net Worth 1261 1014 (iv) Net Current Assets 727 427 (v) Cost of Sales 23220 20273 (vi) Net Value Added (at market price) 2178 2041 (vii) Total Regular Employees (Nos.) 286 289(viii) Avg. Monthly Emoluments per Employee(`) 41317 35784
PROFIT & LOSS ACCOUNT (` in Lakhs)
PARTICULARS 2011-12 2010-11(I) Revenue from Operations (Gross) 22912 20307 Less : Excise Duty 0 0 Revenue from Operations (Net) 22912 20307(II) Other Income 649 583(III) Total Revenue (I+II) 23561 20890(IV) Expenditure on: (a) Cost of materials consumed 14 54 (b) Purchase of stock-in-trade 0 0 (c) Changes in inventories of finished goods, 0 0 work-in-progress and stock in trade (d) Stores & Spares 0 0 (e) Power & Fuel 0 0 (f) Salary, Wages & Benefits/Employees Expense 1418 1241 (g) Other Operating/direct/manufacturing 21356 18641
Expenses (h) Rent, Royalty & Cess 8 4 (i) Loss on sale of Assets/Investments 0 0 (j) Other Expenses 408 319Total Expenditure (IV (a to j)) 23204 20259(V) PROFIT BEFORE DEPRECIATION, & 357 631IMPAIRMENT, FINANCE CHARGES/INTEREST,EXCEPTIONAL & EXTRAORDINARY ITEMS &TAXES (PBDIEET)(III-IV)(VI) Depreciation, Depletion & Amortisation 16 14(VII) Impairment 0 0(VIII) PROFIT BEFORE FINANCE COST/INTEREST, 341 617EXCEPTIONAL, EXTRA-ORDINARY ITEMS &TAXES (PBIEET)(V-VI-VII)(IX) Finance Cost (a) On Central Government Loans 0 0 (b) On Foreign Loans 0 0 (c) Others 26 29 (d) Less Finance Cost Capitalised 0 0 (e) Charged to P & L Account (a+b+c+d) 26 29(X) PROFIT BEFORE EXCEPTIONAL & EXTRA- 315 588ORDINARY ITEMS & TAX (PBEET)(VIII-IXe)(XI) Exceptional Items 0 0(XII) PROFIT BEFORE EXTRA-ORDINARY 315 588ITEMS & TAX (PBET)(X-XI)(XIII) Extra-Ordinary Items 7 12(XIV) PROFIT BEFORE TAX (PBT)(XII-XIII) 308 576(XV) TAX PROVISIONS 61 115(XVI) NET PROFIT / LOSS FOR THE PERIOD FROM 247 461CONTINUING OPERATIONS AFTER TAX(XIV-XV)(XVII) Profit/Loss from discontinuing operations 0 0(XVIII) Tax expenses of discontinuing operations 0 0(XIX) Profit/Loss from discontinuing operations 0 0(after Tax)(XVII-XVIII)(XX) Profit/Loss for the period (XVI+XIX) 247 461Financial Ratios (i) Sales : Capital Employed 1816.97 2002.66 (ii) Cost of Sales : Sales 101.34 99.83 (iii) Salary/Wages : Sales 6.19 6.11 (iv) Net Profit : Net Worth 19.59 45.46 (v) Debt : Equity 0 0 (vi) Current Ratio 1.03 1.02 (vii) Trade Recievables : Sales 43.16 35.38 (viii) Total Inventory : Sales 0.09 0.17
2011-12 Provisional

Contract & Construction Services454
The CompanyHindustan Steel Works Corporation (HSCL) was incorporated
on 23.06.1964 with the objective of creating an organization capableof undertaking complete construction of modern integrated SteelPlants in the Public Sector.
HSCL is a Schedule-‘B’ BRPSE referred CPSE in Contract &Construction Services sector under the administrative control ofM/o Steel with 100% shareholding by the Government of India.The company employed 517 regular employees (Executives 144 &Non-Executives 373) as on 31.3.2012.Its Registered and Corporateoffices are at Kolkata, West Bengal.
Vision / Mission The Vision / Mission of the Company are to become a
profitable Construction Agency as a PSU and contribute indevelopment of the country by execution of various infrastructureand Steel Sector projects.
Industrial / Business OperationsHSCL is involved in undertaking construction activities in the
areas of steel plants (like setting up of Bokaro Bhilai, Rourkela,Vizaz, Durgapur etc. in the past) power, oil and gas, roads /highways, bridges, dams, underground communication and transportsystem, industrial and township complexes etc. with high degree ofplanning, co-ordination and modern sophisticated techniques.Presently the company carries out a number of project packagesunder the capacity expansion programme of SAIL and RINL alongwith regular operation and maintenance jobs of these plants.
It has one Joint Venture (project specific) namely HSCL-SriconInfrastructure Private Limited for construction of Nagpur-HyderabadSection of NH 7.
Performance Highlights The physical performances of the company for last two years
are given below:—
Hindustan Steel Works Corporation
www.hscl.co.in
Main Services U n i t Performance during
2010-12 2010-11
Project Construction ` in Cr. 1208.16 996.30
EBIT
DA
& P
AT (
Rs.
cro
re)
TOTAL R
EVENU
E (Rs. crore)
Fig. 1
The current ratio of company is at 0.47:1 during 2011-12 asagainst 0.49:1 in the pervious year. Balance Sheet and Profit &
Loss Account of the company and selected financial ratios duringthe period 2010-11 to 2011-12 can be seen on the adjoining page.
Total Revenue of the company registered an increase of `224.06 crore during 2011-12, which went up from ` 1005.73crore in 2010-11 to ` 1229.79 crore in 2011-12. The losses of thecompany has also gone down by `10.01 crore to ` 28.08 crore,from ` 38.09 crore in previous year due to increase in turnoverwhich has somehow been offset by increase in operating cost.
Strategic issuesThe company has been facing acute financial difficulty since
long. The accumulated losses were at Rs.1383 crores in 1999.Despite a capital restructuring undertaken in 1999, it is still in loss.The revival package was essentially an exercise in capitalrestructuring. The proposal for Organizational, Business andFinancial Restructuring of the Company on the basis of the viabilitystudy conducted has been recommended by BRPSE in its 58th
meeting held on 13.05.2008. The proposal is under considerationof the Govt. of India (GoI).
During last 19 years there has been no recruitment in thecompany. During the next 1-2 years, all the Senior and MiddleManagement level executives will retire.

Public Enterprises Survey 2011-2012: Vol-II 455
Hindustan Steel Works CorporationP-34-A, Gariahat Road (South) Kolkata, West Bengal -700031
BALANCE SHEET (` in Lakhs)
PARTICULARS 2011-12 2010-11I. EQUITY & LIABILITIESAUTHORISED CAPITAL 15000 15000(1) Shareholders’ Funds (a) Share Capital (i) Central Govt 11710 11710 (ii) Others 0 0 (b) Reserves & Surplus -148907 -146099 (c) Money received against share warrants 0 0 Total Shareholders’ Funds (1(a)+1(b)+1(c) -137197 -134389(2) Share application money pending allotment 0 0(3) Non-current Liabilities (a) Long Term Borrowings 8489 33338 (b) Deferred tax liabilities (Net) 11 14 (c) Other Long-term liabilities 20780 17289 (d) Long-term provisions 1412 2384 Total Non-Current Liabilities 3(a) to 3(d) 30692 53025(4) Current Liabilities (a) Short Term Borrowings 102285 76531 (b) Trade Payables 50868 41861 (c) Other current liabilities 86212 76156 (d) Short-term provisions 30 0 Total Current Liabilities 4(a) to 4(d) 239395 194548TOTAL EQUITY & LIABILITIES (1+2+3+4) 132890 113184II. ASSETS(1) Non-Current Assets (a) Total Gross Fixed Assets 9232 9055 (ai) Accumulated Depreciation, Depletion 5114 5379 & Amortisation (aii) Accumulated Impairment 0 0 (b) Total Net Fixed Assets ((a)-(ai)-(aii) 4118 3676 (c) Capital work in progress 0 110 (d) Intangible assets under developmet 1 0 (e) Non-Current Investments 0 0 (f) Deferred Tax Assets (Net) 0 0 (g) Long Term Loans and Advances 15609 14620 (h) Other Non-Current Assets 0 0 Total Non-Current Assets (b+c+d+e+f+g+h) 19728 18406(2) Current Assets (a) Current Investments 0 0 (b) Inventories 193 295 (c) Trade Recievables 52493 41100 (d) Cash & Bank Balance 33331 29185 (e) Short-term Loans & Advances 15284 12831 (f) Other Current Assets 11861 11367 Total Current Assets (a+b+c+d+e+f) 113162 94778TOTAL ASSETS (1+2) 132890 113184Important Indicators (i) Investment 20199 45048 (ii) Capital Employed -128708 -101051 (iii) Net Worth -137197 -134389 (iv) Net Current Assets -126233 -99770 (v) Cost of Sales 115138 94248 (vi) Net Value Added (at market price) 8926 9092 (vii) Total Regular Employees (Nos.) 517 517(viii) Avg. Monthly Emoluments per Employee(`) 38233 44036
PROFIT & LOSS ACCOUNT (` in Lakhs)
PARTICULARS 2011-12 2010-11(I) Revenue from Operations (Gross) 117142 97491 Less : Excise Duty 0 0 Revenue from Operations (Net) 117142 97491(II) Other Income 5837 3082(III) Total Revenue (I+II) 122979 100573(IV) Expenditure on: (a) Cost of materials consumed 0 0 (b) Purchase of stock-in-trade 0 0 (c) Changes in inventories of finished goods, 0 0 work-in-progress and stock in trade (d) Stores & Spares 238 295 (e) Power & Fuel 296 389 (f) Salary, Wages & Benefits/Employees 2372 2732
Expense (g) Other Operating/direct/manufacturing 107072 87984
Expenses (h) Rent, Royalty & Cess 38 35 (i) Loss on sale of Assets/Investments 0 0 (j) Other Expenses 4785 2542Total Expenditure (IV (a to j)) 114801 93977(V) PROFIT BEFORE DEPRECIATION, & 8178 6596IMPAIRMENT, FINANCE CHARGES/INTEREST,EXCEPTIONAL & EXTRAORDINARY ITEMS &TAXES (PBDIEET)(III-IV)(VI) Depreciation, Depletion & Amortisation 337 271(VII) Impairment 0 0(VIII) PROFIT BEFORE FINANCE COST/INTE 7841 6325REST, EXCEPTIONAL, EXTRA-ORDINARYITEMS & TAXES (PBIEET)(V-VI-VII)(IX) Finance Cost (a) On Central Government Loans 10100 10047 (b) On Foreign Loans 0 0 (c) Others 143 117 (d) Less Finance Cost Capitalised 0 0 (e) Charged to P & L Account (a+b+c+d) 10243 10164(X) PROFIT BEFORE EXCEPTIONAL & -2402 -3839EXTRA-ORDINARY ITEMS & TAX (PBEET)(VIII-IXe)(XI) Exceptional Items 409 0(XII) PROFIT BEFORE EXTRA-ORDINARY -2811 -3839ITEMS & TAX (PBET)(X-XI)(XIII) Extra-Ordinary Items 0 0(XIV) PROFIT BEFORE TAX (PBT)(XII-XIII) -2811 -3839(XV) TAX PROVISIONS -3 -30(XVI) NET PROFIT / LOSS FOR THE PERIOD -2808 -3809FROM CONTINUING OPERATIONS AFTERTAX(XIV-XV)(XVII) Profit/Loss from discontinuing operations 0 0(XVIII) Tax expenses of discontinuing operations 0 0(XIX) Profit/Loss from discontinuing operations 0 0(after Tax)(XVII-XVIII)(XX) Profit/Loss for the period (XVI+XIX) -2808 -3809Financial Ratios (i) Sales : Capital Employed -91.01 -96.48 (ii) Cost of Sales : Sales 98.29 96.67 (iii) Salary/Wages : Sales 2.02 2.8 (iv) Net Profit : Net Worth - - (v) Debt : Equity 0.72 2.85 (vi) Current Ratio 0.47 0.49 (vii) Trade Recievables : Sales 44.81 42.16 (viii) Total Inventory : Sales 0.16 0.3

Contract & Construction Services456
The CompanyIRCON International Ltd. (IRCON) was incorporated in 1976
with the objective to carry on construction activities in variousfield of railways, roads, highways, buildings, industrial andresidential complexes, airport constructions, optic fiber Projects,mass rapid transit system etc.
IRCON is a Schedule-A Miniratna listed CPSE in Contract &Construction Services under the administrative control of Ministryof Railways with 99.73% Shareholding by the Government of India.The company employed 1703 regular employees (Executives 1547& Non-Executives 156) as on 31.3.2012. Its Registered and Corporateoffice is at New Delhi.Vision / Mission
The Vision of the company is to be recognized nationally andinternationally as a specialized construction organizationcomparable with the best in the field covering the entire spectrumof construction activities and services in the infrastructure sector.
The Mission of the company is to effectively position theCompany so as to meet the construction needs of infrastructuredevelopment of the changing economic scene in India and abroad.Industrial / Business Operations
IRCON is engaged in providing civil and other constructionservices such as formation and earthwork, track laying and welding,sidings & MGR system for thermal power stations, rehabilitationand up gradation of track, girder erection & regirdering, ballast andquarries, railways workshops, concrete sleepers, tunneling, pilling,bridges etc; electrification of railways, construction of roads andhighways, bridges, tunnels, airport runway, signaling andtelecommunication work, building, electricity transmissionsubstation etc. from its 5 regional offices and other Project offices.
IRCON has two joint ventures companies one wholly ownedsubsidiary company namely Ircon Infrastructure & Services Limited(Ircon ISL). The service segment of the company comprise ofrailways, highways, buildings and others.Performance Highlights
As on 31.3.2012 there were 76 running projects out of which12 were in other countries. The physical performances of thecompany for last two years are given below:
IRCON International Limited
www.ircon.org
EBIT
DA
& P
AT (
Rs.
cro
re)
TOTAL R
EVENU
E (Rs. crore)
Fig. 1
PRO
FITA
BIL
ITY
RAT
IOS
(%)
Fig. 2
CU
RR
ENT R
ATIO
Main Segment Unit 2011-12 2010-11
Railways ` Crore 2907.10 2033.34
Highways ` Crore 488.80 934.56
Buildings ` Crore 76.30 60.67
Strategic issuesThe other objectives of the company are to enhance the size
and value of business activities of the company so as to achieve aturnover of ` 5500 crore by the year 2016-17 and to achieveoptimal returns on the capital employed.
The current ratio of company is at 1.47:1 during 2011-12 asagainst 1.53:1 in the previous year (Fig.2). Balance Sheet and Profit& Loss Account of the company and selected financial ratios duringthe period 2010-11 to 2011-12 can be seen on the adjoining page.
Total Revenue of the company registered an increase of` 527.77 crore during 2011-12, which went up from ` 3254.15crore in 2010-11 to ` 3781.92 crore in 2011-12. The profit of thecompany has gone up by Rs 229.41 crore to ̀ 469.92 crore in 2011-12, from ̀ 240.51 crore in previous year due to increase in operatingincome specially from foreign projects and increase in margins. 51%of the total income has been contributed by foreign projects.

Public Enterprises Survey 2011-2012: Vol-II 457
IRCON International LimitedC-4, District Centre, Saket, New Delhi 110017
BALANCE SHEET (` in Lakhs)
PARTICULARS 2011-12 2010-11I. EQUITY & LIABILITIESAUTHORISED CAPITAL 2500 2500(1) Shareholders’ Funds (a) Share Capital (i) Central Govt 987 987 (ii) Others 3 3 (b) Reserves & Surplus 173304 137241 (c) Money received against share warrants 0 0 Total Shareholders’ Funds (1(a)+1(b)+1(c) 174294 138231(2) Share application money pending allotment 0 0(3) Non-current Liabilities (a) Long Term Borrowings 0 0 (b) Deferred tax liabilities (Net) 0 0 (c) Other Long-term liabilities 27146 70068 (d) Long-term provisions 41574 32478 Total Non-Current Liabilities 3(a) to 3(d) 68720 102546(4) Current Liabilities (a) Short Term Borrowings 0 0 (b) Trade Payables 54407 45185 (c) Other current liabilities 186780 144381 (d) Short-term provisions 68662 67621 Total Current Liabilities 4(a) to 4(d) 309849 257187TOTAL EQUITY & LIABILITIES (1+2+3+4) 552863 497964II. ASSETS(1) Non-Current Assets (a) Total Gross Fixed Assets 49898 51973 (ai) Accumulated Depreciation, 30552 27750 Depletion & Amortisation (aii) Accumulated Impairment 0 0 (b) Total Net Fixed Assets ((a)-(ai)-(aii) 19346 24223 (c) Capital work in progress 240 177 (d) Intangible assets under developmet 25 0 (e) Non-Current Investments 19579 18537 (f) Deferred Tax Assets (Net) 18938 13106 (g) Long Term Loans and Advances 31734 38993 (h) Other Non-Current Assets 8156 8414 Total Non-Current Assets (b+c+d+e+f+g+h) 98018 103450(2) Current Assets (a) Current Investments 1251 0 (b) Inventories 13451 16492 (c) Trade Recievables 84660 87621 (d) Cash & Bank Balance 260119 200781 (e) Short-term Loans & Advances 66619 69210 (f) Other Current Assets 28745 20410 Total Current Assets (a+b+c+d+e+f) 454845 394514TOTAL ASSETS (1+2) 552863 497964Important Indicators (i) Investment 990 990 (ii) Capital Employed 174294 138231 (iii) Net Worth 174294 138231 (iv) Net Current Assets 144996 137327 (v) Cost of Sales 317972 285276 (vi) Net Value Added (at market price) 81430 60340 (vii) Total Regular Employees (Nos.) 1703 1678(viii) Avg. Monthly Emoluments per Employee(`) 77466 82539
PROFIT & LOSS ACCOUNT (` in Lakhs)
PARTICULARS 2011-12 2010-11(I) Revenue from Operations (Gross) 360141 318185 Less : Excise Duty 0 0 Revenue from Operations (Net) 360141 318185(II) Other Income 18051 7230(III) Total Revenue (I+II) 378192 325415(IV) Expenditure on: (a) Cost of materials consumed 45019 52221 (b) Purchase of stock-in-trade 0 0 (c) Changes in inventories of finished goods, 2192 -767 work-in-progress and stock in trade (d) Stores & Spares 0 0 (e) Power & Fuel 461 452 (f) Salary, Wages & Benefits/Employees 15831 16620 Expense (g) Other Operating/direct/manufacturing 207666 183170 Expenses (h) Rent, Royalty & Cess 0 0 (i) Loss on sale of Assets/Investments 6 14 (j) Other Expenses 41119 29889Total Expenditure (IV (a to j)) 312294 281599(V) PROFIT BEFORE DEPRECIATION, & 65898 43816IMPAIRMENT, FINANCE CHARGES/INTEREST,EXCEPTIONAL & EXTRAORDINARY ITEMS &TAXES (PBDIEET)(III-IV)(VI) Depreciation, Depletion & Amortisation 5684 3691(VII) Impairment 0 0(VIII) PROFIT BEFORE FINANCE COST/INTE 60214 40125REST, EXCEPTIONAL, EXTRA-ORDINARYITEMS & TAXES (PBIEET)(V-VI-VII)(IX) Finance Cost (a) On Central Government Loans 0 0 (b) On Foreign Loans 0 0 (c) Others 0 0 (d) Less Finance Cost Capitalised 0 0 (e) Charged to P & L Account (a+b+c+d) 0 0(X) PROFIT BEFORE EXCEPTIONAL & EXTRA- 60214 40125ORDINARY ITEMS & TAX (PBEET)(VIII-IXe)(XI) Exceptional Items 0 0(XII) PROFIT BEFORE EXTRA-ORDINARY 60214 40125ITEMS & TAX (PBET)(X-XI)(XIII) Extra-Ordinary Items 0 0(XIV) PROFIT BEFORE TAX (PBT)(XII-XIII) 60214 40125(XV) TAX PROVISIONS 13222 16074(XVI) NET PROFIT / LOSS FOR THE PERIOD 46992 24051FROM CONTINUING OPERATIONS AFTERTAX(XIV-XV)(XVII) Profit/Loss from discontinuing operations 0 0(XVIII) Tax expenses of discontinuing operations 0 0(XIX) Profit/Loss from discontinuing operations 0 0(after Tax)(XVII-XVIII)(XX) Profit/Loss for the period (XVI+XIX) 46992 24051Financial Ratios (i) Sales : Capital Employed 206.63 230.18 (ii) Cost of Sales : Sales 88.29 89.66 (iii) Salary/Wages : Sales 4.4 5.22 (iv) Net Profit : Net Worth 26.96 17.4 (v) Debt : Equity 0 0 (vi) Current Ratio 1.47 1.53 (vii) Trade Recievables : Sales 23.51 27.54 (viii) Total Inventory : Sales 3.73 5.18

Contract & Construction Services458
The CompanyIRCON Infrastructure & Services Limited (IRCONISL)
incorporated on 30.09.2009 is a wholly-owned subsidiary of IRCONinternational Limited with an objective to undertake infrastructureprojects including planning, designing, development, construction,improvement, commissioning, operation, maintenance and financingof projects. The objectives clause (III A) of the company wasmodified on 12.03.2012. The new objectives of the company are tocarry on the business of hire purchase, leasing of all kinds of movableand immovable properties, to provide consultancy for all kind ofengineering projects.
IRCONISL is an Uncategorized CPSE in Contract andConstruction Services sector under the administrative control ofM/o Railway with 100% shareholding by its holding companyIRCON international Limited. The company employed 8 executives’regular employees as on 31.3.2012. Its Registered and Corporateoffice is at New Delhi.
Vision / MissionThe Vision / Mission of the company is to be recognized as a
specialized infrastructure developer and establish itself as arenowned service provider for all areas of infrastructure projectswith special emphasis on environment, quality and safety.
Industrial / Business OperationsIRCONISL is currently engaged in planning, designing,
development, improvement, commissioning, operation,maintenance, etc. in the field of construction of infrastructure ofMultifunctional Complexes (MFCs), etc. to provide facilities andamenities to users of Indian Railway System spread all over India.This project is taken up in association with Rail Land DevelopmentAuthority.
The physical work of construction was taken up on 23 stationsand has been completed as on 18 stations and is in advance stages ofcompletion on 3 other stations. These 21 MFCs are ready forleasing to 3rd parties for operation and maintenance. Theconstruction work on balance 2 MFCs is expected to be completedin the year 2012-13.
Performance HighlightsTotal Revenue from of the company registered an increase of
` 5.05 crore during 2011-12, which went up from ` 1.10 crore in2010-11 to ` 6.15 crore in 2011-12. The profit of the companyhas gone up by ` 2.49 crore to ` 2.56 crore in 2011-12, from` 0.07 crore in previous year due to increase in receipts from theconsultancy project.
The current ratio of company is at 0.39:1 during 2011-12 asagainst 0.70:1 in the previous year (Fig.2). Balance Sheet and Profit& Loss Account of the company and selected financial ratios duringthe period 2010-11 to 2011-12 can be seen on the adjoining page.
IRCON Infrastructure & Services Limited
www.irconisl.com
Strategic issuesThe current activities of the company relate to infrastructure
projects and consultancy in the related areas. In order to enlarge thescope of operations of the company, the Board of the company,has altered the objects clause of the company. IRCON-ISL hassecured a contract in Myanmar. The company is also undertakingimplementation of identified works of Corporate SocialResponsibility (CSR) of the holding company.
EBIT
DA
& P
AT (
Rs.
cro
re)
TOTAL R
EVENU
E (Rs. crore)
Fig. 1
PRO
FITA
BIL
ITY
RAT
IOS
(%)
CU
RR
ENT R
ATIO
Fig. 2

Public Enterprises Survey 2011-2012: Vol-II 459
IRCON Infrastructure & Services LimitedC-4, District Centre, Saket, NewDelhi-110017
BALANCE SHEET (` in Lakhs)
PARTICULARS 2011-12 2010-11I. EQUITY & LIABILITIESAUTHORISED CAPITAL 1000 1000(1) Shareholders’ Funds (a) Share Capital (i) Central Govt 0 0 (ii) Others 490 490 (b) Reserves & Surplus 261 5 (c) Money received against share warrants 0 0 Total Shareholders’ Funds (1(a)+1(b)+1(c) 751 495(2) Share application money pending allotment 0 0(3) Non-current Liabilities (a) Long Term Borrowings 5092 2320 (b) Deferred tax liabilities (Net) 0 0 (c) Other Long-term liabilities 0 9 (d) Long-term provisions 0 0 Total Non-Current Liabilities 3(a) to 3(d) 5092 2329(4) Current Liabilities (a) Short Term Borrowings 0 0 (b) Trade Payables 697 519 (c) Other current liabilities 557 235 (d) Short-term provisions 124 10 Total Current Liabilities 4(a) to 4(d) 1378 764TOTAL EQUITY & LIABILITIES (1+2+3+4) 7221 3588II. ASSETS(1) Non-Current Assets (a) Total Gross Fixed Assets 0 0 (ai) Accumulated Depreciation, Depletion 0 0 & Amortisation (aii) Accumulated Impairment 0 0 (b) Total Net Fixed Assets ((a)-(ai)-(aii) 0 0 (c) Capital work in progress 6686 3051 (d) Intangible assets under developmet 0 0 (e) Non-Current Investments 0 0 (f) Deferred Tax Assets (Net) 1 3 (g) Long Term Loans and Advances 1 0 (h) Other Non-Current Assets 0 0 Total Non-Current Assets (b+c+d+e+f+g+h) 6688 3054(2) Current Assets (a) Current Investments 0 0 (b) Inventories 0 0 (c) Trade Recievables 84 252 (d) Cash & Bank Balance 210 10 (e) Short-term Loans & Advances 239 272 (f) Other Current Assets 0 0 Total Current Assets (a+b+c+d+e+f) 533 534TOTAL ASSETS (1+2) 7221 3588Important Indicators (i) Investment 5582 2810 (ii) Capital Employed 5843 2815 (iii) Net Worth 751 495 (iv) Net Current Assets -845 -230 (v) Cost of Sales 233 101 (vi) Net Value Added (at market price) 532 14 (vii) Total Regular Employees (Nos.) 8 7(viii) Avg. Monthly Emoluments per Employee(`) 12500 5952
PROFIT & LOSS ACCOUNT (` in Lakhs)
PARTICULARS 2011-12 2010-11(I) Revenue from Operations (Gross) 607 110 Less : Excise Duty 0 0 Revenue from Operations (Net) 607 110(II) Other Income 8 0(III) Total Revenue (I+II) 615 110(IV) Expenditure on: (a) Cost of materials consumed 0 0 (b) Purchase of stock-in-trade 0 0 (c) Changes in inventories of finished goods, 0 0 work-in-progress and stock in trade (d) Stores & Spares 0 0 (e) Power & Fuel 0 0 (f) Salary, Wages & Benefits/Employees Expense 12 5 (g) Other Operating/direct/manufacturing Expenses 220 83 (h) Rent, Royalty & Cess 0 0 (i) Loss on sale of Assets/Investments 0 0 (j) Other Expenses 1 12Total Expenditure (IV (a to j)) 233 100(V) PROFIT BEFORE DEPRECIATION, & 382 10IMPAIRMENT, FINANCE CHARGES/INTEREST,EXCEPTIONAL & EXTRAORDINARY ITEMS &TAXES (PBDIEET)(III-IV)(VI) Depreciation, Depletion & Amortisation 0 1(VII) Impairment 0 0(VIII) PROFIT BEFORE FINANCE COST/INTEREST, EXCEPTIONAL, EXTRA-ORDINARYITEMS & TAXES (PBIEET)(V-VI-VII) 382 9(IX) Finance Cost (a) On Central Government Loans 0 0 (b) On Foreign Loans 0 0 (c) Others 0 0 (d) Less Finance Cost Capitalised 0 0 (e) Charged to P & L Account (a+b+c+d) 0 0(X) PROFIT BEFORE EXCEPTIONAL & EXTRA- 382 9ORDINARY ITEMS & TAX (PBEET)(VIII-IXe)(XI) Exceptional Items 0 0(XII) PROFIT BEFORE EXTRA-ORDINARY 382 9ITEMS & TAX (PBET)(X-XI)(XIII) Extra-Ordinary Items 0 0(XIV) PROFIT BEFORE TAX (PBT)(XII-XIII) 382 9(XV) TAX PROVISIONS 126 2(XVI) NET PROFIT / LOSS FOR THE PERIOD 256 7FROM CONTINUING OPERATIONS AFTER TAX(XIV-XV)(XVII) Profit/Loss from discontinuing operations 0 0(XVIII) Tax expenses of discontinuing operations 0 0(XIX) Profit/Loss from discontinuing operations 0 0(after Tax)(XVII-XVIII)(XX) Profit/Loss for the period (XVI+XIX) 256 7Financial Ratios (i) Sales : Capital Employed 10.39 3.91 (ii) Cost of Sales : Sales 38.39 91.82 (iii) Salary/Wages : Sales 1.98 4.55 (iv) Net Profit : Net Worth 34.09 1.41 (v) Debt : Equity 10.39 4.73 (vi) Current Ratio 0.39 0.7 (vii) Trade Recievables : Sales 13.84 229.09 (viii) Total Inventory : Sales 0 0

Contract & Construction Services460
The CompanyKonkan Railway Corp. Ltd. (KRCL) was incorporated on
19.07.1990 with the objective to construct a new broad gauge railline between Rohu and Mangalore by raising the finance from Non-Government sources.
KRCL is a Schedule-‘A’ BRPSE referred CPSE in Contract &Construction Services sector under the administrative control ofM/o Railways (MoR) with 52.12% shareholding by theGovernment of India (GOI) (the remaining holding is with theGovernments of Maharashtra, Karnataka and Goa). The companyemployed 4703 regular employees (Executives 181& Non-Executives 4522) as on 31.3.2012. Its registered office is at Delhiand Corporate office at Navi Mumbai, Maharashtra.
Vision / MissionThe Vision / Mission of the Company is to evolve into
economic, eco friendly and cost effective catalyst for growth andprosperity in the Konkan Region.
Industrial / Business OperationsKRCL is the Central / State Government Joint Venture
providing services in the field of construction of railway line andrunning of railway services from Roha in Maharashtra to Mangalorein Karnataka.
In addition to the railway transportation, the corporation hasundertaken construction of Katra–Dharam section of railway projectin J&K and construction of road over bridges in Jharkhand,implementation of ACD network in North East Frontier Railwayand other allied works.
Performance HighlightsThe physical performances of the company for last two years
are given below:
Konkan Railway Corp. Ltd.
www.konkanrailway.com
Total Revenue of the company registered an increase of` 72.27croreduring 2011-12, which went up from ` 928.65crorein 2010-11 to ` 1000.92crore in 2011-12.The net profit of thecompany correspondingly increased to ` 18.74 crore, an increaseof ̀ 16.91crore over the previous year’s profit of ̀ 1.83 crore dueto increase in operations and increase in other income.
The current ratio of company is at 1.22:1 during 2011-12 asagainst 1.27:1 in the previous year (Fig.2). Balance Sheet & LossAccount of the company and selected financial ratios during theperiod 2010-11 to 2011-12 can be seen on the adjoining page.
Strategic issuesKRCL is the first and only railway project in the country to
be executed on BOT basis. To enable timely completion of theproject, the corporation had to resort to commercial borrowing onhigh rate of interest. In addition to this the losses were also incurreddue to non-materialization of the projected traffic growth along theroute. A financial restructuring proposal as approved by BRPSEwas approved by the GOI in 2008. After implementation offinancial restructuring, the debt liabilities of the corporation hadcome down and thereby interest burden has reduced.
Konkan Railway Corp. Ltd. (KRCL) is one of the TurnaroundCPSE as per the guidelines issued by the Government of India fordeclaring a sick CPSE as “Turnaround CPSE”.
EBIT
DA
& P
AT (
Rs.
cro
re)
Fig. 1
Fig. 2
TOTAL R
EVENU
E (Rs. crore)
PRO
FITA
BIL
ITY
RAT
IOS
(%)
CU
RR
ENT R
ATIO
Main Services Unit Performance during
2011-12 2010-11
Traffic Earnings ` crores 671.98 600.08
Project Revenue ` crores 274.19 288.09

Public Enterprises Survey 2011-2012: Vol-II 461
Konkan Railway Corp. Ltd.Room No.101, Rail Bhavan, Rail Road, New Delhi-110001
BALANCE SHEET (` in Lakhs)
PARTICULARS 2011-12 2010-11I. EQUITY & LIABILITIESAUTHORISED CAPITAL 488598 488598(1) Shareholders’ Funds (a) Share Capital (i) Central Govt 449080 449080 (ii) Others 39517 39517 (b) Reserves & Surplus -331036 -332910 (c) Money received against share warrants 0 0 Total Shareholders’ Funds (1(a)+1(b)+1(c) 157561 155687(2) Share application money pending allotment 0 0(3) Non-current Liabilities (a) Long Term Borrowings 166670 174000 (b) Deferred tax liabilities (Net) 0 0 (c) Other Long-term liabilities 0 0 (d) Long-term provisions 5473 4071 Total Non-Current Liabilities 3(a) to 3(d) 172143 178071(4) Current Liabilities (a) Short Term Borrowings 7330 5800 (b) Trade Payables 36523 28142 (c) Other current liabilities 36986 53785 (d) Short-term provisions 4570 4097 Total Current Liabilities 4(a) to 4(d) 85409 91824TOTAL EQUITY & LIABILITIES (1+2+3+4) 415113 425582II. ASSETS(1) Non-Current Assets (a) Total Gross Fixed Assets 403912 392939 (ai) Accumulated Depreciation, Depletion 103484 94510 & Amortisation (aii) Accumulated Impairment 0 0 (b) Total Net Fixed Assets ((a)-(ai)-(aii) 300428 298429 (c) Capital work in progress 4051 6860 (d) Intangible assets under developmet 391 31 (e) Non-Current Investments 0 0 (f) Deferred Tax Assets (Net) 0 0 (g) Long Term Loans and Advances 5753 3329 (h) Other Non-Current Assets 0 0 Total Non-Current Assets (b+c+d+e+f+g+h) 310623 308649(2) Current Assets (a) Current Investments 0 0 (b) Inventories 1948 2420 (c) Trade Recievables 38658 29993 (d) Cash & Bank Balance 47818 69414 (e) Short-term Loans & Advances 13892 14496 (f) Other Current Assets 2174 610 Total Current Assets (a+b+c+d+e+f) 104490 116933TOTAL ASSETS (1+2) 415113 425582Important Indicators (i) Investment 655267 662597 (ii) Capital Employed 324231 329687 (iii) Net Worth 157561 155687 (iv) Net Current Assets 19081 25109 (v) Cost of Sales 84801 78593 (vi) Net Value Added (at market price) 34325 29594 (vii) Total Regular Employees (Nos.) 4703 4652(viii) Avg. Monthly Emoluments per Employee(`) 32708 27554
PROFIT & LOSS ACCOUNT (` in Lakhs)
PARTICULARS 2011-12 2010-11(I) Revenue from Operations (Gross) 94617 88811 Less : Excise Duty 0 0 Revenue from Operations (Net) 94617 88811(II) Other Income 5475 4054(III) Total Revenue (I+II) 100092 92865(IV) Expenditure on: (a) Cost of materials consumed 0 0 (b) Purchase of stock-in-trade 0 0 (c) Changes in inventories of finished goods, 0 0 work-in-progress and stock in trade (d) Stores & Spares 0 0 (e) Power & Fuel 6644 539 (f) Salary, Wages & Benefits/Employees 18459 15382 Expense (g) Other Operating/direct/manufacturing 48271 51968 Expenses (h) Rent, Royalty & Cess 48 38 (i) Loss on sale of Assets/Investments 2 0 (j) Other Expenses 2346 2191Total Expenditure (IV (a to j)) 75770 70118(V) PROFIT BEFORE DEPRECIATION, & 24322 22747IMPAIRMENT, FINANCE CHARGES/INTEREST,EXCEPTIONAL & EXTRAORDINARY ITEMS &TAXES (PBDIEET)(III-IV)(VI) Depreciation, Depletion & Amortisation 9033 8475(VII) Impairment 0 0(VIII) PROFIT BEFORE FINANCE COST/ 15289 14272INTEREST, EXCEPTIONAL, EXTRA-ORDINARYITEMS & TAXES (PBIEET)(V-VI-VII)(IX) Finance Cost (a) On Central Government Loans 0 0 (b) On Foreign Loans 0 0 (c) Others 13363 13991 (d) Less Finance Cost Capitalised 0 0 (e) Charged to P & L Account (a+b+c+d) 13363 13991(X) PROFIT BEFORE EXCEPTIONAL & 1926 281EXTRA-ORDINARY ITEMS & TAX (PBEET)(VIII-IXe)(XI) Exceptional Items 52 98(XII) PROFIT BEFORE EXTRA-ORDINARY 1874 183ITEMS & TAX (PBET)(X-XI)(XIII) Extra-Ordinary Items 0 0(XIV) PROFIT BEFORE TAX (PBT)(XII-XIII) 1874 183(XV) TAX PROVISIONS 0 0(XVI) NET PROFIT / LOSS FOR THE PERIOD 1874 183FROM CONTINUING OPERATIONS AFTERTAX (XIV-XV)(XVII) Profit/Loss from discontinuing operations 0 0(XVIII) Tax expenses of discontinuing operations 0 0(XIX) Profit/Loss from discontinuing operations 0 0(after Tax)(XVII-XVIII)(XX) Profit/Loss for the period (XVI+XIX) 1874 183Financial Ratios (i) Sales : Capital Employed 29.18 26.94 (ii) Cost of Sales : Sales 89.63 88.49 (iii) Salary/Wages : Sales 19.51 17.32 (iv) Net Profit : Net Worth 1.19 0.12 (v) Debt : Equity 0.34 0.36 (vi) Current Ratio 1.22 1.27 (vii) Trade Recievables : Sales 40.86 33.77 (viii) Total Inventory : Sales 2.06 2.72

Contract & Construction Services462
The CompanyMineral Exploration Corp. Ltd. (MECL) was carved out of
GSI in 1972 and incorporated on 21.10.1972 with the objective ofcarrying out detailed exploration of mineral potential deposits on acommercial basis, in order to reduce the time lag between the initialdiscovery of a mineral prospect and its eventual exploitation.
MECL is a Schedule-‘B’ BRPSE referred CPSE in Contract &Construction services sector under the administrative control ofM/o Mines, with 100% shareholding by the Government of India.The company employed 1723 regular employees (Executives 306,Non-executives 1417) as on 31.3.2012. Its Registered and Corporateoffices are at Nagpur, Maharashtra.
Vision / MissionThe Vision of the Company is to be the leader in Exploration
of mineral resources by 2020.The Mission of the Company is to provide high quality, cost
effective and time bound geo scientific services for exploration andexploitation of minerals.
Industrial / Business OperationsMECL carries out exploration activities under two major heads,
viz. Promotional Work for coal, lignite and other minerals onbehalf of and funded by the Government of India, and ContractualWork on behalf of other agencies including public sector, privatesector and state Governments. The Zonal offices and RegionalMaintenance Centers of the company are located at Hyderabad,Nagpur, Ranchi and Tinsukia (Assam) and the BusinessDevelopment Centers are at Delhi and Kolkata.
The service range of the company comprises of exploratorydrilling and exploratory / developmental mining.
Performance HighlightsThe physical performance of Company for last two years is
given below:
Mineral Exploration Corp. Ltd.
Strategic issueMECL proposes to phase out the old plants and machineries
which are more than 15 years old in a phased manner and plans toprocure few medium and shallow capacity drilling rigs. Further,MECL has planned to enter into new thrust areas such as exploration,production well drilling, geothermal geotechnical investigation andcommercial mining of bauxite.
MECL is one of the Turnaround CPSE as per the guidelinesissued by the Government of India for declaring a sick CPSE as“Turnaround CPSE”.
Main Services Unit Performance during
2011-12 2010-11
Exploratory Drilling Meters 296301 2,67,097
Exploratory Mining Meters 8605 8805
The total revenue of the Company registered an increase of` 24.05 crore in 2011-12 which went up to ` 158.12 crore in2011-12 from ` 134.07 crore during 2010-11. The net profit of thecompany increased to ̀ 17.32crore, a growth of 5.36 crore over theprevious year profit of ` 11.96 croredue to increased efforts inimproving efficiency, good order book position, induction of newdrill machines.
The current ratio of company is at 9.39:1 during 2011-12 asagainst 6.39:1 in the previous year (Fig.2). Balance Sheet and Profit&Loss Account of the company and selected financial ratios duringthe period 2010-11 to 2011-12 can be seen on the adjoining page. www.mecl.gov.in
EBIT
DA
& P
AT (
Rs.
cro
re)
Fig. 1
Fig. 2
TOTAL R
EVENU
E (Rs. crore)
PRO
FITA
BIL
ITY
RAT
IOS
(%)
CU
RR
ENT R
ATIO

Public Enterprises Survey 2011-2012: Vol-II 463
Mineral Exploration Corp. Ltd.MECL, Dr. Babasaheb Ambedkar Bhavan, Seminary Hills, Nagpur, Maharashtra - 440006
BALANCE SHEET (` in Lakhs)
PARTICULARS 2011-12 2010-11I. EQUITY & LIABILITIESAUTHORISED CAPITAL 12500 12500(1) Shareholders’ Funds (a) Share Capital (i) Central Govt 11955 11955 (ii) Others 0 0 (b) Reserves & Surplus 3561 1863 (c) Money received against share warrants 0 0 Total Shareholders’ Funds (1(a)+1(b)+1(c) 15516 13818(2) Share application money pending allotment 0 0(3) Non-current Liabilities (a) Long Term Borrowings 0 0 (b) Deferred tax liabilities (Net) 147 14 (c) Other Long-term liabilities 291 375 (d) Long-term provisions 45 40 Total Non-Current Liabilities 3(a) to 3(d) 483 429(4) Current Liabilities (a) Short Term Borrowings 0 0 (b) Trade Payables 225 429 (c) Other current liabilities 871 1006 (d) Short-term provisions 299 567 Total Current Liabilities 4(a) to 4(d) 1395 2002TOTAL EQUITY & LIABILITIES (1+2+3+4) 17394 16249II. ASSETS(1) Non-Current Assets (a) Total Gross Fixed Assets 12997 11857 (ai) Accumulated Depreciation, Depletion 9537 9418 & Amortisation (aii) Accumulated Impairment 0 0 (b) Total Net Fixed Assets ((a)-(ai)-(aii) 3460 2439 (c) Capital work in progress 88 147 (d) Intangible assets under developmet 0 0 (e) Non-Current Investments 0 0 (f) Deferred Tax Assets (Net) 0 0 (g) Long Term Loans and Advances 76 71 (h) Other Non-Current Assets 674 492 Total Non-Current Assets (b+c+d+e+f+g+h) 4298 3149(2) Current Assets (a) Current Investments 0 0 (b) Inventories 654 675 (c) Trade Recievables 4011 3270 (d) Cash & Bank Balance 3920 5831 (e) Short-term Loans & Advances 2847 1921 (f) Other Current Assets 1664 1403 Total Current Assets (a+b+c+d+e+f) 13096 13100TOTAL ASSETS (1+2) 17394 16249Important Indicators (i) Investment 11955 11955 (ii) Capital Employed 15516 13818 (iii) Net Worth 15516 13818 (iv) Net Current Assets 11701 11098 (v) Cost of Sales 13306 11682 (vi) Net Value Added (at market price) 14100 12172 (vii) Total Regular Employees (Nos.) 1723 1871(viii) Avg. Monthly Emoluments per Employee(`) 47746 40259
PROFIT & LOSS ACCOUNT (` in Lakhs)
PARTICULARS 2011-12 2010-11(I) Revenue from Operations (Gross) 15067 12916 Less : Excise Duty 0 0 Revenue from Operations (Net) 15067 12916(II) Other Income 745 491(III) Total Revenue (I+II) 15812 13407(IV) Expenditure on: (a) Cost of materials consumed 13 54 (b) Purchase of stock-in-trade 0 0 (c) Changes in inventories of finished goods, -170 -323 work-in-progress and stock in trade (d) Stores & Spares 495 484 (e) Power & Fuel 646 583 (f) Salary, Wages & Benefits/Employees 9872 9039 Expense (g) Other Operating/direct/manufacturing 1338 924 Expenses (h) Rent, Royalty & Cess 93 84 (i) Loss on sale of Assets/Investments 0 0 (j) Other Expenses 618 389Total Expenditure (IV (a to j)) 12905 11234(V) PROFIT BEFORE DEPRECIATION, & 2907 2173IMPAIRMENT, FINANCE CHARGES/INTEREST,EXCEPTIONAL & EXTRAORDINARY ITEMS &TAXES (PBDIEET)(III-IV)(VI) Depreciation, Depletion & Amortisation 401 448(VII) Impairment 0 0(VIII) PROFIT BEFORE FINANCE COST/ 2506 1725INTEREST, EXCEPTIONAL, EXTRA-ORDINARYITEMS & TAXES (PBIEET)(V-VI-VII)(IX) Finance Cost (a) On Central Government Loans 0 0 (b) On Foreign Loans 0 0 (c) Others 0 0 (d) Less Finance Cost Capitalised 0 0 (e) Charged to P & L Account (a+b+c+d) 0 0(X) PROFIT BEFORE EXCEPTIONAL & EXTRA- 2506 1725ORDINARY ITEMS & TAX (PBEET)(VIII-IXe)(XI) Exceptional Items 0 0(XII) PROFIT BEFORE EXTRA-ORDINARY 2506 1725ITEMS & TAX (PBET)(X-XI)(XIII) Extra-Ordinary Items 0 0(XIV) PROFIT BEFORE TAX (PBT)(XII-XIII) 2506 1725(XV) TAX PROVISIONS 774 529(XVI) NET PROFIT / LOSS FOR THE PERIOD 1732 1196FROM CONTINUING OPERATIONS AFTERTAX(XIV-XV)(XVII) Profit/Loss from discontinuing operations 0 0(XVIII) Tax expenses of discontinuing operations 0 0(XIX) Profit/Loss from discontinuing operations 0 0(after Tax)(XVII-XVIII)(XX) Profit/Loss for the period (XVI+XIX) 1732 1196Financial Ratios (i) Sales : Capital Employed 97.11 93.47 (ii) Cost of Sales : Sales 88.31 90.45 (iii) Salary/Wages : Sales 65.52 69.98 (iv) Net Profit : Net Worth 11.16 8.66 (v) Debt : Equity 0 0 (vi) Current Ratio 9.39 6.54 (vii) Trade Recievables : Sales 26.62 25.32 (viii) Total Inventory : Sales 4.34 5.23

Contract & Construction Services464
The CompanyMumbai Railway Vikas Corporation Ltd. (MRVCL) was
incorporated on 12.07.1999 with the objective of augmentingtransport capacity to match the continual growth in the number ofcommuters in Mumbai by developing coordinated plans andimplementing rail infrastructure projects, integrating urbandevelopment plan of Mumbai with rail capacity and investments,undertaking commercial development of Railway land and air space.
MRVC is a Schedule-‘A’ CPSE in Contract and ConstructionServices sector under the administrative control of M/o Railwayswith 51% shareholding by the Government of India and 49% bythe Govt. of Maharashtra (GoM). The company employed 172regular employees (Executives 163 & Non-Executives 9) as on31.3.2012. Its Registered and Corporate offices are at Mumbai,Maharashtra.
Vision / Mission The Vision / Mission of the Company is to develop world
class infrastructure for an efficient, safe and sustainable Railwaysystem for Mumbai suburban section and to provide comfortableand friendly train service to the commuters
Industrial / Business OperationsMRVC is one of the Central-State Governments Joint Venture
involved in implementing & coordinating rail infrastructures projectviz. Mumbai Urban Transport Project (MUTP) in Mumbai. MRVCis also to undertake commercial development of Railway’s land andair space and to coordinate and facilitate improvements in trackdrainage, remove encroachments and trespassers and to coordinatewith organizations operating train services and responsible forprotection of Railway’s right of way for Urban development.
To execute these projects, MRVC receives funds from Ministryof Railway and Government of Maharashtra for further transmissionto various project executing agencies. All the assets created underMUTP project are owned by Indian Railways and not by MumbaiRailway Vikas Corporation Ltd. Hence all the funds received forMUTP project are neither Long Term Loan nor Government Grants,but the funds received for execution of the project.
Performance Highlights The physical performances of the company for last two years
are given below:
Total Revenue from of the company registered an increase of` 13.81 crore during 2011-12, which went up from ` 29.12 crorein 2010-11 to ` 42.93 crore in 2011-12 due to increase in projectexpenditure. The profit of the company has gone up by ` 12.33
Mumbai RailwayVikas Corporation Ltd.
www.mrvc.indianrail.gov.in
crore to ` 22.69 crore in 2011-12, from ` 10.36 crore in previousyear due to increase in other operating revenue like interest onshort term fixed deposits form banks. The company has been givenexemption under section 12A of the Income Tax Act, 1961.
The current ratio of company is at 6.48:1 during 2011-12 asagainst 4.81:1 in the pervious year (Fig.2). Balance Sheet and Profit& Loss Account of the company and selected financial ratios duringthe period 2010-11 to 2011-12 can be seen on the adjoining page.
Main Services Unit Performance during
2011-12 2010-11
Direction & General ` in crore 11.79 9.47Charges Expenditureincurred on MUTP Projects
EBIT
DA
& P
AT (
Rs.
cro
re)
Fig. 1
PRO
FITA
BIL
ITY
RAT
IOS
(%)
CU
RR
ENT R
ATIO
Fig. 2
TOTAL R
EVENU
E (Rs. crore)
Strategic issuesThe company aims to integrate suburban rail capacity
enhancement plans with urban development of Mumbai for whichMRVC has prepared strategic plan for augmenting and strengtheningMumbai suburban rail network with a horizon of 2031.

Public Enterprises Survey 2011-2012: Vol-II 465
Mumbai RailwayVikas Corporation Ltd.Second Floor, Churchgate Station Building, Mumbai 400020
BALANCE SHEET (` in Lakhs)
PARTICULARS 2011-12 2010-11I. EQUITY & LIABILITIESAUTHORISED CAPITAL 2500 2500(1) Shareholders’ Funds (a) Share Capital (i) Central Govt 1275 1275 (ii) Others 1225 1225 (b) Reserves & Surplus 13926 11687 (c) Money received against share warrants 0 0 Total Shareholders’ Funds (1(a)+1(b)+1(c) 16426 14187(2) Share application money pending allotment 0 0(3) Non-current Liabilities (a) Long Term Borrowings 0 0 (b) Deferred tax liabilities (Net) 0 0 (c) Other Long-term liabilities 18685 18706 (d) Long-term provisions 14 11 Total Non-Current Liabilities 3(a) to 3(d) 18699 18717(4) Current Liabilities (a) Short Term Borrowings 0 0 (b) Trade Payables 2722 3083 (c) Other current liabilities 2744 4466 (d) Short-term provisions 107 77 Total Current Liabilities 4(a) to 4(d) 5573 7626TOTAL EQUITY & LIABILITIES (1+2+3+4) 40698 40530II. ASSETS(1) Non-Current Assets (a) Total Gross Fixed Assets 3495 420 (ai) Accumulated Depreciation, Depletion 310 177 & Amortisation (aii) Accumulated Impairment 0 0 (b) Total Net Fixed Assets ((a)-(ai)-(aii) 3185 243 (c) Capital work in progress 1400 3600 (d) Intangible assets under developmet 0 0 (e) Non-Current Investments 0 0 (f) Deferred Tax Assets (Net) 0 0 (g) Long Term Loans and Advances 0 0 (h) Other Non-Current Assets 0 0 Total Non-Current Assets (b+c+d+e+f+g+h) 4585 3843(2) Current Assets (a) Current Investments 0 0 (b) Inventories 0 0 (c) Trade Recievables 0 0 (d) Cash & Bank Balance 29145 28909 (e) Short-term Loans & Advances 4157 5035 (f) Other Current Assets 2811 2743 Total Current Assets (a+b+c+d+e+f) 36113 36687TOTAL ASSETS (1+2) 40698 40530Important Indicators (i) Investment 2500 2500 (ii) Capital Employed 16426 14187 (iii) Net Worth 16426 14187 (iv) Net Current Assets 30540 29061 (v) Cost of Sales 2017 1872 (vi) Net Value Added (at market price) 3934 2815 (vii) Total Regular Employees (Nos.) 172 173(viii) Avg. Monthly Emoluments per Employee(`) 61725 58092
PROFIT & LOSS ACCOUNT (((((` in Lakhs)in Lakhs)in Lakhs)in Lakhs)in Lakhs)
PARTICULARS 2011-12 2010-11(I) Revenue from Operations (Gross) 4292 2908 Less : Excise Duty 0 0 Revenue from Operations (Net) 4292 2908(II) Other Income 1 4(III) Total Revenue (I+II) 4293 2912(IV) Expenditure on: (a) Cost of materials consumed 0 0 (b) Purchase of stock-in-trade 0 0 (c) Changes in inventories of finished goods, 0 0 work-in-progress and stock in trade (d) Stores & Spares 0 0 (e) Power & Fuel 22 33 (f) Salary, Wages & Benefits/Employees Expense 1274 1206 (g) Other Operating/direct/manufacturing Expenses 127 130 (h) Rent, Royalty & Cess 9 11 (i) Loss on sale of Assets/Investments 5 3 (j) Other Expenses 448 459Total Expenditure (IV (a to j)) 1885 1842(V) PROFIT BEFORE DEPRECIATION, & 2408 1070IMPAIRMENT, FINANCE CHARGES/INTEREST,EXCEPTIONAL & EXTRAORDINARY ITEMS &TAXES (PBDIEET)(III-IV)(VI) Depreciation, Depletion & Amortisation 137 33(VII) Impairment 0 0(VIII) PROFIT BEFORE FINANCE COST/ 2271 1037INTEREST, EXCEPTIONAL, EXTRA-ORDINARYITEMS & TAXES (PBIEET)(V-VI-VII)(IX) Finance Cost (a) On Central Government Loans 0 0 (b) On Foreign Loans 0 0 (c) Others 0 0 (d) Less Finance Cost Capitalised 0 0 (e) Charged to P & L Account (a+b+c+d) 0 0(X) PROFIT BEFORE EXCEPTIONAL & EXTRA- 2271 1037ORDINARY ITEMS & TAX (PBEET)(VIII-IXe)(XI) Exceptional Items 0 0(XII) PROFIT BEFORE EXTRA-ORDINARY 2271 1037ITEMS & TAX (PBET)(X-XI)(XIII) Extra-Ordinary Items 0 0(XIV) PROFIT BEFORE TAX (PBT)(XII-XIII) 2271 1037(XV) TAX PROVISIONS 0 0(XVI) NET PROFIT / LOSS FOR THE PERIOD 2271 1037FROM CONTINUING OPERATIONS AFTERTAX(XIV-XV)(XVII) Profit/Loss from discontinuing operations 0 0(XVIII) Tax expenses of discontinuing operations 0 0(XIX) Profit/Loss from discontinuing operations 0 0(after Tax)(XVII-XVIII)(XX) Profit/Loss for the period (XVI+XIX) 2271 1037Financial Ratios (i) Sales : Capital Employed 26.13 20.5 (ii) Cost of Sales : Sales 46.99 64.37 (iii) Salary/Wages : Sales 29.68 41.47 (iv) Net Profit : Net Worth 13.83 7.31 (v) Debt : Equity 0 0 (vi) Current Ratio 6.48 4.81 (vii) Trade Recievables : Sales 0 0 (viii) Total Inventory : Sales 0 0

Contract & Construction Services466
The CompanyNational Projects Construction Corp. Ltd. (NPCC) was
incorporated on 09.01.1957 with the objective of competing withthe domestic and international construction organizations in thefield of planning, design, consultancy / construction of large civil /allied projects in various sectors of economy and serve as a pricedeterrent to the private contractors.
It is a Schedule-‘B’ BRPSE referred CPSE in Contract &Construction Services Sector under the administrative control ofM/o Water Resources with 99.00% shareholding by the Governmentof India. The company employed 1641 regular employees(Executives 524 & Non-Executives 1117) as on 31.3.2012. Itsregistered office is at New Delhi and corporate office at Faridabad,
Vision / Mission The Vision of the Company is to become world-class project
implementing organization with continual & optimal satisfactionto all stakeholders.
The Mission of the Company is to achieve a turnover exceeding` 2000 crore by 2015-16 by focusing value addition at all points ofinteraction with their clients and continuously enhance thecapabilities of organization and employees through innovations.
Industrial / Business OperationsNPCC is engaged in providing services in the field of
construction of large civil and allied projects in sectors relating toirrigation, river valley projects, barrages, canals, hydel and thermalpower, steel, coal, rural and urban transportation, railways etc.through its 98 project units all over India as on 31.03.2012.
Over the last 50 years, the company has completed more than254 projects of national importance all over the country and inmost remote and hazardous locations where private sector isreluctant to work. It has also executed works in the Middle-eastcountries, Nepal.
Performance HighlightsTotal Revenue of the company registered an increase of
` 127.66 crore during 2011-12, which went up from ` 1096.34crore in 2010-11 to ` 1224.00 crore in 2011-12. However, the
National Projects Construction Corp. Ltd.
www.npcc.gov.in
Strategic issuesNPCC was incurring losses on account of lack of orders, heavy
interest burden, surplus manpower etc. A Revival plan recommendedby the BRPSE was approved by the Government on 26.12.2008.The revival plan included conversion of ` 219.43 crore loans andinterest / penal interest of ` 427.46 crore into equity. Accordingly,10% equity shares of Rs.1000/- each, amounting to Rs.582.21 crorewere cancelled and adjusted against accumulated losses as on28.12.2010.
Fig. 1
TOTAL R
EVENU
E (Rs. crore)EB
ITD
A &
PAT
(R
s. c
rore
)
profit of the company has gone down by ` 30.56 crore to ̀ 42.18crore in 2011-12, from ` 72.74 crore in previous year due toincrease in operating expenses.
The current ratio of company is at 1.02:1 during 2011-12 asagainst 0.98:1 in the previous year. Balance Sheet and Profit &Loss Account of the company and selected financial ratios duringthe period 2010-11 to 2011-12 can be seen on the adjoining page.

Public Enterprises Survey 2011-2012: Vol-II 467
National Projects Construction Corp. Ltd.Raja House, 30-31, Nehru Place, New Delhi 110 019
BALANCE SHEET (` in Lakhs)
PARTICULARS 2011-12 2010-11I. EQUITY & LIABILITIESAUTHORISED CAPITAL 70000 70000(1) Shareholders’ Funds (a) Share Capital (i) Central Govt 9348 9348 (ii) Others 105 105 (b) Reserves & Surplus -9836 -14054 (c) Money received against share warrants 0 0 Total Shareholders’ Funds (1(a)+1(b)+1(c) -383 -4601(2) Share application money pending allotment 0 0(3) Non-current Liabilities (a) Long Term Borrowings 6373 5835 (b) Deferred tax liabilities (Net) 0 0 (c) Other Long-term liabilities 0 0 (d) Long-term provisions 3544 2694 Total Non-Current Liabilities 3(a) to 3(d) 9917 8529(4) Current Liabilities (a) Short Term Borrowings 0 0 (b) Trade Payables 22448 23634 (c) Other current liabilities 148942 130129 (d) Short-term provisions 412 0 Total Current Liabilities 4(a) to 4(d) 171802 153763TOTAL EQUITY & LIABILITIES (1+2+3+4) 181336 157691II. ASSETS(1) Non-Current Assets (a) Total Gross Fixed Assets 4360 4540 (ai) Accumulated Depreciation, Depletion 3649 3819 & Amortisation (aii) Accumulated Impairment 0 0 (b) Total Net Fixed Assets ((a)-(ai)-(aii) 711 721 (c) Capital work in progress 179 17 (d) Intangible assets under developmet 0 0 (e) Non-Current Investments 0 0 (f) Deferred Tax Assets (Net) 3549 4673 (g) Long Term Loans and Advances 955 0 (h) Other Non-Current Assets 0 1404 Total Non-Current Assets (b+c+d+e+f+g+h) 5394 6815(2) Current Assets (a) Current Investments 0 0 (b) Inventories 253 118 (c) Trade Recievables 89620 74109 (d) Cash & Bank Balance 71289 60350 (e) Short-term Loans & Advances 13871 15753 (f) Other Current Assets 909 546 Total Current Assets (a+b+c+d+e+f) 175942 150876TOTAL ASSETS (1+2) 181336 157691Important Indicators (i) Investment 15826 15288 (ii) Capital Employed 5990 1234 (iii) Net Worth -383 -4601 (iv) Net Current Assets 4140 -2887 (v) Cost of Sales 117014 106134 (vi) Net Value Added (at market price) 12852 9578 (vii) Total Regular Employees (Nos.) 1641 1740(viii) Avg. Monthly Emoluments per Employee(`) 37619 28860
PROFIT & LOSS ACCOUNT (` in Lakhs)
PARTICULARS 2011-12 2010-11(I) Revenue from Operations (Gross) 116738 106132 Less : Excise Duty 0 0 Revenue from Operations (Net) 116738 106132(II) Other Income 5662 3502(III) Total Revenue (I+II) 122400 109634(IV) Expenditure on: (a) Cost of materials consumed 17 47 (b) Purchase of stock-in-trade 0 0 (c) Changes in inventories of finished goods, 0 0 work-in-progress and stock in trade (d) Stores & Spares 0 0 (e) Power & Fuel 1 2 (f) Salary, Wages & Benefits/Employees Expense 7408 6026 (g) Other Operating/direct/manufacturing Expenses 99512 85765 (h) Rent, Royalty & Cess 58 52 (i) Loss on sale of Assets/Investments 0 0 (j) Other Expenses 9970 14188Total Expenditure (IV (a to j)) 116966 106080(V) PROFIT BEFORE DEPRECIATION, & 5434 3554IMPAIRMENT, FINANCE CHARGES/INTEREST,EXCEPTIONAL & EXTRAORDINARY ITEMS &TAXES (PBDIEET)(III-IV)(VI) Depreciation, Depletion & Amortisation 48 54(VII) Impairment 0 0(VIII) PROFIT BEFORE FINANCE COST/ 5386 3500INTEREST, EXCEPTIONAL, EXTRA-ORDINARYITEMS & TAXES (PBIEET)(V-VI-VII)(IX) Finance Cost (a) On Central Government Loans 43 291 (b) On Foreign Loans 0 0 (c) Others 0 0 (d) Less Finance Cost Capitalised 0 0 (e) Charged to P & L Account (a+b+c+d) 43 291(X) PROFIT BEFORE EXCEPTIONAL & EXTRA- 5343 3209ORDINARY ITEMS & TAX (PBEET)(VIII-IXe)(XI) Exceptional Items 0 0(XII) PROFIT BEFORE EXTRA-ORDINARY 5343 3209ITEMS & TAX (PBET)(X-XI)(XIII) Extra-Ordinary Items 0 0(XIV) PROFIT BEFORE TAX (PBT)(XII-XIII) 5343 3209(XV) TAX PROVISIONS 1125 -4065(XVI) NET PROFIT / LOSS FOR THE PERIOD 4218 7274FROM CONTINUING OPERATIONS AFTERTAX(XIV-XV)(XVII) Profit/Loss from discontinuing operations 0 0(XVIII) Tax expenses of discontinuing operations 0 0(XIX) Profit/Loss from discontinuing operations 0 0(after Tax)(XVII-XVIII)(XX) Profit/Loss for the period (XVI+XIX) 4218 7274Financial Ratios (i) Sales : Capital Employed 1948.88 8600.65 (ii) Cost of Sales : Sales 100.24 100 (iii) Salary/Wages : Sales 6.35 5.68 (iv) Net Profit : Net Worth - - (v) Debt : Equity 0.67 0.62 (vi) Current Ratio 1.02 0.98 (vii) Trade Recievables : Sales 76.77 69.83 (viii) Total Inventory : Sales 0.22 0.11
2011-12 Provisional

Contract & Construction Services468
The CompanyNational Buildings Construction Corporation Limited (NBCC)
was incorporated in 1960 with the objective to become a leadingcompany, in the construction engineering and project managementconsultancy services in India. NBCC is a Schedule “A” listed CPSEin Contract & Construction Services sector under the administrativecontrol of Ministry of Urban Development with 90% shareholdingby the Government of India. The company employed 2227 regularemployees (executives 825 and 1402 non-executives) as on31.3.2012. Its Registered and Corporate Offices are at New Delhi.
Vision/MissionThe Vision of the Company is to be a widely admired Company
and preferred construction Services Company.The Mission is to supply customers with practical, secure,
innovative and cost-efficient construction products and servicesthat meet their needs as well as provide the necessary infrastructurein a socially responsible way.
Industrial / Business OperationsNBCC is engaged in execution of civil engineering projects,
rendering project management consultancy and Real Estate. NBCChas entered in a big way in construction of solid waste managementprojects. A number of Central Government Ministries and variousState Governments are utilizing the services of NBCC as theirexecuting agency.
Performance HighlightsThe segment-wise revenue earned by the Company during the
last two years is given below:
www.nbccindia.gov.in
National Buildings Construction Corporation Ltd.
The current ratio of company is at 1.23 during 2011-12 asagainst 1.15 in the previous year (Fig.2). Balance Sheet and Profit& Loss Account of the company and selected financial ratios duringthe period 2010-11 to 2011-12 can be seen on the adjoining page.
Strategic IssuesThe company is facing stiff competition both in domestic and
international tenders due to diversification by companies, JVformation and participation by international firms. NBCC has signedMoU with TERI to undertake all future construction activities inline with green building concept. Introduction of ERP (EnterpriseResource Planning) and e-publishing of tender enquiries are someof the new initiatives taken by the CPSE.
TOTAL R
EVENU
E (Rs. crore)
Fig. 1
PRO
FITA
BIL
ITY
RAT
IOS
(%)
CU
RR
ENT R
ATIO
Fig. 2
EBIT
DA
& P
AT (
Rs.
cro
re)
Main Segments Unit Performance During
2011-12 2010-11
Real Estate ` in Crore 185.13 144.23
Infrastructure ` in Crore 99.48 63.32
Civil construction and ` in Crore 3144.72 2919.23Project ManagementConsultancy
Total Revenue of the company registered an increase of` 350.85 crore during 2011-12, which went down from ` 3231.46crore in 2010-11 to ` 3582.31 crore in 2011-12.The net profit ofthe company correspondingly also increased to ` 190.17 crore,from ` 140.34 crore in 2010-11, an increase of ` 49.83 crore overprevious year due to increase in revenue from operations along withstrict control on prime cost and wastages, effective projectmonitoring system & increased efficiency.

Public Enterprises Survey 2011-2012: Vol-II 469
National Buildings Construction Corporation Limited (NBCC)NBCC Bhaswan, Lodhi Road, New Delhi-110003
BALANCE SHEET (` in Lakhs)
PARTICULARS 2011-12 2010-11I. EQUITY & LIABILITIESAUTHORISED CAPITAL 12000 12000(1) Shareholders’ Funds (a) Share Capital (i) Central Govt 12000 9000 (ii) Others 0 0 (b) Reserves & Surplus 67550 56414 (c) Money received against share warrants 0 0 Total Shareholders’ Funds (1(a)+1(b)+1(c) 79550 65414(2) Share application money pending allotment 0 0(3) Non-current Liabilities (a) Long Term Borrowings 0 0 (b) Deferred tax liabilities (Net) 0 0 (c) Other Long-term liabilities 20475 22718 (d) Long-term provisions 57 57 Total Non-Current Liabilities 3(a) to 3(d) 20532 22775(4) Current Liabilities (a) Short Term Borrowings 0 0 (b) Trade Payables 117734 96703 (c) Other current liabilities 131909 133642 (d) Short-term provisions 13998 8687 Total Current Liabilities 4(a) to 4(d) 263641 239032TOTAL EQUITY & LIABILITIES (1+2+3+4) 363723 327221II. ASSETS(1) Non-Current Assets (a) Total Gross Fixed Assets 3615 3592 (ai) Accumulated Depreciation, Depletion 1252 1168 & Amortisation (aii) Accumulated Impairment 31 69 (b) Total Net Fixed Assets ((a)-(ai)-(aii) 2332 2355 (c) Capital work in progress 0 0 (d) Intangible assets under developmet 0 0 (e) Non-Current Investments 5733 6414 (f) Deferred Tax Assets (Net) 841 522 (g) Long Term Loans and Advances 13905 13950 (h) Other Non-Current Assets 17194 30141 Total Non-Current Assets (b+c+d+e+f+g+h) 40005 53382(2) Current Assets (a) Current Investments 16627 10845 (b) Inventories 45006 40948 (c) Trade Recievables 85224 56753 (d) Cash & Bank Balance 132519 116979 (e) Short-term Loans & Advances 41536 45983 (f) Other Current Assets 2806 2331 Total Current Assets (a+b+c+d+e+f) 323718 273839TOTAL ASSETS (1+2) 363723 327221Important Indicators (i) Investment 12000 9000 (ii) Capital Employed 79550 65414 (iii) Net Worth 79550 65414 (iv) Net Current Assets 60077 34807 (v) Cost of Sales 329861 301751 (vi) Net Value Added (at market price) 45346 34671 (vii) Total Regular Employees (Nos.) 2224 2332(viii) Avg. Monthly Emoluments per Employee(`) 58907 46087
PROFIT & LOSS ACCOUNT (` in Lakhs)
PARTICULARS 2011-12 2010-11(I) Revenue from Operations (Gross) 344769 314605 Less : Excise Duty 0 0 Revenue from Operations (Net) 344769 314605(II) Other Income 13462 8541(III) Total Revenue (I+II) 358231 323146(IV) Expenditure on: (a) Cost of materials consumed 9227 13993 (b) Purchase of stock-in-trade 0 0 (c) Changes in inventories of finished goods, 4719 0 work-in-progress and stock in trade (d) Stores & Spares 0 0 (e) Power & Fuel 0 0 (f) Salary, Wages & Benefits/Employees Expense 15721 12897 (g) Other Operating/direct/manufacturing Expenses 295898 270022 (h) Rent, Royalty & Cess 134 243 (i) Loss on sale of Assets/Investments 0 0 (j) Other Expenses 3966 4275Total Expenditure (IV (a to j)) 329665 301430(V) PROFIT BEFORE DEPRECIATION, & 28566 21716IMPAIRMENT, FINANCE CHARGES/INTEREST,EXCEPTIONAL & EXTRAORDINARY ITEMS &TAXES (PBDIEET)(III-IV)(VI) Depreciation, Depletion & Amortisation 196 321(VII) Impairment 0 0(VIII) PROFIT BEFORE FINANCE COST/ 28370 21395INTEREST, EXCEPTIONAL, EXTRA-ORDINARYITEMS & TAXES (PBIEET)(V-VI-VII)(IX) Finance Cost (a) On Central Government Loans 0 0 (b) On Foreign Loans
0 0 (c) Others 0 0 (d) Less Finance Cost Capitalised 0 0 (e) Charged to P & L Account (a+b+c+d) 0 0(X) PROFIT BEFORE EXCEPTIONAL & EXTRA- 28370 21395ORDINARY ITEMS & TAX (PBEET)(VIII-IXe)(XI) Exceptional Items 739 432(XII) PROFIT BEFORE EXTRA-ORDINARY 27631 20963ITEMS & TAX (PBET)(X-XI)(XIII) Extra-Ordinary Items -1352 0(XIV) PROFIT BEFORE TAX (PBT)(XII-XIII) 28983 20963(XV) TAX PROVISIONS 9966 6929(XVI) NET PROFIT / LOSS FOR THE PERIOD 19017 14034FROM CONTINUING OPERATIONS AFTERTAX(XIV-XV)(XVII) Profit/Loss from discontinuing operations 0 0(XVIII) Tax expenses of discontinuing operations 0 0(XIX) Profit/Loss from discontinuing operations 0 0(after Tax)(XVII-XVIII)(XX) Profit/Loss for the period (XVI+XIX) 19017 14034Financial Ratios (i) Sales : Capital Employed 433.4 480.94 (ii) Cost of Sales : Sales 95.68 95.91 (iii) Salary/Wages : Sales 4.56 4.1 (iv) Net Profit : Net Worth 23.91 21.45 (v) Debt : Equity 0 0 (vi) Current Ratio 1.23 1.15 (vii) Trade Recievables : Sales 24.72 18.04 (viii) Total Inventory : Sales 13.05 13.02

Contract & Construction Services470
The CompanyProjects and Development India Ltd. (PDIL) was incorporated
on 07.03.1978 with the objective to and act as a store house oftechnical knowledge in the project management relating to fertilizerand allied chemical industry.
PDIL is a Schedule "B" BIFR referred CPSE in Contract andConstruction Sector under the administrative control of M/oChemicals and Fertilizer, D/o Fertilizers with 100% shareholdingby Government of India. The Company employed 459 regularemployees (Executives 423 & Non-Executives 36) as on 31.03.2012.Its Registered and Corporate offices are at Noida (U.P.).
Vision / MissionThe Vision of the company is to be a leading engineering and
project management consultancy organization.
The Mission of the Company is to create and deliver integratedtechno-commercial solutions, optimum in cost, quality and time toall customers; to pursue relentlessly world class quality inengineering consultancy and project management by imbibing bestpractices; to develop, upgrade and improve the manufacturingprocess of Catalyst and other products in line with the ever evolvingneeds of customers.
Industrial / Business OperationsPDIL is an ISO 9001:2008 certified premier design engineering
and consultancy organization in the fertilizer sector. PDIL isproviding Design, Engineering and related project execution servicesfrom concept to commissioning of projects.
PDIL provide third party inspection and nondestructive testingservices to the industry from its 8 operating units, which consist ofone Catalyst Manufacturing Unit at Sindri, Jharkhand, producingrange of Catalysts used in Fertilizer and Oil industries, fiveInspection Offices of PDIL are spread over Mumbai, Chennai,Kolkata, Vishakhapatnam and Hyderabad and two design andengineering units are at NOIDA (U.P.) and Vadodara (Gujarat).
Performance HighlightsThe physical performance of company during the last two
years is mentioned below:
Main Services Unit Production during
2011-12 2010-11
Catalyst M T 74 436(capacity utilization in %) (5.87) (34.6)
The current ratio of company is at 3.27:1 during 2011-12 asagainst 2.76:1 in the previous year (Fig.2). Balance Sheet and Profit& Loss Account of the company and selected financial ratios duringthe period 2010-11 to 2011-12 can be seen on the adjoining page.
Projects and Development India Ltd.
www.pdilin.com
The Company registered an increase of ` 1.80 crore in totalrevenue during 2011-12 which went up to `112.91 crore in2011-12 from ` 111.11 crore during 2010-11. The net profit of thecompany increased to ` 26.08 crore, an increase of ` 5.06 crore in2011-12 over the previous year's profit of ` 21.02 crore due tohigher turnover and higher value of margin in engineering jobs.
Strategic issueMinistry of Chemical & Fertilizers approved the revival
package of the company in 2003. The BIFR has considered therevival proposal and the revival scheme of the company in 2004.The Government of India has extended non plan funds of Rs. 136.51crores towards implementation of the sanctioned revival scheme in2004. The company has been discharged from BIFR in 2006.
Fig.2
Fig.1
EB
ITD
A &
PA
T (
Rs.
cro
re) T
OTA
L R
EV
EN
UE
(Rs. cro
re)
PR
OF
ITA
BIL
ITY
RA
TIO
S (
%)
CU
RR
EN
T R
AT
IO
2010-11 2011-12
2010-11 2011-12

Public Enterprises Survey 2011-2012: Vol-II 471
Projects and Development India Ltd.PDIL Bhawan, A-14, Sector-1, Noida- 201301
BALANCE SHEET (` in Lakhs)PARTICULARS 2011-12 2010-11I. EQUITY & LIABILITIESAUTHORISED CAPITAL 6000 6000(1) Shareholders’ Funds (a) Share Capital (i) Central Govt 1730 1730 (ii) Others 0 0 (b) Reserves & Surplus 11356 9191 (c) Money received against share warrants 0 0 Total Shareholders’ Funds (1(a)+1(b)+1(c) 13086 10921(2) Share application money pending allotment 0 0(3) Non-current Liabilities (a) Long Term Borrowings 0 0 (b) Deferred tax liabilities (Net) 0 0 (c) Other Long-term liabilities 344 239 (d) Long-term provisions 878 819 Total Non-Current Liabilities 3(a) to 3(d) 1222 1058(4) Current Liabilities (a) Short Term Borrowings 0 0 (b) Trade Payables 492 342 (c) Other current liabilities 1578 1833 (d) Short-term provisions 943 897 Total Current Liabilities 4(a) to 4(d) 3013 3072TOTAL EQUITY & LIABILITIES (1+2+3+4) 17321 15051II. ASSETS(1) Non-Current Assets (a) Total Gross Fixed Assets 6116 5558 (ai) Accumulated Depreciation, 3789 3508 Depletion & Amortisation (aii) Accumulated Impairment 196 0 (b) Total Net Fixed Assets ((a)-(ai)-(aii) 2131 2050 (c) Capital work in progress 57 8 (d) Intangible assets under developmet 0 253 (e) Non-Current Investments 0 0 (f) Deferred Tax Assets (Net) 148 108 (g) Long Term Loans and Advances 70 60 (h) Other Non-Current Assets 5058 4085 Total Non-Current Assets (b+c+d+e+f+g+h) 7464 6564(2) Current Assets (a) Current Investments 0 0 (b) Inventories 236 472 (c) Trade Recievables 1879 1725 (d) Cash & Bank Balance 6070 5122 (e) Short-term Loans & Advances 171 169 (f) Other Current Assets 1501 999 Total Current Assets (a+b+c+d+e+f) 9857 8487TOTAL ASSETS (1+2) 17321 15051Important Indicators (i) Investment 1730 1730 (ii) Capital Employed 13086 10921 (iii) Net Worth 13086 10921 (iv) Net Current Assets 6844 5415 (v) Cost of Sales 7462 7932 (vi) Net Value Added (at market price) 9516 9083 (vii) Total Regular Employees (Nos.) 459 492(viii) Avg. Monthly Emoluments per Employee(`) 85458 83249
PROFIT & LOSS ACCOUNT (̀ in Lakhs)
PARTICULARS 2011-12 2010-11(I) Revenue from Operations (Gross) 10098 10385 Less : Excise Duty 41 121 Revenue from Operations (Net) 10057 10264(II) Other Income 1234 847(III) Total Revenue (I+II) 11291 11111(IV) Expenditure on: (a) Cost of materials consumed 83 872 (b) Purchase of stock-in-trade 0 0 (c) Changes in inventories of finished goods, work-in-progress and stock in trade 209 -225 (d) Stores & Spares 21 22 (e) Power & Fuel 193 370 (f) Salary, Wages & Benefits/Employees Expense 4707 4915 (g) Other Operating/direct/manufacturing Expenses 513 747 (h) Rent, Royalty & Cess 34 43 (i) Loss on sale of Assets/Investments 2 1 (j) Other Expenses 1197 970Total Expenditure (IV (a to j)) 6959 7715(V) PROFIT BEFORE DEPRECIATION, & 4332 3396 IMPAIRMENT, FINANCE CHARGES/INTEREST, EXCEPTIONAL & EXTRAORDINARY ITEMS & (PBDIEET)(III-IV)(VI) Depreciation, Depletion & Amortisation 309 218(VII) Impairment 196 0(VIII) PROFIT BEFORE FINANCE COST/INTEREST, 3827 3178 EXCEPTIONAL, EXTRA-ORDINARY ITEMS & TAXES (PBIEET)(V-VI-VII)(IX) Finance Cost (a) On Central Government Loans 0 0 (b) On Foreign Loans 0 0 (c) Others 0 0 (d) Less Finance Cost Capitalised 0 0 (e) Charged to P & L Account (a+b+c+d) 0 0(X) PROFIT BEFORE EXCEPTIONAL & 3827 3178 EXTRA-ORDINARY ITEMS & TAX (PBEET)(VIII-IXe)(XI) Exceptional Items 0 0(XII) PROFIT BEFORE EXTRA-ORDINARY ITEMS & TAX (PBET)(X-XI) 3827 3178(XIII) Extra-Ordinary Items 0 0(XIV) PROFIT BEFORE TAX (PBT)(XII-XIII) 3827 3178(XV) TAX PROVISIONS 1219 1076(XVI) NET PROFIT / LOSS FOR THE PERIOD 2608 2102 FROM CONTINUING OPERATIONS AFTER TAX(XIV-XV)(XVII) Profit/Loss from discontinuing operations 0 0(XVIII) Tax expenses of discontinuing operations 0 0(XIX) Profit/Loss from discontinuing operations(after Tax)(XVII-XVIII) 0 0(XX) Profit/Loss for the period (XVI+XIX) 2608 2102Financial Ratios (i) Sales : Capital Employed 76.85 93.98 (ii) Cost of Sales : Sales 74.2 77.28 (iii) Salary/Wages : Sales 46.8 47.89 (iv) Net Profit : Net Worth 19.93 19.25 (v) Debt : Equity 0 0 (vi) Current Ratio 3.27 2.76 (vii) Trade Recievables : Sales 18.68 16.81 (viii) Total Inventory : Sales 2.35 4.6

Contract & Construction Services472
The CompanyRail Vikas Nigam Ltd. (RVNL) was incorporated on 24.01.2003
under the National Rail Vikas Yojana as a Special Purpose Vehicle(SPV) to implement the railway projects with the objective ofremoving the capacity bottlenecks on the Golden Quadrilateral andits diagonals, providing vital linkages and augmenting capacity ofexisting links including the corridors connecting ports with thehinterland.
RVNL is a Schedule-‘A’ CPSE in Contract & ConstructionServices sector under the administrative control of M/o Railwayswith 100% shareholding by the Government of India. The companyemployed 308 regular employees ( Executives 290, Non-executives18) as on 31.3.2012. Its Registered and Corporate offices are atNew Delhi.
Vision/MissionThe Vision of the Company is to emerge as most efficient rail
infrastructure provider with sound financial base and globalconstruction practices for timely completion of projects.
The Mission of the Company is to create state of art railtransport capacity to meet the growing demand.
Industrial / Business OperationsRVNL business relates to creation and augmentation of capacity
of rail infrastructure, on fast track basis.
Presently the company is implementing 91 projects. Projectsrelate to strengthening of Golden Qardilateral and Diagonals andprovision of Port and connectivity hinterland, Kolkata MetroRaiways and workshop etc. The total length of these projects is9603km out of which 4213 km. have been completed. Forimplementing these projects, the Company is having 24 ProjectImplementing Units at 16 locations Bhopal, Bangalore,Bhubaneswar, Bilaspur, Chennai, Abu Road, Jodhpur, Kolkata,Mumbai, New Delhi Pune, Raipur, Secunderabad, Patna, Lucknowand Waltair (Visakhapatnam).
The company is having five Special Purpose Vehicles (SPVs)joint ventures.
Performance HighlightsThe physical performances of the company for last two years
are given below:
Rail Vikas Nigam Ltd.
www.rvnl.org
EBIT
DA
& P
AT (
Rs.
cro
re)
TOTAL R
EVENU
E (Rs. crore)
Fig. 1
PRO
FITA
BIL
ITY
RAT
IOS
(%)
CU
RR
ENT R
ATIO
Fig. 2
Main Services Unit Performance during
2011-12 2010-11
Doubling / third line In KM 254 211
Gauge Conversion In KM 1 1 62
Railway Electrification In KM 207 159
Total Revenue of the company registered an increase of` 169.18 crore during 2011-12, which went up from ` 1484.15crore in 2010-11 to ` 1653.33 crore in 2011-12. The net profit of
the company increased to ` 98.38 crore, an increase of ` 37.29crore over the previous year profit of ̀ 61.09 crore due to increasein turnover and rationalization of revenue stream by Ministry ofRailways. Increase in profit is also due to increase in other incomeby `15.91 crore during the year as a result of better exchequermanagement.
The current ratio of company is at 11.57:1 during 2011-12 asagainst 9.88:1 in the previous year (Fig.2). Balance Sheet and Profit& Loss Account of the company and selected financial ratios duringthe period 2010-11 to 2011-12 can be seen on the adjoining page.
Strategic IssuesThe revised packaging and phasing of the project for the 2nd
Asian Development Bank (ADB) loan has been finalized. The loanfor the first tranche under this arrangement of US $ 150 million isscheduled to be signed during the FY 2012-13.

Public Enterprises Survey 2011-2012: Vol-II 473
Rail Vikas Nigam Ltd.1st Floor, August Kranti Bhawan, Bhikaji Cama Place, R.K. Puram, New Delhi -110066
BALANCE SHEET (` in Lakhs)
PARTICULARS 2011-12 2010-11
I. EQUITY & LIABILITIES
AUTHORISED CAPITAL 300000 300000(1) Shareholders’ Funds (a) Share Capital (i) Central Govt 208502 208502 (ii) Others 0 0 (b) Reserves & Surplus 22677 15327 (c) Money received against share warrants 0 0 Total Shareholders’ Funds (1(a)+1(b)+1(c) 231179 223829(2) Share application money pending allotment 0 0(3) Non-current Liabilities (a) Long Term Borrowings 570844 407103 (b) Deferred tax liabilities (Net) 0 0 (c) Other Long-term liabilities 33838 32031 (d) Long-term provisions 155 59 Total Non-Current Liabilities 3(a) to 3(d) 604837 439193(4) Current Liabilities (a) Short Term Borrowings 12508 10067 (b) Trade Payables 18423 20063 (c) Other current liabilities 36707 33475 (d) Short-term provisions 4424 3274 Total Current Liabilities 4(a) to 4(d) 72062 66879TOTAL EQUITY & LIABILITIES (1+2+3+4) 908078 729901II. ASSETS(1) Non-Current Assets (a) Total Gross Fixed Assets 1905 1483 (ai) Accumulated Depreciation, Depletion & 1422 1099Amortisation (aii) Accumulated Impairment 0 0 (b) Total Net Fixed Assets ((a)-(ai)-(aii) 483 384 (c) Capital work in progress 0 0 (d) Intangible assets under developmet 0 0 (e) Non-Current Investments 39543 36178 (f) Deferred Tax Assets (Net) 0 0 (g) Long Term Loans and Advances 33838 32031 (h) Other Non-Current Assets 550 245 Total Non-Current Assets (b+c+d+e+f+g+h) 74414 68838(2) Current Assets (a) Current Investments 16250 11049 (b) Inventories 735249 598240 (c) Trade Recievables 13459 7751 (d) Cash & Bank Balance 47318 26818 (e) Short-term Loans & Advances 21388 17205 (f) Other Current Assets 0 0 Total Current Assets (a+b+c+d+e+f) 833664 661063TOTAL ASSETS (1+2) 908078 729901Important Indicators (i) Investment 779346 615605 (ii) Capital Employed 802023 630932 (iii) Net Worth 231179 223829 (iv) Net Current Assets 761602 594184 (v) Cost of Sales 153400 140870 (vi) Net Value Added (at market price) 21778 12501 (vii) Total Regular Employees (Nos.) 308 273(viii) Avg. Monthly Emoluments per Employee(`) 113122 12088
PROFIT & LOSS ACCOUNT (` in Lakhs)
PARTICULARS 2011-12 2010-11
(I) Revenue from Operations (Gross) 159792 144465
Less : Excise Duty 0 0 Revenue from Operations (Net) 159792 144465(II) Other Income 5541 3950(III) Total Revenue (I+II) 165333 148415(IV) Expenditure on: (a) Cost of materials consumed 0 0 (b) Purchase of stock-in-trade 0 0 (c) Changes in inventories of finished goods, work-in-progress and stock in trade 147614 140045 (d) Stores & Spares 0 0 (e) Power & Fuel 92 12 (f) Salary, Wages & Benefits/Employees Expense 4181 396 (g) Other Operating/direct/manufacturing Expenses 135 58 (h) Rent, Royalty & Cess 248 105 (i) Loss on sale of Assets/Investments 0 0 (j) Other Expenses 783 172Total Expenditure (IV (a to j)) 153053 140788(V) PROFIT BEFORE DEPRECIATION, & 12280 7627IMPAIRMENT, FINANCE CHARGES/INTEREST, EXCEPTIONAL & EXTRA-ORDINARY ITEMS & TAXES (PBDIEET)(III-IV)(VI) Depreciation, Depletion & Amortisation 347 82(VII) Impairment 0 0(VIII) PROFIT BEFORE FINANCE COST/ 11933 7545INTEREST, EXCEPTIONAL, EXTRA-ORDINARY ITEMS & TAXES (PBIEET)(V-VI-VII)(IX) Finance Cost (a) On Central Government Loans 0 0 (b) On Foreign Loans 0 0 (c) Others 0 0 (d) Less Finance Cost Capitalised 0 0 (e) Charged to P & L Account (a+b+c+d) 0 0(X) PROFIT BEFORE EXCEPTIONAL & EXTRA- 11933 7545ORDINARY ITEMS & TAX (PBEET)(VIII-IXe)(XI) Exceptional Items 0 0(XII) PROFIT BEFORE EXTRA-ORDINARY 11933 7545ITEMS & TAX (PBET)(X-XI)(XIII) Extra-Ordinary Items 0 0(XIV) PROFIT BEFORE TAX (PBT)(XII-XIII) 11933 7545(XV) TAX PROVISIONS 2095 1436(XVI) NET PROFIT / LOSS FOR THE PERIOD 9838 6109FROM CONTINUING OPERATIONS AFTERTAX(XIV-XV)(XVII) Profit/Loss from discontinuing operations 0 0(XVIII) Tax expenses of discontinuing operations 0 0(XIX) Profit/Loss from discontinuing operations 0 0(after Tax)(XVII-XVIII)(XX) Profit/Loss for the period (XVI+XIX) 9838 6109Financial Ratios (i) Sales : Capital Employed 19.92 22.9 (ii) Cost of Sales : Sales 96 97.51 (iii) Salary/Wages : Sales 2.62 0.27 (iv) Net Profit : Net Worth 4.26 2.73 (v) Debt : Equity 2.74 1.95 (vi) Current Ratio 11.57 9.88 (vii) Trade Recievables : Sales 8.42 5.37 (viii) Total Inventory : Sales 460.13 414.11

Contract & Construction Services448
Braithwaite Burn and Jessop ConstructionCompany Limited
www.bbjconst.com
The CompanyBraithwaite Burn and Jessop (BBJ) Construction Company
Limited (BBJCC) setup in 1935 was incorporated as CPSE on13.09.1987 after it was taken over from the private sector on13.08.1987. The current objective of the company is to maintainmarket leadership in the field of design, fabrication and erection ofsteel bridges in India and selected foreign markets.
It is a Schedule-’B’ BRPSE referred taken over CPSE inContract & Construction Services sector under the administrativecontrol of M/o Heavy Industries and Public Enterprises, D/o HeavyIndustry with its Registered and Corporate offices at Kolkata,West Bengal. The company employed 101 regular employees(Executives 52, Non-executives 49) as on 31.3.2012. BBJCC is a100% subsidiary of Bharat Bhari Udyog Nigam Ltd. (BBUNL).
Vision / MissionThe Vision of the Company is to be a leader in the field of
infrastructure development and all types of steel bridges. The Mission of the Company is to enhance the turnover five
times in next five years.
Industrial / Business OperationsBBJCC is engaged in providing services in the field of
construction of Steel bridges, rehabilitation / restoration andreplacement of early Steel Bridges, construction of PSC GirderBridges, and fabrication of Steel Structure, civil construction includingHeavy foundations and piling work.
The steel girder bridge fabrication units viz. Heavy Plant Yardand Angus Works are located at Kolkata and Hooghly districts ofWest Bengal. Project construction sites are located all over India.
Performance HighlightsThe physical performance of company during the last three
year is mentioned below:
Strategic IssuesThe financial restructuring was approved by GOI on
31.03.2005 as per the recommendation of BRPSE. BraithwaiteBurn and Jessop (BBJ) Construction Company Limited (BBJCC)is one of the Turnaround CPSE as per the guidelines issued by theGovernment of India for declaring a sick CPSE as “TurnaroundCPSE”. It has made a profit before tax in each of three precedingyears & has a positive net worth after implementation of revivalpackage.
BBJ is planning for development of required resources forentering into job of replacement of old bridges with new bridgewithin specified block period.
Main Services U n i t Performance during
2011-12 2010-11
Bridge Project, Civil ` in Crore 199.14 146.51Construction etc.
The Company registered an increase of ̀ 47.18 crore in totalrevenue which went up to ̀ 199.86 crore in 2011-12 from ̀ 152.68crore during 2010-11. The net profit of the companycorrespondingly increased to ` 4.77 crore, an increase of ` 1.17crore over the previous year due to increase in orders execution andincrease in efficiency.
The current ratio of company is at 1.49:1 during 2011-12 asagainst 1.31:1 in the previous year (Fig.2). Balance Sheet and Profit& Loss Account of the company and selected financial ratios duringthe period 2010-11 to 2011-12 can be seen on the adjoining page.
EBIT
DA
& P
AT (
Rs.
cro
re) TO
TAL REVEN
UE (R
s. crore)
Fig. 1
PRO
FITA
BIL
ITY
RAT
IOS
(%)
CU
RR
ENT R
ATIO
Fig. 2

Public Enterprises Survey 2011-2012: Vol-II 449
Braithwaite Burn and Jessop Construction Company Limited27, Rajendra Nath Mukherjee Road, P.O. Box No-264, Kolkata-700001
BALANCE SHEET (` in Lakhs)PARTICULARS 2011-12 2010-11I. EQUITY & LIABILITIESAUTHORISED CAPITAL 3000 3000(1) Shareholders’ Funds (a) Share Capital (i) Central Govt 0 0 (ii) Others 2027 2027 (b) Reserves & Surplus 985 520 (c) Money received against share warrants 0 0 Total Shareholders’ Funds (1(a)+1(b)+1(c) 3012 2547(2) Share application money pending allotment 0 0(3) Non-current Liabilities (a) Long Term Borrowings 1035 1120 (b) Deferred tax liabilities (Net) 0 0 (c) Other Long-term liabilities 16 13 (d) Long-term provisions 25 28 Total Non-Current Liabilities 3(a) to 3(d) 1076 1161(4) Current Liabilities (a) Short Term Borrowings 625 1585 (b) Trade Payables 5414 7008 (c) Other current liabilities 424 716 (d) Short-term provisions 137 117 Total Current Liabilities 4(a) to 4(d) 6600 9426TOTAL EQUITY & LIABILITIES (1+2+3+4) 10688 13134II. ASSETS(1) Non-Current Assets (a) Total Gross Fixed Assets 1707 1543 (ai) Accumulated Depreciation, Depletion 845 727
& Amortisation (aii) Accumulated Impairment 0 0 (b) Total Net Fixed Assets ((a)-(ai)-(aii) 862 816 (c) Capital work in progress 0 0 (d) Intangible assets under developmet 0 0 (e) Non-Current Investments 0 1 (f) Deferred Tax Assets (Net) 0 0 (g) Long Term Loans and Advances 0 0 (h) Other Non-Current Assets 0 0 Total Non-Current Assets (b+c+d+e+f+g+h) 862 817(2) Current Assets (a) Current Investments 0 0 (b) Inventories 2098 3444 (c) Trade Recievables 1218 4082 (d) Cash & Bank Balance 3504 2105 (e) Short-term Loans & Advances 1585 1331 (f) Other Current Assets 1421 1355 Total Current Assets (a+b+c+d+e+f) 9826 12317TOTAL ASSETS (1+2) 10688 13134Important Indicators (i) Investment 3062 3147 (ii) Capital Employed 4047 3667 (iii) Net Worth 3012 2547 (iv) Net Current Assets 3226 2891 (v) Cost of Sales 19296 14642 (vi) Net Value Added (at market price) 3272 2235 (vii) Total Regular Employees (Nos.) 101 98(viii) Avg. Monthly Emoluments per Employee(`) 130693 89116
PROFIT & LOSS ACCOUNT (` in Lakhs)PARTICULARS 2011-12 2010-11(I) Revenue from Operations (Gross) 20033 15260 Less : Excise Duty 364 72 Revenue from Operations (Net) 19669 15188(II) Other Income 317 80(III) Total Revenue (I+II) 19986 15268(IV) Expenditure on: (a) Cost of materials consumed 6538 4656 (b) Purchase of stock-in-trade 0 0 (c) Changes in inventories of finished goods, 118 610 work-in-progress and stock in trade (d) Stores & Spares 440 398 (e) Power & Fuel 205 110 (f) Salary, Wages & Benefits/Employees 1584 1048 Expense (g) Other Operating/direct/manufacturing 9006 7048 Expenses (h) Rent, Royalty & Cess 55 19 (i) Loss on sale of Assets/Investments 0 0 (j) Other Expenses 1232 645Total Expenditure (IV (a to j)) 19178 14534(V) PROFIT BEFORE DEPRECIATION, & 808 734IMPAIRMENT, FINANCE CHARGES/INTEREST,EXCEPTIONAL & EXTRAORDINARY ITEMS &TAXES (PBDIEET)(III-IV)(VI) Depreciation, Depletion & Amortisation 118 108(VII) Impairment 0 0(VIII) PROFIT BEFORE FINANCE COST/INTEREST, 690 626EXCEPTIONAL, EXTRA-ORDINARY ITEMS &TAXES (PBIEET)(V-VI-VII)(IX) Finance Cost (a) On Central Government Loans 48 44 (b) On Foreign Loans 0 0 (c) Others 46 46 (d) Less Finance Cost Capitalised 0 0 (e) Charged to P & L Account (a+b+c+d) 94 90(X) PROFIT BEFORE EXCEPTIONAL & EXTRA-ORDINARY ITEMS & TAX (PBEET)(VIII-IXe) 596 536(XI) Exceptional Items 0 0(XII) PROFIT BEFORE EXTRA-ORDINARY 596 536ITEMS & TAX (PBET)(X-XI)(XIII) Extra-Ordinary Items 0 87(XIV) PROFIT BEFORE TAX (PBT)(XII-XIII) 596 449(XV) TAX PROVISIONS 119 89(XVI) NET PROFIT / LOSS FOR THE PERIOD 477 360FROM CONTINUING OPERATIONS AFTERTAX(XIV-XV)(XVII) Profit/Loss from discontinuing operations 0 0(XVIII) Tax expenses of discontinuing operations 0 0(XIX) Profit/Loss from discontinuing operations 0 0(after Tax)(XVII-XVIII)(XX) Profit/Loss for the period (XVI+XIX) 477 360Financial Ratios (i) Sales : Capital Employed 486.01 414.18 (ii) Cost of Sales : Sales 98.1 96.41 (iii) Salary/Wages : Sales 8.05 6.9 (iv) Net Profit : Net Worth 15.84 14.13 (v) Debt : Equity 0.51 0.55 (vi) Current Ratio 1.49 1.31 (vii) Trade Recievables : Sales 6.19 26.88 (viii) Total Inventory : Sales 10.67 22.68

Contract & Construction Services450
The CompanyBridge & Roof Company (India) Ltd (B&R) is a one source
multidisciplinary engineering construction company incorporatedin 1920 and nationalized in 1972.
It is a Schedule-’ B’, BRPSE referred, Profit Making CPSE inContract & Construction Services sector under the administrativecontrol of Ministry of Heavy Industries & Public Enterprises. Thecompany employed 1557 regular employees (Executives 805 &Non-Executives 752) as on 31.3.2011. Its Registered and Corporateoffices are at Kolkata, West Bengal.
Vision / MissionThe Vision of the Company is to be the leader in construction
field and project management services with customer satisfactionin all respects in India and abroad.
The Mission of the Company is to thrive in the competitiveIndian Construction Industry and to transform itself from being amere construction company to an integrated project managementcompany
Industrial / Business OperationsThe Company is a versatile construction Company having
presence all over India. It has two Strategic Business Units vizProject Division at Kolkata and Howrah Works. Howrah Works isengaged in Structural Fabrication production of Bailey Bridges BunkHouses, Containers, Pot Shells etc. The Zonal Offices are at Mumbaiand Chennai with Liaison office at Delhi, with 55 project locations.
B&R has been playing an important role in the infrastructuraldevelopment of the country Its range of activities cover Civil,Mechanical , Tankage, Piling , Roads and Highways, EPC/LSTK/and Turnkey Jobs etc. Company has executed projects in Iraq,Abu Dhabi, Nepal and Maldives and at present executing a coupleof international projects in Kuwait. It has high credibility of qualityand timely execution of projects of national importance.
Performance HighlightsThe Construction activities comprise around 96% of the total
activities of the company and are not quantifiable in physical terms.Total Revenue of the company registered a reduction of` 68.91 crore during 2011-12, which went down from ` 1334.02crore in 2010-11 to ` 1265.11 crore in 2011-12. The net profit ofthe company correspondingly reduced by `11.88 creore from` 57.67 crore in 2010-11 to ` 45.79 crore in 2011-12 due toreduction in turnover.
The current ratio of company is at 1.24:1 during 2011-12 asagainst 1.20:1 in the previous year (Fig.2). Balance Sheet and Profit& Loss Account of the company and selected financial ratiosduring the period 2010-11 to 2011-12 can be seen on the adjoiningpage.
www.bridgeroof.co.in
Bridge & Roof Co.(India) Ltd.
Strategic issueIn order to increase its business volume and profitability and
stability of operation, the company is planning for formulation ofjoint ventures / consortiums/ associates on job to job basis. Stepsare also being formulated for the tie up with other CPSEs.
Bridge & Roof Company (India) Ltd (B&R) is one of theTurnaround CPSE” as per the guidelines issued by the Governmentof India for declaring a sick CPSE as “Turnaround CPSE”. It hasmade a profit before tax in each of three preceding years & has apositive net worth after implementation of revival package.
EBIT
DA
& P
AT (
Rs.
cro
re)
TOTAL R
EVENU
E (Rs. crore)
Fig. 1
PRO
FITA
BIL
ITY
RAT
IOS
(%)
CU
RR
ENT R
ATIO
Fig. 2

Public Enterprises Survey 2011-2012: Vol-II 451
Bridge & Roof Co.(India) Ltd.Kankaria Centre (5th Floor), 2/1, Russel Street Kolkata, West Bengal - 700 071
BALANCE SHEET (` in Lakhs)
PARTICULARS 2011-12 2010-11I. EQUITY & LIABILITIESAUTHORISED CAPITAL 6000 6000(1) Shareholders’ Funds (a) Share Capital (i) Central Govt 5463 5463 (ii) Others 36 36 (b) Reserves & Surplus 20222 15962 (c) Money received against share warrants 0 0 Total Shareholders’ Funds (1(a)+1(b)+1(c) 25721 21461(2) Share application money pending allotment 0 0(3) Non-current Liabilities (a) Long Term Borrowings 2377 2414 (b) Deferred tax liabilities (Net) 0 0 (c) Other Long-term liabilities 0 0 (d) Long-term provisions 1659 1092 Total Non-Current Liabilities 3(a) to 3(d) 4036 3506(4) Current Liabilities (a) Short Term Borrowings 4525 4990 (b) Trade Payables 62912 59855 (c) Other current liabilities 22368 21470 (d) Short-term provisions 2996 8304 Total Current Liabilities 4(a) to 4(d) 92801 94619TOTAL EQUITY & LIABILITIES (1+2+3+4) 122558 119586II. ASSETS(1) Non-Current Assets (a) Total Gross Fixed Assets 23046 19970 (ai) Accumulated Depreciation, Depletion 16572 15060 & Amortisation (aii) Accumulated Impairment 0 0 (b) Total Net Fixed Assets ((a)-(ai)-(aii) 6474 4910 (c) Capital work in progress 0 0 (d) Intangible assets under developmet 0 0 (e) Non-Current Investments 0 0 (f) Deferred Tax Assets (Net) 963 841 (g) Long Term Loans and Advances 127 387 (h) Other Non-Current Assets 0 0 Total Non-Current Assets (b+c+d+e+f+g+h) 7564 6138(2) Current Assets (a) Current Investments 0 0 (b) Inventories 69583 58453 (c) Trade Recievables 703 1039 (d) Cash & Bank Balance 2303 8196 (e) Short-term Loans & Advances 39216 36699 (f) Other Current Assets 3189 9061 Total Current Assets (a+b+c+d+e+f) 114994 113448TOTAL ASSETS (1+2) 122558 119586Important Indicators (i) Investment 7876 7913 (ii) Capital Employed 28098 23875 (iii) Net Worth 25721 21461 (iv) Net Current Assets 22193 18829 (v) Cost of Sales 118078 123268 (vi) Net Value Added (at market price) 24503 26544 (vii) Total Regular Employees (Nos.) 1585 1557(viii) Avg. Monthly Emoluments per Employee(`) 52135 46724
PROFIT & LOSS ACCOUNT (` in Lakhs)
PARTICULARS 2011-12 2010-11(I) Revenue from Operations (Gross) 126435 133350 Less : Excise Duty 244 251 Revenue from Operations (Net) 126191 133099(II) Other Income 320 303(III) Total Revenue (I+II) 126511 133402(IV) Expenditure on: (a) Cost of materials consumed 27465 30949 (b) Purchase of stock-in-trade 0 0 (c) Changes in inventories of finished goods, 0 0 work-in-progress and stock in trade (d) Stores & Spares 0 0 (e) Power & Fuel 2608 2772 (f) Salary, Wages & Benefits/Employees 9916 8730 Expense (g) Other Operating/direct/manufacturing 69383 69612 Expenses (h) Rent, Royalty & Cess 0 0 (i) Loss on sale of Assets/Investments 0 0 (j) Other Expenses 7172 9821Total Expenditure (IV (a to j)) 116544 121884(V) PROFIT BEFORE DEPRECIATION, & 9967 11518IMPAIRMENT, FINANCE CHARGES/INTEREST,EXCEPTIONAL & EXTRAORDINARY ITEMS &TAXES (PBDIEET)(III-IV)(VI) Depreciation, Depletion & Amortisation 1534 1384(VII) Impairment 0 0(VIII) PROFIT BEFORE FINANCE COST/INTE 8433 10134REST, EXCEPTIONAL, EXTRA-ORDINARYITEMS & TAXES (PBIEET)(V-VI-VII)(IX) Finance Cost (a) On Central Government Loans 0 71 (b) On Foreign Loans 0 0 (c) Others 1604 1354 (d) Less Finance Cost Capitalised 0 0 (e) Charged to P & L Account (a+b+c+d) 1604 1425(X) PROFIT BEFORE EXCEPTIONAL & EXTRA- 6829 8709ORDINARY ITEMS & TAX (PBEET)(VIII-IXe)(XI) Exceptional Items 0 0(XII) PROFIT BEFORE EXTRA-ORDINARY 6829 8709ITEMS & TAX (PBET)(X-XI)(XIII) Extra-Ordinary Items 0 0(XIV) PROFIT BEFORE TAX (PBT)(XII-XIII) 6829 8709(XV) TAX PROVISIONS 2249 2941(XVI) NET PROFIT / LOSS FOR THE PERIOD 4580 5768FROM CONTINUING OPERATIONS AFTERTAX(XIV-XV)(XVII) Profit/Loss from discontinuing operations 0 0(XVIII) Tax expenses of discontinuing operations 0 0(XIX) Profit/Loss from discontinuing operations 0 0(after Tax)(XVII-XVIII)(XX) Profit/Loss for the period (XVI+XIX) 4580 5768Financial Ratios (i) Sales : Capital Employed 449.11 557.48 (ii) Cost of Sales : Sales 93.57 92.61 (iii) Salary/Wages : Sales 7.86 6.56 (iv) Net Profit : Net Worth 17.81 26.88 (v) Debt : Equity 0.43 0.44 (vi) Current Ratio 1.24 1.2 (vii) Trade Recievables : Sales 0.56 0.78 (viii) Total Inventory : Sales 55.14 43.92

Contract & Construction Services452
The CompanyHindustan Prefab Limited (HPL) was incorporated on
27.1.1953 and commenced its business on 16.8.1955. It was earlierfounded as Hindustan Housing Factory Ltd. (in 1950). As yearsrolled by, the company came to be known as HPL, the change inname being necessitated by diversification of its operations. Itsname was changed as HPL w.e.f. 09.03.1978.
HPL is a Schedule-‘C’BRPSE referred CPSE in Contract &Construction Services sector under the administrative control ofM/o Urban Development with 100% shareholding by theGovernment of India. The company employed 286 regularemployees (Executives 16 & Non-executives 270) as on 31.3.2012.Its Registered and Corporate offices are at New Delhi.Vision / Mission
The Vision of the Company is to be a premier organization inthe field of Civil construction and infrastructure industry byembracing state of art and cost effective technology in Prefab /Precast as well as conventional methods committed to total customersatisfaction.
The Mission of the Company is to pioneer Pre-fabricationmethods and technology whereby ensuring optimum Quality andeffortless Construction Techniques within one’s means;Industrial / Business Operations
HPL is now engaged in execution of projects on turnkey basisi.e. from concept to completion on Project Management basis inareas of mass housing & infrastructure works for slum dwellers andurban poor, Institutional buildings and residential complexes,hospital buildings, sewerage treatment plant etcall over the Country.
It has also undertaken projects under JnNURM, for M/oHousing & Urban Poverty Alleviation for execution of its projectsin State of Bihar, Meghalaya, Arunachal Pradesh, Chhattisgarh,Mizoram etc. & Kerala Govt. (NRHM) and is executing a largenumber of projects for paramilitary forces, National LawUniversity, Food Corporation of India, ESIC etc.Performance Highlights
The physical performances of the company for last two yearsare given below:
Hindustan Prefab Ltd.
www.hindprefab.com
Fig. 2
Main Services Unit Performance during
2011-12 2010-11
Project Management Services ` in crore 229.12 203.07
Strategic IssuesHPL was referred to BRPSE and Government had approved
the financial restructuring of HPL as per the recommendations ofBRPSE on16.09.2009. HPL is one of the Turnaround CPSE as perthe guidelines issued by the Government of India for declaring asick CPSE as “Turnaround CPSE”.
The core business of HPL i.e. prefabrication operation havebecome un-economical for about last 6 years due to obsolete Plant& Machinery necessitating the company to take up projectManagement Services for its survival. After financial restructuring,HPL desires to revamp its core business of prefab and to focusmore on execution of turnkey contracts which allow use of prefabconstruction method. Accordingly HPL has undertakenmodernization of its Prefab Plant in Delhi and has setup two newplants at Vishakhapatam in Andhra Pradesh and Pinjore in Haryana.
The Company registered an increase of ` 26.71 crore in totalincome during 2011-12 which went up to `235.61 crore in2011-12 from `208.90crore during 2010-11. The net profit of thecompany however reduced to `2.47crore in 2011-12, a reductionof `2.14 crorefrom the previous year’s profit of ̀ 4.61 crore dueto increase in operating expenses.
The current ratio of company is at 1.03:1 during 2011-12 asagainst 1.02:1 in the previous year (Fig.2). Balance Sheet and Profit& Loss Account of the company and selected financial ratios duringthe period 2010-11 to 2011-12 can be seen on the adjoining page.
EBIT
DA
& P
AT (
Rs.
cro
re)
TOTAL R
EVENU
E (Rs. crore)
Fig. 1
PRO
FITA
BIL
ITY
RAT
IOS
(%)
CU
RR
ENT R
ATIO

Public Enterprises Survey 2011-2012: Vol-II 453
Hindustan Prefab Ltd.Jangpura, New Delhi 110 014
BALANCE SHEET (` in Lakhs)
PARTICULARS 2011-12 2010-11I. EQUITY & LIABILITIESAUTHORISED CAPITAL 13800 13800(1) Shareholders’ Funds (a) Share Capital (i) Central Govt 13477 13477 (ii) Others 0 0 (b) Reserves & Surplus -12216 -12463 (c) Money received against share warrants 0 0 Total Shareholders’ Funds (1(a)+1(b)+1(c) 1261 1014(2) Share application money pending allotment 0 0(3) Non-current Liabilities (a) Long Term Borrowings 0 0 (b) Deferred tax liabilities (Net) 0 0 (c) Other Long-term liabilities 0 0 (d) Long-term provisions 0 0 Total Non-Current Liabilities 3(a) to 3(d) 0 0(4) Current Liabilities (a) Short Term Borrowings 0 0 (b) Trade Payables 10583 9892 (c) Other current liabilities 12013 8860 (d) Short-term provisions 1081 874 Total Current Liabilities 4(a) to 4(d) 23677 19626TOTAL EQUITY & LIABILITIES (1+2+3+4) 24938 20640II. ASSETS(1) Non-Current Assets (a) Total Gross Fixed Assets 819 790 (ai) Accumulated Depreciation, Depletion 469 453 & Amortisation (aii) Accumulated Impairment 0 0 (b) Total Net Fixed Assets ((a)-(ai)-(aii) 350 337 (c) Capital work in progress 0 0 (d) Intangible assets under developmet 0 0 (e) Non-Current Investments 0 0 (f) Deferred Tax Assets (Net) 0 0 (g) Long Term Loans and Advances 0 0 (h) Other Non-Current Assets 184 250 Total Non-Current Assets (b+c+d+e+f+g+h) 534 587(2) Current Assets (a) Current Investments 0 0 (b) Inventories 21 34 (c) Trade Recievables 9888 7184 (d) Cash & Bank Balance 11945 9978 (e) Short-term Loans & Advances 2550 2857 (f) Other Current Assets 0 0 Total Current Assets (a+b+c+d+e+f) 24404 20053TOTAL ASSETS (1+2) 24938 20640Important Indicators (i) Investment 13477 13477 (ii) Capital Employed 1261 1014 (iii) Net Worth 1261 1014 (iv) Net Current Assets 727 427 (v) Cost of Sales 23220 20273 (vi) Net Value Added (at market price) 2178 2041 (vii) Total Regular Employees (Nos.) 286 289(viii) Avg. Monthly Emoluments per Employee(`) 41317 35784
PROFIT & LOSS ACCOUNT (` in Lakhs)
PARTICULARS 2011-12 2010-11(I) Revenue from Operations (Gross) 22912 20307 Less : Excise Duty 0 0 Revenue from Operations (Net) 22912 20307(II) Other Income 649 583(III) Total Revenue (I+II) 23561 20890(IV) Expenditure on: (a) Cost of materials consumed 14 54 (b) Purchase of stock-in-trade 0 0 (c) Changes in inventories of finished goods, 0 0 work-in-progress and stock in trade (d) Stores & Spares 0 0 (e) Power & Fuel 0 0 (f) Salary, Wages & Benefits/Employees Expense 1418 1241 (g) Other Operating/direct/manufacturing 21356 18641
Expenses (h) Rent, Royalty & Cess 8 4 (i) Loss on sale of Assets/Investments 0 0 (j) Other Expenses 408 319Total Expenditure (IV (a to j)) 23204 20259(V) PROFIT BEFORE DEPRECIATION, & 357 631IMPAIRMENT, FINANCE CHARGES/INTEREST,EXCEPTIONAL & EXTRAORDINARY ITEMS &TAXES (PBDIEET)(III-IV)(VI) Depreciation, Depletion & Amortisation 16 14(VII) Impairment 0 0(VIII) PROFIT BEFORE FINANCE COST/INTEREST, 341 617EXCEPTIONAL, EXTRA-ORDINARY ITEMS &TAXES (PBIEET)(V-VI-VII)(IX) Finance Cost (a) On Central Government Loans 0 0 (b) On Foreign Loans 0 0 (c) Others 26 29 (d) Less Finance Cost Capitalised 0 0 (e) Charged to P & L Account (a+b+c+d) 26 29(X) PROFIT BEFORE EXCEPTIONAL & EXTRA- 315 588ORDINARY ITEMS & TAX (PBEET)(VIII-IXe)(XI) Exceptional Items 0 0(XII) PROFIT BEFORE EXTRA-ORDINARY 315 588ITEMS & TAX (PBET)(X-XI)(XIII) Extra-Ordinary Items 7 12(XIV) PROFIT BEFORE TAX (PBT)(XII-XIII) 308 576(XV) TAX PROVISIONS 61 115(XVI) NET PROFIT / LOSS FOR THE PERIOD FROM 247 461CONTINUING OPERATIONS AFTER TAX(XIV-XV)(XVII) Profit/Loss from discontinuing operations 0 0(XVIII) Tax expenses of discontinuing operations 0 0(XIX) Profit/Loss from discontinuing operations 0 0(after Tax)(XVII-XVIII)(XX) Profit/Loss for the period (XVI+XIX) 247 461Financial Ratios (i) Sales : Capital Employed 1816.97 2002.66 (ii) Cost of Sales : Sales 101.34 99.83 (iii) Salary/Wages : Sales 6.19 6.11 (iv) Net Profit : Net Worth 19.59 45.46 (v) Debt : Equity 0 0 (vi) Current Ratio 1.03 1.02 (vii) Trade Recievables : Sales 43.16 35.38 (viii) Total Inventory : Sales 0.09 0.17
2011-12 Provisional

Contract & Construction Services454
The CompanyHindustan Steel Works Corporation (HSCL) was incorporated
on 23.06.1964 with the objective of creating an organization capableof undertaking complete construction of modern integrated SteelPlants in the Public Sector.
HSCL is a Schedule-‘B’ BRPSE referred CPSE in Contract &Construction Services sector under the administrative control ofM/o Steel with 100% shareholding by the Government of India.The company employed 517 regular employees (Executives 144 &Non-Executives 373) as on 31.3.2012.Its Registered and Corporateoffices are at Kolkata, West Bengal.
Vision / Mission The Vision / Mission of the Company are to become a
profitable Construction Agency as a PSU and contribute indevelopment of the country by execution of various infrastructureand Steel Sector projects.
Industrial / Business OperationsHSCL is involved in undertaking construction activities in the
areas of steel plants (like setting up of Bokaro Bhilai, Rourkela,Vizaz, Durgapur etc. in the past) power, oil and gas, roads /highways, bridges, dams, underground communication and transportsystem, industrial and township complexes etc. with high degree ofplanning, co-ordination and modern sophisticated techniques.Presently the company carries out a number of project packagesunder the capacity expansion programme of SAIL and RINL alongwith regular operation and maintenance jobs of these plants.
It has one Joint Venture (project specific) namely HSCL-SriconInfrastructure Private Limited for construction of Nagpur-HyderabadSection of NH 7.
Performance Highlights The physical performances of the company for last two years
are given below:—
Hindustan Steel Works Corporation
www.hscl.co.in
Main Services U n i t Performance during
2010-12 2010-11
Project Construction ` in Cr. 1208.16 996.30
EBIT
DA
& P
AT (
Rs.
cro
re)
TOTAL R
EVENU
E (Rs. crore)
Fig. 1
The current ratio of company is at 0.47:1 during 2011-12 asagainst 0.49:1 in the pervious year. Balance Sheet and Profit &
Loss Account of the company and selected financial ratios duringthe period 2010-11 to 2011-12 can be seen on the adjoining page.
Total Revenue of the company registered an increase of `224.06 crore during 2011-12, which went up from ` 1005.73crore in 2010-11 to ` 1229.79 crore in 2011-12. The losses of thecompany has also gone down by `10.01 crore to ` 28.08 crore,from ` 38.09 crore in previous year due to increase in turnoverwhich has somehow been offset by increase in operating cost.
Strategic issuesThe company has been facing acute financial difficulty since
long. The accumulated losses were at Rs.1383 crores in 1999.Despite a capital restructuring undertaken in 1999, it is still in loss.The revival package was essentially an exercise in capitalrestructuring. The proposal for Organizational, Business andFinancial Restructuring of the Company on the basis of the viabilitystudy conducted has been recommended by BRPSE in its 58th
meeting held on 13.05.2008. The proposal is under considerationof the Govt. of India (GoI).
During last 19 years there has been no recruitment in thecompany. During the next 1-2 years, all the Senior and MiddleManagement level executives will retire.

Public Enterprises Survey 2011-2012: Vol-II 455
Hindustan Steel Works CorporationP-34-A, Gariahat Road (South) Kolkata, West Bengal -700031
BALANCE SHEET (` in Lakhs)
PARTICULARS 2011-12 2010-11I. EQUITY & LIABILITIESAUTHORISED CAPITAL 15000 15000(1) Shareholders’ Funds (a) Share Capital (i) Central Govt 11710 11710 (ii) Others 0 0 (b) Reserves & Surplus -148907 -146099 (c) Money received against share warrants 0 0 Total Shareholders’ Funds (1(a)+1(b)+1(c) -137197 -134389(2) Share application money pending allotment 0 0(3) Non-current Liabilities (a) Long Term Borrowings 8489 33338 (b) Deferred tax liabilities (Net) 11 14 (c) Other Long-term liabilities 20780 17289 (d) Long-term provisions 1412 2384 Total Non-Current Liabilities 3(a) to 3(d) 30692 53025(4) Current Liabilities (a) Short Term Borrowings 102285 76531 (b) Trade Payables 50868 41861 (c) Other current liabilities 86212 76156 (d) Short-term provisions 30 0 Total Current Liabilities 4(a) to 4(d) 239395 194548TOTAL EQUITY & LIABILITIES (1+2+3+4) 132890 113184II. ASSETS(1) Non-Current Assets (a) Total Gross Fixed Assets 9232 9055 (ai) Accumulated Depreciation, Depletion 5114 5379 & Amortisation (aii) Accumulated Impairment 0 0 (b) Total Net Fixed Assets ((a)-(ai)-(aii) 4118 3676 (c) Capital work in progress 0 110 (d) Intangible assets under developmet 1 0 (e) Non-Current Investments 0 0 (f) Deferred Tax Assets (Net) 0 0 (g) Long Term Loans and Advances 15609 14620 (h) Other Non-Current Assets 0 0 Total Non-Current Assets (b+c+d+e+f+g+h) 19728 18406(2) Current Assets (a) Current Investments 0 0 (b) Inventories 193 295 (c) Trade Recievables 52493 41100 (d) Cash & Bank Balance 33331 29185 (e) Short-term Loans & Advances 15284 12831 (f) Other Current Assets 11861 11367 Total Current Assets (a+b+c+d+e+f) 113162 94778TOTAL ASSETS (1+2) 132890 113184Important Indicators (i) Investment 20199 45048 (ii) Capital Employed -128708 -101051 (iii) Net Worth -137197 -134389 (iv) Net Current Assets -126233 -99770 (v) Cost of Sales 115138 94248 (vi) Net Value Added (at market price) 8926 9092 (vii) Total Regular Employees (Nos.) 517 517(viii) Avg. Monthly Emoluments per Employee(`) 38233 44036
PROFIT & LOSS ACCOUNT (` in Lakhs)
PARTICULARS 2011-12 2010-11(I) Revenue from Operations (Gross) 117142 97491 Less : Excise Duty 0 0 Revenue from Operations (Net) 117142 97491(II) Other Income 5837 3082(III) Total Revenue (I+II) 122979 100573(IV) Expenditure on: (a) Cost of materials consumed 0 0 (b) Purchase of stock-in-trade 0 0 (c) Changes in inventories of finished goods, 0 0 work-in-progress and stock in trade (d) Stores & Spares 238 295 (e) Power & Fuel 296 389 (f) Salary, Wages & Benefits/Employees 2372 2732
Expense (g) Other Operating/direct/manufacturing 107072 87984
Expenses (h) Rent, Royalty & Cess 38 35 (i) Loss on sale of Assets/Investments 0 0 (j) Other Expenses 4785 2542Total Expenditure (IV (a to j)) 114801 93977(V) PROFIT BEFORE DEPRECIATION, & 8178 6596IMPAIRMENT, FINANCE CHARGES/INTEREST,EXCEPTIONAL & EXTRAORDINARY ITEMS &TAXES (PBDIEET)(III-IV)(VI) Depreciation, Depletion & Amortisation 337 271(VII) Impairment 0 0(VIII) PROFIT BEFORE FINANCE COST/INTE 7841 6325REST, EXCEPTIONAL, EXTRA-ORDINARYITEMS & TAXES (PBIEET)(V-VI-VII)(IX) Finance Cost (a) On Central Government Loans 10100 10047 (b) On Foreign Loans 0 0 (c) Others 143 117 (d) Less Finance Cost Capitalised 0 0 (e) Charged to P & L Account (a+b+c+d) 10243 10164(X) PROFIT BEFORE EXCEPTIONAL & -2402 -3839EXTRA-ORDINARY ITEMS & TAX (PBEET)(VIII-IXe)(XI) Exceptional Items 409 0(XII) PROFIT BEFORE EXTRA-ORDINARY -2811 -3839ITEMS & TAX (PBET)(X-XI)(XIII) Extra-Ordinary Items 0 0(XIV) PROFIT BEFORE TAX (PBT)(XII-XIII) -2811 -3839(XV) TAX PROVISIONS -3 -30(XVI) NET PROFIT / LOSS FOR THE PERIOD -2808 -3809FROM CONTINUING OPERATIONS AFTERTAX(XIV-XV)(XVII) Profit/Loss from discontinuing operations 0 0(XVIII) Tax expenses of discontinuing operations 0 0(XIX) Profit/Loss from discontinuing operations 0 0(after Tax)(XVII-XVIII)(XX) Profit/Loss for the period (XVI+XIX) -2808 -3809Financial Ratios (i) Sales : Capital Employed -91.01 -96.48 (ii) Cost of Sales : Sales 98.29 96.67 (iii) Salary/Wages : Sales 2.02 2.8 (iv) Net Profit : Net Worth - - (v) Debt : Equity 0.72 2.85 (vi) Current Ratio 0.47 0.49 (vii) Trade Recievables : Sales 44.81 42.16 (viii) Total Inventory : Sales 0.16 0.3

Contract & Construction Services458
The CompanyIRCON Infrastructure & Services Limited (IRCONISL)
incorporated on 30.09.2009 is a wholly-owned subsidiary of IRCONinternational Limited with an objective to undertake infrastructureprojects including planning, designing, development, construction,improvement, commissioning, operation, maintenance and financingof projects. The objectives clause (III A) of the company wasmodified on 12.03.2012. The new objectives of the company are tocarry on the business of hire purchase, leasing of all kinds of movableand immovable properties, to provide consultancy for all kind ofengineering projects.
IRCONISL is an Uncategorized CPSE in Contract andConstruction Services sector under the administrative control ofM/o Railway with 100% shareholding by its holding companyIRCON international Limited. The company employed 8 executives’regular employees as on 31.3.2012. Its Registered and Corporateoffice is at New Delhi.
Vision / MissionThe Vision / Mission of the company is to be recognized as a
specialized infrastructure developer and establish itself as arenowned service provider for all areas of infrastructure projectswith special emphasis on environment, quality and safety.
Industrial / Business OperationsIRCONISL is currently engaged in planning, designing,
development, improvement, commissioning, operation,maintenance, etc. in the field of construction of infrastructure ofMultifunctional Complexes (MFCs), etc. to provide facilities andamenities to users of Indian Railway System spread all over India.This project is taken up in association with Rail Land DevelopmentAuthority.
The physical work of construction was taken up on 23 stationsand has been completed as on 18 stations and is in advance stages ofcompletion on 3 other stations. These 21 MFCs are ready forleasing to 3rd parties for operation and maintenance. Theconstruction work on balance 2 MFCs is expected to be completedin the year 2012-13.
Performance HighlightsTotal Revenue from of the company registered an increase of
` 5.05 crore during 2011-12, which went up from ` 1.10 crore in2010-11 to ` 6.15 crore in 2011-12. The profit of the companyhas gone up by ` 2.49 crore to ` 2.56 crore in 2011-12, from` 0.07 crore in previous year due to increase in receipts from theconsultancy project.
The current ratio of company is at 0.39:1 during 2011-12 asagainst 0.70:1 in the previous year (Fig.2). Balance Sheet and Profit& Loss Account of the company and selected financial ratios duringthe period 2010-11 to 2011-12 can be seen on the adjoining page.
IRCON Infrastructure & Services Limited
www.irconisl.com
Strategic issuesThe current activities of the company relate to infrastructure
projects and consultancy in the related areas. In order to enlarge thescope of operations of the company, the Board of the company,has altered the objects clause of the company. IRCON-ISL hassecured a contract in Myanmar. The company is also undertakingimplementation of identified works of Corporate SocialResponsibility (CSR) of the holding company.
EBIT
DA
& P
AT (
Rs.
cro
re)
TOTAL R
EVENU
E (Rs. crore)
Fig. 1
PRO
FITA
BIL
ITY
RAT
IOS
(%)
CU
RR
ENT R
ATIO
Fig. 2

Public Enterprises Survey 2011-2012: Vol-II 459
IRCON Infrastructure & Services LimitedC-4, District Centre, Saket, NewDelhi-110017
BALANCE SHEET (` in Lakhs)
PARTICULARS 2011-12 2010-11I. EQUITY & LIABILITIESAUTHORISED CAPITAL 1000 1000(1) Shareholders’ Funds (a) Share Capital (i) Central Govt 0 0 (ii) Others 490 490 (b) Reserves & Surplus 261 5 (c) Money received against share warrants 0 0 Total Shareholders’ Funds (1(a)+1(b)+1(c) 751 495(2) Share application money pending allotment 0 0(3) Non-current Liabilities (a) Long Term Borrowings 5092 2320 (b) Deferred tax liabilities (Net) 0 0 (c) Other Long-term liabilities 0 9 (d) Long-term provisions 0 0 Total Non-Current Liabilities 3(a) to 3(d) 5092 2329(4) Current Liabilities (a) Short Term Borrowings 0 0 (b) Trade Payables 697 519 (c) Other current liabilities 557 235 (d) Short-term provisions 124 10 Total Current Liabilities 4(a) to 4(d) 1378 764TOTAL EQUITY & LIABILITIES (1+2+3+4) 7221 3588II. ASSETS(1) Non-Current Assets (a) Total Gross Fixed Assets 0 0 (ai) Accumulated Depreciation, Depletion 0 0 & Amortisation (aii) Accumulated Impairment 0 0 (b) Total Net Fixed Assets ((a)-(ai)-(aii) 0 0 (c) Capital work in progress 6686 3051 (d) Intangible assets under developmet 0 0 (e) Non-Current Investments 0 0 (f) Deferred Tax Assets (Net) 1 3 (g) Long Term Loans and Advances 1 0 (h) Other Non-Current Assets 0 0 Total Non-Current Assets (b+c+d+e+f+g+h) 6688 3054(2) Current Assets (a) Current Investments 0 0 (b) Inventories 0 0 (c) Trade Recievables 84 252 (d) Cash & Bank Balance 210 10 (e) Short-term Loans & Advances 239 272 (f) Other Current Assets 0 0 Total Current Assets (a+b+c+d+e+f) 533 534TOTAL ASSETS (1+2) 7221 3588Important Indicators (i) Investment 5582 2810 (ii) Capital Employed 5843 2815 (iii) Net Worth 751 495 (iv) Net Current Assets -845 -230 (v) Cost of Sales 233 101 (vi) Net Value Added (at market price) 532 14 (vii) Total Regular Employees (Nos.) 8 7(viii) Avg. Monthly Emoluments per Employee(`) 12500 5952
PROFIT & LOSS ACCOUNT (` in Lakhs)
PARTICULARS 2011-12 2010-11(I) Revenue from Operations (Gross) 607 110 Less : Excise Duty 0 0 Revenue from Operations (Net) 607 110(II) Other Income 8 0(III) Total Revenue (I+II) 615 110(IV) Expenditure on: (a) Cost of materials consumed 0 0 (b) Purchase of stock-in-trade 0 0 (c) Changes in inventories of finished goods, 0 0 work-in-progress and stock in trade (d) Stores & Spares 0 0 (e) Power & Fuel 0 0 (f) Salary, Wages & Benefits/Employees Expense 12 5 (g) Other Operating/direct/manufacturing Expenses 220 83 (h) Rent, Royalty & Cess 0 0 (i) Loss on sale of Assets/Investments 0 0 (j) Other Expenses 1 12Total Expenditure (IV (a to j)) 233 100(V) PROFIT BEFORE DEPRECIATION, & 382 10IMPAIRMENT, FINANCE CHARGES/INTEREST,EXCEPTIONAL & EXTRAORDINARY ITEMS &TAXES (PBDIEET)(III-IV)(VI) Depreciation, Depletion & Amortisation 0 1(VII) Impairment 0 0(VIII) PROFIT BEFORE FINANCE COST/INTEREST, EXCEPTIONAL, EXTRA-ORDINARYITEMS & TAXES (PBIEET)(V-VI-VII) 382 9(IX) Finance Cost (a) On Central Government Loans 0 0 (b) On Foreign Loans 0 0 (c) Others 0 0 (d) Less Finance Cost Capitalised 0 0 (e) Charged to P & L Account (a+b+c+d) 0 0(X) PROFIT BEFORE EXCEPTIONAL & EXTRA- 382 9ORDINARY ITEMS & TAX (PBEET)(VIII-IXe)(XI) Exceptional Items 0 0(XII) PROFIT BEFORE EXTRA-ORDINARY 382 9ITEMS & TAX (PBET)(X-XI)(XIII) Extra-Ordinary Items 0 0(XIV) PROFIT BEFORE TAX (PBT)(XII-XIII) 382 9(XV) TAX PROVISIONS 126 2(XVI) NET PROFIT / LOSS FOR THE PERIOD 256 7FROM CONTINUING OPERATIONS AFTER TAX(XIV-XV)(XVII) Profit/Loss from discontinuing operations 0 0(XVIII) Tax expenses of discontinuing operations 0 0(XIX) Profit/Loss from discontinuing operations 0 0(after Tax)(XVII-XVIII)(XX) Profit/Loss for the period (XVI+XIX) 256 7Financial Ratios (i) Sales : Capital Employed 10.39 3.91 (ii) Cost of Sales : Sales 38.39 91.82 (iii) Salary/Wages : Sales 1.98 4.55 (iv) Net Profit : Net Worth 34.09 1.41 (v) Debt : Equity 10.39 4.73 (vi) Current Ratio 0.39 0.7 (vii) Trade Recievables : Sales 13.84 229.09 (viii) Total Inventory : Sales 0 0

Contract & Construction Services456
The CompanyIRCON International Ltd. (IRCON) was incorporated in 1976
with the objective to carry on construction activities in variousfield of railways, roads, highways, buildings, industrial andresidential complexes, airport constructions, optic fiber Projects,mass rapid transit system etc.
IRCON is a Schedule-A Miniratna listed CPSE in Contract &Construction Services under the administrative control of Ministryof Railways with 99.73% Shareholding by the Government of India.The company employed 1703 regular employees (Executives 1547& Non-Executives 156) as on 31.3.2012. Its Registered and Corporateoffice is at New Delhi.Vision / Mission
The Vision of the company is to be recognized nationally andinternationally as a specialized construction organizationcomparable with the best in the field covering the entire spectrumof construction activities and services in the infrastructure sector.
The Mission of the company is to effectively position theCompany so as to meet the construction needs of infrastructuredevelopment of the changing economic scene in India and abroad.Industrial / Business Operations
IRCON is engaged in providing civil and other constructionservices such as formation and earthwork, track laying and welding,sidings & MGR system for thermal power stations, rehabilitationand up gradation of track, girder erection & regirdering, ballast andquarries, railways workshops, concrete sleepers, tunneling, pilling,bridges etc; electrification of railways, construction of roads andhighways, bridges, tunnels, airport runway, signaling andtelecommunication work, building, electricity transmissionsubstation etc. from its 5 regional offices and other Project offices.
IRCON has two joint ventures companies one wholly ownedsubsidiary company namely Ircon Infrastructure & Services Limited(Ircon ISL). The service segment of the company comprise ofrailways, highways, buildings and others.Performance Highlights
As on 31.3.2012 there were 76 running projects out of which12 were in other countries. The physical performances of thecompany for last two years are given below:
IRCON International Limited
www.ircon.org
EBIT
DA
& P
AT (
Rs.
cro
re)
TOTAL R
EVENU
E (Rs. crore)
Fig. 1
PRO
FITA
BIL
ITY
RAT
IOS
(%)
Fig. 2
CU
RR
ENT R
ATIO
Main Segment Unit 2011-12 2010-11
Railways ` Crore 2907.10 2033.34
Highways ` Crore 488.80 934.56
Buildings ` Crore 76.30 60.67
Strategic issuesThe other objectives of the company are to enhance the size
and value of business activities of the company so as to achieve aturnover of ` 5500 crore by the year 2016-17 and to achieveoptimal returns on the capital employed.
The current ratio of company is at 1.47:1 during 2011-12 asagainst 1.53:1 in the previous year (Fig.2). Balance Sheet and Profit& Loss Account of the company and selected financial ratios duringthe period 2010-11 to 2011-12 can be seen on the adjoining page.
Total Revenue of the company registered an increase of` 527.77 crore during 2011-12, which went up from ` 3254.15crore in 2010-11 to ` 3781.92 crore in 2011-12. The profit of thecompany has gone up by Rs 229.41 crore to ̀ 469.92 crore in 2011-12, from ̀ 240.51 crore in previous year due to increase in operatingincome specially from foreign projects and increase in margins. 51%of the total income has been contributed by foreign projects.

Public Enterprises Survey 2011-2012: Vol-II 457
IRCON International LimitedC-4, District Centre, Saket, New Delhi 110017
BALANCE SHEET (` in Lakhs)
PARTICULARS 2011-12 2010-11I. EQUITY & LIABILITIESAUTHORISED CAPITAL 2500 2500(1) Shareholders’ Funds (a) Share Capital (i) Central Govt 987 987 (ii) Others 3 3 (b) Reserves & Surplus 173304 137241 (c) Money received against share warrants 0 0 Total Shareholders’ Funds (1(a)+1(b)+1(c) 174294 138231(2) Share application money pending allotment 0 0(3) Non-current Liabilities (a) Long Term Borrowings 0 0 (b) Deferred tax liabilities (Net) 0 0 (c) Other Long-term liabilities 27146 70068 (d) Long-term provisions 41574 32478 Total Non-Current Liabilities 3(a) to 3(d) 68720 102546(4) Current Liabilities (a) Short Term Borrowings 0 0 (b) Trade Payables 54407 45185 (c) Other current liabilities 186780 144381 (d) Short-term provisions 68662 67621 Total Current Liabilities 4(a) to 4(d) 309849 257187TOTAL EQUITY & LIABILITIES (1+2+3+4) 552863 497964II. ASSETS(1) Non-Current Assets (a) Total Gross Fixed Assets 49898 51973 (ai) Accumulated Depreciation, 30552 27750 Depletion & Amortisation (aii) Accumulated Impairment 0 0 (b) Total Net Fixed Assets ((a)-(ai)-(aii) 19346 24223 (c) Capital work in progress 240 177 (d) Intangible assets under developmet 25 0 (e) Non-Current Investments 19579 18537 (f) Deferred Tax Assets (Net) 18938 13106 (g) Long Term Loans and Advances 31734 38993 (h) Other Non-Current Assets 8156 8414 Total Non-Current Assets (b+c+d+e+f+g+h) 98018 103450(2) Current Assets (a) Current Investments 1251 0 (b) Inventories 13451 16492 (c) Trade Recievables 84660 87621 (d) Cash & Bank Balance 260119 200781 (e) Short-term Loans & Advances 66619 69210 (f) Other Current Assets 28745 20410 Total Current Assets (a+b+c+d+e+f) 454845 394514TOTAL ASSETS (1+2) 552863 497964Important Indicators (i) Investment 990 990 (ii) Capital Employed 174294 138231 (iii) Net Worth 174294 138231 (iv) Net Current Assets 144996 137327 (v) Cost of Sales 317972 285276 (vi) Net Value Added (at market price) 81430 60340 (vii) Total Regular Employees (Nos.) 1703 1678(viii) Avg. Monthly Emoluments per Employee(`) 77466 82539
PROFIT & LOSS ACCOUNT (` in Lakhs)
PARTICULARS 2011-12 2010-11(I) Revenue from Operations (Gross) 360141 318185 Less : Excise Duty 0 0 Revenue from Operations (Net) 360141 318185(II) Other Income 18051 7230(III) Total Revenue (I+II) 378192 325415(IV) Expenditure on: (a) Cost of materials consumed 45019 52221 (b) Purchase of stock-in-trade 0 0 (c) Changes in inventories of finished goods, 2192 -767 work-in-progress and stock in trade (d) Stores & Spares 0 0 (e) Power & Fuel 461 452 (f) Salary, Wages & Benefits/Employees 15831 16620 Expense (g) Other Operating/direct/manufacturing 207666 183170 Expenses (h) Rent, Royalty & Cess 0 0 (i) Loss on sale of Assets/Investments 6 14 (j) Other Expenses 41119 29889Total Expenditure (IV (a to j)) 312294 281599(V) PROFIT BEFORE DEPRECIATION, & 65898 43816IMPAIRMENT, FINANCE CHARGES/INTEREST,EXCEPTIONAL & EXTRAORDINARY ITEMS &TAXES (PBDIEET)(III-IV)(VI) Depreciation, Depletion & Amortisation 5684 3691(VII) Impairment 0 0(VIII) PROFIT BEFORE FINANCE COST/INTE 60214 40125REST, EXCEPTIONAL, EXTRA-ORDINARYITEMS & TAXES (PBIEET)(V-VI-VII)(IX) Finance Cost (a) On Central Government Loans 0 0 (b) On Foreign Loans 0 0 (c) Others 0 0 (d) Less Finance Cost Capitalised 0 0 (e) Charged to P & L Account (a+b+c+d) 0 0(X) PROFIT BEFORE EXCEPTIONAL & EXTRA- 60214 40125ORDINARY ITEMS & TAX (PBEET)(VIII-IXe)(XI) Exceptional Items 0 0(XII) PROFIT BEFORE EXTRA-ORDINARY 60214 40125ITEMS & TAX (PBET)(X-XI)(XIII) Extra-Ordinary Items 0 0(XIV) PROFIT BEFORE TAX (PBT)(XII-XIII) 60214 40125(XV) TAX PROVISIONS 13222 16074(XVI) NET PROFIT / LOSS FOR THE PERIOD 46992 24051FROM CONTINUING OPERATIONS AFTERTAX(XIV-XV)(XVII) Profit/Loss from discontinuing operations 0 0(XVIII) Tax expenses of discontinuing operations 0 0(XIX) Profit/Loss from discontinuing operations 0 0(after Tax)(XVII-XVIII)(XX) Profit/Loss for the period (XVI+XIX) 46992 24051Financial Ratios (i) Sales : Capital Employed 206.63 230.18 (ii) Cost of Sales : Sales 88.29 89.66 (iii) Salary/Wages : Sales 4.4 5.22 (iv) Net Profit : Net Worth 26.96 17.4 (v) Debt : Equity 0 0 (vi) Current Ratio 1.47 1.53 (vii) Trade Recievables : Sales 23.51 27.54 (viii) Total Inventory : Sales 3.73 5.18

Contract & Construction Services460
The CompanyKonkan Railway Corp. Ltd. (KRCL) was incorporated on
19.07.1990 with the objective to construct a new broad gauge railline between Rohu and Mangalore by raising the finance from Non-Government sources.
KRCL is a Schedule-‘A’ BRPSE referred CPSE in Contract &Construction Services sector under the administrative control ofM/o Railways (MoR) with 52.12% shareholding by theGovernment of India (GOI) (the remaining holding is with theGovernments of Maharashtra, Karnataka and Goa). The companyemployed 4703 regular employees (Executives 181& Non-Executives 4522) as on 31.3.2012. Its registered office is at Delhiand Corporate office at Navi Mumbai, Maharashtra.
Vision / MissionThe Vision / Mission of the Company is to evolve into
economic, eco friendly and cost effective catalyst for growth andprosperity in the Konkan Region.
Industrial / Business OperationsKRCL is the Central / State Government Joint Venture
providing services in the field of construction of railway line andrunning of railway services from Roha in Maharashtra to Mangalorein Karnataka.
In addition to the railway transportation, the corporation hasundertaken construction of Katra–Dharam section of railway projectin J&K and construction of road over bridges in Jharkhand,implementation of ACD network in North East Frontier Railwayand other allied works.
Performance HighlightsThe physical performances of the company for last two years
are given below:
Konkan Railway Corp. Ltd.
www.konkanrailway.com
Total Revenue of the company registered an increase of` 72.27croreduring 2011-12, which went up from ` 928.65crorein 2010-11 to ` 1000.92crore in 2011-12.The net profit of thecompany correspondingly increased to ` 18.74 crore, an increaseof ̀ 16.91crore over the previous year’s profit of ̀ 1.83 crore dueto increase in operations and increase in other income.
The current ratio of company is at 1.22:1 during 2011-12 asagainst 1.27:1 in the previous year (Fig.2). Balance Sheet & LossAccount of the company and selected financial ratios during theperiod 2010-11 to 2011-12 can be seen on the adjoining page.
Strategic issuesKRCL is the first and only railway project in the country to
be executed on BOT basis. To enable timely completion of theproject, the corporation had to resort to commercial borrowing onhigh rate of interest. In addition to this the losses were also incurreddue to non-materialization of the projected traffic growth along theroute. A financial restructuring proposal as approved by BRPSEwas approved by the GOI in 2008. After implementation offinancial restructuring, the debt liabilities of the corporation hadcome down and thereby interest burden has reduced.
Konkan Railway Corp. Ltd. (KRCL) is one of the TurnaroundCPSE as per the guidelines issued by the Government of India fordeclaring a sick CPSE as “Turnaround CPSE”.
EBIT
DA
& P
AT (
Rs.
cro
re)
Fig. 1
Fig. 2
TOTAL R
EVENU
E (Rs. crore)
PRO
FITA
BIL
ITY
RAT
IOS
(%)
CU
RR
ENT R
ATIO
Main Services Unit Performance during
2011-12 2010-11
Traffic Earnings ` crores 671.98 600.08
Project Revenue ` crores 274.19 288.09

Public Enterprises Survey 2011-2012: Vol-II 461
Konkan Railway Corp. Ltd.Room No.101, Rail Bhavan, Rail Road, New Delhi-110001
BALANCE SHEET (` in Lakhs)
PARTICULARS 2011-12 2010-11I. EQUITY & LIABILITIESAUTHORISED CAPITAL 488598 488598(1) Shareholders’ Funds (a) Share Capital (i) Central Govt 449080 449080 (ii) Others 39517 39517 (b) Reserves & Surplus -331036 -332910 (c) Money received against share warrants 0 0 Total Shareholders’ Funds (1(a)+1(b)+1(c) 157561 155687(2) Share application money pending allotment 0 0(3) Non-current Liabilities (a) Long Term Borrowings 166670 174000 (b) Deferred tax liabilities (Net) 0 0 (c) Other Long-term liabilities 0 0 (d) Long-term provisions 5473 4071 Total Non-Current Liabilities 3(a) to 3(d) 172143 178071(4) Current Liabilities (a) Short Term Borrowings 7330 5800 (b) Trade Payables 36523 28142 (c) Other current liabilities 36986 53785 (d) Short-term provisions 4570 4097 Total Current Liabilities 4(a) to 4(d) 85409 91824TOTAL EQUITY & LIABILITIES (1+2+3+4) 415113 425582II. ASSETS(1) Non-Current Assets (a) Total Gross Fixed Assets 403912 392939 (ai) Accumulated Depreciation, Depletion 103484 94510 & Amortisation (aii) Accumulated Impairment 0 0 (b) Total Net Fixed Assets ((a)-(ai)-(aii) 300428 298429 (c) Capital work in progress 4051 6860 (d) Intangible assets under developmet 391 31 (e) Non-Current Investments 0 0 (f) Deferred Tax Assets (Net) 0 0 (g) Long Term Loans and Advances 5753 3329 (h) Other Non-Current Assets 0 0 Total Non-Current Assets (b+c+d+e+f+g+h) 310623 308649(2) Current Assets (a) Current Investments 0 0 (b) Inventories 1948 2420 (c) Trade Recievables 38658 29993 (d) Cash & Bank Balance 47818 69414 (e) Short-term Loans & Advances 13892 14496 (f) Other Current Assets 2174 610 Total Current Assets (a+b+c+d+e+f) 104490 116933TOTAL ASSETS (1+2) 415113 425582Important Indicators (i) Investment 655267 662597 (ii) Capital Employed 324231 329687 (iii) Net Worth 157561 155687 (iv) Net Current Assets 19081 25109 (v) Cost of Sales 84801 78593 (vi) Net Value Added (at market price) 34325 29594 (vii) Total Regular Employees (Nos.) 4703 4652(viii) Avg. Monthly Emoluments per Employee(`) 32708 27554
PROFIT & LOSS ACCOUNT (` in Lakhs)
PARTICULARS 2011-12 2010-11(I) Revenue from Operations (Gross) 94617 88811 Less : Excise Duty 0 0 Revenue from Operations (Net) 94617 88811(II) Other Income 5475 4054(III) Total Revenue (I+II) 100092 92865(IV) Expenditure on: (a) Cost of materials consumed 0 0 (b) Purchase of stock-in-trade 0 0 (c) Changes in inventories of finished goods, 0 0 work-in-progress and stock in trade (d) Stores & Spares 0 0 (e) Power & Fuel 6644 539 (f) Salary, Wages & Benefits/Employees 18459 15382 Expense (g) Other Operating/direct/manufacturing 48271 51968 Expenses (h) Rent, Royalty & Cess 48 38 (i) Loss on sale of Assets/Investments 2 0 (j) Other Expenses 2346 2191Total Expenditure (IV (a to j)) 75770 70118(V) PROFIT BEFORE DEPRECIATION, & 24322 22747IMPAIRMENT, FINANCE CHARGES/INTEREST,EXCEPTIONAL & EXTRAORDINARY ITEMS &TAXES (PBDIEET)(III-IV)(VI) Depreciation, Depletion & Amortisation 9033 8475(VII) Impairment 0 0(VIII) PROFIT BEFORE FINANCE COST/ 15289 14272INTEREST, EXCEPTIONAL, EXTRA-ORDINARYITEMS & TAXES (PBIEET)(V-VI-VII)(IX) Finance Cost (a) On Central Government Loans 0 0 (b) On Foreign Loans 0 0 (c) Others 13363 13991 (d) Less Finance Cost Capitalised 0 0 (e) Charged to P & L Account (a+b+c+d) 13363 13991(X) PROFIT BEFORE EXCEPTIONAL & 1926 281EXTRA-ORDINARY ITEMS & TAX (PBEET)(VIII-IXe)(XI) Exceptional Items 52 98(XII) PROFIT BEFORE EXTRA-ORDINARY 1874 183ITEMS & TAX (PBET)(X-XI)(XIII) Extra-Ordinary Items 0 0(XIV) PROFIT BEFORE TAX (PBT)(XII-XIII) 1874 183(XV) TAX PROVISIONS 0 0(XVI) NET PROFIT / LOSS FOR THE PERIOD 1874 183FROM CONTINUING OPERATIONS AFTERTAX (XIV-XV)(XVII) Profit/Loss from discontinuing operations 0 0(XVIII) Tax expenses of discontinuing operations 0 0(XIX) Profit/Loss from discontinuing operations 0 0(after Tax)(XVII-XVIII)(XX) Profit/Loss for the period (XVI+XIX) 1874 183Financial Ratios (i) Sales : Capital Employed 29.18 26.94 (ii) Cost of Sales : Sales 89.63 88.49 (iii) Salary/Wages : Sales 19.51 17.32 (iv) Net Profit : Net Worth 1.19 0.12 (v) Debt : Equity 0.34 0.36 (vi) Current Ratio 1.22 1.27 (vii) Trade Recievables : Sales 40.86 33.77 (viii) Total Inventory : Sales 2.06 2.72

Contract & Construction Services462
The CompanyMineral Exploration Corp. Ltd. (MECL) was carved out of
GSI in 1972 and incorporated on 21.10.1972 with the objective ofcarrying out detailed exploration of mineral potential deposits on acommercial basis, in order to reduce the time lag between the initialdiscovery of a mineral prospect and its eventual exploitation.
MECL is a Schedule-‘B’ BRPSE referred CPSE in Contract &Construction services sector under the administrative control ofM/o Mines, with 100% shareholding by the Government of India.The company employed 1723 regular employees (Executives 306,Non-executives 1417) as on 31.3.2012. Its Registered and Corporateoffices are at Nagpur, Maharashtra.
Vision / MissionThe Vision of the Company is to be the leader in Exploration
of mineral resources by 2020.The Mission of the Company is to provide high quality, cost
effective and time bound geo scientific services for exploration andexploitation of minerals.
Industrial / Business OperationsMECL carries out exploration activities under two major heads,
viz. Promotional Work for coal, lignite and other minerals onbehalf of and funded by the Government of India, and ContractualWork on behalf of other agencies including public sector, privatesector and state Governments. The Zonal offices and RegionalMaintenance Centers of the company are located at Hyderabad,Nagpur, Ranchi and Tinsukia (Assam) and the BusinessDevelopment Centers are at Delhi and Kolkata.
The service range of the company comprises of exploratorydrilling and exploratory / developmental mining.
Performance HighlightsThe physical performance of Company for last two years is
given below:
Mineral Exploration Corp. Ltd.
Strategic issueMECL proposes to phase out the old plants and machineries
which are more than 15 years old in a phased manner and plans toprocure few medium and shallow capacity drilling rigs. Further,MECL has planned to enter into new thrust areas such as exploration,production well drilling, geothermal geotechnical investigation andcommercial mining of bauxite.
MECL is one of the Turnaround CPSE as per the guidelinesissued by the Government of India for declaring a sick CPSE as“Turnaround CPSE”.
Main Services Unit Performance during
2011-12 2010-11
Exploratory Drilling Meters 296301 2,67,097
Exploratory Mining Meters 8605 8805
The total revenue of the Company registered an increase of` 24.05 crore in 2011-12 which went up to ` 158.12 crore in2011-12 from ` 134.07 crore during 2010-11. The net profit of thecompany increased to ̀ 17.32crore, a growth of 5.36 crore over theprevious year profit of ` 11.96 croredue to increased efforts inimproving efficiency, good order book position, induction of newdrill machines.
The current ratio of company is at 9.39:1 during 2011-12 asagainst 6.39:1 in the previous year (Fig.2). Balance Sheet and Profit&Loss Account of the company and selected financial ratios duringthe period 2010-11 to 2011-12 can be seen on the adjoining page. www.mecl.gov.in
EBIT
DA
& P
AT (
Rs.
cro
re)
Fig. 1
Fig. 2
TOTAL R
EVENU
E (Rs. crore)
PRO
FITA
BIL
ITY
RAT
IOS
(%)
CU
RR
ENT R
ATIO

Public Enterprises Survey 2011-2012: Vol-II 463
Mineral Exploration Corp. Ltd.MECL, Dr. Babasaheb Ambedkar Bhavan, Seminary Hills, Nagpur, Maharashtra - 440006
BALANCE SHEET (` in Lakhs)
PARTICULARS 2011-12 2010-11I. EQUITY & LIABILITIESAUTHORISED CAPITAL 12500 12500(1) Shareholders’ Funds (a) Share Capital (i) Central Govt 11955 11955 (ii) Others 0 0 (b) Reserves & Surplus 3561 1863 (c) Money received against share warrants 0 0 Total Shareholders’ Funds (1(a)+1(b)+1(c) 15516 13818(2) Share application money pending allotment 0 0(3) Non-current Liabilities (a) Long Term Borrowings 0 0 (b) Deferred tax liabilities (Net) 147 14 (c) Other Long-term liabilities 291 375 (d) Long-term provisions 45 40 Total Non-Current Liabilities 3(a) to 3(d) 483 429(4) Current Liabilities (a) Short Term Borrowings 0 0 (b) Trade Payables 225 429 (c) Other current liabilities 871 1006 (d) Short-term provisions 299 567 Total Current Liabilities 4(a) to 4(d) 1395 2002TOTAL EQUITY & LIABILITIES (1+2+3+4) 17394 16249II. ASSETS(1) Non-Current Assets (a) Total Gross Fixed Assets 12997 11857 (ai) Accumulated Depreciation, Depletion 9537 9418 & Amortisation (aii) Accumulated Impairment 0 0 (b) Total Net Fixed Assets ((a)-(ai)-(aii) 3460 2439 (c) Capital work in progress 88 147 (d) Intangible assets under developmet 0 0 (e) Non-Current Investments 0 0 (f) Deferred Tax Assets (Net) 0 0 (g) Long Term Loans and Advances 76 71 (h) Other Non-Current Assets 674 492 Total Non-Current Assets (b+c+d+e+f+g+h) 4298 3149(2) Current Assets (a) Current Investments 0 0 (b) Inventories 654 675 (c) Trade Recievables 4011 3270 (d) Cash & Bank Balance 3920 5831 (e) Short-term Loans & Advances 2847 1921 (f) Other Current Assets 1664 1403 Total Current Assets (a+b+c+d+e+f) 13096 13100TOTAL ASSETS (1+2) 17394 16249Important Indicators (i) Investment 11955 11955 (ii) Capital Employed 15516 13818 (iii) Net Worth 15516 13818 (iv) Net Current Assets 11701 11098 (v) Cost of Sales 13306 11682 (vi) Net Value Added (at market price) 14100 12172 (vii) Total Regular Employees (Nos.) 1723 1871(viii) Avg. Monthly Emoluments per Employee(`) 47746 40259
PROFIT & LOSS ACCOUNT (` in Lakhs)
PARTICULARS 2011-12 2010-11(I) Revenue from Operations (Gross) 15067 12916 Less : Excise Duty 0 0 Revenue from Operations (Net) 15067 12916(II) Other Income 745 491(III) Total Revenue (I+II) 15812 13407(IV) Expenditure on: (a) Cost of materials consumed 13 54 (b) Purchase of stock-in-trade 0 0 (c) Changes in inventories of finished goods, -170 -323 work-in-progress and stock in trade (d) Stores & Spares 495 484 (e) Power & Fuel 646 583 (f) Salary, Wages & Benefits/Employees 9872 9039 Expense (g) Other Operating/direct/manufacturing 1338 924 Expenses (h) Rent, Royalty & Cess 93 84 (i) Loss on sale of Assets/Investments 0 0 (j) Other Expenses 618 389Total Expenditure (IV (a to j)) 12905 11234(V) PROFIT BEFORE DEPRECIATION, & 2907 2173IMPAIRMENT, FINANCE CHARGES/INTEREST,EXCEPTIONAL & EXTRAORDINARY ITEMS &TAXES (PBDIEET)(III-IV)(VI) Depreciation, Depletion & Amortisation 401 448(VII) Impairment 0 0(VIII) PROFIT BEFORE FINANCE COST/ 2506 1725INTEREST, EXCEPTIONAL, EXTRA-ORDINARYITEMS & TAXES (PBIEET)(V-VI-VII)(IX) Finance Cost (a) On Central Government Loans 0 0 (b) On Foreign Loans 0 0 (c) Others 0 0 (d) Less Finance Cost Capitalised 0 0 (e) Charged to P & L Account (a+b+c+d) 0 0(X) PROFIT BEFORE EXCEPTIONAL & EXTRA- 2506 1725ORDINARY ITEMS & TAX (PBEET)(VIII-IXe)(XI) Exceptional Items 0 0(XII) PROFIT BEFORE EXTRA-ORDINARY 2506 1725ITEMS & TAX (PBET)(X-XI)(XIII) Extra-Ordinary Items 0 0(XIV) PROFIT BEFORE TAX (PBT)(XII-XIII) 2506 1725(XV) TAX PROVISIONS 774 529(XVI) NET PROFIT / LOSS FOR THE PERIOD 1732 1196FROM CONTINUING OPERATIONS AFTERTAX(XIV-XV)(XVII) Profit/Loss from discontinuing operations 0 0(XVIII) Tax expenses of discontinuing operations 0 0(XIX) Profit/Loss from discontinuing operations 0 0(after Tax)(XVII-XVIII)(XX) Profit/Loss for the period (XVI+XIX) 1732 1196Financial Ratios (i) Sales : Capital Employed 97.11 93.47 (ii) Cost of Sales : Sales 88.31 90.45 (iii) Salary/Wages : Sales 65.52 69.98 (iv) Net Profit : Net Worth 11.16 8.66 (v) Debt : Equity 0 0 (vi) Current Ratio 9.39 6.54 (vii) Trade Recievables : Sales 26.62 25.32 (viii) Total Inventory : Sales 4.34 5.23

Contract & Construction Services464
The CompanyMumbai Railway Vikas Corporation Ltd. (MRVCL) was
incorporated on 12.07.1999 with the objective of augmentingtransport capacity to match the continual growth in the number ofcommuters in Mumbai by developing coordinated plans andimplementing rail infrastructure projects, integrating urbandevelopment plan of Mumbai with rail capacity and investments,undertaking commercial development of Railway land and air space.
MRVC is a Schedule-‘A’ CPSE in Contract and ConstructionServices sector under the administrative control of M/o Railwayswith 51% shareholding by the Government of India and 49% bythe Govt. of Maharashtra (GoM). The company employed 172regular employees (Executives 163 & Non-Executives 9) as on31.3.2012. Its Registered and Corporate offices are at Mumbai,Maharashtra.
Vision / Mission The Vision / Mission of the Company is to develop world
class infrastructure for an efficient, safe and sustainable Railwaysystem for Mumbai suburban section and to provide comfortableand friendly train service to the commuters
Industrial / Business OperationsMRVC is one of the Central-State Governments Joint Venture
involved in implementing & coordinating rail infrastructures projectviz. Mumbai Urban Transport Project (MUTP) in Mumbai. MRVCis also to undertake commercial development of Railway’s land andair space and to coordinate and facilitate improvements in trackdrainage, remove encroachments and trespassers and to coordinatewith organizations operating train services and responsible forprotection of Railway’s right of way for Urban development.
To execute these projects, MRVC receives funds from Ministryof Railway and Government of Maharashtra for further transmissionto various project executing agencies. All the assets created underMUTP project are owned by Indian Railways and not by MumbaiRailway Vikas Corporation Ltd. Hence all the funds received forMUTP project are neither Long Term Loan nor Government Grants,but the funds received for execution of the project.
Performance Highlights The physical performances of the company for last two years
are given below:
Total Revenue from of the company registered an increase of` 13.81 crore during 2011-12, which went up from ` 29.12 crorein 2010-11 to ` 42.93 crore in 2011-12 due to increase in projectexpenditure. The profit of the company has gone up by ` 12.33
Mumbai RailwayVikas Corporation Ltd.
www.mrvc.indianrail.gov.in
crore to ` 22.69 crore in 2011-12, from ` 10.36 crore in previousyear due to increase in other operating revenue like interest onshort term fixed deposits form banks. The company has been givenexemption under section 12A of the Income Tax Act, 1961.
The current ratio of company is at 6.48:1 during 2011-12 asagainst 4.81:1 in the pervious year (Fig.2). Balance Sheet and Profit& Loss Account of the company and selected financial ratios duringthe period 2010-11 to 2011-12 can be seen on the adjoining page.
Main Services Unit Performance during
2011-12 2010-11
Direction & General ` in crore 11.79 9.47Charges Expenditureincurred on MUTP Projects
EBIT
DA
& P
AT (
Rs.
cro
re)
Fig. 1
PRO
FITA
BIL
ITY
RAT
IOS
(%)
CU
RR
ENT R
ATIO
Fig. 2
TOTAL R
EVENU
E (Rs. crore)
Strategic issuesThe company aims to integrate suburban rail capacity
enhancement plans with urban development of Mumbai for whichMRVC has prepared strategic plan for augmenting and strengtheningMumbai suburban rail network with a horizon of 2031.

Public Enterprises Survey 2011-2012: Vol-II 465
Mumbai RailwayVikas Corporation Ltd.Second Floor, Churchgate Station Building, Mumbai 400020
BALANCE SHEET (` in Lakhs)
PARTICULARS 2011-12 2010-11I. EQUITY & LIABILITIESAUTHORISED CAPITAL 2500 2500(1) Shareholders’ Funds (a) Share Capital (i) Central Govt 1275 1275 (ii) Others 1225 1225 (b) Reserves & Surplus 13926 11687 (c) Money received against share warrants 0 0 Total Shareholders’ Funds (1(a)+1(b)+1(c) 16426 14187(2) Share application money pending allotment 0 0(3) Non-current Liabilities (a) Long Term Borrowings 0 0 (b) Deferred tax liabilities (Net) 0 0 (c) Other Long-term liabilities 18685 18706 (d) Long-term provisions 14 11 Total Non-Current Liabilities 3(a) to 3(d) 18699 18717(4) Current Liabilities (a) Short Term Borrowings 0 0 (b) Trade Payables 2722 3083 (c) Other current liabilities 2744 4466 (d) Short-term provisions 107 77 Total Current Liabilities 4(a) to 4(d) 5573 7626TOTAL EQUITY & LIABILITIES (1+2+3+4) 40698 40530II. ASSETS(1) Non-Current Assets (a) Total Gross Fixed Assets 3495 420 (ai) Accumulated Depreciation, Depletion 310 177 & Amortisation (aii) Accumulated Impairment 0 0 (b) Total Net Fixed Assets ((a)-(ai)-(aii) 3185 243 (c) Capital work in progress 1400 3600 (d) Intangible assets under developmet 0 0 (e) Non-Current Investments 0 0 (f) Deferred Tax Assets (Net) 0 0 (g) Long Term Loans and Advances 0 0 (h) Other Non-Current Assets 0 0 Total Non-Current Assets (b+c+d+e+f+g+h) 4585 3843(2) Current Assets (a) Current Investments 0 0 (b) Inventories 0 0 (c) Trade Recievables 0 0 (d) Cash & Bank Balance 29145 28909 (e) Short-term Loans & Advances 4157 5035 (f) Other Current Assets 2811 2743 Total Current Assets (a+b+c+d+e+f) 36113 36687TOTAL ASSETS (1+2) 40698 40530Important Indicators (i) Investment 2500 2500 (ii) Capital Employed 16426 14187 (iii) Net Worth 16426 14187 (iv) Net Current Assets 30540 29061 (v) Cost of Sales 2017 1872 (vi) Net Value Added (at market price) 3934 2815 (vii) Total Regular Employees (Nos.) 172 173(viii) Avg. Monthly Emoluments per Employee(`) 61725 58092
PROFIT & LOSS ACCOUNT (((((` in Lakhs)in Lakhs)in Lakhs)in Lakhs)in Lakhs)
PARTICULARS 2011-12 2010-11(I) Revenue from Operations (Gross) 4292 2908 Less : Excise Duty 0 0 Revenue from Operations (Net) 4292 2908(II) Other Income 1 4(III) Total Revenue (I+II) 4293 2912(IV) Expenditure on: (a) Cost of materials consumed 0 0 (b) Purchase of stock-in-trade 0 0 (c) Changes in inventories of finished goods, 0 0 work-in-progress and stock in trade (d) Stores & Spares 0 0 (e) Power & Fuel 22 33 (f) Salary, Wages & Benefits/Employees Expense 1274 1206 (g) Other Operating/direct/manufacturing Expenses 127 130 (h) Rent, Royalty & Cess 9 11 (i) Loss on sale of Assets/Investments 5 3 (j) Other Expenses 448 459Total Expenditure (IV (a to j)) 1885 1842(V) PROFIT BEFORE DEPRECIATION, & 2408 1070IMPAIRMENT, FINANCE CHARGES/INTEREST,EXCEPTIONAL & EXTRAORDINARY ITEMS &TAXES (PBDIEET)(III-IV)(VI) Depreciation, Depletion & Amortisation 137 33(VII) Impairment 0 0(VIII) PROFIT BEFORE FINANCE COST/ 2271 1037INTEREST, EXCEPTIONAL, EXTRA-ORDINARYITEMS & TAXES (PBIEET)(V-VI-VII)(IX) Finance Cost (a) On Central Government Loans 0 0 (b) On Foreign Loans 0 0 (c) Others 0 0 (d) Less Finance Cost Capitalised 0 0 (e) Charged to P & L Account (a+b+c+d) 0 0(X) PROFIT BEFORE EXCEPTIONAL & EXTRA- 2271 1037ORDINARY ITEMS & TAX (PBEET)(VIII-IXe)(XI) Exceptional Items 0 0(XII) PROFIT BEFORE EXTRA-ORDINARY 2271 1037ITEMS & TAX (PBET)(X-XI)(XIII) Extra-Ordinary Items 0 0(XIV) PROFIT BEFORE TAX (PBT)(XII-XIII) 2271 1037(XV) TAX PROVISIONS 0 0(XVI) NET PROFIT / LOSS FOR THE PERIOD 2271 1037FROM CONTINUING OPERATIONS AFTERTAX(XIV-XV)(XVII) Profit/Loss from discontinuing operations 0 0(XVIII) Tax expenses of discontinuing operations 0 0(XIX) Profit/Loss from discontinuing operations 0 0(after Tax)(XVII-XVIII)(XX) Profit/Loss for the period (XVI+XIX) 2271 1037Financial Ratios (i) Sales : Capital Employed 26.13 20.5 (ii) Cost of Sales : Sales 46.99 64.37 (iii) Salary/Wages : Sales 29.68 41.47 (iv) Net Profit : Net Worth 13.83 7.31 (v) Debt : Equity 0 0 (vi) Current Ratio 6.48 4.81 (vii) Trade Recievables : Sales 0 0 (viii) Total Inventory : Sales 0 0

Contract & Construction Services468
The CompanyNational Buildings Construction Corporation Limited (NBCC)
was incorporated in 1960 with the objective to become a leadingcompany, in the construction engineering and project managementconsultancy services in India. NBCC is a Schedule “A” listed CPSEin Contract & Construction Services sector under the administrativecontrol of Ministry of Urban Development with 90% shareholdingby the Government of India. The company employed 2227 regularemployees (executives 825 and 1402 non-executives) as on31.3.2012. Its Registered and Corporate Offices are at New Delhi.
Vision/MissionThe Vision of the Company is to be a widely admired Company
and preferred construction Services Company.The Mission is to supply customers with practical, secure,
innovative and cost-efficient construction products and servicesthat meet their needs as well as provide the necessary infrastructurein a socially responsible way.
Industrial / Business OperationsNBCC is engaged in execution of civil engineering projects,
rendering project management consultancy and Real Estate. NBCChas entered in a big way in construction of solid waste managementprojects. A number of Central Government Ministries and variousState Governments are utilizing the services of NBCC as theirexecuting agency.
Performance HighlightsThe segment-wise revenue earned by the Company during the
last two years is given below:
www.nbccindia.gov.in
National Buildings Construction Corporation Ltd.
The current ratio of company is at 1.23 during 2011-12 asagainst 1.15 in the previous year (Fig.2). Balance Sheet and Profit& Loss Account of the company and selected financial ratios duringthe period 2010-11 to 2011-12 can be seen on the adjoining page.
Strategic IssuesThe company is facing stiff competition both in domestic and
international tenders due to diversification by companies, JVformation and participation by international firms. NBCC has signedMoU with TERI to undertake all future construction activities inline with green building concept. Introduction of ERP (EnterpriseResource Planning) and e-publishing of tender enquiries are someof the new initiatives taken by the CPSE.
TOTAL R
EVENU
E (Rs. crore)
Fig. 1
PRO
FITA
BIL
ITY
RAT
IOS
(%)
CU
RR
ENT R
ATIO
Fig. 2
EBIT
DA
& P
AT (
Rs.
cro
re)
Main Segments Unit Performance During
2011-12 2010-11
Real Estate ` in Crore 185.13 144.23
Infrastructure ` in Crore 99.48 63.32
Civil construction and ` in Crore 3144.72 2919.23Project ManagementConsultancy
Total Revenue of the company registered an increase of` 350.85 crore during 2011-12, which went down from ` 3231.46crore in 2010-11 to ` 3582.31 crore in 2011-12.The net profit ofthe company correspondingly also increased to ` 190.17 crore,from ` 140.34 crore in 2010-11, an increase of ` 49.83 crore overprevious year due to increase in revenue from operations along withstrict control on prime cost and wastages, effective projectmonitoring system & increased efficiency.

Public Enterprises Survey 2011-2012: Vol-II 469
National Buildings Construction Corporation Limited (NBCC)NBCC Bhaswan, Lodhi Road, New Delhi-110003
BALANCE SHEET (` in Lakhs)
PARTICULARS 2011-12 2010-11I. EQUITY & LIABILITIESAUTHORISED CAPITAL 12000 12000(1) Shareholders’ Funds (a) Share Capital (i) Central Govt 12000 9000 (ii) Others 0 0 (b) Reserves & Surplus 67550 56414 (c) Money received against share warrants 0 0 Total Shareholders’ Funds (1(a)+1(b)+1(c) 79550 65414(2) Share application money pending allotment 0 0(3) Non-current Liabilities (a) Long Term Borrowings 0 0 (b) Deferred tax liabilities (Net) 0 0 (c) Other Long-term liabilities 20475 22718 (d) Long-term provisions 57 57 Total Non-Current Liabilities 3(a) to 3(d) 20532 22775(4) Current Liabilities (a) Short Term Borrowings 0 0 (b) Trade Payables 117734 96703 (c) Other current liabilities 131909 133642 (d) Short-term provisions 13998 8687 Total Current Liabilities 4(a) to 4(d) 263641 239032TOTAL EQUITY & LIABILITIES (1+2+3+4) 363723 327221II. ASSETS(1) Non-Current Assets (a) Total Gross Fixed Assets 3615 3592 (ai) Accumulated Depreciation, Depletion 1252 1168 & Amortisation (aii) Accumulated Impairment 31 69 (b) Total Net Fixed Assets ((a)-(ai)-(aii) 2332 2355 (c) Capital work in progress 0 0 (d) Intangible assets under developmet 0 0 (e) Non-Current Investments 5733 6414 (f) Deferred Tax Assets (Net) 841 522 (g) Long Term Loans and Advances 13905 13950 (h) Other Non-Current Assets 17194 30141 Total Non-Current Assets (b+c+d+e+f+g+h) 40005 53382(2) Current Assets (a) Current Investments 16627 10845 (b) Inventories 45006 40948 (c) Trade Recievables 85224 56753 (d) Cash & Bank Balance 132519 116979 (e) Short-term Loans & Advances 41536 45983 (f) Other Current Assets 2806 2331 Total Current Assets (a+b+c+d+e+f) 323718 273839TOTAL ASSETS (1+2) 363723 327221Important Indicators (i) Investment 12000 9000 (ii) Capital Employed 79550 65414 (iii) Net Worth 79550 65414 (iv) Net Current Assets 60077 34807 (v) Cost of Sales 329861 301751 (vi) Net Value Added (at market price) 45346 34671 (vii) Total Regular Employees (Nos.) 2224 2332(viii) Avg. Monthly Emoluments per Employee(`) 58907 46087
PROFIT & LOSS ACCOUNT (` in Lakhs)
PARTICULARS 2011-12 2010-11(I) Revenue from Operations (Gross) 344769 314605 Less : Excise Duty 0 0 Revenue from Operations (Net) 344769 314605(II) Other Income 13462 8541(III) Total Revenue (I+II) 358231 323146(IV) Expenditure on: (a) Cost of materials consumed 9227 13993 (b) Purchase of stock-in-trade 0 0 (c) Changes in inventories of finished goods, 4719 0 work-in-progress and stock in trade (d) Stores & Spares 0 0 (e) Power & Fuel 0 0 (f) Salary, Wages & Benefits/Employees Expense 15721 12897 (g) Other Operating/direct/manufacturing Expenses 295898 270022 (h) Rent, Royalty & Cess 134 243 (i) Loss on sale of Assets/Investments 0 0 (j) Other Expenses 3966 4275Total Expenditure (IV (a to j)) 329665 301430(V) PROFIT BEFORE DEPRECIATION, & 28566 21716IMPAIRMENT, FINANCE CHARGES/INTEREST,EXCEPTIONAL & EXTRAORDINARY ITEMS &TAXES (PBDIEET)(III-IV)(VI) Depreciation, Depletion & Amortisation 196 321(VII) Impairment 0 0(VIII) PROFIT BEFORE FINANCE COST/ 28370 21395INTEREST, EXCEPTIONAL, EXTRA-ORDINARYITEMS & TAXES (PBIEET)(V-VI-VII)(IX) Finance Cost (a) On Central Government Loans 0 0 (b) On Foreign Loans
0 0 (c) Others 0 0 (d) Less Finance Cost Capitalised 0 0 (e) Charged to P & L Account (a+b+c+d) 0 0(X) PROFIT BEFORE EXCEPTIONAL & EXTRA- 28370 21395ORDINARY ITEMS & TAX (PBEET)(VIII-IXe)(XI) Exceptional Items 739 432(XII) PROFIT BEFORE EXTRA-ORDINARY 27631 20963ITEMS & TAX (PBET)(X-XI)(XIII) Extra-Ordinary Items -1352 0(XIV) PROFIT BEFORE TAX (PBT)(XII-XIII) 28983 20963(XV) TAX PROVISIONS 9966 6929(XVI) NET PROFIT / LOSS FOR THE PERIOD 19017 14034FROM CONTINUING OPERATIONS AFTERTAX(XIV-XV)(XVII) Profit/Loss from discontinuing operations 0 0(XVIII) Tax expenses of discontinuing operations 0 0(XIX) Profit/Loss from discontinuing operations 0 0(after Tax)(XVII-XVIII)(XX) Profit/Loss for the period (XVI+XIX) 19017 14034Financial Ratios (i) Sales : Capital Employed 433.4 480.94 (ii) Cost of Sales : Sales 95.68 95.91 (iii) Salary/Wages : Sales 4.56 4.1 (iv) Net Profit : Net Worth 23.91 21.45 (v) Debt : Equity 0 0 (vi) Current Ratio 1.23 1.15 (vii) Trade Recievables : Sales 24.72 18.04 (viii) Total Inventory : Sales 13.05 13.02

Contract & Construction Services466
The CompanyNational Projects Construction Corp. Ltd. (NPCC) was
incorporated on 09.01.1957 with the objective of competing withthe domestic and international construction organizations in thefield of planning, design, consultancy / construction of large civil /allied projects in various sectors of economy and serve as a pricedeterrent to the private contractors.
It is a Schedule-‘B’ BRPSE referred CPSE in Contract &Construction Services Sector under the administrative control ofM/o Water Resources with 99.00% shareholding by the Governmentof India. The company employed 1641 regular employees(Executives 524 & Non-Executives 1117) as on 31.3.2012. Itsregistered office is at New Delhi and corporate office at Faridabad,
Vision / Mission The Vision of the Company is to become world-class project
implementing organization with continual & optimal satisfactionto all stakeholders.
The Mission of the Company is to achieve a turnover exceeding` 2000 crore by 2015-16 by focusing value addition at all points ofinteraction with their clients and continuously enhance thecapabilities of organization and employees through innovations.
Industrial / Business OperationsNPCC is engaged in providing services in the field of
construction of large civil and allied projects in sectors relating toirrigation, river valley projects, barrages, canals, hydel and thermalpower, steel, coal, rural and urban transportation, railways etc.through its 98 project units all over India as on 31.03.2012.
Over the last 50 years, the company has completed more than254 projects of national importance all over the country and inmost remote and hazardous locations where private sector isreluctant to work. It has also executed works in the Middle-eastcountries, Nepal.
Performance HighlightsTotal Revenue of the company registered an increase of
` 127.66 crore during 2011-12, which went up from ` 1096.34crore in 2010-11 to ` 1224.00 crore in 2011-12. However, the
National Projects Construction Corp. Ltd.
www.npcc.gov.in
Strategic issuesNPCC was incurring losses on account of lack of orders, heavy
interest burden, surplus manpower etc. A Revival plan recommendedby the BRPSE was approved by the Government on 26.12.2008.The revival plan included conversion of ` 219.43 crore loans andinterest / penal interest of ` 427.46 crore into equity. Accordingly,10% equity shares of Rs.1000/- each, amounting to Rs.582.21 crorewere cancelled and adjusted against accumulated losses as on28.12.2010.
Fig. 1
TOTAL R
EVENU
E (Rs. crore)EB
ITD
A &
PAT
(R
s. c
rore
)
profit of the company has gone down by ` 30.56 crore to ̀ 42.18crore in 2011-12, from ` 72.74 crore in previous year due toincrease in operating expenses.
The current ratio of company is at 1.02:1 during 2011-12 asagainst 0.98:1 in the previous year. Balance Sheet and Profit &Loss Account of the company and selected financial ratios duringthe period 2010-11 to 2011-12 can be seen on the adjoining page.

Public Enterprises Survey 2011-2012: Vol-II 467
National Projects Construction Corp. Ltd.Raja House, 30-31, Nehru Place, New Delhi 110 019
BALANCE SHEET (` in Lakhs)
PARTICULARS 2011-12 2010-11I. EQUITY & LIABILITIESAUTHORISED CAPITAL 70000 70000(1) Shareholders’ Funds (a) Share Capital (i) Central Govt 9348 9348 (ii) Others 105 105 (b) Reserves & Surplus -9836 -14054 (c) Money received against share warrants 0 0 Total Shareholders’ Funds (1(a)+1(b)+1(c) -383 -4601(2) Share application money pending allotment 0 0(3) Non-current Liabilities (a) Long Term Borrowings 6373 5835 (b) Deferred tax liabilities (Net) 0 0 (c) Other Long-term liabilities 0 0 (d) Long-term provisions 3544 2694 Total Non-Current Liabilities 3(a) to 3(d) 9917 8529(4) Current Liabilities (a) Short Term Borrowings 0 0 (b) Trade Payables 22448 23634 (c) Other current liabilities 148942 130129 (d) Short-term provisions 412 0 Total Current Liabilities 4(a) to 4(d) 171802 153763TOTAL EQUITY & LIABILITIES (1+2+3+4) 181336 157691II. ASSETS(1) Non-Current Assets (a) Total Gross Fixed Assets 4360 4540 (ai) Accumulated Depreciation, Depletion 3649 3819 & Amortisation (aii) Accumulated Impairment 0 0 (b) Total Net Fixed Assets ((a)-(ai)-(aii) 711 721 (c) Capital work in progress 179 17 (d) Intangible assets under developmet 0 0 (e) Non-Current Investments 0 0 (f) Deferred Tax Assets (Net) 3549 4673 (g) Long Term Loans and Advances 955 0 (h) Other Non-Current Assets 0 1404 Total Non-Current Assets (b+c+d+e+f+g+h) 5394 6815(2) Current Assets (a) Current Investments 0 0 (b) Inventories 253 118 (c) Trade Recievables 89620 74109 (d) Cash & Bank Balance 71289 60350 (e) Short-term Loans & Advances 13871 15753 (f) Other Current Assets 909 546 Total Current Assets (a+b+c+d+e+f) 175942 150876TOTAL ASSETS (1+2) 181336 157691Important Indicators (i) Investment 15826 15288 (ii) Capital Employed 5990 1234 (iii) Net Worth -383 -4601 (iv) Net Current Assets 4140 -2887 (v) Cost of Sales 117014 106134 (vi) Net Value Added (at market price) 12852 9578 (vii) Total Regular Employees (Nos.) 1641 1740(viii) Avg. Monthly Emoluments per Employee(`) 37619 28860
PROFIT & LOSS ACCOUNT (` in Lakhs)
PARTICULARS 2011-12 2010-11(I) Revenue from Operations (Gross) 116738 106132 Less : Excise Duty 0 0 Revenue from Operations (Net) 116738 106132(II) Other Income 5662 3502(III) Total Revenue (I+II) 122400 109634(IV) Expenditure on: (a) Cost of materials consumed 17 47 (b) Purchase of stock-in-trade 0 0 (c) Changes in inventories of finished goods, 0 0 work-in-progress and stock in trade (d) Stores & Spares 0 0 (e) Power & Fuel 1 2 (f) Salary, Wages & Benefits/Employees Expense 7408 6026 (g) Other Operating/direct/manufacturing Expenses 99512 85765 (h) Rent, Royalty & Cess 58 52 (i) Loss on sale of Assets/Investments 0 0 (j) Other Expenses 9970 14188Total Expenditure (IV (a to j)) 116966 106080(V) PROFIT BEFORE DEPRECIATION, & 5434 3554IMPAIRMENT, FINANCE CHARGES/INTEREST,EXCEPTIONAL & EXTRAORDINARY ITEMS &TAXES (PBDIEET)(III-IV)(VI) Depreciation, Depletion & Amortisation 48 54(VII) Impairment 0 0(VIII) PROFIT BEFORE FINANCE COST/ 5386 3500INTEREST, EXCEPTIONAL, EXTRA-ORDINARYITEMS & TAXES (PBIEET)(V-VI-VII)(IX) Finance Cost (a) On Central Government Loans 43 291 (b) On Foreign Loans 0 0 (c) Others 0 0 (d) Less Finance Cost Capitalised 0 0 (e) Charged to P & L Account (a+b+c+d) 43 291(X) PROFIT BEFORE EXCEPTIONAL & EXTRA- 5343 3209ORDINARY ITEMS & TAX (PBEET)(VIII-IXe)(XI) Exceptional Items 0 0(XII) PROFIT BEFORE EXTRA-ORDINARY 5343 3209ITEMS & TAX (PBET)(X-XI)(XIII) Extra-Ordinary Items 0 0(XIV) PROFIT BEFORE TAX (PBT)(XII-XIII) 5343 3209(XV) TAX PROVISIONS 1125 -4065(XVI) NET PROFIT / LOSS FOR THE PERIOD 4218 7274FROM CONTINUING OPERATIONS AFTERTAX(XIV-XV)(XVII) Profit/Loss from discontinuing operations 0 0(XVIII) Tax expenses of discontinuing operations 0 0(XIX) Profit/Loss from discontinuing operations 0 0(after Tax)(XVII-XVIII)(XX) Profit/Loss for the period (XVI+XIX) 4218 7274Financial Ratios (i) Sales : Capital Employed 1948.88 8600.65 (ii) Cost of Sales : Sales 100.24 100 (iii) Salary/Wages : Sales 6.35 5.68 (iv) Net Profit : Net Worth - - (v) Debt : Equity 0.67 0.62 (vi) Current Ratio 1.02 0.98 (vii) Trade Recievables : Sales 76.77 69.83 (viii) Total Inventory : Sales 0.22 0.11
2011-12 Provisional

Contract & Construction Services470
The CompanyProjects and Development India Ltd. (PDIL) was incorporated
on 07.03.1978 with the objective to and act as a store house oftechnical knowledge in the project management relating to fertilizerand allied chemical industry.
PDIL is a Schedule "B" BIFR referred CPSE in Contract andConstruction Sector under the administrative control of M/oChemicals and Fertilizer, D/o Fertilizers with 100% shareholdingby Government of India. The Company employed 459 regularemployees (Executives 423 & Non-Executives 36) as on 31.03.2012.Its Registered and Corporate offices are at Noida (U.P.).
Vision / MissionThe Vision of the company is to be a leading engineering and
project management consultancy organization.
The Mission of the Company is to create and deliver integratedtechno-commercial solutions, optimum in cost, quality and time toall customers; to pursue relentlessly world class quality inengineering consultancy and project management by imbibing bestpractices; to develop, upgrade and improve the manufacturingprocess of Catalyst and other products in line with the ever evolvingneeds of customers.
Industrial / Business OperationsPDIL is an ISO 9001:2008 certified premier design engineering
and consultancy organization in the fertilizer sector. PDIL isproviding Design, Engineering and related project execution servicesfrom concept to commissioning of projects.
PDIL provide third party inspection and nondestructive testingservices to the industry from its 8 operating units, which consist ofone Catalyst Manufacturing Unit at Sindri, Jharkhand, producingrange of Catalysts used in Fertilizer and Oil industries, fiveInspection Offices of PDIL are spread over Mumbai, Chennai,Kolkata, Vishakhapatnam and Hyderabad and two design andengineering units are at NOIDA (U.P.) and Vadodara (Gujarat).
Performance HighlightsThe physical performance of company during the last two
years is mentioned below:
Main Services Unit Production during
2011-12 2010-11
Catalyst M T 74 436(capacity utilization in %) (5.87) (34.6)
The current ratio of company is at 3.27:1 during 2011-12 asagainst 2.76:1 in the previous year (Fig.2). Balance Sheet and Profit& Loss Account of the company and selected financial ratios duringthe period 2010-11 to 2011-12 can be seen on the adjoining page.
Projects and Development India Ltd.
www.pdilin.com
The Company registered an increase of ` 1.80 crore in totalrevenue during 2011-12 which went up to `112.91 crore in2011-12 from ` 111.11 crore during 2010-11. The net profit of thecompany increased to ` 26.08 crore, an increase of ` 5.06 crore in2011-12 over the previous year's profit of ` 21.02 crore due tohigher turnover and higher value of margin in engineering jobs.
Strategic issueMinistry of Chemical & Fertilizers approved the revival
package of the company in 2003. The BIFR has considered therevival proposal and the revival scheme of the company in 2004.The Government of India has extended non plan funds of Rs. 136.51crores towards implementation of the sanctioned revival scheme in2004. The company has been discharged from BIFR in 2006.
Fig.2
Fig.1
EB
ITD
A &
PA
T (
Rs.
cro
re) T
OTA
L R
EV
EN
UE
(Rs. cro
re)
PR
OF
ITA
BIL
ITY
RA
TIO
S (
%)
CU
RR
EN
T R
AT
IO
2010-11 2011-12
2010-11 2011-12

Public Enterprises Survey 2011-2012: Vol-II 471
Projects and Development India Ltd.PDIL Bhawan, A-14, Sector-1, Noida- 201301
BALANCE SHEET (` in Lakhs)PARTICULARS 2011-12 2010-11I. EQUITY & LIABILITIESAUTHORISED CAPITAL 6000 6000(1) Shareholders’ Funds (a) Share Capital (i) Central Govt 1730 1730 (ii) Others 0 0 (b) Reserves & Surplus 11356 9191 (c) Money received against share warrants 0 0 Total Shareholders’ Funds (1(a)+1(b)+1(c) 13086 10921(2) Share application money pending allotment 0 0(3) Non-current Liabilities (a) Long Term Borrowings 0 0 (b) Deferred tax liabilities (Net) 0 0 (c) Other Long-term liabilities 344 239 (d) Long-term provisions 878 819 Total Non-Current Liabilities 3(a) to 3(d) 1222 1058(4) Current Liabilities (a) Short Term Borrowings 0 0 (b) Trade Payables 492 342 (c) Other current liabilities 1578 1833 (d) Short-term provisions 943 897 Total Current Liabilities 4(a) to 4(d) 3013 3072TOTAL EQUITY & LIABILITIES (1+2+3+4) 17321 15051II. ASSETS(1) Non-Current Assets (a) Total Gross Fixed Assets 6116 5558 (ai) Accumulated Depreciation, 3789 3508 Depletion & Amortisation (aii) Accumulated Impairment 196 0 (b) Total Net Fixed Assets ((a)-(ai)-(aii) 2131 2050 (c) Capital work in progress 57 8 (d) Intangible assets under developmet 0 253 (e) Non-Current Investments 0 0 (f) Deferred Tax Assets (Net) 148 108 (g) Long Term Loans and Advances 70 60 (h) Other Non-Current Assets 5058 4085 Total Non-Current Assets (b+c+d+e+f+g+h) 7464 6564(2) Current Assets (a) Current Investments 0 0 (b) Inventories 236 472 (c) Trade Recievables 1879 1725 (d) Cash & Bank Balance 6070 5122 (e) Short-term Loans & Advances 171 169 (f) Other Current Assets 1501 999 Total Current Assets (a+b+c+d+e+f) 9857 8487TOTAL ASSETS (1+2) 17321 15051Important Indicators (i) Investment 1730 1730 (ii) Capital Employed 13086 10921 (iii) Net Worth 13086 10921 (iv) Net Current Assets 6844 5415 (v) Cost of Sales 7462 7932 (vi) Net Value Added (at market price) 9516 9083 (vii) Total Regular Employees (Nos.) 459 492(viii) Avg. Monthly Emoluments per Employee(`) 85458 83249
PROFIT & LOSS ACCOUNT (̀ in Lakhs)
PARTICULARS 2011-12 2010-11(I) Revenue from Operations (Gross) 10098 10385 Less : Excise Duty 41 121 Revenue from Operations (Net) 10057 10264(II) Other Income 1234 847(III) Total Revenue (I+II) 11291 11111(IV) Expenditure on: (a) Cost of materials consumed 83 872 (b) Purchase of stock-in-trade 0 0 (c) Changes in inventories of finished goods, work-in-progress and stock in trade 209 -225 (d) Stores & Spares 21 22 (e) Power & Fuel 193 370 (f) Salary, Wages & Benefits/Employees Expense 4707 4915 (g) Other Operating/direct/manufacturing Expenses 513 747 (h) Rent, Royalty & Cess 34 43 (i) Loss on sale of Assets/Investments 2 1 (j) Other Expenses 1197 970Total Expenditure (IV (a to j)) 6959 7715(V) PROFIT BEFORE DEPRECIATION, & 4332 3396 IMPAIRMENT, FINANCE CHARGES/INTEREST, EXCEPTIONAL & EXTRAORDINARY ITEMS & (PBDIEET)(III-IV)(VI) Depreciation, Depletion & Amortisation 309 218(VII) Impairment 196 0(VIII) PROFIT BEFORE FINANCE COST/INTEREST, 3827 3178 EXCEPTIONAL, EXTRA-ORDINARY ITEMS & TAXES (PBIEET)(V-VI-VII)(IX) Finance Cost (a) On Central Government Loans 0 0 (b) On Foreign Loans 0 0 (c) Others 0 0 (d) Less Finance Cost Capitalised 0 0 (e) Charged to P & L Account (a+b+c+d) 0 0(X) PROFIT BEFORE EXCEPTIONAL & 3827 3178 EXTRA-ORDINARY ITEMS & TAX (PBEET)(VIII-IXe)(XI) Exceptional Items 0 0(XII) PROFIT BEFORE EXTRA-ORDINARY ITEMS & TAX (PBET)(X-XI) 3827 3178(XIII) Extra-Ordinary Items 0 0(XIV) PROFIT BEFORE TAX (PBT)(XII-XIII) 3827 3178(XV) TAX PROVISIONS 1219 1076(XVI) NET PROFIT / LOSS FOR THE PERIOD 2608 2102 FROM CONTINUING OPERATIONS AFTER TAX(XIV-XV)(XVII) Profit/Loss from discontinuing operations 0 0(XVIII) Tax expenses of discontinuing operations 0 0(XIX) Profit/Loss from discontinuing operations(after Tax)(XVII-XVIII) 0 0(XX) Profit/Loss for the period (XVI+XIX) 2608 2102Financial Ratios (i) Sales : Capital Employed 76.85 93.98 (ii) Cost of Sales : Sales 74.2 77.28 (iii) Salary/Wages : Sales 46.8 47.89 (iv) Net Profit : Net Worth 19.93 19.25 (v) Debt : Equity 0 0 (vi) Current Ratio 3.27 2.76 (vii) Trade Recievables : Sales 18.68 16.81 (viii) Total Inventory : Sales 2.35 4.6

Contract & Construction Services472
The CompanyRail Vikas Nigam Ltd. (RVNL) was incorporated on 24.01.2003
under the National Rail Vikas Yojana as a Special Purpose Vehicle(SPV) to implement the railway projects with the objective ofremoving the capacity bottlenecks on the Golden Quadrilateral andits diagonals, providing vital linkages and augmenting capacity ofexisting links including the corridors connecting ports with thehinterland.
RVNL is a Schedule-‘A’ CPSE in Contract & ConstructionServices sector under the administrative control of M/o Railwayswith 100% shareholding by the Government of India. The companyemployed 308 regular employees ( Executives 290, Non-executives18) as on 31.3.2012. Its Registered and Corporate offices are atNew Delhi.
Vision/MissionThe Vision of the Company is to emerge as most efficient rail
infrastructure provider with sound financial base and globalconstruction practices for timely completion of projects.
The Mission of the Company is to create state of art railtransport capacity to meet the growing demand.
Industrial / Business OperationsRVNL business relates to creation and augmentation of capacity
of rail infrastructure, on fast track basis.
Presently the company is implementing 91 projects. Projectsrelate to strengthening of Golden Qardilateral and Diagonals andprovision of Port and connectivity hinterland, Kolkata MetroRaiways and workshop etc. The total length of these projects is9603km out of which 4213 km. have been completed. Forimplementing these projects, the Company is having 24 ProjectImplementing Units at 16 locations Bhopal, Bangalore,Bhubaneswar, Bilaspur, Chennai, Abu Road, Jodhpur, Kolkata,Mumbai, New Delhi Pune, Raipur, Secunderabad, Patna, Lucknowand Waltair (Visakhapatnam).
The company is having five Special Purpose Vehicles (SPVs)joint ventures.
Performance HighlightsThe physical performances of the company for last two years
are given below:
Rail Vikas Nigam Ltd.
www.rvnl.org
EBIT
DA
& P
AT (
Rs.
cro
re)
TOTAL R
EVENU
E (Rs. crore)
Fig. 1
PRO
FITA
BIL
ITY
RAT
IOS
(%)
CU
RR
ENT R
ATIO
Fig. 2
Main Services Unit Performance during
2011-12 2010-11
Doubling / third line In KM 254 211
Gauge Conversion In KM 1 1 62
Railway Electrification In KM 207 159
Total Revenue of the company registered an increase of` 169.18 crore during 2011-12, which went up from ` 1484.15crore in 2010-11 to ` 1653.33 crore in 2011-12. The net profit of
the company increased to ` 98.38 crore, an increase of ` 37.29crore over the previous year profit of ̀ 61.09 crore due to increasein turnover and rationalization of revenue stream by Ministry ofRailways. Increase in profit is also due to increase in other incomeby `15.91 crore during the year as a result of better exchequermanagement.
The current ratio of company is at 11.57:1 during 2011-12 asagainst 9.88:1 in the previous year (Fig.2). Balance Sheet and Profit& Loss Account of the company and selected financial ratios duringthe period 2010-11 to 2011-12 can be seen on the adjoining page.
Strategic IssuesThe revised packaging and phasing of the project for the 2nd
Asian Development Bank (ADB) loan has been finalized. The loanfor the first tranche under this arrangement of US $ 150 million isscheduled to be signed during the FY 2012-13.

Public Enterprises Survey 2011-2012: Vol-II 473
Rail Vikas Nigam Ltd.1st Floor, August Kranti Bhawan, Bhikaji Cama Place, R.K. Puram, New Delhi -110066
BALANCE SHEET (` in Lakhs)
PARTICULARS 2011-12 2010-11
I. EQUITY & LIABILITIES
AUTHORISED CAPITAL 300000 300000(1) Shareholders’ Funds (a) Share Capital (i) Central Govt 208502 208502 (ii) Others 0 0 (b) Reserves & Surplus 22677 15327 (c) Money received against share warrants 0 0 Total Shareholders’ Funds (1(a)+1(b)+1(c) 231179 223829(2) Share application money pending allotment 0 0(3) Non-current Liabilities (a) Long Term Borrowings 570844 407103 (b) Deferred tax liabilities (Net) 0 0 (c) Other Long-term liabilities 33838 32031 (d) Long-term provisions 155 59 Total Non-Current Liabilities 3(a) to 3(d) 604837 439193(4) Current Liabilities (a) Short Term Borrowings 12508 10067 (b) Trade Payables 18423 20063 (c) Other current liabilities 36707 33475 (d) Short-term provisions 4424 3274 Total Current Liabilities 4(a) to 4(d) 72062 66879TOTAL EQUITY & LIABILITIES (1+2+3+4) 908078 729901II. ASSETS(1) Non-Current Assets (a) Total Gross Fixed Assets 1905 1483 (ai) Accumulated Depreciation, Depletion & 1422 1099Amortisation (aii) Accumulated Impairment 0 0 (b) Total Net Fixed Assets ((a)-(ai)-(aii) 483 384 (c) Capital work in progress 0 0 (d) Intangible assets under developmet 0 0 (e) Non-Current Investments 39543 36178 (f) Deferred Tax Assets (Net) 0 0 (g) Long Term Loans and Advances 33838 32031 (h) Other Non-Current Assets 550 245 Total Non-Current Assets (b+c+d+e+f+g+h) 74414 68838(2) Current Assets (a) Current Investments 16250 11049 (b) Inventories 735249 598240 (c) Trade Recievables 13459 7751 (d) Cash & Bank Balance 47318 26818 (e) Short-term Loans & Advances 21388 17205 (f) Other Current Assets 0 0 Total Current Assets (a+b+c+d+e+f) 833664 661063TOTAL ASSETS (1+2) 908078 729901Important Indicators (i) Investment 779346 615605 (ii) Capital Employed 802023 630932 (iii) Net Worth 231179 223829 (iv) Net Current Assets 761602 594184 (v) Cost of Sales 153400 140870 (vi) Net Value Added (at market price) 21778 12501 (vii) Total Regular Employees (Nos.) 308 273(viii) Avg. Monthly Emoluments per Employee(`) 113122 12088
PROFIT & LOSS ACCOUNT (` in Lakhs)
PARTICULARS 2011-12 2010-11
(I) Revenue from Operations (Gross) 159792 144465
Less : Excise Duty 0 0 Revenue from Operations (Net) 159792 144465(II) Other Income 5541 3950(III) Total Revenue (I+II) 165333 148415(IV) Expenditure on: (a) Cost of materials consumed 0 0 (b) Purchase of stock-in-trade 0 0 (c) Changes in inventories of finished goods, work-in-progress and stock in trade 147614 140045 (d) Stores & Spares 0 0 (e) Power & Fuel 92 12 (f) Salary, Wages & Benefits/Employees Expense 4181 396 (g) Other Operating/direct/manufacturing Expenses 135 58 (h) Rent, Royalty & Cess 248 105 (i) Loss on sale of Assets/Investments 0 0 (j) Other Expenses 783 172Total Expenditure (IV (a to j)) 153053 140788(V) PROFIT BEFORE DEPRECIATION, & 12280 7627IMPAIRMENT, FINANCE CHARGES/INTEREST, EXCEPTIONAL & EXTRA-ORDINARY ITEMS & TAXES (PBDIEET)(III-IV)(VI) Depreciation, Depletion & Amortisation 347 82(VII) Impairment 0 0(VIII) PROFIT BEFORE FINANCE COST/ 11933 7545INTEREST, EXCEPTIONAL, EXTRA-ORDINARY ITEMS & TAXES (PBIEET)(V-VI-VII)(IX) Finance Cost (a) On Central Government Loans 0 0 (b) On Foreign Loans 0 0 (c) Others 0 0 (d) Less Finance Cost Capitalised 0 0 (e) Charged to P & L Account (a+b+c+d) 0 0(X) PROFIT BEFORE EXCEPTIONAL & EXTRA- 11933 7545ORDINARY ITEMS & TAX (PBEET)(VIII-IXe)(XI) Exceptional Items 0 0(XII) PROFIT BEFORE EXTRA-ORDINARY 11933 7545ITEMS & TAX (PBET)(X-XI)(XIII) Extra-Ordinary Items 0 0(XIV) PROFIT BEFORE TAX (PBT)(XII-XIII) 11933 7545(XV) TAX PROVISIONS 2095 1436(XVI) NET PROFIT / LOSS FOR THE PERIOD 9838 6109FROM CONTINUING OPERATIONS AFTERTAX(XIV-XV)(XVII) Profit/Loss from discontinuing operations 0 0(XVIII) Tax expenses of discontinuing operations 0 0(XIX) Profit/Loss from discontinuing operations 0 0(after Tax)(XVII-XVIII)(XX) Profit/Loss for the period (XVI+XIX) 9838 6109Financial Ratios (i) Sales : Capital Employed 19.92 22.9 (ii) Cost of Sales : Sales 96 97.51 (iii) Salary/Wages : Sales 2.62 0.27 (iv) Net Profit : Net Worth 4.26 2.73 (v) Debt : Equity 2.74 1.95 (vi) Current Ratio 11.57 9.88 (vii) Trade Recievables : Sales 8.42 5.37 (viii) Total Inventory : Sales 460.13 414.11

Public Enterprises Survey 2011-2012: Vol-II 475
INDUSTRIAL DEVELOPMENT &TECH. CONSULTANCY
SERVICES

Industrial Development & Tech. Consultancy Services476
Blank

Public Enterprises Survey 2011-2012: Vol-II 477
Industrial Development & Technical ConsultancyServices
As on 31.03.2012, there were 17 Central Public SectorEnterprises in the Industrial Development & Technical ConsultancyServices group. The name of these enterprises along with their yearof incorporation in chronological order are given below:-
Sl . Enterprise Year ofNo Incorporation
1 National Research Development 1953Corpn.
2 National Small Industries 1955Corpn. Ltd.
3 Engineers India Ltd. 1965
4 WAPCOS Ltd. 1969
5 Engineering Projects (India) Ltd. 1970
6 MECON Ltd. 1973
7 Rites Ltd. 1974
8 Central Mine Planning & 1975Design Institute Ltd.
9 Telecommunications Consultants 1978(India) Ltd.
10 EDCIL (india) Ltd. 1981
1 1 HSCC (India) Ltd. 1983
12 Certification Engineers 1994International Ltd.
13 Broadcast Engg. Consultants 1995India Ltd.
14 National Informatics Centre 1995Services Incorporated
15 PFC Consulting Ltd. 2008
1 6 Power System Operation 2010Corporation Ltd.
17 PFC Capital Advisory Service Ltd. 2011
2. The enterprises falling in this group are mainly engaged inrending engineering technical and educational consultancy servicesfor construction of all types of projects, plants, installation,certification etc.
3. The consolidated financial position the working results andthe important management ratios of these enterprises are appended.
4. Turnover: The details of turnover of individual enterprisesare given below:
(in Crores)
Sl . Enterprise Turnover
No 2011-12 2010-11
1 Engineers India Ltd. 3898.45 2652.64
2 National Small IndustriesCorpn. Ltd. 1333.95 971.8
3 Engineering Projects(India) Ltd. 901.27 1106.83
4 Rites Ltd. 835.63 698.32
5 MECON Ltd. 723.21 644.37
6 TelecommunicationsConsultants (India) Ltd. 653.54 836.06
7 Central Mine Planning &Design Institute Ltd. 528.43 429.09
8 WAPCOS Ltd. 354.36 351.18
9 National Informatics CentreServices Incorporated 350.59 282.44
1 0 Power System OperationCorporation Ltd. 161.59 88.97
1 1 Broadcast Engg. ConsultantsIndia Ltd. 109.04 90.79
12 EDCIL (india) Ltd. 86.49 67.22
1 3 PFC Consulting Ltd. 49.06 49.9
14 Certification EngineersInternational Ltd. 29.88 29.49
1 5 HSCC (India) Ltd. 29.29 23.11
16 National ResearchDevelopment Corpn. 8.13 8.15
1 7 PFC Capital AdvisoryService Ltd. 0.16 0.00
Sub Total : 10053.07 8330.36
5. Net Profit / Loss : The details of enterprises , which earnednet profit or sustained net loss (-) are given below:
(in Crores)
Sl . Enterprise Adjusted Net Profit/No. Net Loss
2011-12 2010-11
1 Engineers India Ltd. 636.32 522.52
2 Rites Ltd. 164.49 243.92
3 Mecon Ltd. 136.36 93.68
4 National InformaticsCentre Services Incorporated 51.5 39.71
5 Wapcos Ltd. 51.25 36.18
6 Power System OperationCorporation Ltd. 50.52 11.21
7 National Small IndustriesCorpn. Ltd. 41.21 29.78
8 Pfc Consulting Ltd. 27.66 26.96
9 Engineering Projects(India) Ltd. 24.47 15.05
1 0 Central Mine Planning &Design Institute Ltd. 19.61 15.32
11 Hscc (India) Ltd. 14.72 8.33
12 Certification EngineersInternational Ltd. 10.06 10.22
1 3 TelecommunicationsConsultants (India) Ltd. 8.03 13.58

Industrial Development & Tech. Consultancy Services478
14 EDCIL (india) Ltd. 2.45 2.49
15 Broadcast Engg. ConsultantsIndia Ltd. 2.03 5.29
1 6 PFC Capital Advisory Service Ltd. 0.05 0.00
17 National ResearchDevelopment Corpn. -0.58 -1.04
Sub Total : 1240.15 1073.20
6. Dividend : The details of dividend declared by the individualenterprises are given below:
(in Crores)
Sl . Enterprise Dividend
No 2011-12 2010-11
1 Engineers India Ltd. 202.16 168.47
2 Rites Ltd. 33.00 49.00
3 MECON Ltd. 10.98 3.15
4 WAPCOS Ltd. 10.5 7.5
5 Power System OperationCorporation Ltd. 9.20 3.06
6 National Small IndustriesCorpn. Ltd. 8.24 5.96
7 Engineering Projects (India) Ltd. 7.08 7.08
8 Certification EngineersInternational Ltd. 3.50 3.25
9 HSCC (India) Ltd. 3.00 1.73
1 0 TelecommunicationsConsultants (India) Ltd. 1.61 4.32
11 EDCIL (india) Ltd. 1.50 1.50
12 Broadcast Engg. ConsultantsIndia Ltd. 0.43 1.02
Group Total : 291.20 256.04
7. Social Overhead and Township : The total number ofpersons employed and the expenditure incurred on social overheadsand townships are given below:
(in Crores)
Sl. Enterprise Township and SocialNo. Overheads
2011-12 2010-11
1 ENGINEERS INDIA LTD. 636.32 522.52
1 No. of employees (in number) 14249 14126
2 Social overheads: (Rupees in Crore)
(i) Educational 10.93 12.02
(ii) Medical Facilities 16.41 15.64
(iii) Others 20.94 18.77
3 Capital cost of township (Rupees in Crore) 79.53 77.91
4 No. of houses constructed (in numbers) 4704 4608
8. Company wise details in respect of Balance Sheet, Profit andLoss account, Important Indicators and Financial Ratios along withthe write up of individual company are given in the pages below.

Public Enterprises Survey 2011-2012: Vol-II 479
INDUSTRIAL DEVELOPMENT & TECH. CONSULTANCY SERVICES
BALANCE SHEET (` in Lakhs)
PARTICULARS 2011-12 2010-11
I. EQUITY & LIABILITIESAUTHORISED CAPITAL 228545 198345(1) Shareholders’ Funds(a) Share Capital
(i) Central Govt 74728 60388
(ii) Others 8386 8376
(b) Reserves & Surplus 431845 341502
(c) Money received against share warrants 0 0
Total Shareholders’ Funds (1(a)+1(b)+1(c) 514959 410266(2) Share application money pending allotment 0 0(3) Non-current Liabilities(a) Long Term Borrowings 12346 18651
(b) Deferred tax liabilities (Net) 131 893
(c) Other Long-term liabilities 252935 129850
(d) Long-term provisions 65360 54650
Total Non-Current Liabilities 3(a) to 3(d) 330772 204044(4) Current Liabilities(a) Short Term Borrowings 116186 95724
(b) Trade Payables 187462 148650
(c) Other current liabilities 976777 963242
(d) Short-term provisions 118196 105155
Total Current Liabilities 4(a) to 4(d) 1398621 1312771TOTAL EQUITY & LIABILITIES (1+2+3+4) 2244352 1927081II. ASSETS(1) Non-Current Assets(a) Total Gross Fixed Assets 143216 136369(ai) Accumulated Depreciation, Depletion & Amortisation 77654 72429
(aii) Accumulated Impairment 0 489
(b) Total Net Fixed Assets ((a)-(ai)-(aii) 65562 63451(c) Capital work in progress 11476 7134
(d) Intangible assets under developmet 988 0
(e) Non-Current Investments 37594 28649(f) Deferred Tax Assets (Net) 35476 30863(g) Long Term Loans and Advances 177144 49121(h) Other Non-Current Assets 50401 63638Total Non-Current Assets (b+c+d+e+f+g+h) 378641 242856(2) Current Assets
(a) Current Investments 57503 51266
(b) Inventories 391823 365804
(c) Trade Recievables 212743 209214
(d) Cash & Bank Balance 709232 669867
(e) Short-term Loans & Advances 270673 199371
(f) Other Current Assets 223737 188703
Total Current Assets (a+b+c+d+e+f) 1865711 1684225
TOTAL ASSETS (1+2) 2244352 1927081
Important Indicators(i) Investment 95460 87415
(ii) Capital Employed 527305 428917
(iii) Net Worth 514959 410266
(iv) Net Current Assets 467090 371454
(v) Cost of Sales 873424 721800
(vi) Net Value Added (at market price) 415725 367885
(vii) Total Regular Employees (Nos.) 14249 14126
(viii) Avg. Monthly Emoluments per Employee(`) 106305 98845
PROFIT & LOSS ACCOUNT (` in Lakhs)
PARTICULARS 2011-12 2010-11
(I) Revenue from Operations (Gross) 1005307 833036Less : Excise Duty 0 0Revenue from Operations (Net) 1005307 833036(II) Other Income 63912 51592(III) Total Revenue (I+II) 1069219 884628(IV) Expenditure on:(a) Cost of materials consumed 29277 22951(b) Purchase of stock-in-trade 169754 132503(c) Changes in inventories of finished goods, 19107 -16329
work-in-progress and stock in trade(d) Stores & Spares 563 690(e) Power & Fuel 3068 2990(f) Salary, Wages & Benefits/Employees Expense 181768 167554(g) Other Operating/direct/manufacturing Expenses 351829 302557(h) Rent, Royalty & Cess 3959 2823(i) Loss on sale of Assets/Investments 50 33(j) Other Expenses 105498 97410Total Expenditure (IV (a to j)) 864873 713182(V) PROFIT BEFORE DEPRECIATION, & IMPAIRMENT, 204346 171446
FINANCE CHARGES/INTEREST, EXCEPTIONAL &EXTRAORDINARY ITEMS & TAXES (PBDIEET)(III-IV)
(VI) Depreciation, Depletion & Amortisation 8601 8651(VII) Impairment 0 0(VIII) PROFIT BEFORE FINANCE COST/INTEREST, 195745 162795
EXCEPTIONAL, EXTRA-ORDINARY ITEMS &TAXES (PBIEET)(V-VI-VII)
(IX) Finance Cost(a) On Central Government Loans 0 0(b) On Foreign Loans 602 542(c) Others 11248 5289(d) Less Finance Cost Capitalised 0 0(e) Charged to P & L Account (a+b+c+d) 11850 5831(X) PROFIT BEFORE EXCEPTIONAL & 183895 156964
EXTRA-ORDINARY ITEMS & TAX (PBEET)(VIII-IXe)(XI) Exceptional Items -96 -3932(XII) PROFIT BEFORE EXTRA-ORDINARY ITEMS & 183991 160896
TAX (PBET)(X-XI)(XIII) Extra-Ordinary Items 69 25(XIV) PROFIT BEFORE TAX (PBT)(XII-XIII) 183922 160871(XV) TAX PROVISIONS 59907 53551(XVI) NET PROFIT / LOSS FOR THE PERIOD FROM 124015 107320
CONTINUING OPERATIONS AFTER TAX(XIV-XV)(XVII) Profit/Loss from discontinuing operations 0 0(XVIII) Tax expenses of discontinuing operations 0 0(XIX) Profit/Loss from discontinuing operations
(after Tax)(XVII-XVIII) 0 0(XX) Profit/Loss for the period (XVI+XIX) 124015 107320Financial Ratios(i) Sales : Capital Employed 190.65 194.22(ii) Cost of Sales : Sales 86.88 86.65(iii) Salary/Wages : Sales 18.08 20.11(iv) Net Profit : Net Worth 24.08 26.16(v) Debt : Equity 0.15 0.27(vi) Current Ratio 1.33 1.28(vii) Trade Recievables : Sales 21.16 25.11(viii) Total Inventory : Sales 38.98 43.91

Industrial Development & Tech. Consultancy Services480
Broadcast Engineering Consultants India Limited
The CompanyBroadcast Engineering Consultants India Limited (BECIL) was
formed on 24th March 1995 to fulfill the need of an expert agency toadvise in the field of broadcasting. Such expertise till then was,available only with AIR and Doordarshan.
It is a Schedule-'C' Miniratna CPSE in Financial Services sectorunder the administrative control of M/o Information and Broadcastingwith 100% shareholding by the Government of India. The companyemployed 70 regular employees (Executives 42 & Non-Executives28) as on 31.3.2012. Its corporate offices are at NOIDA, U.P; headoffice at New Delhi and regional office in Bangalore.
Vision/MissionThe Vision of the Company is to facilitate the growth of
broadcasting in India and associated Asian Region and provide worldclass consultancy services and also undertakes turnkey jobs in thespecialized fields of broadcast engineering and information technology.
The Mission of the Company is to play a pivotal role in growthof Radio and Television Broadcasting through Terrestrial, Cable andSatellite Transmission in India and abroad, and achieve excellence.
Industrial / Business OperationsBECIL is engaged in providing consultancy services in all
spheres of Broadcast Engineering. It is now a well establishedconsultancy agency, system integrator and turnkey solution providerin all the spheres of Broadcast Engineering and InformationTechnology.. It also provide associated services like training,providing manpower. Its client list includes Government, SemiGovernment, Overseas and Private organizations.
The Areas of Specialization includes FM Broadcasting;Establishment of TV Channels; Installation of Teleports; Design ofDigital Newsroom Systems; Direct to Home (DTH) system; CableHead-End systems; Distance Education Systems through Satellite;Community Radio Stations; Acoustics, Stage lighting, soundreinforcement system etc. The company has contributed to theexpansion of FM Radio by creating Common TransmissionInfrastructure for 248 Private FM Channels in 87 cities.
Performance HighlightsThe physical performance of the company for last two years
is given below:
Total Revenue of the company registered an increase of` 18.68 crore during 2011-12, which went up from ` 92.78 crore in2010-11 to ` 111.46 crore in 2011-12. The net profit of thecompany however reduced by ` 3.26 crore, in 2011-12 to ` 2.03crore as against ` 5.29 crore during previous year because of highcompetitive bidding, low revenue margin, increased cost of material,finance cost and hiring of additionally staff.
The current ratio of company is at 1.33:1 during 2011-12 as against1.25:1 in the previous year (Fig.2). (Fig.2). Balance Sheet and Profit &Loss Account of the company and selected financial ratios during theperiod 2010-11 to 2011-12 can be seen on the adjoining page.
www.becil.com
Strategic IssuesThe company aims to enhance the present share by providing
specialized solutions to a wider range of clients; providing technicalinput and consultancy to Ministry for policy, regulatory &formulation of various papers pertaining to broadcasting; exploreoverseas market and allied areas like surveillance & monitoring. Thecompany aims to establish satellite uplink & downlink systems forTV channels and distance education.
EB
ITD
A &
PA
T (
Rs.
cro
re) T
OTA
L R
EV
EN
UE
(Rs. cro
re)
PR
OF
ITA
BIL
ITY
RA
TIO
S (
%)
CU
RR
EN
T R
AT
IO
Fig.2
Fig.1
Main Services Unit Performance during
2011-12 2010-11
Technical Services ` in Crore 3.41 8.52
Sale ` in Crore 101.06 61.93
Consultancy ` in Crore 6.95 6.03
Income fromMaintenance ofTowers for M/o I&B ` in Crore 0.29 0.32
Contract Income ` in Crore 0.69 22.50
Income from BECILTraining Centre ` in Crore 0.05 -

Public Enterprises Survey 2011-2012: Vol-II 481
BALANCE SHEET (` in Lakhs)
PARTICULARS 2011-12 2010-11
I. EQUITY & LIABILITIESAUTHORISED CAPITAL 250 250(1) Shareholders’ Funds(a) Share Capital
(i) Central Govt 137 137
(ii) Others 0 0
(b) Reserves & Surplus 2960 2807
(c) Money received against share warrants 0 0
Total Shareholders’ Funds (1(a)+1(b)+1(c) 3097 2944(2) Share application money pending allotment 0 0(3) Non-current Liabilities(a) Long Term Borrowings 0 0
(b) Deferred tax liabilities (Net) 0 0
(c) Other Long-term liabilities 705 413
(d) Long-term provisions 68 40
Total Non-Current Liabilities 3(a) to 3(d) 773 453(4) Current Liabilities(a) Short Term Borrowings 370 1879
(b) Trade Payables 2836 1429
(c) Other current liabilities 3843 6211
(d) Short-term provisions 110 426
Total Current Liabilities 4(a) to 4(d) 7159 9945TOTAL EQUITY & LIABILITIES (1+2+3+4) 11029 13342II. ASSETS(1) Non-Current Assets(a) Total Gross Fixed Assets 1757 488(ai) Accumulated Depreciation, Depletion & Amortisation 284 286
(aii) Accumulated Impairment 0 0
(b) Total Net Fixed Assets ((a)-(ai)-(aii) 1473 202(c) Capital work in progress 0 696
(d) Intangible assets under developmet 1 0
(e) Non-Current Investments 0 0(f) Deferred Tax Assets (Net) 41 50(g) Long Term Loans and Advances 0 0(h) Other Non-Current Assets 0 0Total Non-Current Assets (b+c+d+e+f+g+h) 1515 948(2) Current Assets(a) Current Investments 0 0
(b) Inventories 288 159
(c) Trade Recievables 6938 4316
(d) Cash & Bank Balance 1044 4750
(e) Short-term Loans & Advances 1199 3119
(f) Other Current Assets 45 50
Total Current Assets (a+b+c+d+e+f) 9514 12394
TOTAL ASSETS (1+2) 11029 13342
Important Indicators(i) Investment 137 137
(ii) Capital Employed 3097 2944
(iii) Net Worth 3097 2944
(iv) Net Current Assets 2355 2449
(v) Cost of Sales 10618 8333
(vi) Net Value Added (at market price) 2129 1738
(vii) Total Regular Employees (Nos.) 70 47
(viii) Avg. Monthly Emoluments per Employee(`) 42381 46277
PROFIT & LOSS ACCOUNT (` in Lakhs)
PARTICULARS 2011-12 2010-11
(I) Revenue from Operations (Gross) 10904 9079Less : Excise Duty 0 0Revenue from Operations (Net) 10904 9079(II) Other Income 242 199(III) Total Revenue (I+II) 11146 9278(IV) Expenditure on:(a) Cost of materials consumed 9474 5532(b) Purchase of stock-in-trade 0 0(c) Changes in inventories of finished goods, 0 0
work-in-progress and stock in trade(d) Stores & Spares 0 0(e) Power & Fuel 7 0(f) Salary, Wages & Benefits/Employees Expense 356 261(g) Other Operating/direct/manufacturing Expenses 495 2479(h) Rent, Royalty & Cess 34 0(i) Loss on sale of Assets/Investments 0 0(j) Other Expenses 211 16Total Expenditure (IV (a to j)) 10577 8288(V) PROFIT BEFORE DEPRECIATION, & IMPAIRMENT, 569 990
FINANCE CHARGES/INTEREST, EXCEPTIONAL &EXTRAORDINARY ITEMS & TAXES (PBDIEET)(III-IV)
(VI) Depreciation, Depletion & Amortisation 41 45(VII) Impairment 0 0(VIII) PROFIT BEFORE FINANCE COST/INTEREST, 528 945
EXCEPTIONAL, EXTRA-ORDINARY ITEMS &TAXES (PBIEET)(V-VI-VII)
(IX) Finance Cost(a) On Central Government Loans 0 0(b) On Foreign Loans 0 0(c) Others 187 117(d) Less Finance Cost Capitalised 0 0(e) Charged to P & L Account (a+b+c+d) 187 117(X) PROFIT BEFORE EXCEPTIONAL & EXTRA- 341 828
ORDINARY ITEMS & TAX (PBEET)(VIII-IXe)(XI) Exceptional Items 0 0(XII) PROFIT BEFORE EXTRA-ORDINARY ITEMS & 341 828
TAX (PBET)(X-XI)(XIII) Extra-Ordinary Items 69 25(XIV) PROFIT BEFORE TAX (PBT)(XII-XIII) 272 803(XV) TAX PROVISIONS 69 274(XVI) NET PROFIT / LOSS FOR THE PERIOD FROM 203 529
CONTINUING OPERATIONS AFTER TAX(XIV-XV)(XVII) Profit/Loss from discontinuing operations 0 0(XVIII) Tax expenses of discontinuing operations 0 0
(XIX) Profit/Loss from discontinuing operations 0 0 (after Tax)(XVII-XVIII)
(XX) Profit/Loss for the period (XVI+XIX) 203 529Financial Ratios(i) Sales : Capital Employed 352.08 308.39
(ii) Cost of Sales : Sales 97.38 91.78
(iii) Salary/Wages : Sales 3.26 2.87
(iv) Net Profit : Net Worth 6.55 17.97
(v) Debt : Equity 0 0
(vi) Current Ratio 1.33 1.25
(vii) Trade Recievables : Sales 63.63 47.54
(viii) Total Inventory : Sales 2.64 1.75
BROADCAST ENGG. CONSULTANTS INDIA LTD.56/17 A, Block-C, Sector-62, Noida, UP

Industrial Development & Tech. Consultancy Services482
Certification Engineers International Ltd.
The CompanyCertification Engineers International Ltd. (CEI) was set up on
26.10.1994 with an objective to undertake activities related tocertification, re-certification, safety audit and safety managementsystems for offshore and onshore oil and gas facilities and thirdparty inspection, risk analysis, safety, energy, quality audits in thehydrocarbon and other quality sensitive industry.
CEI is a Schedule 'C' CPSE in the Industrial Development andTechnical Consultancy sector under the administrative control ofM/o Petroleum and Natural Gas. The Company employed 81 regularexecutives' employees only as on 31.03.2012. Its registered officeis at New Delhi and corporate office is at Navi Mumbai,Maharashtra. It is a 100% subsidiary of Engineers India Ltd. (EIL).
Vision / MissionThe Vision of the Company is to be a global leader in the
business of ensuring quality, integrity and safety of customer'sassets.
The Mission of the Company is to achieve internationalstandards of excellence in customer services through constant valueaddition and innovation and to cultivate high standards of ethics,quality and integrity.
Industrial / Business OperationsCEI is engaged in providing services in the field of certification,
re-certification, third party inspection (TPI), risk analysis, safety,energy and quality audits and vendor assessment in the Hydrocarbonand other quality sensitive sectors of the industry.
Performance HighlightsThe physical performances of the company for last two years
are given below:
Total Revenue of the company registered an increase of` 1.29 crore during 2011-12, which went up from ` 32.18 crore in2010-11 to ` 33.47 crore in 2011-12. The net profit of the companyhowever declined to ̀ 10.06 crore, a reduction of ` 0.16 crore fromthe previous year 's profit of ` 10.22 on account of lower averagerealization, higher expenses, increased competition , lower level ofactivity in hydrocarbon sector and adverse revenue mix.
The company has taken various measures to reduce averageman-day cost substantially, through fresh recruitments and outsourcing, to effectively counter the pressure of reduced averagerealizations, and higher manpower cost due to pay revision.
The current ratio of company is at 8.65:1 during 2011-12 asagainst 6.31:1 in the previous year (Fig.2). Balance Sheet & Profit
www.certificationengineers.com
& Loss Account of the company and selected financial ratios duringthe period 2011-12 to 2011-12 can be seen on the adjoining page.
Strategic issueThe company is continuously exploring the possibility of
securing Certification & TPI jobs from other sectors / contractorsand enhancing its service portfolio to include areas concerningenvironment, plant operation & safety, specialized engineeringanalysis etc.
The Strength of organisation lies in highly qualified,experienced and quality conscious human resources. The team ofquality Surveyors has been drawn from reputed industries of Oiland Gas, Refinery & Petrochemicals, Sub-sea & Cross CountryPipeline, Chemical & Process, Equipment Manufacturing, PowerPlant and other manufacturing fields besides EIL's InspectionDepartment.
Main Service Unit Performance during
2011-12 2010-11
Certification andThird Party Inspection ` in Crore 29.92 29.49
EB
ITD
A &
PA
T (
Rs.
cro
re) T
OTA
L R
EV
EN
UE
(Rs. cro
re)
PR
OF
ITA
BIL
ITY
RA
TIO
S (
%)
CU
RR
EN
T R
AT
IO
Fig.2
Fig.1

Public Enterprises Survey 2011-2012: Vol-II 483
BALANCE SHEET (` in Lakhs)
PARTICULARS 2011-12 2010-11
I. EQUITY & LIABILITIESAUTHORISED CAPITAL 200 200(1) Shareholders’ Funds(a) Share Capital
(i) Central Govt 0 0
(ii) Others 100 100
(b) Reserves & Surplus 5058 4459
(c) Money received against share warrants 0 0
Total Shareholders’ Funds (1(a)+1(b)+1(c) 5158 4559(2) Share application money pending allotment 0 0(3) Non-current Liabilities(a) Long Term Borrowings 0 0
(b) Deferred tax liabilities (Net) 0 0
(c) Other Long-term liabilities 6 4
(d) Long-term provisions 151 120
Total Non-Current Liabilities 3(a) to 3(d) 157 124(4) Current Liabilities(a) Short Term Borrowings 0 0
(b) Trade Payables 87 68
(c) Other current liabilities 263 308
(d) Short-term provisions 265 281
Total Current Liabilities 4(a) to 4(d) 615 657TOTAL EQUITY & LIABILITIES (1+2+3+4) 5930 5340II. ASSETS(1) Non-Current Assets(a) Total Gross Fixed Assets 407 376(ai) Accumulated Depreciation, Depletion & Amortisation 96 79
(aii) Accumulated Impairment 0 0
(b) Total Net Fixed Assets ((a)-(ai)-(aii) 311 297(c) Capital work in progress 0 0
(d) Intangible assets under developmet 0 0
(e) Non-Current Investments 0 0(f) Deferred Tax Assets (Net) 70 48(g) Long Term Loans and Advances 26 33(h) Other Non-Current Assets 203 822Total Non-Current Assets (b+c+d+e+f+g+h) 610 1200(2) Current Assets(a) Current Investments 0 78(b) Inventories 1 0
(c) Trade Recievables 945 1195
(d) Cash & Bank Balance 3683 2511
(e) Short-term Loans & Advances 174 106
(f) Other Current Assets 517 250
Total Current Assets (a+b+c+d+e+f) 5320 4140
TOTAL ASSETS (1+2) 5930 5340
Important Indicators(i) Investment 100 100
(ii) Capital Employed 5158 4559
(iii) Net Worth 5158 4559
(iv) Net Current Assets 4705 3483
(v) Cost of Sales 1861 1687
(vi) Net Value Added (at market price) 2379 2318
(vii) Total Regular Employees (Nos.) 81 70
(viii) Avg. Monthly Emoluments per Employee(`) 54835 60000
PROFIT & LOSS ACCOUNT (` in Lakhs)
PARTICULARS 2011-12 2010-11
(I) Revenue from Operations (Gross) 2988 2949Less : Excise Duty 0 0Revenue from Operations (Net) 2988 2949(II) Other Income 359 269(III) Total Revenue (I+II) 3347 3218(IV) Expenditure on:(a) Cost of materials consumed 0 0(b) Purchase of stock-in-trade 0 0(c) Changes in inventories of finished goods, -4 0
work-in-progress and stock in trade(d) Stores & Spares 0 0(e) Power & Fuel 13 11(f) Salary, Wages & Benefits/Employees Expense 533 504(g) Other Operating/direct/manufacturing Expenses 1104 1023(h) Rent, Royalty & Cess 48 43(i) Loss on sale of Assets/Investments 0 0(j) Other Expenses 149 89Total Expenditure (IV (a to j)) 1843 1670(V) PROFIT BEFORE DEPRECIATION, & IMPAIRMENT, 1504 1548
FINANCE CHARGES/INTEREST, EXCEPTIONAL &EXTRAORDINARY ITEMS & TAXES (PBDIEET)(III-IV)
(VI) Depreciation, Depletion & Amortisation 18 17(VII) Impairment 0 0(VIII) PROFIT BEFORE FINANCE COST/INTEREST, 1486 1531
EXCEPTIONAL, EXTRA-ORDINARY ITEMS &TAXES (PBIEET)(V-VI-VII)
(IX) Finance Cost(a) On Central Government Loans 0 0(b) On Foreign Loans 0 0(c) Others 0 0(d) Less Finance Cost Capitalised 0 0(e) Charged to P & L Account (a+b+c+d) 0 0(X) PROFIT BEFORE EXCEPTIONAL & EXTRA- 1486 1531
ORDINARY ITEMS & TAX (PBEET)(VIII-IXe)(XI) Exceptional Items 0 0(XII) PROFIT BEFORE EXTRA-ORDINARY ITEMS & 1486 1531
TAX (PBET)(X-XI)(XIII) Extra-Ordinary Items 0 0(XIV) PROFIT BEFORE TAX (PBT)(XII-XIII) 1486 1531(XV) TAX PROVISIONS 480 509(XVI) NET PROFIT / LOSS FOR THE PERIOD FROM 1006 1022
CONTINUING OPERATIONS AFTER TAX(XIV-XV)(XVII) Profit/Loss from discontinuing operations 0 0(XVIII) Tax expenses of discontinuing operations 0 0
(XIX) Profit/Loss from discontinuing operations 0 0(after Tax)(XVII-XVIII)
(XX) Profit/Loss for the period (XVI+XIX) 1006 1022Financial Ratios(i) Sales : Capital Employed 57.93 64.69(ii) Cost of Sales : Sales 62.28 57.21(iii) Salary/Wages : Sales 17.84 17.09(iv) Net Profit : Net Worth 19.5 22.42(v) Debt : Equity 0 0(vi) Current Ratio 8.65 6.3(vii) Trade Recievables : Sales 31.63 40.52(viii) Total Inventory : Sales 0.03 0
CERTIFICATION ENGINEERS INTERNATIONAL L TD.E.I. Annexe (4th Floor), 1, Bhikaiji Cama Place , R.K. Puram, New Delhi-110066

Industrial Development & Tech. Consultancy Services484
Central Mine Planning & Design Institute Ltd.
The CompanyCentral Mine Planning & Design Institute Ltd. (CMPDIL)
was incorporated on 01.11.1975 under the Companies Act, 1956with an objective to provide total consultancy in coal / mineral,exploration, mining, engineering and allied fields as a premierconsultant in India as well in international level.
CMPDI is a Schedule -`B' Miniratna CPSE in Industrial Dev.and Technical Consultancy services sector under the administrativecontrol of Ministry of Coal. CMPDI is a 100% subsidiary of CoalIndia Ltd. (CIL). The company employed 3129 regular employees(Executives 855 & Non-Executives 2274) as on 31.3.2012. ItsRegistered and Corporate office at Ranchi, Jharkhand.
Vision / MissionThe Vision of CMPDIL is to be the global market leader in an
expanding earth resource sector and allied professional activities.
The Mission of CMPDIL is to provide total consultancy incoal and mineral exploration, mining, engineering and allied fields asthe premier consultants in India and a leading one in the internationalarena.
Industrial / Business OperationsCMPDI is one of the subsidiary enterprises providing
consultancy and other allied services in the field of GeologicalExploration, Planning, Design and Support Services, EnvironmentalManagement Services, Management System Services, HRD andspecialized services.
CMPDI is operating through its headquarters at Ranchi andseven regional institutes located at Dhanbad and Ranchi (Jharkhand),Bilaspur (Chhattisgarh), Singrauli (Madhya Pradesh), Asansol (WestBengal), Nagpur (Maharastra) and Bhubaneswar (Orissa) whichrender consultancy services to seven coal producing subsidiarycompanies of Coal India Ltd.(CIL).
Performance Highlights The physical performances of the company for last two years
are given below:
A total of 142 project reports were identified for preparationfor the XI Plan resulting in capacity addition for coal production ofabout 371 Mt, against which, 130 project reports with capacityaddition of about 349 Mt. have already been prepared during2007-12. During XI Plan period, 67 additional project reports withcapacity addition of about 137 Mt. were also prepared.
Total Revenue from of the company registered an increase of` 94.88 crore during 2011-12, which went up from ` 433.55 crorein 2010-11 to ` 528.43 crore in 2011-12. However, the profit of
the company has gone up by ` 4.29 crore to ` 19.61 crore in2011-12, from ` 15.32 crore in previous year due to increase intotal revenue and productivity.
The current ratio of company is at 1.34:1 during 2011-12 asagainst 1.28:1 in the previous year (Fig.2). Balance Sheet and Profit& Loss Account of the company and selected financial ratios duringthe period 2010-11 to 2011-12 can be seen on the adjoining page.
www.cmpdi.co.in
Strategic issuesAbout 51.22 lakh meter of total drilling has been envisaged in
the XII Plan (2012-17) document of M/o Coal, which is to becarried out by CMPDI during XII Plan period through departmentaland outsourced drilling. Development of Shale gas has also emergedout as a promising area of operation for CMPDI. CMPDI's servicesare being sought in generation of Coal Bed Methane (CBM) relateddata under delineation of blocks, preparation of data dossiers, etc.Additionally, emerging area of Information and CommunicationTechnology (ICT) in coal sector will also present additionalopportunity for CMPDI in coming years.
Main Services Unit Performance during
2011-12 2010-11
Drilling Lakh Meter 4.98 4.91
Consultancy job outside CIL No 41 —
`. in Crore 33.26 —
EB
ITD
A &
PA
T (
Rs.
cro
re) T
OTA
L R
EV
EN
UE
(Rs. cro
re)
PR
OF
ITA
BIL
ITY
RA
TIO
S (
%)
CU
RR
EN
T R
AT
IO
Fig.2
Fig.1

Public Enterprises Survey 2011-2012: Vol-II 485
BALANCE SHEET (` in Lakhs)
PARTICULARS 2011-12 2010-11
I. EQUITY & LIABILITIESAUTHORISED CAPITAL 5000 5000(1) Shareholders’ Funds(a) Share Capital
(i) Central Govt 0 0
(ii) Others 1904 1904
(b) Reserves & Surplus 9188 6888
(c) Money received against share warrants 0 0
Total Shareholders’ Funds (1(a)+1(b)+1(c) 11092 8792(2) Share application money pending allotment 0 0(3) Non-current Liabilities(a) Long Term Borrowings 0 0
(b) Deferred tax liabilities (Net) 0 0
(c) Other Long-term liabilities 0 0
(d) Long-term provisions 17040 14171
Total Non-Current Liabilities 3(a) to 3(d) 17040 14171(4) Current Liabilities(a) Short Term Borrowings 0 0
(b) Trade Payables 3345 2295
(c) Other current liabilities 16144 12539
(d) Short-term provisions 15283 17132
Total Current Liabilities 4(a) to 4(d) 34772 31966TOTAL EQUITY & LIABILITIES (1+2+3+4) 62904 54929II. ASSETS(1) Non-Current Assets(a) Total Gross Fixed Assets 18298 16998(ai) Accumulated Depreciation, Depletion & Amortisation 10492 9803
(aii) Accumulated Impairment 0 0
(b) Total Net Fixed Assets ((a)-(ai)-(aii) 7806 7195(c) Capital work in progress 1152 564
(d) Intangible assets under developmet 0 0
(e) Non-Current Investments 0 0(f) Deferred Tax Assets (Net) 7167 5991(g) Long Term Loans and Advances 84 210(h) Other Non-Current Assets 2 2Total Non-Current Assets (b+c+d+e+f+g+h) 16211 13962
(2) Current Assets
(a) Current Investments 0 0
(b) Inventories 677 677
(c) Trade Recievables 24692 19047
(d) Cash & Bank Balance 6121 6104
(e) Short-term Loans & Advances 15198 15135
(f) Other Current Assets 5 4
Total Current Assets (a+b+c+d+e+f) 46693 40967
TOTAL ASSETS (1+2) 62904 54929
Important Indicators(i) Investment 1904 1904
(ii) Capital Employed 11092 8792
(iii) Net Worth 11092 8792
(iv) Net Current Assets 11921 9001
(v) Cost of Sales 49849 40983
(vi) Net Value Added (at market price) 45797 33844
(vii) Total Regular Employees (Nos.) 3129 3102
(viii) Avg. Monthly Emoluments per Employee(`) 89049 72464
PROFIT & LOSS ACCOUNT (` in Lakhs)
PARTICULARS 2011-12 2010-11
(I) Revenue from Operations (Gross) 52843 42909Less : Excise Duty 0 0Revenue from Operations (Net) 52843 42909(II) Other Income 0 446(III) Total Revenue (I+II) 52843 43355(IV) Expenditure on:(a) Cost of materials consumed 1667 1577(b) Purchase of stock-in-trade 0 0(c) Changes in inventories of finished goods, 0 0
work-in-progress and stock in trade(d) Stores & Spares 0 0(e) Power & Fuel 224 207(f) Salary, Wages & Benefits/Employees Expense 33436 26974(g) Other Operating/direct/manufacturing Expenses 0 8937(h) Rent, Royalty & Cess 0 0(i) Loss on sale of Assets/Investments 0 0(j) Other Expenses 13848 2740Total Expenditure (IV (a to j)) 49175 40435(V) PROFIT BEFORE DEPRECIATION, & IMPAIRMENT, 3668 2920
FINANCE CHARGES/INTEREST, EXCEPTIONAL &EXTRAORDINARY ITEMS & TAXES (PBDIEET)(III-IV)
(VI) Depreciation, Depletion & Amortisation 674 548(VII) Impairment 0 0(VIII) PROFIT BEFORE FINANCE COST/INTEREST, 2994 2372
EXCEPTIONAL, EXTRA-ORDINARY ITEMS &TAXES (PBIEET)(V-VI-VII)
(IX) Finance Cost(a) On Central Government Loans 0 0(b) On Foreign Loans 0 0(c) Others 0 3(d) Less Finance Cost Capitalised 0 0(e) Charged to P & L Account (a+b+c+d) 0 3(X) PROFIT BEFORE EXCEPTIONAL & EXTRA- 2994 2369
ORDINARY ITEMS & TAX (PBEET)(VIII-IXe)(XI) Exceptional Items -85 0(XII) PROFIT BEFORE EXTRA-ORDINARY ITEMS & 3079 2369
TAX (PBET)(X-XI)(XIII) Extra-Ordinary Items 0 0(XIV) PROFIT BEFORE TAX (PBT)(XII-XIII) 3079 2369(XV) TAX PROVISIONS 1118 837(XVI) NET PROFIT / LOSS FOR THE PERIOD FROM 1961 1532
CONTINUING OPERATIONS AFTER TAX(XIV-XV)(XVII) Profit/Loss from discontinuing operations 0 0(XVIII) Tax expenses of discontinuing operations 0 0(XIX) Profit/Loss from discontinuing operations 0 0
(after Tax)(XVII-XVIII)(XX) Profit/Loss for the period (XVI+XIX) 1961 1532Financial Ratios(i) Sales : Capital Employed 476.41 488.05
(ii) Cost of Sales : Sales 94.33 95.51
(iii) Salary/Wages : Sales 63.27 62.86
(iv) Net Profit : Net Worth 17.68 17.42
(v) Debt : Equity 0 0
(vi) Current Ratio 1.34 1.28
(vii) Trade Recievables : Sales 46.73 44.39
(viii) Total Inventory : Sales 1.28 1.58
CENTRAL MINE PLANNING & DESIGN INSTITUTE LTD.CMPDI Ltd., Gondwana Place, Kanke Road, Ranchi, Jharkhand - 834 031

Industrial Development & Tech. Consultancy Services486
EdCIL (India) Ltd.
The CompanyEdCIL (India) Ltd. (Education Consultants India Ltd.) was
incorporated in 1981 with the objective of providing educationalconsultancy services, nationally and internationally, in systemdesign, resource development, research and evaluation studies andmanagement development, to enable educational systems to achieveexcellence and to promote Indian education abroad as the singlewindow nodal service provider.
EdCIL is a Schedule-'C' Miniratna CPSE in IndustrialDevelopment & Tech. Consultancy Services sector under theadministrative control of Ministry of Human Resources &Development, D/o Higher Education with 100% shareholding bythe Government of India. The company employed 81 regularemployees (Executives 49, Non-Executives 32) as on 31.3.2012.Its registered office is at New Delhi and Corporate Office is atNOIDA, UP.
Vision / MissionThe Vision / Mission of the company is to provide world-
class educational consultancy services in system design, resourcedevelopment, research & evaluation studies and managementdevelopment, nationally and internationally, to enableeducational systems to achieve excellence. EdCIL will also promoteIndian education abroad as the single window nodal serviceprovider.
Industrial / Business OperationsEd.CIL is engaged in promotion of Indian education abroad by
placement of International students in India institutions andsecondment of Indian teachers / experts abroad, conducting educationfairs, seminars cum counseling sessions, improving liaison withIndian Missions abroad etc.; and providing educational consultancyservices including technical assistance, supply of educational aids,testing, institutional development etc.
The service range of the company comprises of three mainsegments viz Human Resource Development, InstitutionalDevelopment and Technical Assistance.
Performance HighlightsMajor contribution in revenue generation was made by
placement of human resources and providing technicalassistance. The performance of Company for last two years isgiven below:
The Company registered an increase of ` 20.29 crore in totalincome during 2011-12 which went up to ` 89.97 crore in 2011-12from ̀ 69.68 crore during 2010-11 due to increase in revenue fromoperations. The net profit of the company however reduced to` 2.45 crore in 2011-12 as compared to ` 2.49 crore during theprevious year due to increase in operating expenses.
The current ratio of company is at 1.27:1 during 2011-12 asagainst 1.3:1 in the previous year (Fig.2). Balance Sheet and Profit& Loss Account of the company and selected financial ratios duringthe period 2010-11 to 2011-12 can be seen on the adjoining page.
www.edcilindia.co.in
EB
ITD
A &
PA
T (
Rs.
cro
re)
TO
TAL
RE
VE
NU
E (R
s. crore)
PR
OF
ITA
BIL
ITY
RA
TIO
S (
%)
CU
RR
EN
T R
AT
IO
Fig.2
Fig.1
Main Services Unit Performance during
2011-12 2010-11
Technical Assistance ` in Crore 41.425 32.83
Income from HRD ` in Crore 31.62 21.41
InstitutionalDevelopment ` in Crore 3.75 1.39
Strategic IssuesEfforts such as introduction of profit center scheme w.e.f.
1.4.2005, establishment of Research & Planning unit to exploreopportunities for diversification and establishment of an officeeither in South Africa or in ASEAN/Middle East region to promoteBrand India in education sector were made / being made to improvecompetitiveness and cost control.

Public Enterprises Survey 2011-2012: Vol-II 487
BALANCE SHEET (` in Lakhs)
PARTICULARS 2011-12 2010-11
I. EQUITY & LIABILITIESAUTHORISED CAPITAL 150 150(1) Shareholders’ Funds(a) Share Capital
(i) Central Govt 150 150
(ii) Others 0 0
(b) Reserves & Surplus 1935 1875
(c) Money received against share warrants 0 0
Total Shareholders’ Funds (1(a)+1(b)+1(c) 2085 2025(2) Share application money pending allotment 0 0(3) Non-current Liabilities(a) Long Term Borrowings 0 0
(b) Deferred tax liabilities (Net) 0 0
(c) Other Long-term liabilities 161 172
(d) Long-term provisions 0 0
Total Non-Current Liabilities 3(a) to 3(d) 161 172(4) Current Liabilities(a) Short Term Borrowings 0 0
(b) Trade Payables 881 604
(c) Other current liabilities 2911 3056
(d) Short-term provisions 1494 1337
Total Current Liabilities 4(a) to 4(d) 5286 4997TOTAL EQUITY & LIABILITIES (1+2+3+4) 7532 7194II. ASSETS(1) Non-Current Assets(a) Total Gross Fixed Assets 985 962(ai) Accumulated Depreciation, Depletion & Amortisation 442 425
(aii) Accumulated Impairment 0 0
(b) Total Net Fixed Assets ((a)-(ai)-(aii) 543 537(c) Capital work in progress 0 0
(d) Intangible assets under developmet 9 0
(e) Non-Current Investments 0 0(f) Deferred Tax Assets (Net) 85 75(g) Long Term Loans and Advances 203 88(h) Other Non-Current Assets 0 0Total Non-Current Assets (b+c+d+e+f+g+h) 840 700(2) Current Assets(a) Current Investments 0 0(b) Inventories 107 204
(c) Trade Recievables 765 965
(d) Cash & Bank Balance 3489 3628
(e) Short-term Loans & Advances 2331 1697
(f) Other Current Assets 0 0
Total Current Assets (a+b+c+d+e+f) 6692 6494
TOTAL ASSETS (1+2) 7532 7194
Important Indicators(i) Investment 150 150
(ii) Capital Employed 2085 2025
(iii) Net Worth 2085 2025
(iv) Net Current Assets 1406 1497
(v) Cost of Sales 8612 6633
(vi) Net Value Added (at market price) 1584 1484
(vii) Total Regular Employees (Nos.) 81 85
(viii) Avg. Monthly Emoluments per Employee(`) 88477 83235
EdCIL (India) Ltd.10-B, I.P Estate, New Delhi-110002
PROFIT & LOSS ACCOUNT (` in Lakhs)
PARTICULARS 2011-12 2010-11
(I) Revenue from Operations (Gross) 8649 6722Less : Excise Duty 0 0Revenue from Operations (Net) 8649 6722(II) Other Income 348 246(III) Total Revenue (I+II) 8997 6968(IV) Expenditure on:(a) Cost of materials consumed 0 0(b) Purchase of stock-in-trade 0 0(c) Changes in inventories of finished goods, 97 12
work-in-progress and stock in trade(d) Stores & Spares 0 0(e) Power & Fuel 29 27(f) Salary, Wages & Benefits/Employees Expense 860 849(g) Other Operating/direct/manufacturing Expenses 7370 5516(h) Rent, Royalty & Cess 5 5(i) Loss on sale of Assets/Investments 7 9(j) Other Expenses 213 171Total Expenditure (IV (a to j)) 8581 6589(V) PROFIT BEFORE DEPRECIATION, & IMPAIRMENT, 416 379
FINANCE CHARGES/INTEREST, EXCEPTIONAL &EXTRAORDINARY ITEMS & TAXES (PBDIEET)(III-IV)
(VI) Depreciation, Depletion & Amortisation 38 53(VII) Impairment 0 0(VIII) PROFIT BEFORE FINANCE COST/INTEREST, 378 326
EXCEPTIONAL, EXTRA-ORDINARY ITEMS &TAXES (PBIEET)(V-VI-VII)
(IX) Finance Cost(a) On Central Government Loans 0 0(b) On Foreign Loans 0 0(c) Others 0 0(d) Less Finance Cost Capitalised 0 0(e) Charged to P & L Account (a+b+c+d) 0 0(X) PROFIT BEFORE EXCEPTIONAL & EXTRA- 378 326
ORDINARY ITEMS & TAX (PBEET)(VIII-IXe)(XI) Exceptional Items -11 -59(XII) PROFIT BEFORE EXTRA-ORDINARY ITEMS & 389 385
TAX (PBET)(X-XI)(XIII) Extra-Ordinary Items 0 0(XIV) PROFIT BEFORE TAX (PBT)(XII-XIII) 389 385(XV) TAX PROVISIONS 144 136(XVI) NET PROFIT / LOSS FOR THE PERIOD FROM 245 249
CONTINUING OPERATIONS AFTER TAX(XIV-XV)(XVII) Profit/Loss from discontinuing operations 0 0
(XVIII) Tax expenses of discontinuing operations 0 0(XIX) Profit/Loss from discontinuing operations 0 0
(after Tax)(XVII-XVIII)
(XX) Profit/Loss for the period (XVI+XIX) 245 249Financial Ratios(i) Sales : Capital Employed 414.82 331.95
(ii) Cost of Sales : Sales 99.57 98.68
(iii) Salary/Wages : Sales 9.94 12.63
(iv) Net Profit : Net Worth 11.75 12.3
(v) Debt : Equity 0 0
(vi) Current Ratio 1.27 1.3
(vii) Trade Recievables : Sales 8.84 14.36
(viii) Total Inventory : Sales 1.24 3.03
2011-12 Provisional

Industrial Development & Tech. Consultancy Services488
Engineering Projects (India) Ltd.
The CompanyEngineering Projects (India) Limited (EPI) was incorporated
on 16.04.1970 with the main objective to undertake turnkey projectsand consultancy services in India and abroad.
EPI is a Schedule-'B' Mini Ratna, CPSE in IndustrialDevelopment and Technical Consultancy Services Sector under theadministrative control of the Ministry of Heavy Industries & PublicEnterprises with100% shareholding by the Government of India.The company employed 423 regular employees (Executives 404 &Non-Executives 19) as on 31.3.2012.It has its Registered Officeand Corporate Office at New Delhi.
Vision / MissionThe Vision / Mission of the Company is to be the leading
turnkey project execution company committed to quality andtimely completion of projects continuously enhancing stakeholdervalue.
Industrial / Business OperationsEPI is engaged in the field of execution of large and multi-
disciplinary industrial & construction projects on turkey basis andProject Management Consultancy services to undertake operationsacross India the company has its Regional/ Zonal Offices at differentgeographical locations namely New Delhi, Mumbai, Kolkata,Chennai, Guwahati, Hyderabad and Bangalore.
EPI provides integrated services from concept tocommissioning of projects which include the specialized activitiessuch as Feasibility Studies & Detailed Project Reports, Design andEngineering, Supply of Plant & Equipment. Quality Assurance,Construction & Erection, Trial run and Commissioning, Operationand Maintenance and Overall Project Management in almost allareas of engineering, consultancy and construction.
Performance Highlights The physical performances of the company for last two years
are given below:
www.epi.gov.in
the period 2010-11 to 2011-12 can be seen on the adjoiningpage.
Strategic issuesThe company is operating in a highly competitive
environment and there is pressure on margin and profitability.The company has, therefore, adopted the strategy of taking uphigh value projects, diversification into high margin areas andexplores overseas market. It has decided to concentrate on hightechnology areas with potential of high profits is focusing onmarket, multi-modal transportation system like metro rail andmonorail projects. With this in view, EPI has signed four MoUsfor executing monorail projects and taking up the infrastructuredevelopment projects in India, Srilanka, Bangaldesh, Maldives,and African countries.
Main Service Unit Performance during
2011-12 2010-11
Turnkey projectsexecution & projectmanagement consultancy ` in Crore 901.27 1104
EB
ITD
A &
PA
T (
Rs.
cro
re) T
OTA
L R
EV
EN
UE
(Rs. cro
re)
PR
OF
ITA
BIL
ITY
RA
TIO
S (
%)
CU
RR
EN
T R
AT
IO
Fig.2
Fig.1
Total Revenue from of the company registered a reduction of` 190.86 crore during 2011-12, which went down from ` 1128.59crore in 2010-11 to ` 937.73 crore in 2011-12. However, theprofit of the company has gone up by ̀ 9.42 crore to ` 24.47 crorein 2011-12, from ` 15.05 crore in previous year due to increase inproductivity.
The current ratio of company is at 1.01:1 during 2011-12 asagainst 0.99:1 in the previous year (Fig.2). Balance Sheet and Profit& Loss Account of the company and selected financial ratios during

Public Enterprises Survey 2011-2012: Vol-II 489
BALANCE SHEET (` in Lakhs)
PARTICULARS 2011-12 2010-11
I. EQUITY & LIABILITIESAUTHORISED CAPITAL 90940 90940(1) Shareholders’ Funds(a) Share Capital
(i) Central Govt 3541 3541
(ii) Others 1 1
(b) Reserves & Surplus 14131 12507
(c) Money received against share warrants 0 0
Total Shareholders’ Funds (1(a)+1(b)+1(c) 17673 16049(2) Share application money pending allotment 0 0(3) Non-current Liabilities(a) Long Term Borrowings 0 0
(b) Deferred tax liabilities (Net) 0 0
(c) Other Long-term liabilities 11935 9779
(d) Long-term provisions 2049 1909
Total Non-Current Liabilities 3(a) to 3(d) 13984 11688(4) Current Liabilities(a) Short Term Borrowings 0 0
(b) Trade Payables 23667 22437
(c) Other current liabilities 541363 504260
(d) Short-term provisions 2850 2809
Total Current Liabilities 4(a) to 4(d) 567880 529506TOTAL EQUITY & LIABILITIES (1+2+3+4) 599537 557243II. ASSETS(1) Non-Current Assets(a) Total Gross Fixed Assets 1688 1629(ai) Accumulated Depreciation, Depletion & Amortisation 1150 1129
(aii) Accumulated Impairment 0 0
(b) Total Net Fixed Assets ((a)-(ai)-(aii) 538 500(c) Capital work in progress 0 0
(d) Intangible assets under developmet 0 0
(e) Non-Current Investments 0 0(f) Deferred Tax Assets (Net) 896 852(g) Long Term Loans and Advances 20560 22561(h) Other Non-Current Assets 6250 7176Total Non-Current Assets (b+c+d+e+f+g+h) 28244 31089(2) Current Assets(a) Current Investments 0 0(b) Inventories 380032 353463
(c) Trade Recievables 16159 5954
(d) Cash & Bank Balance 28186 30266
(e) Short-term Loans & Advances 26044 18671
(f) Other Current Assets 120872 117800
Total Current Assets (a+b+c+d+e+f) 571293 526154
TOTAL ASSETS (1+2) 599537 557243
Important Indicators(i) Investment 3542 3542
(ii) Capital Employed 17673 16049
(iii) Net Worth 17673 16049
(iv) Net Current Assets 3413 -3352
(v) Cost of Sales 89488 110413
(vi) Net Value Added (at market price) 8820 7070
(vii) Total Regular Employees (Nos.) 423 434
(viii) Avg. Monthly Emoluments per Employee(`) 89362 88844
PROFIT & LOSS ACCOUNT (` in Lakhs)
PARTICULARS 2011-12 2010-11
(I) Revenue from Operations (Gross) 90127 110683Less : Excise Duty 0 0Revenue from Operations (Net) 90127 110683(II) Other Income 3646 2176(III) Total Revenue (I+II) 93773 112859(IV) Expenditure on:(a) Cost of materials consumed 0 0(b) Purchase of stock-in-trade 0 0(c) Changes in inventories of finished goods, 0 0
work-in-progress and stock in trade(d) Stores & Spares 0 0(e) Power & Fuel 92 85(f) Salary, Wages & Benefits/Employees Expense 4536 4627(g) Other Operating/direct/manufacturing Expenses 83347 104558(h) Rent, Royalty & Cess 0 0(i) Loss on sale of Assets/Investments 1 3(j) Other Expenses 1440 1088Total Expenditure (IV (a to j)) 89416 110361(V) PROFIT BEFORE DEPRECIATION, & IMPAIRMENT, 4357 2498
FINANCE CHARGES/INTEREST, EXCEPTIONAL &EXTRAORDINARY ITEMS & TAXES (PBDIEET)(III-IV)
(VI) Depreciation, Depletion & Amortisation 73 55(VII) Impairment 0 0(VIII) PROFIT BEFORE FINANCE COST/INTEREST, 4284 2443
EXCEPTIONAL, EXTRA-ORDINARY ITEMS &TAXES (PBIEET)(V-VI-VII)
(IX) Finance Cost(a) On Central Government Loans 0 0(b) On Foreign Loans 0 0(c) Others 647 186(d) Less Finance Cost Capitalised 0 0(e) Charged to P & L Account (a+b+c+d) 647 186(X) PROFIT BEFORE EXCEPTIONAL & EXTRA- 3637 2257
ORDINARY ITEMS & TAX (PBEET)(VIII-IXe)(XI) Exceptional Items 0 0(XII) PROFIT BEFORE EXTRA-ORDINARY ITEMS & 3637 2257
TAX (PBET)(X-XI)(XIII) Extra-Ordinary Items 0 0(XIV) PROFIT BEFORE TAX (PBT)(XII-XIII) 3637 2257(XV) TAX PROVISIONS 1190 752(XVI) NET PROFIT / LOSS FOR THE PERIOD FROM 2447 1505
CONTINUING OPERATIONS AFTER TAX(XIV-XV)(XVII) Profit/Loss from discontinuing operations 0 0(XVIII) Tax expenses of discontinuing operations 0 0
(XIX) Profit/Loss from discontinuing operations 0 0 (after Tax)(XVII-XVIII)
(XX) Profit/Loss for the period (XVI+XIX) 2447 1505Financial Ratios(i) Sales : Capital Employed 509.97 689.66
(ii) Cost of Sales : Sales 99.29 99.76
(iii) Salary/Wages : Sales 5.03 4.18
(iv) Net Profit : Net Worth 13.85 9.38
(v) Debt : Equity 0 0
(vi) Current Ratio 1.01 0.99
(vii) Trade Recievables : Sales 17.93 5.38
(viii) Total Inventory : Sales 421.66 319.35
ENGINEERING PROJECTS (INDIA) LTD.Core-3, Scope Complex, 7 Lodhi Road, New Delhi-110003

Industrial Development & Tech. Consultancy Services490
Engineers India Ltd.
The CompanyEngineers India Ltd. (EIL) was incorporated on 15.03.1965
with the objective to provide design, engineering and related projectmanagement and consultancy services for the hydrocarbon sectorand the process plants industry in the country.
EIL is a listed Schedule 'A' / Mini Ratna CPSE in the IndustrialDevelopment and Technical Consultancy sector under theadministrative control of Ministry of Petroleum & Natural Gas.The company employed 3450 regular employees (Executives 3079,Non-executives 371 ) as on 31.3.2012. The Registered and CorporateOffice of EIL is at New Delhi.
Vision / MissionThe Vision of the Company is to be a world class globally
competitive EPC and total solutions Consultancy Organisation.
The Mission of the Company is to achieve "Customer Delight"through innovative, cost effective and value added consulting &EPC services and Maximize creation of wealth, value and satisfactionfor stakeholders with high standards of business ethics aligned withnational policies.
Industrial / Business OperationsEIL is engaged in providing engineering consultancy and EPC
services for projects, both in India and abroad through its HeadOffice in New Delhi, regional offices in Chennai, Kolkata andVadodara and a branch office in Mumbai. It has inspection officesat all major equipment manufacturing locations in India and a whollyowned subsidiary, Certification Engineers International Ltd forundertaking independent certification and third party inspectionassignments.
It also have one wholly owned oversea subsidiaries namelyEIL Asia Pacific Sdn. Bhd. and two joint venture companies.
The services provided by the company comprise projectconceptualizing, designing, engineering, procurement, projectmanagement, construction management, pre-commissioning andcommissioning assistance in the hydro-carbon, mining andmetallurgy, and infrastructure sectors.
Performance HighlightsThe physical performance of the company for last two years
are given below:
www.engineersindia.com
Total Revenue of the company registered an increase of` 1317.62 crore during 2011-12, which went up from ` 2813.01crore in 2010-11 to ` 4130.63 crore in 2011-12. The net profit of thecompany correspondingly increased to ` 636.32 crore in 2011-12from ` 522.52 crore during previous year showing an increase of` 113.80 crore due to enhanced operational efficiency and cost control.
The current ratio of company is at 1.76:1during 2011-12 asagainst 1.55:1 in the previous year (Fig.2). Balance Sheet andProfit & Loss Account of the company and selected financial ratiosduring the period 2010-11 to 2011-12 can be seen on the adjoiningpage.
Main Products Unit Performance during
Services 2011-12 2010-11
Project/ Consultancy MillionServices man-hours 5.12 5.07
Consultancy & ` in Crore 1207 1128Engineering
Lump sum TurnkeyProjects (LSTK) ` in Crore 2491 1695
EB
ITD
A &
PA
T (
Rs.
cro
re) T
OTA
L R
EV
EN
UE
(Rs. cro
re)
PR
OF
ITA
BIL
ITY
RA
TIO
S (
%)
CU
RR
EN
T R
AT
IO
Fig.2
Fig.1
Strategic IssuesThe JV is expected to enhance EIL's business prospects in the
Middle East, while diversification in the non-hydrocarbon segmentsof the industrial sectors is envisaged to increase business for thenon-hydrocarbon segment of the company. The company has alsotaken initiative to improve its technology portfolio.

Public Enterprises Survey 2011-2012: Vol-II 491
BALANCE SHEET (` in Lakhs)
PARTICULARS 2011-12 2010-11
I. EQUITY & LIABILITIESAUTHORISED CAPITAL 30000 30000(1) Shareholders’ Funds(a) Share Capital
(i) Central Govt 13545 13545
(ii) Others 3302 3302
(b) Reserves & Surplus 167558 127365
(c) Money received against share warrants 0 0
Total Shareholders’ Funds (1(a)+1(b)+1(c) 184405 144212(2) Share application money pending allotment 0 0(3) Non-current Liabilities(a) Long Term Borrowings 0 0
(b) Deferred tax liabilities (Net) 0 0
(c) Other Long-term liabilities 513 467
(d) Long-term provisions 2002 1635
Total Non-Current Liabilities 3(a) to 3(d) 2515 2102(4) Current Liabilities(a) Short Term Borrowings 0 0
(b) Trade Payables 58723 30717
(c) Other current liabilities 75427 123044
(d) Short-term provisions 53336 46849
Total Current Liabilities 4(a) to 4(d) 187486 200610TOTAL EQUITY & LIABILITIES (1+2+3+4) 374406 346924II. ASSETS(1) Non-Current Assets(a) Total Gross Fixed Assets 18788 19283(ai) Accumulated Depreciation, Depletion & Amortisation 13479 13276
(aii) Accumulated Impairment 0 0
(b) Total Net Fixed Assets ((a)-(ai)-(aii) 5309 6007(c) Capital work in progress 5160 1308
(d) Intangible assets under developmet 0 0
(e) Non-Current Investments 6496 53(f) Deferred Tax Assets (Net) 21426 17564(g) Long Term Loans and Advances 5626 7434(h) Other Non-Current Assets 26 3624Total Non-Current Assets (b+c+d+e+f+g+h) 44043 35990(2) Current Assets(a) Current Investments 57001 51188(b) Inventories 82 87
(c) Trade Recievables 30737 30812
(d) Cash & Bank Balance 164314 172847
(e) Short-term Loans & Advances 18510 22474
(f) Other Current Assets 59719 33526
Total Current Assets (a+b+c+d+e+f) 330363 310934
TOTAL ASSETS (1+2) 374406 346924
Important Indicators(i) Investment 16847 16847
(ii) Capital Employed 184405 144212
(iii) Net Worth 184405 144212
(iv) Net Current Assets 142877 110324
(v) Cost of Sales 321578 202846
(vi) Net Value Added (at market price) 160411 145083
(vii) Total Regular Employees (Nos.) 3450 3417
(viii) Avg. Monthly Emoluments per Employee(`) 130843 126366
PROFIT & LOSS ACCOUNT (` in Lakhs)
PARTICULARS 2011-12 2010-11
(I) Revenue from Operations (Gross) 389845 265264Less : Excise Duty 0 0Revenue from Operations (Net) 389845 265264(II) Other Income 23218 16037(III) Total Revenue (I+II) 413063 281301(IV) Expenditure on:(a) Cost of materials consumed 0 0(b) Purchase of stock-in-trade 0 0(c) Changes in inventories of finished goods, 19963 -17065
work-in-progress and stock in trade(d) Stores & Spares 0 5(e) Power & Fuel 697 690(f) Salary, Wages & Benefits/Employees Expense 54169 51815(g) Other Operating/direct/manufacturing Expenses 219051 147923(h) Rent, Royalty & Cess 846 750(i) Loss on sale of Assets/Investments 8 6(j) Other Expenses 24907 17298Total Expenditure (IV (a to j)) 319641 201422(V) PROFIT BEFORE DEPRECIATION, & IMPAIRMENT, 93422 79879
FINANCE CHARGES/INTEREST, EXCEPTIONAL &EXTRAORDINARY ITEMS & TAXES (PBDIEET)(III-IV)
(VI) Depreciation, Depletion & Amortisation 1945 1430(VII) Impairment 0 0(VIII) PROFIT BEFORE FINANCE COST/INTEREST, 91477 78449
EXCEPTIONAL, EXTRA-ORDINARY ITEMS &TAXES (PBIEET)(V-VI-VII)
(IX) Finance Cost(a) On Central Government Loans 0 0(b) On Foreign Loans 0 0(c) Others 0 0(d) Less Finance Cost Capitalised 0 0(e) Charged to P & L Account (a+b+c+d) 0 0(X) PROFIT BEFORE EXCEPTIONAL & EXTRA- 91477 78449
ORDINARY ITEMS & TAX (PBEET)(VIII-IXe)(XI) Exceptional Items 0 0(XII) PROFIT BEFORE EXTRA-ORDINARY ITEMS & 91477 78449
TAX (PBET)(X-XI)(XIII) Extra-Ordinary Items 0 0(XIV) PROFIT BEFORE TAX (PBT)(XII-XIII) 91477 78449(XV) TAX PROVISIONS 27845 26197(XVI) NET PROFIT / LOSS FOR THE PERIOD FROM 63632 52252
CONTINUING OPERATIONS AFTER TAX(XIV-XV)(XVII) Profit/Loss from discontinuing operations 0 0(XVIII) Tax expenses of discontinuing operations 0 0(XIX) Profit/Loss from discontinuing operations 0 0
(after Tax)(XVII-XVIII)(XX) Profit/Loss for the period (XVI+XIX) 63632 52252Financial Ratios(i) Sales : Capital Employed 211.41 183.94
(ii) Cost of Sales : Sales 82.49 76.47
(iii) Salary/Wages : Sales 13.9 19.53
(iv) Net Profit : Net Worth 34.51 36.23
(v) Debt : Equity 0 0
(vi) Current Ratio 1.76 1.55
(vii) Trade Recievables : Sales 7.88 11.62
(viii) Total Inventory : Sales 0.02 0.03
ENGINEERS INDIA LTD.1, Bhikaiji Cama Place, RK Puram, New Delhi - 110066

Industrial Development & Tech. Consultancy Services492
HSCC (INDIA) LTD.
The CompanyHSCC was incorporated on 30th March 1983 under the
Companies Act, 1956 with an objective to be a market leader inproviding innovative, high quality knowledge based services in thehealth and social sectors by seeking opportunities in special marketniches and to develop as a consultancy organization withcontemporary professional standards in the field of healthcare.
HSCC is Knowledge based, Schedule 'C,' Miniratna CPSE inInfrastructural Development and Technical Consultancy ServicesSector under the administrative control of Ministry of Health &Family welfare, D/O Health with 100% shareholding by the CentralGovernment. The company employed 124 regular employees(Executives 107, Non-executives 17) as on 31.3.2012. Its registeredOffice is at Delhi and Corporate Office at Noida.
Vision/MissionThe Vision of the company is to be a leading consulting
company providing value-added, innovative and integrated servicesfor enhancing healthcare in India and overseas.
The Mission of the company is to provide comprehensiveconcept to commissioning, project planning, architectural,engineering, project management, procurement and related consultingservices for development of buildings and infrastructure forhealthcare and other purposes in India and overseas.
Industrial / Business OperationsHSCC is engaged in providing specialized consultancy services
in the health care and other social sector which include conductingstudies in rehabilitation, up gradation/ modernization and baselinesurvey and to undertake architectural planning & design, projectmanagement, procurement, acquisition of technology, informationtechnology/ recruitment / training in the field of hospitals and medicalrelated institutes and laboratories.
The company has diversified in the areas of hospital wastemanagement, hospital computerization, health related managementstudies and training & recruitment. The service range of the companycomprises of conceptual studies & management consultancy,engineering studies and facility design, project management,procurement, logistics & installation and information technology.
Performance HighlightsThe performance details of the company during the last two
year are as follows:-
Total Revenue of the company registered an increase of` 11.13 crore during 2011-12, which went up from ` 33.45 crore in2010-11 to ` 44.58 crore in 2011-12.The net profit of the companycorrespondingly grew to ` 14.72 crore, an increase of ` 6.38 croreover the previous year profit of ` 8.34 crore due to increase inother income and lower increase in operating expenses as comparedto increase in operations. www.hsccltd.com
The current ratio of company is at 2.69:1 during 2011-12 asagainst 3.64:1 in the previous year (Fig.2). Balance Sheet and Profit& Loss Account of the company and selected financial ratios duringthe period 2010-11 to 2011-12 can be seen on the adjoining page.
Strategic IssuesThe company aims to be known as the most preferred
consulting partner to the clients in the Healthcare and Social Sectorby offering customized innovative solutions through harnessingknowledge pools and team work. The Company has been makingvigorous efforts to expand the area of operations of the companyand has secured orders worth Rs. 50 crores from MOH&FW & Rs.9 crores from other organizations. The human resource managementpolicies are being reviewed from time to time. KnowledgeManagement System, E-tendering, E-procurement, Internal cumConcurrent Audit, etc are being strengthened.
Main Services Unit Performance during2011-12 2010-11
Consultancy Services ` in Lakhs 2928 2311
EB
ITD
A &
PA
T (
Rs.
cro
re) T
OTA
L R
EV
EN
UE
(Rs. cro
re)
PR
OF
ITA
BIL
ITY
RA
TIO
S (
%)
CU
RR
EN
T R
AT
IO
Fig.2
Fig.1

Public Enterprises Survey 2011-2012: Vol-II 493
BALANCE SHEET (` in Lakhs)
PARTICULARS 2011-12 2010-11
I. EQUITY & LIABILITIESAUTHORISED CAPITAL 500 500(1) Shareholders’ Funds(a) Share Capital
(i) Central Govt 240 240
(ii) Others 0 0
(b) Reserves & Surplus 8755 7632
(c) Money received against share warrants 0 0
Total Shareholders’ Funds (1(a)+1(b)+1(c) 8995 7872(2) Share application money pending allotment 0 0(3) Non-current Liabilities(a) Long Term Borrowings 0 0
(b) Deferred tax liabilities (Net) 0 0
(c) Other Long-term liabilities 25784 23537
(d) Long-term provisions 325 331
Total Non-Current Liabilities 3(a) to 3(d) 26109 23868(4) Current Liabilities(a) Short Term Borrowings 0 0
(b) Trade Payables 8 23
(c) Other current liabilities 19364 11467
(d) Short-term provisions 338 41
Total Current Liabilities 4(a) to 4(d) 19710 11531TOTAL EQUITY & LIABILITIES (1+2+3+4) 54814 43271II. ASSETS(1) Non-Current Assets(a) Total Gross Fixed Assets 1148 1114(ai) Accumulated Depreciation, Depletion & Amortisation 547 498
(aii) Accumulated Impairment 0 0
(b) Total Net Fixed Assets ((a)-(ai)-(aii) 601 616(c) Capital work in progress 0 0
(d) Intangible assets under developmet 0 0
(e) Non-Current Investments 0 0(f) Deferred Tax Assets (Net) 140 140(g) Long Term Loans and Advances 966 503(h) Other Non-Current Assets 0 0Total Non-Current Assets (b+c+d+e+f+g+h) 1707 1259(2) Current Assets(a) Current Investments 0 0
(b) Inventories 0 0
(c) Trade Recievables 1355 1955
(d) Cash & Bank Balance 47016 33921
(e) Short-term Loans & Advances 2085 4147
(f) Other Current Assets 2651 1989
Total Current Assets (a+b+c+d+e+f) 53107 42012
TOTAL ASSETS (1+2) 54814 43271
Important Indicators(i) Investment 240 240
(ii) Capital Employed 8995 7872
(iii) Net Worth 8995 7872
(iv) Net Current Assets 33397 30481
(v) Cost of Sales 2105 2025
(vi) Net Value Added (at market price) 4200 2840
(vii) Total Regular Employees (Nos.) 124 164
(viii) Avg. Monthly Emoluments per Employee(`) 97110 69207
PROFIT & LOSS ACCOUNT (` in Lakhs)
PARTICULARS 2011-12 2010-11
(I) Revenue from Operations (Gross) 2929 2311Less : Excise Duty 0 0Revenue from Operations (Net) 2929 2311(II) Other Income 1529 1034(III) Total Revenue (I+II) 4458 3345(IV) Expenditure on:(a) Cost of materials consumed 0 0(b) Purchase of stock-in-trade 0 0(c) Changes in inventories of finished goods, 0 0
work-in-progress and stock in trade(d) Stores & Spares 0 0(e) Power & Fuel 33 29(f) Salary, Wages & Benefits/Employees Expense 1445 1362(g) Other Operating/direct/manufacturing Expenses 151 196(h) Rent, Royalty & Cess 18 22(i) Loss on sale of Assets/Investments 1 0(j) Other Expenses 400 380Total Expenditure (IV (a to j)) 2048 1989(V) PROFIT BEFORE DEPRECIATION, & IMPAIRMENT, 2410 1356
FINANCE CHARGES/INTEREST, EXCEPTIONAL &EXTRAORDINARY ITEMS & TAXES (PBDIEET)(III-IV)
(VI) Depreciation, Depletion & Amortisation 58 36(VII) Impairment 0 0(VIII) PROFIT BEFORE FINANCE COST/INTEREST, 2352 1320
EXCEPTIONAL, EXTRA-ORDINARY ITEMS &TAXES (PBIEET)(V-VI-VII)
(IX) Finance Cost(a) On Central Government Loans 0 0(b) On Foreign Loans 0 0(c) Others 0 0(d) Less Finance Cost Capitalised 0 0(e) Charged to P & L Account (a+b+c+d) 0 0(X) PROFIT BEFORE EXCEPTIONAL & EXTRA- 2352 1320
ORDINARY ITEMS & TAX (PBEET)(VIII-IXe)(XI) Exceptional Items 0 0(XII) PROFIT BEFORE EXTRA-ORDINARY ITEMS & 2352 1320
TAX (PBET)(X-XI)(XIII) Extra-Ordinary Items 0 0(XIV) PROFIT BEFORE TAX (PBT)(XII-XIII) 2352 1320(XV) TAX PROVISIONS 880 487(XVI) NET PROFIT / LOSS FOR THE PERIOD FROM 1472 833
CONTINUING OPERATIONS AFTER TAX(XIV-XV)(XVII) Profit/Loss from discontinuing operations 0 0(XVIII) Tax expenses of discontinuing operations 0 0
(XIX) Profit/Loss from discontinuing operations 0 0(after Tax)(XVII-XVIII)
(XX) Profit/Loss for the period (XVI+XIX) 1472 833Financial Ratios(i) Sales : Capital Employed 32.56 29.36
(ii) Cost of Sales : Sales 71.87 87.62
(iii) Salary/Wages : Sales 49.33 58.94
(iv) Net Profit : Net Worth 16.36 10.58
(v) Debt : Equity 0 0
(vi) Current Ratio 2.69 3.64
(vii) Trade Recievables : Sales 46.26 84.6
(viii) Total Inventory : Sales 0 0
HSCC (INDIA) LTD.205, Eastend Plaza, Plot No. 4, D.D.A.-L.S.C., Centre-2, Vasundhara Enclave, Delhi-110096

Industrial Development & Tech. Consultancy Services494
MECON Ltd.
The CompanyMECON LIMITED (Formerly known as Metallurgical &
Engineering Consultants (India) Limited) was incorporated on31.03.1973 with an objective to operate pre-dominantly in the iron& steel sector, which was its core competence area at that time.
It is a Schedule "A" Miniratna / BRPSE referred CPSE in theIndustrial Development and Technical Consultancy service sectorunder the administrative control of Ministry of Steel with 100%shareholding of Government of India. The company employed 1747regular employees (Executives 1544 & Non-Executives 203) as on31.3.2012. It's registered and Corporate Office is at Ranchi,Jharkhand
Vision / MissionThe Vision / Mission of the company is to develop into an
internationally recognized center of excellence for providing qualityservices in technical consultancy, design & engineering, design &supply of plant, equipment & systems, project implementationfrom concept to commissioning for industrial development &upgradation ventures, development of infrastructure and otherservice sectors.
Industrial / Business OperationsIt is one of the premier multi disciplinary design, engineering,
consultancy and contracting organization in the field of iron &steel, chemicals, refineries & petrochemicals, power, roads &highways, railways, water management, ports & harbours, gas &oil, pipelines, non ferrous, mining, general engineering, environmentalengineering and other related / diversified areas with extensiveoverseas experience. Its scope of services includes the entire gamutof work relating to setting up of projects in green as well as brownfield from concept to commissioning.
MECON, an ISO: 9001-2008 accredited company is registeredwith WB, ADB, EBRD, AFDC and UNIDO and has numerousproject specific alliances with leading technologists across the globein various fields. MECON's multi skilled expertise in 35 technicaldisciplines creates the synergy vital for realizing projects in time,cost and quality.
The company has one 50:50 financial joint venture namelyMECON (Nigeria) Limited with Nigerian Govt.
Performance Highlights The physical performances of the company for last two years
are given below:
Total Revenue of the company registered an increase of` 95.67 crore during 2011-12, which went up from ` 694.77 crore in2010-11 to ` 790.44 crore in 2011-12. The profit of the company has www.meconlimited.co.in
gone up by ` 42.68 crore to ` 136.36 crore in 2011-12, from` 93.68 crore in previous year due to higher volume of business handled.
The current ratio of company is at 2.07:1 during 2011-12 asagainst 2.27:1 in the previous year (Fig.2). Balance Sheet and Profit& Loss Account of the company and selected financial ratios duringthe period 2010-11 to 2011-12 can be seen on the adjoining page.
Strategic issuesMECON was referred to BRPSE and the Board has given its
recommendations in 2006 and revival plan was approved byGovernment in 2007. Under business restructuring, the companyhas already gone ahead with formation of 4 Strategic BusinessUnits (SBUs) namely Metals (Iron & Steel), Oil & Gas, Power andInfrastructure. It is now one of the Turnaround CPSE as per theguidelines issued by the Government of India for declaring a sickCPSE as "Turnaround CPSE".
Main Services Unit Performance during
2011-12 2010-11
Consultancy Service ` in Crore 457.92 423.23
Construction ` in Crore 185.91 218.14Contracts
EB
ITD
A &
PA
T (
Rs.
cro
re) T
OTA
L R
EV
EN
UE
(Rs. cro
re)
PR
OF
ITA
BIL
ITY
RA
TIO
S (
%)
CU
RR
EN
T R
AT
IO
Fig.2
Fig.1

Public Enterprises Survey 2011-2012: Vol-II 495
BALANCE SHEET (` in Lakhs)
PARTICULARS 2011-12 2010-11
I. EQUITY & LIABILITIESAUTHORISED CAPITAL 10400 10400
(1) Shareholders’ Funds
(a) Share Capital
(i) Central Govt 9054 10314
(ii) Others 0 0
(b) Reserves & Surplus 24761 12425
(c) Money received against share warrants 0 0
Total Shareholders’ Funds (1(a)+1(b)+1(c) 33815 22739
(2) Share application money pending allotment 0 0
(3) Non-current Liabilities
(a) Long Term Borrowings 2500 5000
(b) Deferred tax liabilities (Net) 0 647
(c) Other Long-term liabilities 7618 15843
(d) Long-term provisions 22548 19926
Total Non-Current Liabilities 3(a) to 3(d) 32666 41416
(4) Current Liabilities
(a) Short Term Borrowings 1 4
(b) Trade Payables 16919 12515
(c) Other current liabilities 18377 17540
(d) Short-term provisions 14908 10310
Total Current Liabilities 4(a) to 4(d) 50205 40369
TOTAL EQUITY & LIABILITIES (1+2+3+4) 116686 104524
II. ASSETS
(1) Non-Current Assets
(a) Total Gross Fixed Assets 12356 12128
(ai) Accumulated Depreciation, Depletion & Amortisation 5203 4810
(aii) Accumulated Impairment 0 0
(b) Total Net Fixed Assets ((a)-(ai)-(aii) 7153 7318
(c) Capital work in progress 276 221
(d) Intangible assets under developmet 0 0
(e) Non-Current Investments 512 512
(f) Deferred Tax Assets (Net) 83 0
(g) Long Term Loans and Advances 1606 1273
(h) Other Non-Current Assets 3112 3729
Total Non-Current Assets (b+c+d+e+f+g+h) 12742 13053
(2) Current Assets
(a) Current Investments 0 0
(b) Inventories 665 558
(c) Trade Recievables 13063 17769
(d) Cash & Bank Balance 72360 60217
(e) Short-term Loans & Advances 5381 4403
(f) Other Current Assets 12475 8524
Total Current Assets (a+b+c+d+e+f) 103944 91471
TOTAL ASSETS (1+2) 116686 104524
Important Indicators
(i) Investment 11554 15314
(ii) Capital Employed 36315 27739
(iii) Net Worth 33815 22739
(iv) Net Current Assets 53739 51102
(v) Cost of Sales 58412 54909
(vi) Net Value Added (at market price) 52557 52689
(vii) Total Regular Employees (Nos.) 1747 1823
(viii) Avg. Monthly Emoluments per Employee(`) 124246 135514
PROFIT & LOSS ACCOUNT (` in Lakhs)
PARTICULARS 2011-12 2010-11
(I) Revenue from Operations (Gross) 72321 64437Less : Excise Duty 0 0Revenue from Operations (Net) 72321 64437(II) Other Income 6724 5041(III) Total Revenue (I+II) 79045 69478(IV) Expenditure on:(a) Cost of materials consumed 0 0(b) Purchase of stock-in-trade 19806 13935(c) Changes in inventories of finished goods,
work-in-progress and stock in trade -71 511(d) Stores & Spares 266 304(e) Power & Fuel 536 478(f) Salary, Wages & Benefits/Employees Expense 26047 29645(g) Other Operating/direct/manufacturing Expenses 5740 6351(h) Rent, Royalty & Cess 93 43(i) Loss on sale of Assets/Investments 16 5(j) Other Expenses 5589 3234Total Expenditure (IV (a to j)) 58022 54506(V) PROFIT BEFORE DEPRECIATION, & IMPAIRMENT,
FINANCE CHARGES/INTEREST, EXCEPTIONAL &EXTRAORDINARY ITEMS & TAXES (PBDIEET)(III-IV) 21023 14972
(VI) Depreciation, Depletion & Amortisation 406 408(VII) Impairment 0 0(VIII) PROFIT BEFORE FINANCE COST/INTEREST,
EXCEPTIONAL, EXTRA-ORDINARY ITEMS &TAXES (PBIEET)(V-VI-VII) 20617 14564
(IX) Finance Cost(a) On Central Government Loans 0 0(b) On Foreign Loans 0 0(c) Others 464 471(d) Less Finance Cost Capitalised 0 0(e) Charged to P & L Account (a+b+c+d) 464 471(X) PROFIT BEFORE EXCEPTIONAL & EXTRA-
ORDINARY ITEMS & TAX (PBEET)(VIII-IXe) 20153 14093(XI) Exceptional Items 0 0(XII) PROFIT BEFORE EXTRA-ORDINARY ITEMS &
TAX (PBET)(X-XI) 20153 14093(XIII) Extra-Ordinary Items 0 0(XIV) PROFIT BEFORE TAX (PBT)(XII-XIII) 20153 14093(XV) TAX PROVISIONS 6517 4725(XVI) NET PROFIT / LOSS FOR THE PERIOD FROM
CONTINUING OPERATIONS AFTER TAX(XIV-XV) 13636 9368(XVII) Profit/Loss from discontinuing operations 0 0(XVIII) Tax expenses of discontinuing operations 0 0(XIX) Profit/Loss from discontinuing operations
(after Tax)(XVII-XVIII) 0 0(XX) Profit/Loss for the period (XVI+XIX) 13636 9368Financial Ratios(i) Sales : Capital Employed 199.15 232.3
(ii) Cost of Sales : Sales 80.77 85.21
(iii) Salary/Wages : Sales 36.02 46.01
(iv) Net Profit : Net Worth 40.33 41.2
(v) Debt : Equity 0.28 0.48
(vi) Current Ratio 2.07 2.27
(vii) Trade Recievables : Sales 18.06 27.58
(viii) Total Inventory : Sales 0.92 0.87
MECON Ltd.Vivekananda Path, Doranda Ranchi, Jharkhand 834 002

Industrial Development & Tech. Consultancy Services496
National Informatics Centre Services Incorporated
The CompanyNational Informatics Centre Services Inc. (NICSI) was
incorporated on 28.08.1995 as a section 25 company with theobjective to provide support to National Informatics Centre (NIC)in various promotional and commercial activities being undertakenby NIC. It provides operational support for NIC's mega-projectsand provides total IT solutions to the Government organizations.
NICSI is an un-categorized CPSE in Industrial Development& Tech. Consultancy Services Sector under the administrativecontrol of M/o Communication and Information Technology, D/oInformation Technology with 100% shareholding by theGovernment of India. The company employed 45 regular employees(Executives 45 & Non-Executives 0) as on 31.3.2012.Its Registeredand Corporate offices are at New Delhi.
Vision / MissionThe Vision / Mission of NICSI is to be a dominant player in
implementation of Information & Communication Technology(ICT) projects in the Government sector and to help in achievingaccelerated socio-economic development of the country.
Industrial / Business OperationsNICSI is engaged in promoting economic, scientific,
technological, social and cultural development of India bypromoting, assisting and streamlining the creation, adaptation,absorption, application, dissemination, growth and utilization ofInformation Technology including computer Technology, computercommunication networks, informatics, digital automation andcomputer aided modernization in various facets of Governmentand Society including local self governments, educationalinstitutions, financial institutions, societies, libraries, researchinstitutions, etc. in public, private and cooperative sectors throughnon-commercial and commercial applications of the know howmethodologies, software, hardware, database, information base,knowledge base, expertise, infrastructure, Value Added Telecomservices and other services developed by the NIC of the GOI,including its computer communication network (NICNET) andassociated infrastructure and services as well as the network andassociated infrastructure and services of collaborators and associatesof NIC with whom NIC has legally binding relationships.
Performance Highlights The physical performances of the company for last two years
are given below:
www.nicsi.com
` 39.71 crore in previous year due to increase in operating income.
The current ratio of company is at 7.28:1 during 2011-12 asagainst 6.88:1 in the previous year (Fig.2). Balance Sheet and Profit& Loss Account of the company and selected financial ratios duringthe period 2010-11 to 2011-12 can be seen on the adjoining page.
Strategic issuesThe other main objectives of the Company are to promote use
of Information & Communication Technology (ICT) in Government,to support faster implementation of ICT projects, to procurehardware, software and support services for Governmentorganizations at competitive rates through tendering and/or strategicalliance/ agreements with leading ICT and management organizations,to help in the promotion and adoption of new technology in thearea of ICT-enabled change management, to support creation ofexpertise within Government in the frontier areas of ICT and ICT-enabled change management.
Main Services Unit Performance during2011-12 2010-11
Sale of traded Goods ` in Crore 209.68 155.30
Service Income ` in Crore 128.70 102.29
EB
ITD
A &
PA
T (
Rs.
cro
re) T
OTA
L R
EV
EN
UE
(Rs. cro
re)
PR
OF
ITA
BIL
ITY
RA
TIO
S (
%)
CU
RR
EN
T R
AT
IO
Fig.2
Fig.1
Total Revenue of the company registered an increase of` 80.20 crore during 2011-12, which went up from ` 327.22 crorein 2010-11 to ̀ 407.42 crore in 2011-12. The profit of the companyhas gone up by ` 11.79 crore to ` 51.50 crore in 2011-12, from

Public Enterprises Survey 2011-2012: Vol-II 497
BALANCE SHEET (` in Lakhs)
PARTICULARS 2011-12 2010-11
I. EQUITY & LIABILITIESAUTHORISED CAPITAL 200 200(1) Shareholders’ Funds(a) Share Capital
(i) Central Govt 200 200
(ii) Others 0 0
(b) Reserves & Surplus 34392 29242
(c) Money received against share warrants 0 0
Total Shareholders’ Funds (1(a)+1(b)+1(c) 34592 29442(2) Share application money pending allotment 0 0(3) Non-current Liabilities(a) Long Term Borrowings 0 0
(b) Deferred tax liabilities (Net) 59 245
(c) Other Long-term liabilities 187191 60660
(d) Long-term provisions 445 0
Total Non-Current Liabilities 3(a) to 3(d) 187695 60905(4) Current Liabilities(a) Short Term Borrowings 0 0
(b) Trade Payables 8683 9126
(c) Other current liabilities 1352 2221
(d) Short-term provisions 2988 2203
Total Current Liabilities 4(a) to 4(d) 13023 13550TOTAL EQUITY & LIABILITIES (1+2+3+4) 235310 103897II. ASSETS(1) Non-Current Assets(a) Total Gross Fixed Assets 6049 5412(ai) Accumulated Depreciation, Depletion & Amortisation 3097 2502
(aii) Accumulated Impairment 0 0
(b) Total Net Fixed Assets ((a)-(ai)-(aii) 2952 2910(c) Capital work in progress 501 264
(d) Intangible assets under developmet 0 0
(e) Non-Current Investments 0 0(f) Deferred Tax Assets (Net) 0 0(g) Long Term Loans and Advances 131259 3444(h) Other Non-Current Assets 5744 4032Total Non-Current Assets (b+c+d+e+f+g+h) 140456 10650(2) Current Assets(a) Current Investments 0 0(b) Inventories 221 292(c) Trade Recievables 6946 12070
(d) Cash & Bank Balance 80325 78032
(e) Short-term Loans & Advances 7362 2850
(f) Other Current Assets 0 3
Total Current Assets (a+b+c+d+e+f) 94854 93247
TOTAL ASSETS (1+2) 235310 103897
Important Indicators(i) Investment 200 200
(ii) Capital Employed 34592 29442
(iii) Net Worth 34592 29442
(iv) Net Current Assets 81831 79697
(v) Cost of Sales 32964 26828
(vi) Net Value Added (at market price) 11785 8722
(vii) Total Regular Employees (Nos.) 45 52
(viii) Avg. Monthly Emoluments per Employee(`) 138333 116827
PROFIT & LOSS ACCOUNT (` in Lakhs)
PARTICULARS 2011-12 2010-11
(I) Revenue from Operations (Gross) 35059 28244Less : Excise Duty 0 0Revenue from Operations (Net) 35059 28244(II) Other Income 5683 4478(III) Total Revenue (I+II) 40742 32722(IV) Expenditure on:(a) Cost of materials consumed 0 0(b) Purchase of stock-in-trade 17608 13313(c) Changes in inventories of finished goods,
work-in-progress and stock in trade 72 226(d) Stores & Spares 53 37(e) Power & Fuel 132 406(f) Salary, Wages & Benefits/Employees Expense 747 729(g) Other Operating/direct/manufacturing Expenses 10455 8570(h) Rent, Royalty & Cess 1103 437(i) Loss on sale of Assets/Investments 0 0(j) Other Expenses 2200 2498Total Expenditure (IV (a to j)) 32370 26216(V) PROFIT BEFORE DEPRECIATION, & IMPAIRMENT,
FINANCE CHARGES/INTEREST, EXCEPTIONAL &EXTRAORDINARY ITEMS & TAXES (PBDIEET)(III-IV) 8372 6506
(VI) Depreciation, Depletion & Amortisation 594 612(VII) Impairment 0 0(VIII) PROFIT BEFORE FINANCE COST/INTEREST,
EXCEPTIONAL, EXTRA-ORDINARY ITEMS &TAXES (PBIEET)(V-VI-VII) 7778 5894
(IX) Finance Cost(a) On Central Government Loans 0 0(b) On Foreign Loans 0 0(c) Others 0 0(d) Less Finance Cost Capitalised 0 0(e) Charged to P & L Account (a+b+c+d) 0 0(X) PROFIT BEFORE EXCEPTIONAL & EXTRA-
ORDINARY ITEMS & TAX (PBEET)(VIII-IXe) 7778 5894(XI) Exceptional Items 0 0(XII) PROFIT BEFORE EXTRA-ORDINARY ITEMS &
TAX (PBET)(X-XI) 7778 5894(XIII) Extra-Ordinary Items 0 0(XIV) PROFIT BEFORE TAX (PBT)(XII-XIII) 7778 5894(XV) TAX PROVISIONS 2628 1923(XVI) NET PROFIT / LOSS FOR THE PERIOD FROM
CONTINUING OPERATIONS AFTER TAX(XIV-XV) 5150 3971(XVII) Profit/Loss from discontinuing operations 0 0(XVIII) Tax expenses of discontinuing operations 0 0
(XIX) Profit/Loss from discontinuing operations(after Tax)(XVII-XVIII) 0 0
(XX) Profit/Loss for the period (XVI+XIX) 5150 3971Financial Ratios(i) Sales : Capital Employed 101.35 95.93
(ii) Cost of Sales : Sales 94.02 94.99
(iii) Salary/Wages : Sales 2.13 2.58
(iv) Net Profit : Net Worth 14.89 13.49
(v) Debt : Equity 0 0
(vi) Current Ratio 7.28 6.88
(vii) Trade Recievables : Sales 19.81 42.73
(viii) Total Inventory : Sales 0.63 1.03
NATIONAL INFORMATION CENTRE SERVICES INCORPORATEDHall No. 2&3, 6th Floor, NBCC Tower, 15, Bhikaji Cama Place, New Delhi-110066
2011-12 Provisional

Industrial Development & Tech. Consultancy Services498
National Research Development Corpn.
The CompanyNational Research Development Corporation (NRDC) was
incorporated on 31st December 1953 by the Government of India,under Section 25 of the Companies Act, 1956. The primary objectiveof the company is to act as a catalyst to promote, develop andcommercialize the technologies / know how / inventions / patents /processes emanating from various national R&D Institutions.
NRDC is a Schedule 'C' CPSE under Industrial Developmentand Technical Consultancy Services group, under the administrativecontrol of Ministry of Science & Technology, Department ofScientific & Industrial Research with 100% shareholding by theGovernment of India. The company employed 89 regular employees(Executives 40 & Non-Executives 49) as on 31.3.2012. TheCorporation's Registered and Corporate Offices are at New Delhi.
Vision / MissionThe Vision of the Company is to promote, develop, nurture
and commercialize innovative, reliable and competitive technologiesfrom academia, research laboratories, industry and individuals, andbe the topmost Technology Transfer Organization
The Mission of the Company is to provide world classbusiness services in technology, to the wider market of creators andusers of technology, through value addition and partnership and tomediate the marching of technologies that would be needed andsought by industry and other users of technology and, the IntellectualProperties (IP) developed by technology creators.
Industrial / Business OperationsNRDC is engaged in providing technical, commercial and
financial measures needed for closing gaps in the "innovation chain"through which an idea, invention or process is converted into aproduct in the market by way of adding value to the indigenoustechnologies, provide Intellectual Property Rights (IPR),consultancy, etc. and licensing them to entrepreneurs. The servicerange of the company comprises of Licensing, consultancy andother technical services. The operation of the company encompassestwo major roles, viz., Commercial and Promotional. The companyhas one Regional Office at Bengaluru
Performance HighlightsNRDC is Technology Transfer organization. The company is
also getting annual grants from Government of India for the activitiesof Invention Promotion Programme and Technology promotionProgramme. The physical performances of the company for lasttwo years are given below:
www.nrdcindia.com
Total Revenue of the company registered an increase of` 1.14 crore during 2011-12, which went up from ` 9.59 crore in2010-11 to ` 10.73 crore in 2011-12. The losses of the companyhas also gone down by ̀ 0.46 crore to ̀ 0.58 crore in 2011-12, from` 1.04 crore in previous year due to increase in other income.
The current ratio of company is at 1.42:1 during 2011-12 asagainst 1.50:1 in the previous year (Fig.2). Balance Sheet and Profit& Loss Account of the company and selected financial ratios duringthe period 2010-11 to 2011-12 can be seen on the adjoining page.
Main Services Unit Performance during2011-12 2010-11
Premin received ` in Cr. 0.98 1.20
Royalty Earned ` in Cr. 4.69 6.63
Consultancy ` in Cr. 2.47 0.26
Technologies Licensed Nos. 33 49
Technologies assigned Nos. 32 40
Strategic issuesSeveral agencies and Govt. Departments have started their
own Technology Transfer Cells in India thereby posing competitionfor NRDC. However NRDC being a five decade old organizationhas mastered the nuances of technology transfer and has devisednewer ways of capturing the market through innovative marketstrategies for better commercialization.
Fig.2
Fig.1
EB
ITD
A &
PA
T (
Rs.
cro
re) T
OTA
L R
EV
EN
UE
(Rs. cro
re)
PR
OF
ITA
BIL
ITY
RA
TIO
S (
%)
CU
RR
EN
T R
AT
IO

Public Enterprises Survey 2011-2012: Vol-II 499
BALANCE SHEET (` in Lakhs)
PARTICULARS 2011-12 2010-11
I. EQUITY & LIABILITIESAUTHORISED CAPITAL 1000 1000(1) Shareholders’ Funds(a) Share Capital
(i) Central Govt 442 442
(ii) Others 0 0
(b) Reserves & Surplus 434 493
(c) Money received against share warrants 0 0
Total Shareholders’ Funds (1(a)+1(b)+1(c) 876 935(2) Share application money pending allotment 0 0(3) Non-current Liabilities(a) Long Term Borrowings 0 0
(b) Deferred tax liabilities (Net) 0 0
(c) Other Long-term liabilities 76 76
(d) Long-term provisions 152 129
Total Non-Current Liabilities 3(a) to 3(d) 228 205(4) Current Liabilities(a) Short Term Borrowings 0 0
(b) Trade Payables 1480 1430
(c) Other current liabilities 481 368
(d) Short-term provisions 151 32
Total Current Liabilities 4(a) to 4(d) 2112 1830TOTAL EQUITY & LIABILITIES (1+2+3+4) 3216 2970II. ASSETS(1) Non-Current Assets(a) Total Gross Fixed Assets 226 227(ai) Accumulated Depreciation, Depletion & Amortisation 150 141
(aii) Accumulated Impairment 0 0
(b) Total Net Fixed Assets ((a)-(ai)-(aii) 76 86(c) Capital work in progress 0 0
(d) Intangible assets under developmet 0 0
(e) Non-Current Investments 0 0(f) Deferred Tax Assets (Net) 84 58(g) Long Term Loans and Advances 51 61(h) Other Non-Current Assets 0 28Total Non-Current Assets (b+c+d+e+f+g+h) 211 233(2) Current Assets(a) Current Investments 0 0(b) Inventories 0 1
(c) Trade Recievables 1158 1036
(d) Cash & Bank Balance 1602 1508
(e) Short-term Loans & Advances 139 180
(f) Other Current Assets 106 12
Total Current Assets (a+b+c+d+e+f) 3005 2737
TOTAL ASSETS (1+2) 3216 2970
Important Indicators(i) Investment 442 442
(ii) Capital Employed 876 935
(iii) Net Worth 876 935
(iv) Net Current Assets 893 907
(v) Cost of Sales 1157 1117
(vi) Net Value Added (at market price) -254 -461
(vii) Total Regular Employees (Nos.) 89 94
(viii) Avg. Monthly Emoluments per Employee(`) 44663 31560
PROFIT & LOSS ACCOUNT (` in Lakhs)
PARTICULARS 2011-12 2010-11
(I) Revenue from Operations (Gross) 813 815Less : Excise Duty 0 0Revenue from Operations (Net) 813 815(II) Other Income 260 144(III) Total Revenue (I+II) 1073 959(IV) Expenditure on:(a) Cost of materials consumed 0 0(b) Purchase of stock-in-trade 0 6(c) Changes in inventories of finished goods,
work-in-progress and stock in trade 0 0(d) Stores & Spares 0 0(e) Power & Fuel 2 2(f) Salary, Wages & Benefits/Employees Expense 477 356(g) Other Operating/direct/manufacturing Expenses 424 605(h) Rent, Royalty & Cess 3 4(i) Loss on sale of Assets/Investments 0 0(j) Other Expenses 241 133Total Expenditure (IV (a to j)) 1147 1106(V) PROFIT BEFORE DEPRECIATION, & IMPAIRMENT,
FINANCE CHARGES/INTEREST, EXCEPTIONAL &EXTRAORDINARY ITEMS & TAXES (PBDIEET)(III-IV) -74 -147
(VI) Depreciation, Depletion & Amortisation 10 11(VII) Impairment 0 0(VIII) PROFIT BEFORE FINANCE COST/INTEREST,
EXCEPTIONAL, EXTRA-ORDINARY ITEMS &TAXES (PBIEET)(V-VI-VII) -84 -158
(IX) Finance Cost(a) On Central Government Loans 0 0(b) On Foreign Loans 0 0(c) Others 0 0(d) Less Finance Cost Capitalised 0 0(e) Charged to P & L Account (a+b+c+d) 0 0(X) PROFIT BEFORE EXCEPTIONAL & EXTRA-
ORDINARY ITEMS & TAX (PBEET)(VIII-IXe) -84 -158(XI) Exceptional Items 0 0(XII) PROFIT BEFORE EXTRA-ORDINARY ITEMS &
TAX (PBET)(X-XI) -84 -158(XIII) Extra-Ordinary Items 0 0(XIV) PROFIT BEFORE TAX (PBT)(XII-XIII) -84 -158(XV) TAX PROVISIONS -26 -54(XVI) NET PROFIT / LOSS FOR THE PERIOD FROM
CONTINUING OPERATIONS AFTER TAX(XIV-XV) -58 -104(XVII) Profit/Loss from discontinuing operations 0 0(XVIII) Tax expenses of discontinuing operations 0 0
(XIX) Profit/Loss from discontinuing operations(after Tax)(XVII-XVIII) 0 0
(XX) Profit/Loss for the period (XVI+XIX) -58 -104Financial Ratios(i) Sales : Capital Employed 92.81 87.17
(ii) Cost of Sales : Sales 142.31 137.06
(iii) Salary/Wages : Sales 58.67 43.68
(iv) Net Profit : Net Worth -6.62 -11.12
(v) Debt : Equity 0 0
(vi) Current Ratio 1.42 1.5
(vii) Trade Recievables : Sales 142.44 127.12
(viii) Total Inventory : Sales 0 0.12
NATIONAL RESEARCH DEVELOPMENT CORPN.NRDC, 20-22, Zanroordpur Community Centre, Kailash Colony Extension, New Delhi-110048

Industrial Development & Tech. Consultancy Services500
National Small Industries Corpn. Ltd.
The CompanyNational small Industries Corporation Ltd. (NSIC) was
incorporated in 1955 with the objective to aid, counsel, assist,finance, protect and promote the interests of small scale industriesin the country.
NSIC is a Schedule-'B' CPSE in Industrial Development &Tech. Consultancy Services sector under the administrative controlof M/o Micro, Small and Medium Enterprises with 100%shareholding by the Government of India. The Company employed896 employees (Executives 426, Non-Executives 470) as on31.03.2012. Its Registered and Corporate Office is in New Delhi.
Vision / MissionThe Vision of the Corporation is to be a premier organization
fostering the growth of Micro, Small and Medium Enterprises(MSMEs) sector.
The Mission of the Corporation is to promote & supportMicro, Small and Medium Enterprises (MSMEs) Sector byproviding integrated support services encompassing Marketing,Technology, Finance and other services.
Industrial / Business OperationsThe main operations of the Corporation includes Raw Material
Distribution, Single Point Registration for Government Purchase,Consortia and Tender Marketing, Marketing Intelligence, Exhibitionsand Technology Fairs, Buyer Seller meets, Export of Products andProjects, Technology Support, Credit Support, Financing throughsyndication with Banks, Performance & Credit Rating Scheme forSmall Industries, International Cooperation & Consultancy Servicesand other support services to MSMEs which interalia includesinfomediary services under B2B portal, STPs, etc. NSIC is alsooperating godowns MSMEs vis-à-vis availability of raw materials.The corporation has 153 offices at various locations with view toincrease its reach.
Performance HighlightsThe physical performance of Company during last two years
is shows below:-
www. nsic.co.in
in volume of operations due to increase in company's outreach byoperating offices in various new areas and overall improvement inincome from most of its schemes.
The current ratio of company is at 1.24:1 during 2011-12 asagainst 1.14:1 in the previous year (Fig.2). Balance Sheet and Profit& Loss Account of the company and selected financial ratios duringthe period 2010-11 to 2011-12 can be seen on the adjoining page.
Strategic IssuesNSIC increased its reach by operating offices in various new
areas. It has signed MOU with over 50 Industry Associations toprovide service at doorsteps of the MSEs. The company has alsomade arrangements with bulk manufacturers for procuring rawmaterial like steel, aluminum, copper, bitumen, Coal, zinc etc. forSMEs.
EB
ITD
A &
PA
T (
Rs.
cro
re) T
OTA
L R
EV
EN
UE
(Rs. cro
re)
PR
OF
ITA
BIL
ITY
RA
TIO
S (
%)
CU
RR
EN
T R
AT
IO
Fig.2
Fig.1
Main Services Unit Performance during
2011-12 2010-11
Business Turnover 11137 7979
Raw Material Assistance ` in Crore 1573 983Portfolio
Volume of Distribution ` in Crore 10642 7710of Raw Material &Godown Operation
Performance & Credit ` in Crore 13547 10327Rating Units
Revenue from Technical ` in Crore 23.99 18.16 Centers
Total Revenue of the company registered an increase of` 353.78 crore during 2011-12, which went up from ` 993.11 crorein 2010-11 to ` 1346.89 crore in 2011-12.The Net profit howeverincreased by ` 11.43 and reached ` 41.21 crores in 2011-12 from` 29.78 crores in 2010-11. The growth can be attributed to increase

Public Enterprises Survey 2011-2012: Vol-II 501
BALANCE SHEET (` in Lakhs)
PARTICULARS 2011-12 2010-11
I. EQUITY & LIABILITIESAUTHORISED CAPITAL 53500 23500(1) Shareholders’ Funds(a) Share Capital
(i) Central Govt 38799 23299
(ii) Others 0 0
(b) Reserves & Surplus -5828 -8920
(c) Money received against share warrants 0 0
Total Shareholders’ Funds (1(a)+1(b)+1(c) 32971 14379(2) Share application money pending allotment 0 0(3) Non-current Liabilities(a) Long Term Borrowings 5969 5720
(b) Deferred tax liabilities (Net) 0 0
(c) Other Long-term liabilities 336 385
(d) Long-term provisions 2516 2220
Total Non-Current Liabilities 3(a) to 3(d) 8821 8325(4) Current Liabilities(a) Short Term Borrowings 111773 86668
(b) Trade Payables 3687 1950
(c) Other current liabilities 13175 7914
(d) Short-term provisions 6557 4144
Total Current Liabilities 4(a) to 4(d) 135192 100676TOTAL EQUITY & LIABILITIES (1+2+3+4) 176984 123380II. ASSETS(1) Non-Current Assets(a) Total Gross Fixed Assets 9199 9028(ai) Accumulated Depreciation, Depletion & Amortisation 3355 3316
(aii) Accumulated Impairment 0 0
(b) Total Net Fixed Assets ((a)-(ai)-(aii) 5844 5712(c) Capital work in progress 2017 428
(d) Intangible assets under developmet 0 0
(e) Non-Current Investments 8 8(f) Deferred Tax Assets (Net) 0 0(g) Long Term Loans and Advances 979 1842(h) Other Non-Current Assets 230 192Total Non-Current Assets (b+c+d+e+f+g+h) 9078 8182(2) Current Assets(a) Current Investments 0 0(b) Inventories 101 101
(c) Trade Recievables 4480 2959
(d) Cash & Bank Balance 14529 19371
(e) Short-term Loans & Advances 148380 92307
(f) Other Current Assets 416 460
Total Current Assets (a+b+c+d+e+f) 167906 115198
TOTAL ASSETS (1+2) 176984 123380
Important Indicators(i) Investment 44768 29019
(ii) Capital Employed 38940 20099
(iii) Net Worth 32971 14379
(iv) Net Current Assets 32714 14522
(v) Cost of Sales 119528 91300
(vi) Net Value Added (at market price) 14064 8449
(vii) Total Regular Employees (Nos.) 896 895
(viii) Avg. Monthly Emoluments per Employee(`) 62965 52495
PROFIT & LOSS ACCOUNT (` in Lakhs)
PARTICULARS 2011-12 2010-11
(I) Revenue from Operations (Gross) 133395 97180Less : Excise Duty 0 0Revenue from Operations (Net) 133395 97180(II) Other Income 1294 2131(III) Total Revenue (I+II) 134689 99311(IV) Expenditure on:(a) Cost of materials consumed 7 2(b) Purchase of stock-in-trade 103367 77224(c) Changes in inventories of finished goods,work-in-progress and stock in trade -6 15(d) Stores & Spares 0 0(e) Power & Fuel 519 467(f) Salary, Wages & Benefits/Employees Expense 6770 5638(g) Other Operating/direct/manufacturing Expenses 458 415(h) Rent, Royalty & Cess 302 290(i) Loss on sale of Assets/Investments 9 4(j) Other Expenses 7930 7091Total Expenditure (IV (a to j)) 119356 91146(V) PROFIT BEFORE DEPRECIATION, & IMPAIRMENT,FINANCE CHARGES/INTEREST, EXCEPTIONAL &EXTRAORDINARY ITEMS & TAXES (PBDIEET)(III-IV) 15333 8165(VI) Depreciation, Depletion & Amortisation 181 158(VII) Impairment 0 0(VIII) PROFIT BEFORE FINANCE COST/INTEREST,EXCEPTIONAL, EXTRA-ORDINARY ITEMS &TAXES (PBIEET)(V-VI-VII) 15152 8007(IX) Finance Cost(a) On Central Government Loans 0 0(b) On Foreign Loans 587 522(c) Others 8544 3968(d) Less Finance Cost Capitalised 0 0(e) Charged to P & L Account (a+b+c+d) 9131 4490(X) PROFIT BEFORE EXCEPTIONAL & EXTRA-ORDINARY ITEMS & TAX (PBEET)(VIII-IXe) 6021 3517(XI) Exceptional Items 0 0(XII) PROFIT BEFORE EXTRA-ORDINARY ITEMS &TAX (PBET)(X-XI) 6021 3517(XIII) Extra-Ordinary Items 0 0(XIV) PROFIT BEFORE TAX (PBT)(XII-XIII) 6021 3517(XV) TAX PROVISIONS 1900 539(XVI) NET PROFIT / LOSS FOR THE PERIOD FROMCONTINUING OPERATIONS AFTER TAX(XIV-XV) 4121 2978(XVII) Profit/Loss from discontinuing operations 0 0(XVIII) Tax expenses of discontinuing operations 0 0
(XIX) Profit/Loss from discontinuing operations(after Tax)(XVII-XVIII) 0 0(XX) Profit/Loss for the period (XVI+XIX) 4121 2978Financial Ratios(i) Sales : Capital Employed 342.57 483.51
(ii) Cost of Sales : Sales 89.6 93.95
(iii) Salary/Wages : Sales 5.08 5.8
(iv) Net Profit : Net Worth 12.5 20.71
(v) Debt : Equity 0.15 0.25
(vi) Current Ratio 1.24 1.14
(vii) Trade Recievables : Sales 3.36 3.04
(viii) Total Inventory : Sales 0.08 0.1
NATIONAL SMALL INDUSTRIES CORPN. LTD.Laghu Udyog Bhavan Okhla Industrial Estate New Delhi 110020

Industrial Development & Tech. Consultancy Services502
PFC Capital Advisory Service Ltd.
The CompanyPFC Capital Advisory Services Limited (PECAP) was
incorporated on July 18, 2011 as a wholly owned subsidiary ofPFC Ltd with an objective to act as financial consultants, advisers,counselors in investment and capital market; to advise on takeover,mergers, amalgamations, acquisitions, diversifications, rehabilitationor restructuring; market research, feasibility studies, pre investmentstudies ; to act as lead manager; to advice on restructuring, evaluationetc. The certificate for commencement of business was obtained bythe company on September 02, 2011.
The company is an uncategorized CPSE in the IndustrialDevelopment and Technical Consultancy sector under theadministrative control of M/o Power. The company is a whollyowned subsidiary of PFC and the matters related to personneldepartment are being taken care by the holding company. Thecompany employed 2 regular employees (Executive 1 & Non-Executives 1) as on 31.3.2012. Its Registered and Corporate officesare in NCT of Delhi.
Industrial / Business OperationsThe company is rendering debt syndication services in the
areas of power, energy, infrastructure and other industries
Performance HighlightsThe Company's total revenue for the first year operations
during period 2011-12 was ` 0.16 crore. The net profit of thecompany was ` 0.05 crores.
The current ratio of company is at 3.8:1 during 2011-12(Fig.2). Balance Sheet and Profit & Loss Account of the companyand selected financial ratios during the period 2010-11 to 2011-12can be seen on the adjoining page.
www.pfcindia.com
Strategic issuesTo conserve the resources for the business of the company, it
was decided not to declare any dividend for the financial year 2011-12 and to carry forward the profits to the reserves and surplus ofthe company.
EB
ITD
A &
PA
T (
Rs.
cro
re)
TO
TAL
RE
VE
NU
E (R
s. crore)
PR
OF
ITA
BIL
ITY
RA
TIO
S (
%)
CU
RR
EN
T R
AT
IO
Fig.2
Fig.1

Public Enterprises Survey 2011-2012: Vol-II 503
BALANCE SHEET (` in Lakhs)
PARTICULARS 2011-12 2010-11
I. EQUITY & LIABILITIESAUTHORISED CAPITAL 100 0(1) Shareholders’ Funds(a) Share Capital
(i) Central Govt 0 0
(ii) Others 10 0
(b) Reserves & Surplus 5 0(c) Money received against share warrants 0 0Total Shareholders’ Funds (1(a)+1(b)+1(c) 15 0(2) Share application money pending allotment 0 0(3) Non-current Liabilities(a) Long Term Borrowings 0 0
(b) Deferred tax liabilities (Net) 0 0(c) Other Long-term liabilities 0 0(d) Long-term provisions 0 0Total Non-Current Liabilities 3(a) to 3(d) 0 0(4) Current Liabilities(a) Short Term Borrowings 0 0
(b) Trade Payables 0 0(c) Other current liabilities 1 0(d) Short-term provisions 4 0Total Current Liabilities 4(a) to 4(d) 5 0TOTAL EQUITY & LIABILITIES (1+2+3+4) 20 0II. ASSETS(1) Non-Current Assets(a) Total Gross Fixed Assets 0 0(ai) Accumulated Depreciation, Depletion & Amortisation 0 0(aii) Accumulated Impairment 0 0(b) Total Net Fixed Assets ((a)-(ai)-(aii) 0 0(c) Capital work in progress 0 0(d) Intangible assets under developmet 0 0(e) Non-Current Investments 0 0(f) Deferred Tax Assets (Net) 1 0(g) Long Term Loans and Advances 0 0(h) Other Non-Current Assets 0 0Total Non-Current Assets (b+c+d+e+f+g+h) 1 0(2) Current Assets(a) Current Investments 0 0(b) Inventories 0 0(c) Trade Recievables 0 0
(d) Cash & Bank Balance 16 0
(e) Short-term Loans & Advances 3 0
(f) Other Current Assets 0 0
Total Current Assets (a+b+c+d+e+f) 19 0
TOTAL ASSETS (1+2) 20 0
Important Indicators(i) Investment 10 0
(ii) Capital Employed 15 0
(iii) Net Worth 15 0
(iv) Net Current Assets 14 0
(v) Cost of Sales 8 0
(vi) Net Value Added (at market price) 18 0
(vii) Total Regular Employees (Nos.) 2
(viii) Avg. Monthly Emoluments per Employee(`) 25000 0
PROFIT & LOSS ACCOUNT (` in Lakhs)
PARTICULARS 2011-12 2010-11
(I) Revenue from Operations (Gross) 16 0Less : Excise Duty 0 0Revenue from Operations (Net) 16 0(II) Other Income 0 0(III) Total Revenue (I+II) 16 0(IV) Expenditure on:(a) Cost of materials consumed 0 0(b) Purchase of stock-in-trade 0 0(c) Changes in inventories of finished goods,work-in-progress and stock in trade 0 0(d) Stores & Spares 0 0(e) Power & Fuel 0 0(f) Salary, Wages & Benefits/Employees Expense 6 0(g) Other Operating/direct/manufacturing Expenses 0 0(h) Rent, Royalty & Cess 0 0(i) Loss on sale of Assets/Investments 0 0(j) Other Expenses 2 0Total Expenditure (IV (a to j)) 8 0(V) PROFIT BEFORE DEPRECIATION, & IMPAIRMENT,FINANCE CHARGES/INTEREST, EXCEPTIONAL &EXTRAORDINARY ITEMS & TAXES (PBDIEET)(III-IV) 8 0(VI) Depreciation, Depletion & Amortisation 0 0(VII) Impairment 0 0(VIII) PROFIT BEFORE FINANCE COST/INTEREST,EXCEPTIONAL, EXTRA-ORDINARY ITEMS &TAXES (PBIEET)(V-VI-VII) 8 0(IX) Finance Cost(a) On Central Government Loans 0 0(b) On Foreign Loans 0 0(c) Others 0 0(d) Less Finance Cost Capitalised 0 0(e) Charged to P & L Account (a+b+c+d) 0 0(X) PROFIT BEFORE EXCEPTIONAL & EXTRA-ORDINARY ITEMS & TAX (PBEET)(VIII-IXe) 8 0(XI) Exceptional Items 0 0(XII) PROFIT BEFORE EXTRA-ORDINARY ITEMS &TAX (PBET)(X-XI) 8 0(XIII) Extra-Ordinary Items 0 0(XIV) PROFIT BEFORE TAX (PBT)(XII-XIII) 8 0(XV) TAX PROVISIONS 3 0(XVI) NET PROFIT / LOSS FOR THE PERIOD FROMCONTINUING OPERATIONS AFTER TAX(XIV-XV) 5 0(XVII) Profit/Loss from discontinuing operations 0 0(XVIII) Tax expenses of discontinuing operations 0 0(XIX) Profit/Loss from discontinuing operations(after Tax)(XVII-XVIII) 0 0(XX) Profit/Loss for the period (XVI+XIX) 5 0Financial Ratios(i) Sales : Capital Employed 106.67 0
(ii) Cost of Sales : Sales 50 0
(iii) Salary/Wages : Sales 37.5 0
(iv) Net Profit : Net Worth 33.33 0
(v) Debt : Equity 0 0
(vi) Current Ratio 3.80 0
(vii) Trade Recievables : Sales 0 0
(viii) Total Inventory : Sales 0 0
PFC CAPITAL ADVISORY SERVICE LTD.1st Floor, Urjanidhi Building , 1- Barakhamba Lane, Cannaught Place, New Delhi
2011-12 Provisional

Industrial Development & Tech. Consultancy Services504
PFC Consulting Ltd.
The CompanyPFC Consulting Limited (PFCCL)was incorporated on
25.03.2008 with the objective to promote, organize and carry outConsultancy Services in the related activities of Power FinanceCorporation Ltd. (PFC Ltd.). It is a wholly owned subsidiary ofPower Finance Corporation Ltd. It has also been assigned the taskof development of Ultra Mega Power Project and IndependentTransmission Projects by PFC, the holding company.
PFCCL is an uncategorized CPSE in Industrial Development& Tech. Consultancy Services Sector under the administrativecontrol of M/o Power (MoP) .All the employees of the companyare on secondment basis from the Holding Company i.e. PFC. ItsRegistered and Corporate offices are in New Delhi.
Vision / MissionThe Vision of the Company is to become a premier Consulting
Organization in the power sector.
The Mission of the company is to become the leading 'end toend consulting solution provider' in power sector for a sustainabledevelopment.
Industrial / Business OperationsPFCCL is providing a range of consultancy services to Power
Sector. The services offered by the PFCCL are advisory Serviceson issues emanating from implementation of Electricity Act 2003like Reform, Restructuring, Regulatory etc. , Bid Process as per theGuidelines issued by MoP, GoI for various segments of PowerSector, Project-Structuring/ Planning/ Development/ SpecificStudies, implementation monitoring, efficiency improvementprojects forState owned Utilities and IPPs, UMPPs and ITPs ,Human Resource Management Plans , Communication, InformationDissemination and Feedback, Preparation of OrganizationPerformance Improvement Plans, Contract related services for thePower Sector, Financial Management, Resource Mobilization,Accounting Systems etc.
The company has one subsidiary namely DGEN TransmissionCompany Limited with 100% shareholding.
www.pfcindia.com
Performance HighlightsTotal Revenue of the company registered an increase of ̀ 3.44
crore during 2011-12, which went up from ` 52.60crore in 2010-11to ` 56.04crore in 2011-12.The net profit of the company increasedto 27.66crore, an increase of ` 0.70crore over the previous yearprofit of ` 26.96 croredue to increase in the interest received fromFixed Deposits.
The current ratio of company is at 5.15:1 during 2011-12 asagainst 3.51:1 in the previous year (Fig.2). Balance Sheet and Profit& Loss Account of the company and selected financial ratios duringthe period 2010-11 to 2011-12 can be seen on the adjoining page.
EB
ITD
A &
PA
T (
Rs.
cro
re) T
OTA
L R
EV
EN
UE
(Rs. cro
re)
PR
OF
ITA
BIL
ITY
RA
TIO
S (
%)
CU
RR
EN
T R
AT
IO
Fig.2
Fig.1

Public Enterprises Survey 2011-2012: Vol-II 505
BALANCE SHEET (` in Lakhs)
PARTICULARS 2011-12 2010-11
I. EQUITY & LIABILITIESAUTHORISED CAPITAL 5 5(1) Shareholders’ Funds(a) Share Capital
(i) Central Govt 0 0
(ii) Others 5 5
(b) Reserves & Surplus 8599 5833
(c) Money received against share warrants 0 0
Total Shareholders’ Funds (1(a)+1(b)+1(c) 8604 5838(2) Share application money pending allotment 0 0(3) Non-current Liabilities(a) Long Term Borrowings 0 0
(b) Deferred tax liabilities (Net) 5 1
(c) Other Long-term liabilities 0 0
(d) Long-term provisions 0 0
Total Non-Current Liabilities 3(a) to 3(d) 5 1(4) Current Liabilities(a) Short Term Borrowings 0 0
(b) Trade Payables 110 69
(c) Other current liabilities 504 889
(d) Short-term provisions 1440 1362
Total Current Liabilities 4(a) to 4(d) 2054 2320TOTAL EQUITY & LIABILITIES (1+2+3+4) 10663 8159II. ASSETS(1) Non-Current Assets(a) Total Gross Fixed Assets 62 13(ai) Accumulated Depreciation, Depletion & Amortisation 13 5
(aii) Accumulated Impairment 0 0
(b) Total Net Fixed Assets ((a)-(ai)-(aii) 49 8(c) Capital work in progress 0 0
(d) Intangible assets under developmet 0 0
(e) Non-Current Investments 5 0(f) Deferred Tax Assets (Net) 0 0(g) Long Term Loans and Advances 36 0(h) Other Non-Current Assets 0 0Total Non-Current Assets (b+c+d+e+f+g+h) 90 8(2) Current Assets(a) Current Investments 0 0(b) Inventories 0 0(c) Trade Recievables 703 106
(d) Cash & Bank Balance 7826 6515
(e) Short-term Loans & Advances 1465 1502
(f) Other Current Assets 579 28
Total Current Assets (a+b+c+d+e+f) 10573 8151
TOTAL ASSETS (1+2) 10663 8159
Important Indicators(i) Investment 5 5
(ii) Capital Employed 8604 5838
(iii) Net Worth 8604 5838
(iv) Net Current Assets 8519 5831
(v) Cost of Sales 1393 1179
(vi) Net Value Added (at market price) 5335 5204
(vii) Total Regular Employees (Nos.) 0 0
(viii) Avg. Monthly Emoluments per Employee(`) 0 0
PROFIT & LOSS ACCOUNT (` in Lakhs)
PARTICULARS 2011-12 2010-11
(I) Revenue from Operations (Gross) 4906 4990Less : Excise Duty 0 0Revenue from Operations (Net) 4906 4990(II) Other Income 698 270(III) Total Revenue (I+II) 5604 5260(IV) Expenditure on:(a) Cost of materials consumed 0 0(b) Purchase of stock-in-trade 0 0(c) Changes in inventories of finished goods,work-in-progress and stock in trade 0 0(d) Stores & Spares 0 0(e) Power & Fuel 14 39(f) Salary, Wages & Benefits/Employees Expense 868 551(g) Other Operating/direct/manufacturing Expenses 59 447(h) Rent, Royalty & Cess 31 18(i) Loss on sale of Assets/Investments 0 0(j) Other Expenses 413 121Total Expenditure (IV (a to j)) 1385 1176(V) PROFIT BEFORE DEPRECIATION, & IMPAIRMENT,FINANCE CHARGES/INTEREST, EXCEPTIONAL &EXTRAORDINARY ITEMS & TAXES (PBDIEET)(III-IV) 4219 4084(VI) Depreciation, Depletion & Amortisation 8 3(VII) Impairment 0 0(VIII) PROFIT BEFORE FINANCE COST/INTEREST,EXCEPTIONAL, EXTRA-ORDINARY ITEMS &TAXES (PBIEET)(V-VI-VII) 4211 4081(IX) Finance Cost(a) On Central Government Loans 0 0(b) On Foreign Loans 0 0(c) Others 0 22(d) Less Finance Cost Capitalised 0 0(e) Charged to P & L Account (a+b+c+d) 0 22(X) PROFIT BEFORE EXCEPTIONAL & EXTRA-ORDINARY ITEMS & TAX (PBEET)(VIII-IXe) 4211 4059(XI) Exceptional Items 0 0(XII) PROFIT BEFORE EXTRA-ORDINARY ITEMS &TAX (PBET)(X-XI) 4211 4059(XIII) Extra-Ordinary Items 0 0(XIV) PROFIT BEFORE TAX (PBT)(XII-XIII) 4211 4059(XV) TAX PROVISIONS 1445 1363(XVI) NET PROFIT / LOSS FOR THE PERIOD FROMCONTINUING OPERATIONS AFTER TAX(XIV-XV) 2766 2696(XVII) Profit/Loss from discontinuing operations 0 0
(XVIII) Tax expenses of discontinuing operations 0 0
(XIX) Profit/Loss from discontinuing operations(after Tax)(XVII-XVIII) 0 0
(XX) Profit/Loss for the period (XVI+XIX) 2766 2696Financial Ratios(i) Sales : Capital Employed 57.02 85.47
(ii) Cost of Sales : Sales 28.39 23.63
(iii) Salary/Wages : Sales 17.69 11.04
(iv) Net Profit : Net Worth 32.15 46.18
(v) Debt : Equity 0 0
(vi) Current Ratio 5.15 3.51
(vii) Trade Recievables : Sales 14.33 2.12
(viii) Total Inventory : Sales 0 0
PFC CONSULTING LTD.1st Floor, UrjanidhiBuilding , 1- Barakhamba Lane, Cannaught Place, New Delhi

Industrial Development & Tech. Consultancy Services506
Power System Operation Corporation Ltd.
The CompanyPower System Operation Corporation Ltd (POSOCO) was
incorporated as a wholly owned subsidiary of Power Grid on20.03.2009. POSOCO is responsible for Independent SystemOperation. The certificate of commencement of business of thecompany was obtained on 23.03.2010.
Power System Operation Corporation Ltd. isanuncategorizedCPSE in Industrial Development & Tech. ConsultancyServices sector under the administrative control of Ministry ofPower. The company employed 456regular employees(Executives328, Non-executives128) as on 31.3.2012. Its Registeredand Corporate offices are at New Delhi.
Vision / MissionThe Vision / Mission of the company is to ensure integrated
operation of Regional and National Power System, to facilitatetransfer of electric power within and across the regions and trans-national exchange of power with Reliability, Security and Economy.
Industrial / Business OperationsThe company has to exercise supervision and control of all
aspects concerning operational and manpower requirements of theRegional Load DispatchCenters(RLDC) and National LoadDispatchCenters (NLDC).
The NLDC and RLDC have been ensuring smooth operationof the system in accordance with the provisions of Grid Code.POSOCO ensures that practices related to system operation areharmonized across all RLDC and NLDC.
Performance HighlightsThe transmission system availability during 2011-12 was
99.94%. Revenue of POSOCO is regulated by RLDC fee and chargesregulations notified by CERC on 18.9.2010. Revenue of operationsof all RLDC is as per individual tariff orders relating to each RLDCand is as per tariff order of CERC subject to truing up adjustmenton annual basis.
The total revenue of the Company registered an increase of `98.63 crore in 2011-12 which went up to ` 214.34crore in 2011-12from ` 115.71crore during 2010-11. The net profit of the companyincreased to ̀ 50.52 crore in 2011-12, a growth of ̀ 43.31crore overthe previous year profit of ` 7.21crore due to increasein operatingincome.
The current ratio of company is at 1.15:1 during 2011-12 asagainst 1.81:1 in the previous year (Fig.2). Balance Sheet and Profit& Loss Account of the company and selected financial ratios duringthe period 2010-11 to 2011-12 can be seen on the adjoining page.
www.powergridindia.com
Strategic issuesThe function of NLDC are defined as per M/o Power
notification dated 2.3.2005 and function of RLDC are as per section28 of Electricity Act 2003.
All the employees and executives working with RLDCs andNLDC will form the cadre of POSOCO. All the employees ofPOSOCO will form the cadre of Power Grid, the holding company.
EB
ITD
A &
PA
T (
Rs.
cro
re)
TO
TAL
RE
VE
NU
E (R
s. crore)
PR
OF
ITA
BIL
ITY
RA
TIO
S (
%)
CU
RR
EN
T R
AT
IO
Fig.2
Fig.1

Public Enterprises Survey 2011-2012: Vol-II 507
BALANCE SHEET (` in Lakhs)
PARTICULARS 2011-12 2010-11
I. EQUITY & LIABILITIESAUTHORISED CAPITAL 20000 20000(1) Shareholders’ Funds(a) Share Capital
(i) Central Govt 0 0
(ii) Others 3064 3064
(b) Reserves & Surplus 8612 4629
(c) Money received against share warrants 0 0
Total Shareholders’ Funds (1(a)+1(b)+1(c) 11676 7693(2) Share application money pending allotment 0 0(3) Non-current Liabilities(a) Long Term Borrowings 127 4231
(b) Deferred tax liabilities (Net) 0 0
(c) Other Long-term liabilities 2357 1814
(d) Long-term provisions 2695 2370
Total Non-Current Liabilities 3(a) to 3(d) 5179 8415(4) Current Liabilities(a) Short Term Borrowings 0 4904
(b) Trade Payables 213 155
(c) Other current liabilities 62243 95143
(d) Short-term provisions 7601 3513
Total Current Liabilities 4(a) to 4(d) 70057 103715TOTAL EQUITY & LIABILITIES (1+2+3+4) 86912 119823II. ASSETS(1) Non-Current Assets(a) Total Gross Fixed Assets 28149 27678(ai) Accumulated Depreciation, Depletion & Amortisation 24225 22564
(aii) Accumulated Impairment 0 0
(b) Total Net Fixed Assets ((a)-(ai)-(aii) 3924 5114(c) Capital work in progress 289 75
(d) Intangible assets under developmet 0 0
(e) Non-Current Investments 0 0(f) Deferred Tax Assets (Net) 669 335(g) Long Term Loans and Advances 1174 2478(h) Other Non-Current Assets 0 0Total Non-Current Assets (b+c+d+e+f+g+h) 6056 8002(2) Current Assets(a) Current Investments 0 0
(b) Inventories 0 0
(c) Trade Recievables 2172 9002
(d) Cash & Bank Balance 67509 99457
(e) Short-term Loans & Advances 9777 2172
(f) Other Current Assets 1398 1190
Total Current Assets (a+b+c+d+e+f) 80856 111821
TOTAL ASSETS (1+2) 86912 119823
Important Indicators(i) Investment 3191 7295
(ii) Capital Employed 11803 11924
(iii) Net Worth 11676 7693
(iv) Net Current Assets 10799 8106
(v) Cost of Sales 12866 8806
(vi) Net Value Added (at market price) 15985 5913
(vii) Total Regular Employees (Nos.) 456 445
(viii) Avg. Monthly Emoluments per Employee(`) 135636 68446
PROFIT & LOSS ACCOUNT (` in Lakhs)
PARTICULARS 2011-12 2010-11
(I) Revenue from Operations (Gross) 16159 8897Less : Excise Duty 0 0Revenue from Operations (Net) 16159 8897(II) Other Income 5275 2674(III) Total Revenue (I+II) 21434 11571(IV) Expenditure on:(a) Cost of materials consumed 0 0(b) Purchase of stock-in-trade 0 0(c) Changes in inventories of finished goods,work-in-progress and stock in trade 0 0(d) Stores & Spares 0 0(e) Power & Fuel 274 108(f) Salary, Wages & Benefits/Employees Expense 7422 3655(g) Other Operating/direct/manufacturing Expenses 2542 1158(h) Rent, Royalty & Cess 0 0(i) Loss on sale of Assets/Investments 5 1(j) Other Expenses 617 793Total Expenditure (IV (a to j)) 10860 5715(V) PROFIT BEFORE DEPRECIATION, & IMPAIRMENT,FINANCE CHARGES/INTEREST, EXCEPTIONAL &EXTRAORDINARY ITEMS & TAXES (PBDIEET)(III-IV) 10574 5856(VI) Depreciation, Depletion & Amortisation 2011 3092(VII) Impairment 0 0(VIII) PROFIT BEFORE FINANCE COST/INTEREST,EXCEPTIONAL, EXTRA-ORDINARY ITEMS &TAXES (PBIEET)(V-VI-VII) 8563 2764(IX) Finance Cost(a) On Central Government Loans 0 0(b) On Foreign Loans 15 20(c) Others 559 103(d) Less Finance Cost Capitalised 0 0(e) Charged to P & L Account (a+b+c+d) 574 123(X) PROFIT BEFORE EXCEPTIONAL & EXTRA-ORDINARY ITEMS & TAX (PBEET)(VIII-IXe) 7989 2641(XI) Exceptional Items 0 0(XII) PROFIT BEFORE EXTRA-ORDINARY ITEMS &TAX (PBET)(X-XI) 7989 2641(XIII) Extra-Ordinary Items 0 0(XIV) PROFIT BEFORE TAX (PBT)(XII-XIII) 7989 2641(XV) TAX PROVISIONS 2937 1520(XVI) NET PROFIT / LOSS FOR THE PERIOD FROMCONTINUING OPERATIONS AFTER TAX(XIV-XV) 5052 1121(XVII) Profit/Loss from discontinuing operations 0 0(XVIII) Tax expenses of discontinuing operations 0 0(XIX) Profit/Loss from discontinuing operations(after Tax)(XVII-XVIII) 0 0(XX) Profit/Loss for the period (XVI+XIX) 5052 1121Financial Ratios(i) Sales : Capital Employed 136.91 74.61
(ii) Cost of Sales : Sales 79.62 98.98
(iii) Salary/Wages : Sales 45.93 41.08
(iv) Net Profit : Net Worth 43.27 14.57
(v) Debt : Equity 0.04 1.38
(vi) Current Ratio 1.15 1.08
(vii) Trade Recievables : Sales 13.44 101.18
(viii) Total Inventory : Sales 0 0
POWERS SYSTEM OPERATION CORPORATION LTD.B-9, Qutab Industrial Area KatwariaSarai, New Delhi 110 016

Industrial Development & Tech. Consultancy Services508
RITES Ltd.The Company
RITES Ltd. (RITES) was incorporated on 26.04.1974 withthe objective to provide railway related consultancy and inspectionservices in India and abroad.
RITES is a Schedule- 'A'/ Mini Ratna CPSE in InfrastructureDevelopment and Technical Consultancy Services sector underthe administrative control of Ministry of Railways, with 100%Shareholding by the Government of India. The company employed2202 regular employees (Executives 1717, Non-executives 485) ason 31.3.2012. Its registered office is at Delhi and corporate office isat RITES Bhavan sector 29, Gurgaon, Haryana.
Vision / MissionThe vision of the company is to be the fore most provider of
techno economic services and solutions in the transportation andinfrastructure sector globally.
The Mission of the Company is to provide concept tocommissioning consultancy, design, engineering and turnkeysolutions including knowledge management in the field of transport,transportation infrastructure and related technologies of highestprofessional standards.
Industrial / Business OperationsRITES is engaged in providing consultancy, engineering and
project management Services including turnkey project in the fieldof transportation, infrastructure and related technologies in Indiaand 62 countries abroad. The service range of the companycomprises from concept to commissioning in consultancy intransport infrastructure and its related technologies; leasing; export;maintenance and rehabilitation of rolling stock and equipment; andrunning of railway systems under concession agreement.
The company has one Indian subsidiary namely RITESInfrastructure Services Ltd. and two overseas subsidiary Companiesnamely M/s RITES (AFRIKA) Proprietary Limited in Botswanaand RITES Mohawarean Arabia co .Ltd (RMAC) in Saudi Arabia,however in RMAC, contract also has been foreclosed in June 2011.
The company has five joint ventures.
Performance HighlightsThe performance of company for last two yearsare mentioned
below:
Main Services Unit Performance during
2011-12 2010-11
Consultancy ` in Crore 419.03 441.84
Construction projects ` in Crore 16.56 5.15
Export Sales ` in Crore 290.14 148.55
Quality Assurance ` in Crore 85.71 81.01
Lease Services ` in Crore 24.19 21.77
Others ` in Crore 98.46 143.95
company, however, went down to ` 164.49 crore in 2011-12, areduction of ` 79.43 crore as compared to previous year profit of` 243.92 crore due to increase in operating cost.
The current ratio of company is at 1.23:1 during 2011-12 asagainst 1.21:1 in the previous year (Fig.2). Balance Sheet andProfit & Loss Account of the company and selected financialratios during the period 2010-11 to 2011-12 can be seen on theadjoining page.
Strategic IssuesFirst ever domestic leasing of shunting locomotives owned
by RITES started with Bandel Thermal Power Plant, Bandel, WestBengal in July, 2009. During the year, the business of offeringshunting locomotives on lease including operation & maintenancehas been well received by domestic non railway clients. Companyhas so far leased 13 locos to various companies in power / steel andtransport sector.
EB
ITD
A &
PA
T (
Rs.
cro
re) T
OTA
L R
EV
EN
UE
(Rs. cro
re)
PR
OF
ITA
BIL
ITY
RA
TIO
S (
%)
CU
RR
EN
T R
AT
IO
Fig.2
Fig.1
The Company registered an increase of ` 91.82 crore in totalrevenue during 2011-12 which went up to ` 934.09 crore in 2011-12 from ` 842.27 crore during 2010-11. The net profit of the

Public Enterprises Survey 2011-2012: Vol-II 509
BALANCE SHEET (` in Lakhs)
PARTICULARS 2011-12 2010-11
I. EQUITY & LIABILITIESAUTHORISED CAPITAL 10000 10000(1) Shareholders’ Funds(a) Share Capital
(i) Central Govt 4000 4000
(ii) Others 0 0
(b) Reserves & Surplus 96790 84176
(c) Money received against share warrants 0 0
Total Shareholders’ Funds (1(a)+1(b)+1(c) 100790 88176(2) Share application money pending allotment 0 0(3) Non-current Liabilities(a) Long Term Borrowings 0 0
(b) Deferred tax liabilities (Net) 0 0
(c) Other Long-term liabilities 8042 12395
(d) Long-term provisions 12098 9201
Total Non-Current Liabilities 3(a) to 3(d) 20140 21596(4) Current Liabilities(a) Short Term Borrowings 0 0
(b) Trade Payables 11377 11855
(c) Other current liabilities 176679 138229
(d) Short-term provisions 4485 7664
Total Current Liabilities 4(a) to 4(d) 192541 157748TOTAL EQUITY & LIABILITIES (1+2+3+4) 313471 267520II. ASSETS(1) Non-Current Assets(a) Total Gross Fixed Assets 25256 23471(ai) Accumulated Depreciation, Depletion & Amortisation 9075 8530
(aii) Accumulated Impairment 0 489
(b) Total Net Fixed Assets ((a)-(ai)-(aii) 16181 14452(c) Capital work in progress 1963 3578
(d) Intangible assets under developmet 0 0
(e) Non-Current Investments 13819 11322(f) Deferred Tax Assets (Net) 4149 4504(g) Long Term Loans and Advances 14187 8852(h) Other Non-Current Assets 26660 34459Total Non-Current Assets (b+c+d+e+f+g+h) 76959 77167(2) Current Assets(a) Current Investments 502 0(b) Inventories 8709 9342(c) Trade Recievables 22613 33870
(d) Cash & Bank Balance 188551 134707
(e) Short-term Loans & Advances 9227 7514
(f) Other Current Assets 6910 4920
Total Current Assets (a+b+c+d+e+f) 236512 190353
TOTAL ASSETS (1+2) 313471 267520
Important Indicators(i) Investment 4000 4000
(ii) Capital Employed 100790 88176
(iii) Net Worth 100790 88176
(iv) Net Current Assets 43971 32605
(v) Cost of Sales 67808 51794
(vi) Net Value Added (at market price) 57692 65573
(vii) Total Regular Employees (Nos.) 2202 2139
(viii) Avg. Monthly Emoluments per Employee(`) 95584 95146
PROFIT & LOSS ACCOUNT (` in Lakhs)
PARTICULARS 2011-12 2010-11
(I) Revenue from Operations (Gross) 83563 69832Less : Excise Duty 0 0Revenue from Operations (Net) 83563 69832(II) Other Income 9846 14395(III) Total Revenue (I+II) 93409 84227(IV) Expenditure on:(a) Cost of materials consumed 811 49(b) Purchase of stock-in-trade 17790 13025(c) Changes in inventories of finished goods,work-in-progress and stock in trade -944 -28(d) Stores & Spares 244 344(e) Power & Fuel 273 238(f) Salary, Wages & Benefits/Employees Expense 25257 24422(g) Other Operating/direct/manufacturing Expenses 12876 8785(h) Rent, Royalty & Cess 340 266(i) Loss on sale of Assets/Investments 3 5(j) Other Expenses 9767 3461Total Expenditure (IV (a to j)) 66417 50567(V) PROFIT BEFORE DEPRECIATION, & IMPAIRMENT,FINANCE CHARGES/INTEREST, EXCEPTIONAL &EXTRAORDINARY ITEMS & TAXES (PBDIEET)(III-IV) 26992 33660(VI) Depreciation, Depletion & Amortisation 1394 1232(VII) Impairment 0 0(VIII) PROFIT BEFORE FINANCE COST/INTEREST,EXCEPTIONAL, EXTRA-ORDINARY ITEMS &TAXES (PBIEET)(V-VI-VII) 25598 32428(IX) Finance Cost(a) On Central Government Loans 0 0(b) On Foreign Loans 0 0(c) Others 0 0(d) Less Finance Cost Capitalised 0 0(e) Charged to P & L Account (a+b+c+d) 0 0(X) PROFIT BEFORE EXCEPTIONAL & EXTRA-ORDINARY ITEMS & TAX (PBEET)(VIII-IXe) 25598 32428(XI) Exceptional Items 0 -3873(XII) PROFIT BEFORE EXTRA-ORDINARY ITEMS &TAX (PBET)(X-XI) 25598 36301(XIII) Extra-Ordinary Items 0 0(XIV) PROFIT BEFORE TAX (PBT)(XII-XIII) 25598 36301(XV) TAX PROVISIONS 9149 11909(XVI) NET PROFIT / LOSS FOR THE PERIOD FROMCONTINUING OPERATIONS AFTER TAX(XIV-XV) 16449 24392(XVII) Profit/Loss from discontinuing operations 0 0(XVIII) Tax expenses of discontinuing operations 0 0(XIX) Profit/Loss from discontinuing operations(after Tax)(XVII-XVIII) 0 0(XX) Profit/Loss for the period (XVI+XIX) 16449 24392Financial Ratios(i) Sales : Capital Employed 82.91 79.2
(ii) Cost of Sales : Sales 81.15 74.17
(iii) Salary/Wages : Sales 30.23 34.97
(iv) Net Profit : Net Worth 16.32 27.66
(v) Debt : Equity 0 0
(vi) Current Ratio 1.23 1.21
(vii) Trade Recievables : Sales 27.06 48.5
(viii) Total Inventory : Sales 10.42 13.38
RITES LTD.Scope minar, Laxmi nagar, Delhi-110092

Industrial Development & Tech. Consultancy Services510
Telecommunications Consultants (India) Ltd.
The CompanyTelecommunications Consultants India Ltd. (TCIL) was
incorporated on 10.03.1978 with the main objective to provideworld class technology in all fields of telecommunications andinformation technology.
TCIL is a Schedule-'A' Miniratna CPSE in IndustrialDevelopment and Technical Consultancy service sector, under theadministrative control of Ministry of Communications & IT andDepartment of Telecommunications with 100% shareholding bythe Government of India. The company employed 915 regularemployees (Executives 412, Non-executives 503) as on 31.3.2012.Its registered and corporate offices are at New Delhi.
Vision / MissionThe Vision of the company is to excel in providing solutions in
ICT, Power and Infrastructure Sectors globally by anticipatingopportunities in technology.
The Mission of the company is to excel and maintain leadershipin providing Communication solutions on turnkey basis inTelecommunications and Information Technology Service Sectorglobally, and to diversify by providing excellent Infrastructurefacilities particularly in the high- tech areas.
Industrial / Business OperationsTCIL is undertaking turnkey projects in all fields of
Telecommunications & IT in India and abroad. The company hasalso diversified into Architectural Consultancy and CivilConstruction.
The company operates through its regional / Branch offices atChennai, Kuwait, Oman, Algeria, Mauritius, Ethiopia, Saudi Arabia,Nepal and UAE. The company has one overseas subsidiarycompany.
Performance HighlightsThe physical performances of the company for last two years
are given below:
www.tcil-india.com
Main Services Unit Performance during2011-12 2010-11
Telecom & Others ` in Crore 532.67 482.68
Roads ` in Crore 148.12 368.22
EB
ITD
A &
PA
T (
Rs.
cro
re) T
OTA
L R
EV
EN
UE
(Rs. cro
re)
PR
OF
ITA
BIL
ITY
RA
TIO
S (
%)
CU
RR
EN
T R
AT
IO
Fig.2
Fig.1
The Company registered a reduction of ` 170.11 crore intotal revenue during 2011-12 which went down to ` 680.79 crorein 2011-12 from ` 850.90 crore during 2010-11. The net profit ofthe company also declined to ` 8.03 crore in 2011-12 from ̀ 13.58crore in previous year showing a reduction of ` 5.55 crore due tofall in operating income.
The current ratio of company is at 1.25:1 during 2011-12 asagainst 1.19:1 in the previous year (Fig.2). Balance Sheet andProfit & Loss Account of the company and selected financial ratios
Strategic IssuesThe company is trying to explore avenues in new lines of
businesses like WiMAX Franchising, Hybrid/ Green Power,Franchisee in Value Added Services and BOT. Company has adoptedinnovative ICT solution for sustainable health care & education asa part of Research and development. The company has installedsolar lighting in TCIL Bhawan as a part of sustainable development.
during the period 2010-11 to 2011-12 can be seen on the adjoiningpage.

Public Enterprises Survey 2011-2012: Vol-II 511
BALANCE SHEET (` in Lakhs)
PARTICULARS 2011-12 2010-11
I. EQUITY & LIABILITIESAUTHORISED CAPITAL 6000 6000(1) Shareholders’ Funds(a) Share Capital
(i) Central Govt 4320 4320
(ii) Others 0 0
(b) Reserves & Surplus 38338 37722
(c) Money received against share warrants 0 0
Total Shareholders’ Funds (1(a)+1(b)+1(c) 42658 42042(2) Share application money pending allotment 0 0(3) Non-current Liabilities(a) Long Term Borrowings 3750 3700
(b) Deferred tax liabilities (Net) 67 0
(c) Other Long-term liabilities 5877 2497
(d) Long-term provisions 1821 1226
Total Non-Current Liabilities 3(a) to 3(d) 11515 7423(4) Current Liabilities(a) Short Term Borrowings 4042 2269
(b) Trade Payables 44171 42102
(c) Other current liabilities 28306 31348
(d) Short-term provisions 2254 2470
Total Current Liabilities 4(a) to 4(d) 78773 78189TOTAL EQUITY & LIABILITIES (1+2+3+4) 132946 127654II. ASSETS(1) Non-Current Assets(a) Total Gross Fixed Assets 17082 15975(ai) Accumulated Depreciation, Depletion & Amortisation 5301 4368
(aii) Accumulated Impairment 0 0
(b) Total Net Fixed Assets ((a)-(ai)-(aii) 11781 11607(c) Capital work in progress 118 0
(d) Intangible assets under developmet 978 0
(e) Non-Current Investments 16750 16750(f) Deferred Tax Assets (Net) 0 594(g) Long Term Loans and Advances 387 342(h) Other Non-Current Assets 4727 5037Total Non-Current Assets (b+c+d+e+f+g+h) 34741 34330(2) Current Assets(a) Current Investments 0 0(b) Inventories 940 619(c) Trade Recievables 60191 51376
(d) Cash & Bank Balance 5971 5721
(e) Short-term Loans & Advances 13201 15751
(f) Other Current Assets 17902 19857
Total Current Assets (a+b+c+d+e+f) 98205 93324
TOTAL ASSETS (1+2) 132946 127654
Important Indicators(i) Investment 8070 8020
(ii) Capital Employed 46408 45742
(iii) Net Worth 42658 42042
(iv) Net Current Assets 19432 15135
(v) Cost of Sales 65316 82769
(vi) Net Value Added (at market price) 14845 13745
(vii) Total Regular Employees (Nos.) 915 845
(viii) Avg. Monthly Emoluments per Employee(`) 98934 96292
PROFIT & LOSS ACCOUNT (` in Lakhs)
PARTICULARS 2011-12 2010-11
(I) Revenue from Operations (Gross) 65354 83606Less : Excise Duty 0 0Revenue from Operations (Net) 65354 83606(II) Other Income 2725 1484(III) Total Revenue (I+II) 68079 85090(IV) Expenditure on:(a) Cost of materials consumed 7274 4285(b) Purchase of stock-in-trade 10882 11104(c) Changes in inventories of finished goods,work-in-progress and stock in trade 0 0(d) Stores & Spares 0 0(e) Power & Fuel 158 149(f) Salary, Wages & Benefits/Employees Expense 10863 9764(g) Other Operating/direct/manufacturing Expenses 1094 1132(h) Rent, Royalty & Cess 627 528(i) Loss on sale of Assets/Investments 0 0(j) Other Expenses 33372 54948Total Expenditure (IV (a to j)) 64270 81910(V) PROFIT BEFORE DEPRECIATION, & IMPAIRMENT,FINANCE CHARGES/INTEREST, EXCEPTIONAL &EXTRAORDINARY ITEMS & TAXES (PBDIEET)(III-IV) 3809 3180(VI) Depreciation, Depletion & Amortisation 1046 859(VII) Impairment 0 0(VIII) PROFIT BEFORE FINANCE COST/INTEREST,EXCEPTIONAL, EXTRA-ORDINARY ITEMS &TAXES (PBIEET)(V-VI-VII) 2763 2321(IX) Finance Cost(a) On Central Government Loans 0 0(b) On Foreign Loans 0 0(c) Others 847 419(d) Less Finance Cost Capitalised 0 0(e) Charged to P & L Account (a+b+c+d) 847 419(X) PROFIT BEFORE EXCEPTIONAL & EXTRA-ORDINARY ITEMS & TAX (PBEET)(VIII-IXe) 1916 1902(XI) Exceptional Items 0 0(XII) PROFIT BEFORE EXTRA-ORDINARY ITEMS &TAX (PBET)(X-XI) 1916 1902(XIII) Extra-Ordinary Items 0 0(XIV) PROFIT BEFORE TAX (PBT)(XII-XIII) 1916 1902(XV) TAX PROVISIONS 1113 544(XVI) NET PROFIT / LOSS FOR THE PERIOD FROMCONTINUING OPERATIONS AFTER TAX(XIV-XV) 803 1358(XVII) Profit/Loss from discontinuing operations 0 0(XVIII) Tax expenses of discontinuing operations 0 0(XIX) Profit/Loss from discontinuing operations(after Tax)(XVII-XVIII) 0 0(XX) Profit/Loss for the period (XVI+XIX) 803 1358Financial Ratios(i) Sales : Capital Employed 140.82 182.78
(ii) Cost of Sales : Sales 99.94 99
(iii) Salary/Wages : Sales 16.62 11.68
(iv) Net Profit : Net Worth 1.88 3.23
(v) Debt : Equity 0.87 0.86
(vi) Current Ratio 1.25 1.19
(vii) Trade Recievables : Sales 92.1 61.45
(viii) Total Inventory : Sales 1.44 0.74
TELECOMMUNICATIONS CONSULTANTS (INDIA) LTD.TCIL Bhavan, Greater Kailash- 1, New Delhi-110048

Industrial Development & Tech. Consultancy Services512
WAPCOS Ltd.
The CompanyWAPCOS Ltd. was incorporated on 26.06.1969 under the
Companies Act. 1956 with the objective to perform the role of apremier agency for offering integrated package of services of thehighest scientific, technological and managerial quality with a viewto ensure optimal planning and development of water resourcesand maximizing the efficiency of its utilization.
WAPCOS is a Schedule-'B' Miniratna CPSE in IndustrialDevelopment and Technical Consultancy service sector, under theadministrative control of Ministry of Water Resources with 100%shareholding by the Government of India. The company employed539 Regular employees (Executives 417 & Non-Executives 122) ason 31.3.2012. Its registered and corporate offices are at New Delhi.
Vision / MissionThe Vision of the Company is to be a Premier Consultancy
Organization recognized as a Brand in Water, Power andInfrastructure Development for Total Project Solutions in Indiaand Abroad.
The Mission of the Company is to have sustainable profitablegrowth, excellence in performance; use of State-of-the-art TechnicalExpertise; Innovativeness; Capacity Building and meeting society'sneeds.
Industrial / Business OperationsWAPCOS, an ISO 9001:2008 certified company has been
providing consultancy services in all facets of Water Resources,Power and Infrastructure Sectors in India and abroad. The qualitymanagement systems of WAPCOS comply with the QualityAssurance requirements of ISO 9001:2008 for Consultancy Servicesin Water Resources, Power and Infrastructure DevelopmentProjects.
Performance Highlights The physical performances of the company for last two years
are given below:
Total Revenue of the company registered an increase of` 18.15 crore during 2011-12 which went up to ` 375.01 crore in2011-12 from ` 356.86 crore during 2010-11. The profit of thecompany has gone up by ` 15.07 crore to ` 51.25 crore in 2011-12,from ̀ 36.18 crore in previous year due to increase in operating andother income including exchange difference (net).
The current ratio of company is at 1.48:1 during 2011-12 asagainst 1.38:1 in the previous year (Fig.2). Balance Sheet and Profit& Loss Account of the company and selected financial ratios duringthe period 2010-11 to 2011-12 can be seen on the adjoining page.
www.wapcos.gov.in
Strategic issuesWAPCOS strategic importance is in Contribution to National
Development - Involved in JNNURM, PMGSY, Bharat Nirman,NREGA, IEC Programmes, Water Harvesting, Water ResourcesDevelopment Projects etc. WAPCOS has technical superiority inWater & Power Sector. Even when Government Departments desirehighly technically involved study to be conducted in record timeperiod, maintaining the secrecy /confidentiality, WAPCOS has cometo their rescue. Under the Administration of Govt. of India, it is theonly organisation capable of maintaining confidentiality of data ofinter-state / inter Country Rivers while preparing FeasibilityReports, DPRs, Field Investigations etc. and also while carryingsout surveys in border areas like Gujarat, Rajasthan etc.
MEA has awarded a number of projects to WAPCOS directlyin other countries such as Bhutan, Zimbabwe, Afghanistan, Ethiopia,Cambodia etc. Thus, WAPCOS assists MEA in projecting India'simage abroad.
Main Services Unit Performance during
2011-12 2010-11
Consultancy ` in crore 236.47 180.62
Tunkey Contracts ` in crore 117.89 170.56
EB
ITD
A &
PA
T (
Rs.
cro
re) T
OTA
L R
EV
EN
UE
(Rs. cro
re)
PR
OF
ITA
BIL
ITY
RA
TIO
S (
%)
CU
RR
EN
T R
AT
IO
Fig.2
Fig.1

Public Enterprises Survey 2011-2012: Vol-II 513
BALANCE SHEET (` in Lakhs)
PARTICULARS 2011-12 2010-11
I. EQUITY & LIABILITIESAUTHORISED CAPITAL 300 200(1) Shareholders’ Funds(a) Share Capital
(i) Central Govt 300 200
(ii) Others 0 0
(b) Reserves & Surplus 16157 12369
(c) Money received against share warrants 0 0
Total Shareholders’ Funds (1(a)+1(b)+1(c) 16457 12569(2) Share application money pending allotment 0 0(3) Non-current Liabilities(a) Long Term Borrowings 0 0
(b) Deferred tax liabilities (Net) 0 0
(c) Other Long-term liabilities 2334 1808
(d) Long-term provisions 1450 1372
Total Non-Current Liabilities 3(a) to 3(d) 3784 3180(4) Current Liabilities(a) Short Term Borrowings 0 0
(b) Trade Payables 11275 11875
(c) Other current liabilities 16344 8705
(d) Short-term provisions 4132 4582
Total Current Liabilities 4(a) to 4(d) 31751 25162TOTAL EQUITY & LIABILITIES (1+2+3+4) 51992 40911II. ASSETS(1) Non-Current Assets(a) Total Gross Fixed Assets 1766 1587(ai) Accumulated Depreciation, Depletion & Amortisation 745 697
(aii) Accumulated Impairment 0 0
(b) Total Net Fixed Assets ((a)-(ai)-(aii) 1021 890(c) Capital work in progress 0 0
(d) Intangible assets under developmet 0 0
(e) Non-Current Investments 4 4(f) Deferred Tax Assets (Net) 665 652(g) Long Term Loans and Advances 0 0(h) Other Non-Current Assets 3447 4537Total Non-Current Assets (b+c+d+e+f+g+h) 5137 6083(2) Current Assets(a) Current Investments 0 0(b) Inventories 0 301(c) Trade Recievables 19826 16782
(d) Cash & Bank Balance 16690 10312
(e) Short-term Loans & Advances 10197 7343
(f) Other Current Assets 142 90
Total Current Assets (a+b+c+d+e+f) 46855 34828
TOTAL ASSETS (1+2) 51992 40911
Important Indicators(i) Investment 300 200
(ii) Capital Employed 16457 12569
(iii) Net Worth 16457 12569
(iv) Net Current Assets 15104 9666
(v) Cost of Sales 29861 30178
(vi) Net Value Added (at market price) 18378 13674
(vii) Total Regular Employees (Nos.) 539 514
(viii) Avg. Monthly Emoluments per Employee(`) 123315 103794
PROFIT & LOSS ACCOUNT (` in Lakhs)
PARTICULARS 2011-12 2010-11
(I) Revenue from Operations (Gross) 35436 35118Less : Excise Duty 0 0Revenue from Operations (Net) 35436 35118(II) Other Income 2065 568(III) Total Revenue (I+II) 37501 35686(IV) Expenditure on:(a) Cost of materials consumed 10044 11506(b) Purchase of stock-in-trade 301 3896(c) Changes in inventories of finished goods,work-in-progress and stock in trade 0 0(d) Stores & Spares 0 0(e) Power & Fuel 65 54(f) Salary, Wages & Benefits/Employees Expense 7976 6402(g) Other Operating/direct/manufacturing Expenses 6663 4462(h) Rent, Royalty & Cess 509 417(i) Loss on sale of Assets/Investments 0 0(j) Other Expenses 4199 3349Total Expenditure (IV (a to j)) 29757 30086(V) PROFIT BEFORE DEPRECIATION, & IMPAIRMENT,FINANCE CHARGES/INTEREST, EXCEPTIONAL &EXTRAORDINARY ITEMS & TAXES (PBDIEET)(III-IV) 7744 5600(VI) Depreciation, Depletion & Amortisation 104 92(VII) Impairment 0 0(VIII) PROFIT BEFORE FINANCE COST/INTEREST,EXCEPTIONAL, EXTRA-ORDINARY ITEMS &TAXES (PBIEET)(V-VI-VII) 7640 5508(IX) Finance Cost(a) On Central Government Loans 0 0(b) On Foreign Loans 0 0(c) Others 0 0(d) Less Finance Cost Capitalised 0 0(e) Charged to P & L Account (a+b+c+d) 0 0(X) PROFIT BEFORE EXCEPTIONAL & EXTRA-ORDINARY ITEMS & TAX (PBEET)(VIII-IXe) 7640 5508(XI) Exceptional Items 0 0(XII) PROFIT BEFORE EXTRA-ORDINARY ITEMS &TAX (PBET)(X-XI) 7640 5508(XIII) Extra-Ordinary Items 0 0(XIV) PROFIT BEFORE TAX (PBT)(XII-XIII) 7640 5508(XV) TAX PROVISIONS 2515 1890(XVI) NET PROFIT / LOSS FOR THE PERIOD FROMCONTINUING OPERATIONS AFTER TAX(XIV-XV) 5125 3618(XVII) Profit/Loss from discontinuing operations 0 0
(XVIII) Tax expenses of discontinuing operations 0 0(XIX) Profit/Loss from discontinuing operations(after Tax)(XVII-XVIII) 0 0(XX) Profit/Loss for the period (XVI+XIX) 5125 3618Financial Ratios(i) Sales : Capital Employed 215.32 279.4
(ii) Cost of Sales : Sales 84.27 85.93
(iii) Salary/Wages : Sales 22.51 18.23
(iv) Net Profit : Net Worth 31.14 28.79
(v) Debt : Equity 0 0
(vi) Current Ratio 1.48 1.38
(vii) Trade Recievables : Sales 55.95 47.79
(viii) Total Inventory : Sales 0 0.86
WAPCOS LTD.5th Floor Kalish, 26 Kasturba Gandhi Marg, New Delhi.110 001

Industrial Development & Tech. Consultancy Services480
Broadcast Engineering Consultants India Limited
The CompanyBroadcast Engineering Consultants India Limited (BECIL) was
formed on 24th March 1995 to fulfill the need of an expert agency toadvise in the field of broadcasting. Such expertise till then was,available only with AIR and Doordarshan.
It is a Schedule-'C' Miniratna CPSE in Financial Services sectorunder the administrative control of M/o Information and Broadcastingwith 100% shareholding by the Government of India. The companyemployed 70 regular employees (Executives 42 & Non-Executives28) as on 31.3.2012. Its corporate offices are at NOIDA, U.P; headoffice at New Delhi and regional office in Bangalore.
Vision/MissionThe Vision of the Company is to facilitate the growth of
broadcasting in India and associated Asian Region and provide worldclass consultancy services and also undertakes turnkey jobs in thespecialized fields of broadcast engineering and information technology.
The Mission of the Company is to play a pivotal role in growthof Radio and Television Broadcasting through Terrestrial, Cable andSatellite Transmission in India and abroad, and achieve excellence.
Industrial / Business OperationsBECIL is engaged in providing consultancy services in all
spheres of Broadcast Engineering. It is now a well establishedconsultancy agency, system integrator and turnkey solution providerin all the spheres of Broadcast Engineering and InformationTechnology.. It also provide associated services like training,providing manpower. Its client list includes Government, SemiGovernment, Overseas and Private organizations.
The Areas of Specialization includes FM Broadcasting;Establishment of TV Channels; Installation of Teleports; Design ofDigital Newsroom Systems; Direct to Home (DTH) system; CableHead-End systems; Distance Education Systems through Satellite;Community Radio Stations; Acoustics, Stage lighting, soundreinforcement system etc. The company has contributed to theexpansion of FM Radio by creating Common TransmissionInfrastructure for 248 Private FM Channels in 87 cities.
Performance HighlightsThe physical performance of the company for last two years
is given below:
Total Revenue of the company registered an increase of` 18.68 crore during 2011-12, which went up from ` 92.78 crore in2010-11 to ` 111.46 crore in 2011-12. The net profit of thecompany however reduced by ` 3.26 crore, in 2011-12 to ` 2.03crore as against ` 5.29 crore during previous year because of highcompetitive bidding, low revenue margin, increased cost of material,finance cost and hiring of additionally staff.
The current ratio of company is at 1.33:1 during 2011-12 as against1.25:1 in the previous year (Fig.2). (Fig.2). Balance Sheet and Profit &Loss Account of the company and selected financial ratios during theperiod 2010-11 to 2011-12 can be seen on the adjoining page.
www.becil.com
Strategic IssuesThe company aims to enhance the present share by providing
specialized solutions to a wider range of clients; providing technicalinput and consultancy to Ministry for policy, regulatory &formulation of various papers pertaining to broadcasting; exploreoverseas market and allied areas like surveillance & monitoring. Thecompany aims to establish satellite uplink & downlink systems forTV channels and distance education.
EB
ITD
A &
PA
T (
Rs.
cro
re) T
OTA
L R
EV
EN
UE
(Rs. cro
re)
PR
OF
ITA
BIL
ITY
RA
TIO
S (
%)
CU
RR
EN
T R
AT
IO
Fig.2
Fig.1
Main Services Unit Performance during
2011-12 2010-11
Technical Services ` in Crore 3.41 8.52
Sale ` in Crore 101.06 61.93
Consultancy ` in Crore 6.95 6.03
Income fromMaintenance ofTowers for M/o I&B ` in Crore 0.29 0.32
Contract Income ` in Crore 0.69 22.50
Income from BECILTraining Centre ` in Crore 0.05 -

Public Enterprises Survey 2011-2012: Vol-II 481
BALANCE SHEET (` in Lakhs)
PARTICULARS 2011-12 2010-11
I. EQUITY & LIABILITIESAUTHORISED CAPITAL 250 250(1) Shareholders’ Funds(a) Share Capital
(i) Central Govt 137 137
(ii) Others 0 0
(b) Reserves & Surplus 2960 2807
(c) Money received against share warrants 0 0
Total Shareholders’ Funds (1(a)+1(b)+1(c) 3097 2944(2) Share application money pending allotment 0 0(3) Non-current Liabilities(a) Long Term Borrowings 0 0
(b) Deferred tax liabilities (Net) 0 0
(c) Other Long-term liabilities 705 413
(d) Long-term provisions 68 40
Total Non-Current Liabilities 3(a) to 3(d) 773 453(4) Current Liabilities(a) Short Term Borrowings 370 1879
(b) Trade Payables 2836 1429
(c) Other current liabilities 3843 6211
(d) Short-term provisions 110 426
Total Current Liabilities 4(a) to 4(d) 7159 9945TOTAL EQUITY & LIABILITIES (1+2+3+4) 11029 13342II. ASSETS(1) Non-Current Assets(a) Total Gross Fixed Assets 1757 488(ai) Accumulated Depreciation, Depletion & Amortisation 284 286
(aii) Accumulated Impairment 0 0
(b) Total Net Fixed Assets ((a)-(ai)-(aii) 1473 202(c) Capital work in progress 0 696
(d) Intangible assets under developmet 1 0
(e) Non-Current Investments 0 0(f) Deferred Tax Assets (Net) 41 50(g) Long Term Loans and Advances 0 0(h) Other Non-Current Assets 0 0Total Non-Current Assets (b+c+d+e+f+g+h) 1515 948(2) Current Assets(a) Current Investments 0 0
(b) Inventories 288 159
(c) Trade Recievables 6938 4316
(d) Cash & Bank Balance 1044 4750
(e) Short-term Loans & Advances 1199 3119
(f) Other Current Assets 45 50
Total Current Assets (a+b+c+d+e+f) 9514 12394
TOTAL ASSETS (1+2) 11029 13342
Important Indicators(i) Investment 137 137
(ii) Capital Employed 3097 2944
(iii) Net Worth 3097 2944
(iv) Net Current Assets 2355 2449
(v) Cost of Sales 10618 8333
(vi) Net Value Added (at market price) 2129 1738
(vii) Total Regular Employees (Nos.) 70 47
(viii) Avg. Monthly Emoluments per Employee(`) 42381 46277
PROFIT & LOSS ACCOUNT (` in Lakhs)
PARTICULARS 2011-12 2010-11
(I) Revenue from Operations (Gross) 10904 9079Less : Excise Duty 0 0Revenue from Operations (Net) 10904 9079(II) Other Income 242 199(III) Total Revenue (I+II) 11146 9278(IV) Expenditure on:(a) Cost of materials consumed 9474 5532(b) Purchase of stock-in-trade 0 0(c) Changes in inventories of finished goods, 0 0
work-in-progress and stock in trade(d) Stores & Spares 0 0(e) Power & Fuel 7 0(f) Salary, Wages & Benefits/Employees Expense 356 261(g) Other Operating/direct/manufacturing Expenses 495 2479(h) Rent, Royalty & Cess 34 0(i) Loss on sale of Assets/Investments 0 0(j) Other Expenses 211 16Total Expenditure (IV (a to j)) 10577 8288(V) PROFIT BEFORE DEPRECIATION, & IMPAIRMENT, 569 990
FINANCE CHARGES/INTEREST, EXCEPTIONAL &EXTRAORDINARY ITEMS & TAXES (PBDIEET)(III-IV)
(VI) Depreciation, Depletion & Amortisation 41 45(VII) Impairment 0 0(VIII) PROFIT BEFORE FINANCE COST/INTEREST, 528 945
EXCEPTIONAL, EXTRA-ORDINARY ITEMS &TAXES (PBIEET)(V-VI-VII)
(IX) Finance Cost(a) On Central Government Loans 0 0(b) On Foreign Loans 0 0(c) Others 187 117(d) Less Finance Cost Capitalised 0 0(e) Charged to P & L Account (a+b+c+d) 187 117(X) PROFIT BEFORE EXCEPTIONAL & EXTRA- 341 828
ORDINARY ITEMS & TAX (PBEET)(VIII-IXe)(XI) Exceptional Items 0 0(XII) PROFIT BEFORE EXTRA-ORDINARY ITEMS & 341 828
TAX (PBET)(X-XI)(XIII) Extra-Ordinary Items 69 25(XIV) PROFIT BEFORE TAX (PBT)(XII-XIII) 272 803(XV) TAX PROVISIONS 69 274(XVI) NET PROFIT / LOSS FOR THE PERIOD FROM 203 529
CONTINUING OPERATIONS AFTER TAX(XIV-XV)(XVII) Profit/Loss from discontinuing operations 0 0(XVIII) Tax expenses of discontinuing operations 0 0
(XIX) Profit/Loss from discontinuing operations 0 0 (after Tax)(XVII-XVIII)
(XX) Profit/Loss for the period (XVI+XIX) 203 529Financial Ratios(i) Sales : Capital Employed 352.08 308.39
(ii) Cost of Sales : Sales 97.38 91.78
(iii) Salary/Wages : Sales 3.26 2.87
(iv) Net Profit : Net Worth 6.55 17.97
(v) Debt : Equity 0 0
(vi) Current Ratio 1.33 1.25
(vii) Trade Recievables : Sales 63.63 47.54
(viii) Total Inventory : Sales 2.64 1.75
BROADCAST ENGG. CONSULTANTS INDIA LTD.56/17 A, Block-C, Sector-62, Noida, UP

Industrial Development & Tech. Consultancy Services484
Central Mine Planning & Design Institute Ltd.
The CompanyCentral Mine Planning & Design Institute Ltd. (CMPDIL)
was incorporated on 01.11.1975 under the Companies Act, 1956with an objective to provide total consultancy in coal / mineral,exploration, mining, engineering and allied fields as a premierconsultant in India as well in international level.
CMPDI is a Schedule -`B' Miniratna CPSE in Industrial Dev.and Technical Consultancy services sector under the administrativecontrol of Ministry of Coal. CMPDI is a 100% subsidiary of CoalIndia Ltd. (CIL). The company employed 3129 regular employees(Executives 855 & Non-Executives 2274) as on 31.3.2012. ItsRegistered and Corporate office at Ranchi, Jharkhand.
Vision / MissionThe Vision of CMPDIL is to be the global market leader in an
expanding earth resource sector and allied professional activities.
The Mission of CMPDIL is to provide total consultancy incoal and mineral exploration, mining, engineering and allied fields asthe premier consultants in India and a leading one in the internationalarena.
Industrial / Business OperationsCMPDI is one of the subsidiary enterprises providing
consultancy and other allied services in the field of GeologicalExploration, Planning, Design and Support Services, EnvironmentalManagement Services, Management System Services, HRD andspecialized services.
CMPDI is operating through its headquarters at Ranchi andseven regional institutes located at Dhanbad and Ranchi (Jharkhand),Bilaspur (Chhattisgarh), Singrauli (Madhya Pradesh), Asansol (WestBengal), Nagpur (Maharastra) and Bhubaneswar (Orissa) whichrender consultancy services to seven coal producing subsidiarycompanies of Coal India Ltd.(CIL).
Performance Highlights The physical performances of the company for last two years
are given below:
A total of 142 project reports were identified for preparationfor the XI Plan resulting in capacity addition for coal production ofabout 371 Mt, against which, 130 project reports with capacityaddition of about 349 Mt. have already been prepared during2007-12. During XI Plan period, 67 additional project reports withcapacity addition of about 137 Mt. were also prepared.
Total Revenue from of the company registered an increase of` 94.88 crore during 2011-12, which went up from ` 433.55 crorein 2010-11 to ` 528.43 crore in 2011-12. However, the profit of
the company has gone up by ` 4.29 crore to ` 19.61 crore in2011-12, from ` 15.32 crore in previous year due to increase intotal revenue and productivity.
The current ratio of company is at 1.34:1 during 2011-12 asagainst 1.28:1 in the previous year (Fig.2). Balance Sheet and Profit& Loss Account of the company and selected financial ratios duringthe period 2010-11 to 2011-12 can be seen on the adjoining page.
www.cmpdi.co.in
Strategic issuesAbout 51.22 lakh meter of total drilling has been envisaged in
the XII Plan (2012-17) document of M/o Coal, which is to becarried out by CMPDI during XII Plan period through departmentaland outsourced drilling. Development of Shale gas has also emergedout as a promising area of operation for CMPDI. CMPDI's servicesare being sought in generation of Coal Bed Methane (CBM) relateddata under delineation of blocks, preparation of data dossiers, etc.Additionally, emerging area of Information and CommunicationTechnology (ICT) in coal sector will also present additionalopportunity for CMPDI in coming years.
Main Services Unit Performance during
2011-12 2010-11
Drilling Lakh Meter 4.98 4.91
Consultancy job outside CIL No 41 —
`. in Crore 33.26 —
EB
ITD
A &
PA
T (
Rs.
cro
re) T
OTA
L R
EV
EN
UE
(Rs. cro
re)
PR
OF
ITA
BIL
ITY
RA
TIO
S (
%)
CU
RR
EN
T R
AT
IO
Fig.2
Fig.1

Public Enterprises Survey 2011-2012: Vol-II 485
BALANCE SHEET (` in Lakhs)
PARTICULARS 2011-12 2010-11
I. EQUITY & LIABILITIESAUTHORISED CAPITAL 5000 5000(1) Shareholders’ Funds(a) Share Capital
(i) Central Govt 0 0
(ii) Others 1904 1904
(b) Reserves & Surplus 9188 6888
(c) Money received against share warrants 0 0
Total Shareholders’ Funds (1(a)+1(b)+1(c) 11092 8792(2) Share application money pending allotment 0 0(3) Non-current Liabilities(a) Long Term Borrowings 0 0
(b) Deferred tax liabilities (Net) 0 0
(c) Other Long-term liabilities 0 0
(d) Long-term provisions 17040 14171
Total Non-Current Liabilities 3(a) to 3(d) 17040 14171(4) Current Liabilities(a) Short Term Borrowings 0 0
(b) Trade Payables 3345 2295
(c) Other current liabilities 16144 12539
(d) Short-term provisions 15283 17132
Total Current Liabilities 4(a) to 4(d) 34772 31966TOTAL EQUITY & LIABILITIES (1+2+3+4) 62904 54929II. ASSETS(1) Non-Current Assets(a) Total Gross Fixed Assets 18298 16998(ai) Accumulated Depreciation, Depletion & Amortisation 10492 9803
(aii) Accumulated Impairment 0 0
(b) Total Net Fixed Assets ((a)-(ai)-(aii) 7806 7195(c) Capital work in progress 1152 564
(d) Intangible assets under developmet 0 0
(e) Non-Current Investments 0 0(f) Deferred Tax Assets (Net) 7167 5991(g) Long Term Loans and Advances 84 210(h) Other Non-Current Assets 2 2Total Non-Current Assets (b+c+d+e+f+g+h) 16211 13962
(2) Current Assets
(a) Current Investments 0 0
(b) Inventories 677 677
(c) Trade Recievables 24692 19047
(d) Cash & Bank Balance 6121 6104
(e) Short-term Loans & Advances 15198 15135
(f) Other Current Assets 5 4
Total Current Assets (a+b+c+d+e+f) 46693 40967
TOTAL ASSETS (1+2) 62904 54929
Important Indicators(i) Investment 1904 1904
(ii) Capital Employed 11092 8792
(iii) Net Worth 11092 8792
(iv) Net Current Assets 11921 9001
(v) Cost of Sales 49849 40983
(vi) Net Value Added (at market price) 45797 33844
(vii) Total Regular Employees (Nos.) 3129 3102
(viii) Avg. Monthly Emoluments per Employee(`) 89049 72464
PROFIT & LOSS ACCOUNT (` in Lakhs)
PARTICULARS 2011-12 2010-11
(I) Revenue from Operations (Gross) 52843 42909Less : Excise Duty 0 0Revenue from Operations (Net) 52843 42909(II) Other Income 0 446(III) Total Revenue (I+II) 52843 43355(IV) Expenditure on:(a) Cost of materials consumed 1667 1577(b) Purchase of stock-in-trade 0 0(c) Changes in inventories of finished goods, 0 0
work-in-progress and stock in trade(d) Stores & Spares 0 0(e) Power & Fuel 224 207(f) Salary, Wages & Benefits/Employees Expense 33436 26974(g) Other Operating/direct/manufacturing Expenses 0 8937(h) Rent, Royalty & Cess 0 0(i) Loss on sale of Assets/Investments 0 0(j) Other Expenses 13848 2740Total Expenditure (IV (a to j)) 49175 40435(V) PROFIT BEFORE DEPRECIATION, & IMPAIRMENT, 3668 2920
FINANCE CHARGES/INTEREST, EXCEPTIONAL &EXTRAORDINARY ITEMS & TAXES (PBDIEET)(III-IV)
(VI) Depreciation, Depletion & Amortisation 674 548(VII) Impairment 0 0(VIII) PROFIT BEFORE FINANCE COST/INTEREST, 2994 2372
EXCEPTIONAL, EXTRA-ORDINARY ITEMS &TAXES (PBIEET)(V-VI-VII)
(IX) Finance Cost(a) On Central Government Loans 0 0(b) On Foreign Loans 0 0(c) Others 0 3(d) Less Finance Cost Capitalised 0 0(e) Charged to P & L Account (a+b+c+d) 0 3(X) PROFIT BEFORE EXCEPTIONAL & EXTRA- 2994 2369
ORDINARY ITEMS & TAX (PBEET)(VIII-IXe)(XI) Exceptional Items -85 0(XII) PROFIT BEFORE EXTRA-ORDINARY ITEMS & 3079 2369
TAX (PBET)(X-XI)(XIII) Extra-Ordinary Items 0 0(XIV) PROFIT BEFORE TAX (PBT)(XII-XIII) 3079 2369(XV) TAX PROVISIONS 1118 837(XVI) NET PROFIT / LOSS FOR THE PERIOD FROM 1961 1532
CONTINUING OPERATIONS AFTER TAX(XIV-XV)(XVII) Profit/Loss from discontinuing operations 0 0(XVIII) Tax expenses of discontinuing operations 0 0(XIX) Profit/Loss from discontinuing operations 0 0
(after Tax)(XVII-XVIII)(XX) Profit/Loss for the period (XVI+XIX) 1961 1532Financial Ratios(i) Sales : Capital Employed 476.41 488.05
(ii) Cost of Sales : Sales 94.33 95.51
(iii) Salary/Wages : Sales 63.27 62.86
(iv) Net Profit : Net Worth 17.68 17.42
(v) Debt : Equity 0 0
(vi) Current Ratio 1.34 1.28
(vii) Trade Recievables : Sales 46.73 44.39
(viii) Total Inventory : Sales 1.28 1.58
CENTRAL MINE PLANNING & DESIGN INSTITUTE LTD.CMPDI Ltd., Gondwana Place, Kanke Road, Ranchi, Jharkhand - 834 031

Industrial Development & Tech. Consultancy Services482
Certification Engineers International Ltd.
The CompanyCertification Engineers International Ltd. (CEI) was set up on
26.10.1994 with an objective to undertake activities related tocertification, re-certification, safety audit and safety managementsystems for offshore and onshore oil and gas facilities and thirdparty inspection, risk analysis, safety, energy, quality audits in thehydrocarbon and other quality sensitive industry.
CEI is a Schedule 'C' CPSE in the Industrial Development andTechnical Consultancy sector under the administrative control ofM/o Petroleum and Natural Gas. The Company employed 81 regularexecutives' employees only as on 31.03.2012. Its registered officeis at New Delhi and corporate office is at Navi Mumbai,Maharashtra. It is a 100% subsidiary of Engineers India Ltd. (EIL).
Vision / MissionThe Vision of the Company is to be a global leader in the
business of ensuring quality, integrity and safety of customer'sassets.
The Mission of the Company is to achieve internationalstandards of excellence in customer services through constant valueaddition and innovation and to cultivate high standards of ethics,quality and integrity.
Industrial / Business OperationsCEI is engaged in providing services in the field of certification,
re-certification, third party inspection (TPI), risk analysis, safety,energy and quality audits and vendor assessment in the Hydrocarbonand other quality sensitive sectors of the industry.
Performance HighlightsThe physical performances of the company for last two years
are given below:
Total Revenue of the company registered an increase of` 1.29 crore during 2011-12, which went up from ` 32.18 crore in2010-11 to ` 33.47 crore in 2011-12. The net profit of the companyhowever declined to ̀ 10.06 crore, a reduction of ` 0.16 crore fromthe previous year 's profit of ` 10.22 on account of lower averagerealization, higher expenses, increased competition , lower level ofactivity in hydrocarbon sector and adverse revenue mix.
The company has taken various measures to reduce averageman-day cost substantially, through fresh recruitments and outsourcing, to effectively counter the pressure of reduced averagerealizations, and higher manpower cost due to pay revision.
The current ratio of company is at 8.65:1 during 2011-12 asagainst 6.31:1 in the previous year (Fig.2). Balance Sheet & Profit
www.certificationengineers.com
& Loss Account of the company and selected financial ratios duringthe period 2011-12 to 2011-12 can be seen on the adjoining page.
Strategic issueThe company is continuously exploring the possibility of
securing Certification & TPI jobs from other sectors / contractorsand enhancing its service portfolio to include areas concerningenvironment, plant operation & safety, specialized engineeringanalysis etc.
The Strength of organisation lies in highly qualified,experienced and quality conscious human resources. The team ofquality Surveyors has been drawn from reputed industries of Oiland Gas, Refinery & Petrochemicals, Sub-sea & Cross CountryPipeline, Chemical & Process, Equipment Manufacturing, PowerPlant and other manufacturing fields besides EIL's InspectionDepartment.
Main Service Unit Performance during
2011-12 2010-11
Certification andThird Party Inspection ` in Crore 29.92 29.49
EB
ITD
A &
PA
T (
Rs.
cro
re) T
OTA
L R
EV
EN
UE
(Rs. cro
re)
PR
OF
ITA
BIL
ITY
RA
TIO
S (
%)
CU
RR
EN
T R
AT
IO
Fig.2
Fig.1

Public Enterprises Survey 2011-2012: Vol-II 483
BALANCE SHEET (` in Lakhs)
PARTICULARS 2011-12 2010-11
I. EQUITY & LIABILITIESAUTHORISED CAPITAL 200 200(1) Shareholders’ Funds(a) Share Capital
(i) Central Govt 0 0
(ii) Others 100 100
(b) Reserves & Surplus 5058 4459
(c) Money received against share warrants 0 0
Total Shareholders’ Funds (1(a)+1(b)+1(c) 5158 4559(2) Share application money pending allotment 0 0(3) Non-current Liabilities(a) Long Term Borrowings 0 0
(b) Deferred tax liabilities (Net) 0 0
(c) Other Long-term liabilities 6 4
(d) Long-term provisions 151 120
Total Non-Current Liabilities 3(a) to 3(d) 157 124(4) Current Liabilities(a) Short Term Borrowings 0 0
(b) Trade Payables 87 68
(c) Other current liabilities 263 308
(d) Short-term provisions 265 281
Total Current Liabilities 4(a) to 4(d) 615 657TOTAL EQUITY & LIABILITIES (1+2+3+4) 5930 5340II. ASSETS(1) Non-Current Assets(a) Total Gross Fixed Assets 407 376(ai) Accumulated Depreciation, Depletion & Amortisation 96 79
(aii) Accumulated Impairment 0 0
(b) Total Net Fixed Assets ((a)-(ai)-(aii) 311 297(c) Capital work in progress 0 0
(d) Intangible assets under developmet 0 0
(e) Non-Current Investments 0 0(f) Deferred Tax Assets (Net) 70 48(g) Long Term Loans and Advances 26 33(h) Other Non-Current Assets 203 822Total Non-Current Assets (b+c+d+e+f+g+h) 610 1200(2) Current Assets(a) Current Investments 0 78(b) Inventories 1 0
(c) Trade Recievables 945 1195
(d) Cash & Bank Balance 3683 2511
(e) Short-term Loans & Advances 174 106
(f) Other Current Assets 517 250
Total Current Assets (a+b+c+d+e+f) 5320 4140
TOTAL ASSETS (1+2) 5930 5340
Important Indicators(i) Investment 100 100
(ii) Capital Employed 5158 4559
(iii) Net Worth 5158 4559
(iv) Net Current Assets 4705 3483
(v) Cost of Sales 1861 1687
(vi) Net Value Added (at market price) 2379 2318
(vii) Total Regular Employees (Nos.) 81 70
(viii) Avg. Monthly Emoluments per Employee(`) 54835 60000
PROFIT & LOSS ACCOUNT (` in Lakhs)
PARTICULARS 2011-12 2010-11
(I) Revenue from Operations (Gross) 2988 2949Less : Excise Duty 0 0Revenue from Operations (Net) 2988 2949(II) Other Income 359 269(III) Total Revenue (I+II) 3347 3218(IV) Expenditure on:(a) Cost of materials consumed 0 0(b) Purchase of stock-in-trade 0 0(c) Changes in inventories of finished goods, -4 0
work-in-progress and stock in trade(d) Stores & Spares 0 0(e) Power & Fuel 13 11(f) Salary, Wages & Benefits/Employees Expense 533 504(g) Other Operating/direct/manufacturing Expenses 1104 1023(h) Rent, Royalty & Cess 48 43(i) Loss on sale of Assets/Investments 0 0(j) Other Expenses 149 89Total Expenditure (IV (a to j)) 1843 1670(V) PROFIT BEFORE DEPRECIATION, & IMPAIRMENT, 1504 1548
FINANCE CHARGES/INTEREST, EXCEPTIONAL &EXTRAORDINARY ITEMS & TAXES (PBDIEET)(III-IV)
(VI) Depreciation, Depletion & Amortisation 18 17(VII) Impairment 0 0(VIII) PROFIT BEFORE FINANCE COST/INTEREST, 1486 1531
EXCEPTIONAL, EXTRA-ORDINARY ITEMS &TAXES (PBIEET)(V-VI-VII)
(IX) Finance Cost(a) On Central Government Loans 0 0(b) On Foreign Loans 0 0(c) Others 0 0(d) Less Finance Cost Capitalised 0 0(e) Charged to P & L Account (a+b+c+d) 0 0(X) PROFIT BEFORE EXCEPTIONAL & EXTRA- 1486 1531
ORDINARY ITEMS & TAX (PBEET)(VIII-IXe)(XI) Exceptional Items 0 0(XII) PROFIT BEFORE EXTRA-ORDINARY ITEMS & 1486 1531
TAX (PBET)(X-XI)(XIII) Extra-Ordinary Items 0 0(XIV) PROFIT BEFORE TAX (PBT)(XII-XIII) 1486 1531(XV) TAX PROVISIONS 480 509(XVI) NET PROFIT / LOSS FOR THE PERIOD FROM 1006 1022
CONTINUING OPERATIONS AFTER TAX(XIV-XV)(XVII) Profit/Loss from discontinuing operations 0 0(XVIII) Tax expenses of discontinuing operations 0 0
(XIX) Profit/Loss from discontinuing operations 0 0(after Tax)(XVII-XVIII)
(XX) Profit/Loss for the period (XVI+XIX) 1006 1022Financial Ratios(i) Sales : Capital Employed 57.93 64.69(ii) Cost of Sales : Sales 62.28 57.21(iii) Salary/Wages : Sales 17.84 17.09(iv) Net Profit : Net Worth 19.5 22.42(v) Debt : Equity 0 0(vi) Current Ratio 8.65 6.3(vii) Trade Recievables : Sales 31.63 40.52(viii) Total Inventory : Sales 0.03 0
CERTIFICATION ENGINEERS INTERNATIONAL L TD.E.I. Annexe (4th Floor), 1, Bhikaiji Cama Place , R.K. Puram, New Delhi-110066

Industrial Development & Tech. Consultancy Services486
EdCIL (India) Ltd.
The CompanyEdCIL (India) Ltd. (Education Consultants India Ltd.) was
incorporated in 1981 with the objective of providing educationalconsultancy services, nationally and internationally, in systemdesign, resource development, research and evaluation studies andmanagement development, to enable educational systems to achieveexcellence and to promote Indian education abroad as the singlewindow nodal service provider.
EdCIL is a Schedule-'C' Miniratna CPSE in IndustrialDevelopment & Tech. Consultancy Services sector under theadministrative control of Ministry of Human Resources &Development, D/o Higher Education with 100% shareholding bythe Government of India. The company employed 81 regularemployees (Executives 49, Non-Executives 32) as on 31.3.2012.Its registered office is at New Delhi and Corporate Office is atNOIDA, UP.
Vision / MissionThe Vision / Mission of the company is to provide world-
class educational consultancy services in system design, resourcedevelopment, research & evaluation studies and managementdevelopment, nationally and internationally, to enableeducational systems to achieve excellence. EdCIL will also promoteIndian education abroad as the single window nodal serviceprovider.
Industrial / Business OperationsEd.CIL is engaged in promotion of Indian education abroad by
placement of International students in India institutions andsecondment of Indian teachers / experts abroad, conducting educationfairs, seminars cum counseling sessions, improving liaison withIndian Missions abroad etc.; and providing educational consultancyservices including technical assistance, supply of educational aids,testing, institutional development etc.
The service range of the company comprises of three mainsegments viz Human Resource Development, InstitutionalDevelopment and Technical Assistance.
Performance HighlightsMajor contribution in revenue generation was made by
placement of human resources and providing technicalassistance. The performance of Company for last two years isgiven below:
The Company registered an increase of ` 20.29 crore in totalincome during 2011-12 which went up to ` 89.97 crore in 2011-12from ̀ 69.68 crore during 2010-11 due to increase in revenue fromoperations. The net profit of the company however reduced to` 2.45 crore in 2011-12 as compared to ` 2.49 crore during theprevious year due to increase in operating expenses.
The current ratio of company is at 1.27:1 during 2011-12 asagainst 1.3:1 in the previous year (Fig.2). Balance Sheet and Profit& Loss Account of the company and selected financial ratios duringthe period 2010-11 to 2011-12 can be seen on the adjoining page.
www.edcilindia.co.in
EB
ITD
A &
PA
T (
Rs.
cro
re)
TO
TAL
RE
VE
NU
E (R
s. crore)
PR
OF
ITA
BIL
ITY
RA
TIO
S (
%)
CU
RR
EN
T R
AT
IO
Fig.2
Fig.1
Main Services Unit Performance during
2011-12 2010-11
Technical Assistance ` in Crore 41.425 32.83
Income from HRD ` in Crore 31.62 21.41
InstitutionalDevelopment ` in Crore 3.75 1.39
Strategic IssuesEfforts such as introduction of profit center scheme w.e.f.
1.4.2005, establishment of Research & Planning unit to exploreopportunities for diversification and establishment of an officeeither in South Africa or in ASEAN/Middle East region to promoteBrand India in education sector were made / being made to improvecompetitiveness and cost control.

Public Enterprises Survey 2011-2012: Vol-II 487
BALANCE SHEET (` in Lakhs)
PARTICULARS 2011-12 2010-11
I. EQUITY & LIABILITIESAUTHORISED CAPITAL 150 150(1) Shareholders’ Funds(a) Share Capital
(i) Central Govt 150 150
(ii) Others 0 0
(b) Reserves & Surplus 1935 1875
(c) Money received against share warrants 0 0
Total Shareholders’ Funds (1(a)+1(b)+1(c) 2085 2025(2) Share application money pending allotment 0 0(3) Non-current Liabilities(a) Long Term Borrowings 0 0
(b) Deferred tax liabilities (Net) 0 0
(c) Other Long-term liabilities 161 172
(d) Long-term provisions 0 0
Total Non-Current Liabilities 3(a) to 3(d) 161 172(4) Current Liabilities(a) Short Term Borrowings 0 0
(b) Trade Payables 881 604
(c) Other current liabilities 2911 3056
(d) Short-term provisions 1494 1337
Total Current Liabilities 4(a) to 4(d) 5286 4997TOTAL EQUITY & LIABILITIES (1+2+3+4) 7532 7194II. ASSETS(1) Non-Current Assets(a) Total Gross Fixed Assets 985 962(ai) Accumulated Depreciation, Depletion & Amortisation 442 425
(aii) Accumulated Impairment 0 0
(b) Total Net Fixed Assets ((a)-(ai)-(aii) 543 537(c) Capital work in progress 0 0
(d) Intangible assets under developmet 9 0
(e) Non-Current Investments 0 0(f) Deferred Tax Assets (Net) 85 75(g) Long Term Loans and Advances 203 88(h) Other Non-Current Assets 0 0Total Non-Current Assets (b+c+d+e+f+g+h) 840 700(2) Current Assets(a) Current Investments 0 0(b) Inventories 107 204
(c) Trade Recievables 765 965
(d) Cash & Bank Balance 3489 3628
(e) Short-term Loans & Advances 2331 1697
(f) Other Current Assets 0 0
Total Current Assets (a+b+c+d+e+f) 6692 6494
TOTAL ASSETS (1+2) 7532 7194
Important Indicators(i) Investment 150 150
(ii) Capital Employed 2085 2025
(iii) Net Worth 2085 2025
(iv) Net Current Assets 1406 1497
(v) Cost of Sales 8612 6633
(vi) Net Value Added (at market price) 1584 1484
(vii) Total Regular Employees (Nos.) 81 85
(viii) Avg. Monthly Emoluments per Employee(`) 88477 83235
EdCIL (India) Ltd.10-B, I.P Estate, New Delhi-110002
PROFIT & LOSS ACCOUNT (` in Lakhs)
PARTICULARS 2011-12 2010-11
(I) Revenue from Operations (Gross) 8649 6722Less : Excise Duty 0 0Revenue from Operations (Net) 8649 6722(II) Other Income 348 246(III) Total Revenue (I+II) 8997 6968(IV) Expenditure on:(a) Cost of materials consumed 0 0(b) Purchase of stock-in-trade 0 0(c) Changes in inventories of finished goods, 97 12
work-in-progress and stock in trade(d) Stores & Spares 0 0(e) Power & Fuel 29 27(f) Salary, Wages & Benefits/Employees Expense 860 849(g) Other Operating/direct/manufacturing Expenses 7370 5516(h) Rent, Royalty & Cess 5 5(i) Loss on sale of Assets/Investments 7 9(j) Other Expenses 213 171Total Expenditure (IV (a to j)) 8581 6589(V) PROFIT BEFORE DEPRECIATION, & IMPAIRMENT, 416 379
FINANCE CHARGES/INTEREST, EXCEPTIONAL &EXTRAORDINARY ITEMS & TAXES (PBDIEET)(III-IV)
(VI) Depreciation, Depletion & Amortisation 38 53(VII) Impairment 0 0(VIII) PROFIT BEFORE FINANCE COST/INTEREST, 378 326
EXCEPTIONAL, EXTRA-ORDINARY ITEMS &TAXES (PBIEET)(V-VI-VII)
(IX) Finance Cost(a) On Central Government Loans 0 0(b) On Foreign Loans 0 0(c) Others 0 0(d) Less Finance Cost Capitalised 0 0(e) Charged to P & L Account (a+b+c+d) 0 0(X) PROFIT BEFORE EXCEPTIONAL & EXTRA- 378 326
ORDINARY ITEMS & TAX (PBEET)(VIII-IXe)(XI) Exceptional Items -11 -59(XII) PROFIT BEFORE EXTRA-ORDINARY ITEMS & 389 385
TAX (PBET)(X-XI)(XIII) Extra-Ordinary Items 0 0(XIV) PROFIT BEFORE TAX (PBT)(XII-XIII) 389 385(XV) TAX PROVISIONS 144 136(XVI) NET PROFIT / LOSS FOR THE PERIOD FROM 245 249
CONTINUING OPERATIONS AFTER TAX(XIV-XV)(XVII) Profit/Loss from discontinuing operations 0 0
(XVIII) Tax expenses of discontinuing operations 0 0(XIX) Profit/Loss from discontinuing operations 0 0
(after Tax)(XVII-XVIII)
(XX) Profit/Loss for the period (XVI+XIX) 245 249Financial Ratios(i) Sales : Capital Employed 414.82 331.95
(ii) Cost of Sales : Sales 99.57 98.68
(iii) Salary/Wages : Sales 9.94 12.63
(iv) Net Profit : Net Worth 11.75 12.3
(v) Debt : Equity 0 0
(vi) Current Ratio 1.27 1.3
(vii) Trade Recievables : Sales 8.84 14.36
(viii) Total Inventory : Sales 1.24 3.03
2011-12 Provisional

Industrial Development & Tech. Consultancy Services488
Engineering Projects (India) Ltd.
The CompanyEngineering Projects (India) Limited (EPI) was incorporated
on 16.04.1970 with the main objective to undertake turnkey projectsand consultancy services in India and abroad.
EPI is a Schedule-'B' Mini Ratna, CPSE in IndustrialDevelopment and Technical Consultancy Services Sector under theadministrative control of the Ministry of Heavy Industries & PublicEnterprises with100% shareholding by the Government of India.The company employed 423 regular employees (Executives 404 &Non-Executives 19) as on 31.3.2012.It has its Registered Officeand Corporate Office at New Delhi.
Vision / MissionThe Vision / Mission of the Company is to be the leading
turnkey project execution company committed to quality andtimely completion of projects continuously enhancing stakeholdervalue.
Industrial / Business OperationsEPI is engaged in the field of execution of large and multi-
disciplinary industrial & construction projects on turkey basis andProject Management Consultancy services to undertake operationsacross India the company has its Regional/ Zonal Offices at differentgeographical locations namely New Delhi, Mumbai, Kolkata,Chennai, Guwahati, Hyderabad and Bangalore.
EPI provides integrated services from concept tocommissioning of projects which include the specialized activitiessuch as Feasibility Studies & Detailed Project Reports, Design andEngineering, Supply of Plant & Equipment. Quality Assurance,Construction & Erection, Trial run and Commissioning, Operationand Maintenance and Overall Project Management in almost allareas of engineering, consultancy and construction.
Performance Highlights The physical performances of the company for last two years
are given below:
www.epi.gov.in
the period 2010-11 to 2011-12 can be seen on the adjoiningpage.
Strategic issuesThe company is operating in a highly competitive
environment and there is pressure on margin and profitability.The company has, therefore, adopted the strategy of taking uphigh value projects, diversification into high margin areas andexplores overseas market. It has decided to concentrate on hightechnology areas with potential of high profits is focusing onmarket, multi-modal transportation system like metro rail andmonorail projects. With this in view, EPI has signed four MoUsfor executing monorail projects and taking up the infrastructuredevelopment projects in India, Srilanka, Bangaldesh, Maldives,and African countries.
Main Service Unit Performance during
2011-12 2010-11
Turnkey projectsexecution & projectmanagement consultancy ` in Crore 901.27 1104
EB
ITD
A &
PA
T (
Rs.
cro
re) T
OTA
L R
EV
EN
UE
(Rs. cro
re)
PR
OF
ITA
BIL
ITY
RA
TIO
S (
%)
CU
RR
EN
T R
AT
IO
Fig.2
Fig.1
Total Revenue from of the company registered a reduction of` 190.86 crore during 2011-12, which went down from ` 1128.59crore in 2010-11 to ` 937.73 crore in 2011-12. However, theprofit of the company has gone up by ̀ 9.42 crore to ` 24.47 crorein 2011-12, from ` 15.05 crore in previous year due to increase inproductivity.
The current ratio of company is at 1.01:1 during 2011-12 asagainst 0.99:1 in the previous year (Fig.2). Balance Sheet and Profit& Loss Account of the company and selected financial ratios during

Public Enterprises Survey 2011-2012: Vol-II 489
BALANCE SHEET (` in Lakhs)
PARTICULARS 2011-12 2010-11
I. EQUITY & LIABILITIESAUTHORISED CAPITAL 90940 90940(1) Shareholders’ Funds(a) Share Capital
(i) Central Govt 3541 3541
(ii) Others 1 1
(b) Reserves & Surplus 14131 12507
(c) Money received against share warrants 0 0
Total Shareholders’ Funds (1(a)+1(b)+1(c) 17673 16049(2) Share application money pending allotment 0 0(3) Non-current Liabilities(a) Long Term Borrowings 0 0
(b) Deferred tax liabilities (Net) 0 0
(c) Other Long-term liabilities 11935 9779
(d) Long-term provisions 2049 1909
Total Non-Current Liabilities 3(a) to 3(d) 13984 11688(4) Current Liabilities(a) Short Term Borrowings 0 0
(b) Trade Payables 23667 22437
(c) Other current liabilities 541363 504260
(d) Short-term provisions 2850 2809
Total Current Liabilities 4(a) to 4(d) 567880 529506TOTAL EQUITY & LIABILITIES (1+2+3+4) 599537 557243II. ASSETS(1) Non-Current Assets(a) Total Gross Fixed Assets 1688 1629(ai) Accumulated Depreciation, Depletion & Amortisation 1150 1129
(aii) Accumulated Impairment 0 0
(b) Total Net Fixed Assets ((a)-(ai)-(aii) 538 500(c) Capital work in progress 0 0
(d) Intangible assets under developmet 0 0
(e) Non-Current Investments 0 0(f) Deferred Tax Assets (Net) 896 852(g) Long Term Loans and Advances 20560 22561(h) Other Non-Current Assets 6250 7176Total Non-Current Assets (b+c+d+e+f+g+h) 28244 31089(2) Current Assets(a) Current Investments 0 0(b) Inventories 380032 353463
(c) Trade Recievables 16159 5954
(d) Cash & Bank Balance 28186 30266
(e) Short-term Loans & Advances 26044 18671
(f) Other Current Assets 120872 117800
Total Current Assets (a+b+c+d+e+f) 571293 526154
TOTAL ASSETS (1+2) 599537 557243
Important Indicators(i) Investment 3542 3542
(ii) Capital Employed 17673 16049
(iii) Net Worth 17673 16049
(iv) Net Current Assets 3413 -3352
(v) Cost of Sales 89488 110413
(vi) Net Value Added (at market price) 8820 7070
(vii) Total Regular Employees (Nos.) 423 434
(viii) Avg. Monthly Emoluments per Employee(`) 89362 88844
PROFIT & LOSS ACCOUNT (` in Lakhs)
PARTICULARS 2011-12 2010-11
(I) Revenue from Operations (Gross) 90127 110683Less : Excise Duty 0 0Revenue from Operations (Net) 90127 110683(II) Other Income 3646 2176(III) Total Revenue (I+II) 93773 112859(IV) Expenditure on:(a) Cost of materials consumed 0 0(b) Purchase of stock-in-trade 0 0(c) Changes in inventories of finished goods, 0 0
work-in-progress and stock in trade(d) Stores & Spares 0 0(e) Power & Fuel 92 85(f) Salary, Wages & Benefits/Employees Expense 4536 4627(g) Other Operating/direct/manufacturing Expenses 83347 104558(h) Rent, Royalty & Cess 0 0(i) Loss on sale of Assets/Investments 1 3(j) Other Expenses 1440 1088Total Expenditure (IV (a to j)) 89416 110361(V) PROFIT BEFORE DEPRECIATION, & IMPAIRMENT, 4357 2498
FINANCE CHARGES/INTEREST, EXCEPTIONAL &EXTRAORDINARY ITEMS & TAXES (PBDIEET)(III-IV)
(VI) Depreciation, Depletion & Amortisation 73 55(VII) Impairment 0 0(VIII) PROFIT BEFORE FINANCE COST/INTEREST, 4284 2443
EXCEPTIONAL, EXTRA-ORDINARY ITEMS &TAXES (PBIEET)(V-VI-VII)
(IX) Finance Cost(a) On Central Government Loans 0 0(b) On Foreign Loans 0 0(c) Others 647 186(d) Less Finance Cost Capitalised 0 0(e) Charged to P & L Account (a+b+c+d) 647 186(X) PROFIT BEFORE EXCEPTIONAL & EXTRA- 3637 2257
ORDINARY ITEMS & TAX (PBEET)(VIII-IXe)(XI) Exceptional Items 0 0(XII) PROFIT BEFORE EXTRA-ORDINARY ITEMS & 3637 2257
TAX (PBET)(X-XI)(XIII) Extra-Ordinary Items 0 0(XIV) PROFIT BEFORE TAX (PBT)(XII-XIII) 3637 2257(XV) TAX PROVISIONS 1190 752(XVI) NET PROFIT / LOSS FOR THE PERIOD FROM 2447 1505
CONTINUING OPERATIONS AFTER TAX(XIV-XV)(XVII) Profit/Loss from discontinuing operations 0 0(XVIII) Tax expenses of discontinuing operations 0 0
(XIX) Profit/Loss from discontinuing operations 0 0 (after Tax)(XVII-XVIII)
(XX) Profit/Loss for the period (XVI+XIX) 2447 1505Financial Ratios(i) Sales : Capital Employed 509.97 689.66
(ii) Cost of Sales : Sales 99.29 99.76
(iii) Salary/Wages : Sales 5.03 4.18
(iv) Net Profit : Net Worth 13.85 9.38
(v) Debt : Equity 0 0
(vi) Current Ratio 1.01 0.99
(vii) Trade Recievables : Sales 17.93 5.38
(viii) Total Inventory : Sales 421.66 319.35
ENGINEERING PROJECTS (INDIA) LTD.Core-3, Scope Complex, 7 Lodhi Road, New Delhi-110003

Industrial Development & Tech. Consultancy Services490
Engineers India Ltd.
The CompanyEngineers India Ltd. (EIL) was incorporated on 15.03.1965
with the objective to provide design, engineering and related projectmanagement and consultancy services for the hydrocarbon sectorand the process plants industry in the country.
EIL is a listed Schedule 'A' / Mini Ratna CPSE in the IndustrialDevelopment and Technical Consultancy sector under theadministrative control of Ministry of Petroleum & Natural Gas.The company employed 3450 regular employees (Executives 3079,Non-executives 371 ) as on 31.3.2012. The Registered and CorporateOffice of EIL is at New Delhi.
Vision / MissionThe Vision of the Company is to be a world class globally
competitive EPC and total solutions Consultancy Organisation.
The Mission of the Company is to achieve "Customer Delight"through innovative, cost effective and value added consulting &EPC services and Maximize creation of wealth, value and satisfactionfor stakeholders with high standards of business ethics aligned withnational policies.
Industrial / Business OperationsEIL is engaged in providing engineering consultancy and EPC
services for projects, both in India and abroad through its HeadOffice in New Delhi, regional offices in Chennai, Kolkata andVadodara and a branch office in Mumbai. It has inspection officesat all major equipment manufacturing locations in India and a whollyowned subsidiary, Certification Engineers International Ltd forundertaking independent certification and third party inspectionassignments.
It also have one wholly owned oversea subsidiaries namelyEIL Asia Pacific Sdn. Bhd. and two joint venture companies.
The services provided by the company comprise projectconceptualizing, designing, engineering, procurement, projectmanagement, construction management, pre-commissioning andcommissioning assistance in the hydro-carbon, mining andmetallurgy, and infrastructure sectors.
Performance HighlightsThe physical performance of the company for last two years
are given below:
www.engineersindia.com
Total Revenue of the company registered an increase of` 1317.62 crore during 2011-12, which went up from ` 2813.01crore in 2010-11 to ` 4130.63 crore in 2011-12. The net profit of thecompany correspondingly increased to ` 636.32 crore in 2011-12from ` 522.52 crore during previous year showing an increase of` 113.80 crore due to enhanced operational efficiency and cost control.
The current ratio of company is at 1.76:1during 2011-12 asagainst 1.55:1 in the previous year (Fig.2). Balance Sheet andProfit & Loss Account of the company and selected financial ratiosduring the period 2010-11 to 2011-12 can be seen on the adjoiningpage.
Main Products Unit Performance during
Services 2011-12 2010-11
Project/ Consultancy MillionServices man-hours 5.12 5.07
Consultancy & ` in Crore 1207 1128Engineering
Lump sum TurnkeyProjects (LSTK) ` in Crore 2491 1695
EB
ITD
A &
PA
T (
Rs.
cro
re) T
OTA
L R
EV
EN
UE
(Rs. cro
re)
PR
OF
ITA
BIL
ITY
RA
TIO
S (
%)
CU
RR
EN
T R
AT
IO
Fig.2
Fig.1
Strategic IssuesThe JV is expected to enhance EIL's business prospects in the
Middle East, while diversification in the non-hydrocarbon segmentsof the industrial sectors is envisaged to increase business for thenon-hydrocarbon segment of the company. The company has alsotaken initiative to improve its technology portfolio.

Public Enterprises Survey 2011-2012: Vol-II 491
BALANCE SHEET (` in Lakhs)
PARTICULARS 2011-12 2010-11
I. EQUITY & LIABILITIESAUTHORISED CAPITAL 30000 30000(1) Shareholders’ Funds(a) Share Capital
(i) Central Govt 13545 13545
(ii) Others 3302 3302
(b) Reserves & Surplus 167558 127365
(c) Money received against share warrants 0 0
Total Shareholders’ Funds (1(a)+1(b)+1(c) 184405 144212(2) Share application money pending allotment 0 0(3) Non-current Liabilities(a) Long Term Borrowings 0 0
(b) Deferred tax liabilities (Net) 0 0
(c) Other Long-term liabilities 513 467
(d) Long-term provisions 2002 1635
Total Non-Current Liabilities 3(a) to 3(d) 2515 2102(4) Current Liabilities(a) Short Term Borrowings 0 0
(b) Trade Payables 58723 30717
(c) Other current liabilities 75427 123044
(d) Short-term provisions 53336 46849
Total Current Liabilities 4(a) to 4(d) 187486 200610TOTAL EQUITY & LIABILITIES (1+2+3+4) 374406 346924II. ASSETS(1) Non-Current Assets(a) Total Gross Fixed Assets 18788 19283(ai) Accumulated Depreciation, Depletion & Amortisation 13479 13276
(aii) Accumulated Impairment 0 0
(b) Total Net Fixed Assets ((a)-(ai)-(aii) 5309 6007(c) Capital work in progress 5160 1308
(d) Intangible assets under developmet 0 0
(e) Non-Current Investments 6496 53(f) Deferred Tax Assets (Net) 21426 17564(g) Long Term Loans and Advances 5626 7434(h) Other Non-Current Assets 26 3624Total Non-Current Assets (b+c+d+e+f+g+h) 44043 35990(2) Current Assets(a) Current Investments 57001 51188(b) Inventories 82 87
(c) Trade Recievables 30737 30812
(d) Cash & Bank Balance 164314 172847
(e) Short-term Loans & Advances 18510 22474
(f) Other Current Assets 59719 33526
Total Current Assets (a+b+c+d+e+f) 330363 310934
TOTAL ASSETS (1+2) 374406 346924
Important Indicators(i) Investment 16847 16847
(ii) Capital Employed 184405 144212
(iii) Net Worth 184405 144212
(iv) Net Current Assets 142877 110324
(v) Cost of Sales 321578 202846
(vi) Net Value Added (at market price) 160411 145083
(vii) Total Regular Employees (Nos.) 3450 3417
(viii) Avg. Monthly Emoluments per Employee(`) 130843 126366
PROFIT & LOSS ACCOUNT (` in Lakhs)
PARTICULARS 2011-12 2010-11
(I) Revenue from Operations (Gross) 389845 265264Less : Excise Duty 0 0Revenue from Operations (Net) 389845 265264(II) Other Income 23218 16037(III) Total Revenue (I+II) 413063 281301(IV) Expenditure on:(a) Cost of materials consumed 0 0(b) Purchase of stock-in-trade 0 0(c) Changes in inventories of finished goods, 19963 -17065
work-in-progress and stock in trade(d) Stores & Spares 0 5(e) Power & Fuel 697 690(f) Salary, Wages & Benefits/Employees Expense 54169 51815(g) Other Operating/direct/manufacturing Expenses 219051 147923(h) Rent, Royalty & Cess 846 750(i) Loss on sale of Assets/Investments 8 6(j) Other Expenses 24907 17298Total Expenditure (IV (a to j)) 319641 201422(V) PROFIT BEFORE DEPRECIATION, & IMPAIRMENT, 93422 79879
FINANCE CHARGES/INTEREST, EXCEPTIONAL &EXTRAORDINARY ITEMS & TAXES (PBDIEET)(III-IV)
(VI) Depreciation, Depletion & Amortisation 1945 1430(VII) Impairment 0 0(VIII) PROFIT BEFORE FINANCE COST/INTEREST, 91477 78449
EXCEPTIONAL, EXTRA-ORDINARY ITEMS &TAXES (PBIEET)(V-VI-VII)
(IX) Finance Cost(a) On Central Government Loans 0 0(b) On Foreign Loans 0 0(c) Others 0 0(d) Less Finance Cost Capitalised 0 0(e) Charged to P & L Account (a+b+c+d) 0 0(X) PROFIT BEFORE EXCEPTIONAL & EXTRA- 91477 78449
ORDINARY ITEMS & TAX (PBEET)(VIII-IXe)(XI) Exceptional Items 0 0(XII) PROFIT BEFORE EXTRA-ORDINARY ITEMS & 91477 78449
TAX (PBET)(X-XI)(XIII) Extra-Ordinary Items 0 0(XIV) PROFIT BEFORE TAX (PBT)(XII-XIII) 91477 78449(XV) TAX PROVISIONS 27845 26197(XVI) NET PROFIT / LOSS FOR THE PERIOD FROM 63632 52252
CONTINUING OPERATIONS AFTER TAX(XIV-XV)(XVII) Profit/Loss from discontinuing operations 0 0(XVIII) Tax expenses of discontinuing operations 0 0(XIX) Profit/Loss from discontinuing operations 0 0
(after Tax)(XVII-XVIII)(XX) Profit/Loss for the period (XVI+XIX) 63632 52252Financial Ratios(i) Sales : Capital Employed 211.41 183.94
(ii) Cost of Sales : Sales 82.49 76.47
(iii) Salary/Wages : Sales 13.9 19.53
(iv) Net Profit : Net Worth 34.51 36.23
(v) Debt : Equity 0 0
(vi) Current Ratio 1.76 1.55
(vii) Trade Recievables : Sales 7.88 11.62
(viii) Total Inventory : Sales 0.02 0.03
ENGINEERS INDIA LTD.1, Bhikaiji Cama Place, RK Puram, New Delhi - 110066

Industrial Development & Tech. Consultancy Services492
HSCC (INDIA) LTD.
The CompanyHSCC was incorporated on 30th March 1983 under the
Companies Act, 1956 with an objective to be a market leader inproviding innovative, high quality knowledge based services in thehealth and social sectors by seeking opportunities in special marketniches and to develop as a consultancy organization withcontemporary professional standards in the field of healthcare.
HSCC is Knowledge based, Schedule 'C,' Miniratna CPSE inInfrastructural Development and Technical Consultancy ServicesSector under the administrative control of Ministry of Health &Family welfare, D/O Health with 100% shareholding by the CentralGovernment. The company employed 124 regular employees(Executives 107, Non-executives 17) as on 31.3.2012. Its registeredOffice is at Delhi and Corporate Office at Noida.
Vision/MissionThe Vision of the company is to be a leading consulting
company providing value-added, innovative and integrated servicesfor enhancing healthcare in India and overseas.
The Mission of the company is to provide comprehensiveconcept to commissioning, project planning, architectural,engineering, project management, procurement and related consultingservices for development of buildings and infrastructure forhealthcare and other purposes in India and overseas.
Industrial / Business OperationsHSCC is engaged in providing specialized consultancy services
in the health care and other social sector which include conductingstudies in rehabilitation, up gradation/ modernization and baselinesurvey and to undertake architectural planning & design, projectmanagement, procurement, acquisition of technology, informationtechnology/ recruitment / training in the field of hospitals and medicalrelated institutes and laboratories.
The company has diversified in the areas of hospital wastemanagement, hospital computerization, health related managementstudies and training & recruitment. The service range of the companycomprises of conceptual studies & management consultancy,engineering studies and facility design, project management,procurement, logistics & installation and information technology.
Performance HighlightsThe performance details of the company during the last two
year are as follows:-
Total Revenue of the company registered an increase of` 11.13 crore during 2011-12, which went up from ` 33.45 crore in2010-11 to ` 44.58 crore in 2011-12.The net profit of the companycorrespondingly grew to ` 14.72 crore, an increase of ` 6.38 croreover the previous year profit of ` 8.34 crore due to increase inother income and lower increase in operating expenses as comparedto increase in operations. www.hsccltd.com
The current ratio of company is at 2.69:1 during 2011-12 asagainst 3.64:1 in the previous year (Fig.2). Balance Sheet and Profit& Loss Account of the company and selected financial ratios duringthe period 2010-11 to 2011-12 can be seen on the adjoining page.
Strategic IssuesThe company aims to be known as the most preferred
consulting partner to the clients in the Healthcare and Social Sectorby offering customized innovative solutions through harnessingknowledge pools and team work. The Company has been makingvigorous efforts to expand the area of operations of the companyand has secured orders worth Rs. 50 crores from MOH&FW & Rs.9 crores from other organizations. The human resource managementpolicies are being reviewed from time to time. KnowledgeManagement System, E-tendering, E-procurement, Internal cumConcurrent Audit, etc are being strengthened.
Main Services Unit Performance during2011-12 2010-11
Consultancy Services ` in Lakhs 2928 2311
EB
ITD
A &
PA
T (
Rs.
cro
re) T
OTA
L R
EV
EN
UE
(Rs. cro
re)
PR
OF
ITA
BIL
ITY
RA
TIO
S (
%)
CU
RR
EN
T R
AT
IO
Fig.2
Fig.1

Public Enterprises Survey 2011-2012: Vol-II 493
BALANCE SHEET (` in Lakhs)
PARTICULARS 2011-12 2010-11
I. EQUITY & LIABILITIESAUTHORISED CAPITAL 500 500(1) Shareholders’ Funds(a) Share Capital
(i) Central Govt 240 240
(ii) Others 0 0
(b) Reserves & Surplus 8755 7632
(c) Money received against share warrants 0 0
Total Shareholders’ Funds (1(a)+1(b)+1(c) 8995 7872(2) Share application money pending allotment 0 0(3) Non-current Liabilities(a) Long Term Borrowings 0 0
(b) Deferred tax liabilities (Net) 0 0
(c) Other Long-term liabilities 25784 23537
(d) Long-term provisions 325 331
Total Non-Current Liabilities 3(a) to 3(d) 26109 23868(4) Current Liabilities(a) Short Term Borrowings 0 0
(b) Trade Payables 8 23
(c) Other current liabilities 19364 11467
(d) Short-term provisions 338 41
Total Current Liabilities 4(a) to 4(d) 19710 11531TOTAL EQUITY & LIABILITIES (1+2+3+4) 54814 43271II. ASSETS(1) Non-Current Assets(a) Total Gross Fixed Assets 1148 1114(ai) Accumulated Depreciation, Depletion & Amortisation 547 498
(aii) Accumulated Impairment 0 0
(b) Total Net Fixed Assets ((a)-(ai)-(aii) 601 616(c) Capital work in progress 0 0
(d) Intangible assets under developmet 0 0
(e) Non-Current Investments 0 0(f) Deferred Tax Assets (Net) 140 140(g) Long Term Loans and Advances 966 503(h) Other Non-Current Assets 0 0Total Non-Current Assets (b+c+d+e+f+g+h) 1707 1259(2) Current Assets(a) Current Investments 0 0
(b) Inventories 0 0
(c) Trade Recievables 1355 1955
(d) Cash & Bank Balance 47016 33921
(e) Short-term Loans & Advances 2085 4147
(f) Other Current Assets 2651 1989
Total Current Assets (a+b+c+d+e+f) 53107 42012
TOTAL ASSETS (1+2) 54814 43271
Important Indicators(i) Investment 240 240
(ii) Capital Employed 8995 7872
(iii) Net Worth 8995 7872
(iv) Net Current Assets 33397 30481
(v) Cost of Sales 2105 2025
(vi) Net Value Added (at market price) 4200 2840
(vii) Total Regular Employees (Nos.) 124 164
(viii) Avg. Monthly Emoluments per Employee(`) 97110 69207
PROFIT & LOSS ACCOUNT (` in Lakhs)
PARTICULARS 2011-12 2010-11
(I) Revenue from Operations (Gross) 2929 2311Less : Excise Duty 0 0Revenue from Operations (Net) 2929 2311(II) Other Income 1529 1034(III) Total Revenue (I+II) 4458 3345(IV) Expenditure on:(a) Cost of materials consumed 0 0(b) Purchase of stock-in-trade 0 0(c) Changes in inventories of finished goods, 0 0
work-in-progress and stock in trade(d) Stores & Spares 0 0(e) Power & Fuel 33 29(f) Salary, Wages & Benefits/Employees Expense 1445 1362(g) Other Operating/direct/manufacturing Expenses 151 196(h) Rent, Royalty & Cess 18 22(i) Loss on sale of Assets/Investments 1 0(j) Other Expenses 400 380Total Expenditure (IV (a to j)) 2048 1989(V) PROFIT BEFORE DEPRECIATION, & IMPAIRMENT, 2410 1356
FINANCE CHARGES/INTEREST, EXCEPTIONAL &EXTRAORDINARY ITEMS & TAXES (PBDIEET)(III-IV)
(VI) Depreciation, Depletion & Amortisation 58 36(VII) Impairment 0 0(VIII) PROFIT BEFORE FINANCE COST/INTEREST, 2352 1320
EXCEPTIONAL, EXTRA-ORDINARY ITEMS &TAXES (PBIEET)(V-VI-VII)
(IX) Finance Cost(a) On Central Government Loans 0 0(b) On Foreign Loans 0 0(c) Others 0 0(d) Less Finance Cost Capitalised 0 0(e) Charged to P & L Account (a+b+c+d) 0 0(X) PROFIT BEFORE EXCEPTIONAL & EXTRA- 2352 1320
ORDINARY ITEMS & TAX (PBEET)(VIII-IXe)(XI) Exceptional Items 0 0(XII) PROFIT BEFORE EXTRA-ORDINARY ITEMS & 2352 1320
TAX (PBET)(X-XI)(XIII) Extra-Ordinary Items 0 0(XIV) PROFIT BEFORE TAX (PBT)(XII-XIII) 2352 1320(XV) TAX PROVISIONS 880 487(XVI) NET PROFIT / LOSS FOR THE PERIOD FROM 1472 833
CONTINUING OPERATIONS AFTER TAX(XIV-XV)(XVII) Profit/Loss from discontinuing operations 0 0(XVIII) Tax expenses of discontinuing operations 0 0
(XIX) Profit/Loss from discontinuing operations 0 0(after Tax)(XVII-XVIII)
(XX) Profit/Loss for the period (XVI+XIX) 1472 833Financial Ratios(i) Sales : Capital Employed 32.56 29.36
(ii) Cost of Sales : Sales 71.87 87.62
(iii) Salary/Wages : Sales 49.33 58.94
(iv) Net Profit : Net Worth 16.36 10.58
(v) Debt : Equity 0 0
(vi) Current Ratio 2.69 3.64
(vii) Trade Recievables : Sales 46.26 84.6
(viii) Total Inventory : Sales 0 0
HSCC (INDIA) LTD.205, Eastend Plaza, Plot No. 4, D.D.A.-L.S.C., Centre-2, Vasundhara Enclave, Delhi-110096

Industrial Development & Tech. Consultancy Services494
MECON Ltd.
The CompanyMECON LIMITED (Formerly known as Metallurgical &
Engineering Consultants (India) Limited) was incorporated on31.03.1973 with an objective to operate pre-dominantly in the iron& steel sector, which was its core competence area at that time.
It is a Schedule "A" Miniratna / BRPSE referred CPSE in theIndustrial Development and Technical Consultancy service sectorunder the administrative control of Ministry of Steel with 100%shareholding of Government of India. The company employed 1747regular employees (Executives 1544 & Non-Executives 203) as on31.3.2012. It's registered and Corporate Office is at Ranchi,Jharkhand
Vision / MissionThe Vision / Mission of the company is to develop into an
internationally recognized center of excellence for providing qualityservices in technical consultancy, design & engineering, design &supply of plant, equipment & systems, project implementationfrom concept to commissioning for industrial development &upgradation ventures, development of infrastructure and otherservice sectors.
Industrial / Business OperationsIt is one of the premier multi disciplinary design, engineering,
consultancy and contracting organization in the field of iron &steel, chemicals, refineries & petrochemicals, power, roads &highways, railways, water management, ports & harbours, gas &oil, pipelines, non ferrous, mining, general engineering, environmentalengineering and other related / diversified areas with extensiveoverseas experience. Its scope of services includes the entire gamutof work relating to setting up of projects in green as well as brownfield from concept to commissioning.
MECON, an ISO: 9001-2008 accredited company is registeredwith WB, ADB, EBRD, AFDC and UNIDO and has numerousproject specific alliances with leading technologists across the globein various fields. MECON's multi skilled expertise in 35 technicaldisciplines creates the synergy vital for realizing projects in time,cost and quality.
The company has one 50:50 financial joint venture namelyMECON (Nigeria) Limited with Nigerian Govt.
Performance Highlights The physical performances of the company for last two years
are given below:
Total Revenue of the company registered an increase of` 95.67 crore during 2011-12, which went up from ` 694.77 crore in2010-11 to ` 790.44 crore in 2011-12. The profit of the company has www.meconlimited.co.in
gone up by ` 42.68 crore to ` 136.36 crore in 2011-12, from` 93.68 crore in previous year due to higher volume of business handled.
The current ratio of company is at 2.07:1 during 2011-12 asagainst 2.27:1 in the previous year (Fig.2). Balance Sheet and Profit& Loss Account of the company and selected financial ratios duringthe period 2010-11 to 2011-12 can be seen on the adjoining page.
Strategic issuesMECON was referred to BRPSE and the Board has given its
recommendations in 2006 and revival plan was approved byGovernment in 2007. Under business restructuring, the companyhas already gone ahead with formation of 4 Strategic BusinessUnits (SBUs) namely Metals (Iron & Steel), Oil & Gas, Power andInfrastructure. It is now one of the Turnaround CPSE as per theguidelines issued by the Government of India for declaring a sickCPSE as "Turnaround CPSE".
Main Services Unit Performance during
2011-12 2010-11
Consultancy Service ` in Crore 457.92 423.23
Construction ` in Crore 185.91 218.14Contracts
EB
ITD
A &
PA
T (
Rs.
cro
re) T
OTA
L R
EV
EN
UE
(Rs. cro
re)
PR
OF
ITA
BIL
ITY
RA
TIO
S (
%)
CU
RR
EN
T R
AT
IO
Fig.2
Fig.1

Public Enterprises Survey 2011-2012: Vol-II 495
BALANCE SHEET (` in Lakhs)
PARTICULARS 2011-12 2010-11
I. EQUITY & LIABILITIESAUTHORISED CAPITAL 10400 10400
(1) Shareholders’ Funds
(a) Share Capital
(i) Central Govt 9054 10314
(ii) Others 0 0
(b) Reserves & Surplus 24761 12425
(c) Money received against share warrants 0 0
Total Shareholders’ Funds (1(a)+1(b)+1(c) 33815 22739
(2) Share application money pending allotment 0 0
(3) Non-current Liabilities
(a) Long Term Borrowings 2500 5000
(b) Deferred tax liabilities (Net) 0 647
(c) Other Long-term liabilities 7618 15843
(d) Long-term provisions 22548 19926
Total Non-Current Liabilities 3(a) to 3(d) 32666 41416
(4) Current Liabilities
(a) Short Term Borrowings 1 4
(b) Trade Payables 16919 12515
(c) Other current liabilities 18377 17540
(d) Short-term provisions 14908 10310
Total Current Liabilities 4(a) to 4(d) 50205 40369
TOTAL EQUITY & LIABILITIES (1+2+3+4) 116686 104524
II. ASSETS
(1) Non-Current Assets
(a) Total Gross Fixed Assets 12356 12128
(ai) Accumulated Depreciation, Depletion & Amortisation 5203 4810
(aii) Accumulated Impairment 0 0
(b) Total Net Fixed Assets ((a)-(ai)-(aii) 7153 7318
(c) Capital work in progress 276 221
(d) Intangible assets under developmet 0 0
(e) Non-Current Investments 512 512
(f) Deferred Tax Assets (Net) 83 0
(g) Long Term Loans and Advances 1606 1273
(h) Other Non-Current Assets 3112 3729
Total Non-Current Assets (b+c+d+e+f+g+h) 12742 13053
(2) Current Assets
(a) Current Investments 0 0
(b) Inventories 665 558
(c) Trade Recievables 13063 17769
(d) Cash & Bank Balance 72360 60217
(e) Short-term Loans & Advances 5381 4403
(f) Other Current Assets 12475 8524
Total Current Assets (a+b+c+d+e+f) 103944 91471
TOTAL ASSETS (1+2) 116686 104524
Important Indicators
(i) Investment 11554 15314
(ii) Capital Employed 36315 27739
(iii) Net Worth 33815 22739
(iv) Net Current Assets 53739 51102
(v) Cost of Sales 58412 54909
(vi) Net Value Added (at market price) 52557 52689
(vii) Total Regular Employees (Nos.) 1747 1823
(viii) Avg. Monthly Emoluments per Employee(`) 124246 135514
PROFIT & LOSS ACCOUNT (` in Lakhs)
PARTICULARS 2011-12 2010-11
(I) Revenue from Operations (Gross) 72321 64437Less : Excise Duty 0 0Revenue from Operations (Net) 72321 64437(II) Other Income 6724 5041(III) Total Revenue (I+II) 79045 69478(IV) Expenditure on:(a) Cost of materials consumed 0 0(b) Purchase of stock-in-trade 19806 13935(c) Changes in inventories of finished goods,
work-in-progress and stock in trade -71 511(d) Stores & Spares 266 304(e) Power & Fuel 536 478(f) Salary, Wages & Benefits/Employees Expense 26047 29645(g) Other Operating/direct/manufacturing Expenses 5740 6351(h) Rent, Royalty & Cess 93 43(i) Loss on sale of Assets/Investments 16 5(j) Other Expenses 5589 3234Total Expenditure (IV (a to j)) 58022 54506(V) PROFIT BEFORE DEPRECIATION, & IMPAIRMENT,
FINANCE CHARGES/INTEREST, EXCEPTIONAL &EXTRAORDINARY ITEMS & TAXES (PBDIEET)(III-IV) 21023 14972
(VI) Depreciation, Depletion & Amortisation 406 408(VII) Impairment 0 0(VIII) PROFIT BEFORE FINANCE COST/INTEREST,
EXCEPTIONAL, EXTRA-ORDINARY ITEMS &TAXES (PBIEET)(V-VI-VII) 20617 14564
(IX) Finance Cost(a) On Central Government Loans 0 0(b) On Foreign Loans 0 0(c) Others 464 471(d) Less Finance Cost Capitalised 0 0(e) Charged to P & L Account (a+b+c+d) 464 471(X) PROFIT BEFORE EXCEPTIONAL & EXTRA-
ORDINARY ITEMS & TAX (PBEET)(VIII-IXe) 20153 14093(XI) Exceptional Items 0 0(XII) PROFIT BEFORE EXTRA-ORDINARY ITEMS &
TAX (PBET)(X-XI) 20153 14093(XIII) Extra-Ordinary Items 0 0(XIV) PROFIT BEFORE TAX (PBT)(XII-XIII) 20153 14093(XV) TAX PROVISIONS 6517 4725(XVI) NET PROFIT / LOSS FOR THE PERIOD FROM
CONTINUING OPERATIONS AFTER TAX(XIV-XV) 13636 9368(XVII) Profit/Loss from discontinuing operations 0 0(XVIII) Tax expenses of discontinuing operations 0 0(XIX) Profit/Loss from discontinuing operations
(after Tax)(XVII-XVIII) 0 0(XX) Profit/Loss for the period (XVI+XIX) 13636 9368Financial Ratios(i) Sales : Capital Employed 199.15 232.3
(ii) Cost of Sales : Sales 80.77 85.21
(iii) Salary/Wages : Sales 36.02 46.01
(iv) Net Profit : Net Worth 40.33 41.2
(v) Debt : Equity 0.28 0.48
(vi) Current Ratio 2.07 2.27
(vii) Trade Recievables : Sales 18.06 27.58
(viii) Total Inventory : Sales 0.92 0.87
MECON Ltd.Vivekananda Path, Doranda Ranchi, Jharkhand 834 002

Industrial Development & Tech. Consultancy Services498
National Research Development Corpn.
The CompanyNational Research Development Corporation (NRDC) was
incorporated on 31st December 1953 by the Government of India,under Section 25 of the Companies Act, 1956. The primary objectiveof the company is to act as a catalyst to promote, develop andcommercialize the technologies / know how / inventions / patents /processes emanating from various national R&D Institutions.
NRDC is a Schedule 'C' CPSE under Industrial Developmentand Technical Consultancy Services group, under the administrativecontrol of Ministry of Science & Technology, Department ofScientific & Industrial Research with 100% shareholding by theGovernment of India. The company employed 89 regular employees(Executives 40 & Non-Executives 49) as on 31.3.2012. TheCorporation's Registered and Corporate Offices are at New Delhi.
Vision / MissionThe Vision of the Company is to promote, develop, nurture
and commercialize innovative, reliable and competitive technologiesfrom academia, research laboratories, industry and individuals, andbe the topmost Technology Transfer Organization
The Mission of the Company is to provide world classbusiness services in technology, to the wider market of creators andusers of technology, through value addition and partnership and tomediate the marching of technologies that would be needed andsought by industry and other users of technology and, the IntellectualProperties (IP) developed by technology creators.
Industrial / Business OperationsNRDC is engaged in providing technical, commercial and
financial measures needed for closing gaps in the "innovation chain"through which an idea, invention or process is converted into aproduct in the market by way of adding value to the indigenoustechnologies, provide Intellectual Property Rights (IPR),consultancy, etc. and licensing them to entrepreneurs. The servicerange of the company comprises of Licensing, consultancy andother technical services. The operation of the company encompassestwo major roles, viz., Commercial and Promotional. The companyhas one Regional Office at Bengaluru
Performance HighlightsNRDC is Technology Transfer organization. The company is
also getting annual grants from Government of India for the activitiesof Invention Promotion Programme and Technology promotionProgramme. The physical performances of the company for lasttwo years are given below:
www.nrdcindia.com
Total Revenue of the company registered an increase of` 1.14 crore during 2011-12, which went up from ` 9.59 crore in2010-11 to ` 10.73 crore in 2011-12. The losses of the companyhas also gone down by ̀ 0.46 crore to ̀ 0.58 crore in 2011-12, from` 1.04 crore in previous year due to increase in other income.
The current ratio of company is at 1.42:1 during 2011-12 asagainst 1.50:1 in the previous year (Fig.2). Balance Sheet and Profit& Loss Account of the company and selected financial ratios duringthe period 2010-11 to 2011-12 can be seen on the adjoining page.
Main Services Unit Performance during2011-12 2010-11
Premin received ` in Cr. 0.98 1.20
Royalty Earned ` in Cr. 4.69 6.63
Consultancy ` in Cr. 2.47 0.26
Technologies Licensed Nos. 33 49
Technologies assigned Nos. 32 40
Strategic issuesSeveral agencies and Govt. Departments have started their
own Technology Transfer Cells in India thereby posing competitionfor NRDC. However NRDC being a five decade old organizationhas mastered the nuances of technology transfer and has devisednewer ways of capturing the market through innovative marketstrategies for better commercialization.
Fig.2
Fig.1
EB
ITD
A &
PA
T (
Rs.
cro
re) T
OTA
L R
EV
EN
UE
(Rs. cro
re)
PR
OF
ITA
BIL
ITY
RA
TIO
S (
%)
CU
RR
EN
T R
AT
IO

Public Enterprises Survey 2011-2012: Vol-II 499
BALANCE SHEET (` in Lakhs)
PARTICULARS 2011-12 2010-11
I. EQUITY & LIABILITIESAUTHORISED CAPITAL 1000 1000(1) Shareholders’ Funds(a) Share Capital
(i) Central Govt 442 442
(ii) Others 0 0
(b) Reserves & Surplus 434 493
(c) Money received against share warrants 0 0
Total Shareholders’ Funds (1(a)+1(b)+1(c) 876 935(2) Share application money pending allotment 0 0(3) Non-current Liabilities(a) Long Term Borrowings 0 0
(b) Deferred tax liabilities (Net) 0 0
(c) Other Long-term liabilities 76 76
(d) Long-term provisions 152 129
Total Non-Current Liabilities 3(a) to 3(d) 228 205(4) Current Liabilities(a) Short Term Borrowings 0 0
(b) Trade Payables 1480 1430
(c) Other current liabilities 481 368
(d) Short-term provisions 151 32
Total Current Liabilities 4(a) to 4(d) 2112 1830TOTAL EQUITY & LIABILITIES (1+2+3+4) 3216 2970II. ASSETS(1) Non-Current Assets(a) Total Gross Fixed Assets 226 227(ai) Accumulated Depreciation, Depletion & Amortisation 150 141
(aii) Accumulated Impairment 0 0
(b) Total Net Fixed Assets ((a)-(ai)-(aii) 76 86(c) Capital work in progress 0 0
(d) Intangible assets under developmet 0 0
(e) Non-Current Investments 0 0(f) Deferred Tax Assets (Net) 84 58(g) Long Term Loans and Advances 51 61(h) Other Non-Current Assets 0 28Total Non-Current Assets (b+c+d+e+f+g+h) 211 233(2) Current Assets(a) Current Investments 0 0(b) Inventories 0 1
(c) Trade Recievables 1158 1036
(d) Cash & Bank Balance 1602 1508
(e) Short-term Loans & Advances 139 180
(f) Other Current Assets 106 12
Total Current Assets (a+b+c+d+e+f) 3005 2737
TOTAL ASSETS (1+2) 3216 2970
Important Indicators(i) Investment 442 442
(ii) Capital Employed 876 935
(iii) Net Worth 876 935
(iv) Net Current Assets 893 907
(v) Cost of Sales 1157 1117
(vi) Net Value Added (at market price) -254 -461
(vii) Total Regular Employees (Nos.) 89 94
(viii) Avg. Monthly Emoluments per Employee(`) 44663 31560
PROFIT & LOSS ACCOUNT (` in Lakhs)
PARTICULARS 2011-12 2010-11
(I) Revenue from Operations (Gross) 813 815Less : Excise Duty 0 0Revenue from Operations (Net) 813 815(II) Other Income 260 144(III) Total Revenue (I+II) 1073 959(IV) Expenditure on:(a) Cost of materials consumed 0 0(b) Purchase of stock-in-trade 0 6(c) Changes in inventories of finished goods,
work-in-progress and stock in trade 0 0(d) Stores & Spares 0 0(e) Power & Fuel 2 2(f) Salary, Wages & Benefits/Employees Expense 477 356(g) Other Operating/direct/manufacturing Expenses 424 605(h) Rent, Royalty & Cess 3 4(i) Loss on sale of Assets/Investments 0 0(j) Other Expenses 241 133Total Expenditure (IV (a to j)) 1147 1106(V) PROFIT BEFORE DEPRECIATION, & IMPAIRMENT,
FINANCE CHARGES/INTEREST, EXCEPTIONAL &EXTRAORDINARY ITEMS & TAXES (PBDIEET)(III-IV) -74 -147
(VI) Depreciation, Depletion & Amortisation 10 11(VII) Impairment 0 0(VIII) PROFIT BEFORE FINANCE COST/INTEREST,
EXCEPTIONAL, EXTRA-ORDINARY ITEMS &TAXES (PBIEET)(V-VI-VII) -84 -158
(IX) Finance Cost(a) On Central Government Loans 0 0(b) On Foreign Loans 0 0(c) Others 0 0(d) Less Finance Cost Capitalised 0 0(e) Charged to P & L Account (a+b+c+d) 0 0(X) PROFIT BEFORE EXCEPTIONAL & EXTRA-
ORDINARY ITEMS & TAX (PBEET)(VIII-IXe) -84 -158(XI) Exceptional Items 0 0(XII) PROFIT BEFORE EXTRA-ORDINARY ITEMS &
TAX (PBET)(X-XI) -84 -158(XIII) Extra-Ordinary Items 0 0(XIV) PROFIT BEFORE TAX (PBT)(XII-XIII) -84 -158(XV) TAX PROVISIONS -26 -54(XVI) NET PROFIT / LOSS FOR THE PERIOD FROM
CONTINUING OPERATIONS AFTER TAX(XIV-XV) -58 -104(XVII) Profit/Loss from discontinuing operations 0 0(XVIII) Tax expenses of discontinuing operations 0 0
(XIX) Profit/Loss from discontinuing operations(after Tax)(XVII-XVIII) 0 0
(XX) Profit/Loss for the period (XVI+XIX) -58 -104Financial Ratios(i) Sales : Capital Employed 92.81 87.17
(ii) Cost of Sales : Sales 142.31 137.06
(iii) Salary/Wages : Sales 58.67 43.68
(iv) Net Profit : Net Worth -6.62 -11.12
(v) Debt : Equity 0 0
(vi) Current Ratio 1.42 1.5
(vii) Trade Recievables : Sales 142.44 127.12
(viii) Total Inventory : Sales 0 0.12
NATIONAL RESEARCH DEVELOPMENT CORPN.NRDC, 20-22, Zanroordpur Community Centre, Kailash Colony Extension, New Delhi-110048

Industrial Development & Tech. Consultancy Services500
National Small Industries Corpn. Ltd.
The CompanyNational small Industries Corporation Ltd. (NSIC) was
incorporated in 1955 with the objective to aid, counsel, assist,finance, protect and promote the interests of small scale industriesin the country.
NSIC is a Schedule-'B' CPSE in Industrial Development &Tech. Consultancy Services sector under the administrative controlof M/o Micro, Small and Medium Enterprises with 100%shareholding by the Government of India. The Company employed896 employees (Executives 426, Non-Executives 470) as on31.03.2012. Its Registered and Corporate Office is in New Delhi.
Vision / MissionThe Vision of the Corporation is to be a premier organization
fostering the growth of Micro, Small and Medium Enterprises(MSMEs) sector.
The Mission of the Corporation is to promote & supportMicro, Small and Medium Enterprises (MSMEs) Sector byproviding integrated support services encompassing Marketing,Technology, Finance and other services.
Industrial / Business OperationsThe main operations of the Corporation includes Raw Material
Distribution, Single Point Registration for Government Purchase,Consortia and Tender Marketing, Marketing Intelligence, Exhibitionsand Technology Fairs, Buyer Seller meets, Export of Products andProjects, Technology Support, Credit Support, Financing throughsyndication with Banks, Performance & Credit Rating Scheme forSmall Industries, International Cooperation & Consultancy Servicesand other support services to MSMEs which interalia includesinfomediary services under B2B portal, STPs, etc. NSIC is alsooperating godowns MSMEs vis-à-vis availability of raw materials.The corporation has 153 offices at various locations with view toincrease its reach.
Performance HighlightsThe physical performance of Company during last two years
is shows below:-
www. nsic.co.in
in volume of operations due to increase in company's outreach byoperating offices in various new areas and overall improvement inincome from most of its schemes.
The current ratio of company is at 1.24:1 during 2011-12 asagainst 1.14:1 in the previous year (Fig.2). Balance Sheet and Profit& Loss Account of the company and selected financial ratios duringthe period 2010-11 to 2011-12 can be seen on the adjoining page.
Strategic IssuesNSIC increased its reach by operating offices in various new
areas. It has signed MOU with over 50 Industry Associations toprovide service at doorsteps of the MSEs. The company has alsomade arrangements with bulk manufacturers for procuring rawmaterial like steel, aluminum, copper, bitumen, Coal, zinc etc. forSMEs.
EB
ITD
A &
PA
T (
Rs.
cro
re) T
OTA
L R
EV
EN
UE
(Rs. cro
re)
PR
OF
ITA
BIL
ITY
RA
TIO
S (
%)
CU
RR
EN
T R
AT
IO
Fig.2
Fig.1
Main Services Unit Performance during
2011-12 2010-11
Business Turnover 11137 7979
Raw Material Assistance ` in Crore 1573 983Portfolio
Volume of Distribution ` in Crore 10642 7710of Raw Material &Godown Operation
Performance & Credit ` in Crore 13547 10327Rating Units
Revenue from Technical ` in Crore 23.99 18.16 Centers
Total Revenue of the company registered an increase of` 353.78 crore during 2011-12, which went up from ` 993.11 crorein 2010-11 to ` 1346.89 crore in 2011-12.The Net profit howeverincreased by ` 11.43 and reached ` 41.21 crores in 2011-12 from` 29.78 crores in 2010-11. The growth can be attributed to increase

Public Enterprises Survey 2011-2012: Vol-II 501
BALANCE SHEET (` in Lakhs)
PARTICULARS 2011-12 2010-11
I. EQUITY & LIABILITIESAUTHORISED CAPITAL 53500 23500(1) Shareholders’ Funds(a) Share Capital
(i) Central Govt 38799 23299
(ii) Others 0 0
(b) Reserves & Surplus -5828 -8920
(c) Money received against share warrants 0 0
Total Shareholders’ Funds (1(a)+1(b)+1(c) 32971 14379(2) Share application money pending allotment 0 0(3) Non-current Liabilities(a) Long Term Borrowings 5969 5720
(b) Deferred tax liabilities (Net) 0 0
(c) Other Long-term liabilities 336 385
(d) Long-term provisions 2516 2220
Total Non-Current Liabilities 3(a) to 3(d) 8821 8325(4) Current Liabilities(a) Short Term Borrowings 111773 86668
(b) Trade Payables 3687 1950
(c) Other current liabilities 13175 7914
(d) Short-term provisions 6557 4144
Total Current Liabilities 4(a) to 4(d) 135192 100676TOTAL EQUITY & LIABILITIES (1+2+3+4) 176984 123380II. ASSETS(1) Non-Current Assets(a) Total Gross Fixed Assets 9199 9028(ai) Accumulated Depreciation, Depletion & Amortisation 3355 3316
(aii) Accumulated Impairment 0 0
(b) Total Net Fixed Assets ((a)-(ai)-(aii) 5844 5712(c) Capital work in progress 2017 428
(d) Intangible assets under developmet 0 0
(e) Non-Current Investments 8 8(f) Deferred Tax Assets (Net) 0 0(g) Long Term Loans and Advances 979 1842(h) Other Non-Current Assets 230 192Total Non-Current Assets (b+c+d+e+f+g+h) 9078 8182(2) Current Assets(a) Current Investments 0 0(b) Inventories 101 101
(c) Trade Recievables 4480 2959
(d) Cash & Bank Balance 14529 19371
(e) Short-term Loans & Advances 148380 92307
(f) Other Current Assets 416 460
Total Current Assets (a+b+c+d+e+f) 167906 115198
TOTAL ASSETS (1+2) 176984 123380
Important Indicators(i) Investment 44768 29019
(ii) Capital Employed 38940 20099
(iii) Net Worth 32971 14379
(iv) Net Current Assets 32714 14522
(v) Cost of Sales 119528 91300
(vi) Net Value Added (at market price) 14064 8449
(vii) Total Regular Employees (Nos.) 896 895
(viii) Avg. Monthly Emoluments per Employee(`) 62965 52495
PROFIT & LOSS ACCOUNT (` in Lakhs)
PARTICULARS 2011-12 2010-11
(I) Revenue from Operations (Gross) 133395 97180Less : Excise Duty 0 0Revenue from Operations (Net) 133395 97180(II) Other Income 1294 2131(III) Total Revenue (I+II) 134689 99311(IV) Expenditure on:(a) Cost of materials consumed 7 2(b) Purchase of stock-in-trade 103367 77224(c) Changes in inventories of finished goods,work-in-progress and stock in trade -6 15(d) Stores & Spares 0 0(e) Power & Fuel 519 467(f) Salary, Wages & Benefits/Employees Expense 6770 5638(g) Other Operating/direct/manufacturing Expenses 458 415(h) Rent, Royalty & Cess 302 290(i) Loss on sale of Assets/Investments 9 4(j) Other Expenses 7930 7091Total Expenditure (IV (a to j)) 119356 91146(V) PROFIT BEFORE DEPRECIATION, & IMPAIRMENT,FINANCE CHARGES/INTEREST, EXCEPTIONAL &EXTRAORDINARY ITEMS & TAXES (PBDIEET)(III-IV) 15333 8165(VI) Depreciation, Depletion & Amortisation 181 158(VII) Impairment 0 0(VIII) PROFIT BEFORE FINANCE COST/INTEREST,EXCEPTIONAL, EXTRA-ORDINARY ITEMS &TAXES (PBIEET)(V-VI-VII) 15152 8007(IX) Finance Cost(a) On Central Government Loans 0 0(b) On Foreign Loans 587 522(c) Others 8544 3968(d) Less Finance Cost Capitalised 0 0(e) Charged to P & L Account (a+b+c+d) 9131 4490(X) PROFIT BEFORE EXCEPTIONAL & EXTRA-ORDINARY ITEMS & TAX (PBEET)(VIII-IXe) 6021 3517(XI) Exceptional Items 0 0(XII) PROFIT BEFORE EXTRA-ORDINARY ITEMS &TAX (PBET)(X-XI) 6021 3517(XIII) Extra-Ordinary Items 0 0(XIV) PROFIT BEFORE TAX (PBT)(XII-XIII) 6021 3517(XV) TAX PROVISIONS 1900 539(XVI) NET PROFIT / LOSS FOR THE PERIOD FROMCONTINUING OPERATIONS AFTER TAX(XIV-XV) 4121 2978(XVII) Profit/Loss from discontinuing operations 0 0(XVIII) Tax expenses of discontinuing operations 0 0
(XIX) Profit/Loss from discontinuing operations(after Tax)(XVII-XVIII) 0 0(XX) Profit/Loss for the period (XVI+XIX) 4121 2978Financial Ratios(i) Sales : Capital Employed 342.57 483.51
(ii) Cost of Sales : Sales 89.6 93.95
(iii) Salary/Wages : Sales 5.08 5.8
(iv) Net Profit : Net Worth 12.5 20.71
(v) Debt : Equity 0.15 0.25
(vi) Current Ratio 1.24 1.14
(vii) Trade Recievables : Sales 3.36 3.04
(viii) Total Inventory : Sales 0.08 0.1
NATIONAL SMALL INDUSTRIES CORPN. LTD.Laghu Udyog Bhavan Okhla Industrial Estate New Delhi 110020

Industrial Development & Tech. Consultancy Services502
PFC Capital Advisory Service Ltd.
The CompanyPFC Capital Advisory Services Limited (PECAP) was
incorporated on July 18, 2011 as a wholly owned subsidiary ofPFC Ltd with an objective to act as financial consultants, advisers,counselors in investment and capital market; to advise on takeover,mergers, amalgamations, acquisitions, diversifications, rehabilitationor restructuring; market research, feasibility studies, pre investmentstudies ; to act as lead manager; to advice on restructuring, evaluationetc. The certificate for commencement of business was obtained bythe company on September 02, 2011.
The company is an uncategorized CPSE in the IndustrialDevelopment and Technical Consultancy sector under theadministrative control of M/o Power. The company is a whollyowned subsidiary of PFC and the matters related to personneldepartment are being taken care by the holding company. Thecompany employed 2 regular employees (Executive 1 & Non-Executives 1) as on 31.3.2012. Its Registered and Corporate officesare in NCT of Delhi.
Industrial / Business OperationsThe company is rendering debt syndication services in the
areas of power, energy, infrastructure and other industries
Performance HighlightsThe Company's total revenue for the first year operations
during period 2011-12 was ` 0.16 crore. The net profit of thecompany was ` 0.05 crores.
The current ratio of company is at 3.8:1 during 2011-12(Fig.2). Balance Sheet and Profit & Loss Account of the companyand selected financial ratios during the period 2010-11 to 2011-12can be seen on the adjoining page.
www.pfcindia.com
Strategic issuesTo conserve the resources for the business of the company, it
was decided not to declare any dividend for the financial year 2011-12 and to carry forward the profits to the reserves and surplus ofthe company.
EB
ITD
A &
PA
T (
Rs.
cro
re)
TO
TAL
RE
VE
NU
E (R
s. crore)
PR
OF
ITA
BIL
ITY
RA
TIO
S (
%)
CU
RR
EN
T R
AT
IO
Fig.2
Fig.1

Public Enterprises Survey 2011-2012: Vol-II 503
BALANCE SHEET (` in Lakhs)
PARTICULARS 2011-12 2010-11
I. EQUITY & LIABILITIESAUTHORISED CAPITAL 100 0(1) Shareholders’ Funds(a) Share Capital
(i) Central Govt 0 0
(ii) Others 10 0
(b) Reserves & Surplus 5 0(c) Money received against share warrants 0 0Total Shareholders’ Funds (1(a)+1(b)+1(c) 15 0(2) Share application money pending allotment 0 0(3) Non-current Liabilities(a) Long Term Borrowings 0 0
(b) Deferred tax liabilities (Net) 0 0(c) Other Long-term liabilities 0 0(d) Long-term provisions 0 0Total Non-Current Liabilities 3(a) to 3(d) 0 0(4) Current Liabilities(a) Short Term Borrowings 0 0
(b) Trade Payables 0 0(c) Other current liabilities 1 0(d) Short-term provisions 4 0Total Current Liabilities 4(a) to 4(d) 5 0TOTAL EQUITY & LIABILITIES (1+2+3+4) 20 0II. ASSETS(1) Non-Current Assets(a) Total Gross Fixed Assets 0 0(ai) Accumulated Depreciation, Depletion & Amortisation 0 0(aii) Accumulated Impairment 0 0(b) Total Net Fixed Assets ((a)-(ai)-(aii) 0 0(c) Capital work in progress 0 0(d) Intangible assets under developmet 0 0(e) Non-Current Investments 0 0(f) Deferred Tax Assets (Net) 1 0(g) Long Term Loans and Advances 0 0(h) Other Non-Current Assets 0 0Total Non-Current Assets (b+c+d+e+f+g+h) 1 0(2) Current Assets(a) Current Investments 0 0(b) Inventories 0 0(c) Trade Recievables 0 0
(d) Cash & Bank Balance 16 0
(e) Short-term Loans & Advances 3 0
(f) Other Current Assets 0 0
Total Current Assets (a+b+c+d+e+f) 19 0
TOTAL ASSETS (1+2) 20 0
Important Indicators(i) Investment 10 0
(ii) Capital Employed 15 0
(iii) Net Worth 15 0
(iv) Net Current Assets 14 0
(v) Cost of Sales 8 0
(vi) Net Value Added (at market price) 18 0
(vii) Total Regular Employees (Nos.) 2
(viii) Avg. Monthly Emoluments per Employee(`) 25000 0
PROFIT & LOSS ACCOUNT (` in Lakhs)
PARTICULARS 2011-12 2010-11
(I) Revenue from Operations (Gross) 16 0Less : Excise Duty 0 0Revenue from Operations (Net) 16 0(II) Other Income 0 0(III) Total Revenue (I+II) 16 0(IV) Expenditure on:(a) Cost of materials consumed 0 0(b) Purchase of stock-in-trade 0 0(c) Changes in inventories of finished goods,work-in-progress and stock in trade 0 0(d) Stores & Spares 0 0(e) Power & Fuel 0 0(f) Salary, Wages & Benefits/Employees Expense 6 0(g) Other Operating/direct/manufacturing Expenses 0 0(h) Rent, Royalty & Cess 0 0(i) Loss on sale of Assets/Investments 0 0(j) Other Expenses 2 0Total Expenditure (IV (a to j)) 8 0(V) PROFIT BEFORE DEPRECIATION, & IMPAIRMENT,FINANCE CHARGES/INTEREST, EXCEPTIONAL &EXTRAORDINARY ITEMS & TAXES (PBDIEET)(III-IV) 8 0(VI) Depreciation, Depletion & Amortisation 0 0(VII) Impairment 0 0(VIII) PROFIT BEFORE FINANCE COST/INTEREST,EXCEPTIONAL, EXTRA-ORDINARY ITEMS &TAXES (PBIEET)(V-VI-VII) 8 0(IX) Finance Cost(a) On Central Government Loans 0 0(b) On Foreign Loans 0 0(c) Others 0 0(d) Less Finance Cost Capitalised 0 0(e) Charged to P & L Account (a+b+c+d) 0 0(X) PROFIT BEFORE EXCEPTIONAL & EXTRA-ORDINARY ITEMS & TAX (PBEET)(VIII-IXe) 8 0(XI) Exceptional Items 0 0(XII) PROFIT BEFORE EXTRA-ORDINARY ITEMS &TAX (PBET)(X-XI) 8 0(XIII) Extra-Ordinary Items 0 0(XIV) PROFIT BEFORE TAX (PBT)(XII-XIII) 8 0(XV) TAX PROVISIONS 3 0(XVI) NET PROFIT / LOSS FOR THE PERIOD FROMCONTINUING OPERATIONS AFTER TAX(XIV-XV) 5 0(XVII) Profit/Loss from discontinuing operations 0 0(XVIII) Tax expenses of discontinuing operations 0 0(XIX) Profit/Loss from discontinuing operations(after Tax)(XVII-XVIII) 0 0(XX) Profit/Loss for the period (XVI+XIX) 5 0Financial Ratios(i) Sales : Capital Employed 106.67 0
(ii) Cost of Sales : Sales 50 0
(iii) Salary/Wages : Sales 37.5 0
(iv) Net Profit : Net Worth 33.33 0
(v) Debt : Equity 0 0
(vi) Current Ratio 3.80 0
(vii) Trade Recievables : Sales 0 0
(viii) Total Inventory : Sales 0 0
PFC CAPITAL ADVISORY SERVICE LTD.1st Floor, Urjanidhi Building , 1- Barakhamba Lane, Cannaught Place, New Delhi
2011-12 Provisional

Industrial Development & Tech. Consultancy Services504
PFC Consulting Ltd.
The CompanyPFC Consulting Limited (PFCCL)was incorporated on
25.03.2008 with the objective to promote, organize and carry outConsultancy Services in the related activities of Power FinanceCorporation Ltd. (PFC Ltd.). It is a wholly owned subsidiary ofPower Finance Corporation Ltd. It has also been assigned the taskof development of Ultra Mega Power Project and IndependentTransmission Projects by PFC, the holding company.
PFCCL is an uncategorized CPSE in Industrial Development& Tech. Consultancy Services Sector under the administrativecontrol of M/o Power (MoP) .All the employees of the companyare on secondment basis from the Holding Company i.e. PFC. ItsRegistered and Corporate offices are in New Delhi.
Vision / MissionThe Vision of the Company is to become a premier Consulting
Organization in the power sector.
The Mission of the company is to become the leading 'end toend consulting solution provider' in power sector for a sustainabledevelopment.
Industrial / Business OperationsPFCCL is providing a range of consultancy services to Power
Sector. The services offered by the PFCCL are advisory Serviceson issues emanating from implementation of Electricity Act 2003like Reform, Restructuring, Regulatory etc. , Bid Process as per theGuidelines issued by MoP, GoI for various segments of PowerSector, Project-Structuring/ Planning/ Development/ SpecificStudies, implementation monitoring, efficiency improvementprojects forState owned Utilities and IPPs, UMPPs and ITPs ,Human Resource Management Plans , Communication, InformationDissemination and Feedback, Preparation of OrganizationPerformance Improvement Plans, Contract related services for thePower Sector, Financial Management, Resource Mobilization,Accounting Systems etc.
The company has one subsidiary namely DGEN TransmissionCompany Limited with 100% shareholding.
www.pfcindia.com
Performance HighlightsTotal Revenue of the company registered an increase of ̀ 3.44
crore during 2011-12, which went up from ` 52.60crore in 2010-11to ` 56.04crore in 2011-12.The net profit of the company increasedto 27.66crore, an increase of ` 0.70crore over the previous yearprofit of ` 26.96 croredue to increase in the interest received fromFixed Deposits.
The current ratio of company is at 5.15:1 during 2011-12 asagainst 3.51:1 in the previous year (Fig.2). Balance Sheet and Profit& Loss Account of the company and selected financial ratios duringthe period 2010-11 to 2011-12 can be seen on the adjoining page.
EB
ITD
A &
PA
T (
Rs.
cro
re) T
OTA
L R
EV
EN
UE
(Rs. cro
re)
PR
OF
ITA
BIL
ITY
RA
TIO
S (
%)
CU
RR
EN
T R
AT
IO
Fig.2
Fig.1

Public Enterprises Survey 2011-2012: Vol-II 505
BALANCE SHEET (` in Lakhs)
PARTICULARS 2011-12 2010-11
I. EQUITY & LIABILITIESAUTHORISED CAPITAL 5 5(1) Shareholders’ Funds(a) Share Capital
(i) Central Govt 0 0
(ii) Others 5 5
(b) Reserves & Surplus 8599 5833
(c) Money received against share warrants 0 0
Total Shareholders’ Funds (1(a)+1(b)+1(c) 8604 5838(2) Share application money pending allotment 0 0(3) Non-current Liabilities(a) Long Term Borrowings 0 0
(b) Deferred tax liabilities (Net) 5 1
(c) Other Long-term liabilities 0 0
(d) Long-term provisions 0 0
Total Non-Current Liabilities 3(a) to 3(d) 5 1(4) Current Liabilities(a) Short Term Borrowings 0 0
(b) Trade Payables 110 69
(c) Other current liabilities 504 889
(d) Short-term provisions 1440 1362
Total Current Liabilities 4(a) to 4(d) 2054 2320TOTAL EQUITY & LIABILITIES (1+2+3+4) 10663 8159II. ASSETS(1) Non-Current Assets(a) Total Gross Fixed Assets 62 13(ai) Accumulated Depreciation, Depletion & Amortisation 13 5
(aii) Accumulated Impairment 0 0
(b) Total Net Fixed Assets ((a)-(ai)-(aii) 49 8(c) Capital work in progress 0 0
(d) Intangible assets under developmet 0 0
(e) Non-Current Investments 5 0(f) Deferred Tax Assets (Net) 0 0(g) Long Term Loans and Advances 36 0(h) Other Non-Current Assets 0 0Total Non-Current Assets (b+c+d+e+f+g+h) 90 8(2) Current Assets(a) Current Investments 0 0(b) Inventories 0 0(c) Trade Recievables 703 106
(d) Cash & Bank Balance 7826 6515
(e) Short-term Loans & Advances 1465 1502
(f) Other Current Assets 579 28
Total Current Assets (a+b+c+d+e+f) 10573 8151
TOTAL ASSETS (1+2) 10663 8159
Important Indicators(i) Investment 5 5
(ii) Capital Employed 8604 5838
(iii) Net Worth 8604 5838
(iv) Net Current Assets 8519 5831
(v) Cost of Sales 1393 1179
(vi) Net Value Added (at market price) 5335 5204
(vii) Total Regular Employees (Nos.) 0 0
(viii) Avg. Monthly Emoluments per Employee(`) 0 0
PROFIT & LOSS ACCOUNT (` in Lakhs)
PARTICULARS 2011-12 2010-11
(I) Revenue from Operations (Gross) 4906 4990Less : Excise Duty 0 0Revenue from Operations (Net) 4906 4990(II) Other Income 698 270(III) Total Revenue (I+II) 5604 5260(IV) Expenditure on:(a) Cost of materials consumed 0 0(b) Purchase of stock-in-trade 0 0(c) Changes in inventories of finished goods,work-in-progress and stock in trade 0 0(d) Stores & Spares 0 0(e) Power & Fuel 14 39(f) Salary, Wages & Benefits/Employees Expense 868 551(g) Other Operating/direct/manufacturing Expenses 59 447(h) Rent, Royalty & Cess 31 18(i) Loss on sale of Assets/Investments 0 0(j) Other Expenses 413 121Total Expenditure (IV (a to j)) 1385 1176(V) PROFIT BEFORE DEPRECIATION, & IMPAIRMENT,FINANCE CHARGES/INTEREST, EXCEPTIONAL &EXTRAORDINARY ITEMS & TAXES (PBDIEET)(III-IV) 4219 4084(VI) Depreciation, Depletion & Amortisation 8 3(VII) Impairment 0 0(VIII) PROFIT BEFORE FINANCE COST/INTEREST,EXCEPTIONAL, EXTRA-ORDINARY ITEMS &TAXES (PBIEET)(V-VI-VII) 4211 4081(IX) Finance Cost(a) On Central Government Loans 0 0(b) On Foreign Loans 0 0(c) Others 0 22(d) Less Finance Cost Capitalised 0 0(e) Charged to P & L Account (a+b+c+d) 0 22(X) PROFIT BEFORE EXCEPTIONAL & EXTRA-ORDINARY ITEMS & TAX (PBEET)(VIII-IXe) 4211 4059(XI) Exceptional Items 0 0(XII) PROFIT BEFORE EXTRA-ORDINARY ITEMS &TAX (PBET)(X-XI) 4211 4059(XIII) Extra-Ordinary Items 0 0(XIV) PROFIT BEFORE TAX (PBT)(XII-XIII) 4211 4059(XV) TAX PROVISIONS 1445 1363(XVI) NET PROFIT / LOSS FOR THE PERIOD FROMCONTINUING OPERATIONS AFTER TAX(XIV-XV) 2766 2696(XVII) Profit/Loss from discontinuing operations 0 0
(XVIII) Tax expenses of discontinuing operations 0 0
(XIX) Profit/Loss from discontinuing operations(after Tax)(XVII-XVIII) 0 0
(XX) Profit/Loss for the period (XVI+XIX) 2766 2696Financial Ratios(i) Sales : Capital Employed 57.02 85.47
(ii) Cost of Sales : Sales 28.39 23.63
(iii) Salary/Wages : Sales 17.69 11.04
(iv) Net Profit : Net Worth 32.15 46.18
(v) Debt : Equity 0 0
(vi) Current Ratio 5.15 3.51
(vii) Trade Recievables : Sales 14.33 2.12
(viii) Total Inventory : Sales 0 0
PFC CONSULTING LTD.1st Floor, UrjanidhiBuilding , 1- Barakhamba Lane, Cannaught Place, New Delhi

Industrial Development & Tech. Consultancy Services508
RITES Ltd.The Company
RITES Ltd. (RITES) was incorporated on 26.04.1974 withthe objective to provide railway related consultancy and inspectionservices in India and abroad.
RITES is a Schedule- 'A'/ Mini Ratna CPSE in InfrastructureDevelopment and Technical Consultancy Services sector underthe administrative control of Ministry of Railways, with 100%Shareholding by the Government of India. The company employed2202 regular employees (Executives 1717, Non-executives 485) ason 31.3.2012. Its registered office is at Delhi and corporate office isat RITES Bhavan sector 29, Gurgaon, Haryana.
Vision / MissionThe vision of the company is to be the fore most provider of
techno economic services and solutions in the transportation andinfrastructure sector globally.
The Mission of the Company is to provide concept tocommissioning consultancy, design, engineering and turnkeysolutions including knowledge management in the field of transport,transportation infrastructure and related technologies of highestprofessional standards.
Industrial / Business OperationsRITES is engaged in providing consultancy, engineering and
project management Services including turnkey project in the fieldof transportation, infrastructure and related technologies in Indiaand 62 countries abroad. The service range of the companycomprises from concept to commissioning in consultancy intransport infrastructure and its related technologies; leasing; export;maintenance and rehabilitation of rolling stock and equipment; andrunning of railway systems under concession agreement.
The company has one Indian subsidiary namely RITESInfrastructure Services Ltd. and two overseas subsidiary Companiesnamely M/s RITES (AFRIKA) Proprietary Limited in Botswanaand RITES Mohawarean Arabia co .Ltd (RMAC) in Saudi Arabia,however in RMAC, contract also has been foreclosed in June 2011.
The company has five joint ventures.
Performance HighlightsThe performance of company for last two yearsare mentioned
below:
Main Services Unit Performance during
2011-12 2010-11
Consultancy ` in Crore 419.03 441.84
Construction projects ` in Crore 16.56 5.15
Export Sales ` in Crore 290.14 148.55
Quality Assurance ` in Crore 85.71 81.01
Lease Services ` in Crore 24.19 21.77
Others ` in Crore 98.46 143.95
company, however, went down to ` 164.49 crore in 2011-12, areduction of ` 79.43 crore as compared to previous year profit of` 243.92 crore due to increase in operating cost.
The current ratio of company is at 1.23:1 during 2011-12 asagainst 1.21:1 in the previous year (Fig.2). Balance Sheet andProfit & Loss Account of the company and selected financialratios during the period 2010-11 to 2011-12 can be seen on theadjoining page.
Strategic IssuesFirst ever domestic leasing of shunting locomotives owned
by RITES started with Bandel Thermal Power Plant, Bandel, WestBengal in July, 2009. During the year, the business of offeringshunting locomotives on lease including operation & maintenancehas been well received by domestic non railway clients. Companyhas so far leased 13 locos to various companies in power / steel andtransport sector.
EB
ITD
A &
PA
T (
Rs.
cro
re) T
OTA
L R
EV
EN
UE
(Rs. cro
re)
PR
OF
ITA
BIL
ITY
RA
TIO
S (
%)
CU
RR
EN
T R
AT
IO
Fig.2
Fig.1
The Company registered an increase of ` 91.82 crore in totalrevenue during 2011-12 which went up to ` 934.09 crore in 2011-12 from ` 842.27 crore during 2010-11. The net profit of the

Public Enterprises Survey 2011-2012: Vol-II 509
BALANCE SHEET (` in Lakhs)
PARTICULARS 2011-12 2010-11
I. EQUITY & LIABILITIESAUTHORISED CAPITAL 10000 10000(1) Shareholders’ Funds(a) Share Capital
(i) Central Govt 4000 4000
(ii) Others 0 0
(b) Reserves & Surplus 96790 84176
(c) Money received against share warrants 0 0
Total Shareholders’ Funds (1(a)+1(b)+1(c) 100790 88176(2) Share application money pending allotment 0 0(3) Non-current Liabilities(a) Long Term Borrowings 0 0
(b) Deferred tax liabilities (Net) 0 0
(c) Other Long-term liabilities 8042 12395
(d) Long-term provisions 12098 9201
Total Non-Current Liabilities 3(a) to 3(d) 20140 21596(4) Current Liabilities(a) Short Term Borrowings 0 0
(b) Trade Payables 11377 11855
(c) Other current liabilities 176679 138229
(d) Short-term provisions 4485 7664
Total Current Liabilities 4(a) to 4(d) 192541 157748TOTAL EQUITY & LIABILITIES (1+2+3+4) 313471 267520II. ASSETS(1) Non-Current Assets(a) Total Gross Fixed Assets 25256 23471(ai) Accumulated Depreciation, Depletion & Amortisation 9075 8530
(aii) Accumulated Impairment 0 489
(b) Total Net Fixed Assets ((a)-(ai)-(aii) 16181 14452(c) Capital work in progress 1963 3578
(d) Intangible assets under developmet 0 0
(e) Non-Current Investments 13819 11322(f) Deferred Tax Assets (Net) 4149 4504(g) Long Term Loans and Advances 14187 8852(h) Other Non-Current Assets 26660 34459Total Non-Current Assets (b+c+d+e+f+g+h) 76959 77167(2) Current Assets(a) Current Investments 502 0(b) Inventories 8709 9342(c) Trade Recievables 22613 33870
(d) Cash & Bank Balance 188551 134707
(e) Short-term Loans & Advances 9227 7514
(f) Other Current Assets 6910 4920
Total Current Assets (a+b+c+d+e+f) 236512 190353
TOTAL ASSETS (1+2) 313471 267520
Important Indicators(i) Investment 4000 4000
(ii) Capital Employed 100790 88176
(iii) Net Worth 100790 88176
(iv) Net Current Assets 43971 32605
(v) Cost of Sales 67808 51794
(vi) Net Value Added (at market price) 57692 65573
(vii) Total Regular Employees (Nos.) 2202 2139
(viii) Avg. Monthly Emoluments per Employee(`) 95584 95146
PROFIT & LOSS ACCOUNT (` in Lakhs)
PARTICULARS 2011-12 2010-11
(I) Revenue from Operations (Gross) 83563 69832Less : Excise Duty 0 0Revenue from Operations (Net) 83563 69832(II) Other Income 9846 14395(III) Total Revenue (I+II) 93409 84227(IV) Expenditure on:(a) Cost of materials consumed 811 49(b) Purchase of stock-in-trade 17790 13025(c) Changes in inventories of finished goods,work-in-progress and stock in trade -944 -28(d) Stores & Spares 244 344(e) Power & Fuel 273 238(f) Salary, Wages & Benefits/Employees Expense 25257 24422(g) Other Operating/direct/manufacturing Expenses 12876 8785(h) Rent, Royalty & Cess 340 266(i) Loss on sale of Assets/Investments 3 5(j) Other Expenses 9767 3461Total Expenditure (IV (a to j)) 66417 50567(V) PROFIT BEFORE DEPRECIATION, & IMPAIRMENT,FINANCE CHARGES/INTEREST, EXCEPTIONAL &EXTRAORDINARY ITEMS & TAXES (PBDIEET)(III-IV) 26992 33660(VI) Depreciation, Depletion & Amortisation 1394 1232(VII) Impairment 0 0(VIII) PROFIT BEFORE FINANCE COST/INTEREST,EXCEPTIONAL, EXTRA-ORDINARY ITEMS &TAXES (PBIEET)(V-VI-VII) 25598 32428(IX) Finance Cost(a) On Central Government Loans 0 0(b) On Foreign Loans 0 0(c) Others 0 0(d) Less Finance Cost Capitalised 0 0(e) Charged to P & L Account (a+b+c+d) 0 0(X) PROFIT BEFORE EXCEPTIONAL & EXTRA-ORDINARY ITEMS & TAX (PBEET)(VIII-IXe) 25598 32428(XI) Exceptional Items 0 -3873(XII) PROFIT BEFORE EXTRA-ORDINARY ITEMS &TAX (PBET)(X-XI) 25598 36301(XIII) Extra-Ordinary Items 0 0(XIV) PROFIT BEFORE TAX (PBT)(XII-XIII) 25598 36301(XV) TAX PROVISIONS 9149 11909(XVI) NET PROFIT / LOSS FOR THE PERIOD FROMCONTINUING OPERATIONS AFTER TAX(XIV-XV) 16449 24392(XVII) Profit/Loss from discontinuing operations 0 0(XVIII) Tax expenses of discontinuing operations 0 0(XIX) Profit/Loss from discontinuing operations(after Tax)(XVII-XVIII) 0 0(XX) Profit/Loss for the period (XVI+XIX) 16449 24392Financial Ratios(i) Sales : Capital Employed 82.91 79.2
(ii) Cost of Sales : Sales 81.15 74.17
(iii) Salary/Wages : Sales 30.23 34.97
(iv) Net Profit : Net Worth 16.32 27.66
(v) Debt : Equity 0 0
(vi) Current Ratio 1.23 1.21
(vii) Trade Recievables : Sales 27.06 48.5
(viii) Total Inventory : Sales 10.42 13.38
RITES LTD.Scope minar, Laxmi nagar, Delhi-110092

Industrial Development & Tech. Consultancy Services510
Telecommunications Consultants (India) Ltd.
The CompanyTelecommunications Consultants India Ltd. (TCIL) was
incorporated on 10.03.1978 with the main objective to provideworld class technology in all fields of telecommunications andinformation technology.
TCIL is a Schedule-'A' Miniratna CPSE in IndustrialDevelopment and Technical Consultancy service sector, under theadministrative control of Ministry of Communications & IT andDepartment of Telecommunications with 100% shareholding bythe Government of India. The company employed 915 regularemployees (Executives 412, Non-executives 503) as on 31.3.2012.Its registered and corporate offices are at New Delhi.
Vision / MissionThe Vision of the company is to excel in providing solutions in
ICT, Power and Infrastructure Sectors globally by anticipatingopportunities in technology.
The Mission of the company is to excel and maintain leadershipin providing Communication solutions on turnkey basis inTelecommunications and Information Technology Service Sectorglobally, and to diversify by providing excellent Infrastructurefacilities particularly in the high- tech areas.
Industrial / Business OperationsTCIL is undertaking turnkey projects in all fields of
Telecommunications & IT in India and abroad. The company hasalso diversified into Architectural Consultancy and CivilConstruction.
The company operates through its regional / Branch offices atChennai, Kuwait, Oman, Algeria, Mauritius, Ethiopia, Saudi Arabia,Nepal and UAE. The company has one overseas subsidiarycompany.
Performance HighlightsThe physical performances of the company for last two years
are given below:
www.tcil-india.com
Main Services Unit Performance during2011-12 2010-11
Telecom & Others ` in Crore 532.67 482.68
Roads ` in Crore 148.12 368.22
EB
ITD
A &
PA
T (
Rs.
cro
re) T
OTA
L R
EV
EN
UE
(Rs. cro
re)
PR
OF
ITA
BIL
ITY
RA
TIO
S (
%)
CU
RR
EN
T R
AT
IO
Fig.2
Fig.1
The Company registered a reduction of ` 170.11 crore intotal revenue during 2011-12 which went down to ` 680.79 crorein 2011-12 from ` 850.90 crore during 2010-11. The net profit ofthe company also declined to ` 8.03 crore in 2011-12 from ̀ 13.58crore in previous year showing a reduction of ` 5.55 crore due tofall in operating income.
The current ratio of company is at 1.25:1 during 2011-12 asagainst 1.19:1 in the previous year (Fig.2). Balance Sheet andProfit & Loss Account of the company and selected financial ratios
Strategic IssuesThe company is trying to explore avenues in new lines of
businesses like WiMAX Franchising, Hybrid/ Green Power,Franchisee in Value Added Services and BOT. Company has adoptedinnovative ICT solution for sustainable health care & education asa part of Research and development. The company has installedsolar lighting in TCIL Bhawan as a part of sustainable development.
during the period 2010-11 to 2011-12 can be seen on the adjoiningpage.

Public Enterprises Survey 2011-2012: Vol-II 511
BALANCE SHEET (` in Lakhs)
PARTICULARS 2011-12 2010-11
I. EQUITY & LIABILITIESAUTHORISED CAPITAL 6000 6000(1) Shareholders’ Funds(a) Share Capital
(i) Central Govt 4320 4320
(ii) Others 0 0
(b) Reserves & Surplus 38338 37722
(c) Money received against share warrants 0 0
Total Shareholders’ Funds (1(a)+1(b)+1(c) 42658 42042(2) Share application money pending allotment 0 0(3) Non-current Liabilities(a) Long Term Borrowings 3750 3700
(b) Deferred tax liabilities (Net) 67 0
(c) Other Long-term liabilities 5877 2497
(d) Long-term provisions 1821 1226
Total Non-Current Liabilities 3(a) to 3(d) 11515 7423(4) Current Liabilities(a) Short Term Borrowings 4042 2269
(b) Trade Payables 44171 42102
(c) Other current liabilities 28306 31348
(d) Short-term provisions 2254 2470
Total Current Liabilities 4(a) to 4(d) 78773 78189TOTAL EQUITY & LIABILITIES (1+2+3+4) 132946 127654II. ASSETS(1) Non-Current Assets(a) Total Gross Fixed Assets 17082 15975(ai) Accumulated Depreciation, Depletion & Amortisation 5301 4368
(aii) Accumulated Impairment 0 0
(b) Total Net Fixed Assets ((a)-(ai)-(aii) 11781 11607(c) Capital work in progress 118 0
(d) Intangible assets under developmet 978 0
(e) Non-Current Investments 16750 16750(f) Deferred Tax Assets (Net) 0 594(g) Long Term Loans and Advances 387 342(h) Other Non-Current Assets 4727 5037Total Non-Current Assets (b+c+d+e+f+g+h) 34741 34330(2) Current Assets(a) Current Investments 0 0(b) Inventories 940 619(c) Trade Recievables 60191 51376
(d) Cash & Bank Balance 5971 5721
(e) Short-term Loans & Advances 13201 15751
(f) Other Current Assets 17902 19857
Total Current Assets (a+b+c+d+e+f) 98205 93324
TOTAL ASSETS (1+2) 132946 127654
Important Indicators(i) Investment 8070 8020
(ii) Capital Employed 46408 45742
(iii) Net Worth 42658 42042
(iv) Net Current Assets 19432 15135
(v) Cost of Sales 65316 82769
(vi) Net Value Added (at market price) 14845 13745
(vii) Total Regular Employees (Nos.) 915 845
(viii) Avg. Monthly Emoluments per Employee(`) 98934 96292
PROFIT & LOSS ACCOUNT (` in Lakhs)
PARTICULARS 2011-12 2010-11
(I) Revenue from Operations (Gross) 65354 83606Less : Excise Duty 0 0Revenue from Operations (Net) 65354 83606(II) Other Income 2725 1484(III) Total Revenue (I+II) 68079 85090(IV) Expenditure on:(a) Cost of materials consumed 7274 4285(b) Purchase of stock-in-trade 10882 11104(c) Changes in inventories of finished goods,work-in-progress and stock in trade 0 0(d) Stores & Spares 0 0(e) Power & Fuel 158 149(f) Salary, Wages & Benefits/Employees Expense 10863 9764(g) Other Operating/direct/manufacturing Expenses 1094 1132(h) Rent, Royalty & Cess 627 528(i) Loss on sale of Assets/Investments 0 0(j) Other Expenses 33372 54948Total Expenditure (IV (a to j)) 64270 81910(V) PROFIT BEFORE DEPRECIATION, & IMPAIRMENT,FINANCE CHARGES/INTEREST, EXCEPTIONAL &EXTRAORDINARY ITEMS & TAXES (PBDIEET)(III-IV) 3809 3180(VI) Depreciation, Depletion & Amortisation 1046 859(VII) Impairment 0 0(VIII) PROFIT BEFORE FINANCE COST/INTEREST,EXCEPTIONAL, EXTRA-ORDINARY ITEMS &TAXES (PBIEET)(V-VI-VII) 2763 2321(IX) Finance Cost(a) On Central Government Loans 0 0(b) On Foreign Loans 0 0(c) Others 847 419(d) Less Finance Cost Capitalised 0 0(e) Charged to P & L Account (a+b+c+d) 847 419(X) PROFIT BEFORE EXCEPTIONAL & EXTRA-ORDINARY ITEMS & TAX (PBEET)(VIII-IXe) 1916 1902(XI) Exceptional Items 0 0(XII) PROFIT BEFORE EXTRA-ORDINARY ITEMS &TAX (PBET)(X-XI) 1916 1902(XIII) Extra-Ordinary Items 0 0(XIV) PROFIT BEFORE TAX (PBT)(XII-XIII) 1916 1902(XV) TAX PROVISIONS 1113 544(XVI) NET PROFIT / LOSS FOR THE PERIOD FROMCONTINUING OPERATIONS AFTER TAX(XIV-XV) 803 1358(XVII) Profit/Loss from discontinuing operations 0 0(XVIII) Tax expenses of discontinuing operations 0 0(XIX) Profit/Loss from discontinuing operations(after Tax)(XVII-XVIII) 0 0(XX) Profit/Loss for the period (XVI+XIX) 803 1358Financial Ratios(i) Sales : Capital Employed 140.82 182.78
(ii) Cost of Sales : Sales 99.94 99
(iii) Salary/Wages : Sales 16.62 11.68
(iv) Net Profit : Net Worth 1.88 3.23
(v) Debt : Equity 0.87 0.86
(vi) Current Ratio 1.25 1.19
(vii) Trade Recievables : Sales 92.1 61.45
(viii) Total Inventory : Sales 1.44 0.74
TELECOMMUNICATIONS CONSULTANTS (INDIA) LTD.TCIL Bhavan, Greater Kailash- 1, New Delhi-110048

Industrial Development & Tech. Consultancy Services512
WAPCOS Ltd.
The CompanyWAPCOS Ltd. was incorporated on 26.06.1969 under the
Companies Act. 1956 with the objective to perform the role of apremier agency for offering integrated package of services of thehighest scientific, technological and managerial quality with a viewto ensure optimal planning and development of water resourcesand maximizing the efficiency of its utilization.
WAPCOS is a Schedule-'B' Miniratna CPSE in IndustrialDevelopment and Technical Consultancy service sector, under theadministrative control of Ministry of Water Resources with 100%shareholding by the Government of India. The company employed539 Regular employees (Executives 417 & Non-Executives 122) ason 31.3.2012. Its registered and corporate offices are at New Delhi.
Vision / MissionThe Vision of the Company is to be a Premier Consultancy
Organization recognized as a Brand in Water, Power andInfrastructure Development for Total Project Solutions in Indiaand Abroad.
The Mission of the Company is to have sustainable profitablegrowth, excellence in performance; use of State-of-the-art TechnicalExpertise; Innovativeness; Capacity Building and meeting society'sneeds.
Industrial / Business OperationsWAPCOS, an ISO 9001:2008 certified company has been
providing consultancy services in all facets of Water Resources,Power and Infrastructure Sectors in India and abroad. The qualitymanagement systems of WAPCOS comply with the QualityAssurance requirements of ISO 9001:2008 for Consultancy Servicesin Water Resources, Power and Infrastructure DevelopmentProjects.
Performance Highlights The physical performances of the company for last two years
are given below:
Total Revenue of the company registered an increase of` 18.15 crore during 2011-12 which went up to ` 375.01 crore in2011-12 from ` 356.86 crore during 2010-11. The profit of thecompany has gone up by ` 15.07 crore to ` 51.25 crore in 2011-12,from ̀ 36.18 crore in previous year due to increase in operating andother income including exchange difference (net).
The current ratio of company is at 1.48:1 during 2011-12 asagainst 1.38:1 in the previous year (Fig.2). Balance Sheet and Profit& Loss Account of the company and selected financial ratios duringthe period 2010-11 to 2011-12 can be seen on the adjoining page.
www.wapcos.gov.in
Strategic issuesWAPCOS strategic importance is in Contribution to National
Development - Involved in JNNURM, PMGSY, Bharat Nirman,NREGA, IEC Programmes, Water Harvesting, Water ResourcesDevelopment Projects etc. WAPCOS has technical superiority inWater & Power Sector. Even when Government Departments desirehighly technically involved study to be conducted in record timeperiod, maintaining the secrecy /confidentiality, WAPCOS has cometo their rescue. Under the Administration of Govt. of India, it is theonly organisation capable of maintaining confidentiality of data ofinter-state / inter Country Rivers while preparing FeasibilityReports, DPRs, Field Investigations etc. and also while carryingsout surveys in border areas like Gujarat, Rajasthan etc.
MEA has awarded a number of projects to WAPCOS directlyin other countries such as Bhutan, Zimbabwe, Afghanistan, Ethiopia,Cambodia etc. Thus, WAPCOS assists MEA in projecting India'simage abroad.
Main Services Unit Performance during
2011-12 2010-11
Consultancy ` in crore 236.47 180.62
Tunkey Contracts ` in crore 117.89 170.56
EB
ITD
A &
PA
T (
Rs.
cro
re) T
OTA
L R
EV
EN
UE
(Rs. cro
re)
PR
OF
ITA
BIL
ITY
RA
TIO
S (
%)
CU
RR
EN
T R
AT
IO
Fig.2
Fig.1

Public Enterprises Survey 2011-2012: Vol-II 513
BALANCE SHEET (` in Lakhs)
PARTICULARS 2011-12 2010-11
I. EQUITY & LIABILITIESAUTHORISED CAPITAL 300 200(1) Shareholders’ Funds(a) Share Capital
(i) Central Govt 300 200
(ii) Others 0 0
(b) Reserves & Surplus 16157 12369
(c) Money received against share warrants 0 0
Total Shareholders’ Funds (1(a)+1(b)+1(c) 16457 12569(2) Share application money pending allotment 0 0(3) Non-current Liabilities(a) Long Term Borrowings 0 0
(b) Deferred tax liabilities (Net) 0 0
(c) Other Long-term liabilities 2334 1808
(d) Long-term provisions 1450 1372
Total Non-Current Liabilities 3(a) to 3(d) 3784 3180(4) Current Liabilities(a) Short Term Borrowings 0 0
(b) Trade Payables 11275 11875
(c) Other current liabilities 16344 8705
(d) Short-term provisions 4132 4582
Total Current Liabilities 4(a) to 4(d) 31751 25162TOTAL EQUITY & LIABILITIES (1+2+3+4) 51992 40911II. ASSETS(1) Non-Current Assets(a) Total Gross Fixed Assets 1766 1587(ai) Accumulated Depreciation, Depletion & Amortisation 745 697
(aii) Accumulated Impairment 0 0
(b) Total Net Fixed Assets ((a)-(ai)-(aii) 1021 890(c) Capital work in progress 0 0
(d) Intangible assets under developmet 0 0
(e) Non-Current Investments 4 4(f) Deferred Tax Assets (Net) 665 652(g) Long Term Loans and Advances 0 0(h) Other Non-Current Assets 3447 4537Total Non-Current Assets (b+c+d+e+f+g+h) 5137 6083(2) Current Assets(a) Current Investments 0 0(b) Inventories 0 301(c) Trade Recievables 19826 16782
(d) Cash & Bank Balance 16690 10312
(e) Short-term Loans & Advances 10197 7343
(f) Other Current Assets 142 90
Total Current Assets (a+b+c+d+e+f) 46855 34828
TOTAL ASSETS (1+2) 51992 40911
Important Indicators(i) Investment 300 200
(ii) Capital Employed 16457 12569
(iii) Net Worth 16457 12569
(iv) Net Current Assets 15104 9666
(v) Cost of Sales 29861 30178
(vi) Net Value Added (at market price) 18378 13674
(vii) Total Regular Employees (Nos.) 539 514
(viii) Avg. Monthly Emoluments per Employee(`) 123315 103794
PROFIT & LOSS ACCOUNT (` in Lakhs)
PARTICULARS 2011-12 2010-11
(I) Revenue from Operations (Gross) 35436 35118Less : Excise Duty 0 0Revenue from Operations (Net) 35436 35118(II) Other Income 2065 568(III) Total Revenue (I+II) 37501 35686(IV) Expenditure on:(a) Cost of materials consumed 10044 11506(b) Purchase of stock-in-trade 301 3896(c) Changes in inventories of finished goods,work-in-progress and stock in trade 0 0(d) Stores & Spares 0 0(e) Power & Fuel 65 54(f) Salary, Wages & Benefits/Employees Expense 7976 6402(g) Other Operating/direct/manufacturing Expenses 6663 4462(h) Rent, Royalty & Cess 509 417(i) Loss on sale of Assets/Investments 0 0(j) Other Expenses 4199 3349Total Expenditure (IV (a to j)) 29757 30086(V) PROFIT BEFORE DEPRECIATION, & IMPAIRMENT,FINANCE CHARGES/INTEREST, EXCEPTIONAL &EXTRAORDINARY ITEMS & TAXES (PBDIEET)(III-IV) 7744 5600(VI) Depreciation, Depletion & Amortisation 104 92(VII) Impairment 0 0(VIII) PROFIT BEFORE FINANCE COST/INTEREST,EXCEPTIONAL, EXTRA-ORDINARY ITEMS &TAXES (PBIEET)(V-VI-VII) 7640 5508(IX) Finance Cost(a) On Central Government Loans 0 0(b) On Foreign Loans 0 0(c) Others 0 0(d) Less Finance Cost Capitalised 0 0(e) Charged to P & L Account (a+b+c+d) 0 0(X) PROFIT BEFORE EXCEPTIONAL & EXTRA-ORDINARY ITEMS & TAX (PBEET)(VIII-IXe) 7640 5508(XI) Exceptional Items 0 0(XII) PROFIT BEFORE EXTRA-ORDINARY ITEMS &TAX (PBET)(X-XI) 7640 5508(XIII) Extra-Ordinary Items 0 0(XIV) PROFIT BEFORE TAX (PBT)(XII-XIII) 7640 5508(XV) TAX PROVISIONS 2515 1890(XVI) NET PROFIT / LOSS FOR THE PERIOD FROMCONTINUING OPERATIONS AFTER TAX(XIV-XV) 5125 3618(XVII) Profit/Loss from discontinuing operations 0 0
(XVIII) Tax expenses of discontinuing operations 0 0(XIX) Profit/Loss from discontinuing operations(after Tax)(XVII-XVIII) 0 0(XX) Profit/Loss for the period (XVI+XIX) 5125 3618Financial Ratios(i) Sales : Capital Employed 215.32 279.4
(ii) Cost of Sales : Sales 84.27 85.93
(iii) Salary/Wages : Sales 22.51 18.23
(iv) Net Profit : Net Worth 31.14 28.79
(v) Debt : Equity 0 0
(vi) Current Ratio 1.48 1.38
(vii) Trade Recievables : Sales 55.95 47.79
(viii) Total Inventory : Sales 0 0.86
WAPCOS LTD.5th Floor Kalish, 26 Kasturba Gandhi Marg, New Delhi.110 001

Public Enterprises Survey 2011-2012: Vol-II 515
TOURIST SERVICES

Tourist Services516

Public Enterprises Survey 2011-2012: Vol-II 517
20. Tourist
As on 31.03.2012, there were 9 Central Public SectorEnterprises in the Tourist Services group. The name of theseenterprises along with their year of incorporation in chronologicalorder are given below:—
Sl. Enterprise Year ofNo. Incorporation
1 India Tourism Dev. Corpn. Ltd. 19662 Hotel Corpn. of India Ltd. 19713 Ranchi Ashok Bihar Hotel Corpn. Ltd. 1983
4 Utkal Ashok Hotel Corpn. Ltd. 19835 Assam Ashok Hotel Corpn. Ltd. 19856 Donyi Polo Ashok Hotel Ltd. 1985
7 Madhya Pradesh Ashok Hotel Corpn. Ltd. 19858 Pondicherry Ashok Hotel Corpn. Ltd. 19869 Indian Railway Catering and Tourism 1999
Corpn. Ltd.
2. The enterprises falling in this group are mainly engaged
3. The consolidated financial position the working results andthe important management ratios of these enterprises are appended.
4. Turnover : The details of turnover of individualenterprises are given below:
(` in Crores)
Sl. Enterprise TurnoverNo. 2011-12 2010-11
1 Indian Railway Catering and Tourism 514.99 449.59Corpn. Ltd.
2 India Tourism Dev. Corpn. Ltd. 397.63 370.313 Hotel Corpn. of India Ltd. 54.92 51.174 Assam Ashok Hotel Corpn.Ltd. 6.64 5.905 Madhya Pradesh Ashok Hotel
Corpn. Ltd. 6.23 5.676 Ranchi Ashok Bihar Hotel Corpn. Ltd. 2.04 2.347 Donyi Polo Ashok Hotel Ltd. 2.01 1.968 Pondicherry Ashok Hotel Corpn. Ltd. 1.78 2.359 Utkal Ashok Hotel Corpn.Ltd. 0.00 0.00
Sub Total : 986.24 889.29
5. Net Profit / Loss: The details of enterprises , whichearned net profit or sustained net loss (-) are given below:
(` in Crores)Sl. Enterprise Adjusted NetNo. Profit / Net Loss
2011-12 2010-111 Indian Railway Catering and Tourism 48.54 60.79
Corpn. Ltd.2 India Tourism Dev. Corpn. Ltd. 8.54 -8.593 Madhya Pradesh Ashok
Hotel Corpn. Ltd. 0.58 0.324 Donyi Polo Ashok Hotel Ltd. 0.12 0.195 Assam Ashok Hotel Corpn. Ltd. -0.11 -0.596 Pondicherry Ashok Hotel Corpn. Ltd. -0.38 0.067 Ranchi Ashok Bihar Hotel Corpn. Ltd. -0.58 -0.558 Utkal Ashok Hotel Corpn. Ltd. -0.60 -0.719 Hotel Corpn. Of India Ltd. -21.29 -26.71
Sub Total : 34.82 24.21
6. Dividend : The details of dividend declared by the individualenterprises are given below:
(` in Crores)Sl. Enterprise DividendNo. 2011-12 2010-111 Indian Railway Catering and Tourism 9.72 12.15
Corpn. Ltd.2 India Tourism Dev. Corpn. Ltd. 4.29 0.00
Group Total : 14.01 12.15
7. Social Overhead and Township: The total number ofpersons employed and the expenditure incurred on social overheadsand townships are given below:
(` in Crores)Sl. Enterprise Township andNo. Social Overheads
2011-12 2010-111 No. of employees (in number) 5337 57322 Social overheads: (Rupees in Crore)
(i) Educational 1.54 0.1(ii) Medical Facilities 0.65 1.46(iii) Others 0.00 2.24
3 Capital cost of township (Rupees inCrore) 0.00 0.00
4 No. of houses constructed (in numbers) 0.00 0.008. Company wise details in respect of Balance Sheet, Profit
and Loss account, Important Indicators and Financial Ratios alongwith the write up of individual company are given in the pagesbelow.

Tourist Services518

Public Enterprises Survey 2011-2012: Vol-II 519
TOURIST
BALANCE SHEET (` in Lakhs)PARTICULARS 2011-12 2010-11I. EQUITY & LIABILITIESAUTHORISED CAPITAL 25520 25520(1) Shareholders’ Funds (a) Share Capital (i) Central Govt 10250 10299 (ii) Others 5359 5310 (b) Reserves & Surplus 35497 33839 (c) Money received against share warrants 0 0 Total Shareholders’ Funds (1(a)+1(b)+1(c) 51106 49448(2) Share application money pending allotment 0 0(3) Non-current Liabilities (a) Long Term Borrowings 4526 3503 (b) Deferred tax liabilities (Net) 36 41 (c) Other Long-term liabilities 9039 9066 (d) Long-term provisions 11019 9619 Total Non-Current Liabilities 3(a) to 3(d) 24620 22229(4) Current Liabilities (a) Short Term Borrowings 1819 3383 (b) Trade Payables 15316 16278 (c) Other current liabilities 50493 48058 (d) Short-term provisions 4793 3023 Total Current Liabilities 4(a) to 4(d) 72421 70742TOTAL EQUITY & LIABILITIES (1+2+3+4) 148147 142419II. ASSETS(1) Non-Current Assets (a) Total Gross Fixed Assets 37710 31858 (ai) Accumulated Depreciation, Depletion & Amortisation 16697 14727 (aii) Accumulated Impairment 2 2 (b) Total Net Fixed Assets ((a)-(ai)-(aii) 21011 17129 (c) Capital work in progress 532 3856 (d) Intangible assets under developmet 0 0 (e) Non-Current Investments 814 814 (f) Deferred Tax Assets (Net) 2575 3319 (g) Long Term Loans and Advances 5538 5208 (h) Other Non-Current Assets 780 313 Total Non-Current Assets (b+c+d+e+f+g+h) 31250 30639(2) Current Assets (a) Current Investments 0 0 (b) Inventories 1941 2033 (c) Trade Recievables 40416 36520 (d) Cash & Bank Balance 50478 54366 (e) Short-term Loans & Advances 21002 15705 (f) Other Current Assets 3060 3156 Total Current Assets (a+b+c+d+e+f) 116897 111780TOTAL ASSETS (1+2) 148147 142419Important Indicators (i) Investment 20135 19112 (ii) Capital Employed 55632 52951 (iii) Net Worth 51106 49448 (iv) Net Current Assets 44476 41038 (v) Cost of Sales 97319 92042 (vi) Net Value Added (at market price) 46569 39827 (vii) Total Regular Employees (Nos.) 5337 5732(viii) Avg. Monthly Emoluments per Employee(`) 47820 45589
PROFIT & LOSS ACCOUNT (` in Lakhs)PARTICULARS 2011-12 2010-11(I) Revenue from Operations (Gross) 98624 88929 Less : Excise Duty 355 327 Revenue from Operations (Net) 98269 88602(II) Other Income 6045 4677(III) Total Revenue (I+II) 104314 93279(IV) Expenditure on: (a) Cost of materials consumed 12363 12373 (b) Purchase of stock-in-trade 11808 9075 (c) Changes in inventories of finished goods, work-in- 28 227
progress and stock in trade (d) Stores & Spares 0 0 (e) Power & Fuel 3736 3211 (f) Salary, Wages & Benefits/Employees Expense 30626 31358 (g) Other Operating/direct/manufacturing Expenses 27881 26090 (h) Rent, Royalty & Cess 2272 1607 (i) Loss on sale of Assets/Investments 19 8 (j) Other Expenses 6068 5791Total Expenditure (IV (a to j)) 94801 89740(V) PROFIT BEFORE DEPRECIATION, & IMPAIRMENT, 9513 3539
FINANCE CHARGES/INTEREST, EXCEPTIONAL &EXTRAORDINARY ITEMS & TAXES (PBDIEET)(III-IV)
(VI) Depreciation, Depletion & Amortisation 2537 2310(VII) Impairment 0 0(VIII) PROFIT BEFORE FINANCE COST/INTEREST, 6976 1229
EXCEPTIONAL, EXTRA-ORDINARY ITEMS & TAXES(PBIEET)(V-VI-VII)
(IX) Finance Cost (a) On Central Government Loans 0 0 (b) On Foreign Loans 0 0 (c) Others 92 130 (d) Less Finance Cost Capitalised 0 0 (e) Charged to P & L Account (a+b+c+d) 92 130(X) PROFIT BEFORE EXCEPTIONAL & EXTRA-ORDINARY 6884 1099
ITEMS & TAX (PBEET)(VIII-IXe)(XI) Exceptional Items -637 -568(XII) PROFIT BEFORE EXTRA-ORDINARY ITEMS & TAX 7521 1667
(PBET)(X-XI)(XIII) Extra-Ordinary Items 0 0(XIV) PROFIT BEFORE TAX (PBT)(XII-XIII) 7521 1667(XV) TAX PROVISIONS 4135 4200(XVI) NET PROFIT / LOSS FOR THE PERIOD FROM 3386 -2533
CONTINUING OPERATIONS AFTER TAX(XIV-XV)(XVII) Profit/Loss from discontinuing operations 142 7416(XVIII) Tax expenses of discontinuing operations 46 2462(XIX) Profit/Loss from discontinuing operations (after Tax) 96 4954
(XVII-XVIII)(XX) Profit/Loss for the period (XVI+XIX) 3482 2421Financial Ratios (i) Sales : Capital Employed 176.64 167.33 (ii) Cost of Sales : Sales 99.03 103.88 (iii) Salary/Wages : Sales 31.17 35.39 (iv) Net Profit : Net Worth 6.81 4.9 (v) Debt : Equity 0.29 0.22 (vi) Current Ratio 1.61 1.58 (vii) Trade Recievables : Sales 41.13 41.22 (viii) Total Inventory : Sales 1.98 2.29

Tourist Services520
Assam Ashok Hotel Corporation Ltd.
The CompanyAssam Ashok Hotel Corporation Ltd. (AAHCL) was
incorporated on 7.1.1982 with the objective to promote domestictourism and to have a close coordination between the Center andthe State.
AAHCL is an uncategorised CPSE in Tourist Services sectorunder the administrative control of M/o Tourism. AAHCL is asubsidiary of ITDC Ltd. which holds 51% of its equity and Govt.of Assam hold 49%. The company employed 75 regular employees(Executives 6, Non executives 69) as on 31.3.2012. Its Registeredand Corporate offices are at Guwahati, Assam.
Vision / MissionThe Vision and Mission of the Company is to achieve the
excellence as business enterprises through the utmost professionalapproach towards guest satisfaction by providing customer orientedservice in a contemporary ambience.
Industrial / Business OperationsAAHCL is engaged in providing services in the field of Hotel
Business through its 52 twin bedded Room hotel (HotelBrahmaputra Ashok) at Guwahati, Assam.
Performance HighlightsThe physical performances of the company for last two years
are given below:
Total Revenue of the company registered an increase of ̀ 0.76crore during 2011-12, which went up from ̀ 5.92 crore in 2010-11to ` 6.68 crore in 2011-12. The net loss of the companycorrespondingly reduced to ` 0.11 crore, a reduction of ` 0.48crore over the previous year loss of ` 0.59 crore due to increase inoccupancy and turnover. The losses in the current year are also dueto increase in operating expenditure along with payment of arrearpay to employees as per 6th pay commission report of Govt. ofAssam.
The current ratio of company is at 0.34 : 1 during 2011-12 asagainst 0.40 : 1 in the previous year. Balance Sheet and Profit &Loss Account of the company and selected financial ratios duringthe period 2010-11 to 2011-12 can be seen on the adjoining page.
www.theashokgroup.com
Main Services Unit Performance during
2011-12 2010-11
Room occupancy % 58 55
Strategic IssuesThe Hotel Brahmaputra Ashok, built with traditional Assamese
décor, is positioned as the first 5 Star property of the North Eastwith facilities comparable to the other economic hubs of the country.
EBIT
DA
& P
AT (
Rs.
cro
re)
TOTAL R
EVENU
E (Rs. crore)
Fig. 1

Public Enterprises Survey 2011-2012: Vol-II 521
Assam Ashok Hotel Corporation Ltd.Hotel Brahamputra Ashok, M.G Road, Guwahati, Assam - 781 001
BALANCE SHEET (` in Lakhs)PARTICULARS 2011-12 2010-11I. EQUITY & LIABILITIESAUTHORISED CAPITAL 450 450(1) Shareholders’ Funds (a) Share Capital (i) Central Govt 0 49 (ii) Others 100 51 (b) Reserves & Surplus -604 -593 (c) Money received against share warrants 0 0 Total Shareholders’ Funds (1(a)+1(b)+1(c) -504 -493(2) Share application money pending allotment 0 0(3) Non-current Liabilities (a) Long Term Borrowings 294 277 (b) Deferred tax liabilities (Net) 0 0 (c) Other Long-term liabilities 0 0 (d) Long-term provisions 145 118 Total Non-Current Liabilities 3(a) to 3(d) 439 395(4) Current Liabilities (a) Short Term Borrowings 0 0 (b) Trade Payables 35 23 (c) Other current liabilities 457 547 (d) Short-term provisions 11 3 Total Current Liabilities 4(a) to 4(d) 503 573TOTAL EQUITY & LIABILITIES (1+2+3+4) 438 475II. ASSETS(1) Non-Current Assets (a) Total Gross Fixed Assets 495 475 (ai) Accumulated Depreciation, Depletion & Amortisation 256 255 (aii) Accumulated Impairment 2 2 (b) Total Net Fixed Assets ((a)-(ai)-(aii) 237 218 (c) Capital work in progress 9 9 (d) Intangible assets under developmet 0 0 (e) Non-Current Investments 0 0 (f) Deferred Tax Assets (Net) 4 0 (g) Long Term Loans and Advances 18 18 (h) Other Non-Current Assets 0 0 Total Non-Current Assets (b+c+d+e+f+g+h) 268 245(2) Current Assets (a) Current Investments 0 0 (b) Inventories 19 15 (c) Trade Recievables 74 100 (d) Cash & Bank Balance 46 87 (e) Short-term Loans & Advances 31 28 (f) Other Current Assets 0 0 Total Current Assets (a+b+c+d+e+f) 170 230TOTAL ASSETS (1+2) 438 475Important Indicators (i) Investment 394 377 (ii) Capital Employed -210 -216 (iii) Net Worth -504 -493 (iv) Net Current Assets -333 -343 (v) Cost of Sales 655 631 (vi) Net Value Added (at market price) 476 413 (vii) Total Regular Employees (Nos.) 75 75(viii) Avg. Monthly Emoluments per Employee(`) 38222 38111
PROFIT & LOSS ACCOUNT (` in Lakhs)PARTICULARS 2011-12 2010-11(I) Revenue from Operations (Gross) 664 590 Less : Excise Duty 0 0 Revenue from Operations (Net) 664 590(II) Other Income 4 2(III) Total Revenue (I+II) 668 592(IV) Expenditure on: (a) Cost of materials consumed 100 75 (b) Purchase of stock-in-trade 0 0 (c) Changes in inventories of finished goods, 0 0
work-in-progress and stock in trade (d) Stores & Spares 0 0 (e) Power & Fuel 58 52 (f) Salary, Wages & Benefits/Employees Expense 344 343 (g) Other Operating/direct/manufacturing Expenses 70 86 (h) Rent, Royalty & Cess 0 0 (i) Loss on sale of Assets/Investments 1 0 (j) Other Expenses 70 63Total Expenditure (IV (a to j)) 643 619(V) PROFIT BEFORE DEPRECIATION, & IMPAIRMENT, 25 -27
FINANCE CHARGES/INTEREST, EXCEPTIONAL &EXTRAORDINARY ITEMS & TAXES (PBDIEET)(III-IV)
(VI) Depreciation, Depletion & Amortisation 13 12(VII) Impairment 0 0(VIII) PROFIT BEFORE FINANCE COST/INTEREST, 12 -39
EXCEPTIONAL, EXTRA-ORDINARY ITEMS &TAXES (PBIEET)(V-VI-VII)
(IX) Finance Cost (a) On Central Government Loans 0 0 (b) On Foreign Loans 0 0 (c) Others 21 21 (d) Less Finance Cost Capitalised 0 0 (e) Charged to P & L Account (a+b+c+d) 21 21(X) PROFIT BEFORE EXCEPTIONAL & -9 -60
EXTRA-ORDINARY ITEMS & TAX (PBEET)(VIII-IXe)(XI) Exceptional Items -2 -1(XII) PROFIT BEFORE EXTRA-ORDINARY ITEMS & -7 -59
TAX (PBET)(X-XI)(XIII) Extra-Ordinary Items 0 0(XIV) PROFIT BEFORE TAX (PBT)(XII-XIII) -7 -59(XV) TAX PROVISIONS 4 0(XVI) NET PROFIT / LOSS FOR THE PERIOD FROM -11 -59
CONTINUING OPERATIONS AFTER TAX(XIV-XV)(XVII) Profit/Loss from discontinuing operations 0 0(XVIII) Tax expenses of discontinuing operations 0 0(XIX) Profit/Loss from discontinuing operations 0 0
(after Tax)(XVII-XVIII)(XX) Profit/Loss for the period (XVI+XIX) -11 -59Financial Ratios (i) Sales : Capital Employed -316.19 -273.15 (ii) Cost of Sales : Sales 98.64 106.95 (iii) Salary/Wages : Sales 51.81 58.14 (iv) Net Profit : Net Worth - - (v) Debt : Equity 2.94 2.77 (vi) Current Ratio 0.34 0.4 (vii) Trade Recievables : Sales 11.14 16.95 (viii) Total Inventory : Sales 2.86 2.54

Tourist Services522
Donyi Polo Ashok Hotel Ltd.
The CompanyDonyi Polo Ashok Hotel Ltd. (DPAHL) a joint venture of
India Tourism Development Corporation Limited (ITDC) andArunachal Pradesh Industrial Development and FinancialCorporation Limited (APIDFC) was incorporated on 10.08.1987with the objective to promote tourism and to have closercoordination between the center and the state efforts to dispersebenefits of tourism.
DPAHCL is an uncategorised CPSE in Tourist Services sectorunder the administrative control of M/o Tourism. DPAHL is asubsidiary of ITDC Ltd. which holds 51% share in its equity. Thecompany employed 27 regular employees (Executives 3, Non-executives 24) as on 31.3.2012. Its Registered and Corporate officesare at Itanagar, Arunachal Pradesh.
Vision/MissionThe Mission / Vision of the Company is to promote tourism.
Industrial / Business OperationsDPAHL is providing services in the field of hotel business,
boarding and lodging, through its single hotel (Hotel Donyi PoloAshok) at Itanagar, Arunachal Pradesh. The hotel has 18 rooms.
Performance HighlightsThe physical performances of the company for last two years
are given below:
The company registered an increase of ` 0.06 crore in totalrevenue during 2011-12 which went up to ` 2.10 crore in 2011-12from ̀ 2.04 crore during 2010-11 though there is fall in occupancyrate. The net profit of the company however decreased to ` 0.12crore, a decline of ` 0.07 crore from the previous year due toincrease in operating expenses.
The current ratio of company is at 3.54:1 during 2011-12 asagainst 3.04:1 in the previous year (Fig.2). Balance Sheet andProfit & Loss Account of the company and selected financial
www.theashokgroup.com
Main Services Unit Performance during
2011-12 2010-11
Room days sold % 48 56
EBIT
DA
& P
AT (
Rs.
cro
re)
TOTAL R
EVENU
E (Rs. crore)
Fig. 1PR
OFI
TAB
ILIT
Y R
ATIO
S (%
)
CU
RR
ENT R
ATIO
Fig. 2
ratios during the period 2010-11 to 2011-12 can be seen on theadjoining page.

Public Enterprises Survey 2011-2012: Vol-II 523
Donyi Polo Ashok Hotel Ltd.Hotel Donyi Polo Ashok, Sector-C, Itanagar, Papumpare distt., Arunachal Pradesh 791111
BALANCE SHEET (` in Lakhs)PARTICULARS 2011-12 2010-11I. EQUITY & LIABILITIESAUTHORISED CAPITAL 100 100(1) Shareholders’ Funds (a) Share Capital (i) Central Govt 0 0 (ii) Others 100 100 (b) Reserves & Surplus 108 96 (c) Money received against share warrants 0 0 Total Shareholders’ Funds (1(a)+1(b)+1(c) 208 196(2) Share application money pending allotment 0 0(3) Non-current Liabilities (a) Long Term Borrowings 0 0 (b) Deferred tax liabilities (Net) 4 5 (c) Other Long-term liabilities 0 0 (d) Long-term provisions 17 15 Total Non-Current Liabilities 3(a) to 3(d) 21 20(4) Current Liabilities (a) Short Term Borrowings 0 0 (b) Trade Payables 40 7 (c) Other current liabilities 14 35 (d) Short-term provisions 0 27 Total Current Liabilities 4(a) to 4(d) 54 69TOTAL EQUITY & LIABILITIES (1+2+3+4) 283 285II. ASSETS(1) Non-Current Assets (a) Total Gross Fixed Assets 180 155 (ai) Accumulated Depreciation, Depletion & Amortisation 88 80 (aii) Accumulated Impairment 0 0 (b) Total Net Fixed Assets ((a)-(ai)-(aii) 92 75 (c) Capital work in progress 0 0 (d) Intangible assets under developmet 0 0 (e) Non-Current Investments 0 0 (f) Deferred Tax Assets (Net) 0 0 (g) Long Term Loans and Advances 0 0 (h) Other Non-Current Assets 0 0 Total Non-Current Assets (b+c+d+e+f+g+h) 92 75(2) Current Assets (a) Current Investments 0 0 (b) Inventories 8 9 (c) Trade Recievables 59 43 (d) Cash & Bank Balance 99 125 (e) Short-term Loans & Advances 17 27 (f) Other Current Assets 8 6 Total Current Assets (a+b+c+d+e+f) 191 210TOTAL ASSETS (1+2) 283 285Important Indicators (i) Investment 100 100 (ii) Capital Employed 208 196 (iii) Net Worth 208 196 (iv) Net Current Assets 137 141 (v) Cost of Sales 205 178 (vi) Net Value Added (at market price) 123 129 (vii) Total Regular Employees (Nos.) 27 28(viii) Avg. Monthly Emoluments per Employee(`) 29630 26488
PROFIT & LOSS ACCOUNT (` in Lakhs)PARTICULARS 2011-12 2010-11(I) Revenue from Operations (Gross) 201 196 Less : Excise Duty 0 0 Revenue from Operations (Net) 201 196(II) Other Income 9 8(III) Total Revenue (I+II) 210 204(IV) Expenditure on: (a) Cost of materials consumed 43 38 (b) Purchase of stock-in-trade 0 0 (c) Changes in inventories of finished goods, 0 0
work-in-progress and stock in trade (d) Stores & Spares 0 0 (e) Power & Fuel 11 10 (f) Salary, Wages & Benefits/Employees Expense 96 89 (g) Other Operating/direct/manufacturing Expenses 30 16 (h) Rent, Royalty & Cess 1 1 (i) Loss on sale of Assets/Investments 0 0 (j) Other Expenses 17 20Total Expenditure (IV (a to j)) 198 174(V) PROFIT BEFORE DEPRECIATION, & IMPAIRMENT, 12 30
FINANCE CHARGES/INTEREST, EXCEPTIONAL &EXTRAORDINARY ITEMS & TAXES (PBDIEET)(III-IV)
(VI) Depreciation, Depletion & Amortisation 7 4(VII) Impairment 0 0(VIII) PROFIT BEFORE FINANCE COST/INTEREST, 5 26
EXCEPTIONAL, EXTRA-ORDINARY ITEMS &TAXES (PBIEET)(V-VI-VII)
(IX) Finance Cost (a) On Central Government Loans 0 0 (b) On Foreign Loans 0 0 (c) Others 0 0 (d) Less Finance Cost Capitalised 0 0 (e) Charged to P & L Account (a+b+c+d) 0 0(X) PROFIT BEFORE EXCEPTIONAL & EXTRA-ORDINARY 5 26
ITEMS & TAX (PBEET)(VIII-IXe)(XI) Exceptional Items 0 0(XII) PROFIT BEFORE EXTRA-ORDINARY ITEMS & 5 26
TAX (PBET)(X-XI)(XIII) Extra-Ordinary Items 0 0(XIV) PROFIT BEFORE TAX (PBT)(XII-XIII) 5 26(XV) TAX PROVISIONS -7 7(XVI) NET PROFIT / LOSS FOR THE PERIOD FROM 12 19
CONTINUING OPERATIONS AFTER TAX(XIV-XV)(XVII) Profit/Loss from discontinuing operations 0 0(XVIII) Tax expenses of discontinuing operations 0 0(XIX) Profit/Loss from discontinuing operations 0 0
(after Tax)(XVII-XVIII)(XX) Profit/Loss for the period (XVI+XIX) 12 19Financial Ratios (i) Sales : Capital Employed 96.63 100 (ii) Cost of Sales : Sales 101.99 90.82 (iii) Salary/Wages : Sales 47.76 45.41 (iv) Net Profit : Net Worth 5.77 9.69 (v) Debt : Equity 0 0 (vi) Current Ratio 3.54 3.04 (vii) Trade Recievables : Sales 29.35 21.94 (viii) Total Inventory : Sales 3.98 4.59

Tourist Services524
Hotel Corporation of India Ltd.
www.centaurhotels.com
The Company
Hotel Corporation of India Ltd. (HCI) was incorporated on08.07.1971 with the objective to carry on the business of Hotelsand Flight Catering Services. The company was incorporated as awholly owned subsidiary of Air India Ltd.
HCI is a Schedule-'C' CPSE in Tourist Services sector underthe administrative control of M/o Civil Aviation. The companyemployed 1279 regular employees (Executives 271& Non-Executives 1008) as on 31.3.2012. Its registered office is at Mumbai,Maharashtra and corporate office is at IGI Airport, New Delhi.
Industrial / Business Operations
HCI is engaged in providing services in the field of hotel andOn Board air catering through its 2 Hotels at Delhi (Centaur) andSrinagar (Centaur Lake view). The company is also running twoflight catering units at Delhi and Mumbai by the name of Chef-air.
Performance Highlights
The physical performances of the company for last two yearsare given below:
Main Product/Services Unit Performance during
2011-12 2010-11
Room occupancy ` in Crore 28.15 25.77
F&B ` in Crore 22.12 21.21
Other Services ` in Crore 2.79 2.65
Total Revenue of the company registered an increase of ̀ 4.17crore during 2011-12, which went up from ` 53.57 crore in2010-11 to ` 57.74 crore in 2011-12. The losses of the companyhas also gone down by ` 5.42 crore to ` 21.29 crore in 2011-12,from ` 26.71 crore in previous year due to reduction in operatingexpenses.
The current ratio of company is at 0.67:1 during 2011-12 asagainst 1.15:1 in the previous year. Balance Sheet and Profit &Loss Account of the company and selected financial ratios duringthe period 2010-11 to 2011-12 can be seen on the adjoining page.
Strategic issuesAs per the "in principle" sanction received from the M/o Civil
Aviation, the company is in the process of handing over the runningof its two Units i.e. Centaur Lake View Hotel, Srinagar and ChefairFlight Catering, Mumbai to professionals on Management Contract.
EBIT
DA
& P
AT (
Rs.
cro
re)
TOTAL R
EVENU
E (Rs. crore)
Fig. 1

Public Enterprises Survey 2011-2012: Vol-II 525
Hotel Corporation of India Ltd.1st Floor, Transport Annex Building, Air India Complex, Kalina, Santacruz (East), Mumbai-400029
BALANCE SHEET (` in Lakhs)PARTICULARS 2011-12 2010-11I. EQUITY & LIABILITIESAUTHORISED CAPITAL 4100 4100(1) Shareholders’ Funds (a) Share Capital (i) Central Govt 0 0 (ii) Others 4060 4060 (b) Reserves & Surplus -6555 -4426 (c) Money received against share warrants 0 0 Total Shareholders’ Funds (1(a)+1(b)+1(c) -2495 -366(2) Share application money pending allotment 0 0(3) Non-current Liabilities (a) Long Term Borrowings 4036 3022 (b) Deferred tax liabilities (Net) 0 0 (c) Other Long-term liabilities 42 414 (d) Long-term provisions 4607 4465 Total Non-Current Liabilities 3(a) to 3(d) 8685 7901(4) Current Liabilities (a) Short Term Borrowings 17 1637 (b) Trade Payables 933 567 (c) Other current liabilities 1387 959 (d) Short-term provisions 1021 432 Total Current Liabilities 4(a) to 4(d) 3358 3595TOTAL EQUITY & LIABILITIES (1+2+3+4) 9548 11130II. ASSETS(1) Non-Current Assets (a) Total Gross Fixed Assets 3393 3550 (ai) Accumulated Depreciation, Depletion & Amortisation 0 0 (aii) Accumulated Impairment 0 0 (b) Total Net Fixed Assets ((a)-(ai)-(aii) 3393 3550 (c) Capital work in progress 10 21 (d) Intangible assets under developmet 0 0 (e) Non-Current Investments 0 0 (f) Deferred Tax Assets (Net) 0 0 (g) Long Term Loans and Advances 3354 3158 (h) Other Non-Current Assets 545 281 Total Non-Current Assets (b+c+d+e+f+g+h) 7302 7010(2) Current Assets (a) Current Investments 0 0 (b) Inventories 222 216 (c) Trade Recievables 721 625 (d) Cash & Bank Balance 324 2237 (e) Short-term Loans & Advances 979 1042 (f) Other Current Assets 0 0 Total Current Assets (a+b+c+d+e+f) 2246 4120TOTAL ASSETS (1+2) 9548 11130Important Indicators (i) Investment 8096 7082 (ii) Capital Employed 1541 2656 (iii) Net Worth -2495 -366 (iv) Net Current Assets -1112 525 (v) Cost of Sales 7859 7985 (vi) Net Value Added (at market price) 3004 2681 (vii) Total Regular Employees (Nos.) 1279 1325(viii) Avg. Monthly Emoluments per Employee(`) 33157 33390
PROFIT & LOSS ACCOUNT (` in Lakhs)PARTICULARS 2011-12 2010-11(I) Revenue from Operations (Gross) 5492 5117 Less : Excise Duty 0 0 Revenue from Operations (Net) 5492 5117(II) Other Income 282 240(III) Total Revenue (I+II) 5774 5357(IV) Expenditure on: (a) Cost of materials consumed 904 788 (b) Purchase of stock-in-trade 0 0 (c) Changes in inventories of finished goods, 0 0
work-in-progress and stock in trade (d) Stores & Spares 0 0 (e) Power & Fuel 858 780 (f) Salary, Wages & Benefits/Employees Expense 5089 5309 (g) Other Operating/direct/manufacturing Expenses 204 187 (h) Rent, Royalty & Cess 0 0 (i) Loss on sale of Assets/Investments 0 0 (j) Other Expenses 607 724Total Expenditure (IV (a to j)) 7662 7788(V) PROFIT BEFORE DEPRECIATION, & IMPAIRMENT, -1888 -2431
FINANCE CHARGES/INTEREST, EXCEPTIONAL &EXTRAORDINARY ITEMS & TAXES (PBDIEET)(III-IV)
(VI) Depreciation, Depletion & Amortisation 197 197(VII) Impairment 0 0(VIII) PROFIT BEFORE FINANCE COST/INTEREST, -2085 -2628
EXCEPTIONAL, EXTRA-ORDINARY ITEMS & TAXES(PBIEET)(V-VI-VII)
(IX) Finance Cost (a) On Central Government Loans 0 0 (b) On Foreign Loans 0 0 (c) Others 44 43 (d) Less Finance Cost Capitalised 0 0 (e) Charged to P & L Account (a+b+c+d) 44 43(X) PROFIT BEFORE EXCEPTIONAL & EXTRA-ORDINARY -2129 -2671
ITEMS & TAX (PBEET)(VIII-IXe)(XI) Exceptional Items 0 0(XII) PROFIT BEFORE EXTRA-ORDINARY ITEMS & TAX -2129 -2671
(PBET)(X-XI)(XIII) Extra-Ordinary Items 0 0(XIV) PROFIT BEFORE TAX (PBT)(XII-XIII) -2129 -2671(XV) TAX PROVISIONS 0 0(XVI) NET PROFIT / LOSS FOR THE PERIOD FROM -2129 -2671
CONTINUING OPERATIONS AFTER TAX(XIV-XV)(XVII) Profit/Loss from discontinuing operations 0 0(XVIII) Tax expenses of discontinuing operations 0 0(XIX) Profit/Loss from discontinuing operations (after Tax) 0 0
(XVII-XVIII)(XX) Profit/Loss for the period (XVI+XIX) -2129 -2671Financial Ratios (i) Sales : Capital Employed 356.39 192.66 (ii) Cost of Sales : Sales 143.1 156.05 (iii) Salary/Wages : Sales 92.66 103.75 (iv) Net Profit : Net Worth - - (v) Debt : Equity 0.99 0.74 (vi) Current Ratio 0.67 1.15 (vii) Trade Recievables : Sales 13.13 12.21 (viii) Total Inventory : Sales 4.04 4.22
2011-12 Provisional

Tourist Services526
Indian Railway Catering & Tourism Corporation Ltd.
The CompanyIndian Railway Catering and Tourism Corporation Ltd.
(IRCTC) was incorporated on 27.09.1999 under the CompaniesAct, 1956 with an objective to strengthen railways marketing andservice capabilities in the areas of rail catering, tourism andpassengers amenities.
IRCTC is a Schedule - "B" Miniratna CPSE in the TouristService Sector under the administrative control of Ministry ofRailways with 100% shareholding of Government of India. Thecompany employed 1762 regular employees (Executives 992 &Non-Executives 770) as on 31.3.2012. It's registered and CorporateOffice is at New Delhi.
Vision / MissionThe Vision of the Company is to be the leader for providing
high quality travel, tourism and hospitality related services, for arange of customer segments, with consistently high level of customersatisfaction.
Industrial / Business OperationsIRCTC is mainly involved in enhancement of customer services
and facilitation in catering, passenger ticketing through latesttechnology, hospitality, travel and tourism with best industrypractices. The Company operates through its three Railneer bottlingplants at Nangloi (Delhi), Danapur (Bihar) and Palur (Chennai),one Central Kichen at NOIDA, 5 Zonal Offices, 10 Regional Officesand one Internet Ticketing Office (New Delhi). The company hasalso formed a joint venture with Cox & King (India) Ltd. with 50%equity share.
Performance Highlights The physical performances of the company for last two years
are given below:
www.irctc.com
Total Revenue from of the company registered an increase of` 74.78 crore during 2011-12, which went up from ` 468.25 crorein 2010-11 to ` 543.03 crore in 2011-12. However, the profit ofthe company has gone down by ` 12.25 crore to ` 48.54 crore in2011-12, from ̀ 60.79 crore in previous year due to lower growth
Products/Services Unit Performance during
2011-12 2010-11
Room days sold % 48 56
Rail Neer (Packaged Bottle of 83502 64030Drinking water) 1000 ml
Departmental Catering ` in Crores 197.64 198.58
Internet Ticketing ` in Crores 30.38 142.92
Licensee Catering Services ` in Crores 160.64 316.26
Package Tours ` in Crores 98.95 67.04
in revenue as a result of transfer of Licensee Catering Business toRailways and increase in operating expenses.
The current ratio of company is at 1.52:1 during 2011-12 asagainst 1.49:1 in the previous year (Fig.2). Balance Sheet and Profit& Loss Account of the company and selected financial ratios duringthe period 2010-11 to 2011-12 can be seen on the adjoining page.
Strategic issuesAfter catering policy 2010, the Corporation has diversified
into related areas like Non-Railway Catering (NRC), FacilityManagement, Budget Hotels, Hospitality Hubs, Hospitalityinstitutes and Travel & Tourism products and services. TheCorporation has so far opened 39 nos. of NRC units at variousplaces. In 2011-12, Corporation has also taken on the full operationand management of the Maharajas' Express train.
EBIT
DA
& P
AT (
Rs.
cro
re) TO
TAL REVEN
UE (R
s. crore)
Fig. 1
PRO
FITA
BIL
ITY
RAT
IOS
(%)
CU
RR
ENT R
ATIO
Fig. 2
2010-11 2011-12

Public Enterprises Survey 2011-2012: Vol-II 527
Indian Railway Catering & Tourism Corporation Ltd.9th Floor, banl of Baroda Building, Parliament Street, New Delhi 110001
BALANCE SHEET (` in Lakhs)PARTICULARS 2011-12 2010-11I. EQUITY & LIABILITIESAUTHORISED CAPITAL 5000 5000(1) Shareholders’ Funds (a) Share Capital (i) Central Govt 2000 2000 (ii) Others 0 0 (b) Reserves & Surplus 22670 19141 (c) Money received against share warrants 0 0 Total Shareholders’ Funds (1(a)+1(b)+1(c) 24670 21141(2) Share application money pending allotment 0 0(3) Non-current Liabilities (a) Long Term Borrowings 0 0 (b) Deferred tax liabilities (Net) 0 0 (c) Other Long-term liabilities 8546 8104 (d) Long-term provisions 1705 1505 Total Non-Current Liabilities 3(a) to 3(d) 10251 9609(4) Current Liabilities (a) Short Term Borrowings 0 0 (b) Trade Payables 8191 9188 (c) Other current liabilities 33415 29428 (d) Short-term provisions 1180 1413 Total Current Liabilities 4(a) to 4(d) 42786 40029TOTAL EQUITY & LIABILITIES (1+2+3+4) 77707 70779II. ASSETS(1) Non-Current Assets (a) Total Gross Fixed Assets 17876 13518 (ai) Accumulated Depreciation, Depletion & Amortisation 7369 5954 (aii) Accumulated Impairment 0 0 (b) Total Net Fixed Assets ((a)-(ai)-(aii) 10507 7564 (c) Capital work in progress 201 1636 (d) Intangible assets under developmet 0 0 (e) Non-Current Investments 0 0 (f) Deferred Tax Assets (Net) 0 0 (g) Long Term Loans and Advances 1849 1717 (h) Other Non-Current Assets 185 24 Total Non-Current Assets (b+c+d+e+f+g+h) 12742 10941(2) Current Assets (a) Current Investments 0 0 (b) Inventories 545 622 (c) Trade Recievables 27996 26164 (d) Cash & Bank Balance 23819 24586 (e) Short-term Loans & Advances 11487 7625 (f) Other Current Assets 1118 841 Total Current Assets (a+b+c+d+e+f) 64965 59838TOTAL ASSETS (1+2) 77707 70779Important Indicators (i) Investment 2000 2000 (ii) Capital Employed 24670 21141 (iii) Net Worth 24670 21141 (iv) Net Current Assets 22179 19809 (v) Cost of Sales 46612 41226 (vi) Net Value Added (at market price) 21983 19403 (vii) Total Regular Employees (Nos.) 1762 1934(viii) Avg. Monthly Emoluments per Employee(`) 50497 46807
BALANCE SHEET (` in Lakhs)PARTICULARS 2011-12 2010-11(I) Revenue from Operations (Gross) 51499 44959 Less : Excise Duty 355 327 Revenue from Operations (Net) 51144 44632(II) Other Income 3160 2193(III) Total Revenue (I+II) 54304 46825(IV) Expenditure on: (a) Cost of materials consumed 7130 7339 (b) Purchase of stock-in-trade 10280 7748 (c) Changes in inventories of finished goods, 53 166
work-in-progress and stock in trade (d) Stores & Spares 0 0 (e) Power & Fuel 149 152 (f) Salary, Wages & Benefits/Employees Expense 10677 10863 (g) Other Operating/direct/manufacturing Expenses 13135 11156 (h) Rent, Royalty & Cess 795 636 (i) Loss on sale of Assets/Investments 11 5 (j) Other Expenses 2938 1937Total Expenditure (IV (a to j)) 45168 40002(V) PROFIT BEFORE DEPRECIATION, & IMPAIRMENT, 9136 6823
FINANCE CHARGES/INTEREST, EXCEPTIONAL &EXTRAORDINARY ITEMS & TAXES (PBDIEET)(III-IV)
(VI) Depreciation, Depletion & Amortisation 1455 1229(VII) Impairment 0 0(VIII) PROFIT BEFORE FINANCE COST/INTEREST, 7681 5594
EXCEPTIONAL, EXTRA-ORDINARY ITEMS &TAXES (PBIEET)(V-VI-VII)
(IX) Finance Cost (a) On Central Government Loans 0 0 (b) On Foreign Loans 0 0 (c) Others 5 33 (d) Less Finance Cost Capitalised 0 0 (e) Charged to P & L Account (a+b+c+d) 5 33(X) PROFIT BEFORE EXCEPTIONAL & EXTRA-ORDINARY 7676 5561
ITEMS & TAX (PBEET)(VIII-IXe)(XI) Exceptional Items 164 0(XII) PROFIT BEFORE EXTRA-ORDINARY ITEMS & TAX 7512 5561
(PBET)(X-XI)(XIII) Extra-Ordinary Items 0 0(XIV) PROFIT BEFORE TAX (PBT)(XII-XIII) 7512 5561(XV) TAX PROVISIONS 2754 4436(XVI) NET PROFIT / LOSS FOR THE PERIOD FROM 4758 1125
CONTINUING OPERATIONS AFTER TAX(XIV-XV)(XVII) Profit/Loss from discontinuing operations 142 7416(XVIII) Tax expenses of discontinuing operations 46 2462(XIX) Profit/Loss from discontinuing operations 96 4954
(after Tax)(XVII-XVIII)(XX) Profit/Loss for the period (XVI+XIX) 4854 6079Financial Ratios (i) Sales : Capital Employed 207.31 211.12 (ii) Cost of Sales : Sales 91.14 92.37 (iii) Salary/Wages : Sales 20.88 24.34 (iv) Net Profit : Net Worth 19.68 28.75 (v) Debt : Equity 0 0 (vi) Current Ratio 1.52 1.49 (vii) Trade Recievables : Sales 54.74 58.62 (viii) Total Inventory : Sales 1.07 1.39

Tourist Services528
India Tourism Development Corporation Ltd.
www.theashokgroup.com
The CompanyIndia Tourism Development Corporation Ltd. (ITDC) was
incorporated in 1966 with the objective of developing and expandingtourism infrastructure in the country and thereby promoting Indiaas a tourist destination.
ITDC is a Schedule - 'B' listed Mini-ratna CPSE in TouristServices sector, under the administrative control of Ministry ofTourism with 92.11% shareholding by the Government of India.The company employed 2032 regular employees (Executives 340,Non-executives 1692) as on 31.3.2012. Its Registered and CorporateOffices are in New Delhi.
Vision / MissionThe Vision / Mission of the Company is to provide leadership
and play a catalytic role in the development of tourism infrastructurein the country and to achieve excellence in its strategic businessunits through professionalism, transparency, value for money basedand customer-focused services.
Industrial / Business OperationsITDC is engaged in providing tourism related facilities like
hotels, catering units, transport, duty free shopping, entertainment,production of tourist publicity literature, consultancy and executionof tourism and engineering projects, training consultancy inhospitality sector, event management and execution of Son-et-Lumeire (SEL) Shows etc.
The present network of ITDC consists of eight Ashok Groupof Hotels, six Joint Venture Hotels, one Restaurant, eleven TransportUnits, one Tourist Service Station, five Duty Free Shops at airports/seaports, two Sound & Light Shows and three catering outlets.Besides, ITDC is also managing a Hotel at Bharatpur and a TouristComplex at Kosi.
It has seven subsidiaries namely Assam Ashok Hotel,Guwahati; Donyi Polo Ashok Hotel, Itanagar; Ranchi Ashok BiharHotel, Ranchi; Utkal Ashok Hotel, Puri; Pondicherry Ashok Hotel,Pondicherry; M.P. Ashok Hotel, Bhopal and Punjab Ashok HotelCompany (the company is yet to commence business) withshareholding of 51% in each of them except in Utkal Ashok Hotelwhere shareholding is 98%. The two JV s are ITDC Aldeasa IndiaPrivate Ltd., ITDC Showtime Consortium (Partnership Firm).
Performance HighlightsThe Company registered an increase of ` 30.70 crore in total
income during 2011-12 which went up to ` 423.06 crore in2011-12 from ` 392.36 crore during 2010-11. The net profit of thecompany was ` 8.54 crore, a growth of ` 17.13 crore from theprevious year loss of ` 8.59 crore due to increase in turnover andcost control.
The current ratio of company is at 2.11:1 during 2011-12 asagainst 1.95:1 in the previous year (Fig.2). Balance Sheet and Profit& Loss Account of the company and selected financial ratios duringthe period 2010-11 to 2011-12 can be seen on the adjoining page.
Strategic IssuesWhile functioning on commercial lines, ITDC also promotes
role by way of opening of new areas/ destinations including remoteand backward regions where private sector was initially shy toenter. Company also evolves JV schemes for undertaking tourismprojects by forming new companies in collaboration with stategovernment / corporation in each state with equity participation.
EBIT
DA
& P
AT (
Rs.
cro
re)
TOTAL R
EVENU
E (Rs. crore)
Fig. 1
PRO
FITA
BIL
ITY
RAT
IOS
(%)
CU
RR
ENT R
ATIO
Fig. 2

Public Enterprises Survey 2011-2012: Vol-II 529
India Tourism Development Corporation Ltd.7, Scope Complex Lodi Road, New Delhi 110003 Delhi
BALANCE SHEET (` in Lakhs)PARTICULARS 2011-12 2010-11I. EQUITY & LIABILITIESAUTHORISED CAPITAL 15000 15000(1) Shareholders’ Funds (a) Share Capital (i) Central Govt 7900 7900 (ii) Others 677 677 (b) Reserves & Surplus 22309 21954 (c) Money received against share warrants 0 0 Total Shareholders’ Funds (1(a)+1(b)+1(c) 30886 30531(2) Share application money pending allotment 0 0(3) Non-current Liabilities (a) Long Term Borrowings 0 0 (b) Deferred tax liabilities (Net) 0 0 (c) Other Long-term liabilities 451 548 (d) Long-term provisions 4367 3391 Total Non-Current Liabilities 3(a) to 3(d) 4818 3939(4) Current Liabilities (a) Short Term Borrowings 0 0 (b) Trade Payables 6095 6476 (c) Other current liabilities 14436 16360 (d) Short-term provisions 2464 1076 Total Current Liabilities 4(a) to 4(d) 22995 23912TOTAL EQUITY & LIABILITIES (1+2+3+4) 58699 58382II. ASSETS(1) Non-Current Assets (a) Total Gross Fixed Assets 14376 12822 (ai) Accumulated Depreciation, Depletion & Amortisation 8237 7725 (aii) Accumulated Impairment 0 0 (b) Total Net Fixed Assets ((a)-(ai)-(aii) 6139 5097 (c) Capital work in progress 312 2190 (d) Intangible assets under developmet 0 0 (e) Non-Current Investments 814 814 (f) Deferred Tax Assets (Net) 2571 3319 (g) Long Term Loans and Advances 299 303 (h) Other Non-Current Assets 39 0 Total Non-Current Assets (b+c+d+e+f+g+h) 10174 11723(2) Current Assets (a) Current Investments 0 0 (b) Inventories 1125 1151 (c) Trade Recievables 11472 9488 (d) Cash & Bank Balance 25819 26984 (e) Short-term Loans & Advances 8238 6778 (f) Other Current Assets 1871 2258 Total Current Assets (a+b+c+d+e+f) 48525 46659TOTAL ASSETS (1+2) 58699 58382Important Indicators (i) Investment 8577 8577 (ii) Capital Employed 30886 30531 (iii) Net Worth 30886 30531 (iv) Net Current Assets 25530 22747 (v) Cost of Sales 40426 40499 (vi) Net Value Added (at market price) 20370 16575 (vii) Total Regular Employees (Nos.) 2032 2178(viii) Avg. Monthly Emoluments per Employee(`) 56603 54327
PROFIT & LOSS ACCOUNT (` in Lakhs)PARTICULARS 2011-12 2010-11(I) Revenue from Operations (Gross) 39763 37031 Less : Excise Duty 0 0 Revenue from Operations (Net) 39763 37031(II) Other Income 2543 2205(III) Total Revenue (I+II) 42306 39236(IV) Expenditure on: (a) Cost of materials consumed 4063 4010 (b) Purchase of stock-in-trade 1528 1327 (c) Changes in inventories of finished goods, -25 61
work-in-progress and stock in trade (d) Stores & Spares 0 0 (e) Power & Fuel 2570 2123 (f) Salary, Wages & Benefits/Employees Expense 13802 14199 (g) Other Operating/direct/manufacturing Expenses 14389 14574 (h) Rent, Royalty & Cess 1476 970 (i) Loss on sale of Assets/Investments 5 2 (j) Other Expenses 2070 2675Total Expenditure (IV (a to j)) 39878 39941(V) PROFIT BEFORE DEPRECIATION, & IMPAIRMENT, 2428 -705
FINANCE CHARGES/INTEREST, EXCEPTIONAL &EXTRAORDINARY ITEMS & TAXES (PBDIEET)(III-IV)
(VI) Depreciation, Depletion & Amortisation 553 560(VII) Impairment 0 0(VIII) PROFIT BEFORE FINANCE COST/INTEREST, 1875 -1265
EXCEPTIONAL, EXTRA-ORDINARY ITEMS & TAXES(PBIEET)(V-VI-VII)
(IX) Finance Cost (a) On Central Government Loans 0 0 (b) On Foreign Loans 0 0 (c) Others 2 0 (d) Less Finance Cost Capitalised 0 0 (e) Charged to P & L Account (a+b+c+d) 2 0(X) PROFIT BEFORE EXCEPTIONAL & EXTRA-ORDINARY 1873 -1265
ITEMS & TAX (PBEET)(VIII-IXe)(XI) Exceptional Items -329 -92(XII) PROFIT BEFORE EXTRA-ORDINARY ITEMS & TAX 2202 -1173
(PBET)(X-XI)(XIII) Extra-Ordinary Items 0 0(XIV) PROFIT BEFORE TAX (PBT)(XII-XIII) 2202 -1173(XV) TAX PROVISIONS 1348 -314(XVI) NET PROFIT / LOSS FOR THE PERIOD FROM 854 -859
CONTINUING OPERATIONS AFTER TAX(XIV-XV)(XVII) Profit/Loss from discontinuing operations 0 0(XVIII) Tax expenses of discontinuing operations 0 0(XIX) Profit/Loss from discontinuing operations (after Tax) 0 0
(XVII-XVIII)(XX) Profit/Loss for the period (XVI+XIX) 854 -859Financial Ratios (i) Sales : Capital Employed 128.74 121.29 (ii) Cost of Sales : Sales 101.67 109.37 (iii) Salary/Wages : Sales 34.71 38.34 (iv) Net Profit : Net Worth 2.77 -2.81 (v) Debt : Equity 0 0 (vi) Current Ratio 2.11 1.95 (vii) Trade Recievables : Sales 28.85 25.62 (viii) Total Inventory : Sales 2.83 3.11

Tourist Services530
M.P. Ashok Hotel Corporation Ltd.
The CompanyM.P. Ashok Hotel Corporation Ltd. (MAHCL) was created in
the year 1981 by India Tourism Development Corporation Ltd. incollaboration with the Madhya Pradesh State Tourism DevelopmentCorporation and the work for the Hotel Lake View Ashok commencedon August 12, 1981. The objective behind the creation of thecorporation was in line with the objectives of both the ITDC as wellas MPSTDC to develop and expand tourism infrastructure and toplay a promotional role in tourism by opening new destinations &providing class services to the guests/tourists along with earningrevenue for the share-holders.
MAHCL is an uncategorised CPSE in Tourist Services sectorunder the administrative control of the M/o Tourism. MAHCL is asubsidiary of ITDC Ltd. which holds 51% of its equity. TheCompany employed 58 regular employees (Executives 9, Non-executives 49) as on 31.03.2012. Its Registered and Corporate officeare at Bhopal, Madhya Pradesh.
Vision/MissionThe Vision of the Company is to make the hotel Lake View
Ashok comparable to excellence with the best in Bhopal, to providethe best to the esteemed guests setting benchmark for others in thecity, to strive for excellence in all commercial activities and createextraordinary value for the stakeholders.
The Mission of the Company is to achieve excellence as abusiness entity through professionalism, efficiency and innovationby providing customer-oriented services
Industrial / Business OperationsThe company owned single entity - Hotel Lake View Ashok, is
operating with 43 Guest rooms including 39 standard deluxe roomsand 4 Deluxe suites along with three company owned restaurant & onebar as well as another specialty theme restaurant - Shan-e-Bhopaloperating within the hotel. The hotel has also been utilizing its sprawlinglawns for organizing various events as well as large banquets.
Performance HighlightsTotal Revenue of the company increased to ` 6.23 crore in
2011-12 from ` 5.67 crore during 2010-11 showing an increase of` 0.56 crore The net profit of the company also increased to ` 0.56crore, an increase of ` 0.24 crore over the previous year profit of `0.32 crore due to increase in turnover.
The current ratio of company is at 0.68:1 during 2011-12 asagainst 0.54:1 in the previous year. Balance Sheet and Profit & LossAccount of the company and selected financial ratios during theperiod 2010-11 to 2011-12 can be seen on the adjoining page.
www.lakeviewashok.com
Strategic IssuesThe company plans to consolidate and strengthen its core
activities and to play diversified role in providing various tourism-related services, opening newer avenues for the corporation to earnmoney and accretion. The corporate plan shall serve as a guidingdocument for developing strategic and operational plan.
The hotel construction started way back in the year 1981 andthe operations commenced in the year 1989. Since the inception ofthe hotel no renovation was carried out till 2003-2004. Since 2004-05 the hotel has renovated its restaurants, revamped the guestrooms and face-lifted the public areas for providing better servicesto the guests. The renovation plans are still going on.
The highlights of the strategy for coming year will beIntroduction of customer-specific services (tailor-made) - flexiblespecial package deals for marriage parties, event-firms, film units,special student groups, flexible pricing etc.
EBIT
DA
& P
AT (
Rs.
cro
re)
TOTAL R
EVENU
E (Rs. crore)
Fig. 1
2010-11 2011-12
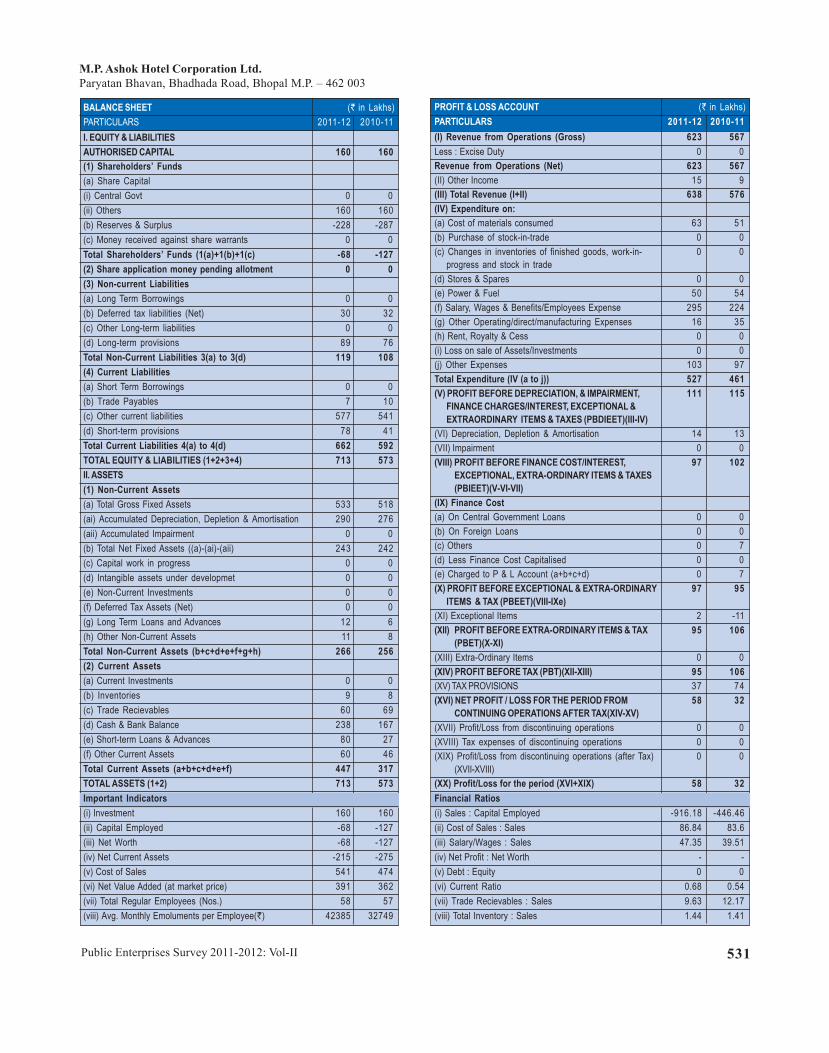
Public Enterprises Survey 2011-2012: Vol-II 531
M.P. Ashok Hotel Corporation Ltd.Paryatan Bhavan, Bhadhada Road, Bhopal M.P. – 462 003
BALANCE SHEET (` in Lakhs)PARTICULARS 2011-12 2010-11I. EQUITY & LIABILITIESAUTHORISED CAPITAL 160 160(1) Shareholders’ Funds(a) Share Capital(i) Central Govt 0 0(ii) Others 160 160(b) Reserves & Surplus -228 -287(c) Money received against share warrants 0 0Total Shareholders’ Funds (1(a)+1(b)+1(c) -68 -127(2) Share application money pending allotment 0 0(3) Non-current Liabilities(a) Long Term Borrowings 0 0(b) Deferred tax liabilities (Net) 30 32(c) Other Long-term liabilities 0 0(d) Long-term provisions 89 76Total Non-Current Liabilities 3(a) to 3(d) 119 108(4) Current Liabilities(a) Short Term Borrowings 0 0(b) Trade Payables 7 10(c) Other current liabilities 577 541(d) Short-term provisions 78 41Total Current Liabilities 4(a) to 4(d) 662 592TOTAL EQUITY & LIABILITIES (1+2+3+4) 713 573II. ASSETS(1) Non-Current Assets(a) Total Gross Fixed Assets 533 518(ai) Accumulated Depreciation, Depletion & Amortisation 290 276(aii) Accumulated Impairment 0 0(b) Total Net Fixed Assets ((a)-(ai)-(aii) 243 242(c) Capital work in progress 0 0(d) Intangible assets under developmet 0 0(e) Non-Current Investments 0 0(f) Deferred Tax Assets (Net) 0 0(g) Long Term Loans and Advances 12 6(h) Other Non-Current Assets 11 8Total Non-Current Assets (b+c+d+e+f+g+h) 266 256(2) Current Assets(a) Current Investments 0 0(b) Inventories 9 8(c) Trade Recievables 60 69(d) Cash & Bank Balance 238 167(e) Short-term Loans & Advances 80 27(f) Other Current Assets 60 46Total Current Assets (a+b+c+d+e+f) 447 317TOTAL ASSETS (1+2) 713 573Important Indicators(i) Investment 160 160(ii) Capital Employed -68 -127(iii) Net Worth -68 -127(iv) Net Current Assets -215 -275(v) Cost of Sales 541 474(vi) Net Value Added (at market price) 391 362(vii) Total Regular Employees (Nos.) 58 57(viii) Avg. Monthly Emoluments per Employee(`) 42385 32749
PROFIT & LOSS ACCOUNT (` in Lakhs)PARTICULARS 2011-12 2010-11(I) Revenue from Operations (Gross) 623 567Less : Excise Duty 0 0Revenue from Operations (Net) 623 567(II) Other Income 15 9(III) Total Revenue (I+II) 638 576(IV) Expenditure on:(a) Cost of materials consumed 63 51(b) Purchase of stock-in-trade 0 0(c) Changes in inventories of finished goods, work-in- 0 0
progress and stock in trade(d) Stores & Spares 0 0(e) Power & Fuel 50 54(f) Salary, Wages & Benefits/Employees Expense 295 224(g) Other Operating/direct/manufacturing Expenses 16 35(h) Rent, Royalty & Cess 0 0(i) Loss on sale of Assets/Investments 0 0(j) Other Expenses 103 97Total Expenditure (IV (a to j)) 527 461(V) PROFIT BEFORE DEPRECIATION, & IMPAIRMENT, 111 115
FINANCE CHARGES/INTEREST, EXCEPTIONAL &EXTRAORDINARY ITEMS & TAXES (PBDIEET)(III-IV)
(VI) Depreciation, Depletion & Amortisation 14 13(VII) Impairment 0 0(VIII) PROFIT BEFORE FINANCE COST/INTEREST, 97 102
EXCEPTIONAL, EXTRA-ORDINARY ITEMS & TAXES(PBIEET)(V-VI-VII)
(IX) Finance Cost(a) On Central Government Loans 0 0(b) On Foreign Loans 0 0(c) Others 0 7(d) Less Finance Cost Capitalised 0 0(e) Charged to P & L Account (a+b+c+d) 0 7(X) PROFIT BEFORE EXCEPTIONAL & EXTRA-ORDINARY 97 95
ITEMS & TAX (PBEET)(VIII-IXe)(XI) Exceptional Items 2 -11(XII) PROFIT BEFORE EXTRA-ORDINARY ITEMS & TAX 95 106
(PBET)(X-XI)(XIII) Extra-Ordinary Items 0 0(XIV) PROFIT BEFORE TAX (PBT)(XII-XIII) 95 106(XV) TAX PROVISIONS 37 74(XVI) NET PROFIT / LOSS FOR THE PERIOD FROM 58 32
CONTINUING OPERATIONS AFTER TAX(XIV-XV)(XVII) Profit/Loss from discontinuing operations 0 0(XVIII) Tax expenses of discontinuing operations 0 0(XIX) Profit/Loss from discontinuing operations (after Tax) 0 0
(XVII-XVIII)(XX) Profit/Loss for the period (XVI+XIX) 58 32Financial Ratios(i) Sales : Capital Employed -916.18 -446.46(ii) Cost of Sales : Sales 86.84 83.6(iii) Salary/Wages : Sales 47.35 39.51(iv) Net Profit : Net Worth - -(v) Debt : Equity 0 0(vi) Current Ratio 0.68 0.54(vii) Trade Recievables : Sales 9.63 12.17(viii) Total Inventory : Sales 1.44 1.41

Tourist Services532
Pondicherry Ashok Hotel Corporation Limited
The CompanyPondicherry Ashok Hotel Corporation Limited (PAHCL) was
incorporated on 16.6.1986 with the objective to promote and developtourism in Pondicherry (now known as Puducherry). It is a JointVenture Company of ITDC, a Central Public Sector Enterprises(CPSE) and PIPDIC (Pondicherry Industrial PromotionDevelopment and Investment Corporation Ltd) an undertaking ofGovt. of Puducherry. Further to these objectives a Beach resortHotel in the name of Hotel Pondicherry Ashok in the UnionTerritories of Puducherry was constructed, which commenced itsbusiness on 06.02.1989
PAHCL is an uncategorised CPSE in Tourist Services sectorunder the administrative control of M/o Tourism with its Registeredand Corporate offices at Union Territory of Puducherry. PAHCL isa subsidiary joint venture of ITDC Ltd. where in ITDC holds 51%equity and PIPDIC holds 49% shares. The company employed35 regular employees (Executives 21, Non-executives 14) as on31.3.2012. The registered office of the Company is situated atPuducherry.
Industrial / Business OperationsThe Hotel Pondicherry Ashok was commissioned with 20
rooms. Now there are 25 rooms including cottages. Its income is fromproviding accommodation as well as provision of food and beverage.
Performance HighlightsThe Company registered an reduction of ` 0.53 crore in total
revenue during 2011-12 which declined to ` 1.86 crore in 2011-12from ` 2.39 crore during 2010-11. The net loss of the companyincreased to ` 0.40 crore in 2011-12, an increase of ` 0.30 croreover the previous year loss of ` 0.10 crore due to fall in operatingincome.
The current ratio of company is at 0.50:1 during 2011-12 asagainst 0.94:1 in the previous year (Fig.2). Balance Sheet andProfit & Loss Account of the company and selected financialratios during the period 2010-11 to 2011-12 can be seen on theadjoining page.
www.ashokresort.com
EBIT
DA
& P
AT (
Rs.
cro
re)
TOTAL R
EVENU
E (Rs. crore)
Fig. 1
PRO
FITA
BIL
ITY
RAT
IOS
(%)
CU
RR
ENT R
ATIO
Fig. 2

Public Enterprises Survey 2011-2012: Vol-II 533
Pondicherry Ashok Hotel Corporation LimitedHotel Pondicherry Ashok, East Coast Road Kalapet Beach, Puducherry-605014
BALANCE SHEET (` in Lakhs)PARTICULARS 2011-12 2010-11I. EQUITY & LIABILITIESAUTHORISED CAPITAL 60 60(1) Shareholders’ Funds(a) Share Capital(i) Central Govt 0 0(ii) Others 60 60(b) Reserves & Surplus 43 81(c) Money received against share warrants 0 0Total Shareholders’ Funds (1(a)+1(b)+1(c) 103 141(2) Share application money pending allotment 0 0(3) Non-current Liabilities(a) Long Term Borrowings 0 0(b) Deferred tax liabilities (Net) 2 4(c) Other Long-term liabilities 0 0(d) Long-term provisions 30 30Total Non-Current Liabilities 3(a) to 3(d) 32 34(4) Current Liabilities(a) Short Term Borrowings 105 96(b) Trade Payables 2 0(c) Other current liabilities 0 0(d) Short-term provisions 39 31Total Current Liabilities 4(a) to 4(d) 146 127TOTAL EQUITY & LIABILITIES (1+2+3+4) 281 302II. ASSETS(1) Non-Current Assets(a) Total Gross Fixed Assets 317 281(ai) Accumulated Depreciation, Depletion & Amortisation 109 98(aii) Accumulated Impairment 0 0(b) Total Net Fixed Assets ((a)-(ai)-(aii) 208 183(c) Capital work in progress 0 0(d) Intangible assets under developmet 0 0(e) Non-Current Investments 0 0(f) Deferred Tax Assets (Net) 0 0(g) Long Term Loans and Advances 0 0(h) Other Non-Current Assets 0 0Total Non-Current Assets (b+c+d+e+f+g+h) 208 183(2) Current Assets(a) Current Investments 0 0(b) Inventories 6 6(c) Trade Recievables 8 7(d) Cash & Bank Balance 43 86(e) Short-term Loans & Advances 13 18(f) Other Current Assets 3 2Total Current Assets (a+b+c+d+e+f) 73 119TOTAL ASSETS (1+2) 281 302Important Indicators(i) Investment 60 60(ii) Capital Employed 103 141(iii) Net Worth 103 141(iv) Net Current Assets -73 -8(v) Cost of Sales 223 235(vi) Net Value Added (at market price) 70 114(vii) Total Regular Employees (Nos.) 35 36(viii) Avg. Monthly Emoluments per Employee(`) 25952 25694
PROFIT & LOSS ACCOUNT (` in Lakhs)PARTICULARS 2011-12 2010-11(I) Revenue from Operations (Gross) 178 235Less : Excise Duty 0 0Revenue from Operations (Net) 178 235(II) Other Income 8 4(III) Total Revenue (I+II) 186 239(IV) Expenditure on:(a) Cost of materials consumed 30 33(b) Purchase of stock-in-trade 0 0(c) Changes in inventories of finished goods, work-in- 0 0
progress and stock in trade(d) Stores & Spares 0 0(e) Power & Fuel 12 10(f) Salary, Wages & Benefits/Employees Expense 109 111(g) Other Operating/direct/manufacturing Expenses 26 24(h) Rent, Royalty & Cess 0 0(i) Loss on sale of Assets/Investments 2 1(j) Other Expenses 32 45Total Expenditure (IV (a to j)) 211 224(V) PROFIT BEFORE DEPRECIATION, & IMPAIRMENT, 25 15
FINANCE CHARGES/INTEREST, EXCEPTIONAL &EXTRAORDINARY ITEMS & TAXES (PBDIEET)(III-IV) -
(VI) Depreciation, Depletion & Amortisation 14 12(VII) Impairment 0 0(VIII) PROFIT BEFORE FINANCE COST/INTEREST, -39 3
EXCEPTIONAL, EXTRA-ORDINARY ITEMS & TAXES(PBIEET)(V-VI-VII)
(IX) Finance Cost(a) On Central Government Loans 0 0(b) On Foreign Loans 0 0(c) Others 0 0(d) Less Finance Cost Capitalised 0 0(e) Charged to P & L Account (a+b+c+d) 0 0(X) PROFIT BEFORE EXCEPTIONAL & EXTRA-ORDINARY -39 3
ITEMS & TAX (PBEET)(VIII-IXe)(XI) Exceptional Items 0 0(XII) PROFIT BEFORE EXTRA-ORDINARY ITEMS & TAX -39 3
(PBET)(X-XI)(XIII) Extra-Ordinary Items 0 0(XIV) PROFIT BEFORE TAX (PBT)(XII-XIII) -39 3(XV) TAX PROVISIONS -1 -3(XVI) NET PROFIT / LOSS FOR THE PERIOD FROM -38 6
CONTINUING OPERATIONS AFTER TAX(XIV-XV)(XVII) Profit/Loss from discontinuing operations 0 0(XVIII) Tax expenses of discontinuing operations 0 0(XIX) Profit/Loss from discontinuing operations (after Tax) 0 0
(XVII-XVIII)(XX) Profit/Loss for the period (XVI+XIX) -38 6Financial Ratios(i) Sales : Capital Employed 172.82 166.67(ii) Cost of Sales : Sales 125.28 100(iii) Salary/Wages : Sales 61.24 47.23(iv) Net Profit : Net Worth -36.89 4.26(v) Debt : Equity 0 0(vi) Current Ratio 0.50 0.94(vii) Trade Recievables : Sales 4.49 2.98(viii) Total Inventory : Sales 3.37 2.55

Tourist Services534
Ranchi Ashok Bihar Hotel Corporation Ltd.
The CompanyRanchi Ashok Bihar Hotel Corporation Ltd. (RABHCL) was
incorporated on 23.07.1983 with the objective to promote tourismparticularly in the state of Bihar.
RABHCL is a joint venture of ITDC Ltd. and Bihar StateTourism Development Corp. Ltd. It is an uncategorized CPSE inTourist Services sector under the administrative control of M/oTourism. The company employed 46 regular employees (Executives22, Non-Executives 24) as on 31.3.2012. Its registered office is atPatna (Bihar) and corporate office is at Ranchi, Jharkhand. RABHCLis a subsidiary of ITDC Ltd. which holds 51% of its equity.
Vision / MissionThe Vision of the Company is to provide leadership and play
a catalytic role in the development of tourism infrastructure in thestate of Jharkhand and to achieve excellence through professionalism,efficiency, value for money and customer- oriented service.
The Mission of the Company is that of installation of propertymanagement system.
Industrial / Business OperationsRABHCL is engaged in providing services in the field of
management of operation of Hotel through its 30 Rooms Hotel(Hotel Ranchi Ashok, Vivekananda Lane, Doranda, Jharkhand) atRanchi, Jharkhand.
Performance HighlightsThe physical performances of the company for last two years
are given below:
www.hotelranchiashok.com
Total Revenue of the company registered a reduction of` 0.22 crore during 2011-12, which went down from ̀ 2.50 crore in2010-11 to ` 2.28 crore in 2011-12 due to lower turnover ascompared to last year. The net loss of the company however wentdown to ` 0.58 crore in 2011-12, as against the previous year lossof ` 0.94 crore due to reduction in operating expenses.
The current ratio of company is at 0.58:1 during 2011-12 asagainst 0.72:1 in the previous year. Balance Sheet and Profit & LossAccount of the company and selected financial ratios during theperiod 2010-11 to 2011-12 can be seen on the adjoining page.
Main Service Unit Performance during
2011-12 2010-11
Room Occupancy % 34 35
EBIT
DA
& P
AT (
Rs.
cro
re)
TOTAL R
EVENU
E (Rs. crore)
Fig. 1
Strategic IssuesAfter the formation of Jaharkhand State, the importance of
capital city of Ranchi has increased and company is focusing itsefforts in this direction to grab major share of business. The hotelhas become very old as such up gradation of property is required tocope with competition. The multiple tax levied by Central as wellas State Government affects the business.

Public Enterprises Survey 2011-2012: Vol-II 535
Ranchi Ashok Bihar Hotel Corporation Ltd.Bihar State Tourism Development Corporation Ltd. Beerchand Patel Path, Patna, Bihar-800001
BALANCE SHEET (` in Lakhs)PARTICULARS 2011-12 2010-11I. EQUITY & LIABILITIESAUTHORISED CAPITAL 100 100(1) Shareholders’ Funds(a) Share Capital(i) Central Govt 0 0(ii) Others 72 72(b) Reserves & Surplus -305 -246(c) Money received against share warrants 0 0Total Shareholders’ Funds (1(a)+1(b)+1(c) -233 -174(2) Share application money pending allotment 0 0(3) Non-current Liabilities(a) Long Term Borrowings 196 196(b) Deferred tax liabilities (Net) 0 0(c) Other Long-term liabilities 0 0(d) Long-term provisions 36 19Total Non-Current Liabilities 3(a) to 3(d) 232 215(4) Current Liabilities(a) Short Term Borrowings 0 0(b) Trade Payables 13 7(c) Other current liabilities 207 188(d) Short-term provisions 0 0Total Current Liabilities 4(a) to 4(d) 220 195TOTAL EQUITY & LIABILITIES (1+2+3+4) 219 236II. ASSETS(1) Non-Current Assets(a) Total Gross Fixed Assets 251 250(ai) Accumulated Depreciation, Depletion & Amortisation 165 159(aii) Accumulated Impairment 0 0(b) Total Net Fixed Assets ((a)-(ai)-(aii) 86 91(c) Capital work in progress 0 0(d) Intangible assets under developmet 0 0(e) Non-Current Investments 0 0(f) Deferred Tax Assets (Net) 0 0(g) Long Term Loans and Advances 5 5(h) Other Non-Current Assets 0 0Total Non-Current Assets (b+c+d+e+f+g+h) 91 96(2) Current Assets(a) Current Investments 0 0(b) Inventories 7 6(c) Trade Recievables 26 24(d) Cash & Bank Balance 81 91(e) Short-term Loans & Advances 14 16(f) Other Current Assets 0 3Total Current Assets (a+b+c+d+e+f) 128 140TOTAL ASSETS (1+2) 219 236Important Indicators(i) Investment 268 268(ii) Capital Employed -37 22(iii) Net Worth -233 -174(iv) Net Current Assets -92 -55(v) Cost of Sales 285 304(vi) Net Value Added (at market price) 157 158(vii) Total Regular Employees (Nos.) 46 45(viii) Avg. Monthly Emoluments per Employee(`) 32246 33704
PROFIT & LOSS ACCOUNT (` in Lakhs)PARTICULARS 2011-12 2010-11(I) Revenue from Operations (Gross) 204 234Less : Excise Duty 0 0Revenue from Operations (Net) 204 234(II) Other Income 24 16(III) Total Revenue (I+II) 228 250(IV) Expenditure on:(a) Cost of materials consumed 30 39(b) Purchase of stock-in-trade 0 0(c) Changes in inventories of finished goods, work-in- 0 0
progress and stock in trade(d) Stores & Spares 0 0(e) Power & Fuel 28 30(f) Salary, Wages & Benefits/Employees Expense 178 182(g) Other Operating/direct/manufacturing Expenses 11 12(h) Rent, Royalty & Cess 0 0(i) Loss on sale of Assets/Investments 0 0(j) Other Expenses 32 36Total Expenditure (IV (a to j)) 279 299(V) PROFIT BEFORE DEPRECIATION, & IMPAIRMENT, 51 -49
FINANCE CHARGES/INTEREST, EXCEPTIONAL &EXTRAORDINARY ITEMS & TAXES (PBDIEET)(III-IV) -
(VI) Depreciation, Depletion & Amortisation 6 5(VII) Impairment 0 0(VIII) PROFIT BEFORE FINANCE COST/INTEREST, -57 -54
EXCEPTIONAL, EXTRA-ORDINARY ITEMS & TAXES(PBIEET)(V-VI-VII)
(IX) Finance Cost(a) On Central Government Loans 0 0(b) On Foreign Loans 0 0(c) Others 1 1(d) Less Finance Cost Capitalised 0 0(e) Charged to P & L Account (a+b+c+d) 1 1(X) PROFIT BEFORE EXCEPTIONAL & EXTRA-ORDINARY -58 -55ITEMS & TAX (PBEET)(VIII-IXe)(XI) Exceptional Items 0 0(XII) PROFIT BEFORE EXTRA-ORDINARY ITEMS & TAX -58 -55
(PBET)(X-XI)(XIII) Extra-Ordinary Items 0 0(XIV) PROFIT BEFORE TAX (PBT)(XII-XIII) -58 -55(XV) TAX PROVISIONS 0 0(XVI) NET PROFIT / LOSS FOR THE PERIOD FROM -58 -55CONTINUING OPERATIONS AFTER TAX(XIV-XV)(XVII) Profit/Loss from discontinuing operations 0 0(XVIII) Tax expenses of discontinuing operations 0 0(XIX) Profit/Loss from discontinuing operations (after Tax) 0 0
(XVII-XVIII)(XX) Profit/Loss for the period (XVI+XIX) -58 -55Financial Ratios(i) Sales : Capital Employed -551.35 1063.64(ii) Cost of Sales : Sales 139.71 129.91(iii) Salary/Wages : Sales 87.25 77.78(iv) Net Profit : Net Worth - -(v) Debt : Equity 2.72 2.72(vi) Current Ratio 0.58 0.72(vii) Trade Recievables : Sales 12.75 10.26(viii) Total Inventory : Sales 3.43 2.56

Tourist Services536
Utkal Ashok Hotel Corp. Ltd.
The Company
Utkal Ashok Hotel Corp. Ltd. (UAHCL) was incorporated in1983 with the objective to promote domestic tourism and to haveclose coordination between the Center and the State efforts todisperse benefits of tourism in the State of Orissa and to relieve thedirect strains on budgetary resources of the Center and State byeliminating duplicate efforts.
UAHCL is an un-categorised sick CPSE in Tourist Servicessector under the administrative control of M/o Tourism. ItsRegistered and Corporate offices are at Puri, Orissa. UAHCL is asubsidiary of ITDC Ltd. which holds 98% of its equity.
Industrial / Business Operations
UAHCL was providing services in the field of Hotel business(accommodation and catering) through its single hotel namely HotelNilachal Ashok at Puri, Orissa. However, since 31.3.2004 the HotelNilachal Ashok has been closed. No staff is working in the Hotel.
Performance Highlights
The company has no operating income. The losses of thecompany has gone down by ̀ 0.11 crore to ̀ 0.60 crore in 2011-12,from ` 0.71 crore in previous year due to variance in ExceptionalItems.
The current ratio of company is at 0.09:1 during 2011-12 and2010-11. Balance Sheet and Profit & Loss Account of the companyand selected financial ratios during the period 2010-11 to 2011-12can be seen on the adjoining page.
www.
EBIT
DA
& P
AT (
Rs.
cro
re)
TOTAL R
EVENU
E (Rs. crore)
Fig. 1
Strategic issues
The company has decided to lease out the Hotel property for40 years to M/s Paul Mech Infrastructure Pvt. Ltd. The process ofleasing has been completed.

Public Enterprises Survey 2011-2012: Vol-II 537
Utkal Ashok Hotel Corp. Ltd.Hotel Neelachal Ashok, VIP Road, Adjoining Raj BhawanPuri, Orissa - 752 001
BALANCE SHEET (` in Lakhs)PARTICULARS 2011-12 2010-11I. EQUITY & LIABILITIESAUTHORISED CAPITAL 550 550(1) Shareholders’ Funds(a) Share Capital(i) Central Govt 350 350(ii) Others 130 130(b) Reserves & Surplus -1941 -1881(c) Money received against share warrants 0 0Total Shareholders’ Funds (1(a)+1(b)+1(c) -1461 -1401(2) Share application money pending allotment 0 0(3) Non-current Liabilities(a) Long Term Borrowings 0 8(b) Deferred tax liabilities (Net) 0 0(c) Other Long-term liabilities 0 0(d) Long-term provisions 23 0Total Non-Current Liabilities 3(a) to 3(d) 23 8(4) Current Liabilities(a) Short Term Borrowings 1697 1650(b) Trade Payables 0 0(c) Other current liabilities 0 0(d) Short-term provisions 0 0Total Current Liabilities 4(a) to 4(d) 1697 1650TOTAL EQUITY & LIABILITIES (1+2+3+4) 259 257II. ASSETS(1) Non-Current Assets(a) Total Gross Fixed Assets 289 289(ai) Accumulated Depreciation, Depletion & Amortisation 183 180(aii) Accumulated Impairment 0 0(b) Total Net Fixed Assets ((a)-(ai)-(aii) 106 109(c) Capital work in progress 0 0(d) Intangible assets under developmet 0 0(e) Non-Current Investments 0 0(f) Deferred Tax Assets (Net) 0 0(g) Long Term Loans and Advances 1 1(h) Other Non-Current Assets 0 0Total Non-Current Assets (b+c+d+e+f+g+h) 107 110(2) Current Assets(a) Current Investments 0 0(b) Inventories 0 0(c) Trade Recievables 0 0(d) Cash & Bank Balance 9 3(e) Short-term Loans & Advances 143 144(f) Other Current Assets 0 0Total Current Assets (a+b+c+d+e+f) 152 147TOTAL ASSETS (1+2) 259 257Important Indicators(i) Investment 480 488(ii) Capital Employed -1461 -1393(iii) Net Worth -1461 -1401(iv) Net Current Assets -1545 -1503(v) Cost of Sales 513 510(vi) Net Value Added (at market price) -5 -8(vii) Total Regular Employees (Nos.) 23 54(viii) Avg. Monthly Emoluments per Employee(`) 13043 5864
PROFIT & LOSS ACCOUNT (` in Lakhs)PARTICULARS 2011-12 2010-11(I) Revenue from Operations (Gross) 0 0Less : Excise Duty 0 0Revenue from Operations (Net) 0 0(II) Other Income 0 0(III) Total Revenue (I+II) 0 0(IV) Expenditure on:(a) Cost of materials consumed 0 0(b) Purchase of stock-in-trade 0 0(c) Changes in inventories of finished goods, work-in- 0 0
and stock in trade progress(d) Stores & Spares 0 0(e) Power & Fuel 0 0(f) Salary, Wages & Benefits/Employees Expense 36 38(g) Other Operating/direct/manufacturing Expenses 0 0(h) Rent, Royalty & Cess 0 0(i) Loss on sale of Assets/Investments 0 0(j) Other Expenses 199 194Total Expenditure (IV (a to j)) 235 232(V) PROFIT BEFORE DEPRECIATION, & IMPAIRMENT, -235 -232
FINANCE CHARGES/INTEREST, EXCEPTIONAL &EXTRAORDINARY ITEMS & TAXES (PBDIEET)(III-IV)
(VI) Depreciation, Depletion & Amortisation 278 278(VII) Impairment 0 0(VIII) PROFIT BEFORE FINANCE COST/INTEREST, -513 -510
EXCEPTIONAL, EXTRA-ORDINARY ITEMS & TAXES(PBIEET)(V-VI-VII)
(IX) Finance Cost(a) On Central Government Loans 0 0(b) On Foreign Loans 0 0(c) Others 19 25(d) Less Finance Cost Capitalised 0 0(e) Charged to P & L Account (a+b+c+d) 19 25(X) PROFIT BEFORE EXCEPTIONAL & EXTRA-ORDINARY -532 -535ITEMS & TAX (PBEET)(VIII-IXe)(XI) Exceptional Items -472 -464(XII) PROFIT BEFORE EXTRA-ORDINARY ITEMS & TAX -60 -71
(PBET)(X-XI)(XIII) Extra-Ordinary Items 0 0(XIV) PROFIT BEFORE TAX (PBT)(XII-XIII) -60 -71(XV) TAX PROVISIONS 0 0(XVI) NET PROFIT / LOSS FOR THE PERIOD FROM -60 -71
CONTINUING OPERATIONS AFTER TAX(XIV-XV)(XVII) Profit/Loss from discontinuing operations 0 0(XVIII) Tax expenses of discontinuing operations 0 0(XIX) Profit/Loss from discontinuing operations (after Tax) 0 0
(XVII-XVIII)(XX) Profit/Loss for the period (XVI+XIX) -60 -71Financial Ratios(i) Sales : Capital Employed 0 0(ii) Cost of Sales : Sales 0 0(iii) Salary/Wages : Sales 0 0(iv) Net Profit : Net Worth - -(v) Debt : Equity 0 0.02(vi) Current Ratio 0.09 0.09(vii) Trade Recievables : Sales 0 0(viii) Total Inventory : Sales 0 0
2011-12 Provisional

Heavy Engineering184
Bharat Heavy Electrical Ltd.
The CompanyBharat Heavy Electrical Ltd. (BHEL) was incorporated on
13.11.1964 with the objective to have indigenous Heavy ElectricalEquipment industry in India. It is a Schedule-A / listed Navratna CPSEin Heavy Engineering sector under the administrative control of Ministryof Heavy Industries and Public Enterprises with 67.72% shareholdingby the Government of India. The Company employed 46748 regularemployees (Executives 13690 & Non-Executives 35700) as on31.03.2012. Its Registered and Corporate office are at New Delhi.Vision / Mission
The Vision of the Company is to be a global engineeringenterprise providing solutions for a better tomorrow. The Missionof the Company is providing sustainable business solutions in thefields of Energy, Industry & Infrastructure.Industrial / Business Operations
BHEL is an integrated power plant equipment manufacturerand one of the largest engineering and manufacturing companies inIndia in terms of turnover. The Company has realised the capabilityto deliver 20,000 MW power equipment capacity per annum enablingto address growing demand for power generation equipment..
BHEL is engaged in the design, engineering, manufacture,construction, testing, commissioning and servicing to core sectors ofthe economy viz., Power, Transmission, Industry, Transportation,Renewable Energy, Oil & Gas and Defence. The wide network ofBHEL's, 15 manufacturing divisions, 2 repair units, 4 regional offices,8 service centres, 8 overseas offices and 15 regional centres, 2subsidiaries and more than 150 Project Sites spread all over India andabroad enables the company to provide most suitable products.
The company has entered into seven joint ventures namely"BHEL GE Gas Turbine Services Ltd." with GEPM, Mauritius,"Power Plant Performance Improvement Ltd." with Siemens AG ofGermany, "NTPC BHEL Power Projects Pvt. Ltd." with NTPC,Udangudi Power Corporation Ltd. with Tamil Nadu Electricity Board,Raichur Power Corporation Ltd. with Karnataka Power CorporationLtd. and Dada Dhuniwale Khandwa Power Ltd. with Madhya PradeshPower Generating Company Ltd. and Latur Power Company Ltd.with Maharashtra Power Generation Company Ltd.Performance Highlights
BHEL's operations are organised around three business sectors,namely Power, Industry, Transmission, Transportation, Oil & Gas,Renewable Energy and International Operations. The product rangeof the company comprises of 180 products. The physicalperformance of the company during the period 2010-11 to 2011-12is mentioned below:
crore in 2010-11 to ̀ 49244.44 crore in 2011-12. Correspondingly,net profit of the company increased to ̀ 7039.96 crore, an increaseof ̀ 1028.76 crore over the previous year profit of ̀ 6011.20 crore.Increase in turnover has contributed to the better financialperformance during the year.
The current ratio of company is at 1.70:1 during 2011-12 asagainst 1.74:1 in the previous year (Fig.2). Balance Sheet and Profit& Loss Account of the company and selected financial ratios duringthe period 2010-11 to 2011-12 can be seen on the adjoining page.
Main Products Unit Performance during
2011-12 2010-11
Boiler, Valves and Boiler M T 1010679 891624Auxiliaries
Steam Turbine / M W 17417/ 16059/Generators 12939 11458
Power Transformers MVA 32745 26202
www.bhel.com
Fig. 1
Fig. 2
Total Revenue of the company registered an increase of` 5977.21 crore during 2011-12, which went up from ` 43267.23
EBIT
DA
& P
AT (
Rs.
cro
re)
TOTAL R
EVENU
E (Rs. crore)
PRO
FITA
BIL
ITY
RAT
IOS
(%)
CU
RR
ENT R
ATIO
Strategic IssuesStrategic Plan 2012-17, attempts to steer the company with
a vision of becoming a global engineering enterprise. It comprisesexpanding the offerings in the power sector by building EPCcapability, focus on industry businesses, expansion of spares &services and adoption of a collaborative approach. '6-Point agenda'viz. Capability Enhancement, Accelerated Project Execution,Product Cost Competitiveness & Quality, Diversification,Engineering & Technology and People Development are the drivingforce for the CPSE.

Public Enterprises Survey 2011-2012: Vol-II 185
\\server4\E\Public Enterprises\VOL 2\9 MANUFACTRUING HEAVY ENGINEERING
Bharat Heavy Electrical Ltd.BHEL House, Siri Fort, New Delhi-110 049
PROFIT & LOSS ACCOUNT (` in Lakhs)PARTICULARS 2011-12 2010-11(I) Revenue from Operations (Gross) 5026081 4401746Less : Excise Duty 228192 177087Revenue from Operations (Net) 4797889 4224659(II) Other Income 126555 102064(III) Total Revenue (I+II) 4924444 4326723(IV) Expenditure on:(a) Cost of materials consumed 2834396 2273921(b) Purchase of stock-in-trade 0 0(c) Changes in inventories of finished goods,work-in-progress and stock in trade -82320 -12735(d) Stores & Spares 56377 46986(e) Power & Fuel 51025 40286(f) Salary, Wages & Benefits/Employees Expense 546583 539671(g) Other Operating/direct/manufacturing Expenses 121301 112598(h) Rent, Royalty & Cess 17477 21322(i) Loss on sale of Assets/Investments 0 0(j) Other Expenses 264251 344245Total Expenditure (IV (a to j)) 3809090 3366294(V) PROFIT BEFORE DEPRECIATION, & IMPAIRMENT,FINANCE CHARGES/INTEREST, EXCEPTIONAL &EXTRAORDINARY ITEMS & TAXES (PBDIEET)(III-IV) 1115354 960429(VI) Depreciation, Depletion & Amortisation 80000 54412(VII) Impairment 0 0(VIII) PROFIT BEFORE FINANCE COST/INTEREST,EXCEPTIONAL, EXTRA-ORDINARY ITEMS &TAXES (PBIEET)(V-VI-VII) 1035354 906017(IX) Finance Cost(a) On Central Government Loans 0 139(b) On Foreign Loans 2078 0(c) Others 3050 5334(d) Less Finance Cost Capitalised 0 0(e) Charged to P & L Account (a+b+c+d) 5128 5473(X) PROFIT BEFORE EXCEPTIONAL & EXTRA-ORDINARYITEMS & TAX (PBEET)(VIII-IXe) 1030226 900544(XI) Exceptional Items 0 0(XII) PROFIT BEFORE EXTRA-ORDINARY ITEMS &TAX (PBET)(X-XI) 1030226 900544(XIII) Extra-Ordinary Items 0 0(XIV) PROFIT BEFORE TAX (PBT)(XII-XIII) 1030226 900544(XV) TAX PROVISIONS 326230 299424(XVI) NET PROFIT / LOSS FOR THE PERIOD FROMCONTINUING OPERATIONS AFTER TAX(XIV-XV) 703996 601120(XVII) Profit/Loss from discontinuing operations 0 0(XVIII) Tax expenses of discontinuing operations 0 0(XIX) Profit/Loss from discontinuing operations(after Tax)(XVII-XVIII) 0 0(XX) Profit/Loss for the period (XVI+XIX) 703996 601120Financial Ratios(i) Sales : Capital Employed 188.18 208.56(ii) Cost of Sales : Sales 81.06 80.97(iii) Salary/Wages : Sales 11.39 12.77(iv) Net Profit : Net Worth 27.75 29.83(v) Debt : Equity 0.25 0.21(vi) Current Ratio 1.7 1.74(vii) Trade Recievables : Sales 54.89 47.59(viii) Total Inventory : Sales 28.02 25.69
BALANCE SHEET (` in Lakhs)PARTICULARS 2011-12 2010-11I. EQUITY & LIABILITIESAUTHORISED CAPITAL 200000 200000(1) Shareholders’ Funds(a) Share Capital(i) Central Govt 33151 33151(ii) Others 15801 15801(b) Reserves & Surplus 2488369 1966432(c) Money received against share warrants 0 0Total Shareholders’ Funds (1(a)+1(b)+1(c) 2537321 2015384(2) Share application money pending allotment 0 0(3) Non-current Liabilities(a) Long Term Borrowings 12343 10214(b) Deferred tax liabilities (Net) 0 0(c) Other Long-term liabilities 755077 914240(d) Long-term provisions 500568 492323Total Non-Current Liabilities 3(a) to 3(d) 1267988 1416777(4) Current Liabilities(a) Short Term Borrowings 0 0(b) Trade Payables 1027131 809542(c) Other current liabilities 1581593 1416995(d) Short-term provisions 263569 267331Total Current Liabilities 4(a) to 4(d) 2872293 2493868TOTAL EQUITY & LIABILITIES (1+2+3+4) 6677602 5926029II. ASSETS(1) Non-Current Assets(a) Total Gross Fixed Assets 970664 804974(ai) Accumulated Depreciation, Depletion & Amortisation 540983 464882(aii) Accumulated Impairment 0 0(b) Total Net Fixed Assets ((a)-(ai)-(aii) 429681 340092(c) Capital work in progress 132463 172340(d) Intangible assets under developmet 2298 1036(e) Non-Current Investments 46167 43917(f) Deferred Tax Assets (Net) 154624 216355(g) Long Term Loans and Advances 90010 88291(h) Other Non-Current Assets 950865 736212Total Non-Current Assets (b+c+d+e+f+g+h) 1806108 1598243(2) Current Assets(a) Current Investments 0 0(b) Inventories 1344450 1085205(c) Trade Recievables 2633613 2010350(d) Cash & Bank Balance 667198 963015(e) Short-term Loans & Advances 211172 238253(f) Other Current Assets 15061 30963Total Current Assets (a+b+c+d+e+f) 4871494 4327786TOTAL ASSETS (1+2) 6677602 5926029Important Indicators(i) Investment 61295 59166(ii) Capital Employed 2549664 2025598(iii) Net Worth 2537321 2015384(iv) Net Current Assets 1999201 1833918(v) Cost of Sales 3889090 3420706(vi) Net Value Added (at market price) 1814366 1645228(vii) Total Regular Employees (Nos.) 49390 46748(viii) Avg. Monthly Emoluments per Employee(`) 92222 96202

Tourist Services522
Donyi Polo Ashok Hotel Ltd.
The CompanyDonyi Polo Ashok Hotel Ltd. (DPAHL) a joint venture of
India Tourism Development Corporation Limited (ITDC) andArunachal Pradesh Industrial Development and FinancialCorporation Limited (APIDFC) was incorporated on 10.08.1987with the objective to promote tourism and to have closercoordination between the center and the state efforts to dispersebenefits of tourism.
DPAHCL is an uncategorised CPSE in Tourist Services sectorunder the administrative control of M/o Tourism. DPAHL is asubsidiary of ITDC Ltd. which holds 51% share in its equity. Thecompany employed 27 regular employees (Executives 3, Non-executives 24) as on 31.3.2012. Its Registered and Corporate officesare at Itanagar, Arunachal Pradesh.
Vision/MissionThe Mission / Vision of the Company is to promote tourism.
Industrial / Business OperationsDPAHL is providing services in the field of hotel business,
boarding and lodging, through its single hotel (Hotel Donyi PoloAshok) at Itanagar, Arunachal Pradesh. The hotel has 18 rooms.
Performance HighlightsThe physical performances of the company for last two years
are given below:
The company registered an increase of ` 0.06 crore in totalrevenue during 2011-12 which went up to ` 2.10 crore in 2011-12from ̀ 2.04 crore during 2010-11 though there is fall in occupancyrate. The net profit of the company however decreased to ` 0.12crore, a decline of ` 0.07 crore from the previous year due toincrease in operating expenses.
The current ratio of company is at 3.54:1 during 2011-12 asagainst 3.04:1 in the previous year (Fig.2). Balance Sheet andProfit & Loss Account of the company and selected financial
www.theashokgroup.com
Main Services Unit Performance during
2011-12 2010-11
Room days sold % 48 56
EBIT
DA
& P
AT (
Rs.
cro
re)
TOTAL R
EVENU
E (Rs. crore)
Fig. 1PR
OFI
TAB
ILIT
Y R
ATIO
S (%
)
CU
RR
ENT R
ATIO
Fig. 2
ratios during the period 2010-11 to 2011-12 can be seen on theadjoining page.

Public Enterprises Survey 2011-2012: Vol-II 523
Donyi Polo Ashok Hotel Ltd.Hotel Donyi Polo Ashok, Sector-C, Itanagar, Papumpare distt., Arunachal Pradesh 791111
BALANCE SHEET (` in Lakhs)PARTICULARS 2011-12 2010-11I. EQUITY & LIABILITIESAUTHORISED CAPITAL 100 100(1) Shareholders’ Funds (a) Share Capital (i) Central Govt 0 0 (ii) Others 100 100 (b) Reserves & Surplus 108 96 (c) Money received against share warrants 0 0 Total Shareholders’ Funds (1(a)+1(b)+1(c) 208 196(2) Share application money pending allotment 0 0(3) Non-current Liabilities (a) Long Term Borrowings 0 0 (b) Deferred tax liabilities (Net) 4 5 (c) Other Long-term liabilities 0 0 (d) Long-term provisions 17 15 Total Non-Current Liabilities 3(a) to 3(d) 21 20(4) Current Liabilities (a) Short Term Borrowings 0 0 (b) Trade Payables 40 7 (c) Other current liabilities 14 35 (d) Short-term provisions 0 27 Total Current Liabilities 4(a) to 4(d) 54 69TOTAL EQUITY & LIABILITIES (1+2+3+4) 283 285II. ASSETS(1) Non-Current Assets (a) Total Gross Fixed Assets 180 155 (ai) Accumulated Depreciation, Depletion & Amortisation 88 80 (aii) Accumulated Impairment 0 0 (b) Total Net Fixed Assets ((a)-(ai)-(aii) 92 75 (c) Capital work in progress 0 0 (d) Intangible assets under developmet 0 0 (e) Non-Current Investments 0 0 (f) Deferred Tax Assets (Net) 0 0 (g) Long Term Loans and Advances 0 0 (h) Other Non-Current Assets 0 0 Total Non-Current Assets (b+c+d+e+f+g+h) 92 75(2) Current Assets (a) Current Investments 0 0 (b) Inventories 8 9 (c) Trade Recievables 59 43 (d) Cash & Bank Balance 99 125 (e) Short-term Loans & Advances 17 27 (f) Other Current Assets 8 6 Total Current Assets (a+b+c+d+e+f) 191 210TOTAL ASSETS (1+2) 283 285Important Indicators (i) Investment 100 100 (ii) Capital Employed 208 196 (iii) Net Worth 208 196 (iv) Net Current Assets 137 141 (v) Cost of Sales 205 178 (vi) Net Value Added (at market price) 123 129 (vii) Total Regular Employees (Nos.) 27 28(viii) Avg. Monthly Emoluments per Employee(`) 29630 26488
PROFIT & LOSS ACCOUNT (` in Lakhs)PARTICULARS 2011-12 2010-11(I) Revenue from Operations (Gross) 201 196 Less : Excise Duty 0 0 Revenue from Operations (Net) 201 196(II) Other Income 9 8(III) Total Revenue (I+II) 210 204(IV) Expenditure on: (a) Cost of materials consumed 43 38 (b) Purchase of stock-in-trade 0 0 (c) Changes in inventories of finished goods, 0 0
work-in-progress and stock in trade (d) Stores & Spares 0 0 (e) Power & Fuel 11 10 (f) Salary, Wages & Benefits/Employees Expense 96 89 (g) Other Operating/direct/manufacturing Expenses 30 16 (h) Rent, Royalty & Cess 1 1 (i) Loss on sale of Assets/Investments 0 0 (j) Other Expenses 17 20Total Expenditure (IV (a to j)) 198 174(V) PROFIT BEFORE DEPRECIATION, & IMPAIRMENT, 12 30
FINANCE CHARGES/INTEREST, EXCEPTIONAL &EXTRAORDINARY ITEMS & TAXES (PBDIEET)(III-IV)
(VI) Depreciation, Depletion & Amortisation 7 4(VII) Impairment 0 0(VIII) PROFIT BEFORE FINANCE COST/INTEREST, 5 26
EXCEPTIONAL, EXTRA-ORDINARY ITEMS &TAXES (PBIEET)(V-VI-VII)
(IX) Finance Cost (a) On Central Government Loans 0 0 (b) On Foreign Loans 0 0 (c) Others 0 0 (d) Less Finance Cost Capitalised 0 0 (e) Charged to P & L Account (a+b+c+d) 0 0(X) PROFIT BEFORE EXCEPTIONAL & EXTRA-ORDINARY 5 26
ITEMS & TAX (PBEET)(VIII-IXe)(XI) Exceptional Items 0 0(XII) PROFIT BEFORE EXTRA-ORDINARY ITEMS & 5 26
TAX (PBET)(X-XI)(XIII) Extra-Ordinary Items 0 0(XIV) PROFIT BEFORE TAX (PBT)(XII-XIII) 5 26(XV) TAX PROVISIONS -7 7(XVI) NET PROFIT / LOSS FOR THE PERIOD FROM 12 19
CONTINUING OPERATIONS AFTER TAX(XIV-XV)(XVII) Profit/Loss from discontinuing operations 0 0(XVIII) Tax expenses of discontinuing operations 0 0(XIX) Profit/Loss from discontinuing operations 0 0
(after Tax)(XVII-XVIII)(XX) Profit/Loss for the period (XVI+XIX) 12 19Financial Ratios (i) Sales : Capital Employed 96.63 100 (ii) Cost of Sales : Sales 101.99 90.82 (iii) Salary/Wages : Sales 47.76 45.41 (iv) Net Profit : Net Worth 5.77 9.69 (v) Debt : Equity 0 0 (vi) Current Ratio 3.54 3.04 (vii) Trade Recievables : Sales 29.35 21.94 (viii) Total Inventory : Sales 3.98 4.59

Tourist Services524
Hotel Corporation of India Ltd.
www.centaurhotels.com
The Company
Hotel Corporation of India Ltd. (HCI) was incorporated on08.07.1971 with the objective to carry on the business of Hotelsand Flight Catering Services. The company was incorporated as awholly owned subsidiary of Air India Ltd.
HCI is a Schedule-'C' CPSE in Tourist Services sector underthe administrative control of M/o Civil Aviation. The companyemployed 1279 regular employees (Executives 271& Non-Executives 1008) as on 31.3.2012. Its registered office is at Mumbai,Maharashtra and corporate office is at IGI Airport, New Delhi.
Industrial / Business Operations
HCI is engaged in providing services in the field of hotel andOn Board air catering through its 2 Hotels at Delhi (Centaur) andSrinagar (Centaur Lake view). The company is also running twoflight catering units at Delhi and Mumbai by the name of Chef-air.
Performance Highlights
The physical performances of the company for last two yearsare given below:
Main Product/Services Unit Performance during
2011-12 2010-11
Room occupancy ` in Crore 28.15 25.77
F&B ` in Crore 22.12 21.21
Other Services ` in Crore 2.79 2.65
Total Revenue of the company registered an increase of ̀ 4.17crore during 2011-12, which went up from ` 53.57 crore in2010-11 to ` 57.74 crore in 2011-12. The losses of the companyhas also gone down by ` 5.42 crore to ` 21.29 crore in 2011-12,from ` 26.71 crore in previous year due to reduction in operatingexpenses.
The current ratio of company is at 0.67:1 during 2011-12 asagainst 1.15:1 in the previous year. Balance Sheet and Profit &Loss Account of the company and selected financial ratios duringthe period 2010-11 to 2011-12 can be seen on the adjoining page.
Strategic issuesAs per the "in principle" sanction received from the M/o Civil
Aviation, the company is in the process of handing over the runningof its two Units i.e. Centaur Lake View Hotel, Srinagar and ChefairFlight Catering, Mumbai to professionals on Management Contract.
EBIT
DA
& P
AT (
Rs.
cro
re)
TOTAL R
EVENU
E (Rs. crore)
Fig. 1

Public Enterprises Survey 2011-2012: Vol-II 525
Hotel Corporation of India Ltd.1st Floor, Transport Annex Building, Air India Complex, Kalina, Santacruz (East), Mumbai-400029
BALANCE SHEET (` in Lakhs)PARTICULARS 2011-12 2010-11I. EQUITY & LIABILITIESAUTHORISED CAPITAL 4100 4100(1) Shareholders’ Funds (a) Share Capital (i) Central Govt 0 0 (ii) Others 4060 4060 (b) Reserves & Surplus -6555 -4426 (c) Money received against share warrants 0 0 Total Shareholders’ Funds (1(a)+1(b)+1(c) -2495 -366(2) Share application money pending allotment 0 0(3) Non-current Liabilities (a) Long Term Borrowings 4036 3022 (b) Deferred tax liabilities (Net) 0 0 (c) Other Long-term liabilities 42 414 (d) Long-term provisions 4607 4465 Total Non-Current Liabilities 3(a) to 3(d) 8685 7901(4) Current Liabilities (a) Short Term Borrowings 17 1637 (b) Trade Payables 933 567 (c) Other current liabilities 1387 959 (d) Short-term provisions 1021 432 Total Current Liabilities 4(a) to 4(d) 3358 3595TOTAL EQUITY & LIABILITIES (1+2+3+4) 9548 11130II. ASSETS(1) Non-Current Assets (a) Total Gross Fixed Assets 3393 3550 (ai) Accumulated Depreciation, Depletion & Amortisation 0 0 (aii) Accumulated Impairment 0 0 (b) Total Net Fixed Assets ((a)-(ai)-(aii) 3393 3550 (c) Capital work in progress 10 21 (d) Intangible assets under developmet 0 0 (e) Non-Current Investments 0 0 (f) Deferred Tax Assets (Net) 0 0 (g) Long Term Loans and Advances 3354 3158 (h) Other Non-Current Assets 545 281 Total Non-Current Assets (b+c+d+e+f+g+h) 7302 7010(2) Current Assets (a) Current Investments 0 0 (b) Inventories 222 216 (c) Trade Recievables 721 625 (d) Cash & Bank Balance 324 2237 (e) Short-term Loans & Advances 979 1042 (f) Other Current Assets 0 0 Total Current Assets (a+b+c+d+e+f) 2246 4120TOTAL ASSETS (1+2) 9548 11130Important Indicators (i) Investment 8096 7082 (ii) Capital Employed 1541 2656 (iii) Net Worth -2495 -366 (iv) Net Current Assets -1112 525 (v) Cost of Sales 7859 7985 (vi) Net Value Added (at market price) 3004 2681 (vii) Total Regular Employees (Nos.) 1279 1325(viii) Avg. Monthly Emoluments per Employee(`) 33157 33390
PROFIT & LOSS ACCOUNT (` in Lakhs)PARTICULARS 2011-12 2010-11(I) Revenue from Operations (Gross) 5492 5117 Less : Excise Duty 0 0 Revenue from Operations (Net) 5492 5117(II) Other Income 282 240(III) Total Revenue (I+II) 5774 5357(IV) Expenditure on: (a) Cost of materials consumed 904 788 (b) Purchase of stock-in-trade 0 0 (c) Changes in inventories of finished goods, 0 0
work-in-progress and stock in trade (d) Stores & Spares 0 0 (e) Power & Fuel 858 780 (f) Salary, Wages & Benefits/Employees Expense 5089 5309 (g) Other Operating/direct/manufacturing Expenses 204 187 (h) Rent, Royalty & Cess 0 0 (i) Loss on sale of Assets/Investments 0 0 (j) Other Expenses 607 724Total Expenditure (IV (a to j)) 7662 7788(V) PROFIT BEFORE DEPRECIATION, & IMPAIRMENT, -1888 -2431
FINANCE CHARGES/INTEREST, EXCEPTIONAL &EXTRAORDINARY ITEMS & TAXES (PBDIEET)(III-IV)
(VI) Depreciation, Depletion & Amortisation 197 197(VII) Impairment 0 0(VIII) PROFIT BEFORE FINANCE COST/INTEREST, -2085 -2628
EXCEPTIONAL, EXTRA-ORDINARY ITEMS & TAXES(PBIEET)(V-VI-VII)
(IX) Finance Cost (a) On Central Government Loans 0 0 (b) On Foreign Loans 0 0 (c) Others 44 43 (d) Less Finance Cost Capitalised 0 0 (e) Charged to P & L Account (a+b+c+d) 44 43(X) PROFIT BEFORE EXCEPTIONAL & EXTRA-ORDINARY -2129 -2671
ITEMS & TAX (PBEET)(VIII-IXe)(XI) Exceptional Items 0 0(XII) PROFIT BEFORE EXTRA-ORDINARY ITEMS & TAX -2129 -2671
(PBET)(X-XI)(XIII) Extra-Ordinary Items 0 0(XIV) PROFIT BEFORE TAX (PBT)(XII-XIII) -2129 -2671(XV) TAX PROVISIONS 0 0(XVI) NET PROFIT / LOSS FOR THE PERIOD FROM -2129 -2671
CONTINUING OPERATIONS AFTER TAX(XIV-XV)(XVII) Profit/Loss from discontinuing operations 0 0(XVIII) Tax expenses of discontinuing operations 0 0(XIX) Profit/Loss from discontinuing operations (after Tax) 0 0
(XVII-XVIII)(XX) Profit/Loss for the period (XVI+XIX) -2129 -2671Financial Ratios (i) Sales : Capital Employed 356.39 192.66 (ii) Cost of Sales : Sales 143.1 156.05 (iii) Salary/Wages : Sales 92.66 103.75 (iv) Net Profit : Net Worth - - (v) Debt : Equity 0.99 0.74 (vi) Current Ratio 0.67 1.15 (vii) Trade Recievables : Sales 13.13 12.21 (viii) Total Inventory : Sales 4.04 4.22
2011-12 Provisional

Tourist Services528
India Tourism Development Corporation Ltd.
www.theashokgroup.com
The CompanyIndia Tourism Development Corporation Ltd. (ITDC) was
incorporated in 1966 with the objective of developing and expandingtourism infrastructure in the country and thereby promoting Indiaas a tourist destination.
ITDC is a Schedule - 'B' listed Mini-ratna CPSE in TouristServices sector, under the administrative control of Ministry ofTourism with 92.11% shareholding by the Government of India.The company employed 2032 regular employees (Executives 340,Non-executives 1692) as on 31.3.2012. Its Registered and CorporateOffices are in New Delhi.
Vision / MissionThe Vision / Mission of the Company is to provide leadership
and play a catalytic role in the development of tourism infrastructurein the country and to achieve excellence in its strategic businessunits through professionalism, transparency, value for money basedand customer-focused services.
Industrial / Business OperationsITDC is engaged in providing tourism related facilities like
hotels, catering units, transport, duty free shopping, entertainment,production of tourist publicity literature, consultancy and executionof tourism and engineering projects, training consultancy inhospitality sector, event management and execution of Son-et-Lumeire (SEL) Shows etc.
The present network of ITDC consists of eight Ashok Groupof Hotels, six Joint Venture Hotels, one Restaurant, eleven TransportUnits, one Tourist Service Station, five Duty Free Shops at airports/seaports, two Sound & Light Shows and three catering outlets.Besides, ITDC is also managing a Hotel at Bharatpur and a TouristComplex at Kosi.
It has seven subsidiaries namely Assam Ashok Hotel,Guwahati; Donyi Polo Ashok Hotel, Itanagar; Ranchi Ashok BiharHotel, Ranchi; Utkal Ashok Hotel, Puri; Pondicherry Ashok Hotel,Pondicherry; M.P. Ashok Hotel, Bhopal and Punjab Ashok HotelCompany (the company is yet to commence business) withshareholding of 51% in each of them except in Utkal Ashok Hotelwhere shareholding is 98%. The two JV s are ITDC Aldeasa IndiaPrivate Ltd., ITDC Showtime Consortium (Partnership Firm).
Performance HighlightsThe Company registered an increase of ` 30.70 crore in total
income during 2011-12 which went up to ` 423.06 crore in2011-12 from ` 392.36 crore during 2010-11. The net profit of thecompany was ` 8.54 crore, a growth of ` 17.13 crore from theprevious year loss of ` 8.59 crore due to increase in turnover andcost control.
The current ratio of company is at 2.11:1 during 2011-12 asagainst 1.95:1 in the previous year (Fig.2). Balance Sheet and Profit& Loss Account of the company and selected financial ratios duringthe period 2010-11 to 2011-12 can be seen on the adjoining page.
Strategic IssuesWhile functioning on commercial lines, ITDC also promotes
role by way of opening of new areas/ destinations including remoteand backward regions where private sector was initially shy toenter. Company also evolves JV schemes for undertaking tourismprojects by forming new companies in collaboration with stategovernment / corporation in each state with equity participation.
EBIT
DA
& P
AT (
Rs.
cro
re)
TOTAL R
EVENU
E (Rs. crore)
Fig. 1
PRO
FITA
BIL
ITY
RAT
IOS
(%)
CU
RR
ENT R
ATIO
Fig. 2

Public Enterprises Survey 2011-2012: Vol-II 529
India Tourism Development Corporation Ltd.7, Scope Complex Lodi Road, New Delhi 110003 Delhi
BALANCE SHEET (` in Lakhs)PARTICULARS 2011-12 2010-11I. EQUITY & LIABILITIESAUTHORISED CAPITAL 15000 15000(1) Shareholders’ Funds (a) Share Capital (i) Central Govt 7900 7900 (ii) Others 677 677 (b) Reserves & Surplus 22309 21954 (c) Money received against share warrants 0 0 Total Shareholders’ Funds (1(a)+1(b)+1(c) 30886 30531(2) Share application money pending allotment 0 0(3) Non-current Liabilities (a) Long Term Borrowings 0 0 (b) Deferred tax liabilities (Net) 0 0 (c) Other Long-term liabilities 451 548 (d) Long-term provisions 4367 3391 Total Non-Current Liabilities 3(a) to 3(d) 4818 3939(4) Current Liabilities (a) Short Term Borrowings 0 0 (b) Trade Payables 6095 6476 (c) Other current liabilities 14436 16360 (d) Short-term provisions 2464 1076 Total Current Liabilities 4(a) to 4(d) 22995 23912TOTAL EQUITY & LIABILITIES (1+2+3+4) 58699 58382II. ASSETS(1) Non-Current Assets (a) Total Gross Fixed Assets 14376 12822 (ai) Accumulated Depreciation, Depletion & Amortisation 8237 7725 (aii) Accumulated Impairment 0 0 (b) Total Net Fixed Assets ((a)-(ai)-(aii) 6139 5097 (c) Capital work in progress 312 2190 (d) Intangible assets under developmet 0 0 (e) Non-Current Investments 814 814 (f) Deferred Tax Assets (Net) 2571 3319 (g) Long Term Loans and Advances 299 303 (h) Other Non-Current Assets 39 0 Total Non-Current Assets (b+c+d+e+f+g+h) 10174 11723(2) Current Assets (a) Current Investments 0 0 (b) Inventories 1125 1151 (c) Trade Recievables 11472 9488 (d) Cash & Bank Balance 25819 26984 (e) Short-term Loans & Advances 8238 6778 (f) Other Current Assets 1871 2258 Total Current Assets (a+b+c+d+e+f) 48525 46659TOTAL ASSETS (1+2) 58699 58382Important Indicators (i) Investment 8577 8577 (ii) Capital Employed 30886 30531 (iii) Net Worth 30886 30531 (iv) Net Current Assets 25530 22747 (v) Cost of Sales 40426 40499 (vi) Net Value Added (at market price) 20370 16575 (vii) Total Regular Employees (Nos.) 2032 2178(viii) Avg. Monthly Emoluments per Employee(`) 56603 54327
PROFIT & LOSS ACCOUNT (` in Lakhs)PARTICULARS 2011-12 2010-11(I) Revenue from Operations (Gross) 39763 37031 Less : Excise Duty 0 0 Revenue from Operations (Net) 39763 37031(II) Other Income 2543 2205(III) Total Revenue (I+II) 42306 39236(IV) Expenditure on: (a) Cost of materials consumed 4063 4010 (b) Purchase of stock-in-trade 1528 1327 (c) Changes in inventories of finished goods, -25 61
work-in-progress and stock in trade (d) Stores & Spares 0 0 (e) Power & Fuel 2570 2123 (f) Salary, Wages & Benefits/Employees Expense 13802 14199 (g) Other Operating/direct/manufacturing Expenses 14389 14574 (h) Rent, Royalty & Cess 1476 970 (i) Loss on sale of Assets/Investments 5 2 (j) Other Expenses 2070 2675Total Expenditure (IV (a to j)) 39878 39941(V) PROFIT BEFORE DEPRECIATION, & IMPAIRMENT, 2428 -705
FINANCE CHARGES/INTEREST, EXCEPTIONAL &EXTRAORDINARY ITEMS & TAXES (PBDIEET)(III-IV)
(VI) Depreciation, Depletion & Amortisation 553 560(VII) Impairment 0 0(VIII) PROFIT BEFORE FINANCE COST/INTEREST, 1875 -1265
EXCEPTIONAL, EXTRA-ORDINARY ITEMS & TAXES(PBIEET)(V-VI-VII)
(IX) Finance Cost (a) On Central Government Loans 0 0 (b) On Foreign Loans 0 0 (c) Others 2 0 (d) Less Finance Cost Capitalised 0 0 (e) Charged to P & L Account (a+b+c+d) 2 0(X) PROFIT BEFORE EXCEPTIONAL & EXTRA-ORDINARY 1873 -1265
ITEMS & TAX (PBEET)(VIII-IXe)(XI) Exceptional Items -329 -92(XII) PROFIT BEFORE EXTRA-ORDINARY ITEMS & TAX 2202 -1173
(PBET)(X-XI)(XIII) Extra-Ordinary Items 0 0(XIV) PROFIT BEFORE TAX (PBT)(XII-XIII) 2202 -1173(XV) TAX PROVISIONS 1348 -314(XVI) NET PROFIT / LOSS FOR THE PERIOD FROM 854 -859
CONTINUING OPERATIONS AFTER TAX(XIV-XV)(XVII) Profit/Loss from discontinuing operations 0 0(XVIII) Tax expenses of discontinuing operations 0 0(XIX) Profit/Loss from discontinuing operations (after Tax) 0 0
(XVII-XVIII)(XX) Profit/Loss for the period (XVI+XIX) 854 -859Financial Ratios (i) Sales : Capital Employed 128.74 121.29 (ii) Cost of Sales : Sales 101.67 109.37 (iii) Salary/Wages : Sales 34.71 38.34 (iv) Net Profit : Net Worth 2.77 -2.81 (v) Debt : Equity 0 0 (vi) Current Ratio 2.11 1.95 (vii) Trade Recievables : Sales 28.85 25.62 (viii) Total Inventory : Sales 2.83 3.11

Tourist Services530
M.P. Ashok Hotel Corporation Ltd.
The CompanyM.P. Ashok Hotel Corporation Ltd. (MAHCL) was created in
the year 1981 by India Tourism Development Corporation Ltd. incollaboration with the Madhya Pradesh State Tourism DevelopmentCorporation and the work for the Hotel Lake View Ashok commencedon August 12, 1981. The objective behind the creation of thecorporation was in line with the objectives of both the ITDC as wellas MPSTDC to develop and expand tourism infrastructure and toplay a promotional role in tourism by opening new destinations &providing class services to the guests/tourists along with earningrevenue for the share-holders.
MAHCL is an uncategorised CPSE in Tourist Services sectorunder the administrative control of the M/o Tourism. MAHCL is asubsidiary of ITDC Ltd. which holds 51% of its equity. TheCompany employed 58 regular employees (Executives 9, Non-executives 49) as on 31.03.2012. Its Registered and Corporate officeare at Bhopal, Madhya Pradesh.
Vision/MissionThe Vision of the Company is to make the hotel Lake View
Ashok comparable to excellence with the best in Bhopal, to providethe best to the esteemed guests setting benchmark for others in thecity, to strive for excellence in all commercial activities and createextraordinary value for the stakeholders.
The Mission of the Company is to achieve excellence as abusiness entity through professionalism, efficiency and innovationby providing customer-oriented services
Industrial / Business OperationsThe company owned single entity - Hotel Lake View Ashok, is
operating with 43 Guest rooms including 39 standard deluxe roomsand 4 Deluxe suites along with three company owned restaurant & onebar as well as another specialty theme restaurant - Shan-e-Bhopaloperating within the hotel. The hotel has also been utilizing its sprawlinglawns for organizing various events as well as large banquets.
Performance HighlightsTotal Revenue of the company increased to ` 6.23 crore in
2011-12 from ` 5.67 crore during 2010-11 showing an increase of` 0.56 crore The net profit of the company also increased to ` 0.56crore, an increase of ` 0.24 crore over the previous year profit of `0.32 crore due to increase in turnover.
The current ratio of company is at 0.68:1 during 2011-12 asagainst 0.54:1 in the previous year. Balance Sheet and Profit & LossAccount of the company and selected financial ratios during theperiod 2010-11 to 2011-12 can be seen on the adjoining page.
www.lakeviewashok.com
Strategic IssuesThe company plans to consolidate and strengthen its core
activities and to play diversified role in providing various tourism-related services, opening newer avenues for the corporation to earnmoney and accretion. The corporate plan shall serve as a guidingdocument for developing strategic and operational plan.
The hotel construction started way back in the year 1981 andthe operations commenced in the year 1989. Since the inception ofthe hotel no renovation was carried out till 2003-2004. Since 2004-05 the hotel has renovated its restaurants, revamped the guestrooms and face-lifted the public areas for providing better servicesto the guests. The renovation plans are still going on.
The highlights of the strategy for coming year will beIntroduction of customer-specific services (tailor-made) - flexiblespecial package deals for marriage parties, event-firms, film units,special student groups, flexible pricing etc.
EBIT
DA
& P
AT (
Rs.
cro
re)
TOTAL R
EVENU
E (Rs. crore)
Fig. 1
2010-11 2011-12

Public Enterprises Survey 2011-2012: Vol-II 531
M.P. Ashok Hotel Corporation Ltd.Paryatan Bhavan, Bhadhada Road, Bhopal M.P. – 462 003
BALANCE SHEET (` in Lakhs)PARTICULARS 2011-12 2010-11I. EQUITY & LIABILITIESAUTHORISED CAPITAL 160 160(1) Shareholders’ Funds(a) Share Capital(i) Central Govt 0 0(ii) Others 160 160(b) Reserves & Surplus -228 -287(c) Money received against share warrants 0 0Total Shareholders’ Funds (1(a)+1(b)+1(c) -68 -127(2) Share application money pending allotment 0 0(3) Non-current Liabilities(a) Long Term Borrowings 0 0(b) Deferred tax liabilities (Net) 30 32(c) Other Long-term liabilities 0 0(d) Long-term provisions 89 76Total Non-Current Liabilities 3(a) to 3(d) 119 108(4) Current Liabilities(a) Short Term Borrowings 0 0(b) Trade Payables 7 10(c) Other current liabilities 577 541(d) Short-term provisions 78 41Total Current Liabilities 4(a) to 4(d) 662 592TOTAL EQUITY & LIABILITIES (1+2+3+4) 713 573II. ASSETS(1) Non-Current Assets(a) Total Gross Fixed Assets 533 518(ai) Accumulated Depreciation, Depletion & Amortisation 290 276(aii) Accumulated Impairment 0 0(b) Total Net Fixed Assets ((a)-(ai)-(aii) 243 242(c) Capital work in progress 0 0(d) Intangible assets under developmet 0 0(e) Non-Current Investments 0 0(f) Deferred Tax Assets (Net) 0 0(g) Long Term Loans and Advances 12 6(h) Other Non-Current Assets 11 8Total Non-Current Assets (b+c+d+e+f+g+h) 266 256(2) Current Assets(a) Current Investments 0 0(b) Inventories 9 8(c) Trade Recievables 60 69(d) Cash & Bank Balance 238 167(e) Short-term Loans & Advances 80 27(f) Other Current Assets 60 46Total Current Assets (a+b+c+d+e+f) 447 317TOTAL ASSETS (1+2) 713 573Important Indicators(i) Investment 160 160(ii) Capital Employed -68 -127(iii) Net Worth -68 -127(iv) Net Current Assets -215 -275(v) Cost of Sales 541 474(vi) Net Value Added (at market price) 391 362(vii) Total Regular Employees (Nos.) 58 57(viii) Avg. Monthly Emoluments per Employee(`) 42385 32749
PROFIT & LOSS ACCOUNT (` in Lakhs)PARTICULARS 2011-12 2010-11(I) Revenue from Operations (Gross) 623 567Less : Excise Duty 0 0Revenue from Operations (Net) 623 567(II) Other Income 15 9(III) Total Revenue (I+II) 638 576(IV) Expenditure on:(a) Cost of materials consumed 63 51(b) Purchase of stock-in-trade 0 0(c) Changes in inventories of finished goods, work-in- 0 0
progress and stock in trade(d) Stores & Spares 0 0(e) Power & Fuel 50 54(f) Salary, Wages & Benefits/Employees Expense 295 224(g) Other Operating/direct/manufacturing Expenses 16 35(h) Rent, Royalty & Cess 0 0(i) Loss on sale of Assets/Investments 0 0(j) Other Expenses 103 97Total Expenditure (IV (a to j)) 527 461(V) PROFIT BEFORE DEPRECIATION, & IMPAIRMENT, 111 115
FINANCE CHARGES/INTEREST, EXCEPTIONAL &EXTRAORDINARY ITEMS & TAXES (PBDIEET)(III-IV)
(VI) Depreciation, Depletion & Amortisation 14 13(VII) Impairment 0 0(VIII) PROFIT BEFORE FINANCE COST/INTEREST, 97 102
EXCEPTIONAL, EXTRA-ORDINARY ITEMS & TAXES(PBIEET)(V-VI-VII)
(IX) Finance Cost(a) On Central Government Loans 0 0(b) On Foreign Loans 0 0(c) Others 0 7(d) Less Finance Cost Capitalised 0 0(e) Charged to P & L Account (a+b+c+d) 0 7(X) PROFIT BEFORE EXCEPTIONAL & EXTRA-ORDINARY 97 95
ITEMS & TAX (PBEET)(VIII-IXe)(XI) Exceptional Items 2 -11(XII) PROFIT BEFORE EXTRA-ORDINARY ITEMS & TAX 95 106
(PBET)(X-XI)(XIII) Extra-Ordinary Items 0 0(XIV) PROFIT BEFORE TAX (PBT)(XII-XIII) 95 106(XV) TAX PROVISIONS 37 74(XVI) NET PROFIT / LOSS FOR THE PERIOD FROM 58 32
CONTINUING OPERATIONS AFTER TAX(XIV-XV)(XVII) Profit/Loss from discontinuing operations 0 0(XVIII) Tax expenses of discontinuing operations 0 0(XIX) Profit/Loss from discontinuing operations (after Tax) 0 0
(XVII-XVIII)(XX) Profit/Loss for the period (XVI+XIX) 58 32Financial Ratios(i) Sales : Capital Employed -916.18 -446.46(ii) Cost of Sales : Sales 86.84 83.6(iii) Salary/Wages : Sales 47.35 39.51(iv) Net Profit : Net Worth - -(v) Debt : Equity 0 0(vi) Current Ratio 0.68 0.54(vii) Trade Recievables : Sales 9.63 12.17(viii) Total Inventory : Sales 1.44 1.41

Tourist Services532
Pondicherry Ashok Hotel Corporation Limited
The CompanyPondicherry Ashok Hotel Corporation Limited (PAHCL) was
incorporated on 16.6.1986 with the objective to promote and developtourism in Pondicherry (now known as Puducherry). It is a JointVenture Company of ITDC, a Central Public Sector Enterprises(CPSE) and PIPDIC (Pondicherry Industrial PromotionDevelopment and Investment Corporation Ltd) an undertaking ofGovt. of Puducherry. Further to these objectives a Beach resortHotel in the name of Hotel Pondicherry Ashok in the UnionTerritories of Puducherry was constructed, which commenced itsbusiness on 06.02.1989
PAHCL is an uncategorised CPSE in Tourist Services sectorunder the administrative control of M/o Tourism with its Registeredand Corporate offices at Union Territory of Puducherry. PAHCL isa subsidiary joint venture of ITDC Ltd. where in ITDC holds 51%equity and PIPDIC holds 49% shares. The company employed35 regular employees (Executives 21, Non-executives 14) as on31.3.2012. The registered office of the Company is situated atPuducherry.
Industrial / Business OperationsThe Hotel Pondicherry Ashok was commissioned with 20
rooms. Now there are 25 rooms including cottages. Its income is fromproviding accommodation as well as provision of food and beverage.
Performance HighlightsThe Company registered an reduction of ` 0.53 crore in total
revenue during 2011-12 which declined to ` 1.86 crore in 2011-12from ` 2.39 crore during 2010-11. The net loss of the companyincreased to ` 0.40 crore in 2011-12, an increase of ` 0.30 croreover the previous year loss of ` 0.10 crore due to fall in operatingincome.
The current ratio of company is at 0.50:1 during 2011-12 asagainst 0.94:1 in the previous year (Fig.2). Balance Sheet andProfit & Loss Account of the company and selected financialratios during the period 2010-11 to 2011-12 can be seen on theadjoining page.
www.ashokresort.com
EBIT
DA
& P
AT (
Rs.
cro
re)
TOTAL R
EVENU
E (Rs. crore)
Fig. 1
PRO
FITA
BIL
ITY
RAT
IOS
(%)
CU
RR
ENT R
ATIO
Fig. 2

Public Enterprises Survey 2011-2012: Vol-II 533
Pondicherry Ashok Hotel Corporation LimitedHotel Pondicherry Ashok, East Coast Road Kalapet Beach, Puducherry-605014
BALANCE SHEET (` in Lakhs)PARTICULARS 2011-12 2010-11I. EQUITY & LIABILITIESAUTHORISED CAPITAL 60 60(1) Shareholders’ Funds(a) Share Capital(i) Central Govt 0 0(ii) Others 60 60(b) Reserves & Surplus 43 81(c) Money received against share warrants 0 0Total Shareholders’ Funds (1(a)+1(b)+1(c) 103 141(2) Share application money pending allotment 0 0(3) Non-current Liabilities(a) Long Term Borrowings 0 0(b) Deferred tax liabilities (Net) 2 4(c) Other Long-term liabilities 0 0(d) Long-term provisions 30 30Total Non-Current Liabilities 3(a) to 3(d) 32 34(4) Current Liabilities(a) Short Term Borrowings 105 96(b) Trade Payables 2 0(c) Other current liabilities 0 0(d) Short-term provisions 39 31Total Current Liabilities 4(a) to 4(d) 146 127TOTAL EQUITY & LIABILITIES (1+2+3+4) 281 302II. ASSETS(1) Non-Current Assets(a) Total Gross Fixed Assets 317 281(ai) Accumulated Depreciation, Depletion & Amortisation 109 98(aii) Accumulated Impairment 0 0(b) Total Net Fixed Assets ((a)-(ai)-(aii) 208 183(c) Capital work in progress 0 0(d) Intangible assets under developmet 0 0(e) Non-Current Investments 0 0(f) Deferred Tax Assets (Net) 0 0(g) Long Term Loans and Advances 0 0(h) Other Non-Current Assets 0 0Total Non-Current Assets (b+c+d+e+f+g+h) 208 183(2) Current Assets(a) Current Investments 0 0(b) Inventories 6 6(c) Trade Recievables 8 7(d) Cash & Bank Balance 43 86(e) Short-term Loans & Advances 13 18(f) Other Current Assets 3 2Total Current Assets (a+b+c+d+e+f) 73 119TOTAL ASSETS (1+2) 281 302Important Indicators(i) Investment 60 60(ii) Capital Employed 103 141(iii) Net Worth 103 141(iv) Net Current Assets -73 -8(v) Cost of Sales 223 235(vi) Net Value Added (at market price) 70 114(vii) Total Regular Employees (Nos.) 35 36(viii) Avg. Monthly Emoluments per Employee(`) 25952 25694
PROFIT & LOSS ACCOUNT (` in Lakhs)PARTICULARS 2011-12 2010-11(I) Revenue from Operations (Gross) 178 235Less : Excise Duty 0 0Revenue from Operations (Net) 178 235(II) Other Income 8 4(III) Total Revenue (I+II) 186 239(IV) Expenditure on:(a) Cost of materials consumed 30 33(b) Purchase of stock-in-trade 0 0(c) Changes in inventories of finished goods, work-in- 0 0
progress and stock in trade(d) Stores & Spares 0 0(e) Power & Fuel 12 10(f) Salary, Wages & Benefits/Employees Expense 109 111(g) Other Operating/direct/manufacturing Expenses 26 24(h) Rent, Royalty & Cess 0 0(i) Loss on sale of Assets/Investments 2 1(j) Other Expenses 32 45Total Expenditure (IV (a to j)) 211 224(V) PROFIT BEFORE DEPRECIATION, & IMPAIRMENT, 25 15
FINANCE CHARGES/INTEREST, EXCEPTIONAL &EXTRAORDINARY ITEMS & TAXES (PBDIEET)(III-IV) -
(VI) Depreciation, Depletion & Amortisation 14 12(VII) Impairment 0 0(VIII) PROFIT BEFORE FINANCE COST/INTEREST, -39 3
EXCEPTIONAL, EXTRA-ORDINARY ITEMS & TAXES(PBIEET)(V-VI-VII)
(IX) Finance Cost(a) On Central Government Loans 0 0(b) On Foreign Loans 0 0(c) Others 0 0(d) Less Finance Cost Capitalised 0 0(e) Charged to P & L Account (a+b+c+d) 0 0(X) PROFIT BEFORE EXCEPTIONAL & EXTRA-ORDINARY -39 3
ITEMS & TAX (PBEET)(VIII-IXe)(XI) Exceptional Items 0 0(XII) PROFIT BEFORE EXTRA-ORDINARY ITEMS & TAX -39 3
(PBET)(X-XI)(XIII) Extra-Ordinary Items 0 0(XIV) PROFIT BEFORE TAX (PBT)(XII-XIII) -39 3(XV) TAX PROVISIONS -1 -3(XVI) NET PROFIT / LOSS FOR THE PERIOD FROM -38 6
CONTINUING OPERATIONS AFTER TAX(XIV-XV)(XVII) Profit/Loss from discontinuing operations 0 0(XVIII) Tax expenses of discontinuing operations 0 0(XIX) Profit/Loss from discontinuing operations (after Tax) 0 0
(XVII-XVIII)(XX) Profit/Loss for the period (XVI+XIX) -38 6Financial Ratios(i) Sales : Capital Employed 172.82 166.67(ii) Cost of Sales : Sales 125.28 100(iii) Salary/Wages : Sales 61.24 47.23(iv) Net Profit : Net Worth -36.89 4.26(v) Debt : Equity 0 0(vi) Current Ratio 0.50 0.94(vii) Trade Recievables : Sales 4.49 2.98(viii) Total Inventory : Sales 3.37 2.55

Tourist Services534
Ranchi Ashok Bihar Hotel Corporation Ltd.
The CompanyRanchi Ashok Bihar Hotel Corporation Ltd. (RABHCL) was
incorporated on 23.07.1983 with the objective to promote tourismparticularly in the state of Bihar.
RABHCL is a joint venture of ITDC Ltd. and Bihar StateTourism Development Corp. Ltd. It is an uncategorized CPSE inTourist Services sector under the administrative control of M/oTourism. The company employed 46 regular employees (Executives22, Non-Executives 24) as on 31.3.2012. Its registered office is atPatna (Bihar) and corporate office is at Ranchi, Jharkhand. RABHCLis a subsidiary of ITDC Ltd. which holds 51% of its equity.
Vision / MissionThe Vision of the Company is to provide leadership and play
a catalytic role in the development of tourism infrastructure in thestate of Jharkhand and to achieve excellence through professionalism,efficiency, value for money and customer- oriented service.
The Mission of the Company is that of installation of propertymanagement system.
Industrial / Business OperationsRABHCL is engaged in providing services in the field of
management of operation of Hotel through its 30 Rooms Hotel(Hotel Ranchi Ashok, Vivekananda Lane, Doranda, Jharkhand) atRanchi, Jharkhand.
Performance HighlightsThe physical performances of the company for last two years
are given below:
www.hotelranchiashok.com
Total Revenue of the company registered a reduction of` 0.22 crore during 2011-12, which went down from ̀ 2.50 crore in2010-11 to ` 2.28 crore in 2011-12 due to lower turnover ascompared to last year. The net loss of the company however wentdown to ` 0.58 crore in 2011-12, as against the previous year lossof ` 0.94 crore due to reduction in operating expenses.
The current ratio of company is at 0.58:1 during 2011-12 asagainst 0.72:1 in the previous year. Balance Sheet and Profit & LossAccount of the company and selected financial ratios during theperiod 2010-11 to 2011-12 can be seen on the adjoining page.
Main Service Unit Performance during
2011-12 2010-11
Room Occupancy % 34 35
EBIT
DA
& P
AT (
Rs.
cro
re)
TOTAL R
EVENU
E (Rs. crore)
Fig. 1
Strategic IssuesAfter the formation of Jaharkhand State, the importance of
capital city of Ranchi has increased and company is focusing itsefforts in this direction to grab major share of business. The hotelhas become very old as such up gradation of property is required tocope with competition. The multiple tax levied by Central as wellas State Government affects the business.

Public Enterprises Survey 2011-2012: Vol-II 535
Ranchi Ashok Bihar Hotel Corporation Ltd.Bihar State Tourism Development Corporation Ltd. Beerchand Patel Path, Patna, Bihar-800001
BALANCE SHEET (` in Lakhs)PARTICULARS 2011-12 2010-11I. EQUITY & LIABILITIESAUTHORISED CAPITAL 100 100(1) Shareholders’ Funds(a) Share Capital(i) Central Govt 0 0(ii) Others 72 72(b) Reserves & Surplus -305 -246(c) Money received against share warrants 0 0Total Shareholders’ Funds (1(a)+1(b)+1(c) -233 -174(2) Share application money pending allotment 0 0(3) Non-current Liabilities(a) Long Term Borrowings 196 196(b) Deferred tax liabilities (Net) 0 0(c) Other Long-term liabilities 0 0(d) Long-term provisions 36 19Total Non-Current Liabilities 3(a) to 3(d) 232 215(4) Current Liabilities(a) Short Term Borrowings 0 0(b) Trade Payables 13 7(c) Other current liabilities 207 188(d) Short-term provisions 0 0Total Current Liabilities 4(a) to 4(d) 220 195TOTAL EQUITY & LIABILITIES (1+2+3+4) 219 236II. ASSETS(1) Non-Current Assets(a) Total Gross Fixed Assets 251 250(ai) Accumulated Depreciation, Depletion & Amortisation 165 159(aii) Accumulated Impairment 0 0(b) Total Net Fixed Assets ((a)-(ai)-(aii) 86 91(c) Capital work in progress 0 0(d) Intangible assets under developmet 0 0(e) Non-Current Investments 0 0(f) Deferred Tax Assets (Net) 0 0(g) Long Term Loans and Advances 5 5(h) Other Non-Current Assets 0 0Total Non-Current Assets (b+c+d+e+f+g+h) 91 96(2) Current Assets(a) Current Investments 0 0(b) Inventories 7 6(c) Trade Recievables 26 24(d) Cash & Bank Balance 81 91(e) Short-term Loans & Advances 14 16(f) Other Current Assets 0 3Total Current Assets (a+b+c+d+e+f) 128 140TOTAL ASSETS (1+2) 219 236Important Indicators(i) Investment 268 268(ii) Capital Employed -37 22(iii) Net Worth -233 -174(iv) Net Current Assets -92 -55(v) Cost of Sales 285 304(vi) Net Value Added (at market price) 157 158(vii) Total Regular Employees (Nos.) 46 45(viii) Avg. Monthly Emoluments per Employee(`) 32246 33704
PROFIT & LOSS ACCOUNT (` in Lakhs)PARTICULARS 2011-12 2010-11(I) Revenue from Operations (Gross) 204 234Less : Excise Duty 0 0Revenue from Operations (Net) 204 234(II) Other Income 24 16(III) Total Revenue (I+II) 228 250(IV) Expenditure on:(a) Cost of materials consumed 30 39(b) Purchase of stock-in-trade 0 0(c) Changes in inventories of finished goods, work-in- 0 0
progress and stock in trade(d) Stores & Spares 0 0(e) Power & Fuel 28 30(f) Salary, Wages & Benefits/Employees Expense 178 182(g) Other Operating/direct/manufacturing Expenses 11 12(h) Rent, Royalty & Cess 0 0(i) Loss on sale of Assets/Investments 0 0(j) Other Expenses 32 36Total Expenditure (IV (a to j)) 279 299(V) PROFIT BEFORE DEPRECIATION, & IMPAIRMENT, 51 -49
FINANCE CHARGES/INTEREST, EXCEPTIONAL &EXTRAORDINARY ITEMS & TAXES (PBDIEET)(III-IV) -
(VI) Depreciation, Depletion & Amortisation 6 5(VII) Impairment 0 0(VIII) PROFIT BEFORE FINANCE COST/INTEREST, -57 -54
EXCEPTIONAL, EXTRA-ORDINARY ITEMS & TAXES(PBIEET)(V-VI-VII)
(IX) Finance Cost(a) On Central Government Loans 0 0(b) On Foreign Loans 0 0(c) Others 1 1(d) Less Finance Cost Capitalised 0 0(e) Charged to P & L Account (a+b+c+d) 1 1(X) PROFIT BEFORE EXCEPTIONAL & EXTRA-ORDINARY -58 -55ITEMS & TAX (PBEET)(VIII-IXe)(XI) Exceptional Items 0 0(XII) PROFIT BEFORE EXTRA-ORDINARY ITEMS & TAX -58 -55
(PBET)(X-XI)(XIII) Extra-Ordinary Items 0 0(XIV) PROFIT BEFORE TAX (PBT)(XII-XIII) -58 -55(XV) TAX PROVISIONS 0 0(XVI) NET PROFIT / LOSS FOR THE PERIOD FROM -58 -55CONTINUING OPERATIONS AFTER TAX(XIV-XV)(XVII) Profit/Loss from discontinuing operations 0 0(XVIII) Tax expenses of discontinuing operations 0 0(XIX) Profit/Loss from discontinuing operations (after Tax) 0 0
(XVII-XVIII)(XX) Profit/Loss for the period (XVI+XIX) -58 -55Financial Ratios(i) Sales : Capital Employed -551.35 1063.64(ii) Cost of Sales : Sales 139.71 129.91(iii) Salary/Wages : Sales 87.25 77.78(iv) Net Profit : Net Worth - -(v) Debt : Equity 2.72 2.72(vi) Current Ratio 0.58 0.72(vii) Trade Recievables : Sales 12.75 10.26(viii) Total Inventory : Sales 3.43 2.56

Tourist Services536
Utkal Ashok Hotel Corp. Ltd.
The Company
Utkal Ashok Hotel Corp. Ltd. (UAHCL) was incorporated in1983 with the objective to promote domestic tourism and to haveclose coordination between the Center and the State efforts todisperse benefits of tourism in the State of Orissa and to relieve thedirect strains on budgetary resources of the Center and State byeliminating duplicate efforts.
UAHCL is an un-categorised sick CPSE in Tourist Servicessector under the administrative control of M/o Tourism. ItsRegistered and Corporate offices are at Puri, Orissa. UAHCL is asubsidiary of ITDC Ltd. which holds 98% of its equity.
Industrial / Business Operations
UAHCL was providing services in the field of Hotel business(accommodation and catering) through its single hotel namely HotelNilachal Ashok at Puri, Orissa. However, since 31.3.2004 the HotelNilachal Ashok has been closed. No staff is working in the Hotel.
Performance Highlights
The company has no operating income. The losses of thecompany has gone down by ̀ 0.11 crore to ̀ 0.60 crore in 2011-12,from ` 0.71 crore in previous year due to variance in ExceptionalItems.
The current ratio of company is at 0.09:1 during 2011-12 and2010-11. Balance Sheet and Profit & Loss Account of the companyand selected financial ratios during the period 2010-11 to 2011-12can be seen on the adjoining page.
www.
EBIT
DA
& P
AT (
Rs.
cro
re)
TOTAL R
EVENU
E (Rs. crore)
Fig. 1
Strategic issues
The company has decided to lease out the Hotel property for40 years to M/s Paul Mech Infrastructure Pvt. Ltd. The process ofleasing has been completed.

Public Enterprises Survey 2011-2012: Vol-II 537
Utkal Ashok Hotel Corp. Ltd.Hotel Neelachal Ashok, VIP Road, Adjoining Raj BhawanPuri, Orissa - 752 001
BALANCE SHEET (` in Lakhs)PARTICULARS 2011-12 2010-11I. EQUITY & LIABILITIESAUTHORISED CAPITAL 550 550(1) Shareholders’ Funds(a) Share Capital(i) Central Govt 350 350(ii) Others 130 130(b) Reserves & Surplus -1941 -1881(c) Money received against share warrants 0 0Total Shareholders’ Funds (1(a)+1(b)+1(c) -1461 -1401(2) Share application money pending allotment 0 0(3) Non-current Liabilities(a) Long Term Borrowings 0 8(b) Deferred tax liabilities (Net) 0 0(c) Other Long-term liabilities 0 0(d) Long-term provisions 23 0Total Non-Current Liabilities 3(a) to 3(d) 23 8(4) Current Liabilities(a) Short Term Borrowings 1697 1650(b) Trade Payables 0 0(c) Other current liabilities 0 0(d) Short-term provisions 0 0Total Current Liabilities 4(a) to 4(d) 1697 1650TOTAL EQUITY & LIABILITIES (1+2+3+4) 259 257II. ASSETS(1) Non-Current Assets(a) Total Gross Fixed Assets 289 289(ai) Accumulated Depreciation, Depletion & Amortisation 183 180(aii) Accumulated Impairment 0 0(b) Total Net Fixed Assets ((a)-(ai)-(aii) 106 109(c) Capital work in progress 0 0(d) Intangible assets under developmet 0 0(e) Non-Current Investments 0 0(f) Deferred Tax Assets (Net) 0 0(g) Long Term Loans and Advances 1 1(h) Other Non-Current Assets 0 0Total Non-Current Assets (b+c+d+e+f+g+h) 107 110(2) Current Assets(a) Current Investments 0 0(b) Inventories 0 0(c) Trade Recievables 0 0(d) Cash & Bank Balance 9 3(e) Short-term Loans & Advances 143 144(f) Other Current Assets 0 0Total Current Assets (a+b+c+d+e+f) 152 147TOTAL ASSETS (1+2) 259 257Important Indicators(i) Investment 480 488(ii) Capital Employed -1461 -1393(iii) Net Worth -1461 -1401(iv) Net Current Assets -1545 -1503(v) Cost of Sales 513 510(vi) Net Value Added (at market price) -5 -8(vii) Total Regular Employees (Nos.) 23 54(viii) Avg. Monthly Emoluments per Employee(`) 13043 5864
PROFIT & LOSS ACCOUNT (` in Lakhs)PARTICULARS 2011-12 2010-11(I) Revenue from Operations (Gross) 0 0Less : Excise Duty 0 0Revenue from Operations (Net) 0 0(II) Other Income 0 0(III) Total Revenue (I+II) 0 0(IV) Expenditure on:(a) Cost of materials consumed 0 0(b) Purchase of stock-in-trade 0 0(c) Changes in inventories of finished goods, work-in- 0 0
and stock in trade progress(d) Stores & Spares 0 0(e) Power & Fuel 0 0(f) Salary, Wages & Benefits/Employees Expense 36 38(g) Other Operating/direct/manufacturing Expenses 0 0(h) Rent, Royalty & Cess 0 0(i) Loss on sale of Assets/Investments 0 0(j) Other Expenses 199 194Total Expenditure (IV (a to j)) 235 232(V) PROFIT BEFORE DEPRECIATION, & IMPAIRMENT, -235 -232
FINANCE CHARGES/INTEREST, EXCEPTIONAL &EXTRAORDINARY ITEMS & TAXES (PBDIEET)(III-IV)
(VI) Depreciation, Depletion & Amortisation 278 278(VII) Impairment 0 0(VIII) PROFIT BEFORE FINANCE COST/INTEREST, -513 -510
EXCEPTIONAL, EXTRA-ORDINARY ITEMS & TAXES(PBIEET)(V-VI-VII)
(IX) Finance Cost(a) On Central Government Loans 0 0(b) On Foreign Loans 0 0(c) Others 19 25(d) Less Finance Cost Capitalised 0 0(e) Charged to P & L Account (a+b+c+d) 19 25(X) PROFIT BEFORE EXCEPTIONAL & EXTRA-ORDINARY -532 -535ITEMS & TAX (PBEET)(VIII-IXe)(XI) Exceptional Items -472 -464(XII) PROFIT BEFORE EXTRA-ORDINARY ITEMS & TAX -60 -71
(PBET)(X-XI)(XIII) Extra-Ordinary Items 0 0(XIV) PROFIT BEFORE TAX (PBT)(XII-XIII) -60 -71(XV) TAX PROVISIONS 0 0(XVI) NET PROFIT / LOSS FOR THE PERIOD FROM -60 -71
CONTINUING OPERATIONS AFTER TAX(XIV-XV)(XVII) Profit/Loss from discontinuing operations 0 0(XVIII) Tax expenses of discontinuing operations 0 0(XIX) Profit/Loss from discontinuing operations (after Tax) 0 0
(XVII-XVIII)(XX) Profit/Loss for the period (XVI+XIX) -60 -71Financial Ratios(i) Sales : Capital Employed 0 0(ii) Cost of Sales : Sales 0 0(iii) Salary/Wages : Sales 0 0(iv) Net Profit : Net Worth - -(v) Debt : Equity 0 0.02(vi) Current Ratio 0.09 0.09(vii) Trade Recievables : Sales 0 0(viii) Total Inventory : Sales 0 0
2011-12 Provisional

Public Enterprises Survey 2011-2012: Vol-II 539
FINANCIAL SERVICES

Financial Services540

Public Enterprises Survey 2011-2012: Vol-II 541
21. Financial Services
As on 31.03.2012, there were 17 Central Public SectorEnterprises in the Financial Services group. The name of theseenterprises along with their year of incorporation in chronologicalorder are given below :—
Sl. Enterprise Year ofNo. Incorporation
1 Export Credit Guarantee Corpn.of India Ltd. 1957
2 Rural Electrification Corpn. Ltd. 19693 Housing & Urban Dev. Corpn. Ltd. 19704 National Film Dev. Corpn. Ltd. 1975
5 Indian Railway Finance Corporation Ltd. 19866 Power Finance Corporation 19867 Indian Renewable Energy Devt.agency Ltd. 1987
8 Indian Vaccine Corp. Ltd. 19889 National Scheduled Castes Finance & 1989
Devp. Corpn.10 National Backward Classes Finance & 1992
Devp. Co.
11 National Minorities Devp. & Finance Corpn. 199412 National Handicapped Finance & Devpt. 1997
Corpn.13 National Safai Karamcharis Finance & 1997
Devpt. Corpn
14 Balmer Lawrie Investments Ltd. 200115 Kumarakruppa Frontier Hotels Ltd. 200116 National Scheduled Tribes Finance & 2001
Devp. Corpn.
17 India Infrastructure Finance Co. Ltd. 2006
2. The enterprises falling in this group are mainly engagedin rending financial services etc.
3. The consolidated financial position the working results andthe important management ratios of these enterprises are appended.
4. Turnover : The details of turnover of individualenterprises are given below:
(` in Crores)Sl. Enterprise TurnoverNo. 2011-12 2010-11
1 2 3 41 Power Finance Corporation 13014.85 10128.49
2 Rural Electrification Corpn. Ltd. 10337.59 8256.913 Indian Railway Finance Corporation 4641.94 3839.44
Ltd.4 Housing & Urban Dev. Corpn. Ltd. 2738.36 2263.46
1 2 3 45 India Infrastructure Finance Co. Ltd. 2540.43 1945.756 Export Credit Guarantee Corpn.of 771.25 680.86
India Ltd.7 Indian Renewable Energy Devt. 519.65 400.96
Agency Ltd.
8 National Film Dev. Corpn. Ltd. 248.44 181.259 National Scheduled Castes Finance 33.69 25.23
& Devp. Corpn.10 National Backward Classes Finance 31.17 26.18
& Devp. Co.
11 Balmer Lawrie Investments Ltd. 30.40 25.3012 National Minorities Devp. & Finance 28.36 26.65
Corpn.13 National Scheduled Tribes Finance & 12.46 10.65
Devp. Corpn.
14 National Safai Karamcharis Finance 8.65 7.60& Devpt. Corpn
15 National Handicapped Finance & 8.32 4.42Devpt. Corpn.
16 Kumarakruppa Frontier Hotels Ltd. 5.59 8.40
17 Indian Vaccine Corp. Ltd. 0.00 0.00Sub Total : 34971.15 27831.55
5. Net Profit / Loss: The details of enterprises , whichearned net profit or sustained net loss (-) are given below:
(` in Crores)Sl. Enterprise Adjusted NetNo. Profit / Net Loss
2011-12 2010-111 2 3 41 Power Finance Corporation 3031.74 2619.582 Rural Electrification Corpn. Ltd. 2817.03 2569.933 Housing & Urban Dev. Corpn. Ltd. 630.33 550.03
4 India Infrastructure Finance Co. Ltd. 585.83 295.805 Indian Railway Finance Corporation Ltd. 480.78 485.206 Export Credit Guarantee Corpn.of 225.21 85.67
India Ltd
7 Indian Renewable Energy Devt. 173.13 120.46agency Ltd.
8 National Minorities Devp. & Finance 39.89 31.61Corpn.
9 Balmer Lawrie Investments Ltd. 28.43 24.23
10 National Backward Classes Finance 24.11 19.20& Devp.co.

Financial Services542
1 2 3 411 National Scheduled Castes Finance 21.59 13.95
& Devp. Corpn.12 National Scheduled Tribes Finance & 9.51 5.96
Devp. Corpn.13 Kumarakruppa Frontier Hotels Ltd. 5.43 5.57
14 National Safai Karamcharis Finance 4.59 4.14& Devpt. Corpn
15 National Film Dev. Corpn. Ltd. 4.08 1.6916 National Handicapped Finance & 3.72 1.55
Devpt. Corpn.
17 Indian Vaccine Corp. Ltd. 0.43 0.43Sub Total : 8085.83 6835.00
6. Dividend : The details of dividend declared by theindividual enterprises are given below:
(` in Crores)Sl. Enterprise DividendNo. 2011-12 2010-111 Power Finance Corporation 791.97 599.712 Rural Electrification Corpn. Ltd. 740.59 740.59
3 Housing & Urban Dev. Corpn. Ltd. 140.01 110.024 Indian Railway Finance Corporation 100.00 100.00
Ltd.5 Export Credit Guarantee Corpn.of 54.00 26.10
India Ltd.6 Indian Renewable Energy Devt. 25.00 20.00
agency Ltd.
7 Balmer Lawrie Investments Ltd. 22.20 18.878 Kumarakruppa Frontier Hotels Ltd. 3.90 4.87
Group Total : 1877.67 1620.16
7. Social Overhead and Township: The total number ofpersons employed and the expenditure incurred on social overheadsand townships are given below:
(` in Crores)Sl. Enterprise Township andNo. Social Overheads
2011-12 2010-111 No. of employees (in number) 309767 3252162 Social overheads: (Rupees in Crore)
(i) Educational 0.00 0.00(ii) Medical Facilities 0.00 0.00(iii) Others 0.00 0.00
3 Capital cost of township (Rupeesin Crore) 0.00 0.00
4 No. of houses constructed (in numbers) 0.00 0.00
8. Company wise details in respect of Balance Sheet, Profitand Loss account, Important Indicators and Financial Ratios alongwith the write up of individual company are given in the pagesbelow.

Public Enterprises Survey 2011-2012: Vol-II 543
BALANCE SHEET (` in Lakhs)PARTICULARS 2011-12 2010-11I. EQUITY & LIABILITIESAUTHORISED CAPITAL 2252140 1622140(1) Shareholders’ Funds(a) Share Capital(i) Central Govt 1287585 1148048(ii) Others 88386 63329(b) Reserves & Surplus 4442666 3532989(c) Money received against share warrants 0 0Total Shareholders’ Funds (1(a)+1(b)+1(c) 5818637 4744366(2) Share application money pending allotment 29900 7876(3) Non-current Liabilities(a) Long Term Borrowings 25789535 19749669(b) Deferred tax liabilities (Net) 353020 309195(c) Other Long-term liabilities 67691 109268(d) Long-term provisions 94181 78276Total Non-Current Liabilities 3(a) to 3(d) 26304427 20246408(4) Current Liabilities(a) Short Term Borrowings 972600 797462(b) Trade Payables 17611 16374(c) Other current liabilities 4283099 3793044(d) Short-term provisions 178253 161878Total Current Liabilities 4(a) to 4(d) 5451563 4768758TOTAL EQUITY & LIABILITIES (1+2+3+4) 37604527 29767408II. ASSETS(1) Non-Current Assets(a) Total Gross Fixed Assets 67952 66333(ai) Accumulated Depreciation, Depletion & Amortisation 23867 22455(aii) Accumulated Impairment 0 3(b) Total Net Fixed Assets ((a)-(ai)-(aii) 44085 43875(c) Capital work in progress 4091 2669(d) Intangible assets under developmet 33 35(e) Non-Current Investments 541272 563196(f) Deferred Tax Assets (Net) 9144 7740(g) Long Term Loans and Advances 30018412 23877685(h) Other Non-Current Assets 158915 106708Total Non-Current Assets (b+c+d+e+f+g+h) 30775952 24601908(2) Current Assets(a) Current Investments 63693 207066(b) Inventories 2 47(c) Trade Recievables 9319 11950(d) Cash & Bank Balance 2210529 1512399(e) Short-term Loans & Advances 2859390 1992478(f) Other Current Assets 1685642 1441560Total Current Assets (a+b+c+d+e+f) 6828575 5165500TOTAL ASSETS (1+2) 37604527 29767408Important Indicators(i) Investment 27195406 20968922(ii) Capital Employed 31638072 24501911(iii) Net Worth 5848537 4752242(iv) Net Current Assets 1377012 396742(v) Cost of Sales 1780112 1400057(vi) Net Value Added (at market price) 1835149 1498322(vii) Total Regular Employees (Nos.) 3179 3179(viii) Avg. Monthly Emoluments per Employee(`) 127223 119146
PROFIT & LOSS ACCOUNT (` in Lakhs)PARTICULARS 2011-12 2010-11(I) Revenue from Operations (Gross) 3497115 2783155Less : Excise Duty 0 0Revenue from Operations (Net) 3497115 2783155(II) Other Income 66269 61304(III) Total Revenue (I+II) 3563384 2844459(IV) Expenditure on:(a) Cost of materials consumed 0 0(b) Purchase of stock-in-trade 0 0(c) Changes in inventories of finished goods, work-in- 0 0
progress and stock in trade(d) Stores & Spares 0 0(e) Power & Fuel 458 433(f) Salary, Wages & Benefits/Employees Expense 48533 45452(g) Other Operating/direct/manufacturing Expenses 1668621 1326163(h) Rent, Royalty & Cess 2018 1864(i) Loss on sale of Assets/Investments 61 51(j) Other Expenses 57615 23032Total Expenditure (IV (a to j)) 1777306 1396995(V) PROFIT BEFORE DEPRECIATION, & IMPAIRMENT, 1786078 1447464
FINANCE CHARGES/INTEREST, EXCEPTIONAL &EXTRAORDINARY ITEMS & TAXES (PBDIEET)(III-IV)
(VI) Depreciation, Depletion & Amortisation 2867 3113(VII) Impairment 0 0(VIII) PROFIT BEFORE FINANCE COST/INTEREST, 1783211 1444351
EXCEPTIONAL, EXTRA-ORDINARY ITEMS & TAXES(PBIEET)(V-VI-VII)
(IX) Finance Cost(a) On Central Government Loans 231 317(b) On Foreign Loans 0 0(c) Others 637679 484789(d) Less Finance Cost Capitalised 0 0(e) Charged to P & L Account (a+b+c+d) 637910 485106(X) PROFIT BEFORE EXCEPTIONAL & EXTRA- 1145301 959245
ORDINARY ITEMS & TAX (PBEET)(VIII-IXe)(XI) Exceptional Items 5232 369(XII) PROFIT BEFORE EXTRA-ORDINARY ITEMS & TAX 1140069 958876
(PBET)(X-XI)(XIII) Extra-Ordinary Items 351 346(XIV) PROFIT BEFORE TAX (PBT)(XII-XIII) 1139718 958530(XV) TAX PROVISIONS 331135 275030(XVI) NET PROFIT / LOSS FOR THE PERIOD FROM
CONTINUING OPERATIONS AFTER TAX(XIV-XV) 808583 683500(XVII) Profit/Loss from discontinuing operations 0 0(XVIII) Tax expenses of discontinuing operations 0 0(XIX) Profit/Loss from discontinuing operations (after Tax) 0 0
(XVII-XVIII)(XX) Profit/Loss for the period (XVI+XIX) 808583 683500Financial Ratios(i) Sales : Capital Employed 11.05 11.36(ii) Cost of Sales : Sales 50.9 50.3(iii) Salary/Wages : Sales 1.39 1.63(iv) Net Profit : Net Worth 13.83 14.38(v) Debt : Equity 18.34 16.2(vi) Current Ratio 1.25 1.08(vii) Trade Recievables : Sales 0.27 0.43(viii) Total Inventory : Sales 0 0
FINANCIAL SERVICES

Financial Services544
Balmer Lawrie Investment Ltd.
The CompanyBalmer Lawrie Investment Ltd. (BLIL) was incorporated on
20.09.2001 with the objective of facilitating the disinvestment ofIBP Co. Ltd., wherein the share holding of IBP Co. in BalmerLawrie & Co. Ltd. was de-merged in favor of BLIL with effect from15.10.2001.
BLIL is an un-categorized listed CPSE in Financial Servicessector under the administrative control of M/o Petroleum & NaturalGas with 59.68% shareholding by the Government of India. Thecompany does not have any employee of its own except its CompanySecretary whose services have been seconded from Balmer Lawrie& Co. Ltd. All services for the company in the nature of accounts,finance, taxation, legal, secretarial, administration etc. are obtainedfrom ‘Balmer Lawrie & Co. Ltd. under a service agreement. ItsRegistered and Corporate offices are at Kolkata, West Bengal.
Vision / MissionThe Vision / Mission of the Company is to better returns to
its shareholders / investors by strictly governing its activities andemphasizing on cutting down unnecessary cost.
Industrial / Business OperationsBLIL is a Non-Banking finance company and engaged in
providing a specific service i.e. to hold the equity shares of itssubsidiary Balmer Lawrie and Co. Ltd. (BL). The equity shares ofthe company are under compulsory demat mode and the shares arelisted in the stock exchanges. The company also holds 100% equityshare holding of its overseas subsidiary company namely BalmerLawrie (UK) Ltd. through its subsidiary company.
Performance HighlightsThe Company registered an increase of ` 5.10 crore in total
revenue during 2011-12 which went up to ̀ 30.40 crore in 2011-12from ` 25.30 crore during 2010-11. The net profit of the companycorrespondingly increased to ` 28.43 crore, an increase of ` 4.20crore over the previous year due to the increase in the amount ofdividend received from its subsidiary and increase in the interestearned on bank deposits.
The current ratio of company is at 2.21:1 during 2011-12 asagainst 2.1:1 in the previous year (Fig.2). Balance Sheet and Profit& Loss Account of the company and selected financial ratios duringthe period 2010-11 to 2011-12 can be seen on the adjoining page.
Strategic issueThe Company was formed as a Special Purpose Vehicle
(‘SPV’) under the erstwhile disinvestment policy of the Governmentof India.
www.blinv.com
EBIT
DA
& P
AT (
Rs.
cro
re)
TOTAL R
EVENU
E (Rs. crore)
Fig. 1
PRO
FITA
BIL
ITY
RAT
IOS
(%)
CU
RR
ENT R
ATIO
Fig. 2

Public Enterprises Survey 2011-2012: Vol-II 545
Balmer Lawrie Investment Ltd.21, Netaji Subhas Road, Kolkata, West Bengal -700001
BALANCE SHEET (` in Lakhs)PARTICULARS 2011-12 2010-11I. EQUITY & LIABILITIESAUTHORISED CAPITAL 2500 2500(1) Shareholders’ Funds (a) Share Capital (i) Central Govt 1325 1325 (ii) Others 895 895 (b) Reserves & Surplus 3839 3215 (c) Money received against share warrants 0 0 Total Shareholders’ Funds (1(a)+1(b)+1(c) 6059 5435(2) Share application money pending allotment 0 0(3) Non-current Liabilities (a) Long Term Borrowings 0 0 (b) Deferred tax liabilities (Net) 0 0 (c) Other Long-term liabilities 0 0 (d) Long-term provisions 0 0 Total Non-Current Liabilities 3(a) to 3(d) 0 0(4) Current Liabilities (a) Short Term Borrowings 0 0 (b) Trade Payables 0 0 (c) Other current liabilities 90 76 (d) Short-term provisions 2220 1887 Total Current Liabilities 4(a) to 4(d) 2310 1963TOTAL EQUITY & LIABILITIES (1+2+3+4) 8369 7398II. ASSETS(1) Non-Current Assets (a) Total Gross Fixed Assets 0 0 (ai) Accumulated Depreciation, Depletion & Amortisation 0 0 (aii) Accumulated Impairment 0 0 (b) Total Net Fixed Assets ((a)-(ai)-(aii) 0 0 (c) Capital work in progress 0 0 (d) Intangible assets under developmet 0 0 (e) Non-Current Investments 3268 3268 (f) Deferred Tax Assets (Net) 0 0 (g) Long Term Loans and Advances 0 0 (h) Other Non-Current Assets 0 0 Total Non-Current Assets (b+c+d+e+f+g+h) 3268 3268(2) Current Assets (a) Current Investments 0 0 (b) Inventories 0 0 (c) Trade Recievables 0 0 (d) Cash & Bank Balance 4959 4050 (e) Short-term Loans & Advances 0 0 (f) Other Current Assets 142 80 Total Current Assets (a+b+c+d+e+f) 5101 4130TOTAL ASSETS (1+2) 8369 7398Important Indicators (i) Investment 2220 2220 (ii) Capital Employed 6059 5435 (iii) Net Worth 6059 5435 (iv) Net Current Assets 2791 2167 (v) Cost of Sales 42 45 (vi) Net Value Added (at market price) 3011 2494 (vii) Total Regular Employees (Nos.) 0 0(viii) Avg. Monthly Emoluments per Employee(`) 0 0
PROFIT & LOSS ACCOUNT (` in Lakhs)PARTICULARS 2011-12 2010-11(I) Revenue from Operations (Gross) 3040 2530 Less : Excise Duty 0 0 Revenue from Operations (Net) 3040 2530(II) Other Income 0 0(III) Total Revenue (I+II) 3040 2530(IV) Expenditure on: (a) Cost of materials consumed 0 0 (b) Purchase of stock-in-trade 0 0 (c) Changes in inventories of finished goods, work-in- 0 0
progress and stock in trade (d) Stores & Spares 0 0 (e) Power & Fuel 0 0 (f) Salary, Wages & Benefits/Employees Expense 13 9 (g) Other Operating/direct/manufacturing Expenses 25 23 (h) Rent, Royalty & Cess 0 0 (i) Loss on sale of Assets/Investments 0 0 (j) Other Expenses 4 13Total Expenditure (IV (a to j)) 42 45(V) PROFIT BEFORE DEPRECIATION, & IMPAIRMENT, 2998 2485 FINANCE CHARGES/INTEREST, EXCEPTIONAL &EXTRAORDINARY ITEMS & TAXES (PBDIEET)(III-IV)(VI) Depreciation, Depletion & Amortisation 0 0(VII) Impairment 0 0(VIII) PROFIT BEFORE FINANCE COST/INTEREST, 2998 2485EXCEPTIONAL, EXTRA-ORDINARY ITEMS &TAXES (PBIEET)(V-VI-VII)(IX) Finance Cost (a) On Central Government Loans 0 0 (b) On Foreign Loans 0 0 (c) Others 0 0 (d) Less Finance Cost Capitalised 0 0 (e) Charged to P & L Account (a+b+c+d) 0 0(X) PROFIT BEFORE EXCEPTIONAL & 2998 2485EXTRA-ORDINARY ITEMS & TAX (PBEET)(VIII-IXe)(XI) Exceptional Items 0 0(XII) PROFIT BEFORE EXTRA-ORDINARY ITEMS & 2998 2485TAX (PBET)(X-XI)(XIII) Extra-Ordinary Items 0 0(XIV) PROFIT BEFORE TAX (PBT)(XII-XIII) 2998 2485(XV) TAX PROVISIONS 155 62(XVI) NET PROFIT / LOSS FOR THE PERIOD FROM 2843 2423CONTINUING OPERATIONS AFTER TAX(XIV-XV)(XVII) Profit/Loss from discontinuing operations 0 0(XVIII) Tax expenses of discontinuing operations 0 0(XIX) Profit/Loss from discontinuing operations 0 0(after Tax)(XVII-XVIII)(XX) Profit/Loss for the period (XVI+XIX) 2843 2423Financial Ratios (i) Sales : Capital Employed 50.17 46.55 (ii) Cost of Sales : Sales 1.38 1.78 (iii) Salary/Wages : Sales 0.43 0.36 (iv) Net Profit : Net Worth 46.92 44.58 (v) Debt : Equity 0 0 (vi) Current Ratio 2.21 2.1 (vii) Trade Recievables : Sales 0 0 (viii) Total Inventory : Sales 0 0

Financial Services546
The CompanyExport Credit Guarantee Corporation of India Ltd. (ECGC)
(earlier known as “Export Risk Corporation of India Ltd.”) was setup on 31.7.1957 with the objective to support and strengthen theexport promotion efforts of the country by issuing credit insurancecovers to protect the exporters against non-realisation on accountof commercial and political risks.
ECGC is an uncategorized CPSE in Financial Services sectorunder the administrative control of M/o Commerce and Industry,D/o Commerce with 100% shareholding by the Government ofIndia. The Company employed 575 regular employees (Executives201 & Non-Executives 374) as on 31.03.2012. It’s registered andCorporate offices are at Mumbai, Maharashtra.
Vision / MissionThe Vision of the Company is to excel in providing export
credit insurance and trade related services. The Mission of the company is to support the Indian Export
Industry by way of providing cost effective Insurance and traderelated services to meet the growing needs of the Indian Exportmarket through optimal utilization of available resources.
Industrial / Business OperationsECGC provides a range of credit risk insurance covers to
exporters against the loss in export of goods and services. It alsooffers guarantees to banks and financial institutions to enableexporters to obtain better facilities from them. ECGC furtherprovides overseas investment insurance to Indian Companiesinvesting in joint ventures abroad in the form of equity or loan andassists exporters in recovering bad debts. Besides Head Office, ithas 51 branch offices and 5 regional offices.
Performance HighlightsThe service segment of the company comprises of Policies
and Guarantees. The physical performance of company during thelast two years is mentioned below:
Total Revenue of the company registered an increase of ̀ 154.45crore during 2011-12, which went up from ` 971.71 crore in2010-11 to ` 1126.16 crore in 2011-12. The Profit howeverincreased to `225.21 crore in 2011-12 from ` 85.66 crore in theprevious year, an increase of `139.55 crore, due to growth of
www.ecgc.in
premium income, decrease in outsourcing claims provision, decreasein operating expenses etc.
The current ratio of company is at 0.68:1 during 2011-122010-11 (Fig.2). Balance Sheet and Profit & Loss Account of thecompany and selected financial ratios during the period 2010-11 to2011-12 can be seen on the adjoining page.
Main Services Unit Performance during
2011-12 2010-11
Business covered ` in Crore 497222.44 431888.34
Premium income ` in Crore 1.004.83 885.49
Claims paid ` in Crore 713.03 620.53
Recoveries made ` in Crore 168.64 136.12
Export Credit Guarantee Corporation of India Ltd.
Strategic issueThe company envisages enhancing ECGC coverage of national
exports by an additional 1.25% over the 5 years by spreadingmarketing efforts, expanding distribution network through alternatechannels and by introducing new and customized products forexporters as well as banks.
EBIT
DA
& P
AT (
Rs.
cro
re)
TOTAL R
EVENU
E (Rs. crore)
Fig. 1
PRO
FITA
BIL
ITY
RAT
IOS
(%)
CU
RR
ENT R
ATIO
Fig. 2

Public Enterprises Survey 2011-2012: Vol-II 547
BALANCE SHEET (` in Lakhs)PARTICULARS 2011-12 2010-11I. EQUITY & LIABILITIESAUTHORISED CAPITAL 100000 100000(1) Shareholders’ Funds (a) Share Capital (i) Central Govt 90000 90000 (ii) Others 0 0 (b) Reserves & Surplus 126774 116223 (c) Money received against share warrants 0 0 Total Shareholders’ Funds (1(a)+1(b)+1(c) 216774 206223(2) Share application money pending allotment 0 0(3) Non-current Liabilities (a) Long Term Borrowings 0 0 (b) Deferred tax liabilities (Net) 0 0 (c) Other Long-term liabilities 0 0 (d) Long-term provisions 47730 45037 Total Non-Current Liabilities 3(a) to 3(d) 47730 45037(4) Current Liabilities (a) Short Term Borrowings 0 0 (b) Trade Payables 1162 1111 (c) Other current liabilities 227620 207657 (d) Short-term provisions 3227 3122 Total Current Liabilities 4(a) to 4(d) 232009 211890TOTAL EQUITY & LIABILITIES (1+2+3+4) 496513 463150II. ASSETS(1) Non-Current Assets (a) Total Gross Fixed Assets 16862 16842 (ai) Accumulated Depreciation, Depletion & Amortisation 4020 3433 (aii) Accumulated Impairment 0 0 (b) Total Net Fixed Assets ((a)-(ai)-(aii) 12842 13409 (c) Capital work in progress 1862 911 (d) Intangible assets under developmet 0 0 (e) Non-Current Investments 323142 304356 (f) Deferred Tax Assets (Net) 2036 405 (g) Long Term Loans and Advances 0 0 (h) Other Non-Current Assets 0 0 Total Non-Current Assets (b+c+d+e+f+g+h) 339882 319081(2) Current Assets (a) Current Investments 15901 12000 (b) Inventories 0 0 (c) Trade Recievables 0 0 (d) Cash & Bank Balance 90245 87686 (e) Short-term Loans & Advances 25434 13407 (f) Other Current Assets 25051 30976 Total Current Assets (a+b+c+d+e+f) 156631 144069TOTAL ASSETS (1+2) 496513 463150Important Indicators (i) Investment 90000 90000 (ii) Capital Employed 216774 206223 (iii) Net Worth 216774 206223 (iv) Net Current Assets -75378 -67821 (v) Cost of Sales 79902 84995 (vi) Net Value Added (at market price) 40541 22895 (vii) Total Regular Employees (Nos.) 575 575(viii) Avg. Monthly Emoluments per Employee(`) 102493 144246
Export Credit Guarantee Corporation of India Ltd.Express Towers, 10th floor, Nariman Point, Mumbai- 400021
PROFIT & LOSS ACCOUNT (` in Lakhs)PARTICULARS 2011-12 2010-11(I) Revenue from Operations (Gross) 77125 68086 Less : Excise Duty 0 0 Revenue from Operations (Net) 77125 68086(II) Other Income 35491 29085(III) Total Revenue (I+II) 112616 97171(IV) Expenditure on: (a) Cost of materials consumed 0 0 (b) Purchase of stock-in-trade 0 0 (c) Changes in inventories of finished goods, work-in- 0 0
progress and stock in trade (d) Stores & Spares 0 0 (e) Power & Fuel 0 0 (f) Salary, Wages & Benefits/Employees Expense 7072 9953 (g) Other Operating/direct/manufacturing Expenses 67622 71414 (h) Rent, Royalty & Cess 736 761 (i) Loss on sale of Assets/Investments 5 20 (j) Other Expenses 3784 2419Total Expenditure (IV (a to j)) 79219 84567(V) PROFIT BEFORE DEPRECIATION, & IMPAIRMENT, 33397 12604FINANCE CHARGES/INTEREST, EXCEPTIONAL &EXTRAORDINARY ITEMS & TAXES (PBDIEET)(III-IV)(VI) Depreciation, Depletion & Amortisation 688 448(VII) Impairment 0 0(VIII) PROFIT BEFORE FINANCE COST/INTEREST, 32709 12156EXCEPTIONAL, EXTRA-ORDINARY ITEMS & TAXES(PBIEET)(V-VI-VII)(IX) Finance Cost (a) On Central Government Loans 0 0 (b) On Foreign Loans 0 0 (c) Others 0 0 (d) Less Finance Cost Capitalised 0 0 (e) Charged to P & L Account (a+b+c+d) 0 0(X) PROFIT BEFORE EXCEPTIONAL & EXTRA-ORDINARY 32709 12156ITEMS & TAX (PBEET)(VIII-IXe)(XI) Exceptional Items 0 0(XII) PROFIT BEFORE EXTRA-ORDINARY ITEMS & 32709 12156TAX (PBET)(X-XI)(XIII) Extra-Ordinary Items 0 0(XIV) PROFIT BEFORE TAX (PBT)(XII-XIII) 32709 12156(XV) TAX PROVISIONS 10188 3589(XVI) NET PROFIT / LOSS FOR THE PERIOD FROM 22521 8567CONTINUING OPERATIONS AFTER TAX(XIV-XV)(XVII) Profit/Loss from discontinuing operations 0 0(XVIII) Tax expenses of discontinuing operations 0 0(XIX) Profit/Loss from discontinuing operations 0 0(after Tax)(XVII-XVIII)(XX) Profit/Loss for the period (XVI+XIX) 22521 8567Financial Ratios (i) Sales : Capital Employed 35.58 33.02 (ii) Cost of Sales : Sales 103.6 124.83 (iii) Salary/Wages : Sales 9.17 14.62 (iv) Net Profit : Net Worth 10.39 4.15 (v) Debt : Equity 0 0 (vi) Current Ratio 0.68 0.68 (vii) Trade Recievables : Sales 0 0 (viii) Total Inventory : Sales 0 0

Financial Services548
The CompanyHousing & Urban Development Corporation Ltd.
(HUDCO)was incorporated on 25.4.1970 with the objective ofproviding long-term finance for construction of houses for residentialpurposes or financing or undertaking housing and urbandevelopment programs in the country; setting up of new or satellitetowns and industrial enterprises of building material, to subscribeto debentures and bonds to be issued by the State Housing (and/or Urban Development) Boards, Improvement Trusts, DevelopmentAuthorities etc. specially for the purpose of housing and urbandevelopment programmes and to promote, establish, assist,collaborate and provide consultancy services for the projects ofdesigning and planning of works relating to housing and developmentprogrammes in India and abroad.
It is a Schedule-’A’ Mini-Ratna CPSE in financial servicessector under the administrative control of M/o Housing and UrbanPoverty Alleviation with 100% shareholding by the Government ofIndia. The Company employed 972 regular employees (Executives693, Non-executives 279) as on 31.03.2012. Its Registered andCorporate offices are at New Delhi.
Vision / MissionThe Vision of the Company is to be among the world’s leading
knowledge hubs and financial organization for habitat development.The Mission of the Company is to promote sustainable habitatdevelopment to enhance the quality of life.
Industrial / Business OperationsThe main activity of the company is to provide financing of
housing and infrastructure projects through financial assistance toagencies like State Housing Boards, Rural Housing Boards, SlumClearance boards, Development Authorities, Improvement Trusts,Municipal Corporations, Primary Cooperative Societies, NGO’s /Private Developers, Joint Sector and individuals.
The company operates through its 41 offices throughout Indiaincluding corporate office, a Training and Research Wing, 20 Regionaloffices and 19 Niwas development offices. The company has 4joint ventures (JV) in infrastructure development sector with shareholding ranging from 26% to 40%.
Performance HighlightsThe performance of Company for last two years is given below:
the previous year showing an increase of ` 80.30 crore due tolowering of interest expenditure as the company was able to mobilizeallocated amount at lower weighted average cost.
The current ratio of company is at 1.04:1 during 2011-12 asagainst 0.71:1 in the previous year (Fig.2). Balance Sheet and Profit& Loss Account of the company and selected financial ratios duringthe period 2010-11 to 2011-12 can be seen on the adjoining page.
Main Services Unit Performance during
2011-12 2010-11
Loan Sanctioned ` Crore 20511 19762
No. of Scheme Sanctioned No. 130 134
Total Revenue of the company registered an increase of` 500.04 crore during 2011-12, which went up from ` 2278.59crore in 2010-11 to ` 2778.63 crore in 2011-12. The net profit ofthe company increased to ` 630.33 crore, from ` 550.03 crore of www.hudco.org
Housing & Urban Development Corporation Ltd.
Strategic IssuesIn view of the dynamic changes in the business environment
for the housing and urban infrastructure sector and the enlargedfocus of HUDCO on its social operations, a need has been felt forrevision of the Corporate Plan towards setting the new operationaland financial benchmarks while imparting increased focus to sociallending. Thus the new Corporate Plan 2020 with measures adoptedto equip the organization to face the challenges of today as well asprepare itself for tomorrow was prepared and approved.
EBIT
DA
& P
AT (
Rs.
cro
re)
TOTAL R
EVENU
E (Rs. crore)
Fig. 1
PRO
FITA
BIL
ITY
RAT
IOS
(%)
CU
RR
ENT R
ATIO
Fig. 2

Public Enterprises Survey 2011-2012: Vol-II 549
Housing & Urban Development Corporation Ltd.HUDCO Bhawan, India Habitat Centre, Lodhi Road, New Delhi-110 003
BALANCE SHEET (` in Lakhs)PARTICULARS 2011-12 2010-11I. EQUITY & LIABILITIESAUTHORISED CAPITAL 250000 250000(1) Shareholders’ Funds(a) Share Capital(i) Central Govt 200190 200190(ii) Others 0 0(b) Reserves & Surplus 398699 351907(c) Money received against share warrants 0 0Total Shareholders’ Funds (1(a)+1(b)+1(c) 598889 552097(2) Share application money pending allotment 0 0(3) Non-current Liabilities(a) Long Term Borrowings 1372299 953154(b) Deferred tax liabilities (Net) 35037 28185(c) Other Long-term liabilities 5174 11971(d) Long-term provisions 21183 16340Total Non-Current Liabilities 3(a) to 3(d) 1433693 1009650(4) Current Liabilities(a) Short Term Borrowings 0 10000(b) Trade Payables 3110 1072(c) Other current liabilities 691951 686100(d) Short-term provisions 21705 14774Total Current Liabilities 4(a) to 4(d) 716766 711946TOTAL EQUITY & LIABILITIES (1+2+3+4) 2749348 2273693II. ASSETS(1) Non-Current Assets(a) Total Gross Fixed Assets 15979 15878(ai) Accumulated Depreciation, Depletion & Amortisation 8841 8457(aii) Accumulated Impairment 0 0(b) Total Net Fixed Assets ((a)-(ai)-(aii) 7138 7421(c) Capital work in progress 1387 1181(d) Intangible assets under developmet 0 0(e) Non-Current Investments 81398 122398(f) Deferred Tax Assets (Net) 0 0(g) Long Term Loans and Advances 1911164 1636671(h) Other Non-Current Assets 0 640Total Non-Current Assets (b+c+d+e+f+g+h) 2001087 1768311(2) Current Assets(a) Current Investments 41000 7500(b) Inventories 0 0(c) Trade Recievables 1252 1657(d) Cash & Bank Balance 277884 71620(e) Short-term Loans & Advances 400499 402217(f) Other Current Assets 27626 22388Total Current Assets (a+b+c+d+e+f) 748261 505382TOTAL ASSETS (1+2) 2749348 2273693Important Indicators(i) Investment 1572489 1153344(ii) Capital Employed 1971188 1505251(iii) Net Worth 598889 552097(iv) Net Current Assets 31495 -206564(v) Cost of Sales 183866 145748(vi) Net Value Added (at market price) 107126 95722(vii) Total Regular Employees (Nos.) 972 972(viii) Avg. Monthly Emoluments per Employee(`) 94753 98122
PROFIT & LOSS ACCOUNT (` in Lakhs)PARTICULARS 2011-12 2010-11(I) Revenue from Operations (Gross) 273836 226346Less : Excise Duty 0 0Revenue from Operations (Net) 273836 226346(II) Other Income 4027 1513(III) Total Revenue (I+II) 277863 227859(IV) Expenditure on:(a) Cost of materials consumed 0 0(b) Purchase of stock-in-trade 0 0(c) Changes in inventories of finished goods, 0 0
work-in-progress and stock in trade(d) Stores & Spares 0 0(e) Power & Fuel 159 159(f) Salary, Wages & Benefits/Employees Expense 11052 11445(g) Other Operating/direct/manufacturing Expenses 163712 128056(h) Rent, Royalty & Cess 53 70(i) Loss on sale of Assets/Investments 0 0(j) Other Expenses 8430 4876Total Expenditure (IV (a to j)) 183406 144606(V) PROFIT BEFORE DEPRECIATION, & 94457 83253
IMPAIRMENT, FINANCE CHARGES/INTEREST, EXCEPTIONAL & EXTRAORDINARYITEMS & TAXES (PBDIEET)(III-IV)
(VI) Depreciation, Depletion & Amortisation 460 1142(VII) Impairment 0 0(VIII) PROFIT BEFORE FINANCE COST/
INTEREST, EXCEPTIONAL, EXTRA-ORDINARYITEMS & TAXES (PBIEET)(V-VI-VII) 93997 82111
(IX) Finance Cost(a) On Central Government Loans 0 0(b) On Foreign Loans 0 0(c) Others 0 0(d) Less Finance Cost Capitalised 0 0(e) Charged to P & L Account (a+b+c+d) 0 0(X) PROFIT BEFORE EXCEPTIONAL & EXTRA-ORDINARY 93997 82111
ITEMS & TAX (PBEET)(VIII-IXe)(XI) Exceptional Items 0 0(XII) PROFIT BEFORE EXTRA-ORDINARY ITEMS & TAX 93997 82111
(PBET)(X-XI)(XIII) Extra-Ordinary Items 0 0(XIV) PROFIT BEFORE TAX (PBT)(XII-XIII) 93997 82111(XV) TAX PROVISIONS 30964 27108(XVI) NET PROFIT / LOSS FOR THE PERIOD FROM 63033 55003
CONTINUING OPERATIONS AFTER TAX(XIV-XV)(XVII) Profit/Loss from discontinuing operations 0 0(XVIII) Tax expenses of discontinuing operations 0 0(XIX) Profit/Loss from discontinuing operations 0 0
(after Tax)(XVII-XVIII)(XX) Profit/Loss for the period (XVI+XIX) 63033 55003Financial Ratios(i) Sales : Capital Employed 13.89 15.04(ii) Cost of Sales : Sales 67.14 64.39(iii) Salary/Wages : Sales 4.04 5.06(iv) Net Profit : Net Worth 10.52 9.96(v) Debt : Equity 6.85 4.76(vi) Current Ratio 1.04 0.71(vii) Trade Recievables : Sales 0.46 0.73(viii) Total Inventory : Sales 0 0

Financial Services550
The CompanyIndia Infrastructure Finance Company Limited (IIFCL) was
incorporated on 5.1.2006 as a Special Purpose Vehicle (SPV) withthe objective of providing financial assistance and acting as afinancial intermediary for the purpose of development andestablishment of infrastructure projects in India.
The company is an un-categorised CPSE in Financial Servicessector under the administrative control of M/o Finance, D/oFinancial Services with 100% shareholding by the Government ofIndia. The company employed 55 regular employees (Executives54 & Non-Executives 1) as on 31.3.2012. Its Registered andCorporate offices are at New Delhi and two regional offices atMumbai and Hyderabad.Vision / Mission
The Vision of the Company is to provide innovative financingsolutions to promote and develop world class infrastructure inIndia.
The Mission of the Company is to adopt best practices infinancing infrastructure and develop core competencies in facilitatinginfrastructure development;Industrial / Business Operations
IIFCL is providing long term financial assistance to variousviable infrastructure projects in the country in terms of the Schemefor Infrastructure Financing. Apart from equity, IIFCL raises longterm debt from the domestic market, debt from bilateral andmultilateral institutions and in foreign currency through externalcommercial borrowings. The borrowings of the company are backedby sovereign guarantee.
Only an infrastructure project implemented by a Public SectorCompany or Private sector company under Public PrivatePartnership (PPP) through a Project Company set up on a ‘nonresource’ basis shall be eligible for financing by IIFCL.
The company has one off-shore wholly owned subsidiary,namely IIFC (UK) Ltd. in London and one Joint Venture companynamely India Infrastructure Fund with equity participation fromIDFC, Citi Bank and IIFCL.Performance Highlights
The physical performances of the company for last two yearsare given below:
India Infrastructure Finance Company Limited
The current ratio of company is at 2.89:1 during 2011-12 asagainst 6.04:1 in the previous year (Fig.2). Balance Sheet and Profit& Loss Account of the company and selected financial ratios duringthe period 2010-11 to 2011-12 can be seen on the adjoining page.
Main Services Unit Performance during
2011-12 2010-11
Projects Sanctioned Nos. 185 37
Loan Sanctioned ` Crore 32048 7402
Loans Disbursed ` Crore 15465 5349
www.hudco.org
Total Revenue of the company registered an increase of` 592.72 crore during 2011-12, which went up from ̀ 1951.88 crorein 2010-11 to ̀ 2544.60 crore in 2011-12. The profit of the companyhas gone up by ` 290.03 crore to ` 585.83 crore in 2011-12, from` 295.80 crore in previous year due to increase in overall business,strict control on costs and maintaining asset quality (Nil NPA).
Strategic issuesThe company initiated the task of developing schemes such
as Credit Enhancement, Infrastructure Debt Fund and Direct lendingConsortium aimed at providing an alternative source of funding tothe infrastructure sector which simultaneously will help banks tomanage their constraints related to Asset liability Mismatch andExposure Norms.
In order to give thrust to conceptualization and setting up ofinnovative, optimum and commercially viable projects for bridgingthe gap in need of infrastructure, IFCL has set-up a wholly-ownedsubsidiary, IIFCL Projects Ltd. (IPL). IPL has already attracted anumber of investors willing to invest equity in the company.
EBIT
DA
& P
AT (
Rs.
cro
re)
TOTAL R
EVENU
E (Rs. crore)
Fig. 1PR
OFI
TAB
ILIT
Y R
ATIO
S (%
)
CU
RR
ENT R
ATIO
Fig. 2

Public Enterprises Survey 2011-2012: Vol-II 551
BALANCE SHEET (` in Lakhs)PARTICULARS 2011-12 2010-11I. EQUITY & LIABILITIESAUTHORISED CAPITAL 500000 200000(1) Shareholders’ Funds (a) Share Capital (i) Central Govt 250000 200000 (ii) Others 0 0 (b) Reserves & Surplus 116808 58225 (c) Money received against share warrants 0 0 Total Shareholders’ Funds (1(a)+1(b)+1(c) 366808 258225(2) Share application money pending allotment 0 0(3) Non-current Liabilities (a) Long Term Borrowings 2084196 1987204 (b) Deferred tax liabilities (Net) 6199 2570 (c) Other Long-term liabilities 132 53 (d) Long-term provisions 11372 5222 Total Non-Current Liabilities 3(a) to 3(d) 2101899 1995049(4) Current Liabilities (a) Short Term Borrowings 274369 118208 (b) Trade Payables 114 299 (c) Other current liabilities 49322 38195 (d) Short-term provisions 200 747 Total Current Liabilities 4(a) to 4(d) 324005 157449TOTAL EQUITY & LIABILITIES (1+2+3+4) 2792712 2410723II. ASSETS(1) Non-Current Assets (a) Total Gross Fixed Assets 188 113 (ai) Accumulated Depreciation, Depletion & Amortisation 79 51 (aii) Accumulated Impairment 0 0 (b) Total Net Fixed Assets ((a)-(ai)-(aii) 109 62 (c) Capital work in progress 0 0 (d) Intangible assets under developmet 0 0 (e) Non-Current Investments 52772 44800 (f) Deferred Tax Assets (Net) 0 0 (g) Long Term Loans and Advances 1803715 1414098 (h) Other Non-Current Assets 0 0 Total Non-Current Assets (b+c+d+e+f+g+h) 1856596 1458960(2) Current Assets (a) Current Investments 1483 182237 (b) Inventories 0 0 (c) Trade Recievables 0 0 (d) Cash & Bank Balance 817908 703808 (e) Short-term Loans & Advances 53844 29169 (f) Other Current Assets 62881 36549 Total Current Assets (a+b+c+d+e+f) 936116 951763TOTAL ASSETS (1+2) 2792712 2410723Important Indicators (i) Investment 2334196 2187204 (ii) Capital Employed 2451004 2245429 (iii) Net Worth 366808 258225 (iv) Net Current Assets 612111 794314 (v) Cost of Sales 163194 150620 (vi) Net Value Added (at market price) 88386 45786 (vii) Total Regular Employees (Nos.) 55 46(viii) Avg. Monthly Emoluments per Employee(`) 136667 80072
India Infrastructure Finance Company Limited18 & 20, Kasturba Gandhi Marg, New Delhi-110 001
PROFIT & LOSS ACCOUNT (` in Lakhs)PARTICULARS 2011-12 2010-11(I) Revenue from Operations (Gross) 254043 194575 Less : Excise Duty 0 0 Revenue from Operations (Net) 254043 194575(II) Other Income 417 613(III) Total Revenue (I+II) 254460 195188(IV) Expenditure on: (a) Cost of materials consumed 0 0 (b) Purchase of stock-in-trade 0 0 (c) Changes in inventories of finished goods, work-in- 0 0
progress and stock in trade (d) Stores & Spares 0 0 (e) Power & Fuel 7 11 (f) Salary, Wages & Benefits/Employees Expense 902 442 (g) Other Operating/direct/manufacturing Expenses 158305 146855 (h) Rent, Royalty & Cess 840 652 (i) Loss on sale of Assets/Investments 0 0 (j) Other Expenses 3104 2635Total Expenditure (IV (a to j)) 163158 150595(V) PROFIT BEFORE DEPRECIATION, & IMPAIRMENT, 91302 44593FINANCE CHARGES/INTEREST, EXCEPTIONAL &EXTRAORDINARY ITEMS & TAXES (PBDIEET)(III-IV)(VI) Depreciation, Depletion & Amortisation 36 25(VII) Impairment 0 0(VIII) PROFIT BEFORE FINANCE COST/INTEREST, 91266 44568EXCEPTIONAL, EXTRA-ORDINARY ITEMS & TAXES(PBIEET)(V-VI-VII)(IX) Finance Cost (a) On Central Government Loans 0 0 (b) On Foreign Loans 0 0 (c) Others 0 0 (d) Less Finance Cost Capitalised 0 0 (e) Charged to P & L Account (a+b+c+d) 0 0(X) PROFIT BEFORE EXCEPTIONAL & EXTRA-ORDINARY 91266 44568ITEMS & TAX (PBEET)(VIII-IXe)(XI) Exceptional Items 4667 0(XII) PROFIT BEFORE EXTRA-ORDINARY ITEMS & 86599 44568TAX (PBET)(X-XI)(XIII) Extra-Ordinary Items 0 0(XIV) PROFIT BEFORE TAX (PBT)(XII-XIII) 86599 44568(XV) TAX PROVISIONS 28016 14988(XVI) NET PROFIT / LOSS FOR THE PERIOD FROM 58583 29580CONTINUING OPERATIONS AFTER TAX(XIV-XV)(XVII) Profit/Loss from discontinuing operations 0 0(XVIII) Tax expenses of discontinuing operations 0 0(XIX) Profit/Loss from discontinuing operations 0 0(after Tax)(XVII-XVIII)(XX) Profit/Loss for the period (XVI+XIX) 58583 29580Financial Ratios (i) Sales : Capital Employed 10.36 8.67 (ii) Cost of Sales : Sales 64.24 77.41 (iii) Salary/Wages : Sales 0.36 0.23 (iv) Net Profit : Net Worth 15.97 11.46 (v) Debt : Equity 8.34 9.94 (vi) Current Ratio 2.89 6.04 (vii) Trade Recievables : Sales 0 0 (viii) Total Inventory : Sales 0 0

Financial Services552
The CompanyThe Indian Vaccines Corporation Limited (IVCOL) was
incorporated as a joint venture company promoted by PasteuMerieux Serium & Vaccines (PMSV), France, Indian PetrochemicalsCorporation Ltd (IPCL) and Department of Biotechnology (Govtof India) in March 1989.
The main objective of the company was to manufactureInjectable Polio Vaccines (IPV) to be incorporated in the massimmunizations programme of Govt. of India. However, IPV wasnot approved by W.H.O. As a result, the project was put on“HOLD” in February 1992. The Govt. of Haryana acquired 108.18acres of land in Manesar for D.B.T., which was later transferred toIVCOL (after its incorporation). The construction activities startedat the site thereafter. M/s PMSV subsequently got disinterested inthe project and expressed its desire to exit the joint venture. Effortswere made to rope in ‘Strategic partner’ as part of the restructuringexercise. The disinvestment of IVCOL, moreover, could not bematerialized. Hence, the promoters decided to lease the balance69.4 acres of land to Reliance Life Sciences Pvt Ltd ( a group co. ofM/s RIL) for setting up a Super Specialty Hospital and Life Scienceand Research and Development Centre (and other related facilities)at this site. The lease agreement in this regard was signed on31.10.2008.
IVOCL is an UncategorizedCPSE in Financial Services sectorunder the administrative control of Ministry of Science & Technologywith 67% shareholding by Central Government.The companyemployed 4 regular executive employees as on 31.3.2012. Theregistered office of the company is at Gurgaon, Haryana andcorporate office is in New Delhi.
Industrial / Business OperationsThe company was to undertake research and development and
manufacture of viral vaccines. Due to problems arising out of changein product mix and technology transfer to the company is on holdsince February, 1992. Now the entire infrastructure of the companyis given on a 30 years lease to M/s Reliance Life Sciences Pvt, Ltd,for the establishment of a life science research and developmentCentre at the project site.
Performance HighlightsTotal Revenue of the company registered an increase of
` 0.06crore during 2011-12, which went up from ` 2.17crore in2010-11 to ` 2.23crore in 2011-12.However, the profit of thecompany has gone down by ` 0.01crore to `0.43 crore, from` 0.44 crore in previous year due to marginally increase in expenditure.
The current ratio of company is at 3.6:1 during 2011-12 asagainst 1.45:1 in the previous year (Fig.2). Balance Sheet and Profit& Loss Account of the company and selected financial ratios duringthe period 2010-11 to 2011-12 can be seen on the adjoining page.
Indian Vaccine Corporation Ltd.
EBIT
DA
& P
AT (
Rs.
cro
re)
TOTAL R
EVENU
E (Rs. crore)
Fig. 1
PRO
FITA
BIL
ITY
RAT
IOS
(%)
CU
RR
ENT R
ATIO
Fig. 2

Public Enterprises Survey 2011-2012: Vol-II 553
Indian Vaccine Corporation LtdManesar, Gurgaon, Haryana.
BALANCE SHEET (` in Lakhs)PARTICULARS 2011-12 2010-11I. EQUITY & LIABILITIESAUTHORISED CAPITAL 5000 5000(1) Shareholders’ Funds (a) Share Capital (i) Central Govt 1253 1253 (ii) Others 626 626 (b) Reserves & Surplus -312 -355 (c) Money received against share warrants 0 0 Total Shareholders’ Funds (1(a)+1(b)+1(c) 1567 1524(2) Share application money pending allotment 0 0(3) Non-current Liabilities (a) Long Term Borrowings 0 101 (b) Deferred tax liabilities (Net) 0 0 (c) Other Long-term liabilities 0 0 (d) Long-term provisions 101 9 Total Non-Current Liabilities 3(a) to 3(d) 101 110(4) Current Liabilities (a) Short Term Borrowings 0 0 (b) Trade Payables 0 0 (c) Other current liabilities 44 41 (d) Short-term provisions 24 43 Total Current Liabilities 4(a) to 4(d) 68 84TOTAL EQUITY & LIABILITIES (1+2+3+4) 1736 1718II. ASSETS(1) Non-Current Assets (a) Total Gross Fixed Assets 1759 1759 (ai) Accumulated Depreciation, Depletion & Amortisation 537 400 (aii) Accumulated Impairment 0 0 (b) Total Net Fixed Assets ((a)-(ai)-(aii) 1222 1359 (c) Capital work in progress 0 0 (d) Intangible assets under developmet 0 0 (e) Non-Current Investments 0 0 (f) Deferred Tax Assets (Net) 80 58 (g) Long Term Loans and Advances 189 179 (h) Other Non-Current Assets 0 0 Total Non-Current Assets (b+c+d+e+f+g+h) 1491 1596(2) Current Assets (a) Current Investments 0 0 (b) Inventories 0 0 (c) Trade Recievables 0 0 (d) Cash & Bank Balance 114 36 (e) Short-term Loans & Advances 92 0 (f) Other Current Assets 39 86 Total Current Assets (a+b+c+d+e+f) 245 122TOTAL ASSETS (1+2) 1736 1718Important Indicators (i) Investment 1879 1980 (ii) Capital Employed 1567 1625 (iii) Net Worth 1567 1524 (iv) Net Current Assets 177 38 (v) Cost of Sales 202 197 (vi) Net Value Added (at market price) 67 65 (vii) Total Regular Employees (Nos.) 4 5(viii) Avg. Monthly Emoluments per Employee(`) 43750 40000
PROFIT & LOSS ACCOUNT (` in Lakhs)PARTICULARS 2011-12 2010-11(I) Revenue from Operations (Gross) 0 0 Less : Excise Duty 0 0 Revenue from Operations (Net) 0 0(II) Other Income 223 217(III) Total Revenue (I+II) 223 217(IV) Expenditure on: (a) Cost of materials consumed 0 0 (b) Purchase of stock-in-trade 0 0 (c) Changes in inventories of finished goods, 0 0work-in-progress and stock in trade (d) Stores & Spares 0 0 (e) Power & Fuel 2 2 (f) Salary, Wages & Benefits/Employees Expense 21 24 (g) Other Operating/direct/manufacturing Expenses 0 0 (h) Rent, Royalty & Cess 0 0 (i) Loss on sale of Assets/Investments 0 0 (j) Other Expenses 42 16Total Expenditure (IV (a to j)) 65 42(V) PROFIT BEFORE DEPRECIATION, & IMPAIRMENT, 158 175FINANCE CHARGES/INTEREST, EXCEPTIONAL &EXTRAORDINARY ITEMS & TAXES (PBDIEET)(III-IV)(VI) Depreciation, Depletion & Amortisation 137 155(VII) Impairment 0 0(VIII) PROFIT BEFORE FINANCE COST/INTEREST, 21 20EXCEPTIONAL, EXTRA-ORDINARY ITEMS & TAXES (PBIEET)(V-VI-VII)(IX) Finance Cost (a) On Central Government Loans 0 0 (b) On Foreign Loans 0 0 (c) Others 0 0 (d) Less Finance Cost Capitalised 0 0 (e) Charged to P & L Account (a+b+c+d) 0 0(X) PROFIT BEFORE EXCEPTIONAL & EXTRA-ORDINARY 21 20ITEMS & TAX (PBEET)(VIII-IXe)(XI) Exceptional Items 0 0(XII) PROFIT BEFORE EXTRA-ORDINARY ITEMS & TAX 21 20(PBET)(X-XI)(XIII) Extra-Ordinary Items 0 0(XIV) PROFIT BEFORE TAX (PBT)(XII-XIII) 21 20(XV) TAX PROVISIONS -22 -23(XVI) NET PROFIT / LOSS FOR THE PERIOD FROM 43 43CONTINUING OPERATIONS AFTER TAX(XIV-XV)(XVII) Profit/Loss from discontinuing operations 0 0(XVIII) Tax expenses of discontinuing operations 0 0(XIX) Profit/Loss from discontinuing operations 0 0(after Tax)(XVII-XVIII)(XX) Profit/Loss for the period (XVI+XIX) 43 43Financial Ratios (i) Sales : Capital Employed 0 0 (ii) Cost of Sales : Sales 0 0 (iii) Salary/Wages : Sales 0 0 (iv) Net Profit : Net Worth 2.74 2.82 (v) Debt : Equity 0 0.05 (vi) Current Ratio 3.60 1.45 (vii) Trade Recievables : Sales 0 0 (viii) Total Inventory : Sales 0 0

Financial Services554
The CompanyIndian Renewable Energy Development Agency Limited
(IREDA) was incorporated on 11.03.1987 with an objective tofinance and promote investment in renewable energy sources.
IREDA is a Schedule-‘B’ CPSE in Financial Services sectorunder the administrative control of Ministry of New and RenewableEnergy with 100% shareholding by the Government of India. Thecompany employed 130 regular employees (Executives 104, Nonexecutives 26) as on 31.3.2012. Its Registered and Corporate officesare in New Delhi.Vision/Mission
The vision of IREDA is to maintain its position as a leadingorganization to provide efficient and effective financing in RenewableEnergy, Energy Efficiency/ Conservation sector in the country.
The Mission of the company is to be a pioneering, participantfriendly and competitive institution for financing and promotingself - sustaining investment in energy generation from RenewableSources, energy efficiency and environment technologies forsustainable development.Industrial / Business Operations
IREDA is engaged in providing financial services and promotingself sustaining investment in energy generation from renewablesources. The Company has one joint venture (JV) namely MPWind Farms Ltd. with an investment of Rs. 12 lakhs in equity.Performance Highlights
As on 31.3.2012, the cumulative loan sanctioned stood at` 18711.87 crore for 2019 projects and disbursed an amount of` 9723.29 crore. The physical performance of company for the lasttwo years are given below:
India Renewable Energy DevelopmentAgency Limited
The current ratio of company is at 2.09:1 during 2011-12 asagainst 1.84:1 in the previous year (Fig.2). Balance Sheet and Profit& Loss Account of the company and selected financial ratios duringthe period 2010-11 to 2011-12 can be seen on the adjoining page.
Main Services Unit Performance during
2011-12 2010-11
Loan sanctioned ` crore 3405.96 3126.42
Disbursements ` crore 1855.04 1224.17
Repayment by borrowers ` crore 336.71 816.93
The net profit of the company correspondingly increased to` 173.13 crore, an increase of ` 52.67 crore over` 120.46 of previous year due to increase in interest income andrecoveries.
Total Revenue of the company registered an increase of` 132.36 crore during 2011-12, which went up from ̀ 402.46 crorein 2010-11 to ` 534.82 crore in 2011-12.
The company received an equity support of ` 50.00 croreeach in 2010 -11 and 2011-12.
Strategic IssuesTo give impetus to the development of Renewable Energy
(RE) & Energy Efficiency (EE) sectors, IREDA introduced severalnew schemes. This year the company took to finance small hydroand wind power projects with renewable energy certificate (REC)mechanism and financed 13 solar grid connected power underJNNSM and other solar programmes. The company has sign MoUwith various state level agencies with a view to develop and promotecommercially viable Renewable energy and Energy Efficiencyprojects in India.
www.ireda.gov.in
EBIT
DA
& P
AT (
Rs.
cro
re)
TOTAL R
EVENU
E (Rs. crore)
Fig. 1
PRO
FITA
BIL
ITY
RAT
IOS
(%)
CU
RR
ENT R
ATIO
Fig. 2

Public Enterprises Survey 2011-2012: Vol-II 555
BALANCE SHEET (` in Lakhs)PARTICULARS 2011-12 2010-11I. EQUITY & LIABILITIESAUTHORISED CAPITAL 100000 100000(1) Shareholders’ Funds (a) Share Capital (i) Central Govt 63960 58960 (ii) Others 0 0 (b) Reserves & Surplus 81839 67453 (c) Money received against share warrants 0 0 Total Shareholders’ Funds (1(a)+1(b)+1(c) 145799 126413(2) Share application money pending allotment 0 0(3) Non-current Liabilities (a) Long Term Borrowings 395916 239806 (b) Deferred tax liabilities (Net) 0 0 (c) Other Long-term liabilities 53 169 (d) Long-term provisions 3215 2855 Total Non-Current Liabilities 3(a) to 3(d) 399184 242830(4) Current Liabilities (a) Short Term Borrowings 2 0 (b) Trade Payables 446 291 (c) Other current liabilities 27686 14251 (d) Short-term provisions 35738 29381 Total Current Liabilities 4(a) to 4(d) 63872 43923TOTAL EQUITY & LIABILITIES (1+2+3+4) 608855 413166II. ASSETS(1) Non-Current Assets (a) Total Gross Fixed Assets 5941 5495 (ai) Accumulated Depreciation, Depletion & Amortisation 1629 1458 (aii) Accumulated Impairment 0 0 (b) Total Net Fixed Assets ((a)-(ai)-(aii) 4312 4037 (c) Capital work in progress 0 19 (d) Intangible assets under developmet 9 24 (e) Non-Current Investments 12 12 (f) Deferred Tax Assets (Net) 5835 5839 (g) Long Term Loans and Advances 452415 304102 (h) Other Non-Current Assets 12970 18141 Total Non-Current Assets (b+c+d+e+f+g+h) 475553 332174(2) Current Assets (a) Current Investments 0 0 (b) Inventories 0 0 (c) Trade Recievables 125 78 (d) Cash & Bank Balance 61388 20455 (e) Short-term Loans & Advances 71694 60290 (f) Other Current Assets 95 169 Total Current Assets (a+b+c+d+e+f) 133302 80992TOTAL ASSETS (1+2) 608855 413166Important Indicators (i) Investment 459876 298766 (ii) Capital Employed 541715 366219 (iii) Net Worth 145799 126413 (iv) Net Current Assets 69430 37069 (v) Cost of Sales 32658 23554 (vi) Net Value Added (at market price) 22752 18319 (vii) Total Regular Employees (Nos.) 130 130(viii) Avg. Monthly Emoluments per Employee(`) 102821 89615
PROFIT & LOSS ACCOUNT (` in Lakhs)PARTICULARS 2011-12 2010-11(I) Revenue from Operations (Gross) 51965 40096 Less : Excise Duty 0 0 Revenue from Operations (Net) 51965 40096(II) Other Income 1517 150(III) Total Revenue (I+II) 53482 40246(IV) Expenditure on: (a) Cost of materials consumed 0 0 (b) Purchase of stock-in-trade 0 0 (c) Changes in inventories of finished goods, work-in- 0 0progress and stock in trade (d) Stores & Spares 0 0 (e) Power & Fuel 39 41 (f) Salary, Wages & Benefits/Employees Expense 1604 1398 (g) Other Operating/direct/manufacturing Expenses 25486 19002 (h) Rent, Royalty & Cess 20 19 (i) Loss on sale of Assets/Investments 12 22 (j) Other Expenses 5185 2791Total Expenditure (IV (a to j)) 32346 23273(V) PROFIT BEFORE DEPRECIATION, & IMPAIRMENT, 21136 16973FINANCE CHARGES/INTEREST, EXCEPTIONAL &EXTRAORDINARY ITEMS & TAXES (PBDIEET)(III-IV)(VI) Depreciation, Depletion & Amortisation 324 303(VII) Impairment 0 0(VIII) PROFIT BEFORE FINANCE COST/INTEREST, 20812 16670EXCEPTIONAL, EXTRA-ORDINARY ITEMS &TAXES (PBIEET)(V-VI-VII)(IX) Finance Cost (a) On Central Government Loans 0 0 (b) On Foreign Loans 0 0 (c) Others 0 0 (d) Less Finance Cost Capitalised 0 0 (e) Charged to P & L Account (a+b+c+d) 0 0(X) PROFIT BEFORE EXCEPTIONAL & EXTRA- 20812 16670ORDINARY ITEMS & TAX (PBEET)(VIII-IXe)(XI) Exceptional Items 0 0(XII) PROFIT BEFORE EXTRA-ORDINARY ITEMS & 20812 16670TAX (PBET)(X-XI)(XIII) Extra-Ordinary Items 0 0(XIV) PROFIT BEFORE TAX (PBT)(XII-XIII) 20812 16670(XV) TAX PROVISIONS 3499 4624(XVI) NET PROFIT / LOSS FOR THE PERIOD FROM 17313 12046CONTINUING OPERATIONS AFTER TAX(XIV-XV)(XVII) Profit/Loss from discontinuing operations 0 0(XVIII) Tax expenses of discontinuing operations 0 0(XIX) Profit/Loss from discontinuing operations 0 0(after Tax)(XVII-XVIII)(XX) Profit/Loss for the period (XVI+XIX) 17313 12046Financial Ratios (i) Sales : Capital Employed 9.59 10.95 (ii) Cost of Sales : Sales 62.85 58.74 (iii) Salary/Wages : Sales 3.09 3.49 (iv) Net Profit : Net Worth 11.87 9.53 (v) Debt : Equity 6.19 4.07 (vi) Current Ratio 2.09 1.84 (vii) Trade Recievables : Sales 0.24 0.19 (viii) Total Inventory : Sales 0 0
Indian Renewable Energy Development Agency LtdIndia Habitat Centre, Core-4 ‘A’ East Court, 1st Floor,Lodhi Road, New Delhi-110003

Financial Services556
The CompanyIndian Railway Finance Corporation Ltd. (IRFC) was
incorporated on 12th December, 1986 as a Public Financial Institutionnotified under Section 4A of the Companies Act, 1956. It is NDFC-ND-Infrastructure Finance Company notified under section 45-1Aof the Reserve Bank of India Act, 1934.
IRFC is a Schedule ‘B’ CPSE in the financial service sectorunder the administrative control of Ministry of Railways with100% shareholding of Government of India. The company employed19 regular employees (executives 7, non executives 12) as on31.3.2012. It’s registered and Corporate Office is at New Delhi.Vision / Mission
The Vision of the Company is to establish IRFC as a premierFinancial Services Company, create synergies with the Ministry ofRailways, select CPSEs & other entities for sustained growth increation of Rail infrastructure.
The Mission of the Company is to make IRFC as one of theleading Financial Service Company in the country, for raising fundsfrom the capital market at competitive cost, for augmenting railwayplan finances, duly ensuring that the Corporation makes optimumprofits from its operations.Industrial / Business Operations
Indian Railway Finance Corporation is the market borrowingarm of Ministry of Railways (MoR). The Annual Plan Outlay ofMOR, as indicated in the Railway Budget, is met through threesources namely Internal Generation, Budgetary Support from theMinistry of Finance and Extra Budgetary Resources (EBR)Requirements. IRFC is a Special Purpose Vehicle set up to meet theEBR of the Indian Railways.
Each year, MoR notifies IRFC regarding the Annual Borrowingtarget. After receiving the annual borrowing target from MoR, IRFCtaps both the domestic and overseas financial market and transferthe funds to MOR. The funds transferred by IRFC to MOR areused for procurement of Rolling Stock Assets including wagons,coaches and locomotives which are leased out to Railways througha 30 years financial lease agreement executed with them. Till date,IRFC has created Rolling Stock assets worth `82,447 Crore forIndian Railways.Performance Highlights
For the year 2011-12, IRFC was given a borrowing target of`14800 crore. The company was able to meet the target at the rateof 8.73% p.a. IRFC was assigned the responsibility of fundingselect capacity enhancement works of Indian Railways to the tuneof Rs.2078.49 crores.
The Company registered an increase of ̀ 801.51 crore in totalrevenue during 2011-12 which went up to ` 4643.11 crore in2011-12 from ̀ 3841.60 crore during 2010-11. The net profit of thecompany however decreased to ` 480.78 crore, a reduction of`4.42 crore over the previous year’s profit of ` 485.20 crore dueto increased tax liability of the company during the year. ProfitAfter Tax (PAT) for the previous year includes an one time gain of` 57 crore on account of reversal of deferred tax liability. Discountingthe impact of this one time / non-recurring gain, the adjusted PATfor the previous year is lower than current year. The increase inprofitability is attributed to the growth in the incremental assets
Indian Railway Finance Corporation Ltd.leased to MoR. IRFC executed a currency swap in respect of theyen denominated Samurai bonds, which resulted in a saving of` 196.59 crores.
The current ratio of company is at 1.15:1 during 2011-12 asagainst 0.78:1 in the previous year (Fig.2). Balance Sheet and Profit& Loss Account of the company and selected financial ratios duringthe period 2010-11 to 2011-12 can be seen on the adjoining page.
EBIT
DA
& P
AT (
Rs.
cro
re)
TOTAL R
EVENU
E (Rs. crore)
Fig. 1
PRO
FITA
BIL
ITY
RAT
IOS
(%)
CU
RR
ENT R
ATIO
Fig. 2
Strategic issueIRFC came up with the public issue of tax free bonds and
mobilized a sum ` 6268.89 crores. The company had adopted adifferential pricing strategy which helped mobilize the target amountin least possible time and in keeping the average issuance cost oflower than other CPSE’s.
www.irfc.in

Public Enterprises Survey 2011-2012: Vol-II 557
Indian Railway Finance Corporation Ltd.UG Floor, East Tower, NBCC Place, Bhisham Pitamah Marg, Pragati Vihar, Lodhi Road New Delhi -110003
BALANCE SHEET (` in Lakhs)PARTICULARS 2011-12 2010-11I. EQUITY & LIABILITIESAUTHORISED CAPITAL 500000 200000(1) Shareholders’ Funds (a) Share Capital (i) Central Govt 210200 160200 (ii) Others 0 0 (b) Reserves & Surplus 304852 268396 (c) Money received against share warrants 0 0 Total Shareholders’ Funds (1(a)+1(b)+1(c) 515052 428596(2) Share application money pending allotment 25000 0(3) Non-current Liabilities (a) Long Term Borrowings 4695025 3453649 (b) Deferred tax liabilities (Net) 303041 270143 (c) Other Long-term liabilities 727 21011 (d) Long-term provisions 4 1 Total Non-Current Liabilities 3(a) to 3(d) 4998797 3744804(4) Current Liabilities (a) Short Term Borrowings 40565 2325 (b) Trade Payables 0 0 (c) Other current liabilities 427253 463765 (d) Short-term provisions 52261 31547 Total Current Liabilities 4(a) to 4(d) 520079 497637TOTAL EQUITY & LIABILITIES (1+2+3+4) 6058928 4671037II. ASSETS(1) Non-Current Assets (a) Total Gross Fixed Assets 1708 1701 (ai) Accumulated Depreciation, Depletion & Amortisation 399 364 (aii) Accumulated Impairment 0 0 (b) Total Net Fixed Assets ((a)-(ai)-(aii) 1309 1337 (c) Capital work in progress 0 0 (d) Intangible assets under developmet 0 0 (e) Non-Current Investments 1458 1668 (f) Deferred Tax Assets (Net) 0 0 (g) Long Term Loans and Advances 5413365 4238413 (h) Other Non-Current Assets 44152 40518 Total Non-Current Assets (b+c+d+e+f+g+h) 5460284 4281936(2) Current Assets (a) Current Investments 210 230 (b) Inventories 0 0 (c) Trade Recievables 0 0 (d) Cash & Bank Balance 154596 49400 (e) Short-term Loans & Advances 66551 36336 (f) Other Current Assets 377287 303135 Total Current Assets (a+b+c+d+e+f) 598644 389101TOTAL ASSETS (1+2) 6058928 4671037Important Indicators (i) Investment 4930225 3613849 (ii) Capital Employed 5235077 3882245 (iii) Net Worth 540052 428596 (iv) Net Current Assets 78565 -108536 (v) Cost of Sales 362991 294325 (vi) Net Value Added (at market price) 101508 90038 (vii) Total Regular Employees (Nos.) 19 19(viii) Avg. Monthly Emoluments per Employee(`) 82456 89035
PROFIT & LOSS ACCOUNT ( `̀̀̀̀ in Lakhs)PARTICULARS 2011-12 2010-11(I) Revenue from Operations (Gross) 464194 383944 Less : Excise Duty 0 0 Revenue from Operations (Net) 464194 383944(II) Other Income 117 216(III) Total Revenue (I+II) 464311 384160(IV) Expenditure on: (a) Cost of materials consumed 0 0 (b) Purchase of stock-in-trade 0 0 (c) Changes in inventories of finished goods, work-in- 0 0
progress and stock in trade (d) Stores & Spares 0 0 (e) Power & Fuel 11 8 (f) Salary, Wages & Benefits/Employees Expense 188 203 (g) Other Operating/direct/manufacturing Expenses 362039 293674 (h) Rent, Royalty & Cess 1 1 (i) Loss on sale of Assets/Investments 1 1 (j) Other Expenses 717 404Total Expenditure (IV (a to j)) 362957 294291(V) PROFIT BEFORE DEPRECIATION, & IMPAIRMENT, 101354 89869FINANCE CHARGES/INTEREST, EXCEPTIONAL &EXTRAORDINARY ITEMS & TAXES (PBDIEET)(III-IV)(VI) Depreciation, Depletion & Amortisation 35 35(VII) Impairment 0 0(VIII) PROFIT BEFORE FINANCE COST/INTEREST, 101319 89834EXCEPTIONAL, EXTRA-ORDINARY ITEMS & TAXES(PBIEET)(V-VI-VII)(IX) Finance Cost (a) On Central Government Loans 0 0 (b) On Foreign Loans 0 0 (c) Others 0 0 (d) Less Finance Cost Capitalised 0 0 (e) Charged to P & L Account (a+b+c+d) 0 0(X) PROFIT BEFORE EXCEPTIONAL & EXTRA-ORDINARY 101319 89834ITEMS & TAX (PBEET)(VIII-IXe)(XI) Exceptional Items 0 0(XII) PROFIT BEFORE EXTRA-ORDINARY ITEMS & TAX 101319 89834(PBET)(X-XI)(XIII) Extra-Ordinary Items 0 0(XIV) PROFIT BEFORE TAX (PBT)(XII-XIII) 101319 89834(XV) TAX PROVISIONS 53241 41314(XVI) NET PROFIT / LOSS FOR THE PERIOD FROM 48078 48520CONTINUING OPERATIONS AFTER TAX(XIV-XV)(XVII) Profit/Loss from discontinuing operations 0 0(XVIII) Tax expenses of discontinuing operations 0 0(XIX) Profit/Loss from discontinuing operations 0 0(after Tax)(XVII-XVIII)(XX) Profit/Loss for the period (XVI+XIX) 48078 48520Financial Ratios (i) Sales : Capital Employed 8.87 9.89 (ii) Cost of Sales : Sales 78.2 76.66 (iii) Salary/Wages : Sales 0.04 0.05 (iv) Net Profit : Net Worth 8.9 11.32 (v) Debt : Equity 19.96 21.56 (vi) Current Ratio 1.15 0.78 (vii) Trade Recievables : Sales 0 0 (viii) Total Inventory : Sales 0 0

Financial Services558
The CompanyKumarakruppa Frontier Hotel Pvt. Ltd. (KFH) was
incorporated on 23.08.2001 with the objective of receiving theland, building and other assets and liabilities of the hotel propertiesgiven on lease-cum-management contract, administering the lease-cum-management contract and receiving the lease payments fromtime to time in pursuance to the Government decision fordisinvestment of ITDC Hotels.
KFH is an un-categorized CPSE in Financial Services sectorunder the administrative control of M/o Tourism with 91%GoIshareholding. The company employed 3regular employees(Executives 2 & Non-Executives 1) as on 31.3.2012. Its Registeredand Corporate offices are at New Delhi.
Vision / MissionThe Vision / Mission of the Company is to administer the
lease-cum-management contracts and receive lease payments fromtime to time.
Industrial / Business OperationsThe company has no business other than receiving lease
payments. The only activity of the company is to receive lease rentfrom Bharat Hotels for the leased property namely Hotel Ashok,Bangalore.
Performance HighlightsTotal Revenue of the company registered areductionof
`2.41crore during 2011-12, which went down from ̀ 12.05crore in2010-11 to `9.64crore in 2011-12.The net profit of the companyalso reduced to `5.43crore, a reduction of `0.14crore over theprevious year profit of `5.57crore due to reduction in income.
Most of its revenues (lease rentals) become a distributable netprofit, which accrues to the Government of India and othershareholders, through dividend.
The current ratio of company is at 1.87:1 during 2011-12 asagainst 1.46:1 in the previous year (Fig.2). Balance Sheet and Profit& Loss Account of the company and selected financial ratios duringthe period 2010-11 to 2011-12 can be seen on the adjoining page.
Kumarakruppa Frontier Hotel Pvt. Ltd.
EBIT
DA
& P
AT (
Rs.
cro
re)
TOTAL R
EVENU
E (Rs. crore)
Fig. 1
PRO
FITA
BIL
ITY
RAT
IOS
(%)
CU
RR
ENT R
ATIO
Fig. 2
Strategic issueThe consideration fixed for leasing of Hotel Ashok Bangalore
was `4.11 crore per annum as Minimum Guaranteed AnnualPayment (MGAP) upto 31.3.2007 which was to be increased by25% w.e.f. 1.4.2007 and in every five years thereafter or 16.5% ofthe gross turnover of the Hotel Ashok Bangalore as Turnover BasedAnnual Payment (TBAP), whichever is higher.
As per the terms of agreement, the lessee has to pay 50% ofthe MGAP for 30 years, which is discounted as upfront amount.The remaining 50% of MGAP/TBAP, after adjusting the amountpaid, is payable by the lessee in each financial year.
After expiration of lease agreement the land and building andother assets and liabilities of the hotel properties is to be given onlease-cum-management contract.

Public Enterprises Survey 2011-2012: Vol-II 559
Kumarakruppa Frontier Hotel Pvt. Ltd.5th Floor, Core 8, SCOPE Complex, 7, Lodhi Road, New Delhi - 110 003
BALANCE SHEET (` in Lakhs)PARTICULARS 2011-12 2010-11I. EQUITY & LIABILITIESAUTHORISED CAPITAL 100 100(1) Shareholders’ Funds (a) Share Capital (i) Central Govt 88 88 (ii) Others 9 9 (b) Reserves & Surplus 1915 1832 (c) Money received against share warrants 0 0 Total Shareholders’ Funds (1(a)+1(b)+1(c) 2012 1929(2) Share application money pending allotment 0 0(3) Non-current Liabilities (a) Long Term Borrowings 0 0 (b) Deferred tax liabilities (Net) 0 0 (c) Other Long-term liabilities 2159 2033 (d) Long-term provisions 0 0 Total Non-Current Liabilities 3(a) to 3(d) 2159 2033(4) Current Liabilities (a) Short Term Borrowings 544 325 (b) Trade Payables 0 0 (c) Other current liabilities 114 87 (d) Short-term provisions 740 1656 Total Current Liabilities 4(a) to 4(d) 1398 2068TOTAL EQUITY & LIABILITIES (1+2+3+4) 5569 6030II. ASSETS(1) Non-Current Assets (a) Total Gross Fixed Assets 709 709 (ai) Accumulated Depreciation, Depletion & Amortisation 583 576 (aii) Accumulated Impairment 0 0 (b) Total Net Fixed Assets ((a)-(ai)-(aii) 126 133 (c) Capital work in progress 0 0 (d) Intangible assets under developmet 0 0 (e) Non-Current Investments 2645 2724 (f) Deferred Tax Assets (Net) 188 161 (g) Long Term Loans and Advances 0 0 (h) Other Non-Current Assets 0 0 Total Non-Current Assets (b+c+d+e+f+g+h) 2959 3018(2) Current Assets (a) Current Investments 0 0 (b) Inventories 0 0 (c) Trade Recievables 263 508 (d) Cash & Bank Balance 1676 1839 (e) Short-term Loans & Advances 493 504 (f) Other Current Assets 178 161 Total Current Assets (a+b+c+d+e+f) 2610 3012TOTAL ASSETS (1+2) 5569 6030Important Indicators (i) Investment 97 97 (ii) Capital Employed 2012 1929 (iii) Net Worth 2012 1929 (iv) Net Current Assets 1212 944 (v) Cost of Sales 59 292 (vi) Net Value Added (at market price) 872 877 (vii) Total Regular Employees (Nos.) 3 3(viii) Avg. Monthly Emoluments per Employee(`) 77778 66667
PROFIT & LOSS ACCOUNT (` in Lakhs)PARTICULARS 2011-12 2010-11(I) Revenue from Operations (Gross) 559 840 Less : Excise Duty 0 0 Revenue from Operations (Net) 559 840(II) Other Income 405 365(III) Total Revenue (I+II) 964 1205(IV) Expenditure on: (a) Cost of materials consumed 0 0 (b) Purchase of stock-in-trade 0 0 (c) Changes in inventories of finished goods, work-in- 0 0
progress and stock in trade (d) Stores & Spares 0 0 (e) Power & Fuel 0 0 (f) Salary, Wages & Benefits/Employees Expense 28 24 (g) Other Operating/direct/manufacturing Expenses 1 0 (h) Rent, Royalty & Cess 17 17 (i) Loss on sale of Assets/Investments 0 0 (j) Other Expenses 6 241Total Expenditure (IV (a to j)) 52 282(V) PROFIT BEFORE DEPRECIATION, & IMPAIRMENT, 912 923 FINANCE CHARGES/INTEREST, EXCEPTIONAL &EXTRAORDINARY ITEMS & TAXES (PBDIEET)(III-IV)(VI) Depreciation, Depletion & Amortisation 7 10(VII) Impairment 0 0(VIII) PROFIT BEFORE FINANCE COST/INTEREST, 905 913EXCEPTIONAL, EXTRA-ORDINARY ITEMS & TAXES(PBIEET)(V-VI-VII)(IX) Finance Cost (a) On Central Government Loans 0 0 (b) On Foreign Loans 0 0 (c) Others 24 2 (d) Less Finance Cost Capitalised 0 0 (e) Charged to P & L Account (a+b+c+d) 24 2(X) PROFIT BEFORE EXCEPTIONAL & EXTRA-ORDINARY 881 911ITEMS & TAX (PBEET)(VIII-IXe)(XI) Exceptional Items 78 77(XII) PROFIT BEFORE EXTRA-ORDINARY ITEMS & TAX 803 834(PBET)(X-XI)(XIII) Extra-Ordinary Items 0 0(XIV) PROFIT BEFORE TAX (PBT)(XII-XIII) 803 834(XV) TAX PROVISIONS 260 277(XVI) NET PROFIT / LOSS FOR THE PERIOD FROM 543 557CONTINUING OPERATIONS AFTER TAX(XIV-XV)(XVII) Profit/Loss from discontinuing operations 0 0(XVIII) Tax expenses of discontinuing operations 0 0(XIX) Profit/Loss from discontinuing operations 0 0(after Tax)(XVII-XVIII)(XX) Profit/Loss for the period (XVI+XIX) 543 557Financial Ratios (i) Sales : Capital Employed 27.78 43.55 (ii) Cost of Sales : Sales 10.55 34.76 (iii) Salary/Wages : Sales 5.01 2.86 (iv) Net Profit : Net Worth 26.99 28.88 (v) Debt : Equity 0 0 (vi) Current Ratio 1.87 1.46 (vii) Trade Recievables : Sales 47.05 60.48 (viii) Total Inventory : Sales 0 0

Financial Services560
National Handicapped Finance & Dev. Corp.The Company
National Handicapped Finance & Dev. Corp. (NHFDC) wasincorporated on 24.01.1997 as a company not for profit underSection 25 of the Companies Act, 1956 with the objective of servingas a catalyst in the economic & social development of persons withdisability by helping them in setting up self-employment projects.
NHFDC is a Schedule-‘C’ CPSE in Financial Services sectorunder the administrative control of M/o Social Justice &Empowerment with 100% shareholding by the Government ofIndia. The company employed 30regular employees (Executives13, Non-executives 17) as on 31.3.2012. Its Registered andCorporate offices are at Faridabad, Haryana. During the year,company received equity of ` 45.00 crores from GoI.
Vision / MissionThe Vision and Mission of the Company is to empower the
disabled persons to break away from the dependence on others anddepressed economic and social conditions by engaging themselvesin productive work and move up the social and economic ladderwith dignity and pride.
Industrial / Business OperationsNHFDC is engaged in providing services in the field of financial
assistance for self-employment of the disabled persons throughState Channelising Agencies (SCAs. The NHFDC functions as anapex institution for channelizing funds to persons with disabilitiesthrough the SCAs nominated by the concerned StateGovernment(s) and Union Territories or Regional Rural Banks(RRBs).
The assistance in the form of loan is provided for setting upsmall business in service / trading sector; purchase of vehicles forcommercial hiring; setting up small industrial unit; agricultureactivities; self-employment amongst persons with mentalretardation, cerebral palsy and autism; professional / educational /training courses; financial assistance for skills and entrepreneurialdevelopment; Micro Credit Finance; and Parents’ Association ofmentally retarded persons.
The company strives to promote economic developmentalactivities & self employment ventures for the persons withdisabilities. It is assisting in up-gradation of entrepreneurial skill,vocational rehabilitation, self employment and in marketing of theirproducts.
Performance HighlightsThe physical performances of the company for last two years
are given below:
The Company registered an increase of ` 3.90 crore in netrevenue during 2011-12 which went up to ̀ 8.33 crore in 2011-12from ` 4.43crore during 2010-11. The net profit of the companyincreased to ̀ 3.72crore in 2011-12, an increase of ̀ 2.17crore overthe previous year profit of `1.55crore.The profitability increaseddue to better management of funds and increase in loan income dueto increase in disbursement.
The current ratio of company is at 17.84:1 during 2011-12 asagainst 10.26:1 in the previous year (Fig.2). Balance Sheet and Profit& Loss Account of the company and selected financial ratios duringthe period 2010-11 to 2011-12 can be seen on the adjoining page.
Main Segments Unit Performance during
2011-12 2010-11
Loan Disbursed ` Cr. 50.86 31.84
Beneficiaries No. 10625 6356
Strategic issueDuring the year NHFDC has taken new initiatives for extending
the outreach to its target group e.g. training of persons withdisabilities; MoU with 17 regional rural banks/ scheduled commercialbanks; proposal for grant of subsidy, EDP training, interest freeeducation loan, grant for reimbursement of one time guarantee;scheme for young professionals with disabilities, advancefunding etc.
EBIT
DA
& P
AT (
Rs.
cro
re)
TOTAL R
EVENU
E (Rs. crore)
Fig. 1
PRO
FITA
BIL
ITY
RAT
IOS
(%)
CU
RR
ENT R
ATIO
Fig. 2

Public Enterprises Survey 2011-2012: Vol-II 561
National Handicapped Finance & Dev. Corp.Red Cross Bhawan, Sector-12, Faridabad, Haryana 121 007
BALANCE SHEET (` in Lakhs)PARTICULARS 2011-12 2010-11I. EQUITY & LIABILITIESAUTHORISED CAPITAL 40000 40000(1) Shareholders’ Funds(a) Share Capital(i) Central Govt 19180 16180(ii) Others 0 0(b) Reserves & Surplus 3130 2758(c) Money received against share warrants 0 0Total Shareholders’ Funds (1(a)+1(b)+1(c) 22310 18938(2) Share application money pending allotment 0 500(3) Non-current Liabilities(a) Long Term Borrowings 0 0(b) Deferred tax liabilities (Net) 0 0(c) Other Long-term liabilities 0 0(d) Long-term provisions 81 52Total Non-Current Liabilities 3(a) to 3(d) 81 52(4) Current Liabilities(a) Short Term Borrowings 0 0(b) Trade Payables 0 0(c) Other current liabilities 322 594(d) Short-term provisions 37 0Total Current Liabilities 4(a) to 4(d) 359 594TOTAL EQUITY & LIABILITIES (1+2+3+4) 22750 20084II. ASSETS(1) Non-Current Assets(a) Total Gross Fixed Assets 118 129(ai) Accumulated Depreciation, Depletion & Amortisation 92 97(aii) Accumulated Impairment 0 0(b) Total Net Fixed Assets ((a)-(ai)-(aii) 26 32(c) Capital work in progress 0 0(d) Intangible assets under developmet 0 0(e) Non-Current Investments 0 0(f) Deferred Tax Assets (Net) 0 0(g) Long Term Loans and Advances 16318 13955(h) Other Non-Current Assets 0 0Total Non-Current Assets (b+c+d+e+f+g+h) 16344 13987(2) Current Assets(a) Current Investments 0 0(b) Inventories 0 0(c) Trade Recievables 206 175(d) Cash & Bank Balance 5999 5806(e) Short-term Loans & Advances 26 33(f) Other Current Assets 175 83Total Current Assets (a+b+c+d+e+f) 6406 6097TOTAL ASSETS (1+2) 22750 20084Important Indicators(i) Investment 19180 16680(ii) Capital Employed 22310 19438(iii) Net Worth 22310 19438(iv) Net Current Assets 6047 5503(v) Cost of Sales 460 288(vi) Net Value Added (at market price) 619 339(vii) Total Regular Employees (Nos.) 30 32(viii) Avg. Monthly Emoluments per Employee(`) 68611 47917
PROFIT & LOSS ACCOUNT (` in Lakhs)PARTICULARS 2011-12 2010-11(I) Revenue from Operations (Gross) 832 442Less : Excise Duty 0 0Revenue from Operations (Net) 832 442(II) Other Income 1 1(III) Total Revenue (I+II) 833 443(IV) Expenditure on:(a) Cost of materials consumed 0 0(b) Purchase of stock-in-trade 0 0(c) Changes in inventories of finished goods, 0 0
work-in-progress and stock in trade(d) Stores & Spares 0 0(e) Power & Fuel 2 3(f) Salary, Wages & Benefits/Employees Expense 247 184(g) Other Operating/direct/manufacturing Expenses 3 2(h) Rent, Royalty & Cess 0 0(i) Loss on sale of Assets/Investments 1 0(j) Other Expenses 201 89Total Expenditure (IV (a to j)) 454 278(V) PROFIT BEFORE DEPRECIATION, & 379 165
IMPAIRMENT, FINANCE CHARGES/INTEREST, EXCEPTIONAL & EXTRAORDINARYITEMS & TAXES (PBDIEET)(III-IV)
(VI) Depreciation, Depletion & Amortisation 7 10(VII) Impairment 0 0(VIII) PROFIT BEFORE FINANCE COST/INTEREST,
EXCEPTIONAL, EXTRA-ORDINARYITEMS & TAXES (PBIEET)(V-VI-VII) 372 155
(IX) Finance Cost(a) On Central Government Loans 0 0(b) On Foreign Loans 0 0(c) Others 0 0(d) Less Finance Cost Capitalised 0 0(e) Charged to P & L Account (a+b+c+d) 0 0(X) PROFIT BEFORE EXCEPTIONAL & EXTRA-ORDINARY 372 155
ITEMS & TAX (PBEET)(VIII-IXe)(XI) Exceptional Items 0 0(XII) PROFIT BEFORE EXTRA-ORDINARY 372 155
ITEMS & TAX (PBET)(X-XI)(XIII) Extra-Ordinary Items 0 0(XIV) PROFIT BEFORE TAX (PBT)(XII-XIII) 372 155(XV) TAX PROVISIONS 0 0(XVI) NET PROFIT / LOSS FOR THE PERIOD FROM 372 155
CONTINUING OPERATIONS AFTER TAX(XIV-XV)(XVII) Profit/Loss from discontinuing operations 0 0(XVIII) Tax expenses of discontinuing operations 0 0(XIX) Profit/Loss from discontinuing operations 0 0
(after Tax)(XVII-XVIII)(XX) Profit/Loss for the period (XVI+XIX) 372 155Financial Ratios(i) Sales : Capital Employed 3.73 2.27(ii) Cost of Sales : Sales 55.29 65.16(iii) Salary/Wages : Sales 29.69 41.63(iv) Net Profit : Net Worth 1.67 0.8(v) Debt : Equity 0 0(vi) Current Ratio 17.84 10.26(vii) Trade Recievables : Sales 24.76 39.59(viii) Total Inventory : Sales 0 0

Financial Services562
The Company National Minorities Development Finance Corporation
(NMDFC) NMDFC was incorporated on 0.09.1994 as a companynot for profit under Section 25 of the Companies Act, 1956 with anobjective to promote economic and developmental activities for thebenefit of backward sections amongst minorities as defined underNational Commission for Minorities Act 1992.
NMDFC is a Schedule – ‘C’ CPSE in Financial Services sectorunder the administrative control of Ministry of Minority Affairswith 65% shareholding by the Govt. of India, 26% by the StateGovt. and 9% by the Groups & individuals having interest inDevelopment of Minorities. The company employed 32 regularemployees (Executives 16 and Non-executives 16) as on 31.3.2012.The registered and corporate office of NMDFC is situated at NewDelhi.
Vision / MissionThe Vision of the Company is to reach and assist all individuals/
groups among minorities who are living below double the povertyline in a phased manner.
The Mission of the Company is to promote economic anddevelopmental activities for the benefit of backward sectionsamongst minorities.
Industrial / Business OperationsNMDFC is a national level apex financing body providing
Financial Assistance / lending to eligible Minorities living belowdouble the poverty line at concessional rates of interest for selfemployment ventures as well as technical and professional education,with preference to women and occupational groups through 36operational State Channellising Agencies (SCAs) operational in 25States and two Union Territories across the country.
The major schemes implemented by NMDFC are Term Loan,Margin Money, Micro Credit, Interest Fee Loan for promotion ofSelf Help Groups, Revolving fund scheme under Micro Financing,Educational Loan, Vocational Training, Grant for skill/designdevelopment/ Marketing assistance scheme.
Performance HighlightsThe physical performances of the company for last two years
are given below:
The current ratio of company is at 104.92:1 during 2011-12as against 74.02:1 in the previous year (Fig.2). Balance Sheet andProfit & Loss Account of the company and selected financial ratiosduring the period 2010-11 to 2011-12 can be seen on the adjoiningpage.
Total Revenue of the company registered an increase of` 16.62 crore during 2011-12, which went up from ` 37.4 crore in2010-11 to ̀ 54.02 crore in 2011-12.The net profit of the companyincreased to ̀ 39.89 crore, an increase of ̀ 8.29 crore over previousyear profit of ` 31.60 crore due to receipt of Govt. Guarantee andless provision on loan.
Main Segments Unit Performance during
2011-12 2010-11
Disbursments of Loans ` in crore. 271.37 233.27
National Minorities Development Finance Corporation
www.nmdfc.org
Strategic IssuesSince NMDFC is a community welfare organisation, it receives
funds from the Government of India and the State Governments forpromoting economic and developmental activities amongst theminorities. During the year 2011-12 the company received abudgetary support of `139.03 crore as equity from Central Govt.and State Govt. Proposal for restructuring of NMDFC is underprocess in the Ministry of Minority Affairs.
EBIT
DA
& P
AT (
Rs.
cro
re) TO
TAL REVEN
UE (R
s. crore)
Fig. 1PR
OFI
TAB
ILIT
Y R
ATIO
S (%
)
CU
RR
ENT R
ATIO
Fig. 2

Public Enterprises Survey 2011-2012: Vol-II 563
National Minorities Development Finance Corporation2nd Floor, Core 2, Scope Minar, Laxmi Nagar, Delhi-110092
BALANCE SHEET (` in Lakhs)PARTICULARS 2011-12 2010-11I. EQUITY & LIABILITIESAUTHORISED CAPITAL 150000 150000(1) Shareholders’ Funds(a) Share Capital(i) Central Govt 87536 76036(ii) Others 19383 17281(b) Reserves & Surplus 20780 16791(c) Money received against share warrants 0 0Total Shareholders’ Funds (1(a)+1(b)+1(c) 127699 110108(2) Share application money pending allotment 300 0(3) Non-current Liabilities(a) Long Term Borrowings 0 0(b) Deferred tax liabilities (Net) 0 0(c) Other Long-term liabilities 77 6(d) Long-term provisions 388 400Total Non-Current Liabilities 3(a) to 3(d) 465 406(4) Current Liabilities(a) Short Term Borrowings 0 0(b) Trade Payables 15 50(c) Other current liabilities 332 319(d) Short-term provisions 35 26Total Current Liabilities 4(a) to 4(d) 382 395TOTAL EQUITY & LIABILITIES (1+2+3+4) 128846 110909II. ASSETS(1) Non-Current Assets(a) Total Gross Fixed Assets 919 711(ai) Accumulated Depreciation, Depletion & Amortisation 227 185(aii) Accumulated Impairment 0 0(b) Total Net Fixed Assets ((a)-(ai)-(aii) 692 526(c) Capital work in progress 0 0(d) Intangible assets under developmet 0 0(e) Non-Current Investments 0 0(f) Deferred Tax Assets (Net) 0 0(g) Long Term Loans and Advances 85858 79093(h) Other Non-Current Assets 2215 2054Total Non-Current Assets (b+c+d+e+f+g+h) 88765 81673(2) Current Assets(a) Current Investments 0 0(b) Inventories 0 0(c) Trade Recievables 179 377(d) Cash & Bank Balance 20624 14788(e) Short-term Loans & Advances 17854 13577(f) Other Current Assets 1424 494Total Current Assets (a+b+c+d+e+f) 40081 29236TOTAL ASSETS (1+2) 128846 110909Important Indicators(i) Investment 107219 93317(ii) Capital Employed 127999 110108(iii) Net Worth 127999 110108(iv) Net Current Assets 39699 28841(v) Cost of Sales 1413 579(vi) Net Value Added (at market price) 4400 3520(vii) Total Regular Employees (Nos.) 33 33(viii) Avg. Monthly Emoluments per Employee(`) 102273 81313
PROFIT & LOSS ACCOUNT (` in Lakhs)PARTICULARS 2011-12 2010-11(I) Revenue from Operations (Gross) 2836 2665Less : Excise Duty 0 0Revenue from Operations (Net) 2836 2665(II) Other Income 2566 1075(III) Total Revenue (I+II) 5402 3740(IV) Expenditure on:(a) Cost of materials consumed 0 0(b) Purchase of stock-in-trade 0 0(c) Changes in inventories of finished goods, 0 0
work-in-progress and stock in trade(d) Stores & Spares 0 0(e) Power & Fuel 3 2(f) Salary, Wages & Benefits/Employees Expense 405 322(g) Other Operating/direct/manufacturing Expenses 144 86(h) Rent, Royalty & Cess 6 37(i) Loss on sale of Assets/Investments 0 0(j) Other Expenses 808 104Total Expenditure (IV (a to j)) 1366 551(V) PROFIT BEFORE DEPRECIATION, & 4036 3189
IMPAIRMENT, FINANCE CHARGES/INTEREST, EXCEPTIONAL & EXTRAORDINARYITEMS & TAXES (PBDIEET)(III-IV)
(VI) Depreciation, Depletion & Amortisation 47 28(VII) Impairment 0 0(VIII) PROFIT BEFORE FINANCE COST/INTEREST,
EXCEPTIONAL, EXTRA-ORDINARYITEMS & TAXES (PBIEET)(V-VI-VII) 3989 3161
(IX) Finance Cost(a) On Central Government Loans 0 0(b) On Foreign Loans 0 0(c) Others 0 0(d) Less Finance Cost Capitalised 0 0(e) Charged to P & L Account (a+b+c+d) 0 0(X) PROFIT BEFORE EXCEPTIONAL & EXTRA-ORDINARY 3989 3161
ITEMS & TAX (PBEET)(VIII-IXe)(XI) Exceptional Items 0 0(XII) PROFIT BEFORE EXTRA-ORDINARY ITEMS & TAX 3989 3161
(PBET)(X-XI)(XIII) Extra-Ordinary Items 0 0(XIV) PROFIT BEFORE TAX (PBT)(XII-XIII) 3989 3161(XV) TAX PROVISIONS 0 0(XVI) NET PROFIT / LOSS FOR THE PERIOD FROM 3989 3161
CONTINUING OPERATIONS AFTER TAX(XIV-XV)(XVII) Profit/Loss from discontinuing operations 0 0(XVIII) Tax expenses of discontinuing operations 0 0(XIX) Profit/Loss from discontinuing operations 0 0
(after Tax)(XVII-XVIII)(XX) Profit/Loss for the period (XVI+XIX) 3989 3161Financial Ratios(i) Sales : Capital Employed 2.22 2.42(ii) Cost of Sales : Sales 49.82 21.73(iii) Salary/Wages : Sales 14.28 12.08(iv) Net Profit : Net Worth 3.12 2.87(v) Debt : Equity 0 0(vi) Current Ratio 104.92 74.02(vii) Trade Recievables : Sales 6.31 14.15(viii) Total Inventory : Sales 0 0

Financial Services564
National Scheduled Tribes Finance and Development CorporationThe Company
National Scheduled Tribes and Finance DevelopmentCorporation (NSTFDC) was incorporated on 10.04.2001, bybifurcating erstwhile National Scheduled Castes and ScheduledTribes Finance and Development Corporation (NSFDC). It is anexclusive corporation setup for economic development of ScheduledTribes. This corporation has been granted license under Section 25of the Companies Act, 1956.
NSTFDC is a Schedule-‘C’ CPSE under the administrativecontrol of Ministry of Tribal Affairs (MoTA) and fully owned bythe Government of India. The company employed 53regularemployees (Executives 25, Non-executives28) as on 31.3.2012. ItsRegistered and Corporate office is at New Delhi.Vision / Mission
The Vision / Mission of the company is economic developmentof Scheduled Tribes on sustainable basis.Industrial / Business Operations
NSTFDC provides financial assistance for viable incomegenerating activities for economic development of Schedule Tribes.The financial assistance is extended at concessional interest rate of4% to 8% chargeable from beneficiaries based on financial assistancegiven. The major schemes are Term Loan Scheme,AdivasiMahilaSashaktikaranYojana (AMSY), Micro Credit Scheme.During the year the corporation has introduced two new schemesnamely ÄdivasiShikshaRrinnYojana (ASRY) and Scheme forFinancial Assistance to Tribal Artisans empanelled with TRIFED.
Company is extending concessional finance through the Central/State Channelising Agencies (SCAs) and other agencies. It alsoprovides financial assistance to organizations/ Institutions engagedin procurement and Marketing of Minor Forest produces/ tribalproducts and other products etc. It provides financial assistance byway of grants through the SCAs for undertaking training programmesfor the skill and entrepreneurial development of eligible scheduledtribes. The company is also involved in capacity building of SCAsand STs through Skill Development and entrepreneurshiporientation.Performance Highlights
The physical performances of the company for last two yearsare given below:
The Company registered a growth of ̀ 7.11crore in total incomeduring 2011-12 which went up to ` 21.81 crore in 2011-12 from` 14.70crore during 2010-11. The net profit of the companyincreased to ̀ 9.51crore in 2011-12, an increase of ̀ 3.55crore overthe previous year due to increase in turnover.
The current ratio of company is at71.64:1 during 2011-12 asagainst 175.07:1 in the previous year (Fig.2). Balance Sheet and Profit& Loss Account of the company and selected financial ratios duringthe period 2010-11 to 2011-12 can be seen on the adjoining page.
Main Services / Unit Performance during
Activities 2011-12 2010-11
Sanctions under Income ` in crores . 192.77 158.17Generating Activities
Beneficiaries covered No. 112489 95632(Sanctions)
Disbursement under Income ` in crores . 113.07 95.18Generating Activities
Beneficiaries covered No. 54485 53996Disbursement)
Recovery ` in crores . 79.49 63.69
Strategic issueThe corporation is making all endeavors to expand its
operations. On the initiative of company RBI vide its circular dated09.09.2011 has allowed all PSUs banks to extend refinance at interestrates prescribed under the schemes of NSTFDC. This refinancewould not be considered violative of the RBI guidelines. Further,RBI vide its circular dated 10.04.2012 has clarified that lending toScheduled Tribes is to be considered as priority sector lending.
EBIT
DA
& P
AT (
Rs.
cro
re)
TOTAL R
EVENU
E (Rs. crore)
Fig. 1
PRO
FITA
BIL
ITY
RAT
IOS
(%)
CU
RR
ENT R
ATIO
Fig. 2

Public Enterprises Survey 2011-2012: Vol-II 565
National Scheduled Tribes Finance and Development CorporationRegistered Office : NBCC Tower, 5th Floor, 15 BhikajiCama Place, New Delhi-110066
BALANCE SHEET (` in Lakhs)PARTICULARS 2011-12 2010-11I. EQUITY & LIABILITIESAUTHORISED CAPITAL 50000 50000(1) Shareholders’ Funds(a) Share Capital(i) Central Govt 31233 23050(ii) Others 0 0(b) Reserves & Surplus 14488 13537(c) Money received against share warrants 0 0Total Shareholders’ Funds (1(a)+1(b)+1(c) 45721 36587(2) Share application money pending allotment 0 4683(3) Non-current Liabilities(a) Long Term Borrowings 0 0(b) Deferred tax liabilities (Net) 0 0(c) Other Long-term liabilities 1 1(d) Long-term provisions 172 141Total Non-Current Liabilities 3(a) to 3(d) 173 142(4) Current Liabilities(a) Short Term Borrowings 0 0(b) Trade Payables 0 0(c) Other current liabilities 34 41(d) Short-term provisions 186 42Total Current Liabilities 4(a) to 4(d) 220 83TOTAL EQUITY & LIABILITIES (1+2+3+4) 46114 41495II. ASSETS(1) Non-Current Assets(a) Total Gross Fixed Assets 602 598(ai) Accumulated Depreciation, Depletion & Amortisation 244 224(aii) Accumulated Impairment 0 0(b) Total Net Fixed Assets ((a)-(ai)-(aii) 358 374(c) Capital work in progress 0 0(d) Intangible assets under developmet 14 11(e) Non-Current Investments 0 0(f) Deferred Tax Assets (Net) 0 0(g) Long Term Loans and Advances 29980 26577(h) Other Non-Current Assets 2 2Total Non-Current Assets (b+c+d+e+f+g+h) 30354 26964(2) Current Assets(a) Current Investments 0 0(b) Inventories 0 0(c) Trade Recievables 0 0(d) Cash & Bank Balance 7182 6834(e) Short-term Loans & Advances 8395 7687(f) Other Current Assets 183 10Total Current Assets (a+b+c+d+e+f) 15760 14531TOTAL ASSETS (1+2) 46114 41495Important Indicators(i) Investment 31233 27733(ii) Capital Employed 45721 41270(iii) Net Worth 45721 41270(iv) Net Current Assets 15540 14448(v) Cost of Sales 743 582(vi) Net Value Added (at market price) 1553 1002(vii) Total Regular Employees (Nos.) 53 54(viii) Avg. Monthly Emoluments per Employee(`) 94182 62346
PROFIT & LOSS ACCOUNT (` in Lakhs)PARTICULARS 2011-12 2010-11(I) Revenue from Operations (Gross) 1246 1065Less : Excise Duty 0 0Revenue from Operations (Net) 1246 1065(II) Other Income 935 405(III) Total Revenue (I+II) 2181 1470(IV) Expenditure on:(a) Cost of materials consumed 0 0(b) Purchase of stock-in-trade 0 0(c) Changes in inventories of finished goods, 0 0
work-in-progress and stock in trade(d) Stores & Spares 0 0(e) Power & Fuel 7 6(f) Salary, Wages & Benefits/Employees Expense 599 404(g) Other Operating/direct/manufacturing Expenses 37 50(h) Rent, Royalty & Cess 3 2(i) Loss on sale of Assets/Investments 0 0(j) Other Expenses 72 92Total Expenditure (IV (a to j)) 718 554(V) PROFIT BEFORE DEPRECIATION, & 1463 916
IMPAIRMENT, FINANCE CHARGES/INTEREST,EXCEPTIONAL & EXTRAORDINARYITEMS & TAXES (PBDIEET)(III-IV)
(VI) Depreciation, Depletion & Amortisation 25 28(VII) Impairment 0 0(VIII) PROFIT BEFORE FINANCE COST/INTEREST,
EXCEPTIONAL, EXTRA-ORDINARYITEMS & TAXES (PBIEET)(V-VI-VII) 1438 888
(IX) Finance Cost(a) On Central Government Loans 0 0(b) On Foreign Loans 0 0(c) Others 0 0(d) Less Finance Cost Capitalised 0 0(e) Charged to P & L Account (a+b+c+d) 0 0(X) PROFIT BEFORE EXCEPTIONAL & EXTRA-ORDINARY
ITEMS & TAX (PBEET)(VIII-IXe) 1438 888(XI) Exceptional Items 487 292(XII) PROFIT BEFORE EXTRA-ORDINARY ITEMS & TAX
(PBET)(X-XI) 951 596(XIII) Extra-Ordinary Items 0 0(XIV) PROFIT BEFORE TAX (PBT)(XII-XIII) 951 596(XV) TAX PROVISIONS 0 0(XVI) NET PROFIT / LOSS FOR THE PERIOD FROM
CONTINUING OPERATIONS AFTER TAX(XIV-XV) 951 596(XVII) Profit/Loss from discontinuing operations 0 0(XVIII) Tax expenses of discontinuing operations 0 0(XIX) Profit/Loss from discontinuing operations
(after Tax)(XVII-XVIII) 0 0(XX) Profit/Loss for the period (XVI+XIX) 951 596Financial Ratios(i) Sales : Capital Employed 2.73 2.58(ii) Cost of Sales : Sales 59.63 54.65(iii) Salary/Wages : Sales 48.07 37.93(iv) Net Profit : Net Worth 2.08 1.44(v) Debt : Equity 0 0(vi) Current Ratio 71.64 175.07(vii) Trade Recievables : Sales 0 0(viii) Total Inventory : Sales 0 0

Financial Services566
The CompanyNational Backward Classes Finance and Development Corp.
(NBCFDC) was incorporated on 13.01.1992 as a company not forprofit under Section 25 of the Companies Act, 1956 with theobjective to promote economic and developmental activities forthe benefit of the members of backward classes living belowdouble the poverty line income limit.
NBCFDC is a Schedule-’C’ CPSE in Financial Services sectorunder the administrative control of M/o Social Justice andEmpowerment with 100% shareholding by the Government of India.The Company employed 46 regular employees (Executives 17 &Non-Executives 29) as on 31.03.2012. Its Registered and Corporateoffices are at New Delhi.Vision / Mission
The Vision of the company is to play a leading role in upliftmentof economic status of the Backward Classes.
The Mission of the company is to provide concessionalfinancial assistance to the eligible members of Backward Classesfor self-employment ventures and skill developmentIndustrial / Business Operations
NBCFD is engaged in providing services in the field ofdisbursement of concessional loan to members of backward classesliving below double the poverty line income limit under selfemployment generation schemes through State ChannelizingAgencies (SCAs) and through State Backward Classes Finance &Development Corporations. The Corporation is implementing termloan, margin money loan and micro finance schemes. It is operatingthrough four regional offices at Kolkata, Mumbai, Chennai andKanpur.
The service range of the company comprises of incomegenerating activities under 4 broad sectors namely Agriculture andAllied activities, Small Business / Artisan and TraditionalOccupation, Service sector and Transport.Performance Highlights
The physical performances of the company for last two yearsare given below:
National Backward Classes Finance &Development Corporation
the cumulative disbursement of funds for the corporation was standat ` 2065.76 crores.
The current ratio of company is at 102.08:1 during 2011-12 asagainst 91.01:1 in the previous year (Fig.2). Balance Sheet andProfit & Loss Account of the company and selected financial ratiosduring the period 2010-11 to 2011-12 can be seen on the adjoining
Main Segments Unit Performance during
2011-12 2010-11
Disbursments of Loans In crore. 215.65 175.33
The Revenue of the company registered an increase of` 6.60 crore during 2011-12 which went up to ` 33.54 crore in2011-12 from ` 26.94 crore during 2010-11. The net profit of thecompany correspondingly increased to ` 24.11 crore, an increaseof ` 4.91 crore over the previous year profit of ` 19.20 crores dueto higher returns on Bank Deposit and due to write back of provisionon loans. The surplus funds generated were used to enhance thelevel of disbursement.
During the year 2011-12 the Corporation received ̀ 71.93 croreas budgetary support from Govt. of India. The corporation has sofar received ̀ 672.35 crores as budgetary support. Up to 31.3.2012,
page.Strategic Issues
Some of the new initiatives taken during the year areEnhancement in education loan limit; Enhancement in unit cost ofmicro finance scheme from 30,000 to 50,000; Establishing linkagesfor monitoring and evaluation, MDPs and training & upgradationof skill with institutes like NID, NIFT, NIRD, NIBM, IIM, ITPO,IGRMS; Monitoring & evaluation of implementation of schemesby SCAs.
EBIT
DA
& P
AT (
Rs.
cro
re) TO
TAL REVEN
UE (R
s. crore)
Fig. 1
PRO
FITA
BIL
ITY
RAT
IOS
(%)
CU
RR
ENT R
ATIO
Fig. 2

Public Enterprises Survey 2011-2012: Vol-II 567
National Backward Classes Finance & Development Corporation5th Floor, N.C.U.I. Building3, Siri Institutional Area, August Kranti Marg , Post Box No. 4617, New Delhi 110016
BALANCE SHEET (` in Lakhs)PARTICULARS 2011-12 2010-11I. EQUITY & LIABILITIESAUTHORISED CAPITAL 70000 70000(1) Shareholders’ Funds(a) Share Capital(i) Central Govt 67235 60042(ii) Others 0 0(b) Reserves & Surplus 29745 27334(c) Money received against share warrants 0 0Total Shareholders’ Funds (1(a)+1(b)+1(c) 96980 87376(2) Share application money pending allotment 0 193(3) Non-current Liabilities(a) Long Term Borrowings 0 0(b) Deferred tax liabilities (Net) 0 0(c) Other Long-term liabilities 0 0(d) Long-term provisions 181 93Total Non-Current Liabilities 3(a) to 3(d) 181 93(4) Current Liabilities(a) Short Term Borrowings 0 0(b) Trade Payables 0 0(c) Other current liabilities 216 284(d) Short-term provisions 211 150Total Current Liabilities 4(a) to 4(d) 427 434TOTAL EQUITY & LIABILITIES (1+2+3+4) 97588 88096II. ASSETS(1) Non-Current Assets(a) Total Gross Fixed Assets 275 271(ai) Accumulated Depreciation, Depletion & Amortisation 203 194(aii) Accumulated Impairment 0 0(b) Total Net Fixed Assets ((a)-(ai)-(aii) 72 77(c) Capital work in progress 0 0(d) Intangible assets under developmet 0 0(e) Non-Current Investments 0 0(f) Deferred Tax Assets (Net) 0 0(g) Long Term Loans and Advances 53928 48500(h) Other Non-Current Assets 1 22Total Non-Current Assets (b+c+d+e+f+g+h) 54001 48599(2) Current Assets(a) Current Investments 0 0(b) Inventories 0 0(c) Trade Recievables 0 0(d) Cash & Bank Balance 11688 7304(e) Short-term Loans & Advances 28420 29216(f) Other Current Assets 3479 2977Total Current Assets (a+b+c+d+e+f) 43587 39497TOTAL ASSETS (1+2) 97588 88096Important Indicators(i) Investment 67235 60235(ii) Capital Employed 96980 87569(iii) Net Worth 96980 87569(iv) Net Current Assets 43160 39063(v) Cost of Sales 943 774(vi) Net Value Added (at market price) 2981 2330(vii) Total Regular Employees (Nos.) 46 49(viii) Avg. Monthly Emoluments per Employee(`) 97283 65136
PROFIT & LOSS ACCOUNT (` in Lakhs)PARTICULARS 2011-12 2010-11(I) Revenue from Operations (Gross) 3117 2618Less : Excise Duty 0 0Revenue from Operations (Net) 3117 2618(II) Other Income 237 76(III) Total Revenue (I+II) 3354 2694(IV) Expenditure on:(a) Cost of materials consumed 0 0(b) Purchase of stock-in-trade 0 0(c) Changes in inventories of finished goods,
work-in-progress and stock in trade 0 0(d) Stores & Spares 0 0(e) Power & Fuel 7 8(f) Salary, Wages & Benefits/Employees Expense 537 383(g) Other Operating/direct/manufacturing Expenses 127 149(h) Rent, Royalty & Cess 46 35(i) Loss on sale of Assets/Investments 0 0(j) Other Expenses 212 187Total Expenditure (IV (a to j)) 929 762(V) PROFIT BEFORE DEPRECIATION, &
IMPAIRMENT, FINANCE CHARGES/INTEREST, EXCEPTIONAL & EXTRAORDINARYITEMS & TAXES (PBDIEET)(III-IV) 2425 1932
(VI) Depreciation, Depletion & Amortisation 14 12(VII) Impairment 0 0(VIII) PROFIT BEFORE FINANCE COST/INTEREST,
EXCEPTIONAL, EXTRA-ORDINARYITEMS & TAXES (PBIEET)(V-VI-VII) 2411 1920
(IX) Finance Cost(a) On Central Government Loans 0 0(b) On Foreign Loans 0 0(c) Others 0 0(d) Less Finance Cost Capitalised 0 0(e) Charged to P & L Account (a+b+c+d) 0 0(X) PROFIT BEFORE EXCEPTIONAL & EXTRA-ORDINARY
ITEMS & TAX (PBEET)(VIII-IXe) 2411 1920(XI) Exceptional Items 0 0(XII) PROFIT BEFORE EXTRA-ORDINARY ITEMS & TAX
(PBET)(X-XI) 2411 1920(XIII) Extra-Ordinary Items 0 0(XIV) PROFIT BEFORE TAX (PBT)(XII-XIII) 2411 1920(XV) TAX PROVISIONS 0 0(XVI) NET PROFIT / LOSS FOR THE PERIOD FROM
CONTINUING OPERATIONS AFTER TAX(XIV-XV) 2411 1920(XVII) Profit/Loss from discontinuing operations 0 0(XVIII) Tax expenses of discontinuing operations 0 0(XIX) Profit/Loss from discontinuing operations
(after Tax)(XVII-XVIII) 0 0(XX) Profit/Loss for the period (XVI+XIX) 2411 1920Financial Ratios(i) Sales : Capital Employed 3.21 2.99(ii) Cost of Sales : Sales 30.25 29.56(iii) Salary/Wages : Sales 17.23 14.63(iv) Net Profit : Net Worth 2.49 2.19(v) Debt : Equity 0 0(vi) Current Ratio 102.08 91.01(vii) Trade Recievables : Sales 0 0(viii) Total Inventory : Sales 0 0

Financial Services568
National Film Development Corp. Ltd.The Company
National Film Development Corp. Ltd. (NFDC) wasincorporated on 11.05.1975 with the objective to plan, promoteand organize an integrated and efficient development of the filmindustry in accordance with the national economic policy andobjectives laid down by the Central Government from time to time.The company was restructured in 1980 by the merger of erstwhileIndian Motion Picture Export Corporation and Film FinanceCorporation, thereby, the company emerged as a Central Agency topromote good cinema in the Country.
NFDC is a Schedule-‘C’ Mini-ratna / BRPSE referred CPSE inFinancial Services sector under the administrative control of M/oInformation and Broadcasting with 100% shareholding by theGovernment of India. Its Registered and Corporate offices are atMumbai, Maharashtra. The Company employed 102 regularemployees (Executives 45, Non-Executives 57) as on 31.03.2012.
Vision / MissionThe Vision / Mission of the Company is to plan, promote and
organize an integrated and efficient development of the film industryin accordance with the national economic policy and objectives laiddown by the Central government from time to time.
Industrial / Business OperationsNFDC is engaged in providing services in the field of film
production, distribution and provide related project services. Theactivities of the company can be bifurcated into development andcommercial activities.
The company operates through three Regional offices inChennai, Delhi and Kolkata and one Branch office at Trivandrum.
Performance HighlightsThe physical performances of the company for last two years
are given below:
The current ratio of company is at 1.14:1 during 2011-12 asagainst 1.1:1 in the previous year (Fig.2). Balance Sheet and Profit& Loss Account of the company and selected financial ratios duringthe period 2010-11 to 2011-12 can be seen on the adjoining page.
Main Services / Unit Performance during
Activities 2011-12 2010-11
Media Campaign for Govt. ` in crores . 197.21 162.32Dept.
Non Feature Film Production No. 26.95 8.90
Service Project ` in crores . 12.50 5.33
Feature Film Production No. 8.74 6.86
Film Distribution ` in crores . 3.03 4.00
Total Revenue of the company registered an increase of ̀ 70.71crore during 2011-12, which went up from ` 185.00 crore in2010-11 to ̀ 255.71 crore in 2011-12 The net profit of the companycorrespondingly increased to ̀ 4.08 crore, an increase of ̀ 2.39 croreover the previous year’s profit of `1.69 crore due to increase inbusiness after the revision of Government policy in October 2009that had allowed NFDC to make inroads into release of advertisementcampaigns that was previously reserved for DAVP only. www.nfdcindia.com
Strategic issueThe company was referred to BRPSE and a revival plan for
the company was approved by the Government in September,2010. As per revival plan of the company, an additional equity wasinfused during 2010-11 and outstanding Government loan alongwith accumulated interest was converted into equity. The revivalplan is under implementation. The conversion of loan into equityand interest outstanding thereon has rid the corporation of theirheavy interest burden and liability to repay the loan. It has helpedthe corporation to clean up its balance sheet and start afresh.
EBIT
DA
& P
AT (
Rs.
cro
re)
TOTAL R
EVENU
E (Rs. crore)
Fig. 1PR
OFI
TAB
ILIT
Y R
ATIO
S (%
)
CU
RR
ENT R
ATIO
Fig. 2

Public Enterprises Survey 2011-2012: Vol-II 569
National Film Development Corp. Ltd.Discovery of India Building, 6th Floor , Nehru Centre, Dr. A. B. Raod, Worli, Mumbai Maharashtra - 400 018
BALANCE SHEET (` in Lakhs)PARTICULARS 2011-12 2010-11I. EQUITY & LIABILITIESAUTHORISED CAPITAL 4540 4540(1) Shareholders’ Funds(a) Share Capital(i) Central Govt 4540 4540(ii) Others 0 0(b) Reserves & Surplus -1799 -2626(c) Money received against share warrants 0 0Total Shareholders’ Funds (1(a)+1(b)+1(c) 2741 1914(2) Share application money pending allotment 0 0(3) Non-current Liabilities(a) Long Term Borrowings 33 50(b) Deferred tax liabilities (Net) 0 0(c) Other Long-term liabilities 242 216(d) Long-term provisions 370 319Total Non-Current Liabilities 3(a) to 3(d) 645 585(4) Current Liabilities(a) Short Term Borrowings 0 0(b) Trade Payables 12764 13551(c) Other current liabilities 5922 4333(d) Short-term provisions 73 66Total Current Liabilities 4(a) to 4(d) 18759 17950TOTAL EQUITY & LIABILITIES (1+2+3+4) 22145 20449II. ASSETS(1) Non-Current Assets(a) Total Gross Fixed Assets 2050 2778(ai) Accumulated Depreciation, Depletion & Amortisation 1473 2298(aii) Accumulated Impairment 0 3(b) Total Net Fixed Assets ((a)-(ai)-(aii) 577 477(c) Capital work in progress 5 29(d) Intangible assets under developmet 0 0(e) Non-Current Investments 0 0(f) Deferred Tax Assets (Net) 0 0(g) Long Term Loans and Advances 98 98(h) Other Non-Current Assets 61 89Total Non-Current Assets (b+c+d+e+f+g+h) 741 693(2) Current Assets(a) Current Investments 0 0(b) Inventories 2 47(c) Trade Recievables 7294 9155(d) Cash & Bank Balance 10903 8087(e) Short-term Loans & Advances 3123 2434(f) Other Current Assets 82 33Total Current Assets (a+b+c+d+e+f) 21404 19756TOTAL ASSETS (1+2) 22145 20449Important Indicators(i) Investment 4573 4590(ii) Capital Employed 2774 1964(iii) Net Worth 2741 1914(iv) Net Current Assets 2645 1806(v) Cost of Sales 25141 18328(vi) Net Value Added (at market price) 63 -256(vii) Total Regular Employees (Nos.) 102 104(viii) Avg. Monthly Emoluments per Employee(`) 57843 33173
PROFIT & LOSS ACCOUNT (` in Lakhs)PARTICULARS 2011-12 2010-11(I) Revenue from Operations (Gross) 24844 18125Less : Excise Duty 0 0Revenue from Operations (Net) 24844 18125(II) Other Income 727 375(III) Total Revenue (I+II) 25571 18500(IV) Expenditure on:(a) Cost of materials consumed 0 0(b) Purchase of stock-in-trade 0 0(c) Changes in inventories of finished goods,
work-in-progress and stock in trade 0 0(d) Stores & Spares 0 0(e) Power & Fuel 28 29(f) Salary, Wages & Benefits/Employees Expense 708 414(g) Other Operating/direct/manufacturing Expenses 23672 17067(h) Rent, Royalty & Cess 92 88(i) Loss on sale of Assets/Investments 16 0(j) Other Expenses 451 649Total Expenditure (IV (a to j)) 24967 18247(V) PROFIT BEFORE DEPRECIATION, &
IMPAIRMENT, FINANCE CHARGES/INTEREST, EXCEPTIONAL & EXTRAORDINARYITEMS & TAXES (PBDIEET)(III-IV) 604 253
(VI) Depreciation, Depletion & Amortisation 190 81(VII) Impairment 0 0(VIII) PROFIT BEFORE FINANCE COST/INTEREST,
EXCEPTIONAL, EXTRA-ORDINARYITEMS & TAXES (PBIEET)(V-VI-VII) 414 172
(IX) Finance Cost(a) On Central Government Loans 0 0(b) On Foreign Loans 0 0(c) Others 6 3(d) Less Finance Cost Capitalised 0 0(e) Charged to P & L Account (a+b+c+d) 6 3(X) PROFIT BEFORE EXCEPTIONAL & EXTRA-ORDINARY
ITEMS & TAX (PBEET)(VIII-IXe) 408 169(XI) Exceptional Items 0 0(XII) PROFIT BEFORE EXTRA-ORDINARY ITEMS & TAX (PBET)(X-XI)408 169(XIII) Extra-Ordinary Items 0 0(XIV) PROFIT BEFORE TAX (PBT)(XII-XIII) 408 169(XV) TAX PROVISIONS 0 0(XVI) NET PROFIT / LOSS FOR THE PERIOD FROM
CONTINUING OPERATIONS AFTER TAX(XIV-XV) 408 169(XVII) Profit/Loss from discontinuing operations 0 0(XVIII) Tax expenses of discontinuing operations 0 0(XIX) Profit/Loss from discontinuing operations
(after Tax)(XVII-XVIII) 0 0(XX) Profit/Loss for the period (XVI+XIX) 408 169Financial Ratios(i) Sales : Capital Employed 895.6 922.86(ii) Cost of Sales : Sales 101.2 101.12(iii) Salary/Wages : Sales 2.85 2.28(iv) Net Profit : Net Worth 14.89 8.83(v) Debt : Equity 0.01 0.01(vi) Current Ratio 1.14 1.1(vii) Trade Recievables : Sales 29.36 50.51(viii) Total Inventory : Sales 0.01 0.26

Financial Services570
National Scheduled Castes Finance &Development Corporation
The CompanyNational Scheduled Castes Finance & Development
Corporation (NSFDC) was incorporated on 8.2.1989 with theobjective to exclusively work for the economic developmentactivities of the people belonging to Scheduled Caste categoriesliving below Double the Poverty Line. NSFDC was incorporatedas a company not for profit under Section 25 of the CompaniesAct, 1956 as
NSFDC is a Schedule - 'C' CPSE engaged in 'CommunityServices' under the administrative control of Ministry of SocialJustice and Empowerment with 100% shareholding by theGovernment of India. Its Registered and Corporate offices are atNew Delhi. The company employed 79 regular employees(Executives 36 & Non-Executives 43) as on 31.3.2012. ItsRegistered and Corporate offices are at New Delhi.
Vision / MissionThe Vision of the Company are to Fight Poverty through
Entrepreneurship.The Mission of the company is to finance, facilitate and
promote the economic development activities of Schedule Castepersons.
Industrial / Business OperationsNSFDC is engaged in providing financial assistance at
concessional interest rates under various credit schemes andextending supports under various non-credit schemes to help theScheduled Caste (SC) beneficiaries through 37 State / UTChannelising Agencies (SCAs) and other recognized institutionsnominated by the respective State / UT Government.
The Company has five Zonal Offices at Bengaluru, Mumbai,Kolkata, Lucknow and Guwahati. The company assists the targetgroup (Double the Poverty Line (DPL) i.e. ̀ 40,000 in Rural Areas& ` 55,000 in Urban Areas) by way of loans and advances, skilltraining, entrepreneurship development programmes and otherknow-how.
Performance HighlightsAs on 31.03.2012 the company has cumulatively disbursed
` 2302.91 crore for ` 8.05 lakh beneficiaries belonging to theScheduled castes. Out of the total beneficiaries covered, ` 4.25lakhs are women. The physical performances of the company forlast two years are given below:
2010-11 to ` 34.15 crore in 2011-12. The profit of the companyhas gone up by ` 7.64 crore in 2011-12 to ` 21.59 crore from` 13.95 crore in previous year
The current ratio of company is at 19.64:1 during 2011-12 asagainst 13.89:1 in the previous year (Fig.2). Balance Sheet and Profit& Loss Account of the company and selected financial ratios duringthe period 2010-11 to 2011-12 can be seen on the adjoining page.
Main Services Unit Performance during
2011-12 2010-11
Total Disbursement ` in Crore 182.77 180.09
Beneficiaries (in Nos.) 43772 47,728
www.nsfdc.nic.in
EBIT
DA
& P
AT (
Rs.
cro
re)
TOTAL R
EVENU
E (Rs. crore)
Fig. 1
PRO
FITA
BIL
ITY
RAT
IOS
(%)
CU
RR
ENT R
ATIO
Fig. 2Strategic issues
The company has undertaken impact evaluation studies ofits schemes through independent agencies. These evaluation studiesare periodically got conducted through the State TechnicalConsultancy Organizations (STCOs). Skill Development TrainingPolicy revised to sanction the programmes directly to the reputedtraining institutions / universities / deemed universities in additionto existing system i.e. SCAs.Total Revenue of the company registered an increase of
` 8.51 crore during 2011-12, which went up from ` 25.64 crore in

Public Enterprises Survey 2011-2012: Vol-II 571
National Scheduled Castes Finance & Development Corporation14th floor, scope minar, core-1 & 2, laxmi nagar district, Laxmi Nagar, Delhi-110092
BALANCE SHEET (` in Lakhs)PARTICULARS 2011-12 2010-11I. EQUITY & LIABILITIESAUTHORISED CAPITAL 100000 100000(1) Shareholders’ Funds(a) Share Capital(i) Central Govt 67580 57180(ii) Others 0 0(b) Reserves & Surplus 23672 21470(c) Money received against share warrants 0 0Total Shareholders’ Funds (1(a)+1(b)+1(c) 91252 78650(2) Share application money pending allotment 100 2500(3) Non-current Liabilities(a) Long Term Borrowings 0 0(b) Deferred tax liabilities (Net) 0 0(c) Other Long-term liabilities 3 7(d) Long-term provisions 247 244Total Non-Current Liabilities 3(a) to 3(d) 250 251(4) Current Liabilities(a) Short Term Borrowings 0 0(b) Trade Payables 0 0(c) Other current liabilities 3106 4060(d) Short-term provisions 138 11Total Current Liabilities 4(a) to 4(d) 3244 4071TOTAL EQUITY & LIABILITIES (1+2+3+4) 94846 85472II. ASSETS(1) Non-Current Assets(a) Total Gross Fixed Assets 939 924(ai) Accumulated Depreciation, Depletion & Amortisation 337 315(aii) Accumulated Impairment 0 0(b) Total Net Fixed Assets ((a)-(ai)-(aii) 602 609(c) Capital work in progress 0 0(d) Intangible assets under developmet 0 0(e) Non-Current Investments 0 0(f) Deferred Tax Assets (Net) 0 0(g) Long Term Loans and Advances 30537 28336(h) Other Non-Current Assets 0 0Total Non-Current Assets (b+c+d+e+f+g+h) 31139 28945(2) Current Assets(a) Current Investments 0 0(b) Inventories 0 0(c) Trade Recievables 0 0(d) Cash & Bank Balance 12716 8454(e) Short-term Loans & Advances 47918 45079(f) Other Current Assets 3073 2994Total Current Assets (a+b+c+d+e+f) 63707 56527TOTAL ASSETS (1+2) 94846 85472Important Indicators(i) Investment 67680 59680(ii) Capital Employed 91352 81150(iii) Net Worth 91352 81150(iv) Net Current Assets 60463 52456(v) Cost of Sales 905 823(vi) Net Value Added (at market price) 2863 2068(vii) Total Regular Employees (Nos.) 79 81(viii) Avg. Monthly Emoluments per Employee(`) 74051 69033
PROFIT & LOSS ACCOUNT (` in Lakhs)PARTICULARS 2011-12 2010-11(I) Revenue from Operations (Gross) 3369 2523Less : Excise Duty 0 0Revenue from Operations (Net) 3369 2523(II) Other Income 46 41(III) Total Revenue (I+II) 3415 2564(IV) Expenditure on:(a) Cost of materials consumed 0 0(b) Purchase of stock-in-trade 0 0(c) Changes in inventories of finished goods,
work-in-progress and stock in trade 0 0(d) Stores & Spares 0 0(e) Power & Fuel 3 3(f) Salary, Wages & Benefits/Employees Expense 702 671(g) Other Operating/direct/manufacturing Expenses 56 45(h) Rent, Royalty & Cess 2 2(i) Loss on sale of Assets/Investments 0 0(j) Other Expenses 120 80Total Expenditure (IV (a to j)) 883 801(V) PROFIT BEFORE DEPRECIATION, & I
MPAIRMENT, FINANCE CHARGES/INTEREST,EXCEPTIONAL & EXTRAORDINARYITEMS & TAXES (PBDIEET)(III-IV) 2532 1763
(VI) Depreciation, Depletion & Amortisation 22 22(VII) Impairment 0 0(VIII) PROFIT BEFORE FINANCE COST/INTEREST,
EXCEPTIONAL, EXTRA-ORDINARYITEMS & TAXES (PBIEET)(V-VI-VII) 2510 1741
(IX) Finance Cost(a) On Central Government Loans 0 0(b) On Foreign Loans 0 0(c) Others 0 0(d) Less Finance Cost Capitalised 0 0(e) Charged to P & L Account (a+b+c+d) 0 0(X) PROFIT BEFORE EXCEPTIONAL & EXTRA-ORDINARY
ITEMS & TAX (PBEET)(VIII-IXe) 2510 1741(XI) Exceptional Items 0 0(XII) PROFIT BEFORE EXTRA-ORDINARY ITEMS & TAX
(PBET)(X-XI) 2510 1741(XIII) Extra-Ordinary Items 351 346(XIV) PROFIT BEFORE TAX (PBT)(XII-XIII) 2159 1395(XV) TAX PROVISIONS 0 0(XVI) NET PROFIT / LOSS FOR THE PERIOD FROM
CONTINUING OPERATIONS AFTER TAX(XIV-XV) 2159 1395(XVII) Profit/Loss from discontinuing operations 0 0(XVIII) Tax expenses of discontinuing operations 0 0(XIX) Profit/Loss from discontinuing operations
(after Tax)(XVII-XVIII) 0 0(XX) Profit/Loss for the period (XVI+XIX) 2159 1395Financial Ratios(i) Sales : Capital Employed 3.69 3.11(ii) Cost of Sales : Sales 26.86 32.62(iii) Salary/Wages : Sales 20.84 26.6(iv) Net Profit : Net Worth 2.36 1.72(v) Debt : Equity 0 0(vi) Current Ratio 19.64 13.89(vii) Trade Recievables : Sales 0 0(viii) Total Inventory : Sales 0 0

Financial Services572
The CompanyNational Safai Karamcharis Finance & Development Corp.
(NSKFDC) was incorporated on 24.1.1997 as a company not forprofit under Section 25 of the Companies Act, 1956 with theobjective of socio-economic upliftment of Safai Karamcharis /Scavengers and their dependents by way of providing financialassistance at concessional rates of interest for any income generatingactivity throughout the country through the State ChannelizingAgencies (SCAs) and to provide technical and professional training,quality control, technology up-gradation, and common facilitycenters for carrying out sanitation works.
NSKFDC is a Schedule-‘C’ CPSE Financial Services sectorunder the administrative control of M/o Social Justice andEmpowerment with 100% shareholding by the Government of India.Its Registered and Corporate offices are at New Delhi. The companyemployed 22 regular employees (6 executives, 16 non executives)as on 31.3.2012.
Vision/MissionThe Vision / Mission of the Company is to empower the Safai
Karamcharis, Scavengers and their dependents to break away fromtraditional occupation, depressed social condition, poverty andleverage them to work their own way up the social and economicladder with dignity and pride.
Industrial / Business OperationsNSKFDC provides concessional financial assistance to income
generating and viable projects to the Safai Karamcharis / Scavengersand their dependents whose income is below double the povertyline through 26 State Channelising Agencies (SCAs) nominated byState Governments / UTs. The financing schemes include TermLoan, Micro Credit Finance (MCF), Mahila Samridhi Yojana(MSY), Educational Loan etc.
Performance HighlightsThe physical performances of the company for last two years
are given below:
& Loss Account of the company and selected financial ratios duringthe period 2010-11 to 2011-12 can be seen on the adjoining page.
National Safai Karamcharis Finance & Development Corp.
Main Segments U n i t Performance during
2011-12 2010-11
Share Capital Received ` in cr. 45.00 40.00
Long Term Loans & Advances
Non-current ` in cr. 137.20 114.39
Current ` in cr. 212.80 172.75
Total Revenue of the company registered an increase of ̀ 1.61crore during 2011-12, which went up from ` 8.9 crore in 2010-11to ` 10.51 crore in 2011-12. The net profit of the companycorrespondingly increased by ` 0.45 crore to ` 4.59 crore in 2011-12, from ` 4.14 crore of previous year.
The current ratio of company is at 223.1:1 during 2011-12 asagainst 9.34 :1in the previous year (Fig.2). Balance Sheet and Profit www.nskfdc.nic.in
EBIT
DA
& P
AT (
Rs.
cro
re)
TOTAL R
EVENU
E (Rs. crore)
Fig. 1
PRO
FITA
BIL
ITY
RAT
IOS
(%) CU
RR
ENT R
ATIO
Fig. 2
Strategic IssuesNSKFDC has taken initiatives like rating & awards, increasing
the payback period, proposals for abolishing charging non utilizationcharges, networking to achieve the mission of providing financialassistance for setting up self employment units and for education loan&skill development training programme etc , to strengthen the SCAs.
For maximum coverage of the beneficiaries under NSKFDCSchemes & Progammes, initiatives like reduction of interest rate,broadening the scope of education loan, providing second time loan,schemes to promote sanitary machines/ equipments have been taken.

Public Enterprises Survey 2011-2012: Vol-II 573
National Safai Karamcharis Finance & Development Corp.B-2, First Floor, G. K. Enclave – II, New Delhi - 110048BALANCE SHEET (` in Lakhs)PARTICULARS 2011-12 2010-11I. EQUITY & LIABILITIESAUTHORISED CAPITAL 60000 30000(1) Shareholders’ Funds(a) Share Capital(i) Central Govt 29999 29999(ii) Others 0 0(b) Reserves & Surplus 3731 3241(c) Money received against share warrants 0 0Total Shareholders’ Funds (1(a)+1(b)+1(c) 33730 33240(2) Share application money pending allotment 4500 0(3) Non-current Liabilities(a) Long Term Borrowings 0 0(b) Deferred tax liabilities (Net) 0 0(c) Other Long-term liabilities 1440 5963(d) Long-term provisions 64 71Total Non-Current Liabilities 3(a) to 3(d) 1504 6034(4) Current Liabilities(a) Short Term Borrowings 0 0(b) Trade Payables 0 0(c) Other current liabilities 109 23(d) Short-term provisions 0 0Total Current Liabilities 4(a) to 4(d) 109 23TOTAL EQUITY & LIABILITIES (1+2+3+4) 39843 39297II. ASSETS(1) Non-Current Assets(a) Total Gross Fixed Assets 93 81(ai) Accumulated Depreciation, Depletion & Amortisation 40 27(aii) Accumulated Impairment 0 0(b) Total Net Fixed Assets ((a)-(ai)-(aii) 53 54(c) Capital work in progress 0 0(d) Intangible assets under developmet 0 0(e) Non-Current Investments 0 0(f) Deferred Tax Assets (Net) 0 0(g) Long Term Loans and Advances 13720 11439(h) Other Non-Current Assets 1752 6322Total Non-Current Assets (b+c+d+e+f+g+h) 15525 17815(2) Current Assets(a) Current Investments 0 0(b) Inventories 0 0(c) Trade Recievables 0 0(d) Cash & Bank Balance 2679 4017(e) Short-term Loans & Advances 21281 17276(f) Other Current Assets 358 189Total Current Assets (a+b+c+d+e+f) 24318 21482TOTAL ASSETS (1+2) 39843 39297Important Indicators(i) Investment 34499 29999(ii) Capital Employed 38230 33240(iii) Net Worth 38230 33240(iv) Net Current Assets 24209 21459(v) Cost of Sales 592 476(vi) Net Value Added (at market price) 609 534(vii) Total Regular Employees (Nos.) 22 23(viii) Avg. Monthly Emoluments per Employee(`) 56818 43478
PROFIT & LOSS ACCOUNT (` in Lakhs)PARTICULARS 2011-12 2010-11(I) Revenue from Operations (Gross) 865 760Less : Excise Duty 0 0Revenue from Operations (Net) 865 760(II) Other Income 186 130(III) Total Revenue (I+II) 1051 890(IV) Expenditure on:(a) Cost of materials consumed 0 0(b) Purchase of stock-in-trade 0 0(c) Changes in inventories of finished goods,
work-in-progress and stock in trade 0 0(d) Stores & Spares 0 0(e) Power & Fuel 1 1(f) Salary, Wages & Benefits/Employees Expense 150 120(g) Other Operating/direct/manufacturing Expenses 185 124(h) Rent, Royalty & Cess 0 0(i) Loss on sale of Assets/Investments 0 0(j) Other Expenses 250 225Total Expenditure (IV (a to j)) 586 470(V) PROFIT BEFORE DEPRECIATION, &
IMPAIRMENT, FINANCE CHARGES/INTEREST,EXCEPTIONAL & EXTRAORDINARYITEMS & TAXES (PBDIEET)(III-IV) 465 420
(VI) Depreciation, Depletion & Amortisation 6 6(VII) Impairment 0 0(VIII) PROFIT BEFORE FINANCE COST/INTEREST,
EXCEPTIONAL, EXTRA-ORDINARYITEMS & TAXES (PBIEET)(V-VI-VII) 459 414
(IX) Finance Cost(a) On Central Government Loans 0 0(b) On Foreign Loans 0 0(c) Others 0 0(d) Less Finance Cost Capitalised 0 0(e) Charged to P & L Account (a+b+c+d) 0 0(X) PROFIT BEFORE EXCEPTIONAL & EXTRA-ORDINARY
ITEMS & TAX (PBEET)(VIII-IXe) 459 414(XI) Exceptional Items 0 0(XII) PROFIT BEFORE EXTRA-ORDINARY ITEMS & TAX
(PBET)(X-XI) 459 414(XIII) Extra-Ordinary Items 0 0(XIV) PROFIT BEFORE TAX (PBT)(XII-XIII) 459 414(XV) TAX PROVISIONS 0 0(XVI) NET PROFIT / LOSS FOR THE PERIOD FROM
CONTINUING OPERATIONS AFTER TAX(XIV-XV) 459 414(XVII) Profit/Loss from discontinuing operations 0 0(XVIII) Tax expenses of discontinuing operations 0 0(XIX) Profit/Loss from discontinuing operations
(after Tax)(XVII-XVIII) 0 0(XX) Profit/Loss for the period (XVI+XIX) 459 414Financial Ratios(i) Sales : Capital Employed 2.26 2.29(ii) Cost of Sales : Sales 68.44 62.63(iii) Salary/Wages : Sales 17.34 15.79(iv) Net Profit : Net Worth 1.2 1.25(v) Debt : Equity 0 0(vi) Current Ratio 223.1 934(vii) Trade Recievables : Sales 0 0(viii) Total Inventory : Sales 0 0

Financial Services574
Power Finance Corporation Ltd.The Company
Power Finance Corporation Ltd. (PFC) was incorporated on16.7.1986 with the objective to provide financial resources andencourage flow of investments to the power and associated sectors forthe requisite flow of investments; to work as a catalyst for optimumutilization of available resources and to mobilize financial resourcesfrom domestic and international sources at competitive rates.
PFC is a Schedule-‘A’ Navratna CPSE in financial services sectorunder the administrative control of M/o Power with 89.78%shareholding by the Government of India. The company employed378 regular employees (Executives 327 & Non-Executives 51) as on31.3.2012. Its Registered and Corporate offices are in New Delhi.
Vision / MissionThe Vision of the Company is to be the leading institution in
financing for sustainable development of the Indian Power Sectorand its linkages, with an eye on global operations.
The Mission of the Company is to become the most preferredFinancial Institution in power and financial sectors, providing bestproducts and services; to promote efficient investments in PowerSector to enable availability of power of the required quality atminimum cost to consumers; to reach out to the global financialsystem for financing power development; to act as a catalyst forreforming India’s Power Sector; and to build human assets andsystems for the Power Sector of tomorrow
Industrial / Business OperationsThe Company is engaged in the business to finance power
projects, power transmission and distribution works, renovationand modernisation of power plants, system improvement andenergy conservation, maintenance and repair of capital equipmentetc, survey and investigation, studies, schemes and experiments,other energy sources, manufacturing of capital equipments, to financeactivities having forward and backward linkages to power projectsfrom its operating units and organise consultancy services etc.
Besides, the corporate office in New Delhi, PFC has twoRegional Offices at Chennai and Mumbai. It has 13 wholly ownedsubsidiary companies, namely PFC Consulting, PFC Green EnergyLimited, PFC Capital Advisory Services LTD, Power EquityCapital Advisors Pvt Ltd, Chhattisgarh Surguja Power Ltd., CoastalKarnataka Power Ltd, Coastal Maharashtra Mega Power Ltd,Coastal Tamil Nadu Power Ltd, Orissa Integrated Power Ltd,Sakhigopal Integrated Power Company Ltd, Ghogharpalli IntegratedPower Ltd, Tatiya Andhra Mega Power Ltd and DGEN &Uttrakhand Transmission Company Ltd. The Company also has 2Joint Ventures (JVs)
Performance Highlights The physical performances of the company for last two years
are given below:
Total Revenue from of the company registered an increase of` 2876.55 crore during 2011-12, which went up from ̀ 10160.56crore in 2010-11 to ̀ 13037.11 crore in 2011-12. The profit of thecompany has gone up by ` 412.16 crore to ` 3031.74 crore in2011-12, from ̀ 2619.58 crore in previous year due to increase inlending operations.
The current ratio of company is at 1.24:1 during 2011-12 asagainst 0.91:1 in the previous year (Fig.2). Balance Sheet and Profit& Loss Account of the company and selected financial ratios duringthe period 2010-11 to 2011-12 can be seen on the adjoining page.
Main Segments Unit Performance during
2011-12 2010-11
Loan Assets ` in Cr. 130072 99571
Total Disbursement ` in Cr. 41418 34121www.pfcindia.com
Strategic issuesTo accelerate growth of the company, PFC is focusing on
additional business in the areas of power trading through powerexchanges, equity financing, Nuclear Funding, Banking operationsand acquisition advisory services.
EBIT
DA
& P
AT (
Rs.
cro
re)
TOTAL R
EVENU
E (Rs. crore)
Fig. 1
PRO
FITA
BIL
ITY
RAT
IOS
(%)
CU
RR
ENT R
ATIO
Fig. 2

Public Enterprises Survey 2011-2012: Vol-II 575
Power Finance Corporation LtdUrjanidhi, 1, Barakhamba Lane, Connaught Place New DelhiBALANCE SHEET (` in Lakhs)PARTICULARS 2011-12 2010-11I. EQUITY & LIABILITIESAUTHORISED CAPITAL 200000 200000(1) Shareholders’ Funds(a) Share Capital(i) Central Govt 97306 103045(ii) Others 34687 11732(b) Reserves & Surplus 1938759 1403472(c) Money received against share warrants 0 0Total Shareholders’ Funds (1(a)+1(b)+1(c) 2070752 1518249(2) Share application money pending allotment 0 0(3) Non-current Liabilities(a) Long Term Borrowings 9586698 6998403(b) Deferred tax liabilities (Net) 8743 8297(c) Other Long-term liabilities 55064 67838(d) Long-term provisions 2895 2516Total Non-Current Liabilities 3(a) to 3(d) 9653400 7077054(4) Current Liabilities(a) Short Term Borrowings 407120 629104(b) Trade Payables 0 0(c) Other current liabilities 1398741 1210660(d) Short-term provisions 27493 28357Total Current Liabilities 4(a) to 4(d) 1833354 1868121TOTAL EQUITY & LIABILITIES (1+2+3+4) 13557506 10463424II. ASSETS(1) Non-Current Assets(a) Total Gross Fixed Assets 10574 9894(ai) Accumulated Depreciation, Depletion & Amortisation 2973 2451(aii) Accumulated Impairment 0 0(b) Total Net Fixed Assets ((a)-(ai)-(aii) 7601 7443(c) Capital work in progress 45 228(d) Intangible assets under developmet 0 0(e) Non-Current Investments 5534 5005(f) Deferred Tax Assets (Net) 0 0(g) Long Term Loans and Advances 11208594 8755567(h) Other Non-Current Assets 54782 2502Total Non-Current Assets (b+c+d+e+f+g+h) 11276556 8770745(2) Current Assets(a) Current Investments 383 383(b) Inventories 0 0(c) Trade Recievables 0 0(d) Cash & Bank Balance 198820 235026(e) Short-term Loans & Advances 1817016 1215253(f) Other Current Assets 264731 242017Total Current Assets (a+b+c+d+e+f) 2280950 1692679TOTAL ASSETS (1+2) 13557506 10463424Important Indicators(i) Investment 9718691 7113180(ii) Capital Employed 11657450 8516652(iii) Net Worth 2070752 1518249(iv) Net Current Assets 447596 -175442(v) Cost of Sales 893283 661636(vi) Net Value Added (at market price) 420027 364556(vii) Total Regular Employees (Nos.) 378 365(viii) Avg. Monthly Emoluments per Employee(`) 158907 153174
PROFIT & LOSS ACCOUNT (` in Lakhs)PARTICULARS 2011-12 2010-11(I) Revenue from Operations (Gross) 1301485 1012849Less : Excise Duty 0 0Revenue from Operations (Net) 1301485 1012849(II) Other Income 2226 3207(III) Total Revenue (I+II) 1303711 1016056(IV) Expenditure on:(a) Cost of materials consumed 0 0(b) Purchase of stock-in-trade 0 0(c) Changes in inventories of finished goods,
work-in-progress and stock in trade 0 0(d) Stores & Spares 0 0(e) Power & Fuel 102 90(f) Salary, Wages & Benefits/Employees Expense 7208 6709(g) Other Operating/direct/manufacturing Expenses 866531 649071(h) Rent, Royalty & Cess 0 0(i) Loss on sale of Assets/Investments 3 6(j) Other Expenses 18900 5261Total Expenditure (IV (a to j)) 892744 661137(V) PROFIT BEFORE DEPRECIATION, &
IMPAIRMENT, FINANCE CHARGES/INTEREST,EXCEPTIONAL & EXTRAORDINARYITEMS & TAXES (PBDIEET)(III-IV) 410967 354919
(VI) Depreciation, Depletion & Amortisation 542 505(VII) Impairment 0 0(VIII) PROFIT BEFORE FINANCE COST/INTEREST,
EXCEPTIONAL, EXTRA-ORDINARYITEMS & TAXES (PBIEET)(V-VI-VII) 410425 354414
(IX) Finance Cost(a) On Central Government Loans 0 0(b) On Foreign Loans 0 0(c) Others 0 0(d) Less Finance Cost Capitalised 0 0(e) Charged to P & L Account (a+b+c+d) 0 0(X) PROFIT BEFORE EXCEPTIONAL & EXTRA-ORDINARY
ITEMS & TAX (PBEET)(VIII-IXe) 410425 354414(XI) Exceptional Items 0 0(XII) PROFIT BEFORE EXTRA-ORDINARY ITEMS & TAX
(PBET)(X-XI) 410425 354414(XIII) Extra-Ordinary Items 0 0(XIV) PROFIT BEFORE TAX (PBT)(XII-XIII) 410425 354414(XV) TAX PROVISIONS 107251 92456(XVI) NET PROFIT / LOSS FOR THE PERIOD FROM
CONTINUING OPERATIONS AFTER TAX(XIV-XV) 303174 261958(XVII) Profit/Loss from discontinuing operations 0 0(XVIII) Tax expenses of discontinuing operations 0 0(XIX) Profit/Loss from discontinuing operations
(after Tax)(XVII-XVIII) 0 0(XX) Profit/Loss for the period (XVI+XIX) 303174 261958Financial Ratios(i) Sales : Capital Employed 11.16 11.89(ii) Cost of Sales : Sales 68.64 65.32(iii) Salary/Wages : Sales 0.55 0.66(iv) Net Profit : Net Worth 14.64 17.25(v) Debt : Equity 72.63 60.97(vi) Current Ratio 1.24 0.91(vii) Trade Recievables : Sales 0 0(viii) Total Inventory : Sales 0 0

Financial Services576
Rural Electrification Corporation LimitedThe Company
Rural Electrification Corporation Ltd. (REC) was incorporatedon 25.7.1969 under the Companies Act, 1956 with the main objectiveof financing rural electrification schemes in the country.
REC is a Schedule-’A’ / Navratna CPSE in Financial Servicessector under the administrative control of Ministry of Power with66.80% shareholding by the Government of India. The companyemployed 678 regular employees (Executives 432 & Non-Executives246) as on 31.3.2012. Its Registered and Corporate Office is atNew Delhi. REC is also a registered NBFC with InfrastructureFinance Company (IFC) status.Vision/Mission
The Vision / Mission of the company is to facilitate availabilityof electricity for accelerated growth and for enrichment of qualityof life of rural and urban population and to act as a competitive,client-friendly and development oriented organization for financingand promoting projects covering power generation, powerconservation, power transmission and power distribution networkin the country.Industrial / Business Operations
REC is engaged in financing projects /schemes of powergeneration, transmission distribution, rural electrification, systemimprovement renovation and modernization of power plants inboth public and private sector. It has two subsidiary companiesnamely, REC Transmission Projects Company Ltd. and REC PowerDistribution Company Ltd.
It is the Nodal Agency for implementation of Rajiv GandhiGraminVidyutikaranYojana (RGGVY), a Government of IndiaScheme for rural electricity infrastructure and householdelectrification. Besides corporate office, it operates through 5 ZonalOffices, 18 Project Offices, 2 Sub-offices and 1 Training Centre.Performance Highlights
The physical performance of Company for the last two yearsis given below:
www.recindia.nic.in
Main Segments Unit Performance during
2011-12 2010-11
Mobilization of resources `Crore 29709 25855
Loan sanctioned `Crore 51297 66420(excluding subsidy under RGGVY)
Disbursement `Crore 30593 28517(including subsidy underRGGVY)
Recoveries `Crore 18440 16951
the period 2010-11 to 2011-12 can be seen on the adjoining page.Strategic Issues
The Company aims to facilitate availability of electricity foraccelerated growth and for enrichment of quality of life of rural andurban population by acting as a competitive, client-friendly anddevelopment oriented organization for financing and promotingprojects covering power generation, power conservation, powertransmission and power distribution network in the country.
The Company also proposes to enlarge the mandate, subjectto approval of its shareholders, by financing and providingassistance for those activities having a forward and/or backwardlinkage with power projects, (including but not limited to), such asdevelopment of coal and other mining activities for use as fuel inpower projects, development of other fuel supply arrangementsfor the power sector, and to meet other enabling infrastructurefacilities that may be required for the speedy and effectivedevelopment of power sector.
EBIT
DA
& P
AT (
Rs.
cro
re)
TOTAL R
EVENU
E (Rs. crore)
Fig. 1PR
OFI
TAB
ILIT
Y R
ATIO
S (%
)
CU
RR
ENT R
ATIO
Fig. 2
The current ratio of company is at 1.01:1 during 2011-12 asagainst 0.97:1in the pervious year (Fig.2). Balance Sheet and Profit& Loss Account of the company and selected financial ratios during
Total Revenue of the company registered an increase of` 2013.81 crore during 2011-12, which went up from ` 8495.26crore in 2010-11 to ` 10509.07 crore in 2011-12. The net profitof the company correspondingly increased to ` 2817.03crore, anincrease of ̀ 247.10crore over the previous year due to increase inBusiness i.e. Disbursements. The recovery rate during the year2011-12 has increased in a big way.

Public Enterprises Survey 2011-2012: Vol-II 577
Rural Electrification Corporation LimitedDDA Building, Nehru Place, New Delhi - 110019
BALANCE SHEET (` in Lakhs)PARTICULARS 2011-12 2010-11I. EQUITY & LIABILITIESAUTHORISED CAPITAL 120000 120000(1) Shareholders’ Funds(a) Share Capital(i) Central Govt 65960 65960(ii) Others 32786 32786(b) Reserves & Surplus 1375746 1180116(c) Money received against share warrants 0 0Total Shareholders’ Funds (1(a)+1(b)+1(c) 1474492 1278862(2) Share application money pending allotment 0 0(3) Non-current Liabilities(a) Long Term Borrowings 7655368 6117302(b) Deferred tax liabilities (Net) 0 0(c) Other Long-term liabilities 2619 0(d) Long-term provisions 6178 4976Total Non-Current Liabilities 3(a) to 3(d) 7664165 6122278(4) Current Liabilities(a) Short Term Borrowings 250000 37500(b) Trade Payables 0 0(c) Other current liabilities 1450237 1162558(d) Short-term provisions 33965 50069Total Current Liabilities 4(a) to 4(d) 1734202 1250127TOTAL EQUITY & LIABILITIES (1+2+3+4) 10872859 8651267II. ASSETS(1) Non-Current Assets(a) Total Gross Fixed Assets 9236 8450(ai) Accumulated Depreciation, Depletion & Amortisation 2190 1925(aii) Accumulated Impairment 0 0(b) Total Net Fixed Assets ((a)-(ai)-(aii) 7046 6525(c) Capital work in progress 792 301(d) Intangible assets under developmet 10 0(e) Non-Current Investments 71043 78965(f) Deferred Tax Assets (Net) 1005 1277(g) Long Term Loans and Advances 8998531 7320657(h) Other Non-Current Assets 42980 36418Total Non-Current Assets (b+c+d+e+f+g+h) 9121407 7444143(2) Current Assets(a) Current Investments 4716 4716(b) Inventories 0 0(c) Trade Recievables 0 0(d) Cash & Bank Balance 531148 283189(e) Short-term Loans & Advances 296750 120000(f) Other Current Assets 918838 799219Total Current Assets (a+b+c+d+e+f) 1751452 1207124TOTAL ASSETS (1+2) 10872859 8651267Important Indicators(i) Investment 7754114 6216048(ii) Capital Employed 9129860 7396164(iii) Net Worth 1474492 1278862(iv) Net Current Assets 17250 -43003(v) Cost of Sales 33718 16795(vi) Net Value Added (at market price) 1037771 848033(vii) Total Regular Employees (Nos.) 678 688(viii) Avg. Monthly Emoluments per Employee(`) 210140 154397
PROFIT & LOSS ACCOUNT (` in Lakhs)PARTICULARS 2011-12 2010-11(I) Revenue from Operations (Gross) 1033759 825691Less : Excise Duty 0 0Revenue from Operations (Net) 1033759 825691(II) Other Income 17148 23835(III) Total Revenue (I+II) 1050907 849526(IV) Expenditure on:(a) Cost of materials consumed 0 0(b) Purchase of stock-in-trade 0 0(c) Changes in inventories of finished goods,
work-in-progress and stock in trade 0 0(d) Stores & Spares 0 0(e) Power & Fuel 87 70(f) Salary, Wages & Benefits/Employees Expense 17097 12747(g) Other Operating/direct/manufacturing Expenses 676 545(h) Rent, Royalty & Cess 202 180(i) Loss on sale of Assets/Investments 23 2(j) Other Expenses 15329 2950Total Expenditure (IV (a to j)) 33414 16494(V) PROFIT BEFORE DEPRECIATION, &
IMPAIRMENT, FINANCE CHARGES/INTEREST,EXCEPTIONAL & EXTRAORDINARYITEMS & TAXES (PBDIEET)(III-IV) 1017493 833032
(VI) Depreciation, Depletion & Amortisation 327 303(VII) Impairment 0 0(VIII) PROFIT BEFORE FINANCE COST/INTEREST,
EXCEPTIONAL, EXTRA-ORDINARYITEMS & TAXES (PBIEET)(V-VI-VII) 1017166 832729
(IX) Finance Cost(a) On Central Government Loans 231 317(b) On Foreign Loans 0 0(c) Others 637649 484784(d) Less Finance Cost Capitalised 0 0(e) Charged to P & L Account (a+b+c+d) 637880 485101(X) PROFIT BEFORE EXCEPTIONAL & EXTRA-ORDINARY
ITEMS & TAX (PBEET)(VIII-IXe) 379286 347628(XI) Exceptional Items 0 0(XII) PROFIT BEFORE EXTRA-ORDINARY ITEMS & TAX
(PBET)(X-XI) 379286 347628(XIII) Extra-Ordinary Items 0 0(XIV) PROFIT BEFORE TAX (PBT)(XII-XIII) 379286 347628(XV) TAX PROVISIONS 97583 90635(XVI) NET PROFIT / LOSS FOR THE PERIOD FROM
CONTINUING OPERATIONS AFTER TAX(XIV-XV) 281703 256993(XVII) Profit/Loss from discontinuing operations 0 0(XVIII) Tax expenses of discontinuing operations 0 0(XIX) Profit/Loss from discontinuing operations
(after Tax)(XVII-XVIII) 0 0(XX) Profit/Loss for the period (XVI+XIX) 281703 256993Financial Ratios(i) Sales : Capital Employed 11.32 11.16(ii) Cost of Sales : Sales 3.26 2.03(iii) Salary/Wages : Sales 1.65 1.54(iv) Net Profit : Net Worth 19.11 20.1(v) Debt : Equity 77.53 61.95(vi) Current Ratio 1.01 0.97(vii) Trade Recievables : Sales 0 0(viii) Total Inventory : Sales 0 0

Financial Services544
Balmer Lawrie Investment Ltd.
The CompanyBalmer Lawrie Investment Ltd. (BLIL) was incorporated on
20.09.2001 with the objective of facilitating the disinvestment ofIBP Co. Ltd., wherein the share holding of IBP Co. in BalmerLawrie & Co. Ltd. was de-merged in favor of BLIL with effect from15.10.2001.
BLIL is an un-categorized listed CPSE in Financial Servicessector under the administrative control of M/o Petroleum & NaturalGas with 59.68% shareholding by the Government of India. Thecompany does not have any employee of its own except its CompanySecretary whose services have been seconded from Balmer Lawrie& Co. Ltd. All services for the company in the nature of accounts,finance, taxation, legal, secretarial, administration etc. are obtainedfrom ‘Balmer Lawrie & Co. Ltd. under a service agreement. ItsRegistered and Corporate offices are at Kolkata, West Bengal.
Vision / MissionThe Vision / Mission of the Company is to better returns to
its shareholders / investors by strictly governing its activities andemphasizing on cutting down unnecessary cost.
Industrial / Business OperationsBLIL is a Non-Banking finance company and engaged in
providing a specific service i.e. to hold the equity shares of itssubsidiary Balmer Lawrie and Co. Ltd. (BL). The equity shares ofthe company are under compulsory demat mode and the shares arelisted in the stock exchanges. The company also holds 100% equityshare holding of its overseas subsidiary company namely BalmerLawrie (UK) Ltd. through its subsidiary company.
Performance HighlightsThe Company registered an increase of ` 5.10 crore in total
revenue during 2011-12 which went up to ̀ 30.40 crore in 2011-12from ` 25.30 crore during 2010-11. The net profit of the companycorrespondingly increased to ` 28.43 crore, an increase of ` 4.20crore over the previous year due to the increase in the amount ofdividend received from its subsidiary and increase in the interestearned on bank deposits.
The current ratio of company is at 2.21:1 during 2011-12 asagainst 2.1:1 in the previous year (Fig.2). Balance Sheet and Profit& Loss Account of the company and selected financial ratios duringthe period 2010-11 to 2011-12 can be seen on the adjoining page.
Strategic issueThe Company was formed as a Special Purpose Vehicle
(‘SPV’) under the erstwhile disinvestment policy of the Governmentof India.
www.blinv.com
EBIT
DA
& P
AT (
Rs.
cro
re)
TOTAL R
EVENU
E (Rs. crore)
Fig. 1
PRO
FITA
BIL
ITY
RAT
IOS
(%)
CU
RR
ENT R
ATIO
Fig. 2

Public Enterprises Survey 2011-2012: Vol-II 545
Balmer Lawrie Investment Ltd.21, Netaji Subhas Road, Kolkata, West Bengal -700001
BALANCE SHEET (` in Lakhs)PARTICULARS 2011-12 2010-11I. EQUITY & LIABILITIESAUTHORISED CAPITAL 2500 2500(1) Shareholders’ Funds (a) Share Capital (i) Central Govt 1325 1325 (ii) Others 895 895 (b) Reserves & Surplus 3839 3215 (c) Money received against share warrants 0 0 Total Shareholders’ Funds (1(a)+1(b)+1(c) 6059 5435(2) Share application money pending allotment 0 0(3) Non-current Liabilities (a) Long Term Borrowings 0 0 (b) Deferred tax liabilities (Net) 0 0 (c) Other Long-term liabilities 0 0 (d) Long-term provisions 0 0 Total Non-Current Liabilities 3(a) to 3(d) 0 0(4) Current Liabilities (a) Short Term Borrowings 0 0 (b) Trade Payables 0 0 (c) Other current liabilities 90 76 (d) Short-term provisions 2220 1887 Total Current Liabilities 4(a) to 4(d) 2310 1963TOTAL EQUITY & LIABILITIES (1+2+3+4) 8369 7398II. ASSETS(1) Non-Current Assets (a) Total Gross Fixed Assets 0 0 (ai) Accumulated Depreciation, Depletion & Amortisation 0 0 (aii) Accumulated Impairment 0 0 (b) Total Net Fixed Assets ((a)-(ai)-(aii) 0 0 (c) Capital work in progress 0 0 (d) Intangible assets under developmet 0 0 (e) Non-Current Investments 3268 3268 (f) Deferred Tax Assets (Net) 0 0 (g) Long Term Loans and Advances 0 0 (h) Other Non-Current Assets 0 0 Total Non-Current Assets (b+c+d+e+f+g+h) 3268 3268(2) Current Assets (a) Current Investments 0 0 (b) Inventories 0 0 (c) Trade Recievables 0 0 (d) Cash & Bank Balance 4959 4050 (e) Short-term Loans & Advances 0 0 (f) Other Current Assets 142 80 Total Current Assets (a+b+c+d+e+f) 5101 4130TOTAL ASSETS (1+2) 8369 7398Important Indicators (i) Investment 2220 2220 (ii) Capital Employed 6059 5435 (iii) Net Worth 6059 5435 (iv) Net Current Assets 2791 2167 (v) Cost of Sales 42 45 (vi) Net Value Added (at market price) 3011 2494 (vii) Total Regular Employees (Nos.) 0 0(viii) Avg. Monthly Emoluments per Employee(`) 0 0
PROFIT & LOSS ACCOUNT (` in Lakhs)PARTICULARS 2011-12 2010-11(I) Revenue from Operations (Gross) 3040 2530 Less : Excise Duty 0 0 Revenue from Operations (Net) 3040 2530(II) Other Income 0 0(III) Total Revenue (I+II) 3040 2530(IV) Expenditure on: (a) Cost of materials consumed 0 0 (b) Purchase of stock-in-trade 0 0 (c) Changes in inventories of finished goods, work-in- 0 0
progress and stock in trade (d) Stores & Spares 0 0 (e) Power & Fuel 0 0 (f) Salary, Wages & Benefits/Employees Expense 13 9 (g) Other Operating/direct/manufacturing Expenses 25 23 (h) Rent, Royalty & Cess 0 0 (i) Loss on sale of Assets/Investments 0 0 (j) Other Expenses 4 13Total Expenditure (IV (a to j)) 42 45(V) PROFIT BEFORE DEPRECIATION, & IMPAIRMENT, 2998 2485 FINANCE CHARGES/INTEREST, EXCEPTIONAL &EXTRAORDINARY ITEMS & TAXES (PBDIEET)(III-IV)(VI) Depreciation, Depletion & Amortisation 0 0(VII) Impairment 0 0(VIII) PROFIT BEFORE FINANCE COST/INTEREST, 2998 2485EXCEPTIONAL, EXTRA-ORDINARY ITEMS &TAXES (PBIEET)(V-VI-VII)(IX) Finance Cost (a) On Central Government Loans 0 0 (b) On Foreign Loans 0 0 (c) Others 0 0 (d) Less Finance Cost Capitalised 0 0 (e) Charged to P & L Account (a+b+c+d) 0 0(X) PROFIT BEFORE EXCEPTIONAL & 2998 2485EXTRA-ORDINARY ITEMS & TAX (PBEET)(VIII-IXe)(XI) Exceptional Items 0 0(XII) PROFIT BEFORE EXTRA-ORDINARY ITEMS & 2998 2485TAX (PBET)(X-XI)(XIII) Extra-Ordinary Items 0 0(XIV) PROFIT BEFORE TAX (PBT)(XII-XIII) 2998 2485(XV) TAX PROVISIONS 155 62(XVI) NET PROFIT / LOSS FOR THE PERIOD FROM 2843 2423CONTINUING OPERATIONS AFTER TAX(XIV-XV)(XVII) Profit/Loss from discontinuing operations 0 0(XVIII) Tax expenses of discontinuing operations 0 0(XIX) Profit/Loss from discontinuing operations 0 0(after Tax)(XVII-XVIII)(XX) Profit/Loss for the period (XVI+XIX) 2843 2423Financial Ratios (i) Sales : Capital Employed 50.17 46.55 (ii) Cost of Sales : Sales 1.38 1.78 (iii) Salary/Wages : Sales 0.43 0.36 (iv) Net Profit : Net Worth 46.92 44.58 (v) Debt : Equity 0 0 (vi) Current Ratio 2.21 2.1 (vii) Trade Recievables : Sales 0 0 (viii) Total Inventory : Sales 0 0

Financial Services546
The CompanyExport Credit Guarantee Corporation of India Ltd. (ECGC)
(earlier known as “Export Risk Corporation of India Ltd.”) was setup on 31.7.1957 with the objective to support and strengthen theexport promotion efforts of the country by issuing credit insurancecovers to protect the exporters against non-realisation on accountof commercial and political risks.
ECGC is an uncategorized CPSE in Financial Services sectorunder the administrative control of M/o Commerce and Industry,D/o Commerce with 100% shareholding by the Government ofIndia. The Company employed 575 regular employees (Executives201 & Non-Executives 374) as on 31.03.2012. It’s registered andCorporate offices are at Mumbai, Maharashtra.
Vision / MissionThe Vision of the Company is to excel in providing export
credit insurance and trade related services. The Mission of the company is to support the Indian Export
Industry by way of providing cost effective Insurance and traderelated services to meet the growing needs of the Indian Exportmarket through optimal utilization of available resources.
Industrial / Business OperationsECGC provides a range of credit risk insurance covers to
exporters against the loss in export of goods and services. It alsooffers guarantees to banks and financial institutions to enableexporters to obtain better facilities from them. ECGC furtherprovides overseas investment insurance to Indian Companiesinvesting in joint ventures abroad in the form of equity or loan andassists exporters in recovering bad debts. Besides Head Office, ithas 51 branch offices and 5 regional offices.
Performance HighlightsThe service segment of the company comprises of Policies
and Guarantees. The physical performance of company during thelast two years is mentioned below:
Total Revenue of the company registered an increase of ̀ 154.45crore during 2011-12, which went up from ` 971.71 crore in2010-11 to ` 1126.16 crore in 2011-12. The Profit howeverincreased to `225.21 crore in 2011-12 from ` 85.66 crore in theprevious year, an increase of `139.55 crore, due to growth of
www.ecgc.in
premium income, decrease in outsourcing claims provision, decreasein operating expenses etc.
The current ratio of company is at 0.68:1 during 2011-122010-11 (Fig.2). Balance Sheet and Profit & Loss Account of thecompany and selected financial ratios during the period 2010-11 to2011-12 can be seen on the adjoining page.
Main Services Unit Performance during
2011-12 2010-11
Business covered ` in Crore 497222.44 431888.34
Premium income ` in Crore 1.004.83 885.49
Claims paid ` in Crore 713.03 620.53
Recoveries made ` in Crore 168.64 136.12
Export Credit Guarantee Corporation of India Ltd.
Strategic issueThe company envisages enhancing ECGC coverage of national
exports by an additional 1.25% over the 5 years by spreadingmarketing efforts, expanding distribution network through alternatechannels and by introducing new and customized products forexporters as well as banks.
EBIT
DA
& P
AT (
Rs.
cro
re)
TOTAL R
EVENU
E (Rs. crore)
Fig. 1
PRO
FITA
BIL
ITY
RAT
IOS
(%)
CU
RR
ENT R
ATIO
Fig. 2

Public Enterprises Survey 2011-2012: Vol-II 547
BALANCE SHEET (` in Lakhs)PARTICULARS 2011-12 2010-11I. EQUITY & LIABILITIESAUTHORISED CAPITAL 100000 100000(1) Shareholders’ Funds (a) Share Capital (i) Central Govt 90000 90000 (ii) Others 0 0 (b) Reserves & Surplus 126774 116223 (c) Money received against share warrants 0 0 Total Shareholders’ Funds (1(a)+1(b)+1(c) 216774 206223(2) Share application money pending allotment 0 0(3) Non-current Liabilities (a) Long Term Borrowings 0 0 (b) Deferred tax liabilities (Net) 0 0 (c) Other Long-term liabilities 0 0 (d) Long-term provisions 47730 45037 Total Non-Current Liabilities 3(a) to 3(d) 47730 45037(4) Current Liabilities (a) Short Term Borrowings 0 0 (b) Trade Payables 1162 1111 (c) Other current liabilities 227620 207657 (d) Short-term provisions 3227 3122 Total Current Liabilities 4(a) to 4(d) 232009 211890TOTAL EQUITY & LIABILITIES (1+2+3+4) 496513 463150II. ASSETS(1) Non-Current Assets (a) Total Gross Fixed Assets 16862 16842 (ai) Accumulated Depreciation, Depletion & Amortisation 4020 3433 (aii) Accumulated Impairment 0 0 (b) Total Net Fixed Assets ((a)-(ai)-(aii) 12842 13409 (c) Capital work in progress 1862 911 (d) Intangible assets under developmet 0 0 (e) Non-Current Investments 323142 304356 (f) Deferred Tax Assets (Net) 2036 405 (g) Long Term Loans and Advances 0 0 (h) Other Non-Current Assets 0 0 Total Non-Current Assets (b+c+d+e+f+g+h) 339882 319081(2) Current Assets (a) Current Investments 15901 12000 (b) Inventories 0 0 (c) Trade Recievables 0 0 (d) Cash & Bank Balance 90245 87686 (e) Short-term Loans & Advances 25434 13407 (f) Other Current Assets 25051 30976 Total Current Assets (a+b+c+d+e+f) 156631 144069TOTAL ASSETS (1+2) 496513 463150Important Indicators (i) Investment 90000 90000 (ii) Capital Employed 216774 206223 (iii) Net Worth 216774 206223 (iv) Net Current Assets -75378 -67821 (v) Cost of Sales 79902 84995 (vi) Net Value Added (at market price) 40541 22895 (vii) Total Regular Employees (Nos.) 575 575(viii) Avg. Monthly Emoluments per Employee(`) 102493 144246
Export Credit Guarantee Corporation of India Ltd.Express Towers, 10th floor, Nariman Point, Mumbai- 400021
PROFIT & LOSS ACCOUNT (` in Lakhs)PARTICULARS 2011-12 2010-11(I) Revenue from Operations (Gross) 77125 68086 Less : Excise Duty 0 0 Revenue from Operations (Net) 77125 68086(II) Other Income 35491 29085(III) Total Revenue (I+II) 112616 97171(IV) Expenditure on: (a) Cost of materials consumed 0 0 (b) Purchase of stock-in-trade 0 0 (c) Changes in inventories of finished goods, work-in- 0 0
progress and stock in trade (d) Stores & Spares 0 0 (e) Power & Fuel 0 0 (f) Salary, Wages & Benefits/Employees Expense 7072 9953 (g) Other Operating/direct/manufacturing Expenses 67622 71414 (h) Rent, Royalty & Cess 736 761 (i) Loss on sale of Assets/Investments 5 20 (j) Other Expenses 3784 2419Total Expenditure (IV (a to j)) 79219 84567(V) PROFIT BEFORE DEPRECIATION, & IMPAIRMENT, 33397 12604FINANCE CHARGES/INTEREST, EXCEPTIONAL &EXTRAORDINARY ITEMS & TAXES (PBDIEET)(III-IV)(VI) Depreciation, Depletion & Amortisation 688 448(VII) Impairment 0 0(VIII) PROFIT BEFORE FINANCE COST/INTEREST, 32709 12156EXCEPTIONAL, EXTRA-ORDINARY ITEMS & TAXES(PBIEET)(V-VI-VII)(IX) Finance Cost (a) On Central Government Loans 0 0 (b) On Foreign Loans 0 0 (c) Others 0 0 (d) Less Finance Cost Capitalised 0 0 (e) Charged to P & L Account (a+b+c+d) 0 0(X) PROFIT BEFORE EXCEPTIONAL & EXTRA-ORDINARY 32709 12156ITEMS & TAX (PBEET)(VIII-IXe)(XI) Exceptional Items 0 0(XII) PROFIT BEFORE EXTRA-ORDINARY ITEMS & 32709 12156TAX (PBET)(X-XI)(XIII) Extra-Ordinary Items 0 0(XIV) PROFIT BEFORE TAX (PBT)(XII-XIII) 32709 12156(XV) TAX PROVISIONS 10188 3589(XVI) NET PROFIT / LOSS FOR THE PERIOD FROM 22521 8567CONTINUING OPERATIONS AFTER TAX(XIV-XV)(XVII) Profit/Loss from discontinuing operations 0 0(XVIII) Tax expenses of discontinuing operations 0 0(XIX) Profit/Loss from discontinuing operations 0 0(after Tax)(XVII-XVIII)(XX) Profit/Loss for the period (XVI+XIX) 22521 8567Financial Ratios (i) Sales : Capital Employed 35.58 33.02 (ii) Cost of Sales : Sales 103.6 124.83 (iii) Salary/Wages : Sales 9.17 14.62 (iv) Net Profit : Net Worth 10.39 4.15 (v) Debt : Equity 0 0 (vi) Current Ratio 0.68 0.68 (vii) Trade Recievables : Sales 0 0 (viii) Total Inventory : Sales 0 0

Financial Services548
The CompanyHousing & Urban Development Corporation Ltd.
(HUDCO)was incorporated on 25.4.1970 with the objective ofproviding long-term finance for construction of houses for residentialpurposes or financing or undertaking housing and urbandevelopment programs in the country; setting up of new or satellitetowns and industrial enterprises of building material, to subscribeto debentures and bonds to be issued by the State Housing (and/or Urban Development) Boards, Improvement Trusts, DevelopmentAuthorities etc. specially for the purpose of housing and urbandevelopment programmes and to promote, establish, assist,collaborate and provide consultancy services for the projects ofdesigning and planning of works relating to housing and developmentprogrammes in India and abroad.
It is a Schedule-’A’ Mini-Ratna CPSE in financial servicessector under the administrative control of M/o Housing and UrbanPoverty Alleviation with 100% shareholding by the Government ofIndia. The Company employed 972 regular employees (Executives693, Non-executives 279) as on 31.03.2012. Its Registered andCorporate offices are at New Delhi.
Vision / MissionThe Vision of the Company is to be among the world’s leading
knowledge hubs and financial organization for habitat development.The Mission of the Company is to promote sustainable habitatdevelopment to enhance the quality of life.
Industrial / Business OperationsThe main activity of the company is to provide financing of
housing and infrastructure projects through financial assistance toagencies like State Housing Boards, Rural Housing Boards, SlumClearance boards, Development Authorities, Improvement Trusts,Municipal Corporations, Primary Cooperative Societies, NGO’s /Private Developers, Joint Sector and individuals.
The company operates through its 41 offices throughout Indiaincluding corporate office, a Training and Research Wing, 20 Regionaloffices and 19 Niwas development offices. The company has 4joint ventures (JV) in infrastructure development sector with shareholding ranging from 26% to 40%.
Performance HighlightsThe performance of Company for last two years is given below:
the previous year showing an increase of ` 80.30 crore due tolowering of interest expenditure as the company was able to mobilizeallocated amount at lower weighted average cost.
The current ratio of company is at 1.04:1 during 2011-12 asagainst 0.71:1 in the previous year (Fig.2). Balance Sheet and Profit& Loss Account of the company and selected financial ratios duringthe period 2010-11 to 2011-12 can be seen on the adjoining page.
Main Services Unit Performance during
2011-12 2010-11
Loan Sanctioned ` Crore 20511 19762
No. of Scheme Sanctioned No. 130 134
Total Revenue of the company registered an increase of` 500.04 crore during 2011-12, which went up from ` 2278.59crore in 2010-11 to ` 2778.63 crore in 2011-12. The net profit ofthe company increased to ` 630.33 crore, from ` 550.03 crore of www.hudco.org
Housing & Urban Development Corporation Ltd.
Strategic IssuesIn view of the dynamic changes in the business environment
for the housing and urban infrastructure sector and the enlargedfocus of HUDCO on its social operations, a need has been felt forrevision of the Corporate Plan towards setting the new operationaland financial benchmarks while imparting increased focus to sociallending. Thus the new Corporate Plan 2020 with measures adoptedto equip the organization to face the challenges of today as well asprepare itself for tomorrow was prepared and approved.
EBIT
DA
& P
AT (
Rs.
cro
re)
TOTAL R
EVENU
E (Rs. crore)
Fig. 1
PRO
FITA
BIL
ITY
RAT
IOS
(%)
CU
RR
ENT R
ATIO
Fig. 2

Public Enterprises Survey 2011-2012: Vol-II 549
Housing & Urban Development Corporation Ltd.HUDCO Bhawan, India Habitat Centre, Lodhi Road, New Delhi-110 003
BALANCE SHEET (` in Lakhs)PARTICULARS 2011-12 2010-11I. EQUITY & LIABILITIESAUTHORISED CAPITAL 250000 250000(1) Shareholders’ Funds(a) Share Capital(i) Central Govt 200190 200190(ii) Others 0 0(b) Reserves & Surplus 398699 351907(c) Money received against share warrants 0 0Total Shareholders’ Funds (1(a)+1(b)+1(c) 598889 552097(2) Share application money pending allotment 0 0(3) Non-current Liabilities(a) Long Term Borrowings 1372299 953154(b) Deferred tax liabilities (Net) 35037 28185(c) Other Long-term liabilities 5174 11971(d) Long-term provisions 21183 16340Total Non-Current Liabilities 3(a) to 3(d) 1433693 1009650(4) Current Liabilities(a) Short Term Borrowings 0 10000(b) Trade Payables 3110 1072(c) Other current liabilities 691951 686100(d) Short-term provisions 21705 14774Total Current Liabilities 4(a) to 4(d) 716766 711946TOTAL EQUITY & LIABILITIES (1+2+3+4) 2749348 2273693II. ASSETS(1) Non-Current Assets(a) Total Gross Fixed Assets 15979 15878(ai) Accumulated Depreciation, Depletion & Amortisation 8841 8457(aii) Accumulated Impairment 0 0(b) Total Net Fixed Assets ((a)-(ai)-(aii) 7138 7421(c) Capital work in progress 1387 1181(d) Intangible assets under developmet 0 0(e) Non-Current Investments 81398 122398(f) Deferred Tax Assets (Net) 0 0(g) Long Term Loans and Advances 1911164 1636671(h) Other Non-Current Assets 0 640Total Non-Current Assets (b+c+d+e+f+g+h) 2001087 1768311(2) Current Assets(a) Current Investments 41000 7500(b) Inventories 0 0(c) Trade Recievables 1252 1657(d) Cash & Bank Balance 277884 71620(e) Short-term Loans & Advances 400499 402217(f) Other Current Assets 27626 22388Total Current Assets (a+b+c+d+e+f) 748261 505382TOTAL ASSETS (1+2) 2749348 2273693Important Indicators(i) Investment 1572489 1153344(ii) Capital Employed 1971188 1505251(iii) Net Worth 598889 552097(iv) Net Current Assets 31495 -206564(v) Cost of Sales 183866 145748(vi) Net Value Added (at market price) 107126 95722(vii) Total Regular Employees (Nos.) 972 972(viii) Avg. Monthly Emoluments per Employee(`) 94753 98122
PROFIT & LOSS ACCOUNT (` in Lakhs)PARTICULARS 2011-12 2010-11(I) Revenue from Operations (Gross) 273836 226346Less : Excise Duty 0 0Revenue from Operations (Net) 273836 226346(II) Other Income 4027 1513(III) Total Revenue (I+II) 277863 227859(IV) Expenditure on:(a) Cost of materials consumed 0 0(b) Purchase of stock-in-trade 0 0(c) Changes in inventories of finished goods, 0 0
work-in-progress and stock in trade(d) Stores & Spares 0 0(e) Power & Fuel 159 159(f) Salary, Wages & Benefits/Employees Expense 11052 11445(g) Other Operating/direct/manufacturing Expenses 163712 128056(h) Rent, Royalty & Cess 53 70(i) Loss on sale of Assets/Investments 0 0(j) Other Expenses 8430 4876Total Expenditure (IV (a to j)) 183406 144606(V) PROFIT BEFORE DEPRECIATION, & 94457 83253
IMPAIRMENT, FINANCE CHARGES/INTEREST, EXCEPTIONAL & EXTRAORDINARYITEMS & TAXES (PBDIEET)(III-IV)
(VI) Depreciation, Depletion & Amortisation 460 1142(VII) Impairment 0 0(VIII) PROFIT BEFORE FINANCE COST/
INTEREST, EXCEPTIONAL, EXTRA-ORDINARYITEMS & TAXES (PBIEET)(V-VI-VII) 93997 82111
(IX) Finance Cost(a) On Central Government Loans 0 0(b) On Foreign Loans 0 0(c) Others 0 0(d) Less Finance Cost Capitalised 0 0(e) Charged to P & L Account (a+b+c+d) 0 0(X) PROFIT BEFORE EXCEPTIONAL & EXTRA-ORDINARY 93997 82111
ITEMS & TAX (PBEET)(VIII-IXe)(XI) Exceptional Items 0 0(XII) PROFIT BEFORE EXTRA-ORDINARY ITEMS & TAX 93997 82111
(PBET)(X-XI)(XIII) Extra-Ordinary Items 0 0(XIV) PROFIT BEFORE TAX (PBT)(XII-XIII) 93997 82111(XV) TAX PROVISIONS 30964 27108(XVI) NET PROFIT / LOSS FOR THE PERIOD FROM 63033 55003
CONTINUING OPERATIONS AFTER TAX(XIV-XV)(XVII) Profit/Loss from discontinuing operations 0 0(XVIII) Tax expenses of discontinuing operations 0 0(XIX) Profit/Loss from discontinuing operations 0 0
(after Tax)(XVII-XVIII)(XX) Profit/Loss for the period (XVI+XIX) 63033 55003Financial Ratios(i) Sales : Capital Employed 13.89 15.04(ii) Cost of Sales : Sales 67.14 64.39(iii) Salary/Wages : Sales 4.04 5.06(iv) Net Profit : Net Worth 10.52 9.96(v) Debt : Equity 6.85 4.76(vi) Current Ratio 1.04 0.71(vii) Trade Recievables : Sales 0.46 0.73(viii) Total Inventory : Sales 0 0

Financial Services550
The CompanyIndia Infrastructure Finance Company Limited (IIFCL) was
incorporated on 5.1.2006 as a Special Purpose Vehicle (SPV) withthe objective of providing financial assistance and acting as afinancial intermediary for the purpose of development andestablishment of infrastructure projects in India.
The company is an un-categorised CPSE in Financial Servicessector under the administrative control of M/o Finance, D/oFinancial Services with 100% shareholding by the Government ofIndia. The company employed 55 regular employees (Executives54 & Non-Executives 1) as on 31.3.2012. Its Registered andCorporate offices are at New Delhi and two regional offices atMumbai and Hyderabad.Vision / Mission
The Vision of the Company is to provide innovative financingsolutions to promote and develop world class infrastructure inIndia.
The Mission of the Company is to adopt best practices infinancing infrastructure and develop core competencies in facilitatinginfrastructure development;Industrial / Business Operations
IIFCL is providing long term financial assistance to variousviable infrastructure projects in the country in terms of the Schemefor Infrastructure Financing. Apart from equity, IIFCL raises longterm debt from the domestic market, debt from bilateral andmultilateral institutions and in foreign currency through externalcommercial borrowings. The borrowings of the company are backedby sovereign guarantee.
Only an infrastructure project implemented by a Public SectorCompany or Private sector company under Public PrivatePartnership (PPP) through a Project Company set up on a ‘nonresource’ basis shall be eligible for financing by IIFCL.
The company has one off-shore wholly owned subsidiary,namely IIFC (UK) Ltd. in London and one Joint Venture companynamely India Infrastructure Fund with equity participation fromIDFC, Citi Bank and IIFCL.Performance Highlights
The physical performances of the company for last two yearsare given below:
India Infrastructure Finance Company Limited
The current ratio of company is at 2.89:1 during 2011-12 asagainst 6.04:1 in the previous year (Fig.2). Balance Sheet and Profit& Loss Account of the company and selected financial ratios duringthe period 2010-11 to 2011-12 can be seen on the adjoining page.
Main Services Unit Performance during
2011-12 2010-11
Projects Sanctioned Nos. 185 37
Loan Sanctioned ` Crore 32048 7402
Loans Disbursed ` Crore 15465 5349
www.hudco.org
Total Revenue of the company registered an increase of` 592.72 crore during 2011-12, which went up from ̀ 1951.88 crorein 2010-11 to ̀ 2544.60 crore in 2011-12. The profit of the companyhas gone up by ` 290.03 crore to ` 585.83 crore in 2011-12, from` 295.80 crore in previous year due to increase in overall business,strict control on costs and maintaining asset quality (Nil NPA).
Strategic issuesThe company initiated the task of developing schemes such
as Credit Enhancement, Infrastructure Debt Fund and Direct lendingConsortium aimed at providing an alternative source of funding tothe infrastructure sector which simultaneously will help banks tomanage their constraints related to Asset liability Mismatch andExposure Norms.
In order to give thrust to conceptualization and setting up ofinnovative, optimum and commercially viable projects for bridgingthe gap in need of infrastructure, IFCL has set-up a wholly-ownedsubsidiary, IIFCL Projects Ltd. (IPL). IPL has already attracted anumber of investors willing to invest equity in the company.
EBIT
DA
& P
AT (
Rs.
cro
re)
TOTAL R
EVENU
E (Rs. crore)
Fig. 1PR
OFI
TAB
ILIT
Y R
ATIO
S (%
)
CU
RR
ENT R
ATIO
Fig. 2

Public Enterprises Survey 2011-2012: Vol-II 551
BALANCE SHEET (` in Lakhs)PARTICULARS 2011-12 2010-11I. EQUITY & LIABILITIESAUTHORISED CAPITAL 500000 200000(1) Shareholders’ Funds (a) Share Capital (i) Central Govt 250000 200000 (ii) Others 0 0 (b) Reserves & Surplus 116808 58225 (c) Money received against share warrants 0 0 Total Shareholders’ Funds (1(a)+1(b)+1(c) 366808 258225(2) Share application money pending allotment 0 0(3) Non-current Liabilities (a) Long Term Borrowings 2084196 1987204 (b) Deferred tax liabilities (Net) 6199 2570 (c) Other Long-term liabilities 132 53 (d) Long-term provisions 11372 5222 Total Non-Current Liabilities 3(a) to 3(d) 2101899 1995049(4) Current Liabilities (a) Short Term Borrowings 274369 118208 (b) Trade Payables 114 299 (c) Other current liabilities 49322 38195 (d) Short-term provisions 200 747 Total Current Liabilities 4(a) to 4(d) 324005 157449TOTAL EQUITY & LIABILITIES (1+2+3+4) 2792712 2410723II. ASSETS(1) Non-Current Assets (a) Total Gross Fixed Assets 188 113 (ai) Accumulated Depreciation, Depletion & Amortisation 79 51 (aii) Accumulated Impairment 0 0 (b) Total Net Fixed Assets ((a)-(ai)-(aii) 109 62 (c) Capital work in progress 0 0 (d) Intangible assets under developmet 0 0 (e) Non-Current Investments 52772 44800 (f) Deferred Tax Assets (Net) 0 0 (g) Long Term Loans and Advances 1803715 1414098 (h) Other Non-Current Assets 0 0 Total Non-Current Assets (b+c+d+e+f+g+h) 1856596 1458960(2) Current Assets (a) Current Investments 1483 182237 (b) Inventories 0 0 (c) Trade Recievables 0 0 (d) Cash & Bank Balance 817908 703808 (e) Short-term Loans & Advances 53844 29169 (f) Other Current Assets 62881 36549 Total Current Assets (a+b+c+d+e+f) 936116 951763TOTAL ASSETS (1+2) 2792712 2410723Important Indicators (i) Investment 2334196 2187204 (ii) Capital Employed 2451004 2245429 (iii) Net Worth 366808 258225 (iv) Net Current Assets 612111 794314 (v) Cost of Sales 163194 150620 (vi) Net Value Added (at market price) 88386 45786 (vii) Total Regular Employees (Nos.) 55 46(viii) Avg. Monthly Emoluments per Employee(`) 136667 80072
India Infrastructure Finance Company Limited18 & 20, Kasturba Gandhi Marg, New Delhi-110 001
PROFIT & LOSS ACCOUNT (` in Lakhs)PARTICULARS 2011-12 2010-11(I) Revenue from Operations (Gross) 254043 194575 Less : Excise Duty 0 0 Revenue from Operations (Net) 254043 194575(II) Other Income 417 613(III) Total Revenue (I+II) 254460 195188(IV) Expenditure on: (a) Cost of materials consumed 0 0 (b) Purchase of stock-in-trade 0 0 (c) Changes in inventories of finished goods, work-in- 0 0
progress and stock in trade (d) Stores & Spares 0 0 (e) Power & Fuel 7 11 (f) Salary, Wages & Benefits/Employees Expense 902 442 (g) Other Operating/direct/manufacturing Expenses 158305 146855 (h) Rent, Royalty & Cess 840 652 (i) Loss on sale of Assets/Investments 0 0 (j) Other Expenses 3104 2635Total Expenditure (IV (a to j)) 163158 150595(V) PROFIT BEFORE DEPRECIATION, & IMPAIRMENT, 91302 44593FINANCE CHARGES/INTEREST, EXCEPTIONAL &EXTRAORDINARY ITEMS & TAXES (PBDIEET)(III-IV)(VI) Depreciation, Depletion & Amortisation 36 25(VII) Impairment 0 0(VIII) PROFIT BEFORE FINANCE COST/INTEREST, 91266 44568EXCEPTIONAL, EXTRA-ORDINARY ITEMS & TAXES(PBIEET)(V-VI-VII)(IX) Finance Cost (a) On Central Government Loans 0 0 (b) On Foreign Loans 0 0 (c) Others 0 0 (d) Less Finance Cost Capitalised 0 0 (e) Charged to P & L Account (a+b+c+d) 0 0(X) PROFIT BEFORE EXCEPTIONAL & EXTRA-ORDINARY 91266 44568ITEMS & TAX (PBEET)(VIII-IXe)(XI) Exceptional Items 4667 0(XII) PROFIT BEFORE EXTRA-ORDINARY ITEMS & 86599 44568TAX (PBET)(X-XI)(XIII) Extra-Ordinary Items 0 0(XIV) PROFIT BEFORE TAX (PBT)(XII-XIII) 86599 44568(XV) TAX PROVISIONS 28016 14988(XVI) NET PROFIT / LOSS FOR THE PERIOD FROM 58583 29580CONTINUING OPERATIONS AFTER TAX(XIV-XV)(XVII) Profit/Loss from discontinuing operations 0 0(XVIII) Tax expenses of discontinuing operations 0 0(XIX) Profit/Loss from discontinuing operations 0 0(after Tax)(XVII-XVIII)(XX) Profit/Loss for the period (XVI+XIX) 58583 29580Financial Ratios (i) Sales : Capital Employed 10.36 8.67 (ii) Cost of Sales : Sales 64.24 77.41 (iii) Salary/Wages : Sales 0.36 0.23 (iv) Net Profit : Net Worth 15.97 11.46 (v) Debt : Equity 8.34 9.94 (vi) Current Ratio 2.89 6.04 (vii) Trade Recievables : Sales 0 0 (viii) Total Inventory : Sales 0 0

Financial Services556
The CompanyIndian Railway Finance Corporation Ltd. (IRFC) was
incorporated on 12th December, 1986 as a Public Financial Institutionnotified under Section 4A of the Companies Act, 1956. It is NDFC-ND-Infrastructure Finance Company notified under section 45-1Aof the Reserve Bank of India Act, 1934.
IRFC is a Schedule ‘B’ CPSE in the financial service sectorunder the administrative control of Ministry of Railways with100% shareholding of Government of India. The company employed19 regular employees (executives 7, non executives 12) as on31.3.2012. It’s registered and Corporate Office is at New Delhi.Vision / Mission
The Vision of the Company is to establish IRFC as a premierFinancial Services Company, create synergies with the Ministry ofRailways, select CPSEs & other entities for sustained growth increation of Rail infrastructure.
The Mission of the Company is to make IRFC as one of theleading Financial Service Company in the country, for raising fundsfrom the capital market at competitive cost, for augmenting railwayplan finances, duly ensuring that the Corporation makes optimumprofits from its operations.Industrial / Business Operations
Indian Railway Finance Corporation is the market borrowingarm of Ministry of Railways (MoR). The Annual Plan Outlay ofMOR, as indicated in the Railway Budget, is met through threesources namely Internal Generation, Budgetary Support from theMinistry of Finance and Extra Budgetary Resources (EBR)Requirements. IRFC is a Special Purpose Vehicle set up to meet theEBR of the Indian Railways.
Each year, MoR notifies IRFC regarding the Annual Borrowingtarget. After receiving the annual borrowing target from MoR, IRFCtaps both the domestic and overseas financial market and transferthe funds to MOR. The funds transferred by IRFC to MOR areused for procurement of Rolling Stock Assets including wagons,coaches and locomotives which are leased out to Railways througha 30 years financial lease agreement executed with them. Till date,IRFC has created Rolling Stock assets worth `82,447 Crore forIndian Railways.Performance Highlights
For the year 2011-12, IRFC was given a borrowing target of`14800 crore. The company was able to meet the target at the rateof 8.73% p.a. IRFC was assigned the responsibility of fundingselect capacity enhancement works of Indian Railways to the tuneof Rs.2078.49 crores.
The Company registered an increase of ̀ 801.51 crore in totalrevenue during 2011-12 which went up to ` 4643.11 crore in2011-12 from ̀ 3841.60 crore during 2010-11. The net profit of thecompany however decreased to ` 480.78 crore, a reduction of`4.42 crore over the previous year’s profit of ` 485.20 crore dueto increased tax liability of the company during the year. ProfitAfter Tax (PAT) for the previous year includes an one time gain of` 57 crore on account of reversal of deferred tax liability. Discountingthe impact of this one time / non-recurring gain, the adjusted PATfor the previous year is lower than current year. The increase inprofitability is attributed to the growth in the incremental assets
Indian Railway Finance Corporation Ltd.leased to MoR. IRFC executed a currency swap in respect of theyen denominated Samurai bonds, which resulted in a saving of` 196.59 crores.
The current ratio of company is at 1.15:1 during 2011-12 asagainst 0.78:1 in the previous year (Fig.2). Balance Sheet and Profit& Loss Account of the company and selected financial ratios duringthe period 2010-11 to 2011-12 can be seen on the adjoining page.
EBIT
DA
& P
AT (
Rs.
cro
re)
TOTAL R
EVENU
E (Rs. crore)
Fig. 1
PRO
FITA
BIL
ITY
RAT
IOS
(%)
CU
RR
ENT R
ATIO
Fig. 2
Strategic issueIRFC came up with the public issue of tax free bonds and
mobilized a sum ` 6268.89 crores. The company had adopted adifferential pricing strategy which helped mobilize the target amountin least possible time and in keeping the average issuance cost oflower than other CPSE’s.
www.irfc.in

Public Enterprises Survey 2011-2012: Vol-II 557
Indian Railway Finance Corporation Ltd.UG Floor, East Tower, NBCC Place, Bhisham Pitamah Marg, Pragati Vihar, Lodhi Road New Delhi -110003
BALANCE SHEET (` in Lakhs)PARTICULARS 2011-12 2010-11I. EQUITY & LIABILITIESAUTHORISED CAPITAL 500000 200000(1) Shareholders’ Funds (a) Share Capital (i) Central Govt 210200 160200 (ii) Others 0 0 (b) Reserves & Surplus 304852 268396 (c) Money received against share warrants 0 0 Total Shareholders’ Funds (1(a)+1(b)+1(c) 515052 428596(2) Share application money pending allotment 25000 0(3) Non-current Liabilities (a) Long Term Borrowings 4695025 3453649 (b) Deferred tax liabilities (Net) 303041 270143 (c) Other Long-term liabilities 727 21011 (d) Long-term provisions 4 1 Total Non-Current Liabilities 3(a) to 3(d) 4998797 3744804(4) Current Liabilities (a) Short Term Borrowings 40565 2325 (b) Trade Payables 0 0 (c) Other current liabilities 427253 463765 (d) Short-term provisions 52261 31547 Total Current Liabilities 4(a) to 4(d) 520079 497637TOTAL EQUITY & LIABILITIES (1+2+3+4) 6058928 4671037II. ASSETS(1) Non-Current Assets (a) Total Gross Fixed Assets 1708 1701 (ai) Accumulated Depreciation, Depletion & Amortisation 399 364 (aii) Accumulated Impairment 0 0 (b) Total Net Fixed Assets ((a)-(ai)-(aii) 1309 1337 (c) Capital work in progress 0 0 (d) Intangible assets under developmet 0 0 (e) Non-Current Investments 1458 1668 (f) Deferred Tax Assets (Net) 0 0 (g) Long Term Loans and Advances 5413365 4238413 (h) Other Non-Current Assets 44152 40518 Total Non-Current Assets (b+c+d+e+f+g+h) 5460284 4281936(2) Current Assets (a) Current Investments 210 230 (b) Inventories 0 0 (c) Trade Recievables 0 0 (d) Cash & Bank Balance 154596 49400 (e) Short-term Loans & Advances 66551 36336 (f) Other Current Assets 377287 303135 Total Current Assets (a+b+c+d+e+f) 598644 389101TOTAL ASSETS (1+2) 6058928 4671037Important Indicators (i) Investment 4930225 3613849 (ii) Capital Employed 5235077 3882245 (iii) Net Worth 540052 428596 (iv) Net Current Assets 78565 -108536 (v) Cost of Sales 362991 294325 (vi) Net Value Added (at market price) 101508 90038 (vii) Total Regular Employees (Nos.) 19 19(viii) Avg. Monthly Emoluments per Employee(`) 82456 89035
PROFIT & LOSS ACCOUNT ( `̀̀̀̀ in Lakhs)PARTICULARS 2011-12 2010-11(I) Revenue from Operations (Gross) 464194 383944 Less : Excise Duty 0 0 Revenue from Operations (Net) 464194 383944(II) Other Income 117 216(III) Total Revenue (I+II) 464311 384160(IV) Expenditure on: (a) Cost of materials consumed 0 0 (b) Purchase of stock-in-trade 0 0 (c) Changes in inventories of finished goods, work-in- 0 0
progress and stock in trade (d) Stores & Spares 0 0 (e) Power & Fuel 11 8 (f) Salary, Wages & Benefits/Employees Expense 188 203 (g) Other Operating/direct/manufacturing Expenses 362039 293674 (h) Rent, Royalty & Cess 1 1 (i) Loss on sale of Assets/Investments 1 1 (j) Other Expenses 717 404Total Expenditure (IV (a to j)) 362957 294291(V) PROFIT BEFORE DEPRECIATION, & IMPAIRMENT, 101354 89869FINANCE CHARGES/INTEREST, EXCEPTIONAL &EXTRAORDINARY ITEMS & TAXES (PBDIEET)(III-IV)(VI) Depreciation, Depletion & Amortisation 35 35(VII) Impairment 0 0(VIII) PROFIT BEFORE FINANCE COST/INTEREST, 101319 89834EXCEPTIONAL, EXTRA-ORDINARY ITEMS & TAXES(PBIEET)(V-VI-VII)(IX) Finance Cost (a) On Central Government Loans 0 0 (b) On Foreign Loans 0 0 (c) Others 0 0 (d) Less Finance Cost Capitalised 0 0 (e) Charged to P & L Account (a+b+c+d) 0 0(X) PROFIT BEFORE EXCEPTIONAL & EXTRA-ORDINARY 101319 89834ITEMS & TAX (PBEET)(VIII-IXe)(XI) Exceptional Items 0 0(XII) PROFIT BEFORE EXTRA-ORDINARY ITEMS & TAX 101319 89834(PBET)(X-XI)(XIII) Extra-Ordinary Items 0 0(XIV) PROFIT BEFORE TAX (PBT)(XII-XIII) 101319 89834(XV) TAX PROVISIONS 53241 41314(XVI) NET PROFIT / LOSS FOR THE PERIOD FROM 48078 48520CONTINUING OPERATIONS AFTER TAX(XIV-XV)(XVII) Profit/Loss from discontinuing operations 0 0(XVIII) Tax expenses of discontinuing operations 0 0(XIX) Profit/Loss from discontinuing operations 0 0(after Tax)(XVII-XVIII)(XX) Profit/Loss for the period (XVI+XIX) 48078 48520Financial Ratios (i) Sales : Capital Employed 8.87 9.89 (ii) Cost of Sales : Sales 78.2 76.66 (iii) Salary/Wages : Sales 0.04 0.05 (iv) Net Profit : Net Worth 8.9 11.32 (v) Debt : Equity 19.96 21.56 (vi) Current Ratio 1.15 0.78 (vii) Trade Recievables : Sales 0 0 (viii) Total Inventory : Sales 0 0

Financial Services554
The CompanyIndian Renewable Energy Development Agency Limited
(IREDA) was incorporated on 11.03.1987 with an objective tofinance and promote investment in renewable energy sources.
IREDA is a Schedule-‘B’ CPSE in Financial Services sectorunder the administrative control of Ministry of New and RenewableEnergy with 100% shareholding by the Government of India. Thecompany employed 130 regular employees (Executives 104, Nonexecutives 26) as on 31.3.2012. Its Registered and Corporate officesare in New Delhi.Vision/Mission
The vision of IREDA is to maintain its position as a leadingorganization to provide efficient and effective financing in RenewableEnergy, Energy Efficiency/ Conservation sector in the country.
The Mission of the company is to be a pioneering, participantfriendly and competitive institution for financing and promotingself - sustaining investment in energy generation from RenewableSources, energy efficiency and environment technologies forsustainable development.Industrial / Business Operations
IREDA is engaged in providing financial services and promotingself sustaining investment in energy generation from renewablesources. The Company has one joint venture (JV) namely MPWind Farms Ltd. with an investment of Rs. 12 lakhs in equity.Performance Highlights
As on 31.3.2012, the cumulative loan sanctioned stood at` 18711.87 crore for 2019 projects and disbursed an amount of` 9723.29 crore. The physical performance of company for the lasttwo years are given below:
India Renewable Energy DevelopmentAgency Limited
The current ratio of company is at 2.09:1 during 2011-12 asagainst 1.84:1 in the previous year (Fig.2). Balance Sheet and Profit& Loss Account of the company and selected financial ratios duringthe period 2010-11 to 2011-12 can be seen on the adjoining page.
Main Services Unit Performance during
2011-12 2010-11
Loan sanctioned ` crore 3405.96 3126.42
Disbursements ` crore 1855.04 1224.17
Repayment by borrowers ` crore 336.71 816.93
The net profit of the company correspondingly increased to` 173.13 crore, an increase of ` 52.67 crore over` 120.46 of previous year due to increase in interest income andrecoveries.
Total Revenue of the company registered an increase of` 132.36 crore during 2011-12, which went up from ̀ 402.46 crorein 2010-11 to ` 534.82 crore in 2011-12.
The company received an equity support of ` 50.00 croreeach in 2010 -11 and 2011-12.
Strategic IssuesTo give impetus to the development of Renewable Energy
(RE) & Energy Efficiency (EE) sectors, IREDA introduced severalnew schemes. This year the company took to finance small hydroand wind power projects with renewable energy certificate (REC)mechanism and financed 13 solar grid connected power underJNNSM and other solar programmes. The company has sign MoUwith various state level agencies with a view to develop and promotecommercially viable Renewable energy and Energy Efficiencyprojects in India.
www.ireda.gov.in
EBIT
DA
& P
AT (
Rs.
cro
re)
TOTAL R
EVENU
E (Rs. crore)
Fig. 1
PRO
FITA
BIL
ITY
RAT
IOS
(%)
CU
RR
ENT R
ATIO
Fig. 2

Public Enterprises Survey 2011-2012: Vol-II 555
BALANCE SHEET (` in Lakhs)PARTICULARS 2011-12 2010-11I. EQUITY & LIABILITIESAUTHORISED CAPITAL 100000 100000(1) Shareholders’ Funds (a) Share Capital (i) Central Govt 63960 58960 (ii) Others 0 0 (b) Reserves & Surplus 81839 67453 (c) Money received against share warrants 0 0 Total Shareholders’ Funds (1(a)+1(b)+1(c) 145799 126413(2) Share application money pending allotment 0 0(3) Non-current Liabilities (a) Long Term Borrowings 395916 239806 (b) Deferred tax liabilities (Net) 0 0 (c) Other Long-term liabilities 53 169 (d) Long-term provisions 3215 2855 Total Non-Current Liabilities 3(a) to 3(d) 399184 242830(4) Current Liabilities (a) Short Term Borrowings 2 0 (b) Trade Payables 446 291 (c) Other current liabilities 27686 14251 (d) Short-term provisions 35738 29381 Total Current Liabilities 4(a) to 4(d) 63872 43923TOTAL EQUITY & LIABILITIES (1+2+3+4) 608855 413166II. ASSETS(1) Non-Current Assets (a) Total Gross Fixed Assets 5941 5495 (ai) Accumulated Depreciation, Depletion & Amortisation 1629 1458 (aii) Accumulated Impairment 0 0 (b) Total Net Fixed Assets ((a)-(ai)-(aii) 4312 4037 (c) Capital work in progress 0 19 (d) Intangible assets under developmet 9 24 (e) Non-Current Investments 12 12 (f) Deferred Tax Assets (Net) 5835 5839 (g) Long Term Loans and Advances 452415 304102 (h) Other Non-Current Assets 12970 18141 Total Non-Current Assets (b+c+d+e+f+g+h) 475553 332174(2) Current Assets (a) Current Investments 0 0 (b) Inventories 0 0 (c) Trade Recievables 125 78 (d) Cash & Bank Balance 61388 20455 (e) Short-term Loans & Advances 71694 60290 (f) Other Current Assets 95 169 Total Current Assets (a+b+c+d+e+f) 133302 80992TOTAL ASSETS (1+2) 608855 413166Important Indicators (i) Investment 459876 298766 (ii) Capital Employed 541715 366219 (iii) Net Worth 145799 126413 (iv) Net Current Assets 69430 37069 (v) Cost of Sales 32658 23554 (vi) Net Value Added (at market price) 22752 18319 (vii) Total Regular Employees (Nos.) 130 130(viii) Avg. Monthly Emoluments per Employee(`) 102821 89615
PROFIT & LOSS ACCOUNT (` in Lakhs)PARTICULARS 2011-12 2010-11(I) Revenue from Operations (Gross) 51965 40096 Less : Excise Duty 0 0 Revenue from Operations (Net) 51965 40096(II) Other Income 1517 150(III) Total Revenue (I+II) 53482 40246(IV) Expenditure on: (a) Cost of materials consumed 0 0 (b) Purchase of stock-in-trade 0 0 (c) Changes in inventories of finished goods, work-in- 0 0progress and stock in trade (d) Stores & Spares 0 0 (e) Power & Fuel 39 41 (f) Salary, Wages & Benefits/Employees Expense 1604 1398 (g) Other Operating/direct/manufacturing Expenses 25486 19002 (h) Rent, Royalty & Cess 20 19 (i) Loss on sale of Assets/Investments 12 22 (j) Other Expenses 5185 2791Total Expenditure (IV (a to j)) 32346 23273(V) PROFIT BEFORE DEPRECIATION, & IMPAIRMENT, 21136 16973FINANCE CHARGES/INTEREST, EXCEPTIONAL &EXTRAORDINARY ITEMS & TAXES (PBDIEET)(III-IV)(VI) Depreciation, Depletion & Amortisation 324 303(VII) Impairment 0 0(VIII) PROFIT BEFORE FINANCE COST/INTEREST, 20812 16670EXCEPTIONAL, EXTRA-ORDINARY ITEMS &TAXES (PBIEET)(V-VI-VII)(IX) Finance Cost (a) On Central Government Loans 0 0 (b) On Foreign Loans 0 0 (c) Others 0 0 (d) Less Finance Cost Capitalised 0 0 (e) Charged to P & L Account (a+b+c+d) 0 0(X) PROFIT BEFORE EXCEPTIONAL & EXTRA- 20812 16670ORDINARY ITEMS & TAX (PBEET)(VIII-IXe)(XI) Exceptional Items 0 0(XII) PROFIT BEFORE EXTRA-ORDINARY ITEMS & 20812 16670TAX (PBET)(X-XI)(XIII) Extra-Ordinary Items 0 0(XIV) PROFIT BEFORE TAX (PBT)(XII-XIII) 20812 16670(XV) TAX PROVISIONS 3499 4624(XVI) NET PROFIT / LOSS FOR THE PERIOD FROM 17313 12046CONTINUING OPERATIONS AFTER TAX(XIV-XV)(XVII) Profit/Loss from discontinuing operations 0 0(XVIII) Tax expenses of discontinuing operations 0 0(XIX) Profit/Loss from discontinuing operations 0 0(after Tax)(XVII-XVIII)(XX) Profit/Loss for the period (XVI+XIX) 17313 12046Financial Ratios (i) Sales : Capital Employed 9.59 10.95 (ii) Cost of Sales : Sales 62.85 58.74 (iii) Salary/Wages : Sales 3.09 3.49 (iv) Net Profit : Net Worth 11.87 9.53 (v) Debt : Equity 6.19 4.07 (vi) Current Ratio 2.09 1.84 (vii) Trade Recievables : Sales 0.24 0.19 (viii) Total Inventory : Sales 0 0
Indian Renewable Energy Development Agency LtdIndia Habitat Centre, Core-4 ‘A’ East Court, 1st Floor,Lodhi Road, New Delhi-110003

Financial Services552
The CompanyThe Indian Vaccines Corporation Limited (IVCOL) was
incorporated as a joint venture company promoted by PasteuMerieux Serium & Vaccines (PMSV), France, Indian PetrochemicalsCorporation Ltd (IPCL) and Department of Biotechnology (Govtof India) in March 1989.
The main objective of the company was to manufactureInjectable Polio Vaccines (IPV) to be incorporated in the massimmunizations programme of Govt. of India. However, IPV wasnot approved by W.H.O. As a result, the project was put on“HOLD” in February 1992. The Govt. of Haryana acquired 108.18acres of land in Manesar for D.B.T., which was later transferred toIVCOL (after its incorporation). The construction activities startedat the site thereafter. M/s PMSV subsequently got disinterested inthe project and expressed its desire to exit the joint venture. Effortswere made to rope in ‘Strategic partner’ as part of the restructuringexercise. The disinvestment of IVCOL, moreover, could not bematerialized. Hence, the promoters decided to lease the balance69.4 acres of land to Reliance Life Sciences Pvt Ltd ( a group co. ofM/s RIL) for setting up a Super Specialty Hospital and Life Scienceand Research and Development Centre (and other related facilities)at this site. The lease agreement in this regard was signed on31.10.2008.
IVOCL is an UncategorizedCPSE in Financial Services sectorunder the administrative control of Ministry of Science & Technologywith 67% shareholding by Central Government.The companyemployed 4 regular executive employees as on 31.3.2012. Theregistered office of the company is at Gurgaon, Haryana andcorporate office is in New Delhi.
Industrial / Business OperationsThe company was to undertake research and development and
manufacture of viral vaccines. Due to problems arising out of changein product mix and technology transfer to the company is on holdsince February, 1992. Now the entire infrastructure of the companyis given on a 30 years lease to M/s Reliance Life Sciences Pvt, Ltd,for the establishment of a life science research and developmentCentre at the project site.
Performance HighlightsTotal Revenue of the company registered an increase of
` 0.06crore during 2011-12, which went up from ` 2.17crore in2010-11 to ` 2.23crore in 2011-12.However, the profit of thecompany has gone down by ` 0.01crore to `0.43 crore, from` 0.44 crore in previous year due to marginally increase in expenditure.
The current ratio of company is at 3.6:1 during 2011-12 asagainst 1.45:1 in the previous year (Fig.2). Balance Sheet and Profit& Loss Account of the company and selected financial ratios duringthe period 2010-11 to 2011-12 can be seen on the adjoining page.
Indian Vaccine Corporation Ltd.
EBIT
DA
& P
AT (
Rs.
cro
re)
TOTAL R
EVENU
E (Rs. crore)
Fig. 1
PRO
FITA
BIL
ITY
RAT
IOS
(%)
CU
RR
ENT R
ATIO
Fig. 2

Public Enterprises Survey 2011-2012: Vol-II 553
Indian Vaccine Corporation LtdManesar, Gurgaon, Haryana.
BALANCE SHEET (` in Lakhs)PARTICULARS 2011-12 2010-11I. EQUITY & LIABILITIESAUTHORISED CAPITAL 5000 5000(1) Shareholders’ Funds (a) Share Capital (i) Central Govt 1253 1253 (ii) Others 626 626 (b) Reserves & Surplus -312 -355 (c) Money received against share warrants 0 0 Total Shareholders’ Funds (1(a)+1(b)+1(c) 1567 1524(2) Share application money pending allotment 0 0(3) Non-current Liabilities (a) Long Term Borrowings 0 101 (b) Deferred tax liabilities (Net) 0 0 (c) Other Long-term liabilities 0 0 (d) Long-term provisions 101 9 Total Non-Current Liabilities 3(a) to 3(d) 101 110(4) Current Liabilities (a) Short Term Borrowings 0 0 (b) Trade Payables 0 0 (c) Other current liabilities 44 41 (d) Short-term provisions 24 43 Total Current Liabilities 4(a) to 4(d) 68 84TOTAL EQUITY & LIABILITIES (1+2+3+4) 1736 1718II. ASSETS(1) Non-Current Assets (a) Total Gross Fixed Assets 1759 1759 (ai) Accumulated Depreciation, Depletion & Amortisation 537 400 (aii) Accumulated Impairment 0 0 (b) Total Net Fixed Assets ((a)-(ai)-(aii) 1222 1359 (c) Capital work in progress 0 0 (d) Intangible assets under developmet 0 0 (e) Non-Current Investments 0 0 (f) Deferred Tax Assets (Net) 80 58 (g) Long Term Loans and Advances 189 179 (h) Other Non-Current Assets 0 0 Total Non-Current Assets (b+c+d+e+f+g+h) 1491 1596(2) Current Assets (a) Current Investments 0 0 (b) Inventories 0 0 (c) Trade Recievables 0 0 (d) Cash & Bank Balance 114 36 (e) Short-term Loans & Advances 92 0 (f) Other Current Assets 39 86 Total Current Assets (a+b+c+d+e+f) 245 122TOTAL ASSETS (1+2) 1736 1718Important Indicators (i) Investment 1879 1980 (ii) Capital Employed 1567 1625 (iii) Net Worth 1567 1524 (iv) Net Current Assets 177 38 (v) Cost of Sales 202 197 (vi) Net Value Added (at market price) 67 65 (vii) Total Regular Employees (Nos.) 4 5(viii) Avg. Monthly Emoluments per Employee(`) 43750 40000
PROFIT & LOSS ACCOUNT (` in Lakhs)PARTICULARS 2011-12 2010-11(I) Revenue from Operations (Gross) 0 0 Less : Excise Duty 0 0 Revenue from Operations (Net) 0 0(II) Other Income 223 217(III) Total Revenue (I+II) 223 217(IV) Expenditure on: (a) Cost of materials consumed 0 0 (b) Purchase of stock-in-trade 0 0 (c) Changes in inventories of finished goods, 0 0work-in-progress and stock in trade (d) Stores & Spares 0 0 (e) Power & Fuel 2 2 (f) Salary, Wages & Benefits/Employees Expense 21 24 (g) Other Operating/direct/manufacturing Expenses 0 0 (h) Rent, Royalty & Cess 0 0 (i) Loss on sale of Assets/Investments 0 0 (j) Other Expenses 42 16Total Expenditure (IV (a to j)) 65 42(V) PROFIT BEFORE DEPRECIATION, & IMPAIRMENT, 158 175FINANCE CHARGES/INTEREST, EXCEPTIONAL &EXTRAORDINARY ITEMS & TAXES (PBDIEET)(III-IV)(VI) Depreciation, Depletion & Amortisation 137 155(VII) Impairment 0 0(VIII) PROFIT BEFORE FINANCE COST/INTEREST, 21 20EXCEPTIONAL, EXTRA-ORDINARY ITEMS & TAXES (PBIEET)(V-VI-VII)(IX) Finance Cost (a) On Central Government Loans 0 0 (b) On Foreign Loans 0 0 (c) Others 0 0 (d) Less Finance Cost Capitalised 0 0 (e) Charged to P & L Account (a+b+c+d) 0 0(X) PROFIT BEFORE EXCEPTIONAL & EXTRA-ORDINARY 21 20ITEMS & TAX (PBEET)(VIII-IXe)(XI) Exceptional Items 0 0(XII) PROFIT BEFORE EXTRA-ORDINARY ITEMS & TAX 21 20(PBET)(X-XI)(XIII) Extra-Ordinary Items 0 0(XIV) PROFIT BEFORE TAX (PBT)(XII-XIII) 21 20(XV) TAX PROVISIONS -22 -23(XVI) NET PROFIT / LOSS FOR THE PERIOD FROM 43 43CONTINUING OPERATIONS AFTER TAX(XIV-XV)(XVII) Profit/Loss from discontinuing operations 0 0(XVIII) Tax expenses of discontinuing operations 0 0(XIX) Profit/Loss from discontinuing operations 0 0(after Tax)(XVII-XVIII)(XX) Profit/Loss for the period (XVI+XIX) 43 43Financial Ratios (i) Sales : Capital Employed 0 0 (ii) Cost of Sales : Sales 0 0 (iii) Salary/Wages : Sales 0 0 (iv) Net Profit : Net Worth 2.74 2.82 (v) Debt : Equity 0 0.05 (vi) Current Ratio 3.60 1.45 (vii) Trade Recievables : Sales 0 0 (viii) Total Inventory : Sales 0 0

Financial Services558
The CompanyKumarakruppa Frontier Hotel Pvt. Ltd. (KFH) was
incorporated on 23.08.2001 with the objective of receiving theland, building and other assets and liabilities of the hotel propertiesgiven on lease-cum-management contract, administering the lease-cum-management contract and receiving the lease payments fromtime to time in pursuance to the Government decision fordisinvestment of ITDC Hotels.
KFH is an un-categorized CPSE in Financial Services sectorunder the administrative control of M/o Tourism with 91%GoIshareholding. The company employed 3regular employees(Executives 2 & Non-Executives 1) as on 31.3.2012. Its Registeredand Corporate offices are at New Delhi.
Vision / MissionThe Vision / Mission of the Company is to administer the
lease-cum-management contracts and receive lease payments fromtime to time.
Industrial / Business OperationsThe company has no business other than receiving lease
payments. The only activity of the company is to receive lease rentfrom Bharat Hotels for the leased property namely Hotel Ashok,Bangalore.
Performance HighlightsTotal Revenue of the company registered areductionof
`2.41crore during 2011-12, which went down from ̀ 12.05crore in2010-11 to `9.64crore in 2011-12.The net profit of the companyalso reduced to `5.43crore, a reduction of `0.14crore over theprevious year profit of `5.57crore due to reduction in income.
Most of its revenues (lease rentals) become a distributable netprofit, which accrues to the Government of India and othershareholders, through dividend.
The current ratio of company is at 1.87:1 during 2011-12 asagainst 1.46:1 in the previous year (Fig.2). Balance Sheet and Profit& Loss Account of the company and selected financial ratios duringthe period 2010-11 to 2011-12 can be seen on the adjoining page.
Kumarakruppa Frontier Hotel Pvt. Ltd.
EBIT
DA
& P
AT (
Rs.
cro
re)
TOTAL R
EVENU
E (Rs. crore)
Fig. 1
PRO
FITA
BIL
ITY
RAT
IOS
(%)
CU
RR
ENT R
ATIO
Fig. 2
Strategic issueThe consideration fixed for leasing of Hotel Ashok Bangalore
was `4.11 crore per annum as Minimum Guaranteed AnnualPayment (MGAP) upto 31.3.2007 which was to be increased by25% w.e.f. 1.4.2007 and in every five years thereafter or 16.5% ofthe gross turnover of the Hotel Ashok Bangalore as Turnover BasedAnnual Payment (TBAP), whichever is higher.
As per the terms of agreement, the lessee has to pay 50% ofthe MGAP for 30 years, which is discounted as upfront amount.The remaining 50% of MGAP/TBAP, after adjusting the amountpaid, is payable by the lessee in each financial year.
After expiration of lease agreement the land and building andother assets and liabilities of the hotel properties is to be given onlease-cum-management contract.

Public Enterprises Survey 2011-2012: Vol-II 559
Kumarakruppa Frontier Hotel Pvt. Ltd.5th Floor, Core 8, SCOPE Complex, 7, Lodhi Road, New Delhi - 110 003
BALANCE SHEET (` in Lakhs)PARTICULARS 2011-12 2010-11I. EQUITY & LIABILITIESAUTHORISED CAPITAL 100 100(1) Shareholders’ Funds (a) Share Capital (i) Central Govt 88 88 (ii) Others 9 9 (b) Reserves & Surplus 1915 1832 (c) Money received against share warrants 0 0 Total Shareholders’ Funds (1(a)+1(b)+1(c) 2012 1929(2) Share application money pending allotment 0 0(3) Non-current Liabilities (a) Long Term Borrowings 0 0 (b) Deferred tax liabilities (Net) 0 0 (c) Other Long-term liabilities 2159 2033 (d) Long-term provisions 0 0 Total Non-Current Liabilities 3(a) to 3(d) 2159 2033(4) Current Liabilities (a) Short Term Borrowings 544 325 (b) Trade Payables 0 0 (c) Other current liabilities 114 87 (d) Short-term provisions 740 1656 Total Current Liabilities 4(a) to 4(d) 1398 2068TOTAL EQUITY & LIABILITIES (1+2+3+4) 5569 6030II. ASSETS(1) Non-Current Assets (a) Total Gross Fixed Assets 709 709 (ai) Accumulated Depreciation, Depletion & Amortisation 583 576 (aii) Accumulated Impairment 0 0 (b) Total Net Fixed Assets ((a)-(ai)-(aii) 126 133 (c) Capital work in progress 0 0 (d) Intangible assets under developmet 0 0 (e) Non-Current Investments 2645 2724 (f) Deferred Tax Assets (Net) 188 161 (g) Long Term Loans and Advances 0 0 (h) Other Non-Current Assets 0 0 Total Non-Current Assets (b+c+d+e+f+g+h) 2959 3018(2) Current Assets (a) Current Investments 0 0 (b) Inventories 0 0 (c) Trade Recievables 263 508 (d) Cash & Bank Balance 1676 1839 (e) Short-term Loans & Advances 493 504 (f) Other Current Assets 178 161 Total Current Assets (a+b+c+d+e+f) 2610 3012TOTAL ASSETS (1+2) 5569 6030Important Indicators (i) Investment 97 97 (ii) Capital Employed 2012 1929 (iii) Net Worth 2012 1929 (iv) Net Current Assets 1212 944 (v) Cost of Sales 59 292 (vi) Net Value Added (at market price) 872 877 (vii) Total Regular Employees (Nos.) 3 3(viii) Avg. Monthly Emoluments per Employee(`) 77778 66667
PROFIT & LOSS ACCOUNT (` in Lakhs)PARTICULARS 2011-12 2010-11(I) Revenue from Operations (Gross) 559 840 Less : Excise Duty 0 0 Revenue from Operations (Net) 559 840(II) Other Income 405 365(III) Total Revenue (I+II) 964 1205(IV) Expenditure on: (a) Cost of materials consumed 0 0 (b) Purchase of stock-in-trade 0 0 (c) Changes in inventories of finished goods, work-in- 0 0
progress and stock in trade (d) Stores & Spares 0 0 (e) Power & Fuel 0 0 (f) Salary, Wages & Benefits/Employees Expense 28 24 (g) Other Operating/direct/manufacturing Expenses 1 0 (h) Rent, Royalty & Cess 17 17 (i) Loss on sale of Assets/Investments 0 0 (j) Other Expenses 6 241Total Expenditure (IV (a to j)) 52 282(V) PROFIT BEFORE DEPRECIATION, & IMPAIRMENT, 912 923 FINANCE CHARGES/INTEREST, EXCEPTIONAL &EXTRAORDINARY ITEMS & TAXES (PBDIEET)(III-IV)(VI) Depreciation, Depletion & Amortisation 7 10(VII) Impairment 0 0(VIII) PROFIT BEFORE FINANCE COST/INTEREST, 905 913EXCEPTIONAL, EXTRA-ORDINARY ITEMS & TAXES(PBIEET)(V-VI-VII)(IX) Finance Cost (a) On Central Government Loans 0 0 (b) On Foreign Loans 0 0 (c) Others 24 2 (d) Less Finance Cost Capitalised 0 0 (e) Charged to P & L Account (a+b+c+d) 24 2(X) PROFIT BEFORE EXCEPTIONAL & EXTRA-ORDINARY 881 911ITEMS & TAX (PBEET)(VIII-IXe)(XI) Exceptional Items 78 77(XII) PROFIT BEFORE EXTRA-ORDINARY ITEMS & TAX 803 834(PBET)(X-XI)(XIII) Extra-Ordinary Items 0 0(XIV) PROFIT BEFORE TAX (PBT)(XII-XIII) 803 834(XV) TAX PROVISIONS 260 277(XVI) NET PROFIT / LOSS FOR THE PERIOD FROM 543 557CONTINUING OPERATIONS AFTER TAX(XIV-XV)(XVII) Profit/Loss from discontinuing operations 0 0(XVIII) Tax expenses of discontinuing operations 0 0(XIX) Profit/Loss from discontinuing operations 0 0(after Tax)(XVII-XVIII)(XX) Profit/Loss for the period (XVI+XIX) 543 557Financial Ratios (i) Sales : Capital Employed 27.78 43.55 (ii) Cost of Sales : Sales 10.55 34.76 (iii) Salary/Wages : Sales 5.01 2.86 (iv) Net Profit : Net Worth 26.99 28.88 (v) Debt : Equity 0 0 (vi) Current Ratio 1.87 1.46 (vii) Trade Recievables : Sales 47.05 60.48 (viii) Total Inventory : Sales 0 0

Financial Services566
The CompanyNational Backward Classes Finance and Development Corp.
(NBCFDC) was incorporated on 13.01.1992 as a company not forprofit under Section 25 of the Companies Act, 1956 with theobjective to promote economic and developmental activities forthe benefit of the members of backward classes living belowdouble the poverty line income limit.
NBCFDC is a Schedule-’C’ CPSE in Financial Services sectorunder the administrative control of M/o Social Justice andEmpowerment with 100% shareholding by the Government of India.The Company employed 46 regular employees (Executives 17 &Non-Executives 29) as on 31.03.2012. Its Registered and Corporateoffices are at New Delhi.Vision / Mission
The Vision of the company is to play a leading role in upliftmentof economic status of the Backward Classes.
The Mission of the company is to provide concessionalfinancial assistance to the eligible members of Backward Classesfor self-employment ventures and skill developmentIndustrial / Business Operations
NBCFD is engaged in providing services in the field ofdisbursement of concessional loan to members of backward classesliving below double the poverty line income limit under selfemployment generation schemes through State ChannelizingAgencies (SCAs) and through State Backward Classes Finance &Development Corporations. The Corporation is implementing termloan, margin money loan and micro finance schemes. It is operatingthrough four regional offices at Kolkata, Mumbai, Chennai andKanpur.
The service range of the company comprises of incomegenerating activities under 4 broad sectors namely Agriculture andAllied activities, Small Business / Artisan and TraditionalOccupation, Service sector and Transport.Performance Highlights
The physical performances of the company for last two yearsare given below:
National Backward Classes Finance &Development Corporation
the cumulative disbursement of funds for the corporation was standat ` 2065.76 crores.
The current ratio of company is at 102.08:1 during 2011-12 asagainst 91.01:1 in the previous year (Fig.2). Balance Sheet andProfit & Loss Account of the company and selected financial ratiosduring the period 2010-11 to 2011-12 can be seen on the adjoining
Main Segments Unit Performance during
2011-12 2010-11
Disbursments of Loans In crore. 215.65 175.33
The Revenue of the company registered an increase of` 6.60 crore during 2011-12 which went up to ` 33.54 crore in2011-12 from ` 26.94 crore during 2010-11. The net profit of thecompany correspondingly increased to ` 24.11 crore, an increaseof ` 4.91 crore over the previous year profit of ` 19.20 crores dueto higher returns on Bank Deposit and due to write back of provisionon loans. The surplus funds generated were used to enhance thelevel of disbursement.
During the year 2011-12 the Corporation received ̀ 71.93 croreas budgetary support from Govt. of India. The corporation has sofar received ̀ 672.35 crores as budgetary support. Up to 31.3.2012,
page.Strategic Issues
Some of the new initiatives taken during the year areEnhancement in education loan limit; Enhancement in unit cost ofmicro finance scheme from 30,000 to 50,000; Establishing linkagesfor monitoring and evaluation, MDPs and training & upgradationof skill with institutes like NID, NIFT, NIRD, NIBM, IIM, ITPO,IGRMS; Monitoring & evaluation of implementation of schemesby SCAs.
EBIT
DA
& P
AT (
Rs.
cro
re) TO
TAL REVEN
UE (R
s. crore)
Fig. 1
PRO
FITA
BIL
ITY
RAT
IOS
(%)
CU
RR
ENT R
ATIO
Fig. 2

Public Enterprises Survey 2011-2012: Vol-II 567
National Backward Classes Finance & Development Corporation5th Floor, N.C.U.I. Building3, Siri Institutional Area, August Kranti Marg , Post Box No. 4617, New Delhi 110016
BALANCE SHEET (` in Lakhs)PARTICULARS 2011-12 2010-11I. EQUITY & LIABILITIESAUTHORISED CAPITAL 70000 70000(1) Shareholders’ Funds(a) Share Capital(i) Central Govt 67235 60042(ii) Others 0 0(b) Reserves & Surplus 29745 27334(c) Money received against share warrants 0 0Total Shareholders’ Funds (1(a)+1(b)+1(c) 96980 87376(2) Share application money pending allotment 0 193(3) Non-current Liabilities(a) Long Term Borrowings 0 0(b) Deferred tax liabilities (Net) 0 0(c) Other Long-term liabilities 0 0(d) Long-term provisions 181 93Total Non-Current Liabilities 3(a) to 3(d) 181 93(4) Current Liabilities(a) Short Term Borrowings 0 0(b) Trade Payables 0 0(c) Other current liabilities 216 284(d) Short-term provisions 211 150Total Current Liabilities 4(a) to 4(d) 427 434TOTAL EQUITY & LIABILITIES (1+2+3+4) 97588 88096II. ASSETS(1) Non-Current Assets(a) Total Gross Fixed Assets 275 271(ai) Accumulated Depreciation, Depletion & Amortisation 203 194(aii) Accumulated Impairment 0 0(b) Total Net Fixed Assets ((a)-(ai)-(aii) 72 77(c) Capital work in progress 0 0(d) Intangible assets under developmet 0 0(e) Non-Current Investments 0 0(f) Deferred Tax Assets (Net) 0 0(g) Long Term Loans and Advances 53928 48500(h) Other Non-Current Assets 1 22Total Non-Current Assets (b+c+d+e+f+g+h) 54001 48599(2) Current Assets(a) Current Investments 0 0(b) Inventories 0 0(c) Trade Recievables 0 0(d) Cash & Bank Balance 11688 7304(e) Short-term Loans & Advances 28420 29216(f) Other Current Assets 3479 2977Total Current Assets (a+b+c+d+e+f) 43587 39497TOTAL ASSETS (1+2) 97588 88096Important Indicators(i) Investment 67235 60235(ii) Capital Employed 96980 87569(iii) Net Worth 96980 87569(iv) Net Current Assets 43160 39063(v) Cost of Sales 943 774(vi) Net Value Added (at market price) 2981 2330(vii) Total Regular Employees (Nos.) 46 49(viii) Avg. Monthly Emoluments per Employee(`) 97283 65136
PROFIT & LOSS ACCOUNT (` in Lakhs)PARTICULARS 2011-12 2010-11(I) Revenue from Operations (Gross) 3117 2618Less : Excise Duty 0 0Revenue from Operations (Net) 3117 2618(II) Other Income 237 76(III) Total Revenue (I+II) 3354 2694(IV) Expenditure on:(a) Cost of materials consumed 0 0(b) Purchase of stock-in-trade 0 0(c) Changes in inventories of finished goods,
work-in-progress and stock in trade 0 0(d) Stores & Spares 0 0(e) Power & Fuel 7 8(f) Salary, Wages & Benefits/Employees Expense 537 383(g) Other Operating/direct/manufacturing Expenses 127 149(h) Rent, Royalty & Cess 46 35(i) Loss on sale of Assets/Investments 0 0(j) Other Expenses 212 187Total Expenditure (IV (a to j)) 929 762(V) PROFIT BEFORE DEPRECIATION, &
IMPAIRMENT, FINANCE CHARGES/INTEREST, EXCEPTIONAL & EXTRAORDINARYITEMS & TAXES (PBDIEET)(III-IV) 2425 1932
(VI) Depreciation, Depletion & Amortisation 14 12(VII) Impairment 0 0(VIII) PROFIT BEFORE FINANCE COST/INTEREST,
EXCEPTIONAL, EXTRA-ORDINARYITEMS & TAXES (PBIEET)(V-VI-VII) 2411 1920
(IX) Finance Cost(a) On Central Government Loans 0 0(b) On Foreign Loans 0 0(c) Others 0 0(d) Less Finance Cost Capitalised 0 0(e) Charged to P & L Account (a+b+c+d) 0 0(X) PROFIT BEFORE EXCEPTIONAL & EXTRA-ORDINARY
ITEMS & TAX (PBEET)(VIII-IXe) 2411 1920(XI) Exceptional Items 0 0(XII) PROFIT BEFORE EXTRA-ORDINARY ITEMS & TAX
(PBET)(X-XI) 2411 1920(XIII) Extra-Ordinary Items 0 0(XIV) PROFIT BEFORE TAX (PBT)(XII-XIII) 2411 1920(XV) TAX PROVISIONS 0 0(XVI) NET PROFIT / LOSS FOR THE PERIOD FROM
CONTINUING OPERATIONS AFTER TAX(XIV-XV) 2411 1920(XVII) Profit/Loss from discontinuing operations 0 0(XVIII) Tax expenses of discontinuing operations 0 0(XIX) Profit/Loss from discontinuing operations
(after Tax)(XVII-XVIII) 0 0(XX) Profit/Loss for the period (XVI+XIX) 2411 1920Financial Ratios(i) Sales : Capital Employed 3.21 2.99(ii) Cost of Sales : Sales 30.25 29.56(iii) Salary/Wages : Sales 17.23 14.63(iv) Net Profit : Net Worth 2.49 2.19(v) Debt : Equity 0 0(vi) Current Ratio 102.08 91.01(vii) Trade Recievables : Sales 0 0(viii) Total Inventory : Sales 0 0

Financial Services568
National Film Development Corp. Ltd.The Company
National Film Development Corp. Ltd. (NFDC) wasincorporated on 11.05.1975 with the objective to plan, promoteand organize an integrated and efficient development of the filmindustry in accordance with the national economic policy andobjectives laid down by the Central Government from time to time.The company was restructured in 1980 by the merger of erstwhileIndian Motion Picture Export Corporation and Film FinanceCorporation, thereby, the company emerged as a Central Agency topromote good cinema in the Country.
NFDC is a Schedule-‘C’ Mini-ratna / BRPSE referred CPSE inFinancial Services sector under the administrative control of M/oInformation and Broadcasting with 100% shareholding by theGovernment of India. Its Registered and Corporate offices are atMumbai, Maharashtra. The Company employed 102 regularemployees (Executives 45, Non-Executives 57) as on 31.03.2012.
Vision / MissionThe Vision / Mission of the Company is to plan, promote and
organize an integrated and efficient development of the film industryin accordance with the national economic policy and objectives laiddown by the Central government from time to time.
Industrial / Business OperationsNFDC is engaged in providing services in the field of film
production, distribution and provide related project services. Theactivities of the company can be bifurcated into development andcommercial activities.
The company operates through three Regional offices inChennai, Delhi and Kolkata and one Branch office at Trivandrum.
Performance HighlightsThe physical performances of the company for last two years
are given below:
The current ratio of company is at 1.14:1 during 2011-12 asagainst 1.1:1 in the previous year (Fig.2). Balance Sheet and Profit& Loss Account of the company and selected financial ratios duringthe period 2010-11 to 2011-12 can be seen on the adjoining page.
Main Services / Unit Performance during
Activities 2011-12 2010-11
Media Campaign for Govt. ` in crores . 197.21 162.32Dept.
Non Feature Film Production No. 26.95 8.90
Service Project ` in crores . 12.50 5.33
Feature Film Production No. 8.74 6.86
Film Distribution ` in crores . 3.03 4.00
Total Revenue of the company registered an increase of ̀ 70.71crore during 2011-12, which went up from ` 185.00 crore in2010-11 to ̀ 255.71 crore in 2011-12 The net profit of the companycorrespondingly increased to ̀ 4.08 crore, an increase of ̀ 2.39 croreover the previous year’s profit of `1.69 crore due to increase inbusiness after the revision of Government policy in October 2009that had allowed NFDC to make inroads into release of advertisementcampaigns that was previously reserved for DAVP only. www.nfdcindia.com
Strategic issueThe company was referred to BRPSE and a revival plan for
the company was approved by the Government in September,2010. As per revival plan of the company, an additional equity wasinfused during 2010-11 and outstanding Government loan alongwith accumulated interest was converted into equity. The revivalplan is under implementation. The conversion of loan into equityand interest outstanding thereon has rid the corporation of theirheavy interest burden and liability to repay the loan. It has helpedthe corporation to clean up its balance sheet and start afresh.
EBIT
DA
& P
AT (
Rs.
cro
re)
TOTAL R
EVENU
E (Rs. crore)
Fig. 1PR
OFI
TAB
ILIT
Y R
ATIO
S (%
)
CU
RR
ENT R
ATIO
Fig. 2

Public Enterprises Survey 2011-2012: Vol-II 569
National Film Development Corp. Ltd.Discovery of India Building, 6th Floor , Nehru Centre, Dr. A. B. Raod, Worli, Mumbai Maharashtra - 400 018
BALANCE SHEET (` in Lakhs)PARTICULARS 2011-12 2010-11I. EQUITY & LIABILITIESAUTHORISED CAPITAL 4540 4540(1) Shareholders’ Funds(a) Share Capital(i) Central Govt 4540 4540(ii) Others 0 0(b) Reserves & Surplus -1799 -2626(c) Money received against share warrants 0 0Total Shareholders’ Funds (1(a)+1(b)+1(c) 2741 1914(2) Share application money pending allotment 0 0(3) Non-current Liabilities(a) Long Term Borrowings 33 50(b) Deferred tax liabilities (Net) 0 0(c) Other Long-term liabilities 242 216(d) Long-term provisions 370 319Total Non-Current Liabilities 3(a) to 3(d) 645 585(4) Current Liabilities(a) Short Term Borrowings 0 0(b) Trade Payables 12764 13551(c) Other current liabilities 5922 4333(d) Short-term provisions 73 66Total Current Liabilities 4(a) to 4(d) 18759 17950TOTAL EQUITY & LIABILITIES (1+2+3+4) 22145 20449II. ASSETS(1) Non-Current Assets(a) Total Gross Fixed Assets 2050 2778(ai) Accumulated Depreciation, Depletion & Amortisation 1473 2298(aii) Accumulated Impairment 0 3(b) Total Net Fixed Assets ((a)-(ai)-(aii) 577 477(c) Capital work in progress 5 29(d) Intangible assets under developmet 0 0(e) Non-Current Investments 0 0(f) Deferred Tax Assets (Net) 0 0(g) Long Term Loans and Advances 98 98(h) Other Non-Current Assets 61 89Total Non-Current Assets (b+c+d+e+f+g+h) 741 693(2) Current Assets(a) Current Investments 0 0(b) Inventories 2 47(c) Trade Recievables 7294 9155(d) Cash & Bank Balance 10903 8087(e) Short-term Loans & Advances 3123 2434(f) Other Current Assets 82 33Total Current Assets (a+b+c+d+e+f) 21404 19756TOTAL ASSETS (1+2) 22145 20449Important Indicators(i) Investment 4573 4590(ii) Capital Employed 2774 1964(iii) Net Worth 2741 1914(iv) Net Current Assets 2645 1806(v) Cost of Sales 25141 18328(vi) Net Value Added (at market price) 63 -256(vii) Total Regular Employees (Nos.) 102 104(viii) Avg. Monthly Emoluments per Employee(`) 57843 33173
PROFIT & LOSS ACCOUNT (` in Lakhs)PARTICULARS 2011-12 2010-11(I) Revenue from Operations (Gross) 24844 18125Less : Excise Duty 0 0Revenue from Operations (Net) 24844 18125(II) Other Income 727 375(III) Total Revenue (I+II) 25571 18500(IV) Expenditure on:(a) Cost of materials consumed 0 0(b) Purchase of stock-in-trade 0 0(c) Changes in inventories of finished goods,
work-in-progress and stock in trade 0 0(d) Stores & Spares 0 0(e) Power & Fuel 28 29(f) Salary, Wages & Benefits/Employees Expense 708 414(g) Other Operating/direct/manufacturing Expenses 23672 17067(h) Rent, Royalty & Cess 92 88(i) Loss on sale of Assets/Investments 16 0(j) Other Expenses 451 649Total Expenditure (IV (a to j)) 24967 18247(V) PROFIT BEFORE DEPRECIATION, &
IMPAIRMENT, FINANCE CHARGES/INTEREST, EXCEPTIONAL & EXTRAORDINARYITEMS & TAXES (PBDIEET)(III-IV) 604 253
(VI) Depreciation, Depletion & Amortisation 190 81(VII) Impairment 0 0(VIII) PROFIT BEFORE FINANCE COST/INTEREST,
EXCEPTIONAL, EXTRA-ORDINARYITEMS & TAXES (PBIEET)(V-VI-VII) 414 172
(IX) Finance Cost(a) On Central Government Loans 0 0(b) On Foreign Loans 0 0(c) Others 6 3(d) Less Finance Cost Capitalised 0 0(e) Charged to P & L Account (a+b+c+d) 6 3(X) PROFIT BEFORE EXCEPTIONAL & EXTRA-ORDINARY
ITEMS & TAX (PBEET)(VIII-IXe) 408 169(XI) Exceptional Items 0 0(XII) PROFIT BEFORE EXTRA-ORDINARY ITEMS & TAX (PBET)(X-XI)408 169(XIII) Extra-Ordinary Items 0 0(XIV) PROFIT BEFORE TAX (PBT)(XII-XIII) 408 169(XV) TAX PROVISIONS 0 0(XVI) NET PROFIT / LOSS FOR THE PERIOD FROM
CONTINUING OPERATIONS AFTER TAX(XIV-XV) 408 169(XVII) Profit/Loss from discontinuing operations 0 0(XVIII) Tax expenses of discontinuing operations 0 0(XIX) Profit/Loss from discontinuing operations
(after Tax)(XVII-XVIII) 0 0(XX) Profit/Loss for the period (XVI+XIX) 408 169Financial Ratios(i) Sales : Capital Employed 895.6 922.86(ii) Cost of Sales : Sales 101.2 101.12(iii) Salary/Wages : Sales 2.85 2.28(iv) Net Profit : Net Worth 14.89 8.83(v) Debt : Equity 0.01 0.01(vi) Current Ratio 1.14 1.1(vii) Trade Recievables : Sales 29.36 50.51(viii) Total Inventory : Sales 0.01 0.26

Financial Services560
National Handicapped Finance & Dev. Corp.The Company
National Handicapped Finance & Dev. Corp. (NHFDC) wasincorporated on 24.01.1997 as a company not for profit underSection 25 of the Companies Act, 1956 with the objective of servingas a catalyst in the economic & social development of persons withdisability by helping them in setting up self-employment projects.
NHFDC is a Schedule-‘C’ CPSE in Financial Services sectorunder the administrative control of M/o Social Justice &Empowerment with 100% shareholding by the Government ofIndia. The company employed 30regular employees (Executives13, Non-executives 17) as on 31.3.2012. Its Registered andCorporate offices are at Faridabad, Haryana. During the year,company received equity of ` 45.00 crores from GoI.
Vision / MissionThe Vision and Mission of the Company is to empower the
disabled persons to break away from the dependence on others anddepressed economic and social conditions by engaging themselvesin productive work and move up the social and economic ladderwith dignity and pride.
Industrial / Business OperationsNHFDC is engaged in providing services in the field of financial
assistance for self-employment of the disabled persons throughState Channelising Agencies (SCAs. The NHFDC functions as anapex institution for channelizing funds to persons with disabilitiesthrough the SCAs nominated by the concerned StateGovernment(s) and Union Territories or Regional Rural Banks(RRBs).
The assistance in the form of loan is provided for setting upsmall business in service / trading sector; purchase of vehicles forcommercial hiring; setting up small industrial unit; agricultureactivities; self-employment amongst persons with mentalretardation, cerebral palsy and autism; professional / educational /training courses; financial assistance for skills and entrepreneurialdevelopment; Micro Credit Finance; and Parents’ Association ofmentally retarded persons.
The company strives to promote economic developmentalactivities & self employment ventures for the persons withdisabilities. It is assisting in up-gradation of entrepreneurial skill,vocational rehabilitation, self employment and in marketing of theirproducts.
Performance HighlightsThe physical performances of the company for last two years
are given below:
The Company registered an increase of ` 3.90 crore in netrevenue during 2011-12 which went up to ̀ 8.33 crore in 2011-12from ` 4.43crore during 2010-11. The net profit of the companyincreased to ̀ 3.72crore in 2011-12, an increase of ̀ 2.17crore overthe previous year profit of `1.55crore.The profitability increaseddue to better management of funds and increase in loan income dueto increase in disbursement.
The current ratio of company is at 17.84:1 during 2011-12 asagainst 10.26:1 in the previous year (Fig.2). Balance Sheet and Profit& Loss Account of the company and selected financial ratios duringthe period 2010-11 to 2011-12 can be seen on the adjoining page.
Main Segments Unit Performance during
2011-12 2010-11
Loan Disbursed ` Cr. 50.86 31.84
Beneficiaries No. 10625 6356
Strategic issueDuring the year NHFDC has taken new initiatives for extending
the outreach to its target group e.g. training of persons withdisabilities; MoU with 17 regional rural banks/ scheduled commercialbanks; proposal for grant of subsidy, EDP training, interest freeeducation loan, grant for reimbursement of one time guarantee;scheme for young professionals with disabilities, advancefunding etc.
EBIT
DA
& P
AT (
Rs.
cro
re)
TOTAL R
EVENU
E (Rs. crore)
Fig. 1
PRO
FITA
BIL
ITY
RAT
IOS
(%)
CU
RR
ENT R
ATIO
Fig. 2

Public Enterprises Survey 2011-2012: Vol-II 561
National Handicapped Finance & Dev. Corp.Red Cross Bhawan, Sector-12, Faridabad, Haryana 121 007
BALANCE SHEET (` in Lakhs)PARTICULARS 2011-12 2010-11I. EQUITY & LIABILITIESAUTHORISED CAPITAL 40000 40000(1) Shareholders’ Funds(a) Share Capital(i) Central Govt 19180 16180(ii) Others 0 0(b) Reserves & Surplus 3130 2758(c) Money received against share warrants 0 0Total Shareholders’ Funds (1(a)+1(b)+1(c) 22310 18938(2) Share application money pending allotment 0 500(3) Non-current Liabilities(a) Long Term Borrowings 0 0(b) Deferred tax liabilities (Net) 0 0(c) Other Long-term liabilities 0 0(d) Long-term provisions 81 52Total Non-Current Liabilities 3(a) to 3(d) 81 52(4) Current Liabilities(a) Short Term Borrowings 0 0(b) Trade Payables 0 0(c) Other current liabilities 322 594(d) Short-term provisions 37 0Total Current Liabilities 4(a) to 4(d) 359 594TOTAL EQUITY & LIABILITIES (1+2+3+4) 22750 20084II. ASSETS(1) Non-Current Assets(a) Total Gross Fixed Assets 118 129(ai) Accumulated Depreciation, Depletion & Amortisation 92 97(aii) Accumulated Impairment 0 0(b) Total Net Fixed Assets ((a)-(ai)-(aii) 26 32(c) Capital work in progress 0 0(d) Intangible assets under developmet 0 0(e) Non-Current Investments 0 0(f) Deferred Tax Assets (Net) 0 0(g) Long Term Loans and Advances 16318 13955(h) Other Non-Current Assets 0 0Total Non-Current Assets (b+c+d+e+f+g+h) 16344 13987(2) Current Assets(a) Current Investments 0 0(b) Inventories 0 0(c) Trade Recievables 206 175(d) Cash & Bank Balance 5999 5806(e) Short-term Loans & Advances 26 33(f) Other Current Assets 175 83Total Current Assets (a+b+c+d+e+f) 6406 6097TOTAL ASSETS (1+2) 22750 20084Important Indicators(i) Investment 19180 16680(ii) Capital Employed 22310 19438(iii) Net Worth 22310 19438(iv) Net Current Assets 6047 5503(v) Cost of Sales 460 288(vi) Net Value Added (at market price) 619 339(vii) Total Regular Employees (Nos.) 30 32(viii) Avg. Monthly Emoluments per Employee(`) 68611 47917
PROFIT & LOSS ACCOUNT (` in Lakhs)PARTICULARS 2011-12 2010-11(I) Revenue from Operations (Gross) 832 442Less : Excise Duty 0 0Revenue from Operations (Net) 832 442(II) Other Income 1 1(III) Total Revenue (I+II) 833 443(IV) Expenditure on:(a) Cost of materials consumed 0 0(b) Purchase of stock-in-trade 0 0(c) Changes in inventories of finished goods, 0 0
work-in-progress and stock in trade(d) Stores & Spares 0 0(e) Power & Fuel 2 3(f) Salary, Wages & Benefits/Employees Expense 247 184(g) Other Operating/direct/manufacturing Expenses 3 2(h) Rent, Royalty & Cess 0 0(i) Loss on sale of Assets/Investments 1 0(j) Other Expenses 201 89Total Expenditure (IV (a to j)) 454 278(V) PROFIT BEFORE DEPRECIATION, & 379 165
IMPAIRMENT, FINANCE CHARGES/INTEREST, EXCEPTIONAL & EXTRAORDINARYITEMS & TAXES (PBDIEET)(III-IV)
(VI) Depreciation, Depletion & Amortisation 7 10(VII) Impairment 0 0(VIII) PROFIT BEFORE FINANCE COST/INTEREST,
EXCEPTIONAL, EXTRA-ORDINARYITEMS & TAXES (PBIEET)(V-VI-VII) 372 155
(IX) Finance Cost(a) On Central Government Loans 0 0(b) On Foreign Loans 0 0(c) Others 0 0(d) Less Finance Cost Capitalised 0 0(e) Charged to P & L Account (a+b+c+d) 0 0(X) PROFIT BEFORE EXCEPTIONAL & EXTRA-ORDINARY 372 155
ITEMS & TAX (PBEET)(VIII-IXe)(XI) Exceptional Items 0 0(XII) PROFIT BEFORE EXTRA-ORDINARY 372 155
ITEMS & TAX (PBET)(X-XI)(XIII) Extra-Ordinary Items 0 0(XIV) PROFIT BEFORE TAX (PBT)(XII-XIII) 372 155(XV) TAX PROVISIONS 0 0(XVI) NET PROFIT / LOSS FOR THE PERIOD FROM 372 155
CONTINUING OPERATIONS AFTER TAX(XIV-XV)(XVII) Profit/Loss from discontinuing operations 0 0(XVIII) Tax expenses of discontinuing operations 0 0(XIX) Profit/Loss from discontinuing operations 0 0
(after Tax)(XVII-XVIII)(XX) Profit/Loss for the period (XVI+XIX) 372 155Financial Ratios(i) Sales : Capital Employed 3.73 2.27(ii) Cost of Sales : Sales 55.29 65.16(iii) Salary/Wages : Sales 29.69 41.63(iv) Net Profit : Net Worth 1.67 0.8(v) Debt : Equity 0 0(vi) Current Ratio 17.84 10.26(vii) Trade Recievables : Sales 24.76 39.59(viii) Total Inventory : Sales 0 0

Financial Services562
The Company National Minorities Development Finance Corporation
(NMDFC) NMDFC was incorporated on 0.09.1994 as a companynot for profit under Section 25 of the Companies Act, 1956 with anobjective to promote economic and developmental activities for thebenefit of backward sections amongst minorities as defined underNational Commission for Minorities Act 1992.
NMDFC is a Schedule – ‘C’ CPSE in Financial Services sectorunder the administrative control of Ministry of Minority Affairswith 65% shareholding by the Govt. of India, 26% by the StateGovt. and 9% by the Groups & individuals having interest inDevelopment of Minorities. The company employed 32 regularemployees (Executives 16 and Non-executives 16) as on 31.3.2012.The registered and corporate office of NMDFC is situated at NewDelhi.
Vision / MissionThe Vision of the Company is to reach and assist all individuals/
groups among minorities who are living below double the povertyline in a phased manner.
The Mission of the Company is to promote economic anddevelopmental activities for the benefit of backward sectionsamongst minorities.
Industrial / Business OperationsNMDFC is a national level apex financing body providing
Financial Assistance / lending to eligible Minorities living belowdouble the poverty line at concessional rates of interest for selfemployment ventures as well as technical and professional education,with preference to women and occupational groups through 36operational State Channellising Agencies (SCAs) operational in 25States and two Union Territories across the country.
The major schemes implemented by NMDFC are Term Loan,Margin Money, Micro Credit, Interest Fee Loan for promotion ofSelf Help Groups, Revolving fund scheme under Micro Financing,Educational Loan, Vocational Training, Grant for skill/designdevelopment/ Marketing assistance scheme.
Performance HighlightsThe physical performances of the company for last two years
are given below:
The current ratio of company is at 104.92:1 during 2011-12as against 74.02:1 in the previous year (Fig.2). Balance Sheet andProfit & Loss Account of the company and selected financial ratiosduring the period 2010-11 to 2011-12 can be seen on the adjoiningpage.
Total Revenue of the company registered an increase of` 16.62 crore during 2011-12, which went up from ` 37.4 crore in2010-11 to ̀ 54.02 crore in 2011-12.The net profit of the companyincreased to ̀ 39.89 crore, an increase of ̀ 8.29 crore over previousyear profit of ` 31.60 crore due to receipt of Govt. Guarantee andless provision on loan.
Main Segments Unit Performance during
2011-12 2010-11
Disbursments of Loans ` in crore. 271.37 233.27
National Minorities Development Finance Corporation
www.nmdfc.org
Strategic IssuesSince NMDFC is a community welfare organisation, it receives
funds from the Government of India and the State Governments forpromoting economic and developmental activities amongst theminorities. During the year 2011-12 the company received abudgetary support of `139.03 crore as equity from Central Govt.and State Govt. Proposal for restructuring of NMDFC is underprocess in the Ministry of Minority Affairs.
EBIT
DA
& P
AT (
Rs.
cro
re) TO
TAL REVEN
UE (R
s. crore)
Fig. 1PR
OFI
TAB
ILIT
Y R
ATIO
S (%
)
CU
RR
ENT R
ATIO
Fig. 2

Public Enterprises Survey 2011-2012: Vol-II 563
National Minorities Development Finance Corporation2nd Floor, Core 2, Scope Minar, Laxmi Nagar, Delhi-110092
BALANCE SHEET (` in Lakhs)PARTICULARS 2011-12 2010-11I. EQUITY & LIABILITIESAUTHORISED CAPITAL 150000 150000(1) Shareholders’ Funds(a) Share Capital(i) Central Govt 87536 76036(ii) Others 19383 17281(b) Reserves & Surplus 20780 16791(c) Money received against share warrants 0 0Total Shareholders’ Funds (1(a)+1(b)+1(c) 127699 110108(2) Share application money pending allotment 300 0(3) Non-current Liabilities(a) Long Term Borrowings 0 0(b) Deferred tax liabilities (Net) 0 0(c) Other Long-term liabilities 77 6(d) Long-term provisions 388 400Total Non-Current Liabilities 3(a) to 3(d) 465 406(4) Current Liabilities(a) Short Term Borrowings 0 0(b) Trade Payables 15 50(c) Other current liabilities 332 319(d) Short-term provisions 35 26Total Current Liabilities 4(a) to 4(d) 382 395TOTAL EQUITY & LIABILITIES (1+2+3+4) 128846 110909II. ASSETS(1) Non-Current Assets(a) Total Gross Fixed Assets 919 711(ai) Accumulated Depreciation, Depletion & Amortisation 227 185(aii) Accumulated Impairment 0 0(b) Total Net Fixed Assets ((a)-(ai)-(aii) 692 526(c) Capital work in progress 0 0(d) Intangible assets under developmet 0 0(e) Non-Current Investments 0 0(f) Deferred Tax Assets (Net) 0 0(g) Long Term Loans and Advances 85858 79093(h) Other Non-Current Assets 2215 2054Total Non-Current Assets (b+c+d+e+f+g+h) 88765 81673(2) Current Assets(a) Current Investments 0 0(b) Inventories 0 0(c) Trade Recievables 179 377(d) Cash & Bank Balance 20624 14788(e) Short-term Loans & Advances 17854 13577(f) Other Current Assets 1424 494Total Current Assets (a+b+c+d+e+f) 40081 29236TOTAL ASSETS (1+2) 128846 110909Important Indicators(i) Investment 107219 93317(ii) Capital Employed 127999 110108(iii) Net Worth 127999 110108(iv) Net Current Assets 39699 28841(v) Cost of Sales 1413 579(vi) Net Value Added (at market price) 4400 3520(vii) Total Regular Employees (Nos.) 33 33(viii) Avg. Monthly Emoluments per Employee(`) 102273 81313
PROFIT & LOSS ACCOUNT (` in Lakhs)PARTICULARS 2011-12 2010-11(I) Revenue from Operations (Gross) 2836 2665Less : Excise Duty 0 0Revenue from Operations (Net) 2836 2665(II) Other Income 2566 1075(III) Total Revenue (I+II) 5402 3740(IV) Expenditure on:(a) Cost of materials consumed 0 0(b) Purchase of stock-in-trade 0 0(c) Changes in inventories of finished goods, 0 0
work-in-progress and stock in trade(d) Stores & Spares 0 0(e) Power & Fuel 3 2(f) Salary, Wages & Benefits/Employees Expense 405 322(g) Other Operating/direct/manufacturing Expenses 144 86(h) Rent, Royalty & Cess 6 37(i) Loss on sale of Assets/Investments 0 0(j) Other Expenses 808 104Total Expenditure (IV (a to j)) 1366 551(V) PROFIT BEFORE DEPRECIATION, & 4036 3189
IMPAIRMENT, FINANCE CHARGES/INTEREST, EXCEPTIONAL & EXTRAORDINARYITEMS & TAXES (PBDIEET)(III-IV)
(VI) Depreciation, Depletion & Amortisation 47 28(VII) Impairment 0 0(VIII) PROFIT BEFORE FINANCE COST/INTEREST,
EXCEPTIONAL, EXTRA-ORDINARYITEMS & TAXES (PBIEET)(V-VI-VII) 3989 3161
(IX) Finance Cost(a) On Central Government Loans 0 0(b) On Foreign Loans 0 0(c) Others 0 0(d) Less Finance Cost Capitalised 0 0(e) Charged to P & L Account (a+b+c+d) 0 0(X) PROFIT BEFORE EXCEPTIONAL & EXTRA-ORDINARY 3989 3161
ITEMS & TAX (PBEET)(VIII-IXe)(XI) Exceptional Items 0 0(XII) PROFIT BEFORE EXTRA-ORDINARY ITEMS & TAX 3989 3161
(PBET)(X-XI)(XIII) Extra-Ordinary Items 0 0(XIV) PROFIT BEFORE TAX (PBT)(XII-XIII) 3989 3161(XV) TAX PROVISIONS 0 0(XVI) NET PROFIT / LOSS FOR THE PERIOD FROM 3989 3161
CONTINUING OPERATIONS AFTER TAX(XIV-XV)(XVII) Profit/Loss from discontinuing operations 0 0(XVIII) Tax expenses of discontinuing operations 0 0(XIX) Profit/Loss from discontinuing operations 0 0
(after Tax)(XVII-XVIII)(XX) Profit/Loss for the period (XVI+XIX) 3989 3161Financial Ratios(i) Sales : Capital Employed 2.22 2.42(ii) Cost of Sales : Sales 49.82 21.73(iii) Salary/Wages : Sales 14.28 12.08(iv) Net Profit : Net Worth 3.12 2.87(v) Debt : Equity 0 0(vi) Current Ratio 104.92 74.02(vii) Trade Recievables : Sales 6.31 14.15(viii) Total Inventory : Sales 0 0

Financial Services572
The CompanyNational Safai Karamcharis Finance & Development Corp.
(NSKFDC) was incorporated on 24.1.1997 as a company not forprofit under Section 25 of the Companies Act, 1956 with theobjective of socio-economic upliftment of Safai Karamcharis /Scavengers and their dependents by way of providing financialassistance at concessional rates of interest for any income generatingactivity throughout the country through the State ChannelizingAgencies (SCAs) and to provide technical and professional training,quality control, technology up-gradation, and common facilitycenters for carrying out sanitation works.
NSKFDC is a Schedule-‘C’ CPSE Financial Services sectorunder the administrative control of M/o Social Justice andEmpowerment with 100% shareholding by the Government of India.Its Registered and Corporate offices are at New Delhi. The companyemployed 22 regular employees (6 executives, 16 non executives)as on 31.3.2012.
Vision/MissionThe Vision / Mission of the Company is to empower the Safai
Karamcharis, Scavengers and their dependents to break away fromtraditional occupation, depressed social condition, poverty andleverage them to work their own way up the social and economicladder with dignity and pride.
Industrial / Business OperationsNSKFDC provides concessional financial assistance to income
generating and viable projects to the Safai Karamcharis / Scavengersand their dependents whose income is below double the povertyline through 26 State Channelising Agencies (SCAs) nominated byState Governments / UTs. The financing schemes include TermLoan, Micro Credit Finance (MCF), Mahila Samridhi Yojana(MSY), Educational Loan etc.
Performance HighlightsThe physical performances of the company for last two years
are given below:
& Loss Account of the company and selected financial ratios duringthe period 2010-11 to 2011-12 can be seen on the adjoining page.
National Safai Karamcharis Finance & Development Corp.
Main Segments U n i t Performance during
2011-12 2010-11
Share Capital Received ` in cr. 45.00 40.00
Long Term Loans & Advances
Non-current ` in cr. 137.20 114.39
Current ` in cr. 212.80 172.75
Total Revenue of the company registered an increase of ̀ 1.61crore during 2011-12, which went up from ` 8.9 crore in 2010-11to ` 10.51 crore in 2011-12. The net profit of the companycorrespondingly increased by ` 0.45 crore to ` 4.59 crore in 2011-12, from ` 4.14 crore of previous year.
The current ratio of company is at 223.1:1 during 2011-12 asagainst 9.34 :1in the previous year (Fig.2). Balance Sheet and Profit www.nskfdc.nic.in
EBIT
DA
& P
AT (
Rs.
cro
re)
TOTAL R
EVENU
E (Rs. crore)
Fig. 1
PRO
FITA
BIL
ITY
RAT
IOS
(%) CU
RR
ENT R
ATIO
Fig. 2
Strategic IssuesNSKFDC has taken initiatives like rating & awards, increasing
the payback period, proposals for abolishing charging non utilizationcharges, networking to achieve the mission of providing financialassistance for setting up self employment units and for education loan&skill development training programme etc , to strengthen the SCAs.
For maximum coverage of the beneficiaries under NSKFDCSchemes & Progammes, initiatives like reduction of interest rate,broadening the scope of education loan, providing second time loan,schemes to promote sanitary machines/ equipments have been taken.

Public Enterprises Survey 2011-2012: Vol-II 573
National Safai Karamcharis Finance & Development Corp.B-2, First Floor, G. K. Enclave – II, New Delhi - 110048BALANCE SHEET (` in Lakhs)PARTICULARS 2011-12 2010-11I. EQUITY & LIABILITIESAUTHORISED CAPITAL 60000 30000(1) Shareholders’ Funds(a) Share Capital(i) Central Govt 29999 29999(ii) Others 0 0(b) Reserves & Surplus 3731 3241(c) Money received against share warrants 0 0Total Shareholders’ Funds (1(a)+1(b)+1(c) 33730 33240(2) Share application money pending allotment 4500 0(3) Non-current Liabilities(a) Long Term Borrowings 0 0(b) Deferred tax liabilities (Net) 0 0(c) Other Long-term liabilities 1440 5963(d) Long-term provisions 64 71Total Non-Current Liabilities 3(a) to 3(d) 1504 6034(4) Current Liabilities(a) Short Term Borrowings 0 0(b) Trade Payables 0 0(c) Other current liabilities 109 23(d) Short-term provisions 0 0Total Current Liabilities 4(a) to 4(d) 109 23TOTAL EQUITY & LIABILITIES (1+2+3+4) 39843 39297II. ASSETS(1) Non-Current Assets(a) Total Gross Fixed Assets 93 81(ai) Accumulated Depreciation, Depletion & Amortisation 40 27(aii) Accumulated Impairment 0 0(b) Total Net Fixed Assets ((a)-(ai)-(aii) 53 54(c) Capital work in progress 0 0(d) Intangible assets under developmet 0 0(e) Non-Current Investments 0 0(f) Deferred Tax Assets (Net) 0 0(g) Long Term Loans and Advances 13720 11439(h) Other Non-Current Assets 1752 6322Total Non-Current Assets (b+c+d+e+f+g+h) 15525 17815(2) Current Assets(a) Current Investments 0 0(b) Inventories 0 0(c) Trade Recievables 0 0(d) Cash & Bank Balance 2679 4017(e) Short-term Loans & Advances 21281 17276(f) Other Current Assets 358 189Total Current Assets (a+b+c+d+e+f) 24318 21482TOTAL ASSETS (1+2) 39843 39297Important Indicators(i) Investment 34499 29999(ii) Capital Employed 38230 33240(iii) Net Worth 38230 33240(iv) Net Current Assets 24209 21459(v) Cost of Sales 592 476(vi) Net Value Added (at market price) 609 534(vii) Total Regular Employees (Nos.) 22 23(viii) Avg. Monthly Emoluments per Employee(`) 56818 43478
PROFIT & LOSS ACCOUNT (` in Lakhs)PARTICULARS 2011-12 2010-11(I) Revenue from Operations (Gross) 865 760Less : Excise Duty 0 0Revenue from Operations (Net) 865 760(II) Other Income 186 130(III) Total Revenue (I+II) 1051 890(IV) Expenditure on:(a) Cost of materials consumed 0 0(b) Purchase of stock-in-trade 0 0(c) Changes in inventories of finished goods,
work-in-progress and stock in trade 0 0(d) Stores & Spares 0 0(e) Power & Fuel 1 1(f) Salary, Wages & Benefits/Employees Expense 150 120(g) Other Operating/direct/manufacturing Expenses 185 124(h) Rent, Royalty & Cess 0 0(i) Loss on sale of Assets/Investments 0 0(j) Other Expenses 250 225Total Expenditure (IV (a to j)) 586 470(V) PROFIT BEFORE DEPRECIATION, &
IMPAIRMENT, FINANCE CHARGES/INTEREST,EXCEPTIONAL & EXTRAORDINARYITEMS & TAXES (PBDIEET)(III-IV) 465 420
(VI) Depreciation, Depletion & Amortisation 6 6(VII) Impairment 0 0(VIII) PROFIT BEFORE FINANCE COST/INTEREST,
EXCEPTIONAL, EXTRA-ORDINARYITEMS & TAXES (PBIEET)(V-VI-VII) 459 414
(IX) Finance Cost(a) On Central Government Loans 0 0(b) On Foreign Loans 0 0(c) Others 0 0(d) Less Finance Cost Capitalised 0 0(e) Charged to P & L Account (a+b+c+d) 0 0(X) PROFIT BEFORE EXCEPTIONAL & EXTRA-ORDINARY
ITEMS & TAX (PBEET)(VIII-IXe) 459 414(XI) Exceptional Items 0 0(XII) PROFIT BEFORE EXTRA-ORDINARY ITEMS & TAX
(PBET)(X-XI) 459 414(XIII) Extra-Ordinary Items 0 0(XIV) PROFIT BEFORE TAX (PBT)(XII-XIII) 459 414(XV) TAX PROVISIONS 0 0(XVI) NET PROFIT / LOSS FOR THE PERIOD FROM
CONTINUING OPERATIONS AFTER TAX(XIV-XV) 459 414(XVII) Profit/Loss from discontinuing operations 0 0(XVIII) Tax expenses of discontinuing operations 0 0(XIX) Profit/Loss from discontinuing operations
(after Tax)(XVII-XVIII) 0 0(XX) Profit/Loss for the period (XVI+XIX) 459 414Financial Ratios(i) Sales : Capital Employed 2.26 2.29(ii) Cost of Sales : Sales 68.44 62.63(iii) Salary/Wages : Sales 17.34 15.79(iv) Net Profit : Net Worth 1.2 1.25(v) Debt : Equity 0 0(vi) Current Ratio 223.1 934(vii) Trade Recievables : Sales 0 0(viii) Total Inventory : Sales 0 0

Financial Services570
National Scheduled Castes Finance &Development Corporation
The CompanyNational Scheduled Castes Finance & Development
Corporation (NSFDC) was incorporated on 8.2.1989 with theobjective to exclusively work for the economic developmentactivities of the people belonging to Scheduled Caste categoriesliving below Double the Poverty Line. NSFDC was incorporatedas a company not for profit under Section 25 of the CompaniesAct, 1956 as
NSFDC is a Schedule - 'C' CPSE engaged in 'CommunityServices' under the administrative control of Ministry of SocialJustice and Empowerment with 100% shareholding by theGovernment of India. Its Registered and Corporate offices are atNew Delhi. The company employed 79 regular employees(Executives 36 & Non-Executives 43) as on 31.3.2012. ItsRegistered and Corporate offices are at New Delhi.
Vision / MissionThe Vision of the Company are to Fight Poverty through
Entrepreneurship.The Mission of the company is to finance, facilitate and
promote the economic development activities of Schedule Castepersons.
Industrial / Business OperationsNSFDC is engaged in providing financial assistance at
concessional interest rates under various credit schemes andextending supports under various non-credit schemes to help theScheduled Caste (SC) beneficiaries through 37 State / UTChannelising Agencies (SCAs) and other recognized institutionsnominated by the respective State / UT Government.
The Company has five Zonal Offices at Bengaluru, Mumbai,Kolkata, Lucknow and Guwahati. The company assists the targetgroup (Double the Poverty Line (DPL) i.e. ̀ 40,000 in Rural Areas& ` 55,000 in Urban Areas) by way of loans and advances, skilltraining, entrepreneurship development programmes and otherknow-how.
Performance HighlightsAs on 31.03.2012 the company has cumulatively disbursed
` 2302.91 crore for ` 8.05 lakh beneficiaries belonging to theScheduled castes. Out of the total beneficiaries covered, ` 4.25lakhs are women. The physical performances of the company forlast two years are given below:
2010-11 to ` 34.15 crore in 2011-12. The profit of the companyhas gone up by ` 7.64 crore in 2011-12 to ` 21.59 crore from` 13.95 crore in previous year
The current ratio of company is at 19.64:1 during 2011-12 asagainst 13.89:1 in the previous year (Fig.2). Balance Sheet and Profit& Loss Account of the company and selected financial ratios duringthe period 2010-11 to 2011-12 can be seen on the adjoining page.
Main Services Unit Performance during
2011-12 2010-11
Total Disbursement ` in Crore 182.77 180.09
Beneficiaries (in Nos.) 43772 47,728
www.nsfdc.nic.in
EBIT
DA
& P
AT (
Rs.
cro
re)
TOTAL R
EVENU
E (Rs. crore)
Fig. 1
PRO
FITA
BIL
ITY
RAT
IOS
(%)
CU
RR
ENT R
ATIO
Fig. 2Strategic issues
The company has undertaken impact evaluation studies ofits schemes through independent agencies. These evaluation studiesare periodically got conducted through the State TechnicalConsultancy Organizations (STCOs). Skill Development TrainingPolicy revised to sanction the programmes directly to the reputedtraining institutions / universities / deemed universities in additionto existing system i.e. SCAs.Total Revenue of the company registered an increase of
` 8.51 crore during 2011-12, which went up from ` 25.64 crore in

Public Enterprises Survey 2011-2012: Vol-II 571
National Scheduled Castes Finance & Development Corporation14th floor, scope minar, core-1 & 2, laxmi nagar district, Laxmi Nagar, Delhi-110092
BALANCE SHEET (` in Lakhs)PARTICULARS 2011-12 2010-11I. EQUITY & LIABILITIESAUTHORISED CAPITAL 100000 100000(1) Shareholders’ Funds(a) Share Capital(i) Central Govt 67580 57180(ii) Others 0 0(b) Reserves & Surplus 23672 21470(c) Money received against share warrants 0 0Total Shareholders’ Funds (1(a)+1(b)+1(c) 91252 78650(2) Share application money pending allotment 100 2500(3) Non-current Liabilities(a) Long Term Borrowings 0 0(b) Deferred tax liabilities (Net) 0 0(c) Other Long-term liabilities 3 7(d) Long-term provisions 247 244Total Non-Current Liabilities 3(a) to 3(d) 250 251(4) Current Liabilities(a) Short Term Borrowings 0 0(b) Trade Payables 0 0(c) Other current liabilities 3106 4060(d) Short-term provisions 138 11Total Current Liabilities 4(a) to 4(d) 3244 4071TOTAL EQUITY & LIABILITIES (1+2+3+4) 94846 85472II. ASSETS(1) Non-Current Assets(a) Total Gross Fixed Assets 939 924(ai) Accumulated Depreciation, Depletion & Amortisation 337 315(aii) Accumulated Impairment 0 0(b) Total Net Fixed Assets ((a)-(ai)-(aii) 602 609(c) Capital work in progress 0 0(d) Intangible assets under developmet 0 0(e) Non-Current Investments 0 0(f) Deferred Tax Assets (Net) 0 0(g) Long Term Loans and Advances 30537 28336(h) Other Non-Current Assets 0 0Total Non-Current Assets (b+c+d+e+f+g+h) 31139 28945(2) Current Assets(a) Current Investments 0 0(b) Inventories 0 0(c) Trade Recievables 0 0(d) Cash & Bank Balance 12716 8454(e) Short-term Loans & Advances 47918 45079(f) Other Current Assets 3073 2994Total Current Assets (a+b+c+d+e+f) 63707 56527TOTAL ASSETS (1+2) 94846 85472Important Indicators(i) Investment 67680 59680(ii) Capital Employed 91352 81150(iii) Net Worth 91352 81150(iv) Net Current Assets 60463 52456(v) Cost of Sales 905 823(vi) Net Value Added (at market price) 2863 2068(vii) Total Regular Employees (Nos.) 79 81(viii) Avg. Monthly Emoluments per Employee(`) 74051 69033
PROFIT & LOSS ACCOUNT (` in Lakhs)PARTICULARS 2011-12 2010-11(I) Revenue from Operations (Gross) 3369 2523Less : Excise Duty 0 0Revenue from Operations (Net) 3369 2523(II) Other Income 46 41(III) Total Revenue (I+II) 3415 2564(IV) Expenditure on:(a) Cost of materials consumed 0 0(b) Purchase of stock-in-trade 0 0(c) Changes in inventories of finished goods,
work-in-progress and stock in trade 0 0(d) Stores & Spares 0 0(e) Power & Fuel 3 3(f) Salary, Wages & Benefits/Employees Expense 702 671(g) Other Operating/direct/manufacturing Expenses 56 45(h) Rent, Royalty & Cess 2 2(i) Loss on sale of Assets/Investments 0 0(j) Other Expenses 120 80Total Expenditure (IV (a to j)) 883 801(V) PROFIT BEFORE DEPRECIATION, & I
MPAIRMENT, FINANCE CHARGES/INTEREST,EXCEPTIONAL & EXTRAORDINARYITEMS & TAXES (PBDIEET)(III-IV) 2532 1763
(VI) Depreciation, Depletion & Amortisation 22 22(VII) Impairment 0 0(VIII) PROFIT BEFORE FINANCE COST/INTEREST,
EXCEPTIONAL, EXTRA-ORDINARYITEMS & TAXES (PBIEET)(V-VI-VII) 2510 1741
(IX) Finance Cost(a) On Central Government Loans 0 0(b) On Foreign Loans 0 0(c) Others 0 0(d) Less Finance Cost Capitalised 0 0(e) Charged to P & L Account (a+b+c+d) 0 0(X) PROFIT BEFORE EXCEPTIONAL & EXTRA-ORDINARY
ITEMS & TAX (PBEET)(VIII-IXe) 2510 1741(XI) Exceptional Items 0 0(XII) PROFIT BEFORE EXTRA-ORDINARY ITEMS & TAX
(PBET)(X-XI) 2510 1741(XIII) Extra-Ordinary Items 351 346(XIV) PROFIT BEFORE TAX (PBT)(XII-XIII) 2159 1395(XV) TAX PROVISIONS 0 0(XVI) NET PROFIT / LOSS FOR THE PERIOD FROM
CONTINUING OPERATIONS AFTER TAX(XIV-XV) 2159 1395(XVII) Profit/Loss from discontinuing operations 0 0(XVIII) Tax expenses of discontinuing operations 0 0(XIX) Profit/Loss from discontinuing operations
(after Tax)(XVII-XVIII) 0 0(XX) Profit/Loss for the period (XVI+XIX) 2159 1395Financial Ratios(i) Sales : Capital Employed 3.69 3.11(ii) Cost of Sales : Sales 26.86 32.62(iii) Salary/Wages : Sales 20.84 26.6(iv) Net Profit : Net Worth 2.36 1.72(v) Debt : Equity 0 0(vi) Current Ratio 19.64 13.89(vii) Trade Recievables : Sales 0 0(viii) Total Inventory : Sales 0 0

Financial Services564
National Scheduled Tribes Finance and Development CorporationThe Company
National Scheduled Tribes and Finance DevelopmentCorporation (NSTFDC) was incorporated on 10.04.2001, bybifurcating erstwhile National Scheduled Castes and ScheduledTribes Finance and Development Corporation (NSFDC). It is anexclusive corporation setup for economic development of ScheduledTribes. This corporation has been granted license under Section 25of the Companies Act, 1956.
NSTFDC is a Schedule-‘C’ CPSE under the administrativecontrol of Ministry of Tribal Affairs (MoTA) and fully owned bythe Government of India. The company employed 53regularemployees (Executives 25, Non-executives28) as on 31.3.2012. ItsRegistered and Corporate office is at New Delhi.Vision / Mission
The Vision / Mission of the company is economic developmentof Scheduled Tribes on sustainable basis.Industrial / Business Operations
NSTFDC provides financial assistance for viable incomegenerating activities for economic development of Schedule Tribes.The financial assistance is extended at concessional interest rate of4% to 8% chargeable from beneficiaries based on financial assistancegiven. The major schemes are Term Loan Scheme,AdivasiMahilaSashaktikaranYojana (AMSY), Micro Credit Scheme.During the year the corporation has introduced two new schemesnamely ÄdivasiShikshaRrinnYojana (ASRY) and Scheme forFinancial Assistance to Tribal Artisans empanelled with TRIFED.
Company is extending concessional finance through the Central/State Channelising Agencies (SCAs) and other agencies. It alsoprovides financial assistance to organizations/ Institutions engagedin procurement and Marketing of Minor Forest produces/ tribalproducts and other products etc. It provides financial assistance byway of grants through the SCAs for undertaking training programmesfor the skill and entrepreneurial development of eligible scheduledtribes. The company is also involved in capacity building of SCAsand STs through Skill Development and entrepreneurshiporientation.Performance Highlights
The physical performances of the company for last two yearsare given below:
The Company registered a growth of ̀ 7.11crore in total incomeduring 2011-12 which went up to ` 21.81 crore in 2011-12 from` 14.70crore during 2010-11. The net profit of the companyincreased to ̀ 9.51crore in 2011-12, an increase of ̀ 3.55crore overthe previous year due to increase in turnover.
The current ratio of company is at71.64:1 during 2011-12 asagainst 175.07:1 in the previous year (Fig.2). Balance Sheet and Profit& Loss Account of the company and selected financial ratios duringthe period 2010-11 to 2011-12 can be seen on the adjoining page.
Main Services / Unit Performance during
Activities 2011-12 2010-11
Sanctions under Income ` in crores . 192.77 158.17Generating Activities
Beneficiaries covered No. 112489 95632(Sanctions)
Disbursement under Income ` in crores . 113.07 95.18Generating Activities
Beneficiaries covered No. 54485 53996Disbursement)
Recovery ` in crores . 79.49 63.69
Strategic issueThe corporation is making all endeavors to expand its
operations. On the initiative of company RBI vide its circular dated09.09.2011 has allowed all PSUs banks to extend refinance at interestrates prescribed under the schemes of NSTFDC. This refinancewould not be considered violative of the RBI guidelines. Further,RBI vide its circular dated 10.04.2012 has clarified that lending toScheduled Tribes is to be considered as priority sector lending.
EBIT
DA
& P
AT (
Rs.
cro
re)
TOTAL R
EVENU
E (Rs. crore)
Fig. 1
PRO
FITA
BIL
ITY
RAT
IOS
(%)
CU
RR
ENT R
ATIO
Fig. 2

Public Enterprises Survey 2011-2012: Vol-II 565
National Scheduled Tribes Finance and Development CorporationRegistered Office : NBCC Tower, 5th Floor, 15 BhikajiCama Place, New Delhi-110066
BALANCE SHEET (` in Lakhs)PARTICULARS 2011-12 2010-11I. EQUITY & LIABILITIESAUTHORISED CAPITAL 50000 50000(1) Shareholders’ Funds(a) Share Capital(i) Central Govt 31233 23050(ii) Others 0 0(b) Reserves & Surplus 14488 13537(c) Money received against share warrants 0 0Total Shareholders’ Funds (1(a)+1(b)+1(c) 45721 36587(2) Share application money pending allotment 0 4683(3) Non-current Liabilities(a) Long Term Borrowings 0 0(b) Deferred tax liabilities (Net) 0 0(c) Other Long-term liabilities 1 1(d) Long-term provisions 172 141Total Non-Current Liabilities 3(a) to 3(d) 173 142(4) Current Liabilities(a) Short Term Borrowings 0 0(b) Trade Payables 0 0(c) Other current liabilities 34 41(d) Short-term provisions 186 42Total Current Liabilities 4(a) to 4(d) 220 83TOTAL EQUITY & LIABILITIES (1+2+3+4) 46114 41495II. ASSETS(1) Non-Current Assets(a) Total Gross Fixed Assets 602 598(ai) Accumulated Depreciation, Depletion & Amortisation 244 224(aii) Accumulated Impairment 0 0(b) Total Net Fixed Assets ((a)-(ai)-(aii) 358 374(c) Capital work in progress 0 0(d) Intangible assets under developmet 14 11(e) Non-Current Investments 0 0(f) Deferred Tax Assets (Net) 0 0(g) Long Term Loans and Advances 29980 26577(h) Other Non-Current Assets 2 2Total Non-Current Assets (b+c+d+e+f+g+h) 30354 26964(2) Current Assets(a) Current Investments 0 0(b) Inventories 0 0(c) Trade Recievables 0 0(d) Cash & Bank Balance 7182 6834(e) Short-term Loans & Advances 8395 7687(f) Other Current Assets 183 10Total Current Assets (a+b+c+d+e+f) 15760 14531TOTAL ASSETS (1+2) 46114 41495Important Indicators(i) Investment 31233 27733(ii) Capital Employed 45721 41270(iii) Net Worth 45721 41270(iv) Net Current Assets 15540 14448(v) Cost of Sales 743 582(vi) Net Value Added (at market price) 1553 1002(vii) Total Regular Employees (Nos.) 53 54(viii) Avg. Monthly Emoluments per Employee(`) 94182 62346
PROFIT & LOSS ACCOUNT (` in Lakhs)PARTICULARS 2011-12 2010-11(I) Revenue from Operations (Gross) 1246 1065Less : Excise Duty 0 0Revenue from Operations (Net) 1246 1065(II) Other Income 935 405(III) Total Revenue (I+II) 2181 1470(IV) Expenditure on:(a) Cost of materials consumed 0 0(b) Purchase of stock-in-trade 0 0(c) Changes in inventories of finished goods, 0 0
work-in-progress and stock in trade(d) Stores & Spares 0 0(e) Power & Fuel 7 6(f) Salary, Wages & Benefits/Employees Expense 599 404(g) Other Operating/direct/manufacturing Expenses 37 50(h) Rent, Royalty & Cess 3 2(i) Loss on sale of Assets/Investments 0 0(j) Other Expenses 72 92Total Expenditure (IV (a to j)) 718 554(V) PROFIT BEFORE DEPRECIATION, & 1463 916
IMPAIRMENT, FINANCE CHARGES/INTEREST,EXCEPTIONAL & EXTRAORDINARYITEMS & TAXES (PBDIEET)(III-IV)
(VI) Depreciation, Depletion & Amortisation 25 28(VII) Impairment 0 0(VIII) PROFIT BEFORE FINANCE COST/INTEREST,
EXCEPTIONAL, EXTRA-ORDINARYITEMS & TAXES (PBIEET)(V-VI-VII) 1438 888
(IX) Finance Cost(a) On Central Government Loans 0 0(b) On Foreign Loans 0 0(c) Others 0 0(d) Less Finance Cost Capitalised 0 0(e) Charged to P & L Account (a+b+c+d) 0 0(X) PROFIT BEFORE EXCEPTIONAL & EXTRA-ORDINARY
ITEMS & TAX (PBEET)(VIII-IXe) 1438 888(XI) Exceptional Items 487 292(XII) PROFIT BEFORE EXTRA-ORDINARY ITEMS & TAX
(PBET)(X-XI) 951 596(XIII) Extra-Ordinary Items 0 0(XIV) PROFIT BEFORE TAX (PBT)(XII-XIII) 951 596(XV) TAX PROVISIONS 0 0(XVI) NET PROFIT / LOSS FOR THE PERIOD FROM
CONTINUING OPERATIONS AFTER TAX(XIV-XV) 951 596(XVII) Profit/Loss from discontinuing operations 0 0(XVIII) Tax expenses of discontinuing operations 0 0(XIX) Profit/Loss from discontinuing operations
(after Tax)(XVII-XVIII) 0 0(XX) Profit/Loss for the period (XVI+XIX) 951 596Financial Ratios(i) Sales : Capital Employed 2.73 2.58(ii) Cost of Sales : Sales 59.63 54.65(iii) Salary/Wages : Sales 48.07 37.93(iv) Net Profit : Net Worth 2.08 1.44(v) Debt : Equity 0 0(vi) Current Ratio 71.64 175.07(vii) Trade Recievables : Sales 0 0(viii) Total Inventory : Sales 0 0

Financial Services574
Power Finance Corporation Ltd.The Company
Power Finance Corporation Ltd. (PFC) was incorporated on16.7.1986 with the objective to provide financial resources andencourage flow of investments to the power and associated sectors forthe requisite flow of investments; to work as a catalyst for optimumutilization of available resources and to mobilize financial resourcesfrom domestic and international sources at competitive rates.
PFC is a Schedule-‘A’ Navratna CPSE in financial services sectorunder the administrative control of M/o Power with 89.78%shareholding by the Government of India. The company employed378 regular employees (Executives 327 & Non-Executives 51) as on31.3.2012. Its Registered and Corporate offices are in New Delhi.
Vision / MissionThe Vision of the Company is to be the leading institution in
financing for sustainable development of the Indian Power Sectorand its linkages, with an eye on global operations.
The Mission of the Company is to become the most preferredFinancial Institution in power and financial sectors, providing bestproducts and services; to promote efficient investments in PowerSector to enable availability of power of the required quality atminimum cost to consumers; to reach out to the global financialsystem for financing power development; to act as a catalyst forreforming India’s Power Sector; and to build human assets andsystems for the Power Sector of tomorrow
Industrial / Business OperationsThe Company is engaged in the business to finance power
projects, power transmission and distribution works, renovationand modernisation of power plants, system improvement andenergy conservation, maintenance and repair of capital equipmentetc, survey and investigation, studies, schemes and experiments,other energy sources, manufacturing of capital equipments, to financeactivities having forward and backward linkages to power projectsfrom its operating units and organise consultancy services etc.
Besides, the corporate office in New Delhi, PFC has twoRegional Offices at Chennai and Mumbai. It has 13 wholly ownedsubsidiary companies, namely PFC Consulting, PFC Green EnergyLimited, PFC Capital Advisory Services LTD, Power EquityCapital Advisors Pvt Ltd, Chhattisgarh Surguja Power Ltd., CoastalKarnataka Power Ltd, Coastal Maharashtra Mega Power Ltd,Coastal Tamil Nadu Power Ltd, Orissa Integrated Power Ltd,Sakhigopal Integrated Power Company Ltd, Ghogharpalli IntegratedPower Ltd, Tatiya Andhra Mega Power Ltd and DGEN &Uttrakhand Transmission Company Ltd. The Company also has 2Joint Ventures (JVs)
Performance Highlights The physical performances of the company for last two years
are given below:
Total Revenue from of the company registered an increase of` 2876.55 crore during 2011-12, which went up from ̀ 10160.56crore in 2010-11 to ̀ 13037.11 crore in 2011-12. The profit of thecompany has gone up by ` 412.16 crore to ` 3031.74 crore in2011-12, from ̀ 2619.58 crore in previous year due to increase inlending operations.
The current ratio of company is at 1.24:1 during 2011-12 asagainst 0.91:1 in the previous year (Fig.2). Balance Sheet and Profit& Loss Account of the company and selected financial ratios duringthe period 2010-11 to 2011-12 can be seen on the adjoining page.
Main Segments Unit Performance during
2011-12 2010-11
Loan Assets ` in Cr. 130072 99571
Total Disbursement ` in Cr. 41418 34121www.pfcindia.com
Strategic issuesTo accelerate growth of the company, PFC is focusing on
additional business in the areas of power trading through powerexchanges, equity financing, Nuclear Funding, Banking operationsand acquisition advisory services.
EBIT
DA
& P
AT (
Rs.
cro
re)
TOTAL R
EVENU
E (Rs. crore)
Fig. 1
PRO
FITA
BIL
ITY
RAT
IOS
(%)
CU
RR
ENT R
ATIO
Fig. 2

Public Enterprises Survey 2011-2012: Vol-II 575
Power Finance Corporation LtdUrjanidhi, 1, Barakhamba Lane, Connaught Place New DelhiBALANCE SHEET (` in Lakhs)PARTICULARS 2011-12 2010-11I. EQUITY & LIABILITIESAUTHORISED CAPITAL 200000 200000(1) Shareholders’ Funds(a) Share Capital(i) Central Govt 97306 103045(ii) Others 34687 11732(b) Reserves & Surplus 1938759 1403472(c) Money received against share warrants 0 0Total Shareholders’ Funds (1(a)+1(b)+1(c) 2070752 1518249(2) Share application money pending allotment 0 0(3) Non-current Liabilities(a) Long Term Borrowings 9586698 6998403(b) Deferred tax liabilities (Net) 8743 8297(c) Other Long-term liabilities 55064 67838(d) Long-term provisions 2895 2516Total Non-Current Liabilities 3(a) to 3(d) 9653400 7077054(4) Current Liabilities(a) Short Term Borrowings 407120 629104(b) Trade Payables 0 0(c) Other current liabilities 1398741 1210660(d) Short-term provisions 27493 28357Total Current Liabilities 4(a) to 4(d) 1833354 1868121TOTAL EQUITY & LIABILITIES (1+2+3+4) 13557506 10463424II. ASSETS(1) Non-Current Assets(a) Total Gross Fixed Assets 10574 9894(ai) Accumulated Depreciation, Depletion & Amortisation 2973 2451(aii) Accumulated Impairment 0 0(b) Total Net Fixed Assets ((a)-(ai)-(aii) 7601 7443(c) Capital work in progress 45 228(d) Intangible assets under developmet 0 0(e) Non-Current Investments 5534 5005(f) Deferred Tax Assets (Net) 0 0(g) Long Term Loans and Advances 11208594 8755567(h) Other Non-Current Assets 54782 2502Total Non-Current Assets (b+c+d+e+f+g+h) 11276556 8770745(2) Current Assets(a) Current Investments 383 383(b) Inventories 0 0(c) Trade Recievables 0 0(d) Cash & Bank Balance 198820 235026(e) Short-term Loans & Advances 1817016 1215253(f) Other Current Assets 264731 242017Total Current Assets (a+b+c+d+e+f) 2280950 1692679TOTAL ASSETS (1+2) 13557506 10463424Important Indicators(i) Investment 9718691 7113180(ii) Capital Employed 11657450 8516652(iii) Net Worth 2070752 1518249(iv) Net Current Assets 447596 -175442(v) Cost of Sales 893283 661636(vi) Net Value Added (at market price) 420027 364556(vii) Total Regular Employees (Nos.) 378 365(viii) Avg. Monthly Emoluments per Employee(`) 158907 153174
PROFIT & LOSS ACCOUNT (` in Lakhs)PARTICULARS 2011-12 2010-11(I) Revenue from Operations (Gross) 1301485 1012849Less : Excise Duty 0 0Revenue from Operations (Net) 1301485 1012849(II) Other Income 2226 3207(III) Total Revenue (I+II) 1303711 1016056(IV) Expenditure on:(a) Cost of materials consumed 0 0(b) Purchase of stock-in-trade 0 0(c) Changes in inventories of finished goods,
work-in-progress and stock in trade 0 0(d) Stores & Spares 0 0(e) Power & Fuel 102 90(f) Salary, Wages & Benefits/Employees Expense 7208 6709(g) Other Operating/direct/manufacturing Expenses 866531 649071(h) Rent, Royalty & Cess 0 0(i) Loss on sale of Assets/Investments 3 6(j) Other Expenses 18900 5261Total Expenditure (IV (a to j)) 892744 661137(V) PROFIT BEFORE DEPRECIATION, &
IMPAIRMENT, FINANCE CHARGES/INTEREST,EXCEPTIONAL & EXTRAORDINARYITEMS & TAXES (PBDIEET)(III-IV) 410967 354919
(VI) Depreciation, Depletion & Amortisation 542 505(VII) Impairment 0 0(VIII) PROFIT BEFORE FINANCE COST/INTEREST,
EXCEPTIONAL, EXTRA-ORDINARYITEMS & TAXES (PBIEET)(V-VI-VII) 410425 354414
(IX) Finance Cost(a) On Central Government Loans 0 0(b) On Foreign Loans 0 0(c) Others 0 0(d) Less Finance Cost Capitalised 0 0(e) Charged to P & L Account (a+b+c+d) 0 0(X) PROFIT BEFORE EXCEPTIONAL & EXTRA-ORDINARY
ITEMS & TAX (PBEET)(VIII-IXe) 410425 354414(XI) Exceptional Items 0 0(XII) PROFIT BEFORE EXTRA-ORDINARY ITEMS & TAX
(PBET)(X-XI) 410425 354414(XIII) Extra-Ordinary Items 0 0(XIV) PROFIT BEFORE TAX (PBT)(XII-XIII) 410425 354414(XV) TAX PROVISIONS 107251 92456(XVI) NET PROFIT / LOSS FOR THE PERIOD FROM
CONTINUING OPERATIONS AFTER TAX(XIV-XV) 303174 261958(XVII) Profit/Loss from discontinuing operations 0 0(XVIII) Tax expenses of discontinuing operations 0 0(XIX) Profit/Loss from discontinuing operations
(after Tax)(XVII-XVIII) 0 0(XX) Profit/Loss for the period (XVI+XIX) 303174 261958Financial Ratios(i) Sales : Capital Employed 11.16 11.89(ii) Cost of Sales : Sales 68.64 65.32(iii) Salary/Wages : Sales 0.55 0.66(iv) Net Profit : Net Worth 14.64 17.25(v) Debt : Equity 72.63 60.97(vi) Current Ratio 1.24 0.91(vii) Trade Recievables : Sales 0 0(viii) Total Inventory : Sales 0 0

Financial Services576
Rural Electrification Corporation LimitedThe Company
Rural Electrification Corporation Ltd. (REC) was incorporatedon 25.7.1969 under the Companies Act, 1956 with the main objectiveof financing rural electrification schemes in the country.
REC is a Schedule-’A’ / Navratna CPSE in Financial Servicessector under the administrative control of Ministry of Power with66.80% shareholding by the Government of India. The companyemployed 678 regular employees (Executives 432 & Non-Executives246) as on 31.3.2012. Its Registered and Corporate Office is atNew Delhi. REC is also a registered NBFC with InfrastructureFinance Company (IFC) status.Vision/Mission
The Vision / Mission of the company is to facilitate availabilityof electricity for accelerated growth and for enrichment of qualityof life of rural and urban population and to act as a competitive,client-friendly and development oriented organization for financingand promoting projects covering power generation, powerconservation, power transmission and power distribution networkin the country.Industrial / Business Operations
REC is engaged in financing projects /schemes of powergeneration, transmission distribution, rural electrification, systemimprovement renovation and modernization of power plants inboth public and private sector. It has two subsidiary companiesnamely, REC Transmission Projects Company Ltd. and REC PowerDistribution Company Ltd.
It is the Nodal Agency for implementation of Rajiv GandhiGraminVidyutikaranYojana (RGGVY), a Government of IndiaScheme for rural electricity infrastructure and householdelectrification. Besides corporate office, it operates through 5 ZonalOffices, 18 Project Offices, 2 Sub-offices and 1 Training Centre.Performance Highlights
The physical performance of Company for the last two yearsis given below:
www.recindia.nic.in
Main Segments Unit Performance during
2011-12 2010-11
Mobilization of resources `Crore 29709 25855
Loan sanctioned `Crore 51297 66420(excluding subsidy under RGGVY)
Disbursement `Crore 30593 28517(including subsidy underRGGVY)
Recoveries `Crore 18440 16951
the period 2010-11 to 2011-12 can be seen on the adjoining page.Strategic Issues
The Company aims to facilitate availability of electricity foraccelerated growth and for enrichment of quality of life of rural andurban population by acting as a competitive, client-friendly anddevelopment oriented organization for financing and promotingprojects covering power generation, power conservation, powertransmission and power distribution network in the country.
The Company also proposes to enlarge the mandate, subjectto approval of its shareholders, by financing and providingassistance for those activities having a forward and/or backwardlinkage with power projects, (including but not limited to), such asdevelopment of coal and other mining activities for use as fuel inpower projects, development of other fuel supply arrangementsfor the power sector, and to meet other enabling infrastructurefacilities that may be required for the speedy and effectivedevelopment of power sector.
EBIT
DA
& P
AT (
Rs.
cro
re)
TOTAL R
EVENU
E (Rs. crore)
Fig. 1PR
OFI
TAB
ILIT
Y R
ATIO
S (%
)
CU
RR
ENT R
ATIO
Fig. 2
The current ratio of company is at 1.01:1 during 2011-12 asagainst 0.97:1in the pervious year (Fig.2). Balance Sheet and Profit& Loss Account of the company and selected financial ratios during
Total Revenue of the company registered an increase of` 2013.81 crore during 2011-12, which went up from ` 8495.26crore in 2010-11 to ` 10509.07 crore in 2011-12. The net profitof the company correspondingly increased to ` 2817.03crore, anincrease of ̀ 247.10crore over the previous year due to increase inBusiness i.e. Disbursements. The recovery rate during the year2011-12 has increased in a big way.

Public Enterprises Survey 2011-2012: Vol-II 577
Rural Electrification Corporation LimitedDDA Building, Nehru Place, New Delhi - 110019
BALANCE SHEET (` in Lakhs)PARTICULARS 2011-12 2010-11I. EQUITY & LIABILITIESAUTHORISED CAPITAL 120000 120000(1) Shareholders’ Funds(a) Share Capital(i) Central Govt 65960 65960(ii) Others 32786 32786(b) Reserves & Surplus 1375746 1180116(c) Money received against share warrants 0 0Total Shareholders’ Funds (1(a)+1(b)+1(c) 1474492 1278862(2) Share application money pending allotment 0 0(3) Non-current Liabilities(a) Long Term Borrowings 7655368 6117302(b) Deferred tax liabilities (Net) 0 0(c) Other Long-term liabilities 2619 0(d) Long-term provisions 6178 4976Total Non-Current Liabilities 3(a) to 3(d) 7664165 6122278(4) Current Liabilities(a) Short Term Borrowings 250000 37500(b) Trade Payables 0 0(c) Other current liabilities 1450237 1162558(d) Short-term provisions 33965 50069Total Current Liabilities 4(a) to 4(d) 1734202 1250127TOTAL EQUITY & LIABILITIES (1+2+3+4) 10872859 8651267II. ASSETS(1) Non-Current Assets(a) Total Gross Fixed Assets 9236 8450(ai) Accumulated Depreciation, Depletion & Amortisation 2190 1925(aii) Accumulated Impairment 0 0(b) Total Net Fixed Assets ((a)-(ai)-(aii) 7046 6525(c) Capital work in progress 792 301(d) Intangible assets under developmet 10 0(e) Non-Current Investments 71043 78965(f) Deferred Tax Assets (Net) 1005 1277(g) Long Term Loans and Advances 8998531 7320657(h) Other Non-Current Assets 42980 36418Total Non-Current Assets (b+c+d+e+f+g+h) 9121407 7444143(2) Current Assets(a) Current Investments 4716 4716(b) Inventories 0 0(c) Trade Recievables 0 0(d) Cash & Bank Balance 531148 283189(e) Short-term Loans & Advances 296750 120000(f) Other Current Assets 918838 799219Total Current Assets (a+b+c+d+e+f) 1751452 1207124TOTAL ASSETS (1+2) 10872859 8651267Important Indicators(i) Investment 7754114 6216048(ii) Capital Employed 9129860 7396164(iii) Net Worth 1474492 1278862(iv) Net Current Assets 17250 -43003(v) Cost of Sales 33718 16795(vi) Net Value Added (at market price) 1037771 848033(vii) Total Regular Employees (Nos.) 678 688(viii) Avg. Monthly Emoluments per Employee(`) 210140 154397
PROFIT & LOSS ACCOUNT (` in Lakhs)PARTICULARS 2011-12 2010-11(I) Revenue from Operations (Gross) 1033759 825691Less : Excise Duty 0 0Revenue from Operations (Net) 1033759 825691(II) Other Income 17148 23835(III) Total Revenue (I+II) 1050907 849526(IV) Expenditure on:(a) Cost of materials consumed 0 0(b) Purchase of stock-in-trade 0 0(c) Changes in inventories of finished goods,
work-in-progress and stock in trade 0 0(d) Stores & Spares 0 0(e) Power & Fuel 87 70(f) Salary, Wages & Benefits/Employees Expense 17097 12747(g) Other Operating/direct/manufacturing Expenses 676 545(h) Rent, Royalty & Cess 202 180(i) Loss on sale of Assets/Investments 23 2(j) Other Expenses 15329 2950Total Expenditure (IV (a to j)) 33414 16494(V) PROFIT BEFORE DEPRECIATION, &
IMPAIRMENT, FINANCE CHARGES/INTEREST,EXCEPTIONAL & EXTRAORDINARYITEMS & TAXES (PBDIEET)(III-IV) 1017493 833032
(VI) Depreciation, Depletion & Amortisation 327 303(VII) Impairment 0 0(VIII) PROFIT BEFORE FINANCE COST/INTEREST,
EXCEPTIONAL, EXTRA-ORDINARYITEMS & TAXES (PBIEET)(V-VI-VII) 1017166 832729
(IX) Finance Cost(a) On Central Government Loans 231 317(b) On Foreign Loans 0 0(c) Others 637649 484784(d) Less Finance Cost Capitalised 0 0(e) Charged to P & L Account (a+b+c+d) 637880 485101(X) PROFIT BEFORE EXCEPTIONAL & EXTRA-ORDINARY
ITEMS & TAX (PBEET)(VIII-IXe) 379286 347628(XI) Exceptional Items 0 0(XII) PROFIT BEFORE EXTRA-ORDINARY ITEMS & TAX
(PBET)(X-XI) 379286 347628(XIII) Extra-Ordinary Items 0 0(XIV) PROFIT BEFORE TAX (PBT)(XII-XIII) 379286 347628(XV) TAX PROVISIONS 97583 90635(XVI) NET PROFIT / LOSS FOR THE PERIOD FROM
CONTINUING OPERATIONS AFTER TAX(XIV-XV) 281703 256993(XVII) Profit/Loss from discontinuing operations 0 0(XVIII) Tax expenses of discontinuing operations 0 0(XIX) Profit/Loss from discontinuing operations
(after Tax)(XVII-XVIII) 0 0(XX) Profit/Loss for the period (XVI+XIX) 281703 256993Financial Ratios(i) Sales : Capital Employed 11.32 11.16(ii) Cost of Sales : Sales 3.26 2.03(iii) Salary/Wages : Sales 1.65 1.54(iv) Net Profit : Net Worth 19.11 20.1(v) Debt : Equity 77.53 61.95(vi) Current Ratio 1.01 0.97(vii) Trade Recievables : Sales 0 0(viii) Total Inventory : Sales 0 0

Public Enterprises Survey 2011-2012: Vol-II 579
TELECOMMUNICATIONSERVICES &
INFORMATION TECH. SERVICES

Telecommunication Services & Information Tech. Services580

Public Enterprises Survey 2011-2012: Vol-II 581
22. Telecommunication Services
As on 31.03.2012, there were 4 Central Public SectorEnterprises in the Telecommunication Services & Information Tech.Services group. The names of these enterprises along with theiryear of incorporation in chronological order are given below:—
Sl. Enterprise Year ofNo. Incorporation
1 Mahanagar Telephone Ltd. 1966
2 Bharat Sanchar Nigam Ltd. 19713 Millennium Telecom Ltd, 19834 Railtel Corporation India Ltd. 1983
2. The enterprises falling in this group are mainly engagedin rending Telecommunication and Internet services etc.
3. The consolidated financial position the working results andthe important management ratios of these enterprises are appended.
4. Turnover : The details of turnover of individualenterprises are given below:
(` in Crores)Sl. Enterprise TurnoverNo. 2011-12 2010-11
1 Bharat Sanchar Nigam Ltd. 25998.50 27044.712 Mahanagar Telephone Nigam Ltd. 3373.25 3673.953 Railtel Corporation India Ltd. 347.42 349.74
4 Millennium Telecom Ltd. 0.00 0.00Group Total : 29719.17 31068.40
5. Net Profit / Loss: The details of enterprises , whichearned net profit or sustained net loss (-) are given below:
(` in Crores)Sl. Enterprise Adjusted NetNo. Profit / Net Loss
2011-12 2010-111 Railtel Corporation India Ltd. 85.85 95.412 Millennium Telecom Ltd. -0.20 -0.49
3 Mahanagar Telephone Nigam Ltd. -4109.78 -2801.924 Bharat Sanchar Nigam Ltd. -8850.70 -6384.26
Group Total : -12874.83 -9091.26
6. Dividend : The details of dividend declared by the individualenterprises are given below:
(` in Crores)Sl. Enterprise DividendNo. 2011-12 2010-111 Railtel Corporation India Ltd. 9.72 12.15
Group Total : 14.01 12.15
7. Social Overhead and Township: The total number ofpersons employed and the expenditure incurred on social overheadsand townships are given below:
(` in Crores)Sl. Enterprise Township andNo. Social Overheads
2011-12 2010-111 No. of employees (in number) 309767 3252162 Social overheads: (Rupees in Crore)
(i) Educational 0.00 0.00(ii) Medical Facilities 0.00 0.00(iii) Others 0.00 0.00
3 Capital cost of township (Rupeesin Crore) 0.00 0.00
4 No. of houses constructed (in numbers) 0.00 0.00
8. Company wise details in respect of Balance Sheet, Profitand Loss account, Important Indicators and Financial Ratios alongwith the write up of individual company are given in the pagesbelow.

Telecommunication Services & Information Tech. Services582

Public Enterprises Survey 2011-2012: Vol-II 583
TELECOMMUNICATION SERVICES
BALANCE SHEET (` in Lakhs)PARTICULARS 2011-12 2010-11I. EQUITY & LIABILITIESAUTHORISED CAPITAL 1940000 1940000(1) Shareholders’ Funds (a) Share Capital (i) Central Govt 1317531 1317532 (ii) Others 27851 27850 (b) Reserves & Surplus 6096137 7389949 (c) Money received against share warrants 0 0 Total Shareholders’ Funds (1(a)+1(b)+1(c) 7441519 8735331(2) Share application money pending allotment 432 15(3) Non-current Liabilities (a) Long Term Borrowings 804614 365932 (b) Deferred tax liabilities (Net) 127 89 (c) Other Long-term liabilities 779246 767549 (d) Long-term provisions 1448926 1309863 Total Non-Current Liabilities 3(a) to 3(d) 3032913 2443433(4) Current Liabilities (a) Short Term Borrowings 468906 563292 (b) Trade Payables 1015131 1165931 (c) Other current liabilities 883070 899434 (d) Short-term provisions 213439 176733 Total Current Liabilities 4(a) to 4(d) 2580546 2805390TOTAL EQUITY & LIABILITIES (1+2+3+4) 13055410 13984169II. ASSETS(1) Non-Current Assets (a) Total Gross Fixed Assets 20158319 19802345 (ai) Accumulated Depreciation, Depletion & Amortisation 11822176 10872956 (aii) Accumulated Impairment 0 0 (b) Total Net Fixed Assets ((a)-(ai)-(aii) 8336143 8929389 (c) Capital work in progress 521044 641527 (d) Intangible assets under developmet 2043 1267 (e) Non-Current Investments 623550 599607 (f) Deferred Tax Assets (Net) 6238 9215 (g) Long Term Loans and Advances 561970 564663 (h) Other Non-Current Assets 317043 265664 Total Non-Current Assets (b+c+d+e+f+g+h) 10368031 11011332(2) Current Assets (a) Current Investments 27000 0 (b) Inventories 67984 63972 (c) Trade Recievables 829592 864706 (d) Cash & Bank Balance 264334 300691 (e) Short-term Loans & Advances 217378 226048 (f) Other Current Assets 1281091 1517420 Total Current Assets (a+b+c+d+e+f) 2687379 2972837TOTAL ASSETS (1+2) 13055410 13984169Important Indicators (i) Investment 2150428 1711329 (ii) Capital Employed 8246565 9101278 (iii) Net Worth 7441951 8735346 (iv) Net Current Assets 106833 167447 (v) Cost of Sales 4361627 4243176 (vi) Net Value Added (at market price) 621494 946856 (vii) Total Regular Employees (Nos.) 309767 325216(viii) Avg. Monthly Emoluments per Employee(`) 46146 43748
PROFIT & LOSS ACCOUNT (` in Lakhs)PARTICULARS 2011-12 2010-11(I) Revenue from Operations (Gross) 2971917 3106840 Less : Excise Duty 0 0 Revenue from Operations (Net) 2971917 3106840(II) Other Income 224289 297449(III) Total Revenue (I+II) 3196206 3404289(IV) Expenditure on: (a) Cost of materials consumed 64 175 (b) Purchase of stock-in-trade 0 0 (c) Changes in inventories of finished goods, 0 0
work-in-progress and stock in trade (d) Stores & Spares 0 0 (e) Power & Fuel 250538 243565 (f) Salary, Wages & Benefits/Employees Expense 1715352 1707302 (g) Other Operating/direct/manufacturing Expenses 446635 391546 (h) Rent, Royalty & Cess 40922 41673 (i) Loss on sale of Assets/Investments 1818 1047 (j) Other Expenses 830027 738772Total Expenditure (IV (a to j)) 3285356 3124080(V) PROFIT BEFORE DEPRECIATION, & IMPAIRMENT, -89150 280209
FINANCE CHARGES/INTEREST, EXCEPTIONAL &EXTRAORDINARY ITEMS & TAXES (PBDIEET)(III-IV)
(VI) Depreciation, Depletion & Amortisation 1077688 1118273(VII) Impairment 401 1870(VIII) PROFIT BEFORE FINANCE COST/INTEREST, -1167239 -839934
EXCEPTIONAL, EXTRA-ORDINARY ITEMS & TAXES(PBIEET)(V-VI-VII)
(IX) Finance Cost (a) On Central Government Loans 16715 31205 (b) On Foreign Loans 0 0 (c) Others 97232 54509 (d) Less Finance Cost Capitalised 0 0 (e) Charged to P & L Account (a+b+c+d) 113947 85714(X) PROFIT BEFORE EXCEPTIONAL & EXTRA-ORDINARY
ITEMS & TAX (PBEET)(VIII-IXe) -1281186 -925648(XI) Exceptional Items 1432 0(XII) PROFIT BEFORE EXTRA-ORDINARY ITEMS & TAX
(PBET)(X-XI) -1282618 -925648(XIII) Extra-Ordinary Items 0 0(XIV) PROFIT BEFORE TAX (PBT)(XII-XIII) -1282618 -925648(XV) TAX PROVISIONS 4865 -16522(XVI) NET PROFIT / LOSS FOR THE PERIOD FROM
CONTINUING OPERATIONS AFTER TAX(XIV-XV) -1287483 -909126(XVII) Profit/Loss from discontinuing operations 0 0(XVIII) Tax expenses of discontinuing operations 0 0(XIX) Profit/Loss from discontinuing operations (after Tax)
(XVII-XVIII) 0 0(XX) Profit/Loss for the period (XVI+XIX) -1287483 -909126Financial Ratios (i) Sales : Capital Employed 36.04 34.14 (ii) Cost of Sales : Sales 146.76 136.58 (iii) Salary/Wages : Sales 57.72 54.95 (iv) Net Profit : Net Worth -17.3 -10.41 (v) Debt : Equity 0.6 0.27 (vi) Current Ratio 1.04 1.06 (vii) Trade Recievables : Sales 27.91 27.83 (viii) Total Inventory : Sales 2.29 2.06

Telecommunication Services & Information Tech. Services584
Bharat Sanchar Nigam Ltd.
The CompanyBharat Sanchar Nigam Ltd (BSNL) was incorporated on
15.9.2000 under the Companies Act 1956 with an objective to takeover the business of providing telecom services and network oferstwhile D/o Telecommunications along with all assets andliabilities, contractual rights and obligations w.e.f. 1.10.2000.
BSNL is a Schedule 'A' Miniratna category CPSE inTelecommunication and IT Sector under the administrative controlof M/o Communication and Information Technology, D/oTelecommunications with 100% shareholding by the Governmentof India. The company employed 2,67,906 regular employees(Executives 52,983 & Non-Executives 2,14,923) as on 31.3.2012.Its Registered and Corporate Office is at New Delhi.
Vision / MissionThe Vision / Mission of the company is to be the leading
telecom service provider in India with global presence.
Industrial / Business OperationsBSNL is engaged in providing all types of Telecommunication
services in 47 telecom circles (including registered office) spread allover India other than cities of Delhi and Mumbai. The networkinfrastructure of BSNL includes 37,613 telephone exchanges.
Performance Highlights The physical performances of the company for last two years
are given below:
Strategic issuesIn The 12th Five Year Plan (2012-17) BSNL may strive to
make the entire landline customer base network IP enabled. Themigration shall result in reduction of operational cost, along withease of induction of new value added services to the landlinecustomers.
A Special Purpose Vehicle (SPV), namely, Bharat BroadbandNetwork Limited (BBNL) has been formed by GoI, MoC & IT,D/o Telecommunications on 25th February 2012, to connect2,50,000 Gram Panchayats on OFC. The wholly owned Govt.Company has been promoted by BSNL, PGCIL and RAILTEL.
Main Products Unit Performance during2011-12 2010-11
Total Telephone Lakhs 1209.81 1170.59Connections Connections
Mobile Lakhs Lines 738.91 711.86
VPT Lakhs No. 5.77 5.76
Broadband Wire line Lakhs Lines 89.15 74.92
WLL Lakhs Lines 88.31 88.49
Total Revenue from of the company registered a reduction of` 1754.12 crore during 2011-12, which went down from` 29687.62 crore in 2010-11 to ` 27933.50 crore in 2011-12. Theloss of the company has gone up by ` 2466.44 crore to ` 8850.70crore in 2011-12, from ̀ 6384.30 crore in previous year due to fallin operating income due to increase in competition, reduction inIUC rates by the sector regulator, Mobile expansion and shift intraffic from landline to mobile, multiple SIM usages and addition oflow Average Revenue Per User (ARPU) customers from rural andsemi- urban areas & STD becoming local call. The license andspectrum charges put a burden of ` 1542.76 crore on the companyduring the year 2011-12.
The current ratio of company is at 1.24:1 during 2011-12 asagainst 1.39:1 in the previous year (Fig.2). Balance Sheet and Profit& Loss Account of the company and selected financial ratios duringthe period 2010-11 to 2011-12 can be seen on the adjoining page.
EBIT
DA
& P
AT (
Rs.
cro
re)
TOTAL R
EVENU
E (Rs. crore)
Fig. 1
PRO
FITA
BIL
ITY
RAT
IOS
(%)
CU
RR
ENT R
ATIO
Fig. 2

Public Enterprises Survey 2011-2012: Vol-II 585
Bharat Sanchar Nigam Ltd.H.C.Mathur Lane, Janpath, New Delhi-110 001
BALANCE SHEET (` in Lakhs)PARTICULARS 2011-12 2010-11I. EQUITY & LIABILITIESAUTHORISED CAPITAL 1750000 1750000(1) Shareholders’ Funds (a) Share Capital (i) Central Govt 1250000 1250000 (ii) Others 0 0 (b) Reserves & Surplus 5867102 6756875 (c) Money received against share warrants 0 0 Total Shareholders’ Funds (1(a)+1(b)+1(c) 7117102 8006875(2) Share application money pending allotment 0 0(3) Non-current Liabilities (a) Long Term Borrowings 98318 98318 (b) Deferred tax liabilities (Net) 0 0 (c) Other Long-term liabilities 426257 452605 (d) Long-term provisions 627981 583098 Total Non-Current Liabilities 3(a) to 3(d) 1152556 1134021(4) Current Liabilities (a) Short Term Borrowings 204047 72000 (b) Trade Payables 984668 1139305 (c) Other current liabilities 612631 622374 (d) Short-term provisions 128015 121231 Total Current Liabilities 4(a) to 4(d) 1929361 1954910TOTAL EQUITY & LIABILITIES (1+2+3+4) 10199019 11095806II. ASSETS(1) Non-Current Assets (a) Total Gross Fixed Assets 17052745 16774218 (ai) Accumulated Depreciation, Depletion & Amortisation 10349571 9544982 (aii) Accumulated Impairment 0 0 (b) Total Net Fixed Assets ((a)-(ai)-(aii) 6703174 7229236 (c) Capital work in progress 428048 523412 (d) Intangible assets under developmet 2043 1267 (e) Non-Current Investments 601352 550141 (f) Deferred Tax Assets (Net) 6238 9215 (g) Long Term Loans and Advances 66896 74637 (h) Other Non-Current Assets 0 0 Total Non-Current Assets (b+c+d+e+f+g+h) 7807751 8387908(2) Current Assets (a) Current Investments 0 0 (b) Inventories 57698 51359 (c) Trade Recievables 785884 818109 (d) Cash & Bank Balance 188509 250008 (e) Short-term Loans & Advances 114142 124391 (f) Other Current Assets 1245035 1464031 Total Current Assets (a+b+c+d+e+f) 2391268 2707898TOTAL ASSETS (1+2) 10199019 11095806Important Indicators (i) Investment 1348318 1348318 (ii) Capital Employed 7215420 8105193 (iii) Net Worth 7117102 8006875 (iv) Net Current Assets 461907 752988 (v) Cost of Sales 3657031 3587302 (vi) Net Value Added (at market price) 507653 791077 (vii) Total Regular Employees (Nos.) 267906 281635(viii) Avg. Monthly Emoluments per Employee(`) 41700 40806
PROFIT & LOSS ACCOUNT (` in Lakhs)PARTICULARS 2011-12 2010-11(I) Revenue from Operations (Gross) 2599850 2704471 Less : Excise Duty 0 0 Revenue from Operations (Net) 2599850 2704471(II) Other Income 193500 264291(III) Total Revenue (I+II) 2793350 2968762(IV) Expenditure on: (a) Cost of materials consumed 0 0 (b) Purchase of stock-in-trade 0 0 (c) Changes in inventories of finished goods, work-in- 0 0
progress and stock in trade (d) Stores & Spares 0 0 (e) Power & Fuel 228509 222787 (f) Salary, Wages & Benefits/Employees Expense 1340604 1379095 (g) Other Operating/direct/manufacturing Expenses 414102 354375 (h) Rent, Royalty & Cess 32175 32807 (i) Loss on sale of Assets/Investments 0 0 (j) Other Expenses 724209 625695Total Expenditure (IV (a to j)) 2739599 2614759(V) PROFIT BEFORE DEPRECIATION, & IMPAIRMENT, 53751 354003FINANCE CHARGES/INTEREST, EXCEPTIONAL &EXTRAORDINARY ITEMS & TAXES (PBDIEET)(III-IV)(VI) Depreciation, Depletion & Amortisation 917432 972543(VII) Impairment 0 0(VIII) PROFIT BEFORE FINANCE COST/INTEREST, -863681 -618540EXCEPTIONAL, EXTRA-ORDINARY ITEMS & TAXES(PBIEET)(V-VI-VII)(IX) Finance Cost (a) On Central Government Loans 16715 31205 (b) On Foreign Loans 0 0 (c) Others 1697 8234 (d) Less Finance Cost Capitalised 0 0 (e) Charged to P & L Account (a+b+c+d) 18412 39439(X) PROFIT BEFORE EXCEPTIONAL & EXTRA-ORDINARY I -882093 -657979TEMS & TAX (PBEET)(VIII-IXe)(XI) Exceptional Items 0 0(XII) PROFIT BEFORE EXTRA-ORDINARY ITEMS & TAX -882093 -657979(PBET)(X-XI)(XIII) Extra-Ordinary Items 0 0(XIV) PROFIT BEFORE TAX (PBT)(XII-XIII) -882093 -657979(XV) TAX PROVISIONS 2977 -19553(XVI) NET PROFIT / LOSS FOR THE PERIOD FROM -885070 -638426
CONTINUING OPERATIONS AFTER TAX(XIV-XV)(XVII) Profit/Loss from discontinuing operations 0 0(XVIII) Tax expenses of discontinuing operations 0 0(XIX) Profit/Loss from discontinuing operations 0 0
(after Tax)(XVII-XVIII)(XX) Profit/Loss for the period (XVI+XIX) -885070 -638426Financial Ratios (i) Sales : Capital Employed 36.03 33.37 (ii) Cost of Sales : Sales 140.66 132.64 (iii) Salary/Wages : Sales 51.56 50.99 (iv) Net Profit : Net Worth -12.44 -7.97 (v) Debt : Equity 0.08 0.08 (vi) Current Ratio 1.24 1.39 (vii) Trade Recievables : Sales 30.23 30.25 (viii) Total Inventory : Sales 2.22 1.9

Telecommunication Services & Information Tech. Services586
Millennium Telecom Limited
The Company
Millennium Telecom Limited (MTL) was incorporated on22.11.2000 with an objective to provide Internet / Intranet andInformation Technology enabled services in India and abroad.
It is an un-categorized CPSE in Telecommunication Servicessector under the administrative control of M/o Communicationand Information Technology, D/o Tele-communications. ItsRegistered and Corporate offices are at Mumbai, Maharashtra.MTL iscurrently a wholly owned subsidiary of MahanagarTelephone Nigam Ltd (MTNL).
Vision / Mission
The Vision / Mission of the Company is to be the key enablerand leading services provider in the internet/intranet and IT.
Industrial / Business Operations
MTL was formed by MTNL as its wholly owned subsidiarycompany basically for providing internet and other value addedservices in the year 2000. During the year 2007-08 MTL haddecided to undertake undersea cable laying project to have ownundersea cable from India to Middle East with ultimate aim toextend upto USA. As per the directions of the DOT, BSNL wastaken as 50% Joint Venture partner in the said project. However,during 2010-11, the Board had observed that, the cost of layingcable was very high while the bandwidth prices had gone down.Accordingly, the Board decided not to undertake the said project.Later in the year 2011, the Board decided to undertake new activitiesalong with BSNL but in 2012, BSNL has withdrawn itself from theJoint Venture stating that since the Sub-marine cable project hasbeen discontinued, there is no need to continue with the JointVenture. Thus, as of now, MTL is a wholly owned subsidiary ofMTNL.
Performance Highlights
The Company registered a reduction of ` 0.03crore intotal income during 2011-12 which went down to ` 0.18 crore in2011-12 from ` 0.21 crore during 2010-11 due to fall in otherincome. The company has no operating income during last twoyears.The income earned is via interest on Fixed Deposits.
The company showed a net loss of ̀ 0.20crore during the yearas against the loss of ` 0.49croreduring last year due to lowerprovisions made for direct taxes.
The current ratio of company is at 3.05:1 during 2011-12as against 4.48:1 in the pervious year (Fig.2). Balance Sheet andProfit & Loss Account of the company and selected financial ratiosduring the period 2010-11 to 2011-12 can be seen on the adjoiningpage.
Strategic issuesThe Board of MTL has now decided to enter into new lines of
business which could be telecom related as well as other areas.Some of the new lines of business could be Infrastructure sharing,Data Centre Outsourcing application including Web Hosting, CloudComputing, and providing Turn Key Solution in response to varioustenders in Central Government / State Governments / PSUs Banks/ Private Corporates, etc. or directly on GFR basis, Marketing andSelling of digital signatures of MTNL taking franchisee/distributorship of MTNL Mobile Products and SIM Cards ofother operators. The Management is working on the above line ofbusiness and is hopeful to generate revenue in the years to come.
EBIT
DA
& P
AT (
Rs.
cro
re)
TOTAL R
EVENU
E (Rs. crore)
Fig. 1
CU
RR
ENT R
ATIO
Fig. 2
PRO
FITA
BIL
ITY
RAT
IOS
(%)

Public Enterprises Survey 2011-2012: Vol-II 587
Millennium Telecom Limited15th Floor, V.S.Marg, Dadar (W), Mumbai, Maharashtra-400028
PROFIT & LOSS ACCOUNT (`̀̀̀̀ in Lakhs)PARTICULARS 2011-12 2010-11(I) Revenue from Operations (Gross) 0 0 Less : Excise Duty 0 0 Revenue from Operations (Net) 0 0(II) Other Income 18 21(III) Total Revenue (I+II) 18 21(IV) Expenditure on: (a) Cost of materials consumed 0 0 (b) Purchase of stock-in-trade 0 0 (c) Changes in inventories of finished goods, work-in- 0 0progress and stock in trade (d) Stores & Spares 0 0 (e) Power & Fuel 0 0 (f) Salary, Wages & Benefits/Employees Expense 0 0 (g) Other Operating/direct/manufacturing Expenses 0 0 (h) Rent, Royalty & Cess 0 0 (i) Loss on sale of Assets/Investments 0 0 (j) Other Expenses 6 3Total Expenditure (IV (a to j)) 6 3(V) PROFIT BEFORE DEPRECIATION, & IMPAIRMENT, 12 18FINANCE CHARGES/INTEREST, EXCEPTIONAL &EXTRAORDINARY ITEMS & TAXES (PBDIEET)(III-IV)(VI) Depreciation, Depletion & Amortisation 2 2(VII) Impairment 0 0(VIII) PROFIT BEFORE FINANCE COST/INTEREST, 10 16EXCEPTIONAL, EXTRA-ORDINARY ITEMS & TAXES(PBIEET)(V-VI-VII)(IX) Finance Cost (a) On Central Government Loans 0 0 (b) On Foreign Loans 0 0 (c) Others 0 0 (d) Less Finance Cost Capitalised 0 0 (e) Charged to P & L Account (a+b+c+d) 0 0(X) PROFIT BEFORE EXCEPTIONAL & EXTRA-ORDINARY 10 16ITEMS & TAX (PBEET)(VIII-IXe)(XI) Exceptional Items 23 0(XII) PROFIT BEFORE EXTRA-ORDINARY ITEMS & TAX -13 16(PBET) (X-XI)(XIII) Extra-Ordinary Items 0 0(XIV) PROFIT BEFORE TAX (PBT)(XII-XIII) -13 16(XV) TAX PROVISIONS 7 65(XVI) NET PROFIT / LOSS FOR THE PERIOD FROM -20 -49CONTINUING OPERATIONS AFTER TAX(XIV-XV)(XVII) Profit/Loss from discontinuing operations 0 0(XVIII) Tax expenses of discontinuing operations 0 0(XIX) Profit/Loss from discontinuing operations (after Tax) 0 0(XVII-XVIII)(XX) Profit/Loss for the period (XVI+XIX) -20 -49Financial Ratios (i) Sales : Capital Employed 0 0 (ii) Cost of Sales : Sales 0 0 (iii) Salary/Wages : Sales 0 0 (iv) Net Profit : Net Worth -3.99 -9.4 (v) Debt : Equity 0 0 (vi) Current Ratio 3.05 4.48 (vii) Trade Recievables : Sales 0 0 (viii) Total Inventory : Sales 0 0
BALANCE SHEET (` in Lakhs)PARTICULARS 2011-12 2010-11I. EQUITY & LIABILITIESAUTHORISED CAPITAL 10000 10000(1) Shareholders’ Funds (a) Share Capital (i) Central Govt 0 0 (ii) Others 288 288 (b) Reserves & Surplus 213 233 (c) Money received against share warrants 0 0 Total Shareholders’ Funds (1(a)+1(b)+1(c) 501 521(2) Share application money pending allotment 0 0(3) Non-current Liabilities (a) Long Term Borrowings 0 0 (b) Deferred tax liabilities (Net) 1 1 (c) Other Long-term liabilities 0 0 (d) Long-term provisions 0 0 Total Non-Current Liabilities 3(a) to 3(d) 1 1(4) Current Liabilities (a) Short Term Borrowings 53 18 (b) Trade Payables 27 27 (c) Other current liabilities 49 49 (d) Short-term provisions 0 0 Total Current Liabilities 4(a) to 4(d) 129 94TOTAL EQUITY & LIABILITIES (1+2+3+4) 631 616II. ASSETS(1) Non-Current Assets (a) Total Gross Fixed Assets 38 40 (ai) Accumulated Depreciation, Depletion & Amortisation 33 31 (aii) Accumulated Impairment 0 0 (b) Total Net Fixed Assets ((a)-(ai)-(aii) 5 9 (c) Capital work in progress 0 0 (d) Intangible assets under developmet 0 0 (e) Non-Current Investments 0 0 (f) Deferred Tax Assets (Net) 0 0 (g) Long Term Loans and Advances 142 73 (h) Other Non-Current Assets 90 113 Total Non-Current Assets (b+c+d+e+f+g+h) 237 195(2) Current Assets (a) Current Investments 0 0 (b) Inventories 0 0 (c) Trade Recievables 137 137 (d) Cash & Bank Balance 253 245 (e) Short-term Loans & Advances 2 2 (f) Other Current Assets 2 37 Total Current Assets (a+b+c+d+e+f) 394 421TOTAL ASSETS (1+2) 631 616Important Indicators (i) Investment 288 288 (ii) Capital Employed 501 521 (iii) Net Worth 501 521 (iv) Net Current Assets 265 327 (v) Cost of Sales 8 5 (vi) Net Value Added (at market price) -13 16 (vii) Total Regular Employees (Nos.) 0 0(viii) Avg. Monthly Emoluments per Employee(`) 0 0

Telecommunication Services & Information Tech. Services588
Mahanagar Telephone Nigam Ltd.
The CompanyMahanagar Telephone Nigam Ltd. (MTNL)was incorporated
on 28.2.1986 with the objective of taking over the management,control and operation of Telecom Network at Mumbai and Delhiwith a view to raise necessary financial resources for developmentneeds for areas of operations and to up-grade the same.
MTNL is a Schedule 'A' / Navratna listed CPSE inTelecommunication Services sector under the administrative controlof M/o Communication and Information Technology, D/oTelecommunications with 56.25% shareholding by the Governmentof India. The company employed 41591 regular employees(Executives 5940, Non-executives 35651) as on 31.3.2012. ItsRegistered and Corporate offices are at New Delhi.
Vision / MissionThe Vision / Mission of the Company is toprovide a world
class Telecom services in a leading way, keeping the customer'sdelight as its aim, so that it continues to be a premier Indian TelecomCompany.
Industrial / Business OperationsMTNL is engaged in providing all types of Telecommunication
services including Basic Telephone services, Cellular (GSM andCDMA), Mobile services, internet and value added services inDelhi and Mumbai through its 558 exchanges and other networkwith Equipped capacity of 10.72 Million.
It has two wholly owned subsidiaries namely MillenniumTelecom Ltd. (MTL) and Mahanagar Telephone Mauritius Ltd.The company also has two financial Joint Ventures.
Performance HighlightsThe physical performances of the company for last two years
are given below:
Strategic issueThe telecommunication sector in India is one of the most
competitive sectors. The high level of license fee is a big strain onthe finances of the company. Earlier, only a limited number ofoperators could provide telecom services in a particular circle. Now,this restriction has been removed and unlimited operators havebeen allowed in the market. This has leads to more competition inthe market leading to still lower tariffs. MTNL is confined to Delhiand Mumbai and is not able to operate in Tier-II and Tier-III citieswhere maximum growth is taking place. This restriction on servicearea also impacts MTNL in another way. MTNL has asked theDoT to refund the entire amount of 3G and BWA spectrum charges.MTNL's licenses to provide Basic Service and as an ISP are tocome up for renewal in 2013-14 and GSM licenses in 2017-18. Thecosts associated with renewal and reframing of spectrum from 900MHz band to 1800 MHz band may be substantial.
EBIT
DA
& P
AT (
Rs.
cro
re)
TOTAL R
EVENU
E (Rs. crore)
Fig. 1
PRO
FITA
BIL
ITY
RAT
IOS
(%)
CU
RR
ENT R
ATIO
Fig. 2
Total Revenue of the company registered a reduction of` 367.58 crore during 2011-12, which went down from ` 3991.99crore in 2010-11 to ` 3624.41 crore in 2011-12 due to fall inoperating income.The net loss of the company was ` 4109.78crore, an increase of ̀ 1307.86 crore over the previous year's loss of` 2801.92 crore due to reducing tariff and intense competition fromother operators. Further payment of spectrum charges in excess of` 11,000 crores for acquiring 3G and BWA spectrum has put strainon the finance of the company.
The current ratio of company is at 0.31:1during 2011-12 asagainst 0.23:1 in the previous year (Fig.2). Balance Sheet and Profit& Loss Account of the company and selected financial ratios duringthe period 2010-11 to 2011-12 can be seen on the adjoining page.
Main Services Unit Performance during2011-12 2010-11
Landline including No. of 35,65,896 35,81,148WLL Fixed Subscribers
GSM “ 55,85,082 51,99,337

Public Enterprises Survey 2011-2012: Vol-II 589
Mahanagar Telephone Nigam Ltd.Tower 1, 12th Floor, 124 Connaught Circus, New Delhi-110 001
BALANCE SHEET (‘`̀̀̀̀ in Lakhs)PARTICULARS 2011-12 2010-11I. EQUITY & LIABILITIESAUTHORISED CAPITAL 80000 80000(1) Shareholders’ Funds (a) Share Capital (i) Central Govt 35437 35438 (ii) Others 27563 27562 (b) Reserves & Surplus 190671 601648 (c) Money received against share warrants 0 0 Total Shareholders’ Funds (1(a)+1(b)+1(c) 253671 664648(2) Share application money pending allotment 0 0(3) Non-current Liabilities (a) Long Term Borrowings 700000 255397 (b) Deferred tax liabilities (Net) 0 0 (c) Other Long-term liabilities 293498 274203 (d) Long-term provisions 820478 723321 Total Non-Current Liabilities 3(a) to 3(d) 1813976 1252921(4) Current Liabilities (a) Short Term Borrowings 264749 490170 (b) Trade Payables 25594 22398 (c) Other current liabilities 252388 263481 (d) Short-term provisions 80335 50813 Total Current Liabilities 4(a) to 4(d) 623066 826862TOTAL EQUITY & LIABILITIES (1+2+3+4) 2690713 2744431II. ASSETS(1) Non-Current Assets (a) Total Gross Fixed Assets 3011701 2937037 (ai) Accumulated Depreciation, Depletion & Amortisation 1435683 1304734 (aii) Accumulated Impairment 0 0 (b) Total Net Fixed Assets ((a)-(ai)-(aii) 1576018 1632303 (c) Capital work in progress 89700 115382 (d) Intangible assets under developmet 0 0 (e) Non-Current Investments 22198 49466 (f) Deferred Tax Assets (Net) 0 0 (g) Long Term Loans and Advances 493669 488849 (h) Other Non-Current Assets 316953 265551 Total Non-Current Assets (b+c+d+e+f+g+h) 2498538 2551551(2) Current Assets (a) Current Investments 27000 0 (b) Inventories 10056 12548 (c) Trade Recievables 32883 33906 (d) Cash & Bank Balance 8683 14014 (e) Short-term Loans & Advances 80429 79959 (f) Other Current Assets 33124 52453 Total Current Assets (a+b+c+d+e+f) 192175 192880TOTAL ASSETS (1+2) 2690713 2744431Important Indicators (i) Investment 763000 318397 (ii) Capital Employed 953671 920045 (iii) Net Worth 253671 664648 (iv) Net Current Assets -430891 -633982 (v) Cost of Sales 676685 630380 (vi) Net Value Added (at market price) 90390 134520 (vii) Total Regular Employees (Nos.) 41591 43311(viii) Avg. Monthly Emoluments per Employee(`) 74366 62481
PROFIT & LOSS ACCOUNT (` in Lakhs)PARTICULARS 2011-12 2010-11(I) Revenue from Operations (Gross) 337325 367395 Less : Excise Duty 0 0 Revenue from Operations (Net) 337325 367395(II) Other Income 25116 31804(III) Total Revenue (I+II) 362441 399199(IV) Expenditure on: (a) Cost of materials consumed 0 0 (b) Purchase of stock-in-trade 0 0 (c) Changes in inventories of finished goods, work-in- 0 0progress and stock in trade (d) Stores & Spares 0 0 (e) Power & Fuel 21353 20223 (f) Salary, Wages & Benefits/Employees Expense 371156 324732 (g) Other Operating/direct/manufacturing Expenses 20339 22837 (h) Rent, Royalty & Cess 8101 8425 (i) Loss on sale of Assets/Investments 1818 1009 (j) Other Expenses 106114 113149Total Expenditure (IV (a to j)) 528881 490375(V) PROFIT BEFORE DEPRECIATION, & IMPAIRMENT, -166440 -91176FINANCE CHARGES/INTEREST, EXCEPTIONAL &EXTRAORDINARY ITEMS & TAXES (PBDIEET)(III-IV)(VI) Depreciation, Depletion & Amortisation 149622 141014(VII) Impairment 0 0(VIII) PROFIT BEFORE FINANCE COST/INTEREST, -316062 -232190EXCEPTIONAL, EXTRA-ORDINARY ITEMS & TAXES(PBIEET)(V-VI-VII)(IX) Finance Cost (a) On Central Government Loans 0 0 (b) On Foreign Loans 0 0 (c) Others 94916 45148 (d) Less Finance Cost Capitalised 0 0 (e) Charged to P & L Account (a+b+c+d) 94916 45148(X) PROFIT BEFORE EXCEPTIONAL & EXTRA-ORDINARY -410978 -277338ITEMS & TAX (PBEET)(VIII-IXe)(XI) Exceptional Items 0 0(XII) PROFIT BEFORE EXTRA-ORDINARY ITEMS & TAX -410978 -277338 (PBET)(X-XI)(XIII) Extra-Ordinary Items 0 0(XIV) PROFIT BEFORE TAX (PBT)(XII-XIII) -410978 -277338(XV) TAX PROVISIONS 0 2854(XVI) NET PROFIT / LOSS FOR THE PERIOD FROM -410978 -280192CONTINUING OPERATIONS AFTER TAX(XIV-XV)(XVII) Profit/Loss from discontinuing operations 0 0(XVIII) Tax expenses of discontinuing operations 0 0(XIX) Profit/Loss from discontinuing operations 0 0 (after Tax)(XVII-XVIII)(XX) Profit/Loss for the period (XVI+XIX) -410978 -280192Financial Ratios (i) Sales : Capital Employed 35.37 39.93 (ii) Cost of Sales : Sales 200.6 171.58 (iii) Salary/Wages : Sales 110.03 88.39 (iv) Net Profit : Net Worth -162.01 -42.16 (v) Debt : Equity 11.11 4.05 (vi) Current Ratio 0.31 0.23 (vii) Trade Recievables : Sales 9.75 9.23 (viii) Total Inventory : Sales 2.98 3.42

Telecommunication Services & Information Tech. Services590
RailTel Corporation of India Limited
The CompanyRailTel Corporation of India Limited(RailTel) was incorporated
on 26.09.2000 with the objective of expeditiously modernizingRailways' train control, operational safety systems & network,creating nationwide broadband telecom and multimedia network tosupplement national telecom infrastructure.
RailTel is a Schedule 'A' CPSE in Telecommunication Servicessector under the administrative control of M/o Railways with 100%shareholding by the Government of India. The company employed270 regular employees (Executives 114, Non-executives 156) as on31.3.2012. TheIts Registered and Corporate offices are at New Delhi.
Vision / MissionThe Vision of the Company is to become preferred telecom
solution and services provider for knowledge economy.The Mission of the Company is to attain leadership in
providing premier telecom infrastructure service by offering cost-effective state-of-the-art communication solutions.
Industrial / Business OperationsRailTel is one of the leading Telecommunication infrastructure
provider company in the country. RailTel has exclusive seamlessRight of Way (RoW) along 63,000 KM of Railway Track passingthrough 7000 stations across the country. RailTel owns41022RKMs (Route Kilometers) of Core OFC Network in thecountry connecting over 4107 stations / locations till March 2012.
The services offered by RailTel includes National LongDistance Bandwidth leasing (2 Mbps to 155 Mbps &above), InternetServices, Tower Space for Antennae (1000+ towers nationwide),Co-location services, Dark Fibre leasing and VPN services.
Performance HighlightsDuring the year 2011-12 company laid 2995 KMs of OFC.
The total STM 1 connectivity has reached to 36075 RKMs andSTM 16 network is operational on 28,724 RKMs. The physicalperformances of the company for last two years are given below:
Main Services Unit Performance during
2011-12 2010-11
Total Capacity Gbps of 115 59Leased bandwidth
The Company registered an increase of ` 40.90 crore in totalrevenue during 2011-12 which went up to ` 403.97 crore in2011-12 from ` 363.07 crore during 2010-11 due to increase inturnover. The net profit of the company however reduced to` 85.85 crore in 2011-12, a reduction of ` 9.56 crore from theprevious year's profit of ̀ 95.41 crore due to higher provision madefor taxes. The operating profit is, however, higher than last year.
The current ratio of company is at 3.70:1 during 2011-12 asagainst 3.05:1 in the previous year (Fig.2). Balance Sheet and Profit& Loss Account of the company and selected financial ratios duringthe period 2010-11 to 2011-12 can be seen on the adjoining page.
Strategic issueCurrent issue facing the organization is not only to sustain
present bandwidth business but to increase volumes in this periodof heavily falling Bandwidth prices. Despite experiencing severalhitches in the industry, the outlook seems to be positive in the lightof robust customer growth in retail as well as enterprise segmentand introduction of new NTP-12. In addition, Govt. spending increation of various telecoms based ICT projects incl. NOFN, USOF,CCTNS, E-toll, DCN, etc will also add to the optimism in theindustry. RailTel will greatly benefit specially, in the various areasof Govt. projects. In addition, opportunities are also being exploredin the creation of network for implementation of modern signalingtechnology in Indian Railways. Further introduction of new servicesin the areas of consultancy, data center, TP, CDN shall also opennew opportunities for revenue earning.
EBIT
DA
& P
AT (
Rs.
cro
re) TO
TAL REVEN
UE (R
s. crore)
Fig. 1
PRO
FITA
BIL
ITY
RAT
IOS
(%)
CU
RR
ENT R
ATIO
Fig. 2

Public Enterprises Survey 2011-2012: Vol-II 591
RailTel Corporation of India Limited10th Floor, Bank of Baroda Building, 16, SansadMarg, New Delhi-110001
BALANCE SHEET (`̀̀̀̀ in Lakhs)PARTICULARS 2011-12 2010-11I. EQUITY & LIABILITIESAUTHORISED CAPITAL 100000 100000(1) Shareholders’ Funds (a) Share Capital (i) Central Govt 32094 32094 (ii) Others 0 0 (b) Reserves & Surplus 38151 31193 (c) Money received against share warrants 0 0 Total Shareholders’ Funds (1(a)+1(b)+1(c) 70245 63287(2) Share application money pending allotment 432 15(3) Non-current Liabilities (a) Long Term Borrowings 6296 12217 (b) Deferred tax liabilities (Net) 126 88 (c) Other Long-term liabilities 59491 40741 (d) Long-term provisions 467 3444 Total Non-Current Liabilities 3(a) to 3(d) 66380 56490(4) Current Liabilities (a) Short Term Borrowings 57 1104 (b) Trade Payables 4842 4201 (c) Other current liabilities 18002 13530 (d) Short-term provisions 5089 4689 Total Current Liabilities 4(a) to 4(d) 27990 23524TOTAL EQUITY & LIABILITIES (1+2+3+4) 165047 143316II. ASSETS(1) Non-Current Assets (a) Total Gross Fixed Assets 93835 91050 (ai) Accumulated Depreciation, Depletion & Amortisation 36889 23209 (aii) Accumulated Impairment 0 0 (b) Total Net Fixed Assets ((a)-(ai)-(aii) 56946 67841 (c) Capital work in progress 3296 2733 (d) Intangible assets under developmet 0 0 (e) Non-Current Investments 0 0 (f) Deferred Tax Assets (Net) 0 0 (g) Long Term Loans and Advances 1263 1104 (h) Other Non-Current Assets 0 0 Total Non-Current Assets (b+c+d+e+f+g+h) 61505 71678(2) Current Assets (a) Current Investments 0 0 (b) Inventories 230 65 (c) Trade Recievables 10688 12554 (d) Cash & Bank Balance 66889 36424 (e) Short-term Loans & Advances 22805 21696 (f) Other Current Assets 2930 899 Total Current Assets (a+b+c+d+e+f) 103542 71638TOTAL ASSETS (1+2) 165047 143316Important Indicators (i) Investment 38822 44326 (ii) Capital Employed 76973 75519 (iii) Net Worth 70677 63302 (iv) Net Current Assets 75552 48114 (v) Cost of Sales 27903 25489 (vi) Net Value Added (at market price) 23464 21243 (vii) Total Regular Employees (Nos.) 270 270(viii) Avg. Monthly Emoluments per Employee(`) 110864 107253
PROFIT & LOSS ACCOUNT (` in Lakhs)PARTICULARS 2011-12 2010-11(I) Revenue from Operations (Gross) 34742 34974 Less : Excise Duty 0 0 Revenue from Operations (Net) 34742 34974(II) Other Income 5655 1333(III) Total Revenue (I+II) 40397 36307(IV) Expenditure on: (a) Cost of materials consumed 64 175 (b) Purchase of stock-in-trade 0 0 (c) Changes in inventories of finished goods, work-in- 0 0
progress and stock in trade (d) Stores & Spares 0 0 (e) Power & Fuel 676 555 (f) Salary, Wages & Benefits/Employees Expense 3592 3475 (g) Other Operating/direct/manufacturing Expenses 12194 14334 (h) Rent, Royalty & Cess 646 441 (i) Loss on sale of Assets/Investments 0 38 (j) Other Expenses -302 -75Total Expenditure (IV (a to j)) 16870 18943(V) PROFIT BEFORE DEPRECIATION, & IMPAIRMENT, 23527 17364
FINANCE CHARGES/INTEREST, EXCEPTIONAL &EXTRAORDINARY ITEMS & TAXES (PBDIEET)(III-IV)
(VI) Depreciation, Depletion & Amortisation 10632 4714(VII) Impairment 401 1870(VIII) PROFIT BEFORE FINANCE COST/INTEREST, 12494 10780
EXCEPTIONAL, EXTRA-ORDINARY ITEMS & TAXES(PBIEET)(V-VI-VII)
(IX) Finance Cost (a) On Central Government Loans 0 0 (b) On Foreign Loans 0 0 (c) Others 619 1127 (d) Less Finance Cost Capitalised 0 0 (e) Charged to P & L Account (a+b+c+d) 619 1127(X) PROFIT BEFORE EXCEPTIONAL & EXTRA-ORDINARY 11875 9653
ITEMS & TAX (PBEET)(VIII-IXe)(XI) Exceptional Items 1409 0(XII) PROFIT BEFORE EXTRA-ORDINARY ITEMS & TAX 10466 9653
(PBET)(X-XI)(XIII) Extra-Ordinary Items 0 0(XIV) PROFIT BEFORE TAX (PBT)(XII-XIII) 10466 9653(XV) TAX PROVISIONS 1881 112(XVI) NET PROFIT / LOSS FOR THE PERIOD FROM 8585 9541
CONTINUING OPERATIONS AFTER TAX(XIV-XV)(XVII) Profit/Loss from discontinuing operations 0 0(XVIII) Tax expenses of discontinuing operations 0 0(XIX) Profit/Loss from discontinuing operations 0 0
(after Tax) (XVII-XVIII)(XX) Profit/Loss for the period (XVI+XIX) 8585 9541Financial Ratios (i) Sales : Capital Employed 45.14 46.31 (ii) Cost of Sales : Sales 80.31 72.88 (iii) Salary/Wages : Sales 10.34 9.94 (iv) Net Profit : Net Worth 12.15 15.07 (v) Debt : Equity 0.19 0.38 (vi) Current Ratio 3.70 3.05 (vii) Trade Recievables : Sales 30.76 35.9 (viii) Total Inventory : Sales 0.66 0.19

Telecommunication Services & Information Tech. Services584
Bharat Sanchar Nigam Ltd.
The CompanyBharat Sanchar Nigam Ltd (BSNL) was incorporated on
15.9.2000 under the Companies Act 1956 with an objective to takeover the business of providing telecom services and network oferstwhile D/o Telecommunications along with all assets andliabilities, contractual rights and obligations w.e.f. 1.10.2000.
BSNL is a Schedule 'A' Miniratna category CPSE inTelecommunication and IT Sector under the administrative controlof M/o Communication and Information Technology, D/oTelecommunications with 100% shareholding by the Governmentof India. The company employed 2,67,906 regular employees(Executives 52,983 & Non-Executives 2,14,923) as on 31.3.2012.Its Registered and Corporate Office is at New Delhi.
Vision / MissionThe Vision / Mission of the company is to be the leading
telecom service provider in India with global presence.
Industrial / Business OperationsBSNL is engaged in providing all types of Telecommunication
services in 47 telecom circles (including registered office) spread allover India other than cities of Delhi and Mumbai. The networkinfrastructure of BSNL includes 37,613 telephone exchanges.
Performance Highlights The physical performances of the company for last two years
are given below:
Strategic issuesIn The 12th Five Year Plan (2012-17) BSNL may strive to
make the entire landline customer base network IP enabled. Themigration shall result in reduction of operational cost, along withease of induction of new value added services to the landlinecustomers.
A Special Purpose Vehicle (SPV), namely, Bharat BroadbandNetwork Limited (BBNL) has been formed by GoI, MoC & IT,D/o Telecommunications on 25th February 2012, to connect2,50,000 Gram Panchayats on OFC. The wholly owned Govt.Company has been promoted by BSNL, PGCIL and RAILTEL.
Main Products Unit Performance during2011-12 2010-11
Total Telephone Lakhs 1209.81 1170.59Connections Connections
Mobile Lakhs Lines 738.91 711.86
VPT Lakhs No. 5.77 5.76
Broadband Wire line Lakhs Lines 89.15 74.92
WLL Lakhs Lines 88.31 88.49
Total Revenue from of the company registered a reduction of` 1754.12 crore during 2011-12, which went down from` 29687.62 crore in 2010-11 to ` 27933.50 crore in 2011-12. Theloss of the company has gone up by ` 2466.44 crore to ` 8850.70crore in 2011-12, from ̀ 6384.30 crore in previous year due to fallin operating income due to increase in competition, reduction inIUC rates by the sector regulator, Mobile expansion and shift intraffic from landline to mobile, multiple SIM usages and addition oflow Average Revenue Per User (ARPU) customers from rural andsemi- urban areas & STD becoming local call. The license andspectrum charges put a burden of ` 1542.76 crore on the companyduring the year 2011-12.
The current ratio of company is at 1.24:1 during 2011-12 asagainst 1.39:1 in the previous year (Fig.2). Balance Sheet and Profit& Loss Account of the company and selected financial ratios duringthe period 2010-11 to 2011-12 can be seen on the adjoining page.
EBIT
DA
& P
AT (
Rs.
cro
re)
TOTAL R
EVENU
E (Rs. crore)
Fig. 1
PRO
FITA
BIL
ITY
RAT
IOS
(%)
CU
RR
ENT R
ATIO
Fig. 2

Public Enterprises Survey 2011-2012: Vol-II 585
Bharat Sanchar Nigam Ltd.H.C.Mathur Lane, Janpath, New Delhi-110 001
BALANCE SHEET (` in Lakhs)PARTICULARS 2011-12 2010-11I. EQUITY & LIABILITIESAUTHORISED CAPITAL 1750000 1750000(1) Shareholders’ Funds (a) Share Capital (i) Central Govt 1250000 1250000 (ii) Others 0 0 (b) Reserves & Surplus 5867102 6756875 (c) Money received against share warrants 0 0 Total Shareholders’ Funds (1(a)+1(b)+1(c) 7117102 8006875(2) Share application money pending allotment 0 0(3) Non-current Liabilities (a) Long Term Borrowings 98318 98318 (b) Deferred tax liabilities (Net) 0 0 (c) Other Long-term liabilities 426257 452605 (d) Long-term provisions 627981 583098 Total Non-Current Liabilities 3(a) to 3(d) 1152556 1134021(4) Current Liabilities (a) Short Term Borrowings 204047 72000 (b) Trade Payables 984668 1139305 (c) Other current liabilities 612631 622374 (d) Short-term provisions 128015 121231 Total Current Liabilities 4(a) to 4(d) 1929361 1954910TOTAL EQUITY & LIABILITIES (1+2+3+4) 10199019 11095806II. ASSETS(1) Non-Current Assets (a) Total Gross Fixed Assets 17052745 16774218 (ai) Accumulated Depreciation, Depletion & Amortisation 10349571 9544982 (aii) Accumulated Impairment 0 0 (b) Total Net Fixed Assets ((a)-(ai)-(aii) 6703174 7229236 (c) Capital work in progress 428048 523412 (d) Intangible assets under developmet 2043 1267 (e) Non-Current Investments 601352 550141 (f) Deferred Tax Assets (Net) 6238 9215 (g) Long Term Loans and Advances 66896 74637 (h) Other Non-Current Assets 0 0 Total Non-Current Assets (b+c+d+e+f+g+h) 7807751 8387908(2) Current Assets (a) Current Investments 0 0 (b) Inventories 57698 51359 (c) Trade Recievables 785884 818109 (d) Cash & Bank Balance 188509 250008 (e) Short-term Loans & Advances 114142 124391 (f) Other Current Assets 1245035 1464031 Total Current Assets (a+b+c+d+e+f) 2391268 2707898TOTAL ASSETS (1+2) 10199019 11095806Important Indicators (i) Investment 1348318 1348318 (ii) Capital Employed 7215420 8105193 (iii) Net Worth 7117102 8006875 (iv) Net Current Assets 461907 752988 (v) Cost of Sales 3657031 3587302 (vi) Net Value Added (at market price) 507653 791077 (vii) Total Regular Employees (Nos.) 267906 281635(viii) Avg. Monthly Emoluments per Employee(`) 41700 40806
PROFIT & LOSS ACCOUNT (` in Lakhs)PARTICULARS 2011-12 2010-11(I) Revenue from Operations (Gross) 2599850 2704471 Less : Excise Duty 0 0 Revenue from Operations (Net) 2599850 2704471(II) Other Income 193500 264291(III) Total Revenue (I+II) 2793350 2968762(IV) Expenditure on: (a) Cost of materials consumed 0 0 (b) Purchase of stock-in-trade 0 0 (c) Changes in inventories of finished goods, work-in- 0 0
progress and stock in trade (d) Stores & Spares 0 0 (e) Power & Fuel 228509 222787 (f) Salary, Wages & Benefits/Employees Expense 1340604 1379095 (g) Other Operating/direct/manufacturing Expenses 414102 354375 (h) Rent, Royalty & Cess 32175 32807 (i) Loss on sale of Assets/Investments 0 0 (j) Other Expenses 724209 625695Total Expenditure (IV (a to j)) 2739599 2614759(V) PROFIT BEFORE DEPRECIATION, & IMPAIRMENT, 53751 354003FINANCE CHARGES/INTEREST, EXCEPTIONAL &EXTRAORDINARY ITEMS & TAXES (PBDIEET)(III-IV)(VI) Depreciation, Depletion & Amortisation 917432 972543(VII) Impairment 0 0(VIII) PROFIT BEFORE FINANCE COST/INTEREST, -863681 -618540EXCEPTIONAL, EXTRA-ORDINARY ITEMS & TAXES(PBIEET)(V-VI-VII)(IX) Finance Cost (a) On Central Government Loans 16715 31205 (b) On Foreign Loans 0 0 (c) Others 1697 8234 (d) Less Finance Cost Capitalised 0 0 (e) Charged to P & L Account (a+b+c+d) 18412 39439(X) PROFIT BEFORE EXCEPTIONAL & EXTRA-ORDINARY I -882093 -657979TEMS & TAX (PBEET)(VIII-IXe)(XI) Exceptional Items 0 0(XII) PROFIT BEFORE EXTRA-ORDINARY ITEMS & TAX -882093 -657979(PBET)(X-XI)(XIII) Extra-Ordinary Items 0 0(XIV) PROFIT BEFORE TAX (PBT)(XII-XIII) -882093 -657979(XV) TAX PROVISIONS 2977 -19553(XVI) NET PROFIT / LOSS FOR THE PERIOD FROM -885070 -638426
CONTINUING OPERATIONS AFTER TAX(XIV-XV)(XVII) Profit/Loss from discontinuing operations 0 0(XVIII) Tax expenses of discontinuing operations 0 0(XIX) Profit/Loss from discontinuing operations 0 0
(after Tax)(XVII-XVIII)(XX) Profit/Loss for the period (XVI+XIX) -885070 -638426Financial Ratios (i) Sales : Capital Employed 36.03 33.37 (ii) Cost of Sales : Sales 140.66 132.64 (iii) Salary/Wages : Sales 51.56 50.99 (iv) Net Profit : Net Worth -12.44 -7.97 (v) Debt : Equity 0.08 0.08 (vi) Current Ratio 1.24 1.39 (vii) Trade Recievables : Sales 30.23 30.25 (viii) Total Inventory : Sales 2.22 1.9

Telecommunication Services & Information Tech. Services588
Mahanagar Telephone Nigam Ltd.
The CompanyMahanagar Telephone Nigam Ltd. (MTNL)was incorporated
on 28.2.1986 with the objective of taking over the management,control and operation of Telecom Network at Mumbai and Delhiwith a view to raise necessary financial resources for developmentneeds for areas of operations and to up-grade the same.
MTNL is a Schedule 'A' / Navratna listed CPSE inTelecommunication Services sector under the administrative controlof M/o Communication and Information Technology, D/oTelecommunications with 56.25% shareholding by the Governmentof India. The company employed 41591 regular employees(Executives 5940, Non-executives 35651) as on 31.3.2012. ItsRegistered and Corporate offices are at New Delhi.
Vision / MissionThe Vision / Mission of the Company is toprovide a world
class Telecom services in a leading way, keeping the customer'sdelight as its aim, so that it continues to be a premier Indian TelecomCompany.
Industrial / Business OperationsMTNL is engaged in providing all types of Telecommunication
services including Basic Telephone services, Cellular (GSM andCDMA), Mobile services, internet and value added services inDelhi and Mumbai through its 558 exchanges and other networkwith Equipped capacity of 10.72 Million.
It has two wholly owned subsidiaries namely MillenniumTelecom Ltd. (MTL) and Mahanagar Telephone Mauritius Ltd.The company also has two financial Joint Ventures.
Performance HighlightsThe physical performances of the company for last two years
are given below:
Strategic issueThe telecommunication sector in India is one of the most
competitive sectors. The high level of license fee is a big strain onthe finances of the company. Earlier, only a limited number ofoperators could provide telecom services in a particular circle. Now,this restriction has been removed and unlimited operators havebeen allowed in the market. This has leads to more competition inthe market leading to still lower tariffs. MTNL is confined to Delhiand Mumbai and is not able to operate in Tier-II and Tier-III citieswhere maximum growth is taking place. This restriction on servicearea also impacts MTNL in another way. MTNL has asked theDoT to refund the entire amount of 3G and BWA spectrum charges.MTNL's licenses to provide Basic Service and as an ISP are tocome up for renewal in 2013-14 and GSM licenses in 2017-18. Thecosts associated with renewal and reframing of spectrum from 900MHz band to 1800 MHz band may be substantial.
EBIT
DA
& P
AT (
Rs.
cro
re)
TOTAL R
EVENU
E (Rs. crore)
Fig. 1
PRO
FITA
BIL
ITY
RAT
IOS
(%)
CU
RR
ENT R
ATIO
Fig. 2
Total Revenue of the company registered a reduction of` 367.58 crore during 2011-12, which went down from ` 3991.99crore in 2010-11 to ` 3624.41 crore in 2011-12 due to fall inoperating income.The net loss of the company was ` 4109.78crore, an increase of ̀ 1307.86 crore over the previous year's loss of` 2801.92 crore due to reducing tariff and intense competition fromother operators. Further payment of spectrum charges in excess of` 11,000 crores for acquiring 3G and BWA spectrum has put strainon the finance of the company.
The current ratio of company is at 0.31:1during 2011-12 asagainst 0.23:1 in the previous year (Fig.2). Balance Sheet and Profit& Loss Account of the company and selected financial ratios duringthe period 2010-11 to 2011-12 can be seen on the adjoining page.
Main Services Unit Performance during2011-12 2010-11
Landline including No. of 35,65,896 35,81,148WLL Fixed Subscribers
GSM “ 55,85,082 51,99,337

Public Enterprises Survey 2011-2012: Vol-II 589
Mahanagar Telephone Nigam Ltd.Tower 1, 12th Floor, 124 Connaught Circus, New Delhi-110 001
BALANCE SHEET (‘`̀̀̀̀ in Lakhs)PARTICULARS 2011-12 2010-11I. EQUITY & LIABILITIESAUTHORISED CAPITAL 80000 80000(1) Shareholders’ Funds (a) Share Capital (i) Central Govt 35437 35438 (ii) Others 27563 27562 (b) Reserves & Surplus 190671 601648 (c) Money received against share warrants 0 0 Total Shareholders’ Funds (1(a)+1(b)+1(c) 253671 664648(2) Share application money pending allotment 0 0(3) Non-current Liabilities (a) Long Term Borrowings 700000 255397 (b) Deferred tax liabilities (Net) 0 0 (c) Other Long-term liabilities 293498 274203 (d) Long-term provisions 820478 723321 Total Non-Current Liabilities 3(a) to 3(d) 1813976 1252921(4) Current Liabilities (a) Short Term Borrowings 264749 490170 (b) Trade Payables 25594 22398 (c) Other current liabilities 252388 263481 (d) Short-term provisions 80335 50813 Total Current Liabilities 4(a) to 4(d) 623066 826862TOTAL EQUITY & LIABILITIES (1+2+3+4) 2690713 2744431II. ASSETS(1) Non-Current Assets (a) Total Gross Fixed Assets 3011701 2937037 (ai) Accumulated Depreciation, Depletion & Amortisation 1435683 1304734 (aii) Accumulated Impairment 0 0 (b) Total Net Fixed Assets ((a)-(ai)-(aii) 1576018 1632303 (c) Capital work in progress 89700 115382 (d) Intangible assets under developmet 0 0 (e) Non-Current Investments 22198 49466 (f) Deferred Tax Assets (Net) 0 0 (g) Long Term Loans and Advances 493669 488849 (h) Other Non-Current Assets 316953 265551 Total Non-Current Assets (b+c+d+e+f+g+h) 2498538 2551551(2) Current Assets (a) Current Investments 27000 0 (b) Inventories 10056 12548 (c) Trade Recievables 32883 33906 (d) Cash & Bank Balance 8683 14014 (e) Short-term Loans & Advances 80429 79959 (f) Other Current Assets 33124 52453 Total Current Assets (a+b+c+d+e+f) 192175 192880TOTAL ASSETS (1+2) 2690713 2744431Important Indicators (i) Investment 763000 318397 (ii) Capital Employed 953671 920045 (iii) Net Worth 253671 664648 (iv) Net Current Assets -430891 -633982 (v) Cost of Sales 676685 630380 (vi) Net Value Added (at market price) 90390 134520 (vii) Total Regular Employees (Nos.) 41591 43311(viii) Avg. Monthly Emoluments per Employee(`) 74366 62481
PROFIT & LOSS ACCOUNT (` in Lakhs)PARTICULARS 2011-12 2010-11(I) Revenue from Operations (Gross) 337325 367395 Less : Excise Duty 0 0 Revenue from Operations (Net) 337325 367395(II) Other Income 25116 31804(III) Total Revenue (I+II) 362441 399199(IV) Expenditure on: (a) Cost of materials consumed 0 0 (b) Purchase of stock-in-trade 0 0 (c) Changes in inventories of finished goods, work-in- 0 0progress and stock in trade (d) Stores & Spares 0 0 (e) Power & Fuel 21353 20223 (f) Salary, Wages & Benefits/Employees Expense 371156 324732 (g) Other Operating/direct/manufacturing Expenses 20339 22837 (h) Rent, Royalty & Cess 8101 8425 (i) Loss on sale of Assets/Investments 1818 1009 (j) Other Expenses 106114 113149Total Expenditure (IV (a to j)) 528881 490375(V) PROFIT BEFORE DEPRECIATION, & IMPAIRMENT, -166440 -91176FINANCE CHARGES/INTEREST, EXCEPTIONAL &EXTRAORDINARY ITEMS & TAXES (PBDIEET)(III-IV)(VI) Depreciation, Depletion & Amortisation 149622 141014(VII) Impairment 0 0(VIII) PROFIT BEFORE FINANCE COST/INTEREST, -316062 -232190EXCEPTIONAL, EXTRA-ORDINARY ITEMS & TAXES(PBIEET)(V-VI-VII)(IX) Finance Cost (a) On Central Government Loans 0 0 (b) On Foreign Loans 0 0 (c) Others 94916 45148 (d) Less Finance Cost Capitalised 0 0 (e) Charged to P & L Account (a+b+c+d) 94916 45148(X) PROFIT BEFORE EXCEPTIONAL & EXTRA-ORDINARY -410978 -277338ITEMS & TAX (PBEET)(VIII-IXe)(XI) Exceptional Items 0 0(XII) PROFIT BEFORE EXTRA-ORDINARY ITEMS & TAX -410978 -277338 (PBET)(X-XI)(XIII) Extra-Ordinary Items 0 0(XIV) PROFIT BEFORE TAX (PBT)(XII-XIII) -410978 -277338(XV) TAX PROVISIONS 0 2854(XVI) NET PROFIT / LOSS FOR THE PERIOD FROM -410978 -280192CONTINUING OPERATIONS AFTER TAX(XIV-XV)(XVII) Profit/Loss from discontinuing operations 0 0(XVIII) Tax expenses of discontinuing operations 0 0(XIX) Profit/Loss from discontinuing operations 0 0 (after Tax)(XVII-XVIII)(XX) Profit/Loss for the period (XVI+XIX) -410978 -280192Financial Ratios (i) Sales : Capital Employed 35.37 39.93 (ii) Cost of Sales : Sales 200.6 171.58 (iii) Salary/Wages : Sales 110.03 88.39 (iv) Net Profit : Net Worth -162.01 -42.16 (v) Debt : Equity 11.11 4.05 (vi) Current Ratio 0.31 0.23 (vii) Trade Recievables : Sales 9.75 9.23 (viii) Total Inventory : Sales 2.98 3.42

Telecommunication Services & Information Tech. Services586
Millennium Telecom Limited
The Company
Millennium Telecom Limited (MTL) was incorporated on22.11.2000 with an objective to provide Internet / Intranet andInformation Technology enabled services in India and abroad.
It is an un-categorized CPSE in Telecommunication Servicessector under the administrative control of M/o Communicationand Information Technology, D/o Tele-communications. ItsRegistered and Corporate offices are at Mumbai, Maharashtra.MTL iscurrently a wholly owned subsidiary of MahanagarTelephone Nigam Ltd (MTNL).
Vision / Mission
The Vision / Mission of the Company is to be the key enablerand leading services provider in the internet/intranet and IT.
Industrial / Business Operations
MTL was formed by MTNL as its wholly owned subsidiarycompany basically for providing internet and other value addedservices in the year 2000. During the year 2007-08 MTL haddecided to undertake undersea cable laying project to have ownundersea cable from India to Middle East with ultimate aim toextend upto USA. As per the directions of the DOT, BSNL wastaken as 50% Joint Venture partner in the said project. However,during 2010-11, the Board had observed that, the cost of layingcable was very high while the bandwidth prices had gone down.Accordingly, the Board decided not to undertake the said project.Later in the year 2011, the Board decided to undertake new activitiesalong with BSNL but in 2012, BSNL has withdrawn itself from theJoint Venture stating that since the Sub-marine cable project hasbeen discontinued, there is no need to continue with the JointVenture. Thus, as of now, MTL is a wholly owned subsidiary ofMTNL.
Performance Highlights
The Company registered a reduction of ` 0.03crore intotal income during 2011-12 which went down to ` 0.18 crore in2011-12 from ` 0.21 crore during 2010-11 due to fall in otherincome. The company has no operating income during last twoyears.The income earned is via interest on Fixed Deposits.
The company showed a net loss of ̀ 0.20crore during the yearas against the loss of ` 0.49croreduring last year due to lowerprovisions made for direct taxes.
The current ratio of company is at 3.05:1 during 2011-12as against 4.48:1 in the pervious year (Fig.2). Balance Sheet andProfit & Loss Account of the company and selected financial ratiosduring the period 2010-11 to 2011-12 can be seen on the adjoiningpage.
Strategic issuesThe Board of MTL has now decided to enter into new lines of
business which could be telecom related as well as other areas.Some of the new lines of business could be Infrastructure sharing,Data Centre Outsourcing application including Web Hosting, CloudComputing, and providing Turn Key Solution in response to varioustenders in Central Government / State Governments / PSUs Banks/ Private Corporates, etc. or directly on GFR basis, Marketing andSelling of digital signatures of MTNL taking franchisee/distributorship of MTNL Mobile Products and SIM Cards ofother operators. The Management is working on the above line ofbusiness and is hopeful to generate revenue in the years to come.
EBIT
DA
& P
AT (
Rs.
cro
re)
TOTAL R
EVENU
E (Rs. crore)
Fig. 1
CU
RR
ENT R
ATIO
Fig. 2
PRO
FITA
BIL
ITY
RAT
IOS
(%)

Public Enterprises Survey 2011-2012: Vol-II 587
Millennium Telecom Limited15th Floor, V.S.Marg, Dadar (W), Mumbai, Maharashtra-400028
PROFIT & LOSS ACCOUNT (`̀̀̀̀ in Lakhs)PARTICULARS 2011-12 2010-11(I) Revenue from Operations (Gross) 0 0 Less : Excise Duty 0 0 Revenue from Operations (Net) 0 0(II) Other Income 18 21(III) Total Revenue (I+II) 18 21(IV) Expenditure on: (a) Cost of materials consumed 0 0 (b) Purchase of stock-in-trade 0 0 (c) Changes in inventories of finished goods, work-in- 0 0progress and stock in trade (d) Stores & Spares 0 0 (e) Power & Fuel 0 0 (f) Salary, Wages & Benefits/Employees Expense 0 0 (g) Other Operating/direct/manufacturing Expenses 0 0 (h) Rent, Royalty & Cess 0 0 (i) Loss on sale of Assets/Investments 0 0 (j) Other Expenses 6 3Total Expenditure (IV (a to j)) 6 3(V) PROFIT BEFORE DEPRECIATION, & IMPAIRMENT, 12 18FINANCE CHARGES/INTEREST, EXCEPTIONAL &EXTRAORDINARY ITEMS & TAXES (PBDIEET)(III-IV)(VI) Depreciation, Depletion & Amortisation 2 2(VII) Impairment 0 0(VIII) PROFIT BEFORE FINANCE COST/INTEREST, 10 16EXCEPTIONAL, EXTRA-ORDINARY ITEMS & TAXES(PBIEET)(V-VI-VII)(IX) Finance Cost (a) On Central Government Loans 0 0 (b) On Foreign Loans 0 0 (c) Others 0 0 (d) Less Finance Cost Capitalised 0 0 (e) Charged to P & L Account (a+b+c+d) 0 0(X) PROFIT BEFORE EXCEPTIONAL & EXTRA-ORDINARY 10 16ITEMS & TAX (PBEET)(VIII-IXe)(XI) Exceptional Items 23 0(XII) PROFIT BEFORE EXTRA-ORDINARY ITEMS & TAX -13 16(PBET) (X-XI)(XIII) Extra-Ordinary Items 0 0(XIV) PROFIT BEFORE TAX (PBT)(XII-XIII) -13 16(XV) TAX PROVISIONS 7 65(XVI) NET PROFIT / LOSS FOR THE PERIOD FROM -20 -49CONTINUING OPERATIONS AFTER TAX(XIV-XV)(XVII) Profit/Loss from discontinuing operations 0 0(XVIII) Tax expenses of discontinuing operations 0 0(XIX) Profit/Loss from discontinuing operations (after Tax) 0 0(XVII-XVIII)(XX) Profit/Loss for the period (XVI+XIX) -20 -49Financial Ratios (i) Sales : Capital Employed 0 0 (ii) Cost of Sales : Sales 0 0 (iii) Salary/Wages : Sales 0 0 (iv) Net Profit : Net Worth -3.99 -9.4 (v) Debt : Equity 0 0 (vi) Current Ratio 3.05 4.48 (vii) Trade Recievables : Sales 0 0 (viii) Total Inventory : Sales 0 0
BALANCE SHEET (` in Lakhs)PARTICULARS 2011-12 2010-11I. EQUITY & LIABILITIESAUTHORISED CAPITAL 10000 10000(1) Shareholders’ Funds (a) Share Capital (i) Central Govt 0 0 (ii) Others 288 288 (b) Reserves & Surplus 213 233 (c) Money received against share warrants 0 0 Total Shareholders’ Funds (1(a)+1(b)+1(c) 501 521(2) Share application money pending allotment 0 0(3) Non-current Liabilities (a) Long Term Borrowings 0 0 (b) Deferred tax liabilities (Net) 1 1 (c) Other Long-term liabilities 0 0 (d) Long-term provisions 0 0 Total Non-Current Liabilities 3(a) to 3(d) 1 1(4) Current Liabilities (a) Short Term Borrowings 53 18 (b) Trade Payables 27 27 (c) Other current liabilities 49 49 (d) Short-term provisions 0 0 Total Current Liabilities 4(a) to 4(d) 129 94TOTAL EQUITY & LIABILITIES (1+2+3+4) 631 616II. ASSETS(1) Non-Current Assets (a) Total Gross Fixed Assets 38 40 (ai) Accumulated Depreciation, Depletion & Amortisation 33 31 (aii) Accumulated Impairment 0 0 (b) Total Net Fixed Assets ((a)-(ai)-(aii) 5 9 (c) Capital work in progress 0 0 (d) Intangible assets under developmet 0 0 (e) Non-Current Investments 0 0 (f) Deferred Tax Assets (Net) 0 0 (g) Long Term Loans and Advances 142 73 (h) Other Non-Current Assets 90 113 Total Non-Current Assets (b+c+d+e+f+g+h) 237 195(2) Current Assets (a) Current Investments 0 0 (b) Inventories 0 0 (c) Trade Recievables 137 137 (d) Cash & Bank Balance 253 245 (e) Short-term Loans & Advances 2 2 (f) Other Current Assets 2 37 Total Current Assets (a+b+c+d+e+f) 394 421TOTAL ASSETS (1+2) 631 616Important Indicators (i) Investment 288 288 (ii) Capital Employed 501 521 (iii) Net Worth 501 521 (iv) Net Current Assets 265 327 (v) Cost of Sales 8 5 (vi) Net Value Added (at market price) -13 16 (vii) Total Regular Employees (Nos.) 0 0(viii) Avg. Monthly Emoluments per Employee(`) 0 0

Telecommunication Services & Information Tech. Services590
RailTel Corporation of India Limited
The CompanyRailTel Corporation of India Limited(RailTel) was incorporated
on 26.09.2000 with the objective of expeditiously modernizingRailways' train control, operational safety systems & network,creating nationwide broadband telecom and multimedia network tosupplement national telecom infrastructure.
RailTel is a Schedule 'A' CPSE in Telecommunication Servicessector under the administrative control of M/o Railways with 100%shareholding by the Government of India. The company employed270 regular employees (Executives 114, Non-executives 156) as on31.3.2012. TheIts Registered and Corporate offices are at New Delhi.
Vision / MissionThe Vision of the Company is to become preferred telecom
solution and services provider for knowledge economy.The Mission of the Company is to attain leadership in
providing premier telecom infrastructure service by offering cost-effective state-of-the-art communication solutions.
Industrial / Business OperationsRailTel is one of the leading Telecommunication infrastructure
provider company in the country. RailTel has exclusive seamlessRight of Way (RoW) along 63,000 KM of Railway Track passingthrough 7000 stations across the country. RailTel owns41022RKMs (Route Kilometers) of Core OFC Network in thecountry connecting over 4107 stations / locations till March 2012.
The services offered by RailTel includes National LongDistance Bandwidth leasing (2 Mbps to 155 Mbps &above), InternetServices, Tower Space for Antennae (1000+ towers nationwide),Co-location services, Dark Fibre leasing and VPN services.
Performance HighlightsDuring the year 2011-12 company laid 2995 KMs of OFC.
The total STM 1 connectivity has reached to 36075 RKMs andSTM 16 network is operational on 28,724 RKMs. The physicalperformances of the company for last two years are given below:
Main Services Unit Performance during
2011-12 2010-11
Total Capacity Gbps of 115 59Leased bandwidth
The Company registered an increase of ` 40.90 crore in totalrevenue during 2011-12 which went up to ` 403.97 crore in2011-12 from ` 363.07 crore during 2010-11 due to increase inturnover. The net profit of the company however reduced to` 85.85 crore in 2011-12, a reduction of ` 9.56 crore from theprevious year's profit of ̀ 95.41 crore due to higher provision madefor taxes. The operating profit is, however, higher than last year.
The current ratio of company is at 3.70:1 during 2011-12 asagainst 3.05:1 in the previous year (Fig.2). Balance Sheet and Profit& Loss Account of the company and selected financial ratios duringthe period 2010-11 to 2011-12 can be seen on the adjoining page.
Strategic issueCurrent issue facing the organization is not only to sustain
present bandwidth business but to increase volumes in this periodof heavily falling Bandwidth prices. Despite experiencing severalhitches in the industry, the outlook seems to be positive in the lightof robust customer growth in retail as well as enterprise segmentand introduction of new NTP-12. In addition, Govt. spending increation of various telecoms based ICT projects incl. NOFN, USOF,CCTNS, E-toll, DCN, etc will also add to the optimism in theindustry. RailTel will greatly benefit specially, in the various areasof Govt. projects. In addition, opportunities are also being exploredin the creation of network for implementation of modern signalingtechnology in Indian Railways. Further introduction of new servicesin the areas of consultancy, data center, TP, CDN shall also opennew opportunities for revenue earning.
EBIT
DA
& P
AT (
Rs.
cro
re) TO
TAL REVEN
UE (R
s. crore)
Fig. 1
PRO
FITA
BIL
ITY
RAT
IOS
(%)
CU
RR
ENT R
ATIO
Fig. 2

Public Enterprises Survey 2011-2012: Vol-II 591
RailTel Corporation of India Limited10th Floor, Bank of Baroda Building, 16, SansadMarg, New Delhi-110001
BALANCE SHEET (`̀̀̀̀ in Lakhs)PARTICULARS 2011-12 2010-11I. EQUITY & LIABILITIESAUTHORISED CAPITAL 100000 100000(1) Shareholders’ Funds (a) Share Capital (i) Central Govt 32094 32094 (ii) Others 0 0 (b) Reserves & Surplus 38151 31193 (c) Money received against share warrants 0 0 Total Shareholders’ Funds (1(a)+1(b)+1(c) 70245 63287(2) Share application money pending allotment 432 15(3) Non-current Liabilities (a) Long Term Borrowings 6296 12217 (b) Deferred tax liabilities (Net) 126 88 (c) Other Long-term liabilities 59491 40741 (d) Long-term provisions 467 3444 Total Non-Current Liabilities 3(a) to 3(d) 66380 56490(4) Current Liabilities (a) Short Term Borrowings 57 1104 (b) Trade Payables 4842 4201 (c) Other current liabilities 18002 13530 (d) Short-term provisions 5089 4689 Total Current Liabilities 4(a) to 4(d) 27990 23524TOTAL EQUITY & LIABILITIES (1+2+3+4) 165047 143316II. ASSETS(1) Non-Current Assets (a) Total Gross Fixed Assets 93835 91050 (ai) Accumulated Depreciation, Depletion & Amortisation 36889 23209 (aii) Accumulated Impairment 0 0 (b) Total Net Fixed Assets ((a)-(ai)-(aii) 56946 67841 (c) Capital work in progress 3296 2733 (d) Intangible assets under developmet 0 0 (e) Non-Current Investments 0 0 (f) Deferred Tax Assets (Net) 0 0 (g) Long Term Loans and Advances 1263 1104 (h) Other Non-Current Assets 0 0 Total Non-Current Assets (b+c+d+e+f+g+h) 61505 71678(2) Current Assets (a) Current Investments 0 0 (b) Inventories 230 65 (c) Trade Recievables 10688 12554 (d) Cash & Bank Balance 66889 36424 (e) Short-term Loans & Advances 22805 21696 (f) Other Current Assets 2930 899 Total Current Assets (a+b+c+d+e+f) 103542 71638TOTAL ASSETS (1+2) 165047 143316Important Indicators (i) Investment 38822 44326 (ii) Capital Employed 76973 75519 (iii) Net Worth 70677 63302 (iv) Net Current Assets 75552 48114 (v) Cost of Sales 27903 25489 (vi) Net Value Added (at market price) 23464 21243 (vii) Total Regular Employees (Nos.) 270 270(viii) Avg. Monthly Emoluments per Employee(`) 110864 107253
PROFIT & LOSS ACCOUNT (` in Lakhs)PARTICULARS 2011-12 2010-11(I) Revenue from Operations (Gross) 34742 34974 Less : Excise Duty 0 0 Revenue from Operations (Net) 34742 34974(II) Other Income 5655 1333(III) Total Revenue (I+II) 40397 36307(IV) Expenditure on: (a) Cost of materials consumed 64 175 (b) Purchase of stock-in-trade 0 0 (c) Changes in inventories of finished goods, work-in- 0 0
progress and stock in trade (d) Stores & Spares 0 0 (e) Power & Fuel 676 555 (f) Salary, Wages & Benefits/Employees Expense 3592 3475 (g) Other Operating/direct/manufacturing Expenses 12194 14334 (h) Rent, Royalty & Cess 646 441 (i) Loss on sale of Assets/Investments 0 38 (j) Other Expenses -302 -75Total Expenditure (IV (a to j)) 16870 18943(V) PROFIT BEFORE DEPRECIATION, & IMPAIRMENT, 23527 17364
FINANCE CHARGES/INTEREST, EXCEPTIONAL &EXTRAORDINARY ITEMS & TAXES (PBDIEET)(III-IV)
(VI) Depreciation, Depletion & Amortisation 10632 4714(VII) Impairment 401 1870(VIII) PROFIT BEFORE FINANCE COST/INTEREST, 12494 10780
EXCEPTIONAL, EXTRA-ORDINARY ITEMS & TAXES(PBIEET)(V-VI-VII)
(IX) Finance Cost (a) On Central Government Loans 0 0 (b) On Foreign Loans 0 0 (c) Others 619 1127 (d) Less Finance Cost Capitalised 0 0 (e) Charged to P & L Account (a+b+c+d) 619 1127(X) PROFIT BEFORE EXCEPTIONAL & EXTRA-ORDINARY 11875 9653
ITEMS & TAX (PBEET)(VIII-IXe)(XI) Exceptional Items 1409 0(XII) PROFIT BEFORE EXTRA-ORDINARY ITEMS & TAX 10466 9653
(PBET)(X-XI)(XIII) Extra-Ordinary Items 0 0(XIV) PROFIT BEFORE TAX (PBT)(XII-XIII) 10466 9653(XV) TAX PROVISIONS 1881 112(XVI) NET PROFIT / LOSS FOR THE PERIOD FROM 8585 9541
CONTINUING OPERATIONS AFTER TAX(XIV-XV)(XVII) Profit/Loss from discontinuing operations 0 0(XVIII) Tax expenses of discontinuing operations 0 0(XIX) Profit/Loss from discontinuing operations 0 0
(after Tax) (XVII-XVIII)(XX) Profit/Loss for the period (XVI+XIX) 8585 9541Financial Ratios (i) Sales : Capital Employed 45.14 46.31 (ii) Cost of Sales : Sales 80.31 72.88 (iii) Salary/Wages : Sales 10.34 9.94 (iv) Net Profit : Net Worth 12.15 15.07 (v) Debt : Equity 0.19 0.38 (vi) Current Ratio 3.70 3.05 (vii) Trade Recievables : Sales 30.76 35.9 (viii) Total Inventory : Sales 0.66 0.19