16 Trading & Marketing Services - DPE
217
359 Public Enterprises Survey 2010-2011: Vol-II As on 31.3.2011, there were 21 Central Public Sector Enterprises in the Trading & Marketing Services group. The name of these enterprises along with their year of incorporation in chronological order are given below : Sl. No. Enterprise Year of Incorporation 1. State Trading Corpn. of India Ltd. 1956 2. Central Warehousing Corpn. 1957 3. Handicrafts & Handloom Exports Corp. of India Ltd. 1962 4. M M T C Ltd. 1963 5. M S T C Ltd. 1964 6. Food Corpn. of India 1965 7. Cotton Corpn. of India Ltd. 1970 8. Jute Corpn. Of India Ltd. 1971 9. P E C Ltd. 1971 10. HMT (International) Ltd. 1975 11. Central Cottage Industries Corpn. Of India Ltd. 1976 12. India Trade Promotion Organisation 1976 13. North Eastern Handicrafts & Handloom Dev.Corpn. Ltd. 1977 14. STCL Ltd. 1982 15. North Eastern Regional Agri. Marketing Corp.Ltd. 1982 16. National Handloom Development Corporation Ltd. 1983 17. Antrix Corporation Ltd. 1993 18. Karnataka Trade Promotion Organisation 2000 19. Tamil Nadu Trade Promotion Organisation 2000 20. NTPC Vidyut Vyapar Nigam Ltd. 2003 21. Central Railside Warehousing Co. Ltd. 2007 2. The enterprises falling in this group are mainly engaged in following activities: i. To regulate trade in certain sensitive products. ii. To control and eliminate to the extend possible speculative activity in the trade of certain products vital to the community. iii. To provide support prices to agricultural products of certain cash crops. vi. To ensure availability of essential consumer products to all sections of the community; v. To arrange import of certain industries in the small sectors with or without high export potential; vi. To provide adequate scientific storage facilities for agricultural products etc. 3. The consolidated financial position, the working results and the important management ratios of these enterprises are appended. 16 Trading & Marketing Services 4. Turnover : The details of turnover of individual enterprises are given below : (`in Crore) Sl. No. Enterprise Turnover 2010-11 2009-10 1. Food Corpn. of India 75168.60 66193.49 2. M M T C Ltd. 68854.49 45124.19 3. State Trading Corpn. of India Ltd. 19984.84 21508.65 4. P E C Ltd. 9969.94 11025.94 5. Handicrafts & Handloom Exports Corp. of India Ltd. 5006.63 1551.06 6. Cotton Corpn. of India Ltd. 2694.53 8274.03 7. M S T C Ltd. 1819.65 4193.09 8. National Handloom Development Corporation Ltd. 1282.54 1065.59 9. Antrix Corporation Ltd. 1035.16 798.77 10. Central Warehousing Corpn. 967.21 890.59 11. India Trade Promotion Organisation 187.97 165.06 12. North Eastern Regional Agri. Marketing Corp.Ltd. 100.69 90.43 13. Central Cottage Industries Corpn. of India Ltd. 63.34 67.59 14. STCL Ltd. 57.99 92.95 15. Central Railside Warehousing Co. Ltd. 48.36 35.35 16. Jute Corpn. Of India Ltd. 47.13 52.16 17. NTPC Vidyut Vyapar Nigam Ltd. 28.12 35.63 18. HMT (International) Ltd. 27.89 30.80 19. Tamil Nadu Trade Promotion Organisation 21.62 14.50 20. North Eastern Handicrafts & Handloom Dev.Corpn. Ltd. 17.27 14.63 21. Karnataka Trade Promotion Organisation 3.04 1.29 Sub Total 187387.01 161225.79
-
Upload
khangminh22 -
Category
Documents
-
view
0 -
download
0
Transcript of 16 Trading & Marketing Services - DPE

359Public Enterprises Survey 2010-2011: Vol-II
As on 31.3.2011, there were 21 Central Public Sector Enterprises in the Trading & Marketing Services group. The name of these enterprises along with their year of incorporation in chronological order are given below :
Sl. No.
Enterprise Year of Incorporation
1. State Trading Corpn. of India Ltd. 1956
2. Central Warehousing Corpn. 1957
3. Handicrafts & Handloom Exports Corp. of India Ltd.
1962
4. M M T C Ltd. 1963
5. M S T C Ltd. 1964
6. Food Corpn. of India 1965
7. Cotton Corpn. of India Ltd. 1970
8. Jute Corpn. Of India Ltd. 1971
9. P E C Ltd. 1971
10. HMT (International) Ltd. 1975
11. Central Cottage Industries Corpn. Of India Ltd.
1976
12. India Trade Promotion Organisation 1976
13. North Eastern Handicrafts & Handloom Dev.Corpn. Ltd.
1977
14. STCL Ltd. 1982
15. North Eastern Regional Agri. Marketing Corp.Ltd.
1982
16. National Handloom Development Corporation Ltd.
1983
17. Antrix Corporation Ltd. 1993
18. Karnataka Trade Promotion Organisation 2000
19. Tamil Nadu Trade Promotion Organisation 2000
20. NTPC Vidyut Vyapar Nigam Ltd. 2003
21. Central Railside Warehousing Co. Ltd. 2007
2. The enterprises falling in this group are mainly engaged in following activities:
i. To regulate trade in certain sensitive products.ii. To control and eliminate to the extend possible
speculative activity in the trade of certain products vital to the community.
iii. To provide support prices to agricultural products of certain cash crops.
vi. To ensure availability of essential consumer products to all sections of the community;
v. To arrange import of certain industries in the small sectors with or without high export potential;
vi. To provide adequate scientific storage facilities foragricultural products etc.
3. Theconsolidatedfinancialposition,theworkingresultsand the important management ratios of these enterprises are appended.
16 Trading & Marketing Services4. Turnover : The details of turnover of individual
enterprises are given below : (`in Crore)
Sl. No.
Enterprise Turnover
2010-11 2009-10
1. Food Corpn. of India 75168.60 66193.49
2. M M T C Ltd. 68854.49 45124.19
3. State Trading Corpn. of India Ltd. 19984.84 21508.65
4. P E C Ltd. 9969.94 11025.94
5. Handicrafts & Handloom Exports Corp. of India Ltd.
5006.63 1551.06
6. Cotton Corpn. of India Ltd. 2694.53 8274.03
7. M S T C Ltd. 1819.65 4193.09
8. National Handloom Development Corporation Ltd.
1282.54 1065.59
9. Antrix Corporation Ltd. 1035.16 798.77
10. Central Warehousing Corpn. 967.21 890.59
11. India Trade Promotion Organisation 187.97 165.06
12. North Eastern Regional Agri. Marketing Corp.Ltd.
100.69 90.43
13. Central Cottage Industries Corpn. of India Ltd.
63.34 67.59
14. STCL Ltd. 57.99 92.95
15. Central Railside Warehousing Co. Ltd.
48.36 35.35
16. Jute Corpn. Of India Ltd. 47.13 52.16
17. NTPC Vidyut Vyapar Nigam Ltd. 28.12 35.63
18. HMT (International) Ltd. 27.89 30.80
19. Tamil Nadu Trade Promotion Organisation
21.62 14.50
20. North Eastern Handicrafts & Handloom Dev.Corpn. Ltd.
17.27 14.63
21. Karnataka Trade Promotion Organisation
3.04 1.29
Sub Total 187387.01 161225.79

360 Trading & Marketing Services
5. Net Profit/Loss : The details of the enterprises, which earnednet profit or sustainednet loss (-) are givenbelow :
(`in Crore)Sl. No.
Enterprise Adjusted Net Profit/Net Loss
2010-11 2009-10
1. Antrix Corporation Ltd. 138.87 108.40
2. Central Warehousing Corpn. 136.17 130.52
3. M M T C Ltd. 121.64 216.24
4. M S T C Ltd. 99.16 86.10
5. P E C Ltd. 70.92 67.72
6. India Trade Promotion Organisation 70.87 77.57
7. State Trading Corpn. of India Ltd. 56.44 106.95
8. NTPC Vidyut Vyapar Nigam Ltd. 30.06 28.39
9. Tamil Nadu Trade Promotion Organisation
14.32 0.44
10. Central Railside Warehousing Co. Ltd.
7.22 8.15
11. National Handloom Development Corporation Ltd.
4.32 3.04
12. Karnataka Trade Promotion Organisation
1.49 -0.54
13. North Eastern Regional Agri. Marketing Corp.Ltd.
1.47 1.12
14. Handicrafts & Handloom Exports Corp. of India Ltd.
0.93 -1.16
15. HMT (International) Ltd. 0.21 2.66
16. Food Corpn. of India -0.19 -364.62
17. Central Cottage Industries Corpn. of India Ltd.
-0.88 -0.19
18. Cotton Corpn. of India Ltd. -0.96 8.18
19. North Eastern Handicrafts & Handloom Dev.Corpn. Ltd.
-1.74 -1.82
20. Jute Corpn. of India Ltd. -11.47 1.56
21. STCL Ltd. -178.02 -443.98
Sub Total 560.83 34.73
6. Dividend : The details of the dividend declared by the individual enterprise are given below :
(`in Crore)Sl. No.
Enterprise Dividend
2010-11 2009-10
1. Antrix Corporation Ltd. 27.78 21.70
2. Central Warehousing Corpn. 27.19 25.83
3. M M T C Ltd. 25.00 45.00
4. State Trading Corpn. of India Ltd. 18.00 28.50
5. NTPC Vidyut Vyapar Nigam Ltd. 15.00 10.00
6. P E C Ltd. 15.00 14.00
7. M S T C Ltd. 2.20 17.23
8. Central Railside Warehousing Co. Ltd.
1.22 0.00
9. National Handloom Development Corporation Ltd.
0.87 0.61
10. HMT (International) Ltd. 0.15 0.15
11. Cotton Corpn. of India Ltd. 0.00 5.00
Group Total 132.41 168.02
7. Social Overheads and Township : The total number of persons employed and the expenditure incurred on social overheads and townships are given below :
(`in Crore)Sl. No.
Enterprise Township and Social Overheads
2010-11 2009-10
1. No. of employees (in number) 43774 46972
2. Social overheads : (Rupees in Crore)
(i) Educational, 23.63 38.44
(ii) Medical Facilities 52.02 28.22
(iii) Others 5.35 6.00
3. Capital cost of township (Rupees in Crore)
29.93 30.57
4. No. of houses constructed (in number)
828 764
8. Company wise details in respect of Balance Sheet, Profit and Loss account, Important Indicators and FinancialRatios along with the write up of individual company are given in the pages below.

361Public Enterprises Survey 2010-2011: Vol-II
Trading & Marketing ServicesBalance Sheet
(` in Lakhs)
(` in Lakhs)
Particulars 2010-11 2009-10 2008-09
AUTHORISED CAPITAL 428800 428800 428800
(1) SOURCES OF FUND
(1.1) SHAREHOLDERS FUNDS
(A)PAID-UPCAPITAL
CENTRAL GOVT 288561 280119 277297
OTHERS 10017 9959 9983
(B) SHARE APPLICATION MONEY 995 994 995
(C) RESERVES & SURPLUS 594563 543604 496778
TOTAL (A) + (B) + (C) 894136 834676 785053
(1.2) LOAN FUNDS
(A) SECURED LOANS 4962746 3893106 4629704
(B) UNSECURED LOANS 1104249 1132517 492976
TOTAL (A) + (B) 6066995 5025623 5122680
(1.3) DEFERRED TAX LIABILITY 5935 2580 2238
TOTAL (1.1) + (1.2) + (1.3) 6967066 5862879 5909971
(2) APPLICATION OF FUNDS
(2.1) FIXED ASSETS
(A) GROSS BLOCK 342018 328329 315843
(B) LESS DEPRECIATION 152710 149361 141666
(C)NETBLOCK(A-B) 189308 178968 174177
(D) CAPITAL WORK IN PROGRESS 7890 5614 4432
TOTAL (C) + (D) 197198 184582 178609
(2.2) INVESTMENT 68805 72313 56304
(2.3) CURRENT ASSETS,LOAN & ADVANCES
(A) INVENTORIES 4671904 3999122 3929410
(B) SUNDRY DEBTORS 2663710 2708922 2817446
(C) CASH & BANK BALANCES 1794753 1109707 1139933
(D) OTHER CURRENT ASSETS 69282 44241 60517
(E) LOAN & ADVANCES 940972 909327 883099
TOTAL (A)+ (B)+ (C)+ (D)+ (E) 10140621 8771319 8830405
(2.4) LESS:CURRENT LIABILITIES & PROVISIONS
(A) CURRENT LIABILITIES 3506164 3187677 3030781
(B) PROVISIONS 152643 173404 154536
TOTAL (A+B) 3658807 3361081 3185317
(2.5)NETCURRENTASSETS(2.3-2.4) 6481814 5410238 5645088
(2.6) DEFERRED REVENUE / PRE.EXPENDITURE 4234 104 6971
(2.7) DEFERRED TAX ASSET 15479 14864 13332
(2.8) PROFIT & LOSS ACCOUNT(DR) 199536 180778 9667
TOTAL (2.1+2.2+2.5+2.6+2.7+2.8) 6967066 5862879 5909971

362 Trading & Marketing Services
Trading & Marketing ServicesProfit and Loss Account
(` in Lakhs)
(` in Lakhs)
Particulars 2010-11 2009-10 2008-09
(1) INCOME
(A) SALES/OPERATING 18738701 16122579 13726802
(B) EXCISE DUTY 5 0 25466
(C)NETSALES(A-B) 18738696 16122579 13701336
(D) OTHER INCOME/RECEIPTS 300801 455624 599003
(I)TOTAL INCOME (C+D+E) 19712478 16661332 16406347
(2) EXPENDITURE
(A) PURCHASE OF FINISHED GOODS CONSUMPTION OF RAW MATERIALS 17360063 14579189 14214116
(B) STORES & SPARES 243261 223914 155780
(C) POWER & FUEL 5265 3306 3884
(D) MANUFACTURING / DIRECT / OPERATING EXPENSES 887904 888039 716586
(E)SALARY,WAGES & BENEFITS / EMPLOYEE EXP. 337692 256155 306796
(F)OTHER EXPENSES 399610 224990 411704
(G)PROVISIONS 3775 71844 8895
(II)TOTAL EXPENDITURE (A to G) 19237570 16247437 15817761
(3)PROFITBEFOREDEP.INT.TAXES&EP(PBDITEP)(I-II) 474908 413895 588586
(4) DEPRECIATION 9014 8802 8553
(5) DRE/PREL EXP WRITTEN OFF 1561 1404 10224
(6)PROFITBEFOREINT.,TAXES&EP(PBITEP)(3-4-5) 464333 403689 569809
(7) INTEREST
(A) ON CENTRALGOVERNMENT LOANS 0 62396 62914
(B) ON FOREIGN LOANS 0 0 0
(C) OTHERS 374343 297607 367527
(D) LESS INTEREST CAPITALISED 0 0 0
(E)CHARGEDTOP&LACCOUNT(A+B+C-D) 374343 360003 430441
(8)PROFIT BEFORE TAX & EP(PBTEP) (6-7E) 89990 43686 139368
(9) TAX PROVISIONS 34093 37614 41019
(10)NETPROFIT/LOSS(-)BEFOREEP(8-9) 55897 6072 98349
(11)NETEXTRA-ORD.ITEMS -186 2599 1687
(12) NET PROFIT / LOSS(-) (10-11) 56083 3473 96662
(13) DIVIDEND DECLARED 13241 16802 13544
(14) DIVIDEND TAX 2154 2801 2279
(15) RETAINED PROFIT (12-13-14) 40688 -16130 80839

363Public Enterprises Survey 2010-2011: Vol-II
Trading & Marketing ServicesManagement Ratio
Particulars 2010-11 2009-10 2008-09
(A.) INDICATORS
(I) GENERAL(Rs. in Lakhs)
(i) INVESTMENT 719377 852822 1158254
(ii) CAPITAL EMPLOYED 6671122 5589206 5819265
(iii) NET WORTH 690366 653794 768415
(iv) COST OF PRODUCTION 19622488 16617646 16266979
(v) COST OF SALES 18949507 16534517 14160971
(vi) VALUE ADDED 1803088 1399299 1433564
(vii) R AND D EXPENDITURE 14 0 0
(II) HUMAN RESOURCE
(viii) EMPLOYEES (OTHER THAN CASUAL)(Nos.) 43774 46972 50380
(ix) AVG.MONTHLY EMOLUMENTS PER EMPLOYEE(Rs.) 64287 45445 50747
(B.) MANAGEMENT RATIO
(i) DEBT : EQUITY 6.79 6.02 6.53
(ii)CURRENTRATIO(CURRENTASSET:CURRENT-LIABILITY 2.77 2.61 2.77
(iii) PBDITEP : TOTAL EMPLOYEMENT (Rs. in Lakhs) 10.85 8.81 11.68
(iv) SUNDRY DEBTORS : SALES (No. of days) 51.88 61.33 75.06
(v) INVENTORY(No. of days)
(a) TOTAL INVENTORY : SALES 91 90.54 104.68
(b) SEMI/FINISHED GOODS : SALES 9.78 10.21 21.87
(vi) INCREMENTAL CAPITAL OUTPUT RATIO(ICOR) 0.34 -0.58 0.26
(%)
(vii) SALES : CAPITAL EMPLOYED 280.89 288.46 235.45
(viii) PBDITEP : CAPITAL EMPLOYED 7.12 7.41 10.11
(ix) PBITEP : CAPITAL EMPLOYED 6.96 7.22 9.79
(x) COST OF SALES : SALES 101.13 102.56 103.35
(xi) MATERIAL COST : SALES 92.64 90.43 103.74
(xii) SALARY & WAGES : SALES 1.8 1.59 2.24
(xiii) R & D EXPENDITURE : SALES 0 0 0
(xiv) PBITEP : SALES 2.48 2.5 4.16
(xv) PBTEP : NET WORTH 13.04 6.68 18.14
(xvi) NET PROFIT : NET WORTH 8.12 0.53 12.58
(xvii) GROSS MARGIN : GROSS BLOCK 138.85 126.06 186.35

364 Trading & Marketing Services
www.antrix.gov.in
Antrix Corporation Limited (ACL) was incorporated on 28.09.1992 as the commercial marketing arm / corporate front of Indian Space Research Organization (ISRO).
ACL is a schedule – ‘B’ Miniratna CPSE in the Trading & Marketing sector under the administrative control of the Department of Space with 100% shareholding by Government of India. It’s registered andCorporateOffice are atBangalore,Karnataka
Vision/MissionThevisionofAntrix is toemergeasagloballysignificant
space company, fully utilizing the strength of ISRO and other Indian entities in thefieldof space.
The mission of Antrix is to enhance & generate commercial spin-offs from ISRO’s programme in the global spacemarkets& establish a commercially viable space industry in India.
Industrial / Business OperationsThe Company is engaged in providing Space Products
and services to national & international customers. ANTRIX’s Business portfolio consists of:
(i) Remote Sensing Services (ii) Spacecraft Systems & Subsystems(iii) Transponder Leasing Services (iv) Lunch Services(v) Mission Support Services (vi) Ground System Services(vii) Spacecraft Testing Facilities (viii) Training & Consultancy Services
Strategic IssuesThe Company intended to provide cost effective& flight
proven space products & services in International markets, to play a substantial role in development of Space Industry in India, monitoring trends in satellite industry (including launch vehicle & ground segment) & to provide inputs to the management of ISRO etc.
Performance HighlightsThe operational performance of the company along with
performance indicators and selected financial ratios during theperiod 2008-09 to 2010-11 can be seen on the oppositepage.
The Company registered an increase of ` 230.27 crore in totalincomeduring2010-11whichwentupto` 1114.19 crore in2010-11 from` 883.92 croreduring2009-10.Thenet profitof the company correspondingly increased to ` 138.87 crore, an increase of ` 30.47 crore over the previous year.
Export of Hylas satellite has contributed in to the increase in turnoverandprofitofthecompany.INSATcapacityisexhaustedhence foreign satellite capacity is being procured which is keeping constant pressureon theprofitmargin.
Human Resource ManagementThe company employed 19 regular employees as on
31.3.2011. The retirement age in the Company is 60 years. It is following CDA 2006 pattern of remuneration. Details of employment in last 3 years are given below:
Particulars 2010-11 2009-10 2008-09Executives including Non-Unionised Supervisors 17 17 5
Non-Executives # 2 2 13Total Employees 19 19 18
# Detail break-up of Non-Executive employees is at Statement no. 25 of volume-I of PE Survey.
16.1 Antrix Corporation Limited

365Public Enterprises Survey 2010-2011: Vol-II
Antrix Corporation LimitedAntrikshBhavan,NewBELRoad,Bangalore,Karnataka -560231
Balance Sheet (` in Lakhs)
Particulars 2010-11 2009-10 2008-09
Authorised Capital 500 500 500
(1) Sources Of Fund
(1.1) Shareholders Funds
(A) Paid-Up Capital
Central Govt 100 100 100
Others 0 0 0
(B) Share Application Money 0 0 0
(C) Reserves & Surplus 66915 56268 47967
Total (A) + (B) + (C) 67015 56368 48067
(1.2) Loan Funds
(A) Secured Loans 0 0 0
(B) Unsecured Loans 0 0 0
Total (A) + (B) 0 0 0
(1.3) Deferred Tax Liability 0 0 0
Total (1.1) + (1.2) + (1.3) 67015 56368 48067
(2) Application Of Funds
(2.1) Fixed Assets
(A) Gross Block 153 147 138
(B) Less Depreciation 114 101 89
(C) Net Block (A-B) 39 46 49
(D) Capital Work In Progress 650 349 0
Total (C) + (D) 689 395 49
(2.2) Investment 20005 22939 12921
(2.3) Current Assets, Loan & Advances
(A) Inventories 0 0 0
(B) Sundry Debtors 30790 16287 26649
(C) Cash & Bank Balances 96766 87922 82829
(D) Other Current Assets 0 0 0
(E) Loan & Advances 69595 54484 31339
Total (A)+ (B)+ (C)+ (D)+ (E) 197151 158693 140817
(2.4) Less:current Liabilities & Provisions
(A) Current Liabilities 148484 123430 102358
(B) Provisions 3250 3060 3529
Total (A+B) 151734 126490 105887
(2.5) Net Current Assets (2.3-2.4) 45417 32203 34930
(2.6) Deferred Revenue / Pre. Expenditure
0 0 0
(2.7) Deferred Tax Asset 904 831 167
(2.8) Profit & Loss Account(Dr) 0 0 0
Total (2.1+2.2+2.5+2.6+2.7+2.8) 67015 56368 48067
Important Indicators 2010-11 2009-10 2008-09
(i) Investment 100 100 100(ii) Capital Employed 45456 32249 34979(iii) Net Worth 67015 56368 48067(iv) Cost of Production 89967 71690 83040(v) Cost of Sales 89967 71690 83040(vi) Gross Value Added (At Market Price) - - -
(vii) Total Employees (Other Than Casuals) (Nos.) 19 19 18
(viii) Avg. Monthly Emoluments Per Employee (Rs.) 28947 25877 20370
Profit & Loss Account (` in Lakhs)
Particulars 2010-11 2009-10 2008-09
(1) Income
(A) Sales/Operating Income 103516 79877 33894
(B) Excise Duty 0 0 0
(C) Net Sales (A-B) 103516 79877 33894
(D) Other Income/Receipts 7903 8515 71996
(E) Accretion/Depletion in Stocks 0 0 0
(I)Total Income (C+D+E) 111419 88392 105890
(2) Expenditure
(A) Purchase of Finished Goods/ Consumption Of Raw Materials 89148 69168 81679
(B) Stores & Spares 0 0 0
(C) Power & Fuel 0 0 0
(D) Manufacturing / Direct / Operating Expenses 71 164 0
(E) Salary, Wages & Benefits / Employee Exp. 66 59 44
(F) Other Expenses 398 323 1266
(G) Provisions 272 1963 39
(II)Total Expenditure (A to G) 89955 71677 83028
(3) Profit Before Dep, Int, Taxes & EP (PBDITEP) (I-II) 21464 16715 22862
(4) Depreciation 12 13 12
(5) Dre/Prel Exp Written Off 0 0 0
(6) Profit Before Int., Taxes & Ep (PBITEP) (3-4-5) 21452 16702 22850
(7) Interest
(A) On Central Government Loans 0 0 0
(B) On Foreign Loans 0 0 0
(C) Others 0 0 0
(D) Less Interest Capitalised 0 0 0
(E) Charged to P & L Account (A+B+C-D) 0 0 0
(8) Profit Before Tax & EP(PBTEP) (6-7E) 21452 16702 22850
(9) Tax Provisions 7514 3956 7784
(10) Net Profit / Loss Before EP (8-9) 13938 12746 15066
(11) Net Extra-Ord. Items 51 1906 27
(12) Net Profit / Loss(-) (10-11) 13887 10840 15039
(13) Dividend Declared 2778 2170 3010
(14) Dividend Tax 461 369 512
(15) Retained Profit (12-13-14) 10648 8301 11517
Financial Ratios 2010-11 2009-10 2008-09
(i) Sales : Capital Employed 227.73 247.69 96.9
(ii) Cost of Sales : Sales 86.91 89.75 245
(iii) Salary / Wages : Sales 0.06 0.07 0.13
(iv) Net Profit : Net Worth 20.72 19.23 31.29
(v) Debt : Equity 0 0 0
(vi) Current Ratio 1.3 1.25 1.33
(vii) Sundry Debtors : Sales (No. of Days) 108.57 74.42 286.98
(viii) Total Inventory : Sales 0 0 0

366 Trading & Marketing Services
www.cottageemporium.in
Central Cottage Industries Corporations of India Limited wasincorporatedon04-02-1976withtheobjectivetopromote,develop, aid, and assist Cottage Industries by organizing product sales in India and abroad.
CCICI is a Schedule-’C’ CPSE in Trading & Marketingsector under the administrative control of M/o Textiles with 100% shareholding by the Government of India. Its Registered andCorporate offices are inNewDelhi.
Vision / MissionThe Vision and Mission of the Company is to promote,
develop, aid, counsel and assist cottage industries by organising their sale in India and abroad.
Industrial / Business OperationsCCICI is engaged in trading of handicrafts and handlooms
and other related services in India and abroad. The operating units of the corporation are situated at Kolkata (West Bengal), Bangalore (Karnataka), Chennai (Tamilnadu), Mumbai (Maharashtra, 3 units), Gurgaon (Haryana), Patna (Bihar) and Delhi. The physical performance of the company during the previous three years are mentioned below: Main Service Segments Unit 2010-11 2009-10 2008-09
Trading (Handicrafts &Handlooms)Domestic ` in crore N.A 64.17 64.44
Exports ` in crore N.A 2.40 3.13
Total ` in crore N.A 67.59 68.59
N.A. : Not Available
Strategic issueCCICI procures merchandise from handicraft and handloom
clusters and from a large number of artisans, craftsmen, weavers, etc. spread throughout the country and also from National Awardees, State Awardees, women organizations, minority and from weaker sections, etc. The retails prices and quality of products of CCICI are considered a benchmark in the trade.
Performance HighlightsThe operational performance of the company along with
performance indicators and selected financial ratios during theperiod2008-09 to 2010-11 canbe seenon theopposite page.
The Company registered a reduction of ` 4.25 crore in total income during 2010-11 which went down to ` 68.25 crore in 2010-11from` 72.50croreduring2009-10.Thenetlossofthecompany increased to ` 0.88 crore, an increase of ` 0.69 crore over the previous year’s loss of ` 0.19 core due to decline in turnover.
During the year, the Gurgoan franchisee was closed and operation of new showrooms at Mumbai started from June/July 2010.
16.2 Central Cottage Industries Corporation of India Limited
Human Resource ManagementThe Company employed 325 regular employees as on
31.03.2011. The retirement age in the Company is 60 years. It is following IDA 2007 pattern of remuneration. Details of employment in last 3 years are given below:
(in Nos.)Particulars 2010-11 2009-10 2008-09
Executives including Non-Unionised Supervisors 142 137 137
Non-Executives # 183 207 214Total Employees 325 344 351
# Detail break-up of Non-Executive employees is at Statement no. 25 of volume-I of PE Survey.

367Public Enterprises Survey 2010-2011: Vol-II
Central Cottage Industries Corporation of India LimitedJawaharVyaparBhawan, Janpath,NewDelhi- 110001
Balance Sheet (` in Lakhs)
Particulars 2010-11 2009-10 2008-09
Authorised Capital 1200 1200 1200
(1) Sources Of Fund
(1.1) Shareholders Funds
(A) Paid-Up Capital
Central Govt 1085 1085 1085
Others 0 0 0
(B) Share Application Money 0 0 0
(C) Reserves & Surplus 1060 1169 1206
Total (A) + (B) + (C) 2145 2254 2291
(1.2) Loan Funds
(A) Secured Loans 0 28 31
(B) Unsecured Loans 0 0 0
Total (A) + (B) 0 28 31
(1.3) Deferred Tax Liability 0 0 0
Total (1.1) + (1.2) + (1.3) 2145 2282 2322
(2) Application Of Funds
(2.1) Fixed Assets
(A) Gross Block 2155 1916 1933
(B) Less Depreciation 929 875 877
(C) Net Block (A-B) 1226 1041 1056
(D) Capital Work In Progress 0 5 11
Total (C) + (D) 1226 1046 1067
(2.2) Investment 0 0 0
(2.3) Current Assets, Loan & Advances
(A) Inventories 545 539 539
(B) Sundry Debtors 284 448 310
(C) Cash & Bank Balances 4144 5106 4758
(D) Other Current Assets 68 115 82
(E) Loan & Advances 660 1182 1108
Total (A)+ (B)+ (C)+ (D)+ (E) 5701 7390 6797
(2.4) Less:current Liabilities & Provisions
(A) Current Liabilities 1866 2558 1992
(B) Provisions 3968 4712 4592
Total (A+B) 5834 7270 6584
(2.5) Net Current Assets (2.3-2.4) -133 120 213
(2.6) Deferred Revenue / Pre. Expenditure 0 0 0
(2.7) Deferred Tax Asset 1052 1116 1042
(2.8) Profit & Loss Account(Dr) 0 0 0
Total (2.1+2.2+2.5+2.6+2.7+2.8) 2145 2282 2322
Important Indicators 2010-11 2009-10 2008-09
(i) Investment 1085 1085 1085
(ii) Capital Employed 1093 1161 1269
(iii) Net Worth 2145 2254 2291
(iv) Cost of Production 7002 7230 7342
(v) Cost of Sales 6997 7229 7389
(vi) Gross Value Added (At Market Price) - - -
(vii) Total Employees (Other Than Casuals) (Nos.) 325 344 351
(viii) Avg. Monthly Emoluments Per Employee (Rs.) 52821 48304 48362
Profit & Loss Account (` in Lakhs)
Particulars 2010-11 2009-10 2008-09
(1) Income
(A) Sales/Operating Income 6334 6759 6859
(B) Excise Duty 5 0 4
(C) Net Sales (A-B) 6329 6759 6855
(D) Other Income/Receipts 491 490 596
(E) Accretion/Depletion in Stocks 5 1 -47
(I)Total Income (C+D+E) 6825 7250 7404
(2) Expenditure
(A) Purchase of Finished Goods/ Consumption Of Raw Materials 3466 3589 3729
(B) Stores & Spares 0 0 0
(C) Power & Fuel 106 120 138
(D) Manufacturing / Direct / Operating Expenses 194 263 427
(E) Salary, Wages & Benefits / Employee Exp. 2060 1994 2037
(F) Other Expenses 1119 1201 951
(G) Provisions 0 7 4
(II)Total Expenditure (A to G) 6945 7174 7286
(3) Profit Before Dep, Int, Taxes & EP (PBDITEP) (I-II) -120 76 118
(4) Depreciation 57 56 56
(5) Dre/Prel Exp Written Off 0 0 0
(6) Profit Before Int., Taxes & Ep (PBITEP) (3-4-5) -177 20 62
(7) Interest
(A) On Central Government Loans 0 0 0
(B) On Foreign Loans 0 0 0
(C) Others 0 0 0
(D) Less Interest Capitalised 0 0 0
(E) Charged to P & L Account (A+B+C-D) 0 0 0
(8) Profit Before Tax & EP(PBTEP) (6-7E) -177 20 62
(9) Tax Provisions -11 37 40
(10) Net Profit / Loss Before EP (8-9) -166 -17 22
(11) Net Extra-Ord. Items -78 2 1
(12) Net Profit / Loss(-) (10-11) -88 -19 21
(13) Dividend Declared 0 0 4
(14) Dividend Tax 0 0 1
(15) Retained Profit (12-13-14) -88 -19 16
Financial Ratios 2010-11 2009-10 2008-09
(i) Sales : Capital Employed 579.05 582.17 540.19
(ii) Cost of Sales : Sales 110.55 106.95 107.79
(iii) Salary / Wages : Sales 32.55 29.5 29.72
(iv) Net Profit : Net Worth -4.1 -0.84 0.92
(v) Debt : Equity 0 0.01 0.01
(vi) Current Ratio 0.98 1.02 1.03
(vii) Sundry Debtors : Sales (No. of Days) 16.38 24.19 16.51
(viii) Total Inventory : Sales 31.43 29.11 28.7
2010-11 PROVISIONAL

368 Trading & Marketing Services
www.cewacor.nic.in
Central Railside Warehouse Company Limited (CRWCL) was incorporated on 10.07.2007 with the broad objectives ofproviding quality storage facility at transit nodes and to maximize the use of Railways assets so as to bring the economy of scales for customers, Railways and the company itself.
It is aSchedule-’C’CPSE inTrading&Marketing sectorunder the administrative control of M/o Consumer Affairs, Food and Public Distribution, Department of Food and Public Distribution. CRWCL is a subsidiary of Central Warehousing Corporation (CWC). Its Registered and Corporate offices areat New Delhi.
Vision/MissionThe Vision of the Company is to provide Multi Modal
Logistics to the trade and support Indian Economy in reducing logistics cost.
The Mission of the Company is to provide quality storage facility at transit nodes, maximize the use of Railways assets; bring economy of scales for customers, Railways and CRWC.
Industrial / Business OperationsCRWCL is engaged in promotion and development
of Railside Warehousing Complexes (RWCs) / Terminals / Multimodal Logistics Hub and providing seamless supply chain managementsystembybetterutilizationofexistinggood-shedsof Railways. The company has 16 Railside Warehouse Complexes all over India as on 31.3.2011. The physical performances of the company for last three years are given below:Main Services Unit Performance During
2010-11 2009-10 2008-09Operating RWCs No. 16 15 13Wagons Handled No, N.A. 83475 68301Quantity Handled Lakh MT N.A. 74.99 67.63Warehousing Logistics
in crore
48.36 35.35 14.88
N.A. Not Available
Strategic IssuesThemainobjectivesofthecompanyare(i)toplan,develop,
promote, acquire and operate Railside Warehousing Complexes / Terminals / Multi-modal Logistics Hub on land leased fromRailways or acquired otherwise; (ii) to promote and provide seamless supply chain management systems rail based logistics within India/abroad; (iii) to carry on business of Multimodal transport operations services within India and abroad by modes of transport to set up and manage disaggregation/aggregation of cargo both for domestic/impex movement within India/abroad; and (iv) to act as a Clearing and Forwarding agents, Consignment Agent and 3PL provider within India and abroad.
Performance HighlightsThe operational performance of the company along with
performance indicators and selected financial ratios during theperiod2008-09 to 2010-11 canbe seenon theopposite page.
The Company registered an increase of ` 13.57 crore in total incomeduring2010-11whichwentupto` 51.08 crore in 2010-11 from ` 37.51 crore during 2009-10. The net profit ofthe company however reduced to ` 7.22 crore, a reduction of `
0.93 crore over the previous year profit of` 8.15 crore due to increase in operating expenses.
16.3 Central Railside Warehouse Company Limited
Human Resource ManagementThe company employed 42 regular employees as on
31.3.2011. The retirement age in the company is 60 years. Details of employment in last 3 years are given below:
Particulars 2010-11 2009-10 2008-09Executives including Non-Unionised Supervisors 42 11 29
Non-Executives # 0 29 9Total Employees 42 40 38
# Detail break-up of Non-Executive employees is at Statement no. 25 of volume-I of PE Survey.

369Public Enterprises Survey 2010-2011: Vol-II
Central Railside Warehouse Company LimitedWarehousing Bhawan, 4/1, Siri Fort Institutiona Area , Hauz Khas New Delhi 110 016
Balance Sheet (` in Lakhs)
Particulars 2010-11 2009-10 2008-09
Authorised Capital 15000 15000 15000
(1) Sources Of Fund
(1.1) Shareholders Funds
(A) Paid-Up Capital
Central Govt 0 0 0
Others 4056 4056 4056
(B) Share Application Money 0 0 0
(C) Reserves & Surplus 1961 1381 566
Total (A) + (B) + (C) 6017 5437 4622
(1.2) Loan Funds
(A) Secured Loans 8924 0 0
(B) Unsecured Loans 0 7291 5691
Total (A) + (B) 8924 7291 5691
(1.3) Deferred Tax Liability 1004 641 409
Total (1.1) + (1.2) + (1.3) 15945 13369 10722
(2) Application Of Funds
(2.1) Fixed Assets
(A) Gross Block 15693 12930 10811
(B) Less Depreciation 736 467 248
(C) Net Block (A-B) 14957 12463 10563
(D) Capital Work In Progress 876 1304 354
Total (C) + (D) 15833 13767 10917
(2.2) Investment 0 0 0
(2.3) Current Assets, Loan & Advances
(A) Inventories 0 4 0
(B) Sundry Debtors 425 278 334
(C) Cash & Bank Balances 330 120 90
(D) Other Current Assets 125 17 35
(E) Loan & Advances 1108 821 431
Total (A)+ (B)+ (C)+ (D)+ (E) 1988 1240 890
(2.4) Less:current Liabilities & Provisions
(A) Current Liabilities 1213 1341 981
(B) Provisions 663 297 104
Total (A+B) 1876 1638 1085
(2.5) Net Current Assets (2.3-2.4) 112 -398 -195
(2.6) Deferred Revenue / Pre. Expenditure 0 0 0
(2.7) Deferred Tax Asset 0 0 0
(2.8) Profit & Loss Account(Dr) 0 0 0
Total (2.1+2.2+2.5+2.6+2.7+2.8) 15945 13369 10722
Important Indicators 2010-11 2009-10 2008-09
(i) Investment 12980 11347 9747
(ii) Capital Employed 15069 12065 10368
(iii) Net Worth 6017 5437 4622
(iv) Cost of Production 3969 2630 991
(v) Cost of Sales 3969 2630 991
(vi) Gross Value Added (At Market Price) - - -
(vii) Total Employees (Other Than Casuals) (Nos.) 42 40 38
(viii) Avg. Monthly Emoluments Per Employee (Rs.) 66270 64583 24561
Profit & Loss Account (` in Lakhs)
Particulars 2010-11 2009-10 2008-09
(1) Income
(A) Sales/Operating Income 4836 3535 1488
(B) Excise Duty 0 0 0
(C) Net Sales (A-B) 4836 3535 1488
(D) Other Income/Receipts 272 216 63
(E) Accretion/Depletion in Stocks 0 0 0
(I)Total Income (C+D+E) 5108 3751 1551
(2) Expenditure
(A) Purchase of Finished Goods/ Consumption Of Raw Materials 0 0 0
(B) Stores & Spares 0 0 11
(C) Power & Fuel 52 54 29
(D) Manufacturing / Direct / Operating Expenses 2320 1671 80
(E) Salary, Wages & Benefits / Employee Exp. 334 310 112
(F) Other Expenses 381 346 52
(G) Provisions 3 0 0
(II)Total Expenditure (A to G) 3090 2381 284
(3) Profit Before Dep, Int, Taxes & EP (PBDITEP) (I-II) 2018 1370 1267
(4) Depreciation 268 219 619
(5) Dre/Prel Exp Written Off 0 0 88
(6) Profit Before Int., Taxes & Ep (PBITEP) (3-4-5) 1750 1151 560
(7) Interest
(A) On Central Government Loans 0 0 0
(B) On Foreign Loans 0 0 0
(C) Others 611 30 0
(D) Less Interest Capitalised 0 0 0
(E) Charged to P & L Account (A+B+C-D) 611 30 0
(8) Profit Before Tax & EP(PBTEP) (6-7E) 1139 1121 560
(9) Tax Provisions 412 303 162
(10) Net Profit / Loss Before EP (8-9) 727 818 398
(11) Net Extra-Ord. Items 5 3 76
(12) Net Profit / Loss(-) (10-11) 722 815 322
(13) Dividend Declared 122 0 0
(14) Dividend Tax 20 0 0
(15) Retained Profit (12-13-14) 580 815 322
Financial Ratios 2010-11 2009-10 2008-09
(i) Sales : Capital Employed 32.09 29.3 14.35
(ii) Cost of Sales : Sales 82.07 74.4 66.6
(iii) Salary / Wages : Sales 6.91 8.77 7.53
(iv) Net Profit : Net Worth 12 14.99 6.97
(v) Debt : Equity 1.48 1.34 1.23
(vi) Current Ratio 1.06 0.76 0.82
(vii) Sundry Debtors : Sales (No. of Days) 32.08 28.7 81.93
(viii) Total Inventory : Sales 0 0.41 0

370 Trading & Marketing Services
www.cewacor.nic.in
Central Warehousing Corporation (CWC) was incorporated in 1957 under the Agricultural Produce (Development & Warehousing) Corporations Act 1956, which was subsequently repealed and replaced by the Warehousing Corporations Act, 1962 withtheobjectivetomeetthechangingneedsofagriculture,trade,industry andother sectorsbyproviding scientificwarehousing,logistic services and related infrastructural facilities. The main objectiveofthecompanyistoprovidescientificstoragefacilitiesfor agricultural inputs, produce andothernotifiedcommoditiesbesides providing logistics infrastructure like CFS/ICD and Land CustomsStations for import-export cargo.
CWC is a Schedule-‘B’ Mini-ratna CPSE in Trading &Marketing sector under the administrative control of the M/o Consumer Affairs, Food & Public Distribution D/o Food & Public Distribution with 55.01% shareholding by the Government of India. The rest of the holding is with SBI, 35 other scheduled banks, 7 insurance companies, 6 other recognized associations / companies dealing in agricultural produce and 400 cooperative societies. Its Registered and Corporate offices are at NewDelhi.
Vision / MissionThe Vision of the Company is to emerge as the leading
global market facilitator by providing integrated warehousing infrastructure and logistic services, as a support to India’s economy, with emphasis on customer’s delight.
The Mission of the Company is to provide total quality services on a global scale in thefield ofWarehousing, logisticservices and related activities with value addition to the customer’s satisfaction.
Industrial / Business OperationsCWCisengagedinprovidingservicesinthefieldofstorage
of agricultural produce and inputs and industrial trade through its 479 warehouses with a total storage capacity of 102.47 lakh MT as on 31.3.2011.
It has also subscribed to the 50% equity of 17 State Warehousing Corporations (SWCs) with the respective State Governments holding the remaining 50%. The aggregate investment by CWC in the equity of SWCs as on 31.3.2011 stood at ` 60.37 crore. These SWCs, as on 31.3.2011, were operating a network of 1585 warehouses with an aggregate storage capacity of 210.98 lakhs MT.
The company has one financial joint venture namelyNational Multi Commodity Exchange of India Ltd. (NMCE) with a shareholding of 29.70%. It has set up one wholly owned subsidiary namely Central Railside Warehouse Company Limited. The physical performances of the company for last three years are given below:Main Product Services
Unit Performance During2010-11 2009-10 2008-09
Warehousing Lakh M.T. 90.77 91.87 81.36Capacity Utilization
% 88 85 82
Strategic issueThe Farmers’ Extension Service Scheme (FESS) is being
operatedbyCWCsince1978-79asapartofCWCwidersocialresponsibility of educating the farming community about post harvestmanagementoffoodgrainsatthefarmlevel,benefitofusing public warehouses, the Warehouse Receipt System etc.
16.4 Central Warehousing CorporationPerformance Highlights
The operational performance of the company along with performance indicators and selected financial ratios during theperiod 2008-09 to 2010-11 can be seen on the oppositepage.
The Company registered an increase of ` 41.60 crore in total incomeduring2010-11whichwentup to` 1029.55 crore in2010-11 from` 987.95 croreduring2009-10.Thenet profitof the company correspondingly increased to ` 136.17 crore, an increase of ` 5.65 crore over the previous year due to increase in turnover as a result of increase in capacity utilization due to increase in storage of food grains procured by the Food Corporation of India (FCI). All segments of operations such as warehousing, marketing facilitation, Container Rail Transport (CRT) operations, CFS/ICDS operations, pest control services, etc. recorded growth.
During the year, 1.45 lakh MT capacity (covered godowns) were added while about 1.15 lakh MT of hired godowns / management warehouses specifically hired for various commodities and 1.16 lakh MT of open storage capacity were de-hired consequent upon release of stocks or termination ofmanagement contract.
Human Resource ManagementThe company employed 5667 regular employees as on
31.3.2011. The retirement age in the company is 60 years. It is following IDA 2007 and CDA 2006 pattern of remuneration. Details of employment in last 3 years are given below:
Particulars 2010-11 2009-10 2008-09Executives including Non-Unionised Supervisors 1394 1322 1313
Non-Executives # 4273 4443 4622Total Employees 5667 5765 5935
# Detail break-up of Non-Executive employees is at Statement no. 25 of volume-I of PE Survey.
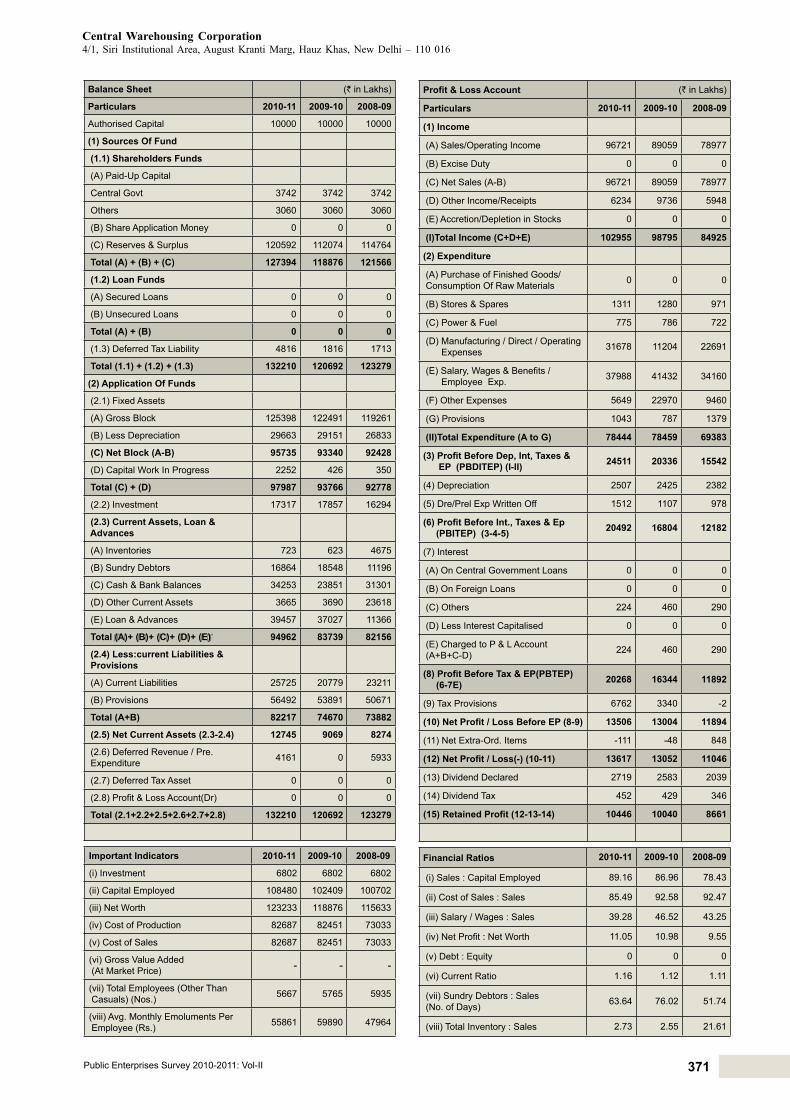
371Public Enterprises Survey 2010-2011: Vol-II
Central Warehousing Corporation 4/1, Siri Institutional Area, August Kranti Marg, Hauz Khas, New Delhi – 110 016
Balance Sheet (` in Lakhs)
Particulars 2010-11 2009-10 2008-09
Authorised Capital 10000 10000 10000
(1) Sources Of Fund
(1.1) Shareholders Funds
(A) Paid-Up Capital
Central Govt 3742 3742 3742
Others 3060 3060 3060
(B) Share Application Money 0 0 0
(C) Reserves & Surplus 120592 112074 114764
Total (A) + (B) + (C) 127394 118876 121566
(1.2) Loan Funds
(A) Secured Loans 0 0 0
(B) Unsecured Loans 0 0 0
Total (A) + (B) 0 0 0
(1.3) Deferred Tax Liability 4816 1816 1713
Total (1.1) + (1.2) + (1.3) 132210 120692 123279
(2) Application Of Funds
(2.1) Fixed Assets
(A) Gross Block 125398 122491 119261
(B) Less Depreciation 29663 29151 26833
(C) Net Block (A-B) 95735 93340 92428
(D) Capital Work In Progress 2252 426 350
Total (C) + (D) 97987 93766 92778
(2.2) Investment 17317 17857 16294
(2.3) Current Assets, Loan & Advances
(A) Inventories 723 623 4675
(B) Sundry Debtors 16864 18548 11196
(C) Cash & Bank Balances 34253 23851 31301
(D) Other Current Assets 3665 3690 23618
(E) Loan & Advances 39457 37027 11366
Total (A)+ (B)+ (C)+ (D)+ (E) 94962 83739 82156
(2.4) Less:current Liabilities & Provisions
(A) Current Liabilities 25725 20779 23211
(B) Provisions 56492 53891 50671
Total (A+B) 82217 74670 73882
(2.5) Net Current Assets (2.3-2.4) 12745 9069 8274
(2.6) Deferred Revenue / Pre. Expenditure 4161 0 5933
(2.7) Deferred Tax Asset 0 0 0
(2.8) Profit & Loss Account(Dr) 0 0 0
Total (2.1+2.2+2.5+2.6+2.7+2.8) 132210 120692 123279
Important Indicators 2010-11 2009-10 2008-09
(i) Investment 6802 6802 6802
(ii) Capital Employed 108480 102409 100702
(iii) Net Worth 123233 118876 115633
(iv) Cost of Production 82687 82451 73033
(v) Cost of Sales 82687 82451 73033
(vi) Gross Value Added (At Market Price) - - -
(vii) Total Employees (Other Than Casuals) (Nos.) 5667 5765 5935
(viii) Avg. Monthly Emoluments Per Employee (Rs.) 55861 59890 47964
Profit & Loss Account (` in Lakhs)
Particulars 2010-11 2009-10 2008-09
(1) Income
(A) Sales/Operating Income 96721 89059 78977
(B) Excise Duty 0 0 0
(C) Net Sales (A-B) 96721 89059 78977
(D) Other Income/Receipts 6234 9736 5948
(E) Accretion/Depletion in Stocks 0 0 0
(I)Total Income (C+D+E) 102955 98795 84925
(2) Expenditure
(A) Purchase of Finished Goods/ Consumption Of Raw Materials 0 0 0
(B) Stores & Spares 1311 1280 971
(C) Power & Fuel 775 786 722
(D) Manufacturing / Direct / Operating Expenses 31678 11204 22691
(E) Salary, Wages & Benefits / Employee Exp. 37988 41432 34160
(F) Other Expenses 5649 22970 9460
(G) Provisions 1043 787 1379
(II)Total Expenditure (A to G) 78444 78459 69383
(3) Profit Before Dep, Int, Taxes & EP (PBDITEP) (I-II) 24511 20336 15542
(4) Depreciation 2507 2425 2382
(5) Dre/Prel Exp Written Off 1512 1107 978
(6) Profit Before Int., Taxes & Ep (PBITEP) (3-4-5) 20492 16804 12182
(7) Interest
(A) On Central Government Loans 0 0 0
(B) On Foreign Loans 0 0 0
(C) Others 224 460 290
(D) Less Interest Capitalised 0 0 0
(E) Charged to P & L Account (A+B+C-D) 224 460 290
(8) Profit Before Tax & EP(PBTEP) (6-7E) 20268 16344 11892
(9) Tax Provisions 6762 3340 -2
(10) Net Profit / Loss Before EP (8-9) 13506 13004 11894
(11) Net Extra-Ord. Items -111 -48 848
(12) Net Profit / Loss(-) (10-11) 13617 13052 11046
(13) Dividend Declared 2719 2583 2039
(14) Dividend Tax 452 429 346
(15) Retained Profit (12-13-14) 10446 10040 8661
Financial Ratios 2010-11 2009-10 2008-09
(i) Sales : Capital Employed 89.16 86.96 78.43
(ii) Cost of Sales : Sales 85.49 92.58 92.47
(iii) Salary / Wages : Sales 39.28 46.52 43.25
(iv) Net Profit : Net Worth 11.05 10.98 9.55
(v) Debt : Equity 0 0 0
(vi) Current Ratio 1.16 1.12 1.11
(vii) Sundry Debtors : Sales (No. of Days) 63.64 76.02 51.74
(viii) Total Inventory : Sales 2.73 2.55 21.61

372 Trading & Marketing Services
www.cotcorp.com
Cotton Corporation of India Ltd. (CCIL) was incorporated on31.07.1970undertheCompaniesAct,1956withanobjectiveto act as a canalizing agency for import of cotton particularly for long and extra long staple varieties. Subsequently, the role of the Corporation underwent changes on several occasions and currently the broad objectives are to ensure remunerative andcompetitive prices to the cotton farmers; to supply cotton to textile industry on reasonable prices; domestic sales operations atnegligiblemargininorder topassonlargerbenefit tocottongrowers; increasing supplies of contamination free cotton to meet growing demand of textile mills etc.
CCI is a Schedule ‘B’ CPSE in Trading and Marketing Services sector under the administrative control of M/o Textiles with 100% shareholding by the Government of India. Its Registered and Corporate office is at NaviMumbai,Maharashtra.
Vision/MissionThe Vission / Mission of the company is to act as the Price
Support Agency of the Government of India in regard to cotton and to undertake commercially viable operations to increase its market share, both in domestic and international cotton trade.
Industrial / Business OperationsCCI is engaged in providing services in carrying out price
support operations, whenever the market prices of kapas touch the support prices announced by the Government without any quantitative limit and commercial operations at the Company’s own risk; undertaking developmental activities related to productivityandqualityofcotton throughits19branchoffices(including Corporate Office) to cover 83 districts and 303procurement centers in various cotton growing states. The service segment of the company comprises of Sale and Purchase of Kapas. The performance details of domestic cotton processing during2010-11 compared to last twoyears are as follows:-
Major products/ Service
UnitVolume of Services provided during the year
2010-11 2009-10 2008-09
Purchases: F. P. Bales Lakh Bales 13.20 13.43 83.95
Lint Lakh qntls 21.61 21.80 141.20
Seeds Lakh qntls. 42.07 42.23 269.70
Sales: F. P. Bales Lakh bales 12.81 75.36 20.99
Seeds Lakh qntls. 43.16 67.62 244.09
Strategic IssuesAs a Nodal Agency of Government of India to undertake
price support operations, Corporation keeps itself in preparedness to meet the eventualities of price support operations. As and when kapas prices touch the level of Minimum Support Price (MSP), kapas purchases are made under MSP operations without any quantitative limits. Under these MSP operations, cotton farmers are free to offer their kapas produce to CCI and Corporation continues purchases of such kapas till the prices rule at MSP level.
In the event of kapas prices ruling above MSP level, Corporation undertakes commercial operations at its own cost for supply of cotton to mills in the State sector as well as private sector. All theseoperationsaredovetailedtobenefitthecotton
16.5 Cotton Corporation of India Ltd.growers on the one hand and supply of quality cotton to the textile mills on the other hand.
The Corporation acted as Implementing Agency for Mini Mission III & IV of Technology Mission on Cotton (TMC). The Corporation achieved 98% of the target under Mini Mission III and 85.9% under the Mini Mission IV. The scheme is closed on 31.12.2010. The Corporation has also introduced a scheme for supply of cotton to mills under Godown Storage Facility (GSF).
Performance HighlightsThe operational performance of the company along with
performance indicators and selected financial ratios during theperiod2008-09 to 2010-11 canbe seenon theopposite page.
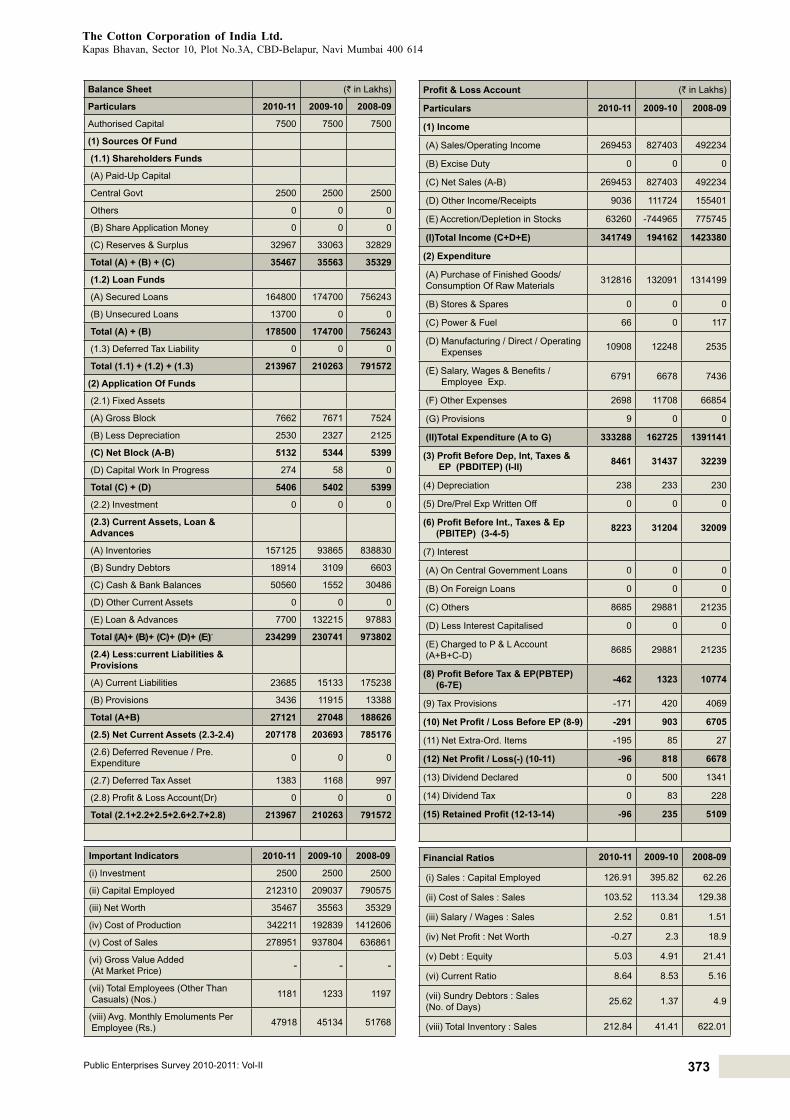
The Company registered an increase of ` 1475.87 crore in total income during 2010-11 which went up to ` 3417.49 crore in 2010-11 from ` 1941.62 crore during 2009-10. TherewasanaccretioninStocksvalueintheFinancialYear2010-11of ` 632.60 as compared to depletion in stock of ` 7449.65 in previous year, resulting in increase in total income.
The Corporation incurred a net loss of ` 0.96 crores during theyear2010-11ascomparedtoaprofitof` 8.18 crore during the year 2009-10due to reduction in sale / operating income.
Steps are being taken to reduce the cost and increase the competitiveness of the product / service and diversify the product / service range include introduction of Scheme for Godown Storage Facility (GSF) evolving norms for Ginning & Packing, bringing down cost of borrowing etc.
Human Resource ManagementThe company employed 1181 regular employees as on
31.3.2011. The retirement age in the company is 60 years. It is following IDA 2007 and CDA 2006 pattern of remuneration. Details of employment in last 3 years are given below:
(Nos.)Particulars 2010-11 2009-10 2008-09
Executives including Non-Unionised Supervisors 127 141 137
Non-Executives # 1054 1092 1060Total Employees 1181 1233 1197
# Detail break-up of Non-Executive employees is at Statement no. 25 of volume-I of PE Survey.
373Public Enterprises Survey 2010-2011: Vol-II
The Cotton Corporation of India Ltd. KapasBhavan,Sector 10,PlotNo.3A,CBD-Belapur,NaviMumbai 400614
Balance Sheet (` in Lakhs)
Particulars 2010-11 2009-10 2008-09
Authorised Capital 7500 7500 7500
(1) Sources Of Fund
(1.1) Shareholders Funds
(A) Paid-Up Capital
Central Govt 2500 2500 2500
Others 0 0 0
(B) Share Application Money 0 0 0
(C) Reserves & Surplus 32967 33063 32829
Total (A) + (B) + (C) 35467 35563 35329
(1.2) Loan Funds
(A) Secured Loans 164800 174700 756243
(B) Unsecured Loans 13700 0 0
Total (A) + (B) 178500 174700 756243
(1.3) Deferred Tax Liability 0 0 0
Total (1.1) + (1.2) + (1.3) 213967 210263 791572
(2) Application Of Funds
(2.1) Fixed Assets
(A) Gross Block 7662 7671 7524
(B) Less Depreciation 2530 2327 2125
(C) Net Block (A-B) 5132 5344 5399
(D) Capital Work In Progress 274 58 0
Total (C) + (D) 5406 5402 5399
(2.2) Investment 0 0 0
(2.3) Current Assets, Loan & Advances
(A) Inventories 157125 93865 838830
(B) Sundry Debtors 18914 3109 6603
(C) Cash & Bank Balances 50560 1552 30486
(D) Other Current Assets 0 0 0
(E) Loan & Advances 7700 132215 97883
Total (A)+ (B)+ (C)+ (D)+ (E) 234299 230741 973802
(2.4) Less:current Liabilities & Provisions
(A) Current Liabilities 23685 15133 175238
(B) Provisions 3436 11915 13388
Total (A+B) 27121 27048 188626
(2.5) Net Current Assets (2.3-2.4) 207178 203693 785176
(2.6) Deferred Revenue / Pre. Expenditure 0 0 0
(2.7) Deferred Tax Asset 1383 1168 997
(2.8) Profit & Loss Account(Dr) 0 0 0
Total (2.1+2.2+2.5+2.6+2.7+2.8) 213967 210263 791572
Important Indicators 2010-11 2009-10 2008-09
(i) Investment 2500 2500 2500
(ii) Capital Employed 212310 209037 790575
(iii) Net Worth 35467 35563 35329
(iv) Cost of Production 342211 192839 1412606
(v) Cost of Sales 278951 937804 636861
(vi) Gross Value Added (At Market Price) - - -
(vii) Total Employees (Other Than Casuals) (Nos.) 1181 1233 1197
(viii) Avg. Monthly Emoluments Per Employee (Rs.) 47918 45134 51768
Profit & Loss Account (` in Lakhs)
Particulars 2010-11 2009-10 2008-09
(1) Income
(A) Sales/Operating Income 269453 827403 492234
(B) Excise Duty 0 0 0
(C) Net Sales (A-B) 269453 827403 492234
(D) Other Income/Receipts 9036 111724 155401
(E) Accretion/Depletion in Stocks 63260 -744965 775745
(I)Total Income (C+D+E) 341749 194162 1423380
(2) Expenditure
(A) Purchase of Finished Goods/ Consumption Of Raw Materials 312816 132091 1314199
(B) Stores & Spares 0 0 0
(C) Power & Fuel 66 0 117
(D) Manufacturing / Direct / Operating Expenses 10908 12248 2535
(E) Salary, Wages & Benefits / Employee Exp. 6791 6678 7436
(F) Other Expenses 2698 11708 66854
(G) Provisions 9 0 0
(II)Total Expenditure (A to G) 333288 162725 1391141
(3) Profit Before Dep, Int, Taxes & EP (PBDITEP) (I-II) 8461 31437 32239
(4) Depreciation 238 233 230
(5) Dre/Prel Exp Written Off 0 0 0
(6) Profit Before Int., Taxes & Ep (PBITEP) (3-4-5) 8223 31204 32009
(7) Interest
(A) On Central Government Loans 0 0 0
(B) On Foreign Loans 0 0 0
(C) Others 8685 29881 21235
(D) Less Interest Capitalised 0 0 0
(E) Charged to P & L Account (A+B+C-D) 8685 29881 21235
(8) Profit Before Tax & EP(PBTEP) (6-7E) -462 1323 10774
(9) Tax Provisions -171 420 4069
(10) Net Profit / Loss Before EP (8-9) -291 903 6705
(11) Net Extra-Ord. Items -195 85 27
(12) Net Profit / Loss(-) (10-11) -96 818 6678
(13) Dividend Declared 0 500 1341
(14) Dividend Tax 0 83 228
(15) Retained Profit (12-13-14) -96 235 5109
Financial Ratios 2010-11 2009-10 2008-09
(i) Sales : Capital Employed 126.91 395.82 62.26
(ii) Cost of Sales : Sales 103.52 113.34 129.38
(iii) Salary / Wages : Sales 2.52 0.81 1.51
(iv) Net Profit : Net Worth -0.27 2.3 18.9
(v) Debt : Equity 5.03 4.91 21.41
(vi) Current Ratio 8.64 8.53 5.16
(vii) Sundry Debtors : Sales (No. of Days) 25.62 1.37 4.9
(viii) Total Inventory : Sales 212.84 41.41 622.01

374 Trading & Marketing Services
www.fciweb.nic.in
Food Corporation of India (FCI) was incorporated in 1965 asNo-ProfitNo-LossmakingcompanyunderFoodCorporationAct,1964withtheobjectivesofprovidingminimumpricesupporttofarmersandsupplyingfood-grainstothegeneralpublicunderthe Public Distribution System. Through maintaining a buffer stock of food grains, it also ensures national food security.
FCIisaSchedule-‘A’CPSEinTrading&Marketingsectorunder the administrative control of M/o Consumer Affairs, Food and Public Distribution, D/o Food and Public Distribution with 100% shareholding by the Government of India. Its Registered office is atNewDelhi.
FCI received a plan assistance of ` 35.00 crore during the year 2010-11 as against` 27.98 crores received in 2009-10 asequity support.
Vision / MissionThe Vision of the Corporation is to initiate procurement
of non-MSP governed commodities on commercial principlesand to ensure adequate buffer for meeting requirements under TPDS & Other Welfare Schemes.
The Mission of the Corporation is to introduce state of art offinancialmanagement inorder to reduce thedependencyonthe present banking system in the country.
Industrial / Business OperationsFCI is the main agency of the Central Government for
procurement, storage and distribution of food grains through its 165 district offices spread all over the country to ensuresteady food grain supplies to 5 lakhs Fair Price Shops (FPS) under Public Distribution System (PDS). The FCI has state-of-the-art technology on food grain preservation,warehousing,transportation and management. The physical performances of the company for last three years are given below:Main Services Unit Performance During
2010-11 2009-10 2008-09Total Cover and Plinth storage capacity
MT N.A. 28.84 25.28
N.A. Not Available
Strategic issueTheprocurementandissuepriceoffoodgrainsisfixedby
the Government of India and the difference between the economic cost and rates realization is reimbursed by the Government as subsidy. The Government of India also provides budgetary support to the Corporation for meeting capital expenditure such as construction of storage, godowns etc.
As a major player in food grain management within thecountry, FCI is now endeavoring to reduce burden on food subsidy through better financial Management, improved stock/ inventory management and real time on-line system. It hasrecently launched the IISFM (Integrated Information System for Food Grains Management) in collaboration with NIC.
Performance HighlightsThe operational performance of the company along with
performance indicators and selected financial ratios during theperiod2008-09 to 2010-11 canbe seenon theopposite page.
The Company registered an increase of ` 6930.63 crore in total income during 2010-11 which went up to ` 81642.51 crore in2010-11 from` 74711.88croreduring2009-10due toincrease in operations. The net losses of the company reduced to ` 0.19 crore during 2010-11 as against a loss of ` 364.62 crore during the previous year due to fall in other expenses.
16.6 Food Corporation of IndiaThe company has provided provisional financial informationfor theyear 2010-11
Human Resource ManagementThe company employed 30628 regular employees as on
31.3.2011. The retirement age in the company is 60 years. It is following IDA 2007 pattern of remuneration. Details of employment in last 3 years are given below:
Particulars 2010-11 2009-10 2008-09Executives including Non-Unionised Supervisors 5822 7007 6202
Non-Executives # 24806 26466 30364Total Employees 30628 33473 36566
# Detail break-up of Non-Executive employees is at Statement no. 25 of volume-I of PE Survey.

375Public Enterprises Survey 2010-2011: Vol-II
Food Corporation of India16-20,BarakhambaLane,NewDelhi-110001
Balance Sheet (` in Lakhs)
Particulars 2010-11 2009-10 2008-09
Authorised Capital 350000 350000 350000
(1) Sources Of Fund
(1.1) Shareholders Funds
(A) Paid-Up Capital
Central Govt 258773 255273 252475
Others 0 0 0
(B) Share Application Money 0 0 0
(C) Reserves & Surplus 0 0 0
Total (A) + (B) + (C) 258773 255273 252475
(1.2) Loan Funds
(A) Secured Loans 3700279 2819485 3094968
(B) Unsecured Loans 880000 898500 261500
Total (A) + (B) 4580279 3717985 3356468
(1.3) Deferred Tax Liability 0 0 0
Total (1.1) + (1.2) + (1.3) 4839052 3973258 3608943
(2) Application Of Funds
(2.1) Fixed Assets
(A) Gross Block 132761 129039 125901
(B) Less Depreciation 94624 93768 90724
(C) Net Block (A-B) 38137 35271 35177
(D) Capital Work In Progress 3016 1392 532
Total (C) + (D) 41153 36663 35709
(2.2) Investment 0 0 0
(2.3) Current Assets, Loan & Advances
(A) Inventories 4162508 3542024 2752562
(B) Sundry Debtors 1486381 1307136 1481414
(C) Cash & Bank Balances 382006 3227 3115
(D) Other Current Assets 43685 36072 22724
(E) Loan & Advances 244940 160234 160274
Total (A)+ (B)+ (C)+ (D)+ (E) 6319520 5048693 4420089
(2.4) Less:current Liabilities & Provisions
(A) Current Liabilities 1564084 1154493 852990
(B) Provisions 0 80 136
Total (A+B) 1564084 1154573 853126
(2.5) Net Current Assets (2.3-2.4) 4755436 3894120 3566963
(2.6) Deferred Revenue / Pre. Expenditure 24 55 313
(2.7) Deferred Tax Asset 0 0 0
(2.8) Profit & Loss Account(Dr) 42439 42420 5958
Total (2.1+2.2+2.5+2.6+2.7+2.8) 4839052 3973258 3608943
Important Indicators 2010-11 2009-10 2008-09
(i) Investment 663193 805733 1112965
(ii) Capital Employed 4793573 3929391 3602140
(iii) Net Worth 216310 212798 246204
(iv) Cost of Production 8164428 7507815 6518214
(v) Cost of Sales 7543940 6718357 5274633
(vi) Gross Value Added (At Market Price) - - -
(vii) Total Employees (Other Than Casuals) (Nos.) 30628 33473 36566
(viii) Avg. Monthly Emoluments Per Employee (Rs.) 64575 39798 49263
Profit & Loss Account (` in Lakhs)
Particulars 2010-11 2009-10 2008-09
(1) Income
(A) Sales/Operating Income 7516860 6619349 5207673
(B) Excise Duty 0 0 0
(C) Net Sales (A-B) 7516860 6619349 5207673
(D) Other Income/Receipts 26903 62381 68555
(E) Accretion/Depletion in Stocks 620488 789458 1243581
(I)Total Income (C+D+E) 8164251 7471188 6519809
(2) Expenditure
(A) Purchase of Finished Goods/ Consumption Of Raw Materials 6581625 6050623 5163452
(B) Stores & Spares 241727 222487 154417
(C) Power & Fuel 1783 1622 1536
(D) Manufacturing / Direct / Operating Expenses 717042 656269 524410
(E) Salary, Wages & Benefits / Employee Exp. 237337 159861 216163
(F) Other Expenses 100521 132142 131086
(G) Provisions 19 36462 0
(II)Total Expenditure (A to G) 7880054 7259466 6191064
(3) Profit Before Dep, Int, Taxes & EP (PBDITEP) (I-II) 284197 211722 328745
(4) Depreciation 3240 3225 2589
(5) Dre/Prel Exp Written Off 32 279 8953
(6) Profit Before Int., Taxes & Ep (PBITEP) (3-4-5) 280925 208218 317203
(7) Interest
(A) On Central Government Loans 0 62396 62914
(B) On Foreign Loans 0 0 0
(C) Others 281102 182449 252694
(D) Less Interest Capitalised 0 0 0
(E) Charged to P & L Account (A+B+C-D) 281102 244845 315608
(8) Profit Before Tax & EP(PBTEP) (6-7E) -177 -36627 1595
(9) Tax Provisions 0 0 1061
(10) Net Profit / Loss Before EP (8-9) -177 -36627 534
(11) Net Extra-Ord. Items -158 -165 0
(12) Net Profit / Loss(-) (10-11) -19 -36462 534
(13) Dividend Declared 0 0 0
(14) Dividend Tax 0 0 0
(15) Retained Profit (12-13-14) -19 -36462 534
Financial Ratios 2010-11 2009-10 2008-09
(i) Sales : Capital Employed 156.81 168.46 144.57
(ii) Cost of Sales : Sales 100.36 101.5 101.29
(iii) Salary / Wages : Sales 3.16 2.42 4.15
(iv) Net Profit : Net Worth -0.01 -17.13 0.22
(v) Debt : Equity 17.7 14.56 13.29
(vi) Current Ratio 4.04 4.37 5.18
(vii) Sundry Debtors : Sales (No. of Days) 72.17 72.08 103.83
(viii) Total Inventory : Sales 202.12 195.31 192.92
2010-11 PROVISIONAL

376 Trading & Marketing Services
www.hhecworld.in
Handicrafts and Handlooms Exports Corporations of India Limited (HHEC) was incorporated in 1962 with the objectiveof developing trade by catalysing exports of handicrafts and handlooms products, and products of village industries. Since then the product range has spread from handicraft and handloom fabricstohand-knittedcarpets,fashiongarments,goldjewelleryand bullion import.
HHEC is a Schedule-’B’ CPSE in Trading & Marketingsector under the administrative control of M/o Textiles with 100% shareholding by the Government of India. Its Registered atNewDelhi&andCorporate office is atNOIDA,UP
Vision / MissionThe vision of the company is to keep India alive on the
world map of demand for craftsmanship products by continuously adapting supply of Indian craftsmanship products to the changing consumer habits in the demand countries and on a continuous basis, develop and supply new products of high quality at the right price to provide a sustainable livelihood to Indian craft persons and weavers.
The mission of the company is to develop, promote and aggressively market the products of Indian crafts and skills abroad thereby providing a marketing channel for craftsmen and artisans and to continuously create demand for Indian crafts and skillsinordertoenhancetheincomeandprofitabilityofIndiancraftsmen and weavers.
Industrial / Business OperationsHHEC is engaged in export & domestic sales of handicrafts,
handlooms products, ready-to-wear garments (includingmanufacturing),carpets,salesofgoldandsilverjewellery/articlesand import & domestic sale of bullion, silk and consignment sales of silver of Inidan Government Mints. The company has four regional offices at Noida in UP, Chennai in Tamil Nadu,Mumbai in Maharashtra and Kolkata in West Bengal.
The physical performances of the company for last three years are given below:Main Services Unit Performance During
2010-11 2009-10 2008-09Export (Direct and Indirect)
in crore N.A. 20.01 43.14
Import in crore N.A. 1531.05 1549.04
Retail in crore N.A. 0.33 1.44
N.A : Not Available
Strategic issueAs an R&D initiative the company is using Eco friendly
Dyes in Fabric Production and use of Natural resources like cane, bamboo, jute etc forHandicrafts.
Performance HighlightsThe operational performance of the company along with
performance indicators and selected financial ratios during theperiod2008-09 to 2010-11 canbe seenon theopposite page.
The Company registered an increase of ` 3446.52crore in total incomeduring2010-11whichwentup to` 5025.43 crore in2010-11 from` 1578.91croreduring2009-10.Thenetprofitof the company correspondingly increased to ` 0.93 crore, an increase of ` 2.09crore over the previous year loss of ` 1.16 crore due to increase in exports and Bullion sales in domestic market. The margins are affected due to increase in competition.
16.7 Handicrafts and Handlooms Exports Corporation of India Limited
Out of total external revenue of ` 5009.34 crores during 2010-11,` 4973.51 crore was contributed by Bullion sales.
Human Resource ManagementThe company employed 146 regular employees as on
31.3.2011. The retirement age in the company is 60 years at board level and 58 years at below board level. It is following IDA 1997 pattern of remuneration. Details of employment in last 3 years are given below:
Particulars 2010-11 2009-10 2008-09Executives including Non-Unionised Supervisors 73 75 57
Non-Executives # 73 74 98Total Employees 146 149 155
# Detail break-up of Non-Executive employees is at Statement no. 25 of volume-I of PE Survey.

377Public Enterprises Survey 2010-2011: Vol-II
Handicrafts and Handlooms Exports Corporations of India Limited JawaharVyaparBhawanAnnexe, 1, Tolstoy Marg New Delhi – 110 001
Balance Sheet (` in Lakhs)
Particulars 2010-11 2009-10 2008-09
Authorised Capital 2000 2000 2000
(1) Sources Of Fund
(1.1) Shareholders Funds
(A) Paid-Up Capital
Central Govt 1382 1382 1382
Others 0 0 0
(B) Share Application Money 0 0 0
(C) Reserves & Surplus 12 14 35
Total (A) + (B) + (C) 1394 1396 1417
(1.2) Loan Funds
(A) Secured Loans 233435 46045 9292
(B) Unsecured Loans 0 0 0
Total (A) + (B) 233435 46045 9292
(1.3) Deferred Tax Liability 0 0 0
Total (1.1) + (1.2) + (1.3) 234829 47441 10709
(2) Application Of Funds
(2.1) Fixed Assets
(A) Gross Block 1593 1534 1519
(B) Less Depreciation 629 586 549
(C) Net Block (A-B) 964 948 970
(D) Capital Work In Progress 0 0 0
Total (C) + (D) 964 948 970
(2.2) Investment 0 0 0
(2.3) Current Assets, Loan & Advances
(A) Inventories 3535 2398 317
(B) Sundry Debtors 1988 1650 2872
(C) Cash & Bank Balances 243233 47943 28843
(D) Other Current Assets 15385 630 5968
(E) Loan & Advances 939 748 1011
Total (A)+ (B)+ (C)+ (D)+ (E) 265080 53369 39011
(2.4) Less:current Liabilities & Provisions
(A) Current Liabilities 31042 6769 29261
(B) Provisions 177 203 112
Total (A+B) 31219 6972 29373
(2.5) Net Current Assets (2.3-2.4) 233861 46397 9638
(2.6) Deferred Revenue / Pre. Expenditure 0 0 101
(2.7) Deferred Tax Asset 0 0 0
(2.8) Profit & Loss Account(Dr) 4 96 0
Total (2.1+2.2+2.5+2.6+2.7+2.8) 234829 47441 10709
Important Indicators 2010-11 2009-10 2008-09
(i) Investment 1382 1382 1382
(ii) Capital Employed 234825 47345 10608
(iii) Net Worth 1390 1300 1316
(iv) Cost of Production 502474 157940 157362
(v) Cost of Sales 501338 155858 160731
(vi) Gross Value Added (At Market Price) - - -
(vii) Total Employees (Other Than Casuals) (Nos.) 146 149 155
(viii) Avg. Monthly Emoluments Per Employee (Rs.) 36872 36913 31022
Profit & Loss Account (` in Lakhs)
Particulars 2010-11 2009-10 2008-09
(1) Income
(A) Sales/Operating Income 500663 155106 159314
(B) Excise Duty 0 0 0
(C) Net Sales (A-B) 500663 155106 159314
(D) Other Income/Receipts 744 703 1377
(E) Accretion/Depletion in Stocks 1136 2082 -3369
(I)Total Income (C+D+E) 502543 157891 157322
(2) Expenditure
(A) Purchase of Finished Goods/ Consumption Of Raw Materials 492067 154885 153386
(B) Stores & Spares 0 0 0
(C) Power & Fuel 10 9 59
(D) Manufacturing / Direct / Operating Expenses 8762 1603 1776
(E) Salary, Wages & Benefits / Employee Exp. 646 660 577
(F) Other Expenses 932 621 841
(G) Provisions 0 21 16
(II)Total Expenditure (A to G) 502417 157799 156655
(3) Profit Before Dep, Int, Taxes & EP (PBDITEP) (I-II) 126 92 667
(4) Depreciation 50 40 61
(5) Dre/Prel Exp Written Off 0 0 0
(6) Profit Before Int., Taxes & Ep (PBITEP) (3-4-5) 76 52 606
(7) Interest
(A) On Central Government Loans 0 0 0
(B) On Foreign Loans 0 0 0
(C) Others 7 101 646
(D) Less Interest Capitalised 0 0 0
(E) Charged to P & L Account (A+B+C-D) 7 101 646
(8) Profit Before Tax & EP(PBTEP) (6-7E) 69 -49 -40
(9) Tax Provisions 13 1 4
(10) Net Profit / Loss Before EP (8-9) 56 -50 -44
(11) Net Extra-Ord. Items -37 66 3
(12) Net Profit / Loss(-) (10-11) 93 -116 -47
(13) Dividend Declared 0 0 0
(14) Dividend Tax 0 0 0
(15) Retained Profit (12-13-14) 93 -116 -47
Financial Ratios 2010-11 2009-10 2008-09
(i) Sales : Capital Employed 213.21 327.61 1501.83
(ii) Cost of Sales : Sales 100.13 100.48 100.89
(iii) Salary / Wages : Sales 0.13 0.43 0.36
(iv) Net Profit : Net Worth 6.69 -8.92 -3.57
(v) Debt : Equity 167.46 32.98 6.56
(vi) Current Ratio 8.49 7.65 1.33
(vii) Sundry Debtors : Sales (No. of Days) 1.45 3.88 6.58
(viii) Total Inventory : Sales 2.58 5.64 0.73

378 Trading & Marketing Services
www.hmti.com
HMT(I)wasincorporatedin1975withtheobjectivetocarryon business in India and abroad. It is a wholly owned subsidiary of HMT Limited and is a Schedule-‘B’ / Mini-ratna CPSE inTrading and Marketing Services sector under the administrative control of M/o Heavy Industries and Public Enterprises, D/o Heavy Industry. Its Registered and Corporate offices are atBangalore, Karnataka.
Vision/MissionThe vision / mission of the company is to carry on business
in India and abroad as exporters, importers and consultants and to undertake project works and technical services abroad, saleof HMT products and other engineering products.
Industrial / Business OperationsHMT(I) is involved in the export of HMT products,
associateproductsaswellassettingupprojectsabroadforgroupcompanies for machines / watches. The physical performance of the company for last three years are given below:Main Product / Services
Unit Performance During2010-11 2009-10 2008-09
HMT Products & Technical Services
` in cr. 8.52 13.38 5.04
Agency & Others ` in cr. 1.03 2.28 1.06
Projects & Services ` in cr. 15.04 12.65 3.26
Trading ` in cr. 0.05 0.00 0.23
Sale of Imports ` in cr. 3.24 2.49 6.77
Total Sales ` in cr. 27.88 30.80 16.36
Strategic IssuesThe strategic and action plans for 2011-12 broadly focus
on high value Machine Tools in the target markets and pursuing projects to ensure higher share in the performance of thecompany.
Performance HighlightsThe operational performance of the company along with
performance indicators and selected financial ratios during theperiod2008-09 to 2010-11 canbe seenon theopposite page.
The Company registered a reduction of ` 2.24 crore in total income during 2010-11 which went down to ` 32.45 crore in 2010-11 from` 34.69 croreduring2009-10due todecrease inturnover as a result of highly competitive international market. Thenetprofitofthecompanyhoweverreducedto` 0.21 crore, a reduction of ` 2.45 crore over the previous year’s profit of ` 2.66 crore due to provisions made for the arrears of the pay / wages revision amounting to ` 3.29 crore.
Human Resource ManagementThe company employed 59 regular employees as on
31.3.2011. The retirement age in the company is 60 years. It is following IDA 1997 pattern of remuneration. Details of employment in last 3 years are given below:
(Nos.)Particulars 2010-11 2009-10 2008-09
Executives including Non-Unionised Supervisors 52 54 53
Non-Executives # 7 7 8Total Employees 59 61 61
# Detail break-up of Non-Executive employees is at Statement no. 25 of volume-I of PE Survey.
16.8 HMT (International) Ltd.

379Public Enterprises Survey 2010-2011: Vol-II
HMT (International) Ltd. HMT Bhawan 59, Bellary Road, Bangalore 560032
Balance Sheet (` in Lakhs)
Particulars 2010-11 2009-10 2008-09
Authorised Capital 800 800 800
(1) Sources Of Fund
(1.1) Shareholders Funds
(A) Paid-Up Capital
Central Govt 0 0 0
Others 72 72 72
(B) Share Application Money 0 0 0
(C) Reserves & Surplus 2480 2476 2227
Total (A) + (B) + (C) 2552 2548 2299
(1.2) Loan Funds
(A) Secured Loans 0 0 22
(B) Unsecured Loans 0 0 0
Total (A) + (B) 0 0 22
(1.3) Deferred Tax Liability 114 111 109
Total (1.1) + (1.2) + (1.3) 2666 2659 2430
(2) Application Of Funds
(2.1) Fixed Assets
(A) Gross Block 734 729 739
(B) Less Depreciation 238 231 231
(C) Net Block (A-B) 496 498 508
(D) Capital Work In Progress 0 0 0
Total (C) + (D) 496 498 508
(2.2) Investment 0 0 0
(2.3) Current Assets, Loan & Advances
(A) Inventories 0 52 1
(B) Sundry Debtors 514 958 613
(C) Cash & Bank Balances 2298 2094 1815
(D) Other Current Assets 0 0 0
(E) Loan & Advances 1008 816 772
Total (A)+ (B)+ (C)+ (D)+ (E) 3820 3920 3201
(2.4) Less:current Liabilities & Provisions
(A) Current Liabilities 947 1073 1008
(B) Provisions 703 686 271
Total (A+B) 1650 1759 1279
(2.5) Net Current Assets (2.3-2.4) 2170 2161 1922
(2.6) Deferred Revenue / Pre. Expenditure 0 0 0
(2.7) Deferred Tax Asset 0 0 0
(2.8) Profit & Loss Account(Dr) 0 0 0
Total (2.1+2.2+2.5+2.6+2.7+2.8) 2666 2659 2430
Important Indicators 2010-11 2009-10 2008-09
(i) Investment 72 72 72
(ii) Capital Employed 2666 2659 2430
(iii) Net Worth 2552 2548 2299
(iv) Cost of Production 2887 3072 1748
(v) Cost of Sales 2939 3020 1780
(vi) Gross Value Added (At Market Price) - - -
(vii) Total Employees (Other Than Casuals) (Nos.) 59 61 61
(viii) Avg. Monthly Emoluments Per Employee (Rs.) 49718 43443 28279
Profit & Loss Account (` in Lakhs)
Particulars 2010-11 2009-10 2008-09
(1) Income
(A) Sales/Operating Income 2789 3080 1636
(B) Excise Duty 0 0 0
(C) Net Sales (A-B) 2789 3080 1636
(D) Other Income/Receipts 508 337 271
(E) Accretion/Depletion in Stocks -52 52 -32
(I)Total Income (C+D+E) 3245 3469 1875
(2) Expenditure
(A) Purchase of Finished Goods/ Consumption Of Raw Materials 1757 1907 1120
(B) Stores & Spares 0 0 0
(C) Power & Fuel 0 0 1
(D) Manufacturing / Direct / Operating Expenses 167 504 12
(E) Salary, Wages & Benefits / Employee Exp. 352 318 207
(F) Other Expenses 592 322 388
(G) Provisions 0 0 0
(II)Total Expenditure (A to G) 2868 3051 1728
(3) Profit Before Dep, Int, Taxes & EP (PBDITEP) (I-II) 377 418 147
(4) Depreciation 18 17 18
(5) Dre/Prel Exp Written Off 0 0 0
(6) Profit Before Int., Taxes & Ep (PBITEP) (3-4-5) 359 401 129
(7) Interest
(A) On Central Government Loans 0 0 0
(B) On Foreign Loans 0 0 0
(C) Others 1 4 2
(D) Less Interest Capitalised 0 0 0
(E) Charged to P & L Account (A+B+C-D) 1 4 2
(8) Profit Before Tax & EP(PBTEP) (6-7E) 358 397 127
(9) Tax Provisions 11 130 20
(10) Net Profit / Loss Before EP (8-9) 347 267 107
(11) Net Extra-Ord. Items 326 1 1
(12) Net Profit / Loss(-) (10-11) 21 266 106
(13) Dividend Declared 15 15 15
(14) Dividend Tax 2 2 2
(15) Retained Profit (12-13-14) 4 249 89
Financial Ratios 2010-11 2009-10 2008-09
(i) Sales : Capital Employed 104.61 115.83 67.33
(ii) Cost of Sales : Sales 105.38 98.05 108.8
(iii) Salary / Wages : Sales 12.62 10.32 12.65
(iv) Net Profit : Net Worth 0.82 10.44 4.61
(v) Debt : Equity 0 0 0.01
(vi) Current Ratio 2.32 2.23 2.5
(vii) Sundry Debtors : Sales (No. of Days) 67.27 113.53 136.76
(viii) Total Inventory : Sales 0 6.16 0.22

380 Trading & Marketing Services
www.indiatradefair.com
India Trade Promotion Organisation (ITPO) was incorporated on30.12.1976with theobjective tomergeTradeDevelopmentAuthority (TDA), a Registered Society, under the administrative control of the Ministry of Commerce & Industry with The Trade Fair Authority of India (TFAI) with effect from 1st January, 1992. TFAI was earlier incorporated, under Section 25 of the Indian Companies Act, 1956, on 30th December, 1976 by amalgamating three organizations of the Government of India viz. India International Trade Fair Organization, Directorate of Exhibitions and Commercial Publicity and Indian Council of Trade Fairs and Exhibitions and commenced operations with effect from 1st March, 1977.
ITPO is a Schedule-‘B’ Miniratna CPSE under theadministrative control of M/o Commerce and Industry, D/o Commerce with 100% shareholding by the Government of India. ItsRegisteredandCorporateofficesareatNewDelhi.ThefourRegional Offices of ITPO are located in Mumbai, Kolkata,Chennai and Bangalore.
Vision/MissionThe mission of the company is to promote, facilitate,
encourage and coordinate various activities and programmes to enhance India’s share of export through trade in goods.
The vision of the company is to be a leader amongst world class trade promotion organizations leveraging India’s strengths internationally. Rapid growth in India’s share of global trade and investments, quality of our services and customer satisfaction will be the touchstone of our success.
Industrial / Business OperationsITPO is engaged in providing services in promotion /
facilitation of trade through organizing / participating in trade fairs in India and abroad thereby increasing India’s exports.
The company has two subsidiaries namely Karnataka Trade Promotion Organisation and Tamil Nadu Trade Promotion Organisation with share holding of 51% in each of them. ITPO also has a 50:50 Joint Venture namely ‘National Centre for Trade Information’ (NCTI) along with the National Informatics Centre (NIC).
The service range of the company comprises of letting out the exhibition halls and convention centre to organize exhibitions, trade fairs and trade development and promotion through specialized programmes such as Buyers-Seller Meetsand coordination of business delegations etc. The physical performance of company during last three years are mentioned belowMain Services Unit 2010-11 2009-10 2008-09Fairs in India Nos 11 16 16Foreign Trade Fairs Nos. 26 29 33
Strategic IssuesITPO is operating a trade portal www.tradeportalofindia.com
having all trade related information including country profiles,product profiles, tradedirectory etc.
ITPO is networking with International Organisation in the fieldofTradeandCommercethroughmembershiporcollaborativearrangements such as Memorandum of Understanding (MOU), ITPO is a founder member of Asia Trade Promotion Forum (ATPF) and participates in its Annual meets regularly.
Performance HighlightsThe operational performance of the company along with
performance indicators and selected financial ratios during theperiod2008-09 to 2010-11 canbe seenon theopposite page.
16.9 India Trade Promotion OrganisationThe Company registered an increase of ` 66.40 crore in
total income during 2010-11whichwent up to ` 305.12 crore in2010-11 from` 238.72 croreduring2009-10.Thenet profitof the company however reduced to ` 70.87 crore, a decrease of ` 6.70 crore over the previous year profit of` 77.57 due to increase in operating expenses..
The Company is registered under Section 25 of the Companies Act, 1956 and as such it does not declare any dividend.
Human Resource ManagementThe company employed 1104 regular employees as on
31.3.2011. The retirement age in the company is 60 years. It is following IDA 2007 pattern of remuneration. Details of employment in last 3 years are given below:
Particulars 2010-11 2009-10 2008-09Executives including Non-Unionised Supervisors 168 287 297
Non-Executives # 936 822 838Total Employees 1104 1109 1135
# Detail break-up of Non-Executive employees is at Statement no. 25 of volume-I of PE Survey.

381Public Enterprises Survey 2010-2011: Vol-II
India Trade Promotion OrganisationPragati Bhawan, Pragati Maidan, New Delhi 110001
Balance Sheet (` in Lakhs)
Particulars 2010-11 2009-10 2008-09
Authorised Capital 50 50 50
(1) Sources Of Fund
(1.1) Shareholders Funds
(A) Paid-Up Capital
Central Govt 25 25 25
Others 0 0 0
(B) Share Application Money 0 0 0
(C) Reserves & Surplus 77734 70647 62889
Total (A) + (B) + (C) 77759 70672 62914
(1.2) Loan Funds
(A) Secured Loans 0 0 0
(B) Unsecured Loans 0 0 0
Total (A) + (B) 0 0 0
(1.3) Deferred Tax Liability 0 0 0
Total (1.1) + (1.2) + (1.3) 77759 70672 62914
(2) Application Of Funds
(2.1) Fixed Assets
(A) Gross Block 10628 8319 8371
(B) Less Depreciation 4465 5219 5129
(C) Net Block (A-B) 6163 3100 3242
(D) Capital Work In Progress 156 970 9
Total (C) + (D) 6319 4070 3251
(2.2) Investment 1241 1239 2041
(2.3) Current Assets, Loan & Advances
(A) Inventories 8 0 0
(B) Sundry Debtors 1020 2016 1333
(C) Cash & Bank Balances 73401 69109 52888
(D) Other Current Assets 4513 1944 2568
(E) Loan & Advances 9046 9811 12279
Total (A)+ (B)+ (C)+ (D)+ (E) 87988 82880 69068
(2.4) Less:current Liabilities & Provisions
(A) Current Liabilities 11432 12352 5156
(B) Provisions 6357 5167 6296
Total (A+B) 17789 17519 11452
(2.5) Net Current Assets (2.3-2.4) 70199 65361 57616
(2.6) Deferred Revenue / Pre. Expenditure 0 2 6
(2.7) Deferred Tax Asset 0 0 0
(2.8) Profit & Loss Account(Dr) 0 0 0
Total (2.1+2.2+2.5+2.6+2.7+2.8) 77759 70672 62914
Important Indicators 2010-11 2009-10 2008-09
(i) Investment 25 25 25
(ii) Capital Employed 76362 68461 60858
(iii) Net Worth 77759 70670 62908
(iv) Cost of Production 23348 13802 13505
(v) Cost of Sales 23348 13802 13505
(vi) Gross Value Added (At Market Price) - - -
(vii) Total Employees (Other Than Casuals) (Nos.) 1104 1109 1135
(viii) Avg. Monthly Emoluments Per Employee (Rs.) 66478 53554 51703
Profit & Loss Account (` in Lakhs)
Particulars 2010-11 2009-10 2008-09
(1) Income
(A) Sales/Operating Income 18797 16506 13954
(B) Excise Duty 0 0 0
(C) Net Sales (A-B) 18797 16506 13954
(D) Other Income/Receipts 11715 7366 8078
(E) Accretion/Depletion in Stocks 0 0 0
(I)Total Income (C+D+E) 30512 23872 22032
(2) Expenditure
(A) Purchase of Finished Goods/ Consumption Of Raw Materials 0 0 0
(B) Stores & Spares 0 0 0
(C) Power & Fuel 1955 0 594
(D) Manufacturing / Direct / Operating Expenses 3690 0 3541
(E) Salary, Wages & Benefits / Employee Exp. 8807 7127 7042
(F) Other Expenses 8475 6278 1833
(G) Provisions 73 130 132
(II)Total Expenditure (A to G) 23000 13535 13142
(3) Profit Before Dep, Int, Taxes & EP (PBDITEP) (I-II) 7512 10337 8890
(4) Depreciation 346 264 358
(5) Dre/Prel Exp Written Off 2 3 5
(6) Profit Before Int., Taxes & Ep (PBITEP) (3-4-5) 7164 10070 8527
(7) Interest
(A) On Central Government Loans 0 0 0
(B) On Foreign Loans 0 0 0
(C) Others 0 0 0
(D) Less Interest Capitalised 0 0 0
(E) Charged to P & L Account (A+B+C-D) 0 0 0
(8) Profit Before Tax & EP(PBTEP) (6-7E) 7164 10070 8527
(9) Tax Provisions 0 0 0
(10) Net Profit / Loss Before EP (8-9) 7164 10070 8527
(11) Net Extra-Ord. Items 77 2313 -37
(12) Net Profit / Loss(-) (10-11) 7087 7757 8564
(13) Dividend Declared 0 0 0
(14) Dividend Tax 0 0 0
(15) Retained Profit (12-13-14) 7087 7757 8564
Financial Ratios 2010-11 2009-10 2008-09
(i) Sales : Capital Employed 24.62 24.11 22.93
(ii) Cost of Sales : Sales 124.21 83.62 96.78
(iii) Salary / Wages : Sales 46.85 43.18 50.47
(iv) Net Profit : Net Worth 9.11 10.98 13.61
(v) Debt : Equity 0 0 0
(vi) Current Ratio 4.95 4.73 6.03
(vii) Sundry Debtors : Sales (No. of Days) 19.81 44.58 34.87
(viii) Total Inventory : Sales 0.16 0 0
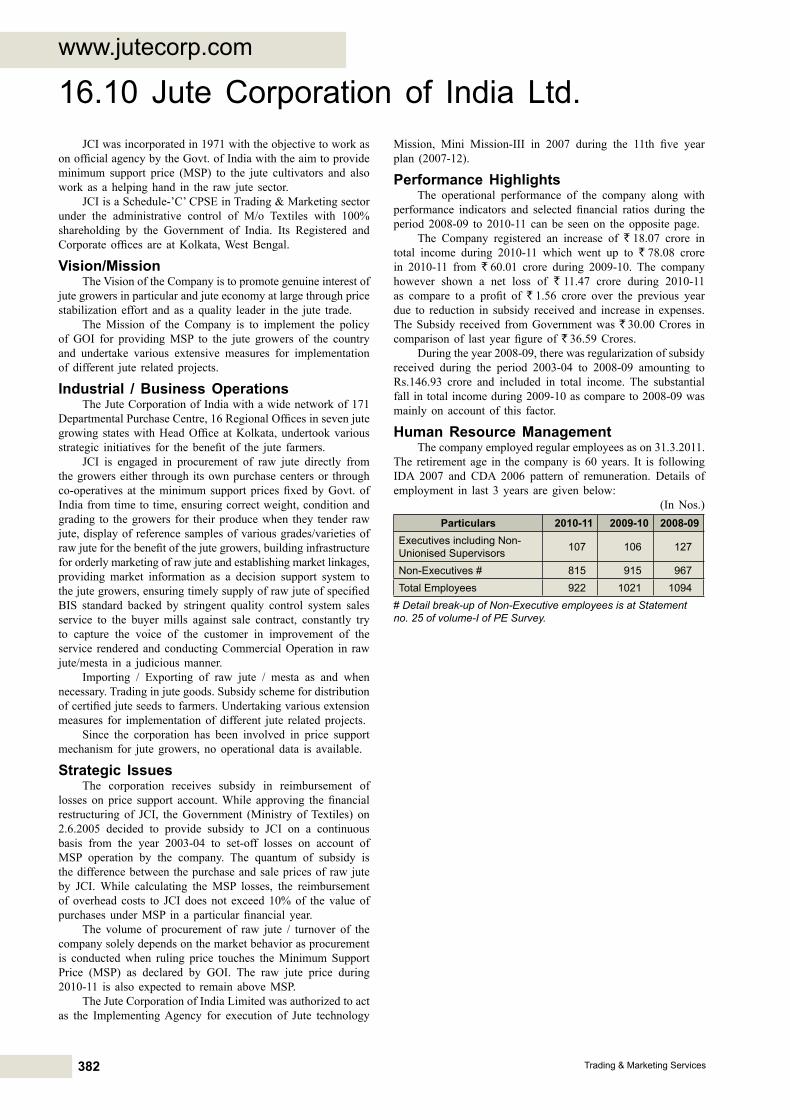
382 Trading & Marketing Services
www.jutecorp.com
JCIwasincorporatedin1971withtheobjectivetoworkasonofficialagencybytheGovt.ofIndiawiththeaimtoprovideminimum support price (MSP) to the jute cultivators and alsowork as a helpinghand in the raw jute sector.
JCIisaSchedule-’C’CPSEinTrading&Marketingsectorunder the administrative control of M/o Textiles with 100% shareholding by the Government of India. Its Registered and Corporate offices are atKolkata,WestBengal.
Vision/MissionThe Vision of the Company is to promote genuine interest of
jutegrowersinparticularandjuteeconomyatlargethroughpricestabilization effort and as a quality leader in the jute trade.
The Mission of the Company is to implement the policy of GOI for providingMSP to the jute growers of the countryand undertake various extensive measures for implementation of different jute relatedprojects.
Industrial / Business OperationsThe Jute Corporation of India with a wide network of 171
DepartmentalPurchaseCentre,16RegionalOfficesinsevenjutegrowing stateswithHeadOfficeatKolkata,undertookvariousstrategic initiatives for thebenefit of the jute farmers.
JCI is engaged in procurement of raw jute directly fromthe growers either through its own purchase centers or through co-operatives at theminimumsupportpricesfixedbyGovt. ofIndia from time to time, ensuring correct weight, condition and grading to the growers for their produce when they tender raw jute,displayofreferencesamplesofvariousgrades/varietiesofrawjuteforthebenefitofthejutegrowers,buildinginfrastructurefororderlymarketingofrawjuteandestablishingmarketlinkages,providing market information as a decision support system to thejutegrowers,ensuringtimelysupplyofrawjuteofspecifiedBIS standard backed by stringent quality control system sales service to the buyer mills against sale contract, constantly try to capture the voice of the customer in improvement of the service rendered and conducting Commercial Operation in raw jute/mesta in a judiciousmanner.
Importing / Exporting of raw jute / mesta as and whennecessary.Tradinginjutegoods.Subsidyschemefordistributionofcertifiedjuteseedstofarmers.Undertakingvariousextensionmeasures for implementationof different jute relatedprojects.
Since the corporation has been involved in price support mechanism for jute growers, nooperational data is available.
Strategic IssuesThe corporation receives subsidy in reimbursement of
losses on price support account.While approving the financialrestructuring of JCI, the Government (Ministry of Textiles) on 2.6.2005 decided to provide subsidy to JCI on a continuous basis from the year 2003-04 to set-off losses on account ofMSP operation by the company. The quantum of subsidy is thedifferencebetweenthepurchaseandsalepricesofrawjuteby JCI. While calculating the MSP losses, the reimbursement of overhead costs to JCI does not exceed 10% of the value of purchases underMSP in a particularfinancial year.
The volume of procurement of raw jute / turnover of thecompany solely depends on the market behavior as procurement is conducted when ruling price touches the Minimum Support Price (MSP) as declared by GOI. The raw jute price during2010-11 is also expected to remain aboveMSP.
The Jute Corporation of India Limited was authorized to act as the Implementing Agency for execution of Jute technology
16.10 Jute Corporation of India Ltd.Mission, Mini Mission-III in 2007 during the 11th five yearplan (2007-12).
Performance HighlightsThe operational performance of the company along with
performance indicators and selected financial ratios during theperiod2008-09 to 2010-11 canbe seenon theopposite page.
The Company registered an increase of ` 18.07 crore in total income during 2010-11 which went up to ` 78.08 crore in 2010-11 from ` 60.01 crore during 2009-10. The companyhowever shown a net loss of ` 11.47 crore during 2010-11as compare to a profit of ` 1.56 crore over the previous year due to reduction in subsidy received and increase in expenses. The Subsidy received from Government was ` 30.00 Crores in comparisonof last yearfigureof` 36.59 Crores.
Duringtheyear2008-09,therewasregularizationofsubsidyreceived during the period 2003-04 to 2008-09 amounting toRs.146.93 crore and included in total income. The substantial fallintotalincomeduring2009-10ascompareto2008-09wasmainly on account of this factor.
Human Resource ManagementThe company employed regular employees as on 31.3.2011.
The retirement age in the company is 60 years. It is following IDA 2007 and CDA 2006 pattern of remuneration. Details of employment in last 3 years are given below:
(In Nos.)Particulars 2010-11 2009-10 2008-09
Executives including Non-Unionised Supervisors 107 106 127
Non-Executives # 815 915 967Total Employees 922 1021 1094
# Detail break-up of Non-Executive employees is at Statement no. 25 of volume-I of PE Survey.

383Public Enterprises Survey 2010-2011: Vol-II
Jute Corporation of India Ltd.15N, Nellie Sengupta Sarani, 7th Floor, Kolkata, West Bengal – 700 087
Balance Sheet (` in Lakhs)
Particulars 2010-11 2009-10 2008-09
Authorised Capital 500 500 500
(1) Sources Of Fund
(1.1) Shareholders Funds
(A) Paid-Up Capital
Central Govt 500 500 500
Others 0 0 0
(B) Share Application Money 0 0 0
(C) Reserves & Surplus 4791 5938 5782
Total (A) + (B) + (C) 5291 6438 6282
(1.2) Loan Funds
(A) Secured Loans 0 0 0
(B) Unsecured Loans 0 0 0
Total (A) + (B) 0 0 0
(1.3) Deferred Tax Liability 0 0 0
Total (1.1) + (1.2) + (1.3) 5291 6438 6282
(2) Application Of Funds
(2.1) Fixed Assets
(A) Gross Block 370 368 366
(B) Less Depreciation 117 110 107
(C) Net Block (A-B) 253 258 259
(D) Capital Work In Progress 0 0 0
Total (C) + (D) 253 258 259
(2.2) Investment 0 0 0
(2.3) Current Assets, Loan & Advances
(A) Inventories 1872 81 577
(B) Sundry Debtors 10 13 582
(C) Cash & Bank Balances 11253 16110 14837
(D) Other Current Assets 269 492 238
(E) Loan & Advances 152 801 455
Total (A)+ (B)+ (C)+ (D)+ (E) 13556 17497 16689
(2.4) Less:current Liabilities & Provisions
(A) Current Liabilities 8399 11130 9038
(B) Provisions 119 187 1628
Total (A+B) 8518 11317 10666
(2.5) Net Current Assets (2.3-2.4) 5038 6180 6023
(2.6) Deferred Revenue / Pre. Expenditure 0 0 0
(2.7) Deferred Tax Asset 0 0 0
(2.8) Profit & Loss Account(Dr) 0 0 0
Total (2.1+2.2+2.5+2.6+2.7+2.8) 5291 6438 6282
Important Indicators 2010-11 2009-10 2008-09
(i) Investment 500 500 500
(ii) Capital Employed 5291 6438 6282
(iii) Net Worth 5291 6438 6282
(iv) Cost of Production 8965 5737 10468
(v) Cost of Sales 7174 6233 21846
(vi) Gross Value Added (At Market Price) - - -
(vii) Total Employees (Other Than Casuals) (Nos.) 922 1021 1094
(viii) Avg. Monthly Emoluments Per Employee (Rs.) 48436 42148 50221
Profit & Loss Account (` in Lakhs)
Particulars 2010-11 2009-10 2008-09
(1) Income
(A) Sales/Operating Income 4713 5216 31982
(B) Excise Duty 0 0 0
(C) Net Sales (A-B) 4713 5216 31982
(D) Other Income/Receipts 1304 1281 434
(E) Accretion/Depletion in Stocks 1791 -496 -11378
(I)Total Income (C+D+E) 7808 6001 21038
(2) Expenditure
(A) Purchase of Finished Goods/ Consumption Of Raw Materials 3202 226 2491
(B) Stores & Spares 0 0 0
(C) Power & Fuel 11 12 13
(D) Manufacturing / Direct / Operating Expenses 183 141 888
(E) Salary, Wages & Benefits / Employee Exp. 5359 5164 6593
(F) Other Expenses 200 186 471
(G) Provisions 0 0 0
(II)Total Expenditure (A to G) 8955 5729 10456
(3) Profit Before Dep, Int, Taxes & EP (PBDITEP) (I-II) -1147 272 10582
(4) Depreciation 7 6 0
(5) Dre/Prel Exp Written Off 0 0 7
(6) Profit Before Int., Taxes & Ep (PBITEP) (3-4-5) -1154 266 10575
(7) Interest
(A) On Central Government Loans 0 0 0
(B) On Foreign Loans 0 0 0
(C) Others 3 2 5
(D) Less Interest Capitalised 0 0 0
(E) Charged to P & L Account (A+B+C-D) 3 2 5
(8) Profit Before Tax & EP(PBTEP) (6-7E) -1157 264 10570
(9) Tax Provisions 0 100 1640
(10) Net Profit / Loss Before EP (8-9) -1157 164 8930
(11) Net Extra-Ord. Items -10 8 -278
(12) Net Profit / Loss(-) (10-11) -1147 156 9208
(13) Dividend Declared 0 0 0
(14) Dividend Tax 0 0 0
(15) Retained Profit (12-13-14) -1147 156 9208
Financial Ratios 2010-11 2009-10 2008-09
(i) Sales : Capital Employed 89.08 81.02 509.11
(ii) Cost of Sales : Sales 152.22 119.5 68.31
(iii) Salary / Wages : Sales 113.71 99 20.61
(iv) Net Profit : Net Worth -21.68 2.42 146.58
(v) Debt : Equity 0 0 0
(vi) Current Ratio 1.59 1.55 1.56
(vii) Sundry Debtors : Sales (No. of Days) 0.77 0.91 6.64
(viii) Total Inventory : Sales 144.98 5.67 6.59
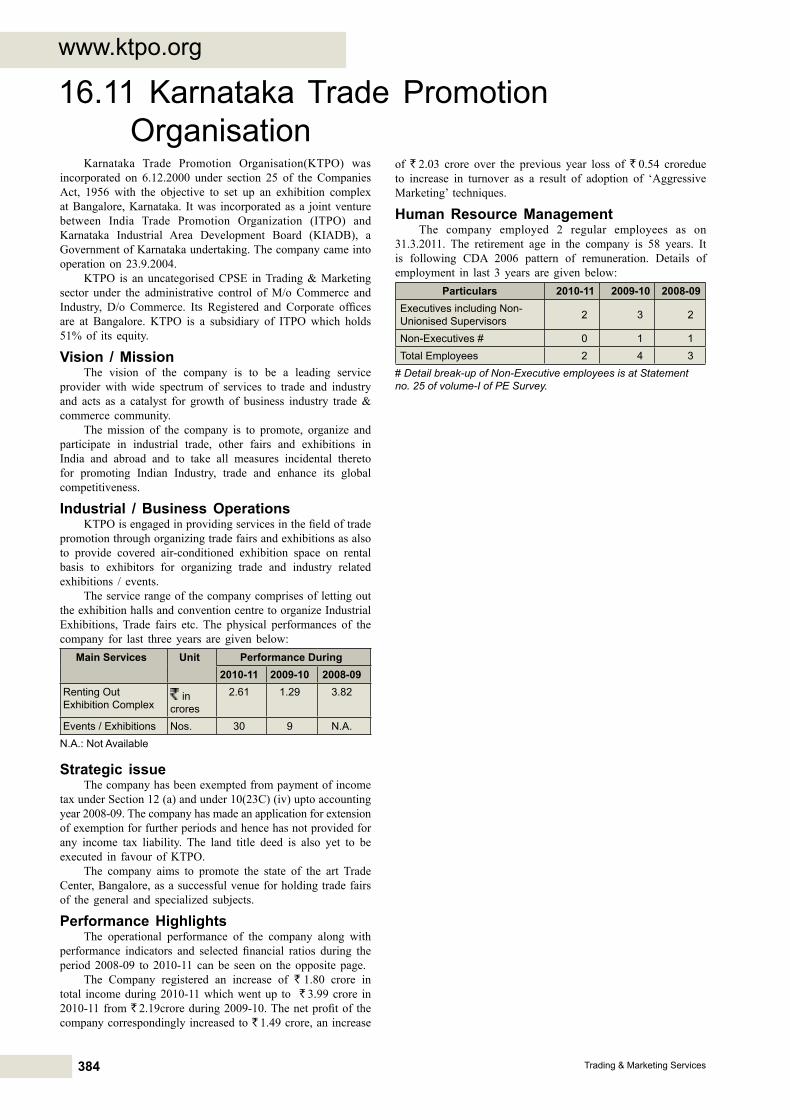
384 Trading & Marketing Services
www.ktpo.org
Karnataka Trade Promotion Organisation(KTPO) was incorporated on 6.12.2000 under section 25 of the Companies Act, 1956 with the objective to set up an exhibition complexatBangalore,Karnataka. Itwas incorporatedasa jointventurebetween India Trade Promotion Organization (ITPO) and Karnataka Industrial Area Development Board (KIADB), a Government of Karnataka undertaking. The company came into operation on 23.9.2004.
KTPO is an uncategorised CPSE in Trading & Marketing sector under the administrative control of M/o Commerce and Industry, D/o Commerce. Its Registered and Corporate officesare at Bangalore. KTPO is a subsidiary of ITPO which holds 51% of its equity.
Vision / MissionThe vision of the company is to be a leading service
provider with wide spectrum of services to trade and industry and acts as a catalyst for growth of business industry trade & commerce community.
The mission of the company is to promote, organize and participate in industrial trade, other fairs and exhibitions in India and abroad and to take all measures incidental thereto for promoting Indian Industry, trade and enhance its global competitiveness.
Industrial / Business OperationsKTPOisengagedinprovidingservicesinthefieldoftrade
promotion through organizing trade fairs and exhibitions as also to provide covered air-conditioned exhibition space on rentalbasis to exhibitors for organizing trade and industry related exhibitions / events.
The service range of the company comprises of letting out the exhibition halls and convention centre to organize Industrial Exhibitions, Trade fairs etc. The physical performances of the company for last three years are given below:
Main Services Unit Performance During2010-11 2009-10 2008-09
Renting Out Exhibition Complex
in crores
2.61 1.29 3.82
Events / Exhibitions Nos. 30 9 N.A.N.A.: Not Available
Strategic issueThe company has been exempted from payment of income
tax under Section 12 (a) and under 10(23C) (iv) upto accounting year2008-09.Thecompanyhasmadeanapplicationforextensionof exemption for further periods and hence has not provided for any income tax liability. The land title deed is also yet to be executed in favour of KTPO.
The company aims to promote the state of the art Trade Center, Bangalore, as a successful venue for holding trade fairs of thegeneral and specialized subjects.
Performance HighlightsThe operational performance of the company along with
performance indicators and selected financial ratios during theperiod2008-09 to 2010-11 canbe seenon theopposite page.
The Company registered an increase of ` 1.80 crore in total incomeduring2010-11whichwentup to ` 3.99 crore in 2010-11from` 2.19croreduring2009-10.Thenetprofitof thecompany correspondingly increased to ` 1.49 crore, an increase
16.11 Karnataka Trade Promotion Organisation
of ` 2.03 crore over the previous year loss of ` 0.54 croredue to increase in turnover as a result of adoption of ‘Aggressive Marketing’ techniques.
Human Resource ManagementThe company employed 2 regular employees as on
31.3.2011. The retirement age in the company is 58 years. It is following CDA 2006 pattern of remuneration. Details of employment in last 3 years are given below:
Particulars 2010-11 2009-10 2008-09Executives including Non-Unionised Supervisors 2 3 2
Non-Executives # 0 1 1Total Employees 2 4 3
# Detail break-up of Non-Executive employees is at Statement no. 25 of volume-I of PE Survey.

385Public Enterprises Survey 2010-2011: Vol-II
Karnataka Trade Promotion OrganisationPlotNo. 121,EPIP IndustrialArea,Whitefield,Bangalore,Karnataka - 560066
Balance Sheet (` in Lakhs)
Particulars 2010-11 2009-10 2008-09
Authorised Capital 2000 2000 2000
(1) Sources Of Fund
(1.1) Shareholders Funds
(A) Paid-Up Capital
Central Govt 0 24 0
Others 50 26 50
(B) Share Application Money 995 994 995
(C) Reserves & Surplus 600 452 506
Total (A) + (B) + (C) 1645 1496 1551
(1.2) Loan Funds
(A) Secured Loans 0 0 0
(B) Unsecured Loans 797 797 796
Total (A) + (B) 797 797 796
(1.3) Deferred Tax Liability 0 0 0
Total (1.1) + (1.2) + (1.3) 2442 2293 2347
(2) Application Of Funds
(2.1) Fixed Assets
(A) Gross Block 1878 1874 1798
(B) Less Depreciation 851 733 614
(C) Net Block (A-B) 1027 1141 1184
(D) Capital Work In Progress 0 0 0
Total (C) + (D) 1027 1141 1184
(2.2) Investment 0 0 0
(2.3) Current Assets, Loan & Advances
(A) Inventories 0 0 0
(B) Sundry Debtors 0 0 0
(C) Cash & Bank Balances 1358 1225 1079
(D) Other Current Assets 0 0 0
(E) Loan & Advances 193 44 110
Total (A)+ (B)+ (C)+ (D)+ (E) 1551 1269 1189
(2.4) Less:current Liabilities & Provisions
(A) Current Liabilities 136 117 27
(B) Provisions 0 0 0
Total (A+B) 136 117 27
(2.5) Net Current Assets (2.3-2.4) 1415 1152 1162
(2.6) Deferred Revenue / Pre. Expenditure 0 0 1
(2.7) Deferred Tax Asset 0 0 0
(2.8) Profit & Loss Account(Dr) 0 0 0
Total (2.1+2.2+2.5+2.6+2.7+2.8) 2442 2293 2347
Important Indicators 2010-11 2009-10 2008-09
(i) Investment 1842 1841 1841
(ii) Capital Employed 2442 2293 2346
(iii) Net Worth 1645 1496 1550
(iv) Cost of Production 245 222 256
(v) Cost of Sales 245 222 256
(vi) Gross Value Added (At Market Price) - - -
(vii) Total Employees (Other Than Casuals) (Nos.) 2 4 3
(viii) Avg. Monthly Emoluments Per Employee (Rs.) 41667 18750 30556
Profit & Loss Account (` in Lakhs)
Particulars 2010-11 2009-10 2008-09
(1) Income
(A) Sales/Operating Income 304 129 382
(B) Excise Duty 0 0 0
(C) Net Sales (A-B) 304 129 382
(D) Other Income/Receipts 95 90 117
(E) Accretion/Depletion in Stocks 0 0 0
(I)Total Income (C+D+E) 399 219 499
(2) Expenditure
(A) Purchase of Finished Goods/ Consumption Of Raw Materials 0 0 0
(B) Stores & Spares 0 0 0
(C) Power & Fuel 30 12 0
(D) Manufacturing / Direct / Operating Expenses 42 40 70
(E) Salary, Wages & Benefits / Employee Exp. 10 9 11
(F) Other Expenses 45 41 43
(G) Provisions 0 0 0
(II)Total Expenditure (A to G) 127 102 124
(3) Profit Before Dep, Int, Taxes & EP (PBDITEP) (I-II) 272 117 375
(4) Depreciation 118 120 132
(5) Dre/Prel Exp Written Off 0 0 0
(6) Profit Before Int., Taxes & Ep (PBITEP) (3-4-5) 154 -3 243
(7) Interest
(A) On Central Government Loans 0 0 0
(B) On Foreign Loans 0 0 0
(C) Others 0 0 0
(D) Less Interest Capitalised 0 0 0
(E) Charged to P & L Account (A+B+C-D) 0 0 0
(8) Profit Before Tax & EP(PBTEP) (6-7E) 154 -3 243
(9) Tax Provisions 0 0 0
(10) Net Profit / Loss Before EP (8-9) 154 -3 243
(11) Net Extra-Ord. Items 5 51 15
(12) Net Profit / Loss(-) (10-11) 149 -54 228
(13) Dividend Declared 0 0 0
(14) Dividend Tax 0 0 0
(15) Retained Profit (12-13-14) 149 -54 228
Financial Ratios 2010-11 2009-10 2008-09
(i) Sales : Capital Employed 12.45 5.63 16.28
(ii) Cost of Sales : Sales 80.59 172.09 67.02
(iii) Salary / Wages : Sales 3.29 6.98 2.88
(iv) Net Profit : Net Worth 9.06 -3.61 14.71
(v) Debt : Equity 0.48 0.53 0.51
(vi) Current Ratio 11.4 10.85 44.04
(vii) Sundry Debtors : Sales (No. of Days) 0 0 0
(viii) Total Inventory : Sales 0 0 0

386 Trading & Marketing Services
www. mmtclimited.co.in
MMTC Limited (till 1993 known as Minerals and Metals Trading Corporation of India Ltd) was set up by Government of India in the year 1963 primarily to regulate the International trade of Minerals and Metals. Over the years new product lines like Agro Commodities, Fertilizers, Precious Metals, Coal & Hydrocarbonswere added to theproduct profile ofMMTC.
MMTC is a schedule ‘A’ / Mini-Ratna listed CPSE inTrading and Marketing Services sector under the administrative control of Ministry of Commerce & Industry with 99.33% of equity shareholding held by Govt. of India. MMTC’s Registered andCorporateofficeareatNewDelhiandthedomesticnetworkofMMTC in India spreads across 76 offices, warehouses andretail outlets.
Duringtheyear2010-11,MMTC’ssharecapitalwasraisedto ` 100 crore. This was done by issuing 50 crore bonus shares in 1:1 ratio in August 2010. The shares were split in 1:10 ratio in July 2010. During the year 2010-11, the share price of thecompany varied between (pre split) ` 37,999 and (post split) `
867.80
Vision/MissionThe Vision and mission of the Company is to be the largest
tradingcompanyofIndiaandamajortradingcompanyofAsia,MMTC aims at improving its position further by achieving sustainable and viable growth rate through excellence in all its activities, generating optimumprofits through total satisfactionof shareholders, customers, suppliers, employees and society.
Industrial / Business OperationsMMTC is India’s largest International Trading Company
and exporter of Mineral, leading exporter / importer of Agro commodities, single largest importer / supplier of Metals including Gold & Silver and a major player in the Coal andHydrocarbons imports by the country. The company commands extensive market coverage in over 65 countries in Asia, Europe, Africa, Oceania and America etc.
MMTC has also putting up a Gold/Silver Medallion manufacturingunit,whichwouldalsoincludeaGoldrefineryasanintegralpart.Foreffectivemarketingofthefinishedproductsfrom this unit, as well as Jewellery from other sources, MMTC has set up in partnership with a leading Indian company, a chain ofretailstoresatvariouscitiesinIndiaformedallions,jewelleryand its home grown brand of ‘SANCHI’ silverware.
The company has one Subsidiary company and 9 Joint Ventures companies. MMTC’s wholly owned subsidiary – MMTC Transnational Pte. Ltd., Singapore (MTPL) was incorporated in October 1994 under the laws of Singapore with a share capital of US$ 1 million. MMTC has also set up Neelachal Ispat Nigam Limited (NINL) – an Iron & Steel plant of 1.1 million tonnes capacity, 0.8 million tonne coke ovens and by product unitwithcaptivepowerplant,jointlywithGovt.ofOrissawithtotal capital expenditure of nearly ` 2000 crores. The projecthasfirmIronoresupply linkagesandalsohascaptiveIronoremining rights for reserves estimated at about 150 million tons. The construction of phase-II of the project with an estimatedcost of ` 18,550 million is under progress
MMTC has already diversified into the area of clean,non-conventional and renewable energy sources by setting upa 15MW Wind Energy Farm in the state of Karnataka, which has already been commissioned. The plant is generating power, which is being sold to the State Electricity Grid and has generated revenues amounting to ` 8.10 crore during the year 2010-11.The physical performance of the company for last three years is given below:
16.12 MMTC LimitedMajor Products/ Services
Unit Services Provided during2010-11 2009-10 2008-09
EXPORTS ` crore 3693 3223 4576
IMPORTS ` crore 63301 39969 30695
DOMESTIC ` crore 1860 1932 1550
Strategic IssuesBesides keeping its position intact in its core areas
of activities, MMTC also associates itself in promotion and development of trade related infrastructure. Aiming at diversification and to add value to trading operations,MMTChas taken various strategic initiatives following public private partnership route, which include, in broad terms, setting up of a Commodity Exchange (which has commenced its operation in November, 2009) and a Currency Exchange (which has commenced its operation in September, 2010).
As a measure of investing in mining infrastructure MMTC is promoting a Joint Venture Company for exploration and development of mines for Minerals, Ferrous and Non-Ferrousores, Precious Metals, Diamonds and Coal etc. MMTC has also been allotted a coal mine in Jharkhand having estimated reserves of about 800 million MT of both coking and thermal coal. MMTC is a member of a consortium, which has constructed permanent Iron Ore Loading berth at Ennore, which is expected to be commissioned shortly. MMTC is also partner in another consortium,whichhasbeenawardedtheprojectforconstructionof a deep draft iron ore berth at Paradip port as well. Moreover, to facilitate promotion of two way trade MMTC took the lead in setting up free trade and warehousing zones at Haldia and Kandla.
Performance HighlightsThe operational performance of the company along with
performance indicators and selected financial ratios during theperiod2008-09 to 2010-11 canbe seenon theopposite page.
The Company registered an increase of ` 20595.41 crore in totalincomeduring2010-11whichwentupto` 68079.51 crore in2010-11from` 47484.10croreduring2009-10.However,thenetprofitofthecompanyreducedto` 121.64 crore, a reduction of ` 94.60croreover thepreviousyearprofitof` 216.24 crore due to increase in other expenses and decrease in margins due to intense competition in all its trade activities.
Human Resource ManagementThe company employed 1762 regular employees as on
31.3.2011.Thismanpowerstrengthincludes20officers,126staffand 84 workers of erstwhile Mica Trading Company Ltd., which had been merged with MMTC pursuant to the orders of BIFR. The retirement age in the company is 60 years. It is following IDA 2007 pattern of remuneration. Details of employment in last 3 years are given below:
Particulars 2010-11 2009-10 2008-09Executives including Non-Unionised Supervisors 584 608 619
Non-Executives # 1178 1230 1263Total Employees 1762 1838 1882
# Detail break-up of Non-Executive employees is at Statement no. 25 of volume-I of PE Survey.

387Public Enterprises Survey 2010-2011: Vol-II
MMTC Limited7, Scope Complex Lodi Road New Delhi 110003
Balance Sheet (` in Lakhs)
Particulars 2010-11 2009-10 2008-09
Authorised Capital 10000 10000 10000
(1) Sources Of Fund
(1.1) Shareholders Funds
(A) Paid-Up Capital
Central Govt 9933 4967 4967
Others 67 33 33
(B) Share Application Money 0 0 0
(C) Reserves & Surplus 127973 123715 107338
Total (A) + (B) + (C) 137973 128715 112338
(1.2) Loan Funds
(A) Secured Loans 500199 461436 430520
(B) Unsecured Loans 108148 55043 0
Total (A) + (B) 608347 516479 430520
(1.3) Deferred Tax Liability 0 0 0
Total (1.1) + (1.2) + (1.3) 746320 645194 542858
(2) Application Of Funds
(2.1) Fixed Assets
(A) Gross Block 20744 20641 20264
(B) Less Depreciation 9659 8467 7296
(C) Net Block (A-B) 11085 12174 12968
(D) Capital Work In Progress 51 72 212
Total (C) + (D) 11136 12246 13180
(2.2) Investment 28308 27291 23154
(2.3) Current Assets, Loan & Advances
(A) Inventories 64797 213483 57853
(B) Sundry Debtors 253973 155231 190732
(C) Cash & Bank Balances 674824 608076 585800
(D) Other Current Assets 0 0 0
(E) Loan & Advances 234583 165347 187232
Total (A)+ (B)+ (C)+ (D)+ (E) 1228177 1142137 1021617
(2.4) Less:current Liabilities & Provisions
(A) Current Liabilities 484656 499719 483502
(B) Provisions 40000 39027 35205
Total (A+B) 524656 538746 518707
(2.5) Net Current Assets (2.3-2.4) 703521 603391 502910
(2.6) Deferred Revenue / Pre. Expenditure 0 0 582
(2.7) Deferred Tax Asset 3355 2266 3032
(2.8) Profit & Loss Account(Dr) 0 0 0
Total (2.1+2.2+2.5+2.6+2.7+2.8) 746320 645194 542858
Important Indicators 2010-11 2009-10 2008-09
(i) Investment 10000 5000 5000
(ii) Capital Employed 714606 615565 515878
(iii) Net Worth 137973 128715 111756
(iv) Cost of Production 6788565 4715104 3766092
(v) Cost of Sales 6937251 4559474 3763560
(vi) Gross Value Added (At Market Price) - - -
(vii) Total Employees (Other Than Casuals) (Nos.) 1762 1838 1882
(viii) Avg. Monthly Emoluments Per Employee (Rs.) 86909 76333 73185
Profit & Loss Account (` in Lakhs)
Particulars 2010-11 2009-10 2008-09
(1) Income
(A) Sales/Operating Income 6885449 4512419 3682076
(B) Excise Duty 0 0 0
(C) Net Sales (A-B) 6885449 4512419 3682076
(D) Other Income/Receipts 71188 80361 103212
(E) Accretion/Depletion in Stocks -148686 155630 2532
(I)Total Income (C+D+E) 6807951 4748410 3787820
(2) Expenditure
(A) Purchase of Finished Goods/ Consumption Of Raw Materials 6458786 4533479 3590697
(B) Stores & Spares 0 0 0
(C) Power & Fuel 202 193 181
(D) Manufacturing / Direct / Operating Expenses 44501 115122 64282
(E) Salary, Wages & Benefits / Employee Exp. 18376 16836 16528
(F) Other Expenses 225973 6689 22316
(G) Provisions 2294 190 4061
(II)Total Expenditure (A to G) 6750132 4672509 3698065
(3) Profit Before Dep, Int, Taxes & EP (PBDITEP) (I-II) 57819 75901 89755
(4) Depreciation 1247 1333 1258
(5) Dre/Prel Exp Written Off 0 0 182
(6) Profit Before Int., Taxes & Ep (PBITEP) (3-4-5) 56572 74568 88315
(7) Interest
(A) On Central Government Loans 0 0 0
(B) On Foreign Loans 0 0 0
(C) Others 37186 41262 66587
(D) Less Interest Capitalised 0 0 0
(E) Charged to P & L Account (A+B+C-D) 37186 41262 66587
(8) Profit Before Tax & EP(PBTEP) (6-7E) 19386 33306 21728
(9) Tax Provisions 7014 11683 7716
(10) Net Profit / Loss Before EP (8-9) 12372 21623 14012
(11) Net Extra-Ord. Items 208 -1 -10
(12) Net Profit / Loss(-) (10-11) 12164 21624 14022
(13) Dividend Declared 2500 4500 0
(14) Dividend Tax 405 747 0
(15) Retained Profit (12-13-14) 9259 16377 14022
Financial Ratios 2010-11 2009-10 2008-09
(i) Sales : Capital Employed 963.53 733.05 713.75
(ii) Cost of Sales : Sales 100.75 101.04 102.21
(iii) Salary / Wages : Sales 0.27 0.37 0.45
(iv) Net Profit : Net Worth 8.82 16.8 12.55
(v) Debt : Equity 4.41 4.01 3.83
(vi) Current Ratio 2.34 2.12 1.97
(vii) Sundry Debtors : Sales (No. of Days) 13.46 12.56 18.91
(viii) Total Inventory : Sales 3.43 17.27 5.73

388 Trading & Marketing Services
www.mstcindia.co.in
M S T C LTD. (MSTC) was incorporated on 9.9.1964 as MetalScrapTradeCorp.Ltd.with theobjectiveofworkingasdiversified tradinghousewith particular emphasis onbulk rawmaterials for steel industry and to gradually build up tie- upswith international trading houses, develop warehousing system and logistics and to undertake disposal of scrap and secondary arising etc. of organizations, both in public and private sector. MSTC today facilities in recycling of scrap for industrial use of raw materials and thereby reduce input cost, conserve natural resources and ultimately protect the environment.
MSTC is a Schedule-‘B’ Mini-ratna CPSE in Trading &Marketing sector under the administrative control of M/o Steel with 90% shareholding by the Government of India and balance 10% by the members of Steel Furnace Association of India and IspatIndustriesLimited.ItsRegisteredandCorporateofficesareat Kolkata, West Bengal.
Vision / MissionThe Vision of the Company is to emerge as a dominant
B2B player in the area of trading with particular emphasis on Steel Industry.
The Mission of the Company is to organize and expand a market for the various commodities handled by it by making transactions as transparent as possible through extensive use of e-commerce.
Industrial / Business OperationsMSTC facilitates recycling of scrap for industrial use of
raw materials and thereby reduces input cost, conserves natural resources and ultimately protect the environment. It under take disposal of ferrous / non-ferrous scrap and other secondaryarising from integrated steel plants under SAIL, RINL etc. and for disposal of scrap and obsolete / surplus stores from other PSUs and Government Department including M/o Defence. It is also involved in import of steel melting scrap for the use of secondary steel industry and finished iron and steel items likeHR Coils, Billets, Pig Iron, DR Pellets, Coke, Coal and other inputs and Petroleum products like Naphtha, Super Kerosene Oil, Furnace Oil etc.
The company functions through its Regional Offices atDelhi, Mumbai, Kolkata and Chennai and Branch Offices atBangalore, Vishakhapatnam, Vadodara, Bhopal and Trichy. It has one subsidiary namely Ferro Scrap Nigam Ltd. (FSNL).
ThemainsegmentofthecompanyservicesareclassifiedasSellingAgency,E-auctiontender,MarketingandE-Procurement.The physical performances of the company for last three years are given below:Main Business segment
Unit Performance During2010-11 2009-10 2008-09
(A) Trading VolumeImported material ` in crore 2580.77 3783.92 6411.96
Indigenous Material
` in crore 3352.25 2395.87 1466.86
Export ` in crore 0.00 205.08 628.62
Total (A) ` in crore 5933.02 6384.87 8507.44
(B) Agency Business VolumeSale of scrap and Manganese
In crore 2568.08 2015.83 1740.43
Sale of coal ` in crore 5565.48 4084.00 4593.00
Total (B) ` in crore 8133.56 6099.83 6333.43
(C) e-Procurement ` in crore 34.19 253.74 4787.00
Total (A+B+C) ` in crore 14100.77 12738.44 19627.87
16.13 M S T C Ltd.Strategic issue
There is huge opportunity for e-trading of variouscommodities particularly agricultural products. Strategic forward integrationinprocessingofiron&steel,jointventureinlogisticsor commodity exchange or mining activities are some of the emerging opportunities for the company.
Performance HighlightsThe operational performance of the company along with
performance indicators and selected financial ratios during theperiod2008-09 to 2010-11 canbe seenon theopposite page.
The Company registered a reduction of ` 2416.04 crore in total incomeduring2010-11whichwentdown to` 1963.49 crore in 2010-11 from ` 4379.53 crore during 2009-10 due todecreaseinfallinpricesofcommoditiesin2010-11ascomparedto 2009-10.Thenet profit of the company, however, increasedto ` 99.16 crore, an increase of ` 13.06 crore over the previous year due to reduction in cost of sale.
Human Resource ManagementThe company employed 316 regular employees as on
31.3.2011. The retirement age in the company is 60 years. It is following IDA 2007 pattern of remuneration. Details of employment in last 3 years are given below:
Particulars 2010-11 2009-10 2008-09Executives including Non-Unionised Supervisors 158 148 157
Non-Executives # 158 163 159Total Employees 316 311 316
# Detail break-up of Non-Executive employees is at Statement no. 25 of volume-I of PE Survey.

389Public Enterprises Survey 2010-2011: Vol-II
M S T C Ltd.225-CA.J.C.BoseRoad,Kolkata,WestBengal 700020
Balance Sheet (` in Lakhs)
Particulars 2010-11 2009-10 2008-09
Authorised Capital 500 500 500
(1) Sources Of Fund
(1.1) Shareholders Funds
(A) Paid-Up Capital
Central Govt 198 198 198
Others 22 22 22
(B) Share Application Money 0 0 0
(C) Reserves & Surplus 50300 40626 34017
Total (A) + (B) + (C) 50520 40846 34237
(1.2) Loan Funds
(A) Secured Loans 41953 47219 37751
(B) Unsecured Loans 74416 106416 152257
Total (A) + (B) 116369 153635 190008
(1.3) Deferred Tax Liability 0 0 0
Total (1.1) + (1.2) + (1.3) 166889 194481 224245
(2) Application Of Funds
(2.1) Fixed Assets
(A) Gross Block 3152 2154 2251
(B) Less Depreciation 1414 1295 1366
(C) Net Block (A-B) 1738 859 885
(D) Capital Work In Progress 0 928 860
Total (C) + (D) 1738 1787 1745
(2.2) Investment 1581 1581 1581
(2.3) Current Assets, Loan & Advances
(A) Inventories 1618 0 165
(B) Sundry Debtors 98529 212574 261151
(C) Cash & Bank Balances 88447 144320 174339
(D) Other Current Assets 1188 1054 3068
(E) Loan & Advances 148514 154702 96187
Total (A)+ (B)+ (C)+ (D)+ (E) 338296 512650 534910
(2.4) Less:current Liabilities & Provisions
(A) Current Liabilities 153291 303367 300798
(B) Provisions 22499 19234 14484
Total (A+B) 175790 322601 315282
(2.5) Net Current Assets (2.3-2.4) 162506 190049 219628
(2.6) Deferred Revenue / Pre. Expenditure 0 0 0
(2.7) Deferred Tax Asset 1064 1064 1291
(2.8) Profit & Loss Account(Dr) 0 0 0
Total (2.1+2.2+2.5+2.6+2.7+2.8) 166889 194481 224245
Important Indicators 2010-11 2009-10 2008-09
(i) Investment 220 220 220
(ii) Capital Employed 164244 190908 220513
(iii) Net Worth 50520 40846 34237
(iv) Cost of Production 181288 424125 694018
(v) Cost of Sales 179670 424290 695252
(vi) Gross Value Added (At Market Price) - - -
(vii) Total Employees (Other Than Casuals) (Nos.) 316 311 316
(viii) Avg. Monthly Emoluments Per Employee (Rs.) 91060 59459 81382
Profit & Loss Account (` in Lakhs)
Particulars 2010-11 2009-10 2008-09
(1) Income
(A) Sales/Operating Income 181965 419309 693351
(B) Excise Duty 0 0 0
(C) Net Sales (A-B) 181965 419309 693351
(D) Other Income/Receipts 12766 18809 14858
(E) Accretion/Depletion in Stocks 1618 -165 -1234
(I)Total Income (C+D+E) 196349 437953 706975
(2) Expenditure
(A) Purchase of Finished Goods/ Consumption Of Raw Materials 164893 405795 673424
(B) Stores & Spares 0 0 0
(C) Power & Fuel 73 73 60
(D) Manufacturing / Direct / Operating Expenses 419 357 347
(E) Salary, Wages & Benefits / Employee Exp. 3453 2219 3086
(F) Other Expenses 2076 881 2864
(G) Provisions 0 450 781
(II)Total Expenditure (A to G) 170914 409775 680562
(3) Profit Before Dep, Int, Taxes & EP (PBDITEP) (I-II) 25435 28178 26413
(4) Depreciation 130 167 256
(5) Dre/Prel Exp Written Off 0 0 0
(6) Profit Before Int., Taxes & Ep (PBITEP) (3-4-5) 25305 28011 26157
(7) Interest
(A) On Central Government Loans 0 0 0
(B) On Foreign Loans 0 0 0
(C) Others 10244 14183 13200
(D) Less Interest Capitalised 0 0 0
(E) Charged to P & L Account (A+B+C-D) 10244 14183 13200
(8) Profit Before Tax & EP(PBTEP) (6-7E) 15061 13828 12957
(9) Tax Provisions 5024 4990 4448
(10) Net Profit / Loss Before EP (8-9) 10037 8838 8509
(11) Net Extra-Ord. Items 121 228 4
(12) Net Profit / Loss(-) (10-11) 9916 8610 8505
(13) Dividend Declared 220 1723 1705
(14) Dividend Tax 22 278 290
(15) Retained Profit (12-13-14) 9674 6609 6510
Financial Ratios 2010-11 2009-10 2008-09
(i) Sales : Capital Employed 110.79 219.64 314.43
(ii) Cost of Sales : Sales 98.74 101.19 100.27
(iii) Salary / Wages : Sales 1.9 0.53 0.45
(iv) Net Profit : Net Worth 19.63 21.08 24.84
(v) Debt : Equity 2.3 3.76 5.55
(vi) Current Ratio 1.92 1.59 1.7
(vii) Sundry Debtors : Sales (No. of Days) 197.64 185.04 137.48
(viii) Total Inventory : Sales 3.25 0 0.09

390 Trading & Marketing Services
www.nhdcltd.com
National Handloom Development Corporation Ltd. (NHDCL)wasincorporatedon22.02.1983withtheobjectivetoserve as a national level agency for promotion and development of the Handloom sector.
NHDCL is aSchedule-‘B’CPSEunder the administrativecontrol of the M/o Textiles with 100% shareholding by the Government of India. Its Registered and Corporate Office areat Lucknow (U.P.).
Vision/MissionThe vision of the company is to be a leading player in
supplying the quality raw material to the handloom sector. The mission of the company is to serve as a National level agency for the promotion and development of the handloom sector.
Industrial / Business OperationsThe main activity of the company is to ensure the availability
of Raw Material like yarn and Dyes & Chemicals to Handloom weavers & supply of Handloom fabrics. The activities of the corporation are divided into three categories (i) Arranging supply of Raw Materials (Yarn and Dyes & Chemicals) (ii) Developmental Activities like Organisation of Appropriate Technology Exhibitions, Organisation of Quality Dyeing Training programme, Organisation of workshop on awareness / senstisation (iii) Marketing Support like Organisation of Expos- Silk Fab,Wool Fab and Establishment of marketing complexes etc.
The Company is engaged in Supply of Yarn, Dyes Chemical and Fabrics from its 32 operating units. The physical performance of Company for last three years is given below:Main Product/s Units 2010-11 2009-10 2008-09Yarn Kgs 120157 98704 79852Dyes & chemical Kgs 2280 2906 2549Fabrics Quantity 44 232 275Yarn Kgs 120157 98704 79852
Strategic IssuesThe othermain objectives of the company are to enlarge
input supplies so as to meet upto 20% of Yarn requirement of Handloom sector by the end of XI plan period subject toavailability of funds under the plan scheme, to enhance its competitive edge in providing quality raw materials i.e. Yarn, Dyes & Chemicals through improved supply chain management. To maintain viability of operations through effective utilization of available resources, to take up development programs so as to contribute to increasing the awareness of schemes / products/ appropriate technology and marketing avenues etc., to continue to act as a channel for routing Central Government funds, loans and grants to Handloom agencies to aid in speedy implementation of programmes for development of the sector, to ensure enhanced contribution from personal through training / counseling and to ensure career progression opportunities.
Performance HighlightsThe operational performance of the company along with
performance indicators and selected financial ratios during theperiod2008-09 to 2010-11 canbe seenon theopposite page.
The Company registered an increase of ` 216.69 crore in total incomeduring2010-11whichwentup to` 1285.14 crore in2010-11from` 1068.45croreduring2009-10.Thenetprofitof the company correspondingly increased to ` 4.32 crore, an increase of ` 1.28 crore over the previous year due to increase in turnover and increase in the coverage.
16.14 National Handloom Development Corporation Ltd.
The domestic market share of the company for yarn supply toHandloomSectorduringtheyear2010-11wasapproximately17.50%.
Human Resource ManagementThe company employed 201 regular employees as on
31.3.2011. The retirement age in the Company is 60 years at Board level and 58 years below board level. It is following IDA 2007 pattern of remuneration. Details of employment in last 3 years are given below:
Particulars 2010-11 2009-10 2008-09Executives including Non-Unionised Supervisors 97 102 106
Non-Executives # 104 105 107Total Employees 201 207 213
# Detail break-up of Non-Executive employees is at Statement no. 25 of volume-I of PE Survey.

391Public Enterprises Survey 2010-2011: Vol-II
National Handloom Development Corporation Ltd. 10-11thFloorVikasDeep22,StationRoadLucknow226019UttarPradesh
Balance Sheet (` in Lakhs)
Particulars 2010-11 2009-10 2008-09
Authorised Capital 2000 2000 2000
(1) Sources Of Fund
(1.1) Shareholders Funds
(A) Paid-Up Capital
Central Govt 1900 1900 1900
Others 0 0 0
(B) Share Application Money 0 0 0
(C) Reserves & Surplus 1446 2371 1098
Total (A) + (B) + (C) 3346 4271 2998
(1.2) Loan Funds
(A) Secured Loans 0 0 3
(B) Unsecured Loans 0 0 0
Total (A) + (B) 0 0 3
(1.3) Deferred Tax Liability 0 0 5
Total (1.1) + (1.2) + (1.3) 3346 4271 3006
(2) Application Of Funds
(2.1) Fixed Assets
(A) Gross Block 456 451 429
(B) Less Depreciation 208 195 200
(C) Net Block (A-B) 248 256 229
(D) Capital Work In Progress 54 0 28
Total (C) + (D) 302 256 257
(2.2) Investment 0 1053 0
(2.3) Current Assets, Loan & Advances
(A) Inventories 177 381 169
(B) Sundry Debtors 8043 9689 4688
(C) Cash & Bank Balances 4197 2350 2825
(D) Other Current Assets 53 30 63
(E) Loan & Advances 2656 3833 2231
Total (A)+ (B)+ (C)+ (D)+ (E) 15126 16283 9976
(2.4) Less:current Liabilities & Provisions
(A) Current Liabilities 11124 12422 6500
(B) Provisions 998 913 727
Total (A+B) 12122 13335 7227
(2.5) Net Current Assets (2.3-2.4) 3004 2948 2749
(2.6) Deferred Revenue / Pre. Expenditure 0 0 0
(2.7) Deferred Tax Asset 40 14 0
(2.8) Profit & Loss Account(Dr) 0 0 0
Total (2.1+2.2+2.5+2.6+2.7+2.8) 3346 4271 3006
Important Indicators 2010-11 2009-10 2008-09
(i) Investment 1900 1900 1900
(ii) Capital Employed 3252 3204 2978
(iii) Net Worth 3346 4271 2998
(iv) Cost of Production 127859 106382 86376
(v) Cost of Sales 127870 106367 86382
(vi) Gross Value Added (At Market Price) - - -
(vii) Total Employees (Other Than Casuals) (Nos.) 201 207 213
(viii) Avg. Monthly Emoluments Per Employee (Rs.) 53109 50765 37989
Profit & Loss Account (` in Lakhs)
Particulars 2010-11 2009-10 2008-09
(1) Income
(A) Sales/Operating Income 128254 106559 86532
(B) Excise Duty 0 0 0
(C) Net Sales (A-B) 128254 106559 86532
(D) Other Income/Receipts 271 271 388
(E) Accretion/Depletion in Stocks -11 15 -6
(I)Total Income (C+D+E) 128514 106845 86914
(2) Expenditure
(A) Purchase of Finished Goods/ Consumption Of Raw Materials 122481 101842 82672
(B) Stores & Spares 0 0 0
(C) Power & Fuel 0 12 10
(D) Manufacturing / Direct / Operating Expenses 3836 3055 2448
(E) Salary, Wages & Benefits / Employee Exp. 1281 1261 971
(F) Other Expenses 205 180 161
(G) Provisions 41 14 98
(II)Total Expenditure (A to G) 127844 106364 86360
(3) Profit Before Dep, Int, Taxes & EP (PBDITEP) (I-II) 670 481 554
(4) Depreciation 15 18 15
(5) Dre/Prel Exp Written Off 0 0 0
(6) Profit Before Int., Taxes & Ep (PBITEP) (3-4-5) 655 463 539
(7) Interest
(A) On Central Government Loans 0 0 0
(B) On Foreign Loans 0 0 0
(C) Others 0 0 1
(D) Less Interest Capitalised 0 0 0
(E) Charged to P & L Account (A+B+C-D) 0 0 1
(8) Profit Before Tax & EP(PBTEP) (6-7E) 655 463 538
(9) Tax Provisions 209 168 139
(10) Net Profit / Loss Before EP (8-9) 446 295 399
(11) Net Extra-Ord. Items 14 -9 5
(12) Net Profit / Loss(-) (10-11) 432 304 394
(13) Dividend Declared 87 61 80
(14) Dividend Tax 14 10 14
(15) Retained Profit (12-13-14) 331 233 300
Financial Ratios 2010-11 2009-10 2008-09
(i) Sales : Capital Employed 3943.85 3325.81 2905.71
(ii) Cost of Sales : Sales 99.7 99.82 99.83
(iii) Salary / Wages : Sales 1 1.18 1.12
(iv) Net Profit : Net Worth 12.91 7.12 13.14
(v) Debt : Equity 0 0 0
(vi) Current Ratio 1.25 1.22 1.38
(vii) Sundry Debtors : Sales (No. of Days) 22.89 33.19 19.77
(viii) Total Inventory : Sales 0.5 1.31 0.71

392 Trading & Marketing Services
www.nehhde.com
North Eastern Handicrafts and Handlooms Development Corporation Ltd. (NEHHDC) was incorporated on 31.3.1977 under the companiesAct, 1956 with an objective to promoteand develop handicrafts and hondlooms in the North Eastern Region.
NEHHDC is a Schedule ‘C’ CPSE in Trading and Marketing services sector unser administrative control of Ministry of Development of North Eastern Region (DONER), with 100% shareholdingbytheGovernmentofIndia.ItsRegisteredOfficeis at Shillong, Meghalaya.
Vision/MissionThe Vision and Mission of the Company is to promote
develop and market the Handloom & Handicraft products of North Eastern Region both within and outside India and provide necessary assistance to artisans & craftsmen of the region in terms of loan technology and training etc.
Industrial / Business OperationsNEHHDC is providing services in the field ofMarketing
of handicrafts and handlooms products through its 5 Emporia located at Kolkata, Bangalore, Guwahati, Shillong, New Delhi and sales promotion office at Chennai. The Corporation alsoconducts North East craft Fairs and exhibitions to promote sales. It also provides training facilities under sponsored programme of theOfficeof theDevelopmentCommissioner (Handicrafts),Government of India, M/o Textiles etc. The physical performances of the company for last three years are given below:Main Serviuces Unit Performance During
2010-11 2009-10 2008-09Purchases:
Handicrafts ` in Crore 7.63 6.65 4.55
Handlooms ` in Crore 5.94 4.79 4.52
Sales:Handicrafts ` in Crore 10.17 8.56 6.70
Handlooms ` in Crore 7.04 6.08 5.47
Strategic IssuesThe company is expected to earn profit in the near
future.
Performance HighlightsThe operational performance of the company along with
performance indicators and selected financial ratios during theperiod2008-09 to 2010-11 canbe seenon theopposite page.
The Company registered an increase of ` 2.59 crore in totalincomeduring2010-11whichwentupto` 17.47 crore in 2010-11from` 14.88croreduring2009-10.Thenetlossofthecompany correspondingly reduced to ` 1.74 crore, a reduction of ` 0.08 crore over the previous year loss of ` 1.82 crore.
The company has set up a Handicraft Design Bank and a Museum at Guwahati.
Human Resource ManagementThe company employed 110 regular employees as on
31.3.2011. The retirement age in the company is 60 years. It is following IDA 1992 and CDA 1996 pattern of remuneration.
16.15 North Eastern Handicrafts and Handlooms Development Corporation Ltd.
Details of employment in last 3 years are given below:Particulars 2010-11 2009-10 2008-09
Executives including Non-Unionised Supervisors 9 10 12
Non-Executives # 101 106 107Total Employees 110 116 119
# Detail break-up of Non-Executive employees is at Statement no. 25 of volume-I of PE Survey.
Technology Up-gradation, Research and Development
The corporation is currently implementing one Research andDevelopmentProject onArtisticTextiles ofAssam.

393Public Enterprises Survey 2010-2011: Vol-II
North Eastern Handicrafts and Handlooms Development Corporation Ltd.C/oPurbashreeEmporium,PoliceBazarShillong,Meghalaya - 793001
Balance Sheet (` in Lakhs)
Particulars 2010-11 2009-10 2008-09
Authorised Capital 200 200 200
(1) Sources Of Fund
(1.1) Shareholders Funds
(A) Paid-Up Capital
Central Govt 200 200 200
Others 0 0 0
(B) Share Application Money 0 0 0
(C) Reserves & Surplus 239 239 239
Total (A) + (B) + (C) 439 439 439
(1.2) Loan Funds
(A) Secured Loans 0 0 33
(B) Unsecured Loans 3402 3202 3002
Total (A) + (B) 3402 3202 3035
(1.3) Deferred Tax Liability 0 0 0
Total (1.1) + (1.2) + (1.3) 3841 3641 3474
(2) Application Of Funds
(2.1) Fixed Assets
(A) Gross Block 125 104 158
(B) Less Depreciation 76 70 122
(C) Net Block (A-B) 49 34 36
(D) Capital Work In Progress 0 0 0
Total (C) + (D) 49 34 36
(2.2) Investment 0 0 0
(2.3) Current Assets, Loan & Advances
(A) Inventories 144 132 139
(B) Sundry Debtors 9 10 11
(C) Cash & Bank Balances 41 110 80
(D) Other Current Assets 7 12 7
(E) Loan & Advances 479 483 384
Total (A)+ (B)+ (C)+ (D)+ (E) 680 747 621
(2.4) Less:current Liabilities & Provisions
(A) Current Liabilities 212 291 151
(B) Provisions 0 0 0
Total (A+B) 212 291 151
(2.5) Net Current Assets (2.3-2.4) 468 456 470
(2.6) Deferred Revenue / Pre. Expenditure 0 0 0
(2.7) Deferred Tax Asset 0 0 0
(2.8) Profit & Loss Account(Dr) 3324 3151 2968
Total (2.1+2.2+2.5+2.6+2.7+2.8) 3841 3641 3474
Important Indicators 2010-11 2009-10 2008-09
(i) Investment 3602 3402 3202
(ii) Capital Employed 517 490 506
(iii) Net Worth -2885 -2712 -2529
(iv) Cost of Production 1919 1670 1379
(v) Cost of Sales 1907 1677 1433
(vi) Gross Value Added (At Market Price) - - -
(vii) Total Employees (Other Than Casuals) (Nos.) 110 116 119
(viii) Avg. Monthly Emoluments Per Employee (Rs.) 17727 16020 14286
Profit & Loss Account (` in Lakhs)
Particulars 2010-11 2009-10 2008-09
(1) Income
(A) Sales/Operating Income 1727 1463 1217
(B) Excise Duty 0 0 0
(C) Net Sales (A-B) 1727 1463 1217
(D) Other Income/Receipts 8 32 18
(E) Accretion/Depletion in Stocks 12 -7 -54
(I)Total Income (C+D+E) 1747 1488 1181
(2) Expenditure
(A) Purchase of Finished Goods/ Consumption Of Raw Materials 1362 1144 908
(B) Stores & Spares 0 0 0
(C) Power & Fuel 7 6 6
(D) Manufacturing / Direct / Operating Expenses 26 25 18
(E) Salary, Wages & Benefits / Employee Exp. 234 223 204
(F) Other Expenses 285 268 239
(G) Provisions 0 0 0
(II)Total Expenditure (A to G) 1914 1666 1375
(3) Profit Before Dep, Int, Taxes & EP (PBDITEP) (I-II) -167 -178 -194
(4) Depreciation 5 4 4
(5) Dre/Prel Exp Written Off 0 0 0
(6) Profit Before Int., Taxes & Ep (PBITEP) (3-4-5) -172 -182 -198
(7) Interest
(A) On Central Government Loans 0 0 0
(B) On Foreign Loans 0 0 0
(C) Others 0 0 0
(D) Less Interest Capitalised 0 0 0
(E) Charged to P & L Account (A+B+C-D) 0 0 0
(8) Profit Before Tax & EP(PBTEP) (6-7E) -172 -182 -198
(9) Tax Provisions 0 0 0
(10) Net Profit / Loss Before EP (8-9) -172 -182 -198
(11) Net Extra-Ord. Items 2 0 3
(12) Net Profit / Loss(-) (10-11) -174 -182 -201
(13) Dividend Declared 0 0 0
(14) Dividend Tax 0 0 0
(15) Retained Profit (12-13-14) -174 -182 -201
Financial Ratios 2010-11 2009-10 2008-09
(i) Sales : Capital Employed 334.04 298.57 240.51
(ii) Cost of Sales : Sales 110.42 114.63 117.75
(iii) Salary / Wages : Sales 13.55 15.24 16.76
(iv) Net Profit : Net Worth - - -
(v) Debt : Equity 7.75 7.29 6.91
(vi) Current Ratio 3.21 2.57 4.11
(vii) Sundry Debtors : Sales (No. of Days) 1.9 2.49 3.3
(viii) Total Inventory : Sales 30.43 32.93 41.69

394 Trading & Marketing Services
www.neramac.com
North-EasternRegionalAgriculturalMarketingCorporationLimited (NERAMAC) was incorporated on 31.03.1982 with the objectivetopurchasethemarketablesurplusoffruitandvegetablein the North Eastern Region to the maximum possible extent through a network of centers and to make necessary arrangement for its processing and marketing.
NERAMAC is a Schedule ‘C’BIFR referred CPSE in Trading & Marketing sector under the administrative control of Ministry of Development of North Eastern Region with 100% shareholding by the Government of India. Its Registered and Corporate Offices are at Guwahati,Assam. BIFR declared thecompany ‘no longer sick’ after its net worth become positive.
Vision / MissionThe Mission / Vision of the company is to contribute
significantlyfortheagro-horticulturaldevelopmentoftheregionby procuring, processing and marketing of at least 50% of the surplus production of agro-horticultural produces that farmersfind difficult tomarket likeGinger, Pineapple,Orange,Apple,Kiwi etc by the year 2015.
Industrial / Business OperationsNERAMAC is mainly involved in trading and marketing of
freshagro-horticultureproducealongwithprocessingofpineappleand cashew and retail vending of processed food items through its 3 operating units at Nalkata, Agartala (Tripura) and Byrnihat (Meghalaya).BesidesRegistered /HeadOffice, it has 5ZonalOfficesinAssam,Tripura,Meghalaya,NagalandandSikkim,2sales outlets at Guwahati and Agartala and one Franchise outlet at Guwahati. The physical performances of the company for last three years are given below:Main Products / Services
Unit Performance During (% capacity utilization)
2010-11 2009-10 2008-09Cashew Nut MT 11.25
(7)11.20
(7)15.20 (10)
Fruit Juice Concentration
MT 18.53 (4)
38.35 (9)
27.29 (6)
Procurement & marketing
` in crores
100.99 88.98 -
Strategic issueThe company aims to help farmers to obtain remunerative
price for their produces by procuring the surplus production directlyfromfarmersthroughCo-operativesorfarmerSocietiesand thus eliminating the middlemen by creating backward and forward linkages.
Performance HighlightsThe operational performance of the company along with
performance indicators and selected financial ratios during theperiod2008-09 to 2010-11 canbe seenon theopposite page.
The Company registered an increase of ` 11.75 crore in total income during 2010-11whichwent up to ` 102.43 crore in 2010-11 from ` 90.68 crore during 2009-10. The net profitof the company correspondingly increased to ` 1.47 crore, an increase of ` 0.35 crore over the previous year due to reduction in expenditure and increase in turnover.
The capacity utilization by the company in respect of Pineapple Juice and Cashew Nut was only 4% and 7% respectively during the year 2010-11. The main thrust of thecorporation is the procurement and marketing activities.
16.16 North-Eastern Regional Agricultural Marketing Corporation Limited
Human Resource ManagementThe company employed 95 regular employees as on
31.3.2011. The retirement age in the company is 60 years. It is following IDA 1997 and CDA 1996 pattern of remuneration. Details of employment in last 3 years are given below:
Particulars 2010-11 2009-10 2008-09Executives including Non-Unionised Supervisors 59 13 39
Non-Executives # 36 79 60Total Employees 95 92 99
# Detail break-up of Non-Executive employees is at Statement no. 25 of volume-I of PE Survey.
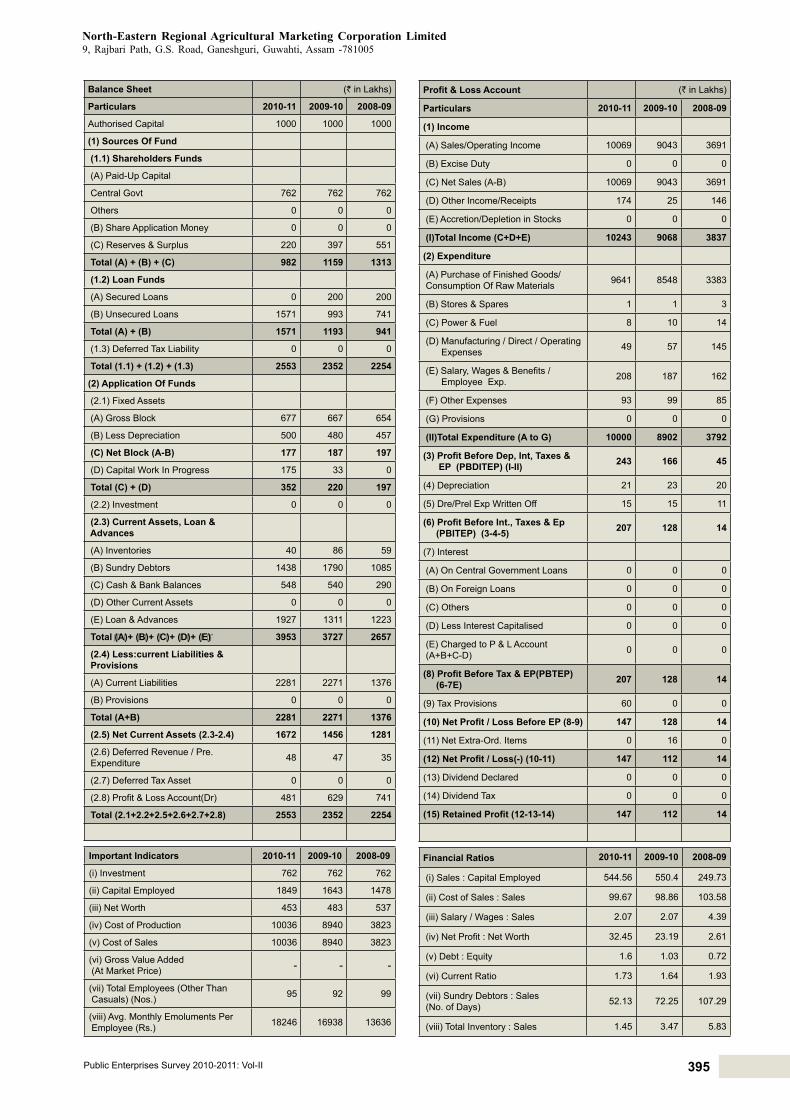
395Public Enterprises Survey 2010-2011: Vol-II
North-Eastern Regional Agricultural Marketing Corporation Limited 9,RajbariPath,G.S.Road,Ganeshguri,Guwahti,Assam -781005
Balance Sheet (` in Lakhs)
Particulars 2010-11 2009-10 2008-09
Authorised Capital 1000 1000 1000
(1) Sources Of Fund
(1.1) Shareholders Funds
(A) Paid-Up Capital
Central Govt 762 762 762
Others 0 0 0
(B) Share Application Money 0 0 0
(C) Reserves & Surplus 220 397 551
Total (A) + (B) + (C) 982 1159 1313
(1.2) Loan Funds
(A) Secured Loans 0 200 200
(B) Unsecured Loans 1571 993 741
Total (A) + (B) 1571 1193 941
(1.3) Deferred Tax Liability 0 0 0
Total (1.1) + (1.2) + (1.3) 2553 2352 2254
(2) Application Of Funds
(2.1) Fixed Assets
(A) Gross Block 677 667 654
(B) Less Depreciation 500 480 457
(C) Net Block (A-B) 177 187 197
(D) Capital Work In Progress 175 33 0
Total (C) + (D) 352 220 197
(2.2) Investment 0 0 0
(2.3) Current Assets, Loan & Advances
(A) Inventories 40 86 59
(B) Sundry Debtors 1438 1790 1085
(C) Cash & Bank Balances 548 540 290
(D) Other Current Assets 0 0 0
(E) Loan & Advances 1927 1311 1223
Total (A)+ (B)+ (C)+ (D)+ (E) 3953 3727 2657
(2.4) Less:current Liabilities & Provisions
(A) Current Liabilities 2281 2271 1376
(B) Provisions 0 0 0
Total (A+B) 2281 2271 1376
(2.5) Net Current Assets (2.3-2.4) 1672 1456 1281
(2.6) Deferred Revenue / Pre. Expenditure 48 47 35
(2.7) Deferred Tax Asset 0 0 0
(2.8) Profit & Loss Account(Dr) 481 629 741
Total (2.1+2.2+2.5+2.6+2.7+2.8) 2553 2352 2254
Important Indicators 2010-11 2009-10 2008-09
(i) Investment 762 762 762
(ii) Capital Employed 1849 1643 1478
(iii) Net Worth 453 483 537
(iv) Cost of Production 10036 8940 3823
(v) Cost of Sales 10036 8940 3823
(vi) Gross Value Added (At Market Price) - - -
(vii) Total Employees (Other Than Casuals) (Nos.) 95 92 99
(viii) Avg. Monthly Emoluments Per Employee (Rs.) 18246 16938 13636
Profit & Loss Account (` in Lakhs)
Particulars 2010-11 2009-10 2008-09
(1) Income
(A) Sales/Operating Income 10069 9043 3691
(B) Excise Duty 0 0 0
(C) Net Sales (A-B) 10069 9043 3691
(D) Other Income/Receipts 174 25 146
(E) Accretion/Depletion in Stocks 0 0 0
(I)Total Income (C+D+E) 10243 9068 3837
(2) Expenditure
(A) Purchase of Finished Goods/ Consumption Of Raw Materials 9641 8548 3383
(B) Stores & Spares 1 1 3
(C) Power & Fuel 8 10 14
(D) Manufacturing / Direct / Operating Expenses 49 57 145
(E) Salary, Wages & Benefits / Employee Exp. 208 187 162
(F) Other Expenses 93 99 85
(G) Provisions 0 0 0
(II)Total Expenditure (A to G) 10000 8902 3792
(3) Profit Before Dep, Int, Taxes & EP (PBDITEP) (I-II) 243 166 45
(4) Depreciation 21 23 20
(5) Dre/Prel Exp Written Off 15 15 11
(6) Profit Before Int., Taxes & Ep (PBITEP) (3-4-5) 207 128 14
(7) Interest
(A) On Central Government Loans 0 0 0
(B) On Foreign Loans 0 0 0
(C) Others 0 0 0
(D) Less Interest Capitalised 0 0 0
(E) Charged to P & L Account (A+B+C-D) 0 0 0
(8) Profit Before Tax & EP(PBTEP) (6-7E) 207 128 14
(9) Tax Provisions 60 0 0
(10) Net Profit / Loss Before EP (8-9) 147 128 14
(11) Net Extra-Ord. Items 0 16 0
(12) Net Profit / Loss(-) (10-11) 147 112 14
(13) Dividend Declared 0 0 0
(14) Dividend Tax 0 0 0
(15) Retained Profit (12-13-14) 147 112 14
Financial Ratios 2010-11 2009-10 2008-09
(i) Sales : Capital Employed 544.56 550.4 249.73
(ii) Cost of Sales : Sales 99.67 98.86 103.58
(iii) Salary / Wages : Sales 2.07 2.07 4.39
(iv) Net Profit : Net Worth 32.45 23.19 2.61
(v) Debt : Equity 1.6 1.03 0.72
(vi) Current Ratio 1.73 1.64 1.93
(vii) Sundry Debtors : Sales (No. of Days) 52.13 72.25 107.29
(viii) Total Inventory : Sales 1.45 3.47 5.83

396 Trading & Marketing Services
www.ntpc.co.in
NTPC Vidyut Vyapar Nigam Ltd. (NVVN) was incorporated in 2003 as a wholly owned subsidiary of NTPC Ltd. with the objectivetoundertakebusinessofsaleandpurchaseofelectricpower, to effectively utilise installed capacity and thus enable reduction in the cost of power. The company was granted category ‘I’ Trading License by Central Electricity Regulatory Commission (CERC), the highest category of license.
NVVNisanun-categarisedCPSEinTrading&Marketingsector under the administrative control of M/o Power with its Registered andCorporate offices atNewDelhi.
Vision/MissionThe Vision of the company is to be a catalyst in development
of wholesale power market in India enabling trading of surplus power.
The Mission of the company is to provide good value to potential sellers and develop commercial arrangement for their surplus power, provide viable alternative to buyers and enable NTPC to maintain optimal generation level through mutually beneficial trading transactions.
Industrial / Business OperationsNVVN is involved in the business of power trading and
ash trading. NVVN is actively involved in facilitating the development of a wholesale electricity market in India. The physical performance of company during last 3 years are mentioned below: Main Product / Services
Unit Performance During2010-11 2009-10 2008-09
Power Trading MUs 6933 5549 4831
Fly Ash MT N.A. 759056 634768
N.A. – Not Available
Strategic IssuesThe Government has approved the Jawaharlal Nehru
National Solar Mission in November, 2009, with an aim to have capacity of 20000 MW of solar power by 2022, with immediatetargetfor1000MWby2013forphase-I.GovernmenthasdesignatedNVVNasaNodalAgencyforfirstphaseoftheNationalSolarMission for 2009-13.
Performance HighlightsThe operational performance of the company along with
performance indicators and selected financial ratios during theperiod2008-09 to 2010-11 canbe seenon theopposite page.
The Company registered a reduction of ` 6.18 crore in total income during 2010-11 which went down to ` 78.95 crore in 2010-11 from ` 85.13 crore during 2009-10. The net profit ofthe company however increased to ` 30.06 crore, an increase of ` 1.67 crore over the previous year due to reduction in other expenditure.
16.17 NTPC Vidyut Vyapar Nigam Ltd.Human Resource Management
The company employed 53 regular employees as on 31.3.2011. The retirement age in the company is 60 years. It is following IDA 2007 pattern of remuneration. Details of employment in last 3 years are given below:
Particulars 2010-11 2009-10 2008-09Executives including Non-Unionised Supervisors 52 39 34
Non-Executives # 1 1 1Total Employees 53 40 35
#Detailbreak-up of Non-Executive employees is at Statement no. 25 of volume-I of PE Survey.

397Public Enterprises Survey 2010-2011: Vol-II
NTPC Vidyut Vyapar Nigam Ltd.NTPCBhawan,SCOPEComplex, 7, InstitutionalArea,LodhiRoadNewDelhi-110003
Balance Sheet (` in Lakhs)
Particulars 2010-11 2009-10 2008-09
Authorised Capital 2000 2000 2000
(1) Sources Of Fund
(1.1) Shareholders Funds
(A) Paid-Up Capital
Central Govt 0 0 0
Others 2000 2000 2000
(B) Share Application Money 0 0 0
(C) Reserves & Surplus 8891 7628 5955
Total (A) + (B) + (C) 10891 9628 7955
(1.2) Loan Funds
(A) Secured Loans 0 0 0
(B) Unsecured Loans 5896 1062 0
Total (A) + (B) 5896 1062 0
(1.3) Deferred Tax Liability 1 2 2
Total (1.1) + (1.2) + (1.3) 16788 10692 7957
(2) Application Of Funds
(2.1) Fixed Assets
(A) Gross Block 65 61 43
(B) Less Depreciation 37 32 25
(C) Net Block (A-B) 28 29 18
(D) Capital Work In Progress 0 0 0
Total (C) + (D) 28 29 18
(2.2) Investment 0 0 0
(2.3) Current Assets, Loan & Advances
(A) Inventories 2 6 17
(B) Sundry Debtors 11755 9307 6209
(C) Cash & Bank Balances 14471 11222 12165
(D) Other Current Assets 321 182 343
(E) Loan & Advances 424 246 34
Total (A)+ (B)+ (C)+ (D)+ (E) 26973 20963 18768
(2.4) Less:current Liabilities & Provisions
(A) Current Liabilities 8457 9123 9852
(B) Provisions 1756 1177 977
Total (A+B) 10213 10300 10829
(2.5) Net Current Assets (2.3-2.4) 16760 10663 7939
(2.6) Deferred Revenue / Pre. Expenditure 0 0 0
(2.7) Deferred Tax Asset 0 0 0
(2.8) Profit & Loss Account(Dr) 0 0 0
Total (2.1+2.2+2.5+2.6+2.7+2.8) 16788 10692 7957
Important Indicators 2010-11 2009-10 2008-09
(i) Investment 2000 2000 2000
(ii) Capital Employed 16788 10692 7957
(iii) Net Worth 10891 9628 7955
(iv) Cost of Production 3382 4205 4554
(v) Cost of Sales 3382 4205 4554
(vi) Gross Value Added (At Market Price) - - -
(vii) Total Employees (Other Than Casuals) (Nos.) 53 40 35
(viii) Avg. Monthly Emoluments Per Employee (Rs.) 90252 135625 141190
Profit & Loss Account (` in Lakhs)
Particulars 2010-11 2009-10 2008-09
(1) Income
(A) Sales/Operating Income 2812 3563 6859
(B) Excise Duty 0 0 0
(C) Net Sales (A-B) 2812 3563 6859
(D) Other Income/Receipts 5083 4950 5247
(E) Accretion/Depletion in Stocks 0 0 0
(I)Total Income (C+D+E) 7895 8513 12106
(2) Expenditure
(A) Purchase of Finished Goods/ Consumption Of Raw Materials 0 5 24
(B) Stores & Spares 0 0 0
(C) Power & Fuel 15 9 6
(D) Manufacturing / Direct / Operating Expenses 2506 92 74
(E) Salary, Wages & Benefits / Employee Exp. 574 651 593
(F) Other Expenses 261 3437 3831
(G) Provisions 0 0 0
(II)Total Expenditure (A to G) 3356 4194 4528
(3) Profit Before Dep, Int, Taxes & EP (PBDITEP) (I-II) 4539 4319 7578
(4) Depreciation 6 7 7
(5) Dre/Prel Exp Written Off 0 0 0
(6) Profit Before Int., Taxes & Ep (PBITEP) (3-4-5) 4533 4312 7571
(7) Interest
(A) On Central Government Loans 0 0 0
(B) On Foreign Loans 0 0 0
(C) Others 20 4 19
(D) Less Interest Capitalised 0 0 0
(E) Charged to P & L Account (A+B+C-D) 20 4 19
(8) Profit Before Tax & EP(PBTEP) (6-7E) 4513 4308 7552
(9) Tax Provisions 1507 1469 2571
(10) Net Profit / Loss Before EP (8-9) 3006 2839 4981
(11) Net Extra-Ord. Items 0 0 28
(12) Net Profit / Loss(-) (10-11) 3006 2839 4953
(13) Dividend Declared 1500 1000 1000
(14) Dividend Tax 243 166 170
(15) Retained Profit (12-13-14) 1263 1673 3783
Financial Ratios 2010-11 2009-10 2008-09
(i) Sales : Capital Employed 16.75 33.32 86.2
(ii) Cost of Sales : Sales 120.27 118.02 66.39
(iii) Salary / Wages : Sales 20.41 18.27 8.65
(iv) Net Profit : Net Worth 27.6 29.49 62.26
(v) Debt : Equity 0.54 0.11 0
(vi) Current Ratio 2.64 2.04 1.73
(vii) Sundry Debtors : Sales (No. of Days) 1525.81 953.43 330.41
(viii) Total Inventory : Sales 0.26 0.61 0.9

398 Trading & Marketing Services
www.www. peclimited.com
PEC Ltd. was incorporated in April 1971 as Public Sector Undertaking under Ministry of Commerce & Industry, Govt. of India. The company is engaged in export of engineering equipment and projects specially from small and mediumenterprises, besides export and import of bulk items viz. agro commodities, edible oil, bullion, industrial raw materials, domestic trade, etc.
PEC is a Schedule – B / Miniratna CPSE in Trading and Marketing Services under Ministry of Commerce & Industry with 100%shareholdingbytheGovernment.TheRegisteredOfficeoftheCompanyis locatedatNewDelhihaving14branchofficesin allmajor cities andports of India.
Vision / MissionThe Mission of the Company are to trade in the international
and domestic market in a manner to create an image of quality, reliability, ethical values and sustained long term relationship with the customers and other business partners by export of engineering projects and equipment specially from small andmedium enterprises; and export and import and domestic trade of commodities, raw materials and bullion etc. and develop new products and new markets and to serve as an effective instrument of public policy and social responsibility.
Industrial / Business OperationsPEC is one of the pioneering enterprises providing
services in the field of export of projects, equipment, capitalgoods, agricultural commodities, import & domestic trading of agricultural commodities, industrial raw materials and import of bullion.
The scope of PEC’s business activity not only covers export and import but also structuring of Special Trading Arrangements, counter trade transactions, third country trading and domestic marketing. The physical performances of the company for last three years are given below:Main Services Unit Performance During
2010-11 2009-10 2008-09Export ` crore 1136.25 1254.91 1261.78
Import ` crore 7906.80 8881.57 8520.28
Domestic ` crore 926.89 889.46 492.72
TOTAL ` crore 9969.94 11025.94 10274.78
Strategic issuePEC continues with its commitment to promote export of
engineering and manufactured goods. Over the years, business of PEC has changed with industrial raw materials, commodities and bullionconstitutingmajorpartof its turnoverandprofit.Someof the key initiatives have been consolidation of existing line of business and selective diversification into sustainable businessareas, improvingoperational efficiency and cost effectiveness.
PEC continues to strive in its efforts to capture new opportunities in international as well as domestic trade to sustain. PEC looks forward optimistically to achieve higher targets in future.
With view to leverage, PEC’s core competency in trade related services a feasibility study was conducted on ware housing facility at port area during the year. Visakhapatnam and Kota were shortlisted.
PEC is committed to technological improvement. Networking through computers within the organization has been undertaken to implement commercial and accounting automation and achieve efficiency in operations.
16.18 PEC Ltd.Performance Highlights
The operational performance of the company along with performance indicators and selected financial ratios during theperiod2008-09 to 2010-11 canbe seenon theopposite page.
The Company registered a reduction of ` 142.89 crore in total income during 2010-11 which went down to ` 11260.31 crore in 2010-11 from ` 11403.20 crore during 2009-10 dueto intense competition in its trade activities , both from local aswell as international players.Thenet profit of the companyhowever increased to ` 70.92 crore, an increase of ` 3.20 crore over the previous year due to optimum utilization of available resources..
Human Resource ManagementThe company employed 193 regular employees as on
31.3.2011. The retirement age in the company is 60 years. It is following IDA 2007 pattern of remuneration. Details of employment in last 3 years are given below:
Particulars 2010-11 2009-10 2008-09Executives including Non-Unionised Supervisors 161 163 161
Non-Executives # 32 34 36Total Employees 193 197 197
# Detail break-up of Non-Executive employees is at Statement no. 25 of volume-I of PE Survey.

399Public Enterprises Survey 2010-2011: Vol-II
PEC Ltd.Hansalaya, 15 Barakhamba Road, New Delhi
Balance Sheet (` in Lakhs)
Particulars 2010-11 2009-10 2008-09
Authorised Capital 3000 3000 3000
(1) Sources Of Fund
(1.1) Shareholders Funds
(A) Paid-Up Capital
Central Govt 2000 2000 2000
Others 0 0 0
(B) Share Application Money 0 0 0
(C) Reserves & Surplus 26551 21203 16069
Total (A) + (B) + (C) 28551 23203 18069
(1.2) Loan Funds
(A) Secured Loans 13400 6800 5
(B) Unsecured Loans 6000 16000 0
Total (A) + (B) 19400 22800 5
(1.3) Deferred Tax Liability 0 0 0
Total (1.1) + (1.2) + (1.3) 47951 46003 18074
(2) Application Of Funds
(2.1) Fixed Assets
(A) Gross Block 596 561 549
(B) Less Depreciation 511 460 432
(C) Net Block (A-B) 85 101 117
(D) Capital Work In Progress 0 0 0
Total (C) + (D) 85 101 117
(2.2) Investment 40 40 0
(2.3) Current Assets, Loan & Advances
(A) Inventories 147429 88737 117494
(B) Sundry Debtors 281685 308102 253972
(C) Cash & Bank Balances 31177 32383 44557
(D) Other Current Assets 0 0 0
(E) Loan & Advances 131845 121788 84556
Total (A)+ (B)+ (C)+ (D)+ (E) 592136 551010 500579
(2.4) Less:current Liabilities & Provisions
(A) Current Liabilities 543666 503682 480814
(B) Provisions 1743 2531 2490
Total (A+B) 545409 506213 483304
(2.5) Net Current Assets (2.3-2.4) 46727 44797 17275
(2.6) Deferred Revenue / Pre. Expenditure 0 0 0
(2.7) Deferred Tax Asset 1099 1065 682
(2.8) Profit & Loss Account(Dr) 0 0 0
Total (2.1+2.2+2.5+2.6+2.7+2.8) 47951 46003 18074
Important Indicators 2010-11 2009-10 2008-09
(i) Investment 2000 2000 2000
(ii) Capital Employed 46812 44898 17392
(iii) Net Worth 28551 23203 18069
(iv) Cost of Production 1115375 1130024 1121890
(v) Cost of Sales 1056683 1158782 1109362
(vi) Gross Value Added (At Market Price) - - -
(vii) Total Employees (Other Than Casuals) (Nos.) 193 197 197
(viii) Avg. Monthly Emoluments Per Employee (Rs.) 115242 84941 105626
Profit & Loss Account (` in Lakhs)
Particulars 2010-11 2009-10 2008-09
(1) Income
(A) Sales/Operating Income 996994 1102594 1027478
(B) Excise Duty 0 0 0
(C) Net Sales (A-B) 996994 1102594 1027478
(D) Other Income/Receipts 70345 66484 93112
(E) Accretion/Depletion in Stocks 58692 -28758 12528
(I)Total Income (C+D+E) 1126031 1140320 1133118
(2) Expenditure
(A) Purchase of Finished Goods/ Consumption Of Raw Materials 1059868 1078380 1038495
(B) Stores & Spares 0 0 0
(C) Power & Fuel 29 30 30
(D) Manufacturing / Direct / Operating Expenses 13911 14677 6238
(E) Salary, Wages & Benefits / Employee Exp. 2669 2008 2497
(F) Other Expenses 38824 33787 74568
(G) Provisions 18 1085 5
(II)Total Expenditure (A to G) 1115319 1129967 1121833
(3) Profit Before Dep, Int, Taxes & EP (PBDITEP) (I-II) 10712 10353 11285
(4) Depreciation 56 57 57
(5) Dre/Prel Exp Written Off 0 0 0
(6) Profit Before Int., Taxes & Ep (PBITEP) (3-4-5) 10656 10296 11228
(7) Interest
(A) On Central Government Loans 0 0 0
(B) On Foreign Loans 0 0 0
(C) Others 0 0 0
(D) Less Interest Capitalised 0 0 0
(E) Charged to P & L Account (A+B+C-D) 0 0 0
(8) Profit Before Tax & EP(PBTEP) (6-7E) 10656 10296 11228
(9) Tax Provisions 3564 3517 4009
(10) Net Profit / Loss Before EP (8-9) 7092 6779 7219
(11) Net Extra-Ord. Items 0 7 2
(12) Net Profit / Loss(-) (10-11) 7092 6772 7217
(13) Dividend Declared 1500 1400 1500
(14) Dividend Tax 243 238 255
(15) Retained Profit (12-13-14) 5349 5134 5462
Financial Ratios 2010-11 2009-10 2008-09
(i) Sales : Capital Employed 2129.78 2455.78 5907.76
(ii) Cost of Sales : Sales 105.99 105.1 107.97
(iii) Salary / Wages : Sales 0.27 0.18 0.24
(iv) Net Profit : Net Worth 24.84 29.19 39.94
(v) Debt : Equity 0.68 0.98 0
(vi) Current Ratio 1.09 1.09 1.04
(vii) Sundry Debtors : Sales (No. of Days) 103.13 101.99 90.22
(viii) Total Inventory : Sales 53.97 29.38 41.74

400 Trading & Marketing Services
www.stc.gov.in
State Trading Corporation of India Ltd. (STC) was incorporated in 1956 under the Companies Act, 1956 with primaryobjective to tradewithEastEuropeancountriesand tosupplement the efforts of private trade and industry in developing exports from the country.
It is a Schedule –‘A’, Mini-ratna listed CPSE in Tradingand Marketing Syndicate under the administrative control of Ministry of Commerce and Industry, Department of Commerce with 91.023% shareholding by the Government of India. It’s registered and corporate office is atNewDelhi.
Vision/MissionThe mission of the company is to emerge as one of the
largest global trading companies with international standards of excellence nurturing a blend of quality, business ethics and proactive enthusiasm to enhance stakeholders’ value. To develop core competencies in selected areas and exploit the market opportunities in these areas to its best advantage is one of the major objectivesofSTC.
Industrial / Business OperationsSTC is involved in exports, imports and domestic trading
activities in a large basket of items through its 13 branch offices, mostly located at major port towns of the country. Ithas one wholly owned subsidiary, namely, STCL Ltd. situated at Bangalore. The company has also formed a Joint Venture namely NSS Satpura Agro Development Co. with NAFED and STCL with a share holding of 25%, 50% and 25% respectively.
The exports of the company include agricultural commodities such as rice, tea, cashew, castor oil, sugar, maize and manufactured products like pharmaceuticals, construction materials, consumer goods, steel raw materials, iron ore, gold jewellery, etc. The Company undertakes imports of bullion,hydrocarbons, minerals, metals, fertilizers, petro-chemicals,edible oils, etc. It also arranges imports of essential items of mass consumption such as wheat, pulses and edible oils to meet domestic shortages as and when called upon by the Govt. of India to do so. It imports crucial raw materials as and when needed by the Indian Industry. It also undertakes import of technical and security equipment on behalf of Forensic Science Laboratories, State Police and Intelligence Departments and Paramilitary Organizations. STC also undertakes counter trade and offset operations against purchases by the Government of India as also third county trading. Besides, exports and imports, STC also undertakes domestic sales of hydrocarbons, metals, tea, pulses,jute,etc.Thesegment-wiseperformanceofthecompanyfor last three years are given below:Main Services
Unit Trading During2010-11 2009-10 2008-09
Imports ` crore 18938 19049 16316
Exports ` crore 492 1504 2132
Domestic Sale ` crore 555 956 1338
Strategic IssuesWith a view to increase its turnover and profitability, the
Corporation has formulated certain strategies. These include enlargementofsupplybasethroughmarketingtie-ups,leveragingimport assistance for generating additional export opportunities, increased participation in tenders under Government of India aid/grant programmes, utilization of port based infrastructure, export of tea under own brand name, undertaking contract farming abroad, domestic trading on STC’s own account in items like
16.19 State Trading Corporation of India Ltd. soya seeds, chana, mustard seeds, etc. In addition, the Corporation shall continue to lay added emphasis on developing business of existingitems,suchas,bullion,coal,fertilizers,ferrous&non-ferrous metals, minerals & ores, edible oils, pulses, etc.
Performance HighlightsThe operational performance of the company along with
performance indicators and selected financial ratios during theperiod2008-09 to 2010-11 canbe seenon theopposite page.
The Company registered an increase of ` 57.58 crore in total incomeduring 2010-11whichwent up to` 21,475.38 crore in 2010-11 from` 21,417.80croreduring2009-10.Thenetprofitof the company however reduced to ` 56.44 crore, a decrease of ` 50.51croreover thepreviousyear’sprofitof` 106.95 due to fall in turnover and increase in other expenses and overheads on account of increase in the salaries and allowances as a result of payment of arrears of perks and allowances and higher interest expenditure due to higher interest rates and delay in payment of dues by the associates etc.
Theturnoverduring2010-11ismainlycontributedbyhighimports of items like bullion, fertilizers, edible oils, pulses, etc. During the year, STC undertook a number of new initiatives to increase its business. These included exports of a number of new items like molasses to Amsterdam & South Korea, transport & construction vehicles to Benin and sesame seeds to Vietnam. It also re-started operations from its office at Bhopal to increasebusiness in agro commodities. The Corporation continued to undertake import of pulses on Govt. directions for sale in the open market and also procured pulses and edible oils on behalf of state governments for distribution under PDS thereby covering weaker sections of the society.
Duringtheyear,STC,forthefirsttime,undertookimportsof manganese ore. The Corporation obtained order for supply of 12 million MT of imported steam coal to NTPC for its various power plants spread across the country. It also signed an agreement with an overseas Government company for exports of tea under STC’s own brand.
Human Resource ManagementThe company employed 864 regular employees as on
31.3.2011. The retirement age in the company is 60 years. It is following IDA 2007 pattern of remuneration. Details of employment in last 3 years are given below:
Particulars 2010-11 2009-10 2008-09Executives including Non-Unionised Supervisors 536 539 518
Non-Executives # 328 353 380Total Employees 864 892 898
#Detailbreak-up of Non-Executive employees is at Statement no. 25 of volume-I of PE Survey.

401Public Enterprises Survey 2010-2011: Vol-II
The State Trading Corporation Of India Ltd. (STC)Jawahar Vyapar Bhavan Tolstoy Marg New Delhi 110001
Balance Sheet (` in Lakhs)
Particulars 2010-11 2009-10 2008-09
Authorised Capital 20000 20000 20000
(1) Sources Of Fund
(1.1) Shareholders Funds
(A) Paid-Up Capital
Central Govt 5461 5461 5461
Others 539 539 539
(B) Share Application Money 0 0 0
(C) Reserves & Surplus 61946 58394 51029
Total (A) + (B) + (C) 67946 64394 57029
(1.2) Loan Funds
(A) Secured Loans 146851 205833 171004
(B) Unsecured Loans 8058 40952 66728
Total (A) + (B) 154909 246785 237732
(1.3) Deferred Tax Liability 0 0 0
Total (1.1) + (1.2) + (1.3) 222855 311179 294761
(2) Application Of Funds
(2.1) Fixed Assets
(A) Gross Block 8979 8915 6216
(B) Less Depreciation 3673 3420 3198
(C) Net Block (A-B) 5306 5495 3018
(D) Capital Work In Progress 337 0 747
Total (C) + (D) 5643 5495 3765
(2.2) Investment 303 303 303
(2.3) Current Assets, Loan & Advances
(A) Inventories 131375 56701 146374
(B) Sundry Debtors 450795 661096 555852
(C) Cash & Bank Balances 73703 48683 65660
(D) Other Current Assets 0 0 0
(E) Loan & Advances 43362 58358 73868
Total (A)+ (B)+ (C)+ (D)+ (E) 699235 824838 841754
(2.4) Less:current Liabilities & Provisions
(A) Current Liabilities 479521 499855 540258
(B) Provisions 9387 26942 16920
Total (A+B) 488908 526797 557178
(2.5) Net Current Assets (2.3-2.4) 210327 298041 284576
(2.6) Deferred Revenue / Pre. Expenditure 0 0 0
(2.7) Deferred Tax Asset 6582 7340 6117
(2.8) Profit & Loss Account(Dr) 0 0 0
Total (2.1+2.2+2.5+2.6+2.7+2.8) 222855 311179 294761
Important Indicators 2010-11 2009-10 2008-09
(i) Investment 6000 6000 6000
(ii) Capital Employed 215633 303536 287594
(iii) Net Worth 67946 64394 57029
(iv) Cost of Production 2139893 2124445 2085928
(v) Cost of Sales 2065161 2214113 2004311
(vi) Gross Value Added (At Market Price) - - -
(vii) Total Employees (Other Than Casuals) (Nos.) 864 892 898
(viii) Avg. Monthly Emoluments Per Employee (Rs.) 101466 82240 74703
Profit & Loss Account (` in Lakhs)
Particulars 2010-11 2009-10 2008-09
(1) Income
(A) Sales/Operating Income 1998484 2150865 1978584
(B) Excise Duty 0 0 25462
(C) Net Sales (A-B) 1998484 2150865 1953122
(D) Other Income/Receipts 74322 80583 66607
(E) Accretion/Depletion in Stocks 74732 -89668 81617
(I)Total Income (C+D+E) 2147538 2141780 2101346
(2) Expenditure
(A) Purchase of Finished Goods/ Consumption Of Raw Materials 2053168 2028387 1884673
(B) Stores & Spares 222 146 378
(C) Power & Fuel 136 147 154
(D) Manufacturing / Direct / Operating Expenses 47018 70282 86394
(E) Salary, Wages & Benefits / Employee Exp. 10520 8803 8050
(F) Other Expenses 10770 3043 93819
(G) Provisions 0 1351 2380
(II)Total Expenditure (A to G) 2121834 2112159 2075848
(3) Profit Before Dep, Int, Taxes & EP (PBDITEP) (I-II) 25704 29621 25498
(4) Depreciation 306 246 238
(5) Dre/Prel Exp Written Off 0 0 0
(6) Profit Before Int., Taxes & Ep (PBITEP) (3-4-5) 25398 29375 25260
(7) Interest
(A) On Central Government Loans 0 0 0
(B) On Foreign Loans 0 0 0
(C) Others 17753 12040 9842
(D) Less Interest Capitalised 0 0 0
(E) Charged to P & L Account (A+B+C-D) 17753 12040 9842
(8) Profit Before Tax & EP(PBTEP) (6-7E) 7645 17335 15418
(9) Tax Provisions 2319 6398 6636
(10) Net Profit / Loss Before EP (8-9) 5326 10937 8782
(11) Net Extra-Ord. Items -318 242 931
(12) Net Profit / Loss(-) (10-11) 5644 10695 7851
(13) Dividend Declared 1800 2850 2850
(14) Dividend Tax 292 479 461
(15) Retained Profit (12-13-14) 3552 7366 4540
Financial Ratios 2010-11 2009-10 2008-09
(i) Sales : Capital Employed 926.8 708.6 679.12
(ii) Cost of Sales : Sales 103.34 102.94 102.62
(iii) Salary / Wages : Sales 0.53 0.41 0.41
(iv) Net Profit : Net Worth 8.31 16.61 13.77
(v) Debt : Equity 2.28 3.83 4.17
(vi) Current Ratio 1.43 1.57 1.51
(vii) Sundry Debtors : Sales (No. of Days) 82.33 112.19 103.88
(viii) Total Inventory : Sales 23.99 9.62 27.35

402 Trading & Marketing Services
www.stclindia.com
STCL Ltd. (STCL) was incorporated on 23.10.1982 (as ‘Cardamom Trading Corporation Ltd.’, which was renamed as ‘Spices Trading Corporation Ltd.’ in 1987 and further renamed as ‘STCLLtd.’, in 2004)with the objective to trade in spicesand agricultural products in domestic and international markets, to process and cure spices and to manufacture spice products and agricultural products of international standards and to carry on domestic and international trade in all kinds of industrial goods, iron ore, bullion, preciousmetals, limestone,met-coke,other minerals, polymer, polyester yarn, cotton yarn and such other textile products, PVC resins, HMS Scraps and other metal scrap.
STCL is a Schedule ‘C’ CPSE in Trading & Marketing sector under the administrative control of Ministry of Commerce and Industry, Department of Commerce. Its Registered and Corporate officesareatBangalore,Karnataka.STCLisa100%subsidiaryof The State Trading Corporation of India Ltd.
Vision/MissionThe Vision / Mission of the Company is to emerge as global
trading company by constantly staying ahead of change in a sustainedmannerbyachievinghigherturnoverandprofitability/ productivity as well as help the growing community (farmers) to realize better price for their produce, which would help them to improve their overall standard of living.
Industrial / Business OperationsSTCL is engaged in trading of spices, agricultural
commodities and supply of agriculture inputs to growers; to conduct Cardamom auctions; to import and export spices, agriculture commodities and other commodities, distribution of spices and spice powders and import and export of industrial inputs including minerals and metals through its 12 branch offices.Thephysicalperformanceofthecompanyforlastthreeyears are given below:Main Services Unit Performance During
2010-11 2009-10 2008-09
Domestic Trading crores N.A. N.A. 382.78
Export Trading crores N.A. N.A. 1722.27
N.A. Not Available
Strategic IssuesSTCL has been recognized as ‘Star Export House’ by the
DGFT based on its exports performance.
Performance HighlightsThe operational performance of the company along with
performance indicators and selected financial ratios during theperiod2008-09 to 2010-11 canbe seenon theopposite page.
The Company registered a reduction of ` 1.76 crore in totalincomeduring2010-11whichwentdownto` 68.87 crore in 2010-11 from` 102.63 crore during 2009-10.However, thecompany incurred a loss of ` 178.02 crores during the year 2010-11 as compared to a loss of ` 443.98 crore during the year 2009-10.
The turnover and profitability of the company during thelast two years is affected on account of facilities having been withdraws by banks in view of development of LC’s under merchanting trade transactions amounting to ` 1,167.48 crore during the year 2008-09. STCL has taken all necessary stepsfor recovery through appropriate agencies including legal course of action, which are in progress.
16.20 STCL Ltd.In view of lack of funds or banking limits, the company
activities during 2010-11 remained confinedmainly to issuingNOC in respect of onion exports and undertaking cardamom auction.
The annual accounts of STCL for 2010-11 are yet to befinalized.
Human Resource ManagementThe company employed 56 regular employees as on
31.3.2011. The retirement age in the company is 60 years. It is following IDA 2007 pattern of remuneration. Details of employment in last 3 years are given below:
Particulars 2010-11 2009-10 2008-09Executives including Non-Unionised Supervisors 19 19 36
Non-Executives # 37 37 27Total Employees 56 56 63
# Detail break-up of Non-Executive employees is at Statement no. 25 of volume-I of PE Survey.

403Public Enterprises Survey 2010-2011: Vol-II
STCL Ltd.166/2, 13th Main Road, Vasanthnagar, Bangalore, Karnataka 560 052
Balance Sheet (` in Lakhs)
Particulars 2010-11 2009-10 2008-09
Authorised Capital 500 500 500
(1) Sources Of Fund
(1.1) Shareholders Funds
(A) Paid-Up Capital
Central Govt 0 0 0
Others 150 150 150
(B) Share Application Money 0 0 0
(C) Reserves & Surplus 1751 801 6961
Total (A) + (B) + (C) 1901 951 7111
(1.2) Loan Funds
(A) Secured Loans 152905 131360 129632
(B) Unsecured Loans 0 0 0
Total (A) + (B) 152905 131360 129632
(1.3) Deferred Tax Liability 0 10 0
Total (1.1) + (1.2) + (1.3) 154806 132321 136743
(2) Application Of Funds
(2.1) Fixed Assets
(A) Gross Block 1381 1352 657
(B) Less Depreciation 406 246 111
(C) Net Block (A-B) 975 1106 546
(D) Capital Work In Progress 26 26 1285
Total (C) + (D) 1001 1132 1831
(2.2) Investment 10 10 10
(2.3) Current Assets, Loan & Advances
(A) Inventories 6 10 9639
(B) Sundry Debtors 181 565 11701
(C) Cash & Bank Balances 3835 1270 695
(D) Other Current Assets 3 3 1803
(E) Loan & Advances 2063 4858 120125
Total (A)+ (B)+ (C)+ (D)+ (E) 6088 6706 143963
(2.4) Less:current Liabilities & Provisions
(A) Current Liabilities 4492 6631 6063
(B) Provisions 1089 3378 3002
Total (A+B) 5581 10009 9065
(2.5) Net Current Assets (2.3-2.4) 507 -3303 134898
(2.6) Deferred Revenue / Pre. Expenditure 0 0 0
(2.7) Deferred Tax Asset 0 0 4
(2.8) Profit & Loss Account(Dr) 153288 134482 0
Total (2.1+2.2+2.5+2.6+2.7+2.8) 154806 132321 136743
Important Indicators 2010-11 2009-10 2008-09
(i) Investment 150 150 150
(ii) Capital Employed 1482 -2197 135444
(iii) Net Worth -151387 -133531 7111
(iv) Cost of Production 24905 56478 223468
(v) Cost of Sales 24909 56528 217343
(vi) Gross Value Added (At Market Price) - - -
(vii) Total Employees (Other Than Casuals) (Nos.) 56 56 63
(viii) Avg. Monthly Emoluments Per Employee (Rs.) 48661 45833 36376
Profit & Loss Account (` in Lakhs)
Particulars 2010-11 2009-10 2008-09
(1) Income
(A) Sales/Operating Income 5799 9295 217044
(B) Excise Duty 0 0 0
(C) Net Sales (A-B) 5799 9295 217044
(D) Other Income/Receipts 1092 1018 2361
(E) Accretion/Depletion in Stocks -4 -50 6125
(I)Total Income (C+D+E) 6887 10263 225530
(2) Expenditure
(A) Purchase of Finished Goods/ Consumption Of Raw Materials 5783 9120 219784
(B) Stores & Spares 0 0 0
(C) Power & Fuel 7 10 4
(D) Manufacturing / Direct / Operating Expenses 5 33 2
(E) Salary, Wages & Benefits / Employee Exp. 327 308 275
(F) Other Expenses 112 297 349
(G) Provisions 3 29384 0
(II)Total Expenditure (A to G) 6237 39152 220414
(3) Profit Before Dep, Int, Taxes & EP (PBDITEP) (I-II) 650 -28889 5116
(4) Depreciation 161 135 48
(5) Dre/Prel Exp Written Off 0 0 0
(6) Profit Before Int., Taxes & Ep (PBITEP) (3-4-5) 489 -29024 5068
(7) Interest
(A) On Central Government Loans 0 0 0
(B) On Foreign Loans 0 0 0
(C) Others 18507 17191 3006
(D) Less Interest Capitalised 0 0 0
(E) Charged to P & L Account (A+B+C-D) 18507 17191 3006
(8) Profit Before Tax & EP(PBTEP) (6-7E) -18018 -46215 2062
(9) Tax Provisions -134 1102 722
(10) Net Profit / Loss Before EP (8-9) -17884 -47317 1340
(11) Net Extra-Ord. Items -82 -2919 -7
(12) Net Profit / Loss(-) (10-11) -17802 -44398 1347
(13) Dividend Declared 0 0 0
(14) Dividend Tax 0 0 0
(15) Retained Profit (12-13-14) -17802 -44398 1347
Financial Ratios 2010-11 2009-10 2008-09
(i) Sales : Capital Employed 391.3 -423.08 160.25
(ii) Cost of Sales : Sales 429.54 608.15 100.14
(iii) Salary / Wages : Sales 5.64 3.31 0.13
(iv) Net Profit : Net Worth - - 18.94
(v) Debt : Equity 80.43 138.13 18.23
(vi) Current Ratio 1.09 0.67 15.88
(vii) Sundry Debtors : Sales (No. of Days) 11.39 22.19 19.68
(viii) Total Inventory : Sales 0.38 0.39 16.21
2010-11 PROVISIONAL

404 Trading & Marketing Services
www.chennaitradecentre.org
Tamil Nadu Trade Promotion Organization (TNTPO) was incorporated on 17.11.2000 as a joint venture between IndiaTrade Promotion Organization (ITPO) and Tamilnadu Industrial Development Corporation Limited (TIDCO) under section 25 of the Companies Act, 1956 with a shareholding pattern of 51% and 49 % respectively making it a subsidiary of ITPO. The objectivewas topromote,organizeandparticipate in industrialtrade and other fairs / exhibitions in India and abroad and to take all measures incidental thereto for promoting Indian industry and trade and enhance its global competitiveness and to organize trade fairs and exhibitions and invite wider participation in export promotion activities like Buyers Sellers Meet, Contact Promotion Programs and India Promotions with Departmental stores.
TNTPO is a Schedule ‘C’ CPSE in Trading & Marketing sector under the Ministry of Commerce and Industry, Department of Commerce. The company is having its registered office atChennai.
Industrial / Business OperationsTNTPO is engaged in promotion of trade and industry
by letting out the exhibition halls and convention centers for Industrial Exhibitions, trade fairs, annual day functions, Award functions, Product launch, Seminars, Conferences and other business functions etc. and also to organize trade fairs and exhibitions in India and abroad and invite wider participation in export promotion activities like Buyer Seller meets; Contact Promotion Programmes; India Promotions with Departments stores such as Product – Specific Promotions, Product Development & Adaptation and undertake market studies to determine the market potential and export promotion measures to tap export opportunities.
TNTPO has a convention centre with facilities of international standards. The Convention Centre at Chennai is a multi-purposehallwith10560sq.mtrsofairconditionedspaceand offers a variety of conferencing and banquet rooms for 250 to1500delegates. It has beendesignedwithultra-modernfacilities like Infrared Digital Interpretation system, theatrical lightingsystem,digitalaudio-videosystem,modernfireprotectionand security system etc.
The physical performances of the company for last three years are given below:Main Services Unit Performance During
2010-11 2009-10 2008-09No. of exhibitions (Both in Convention centre& Halls)
Nos. N.A. 147 148
N.A. Not Available
Performance HighlightsThe operational performance of the company along with
performance indicators and selected financial ratios during theperiod2008-09 to 2010-11 canbe seenon theopposite page.
The Company registered an increase of ` 8.07 crore in total income during 2010-11 which went up to ` 25.09 crore in 2010-11 from ` 17.02 crore during 2009-10. The net profitof the company correspondingly increased to ` 14.32 crore, an increase of ` 13.88 crore over the previous year due to increase in turnover.
The profitability was low in 2009-10 due to provision ofpriorperiodadjustmentof8.13 croremade for lease rent of land tobepaidfrom2001-02to2009-10,pendingresolutionofissues
16.21 Tamil Nadu Trade Promotion Organization
connected with the original arrangements for land.
Human Resource ManagementThe company employed 29regular employees as on
31.3.2011. The retirement age in the company is 60 years. It is following CDA 2006 pattern of remuneration. Details of employment in last 3 years are given below:
Particulars 2010-11 2009-10 2008-09Executives including Non-Unionised Supervisors 6 5 5
Non-Executives # 23 0 0Total Employees 29 5 5
# Detail break-up of Non-Executive employees is at Statement no. 25 of volume-I of PE Survey.

405Public Enterprises Survey 2010-2011: Vol-II
Tamil Nadu Trade Promotion Organization ChennaiTradeCentreComplex,MountPoonamalleRoad,Nandamabkkam,Chennai,TamilNadu-600089
Balance Sheet (` in Lakhs)
Particulars 2010-11 2009-10 2008-09
Authorised Capital 50 50 50
(1) Sources Of Fund
(1.1) Shareholders Funds
(A) Paid-Up Capital
Central Govt 0 0 0
Others 1 1 1
(B) Share Application Money 0 0 0
(C) Reserves & Surplus 6134 4748 4750
Total (A) + (B) + (C) 6135 4749 4751
(1.2) Loan Funds
(A) Secured Loans 0 0 0
(B) Unsecured Loans 2261 2261 2261
Total (A) + (B) 2261 2261 2261
(1.3) Deferred Tax Liability 0 0 0
Total (1.1) + (1.2) + (1.3) 8396 7010 7012
(2) Application Of Funds
(2.1) Fixed Assets
(A) Gross Block 6818 6405 6261
(B) Less Depreciation 1330 1128 933
(C) Net Block (A-B) 5488 5277 5328
(D) Capital Work In Progress 23 51 44
Total (C) + (D) 5511 5328 5372
(2.2) Investment 0 0 0
(2.3) Current Assets, Loan & Advances
(A) Inventories 0 0 0
(B) Sundry Debtors 112 115 139
(C) Cash & Bank Balances 3908 2494 1481
(D) Other Current Assets 0 0 0
(E) Loan & Advances 321 218 231
Total (A)+ (B)+ (C)+ (D)+ (E) 4341 2827 1851
(2.4) Less:current Liabilities & Provisions
(A) Current Liabilities 1451 1141 207
(B) Provisions 6 4 4
Total (A+B) 1457 1145 211
(2.5) Net Current Assets (2.3-2.4) 2884 1682 1640
(2.6) Deferred Revenue / Pre. Expenditure 1 0 0
(2.7) Deferred Tax Asset 0 0 0
(2.8) Profit & Loss Account(Dr) 0 0 0
Total (2.1+2.2+2.5+2.6+2.7+2.8) 8396 7010 7012
Important Indicators 2010-11 2009-10 2008-09
(i) Investment 2262 1 1
(ii) Capital Employed 8372 6959 6968
(iii) Net Worth 6134 4749 4751
(iv) Cost of Production 1083 845 886
(v) Cost of Sales 1083 845 886
(vi) Gross Value Added (At Market Price) - - -
(vii) Total Employees (Other Than Casuals) (Nos.) 29 5 5
(viii) Avg. Monthly Emoluments Per Employee (Rs.) 86207 78333 80000
Profit & Loss Account (` in Lakhs)
Particulars 2010-11 2009-10 2008-09
(1) Income
(A) Sales/Operating Income 2162 1450 1577
(B) Excise Duty 0 0 0
(C) Net Sales (A-B) 2162 1450 1577
(D) Other Income/Receipts 347 252 218
(E) Accretion/Depletion in Stocks 0 0 0
(I)Total Income (C+D+E) 2509 1702 1795
(2) Expenditure
(A) Purchase of Finished Goods/ Consumption Of Raw Materials 0 0 0
(B) Stores & Spares 0 0 0
(C) Power & Fuel 0 201 210
(D) Manufacturing / Direct / Operating Expenses 576 232 208
(E) Salary, Wages & Benefits / Employee Exp. 300 47 48
(F) Other Expenses 1 171 227
(G) Provisions 0 0 0
(II)Total Expenditure (A to G) 877 651 693
(3) Profit Before Dep, Int, Taxes & EP (PBDITEP) (I-II) 1632 1051 1102
(4) Depreciation 206 194 193
(5) Dre/Prel Exp Written Off 0 0 0
(6) Profit Before Int., Taxes & Ep (PBITEP) (3-4-5) 1426 857 909
(7) Interest
(A) On Central Government Loans 0 0 0
(B) On Foreign Loans 0 0 0
(C) Others 0 0 0
(D) Less Interest Capitalised 0 0 0
(E) Charged to P & L Account (A+B+C-D) 0 0 0
(8) Profit Before Tax & EP(PBTEP) (6-7E) 1426 857 909
(9) Tax Provisions 0 0 0
(10) Net Profit / Loss Before EP (8-9) 1426 857 909
(11) Net Extra-Ord. Items -6 813 48
(12) Net Profit / Loss(-) (10-11) 1432 44 861
(13) Dividend Declared 0 0 0
(14) Dividend Tax 0 0 0
(15) Retained Profit (12-13-14) 1432 44 861
Financial Ratios 2010-11 2009-10 2008-09
(i) Sales : Capital Employed 25.82 20.84 22.63
(ii) Cost of Sales : Sales 50.09 58.28 56.18
(iii) Salary / Wages : Sales 13.88 3.24 3.04
(iv) Net Profit : Net Worth 23.35 0.93 18.12
(v) Debt : Equity 0.37 0.48 0.48
(vi) Current Ratio 2.98 2.47 8.77
(vii) Sundry Debtors : Sales (No. of Days) 18.91 28.95 32.17
(viii) Total Inventory : Sales 0 0 0
2010-11 PROVISIONAL

407Public Enterprises Survey 2010-2011: Vol-II
As on 31.3.2011, there were 12 Central Public Sector Enterprises in the Transportation Services group. The name of these enterprises along with their year of incorporation in chronological order are given below :
Sl. No.
Enterprise Year of Incorporation
1. Shipping Corporation Of India Ltd. 1961
2. Central Inland Water Transport Corpn. Ltd. 1967
3. Air India Charters Ltd. 1972
4. Dredging Corpn. of India Ltd. 1977
5. Airline Allied Services Ltd. 1983
6. Pawan Hans Helicopters Ltd. 1985
7. Container Corporation of India Ltd. 1988
8. Airports Authority of India Ltd. 1996
9. Ennore Port Ltd. 1999
10. Air India Air Transport Services Ltd. 2003
11. Fresh & Healthy Enterprises Ltd. 2006
12. Air India Ltd. 2007
2. The enterprises falling in this group are mainly engaged in providing transport by Air, Road and Sea, management of national as well integernational airports, creating and maintaining required depth in ports and rivers, providing helicopter services etc.
3. Theconsolidatedfinancialposition,theworkingresultsand the important management ratios of these enterprises are appended.
4. Turnover : The details of turnover of individual enterprises are given below :
(`in Crore)Sl. No.
Enterprise Turnover
2010-11 2009-10
1. Air India Ltd. 13974.39 13108.62
2. Airports Authority of India Ltd. 5027.71 4129.70
3. Container Corporation of India Ltd. 3828.12 3705.68
4. Shipping Corporation of India Ltd. 3543.42 3463.12
5. Air India Charters Ltd. 1311.28 1345.35
6. Dredging Corpn. of India Ltd. 457.85 645.41
7. Pawan Hans Helicopters Ltd. 386.46 368.52
8. Airline Allied Services Ltd. 290.35 317.29
9. Ennore Port Ltd. 185.14 156.81
10. Fresh & Healthy Enterprises Ltd. 64.35 24.92
11. Air India Air Transport Services Ltd. 48.37 62.01
12. Central Inland Water Transport Corpn. Ltd.
1.50 2.50
Sub Total 29118.94 27329.93
17 Transportation Services5. Net Profit/Loss : The details of the enterprises, which
earnednet profit or sustainednet loss (-) are givenbelow :(`in Crore)
Sl. No.
Enterprise Adjusted Net Profit/Net Loss
2010-11 2009-10
1. Container Corporation Of India Ltd. 875.95 786.69
2. Airports Authority of India Ltd. 712.39 712.29
3. Shipping Corporation of India Ltd. 567.35 376.91
4. Ennore Port Ltd. 55.58 48.66
5. Dredging Corpn. of India Ltd. 39.51 70.05
6. Pawan Hans Helicopters Ltd. 18.51 35.59
7. Fresh & Healthy Enterprises Ltd. 0.42 -9.06
8. Air India Air Transport Services Ltd. -0.18 -0.16
9. Central Inland Water Transport Corpn. Ltd.
-4.68 -1.82
10. Airline Allied Services Ltd. -29.12 -41.54
11. Air India Charters Ltd. -391.22 -360.69
12. Air India Ltd. -6865.17 -5552.44
Sub Total -5020.66 -3935.52
6. Dividend : The details of the dividend declared by the individual enterprise are given below :
(`in Crore)Sl. No.
Enterprise Dividend
2010-11 2009-10
1. Shipping Corporation of India Ltd. 256.19 211.73
2. Container Corporation of India Ltd. 201.48 181.98
3. Airports Authority of India Ltd. 169.30 142.50
4. Ennore Port Ltd. 11.12 9.73
5. Dredging Corpn. of India Ltd. 0.00 8.40
Group Total 638.09 554.34
7. Social Overheads and Township : The total number of persons employed and the expenditure incurred on social overheads and townships are given below :
(`in Crore)Sl. No.
Enterprise Township and Social Overheads
2010-11 2009-10
1. No. of employees (in number) 54844 59012
2. Social overheads : (Rupees in Crore)
(i) Educational, 212.68 270.96
(ii) Medical Facilities 243.52 205.91
(iii) Others 43.34 37.22
3. Capital cost of township (Rupees in Crore)
274.58 276.31
4. No. of houses constructed (in number)
5376 5311
8. Company wise details in respect of Balance Sheet, ProfitandLossaccount,ImportantIndicatorsandFinancialRatiosalong with the write up of individual company are given in the pages below.

408 Transportation Services

409Public Enterprises Survey 2010-2011: Vol-II
Transportation ServicesBalance Sheet
(` in Lakhs)
(` in Lakhs)
Particulars 2010-11 2009-10 2008-09
AUTHORISED CAPITAL 807166 735939 379481
(1) SOURCES OF FUND
(1.1) SHAREHOLDERS FUNDS
(A)PAID-UPCAPITAL
CENTRAL GOVT 365715 243123 158151
OTHERS 52391 34336 33023
(B) SHARE APPLICATION MONEY 0 1500 0
(C) RESERVES & SURPLUS 2048609 1864802 1689081
TOTAL (A) + (B) + (C) 2466715 2143761 1880255
(1.2) LOAN FUNDS
(A) SECURED LOANS 1886791 1276691 803122
(B) UNSECURED LOANS 3395898 3338996 2987521
TOTAL (A) + (B) 5282689 4615687 3790643
(1.3) DEFERRED TAX LIABILITY 76719 28811 26082
TOTAL (1.1) + (1.2) + (1.3) 7826123 6788259 5696980
(2) APPLICATION OF FUNDS
(2.1) FIXED ASSETS
(A) GROSS BLOCK 7020389 6201203 5022428
(B) LESS DEPRECIATION 1901404 1609158 1354216
(C)NETBLOCK(A-B) 5118985 4592045 3668212
(D) CAPITAL WORK IN PROGRESS 804987 811189 994095
TOTAL (C) + (D) 5923972 5403234 4662307
(2.2) INVESTMENT 221253 180505 143852
(2.3) CURRENT ASSETS,LOAN & ADVANCES
(A) INVENTORIES 115660 124812 131383
(B) SUNDRY DEBTORS 492308 450603 427062
(C) CASH & BANK BALANCES 549507 580643 658266
(D) OTHER CURRENT ASSETS 99094 96774 80869
(E) LOAN & ADVANCES 721074 886765 773809
TOTAL (A)+ (B)+ (C)+ (D)+ (E) 1977643 2139597 2071389
(2.4) LESS:CURRENT LIABILITIES & PROVISIONS
(A) CURRENT LIABILITIES 1295402 1198292 1049524
(B) PROVISIONS 742492 756125 598152
TOTAL (A+B) 2037894 1954417 1647676
(2.5)NETCURRENTASSETS(2.3-2.4) -60251 185180 423713
(2.6) DEFERRED REVENUE / PRE.EXPENDITURE 80 154 15953
(2.7) DEFERRED TAX ASSET 305364 306969 335510
(2.8) PROFIT & LOSS ACCOUNT(DR) 1435705 712217 115645
TOTAL (2.1+2.2+2.5+2.6+2.7+2.8) 7826123 6788259 5696980

410 Transportation Services
Transportation ServicesProfit and Loss Account
(` in Lakhs)
(` in Lakhs)
Particulars 2010-11 2009-10 2008-09
(1) INCOME
(A) SALES/OPERATING 2911894 2732993 2756167
(B) EXCISE DUTY 1785 1475 617
(C)NETSALES(A-B) 2910109 2731518 2755550
(D) OTHER INCOME/RECEIPTS 127708 153714 137545
(I)TOTAL INCOME (C+D+E) 3037555 2884795 2893153
(2) EXPENDITURE
(A) PURCHASE OF FINISHED GOODS CONSUMPTION OF RAW MATERIALS 3963 1575 4426
(B) STORES & SPARES 131971 167182 92982
(C) POWER & FUEL 820597 692642 916380
(D) MANUFACTURING / DIRECT / OPERATING EXPENSES 948174 948260 918798
(E)SALARY,WAGES & BENEFITS / EMPLOYEE EXP. 630143 592378 573164
(F)OTHER EXPENSES 126228 194685 323332
(G)PROVISIONS 75664 26473 13907
(II)TOTAL EXPENDITURE (A to G) 2736740 2623195 2842989
(3)PROFITBEFOREDEP.INT.TAXES&EP(PBDITEP)(I-II) 300815 261600 50164
(4) DEPRECIATION 345064 294555 255342
(5) DRE/PREL EXP WRITTEN OFF 7041 8 12
(6)PROFITBEFOREINT.,TAXES&EP(PBITEP)(3-4-5) -51290 -32963 -205190
(7) INTEREST
(A) ON CENTRALGOVERNMENT LOANS 224 477 144
(B) ON FOREIGN LOANS 122368 74777 42658
(C) OTHERS 241058 198250 146516
(D) LESS INTEREST CAPITALISED 0 0 0
(E)CHARGEDTOP&LACCOUNT(A+B+C-D) 363650 273504 189318
(8)PROFIT BEFORE TAX & EP(PBTEP) (6-7E) -414940 -306467 -394508
(9) TAX PROVISIONS 95679 87478 -49989
(10)NETPROFIT/LOSS(-)BEFOREEP(8-9) -510619 -393945 -344519
(11)NETEXTRA-ORD.ITEMS -8553 -393 12032
(12) NET PROFIT / LOSS(-) (10-11) -502066 -393552 -356551
(13) DIVIDEND DECLARED 63809 55434 62622
(14) DIVIDEND TAX 10447 9239 10642
(15) RETAINED PROFIT (12-13-14) -576322 -458225 -429815

411Public Enterprises Survey 2010-2011: Vol-II
Transportation ServicesManagement Ratio
Particulars 2010-11 2009-10 2008-09
(A.) INDICATORS
(I) GENERAL(Rs. in Lakhs)
(i) INVESTMENT 3118944 2700275 2186690
(ii) CAPITAL EMPLOYED 5058734 4777225 4091925
(iii) NET WORTH 1030930 1431390 1748657
(iv) COST OF PRODUCTION 3452495 3191262 3287661
(v) COST OF SALES 3452757 3191699 3287603
(vi) VALUE ADDED 1953316 1869682 1741820
(vii) R AND D EXPENDITURE 109 0 494
(II) HUMAN RESOURCE
(viii) EMPLOYEES (OTHER THAN CASUAL)(Nos.) 54844 59012 60923
(ix) AVG.MONTHLY EMOLUMENTS PER EMPLOYEE(Rs.) 95748 83652 78400
(B.) MANAGEMENT RATIO
(i) DEBT : EQUITY 2.14 2.15 2.02
(ii)CURRENTRATIO(CURRENTASSET:CURRENT-LIABILITY 0.97 1.09 1.26
(iii) PBDITEP : TOTAL EMPLOYEMENT (Rs. in Lakhs) 5.48 4.43 0.82
(iv) SUNDRY DEBTORS : SALES (No. of days) 61.75 60.21 56.57
(v) INVENTORY(No. of days)
(a) TOTAL INVENTORY : SALES 14.51 16.68 17.4
(b) SEMI/FINISHED GOODS : SALES 0.06 0.31 0.17
(vi) INCREMENTAL CAPITAL OUTPUT RATIO(ICOR) 1.57 -27.94 9.39
(%)
(vii) SALES : CAPITAL EMPLOYED 57.53 57.18 67.34
(viii) PBDITEP : CAPITAL EMPLOYED 5.95 5.48 1.23
(ix) PBITEP : CAPITAL EMPLOYED -1.01 -0.69 -5.01
(x) COST OF SALES : SALES 118.65 116.85 119.31
(xi) MATERIAL COST : SALES 0.14 0.06 0.16
(xii) SALARY & WAGES : SALES 21.65 21.69 20.8
(xiii) R & D EXPENDITURE : SALES 0 0 0.02
(xiv) PBITEP : SALES -1.76 -1.21 -7.45
(xv) PBTEP : NET WORTH -40.25 -21.41 -22.56
(xvi) NET PROFIT : NET WORTH -48.7 -27.49 -20.39
(xvii) GROSS MARGIN : GROSS BLOCK 4.28 4.22 1

412 Transportation Services
www.airindia.in
Air India Air Transport Services Limited (AIATS) was incorporated on 09.06.2003 with the objective of carrying onthe business of providing all types of services at airport.
AIATS is an un-categorised CPSE in Transport Servicessector under the administrative control of M/o Civil Aviation. Its registered office is at New Delhi and Corporate office atMumbai, Maharashtra. AIATS is 100% subsidiary of Air India Limited.
Vision / MissionThe vision / mission / objectives of the company are
to carry on the business of repairing, maintaining, servicing, refurbishing providing engineering services of and for aircraft, flying machines, aerial conveyances, engines, auxiliary powerunits and all components and parts thereof.
Industrial / Business OperationsAIATS is engaged in carrying on the business of providing
services at airports to any entity or persons engaged in transporting passengers, goods, mail and cargo by air, such services to include, without limitation, ground handling and ramp handling services including passenger embarking and disembarking and handling, cargo and baggage loading and unloading and handling, aircraft dispatch, load control, aircraft loading, handling of dangerous goods, security, departure control, facilitation cabin cleaning services, flight preparation, in-flightassistance, post flight activities, liaison and administrationservices, communication and training of personnel in any part of the world. The physical performances of the company for last three years are given below:Main Product / Services
Unit Performance During2010-11 2009-10 2008-09
Handling Services (Sales)
` in crore
N.A. N.A. 59.78
N.A. : Not Available
Performance HighlightsThe operational performance of the company along with
performance indicators and selected financial ratios during theperiod2008-09 to 2010-11 canbe seenon theopposite page.
The Company registered a reduction of ` 13.53 crore in totalincomeduring2010-11whichwentdownto` 48.60 crore in 2010-11 from ` 62.13crore during 2009-10.The net loss ofthe company increased to ` 0.18 crore, an increase of ` 0.02 crore over the previous year’s loss of ` 0.16 core due to fall in turnover.
Human Resource ManagementThe company employed 1683 regular employees as on
31.3.2011. The retirement age in the company is 60 years. Details of employment in last 3 years are given below:
(in Nos.)Particulars 2010-11 2009-10 2008-09
Executives including Non-Unionised Supervisors 11 0 583
Non-Executives # 1672 1071 757Total Employees 1683 1071 1340
# Detail break-up of Non-Executive employees is at Statement no. 25 of volume-I of PE Survey.
17.1 Air India Air Transport Services Limited

413Public Enterprises Survey 2010-2011: Vol-II
Air India Air Transport Services Limited3rdFloorTower2, JeewanBharti 124,ConnaughtCircusNewDelhi-110001
Balance Sheet (` in Lakhs)
Particulars 2010-11 2009-10 2008-09
Authorised Capital 10000 10000 10000
(1) Sources Of Fund
(1.1) Shareholders Funds
(A) Paid-Up Capital
Central Govt 0 0 0
Others 5 5 5
(B) Share Application Money 0 0 0
(C) Reserves & Surplus 0 0 0
Total (A) + (B) + (C) 5 5 5
(1.2) Loan Funds
(A) Secured Loans 0 0 0
(B) Unsecured Loans 0 0 0
Total (A) + (B) 0 0 0
(1.3) Deferred Tax Liability 0 0 0
Total (1.1) + (1.2) + (1.3) 5 5 5
(2) Application Of Funds
(2.1) Fixed Assets
(A) Gross Block 1 1 2
(B) Less Depreciation 0 1 1
(C) Net Block (A-B) 1 0 1
(D) Capital Work In Progress 0 0 0
Total (C) + (D) 1 0 1
(2.2) Investment 0 0 0
(2.3) Current Assets, Loan & Advances
(A) Inventories 0 0 0
(B) Sundry Debtors 431 541 666
(C) Cash & Bank Balances 9 8 40
(D) Other Current Assets 0 0 0
(E) Loan & Advances 560 510 355
Total (A)+ (B)+ (C)+ (D)+ (E) 1000 1059 1061
(2.4) Less:current Liabilities & Provisions
(A) Current Liabilities 1258 1260 1247
(B) Provisions 63 73 79
Total (A+B) 1321 1333 1326
(2.5) Net Current Assets (2.3-2.4) -321 -274 -265
(2.6) Deferred Revenue / Pre. Expenditure 20 27 33
(2.7) Deferred Tax Asset 36 0 0
(2.8) Profit & Loss Account(Dr) 269 252 236
Total (2.1+2.2+2.5+2.6+2.7+2.8) 5 5 5
Important Indicators 2010-11 2009-10 2008-09
(i) Investment 5 5 5
(ii) Capital Employed -320 -274 -264
(iii) Net Worth -284 -274 -264
(iv) Cost of Production 4947 6229 6087
(v) Cost of Sales 4947 6229 6087
(vi) Gross Value Added (At Market Price) - - -
(vii) Total Employees (Other Than Casuals) (Nos.) 1683 1071 1340
(viii) Avg. Monthly Emoluments Per Employee (Rs.) 14320 30493 24838
Profit & Loss Account (` in Lakhs)
Particulars 2010-11 2009-10 2008-09
(1) Income
(A) Sales/Operating Income 4837 6201 5978
(B) Excise Duty 0 0 0
(C) Net Sales (A-B) 4837 6201 5978
(D) Other Income/Receipts 23 12 15
(E) Accretion/Depletion in Stocks 0 0 0
(I)Total Income (C+D+E) 4860 6213 5993
(2) Expenditure
(A) Purchase of Finished Goods/ Consumption Of Raw Materials 0 0 0
(B) Stores & Spares 0 0 0
(C) Power & Fuel 0 0 0
(D) Manufacturing / Direct / Operating Expenses 2049 2035 2018
(E) Salary, Wages & Benefits / Employee Exp. 2892 3919 3994
(F) Other Expenses 0 268 67
(G) Provisions 0 0 0
(II)Total Expenditure (A to G) 4941 6222 6079
(3) Profit Before Dep, Int, Taxes & EP (PBDITEP) (I-II) -81 -9 -86
(4) Depreciation 0 7 1
(5) Dre/Prel Exp Written Off 6 0 7
(6) Profit Before Int., Taxes & Ep (PBITEP) (3-4-5) -87 -16 -94
(7) Interest
(A) On Central Government Loans 0 0 0
(B) On Foreign Loans 0 0 0
(C) Others 0 0 0
(D) Less Interest Capitalised 0 0 0
(E) Charged to P & L Account (A+B+C-D) 0 0 0
(8) Profit Before Tax & EP(PBTEP) (6-7E) -87 -16 -94
(9) Tax Provisions -37 0 4
(10) Net Profit / Loss Before EP (8-9) -50 -16 -98
(11) Net Extra-Ord. Items -32 0 0
(12) Net Profit / Loss(-) (10-11) -18 -16 -98
(13) Dividend Declared 0 0 0
(14) Dividend Tax 0 0 0
(15) Retained Profit (12-13-14) -18 -16 -98
Financial Ratios 2010-11 2009-10 2008-09
(i) Sales : Capital Employed -1511.56 -2263.14 -2264.39
(ii) Cost of Sales : Sales 102.27 100.45 101.82
(iii) Salary / Wages : Sales 59.79 63.2 66.81
(iv) Net Profit : Net Worth - - -
(v) Debt : Equity 0 0 0
(vi) Current Ratio 0.76 0.79 0.8
(vii) Sundry Debtors : Sales (No. of Days) 32.52 31.84 40.66
(viii) Total Inventory : Sales 0 0 0
2010-11 PROVISIONAL

414 Transportation Services
www.airindia.in
Air India Charters Limited (AICL) was incorporated on 9.09.1971withtheobjectiveofundertakingCharteredoperations/ Flights and overcoming the situation created by discounting of fares by Arab carriers and other non-scheduled operators.However, in 1988 through an amendment, the objective of thecompany changed to provide quality services to the client airlines. In 2004-05, the company sawmetamorphosis in its role frommerely a service provider of ground handling and security to the first international lowcost, no frill budget airline from India
AICL is an un-categorised CPSE in Transport Servicessector under the administrative control of M/o Civil Aviation. Its Registered andCorporate offices are atMumbai,Maharashtra.AICL is a wholly owned subsidiary of Air India Ltd.
Industrial / Business OperationsAICL is engaged in providing various ground handling
services. The company took a new dimension in setting up a low cost service namely ‘Air India Express’ under its management from Kerala to certain points in the Gulf which is considered to be advantageous to millions of people working abroad especially in the Gulf & Middle East and South East Asia.
Company is engaged in providing three main services i.e. Passenger Carrier, Cargo Carrier, and Handling Services.
Strategic issueAs per the resolution passed by the Board of Directors and
as per the terms of amended MoU between National Aviation Company of India Limited (NACIL) and AICL, the revenue earned by AICL will be shared in the ratio of 25% and 75% respectively, retrospectively, from 1st April, 2005. The company has made changes in respect of providing deprecation on aircrafts and airframes equipments.
Performance HighlightsThe operational performance of the company along with
performance indicators and selected financial ratios during theperiod 2008-09 to 2010-11 can be seen on the oppositepage.
The Company registered a reduction of ` 50.20 crore in total income during 2010-11 which went down to ` 1351.66 crorein2010-11from` 1401.86croreduring2009-10.Thenetloss of the company increased to ` 391.22 crore, an increase of ` 30.53 ccrore over the previous year’s loss of ` 360.69 crore due to fall in turnover and increase in interest cost.
No detailed performance related information is provided by the company, except provisional accounting information.
17.2 Air India Charters Limited
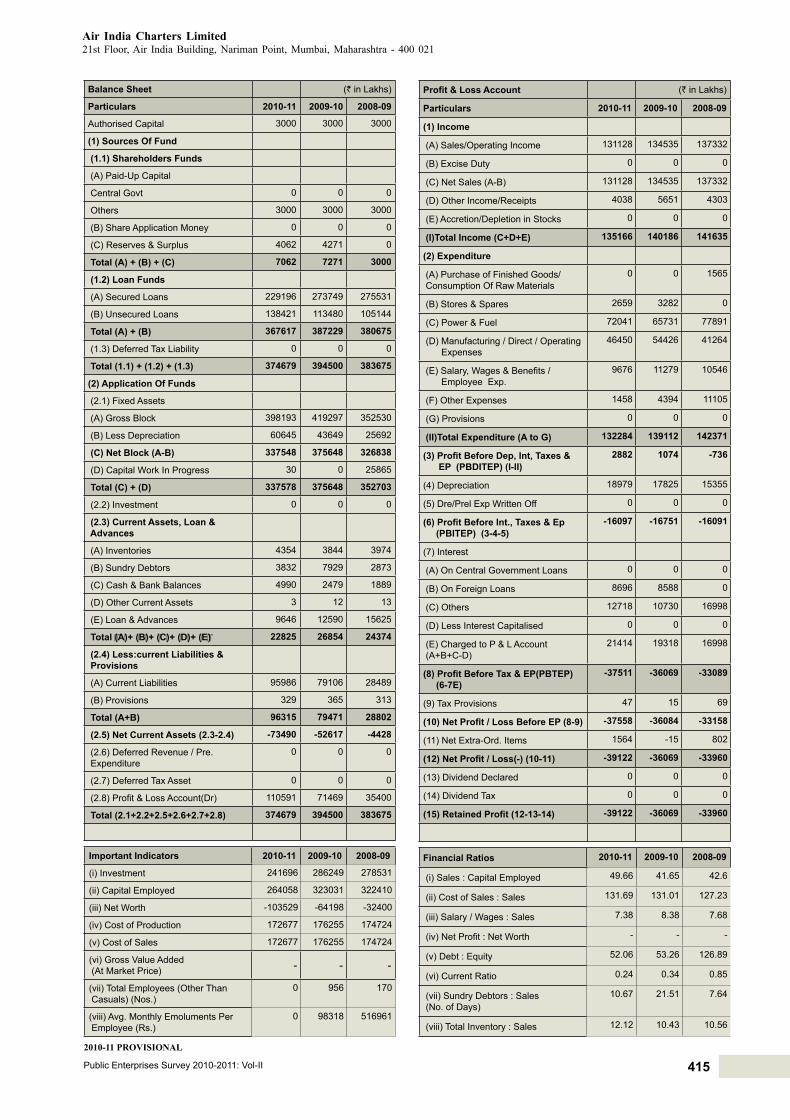
415Public Enterprises Survey 2010-2011: Vol-II
Air India Charters Limited21stFloor,Air IndiaBuilding,NarimanPoint,Mumbai,Maharashtra - 400021
Balance Sheet (` in Lakhs)
Particulars 2010-11 2009-10 2008-09
Authorised Capital 3000 3000 3000
(1) Sources Of Fund
(1.1) Shareholders Funds
(A) Paid-Up Capital
Central Govt 0 0 0
Others 3000 3000 3000
(B) Share Application Money 0 0 0
(C) Reserves & Surplus 4062 4271 0
Total (A) + (B) + (C) 7062 7271 3000
(1.2) Loan Funds
(A) Secured Loans 229196 273749 275531
(B) Unsecured Loans 138421 113480 105144
Total (A) + (B) 367617 387229 380675
(1.3) Deferred Tax Liability 0 0 0
Total (1.1) + (1.2) + (1.3) 374679 394500 383675
(2) Application Of Funds
(2.1) Fixed Assets
(A) Gross Block 398193 419297 352530
(B) Less Depreciation 60645 43649 25692
(C) Net Block (A-B) 337548 375648 326838
(D) Capital Work In Progress 30 0 25865
Total (C) + (D) 337578 375648 352703
(2.2) Investment 0 0 0
(2.3) Current Assets, Loan & Advances
(A) Inventories 4354 3844 3974
(B) Sundry Debtors 3832 7929 2873
(C) Cash & Bank Balances 4990 2479 1889
(D) Other Current Assets 3 12 13
(E) Loan & Advances 9646 12590 15625
Total (A)+ (B)+ (C)+ (D)+ (E) 22825 26854 24374
(2.4) Less:current Liabilities & Provisions
(A) Current Liabilities 95986 79106 28489
(B) Provisions 329 365 313
Total (A+B) 96315 79471 28802
(2.5) Net Current Assets (2.3-2.4) -73490 -52617 -4428
(2.6) Deferred Revenue / Pre. Expenditure
0 0 0
(2.7) Deferred Tax Asset 0 0 0
(2.8) Profit & Loss Account(Dr) 110591 71469 35400
Total (2.1+2.2+2.5+2.6+2.7+2.8) 374679 394500 383675
Important Indicators 2010-11 2009-10 2008-09
(i) Investment 241696 286249 278531
(ii) Capital Employed 264058 323031 322410
(iii) Net Worth -103529 -64198 -32400
(iv) Cost of Production 172677 176255 174724
(v) Cost of Sales 172677 176255 174724
(vi) Gross Value Added (At Market Price) - - -
(vii) Total Employees (Other Than Casuals) (Nos.)
0 956 170
(viii) Avg. Monthly Emoluments Per Employee (Rs.)
0 98318 516961
Profit & Loss Account (` in Lakhs)
Particulars 2010-11 2009-10 2008-09
(1) Income
(A) Sales/Operating Income 131128 134535 137332
(B) Excise Duty 0 0 0
(C) Net Sales (A-B) 131128 134535 137332
(D) Other Income/Receipts 4038 5651 4303
(E) Accretion/Depletion in Stocks 0 0 0
(I)Total Income (C+D+E) 135166 140186 141635
(2) Expenditure
(A) Purchase of Finished Goods/ Consumption Of Raw Materials
0 0 1565
(B) Stores & Spares 2659 3282 0
(C) Power & Fuel 72041 65731 77891
(D) Manufacturing / Direct / Operating Expenses
46450 54426 41264
(E) Salary, Wages & Benefits / Employee Exp.
9676 11279 10546
(F) Other Expenses 1458 4394 11105
(G) Provisions 0 0 0
(II)Total Expenditure (A to G) 132284 139112 142371
(3) Profit Before Dep, Int, Taxes & EP (PBDITEP) (I-II)
2882 1074 -736
(4) Depreciation 18979 17825 15355
(5) Dre/Prel Exp Written Off 0 0 0
(6) Profit Before Int., Taxes & Ep (PBITEP) (3-4-5)
-16097 -16751 -16091
(7) Interest
(A) On Central Government Loans 0 0 0
(B) On Foreign Loans 8696 8588 0
(C) Others 12718 10730 16998
(D) Less Interest Capitalised 0 0 0
(E) Charged to P & L Account (A+B+C-D)
21414 19318 16998
(8) Profit Before Tax & EP(PBTEP) (6-7E)
-37511 -36069 -33089
(9) Tax Provisions 47 15 69
(10) Net Profit / Loss Before EP (8-9) -37558 -36084 -33158
(11) Net Extra-Ord. Items 1564 -15 802
(12) Net Profit / Loss(-) (10-11) -39122 -36069 -33960
(13) Dividend Declared 0 0 0
(14) Dividend Tax 0 0 0
(15) Retained Profit (12-13-14) -39122 -36069 -33960
Financial Ratios 2010-11 2009-10 2008-09
(i) Sales : Capital Employed 49.66 41.65 42.6
(ii) Cost of Sales : Sales 131.69 131.01 127.23
(iii) Salary / Wages : Sales 7.38 8.38 7.68
(iv) Net Profit : Net Worth - - -
(v) Debt : Equity 52.06 53.26 126.89
(vi) Current Ratio 0.24 0.34 0.85
(vii) Sundry Debtors : Sales (No. of Days)
10.67 21.51 7.64
(viii) Total Inventory : Sales 12.12 10.43 10.56
2010-11 PROVISIONAL

416 Transportation Services
www.airindia.in
Airline Allied Services Limited (AASL) was incorporated on 13.09.1983 with the objective of creating a profit centerunder thesubsidiarycompanystructure forspeedyandflexibledecision-making and also to utilize the fleet effectively. Thecompany was revitalized as scheduled airline in 1996 and named as Alliance Air.
AASL isaanUn-categorisedCPSE inTransportServicessector under the administrative control of M/o Civil Aviation. It is a 100% subsidiary of Air India Limited. Its Registered and Corporate offices are atNewDelhi.
Industrial / Business OperationsAASL is engaged in providing services in the field of
domesticAirline business through operation of B-737 aircraftandATR-42-320Air Cargo.The physical performances of thecompany for last three years are given below:Main Product / Services
Unit Performance During2010-11 2009-10 2008-09
ATKMs Million N.A. 63.10 59.96N.A. : Not Available
Performance HighlightsThe operational performance of the company along with
performance indicators and selected financial ratios during theperiod2008-09 to 2010-11 canbe seenon theopposite page.
The Company registered a reduction of ` 10.37 crore in total income during 2010-11 which went down to ` 358.26crore in 2010-11from` 368.63croreduring2009-10.Thenetlossofthecompany reduced to ` 29.12 crore, a reduction of ` 12.42crore over the previous year’s loss of ` 41.54 crore due to fall in operating expenses.
Human Resource ManagementThe company employed 648regular employees as on
31.3.2011. Details of employment in last 3 years are given below:
Particulars 2010-11 2009-10 2008-09Executives including Non-Unionised Supervisors 322 644 692
Non-Executives # 326 0 0Total Employees 648 644 692
#Detailbreak-up of Non-Executive employees is at Statement no. 25 of volume-I of PE Survey.
17.3 Airline Allied Services Limited

417Public Enterprises Survey 2010-2011: Vol-II
Airline Allied Services LimitedDomesticArrivalTerminal-I, 1stFloor, I.G.IAirport, Palam,NewDelhi-110037
Balance Sheet (` in Lakhs)
Particulars 2010-11 2009-10 2008-09
Authorised Capital 500 500 500
(1) Sources Of Fund
(1.1) Shareholders Funds
(A) Paid-Up Capital
Central Govt 0 0 0
Others 225 225 225
(B) Share Application Money 0 0 0
(C) Reserves & Surplus 0 0 0
Total (A) + (B) + (C) 225 225 225
(1.2) Loan Funds
(A) Secured Loans 0 0 0
(B) Unsecured Loans 0 0 0
Total (A) + (B) 0 0 0
(1.3) Deferred Tax Liability 0 0 0
Total (1.1) + (1.2) + (1.3) 225 225 225
(2) Application Of Funds
(2.1) Fixed Assets
(A) Gross Block 609 591 578
(B) Less Depreciation 463 412 375
(C) Net Block (A-B) 146 179 203
(D) Capital Work In Progress 0 0 0
Total (C) + (D) 146 179 203
(2.2) Investment 0 0 0
(2.3) Current Assets, Loan & Advances
(A) Inventories 1360 1320 1249
(B) Sundry Debtors 5848 13280 7078
(C) Cash & Bank Balances 38 8 17
(D) Other Current Assets 2088 3416 2394
(E) Loan & Advances 1187 864 764
Total (A)+ (B)+ (C)+ (D)+ (E) 10521 18888 11502
(2.4) Less:current Liabilities & Provisions
(A) Current Liabilities 63940 70406 59963
(B) Provisions 4792 3813 2740
Total (A+B) 68732 74219 62703
(2.5) Net Current Assets (2.3-2.4) -58211 -55331 -51201
(2.6) Deferred Revenue / Pre. Expenditure 0 0 0
(2.7) Deferred Tax Asset 0 0 0
(2.8) Profit & Loss Account(Dr) 58290 55377 51223
Total (2.1+2.2+2.5+2.6+2.7+2.8) 225 225 225
Important Indicators 2010-11 2009-10 2008-09
(i) Investment 225 225 225
(ii) Capital Employed -58065 -55152 -50998
(iii) Net Worth -58065 -55152 -50998
(iv) Cost of Production 38479 40795 37000
(v) Cost of Sales 38479 40795 37000
(vi) Gross Value Added (At Market Price) - - -
(vii) Total Employees (Other Than Casuals) (Nos.) 648 644 692
(viii) Avg. Monthly Emoluments Per Employee (Rs.) 61548 62189 54191
Profit & Loss Account (` in Lakhs)
Particulars 2010-11 2009-10 2008-09
(1) Income
(A) Sales/Operating Income 29035 31729 24340
(B) Excise Duty 0 0 0
(C) Net Sales (A-B) 29035 31729 24340
(D) Other Income/Receipts 6791 5134 677
(E) Accretion/Depletion in Stocks 0 0 0
(I)Total Income (C+D+E) 35826 36863 25017
(2) Expenditure
(A) Purchase of Finished Goods/ Consumption Of Raw Materials 0 0 0
(B) Stores & Spares 777 523 564
(C) Power & Fuel 11204 12751 12806
(D) Manufacturing / Direct / Operating Expenses 20983 22267 18756
(E) Salary, Wages & Benefits / Employee Exp. 4786 4806 4500
(F) Other Expenses 0 0 0
(G) Provisions 689 410 336
(II)Total Expenditure (A to G) 38439 40757 36962
(3) Profit Before Dep, Int, Taxes & EP (PBDITEP) (I-II) -2613 -3894 -11945
(4) Depreciation 40 38 38
(5) Dre/Prel Exp Written Off 0 0 0
(6) Profit Before Int., Taxes & Ep (PBITEP) (3-4-5) -2653 -3932 -11983
(7) Interest
(A) On Central Government Loans 0 0 0
(B) On Foreign Loans 0 0 0
(C) Others 0 0 0
(D) Less Interest Capitalised 0 0 0
(E) Charged to P & L Account (A+B+C-D) 0 0 0
(8) Profit Before Tax & EP(PBTEP) (6-7E) -2653 -3932 -11983
(9) Tax Provisions 0 0 0
(10) Net Profit / Loss Before EP (8-9) -2653 -3932 -11983
(11) Net Extra-Ord. Items 259 222 -3800
(12) Net Profit / Loss(-) (10-11) -2912 -4154 -8183
(13) Dividend Declared 0 0 0
(14) Dividend Tax 0 0 0
(15) Retained Profit (12-13-14) -2912 -4154 -8183
Financial Ratios 2010-11 2009-10 2008-09
(i) Sales : Capital Employed -50 -57.53 -47.73
(ii) Cost of Sales : Sales 132.53 128.57 152.01
(iii) Salary / Wages : Sales 16.48 15.15 18.49
(iv) Net Profit : Net Worth - - -
(v) Debt : Equity 0 0 0
(vi) Current Ratio 0.15 0.25 0.18
(vii) Sundry Debtors : Sales (No. of Days) 73.52 152.77 106.14
(viii) Total Inventory : Sales 17.1 15.18 18.73
2010-11 PROVISIONAL

418 Transportation Services
www.aai.aero
Airport Authority of India (AAI) was incorporated in 1996 through the Act of Parliament, namely The Airport Authority of India Act, 1994 by merger of International Airports Authority of IndiaandNationalAirportsAuthoritywiththeobjectivetohavean integrated development and modernization of the airports in India to international standards.
AAIisaSchedule-‘A’MiniratnaCPSEinTransportServicessector under the administrative control of M/o Civil Aviationwith 100% shareholding by the Government of India. Its Registered andCorporate office is atNewDelhi.
Vision / MissionThe Vision of the Company is to be a world class
Organization providing leadership in Air Traffic Services andAirport Management & making a major hub in Asia PacificRegion by 2016.
The Mission of the Company is to achieve highest standards of safety and quality in Air Traffic Services and AirportManagement by providing State of the art infrastructure for total customer satisfaction, contributing to economic growth and prosperity of the nation.
Industrial / Business OperationsAAI is involved in development and modernization of
airportsandprovidingAirTrafficservices in thedesignatedairspace in the entire Indian air space. Currently it manages 115 airports viz 14 International Airports (including 3 Joint Ventures (JVs)), 8 Customs airports, 23 Civil Enclaves and 81 Domestic airports. In addition,AAI alsoprovidesCNS-ATM facilities at11 other airports.
AAI have 7 JVs for airports including Delhi, Mumbai, Bengaluru & Hyderabad which are handed over to Joint Venture Companies (JVCs)) namely Delhi International Airport Pvt. Ltd. (DIAL), Mumbai International Airport Pvt. Ltd. (MIAL), National Flying Training Institute Pvt. Ltd. (NFTIPL) with a share holding of 26%, 26% and 49% respectively. In addition to above, AAI also has one more JV namely MIHAN India Pvt. Ltd. with Govt. of Maharashtra with a share holding of 49%.
ThemajorsourcesofrevenueofAAIareRoute/TerminalNavigational Facilities, Landing & Parking, Cargo Handling and Passenger Services.
The physical performances of the company for last three years are given below:Main Services
Unit Performance During2010-11 2009-10 2008-09
Aircraft Movements Nos. in 000 1393 1331 1306
Cargo 000’ Tonne 2348 1962 1697 Passengers Handled No. in lacs 1434 1238 1089
Strategic issueWith new Terminals being commissioned in Tier 2 and
Tier 3 cities in the country, the focus of the expansion of Civil Aviation has now shifted from the metro cities to these Tier 2 and Tier 3 cities in the country. AAI has to resort to borrowing inorder tofinanceitscapitalexpenditurerequirementoverandabove the surplus generated by it.
Performance HighlightsThe operational performance of the company along with
performance indicators and selected financial ratios during theperiod2008-09 to 2010-11 canbe seenon theopposite page.
The Company registered an increase of ` 523.92 crore in
17.4 Airport Authority of Indiatotal incomeduring2010-11whichwentup to` 5139.21 crore in2010-11from` 4615.29croreduring2009-10duetogrowthinaircraftmovementandpassengershandled.Thenetprofitofthe company however marginally increased to ` 712.39 crore, an increase of ` 0.10 crore over the previous yeardue to increase in operating expenses andPriorPeriodAdjustments.
Human Resource ManagementThe company employed18243 regular employees as on
31.3.2011. The retirement age in the company is 60 years. It is following IDA 2007 pattern of remuneration. Details of employment in last 3 years are given below:
Particulars 2010-11 2009-10 2008-09Executives including Non-Unionised Supervisors 6326 6174 7519
Non-Executives # 11917 12340 12054Total Employees 18243 18514 19573
#Detailbreak-up of Non-Executive employees is at Statement no. 25 of volume-I of PE Survey.

419Public Enterprises Survey 2010-2011: Vol-II
Airport Authority of IndiaRajivGandhiBhawan,SafdarjugAirportNewDelhi – 110003
Balance Sheet (` in Lakhs)
Particulars 2010-11 2009-10 2008-09
Authorised Capital 65561 62334 57376
(1) Sources Of Fund
(1.1) Shareholders Funds
(A) Paid-Up Capital
Central Govt 65561 62334 57376
Others 0 0 0
(B) Share Application Money 0 0 0
(C) Reserves & Surplus 696097 666924 578983
Total (A) + (B) + (C) 761658 729258 636359
(1.2) Loan Funds
(A) Secured Loans 60000 30000 0
(B) Unsecured Loans 62523 37194 23005
Total (A) + (B) 122523 67194 23005
(1.3) Deferred Tax Liability 44081 0 0
Total (1.1) + (1.2) + (1.3) 928262 796452 659364
(2) Application Of Funds
(2.1) Fixed Assets
(A) Gross Block 1223869 1031821 883904
(B) Less Depreciation 687854 600224 529490
(C) Net Block (A-B) 536015 431597 354414
(D) Capital Work In Progress 374752 318594 199643
Total (C) + (D) 910767 750191 554057
(2.2) Investment 97614 92152 85409
(2.3) Current Assets, Loan & Advances
(A) Inventories 9263 6542 6481
(B) Sundry Debtors 102199 81535 82701
(C) Cash & Bank Balances 10621 36207 38943
(D) Other Current Assets 22030 21380 22324
(E) Loan & Advances 450011 583163 525869
Total (A)+ (B)+ (C)+ (D)+ (E) 594124 728827 676318
(2.4) Less:current Liabilities & Provisions
(A) Current Liabilities 225321 261628 284636
(B) Provisions 515658 570298 423042
Total (A+B) 740979 831926 707678
(2.5) Net Current Assets (2.3-2.4) -146855 -103099 -31360
(2.6) Deferred Revenue / Pre. Expenditure 0 0 0
(2.7) Deferred Tax Asset 66736 57208 51258
(2.8) Profit & Loss Account(Dr) 0 0 0
Total (2.1+2.2+2.5+2.6+2.7+2.8) 928262 796452 659364
Important Indicators 2010-11 2009-10 2008-09
(i) Investment 133084 101748 65381
(ii) Capital Employed 389160 328498 323054
(iii) Net Worth 761658 729258 636359
(iv) Cost of Production 375928 338223 284373
(v) Cost of Sales 375928 338223 284373
(vi) Gross Value Added (At Market Price) - - -
(vii) Total Employees (Other Than Casuals) (Nos.) 18243 18514 19573
(viii) Avg. Monthly Emoluments Per Employee (Rs.) 75604 72595 60697
Profit & Loss Account (` in Lakhs)
Particulars 2010-11 2009-10 2008-09
(1) Income
(A) Sales/Operating Income 502771 412970 390872
(B) Excise Duty 0 0 0
(C) Net Sales (A-B) 502771 412970 390872
(D) Other Income/Receipts 11150 48559 27723
(E) Accretion/Depletion in Stocks 0 0 0
(I)Total Income (C+D+E) 513921 461529 418595
(2) Expenditure
(A) Purchase of Finished Goods/ Consumption Of Raw Materials 0 0 0
(B) Stores & Spares 2640 2076 2307
(C) Power & Fuel 15006 12538 11247
(D) Manufacturing / Direct / Operating Expenses 79390 24214 29823
(E) Salary, Wages & Benefits / Employee Exp. 165509 161283 142562
(F) Other Expenses 18436 61855 29498
(G) Provisions 4496 1689 6094
(II)Total Expenditure (A to G) 285477 263655 221531
(3) Profit Before Dep, Int, Taxes & EP (PBDITEP) (I-II) 228444 197874 197064
(4) Depreciation 89336 73775 62580
(5) Dre/Prel Exp Written Off 0 0 0
(6) Profit Before Int., Taxes & Ep (PBITEP) (3-4-5) 139108 124099 134484
(7) Interest
(A) On Central Government Loans 224 477 144
(B) On Foreign Loans 3 4 5
(C) Others 888 312 113
(D) Less Interest Capitalised 0 0 0
(E) Charged to P & L Account (A+B+C-D) 1115 793 262
(8) Profit Before Tax & EP(PBTEP) (6-7E) 137993 123306 134222
(9) Tax Provisions 63390 51615 63651
(10) Net Profit / Loss Before EP (8-9) 74603 71691 70571
(11) Net Extra-Ord. Items 3364 462 1851
(12) Net Profit / Loss(-) (10-11) 71239 71229 68720
(13) Dividend Declared 16930 14250 13740
(14) Dividend Tax 2746 2367 2335
(15) Retained Profit (12-13-14) 51563 54612 52645
Financial Ratios 2010-11 2009-10 2008-09
(i) Sales : Capital Employed 129.19 125.71 120.99
(ii) Cost of Sales : Sales 74.77 81.9 72.75
(iii) Salary / Wages : Sales 32.92 39.05 36.47
(iv) Net Profit : Net Worth 9.35 9.77 10.8
(v) Debt : Equity 0.16 0.09 0.04
(vi) Current Ratio 0.8 0.88 0.96
(vii) Sundry Debtors : Sales (No. of Days) 74.19 72.06 77.23
(viii) Total Inventory : Sales 6.72 5.78 6.05
2010-11 PROVISIONAL

420 Transportation Services
www.ciwtcltd.com
Central Inland Water Transport Corp. Ltd. (CIWTC) was incorporated on 22.2.1967 to take over the assets of the erstwhile Rivers Steams Navigation Company Ltd. with an objective toutilize the Inland Water Transport (IWT) mode of transportation as an operator.
CIWTCisaSchedule-‘C’BRPSEreferredsicktakenoverCPSE in Transport Services Sector under the administrative control of M/o Shipping, Road Transport and Highways, Department of Shipping with 99.89% shareholding by the Government of India. Its Registered and Corporate offices areat Kolkata, West Bengal.
Vision / MissionThe Vision of the Company is to see that IWT sector
prosper competitively at par with the rest of the transportation modes viz. road, rail and air.
The Mission of the Company is to operate IWT services and to strive for achieving the break even in the shortest possible time by continuously reducing the operational cost and losses.
Industrial / Business OperationsCIWTC is engaged in transportation of Cargo on the route
ofN.W.-I,N.W.-II,Bangladesh,Sectorandlighterageoperationin river Hooghly through its single operating unit namely River Service Division Kolkata, West Bengal.The physical performances of the company for last three years are given below:Main Product / Services
Unit Performance During2010-11 2009-10 2008-09
I.W.T Transportation of Cargo
MT 42882 189045 95630
Capacity Utilization % 93% 99% 98%
Strategic issueRevival scheme for the company was sanctioned by the
Government of India in 2001 and a new revival scheme was sanctioned in 2005 on the basis of the recommendations of BRPSE. As per the revival plan, one unit for ship building and ship repairingviz.RajabaganDockyardwas tobedisposedoffto Garden Reach Shipbuilders & Engineers Limited (GRSE) and manpower of the company was to be brought down to 43. After implementation of above, disinvestment of the company is to be taken up in favor of private parties.
Performance HighlightsThe operational performance of the company along with
performance indicators and selected financial ratios during theperiod2008-09 to 2010-11 canbe seenon theopposite page.
The Company registered an increase of ` 0.44 crore in total incomeduring 2010-11whichwent up to` 19.20crore in 2010-11 from ` 18.76crore during 2009-10 due to increase inother income. The net loss of the company however increased to ` 4.68 crore, an increase of ` 2.86 crore over the previous year loss of ` 1.82 crore due to fall in turnover.The company hasprovidedprovisionalfigures.
17.5 Central Inland Water Transport Corp. Ltd.
Human Resource ManagementThe company employed 390regular employees as on
31.3.2011. The retirement age in the company is 58 years. It is following IDA 1997 and CDA 1996 pattern of remuneration. Details of employment in last 3 years are given below:
Particulars 2010-11 2009-10 2008-09Executives including Non-Unionised Supervisors 24 26 23
Non-Executives # 366 386 400Total Employees 390 412 423
#Detailbreak-up of Non-Executive employees is at Statement no. 25 of volume-I of PE Survey.
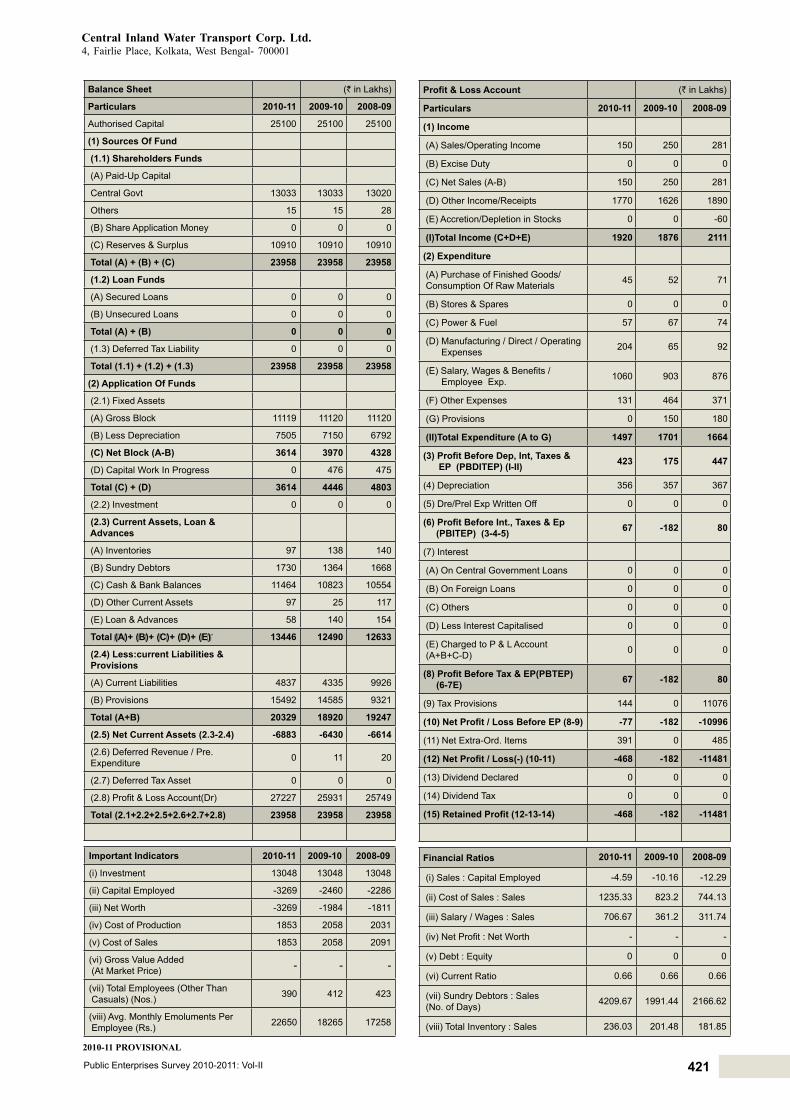
421Public Enterprises Survey 2010-2011: Vol-II
Central Inland Water Transport Corp. Ltd. 4,FairliePlace,Kolkata,WestBengal- 700001
Balance Sheet (` in Lakhs)
Particulars 2010-11 2009-10 2008-09
Authorised Capital 25100 25100 25100
(1) Sources Of Fund
(1.1) Shareholders Funds
(A) Paid-Up Capital
Central Govt 13033 13033 13020
Others 15 15 28
(B) Share Application Money 0 0 0
(C) Reserves & Surplus 10910 10910 10910
Total (A) + (B) + (C) 23958 23958 23958
(1.2) Loan Funds
(A) Secured Loans 0 0 0
(B) Unsecured Loans 0 0 0
Total (A) + (B) 0 0 0
(1.3) Deferred Tax Liability 0 0 0
Total (1.1) + (1.2) + (1.3) 23958 23958 23958
(2) Application Of Funds
(2.1) Fixed Assets
(A) Gross Block 11119 11120 11120
(B) Less Depreciation 7505 7150 6792
(C) Net Block (A-B) 3614 3970 4328
(D) Capital Work In Progress 0 476 475
Total (C) + (D) 3614 4446 4803
(2.2) Investment 0 0 0
(2.3) Current Assets, Loan & Advances
(A) Inventories 97 138 140
(B) Sundry Debtors 1730 1364 1668
(C) Cash & Bank Balances 11464 10823 10554
(D) Other Current Assets 97 25 117
(E) Loan & Advances 58 140 154
Total (A)+ (B)+ (C)+ (D)+ (E) 13446 12490 12633
(2.4) Less:current Liabilities & Provisions
(A) Current Liabilities 4837 4335 9926
(B) Provisions 15492 14585 9321
Total (A+B) 20329 18920 19247
(2.5) Net Current Assets (2.3-2.4) -6883 -6430 -6614
(2.6) Deferred Revenue / Pre. Expenditure 0 11 20
(2.7) Deferred Tax Asset 0 0 0
(2.8) Profit & Loss Account(Dr) 27227 25931 25749
Total (2.1+2.2+2.5+2.6+2.7+2.8) 23958 23958 23958
Important Indicators 2010-11 2009-10 2008-09
(i) Investment 13048 13048 13048
(ii) Capital Employed -3269 -2460 -2286
(iii) Net Worth -3269 -1984 -1811
(iv) Cost of Production 1853 2058 2031
(v) Cost of Sales 1853 2058 2091
(vi) Gross Value Added (At Market Price) - - -
(vii) Total Employees (Other Than Casuals) (Nos.) 390 412 423
(viii) Avg. Monthly Emoluments Per Employee (Rs.) 22650 18265 17258
Profit & Loss Account (` in Lakhs)
Particulars 2010-11 2009-10 2008-09
(1) Income
(A) Sales/Operating Income 150 250 281
(B) Excise Duty 0 0 0
(C) Net Sales (A-B) 150 250 281
(D) Other Income/Receipts 1770 1626 1890
(E) Accretion/Depletion in Stocks 0 0 -60
(I)Total Income (C+D+E) 1920 1876 2111
(2) Expenditure
(A) Purchase of Finished Goods/ Consumption Of Raw Materials 45 52 71
(B) Stores & Spares 0 0 0
(C) Power & Fuel 57 67 74
(D) Manufacturing / Direct / Operating Expenses 204 65 92
(E) Salary, Wages & Benefits / Employee Exp. 1060 903 876
(F) Other Expenses 131 464 371
(G) Provisions 0 150 180
(II)Total Expenditure (A to G) 1497 1701 1664
(3) Profit Before Dep, Int, Taxes & EP (PBDITEP) (I-II) 423 175 447
(4) Depreciation 356 357 367
(5) Dre/Prel Exp Written Off 0 0 0
(6) Profit Before Int., Taxes & Ep (PBITEP) (3-4-5) 67 -182 80
(7) Interest
(A) On Central Government Loans 0 0 0
(B) On Foreign Loans 0 0 0
(C) Others 0 0 0
(D) Less Interest Capitalised 0 0 0
(E) Charged to P & L Account (A+B+C-D) 0 0 0
(8) Profit Before Tax & EP(PBTEP) (6-7E) 67 -182 80
(9) Tax Provisions 144 0 11076
(10) Net Profit / Loss Before EP (8-9) -77 -182 -10996
(11) Net Extra-Ord. Items 391 0 485
(12) Net Profit / Loss(-) (10-11) -468 -182 -11481
(13) Dividend Declared 0 0 0
(14) Dividend Tax 0 0 0
(15) Retained Profit (12-13-14) -468 -182 -11481
Financial Ratios 2010-11 2009-10 2008-09
(i) Sales : Capital Employed -4.59 -10.16 -12.29
(ii) Cost of Sales : Sales 1235.33 823.2 744.13
(iii) Salary / Wages : Sales 706.67 361.2 311.74
(iv) Net Profit : Net Worth - - -
(v) Debt : Equity 0 0 0
(vi) Current Ratio 0.66 0.66 0.66
(vii) Sundry Debtors : Sales (No. of Days) 4209.67 1991.44 2166.62
(viii) Total Inventory : Sales 236.03 201.48 181.85
2010-11 PROVISIONAL

422 Transportation Services
www.concorindia.com
Container Corporation of India Limited (CONCOR) was incorporated on 10.03.1988 and began its operation in November 1989 by taking over seven ICDs from the Indian Railways and to serve as a catalyst for boosting India’s EXIM and Domestic trade and commerce by providing efficient and reliable multimodallogistic support and to ensure growing stakeholder value. The currentobjectivesaretofocusonprovidinghighqualityofserviceto its customers, presence in the complete logistics value chain and to maximise the productive utilisation of resources.
CONCOR is a Schedule ‘A’, listed Miniratna CPSE in transportation services sector under the administrative control of Ministry of Railways with 63.09% shareholding by the Government of India. It’s registered andCorporateOffices areat New Delhi.
Vision / MissionThe vision of the company is to provide responsive,
cost effective, efficient and reliable logistics solutions to itscustomers through synergy with community partners and ensuring profitability andgrowth.
The mission of the company is to join its communitypartners and stake holders to make CONCOR a company of outstanding quality.
Industrial / Business OperationsThe company operates as a carrier, Inland port operator and
terminal services provider. The Company’s main function is to provide cost effective and reliable logistics support services to its customers. The bouquet of logistics services that are offered to trade comprises of operation of Inland Ports and Domestic Container Terminals transportation by rail, road, warehousing, storage,end-to-endlogisticssolutions,movementofrefrigeratedcargo in containers and providing other value added solutions. The Company has established itself as the leading logistics company in the country.
CONCOR has established a vast network of container terminals all over the country at prime locations which are the centers for generation of cargo and its consumption. These capacities have been created to meet the growing demand of trade. At present, CONCOR has a total of 61 terminals of which 18 are pure EXIM terminals, 30 Combined Terminals and 13 pure Domestic terminals. These terminals are connected by rail/road across the length and breadth of the country and the company is in the process of setting up 6 new terminals in the coming years.
The physical performances of the company for last three years are given below:Main Product / Services
Unit Performance During2010-11 2009-10 2008-09
International Handling (EXIM)
TEUs 20,18,551 18,82,277 18,54,959
Domestic Handling
TEUs 5,43,746 5,38,970 4,53,273
Total Handling (EXIM + Domestic)
TEUs 25,62,297 24,21,247 23,08,232
Strategic issueThe increase in the EXIM business of CONCOR was inspite
of gradual induction of rolling stock by other train operators. With continuance of the recessionary trend and the stiff competition from the other train operators, it will be a challenge to retain company share and growth. In order to attract more volumes, the company will continue to match and strive to surpass the
17.6 Container Corporation of India Limited services offered by other operators in terms of quality of services and pricing.
Performance HighlightsThe operational performance of the company along with
performance indicators and selected financial ratios during theperiod2008-09 to 2010-11 canbe seenon theopposite page.
The Company registered an increase of ` 144.45 crore in total incomeduring2010-11whichwentup to` 4030.18 crore in2010-11 from` 3885.73croreduring2009-10.Thenetprofitof the company correspondingly increased to ` 875.95 crore, an increase of ` 89.26 crore over the previous year due to increase in operations and expenditure control.
CONCOR derives its revenues broadly from two sources, i.e., transportation and terminal management, both in EXIM and Domestic segments.
56 Terminals including eight Regional Offices and Corporate Office of company have been certified as per newISO 9001:2008 for compliance of processes have been carried out during the year.
During the last fiscal year 565 high speed BLC wagonswere added to the existing fleet of owned wagons; increasingthe holding of high speed wagon to 9,309 units. With these, the total wagon holding is now 10,666 units as at the end of thefiscal.
Thirty Three (33) new Reach Stackers were purchased taking the total number of these special container handling equipments owned by the company to 55.
Two new terminals were commissioned during the year, at Khemli (Rajasthan) andRourkela (Orissa).
Human Resource ManagementThe company employed 1147 regular employees as on
31.3.2011. The retirement age in the company is 60 years. It is following IDA 2007 pattern of remuneration. Details of employment in last 3 years are given below:
Particulars 2010-11 2009-10 2008-09Executives including Non-Unionised Supervisors 391 387 390
Non-Executives # 756 739 765Total Employees 1147 1126 1155
# Detail break-up of Non-Executive employees is at Statement no. 25 of volume-I of PE Survey.

423Public Enterprises Survey 2010-2011: Vol-II
Container Corporation of India Limited CONCORBhawan,C-3MathuraRoad,Opposite,ApolloHospital,NewDelhi-110076
Balance Sheet (` in Lakhs)
Particulars 2010-11 2009-10 2008-09
Authorised Capital 20000 20000 20000
(1) Sources Of Fund
(1.1) Shareholders Funds
(A) Paid-Up Capital
Central Govt 8200 8200 8200
Others 4798 4798 4798
(B) Share Application Money 0 0 0
(C) Reserves & Surplus 484783 420642 363223
Total (A) + (B) + (C) 497781 433640 376221
(1.2) Loan Funds
(A) Secured Loans 0 0 0
(B) Unsecured Loans 0 0 0
Total (A) + (B) 0 0 0
(1.3) Deferred Tax Liability 22856 21090 19376
Total (1.1) + (1.2) + (1.3) 520637 454730 395597
(2) Application Of Funds
(2.1) Fixed Assets
(A) Gross Block 328615 298886 264095
(B) Less Depreciation 95913 82500 69198
(C) Net Block (A-B) 232702 216386 194897
(D) Capital Work In Progress 31914 19906 24569
Total (C) + (D) 264616 236292 219466
(2.2) Investment 27210 24054 24410
(2.3) Current Assets, Loan & Advances
(A) Inventories 626 699 508
(B) Sundry Debtors 1727 1764 1572
(C) Cash & Bank Balances 229568 198951 176351
(D) Other Current Assets 10162 11204 7712
(E) Loan & Advances 41799 44620 27550
Total (A)+ (B)+ (C)+ (D)+ (E) 283882 257238 213693
(2.4) Less:current Liabilities & Provisions
(A) Current Liabilities 39664 48357 48018
(B) Provisions 15407 14497 13954
Total (A+B) 55071 62854 61972
(2.5) Net Current Assets (2.3-2.4) 228811 194384 151721
(2.6) Deferred Revenue / Pre. Expenditure 0 0 0
(2.7) Deferred Tax Asset 0 0 0
(2.8) Profit & Loss Account(Dr) 0 0 0
Total (2.1+2.2+2.5+2.6+2.7+2.8) 520637 454730 395597
Important Indicators 2010-11 2009-10 2008-09
(i) Investment 12998 12998 12998
(ii) Capital Employed 461513 410770 346618
(iii) Net Worth 497781 433640 376221
(iv) Cost of Production 297191 287914 260201
(v) Cost of Sales 297191 287914 260201
(vi) Gross Value Added (At Market Price) - - -
(vii) Total Employees (Other Than Casuals) (Nos.) 1147 1126 1155
(viii) Avg. Monthly Emoluments Per Employee (Rs.) 63521 62063 58326
Profit & Loss Account (` in Lakhs)
Particulars 2010-11 2009-10 2008-09
(1) Income
(A) Sales/Operating Income 382812 370568 341716
(B) Excise Duty 0 0 0
(C) Net Sales (A-B) 382812 370568 341716
(D) Other Income/Receipts 20206 18005 21109
(E) Accretion/Depletion in Stocks 0 0 0
(I)Total Income (C+D+E) 403018 388573 362825
(2) Expenditure
(A) Purchase of Finished Goods/ Consumption Of Raw Materials 0 0 0
(B) Stores & Spares 267 229 214
(C) Power & Fuel 509 519 2131
(D) Manufacturing / Direct / Operating Expenses 259572 259471 225063
(E) Salary, Wages & Benefits / Employee Exp. 8743 8386 8084
(F) Other Expenses 13500 5797 12865
(G) Provisions 77 2 253
(II)Total Expenditure (A to G) 282668 274404 248610
(3) Profit Before Dep, Int, Taxes & EP (PBDITEP) (I-II) 120350 114169 114215
(4) Depreciation 14523 13510 11591
(5) Dre/Prel Exp Written Off 0 0 0
(6) Profit Before Int., Taxes & Ep (PBITEP) (3-4-5) 105827 100659 102624
(7) Interest
(A) On Central Government Loans 0 0 0
(B) On Foreign Loans 0 0 0
(C) Others 0 0 0
(D) Less Interest Capitalised 0 0 0
(E) Charged to P & L Account (A+B+C-D) 0 0 0
(8) Profit Before Tax & EP(PBTEP) (6-7E) 105827 100659 102624
(9) Tax Provisions 17977 21992 23473
(10) Net Profit / Loss Before EP (8-9) 87850 78667 79151
(11) Net Extra-Ord. Items 255 -2 31
(12) Net Profit / Loss(-) (10-11) 87595 78669 79120
(13) Dividend Declared 20148 18198 18198
(14) Dividend Tax 3306 3052 3093
(15) Retained Profit (12-13-14) 64141 57419 57829
Financial Ratios 2010-11 2009-10 2008-09
(i) Sales : Capital Employed 82.95 90.21 98.59
(ii) Cost of Sales : Sales 77.63 77.7 76.15
(iii) Salary / Wages : Sales 2.28 2.26 2.37
(iv) Net Profit : Net Worth 17.6 18.14 21.03
(v) Debt : Equity 0 0 0
(vi) Current Ratio 5.15 4.09 3.45
(vii) Sundry Debtors : Sales (No. of Days) 1.65 1.74 1.68
(viii) Total Inventory : Sales 0.6 0.69 0.54

424 Transportation Services
www.dci.gov.in
DCI was incorporated in 1977 under the Companies Act, 1956withanobjectivetoprovideintegrateddredgingandrelatedmarine services for promoting the national and international maritime trade, beach nourishment, reclamation, inland dredging, environmental protection, etc. and to become a global player in thefieldof dredging.
DCI is a schedule –‘B’ / Miniratna listed CPSE in Transportation Services Sector under the administrative control of M/o Shipping, D/o Shipping, with 78.57% shareholding by theGovernment.ItsRegisteredOfficeisatDelhiandCorporateoffice atVisakhapatnam,AndhraPradesh.
Vision / MissionThe Vision / Mission of the Company is to provide integrated
dredging and related marine services for promoting the national and international maritime trade beach nourishment reclamation inland dredging environmental protection and to become a global player in thefieldof dredging.
Industrial / Business OperationsDCI is engaged in providing services in the field of
maintenance dredging, capital dredging, beach nourishment, reclamation and environmental protection through its 6ProjectOffices out of which one each are located in the states ofAndhra Pradesh, Karnataka, Orissa, Tamilnadu and two in West Bengal. As on 31.3.2011, the company has among others, 10 Trailer Suction Hopper Dredgers (TSHD) and 3 Cutter Suction Dredgers (CSD). DCI’s customers include Major Ports underM/oShipping,Non-MajorPortsunderGovernmentofIndiaandState Governments, private ports, the Indian Navy and shipyards. The physical performances of the company for last three years are given below:Main Product / Services
Unit Performance During (capacity utilization)
2010-11 2009-10 2008-09DREDGING DAYS 2878 2576 490Dredging sand, silt, clay, rock
Lakhs Cubic Mtrs.
- (79%)
540 (81%)*
489.6 (67%)
* Note: With effect from 2009-10, the Capacity utilization is recorded on the basis of dredging days.
Strategic issueThe Indian dredging market is primarily maintenance
dredgingoriented.However,somecapitaldredgingprojectsarealso in theoffing.DCIhas already secured theEnnoreCapitaldredging project on tender basis. Contract for procurement ofthree TSHDs of 5500 cum capacity each were signed during 2010-11.The vessels are scheduled for delivery inNovember,2012, May 2013 and October 2014.
In the future, increased private sector participation in port development and related capital dredging activity is expected. Accordingly, the customer profile of DCI’s is expected tochange.
Performance HighlightsThe operational performance of the company along with
performance indicators and selected financial ratios during theperiod2008-09 to 2010-11 canbe seenon theopposite page.
The Company registered a reduction of ` 171.23 crore in total income during 2010-11 which went down to ` 522.72 crore in 2010-11 from` 693.95 crore during 2009-10.The netprofit of the company reduced to` 39.51 crore, a reduction of ` 30.54croreoverthepreviousyear’sprofitof` 70.05 core due
17.7 Dredging Corporation of India Limitedto reduction in operational income, opening up of the Dredging sector to foreign players etc.
Human Resource ManagementThe company employed 684 regular employees as on
31.3.2011. The retirement age in the company is 60 years. It is following IDA 2007 pattern of remuneration. Details of employment in last 3 years are given below:
Particulars 2010-11 2009-10 2008-09Executives including Non-Unionised Supervisors 321 328 338
Non-Executives # 363 394 427Total Employees 684 722 765
# Detail break-up of Non-Executive employees is at Statement no. 25 of volume-I of PE Survey.

425Public Enterprises Survey 2010-2011: Vol-II
Dredging Corporation of India Limited Core2, 1stFloor,ScopeMinar,PlotNo.2A&2B,LaxminagarDistrictCentre,Delhi-110091
Balance Sheet (` in Lakhs)
Particulars 2010-11 2009-10 2008-09
Authorised Capital 3000 3000 3000
(1) Sources Of Fund
(1.1) Shareholders Funds
(A) Paid-Up Capital
Central Govt 2200 2200 2200
Others 600 600 600
(B) Share Application Money 0 0 0
(C) Reserves & Surplus 134055 130103 124078
Total (A) + (B) + (C) 136855 132903 126878
(1.2) Loan Funds
(A) Secured Loans 0 0 0
(B) Unsecured Loans 0 0 551
Total (A) + (B) 0 0 551
(1.3) Deferred Tax Liability 0 0 0
Total (1.1) + (1.2) + (1.3) 136855 132903 127429
(2) Application Of Funds
(2.1) Fixed Assets
(A) Gross Block 126738 99458 95663
(B) Less Depreciation 78011 71012 64437
(C) Net Block (A-B) 48727 28446 31226
(D) Capital Work In Progress 17065 26913 23850
Total (C) + (D) 65792 55359 55076
(2.2) Investment 3000 3000 3000
(2.3) Current Assets, Loan & Advances
(A) Inventories 9187 8945 8179
(B) Sundry Debtors 34046 40572 30895
(C) Cash & Bank Balances 23527 24335 33184
(D) Other Current Assets 9315 12133 16573
(E) Loan & Advances 9742 12284 10046
Total (A)+ (B)+ (C)+ (D)+ (E) 85817 98269 98877
(2.4) Less:current Liabilities & Provisions
(A) Current Liabilities 17031 21937 27121
(B) Provisions 723 1788 2403
Total (A+B) 17754 23725 29524
(2.5) Net Current Assets (2.3-2.4) 68063 74544 69353
(2.6) Deferred Revenue / Pre. Expenditure 0 0 0
(2.7) Deferred Tax Asset 0 0 0
(2.8) Profit & Loss Account(Dr) 0 0 0
Total (2.1+2.2+2.5+2.6+2.7+2.8) 136855 132903 127429
Important Indicators 2010-11 2009-10 2008-09
(i) Investment 2800 2800 3351
(ii) Capital Employed 116790 102990 100579
(iii) Net Worth 136855 132903 126878
(iv) Cost of Production 47785 61668 77020
(v) Cost of Sales 47785 61668 77020
(vi) Gross Value Added (At Market Price) - - -
(vii) Total Employees (Other Than Casuals) (Nos.) 684 722 765
(viii) Avg. Monthly Emoluments Per Employee (Rs.) 81299 84107 90240
Profit & Loss Account (` in Lakhs)
Particulars 2010-11 2009-10 2008-09
(1) Income
(A) Sales/Operating Income 45785 64541 68522
(B) Excise Duty 0 0 0
(C) Net Sales (A-B) 45785 64541 68522
(D) Other Income/Receipts 6487 4854 14700
(E) Accretion/Depletion in Stocks 0 0 0
(I)Total Income (C+D+E) 52272 69395 83222
(2) Expenditure
(A) Purchase of Finished Goods/ Consumption Of Raw Materials 0 0 0
(B) Stores & Spares 4161 6402 3509
(C) Power & Fuel 19948 17217 20275
(D) Manufacturing / Direct / Operating Expenses 3548 19333 38083
(E) Salary, Wages & Benefits / Employee Exp. 6673 7287 8284
(F) Other Expenses 2187 1458 67
(G) Provisions 4236 3359 1706
(II)Total Expenditure (A to G) 40753 55056 71924
(3) Profit Before Dep, Int, Taxes & EP (PBDITEP) (I-II) 11519 14339 11298
(4) Depreciation 0 6602 5268
(5) Dre/Prel Exp Written Off 7032 0 0
(6) Profit Before Int., Taxes & Ep (PBITEP) (3-4-5) 4487 7737 6030
(7) Interest
(A) On Central Government Loans 0 0 0
(B) On Foreign Loans 0 10 -172
(C) Others 0 0 0
(D) Less Interest Capitalised 0 0 0
(E) Charged to P & L Account (A+B+C-D) 0 10 -172
(8) Profit Before Tax & EP(PBTEP) (6-7E) 4487 7727 6202
(9) Tax Provisions 536 761 1552
(10) Net Profit / Loss Before EP (8-9) 3951 6966 4650
(11) Net Extra-Ord. Items 0 -39 13
(12) Net Profit / Loss(-) (10-11) 3951 7005 4637
(13) Dividend Declared 0 840 1400
(14) Dividend Tax 0 139 238
(15) Retained Profit (12-13-14) 3951 6026 2999
Financial Ratios 2010-11 2009-10 2008-09
(i) Sales : Capital Employed 39.2 62.67 68.13
(ii) Cost of Sales : Sales 104.37 95.55 112.4
(iii) Salary / Wages : Sales 14.57 11.29 12.09
(iv) Net Profit : Net Worth 2.89 5.27 3.65
(v) Debt : Equity 0 0 0
(vi) Current Ratio 4.83 4.14 3.35
(vii) Sundry Debtors : Sales (No. of Days) 271.42 229.45 164.57
(viii) Total Inventory : Sales 73.24 50.59 43.57

426 Transportation Services
www.ennoreport.gov.in
Ennore Port Ltd. (EPL) was developed near Chennai on the EastCoastofIndia.ThePortwasdeclaredasMajorPortunderthe Indian Port Act, 1908, in March 1999 and incorporated as a Company. Ennore Port was formally declared open in February 2001 and commercial operation commenced in June 2001 with two coal berths to handle coal needed for the Thermal Power Station of TNEB in Tamil Nadu. Modern unloading equipment and conveyors have been installed on the coal berths by TNEB. The capacity of coal handling facility is 12 MTPA.
ItisaSchedule-‘B’/MiniratnaCPSEinTransportServicessector under the administrative control of M/o Shipping with 66.67% shareholding by the Government of India. Its Registered andCorporate offices are atChennai,Tamilnadu.
Vision/MissionThe vision of the Company is to work as a commercially
oriented corporate. EPL strives to expedite its growth, provide efficient,costeffectiveandhighlyproductiveport servicesandfacilities through involvement of private capital and management and the effective leveraging of its assets and inherent advantages to the benefit of port users, its shareholders, the economy andthe Nation.
The Mission of the Company is to develop Port Services of International Standards.
Industrial / Business OperationsEPL is functioning on a Landlord Management Model. All
the cargo handling facilities are being developed mainly through private sector on BOT basis. The common facilities such as creation of necessary depths in the harbour and in the channel by dredging, aids to navigation, road / rail connectivity, etc. are funded and developed by EPL. The physical performances of the company for last three years are given below:Services Units Unit Performance During
2010-11 2009-10 2008-09
Port Services # Million M.T. 11.01 10.70 11.50
# Coal, Iron Ore, POL, & other cargo etc.
Strategic IssuesTheobjectiveofthecompanyistoincreasecargohandling
capacityfromthepresent15MMTPAto61.5MMTPAby2014-15 through development of state of art new terminals with Public Private Partnership. The second phase expansion of the Ennore Port has been taken up during 11th Five Year Plan.
The on-going Projects are development of Coal Terminalfor Users other than TNEB with capacity of 8MTPA at a projectcostof 400 crores; development of Iron Ore Terminal with capacity of 12 MTPA at a project cost of 480 crores; construction of General Cargo Berth at a cost of Rs.110 crores and works on the Rail Connectivity to coal / iron ore stack yards and construction of internal roads network at a total estimated cost of 52 crores are in progress.
The Proposed Projects are development of World ClassContainer Terminal with a capacity of 18MTPA (1.5 million TEUs) at an estimated cost of 1407crores. Work has been awardedandtheprojectisanticipatedforcommissioningduring2013-14 and the project of Capital Dredging (Phase II) at aninvestment of ` 200 crores to provide 18mt depth at Iron ore berth areas, 19mt in Basin and 20mt in the channel. The work is in progress and expected to be completed in 2012-13.
17.8 Ennore Port Ltd.Performance Highlights
The operational performance of the company along with performance indicators and selected financial ratios during theperiod2008-09 to 2010-11 canbe seenon theopposite page.
The Company registered an increase of ` 22.58 crore in total income during 2010-11which went up to ` 168.11 crore in2010-11 from` 145.53 croreduring2009-10.Thenet profitof the company correspondingly increased to ` 55.58 crore, an increase of ` 6.92 crore over the previous year due to increase in operating income / turnover.
Human Resource ManagementThe company employed 88 regular employees as on
31.3.2011. The retirement age in the company is 60 years. It is following IDA 2007 pattern of remuneration. Details of employment in last 3 years are given below:
Particulars 2010-11 2009-10 2008-09Executives including Non-Unionised Supervisors 45 43 43
Non-Executives # 43 43 22Total Employees 88 86 65
# Detail break-up of Non-Executive employees is at Statement no. 25 of volume-I of PE Survey.

427Public Enterprises Survey 2010-2011: Vol-II
Ennore Port Ltd. P.T.LeeChengalvarayaNaickerMaaligai, 23,RajajiSalai,Chennai,Tamilnadu-600001
Balance Sheet (` in Lakhs)
Particulars 2010-11 2009-10 2008-09
Authorised Capital 50000 50000 50000
(1) Sources Of Fund
(1.1) Shareholders Funds
(A) Paid-Up Capital
Central Govt 20000 20000 20000
Others 10000 10000 10000
(B) Share Application Money 0 0 0
(C) Reserves & Surplus 16381 12119 8392
Total (A) + (B) + (C) 46381 42119 38392
(1.2) Loan Funds
(A) Secured Loans 42622 39943 38958
(B) Unsecured Loans 0 1750 1850
Total (A) + (B) 42622 41693 40808
(1.3) Deferred Tax Liability 0 0 0
Total (1.1) + (1.2) + (1.3) 89003 83812 79200
(2) Application Of Funds
(2.1) Fixed Assets
(A) Gross Block 86389 80743 80225
(B) Less Depreciation 10288 9907 8657
(C) Net Block (A-B) 76101 70836 71568
(D) Capital Work In Progress 9994 9508 4342
Total (C) + (D) 86095 80344 75910
(2.2) Investment 3875 3000 2450
(2.3) Current Assets, Loan & Advances
(A) Inventories 479 479 479
(B) Sundry Debtors 994 389 280
(C) Cash & Bank Balances 530 1456 635
(D) Other Current Assets 11 6 8
(E) Loan & Advances 14259 11931 13043
Total (A)+ (B)+ (C)+ (D)+ (E) 16273 14261 14445
(2.4) Less:current Liabilities & Provisions
(A) Current Liabilities 12437 10590 11427
(B) Provisions 4803 3203 2178
Total (A+B) 17240 13793 13605
(2.5) Net Current Assets (2.3-2.4) -967 468 840
(2.6) Deferred Revenue / Pre. Expenditure 0 0 0
(2.7) Deferred Tax Asset 0 0 0
(2.8) Profit & Loss Account(Dr) 0 0 0
Total (2.1+2.2+2.5+2.6+2.7+2.8) 89003 83812 79200
Important Indicators 2010-11 2009-10 2008-09
(i) Investment 30000 71693 31850
(ii) Capital Employed 75134 71304 72408
(iii) Net Worth 46381 42119 38392
(iv) Cost of Production 9785 8660 8976
(v) Cost of Sales 9785 8660 8976
(vi) Gross Value Added (At Market Price) - - -
(vii) Total Employees (Other Than Casuals) (Nos.) 88 86 65
(viii) Avg. Monthly Emoluments Per Employee (Rs.) 56534 75000 46282
Profit & Loss Account (` in Lakhs)
Particulars 2010-11 2009-10 2008-09
(1) Income
(A) Sales/Operating Income 18514 15681 14393
(B) Excise Duty 1785 1475 617
(C) Net Sales (A-B) 16729 14206 13776
(D) Other Income/Receipts 82 347 424
(E) Accretion/Depletion in Stocks 0 0 0
(I)Total Income (C+D+E) 16811 14553 14200
(2) Expenditure
(A) Purchase of Finished Goods/ Consumption Of Raw Materials 0 0 0
(B) Stores & Spares 0 0 0
(C) Power & Fuel 192 200 151
(D) Manufacturing / Direct / Operating Expenses 1514 1577 2315
(E) Salary, Wages & Benefits / Employee Exp. 597 774 361
(F) Other Expenses 1924 533 706
(G) Provisions 0 0 0
(II)Total Expenditure (A to G) 4227 3084 3533
(3) Profit Before Dep, Int, Taxes & EP (PBDITEP) (I-II) 12584 11469 10667
(4) Depreciation 1293 1263 1182
(5) Dre/Prel Exp Written Off 0 0 0
(6) Profit Before Int., Taxes & Ep (PBITEP) (3-4-5) 11291 10206 9485
(7) Interest
(A) On Central Government Loans 0 0 0
(B) On Foreign Loans 0 0 0
(C) Others 4265 4313 4261
(D) Less Interest Capitalised 0 0 0
(E) Charged to P & L Account (A+B+C-D) 4265 4313 4261
(8) Profit Before Tax & EP(PBTEP) (6-7E) 7026 5893 5224
(9) Tax Provisions 1428 1080 545
(10) Net Profit / Loss Before EP (8-9) 5598 4813 4679
(11) Net Extra-Ord. Items 40 -53 533
(12) Net Profit / Loss(-) (10-11) 5558 4866 4146
(13) Dividend Declared 1112 973 622
(14) Dividend Tax 185 165 105
(15) Retained Profit (12-13-14) 4261 3728 3419
Financial Ratios 2010-11 2009-10 2008-09
(i) Sales : Capital Employed 22.27 19.92 19.03
(ii) Cost of Sales : Sales 58.49 60.96 65.16
(iii) Salary / Wages : Sales 3.57 5.45 2.62
(iv) Net Profit : Net Worth 11.98 11.55 10.8
(v) Debt : Equity 0.92 0.99 1.06
(vi) Current Ratio 0.94 1.03 1.06
(vii) Sundry Debtors : Sales (No. of Days) 21.69 9.99 7.42
(viii) Total Inventory : Sales 10.45 12.31 12.69

428 Transportation Services
www.fhel.co.in
Fresh & Healthy Enterprises Limited (FHEL) is a wholly owned subsidiary of Container Corporation of India (CONCOR). Itwas incorporated on 1.2.2006with the objective to set up aworld class cold chain infrastructure in India, and to provide complete cold chain logistics solutions to the various stakeholders in this area.
FHEL is an un-categorized CPSE under the Ministry ofRailways&itsRegisteredOfficeisinNewDelhiandcorporateoffice is atSonepat,Haryana.
Vision / MissionThe Vision / Mission of the Company is to develop into a
world class organizationusing state-of-the–art technologies forprocurement, transportation, storage, and distribution of fruits and vegetables in the country. This is to be achieved through setting up modern controlled atmosphere storage facilities and by developing strong long term linkages with farmers, agricultural institutes, logistics, operations and governmental agencies with emphasis on information technology solutions for all activities. The Company will strive to provide value for money to its customers throughprovidingqualitative and efficient services.
Industrial / Business OperationsFHEL is involved in the procurement, transportation, storage
and distribution of fruits and vegetables through integrated controlled atmosphere storage, operation & logistics through its regionalandworksofficeatShimla(H.P.)andSonepat(Haryana)respectively. The physical performances of the company for last three years are given below:Main Product / Services
Unit Performance During2010-11 2009-10 2008-09
Apple procured MT 9361 2856 8000Apple marketed MT 9539 - -
TheCompanystarted itsoperation in theyear2006-07byprocuring apples from Shilma and Kinnaur districts of Himachal Pradesh forwhich itcommissioned12000MTstate-of-art-CAStore, currently the largest in the country.
Strategic issueThe Company aims to improve efficiencies and be
recognized as setting standards for excellence, particularly for quality of products and services. The broad approach of FHEL is to source fresh produce directly from farmers, and then sell directly to retail chains. FHEL is also working with farmers to adopt modern scientific orchard management techniques toimprove quality and yield.
Performance HighlightsThe operational performance of the company along with
performance indicators and selected financial ratios during theperiod2008-09 to 2010-11 canbe seenon theopposite page.
The Company registered an increase of ` 40.84 crore in total income during 2010-11 which went up to ` 62.03 crore in 2010-11 from ` 21.19 crore during 2009-10. Accordinglyas against a loss of ` 9.06 crore during 2009-10 the companyearnedaprofitof` 0.42croreduring2010-11.Despiteincreasein turnover, theprofitabilitywas lowdue to increase incostofsale, employee cost and other expenses.
During2007-08,FHELprocured,storedandmarketedabout12000MT of apples however due to bad crop in 2009-10 theprocurementwas2856MTonly.In2010-11theapplecropwasgood resulting in increased turnover.
17.9 Fresh and Healthy Enterprises Ltd.Human Resource Management
The company employed 33 regular employees as on 31.3.2011. The retirement age in the company is 60 years. It is following IDA 2007 pattern of remuneration. Details of employment in last 3 years are given below:
Particulars 2010-11 2009-10 2008-09Executives including Non-Unionised Supervisors 16 14 11
Non-Executives # 17 7 1Total Employees 33 21 12
# Detail break-up of Non-Executive employees is at Statement no. 25 of volume-I of PE Survey.

429Public Enterprises Survey 2010-2011: Vol-II
Fresh and Healthy Enterprises Ltd.CONCORBhawan,C-3,MathuraRoad,Opp.ApolloHospital ,NewDelhi-110076.
Balance Sheet (` in Lakhs)
Particulars 2010-11 2009-10 2008-09
Authorised Capital 5000 5000 3500
(1) Sources Of Fund
(1.1) Shareholders Funds
(A) Paid-Up Capital
Central Govt 0 0 0
Others 4827 4827 3500
(B) Share Application Money 0 0 0
(C) Reserves & Surplus 11 11 0
Total (A) + (B) + (C) 4838 4838 3500
(1.2) Loan Funds
(A) Secured Loans 4732 4242 4871
(B) Unsecured Loans 2858 3365 2764
Total (A) + (B) 7590 7607 7635
(1.3) Deferred Tax Liability 19 0 0
Total (1.1) + (1.2) + (1.3) 12447 12445 11135
(2) Application Of Funds
(2.1) Fixed Assets
(A) Gross Block 8169 8143 8132
(B) Less Depreciation 1306 942 576
(C) Net Block (A-B) 6863 7201 7556
(D) Capital Work In Progress 0 0 0
Total (C) + (D) 6863 7201 7556
(2.2) Investment 0 0 0
(2.3) Current Assets, Loan & Advances
(A) Inventories 622 877 1314
(B) Sundry Debtors 1237 208 465
(C) Cash & Bank Balances 40 299 314
(D) Other Current Assets 16 5 6
(E) Loan & Advances 76 78 83
Total (A)+ (B)+ (C)+ (D)+ (E) 1991 1467 2182
(2.4) Less:current Liabilities & Provisions
(A) Current Liabilities 286 143 1619
(B) Provisions 29 32 27
Total (A+B) 315 175 1646
(2.5) Net Current Assets (2.3-2.4) 1676 1292 536
(2.6) Deferred Revenue / Pre. Expenditure
6 8 6
(2.7) Deferred Tax Asset 0 0 0
(2.8) Profit & Loss Account(Dr) 3902 3944 3037
Total (2.1+2.2+2.5+2.6+2.7+2.8) 12447 12445 11135
Important Indicators 2010-11 2009-10 2008-09
(i) Investment 11299 9069 8371
(ii) Capital Employed 8539 8493 8092
(iii) Net Worth 930 886 457
(iv) Cost of Production 6142 3025 4870
(v) Cost of Sales 6404 3462 4752
(vi) Gross Value Added (At Market Price) - - -
(vii) Total Employees (Other Than Casuals) (Nos.)
33 21 12
(viii) Avg. Monthly Emoluments Per Employee (Rs.)
36111 59127 129167
Profit & Loss Account (` in Lakhs)
Particulars 2010-11 2009-10 2008-09
(1) Income
(A) Sales/Operating Income 6435 2492 3509
(B) Excise Duty 0 0 0
(C) Net Sales (A-B) 6435 2492 3509
(D) Other Income/Receipts 30 64 41
(E) Accretion/Depletion in Stocks -262 -437 118
(I)Total Income (C+D+E) 6203 2119 3668
(2) Expenditure
(A) Purchase of Finished Goods/ Consumption Of Raw Materials
3918 1523 2790
(B) Stores & Spares 16 0 3
(C) Power & Fuel 186 101 200
(D) Manufacturing / Direct / Operating Expenses
777 293 552
(E) Salary, Wages & Benefits / Employee Exp.
143 149 186
(F) Other Expenses 227 202 324
(G) Provisions 0 0 0
(II)Total Expenditure (A to G) 5267 2268 4055
(3) Profit Before Dep, Int, Taxes & EP (PBDITEP) (I-II)
936 -149 -387
(4) Depreciation 364 367 363
(5) Dre/Prel Exp Written Off 3 8 5
(6) Profit Before Int., Taxes & Ep (PBITEP) (3-4-5)
569 -524 -755
(7) Interest
(A) On Central Government Loans 0 0 0
(B) On Foreign Loans 0 0 0
(C) Others 508 382 447
(D) Less Interest Capitalised 0 0 0
(E) Charged to P & L Account (A+B+C-D)
508 382 447
(8) Profit Before Tax & EP(PBTEP) (6-7E)
61 -906 -1202
(9) Tax Provisions 19 0 3
(10) Net Profit / Loss Before EP (8-9) 42 -906 -1205
(11) Net Extra-Ord. Items 0 0 0
(12) Net Profit / Loss(-) (10-11) 42 -906 -1205
(13) Dividend Declared 0 0 0
(14) Dividend Tax 0 0 0
(15) Retained Profit (12-13-14) 42 -906 -1205
Financial Ratios 2010-11 2009-10 2008-09
(i) Sales : Capital Employed 75.36 29.34 43.36
(ii) Cost of Sales : Sales 99.52 138.92 135.42
(iii) Salary / Wages : Sales 2.22 5.98 5.3
(iv) Net Profit : Net Worth 4.52 -102.26 -263.68
(v) Debt : Equity 1.57 1.57 2.18
(vi) Current Ratio 6.32 8.38 1.33
(vii) Sundry Debtors : Sales (No. of Days)
70.16 30.47 48.37
(viii) Total Inventory : Sales 35.28 128.45 136.68

430 Transportation Services
www.airindia.in
National Aviation Company of India Ltd. (NACIL) (now Air India Ltd.) was incorporated on 30.3.2007 and commenced its business from14.05.2007with theobjectiveofsynergizing theactivities of merged airlines (Air India and Indian Airlines) so as to take on the growing competition from the private airlines and large international carriers. The merger was done under section 391-394oftheCompaniesAct,1956.Duringtheyear2010-11,the name of company changed to Air India Ltd. (AI).
Air India is a Schedule-‘A’ CPSE in Transport Servicessector under the administrative control of the M/o Civil Aviation with 100% shareholding by the Government of India. Its registered office is atNewDelhi and corporate office is atMumbai, Maharashtra.
Industrial / Business OperationsAir India comprises six Strategic Business Units (SBUs)
comprising Passenger; Cargo; Ground Handling Services; Low Cost Carrier (LCCs); MRO (Airframes and Engines / Components); and Related Business. The merged entity also has a Corporate Services Group. The company operates from 5 regional and4officesabroad.The company has not provided any details of physical performance during last three years.
The company has fivewholly owned subsidiaries namelyHotel Corporation of India,Air-India Charters Ltd.,Air IndiaAir Transport Services Ltd., Air India Engineering Services Ltd., and Airlines Allied Services Ltd. The company also has one 50:50 Joint Venture namely Air India SATS Airport Services Private Ltd.
Strategic issueIn view of consolidation of the global aviation environment,
wherein critical / mass size is a key success factor, the Air India and Indian Airlines were merged in a single company. The merger was expected to provide an opportunity to leverage combined assets and capital. Post merger, the new entity was expected to retain Brand Name “Air India” with “Maharaja”as its mascot. Along with size, the new entity was expected to create considerable synergy, since the two airlines could feed traffic to eachother.The synergybenefitswere in the areas ofroute rationalization; fuel procurement; stores and inventory purchase both aircraft and non-aircraft; insurance benefits;handlingofflights; and employeeproductivity.Besides, itwasto result in redeployment of aircraft since Air India and Indian Airlines were flying on some common routes in the Gulf andSouth East Asia.
Performance HighlightsThe operational performance of the company along with
performance indicators and selected financial ratios during theperiod2008-09 to 2010-11 canbe seenon theopposite page.
The Company registered an increase of ` 852.84 crore in totalincomeduring2010-11whichwentupto` 14255.11 crore in2010-11from` 13402.27croreduring2009-10duetoincreasein turnover. The net loss of the company however increased to ` 6865.17 crore, an increase of ` 1312.73 crore over the previous year’s loss of ` 5552.44 crore due to increase in operating cost and interest cost.
17.10 Air India Ltd.Human Resource Management
The company employed 28085 regular employees as on 31.3.2011. The retirement age in the company is 60 years at Board level and 58 years below board level. Details of employment in last 3 years are given below:
Particulars 2010-11 2009-10 2008-09Executives including Non-Unionised Supervisors 6459 6457 3691
Non-Executives # 21626 23173 27415Total Employees 28085 29630 31106
# Detail break-up of Non-Executive employees is at Statement no. 25 of volume-I of PE Survey.

431Public Enterprises Survey 2010-2011: Vol-II
Air India Ltd.Airlines House, 113, GurudwaraRakabgn Road, New Delhi – 110 001
Balance Sheet (` in Lakhs)
Particulars 2010-11 2009-10 2008-09
Authorised Capital 500005 500005 150005
(1) Sources Of Fund
(1.1) Shareholders Funds
(A) Paid-Up Capital
Central Govt 214500 94500 14500
Others 0 0 0
(B) Share Application Money 0 0 0
(C) Reserves & Surplus 8047 6248 6335
Total (A) + (B) + (C) 222547 100748 20835
(1.2) Loan Funds
(A) Secured Loans 1070804 659071 236595
(B) Unsecured Loans 3192096 3183207 2854207
Total (A) + (B) 4262900 3842278 3090802
(1.3) Deferred Tax Liability 0 0 0
Total (1.1) + (1.2) + (1.3) 4485447 3943026 3111637
(2) Application Of Funds
(2.1) Fixed Assets
(A) Gross Block 3544089 3284105 2432940
(B) Less Depreciation 472825 319906 183805
(C) Net Block (A-B) 3071264 2964199 2249135
(D) Capital Work In Progress 189642 246562 501137
Total (C) + (D) 3260906 3210761 2750272
(2.2) Investment 59998 41344 17437
(2.3) Current Assets, Loan & Advances
(A) Inventories 67596 86778 96421
(B) Sundry Debtors 283762 257911 247310
(C) Cash & Bank Balances 41644 52847 113964
(D) Other Current Assets 8252 7681 5616
(E) Loan & Advances 138061 144665 106640
Total (A)+ (B)+ (C)+ (D)+ (E) 539315 549882 569951
(2.4) Less:current Liabilities & Provisions
(A) Current Liabilities 692411 554667 425146
(B) Provisions 156379 109299 100409
Total (A+B) 848790 663966 525555
(2.5) Net Current Assets (2.3-2.4) -309475 -114084 44396
(2.6) Deferred Revenue / Pre. Expenditure 0 0 15280
(2.7) Deferred Tax Asset 238592 249761 284252
(2.8) Profit & Loss Account(Dr) 1235426 555244 0
Total (2.1+2.2+2.5+2.6+2.7+2.8) 4485447 3943026 3111637
Important Indicators 2010-11 2009-10 2008-09
(i) Investment 2123210 1877532 1472041
(ii) Capital Employed 2761789 2850115 2293531
(iii) Net Worth -1012879 -454496 5555
(iv) Cost of Production 2129181 1901502 2056233
(v) Cost of Sales 2129181 1901502 2056233
(vi) Gross Value Added (At Market Price) - - -
(vii) Total Employees (Other Than Casuals) (Nos.) 28085 29630 31106
(viii) Avg. Monthly Emoluments Per Employee (Rs.) 110583 94407 89448
Profit & Loss Account (` in Lakhs)
Particulars 2010-11 2009-10 2008-09
(1) Income
(A) Sales/Operating Income 1397439 1310862 1322452
(B) Excise Duty 0 0 0
(C) Net Sales (A-B) 1397439 1310862 1322452
(D) Other Income/Receipts 28072 29365 25486
(E) Accretion/Depletion in Stocks 0 0 0
(I)Total Income (C+D+E) 1425511 1340227 1347938
(2) Expenditure
(A) Purchase of Finished Goods/ Consumption Of Raw Materials 0 0 0
(B) Stores & Spares 91839 122942 55605
(C) Power & Fuel 617136 508013 713731
(D) Manufacturing / Direct / Operating Expenses 425211 463140 472441
(E) Salary, Wages & Benefits / Employee Exp. 372687 335672 333885
(F) Other Expenses 58311 69619 196927
(G) Provisions 65397 19702 0
(II)Total Expenditure (A to G) 1630581 1519088 1772589
(3) Profit Before Dep, Int, Taxes & EP (PBDITEP) (I-II) -205070 -178861 -424651
(4) Depreciation 169010 138979 122589
(5) Dre/Prel Exp Written Off 0 0 0
(6) Profit Before Int., Taxes & Ep (PBITEP) (3-4-5) -374080 -317840 -547240
(7) Interest
(A) On Central Government Loans 0 0 0
(B) On Foreign Loans 109505 62708 38504
(C) Others 220085 180727 122551
(D) Less Interest Capitalised 0 0 0
(E) Charged to P & L Account (A+B+C-D) 329590 243435 161055
(8) Profit Before Tax & EP(PBTEP) (6-7E) -703670 -561275 -708295
(9) Tax Provisions 150 154 -164037
(10) Net Profit / Loss Before EP (8-9) -703820 -561429 -544258
(11) Net Extra-Ord. Items -17303 -6185 10568
(12) Net Profit / Loss(-) (10-11) -686517 -555244 -554826
(13) Dividend Declared 0 0 0
(14) Dividend Tax 0 0 0
(15) Retained Profit (12-13-14) -686517 -555244 -554826
Financial Ratios 2010-11 2009-10 2008-09
(i) Sales : Capital Employed 50.6 45.99 57.66
(ii) Cost of Sales : Sales 152.36 145.06 155.49
(iii) Salary / Wages : Sales 26.67 25.61 25.25
(iv) Net Profit : Net Worth - - -9987.87
(v) Debt : Equity 19.16 38.14 148.35
(vi) Current Ratio 0.64 0.83 1.08
(vii) Sundry Debtors : Sales (No. of Days) 74.12 71.81 68.26
(viii) Total Inventory : Sales 17.66 24.16 26.61
2010-11 PROVISIONAL

432 Transportation Services
www.pawanhans.co.in
Pawan Hans Helicopters Limited (PHHL) was incorporated on15-10-1985with theobjective toprovidehelicoptersupportservices to meet the requirement of oil & non-oil sector,other remote areas and to provide charter service to promote tourism.
PHHL is a Schedule-‘B’CPSE inTransportationServicessector under the administrative control of M/o Civil Aviation with 78.5% shareholding by the Government of India and 21.5% is withONGCLtd., a Navratna CPSE. Its registered office is inNewDelhi and corporate office is atNoida (U.P.).
Vision/MissionThe vision of the company is to meet customer’s
expectations. The Mission of the Company is to become a market leader in Asia in helicopter operations and provide repair / overhaul services of helicopter components / assemblies at par with international standard.
Industrial / Business OperationsPHHL is engaged in providing Helicopter services in
exploration & production sector, connecting inaccessible & hilly areasinnortheast,inter-islandconnectivity,pipelinesurveillance,pilgrimage services, hot line insulator washing for Power grid through its fleet of 41 helicopters consisting of Dauphin, BellandMi-172etc.The company is alsomaintaining&operatinghelicopters owned by other customers such as Govt. of Bihar and Gujarat,BSFandONGC.Thecompanyisalsoindevelopmentofheliport and helipad. The physical performances of the company for last three years are given below:Main Services Unit Performance During
2010-11 2009-10 2008-09Helicopter Flying Hrs. 32175 29890 27050Capacity Utiliation
% 83% 83% 81%
Strategic IssuesThecompanyaimsattoenhanceitsfleetofHelicoptersin
the next few years. It is also considering adding Ultra Light and LightDoubleEngine helicopters to its fleet in the near future.PHHL has also launched an Aircraft Maintenance Engineering (AME) training institute at Mumbai.
Performance HighlightsThe operational performance of the company along with
performance indicators and selected financial ratios during theperiod2008-09 to 2010-11 canbe seenon theopposite page.
The Company registered an increase of ` 34.36 crore in total income during 2010-11whichwent up to ` 430.45 crore in2010-11 from` 396.09 croreduring2009-10.Thenet profitof the company however reduced to ` 18.51 crore, a reduction of ` 17.08 crore over the previous year profit of` 35.59 crore due to increase in other expenses. There is increase in operating profitofthecompanyhowevernetprofitreducedduetohigherprovisions made for interest and tax.
During theyear there isenhancementofHelicopterfleet /JV planes and operation start in new areas leading to increase in turnover.
17.11 Pawan Hans Helicopters LimitedHuman Resource Management
The company employed 528 regular employees as on 31.3.2011. The retirement age in the company is 60 years. It is following IDA 1997 pattern of remuneration. Details of employment in last 3 years are given below:
Particulars 2010-11 2009-10 2008-09Executives including Non-Unionised Supervisors 202 184 195
Non-Executives # 326 341 354Total Employees 528 525 549
# Detail break-up of Non-Executive employees is at Statement no. 25 of volume-I of PE Survey.
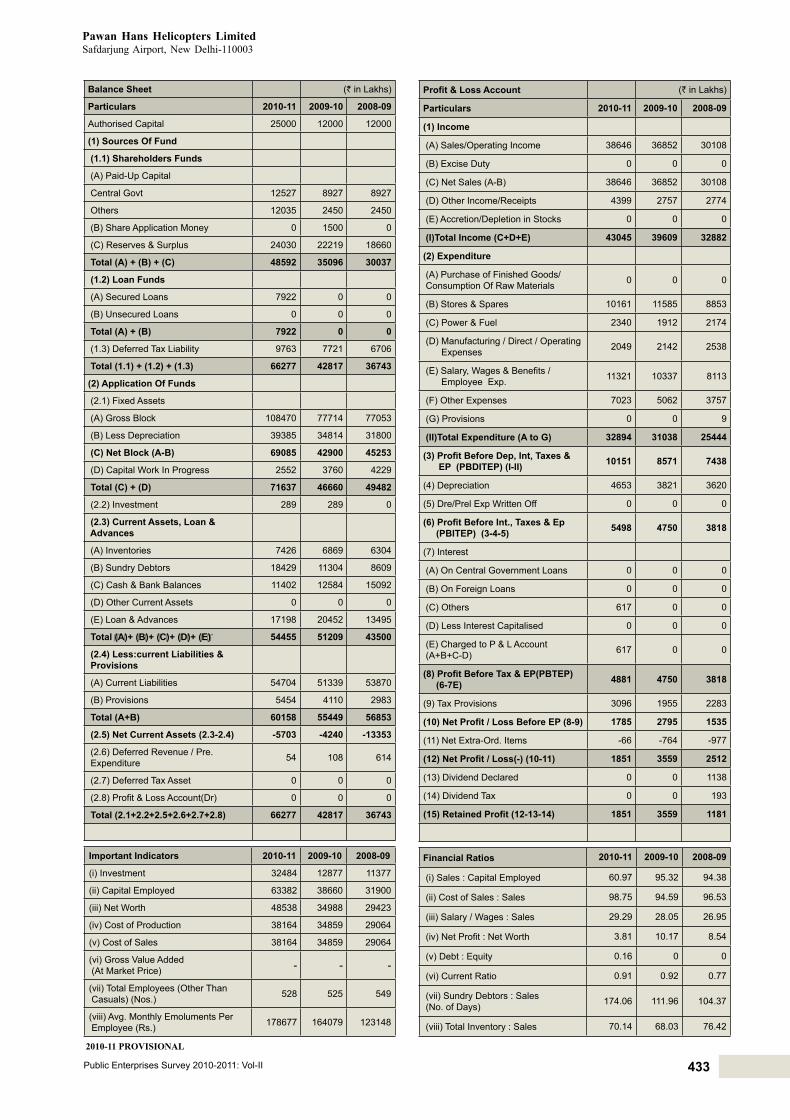
433Public Enterprises Survey 2010-2011: Vol-II
Pawan Hans Helicopters LimitedSafdarjungAirport,NewDelhi-110003
Balance Sheet (` in Lakhs)
Particulars 2010-11 2009-10 2008-09
Authorised Capital 25000 12000 12000
(1) Sources Of Fund
(1.1) Shareholders Funds
(A) Paid-Up Capital
Central Govt 12527 8927 8927
Others 12035 2450 2450
(B) Share Application Money 0 1500 0
(C) Reserves & Surplus 24030 22219 18660
Total (A) + (B) + (C) 48592 35096 30037
(1.2) Loan Funds
(A) Secured Loans 7922 0 0
(B) Unsecured Loans 0 0 0
Total (A) + (B) 7922 0 0
(1.3) Deferred Tax Liability 9763 7721 6706
Total (1.1) + (1.2) + (1.3) 66277 42817 36743
(2) Application Of Funds
(2.1) Fixed Assets
(A) Gross Block 108470 77714 77053
(B) Less Depreciation 39385 34814 31800
(C) Net Block (A-B) 69085 42900 45253
(D) Capital Work In Progress 2552 3760 4229
Total (C) + (D) 71637 46660 49482
(2.2) Investment 289 289 0
(2.3) Current Assets, Loan & Advances
(A) Inventories 7426 6869 6304
(B) Sundry Debtors 18429 11304 8609
(C) Cash & Bank Balances 11402 12584 15092
(D) Other Current Assets 0 0 0
(E) Loan & Advances 17198 20452 13495
Total (A)+ (B)+ (C)+ (D)+ (E) 54455 51209 43500
(2.4) Less:current Liabilities & Provisions
(A) Current Liabilities 54704 51339 53870
(B) Provisions 5454 4110 2983
Total (A+B) 60158 55449 56853
(2.5) Net Current Assets (2.3-2.4) -5703 -4240 -13353
(2.6) Deferred Revenue / Pre. Expenditure 54 108 614
(2.7) Deferred Tax Asset 0 0 0
(2.8) Profit & Loss Account(Dr) 0 0 0
Total (2.1+2.2+2.5+2.6+2.7+2.8) 66277 42817 36743
Important Indicators 2010-11 2009-10 2008-09
(i) Investment 32484 12877 11377
(ii) Capital Employed 63382 38660 31900
(iii) Net Worth 48538 34988 29423
(iv) Cost of Production 38164 34859 29064
(v) Cost of Sales 38164 34859 29064
(vi) Gross Value Added (At Market Price) - - -
(vii) Total Employees (Other Than Casuals) (Nos.) 528 525 549
(viii) Avg. Monthly Emoluments Per Employee (Rs.) 178677 164079 123148
Profit & Loss Account (` in Lakhs)
Particulars 2010-11 2009-10 2008-09
(1) Income
(A) Sales/Operating Income 38646 36852 30108
(B) Excise Duty 0 0 0
(C) Net Sales (A-B) 38646 36852 30108
(D) Other Income/Receipts 4399 2757 2774
(E) Accretion/Depletion in Stocks 0 0 0
(I)Total Income (C+D+E) 43045 39609 32882
(2) Expenditure
(A) Purchase of Finished Goods/ Consumption Of Raw Materials 0 0 0
(B) Stores & Spares 10161 11585 8853
(C) Power & Fuel 2340 1912 2174
(D) Manufacturing / Direct / Operating Expenses 2049 2142 2538
(E) Salary, Wages & Benefits / Employee Exp. 11321 10337 8113
(F) Other Expenses 7023 5062 3757
(G) Provisions 0 0 9
(II)Total Expenditure (A to G) 32894 31038 25444
(3) Profit Before Dep, Int, Taxes & EP (PBDITEP) (I-II) 10151 8571 7438
(4) Depreciation 4653 3821 3620
(5) Dre/Prel Exp Written Off 0 0 0
(6) Profit Before Int., Taxes & Ep (PBITEP) (3-4-5) 5498 4750 3818
(7) Interest
(A) On Central Government Loans 0 0 0
(B) On Foreign Loans 0 0 0
(C) Others 617 0 0
(D) Less Interest Capitalised 0 0 0
(E) Charged to P & L Account (A+B+C-D) 617 0 0
(8) Profit Before Tax & EP(PBTEP) (6-7E) 4881 4750 3818
(9) Tax Provisions 3096 1955 2283
(10) Net Profit / Loss Before EP (8-9) 1785 2795 1535
(11) Net Extra-Ord. Items -66 -764 -977
(12) Net Profit / Loss(-) (10-11) 1851 3559 2512
(13) Dividend Declared 0 0 1138
(14) Dividend Tax 0 0 193
(15) Retained Profit (12-13-14) 1851 3559 1181
Financial Ratios 2010-11 2009-10 2008-09
(i) Sales : Capital Employed 60.97 95.32 94.38
(ii) Cost of Sales : Sales 98.75 94.59 96.53
(iii) Salary / Wages : Sales 29.29 28.05 26.95
(iv) Net Profit : Net Worth 3.81 10.17 8.54
(v) Debt : Equity 0.16 0 0
(vi) Current Ratio 0.91 0.92 0.77
(vii) Sundry Debtors : Sales (No. of Days) 174.06 111.96 104.37
(viii) Total Inventory : Sales 70.14 68.03 76.42
2010-11 PROVISIONAL

434 Transportation Services
www.shipindia.com
SCIwas incorporatedon02.10.1961with theobjective toserve India’s overseas and costal sea born trades as its primary flag carrier and be an important player in the field of globalmaritime transportation as also in diverse fields like offshoreand other marine transport infrastructure.
SCI was incorporated by amalgamation of Eastern Shipping Corporation and Western Shipping Corporation. Subsequently two more Shipping Companies viz. M/s Jayanti Shipping Company and M/s Mogul Line Ltd. were merged with the SCI in 1973 and 1986 respectively. The SCI has undergone change from Private Limited Company to Public Limited Company with effect from 18.09.1992.
SCI is a Schedule ‘A’ listed Navratna CPSE under the administrative control of M/o Shipping, D/o Shipping with 63.75% shareholding by the Government of India. Its Registered andCorporate offices are atMumbai,Maharashtra.
Vision / MissionThe Vision of the Company is to emerge as a team of
inspired performers in the field of Maritime Transportationserving Indian and Global trades with focus on Maintaining its “Numero Uno” position in Indian shipping, establishing a major global presence, evolving suitable business models toexploit emerging opportunities; Safety of people and property, and protection of Environment.
The mission of the company is to serve India’s overseas andcoastalseabornetradesasitisaprimaryflagcarrierandbeanimportantplayerinthefieldofglobalmaritimetransportationasalsoindiversefieldslikeOffshoreandothermarinetransportinfrastructure.
Industrial / Business OperationsThe main activities of the SCI comprises of operating
shipping services in practically all areas of shipping business, catering to the requirements of the country’s EXIM trade and coastal trade and International cross trades.
The company is operating its 81 vessels under three major segments namely liner, bulk and other segments. Theliner segment includes 2 breakbulk vessels and 5 container vessels, and the bulk segment includes 39 tankers (both crude & product), and 17 offshore supply vessels which are on time charter to ONGC and 2 passengers cum cargo (coastal) vessels. SCI is also operating ONGC owned 5 specialized vessels. It also manages 20 offshore supply vessels on behalf of ONGC under O&M contract on ‘cost plus’ basis
BesidesitsHeadOfficeatMumbai, itoperatesthroughitsRegional offices atNewDelhi,Kolkata,Chennai, London andBranchoffices atHaldia andPortBlair.
The company has six joint ventures namely Irano HindShipping Co., India LNG Transport Companies (No. 1, 2 & 3) Ltd., SCI Forbes Limited and SAIL SCI Shipping Pvt. Ltd. with an equity participation of 49%, 29%, 29%, 26%, 50% and 50% respectively. SCI is also one of the shareholders in the special purpose vehicle, M/s Sethusamudram Corporation Ltd. with contribution of 6.71% in its equity.
17.12 Shipping Corporation of India Ltd.The physical performances of the company for last three
years are given below:Main Product / Services
Unit Performance During2010-11 2009-10 2008-09
Freight ` in Crore 2261.40 2071.1 2402.50
Charter Hire ` in Crore 1109.77 1217.38 1600.12
Demurrage ` in Crore 107.11 102.19 95.37
Receipts towards managed vessels
` in Crore 65.14 71.84 68.64
Strategic issueThe SCI had proposed acquisition of 62 vessels in different
categories during the11thFiveYearPlanperiod (2007-12), ofwhich as on 01.09.2011, SCI had placed orders of 39 vessels, 9 of which have been delivered and the remaining 30 vessels are still to be delivered. The remaining 23 vessels would be considered for acquisition; however, in view of the prevailing scenario of the depressed freight markets, volatility in the shipbuildingpricescoupledwith the shipfinancingdifficulties,the SCI would review the acquisition plan from time to time in line with the market requirements. The acquisition projectsare proposed to be financed with a mix of Debt and internalresources in the ratio 80:20.
Performance HighlightsThe operational performance of the company along with
performance indicators and selected financial ratios during theperiod2008-09 to 2010-11 canbe seenon theopposite page.
The Company registered an increase of ` 153.50crore in total incomeduring2010-11whichwentup to` 3990.02 crore in2010-11from` 3836.52croreduring2009-10.Thenetprofitof the company correspondingly increased to ` 567.35crore, an increase of ` 190.44 crore over the previous year due to better performance of Liner and increased revenue from sale of vessels.
The average capacity utilization during the year was 84.71%. About 70% of the company’s turnover comes from Bulk segment.
Human Resource ManagementThe company employed 3315 regular employees as on
31.3.2011. The retirement age of board level employees in the company is 60 years or completion of tenure whichever is earlier. The retirement age at below board level employee is 58 yearsforthosewhojoinedafteryear2002.It isfollowingIDA2007 pattern of remuneration. Details of employment in last 3 years are given below:
Particulars 2010-11 2009-10 2008-09Executives including Non-Unionised Supervisors 2423 790 3280
Non-Executives # 892 4515 1793Total Employees 3315 5305 5073
# Detail break-up of Non-Executive employees is at Statement no. 25 of volume-I of PE Survey.
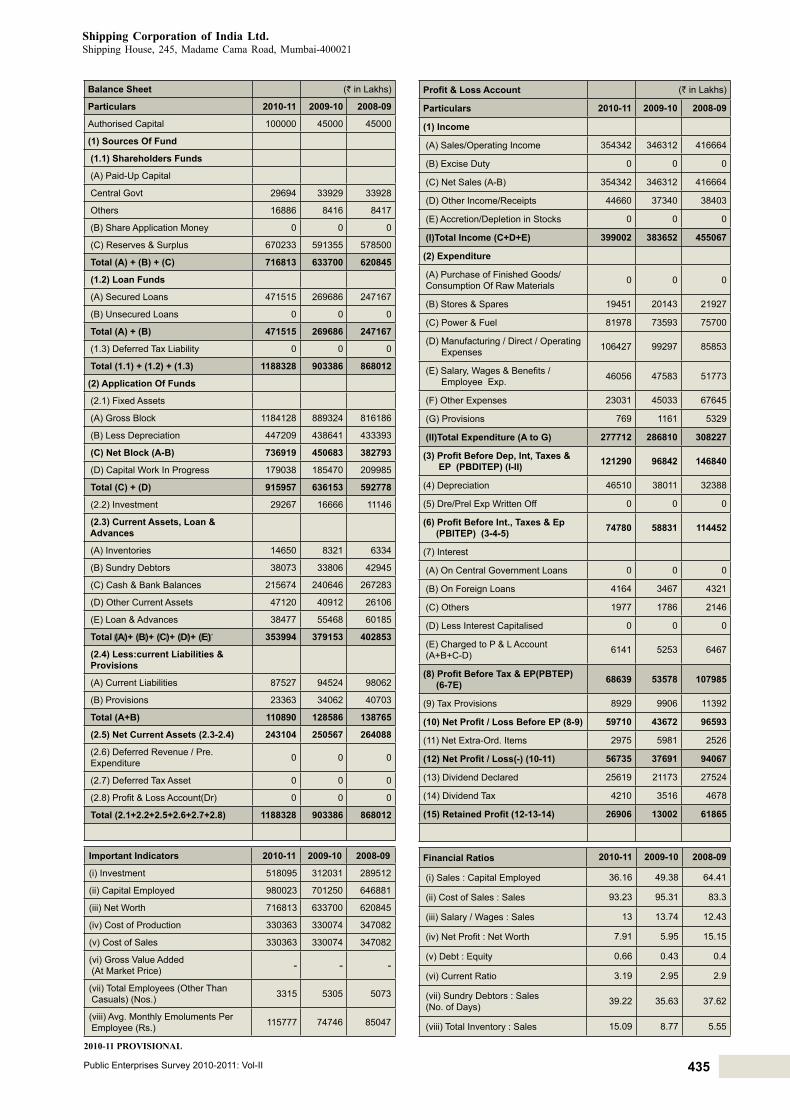
435Public Enterprises Survey 2010-2011: Vol-II
Shipping Corporation of India Ltd.ShippingHouse, 245,MadameCamaRoad,Mumbai-400021
Balance Sheet (` in Lakhs)
Particulars 2010-11 2009-10 2008-09
Authorised Capital 100000 45000 45000
(1) Sources Of Fund
(1.1) Shareholders Funds
(A) Paid-Up Capital
Central Govt 29694 33929 33928
Others 16886 8416 8417
(B) Share Application Money 0 0 0
(C) Reserves & Surplus 670233 591355 578500
Total (A) + (B) + (C) 716813 633700 620845
(1.2) Loan Funds
(A) Secured Loans 471515 269686 247167
(B) Unsecured Loans 0 0 0
Total (A) + (B) 471515 269686 247167
(1.3) Deferred Tax Liability 0 0 0
Total (1.1) + (1.2) + (1.3) 1188328 903386 868012
(2) Application Of Funds
(2.1) Fixed Assets
(A) Gross Block 1184128 889324 816186
(B) Less Depreciation 447209 438641 433393
(C) Net Block (A-B) 736919 450683 382793
(D) Capital Work In Progress 179038 185470 209985
Total (C) + (D) 915957 636153 592778
(2.2) Investment 29267 16666 11146
(2.3) Current Assets, Loan & Advances
(A) Inventories 14650 8321 6334
(B) Sundry Debtors 38073 33806 42945
(C) Cash & Bank Balances 215674 240646 267283
(D) Other Current Assets 47120 40912 26106
(E) Loan & Advances 38477 55468 60185
Total (A)+ (B)+ (C)+ (D)+ (E) 353994 379153 402853
(2.4) Less:current Liabilities & Provisions
(A) Current Liabilities 87527 94524 98062
(B) Provisions 23363 34062 40703
Total (A+B) 110890 128586 138765
(2.5) Net Current Assets (2.3-2.4) 243104 250567 264088
(2.6) Deferred Revenue / Pre. Expenditure 0 0 0
(2.7) Deferred Tax Asset 0 0 0
(2.8) Profit & Loss Account(Dr) 0 0 0
Total (2.1+2.2+2.5+2.6+2.7+2.8) 1188328 903386 868012
Important Indicators 2010-11 2009-10 2008-09
(i) Investment 518095 312031 289512
(ii) Capital Employed 980023 701250 646881
(iii) Net Worth 716813 633700 620845
(iv) Cost of Production 330363 330074 347082
(v) Cost of Sales 330363 330074 347082
(vi) Gross Value Added (At Market Price) - - -
(vii) Total Employees (Other Than Casuals) (Nos.) 3315 5305 5073
(viii) Avg. Monthly Emoluments Per Employee (Rs.) 115777 74746 85047
Profit & Loss Account (` in Lakhs)
Particulars 2010-11 2009-10 2008-09
(1) Income
(A) Sales/Operating Income 354342 346312 416664
(B) Excise Duty 0 0 0
(C) Net Sales (A-B) 354342 346312 416664
(D) Other Income/Receipts 44660 37340 38403
(E) Accretion/Depletion in Stocks 0 0 0
(I)Total Income (C+D+E) 399002 383652 455067
(2) Expenditure
(A) Purchase of Finished Goods/ Consumption Of Raw Materials 0 0 0
(B) Stores & Spares 19451 20143 21927
(C) Power & Fuel 81978 73593 75700
(D) Manufacturing / Direct / Operating Expenses 106427 99297 85853
(E) Salary, Wages & Benefits / Employee Exp. 46056 47583 51773
(F) Other Expenses 23031 45033 67645
(G) Provisions 769 1161 5329
(II)Total Expenditure (A to G) 277712 286810 308227
(3) Profit Before Dep, Int, Taxes & EP (PBDITEP) (I-II) 121290 96842 146840
(4) Depreciation 46510 38011 32388
(5) Dre/Prel Exp Written Off 0 0 0
(6) Profit Before Int., Taxes & Ep (PBITEP) (3-4-5) 74780 58831 114452
(7) Interest
(A) On Central Government Loans 0 0 0
(B) On Foreign Loans 4164 3467 4321
(C) Others 1977 1786 2146
(D) Less Interest Capitalised 0 0 0
(E) Charged to P & L Account (A+B+C-D) 6141 5253 6467
(8) Profit Before Tax & EP(PBTEP) (6-7E) 68639 53578 107985
(9) Tax Provisions 8929 9906 11392
(10) Net Profit / Loss Before EP (8-9) 59710 43672 96593
(11) Net Extra-Ord. Items 2975 5981 2526
(12) Net Profit / Loss(-) (10-11) 56735 37691 94067
(13) Dividend Declared 25619 21173 27524
(14) Dividend Tax 4210 3516 4678
(15) Retained Profit (12-13-14) 26906 13002 61865
Financial Ratios 2010-11 2009-10 2008-09
(i) Sales : Capital Employed 36.16 49.38 64.41
(ii) Cost of Sales : Sales 93.23 95.31 83.3
(iii) Salary / Wages : Sales 13 13.74 12.43
(iv) Net Profit : Net Worth 7.91 5.95 15.15
(v) Debt : Equity 0.66 0.43 0.4
(vi) Current Ratio 3.19 2.95 2.9
(vii) Sundry Debtors : Sales (No. of Days) 39.22 35.63 37.62
(viii) Total Inventory : Sales 15.09 8.77 5.55
2010-11 PROVISIONAL

437Public Enterprises Survey 2010-2011: Vol-II
As on 31.3.2011, there were 13 Central Public Sector Enterprises in the Contract & Construction Services group. The name of these enterprises along with their year of incorporation in chronological order are given below :
Sl. No.
Enterprise Year of Incorporation
1. Hindustan Prefab Ltd. 1953
2. NationalProjectsConstructionCorpn.Ltd. 1957
3. National Bldg. Constn. Corpn. Ltd. 1960
4. Hindustan Steelworks Costn. Ltd. 1964
5. Bridge & Roof Co.(India) Ltd. 1972
6. Mineral Exploration Corpn. Ltd. 1972
7. IRCON International Ltd. 1976
8. Projects&DevelopmentIndiaLtd. 1978
9. BBJ Construction Company Ltd. 1984
10. Konkan Railway Corporation Ltd. 1990
11. Mumbai Railway Vikas Corporation Ltd. 1999
12. Rail Vikas Nigam Ltd. 2003
13. IRCON Infrastructure & Services Ltd. 2010
2. The enterprises falling in this group are mainly engaged in construction of houses, railway lines, roads and bridges and providing consultancy services in alliedfields andworks etc.
3. Theconsolidatedfinancialposition,theworkingresultsand the important management ratios of these enterprises are appended.
4. Turnover : The details of turnover of individual enterprises are given below :
(`in Crore)Sl. No.
Enterprise Turnover
2010-11 2009-10
1. IRCON International Ltd. 3175.33 3152.88
2. National Bldg. Constn. Corpn. Ltd. 3126.77 2981.98
3. Rail Vikas Nigam Ltd. 1444.65 1749.08
4. Bridge & Roof Co.(India) Ltd. 1328.97 1162.01
5. NationalProjectsConstructionCorpn. Ltd.
1069.46 991.22
6. Hindustan Steelworks Costn. Ltd. 974.90 785.17
7. Konkan Railway Corporation Ltd. 600.01 588.27
8. Hindustan Prefab Ltd. 203.07 162.43
9. BbjConstructionCompanyLtd. 152.60 77.90
10. Mineral Exploration Corpn. Ltd. 128.90 122.42
11. Projects&DevelopmentIndiaLtd. 103.85 74.93
12. Mumbai Railway Vikas Corporation Ltd.
9.47 14.28
13. IRCON Infrastructure & Services Ltd.
1.10 0.00
Sub Total 12319.08 11862.57
5. Net Profit/Loss : The details of the enterprises, which earnednet profit or sustainednet loss (-) are givenbelow :
18 Contract & Construction Services(`in Crore)
Sl. No.
Enterprise Adjusted Net Profit/Net Loss
2010-11 2009-10
1. IRCON International Ltd. 240.51 182.18
2. National Bldg. Constn. Corpn. Ltd. 140.34 116.50
3. Rail Vikas Nigam Ltd. 61.09 51.91
4. Bridge & Roof Co.(India) Ltd. 57.68 42.00
5. NationalProjectsConstructionCorpn. Ltd.
29.70 31.29
6. Projects&DevelopmentIndiaLtd. 21.01 14.48
7. Mineral Exploration Corpn. Ltd. 11.95 14.47
8. Mumbai Railway Vikas Corporation Ltd.
10.37 25.80
9. Hindustan Prefab Ltd. 4.61 2.47
10. BBJ Construction Company Ltd. 3.60 2.76
11. Konkan Railway Corporation Ltd. 1.83 11.63
12. IRCON Infrastructure & Services Ltd.
0.07 0.00
13. Hindustan Steelworks Costn. Ltd. -38.09 -54.59
Sub Total 544.67 440.90
6. Dividend : The details of the dividend declared by the individual enterprise are given below :
(`in Crore)Sl. No.
Enterprise Dividend
2010-11 2009-10
1. IRCON International Ltd. 49.49 36.62
2. National Bldg. Constn. Corpn. Ltd. 28.07 23.30
3. Rail Vikas Nigam Ltd. 12.50 10.00
4. Projects&DevelopmentIndiaLtd. 3.81 3.81
5. Bridge & Roof Co.(India) Ltd. 1.65 1.10
6. BBJ Construction Company Ltd. 0.05 0.05
Group Total 95.57 74.88
7. Social Overheads and Township : The total number of persons employed and the expenditure incurred on social overheads and townships are given below :
(`in Crore)Sl. No.
Enterprise Township and Social Overheads
2010-11 2009-10
1. No. of employees (in number) 17114 16358
2. Social overheads : (Rupees in Crore)
(i) Educational, 4.06 7.02
(ii) Medical Facilities 11.16 11.16
(iii) Others 9.53 9.53
3. Capital cost of township (Rupees in Crore)
79.73 79.73
4. No. of houses constructed (in number)
3166 3166
8. Company wise details in respect of Balance Sheet, ProfitandLossaccount,ImportantIndicatorsandFinancialRatiosalong with the write up of individual company are given in the pages below.

438 Contract & Construction Services

439Public Enterprises Survey 2010-2011: Vol-II
Contract & Construction ServicesBalance Sheet
(` in Lakhs)
(` in Lakhs)
Particulars 2010-11 2009-10 2008-09
AUTHORISED CAPITAL 932898 932898 919098
(1) SOURCES OF FUND
(1.1) SHAREHOLDERS FUNDS
(A)PAID-UPCAPITAL
CENTRAL GOVT 722534 749938 642730
OTHERS 43396 42946 42906
(B) SHARE APPLICATION MONEY 0 0 12780
(C) RESERVES & SURPLUS 248211 204750 171218
TOTAL (A) + (B) + (C) 1014141 997634 869634
(1.2) LOAN FUNDS
(A) SECURED LOANS 260048 297829 322333
(B) UNSECURED LOANS 535735 621414 562182
TOTAL (A) + (B) 795783 919243 884515
(1.3) DEFERRED TAX LIABILITY 28 219 272
TOTAL (1.1) + (1.2) + (1.3) 1809952 1917096 1754421
(2) APPLICATION OF FUNDS
(2.1) FIXED ASSETS
(A) GROSS BLOCK 499797 487451 475164
(B) LESS DEPRECIATION 159037 146653 134106
(C)NETBLOCK(A-B) 340760 340798 341058
(D) CAPITAL WORK IN PROGRESS 14224 9918 11803
TOTAL (C) + (D) 354984 350716 352861
(2.2) INVESTMENT 95832 71296 53813
(2.3) CURRENT ASSETS,LOAN & ADVANCES
(A) INVENTORIES 735387 788319 112291
(B) SUNDRY DEBTORS 346169 260706 237649
(C) CASH & BANK BALANCES 570046 459935 354758
(D) OTHER CURRENT ASSETS 63165 18823 521241
(E) LOAN & ADVANCES 313834 352507 341607
TOTAL (A)+ (B)+ (C)+ (D)+ (E) 2028601 1880290 1567546
(2.4) LESS:CURRENT LIABILITIES & PROVISIONS
(A) CURRENT LIABILITIES 1026465 690914 671967
(B) PROVISIONS 167750 272994 124236
TOTAL (A+B) 1194215 963908 796203
(2.5)NETCURRENTASSETS(2.3-2.4) 834386 916382 771343
(2.6) DEFERRED REVENUE / PRE.EXPENDITURE 11 26 242
(2.7) DEFERRED TAX ASSET 19332 10819 8242
(2.8) PROFIT & LOSS ACCOUNT(DR) 505407 567857 567920
TOTAL (2.1+2.2+2.5+2.6+2.7+2.8) 1809952 1917096 1754421

440 Contract & Construction Services
Contract & Construction ServicesProfit and Loss Account
(` in Lakhs)
(` in Lakhs)
Particulars 2010-11 2009-10 2008-09
(1) INCOME
(A) SALES/OPERATING 1231908 1186257 976982
(B) EXCISE DUTY 193 131 254
(C)NETSALES(A-B) 1231715 1186126 976728
(D) OTHER INCOME/RECEIPTS 64390 46158 57663
(I)TOTAL INCOME (C+D+E) 1296375 1224910 1024058
(2) EXPENDITURE
(A) PURCHASE OF FINISHED GOODS CONSUMPTION OF RAW MATERIALS 103128 107465 95741
(B) STORES & SPARES 1188 3383 850
(C) POWER & FUEL 19075 17260 18308
(D) MANUFACTURING / DIRECT / OPERATING EXPENSES 888356 873605 704605
(E)SALARY,WAGES & BENEFITS / EMPLOYEE EXP. 75942 69090 68288
(F)OTHER EXPENSES 62115 36456 31940
(G)PROVISIONS 21485 11596 10681
(II)TOTAL EXPENDITURE (A to G) 1171289 1118855 930413
(3)PROFITBEFOREDEP.INT.TAXES&EP(PBDITEP)(I-II) 125086 106055 93645
(4) DEPRECIATION 15089 14559 14798
(5) DRE/PREL EXP WRITTEN OFF 1126 317 624
(6)PROFITBEFOREINT.,TAXES&EP(PBITEP)(3-4-5) 108871 91179 78223
(7) INTEREST
(A) ON CENTRALGOVERNMENT LOANS 10101 10271 10763
(B) ON FOREIGN LOANS 0 0 0
(C) OTHERS 14518 18107 21493
(D) LESS INTEREST CAPITALISED 0 0 0
(E)CHARGEDTOP&LACCOUNT(A+B+C-D) 24619 28378 32256
(8)PROFIT BEFORE TAX & EP(PBTEP) (6-7E) 84252 62801 45967
(9) TAX PROVISIONS 29172 19342 16410
(10)NETPROFIT/LOSS(-)BEFOREEP(8-9) 55080 43459 29557
(11)NETEXTRA-ORD.ITEMS 613 -631 543
(12) NET PROFIT / LOSS(-) (10-11) 54467 44090 29014
(13) DIVIDEND DECLARED 9557 7488 7353
(14) DIVIDEND TAX 1572 1269 1252
(15) RETAINED PROFIT (12-13-14) 43338 35333 20409

441Public Enterprises Survey 2010-2011: Vol-II
Contract & Construction ServicesManagement Ratio
Particulars 2010-11 2009-10 2008-09
(A.) INDICATORS
(I) GENERAL(Rs. in Lakhs)
(i) INVESTMENT 1552007 1704549 1326616
(ii) CAPITAL EMPLOYED 1175146 1257180 1112401
(iii) NET WORTH 508723 429751 301472
(iv) COST OF PRODUCTION 1212123 1162109 978091
(v) COST OF SALES 1211853 1169483 988424
(vi) VALUE ADDED 1108594 1050644 851496
(vii) R AND D EXPENDITURE 24 26 9
(II) HUMAN RESOURCE
(viii) EMPLOYEES (OTHER THAN CASUAL)(Nos.) 16255 16360 17114
(ix) AVG.MONTHLY EMOLUMENTS PER EMPLOYEE(Rs.) 38933 35193 33252
(B.) MANAGEMENT RATIO
(i) DEBT : EQUITY 0.78 0.92 1.02
(ii)CURRENTRATIO(CURRENTASSET:CURRENT-LIABILITY 1.7 1.95 1.97
(iii) PBDITEP : TOTAL EMPLOYEMENT (Rs. in Lakhs) 7.7 6.48 5.47
(iv) SUNDRY DEBTORS : SALES (No. of days) 102.58 80.23 88.81
(v) INVENTORY(No. of days)
(a) TOTAL INVENTORY : SALES 217.92 242.59 41.96
(b) SEMI/FINISHED GOODS : SALES 212.29 235.52 29.69
(vi) INCREMENTAL CAPITAL OUTPUT RATIO(ICOR) -1.54 0.68 1.13
(%)
(vii) SALES : CAPITAL EMPLOYED 104.81 94.35 87.8
(viii) PBDITEP : CAPITAL EMPLOYED 10.64 8.44 8.42
(ix) PBITEP : CAPITAL EMPLOYED 9.26 7.25 7.03
(x) COST OF SALES : SALES 98.39 98.6 101.2
(xi) MATERIAL COST : SALES 8.37 9.06 9.8
(xii) SALARY & WAGES : SALES 6.17 5.82 6.99
(xiii) R & D EXPENDITURE : SALES 0 0 0
(xiv) PBITEP : SALES 8.84 7.69 8.01
(xv) PBTEP : NET WORTH 16.56 14.61 15.25
(xvi) NET PROFIT : NET WORTH 10.71 10.26 9.62
(xvii) GROSS MARGIN : GROSS BLOCK 25.03 21.76 19.71

442 Contract & Construction Services
www.bbjconst.com
Braithwaite Burn and Jessop (BBJ) Construction Company Limited (BBJCC) setup in 1935 was incorporated as CPSE in 1984 after it was taken over from the private sector on 13.08.1987. The current objective of the company is to maintain marketleadershipinthefieldofdesign,fabricationanderectionofsteelbridges in India and selected foreign markets.
It is a Schedule-’B’ BRPSE referred taken over CPSE inContract & Construction Services sector under the administrative control of M/o Heavy Industries and Public Enterprises, D/o Heavy Industry with its Registered and Corporate offices atKolkata, West Bengal. BBJCC is a 100% subsidiary of Bharat Bhari Udyog Nigam Ltd. (BBUNL).
Vision/MissionThe Vision of the Company is to be a leader in construction
of all types of steel bridges and infrastructure development.The Mission of the Company is to enhance the turnover
five times in nextfiveyears.
Industrial / Business OperationsBBJCC is engaged in providing services in the field of
construction of Steel bridges, rehabilitation / restoration and replacement of early Steel Bridges, construction of PSC Girder Bridges, and fabrication of Steel Structure, civil construction including Heavy foundations and piling work.
The steel girder bridge fabrication units viz. Heavy Plant Yard and Angus Works are located at Kolkata and Hooghly districts ofWest Bengal. Project construction sites are locatedall over India. The physical performance of company during the last three year is mentioned below: Main Services Unit Performance During
2010-11 2009-10 2008-09Bridge Project, Civil Construction etc.
` in Crore 82.56 68.11 87.72
Strategic IssuesThe financial restructuring was approved by GOI on
31.03.2005 as per the recommendation of BRPSE. BBJ is planning for development of required resources for entering into job of replacement of old bridgeswith newbridgewithinspecifiedblockperiod.
Performance HighlightsThe operational performance of the company along with
performance indicators and selected financial ratios during theperiod2008-09 to 2010-11 canbe seenon theopposite page.
The Company registered an increase of ` 63.49 crore in total income during 2010-11whichwent up to ` 146.58 crore in 2010-11 from ` 83.09 crore during 2009-10. The net profitof the company correspondingly increased to ` 3.6 crore, an increase of ` 0.84 crore over the previous year due to increase in orders.
18.1 BBJ Construction Company Limited Human Resource Management
The company employed 99 regular employees as on 31.3.2011. The retirement age in the company is 60 years. It is following IDA 1997 pattern of remuneration. Details of employment in last 3 years are given below:
Particulars 2010-11 2009-10 2008-09Executives including Non-Unionised Supervisors 50 49 49
Non-Executives # 49 49 424Total Employees 99 98 473
# Detail break-up of Non-Executive employees is at Statement no. 25 of volume-I of PE Survey.

443Public Enterprises Survey 2010-2011: Vol-II
BBJ Construction Company Limited 27,RajendraNathMukherjeeRoad,P.O.BoxNo-264,Kolkata-700001
Balance Sheet (` in Lakhs)
Particulars 2010-11 2009-10 2008-09
Authorised Capital 3000 3000 3000
(1) Sources Of Fund
(1.1) Shareholders Funds
(A) Paid-Up Capital
Central Govt 0 0 0
Others 2027 2027 2027
(B) Share Application Money 0 0 0
(C) Reserves & Surplus 520 166 0
Total (A) + (B) + (C) 2547 2193 2027
(1.2) Loan Funds
(A) Secured Loans 1123 773 230
(B) Unsecured Loans 1582 1575 1535
Total (A) + (B) 2705 2348 1765
(1.3) Deferred Tax Liability 0 0 0
Total (1.1) + (1.2) + (1.3) 5252 4541 3792
(2) Application Of Funds
(2.1) Fixed Assets
(A) Gross Block 1543 1258 962
(B) Less Depreciation 727 617 550
(C) Net Block (A-B) 816 641 412
(D) Capital Work In Progress 0 0 8
Total (C) + (D) 816 641 420
(2.2) Investment 1 1 1
(2.3) Current Assets, Loan & Advances
(A) Inventories 3444 2388 1953
(B) Sundry Debtors 4083 2617 2178
(C) Cash & Bank Balances 2105 4045 1399
(D) Other Current Assets 1354 1153 913
(E) Loan & Advances 1331 1164 1388
Total (A)+ (B)+ (C)+ (D)+ (E) 12317 11367 7831
(2.4) Less:current Liabilities & Provisions
(A) Current Liabilities 7737 7290 4487
(B) Provisions 145 179 73
Total (A+B) 7882 7469 4560
(2.5) Net Current Assets (2.3-2.4) 4435 3898 3271
(2.6) Deferred Revenue / Pre. Expenditure 0 1 0
(2.7) Deferred Tax Asset 0 0 0
(2.8) Profit & Loss Account(Dr) 0 0 100
Total (2.1+2.2+2.5+2.6+2.7+2.8) 5252 4541 3792
Important Indicators 2010-11 2009-10 2008-09
(i) Investment 3609 3602 3562
(ii) Capital Employed 5251 4539 3683
(iii) Net Worth 2547 2192 1927
(iv) Cost of Production 14103 7863 6162
(v) Cost of Sales 14713 7397 5629
(vi) Gross Value Added (At Market Price) - - -
(vii) Total Employees (Other Than Casuals) (Nos.) 99 98 473
(viii) Avg. Monthly Emoluments Per Employee (Rs.) 88215 72279 13531
Profit & Loss Account (` in Lakhs)
Particulars 2010-11 2009-10 2008-09
(1) Income
(A) Sales/Operating Income 15260 7790 5979
(B) Excise Duty 72 112 212
(C) Net Sales (A-B) 15188 7678 5767
(D) Other Income/Receipts 80 165 221
(E) Accretion/Depletion in Stocks -610 466 533
(I)Total Income (C+D+E) 14658 8309 6521
(2) Expenditure
(A) Purchase of Finished Goods/ Consumption Of Raw Materials 4656 4164 2645
(B) Stores & Spares 398 154 148
(C) Power & Fuel 110 67 89
(D) Manufacturing / Direct / Operating Expenses 6640 2034 2079
(E) Salary, Wages & Benefits / Employee Exp. 1048 850 768
(F) Other Expenses 1053 451 381
(G) Provisions 0 0 0
(II)Total Expenditure (A to G) 13905 7720 6110
(3) Profit Before Dep, Int, Taxes & EP (PBDITEP) (I-II) 753 589 411
(4) Depreciation 108 72 34
(5) Dre/Prel Exp Written Off 0 0 0
(6) Profit Before Int., Taxes & Ep (PBITEP) (3-4-5) 645 517 377
(7) Interest
(A) On Central Government Loans 44 43 0
(B) On Foreign Loans 0 0 0
(C) Others 46 28 18
(D) Less Interest Capitalised 0 0 0
(E) Charged to P & L Account (A+B+C-D) 90 71 18
(8) Profit Before Tax & EP(PBTEP) (6-7E) 555 446 359
(9) Tax Provisions 89 57 34
(10) Net Profit / Loss Before EP (8-9) 466 389 325
(11) Net Extra-Ord. Items 106 113 72
(12) Net Profit / Loss(-) (10-11) 360 276 253
(13) Dividend Declared 5 5 0
(14) Dividend Tax 1 0 0
(15) Retained Profit (12-13-14) 354 271 253
Financial Ratios 2010-11 2009-10 2008-09
(i) Sales : Capital Employed 289.24 169.16 156.58
(ii) Cost of Sales : Sales 96.87 96.34 97.61
(iii) Salary / Wages : Sales 6.9 11.07 13.32
(iv) Net Profit : Net Worth 14.13 12.59 13.13
(v) Debt : Equity 1.06 1.07 0.87
(vi) Current Ratio 1.56 1.52 1.72
(vii) Sundry Debtors : Sales (No. of Days) 98.12 124.41 137.85
(viii) Total Inventory : Sales 82.77 113.52 123.61

444 Contract & Construction Services
www.bridgeroof.co.in
Bridge & Roof Company (India) Ltd (B&R) is a one source multidisciplinary engineering construction company incorporated in 1920 and nationalized in 1972.
ItisaSchedule-’B’,BRPSEreferred,ProfitMakingCPSEinContract & Construction Services sector under the administrative control of Ministry of Heavy Industries & Public Enterprises. Its Registered and Corporate offices are at West Bengal. TheZonalOffices are atMumbai andChennaiwith Liaison officeatDelhi,with55project locations.
Vision / MissionThe Vision of the Company is to be the leader in construction
fieldandprojectmanagementserviceswithcustomersatisfactionin al respects in India and abroad.
The Mission of the Company is to thrive in the competitive Indian construction industry and to transform itself from being a mereconstructioncompanytoanintegratedprojectmanagementcompany
Industrial / Business OperationsThe Company is a versatile construction Company having
presence all over India. It has two Strategic Business Units viz ProjectDivisionatKolkataandHowrahWorks.HowrahWorksis engaged in Structural Fabrication production of Bailey Bridges Bunk Houses, Containers, Pot Shells etc.
B&R has been playing an important role in the infrastructural development of the country Its range of activities cover Civil Mechanical and Turnkey Construction Tankage Piling etc. in the areasofRefineries,PowerRoadsandHighways,HydroCarbon,Housing and urban Development, Sports Complex, Environmental Projectsetc.CompanyhasexecutedprojectsinIraqAbuDhabiNepal and Maldives and at present executing a Couple of internationalprojectsinKuwait.Ithashighcredibilityofqualityand timely executionof projects of national importance.
The Construction activities comprise around 96% of the total activities of the company and are not quantifiable inphysical terms.
Strategic issueB&R is trying to increase its turnover from Rs.1333.49 crore
to Rs.2000 crore by 2014-2015. The strategy is to effectivelyand fruitfully utilize its resources.
Inviewof itswidelydispersedproject sitesallover Indiaand abroad, apart from Networking facilities available at all offices and Howrah Works, the company has successfullyimplemented Enterprise Resource Planning (ERP) for linking variousoffices.
Performance HighlightsThe operational performance of the company along with
performance indicators and selected financial ratios during theperiod2008-09 to 2010-11 canbe seenon theopposite page.
The Company registered an increase of ` 199.33 crore in total incomeduring2010-11whichwentup to` 1336.82 crore in2010-11from` 1137.49croreduring2009-10.Thenetprofitof the company correspondingly increased to ` 57.68 crore, an increase of ` 15.68 crore over the previous year.
18.2 Bridge & Roof Co.(India) Ltd. Human Resource Management
The company employed 1557 regular employees as on 31.3.2011. The retirement age in the company is 60 years. It is following IDA 2007 pattern of remuneration. Details of employment in last 3 years are given below:
Particulars 2010-11 2009-10 2008-09Executives including Non-Unionised Supervisors 805 736 706
Non-Executives # 752 795 777Total Employees 1557 1531 1483
# Detail break-up of Non-Executive employees is at Statement no. 25 of volume-I of PE Survey.

445Public Enterprises Survey 2010-2011: Vol-II
Bridge & Roof Co.(India) Ltd. KankariaCentre (5thFloor), 2/1,RusselStreetKolkata,WestBengal - 700071
Balance Sheet (` in Lakhs)
Particulars 2010-11 2009-10 2008-09
Authorised Capital 6000 6000 6000
(1) Sources Of Fund
(1.1) Shareholders Funds
(A) Paid-Up Capital
Central Govt 5469 5469 5469
Others 30 30 30
(B) Share Application Money 0 0 0
(C) Reserves & Surplus 15962 10385 6314
Total (A) + (B) + (C) 21461 15884 11813
(1.2) Loan Funds
(A) Secured Loans 4990 5379 6716
(B) Unsecured Loans 0 900 1500
Total (A) + (B) 4990 6279 8216
(1.3) Deferred Tax Liability 0 0 0
Total (1.1) + (1.2) + (1.3) 26451 22163 20029
(2) Application Of Funds
(2.1) Fixed Assets
(A) Gross Block 19971 18137 17232
(B) Less Depreciation 15060 13677 12316
(C) Net Block (A-B) 4911 4460 4916
(D) Capital Work In Progress 0 0 0
Total (C) + (D) 4911 4460 4916
(2.2) Investment 0 0 0
(2.3) Current Assets, Loan & Advances
(A) Inventories 58452 47115 42457
(B) Sundry Debtors 1039 737 671
(C) Cash & Bank Balances 8196 6615 1635
(D) Other Current Assets 43892 0 0
(E) Loan & Advances 0 33195 27558
Total (A)+ (B)+ (C)+ (D)+ (E) 111579 87662 72321
(2.4) Less:current Liabilities & Provisions
(A) Current Liabilities 81485 64429 53818
(B) Provisions 9395 6349 4327
Total (A+B) 90880 70778 58145
(2.5) Net Current Assets (2.3-2.4) 20699 16884 14176
(2.6) Deferred Revenue / Pre. Expenditure 0 0 0
(2.7) Deferred Tax Asset 841 819 937
(2.8) Profit & Loss Account(Dr) 0 0 0
Total (2.1+2.2+2.5+2.6+2.7+2.8) 26451 22163 20029
Important Indicators 2010-11 2009-10 2008-09
(i) Investment 5499 6399 6999
(ii) Capital Employed 25610 21344 19092
(iii) Net Worth 21461 15884 11813
(iv) Cost of Production 124973 107338 88604
(v) Cost of Sales 124640 110120 90706
(vi) Gross Value Added (At Market Price) - - -
(vii) Total Employees (Other Than Casuals) (Nos.) 1557 1531 1483
(viii) Avg. Monthly Emoluments Per Employee (Rs.) 46724 43800 45493
Profit & Loss Account (` in Lakhs)
Particulars 2010-11 2009-10 2008-09
(1) Income
(A) Sales/Operating Income 132897 116201 93510
(B) Excise Duty 0 0 0
(C) Net Sales (A-B) 132897 116201 93510
(D) Other Income/Receipts 452 330 522
(E) Accretion/Depletion in Stocks 333 -2782 -2102
(I)Total Income (C+D+E) 133682 113749 91930
(2) Expenditure
(A) Purchase of Finished Goods/ Consumption Of Raw Materials 31282 26964 25181
(B) Stores & Spares 0 0 0
(C) Power & Fuel 2772 2193 1949
(D) Manufacturing / Direct / Operating Expenses 72378 62529 47825
(E) Salary, Wages & Benefits / Employee Exp. 8730 8047 8096
(F) Other Expenses 7763 5208 1789
(G) Provisions 0 5 5
(II)Total Expenditure (A to G) 122925 104946 84845
(3) Profit Before Dep, Int, Taxes & EP (PBDITEP) (I-II) 10757 8803 7085
(4) Depreciation 1383 1362 1521
(5) Dre/Prel Exp Written Off 0 0 0
(6) Profit Before Int., Taxes & Ep (PBITEP) (3-4-5) 9374 7441 5564
(7) Interest
(A) On Central Government Loans 71 180 261
(B) On Foreign Loans 0 0 0
(C) Others 594 850 1977
(D) Less Interest Capitalised 0 0 0
(E) Charged to P & L Account (A+B+C-D) 665 1030 2238
(8) Profit Before Tax & EP(PBTEP) (6-7E) 8709 6411 3326
(9) Tax Provisions 2949 2378 1159
(10) Net Profit / Loss Before EP (8-9) 5760 4033 2167
(11) Net Extra-Ord. Items -8 -167 -1
(12) Net Profit / Loss(-) (10-11) 5768 4200 2168
(13) Dividend Declared 165 110 55
(14) Dividend Tax 27 18 9
(15) Retained Profit (12-13-14) 5576 4072 2104
Financial Ratios 2010-11 2009-10 2008-09
(i) Sales : Capital Employed 518.93 544.42 489.79
(ii) Cost of Sales : Sales 93.79 94.77 97
(iii) Salary / Wages : Sales 6.57 6.93 8.66
(iv) Net Profit : Net Worth 26.88 26.44 18.35
(v) Debt : Equity 0.23 0.4 0.7
(vi) Current Ratio 1.23 1.24 1.24
(vii) Sundry Debtors : Sales (No. of Days) 2.85 2.31 2.62
(viii) Total Inventory : Sales 160.54 147.99 165.72

446 Contract & Construction Services
www.hindprefab.com
Hindustan Prefab Limited (HPL) was incorporated on 27.1.1953 and commenced its business on 16.8.1955. It was earlier founded as Hindustan Housing Factory Ltd. (in 1950), which was set up at the behest of Pandit Jawaharlal Nehru, the first Prime Minister of India for solving the housingproblem created due to influx of refugees fromWest Pakistan.As years rolled by, the company came to be known as HPL, the change in name being necessitated by diversification of its operations. HPL thus became a fully integrated company with modern prefabrication facilities and a railway siding of its own in the heart of Delhi to undertake faster and challenging jobsin the country.
HPL is a Schedule-‘C’ (w.e.f 28.06.2011) BRPSE referred CPSE in Contract & Construction Services sector under the administrative control of M/o Urban Development with 100% shareholding by the Government of India. Its Registered and Corporate offices are at New Delhi.
Vision / MissionThe Vision of the Company is to be a premier organization
in thefieldofCivil construction and infrastructure industrybyembracing state of art and cost effective technology in Prefab /Precast as well as conventional methods committed to total customer satisfaction.
The Mission of the Company is to pioneer Prefabrication methods and technology whereby ensuring optimum Quality and effortless Construction Techniques within one’s means; to become the customers most preferred choice by attaining excellence in quality and on time completion of value added ventures; to act as execution arm of Govt. of India, Ministry of Housing & Urban Poverty Alleviation for mass housing /development of infrastructure in urban areas; to act in a socially responsible manner whilst upholding environmental responsibility ensuring customer & employee satisfaction by enhancing employee competence and ensuring the interest of other stake holders.
Industrial / Business OperationsHPL is now functioning as a service oriented company
offering project management services in the construction ofEconomically Weaker Section (EWS) / Low Income Group (LIG) housing with infrastructure, Institutional Buildings etc in North Eastern States, border and tribal areas besides 14 other StatesintheCountry.IthasundertakenprojectsunderJNNURM,NRHM etc. HPL has signed memorandum of understanding with SAIL on 19thJan2011tocarrytechno-economicfeasibilitystudyon production of prefabricated structure in steel and concrete.
The physical performances of the company for last three years are given below:Main Services Unit Performance During
2010-11 2009-10 2008-09Project Management Services
` in crore 203.07 162.43 150.32
It is expected that the Company, while continuing with its existing activities, will also be in a position to re-start prefabmanufacturing on its own, without seeking any financialassistancefrom the government.
Strategic IssuesGovernment has approved the financial restructuring
of Hindustan Prefab Limited as per the recommendations of BRPSE on 16.09.2009. As a result, outstanding Government of India loan and interest thereon as on 31.03.2008
18.3 Hindustan Prefab Ltd.amounting to ` 128 Crore has been converted into equity thereby increasing the authorized capital of HPL from the existing ` 10 Crore to ` 138 Crore. The company has submitted a request to GoI for its up gradation to a Schedule ‘B’ company.
Performance HighlightsThe operational performance of the company along with
performance indicators and selected financial ratios during theperiod 2008-09 to 2010-11 can be seen on the oppositepage.
The Company registered an increase of ` 40.71crore in total income during 2010-11whichwent up to ` 208.90 crore in2010-11 from` 168.19 croreduring2009-10.Thenet profitof the company correspondingly increased to ` 4.61 crore, an increase of ` 2.14 crore over the previous year due to increase in turnover.
Human Resource ManagementThe Company employed 431 regular employees as on
31.03.2011. The retirement age in the Company is 58 years. It is following IDA 2007 and CDA 2006 pattern of remuneration. Details of employment in last 3 years are given below:
Particulars 2010-11 2009-10 2008-09Executives including Non-Unionised Supervisors
157 155 32
Non-Executives # 274 285 377Total Employees 431 440 409
# Detail break-up of Non-Executive employees is at Statement no. 25 of volume-I of PE Survey.
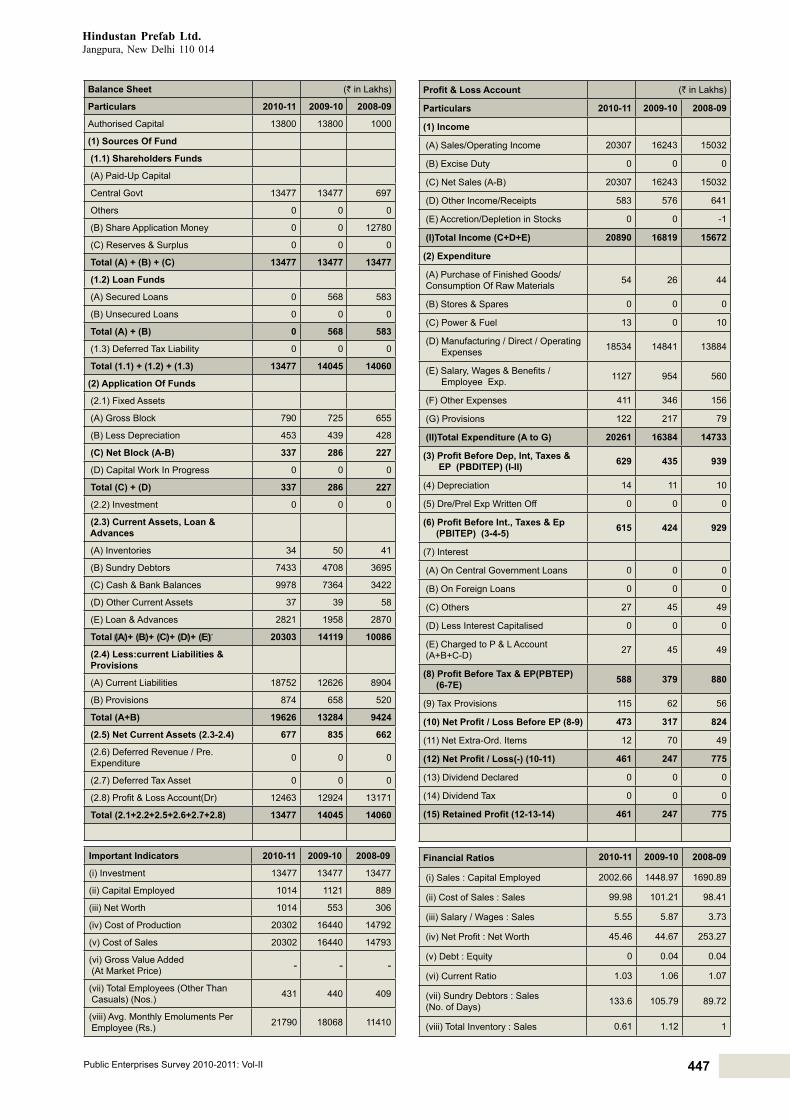
447Public Enterprises Survey 2010-2011: Vol-II
Hindustan Prefab Ltd.Jangpura, New Delhi 110 014
Balance Sheet (` in Lakhs)
Particulars 2010-11 2009-10 2008-09
Authorised Capital 13800 13800 1000
(1) Sources Of Fund
(1.1) Shareholders Funds
(A) Paid-Up Capital
Central Govt 13477 13477 697
Others 0 0 0
(B) Share Application Money 0 0 12780
(C) Reserves & Surplus 0 0 0
Total (A) + (B) + (C) 13477 13477 13477
(1.2) Loan Funds
(A) Secured Loans 0 568 583
(B) Unsecured Loans 0 0 0
Total (A) + (B) 0 568 583
(1.3) Deferred Tax Liability 0 0 0
Total (1.1) + (1.2) + (1.3) 13477 14045 14060
(2) Application Of Funds
(2.1) Fixed Assets
(A) Gross Block 790 725 655
(B) Less Depreciation 453 439 428
(C) Net Block (A-B) 337 286 227
(D) Capital Work In Progress 0 0 0
Total (C) + (D) 337 286 227
(2.2) Investment 0 0 0
(2.3) Current Assets, Loan & Advances
(A) Inventories 34 50 41
(B) Sundry Debtors 7433 4708 3695
(C) Cash & Bank Balances 9978 7364 3422
(D) Other Current Assets 37 39 58
(E) Loan & Advances 2821 1958 2870
Total (A)+ (B)+ (C)+ (D)+ (E) 20303 14119 10086
(2.4) Less:current Liabilities & Provisions
(A) Current Liabilities 18752 12626 8904
(B) Provisions 874 658 520
Total (A+B) 19626 13284 9424
(2.5) Net Current Assets (2.3-2.4) 677 835 662
(2.6) Deferred Revenue / Pre. Expenditure 0 0 0
(2.7) Deferred Tax Asset 0 0 0
(2.8) Profit & Loss Account(Dr) 12463 12924 13171
Total (2.1+2.2+2.5+2.6+2.7+2.8) 13477 14045 14060
Important Indicators 2010-11 2009-10 2008-09
(i) Investment 13477 13477 13477
(ii) Capital Employed 1014 1121 889
(iii) Net Worth 1014 553 306
(iv) Cost of Production 20302 16440 14792
(v) Cost of Sales 20302 16440 14793
(vi) Gross Value Added (At Market Price) - - -
(vii) Total Employees (Other Than Casuals) (Nos.) 431 440 409
(viii) Avg. Monthly Emoluments Per Employee (Rs.) 21790 18068 11410
Profit & Loss Account (` in Lakhs)
Particulars 2010-11 2009-10 2008-09
(1) Income
(A) Sales/Operating Income 20307 16243 15032
(B) Excise Duty 0 0 0
(C) Net Sales (A-B) 20307 16243 15032
(D) Other Income/Receipts 583 576 641
(E) Accretion/Depletion in Stocks 0 0 -1
(I)Total Income (C+D+E) 20890 16819 15672
(2) Expenditure
(A) Purchase of Finished Goods/ Consumption Of Raw Materials 54 26 44
(B) Stores & Spares 0 0 0
(C) Power & Fuel 13 0 10
(D) Manufacturing / Direct / Operating Expenses 18534 14841 13884
(E) Salary, Wages & Benefits / Employee Exp. 1127 954 560
(F) Other Expenses 411 346 156
(G) Provisions 122 217 79
(II)Total Expenditure (A to G) 20261 16384 14733
(3) Profit Before Dep, Int, Taxes & EP (PBDITEP) (I-II) 629 435 939
(4) Depreciation 14 11 10
(5) Dre/Prel Exp Written Off 0 0 0
(6) Profit Before Int., Taxes & Ep (PBITEP) (3-4-5) 615 424 929
(7) Interest
(A) On Central Government Loans 0 0 0
(B) On Foreign Loans 0 0 0
(C) Others 27 45 49
(D) Less Interest Capitalised 0 0 0
(E) Charged to P & L Account (A+B+C-D) 27 45 49
(8) Profit Before Tax & EP(PBTEP) (6-7E) 588 379 880
(9) Tax Provisions 115 62 56
(10) Net Profit / Loss Before EP (8-9) 473 317 824
(11) Net Extra-Ord. Items 12 70 49
(12) Net Profit / Loss(-) (10-11) 461 247 775
(13) Dividend Declared 0 0 0
(14) Dividend Tax 0 0 0
(15) Retained Profit (12-13-14) 461 247 775
Financial Ratios 2010-11 2009-10 2008-09
(i) Sales : Capital Employed 2002.66 1448.97 1690.89
(ii) Cost of Sales : Sales 99.98 101.21 98.41
(iii) Salary / Wages : Sales 5.55 5.87 3.73
(iv) Net Profit : Net Worth 45.46 44.67 253.27
(v) Debt : Equity 0 0.04 0.04
(vi) Current Ratio 1.03 1.06 1.07
(vii) Sundry Debtors : Sales (No. of Days) 133.6 105.79 89.72
(viii) Total Inventory : Sales 0.61 1.12 1

448 Contract & Construction Services
www.hscl.co.in
Hindustan Steel Works Corporation (HSCL) was incorporated on 23.06.1964 with the objective of creating anorganization capable of undertaking complete construction of modern integrated Steel Plants in the Public Sector.
HSCLisaSchedule-‘B’BRPSEreferredCPSEinContract& Construction Services sector under the administrative control of M/o Steel with 100% shareholding by the Government of India.ItsRegisteredandCorporateofficesareatKolkata,WestBengal.
Vision/MissionThe Vision / Mission of the Company are to become a
profitable Construction Agency as a PSU and contribute indevelopment of the country by execution of various infrastructure andSteelSector projects.
Industrial / Business OperationsHSCL is involved in undertaking construction activities
in the areas of steel plants (like setting up of Bokaro Bhilai, Rourkela, Vizaz, Durgapur etc. in the past) power, oil and gas, roads / highways, bridges, dams, underground communication and transport system, industrial and township complexes etc. with highdegreeofplanning,co-ordinationandmodernsophisticatedtechniques. Presently the company carries out a number of project packages under the capacity expansion programme ofSAIL and RINL along with regular operation and maintenance jobsof theseplants.
IthasoneJointVenturenamelyHSCL-SriconInfrastructurePrivate Limited for construction ofNagpur-Hyderabad Sectionof NH 7 with 51% equity holding. The physical performances of the company for last three years are given below:Main Services Unit Performance During
2010-11 2009-10 2008-09Project Construction ` in Cr. 996.30 800.35 721.26
Strategic IssuesThe company has been facing acute financial difficulty
since long. The accumulated losses were at Rs.1383 crores in 1999. Despite a capital restructuring undertaken in 1999, it is still in loss. The revival package was essentially an exercise in capital restructuring, except for Rs 79.33 crore to meet statutory liabilities, although the package did not include fresh infusion of funds. The proposal for Organizational, Business and Financial Restructuring of the Company on the basis of the viability study conducted by M/s A.F. Ferguson & Co. has been recommended by BRPSE in its 58th meting held on 13.05.2008. The proposal is under consideration of the Govt. of India (GoI).
The company was one of the three CPSEs identified byGoItocarryouttheconstructionandrepairof50,000low-costhouses in Sri Lank as part of a commitment for the resettlement of internally displaced persons and the plantation community. Thework is scheduled for initiation in 2011-12.
Performance HighlightsThe operational performance of the company along with
performance indicators and selected financial ratios during theperiod2008-09 to 2010-11 canbe seenon theopposite page.
The Company registered an increase of ` 177.35 crore in total incomeduring2010-11whichwentup to` 1005.72 crore in 2010-11 from ` 828.37 crore during 2009-10. The net lossof the company correspondingly reduced to ` 38.09 crore, a
18.4 Hindustan Steel Works Construction Ltd.
reduction of ` 16.50 crore over the previous year loss of ` 54.59 crore.Thecompanyhasshownoperatingprofit.InterestonGoIloan is one of the main contributors to net loss.
Human Resource ManagementThe company employed 751 regular employees as on
31.3.2011. The retirement age in the Company is 60 years at board level and 58 years at below board level. It is following IDA 1992 and CDA 1996 pattern of remuneration. Details of employment in last 3 years are given below:
Particulars 2010-11 2009-10 2008-09Executives including Non-Unionised Supervisors 138 187 210
Non-Executives # 613 820 1038Total Employees 751 1007 1248
#Detailbreak-up of Non-Executive employees is at Statement no. 25 of volume-I of PE Survey.

449Public Enterprises Survey 2010-2011: Vol-II
Hindustan Steel Works Construction Ltd.P-34-A,GariahatRoad (South)Kolkata,WestBengal -700031
Balance Sheet (` in Lakhs)
Particulars 2010-11 2009-10 2008-09
Authorised Capital 15000 15000 15000
(1) Sources Of Fund
(1.1) Shareholders Funds
(A) Paid-Up Capital
Central Govt 11710 11710 11710
Others 0 0 0
(B) Share Application Money 0 0 0
(C) Reserves & Surplus 1 1 1
Total (A) + (B) + (C) 11711 11711 11711
(1.2) Loan Funds
(A) Secured Loans 54905 54969 56258
(B) Unsecured Loans 105264 95330 94247
Total (A) + (B) 160169 150299 150505
(1.3) Deferred Tax Liability 14 45 48
Total (1.1) + (1.2) + (1.3) 171894 162055 162264
(2) Application Of Funds
(2.1) Fixed Assets
(A) Gross Block 9054 8106 7575
(B) Less Depreciation 5379 5212 5085
(C) Net Block (A-B) 3675 2894 2490
(D) Capital Work In Progress 110 16 0
Total (C) + (D) 3785 2910 2490
(2.2) Investment 0 0 0
(2.3) Current Assets, Loan & Advances
(A) Inventories 295 588 2394
(B) Sundry Debtors 41100 31166 20467
(C) Cash & Bank Balances 29186 20542 17173
(D) Other Current Assets 0 0 0
(E) Loan & Advances 38818 25592 24216
Total (A)+ (B)+ (C)+ (D)+ (E) 109399 77888 64250
(2.4) Less:current Liabilities & Provisions
(A) Current Liabilities 85006 58527 39882
(B) Provisions 2384 2507 1591
Total (A+B) 87390 61034 41473
(2.5) Net Current Assets (2.3-2.4) 22009 16854 22777
(2.6) Deferred Revenue / Pre. Expenditure 0 0 166
(2.7) Deferred Tax Asset 0 0 0
(2.8) Profit & Loss Account(Dr) 146100 142291 136831
Total (2.1+2.2+2.5+2.6+2.7+2.8) 171894 162055 162264
Important Indicators 2010-11 2009-10 2008-09
(i) Investment 168810 162001 157536
(ii) Capital Employed 25684 19748 25267
(iii) Net Worth -134389 -130580 -125286
(iv) Cost of Production 104336 87855 75106
(v) Cost of Sales 104336 87855 75106
(vi) Gross Value Added (At Market Price) - - -
(vii) Total Employees (Other Than Casuals) (Nos.) 751 1007 1248
(viii) Avg. Monthly Emoluments Per Employee (Rs.) 30315 30511 12146
Profit & Loss Account (` in Lakhs)
Particulars 2010-11 2009-10 2008-09
(1) Income
(A) Sales/Operating Income 97490 78517 70640
(B) Excise Duty 0 0 0
(C) Net Sales (A-B) 97490 78517 70640
(D) Other Income/Receipts 3082 4320 2970
(E) Accretion/Depletion in Stocks 0 0 0
(I)Total Income (C+D+E) 100572 82837 73610
(2) Expenditure
(A) Purchase of Finished Goods/ Consumption Of Raw Materials 0 0 0
(B) Stores & Spares 171 2787 189
(C) Power & Fuel 404 401 327
(D) Manufacturing / Direct / Operating Expenses 88134 68929 62550
(E) Salary, Wages & Benefits / Employee Exp. 2732 3687 1819
(F) Other Expenses 2327 1602 1981
(G) Provisions 250 172 1146
(II)Total Expenditure (A to G) 94018 77578 68012
(3) Profit Before Dep, Int, Taxes & EP (PBDITEP) (I-II) 6554 5259 5598
(4) Depreciation 271 280 277
(5) Dre/Prel Exp Written Off 0 0 296
(6) Profit Before Int., Taxes & Ep (PBITEP) (3-4-5) 6283 4979 5025
(7) Interest
(A) On Central Government Loans 9986 9834 6354
(B) On Foreign Loans 0 0 0
(C) Others 61 163 167
(D) Less Interest Capitalised 0 0 0
(E) Charged to P & L Account (A+B+C-D) 10047 9997 6521
(8) Profit Before Tax & EP(PBTEP) (6-7E) -3764 -5018 -1496
(9) Tax Provisions -30 -3 17
(10) Net Profit / Loss Before EP (8-9) -3734 -5015 -1513
(11) Net Extra-Ord. Items 75 444 -825
(12) Net Profit / Loss(-) (10-11) -3809 -5459 -688
(13) Dividend Declared 0 0 0
(14) Dividend Tax 0 0 0
(15) Retained Profit (12-13-14) -3809 -5459 -688
Financial Ratios 2010-11 2009-10 2008-09
(i) Sales : Capital Employed 379.57 397.59 279.57
(ii) Cost of Sales : Sales 107.02 111.89 106.32
(iii) Salary / Wages : Sales 2.8 4.7 2.58
(iv) Net Profit : Net Worth - - -
(v) Debt : Equity 13.68 12.83 12.85
(vi) Current Ratio 1.25 1.28 1.55
(vii) Sundry Debtors : Sales (No. of Days) 153.88 144.88 105.75
(viii) Total Inventory : Sales 1.1 2.73 12.37

450 Contract & Construction Services
www.irconisl.com
IRCON Infrastructure & Services Limited (IRCONISL) incorporated on 30.09.2009 is a wholly-owned subsidiaryof IRCON international Limited. The main objective of thecompany is to undertake infrastructure projects includingplanning, designing, development, construction, improvement, commissioning, operation, maintenance and financing of projects and various projects. It also carries out infrastructureconstruction work on BOT, BOOT, BLT etc or otherwise or any otherschemeorprojectfoundsuitableinandrelatedtothefieldof infrastructureprojects andother ancillaryfields thatmaybeassigned to or secured by the company on its own or through its holding company or subsidiary (ies) including financingof those projects and their services including commissioning,operation, maintenance, etc.
IRCONISLisaun-categorizedCPSEinFinancialServicesSector under the administrative control of Ministry of Railway with 100% shareholding by the IRCON international Limited. Its registeredOffice is atDelhi.
Vision/MissionThe vision mission of the company is to be recognized as
a specialized infrastructure developer and establish itself as a renownedserviceproviderforallareasofinfrastructureprojectswith special emphasis on environment, quality and safety.
Industrial / Business OperationsIRCONISL is engaged in planning, designing, development,
improvement, commissioning, operation, maintenance, etc. in thefieldofconstructionof infrastructureof24MultifunctionalComplexes (MFCs), etc. to provide facilities and amenities to users of Indian Railway System spread all over India. This project is taken up in association with rail land developmentauthority.
Physical works of construction on 7 stations have been completed during the year under review and is in advance stages of completion on 14 other stations.
Strategic IssuesThe other objective of the company are to establish an
environment, safety and training wing for providing services to government/other organizations and to achieve optimal returns on the capital employed.
Performance HighlightsThe operational performance of the company along with
performanceindicatorsandselectedfinancialratiosduring2010-11 can be seen on the opposite page.
The company has recorded an operating turnover of `
1.10 crores during the first full year of operation itself. SinceMultifunctional Complexes (MFCs) were under construction, there was no operating turnover during the previous year (comprising six month and one day). The company has achieved aprofit of` 0.07 crore in 2010-11.
Human Resource ManagementThe company employed 7 regular employees as on
31.3.2011. All the employees are on secondment basis from IRCON, the holding company. The company shall adopt the policy developed and adopted by the holding company.
18.5 IRCON Infrastructure & Services Limited

451Public Enterprises Survey 2010-2011: Vol-II
IRCON Infrastructure & Services Limited C-4,DistrictCentre,Saket,NewDelhi-110017
Balance Sheet (` in Lakhs)
Particulars 2010-11 2009-10 2008-09
Authorised Capital 1000 1000 0
(1) Sources Of Fund
(1.1) Shareholders Funds
(A) Paid-Up Capital
Central Govt 0 0 0
Others 490 40 0
(B) Share Application Money 0 0 0
(C) Reserves & Surplus 5 0 0
Total (A) + (B) + (C) 495 40 0
(1.2) Loan Funds
(A) Secured Loans 0 0 0
(B) Unsecured Loans 2320 0 0
Total (A) + (B) 2320 0 0
(1.3) Deferred Tax Liability 0 0 0
Total (1.1) + (1.2) + (1.3) 2815 40 0
(2) Application Of Funds
(2.1) Fixed Assets
(A) Gross Block 0 0 0
(B) Less Depreciation 0 0 0
(C) Net Block (A-B) 0 0 0
(D) Capital Work In Progress 3051 78 0
Total (C) + (D) 3051 78 0
(2.2) Investment 0 0 0
(2.3) Current Assets, Loan & Advances
(A) Inventories 0 0 0
(B) Sundry Debtors 252 0 0
(C) Cash & Bank Balances 9 32 0
(D) Other Current Assets 0 0 0
(E) Loan & Advances 272 0 0
Total (A)+ (B)+ (C)+ (D)+ (E) 533 32 0
(2.4) Less:current Liabilities & Provisions
(A) Current Liabilities 762 75 0
(B) Provisions 10 1 0
Total (A+B) 772 76 0
(2.5) Net Current Assets (2.3-2.4) -239 -44 0
(2.6) Deferred Revenue / Pre. Expenditure 0 6 0
(2.7) Deferred Tax Asset 3 0 0
(2.8) Profit & Loss Account(Dr) 0 0 0
Total (2.1+2.2+2.5+2.6+2.7+2.8) 2815 40 0
Important Indicators 2010-11 2009-10 2008-09
(i) Investment 2810 40 0
(ii) Capital Employed -239 -44 0
(iii) Net Worth 495 34 0
(iv) Cost of Production 101 0 0
(v) Cost of Sales 101 0 0
(vi) Gross Value Added (At Market Price) - - -
(vii) Total Employees (Other Than Casuals) (Nos.) 7 2 0
(viii) Avg. Monthly Emoluments Per Employee (Rs.) 7143 0 0
Profit & Loss Account (` in Lakhs)
Particulars 2010-11 2009-10 2008-09
(1) Income
(A) Sales/Operating Income 110 0 0
(B) Excise Duty 0 0 0
(C) Net Sales (A-B) 110 0 0
(D) Other Income/Receipts 0 0 0
(E) Accretion/Depletion in Stocks 0 0 0
(I)Total Income (C+D+E) 110 0 0
(2) Expenditure
(A) Purchase of Finished Goods/ Consumption Of Raw Materials 0 0 0
(B) Stores & Spares 0 0 0
(C) Power & Fuel 0 0 0
(D) Manufacturing / Direct / Operating Expenses 83 0 0
(E) Salary, Wages & Benefits / Employee Exp. 6 0 0
(F) Other Expenses 6 0 0
(G) Provisions 0 0 0
(II)Total Expenditure (A to G) 95 0 0
(3) Profit Before Dep, Int, Taxes & EP (PBDITEP) (I-II) 15 0 0
(4) Depreciation 0 0 0
(5) Dre/Prel Exp Written Off 6 0 0
(6) Profit Before Int., Taxes & Ep (PBITEP) (3-4-5) 9 0 0
(7) Interest
(A) On Central Government Loans 0 0 0
(B) On Foreign Loans 0 0 0
(C) Others 0 0 0
(D) Less Interest Capitalised 0 0 0
(E) Charged to P & L Account (A+B+C-D) 0 0 0
(8) Profit Before Tax & EP(PBTEP) (6-7E) 9 0 0
(9) Tax Provisions 2 0 0
(10) Net Profit / Loss Before EP (8-9) 7 0 0
(11) Net Extra-Ord. Items 0 0 0
(12) Net Profit / Loss(-) (10-11) 7 0 0
(13) Dividend Declared 0 0 0
(14) Dividend Tax 0 0 0
(15) Retained Profit (12-13-14) 7 0 0
Financial Ratios 2010-11 2009-10 2008-09
(i) Sales : Capital Employed -46.03 0 0
(ii) Cost of Sales : Sales 91.82 0 0
(iii) Salary / Wages : Sales 5.45 0 0
(iv) Net Profit : Net Worth 1.41 0 0
(v) Debt : Equity 4.69 0 0
(vi) Current Ratio 0.69 0.42 0
(vii) Sundry Debtors : Sales (No. of Days) 836.18 0 0
(viii) Total Inventory : Sales 0 0 0

452 Contract & Construction Services
www.ircon.org
IRCON International Ltd. (IRCON) was incorporated in 1976 with the objective to carry on construction activities invariousfieldof railways, roads,highways,buildings, industrialand residential complexes, airport constructions, optic fiberProjects,mass rapid transit systemetc.
IRCON is a Schedule-AMiniratna listedCPSE under theadministrative control of Ministry of Railways with 99.73% Shareholding by the Government of India. Its Registered and Corporate office is atNewDelhi.
Vision/MissionThe Vision of the company is to be recognized nationally
and internationally as a specialized construction organization comparablewiththebestinthefieldcoveringtheentirespectrumof construction activities and services in the infrastructure sector.
The Mission of the company is to effectively position the Company so as to meet the construction needs of infrastructure development of the changing economic scene in India and abroad and to earn global recognition by providing high quality products and services in time and in conformity with the best engineering practices.
Industrial / Business OperationsIRCON is engaged in providing civil and other construction
services such as formation and earthwork, track laying and welding, sidings & MGR system for thermal power stations, rehabilitation and up gradation of track, girder erection & regirdering, ballast and quarries, railways workshops, concrete sleepers, tunneling, pilling, bridges etc; electrification ofrailways, construction of roads and highways, bridges, tunnels, airport runway, signaling and telecommunication work, building, electricity transmission substation etc.
Besides 50 Regional/Project offices in India, IRCON hasProject Offices in Afghanistan, Algeria, Ethiopia, Malaysia,Mozambique,NepalandSrilanka.IRCONhastwojointventurescompanies namely Companhia Dos Caminhos De Ferro Da Beira (CCFB),Mozambiquewith 25% shareholding and Ircon-SomaTollway Private Limited (ISTPL), India with 50% shareholding and one wholly owned subsidiary company namely Ircon Infrastructure & Services Limited (Ircon ISL).
The service segment of the company comprise of railways, highways, buildings and others. The physical performance of companyduring2008-09 to 2010-11 is shownbelow:-Main Segment Unit 2010-11 2009-10 2008-09 Railways ` Crore 2033.34 1800.60 1449.10
Highways ` Crore 934.56 1003.50 933.90
Buildings ` Crore 60.67 27.30 59.90
Others ` Crore 146.76 321.50 211.40
TOTAL ` Crore 3175.33 3152.90 2654.30
Strategic IssuesThe other objectives of the company are to enhance the
size and value of business activities of the company so as to achievea turnoverof ` 3500croreby theyear2011-12and toachieve optimal returns on the capital employed.
Performance HighlightsThe operational performance of the company along with
performance indicators and selected financial ratios during theperiod2008-09 to 2010-11 canbe seenonopposite page.
The Company registered an increase of ` 37.24 crore in
18.6 IRCON International Limited total incomeduring2010-11whichwentup to` 3254.15 crore in2010-11from` 3216.91croreduring2009-10.Thenetprofitof the company correspondingly increased to ` 240.51 crore, an increase of ` 58.33 crore over the previous year due to increase in turnover as a result of higher contracts and due to higher margin in foreignprojects.
The Company has made headway in acquiring expertise in Metro and MRTS works and is specialized in laying ballast less track which has been commended by the client. The Company has so far successfully completed over 98 projects in severalforeign countries and over 291 varied projects in all parts ofIndia includingdifficult terrains likePunjabwhenitwas in themidst of peak terrorist threats, North-Eastern region etc. Evennow the Company is executing projects in Kashmir and otherareas despite hardships.
Human Resource ManagementThe company employed 1678 regular employees as on
31.3.2011. The retirement age in the company is 60 years. It is following IDA 2007 and CDA 2006 pattern of remuneration. Details of employment in last 3 years are given below:
Particulars 2010-11 2009-10 2008-09Executives including Non-Unionised Supervisors 1321 1377 1577
Non-Executives # 357 374 387Total Employees 1678 1751 1964
# Detail break-up of Non-Executive employees is at Statement no. 25 of volume-I of PE Survey.

453Public Enterprises Survey 2010-2011: Vol-II
IRCON International Limited Palika Bhavan Sector 13, R.K. Puram New Delhi 110066
Balance Sheet (` in Lakhs)
Particulars 2010-11 2009-10 2008-09
Authorised Capital 2500 2500 2500
(1) Sources Of Fund
(1.1) Shareholders Funds
(A) Paid-Up Capital
Central Govt 988 988 988
Others 2 2 2
(B) Share Application Money 0 0 0
(C) Reserves & Surplus 137241 118938 106485
Total (A) + (B) + (C) 138231 119928 107475
(1.2) Loan Funds
(A) Secured Loans 0 529 330
(B) Unsecured Loans 0 0 0
Total (A) + (B) 0 529 330
(1.3) Deferred Tax Liability 0 0 0
Total (1.1) + (1.2) + (1.3) 138231 120457 107805
(2) Application Of Funds
(2.1) Fixed Assets
(A) Gross Block 51973 48415 48262
(B) Less Depreciation 27750 25676 22559
(C) Net Block (A-B) 24223 22739 25703
(D) Capital Work In Progress 177 950 302
Total (C) + (D) 24400 23689 26005
(2.2) Investment 31347 12954 23450
(2.3) Current Assets, Loan & Advances
(A) Inventories 30046 37336 43052
(B) Sundry Debtors 87621 47001 38647
(C) Cash & Bank Balances 203624 131402 98387
(D) Other Current Assets 12468 13395 12483
(E) Loan & Advances 95094 86191 75849
Total (A)+ (B)+ (C)+ (D)+ (E) 428853 315325 268418
(2.4) Less:current Liabilities & Provisions
(A) Current Liabilities 259377 17678 174264
(B) Provisions 100098 222578 41930
Total (A+B) 359475 240256 216194
(2.5) Net Current Assets (2.3-2.4) 69378 75069 52224
(2.6) Deferred Revenue / Pre. Expenditure 0 6 0
(2.7) Deferred Tax Asset 13106 8739 6126
(2.8) Profit & Loss Account(Dr) 0 0 0
Total (2.1+2.2+2.5+2.6+2.7+2.8) 138231 120457 107805
Important Indicators 2010-11 2009-10 2008-09
(i) Investment 990 990 990
(ii) Capital Employed 93601 97808 77927
(iii) Net Worth 138231 119922 107475
(iv) Cost of Production 285075 295578 259597
(v) Cost of Sales 285075 295578 259597
(vi) Gross Value Added (At Market Price) - - -
(vii) Total Employees (Other Than Casuals) (Nos.) 1678 1751 1964
(viii) Avg. Monthly Emoluments Per Employee (Rs.) 68370 62155 53679
Profit & Loss Account (` in Lakhs)
Particulars 2010-11 2009-10 2008-09
(1) Income
(A) Sales/Operating Income 317533 315288 265431
(B) Excise Duty 0 0 0
(C) Net Sales (A-B) 317533 315288 265431
(D) Other Income/Receipts 7882 6403 13329
(E) Accretion/Depletion in Stocks 0 0 0
(I)Total Income (C+D+E) 325415 321691 278760
(2) Expenditure
(A) Purchase of Finished Goods/ Consumption Of Raw Materials 52221 64579 63734
(B) Stores & Spares 0 0 0
(C) Power & Fuel 452 345 372
(D) Manufacturing / Direct / Operating Expenses 163244 182553 154000
(E) Salary, Wages & Benefits / Employee Exp. 13767 13060 12651
(F) Other Expenses 32689 22923 19307
(G) Provisions 19011 7991 5114
(II)Total Expenditure (A to G) 281384 291451 255178
(3) Profit Before Dep, Int, Taxes & EP (PBDITEP) (I-II) 44031 30240 23582
(4) Depreciation 3691 4127 4419
(5) Dre/Prel Exp Written Off 0 0 0
(6) Profit Before Int., Taxes & Ep (PBITEP) (3-4-5) 40340 26113 19163
(7) Interest
(A) On Central Government Loans 0 0 0
(B) On Foreign Loans 0 0 0
(C) Others 0 0 0
(D) Less Interest Capitalised 0 0 0
(E) Charged to P & L Account (A+B+C-D) 0 0 0
(8) Profit Before Tax & EP(PBTEP) (6-7E) 40340 26113 19163
(9) Tax Provisions 16074 8182 4749
(10) Net Profit / Loss Before EP (8-9) 24266 17931 14414
(11) Net Extra-Ord. Items 215 -287 396
(12) Net Profit / Loss(-) (10-11) 24051 18218 14018
(13) Dividend Declared 4949 3662 2969
(14) Dividend Tax 807 622 505
(15) Retained Profit (12-13-14) 18295 13934 10544
Financial Ratios 2010-11 2009-10 2008-09
(i) Sales : Capital Employed 339.24 322.35 340.61
(ii) Cost of Sales : Sales 89.78 93.75 97.8
(iii) Salary / Wages : Sales 4.34 4.14 4.77
(iv) Net Profit : Net Worth 17.4 15.19 13.04
(v) Debt : Equity 0 0 0
(vi) Current Ratio 1.19 1.31 1.24
(vii) Sundry Debtors : Sales (No. of Days) 100.72 54.41 53.14
(viii) Total Inventory : Sales 34.54 43.22 59.2

454 Contract & Construction Services
www.konkanrailway.com
Konkan Railway Corp. Ltd. (KRCL) was incorporated on 19.07.1990withtheobjectivetoconstructanewbroadgaugerailline betweenRohu andMangalore by raising thefinance fromNon-Governmentsources.Thecurrentobjectivesaretoprovideexcellent services to the shareholders, customers, investors, ensuring safety to passengers and improving productivity through efficiency in all spheres of activities.
KRCLisaSchedule-‘A’BRPSEreferredCPSEinContract& Construction Services sector under the administrative control of M/o Railways (MoR) with 91.91% shareholding by the Government of India (GOI) (the remaining holding is with the Governments of Maharashtra, Karnataka and Goa). Its registered office is at Delhi and Corporate office at NaviMumbai, Maharashtra.
During last three years, the interest liabilities on bonds were converted into preference shares as per the Financial Restructuring of the company.
Vision / MissionThe Vision / Mission of the Company is to evolve into
economic, eco friendly and cost effective catalyst for growth and prosperity in the Konkan Region.
Industrial / Business OperationsKRCL is the Central / State Government Joint Venture
providing services in the field of construction of railway lineand running of railway services from Roha in Maharashtra to Mangalore in Karnataka.
In addition to the railway transportation, the corporation has undertaken construction of Katra - Laole railway projectin J&K and construction of road over bridges in Jharkhand, implementation of ACD network in North East Frontier Railway and other allied works.The physical performances of the company for last three years are given below:Main Product / Services
Unit Performance During2010-11 2009-10 2008-09
Passenger Transportation
Millions N.A. 37.76 36.01
Originating Loading Million Tons
1.499 1.570 1.123
RO-RO No. of Trucks
N.A. 37620 24041
N.A.: Not Available
Strategic issueKRCListhefirstandonlyrailwayprojectinthecountryto
be executed on BOT basis. To enable timely completion of the project, the corporationhad to resort to commercial borrowingon high rate of interest. In addition to this the losses were also incurredduetonon-materializationoftheprojectedtrafficgrowthalong the route.Afinancial restructuring proposal as approvedby Board for Reconstruction for Public Sector Enterprises (BRPSE)wasapprovedbytheGOIin2008.Asperthefinancialrestructuring, the cost of debt provided by MoR together with interest accrued thereon, have been converted into preferential shares redeemable at the end of 15 to 20 years. The dividend payablewillbenon-cumulativeatthedividendratewhichMoRpays to GOI. Any future loans provided by MoR to KRCL will also be converted into non-cumulative redeemable preferentialshares.Afterimplementationoffinancialrestructuring,thedebtliabilities of the corporation had come down and thereby interest burden reduced.
18.7 Konkan Railway Corp. Ltd. Performance Highlights
The operational performance of the company along with performance indicators and selected financial ratios during theperiod2008-09 to 2010-11 canbe seenon theopposite page.
The Company registered an increase of 158.16 crore in total income during 2010-11 which went up to 924.43crore in 2010-11 from 766.27crore during 2009-10. The net profitof the company reduced to 1.83 crore, areduction of9.80crore over thepreviousyear’sprofitof11.63crore due to increase in operating expenses.
Human Resource ManagementThe company employed 4655 regular employees as on
31.3.2011. The retirement age in the company is 60 years. It is following IDA 2007 and CDA 2006 pattern of remuneration. Details of employment in last 3 years are given below:
Particulars 2010-11 2009-10 2008-09Executives including Non-Unionised Supervisors 182 176 178
Non-Executives # 4473 4177 4126Total Employees 4655 4353 4304
# Detail break-up of Non-Executive employees is at Statement no. 25 of volume-I of PE Survey.

455Public Enterprises Survey 2010-2011: Vol-II
Konkan Railway Corp. Ltd. RoomNo.101,RailBhavan,RailRoad,NewDelhi-110001
Balance Sheet (` in Lakhs)
Particulars 2010-11 2009-10 2008-09
Authorised Capital 488598 488598 488598
(1) Sources Of Fund
(1.1) Shareholders Funds
(A) Paid-Up Capital
Central Govt 449080 418263 388525
Others 39517 39517 39517
(B) Share Application Money 0 0 0
(C) Reserves & Surplus 0 0 0
Total (A) + (B) + (C) 488597 457780 428042
(1.2) Loan Funds
(A) Secured Loans 179800 211850 236850
(B) Unsecured Loans 0 0 0
Total (A) + (B) 179800 211850 236850
(1.3) Deferred Tax Liability 0 0 0
Total (1.1) + (1.2) + (1.3) 668397 669630 664892
(2) Application Of Funds
(2.1) Fixed Assets
(A) Gross Block 392939 387611 379244
(B) Less Depreciation 94510 86175 78491
(C) Net Block (A-B) 298429 301436 300753
(D) Capital Work In Progress 6878 5874 9171
Total (C) + (D) 305307 307310 309924
(2.2) Investment 0 0 0
(2.3) Current Assets, Loan & Advances
(A) Inventories 2433 1404 1605
(B) Sundry Debtors 29934 31526 32273
(C) Cash & Bank Balances 69414 49162 34083
(D) Other Current Assets 609 1340 845
(E) Loan & Advances 16740 14397 12314
Total (A)+ (B)+ (C)+ (D)+ (E) 119130 97829 81120
(2.4) Less:current Liabilities & Provisions
(A) Current Liabilities 71823 60100 23694
(B) Provisions 17127 8502 36713
Total (A+B) 88950 68602 60407
(2.5) Net Current Assets (2.3-2.4) 30180 29227 20713
(2.6) Deferred Revenue / Pre. Expenditure 0 0 0
(2.7) Deferred Tax Asset 0 0 0
(2.8) Profit & Loss Account(Dr) 332910 333093 334255
Total (2.1+2.2+2.5+2.6+2.7+2.8) 668397 669630 664892
Important Indicators 2010-11 2009-10 2008-09
(i) Investment 668397 669630 428042
(ii) Capital Employed 328609 330663 321466
(iii) Net Worth 155687 124687 93787
(iv) Cost of Production 92159 76291 86496
(v) Cost of Sales 92159 76291 86496
(vi) Gross Value Added (At Market Price) - - -
(vii) Total Employees (Other Than Casuals) (Nos.) 4655 4353 4304
(viii) Avg. Monthly Emoluments Per Employee (Rs.) 27538 27527 34582
Profit & Loss Account (` in Lakhs)
Particulars 2010-11 2009-10 2008-09
(1) Income
(A) Sales/Operating Income 60001 58827 57567
(B) Excise Duty 0 0 0
(C) Net Sales (A-B) 60001 58827 57567
(D) Other Income/Receipts 32442 17800 21091
(E) Accretion/Depletion in Stocks 0 0 0
(I)Total Income (C+D+E) 92443 76627 78658
(2) Expenditure
(A) Purchase of Finished Goods/ Consumption Of Raw Materials 0 0 0
(B) Stores & Spares 0 0 0
(C) Power & Fuel 13978 12973 14340
(D) Manufacturing / Direct / Operating Expenses 29255 23906 27453
(E) Salary, Wages & Benefits / Employee Exp. 15383 14379 17861
(F) Other Expenses 11970 1008 567
(G) Provisions 40 0 0
(II)Total Expenditure (A to G) 70626 52266 60221
(3) Profit Before Dep, Int, Taxes & EP (PBDITEP) (I-II) 21817 24361 18437
(4) Depreciation 8465 7676 7567
(5) Dre/Prel Exp Written Off 0 0 0
(6) Profit Before Int., Taxes & Ep (PBITEP) (3-4-5) 13352 16685 10870
(7) Interest
(A) On Central Government Loans 0 0 0
(B) On Foreign Loans 0 0 0
(C) Others 13068 16349 18708
(D) Less Interest Capitalised 0 0 0
(E) Charged to P & L Account (A+B+C-D) 13068 16349 18708
(8) Profit Before Tax & EP(PBTEP) (6-7E) 284 336 -7838
(9) Tax Provisions 3 1 42
(10) Net Profit / Loss Before EP (8-9) 281 335 -7880
(11) Net Extra-Ord. Items 98 -828 130
(12) Net Profit / Loss(-) (10-11) 183 1163 -8010
(13) Dividend Declared 0 0 0
(14) Dividend Tax 0 0 0
(15) Retained Profit (12-13-14) 183 1163 -8010
Financial Ratios 2010-11 2009-10 2008-09
(i) Sales : Capital Employed 18.26 17.79 17.91
(ii) Cost of Sales : Sales 153.6 129.69 150.25
(iii) Salary / Wages : Sales 25.64 24.44 31.03
(iv) Net Profit : Net Worth 0.12 0.93 -8.54
(v) Debt : Equity 0.37 0.46 0.55
(vi) Current Ratio 1.34 1.43 1.34
(vii) Sundry Debtors : Sales (No. of Days) 182.1 195.61 204.62
(viii) Total Inventory : Sales 14.8 8.71 10.18

456 Contract & Construction Services
www.mecl.gov.in
MECL was carved out of GSI in 1972 and incorporated on 21.10.1972withtheobjectiveofcarryingoutdetailedexplorationof mineral potential deposits on a commercial basis, in order to reduce the time lag between the initial discovery of a mineral prospect and its eventual exploitation.
MECLisaSchedule-‘B’CPSEinContract&Constructionservices sector under the administrative control of M/o Mines, with 100% shareholding by the Government of India. Its Registered andCorporate offices are atNagpur,Maharashtra.
Vision / MissionThe Vision of the Company is to be the leader in Exploration
of mineral resources by 2020. The Mission of the Company is to provide high quality, cost
effectiveand timeboundgeoscientificservices forexplorationand exploitation of minerals.
Industrial / Business OperationsMECL carries out exploration activities under two major
heads, viz. Promotional Work for coal, lignite and other minerals on behalf of and funded by the Government of India, and Contractual Work on behalf of other agencies including public sector, private sector and stateGovernments.TheZonal officesand Regional Maintenance Centers of the company are located at Hyderabad, Nagpur, Ranchi and Tinsukia (Assam) and the Business Development Centers are at Delhi and Kolkata.
The service range of the company comprises of exploratory drilling and exploratory / developmental mining. The physical performance of Company for last three years is given below:Main Services Unit Performance During
2010-11 2009-10 2008-09Exploratory Drilling
Meters 2,67,097 2,53,550 2,21,847
Exploratory Mining
Meters 8805 6607 5900
Strategic issueFor expanding its activities and entering into new areas in
thefieldofmineralexploration,ithasenteredintoanMoUwithM/s.BEMLforparticipationintheforthcomingminingprojects/ tenders and offering exploration / mining also allied services to the coal & non coal mining sector in India.
It has also entered into anMoU with the Directorate of Atomic Mineral Exploration & Research (AMD) for drilling in Halbhavi-Muktapur-Mandnaliblock,districtGulburga,Karnatakaand M/s. Mahatamil, for detailed exploration of coal in Gare Palma,Sector-II,MandRaigarh coalfield,Chhattisgarh.
MECL proposes to phase out the old plants and machineries which are more than 15 years old in a phased manner and planned to procure few medium and shallow capacity drilling rigs. Further, MECL has planned to enter into new thrust areas such as exploration, production well drilling, geothermal geotechnical investigation and commercial mining of bauxite. The source of funding for the said activities shall be met with internal resources for which MECL has proposed ` 49.00 crores duringXIIthfiveyear plan
Performance HighlightsThe operational performance of the company along with
performance indicators and selected financial ratios during theperiod2008-09 to 2010-11 canbe seenon theopposite page.
The Company registered an increase of ` 10.24 crore in total incomeduring2010-11whichwentup to ` 137.30 crore in2010-11 from` 127.06 croreduring2009-10.Thenet profit
18.8 Mineral Exploration Corp. Ltd.of the company however reduced to ` 11.95 crore, a reduction of ` 2.52croreoverthepreviousyearprofitof` 14.47 crore due to increase in operating expenses.
During2010-11,atotalof8500nos.ofNQTubing,10nos.of rock Drill Machines (Mining), a Flame Photometer, 3 nos. of Battery operated locomotive, 1 no. of borehole deviation camera were procured. Two nos. of high tech hydrostatics drills having capacity to drill upto 1500 m in NQ size, 1 no. diesel operated locomotive for developmental mining work, 1 no. of Global Positioning System (GPS) and 8 nos. of heavy duty mud pump are in advanced stage of procurement. Further, 10 no. of heavy duty skid mounted diamond core drill machines (capacity – 900 m), 1 no. of CNC machine, 5 nos. of electronic total stations and 5 nos. of hand held GPS are also under procurement.
Human Resource ManagementThe company employed 1871 regular employees as on
31.3.2011. The retirement age in the company is 60 years. It is following IDA 2007 pattern of remuneration. Details of employment in last 3 years are given below:
Particulars 2010-11 2009-10 2008-09Executives including Non-Unionised Supervisors 286 300 286
Non-Executives # 1585 1647 1675Total Employees 1871 1947 1961
# Detail break-up of Non-Executive employees is at Statement no. 25 of volume-I of PE Survey.
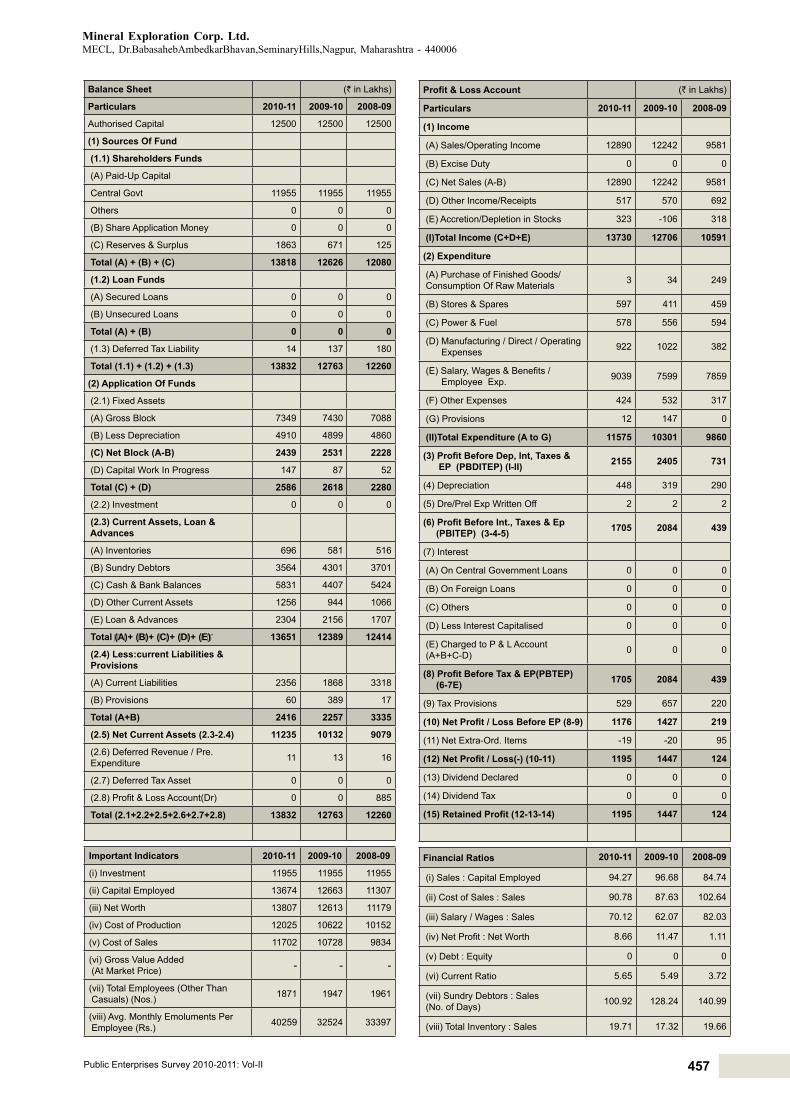
457Public Enterprises Survey 2010-2011: Vol-II
Mineral Exploration Corp. Ltd. MECL,Dr.BabasahebAmbedkarBhavan,SeminaryHills,Nagpur,Maharashtra - 440006
Balance Sheet (` in Lakhs)
Particulars 2010-11 2009-10 2008-09
Authorised Capital 12500 12500 12500
(1) Sources Of Fund
(1.1) Shareholders Funds
(A) Paid-Up Capital
Central Govt 11955 11955 11955
Others 0 0 0
(B) Share Application Money 0 0 0
(C) Reserves & Surplus 1863 671 125
Total (A) + (B) + (C) 13818 12626 12080
(1.2) Loan Funds
(A) Secured Loans 0 0 0
(B) Unsecured Loans 0 0 0
Total (A) + (B) 0 0 0
(1.3) Deferred Tax Liability 14 137 180
Total (1.1) + (1.2) + (1.3) 13832 12763 12260
(2) Application Of Funds
(2.1) Fixed Assets
(A) Gross Block 7349 7430 7088
(B) Less Depreciation 4910 4899 4860
(C) Net Block (A-B) 2439 2531 2228
(D) Capital Work In Progress 147 87 52
Total (C) + (D) 2586 2618 2280
(2.2) Investment 0 0 0
(2.3) Current Assets, Loan & Advances
(A) Inventories 696 581 516
(B) Sundry Debtors 3564 4301 3701
(C) Cash & Bank Balances 5831 4407 5424
(D) Other Current Assets 1256 944 1066
(E) Loan & Advances 2304 2156 1707
Total (A)+ (B)+ (C)+ (D)+ (E) 13651 12389 12414
(2.4) Less:current Liabilities & Provisions
(A) Current Liabilities 2356 1868 3318
(B) Provisions 60 389 17
Total (A+B) 2416 2257 3335
(2.5) Net Current Assets (2.3-2.4) 11235 10132 9079
(2.6) Deferred Revenue / Pre. Expenditure 11 13 16
(2.7) Deferred Tax Asset 0 0 0
(2.8) Profit & Loss Account(Dr) 0 0 885
Total (2.1+2.2+2.5+2.6+2.7+2.8) 13832 12763 12260
Important Indicators 2010-11 2009-10 2008-09
(i) Investment 11955 11955 11955
(ii) Capital Employed 13674 12663 11307
(iii) Net Worth 13807 12613 11179
(iv) Cost of Production 12025 10622 10152
(v) Cost of Sales 11702 10728 9834
(vi) Gross Value Added (At Market Price) - - -
(vii) Total Employees (Other Than Casuals) (Nos.) 1871 1947 1961
(viii) Avg. Monthly Emoluments Per Employee (Rs.) 40259 32524 33397
Profit & Loss Account (` in Lakhs)
Particulars 2010-11 2009-10 2008-09
(1) Income
(A) Sales/Operating Income 12890 12242 9581
(B) Excise Duty 0 0 0
(C) Net Sales (A-B) 12890 12242 9581
(D) Other Income/Receipts 517 570 692
(E) Accretion/Depletion in Stocks 323 -106 318
(I)Total Income (C+D+E) 13730 12706 10591
(2) Expenditure
(A) Purchase of Finished Goods/ Consumption Of Raw Materials 3 34 249
(B) Stores & Spares 597 411 459
(C) Power & Fuel 578 556 594
(D) Manufacturing / Direct / Operating Expenses 922 1022 382
(E) Salary, Wages & Benefits / Employee Exp. 9039 7599 7859
(F) Other Expenses 424 532 317
(G) Provisions 12 147 0
(II)Total Expenditure (A to G) 11575 10301 9860
(3) Profit Before Dep, Int, Taxes & EP (PBDITEP) (I-II) 2155 2405 731
(4) Depreciation 448 319 290
(5) Dre/Prel Exp Written Off 2 2 2
(6) Profit Before Int., Taxes & Ep (PBITEP) (3-4-5) 1705 2084 439
(7) Interest
(A) On Central Government Loans 0 0 0
(B) On Foreign Loans 0 0 0
(C) Others 0 0 0
(D) Less Interest Capitalised 0 0 0
(E) Charged to P & L Account (A+B+C-D) 0 0 0
(8) Profit Before Tax & EP(PBTEP) (6-7E) 1705 2084 439
(9) Tax Provisions 529 657 220
(10) Net Profit / Loss Before EP (8-9) 1176 1427 219
(11) Net Extra-Ord. Items -19 -20 95
(12) Net Profit / Loss(-) (10-11) 1195 1447 124
(13) Dividend Declared 0 0 0
(14) Dividend Tax 0 0 0
(15) Retained Profit (12-13-14) 1195 1447 124
Financial Ratios 2010-11 2009-10 2008-09
(i) Sales : Capital Employed 94.27 96.68 84.74
(ii) Cost of Sales : Sales 90.78 87.63 102.64
(iii) Salary / Wages : Sales 70.12 62.07 82.03
(iv) Net Profit : Net Worth 8.66 11.47 1.11
(v) Debt : Equity 0 0 0
(vi) Current Ratio 5.65 5.49 3.72
(vii) Sundry Debtors : Sales (No. of Days) 100.92 128.24 140.99
(viii) Total Inventory : Sales 19.71 17.32 19.66

458 Contract & Construction Services
www.mrvc.indianrail.gov.in
Mumbai Railway Vikas Corporation Ltd. (MRVCL) was incorporated on 12.07.1999 with the objective of augmentingtransport capacity to match the continual growth in the number of commuters in Mumbai by developing coordinated plans and implementing rail infrastructure projects, integratingurbandevelopment plan of Mumbai with rail capacity and investments, undertaking commercial development of Railway land and air space.
MRVCisaSchedule-‘A’CPSEinContractandConstructionServices sector under the administrative control of M/o Railways with 51% shareholding by the Government of India and 49% by the Govt. of Maharashtra (GoM). Its Registered and Corporate offices are atMumbai,Maharashtra.
Vision / MissionThe Vision / Mission of the Company is to develop world
classinfrastructureforanefficient,safeandsustainableRailwaysystem for Mumbai suburban sectionand to provide comfortable and friendly train service to the commuters.
Industrial / Business OperationsMRVCisoneoftheCentral-StateGovernmentsJointVenture
involved in implementing & coordinating rail infrastructures project viz. Mumbai Urban Transport Project (MUTP) inMumbai. MRVC is also to undertake commercial development of Railway’s land and air space and to coordinate and facilitate improvements in track drainage, remove encroachments and trespassers and to coordinate with organizations operating train services and responsible for protection of Railway’s right of way for Urban development.
MRVC is a Project executing agency and is at presentexecutingMUTP Phase-I at a total anticipated cost of ` 3480 Crores for Mumbai Suburban Section, the cost of which will be shared between M/o Railways and Govt. of Maharashtra in a 50:50 ratio.Approximately 50%of the project cost is raisedthrough World Bank loan. The repayment of loan to World Bank is done by M/o Railways and Government of Maharashtra in equal ratio by levying surcharge on the existing fares.
To execute these projects, MRVC receives funds fromMinistry of Railway and Government of Maharashtra for further transmissiontovariousprojectexecutingagencies.AlltheassetscreatedunderMUTPprojectareownedbyIndianRailwaysandnot by Mumbai Railway Vikas Corporation Ltd. Hence all the funds received forMUTPproject are neitherLongTermLoannor Government Grants, but the funds received for execution of the project. The physical performances of the company forlast three years are given below:Main Services Unit Performance During
2010-11 2009-10 2008-09Direction & General Charges
` in Lakhs
947 1428 1046
Strategic issueMinistry of Railways has sanctioned MUTP-2 at total
cost of ` 5300 Crores. The work under MUTP 2 has also commenced. A loan of ` 1910 Crore has been signed with world bank on 23.02.10. The loan will be utilized for procurement of electrics, conversion of Traction from 1500 V DC to 25 kV AC, augmentation of EMU Maintenance & Facilities, additional stabling lines, technical studies, etc.
18.9 Mumbai Railway Vikas Corporation Ltd.
Performance HighlightsThe operational performance of the company along with
performance indicators and selected financial ratios during theperiod2008-09 to 2010-11 canbe seenon theopposite page.
The Company registered a reduction of ` 12.72 crore in totalincomeduring2010-11whichwentdownto` 29.12 crore in 2010-11 from ` 41.84 crore during 2009-10. The net profitof the company reduced to ` 10.37 crore, areduction of ` 15.43 croreoverthepreviousyear’sprofitof` 25.80 crore due to fall in turnover and other income.The turnover decreased during the year compared to previous year due to lower realization of direction and general charges.
The company has been given exemption under section 12A of the Income Tax Act, 1961 in respect of ‘No’ provision ofIncomeTaxandFringeBenefitTax.Companyploughsbackitssurplusfor thefurtheranceof theobjectivesof thecompanywithinaperiodof5yearsofaccrualofsuchprofitincomplianceof Income Tax Act, 1961.
Human Resource ManagementThe company employed 195 regular employees as on
31.3.2011. The retirement age in the company is 60 years. It is following IDA 2007 and CDA 2006 pattern of remuneration. Details of employment in last 3 years are given below:
Particulars 2010-11 2009-10 2008-09Executives including Non-Unionised Supervisors
165 163 145
Non-Executives # 30 29 32Total Employees 195 192 177
#Detail break-up of Non-Executive employees is at Statement no. 25 of volume-I of PE Survey.

459Public Enterprises Survey 2010-2011: Vol-II
Mumbai RailwayVikas Corporation Ltd.Second Floor, Churchgate Station Building, Mumbai 400020
Balance Sheet (` in Lakhs)
Particulars 2010-11 2009-10 2008-09
Authorised Capital 2500 2500 2500
(1) Sources Of Fund
(1.1) Shareholders Funds
(A) Paid-Up Capital
Central Govt 1275 1275 1275
Others 1225 1225 1225
(B) Share Application Money 0 0 0
(C) Reserves & Surplus 11687 10727 8148
Total (A) + (B) + (C) 14187 13227 10648
(1.2) Loan Funds
(A) Secured Loans 18706 23440 20875
(B) Unsecured Loans 0 0 0
Total (A) + (B) 18706 23440 20875
(1.3) Deferred Tax Liability 0 0 0
Total (1.1) + (1.2) + (1.3) 32893 36667 31523
(2) Application Of Funds
(2.1) Fixed Assets
(A) Gross Block 420 407 368
(B) Less Depreciation 176 145 123
(C) Net Block (A-B) 244 262 245
(D) Capital Work In Progress 3600 2787 2128
Total (C) + (D) 3844 3049 2373
(2.2) Investment 0 0 0
(2.3) Current Assets, Loan & Advances
(A) Inventories 0 0 0
(B) Sundry Debtors 0 0 0
(C) Cash & Bank Balances 28910 28631 23090
(D) Other Current Assets 0 0 0
(E) Loan & Advances 7777 65422 47692
Total (A)+ (B)+ (C)+ (D)+ (E) 36687 94053 70782
(2.4) Less:current Liabilities & Provisions
(A) Current Liabilities 7549 60427 41628
(B) Provisions 89 8 5
Total (A+B) 7638 60435 41633
(2.5) Net Current Assets (2.3-2.4) 29049 33618 29149
(2.6) Deferred Revenue / Pre. Expenditure 0 0 1
(2.7) Deferred Tax Asset 0 0 0
(2.8) Profit & Loss Account(Dr) 0 0 0
Total (2.1+2.2+2.5+2.6+2.7+2.8) 32893 36667 31523
Important Indicators 2010-11 2009-10 2008-09
(i) Investment 21206 25940 23375
(ii) Capital Employed 29293 33880 29394
(iii) Net Worth 14187 13227 10647
(iv) Cost of Production 1839 1600 1665
(v) Cost of Sales 1839 1600 1665
(vi) Gross Value Added (At Market Price) - - -
(vii) Total Employees (Other Than Casuals) (Nos.) 195 192 177
(viii) Avg. Monthly Emoluments Per Employee (Rs.) 53761 46788 51789
Profit & Loss Account (` in Lakhs)
Particulars 2010-11 2009-10 2008-09
(1) Income
(A) Sales/Operating Income 947 1428 1046
(B) Excise Duty 0 0 0
(C) Net Sales (A-B) 947 1428 1046
(D) Other Income/Receipts 1965 2756 2592
(E) Accretion/Depletion in Stocks 0 0 0
(I)Total Income (C+D+E) 2912 4184 3638
(2) Expenditure
(A) Purchase of Finished Goods/ Consumption Of Raw Materials 0 0 0
(B) Stores & Spares 0 0 0
(C) Power & Fuel 33 27 21
(D) Manufacturing / Direct / Operating Expenses 39 43 42
(E) Salary, Wages & Benefits / Employee Exp. 1258 1078 1100
(F) Other Expenses 475 418 409
(G) Provisions 0 0 0
(II)Total Expenditure (A to G) 1805 1566 1572
(3) Profit Before Dep, Int, Taxes & EP (PBDITEP) (I-II) 1107 2618 2066
(4) Depreciation 34 33 25
(5) Dre/Prel Exp Written Off 0 1 1
(6) Profit Before Int., Taxes & Ep (PBITEP) (3-4-5) 1073 2584 2040
(7) Interest
(A) On Central Government Loans 0 0 67
(B) On Foreign Loans 0 0 0
(C) Others 0 0 0
(D) Less Interest Capitalised 0 0 0
(E) Charged to P & L Account (A+B+C-D) 0 0 67
(8) Profit Before Tax & EP(PBTEP) (6-7E) 1073 2584 1973
(9) Tax Provisions 0 0 0
(10) Net Profit / Loss Before EP (8-9) 1073 2584 1973
(11) Net Extra-Ord. Items 36 4 210
(12) Net Profit / Loss(-) (10-11) 1037 2580 1763
(13) Dividend Declared 0 0 0
(14) Dividend Tax 0 0 0
(15) Retained Profit (12-13-14) 1037 2580 1763
Financial Ratios 2010-11 2009-10 2008-09
(i) Sales : Capital Employed 3.23 4.21 3.56
(ii) Cost of Sales : Sales 194.19 112.04 159.18
(iii) Salary / Wages : Sales 132.84 75.49 105.16
(iv) Net Profit : Net Worth 7.31 19.51 16.56
(v) Debt : Equity 1.32 1.77 1.96
(vi) Current Ratio 4.8 1.56 1.7
(vii) Sundry Debtors : Sales (No. of Days) 0 0 0
(viii) Total Inventory : Sales 0 0 0

460 Contract & Construction Services
www.nbccindia.gov.in
National Buildings Construction Corporation Limited (NBCC)wasincorporatedin1960withtheobjectivetobecomea leadingcompany, in theconstructionengineeringandprojectmanagement consultancy services in India.
NBCC is a Schedule “A” CPSE in Contract & Construction Services sector under the administrative control of Ministry of Urban Development with 100% shareholding by the Government of India. Its Registered and Corporate Offices are at NewDelhi.
Vision/MissionThe Vision of the Company is to be a widely admired
Company and preferred construction Services Company.The Mission is to supply customers with practical, secure,
innovativeandcost-efficientconstructionproducts(andservices)that meet their needs as well as build the necessary infrastructure in a socially responsible way.
Industrial / Business OperationsNBCC is engaged in execution of civil engineering
projects, rendering project management consultancy servicesand Development of Real Estate Projects and EngineeringProcurement and Construction (EPC) contracts. The company has diversifiedintoalmostallfieldsofconstructionsectorincludinghighly specialized works like water treatment & sewage treatment plants, water supply pipe line work, flyover, road work, masshousing projects, EPC projects and SolidWasteManagement.Due to vast experience and quality of services rendered by NBCC, a number of Central Government Ministries and various State Governments are utilizing the services of NBCC as their extended engineering arm.
The company has five Joint Ventures namely “Jamal –NBCCInternational(Proprietary)Ltd.”Botswana,NBCC-AMC,NBCC-R.K.Millen& Co., NBCC-MHG andNBCC-ABwitha share holding of 49%,80.16% & 50% each respectively. The segment-wise revenue earned by the Company during the lastthree years is given below:Main Segments Unit Performance During
2010-11 2009-10 2008-09Real Estate ` in Crore 144.23 187.22 208.85
Infrastructure ` in Crore 63.32 83.76 101.42
Civil construction and Project Management Consultancy
` in Crore 2919.23 2711.01 1730.93
Strategic IssuesThe Government on 11th August, 2011 has approved the
proposal for disinvestment of 10% equity of NBCC through an IPO. Accordingly company would be listed on the stock exchange. As per listing requirement the company is to induct independent Directors on the Board of the company.
Performance HighlightsThe operational performance of the company along with
performance indicators and selected financial ratios during theperiod2008-09 to 2010-11 canbe seenon theopposite page.
The Company registered an increase of ` 211.58 crore in total income during 2010-11whichwent up to` 3231.49crore in2010-11from` 3019.91croreduring2009-10.Thenetprofitof the company correspondingly increased to ` 140.34 crore, an increase of ` 23.84 crore over the previous year due to increase
18.10 National Buildings Construction Corporation Limited
in turnover and other income along with reduction in overheads and effectiveprojectmonitoring system.
NBCC is currently contributing significantly in the development of North Eastern Region by executing a large number of Central Government Developmental Project under10%non-lapsablefund.NBCCisalsoexecutingBorderFencingwork for the M/o Home Affairs in Northern Eastern States.
Human Resource ManagementThe company employed 2341 regular employees as on
31.3.2011. The retirement age in the company is 60 years. It is following IDA 2007 and CDA 2006 pattern of remuneration. Details of employment in last 3 years are given below:
Particulars 2010-11 2009-10 2008-09Executives including Non-Unionised Supervisors 862 614 625
Non-Executives # 1479 1758 1719Total Employees 2341 2372 2344
# Detail break-up of Non-Executive employees is at Statement no. 25 of volume-I of PE Survey.

461Public Enterprises Survey 2010-2011: Vol-II
National Buildings Construction Corporation LimitedNBCCBhaswan,LodhiRoad,NewDelhi-110003
Balance Sheet (` in Lakhs)
Particulars 2010-11 2009-10 2008-09
Authorised Capital 12000 12000 12000(1) Sources Of Fund
(1.1) Shareholders Funds
(A) Paid-Up Capital
Central Govt 9000 9000 9000 Others 0 0 0 (B) Share Application Money 0 0 0 (C) Reserves & Surplus 56414 45653 36730 Total (A) + (B) + (C) 65414 54653 45730 (1.2) Loan Funds
(A) Secured Loans 0 0 0 (B) Unsecured Loans 0 0 0 Total (A) + (B) 0 0 0 (1.3) Deferred Tax Liability 0 0 0 Total (1.1) + (1.2) + (1.3) 65414 54653 45730(2) Application Of Funds
(2.1) Fixed Assets
(A) Gross Block 3593 3581 2342 (B) Less Depreciation 1168 1067 1010 (C) Net Block (A-B) 2425 2514 1332 (D) Capital Work In Progress 0 0 0 Total (C) + (D) 2425 2514 1332 (2.2) Investment 17258 25014 775 (2.3) Current Assets, Loan & Advances (A) Inventories 40948 26664 19602 (B) Sundry Debtors 86894 88213 77775 (C) Cash & Bank Balances 116980 94391 104515 (D) Other Current Assets 2331 820 891 (E) Loan & Advances 80859 65126 58110 Total (A)+ (B)+ (C)+ (D)+ (E) 328012 275214 260893 (2.4) Less:current Liabilities & Provisions (A) Current Liabilities 253063 226256 187563 (B) Provisions 29740 22369 30211 Total (A+B) 282803 248625 217774 (2.5) Net Current Assets (2.3-2.4) 45209 26589 43119 (2.6) Deferred Revenue / Pre. Expenditure
0 0 3
(2.7) Deferred Tax Asset 522 536 501 (2.8) Profit & Loss Account(Dr) 0 0 0 Total (2.1+2.2+2.5+2.6+2.7+2.8) 65414 54653 45730
Important Indicators 2010-11 2009-10 2008-09
(i) Investment 9000 9000 9000
(ii) Capital Employed 47634 29103 44451
(iii) Net Worth 65414 54653 45727
(iv) Cost of Production 302207 284528 180418
(v) Cost of Sales 302207 289442 189506
(vi) Gross Value Added (At Market Price) - - -
(vii) Total Employees (Other Than Casuals) (Nos.) 2341 2372 2344
(viii) Avg. Monthly Emoluments Per Employee (Rs.) 40513 37310 33092
Profit & Loss Account (` in Lakhs)
Particulars 2010-11 2009-10 2008-09
(1) Income
(A) Sales/Operating Income 312677 298198 204120
(B) Excise Duty 0 0 0
(C) Net Sales (A-B) 312677 298198 204120
(D) Other Income/Receipts 10472 8707 9473
(E) Accretion/Depletion in Stocks 0 -4914 -9088
(I)Total Income (C+D+E) 323149 301991 204505
(2) Expenditure
(A) Purchase of Finished Goods/ Consumption Of Raw Materials 13993 11553 3440
(B) Stores & Spares 0 0 0
(C) Power & Fuel 363 455 366
(D) Manufacturing / Direct / Operating Expenses 271193 256535 161842
(E) Salary, Wages & Benefits / Employee Exp. 11381 10620 9308
(F) Other Expenses 1890 1930 2045
(G) Provisions 1516 2378 2519
(II)Total Expenditure (A to G) 300336 283471 179520
(3) Profit Before Dep, Int, Taxes & EP (PBDITEP) (I-II) 22813 18520 24985
(4) Depreciation 321 312 307
(5) Dre/Prel Exp Written Off 1118 258 269
(6) Profit Before Int., Taxes & Ep (PBITEP) (3-4-5) 21374 17950 24409
(7) Interest
(A) On Central Government Loans 0 0 0
(B) On Foreign Loans 0 0 0
(C) Others 432 487 322
(D) Less Interest Capitalised 0 0 0
(E) Charged to P & L Account (A+B+C-D) 432 487 322
(8) Profit Before Tax & EP(PBTEP) (6-7E) 20942 17463 24087
(9) Tax Provisions 6929 5809 8079
(10) Net Profit / Loss Before EP (8-9) 14013 11654 16008
(11) Net Extra-Ord. Items -21 4 92
(12) Net Profit / Loss(-) (10-11) 14034 11650 15916
(13) Dividend Declared 2807 2330 3183
(14) Dividend Tax 466 396 541
(15) Retained Profit (12-13-14) 10761 8924 12192
Financial Ratios 2010-11 2009-10 2008-09
(i) Sales : Capital Employed 656.42 1024.63 459.2
(ii) Cost of Sales : Sales 96.65 97.06 92.84
(iii) Salary / Wages : Sales 3.64 3.56 4.56
(iv) Net Profit : Net Worth 21.45 21.32 34.81
(v) Debt : Equity 0 0 0
(vi) Current Ratio 1.16 1.11 1.2
(vii) Sundry Debtors : Sales (No. of Days) 101.43 107.97 139.07
(viii) Total Inventory : Sales 47.8 32.64 35.05
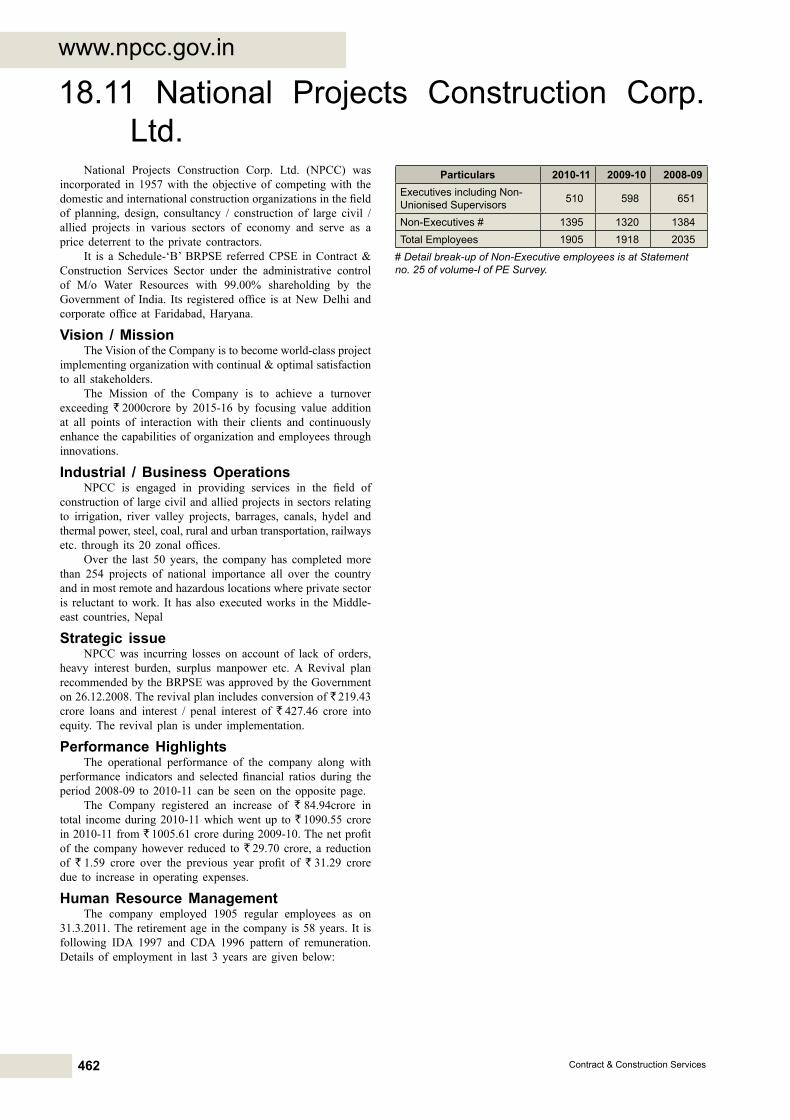
462 Contract & Construction Services
www.npcc.gov.in
National Projects Construction Corp. Ltd. (NPCC) wasincorporated in 1957with the objective of competingwith thedomesticandinternationalconstructionorganizationsinthefieldof planning, design, consultancy / construction of large civil / allied projects in various sectors of economy and serve as aprice deterrent to the private contractors.
It is aSchedule-‘B’BRPSE referredCPSE inContract&Construction Services Sector under the administrative control of M/o Water Resources with 99.00% shareholding by the Governmentof India. Its registeredoffice is atNewDelhi andcorporate office atFaridabad,Haryana.
Vision / MissionTheVisionoftheCompanyistobecomeworld-classproject
implementing organization with continual & optimal satisfaction to all stakeholders.
The Mission of the Company is to achieve a turnover exceeding ` 2000crore by 2015-16 by focusing value additionat all points of interaction with their clients and continuously enhance the capabilities of organization and employees through innovations.
Industrial / Business OperationsNPCC is engaged in providing services in the field of
constructionoflargecivilandalliedprojectsinsectorsrelatingto irrigation, river valley projects, barrages, canals, hydel andthermal power, steel, coal, rural and urban transportation, railways etc. through its 20 zonal offices.
Over the last 50 years, the company has completed more than 254 projects of national importance all over the countryand in most remote and hazardous locations where private sector is reluctant towork. Ithasalsoexecutedworks in theMiddle-east countries, Nepal
Strategic issueNPCC was incurring losses on account of lack of orders,
heavy interest burden, surplus manpower etc. A Revival plan recommended by the BRPSE was approved by the Government on 26.12.2008. The revival plan includes conversion of ` 219.43 crore loans and interest / penal interest of ` 427.46 crore into equity. The revival plan is under implementation.
Performance HighlightsThe operational performance of the company along with
performance indicators and selected financial ratios during theperiod2008-09 to 2010-11 canbe seenon theopposite page.
The Company registered an increase of ` 84.94crore in total incomeduring2010-11whichwentup to` 1090.55 crore in2010-11from` 1005.61croreduring2009-10.Thenetprofitof the company however reduced to ` 29.70 crore, a reduction of ` 1.59 crore over the previous year profit of ` 31.29 crore due to increase in operating expenses.
Human Resource ManagementThe company employed 1905 regular employees as on
31.3.2011. The retirement age in the company is 58 years. It is following IDA 1997 and CDA 1996 pattern of remuneration. Details of employment in last 3 years are given below:
18.11 National Projects Construction Corp. Ltd.
Particulars 2010-11 2009-10 2008-09Executives including Non-Unionised Supervisors 510 598 651
Non-Executives # 1395 1320 1384Total Employees 1905 1918 2035
# Detail break-up of Non-Executive employees is at Statement no. 25 of volume-I of PE Survey.

463Public Enterprises Survey 2010-2011: Vol-II
National Projects Construction Corp. Ltd. RajaHouse, 30-31,NehruPlace,NewDelhi 110019
Balance Sheet (` in Lakhs)
Particulars 2010-11 2009-10 2008-09
Authorised Capital 70000 70000 70000
(1) Sources Of Fund
(1.1) Shareholders Funds
(A) Paid-Up Capital
Central Govt 9348 67569 2879
Others 105 105 105
(B) Share Application Money 0 0 0
(C) Reserves & Surplus 0 0 0
Total (A) + (B) + (C) 9453 67674 2984
(1.2) Loan Funds
(A) Secured Loans 524 321 491
(B) Unsecured Loans 9399 1003 73900
Total (A) + (B) 9923 1324 74391
(1.3) Deferred Tax Liability 0 0 0
Total (1.1) + (1.2) + (1.3) 19376 68998 77375
(2) Application Of Funds
(2.1) Fixed Assets
(A) Gross Block 4557 4841 5117
(B) Less Depreciation 3820 4079 4316
(C) Net Block (A-B) 737 762 801
(D) Capital Work In Progress 0 0 0
Total (C) + (D) 737 762 801
(2.2) Investment 0 0 0
(2.3) Current Assets, Loan & Advances
(A) Inventories 327 354 383
(B) Sundry Debtors 74923 40649 51975
(C) Cash & Bank Balances 60350 45070 15898
(D) Other Current Assets 547 462 44
(E) Loan & Advances 17157 13154 13473
Total (A)+ (B)+ (C)+ (D)+ (E) 153304 99689 81773
(2.4) Less:current Liabilities & Provisions
(A) Current Liabilities 150448 107846 85208
(B) Provisions 2903 3764 3247
Total (A+B) 153351 111610 88455
(2.5) Net Current Assets (2.3-2.4) -47 -11921 -6682
(2.6) Deferred Revenue / Pre. Expenditure 0 0 0
(2.7) Deferred Tax Asset 4752 608 578
(2.8) Profit & Loss Account(Dr) 13934 79549 82678
Total (2.1+2.2+2.5+2.6+2.7+2.8) 19376 68998 77375
Important Indicators 2010-11 2009-10 2008-09
(i) Investment 18852 68677 70448
(ii) Capital Employed 690 -11159 -5881
(iii) Net Worth -4481 -11875 -79694
(iv) Cost of Production 106022 97441 86720
(v) Cost of Sales 106022 97441 86720
(vi) Gross Value Added (At Market Price) - - -
(vii) Total Employees (Other Than Casuals) (Nos.) 1905 1918 2035
(viii) Avg. Monthly Emoluments Per Employee (Rs.) 27642 19139 18939
Profit & Loss Account (` in Lakhs)
Particulars 2010-11 2009-10 2008-09
(1) Income
(A) Sales/Operating Income 106946 99122 82556
(B) Excise Duty 0 0 0
(C) Net Sales (A-B) 106946 99122 82556
(D) Other Income/Receipts 2109 1439 1549
(E) Accretion/Depletion in Stocks 0 0 0
(I)Total Income (C+D+E) 109055 100561 84105
(2) Expenditure
(A) Purchase of Finished Goods/ Consumption Of Raw Materials 47 93 274
(B) Stores & Spares 0 1 0
(C) Power & Fuel 2 4 7
(D) Manufacturing / Direct / Operating Expenses 97971 90913 71640
(E) Salary, Wages & Benefits / Employee Exp. 6319 4405 4625
(F) Other Expenses 805 897 3991
(G) Provisions 534 666 1818
(II)Total Expenditure (A to G) 105678 96979 82355
(3) Profit Before Dep, Int, Taxes & EP (PBDITEP) (I-II) 3377 3582 1750
(4) Depreciation 54 63 32
(5) Dre/Prel Exp Written Off 0 0 0
(6) Profit Before Int., Taxes & Ep (PBITEP) (3-4-5) 3323 3519 1718
(7) Interest
(A) On Central Government Loans 0 214 4081
(B) On Foreign Loans 0 0 0
(C) Others 290 185 252
(D) Less Interest Capitalised 0 0 0
(E) Charged to P & L Account (A+B+C-D) 290 399 4333
(8) Profit Before Tax & EP(PBTEP) (6-7E) 3033 3120 -2615
(9) Tax Provisions 0 -32 16
(10) Net Profit / Loss Before EP (8-9) 3033 3152 -2631
(11) Net Extra-Ord. Items 63 23 239
(12) Net Profit / Loss(-) (10-11) 2970 3129 -2870
(13) Dividend Declared 0 0 0
(14) Dividend Tax 0 0 0
(15) Retained Profit (12-13-14) 2970 3129 -2870
Financial Ratios 2010-11 2009-10 2008-09
(i) Sales : Capital Employed 15499.42 -888.27 -1403.77
(ii) Cost of Sales : Sales 99.14 98.3 105.04
(iii) Salary / Wages : Sales 5.91 4.44 5.6
(iv) Net Profit : Net Worth - - -
(v) Debt : Equity 1.05 0.02 24.93
(vi) Current Ratio 1 0.89 0.92
(vii) Sundry Debtors : Sales (No. of Days) 255.71 149.68 229.79
(viii) Total Inventory : Sales 1.12 1.3 1.69
2010-11 PROVISIONAL

464 Contract & Construction Services
www.pdilin.com
PDILwasincorporatedon07.03.1978withtheobjectivetoand act as a store house of technical knowledge in the projectmanagement relating to fertilizer and allied chemical industry.
PDIL is a Schedule “B” BIFR referred CPSE in contract and construction sector under the administrative control of M/o Chemicals and Fertilizer, D/o Fertilizers with 100% shareholding by Government of India. Its Registered and Corporate officesare at Noida (U.P.).
Vision / MissionThe Vision of the company is to be a leading engineering
andprojectmanagement consultancyorganization.The Mission of the Company is to create and deliver
integratedtechno-commercialsolutionoptimumincost,qualityand time to all customers; to pursue relentlessly world class quality in engineering consultancy andprojectmanagementbyimbibing best practices; to develop, upgrade and improve the manufacturing process of Catalyst and other products in line with the ever evolving need of customers.
Industrial / Business OperationsPDIL, an ISO 9001:2000 certified company, is a premier
design engineering and consultancy organization, committed towardstechnologicalexcellenceandself-relianceinthegrowthof the fertilizer and allied chemical industries.
PDIL also has Catalyst Manufacturing Unit at Sindri, Jharkhand, producing range of Catalysts used in Fertilizer and Oil industries.InspectionOfficesofPDILarespreadoverNOIDA,Baroda, Mumbai, Chennai, Kolkata and Hyderabad and provide third party inspection and non destructive testing services to the industry from its 6 operating units.
The physical performance of company during the last three years is mentioned below: Main Services Unit Production during
2010-11 2009-10 2008-09Catalyst MT 436 59 182
Engineering & Consultancy
crores N.A. 72.37 55.28
Strategic issueOvertheyearsthecompanyhasdiversifieditstechnological
base in other industry sectors and PDIL now provides its services for projects in thefieldofFertilizers,Chemicals,Oil andGas,City Gas Distribution, Refinery, Power, Petrochemical andInfrastructure. PDIL is ready to take up the new challenge in executingtheBrownfield,Greenfield,RevampandExpansionProjects ofmany fertilizer units in the country.
PDIL has made extensive efforts to provide services in ProjectsbeingsetupoutsidethecountryandpresentlyprovidingPMC Services for Algeria Oman Fertilizer Project at Arzew,Algeria forAOA,Algeria. PDIL is also executing the job ofHealth Study of Natural Gas Let Down station in Ammonia Plant at Oman for OMIFCO.
Performance HighlightsThe operational performance of the company along with
performance indicators and selected financial ratios during theperiod2008-09 to 2010-11 canbe seenon theopposite page.
The Company registered an increase of ` 30.30 crore in total incomeduring2010-11whichwent up to ` 113.45 crore in 2010-11 from ` 83.15 crore during 2009-10. The net profitof the company correspondingly increased to ` 21.01 crore, an increase of ` 6.53 crore over the previous year due to higher order booking.
18.12 Projects and Development India Ltd.Human Resource Management
The Company employed 492 regular employees as on 31.03.2011. The retirement age in the Company is 60 years. It is following IDA 2007 pattern of remuneration. Details of employment in last 3 years are given below:
Particulars 2010-11 2009-10 2008-09Executives including Non-Unionised Supervisors 458 469 450
Non-Executives # 34 35 37Total Employees 492 504 487
# Detail break-up of Non-Executive employees is at Statement no. 25 of volume-I of PE Survey.

465Public Enterprises Survey 2010-2011: Vol-II
Projects and Development India Ltd.PDILBhawan,A-14,Sector-1,Noida- 201301
Balance Sheet (` in Lakhs)
Particulars 2010-11 2009-10 2008-09
Authorised Capital 6000 6000 6000
(1) Sources Of Fund
(1.1) Shareholders Funds
(A) Paid-Up Capital
Central Govt 1730 1730 1730
Others 0 0 0
(B) Share Application Money 0 0 0
(C) Reserves & Surplus 9190 7533 6759
Total (A) + (B) + (C) 10920 9263 8489
(1.2) Loan Funds
(A) Secured Loans 0 0 0
(B) Unsecured Loans 0 0 0
Total (A) + (B) 0 0 0
(1.3) Deferred Tax Liability 0 37 44
Total (1.1) + (1.2) + (1.3) 10920 9300 8533
(2) Application Of Funds
(2.1) Fixed Assets
(A) Gross Block 6125 5851 5334
(B) Less Depreciation 3985 3850 3720
(C) Net Block (A-B) 2140 2001 1614
(D) Capital Work In Progress 261 126 142
Total (C) + (D) 2401 2127 1756
(2.2) Investment 0 0 0
(2.3) Current Assets, Loan & Advances
(A) Inventories 472 242 288
(B) Sundry Debtors 1575 1834 1481
(C) Cash & Bank Balances 8645 6461 7044
(D) Other Current Assets 671 670 327
(E) Loan & Advances 1178 1985 1488
Total (A)+ (B)+ (C)+ (D)+ (E) 12541 11192 10628
(2.4) Less:current Liabilities & Provisions
(A) Current Liabilities 2538 1928 2472
(B) Provisions 1592 2091 1384
Total (A+B) 4130 4019 3856
(2.5) Net Current Assets (2.3-2.4) 8411 7173 6772
(2.6) Deferred Revenue / Pre. Expenditure 0 0 5
(2.7) Deferred Tax Asset 108 0 0
(2.8) Profit & Loss Account(Dr) 0 0 0
Total (2.1+2.2+2.5+2.6+2.7+2.8) 10920 9300 8533
Important Indicators 2010-11 2009-10 2008-09
(i) Investment 1730 1730 1730
(ii) Capital Employed 10551 9174 8386
(iii) Net Worth 10920 9263 8484
(iv) Cost of Production 8112 6181 5346
(v) Cost of Sales 7888 6219 5339
(vi) Gross Value Added (At Market Price) - - -
(vii) Total Employees (Other Than Casuals) (Nos.) 492 504 487
(viii) Avg. Monthly Emoluments Per Employee (Rs.) 80572 66601 56793
Profit & Loss Account (` in Lakhs)
Particulars 2010-11 2009-10 2008-09
(1) Income
(A) Sales/Operating Income 10385 7493 6103
(B) Excise Duty 121 19 42
(C) Net Sales (A-B) 10264 7474 6061
(D) Other Income/Receipts 857 879 1239
(E) Accretion/Depletion in Stocks 224 -38 7
(I)Total Income (C+D+E) 11345 8315 7307
(2) Expenditure
(A) Purchase of Finished Goods/ Consumption Of Raw Materials 872 52 174
(B) Stores & Spares 22 30 54
(C) Power & Fuel 370 222 220
(D) Manufacturing / Direct / Operating Expenses 0 835 626
(E) Salary, Wages & Benefits / Employee Exp. 4757 4028 3319
(F) Other Expenses 1873 752 705
(G) Provisions 0 20 0
(II)Total Expenditure (A to G) 7894 5939 5098
(3) Profit Before Dep, Int, Taxes & EP (PBDITEP) (I-II) 3451 2376 2209
(4) Depreciation 218 237 243
(5) Dre/Prel Exp Written Off 0 5 5
(6) Profit Before Int., Taxes & Ep (PBITEP) (3-4-5) 3233 2134 1961
(7) Interest
(A) On Central Government Loans 0 0 0
(B) On Foreign Loans 0 0 0
(C) Others 0 0 0
(D) Less Interest Capitalised 0 0 0
(E) Charged to P & L Account (A+B+C-D) 0 0 0
(8) Profit Before Tax & EP(PBTEP) (6-7E) 3233 2134 1961
(9) Tax Provisions 1076 673 393
(10) Net Profit / Loss Before EP (8-9) 2157 1461 1568
(11) Net Extra-Ord. Items 56 13 86
(12) Net Profit / Loss(-) (10-11) 2101 1448 1482
(13) Dividend Declared 381 381 346
(14) Dividend Tax 63 63 61
(15) Retained Profit (12-13-14) 1657 1004 1075
Financial Ratios 2010-11 2009-10 2008-09
(i) Sales : Capital Employed 97.28 81.47 72.28
(ii) Cost of Sales : Sales 76.85 83.21 88.09
(iii) Salary / Wages : Sales 46.35 53.89 54.76
(iv) Net Profit : Net Worth 19.24 15.63 17.47
(v) Debt : Equity 0 0 0
(vi) Current Ratio 3.04 2.78 2.76
(vii) Sundry Debtors : Sales (No. of Days) 56.01 89.57 89.19
(viii) Total Inventory : Sales 16.78 11.82 17.34
2010-11 PROVISIONAL

466 Contract & Construction Services
www.rvnl.org
Rail Vikas Nigam Ltd. (RVNL) was incorporated on 24.01.2003 under theNational RailVikasYojana as a SpecialPurposeVehicle (SPV) to implement the railway projectswiththeobjectiveofremovingthecapacitybottlenecksontheGoldenQuadrilateral and its diagonals, providing vital linkages and augmenting capacity of existing links including the corridors connecting ports with the hinterland.
RVNLisaSchedule-‘A’CPSEinContract&ConstructionServices sector under the administrative control of M/o Railways with 100% shareholding by the Government of India. Its Registered andCorporate offices are atNewDelhi.
Vision/MissionTheVisionof theCompany is toemergeasmostefficient
railinfrastructureproviderwithsoundfinancialbaseandglobalconstructionpractices for timely completionof projects.
The Mission of the Company is to creae state of art rail transport capacity to meet the growing demand.
Industrial / Business OperationsRVNLundertakesprojectdevelopmentandimplementation
and has been mandated to undertake resource mobilization directly or by creation of project specific SPVs. Projects areto be implemented on a commercial format, involving limited budgetary financial resources and focusing mainly on privatesector participation and market borrowings.
Presentlythecompanyisimplementing73projects,outofwhich36projectsrelatetostrengtheningofGoldenQardilateraland Diagonals and 29 projects relate to provision of Portconnectivity and corridors to hinterland, 4 projects of KolkataMetro Raiways and 4 projects pertaining to workshop etc. Ofthese73projects, 23projects havebeen fully completed.
Thetotallengthoftheseprojectsis8095km.outofwhich3741km.havebeencompleted.Forimplementingtheseprojects,theCompanyishaving12ProjectImplementingUnitsatBhopal,Bangalore, Bhubaneswar, Bilaspur, Chennai, Jaipur, Kolkata, Navi Mumbai, New Delhi Pune, Raipur and Secunderabad.
The company is having five Special Purpose Vehicles(SPVs)jointventuresnamelyKrishnapatnamRailwayCompanyLtd.,HaridaspurParadipRailwayCompanyLtd.,Bharuch-DahejRailway Company Ltd., Kutch railway Company Ltd. and Angul Sukinda Railway Company Ltd. with equity participation of 30%, 48.43%, 25%, 50% and 45% respectively.
Strategic IssuesThe revised packaging and phasing of the project for the
2ndAsian Development Bank (ADB) loan has been finalized.This is, however subject to change depending upon the loannegotiationandsizeofthefirsttranchefinalizedinconsultationwith ADB & D/o Economic Affairs (DEA).
Performance HighlightsThe operational performance of the company along with
performance indicators and selected financial ratios during theperiod2008-09 to 2010-11 canbe seenon theopposite page.
The Company showed a reduction of ` 287.07 crore in total income during 2010-11 which went down to ` 1484.14 crore in 2010-11 from ` 1771.21 crore during 2009-10 as thenumber of projects are near completion and the order book ofthecompanyhasbeendepleted.Thenetprofitof thecompanyhowever increased to ` 61.09 crore, an increase of ` 9.18 crore over the previous year profit of` 51.91 crore due to reduction in the direct operating expenses / fall in expenditure booking on theprojects.
18.13 Rail Vikas Nigam Ltd. Theprogressofsomeoftheprojectswasalsoaffecteddue
totheproblemsoflandacquisition.Fivemajorprojectswithanestimated cost of ` 5350 crore could not take off due to delay in the processing of 2nd ADB loan.
Human Resource ManagementThe company employed 273 regular employees as on
31.3.2011. The retirement age in the Company is 60 years. It is following IDA 2007 and CDA 2006 pattern of remuneration. Details of employment in last 3 years are given below:
Particulars 2010-11 2009-10 2008-09Executives including Non-Unionised Supervisors 245 219 209
Non-Executives # 28 26 20Total Employees 273 245 229
# Detail break-up of Non-Executive employees is at Statement no. 25 of volume-I of PE Survey.

467Public Enterprises Survey 2010-2011: Vol-II
Rail Vikas Nigam Ltd. 1stFloor,AugustKrantiBhawan,BhikajiCamaPlace,R.K.Puram,NewDelhi -110066
Balance Sheet (` in Lakhs)
Particulars 2010-11 2009-10 2008-09
Authorised Capital 300000 300000 300000
(1) Sources Of Fund
(1.1) Shareholders Funds
(A) Paid-Up Capital
Central Govt 208502 208502 208502
Others 0 0 0
(B) Share Application Money 0 0 0
(C) Reserves & Surplus 15328 10676 6656
Total (A) + (B) + (C) 223830 219178 215158
(1.2) Loan Funds
(A) Secured Loans 0 0 0
(B) Unsecured Loans 417170 522606 391000
Total (A) + (B) 417170 522606 391000
(1.3) Deferred Tax Liability 0 0 0
Total (1.1) + (1.2) + (1.3) 641000 741784 606158
(2) Application Of Funds
(2.1) Fixed Assets
(A) Gross Block 1483 1089 985
(B) Less Depreciation 1099 817 648
(C) Net Block (A-B) 384 272 337
(D) Capital Work In Progress 0 0 0
Total (C) + (D) 384 272 337
(2.2) Investment 47226 33327 29587
(2.3) Current Assets, Loan & Advances
(A) Inventories 598240 671597 0
(B) Sundry Debtors 7751 7954 4786
(C) Cash & Bank Balances 26818 61813 42688
(D) Other Current Assets 0 0 504614
(E) Loan & Advances 49483 42167 74942
Total (A)+ (B)+ (C)+ (D)+ (E) 682292 783531 627030
(2.4) Less:current Liabilities & Provisions
(A) Current Liabilities 85569 71864 46729
(B) Provisions 3333 3599 4218
Total (A+B) 88902 75463 50947
(2.5) Net Current Assets (2.3-2.4) 593390 708068 576083
(2.6) Deferred Revenue / Pre. Expenditure 0 0 51
(2.7) Deferred Tax Asset 0 117 100
(2.8) Profit & Loss Account(Dr) 0 0 0
Total (2.1+2.2+2.5+2.6+2.7+2.8) 641000 741784 606158
Important Indicators 2010-11 2009-10 2008-09
(i) Investment 625672 731108 599502
(ii) Capital Employed 593774 708340 576420
(iii) Net Worth 223830 219178 215107
(iv) Cost of Production 140869 170372 163033
(v) Cost of Sales 140869 170372 163033
(vi) Gross Value Added (At Market Price) - - -
(vii) Total Employees (Other Than Casuals) (Nos.) 273 245 229
(viii) Avg. Monthly Emoluments Per Employee (Rs.) 12057 13027 11718
Profit & Loss Account (` in Lakhs)
Particulars 2010-11 2009-10 2008-09
(1) Income
(A) Sales/Operating Income 144465 174908 165417
(B) Excise Duty 0 0 0
(C) Net Sales (A-B) 144465 174908 165417
(D) Other Income/Receipts 3949 2213 3344
(E) Accretion/Depletion in Stocks 0 0 0
(I)Total Income (C+D+E) 148414 177121 168761
(2) Expenditure
(A) Purchase of Finished Goods/ Consumption Of Raw Materials 0 0 0
(B) Stores & Spares 0 0 0
(C) Power & Fuel 0 17 13
(D) Manufacturing / Direct / Operating Expenses 139963 169465 162282
(E) Salary, Wages & Benefits / Employee Exp. 395 383 322
(F) Other Expenses 429 389 292
(G) Provisions 0 0 0
(II)Total Expenditure (A to G) 140787 170254 162909
(3) Profit Before Dep, Int, Taxes & EP (PBDITEP) (I-II) 7627 6867 5852
(4) Depreciation 82 67 73
(5) Dre/Prel Exp Written Off 0 51 51
(6) Profit Before Int., Taxes & Ep (PBITEP) (3-4-5) 7545 6749 5728
(7) Interest
(A) On Central Government Loans 0 0 0
(B) On Foreign Loans 0 0 0
(C) Others 0 0 0
(D) Less Interest Capitalised 0 0 0
(E) Charged to P & L Account (A+B+C-D) 0 0 0
(8) Profit Before Tax & EP(PBTEP) (6-7E) 7545 6749 5728
(9) Tax Provisions 1436 1558 1645
(10) Net Profit / Loss Before EP (8-9) 6109 5191 4083
(11) Net Extra-Ord. Items 0 0 0
(12) Net Profit / Loss(-) (10-11) 6109 5191 4083
(13) Dividend Declared 1250 1000 800
(14) Dividend Tax 208 170 136
(15) Retained Profit (12-13-14) 4651 4021 3147
Financial Ratios 2010-11 2009-10 2008-09
(i) Sales : Capital Employed 24.33 24.69 28.7
(ii) Cost of Sales : Sales 97.51 97.41 98.56
(iii) Salary / Wages : Sales 0.27 0.22 0.19
(iv) Net Profit : Net Worth 2.73 2.37 1.9
(v) Debt : Equity 1.86 2.38 1.82
(vi) Current Ratio 7.67 10.38 12.31
(vii) Sundry Debtors : Sales (No. of Days) 19.58 16.6 10.56
(viii) Total Inventory : Sales 1511.49 1401.5 0

469Public Enterprises Survey 2010-2011: Vol-II
As on 31.3.2011, there were 16 Central Public Sector Enterprises in the agro-based industries group. The name of these enterprises along with their year of incorporation in chronological order are given below :
Sl. No.
Enterprise Year of Incorporation
1. National Research Development Corpn. 1953
2. National Small Industries Corpn. Ltd. 1955
3. Engineers India Ltd. 1965
4. WAPCoS Ltd. 1969
5. Engineering Projects (India) Ltd. 1970
6. MECoN Ltd. 1973
7. RITES Ltd. 1974
8. Central Mine Planning & Design Institute Ltd.
1975
9. Telecommunications Consultants (India) Ltd.
1978
10. EdCIL (India) Ltd. 1981
11. HSCC (India) Ltd. 1983
12. Certification Engineers International Ltd. 1994
13. Broadcast Engg. Consultants India Ltd. 1995
14. National Informatics Centre Services Incorporated
1995
15. PfC Consulting Ltd. 2008
16. Power System operation Corporation Ltd. 2010
2. The enterprises falling in this group are mainly engaged in rendering engineering technical and educational consultancy services for construction of all types of projects, plants, installation, certification etc.
3. The consolidated financial position, the working results and the important management ratios of these enterprises are appended.
4. Turnover : The details of turnover of individual enterprises are given below :
(`in Crore)Sl. No.
Enterprise Turnover
2010-11 2009-10
1. Engineers India Ltd. 2652.63 1984.10
2. Engineering Projects (India) Ltd. 1103.68 1062.00
3. National Small Industries Corpn. Ltd. 850.96 596.28
4. Telecommunications Consultants (India) Ltd.
844.52 682.47
5. RITES Ltd. 750.50 602.36
6. MECoN Ltd. 641.38 604.78
7. Central Mine Planning & Design Institute Ltd.
473.29 453.53
8. WAPCoS Ltd. 351.18 302.14
9. National Informatics Centre Services Incorporated
155.30 95.30
10. Power System operation Corporation Ltd.
97.31 0.00
11. Broadcast Engg. Consultants India Ltd.
90.79 10.24
19 Industrial Development & Tech. Consultancy Services
12. EdCIL (India) Ltd. 67.22 65.46
13. PfC Consulting Ltd. 46.06 41.10
14. Certification Engineers International Ltd.
29.49 23.92
15. HSCC (India) Ltd. 23.12 21.42
16. National Research Development Corpn.
8.16 9.34
Sub Total 8185.59 6554.44
5. Net Profit/Loss : The details of the enterprises, which earned net profit or sustained net loss (-) are given below :
(`in Crore)Sl. No.
Enterprise Adjusted Net Profit/Net Loss
2010-11 2009-10
1. Engineers India Ltd. 522.52 435.58
2. RITES Ltd. 243.92 111.95
3. MECoN Ltd. 93.68 82.62
4. National Informatics Centre Services Incorporated
39.71 31.39
5. WAPCoS Ltd. 36.18 30.03
6. National Small Industries Corpn. Ltd. 29.78 24.27
7. PfC Consulting Ltd. 26.96 21.62
8. Central Mine Planning & Design Institute Ltd.
15.32 11.46
9. Engineering Projects (India) Ltd. 15.05 40.01
10. Telecommunications Consultants (India) Ltd.
13.58 14.46
11. Certification Engineers International Ltd.
10.22 8.93
12. Power System operation Corporation Ltd.
9.93 0.00
13. HSCC (India) Ltd. 8.34 8.60
14. Broadcast Engg. Consultants India Ltd.
5.29 1.52
15. EdCIL (India) Ltd. 2.49 4.02
16. National Research Development Corpn.
-1.04 0.12
Sub Total 1071.93 826.58

470 Industrial Development & Tech. Consultancy Services
6. Dividend : The details of the dividend declared by the individual enterprise are given below :
(`in Crore)Sl. No.
Enterprise Dividend
2010-11 2009-10
1. Engineers India Ltd. 168.47 595.25
2. RITES Ltd. 49.00 23.00
3. WAPCoS Ltd. 7.50 6.00
4. Engineering Projects (India) Ltd. 7.08 7.08
5. National Small Industries Corpn. Ltd. 5.96 4.85
6. Telecommunications Consultants (India) Ltd.
4.32 4.32
7. Certification Engineers International Ltd.
3.25 3.00
8. MECoN Ltd. 3.15 3.15
9. Power System operation Corporation Ltd.
3.06 0.00
10. HSCC (India) Ltd. 1.73 1.73
11. EdCIL (India) Ltd. 1.50 1.50
12. Broadcast Engg. Consultants India Ltd.
1.02 0.28
Group Total 256.04 650.16
7. Social Overheads and Township : The total number of persons employed and the expenditure incurred on social overheads and townships are given below :
(`in Crore)Sl. No.
Enterprise Township and Social Overheads
2010-11 2009-10
1. No. of employees (in number) 15090 14465
2. Social overheads : (Rupees in Crore)
(i) Educational, 12.19 10.15
(ii) Medical facilities 28.79 93623.50
(iii) others 24.97 23.61
3. Capital cost of township (Rupees in Crore)
77.60 74.35
4. No. of houses constructed (in number)
4608 4608
8. Company wise details in respect of Balance Sheet, Profit and Loss account, Important Indicators and Financial Ratios along with the write up of individual company are given in the pages below.
Industrial Development & Technical Consultancy

471Public Enterprises Survey 2010-2011: Vol-II
Industrial Development & Tech. Consultancy Services
Balance Sheet(` in Lakhs)
(` in Lakhs)
Particulars 2010-11 2009-10 2008-09
AUTHoRISED CAPITAL 198395 178395 158695
(1) SOURCES OF FUND
(1.1) SHAREHoLDERS fUNDS
(A) PAID-UP CAPITAL
CENTRAL GoVT 60388 51920 51920
oTHERS 8376 2554 2604
(B) SHARE APPLICATIoN MoNEY 0 0 0
(C) RESERVES & SURPLUS 351900 283934 287271
TOTAL (A) + (B) + (C) 420664 338408 341795
(1.2) LoAN fUNDS
(A) SECURED LoANS 88164 48867 26477
(B) UNSECURED LoANS 29956 18467 23557
TOTAL (A) + (B) 118120 67334 50034
(1.3) DEfERRED TAX LIABILITY 892 425 500
TOTAL (1.1) + (1.2) + (1.3) 539676 406167 392329
(2) APPLICATION OF FUNDS
(2.1) fIXED ASSETS
(A) GRoSS BLoCK 136195 91176 84934
(B) LESS DEPRECIATIoN 72535 45091 41290
(C) NET BLoCK (A-B) 63660 46085 43644
(D) CAPITAL WoRK IN PRoGRESS 7971 15050 8634
TOTAL (C) + (D) 71631 61135 52278
(2.2) INVESTMENT 81344 32215 35971
(2.3) CURRENT ASSETS,LoAN & ADVANCES
(A) INVENToRIES 387294 274907 261338
(B) SUNDRY DEBToRS 230537 194340 177818
(C) CASH & BANK BALANCES 697780 490794 457891
(D) oTHER CURRENT ASSETS 52503 61252 44192
(E) LoAN & ADVANCES 379513 275753 245350
TOTAL (A)+ (B)+ (C)+ (D)+ (E) 1747627 1297046 1186589
(2.4) LESS:CURRENT LIABILITIES & PRoVISIoNS
(A) CURRENT LIABILITIES 1266708 930208 830078
(B) PRoVISIoNS 135318 94151 95370
TOTAL (A+B) 1402026 1024359 925448
(2.5) NET CURRENT ASSETS(2.3-2.4) 345601 272687 261141
(2.6) DEfERRED REVENUE / PRE.EXPENDITURE 4505 1 246
(2.7) DEfERRED TAX ASSET 26358 27478 21495
(2.8) PRofIT & LoSS ACCoUNT(DR) 10237 12651 21198
TOTAL (2.1+2.2+2.5+2.6+2.7+2.8) 539676 406167 392329

472 Industrial Development & Tech. Consultancy Services
Industrial Development & Tech. Consultancy Services
Profit and Loss Account
(` in Lakhs)
Industrial Development & Technical Consultancy
(` in Lakhs)
Particulars 2010-11 2009-10 2008-09
(1) INCoME
(A) SALES/oPERATING 818559 655444 554349
(B) EXCISE DUTY 9638 4637 4515
(C) NET SALES (A-B) 808921 650807 549834
(D) oTHER INCoME/RECEIPTS 79669 65061 71518
(I)TOTAL INCOME (C+D+E) 909187 718174 623900
(2) EXPENDITURE
(A) PURCHASE of fINISHED GooDS CoNSUMPTIoN of RAW MATERIALS 215572 97107 88082
(B) SToRES & SPARES 6553 10074 15606
(C) PoWER & fUEL 2936 2123 1735
(D) MANUfACTURING / DIRECT / oPERATING EXPENSES 200518 220501 127013
(E)SALARY,WAGES & BENEfITS / EMPLoYEE EXP. 165338 146569 137720
(f)oTHER EXPENSES 134466 102347 139548
(G)PRoVISIoNS 7510 10379 13339
(II)TOTAL EXPENDITURE (A to G) 732893 589100 523043
(3) PRofIT BEfoRE DEP. INT. TAXES & EP(PBDITEP) (I-II) 176294 129074 100857
(4) DEPRECIATIoN 8576 4436 4085
(5) DRE/PREL EXP WRITTEN off 489 76 183
(6) PRofIT BEfoRE INT., TAXES & EP (PBITEP) (3-4-5) 167229 124562 96589
(7) INTEREST
(A) oN CENTRALGoVERNMENT LoANS 0 158 0
(B) oN foREIGN LoANS 522 629 665
(C) oTHERS 5272 2739 2405
(D) LESS INTEREST CAPITALISED 0 0 0
(E) CHARGED To P & L ACCoUNT (A+B+C-D) 5794 3526 3070
(8)PROFIT BEFORE TAX & EP(PBTEP) (6-7E) 161435 121036 93519
(9) TAX PRoVISIoNS 53555 37914 29043
(10) NET PRofIT / LoSS(-) BEfoRE EP (8-9) 107880 83122 64476
(11) NET EXTRA-oRD.ITEMS 687 464 904
(12) NET PROFIT / LOSS(-) (10-11) 107193 82658 63572
(13) DIVIDEND DECLARED 25604 65016 14942
(14) DIVIDEND TAX 4092 11015 2510
(15) RETAINED PROFIT (12-13-14) 77497 6627 46120

473Public Enterprises Survey 2010-2011: Vol-II
Industrial Development & Tech. Consultancy Services
Management Ratio
Particulars 2010-11 2009-10 2008-09
(A.) INDICATORS
(I) GENERAL(Rs. in Lakhs)
(i) INVESTMENT 87129 77835 81288
(ii) CAPITAL EMPLoYED 409261 318772 304785
(iii) NET WoRTH 405922 325756 320351
(iv) CoST of PRoDUCTIoN 747752 597138 530381
(v) CoST of SALES 727155 594832 527833
(vi) VALUE ADDED 604457 543809 446959
(vii) R AND D EXPENDITURE 1616 1205 843
(II) HUMAN RESOURCE
(viii) EMPLoYEES (oTHER THAN CASUAL)(Nos.) 15090 14465 15282
(ix) AVG.MoNTHLY EMoLUMENTS PER EMPLoYEE(Rs.) 91307 84439 75099
(B.) MANAGEMENT RATIO
(i) DEBT : EQUITY 0.28 0.2 0.15
(ii) CURRENT RATIo (CURRENT ASSET:CURRENT- LIABILITY 1.25 1.27 1.28
(iii) PBDITEP : TOTAL EMPLOYEMENT (Rs. in Lakhs) 11.68 8.92 6.6
(iv) SUNDRY DEBToRS : SALES (No. of days) 104.02 108.99 118.04
(v) INVENToRY(No. of days)
(a) ToTAL INVENToRY : SALES 174.75 154.18 173.49
(b) SEMI/fINISHED GooDS : SALES 173.79 152.99 172.06
(vi) INCREMENTAL CAPITAL oUTPUT RATIo(ICoR) 0.51 0.14 0.32
(%)
(vii) SALES : CAPITAL EMPLoYED 197.65 204.16 180.4
(viii) PBDITEP : CAPITAL EMPLoYED 43.08 40.49 33.09
(ix) PBITEP : CAPITAL EMPLoYED 40.86 39.08 31.69
(x) CoST of SALES : SALES 89.89 91.4 96
(xi) MATERIAL CoST : SALES 26.65 14.92 16.02
(xii) SALARY & WAGES : SALES 20.44 22.52 25.05
(xiii) R & D EXPENDITURE : SALES 0.2 0.19 0.15
(xiv) PBITEP : SALES 20.67 19.14 17.57
(xv) PBTEP : NET WoRTH 39.77 37.16 29.19
(xvi) NET PRofIT : NET WoRTH 26.41 25.37 19.84
(xvii) GRoSS MARGIN : GRoSS BLoCK 129.44 141.57 118.75
474 Industrial Development & Tech. Consultancy Services
www.becil.com
With the opening of broadcasting sector after the gulf war, Indian companies also felt the need to broadcast via satellite. These companies needed an expert agency to advise them in the field of broadcasting. Such expertise till then was, available only with AIR and Doordarshan. The Ministry of Information and Broadcasting therefore decided to incorporate one such agency for this purpose. Thus Broadcast Engineering Consultants India Limited (BECIL) was formed on 24th March 1995.
It is a Schedule-‘C’ Miniratna CPSE in financial Services sector under the administrative control of M/o Information and Broadcasting with 100% shareholding by the Government of India. Its Registered and Project offices are at NOIDA, U.P. and Head office at New Delhi.
Vision/MissionThe Vision of the Company is to enhance the present share
in the market by providing specialized and customized solutions to a wider range of clients.
The Mission of the Company is to play a pivotal role in growth of Radio and Television Broadcasting through Terrestrial, Cable and Satellite Transmission in India and abroad, and achieve excellence.
Industrial / Business OperationsBECIL is engaged in providing consultancy services in all
spheres of Broadcast Engineering. It is now a well established consultancy agency, system integrator and turnkey solution provider in all the spheres of Broadcast Engineering. It also undertakes operation and maintenance of various types of broadcast systems. Its client list includes Government, Semi Government, Overseas and Private organizations.
The Areas of Specialization includes FM Broadcasting; Establishment of TV Channels; Installation of Teleports; Design of Digital Newsroom Systems; Direct to Home (DTH) system; Cable Head-End systems; Distance Education Systems through Satellite; Community Radio Stations; Acoustics, Stage lighting, sound reinforcement system etc. The company has contributed to the expansion of fM Radio by creating Common Transmission Infrastructure for 248 Private fM Channels in 87 cities. The physical performance of the company for last three years are given below:Main Services Unit Performance During
2010-11 2009-10 2008-09
Sale including exports
` in Crore 61.93 2.91 -
Consultancy ` in Crore 6.03 7.32 10.12
Contract Income ` in Crore 2.25 2.39 1.30
Income from Renting Tower
` in Crore 3.27 0.33 0.30
Strategic IssuesThe management has been taking a number of initiatives to
diversify the business activities in other areas such as Technical Audit / Certification of Broadcast systems, establishment of electronic facilities for coverage of major sporting events, supply of electronic equipment to various defence organizations and security agencies etc. which have started showing results. Company has signed an agreement with SCTE, London for providing training to various Broadcast professional in Cable TV. At present there is official training institute for providing such training and SCTE, London is pioneered organization which
19.1 Broadcast Engineering Consultants India Limited
certify the training. Management has opened one regional office in Banaglore to cater the need of business in south and also geographically expand the business. Previously all business are executed through NCR. But with opening of regional office, company is able to get new business. further Management is planning to open few other regional centers across the county. The company has expanded its manpower deployment portfolio by adding AIR News Service, Electronic Media Monitoring Centre & TV Studios in Delhi College of Engg. and Indira Gandhi National Centre for Culture and Arts.
Given the sound financial health of the company with adequate resources and surpluses, the management has taken a number of fresh initiatives for expanding the business of the company. These initiatives include forging strategic alliances with a number of national and international companies, exploration of new business areas in domestic and foreign markets and recruitment in the core cadres as a part of implementation of Corporate Plan.
Recently Ministry of Information & Broadcasting has conveyed that on considering BECIL‘s organizational strength and capabilities the GoM on Prasar Bharati has recommended to utilize the services of BECIL on nomination basis under provision of Rule 176 of GfR for implementing Prasar Bharati Projects relating to acquisition, procurement, modernization and up-gradation, either on a turnkey or job work/ consultancy basis for a period of 3(three) years on a case to case basis.
Performance HighlightsThe operational performance of the company along with
performance indicators and selected financial ratios during the period 2008-09 to 2010-11 can be seen on the opposite page.
The Company registered an increase of ` 77.9 crore in total income during 2010-11 which went up to ` 93.51 crore in 2010-11 from ` 15.61 crore during 2009-10. The net profit of the company correspondingly increased to ` 5.29 crore, an increase of ` 3.77 crore over the previous year.
BECIL is a profit making PSE since its inception. The growth in turnover is due to execution of very high value projects in the year under consideration. The previous year main business was through Common Transmission Infrastructure (CTI) project received by the company for setting of fM facilities across the country but this project has constituted meager contribution in turnover as only residual work was done.
Human Resource ManagementThe company employed 47 regular employees as on
31.3.2011. The retirement age in the company is 60 years. It is following IDA 2007 pattern of remuneration. Details of employment in last 3 years are given below:
Particulars 2010-11 2009-10 2008-09Executives including Non-Unionised Supervisors 47 30 2
Non-Executives # 0 0 10Total Employees 47 30 12
# Detail break-up of Non-Executive employees is at Statement no. 25 of volume-I of PE Survey.
Broadcast Engineering Consultants India Limited

475Public Enterprises Survey 2010-2011: Vol-II
Broadcast Engineering Consultants India Limited56/17 A, Block-C, Sector-62, Noida, UP
Balance Sheet (` in Lakhs)
Particulars 2010-11 2009-10 2008-09
Authorised Capital 250 250 250
(1) Sources Of Fund
(1.1) Shareholders Funds
(A) Paid-Up Capital
Central Govt 137 137 137
Others 0 0 0
(B) Share Application Money 0 0 0
(C) Reserves & Surplus 2808 2397 2279
Total (A) + (B) + (C) 2945 2534 2416
(1.2) Loan Funds
(A) Secured Loans 1879 0 0
(B) Unsecured Loans 0 0 0
Total (A) + (B) 1879 0 0
(1.3) Deferred Tax Liability 0 0 0
Total (1.1) + (1.2) + (1.3) 4824 2534 2416
(2) Application Of Funds
(2.1) Fixed Assets
(A) Gross Block 488 455 417
(B) Less Depreciation 286 247 219
(C) Net Block (A-B) 202 208 198
(D) Capital Work In Progress 697 290 257
Total (C) + (D) 899 498 455
(2.2) Investment 0 0 0
(2.3) Current Assets, Loan & Advances
(A) Inventories 159 104 113
(B) Sundry Debtors 4316 1777 1956
(C) Cash & Bank Balances 4750 3877 4284
(D) Other Current Assets 50 51 89
(E) Loan & Advances 3119 1794 2023
Total (A)+ (B)+ (C)+ (D)+ (E) 12394 7603 8465
(2.4) Less:current Liabilities & Provisions
(A) Current Liabilities 8053 5434 6110
(B) Provisions 466 166 419
Total (A+B) 8519 5600 6529
(2.5) Net Current Assets (2.3-2.4) 3875 2003 1936
(2.6) Deferred Revenue / Pre. Expenditure
0 0 0
(2.7) Deferred Tax Asset 50 33 25
(2.8) Profit & Loss Account(Dr) 0 0 0
Total (2.1+2.2+2.5+2.6+2.7+2.8) 4824 2534 2416
Important Indicators 2010-11 2009-10 2008-09
(i) Investment 137 137 137
(ii) Capital Employed 4077 2211 2134
(iii) Net Worth 2945 2534 2416
(iv) Cost of Production 8523 1289 2486
(v) Cost of Sales 8450 1282 2432
(vi) Gross Value Added (At Market Price) - - -
(vii) Total Employees (Other Than Casuals) (Nos.) 47 30 12
(viii) Avg. Monthly Emoluments Per Employee (Rs.) 41844 50278 143750
Profit & Loss Account (` in Lakhs)
Particulars 2010-11 2009-10 2008-09
(1) Income
(A) Sales/Operating Income 9079 1024 1588
(B) Excise Duty 0 0 0
(C) Net Sales (A-B) 9079 1024 1588
(D) Other Income/Receipts 199 530 1620
(E) Accretion/Depletion in Stocks 73 7 54
(I)Total Income (C+D+E) 9351 1561 3262
(2) Expenditure
(A) Purchase of Finished Goods/ Consumption Of Raw Materials 5459 369 1518
(B) Stores & Spares 0 0 0
(C) Power & Fuel 3 0 5
(D) Manufacturing / Direct / Operating Expenses 54 285 80
(E) Salary, Wages & Benefits / Employee Exp. 236 181 207
(F) Other Expenses 2634 425 635
(G) Provisions 41 0 9
(II)Total Expenditure (A to G) 8427 1260 2454
(3) Profit Before Dep, Int, Taxes & EP (PBDITEP) (I-II) 924 301 808
(4) Depreciation 44 29 32
(5) Dre/Prel Exp Written Off 0 0 0
(6) Profit Before Int., Taxes & Ep (PBITEP) (3-4-5) 880 272 776
(7) Interest
(A) On Central Government Loans 0 0 0
(B) On Foreign Loans 0 0 0
(C) Others 52 0 0
(D) Less Interest Capitalised 0 0 0
(E) Charged to P & L Account (A+B+C-D) 52 0 0
(8) Profit Before Tax & EP(PBTEP) (6-7E) 828 272 776
(9) Tax Provisions 274 84 271
(10) Net Profit / Loss Before EP (8-9) 554 188 505
(11) Net Extra-Ord. Items 25 36 -3
(12) Net Profit / Loss(-) (10-11) 529 152 508
(13) Dividend Declared 102 28 100
(14) Dividend Tax 17 5 17
(15) Retained Profit (12-13-14) 410 119 391
Financial Ratios 2010-11 2009-10 2008-09
(i) Sales : Capital Employed 222.69 46.31 74.41
(ii) Cost of Sales : Sales 93.07 125.2 153.15
(iii) Salary / Wages : Sales 2.6 17.68 13.04
(iv) Net Profit : Net Worth 17.96 6 21.03
(v) Debt : Equity 0.64 0 0
(vi) Current Ratio 1.45 1.36 1.3
(vii) Sundry Debtors : Sales (No. of Days) 173.51 633.4 449.58
(viii) Total Inventory : Sales 6.39 37.07 25.97

476 Industrial Development & Tech. Consultancy Services
www.cmpdi.co.in
Central Mine Planning & Design Institute Ltd. (CMPDIL) was incorporated on 01.11.1975 under the Companies Act, 1956 with an objective to provide total consultancy in coal / mineral, exploration, mining, engineering and allied fields as a premier consultant in India as well in international level.
CMPDI is a Schedule -`B’ Miniratna CPSE in Industrial Dev. and Technical Consultancy services sector under the administrative control of Ministry of Coal with its Registered and Corporate office at Ranchi, Jharkhand. CMPDI is a 100% subsidiary of Coal India Ltd. (CIL).
Vision/MissionThe vision of CMPDIL is to be the global market leader
in an expanding earth resource sector and allied professional activities.
The Mission of CMPDIL is to provide total consultancy in coal and mineral exploration, mining, engineering and allied fields as the premier consultants in India and a leading one in the international arena.
Industrial / Business OperationsCMPDI is one of the subsidiary enterprises providing
consultancy and other allied services in the field of geological exploration, Project Planning & Design, Engineering Services in the field of designing system and sub-system for mines, beneficiation and utilisation plants, coal handling plants, power supply systems, workshops and other units, architectural planning & design etc.
CMPDI is operating through its headquarters at Ranchi and seven regional institutes located at Dhanbad and Ranchi (Jharkhand), Bilaspur (Chhattisgarh), Singrauli (Madhya Pradesh), Asansol (West Bengal), Nagpur (Maharastra) and Bhubaneswar (orissa) which render consultancy services to seven coal producing subsidiary companies of Coal India Ltd.(CIL). Consultancy services to non-CIL clients like SAIL-ISP, NTPC, Neyvelli Lignite Corporation Ltd., SCCL, MECL, Tata Steel, M/s. Essar Mineral Resources Ltd. (Mahan Coal Company), o/o Commissioner of Customs, Gujarat, UCM Coal Company Limited, JSPL, Adani Mining Pvt. Ltd., CEA, M/s Field Mining and Ispat Limited etc were also provided by CMPDI. CMPDI also handled specialised assignments of Ministry of Coal and CIL. The physical performances of the company for last three years are given below:
Main Services Unit Performance During2010-11 2009-10 2008-09
Drilling 000 Mtrs
491 470 272
Project Reports etc.
Nos. 383 includes 126- Form I
410 includes 137 Form I
441 includes 180 Form I
Performance HighlightsThe operational performance of the company along with
performance indicators and selected financial ratios during the period 2008-09 to 2010-11 can be seen on the opposite page.
19.2 Central Mine Planning & Design Institute Ltd.
The Company registered a decrease of ` 21.47 crore in total income during 2010-11 which went down to ` 435.82 crore in 2010-11 from ` 457.29 crore during 2009-10. The net profit of the company however increased to ` 15.32 crore, an increase of ` 3.86 crore over the previous year due to higher productivity.
Human Resource ManagementThe company employed 3102 regular employees as on
31.3.2011. The retirement age in the company is 60 years. It is following IDA 2007 pattern of remuneration. Details of employment in last 3 years are given below:
Particulars 2010-11 2009-10 2008-09Executives including Non-Unionised Supervisors
811 824 772
Non-Executives # 2291 2332 2293Total Employees 3102 3156 3065
# Detail break-up of Non-Executive employees is at Statement no. 25 of volume-I of PE Survey.
Technology Up-gradation, Research & Development
During the X Plan Period, a total of 56 projects have been completed by various agencies.

477Public Enterprises Survey 2010-2011: Vol-II
Central Mine Planning & Design Institute Ltd. CMPDI Ltd., Gondwana Place, Kanke Road, Ranchi, Jharkhand – 834 031
Balance Sheet (` in Lakhs)
Particulars 2010-11 2009-10 2008-09
Authorised Capital 5000 5000 5000
(1) Sources Of Fund
(1.1) Shareholders Funds
(A) Paid-Up Capital
Central Govt 0 0 0
Others 1904 1904 1904
(B) Share Application Money 0 0 0
(C) Reserves & Surplus 6851 5475 4845
Total (A) + (B) + (C) 8755 7379 6749
(1.2) Loan Funds
(A) Secured Loans 0 0 0
(B) Unsecured Loans 0 4 181
Total (A) + (B) 0 4 181
(1.3) Deferred Tax Liability 0 0 0
Total (1.1) + (1.2) + (1.3) 8755 7383 6930
(2) Application Of Funds
(2.1) Fixed Assets
(A) Gross Block 16643 15583 14229
(B) Less Depreciation 9398 8775 8311
(C) Net Block (A-B) 7245 6808 5918
(D) Capital Work In Progress 513 139 804
Total (C) + (D) 7758 6947 6722
(2.2) Investment 0 0 0
(2.3) Current Assets, Loan & Advances
(A) Inventories 677 629 399
(B) Sundry Debtors 19047 27587 24968
(C) Cash & Bank Balances 6104 6924 4714
(D) Other Current Assets 3857 5410 880
(E) Loan & Advances 11356 6913 5368
Total (A)+ (B)+ (C)+ (D)+ (E) 41041 47463 36329
(2.4) Less:current Liabilities & Provisions
(A) Current Liabilities 37122 45239 36465
(B) Provisions 8913 7239 4012
Total (A+B) 46035 52478 40477
(2.5) Net Current Assets (2.3-2.4) -4994 -5015 -4148
(2.6) Deferred Revenue / Pre. Expenditure 0 0 0
(2.7) Deferred Tax Asset 5991 5451 4356
(2.8) Profit & Loss Account(Dr) 0 0 0
Total (2.1+2.2+2.5+2.6+2.7+2.8) 8755 7383 6930
Important Indicators 2010-11 2009-10 2008-09
(i) Investment 1904 1904 1904
(ii) Capital Employed 2251 1793 1770
(iii) Net Worth 8755 7379 6749
(iv) Cost of Production 41482 43507 32597
(v) Cost of Sales 41482 43507 32597
(vi) Gross Value Added (At Market Price) - - -
(vii) Total Employees (Other Than Casuals) (Nos.) 3102 3156 3065
(viii) Avg. Monthly Emoluments Per Employee (Rs.) 72421 73608 68766
Profit & Loss Account (` in Lakhs)
Particulars 2010-11 2009-10 2008-09
(1) Income
(A) Sales/Operating Income 47329 45353 32982
(B) Excise Duty 4420 0 0
(C) Net Sales (A-B) 42909 45353 32982
(D) Other Income/Receipts 673 376 295
(E) Accretion/Depletion in Stocks 0 0 0
(I)Total Income (C+D+E) 43582 45729 33277
(2) Expenditure
(A) Purchase of Finished Goods/ Consumption Of Raw Materials 0 0 0
(B) Stores & Spares 1612 1237 1118
(C) Power & Fuel 207 230 191
(D) Manufacturing / Direct / Operating Expenses 1017 8954 2430
(E) Salary, Wages & Benefits / Employee Exp. 26958 27877 25292
(F) Other Expenses 11211 4624 3167
(G) Provisions 0 176 65
(II)Total Expenditure (A to G) 41005 43098 32263
(3) Profit Before Dep, Int, Taxes & EP (PBDITEP) (I-II) 2577 2631 1014
(4) Depreciation 474 383 285
(5) Dre/Prel Exp Written Off 0 0 0
(6) Profit Before Int., Taxes & Ep (PBITEP) (3-4-5) 2103 2248 729
(7) Interest
(A) On Central Government Loans 0 0 0
(B) On Foreign Loans 0 0 0
(C) Others 3 26 49
(D) Less Interest Capitalised 0 0 0
(E) Charged to P & L Account (A+B+C-D) 3 26 49
(8) Profit Before Tax & EP(PBTEP) (6-7E) 2100 2222 680
(9) Tax Provisions 837 815 190
(10) Net Profit / Loss Before EP (8-9) 1263 1407 490
(11) Net Extra-Ord. Items -269 261 6
(12) Net Profit / Loss(-) (10-11) 1532 1146 484
(13) Dividend Declared 0 0 0
(14) Dividend Tax 0 0 0
(15) Retained Profit (12-13-14) 1532 1146 484
Financial Ratios 2010-11 2009-10 2008-09
(i) Sales : Capital Employed 1906.22 2529.45 1863.39
(ii) Cost of Sales : Sales 96.67 95.93 98.83
(iii) Salary / Wages : Sales 62.83 61.47 76.68
(iv) Net Profit : Net Worth 17.5 15.53 7.17
(v) Debt : Equity 0 0 0.03
(vi) Current Ratio 0.89 0.9 0.9
(vii) Sundry Debtors : Sales (No. of Days) 162.02 222.02 276.31
(viii) Total Inventory : Sales 5.76 5.06 4.42

478 Industrial Development & Tech. Consultancy Services
www.certificationengineers.com
Certification Engineers International Ltd. (CEI) was set up ON 26.10.1994 with an objective to undertake activities related to certification, re-certification, safety audit and safety management systems for offshore and onshore oil and gas facilities and third party inspection of equipments and installations in the hydrocarbon and other quality sensitive sectors.
CEI is a Schedule ‘C’ CPSE under the administrative control of M/o Petroleum and Natural Gas. Its registered office is at New Delhi and Corporate office is at Navi Mumbai, Maharashtra. It is a 100% subsidiary of Engineers India Ltd. (EIL).
Vision / MissionThe Vision of the Company is to be a leader in the business
of ensuring quality, integrity and safety of customer’s assets.The Mission of the Company is to achieve international
standards of excellence in customer services, to cultivate high standards of ethics and quality for strong brand equity at competitive rates and to achieve high standards of safety and statutory compliance.
Industrial / Business OperationsCEIL is engaged in providing services in the field of
certification, re-certification, third party inspection (TPI), risk analysis, safety, energy and quality audits and vendor assessment. The physical performances of the company for last three years are given below:Main Product / Services
Unit Performance During2010-11 2009-10 2008-09
Certification and Third Party Inspection
` crore 29.49 23.92 24.75
Strategic issueThe company is continuously exploring the possibility of
securing Certification & TPI jobs from other sectors / contractors and enhancing its service portfolio to include areas concerning environment, plant operation & safety, specialized engineering analysis etc.
Performance HighlightsThe operational performance of the company along with
performance indicators and selected financial ratios during the period 2008-09 to 2010-11 can be seen on the opposite page.
The Company registered an increase of ` 5.95 crore in total income during 2010-11 which went up to ` 32.18 crore in 2010-11 from ` 26.23 crore during 2009-10. The net profit of the company correspondingly increased to ` 10.22 crore, an increase of ` 1.29 crore over the previous year on account of higher level of activity and favorable revenue mix.
The company has taken various measures to reduce average man-day cost substantially, through fresh recruitment and out sourcing, to effectively counter the pressure of reduced average realizations, and higher manpower cost due to pay revision.
19.3 Certification Engineers International Ltd.Human Resource Management
The company employed 70 regular employees as on 31.3.2011. The retirement age in the company is 60 years. It is following IDA 2007 pattern of remuneration. Details of employment in last 3 years are given below:
Particulars 2010-11 2009-10 2008-09Executives including Non-Unionised Supervisors
63 50 56
Non-Executives # 7 0 0Total Employees 70 50 56
# Detail break-up of Non-Executive employees is at Statement no. 25 of volume-I of PE Survey.
The Strength of organisation lies in highly qualified, experienced and quality conscious human resources. The team of quality Surveyors has been drawn from reputed industries of oil and Gas, Refinery & Petrochemicals, Sub-sea & Cross Country Pipeline, Chemical & Process, Equipment Manufacturing, Power Plant and other manufacturing fields besides EIL’s Inspection Dept.

479Public Enterprises Survey 2010-2011: Vol-II
Certification Engineers International Ltd. E.I. Annexe (4th Floor), 1, Bhikaiji Cama Place , R.K. Puram, New Delhi-110066
Balance Sheet (` in Lakhs)
Particulars 2010-11 2009-10 2008-09
Authorised Capital 200 200 200
(1) Sources Of Fund
(1.1) Shareholders Funds
(A) Paid-Up Capital
Central Govt 0 0 0
Others 100 100 100
(B) Share Application Money 0 0 0
(C) Reserves & Surplus 4459 3815 3272
Total (A) + (B) + (C) 4559 3915 3372
(1.2) Loan Funds
(A) Secured Loans 0 0 0
(B) Unsecured Loans 0 0 0
Total (A) + (B) 0 0 0
(1.3) Deferred Tax Liability 0 0 0
Total (1.1) + (1.2) + (1.3) 4559 3915 3372
(2) Application Of Funds
(2.1) Fixed Assets
(A) Gross Block 376 369 369
(B) Less Depreciation 79 62 48
(C) Net Block (A-B) 297 307 321
(D) Capital Work In Progress 0 0 0
Total (C) + (D) 297 307 321
(2.2) Investment 79 0 0
(2.3) Current Assets, Loan & Advances
(A) Inventories 1 1 2
(B) Sundry Debtors 1194 977 916
(C) Cash & Bank Balances 3303 2899 2566
(D) Other Current Assets 280 277 163
(E) Loan & Advances 140 105 102
Total (A)+ (B)+ (C)+ (D)+ (E) 4918 4259 3749
(2.4) Less:current Liabilities & Provisions
(A) Current Liabilities 381 380 384
(B) Provisions 402 310 332
Total (A+B) 783 690 716
(2.5) Net Current Assets (2.3-2.4) 4135 3569 3033
(2.6) Deferred Revenue / Pre. Expenditure 0 0 0
(2.7) Deferred Tax Asset 48 39 18
(2.8) Profit & Loss Account(Dr) 0 0 0
Total (2.1+2.2+2.5+2.6+2.7+2.8) 4559 3915 3372
Important Indicators 2010-11 2009-10 2008-09
(i) Investment 100 100 100
(ii) Capital Employed 4432 3876 3354
(iii) Net Worth 4559 3915 3372
(iv) Cost of Production 1680 1260 1212
(v) Cost of Sales 1680 1261 1214
(vi) Gross Value Added (At Market Price) - - -
(vii) Total Employees (Other Than Casuals) (Nos.) 70 50 56
(viii) Avg. Monthly Emoluments Per Employee (Rs.) 59524 62500 48363
Profit & Loss Account (` in Lakhs)
Particulars 2010-11 2009-10 2008-09
(1) Income
(A) Sales/Operating Income 2949 2392 2475
(B) Excise Duty 0 0 0
(C) Net Sales (A-B) 2949 2392 2475
(D) Other Income/Receipts 269 232 262
(E) Accretion/Depletion in Stocks 0 -1 -2
(I)Total Income (C+D+E) 3218 2623 2735
(2) Expenditure
(A) Purchase of Finished Goods/ Consumption Of Raw Materials 0 0 0
(B) Stores & Spares 0 0 0
(C) Power & Fuel 11 11 9
(D) Manufacturing / Direct / Operating Expenses 18 19 15
(E) Salary, Wages & Benefits / Employee Exp. 500 375 325
(F) Other Expenses 1108 841 849
(G) Provisions 26 0 0
(II)Total Expenditure (A to G) 1663 1246 1198
(3) Profit Before Dep, Int, Taxes & EP (PBDITEP) (I-II) 1555 1377 1537
(4) Depreciation 17 14 14
(5) Dre/Prel Exp Written Off 0 0 0
(6) Profit Before Int., Taxes & Ep (PBITEP) (3-4-5) 1538 1363 1523
(7) Interest
(A) On Central Government Loans 0 0 0
(B) On Foreign Loans 0 0 0
(C) Others 0 0 0
(D) Less Interest Capitalised 0 0 0
(E) Charged to P & L Account (A+B+C-D) 0 0 0
(8) Profit Before Tax & EP(PBTEP) (6-7E) 1538 1363 1523
(9) Tax Provisions 509 472 547
(10) Net Profit / Loss Before EP (8-9) 1029 891 976
(11) Net Extra-Ord. Items 7 -2 9
(12) Net Profit / Loss(-) (10-11) 1022 893 967
(13) Dividend Declared 325 300 300
(14) Dividend Tax 53 50 51
(15) Retained Profit (12-13-14) 644 543 616
Financial Ratios 2010-11 2009-10 2008-09
(i) Sales : Capital Employed 66.54 61.71 73.79
(ii) Cost of Sales : Sales 56.97 52.72 49.05
(iii) Salary / Wages : Sales 16.95 15.68 13.13
(iv) Net Profit : Net Worth 22.42 22.81 28.68
(v) Debt : Equity 0 0 0
(vi) Current Ratio 6.28 6.17 5.24
(vii) Sundry Debtors : Sales (No. of Days) 147.78 149.08 135.09
(viii) Total Inventory : Sales 0.12 0.15 0.29

480 Industrial Development & Tech. Consultancy Services
www.edcilindia.co.in
EdCIL (India) Limited (EdCIL) was incorporated in 1981 with the objective of providing educational consultancy services, nationally and internationally, in system design, resource development, research and evaluation studies and management development, to enable educational systems to achieve excellence and to promote Indian education abroad as the single window nodal service provider.
EdCIL is a Schedule-‘C’ Miniratna CPSE in Industrial Development & Tech. Consultancy Services sector under the administrative control of Ministry of Human Resources & Development, D/o Higher Education with 100% shareholding by the Government of India. Its registered office is at New Delhi and Corporate Office is at NOIDA, UP.
Vision/MissionThe vision of the company is to promote Indian education
abroad as the single window nodal service provider.The mission of the company is to provide world-class
educational consultancy.
Industrial / Business OperationsEd.CIL is engaged in promotion of Indian education abroad
by placement of International students in India institutions and secondment of Indian teachers / experts abroad, conducting education fairs, seminars cum counseling sessions, improving liaison with Indian Missions abroad etc.; and providing educational consultancy services including technical assistance, supply of educational aids, testing, institutional development etc.
The service range of the company comprises of three main segments viz Human Resource Development, Institutional Development and Technical Assistance. The performance of Company for last three years is given below:Main Services Unit Performance During
2010-11 2009-10 2008-09Technical Assistance
` in Crore
32.97 23.01 18.48
Income from HRD ` in Crore
32.87 36.57 30,20
Institutional Development
` in Crore
1.39 5.88 5.14
Strategic IssuesEfforts such as introduction of profit center scheme w.e.f.
1.4.2005, establishment of Research & Planning unit to explore opportunities for diversification and establishment of an office either in South Africa or in ASEAN/Middle East region to promote Brand India in education sector were made / being made to improve competitiveness and cost control.
Performance HighlightsThe operational performance of the company along with
performance indicators and selected financial ratios during the period 2008-09 to 2010-11 can be seen on the opposite page.
The Company registered an increase of ` 0.79 crore in total income during 2010-11 which went up to ` 69.68 crore in 2010-11 from ` 68.89 crore during 2009-10. The net profit of the company however reduced to ` 2.49 crore as compared to
19.4 EdCIL (India) Limited` 4.02 crore during the previous year due to marginal increase in turnover.
Major contribution in revenue generation was made by placement of human resources and providing technical assistance.
Human Resource ManagementThe company employed 85 regular employees as on
31.3.2011. The retirement age in the company is 60 years. It is following IDA 2007 pattern of remuneration. Details of employment in last 3 years are given below:
Particulars 2010-11 2009-10 2008-09Executives including Non-Unionised Supervisors 53 49 50
Non-Executives # 32 32 32Total Employees 85 81 82
# Detail break-up of Non-Executive employees is at Statement no. 25 of volume-I of PE Survey.

481Public Enterprises Survey 2010-2011: Vol-II
EdCIL (India) Limited10-b, I.P Estate, New Delhi-110002
Balance Sheet (` in Lakhs)
Particulars 2010-11 2009-10 2008-09
Authorised Capital 200 200 200
(1) Sources Of Fund
(1.1) Shareholders Funds
(A) Paid-Up Capital
Central Govt 150 150 150
Others 0 0 0
(B) Share Application Money 0 0 0
(C) Reserves & Surplus 1874 1808 1581
Total (A) + (B) + (C) 2024 1958 1731
(1.2) Loan Funds
(A) Secured Loans 0 0 0
(B) Unsecured Loans 0 0 0
Total (A) + (B) 0 0 0
(1.3) Deferred Tax Liability 0 0 0
Total (1.1) + (1.2) + (1.3) 2024 1958 1731
(2) Application Of Funds
(2.1) Fixed Assets
(A) Gross Block 962 961 935
(B) Less Depreciation 425 404 376
(C) Net Block (A-B) 537 557 559
(D) Capital Work In Progress 0 0 0
Total (C) + (D) 537 557 559
(2.2) Investment 0 0 0
(2.3) Current Assets, Loan & Advances
(A) Inventories 204 216 99
(B) Sundry Debtors 965 1137 1038
(C) Cash & Bank Balances 3617 4007 3651
(D) Other Current Assets 0 0 0
(E) Loan & Advances 1792 1321 1274
Total (A)+ (B)+ (C)+ (D)+ (E) 6578 6681 6062
(2.4) Less:current Liabilities & Provisions
(A) Current Liabilities 3830 4133 3965
(B) Provisions 1336 1191 997
Total (A+B) 5166 5324 4962
(2.5) Net Current Assets (2.3-2.4) 1412 1357 1100
(2.6) Deferred Revenue / Pre. Expenditure 0 0 0
(2.7) Deferred Tax Asset 75 44 72
(2.8) Profit & Loss Account(Dr) 0 0 0
Total (2.1+2.2+2.5+2.6+2.7+2.8) 2024 1958 1731
Important Indicators 2010-11 2009-10 2008-09
(i) Investment 150 150 150
(ii) Capital Employed 1949 1914 1659
(iii) Net Worth 2024 1958 1731
(iv) Cost of Production 6642 6223 5352
(v) Cost of Sales 6642 6223 5352
(vi) Gross Value Added (At Market Price) - - -
(vii) Total Employees (Other Than Casuals) (Nos.) 85 81 82
(viii) Avg. Monthly Emoluments Per Employee (Rs.) 83235 81584 69614
Profit & Loss Account (` in Lakhs)
Particulars 2010-11 2009-10 2008-09
(1) Income
(A) Sales/Operating Income 6722 6546 5383
(B) Excise Duty 0 0 0
(C) Net Sales (A-B) 6722 6546 5383
(D) Other Income/Receipts 246 343 491
(E) Accretion/Depletion in Stocks 0 0 0
(I)Total Income (C+D+E) 6968 6889 5874
(2) Expenditure
(A) Purchase of Finished Goods/ Consumption Of Raw Materials 0 0 0
(B) Stores & Spares 0 0 0
(C) Power & Fuel 17 24 29
(D) Manufacturing / Direct / Operating Expenses 2780 5260 4460
(E) Salary, Wages & Benefits / Employee Exp. 849 793 685
(F) Other Expenses 2943 111 149
(G) Provisions 0 1 0
(II)Total Expenditure (A to G) 6589 6189 5323
(3) Profit Before Dep, Int, Taxes & EP (PBDITEP) (I-II) 379 700 551
(4) Depreciation 53 32 29
(5) Dre/Prel Exp Written Off 0 2 0
(6) Profit Before Int., Taxes & Ep (PBITEP) (3-4-5) 326 666 522
(7) Interest
(A) On Central Government Loans 0 0 0
(B) On Foreign Loans 0 0 0
(C) Others 0 0 0
(D) Less Interest Capitalised 0 0 0
(E) Charged to P & L Account (A+B+C-D) 0 0 0
(8) Profit Before Tax & EP(PBTEP) (6-7E) 326 666 522
(9) Tax Provisions 136 271 193
(10) Net Profit / Loss Before EP (8-9) 190 395 329
(11) Net Extra-Ord. Items -59 -7 13
(12) Net Profit / Loss(-) (10-11) 249 402 316
(13) Dividend Declared 150 150 128
(14) Dividend Tax 25 25 22
(15) Retained Profit (12-13-14) 74 227 166
Financial Ratios 2010-11 2009-10 2008-09
(i) Sales : Capital Employed 344.89 342.01 324.47
(ii) Cost of Sales : Sales 98.81 95.07 99.42
(iii) Salary / Wages : Sales 12.63 12.11 12.73
(iv) Net Profit : Net Worth 12.3 20.53 18.26
(v) Debt : Equity 0 0 0
(vi) Current Ratio 1.27 1.25 1.22
(vii) Sundry Debtors : Sales (No. of Days) 52.4 63.4 70.38
(viii) Total Inventory : Sales 11.08 12.04 6.71

482 Industrial Development & Tech. Consultancy Services
www.epi.gov.in
Engineering Projects (India) Limited (EPI) was incorporated on 16.04.1970 with the main objective to undertake turnkey projects and consultancy services in India and abroad. EPI is the first Indian Company to undertake large civil and industrial projects abroad.
EPI is a Schedule-‘B’ Mini Ratna, CPSE in Industrial Development and Technical Consultancy Services Sector under the administrative control of the Ministry of Heavy Industries & Public Enterprises with 99.97% shareholding by the Government of India.
It has its Registered Office and Corporate Office at New Delhi and Regional/ Zonal Offices at different geographical locations viz. New Delhi, Mumbai, Kolkata, Chennai, Guwahati, Hyderabad and Bangalore to undertake operations across India. EPI has pan-India presence with projects sites spread all over the country.
Vision/MissionThe vision / Mission of the Company is to be the leading
turnkey project execution company committed to quality and timely completion of projects continuously enhancing stakeholder value.
Industrial / Business OperationsEPI is engaged in the field of execution of large and multi-
disciplinary industrial & construction projects on turkey basis and Project Management Consultancy services in the areas like Civil and Structural Work, Metallurgical Sector, Water Supply and Environmental Engineering, Defence, Housing, Townships, Hospitals & Institutional Buildings, Coal & Material Handling Systems, Industrial & Process Plants, oil and Petrochemicals, Transmission Lines/Sub Stations, Irrigation, Dams & Canal Works , Roads & Highways , Shore Protection Works, Airports, Sports Stadia, Mining projects etc.
EPI provides integrated services from concept to commissioning of projects which include the specialized activities such as feasibility Studies & Detailed Project Reports, Design and Engineering, Supply of Plant & Equipment. Quality Assurance, Construction & Erection, Trial run and Commissioning, operation and Maintenance and overall Project Management in almost all areas of engineering, consultancy and construction. The physical performances of the company for last three years are given below:Main Product Unit Performance During
2010-11 2009-10 2008-09
Turnkey projects execution & project management consultancy
` cr 1104 1062 959
Strategic IssuesThe company is operating in a highly competitive
environment and there is pressure on margin and profitability. The company has, therefore, adopted the strategy of taking up high value projects, diversification into high margin areas and explores overseas market. It has decided to concentrate on high technology areas with potential of high profits. The company is focusing on re-entering overseas market, multi-modal transportation system like metro rail and monorail projects. With this in view, EPI has signed four nos. of MoUs for executing monorail projects and taking up the infrastructure development projects in India, Srilanka, Bangaldesh, Maldives, and African countries.
19.5 Engineering Projects (India) Ltd.Performance Highlights
The operational performance of the company along with performance indicators and selected financial ratios during the period 2008-09 to 2010-11 can be seen on the opposite page.
The Company registered an increase of ` 42.12 crore in total income during 2010-11 which went up to ` 1128.59 crore in 2010-11 from ` 1086.47 crore during 2009-10. The net profit of the company however reduced to ` 15.05 crores in 2010-11 a reduction of ` 24.96 crore, as compared with a profit of ` 40.01 crores in 2009-10. This decrease in the profit is due to the increase in the operating expenses along with other expenses like increase in limit of gratuity payment, contribution to Pf trust, payment of pay arrears over and above the provision made.
The company secured 13 projects amounting to ` 1411.47 crores during the year. As on 31st March, 2011, the company had 88 projects valued at ` 7567.79 crores in hand and balance work on these projects was worth ` 4157 crores.
EPI consolidated its operations by reducing number of small value projects, to optimize utilization of its resources and concentrated its efforts on securing large value projects. As a result, average projects size of EPI has gone up from ` 73.00 crores in March, 2010 to ` 86.00 crores in March,2011. This has borne fruits and resulted in reduction in cost and increase in margins. Accordingly the per employee productivity of the company increased to ` 2.54 crore during the year which is stated as one of the best in the Indian Engineering & Construction Industry.
Human Resource ManagementThe company employed 434 regular employees as on
31.3.2011. The retirement age in the company is 60 years. It is following IDA 2007 & CDA 2006 pattern of remuneration. Details of employment in last 3 years are given below:
Particulars 2010-11 2009-10 2008-09Executives including Non-Unionised Supervisors 415 393 430
Non-Executives # 19 38 39Total Employees 434 431 469
# Detail break-up of Non-Executive employees is at Statement no. 25 of volume-I of PE Survey.
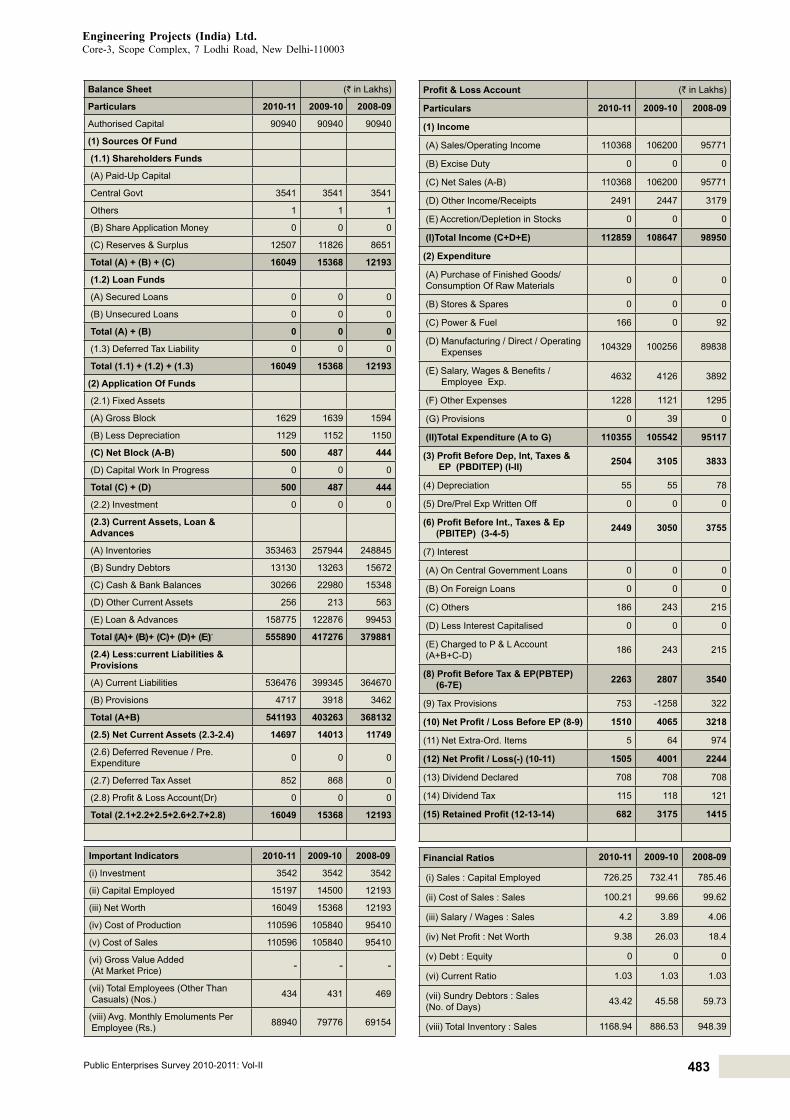
483Public Enterprises Survey 2010-2011: Vol-II
Engineering Projects (India) Ltd.Core-3, Scope Complex, 7 Lodhi Road, New Delhi-110003
Balance Sheet (` in Lakhs)
Particulars 2010-11 2009-10 2008-09
Authorised Capital 90940 90940 90940
(1) Sources Of Fund
(1.1) Shareholders Funds
(A) Paid-Up Capital
Central Govt 3541 3541 3541
Others 1 1 1
(B) Share Application Money 0 0 0
(C) Reserves & Surplus 12507 11826 8651
Total (A) + (B) + (C) 16049 15368 12193
(1.2) Loan Funds
(A) Secured Loans 0 0 0
(B) Unsecured Loans 0 0 0
Total (A) + (B) 0 0 0
(1.3) Deferred Tax Liability 0 0 0
Total (1.1) + (1.2) + (1.3) 16049 15368 12193
(2) Application Of Funds
(2.1) Fixed Assets
(A) Gross Block 1629 1639 1594
(B) Less Depreciation 1129 1152 1150
(C) Net Block (A-B) 500 487 444
(D) Capital Work In Progress 0 0 0
Total (C) + (D) 500 487 444
(2.2) Investment 0 0 0
(2.3) Current Assets, Loan & Advances
(A) Inventories 353463 257944 248845
(B) Sundry Debtors 13130 13263 15672
(C) Cash & Bank Balances 30266 22980 15348
(D) Other Current Assets 256 213 563
(E) Loan & Advances 158775 122876 99453
Total (A)+ (B)+ (C)+ (D)+ (E) 555890 417276 379881
(2.4) Less:current Liabilities & Provisions
(A) Current Liabilities 536476 399345 364670
(B) Provisions 4717 3918 3462
Total (A+B) 541193 403263 368132
(2.5) Net Current Assets (2.3-2.4) 14697 14013 11749
(2.6) Deferred Revenue / Pre. Expenditure 0 0 0
(2.7) Deferred Tax Asset 852 868 0
(2.8) Profit & Loss Account(Dr) 0 0 0
Total (2.1+2.2+2.5+2.6+2.7+2.8) 16049 15368 12193
Important Indicators 2010-11 2009-10 2008-09
(i) Investment 3542 3542 3542
(ii) Capital Employed 15197 14500 12193
(iii) Net Worth 16049 15368 12193
(iv) Cost of Production 110596 105840 95410
(v) Cost of Sales 110596 105840 95410
(vi) Gross Value Added (At Market Price) - - -
(vii) Total Employees (Other Than Casuals) (Nos.) 434 431 469
(viii) Avg. Monthly Emoluments Per Employee (Rs.) 88940 79776 69154
Profit & Loss Account (` in Lakhs)
Particulars 2010-11 2009-10 2008-09
(1) Income
(A) Sales/Operating Income 110368 106200 95771
(B) Excise Duty 0 0 0
(C) Net Sales (A-B) 110368 106200 95771
(D) Other Income/Receipts 2491 2447 3179
(E) Accretion/Depletion in Stocks 0 0 0
(I)Total Income (C+D+E) 112859 108647 98950
(2) Expenditure
(A) Purchase of Finished Goods/ Consumption Of Raw Materials 0 0 0
(B) Stores & Spares 0 0 0
(C) Power & Fuel 166 0 92
(D) Manufacturing / Direct / Operating Expenses 104329 100256 89838
(E) Salary, Wages & Benefits / Employee Exp. 4632 4126 3892
(F) Other Expenses 1228 1121 1295
(G) Provisions 0 39 0
(II)Total Expenditure (A to G) 110355 105542 95117
(3) Profit Before Dep, Int, Taxes & EP (PBDITEP) (I-II) 2504 3105 3833
(4) Depreciation 55 55 78
(5) Dre/Prel Exp Written Off 0 0 0
(6) Profit Before Int., Taxes & Ep (PBITEP) (3-4-5) 2449 3050 3755
(7) Interest
(A) On Central Government Loans 0 0 0
(B) On Foreign Loans 0 0 0
(C) Others 186 243 215
(D) Less Interest Capitalised 0 0 0
(E) Charged to P & L Account (A+B+C-D) 186 243 215
(8) Profit Before Tax & EP(PBTEP) (6-7E) 2263 2807 3540
(9) Tax Provisions 753 -1258 322
(10) Net Profit / Loss Before EP (8-9) 1510 4065 3218
(11) Net Extra-Ord. Items 5 64 974
(12) Net Profit / Loss(-) (10-11) 1505 4001 2244
(13) Dividend Declared 708 708 708
(14) Dividend Tax 115 118 121
(15) Retained Profit (12-13-14) 682 3175 1415
Financial Ratios 2010-11 2009-10 2008-09
(i) Sales : Capital Employed 726.25 732.41 785.46
(ii) Cost of Sales : Sales 100.21 99.66 99.62
(iii) Salary / Wages : Sales 4.2 3.89 4.06
(iv) Net Profit : Net Worth 9.38 26.03 18.4
(v) Debt : Equity 0 0 0
(vi) Current Ratio 1.03 1.03 1.03
(vii) Sundry Debtors : Sales (No. of Days) 43.42 45.58 59.73
(viii) Total Inventory : Sales 1168.94 886.53 948.39

484 Industrial Development & Tech. Consultancy Services
www.engineersindia.com
Engineers India Ltd. (EIL) was incorporated on 15.03.1965 with the objective to provide design, engineering and related project management and consultancy services for the hydrocarbon sector and the process plants industry in the country.
EIL is a listed Schedule ‘A’ / Mini Ratna CPSE in the Industrial Development and Technical Consultancy sector under the administrative control of Ministry of Petroleum & Natural Gas. In July 2010, 10% of the paid-up equity of the company was disinvested through a Public offering (fPo) which reduced the share holding of the Government to 80.40% from 90.40%. The Registered and Corporate Office of EIL is at New Delhi.
Vision/MissionThe Vision of the Company is to be a world class globally
competitive EPC and total solutions Consultancy organisation.The Mission of the Company is to Achieve “Customer
Delight” through innovative, cost effective and value added consulting & EPC services and Maximize creation of wealth, value and satisfaction for stakeholders with high standards of business ethics aligned with national policies.
Industrial / Business OperationsEIL is engaged in providing engineering consultancy and
EPC services for projects, both in India and abroad through its Head Office in New Delhi, regional offices in Chennai, Kolkata and Vadodara and a branch office in Mumbai. It has inspection offices at all major equipment manufacturing locations in India and a wholly owned subsidiary, Certification Engineers International Ltd for undertaking independent certification and third party inspection assignments.
Overseas, EIL has an engineering office in Abu Dhabi which is the hub for its activities in the Middle East, a marketing office in Shanghai, inspection offices in London and Italy and a wholly owned subsidiary, EIL Asia Pacific Sdn. Bhd. in Malaysia. Besides, EIL has setup two joint venture companies, one with M/s. Tata Projects Limited for pursuing projects on EPC basis in selected sectors such as oil & gas, fertilizer, steel railways, power and infrastructures and the other with M/s. IOT Infrastructure and Energy Services Limited and M/s Jabal Dhahran Company Limited for providing projects engineering and consultancy services in Saudi Arabia.
The services provided by the company comprise project conceptualizing, designing, engineering, procurement, project management, construction management, pre-commissioning and commissioning assistance in the hydro-carbon, mining and metallurgy, and infrastructure sectors. The physical performance of the company for last three years are given below:Main Product / Services
Unit Performance During2010-11 2009-10 2008-09
Consultancy & Engineering
` Crores 1127.94 1055.33 824.55
Lump sum Turnkey Projects (LSTK)
` Crores 1695.34 938.47 707.91
Strategic IssuesThe Company has identified enhancing hydrocarbon sector
geographic footprint, entry into non-oil energy sector along with gas-based fertilizer, urban infrastructure, water and waste management as key drivers for future growth. The geographic markets being targeted include Brazil and Venezuela in Latin America, Ghana and Sudan in Africa and oman and Saudi Arabia in the Middle East. The segments of the non-oil energy sector identified for diversification include nuclear power, solar
19.6 Engineers India Limitedpower, wind power and city gas distribution.
Performance HighlightsThe operational performance of the company along with
performance indicators and selected financial ratios during the period 2008-09 to 2010-11 can be seen on the opposite page.
The Company registered an increase of ` 806.18 crore in total income during 2010-11 which went up to ` 2983.65 crore in 2010-11 from ` 2177.47 crore during 2009-10. The income from consultancy business increased by 7%, where as Lumpsum Turnkey Project income increased by 81% and income from services increased by 42%. The net profit of the company correspondingly increased to ` 522.52 crore, an increase of `
86.94 crore over the previous year due to enhanced operational efficiency and cost control. The company declared a dividend of 100% as compared to 60% in the previous financial year which excluded the special dividend of 1000%.
Human Resource ManagementThe company employed 3417 regular employees as on
31.3.2011. The retirement age in the company is 60 years. It is following IDA 2007 and CDA 2006 pattern of remuneration. Details of employment in last 3 years are given below:
Particulars 2010-11 2009-10 2008-09Executives including Non-Unionised Supervisors 3062 2921 2710
Non-Executives # 355 380 392Total Employees 3417 3301 3102
# Detail break-up of Non-Executive employees is at Statement no. 25 of volume-I of PE Survey.
Technology Up-gradation, Research & Development
The Company pursued its R&D initiatives towards consolidation and commercial application of existing technologies, development of new technologies and hardware for enhancement of its technology portfolio for project execution and related services. The developmental activities were pursued both in-house and in-collaboration with other R&D institutes/organisations like IOCL-R&D, IIP, BPCL (R&D) etc. During the year, the company was granted four patents and filed applications for two patents. The company has on date 13 patents and 16 more patent applications are pending finalization.
Technologies commercially utilised during the year included the Trickle Bed Reactor developed jointly with IOC (R&D); the CFC technology jointly developed with IOC (R&D); the CATSoL technology for gas treatment and the application of inhouse developed proprietary structured packings (PARLPARK). The development projects for new technologies included coal-to-liquid, carbon dioxide removal from natural gas and naphtha & diesel desulphurisation. The R&D expenditure during the year at ` 15.41 crores showed an increase of 35.15 % over the preceding year.

485Public Enterprises Survey 2010-2011: Vol-II
Engineers India Limited1, Bhikaiji Cama Place, RK Puram, New Delhi – 110066
Balance Sheet (` in Lakhs)
Particulars 2010-11 2009-10 2008-09
Authorised Capital 30000 10000 10000
(1) Sources Of Fund
(1.1) Shareholders Funds
(A) Paid-Up Capital
Central Govt 13545 5077 5077
Others 3302 539 539
(B) Share Application Money 0 0 0
(C) Reserves & Surplus 127365 105855 131918
Total (A) + (B) + (C) 144212 111471 137534
(1.2) Loan Funds
(A) Secured Loans 0 0 0
(B) Unsecured Loans 0 0 0
Total (A) + (B) 0 0 0
(1.3) Deferred Tax Liability 0 0 0
Total (1.1) + (1.2) + (1.3) 144212 111471 137534
(2) Application Of Funds
(2.1) Fixed Assets
(A) Gross Block 19283 18241 16707
(B) Less Depreciation 13276 12236 11231
(C) Net Block (A-B) 6007 6005 5476
(D) Capital Work In Progress 2194 1185 602
Total (C) + (D) 8201 7190 6078
(2.2) Investment 51242 10073 15370
(2.3) Current Assets, Loan & Advances
(A) Inventories 21374 4319 3337
(B) Sundry Debtors 31690 31674 30009
(C) Cash & Bank Balances 176469 176397 189416
(D) Other Current Assets 12240 21095 20410
(E) Loan & Advances 25661 18453 22255
Total (A)+ (B)+ (C)+ (D)+ (E) 267434 251938 265427
(2.4) Less:current Liabilities & Provisions
(A) Current Liabilities 154228 140041 129235
(B) Provisions 46001 31840 31794
Total (A+B) 200229 171881 161029
(2.5) Net Current Assets (2.3-2.4) 67205 80057 104398
(2.6) Deferred Revenue / Pre. Expenditure 0 0 18
(2.7) Deferred Tax Asset 17564 14151 11670
(2.8) Profit & Loss Account(Dr) 0 0 0
Total (2.1+2.2+2.5+2.6+2.7+2.8) 144212 111471 137534
Important Indicators 2010-11 2009-10 2008-09
(i) Investment 16847 5616 5616
(ii) Capital Employed 73212 86062 109874
(iii) Net Worth 144212 111471 137516
(iv) Cost of Production 219334 151619 123352
(v) Cost of Sales 202269 150649 123209
(vi) Gross Value Added (At Market Price) - - -
(vii) Total Employees (Other Than Casuals) (Nos.) 3417 3301 3102
(viii) Avg. Monthly Emoluments Per Employee (Rs.) 126378 122917 103946
Profit & Loss Account (` in Lakhs)
Particulars 2010-11 2009-10 2008-09
(1) Income
(A) Sales/Operating Income 265263 198410 153103
(B) Excise Duty 0 0 0
(C) Net Sales (A-B) 265263 198410 153103
(D) Other Income/Receipts 16037 18367 22153
(E) Accretion/Depletion in Stocks 17065 970 143
(I)Total Income (C+D+E) 298365 217747 175399
(2) Expenditure
(A) Purchase of Finished Goods/ Consumption Of Raw Materials 81189 0 0
(B) Stores & Spares 5 2 1
(C) Power & Fuel 690 674 584
(D) Manufacturing / Direct / Operating Expenses 66561 85635 1052
(E) Salary, Wages & Benefits / Employee Exp. 51820 48690 38693
(F) Other Expenses 11070 10352 77376
(G) Provisions 6398 4839 4537
(II)Total Expenditure (A to G) 217733 150192 122243
(3) Profit Before Dep, Int, Taxes & EP (PBDITEP) (I-II) 80632 67555 53156
(4) Depreciation 1454 1298 1081
(5) Dre/Prel Exp Written Off 0 0 3
(6) Profit Before Int., Taxes & Ep (PBITEP) (3-4-5) 79178 66257 52072
(7) Interest
(A) On Central Government Loans 0 0 0
(B) On Foreign Loans 0 0 0
(C) Others 147 129 25
(D) Less Interest Capitalised 0 0 0
(E) Charged to P & L Account (A+B+C-D) 147 129 25
(8) Profit Before Tax & EP(PBTEP) (6-7E) 79031 66128 52047
(9) Tax Provisions 26201 22490 17594
(10) Net Profit / Loss Before EP (8-9) 52830 43638 34453
(11) Net Extra-Ord. Items 578 80 0
(12) Net Profit / Loss(-) (10-11) 52252 43558 34453
(13) Dividend Declared 16847 59525 10389
(14) Dividend Tax 2664 10095 1736
(15) Retained Profit (12-13-14) 32741 -26062 22328
Financial Ratios 2010-11 2009-10 2008-09
(i) Sales : Capital Employed 362.32 230.54 139.34
(ii) Cost of Sales : Sales 76.25 75.93 80.47
(iii) Salary / Wages : Sales 19.54 24.54 25.27
(iv) Net Profit : Net Worth 36.23 39.08 25.05
(v) Debt : Equity 0 0 0
(vi) Current Ratio 1.34 1.47 1.65
(vii) Sundry Debtors : Sales (No. of Days) 43.61 58.27 71.54
(viii) Total Inventory : Sales 29.41 7.95 7.96

486 Industrial Development & Tech. Consultancy Services
www. hsccltd.com
HSCC (India) Limited (HSCC) was incorporated on 30th March 1983 under the Companies Act, 1956 with an objective to be a market leader in providing innovative, high quality knowledge based services in the health and social sectors by seeking opportunities in special market niches and to develop as a consultancy organization with contemporary professional standards in the field of healthcare.
HSCC is a Knowledge based, Schedule ‘C,’ Miniratna CPSE in Infrastructural Development and Technical Consultancy Services Sector under the administrative control of Ministry of Health & family welfare, D/o Health with 100% shareholding by the Central Government. Its registered Office is at Delhi and Corporate Office at Noida.
Vision/MissionThe mission of the company is to provide comprehensive
concept to commissioning, project planning, architectural, engineering, project management, procurement and related consulting services for development of buildings and infrastructure for healthcare and other purposes in India and overseas.
The vision of the company is to be a leading consulting company providing value-added, innovative and integrated services for enhancing healthcare in India and overseas, leveraging its core competence in other infrastructure projects and providing an invigorating and enabling work environment to its professional employees.
Industrial / Business OperationsHSCC is engaged in providing specialized consultancy
services in the health care and other social sector which include to conduct studies in rehabilitation, up gradation/ modernization and baseline survey and to undertake architectural planning & design, project management, procurement, acquisition of technology, information technology/ recruitment / training in the field of hospitals and medical related institutes and laboratories.
The service range of the company comprises of conceptual studies & management consultancy, engineering studies and facility design, project management, procurement, logistics & installation and information technology. The performance details of the company during the last three year are as follows-
Main Services Unit Performance During2010-11 2009-10 2008-09
Consultancy Services
` in Lakhs
2311 2097 1936
Strategic IssuesThe company aims to be known as the most preferred
consulting partner to the clients in the Healthcare and Social Sector by offering Customized innovative solutions through harnessing knowledge pools and team work. The Company has been making vigorous efforts to expand the area of operations of
19.7 HSCC (India) Limitedthe company. The Company being in the field of Health Care, all its activities and operations are indirectly dedicated towards the social responsibility. The human resource management policies are being reviewed from time to time. Knowledge Management System, E-tendering, E-procurement, Internal cum Concurrent Audit, etc are being strengthened.
Performance HighlightsThe operational performance of the company along with
performance indicators and selected financial ratios during the period 2008-09 to 2010-11 can be seen on the opposite page.
The Company registered a reduction of ` 0.14 crore in total income during 2010-11 which went down to ` 33.46 crore in 2010-11 from ` 33.60 crore during 2009-10. The net profit of the company correspondingly reduced to ` 8.34 crore, a reduction of ` 0.26 crore over the previous year profit of ` 8.60 crore due to fall in other income as a result of further investments.
Human Resource ManagementThe company employed 164 regular employees as on
31.3.2011. The retirement age in the company is 60 years. It is following IDA 2007 and CDA-2006 pattern of remuneration. Details of employment in last 3 years are given below:
(Nos.)Particulars 2010-11 2009-10 2008-09
Executives including Non-Unionised Supervisors 147 118 122
Non-Executives # 17 17 17Total Employees 164 135 139
# Detail break-up of Non-Executive employees is at Statement no. 25 of volume-I of PE Survey.

487Public Enterprises Survey 2010-2011: Vol-II
HSCC (India) Limited205, Eastend Plaza, Plot No. 4, D.D.A.-L.S.C., Centre-2, Vasundhara Enclave, Delhi-110096
Balance Sheet (` in Lakhs)
Particulars 2010-11 2009-10 2008-09
Authorised Capital 500 500 500
(1) Sources Of Fund
(1.1) Shareholders Funds
(A) Paid-Up Capital
Central Govt 240 240 240
Others 0 0 0
(B) Share Application Money 0 0 0
(C) Reserves & Surplus 7632 6999 6341
Total (A) + (B) + (C) 7872 7239 6581
(1.2) Loan Funds
(A) Secured Loans 0 0 0
(B) Unsecured Loans 0 0 0
Total (A) + (B) 0 0 0
(1.3) Deferred Tax Liability 0 0 0
Total (1.1) + (1.2) + (1.3) 7872 7239 6581
(2) Application Of Funds
(2.1) Fixed Assets
(A) Gross Block 1113 1121 1126
(B) Less Depreciation 499 489 451
(C) Net Block (A-B) 614 632 675
(D) Capital Work In Progress 0 0 0
Total (C) + (D) 614 632 675
(2.2) Investment 0 0 0
(2.3) Current Assets, Loan & Advances
(A) Inventories 0 0 0
(B) Sundry Debtors 1956 1247 654
(C) Cash & Bank Balances 33921 37596 34657
(D) Other Current Assets 1990 2570 2074
(E) Loan & Advances 4651 4833 4542
Total (A)+ (B)+ (C)+ (D)+ (E) 42518 46246 41927
(2.4) Less:current Liabilities & Provisions
(A) Current Liabilities 35028 39275 35668
(B) Provisions 372 531 448
Total (A+B) 35400 39806 36116
(2.5) Net Current Assets (2.3-2.4) 7118 6440 5811
(2.6) Deferred Revenue / Pre. Expenditure 0 0 0
(2.7) Deferred Tax Asset 140 167 95
(2.8) Profit & Loss Account(Dr) 0 0 0
Total (2.1+2.2+2.5+2.6+2.7+2.8) 7872 7239 6581
Important Indicators 2010-11 2009-10 2008-09
(i) Investment 240 240 240
(ii) Capital Employed 7732 7072 6486
(iii) Net Worth 7872 7239 6581
(iv) Cost of Production 1993 2014 1740
(v) Cost of Sales 1993 2014 1740
(vi) Gross Value Added (At Market Price) - - -
(vii) Total Employees (Other Than Casuals) (Nos.) 164 135 139
(viii) Avg. Monthly Emoluments Per Employee (Rs.) 69207 80000 64029
Profit & Loss Account (` in Lakhs)
Particulars 2010-11 2009-10 2008-09
(1) Income
(A) Sales/Operating Income 2312 2142 1936
(B) Excise Duty 0 0 0
(C) Net Sales (A-B) 2312 2142 1936
(D) Other Income/Receipts 1034 1218 1337
(E) Accretion/Depletion in Stocks 0 0 0
(I)Total Income (C+D+E) 3346 3360 3273
(2) Expenditure
(A) Purchase of Finished Goods/ Consumption Of Raw Materials 0 0 0
(B) Stores & Spares 0 0 0
(C) Power & Fuel 29 29 24
(D) Manufacturing / Direct / Operating Expenses 71 47 206
(E) Salary, Wages & Benefits / Employee Exp. 1362 1296 1068
(F) Other Expenses 493 447 325
(G) Provisions 2 155 73
(II)Total Expenditure (A to G) 1957 1974 1696
(3) Profit Before Dep, Int, Taxes & EP (PBDITEP) (I-II) 1389 1386 1577
(4) Depreciation 36 40 44
(5) Dre/Prel Exp Written Off 0 0 0
(6) Profit Before Int., Taxes & Ep (PBITEP) (3-4-5) 1353 1346 1533
(7) Interest
(A) On Central Government Loans 0 0 0
(B) On Foreign Loans 0 0 0
(C) Others 0 0 0
(D) Less Interest Capitalised 0 0 0
(E) Charged to P & L Account (A+B+C-D) 0 0 0
(8) Profit Before Tax & EP(PBTEP) (6-7E) 1353 1346 1533
(9) Tax Provisions 487 486 563
(10) Net Profit / Loss Before EP (8-9) 866 860 970
(11) Net Extra-Ord. Items 32 0 0
(12) Net Profit / Loss(-) (10-11) 834 860 970
(13) Dividend Declared 173 173 208
(14) Dividend Tax 28 29 35
(15) Retained Profit (12-13-14) 633 658 727
Financial Ratios 2010-11 2009-10 2008-09
(i) Sales : Capital Employed 29.9 30.29 29.85
(ii) Cost of Sales : Sales 86.2 94.02 89.88
(iii) Salary / Wages : Sales 58.91 60.5 55.17
(iv) Net Profit : Net Worth 10.59 11.88 14.74
(v) Debt : Equity 0 0 0
(vi) Current Ratio 1.2 1.16 1.16
(vii) Sundry Debtors : Sales (No. of Days) 308.8 212.49 123.3
(viii) Total Inventory : Sales 0 0 0

488 Industrial Development & Tech. Consultancy Services
www.meconlimited.co.in
Mecon Limited (Formerly known as Metallurgical & Engineering Consultants (India) (MECoN) Limited) was incorporated on 31.03.1973.
It is a schedule – “A” Miniratna / BRPSE referred CPSE in the Industrial Development and Technical Consultancy service sector under the administrative control of Ministry of Steel with 100% shareholding of Government of India. It’s registered and Corporate Office is at Ranchi, Jharkhand.
Vision / MissionThe vision / mission of the company is to develop
into an internationally recognized center of excellence for providing quality services in technical consultancy, design & engineering, design & supply of plant, equipment & systems, project implementation from concept to commissioning for industrial development & upgradation ventures, development of infrastructure and other service sectors.
Industrial / Business OperationsIt is one of the premier multi disciplinary design,
engineering, consultancy and contracting organization in the field of iron & steel, chemicals, refineries & petrochemicals, power, roads & highways, railways, water management, ports & harbours, gas & oil, pipelines, non ferrous, mining, general engineering, environmental engineering and other related / diversified areas with extensive overseas experience. Its scope of services include the entire gamut of work relating to setting up of projects in green as well as brown field from concept to commissioning.
MECoN, an ISo: 9001-2008 accredited company is registered with WB, ADB, EBRD, AfDC and UNIDo and has numerous project specific alliances with leading technologists across the globe in various fields. The company has one financial joint venture namely MECoN (Nigeria) Limited with 50% share holding.
MECON’s multi skilled expertise in 35 technical disciplines creates the synergy vital for realizing projects in time, cost and quality. The physical performances of the company for last three years are given below:Main Services Unit Performance During
2010-11 2009-10 2008-09Engineering and Consultancy Service
` in crore
641.38 604.77 552.44
Strategic issueMECoN was referred to BRPSE and board has given its
recommendations in 2006 and revival plan was approved by Government in 2007. The revival plan is under implementation. Since Steel Industry is prone to cyclical upheavals in terms of prices and consumption, the company took steps to diversify its activities in various other areas. Under business restructuring, the company has already gone ahead with formation of 4 Strategic Business Units (SBUs) namely Metals (Iron & Steel), oil & Gas, Power and Infrastructure.
During its early days, the company operated pre-dominantly in the iron & steel sector, which was its core competence area and for which the company was incorporated by the Government of India.
19.8 MECON LimitedPerformance Highlights
The operational performance of the company along with performance indicators and selected financial ratios during the period 2008-09 to 2010-11 can be seen on the opposite page.
The Company registered an increase of ` 20.56 crore in total income during 2010-11 which went up to ` 689.42 crore in 2010-11 from ` 668.86 crore during 2009-10. The net profit of the company correspondingly increased to ` 93.68 crore, an increase of ` 11.06 crore over the previous year due to improved overall operation of the company, increase in efficiency due to better overall planning & co-ordination, off-loading of low end engineering activities, standardization, extensive use of modern design software / aids, etc.
Human Resource ManagementThe company employed 1823 regular employees as on
31.3.2011. The retirement age in the company is 60 years. It is following IDA 2007 and CDA 2006 pattern of remuneration. Details of employment in last 3 years are given below:
Particulars 2010-11 2009-10 2008-09Executives including Non-Unionised Supervisors 1620 1709 1656
Non-Executives # 203 204 457Total Employees 1823 1913 2113
# Detail break-up of Non-Executive employees is at Statement no. 25 of volume-I of PE Survey.
As per revival plan, of the company Government of India is to give 50% interest subsidy (not exceeding ` 6.50 crores per annum) on VRS loan to be phased out by 2013-14 and waiver of guarantee fee (not exceeding ` 1.92 crores per annum) on VRS loan till 2013-14 or till the loans are retired, whichever is earlier.
Technology Up-gradation, Research and Development
The R & D Division of MECON was recognized by Department of Scientific and Industrial Research, Govt. of India in 1986 as In-house R & D unit and is subsequently getting renewal of recognition in every three years. MECON undertakes applied research & experimental development in core areas of business. Most of the programs are funded by external agencies as DRDo, DST, Ministry of Environment, M/o Steel etc.

489Public Enterprises Survey 2010-2011: Vol-II
MECON LimitedVivekananda Path, Doranda Ranchi, Jharkhand 834 002
Balance Sheet (` in Lakhs)
Particulars 2010-11 2009-10 2008-09
Authorised Capital 10400 10400 10400
(1) Sources Of Fund
(1.1) Shareholders Funds
(A) Paid-Up Capital
Central Govt 10314 10314 10314
Others 0 0 0
(B) Share Application Money 0 0 0
(C) Reserves & Surplus 12425 3447 2391
Total (A) + (B) + (C) 22739 13761 12705
(1.2) Loan Funds
(A) Secured Loans 4 15 510
(B) Unsecured Loans 8508 12002 15637
Total (A) + (B) 8512 12017 16147
(1.3) Deferred Tax Liability 647 169 326
Total (1.1) + (1.2) + (1.3) 31898 25947 29178
(2) Application Of Funds
(2.1) Fixed Assets
(A) Gross Block 12128 11691 11400
(B) Less Depreciation 4811 4416 4065
(C) Net Block (A-B) 7317 7275 7335
(D) Capital Work In Progress 222 248 149
Total (C) + (D) 7539 7523 7484
(2.2) Investment 512 510 510
(2.3) Current Assets, Loan & Advances
(A) Inventories 558 1038 1700
(B) Sundry Debtors 21468 16315 14271
(C) Cash & Bank Balances 60217 48695 47486
(D) Other Current Assets 8554 8683 3116
(E) Loan & Advances 5573 6335 9963
Total (A)+ (B)+ (C)+ (D)+ (E) 96370 81066 76536
(2.4) Less:current Liabilities & Provisions
(A) Current Liabilities 50276 45670 44519
(B) Provisions 22247 17482 17662
Total (A+B) 72523 63152 62181
(2.5) Net Current Assets (2.3-2.4) 23847 17914 14355
(2.6) Deferred Revenue / Pre. Expenditure 0 0 15
(2.7) Deferred Tax Asset 0 0 0
(2.8) Profit & Loss Account(Dr) 0 0 6814
Total (2.1+2.2+2.5+2.6+2.7+2.8) 31898 25947 29178
Important Indicators 2010-11 2009-10 2008-09
(i) Investment 18822 22316 25951
(ii) Capital Employed 31164 25189 21690
(iii) Net Worth 22739 13761 5876
(iv) Cost of Production 54833 54471 54140
(v) Cost of Sales 55344 55129 53561
(vi) Gross Value Added (At Market Price) - - -
(vii) Total Employees (Other Than Casuals) (Nos.) 1823 1913 2113
(viii) Avg. Monthly Emoluments Per Employee (Rs.) 130161 90517 103108
Profit & Loss Account (` in Lakhs)
Particulars 2010-11 2009-10 2008-09
(1) Income
(A) Sales/Operating Income 64138 60478 59037
(B) Excise Duty 0 0 0
(C) Net Sales (A-B) 64138 60478 59037
(D) Other Income/Receipts 5315 7066 1850
(E) Accretion/Depletion in Stocks -511 -658 579
(I)Total Income (C+D+E) 68942 66886 61466
(2) Expenditure
(A) Purchase of Finished Goods/ Consumption Of Raw Materials 13977 21605 12241
(B) Stores & Spares 304 252 276
(C) Power & Fuel 478 456 404
(D) Manufacturing / Direct / Operating Expenses 6384 6068 8940
(E) Salary, Wages & Benefits / Employee Exp. 28474 20779 26144
(F) Other Expenses 4259 4171 3929
(G) Provisions 179 20 1035
(II)Total Expenditure (A to G) 54055 53351 52969
(3) Profit Before Dep, Int, Taxes & EP (PBDITEP) (I-II) 14887 13535 8497
(4) Depreciation 384 305 384
(5) Dre/Prel Exp Written Off 0 74 180
(6) Profit Before Int., Taxes & Ep (PBITEP) (3-4-5) 14503 13156 7933
(7) Interest
(A) On Central Government Loans 0 158 0
(B) On Foreign Loans 0 0 0
(C) Others 394 583 607
(D) Less Interest Capitalised 0 0 0
(E) Charged to P & L Account (A+B+C-D) 394 741 607
(8) Profit Before Tax & EP(PBTEP) (6-7E) 14109 12415 7326
(9) Tax Provisions 4725 4207 887
(10) Net Profit / Loss Before EP (8-9) 9384 8208 6439
(11) Net Extra-Ord. Items 16 -54 -150
(12) Net Profit / Loss(-) (10-11) 9368 8262 6589
(13) Dividend Declared 315 315 315
(14) Dividend Tax 51 52 54
(15) Retained Profit (12-13-14) 9002 7895 6220
Financial Ratios 2010-11 2009-10 2008-09
(i) Sales : Capital Employed 205.81 240.1 272.19
(ii) Cost of Sales : Sales 86.29 91.16 90.72
(iii) Salary / Wages : Sales 44.39 34.36 44.28
(iv) Net Profit : Net Worth 41.2 60.04 112.13
(v) Debt : Equity 0.37 0.87 1.27
(vi) Current Ratio 1.33 1.28 1.23
(vii) Sundry Debtors : Sales (No. of Days) 122.17 98.47 88.23
(viii) Total Inventory : Sales 3.18 6.26 10.51

490 Industrial Development & Tech. Consultancy Services
www.nicsi.com
National Informatics Centre Services Inc. (NICSI) was incorporated on 28.08.1995 as a section 25 company with the objective to provide support to National Informatics Centre (NIC) in various promotional and commercial activities being undertaken by NIC. It provides operational support for NIC’s mega-projects and provides total IT solutions to the Government organizations
NICSI is an un-categorized CPSE in Industrial Development & Tech. Consultancy Services Sector under the administrative control of M/o Communication and Information Technology, D/o Information Technology with 100% shareholding by the Government of India. Its Registered and Corporate offices are at New Delhi.
Vision/MissionThe Vision / Mission of NICSI is to be dominant player in
implementation of ICT projects in the Government sector and to help in achieving accelerated socio-economic development of the country.
Industrial / Business OperationsNICSI is engaged in promoting economic, scientific,
technological, social and cultural development of India by promoting, assisting and streamlining the creation, adaptation, absorption, application, dissemination, growth and utilization of Information Technology including computer Technology, computer communication networks, informatics, digital automation and computer aided modernization in various facets of Government and Society including local self governments, educational institutions, financial institutions, societies, libraries, research institutions, etc. in public, private and cooperative sectors through non-commercial and commercial applications of the know how methodologies, software, hardware, database, information base, knowledge base, expertise, infrastructure, Value Added Telecom services and other services developed by the NIC of the GoI, including its computer communication network (NICNET) and associated infrastructure and services as well as the network and associated infrastructure and services of collaborators and associates of NIC with whom NIC has legally binding relationships. The physical performances of the company for last three years are given below:
Main Services Unit Performance During2010-11 2009-10 2008-09
Software ` crore 45.31 24.08 -
Routers / Switches ` crore 109.99 62.57 -
Services & Support receipts ` crore 102.29 75.50 -
Strategic IssuesThe other main objectives of the Company are to promote
use of Information & Communication Technology (ICT) in Government, to support faster implementation of ICT projects, to procure hardware, software and support services for Government organizations at competitive rates through tendering and/or strategic alliance/ agreements with leading ICT and management organizations, to help in the promotion and adoption of new technology in the area of ICT-enabled change management, to support creation of expertise within Government in the frontier areas of ICT and ICT-enabled change management.
19.9 National Informatics Centre Services Inc.
Performance HighlightsThe operational performance of the company along with
performance indicators and selected financial ratios during the period 2008-09 to 2010-11 can be seen on the opposite page.
The Company registered an increase of ` 113.93 crore in total income during 2010-11 which went up to ` 327.22 crore in 2010-11 from ` 213.29 crore during 2009-10. The net profit of the company correspondingly increased to ` 39.71 crore, an increase of ` 8.32 crore over the previous year due to increase in operations.
Human Resource ManagementThe company employed 52 regular employees as on
31.3.2011. The retirement age in the Company is 60 years. It is following IDA 2007 and CDA 2006 pattern of remuneration. Details of employment in last 3 years are given below:
Particulars 2010-11 2009-10 2008-09Executives including Non-Unionised Supervisors 52 27 22
Non-Executives # 0 27 17Total Employees 52 54 39
# Detail break-up of Non-Executive employees is at Statement no. 25 of volume-I of PE Survey.
All the employees are working on deputation basis from NIC except company secretary and a drive (which are appointed on contract basis).

491Public Enterprises Survey 2010-2011: Vol-II
National Informatics Centre Services Inc. Hall No. 2&3, 6th Floor, NBCC Tower, 15, Bhikaji Cama Place, New Delhi-110066
Balance Sheet (` in Lakhs)
Particulars 2010-11 2009-10 2008-09
Authorised Capital 200 200 200
(1) Sources Of Fund
(1.1) Shareholders Funds
(A) Paid-Up Capital
Central Govt 200 200 200
Others 0 0 0
(B) Share Application Money 0 0 0
(C) Reserves & Surplus 29242 25270 22131
Total (A) + (B) + (C) 29442 25470 22331
(1.2) Loan Funds
(A) Secured Loans 0 0 0
(B) Unsecured Loans 0 0 0
Total (A) + (B) 0 0 0
(1.3) Deferred Tax Liability 245 256 174
Total (1.1) + (1.2) + (1.3) 29687 25726 22505
(2) Application Of Funds
(2.1) Fixed Assets
(A) Gross Block 5412 4752 4370
(B) Less Depreciation 2502 1890 1349
(C) Net Block (A-B) 2910 2862 3021
(D) Capital Work In Progress 264 0 0
Total (C) + (D) 3174 2862 3021
(2.2) Investment 0 0 0
(2.3) Current Assets, Loan & Advances
(A) Inventories 493 559 209
(B) Sundry Debtors 16103 13088 10351
(C) Cash & Bank Balances 79709 48826 47557
(D) Other Current Assets 0 0 0
(E) Loan & Advances 4418 1805 1491
Total (A)+ (B)+ (C)+ (D)+ (E) 100723 64278 59608
(2.4) Less:current Liabilities & Provisions
(A) Current Liabilities 72240 41413 40001
(B) Provisions 1970 1 123
Total (A+B) 74210 41414 40124
(2.5) Net Current Assets (2.3-2.4) 26513 22864 19484
(2.6) Deferred Revenue / Pre. Expenditure 0 0 0
(2.7) Deferred Tax Asset 0 0 0
(2.8) Profit & Loss Account(Dr) 0 0 0
Total (2.1+2.2+2.5+2.6+2.7+2.8) 29687 25726 22505
Important Indicators 2010-11 2009-10 2008-09
(i) Investment 200 200 200
(ii) Capital Employed 29423 25726 22505
(iii) Net Worth 29442 25470 22331
(iv) Cost of Production 26773 16373 15077
(v) Cost of Sales 26773 16061 15236
(vi) Gross Value Added (At Market Price) - - -
(vii) Total Employees (Other Than Casuals) (Nos.) 52 54 39
(viii) Avg. Monthly Emoluments Per Employee (Rs.) 118750 87191 111325
Profit & Loss Account (` in Lakhs)
Particulars 2010-11 2009-10 2008-09
(1) Income
(A) Sales/Operating Income 15530 9530 8680
(B) Excise Duty 0 0 0
(C) Net Sales (A-B) 15530 9530 8680
(D) Other Income/Receipts 17192 11487 11534
(E) Accretion/Depletion in Stocks 0 312 -159
(I)Total Income (C+D+E) 32722 21329 20055
(2) Expenditure
(A) Purchase of Finished Goods/ Consumption Of Raw Materials 13539 7868 7821
(B) Stores & Spares 0 0 0
(C) Power & Fuel 406 51 0
(D) Manufacturing / Direct / Operating Expenses 1528 1047 4776
(E) Salary, Wages & Benefits / Employee Exp. 741 565 521
(F) Other Expenses 9947 6301 1299
(G) Provisions 0 0 0
(II)Total Expenditure (A to G) 26161 15832 14417
(3) Profit Before Dep, Int, Taxes & EP (PBDITEP) (I-II) 6561 5497 5638
(4) Depreciation 612 541 519
(5) Dre/Prel Exp Written Off 0 0 0
(6) Profit Before Int., Taxes & Ep (PBITEP) (3-4-5) 5949 4956 5119
(7) Interest
(A) On Central Government Loans 0 0 0
(B) On Foreign Loans 0 0 0
(C) Others 0 0 141
(D) Less Interest Capitalised 0 0 0
(E) Charged to P & L Account (A+B+C-D) 0 0 141
(8) Profit Before Tax & EP(PBTEP) (6-7E) 5949 4956 4978
(9) Tax Provisions 1923 1751 1732
(10) Net Profit / Loss Before EP (8-9) 4026 3205 3246
(11) Net Extra-Ord. Items 55 66 111
(12) Net Profit / Loss(-) (10-11) 3971 3139 3135
(13) Dividend Declared 0 0 0
(14) Dividend Tax 0 0 0
(15) Retained Profit (12-13-14) 3971 3139 3135
Financial Ratios 2010-11 2009-10 2008-09
(i) Sales : Capital Employed 52.78 37.04 38.57
(ii) Cost of Sales : Sales 172.4 168.53 175.53
(iii) Salary / Wages : Sales 4.77 5.93 6
(iv) Net Profit : Net Worth 13.49 12.32 14.04
(v) Debt : Equity 0 0 0
(vi) Current Ratio 1.36 1.55 1.49
(vii) Sundry Debtors : Sales (No. of Days) 378.47 501.27 435.27
(viii) Total Inventory : Sales 11.59 21.41 8.79
2010-11 PROVISIONAL
492 Industrial Development & Tech. Consultancy Services
www.nrdcindia.com
National Research Development Corporation (NRDC)was incorporated on 31st December 1953 by the Government of India, under Section 25 of the Companies Act, 1956. The primary objective of the company is to act as a catalyst to promote, develop and commercialize the technologies / knowhow / inventions / patents / processes emanating from various national R&D Institutions.
NRDC is a Schedule ‘C’ CPSE under Industrial Development and Technical Consultancy Services group, under the administrative control of Ministry of Science & Technology, Department of Scientific & Industrial Research with 100% shareholding by the Government of India. The Corporation’s Registered and Corporate Offices are at New Delhi and it has one Regional Office at Bangalore.
Vision / MissionThe Vision of the Company is to promote, develop,
nurture and commercialize innovative, reliable and competitive technologies from academia, research laboratories, industry and individuals, and be the topmost Technology Transfer Organization
The Mission of the Company is to provide world class business services in technology, to the wider market of creators and users of technology, through value addition and partnership and to mediate the marching of technologies that would be needed and sought by industry and other users of technology and, the Intellectual Properties (IP) developed by technology creators.
Industrial / Business OperationsNRDC is engaged in providing technical, commercial and
financial measures needed for closing gaps in the “innovation chain” through which an idea, invention or process is converted into a product in the market by way of adding value to the indigenous technologies, provide Intellectual Property Rights (IPR), consultancy, etc. and licensing them to entrepreneurs. The service range of the company comprises of Licensing, consultancy and other technical services. The operations of the company encompasses two major roles, viz., Commercial and Promotional
The physical performances of the company for last three years are given below:
Main Services Unit Performance During2010-11 2009-10 2008-09
Premiareceived ` in Cr. 1.20 0.42 1.20
Royalty Earned ` in Cr. 6.63 5.76 6.42
Consultancy in Cr. - 3.14 2.12
Licence Agreements signed
Nos. - 41 36
Strategic issueSeveral agencies and Govt. Departments have started
their own Technology Transfer cells in India thereby posing competition for NRDC. However NRDC being a five decade old organization has mastered the nuances of technology transfer and has devised newer ways of capturing the market through innovative market strategies for better commercialization.
19.10 National Research Development Corporation
Performance HighlightsThe operational performance of the company along with
performance indicators and selected financial ratios during the period 2008-09 to 2010-11 can be seen on the opposite page.
The Company registered a reduction of ` 1.27crore in total income during 2010-11 which went down to ` 9.59 crore in 2010-11 from ` 10.86crore during 2009-10. The company accordingly showed a net loss of ` 1.04 croreover the previous year’s profit of ` 0.12 crore due to fall in income.
The decrease in income is due to fall in consultancy income and decrease in export income due to completion of projects assigned earlier and no new project being undertake by the corporation.
Human Resource ManagementThe company employed 94regular employees as on
31.3.2011. The retirement age in the company is 60 years. It is following IDA 2007 and CDA 2006 pattern of remuneration. Details of employment in last 3 years are given below:
(In Nos.)Particulars 2010-11 2009-10 2008-09
Executives including Non-Unionised Supervisors 44 45 40
Non-Executives # 50 42 51Total Employees 94 87 91
# Detail break-up of Non-Executive employees is at Statement no. 25 of volume-I of PE Survey.

493Public Enterprises Survey 2010-2011: Vol-II
National Research Development Corporation NRDC, 20-22, Zanroordpur Community Centre, Kailash Colony Extension, New Delhi-110048
Balance Sheet (` in Lakhs)
Particulars 2010-11 2009-10 2008-09
Authorised Capital 1000 1000 1000
(1) Sources Of Fund
(1.1) Shareholders Funds
(A) Paid-Up Capital
Central Govt 442 442 442
Others 0 0 0
(B) Share Application Money 0 0 0
(C) Reserves & Surplus 492 596 584
Total (A) + (B) + (C) 934 1038 1026
(1.2) Loan Funds
(A) Secured Loans 0 0 0
(B) Unsecured Loans 0 0 0
Total (A) + (B) 0 0 0
(1.3) Deferred Tax Liability 0 0 0
Total (1.1) + (1.2) + (1.3) 934 1038 1026
(2) Application Of Funds
(2.1) Fixed Assets
(A) Gross Block 226 223 211
(B) Less Depreciation 140 129 118
(C) Net Block (A-B) 86 94 93
(D) Capital Work In Progress 0 0 0
Total (C) + (D) 86 94 93
(2.2) Investment 0 60 60
(2.3) Current Assets, Loan & Advances
(A) Inventories 1 4 2
(B) Sundry Debtors 1036 772 619
(C) Cash & Bank Balances 1508 1478 1402
(D) Other Current Assets 40 37 61
(E) Loan & Advances 242 272 278
Total (A)+ (B)+ (C)+ (D)+ (E) 2827 2563 2362
(2.4) Less:current Liabilities & Provisions
(A) Current Liabilities 1875 1555 1341
(B) Provisions 161 127 152
Total (A+B) 2036 1682 1493
(2.5) Net Current Assets (2.3-2.4) 791 881 869
(2.6) Deferred Revenue / Pre. Expenditure 0 0 0
(2.7) Deferred Tax Asset 57 3 4
(2.8) Profit & Loss Account(Dr) 0 0 0
Total (2.1+2.2+2.5+2.6+2.7+2.8) 934 1038 1026
Important Indicators 2010-11 2009-10 2008-09
(i) Investment 442 442 442
(ii) Capital Employed 877 975 962
(iii) Net Worth 934 1038 1026
(iv) Cost of Production 1117 1071 1158
(v) Cost of Sales 1117 1071 1158
(vi) Gross Value Added (At Market Price) - - -
(vii) Total Employees (Other Than Casuals) (Nos.) 94 87 91
(viii) Avg. Monthly Emoluments Per Employee (Rs.) 33599 30077 28388
Profit & Loss Account (` in Lakhs)
Particulars 2010-11 2009-10 2008-09
(1) Income
(A) Sales/Operating Income 816 934 1046
(B) Excise Duty 0 0 0
(C) Net Sales (A-B) 816 934 1046
(D) Other Income/Receipts 143 152 174
(E) Accretion/Depletion in Stocks 0 0 0
(I)Total Income (C+D+E) 959 1086 1220
(2) Expenditure
(A) Purchase of Finished Goods/ Consumption Of Raw Materials 6 0 62
(B) Stores & Spares 0 0 0
(C) Power & Fuel 3 2 3
(D) Manufacturing / Direct / Operating Expenses 583 463 531
(E) Salary, Wages & Benefits / Employee Exp. 379 314 310
(F) Other Expenses 135 281 241
(G) Provisions 0 0 0
(II)Total Expenditure (A to G) 1106 1060 1147
(3) Profit Before Dep, Int, Taxes & EP (PBDITEP) (I-II) -147 26 73
(4) Depreciation 11 11 11
(5) Dre/Prel Exp Written Off 0 0 0
(6) Profit Before Int., Taxes & Ep (PBITEP) (3-4-5) -158 15 62
(7) Interest
(A) On Central Government Loans 0 0 0
(B) On Foreign Loans 0 0 0
(C) Others 0 0 0
(D) Less Interest Capitalised 0 0 0
(E) Charged to P & L Account (A+B+C-D) 0 0 0
(8) Profit Before Tax & EP(PBTEP) (6-7E) -158 15 62
(9) Tax Provisions -54 3 30
(10) Net Profit / Loss Before EP (8-9) -104 12 32
(11) Net Extra-Ord. Items 0 0 0
(12) Net Profit / Loss(-) (10-11) -104 12 32
(13) Dividend Declared 0 0 0
(14) Dividend Tax 0 0 0
(15) Retained Profit (12-13-14) -104 12 32
Financial Ratios 2010-11 2009-10 2008-09
(i) Sales : Capital Employed 93.04 95.79 108.73
(ii) Cost of Sales : Sales 136.89 114.67 110.71
(iii) Salary / Wages : Sales 46.45 33.62 29.64
(iv) Net Profit : Net Worth -11.13 1.16 3.12
(v) Debt : Equity 0 0 0
(vi) Current Ratio 1.39 1.52 1.58
(vii) Sundry Debtors : Sales (No. of Days) 463.41 301.69 216
(viii) Total Inventory : Sales 0.45 1.56 0.7

494 Industrial Development & Tech. Consultancy Services
www.nsic.co.in
National small Industries Corporation Ltd. (NSIC) was incorporated in 1955 with the objective to aid, counsel, assist, finance, protect and promote the interests of small scale industries in the country.
NSIC is a Schedule-B CPSE in Industrial Development & Tech. Consultancy Services sector under the administrative control of M/o Micro, Small and Medium Enterprises with 100% shareholding by the Government of India. Its Registered and Corporate Office is in New Delhi.
Vision / MissionThe Vision of the Corporation is to be a premier organization
fostering the growth of Micro, Small and Medium Enterprises (MSMEs) sector.
The Mission of the Corporation is to promote & support Micro, Small and Medium Enterprises (MSMEs) Sector by providing integrated support services encompassing Marketing, Technology, finance and other services.
Industrial / Business OperationsThe main operations of the Corporation includes Raw
Material Distribution, Single Point Registration for Government Purchase, Consortia and Tender Marketing, Marketing Intelligence, Exhibitions and Technology fairs, Buyer Seller meets, Export of Products and Projects, Technology Support, Credit Support, Financing through syndication with Banks, Performance & Credit Rating Scheme for Small Industries, International Cooperation & Consultancy Services and other support services to MSMEs which interalia includes infomediary services under B2B portal, STPs, etc. NSIC is also operating godowns at Tarapur, Delhi, faridabad, Bangalore, Badli and Silvasa to facilitate MSMEs vis-à-vis availability of raw materials.
The physical performance of Company during the period 2008-09 to 2010-11 is shows below:-
(In Crore)Major Services Rendering Services During
2010-11 2009-10 2008-09Business Turnover 7979 4488 3508Raw Material Assistance Portfolio
983 578 306
Volume of Distribution of Raw Material` & Godown Operation
7710 4302 3323
Government Purchase Units 3544 3327 2677Performance & Credit Rating Units
10327 7531 5011
Revenue from Technical Centers
18.16 17.16 12.54
Strategic IssuesNSIC increased its reach by operating offices in various
new areas. Apart from the improvements, various new initiatives have been taken to help the MSME sector in terms of business as well as reach. NSIC established a Marketing Intelligence Cell for collecting and disseminating both domestic and international marketing intelligence in coordination with other relevant departments / agencies. NSIC launched a web portal for disseminating marketing intelligence to the MSME sector in
19.11 National Small Industries Corporation Ltd.
the country. The web portal will facilitate connectivity to Indian MSMEs and to global enterprises in accessing information about the products and technologies available from MSME sector in India. It has signed MoU with over 50 Industry Associations to provide service at doorsteps of the MSEs. Total number of Godowns / distribution centers reached to 24. The company has also made arrangements with bulk manufacturers like Steel Authority of India Limited, Rashtriya Ispat Nigam Limited, Nalco, Hindustan copper Limited, Chennai Petroleum Corporation Limited, Coal India Limited and Sterlite Group for procuring raw material like steel, aluminum, copper, bitumen, Coal, zinc etc. for SMEs. The company is making arrangements with Gas Authority of India Limited and Indian oil Corporation Limited for material handling arrangement with respect of LDPE/HDPE.
Performance HighlightsThe operational performance of the company along with
performance indicators and selected financial ratios during the period 2008-09 to 2010-11 can be seen on the opposite page.
The Company registered an increase of ` 292.82 crore in total income during 2010-11 which went up to ` 991.84 crore in 2010-11 from ` 699.02 crore during 2009-10. The net profit of the company correspondingly increased to ` 29.78 crore, an increase of ` 5.51 crore over the previous year due to increase in operational performance.
Human Resource ManagementThe Company employed 864 regular employees (executives
408 and non-executive 456 as on 31.03.2011. It is following IDA 2007 and CDA 2006 pattern of remuneration. The retirement age of the company is 60 years.
(Nos.)Particulars 2010-11 2009-10 2008-09
Executives including Non-Unionised Supervisors 408 389 353
Non-Executives # 456 478 486Total Employees 864 867 839
# Detail break-up of Non-Executive employees is at Statement no. 25 of volume-I of PE Survey.

495Public Enterprises Survey 2010-2011: Vol-II
National Small Industries Corporation Ltd. Laghu Udyog Bhavan Okhla Industrial Estate New Delhi 110020
Balance Sheet (` in Lakhs)
Particulars 2010-11 2009-10 2008-09
Authorised Capital 23500 23500 23500
(1) Sources Of Fund
(1.1) Shareholders Funds
(A) Paid-Up Capital
Central Govt 23299 23299 23299
Others 0 0 0
(B) Share Application Money 0 0 0
(C) Reserves & Surplus 1317 1336 1467
Total (A) + (B) + (C) 24616 24635 24766
(1.2) Loan Funds
(A) Secured Loans 81668 43247 21448
(B) Unsecured Loans 10907 5859 6865
Total (A) + (B) 92575 49106 28313
(1.3) Deferred Tax Liability 0 0 0
Total (1.1) + (1.2) + (1.3) 117191 73741 53079
(2) Application Of Funds
(2.1) Fixed Assets
(A) Gross Block 9028 6139 6183
(B) Less Depreciation 3317 3353 3429
(C) Net Block (A-B) 5711 2786 2754
(D) Capital Work In Progress 428 3010 1075
Total (C) + (D) 6139 5796 3829
(2.2) Investment 8 93 83
(2.3) Current Assets, Loan & Advances
(A) Inventories 102 117 106
(B) Sundry Debtors 2959 3565 3627
(C) Cash & Bank Balances 19371 8321 7728
(D) Other Current Assets 1746 1478 1810
(E) Loan & Advances 93055 55502 31975
Total (A)+ (B)+ (C)+ (D)+ (E) 117233 68983 45246
(2.4) Less:current Liabilities & Provisions
(A) Current Liabilities 9917 8530 6709
(B) Provisions 6510 5125 3967
Total (A+B) 16427 13655 10676
(2.5) Net Current Assets (2.3-2.4) 100806 55328 34570
(2.6) Deferred Revenue / Pre. Expenditure 1 1 213
(2.7) Deferred Tax Asset 0 0 0
(2.8) Profit & Loss Account(Dr) 10237 12523 14384
Total (2.1+2.2+2.5+2.6+2.7+2.8) 117191 73741 53079
Important Indicators 2010-11 2009-10 2008-09
(i) Investment 29206 29158 30164
(ii) Capital Employed 106517 58114 37324
(iii) Net Worth 14378 12111 10169
(iv) Cost of Production 95664 67089 59855
(v) Cost of Sales 95679 67074 59857
(vi) Gross Value Added (At Market Price) - - -
(vii) Total Employees (Other Than Casuals) (Nos.) 864 867 839
(viii) Avg. Monthly Emoluments Per Employee (Rs.) 54379 44704 40574
Profit & Loss Account (` in Lakhs)
Particulars 2010-11 2009-10 2008-09
(1) Income
(A) Sales/Operating Income 85096 59628 49481
(B) Excise Duty 0 0 0
(C) Net Sales (A-B) 85096 59628 49481
(D) Other Income/Receipts 14103 10259 11297
(E) Accretion/Depletion in Stocks -15 15 -2
(I)Total Income (C+D+E) 99184 69902 60776
(2) Expenditure
(A) Purchase of Finished Goods/ Consumption Of Raw Materials 77224 53842 49076
(B) Stores & Spares 2 10 11
(C) Power & Fuel 357 294 12
(D) Manufacturing / Direct / Operating Expenses 622 778 344
(E) Salary, Wages & Benefits / Employee Exp. 5638 4651 4085
(F) Other Expenses 7173 5065 4307
(G) Provisions 0 70 2
(II)Total Expenditure (A to G) 91016 64710 57837
(3) Profit Before Dep, Int, Taxes & EP (PBDITEP) (I-II) 8168 5192 2939
(4) Depreciation 159 100 98
(5) Dre/Prel Exp Written Off 0 0 0
(6) Profit Before Int., Taxes & Ep (PBITEP) (3-4-5) 8009 5092 2841
(7) Interest
(A) On Central Government Loans 0 0 0
(B) On Foreign Loans 522 629 665
(C) Others 3967 1650 1255
(D) Less Interest Capitalised 0 0 0
(E) Charged to P & L Account (A+B+C-D) 4489 2279 1920
(8) Profit Before Tax & EP(PBTEP) (6-7E) 3520 2813 921
(9) Tax Provisions 539 167 90
(10) Net Profit / Loss Before EP (8-9) 2981 2646 831
(11) Net Extra-Ord. Items 3 219 229
(12) Net Profit / Loss(-) (10-11) 2978 2427 602
(13) Dividend Declared 596 485 120
(14) Dividend Tax 97 81 20
(15) Retained Profit (12-13-14) 2285 1861 462
Financial Ratios 2010-11 2009-10 2008-09
(i) Sales : Capital Employed 79.89 102.61 132.57
(ii) Cost of Sales : Sales 112.44 112.49 120.97
(iii) Salary / Wages : Sales 6.63 7.8 8.26
(iv) Net Profit : Net Worth 20.71 20.04 5.92
(v) Debt : Equity 3.76 1.99 1.14
(vi) Current Ratio 7.14 5.05 4.24
(vii) Sundry Debtors : Sales (No. of Days) 12.69 21.82 26.75
(viii) Total Inventory : Sales 0.44 0.72 0.78

496 Industrial Development & Tech. Consultancy Services
www.pfcindia.com
PfC Consulting Limited (PfCCL)was incorporated on 25.03.2008 with the objective to promote, organize and carry out Consultancy Services in the related activities of PfC Ltd., a CPSE. It has also been assigned the task of development of Ultra Mega Power Project and Independent Transmission Projects by PfC.
PFCCL is an uncategorized CPSE in Industrial Development & Tech. Consultancy Services Sector under the administrative control of M/o Power. Its Registered and Corporate offices are in New Delhi. It is a wholly owned subsidiary of Power finance Corporation Ltd..
Vision / MissionThe Vision of the Company is to become a premier
Consultanting organisation in the power sector. The Mission of the company is to become the leading
‘end to end consulting solution provider’ in power sector for a sustainable development.
Industrial / Business OperationsThe main activity of the company is to work as a
Management Consultant. The services offered by the PfCCL are in the power sector only and consists of Reforms, Restructuring and Regulatory aspects, bid process management, resource mobilization, accounting systems, Project Structuring / Planning / Development / Specific studies implementation, implementation monitoring, efficiency improvement projects for both State owned utilities and IPPs, development of sustainable human resource Plans, Communication and Information dissemination, Information Management Systems, Legal and Contract related Services.
Till date, PfCCL has assisted 37 clients spread across 20 States. PfCCL is handling consultancy assignments under Procurement of Power for Govt. of Punjab, Rajasthan & Jharkhand.
19.12 PFC Consulting Limited Performance Highlights
The operational performance of the company along with performance indicators and selected financial ratios during the period 2008-09 to 2010-11 can be seen on the opposite page.
The Company registered an increase of ` 7.32 crore in total income during 2010-11 which went up to ` 52.59 crore in 2010-11 from ` 45.27 crore during 2009-10. The net profit of the company correspondingly increased to ` 26.96 crore, an increase of ` 5.34 crore over the previous year due to higher human productivity and reduction in expenditure.
Human Resource ManagementAll the employees of the company are on secondment basis
from the Holding Company i.e. PfC. The related expenses are paid by the holding company and allocated to the company.

497Public Enterprises Survey 2010-2011: Vol-II
PFC Consulting Limited 1st Floor, UrjanidhiBuilding , 1- Barakhamba Lane, Cannaught Place, New Delhi
Balance Sheet (` in Lakhs)
Particulars 2010-11 2009-10 2008-09
Authorised Capital 5 5 5
(1) Sources Of Fund
(1.1) Shareholders Funds
(A) Paid-Up Capital
Central Govt 0 0 0
Others 5 5 5
(B) Share Application Money 0 0 0
(C) Reserves & Surplus 5833 3138 975
Total (A) + (B) + (C) 5838 3143 980
(1.2) Loan Funds
(A) Secured Loans 0 0 0
(B) Unsecured Loans 0 0 0
Total (A) + (B) 0 0 0
(1.3) Deferred Tax Liability 0 0 0
Total (1.1) + (1.2) + (1.3) 5838 3143 980
(2) Application Of Funds
(2.1) Fixed Assets
(A) Gross Block 13 9 4
(B) Less Depreciation 5 2 1
(C) Net Block (A-B) 8 7 3
(D) Capital Work In Progress 0 0 0
Total (C) + (D) 8 7 3
(2.2) Investment 0 63 10
(2.3) Current Assets, Loan & Advances
(A) Inventories 0 0 0
(B) Sundry Debtors 105 710 463
(C) Cash & Bank Balances 6515 5868 2597
(D) Other Current Assets 747 113 21
(E) Loan & Advances 1502 1319 418
Total (A)+ (B)+ (C)+ (D)+ (E) 8869 8010 3499
(2.4) Less:current Liabilities & Provisions
(A) Current Liabilities 1677 3799 1999
(B) Provisions 1362 1138 533
Total (A+B) 3039 4937 2532
(2.5) Net Current Assets (2.3-2.4) 5830 3073 967
(2.6) Deferred Revenue / Pre. Expenditure 0 0 0
(2.7) Deferred Tax Asset 0 0 0
(2.8) Profit & Loss Account(Dr) 0 0 0
Total (2.1+2.2+2.5+2.6+2.7+2.8) 5838 3143 980
Important Indicators 2010-11 2009-10 2008-09
(i) Investment 5 5 5
(ii) Capital Employed 5838 3080 970
(iii) Net Worth 5838 3143 980
(iv) Cost of Production 1200 1223 733
(v) Cost of Sales 1200 1223 733
(vi) Gross Value Added (At Market Price) - - -
(vii) Total Employees (Other Than Casuals) (Nos.) 0 0 0
(viii) Avg. Monthly Emoluments Per Employee (Rs.) 0 0 0
Profit & Loss Account (` in Lakhs)
Particulars 2010-11 2009-10 2008-09
(1) Income
(A) Sales/Operating Income 4606 4110 2085
(B) Excise Duty 0 0 0
(C) Net Sales (A-B) 4606 4110 2085
(D) Other Income/Receipts 653 417 154
(E) Accretion/Depletion in Stocks 0 0 0
(I)Total Income (C+D+E) 5259 4527 2239
(2) Expenditure
(A) Purchase of Finished Goods/ Consumption Of Raw Materials 0 0 0
(B) Stores & Spares 0 0 0
(C) Power & Fuel 39 31 0
(D) Manufacturing / Direct / Operating Expenses 626 253 369
(E) Salary, Wages & Benefits / Employee Exp. 0 584 195
(F) Other Expenses 506 280 167
(G) Provisions 0 0 0
(II)Total Expenditure (A to G) 1171 1148 731
(3) Profit Before Dep, Int, Taxes & EP (PBDITEP) (I-II) 4088 3379 1508
(4) Depreciation 2 1 1
(5) Dre/Prel Exp Written Off 0 0 0
(6) Profit Before Int., Taxes & Ep (PBITEP) (3-4-5) 4086 3378 1507
(7) Interest
(A) On Central Government Loans 0 0 0
(B) On Foreign Loans 0 0 0
(C) Others 27 74 1
(D) Less Interest Capitalised 0 0 0
(E) Charged to P & L Account (A+B+C-D) 27 74 1
(8) Profit Before Tax & EP(PBTEP) (6-7E) 4059 3304 1506
(9) Tax Provisions 1362 1139 531
(10) Net Profit / Loss Before EP (8-9) 2697 2165 975
(11) Net Extra-Ord. Items 1 3 0
(12) Net Profit / Loss(-) (10-11) 2696 2162 975
(13) Dividend Declared 0 0 0
(14) Dividend Tax 0 0 0
(15) Retained Profit (12-13-14) 2696 2162 975
Financial Ratios 2010-11 2009-10 2008-09
(i) Sales : Capital Employed 78.9 133.44 214.95
(ii) Cost of Sales : Sales 26.05 29.76 35.16
(iii) Salary / Wages : Sales 0 14.21 9.35
(iv) Net Profit : Net Worth 46.18 68.79 99.49
(v) Debt : Equity 0 0 0
(vi) Current Ratio 2.92 1.62 1.38
(vii) Sundry Debtors : Sales (No. of Days) 8.32 63.05 81.05
(viii) Total Inventory : Sales 0 0 0

498 Industrial Development & Tech. Consultancy Services
www.pfcindia.com
Power System operation Corporation Ltd (PoSoCo) was incorporated as a wholly owned subsidiary of Power Grid Corporation of India Ltd. on 20.03.2009. PoSoCo is responsible for independent System Operation. The certificate of commencement of business of the company has been obtained on the 23.03.2010.
Power System Operation Corporation Ltd. is an uncategorized CPSE in Industrial Development & Tech.Consultancy Services sector under the administrative control of Ministry of Power. Its Registered and Corporate offices are at New Delhi.
Vision / MissionThe Mission of the company is to ensure integrated operation
of Regional and National Power System to facilitate transfer of electric power within and across the regions and trans-national exchange of power with Reliability, Security and Economy.
Industrial / Business OperationsThe company is to exercise supervision and control of all
aspects concerning operational and manpower requirements of the Regional Load Dispatch Centers (RLDC) and National Load Dispatch Centers (NLDC).
The NLDC and RLDC have been ensuring smooth operation of the system in accordance with the provisions of Grid Code. PoSCo ensures that practices related to system operation are harmonized across all RLDC and NLDC.
Performance HighlightsThe operational performance of the company along with
performance indicators and selected financial ratios during the period 2008-09 to 2010-11 can be seen on the opposite page.
In the first year of operation, the company posted an income of `115.71 crore and a profit of `9.93 crore.
Human Resource ManagementThe company employed 445 regular employees as on
31.3.2011. The retirement age in the company is 60 years. It is following IDA 2007 pattern of remuneration. Details of employment during 2010-11 is given below:
Particulars 2010-11 2009-10 2008-09Executives including Non-Unionised Supervisors 309 0 0
Non-Executives # 136 0 0Total Employees 445 0 0
# Detail break-up of Non-Executive employees is at Statement no. 25 of volume-I of PE Survey.
All the employees and executives working with RLDCs and NLDC will form the cadre of PASoCo. All the employees of PASoCo will form the cadre of PoWERGRID, the holding company.
19.13 Power System Operation Corporation Ltd

499Public Enterprises Survey 2010-2011: Vol-II
Power System Operation Corporation Ltd B-9, Qutab Industrial Area KatwariaSarai, New Delhi 110 016
Balance Sheet (` in Lakhs)
Particulars 2010-11 2009-10 2008-09
Authorised Capital 20000 20000 0
(1) Sources Of Fund
(1.1) Shareholders Funds
(A) Paid-Up Capital
Central Govt 0 0 0
Others 3064 5 0
(B) Share Application Money 0 0 0
(C) Reserves & Surplus 4828 0 0
Total (A) + (B) + (C) 7892 5 0
(1.2) Loan Funds
(A) Secured Loans 0 0 0
(B) Unsecured Loans 8935 0 0
Total (A) + (B) 8935 0 0
(1.3) Deferred Tax Liability 0 0 0
Total (1.1) + (1.2) + (1.3) 16827 5 0
(2) Application Of Funds
(2.1) Fixed Assets
(A) Gross Block 27678 0 0
(B) Less Depreciation 22564 0 0
(C) Net Block (A-B) 5114 0 0
(D) Capital Work In Progress 75 0 0
Total (C) + (D) 5189 0 0
(2.2) Investment 0 0 0
(2.3) Current Assets, Loan & Advances
(A) Inventories 0 0 0
(B) Sundry Debtors 9002 0 0
(C) Cash & Bank Balances 99457 5 0
(D) Other Current Assets 1190 0 0
(E) Loan & Advances 4649 0 0
Total (A)+ (B)+ (C)+ (D)+ (E) 114298 5 0
(2.4) Less:current Liabilities & Provisions
(A) Current Liabilities 97112 128 0
(B) Provisions 5883 0 0
Total (A+B) 102995 128 0
(2.5) Net Current Assets (2.3-2.4) 11303 -123 0
(2.6) Deferred Revenue / Pre. Expenditure
0 0 0
(2.7) Deferred Tax Asset 335 0 0
(2.8) Profit & Loss Account(Dr) 0 128 0
Total (2.1+2.2+2.5+2.6+2.7+2.8) 16827 5 0
Important Indicators 2010-11 2009-10 2008-09
(i) Investment 3064 5 0
(ii) Capital Employed 16417 -123 0
(iii) Net Worth 7892 -123 0
(iv) Cost of Production 8930 0 0
(v) Cost of Sales 8930 0 0
(vi) Gross Value Added (At Market Price) - - -
(vii) Total Employees (Other Than Casuals) (Nos.)
445 0 0
(viii) Avg. Monthly Emoluments Per Employee (Rs.)
68446 0 0
Profit & Loss Account (` in Lakhs)
Particulars 2010-11 2009-10 2008-09
(1) Income
(A) Sales/Operating Income 9731 0 0
(B) Excise Duty 0 0 0
(C) Net Sales (A-B) 9731 0 0
(D) Other Income/Receipts 1840 0 0
(E) Accretion/Depletion in Stocks 0 0 0
(I)Total Income (C+D+E) 11571 0 0
(2) Expenditure
(A) Purchase of Finished Goods/ Consumption Of Raw Materials
0 0 0
(B) Stores & Spares 0 0 0
(C) Power & Fuel 0 0 0
(D) Manufacturing / Direct / Operating Expenses
2086 0 0
(E) Salary, Wages & Benefits / Employee Exp.
3655 0 0
(F) Other Expenses 0 0 0
(G) Provisions 0 0 0
(II)Total Expenditure (A to G) 5741 0 0
(3) Profit Before Dep, Int, Taxes & EP (PBDITEP) (I-II)
5830 0 0
(4) Depreciation 3092 0 0
(5) Dre/Prel Exp Written Off 0 0 0
(6) Profit Before Int., Taxes & Ep (PBITEP) (3-4-5)
2738 0 0
(7) Interest
(A) On Central Government Loans 0 0 0
(B) On Foreign Loans 0 0 0
(C) Others 97 0 0
(D) Less Interest Capitalised 0 0 0
(E) Charged to P & L Account (A+B+C-D)
97 0 0
(8) Profit Before Tax & EP(PBTEP) (6-7E)
2641 0 0
(9) Tax Provisions 1520 0 0
(10) Net Profit / Loss Before EP (8-9) 1121 0 0
(11) Net Extra-Ord. Items 128 0 0
(12) Net Profit / Loss(-) (10-11) 993 0 0
(13) Dividend Declared 306 0 0
(14) Dividend Tax 50 0 0
(15) Retained Profit (12-13-14) 637 0 0
Financial Ratios 2010-11 2009-10 2008-09
(i) Sales : Capital Employed 59.27 0 0
(ii) Cost of Sales : Sales 91.77 0 0
(iii) Salary / Wages : Sales 37.56 0 0
(iv) Net Profit : Net Worth 12.58 - 0
(v) Debt : Equity 1.13 0 0
(vi) Current Ratio 1.11 0.04 0
(vii) Sundry Debtors : Sales (No. of Days) 337.66 0 0
(viii) Total Inventory : Sales 0 0 0

500 Industrial Development & Tech. Consultancy Services
www.rites.com
RITES Ltd. (RITES) was incorporated on 26.04.1974 with the objective to provide railway related consultancy and inspection services in India and abroad.
RITES is a Schedule– ‘A’/ Mini Ratna CPSE in Infrastructure Development and Technical Consultancy Services sector under the administrative control of Ministry of Railways, with 100% Shareholding by the Government of India. Its registered office is at Delhi and corporate office is at RITES Bhavan sector 29, Gurgaon, Haryana.
Vision / MissionThe Mission of the Company is to provide concept to
commissioning consultancy, design, engineering and turnkey solutions in the field of transport, transportation infrastructure and related technologies of highest professional standards. To stay current with international trends and practices and assimilate state- of- the- art technologies to provide quality and value to client. To be recognized as a think tank for development of national policies, priorities and strategies in the Transportation and Infrastructure sector. The Vision of the Company is to be the foremost provider of techno economic services and solutions globally in the Transportation and Infrastructure Sector.
Industrial / Business OperationsRITES is engaged in providing consultancy, engineering and
project management Services including turnkey project in the field of transportation, infrastructure and related technologies in India and over 62 countries abroad.
The company has four Subsidiary Companies namely M/s RITES (AfRIKA) Proprietary Limited in Botswana and M/s Tanzania Railways Limited in Tanzania, RITES mohawarean Arabia co .Ltd in Saudi Arabia and RITES Infrastructure Services Ltd. in India and six financial joint ventures namely Geoconsult - RITES, Geoconsult – RITES NRT 1, RICoN, Ganga expressway consultant Pvt. Ltd., SAIL RITES Bengal Wagon Industry Pvt Ltd in India and Cominhos De ferro de Beira SARL, Beira (CCfB) in Mozambique with proportionate share of interest 13%, 16%, 51% 25%, 50% and 26% respectively. The service range of the company comprises of consultancy, export sales inspection and lease services etc. The performance of company during the period 2008-09 to 2010-11 are mentioned below:
Main Services Unit Performance During2010-11 2009-10 2008-09
Consultancy ` in Cr. 444.79 399.01 332.73Construction projects
` in Cr. 5.15 16.69 20.38
Export Sales ` in Cr. 148.55 47.19 59.40Inspection ` in Cr. 78.06 75.91 74.94Lease Services ` in Cr. 21.77 17.19 50.25Others ` in Cr. 182.68 67.27 134.50
Strategic Issuesfirst ever d o m e s t i c leasing of shunting locomotives
owned by RITES started w i t h B a n d e l Thermal Power Plant, Bandel, West Bengal in July, 2009. Company has so far supplied 8 more shunting locomotives for domestic leasing to various power / steel plants / ports. further, four shunting locomotives are under manufacture.
19.14 RITES Ltd.Performance Highlights
The operational performance of the company along with performance indicators and selected financial ratios during the period 2008-09to 2010-11 can be seen on the opposite page. The Company registered an increase of ` 280.98 crore in total income during 2010-11 which went up to ` 920.85 crore in 2010-11 from ` 639.87 crore during 2009-10. The net profit of the company increased to ` 243.92 crore, an increase of `
131.97 crore over the previous year due to increase in turnover and other income as a result of high productivity.
Human Resource ManagementThe Company employed 3134 regular employees
as on 31.03.2011. The retirement age in the Company is 60 years. It is following IDA 2007 and CDA 2006 pattern of remuneration. Details of employment in last 3 years are given below:
Particulars 2010-11 2009-10 2008-09Executives including Non-Unionised Supervisors
2646 1654 2516
Non-Executives # 488 1348 527
Total Employees 3134 3002 3043
# Detail break-up of Non-Executive employees is at Statement no. 25 of volume-I of PE Survey.

501Public Enterprises Survey 2010-2011: Vol-II
RITES Ltd.Scope minar, Laxminagar, Delhi-110092
Balance Sheet (` in Lakhs)
Particulars 2010-11 2009-10 2008-09
Authorised Capital 10000 10000 10000
(1) Sources Of Fund
(1.1) Shareholders Funds
(A) Paid-Up Capital
Central Govt 4000 4000 4000
Others 0 0 0
(B) Share Application Money 0 0 0
(C) Reserves & Surplus 84176 65484 56975
Total (A) + (B) + (C) 88176 69484 60975
(1.2) Loan Funds
(A) Secured Loans 0 0 0
(B) Unsecured Loans 0 0 0
Total (A) + (B) 0 0 0
(1.3) Deferred Tax Liability 0 0 0
Total (1.1) + (1.2) + (1.3) 88176 69484 60975
(2) Application Of Funds
(2.1) Fixed Assets
(A) Gross Block 23654 20208 18263
(B) Less Depreciation 9039 7429 6376
(C) Net Block (A-B) 14615 12779 11887
(D) Capital Work In Progress 3578 3591 1173
Total (C) + (D) 18193 16370 13060
(2.2) Investment 11233 6206 5411
(2.3) Current Assets, Loan & Advances
(A) Inventories 9342 5082 3679
(B) Sundry Debtors 35078 21915 22786
(C) Cash & Bank Balances 156540 111616 81220
(D) Other Current Assets 3965 3973 3256
(E) Loan & Advances 35056 24587 34203
Total (A)+ (B)+ (C)+ (D)+ (E) 239981 167173 145144
(2.4) Less:current Liabilities & Provisions
(A) Current Liabilities 160095 108662 84503
(B) Provisions 25640 17449 22460
Total (A+B) 185735 126111 106963
(2.5) Net Current Assets (2.3-2.4) 54246 41062 38181
(2.6) Deferred Revenue / Pre. Expenditure
4504 0 0
(2.7) Deferred Tax Asset 0 5846 4323
(2.8) Profit & Loss Account(Dr) 0 0 0
Total (2.1+2.2+2.5+2.6+2.7+2.8) 88176 69484 60975
Important Indicators 2010-11 2009-10 2008-09
(i) Investment 4000 4000 4000
(ii) Capital Employed 68861 53841 50068
(iii) Net Worth 83672 69484 60975
(iv) Cost of Production 55761 47344 53994
(v) Cost of Sales 51776 45683 52059
(vi) Gross Value Added (At Market Price) - - -
(vii) Total Employees (Other Than Casuals) (Nos.)
3134 3002 3043
(viii) Avg. Monthly Emoluments Per Employee (Rs.)
64755 60587 60196
Profit & Loss Account (` in Lakhs)
Particulars 2010-11 2009-10 2008-09
(1) Income
(A) Sales/Operating Income 75050 60236 58285
(B) Excise Duty 5218 4637 4515
(C) Net Sales (A-B) 69832 55599 53770
(D) Other Income/Receipts 18268 6727 13450
(E) Accretion/Depletion in Stocks 3985 1661 1935
(I)Total Income (C+D+E) 92085 63987 69155
(2) Expenditure
(A) Purchase of Finished Goods/ Consumption Of Raw Materials
13074 4634 4754
(B) Stores & Spares 345 965 2857
(C) Power & Fuel 238 217 186
(D) Manufacturing / Direct / Operating Expenses
11695 10783 12289
(E) Salary, Wages & Benefits / Employee Exp.
24353 21826 21981
(F) Other Expenses 4049 4090 3954
(G) Provisions 286 3665 6908
(II)Total Expenditure (A to G) 54040 46180 52929
(3) Profit Before Dep, Int, Taxes & EP (PBDITEP) (I-II)
38045 17807 16226
(4) Depreciation 1232 1164 1065
(5) Dre/Prel Exp Written Off 489 0 0
(6) Profit Before Int., Taxes & Ep (PBITEP) (3-4-5)
36324 16643 15161
(7) Interest
(A) On Central Government Loans 0 0 0
(B) On Foreign Loans 0 0 0
(C) Others 0 0 0
(D) Less Interest Capitalised 0 0 0
(E) Charged to P & L Account (A+B+C-D)
0 0 0
(8) Profit Before Tax & EP(PBTEP) (6-7E)
36324 16643 15161
(9) Tax Provisions 11909 5370 5541
(10) Net Profit / Loss Before EP (8-9) 24415 11273 9620
(11) Net Extra-Ord. Items 23 78 192
(12) Net Profit / Loss(-) (10-11) 24392 11195 9428
(13) Dividend Declared 4900 2300 2000
(14) Dividend Tax 800 386 340
(15) Retained Profit (12-13-14) 18692 8509 7088
Financial Ratios 2010-11 2009-10 2008-09
(i) Sales : Capital Employed 101.41 103.27 107.39
(ii) Cost of Sales : Sales 74.14 82.17 96.82
(iii) Salary / Wages : Sales 34.87 39.26 40.88
(iv) Net Profit : Net Worth 29.15 16.11 15.46
(v) Debt : Equity 0 0 0
(vi) Current Ratio 1.29 1.33 1.36
(vii) Sundry Debtors : Sales (No. of Days)
183.35 143.87 154.68
(viii) Total Inventory : Sales 48.83 33.36 24.97

504 Industrial Development & Tech. Consultancy Services
www.wapcos.gov.in
WAPCoS was incorporated on 26.06.1969 under the Companies Act. 1956 with the objective to perform the role of a premier agency for offering integrated package of services of the highest scientific, technological and managerial quality with a view to ensure optimal planning and development of water resources and maximizing the efficiency of its utilization.
WAPCoS is a Schedule-‘B’ Miniratna CPSE in Industrial Development and Technical Consultancy service sector, under the administrative control of Ministry of Water Resources with 100% shareholding by the Government of India. Its registered and corporate offices are at New Delhi.
Vision / MissionThe Vision of the Company is to be a Premier Consultancy
organisation recognised as a Brand in Water, Power and Infrastructure Development for Total Project Solutions in India and Abroad.
The Mission of the Company is to have Sustainable Profitable Growth, Excellence in Performance; use of State-of-the-art Technical Expertise; Innovativeness; Capacity Building and Meeting Society’s Needs.
Industrial / Business OperationsWAPCOS, an ISO 9001:2008 certified company has been
providing consultancy services in all facets of Water Resources, Power and Infrastructure Sectors in India and abroad. The quality management systems of WAPCoS comply with the Quality Assurance requirements of ISo 9001:2008 for Consultancy Services in Water Resources, Power and Infrastructure Development Projects. The Order Book Position for the last three years has been as follows:Geographical Segments
Unit Performance During2010-11 2009-10 2008-09
Domestic orders in crore 204.93 143.76 124.96
Overseas orders in crore 191.55 172.08 127.50
Total orders in crore 396.48 315.84 252.46
Strategic issueWAPCoS strategic importance is in Contribution to National
Development – Involved in JNNURM, PMGSY, Bharat Nirman, NREGA, IEC Programmes, Water Harvesting, Water Resources Development Projects etc. WAPCoS has technical superiority in Water & Power Sector. Even when Government Departments desire highly technically involved study to be conducted in record time period, maintaining the secrecy /confidentiality, WAPCOS has come to their rescue. Under the Administration of Govt. of India, it is the only organisation capable of maintaining confidentiality of data of inter-state / inter Country Rivers while preparing feasibility Reports, DPRs, field Investigations etc. and also while carryings out surveys in border areas like Gujarat, Rajasthan etc.
The presence of WAPCOS in the market, forces the competitors to quote on competitive basis. Besides, WAPCoS works on low profit margins within the low budgetary allocations of State Govt. On several occasions works on credit for cash starved State Govts. have been carried out in the interest of continued development works in the states.
19.16 WAPCOS Ltd.MEA has awarded a number of projects to WAPCoS directly
in other countries such as Bhutan, Zimbabwe, Afghanistan, Ethiopia, Cambodia etc. WAPCoS has been representing at various National and International forums to project Company’s image as a leading consultancy firm in Water Resources, Power and Infrastructure Development. As a part of Brand Building during the year under review, Officers of WAPCOS vigorously participated in National/International events. Thus, WAPCoS assists MEA in projecting India’s image abroad.
Performance HighlightsThe operational performance of the company along with
performance indicators and selected financial ratios during the period 2008-09 to 2010-11 can be seen on the opposite page.
The Company registered an increase of ` 50.62 crore in total income during 2010-11 which went up to ` 356.86 crore in 2010-11 from ` 306.24 crore during 2009-10. The net profit of the company correspondingly increased to ` 36.18 crore, an increase of ` 6.15 crore over the previous year due to increase in business. In addition, export projects valued at US$ 20 Million have been negotiated and agreements are under finalization.
Turnover per Employees, reflecting productivity of the company grew to ` 26.77 lakh in the year 2010-11 from ` 21.89 lakh in 2009-10 (increase of 21.88%)
Human Resource ManagementThe company employed 514 regular employees as on
31.3.2011. The retirement age in the company is 60 years. It is following IDA 2007 pattern of remuneration. Details of employment in last 3 years are given below:
(Nos.)Particulars 2010-11 2009-10 2008-09
Executives including Non-Unionised Supervisors
388 320 873
Non-Executives # 126 188 506Total Employees 514 508 1379
# Detail break-up of Non-Executive employees is at Statement no. 25 of volume-I of PE Survey.
The Company derives strength from its Human Resources, which is its backbone. The company has inbuilt capability to provide multi-disciplinary teams comprising of its own core group of professionals and specialist from various organizations of Government of India and other State Government Departments. In order to develop Company’s own cadre, appointments were made of Experts / Engineer Trainees and Management Trainees. Further, the technical know-how possessed by deputationists has been got transferred to Company’s own Engineers. Better working conditions have been provided to employees to enable them to provide their best to Organization.

505Public Enterprises Survey 2010-2011: Vol-II
WAPCOS Ltd.5th floor Kalish, 26 Kasturba Gandhi Marg, New Delhi.110 001
Balance Sheet (` in Lakhs)
Particulars 2010-11 2009-10 2008-09
Authorised Capital 200 200 200
(1) Sources Of Fund
(1.1) Shareholders Funds
(A) Paid-Up Capital
Central Govt 200 200 200
Others 0 0 0
(B) Share Application Money 0 0 0
(C) Reserves & Surplus 12369 9622 7321
Total (A) + (B) + (C) 12569 9822 7521
(1.2) Loan Funds
(A) Secured Loans 0 0 0
(B) Unsecured Loans 0 0 0
Total (A) + (B) 0 0 0
(1.3) Deferred Tax Liability 0 0 0
Total (1.1) + (1.2) + (1.3) 12569 9822 7521
(2) Application Of Funds
(2.1) Fixed Assets
(A) Gross Block 1587 1511 1484
(B) Less Depreciation 697 638 637
(C) Net Block (A-B) 890 873 847
(D) Capital Work In Progress 0 0 0
Total (C) + (D) 890 873 847
(2.2) Investment 4 3 3
(2.3) Current Assets, Loan & Advances
(A) Inventories 301 4197 2143
(B) Sundry Debtors 16782 13214 9586
(C) Cash & Bank Balances 10312 5373 5559
(D) Other Current Assets 90 30 39
(E) Loan & Advances 11881 10037 12753
Total (A)+ (B)+ (C)+ (D)+ (E) 39366 32851 30080
(2.4) Less:current Liabilities & Provisions
(A) Current Liabilities 22569 19845 18616
(B) Provisions 5774 4684 5312
Total (A+B) 28343 24529 23928
(2.5) Net Current Assets (2.3-2.4) 11023 8322 6152
(2.6) Deferred Revenue / Pre. Expenditure 0 0 0
(2.7) Deferred Tax Asset 652 624 519
(2.8) Profit & Loss Account(Dr) 0 0 0
Total (2.1+2.2+2.5+2.6+2.7+2.8) 12569 9822 7521
Important Indicators 2010-11 2009-10 2008-09
(i) Investment 200 200 200
(ii) Capital Employed 11913 9195 6999
(iii) Net Worth 12569 9822 7521
(iv) Cost of Production 30036 26065 19231
(v) Cost of Sales 30036 26065 19231
(vi) Gross Value Added (At Market Price) - - -
(vii) Total Employees (Other Than Casuals) (Nos.) 514 508 1379
(viii) Avg. Monthly Emoluments Per Employee (Rs.) 96903 85679 32669
Profit & Loss Account (` in Lakhs)
Particulars 2010-11 2009-10 2008-09
(1) Income
(A) Sales/Operating Income 35118 30214 20508
(B) Excise Duty 0 0 0
(C) Net Sales (A-B) 35118 30214 20508
(D) Other Income/Receipts 568 410 855
(E) Accretion/Depletion in Stocks 0 0 0
(I)Total Income (C+D+E) 35686 30624 21363
(2) Expenditure
(A) Purchase of Finished Goods/ Consumption Of Raw Materials 0 0 0
(B) Stores & Spares 0 0 0
(C) Power & Fuel 170 104 77
(D) Manufacturing / Direct / Operating Expenses 742 653 403
(E) Salary, Wages & Benefits / Employee Exp. 5977 5223 5406
(F) Other Expenses 22870 19698 12955
(G) Provisions 185 309 304
(II)Total Expenditure (A to G) 29944 25987 19145
(3) Profit Before Dep, Int, Taxes & EP (PBDITEP) (I-II) 5742 4637 2218
(4) Depreciation 92 78 86
(5) Dre/Prel Exp Written Off 0 0 0
(6) Profit Before Int., Taxes & Ep (PBITEP) (3-4-5) 5650 4559 2132
(7) Interest
(A) On Central Government Loans 0 0 0
(B) On Foreign Loans 0 0 0
(C) Others 0 0 0
(D) Less Interest Capitalised 0 0 0
(E) Charged to P & L Account (A+B+C-D) 0 0 0
(8) Profit Before Tax & EP(PBTEP) (6-7E) 5650 4559 2132
(9) Tax Provisions 1890 1520 783
(10) Net Profit / Loss Before EP (8-9) 3760 3039 1349
(11) Net Extra-Ord. Items 142 36 -27
(12) Net Profit / Loss(-) (10-11) 3618 3003 1376
(13) Dividend Declared 750 600 350
(14) Dividend Tax 122 102 59
(15) Retained Profit (12-13-14) 2746 2301 967
Financial Ratios 2010-11 2009-10 2008-09
(i) Sales : Capital Employed 294.79 328.59 293.01
(ii) Cost of Sales : Sales 85.53 86.27 93.77
(iii) Salary / Wages : Sales 17.02 17.29 26.36
(iv) Net Profit : Net Worth 28.79 30.57 18.3
(v) Debt : Equity 0 0 0
(vi) Current Ratio 1.39 1.34 1.26
(vii) Sundry Debtors : Sales (No. of Days) 174.42 159.63 170.61
(viii) Total Inventory : Sales 3.13 50.7 38.14

505Public Enterprises Survey 2010-2011: Vol-II
As on 31.3.2011, there were 9 Central Public Sector Enterprises in the Tourist Services group. The name of these enterprises along with their year of incorporation in chronological order are given below :
Sl. No.
Enterprise Year of Incorporation
1. India Tourism Dev. Corpn. Ltd. 1966
2. Hotel Corpn. of India Ltd. 1971
3. Ranchi Ashok Bihar Hotel Corpn. Ltd. 1983
4. Utkal Ashok Hotel Corpn. Ltd. 1983
5. Assam Ashok Hotel Corpn. Ltd. 1985
6. Donyi Polo Ashok Hotel Ltd. 1985
7. Madhya Pradesh Ashok Hotel Corpn. Ltd. 1985
8. Pondicherry Ashok Hotel Corpn. Ltd. 1986
9. Indian Railway Catering And Tourism Corpn. Ltd.
1999
2. The enterprises falling in this group are mainly engaged in Construction and Management of Hotels, Restaurants, Tourist Bunglows, Duty free Trade etc.
3. The consolidated financial position, the working results and the important management ratios of these enterprises are appended.
4. Turnover : The details of turnover of individual enterprises are given below :
(`in Crore)Sl. No.
Enterprise Turnover
2010-11 2009-10
1. Indian Railway Catering And Tourism Corpn. Ltd.
741.23 694.95
2. India Tourism Dev. Corpn. Ltd. 367.18 271.59
3. Hotel Corpn. of India Ltd. 48.38 39.63
4. Assam Ashok Hotel Corpn. Ltd. 5.81 3.75
5. Madhya Pradesh Ashok Hotel Corpn. Ltd.
5.04 4.18
6. Ranchi Ashok Bihar Hotel Corpn. Ltd.
2.32 2.62
7. Pondicherry Ashok Hotel Corpn. Ltd. 2.19 2.20
8. Donyi Polo Ashok Hotel Ltd. 1.96 2.18
9. Utkal Ashok Hotel Corpn. Ltd. 0.00 0.00
Sub Total 1174.11 1021.10
5. Net Profit/Loss : The details of the enterprises, which earned net profit or sustained net loss (-) are given below :
20 Tourist Services(`in Crore)
Sl. No.
Enterprise Adjusted Net Profit/Net Loss
2010-11 2009-10
1. Indian Railway Catering And Tourism Corpn. Ltd.
60.79 63.05
2. Madhya Pradesh Ashok Hotel Corpn. Ltd.
0.32 0.72
3. Donyi Polo Ashok Hotel Ltd. 0.19 0.07
4. Pondicherry Ashok Hotel Corpn. Ltd. 0.06 0.09
5. Ranchi Ashok Bihar Hotel Corpn. Ltd.
-0.55 0.10
6. Assam Ashok Hotel Corpn. Ltd. -0.59 -1.18
7. Utkal Ashok Hotel Corpn. Ltd. -0.71 -1.60
8. India Tourism Dev. Corpn. Ltd. -8.59 -14.31
9. Hotel Corpn. of India Ltd. -20.20 -29.11
Sub Total 30.72 17.83
6. Dividend : The details of the dividend declared by the individual enterprise are given below :
(`in Crore)Sl. No.
Enterprise Dividend
2010-11 2009-10
1. Indian Railway Catering And Tourism Corpn. Ltd.
12.16 12.61
Group Total 12.16 12.61
7. Social Overheads and Township : The total number of persons employed and the expenditure incurred on social overheads and townships are given below :
(`in Crore)Sl. No.
Enterprise Township and Social Overheads
2010-11 2009-10
1. No. of employees (in number) 5806 6583
2. Social overheads : (Rupees in Crore)
(i) Educational, 0.02 0.01
(ii) Medical facilities 0.00 2.33
(iii) others 0.00 0.00
3. Capital cost of township (Rupees in Crore)
0.00 0.00
4. No. of houses constructed (in number)
0 2
8. Company wise details in respect of Balance Sheet, Profit and Loss account, Important Indicators and Financial Ratios along with the write up of individual company are given in the pages below.

506 Tourist Services

507Public Enterprises Survey 2010-2011: Vol-II
Tourist ServicesBalance Sheet
(` in Lakhs)
(` in Lakhs)
Particulars 2010-11 2009-10 2008-09
AUTHoRISED CAPITAL 807166 735939 379481
(1) SOURCES OF FUND
(1.1) SHAREHoLDERS fUNDS
(A) PAID-UP CAPITAL
CENTRAL GoVT 365715 243123 158151
oTHERS 52391 34336 33023
(B) SHARE APPLICATIoN MoNEY 0 1500 0
(C) RESERVES & SURPLUS 2048609 1864802 1689081
TOTAL (A) + (B) + (C) 2466715 2143761 1880255
(1.2) LoAN fUNDS
(A) SECURED LoANS 1886791 1276691 803122
(B) UNSECURED LoANS 3395898 3338996 2987521
TOTAL (A) + (B) 5282689 4615687 3790643
(1.3) DEfERRED TAX LIABILITY 76719 28811 26082
TOTAL (1.1) + (1.2) + (1.3) 7826123 6788259 5696980
(2) APPLICATION OF FUNDS
(2.1) fIXED ASSETS
(A) GRoSS BLoCK 7020389 6201203 5022428
(B) LESS DEPRECIATIoN 1901404 1609158 1354216
(C) NET BLoCK (A-B) 5118985 4592045 3668212
(D) CAPITAL WoRK IN PRoGRESS 804987 811189 994095
TOTAL (C) + (D) 5923972 5403234 4662307
(2.2) INVESTMENT 221253 180505 143852
(2.3) CURRENT ASSETS,LoAN & ADVANCES
(A) INVENToRIES 115660 124812 131383
(B) SUNDRY DEBToRS 492308 450603 427062
(C) CASH & BANK BALANCES 549507 580643 658266
(D) oTHER CURRENT ASSETS 99094 96774 80869
(E) LoAN & ADVANCES 721074 886765 773809
TOTAL (A)+ (B)+ (C)+ (D)+ (E) 1977643 2139597 2071389
(2.4) LESS:CURRENT LIABILITIES & PRoVISIoNS
(A) CURRENT LIABILITIES 1295402 1198292 1049524
(B) PRoVISIoNS 742492 756125 598152
TOTAL (A+B) 2037894 1954417 1647676
(2.5) NET CURRENT ASSETS(2.3-2.4) -60251 185180 423713
(2.6) DEfERRED REVENUE / PRE.EXPENDITURE 80 154 15953
(2.7) DEfERRED TAX ASSET 305364 306969 335510
(2.8) PRofIT & LoSS ACCoUNT(DR) 1435705 712217 115645
TOTAL (2.1+2.2+2.5+2.6+2.7+2.8) 7826123 6788259 5696980

508 Tourist Services
Tourist ServicesProfit and Loss Account
(` in Lakhs)
(` in Lakhs)
Particulars 2010-11 2009-10 2008-09
(1) INCoME
(A) SALES/oPERATING 2911894 2732993 2756167
(B) EXCISE DUTY 1785 1475 617
(C) NET SALES (A-B) 2910109 2731518 2755550
(D) oTHER INCoME/RECEIPTS 127708 153714 137545
(I)TOTAL INCOME (C+D+E) 3037555 2884795 2893153
(2) EXPENDITURE
(A) PURCHASE of fINISHED GooDS CoNSUMPTIoN of RAW MATERIALS 3963 1575 4426
(B) SToRES & SPARES 131971 167182 92982
(C) PoWER & fUEL 820597 692642 916380
(D) MANUfACTURING / DIRECT / oPERATING EXPENSES 948174 948260 918798
(E)SALARY,WAGES & BENEfITS / EMPLoYEE EXP. 630143 592378 573164
(f)oTHER EXPENSES 126228 194685 323332
(G)PRoVISIoNS 75664 26473 13907
(II)TOTAL EXPENDITURE (A to G) 2736740 2623195 2842989
(3) PRofIT BEfoRE DEP. INT. TAXES & EP(PBDITEP) (I-II) 300815 261600 50164
(4) DEPRECIATIoN 345064 294555 255342
(5) DRE/PREL EXP WRITTEN off 7041 8 12
(6) PRofIT BEfoRE INT., TAXES & EP (PBITEP) (3-4-5) -51290 -32963 -205190
(7) INTEREST
(A) oN CENTRALGoVERNMENT LoANS 224 477 144
(B) oN foREIGN LoANS 122368 74777 42658
(C) oTHERS 241058 198250 146516
(D) LESS INTEREST CAPITALISED 0 0 0
(E) CHARGED To P & L ACCoUNT (A+B+C-D) 363650 273504 189318
(8)PROFIT BEFORE TAX & EP(PBTEP) (6-7E) -414940 -306467 -394508
(9) TAX PRoVISIoNS 95679 87478 -49989
(10) NET PRofIT / LoSS(-) BEfoRE EP (8-9) -510619 -393945 -344519
(11) NET EXTRA-oRD.ITEMS -8553 -393 12032
(12) NET PROFIT / LOSS(-) (10-11) -502066 -393552 -356551
(13) DIVIDEND DECLARED 63809 55434 62622
(14) DIVIDEND TAX 10447 9239 10642
(15) RETAINED PROFIT (12-13-14) -576322 -458225 -429815

509Public Enterprises Survey 2010-2011: Vol-II
Tourist ServicesManagement Ratio
Particulars 2010-11 2009-10 2008-09
(A.) INDICATORS
(I) GENERAL(Rs. in Lakhs)
(i) INVESTMENT 3118944 2700275 2186690
(ii) CAPITAL EMPLoYED 5058734 4777225 4091925
(iii) NET WoRTH 1030930 1431390 1748657
(iv) CoST of PRoDUCTIoN 3452495 3191262 3287661
(v) CoST of SALES 3452757 3191699 3287603
(vi) VALUE ADDED 1953316 1869682 1741820
(vii) R AND D EXPENDITURE 109 0 494
(II) HUMAN RESOURCE
(viii) EMPLoYEES (oTHER THAN CASUAL)(Nos.) 54844 59012 60923
(ix) AVG.MoNTHLY EMoLUMENTS PER EMPLoYEE(Rs.) 95748 83652 78400
(B.) MANAGEMENT RATIO
(i) DEBT : EQUITY 2.14 2.15 2.02
(ii) CURRENT RATIo (CURRENT ASSET:CURRENT- LIABILITY 0.97 1.09 1.26
(iii) PBDITEP : TOTAL EMPLOYEMENT (Rs. in Lakhs) 5.48 4.43 0.82
(iv) SUNDRY DEBToRS : SALES (No. of days) 61.75 60.21 56.57
(v) INVENToRY(No. of days)
(a) ToTAL INVENToRY : SALES 14.51 16.68 17.4
(b) SEMI/fINISHED GooDS : SALES 0.06 0.31 0.17
(vi) INCREMENTAL CAPITAL oUTPUT RATIo(ICoR) 1.57 -27.94 9.39
(%)
(vii) SALES : CAPITAL EMPLoYED 57.53 57.18 67.34
(viii) PBDITEP : CAPITAL EMPLoYED 5.95 5.48 1.23
(ix) PBITEP : CAPITAL EMPLoYED -1.01 -0.69 -5.01
(x) CoST of SALES : SALES 118.65 116.85 119.31
(xi) MATERIAL CoST : SALES 0.14 0.06 0.16
(xii) SALARY & WAGES : SALES 21.65 21.69 20.8
(xiii) R & D EXPENDITURE : SALES 0 0 0.02
(xiv) PBITEP : SALES -1.76 -1.21 -7.45
(xv) PBTEP : NET WoRTH -40.25 -21.41 -22.56
(xvi) NET PRofIT : NET WoRTH -48.7 -27.49 -20.39
(xvii) GRoSS MARGIN : GRoSS BLoCK 4.28 4.22 1

510 Tourist Services
www.theashokgroup.com
Assam Ashok Hotel Corporation Ltd. (AAHCL) was incorporated on 7.1.1982 with the objective to promote domestic tourism and to have a close coordination between the Center and the State.
AAHCL is an uncategorised CPSE in Tourist Services sector under the administrative control of M/o Tourism. Its Registered and Corporate offices are at Guwahati, Assam. AAHCL is a subsidiary of ITDC Ltd. which holds 51% of its equity and Govt. of Assam hold 49%.
Vision / MissionThe Vision and Mission of the Company is to The Vision /
Mission of the Company is to achieve the excellence as business enterprises through the utmost professional approach towards guest satisfaction by providing customer oriented service in a contemporary ambience.
Industrial / Business OperationsAAHCL is engaged in providing services in the field
of Hotel Business through its 52 twin bedded Room hotel (Hotel Brahmaputra Ashok) at Guwahati, Assam. The physical performances of the company for last three years are given below:
Main Services Unit Performance During2010-11 2009-10 2008-09
Room occupancy % 55 37 47
Strategic IssuesThe Hotel Brahmaputra Ashok, built with traditional
Assamese décor, is positioned as the first 5 Star property of the North East with facilities comparable to the other economic hubs of the country.
Performance HighlightsThe operational performance of the company along with
performance indicators and selected financial ratios during the period 2008-09 to 2010-11 can be seen on the opposite page.
The Company registered an increase of ` 2.14 crore in total income during 2010-11 which went up to ` 5.92 crore in 2010-11 from ` 3.78 crore during 2009-10. The net loss of the company correspondingly reduced to ` 0.59 crore, a reduction of ` 0.59 crore over the previous year loss of ` 1.18 crore due to increase in occupancy and turnover. The losses in the current year are due to pay revision of employees as per 6th pay commission report of Govt. of Assam.
20.1 Assam Ashok Hotel Corporation Ltd.Human Resource Management
The company employed 75 regular employees as on 31.3.2011. The retirement age in the Company is 58 years. It is following IDA 2007 and CDA 2006 pattern of remuneration. Details of employment in last 3 years are given below:
Particulars 2010-11 2009-10 2008-09Executives including Non-Unionised Supervisors 5 4 4
Non-Executives # 70 70 70Total Employees 75 74 74
# Detail break-up of Non-Executive employees is at Statement no. 25 of volume-I of PE Survey.

511Public Enterprises Survey 2010-2011: Vol-II
Assam Ashok Hotel Corporation Ltd.Hotel Brahamputra Ashok, M.G Road, Guwahati, Assam – 781 001
Particulars 2009-10 2008-09 2007-08Balance Sheet (` in Lakhs)
Particulars 2010-11 2009-10 2008-09
Authorised Capital 450 450 450
(1) Sources Of Fund
(1.1) Shareholders Funds
(A) Paid-Up Capital
Central Govt 0 0 0
Others 100 100 100
(B) Share Application Money 0 0 0
(C) Reserves & Surplus 25 25 25
Total (A) + (B) + (C) 125 125 125
(1.2) Loan Funds
(A) Secured Loans 277 259 241
(B) Unsecured Loans 0 0 0
Total (A) + (B) 277 259 241
(1.3) Deferred Tax Liability 0 0 0
Total (1.1) + (1.2) + (1.3) 402 384 366
(2) Application Of Funds
(2.1) Fixed Assets
(A) Gross Block 475 458 455
(B) Less Depreciation 257 245 233
(C) Net Block (A-B) 218 213 222
(D) Capital Work In Progress 8 14 9
Total (C) + (D) 226 227 231
(2.2) Investment 0 0 0
(2.3) Current Assets, Loan & Advances
(A) Inventories 15 10 12
(B) Sundry Debtors 100 119 214
(C) Cash & Bank Balances 87 16 33
(D) Other Current Assets 0 0 0
(E) Loan & Advances 47 43 50
Total (A)+ (B)+ (C)+ (D)+ (E) 249 188 309
(2.4) Less:current Liabilities & Provisions
(A) Current Liabilities 572 528 555
(B) Provisions 119 61 59
Total (A+B) 691 589 614
(2.5) Net Current Assets (2.3-2.4) -442 -401 -305
(2.6) Deferred Revenue / Pre. Expenditure 0 0 0
(2.7) Deferred Tax Asset 0 0 0
(2.8) Profit & Loss Account(Dr) 618 558 440
Total (2.1+2.2+2.5+2.6+2.7+2.8) 402 384 366
Important Indicators 2010-11 2009-10 2008-09
(i) Investment 100 100 100
(ii) Capital Employed -224 -188 -83
(iii) Net Worth -493 -433 -315
(iv) Cost of Production 646 486 544
(v) Cost of Sales 646 486 544
(vi) Gross Value Added (At Market Price) - - -
(vii) Total Employees (Other Than Casuals) (Nos.) 75 74 74
(viii) Avg. Monthly Emoluments Per Employee (Rs.) 38222 21622 21396
Profit & Loss Account (` in Lakhs)
Particulars 2010-11 2009-10 2008-09
(1) Income
(A) Sales/Operating Income 581 375 518
(B) Excise Duty 0 0 0
(C) Net Sales (A-B) 581 375 518
(D) Other Income/Receipts 11 3 37
(E) Accretion/Depletion in Stocks 0 0 0
(I)Total Income (C+D+E) 592 378 555
(2) Expenditure
(A) Purchase of Finished Goods/ Consumption Of Raw Materials 75 56 138
(B) Stores & Spares 0 0 0
(C) Power & Fuel 51 43 45
(D) Manufacturing / Direct / Operating Expenses 63 62 137
(E) Salary, Wages & Benefits / Employee Exp. 344 192 190
(F) Other Expenses 74 37 0
(G) Provisions 6 63 0
(II)Total Expenditure (A to G) 613 453 510
(3) Profit Before Dep, Int, Taxes & EP (PBDITEP) (I-II) -21 -75 45
(4) Depreciation 12 12 13
(5) Dre/Prel Exp Written Off 0 0 0
(6) Profit Before Int., Taxes & Ep (PBITEP) (3-4-5) -33 -87 32
(7) Interest
(A) On Central Government Loans 0 0 0
(B) On Foreign Loans 0 0 0
(C) Others 21 21 21
(D) Less Interest Capitalised 0 0 0
(E) Charged to P & L Account (A+B+C-D) 21 21 21
(8) Profit Before Tax & EP(PBTEP) (6-7E) -54 -108 11
(9) Tax Provisions 0 0 5
(10) Net Profit / Loss Before EP (8-9) -54 -108 6
(11) Net Extra-Ord. Items 5 10 -34
(12) Net Profit / Loss(-) (10-11) -59 -118 40
(13) Dividend Declared 0 0 0
(14) Dividend Tax 0 0 0
(15) Retained Profit (12-13-14) -59 -118 40
Financial Ratios 2010-11 2009-10 2008-09
(i) Sales : Capital Employed -259.38 -199.47 -624.1
(ii) Cost of Sales : Sales 111.19 129.6 105.02
(iii) Salary / Wages : Sales 59.21 51.2 36.68
(iv) Net Profit : Net Worth - - -
(v) Debt : Equity 2.22 2.07 1.93
(vi) Current Ratio 0.36 0.32 0.5
(vii) Sundry Debtors : Sales (No. of Days) 62.82 115.83 150.79
(viii) Total Inventory : Sales 9.42 9.73 8.46

512 Tourist Services
www.theashokgroup.com
Donyi Polo Ashok Hotel Ltd. (DPAHL) a joint venture of India Tourism Development Corporation Limited (ITDC) and Arunachal Pradesh Industrial Development and financial Corporation Limited (APIDfC) was incorporated in 1985 with the objective to promote tourism and to have closure coordination between the center and the state efforts to disperse benefits of tourism.
DPAHCL is an uncategorised CPSE in Tourist Services sector under the administrative control of M/o Tourism. Its Registered and Corporate offices are at Itanagar, Arunachal Pradesh. DPAHL is a subsidiary of ITDC Ltd. which holds 51% share in its equity.
Vision/MissionThe Mission / vision of the Company is to promote
tourism.
Industrial / Business OperationsDPAHL is providing services in the field of hotel business,
boarding and lodging, through its single hotel (Hotel Donyi Polo Ashok) at Itanagar, Arunachal Pradesh. The physical performances of the company for last three years are given below:
Main Services
Unit Performance During2010-11 2009-10 2008-09
Room days sold
% Occupancy 56 61 67
Performance HighlightsThe operational performance of the company along with
performance indicators and selected financial ratios during the period 2008-09 to 2010-11 can be seen on the opposite page.
The Company registered a reduction of ` 0.26 crore in total income during 2010-11 which went down to ` 2.04 crore in 2010-11 from ` 2.30 crore during 2009-10 due to fall in occupancy rate. The net profit of the company however increased to ` 0.19 crore, an increase of ` 0.12 crore over the previous year due to reduction in operating cost.
Human Resource ManagementThe company employed 43 regular employees as on
31.3.2011. The retirement age in the company is 60 years. It is following IDA 2007 and CDA 2006 pattern of remuneration. Details of employment in last 3 years are given below:
Particulars 2010-11 2009-10 2008-09Executives including Non-Unionised Supervisors 4 4 6
Non-Executives # 39 39 32Total Employees 43 43 38
# Detail break-up of Non-Executive employees is at Statement no. 25 of volume-I of PE Survey.
20.2 Donyi Polo Ashok Hotel Ltd.

513Public Enterprises Survey 2010-2011: Vol-II
Donyi Polo Ashok Hotel Ltd.Hotel Donyi Polo Ashok Sector-C, Itanagar, Arunachal Pradesh 791111
Balance Sheet (` in Lakhs)
Particulars 2010-11 2009-10 2008-09
Authorised Capital 100 100 100
(1) Sources Of Fund
(1.1) Shareholders Funds
(A) Paid-Up Capital
Central Govt 0 0 51
Others 100 100 49
(B) Share Application Money 0 0 0
(C) Reserves & Surplus 96 77 61
Total (A) + (B) + (C) 196 177 161
(1.2) Loan Funds
(A) Secured Loans 0 0 0
(B) Unsecured Loans 0 0 0
Total (A) + (B) 0 0 0
(1.3) Deferred Tax Liability 5 5 6
Total (1.1) + (1.2) + (1.3) 201 182 167
(2) Application Of Funds
(2.1) Fixed Assets
(A) Gross Block 156 154 158
(B) Less Depreciation 81 79 80
(C) Net Block (A-B) 75 75 78
(D) Capital Work In Progress 0 0 0
Total (C) + (D) 75 75 78
(2.2) Investment 0 0 0
(2.3) Current Assets, Loan & Advances
(A) Inventories 9 8 7
(B) Sundry Debtors 43 52 24
(C) Cash & Bank Balances 125 91 134
(D) Other Current Assets 6 4 6
(E) Loan & Advances 27 19 14
Total (A)+ (B)+ (C)+ (D)+ (E) 210 174 185
(2.4) Less:current Liabilities & Provisions
(A) Current Liabilities 42 33 47
(B) Provisions 42 34 49
Total (A+B) 84 67 96
(2.5) Net Current Assets (2.3-2.4) 126 107 89
(2.6) Deferred Revenue / Pre. Expenditure 0 0 0
(2.7) Deferred Tax Asset 0 0 0
(2.8) Profit & Loss Account(Dr) 0 0 0
Total (2.1+2.2+2.5+2.6+2.7+2.8) 201 182 167
Important Indicators 2010-11 2009-10 2008-09
(i) Investment 100 100 100
(ii) Capital Employed 201 182 167
(iii) Net Worth 196 177 161
(iv) Cost of Production 176 209 154
(v) Cost of Sales 176 209 154
(vi) Gross Value Added (At Market Price) - - -
(vii) Total Employees (Other Than Casuals) (Nos.) 43 43 38
(viii) Avg. Monthly Emoluments Per Employee (Rs.) 17248 21899 14254
Profit & Loss Account (` in Lakhs)
Particulars 2010-11 2009-10 2008-09
(1) Income
(A) Sales/Operating Income 196 218 180
(B) Excise Duty 0 0 0
(C) Net Sales (A-B) 196 218 180
(D) Other Income/Receipts 8 12 11
(E) Accretion/Depletion in Stocks 0 0 0
(I)Total Income (C+D+E) 204 230 191
(2) Expenditure
(A) Purchase of Finished Goods/ Consumption Of Raw Materials 39 41 34
(B) Stores & Spares 0 0 0
(C) Power & Fuel 10 10 7
(D) Manufacturing / Direct / Operating Expenses 8 17 14
(E) Salary, Wages & Benefits / Employee Exp. 89 113 65
(F) Other Expenses 26 23 29
(G) Provisions 0 0 0
(II)Total Expenditure (A to G) 172 204 149
(3) Profit Before Dep, Int, Taxes & EP (PBDITEP) (I-II) 32 26 42
(4) Depreciation 4 5 5
(5) Dre/Prel Exp Written Off 0 0 0
(6) Profit Before Int., Taxes & Ep (PBITEP) (3-4-5) 28 21 37
(7) Interest
(A) On Central Government Loans 0 0 0
(B) On Foreign Loans 0 0 0
(C) Others 0 0 0
(D) Less Interest Capitalised 0 0 0
(E) Charged to P & L Account (A+B+C-D) 0 0 0
(8) Profit Before Tax & EP(PBTEP) (6-7E) 28 21 37
(9) Tax Provisions 7 15 11
(10) Net Profit / Loss Before EP (8-9) 21 6 26
(11) Net Extra-Ord. Items 2 -1 0
(12) Net Profit / Loss(-) (10-11) 19 7 26
(13) Dividend Declared 0 0 0
(14) Dividend Tax 0 0 0
(15) Retained Profit (12-13-14) 19 7 26
Financial Ratios 2010-11 2009-10 2008-09
(i) Sales : Capital Employed 97.51 119.78 107.78
(ii) Cost of Sales : Sales 89.8 95.87 85.56
(iii) Salary / Wages : Sales 45.41 51.83 36.11
(iv) Net Profit : Net Worth 9.69 3.95 16.15
(v) Debt : Equity 0 0 0
(vi) Current Ratio 2.5 2.6 1.93
(vii) Sundry Debtors : Sales (No. of Days) 80.08 87.06 48.67
(viii) Total Inventory : Sales 16.76 13.39 14.19

514 Tourist Services
www.centaurhotels.com
Hotel Corporation of India Ltd. (HCI) was incorporated on 08.07.1971 with the objective to carry on the business of Hotels and flight Catering Services. The company was incorporated as a wholly owned subsidiary of Air India Ltd.
HCI is a Schedule-‘C’ CPSE in Tourist Services sector under the administrative control of M/o Civil Aviation. Its registered office is at Mumbai, Maharashtra and corporate office is at IGI Airport, New Delhi.
Industrial / Business OperationsHCI is engaged in providing services in the field of hotel
and on board air catering through its 2 Hotels at Delhi (Centaur) and Srinagar (Centaur Lake view). The company is also running two flight catering units at Delhi and Mumbai by the name of Chefair. The physical performance of company during the period 2007-08 to 2009-10 is shown below:Main Services / Segments Unit 2010-11 2009-10 2008-09
Room Sales ` in Crore N.A. 17.83 20.62
F&B sales ` in Crore N.A. 18.99 21.15
Other Services ` in Crore N.A. 1.75 3.47
N.A.: Not Available
Strategic issueAs per the “in principle” sanction received from the M/o
Civil Aviation, the company is in the process of handing over the running of its two Units i.e. Centaur Lake View Hotel, Srinagar and Chefair flight Catering, Mumbai to professionals on Management Contract.
Performance HighlightsThe operational performance of the company along with
performance indicators and selected financial ratios during the period 2008-09 to 2010-11 can be seen on the opposite page.
The Company registered an increase of ` 10.55 crore in total income during 2010-11 which went up to ` 51.84 crore in 2010-11 from ` 41.29 crore during 2009-10. The net loss of the company reduced to ` 20.20 crore, a reduction of ` 8.91 crore over the previous year’s loss of ` 29.11 crore due to increase in turnover.
Human Resource ManagementThe Company employed 1383 regular employees as on
31.03.2011. The retirement age in the Company is 58 years. Details of employment in last 3 years are given below:
(Nos.)Particulars 2010-11 2009-10 2008-09
Executives including Non-Unionised Supervisors 983 618 615
Non-Executives # 400 765 824Total Employees 1383 1383 1439
#Detail break-up of Non-Executive employees is at Statement no. 25 of volume-I of PE Survey.
20.3 Hotel Corporation of India Ltd.

515Public Enterprises Survey 2010-2011: Vol-II
Hotel Corporation of India Ltd.1st Floor, Transport Annex Building, Air India Complex, Kalina, Santacruz (East), Mumbai- 400029
Balance Sheet (` in Lakhs)
Particulars 2010-11 2009-10 2008-09
Authorised Capital 4100 4100 4100
(1) Sources Of Fund
(1.1) Shareholders Funds
(A) Paid-Up Capital
Central Govt 0 0 0
Others 4060 4060 4060
(B) Share Application Money 0 0 0
(C) Reserves & Surplus -3774 0 1156
Total (A) + (B) + (C) 286 4060 5216
(1.2) Loan Funds
(A) Secured Loans 1512 520 0
(B) Unsecured Loans 0 0 0
Total (A) + (B) 1512 520 0
(1.3) Deferred Tax Liability 0 0 0
Total (1.1) + (1.2) + (1.3) 1798 4580 5216
(2) Application Of Funds
(2.1) Fixed Assets
(A) Gross Block 8270 8270 8182
(B) Less Depreciation 4789 4576 4348
(C) Net Block (A-B) 3481 3694 3834
(D) Capital Work In Progress 21 21 109
Total (C) + (D) 3502 3715 3943
(2.2) Investment 0 0 0
(2.3) Current Assets, Loan & Advances
(A) Inventories 209 228 267
(B) Sundry Debtors 716 696 1090
(C) Cash & Bank Balances 888 888 1219
(D) Other Current Assets 0 0 0
(E) Loan & Advances 4055 4055 4614
Total (A)+ (B)+ (C)+ (D)+ (E) 5868 5867 7190
(2.4) Less:current Liabilities & Provisions
(A) Current Liabilities 4269 4295 3667
(B) Provisions 3303 2462 2250
Total (A+B) 7572 6757 5917
(2.5) Net Current Assets (2.3-2.4) -1704 -890 1273
(2.6) Deferred Revenue / Pre. Expenditure 0 0 0
(2.7) Deferred Tax Asset 0 0 0
(2.8) Profit & Loss Account(Dr) 0 1755 0
Total (2.1+2.2+2.5+2.6+2.7+2.8) 1798 4580 5216
Important Indicators 2010-11 2009-10 2008-09
(i) Investment 4060 4060 4060
(ii) Capital Employed 1777 2804 5107
(iii) Net Worth 286 2305 5216
(iv) Cost of Production 7204 6954 6715
(v) Cost of Sales 7204 6954 6715
(vi) Gross Value Added (At Market Price) - - -
(vii) Total Employees (Other Than Casuals) (Nos.) 1383 1383 1439
(viii) Avg. Monthly Emoluments Per Employee (Rs.) 26283 25898 24473
Profit & Loss Account (` in Lakhs)
Particulars 2010-11 2009-10 2008-09
(1) Income
(A) Sales/Operating Income 4838 3963 4610
(B) Excise Duty 0 0 0
(C) Net Sales (A-B) 4838 3963 4610
(D) Other Income/Receipts 346 166 295
(E) Accretion/Depletion in Stocks 0 0 0
(I)Total Income (C+D+E) 5184 4129 4905
(2) Expenditure
(A) Purchase of Finished Goods/ Consumption Of Raw Materials 703 728 675
(B) Stores & Spares 42 44 40
(C) Power & Fuel 807 752 817
(D) Manufacturing / Direct / Operating Expenses 0 435 0
(E) Salary, Wages & Benefits / Employee Exp. 4362 4298 4226
(F) Other Expenses 1026 315 737
(G) Provisions 1 119 0
(II)Total Expenditure (A to G) 6941 6691 6495
(3) Profit Before Dep, Int, Taxes & EP (PBDITEP) (I-II) -1757 -2562 -1590
(4) Depreciation 213 232 220
(5) Dre/Prel Exp Written Off 0 0 0
(6) Profit Before Int., Taxes & Ep (PBITEP) (3-4-5) -1970 -2794 -1810
(7) Interest
(A) On Central Government Loans 0 0 0
(B) On Foreign Loans 0 0 0
(C) Others 50 31 0
(D) Less Interest Capitalised 0 0 0
(E) Charged to P & L Account (A+B+C-D) 50 31 0
(8) Profit Before Tax & EP(PBTEP) (6-7E) -2020 -2825 -1810
(9) Tax Provisions 0 0 12
(10) Net Profit / Loss Before EP (8-9) -2020 -2825 -1822
(11) Net Extra-Ord. Items 0 86 39
(12) Net Profit / Loss(-) (10-11) -2020 -2911 -1861
(13) Dividend Declared 0 0 0
(14) Dividend Tax 0 0 0
(15) Retained Profit (12-13-14) -2020 -2911 -1861
Financial Ratios 2010-11 2009-10 2008-09
(i) Sales : Capital Employed 272.26 141.33 90.27
(ii) Cost of Sales : Sales 148.9 175.47 145.66
(iii) Salary / Wages : Sales 90.16 108.45 91.67
(iv) Net Profit : Net Worth -706.29 -126.29 -35.68
(v) Debt : Equity 5.29 0.13 0
(vi) Current Ratio 0.77 0.87 1.22
(vii) Sundry Debtors : Sales (No. of Days) 54.02 64.1 86.3
(viii) Total Inventory : Sales 15.77 21 21.14
2010-11 PROVISIONAL

516 Tourist Services
www. theashokgroup.com
India Tourism Development Corporation Ltd. (ITDC) was incorporated in 1966 with the objective of developing and expanding tourism infrastructure in the country and thereby promoting India as a tourist destination.
ITDC is a Schedule – ‘B’ listed Mini-ratna CPSE in Tourist Services sector, under the administrative control of Ministry of Tourism with 92.11% shareholding by the Government of India. Its Registered and Corporate Offices are in New Delhi.
Vision / MissionThe Vision / Mission of the Company is to provide leadership
and play a catalytic & pioneering role in the development of tourism infrastructure in the country and to achieve excellence in its strategic business units through professionalism, transparency, value for money based customer-focused services; be future ready in ever-changing & evolving dynamic global tourism scenario.
Industrial / Business OperationsITDC is engaged in providing tourism related facilities like
hotels, transport, duty free shopping, entertainment, production of tourist publicity literature, consultancy and execution of tourism and engineering projects, training consultancy in hospitality sector, event management and execution of Son-et-Lumeire (SEL) Shows etc.
The present network of ITDC consists of eight Ashok Group of Hotels, six Joint Venture Hotels, one Restaurant, eleven Transport Units, one Tourist Service Station, five Duty free Shops at airports/seaports, two Sound & Light Shows and three catering outlets. Besides, ITDC is also managing a Hotel at Bharatpur and a Tourist Complex at Kosi.
It has seven subsidiaries namely Assam Ashok Hotel, Guwahati; Donyi Polo Ashok Hotel, Itanagar; Ranchi Ashok Bihar Hotel, Ranchi; Utkal Ashok Hotel, Puri; Pondicherry Ashok Hotel, Pondicherry; M.P. Ashok Hotel, Bhopal and Punjab Ashok Hotel Company (the company is yet to commence business) with shareholding of 51% in each of them except in Utkal Ashok Hotel where shareholding is 98%.
Strategic Issues The Company undertakes renovation / upgradation of its
hotel properties in a planned manner. It aims to maximize the revenue by leveraging resources of existing hotels through Public Private Partnership (PPP).
ITDC, a well established brand for 45 years aims to play a
20.4 India Tourism Development Corporation Ltd.
critical role in the tourism education sector, event management and development of tourism infrastructure in the country. The company properties are at prime locations but infrastructure is lagging along with ageing manpower and high establishment cost.
Performance HighlightsThe operational performance of the company along with
performance indicators and selected financial ratios during the period 2008-09 to 2010-11 can be seen on the opposite page.
The Company registered an increase of ` 92.61 crore in total income during 2010-11 which went up to ` 392.36 crore in 2010-11 from ` 299.75 crore during 2009-10. The net loss of the company was ` 8.59 crore, a reduction of ` 5.72 crore over the previous year loss of ` 14.31 crore. Although there was an increase in turnover but the corresponding increase in expenditure incurred on renovation of hotel properties lead to losses.
Hotel Division of ITDC is major business segment. It accounts for 65% of the turnover of ITDC. The focus of the year 2010-11 for Delhi based Hotels was successful hosting of Commonwealth Games in october, 2010.
Human Resource ManagementThe Company employed 2178 regular employees as on
31.03.2011. The retirement age in the Company is 58 years. It is following IDA 2007 and CDA 2006 pattern remuneration. Details of employment in last 3 years are given below :
Particulars 2010-11 2009-10 2008-09Executives including Non-Unionised Supervisors 369 372 354
Non-Executives # 1809 1872 2053Total Employees 2178 2244 2407
# Detail break-up of Non-Executive employees is at Statement no. 25 of volume-I of PE Survey.

517Public Enterprises Survey 2010-2011: Vol-II
India Tourism Development Corporation Ltd.7, Scope Complex Lodi Road New Delhi 110003 Delhi
Balance Sheet (` in Lakhs)
Particulars 2010-11 2009-10 2008-09
Authorised Capital 15000 15000 15000
(1) Sources Of Fund
(1.1) Shareholders Funds
(A) Paid-Up Capital
Central Govt 7900 7900 6075
Others 677 677 677
(B) Share Application Money 0 0 7300
(C) Reserves & Surplus 21955 22803 18779
Total (A) + (B) + (C) 30532 31380 32831
(1.2) Loan Funds
(A) Secured Loans 0 0 0
(B) Unsecured Loans 0 11 0
Total (A) + (B) 0 11 0
(1.3) Deferred Tax Liability 0 0 0
Total (1.1) + (1.2) + (1.3) 30532 31391 32831
(2) Application Of Funds
(2.1) Fixed Assets
(A) Gross Block 14019 12867 12012
(B) Less Depreciation 7725 7479 7404
(C) Net Block (A-B) 6294 5388 4608
(D) Capital Work In Progress 2190 4457 911
Total (C) + (D) 8484 9845 5519
(2.2) Investment 814 814 2651
(2.3) Current Assets, Loan & Advances
(A) Inventories 1151 1102 985
(B) Sundry Debtors 9456 7455 8125
(C) Cash & Bank Balances 26985 30080 31585
(D) Other Current Assets 816 656 580
(E) Loan & Advances 7357 8565 7063
Total (A)+ (B)+ (C)+ (D)+ (E) 45765 47858 48338
(2.4) Less:current Liabilities & Provisions
(A) Current Liabilities 23384 25112 18036
(B) Provisions 4466 5020 7557
Total (A+B) 27850 30132 25593
(2.5) Net Current Assets (2.3-2.4) 17915 17726 22745
(2.6) Deferred Revenue / Pre. Expenditure 0 0 219
(2.7) Deferred Tax Asset 3319 3006 1697
(2.8) Profit & Loss Account(Dr) 0 0 0
Total (2.1+2.2+2.5+2.6+2.7+2.8) 30532 31391 32831
Important Indicators 2010-11 2009-10 2008-09
(i) Investment 8577 8588 14052
(ii) Capital Employed 24209 23114 27353
(iii) Net Worth 30532 31380 32612
(iv) Cost of Production 40485 31453 37913
(v) Cost of Sales 40485 31453 37913
(vi) Gross Value Added (At Market Price) - - -
(vii) Total Employees (Other Than Casuals) (Nos.) 2178 2244 2407
(viii) Avg. Monthly Emoluments Per Employee (Rs.) 54480 52432 40129
Profit & Loss Account (` in Lakhs)
Particulars 2010-11 2009-10 2008-09
(1) Income
(A) Sales/Operating Income 36718 27159 37000
(B) Excise Duty 0 0 0
(C) Net Sales (A-B) 36718 27159 37000
(D) Other Income/Receipts 2518 2816 4067
(E) Accretion/Depletion in Stocks 0 0 0
(I)Total Income (C+D+E) 39236 29975 41067
(2) Expenditure
(A) Purchase of Finished Goods/ Consumption Of Raw Materials 5407 3930 10486
(B) Stores & Spares 0 0 0
(C) Power & Fuel 2123 1908 2325
(D) Manufacturing / Direct / Operating Expenses 17302 10789 12678
(E) Salary, Wages & Benefits / Employee Exp. 14239 14119 11591
(F) Other Expenses 146 1 11
(G) Provisions 708 294 392
(II)Total Expenditure (A to G) 39925 31041 37483
(3) Profit Before Dep, Int, Taxes & EP (PBDITEP) (I-II) -689 -1066 3584
(4) Depreciation 560 412 428
(5) Dre/Prel Exp Written Off 0 0 0
(6) Profit Before Int., Taxes & Ep (PBITEP) (3-4-5) -1249 -1478 3156
(7) Interest
(A) On Central Government Loans 0 0 0
(B) On Foreign Loans 0 0 0
(C) Others 0 0 2
(D) Less Interest Capitalised 0 0 0
(E) Charged to P & L Account (A+B+C-D) 0 0 2
(8) Profit Before Tax & EP(PBTEP) (6-7E) -1249 -1478 3154
(9) Tax Provisions -315 -620 1329
(10) Net Profit / Loss Before EP (8-9) -934 -858 1825
(11) Net Extra-Ord. Items -75 573 -713
(12) Net Profit / Loss(-) (10-11) -859 -1431 2538
(13) Dividend Declared 0 0 858
(14) Dividend Tax 0 0 0
(15) Retained Profit (12-13-14) -859 -1431 1680
Financial Ratios 2010-11 2009-10 2008-09
(i) Sales : Capital Employed 151.67 117.5 135.27
(ii) Cost of Sales : Sales 110.26 115.81 102.47
(iii) Salary / Wages : Sales 38.78 51.99 31.33
(iv) Net Profit : Net Worth -2.81 -4.56 7.78
(v) Debt : Equity 0 0 0
(vi) Current Ratio 1.64 1.59 1.89
(vii) Sundry Debtors : Sales (No. of Days) 94 100.19 80.15
(viii) Total Inventory : Sales 11.44 14.81 9.72

518 Tourist Services
www.irctc.com
Indian Railway Catering and Tourism Corporation Ltd. (IRCTC) was incorporated on 27.09.1999 under the Companies Act, 1956 with an objective to strengthen railways marketing and service capabilities in the areas of rail catering, tourism and passengers amenities.
IRCTC is a schedule – “B” Miniratna CPSE in the tourist service sector under the administrative control of Ministry of Railways with 100% shareholding of Government of India. It’s registered and Corporate Office is at New Delhi.
Vision/MissionThe Vision of the Company is to be the leader for providing
high quality travel, tourism and hospitality related services, for a range of customer segments, with consistently high level of customer satisfaction.
Industrial / Business OperationsIRCTC is mainly involved in enhancement of customer
services and facilitation in catering, passenger ticketing through latest technology, hospitality, travel and tourism with best industry practices. The Company operates through its three Railneer bottling plants at Nangloi (Delhi), Danapur (Bihar) and Palur (Chennai). 6 Zonal Offices, 10 Regional Offices and one Internet Ticketing Office (New Delhi). The company has also formed a joint venture with Cox & King (India) Ltd. with 50% equity share. The performance of Company for last three years are given below:
Products / Services Unit2010-11 2009-10 2008-09(% capacity utilization)#
Rail Neer (Packaged Drinking water)
Bottle of 1000 ml
64030 (95)
54216 (81)
37996 (80)
Departmental Catering
Rs. in crores 198.58 147.05 138.93
Internet Ticketing Rs. in crores 142.92 112.89 83.92
Licencee Catering Services
Rs. in crores 316.26 369.44 344.84
Package Tours Rs. in crores 67.04 44.72 27.94
# there is variation in total installed capacity during last three years.
Strategic IssuesAfter catering policy 2010, IRCTC has accelerated its effort
for capturing the non railway catering business. It also provides Catering services at various offices & institutions and also events and function such as commonwealth games Delhi 2010. Apart from this IRCTC has opened food factory at Noida with a capacity of about 25000 meals per day. It is fully Automated factory with equipment from the best manufactures & Professionals from India and abroad. Another packaged drinking water plant is being set up at Ahbernath (Mumbai).
Performance HighlightsThe operational performance of the company along with
performance indicators and selected financial ratios during the period 2008-09 to 2010-11 can be seen on the opposite page.
The Company registered an increase of ` 39.50 crore in total income during 2010-11 which went up to ` 763.27 crore in 2010-11 from ` 723.77 crore during 2009-10. The net profit of the company was ` 60.79 crore, a decrease of ` 2.26 crore over the previous year. The growth in income is marginal due
20.5 Indian Railway Catering & Tourism Corporation Ltd.
to impact of revenue from licencee catering, which has come down due to transfer to Railway as per Catering Policy 2010 and the impact of reduction in service charges for internet ticketing. The reason for decrease in the profit is higher income tax provision for the year.
Human Resource ManagementThe company employed 1934 regular employees as on
31.3.2011. The retirement age in the company is 60 years. It is following IDA 2007 and CDA 2006 pattern of remuneration. Details of employment in last 3 years are given below:
Particulars 2010-11 2009-10 2008-09Executives including Non-Unionised Supervisors
1131 1289 1422
Non-Executives # 803 1356 1928Total Employees 1934 2645 3350
#Detailbreak-up of Non-Executive employees is at Statement no. 25 of volume-I of PE Survey.
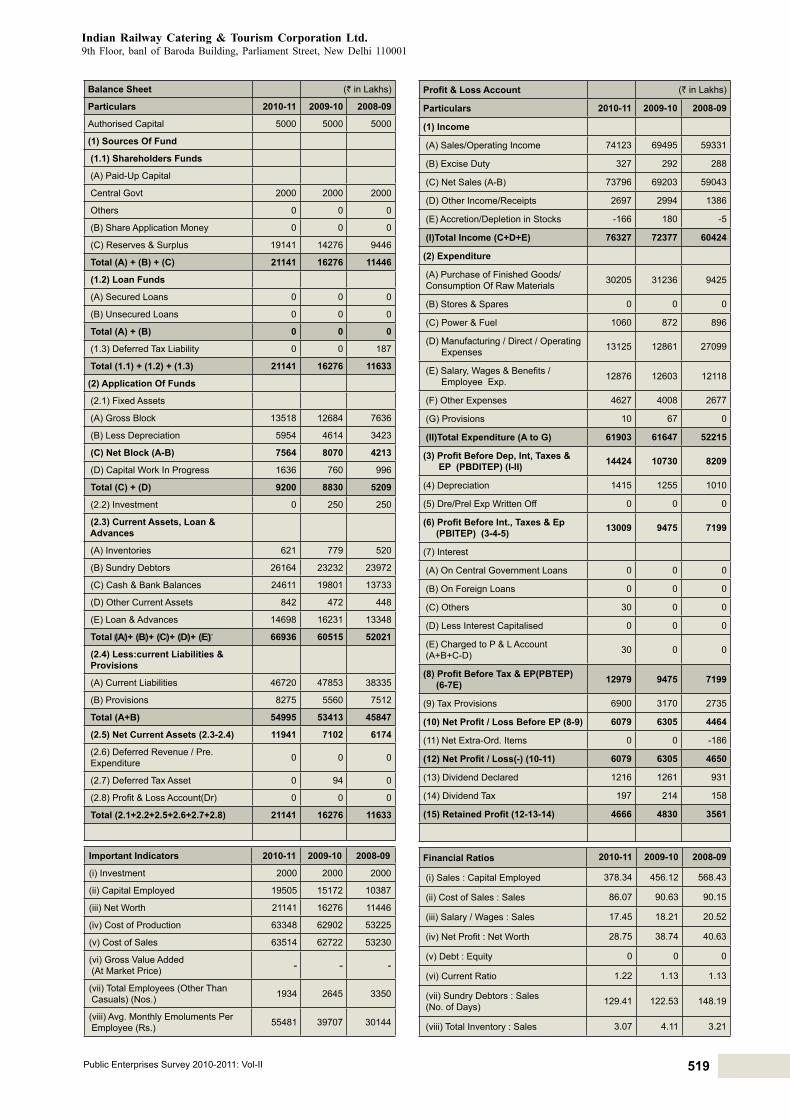
519Public Enterprises Survey 2010-2011: Vol-II
Indian Railway Catering & Tourism Corporation Ltd.9th floor, banl of Baroda Building, Parliament Street, New Delhi 110001
Balance Sheet (` in Lakhs)
Particulars 2010-11 2009-10 2008-09
Authorised Capital 5000 5000 5000
(1) Sources Of Fund
(1.1) Shareholders Funds
(A) Paid-Up Capital
Central Govt 2000 2000 2000
Others 0 0 0
(B) Share Application Money 0 0 0
(C) Reserves & Surplus 19141 14276 9446
Total (A) + (B) + (C) 21141 16276 11446
(1.2) Loan Funds
(A) Secured Loans 0 0 0
(B) Unsecured Loans 0 0 0
Total (A) + (B) 0 0 0
(1.3) Deferred Tax Liability 0 0 187
Total (1.1) + (1.2) + (1.3) 21141 16276 11633
(2) Application Of Funds
(2.1) Fixed Assets
(A) Gross Block 13518 12684 7636
(B) Less Depreciation 5954 4614 3423
(C) Net Block (A-B) 7564 8070 4213
(D) Capital Work In Progress 1636 760 996
Total (C) + (D) 9200 8830 5209
(2.2) Investment 0 250 250
(2.3) Current Assets, Loan & Advances
(A) Inventories 621 779 520
(B) Sundry Debtors 26164 23232 23972
(C) Cash & Bank Balances 24611 19801 13733
(D) Other Current Assets 842 472 448
(E) Loan & Advances 14698 16231 13348
Total (A)+ (B)+ (C)+ (D)+ (E) 66936 60515 52021
(2.4) Less:current Liabilities & Provisions
(A) Current Liabilities 46720 47853 38335
(B) Provisions 8275 5560 7512
Total (A+B) 54995 53413 45847
(2.5) Net Current Assets (2.3-2.4) 11941 7102 6174
(2.6) Deferred Revenue / Pre. Expenditure 0 0 0
(2.7) Deferred Tax Asset 0 94 0
(2.8) Profit & Loss Account(Dr) 0 0 0
Total (2.1+2.2+2.5+2.6+2.7+2.8) 21141 16276 11633
Important Indicators 2010-11 2009-10 2008-09
(i) Investment 2000 2000 2000
(ii) Capital Employed 19505 15172 10387
(iii) Net Worth 21141 16276 11446
(iv) Cost of Production 63348 62902 53225
(v) Cost of Sales 63514 62722 53230
(vi) Gross Value Added (At Market Price) - - -
(vii) Total Employees (Other Than Casuals) (Nos.) 1934 2645 3350
(viii) Avg. Monthly Emoluments Per Employee (Rs.) 55481 39707 30144
Profit & Loss Account (` in Lakhs)
Particulars 2010-11 2009-10 2008-09
(1) Income
(A) Sales/Operating Income 74123 69495 59331
(B) Excise Duty 327 292 288
(C) Net Sales (A-B) 73796 69203 59043
(D) Other Income/Receipts 2697 2994 1386
(E) Accretion/Depletion in Stocks -166 180 -5
(I)Total Income (C+D+E) 76327 72377 60424
(2) Expenditure
(A) Purchase of Finished Goods/ Consumption Of Raw Materials 30205 31236 9425
(B) Stores & Spares 0 0 0
(C) Power & Fuel 1060 872 896
(D) Manufacturing / Direct / Operating Expenses 13125 12861 27099
(E) Salary, Wages & Benefits / Employee Exp. 12876 12603 12118
(F) Other Expenses 4627 4008 2677
(G) Provisions 10 67 0
(II)Total Expenditure (A to G) 61903 61647 52215
(3) Profit Before Dep, Int, Taxes & EP (PBDITEP) (I-II) 14424 10730 8209
(4) Depreciation 1415 1255 1010
(5) Dre/Prel Exp Written Off 0 0 0
(6) Profit Before Int., Taxes & Ep (PBITEP) (3-4-5) 13009 9475 7199
(7) Interest
(A) On Central Government Loans 0 0 0
(B) On Foreign Loans 0 0 0
(C) Others 30 0 0
(D) Less Interest Capitalised 0 0 0
(E) Charged to P & L Account (A+B+C-D) 30 0 0
(8) Profit Before Tax & EP(PBTEP) (6-7E) 12979 9475 7199
(9) Tax Provisions 6900 3170 2735
(10) Net Profit / Loss Before EP (8-9) 6079 6305 4464
(11) Net Extra-Ord. Items 0 0 -186
(12) Net Profit / Loss(-) (10-11) 6079 6305 4650
(13) Dividend Declared 1216 1261 931
(14) Dividend Tax 197 214 158
(15) Retained Profit (12-13-14) 4666 4830 3561
Financial Ratios 2010-11 2009-10 2008-09
(i) Sales : Capital Employed 378.34 456.12 568.43
(ii) Cost of Sales : Sales 86.07 90.63 90.15
(iii) Salary / Wages : Sales 17.45 18.21 20.52
(iv) Net Profit : Net Worth 28.75 38.74 40.63
(v) Debt : Equity 0 0 0
(vi) Current Ratio 1.22 1.13 1.13
(vii) Sundry Debtors : Sales (No. of Days) 129.41 122.53 148.19
(viii) Total Inventory : Sales 3.07 4.11 3.21
520 Tourist Services
www.lakeviewashok.com
M.P. Ashok Hotel Corporation Ltd. was created in the year 1985 by India Tourism Development Corporation Ltd. in collaboration with the Madhya Pradesh State Tourism Development Corporation. The objective behind the creation of the corporation was in line with the objectives of both the ITDC as well as MPSTDC to develop and expand tourism infrastructure and to play a promotional role in tourism by opening new destinations & providing class services to the guests/tourists along with earning revenue for the share-holders.
MAHCL is an uncategorised CPSE in Tourist Services sector under the administrative control of the M/o Tourism. Its Registered and Corporate office are at Bhopal, Madhya Pradesh. MAHCL is a subsidiary of ITDC Ltd. which holds 51% of its equity.
Vision/MissionThe Vision of the Company is to make the hotel Lake View
Ashok comparable to excellence with the best in Bhopal, in fact, to provide the best to the esteemed guests setting benchmark for others in the city, to strive for excellence in all commercial activities and create extraordinary value for the stakeholders. The Mission of the Company is to achieve excellence as a business entity through professionalism, efficiency and innovation by providing customer-oriented services
Industrial / Business OperationsThe company owned single entity – Hotel Lake View
Ashok, is operating with 43 Guest rooms including 39 standard deluxe rooms and 4 Deluxe suites along with three company owned restaurant & one bar as well as another specialty theme restaurant – Shan-e-Bhopal operating within the hotel. The hotel has also been utilizing its sprawling lawns for organizing various events as well as large banquets.
Strategic IssuesThe company plans to consolidate and strengthen its core
activities and to play diversified role in providing various tourism-related services, opening newer avenues for the corporation to earn money and accretion. The corporate plan shall serve as a guiding document for developing strategic and operational plan.
The hotel construction started way back in the year 1981 and the operations commenced in the year 1989. Since the inception of the hotel no renovation was carried out till 2003-2004. Since 2004-05 the hotel has renovated its restaurants, revamped the guest rooms and face-lifted the public areas for providing better services to the guests. The renovation plans are still under going.
The highlights of the strategy for coming year 2011-12 will be Introduction of customer-specific services (tailor-made) – flexible special package deals for marriage parties, event-firms, film units, special student groups etc.
Performance HighlightsThe operational performance of the company along with
performance indicators and selected financial ratios during the period 2008-09 to 2010-11 can be seen on the opposite page.
20.6 M.P. Ashok Hotel Corporation Ltd.The Company registered an increase of ` 0.93 crore in
total income during 2010-11 which went up to ` 5.77 crore in 2010-11 from ` 4.84 crore during 2009-10. The net profit of the company however decreased to ` 0.32 crore, a reduction of ` 0.40 crore over the previous year profit of ` 0.72 crore due to increase in operating cost along with increase in employees remuneration and benefits.
Human Resource ManagementThe Company employed 57 regular employees as on
31.03.2011. The retirement age in the Company is 58 years. It is following IDA 2007 and CDA 2006 pattern of remuneration. Details of employment in last 3 years are given below:
(in Nos.)Particulars 2010-11 2009-10 2008-09
Executives including Non-Unionised Supervisors 33 2 18
Non-Executives # 24 54 96Total Employees 57 56 114
# Detail break-up of Non-Executive employees is at Statement no. 25 of volume-I of PE Survey.
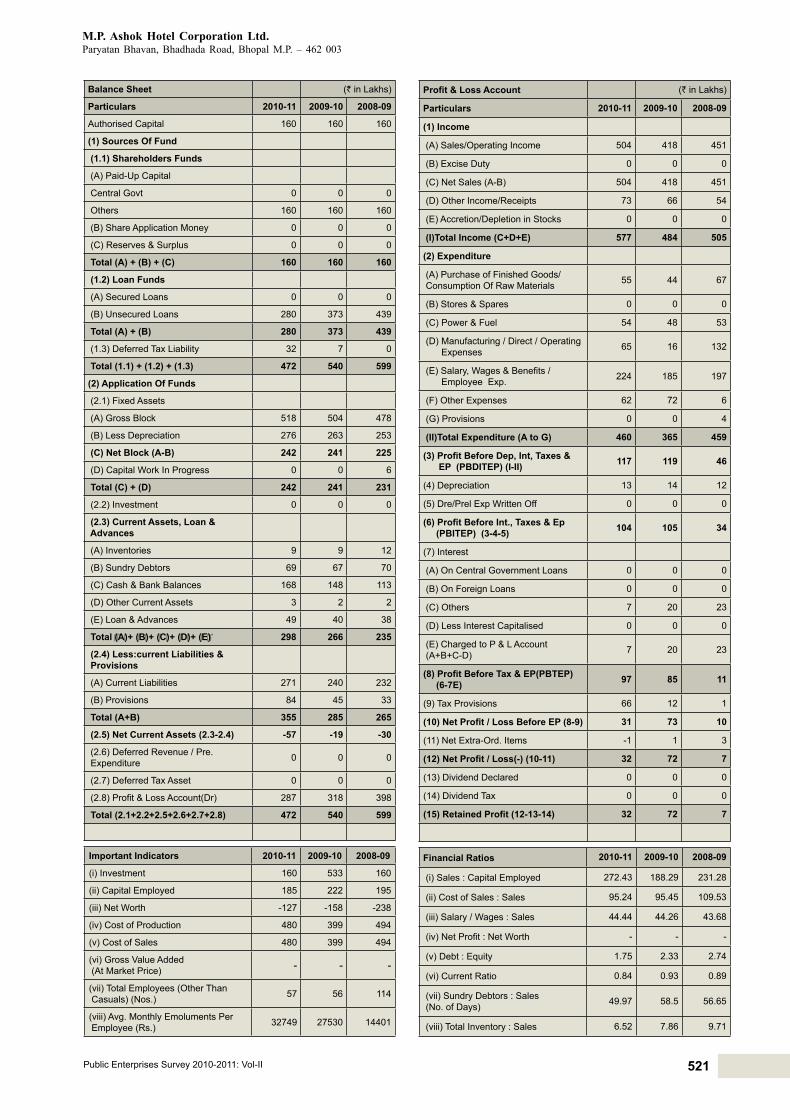
521Public Enterprises Survey 2010-2011: Vol-II
M.P. Ashok Hotel Corporation Ltd.Paryatan Bhavan, Bhadhada Road, Bhopal M.P. – 462 003
Balance Sheet (` in Lakhs)
Particulars 2010-11 2009-10 2008-09
Authorised Capital 160 160 160
(1) Sources Of Fund
(1.1) Shareholders Funds
(A) Paid-Up Capital
Central Govt 0 0 0
Others 160 160 160
(B) Share Application Money 0 0 0
(C) Reserves & Surplus 0 0 0
Total (A) + (B) + (C) 160 160 160
(1.2) Loan Funds
(A) Secured Loans 0 0 0
(B) Unsecured Loans 280 373 439
Total (A) + (B) 280 373 439
(1.3) Deferred Tax Liability 32 7 0
Total (1.1) + (1.2) + (1.3) 472 540 599
(2) Application Of Funds
(2.1) Fixed Assets
(A) Gross Block 518 504 478
(B) Less Depreciation 276 263 253
(C) Net Block (A-B) 242 241 225
(D) Capital Work In Progress 0 0 6
Total (C) + (D) 242 241 231
(2.2) Investment 0 0 0
(2.3) Current Assets, Loan & Advances
(A) Inventories 9 9 12
(B) Sundry Debtors 69 67 70
(C) Cash & Bank Balances 168 148 113
(D) Other Current Assets 3 2 2
(E) Loan & Advances 49 40 38
Total (A)+ (B)+ (C)+ (D)+ (E) 298 266 235
(2.4) Less:current Liabilities & Provisions
(A) Current Liabilities 271 240 232
(B) Provisions 84 45 33
Total (A+B) 355 285 265
(2.5) Net Current Assets (2.3-2.4) -57 -19 -30
(2.6) Deferred Revenue / Pre. Expenditure 0 0 0
(2.7) Deferred Tax Asset 0 0 0
(2.8) Profit & Loss Account(Dr) 287 318 398
Total (2.1+2.2+2.5+2.6+2.7+2.8) 472 540 599
Important Indicators 2010-11 2009-10 2008-09
(i) Investment 160 533 160
(ii) Capital Employed 185 222 195
(iii) Net Worth -127 -158 -238
(iv) Cost of Production 480 399 494
(v) Cost of Sales 480 399 494
(vi) Gross Value Added (At Market Price) - - -
(vii) Total Employees (Other Than Casuals) (Nos.) 57 56 114
(viii) Avg. Monthly Emoluments Per Employee (Rs.) 32749 27530 14401
Profit & Loss Account (` in Lakhs)
Particulars 2010-11 2009-10 2008-09
(1) Income
(A) Sales/Operating Income 504 418 451
(B) Excise Duty 0 0 0
(C) Net Sales (A-B) 504 418 451
(D) Other Income/Receipts 73 66 54
(E) Accretion/Depletion in Stocks 0 0 0
(I)Total Income (C+D+E) 577 484 505
(2) Expenditure
(A) Purchase of Finished Goods/ Consumption Of Raw Materials 55 44 67
(B) Stores & Spares 0 0 0
(C) Power & Fuel 54 48 53
(D) Manufacturing / Direct / Operating Expenses 65 16 132
(E) Salary, Wages & Benefits / Employee Exp. 224 185 197
(F) Other Expenses 62 72 6
(G) Provisions 0 0 4
(II)Total Expenditure (A to G) 460 365 459
(3) Profit Before Dep, Int, Taxes & EP (PBDITEP) (I-II) 117 119 46
(4) Depreciation 13 14 12
(5) Dre/Prel Exp Written Off 0 0 0
(6) Profit Before Int., Taxes & Ep (PBITEP) (3-4-5) 104 105 34
(7) Interest
(A) On Central Government Loans 0 0 0
(B) On Foreign Loans 0 0 0
(C) Others 7 20 23
(D) Less Interest Capitalised 0 0 0
(E) Charged to P & L Account (A+B+C-D) 7 20 23
(8) Profit Before Tax & EP(PBTEP) (6-7E) 97 85 11
(9) Tax Provisions 66 12 1
(10) Net Profit / Loss Before EP (8-9) 31 73 10
(11) Net Extra-Ord. Items -1 1 3
(12) Net Profit / Loss(-) (10-11) 32 72 7
(13) Dividend Declared 0 0 0
(14) Dividend Tax 0 0 0
(15) Retained Profit (12-13-14) 32 72 7
Financial Ratios 2010-11 2009-10 2008-09
(i) Sales : Capital Employed 272.43 188.29 231.28
(ii) Cost of Sales : Sales 95.24 95.45 109.53
(iii) Salary / Wages : Sales 44.44 44.26 43.68
(iv) Net Profit : Net Worth - - -
(v) Debt : Equity 1.75 2.33 2.74
(vi) Current Ratio 0.84 0.93 0.89
(vii) Sundry Debtors : Sales (No. of Days) 49.97 58.5 56.65
(viii) Total Inventory : Sales 6.52 7.86 9.71

522 Tourist Services
www.ashokresort.com
Pondicherry Ashok Hotel Corporation Limited (PAHCL) was incorporated on 16.6.1986 with the objective to promote and develop tourism in Pondicherry (now known as Puducherry). It is a Joint Venture Company of ITDC, a Central Public Sector Enterprises (CPSE) and PIPDIC (Pondicherry Industrial Promotion Development and Investment Corporation Ltd) an undertaking of Govt. of Puducherry. Further to these objectives a Beach resort Hotel in the name of Hotel Pondicherry Ashok in the Union Territories of Puducherry was constructed, which commenced its business on 06.02.1989
PAHCL is an uncategorised CPSE in Tourist Services sector under the administrative control of M/o Tourism with its Registered and Corporate offices at Union Territory of Puducherry. PAHCL is a subsidiary joint venture of ITDC Ltd. where in ITDC holds 51% equity and PIPDIC holds 49% shares. The registered office of the Company is situated at Puducherry.
Industrial / Business OperationsThe Hotel Pondicherry Ashok was commissioned with 20
rooms. Now there are 25 rooms including cottages. Its income is from providing accommodation as well as provision of food and beverage.
Strategic IssuesThe company was a non-industrial sick enterprise whose net
worth had eroded completely in 2001-02. However, the net worth of the company turned positive during the last four years.
Performance HighlightsThe operational performance of the company along with
performance indicators and selected financial ratios during the period 2008-09 to 2010-11 can be seen on the opposite page.
The Company registered an increase of ` 0.02 crore in total income during 2010-11 which went up to ` 2.39 crore in 2010-11 from ` 2.37 crore during 2009-10. The net profit of the company however reduced to ` 0.06 crore, a decrease of `
0.03 crore over the previous year profit of ` 0.09 crore due to increase in operating expenses.
Human Resource ManagementThe company employed regular employees as on 31.3.2011.
The retirement age in the Company is 58 years. It is following IDA 2007 and CDA 2006 pattern of remuneration. Details of employment in last 3 years are given below:
Particulars 2010-11 2009-10 2008-09Executives including Non-Unionised Supervisors 22 8 9
Non-Executives # 14 30 26Total Employees 36 38 35
# Detail break-up of Non-Executive employees is at Statement no. 25 of volume-I of PE Survey.
20.7 Pondicherry Ashok Hotel Corporation Limited

523Public Enterprises Survey 2010-2011: Vol-II
Pondicherry Ashok Hotel Corporation LimitedHotel Pondicherry Ashok, East Coast Road Kalapet Beach, Puducherry-605014
Balance Sheet (` in Lakhs)
Particulars 2010-11 2009-10 2008-09
Authorised Capital 60 60 60
(1) Sources Of Fund
(1.1) Shareholders Funds
(A) Paid-Up Capital
Central Govt 0 0 0
Others 60 60 60
(B) Share Application Money 0 0 0
(C) Reserves & Surplus 81 75 66
Total (A) + (B) + (C) 141 135 126
(1.2) Loan Funds
(A) Secured Loans 0 0 0
(B) Unsecured Loans 0 0 0
Total (A) + (B) 0 0 0
(1.3) Deferred Tax Liability 4 12 8
Total (1.1) + (1.2) + (1.3) 145 147 134
(2) Application Of Funds
(2.1) Fixed Assets
(A) Gross Block 281 263 186
(B) Less Depreciation 98 87 77
(C) Net Block (A-B) 183 176 109
(D) Capital Work In Progress 0 0 0
Total (C) + (D) 183 176 109
(2.2) Investment 0 0 0
(2.3) Current Assets, Loan & Advances
(A) Inventories 6 6 6
(B) Sundry Debtors 7 19 17
(C) Cash & Bank Balances 86 93 58
(D) Other Current Assets 1 1 1
(E) Loan & Advances 18 18 53
Total (A)+ (B)+ (C)+ (D)+ (E) 118 137 135
(2.4) Less:current Liabilities & Provisions
(A) Current Liabilities 120 132 106
(B) Provisions 36 34 42
Total (A+B) 156 166 148
(2.5) Net Current Assets (2.3-2.4) -38 -29 -13
(2.6) Deferred Revenue / Pre. Expenditure 0 0 0
(2.7) Deferred Tax Asset 0 0 0
(2.8) Profit & Loss Account(Dr) 0 0 38
Total (2.1+2.2+2.5+2.6+2.7+2.8) 145 147 134
Important Indicators 2010-11 2009-10 2008-09
(i) Investment 60 60 60
(ii) Capital Employed 145 147 96
(iii) Net Worth 141 135 88
(iv) Cost of Production 235 216 197
(v) Cost of Sales 235 216 197
(vi) Gross Value Added (At Market Price) - - -
(vii) Total Employees (Other Than Casuals) (Nos.) 36 38 35
(viii) Avg. Monthly Emoluments Per Employee (Rs.) 25694 22588 16905
Profit & Loss Account (` in Lakhs)
Particulars 2010-11 2009-10 2008-09
(1) Income
(A) Sales/Operating Income 219 220 235
(B) Excise Duty 0 0 0
(C) Net Sales (A-B) 219 220 235
(D) Other Income/Receipts 20 17 19
(E) Accretion/Depletion in Stocks 0 0 0
(I)Total Income (C+D+E) 239 237 254
(2) Expenditure
(A) Purchase of Finished Goods/ Consumption Of Raw Materials 33 32 39
(B) Stores & Spares 0 0 0
(C) Power & Fuel 10 9 10
(D) Manufacturing / Direct / Operating Expenses 24 0 0
(E) Salary, Wages & Benefits / Employee Exp. 111 103 71
(F) Other Expenses 34 59 72
(G) Provisions 11 0 0
(II)Total Expenditure (A to G) 223 203 192
(3) Profit Before Dep, Int, Taxes & EP (PBDITEP) (I-II) 16 34 62
(4) Depreciation 12 12 5
(5) Dre/Prel Exp Written Off 0 1 0
(6) Profit Before Int., Taxes & Ep (PBITEP) (3-4-5) 4 21 57
(7) Interest
(A) On Central Government Loans 0 0 0
(B) On Foreign Loans 0 0 0
(C) Others 0 0 0
(D) Less Interest Capitalised 0 0 0
(E) Charged to P & L Account (A+B+C-D) 0 0 0
(8) Profit Before Tax & EP(PBTEP) (6-7E) 4 21 57
(9) Tax Provisions -3 12 15
(10) Net Profit / Loss Before EP (8-9) 7 9 42
(11) Net Extra-Ord. Items 1 0 4
(12) Net Profit / Loss(-) (10-11) 6 9 38
(13) Dividend Declared 0 0 0
(14) Dividend Tax 0 0 0
(15) Retained Profit (12-13-14) 6 9 38
Financial Ratios 2010-11 2009-10 2008-09
(i) Sales : Capital Employed 151.03 149.66 244.79
(ii) Cost of Sales : Sales 107.31 98.18 83.83
(iii) Salary / Wages : Sales 50.68 46.82 30.21
(iv) Net Profit : Net Worth 4.26 6.67 43.18
(v) Debt : Equity 0 0 0
(vi) Current Ratio 0.76 0.83 0.91
(vii) Sundry Debtors : Sales (No. of Days) 11.67 31.52 26.4
(viii) Total Inventory : Sales 10 9.95 9.32

524 Tourist Services
www.hotelranchiashok.com
Ranchi Ashok Bihar Hotel Corporation Ltd. (RABHCL) was incorporated on 23.07.1983 with the objective to promote tourism particularly in the state of Bihar.
RABHCL is a joint venture of ITDC Ltd. and Bihar State Tourism Development Corp. Ltd. It is an uncategorized CPSE in Tourist Services sector under the administrative control of M/o Tourism. Its registered office is at Patna (Bihar) and corporate office is at Ranchi, Jharkhand. RABHCL is a subsidiary of ITDC Ltd. which holds 51% of its equity.
Vision / MissionThe Vision of the Company is to provide leadership and
play a catalytic role in the development of tourism infrastructure in the state of Jharkhand and to achieve excellence through professionalism, efficiency, value for money and customer- oriented service.
The Mission of the Company is that of installation of property management system.
Industrial / Business OperationsRABHCL is engaged in providing services in the field of
management of operation of Hotel through its 30 Rooms Hotel (Hotel Ranchi Ashok, Vivekananda Lane, Doranda, Jharkhand) at Ranchi, Jharkhand. The physical performances of the company for last three years are given below:Main Services Unit Performance During
2010-11 2009-10 2008-09Room Occupancy % N.A. 39 48
N.A. not Available
Strategic IssuesAfter the formation of Jaharkhand State, the importance of
capital city of Ranchi has increased and company is focusing its efforts in this direction to grab major share of business. The hotel has become very old as such up gradation of property required to cope with competition. The multiple tax levied on hotel discouraging tourist.
Performance HighlightsThe operational performance of the company along with
performance indicators and selected financial ratios during the period 2008-09 to 2010-11 can be seen on the opposite page.
The Company registered a reduction of ` 0.28 crore in total income during 2010-11 which went down to ` 2.50 crore in 2010-11 from ` 2.78 crore during 2009-10. The company has shown a net loss of ` 0.55 crore, as against the previous year profit of ` 0.10 crore due to reduction in turnover and increase in the expenditure along with competition in the hotel business from private sector.
20.8 Ranchi Ashok Bihar Hotel Corporation Ltd.
Human Resource ManagementThe company employed 48 regular employees as on
31.3.2011. The retirement age in the Company is 58 years. It is following IDA 2007 and CDA 1996 pattern of remuneration. Details of employment in last 3 years are given below:
Particulars 2010-11 2009-10 2008-09Executives including Non-Unionised Supervisors
8 8 7
Non-Executives # 40 40 41Total Employees 48 48 48
#Detail break-up of Non-Executive employees is at Statement no. 25 of volume-I of PE Survey.

525Public Enterprises Survey 2010-2011: Vol-II
Ranchi Ashok Bihar Hotel Corporation Ltd.Bihar State Tourism Development Corporation Ltd. Beerchand Patel Path, Patna, Bihar-800001
Balance Sheet (` in Lakhs)
Particulars 2010-11 2009-10 2008-09
Authorised Capital 100 100 100
(1) Sources Of Fund
(1.1) Shareholders Funds
(A) Paid-Up Capital
Central Govt 0 0 0
Others 72 72 72
(B) Share Application Money 0 0 0
(C) Reserves & Surplus 5 0 0
Total (A) + (B) + (C) 77 72 72
(1.2) Loan Funds
(A) Secured Loans 196 196 196
(B) Unsecured Loans 0 0 0
Total (A) + (B) 196 196 196
(1.3) Deferred Tax Liability 0 0 0
Total (1.1) + (1.2) + (1.3) 273 268 268
(2) Application Of Funds
(2.1) Fixed Assets
(A) Gross Block 250 226 225
(B) Less Depreciation 159 154 150
(C) Net Block (A-B) 91 72 75
(D) Capital Work In Progress 0 0 0
Total (C) + (D) 91 72 75
(2.2) Investment 0 0 0
(2.3) Current Assets, Loan & Advances
(A) Inventories 6 7 8
(B) Sundry Debtors 24 38 32
(C) Cash & Bank Balances 91 102 88
(D) Other Current Assets 2 4 3
(E) Loan & Advances 22 29 29
Total (A)+ (B)+ (C)+ (D)+ (E) 145 180 160
(2.4) Less:current Liabilities & Provisions
(A) Current Liabilities 196 169 162
(B) Provisions 19 12 12
Total (A+B) 215 181 174
(2.5) Net Current Assets (2.3-2.4) -70 -1 -14
(2.6) Deferred Revenue / Pre. Expenditure 0 0 0
(2.7) Deferred Tax Asset 0 0 0
(2.8) Profit & Loss Account(Dr) 252 197 207
Total (2.1+2.2+2.5+2.6+2.7+2.8) 273 268 268
2008-09 PROVISIONAL
Important Indicators 2010-11 2009-10 2008-09
(i) Investment 268 72 268
(ii) Capital Employed 21 71 61
(iii) Net Worth -175 -125 -135
(iv) Cost of Production 305 256 244
(v) Cost of Sales 305 256 244
(vi) Gross Value Added (At Market Price) - - -
(vii) Total Employees (Other Than Casuals) (Nos.) 48 48 48
(viii) Avg. Monthly Emoluments Per Employee (Rs.) 31597 22222 20139
Profit & Loss Account (` in Lakhs)
Particulars 2010-11 2009-10 2008-09
(1) Income
(A) Sales/Operating Income 232 262 259
(B) Excise Duty 0 0 0
(C) Net Sales (A-B) 232 262 259
(D) Other Income/Receipts 18 16 17
(E) Accretion/Depletion in Stocks 0 0 0
(I)Total Income (C+D+E) 250 278 276
(2) Expenditure
(A) Purchase of Finished Goods/ Consumption Of Raw Materials 39 43 39
(B) Stores & Spares 9 13 9
(C) Power & Fuel 30 27 30
(D) Manufacturing / Direct / Operating Expenses 29 33 24
(E) Salary, Wages & Benefits / Employee Exp. 182 128 116
(F) Other Expenses 10 7 21
(G) Provisions 0 0 0
(II)Total Expenditure (A to G) 299 251 239
(3) Profit Before Dep, Int, Taxes & EP (PBDITEP) (I-II) -49 27 37
(4) Depreciation 5 4 4
(5) Dre/Prel Exp Written Off 0 0 0
(6) Profit Before Int., Taxes & Ep (PBITEP) (3-4-5) -54 23 33
(7) Interest
(A) On Central Government Loans 0 0 0
(B) On Foreign Loans 0 0 0
(C) Others 1 1 1
(D) Less Interest Capitalised 0 0 0
(E) Charged to P & L Account (A+B+C-D) 1 1 1
(8) Profit Before Tax & EP(PBTEP) (6-7E) -55 22 32
(9) Tax Provisions 0 7 11
(10) Net Profit / Loss Before EP (8-9) -55 15 21
(11) Net Extra-Ord. Items 0 5 1
(12) Net Profit / Loss(-) (10-11) -55 10 20
(13) Dividend Declared 0 0 0
(14) Dividend Tax 0 0 0
(15) Retained Profit (12-13-14) -55 10 20
Financial Ratios 2010-11 2009-10 2008-09
(i) Sales : Capital Employed 1104.76 369.01 424.59
(ii) Cost of Sales : Sales 131.47 97.71 94.21
(iii) Salary / Wages : Sales 78.45 48.85 44.79
(iv) Net Profit : Net Worth - - -
(v) Debt : Equity 2.55 2.72 2.72
(vi) Current Ratio 0.67 0.99 0.92
(vii) Sundry Debtors : Sales (No. of Days) 37.76 52.94 45.1
(viii) Total Inventory : Sales 9.44 9.75 11.27

526 Tourist Services
Utkal Ashok Hotel Corp. Ltd. (UAHCL) was incorporated in 1983 with the objective to promote domestic tourism and to have close coordination between the Center and the State efforts to disperse benefits of tourism in the State of Orissa and to relieve the direct strains on budgetary resources of the Center and State by eliminating duplicate efforts.
UAHCL is an un-categorised sick CPSE in Tourist Services sector under the administrative control of M/o Tourism. Its Registered and Corporate offices are at Puri, Orissa. UAHCL is a subsidiary of ITDC Ltd. which holds 98% of its equity.
Industrial / Business OperationsUAHCL was providing services in the field of Hotel business
(accommodation and catering) through its single hotel namely Hotel Nilachal Ashok at Puri, Orissa. However, since 31.3.2004 the Hotel Nilachal Ashok has been closed.
Strategic issueThe company has decided to lease out the Hotel property
for 40 years to M/s Paulmech Infrastructure Pvt. Ltd.. The property will be handed over to the lesser shortly after getting all regulatory approval.
Performance HighlightsThe operational performance of the company along with
performance indicators and selected financial ratios during the period 2008-09 to 2010-11 can be seen on the opposite page.
The Company registered a ‘Nil’ income during 2010-11. The operating loss of the company went down to ` 0.71 crore in 2010-11 from ` 1.60 crore during 2009-10, a reduction of ` 0.89 crore over the previous year mainly due to fall in salary & wages and reduction in interest cost.
Human Resource ManagementThe company employed 52regular employees as on
31.3.2011. 29 employees have taken VRS in June, 2011. The
20.9 Utkal Ashok Hotel Corp. Ltd. retirement age in the company is 58 years for below board level employees. Details of employment in last 3 years are given below:
Particulars 2010-11 2009-10 2008-09Executives including Non-Unionised Supervisors 0 27 1
Non-Executives # 52 25 53Total Employees 52 52 54
#Detail break-up of Non-Executive employees is at Statement no. 25 of volume-I of PE Survey.

527Public Enterprises Survey 2010-2011: Vol-II
Utkal Ashok Hotel Corp. Ltd. Hotel Neelachal Ashok, VIP Road, Adjoining Raj Bhawan Puri, Orissa – 752 001
Balance Sheet (` in Lakhs)
Particulars 2010-11 2009-10 2008-09
Authorised Capital 550 550 550
(1) Sources Of Fund
(1.1) Shareholders Funds
(A) Paid-Up Capital
Central Govt 0 0 0
Others 480 480 480
(B) Share Application Money 0 0 0
(C) Reserves & Surplus 15 15 15
Total (A) + (B) + (C) 495 495 495
(1.2) Loan Funds
(A) Secured Loans 0 0 0
(B) Unsecured Loans 494 773 986
Total (A) + (B) 494 773 986
(1.3) Deferred Tax Liability 0 0 0
Total (1.1) + (1.2) + (1.3) 989 1268 1481
(2) Application Of Funds
(2.1) Fixed Assets
(A) Gross Block 289 289 289
(B) Less Depreciation 180 177 174
(C) Net Block (A-B) 109 112 115
(D) Capital Work In Progress 0 0 0
Total (C) + (D) 109 112 115
(2.2) Investment 0 0 0
(2.3) Current Assets, Loan & Advances
(A) Inventories 0 0 0
(B) Sundry Debtors 0 0 0
(C) Cash & Bank Balances 3 2 4
(D) Other Current Assets 0 0 0
(E) Loan & Advances 145 2 3
Total (A)+ (B)+ (C)+ (D)+ (E) 148 4 7
(2.4) Less:current Liabilities & Provisions
(A) Current Liabilities 1171 647 279
(B) Provisions -7 25 27
Total (A+B) 1164 672 306
(2.5) Net Current Assets (2.3-2.4) -1016 -668 -299
(2.6) Deferred Revenue / Pre. Expenditure 0 0 0
(2.7) Deferred Tax Asset 0 0 0
(2.8) Profit & Loss Account(Dr) 1896 1824 1665
Total (2.1+2.2+2.5+2.6+2.7+2.8) 989 1268 1481
Important Indicators 2010-11 2009-10 2008-09
(i) Investment 974 1253 480
(ii) Capital Employed -907 -556 -184
(iii) Net Worth -1401 -1329 -1170
(iv) Cost of Production 70 160 139
(v) Cost of Sales 70 160 139
(vi) Gross Value Added (At Market Price) - - -
(vii) Total Employees (Other Than Casuals) (Nos.) 52 52 54
(viii) Avg. Monthly Emoluments Per Employee (Rs.) 6090 11218 8796
Profit & Loss Account (` in Lakhs)
Particulars 2010-11 2009-10 2008-09
(1) Income
(A) Sales/Operating Income 0 0 3
(B) Excise Duty 0 0 0
(C) Net Sales (A-B) 0 0 3
(D) Other Income/Receipts 0 0 2
(E) Accretion/Depletion in Stocks 0 0 0
(I)Total Income (C+D+E) 0 0 5
(2) Expenditure
(A) Purchase of Finished Goods/ Consumption Of Raw Materials 0 0 0
(B) Stores & Spares 0 0 0
(C) Power & Fuel 0 0 0
(D) Manufacturing / Direct / Operating Expenses 0 0 13
(E) Salary, Wages & Benefits / Employee Exp. 38 70 57
(F) Other Expenses 4 8 0
(G) Provisions 0 0 0
(II)Total Expenditure (A to G) 42 78 70
(3) Profit Before Dep, Int, Taxes & EP (PBDITEP) (I-II) -42 -78 -65
(4) Depreciation 3 0 6
(5) Dre/Prel Exp Written Off 0 3 0
(6) Profit Before Int., Taxes & Ep (PBITEP) (3-4-5) -45 -81 -71
(7) Interest
(A) On Central Government Loans 25 0 0
(B) On Foreign Loans 0 0 0
(C) Others 0 79 63
(D) Less Interest Capitalised 0 0 0
(E) Charged to P & L Account (A+B+C-D) 25 79 63
(8) Profit Before Tax & EP(PBTEP) (6-7E) -70 -160 -134
(9) Tax Provisions 0 0 0
(10) Net Profit / Loss Before EP (8-9) -70 -160 -134
(11) Net Extra-Ord. Items 1 0 5
(12) Net Profit / Loss(-) (10-11) -71 -160 -139
(13) Dividend Declared 0 0 0
(14) Dividend Tax 0 0 0
(15) Retained Profit (12-13-14) -71 -160 -139
Financial Ratios 2010-11 2009-10 2008-09
(i) Sales : Capital Employed 0 0 -1.63
(ii) Cost of Sales : Sales 0 0 4633.33
(iii) Salary / Wages : Sales 0 0 1900
(iv) Net Profit : Net Worth - - -
(v) Debt : Equity 1 1.56 1.99
(vi) Current Ratio 0.13 0.01 0.02
(vii) Sundry Debtors : Sales (No. of Days) 0 0 0
(viii) Total Inventory : Sales 0 0 0

529Public Enterprises Survey 2010-2011: Vol-II
As on 31.3.2011, there were 16 Central Public Sector Enterprises in the financial Services group. The name of these enterprises along with their year of incorporation in chronological order are given below :
Sl. No.
Enterprise Year of Incorporation
1. Export Credit Guarantee Corpn. of India Ltd.
1957
2. Housing & Urban Dev. Corpn. Ltd. 1970
3. National film Dev. Corpn. Ltd. 1975
4. Power finance Corporation 1986
5. Indian Railway finance Corporation Ltd. 1986
6. Indian Renewable Energy Devt.Agency Ltd.
1987
7. Indian Vaccine Corp. Ltd. 1988
8. National Scheduled Castes finance & Devp. Corpn.
1989
9. National Backward Classes Finance & Devp.Co.
1992
10. National Minorities Devp. & finance Corpn.
1994
11. National Safai Karamcharis finance & Devpt. Corpn
1997
12. National Handicapped finance & Devpt. Corpn.
1997
13. National Scheduled Tribes finance & Devp. Corpn.
2001
14. Balmer Lawrie Investments Ltd. 2001
15. Kumarakruppa Frontier Hotels Ltd. 2001
16. India Infrastructure finance Co. Ltd. 2006
2. The enterprises falling in this group are mainly engaged in rendering financial services etc.
3. The consolidated financial position, the working results and the important management ratios of these enterprises are appended.
4. Turnover : The details of turnover of individual enterprises are given below :
(`in Crore)Sl. No.
Enterprise Turnover
2010-11 2009-10
1. Power finance Corporation 10128.49 8002.10
2. Indian Railway finance Corporation Ltd.
3818.05 3433.62
3. Housing & Urban Dev. Corpn. Ltd. 2276.20 2507.75
4. India Infrastructure finance Co. Ltd. 1931.68 1548.55
5. Export Credit Guarantee Corpn.of India Ltd.
674.87 575.99
6. Indian Renewable Energy Devt.Agency Ltd.
363.41 321.79
7. National film Dev. Corpn. Ltd. 181.25 64.57
8. National Minorities Devp. & finance Corpn.
26.66 23.15
9. National Scheduled Castes finance & Devp. Corpn.
22.29 20.81
10. National Backward Classes Finance & Devp.Co.
22.21 22.05
21 Financial Services11. Kumarakruppa Frontier Hotels Ltd. 12.05 0.00
12. National Scheduled Tribes finance & Devp. Corpn.
10.65 9.80
13. National Safai Karamcharis finance & Devpt. Corpn
8.89 6.18
14. Balmer Lawrie Investments Ltd. 0.00 0.00
15. Indian Vaccine Corp. Ltd. 0.00 0.00
16. National Handicapped finance & Devpt. Corpn.
0.00 2.96
Sub Total 19476.70 16539.32
5. Net Profit/Loss : The details of the enterprises, which earned net profit or sustained net loss (-) are given below :
(`in Crore)Sl. No.
Enterprise Adjusted Net Profit/Net Loss
2010-11 2009-10
1. Power finance Corporation 2619.58 2357.25
2. Housing & Urban Dev. Corpn. Ltd. 550.03 495.31
3. Indian Railway finance Corporation Ltd.
485.20 442.69
4. India Infrastructure finance Co. Ltd. 295.80 153.76
5. Indian Renewable Energy Devt.Agency Ltd.
120.46 72.69
6. Export Credit Guarantee Corpn. of India Ltd.
85.66 53.73
7. National Minorities Devp. & finance Corpn.
31.61 15.13
8. Balmer Lawrie Investments Ltd. 24.23 21.11
9. National Backward Classes Finance & Devp.Co.
19.20 15.87
10. National Scheduled Castes finance & Devp. Corpn.
13.96 19.76
11. National Scheduled Tribes finance & Devp. Corpn.
5.96 5.84
12. Kumarakruppa Frontier Hotels Ltd. 5.53 7.46
13. National Safai Karamcharis finance & Devpt. Corpn
4.14 1.91
14. National film Dev. Corpn. Ltd. 1.69 -7.13
15. National Handicapped finance & Devpt. Corpn.
1.66 2.74
16. Indian Vaccine Corp. Ltd. 0.43 0.00
Sub Total 4265.14 3658.12
6. Dividend : The details of the dividend declared by the individual enterprise are given below :

530 Financial Services
(`in Crore)Sl. No.
Enterprise Dividend
2010-11 2009-10
1. Power finance Corporation 599.71 516.50
2. Housing & Urban Dev. Corpn. Ltd. 110.02 59.08
3. Indian Railway finance Corporation Ltd.
100.00 100.00
4. Export Credit Guarantee Corpn. of India Ltd.
30.33 10.75
5. Indian Renewable Energy Devt.Agency Ltd.
20.00 14.54
6. Balmer Lawrie Investments Ltd. 18.87 16.87
Group Total 878.93 717.74
7. Social Overheads and Township : The total number of persons employed and the expenditure incurred on social overheads and townships are given below :
(`in Crore)Sl. No.
Enterprise Township and Social Overheads
2010-11 2009-10
1. No. of employees (in number) 2516 2511
2. Social overheads : (Rupees in Crore)
(i) Educational, 4.27 5.27
(ii) Medical facilities 19.42 8.48
(iii) others 5.51 0.49
3. Capital cost of township (Rupees in Crore)
123.34 0.00
4. No. of houses constructed (in number)
0 0
8. Company wise details in respect of Balance Sheet, Profit and Loss account, Important Indicators and Financial Ratios along with the write up of individual company are given in the pages below.

531Public Enterprises Survey 2010-2011: Vol-II
Financial ServicesBalance Sheet
(` in Lakhs)
(` in Lakhs)
Particulars 2010-11 2009-10 2008-09
AUTHoRISED CAPITAL 1502140 1449000 1324000
(1) SOURCES OF FUND
(1.1) SHAREHoLDERS fUNDS
(A) PAID-UP CAPITAL
CENTRAL GoVT 1082088 973941 816871
oTHERS 30542 27799 13263
(B) SHARE APPLICATIoN MoNEY 7876 161 64052
(C) RESERVES & SURPLUS 2393979 2078059 1725051
TOTAL (A) + (B) + (C) 3514485 3079960 2619237
(1.2) LoAN fUNDS
(A) SECURED LoANS 3409456 2984259 2413450
(B) UNSECURED LoANS 12901697 10765353 9231198
TOTAL (A) + (B) 16311153 13749612 11644648
(1.3) DEfERRED TAX LIABILITY 309195 275961 254880
TOTAL (1.1) + (1.2) + (1.3) 20134833 17105533 14518765
(2) APPLICATION OF FUNDS
(2.1) fIXED ASSETS
(A) GRoSS BLoCK 57865 55349 55296
(B) LESS DEPRECIATIoN 20521 18382 17071
(C) NET BLoCK (A-B) 37344 36967 38225
(D) CAPITAL WoRK IN PRoGRESS 2428 1337 1054
TOTAL (C) + (D) 39772 38304 39279
(2.2) INVESTMENT 6772470 5886860 3579163
(2.3) CURRENT ASSETS,LoAN & ADVANCES
(A) INVENToRIES 47 46 176
(B) SUNDRY DEBToRS 11409 7991018 6442530
(C) CASH & BANK BALANCES 1245840 1122803 1558733
(D) oTHER CURRENT ASSETS 349126 265136 241599
(E) LoAN & ADVANCES 12694164 2694613 3456092
TOTAL (A)+ (B)+ (C)+ (D)+ (E) 14300586 12073616 11699130
(2.4) LESS:CURRENT LIABILITIES & PRoVISIoNS
(A) CURRENT LIABILITIES 798981 621807 514216
(B) PRoVISIoNS 189373 280553 300363
TOTAL (A+B) 988354 902360 814579
(2.5) NET CURRENT ASSETS(2.3-2.4) 13312232 11171256 10884551
(2.6) DEfERRED REVENUE / PRE.EXPENDITURE 204 294 8977
(2.7) DEfERRED TAX ASSET 6302 4754 3324
(2.8) PRofIT & LoSS ACCoUNT(DR) 3853 4065 3471
TOTAL (2.1+2.2+2.5+2.6+2.7+2.8) 20134833 17105533 14518765
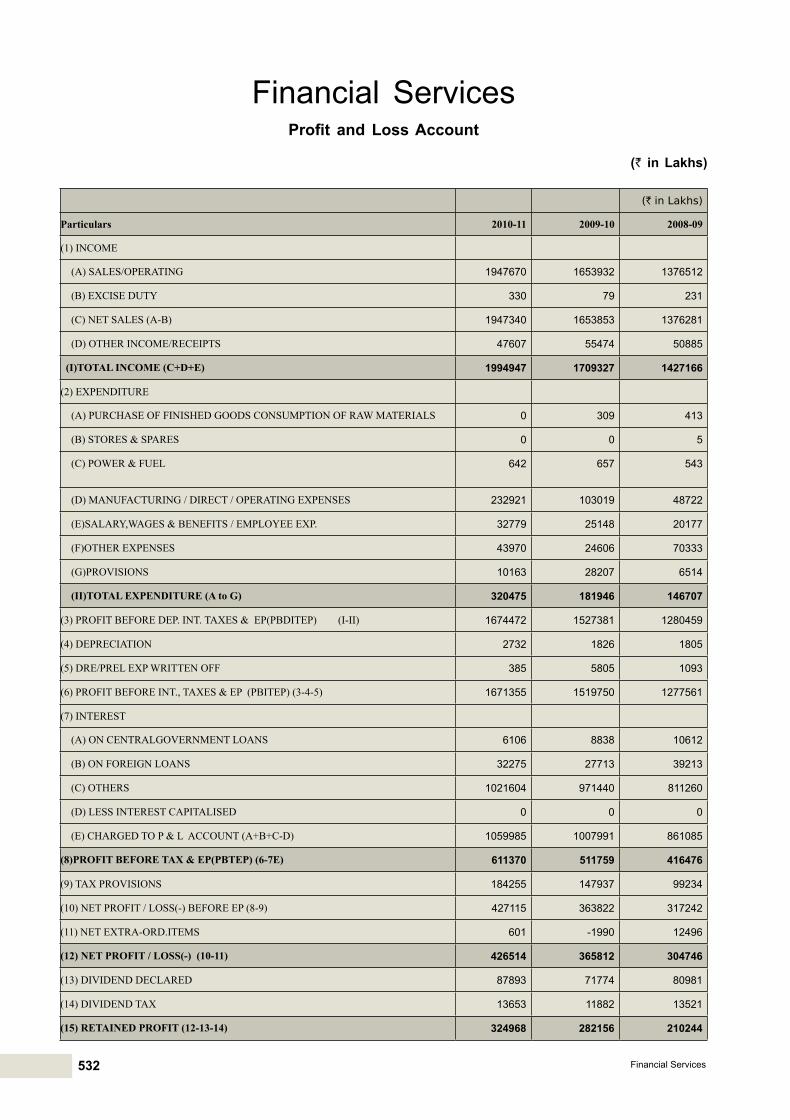
532 Financial Services
Financial ServicesProfit and Loss Account
(` in Lakhs)
(` in Lakhs)
Particulars 2010-11 2009-10 2008-09
(1) INCoME
(A) SALES/oPERATING 1947670 1653932 1376512
(B) EXCISE DUTY 330 79 231
(C) NET SALES (A-B) 1947340 1653853 1376281
(D) oTHER INCoME/RECEIPTS 47607 55474 50885
(I)TOTAL INCOME (C+D+E) 1994947 1709327 1427166
(2) EXPENDITURE
(A) PURCHASE of fINISHED GooDS CoNSUMPTIoN of RAW MATERIALS 0 309 413
(B) SToRES & SPARES 0 0 5
(C) PoWER & fUEL 642 657 543
(D) MANUfACTURING / DIRECT / oPERATING EXPENSES 232921 103019 48722
(E)SALARY,WAGES & BENEfITS / EMPLoYEE EXP. 32779 25148 20177
(f)oTHER EXPENSES 43970 24606 70333
(G)PRoVISIoNS 10163 28207 6514
(II)TOTAL EXPENDITURE (A to G) 320475 181946 146707
(3) PRofIT BEfoRE DEP. INT. TAXES & EP(PBDITEP) (I-II) 1674472 1527381 1280459
(4) DEPRECIATIoN 2732 1826 1805
(5) DRE/PREL EXP WRITTEN off 385 5805 1093
(6) PRofIT BEfoRE INT., TAXES & EP (PBITEP) (3-4-5) 1671355 1519750 1277561
(7) INTEREST
(A) oN CENTRALGoVERNMENT LoANS 6106 8838 10612
(B) oN foREIGN LoANS 32275 27713 39213
(C) oTHERS 1021604 971440 811260
(D) LESS INTEREST CAPITALISED 0 0 0
(E) CHARGED To P & L ACCoUNT (A+B+C-D) 1059985 1007991 861085
(8)PROFIT BEFORE TAX & EP(PBTEP) (6-7E) 611370 511759 416476
(9) TAX PRoVISIoNS 184255 147937 99234
(10) NET PRofIT / LoSS(-) BEfoRE EP (8-9) 427115 363822 317242
(11) NET EXTRA-oRD.ITEMS 601 -1990 12496
(12) NET PROFIT / LOSS(-) (10-11) 426514 365812 304746
(13) DIVIDEND DECLARED 87893 71774 80981
(14) DIVIDEND TAX 13653 11882 13521
(15) RETAINED PROFIT (12-13-14) 324968 282156 210244

533Public Enterprises Survey 2010-2011: Vol-II
Financial ServicesManagement Ratio
Particulars 2010-11 2009-10 2008-09
(A.) INDICATORS
(I) GENERAL(Rs. in Lakhs)
(i) INVESTMENT 16790129 14351820 12220704
(ii) CAPITAL EMPLoYED 13349576 11208223 10922776
(iii) NET WoRTH 3510428 3075601 2606789
(iv) CoST of PRoDUCTIoN 1383577 1197568 1010690
(v) CoST of SALES 1383577 1197568 1010690
(vi) VALUE ADDED 1946698 1652887 1375320
(vii) R AND D EXPENDITURE 19 170 56
(II) HUMAN RESOURCE
(viii) EMPLoYEES (oTHER THAN CASUAL)(Nos.) 2516 2511 2532
(ix) AVG.MoNTHLY EMoLUMENTS PER EMPLoYEE(Rs.) 108568 83459 66407
(B.) MANAGEMENT RATIO
(i) DEBT : EQUITY 4.64 4.46 4.45
(ii) CURRENT RATIo (CURRENT ASSET:CURRENT- LIABILITY 14.47 13.38 14.36
(iii) PBDITEP : TOTAL EMPLOYEMENT (Rs. in Lakhs) 665.53 608.28 505.71
(iv) SUNDRY DEBToRS : SALES (No. of days) 2.14 1763.59 1708.61
(v) INVENToRY(No. of days)
(a) ToTAL INVENToRY : SALES 0.01 0.01 0.05
(b) SEMI/fINISHED GooDS : SALES 0 0 0
(vi) INCREMENTAL CAPITAL oUTPUT RATIo(ICoR) 7.3 1.03 10.12
(%)
(vii) SALES : CAPITAL EMPLoYED 14.59 14.76 12.6
(viii) PBDITEP : CAPITAL EMPLoYED 12.54 13.63 11.72
(ix) PBITEP : CAPITAL EMPLoYED 12.52 13.56 11.7
(x) CoST of SALES : SALES 71.05 72.41 73.44
(xi) MATERIAL CoST : SALES 0 0.02 0.03
(xii) SALARY & WAGES : SALES 1.68 1.52 1.47
(xiii) R & D EXPENDITURE : SALES 0 0.01 0
(xiv) PBITEP : SALES 85.83 91.89 92.83
(xv) PBTEP : NET WoRTH 17.42 16.64 15.98
(xvi) NET PRofIT : NET WoRTH 12.15 11.89 11.69
(xvii) GRoSS MARGIN : GRoSS BLoCK 2893.76 2759.55 2315.64

534 Financial Services
www. blinv.com
Balmer Lawrie Investment Ltd. (BLIL) was incorporated on 20.09.2001 with the objective of facilitating the disinvestment of IBP Co. Ltd., wherein the share holding of IBP Co. in Balmer Lawrie & Co. Ltd. was de-merged in favor of BLIL with effect from 15.10.2001.
BLIL is an un-categorized listed CPSE in Financial Services sector under the administrative control of M/o Petroleum & Natural Gas with 59.68% shareholding by the Government of India. Its Registered and Corporate offices are at Kolkata, West Bengal.
Industrial / Business OperationsBLIL is a Non-Banking finance company and engaged in
providing a specific service i.e. to hold the equity shares of its subsidiary Balmer Lawrie and Co. Ltd. (BL). The equity shares of the company are under compulsory demat mode and the shares are listed in the stock exchanges. The company also holds 100% equity share holding of its overseas subsidiary company namely Balmer Lawrie (UK) Ltd.
Strategic issueThe Company was formed as a Special Purpose Vehicle
(‘SPV’) under the erstwhile disinvestment policy of the Government of India.
Performance HighlightsThe operational performance of the company along with
performance indicators and selected financial ratios during the period 2008-09 to 2010-11 can be seen on the opposite page.
The Company registered an increase of ` 3.14 crore in total income during 2010-11 which went up to ` 25.30 crore in 2010-11 from ` 22.16 crore during 2009-10. The net profit of the company correspondingly increased to ` 24.23 crore, an increase of ` 3.12 crore over the previous year due to the increase in the amount of dividend received from its subsidiary and increase in the quantum of bank deposits.
Human Resource ManagementThe company does not have any employee of its own except
its Company Secretary whose services have been seconded from Balmer Lawrie & Co. Ltd. All services for the company in the nature of accounts, finance, taxation, legal, secretarial, administration etc. are obtained from ‘Balmer Lawrie & Co. Ltd. under a service agreement.
21.1 Balmer Lawrie Investment Ltd.

535Public Enterprises Survey 2010-2011: Vol-II
Balmer Lawrie Investment Ltd.21, Netaji Subhas Road, Kolkata, West Bengal -700001
Balance Sheet (` in Lakhs)
Particulars 2010-11 2009-10 2008-09
Authorised Capital 2500 2500 2500
(1) Sources Of Fund
(1.1) Shareholders Funds
(A) Paid-Up Capital
Central Govt 1325 1325 1325
Others 895 895 895
(B) Share Application Money 0 0 0
(C) Reserves & Surplus 3215 2679 2255
Total (A) + (B) + (C) 5435 4899 4475
(1.2) Loan Funds
(A) Secured Loans 0 0 0
(B) Unsecured Loans 0 0 0
Total (A) + (B) 0 0 0
(1.3) Deferred Tax Liability 0 0 0
Total (1.1) + (1.2) + (1.3) 5435 4899 4475
(2) Application Of Funds
(2.1) Fixed Assets
(A) Gross Block 0 0 0
(B) Less Depreciation 0 0 0
(C) Net Block (A-B) 0 0 0
(D) Capital Work In Progress 0 0 0
Total (C) + (D) 0 0 0
(2.2) Investment 3268 3268 3268
(2.3) Current Assets, Loan & Advances
(A) Inventories 0 0 0
(B) Sundry Debtors 0 0 0
(C) Cash & Bank Balances 4050 3270 2554
(D) Other Current Assets 0 0 0
(E) Loan & Advances 80 109 112
Total (A)+ (B)+ (C)+ (D)+ (E) 4130 3379 2666
(2.4) Less:current Liabilities & Provisions
(A) Current Liabilities 76 61 38
(B) Provisions 1887 1687 1421
Total (A+B) 1963 1748 1459
(2.5) Net Current Assets (2.3-2.4) 2167 1631 1207
(2.6) Deferred Revenue / Pre. Expenditure 0 0 0
(2.7) Deferred Tax Asset 0 0 0
(2.8) Profit & Loss Account(Dr) 0 0 0
Total (2.1+2.2+2.5+2.6+2.7+2.8) 5435 4899 4475
Important Indicators 2010-11 2009-10 2008-09
(i) Investment 2220 2220 2220
(ii) Capital Employed 2167 1631 1207
(iii) Net Worth 5435 4899 4475
(iv) Cost of Production 45 46 40
(v) Cost of Sales 45 46 40
(vi) Gross Value Added (At Market Price) - - -
(vii) Total Employees (Other Than Casuals) (Nos.) 1 1 0
(viii) Avg. Monthly Emoluments Per Employee (Rs.) 75000 75000 0
Profit & Loss Account (` in Lakhs)
Particulars 2010-11 2009-10 2008-09
(1) Income
(A) Sales/Operating Income 0 0 0
(B) Excise Duty 0 0 0
(C) Net Sales (A-B) 0 0 0
(D) Other Income/Receipts 2530 2216 1889
(E) Accretion/Depletion in Stocks 0 0 0
(I)Total Income (C+D+E) 2530 2216 1889
(2) Expenditure
(A) Purchase of Finished Goods/ Consumption Of Raw Materials 0 0 0
(B) Stores & Spares 0 0 0
(C) Power & Fuel 0 0 0
(D) Manufacturing / Direct / Operating Expenses 0 0 0
(E) Salary, Wages & Benefits / Employee Exp. 9 9 9
(F) Other Expenses 36 37 31
(G) Provisions 0 0 0
(II)Total Expenditure (A to G) 45 46 40
(3) Profit Before Dep, Int, Taxes & EP (PBDITEP) (I-II) 2485 2170 1849
(4) Depreciation 0 0 0
(5) Dre/Prel Exp Written Off 0 0 0
(6) Profit Before Int., Taxes & Ep (PBITEP) (3-4-5) 2485 2170 1849
(7) Interest
(A) On Central Government Loans 0 0 0
(B) On Foreign Loans 0 0 0
(C) Others 0 0 0
(D) Less Interest Capitalised 0 0 0
(E) Charged to P & L Account (A+B+C-D) 0 0 0
(8) Profit Before Tax & EP(PBTEP) (6-7E) 2485 2170 1849
(9) Tax Provisions 62 59 53
(10) Net Profit / Loss Before EP (8-9) 2423 2111 1796
(11) Net Extra-Ord. Items 0 0 0
(12) Net Profit / Loss(-) (10-11) 2423 2111 1796
(13) Dividend Declared 1887 1687 1421
(14) Dividend Tax 0 0 0
(15) Retained Profit (12-13-14) 536 424 375
Financial Ratios 2010-11 2009-10 2008-09
(i) Sales : Capital Employed 0 0 0
(ii) Cost of Sales : Sales 0 0 0
(iii) Salary / Wages : Sales 0 0 0
(iv) Net Profit : Net Worth 44.58 43.09 40.13
(v) Debt : Equity 0 0 0
(vi) Current Ratio 2.1 1.93 1.83
(vii) Sundry Debtors : Sales (No. of Days) 0 0 0
(viii) Total Inventory : Sales 0 0 0

536 Financial Services
www.ecgc.in
Export Credit Guarantee Corporation of India Ltd. (ECGC) (earlier known as “Export Risk Corporation of India Ltd.”) was set up on 31.7.1957 with the objective to support and strengthen the export promotion efforts of the country by issuing credit insurance covers to protect the exporters against non-realisation on account of commercial and political risks.
ECGC is an uncategorized CPSE in Financial Services sector under the administrative control of M/o Commerce and Industry, D/o Commerce with 100% shareholding by the Government of India. It’s Registered and Corporate offices are at Mumbai, Maharashtra.
Vision / MissionThe Vision of the Company is to excel in providing export
credit insurance and trade related services.The mission of the company is to support the Indian Export
Industry by way of providing cost effective Insurance and trade related services to meet the growing needs of the Indian Export market through optimal utilization of available resources.
Industrial / Business OperationsECGC provides a range of credit risk insurance covers to
exporters against the loss in export of goods and services. It also offers guarantees to banks and financial institutions to enable exporters to obtain better facilities from them. ECGC further provides overseas investment insurance to Indian Companies investing in joint ventures abroad in the form of equity or loan. Besides Head Office, it has 51 branch offices. The service segment of the company comprises of Policies and Guarantees. The physical performance of company during the last three years is mentioned below: Main Services
Unit Performance During2010-11 2009-10 2008-09
Business covered
` in crore 431888.34 363728.31 335457.47
Premium income
` in crore 885.49 813.00 744.68
Claims paid ` in crore 620.53 641.72 451.42
Recoveries made
` in crore 136.12 133.60 208.58
Strategic issueThe company being covered under the regulatory regime of
the Insurance Regulatory and Development Authority (IRDA), an effort is being made to gradually shift from bank deposits to newer investment opportunities with the relevant regulatory provisions.
Performance HighlightsThe operational performance of the company along with
performance indicators and selected financial ratios during the period 2008-09 to 2010-11 can be seen on the opposite page.
The Company registered an increase of ` 102.06 crore in total income during 2010-11 which went up to ` 971.72 crore in 2010-11 from ` 869.66 crore during 2009-10. The net profit of the company correspondingly increased to ` 85.66 crore, an increase of ` 31.93 crore over the previous year due to increase in turnover.
21.2 Export Credit Guarantee Corporation of India Ltd.
Human Resource ManagementThe Company employed 575 regular employees as on
31.03.2011. The retirement age in the Company is 60 years. Details of employment in last 3 years are given below:
(Nos.)Particulars 2010-11 2009-10 2008-09
Executives including Non-Unionised Supervisors 197 197 187
Non-Executives # 378 389 377Total Employees 575 586 564
# Detail break-up of Non-Executive employees is at Statement no. 25 of volume-I of PE Survey.

537Public Enterprises Survey 2010-2011: Vol-II
Export Credit Guarantee Corporation of India Ltd.Express Towers, 10th floor, Nariman Point, Mumbai- 400021
Balance Sheet (` in Lakhs)
Particulars 2010-11 2009-10 2008-09
Authorised Capital 100000 100000 100000
(1) Sources Of Fund
(1.1) Shareholders Funds
(A) Paid-Up Capital
Central Govt 90000 90000 90000
Others 0 0 0
(B) Share Application Money 0 0 0
(C) Reserves & Surplus 108271 105894 98622
Total (A) + (B) + (C) 198271 195894 188622
(1.2) Loan Funds
(A) Secured Loans 0 27 0
(B) Unsecured Loans 7951 0 3133
Total (A) + (B) 7951 27 3133
(1.3) Deferred Tax Liability 0 0 0
Total (1.1) + (1.2) + (1.3) 206222 195921 191755
(2) Application Of Funds
(2.1) Fixed Assets
(A) Gross Block 16842 16412 16164
(B) Less Depreciation 3434 3064 2649
(C) Net Block (A-B) 13408 13348 13515
(D) Capital Work In Progress 911 158 114
Total (C) + (D) 14319 13506 13629
(2.2) Investment 316357 262046 106198
(2.3) Current Assets, Loan & Advances
(A) Inventories 0 0 0
(B) Sundry Debtors 0 0 2955
(C) Cash & Bank Balances 87686 79227 200179
(D) Other Current Assets 44383 26420 25809
(E) Loan & Advances 0 17970 1233
Total (A)+ (B)+ (C)+ (D)+ (E) 132069 123617 230176
(2.4) Less:current Liabilities & Provisions
(A) Current Liabilities 208767 167054 121584
(B) Provisions 48160 38257 39907
Total (A+B) 256927 205311 161491
(2.5) Net Current Assets (2.3-2.4) -124858 -81694 68685
(2.6) Deferred Revenue / Pre. Expenditure 0 0 3025
(2.7) Deferred Tax Asset 404 2063 218
(2.8) Profit & Loss Account(Dr) 0 0 0
Total (2.1+2.2+2.5+2.6+2.7+2.8) 206222 195921 191755
Important Indicators 2010-11 2009-10 2008-09
(i) Investment 97951 90027 90000
(ii) Capital Employed -111450 -68346 82200
(iii) Net Worth 198271 195894 185597
(iv) Cost of Production 85410 80419 45464
(v) Cost of Sales 85410 80419 45464
(vi) Gross Value Added (At Market Price) - - -
(vii) Total Employees (Other Than Casuals) (Nos.) 575 586 564
(viii) Avg. Monthly Emoluments Per Employee (Rs.) 144246 70392 64775
Profit & Loss Account (` in Lakhs)
Particulars 2010-11 2009-10 2008-09
(1) Income
(A) Sales/Operating Income 67487 57599 52527
(B) Excise Duty 0 0 0
(C) Net Sales (A-B) 67487 57599 52527
(D) Other Income/Receipts 29685 29367 36766
(E) Accretion/Depletion in Stocks 0 0 0
(I)Total Income (C+D+E) 97172 86966 89293
(2) Expenditure
(A) Purchase of Finished Goods/ Consumption Of Raw Materials 0 0 0
(B) Stores & Spares 0 0 0
(C) Power & Fuel 292 299 234
(D) Manufacturing / Direct / Operating Expenses 74717 67518 35523
(E) Salary, Wages & Benefits / Employee Exp. 9953 4950 4384
(F) Other Expenses 0 7207 4577
(G) Provisions 0 0 301
(II)Total Expenditure (A to G) 84962 79974 45019
(3) Profit Before Dep, Int, Taxes & EP (PBDITEP) (I-II) 12210 6992 44274
(4) Depreciation 448 439 433
(5) Dre/Prel Exp Written Off 0 6 0
(6) Profit Before Int., Taxes & Ep (PBITEP) (3-4-5) 11762 6547 43841
(7) Interest
(A) On Central Government Loans 0 0 12
(B) On Foreign Loans 0 0 0
(C) Others 0 0 0
(D) Less Interest Capitalised 0 0 0
(E) Charged to P & L Account (A+B+C-D) 0 0 12
(8) Profit Before Tax & EP(PBTEP) (6-7E) 11762 6547 43829
(9) Tax Provisions 3370 3044 15465
(10) Net Profit / Loss Before EP (8-9) 8392 3503 28364
(11) Net Extra-Ord. Items -174 -1870 25
(12) Net Profit / Loss(-) (10-11) 8566 5373 28339
(13) Dividend Declared 3033 1075 18000
(14) Dividend Tax 0 182 3059
(15) Retained Profit (12-13-14) 5533 4116 7280
Financial Ratios 2010-11 2009-10 2008-09
(i) Sales : Capital Employed -60.55 -84.28 63.9
(ii) Cost of Sales : Sales 126.56 139.62 86.55
(iii) Salary / Wages : Sales 14.75 8.59 8.35
(iv) Net Profit : Net Worth 4.32 2.74 15.27
(v) Debt : Equity 0.04 0 0.02
(vi) Current Ratio 0.51 0.6 1.43
(vii) Sundry Debtors : Sales (No. of Days) 0 0 20.53
(viii) Total Inventory : Sales 0 0 0
2010-11 PROVISIONAL

538 Financial Services
www.hudco.org
Housing & Urban Development Corporation Ltd. (HUDCo)was incorporated on 25.4.1970 with the objective of providing long-term finance for construction of houses for residential purposes or financing or undertaking housing and urban development programs in the country, setting up of new or satellite towns and industrial enterprises of building material, to subscribe to the debentures and bonds to be issued by the State Housing (and/or Urban Development) Boards, Improvement Trusts, Development Authorities etc. specially for the purpose of housing and urban development programmes and to promote, establish, assist, collaborate and provide consultancy services for the projects of designing and planning of works relating to housing and development programmes in India and abroad.
It is a Schedule-’A’ Mini-Ratna CPSE in financial services sector under the administrative control of M/o Housing and Urban Poverty Alleviation with 100% shareholding by the Government of India. Its Registered and Corporate offices are at New Delhi.
Vision / MissionThe Vision of the Company is to be among the world’s
leading knowledge hubs and financial organization for habitat settlement. The Mission of the Company is to promote sustainable habitat development to enhance the quality of life.
Industrial / Business OperationsThe main activity of the company is to provide financing of
housing and infrastructure projects through financial assistance to agencies like State Housing Boards, Rural Housing Boards, Slum Clearance boards, Development Authorities, Improvement Trusts, Municipal Corporations, Primary Cooperative Societies, NGO’s / Private Developers, Joint Sector and individuals.
The company operates through its 41 offices throughout India including corporate office, a Training and Research Wing, 20 Regional offices and 19 Niwas development offices. The company has 4 joint ventures (JV) in infrastructure development sector with share holding ranging from 26% to 40%.The performance of Company for last three years is given below:Main Services Unit Performance During
2010-11 2009-10 2008-09
Loan Sanctions ` Crore 19762 16624 14754
No. of Scheme Sanctioned
No. 134 145 192
21.3 Housing & Urban Development Corporation Ltd.
Strategic IssuesIn view of the dynamic changes in the business environment
for the housing and urban infrastructure sector and the enlarged focus of HUDCo on its social operations, a need has been felt for revision of the Corporate Plan towards setting the new operational and financial benchmarks while imparting increased focus to social lending.
Performance HighlightsThe operational performance of the company along with
performance indicators and selected financial ratios during the period 2008-09 to 2010-11 can be seen on the opposite page. The Company registered a reduction of ` 249.76 crore in total income during 2010-11 which went down to ` 2278.59 crore in 2010-11 from ` 2528.35 crore during 2009-10. The fall in income is mainly due to fall in operating income. The net profit of the company however increased to ` 550.03 crore, an increase of ` 54.72 crore over the previous year due to lower provisions and fall in interest.
Human Resource Management The Company employed 993 regular employee as on
31.03.2011. The retirement age in the Company is 60 years. It is following IDA 2007 pattern of remuneration. Details of employment in last 3 years are given below:
(Nos.)Particulars 2010-11 2009-10 2008-09
Executives including Non-Unionised Supervisors 677 687 561
Non-Executives # 316 319 466Total Employees 993 1006 1027
# Detail break-up of Non-Executive employees is at Statement no. 25 of volume-I of PE Survey.

539Public Enterprises Survey 2010-2011: Vol-II
Housing & Urban Development Corporation Ltd.HUDCo Bhawan, India Habitat Centre, Lodhi Road, New Delhi-110 003
Balance Sheet (` in Lakhs)
Particulars 2010-11 2009-10 2008-09
Authorised Capital 250000 250000 250000
(1) Sources Of Fund
(1.1) Shareholders Funds
(A) Paid-Up Capital
Central Govt 200190 200190 200190
Others 0 0 0
(B) Share Application Money 0 0 0
(C) Reserves & Surplus 351907 309519 266596
Total (A) + (B) + (C) 552097 509709 466786
(1.2) Loan Funds
(A) Secured Loans 17909 18953 19919
(B) Unsecured Loans 1559957 1533095 1905014
Total (A) + (B) 1577866 1552048 1924933
(1.3) Deferred Tax Liability 28185 23736 23439
Total (1.1) + (1.2) + (1.3) 2158148 2085493 2415158
(2) Application Of Funds
(2.1) Fixed Assets
(A) Gross Block 15878 14250 14187
(B) Less Depreciation 8457 7362 6990
(C) Net Block (A-B) 7421 6888 7197
(D) Capital Work In Progress 1181 959 907
Total (C) + (D) 8602 7847 8104
(2.2) Investment 129898 152399 204319
(2.3) Current Assets, Loan & Advances
(A) Inventories 0 0 0
(B) Sundry Debtors 1657 1215 2182
(C) Cash & Bank Balances 71620 75586 105239
(D) Other Current Assets 23028 19080 26913
(E) Loan & Advances 2032077 1936913 2195321
Total (A)+ (B)+ (C)+ (D)+ (E) 2128382 2032794 2329655
(2.4) Less:current Liabilities & Provisions
(A) Current Liabilities 84430 91634 94004
(B) Provisions 24304 15913 34956
Total (A+B) 108734 107547 128960
(2.5) Net Current Assets (2.3-2.4) 2019648 1925247 2200695
(2.6) Deferred Revenue / Pre. Expenditure 0 0 2040
(2.7) Deferred Tax Asset 0 0 0
(2.8) Profit & Loss Account(Dr) 0 0 0
Total (2.1+2.2+2.5+2.6+2.7+2.8) 2158148 2085493 2415158
Important Indicators 2010-11 2009-10 2008-09
(i) Investment 1768056 1730238 2125123
(ii) Capital Employed 2027069 1932135 2207892
(iii) Net Worth 552097 509709 464746
(iv) Cost of Production 145740 174339 194197
(v) Cost of Sales 145740 174339 194197
(vi) Gross Value Added (At Market Price) - - -
(vii) Total Employees (Other Than Casuals) (Nos.) 993 1006 1027
(viii) Avg. Monthly Emoluments Per Employee (Rs.) 96047 76607 61465
Profit & Loss Account (` in Lakhs)
Particulars 2010-11 2009-10 2008-09
(1) Income
(A) Sales/Operating Income 227620 250775 270825
(B) Excise Duty 0 0 0
(C) Net Sales (A-B) 227620 250775 270825
(D) Other Income/Receipts 239 2060 493
(E) Accretion/Depletion in Stocks 0 0 0
(I)Total Income (C+D+E) 227859 252835 271318
(2) Expenditure
(A) Purchase of Finished Goods/ Consumption Of Raw Materials 0 0 0
(B) Stores & Spares 0 0 0
(C) Power & Fuel 159 142 120
(D) Manufacturing / Direct / Operating Expenses 1094 692 606
(E) Salary, Wages & Benefits / Employee Exp. 11445 9248 7575
(F) Other Expenses 3434 2565 20803
(G) Provisions 2923 21080 0
(II)Total Expenditure (A to G) 19055 33727 29104
(3) Profit Before Dep, Int, Taxes & EP (PBDITEP) (I-II) 208804 219108 242214
(4) Depreciation 1142 452 467
(5) Dre/Prel Exp Written Off 0 2287 956
(6) Profit Before Int., Taxes & Ep (PBITEP) (3-4-5) 207662 216369 240791
(7) Interest
(A) On Central Government Loans 304 304 304
(B) On Foreign Loans 4372 5316 6556
(C) Others 120867 132253 156810
(D) Less Interest Capitalised 0 0 0
(E) Charged to P & L Account (A+B+C-D) 125543 137873 163670
(8) Profit Before Tax & EP(PBTEP) (6-7E) 82119 78496 77121
(9) Tax Provisions 27145 29052 25552
(10) Net Profit / Loss Before EP (8-9) 54974 49444 51569
(11) Net Extra-Ord. Items -29 -87 11470
(12) Net Profit / Loss(-) (10-11) 55003 49531 40099
(13) Dividend Declared 11002 5908 4524
(14) Dividend Tax 1785 981 769
(15) Retained Profit (12-13-14) 42216 42642 34806
Financial Ratios 2010-11 2009-10 2008-09
(i) Sales : Capital Employed 11.23 12.98 12.27
(ii) Cost of Sales : Sales 64.03 69.52 71.71
(iii) Salary / Wages : Sales 5.03 3.69 2.8
(iv) Net Profit : Net Worth 9.96 9.72 8.63
(v) Debt : Equity 2.86 3.04 4.12
(vi) Current Ratio 19.57 18.9 18.06
(vii) Sundry Debtors : Sales (No. of Days) 2.66 1.77 2.94
(viii) Total Inventory : Sales 0 0 0

540 Financial Services
www.iifcl.org
India Infrastructure finance Company Limited (IIfCL) was incorporated on 5.1.2006 as a Special Purpose Vehicle (SPV) with the objective of providing financial assistance and acting as a financial intermediary for the purpose of development and establishment of infrastructure projects in India.
The company is an un-categorised CPSE in financial Services sector under the administrative control of M/o finance, D/o financial Services with 100% shareholding by the Government of India. Its Registered and Corporate offices are at New Delhi.
Vision / MissionThe Vision of the Company is to provide innovative
financing solutions to promote and develop world class infrastructure in India.
The Mission of the Company is to adopt best practices in financing infrastructure and develop core competencies in facilitating infrastructure development; develop a team of highly engaged employees to deliver services in a professional manner and to the satisfaction of all stakeholders
Industrial / Business OperationsIIFCL is providing long term financial assistance to various
viable infrastructure projects in the country in terms of the Scheme for Infrastructure financing. Apart from equity, IIfCL raises long term debt from the domestic market, debt from bilateral and multilateral institutions and in foreign currency through external commercial borrowings. The borrowings of the company are backed by sovereign guarantee.
The infrastructure projects include road and bridges, railway, seaport, airports & other transport projects, power, urban transport, water supply, sewerage, solid waste management, gas pipeline, projects in special economic zones etc.
It is only a infrastructure project implemented by a Public Sector Company or Private sector company under Public Private Partnership (PPP) through a Project Company set up on a ‘non resource’ basis that shall be eligible for financing by IIFCL.
The company has one off-shore wholly owned subsidiary, namely IIfC (UK) Ltd. in London. The subsidiary channels part of the foreign exchange reserves of the country for creation of infrastructure assets by way of lending to Indian companies implementing infrastructure projects, solely for meeting their capital expenditure for imports outside India. The company also has one Joint Venture company namely India Infrastructure Fund with equity participation from IDFC, Citi Bank and IIFCL.The physical performances of the company for last three years are given below:Main Services Unit Performance During
2010-11 2009-10 2008-09Projects Sanctioned Nos. 37 32 29Loan Sanctioned ` crore 7402 5616 1791
Loans Disbursed ` crore 5349 5095 -
on cumulative basis, gross sanctions as on 31.3.2011 were ` 31,778 crore to 176 projects involving project cost of ` 2,70,920 crore.
Strategic issueThe company initiated the task of developing a product on
Credit Enhancement aimed at providing an alternative source of funding to the infrastructure sector which simultaneously will
21.4 India Infrastructure Finance Company Limited
help banks to manage their constraints related to Asset liability Mismatch and Exposure Norms.
Performance HighlightsThe operational performance of the company along with
performance indicators and selected financial ratios during the period 2008-09 to 2010-11 can be seen on the opposite page.
The Company registered an increase of ` 366.56 crore in total income during 2010-11 which went up to ` 1951.96 crore in 2010-11 from ` 1585.40 crore during 2009-10. The net profit of the company correspondingly increased to ` 295.80 crore, an increase of ` 142.04 crore over the previous year due to increase in overall business growth and strict control on costs.
During the year, the company implemented Modified Takeout finance Scheme which is aimed at addressing the asset liability mismatch issues and the prudential exposure constraints faced by banks. The company has signed MoU with 4 banks for deal flows under the scheme. Till 31st March 2011, the company has sanctioned 7 proposals for takeout amount of ` 1517.84 crore. Out of 7 proposals, one transaction for takeout amount of ` 70.30 crore (road sector) has been successfully completed. Further, various steps have been taken by the company for building awareness amongst banks and other eligible institutions for popularizing the take out finance scheme.
During the year, the company mobilized long term resources from the domestic market through issuance of long term tax saving infrastructure bonds. Government of India approved IIfCL as an eligible institution to raise funds through issuance of long term infrastructure bonds during the year, under Section 80CCf of the Income Tax Act, 1961. The company raised amount aggregating to ` 90.96 crore.
Human Resource ManagementThe company employed 50 regular employees as on
31.3.2011. The retirement age in the company is 60 years. It is following IDA 2007 and CDA 2006 pattern of remuneration. Details of employment in last 3 years are given below:
Particulars 2010-11 2009-10 2008-09Executives including Non-Unionised Supervisors 49 29 22
Non-Executives # 1 1 1Total Employees 50 30 23
# Detail break-up of Non-Executive employees is at Statement no. 25 of volume-I of PE Survey.

541Public Enterprises Survey 2010-2011: Vol-II
India Infrastructure Finance Company Limited 1201-1207, Naurang House, Kasturba Gandhi Marg, New Delhi-110 001
Balance Sheet (` in Lakhs)
Particulars 2010-11 2009-10 2008-09
Authorised Capital 200000 200000 200000
(1) Sources Of Fund
(1.1) Shareholders Funds
(A) Paid-Up Capital
Central Govt 200000 180000 100000
Others 0 0 0
(B) Share Application Money 0 0 30000
(C) Reserves & Surplus 58225 28645 13395
Total (A) + (B) + (C) 258225 208645 143395
(1.2) Loan Funds
(A) Secured Loans 127304 0 0
(B) Unsecured Loans 1978108 1847438 1441936
Total (A) + (B) 2105412 1847438 1441936
(1.3) Deferred Tax Liability 2570 828 238
Total (1.1) + (1.2) + (1.3) 2366207 2056911 1585569
(2) Application Of Funds
(2.1) Fixed Assets
(A) Gross Block 113 159 151
(B) Less Depreciation 51 73 42
(C) Net Block (A-B) 62 86 109
(D) Capital Work In Progress 25 13 10
Total (C) + (D) 87 99 119
(2.2) Investment 1675273 1536639 96317
(2.3) Current Assets, Loan & Advances
(A) Inventories 0 0 0
(B) Sundry Debtors 0 0 0
(C) Cash & Bank Balances 703808 548717 1006602
(D) Other Current Assets 30594 11218 12274
(E) Loan & Advances 13647 7778 496363
Total (A)+ (B)+ (C)+ (D)+ (E) 748049 567713 1515239
(2.4) Less:current Liabilities & Provisions
(A) Current Liabilities 38536 36237 18725
(B) Provisions 18666 11303 7475
Total (A+B) 57202 47540 26200
(2.5) Net Current Assets (2.3-2.4) 690847 520173 1489039
(2.6) Deferred Revenue / Pre. Expenditure 0 0 94
(2.7) Deferred Tax Asset 0 0 0
(2.8) Profit & Loss Account(Dr) 0 0 0
Total (2.1+2.2+2.5+2.6+2.7+2.8) 2366207 2056911 1585569
Important Indicators 2010-11 2009-10 2008-09
(i) Investment 2305412 2027438 1571936
(ii) Capital Employed 690909 520259 1489148
(iii) Net Worth 258225 208645 143301
(iv) Cost of Production 150542 134807 48515
(v) Cost of Sales 150542 134807 48515
(vi) Gross Value Added (At Market Price) - - -
(vii) Total Employees (Other Than Casuals) (Nos.) 50 30 23
(viii) Avg. Monthly Emoluments Per Employee (Rs.) 71500 77500 67029
Profit & Loss Account (` in Lakhs)
Particulars 2010-11 2009-10 2008-09
(1) Income
(A) Sales/Operating Income 193168 154855 62621
(B) Excise Duty 0 0 0
(C) Net Sales (A-B) 193168 154855 62621
(D) Other Income/Receipts 2028 3685 865
(E) Accretion/Depletion in Stocks 0 0 0
(I)Total Income (C+D+E) 195196 158540 63486
(2) Expenditure
(A) Purchase of Finished Goods/ Consumption Of Raw Materials 0 0 0
(B) Stores & Spares 0 0 0
(C) Power & Fuel 10 15 9
(D) Manufacturing / Direct / Operating Expenses 147360 7000 3317
(E) Salary, Wages & Benefits / Employee Exp. 429 279 185
(F) Other Expenses 1306 420 2164
(G) Provisions 1412 2803 17
(II)Total Expenditure (A to G) 150517 10517 5692
(3) Profit Before Dep, Int, Taxes & EP (PBDITEP) (I-II) 44679 148023 57794
(4) Depreciation 25 47 24
(5) Dre/Prel Exp Written Off 0 0 0
(6) Profit Before Int., Taxes & Ep (PBITEP) (3-4-5) 44654 147976 57770
(7) Interest
(A) On Central Government Loans 0 0 0
(B) On Foreign Loans 0 0 0
(C) Others 0 124243 42799
(D) Less Interest Capitalised 0 0 0
(E) Charged to P & L Account (A+B+C-D) 0 124243 42799
(8) Profit Before Tax & EP(PBTEP) (6-7E) 44654 23733 14971
(9) Tax Provisions 14989 8414 4988
(10) Net Profit / Loss Before EP (8-9) 29665 15319 9983
(11) Net Extra-Ord. Items 85 -57 -82
(12) Net Profit / Loss(-) (10-11) 29580 15376 10065
(13) Dividend Declared 0 0 0
(14) Dividend Tax 0 0 0
(15) Retained Profit (12-13-14) 29580 15376 10065
Financial Ratios 2010-11 2009-10 2008-09
(i) Sales : Capital Employed 27.96 29.76 4.21
(ii) Cost of Sales : Sales 77.93 87.05 77.47
(iii) Salary / Wages : Sales 0.22 0.18 0.3
(iv) Net Profit : Net Worth 11.46 7.37 7.02
(v) Debt : Equity 8.15 8.85 10.06
(vi) Current Ratio 13.08 11.94 57.83
(vii) Sundry Debtors : Sales (No. of Days) 0 0 0
(viii) Total Inventory : Sales 0 0 0
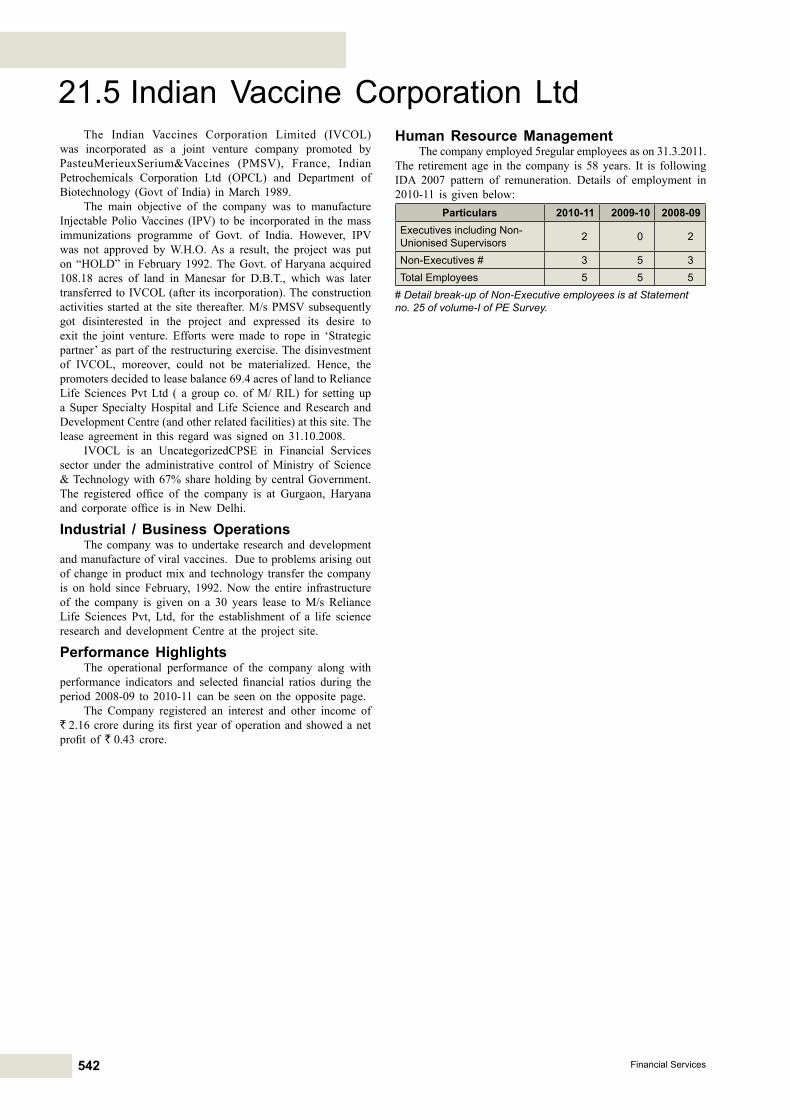
542 Financial Services
The Indian Vaccines Corporation Limited (IVCoL) was incorporated as a joint venture company promoted by PasteuMerieuxSerium&Vaccines (PMSV), france, Indian Petrochemicals Corporation Ltd (oPCL) and Department of Biotechnology (Govt of India) in March 1989.
The main objective of the company was to manufacture Injectable Polio Vaccines (IPV) to be incorporated in the mass immunizations programme of Govt. of India. However, IPV was not approved by W.H.o. As a result, the project was put on “HoLD” in february 1992. The Govt. of Haryana acquired 108.18 acres of land in Manesar for D.B.T., which was later transferred to IVCoL (after its incorporation). The construction activities started at the site thereafter. M/s PMSV subsequently got disinterested in the project and expressed its desire to exit the joint venture. Efforts were made to rope in ‘Strategic partner’ as part of the restructuring exercise. The disinvestment of IVCOL, moreover, could not be materialized. Hence, the promoters decided to lease balance 69.4 acres of land to Reliance Life Sciences Pvt Ltd ( a group co. of M/ RIL) for setting up a Super Specialty Hospital and Life Science and Research and Development Centre (and other related facilities) at this site. The lease agreement in this regard was signed on 31.10.2008.
IVOCL is an UncategorizedCPSE in Financial Services sector under the administrative control of Ministry of Science & Technology with 67% share holding by central Government. The registered office of the company is at Gurgaon, Haryana and corporate office is in New Delhi.
Industrial / Business OperationsThe company was to undertake research and development
and manufacture of viral vaccines. Due to problems arising out of change in product mix and technology transfer the company is on hold since february, 1992. Now the entire infrastructure of the company is given on a 30 years lease to M/s Reliance Life Sciences Pvt, Ltd, for the establishment of a life science research and development Centre at the project site.
Performance HighlightsThe operational performance of the company along with
performance indicators and selected financial ratios during the period 2008-09 to 2010-11 can be seen on the opposite page.
The Company registered an interest and other income of ` 2.16 crore during its first year of operation and showed a net profit of ` 0.43 crore.
21.5 Indian Vaccine Corporation LtdHuman Resource Management
The company employed 5regular employees as on 31.3.2011. The retirement age in the company is 58 years. It is following IDA 2007 pattern of remuneration. Details of employment in 2010-11 is given below:
Particulars 2010-11 2009-10 2008-09Executives including Non-Unionised Supervisors 2 0 2
Non-Executives # 3 5 3Total Employees 5 5 5
# Detail break-up of Non-Executive employees is at Statement no. 25 of volume-I of PE Survey.

543Public Enterprises Survey 2010-2011: Vol-II
Indian Vaccine Corporation LtdManesar, Gurgaon, Haryana.
Balance Sheet (` in Lakhs)
Particulars 2010-11 2009-10 2008-09
Authorised Capital 5000 5000 5000
(1) Sources Of Fund
(1.1) Shareholders Funds
(A) Paid-Up Capital
Central Govt 1253 1253 1253
Others 626 626 626
(B) Share Application Money 0 0 0
(C) Reserves & Surplus 191 191 191
Total (A) + (B) + (C) 2070 2070 2070
(1.2) Loan Funds
(A) Secured Loans 0 0 0
(B) Unsecured Loans 101 281 381
Total (A) + (B) 101 281 381
(1.3) Deferred Tax Liability 0 0 0
Total (1.1) + (1.2) + (1.3) 2171 2351 2451
(2) Application Of Funds
(2.1) Fixed Assets
(A) Gross Block 1759 1759 1752
(B) Less Depreciation 400 245 69
(C) Net Block (A-B) 1359 1514 1683
(D) Capital Work In Progress 0 0 0
Total (C) + (D) 1359 1514 1683
(2.2) Investment 0 0 0
(2.3) Current Assets, Loan & Advances
(A) Inventories 0 0 0
(B) Sundry Debtors 0 0 0
(C) Cash & Bank Balances 36 69 19
(D) Other Current Assets 0 0 0
(E) Loan & Advances 265 240 131
Total (A)+ (B)+ (C)+ (D)+ (E) 301 309 150
(2.4) Less:current Liabilities & Provisions
(A) Current Liabilities 42 42 42
(B) Provisions 52 55 49
Total (A+B) 94 97 91
(2.5) Net Current Assets (2.3-2.4) 207 212 59
(2.6) Deferred Revenue / Pre. Expenditure 0 0 0
(2.7) Deferred Tax Asset 59 36 0
(2.8) Profit & Loss Account(Dr) 546 589 709
Total (2.1+2.2+2.5+2.6+2.7+2.8) 2171 2351 2451
Important Indicators 2010-11 2009-10 2008-09
(i) Investment 1879 1879 1879
(ii) Capital Employed 1566 1726 1742
(iii) Net Worth 1524 1481 1361
(iv) Cost of Production 204 0 0
(v) Cost of Sales 204 0 0
(vi) Gross Value Added (At Market Price) - - -
(vii) Total Employees (Other Than Casuals) (Nos.) 5 5 5
(viii) Avg. Monthly Emoluments Per Employee (Rs.) 40000 0 0
Profit & Loss Account (` in Lakhs)
Particulars 2010-11 2009-10 2008-09
(1) Income
(A) Sales/Operating Income 0 0 0
(B) Excise Duty 0 0 0
(C) Net Sales (A-B) 0 0 0
(D) Other Income/Receipts 216 0 0
(E) Accretion/Depletion in Stocks 0 0 0
(I)Total Income (C+D+E) 216 0 0
(2) Expenditure
(A) Purchase of Finished Goods/ Consumption Of Raw Materials 0 0 0
(B) Stores & Spares 0 0 0
(C) Power & Fuel 0 0 0
(D) Manufacturing / Direct / Operating Expenses 4 0 0
(E) Salary, Wages & Benefits / Employee Exp. 24 0 0
(F) Other Expenses 21 0 0
(G) Provisions 0 0 0
(II)Total Expenditure (A to G) 49 0 0
(3) Profit Before Dep, Int, Taxes & EP (PBDITEP) (I-II) 167 0 0
(4) Depreciation 155 0 0
(5) Dre/Prel Exp Written Off 0 0 0
(6) Profit Before Int., Taxes & Ep (PBITEP) (3-4-5) 12 0 0
(7) Interest
(A) On Central Government Loans 0 0 0
(B) On Foreign Loans 0 0 0
(C) Others 0 0 0
(D) Less Interest Capitalised 0 0 0
(E) Charged to P & L Account (A+B+C-D) 0 0 0
(8) Profit Before Tax & EP(PBTEP) (6-7E) 12 0 0
(9) Tax Provisions -31 0 0
(10) Net Profit / Loss Before EP (8-9) 43 0 0
(11) Net Extra-Ord. Items 0 0 0
(12) Net Profit / Loss(-) (10-11) 43 0 0
(13) Dividend Declared 0 0 0
(14) Dividend Tax 0 0 0
(15) Retained Profit (12-13-14) 43 0 0
Financial Ratios 2010-11 2009-10 2008-09
(i) Sales : Capital Employed 0 0 0
(ii) Cost of Sales : Sales 0 0 0
(iii) Salary / Wages : Sales 0 0 0
(iv) Net Profit : Net Worth 2.82 0 0
(v) Debt : Equity 0.05 0.14 0.18
(vi) Current Ratio 3.2 3.19 1.65
(vii) Sundry Debtors : Sales (No. of Days) 0 0 0
(viii) Total Inventory : Sales 0 0 0

544 Financial Services
www.irfc.in
Indian Railway finance Corporation Ltd. was incorporated on 12th December, 1986 as a Public Financial Institution notified under section 4A of the Companies Act, 1956.
IRFC is a Schedule ‘B’ CPSE in the financial service sector under the administrative control of Ministry of Railways with 100% shareholding of Government of India. Its registered and Corporate Office is at New Delhi.
Vision / MissionThe Vision of the Company is to establish IRfC as a premier
financial Services Company, create synergies with the Ministry of Railways, select CPSEs & other entities for sustained growth in creation of Rail infrastructure and enhance shareholders value through optimization of profitability, retaining a risk profile consistent with its symbiotic relationship with the Ministry.
The Mission of the Company is to make IRFC as one of the leading financial Service Company in the country, for raising funds from the capital market at competitive cost, for augmenting railway plan finances, duly ensuring that the Corporation makes optimum profits from its operations.
Industrial / Business OperationsIndian Railway Finance Corporation is the market borrowing
arm of Ministry of Railways (MoR). The Annual Plan outlay of MoR as indicated in the Railway Budget is met through three sources namely Internal Generation, Budgetary Support from the Ministry of finance and Extra Budgetary Resources (EBR) Requirements. IRfC is a Special Purpose Vehicle set up to meet the EBR of the Indian Railways.
Each year, MOR notifies IRFC regarding the Annual Borrowing target. After receiving the annual borrowing target from MOR, IRFC taps both the domestic and overseas financial market and transfer the funds to MOR. The funds transferred by IRFC to MOR are used for procurement of Rolling Stock Assets including wagons, coaches and locomotives which are leased out to Railways through a 30 years financial lease agreement executed with them. Till date, IRFC has created Rolling Stock assets worth ` 69,843 Crore for Indian Railways.
Strategic issueAt a total of ` 20,594.38 crore, the borrowing target for
2010-11, shows a quantum jump of 110% over the previous year. In recognition of the degree of difficulty involved in undertaking such an exercise, the Government has decided to permit the company to issue tax-free bonds valued at ` 10,000 crore during 2010-11.
The business of the Company with the Railway Ministry has grown considerably during the recent years. from an annual target of ` 2,510 crore in 2002-03, the borrowing target assigned for the current year stands at ` 20,594 crore, including the funding support to be provided to RVNL. The trend represented by this of more than eight-fold increase in annual borrowing target over a period of nine years is likely to continue. This is bound to further accentuate the problem of the Company’s financial gearing coming under stress. frequent instances of additional
21.6 Indian Railway Finance Corporation Ltd.equity infusion of ` 300 crore in March 2009, ` 291 crore in November 2009 and ` 511 crore in october 2010 did help to some extent, but the Company is already faced with a pressing need for further equity infusion to sustain its daunting borrowing programme during the current year. Given the nature of the problem, the Company would do well to explore all possible options for equipping itself appropriately to meet this challenge. It is in this context that the Authorised Capital was enhanced from ` 1,000 crore to ` 2,000 crore with the approval of the Shareholders in 2009, and further increased to ` 5,000 crore in June, 2011. Likewise, an appropriate increase in its paid up capital from the present ` 1,602 crore is also planned.
Performance HighlightsThe operational performance of the company along with
performance indicators and selected financial ratios during the period 2008-09 to 2010-11 can be seen on the opposite page.
The Company registered an increase of ` 357.71 crore in total income during 2010-11 which went up to ` 3841.65 crore in 2010-11 from ` 3483.94 crore during 2009-10. The net profit of the company correspondingly increased to ` 485.20 crore, an increase of ` 42.51 crore over the previous year due to lower lease rental liability of the company, lower quantum of bond issue expenses etc.
for the year 2010-11, IRfC was given a borrowing target of ` 9792 crore. The company was able to meet the target at the rate of 7.62% p.a. The company had mobilized an amount of US$732.94 Million from the overseas market during 2010-11. The low interest rates associated with the overseas borrowings have helped the company to keep the overall cost of borrowing at lower level.
Human Resource ManagementThe company employed 19 regular employees as on
31.3.2011. The retirement age in the company is 60 years. It is following IDA 2007 pattern of remuneration. Details of employment in last 3 years are given below:
Particulars 2010-11 2009-10 2008-09Executives including Non-Unionised Supervisors 7 7 8
Non-Executives # 12 12 12Total Employees 19 19 20
# Detail break-up of Non-Executive employees is at Statement no. 25 of volume-I of PE Survey.

545Public Enterprises Survey 2010-2011: Vol-II
Indian Railway Finance Corporation Ltd.UG floor, East Tower, NBCC Place, Bhisham Pitamah Marg, Pragati Vihar, Lodhi Road New Delhi -110003
Balance Sheet (` in Lakhs)
Particulars 2010-11 2009-10 2008-09
Authorised Capital 200000 200000 100000
(1) Sources Of Fund
(1.1) Shareholders Funds
(A) Paid-Up Capital
Central Govt 160200 109100 50000
Others 0 0 0
(B) Share Application Money 0 0 30000
(C) Reserves & Surplus 268397 231448 198070
Total (A) + (B) + (C) 428597 340548 278070
(1.2) Loan Funds
(A) Secured Loans 3125673 2794470 2260025
(B) Unsecured Loans 686774 566388 478846
Total (A) + (B) 3812447 3360858 2738871
(1.3) Deferred Tax Liability 270143 246702 225655
Total (1.1) + (1.2) + (1.3) 4511187 3948108 3242596
(2) Application Of Funds
(2.1) Fixed Assets
(A) Gross Block 1701 1699 1708
(B) Less Depreciation 364 330 309
(C) Net Block (A-B) 1337 1369 1399
(D) Capital Work In Progress 0 0 0
Total (C) + (D) 1337 1369 1399
(2.2) Investment 4533720 3839433 3156391
(2.3) Current Assets, Loan & Advances
(A) Inventories 0 0 0
(B) Sundry Debtors 0 0 0
(C) Cash & Bank Balances 49400 150820 101274
(D) Other Current Assets 49622 43081 36028
(E) Loan & Advances 34942 31589 42631
Total (A)+ (B)+ (C)+ (D)+ (E) 133964 225490 179933
(2.4) Less:current Liabilities & Provisions
(A) Current Liabilities 126286 90049 77372
(B) Provisions 31548 28253 21164
Total (A+B) 157834 118302 98536
(2.5) Net Current Assets (2.3-2.4) -23870 107188 81397
(2.6) Deferred Revenue / Pre. Expenditure 0 118 3409
(2.7) Deferred Tax Asset 0 0 0
(2.8) Profit & Loss Account(Dr) 0 0 0
Total (2.1+2.2+2.5+2.6+2.7+2.8) 4511187 3948108 3242596
Important Indicators 2010-11 2009-10 2008-09
(i) Investment 3970322 3325058 2644255
(ii) Capital Employed -22533 108557 82796
(iii) Net Worth 428597 340430 274661
(iv) Cost of Production 294331 269554 236706
(v) Cost of Sales 294331 269554 236706
(vi) Gross Value Added (At Market Price) - - -
(vii) Total Employees (Other Than Casuals) (Nos.) 19 19 20
(viii) Avg. Monthly Emoluments Per Employee (Rs.) 89035 68421 69167
Profit & Loss Account (` in Lakhs)
Particulars 2010-11 2009-10 2008-09
(1) Income
(A) Sales/Operating Income 381805 343362 301537
(B) Excise Duty 0 0 0
(C) Net Sales (A-B) 381805 343362 301537
(D) Other Income/Receipts 2360 5032 941
(E) Accretion/Depletion in Stocks 0 0 0
(I)Total Income (C+D+E) 384165 348394 302478
(2) Expenditure
(A) Purchase of Finished Goods/ Consumption Of Raw Materials 0 0 0
(B) Stores & Spares 0 0 0
(C) Power & Fuel 1 10 10
(D) Manufacturing / Direct / Operating Expenses 6361 19914 1266
(E) Salary, Wages & Benefits / Employee Exp. 203 156 166
(F) Other Expenses 4648 226 344
(G) Provisions 0 0 0
(II)Total Expenditure (A to G) 11213 20306 1786
(3) Profit Before Dep, Int, Taxes & EP (PBDITEP) (I-II) 372952 328088 300692
(4) Depreciation 35 35 37
(5) Dre/Prel Exp Written Off 181 3455 0
(6) Profit Before Int., Taxes & Ep (PBITEP) (3-4-5) 372736 324598 300655
(7) Interest
(A) On Central Government Loans 0 0 0
(B) On Foreign Loans 19831 19554 19620
(C) Others 263071 226204 215263
(D) Less Interest Capitalised 0 0 0
(E) Charged to P & L Account (A+B+C-D) 282902 245758 234883
(8) Profit Before Tax & EP(PBTEP) (6-7E) 89834 78840 65772
(9) Tax Provisions 41364 34559 47689
(10) Net Profit / Loss Before EP (8-9) 48470 44281 18083
(11) Net Extra-Ord. Items -50 12 4
(12) Net Profit / Loss(-) (10-11) 48520 44269 18079
(13) Dividend Declared 10000 10000 10000
(14) Dividend Tax 1660 1700 1700
(15) Retained Profit (12-13-14) -2702 -2393 -1683
Financial Ratios 2010-11 2009-10 2008-09
(i) Sales : Capital Employed -1694.43 316.3 364.19
(ii) Cost of Sales : Sales 77.09 78.5 78.5
(iii) Salary / Wages : Sales 0.05 0.05 0.06
(iv) Net Profit : Net Worth 11.32 13 6.58
(v) Debt : Equity 8.9 9.87 9.85
(vi) Current Ratio 0.85 1.91 1.83
(vii) Sundry Debtors : Sales (No. of Days) 0 0 0
(viii) Total Inventory : Sales 0 0 0

546 Financial Services
www.ireda.gov.in
Indian Renewable Energy Development Agency Limited (IREDA) was incorporated on 11.03.1987 with an objective to finance and promote investment in renewable energy sources.
IREDA is a Schedule-‘B’ CPSE in financial Services sector under the administrative control of Ministry of New and Renewable Energy with 100% shareholding by the Government of India. Its Registered and Corporate offices are in New Delhi. The company received a equity support of ` 50.00 crore during 2010-11 as against a equity support of ` 19.60 crore in 2009-10.
Vision/MissionThe vision of IREDA is to maintain its position as a leading
organization to provide efficient and effective financing in Renewable Energy, Energy Efficiency and Conservation. Focus of its services would be customer satisfaction, timely and prompt response, to increase market share in financing, to grow into apex level financial institution, to encourage micro excellence and organisational flexibility
The mission of the company is to be a pioneering, participant friendly and competitive institution for financing and promoting self - sustaining investment in energy generation from Renewable Sources, energy efficiency and environment technologies for sustainable development.
Industrial / Business OperationsIREDA is engaged in providing financial services and
promoting self sustaining investment in energy generation from renewable sources. The Company has one joint venture (JV) namely MP Wind farms Ltd. with an investment of ` 12 lakhs in equity. The physical performance of Company for the last three years are given below:Main Product / Services
Unit Performance During2010-11 2009-10 2008-09
Loan sanctioned ` crore 3126.42 1823.91 1489.93
Disbursements ` crore 1224.17 890.03 770.95
Repayment by borrowers
` crore 816.93 437.17 262.00
Strategic IssuesTo give impetus to the development of Renewable Energy
(RE) & Energy Efficiency (EE) sectors, IREDA introduced several new schemes.
Performance HighlightsThe operational performance of the company along with
performance indicators and selected financial ratios during the period 2008-09 to 2010-11 can be seen on the opposite page.
The Company registered an increase of ` 57.21 crore in total income during 2010-11 which went up to ` 402.46 crore in 2010-11 from ` 345.25 crore during 2009-10. The net profit of the company correspondingly increased to ` 120.46 crore, an increase of ` 47.77 crore over the previous year due to increase in interest income and recoveries.
The level of Net NPA during the year 2010-11 stood at 0.79% as against (-) 1.17% during 2009-10 and 3.27% during 2008-09.
21.7 Indian Renewable Energy Development Agency Limited
Human Resource ManagementThe company employed 130 regular employees as on
31.3.2011. The retirement age in the company is 60 years. It is following IDA 2007 pattern of remuneration. Details of employment in last 3 years are given below:
Particulars 2010-11 2009-10 2008-09Executives including Non-Unionised Supervisors 104 97 86
Non-Executives # 26 24 27Total Employees 130 121 113
# Detail break-up of Non-Executive employees is at Statement no. 25 of volume-I of PE Survey.

547Public Enterprises Survey 2010-2011: Vol-II
Indian Renewable Energy Development Agency LimitedIndia Habitat Centre, Core-4 ‘A’ East Court, 1st floor,Lodhi Road, New Delhi-110003
Balance Sheet (` in Lakhs)
Particulars 2010-11 2009-10 2008-09
Authorised Capital 100000 100000 100000
(1) Sources Of Fund
(1.1) Shareholders Funds
(A) Paid-Up Capital
Central Govt 58960 53960 52000
Others 0 0 0
(B) Share Application Money 0 0 0
(C) Reserves & Surplus 67452 42096 37193
Total (A) + (B) + (C) 126412 96056 89193
(1.2) Loan Funds
(A) Secured Loans 115034 170809 133058
(B) Unsecured Loans 132485 104672 92639
Total (A) + (B) 247519 275481 225697
(1.3) Deferred Tax Liability 0 0 0
Total (1.1) + (1.2) + (1.3) 373931 371537 314890
(2) Application Of Funds
(2.1) Fixed Assets
(A) Gross Block 5496 5804 5688
(B) Less Depreciation 1458 1515 1208
(C) Net Block (A-B) 4038 4289 4480
(D) Capital Work In Progress 43 23 23
Total (C) + (D) 4081 4312 4503
(2.2) Investment 12 12 12
(2.3) Current Assets, Loan & Advances
(A) Inventories 0 0 0
(B) Sundry Debtors 0 0 0
(C) Cash & Bank Balances 38596 92535 76284
(D) Other Current Assets 570 480 751
(E) Loan & Advances 364069 302236 254556
Total (A)+ (B)+ (C)+ (D)+ (E) 403235 395251 331591
(2.4) Less:current Liabilities & Provisions
(A) Current Liabilities 6998 5891 6198
(B) Provisions 32238 24926 18205
Total (A+B) 39236 30817 24403
(2.5) Net Current Assets (2.3-2.4) 363999 364434 307188
(2.6) Deferred Revenue / Pre. Expenditure 0 124 81
(2.7) Deferred Tax Asset 5839 2655 3106
(2.8) Profit & Loss Account(Dr) 0 0 0
Total (2.1+2.2+2.5+2.6+2.7+2.8) 373931 371537 314890
Important Indicators 2010-11 2009-10 2008-09
(i) Investment 306479 329441 277697
(ii) Capital Employed 368037 368723 311668
(iii) Net Worth 126412 95932 89112
(iv) Cost of Production 23568 20497 18918
(v) Cost of Sales 23568 20497 18918
(vi) Gross Value Added (At Market Price) - - -
(vii) Total Employees (Other Than Casuals) (Nos.) 130 121 113
(viii) Avg. Monthly Emoluments Per Employee (Rs.) 86218 96488 95870
Profit & Loss Account (` in Lakhs)
Particulars 2010-11 2009-10 2008-09
(1) Income
(A) Sales/Operating Income 36341 32179 23982
(B) Excise Duty 330 79 231
(C) Net Sales (A-B) 36011 32100 23751
(D) Other Income/Receipts 4235 2425 3760
(E) Accretion/Depletion in Stocks 0 0 0
(I)Total Income (C+D+E) 40246 34525 27511
(2) Expenditure
(A) Purchase of Finished Goods/ Consumption Of Raw Materials 0 0 0
(B) Stores & Spares 0 0 0
(C) Power & Fuel 41 43 10
(D) Manufacturing / Direct / Operating Expenses 1862 1017 854
(E) Salary, Wages & Benefits / Employee Exp. 1345 1401 1300
(F) Other Expenses 760 258 1711
(G) Provisions 2255 3633 4296
(II)Total Expenditure (A to G) 6263 6352 8171
(3) Profit Before Dep, Int, Taxes & EP (PBDITEP) (I-II) 33983 28173 19340
(4) Depreciation 303 311 241
(5) Dre/Prel Exp Written Off 123 14 8
(6) Profit Before Int., Taxes & Ep (PBITEP) (3-4-5) 33557 27848 19091
(7) Interest
(A) On Central Government Loans 180 181 182
(B) On Foreign Loans 2852 1163 1759
(C) Others 13847 12476 8557
(D) Less Interest Capitalised 0 0 0
(E) Charged to P & L Account (A+B+C-D) 16879 13820 10498
(8) Profit Before Tax & EP(PBTEP) (6-7E) 16678 14028 8593
(9) Tax Provisions 4623 6836 2969
(10) Net Profit / Loss Before EP (8-9) 12055 7192 5624
(11) Net Extra-Ord. Items 9 -77 3
(12) Net Profit / Loss(-) (10-11) 12046 7269 5621
(13) Dividend Declared 2000 1454 1125
(14) Dividend Tax 324 241 191
(15) Retained Profit (12-13-14) 9722 5574 4305
Financial Ratios 2010-11 2009-10 2008-09
(i) Sales : Capital Employed 9.78 8.71 7.62
(ii) Cost of Sales : Sales 65.45 63.85 79.65
(iii) Salary / Wages : Sales 3.73 4.36 5.47
(iv) Net Profit : Net Worth 9.53 7.58 6.31
(v) Debt : Equity 1.96 2.87 2.53
(vi) Current Ratio 10.28 12.83 13.59
(vii) Sundry Debtors : Sales (No. of Days) 0 0 0
(viii) Total Inventory : Sales 0 0 0

548 Financial Services
www.nhpcindia.com
Kumarakruppa Frontier Hotel Pvt. Ltd. (KFH) was incorporated on 23.08.2001 with the objective of receiving the land, building and other assets and liabilities of the hotel properties given on lease-cum-management contract, administering the lease-cum-management contract and receiving the lease payments from time to time.
KFH is an un-categorized CPSE in Financial Services sector under the administrative control of M/o Tourism with 90.72% GoI share holding. Its Registered and Corporate offices are at New Delhi.
Industrial / Business OperationsThe only activity of the company is to receive lease rent
from Bharat Hotels for the leased property.
Strategic issueThe consideration fixed for leasing of Hotel Ashok Bangalore
was ` 4.11 crore per annum as Minimum Guaranteed Annual Payment (MGAP) upto 31.3.2007 which was to be increased by 25% w.e.f. 1.4.2007 and in every five years thereafter or 16.5% of the gross turnover of the Hotel Ashok Bangalore as Turnover Based Annual Payment (TBAP), whichever is higher.
As per the terms of agreement, the lessee has to pay 50% of the MGAP for 30 years, which is discounted as upfront amount. The remaining 50% of MGAP/TBAP, after adjusting the amount paid, is payable by the lessee in each financial year.
Performance HighlightsThe operational performance of the company along with
performance indicators and selected financial ratios during the period 2008-09 to 2010-11 can be seen on the opposite page.
The Company registered an increase of ` 0.55 crore in total income during 2010-11 which went up to ` 12.05 crore in 2010-11 from ` 11.50 crore during 2009-10. The net profit of the company however reduced to ` 5.53 crore, a reduction of ` 1.93 crore over the previous year profit of ` 7.46 crore due to increase in other expenses.
The company has recommended dividend of 500% on the paid-up share capital for the year 2010-11.
Human Resource ManagementThe company employed 3 regular employees as on
31.3.2011. The retirement age in the company is 58 years. It is
21.8 Kumarakruppa Frontier Hotel Pvt. Ltd. following IDA 2007 and CDA 2006 pattern of remuneration. Details of employment in last 3 years are given below:
Particulars 2010-11 2009-10 2008-09Executives including Non-Unionised Supervisors 3 2 2
Non-Executives # 0 2 0Total Employees 3 4 2
# Detail break-up of Non-Executive employees is at Statement no. 25 of volume-I of PE Survey.

549Public Enterprises Survey 2010-2011: Vol-II
Kumarakruppa Frontier Hotel Pvt. Ltd. 5th floor, Core 8, SCoPE Complex, 7, Lodhi Road, New Delhi - 110 003
Balance Sheet (` in Lakhs)
Particulars 2010-11 2009-10 2008-09
Authorised Capital 100 100 100
(1) Sources Of Fund
(1.1) Shareholders Funds
(A) Paid-Up Capital
Central Govt 88 88 88
Others 9 9 10
(B) Share Application Money 0 0 0
(C) Reserves & Surplus 1832 1822 1236
Total (A) + (B) + (C) 1929 1919 1334
(1.2) Loan Funds
(A) Secured Loans 0 0 0
(B) Unsecured Loans 0 0 0
Total (A) + (B) 0 0 0
(1.3) Deferred Tax Liability 0 0 0
Total (1.1) + (1.2) + (1.3) 1929 1919 1334
(2) Application Of Funds
(2.1) Fixed Assets
(A) Gross Block 709 708 708
(B) Less Depreciation 576 573 555
(C) Net Block (A-B) 133 135 153
(D) Capital Work In Progress 0 0 0
Total (C) + (D) 133 135 153
(2.2) Investment 2724 2916 2405
(2.3) Current Assets, Loan & Advances
(A) Inventories 0 0 0
(B) Sundry Debtors 508 354 450
(C) Cash & Bank Balances 6 25 40
(D) Other Current Assets 2497 288 3010
(E) Loan & Advances 0 1916 0
Total (A)+ (B)+ (C)+ (D)+ (E) 3011 2583 3500
(2.4) Less:current Liabilities & Provisions
(A) Current Liabilities 2664 2232 231
(B) Provisions 1437 1483 4493
Total (A+B) 4101 3715 4724
(2.5) Net Current Assets (2.3-2.4) -1090 -1132 -1224
(2.6) Deferred Revenue / Pre. Expenditure 162 0 0
(2.7) Deferred Tax Asset 0 0 0
(2.8) Profit & Loss Account(Dr) 0 0 0
Total (2.1+2.2+2.5+2.6+2.7+2.8) 1929 1919 1334
Important Indicators 2010-11 2009-10 2008-09
(i) Investment 97 97 98
(ii) Capital Employed -957 -997 -1071
(iii) Net Worth 1767 1919 1334
(iv) Cost of Production 375 54 55
(v) Cost of Sales 375 54 55
(vi) Gross Value Added (At Market Price) - - -
(vii) Total Employees (Other Than Casuals) (Nos.) 3 4 2
(viii) Avg. Monthly Emoluments Per Employee (Rs.) 66667 39583 79167
Profit & Loss Account (` in Lakhs)
Particulars 2010-11 2009-10 2008-09
(1) Income
(A) Sales/Operating Income 1205 0 0
(B) Excise Duty 0 0 0
(C) Net Sales (A-B) 1205 0 0
(D) Other Income/Receipts 0 1150 1255
(E) Accretion/Depletion in Stocks 0 0 0
(I)Total Income (C+D+E) 1205 1150 1255
(2) Expenditure
(A) Purchase of Finished Goods/ Consumption Of Raw Materials 0 0 0
(B) Stores & Spares 0 0 0
(C) Power & Fuel 0 0 0
(D) Manufacturing / Direct / Operating Expenses 0 17 18
(E) Salary, Wages & Benefits / Employee Exp. 24 19 19
(F) Other Expenses 341 0 0
(G) Provisions 0 0 0
(II)Total Expenditure (A to G) 365 36 37
(3) Profit Before Dep, Int, Taxes & EP (PBDITEP) (I-II) 840 1114 1218
(4) Depreciation 10 18 18
(5) Dre/Prel Exp Written Off 0 0 0
(6) Profit Before Int., Taxes & Ep (PBITEP) (3-4-5) 830 1096 1200
(7) Interest
(A) On Central Government Loans 0 0 0
(B) On Foreign Loans 0 0 0
(C) Others 0 0 0
(D) Less Interest Capitalised 0 0 0
(E) Charged to P & L Account (A+B+C-D) 0 0 0
(8) Profit Before Tax & EP(PBTEP) (6-7E) 830 1096 1200
(9) Tax Provisions 277 350 396
(10) Net Profit / Loss Before EP (8-9) 553 746 804
(11) Net Extra-Ord. Items 0 0 0
(12) Net Profit / Loss(-) (10-11) 553 746 804
(13) Dividend Declared 0 0 0
(14) Dividend Tax 0 0 0
(15) Retained Profit (12-13-14) 553 746 804
Financial Ratios 2010-11 2009-10 2008-09
(i) Sales : Capital Employed -125.91 0 0
(ii) Cost of Sales : Sales 31.12 0 0
(iii) Salary / Wages : Sales 1.99 0 0
(iv) Net Profit : Net Worth 31.3 38.87 60.27
(v) Debt : Equity 0 0 0
(vi) Current Ratio 0.73 0.7 0.74
(vii) Sundry Debtors : Sales (No. of Days) 153.88 0 0
(viii) Total Inventory : Sales 0 0 0
2010-11 PROVISIONAL

550 Financial Services
www.nbcfdc.org.in
National Backward Classes Finance and Development Corp. (NBCfDC) was incorporated on 13.01.1992 as a company not for profit under Section 25 of the Companies Act, 1956 with the objective to promote economic and developmental activities for the benefit of the members of backward classes living below double the poverty line income limit.
NBCfDC is a Schedule-’C’ CPSE in financial Services sector under the administrative control of M/o Social Justice and Empowerment with 100% shareholding by the Government of India. Its Registered and Corporate offices are at New Delhi.
Vision/MissionThe vision of the company is to play a leading role in
upliftment of economic status of the Backward Classes.The mission of the company is to provide concessional
financial assistance to the eligible members of Backward Classes for self-employment ventures and skill development
Industrial / Business OperationsNBCFD is engaged in providing services in the field of
disbursement of concessional loan to members of backward classes living below double the poverty line income limit under self employment generation schemes through State Channelizing Agencies (SCAs) and through State Backward Classes Finance & Development Corporations. The Corporation is implementing term loan, margin money loan and micro finance schemes. It is operating through four regional offices at Kolkata, Mumbai, Chennai and Kanpur.
The service range of the company comprises of income generating activities under 4 broad sectors namely Agriculture and Allied activities, Small Business / Artisan and Traditional occupation, Service sector and Transport. The physical performances of the company for last three years are given below:Main Product / Services
Unit Performance During2010-11 2009-10 2008-09
Loan Disbursement In cr 175.33 158.49 151.02
Strategic IssuesThe functioning of the NBCfDC will be re-oriented with
a view to covering a large number of beneficiaries by providing adequate financial assistance at concessional rate of interest for setting up micro-enterprises for self-employment and also diversify the funds to equip the target group to be gainfully employed through education and training and up gradation of skills and entrepreneurial development.
Artisans beloging to backward class will be encouraged by providing financial and other assistance to pursue skill based traditional occupations for producing goods as per the demand existing in market both inside the country as well as abroad
Performance HighlightsThe operational performance of the company along with
performance indicators and selected financial ratios during the period 2008-09 to 2010-11 can be seen on the opposite page.
The Company registered an increase of ` 1.72 crore in total income during 2010-11 which went up to ` 26.94 crore in 2010-11 from ` 25.22 crore during 2009-10. The net profit of the company correspondingly increased to ` 19.20 crore, an increase of ` 3.33 crore over the previous year due to higher returns on Bank Deposit and due to write back of provision on loans in current year. The surplus funds generated were used to enhance the level of disbursement.
21.9 National Backward Classes Finance & Development Corporation
During the year 2010-11 the Corporation received ` 40.00 crore as budgetary support from Govt. of India in the form of fresh equity. The corporation has so far received ` 602.35 crores as budgetary support. Up to 31.3.2011, the cumulative disbursement of funds for the corporation was stand at ` 1850.11 crores.
Human Resource ManagementThe company employed 47 regular employees as on
31.3.2011. The retirement age in the company is 60 years. It is following IDA 2007 pattern of remuneration. Details of employment in last 3 years are given below:
Particulars 2010-11 2009-10 2008-09Executives including Non-Unionised Supervisors 18 19 19
Non-Executives # 29 29 30Total Employees 47 48 49
# Detail break-up of Non-Executive employees is at Statement no. 25 of volume-I of PE Survey.

551Public Enterprises Survey 2010-2011: Vol-II
National Backward Classes Finance & Development Corporation5th floor, N.C.U.I. Building3, Siri Institutional Area, Agust Kranti Marg, Post Box No. 4617, New Delhi 110016
2008-09Balance Sheet (` in Lakhs)
Particulars 2010-11 2009-10 2008-09
Authorised Capital 70000 70000 70000
(1) Sources Of Fund
(1.1) Shareholders Funds
(A) Paid-Up Capital
Central Govt 60042 56235 52635
Others 0 0 0
(B) Share Application Money 193 0 100
(C) Reserves & Surplus 27334 25414 23827
Total (A) + (B) + (C) 87569 81649 76562
(1.2) Loan Funds
(A) Secured Loans 0 0 0
(B) Unsecured Loans 0 0 0
Total (A) + (B) 0 0 0
(1.3) Deferred Tax Liability 0 0 0
Total (1.1) + (1.2) + (1.3) 87569 81649 76562
(2) Application Of Funds
(2.1) Fixed Assets
(A) Gross Block 253 244 254
(B) Less Depreciation 180 172 179
(C) Net Block (A-B) 73 72 75
(D) Capital Work In Progress 0 0 0
Total (C) + (D) 73 72 75
(2.2) Investment 0 0 0
(2.3) Current Assets, Loan & Advances
(A) Inventories 0 0 0
(B) Sundry Debtors 0 0 0
(C) Cash & Bank Balances 7303 4582 4283
(D) Other Current Assets 153 141 70
(E) Loan & Advances 80522 77795 73324
Total (A)+ (B)+ (C)+ (D)+ (E) 87978 82518 77677
(2.4) Less:current Liabilities & Provisions
(A) Current Liabilities 243 589 891
(B) Provisions 243 353 300
Total (A+B) 486 942 1191
(2.5) Net Current Assets (2.3-2.4) 87492 81576 76486
(2.6) Deferred Revenue / Pre. Expenditure 4 1 1
(2.7) Deferred Tax Asset 0 0 0
(2.8) Profit & Loss Account(Dr) 0 0 0
Total (2.1+2.2+2.5+2.6+2.7+2.8) 87569 81649 76562
Important Indicators 2010-11 2009-10 2008-09
(i) Investment 60235 56235 52735
(ii) Capital Employed 87565 81648 76561
(iii) Net Worth 87565 81648 76561
(iv) Cost of Production 773 935 909
(v) Cost of Sales 773 935 909
(vi) Gross Value Added (At Market Price) - - -
(vii) Total Employees (Other Than Casuals) (Nos.) 47 48 49
(viii) Avg. Monthly Emoluments Per Employee (Rs.) 67908 65278 71599
Profit & Loss Account (` in Lakhs)
Particulars 2010-11 2009-10 2008-09
(1) Income
(A) Sales/Operating Income 2221 2205 2162
(B) Excise Duty 0 0 0
(C) Net Sales (A-B) 2221 2205 2162
(D) Other Income/Receipts 473 317 643
(E) Accretion/Depletion in Stocks 0 0 0
(I)Total Income (C+D+E) 2694 2522 2805
(2) Expenditure
(A) Purchase of Finished Goods/ Consumption Of Raw Materials 0 0 0
(B) Stores & Spares 0 0 0
(C) Power & Fuel 8 9 7
(D) Manufacturing / Direct / Operating Expenses 57 145 25
(E) Salary, Wages & Benefits / Employee Exp. 383 376 421
(F) Other Expenses 312 128 273
(G) Provisions 3 269 174
(II)Total Expenditure (A to G) 763 927 900
(3) Profit Before Dep, Int, Taxes & EP (PBDITEP) (I-II) 1931 1595 1905
(4) Depreciation 10 8 9
(5) Dre/Prel Exp Written Off 0 0 0
(6) Profit Before Int., Taxes & Ep (PBITEP) (3-4-5) 1921 1587 1896
(7) Interest
(A) On Central Government Loans 0 0 0
(B) On Foreign Loans 0 0 0
(C) Others 0 0 0
(D) Less Interest Capitalised 0 0 0
(E) Charged to P & L Account (A+B+C-D) 0 0 0
(8) Profit Before Tax & EP(PBTEP) (6-7E) 1921 1587 1896
(9) Tax Provisions 0 0 3
(10) Net Profit / Loss Before EP (8-9) 1921 1587 1893
(11) Net Extra-Ord. Items 1 0 11
(12) Net Profit / Loss(-) (10-11) 1920 1587 1882
(13) Dividend Declared 0 0 0
(14) Dividend Tax 0 0 0
(15) Retained Profit (12-13-14) 1920 1587 1882
Financial Ratios 2010-11 2009-10 2008-09
(i) Sales : Capital Employed 2.54 2.7 2.82
(ii) Cost of Sales : Sales 34.8 42.4 42.04
(iii) Salary / Wages : Sales 17.24 17.05 19.47
(iv) Net Profit : Net Worth 2.19 1.94 2.46
(v) Debt : Equity 0 0 0
(vi) Current Ratio 181.02 87.6 65.22
(vii) Sundry Debtors : Sales (No. of Days) 0 0 0
(viii) Total Inventory : Sales 0 0 0
2010-11 PROVISIONAL

552 Financial Services
www.nfdcindia.com
National film Development Corp. Ltd. (NfDC) was incorporated on 11.05.1975 with the objective to plan, promote and organize an integrated and efficient development of the film industry in accordance with the national economic policy and objectives laid down by the Central Government from time to time. The company was restructured in 1980 by the merger of erstwhile Indian Motion Picture Export Corporation and film finance Corporation, thereby, the company emerged as a Central Agency to promote Good Cinema in the country.
NfDC is a Schedule-‘C’ Mini-ratna / BRPSE referred CPSE in financial Services sector under the administrative control of M/o Information and Broadcasting with 100% shareholding by the Government of India. Its Registered and Corporate offices are at Mumbai, Maharashtra.
As per revival plan of the company, the paid-up capital of the company, during the year 2010-11, increased from 14.00 crore to 45.40 crore as a result of an infusion of additional equity of 3.00 crore by Government of India and the outstanding Government loan of 19.77 crores along with accumulated interest of 8.63 crores on it was converted into equity.
Vision / MissionThe Vision / Mission of the Company is to plan, promote
and organize an integrated and efficient development of the film industry in accordance with the national economic policy and objectives laid down by the Central government from time to time.
Industrial / Business OperationsNFDC is engaged in providing services in the field of film
production, distribution and provide related project services. The activities of the company can be bifurcated into development and commercial activities.
The company operates through three Regional offices in Chennai, Delhi and Kolkata and one Branch office at Trivandrum. The physical performances of the company for last three years are given below:Main Services Unit Performance During
2010-11 2009-10 2008-09Media Campaign for Govt. Dept.
in Crore 162.32 44.00 -
Commissioned Production
in Crore 8.90 7.47 1.76
Grant in aid for regional film production
in Crore 6.24 4.89 -
Service Project in Crore 5.33 4.71 5.02
Film Distribution in Crore 4.00 3.02 7.60
Strategic issueThe company was referred to BRPSE and a revival plan for
the company was approved by the Government in September, 2010. As per revival plan of the company, an additional equity was infused and outstanding Government loan along with accumulated interest was converted into equity. The revival plan is under implementation.
Performance HighlightsThe operational performance of the company along with
21.10 National Film Development Corp. Ltd.performance indicators and selected financial ratios during the period 2008-09 to 2010-11 can be seen on the opposite page.
The Company registered an increase of ` 116.80 crore in total income during 2010-11 which went up to ` 185.00 crore in 2010-11 from ` 68.20 crore during 2009-10. The net profit of the company correspondingly increased to ` 1.69 crore, an increase of ` 8.82 crore over the previous year loss of ` 7.13 crore due to increase in business during last two years after the revision of Government policy in october 2009 that had allowed NFDC to make inroads into release of advertisement campaigns that was previously reserved for DAVP only.
The conversion of loan into equity and interest outstanding thereon will rid the corporation of their heavy interest burden and liability to repay the loan. It has helped the corporation to cleanup its balance sheet and start afresh.
Government has further consented to support the development activities of the company by providing Grant-in-Aid for some of the major development activities undertaken by NfDC. During 2010-11, Government has sanctioned a Grant-in-Aid of 9.99 crores for film production.
Human Resource ManagementThe company employed 104 regular employees as on
31.3.2011. The retirement age in the company is 60 years. It is following IDA 2007 pattern of remuneration. Details of employment in last 3 years are given below:
Particulars 2010-11 2009-10 2008-09Executives including Non-Unionised Supervisors
47 66 104
Non-Executives # 57 72 85Total Employees 104 138 189
# Detail break-up of Non-Executive employees is at Statement no. 25 of volume-I of PE Survey.
There was substantial reduction in manpower of NfDC since last two years as employees availed Voluntary Retirement under the VRS/VSS scheme announced by the corporation as per the restructuring plan of the company.

553Public Enterprises Survey 2010-2011: Vol-II
National Film Development Corp. Ltd. Discovery of India Building, 6th floor , Nehru Centre, Dr. A. B. Raod, Worli, Mumbai Maharashtra - 400 018
Balance Sheet (` in Lakhs)
Particulars 2010-11 2009-10 2008-09
Authorised Capital 4540 1400 1400
(1) Sources Of Fund
(1.1) Shareholders Funds
(A) Paid-Up Capital
Central Govt 4540 1400 1400
Others 0 0 0
(B) Share Application Money 0 0 0
(C) Reserves & Surplus 699 674 216
Total (A) + (B) + (C) 5239 2074 1616
(1.2) Loan Funds
(A) Secured Loans 0 0 448
(B) Unsecured Loans 0 2638 2340
Total (A) + (B) 0 2638 2788
(1.3) Deferred Tax Liability 0 0 0
Total (1.1) + (1.2) + (1.3) 5239 4712 4404
(2) Application Of Funds
(2.1) Fixed Assets
(A) Gross Block 2779 2596 2559
(B) Less Depreciation 2302 2248 2188
(C) Net Block (A-B) 477 348 371
(D) Capital Work In Progress 29 11 0
Total (C) + (D) 506 359 371
(2.2) Investment 0 0 0
(2.3) Current Assets, Loan & Advances
(A) Inventories 47 46 176
(B) Sundry Debtors 9244 3873 711
(C) Cash & Bank Balances 8080 2747 2154
(D) Other Current Assets 33 12 44
(E) Loan & Advances 2538 1071 886
Total (A)+ (B)+ (C)+ (D)+ (E) 19942 7749 3971
(2.4) Less:current Liabilities & Provisions
(A) Current Liabilities 18148 6469 2656
(B) Provisions 386 403 371
Total (A+B) 18534 6872 3027
(2.5) Net Current Assets (2.3-2.4) 1408 877 944
(2.6) Deferred Revenue / Pre. Expenditure 18 0 327
(2.7) Deferred Tax Asset 0 0 0
(2.8) Profit & Loss Account(Dr) 3307 3476 2762
Total (2.1+2.2+2.5+2.6+2.7+2.8) 5239 4712 4404
Important Indicators 2010-11 2009-10 2008-09
(i) Investment 4540 4038 4188
(ii) Capital Employed 1885 1225 1315
(iii) Net Worth 1914 -1402 -1473
(iv) Cost of Production 17900 7283 2344
(v) Cost of Sales 17900 7283 2344
(vi) Gross Value Added (At Market Price) - - -
(vii) Total Employees (Other Than Casuals) (Nos.) 104 138 189
(viii) Avg. Monthly Emoluments Per Employee (Rs.) 33173 26872 25309
Profit & Loss Account (` in Lakhs)
Particulars 2010-11 2009-10 2008-09
(1) Income
(A) Sales/Operating Income 18125 6457 1432
(B) Excise Duty 0 0 0
(C) Net Sales (A-B) 18125 6457 1432
(D) Other Income/Receipts 375 363 299
(E) Accretion/Depletion in Stocks 0 0 0
(I)Total Income (C+D+E) 18500 6820 1731
(2) Expenditure
(A) Purchase of Finished Goods/ Consumption Of Raw Materials 0 309 413
(B) Stores & Spares 0 0 5
(C) Power & Fuel 29 27 30
(D) Manufacturing / Direct / Operating Expenses 777 251 0
(E) Salary, Wages & Benefits / Employee Exp. 414 445 574
(F) Other Expenses 16564 5873 839
(G) Provisions 28 4 11
(II)Total Expenditure (A to G) 17812 6909 1872
(3) Profit Before Dep, Int, Taxes & EP (PBDITEP) (I-II) 688 -89 -141
(4) Depreciation 81 73 76
(5) Dre/Prel Exp Written Off 4 0 101
(6) Profit Before Int., Taxes & Ep (PBITEP) (3-4-5) 603 -162 -318
(7) Interest
(A) On Central Government Loans 0 283 295
(B) On Foreign Loans 0 0 0
(C) Others 3 18 0
(D) Less Interest Capitalised 0 0 0
(E) Charged to P & L Account (A+B+C-D) 3 301 295
(8) Profit Before Tax & EP(PBTEP) (6-7E) 600 -463 -613
(9) Tax Provisions 0 0 53
(10) Net Profit / Loss Before EP (8-9) 600 -463 -666
(11) Net Extra-Ord. Items 431 250 447
(12) Net Profit / Loss(-) (10-11) 169 -713 -1113
(13) Dividend Declared 0 0 0
(14) Dividend Tax 0 0 0
(15) Retained Profit (12-13-14) 169 -713 -1113
Financial Ratios 2010-11 2009-10 2008-09
(i) Sales : Capital Employed 961.54 527.1 108.9
(ii) Cost of Sales : Sales 98.76 112.79 163.69
(iii) Salary / Wages : Sales 2.28 6.89 40.08
(iv) Net Profit : Net Worth 8.83 - -
(v) Debt : Equity 0 1.27 1.73
(vi) Current Ratio 1.08 1.13 1.31
(vii) Sundry Debtors : Sales (No. of Days) 186.16 218.93 181.23
(viii) Total Inventory : Sales 0.95 2.6 44.86
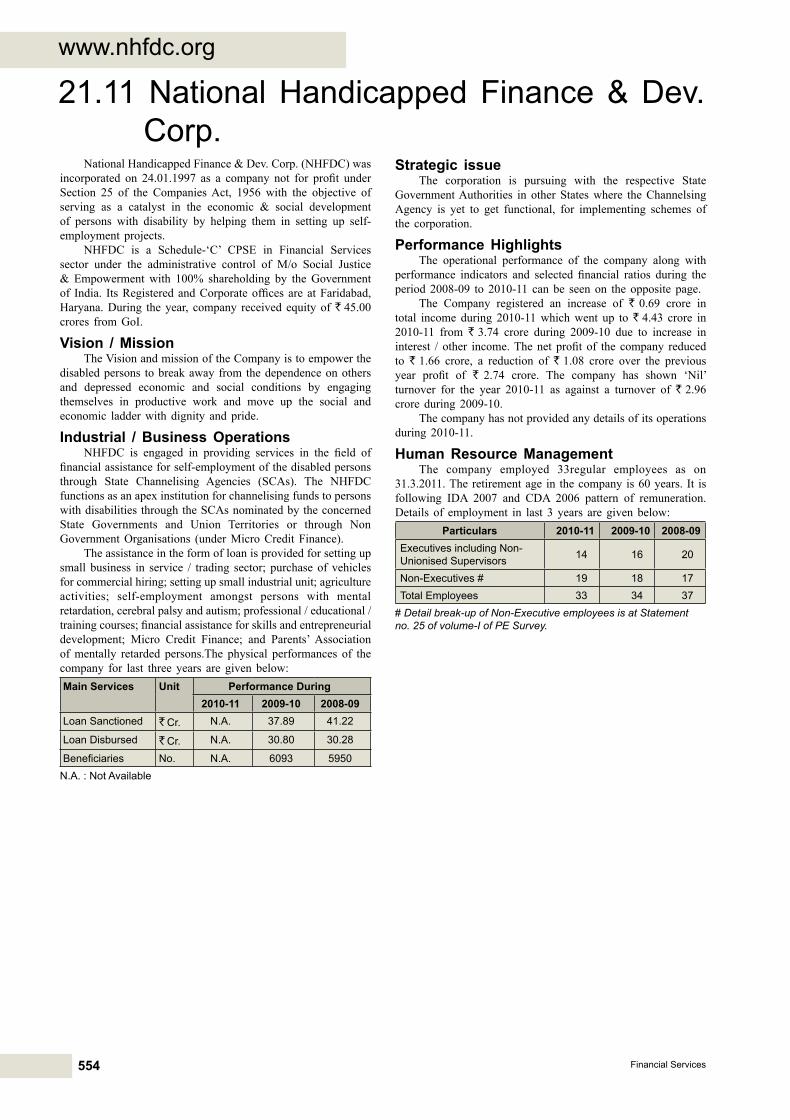
554 Financial Services
www.nhfdc.org
National Handicapped finance & Dev. Corp. (NHfDC) was incorporated on 24.01.1997 as a company not for profit under Section 25 of the Companies Act, 1956 with the objective of serving as a catalyst in the economic & social development of persons with disability by helping them in setting up self-employment projects.
NHfDC is a Schedule-‘C’ CPSE in financial Services sector under the administrative control of M/o Social Justice & Empowerment with 100% shareholding by the Government of India. Its Registered and Corporate offices are at Faridabad, Haryana. During the year, company received equity of ` 45.00 crores from GoI.
Vision / MissionThe Vision and mission of the Company is to empower the
disabled persons to break away from the dependence on others and depressed economic and social conditions by engaging themselves in productive work and move up the social and economic ladder with dignity and pride.
Industrial / Business OperationsNHFDC is engaged in providing services in the field of
financial assistance for self-employment of the disabled persons through State Channelising Agencies (SCAs). The NHfDC functions as an apex institution for channelising funds to persons with disabilities through the SCAs nominated by the concerned State Governments and Union Territories or through Non Government organisations (under Micro Credit finance).
The assistance in the form of loan is provided for setting up small business in service / trading sector; purchase of vehicles for commercial hiring; setting up small industrial unit; agriculture activities; self-employment amongst persons with mental retardation, cerebral palsy and autism; professional / educational / training courses; financial assistance for skills and entrepreneurial development; Micro Credit Finance; and Parents’ Association of mentally retarded persons.The physical performances of the company for last three years are given below:Main Services Unit Performance During
2010-11 2009-10 2008-09Loan Sanctioned ` Cr. N.A. 37.89 41.22
Loan Disbursed ` Cr. N.A. 30.80 30.28
Beneficiaries No. N.A. 6093 5950N.A. : Not Available
21.11 National Handicapped Finance & Dev. Corp.
Strategic issueThe corporation is pursuing with the respective State
Government Authorities in other States where the Channelsing Agency is yet to get functional, for implementing schemes of the corporation.
Performance HighlightsThe operational performance of the company along with
performance indicators and selected financial ratios during the period 2008-09 to 2010-11 can be seen on the opposite page.
The Company registered an increase of ` 0.69 crore in total income during 2010-11 which went up to ` 4.43 crore in 2010-11 from ` 3.74 crore during 2009-10 due to increase in interest / other income. The net profit of the company reduced to ` 1.66 crore, a reduction of ` 1.08 crore over the previous year profit of ` 2.74 crore. The company has shown ‘Nil’ turnover for the year 2010-11 as against a turnover of ` 2.96 crore during 2009-10.
The company has not provided any details of its operations during 2010-11.
Human Resource ManagementThe company employed 33regular employees as on
31.3.2011. The retirement age in the company is 60 years. It is following IDA 2007 and CDA 2006 pattern of remuneration. Details of employment in last 3 years are given below:
Particulars 2010-11 2009-10 2008-09Executives including Non-Unionised Supervisors 14 16 20
Non-Executives # 19 18 17Total Employees 33 34 37
# Detail break-up of Non-Executive employees is at Statement no. 25 of volume-I of PE Survey.

555Public Enterprises Survey 2010-2011: Vol-II
National Handicapped Finance & Dev. Corp. Red Cross Bhawan, Sector-12, faridabad, Haryana 121 007
Balance Sheet (` in Lakhs)
Particulars 2010-11 2009-10 2008-09
Authorised Capital 40000 40000 40000
(1) Sources Of Fund
(1.1) Shareholders Funds
(A) Paid-Up Capital
Central Govt 16180 11680 9880
Others 0 0 0
(B) Share Application Money 500 0 900
(C) Reserves & Surplus 2758 2603 2329
Total (A) + (B) + (C) 19438 14283 13109
(1.2) Loan Funds
(A) Secured Loans 0 0 0
(B) Unsecured Loans 0 0 0
Total (A) + (B) 0 0 0
(1.3) Deferred Tax Liability 0 0 0
Total (1.1) + (1.2) + (1.3) 19438 14283 13109
(2) Application Of Funds
(2.1) Fixed Assets
(A) Gross Block 128 127 123
(B) Less Depreciation 97 87 77
(C) Net Block (A-B) 31 40 46
(D) Capital Work In Progress 0 0 0
Total (C) + (D) 31 40 46
(2.2) Investment 0 0 0
(2.3) Current Assets, Loan & Advances
(A) Inventories 0 0 0
(B) Sundry Debtors 0 0 0
(C) Cash & Bank Balances 0 714 1267
(D) Other Current Assets 0 15 8
(E) Loan & Advances 19407 13818 11995
Total (A)+ (B)+ (C)+ (D)+ (E) 19407 14547 13270
(2.4) Less:current Liabilities & Provisions
(A) Current Liabilities 0 265 187
(B) Provisions 0 39 20
Total (A+B) 0 304 207
(2.5) Net Current Assets (2.3-2.4) 19407 14243 13063
(2.6) Deferred Revenue / Pre. Expenditure 0 0 0
(2.7) Deferred Tax Asset 0 0 0
(2.8) Profit & Loss Account(Dr) 0 0 0
Total (2.1+2.2+2.5+2.6+2.7+2.8) 19438 14283 13109
Important Indicators 2010-11 2009-10 2008-09
(i) Investment 16680 11680 10780
(ii) Capital Employed 19438 14283 13109
(iii) Net Worth 19438 14283 13109
(iv) Cost of Production 266 327 594
(v) Cost of Sales 266 327 594
(vi) Gross Value Added (At Market Price) - - -
(vii) Total Employees (Other Than Casuals) (Nos.) 33 34 37
(viii) Avg. Monthly Emoluments Per Employee (Rs.) 46465 42402 28604
Profit & Loss Account (` in Lakhs)
Particulars 2010-11 2009-10 2008-09
(1) Income
(A) Sales/Operating Income 0 296 247
(B) Excise Duty 0 0 0
(C) Net Sales (A-B) 0 296 247
(D) Other Income/Receipts 443 78 79
(E) Accretion/Depletion in Stocks 0 0 0
(I)Total Income (C+D+E) 443 374 326
(2) Expenditure
(A) Purchase of Finished Goods/ Consumption Of Raw Materials 0 0 0
(B) Stores & Spares 0 0 0
(C) Power & Fuel 0 0 4
(D) Manufacturing / Direct / Operating Expenses 0 0 0
(E) Salary, Wages & Benefits / Employee Exp. 184 173 127
(F) Other Expenses 64 127 163
(G) Provisions 8 13 285
(II)Total Expenditure (A to G) 256 313 579
(3) Profit Before Dep, Int, Taxes & EP (PBDITEP) (I-II) 187 61 -253
(4) Depreciation 10 14 15
(5) Dre/Prel Exp Written Off 0 0 0
(6) Profit Before Int., Taxes & Ep (PBITEP) (3-4-5) 177 47 -268
(7) Interest
(A) On Central Government Loans 0 0 0
(B) On Foreign Loans 0 0 0
(C) Others 0 0 0
(D) Less Interest Capitalised 0 0 0
(E) Charged to P & L Account (A+B+C-D) 0 0 0
(8) Profit Before Tax & EP(PBTEP) (6-7E) 177 47 -268
(9) Tax Provisions 0 0 0
(10) Net Profit / Loss Before EP (8-9) 177 47 -268
(11) Net Extra-Ord. Items 11 -227 21
(12) Net Profit / Loss(-) (10-11) 166 274 -289
(13) Dividend Declared 0 0 0
(14) Dividend Tax 0 0 0
(15) Retained Profit (12-13-14) 166 274 -289
Financial Ratios 2010-11 2009-10 2008-09
(i) Sales : Capital Employed 0 2.07 1.88
(ii) Cost of Sales : Sales 0 110.47 240.49
(iii) Salary / Wages : Sales 0 58.45 51.42
(iv) Net Profit : Net Worth 0.85 1.92 -2.2
(v) Debt : Equity 0 0 0
(vi) Current Ratio 0 47.85 64.11
(vii) Sundry Debtors : Sales (No. of Days) 0 0 0
(viii) Total Inventory : Sales 0 0 0
2010-11 PROVISIONAL

556 Financial Services
www.nmdfc.org
National Minorities Development finance Corporation (NMDfC) was incorporated on 30.09.1994 under Section 25 of the Companies Act, 1956 with an objective to promote economic and developmental activities for the benefit of backward sections amongst minorities as defined under National Commission for Minorities Act 1992.
NMDFC is a Schedule – C CPSE in Financial Services sector under the administrative control of Ministry of Minority Affairs with 8148% shareholding by the Govt. of India, and rest by the State Govt. and Groups & individuals having interest in Development of Minorities. The registered and corporate office of NMDfC is situated at New Delhi.
Vision/MissionThe Vision of the Company is to reach and assist all
individuals/ groups among minorities who are living below double the poverty line in a phased manner.
The Mission of the Company is to promote economic and developmental activities for the benefit of backward sections amongst minorities.
Industrial / Business OperationsNMDFC is a national level apex financing body providing
financial Assistance / lending to eligible Minorities living below double the poverty line at concessional rates of interest for self employment ventures as well as technical and professional education, with preference to women and occupational groups through 36 operational State Channellising Agencies (SCAs) operational in 25 States and two Union Territories across the country.
The major schemes implemented by NMDfC are Term Loan, Margin Money, Micro Credit, Interest fee Loan for promotion of Self Help Groups, Revolving fund scheme under Micro financing, Educational Loan, Vocational Training, Grant for skill/design development/ Marketing assistance scheme. The physical performances of the company for last three years are given below:Main Services Unit Value of Services Provided during
2010-11 2009-10 2008-09
Disbursements of Loans
` in crore
233.27 197.75 130.42
Strategic IssuesSince NMDfC is a community welfare organisation, it
receives funds from the Government of India and the State Governments for promoting economic and developmental activities amongst the minorities. During the year the company received a budgetary support of ` 141.83 crore as equity from Central Govt. and State Govt.
Performance HighlightsThe operational performance of the company along with
performance indicators and selected financial ratios during the period 2008-09 to 2010-11 can be seen on the opposite page.
21.12 National Minorities Development Finance Corporation
The Company registered an increase of ` 9.69 crore in total income during 2010-11 which went up to ` 37.41 crore in 2010-11 from ` 27.72 crore during 2009-10. The net profit of the company increased to ` 31.61 crore, an increase of ` 16.48 crore over the previous year due to receipt of Govt. Guarantee and less provision on loan.
Human Resource ManagementThe company employed 33 regular employees as on
31.3.2011. The retirement age in the company is 60 years. It is following IDA 2007 and CDA 2006 pattern of remuneration. Details of employment in last 3 years are given below:
Particulars 2010-11 2009-10 2008-09Executives including Non-Unionised Supervisors
17 17 17
Non-Executives # 16 16 16Total Employees 33 33 33
#Detailbreak-up of Non-Executive employees is at Statement no. 25 of volume-I of PE Survey.
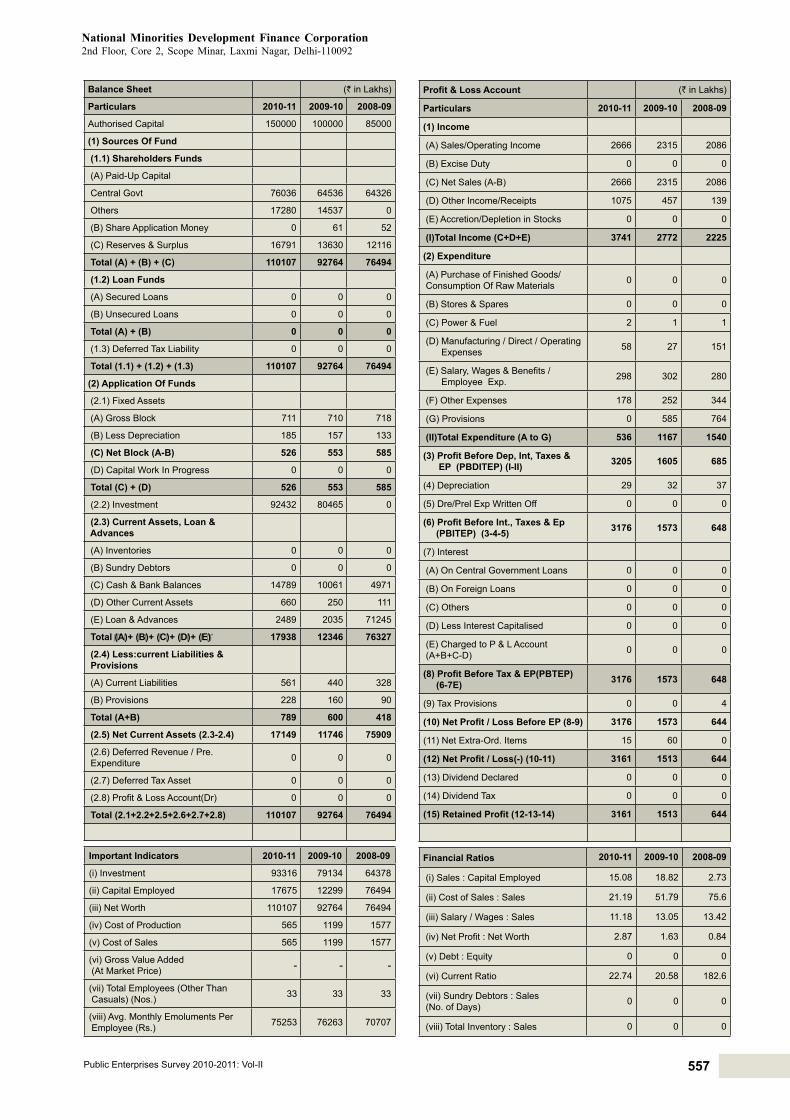
557Public Enterprises Survey 2010-2011: Vol-II
National Minorities Development Finance Corporation2nd floor, Core 2, Scope Minar, Laxmi Nagar, Delhi-110092
Balance Sheet (` in Lakhs)
Particulars 2010-11 2009-10 2008-09
Authorised Capital 150000 100000 85000
(1) Sources Of Fund
(1.1) Shareholders Funds
(A) Paid-Up Capital
Central Govt 76036 64536 64326
Others 17280 14537 0
(B) Share Application Money 0 61 52
(C) Reserves & Surplus 16791 13630 12116
Total (A) + (B) + (C) 110107 92764 76494
(1.2) Loan Funds
(A) Secured Loans 0 0 0
(B) Unsecured Loans 0 0 0
Total (A) + (B) 0 0 0
(1.3) Deferred Tax Liability 0 0 0
Total (1.1) + (1.2) + (1.3) 110107 92764 76494
(2) Application Of Funds
(2.1) Fixed Assets
(A) Gross Block 711 710 718
(B) Less Depreciation 185 157 133
(C) Net Block (A-B) 526 553 585
(D) Capital Work In Progress 0 0 0
Total (C) + (D) 526 553 585
(2.2) Investment 92432 80465 0
(2.3) Current Assets, Loan & Advances
(A) Inventories 0 0 0
(B) Sundry Debtors 0 0 0
(C) Cash & Bank Balances 14789 10061 4971
(D) Other Current Assets 660 250 111
(E) Loan & Advances 2489 2035 71245
Total (A)+ (B)+ (C)+ (D)+ (E) 17938 12346 76327
(2.4) Less:current Liabilities & Provisions
(A) Current Liabilities 561 440 328
(B) Provisions 228 160 90
Total (A+B) 789 600 418
(2.5) Net Current Assets (2.3-2.4) 17149 11746 75909
(2.6) Deferred Revenue / Pre. Expenditure 0 0 0
(2.7) Deferred Tax Asset 0 0 0
(2.8) Profit & Loss Account(Dr) 0 0 0
Total (2.1+2.2+2.5+2.6+2.7+2.8) 110107 92764 76494
Important Indicators 2010-11 2009-10 2008-09
(i) Investment 93316 79134 64378
(ii) Capital Employed 17675 12299 76494
(iii) Net Worth 110107 92764 76494
(iv) Cost of Production 565 1199 1577
(v) Cost of Sales 565 1199 1577
(vi) Gross Value Added (At Market Price) - - -
(vii) Total Employees (Other Than Casuals) (Nos.) 33 33 33
(viii) Avg. Monthly Emoluments Per Employee (Rs.) 75253 76263 70707
Profit & Loss Account (` in Lakhs)
Particulars 2010-11 2009-10 2008-09
(1) Income
(A) Sales/Operating Income 2666 2315 2086
(B) Excise Duty 0 0 0
(C) Net Sales (A-B) 2666 2315 2086
(D) Other Income/Receipts 1075 457 139
(E) Accretion/Depletion in Stocks 0 0 0
(I)Total Income (C+D+E) 3741 2772 2225
(2) Expenditure
(A) Purchase of Finished Goods/ Consumption Of Raw Materials 0 0 0
(B) Stores & Spares 0 0 0
(C) Power & Fuel 2 1 1
(D) Manufacturing / Direct / Operating Expenses 58 27 151
(E) Salary, Wages & Benefits / Employee Exp. 298 302 280
(F) Other Expenses 178 252 344
(G) Provisions 0 585 764
(II)Total Expenditure (A to G) 536 1167 1540
(3) Profit Before Dep, Int, Taxes & EP (PBDITEP) (I-II) 3205 1605 685
(4) Depreciation 29 32 37
(5) Dre/Prel Exp Written Off 0 0 0
(6) Profit Before Int., Taxes & Ep (PBITEP) (3-4-5) 3176 1573 648
(7) Interest
(A) On Central Government Loans 0 0 0
(B) On Foreign Loans 0 0 0
(C) Others 0 0 0
(D) Less Interest Capitalised 0 0 0
(E) Charged to P & L Account (A+B+C-D) 0 0 0
(8) Profit Before Tax & EP(PBTEP) (6-7E) 3176 1573 648
(9) Tax Provisions 0 0 4
(10) Net Profit / Loss Before EP (8-9) 3176 1573 644
(11) Net Extra-Ord. Items 15 60 0
(12) Net Profit / Loss(-) (10-11) 3161 1513 644
(13) Dividend Declared 0 0 0
(14) Dividend Tax 0 0 0
(15) Retained Profit (12-13-14) 3161 1513 644
Financial Ratios 2010-11 2009-10 2008-09
(i) Sales : Capital Employed 15.08 18.82 2.73
(ii) Cost of Sales : Sales 21.19 51.79 75.6
(iii) Salary / Wages : Sales 11.18 13.05 13.42
(iv) Net Profit : Net Worth 2.87 1.63 0.84
(v) Debt : Equity 0 0 0
(vi) Current Ratio 22.74 20.58 182.6
(vii) Sundry Debtors : Sales (No. of Days) 0 0 0
(viii) Total Inventory : Sales 0 0 0

558 Financial Services
www.nskfdc.nic.in
National Safai Karamcharis finance & Development Corp. (NSKfDC) was incorporated on 24.1.1997 as a company not for profit under Section 25 of the Companies Act, 1956 with the objective of to promote socio-economic upliftment of Safai Karamcharis/Scavengers and their dependents by way of providing financial assistance at concessional rates of interest for any income generating activity through out the country through the State Channelising Agencies (SCAs) and to provide technical and professional training, quality control, technology up-gradation, and common facility centers for carrying out sanitation works.
NSKfDC is a Schedule-‘C’ CPSE financial Services sector under the administrative control of M/o Social Justice and Empowerment with 100% shareholding by the Government of India. Its Registered and Corporate offices are at New Delhi.
Vision/MissionThe Vision / Mission of the Company is to empower the
Safai Karamcharis, Scavengers and their dependents to break away from traditional occupation, depressed social condition, poverty and leverage them to work their own way up the social and economic ladder with dignity and pride.
Industrial / Business OperationsNSKFDC provides concessional financial assistance to
income generating and viable projects to the Safai Karamcharis / Scavengers and their dependents whose income is below double the poverty line through 26 State Channelising Agencies (SCAs) nominated by State Governments / UTs. The financing schemes include Term Loan, Micro Credit finance (MCf), Mahila Samridhi Yojana (MSY), Educational Loan etc. The physical performances of the company for last three years are given below:Main Services / Segments
Unit Performance During2010-11 2009-10 2008-09
Share Capital Received
` in cr. 40.00 60.00 -
Total Loan Disbursed ` in cr. NA NA 72.86
Total Beneficiaries Covered
Nos. NA NA 21187
NA – not available / not provided by the company
A Scavenger/Safai Karamchari and their dependents duly identified under the NSLRS/survey/registered co-operative society of Safai Karamcharis/ legally constituted association/firm promoted by the target group and also all those who produce a certificate from local Revenue Officer/local Municipal officer/Cantonment Executive Officer/Railway Officer not below the rank of gazetted officer. Under section 3 of 1993 Act, the definition of the target group is as follows:
“Scavenger” means and includes a Safai Karamchari wholly or partially employed for manual handling of human excreta and includes his dependents. Safai Karamchari means a person engaged in, or employed for any sanitation work and includes his dependents. “Dependent” in relation to a Safai Karamchari or a Scavenger means and includes a member of his family who is
21.13 National Safai Karamcharis Finance & Development Corp.
dependent on him and attained the age of 18 years & above.Priority shall be given to Scavengers, and amongst
scavengers, those Scavengers whose income is below double poverty line; Women from among the target group and Disabled persons among the target group.
NSKfDC provides loans to SCAs for different schemes at the interest rate of 1 to 3% which in turn give these loans to target beneficiaries at the rate not exceeding 6%. Funds are provided generally by way of equity through budgetary support every year.
Term loan upto 90% of the projects costing upto Rs.10.00 lac is given (including sanitation-based equipments). The balance 10% is to be provided by the State Channelising Agencies (SCAs) as margin money including subsidy along with promoter’s contribution. Promoter’s contribution not to be insisted upto project cost of Rs.2.00 lac and beyond Rs.2.00 lac, minimum promoter’s contribution to be insisted would be 5%. No income limit is fixed for availing financial assistance. Loan shall be repaid within 5 years and thereafter the penal interest @ 2% is chargeable from the beneficiary.
Strategic IssuesThe company has requested M/o Social Justice &
Empowerment for enhancement of authorized share capital to ` 515 crore.
Performance HighlightsThe operational performance of the company along with
performance indicators and selected financial ratios during the period 2008-09 to 2010-11 can be seen on the opposite page.
The Company registered an increase of ` 2.12 crore in total income during 2010-11 which went up to ` 8.90 crore in 2010-11 from ` 6.78 crore during 2009-10. The net profit of the company correspondingly increased to ` 4.14 crore, an increase of ` 2.23 crore over the previous year.
Human Resource ManagementThe company employed 23 regular employees as on
31.3.2011. The retirement age in the company is 60 years. It is following IDA 2007 pattern of remuneration. Details of employment in last 3 years are given below:
Particulars 2010-11 2009-10 2008-09Executives including Non-Unionised Supervisors 14 6 6
Non-Executives # 9 17 8Total Employees 23 23 14
# Detail break-up of Non-Executive employees is at Statement no. 25 of volume-I of PE Survey.

559Public Enterprises Survey 2010-2011: Vol-II
National Safai Karamcharis Finance & Development Corp. B-2, First Floor, G. K. Enclave – II, New Delhi - 110048
Balance Sheet (` in Lakhs)
Particulars 2010-11 2009-10 2008-09
Authorised Capital 30000 30000 20000
(1) Sources Of Fund
(1.1) Shareholders Funds
(A) Paid-Up Capital
Central Govt 29999 25999 19999
Others 0 0 0
(B) Share Application Money 0 0 3000
(C) Reserves & Surplus 3241 2798 2580
Total (A) + (B) + (C) 33240 28797 25579
(1.2) Loan Funds
(A) Secured Loans 0 0 0
(B) Unsecured Loans 0 0 0
Total (A) + (B) 0 0 0
(1.3) Deferred Tax Liability 0 0 0
Total (1.1) + (1.2) + (1.3) 33240 28797 25579
(2) Application Of Funds
(2.1) Fixed Assets
(A) Gross Block 81 44 40
(B) Less Depreciation 27 21 18
(C) Net Block (A-B) 54 23 22
(D) Capital Work In Progress 0 0 0
Total (C) + (D) 54 23 22
(2.2) Investment 0 0 0
(2.3) Current Assets, Loan & Advances
(A) Inventories 0 0 0
(B) Sundry Debtors 0 0 0
(C) Cash & Bank Balances 10152 3936 4485
(D) Other Current Assets 376 341 254
(E) Loan & Advances 28715 27861 23319
Total (A)+ (B)+ (C)+ (D)+ (E) 39243 32138 28058
(2.4) Less:current Liabilities & Provisions
(A) Current Liabilities 5986 3360 2472
(B) Provisions 71 55 29
Total (A+B) 6057 3415 2501
(2.5) Net Current Assets (2.3-2.4) 33186 28723 25557
(2.6) Deferred Revenue / Pre. Expenditure 0 51 0
(2.7) Deferred Tax Asset 0 0 0
(2.8) Profit & Loss Account(Dr) 0 0 0
Total (2.1+2.2+2.5+2.6+2.7+2.8) 33240 28797 25579
Important Indicators 2010-11 2009-10 2008-09
(i) Investment 29999 25999 22999
(ii) Capital Employed 33240 28746 25579
(iii) Net Worth 33240 28746 25579
(iv) Cost of Production 493 534 568
(v) Cost of Sales 493 534 568
(vi) Gross Value Added (At Market Price) - - -
(vii) Total Employees (Other Than Casuals) (Nos.) 23 23 14
(viii) Avg. Monthly Emoluments Per Employee (Rs.) 43478 51087 55357
Profit & Loss Account (` in Lakhs)
Particulars 2010-11 2009-10 2008-09
(1) Income
(A) Sales/Operating Income 889 618 616
(B) Excise Duty 0 0 0
(C) Net Sales (A-B) 889 618 616
(D) Other Income/Receipts 1 60 8
(E) Accretion/Depletion in Stocks 0 0 0
(I)Total Income (C+D+E) 890 678 624
(2) Expenditure
(A) Purchase of Finished Goods/ Consumption Of Raw Materials 0 0 0
(B) Stores & Spares 0 0 0
(C) Power & Fuel 1 1 1
(D) Manufacturing / Direct / Operating Expenses 155 5 134
(E) Salary, Wages & Benefits / Employee Exp. 120 141 93
(F) Other Expenses 211 282 165
(G) Provisions 0 101 171
(II)Total Expenditure (A to G) 487 530 564
(3) Profit Before Dep, Int, Taxes & EP (PBDITEP) (I-II) 403 148 60
(4) Depreciation 6 4 4
(5) Dre/Prel Exp Written Off 0 0 0
(6) Profit Before Int., Taxes & Ep (PBITEP) (3-4-5) 397 144 56
(7) Interest
(A) On Central Government Loans 0 0 0
(B) On Foreign Loans 0 0 0
(C) Others 0 0 0
(D) Less Interest Capitalised 0 0 0
(E) Charged to P & L Account (A+B+C-D) 0 0 0
(8) Profit Before Tax & EP(PBTEP) (6-7E) 397 144 56
(9) Tax Provisions 0 0 2
(10) Net Profit / Loss Before EP (8-9) 397 144 54
(11) Net Extra-Ord. Items -17 -47 2
(12) Net Profit / Loss(-) (10-11) 414 191 52
(13) Dividend Declared 0 0 0
(14) Dividend Tax 0 0 0
(15) Retained Profit (12-13-14) 414 191 52
Financial Ratios 2010-11 2009-10 2008-09
(i) Sales : Capital Employed 2.67 2.15 2.41
(ii) Cost of Sales : Sales 55.46 86.41 92.21
(iii) Salary / Wages : Sales 13.5 22.82 15.1
(iv) Net Profit : Net Worth 1.25 0.66 0.2
(v) Debt : Equity 0 0 0
(vi) Current Ratio 6.48 9.41 11.22
(vii) Sundry Debtors : Sales (No. of Days) 0 0 0
(viii) Total Inventory : Sales 0 0 0

560 Financial Services
www.nsfdc.nic.in
National Scheduled Castes finance & Development Corporation (NSfDC) was incorporated on 8.2.1989 with the objective to exclusively work for the economic development activities of the people belonging to Scheduled Caste categories living below Double the Poverty Line. NSfDC was incorporated as a company not for profit under Section 25 of the Companies Act, 1956 as National Scheduled Castes and Scheduled Tribes finance and Development Corporation, which was later bifurcated into two Corporations, one for Scheduled Castes and another for Scheduled Tribes w.e.f. 10.4.2001.
NSfDC is a Schedule - ‘C’ CPSE engaged in ‘Community Services’ under the administrative control of Ministry of Social Justice and Empowerment with 100% shareholding by the Government of India. Its Registered and Corporate offices are at New Delhi.
Vision / MissionThe Vision of the Company are to fight Poverty through
Entrepreneurship. The Mission of the company is to finance, facilitate and promote the economic development activities of Schedule Caste persons.
Industrial / Business OperationsNSFDC is engaged in providing financial assistance at
concessional interest rates under various credit schemes and extending supports under various non-credit schemes to help the Scheduled Caste (SC) beneficiaries through 37 State / UT Channelising Agencies (SCAs) and other recognized institutions nominated by the respective State / UT Government.
At the beginning of each financial year, the company notionally allocates funds to the SCAs in proportion to the Scheduled Caste population of the country represented by the respective State/UT. Beneficiaries are required to pay 3.5% to 10% per annum interest depending upon the scheme and extent of loan. The company also provides advisory services to the target group and arranges Exhibition-cum- Fairs for marketing the products of beneficiaries.
The Company has five Zonal Offices at Bengaluru, Mumbai, Kolkata, Lucknow and Guwahati. The company assists the target group by way of loans and advances, skill training, entrepreneurship development programmes and other know-how. To facilitate this process, company has circulated Lending Policy Document with clear stipulations and formats along with responsibilities to all SCAs and agencies for implementation. The performance of company during last 3 years is shown below:Main Services Units 2010-11 2009-10 2008-09Total Disbursement (Beneficiaries)
` in Crore (in Nos.)
180.09 (47,728)
151.19 (58,983)
145.33 (37,041)
Strategic IssuesThe loan limit under Micro Credit Schemes has been raised
from ` 25,000 to ` 30,000 per unit w.e.f. 1.10.2006. Repayment Period under Term Loan has been increased by one more year for the schemes having repayment period less than 9 years. The Higher Rate of Interest (HRI) has been abolished in case of part refund. Educational Loan Scheme has been introduced for providing loan to students belonging to Scheduled Castes to pursue full time Professional/Technical Education in India as
21.14 National Scheduled Castes Finance & Development Corporation
well as Abroad. It has continued both the Incentive Schemes introduced for SCAs earlier giving them Awards based on their performances. Further, Lending Policy has been made flexible and liberal to empower SCAs to sanction schemes based on local needs and beneficiary choice. Timely and periodic monitoring of the schemes for increase in fund utilization level by the SCAs and recovery from the beneficiaries is the priority area. The company has undertaken impact evaluation studies of its schemes through independent agencies.
Performance HighlightsThe operational performance of the company along with
performance indicators and selected financial ratios during the period 2008-09 to 2010-11 can be seen on the opposite page.
The Company registered an increase of ` 2.91 crore in total income during 2010-11 which went up to ` 25.64 crore in 2010-11 from ` 22.73 crore during 2009-10. The net profit of the company reduced to ` 13.96 crore, a decrease of ` 5.80 crore over the previous year due to increase in administrative cost, provision for bad & doubtful loans and prior period expenses.
Human Resource ManagementThe Company employed 81 regular employees as on
31.03.2011. The retirement age in the Company is 60 years. It is following IDA 2007 pattern of remuneration. Details of employment in last 3 years are given below:
Particulars 2010-11 2009-10 2008-09Executives including Non-Unionised Supervisors 36 38 39
Non-Executives # 45 45 45Total Employees 81 83 84
# Detail break-up of Non-Executive employees is at Statement no. 25 of volume-I of PE Survey.

561Public Enterprises Survey 2010-2011: Vol-II
National Scheduled Castes Finance & Development Corporation 14th floor, Scope minar, core-1 & 2, laxmi nagar district, Laxmi Nagar, Delhi-110092
Balance Sheet (` in Lakhs)
Particulars 2010-11 2009-10 2008-09
Authorised Capital 100000 100000 100000
(1) Sources Of Fund
(1.1) Shareholders Funds
(A) Paid-Up Capital
Central Govt 57180 52080 47680
Others 0 0 0
(B) Share Application Money 2500 100 0
(C) Reserves & Surplus 21470 20054 18063
Total (A) + (B) + (C) 81150 72234 65743
(1.2) Loan Funds
(A) Secured Loans 0 0 0
(B) Unsecured Loans 0 0 0
Total (A) + (B) 0 0 0
(1.3) Deferred Tax Liability 0 0 0
Total (1.1) + (1.2) + (1.3) 81150 72234 65743
(2) Application Of Funds
(2.1) Fixed Assets
(A) Gross Block 923 921 919
(B) Less Depreciation 315 295 271
(C) Net Block (A-B) 608 626 648
(D) Capital Work In Progress 0 0 0
Total (C) + (D) 608 626 648
(2.2) Investment 0 0 0
(2.3) Current Assets, Loan & Advances
(A) Inventories 0 0 0
(B) Sundry Debtors 0 0 0
(C) Cash & Bank Balances 8454 5924 3277
(D) Other Current Assets 3010 4306 2251
(E) Loan & Advances 73415 66619 63102
Total (A)+ (B)+ (C)+ (D)+ (E) 84879 76849 68630
(2.4) Less:current Liabilities & Provisions
(A) Current Liabilities 4067 5012 3310
(B) Provisions 270 229 225
Total (A+B) 4337 5241 3535
(2.5) Net Current Assets (2.3-2.4) 80542 71608 65095
(2.6) Deferred Revenue / Pre. Expenditure 0 0 0
(2.7) Deferred Tax Asset 0 0 0
(2.8) Profit & Loss Account(Dr) 0 0 0
Total (2.1+2.2+2.5+2.6+2.7+2.8) 81150 72234 65743
Important Indicators 2010-11 2009-10 2008-09
(i) Investment 59680 52180 47680
(ii) Capital Employed 81150 72234 65743
(iii) Net Worth 81150 72234 65743
(iv) Cost of Production 891 230 1077
(v) Cost of Sales 891 230 1077
(vi) Gross Value Added (At Market Price) - - -
(vii) Total Employees (Other Than Casuals) (Nos.) 81 83 84
(viii) Avg. Monthly Emoluments Per Employee (Rs.) 68621 53514 45139
Profit & Loss Account (` in Lakhs)
Particulars 2010-11 2009-10 2008-09
(1) Income
(A) Sales/Operating Income 2229 2081 1772
(B) Excise Duty 0 0 0
(C) Net Sales (A-B) 2229 2081 1772
(D) Other Income/Receipts 335 192 364
(E) Accretion/Depletion in Stocks 0 0 0
(I)Total Income (C+D+E) 2564 2273 2136
(2) Expenditure
(A) Purchase of Finished Goods/ Consumption Of Raw Materials 0 0 0
(B) Stores & Spares 0 0 0
(C) Power & Fuel 3 2 0
(D) Manufacturing / Direct / Operating Expenses 46 123 0
(E) Salary, Wages & Benefits / Employee Exp. 667 533 455
(F) Other Expenses 84 135 315
(G) Provisions 69 -587 278
(II)Total Expenditure (A to G) 869 206 1048
(3) Profit Before Dep, Int, Taxes & EP (PBDITEP) (I-II) 1695 2067 1088
(4) Depreciation 22 24 29
(5) Dre/Prel Exp Written Off 0 0 0
(6) Profit Before Int., Taxes & Ep (PBITEP) (3-4-5) 1673 2043 1059
(7) Interest
(A) On Central Government Loans 0 0 0
(B) On Foreign Loans 0 0 0
(C) Others 0 0 0
(D) Less Interest Capitalised 0 0 0
(E) Charged to P & L Account (A+B+C-D) 0 0 0
(8) Profit Before Tax & EP(PBTEP) (6-7E) 1673 2043 1059
(9) Tax Provisions 0 0 6
(10) Net Profit / Loss Before EP (8-9) 1673 2043 1053
(11) Net Extra-Ord. Items 277 67 -7
(12) Net Profit / Loss(-) (10-11) 1396 1976 1060
(13) Dividend Declared 0 0 0
(14) Dividend Tax 0 0 0
(15) Retained Profit (12-13-14) 1396 1976 1060
Financial Ratios 2010-11 2009-10 2008-09
(i) Sales : Capital Employed 2.75 2.88 2.7
(ii) Cost of Sales : Sales 39.97 11.05 60.78
(iii) Salary / Wages : Sales 29.92 25.61 25.68
(iv) Net Profit : Net Worth 1.72 2.74 1.61
(v) Debt : Equity 0 0 0
(vi) Current Ratio 19.57 14.66 19.41
(vii) Sundry Debtors : Sales (No. of Days) 0 0 0
(viii) Total Inventory : Sales 0 0 0

562 Financial Services
www.nstfdc.nic.in
National Scheduled Tribes and finance Development Corporation (NSTfDC) was incorporated on 10.04.2001, by bifurcating erstwhile National Scheduled Castes and Scheduled Tribes finance and Development Corporation (NSfDC). It is an exclusive corporation setup for economic development of Scheduled Tribes. This corporation has been granted license under Section 25 of the Companies Act, 1956.
NSTfDC is a Schedule-‘C’ CPSE under the administrative control of Ministry of Tribal Affairs (MoTA) and fully owned by the Government of India. Its Registered and Corporate office is at New Delhi.
During the year, share capital of ` 46.83 crore is pending for allotment as on 31.3.2011.
Vision / MissionThe Vision / Mission of the company is economic
development of Scheduled Tribes on a sustainable basis.
Industrial / Business OperationsNSTFDC provides financial assistance for viable income
generating activities for economic development of Schedule Tribes. The financial assistance is extended at concessional interest rate of 4% to 8% chargeable from beneficiaries based on financial assistance given.
Company is extending concessional finance through the Central/ State Channelising Agencies (SCAs) and other agencies. It also provides financial assistance to organizations/ Institutions engaged in procurement and Marketing of Minor Forest produces/ tribal products and other products etc. It provides financial assistance by way of grants through the SCAs for undertaking training programmes for the skill and entrepreneurial development of eligible scheduled tribes. The company is also involved in capacity building of SCAs and STs through Skill Development and entrepreneurship orientation.
The physical performances of the company for last three years are given below:Main Services Unit Performance During
2010-11 2009-10 2008-09Sanctions under Income Generating Activities
` in crores
158.17 154.24 152.92
Disbursement under Income Generating Activities
` in crores
95.18 83.76 84.74
Strategic issueIn order to formulate a strategic action plan for covering
larger number of STs over a period of 20 years, the corporation has awarded the task of conducting Business Process Re-engineering Study to XLRI Jamshedpur. The study is interalia likely to recommend alternate securitization of loan, optimum loan size etc. Based on the recommendations of the study, the Corporation will prepare its Strategic Action Plan.
Performance HighlightsThe Company registered a reduction of ` 1.06 crore in
total income during 2010-11 which went down to ` 14.7crore in 2010-11 from ` 15.76crore during 2009-10 due to fall in other income. The net profit of the company however increased to `
5.96crore, an increase of ` 0.12 crore over the previous year due to increase in turnover.
21.15 National Scheduled Tribes Finance and Development Corporation
During the year, the corporation did the highest coverage of 95632 beneficiaries under income generating activities since inception.
Human Resource ManagementThe company employed 54regular employees as on
31.3.2011. The retirement age in the company is 60 years. It is following IDA 2007 and CDA 2006 pattern of remuneration. Details of employment in last 3 years are given below:
Particulars 2010-11 2009-10 2008-09Executives including Non-Unionised Supervisors 25 26 27
Non-Executives # 29 30 29Total Employees 54 56 56
# Detail break-up of Non-Executive employees is at Statement no. 25 of volume-I of PE Survey.

563Public Enterprises Survey 2010-2011: Vol-II
National Scheduled Tribes Finance and Development CorporationRegistered Office : NBCC Tower, 5th Floor, 15 BhikajiCama Place, New Delhi-110066
Balance Sheet (` in Lakhs)
Particulars 2010-11 2009-10 2008-09
Authorised Capital 50000 50000 50000
(1) Sources Of Fund
(1.1) Shareholders Funds
(A) Paid-Up Capital
Central Govt 23050 23050 23050
Others 0 0 0
(B) Share Application Money 4683 0 0
(C) Reserves & Surplus 13537 12941 12357
Total (A) + (B) + (C) 41270 35991 35407
(1.2) Loan Funds
(A) Secured Loans 0 0 0
(B) Unsecured Loans 0 0 0
Total (A) + (B) 0 0 0
(1.3) Deferred Tax Liability 0 0 0
Total (1.1) + (1.2) + (1.3) 41270 35991 35407
(2) Application Of Funds
(2.1) Fixed Assets
(A) Gross Block 598 595 592
(B) Less Depreciation 224 196 165
(C) Net Block (A-B) 374 399 427
(D) Capital Work In Progress 11 0 0
Total (C) + (D) 385 399 427
(2.2) Investment 0 0 0
(2.3) Current Assets, Loan & Advances
(A) Inventories 0 0 0
(B) Sundry Debtors 0 0 0
(C) Cash & Bank Balances 6834 5160 6882
(D) Other Current Assets 13 228 19
(E) Loan & Advances 34264 30361 28299
Total (A)+ (B)+ (C)+ (D)+ (E) 41111 35749 35200
(2.4) Less:current Liabilities & Provisions
(A) Current Liabilities 30 20 119
(B) Provisions 196 137 101
Total (A+B) 226 157 220
(2.5) Net Current Assets (2.3-2.4) 40885 35592 34980
(2.6) Deferred Revenue / Pre. Expenditure 0 0 0
(2.7) Deferred Tax Asset 0 0 0
(2.8) Profit & Loss Account(Dr) 0 0 0
Total (2.1+2.2+2.5+2.6+2.7+2.8) 41270 35991 35407
Important Indicators 2010-11 2009-10 2008-09
(i) Investment 27733 23050 23050
(ii) Capital Employed 41259 35991 35407
(iii) Net Worth 41270 35991 35407
(iv) Cost of Production 839 993 417
(v) Cost of Sales 839 993 417
(vi) Gross Value Added (At Market Price) - - -
(vii) Total Employees (Other Than Casuals) (Nos.) 54 56 56
(viii) Avg. Monthly Emoluments Per Employee (Rs.) 62346 52381 42262
Profit & Loss Account (` in Lakhs)
Particulars 2010-11 2009-10 2008-09
(1) Income
(A) Sales/Operating Income 1065 980 968
(B) Excise Duty 0 0 0
(C) Net Sales (A-B) 1065 980 968
(D) Other Income/Receipts 405 596 767
(E) Accretion/Depletion in Stocks 0 0 0
(I)Total Income (C+D+E) 1470 1576 1735
(2) Expenditure
(A) Purchase of Finished Goods/ Consumption Of Raw Materials 0 0 0
(B) Stores & Spares 0 0 0
(C) Power & Fuel 6 6 6
(D) Manufacturing / Direct / Operating Expenses 7 10 21
(E) Salary, Wages & Benefits / Employee Exp. 404 352 284
(F) Other Expenses 102 79 75
(G) Provisions 292 515 0
(II)Total Expenditure (A to G) 811 962 386
(3) Profit Before Dep, Int, Taxes & EP (PBDITEP) (I-II) 659 614 1349
(4) Depreciation 28 31 31
(5) Dre/Prel Exp Written Off 0 0 0
(6) Profit Before Int., Taxes & Ep (PBITEP) (3-4-5) 631 583 1318
(7) Interest
(A) On Central Government Loans 0 0 0
(B) On Foreign Loans 0 0 0
(C) Others 0 0 0
(D) Less Interest Capitalised 0 0 0
(E) Charged to P & L Account (A+B+C-D) 0 0 0
(8) Profit Before Tax & EP(PBTEP) (6-7E) 631 583 1318
(9) Tax Provisions 0 0 3
(10) Net Profit / Loss Before EP (8-9) 631 583 1315
(11) Net Extra-Ord. Items 35 -1 604
(12) Net Profit / Loss(-) (10-11) 596 584 711
(13) Dividend Declared 0 0 0
(14) Dividend Tax 0 0 0
(15) Retained Profit (12-13-14) 596 584 711
Financial Ratios 2010-11 2009-10 2008-09
(i) Sales : Capital Employed 2.58 2.72 2.73
(ii) Cost of Sales : Sales 78.78 101.33 43.08
(iii) Salary / Wages : Sales 37.93 35.92 29.34
(iv) Net Profit : Net Worth 1.44 1.62 2.01
(v) Debt : Equity 0 0 0
(vi) Current Ratio 181.91 227.7 160
(vii) Sundry Debtors : Sales (No. of Days) 0 0 0
(viii) Total Inventory : Sales 0 0 0

564 Financial Services
www.pfcindia.com
Power finance Corporation Ltd. (PfC) was incorporated on 16.7.1986 with the objective to provide financial resources and encourage flow of investments to the power and associated sectors for the requisite flow of investments; to work as a catalyst for optimum utilization of available resources and to mobilize financial resources from domestic and international sources at competitive rates.
PFC is a Schedule-‘A’ Navratna CPSE in financial services sector under the administrative control of M/o Power with 89.78% shareholding by the Government of India. Its Registered and Corporate offices are in New Delhi.
Vision/MissionThe Vision of the Company is to be the leading institution
in financing for sustainable development of the Indian Power Sector and its linkages, with an eye on global operations.
The Mission of the Company is to become the most preferred Financial Institution in power and financial sectors, providing best products and services; to promote efficient investments in Power Sector to enable availability of power of the required quality at minimum cost to consumers; to reach out to the global financial system for financing power development; to act as a catalyst for reforming India’s Power Sector; and to build human assets and systems for the Power Sector of tomorrow.
Industrial / Business OperationsThe Company is engaged in the business to finance power
projects, power transmission and distribution works, renovation and modernisation of power plants, system improvement and energy conservation, maintenance and repair of capital equipment etc, survey and investigation, studies, schemes and experiments, other energy sources, manufacturing of capital equipments, to finance activities having forward and backward linkages to power projects from its operating units and organise consultancy services etc.
Besides, the corporate office in New Delhi, PFC has two Regional Offices at Chennai and Mumbai. It has ten wholly owned subsidiary companies, namely (i) PfC Consulting Ltd., (ii) Chhattisgarh Surguja Power Ltd. (previously known as Akaltara Power Limited), (iii) Coastal Karnataka Power Limited, (iv) Coastal Maharashtra Mega Power Limited, (v) Coastal Tamilnadu Power Limited, (vi) Orissa Integrated Power Ltd. (vii) Sakhigopal Integrated Power Company Ltd., (viii) Ghogharpalli Integrated Power Company Ltd., (ix) Tatiya Andhra Mega Power Ltd., (x) PfC Green Energy Ltd.
The Company also has 2 Joint Ventures (JVs) namely Energy Efficiency Services Ltd. (EESL) and National Power Exchange Ltd. with equity participation of 25% and 16.66% respectively.
The product range of the company comprises Rupee Term Loan, foreign Currency Term Loan, Line of Credit, Suppliers Credit, Working Capital Loan, Bridge Loan, Bill discounting, Lease Finance, Debt Re-financing, Take out Financing and Grants. The physical performances of the company for last three years are given below:Main Services Unit Performance During
2010-11 2009-10 2008-09Loan Assets In cr 99571 79856 64429Total Disbursement In cr 34121 25808 21052
Strategic IssuesTo accelerate growth of the company, PfC is focusing on
21.16 Power Finance Corporation Ltd.additional business in the areas of equity financing, forward and backward linkage projects in allied power sector. Energy Efficiency Services Ltd. (EESL), a JV, has been created along with REC, NTPC and PGCIL (all CPSEs) to promote energy efficiency and energy conservation projects. EESL would be one of the main implementation arms of the National Mission on Enhanced Energy Efficiency (NMEEE), which is one of the eight National Missions announced by the Hon’ble Prime Minister as a part of “National Action Plan on Climate Change”.
Performance HighlightsThe operational performance of the company along with
performance indicators and selected financial ratios during the period 2008-09 to 2010-11 can be seen on the opposite page.
The Company registered an increase of ` 2083.70 crore in total income during 2010-11 which went up to ` 10160.56 crore in 2010-11 from ` 8076.86 crore during 2009-10. The net profit of the company correspondingly increased to ` 2619.58 crore, an increase of ` 262.33 crore over the previous year due to increase in lending operations. Loan assets increased by 24.73% over the previous year.
Human Resource ManagementThe company employed 365 regular employees as on
31.3.2011. The retirement age in the company is 60 years. It is following IDA 2007 pattern of remuneration. Details of employment in last 3 years are given below:
Particulars 2010-11 2009-10 2008-09Executives including Non-Unionised Supervisors
312 256 246
Non-Executives # 53 68 70Total Employees 365 324 316
#Detailbreak-up of Non-Executive employees is at Statement no. 25 of volume-I of PE Survey.

565Public Enterprises Survey 2010-2011: Vol-II
Power Finance Corporation Ltd.Urjanidhi, 1, Barakhamba Lane, Connaught Place New Delhi
Particulars 2008-09Balance Sheet (` in Lakhs)
Particulars 2010-11 2009-10 2008-09
Authorised Capital 200000 200000 200000
(1) Sources Of Fund
(1.1) Shareholders Funds
(A) Paid-Up Capital
Central Govt 103045 103045 103045
Others 11732 11732 11732
(B) Share Application Money 0 0 0
(C) Reserves & Surplus 1448659 1277651 1036005
Total (A) + (B) + (C) 1563436 1392428 1150782
(1.2) Loan Funds
(A) Secured Loans 23536 0 0
(B) Unsecured Loans 8536321 6710841 5306909
Total (A) + (B) 8559857 6710841 5306909
(1.3) Deferred Tax Liability 8297 4695 5548
Total (1.1) + (1.2) + (1.3) 10131590 8107964 6463239
(2) Application Of Funds
(2.1) Fixed Assets
(A) Gross Block 9894 9321 9733
(B) Less Depreciation 2451 2044 2218
(C) Net Block (A-B) 7443 7277 7515
(D) Capital Work In Progress 228 173 0
Total (C) + (D) 7671 7450 7515
(2.2) Investment 18786 9682 10253
(2.3) Current Assets, Loan & Advances
(A) Inventories 0 0 0
(B) Sundry Debtors 0 7985576 6436232
(C) Cash & Bank Balances 235026 139430 39223
(D) Other Current Assets 194187 159276 134057
(E) Loan & Advances 10007734 176302 193575
Total (A)+ (B)+ (C)+ (D)+ (E) 10436947 8460584 6803087
(2.4) Less:current Liabilities & Provisions
(A) Current Liabilities 302147 212452 186059
(B) Provisions 29687 157300 171557
Total (A+B) 331834 369752 357616
(2.5) Net Current Assets (2.3-2.4) 10105113 8090832 6445471
(2.6) Deferred Revenue / Pre. Expenditure 20 0 0
(2.7) Deferred Tax Asset 0 0 0
(2.8) Profit & Loss Account(Dr) 0 0 0
Total (2.1+2.2+2.5+2.6+2.7+2.8) 10131590 8107964 6463239
Important Indicators 2010-11 2009-10 2008-09
(i) Investment 8045530 6593106 5281686
(ii) Capital Employed 10112556 8098109 6452986
(iii) Net Worth 1563416 1392428 1150782
(iv) Cost of Production 661635 506351 459309
(v) Cost of Sales 661635 506351 459309
(vi) Gross Value Added (At Market Price) - - -
(vii) Total Employees (Other Than Casuals) (Nos.) 365 324 316
(viii) Avg. Monthly Emoluments Per Employee (Rs.) 157009 173971 113528
Profit & Loss Account (` in Lakhs)
Particulars 2010-11 2009-10 2008-09
(1) Income
(A) Sales/Operating Income 1012849 800210 655737
(B) Excise Duty 0 0 0
(C) Net Sales (A-B) 1012849 800210 655737
(D) Other Income/Receipts 3207 7476 2617
(E) Accretion/Depletion in Stocks 0 0 0
(I)Total Income (C+D+E) 1016056 807686 658354
(2) Expenditure
(A) Purchase of Finished Goods/ Consumption Of Raw Materials 0 0 0
(B) Stores & Spares 0 0 0
(C) Power & Fuel 90 102 111
(D) Manufacturing / Direct / Operating Expenses 423 6300 6807
(E) Salary, Wages & Benefits / Employee Exp. 6877 6764 4305
(F) Other Expenses 15909 7017 38529
(G) Provisions 3173 -209 217
(II)Total Expenditure (A to G) 26472 19974 49969
(3) Profit Before Dep, Int, Taxes & EP (PBDITEP) (I-II) 989584 787712 608385
(4) Depreciation 428 338 384
(5) Dre/Prel Exp Written Off 77 43 28
(6) Profit Before Int., Taxes & Ep (PBITEP) (3-4-5) 989079 787331 607973
(7) Interest
(A) On Central Government Loans 5622 8070 9819
(B) On Foreign Loans 5220 1680 11278
(C) Others 623816 476246 387831
(D) Less Interest Capitalised 0 0 0
(E) Charged to P & L Account (A+B+C-D) 634658 485996 408928
(8) Profit Before Tax & EP(PBTEP) (6-7E) 354421 301335 199045
(9) Tax Provisions 92456 65623 2051
(10) Net Profit / Loss Before EP (8-9) 261965 235712 196994
(11) Net Extra-Ord. Items 7 -13 -2
(12) Net Profit / Loss(-) (10-11) 261958 235725 196996
(13) Dividend Declared 59971 51650 45911
(14) Dividend Tax 9884 8778 7802
(15) Retained Profit (12-13-14) 192103 175297 143283
Financial Ratios 2010-11 2009-10 2008-09
(i) Sales : Capital Employed 10.02 9.88 10.16
(ii) Cost of Sales : Sales 65.32 63.28 70.04
(iii) Salary / Wages : Sales 0.68 0.85 0.66
(iv) Net Profit : Net Worth 16.76 16.93 17.12
(v) Debt : Equity 5.48 4.82 4.61
(vi) Current Ratio 31.45 22.88 19.02
(vii) Sundry Debtors : Sales (No. of Days) 0 3642.46 3582.57
(viii) Total Inventory : Sales 0 0 0

567Public Enterprises Survey 2010-2011: Vol-II
As on 31.3.2011, there were 4 Central Public Sector Enterprises in the Telecommunication Services & Information Tech. Services group. The name of these enterprises along with their year of incorporation in chronological order are given below :
Sl. No.
Enterprise Year of Incorporation
1. Mahanagar Telephone Nigam Ltd. 1986
2. Bharat Sanchar Nigam Ltd. 2000
3. Millennium Telecom Ltd. 2000
4. Railtel Corporation India Ltd. 2000
2. The enterprises falling in this group are mainly engaged in rendering Telecommunication and Internet Services.
3. The consolidated financial position, the working results and the important management ratios of these enterprises are appended.
4. Turnover : The details of turnover of individual enterprises are given below :
(`in Crore)Sl. No.
Enterprise Turnover
2010-11 2009-10
1. Bharat Sanchar Nigam Ltd. 21297.32 22167.89
2. Mahanagar Telephone Nigam Ltd. 3673.95 3656.10
3. Railtel Corporation India Ltd. 326.27 388.10
4. Millennium Telecom Ltd. 0.00 0.00
5. Sub Total 25297.54 26212.09
5. Net Profit/Loss : The details of the enterprises, which earned net profit or sustained net loss (-) are given below :
(`in Crore)Sl. No.
Enterprise Adjusted Net Profit/Net Loss
2010-11 2009-10
1. Railtel Corporation India Ltd. 95.41 112.29
2. Millennium Telecom Ltd. -0.49 0.12
3. Mahanagar Telephone Nigam Ltd. -2801.91 -2610.97
4. Bharat Sanchar Nigam Ltd. -6384.26 -1822.65
Sub Total -9091.25 -4321.21
22 Telecommunication Services & Information Tech. Services
6. Dividend : The details of the dividend declared by the individual enterprise are given below :
(`in Crore)Sl. No.
Enterprise Dividend
2010-11 2009-10
1. Railtel Corporation India Ltd. 13.00 15.00
Group Total 13.00 15.00
7. Social Overheads and Township : The total number of persons employed and the expenditure incurred on social overheads and townships are given below :
(`in Crore)Sl. No.
Enterprise Township and Social Overheads
2010-11 2009-10
1. No. of employees (in number) 325335 337371
2. Social overheads : (Rupees in Crore)
(i) Educational, 0.00 0.00
(ii) Medical facilities 0.00 0.00
(iii) others 0.00 0.00
3. Capital cost of township (Rupees in Crore)
0.00 0.00
4. No. of houses constructed (in number)
0 0
8. Company wise details in respect of Balance Sheet, Profit and Loss account, Important Indicators and Financial Ratios along with the write up of individual company are given in the pages below.

568 Telecommunication Services & Information Tech. Services

569Public Enterprises Survey 2010-2011: Vol-II
Telecommunication Services & Information Tech. Services
Balance Sheet
(` in Lakhs)
(` in Lakhs)
Particulars 2010-11 2009-10 2008-09
AUTHoRISED CAPITAL 1940000 1940000 1940000
(1) SOURCES OF FUND
(1.1) SHAREHoLDERS fUNDS
(A) PAID-UP CAPITAL
CENTRAL GoVT 1317532 1317531 1317531
oTHERS 27850 27851 27851
(B) SHARE APPLICATIoN MoNEY 15 0 0
(C) RESERVES & SURPLUS 7389949 8538157 8770259
TOTAL (A) + (B) + (C) 8735346 9883539 10115641
(1.2) LoAN fUNDS
(A) SECURED LoANS 261697 8400 10500
(B) UNSECURED LoANS 678916 159626 349723
TOTAL (A) + (B) 940613 168026 360223
(1.3) DEfERRED TAX LIABILITY 89 12415 100016
TOTAL (1.1) + (1.2) + (1.3) 9676048 10063980 10575880
(2) APPLICATION OF FUNDS
(2.1) fIXED ASSETS
(A) GRoSS BLoCK 19743244 18969415 14935626
(B) LESS DEPRECIATIoN 10876386 9849540 8807857
(C) NET BLoCK (A-B) 8866858 9119875 6127769
(D) CAPITAL WoRK IN PRoGRESS 638079 718223 596043
TOTAL (C) + (D) 9504937 9838098 6723812
(2.2) INVESTMENT 599607 70953 66510
(2.3) CURRENT ASSETS,LoAN & ADVANCES
(A) INVENToRIES 407437 521799 476435
(B) SUNDRY DEBToRS 706483 557680 555348
(C) CASH & BANK BALANCES 300696 3532161 4304167
(D) oTHER CURRENT ASSETS 166263 116740 121582
(E) LoAN & ADVANCES 2312299 2605980 2023866
TOTAL (A)+ (B)+ (C)+ (D)+ (E) 3893178 7334360 7481398
(2.4) LESS:CURRENT LIABILITIES & PRoVISIoNS
(A) CURRENT LIABILITIES 2822559 6024929 2589191
(B) PRoVISIoNS 1508443 1389918 1116431
TOTAL (A+B) 4331002 7414847 3705622
(2.5) NET CURRENT ASSETS(2.3-2.4) -437824 -80487 3775776
(2.6) DEfERRED REVENUE / PRE.EXPENDITURE 113 113 9782
(2.7) DEfERRED TAX ASSET 9215 0 0
(2.8) PRofIT & LoSS ACCoUNT(DR) 0 235303 0
TOTAL (2.1+2.2+2.5+2.6+2.7+2.8) 9676048 10063980 10575880

570 Telecommunication Services & Information Tech. Services
Telecommunication Services & Information Tech. Services
Profit and Loss Account
(` in Lakhs)
Particulars 2010-11 2009-10 2008-09
(1) INCoME
(A) SALES/oPERATING 2529754 2621209 2770677
(B) EXCISE DUTY 0 0 0
(C) NET SALES (A-B) 2529754 2621209 2770677
(D) oTHER INCoME/RECEIPTS 874535 1129107 1374212
(I)TOTAL INCOME (C+D+E) 3404289 3750316 4144889
(2) EXPENDITURE
(A) PURCHASE of fINISHED GooDS CoNSUMPTIoN of RAW MATERIALS 0 0 0
(B) SToRES & SPARES 0 0 0
(C) PoWER & fUEL 243890 203658 196641
(D) MANUfACTURING / DIRECT / oPERATING EXPENSES 417405 608097 465998
(E)SALARY,WAGES & BENEfITS / EMPLoYEE EXP. 1553604 1545012 1352646
(f)oTHER EXPENSES 653813 411804 879092
(G)PRoVISIoNS 229691 371745 95272
(II)TOTAL EXPENDITURE (A to G) 3098403 3140316 2989649
(3) PRofIT BEfoRE DEP. INT. TAXES & EP(PBDITEP) (I-II) 305886 610000 1155240
(4) DEPRECIATIoN 1118666 1100338 926412
(5) DRE/PREL EXP WRITTEN off 0 0 0
(6) PRofIT BEfoRE INT., TAXES & EP (PBITEP) (3-4-5) -812780 -490338 228828
(7) INTEREST
(A) oN CENTRALGoVERNMENT LoANS 32331 34471 43154
(B) oN foREIGN LoANS 0 0 0
(C) oTHERS 52977 2295 3239
(D) LESS INTEREST CAPITALISED 0 0 0
(E) CHARGED To P & L ACCoUNT (A+B+C-D) 85308 36766 46393
(8)PROFIT BEFORE TAX & EP(PBTEP) (6-7E) -898088 -527104 182435
(9) TAX PRoVISIoNS -19258 -72450 80080
(10) NET PRofIT / LoSS(-) BEfoRE EP (8-9) -878830 -454654 102355
(11) NET EXTRA-oRD.ITEMS 30295 -22533 13499
(12) NET PROFIT / LOSS(-) (10-11) -909125 -432121 88856
(13) DIVIDEND DECLARED 1300 1500 7100
(14) DIVIDEND TAX 216 255 1207
(15) RETAINED PROFIT (12-13-14) -910641 -433876 80549

571Public Enterprises Survey 2010-2011: Vol-II
Telecommunication Services & Information Tech. Services
Management Ratio
Particulars 2010-11 2009-10 2008-09
(A.) INDICATORS
(I) GENERAL(Rs. in Lakhs)
(i) INVESTMENT 1795832 1507152 1705598
(ii) CAPITAL EMPLoYED 8429034 9039388 9903545
(iii) NET WoRTH 8735233 9648123 10105859
(iv) CoST of PRoDUCTIoN 4302377 4277420 3962454
(v) CoST of SALES 4302377 4277420 3962454
(vi) VALUE ADDED 2285864 2417551 2574036
(vii) R AND D EXPENDITURE 7778 0 0
(II) HUMAN RESOURCE
(viii) EMPLoYEES (oTHER THAN CASUAL)(Nos.) 325335 337371 346377
(ix) AVG.MoNTHLY EMoLUMENTS PER EMPLoYEE(Rs.) 39795 38163 32543
(B.) MANAGEMENT RATIO
(i) DEBT : EQUITY 0.11 0.02 0.04
(ii) CURRENT RATIo (CURRENT ASSET:CURRENT- LIABILITY 0.9 0.99 2.02
(iii) PBDITEP : TOTAL EMPLOYEMENT (Rs. in Lakhs) 0.94 1.81 3.34
(iv) SUNDRY DEBToRS : SALES (No. of days) 101.93 77.66 73.16
(v) INVENToRY(No. of days)
(a) ToTAL INVENToRY : SALES 58.79 72.66 62.76
(b) SEMI/fINISHED GooDS : SALES 0 2.2 2.05
(vi) INCREMENTAL CAPITAL oUTPUT RATIo(ICoR) 6.67 5.78 0.7
(%)
(vii) SALES : CAPITAL EMPLoYED 30.01 29 27.98
(viii) PBDITEP : CAPITAL EMPLoYED 3.63 6.75 11.66
(ix) PBITEP : CAPITAL EMPLoYED -9.64 -5.42 2.31
(x) CoST of SALES : SALES 170.07 163.19 143.01
(xi) MATERIAL CoST : SALES 0 0 0
(xii) SALARY & WAGES : SALES 61.41 58.94 48.82
(xiii) R & D EXPENDITURE : SALES 0.31 0 0
(xiv) PBITEP : SALES -32.13 -18.71 8.26
(xv) PBTEP : NET WoRTH -10.28 -5.46 1.81
(xvi) NET PRofIT : NET WoRTH -10.41 -4.48 0.88
(xvii) GRoSS MARGIN : GRoSS BLoCK 1.55 3.22 7.73

572 Telecommunication Services & Information Tech. Services
www.bsnl.co.in
Bharat Sanchar Nigam Ltd. (BSNL) was incorporated on 15.9.2000 under the Companies Act 1956 with an objective to take over the business of providing telecom services and network of erstwhile D/o Telecommunications along with all assets and liabilities, contractual rights and obligations wef 1.10.2000.
BSNL is a Schedule ‘A’ Miniratna category CPSE in Telecommunication and IT Sector under the administrative control of M/o Communication and Information Technology, D/o Telecommunications with 100% shareholding by the Government of India. Its Registered and Corporate Office is at New Delhi.
Vision/MissionThe vision / mission of the company are to provide world
class telecom services on demand using state of art technology for our valued customers at affordable price, be the leading Telecom Service Provide in India with global presence, create a customer focused organization with excellence in sales, marketing and customer care, leverage technology to provide affordable and innovative products/services across customer segments, provide a conducive work environment with strong focus on performance, establish efficient business processes enabled by IT.
Industrial / Business OperationsBSNL is engaged in providing all types of Telecommunication
services in 47 telecom circles (including register office) spread all over India other than cities of Delhi and Mumbai. The network infrastructure of BSNL includes 37963 telephone exchanges. The physical performance of the company for last three years are given below:Main Product / Connections
Unit Performance During2010-11 2009-10 2008-09
Broadband Millions 7.49 5.38 3.56
GSM Millions 86.14 63.34 46.71
Landline Millions 25.22 27.82 29.34
WLL Millions 5.57 6.15 5.46
TFFH Millions 0.00 n/a n/a
Total working connections
Millions Lines
117.059 97.281 81.491
Strategic IssuesThe key concern areas / various issues that are affecting
BSNL are substitution of Mobile to Landline, Competitive market with multiple operators, High Manpower Cost of 42 % against the industry average of 5-6%, Challenges vis-à-vis the skill set of the employees, Commitments for nation-building leading to un-remunerative operations in rural areas, and Removal/Phasing out of concessions are some of the key areas of concern posing big challenge before BSNL.
However new initiatives are taken for increasing the revenues e.g., Infra-sharing; Optimising CAPEX and OPEX through Convergence; Fortification of stable revenue steams; Focus on city based monitoring of services by giving concerted focus to Broadband services, Enterprise Business and Government Projects
22.1 Bharat Sanchar Nigam Ltd. for premium services such as 3G and Enterprise, Aggressive Push on data usage and value added services, Sustained focus on customer care, service delivery and service assurance, attention on sales and marketing of company’s services by increasing number of franchisees/retailers and thrust on value added services etc.
Performance HighlightsThe operational performance of the company along with
performance indicators and selected financial ratios during the period 2008-09 to 2010-11 can be seen on the opposite page.
The Company registered a decrease of ` 2357.79 crore in total income during 2010-11 which went down to ` 29687.62 crore in 2010-11 from ` 32045.41 crore during 2009-10. The net loss of the company correspondingly increased to ` 6384.26 crore, an increase of ` 4561.61 crore over the previous year due to hyper competitive tariff regime resulting in a declining trend in the overall revenues. The other reasons for losses are reduction in the revenue of landline due to fixed mobile substitution and surrender of landline, limited growth in mobility due to hyper competition in the Telecom industry, sharp reduction in tariff, higher cost on wages and salary due to large number of legacy workforce inherited by BSNL on its formation on 1.10.2000
Human Resource ManagementThe company employed 2,81,635 regular employees as on
31.3.2011. The retirement age in the company is 60 years. It is following IDA 2007 and CDA 2006 pattern of remuneration. Details of employment in last 3 years are given below:
Particulars 2010-11 2009-10 2008-09Executives including Non-Unionised Supervisors 56113 55432 56016
Non-Executives # 225522 236668 243824Total Employees 281635 292100 299840
# Detail break-up of Non-Executive employees is at Statement no. 25 of volume-I of PE Survey.
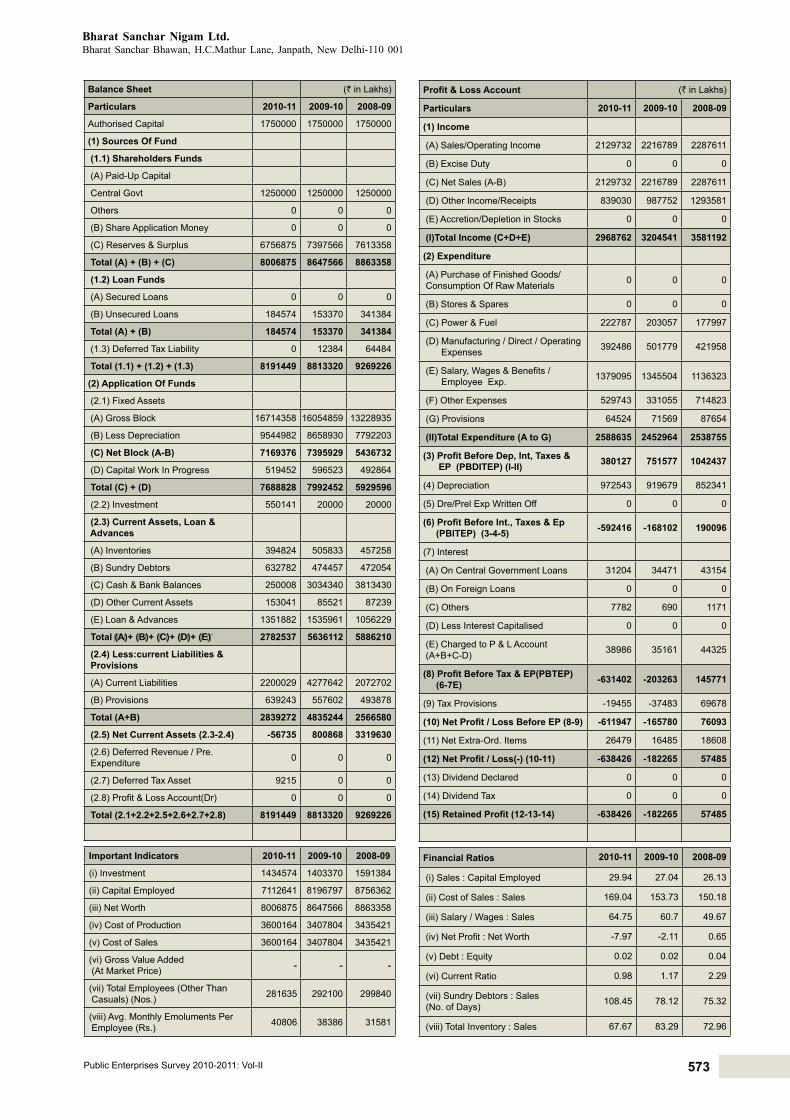
573Public Enterprises Survey 2010-2011: Vol-II
Bharat Sanchar Nigam Ltd. Bharat Sanchar Bhawan, H.C.Mathur Lane, Janpath, New Delhi-110 001
Balance Sheet (` in Lakhs)
Particulars 2010-11 2009-10 2008-09
Authorised Capital 1750000 1750000 1750000
(1) Sources Of Fund
(1.1) Shareholders Funds
(A) Paid-Up Capital
Central Govt 1250000 1250000 1250000
Others 0 0 0
(B) Share Application Money 0 0 0
(C) Reserves & Surplus 6756875 7397566 7613358
Total (A) + (B) + (C) 8006875 8647566 8863358
(1.2) Loan Funds
(A) Secured Loans 0 0 0
(B) Unsecured Loans 184574 153370 341384
Total (A) + (B) 184574 153370 341384
(1.3) Deferred Tax Liability 0 12384 64484
Total (1.1) + (1.2) + (1.3) 8191449 8813320 9269226
(2) Application Of Funds
(2.1) Fixed Assets
(A) Gross Block 16714358 16054859 13228935
(B) Less Depreciation 9544982 8658930 7792203
(C) Net Block (A-B) 7169376 7395929 5436732
(D) Capital Work In Progress 519452 596523 492864
Total (C) + (D) 7688828 7992452 5929596
(2.2) Investment 550141 20000 20000
(2.3) Current Assets, Loan & Advances
(A) Inventories 394824 505833 457258
(B) Sundry Debtors 632782 474457 472054
(C) Cash & Bank Balances 250008 3034340 3813430
(D) Other Current Assets 153041 85521 87239
(E) Loan & Advances 1351882 1535961 1056229
Total (A)+ (B)+ (C)+ (D)+ (E) 2782537 5636112 5886210
(2.4) Less:current Liabilities & Provisions
(A) Current Liabilities 2200029 4277642 2072702
(B) Provisions 639243 557602 493878
Total (A+B) 2839272 4835244 2566580
(2.5) Net Current Assets (2.3-2.4) -56735 800868 3319630
(2.6) Deferred Revenue / Pre. Expenditure 0 0 0
(2.7) Deferred Tax Asset 9215 0 0
(2.8) Profit & Loss Account(Dr) 0 0 0
Total (2.1+2.2+2.5+2.6+2.7+2.8) 8191449 8813320 9269226
Important Indicators 2010-11 2009-10 2008-09
(i) Investment 1434574 1403370 1591384
(ii) Capital Employed 7112641 8196797 8756362
(iii) Net Worth 8006875 8647566 8863358
(iv) Cost of Production 3600164 3407804 3435421
(v) Cost of Sales 3600164 3407804 3435421
(vi) Gross Value Added (At Market Price) - - -
(vii) Total Employees (Other Than Casuals) (Nos.) 281635 292100 299840
(viii) Avg. Monthly Emoluments Per Employee (Rs.) 40806 38386 31581
Profit & Loss Account (` in Lakhs)
Particulars 2010-11 2009-10 2008-09
(1) Income
(A) Sales/Operating Income 2129732 2216789 2287611
(B) Excise Duty 0 0 0
(C) Net Sales (A-B) 2129732 2216789 2287611
(D) Other Income/Receipts 839030 987752 1293581
(E) Accretion/Depletion in Stocks 0 0 0
(I)Total Income (C+D+E) 2968762 3204541 3581192
(2) Expenditure
(A) Purchase of Finished Goods/ Consumption Of Raw Materials 0 0 0
(B) Stores & Spares 0 0 0
(C) Power & Fuel 222787 203057 177997
(D) Manufacturing / Direct / Operating Expenses 392486 501779 421958
(E) Salary, Wages & Benefits / Employee Exp. 1379095 1345504 1136323
(F) Other Expenses 529743 331055 714823
(G) Provisions 64524 71569 87654
(II)Total Expenditure (A to G) 2588635 2452964 2538755
(3) Profit Before Dep, Int, Taxes & EP (PBDITEP) (I-II) 380127 751577 1042437
(4) Depreciation 972543 919679 852341
(5) Dre/Prel Exp Written Off 0 0 0
(6) Profit Before Int., Taxes & Ep (PBITEP) (3-4-5) -592416 -168102 190096
(7) Interest
(A) On Central Government Loans 31204 34471 43154
(B) On Foreign Loans 0 0 0
(C) Others 7782 690 1171
(D) Less Interest Capitalised 0 0 0
(E) Charged to P & L Account (A+B+C-D) 38986 35161 44325
(8) Profit Before Tax & EP(PBTEP) (6-7E) -631402 -203263 145771
(9) Tax Provisions -19455 -37483 69678
(10) Net Profit / Loss Before EP (8-9) -611947 -165780 76093
(11) Net Extra-Ord. Items 26479 16485 18608
(12) Net Profit / Loss(-) (10-11) -638426 -182265 57485
(13) Dividend Declared 0 0 0
(14) Dividend Tax 0 0 0
(15) Retained Profit (12-13-14) -638426 -182265 57485
Financial Ratios 2010-11 2009-10 2008-09
(i) Sales : Capital Employed 29.94 27.04 26.13
(ii) Cost of Sales : Sales 169.04 153.73 150.18
(iii) Salary / Wages : Sales 64.75 60.7 49.67
(iv) Net Profit : Net Worth -7.97 -2.11 0.65
(v) Debt : Equity 0.02 0.02 0.04
(vi) Current Ratio 0.98 1.17 2.29
(vii) Sundry Debtors : Sales (No. of Days) 108.45 78.12 75.32
(viii) Total Inventory : Sales 67.67 83.29 72.96

574 Telecommunication Services & Information Tech. Services
www.mtnl.net.in
Mahanagar Telephone Nigam Ltd. (MTNL)was incorporated on 28.2.1986 with the objective of taking over the management, control and operation of Telecom Network at Mumbai and Delhi with a view to raise necessary financial resources for development needs for areas of operations and to up-grade the same.
MTNL is a Schedule ‘A’ / Navratna listed CPSE in Telecommunication Services sector under the administrative control of M/o Communication and Information Technology, D/o Telecommunications with 56.25% shareholding by the Government of India. Its Registered and Corporate offices are at New Delhi.
Vision / MissionThe Vision / Mission of the Company is toprovide a world
class Telecom services in a leading way, keeping the customer’s delight as its aim, so that it continues to be a premier Indian Telecom Company.
Industrial / Business OperationsMTNL is engaged in providing all types of Telecommunication
services including Basic Telephone services, Cellular (GSM and CDMA), Mobile services, internet and value added services in Delhi and Mumbai through its 558 exchanges and other network with Equipped capacity of 10.72 Million.
It has two wholly owned subsidiaries namely Millennium Telecom Ltd. (MTL) and Mahanagar Telephone Mauritius Ltd. The company also has two financial Joint Ventures namely United Telecom Ltd. with a share of 26.68% with VSNL, TCIL and NVPL (Local Partner in Nepal) to provide CDMA based basic service in Nepal; and MTNL STPI IT Services Ltd. with STPI, a Society under D/o Information Technology with 50:50 partnership. The physical performances of the company for last three years are given below:Main Services
Unit Performance During2010-11 2009-10 2008-09
Landline including WLL Fixed
No. of Subscribers
35,81,14836,23,110 36,94,970
GSM No. of Subscribers
51,99,337 47,87,853 41,76,676
WLL No. of Subscribers
1,62,490 1,83,207 1,84,072
Broadband No. of Subscribers
9,42,317 8,15,830 6,95,500
Strategic issueThe activities of MTNL are confined only to two cities i.e.
Delhi and Mumbai, it is not in a position to expand its telecom services beyond the area of jurisdiction.
Reduction of tariffs due to intense competition from other mobile operators and the basic service operators resulting in increased pressure on the margins.
A major portion of revenue is spent on staff. In comparison of the staff costs of other operators, it is about 7.44% of the revenue. for the absorbed employees whose pension is being paid by MTNL, DoT has not yet borne its share for the period of service rendered by the employees as government staff under DoT.
22.2 Mahanagar Telephone Nigam Ltd. Performance Highlights
The operational performance of the company along with performance indicators and selected financial ratios during the period 2008-09 to 2010-11 can be seen on the opposite page.
The Company registered a reduction of ` 1065.83 crore in total income during 2010-11 which went down to ` 3991.99 crore in 2010-11 from ` 5057.82crore during 2009-10. The net loss of the company increased to ` 2801.91crore, an increase of ` 190.95 crore over the previous year’s loss of ` 2610.96crore due to reducing tariff and intense competition from other mobile operators.
Human Resource ManagementThe company employed 43311 regular employees as on
31.3.2011. The retirement age in the company is 60 years. It is following IDA 2007 and CDA 2006 pattern of remuneration. Details of employment in last 3 years are given below:
Particulars 2010-11 2009-10 2008-09Executives including Non-Unionised Supervisors 1183 1190 1269
Non-Executives # 42128 43720 44886Total Employees 43311 44910 46155
# Detail break-up of Non-Executive employees is at Statement no. 25 of volume-I of PE Survey.
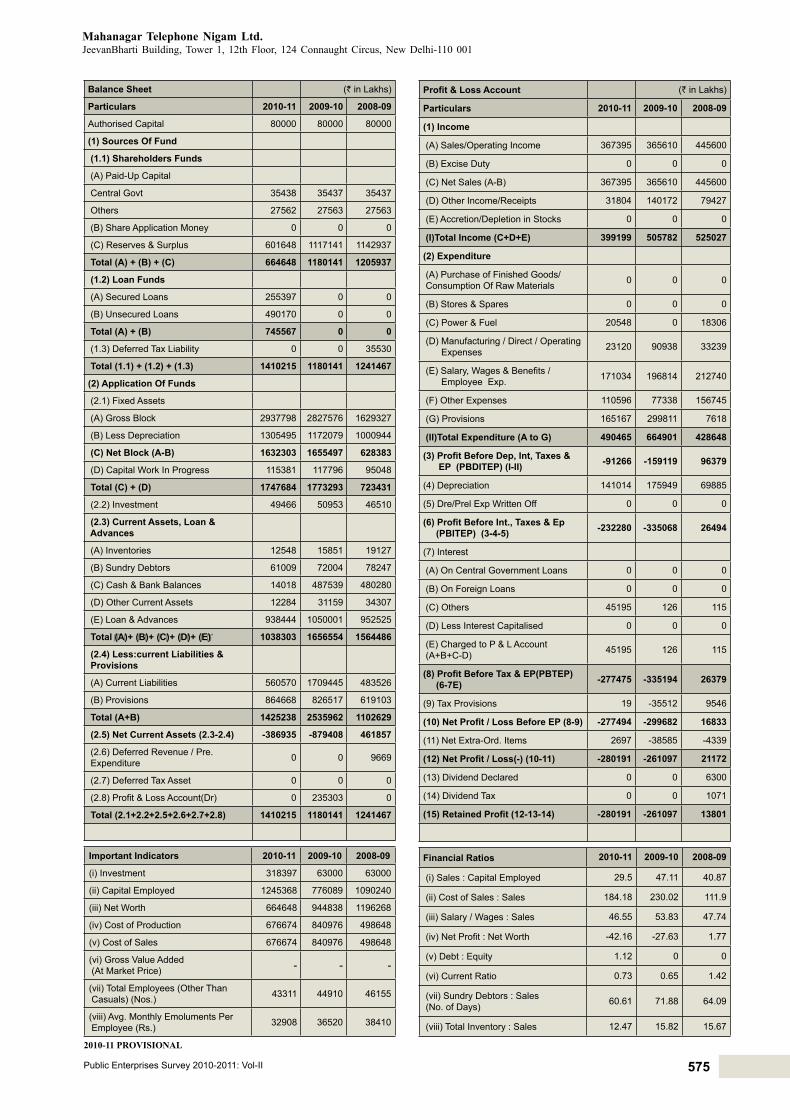
575Public Enterprises Survey 2010-2011: Vol-II
Mahanagar Telephone Nigam Ltd. JeevanBharti Building, Tower 1, 12th Floor, 124 Connaught Circus, New Delhi-110 001
Balance Sheet (` in Lakhs)
Particulars 2010-11 2009-10 2008-09
Authorised Capital 80000 80000 80000
(1) Sources Of Fund
(1.1) Shareholders Funds
(A) Paid-Up Capital
Central Govt 35438 35437 35437
Others 27562 27563 27563
(B) Share Application Money 0 0 0
(C) Reserves & Surplus 601648 1117141 1142937
Total (A) + (B) + (C) 664648 1180141 1205937
(1.2) Loan Funds
(A) Secured Loans 255397 0 0
(B) Unsecured Loans 490170 0 0
Total (A) + (B) 745567 0 0
(1.3) Deferred Tax Liability 0 0 35530
Total (1.1) + (1.2) + (1.3) 1410215 1180141 1241467
(2) Application Of Funds
(2.1) Fixed Assets
(A) Gross Block 2937798 2827576 1629327
(B) Less Depreciation 1305495 1172079 1000944
(C) Net Block (A-B) 1632303 1655497 628383
(D) Capital Work In Progress 115381 117796 95048
Total (C) + (D) 1747684 1773293 723431
(2.2) Investment 49466 50953 46510
(2.3) Current Assets, Loan & Advances
(A) Inventories 12548 15851 19127
(B) Sundry Debtors 61009 72004 78247
(C) Cash & Bank Balances 14018 487539 480280
(D) Other Current Assets 12284 31159 34307
(E) Loan & Advances 938444 1050001 952525
Total (A)+ (B)+ (C)+ (D)+ (E) 1038303 1656554 1564486
(2.4) Less:current Liabilities & Provisions
(A) Current Liabilities 560570 1709445 483526
(B) Provisions 864668 826517 619103
Total (A+B) 1425238 2535962 1102629
(2.5) Net Current Assets (2.3-2.4) -386935 -879408 461857
(2.6) Deferred Revenue / Pre. Expenditure 0 0 9669
(2.7) Deferred Tax Asset 0 0 0
(2.8) Profit & Loss Account(Dr) 0 235303 0
Total (2.1+2.2+2.5+2.6+2.7+2.8) 1410215 1180141 1241467
Important Indicators 2010-11 2009-10 2008-09
(i) Investment 318397 63000 63000
(ii) Capital Employed 1245368 776089 1090240
(iii) Net Worth 664648 944838 1196268
(iv) Cost of Production 676674 840976 498648
(v) Cost of Sales 676674 840976 498648
(vi) Gross Value Added (At Market Price) - - -
(vii) Total Employees (Other Than Casuals) (Nos.) 43311 44910 46155
(viii) Avg. Monthly Emoluments Per Employee (Rs.) 32908 36520 38410
Profit & Loss Account (` in Lakhs)
Particulars 2010-11 2009-10 2008-09
(1) Income
(A) Sales/Operating Income 367395 365610 445600
(B) Excise Duty 0 0 0
(C) Net Sales (A-B) 367395 365610 445600
(D) Other Income/Receipts 31804 140172 79427
(E) Accretion/Depletion in Stocks 0 0 0
(I)Total Income (C+D+E) 399199 505782 525027
(2) Expenditure
(A) Purchase of Finished Goods/ Consumption Of Raw Materials 0 0 0
(B) Stores & Spares 0 0 0
(C) Power & Fuel 20548 0 18306
(D) Manufacturing / Direct / Operating Expenses 23120 90938 33239
(E) Salary, Wages & Benefits / Employee Exp. 171034 196814 212740
(F) Other Expenses 110596 77338 156745
(G) Provisions 165167 299811 7618
(II)Total Expenditure (A to G) 490465 664901 428648
(3) Profit Before Dep, Int, Taxes & EP (PBDITEP) (I-II) -91266 -159119 96379
(4) Depreciation 141014 175949 69885
(5) Dre/Prel Exp Written Off 0 0 0
(6) Profit Before Int., Taxes & Ep (PBITEP) (3-4-5) -232280 -335068 26494
(7) Interest
(A) On Central Government Loans 0 0 0
(B) On Foreign Loans 0 0 0
(C) Others 45195 126 115
(D) Less Interest Capitalised 0 0 0
(E) Charged to P & L Account (A+B+C-D) 45195 126 115
(8) Profit Before Tax & EP(PBTEP) (6-7E) -277475 -335194 26379
(9) Tax Provisions 19 -35512 9546
(10) Net Profit / Loss Before EP (8-9) -277494 -299682 16833
(11) Net Extra-Ord. Items 2697 -38585 -4339
(12) Net Profit / Loss(-) (10-11) -280191 -261097 21172
(13) Dividend Declared 0 0 6300
(14) Dividend Tax 0 0 1071
(15) Retained Profit (12-13-14) -280191 -261097 13801
Financial Ratios 2010-11 2009-10 2008-09
(i) Sales : Capital Employed 29.5 47.11 40.87
(ii) Cost of Sales : Sales 184.18 230.02 111.9
(iii) Salary / Wages : Sales 46.55 53.83 47.74
(iv) Net Profit : Net Worth -42.16 -27.63 1.77
(v) Debt : Equity 1.12 0 0
(vi) Current Ratio 0.73 0.65 1.42
(vii) Sundry Debtors : Sales (No. of Days) 60.61 71.88 64.09
(viii) Total Inventory : Sales 12.47 15.82 15.67
2010-11 PROVISIONAL

576 Telecommunication Services & Information Tech. Services
www.mtnl.net.in
Millennium Telecom Limited (MTL) was incorporated on 22.11.2000 with an objective to provide Internet / Intranet and Information Technology enabled services in India and abroad
It is an un-categorized CPSE in Telecommunication Services sector under the administrative control of M/o Communication and Information Technology, D/o Tele-communications. Its Registered and Corporate offices are at Mumbai, Maharashtra. MTL iscurrently a wholly owned subsidiary of Mahanagar Telephone Nigam Ltd (MTNL).
Millennium Telecom Ltd. (MTL) is now converted in to a 50:50 joint venture of MTNL and Bharat Sanchar Nigam Ltd. (BSNL) as per directives of D/o Tele-communications (DoT).
Vision / MissionThe Vision / Mission of the Company is to be the key enabler
and leading services provider in the internet/intranet and IT.
Industrial / Business OperationsMTL was originally formed by MTNL as a wholly owned
subsidiary basically for providing internet and other value added services. In the year 2008, MTL had planned to lay sub-marine cable from Indian Coasts to Middle East and then to Europe. The DOT had directed MTNL to take BSNL as 50% partner in the said project. MTL now being 50:50 Joint Venture of MTNL and BSNL had invited a Global Tender for lying of Submarine Cable. However because of decline in bandwidth prices, high costs of laying the cable, various operational and financial reasons, the Board found it non- viable at those rates and hence cancelled the Tender. The company has now decided to enter into new line of business which could be Telecom related as well as other areas.Currently all the shares of MTL are being held by MTNL.
Performance HighlightsThe operational performance of the company along with
performance indicators and selected financial ratios during the period 2008-09 to 2010-11 can be seen on the opposite page.
The Company registered a reduction of ` 0.02 crore in total income during 2010-11 which went down to ` 0.21 crore in 2010-11 from ` 0.23 crore during 2009-10 due to fall in other income. The company showed a net loss of ` 0.49crore during the year as against the profit of ` 0.12 croreduring last year due to higher provisions made for direct taxes.
During the Year the company has no operating income. The income earned is via interest on fixed Deposits.
22.3 Millennium Telecom Limited

577Public Enterprises Survey 2010-2011: Vol-II
Millennium Telecom Limited Telephone House, 15th floor, V.S.Marg, Dadar (W), Mumbai, Maharashtra-400028
Balance Sheet (` in Lakhs)
Particulars 2010-11 2009-10 2008-09
Authorised Capital 10000 10000 10000
(1) Sources Of Fund
(1.1) Shareholders Funds
(A) Paid-Up Capital
Central Govt 0 0 0
Others 288 288 288
(B) Share Application Money 0 0 0
(C) Reserves & Surplus 233 282 270
Total (A) + (B) + (C) 521 570 558
(1.2) Loan Funds
(A) Secured Loans 0 0 0
(B) Unsecured Loans 8 8 7
Total (A) + (B) 8 8 7
(1.3) Deferred Tax Liability 1 1 2
Total (1.1) + (1.2) + (1.3) 530 579 567
(2) Application Of Funds
(2.1) Fixed Assets
(A) Gross Block 38 38 38
(B) Less Depreciation 30 28 25
(C) Net Block (A-B) 8 10 13
(D) Capital Work In Progress 0 0 0
Total (C) + (D) 8 10 13
(2.2) Investment 0 0 0
(2.3) Current Assets, Loan & Advances
(A) Inventories 0 0 0
(B) Sundry Debtors 137 137 137
(C) Cash & Bank Balances 245 245 284
(D) Other Current Assets 39 20 3
(E) Loan & Advances 107 161 114
Total (A)+ (B)+ (C)+ (D)+ (E) 528 563 538
(2.4) Less:current Liabilities & Provisions
(A) Current Liabilities 86 80 76
(B) Provisions 33 27 21
Total (A+B) 119 107 97
(2.5) Net Current Assets (2.3-2.4) 409 456 441
(2.6) Deferred Revenue / Pre. Expenditure 113 113 113
(2.7) Deferred Tax Asset 0 0 0
(2.8) Profit & Loss Account(Dr) 0 0 0
Total (2.1+2.2+2.5+2.6+2.7+2.8) 530 579 567
Important Indicators 2010-11 2009-10 2008-09
(i) Investment 288 288 288
(ii) Capital Employed 417 466 454
(iii) Net Worth 408 457 445
(iv) Cost of Production 4 5 8
(v) Cost of Sales 4 5 8
(vi) Gross Value Added (At Market Price) - - -
(vii) Total Employees (Other Than Casuals) (Nos.) 0 0 0
(viii) Avg. Monthly Emoluments Per Employee (Rs.) 0 0 0
Profit & Loss Account (` in Lakhs)
Particulars 2010-11 2009-10 2008-09
(1) Income
(A) Sales/Operating Income 0 0 0
(B) Excise Duty 0 0 0
(C) Net Sales (A-B) 0 0 0
(D) Other Income/Receipts 21 23 26
(E) Accretion/Depletion in Stocks 0 0 0
(I)Total Income (C+D+E) 21 23 26
(2) Expenditure
(A) Purchase of Finished Goods/ Consumption Of Raw Materials 0 0 0
(B) Stores & Spares 0 0 0
(C) Power & Fuel 0 0 0
(D) Manufacturing / Direct / Operating Expenses 0 0 2
(E) Salary, Wages & Benefits / Employee Exp. 0 0 0
(F) Other Expenses 2 2 2
(G) Provisions 0 0 0
(II)Total Expenditure (A to G) 2 2 4
(3) Profit Before Dep, Int, Taxes & EP (PBDITEP) (I-II) 19 21 22
(4) Depreciation 2 3 4
(5) Dre/Prel Exp Written Off 0 0 0
(6) Profit Before Int., Taxes & Ep (PBITEP) (3-4-5) 17 18 18
(7) Interest
(A) On Central Government Loans 0 0 0
(B) On Foreign Loans 0 0 0
(C) Others 0 0 0
(D) Less Interest Capitalised 0 0 0
(E) Charged to P & L Account (A+B+C-D) 0 0 0
(8) Profit Before Tax & EP(PBTEP) (6-7E) 17 18 18
(9) Tax Provisions 66 6 20
(10) Net Profit / Loss Before EP (8-9) -49 12 -2
(11) Net Extra-Ord. Items 0 0 3
(12) Net Profit / Loss(-) (10-11) -49 12 -5
(13) Dividend Declared 0 0 0
(14) Dividend Tax 0 0 0
(15) Retained Profit (12-13-14) -49 12 -5
Financial Ratios 2010-11 2009-10 2008-09
(i) Sales : Capital Employed 0 0 0
(ii) Cost of Sales : Sales 0 0 0
(iii) Salary / Wages : Sales 0 0 0
(iv) Net Profit : Net Worth -12.01 2.63 -1.12
(v) Debt : Equity 0.02 0.01 0.01
(vi) Current Ratio 4.44 5.26 5.55
(vii) Sundry Debtors : Sales (No. of Days) 0 0 0
(viii) Total Inventory : Sales 0 0 0

578 Telecommunication Services & Information Tech. Services
www.railtelindia.com
RailTel Corporation of India Limited(RailTel) was incorporated on 26.09.2000 with the objective of expeditiously modernizing Railways’ train control, operational safety systems & network, creating nationwide broadband telecom and multimedia network to supplement national telecom infrastructure to spur growth of telecom, internet and IT enabled value added services, and generating revenue through commercial exploitation of its network.
RailTel is a Schedule ‘A’ CPSE in Telecommunication Services sector under the administrative control of M/o Railways with 100% shareholding by the Government of India. Its Registered and Corporate offices are at New Delhi.
Vision / MissionThe Vision of the Company is to become preferred telecom
solution and services provider for knowledge economy.The Mission of the Company is to attain leadership in
providing premier telecom infrastructure service by offering cost-effective state-of-the-art communication solutions.
Industrial / Business OperationsRailTel is one of the leading Telecommunication
infrastructure provider company in the country. RailTel owns 37,708RKMs (Route Kilometers) of Core OFC Network in the country connecting over 3918 stations / locations. Based on this OFC Network, it supports the telecom infrastructure requirement of the Telcos, private sector, enterprise sector and Government sectors. Leasing of domestic leased circuit is the main business area of RailTel under National Long Distance license. RailTel also owns and leases MPLS based IP-VPN services. RailTel is also a major Internet Bandwidth service provider to enterprises and Government sectors.
RailTel enterprise Portfolio includes Transmission Services, Broadband Services, data and Internet Services. The physical performances of the company for last three years are given below:
Main Services Unit Performance During2010-11 2009-10 2008-09
Total Capacity Leased
Gbps of bandwidth
59 54 42
Strategic issueRailTel has exclusive seamless Right of Way (RoW) along
63,000 KM of Railway Track passing through 7000 stations across the country. Using this RoW, about 40873 KM of ofC has already been laid and over 37708 KM has been commissioned till March, 2011. Works on other about 10,000 KMs are in various stage of completion.
RailTel was one of the pioneers in providing necessary and timely inputs to National Knowledge Commission, a high level Advisory Body to the Prime Minister of India, which envisaged establishing the National Knowledge Network (NKN) with multiple Giga Bit Bandwidth links to connect Knowledge Institutions across the country. This has resulted into creating a robust, reliable and most economic network in the country for this project of national importance. Accordingly, RailTel has been included as a major partner for this project. The cabinet approve the project in March, 2010 and an outlay of ` 5,990 crore has been approved. The project will be implemented over a period
22.4 RailTel Corporation of India Limitedof next two years and operated for over next 10 years.
Performance HighlightsThe operational performance of the company along with
performance indicators and selected financial ratios during the period 2008-09 to 2010-11 can be seen on the opposite page.
The Company registered a reduction of ` 36.63 crore in total income during 2010-11 which went down to ` 363.07 crore in 2010-11 from ` 399.70crore during 2009-10. The net profit of the company reduced to ` 95.41 crore, areduction of ` 16.88crore over the previous year’s profit of ` 112.29croredue to fall in turnover as a result of stiff competition in the market&heavy discounts offered by other telecom operators.
During the year 2010-11 company laid 2910 KMs of ofC. RailTel has also provided STM 1 connectivity to approximately 200 stations during 2010-11.
Human Resource ManagementThe company employed 389 regular employees as on
31.3.2011. The retirement age in the company is 60 years. It is following IDA 2007 and CDA 2006 pattern of remuneration. Details of employment in last 3 years are given below:
Particulars 2010-11 2009-10 2008-09Executives including Non-Unionised Supervisors
308 361 382
Non-Executives # 81 0 0Total Employees 389 361 382
# Detail break-up of Non-Executive employees is at Statement no. 25 of volume-I of PE Survey.

579Public Enterprises Survey 2010-2011: Vol-II
RailTel Corporation of India Limited 10th Floor, Bank of Baroda Building, 16, SansadMarg, New Delhi-110001
Balance Sheet (` in Lakhs)
Particulars 2010-11 2009-10 2008-09
Authorised Capital 100000 100000 100000
(1) Sources Of Fund
(1.1) Shareholders Funds
(A) Paid-Up Capital
Central Govt 32094 32094 32094
Others 0 0 0
(B) Share Application Money 15 0 0
(C) Reserves & Surplus 31193 23168 13694
Total (A) + (B) + (C) 63302 55262 45788
(1.2) Loan Funds
(A) Secured Loans 6300 8400 10500
(B) Unsecured Loans 4164 6248 8332
Total (A) + (B) 10464 14648 18832
(1.3) Deferred Tax Liability 88 30 0
Total (1.1) + (1.2) + (1.3) 73854 69940 64620
(2) Application Of Funds
(2.1) Fixed Assets
(A) Gross Block 91050 86942 77326
(B) Less Depreciation 25879 18503 14685
(C) Net Block (A-B) 65171 68439 62641
(D) Capital Work In Progress 3246 3904 8131
Total (C) + (D) 68417 72343 70772
(2.2) Investment 0 0 0
(2.3) Current Assets, Loan & Advances
(A) Inventories 65 115 50
(B) Sundry Debtors 12555 11082 4910
(C) Cash & Bank Balances 36425 10037 10173
(D) Other Current Assets 899 40 33
(E) Loan & Advances 21866 19857 14998
Total (A)+ (B)+ (C)+ (D)+ (E) 71810 41131 30164
(2.4) Less:current Liabilities & Provisions
(A) Current Liabilities 61874 37762 32887
(B) Provisions 4499 5772 3429
Total (A+B) 66373 43534 36316
(2.5) Net Current Assets (2.3-2.4) 5437 -2403 -6152
(2.6) Deferred Revenue / Pre. Expenditure 0 0 0
(2.7) Deferred Tax Asset 0 0 0
(2.8) Profit & Loss Account(Dr) 0 0 0
Total (2.1+2.2+2.5+2.6+2.7+2.8) 73854 69940 64620
Important Indicators 2010-11 2009-10 2008-09
(i) Investment 42573 40494 50926
(ii) Capital Employed 70608 66036 56489
(iii) Net Worth 63302 55262 45788
(iv) Cost of Production 25535 28635 28377
(v) Cost of Sales 25535 28635 28377
(vi) Gross Value Added (At Market Price) - - -
(vii) Total Employees (Other Than Casuals) (Nos.) 389 361 382
(viii) Avg. Monthly Emoluments Per Employee (Rs.) 74443 62188 78163
Profit & Loss Account (` in Lakhs)
Particulars 2010-11 2009-10 2008-09
(1) Income
(A) Sales/Operating Income 32627 38810 37466
(B) Excise Duty 0 0 0
(C) Net Sales (A-B) 32627 38810 37466
(D) Other Income/Receipts 3680 1160 1178
(E) Accretion/Depletion in Stocks 0 0 0
(I)Total Income (C+D+E) 36307 39970 38644
(2) Expenditure
(A) Purchase of Finished Goods/ Consumption Of Raw Materials 0 0 0
(B) Stores & Spares 0 0 0
(C) Power & Fuel 555 601 338
(D) Manufacturing / Direct / Operating Expenses 1799 15380 10799
(E) Salary, Wages & Benefits / Employee Exp. 3475 2694 3583
(F) Other Expenses 13472 3409 7522
(G) Provisions 0 365 0
(II)Total Expenditure (A to G) 19301 22449 22242
(3) Profit Before Dep, Int, Taxes & EP (PBDITEP) (I-II) 17006 17521 16402
(4) Depreciation 5107 4707 4182
(5) Dre/Prel Exp Written Off 0 0 0
(6) Profit Before Int., Taxes & Ep (PBITEP) (3-4-5) 11899 12814 12220
(7) Interest
(A) On Central Government Loans 1127 0 0
(B) On Foreign Loans 0 0 0
(C) Others 0 1479 1953
(D) Less Interest Capitalised 0 0 0
(E) Charged to P & L Account (A+B+C-D) 1127 1479 1953
(8) Profit Before Tax & EP(PBTEP) (6-7E) 10772 11335 10267
(9) Tax Provisions 112 539 836
(10) Net Profit / Loss Before EP (8-9) 10660 10796 9431
(11) Net Extra-Ord. Items 1119 -433 -773
(12) Net Profit / Loss(-) (10-11) 9541 11229 10204
(13) Dividend Declared 1300 1500 800
(14) Dividend Tax 216 255 136
(15) Retained Profit (12-13-14) 8025 9474 9268
Financial Ratios 2010-11 2009-10 2008-09
(i) Sales : Capital Employed 46.21 58.77 66.32
(ii) Cost of Sales : Sales 78.26 73.78 75.74
(iii) Salary / Wages : Sales 10.65 6.94 9.56
(iv) Net Profit : Net Worth 15.07 20.32 22.29
(v) Debt : Equity 0.17 0.27 0.41
(vi) Current Ratio 1.08 0.94 0.83
(vii) Sundry Debtors : Sales (No. of Days) 140.45 104.22 47.83
(viii) Total Inventory : Sales 0.73 1.08 0.49