An EBV membrane protein expressed in immortalized lymphocytes transforms established rodent cells
Upload
independentCategory
view
3download
0
This article appeared in a journal published by Elsevier. The attachedcopy is furnished to the author for internal non-commercial researchand education use, including for instruction at the authors institution
and sharing with colleagues.
Other uses, including reproduction and distribution, or selling orlicensing copies, or posting to personal, institutional or third party
websites are prohibited.
In most cases authors are permitted to post their version of thearticle (e.g. in Word or Tex form) to their personal website orinstitutional repository. Authors requiring further information
regarding Elsevier’s archiving and manuscript policies areencouraged to visit:
http://www.elsevier.com/copyright

Author's personal copy
Original Investigation
Contrasting genetic structure of urban and rural populations of the wildrodent Calomys musculinus (Cricetidae, Sigmodontinae)
Marina B. Chiappero a,n, Graciela M. Panzetta-Dutari b, Daniela Gomez c, Ernesto Castillo c,Jaime J. Polop c, Cristina N. Gardenal a
a Genetica de Poblaciones y Evolucion, Facultad de Ciencias Exactas, Fısicas y Naturales, Universidad Nacional de Cordoba, Av. Velez Sarsfield 299, 5000 Cordoba, Argentinab Departamento de Bioquımica Clınica, Facultad de Ciencias Quımicas, Universidad Nacional de Cordoba, Haya de la Torre y Medina Allende, Ciudad Universitaria, 5000 Cordoba,
Argentinac Grupo de Investigaciones en Ecologıa de Poblaciones, Departamento de Ciencias Naturales, Universidad Nacional de Rıo Cuarto, Agencia Postal No. 3, 5800 Rıo Cuarto, Argentina
a r t i c l e i n f o
Article history:
Received 10 November 2009
Accepted 14 February 2010
Keywords:
Calomys musculinus
Genetic structure
Microsatellites
Agroecosystems
Urban populations
a b s t r a c t
The alteration of landscapes by human activities worldwide has forced many animal species to persist
in remnants of natural habitats. One of the best examples of this process occurs in central-east
Argentina, where the original prairies were almost completely replaced by agricultural land, cattle
production areas and increasing urbanization. We used nine microsatellite loci to analyze the
population genetic structure of the Sigmodontine rodent Calomys musculinus in two anthropically
altered habitats: an agroecosystem and a city. Rodents inhabiting urban vacant lots showed higher
levels of relatedness and genetic differentiation than rodents inhabiting the agroecosystem. Urban
rodents presented a pattern of isolation by distance; in the rural habitat this pattern was present only
along the border of a secondary road, but not over the entire area surveyed. In the city, a spatially
limited but buffered environment, populations would be small, demographically stable, and dispersal
would be restricted. On the contrary, in agroecosystems populations would experience a high rate of
turn over: local demes would originate each year by a mixture of overwintering individuals, and
dispersal would occur preferentially along the weedy borders of fields.
& 2010 Deutsche Gesellschaft fur Saugetierkunde. Published by Elsevier Gmbh. All rights reserved.
Introduction
Human activities, mainly agriculture and urban development,alter landscapes worldwide forcing many animal species topersist in highly modified remnants of natural habitats that areusually smaller and more isolated than the unmodified ones. Thismay cause populations to be less connected by gene flow thanhave been historically and therefore more susceptible to theeffects of genetic drift, that is, accelerated loss of geneticvariability, increase of consanguinity within populations, andincreased genetic differentiation among populations (Frankham,1995; Gerlach and Musolf, 2000; Noel et al., 2007; Walker et al.,2008). An example of this kind of process occurs in central-eastArgentina, a phytogeographic region called Humid Pampa thatcovers an area of approximately 500,000 km2. In a process thatbegan slowly around 1880 and accelerated during the second halfof the 20th century, the original prairies were almost completely
replaced by agricultural and cattle production areas, accompaniedby increasing urbanization (Manuel-Navarrete et al., 2005). Theresulting landscape pattern consists of large areas of crops andlivestock pastures separated by fencelines, roads and railroads,along which a community of native and introduced weeds usuallypersists. These ‘‘border’’ habitats are currently the most similar tothe original ones, but occupy only a reduced part of their pastextension (Crespo, 1966; Crespo et al., 1970; Ellis et al., 1997).These changes were detrimental to the micro and macro-faunainhabiting the Humid Pampa because of the increase of thesurface occupied by highly disturbed and unstable environmentsas crop fields that offer appropriate resources only temporally.However, some authors state that opportunistic species capable tocope with, or take advantage of, unstable habitat would have beenfavored by the landscape changes brought by agriculture (Crespo1966; Bilenca, 2000). One of these species is Calomys musculinus, aSigmodontine rodent widely distributed in Argentina, character-ized by a high frequency of post-partum estrus, short gestationperiod, long breeding season, large litter size, and a wide habitatand diet tolerance, which make the species a successful invader. Itis found in borders throughout the year, from where it colonizescrop fields when they offer a good cover and returns to theborders when harvest and plowing destroy the habitat (Crespo
Contents lists available at ScienceDirect
journal homepage: www.elsevier.de/mambio
Mammalian Biology
1616-5047/$ - see front matter & 2010 Deutsche Gesellschaft fur Saugetierkunde. Published by Elsevier Gmbh. All rights reserved.
doi:10.1016/j.mambio.2010.02.003
n Corresponding author. Tel.: +54 351 4332100; fax: +54 351 4332097.
E-mail addresses: [email protected],
[email protected] (M.B. Chiappero).
Mamm. biol. 76 (2011) 41–50

Author's personal copy
et al., 1970; Ellis et al., 1997, 1998; Busch et al., 2000). Resultsfrom studies using capture-mark-recapture (CMR) techniquessuggest that this species has a low vagility. de Villafane andBonaventura (1987) found that only 0.6% of the capturedindividuals moved 200 m to a trapping grid different than theiroriginal. Steinmann et al. (2005) reported that average homerange sizes in populations from an experimental enclosure wereof 600.6 m2 for males and 274.3 m2 for females. However,interpolating CMR results to dispersal capability is not straight-forward, since animals that move beyond the study area and/orare not recaptured, cannot be recorded. Previous reports onC. musculinus genetic structure show that, at a geographic scale often to 700 km, the pattern of geographic distribution of allozyme,RAPDs and mtDNA polymorphisms is compatible with a processof differentiation by genetic drift that proceeds faster thanhomogenization by gene flow (Chiappero and Gardenal, 2003;Gonzalez Ittig and Gardenal, 2004). However, mtDNA revealedthat at distances of 75 km or less, populations show correlationbetween geographic and genetic distances (Gonzalez Ittig andGardenal, 2004). Although border habitats are narrow (1-10 m)and linear instead of two-dimensional, they can go uninterruptedfor several kilometers. Therefore, the continuity of these habitats,suitable for the species, does not rule out that at smallergeographic scales than those studied previously, gene flow couldbe the predominant force over genetic drift.
Besides changes brought by agriculture, increasing urbaniza-tion is a demographic tendency that cannot be neglected in theHumid Pampa. Cities often do not have a compact shape, but anirregular form, with urbanized areas encircling remnants ofnatural habitats, which can harbor diverse species of wild floraand fauna (Pickett et al., 2001; Manuel-Navarrete et al., 2005).These urban habitats may offer a more stable and milderenvironment than non-urban ones: cities are warmer than thesurrounding land, show a lower day/night and summer/wintertemperature range, have more precipitations, and for somespecies offer food of anthropogenic origin. However, patches ofnatural habitat within cities are usually highly isolated, decreas-ing the opportunities for dispersal (Pickett et al., 2001; Luniak,2004). Recently, in a study designed to determine rodent speciesdistribution and abundance in the city of Rıo Cuarto (centralArgentina), 26% of the total captures were wild rodents,C. musculinus being the most frequent species with 18.8% of totalcaptures. C. musculinus was captured in non built-up areas with avegetation cover similar to that of rural ‘‘border’’ habitats asstream banks, vacant areas, railway banks and rubbish dumpsinside the city. This finding was surprising because there were noprevious reports about the presence of C. musculinus in areas otherthan rural ones. Then, the question of the origin of these urbanpopulations arised: are they native and were encircled by thegrowth of the city, or the habitat patches were recently colonizedby individuals dispersing from surrounding agricultural fields andthese populations are still in contact with rural ones by gene flow(Castillo et al., 2003; Gomez et al., 2008)?.
There are very few studies on wild rodent populationsoccupying green spaces inside cities, and none of them includecomparisons of genetic structure between urban and non-urbanareas. Therefore, C. musculinus offers a good opportunity toexamine the effects that anthropogenic habitats have on thegenetic structure of wild species. In this work, we investigate thegenetic structure of populations of C. musculinus in an agroeco-system and in an urban environment in order to assess therelationships between urban and rural populations, evaluate thedispersion potential of individuals at a small geographic scale andcompare the levels of genetic variability, relatedness anddifferentiation of C. musculinus living in these two anthropicallyaltered habitats.
Material and methods
Study area and sampling
We conducted this study in two main areas, one urban and onerural in Cordoba Province, central Argentina (Fig. 1). The urbansamples were obtained in vacant areas with a minimum surface of5,000 m2 characterized by permanent grassland vegetation andlow to no maintenance inside the city of Rıo Cuarto (33150S,641180W; 150,000 inhabitants). Castillo et al. (2003) determinedthat lots with these characteristics can sustain a population ofC. musculinus. Fifteen trapping sites were set, each one consistingin two lines of ten traps every ten meters separated byapproximately 150 m. In the large vacant area in the south-westof the city (Fig. 1), six trapping sites were set (U1 to U6), every 600- 1000 m. Trapping sites U7 to U15 (Fig. 1) were set in each of ninevacant areas that fulfilled the requirements. The division into lotsof these areas began about 1940, but while the area around U9and U10 was rapidly urbanized, in the rest of the sites this processwas relatively slower.
The rural area was located approximately ten km north-east ofRıo Cuarto and consisted of a matrix of crop fields and livestockpastures, crossed by fence lines and secondary roads along whichgrows a community of weeds and remains of the original flora, the‘‘border’’ habitat. Unlike the urban vacant areas, these ‘‘border’’habitats are not patchy but continuous. Therefore, the samplingdesign consisted of 15 trapping sites every 1-2 km alongsecondary roads (R1 to R15; Fig. 1). Two lines of ten trapsseparated by ten meters were set per site, one along the weedyborder of the road and one 150 m inside the adjacent crop field.Each trapping site was considered as a subpopulation, within therural or the urban populations.
All captures were performed during four consecutive days, inApril 2003 and May 2005 for the urban habitats, and in May 2003for the rural area. A total of 151 C. musculinus were captured: 74 inthe rural area and 77 in the city. Sample sizes obtained in eachsubpopulation are indicated in Fig. 1. In the rural area, noindividuals were captured in the crop field trap lines, except inR10 (two individuals) and in R13 (one individual). Individualswere carried to the laboratory, euthanized with isofluoraneinhalation and the tail tip cut and conserved in 80% ethanol untilDNA extraction.
Genotyping
DNA was extracted from tail tips using DirectPCR (Tail)(Viagen-Biotech Inc., Los Angeles CA). Individuals of C. musculinus
were genotyped for nine specific microsatellite loci. Six of them(Cmu1, Cmu2, Cmu3, Cmu4, Cmu11 and Cmu13) were described inChiappero et al. (2005); polymerase chain reactions for these locifollowed the protocol described therein. Three additional loci(Cmu14, Cmu15 and Cmu17) were isolated and characterized fromthe same partial library using the same methodology. For PCRamplification of these new loci, we used the same reaction mixand cycling program, and optimized the annealing temperature(Table 1 summarizes information for new loci).
Amplified alleles were separated by electrophoresis using theTris-Glycine buffer system (White et al., 2002) on 20 cm long,native polyacrylamide gels (7% acrylamide-bisacrylamide 19:1 forloci Cmu2, Cmu14, Cmu15 and Cmu17; 9% for Cmu13; 8% for theremaining loci). Gels were run at 280 V for 3 h 30 min, stainedwith SybrGreen (Invitrogen, Carlsbad, CA) and photographed.Allele sizes were determined by comparison against a molecularsize standard (10 pb DNA Ladder, Invitrogen).
M.B. Chiappero et al. / Mamm. biol. 76 (2011) 41–5042

Author's personal copy
To confirm genotypes and to minimize errors associated withelectrophoresis and allele scoring, all amplifications were electro-phoresed a second or a third time, running together thoseindividuals that appeared to have similar genotypes in the first run.
Data analysis
Due to the small sample sizes obtained for some of thesubpopulations (Fig. 1) levels of genetic variability, relatednessand genetic differentiation were calculated either by usingpopulation-based methods, for subpopulations with eight ormore individuals (R4, R7, R13, R14, U9, U10, U15, and pooling ofU1 to U6), or using individual-based methods and considering allcaptured rodents.
Each subpopulation with NZ8 was checked for the presenceof null alleles and/or scoring errors due to stuttering or to largeallele drop outs using the software MICROCHECKER (van Oosterhoutet al., 2004). Conformance to Hardy-Weinberg equilibrium wasassessed using the index f, the correlation between alleles withinindividuals within populations (analogous to Wright’s FIS).Significance levels for f were adjusted using the sequentialBonferroni correction for multiple tests (Rice, 1989). Geneticvariability was measured as mean allelic richness using therarefaction method, in which genotype data are resampled to givesample sizes equal to the smallest population, in this case N=8(AR; El Mousadik and Petit, 1996) and gene diversity (HS; Nei,1987). These calculations were performed using FSTAT (Goudet,2001). Differences in variability levels between rural and urbansamples were estimated using the test for comparison amonggroups of samples implemented in FSTAT. For each statistic, this
test calculates the average over samples and loci for each groupand then computes the difference between the two groups. Toobtain statistical significances, 10000 permutations allocatingeach sample at random to the different groups were performed,and the tested statistic was calculated from the permuted datasets. The one-sided P-value is the proportion of randomized datasets giving a larger value for the tested statistic than the observedone (Goudet, 2001).
Genetic variability was estimated at the individual level asindividual heterozygosity (IH; Coulson et al., 1998). To calculateIH, a locus was scored as 0 if the individual was homozygous or 1if it was heterozygous, and these values were averaged over allloci scored in the individual. Then, the mean IH was obtained forrural and for urban rodents. IH was calculated using the macroprovided by Bill Amos at the website http://www.zoo.cam.ac.uk/zoostaff/amos. Significance of IH differences between rural andurban rodents was obtained with the Wilcoxon-Mann-Whitneytest using the program INFOSTAT (InfoStat, 2008).
Mean relatedness (r) between pairs of individuals within eachsubpopulation was calculated according to Queller and Goodnight(1989) with GENALEX 6.2 (Peakall and Smouse, 2006) andbootstrap resampling (10000 times) was used to obtain a 95%confidence interval around each within-subpopulation estimateof mean relatedness. Genotypes from rural or urban populationswere also permuted 10000 times to obtain a 95% confidenceinterval around 0, representing the range of r values that would beexpected if reproduction were random across subpopulations.Values of r that fall outside these limits indicate an increasedrelatedness in that site relative to background levels.
At the individual level, internal relatedness (IR) was calculatedfor each individual according to Amos et al. (2001) as
10 km
R15 (0)
R14 (12)
R13 (10)
R1 2(3) R1 1 R10 R9
(3)
R8(6)
R7(9)
R6(4)
R5(6)
R4(8)
R3 (0)R1 (4)R2 (3)
1km (4)(2)
N
Río Cuarto
0
U14(1)
0 1.5km
U15 (12)
River Cuarto
U1(6)U2(1)U3 (2)U4(2)
U5 (5 )U6 (5 )
U7(2)
U8(3)
U9(10)
U12 (5 )
U13(2)U10 (20)
U1 1(1)
33º1
0’S
33ºS 64º20’ W 64º10’ W
Fig. 1. Map of the study site in central Argentina. Right panel: rural population; left panel: urban population. Vacant lots and crop fields are in white, built-up areas in grey.
Sample sizes are indicated in parenthesis.
Table 1Description of three new microsatellite loci isolated from Calomys musculinus.
Locus name Sequenced core motif Primer pair sequences (50 �30) Ta (1C) Range of allele size GenBank Accesion no
Cmu14 (AC)25 F: CGATTCCTTCACATGCACC 50 149-201 EF571644
R: GAGATGTGCCTGCCTCTGCC
Cmu15 (GT)22 F:CTACAAGACCCTTGTGAG 50 153-195 EF571645
R:CTTTCCTCTTTCTTTCTCTC
Cmu17 (GT)14(GA)29 F:GCACATTTATTCTGAGCTAGTG 50 158-210 EF566980
R:CCATTTTTAACTGTCTGGATG
M.B. Chiappero et al. / Mamm. biol. 76 (2011) 41–50 43

Author's personal copy
IR¼ 2H�P
fi=2N�P
fi, where H is the number of homozygousloci, N is the number of loci scored, and fi is the frequency of theith allele contained in the genotype. IR derives from Queller andGoodnight’s relatedness index and measures the relatedness of anindividual’s parents, that is, the relatedness between the twohaploid genomes in a diploid individual. It is centered on zero(individuals born to unrelated parents), with negative valuessuggesting outbreeding and high positive values, inbreeding(Amos et al., 2001). IR was calculated using the macro providedby Bill Amos at the website http://www.zoo.cam.ac.uk/zoostaff/amos. Mean IR for the rural and the urban populations werecalculated and bootstrap resampling (5000 times) was used toobtain a 95% confidence interval around each mean. Significanceof IR differences between rural and urban rodents was obtainedusing the Wilcoxon-Mann-Whitney test. These calculations wereperformed with INFOSTAT.
Genetic structure was evaluated through F-statistics (Wright,1951) using the estimators developed by Weir and Cockerham(1984). Since small sample sizes can lead to an overestimation ofgenetic differentiation, individuals from urban or rural originwere pooled and the overall level of genetic differentiationbetween both populations was quantified by means of the yindex (the correlation of pairs of alleles between individualswithin populations, analogous to Wright’s FST). Additionally, thisdata set was used to evaluate the presence of a Wahlund effectwithin the rural and the urban populations by calculating theindex f. This phenomenon occurs when demes with differentallele frequencies are considered as a single random matingpopulation, in which case the lumped population shows values off40. Since C. musculinus has a promiscuous-polygynous matingsystem (Steinmann et al., 2005) and local demes in the speciesexhibit random mating (Chiappero et al., 2002), f is expected to be0 for groups of individuals pertaining to a single randomlyinterbreeding population. We used the program FSTAT (Goudet,2001) to perform these calculations. The significance of y and fwas assessed through the randomization test implemented inFSTAT using 10000 permutations.
Genetic differentiation between pairs of individuals (a) wasestimated according to Rousset (2000) using GENEPOP 4 (Raymondand Rousset, 2003). Values of a were sorted in four groupsaccording to the following criteria: 1) values for pairs of rodentsfrom the same rural subpopulation, 2) from different ruralsubpopulations, 3) the same urban subpopulation, and 4) differenturban subpopulations. Mean a was calculated for each group andbootstrap resampling (5000 times) was used to obtain a 95%confidence interval around each mean. Significance of differencesin a between groups 1) and 2), and 3) and 4) were assessedthrough a Wilcoxon matched pairs test, while significance ofdifferences between groups 1) and 3), and 2) and 4) were obtainedby a Wilcoxon-Mann-Whitney test using INFOSTAT.
The association between a and geographic distance wasinvestigated separately for urban and rural samples by means ofMantel tests, using GENALEX; P-values were obtained after 10000permutations. Geographic distances were measured as a straightline separating each two subpopulations (that is, assuming a two-dimensional model). For rural samples, geographic distances werealso measured along secondary roads, that is, the distance that C.
musculinus individuals should move if they disperse only alongborder habitats (that is, considering a one-dimensional model).Genetic differentiation was regressed on the natural logarithm ofgeographic distance for the two-dimensional model, and ongeographic distance for the one-dimensional model (Rousset, 1997).
Additionally to traditional population genetic analyses, weused the Bayesian clustering method implemented in the soft-ware STRUCTURE 2.2.3 (Pritchard et al., 2000; Falush et al., 2003)to infer the most likely number of clusters of individuals (K) in the
C. musculinus sample and their admixture proportions. Weincluded all captured individuals in these analyses. By using aMarkov chain Monte Carlo (MCMC) method, STRUCTURE esti-mates the ln of the posterior probability of the data (themultilocus genotypes of sampled individuals) for a given valueof K, ln P(X9K), under the assumption of Hardy-Weinberg andlinkage equilibria within each cluster. A pilot analysis showedthat P(X9K) was higher between K=2 and K=8. Therefore, theanalysis was performed for values of K from 1 to 9, by running tenindependent chains consisting of 1�105 MCMC cycles for burn inand 2�105 for data collection, using subpopulation membershipas prior information, assuming correlated allele frequenciesamong populations, allowing for admixture (i.e. gene flow) andsetting the allele frequency prior parameter l to one. The mostprobable number of clusters was chosen by using the statisticsDK, which is based on the rate of change in the probability of databetween successive K values (Evanno et al., 2005). Individualmembership coefficients (Q) obtained in the 10 MCMC runs withthis K were combined using the program CLUMPP 1.1 (Jakobssonand Rosenberg, 2007) and represented graphically using DISTRUCT
(Rosenberg, 2004). When correlated allele frequencies amongpopulations are assumed, STRUCTURE also estimates the allelefrequencies of the hypothetical ancestral population, and for eachcluster it calculates Fk, a quantity analogous to Wright’s FST
measuring the departure of each cluster from the ancestralpopulation. Fk values are interpreted as the magnitude of geneticdrift experienced by cluster k after population subdivision. Fk
values reported are the averages across ten MCMC runs.Given that Bayesian methods rely on MCMC and therefore results
are not exact solutions but approximations of unknown precision,Guillot et al. (2009) adviced to validate results by using more thanone method. We analyzed our data set using spatial PrincipalComponent Analysis (sPCA; Jombart et al., 2008). This is amodification of common PCA, which aims to find synthetic variablesthat optimize the product of the variance of individuals (orpopulations) and their autocorrelation. Individuals are then arrangedaccording to a score that summarizes both aspects of geneticstructure. This method has the advantage of making no assumptionsconcerning mating system, linkage equilibrium, population structureor allele frequency models. The program Adegenet 1.2-3 (Jombart,2008) was used to calculate sPCA using the inverse distance methodto define the connection network. We also carried out two testsproposed by Jombart et al. (2008) and implemented in Adegenet, toassess the significance of global and local structures, where globalstructure is present when there is variability among individualsassociated with positive spatial autocorrelation, while a localstructure is present when a large variance among individuals isassociated with negative spatial autocorrelation.
Results
All nine microsatellite loci were polymorphic both in the ruraland in the urban populations, with the number of alleles per locusranging from 2 to 16. Microchecker analysis detected the presenceof a null allele in locus Cmu2 in subpopulations U9, U10 and U15,but null homozygotes were only observed in subpopulation U10.There were no evidences of stuttering or large allele dropout at anylocus. Significant departures from Hardy-Weinberg equilibriumafter Bonferroni correction were found only in locus Cmu2 in thosesubpopulations were Microchecker detected the presence of a nullallele. Therefore, this locus was excluded from all analyses, exceptof Bayesian clustering, where the option of ‘‘null allele present’’available in STRUCTURE was activated for this locus.
The rural and urban subpopulations showed similar levels ofallelic richness and gene diversity; although values for the rural
M.B. Chiappero et al. / Mamm. biol. 76 (2011) 41–5044
Author's personal copy
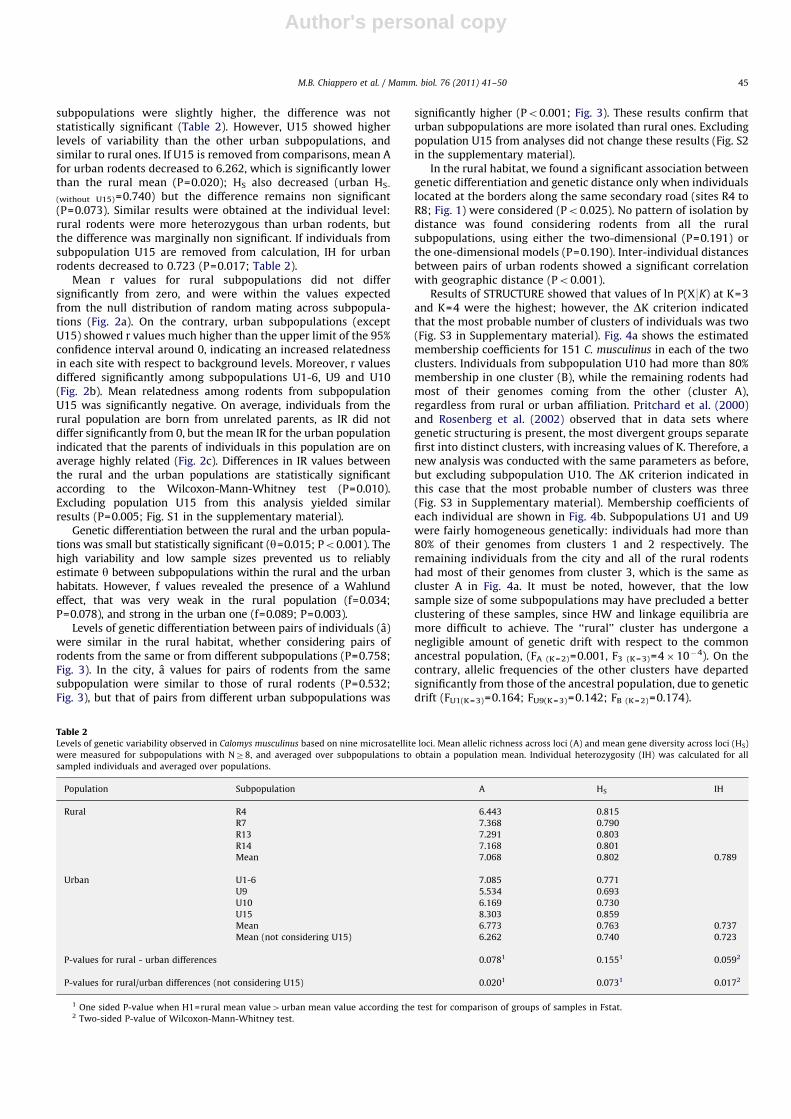
subpopulations were slightly higher, the difference was notstatistically significant (Table 2). However, U15 showed higherlevels of variability than the other urban subpopulations, andsimilar to rural ones. If U15 is removed from comparisons, mean Afor urban rodents decreased to 6.262, which is significantly lowerthan the rural mean (P=0.020); HS also decreased (urban HS-
(without U15)=0.740) but the difference remains non significant(P=0.073). Similar results were obtained at the individual level:rural rodents were more heterozygous than urban rodents, butthe difference was marginally non significant. If individuals fromsubpopulation U15 are removed from calculation, IH for urbanrodents decreased to 0.723 (P=0.017; Table 2).
Mean r values for rural subpopulations did not differsignificantly from zero, and were within the values expectedfrom the null distribution of random mating across subpopula-tions (Fig. 2a). On the contrary, urban subpopulations (exceptU15) showed r values much higher than the upper limit of the 95%confidence interval around 0, indicating an increased relatednessin each site with respect to background levels. Moreover, r valuesdiffered significantly among subpopulations U1-6, U9 and U10(Fig. 2b). Mean relatedness among rodents from subpopulationU15 was significantly negative. On average, individuals from therural population are born from unrelated parents, as IR did notdiffer significantly from 0, but the mean IR for the urban populationindicated that the parents of individuals in this population are onaverage highly related (Fig. 2c). Differences in IR values betweenthe rural and the urban populations are statistically significantaccording to the Wilcoxon-Mann-Whitney test (P=0.010).Excluding population U15 from this analysis yielded similarresults (P=0.005; Fig. S1 in the supplementary material).
Genetic differentiation between the rural and the urban popula-tions was small but statistically significant (y=0.015; Po0.001). Thehigh variability and low sample sizes prevented us to reliablyestimate y between subpopulations within the rural and the urbanhabitats. However, f values revealed the presence of a Wahlundeffect, that was very weak in the rural population (f=0.034;P=0.078), and strong in the urban one (f=0.089; P=0.003).
Levels of genetic differentiation between pairs of individuals (a)were similar in the rural habitat, whether considering pairs ofrodents from the same or from different subpopulations (P=0.758;Fig. 3). In the city, a values for pairs of rodents from the samesubpopulation were similar to those of rural rodents (P=0.532;Fig. 3), but that of pairs from different urban subpopulations was
significantly higher (Po0.001; Fig. 3). These results confirm thaturban subpopulations are more isolated than rural ones. Excludingpopulation U15 from analyses did not change these results (Fig. S2in the supplementary material).
In the rural habitat, we found a significant association betweengenetic differentiation and genetic distance only when individualslocated at the borders along the same secondary road (sites R4 toR8; Fig. 1) were considered (Po0.025). No pattern of isolation bydistance was found considering rodents from all the ruralsubpopulations, using either the two-dimensional (P=0.191) orthe one-dimensional models (P=0.190). Inter-individual distancesbetween pairs of urban rodents showed a significant correlationwith geographic distance (Po0.001).
Results of STRUCTURE showed that values of ln P(X9K) at K=3and K=4 were the highest; however, the DK criterion indicatedthat the most probable number of clusters of individuals was two(Fig. S3 in Supplementary material). Fig. 4a shows the estimatedmembership coefficients for 151 C. musculinus in each of the twoclusters. Individuals from subpopulation U10 had more than 80%membership in one cluster (B), while the remaining rodents hadmost of their genomes coming from the other (cluster A),regardless from rural or urban affiliation. Pritchard et al. (2000)and Rosenberg et al. (2002) observed that in data sets wheregenetic structuring is present, the most divergent groups separatefirst into distinct clusters, with increasing values of K. Therefore, anew analysis was conducted with the same parameters as before,but excluding subpopulation U10. The DK criterion indicated inthis case that the most probable number of clusters was three(Fig. S3 in Supplementary material). Membership coefficients ofeach individual are shown in Fig. 4b. Subpopulations U1 and U9were fairly homogeneous genetically: individuals had more than80% of their genomes from clusters 1 and 2 respectively. Theremaining individuals from the city and all of the rural rodentshad most of their genomes from cluster 3, which is the same ascluster A in Fig. 4a. It must be noted, however, that the lowsample size of some subpopulations may have precluded a betterclustering of these samples, since HW and linkage equilibria aremore difficult to achieve. The ‘‘rural’’ cluster has undergone anegligible amount of genetic drift with respect to the commonancestral population, (FA (K =2)=0.001, F3 (K = 3)=4�10�4). On thecontrary, allelic frequencies of the other clusters have departedsignificantly from those of the ancestral population, due to geneticdrift (FU1(K = 3)=0.164; FU9(K =3)=0.142; FB (K = 2)=0.174).
Table 2Levels of genetic variability observed in Calomys musculinus based on nine microsatellite loci. Mean allelic richness across loci (A) and mean gene diversity across loci (HS)
were measured for subpopulations with NZ8, and averaged over subpopulations to obtain a population mean. Individual heterozygosity (IH) was calculated for all
sampled individuals and averaged over populations.
Population Subpopulation A HS IH
Rural R4 6.443 0.815
R7 7.368 0.790
R13 7.291 0.803
R14 7.168 0.801
Mean 7.068 0.802 0.789
Urban U1-6 7.085 0.771
U9 5.534 0.693
U10 6.169 0.730
U15 8.303 0.859
Mean 6.773 0.763 0.737
Mean (not considering U15) 6.262 0.740 0.723
P-values for rural - urban differences 0.0781 0.1551 0.0592
P-values for rural/urban differences (not considering U15) 0.0201 0.0731 0.0172
1 One sided P-value when H1=rural mean value4urban mean value according the test for comparison of groups of samples in Fstat.2 Two-sided P-value of Wilcoxon-Mann-Whitney test.
M.B. Chiappero et al. / Mamm. biol. 76 (2011) 41–50 45

Author's personal copy
Spatial PCA analysis indicated a significant global structure inthe C. musculinus data set (P=0.004) and no local structure(P=0.296). Only the first eigenvalue was retained; scores showeda pattern very similar to that obtained using STRUCTURE: a fairlyhomogeneous rural population, and genetically differentiatedurban subpopulations, being subpopulations U9 and U10 the
most divergent (Fig. S4 in Supplementary material). We alsoperformed a sPCA analysis on the rural and urban data setsseparately (Fig. 5). In the urban population, a highly significant
betweensubpopulations
withinsubpopulation
betweensubpopulations
Rural population Urban population
â
within subpopulation
0
0.02
0.04
0.06
0.08
0.1
0.12
0.14
Fig. 3. Mean values of genetic differentiation (a), calculated considering pairs of
rodents from the same or from different subpopulations within rural or urban
populations. Vertical lines indicate the 95% confidence interval around the mean
obtained by 5,000 bootstrap permutations.
R1
R2
R4
R5
R6
R7
R8
R9
R10R11R12
R13
R14
U1
U2U3U4
U5
U6
Q QK=2; cluster: =A =B K = 3; cluster : = 1 = 2 = 3
U7U8
U9
R1
R2
R4
R5
R6
R7
R8
R9
R10R11R12
R13
R14
U1
U2U3U4
U5
U6
U7U8
U9
U11
U12
U11U12
U13U14
U15
U15
U10U13U14
Fig. 4. Bayesian clustering analysis performed with STRUCTURE. a) Plot of
individual membership coefficients for K=2 and considering rodents from all
subpopulations. b) Plot of the individual membership coefficients for K=3 when
subpopulation U10 is excluded. Each individual is represented by a vertical line
broken into segments of different shades of grey, with lengths proportional to its
membership to each of the clusters. Black vertical lines separate individuals
pertaining to different subpopulations.
-0.20
-0.10
0.00
0.10
R4 R7 R13 R14
r
U9 U10 U15
00.020.040.060.08
0.120.140.16
IR
-0.20
-0.10
0.00
0.10
0.20
0.30
Rural population
Urban population
0.1
-0.02Rural Urban
Population
U1-6
Fig. 2. Mean within population pair-wise relatedness ‘‘r’’ for rural (a) and urban
(b) populations of Calomys musculinus. Circles and bars represent the mean and
95% confidence interval of r obtained by 10,000 bootstrap replicates. The broken
line indicates the 95% upper and lower limits of expected values of r if
reproduction were random across subpopulations, generated by 10,000 permuta-
tions of genotypes from rural or urban populations. c) Mean individual relatedness
(IR) for rural and urban individuals. Vertical lines indicate the 95% confidence
interval around the mean obtained by 5,000 bootstrap permutations.
M.B. Chiappero et al. / Mamm. biol. 76 (2011) 41–5046

Author's personal copy
global structure (Po0.001) and no local structure (P=0.845) waspresent. U9 and U10 were the most differentiated subpopulations,while most individuals in the southwest of the city belong to asingle genetic cluster. These results are also similar to thoseobtained with STRUCTURE (Fig. 4b). However, it is worth notingthat individual’s scores within all subpopulations except for U15were very similar, indicating a high relationship betweenindividuals within subpopulations. In U15, two groups of fairlygenetically homogeneous individuals are evident, explaining thehigh genetic variability, and the very low mean r value found inthis subpopulation (Table 2).
Contrary to the urban population, in the rural area no globalstructure was found (P=0.851), but there was a marginally nonsignificant local structure (P=0.074), indicating higher geneticdifferences among neighbors than among random pairs ofindividuals. Individuals within rural subpopulations show largerdifferences in scores than individuals within urban ones.
Discussion
Modification of natural habitats in central Argentina has leftlittle of wild rodents’ original habitats, which remain as linearborder habitats along water currents, fence lines and secondaryroads, and as isolated patches of vacant lots inside urbanizedareas. In this paper we present the first study on the geneticstructure of a wild rodent in these two types of anthropicallyaltered environments. We found a low but statistically significant
differentiation between the urban and the rural populations(y=0.012; Po0.05), comparable to the values obtained usingother genetic markers by Chiappero et al. (2002) and GonzalezIttig and Gardenal (2004) for populations separated by similardistances. Levels and patterns of genetic structuring differedsubstantially in agroecosystem subpopulations compared to thoseinside a city. We obtained similar results, either using population-based or individual-based methods.
The main characteristic of the habitat in the rural population islinearity. Border habitats are usually narrow, but can be severalkilometers long. We found no evidence of increased relatednessamong rural individuals: IR levels indicated that on average, ruralrodents are born from unrelated parents. Also, mean relatednesswithin subpopulations was not significantly higher than back-ground levels. A weak, marginally non significant Wahlund effectwas observed, and genetic differentiation between pairs ofindividuals was similar within and between subpopulations.Besides, STRUCTURE analysis showed that all rural rodents areassigned to a single cluster, and sPCA found a marginally non-significant local structure, indicating that neighboring individualstend to be less related than a random pair. These results suggestthat connectivity among subpopulations in the rural habitat areenough to counterbalance the effects of genetic drift at a localscale. No isolation by distance (IBD) pattern was found, eitherassuming that dispersal takes place through crop fields (two-dimensional model) or along border habitats (one-dimensionalmodel). However, an IBD pattern was indeed present when theanalysis was restricted to rodents captured along the border of the
Fig. 5. sPCA analysis for the urban and rural populations. Upper left pannels display eigenvalues; upper right pannels plot the decomposition of eigenvalues in their
variance and spatial autocorrelation components; bottom pannels show the individual’s scores according to the first positive eigenvalue for the urban population and the
first negative eigenvalue for the rural population. Individual scores are represented as squares with size proportional to the value of the score, so that the maximum
differentiation is between large white squares and large black squares.
M.B. Chiappero et al. / Mamm. biol. 76 (2011) 41–50 47

Author's personal copy
same secondary road. An IBD pattern is established if matings aremore probable between individuals born closer than betweenindividuals born further away (which causes an increase of a withgeographic distance) and enough time of demographic stabilityhas elapsed to establish equilibrium between gene flow andgenetic drift. Processes like fluctuations in effective populationsize, extinction and recolonization of populations, and/or habitatchanges can prevent this equilibrium to be achieved or main-tained in time (Whitlock, 1992; Slatkin, 1993; Poissant et al.,2005). Hutchison and Templeton (1999) noted that the relativeinfluences of gene flow and genetic drift change as populations (orindividuals) become more geographically separated, and there-fore it is possible to detect an IBD pattern at a small geographicscale and not at a larger one. Slatkin (1993) established that thesize of the region within which IBD is evident among set ofrecently established populations increases with
ffiffiffiffiffiffiffiffiffiffiffiffiffiffiffi2Nemtp
, where tis the time since the foundation of the population, Ne is theeffective size of the population and m the migration rate. Thereare evidences indicating that populations of C. musculinus aredemographically unstable. Local populations at a small geo-graphic scale may not persist for long periods because crop fieldsare inherently unstable habitats and the borders sometimesexperience weed control by fire, mechanical or chemical methods.Besides, they undergo seasonal fluctuations in density, asmeasured by trapping success, with minimum values (includingzero) at the end of winter/beginning of spring and maximumvalues in autumn. Chiappero et al. (2006) found, along a two yearstudy, that significant fluctuations of population effective size andof levels of genetic variability accompanied changes in density intwo populations of this species. The authors also reported thatdespite those large fluctuations, there was no evidence of geneticbottlenecks. It was proposed that the mixing of overwinteringanimals from various origins at the beginning of each newbreeding season caused the recovery of both Ne and geneticvariability (Chiappero et al., 2006). This mechanism could explainthe low relatedness among individuals found in the rural habitat,the very low genetic drift experienced by the ‘‘rural’’ cluster asshown by STRUCTURE analysis, the presence of IBD only along thesame ‘‘border’’, and the local structure found by sPCA analysis.Despite the role of linear habitats as dispersal corridors amonghabitat patches has been addressed by several authors (Merriamand Lanoue, 1990; Ruefenacht and Knight, 1995; Mech and Hallet,2001; Banks et al., 2005; among others), dispersal within one-dimensional habitats is a much less treated issue. Aars et al.(1998) found that gene flow was much more restricted in a one-dimensional habitat compared to a two-dimensional one in bankvoles (Myodes glareolus, formerly Clethrionomys) inhabiting thelinear sides of the river Glomma (Norway). If a similar situationoccurred in C. musculinus, the establishment of IBD in the linearhabitat should take longer compared to the two dimensionalhabitat, which suggests that, unlike the bank vole, in C. musculinus
dispersal would be more frequent through linear habitats. Blaumand Wichmann (2007) found that the temporal configuration ofthe habitat has also an important impact on dispersal and geneflow in a fragmented landscape. They reported that geneticconnectivity among populations of the hairy-footed gerbil in theKalahari desert was higher during years of increased averagerainfall that cause a temporal change of the inhospitable shrub-dominated matrix to a hospitable grass-dominated one. InPampean agroecosystems, a similar temporal change of inhos-pitable to hospitable habitat for C. musculinus occurs every timecrops are grown enough to offer a good cover (de Villafane et al.,1988; Ellis et al., 1997). Thus, temporal connectivity in the twodimensional occurs in ‘‘pulses’’, unlike the border habitat where itis continuous. Samples analyzed here were obtained in autumn,near the end of the breeding season when population density is
the highest. The presence of an IBD pattern along linear habitatsand not in the total rural samples indicates that it had time tobecome established during the breeding season only amongnearby individuals in the continuously available one dimensionalhabitat.
A strong Wahlund effect was found in the urban population.sPCA showed that the most extremely differentiated population isU10 (Fig. 5). In the Bayesian clustering analysis, individuals fromsubpopulations U1, U9 and U10 formed separate clusters (Fig. 4)with high Fk values, indicating that important levels of geneticdrift occurred following subdivision of the ancestral population.This result indicates that these subpopulations are the mostisolated in the city, and probably have been for the longest time.The division into lots and the construction of streets in allsampled areas date back to the decades of 1940-1950. However,not all have developed at the same rate: while the area ofsubpopulations U9 and U10 was rapidly urbanized, most of theother locations have still a low density of buildings. Subpopula-tions U7, U8 and U11 to U14 are located at the outskirts of the cityor near the river, where there is some continuity with the ruralareas (Fig. 1). Rodents from these subpopulations have approxi-mately 70% of membership in cluster 3, which is the predominantone in the rural population. Subpopulations U2 to U6, and U15,are separated from rural areas by the two-way paved road (builtin 1968) that surrounds most of the city (Fig. 1). Merriam et al.(1989), Gerlach and Musolf (2000) and Hirota et al. (2004)showed that roads significantly decrease gene flow among rodentpopulations, but individuals from these subpopulations have asignificant part of their genomes from the ‘‘rural’’ cluster. SinceSTRUCTURE tries to find groups of individuals that maximize HWand linkage equilibrium, these subpopulations would have notenough genotypic information to separate them in differentclusters. However, similar results were obtained using sPCA,which does not make any of the assumptions of STRUCTURE:individuals belonging to subpopulations U1 to U7, U12 and one ofthe rodents captured in U13 had similar scores than ruralindividuals (Fig. S3). These results suggest that either some levelof gene flow is still maintained with surrounding rural popula-tions despite the road, or that membership coefficients arereflecting the more recent isolation of these subpopulations, thathave not yet drifted away from each other and from rural ones.
Urban subpopulations of C. musculinus showed an increasedrelatedness compared to background levels; IR levels indicatedthat, on average, urban rodents are born from highly relatedparents. In the absence of an endogamic mating system, increasedrelatedness in a population may occur when its effective size islow, either because of a small census size, low levels of geneticinterchange with other populations, or both. Rodents inside urbansample sites also showed less genetic variability (A, He and IH;Table 2) compared with rural ones. Genetic differentiation ofrodents from different urban sample sites was significantly higherthan in the rural habitat (Fig. 3). These results suggest that urbansubpopulations have a lower effective size and are more isolatedfrom each other than rural ones. Similar results were obtained inother studies comparing rural and urban populations of specieswith varying dispersal capabilities: highly vagile species askestrels (Rutkowski et al., 2006) and foxes (Wandeler et al.,2003), and low dispersal species as amphibians (Hitchings andBeebee, 1997, 1998; Noel et al., 2007). However, the presence ofan isolation by distance pattern indicates that some gene flowamong them must be still ongoing, that these populations wouldbe demographically more stable than rural ones, and that theyshould have been in its present location for enough time for thatpattern to develop. Demographic stability could be attainedthrough a better winter survival. Given that temperatures incities can be up to 10 1C warmer than in surrounding rural areas
M.B. Chiappero et al. / Mamm. biol. 76 (2011) 41–5048

Author's personal copy
(Luniak, 2004), this may lead to smaller drops in effectivepopulation size during winter for urban rodents compared torural ones. Regarding gene flow, several authors have addressedthe importance of non built-up areas in cities to maintain theconnectivity among urban populations of wild rodents. Hirotaet al. (2004) found that the green tract along the Tama River inTokio acted as a stable habitat and a corridor for dispersal for therodent Apodemus speciosus. Baker et al. (2003) observed that theabundance of the wild rodent Apodemus silvaticus in gardens ofthe city of Bristol was inversely related to the distance to thenearest patch of natural or semi-natural habitat. Dickman andDoncaster (1989) studied dispersal among habitat patches withinthe city of Oxford in two species of wild rodents, Apodemus
sylvaticus and Myodes glareolus. They found that the time ofrecolonization of experimentally cleared patches was inverselyrelated to the distance to the source populations. As can be seen inFig. 1, the river banks and a few green areas in Rıo Cuarto couldact as dispersal corridors for C. musculinus, allowing some geneflow and avoiding the random differentiation that would occur ifthere were no gene flow at all. The more restricted connectivitybetween suitable habitats in the city compared to agroecosystemswould prevent the mixing of overwintering animals that occurs inrural populations and therefore, at the beginning of each breedingperiod the overwintering individuals that start the new breedingpopulation would come almost exclusively from the population ofthe previous year.
The low levels of genetic variability, the high relatednesswithin subpopulation and the large genetic differentiationbetween subpopulations found in urban samples are compatiblewith two alternative explanations: a recent colonization of greenspaces inside the city by few individuals from different ruralsources, or the persistence of small and isolated native popula-tions. However, the IBD pattern found and the results ofSTRUCTURE are only compatible with the hypothesis that urbanrodents are native and were encircled by the growth of the city.Luniak (2004) states that the main pre-requisites for a wildspecies to successfully live in urban environments are a generalecological, demographic and behavioral plasticity and, particu-larly, a wide habitat and diet tolerance. These characteristics areproper of C. musculinus (Busch et al., 1997, 2000; Ellis et al., 1998)and would allow the species to adapt to urban habitats andmaintain stable although small populations.
In conclusion, the results presented here indicate that ruraland urban populations of C. musculinus have a different geneticstructure. Populations in agroecosystems would be highlydynamic, and their structure determined by the annual cycle ofnearly extinction of populations and recolonization by a mixing ofoverwintering animals. This process would preclude the geneticdifferentiation of populations and the establishment of isolationby distance patterns over large areas. Dispersal would occurpreferentially along border habitats. On the contrary, there wouldbe no extinction-recolonization dynamics in the city: populationswould be smaller but demographically more stable, favored bythe important capacity of the species to adapt to a variety ofenvironments. Urban populations inside the city of Rıo Cuartowould be relictual ones that were encircled by the growth of thecity.
Acknowledgements
This work was supported, in part, by grants of the AgenciaNacional de Promocion Cientıfica y Tecnologica (PICT N1 353) ofArgentina, and the Secretarıa de Ciencia y Tecnologıa (UniversidadNacional de Cordoba, Argentina). MBC, CNG and GMP-D arecareer investigators of the Consejo Nacional de Investigaciones
Cientıficas y Tecnologicas (CONICET) of Argentina. DG is a post-doctoral fellow of CONICET.
Appendix A. Supplementary material
Supplementary data associated with this article can be foundin the online version at doi:10.1016/j.mambio.2010.02.003.
References
Aars, J., Ims, R.A., Liu, H.-P., Mulvey, M., Smith, M.H., 1998. Bank voles in linearhabitats show restricted gene flow as revealed by mitochondrial DNA(mtDNA). Mol. Ecol. 7, 1383–1389.
Amos, W., Worthington Wilmer, J., Fullard, K., Burg, T.M., Croxall, J.P., Bloch, D.,Coulson, T., 2001. The influence of parental relatedness on reproductivesuccess. Proc. R. Soc. London B 268, 2021–2027.
Baker, P.J., Ansell, R.J., Dodds, P.A.A., Webber, C.E., Harris, S., 2003. Factors affectingthe distribution of small mammals in an urban area. Mamm. Rev. 33, 95–100.
Banks, S.C., Lindenmayer, D.B., Ward, S.J., Taylor, A.C., 2005. The effects of habitatfragmentation via forestry plantation establishment on spatial genotypicstructure in the small marsupial carnivore, Antechinus agilis. Mol. Ecol. 14,1667–1680.
Bilenca, D.N., 2000. Los agroecosistemas y la conservacion de la biodiversidad: elcaso del pastizal pampeano. Gerencia Ambiental 67, 566–567.
Blaum, N., Wichmann, M.C., 2007. Short-term transformation of matrix intohospitable habitat facilitates gene flow and mitigates fragmentation. J. Anim.Ecol. 76, 1116–1127.
Busch, M., Alvarez, M.R., Cittadino, E.A., Kravetz, F.O., 1997. Habitat selection andinterspecific competition in rodents in pampean agroecosystems. Mammalia61, 167–184.
Busch, M., Mino, M.H., Dadon, J.R., Hodara, K., 2000. Habitat selection by Calomysmusculinus (Muridae, Sigmodontinae) in crop areas of the Pampean region,Argentina. Ecol. Aust. 10, 15–26.
Castillo, E., Priotto, J., Ambrosio, A.M., Provensal, M.C., Pini, N., Morales, M.A.,Steinmann, A., Polop, J.J., 2003. Commensal and wild rodents in an urban areaof Argentina. Int. Biodeter. Biodeg. 52, 135–141.
Chiappero, M.B., Gardenal, C.N., 2003. Restricted gene flow in Calomys musculinus(Rodentia, Muridae), the natural reservoir of Junin virus. J. Hered. 94, 490–495.
Chiappero, M.B., Gardenal, C.N., Panzetta-Dutari, G.M., 2005. Isolation andcharacterization of microsatellite markers in Calomys musculinus (Muridae,Sigmodontinae, Phyllotini), the natural reservoir of Junin virus. Mol. Ecol.Notes 5, 593–595.
Chiappero, M.B., Calderon, G.E., Gardenal, C.N., 2006. Temporal fluctuation ofeffective size in populations of Calomys musculinus (Muridae: Sigmodontinae).J. Mamm. 87, 848–854.
Chiappero, M.B., Sabattini, M.S., Blanco, A., Calderon, G.E., Gardenal, C.N., 2002.Gene flow among Calomys musculinus (Rodentia, Muridae) populations inArgentina. Genetica 114, 63–72.
Coulson, T.N., Pemberton, J.M., Albon, S.D., Beaumont, M., Marshall, T.C., Slate, J.,Guinness, F.E., Clutton-Brock, T.H., 1998. Microsatellites reveal heterosis in reddeer. Proc. R. Soc. London B 265, 489–495.
Crespo, J.A., 1966. Ecologıa de una comunidad de roedores silvestres en el partidode Rojas, provincia de Buenos Aires. Ecologıa 1, 79–134.
Crespo, J.A., Sabattini, M.S., Piantanida, M.J., de Villafane, G., 1970. Estudiosecologicos sobre roedores silvestres, Observaciones sobre densidad, reprodu-cion y estructura de comunidades de roedores silvestres del sur de Cordoba.Ministerio de Bienestar Social, Republica Argentina.
de Villafane, G., Bonaventura, S.M., 1987. Ecological studies in crop fields of theendemic area of Argentine hemorrhagic fever. Calomys musculinus movementsin relation to habitat and abundance. Mammalia 51, 233–248.
de Villafane, G., Bonaventura, S.M., Bellocq, M.I., Percich, R.E., 1988. Habitatselection, social structure, density and predation in populations of cricetinerodents in the Pampa region of Argentina and the effects of agriculturalpractices on them. Mammalia 52, 340–359.
Dickman, D.R., Doncaster, C.P., 1989. The ecology of small mammals in urbanhabitats. II. Demography and dispersal. J. Anim. Ecol. 58, 119–127.
Ellis, B.A., Mills, J.N., Glass, G.E., McKee, K.T., Enrıa, D.A., Childs, J.E., 1998. Dietaryhabits of the common rodents in an agroecosystem in Argentina. J. Mammal.79, 1203–1220.
Ellis, B.A., Mills, J.N., Childs, J.E., Muzzini, M.C., McKee Jr, K.T., Enria, D.A., Glass, G.E.,1997. Structure and floristics of habitats associated with five rodent species inan agroecosystem in central Argentina. J. Zool. 243, 437–460.
El Mousadik, A., Petit, R.J., 1996. High level of genetic differentiation for allelicrichness among populations of the argan tree [Argania spinosa (L.) Skeels]endemic to Morocco. Theor. Appl. Genet. 92, 832–839.
Evanno, G., Regnaut, S., Goudet, J., 2005. Detecting the number of clusters ofindividuals using the software STRUCTURE: a simulation study. Mol. Ecol. 14,2611–2620.
M.B. Chiappero et al. / Mamm. biol. 76 (2011) 41–50 49

Author's personal copy
Falush, D., Stephens, M., Pritchard, J.K., 2003. Inference of population structure:extensions to linked loci and correlated allele frequencies. Genetics 164,1567–1587.
Frankham, R., 1995. Conservation genetics. Annu. Rev. Genet. 29, 305–327.Gerlach, G., Musolf, K., 2000. Fragmentation of landscape as a cause for genetic
segregation of bank vole populations. Conserv. Biol. 14, 1–10.Gomez, M.D., Priotto, J., Provensal, M.C., Steinmann, A., Castillo, E., Polop, J.J., 2008.
A population study of house mice (Mus musculus) inhabiting different habitatsin an Argentine urban area. Int. Biodeterior. Biodegrad. 62, 270–273.
Gonzalez Ittig, R.E., Gardenal, C.N., 2004. Recent range expansion and low levels ofcontemporary gene flow in Calomys musculinus: its relationship with theemergence and spread of Argentine hemorrhagic fever. Heredity 93, 535–541.
Goudet, J., 2001. FSTAT, a program to estimate and test gene diversities andfixation indices (version 2.9.3). Updated from: Goudet, J. 1995: FSTAT (vers.1.2): a computer program to calculate F-statistics. J. Hered. 86, 485–486.
Guillot, G., Leblois, R., Coulon, A., Frantz, A., 2009. Statistical methods in spatialgenetics. Mol. Ecol. 18, 4734–4756.
Hirota, T., Hirohata, T., Mashima, H., Sato, T., Obara, Y., 2004. Population structureof the large Japanese field mouse Apodemus speciosus (Rodentia: Muridae) insuburban landscape based on mitochondrial D-loop sequences. Mol. Ecol. 13,3275–3282.
Hitchings, S.P., Beebee, T.J.C., 1997. Genetic structuring as a result of barriers togene flow in urban Rana temporaria (common frog) populations: implicationsfor biodiversity conservation. Heredity 79, 117–127.
Hitchings, S.P., Beebee, T.J.C., 1998. Loss of genetic diversity and fitness in CommonToad (Bufo bufo) populations isolated by inimical habitat. J. Evol. Biol. 11,269–283.
Hutchison, D., Templeton, A.R., 1999. Correlation of pairwise genetic andgeographic distance measures: inferring the relative influences of gene flowand drift on the distribution of genetic variability. Evolution 53, 1898–1914.
InfoStat, 2008. InfoStat version 2008. Grupo InfoStat, FCA, Universidad Nacional deCordoba, Argentina.
Jakobsson, M., Rosenberg, N.A., 2007. CLUMPP: a cluster matching and permuta-tion program for dealing with label switching and multimodality in analysis ofpopulation structure. Bioinformatics 23, 1801–1806.
Jombart, T., 2008. Adegenet: a R package for the multivariate analysis of geneticmarkers. Bioinformatics 24, 1403–1405.
Jombart, T., Devillard, S., Dufour, A.-B., Pontier, D., 2008. Revealing cryptic spatialpatterns in genetic variability by a new multivariate method. Heredity 101,92–103.
Luniak, M., 2004. Synurbization - adaptation of animal wildlife to urbandevelopment. In: Shaw, W.W., Harris, L.K., Vandruff, L. (Eds.), Proceedings ofthe Fourth International Symposium on Urban Wildlife Conservation.University of Tucson, Arizona, pp. 50–55.
Manuel-Navarrete, D., Gallopın, G., Blanco, M., Dıaz-Zorita, M., Ferraro, D., Herzer,H., Laterra, P., Morello, J., Murmis, M.R., Pengue, W., Pineiro, M., Podesta, G.,Satorre, E.H., Torrent, M., Torres, F., Viglizzo, E., Caputo, M.G., Celis, A., 2005.Analisis sistemico de la agriculturizacion en la pampa humeda argentina y susconsecuencias en regiones extrapampeanas: sostenibilidad, brechas deconocimiento e integracion de polıticas. CEPAL—SERIE Medio ambiente ydesarrollo 118, 1–65.
Mech, S.G., Hallet, J.G., 2001. Evaluating the effectiveness of corridors: a geneticapproach. Conserv. Biol. 15, 467–474.
Merriam, G., Kozakiewicz, M., Tsuchiya, E., Hawley, K., 1989. Barriers as boundariesfor metapopulations and demes of Peromyscus leucopus in farm landscapes.Landsc. Ecol. 2, 227–235.
Merriam, G., Lanoue, A., 1990. Corridor use by small mammals: field measurement forthree experimental types of Peromyscus leucopus. Landscape Ecol. 4, 123–131.
Noel, S., Ouellet, M., Galois, P., Lapointe, F.-J., 2007. Impact of urban fragmentationon the genetic structure of the eastern red-backed salamander. Conserv. Genet.8, 599–606.
Nei, M., 1987. Molecular Evolutionary Genetics. Columbia University Press,New York.
Peakall, R., Smouse, P.E., 2006. GENALEX 6: genetic analysis in Excel. Populationgenetic software for teaching and research. Mol. Ecol. Notes 6, 288–295.
Pickett, S.T.A., Cadenasso, M.L., Grove, J.M., Nilon, C.H., Pouyat, R.V., Zipperer, W.C.,Costanza, R., 2001. Urban ecological systems: linking terrestrial ecological,physical and socioeconomic components of metropolitan areas. Ann. Rev. Ecol.Syst. 32, 127–157.
Poissant, J., Knight, T.W., Ferguson, M.M., 2005. Nonequilibrium conditionsfollowing landscape rearrangement: the relative contribution of past andcurrent hydrological landscapes on the genetic structure of a stream-dwellingfish. Mol. Ecol. 14, 1321–1331.
Pritchard, J.K., Stephens, M., Donnelly, P., 2000. Inference of population structureusing multilocus genotype data. Genetics 155, 945–959.
Queller, D.C., Goodnight, K.F., 1989. Estimating relatedness using genetic markers.Evolution 42, 258–275.
Raymond, M., Rousset, F., 2003. GENEPOP 3.4, updated version of: Raymond, M.,Rousset, F., 1995. GENEPOP (version 1.2): population genetics software forexact tests and ecumenicism. J. Hered. 86, 248–249.
Rice, W.R., 1989. Analysing tables of statistical tests. Evolution 43, 223–225.Rousset, F., 1997. Genetic differentiation and estimation of gene flow from
F-statistics under isolation by distance. Genetics 145, 1219–1228.Rousset, F., 2000. Genetic differentiation between individuals. J. Evol. Biol. 13,
58–62.Rosenberg, N.A., 2004. Distruct: a program for the graphical display of population
structure. Mol. Ecol. Notes 4, 137–138.Rosenberg, N.A., Pritchard, J.K., Weber, J.L., Cann, H.M., Kidd, K.K., Zhivotovsky, L.A.,
Feldman, M.W., 2002. Genetic structure of human populations. Science 298,2381–2385.
Ruefenacht, B., Knight, R.L., 1995. Influences of corridor continuity and width onsurvival and movement of deermice Peromyscus maniculatus. Biol. Conserv. 71,269–274.
Rutkowski, R., Rejt, L., Szczuka, A., 2006. Analysis of microsatellite polymorphismand genetic differentiation in urban and rural kestrels Falco tinnunculus (L). Pol.J. Ecol. 54, 473–480.
Slatkin, M., 1993. Isolation by distance in equilibrium and non equilibriumpopulations. Evolution 47, 264–279.
Steinmann, A.R., Priotto, J.W., Castillo, E.A., Polop, J.J., 2005. Size and overlap ofhome range in Calomys musculinus (Muridae: Sigmodontinae). Acta Theriol. 50,197–206.
van Oosterhout, C., Hutchinson, W.F., Wills, D.P.M., Shipley, P., 2004. MICRO-CHECKER (version 2.2.3): software for identifying and correcting genotypingerrors in microsatellite data. Mol. Ecol. Notes 4, 535–538.
Wandeler, P., Funk, S.M., Largiader, C.R., Gloor, S., Breitenmoser, U., 2003. Thecity-fox phenomenon: genetic consequences of a recent colonization of urbanhabitat. Mol. Ecol. 12, 647–656.
Walker, F.M., Sunnucks, P., Taylor, A.C., 2008. Evidence for habitat fragmentationaltering within-population processes in wombats. Mol. Ecol. 17, 1674–1684.
Weir, B.S., Cockerham, C.C., 1984. Estimating F-statistics for the analysis ofpopulation structure. Evolution 38, 1358–1370.
White, E., Sahota, R., Edes, C.C., 2002. Rapid microsatellite analysis usingdiscontinuous polyacrylamide gel electrophoresis. Genome 45, 1107–1109.
Whitlock, M.C., 1992. Temporal fluctuations in demographic parameters and thegenetic variance among populations. Evolution 46, 608–615.
Wright, S., 1951. The genetical structure of populations. Ann. Eugen. 15, 323–354.
M.B. Chiappero et al. / Mamm. biol. 76 (2011) 41–5050
Copyright © 2022 FDOKUMEN