
Phosphate bacterial solubilization: A key rhizosphere driving ...
G
T
Cp
La
b
a
ARRAA
KAPSS
1
cuppeistnofeamicBJwi
A
(
0d
ARTICLE IN PRESS Model
AL-12163; No. of Pages 7
Talanta xxx (2011) xxx– xxx
Contents lists available at ScienceDirect
Talanta
j ourna l ho me page: www.elsev ier .com/ locate / ta lanta
ontinuous flow method for the simultaneous determination ofhosphate/arsenate based on their different kinetic characteristics
aura Borgninoa,b, Valeria Pfaffenb, Pedro J. Depetrisa, Miriam Palomequea,∗
CICTERRA, Universidad Nacional de Córdoba, Ciudad Universitaria, 5000, Córdoba, ArgentinaINFIQC, Universidad Nacional de Córdoba, Ciudad Universitaria, 5000, Córdoba, Argentina
r t i c l e i n f o
rticle history:eceived 1 February 2011eceived in revised form 27 May 2011ccepted 1 June 2011vailable online xxx
a b s t r a c t
This paper proposes a new automated spectrophotometric method for the simultaneous determinationof phosphate and arsenate without pre-treatment, which is faster, simpler, less expensive and hazardousthan other well-known methods used with water samples. Such method is based on the different kineticcharacteristics of complex formation of phosphate and arsenate with ammonium molybdate. A flow
eywords:rsenatehosphatetopped-flow
system was used in order to achieve good mixing and to provide precise time control. All the measure-ments were performed at the isosbestic point wavelength (885 nm). Chemical variables were optimizedby factorial design (ammonium molybdate 0.015 mol L−1, potassium antimony tartrate 1 × 10⁻⁴ mol L−1,and sulphuric acid 0.7 mol L−1). An appropriate linear range for both analytes (0.50–8.00 �mol L−1), goodinter-day reproducibility (4.9% [P] and 3.3% [P + As]) and a sample throughput of 6 h−1 were obtained.
.4 �m −1 −1
pectrophotometry The detection limits are 0. Introduction
Arsenic and phosphorus are very important in aquatic geo-hemistry and sediment–water interface sciences because they aresually involved in processes related to water contamination. Phos-horus is an essential nutrient for the aquatic biota and limits itsrimary productivity [1]. Although it is not toxic, an overload accel-rates eutrophication [2] and impairs water quality [1]. Phosphoruss released into the aquatic environment mainly by anthropogenicources (industrial, agricultural, and mining activities). Arsenic, onhe other hand, is not only toxic but also carcinogenic, and bothatural and anthropogenic sources are responsible for high levelsf it which contaminate the environment [3,4]. It can be found inood, water, and air in organic and inorganic form [5] and it canxist in several oxidation states (−3, 0, +3 and +5) [6–8]. Inorganicrsenic species occur as arsenite and arsenate, the former beinguch more toxic [6] and predominant under anaerobic (reduc-
ng) conditions, while arsenate is stable under aerobic (oxidizing)onditions [3,7]. In recent years, many countries (e.g. China, Chile,angladesh, Taiwan, Mexico, Argentina, Poland, Canada, Hungary,
Please cite this article in press as: L. Borgnino, et al., Talanta (2011), doi:10
apan, and India) have reported high concentrations of arsenate inater, soil and sediments [7,9]. Long-term consumption of drink-
ng water contaminated with arsenate is a major threat to human
∗ Corresponding author at: FCEFyN UNC, Av Vélez Sarsfield 1611, 5016, Córdoba,rgentina. Tel.: +54 351 4693555; fax: +54 351 4334139.
E-mail addresses: [email protected], [email protected]. Palomeque).
039-9140/$ – see front matter © 2011 Elsevier B.V. All rights reserved.oi:10.1016/j.talanta.2011.06.001
ol L P and 0.19 �mol L [P + As] (3.3 Sy/x). The method was validated.© 2011 Elsevier B.V. All rights reserved.
health since it has been reported to cause skin, lung, kidney, andliver cancer [3,6].
Although food, which mainly contains organic forms of arsen-ate, is the main source of arsenate exposure, its toxicity in drinkingwater is more significant due to the high levels of inorganic speciesthat can be present. The US EPA regulation requires the concentra-tion of inorganic arsenate in drinking water to be below 10 �g L−1,which demands more accurate and sensitive analytical techniques.So far, hydride generation atomic absorption spectrophotome-try (HG-AAS), inductively-coupled plasma (ICP), graphite furnace(ETAAS), and ICP mass spectrometry (MS) are the most accuratelaboratory instrumentation suitable for arsenate measurement inwater, with detection limits that could well satisfy the US EPArequirements. However, this instrumentation is very expensive andnot always available in routine laboratories. On the other hand, thecolorimetric molybdenum blue method (standard method) is sim-ple and only requires a photometer, but it is not suitable for thedetermination of arsenate at trace levels. Thus, there is a pressingneed for affordable, simple methods with low limits of detection inorder to determine arsenate at low level concentrations in accor-dance with stringent EPA requirements.
The molybdenum blue method is well-established for deter-mining inorganic arsenate and phosphate in solution, and it hasbeen broadly used [10]. However, arsenate determination by thismethod has the disadvantage of requiring around 1 h for color
.1016/j.talanta.2011.06.001
development of the arsenate–molybdate complex. Furthermore,arsenate/phosphate mixtures cannot be quantified simultaneouslybecause both species exhibit the same behavior and interferewith each other. For this reason, several modifications of the
IN PRESSG Model
T
2 lanta xxx (2011) xxx– xxx
mLpstiporwmsmarLtcbeaprs[drm
sfoopaoo
2
2
Hq
ar
w(aw
t
2
a(tas
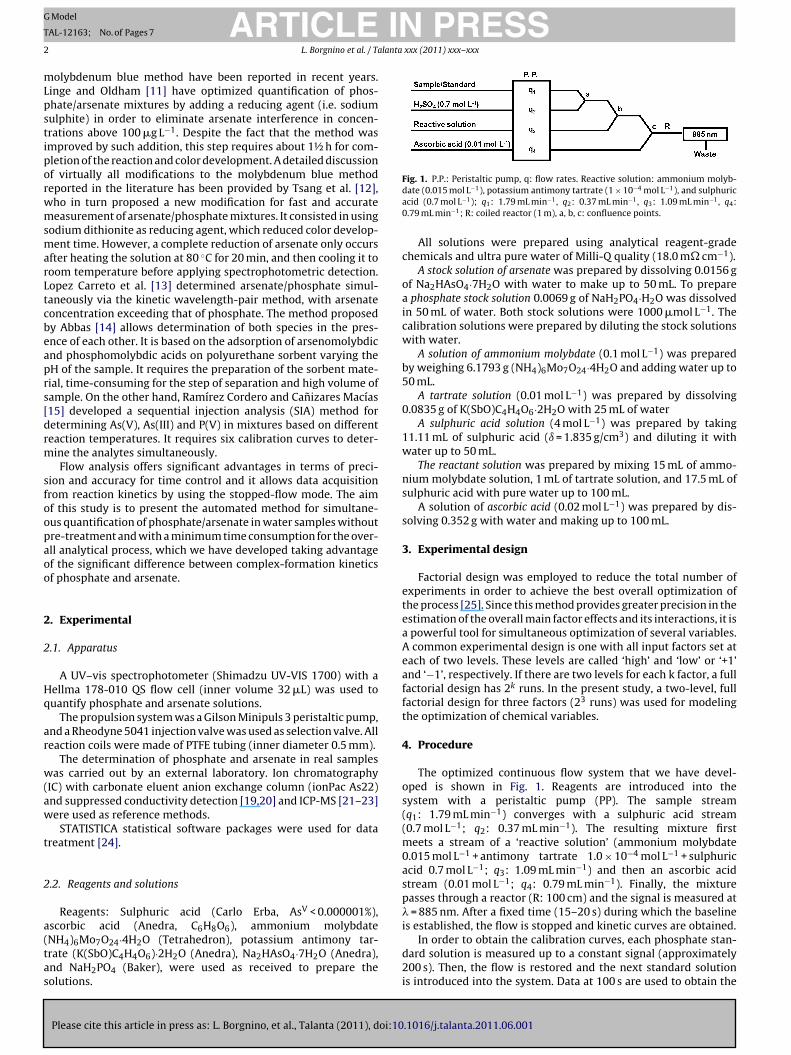
Fig. 1. P.P.: Peristaltic pump, q: flow rates. Reactive solution: ammonium molyb-
ARTICLEAL-12163; No. of Pages 7
L. Borgnino et al. / Ta
olybdenum blue method have been reported in recent years.inge and Oldham [11] have optimized quantification of phos-hate/arsenate mixtures by adding a reducing agent (i.e. sodiumulphite) in order to eliminate arsenate interference in concen-rations above 100 �g L−1. Despite the fact that the method wasmproved by such addition, this step requires about 1½ h for com-letion of the reaction and color development. A detailed discussionf virtually all modifications to the molybdenum blue methodeported in the literature has been provided by Tsang et al. [12],ho in turn proposed a new modification for fast and accurateeasurement of arsenate/phosphate mixtures. It consisted in using
odium dithionite as reducing agent, which reduced color develop-ent time. However, a complete reduction of arsenate only occurs
fter heating the solution at 80 ◦C for 20 min, and then cooling it tooom temperature before applying spectrophotometric detection.opez Carreto et al. [13] determined arsenate/phosphate simul-aneously via the kinetic wavelength-pair method, with arsenateoncentration exceeding that of phosphate. The method proposedy Abbas [14] allows determination of both species in the pres-nce of each other. It is based on the adsorption of arsenomolybdicnd phosphomolybdic acids on polyurethane sorbent varying theH of the sample. It requires the preparation of the sorbent mate-ial, time-consuming for the step of separation and high volume ofample. On the other hand, Ramírez Cordero and Canizares Macías15] developed a sequential injection analysis (SIA) method foretermining As(V), As(III) and P(V) in mixtures based on differenteaction temperatures. It requires six calibration curves to deter-ine the analytes simultaneously.Flow analysis offers significant advantages in terms of preci-
ion and accuracy for time control and it allows data acquisitionrom reaction kinetics by using the stopped-flow mode. The aimf this study is to present the automated method for simultane-us quantification of phosphate/arsenate in water samples withoutre-treatment and with a minimum time consumption for the over-ll analytical process, which we have developed taking advantagef the significant difference between complex-formation kineticsf phosphate and arsenate.
. Experimental
.1. Apparatus
A UV–vis spectrophotometer (Shimadzu UV-VIS 1700) with aellma 178-010 QS flow cell (inner volume 32 �L) was used touantify phosphate and arsenate solutions.
The propulsion system was a Gilson Minipuls 3 peristaltic pump,nd a Rheodyne 5041 injection valve was used as selection valve. Alleaction coils were made of PTFE tubing (inner diameter 0.5 mm).
The determination of phosphate and arsenate in real samplesas carried out by an external laboratory. Ion chromatography
IC) with carbonate eluent anion exchange column (ionPac As22)nd suppressed conductivity detection [19,20] and ICP-MS [21–23]ere used as reference methods.
STATISTICA statistical software packages were used for datareatment [24].
.2. Reagents and solutions
Reagents: Sulphuric acid (Carlo Erba, AsV < 0.000001%),scorbic acid (Anedra, C6H8O6), ammonium molybdate
Please cite this article in press as: L. Borgnino, et al., Talanta (2011), doi:10
NH4)6Mo7O24·4H2O (Tetrahedron), potassium antimony tar-rate (K(SbO)C4H4O6)·2H2O (Anedra), Na2HAsO4·7H2O (Anedra),nd NaH2PO4 (Baker), were used as received to prepare theolutions.
date (0.015 mol L−1), potassium antimony tartrate (1 × 10⁻⁴ mol L−1), and sulphuricacid (0.7 mol L−1); q1: 1.79 mL min−1, q2: 0.37 mL min−1, q3: 1.09 mL min−1, q4:0.79 mL min−1; R: coiled reactor (1 m), a, b, c: confluence points.
All solutions were prepared using analytical reagent-gradechemicals and ultra pure water of Milli-Q quality (18.0 m� cm−1).
A stock solution of arsenate was prepared by dissolving 0.0156 gof Na2HAsO4·7H2O with water to make up to 50 mL. To preparea phosphate stock solution 0.0069 g of NaH2PO4·H2O was dissolvedin 50 mL of water. Both stock solutions were 1000 �mol L−1. Thecalibration solutions were prepared by diluting the stock solutionswith water.
A solution of ammonium molybdate (0.1 mol L−1) was preparedby weighing 6.1793 g (NH4)6Mo7O24·4H2O and adding water up to50 mL.
A tartrate solution (0.01 mol L−1) was prepared by dissolving0.0835 g of K(SbO)C4H4O6·2H2O with 25 mL of water
A sulphuric acid solution (4 mol L−1) was prepared by taking11.11 mL of sulphuric acid (ı = 1.835 g/cm3) and diluting it withwater up to 50 mL.
The reactant solution was prepared by mixing 15 mL of ammo-nium molybdate solution, 1 mL of tartrate solution, and 17.5 mL ofsulphuric acid with pure water up to 100 mL.
A solution of ascorbic acid (0.02 mol L−1) was prepared by dis-solving 0.352 g with water and making up to 100 mL.
3. Experimental design
Factorial design was employed to reduce the total number ofexperiments in order to achieve the best overall optimization ofthe process [25]. Since this method provides greater precision in theestimation of the overall main factor effects and its interactions, it isa powerful tool for simultaneous optimization of several variables.A common experimental design is one with all input factors set ateach of two levels. These levels are called ‘high’ and ‘low’ or ‘+1’and ‘−1’, respectively. If there are two levels for each k factor, a fullfactorial design has 2k runs. In the present study, a two-level, fullfactorial design for three factors (23 runs) was used for modelingthe optimization of chemical variables.
4. Procedure
The optimized continuous flow system that we have devel-oped is shown in Fig. 1. Reagents are introduced into thesystem with a peristaltic pump (PP). The sample stream(q1: 1.79 mL min−1) converges with a sulphuric acid stream(0.7 mol L−1; q2: 0.37 mL min−1). The resulting mixture firstmeets a stream of a ‘reactive solution’ (ammonium molybdate0.015 mol L−1 + antimony tartrate 1.0 × 10⁻⁴ mol L−1 + sulphuricacid 0.7 mol L−1; q3: 1.09 mL min−1) and then an ascorbic acidstream (0.01 mol L−1; q4: 0.79 mL min−1). Finally, the mixturepasses through a reactor (R: 100 cm) and the signal is measured at� = 885 nm. After a fixed time (15–20 s) during which the baselineis established, the flow is stopped and kinetic curves are obtained.
.1016/j.talanta.2011.06.001
In order to obtain the calibration curves, each phosphate stan-dard solution is measured up to a constant signal (approximately200 s). Then, the flow is restored and the next standard solutionis introduced into the system. Data at 100 s are used to obtain the

ARTICLE IN PRESSG Model
TAL-12163; No. of Pages 7
L. Borgnino et al. / Talanta xxx (2011) xxx– xxx 3
Table 1Factorial design matrix for three variables and experimental absorbance values.
Experiment Replicate A B C Absorbance � (nm)a
1 1 −1 −1 −1 0.116 8332 1 +1 −1 −1 0.118 8413 1 −1 +1 −1 0.000 –4 1 +1 +1 −1 0.000 –5 1 −1 −1 +1 0.081 8306 1 +1 −1 +1 0.000 –7 1 −1 +1 +1 0.124 8668 1 +1 +1 +1 0.128 8889 2 −1 −1 −1 0.110 833
10 2 +1 −1 −1 0.115 84111 2 −1 +1 −1 0.000 –12 2 +1 +1 −1 0.000 –13 2 −1 −1 +1 0.084 83014 2 +1 −1 +1 0.000 –15 2 −1 +1 +1 0.127 86616 2 +1 +1 +1 0.130 888
T
im(
m5ptir
5
dtacc
5
phisapl
TA
he experiments were randomly performed.a Isosbestic point wavelengths.
ndividual phosphate (P) calibration curve, while data at a maxi-um absorbance value are considered for phosphate plus arsenate
P + As).When real samples are introduced into the system, the signal is
easured for more than 600 s after stopping the flow (see Section.4), because this is the minimum time needed to obtain a com-lete color development for the molybdoarsenate complex. Thus,he absorbance measured at 100 s and that measured after reach-ng constant value are considered for determining P and (P + As),espectively, by using the corresponding calibration curves.
. Results and discussion
The proposed method was based on the formation of molyb-oarsenate and molybdophosphate complexes, taking into accountheir kinetic characteristics. Our interest was the development of anutomated system for simultaneous determination of both chemi-al species, without sample pre-treatment and with minimum timeonsumption.
.1. Selection of flow manifold
Configuration of the flow injection system was tested using ahosphate standard solution since phosphate has a reaction rateigher than that of arsenate. In this case, a standard volume was
njected into a sulphuric acid carrier solution. After mixing, this
Please cite this article in press as: L. Borgnino, et al., Talanta (2011), doi:10
olution merged first with a stream of reactant solution in a reactor,nd then with ascorbic acid in a second reactor, where the com-lex was formed. Different sample volumes, flow rates, and reactor
engths were analyzed, but no signal improvement was observed.
able 2nalysis of variance for absorbance with Table 1 data.
Factor Sum ofsquares (SS)
Degrees offreedom (d.f.)
A 0.001482 1
B 0.000992 1
C 0.002500 1
A × B 0.001681 1
A × C 0.001640 1
B × C 0.040602 1
A × B × C 0.001849 1
Error 0.000004 8
Total SS 0.050751 15
a Significant factor at p < 0.05.
Best reproducibility, enhanced signal intensity, and a lowerlimit of detection were attained with a continuous flow systemdesign, as shown in Fig. 1. By using this system, an appropriate andreproducible time control was achieved, allowing the stopped-flowmode to be applied. Bearing in mind that the sample is continu-ously introduced, the system was designed to maintain the orderof reagent addition reported as optimal in a previous work [12].The optimization of chemical variables was carried out under theseconditions (see below).
5.2. Influence of chemical and hydrodynamic variables
Phosphate and arsenate have similar physical and chemicalproperties. They are usually found together in water, phos-phate commonly occurring at higher concentrations than arsenate.Besides, both anions can develop molybdophosphate and molyb-doarsenate complexes with similar characteristics, but differentcomplex-formation kinetics (i.e. under the same experimental con-ditions [12,16], the kinetics of phosphate complex-formation isfaster than that of arsenate). In the developed procedure, the con-centration of reagents involved in the ‘reactive solution’ has asignificant dependence on their concentration ratio and on arsenateand phosphate concentration in solution, so they will have an influ-ence on the color development rate, the stability of the complexes,etc. Their concentrations, as well as that of the other reagentsin the system, were optimized together using chemometric tools.The study was first carried out by applying a 24 factorial design
.1016/j.talanta.2011.06.001
[24] which considered the following factors: ascorbic acid, ammo-nium molybdate, potassium antimony tartrate, and sulphuric acidconcentration. The ascorbic acid concentration did not have anysignificant effect on color development, as previously reported
Mean squares(MS)
F ratio p levela
0.001482 2964.50 0.0000.000992 1984.50 0.0000.002500 5000.00 0.0000.001681 3362.00 0.0000.001640 3280.50 0.0000.040602 81204.50 0.0000.001849 3698.00 0.0000.000001 0.000
0.000
ARTICLE IN PRESSG Model
TAL-12163; No. of Pages 7
4 L. Borgnino et al. / Talanta xxx (2011) xxx– xxx
ifican
[(iaatbbEc0madssaefpaiotHt0b
t(rhcwmto
Table 3. Large variations in flow variables around the original valuesproduced significant changes in the reagent concentration ratio andthe appearance of a precipitate. Thus, using the selected conditions,the working wavelength was 885 nm (Fig. 3 – inset).
Table 3Studied range of flow variables and their optimum values.
Variable Studiedvariable range
Optimum valueof variable
q1 (mL min−1) 1.00–2.00 1.79q2 (mL min−1) 0.2–1.00 0.37q (mL min−1) 0.5–1.50 1.09
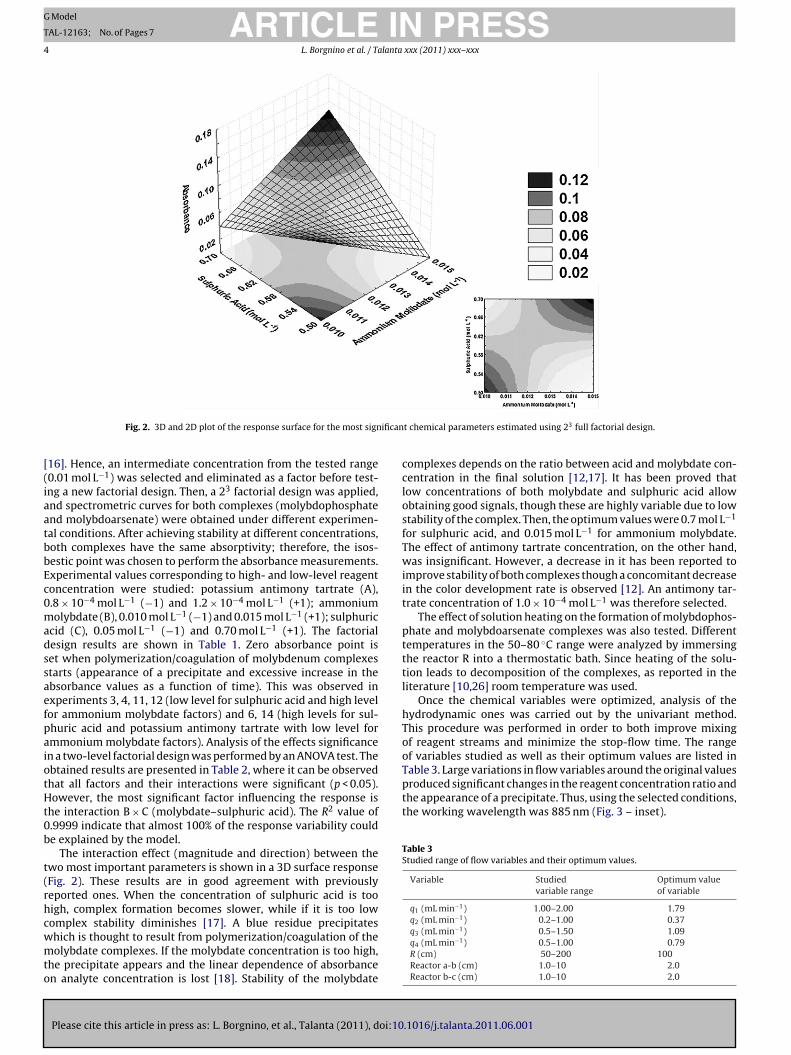
Fig. 2. 3D and 2D plot of the response surface for the most sign
16]. Hence, an intermediate concentration from the tested range0.01 mol L−1) was selected and eliminated as a factor before test-ng a new factorial design. Then, a 23 factorial design was applied,nd spectrometric curves for both complexes (molybdophosphatend molybdoarsenate) were obtained under different experimen-al conditions. After achieving stability at different concentrations,oth complexes have the same absorptivity; therefore, the isos-estic point was chosen to perform the absorbance measurements.xperimental values corresponding to high- and low-level reagentoncentration were studied: potassium antimony tartrate (A),.8 × 10−4 mol L−1 (−1) and 1.2 × 10⁻⁴ mol L−1 (+1); ammoniumolybdate (B), 0.010 mol L−1 (−1) and 0.015 mol L−1 (+1); sulphuric
cid (C), 0.05 mol L−1 (−1) and 0.70 mol L−1 (+1). The factorialesign results are shown in Table 1. Zero absorbance point iset when polymerization/coagulation of molybdenum complexestarts (appearance of a precipitate and excessive increase in thebsorbance values as a function of time). This was observed inxperiments 3, 4, 11, 12 (low level for sulphuric acid and high levelor ammonium molybdate factors) and 6, 14 (high levels for sul-huric acid and potassium antimony tartrate with low level formmonium molybdate factors). Analysis of the effects significancen a two-level factorial design was performed by an ANOVA test. Thebtained results are presented in Table 2, where it can be observedhat all factors and their interactions were significant (p < 0.05).owever, the most significant factor influencing the response is
he interaction B × C (molybdate–sulphuric acid). The R2 value of.9999 indicate that almost 100% of the response variability coulde explained by the model.
The interaction effect (magnitude and direction) between thewo most important parameters is shown in a 3D surface responseFig. 2). These results are in good agreement with previouslyeported ones. When the concentration of sulphuric acid is tooigh, complex formation becomes slower, while if it is too lowomplex stability diminishes [17]. A blue residue precipitates
Please cite this article in press as: L. Borgnino, et al., Talanta (2011), doi:10
hich is thought to result from polymerization/coagulation of theolybdate complexes. If the molybdate concentration is too high,
he precipitate appears and the linear dependence of absorbancen analyte concentration is lost [18]. Stability of the molybdate
t chemical parameters estimated using 23 full factorial design.
complexes depends on the ratio between acid and molybdate con-centration in the final solution [12,17]. It has been proved thatlow concentrations of both molybdate and sulphuric acid allowobtaining good signals, though these are highly variable due to lowstability of the complex. Then, the optimum values were 0.7 mol L−1
for sulphuric acid, and 0.015 mol L−1 for ammonium molybdate.The effect of antimony tartrate concentration, on the other hand,was insignificant. However, a decrease in it has been reported toimprove stability of both complexes though a concomitant decreasein the color development rate is observed [12]. An antimony tar-trate concentration of 1.0 × 10⁻⁴ mol L−1 was therefore selected.
The effect of solution heating on the formation of molybdophos-phate and molybdoarsenate complexes was also tested. Differenttemperatures in the 50–80 ◦C range were analyzed by immersingthe reactor R into a thermostatic bath. Since heating of the solu-tion leads to decomposition of the complexes, as reported in theliterature [10,26] room temperature was used.
Once the chemical variables were optimized, analysis of thehydrodynamic ones was carried out by the univariant method.This procedure was performed in order to both improve mixingof reagent streams and minimize the stop-flow time. The rangeof variables studied as well as their optimum values are listed in
.1016/j.talanta.2011.06.001
3
q4 (mL min−1) 0.5–1.00 0.79R (cm) 50–200 100Reactor a-b (cm) 1.0–10 2.0Reactor b-c (cm) 1.0–10 2.0

ARTICLE IN PRESSG Model
TAL-12163; No. of Pages 7
L. Borgnino et al. / Talanta xxx (2011) xxx– xxx 5
Table 4Effect of possible interferents on the signal of total concentration for P + As(2.5 �mol L−1).
Interferent Amount (mg L−1) Error %
Na+ 150 4.2K+ 146 2.3Ca2+ 120 2.7Mg2+ 30 1.7Cr6+ 0.2 4.2Cl− 230 −3.9F− 2 1.6SO4
2− 300 2.5NO3
− 1 −2.0NO2
− 0.3 −3.1Si 25 4.8
Table 5Comparison of slopes at 100 s.
Samples Slopes of standardaddition methodcalibration
|tcalculated value|
A 0.00436 ± 0.00002 0.95B 0.00376 ± 0.00036 0.47C 0.00355 ± 0.00063 0.81D 0.00395 ± 0.00028 0.00
S
5
osFlwmm6lcf
5
d
F8l
studied. On the other hand, an increment in the signal is observed at120 and 600 s as arsenate concentration increases. Then, phosphatecould well be determined until 100 s without arsenate interfer-
E 0.00382 ± 0.00155 0.00
lope of the calibration curve at 100 s: 0.00392 (±0.00010); t(4,� = 5%) = 2.776.
.3. Kinetic characteristics of the complex-formation reactions
Using the above-mentioned operational conditions, it wasbserved that phosphate develops the molybdophosphate complexignificantly faster than arsenate, as previously reported [12,16].or this reason, absorbance vs. time curves from different ana-yte concentrations were carried out, beginning from the moment
hen the flow system is stopped (Fig. 3). As it can be seen, theolybdophosphate complex reaches signal stability at approxi-ately 200 s, while the molybdoarsenate complex does so at above
00 s. In both cases, the maximum signal reached at the same ana-yte concentration has the same absorbance value. This fact allowedalibration curves to be obtained using only phosphate standardsor the determination of both analytes.
.4. Analytical application
Please cite this article in press as: L. Borgnino, et al., Talanta (2011), doi:10
In order to eliminate the interference of arsenate in phosphateetermination, some reducing agents were used to pre-treat the
ig. 3. Kinetic curves from: blank (grey line), As 1 �mol L−1 (dotted line), As �mol L−1 (black line), P 1 �mol L−1 (dash-dot line) and P 8 �mol L−1 (dashed grey
ine).
Fig. 4. Absorbance values of solutions measured at different times and As:P con-centration ratios (P concentrations: 1, 2, and 3 �mol L−1) and under optimumexperimental conditions.
sample. Since this resulted in a very tedious and time-consumingprocedure, we decided to perform a simultaneous determination ofboth analytes without sample pre-treatment, taking advantage ofthe significant differences in the complex-formation kinetics andconsidering reproducible time control with flow systems.
The difference between both signals depends on the concen-tration ratio between the analytes. While the molybdophosphatecomplex formation is detected from the moment when the sys-tem flow is stopped, the molybdoarsenate complex signal beginsto be significant at 120 s, in relation to the molybdophosphatecomplex signal at the same time. For this reason, kinetic curveswere performed according to the above-mentioned procedure,and absorbance values at 80, 100, 120 and 600 s were obtained.Solutions at three different phosphate concentrations (1, 2 and3 �mol L−1) and increasing concentrations of arsenate on each onewere prepared. Fig. 4 depicts the absorbance vs. concentration ratiocurves. From the comparison between them, it is clear that datacorresponding to 80 and 100 s are constant for all the As:P ratios
.1016/j.talanta.2011.06.001
Fig. 5. Kinetic curves obtained by using the flow system proposed (standard concen-trations: 0.5; 1.0; 2.0; 3.0; 5.0; and 8.0 �mol L−1) in order to obtain the calibrationcurves. Inset: calibration curves obtained by using measurements from the kineticcurves at 100 s and 200 s.

ARTICLE ING Model
TAL-12163; No. of Pages 7
6 L. Borgnino et al. / Talanta
Table 6Comparison of slopes at 600 s.
Samples Slopes of standardaddition methodcalibration
|tcalculated value|
A 0.00774 ± 0.00181 0.26B 0.00782 ± 0.00140 0.33C 0.00726 ± 0.00118 0.58D 0.00759 ± 0.00079 0.00
S
eigi
pf(AARob(
TP
t
E 0.00798 ± 0.00002 0.11
lope of the calibration curve at 600 s: 0.00758 (±0.00011); t(4,� = 5%) = 2.776.
nce, thus maximizing analytical sensitivity and minimizing errorn phosphate quantification. Phosphate concentration in nature isenerally higher than that of arsenate; then, the latter would notnterfere in phosphate determination at 100 s.
The calibration curves for P and P + As were obtained using phos-hate standards at different concentration values. Kinetic curvesor each standard were recorded until the signal was constantFig. 5). The linear range for simultaneous determination of P ands was 0.50–8.00 �mol L−1. The calibration curve at 100 s was
= 0.00392 (±0.00013) [�mol L−1 X] + 0.00505 (±0.00052), n = 12,2 −1
Please cite this article in press as: L. Borgnino, et al., Talanta (2011), doi:10
= 0.996, detection limit (LOD) = 0.4 �mol L (3.3 Sy/x), allowingnly P determination. When the signal was constant, the cali-ration curve was A = 0.00758 (±0.00011) [�mol L−1 X] + 0.01431±0.00043), n = 12, R2 = 0.999 with a LOD of 0.19 �mol L−1 (3.3 Sy/x)
able 7 and As determination in real samples. Study of recovery using the same samples.
Samplea Amount (�mol L−1)
Added Found ± SDb
(P + As) Proposed method
100 s (P) 600 s (P +
A 0 0.52 ± 0.04 0.58 ± 0B 0 0.51 ± 0.04 0.51 ± 0C 0 0.55 ± 0.06 0.58 ± 0D 0 0.58 ± 0.06 0.60 ± 0E-I 0 n.d. n.d.
J 0 3.01 ± 0.03 5.27 ± 0K 0 1.73 ± 0.04 2.94 ± 0
Amount (�mol L−1)
Added Recovery ± SDb
(P + As) 100 s
A 1.50 + 1.02 1.55 ± 0.08
B 1.50 + 1.02 1.43 ± 0.09
C 1.50 + 1.02 1.56 ± 0.06
D 1.50 + 1.02 1.50 ± 0.07
E 1.50 + 1.02 1.52 ± 0.08
F 1.50 + 1.02 1.51 ± 0.09
J 1.00 + 1.02 0.96 ± 0.08
K 1.50 + 1.02 1.46 ± 0.05
A 2.50 + 1.53 2.38 ± 0.04
B 2.50 + 1.53 2.58 ± 0.06
C 2.50 + 1.53 2.32 ± 0.07
D 2.50 + 1.53 2.50 ± 0.05
E 2.50 + 1.53 2.48 ± 0.03
K 2.50 + 1.53 2.52 ± 0.03
B 3.00 + 1.02 2.90 ± 0.04
C 3.00 + 1.02 2.83 ± 0.05
G 3.00 + 1.02 2.96 ± 0.04
H 3.00 + 1.02 3.20 ± 0.06
I 3.00 + 1.02 3.10 ± 0.05
a A–D: well water samples from different points of the city of Cordoba, E–I: river waterhe city of Coronel Pringles, both samples from the province of Buenos Aires, Argentina.
b Standard deviation n = 3; n.d.: not detected.c Results by using IC (P: LOD 150 �g L−1 ∼ 4.7 �mol L−1).d Values obtained by using ICP-MS (As: LOD 0.03 �g L−1 ∼ 4 × 10⁻⁴ �mol L−1).
PRESS xxx (2011) xxx– xxx
allowing determination of the total P + As content. The inter-dayreproducibility (RSD %) was estimated by running six inde-pendent calibration curves under different conditions (standardsolution, reagent solution, etc.) on different days. The mean slopeswere 0.00392 (±0.00019) [RSD = 4.9%], and 0.00763 (±0.00026)[RSD = 3.3%], respectively (n = 6 calibration curves) and a samplethroughput of 6 h−1 was obtained.
5.5. Validation and application to real samples
The effect of ions commonly present in natural water sampleswas evaluated. No interference was found (relative error < 5% on thesignal) for 1.5 �mol L−1 P + 1.0 �mol L−1 As standards over a totalconcentration of P + As [�mol L−1] (Table 4).
Matrix interferences can be evaluated by comparing the slopesfor the standard addition curve on real samples with the cali-bration curve. If the matrix does not interfere, both lines musthave the same slope. For standard addition, potable water andriver water samples filtered with a 0.45 �m-filter to remove par-ticulate matter were used. The total dissolved solids (TDS) wereless than 3000 mg L−1 for all the samples used, depending ontheir origin. Tables 5 and 6 show the slopes obtained for 5 stan-
.1016/j.talanta.2011.06.001
dard addition curves for different samples (A–E) at 100 and 600 s,respectively. The slopes were compared with the calibration curveslope by the “t” test [27] and no statistical differences were found(tcalculate value < t(4,� = 0.05)), indicating the absence of a matrix effect.
Reference methods
As) As Phosphorusc Arsenicd
.03 n.d. n.d. 0.13
.02 n.d. n.d. 0.11
.04 n.d. n.d. 0.09
.01 n.d. n.d. 0.06n.d. n.d. <0.02
.01 2.26 n.d. 2.32
.03 1.21 n.d. 1.14
Recovery %
600 s P As
2.47 ± 0.02 103.3 92.12.40 ± 0.03 95.3 95.12.54 ± 0.03 104.0 96.12.40 ± 0.04 100.0 88.22.53 ± 0.01 101.3 98.02.54 ± 0.02 100.6 101.02.02 ± 0.00 96.0 103.92.49 ± 0.01 97.3 100.14.06 ± 0.01 95.2 112.03.99 ± 0.00 103.2 92.23.80 ± 0.04 92.8 98.74.07 ± 0.03 100.0 104.73.96 ± 0.01 99.2 98.74.10 ± 0.00 100.8 97.43.90 ± 0.01 96.7 98.03.93 ± 0.00 94.3 107.84.01 ± 0.02 98.7 102.94.19 ± 0.00 106.7 97.04.19 ± 0.01 103.3 106.8
; J: well water sample from the city of Bahía Blanca and K: well water sample from
ING Model
T
lanta
wptccptmfwdtpam
eit
ttp
6
ppIamthwparaana
[[[[
[[[[[[[
[
[
[[[
ARTICLEAL-12163; No. of Pages 7
L. Borgnino et al. / Ta
The results obtained via the developed method were comparedith those obtained in an external laboratory (methods used: IC (forhosphate determination) and ICP-MS (for arsenate determina-ion) (Table 7). It can be observed that, in these samples, phosphateould not be determined by using the reference method because itsoncentration was below the corresponding detection limit. Sam-les A–D showed the same signals at 100 s and at 600 s, indicatinghat only phosphate could be determined in them by the proposed
ethod. Moreover, samples E–I, did not show significant signalsor both analytes. For samples A–I, though arsenate concentrationas below the detection limit, it could not be determined by theeveloped method. This is consistent with the results obtained viahe reference method for arsenate determination. However, bothhosphate and arsenate were detected in samples J and K, and thersenic concentration agrees with that obtained by the referenceethod.On the other hand, the same samples were spiked and the recov-
ry percentages were obtained (Table 7) which were satisfactoryndicating that the proposed method is appropriate to be appliedo these kinds of samples.
For the above-exposed findings, the recovery percentages andhe standard addition method allowed discarding proportional sys-ematic errors, and therefore the accuracy of this methodology wasroved.
. Conclusions
In relation to other methodology for the measurement of phos-hate/arsenate mixtures cited in the literature [10–14], the methodroposed in the present work offers some significant advantages.
t is readily applicable to natural water samples and it is fasternd simpler, since no pre-treatment is necessary before the for-ation of the colored complex with ammonium molybdate. Thus,
he time of the total analytical process is minimized. Besides, itas good sensitivity and reproducibility since the detection limitas improved as compared with other flow methodology [15]. Itsrecision and linear range is appropriate for phosphate and arsen-te determination in natural water samples. Finally, its very loweagent consumption and minimal waste make it more afford-
Please cite this article in press as: L. Borgnino, et al., Talanta (2011), doi:10
ble and less hazardous than other known methods. Because ofll these features we can definitely propose it as quite a conve-ient method for the simultaneous determination of phosphate andrsenate.
[[
PRESS xxx (2011) xxx– xxx 7
Acknowledgements
The authors wish to acknowledge CONICET and SeCyT-UNC forfinancial support. L.B. and P.D. are members of CICyT in ArgentinaısCONICET. VP thanks CONICET for the scholarships granted. We areespecially grateful to P.I. Ortiz for her helpful suggestions whichimproved this manuscript. Language assistance by translator Ms.Karina Plasencia is gratefully acknowledged.
References
[1] R. Pourriot, M. Meybeck, Limnologie Générale, Masson, Paris, 1995.[2] J. Hilton, M. O’Hare, M.J. Bowes, J.I. Jones, Sci. Total Environ. 365 (2006) 66.[3] United States Environmental Protection Agency, UESPA, 1999, Doc. EPA 815-P-
01-001.[4] D. Mohan, C.U. Pittmant, J. Hazard. Mater. 142 (2007) 1.[5] P.L. Smedley, D.G. Kinniburgh, Appl. Geochem. 17 (2001) 517.[6] L. Ebdon, L. Pitts, R. Cornelis, H. Crews, O.F.X. Donard, Ph. Quevauviller (Eds.),
Trace Element Speciation For Environmental, Food and Health, Royal Societyof Chemistry, Cambridge, 2001.
[7] B.K. Mandaland, K.T. Suzuki, Talanta 58 (2002) 201.[8] World Health Organization, Guidelines for Drinking-water Quality [electronic
resource]: Incorporating First Addendum, vol.1, Recommendations, third ed.,2006.
[9] J.D. Paoloni, M.E. Sequeira, C.E. Fiorentino, J. Environ. Health 67 (2005) 50.10] V. Lenoble, V. Deluchat, B. Serpaud, J.-C. Bollinger, Talanta 61 (2003) 267.11] K.L. Linge, C.E. Oldham, Anal. Chim. Acta 450 (2001) 247.12] S. Tsang, F. Phu, M.M. Baum, G.A. Poskrebyshev, Talanta 71 (2007) 1560.13] Lopez Carreto, D. Sicilia, S. Rubio, D. Perez-Bendito, Anal. Chim. Acta 283 (1993)
481.14] M.N.D. Abbas, Anal. Lett. 36 (2003) 1231.15] B.E. Ramírez Cordero, M.P. Canizares Macías, Talanta (2009) 1069.16] S. Blomqvist, K. Hjellstrom, A. Sjosten, Int. J. Environ. Anal. Chem. 54 (1993) 31.17] R.E. Stauffer, Anal. Chem. 55 (1983) 1205.18] T. Liu, E. Diemann, H. Li, A.W.M. Dress, A. Muller, Nature 426 (2003) 59.19] V. Ruiz-Calero, M.T. Galceran, Talanta 66 (2005) 376.20] K. Dash, S. Thangavel, S.V. Rao, K. Chandrasekaran, S.C. Chaurasia, J. Arunacha-
lam, J. Chromatogr. A 1036 (2004) 223.21] M. Gerboles, D. Buzica, R.J.C. Brown, R.E. Yardley, A. Hanus-Illnar, M. Salfinger,
B. Vallant, E. Adriaenssens, N. Claeys, E. Roekens, K. Sega, J. Jurasovic, S. Rych-lik, E. Rabinak, G. Tanet, R. Passarella, V. Pedroni, V. Karlsson, L. Alleman, U.Pfeffer, D. Gladtke, A. Olschewski, B. O’Leary, M. O’Dwyer, D. Pockeviciute, J.Biel-Cwikowska, J. Tursic, Atmos. Environ. 45 (2011) 3488.
22] E.J. Llorent-Martínez, P. Ortega-Barrales, M.L. Fernández-De Córdova, A.Domínguez-Vidal, A. Ruiz-Medina, Food Chem. 127 (2011) 1257.
23] Z. Fiket, N. Mikac, G. Kniewald, Food Chem. 126 (2011) 941.24] Statistica V. 6, StatSoft, Tulsa, USA, 2001.25] D.C. Montgomery, Design and Analysis of Experiments, third ed., Wiley and
.1016/j.talanta.2011.06.001
Sons, 1991.26] A. Sjosten, S. Blomqvist, Water Res. 31 (1997) 1818.27] D.L. Massart, B.G.M. Vandeginste, L.M.C. Buydens, S. De Jong, P.J. Lewi, J.
Smeyers-Verbeke, Handbook of Chemometrics and Qualimetrics, Part A, Else-vier, Amsterdam, 1997.
Copyright © 2022 FDOKUMEN