A new arsenate reductase involved in arsenic detoxification in Anabaena sp. PCC7120
Upload
independentCategory
view
2download
0
QUT Digital Repository: http://eprints.qut.edu.au/
Frost, Ray L. and Keeffe, Eloise C. and Cejka, Jiri and Sejkora, Jiri (2009) Vibrational spectroscopic study of the arsenate mineral strashimirite Cu8(AsO4)4(OH)4.5H2O - relationship to other basic copper arsenates. Vibrational Spectroscopy, 50(2). pp. 289-297.
© Copyright 2009 Elsevier BV
1
Vibrational spectroscopic study of the arsenate mineral 1
strashimirite Cu8(AsO4)4(OH)4.5H2O - Relationship to other 2
basic copper arsenates 3
4
Ray L. Frost a,•, Jiří Sejkora a, Jiří Čejka a,b, Eloise C. Keeffe a 5
6 a Inorganic Materials Research Program, School of Physical and Chemical 7
Sciences, Queensland University of Technology, GPO Box 2434, Brisbane, 8
Queensland 4001, Australia 9 b National Museum, Václavské náměstí 68, CZ-115 79 Praha 1, Czech Republic 10
11
Abstract 12
13
The basic copper arsenate mineral strashimirite Cu8(AsO4)4(OH)4.5H2O from two 14
different localities has been studied by Raman spectroscopy and complemented by 15
infrared spectroscopy. Two strashimirite mineral samples were obtained from the 16
Czech (sample A) and Slovak (sample B) Republics. Two Raman bands for sample A 17
are identified at 839 and 856 cm-1 and for sample B at 843 and 891 cm-1 are assigned 18
to the ν1 (AsO43-) symmetric and the ν3 (AsO4
3-) antisymmetric stretching modes, 19
respectively. The broad band for sample A centred upon 500 cm-1, resolved into 20
component bands at 467, 497, 526 and 554 cm-1 and for sample B at 507 and 560 21
cm-1 include bands which are attributable to the ν4 (AsO43-) bending mode. In the 22
Raman spectra, two bands (sample A) at 337 and 393 cm-1 and at 343 and 374 cm-1 23
for sample B are attributed to the ν2 (AsO43-) bending mode. The Raman spectrum of 24
strashimirite sample A shows three resolved bands at 3450, 3488 and 3585 cm-1. The 25
first two bands are attributed to water stretching vibrations whereas the band at 3585 26
cm-1 to OH stretching vibrations of the hydroxyl units. Two bands (3497 and 3444 27
cm-1) are observed in the Raman spectrum of B. A comparison is made of the Raman 28
spectrum of strashimirite with the Raman spectra of other selected basic copper 29
arsenates including olivenite, cornwallite, cornubite and clinoclase. 30
31
• Corresponding author. E-mail address: [email protected] (R.L. Frost)

2
Keywords: Raman spectroscopy, infrared spectroscopy, strashimirite, olivenite, 32
clinoclase, cornwallite, arsenate minerals 33
34
35
1. Introduction 36
37
The mineral strashimirite Cu8(AsO4)4(OH)4.5H2O is a hydrated hydroxyl divalent 38
copper arsenate[1, 2]. The mineral is of monoclinic symmetry with space group 39
P21/m and may be compared with other hydroxyl copper arsenate minerals, including 40
euchroite Cu2(AsO4)(OH).3H2O, olivenite Cu2(AsO4)(OH), cornwallite 41
Cu5(AsO4)2(OH)4. Olivenite is monoclinic, space group P21/n and is the most 42
common secondary mineral of the oxidized zone of hydrothermal deposits. Other 43
related copper and arsenate minerals are the minerals cornwallite [Cu5(AsO4)2(OH)4] 44
and clinoclase [Cu3(AsO4) (OH)3]. Each of these minerals occurs in the oxidized 45
zones of copper deposits and olivenite is by far the commonest [3, 4]. Cornwallite and 46
clinoclase are rare secondary mineral that crystallise monoclinic, space group P21/a 47
[3, 5, 6]. 48
49
The relative stabilities of the basic copper arsenates have been determined 50
using estimated chemical parameters and experimentally determined solubility 51
products [7, 8]. Magalhaes et al. have reported the relative stability of copper 52
arsenate minerals [9]. Normal anhydrous copper(II) arsenate is known as the 53
naturally occurring species lammerite [Cu3(AsO4)2], but it is very rare[10]. The more 54
basic stoichiometries occupy fields at higher pH as expected. Since olivenite is the 55
stable phase under chemical conditions intermediate to those that serve to stabilize 56
cornwallite and clinoclase, paragenetic relationships have been explored. [10] 57
Olivenite is often found with either cornwallite or clinoclase, but not together. The 58
stability of the basic copper arsenate minerals is related to their redox potential and 59
phase fields exist for the related minerals olivenite, cornubite [Cu5(AsO4)2(OH)4], 60
clinoclase and cornwallite. Thus, the structure of these phase related minerals are 61
related and should provide similar spectra, which should differ in terms of the 62
intensity and position of the bands according to the relative mole ratios of Cu/As/OH 63
and the number and site symmetry of the formula units in the unit cell of the minerals. 64
65
3
Whilst the infrared spectra of some minerals have been forthcoming, few 66
comprehensive studies of related minerals such as the basic copper arsenates have 67
been undertaken[11-13]. The structural investigation of some arsenates and the nature 68
of the hydrogen bond in these structures have been reported[14-24]. It was found that 69
the hydroxyl unit was coordinated directly to the metal ion and formed hydrogen 70
bonds to the arsenate anion[25]. The basic copper arsenates include a significant 71
number of diagenetically related minerals. Raman spectroscopy is important tool for 72
our understanding of diagenetically related minerals such as the basic copper arsenate 73
minerals. The aim of this paper is to interpret the Raman spectrum of strashimirite on 74
the basis of mineral structure, the structure of which is uncertain. This research 75
reported here, is part of systematic studies on the vibrational spectra of minerals of 76
secondary origin in the oxide supergene zone and their synthetic analogs. 77
78
2. Experimental 79
80
2.1. Minerals 81
82
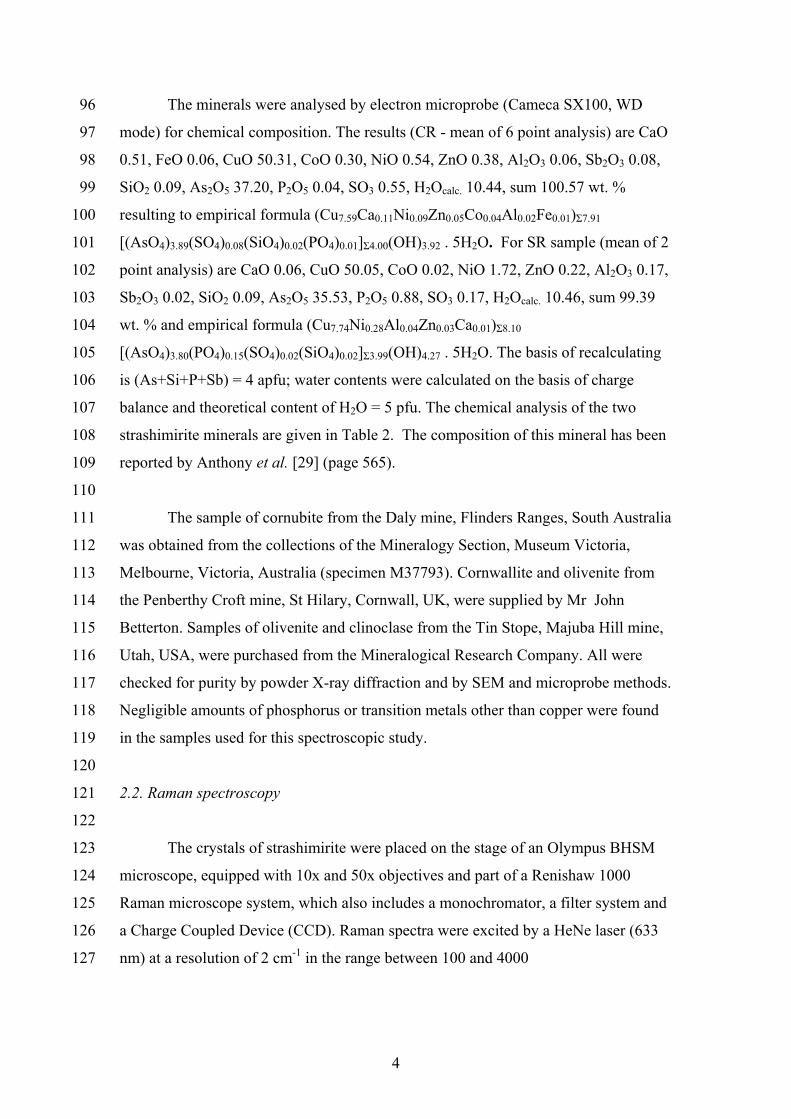
The studied samples of the mineral strashimirite were found at the Zálesí 83
deposit, the Rychlebské hory Mountains, northern Moravia, Czech Republic, and 84
Svätodušná deposit near Lubietová, central Slovakia, Slovak Republic. These 85
strashimirite minerals are labelled sample A and sample B. These samples are 86
deposited in the mineralogical collections of the National Museum Prague. The 87
samples were analysed for phase purity by X-ray powder diffraction and no minor 88
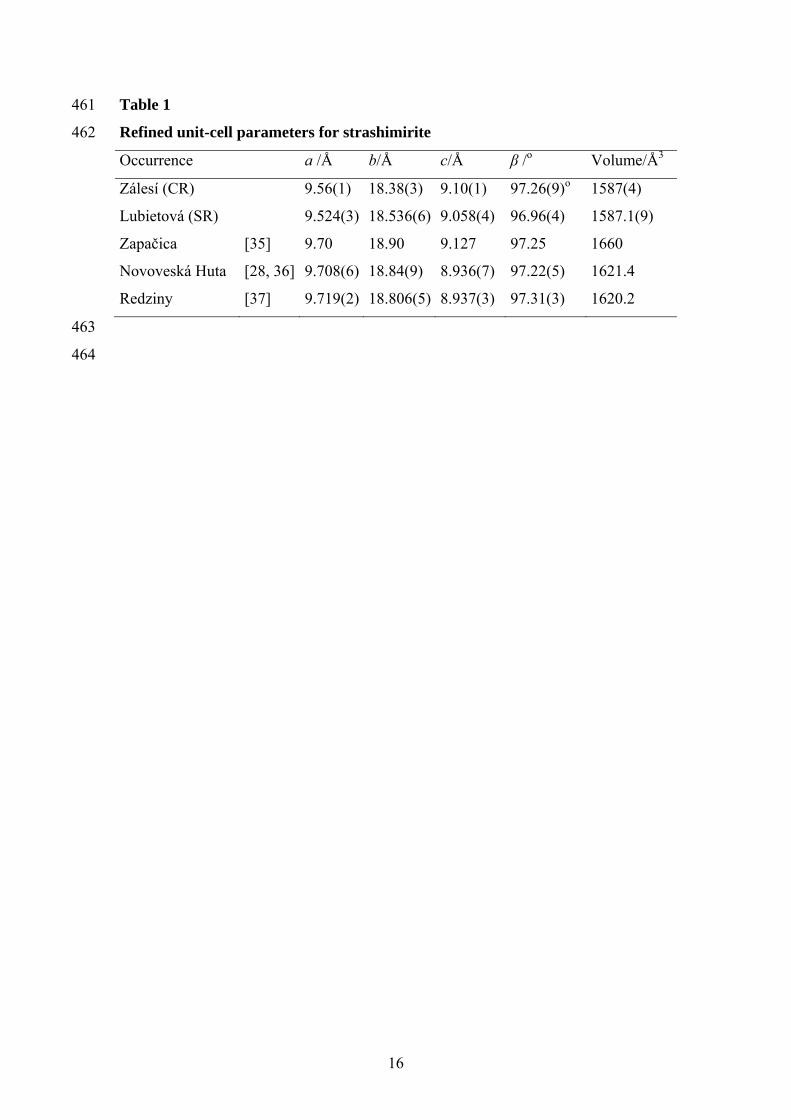
significant impurities were found. Their refined unit-cell parameters for monoclinic 89
primitive space group are a=9.56(1), b=18.38(3), c=9.10(1) Å, β= 97.26(9)o, V= 90
1587(4) Å3 (CR) and a=9.524(3), b=18.536(6), c=9.058(4) Å, β=96.96(4)o, 91
V=1587.1(9) Å3 (SR). Inferred values of unit-cell parameters are substantially 92
lower than those as yet published [26-28] . The refined parameters of strashimirite 93
are provided in Table 1. This phenomenon may be probably caused by observed 94
anionic isomorphism (As⇔P, As⇔S). 95
4
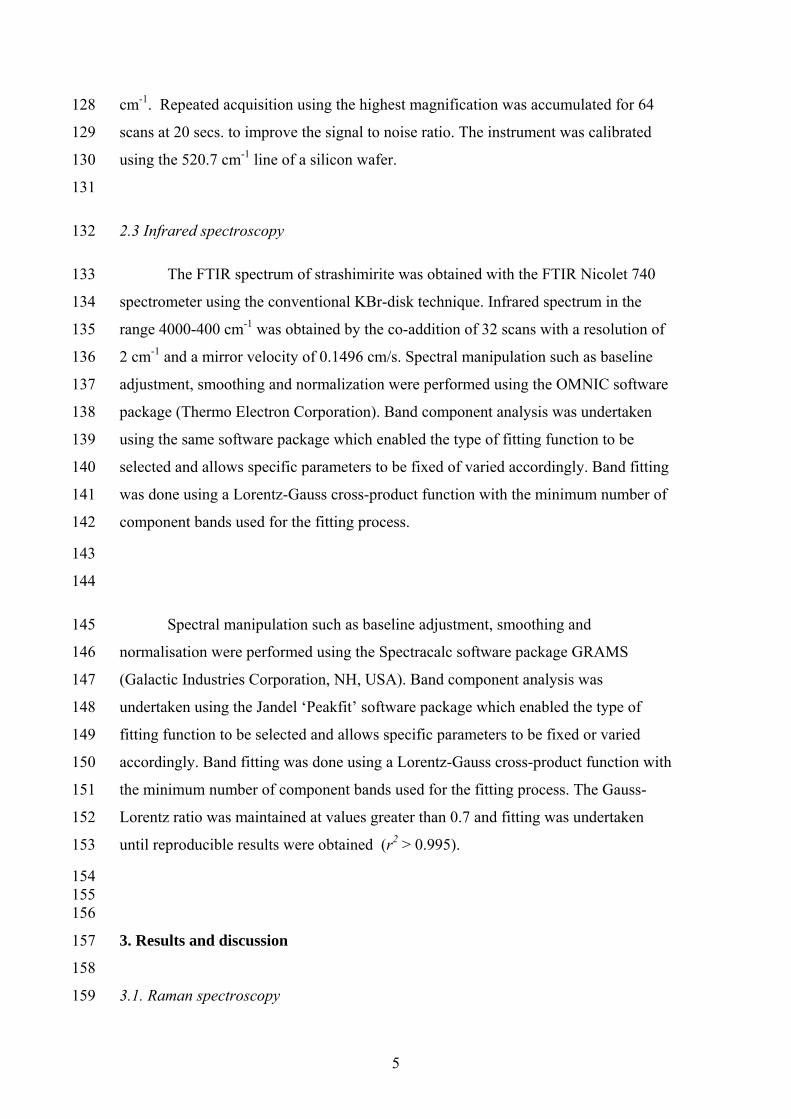
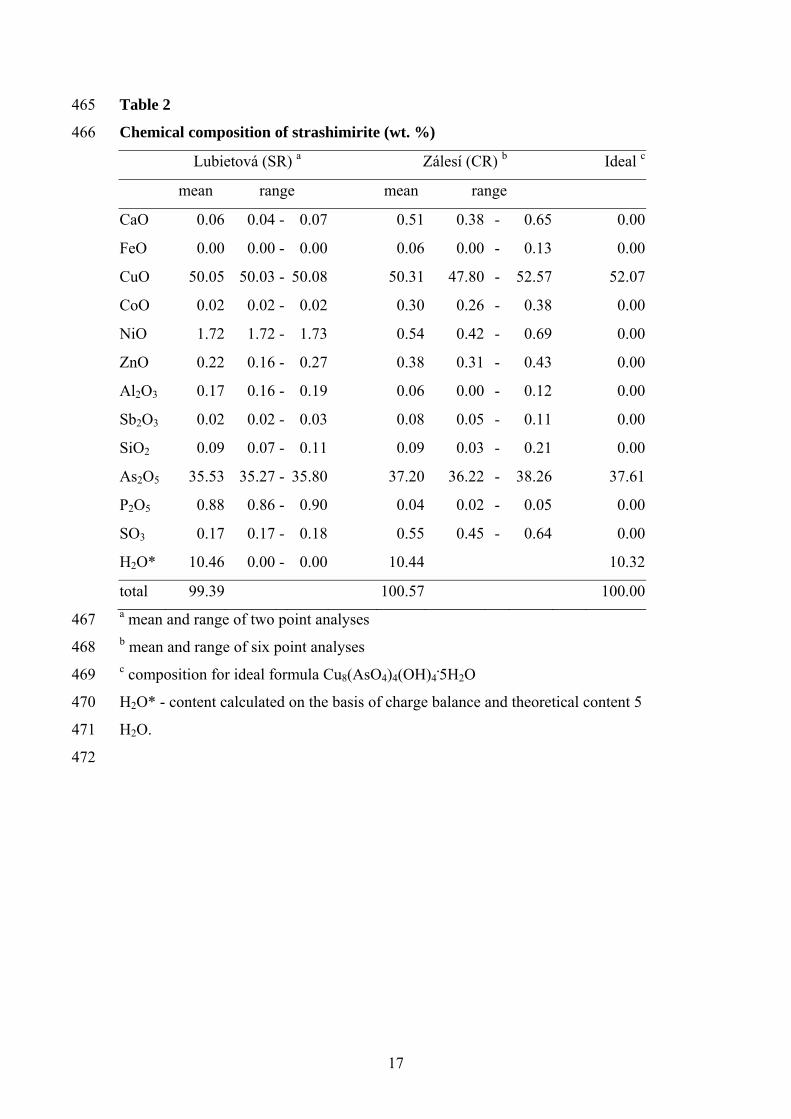
The minerals were analysed by electron microprobe (Cameca SX100, WD 96
mode) for chemical composition. The results (CR - mean of 6 point analysis) are CaO 97
0.51, FeO 0.06, CuO 50.31, CoO 0.30, NiO 0.54, ZnO 0.38, Al2O3 0.06, Sb2O3 0.08, 98
SiO2 0.09, As2O5 37.20, P2O5 0.04, SO3 0.55, H2Ocalc. 10.44, sum 100.57 wt. % 99
resulting to empirical formula (Cu7.59Ca0.11Ni0.09Zn0.05Co0.04Al0.02Fe0.01)Σ7.91 100
[(AsO4)3.89(SO4)0.08(SiO4)0.02(PO4)0.01]Σ4.00(OH)3.92 . 5H2O. For SR sample (mean of 2 101
point analysis) are CaO 0.06, CuO 50.05, CoO 0.02, NiO 1.72, ZnO 0.22, Al2O3 0.17, 102
Sb2O3 0.02, SiO2 0.09, As2O5 35.53, P2O5 0.88, SO3 0.17, H2Ocalc. 10.46, sum 99.39 103
wt. % and empirical formula (Cu7.74Ni0.28Al0.04Zn0.03Ca0.01)Σ8.10 104
[(AsO4)3.80(PO4)0.15(SO4)0.02(SiO4)0.02]Σ3.99(OH)4.27 . 5H2O. The basis of recalculating 105
is (As+Si+P+Sb) = 4 apfu; water contents were calculated on the basis of charge 106
balance and theoretical content of H2O = 5 pfu. The chemical analysis of the two 107
strashimirite minerals are given in Table 2. The composition of this mineral has been 108
reported by Anthony et al. [29] (page 565). 109
110
The sample of cornubite from the Daly mine, Flinders Ranges, South Australia 111
was obtained from the collections of the Mineralogy Section, Museum Victoria, 112
Melbourne, Victoria, Australia (specimen M37793). Cornwallite and olivenite from 113
the Penberthy Croft mine, St Hilary, Cornwall, UK, were supplied by Mr John 114
Betterton. Samples of olivenite and clinoclase from the Tin Stope, Majuba Hill mine, 115
Utah, USA, were purchased from the Mineralogical Research Company. All were 116
checked for purity by powder X-ray diffraction and by SEM and microprobe methods. 117
Negligible amounts of phosphorus or transition metals other than copper were found 118
in the samples used for this spectroscopic study. 119
120
2.2. Raman spectroscopy 121
122
The crystals of strashimirite were placed on the stage of an Olympus BHSM 123
microscope, equipped with 10x and 50x objectives and part of a Renishaw 1000 124
Raman microscope system, which also includes a monochromator, a filter system and 125
a Charge Coupled Device (CCD). Raman spectra were excited by a HeNe laser (633 126
nm) at a resolution of 2 cm-1 in the range between 100 and 4000 127
5
cm-1. Repeated acquisition using the highest magnification was accumulated for 64 128
scans at 20 secs. to improve the signal to noise ratio. The instrument was calibrated 129
using the 520.7 cm-1 line of a silicon wafer. 130
131
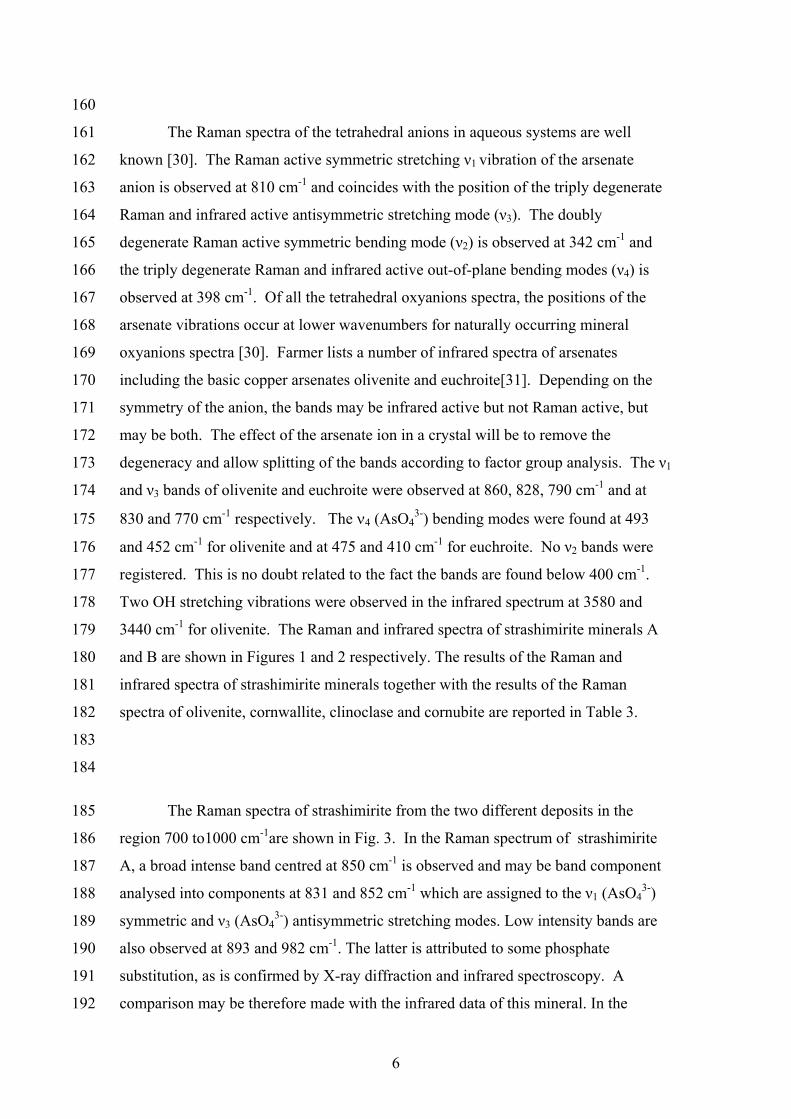
2.3 Infrared spectroscopy 132
The FTIR spectrum of strashimirite was obtained with the FTIR Nicolet 740 133
spectrometer using the conventional KBr-disk technique. Infrared spectrum in the 134
range 4000-400 cm-1 was obtained by the co-addition of 32 scans with a resolution of 135
2 cm-1 and a mirror velocity of 0.1496 cm/s. Spectral manipulation such as baseline 136
adjustment, smoothing and normalization were performed using the OMNIC software 137
package (Thermo Electron Corporation). Band component analysis was undertaken 138
using the same software package which enabled the type of fitting function to be 139
selected and allows specific parameters to be fixed of varied accordingly. Band fitting 140
was done using a Lorentz-Gauss cross-product function with the minimum number of 141
component bands used for the fitting process. 142
143
144
Spectral manipulation such as baseline adjustment, smoothing and 145
normalisation were performed using the Spectracalc software package GRAMS 146
(Galactic Industries Corporation, NH, USA). Band component analysis was 147
undertaken using the Jandel ‘Peakfit’ software package which enabled the type of 148
fitting function to be selected and allows specific parameters to be fixed or varied 149
accordingly. Band fitting was done using a Lorentz-Gauss cross-product function with 150
the minimum number of component bands used for the fitting process. The Gauss-151
Lorentz ratio was maintained at values greater than 0.7 and fitting was undertaken 152
until reproducible results were obtained (r2 > 0.995). 153
154 155 156
3. Results and discussion 157
158
3.1. Raman spectroscopy 159
6
160
The Raman spectra of the tetrahedral anions in aqueous systems are well 161
known [30]. The Raman active symmetric stretching ν1 vibration of the arsenate 162
anion is observed at 810 cm-1 and coincides with the position of the triply degenerate 163
Raman and infrared active antisymmetric stretching mode (ν3). The doubly 164
degenerate Raman active symmetric bending mode (ν2) is observed at 342 cm-1 and 165
the triply degenerate Raman and infrared active out-of-plane bending modes (ν4) is 166
observed at 398 cm-1. Of all the tetrahedral oxyanions spectra, the positions of the 167
arsenate vibrations occur at lower wavenumbers for naturally occurring mineral 168
oxyanions spectra [30]. Farmer lists a number of infrared spectra of arsenates 169
including the basic copper arsenates olivenite and euchroite[31]. Depending on the 170
symmetry of the anion, the bands may be infrared active but not Raman active, but 171
may be both. The effect of the arsenate ion in a crystal will be to remove the 172
degeneracy and allow splitting of the bands according to factor group analysis. The ν1 173
and ν3 bands of olivenite and euchroite were observed at 860, 828, 790 cm-1 and at 174
830 and 770 cm-1 respectively. The ν4 (AsO43-) bending modes were found at 493 175
and 452 cm-1 for olivenite and at 475 and 410 cm-1 for euchroite. No ν2 bands were 176
registered. This is no doubt related to the fact the bands are found below 400 cm-1. 177
Two OH stretching vibrations were observed in the infrared spectrum at 3580 and 178
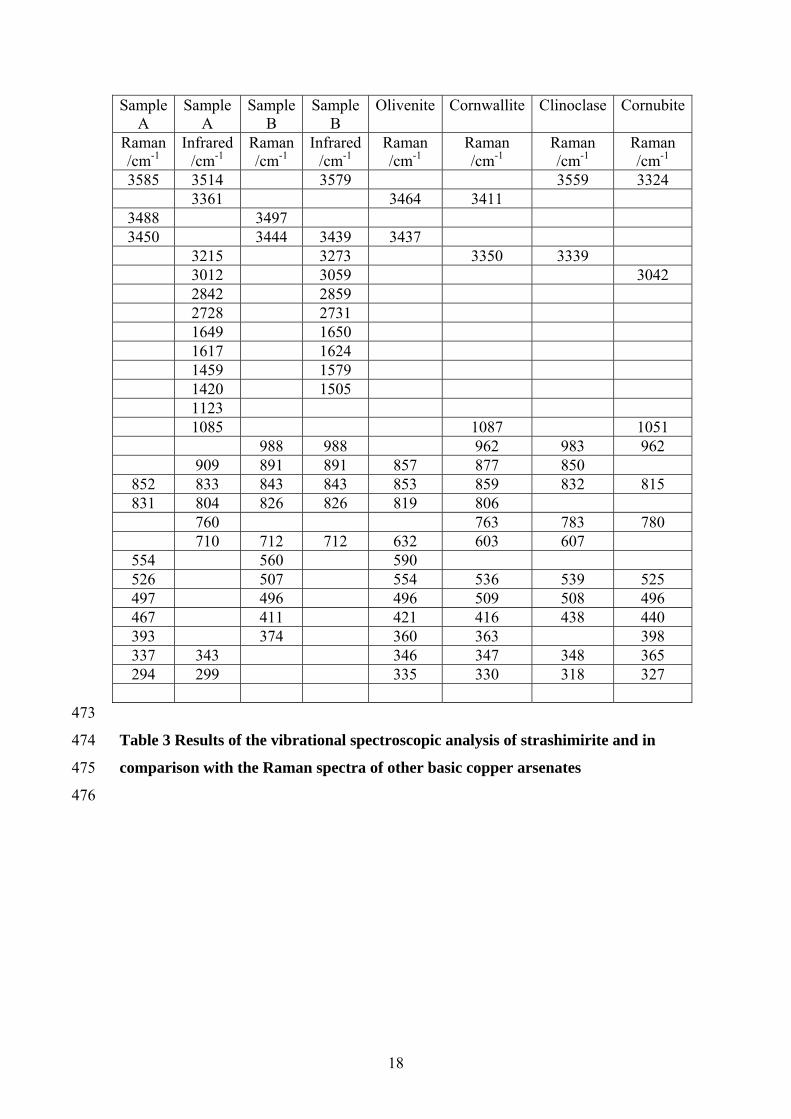
3440 cm-1 for olivenite. The Raman and infrared spectra of strashimirite minerals A 179
and B are shown in Figures 1 and 2 respectively. The results of the Raman and 180
infrared spectra of strashimirite minerals together with the results of the Raman 181
spectra of olivenite, cornwallite, clinoclase and cornubite are reported in Table 3. 182
183
184
The Raman spectra of strashimirite from the two different deposits in the 185
region 700 to1000 cm-1are shown in Fig. 3. In the Raman spectrum of strashimirite 186
A, a broad intense band centred at 850 cm-1 is observed and may be band component 187
analysed into components at 831 and 852 cm-1 which are assigned to the ν1 (AsO43-) 188
symmetric and ν3 (AsO43-) antisymmetric stretching modes. Low intensity bands are 189
also observed at 893 and 982 cm-1. The latter is attributed to some phosphate 190
substitution, as is confirmed by X-ray diffraction and infrared spectroscopy. A 191
comparison may be therefore made with the infrared data of this mineral. In the 192
7
infrared spectrum of A (Fig. 4) intense infrared bands are observed at 760 and 833 193
cm-1 with two shoulder bands at 804 and 909 cm-1. The latter band at 909 cm-1 194
corresponds reasonably well with the Raman band at 893 cm-1 and the 833 cm-1 195
infrared band corresponds to the Raman band at 839 cm-1. Low intensity infrared 196
bands are observed at 1002, 1085 and 1123 cm-1 which are assigned to (PO43-) for 197
(AsO43-) substitution or to (SO4
2-) substitution. 198
199
The Raman spectrum of strashimirite B in the 700 to 1000 cm-1 region shows 200
greater complexity. Bands are observed at 826, 843, 891 and 988 cm-1. The band at 201
988 cm-1 may be probably attributed to the ν1 (PO43-) or ν1 (SO4
2-). A band is also 202
observed at 771 cm-1. The attribution of which is unknown. One possibility is that 203
this is a water librational mode. Such a band should show greater intensity in the 204
infrared spectrum but this is not the case. The two bands at 826 and 843 cm-1 are 205
assigned to the ν1 (AsO43-) symmetric and ν3 (AsO4
3-) antisymmetric stretching 206
modes. The infrared spectrum of strashimirite B is reported in Fig. 1b (supplementary 207
information). An intense infrared band is found at 843 cm-1 with two shoulder bands 208
at 826 and 891 cm-1. The correspondence between the infrared data and Raman data 209
is good for strashimirite B. Because of the diagenetic relationship between the basic 210
copper arsenate minerals, a comparison of the Raman spectra with the other minerals 211
can be made (see Table 3). The Raman spectrum of olivenite shows two (AsO43-) 212
bands at 853 and 820 cm-1; cornwallite at 859 and 806 cm-1, cornubite at 815 and 780 213
cm-1 and clinoclase at 823 and 771 cm-1[30, 32]. Additional very weak Raman bands 214
for olivenite are observed at 880 and 790 cm-1. The most intense band is assigned to 215
the ν1 symmetric stretching vibration. This assignment differs from that described by 216
Sumin de Portilla [25]. In his work, the ν3 mode was described as splitting into four 217
components at 870, 830, 800 and 750 cm-1. Farmer suggested that the ν1 and ν3 218
modes overlapped and were to be found at the same frequency [31]. Whilst this is 219
highly unusual, it is suggested that the two vibrations at 853 and 820 cm-1 are the 220
(AsO43-) symmetric and antisymmetric stretching vibrations, respectively. Griffith 221
reported the Raman spectrum of olivenite[33] at 880 (A׀), 856 (B2u), 810 (A׀) and 790 222
(B2u) cm-1. The observation of the bands 853 and 820 cm-1 is in good agreement with 223
the data published by Griffith [33]. The most intense bands in the Raman spectra are 224
the bands at 853 and 810 cm-1. Factor group analysis suggests that there should be 225
8
one active Raman band and one active infrared band in the (AsO43-) stretching region. 226
Additional bands result from a loss of site symmetry. The difference in intensity is 227
related to the number of (AsO43-) units involved in this site symmetry reduction. Thus 228
the other two infrared bands observed at 800 and 750 cm-1 for olivenite are the 229
corresponding ν3 vibrations. The second band observed at 806 and 771 cm-1 is more 230
intense for cornwallite and clinoclase. The (AsO43-) stretching vibration for olivenite 231
and cornwallite are in similar band positions, suggesting a similar molecular structure. 232
For cornubite two bands are observed at 815 and 780 233
cm-1. 234
235
Stoilova and Minceva-Stefanova reported the infrared spectrum of a type 236
strashimirite mineral from Bulgaria[1]. These researchers identified infrared bands at 237
766 and 863 cm-1 and assigned these bands to the ν1 (AsO43-) symmetric and ν3 238
antisymmetric stretching modes. The intense Raman bands at 845 cm-1 for 239
strashimirite A and 843 cm-1 for strashimirite B tend to suggest that the assignation of 240
Stoilova and Minceva-Stefanova may compliment the Raman and infrared results 241
reported in this work. . Further the bands are highly polarised, confirming the 242
assignment of the Raman band. Magalhaes et al. studied the solution chemistry of 243
copper arsenate mineral [9]. These authors reported the relationship between 244
euchroite Cu2(AsO4)(OH).3H2O, strashimirite Cu8(AsO4)4(OH)4.4H2O and arhbarite 245
Cu2Mg(AsO4)(OH)3. Complex paragenetic relationships exist between these copper 246
arsenate minerals. An example of this relationship exists for the minerals of the 247
Zapachitsa deposit in Bulgaria. The sequence of deposition of the copper arsenate 248
minerals is proposed to be cornwallite-olivenite-tyrolite-strashimirite-conichalcite. It 249
is possible that the mineral sample reported based upon infrared spectra, by Stoilova 250
and Minceva-Stefanova may be likely a mixture of some minerals from this mineral 251
paragenetic sequence. 252
253
The Raman spectra of strashimirite A and B in the 100 to 600 cm-1 region are 254
shown in Fig. 5. A broad band centred upon 500 cm-1 for strashimirite A, which may 255
be resolved into component bands at 467, 497, 526 and 554 cm-1 probably includes 256
bands attributable to the ν4 (AsO43-) bending mode. The observation of multiple 257
bands suggests that the symmetry of the (AsO43-) ion has been reduced. The shoulder 258
band at 467 cm-1 is probably ascribed to the CuO stretching mode. The higher 259
9
wavenumber band may be assigned to a water librational mode. A band in this 260
position is expected although in the Raman spectrum may be of low intensity. A 261
Raman band is observed at 560 cm-1 for strashimirite B. The band at 507 cm-1 for 262
strashimirite B is broad and is assigned to the ν4 (AsO4)3- bending mode. Stoilova and 263
Minceva-Stefanova reported infrared bands at 430, 470 and 92 and assigned these 264
bands to ν4 (AsO43-) bending mode [1]. The appearance of multiple bands in the ν4 265
(AsO43-) bending region further provides evidence for the reduction of the symmetry 266
of the (AsO43-) anion to C2v or even lower. 267
268
The low wavenumber region of the basic copper arsenates is complex and it is 269
difficult to separate the Raman bands according to their symmetry. The spectrum of 270
the low wavenumber region of the basic copper arsenates may be divided into three 271
separate regions: (a) 450 to 650 cm-1 (b) 400 to 450 cm-1 and (c) 400 to 250 cm-1. It is 272
proposed that these three regions define the (a) ν4 modes (b) ν2 modes and (c) (AsO43) 273
lattice modes. The ν2 bending vibration should be common to all the basic copper 274
arsenates spectra and should be intense. The (AsO43-) bending mode (ν2) should be 275
found at around 342 cm-1. In the Raman spectrum of A, two bands at 337 and 393 276
cm-1 may be ascribed to this vibrational mode. Three Raman bands are observed for 277
B at 343, 374 and 411 cm-1. The first band is attributed to the ν2 (AsO43-) bending 278
mode. The band at 350 cm-1 for olivenite, 340 cm-1 for cornwallite and at 380 cm-1 is 279
assigned to the ν2 (AsO43-) symmetric bending vibration. The observation of this 280
mode below 400 cm-1 has been predicted but not reported [31]. Our results differ 281
from those of Griffith who reported bands at 324 and 310 cm-1 for the (AsO43-) 282
bending modes of olivenite [33]. 283
284
In the low wavenumber region of the basic copper arsenates, intense Raman 285
bands are observed (Fig. 5). In the Raman spectrum of the low wavenumber region 286
for A, Raman bands are observed at 152, 172, 220, 239 and 294 cm-1. In the Raman 287
spectrum of the low wavenumber region bands for B are observed at 144, 183, 219, 288
242 and 299 cm-1. The intense sharp band at 299 cm-1 is assigned to the AsO 289
stretching vibration. In the structure of strashimirite it is proposed (without the single 290
crystal X-ray evidence) that the (AsO43) units are not equivalent and thus more than 291
one CuO vibration will exist. Stoilova and Minceva-Stefanova tabled results for the 292
CuO stretching vibration at 492 and 540 cm-1 in the infrared spectrum [1]. For 293
10
olivenite intense bands are observed at 310 and 286 cm-1 and are assigned to the CuO 294
stretching vibration. A second low intensity band is observed at 258 cm-1 and may be 295
also assigned to a CuO stretching vibration. Two CuO vibrations exist because there 296
are two types of units namely OH and AsO4 units coordinating to the copper. The 297
intense bands for A at 144 and 183 cm-1 may be assigned to OCuO bending 298
vibrations. Intense Raman bands are also observed at 219 and 151 cm-1 for olivenite, 299
198 and 172 cm-1 for cornwallite and at 189 and 185 cm-1 for clinoclase. These bands 300
may also be assigned to OCuO bending vibrations. 301
302
The Raman spectrum in the OH stretching region of strashimirite A and B are 303
shown in Fig. 6. The infrared spectra of the strashimirite minerals are shown in Fig. 304
7. The Raman spectrum of A shows three resolved bands at 3450, 3588 and 3585 cm-305 1. The first two bands are attributed to water stretching vibrations and the band at 306
3585 cm-1 to the OH stretching vibrations of the hydroxyl units. The infrared 307
spectrum of A shows a complex set of overlapping bands. Band component analysis 308
resolves component bands at 2728, 3012, 3235 cm-1 ascribed to water stretching 309
bands; and component bands at 3361 and 3514 cm-1 attributed to the OH stretching 310
vibrations of hydroxyl ions. The Raman spectrum in this spectral region for B shows 311
a broad band centred on 3444 cm-1 with a sharp intense band at 3497 cm-1. One likely 312
assignment is that the first band is due to the water stretching vibration and the latter 313
to the stretching vibration of the hydroxyl units. As for strashimirite A, a complex set 314
of overlapping infrared bands are observed. Infrared bands are observed at 2731, 315
3059 and 3273 cm-1 assigned to water stretching bands and at 3439 and 3579 cm-1 316
assigned to the OH unit stretching vibrations of the hydroxyl ions. 317
318
Stoilova and Minceva-Stefanova reported the infrared OH stretching bands at 319
3380, 3420 and 3500 cm-1 [1]. These values differ from those reported in Fig. 5. 320
These authors considered that these bands provided evidence of strong hydrogen 321
bonds in the strashimirite mineral. Low intensity infrared bands found by these 322
authors were observed at 2133, 2740 and 2900 cm-1 and provided further evidence of 323
strong hydrogen bonds in the strashimirite structure. In our Raman spectrum of 324
strashimirite low intensity bands were found at 2124, 2346, 2924 and 3058 cm-1. In 325
our infrared spectrum, bands were observed at around 2730 and 2842 cm-1 supporting 326
the proposition by Minceva-Stefanova for strong hydrogen bonding in the 327
11
strashimirite structure. The observation of these bands in our Raman and infrared 328
spectra supports the concept of strong hydrogen bond interactions between the water 329
units and the arsenate anions. 330
331
A comparison may be made with the Raman spectrum of the hydroxyl 332
stretching region of other basic copper arsenates (Table 3). The Raman spectrum of 333
olivenite displays two overlapping bands centred upon 3464 and 3437 cm-1; and for 334
cornwallite two partially band-separated peaks are observed at 3411 and 3350 cm-1. 335
In the Raman spectrum of cornubite, two bands are observed at 3324 and 3042 cm-1. 336
For clinoclase two well separated bands separated peaks are observed at 3559 and 337
3339 cm-1. The observation of two hydroxyl-stretching vibrations means that there 338
are two distinct and different hydroxyl units in the basic copper arsenate minerals. 339
The difference between the peak positions of olivenite and cornwallite is related to the 340
strength of the hydrogen bond formed between the hydroxyl unit and adjacent 341
arsenate units. This bonding is much stronger in cornwallite as indicated by the lower 342
wavenumber position of the hydroxyl-stretching vibrations. One interpretation is that 343
the higher wavenumber vibration is ascribed to the As-OH vibration and the lower 344
wavenumber hydroxyl stretching frequency to the As-OH..O vibration. 345
346
The infrared spectra of the strashimirite minerals A and B are shown in Fig. 8. 347
The 1300 to 1800 cm-1 spectral profile for A, may be resolved into component bands 348
at 1617, 1649 and 1673 cm-1 with additional low intensity bands at 1420 and 1459 349
cm-1. These latter two bands may indicate the presence of carbonate anions. 350
However, no carbonate ions were inferred from the analysis. It is likely these low 351
intensity infrared bands are due to overtone or combination bands. The infrared band 352
at 1617 cm-1 is typical of weakly hydrogen bonded water and the two bands at 1649 353
and 1673 cm-1 are attributed to strongly hydrogen bonded water. The identification of 354
these bands supports the concept that water is strongly bonded in the structure of 355
strashimirite and is required for the stability of the mineral. The infrared spectrum of 356
strashimirite B also shows bands at 1624 and 1674 cm-1, which supports the concept 357
of two types of water in the strashimirite structure. 358
359
360
3.2. Diagenetic relationships between the basic copper arsenate minerals 361
12
362
Williams [10] has presented phase stability relationships between a range of 363
diagenetically related minerals including the basic copper arsenates. Magalhaes et al. 364
[34] reported the relative stabilities of the basic copper arsenates using estimated 365
chemical parameters and experimentally determined solubility products are available 366
[7, 8]. The difference in stability is attributed to pH, temperature of crystallization and 367
the relative redox potentials. One possible set of relationships is as follows: 368
Euchroite Cu2(AsO4)(OH).3H2O → olivenite Cu2(AsO4)(OH) 369
→ strashimirite Cu8(AsO4)4(OH)4.5H2O → arhbarite Cu2Mg(AsO4)(OH)3. A 370
complex set of equilibria exists between these minerals. The presence of other cations 371
in the solution such as Ca2+ can affect these equilibria [34]. 372
373
4. Conclusions 374
375
Raman spectroscopy has been used to characterise the mineral strashimirite. 376
Two samples from the Czech and Slovak Republics were used. The Raman spectra of 377
the two minerals differed and this difference may probably be connected with anionic 378
isomorphic substitution As ⇔ S for A and As ⇔ P, S for B. Characteristic Raman 379
bands of the (AsO4)3- stretching and bending vibrations were identified and described. 380
Raman bands attributable to the OH stretching vibrations of water and hydroxyl units 381
were analysed. 382
383
A comparison was made with the Raman spectrum of strashimirite with other selected 384
basic copper arsenate minerals. A description of the relative stability of the mineral 385
strashimirite relative to other basic copper arsenate minerals is provided. 386
387
Acknowledgments 388
389
The financial and infra-structure support of the Queensland University of 390
Technology, Inorganic Materials Research Program is gratefully acknowledged. The 391
Australian Research Council (ARC) is thanked for funding the instrumentation. This 392
work was also supported by Ministry of Culture of the Czech Republic 393
(MK00002327201) to Jiří Sejkora. 394
13
395
396
14
References 397
[1] D. Stoilova, J. Minceva-Stefanova, Dokladi na Bulgarskata Akademiya na 398 Naukite 54 (2001) 49-52. 399 [2] I. Mincheva-Stefanova, Zapiski Vsesoyuznogo Mineralogicheskogo 400 Obshchestva 97 (1968) 470-477. 401 [3] L.G. Berry, Amer. Mineral. 36 (1951) 484-503. 402 [4] P.C. Burns, F.C. Hawthorne, Can. Mineral. 33 (1995) 885-888. 403 [5] S. Ghose, M. Fehlmann, M. Sundaralingam, Acta Cryst. 18 (1965) 777-787. 404 [6] R.K. Eby, F.C. Hawthorne, Acta Crystallogr., Sect. C: Cryst. Struct. Commun. 405 C46 (1990) 2291-2294. 406 [7] R. Mas, Ann. chim. 4 (1949) 459-504. 407 [8] R. Mas, Compt. rend. 227 (1948) 1245-1247. 408 [9] M.C.F. Magalhaes, J.D. Pedrosa de Jesus, P.A. Williams, Mineralogical 409 Magazine 52 (1988) 679-690. 410 [10] P.A. Williams, Oxide Zone Geochemistry, Ellis Horwood Ltd, Chichester, 411 West Sussex, England,, 1990. 412 [11] M.T. Paques-Ledent, P. Tarte, Spectrochim. Acta, Part A 30A (1974) 673-689. 413 [12] S.V. Gevork'yan, A.S. Povarennykh, Konst. Svoistva Miner. 9 (1975) 73-81. 414 [13] R.S.W. Braithwaite, Mineral. Mag. 47 (1983) 51-57. 415 [14] R.L. Frost, J.M. Bouzaid, Journal of Raman Spectroscopy 38 (2007) 873-879. 416 [15] R.L. Frost, J.M. Bouzaid, W.N. Martens, B.J. Reddy, Journal of Raman 417 Spectroscopy 38 (2007) 135-141. 418 [16] R.L. Frost, J. Cejka, Journal of Raman Spectroscopy 38 (2007) 1488-1493. 419 [17] R.L. Frost, J. Cejka, G.A. Ayoko, M.L. Weier, Journal of Raman 420 Spectroscopy 38 (2007) 1311-1319. 421 [18] R.L. Frost, J. Cejka, M.L. Weier, Journal of Raman Spectroscopy 38 (2007) 422 460-466. 423 [19] R.L. Frost, J. Cejka, M.L. Weier, W.N. Martens, G.A. Ayoko, Journal of 424 Raman Spectroscopy 38 (2007) 398-409. 425 [20] R.L. Frost, M.J. Dickfos, Journal of Raman Spectroscopy 38 (2007) 1516-426 1522. 427 [21] R.L. Frost, S.J. Palmer, J.M. Bouzaid, B.J. Reddy, Journal of Raman 428 Spectroscopy 38 (2007) 68-77. 429 [22] R.L. Frost, C. Pinto, Journal of Raman Spectroscopy 38 (2007) 841-845. 430 [23] R.L. Frost, M.L. Weier, P.A. Williams, P. Leverett, J.T. Kloprogge, Journal of 431 Raman Spectroscopy 38 (2007) 574-583. 432 [24] A.J. Locke, W.N. Martens, R.L. Frost, Journal of Raman Spectroscopy 38 433 (2007) 1429-1435. 434 [25] V.I. Sumin De Portilla, Can. Mineral. 12 (1974) 262-268. 435 [26] B. Gołębiowska, Mineralogia Polonica 30 (1999) 3-11. 436 [27] J. Mincheva-Stefanova, Geochemistry, Mineralogy and Petrology, 33 (1998) 437 3-14. 438 [28] T. Řídkošil, Časopis pro mineralogii a geologii 23 (1978) 214-215. 439 [29] J.W. Anthony, R.A. Bideaux, K.W. Bladh, M.C. Nichols, Handbook of 440 Mineralogy IV, Arsenates, phosphates, vanadates., Mineral Data Publishing, Tucson, 441 Arizona 2000. 442 [30] R.L. Frost, W.N. Martens, P.A. Williams, Journal of Raman Spectroscopy 33 443 (2002) 475-484. 444 [31] V.C. Farmer, Mineralogical Society Monograph 4: The Infrared Spectra of 445 Minerals, 1974. 446
15
[32] R.L. Frost, W. Martens, P.A. Williams, J.T. Kloprogge, Journal of Raman 447 Spectroscopy 34 (2003) 751-759. 448 [33] W.P. Griffith, Journal of the Chemical Society [Section] A: Inorganic, 449 Physical, Theoretical (1970) 286-291. 450 [34] M.C.F. Magalhaes, J.D. Pedrosa de Jesus, P.A. Williams, Mineral. Mag. 52 451 (1988) 679-690. 452 [35] I. Minceva-Stefanova, Geokhimiya, Mineralogiya i Petrologiya 20-21 (1986) 453 49-57, 48 plates. 454 [36] J. Mincheva-Stefanova, Geochemistry, Mineralogy and Petrology (1986) 20-455 21. 456 [37] B. Gołębiowska, Mineralogia Polonica 30 (1999) 3-11. 457 458 459
460
16
Table 1 461
Refined unit-cell parameters for strashimirite 462
Occurrence a /Å b/Å c/Å β /o Volume/Å3
Zálesí (CR) 9.56(1) 18.38(3) 9.10(1) 97.26(9)o 1587(4)
Lubietová (SR) 9.524(3) 18.536(6) 9.058(4) 96.96(4) 1587.1(9)
Zapačica [35] 9.70 18.90 9.127 97.25 1660
Novoveská Huta [28, 36] 9.708(6) 18.84(9) 8.936(7) 97.22(5) 1621.4
Redziny [37] 9.719(2) 18.806(5) 8.937(3) 97.31(3) 1620.2
463
464
17
Table 2 465
Chemical composition of strashimirite (wt. %) 466
Lubietová (SR) a Zálesí (CR) b Ideal c
mean range mean range
CaO 0.06 0.04 - 0.07 0.51 0.38 - 0.65 0.00
FeO 0.00 0.00 - 0.00 0.06 0.00 - 0.13 0.00
CuO 50.05 50.03 - 50.08 50.31 47.80 - 52.57 52.07
CoO 0.02 0.02 - 0.02 0.30 0.26 - 0.38 0.00
NiO 1.72 1.72 - 1.73 0.54 0.42 - 0.69 0.00
ZnO 0.22 0.16 - 0.27 0.38 0.31 - 0.43 0.00
Al2O3 0.17 0.16 - 0.19 0.06 0.00 - 0.12 0.00
Sb2O3 0.02 0.02 - 0.03 0.08 0.05 - 0.11 0.00
SiO2 0.09 0.07 - 0.11 0.09 0.03 - 0.21 0.00
As2O5 35.53 35.27 - 35.80 37.20 36.22 - 38.26 37.61
P2O5 0.88 0.86 - 0.90 0.04 0.02 - 0.05 0.00
SO3 0.17 0.17 - 0.18 0.55 0.45 - 0.64 0.00
H2O* 10.46 0.00 - 0.00 10.44 10.32
total 99.39 100.57 100.00 a mean and range of two point analyses 467 b mean and range of six point analyses 468 c composition for ideal formula Cu8(AsO4)4(OH)4
.5H2O 469
H2O* - content calculated on the basis of charge balance and theoretical content 5 470
H2O. 471
472
18
Sample A
Sample A
Sample B
Sample B
Olivenite
Cornwallite Clinoclase Cornubite
Raman /cm-1
Infrared/cm-1
Raman /cm-1
Infrared/cm-1
Raman /cm-1
Raman /cm-1
Raman /cm-1
Raman /cm-1
3585 3514 3579 3559 3324 3361 3464 3411
3488 3497 3450 3444 3439 3437
3215 3273 3350 3339 3012 3059 3042 2842 2859 2728 2731 1649 1650 1617 1624 1459 1579 1420 1505 1123 1085 1087 1051 988 988 962 983 962 909 891 891 857 877 850
852 833 843 843 853 859 832 815 831 804 826 826 819 806
760 763 783 780 710 712 712 632 603 607
554 560 590 526 507 554 536 539 525 497 496 496 509 508 496 467 411 421 416 438 440 393 374 360 363 398 337 343 346 347 348 365 294 299 335 330 318 327
473
Table 3 Results of the vibrational spectroscopic analysis of strashimirite and in 474
comparison with the Raman spectra of other basic copper arsenates 475
476
19
Legends to figures 477
478
Fig. 1 Raman spectrum of strashimirite samples A and B in the 100 to 4000 cm-1 479
region. 480
Fig. 2 Infrared spectrum of strashimirite samples A and B in the 600 to 4000 cm-1 481
region. 482
Fig. 3 Raman spectrum of strashimirite samples A and B in the 700 to 1000 cm-1 483
region. 484
Fig. 4 Infrared spectra of strashimirite samples A and B in the 700 to 1300 cm-1 485 region. 486
487
Fig. 5 Raman spectrum of strashimirite samples A and B in the 100 to 600 cm-1 488
region. 489
Fig. 6 Raman spectrum of strashimirite samples A and B in the OH stretching 490
region. 491
Fig. 7 Infrared spectrum of strashimirite samples A and B in the OH stretching 492
region. 493
Fig. 8 Infrared spectrum of strashimirite samples A and B in the 1300-1800 cm-1 494
stretching region. 495
496
497
Legends to tables 498
499
Table 1 Refined unit-cell parameters for strashimirite 500
Table 2 Chemical composition of strashimirite (wt. %) 501
Table 3 Results of the vibrational spectroscopic analysis of strashimirite 502
503
Copyright © 2022 FDOKUMEN