Motives for Introducing Species: Palestine's Carp as a Case Study
Upload
independentCategory
view
2download
0
Enhanced Accumulation of Arsenate in Carp in the Presenceof Titanium Dioxide Nanoparticles
Hongwen Sun & Xuezhi Zhang & Qian Niu & Yongsheng Chen & John C. Crittenden
Received: 24 January 2006 /Accepted: 28 May 2006 / Published online: 25 July 2006# Springer Science + Business Media B.V. 2006
Abstract In this study adsorption of arsenic (As) ontoTiO2 nanoparticles and the facilitated transport of Asinto carp (Cyprinus carpio) by TiO2 nanoparticleswas examined. Adsorption kinetics and adsorptionisotherm were conducted by adding As(V) to TiO2
suspensions. Facilitated transport of As by TiO2
nanoparticles was assessed by accumulation testsexposing carp to As(V) contaminated water in thepresence of TiO2 nanoparticles. The results showedthat TiO2 nanoparticles had a significant adsorptioncapacity for As(V). Equilibrium was establishedwithin 30 min and the isotherm data was describedby Freundlich isotherm. The KF and 1/n were20.71 mg/g and 0.58, respectively. When exposed toAs(V)-contaminated water in the presence of TiO2
nanoparticles, carp accumulated considerably moreAs, and As concentration in carp increased by 132%after 25 days exposure. Considerable As and TiO2
accumulated in intestine, stomach and gills of the fish,and the lowest level of accumulation was found inmuscle. Accumulation of As and TiO2 in stomach,
intestine and gills are significant. Arsenic accumula-tion in these tissues was enhanced by the presence ofTiO2 nanoparticles. TiO2 nanoparticles that haveaccumulated in intestine and gills may releaseadsorbed As and As bound on TiO2 nanoparticleswhich cannot be released maybe transported by TiO2
nanoparticles as they transferred in the body. In thiswork, an enhancement of 80% and 126% Asconcentration in liver and muscle after 20 days ofexposure was found.
Keywords arsenic . TiO2. nanoparticles .
accumulation . carp . facilitated transport
1 Introduction
Extensive research on the applications of nano-materials, including catalysis, drug delivery, medicaldiagnostics, enzyme immobilization, sensors andpollution control has been carried out recently (Konget al., 2000; Králik & Biffis, 2001; Long & Yang,2001; Kipp, 2004). Some nanomaterials, such as TiO2
nanoparticles are now in daily use including popularsunscreens, toothpaste and cosmetics. Currently, morethan 140 companies worldwide have already engagedin manufacture of nanoparticles. There are at least 44elements in the Periodic Table commercially availablein nanoscale form, and more elements are beingadded to this list (ETC Group, 2003). During the next10–15 years, nanotechnology sectors are expected to
Water Air Soil Pollut (2007) 178:245–254DOI 10.1007/s11270-006-9194-y
H. Sun (*) :X. Zhang :Q. NiuCollege of Environmental Science and Engineering,Nankai University, Tianjin 300071, Chinae-mail: [email protected]
Y. Chen : J. C. CrittendenDepartment of Civil and Environmental Engineering,Arizona State University, Tempe, AZ 85287, USA

exceed $1 trillion annually in global industrial outputand to employ about 2 million workers (Roco &Bainbridge, 2001). Although these estimates reflectuncertainty in predicting the commercialization of anemerging technology, there is little doubt that aninevitable consequence of this rapid growth is theeventual exposure of humans and other environmentalreceptors to nanoscale materials. Recent research isnow showing that when normally harmless bulkmaterials are made into nanoparticles they tend tobecome toxic (Howard & Maynard, 1999). The sizeeffect is considerably more important to nanoparticlestoxicity than the actual composition of the material(Donaldson, Stone, Gilmour, Brown, & MacNee,2000; Öberdörster, 2000; Gumbleton, 2001; Tinkle,Antonini, & Rich, 2003). Tan’s study shown TiO2
nanoparticles used in sunscreen, can get deep enoughinto the skin to be taken up into the lymphatic system,while larger particles are not (greater than 1 μm indiameter) (Tan, Commens, Burnett, & Snitch, 1996).In vivo studies show that nanoparticles can produceinflammation in lungs of laboratory animals afterexposure to nanoparticles aerosols (Donaldson et al.,2000; Öberdörster, 2000). In vitro studies show thatnanoparticles could produce free radicals that cancause cellular damage. This damage can be man-ifested in different ways, including genotoxicity andaltered cell death rates (Afaq, Abidi, Matin, &Rahman, 1998; Rahman et al., 2002).
Although there is an increasing amount of researchon the toxicology of nanomaterials, little is currentlyknown about the fate, transport, and transformation ofnanosized materials once they enter the environment.Many studies have shown that colloids, both organicand inorganic, have been implicated in the transportof toxic pollutants such as metals, radionuclides, andcertain ionizable organic pesticides in laboratory andfield tests (Amrhein, Mosher, & Strong, 1993;Honeyman, 1999). The large surface area, crystallinestructure, and reactivity of some nanoparticles mayfacilitate transport of toxic materials in the environ-ment (Zhang & Masciangioli, 2003). However, thereis little to no data indicating how and to what extentemerging nanoparticles may facilitate the transport oftoxic pollutants or viruses in the environment.
Arsenic is widely distributed in the environmentand is known to be highly toxic to humans. Theaccumulation of As in fish has received significantattention as a consequence of human and wildlife
concerns resulting from the consumption of fish withelevated As (Davis, Sellstone, Clough, Barrick, &Yare, 1996; Lewis et al., 2002). Nanocrystalline TiO2
has a great adsorption capacity for arsenic ions due toits high surface area and the presence of high affinitysurface hydroxyl groups (Pena, Meng, Korfiatis, &Jing, 2006). Accordingly, the following hypothesisneeds to be examined, “Will the accumulation of Asin fish be enhanced by the facilitated transport ofnanoparticles or diminished because of the reductionof free soluble As in aqueous phase due to itsadsorption onto titanium dioxide nanoparticles?” Inthis research, the adsorption of As(V) onto TiO2 andthe potential of TiO2 nanoparticles to facilitate thetransport of As to carp (Cyprinus carpio) wereexamined.
2 Materials and Methods
2.1 Reagents and solutions
All reagents used were of analytical reagent gradeexcept for acids, which were of trace metal analysisgrade. Mini-Q quality water was used for preparationof stock solution. Laboratory equipment and contain-ers were washed in 25% (v/v) HNO3 solution for atleast 12 h prior to each use.
Na3AsO4•12H2O was used for preparation of As(V) stock solutions (100 mg/l). The standard stocksolutions were stored in glass bottles kept at 4°C inthe dark. Fresh solutions were made from the stocksolution for each experiment. The reductant solutionused for hydride generation was 2% (w/v) NaBH4
dissolved in 0.5% (w/v) NaOH solution, which wasprepared immediately prior to use. Degussa P25titanium dioxide nanoparticles, with an average BETsurface area of 50 m2/g and an average particle size of21 nm, was used for all experiments. Stock suspen-sions of TiO2 nanoparticles were prepared (1.0 g/l)and then sonicated for 10 min (50 w/l at 40 kHz)before use.
Standard titanium (IV) stock solution (1.0 g/l) wasprepared by heating 0.4169 g TiO2 nanoparticles in asolution containing sulphuric acid and ammoniumsulphate and finally diluted to 250 ml with distilledwater. Low-concentration standards were prepareddaily by diluting of the stock solution with sulphuricacid (10% v/v).
246 Water Air Soil Pollut (2007) 178:245–254

2.2 Instrumentation
A microwave digestion system (WX-3000 plus, EUChemical Instruments Co., Ltd, Shanghai, China) wasused for sample digestion. An inductively coupledplasma optical emission spectrometry (ICP-OES)(IRIS Intrepid II, Thermo Electron, USA) was used todetermine TiO2 concentration in digested samples.Arsenic was measured using an atomic fluorescencespectrometry equipped with hydride generation (HG-AFS 2201, Haiguang Co., Beijing, China). A trans-mission electron microscopy (TEM) (Tecnai G2 20S-Twin, Philip) was used to get the shape andaggregation information of TiO2 nanoparticles inwater. An ion chromatograph (DX120, Dionex,USA) was used for the analysis of ions in water.
2.3 Adsorption of As(V) onto TiO2 nanoparticles
Adsorption kinetics and isotherm were determinedusing batch experiments. Dechlorinated tap water wasused in the experiment in order to keep similar watercircumstances with those in the accumulation tests.The major cations and their concentrations in thedechlorinated water were Ca2+(47.8 ± 1.88 mg/l),Na+(28.0 ± 0.94 mg/l), Mg2+(26.4 ± 5.94 mg/l) andK+(5.5 ± 0.34 mg/l). The major anions and theirconcentrations were SO4
2−(81.9 ± 2.49 mg/l),Cl−(48.79 ± 5.24 mg/l), NO3
− (2.22 ± 0.49 mg/l) andF− (0.63 ± 0.16 mg/l. The pH of the water was 7.8. Ineach experiment, 100 ml TiO2 suspensions containingappropriate amount of TiO2 were prepared and addedto a series of 250 ml Pyrex glass Erlenmeyer flasks.Then the required amount of As stock solution wasadded into the flasks. The flasks were put in areciprocating shaker and kept in dark at 25 ± 1°C and150 rpm. Residual aqueous As concentration wasanalyzed after the suspensions were centrifuged twicefor 10 min at 12,000 rpm using a high-speed centrifuge(Hermle Z323, Germany) at 0, 30, 60, 120, 180, and360 min. The adsorption isotherm was studied byvarying the initial As(V) concentration under a fixedconcentration of TiO2 suspensions of 10 mg/l.Isotherm tests were conducted for 3 h and thenresidual aqueous As concentration was analyzed.The adsorbed amount of As onto TiO2 was calculatedfrom the initial and final concentrations of As. Blankexperiments were also conducted demonstrated thatAs adsorption onto the walls of the flasks was
negligible (97–100% of initial concentration wereobserved for time scale of this study).
2.4 Accumulation experiment
A group of carp (Cyprinus carpio) was purchasedfrom a local pet shop. The initial body weight andlength of the fish were 6.1 ± 1.2 g and 4.0 ± 0.7 cmrespectively. All fish were acclimatized in dechlori-nated tap water with a natural light/dark cycle for 10 dbefore each experiment. For the accumulation tests,specific amount of As(V) stock solutions were addedinto two glass tanks containing 16 l dechlorinated tapwater respectively, and the initial concentration of Aswas 200.0 ± 10.2 μg/l. In one tank, 0.160 g TiO2
nanoparticles were added and allowed to equilibratefor 2 h. 36 carp were then added to each tank. Thefish were fed with a commercial food once a dayduring the experiment.
When TiO2 nanoparticles were added to the water,a translucent and unstable suspension of TiO2 nano-particles formed. Some of the unstable particlessettled out of solution. To maintain a relative stableaqueous phase concentrations of 200.0 μg/l As and10.0 mg/l TiO2, the solution was replaced every day.During the tests, the tanks were aerated slightly andthe temperature (23 ± 2°C) of water was maintainedfor each exposure. A control test without thecontaminants was conducted under the same condi-tions. Three fish were removed and sacrificed at 2, 5,10, 15, 20 and 25th day, and on the 2nd, 5th, 10th and20th day, four carp from each of the three treatmentswere dissected into skin and scales, muscle, gills,liver, stomach and intestine. After pretreatment,arsenic and TiO2 concentrations in carp or differenttissues of carp were analyzed, respectively.
2.5 Analytical procedures
Arsenic was measured using HG-AFS. The followinginstrumental parameters were used: current of lamp40 mA; high voltage of PMT 300; carrier gas (Ar)flow rate 0.3 l/min; shielded sheath (Ar) flow rate0.5 min/l; peristaltic pump rate 130 rmp; observationheight 8 mm and resonance wavelength 193.7.Thiourea (5%)–ascorbic acid (5%) mixing reagentwas used for pre-reduction of arsenate, and hydro-chloric acid (5%) media was used for hydridegeneration.
Water Air Soil Pollut (2007) 178:245–254 247

Fish or fish tissues were dried at 105°C for at least24 h until a constant weight was achieved. Then thedried fish were ground into powder. Approximately0.20 g dried sample and 4.0 ml concentrated HNO3
was added into each of six PTFE digestion tubes.After 10 min, the vessels were sealed and put in themicrowave. Then the samples were digested using athree-stage digestion protocol presented in Table I.Afterwards the vessel was allowed to cool. Filtrationof the samples was not required since the dissolutionwas complete.
For As analysis, the excess acid was removed fromthe digested solution by heating the digested solutionto near dryness at 90°C using an electric furnace.Then total As in carp was determined after pre-reduction of As(V). Triplicate analyses were per-formed for each sample. The accuracy of themeasurement was tested by the analysis of a certifiedreference material, GBW 08571 (mussel sample,National Research Center for CRM’s, Beijing), whichhas a certified value of 6.1 ± 1.1 μg/g As. The valuewe obtained was 5.8 ± 0.7 μg/g.
For TiO2 analysis, the digest solutions weretransferred to triangular flasks and evaporated todryness. TiO2 nanoparticles released by digestionwere decomposed into titanium (IV) ion by heatingwith 5 ml of the sulphuric acid–ammonium sulphatesolution. After cooling, the above solution wastransferred quantitatively to a 25-ml volumetric flask.TiO2 concentration in digested samples was deter-mined by ICP-OES. The instrumental parameterswere: RF power 1150 W; nebulizer pressure 22 psi;carrier gas (Ar) flow rate 0.5 l/min; peristaltic pumprate 130 rmp; integration time high WL range 5 s, lowWL range 30 s; and wavelength 336.121 nm.
Several quality control (QC) measures were takenduring the analysis of samples. First, a calibrationblank and a calibration standard (10.0 mg/l) were runbefore and after every five samples. The standardconcentration was required to be within 5% of its
nominal concentration for the analysis of bracketedsamples to be considered valid. Second, a calibrationstandard was also prepared at a concentration withinthe calibration range using a titanium stock solutionpurchased from another vendor (GSB G 65014-90(2201), Central Iron & Steel Research Institute,Beijing). This calibration standard was then analyzedto verify analyte concentration and instrument cali-bration. Third, triplicate digestions and analyses wereperformed for each sample.
Because biological standard reference materialscontaining TiO2 were not available, laboratory con-trols were prepared. Fish samples were pooledtogether and mechanically homogenized to form auniform control tissue matrix. About 0.20 g fishsimple aliquots were transferred directly into each ofsix acid-cleaned PTFE digestion tubes. Four of thematrix aliquots were fortified with 0.020 g TiO2
nanoparticles (0.80 g Ti/ml of final analysis solution),while the remaining two were not fortified and servedas matrix blanks. These samples were digested,evaporated, decomposed and analyzed as describedabove. The titanium dioxide recovery in thesesamples ranged from 90 to 105%.
2.6 Statistical analysis
For As(V) concentrations in water, and As and TiO2
concentrations in fish, the mean values were calcu-lated from the three replicates and expressed withstandard deviation (n=3). The homogeneity of vari-ance was checked out and a one-way analysis ofvariance (ANOVA) was then performed to assess thesignificance of differences observed between Asconcentrations in fish or tissues exposed to As-contaminated water with and without TiO2. Allstatistical analyses were conducted at a significancelevel of 0.05.
3 Results and Discussion
3.1 Characterization of TiO2 nanoparticles in water
Nanomaterials have a much smaller size, largersurface area and surface energy compared to normalmaterials, so they are prone to aggregate. TEMimages of TiO2 nanoparticles in water are presentedin Figure 1. The images show that although most
Table I Microwave sequence for sample digestion
Stage Power(1–9)
Temperature(°C)
Pressure(MPa)
Time(min)
1 8 150 1 52 6 180 2 53 6 190 2 5
248 Water Air Soil Pollut (2007) 178:245–254

particles aggregate together, due to the small originalparticle size (of about 21 nm), the aggregations arestill relatively small, and most of the particles arewithin 50–400 nm.
3.2 Adsorption of As onto TiO2 nanoparticles
The adsorption of As onto nanoparticles was observedfor 6 h, and the results are shown in Figure 2. As(V)was adsorbed onto TiO2 nanoparticles quickly, andequilibrium was reached within 30 min. At the ad-sorption equilibrium, about 25% of the initial As(V)was adsorbed onto TiO2 nanoparticles. The equilibri-um time is in agreement with that reported by Dutta etal. (Dutta, Ray, Sharma, & Millero, 2004), who foundthat the adsorption equilibria of both As(III) and As(V) onto P25 TiO2 nanoparticles were established in
approximately 1 h. Unlike other porous media inwhich adsorption is possibly occurring through porediffusion steps and takes a longer time to reachequilibrium, Degussa P25 is made of nonporous TiO2
particles where only liquid phased diffusion occurs,This type of mass transfer requires less time to reachequilibrium (Dutta et al., 2004).
3.3 Adsorption isotherm
The adsorption isotherm was determined using 2 h ofequilibrium time. Experimental data of As(V) adsorp-tion onto TiO2 nanoparticles was described by theFreundlich isotherm [Equation (1)] and the correlationcoefficients (R2) was 0.946. The date and theFreundlich fit are shown in Figure 3.
log q ¼ log KF þ 1
nlogCe ð1Þ
where q (mg/g) is the amount of adsorbed As, Ce isthe equilibrium As concentration in solution (mg/l),KF and 1/n are the Freundlich constants. TheFreundlich parameters were obtained by nonlinearleast-squares regression analysis. The constants KF
and 1/n were found to be 20.71 mg/g and 0.58. It hasbeen reported that the KF values of activated aluminaand Portland cement for the adsorption of As wereless than 0.224 and 3.89 mg/g (Kundu et al., 2004;Singh and Pant, 2004), respectively. In comparison, itis clear that the KF obtained in this study is very high.The small particle size (21 nm) and large BET surfacearea of P25 TiO2 nanoparticles (50 m2/g) may accountfor their strong adsorption ability.
Figure 1 TEM images ofTiO2 nanoparticles in water.
0 60 120 180 240 300 360130
140
150
160
170
180
190
200
210
As
conc
entr
atio
n (μ
g/L
)
Adsorption time (min)Figure 2 Adsorption kinetics of As(V) onto TiO2 nanoparticles.
Water Air Soil Pollut (2007) 178:245–254 249
3.4 The enhanced accumulation of As in carpin the presence of TiO2
When TiO2 nanoparticles were added into water, As(V) concentration decreased due to the adsorption ofTiO2. As a result, As(V) aqueous concentrations were150.0 ± 7.6 μg/l for the tank in the presence of TiO2
nanoparticles and 200.0 ± 10.2 μg/l for the tank in theabsence of TiO2 nanoparticles. TiO2 concentrationswere 10.0 ± 1.3 mg/l when TiO2 nanoparticles wereadded into the tank.
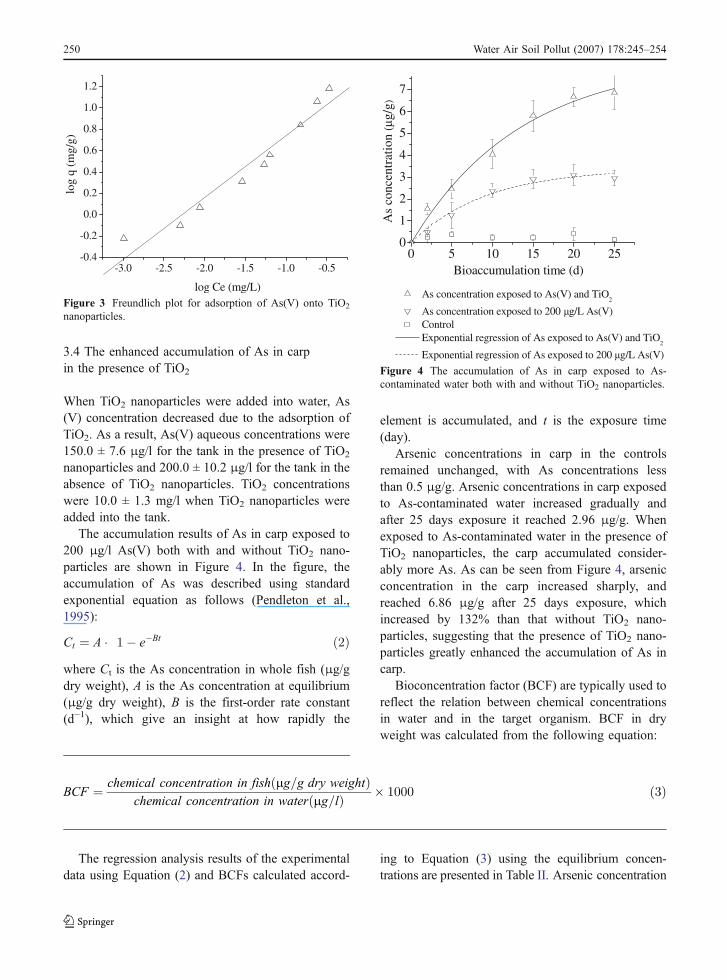
The accumulation results of As in carp exposed to200 μg/l As(V) both with and without TiO2 nano-particles are shown in Figure 4. In the figure, theaccumulation of As was described using standardexponential equation as follows (Pendleton et al.,1995):
Ct ¼ A � 1� e�Bt� � ð2Þ
where Ct is the As concentration in whole fish (μg/gdry weight), A is the As concentration at equilibrium(μg/g dry weight), B is the first-order rate constant(d−1), which give an insight at how rapidly the
element is accumulated, and t is the exposure time(day).
Arsenic concentrations in carp in the controlsremained unchanged, with As concentrations lessthan 0.5 μg/g. Arsenic concentrations in carp exposedto As-contaminated water increased gradually andafter 25 days exposure it reached 2.96 μg/g. Whenexposed to As-contaminated water in the presence ofTiO2 nanoparticles, the carp accumulated consider-ably more As. As can be seen from Figure 4, arsenicconcentration in the carp increased sharply, andreached 6.86 μg/g after 25 days exposure, whichincreased by 132% than that without TiO2 nano-particles, suggesting that the presence of TiO2 nano-particles greatly enhanced the accumulation of As incarp.
Bioconcentration factor (BCF) are typically used toreflect the relation between chemical concentrationsin water and in the target organism. BCF in dryweight was calculated from the following equation:
BCF ¼ chemical concentration in fish 2g=g dry weightð Þchemical concentration in water 2g=lÞð � 1000 ð3Þ
The regression analysis results of the experimentaldata using Equation (2) and BCFs calculated accord-
ing to Equation (3) using the equilibrium concen-trations are presented in Table II. Arsenic concentration
-3.0 -2.5 -2.0 -1.5 -1.0 -0.5-0.4
-0.2
0.0
0.2
0.4
0.6
0.8
1.0
1.2
log Ce (mg/L)
log
q (m
g/g)
Figure 3 Freundlich plot for adsorption of As(V) onto TiO2
nanoparticles.
0 5 10 15 20 250
1
2
3
4
5
6
7
As
conc
entr
atio
n (μ
g/g)
Bioaccumulation time (d)
As concentration exposed to As(V) and TiO2
As concentration exposed to 200 μ g/L As(V) Control Exponential regression of As exposed to As(V) and TiO
2
Exponential regression of As exposed to 200 μg/L As(V)
Figure 4 The accumulation of As in carp exposed to As-contaminated water both with and without TiO2 nanoparticles.
250 Water Air Soil Pollut (2007) 178:245–254

in carp at equilibrium (A value) in the presence of TiO2
nanoparticles is much higher than that exposed to As(V) only. Also the BCFs at equilibrium in the presenceof TiO2 nanoparticles is 55.6, which is almost twofoldhigher than that in the absence of TiO2 nanoparticles(22.67). Although the free soluble As concentration inwater in the presence of TiO2 nanoparticles decreasedfrom 200 to 150 μg/l due to the strong adsorption ontoTiO2 nanoparticles, the carp exposed to the contami-nated media accumulated more As, suggesting that thepresence of TiO2 nanoparticles greatly enhanced theaccumulation of As in carp.
TiO2 concentration in carp was analyzed simulta-neously and the results are given in Figure 5. Strongaccumulation of TiO2 nanoparticles in carp wasobserved. TiO2 concentration in carp reached4.95 mg/g on the 10th day. Experimental data ofTiO2 nanoparticles accumulation in carp gave a betterfit using the exponential equation (R2 = 0.972), whereA and B are 6.17 mg/g and 0.142d-1, respectively.Moreover, a positive correlation between As concen-tration and TiO2 concentration during the duration ofexposure existed with a correlation coefficient greaterthan 0.975.
Grolimund, Borkovec, Barmettler, & Sticher(1996) demonstrated that mobilized colloids canprovide a pathway for rapid transport of Pb. Flury,Mathison, & Harsh (2002) found that colloidsmobilized in flow experiments with packed sedimentscarried Cs along. In another study, Maia, Mehnert, &Schafer-Korting (2000) reported the great potential ofsolid lipid nanoparticles (SLN) to improve drugabsorption by the skin. In their study, penetration ofprednicarbate incorporated into SLN into human skinincreased by 30% as compared to prednicarbatecream. This study provides evidence of facilitatedaccumulation of the toxic contaminant by TiO2
nanoparticles in the aquatic organisms. Carp accumu-lated more As in the presence of TiO2 nanoparticlesdue to the facilitated transport. Hence, research shouldnot be addressed only on the fate and toxicity ofnanoparticles themselves, but also to the potential ofthe facilitated transport of other trace toxic pollutantswhen they co-exist, which is a significant step inbetter understanding of the potential exposure risksthat nanoparticles might cause.
3.5 The distribution of As and TiO2 in differenttissues of carp
Carp taken on the 2nd, 5th, 10th, 20th day weredissected. Arsenic and TiO2 in different tissues wereanalyzed and the results are shown in Figure 6.Considerable As and TiO2 accumulated in intestine,stomach and gills of the fish, and the lowest level ofaccumulation was found in muscle. The presence ofTiO2 nanoparticles did not change the distributionof As. The order of As and TiO2 accumulation indifferent parts of carp was intestine > stomach > gills >liver > skin and scales > muscle.
Comparing As concentration in the tissues of carpexposed to As-contaminated water in the absence ofTiO2 nanoparticles with those in the absence of TiO2
nanoparticles, Arsenic concentration in stomach,intestine and gills in all exposure periods, arsenicconcentration in liver and muscle on the 5th, 10th and20th day and As concentration in skin and scales atthe 10th day exposure are significantly higher.
Heavy metals enter the aquatic organism throughdirect consumption of water or food and throughnondietary routes such as uptake through absorbingepithelia. The gills, skin, and digestive tract arepotential sites of adsorption of waterborne chemicals
Table II The exponential accumulation parameters and BCF
Exposed media A (μg/g) B (d−1) R2 BCF
As 3.40 0.109 0.983 22.67As and TiO2 8.34 0.074 0.991 55.60
0 5 10 15 20 250
1
2
3
4
5
6
7
Bioaccumulation time (d)
TiO
2 c
on
cen
trat
ion
mg
/L
TiO2 concentration exposed to As and TiO
2
Control
Exponential regression of TiO2 exposed to As and TiO
2
Figure 5 The accumulation of TiO2 nanoparticles in carp.
Water Air Soil Pollut (2007) 178:245–254 251

0.00.20.40.60.81.01.21.41.61.82.0
2 5 10 200.00.20.40.60.81.01.21.41.61.82.0
TiO
2 con
cent
rato
n (m
g/g)
Bioaccumulation time (d)
Ars
enic
con
cent
rati
on (
μ g/g
)(a) skin and scales
∗ ∗ ∗
∗
∗
∗ ∗
∗
∗ ∗
∗
∗ ∗
∗ ∗
∗
0.0
0.1
0.2
0.3
0.4
0.5
0.6
2 5 10 200.0
0.1
0.2
0.3
0.4
0.5
0.6
TiO
2 con
cent
rati
on (
mg/
g)
Bioaccumulation time (d)
Ars
enic
con
cent
rati
on (
μ g/g
)
(b) muscle
0.00.51.01.52.02.53.03.54.04.55.0
2 5 10 200.00.51.01.52.02.53.03.54.04.55.0
T
iO2 c
once
ntra
tion
(m
g/g)
Bioaccumulation time (d)
Ars
enic
con
cent
rati
on (
μg/g
)
(c) gills
0.0
0.5
1.0
1.5
2.0
2.5
2 5 10 200.0
0.5
1.0
1.5
2.0
2.5
∗
∗
∗
TiO
2 con
cent
rati
on (
mg/
g)
Bioaccumulation time (d)
Ars
enic
con
cent
rati
on (
μg/g
)
(d) liver
0
2
4
6
8
10
12
14
2 5 10 200
2
4
6
8
10
12
14
TiO
2 con
cent
rati
on (
mg/
g)
Bioaccumulation time (d)
Ars
enic
con
cent
rati
on (
μg/g
)
(e) stomach
0
10
20
30
40
50
60
70
80
2 5 10 200
10
20
30
40
50
60
70
80
TiO
2 con
cent
rati
on (
mg/
g)
Bioaccumulation time (d)
Ars
enic
con
cent
rati
on (
μ g/g
)
(f) intestine
As control As exposed to 200 μ g/L As As exposed to As and TiO
2
Ti control TiO
2 exposed to As and TiO
2
Figure 6 The accumulation of As and TiO2 in tissues of carpexposed for 2, 5, 10 and 20 days: a skin and scales; b muscle;c gills; d liver; e stomach; f intestine. Data are expressed as
mean±SE. Asterisks denote means As concentrations, which aresignificantly different from those exposed to without TiO2
nanoparticles at that duration (P < 0.05).
252 Water Air Soil Pollut (2007) 178:245–254

(Pedlar & Klaverkamp, 2002). Tan’s study shows thatTiO2 nanoparticles used in sunscreen can get deepenough into the skin to be taken up into the lymphaticsystem, while larger particles (greater than 1 μm indiameter) cannot (Tan et al., 1996). However, in ourstudy there was no significant enhancement of Asconcentration in the skin and scales, with theexception of that on the 10th day, indicating that thefacilitated transport of As by TiO2 nanoparticlesthrough skin negligible.
Accumulation of As and TiO2 in stomach, intestineand gills are significant and accumulation of As inthese tissues are enhanced by the presence of TiO2
nanoparticles. As stated in the above, a large amountof As were adsorbed onto TiO2 nanoparticles. Thebound As was transported to carp as TiO2 nano-particles were consumed by the carp, thus resultingthe enhancement of As concentration in the stomachand intestine. Gills are in direct contact with aquaticenvironment and are a physiologically complex andvulnerable structure, making them target organs forwaterborne toxicants (Reid & McDonald, 1991).Moreover, the amount of mucus on the gill surfaceincreases during metal exposure (Handy & Eddy,1991), which may contribute to the adsorption ofTiO2 nanoparticles onto gill. Direct uptake of TiO2
nanoparticles via gills and intestine may occur, andsubsequently TiO2 nanoparticles was rapidly trans-ferred, distributed and accumulated, resulting the highconcentration of TiO2 in liver and muscle. Facilitatedtransport of As may occur when TiO2 nanoparticlestransported via gills and intestine. As TiO2 nano-particles accumulated in intestine and gills, theadsorbed As on the surface of TiO2 nanoparticlesmay be released and uptake by the body; while theresidual As bound on TiO2 nanoparticles whichcannot be released maybe transported by TiO2 nano-particles as they transferred in the body. As a result,after 20 days of exposure, Arsenic concentration inliver and muscle of carp exposed to As-contaminatedwater in the presence of TiO2 nanoparticles increasedby 80% and 126%, as compared with that in theabsence of TiO2 nanoparticles.
4 Conclusion
The small particle size and large specific surface areaof P25 TiO2 nanoparticles may account for their strong
adsorption capacity for As(V). Facilitated transport ofAs occurred when carp were exposed to As-contam-inated water in the presence of TiO2 nanoparticles, andthe carp accumulated considerably more As in thepresence of TiO2. Accumulation of As and TiO2 instomach, intestine and gills are significant andaccumulation of As in these tissues were enhancedby the presence of TiO2 nanoparticles. As TiO2
nanoparticles accumulated in intestine and gills, theadsorbed As on the surface of TiO2 nanoparticles maybe released and uptake by the body; while the residualAs bound on TiO2 nanoparticles which cannot bereleased maybe transported by TiO2 nanoparticles asthey transferred in the body. As a result, there are80% and 126% enhancement of As concentration inliver and muscle after 20 days of exposure.
Acknowledgments The work was supported by the ExcellentYoung Fellow Plan for New Century issued by MinistryEducation of China and by the National Water Quality Centerat Arizona State University. Any opinions, findings, conclu-sions, or recommendations expressed in this paper are those ofthe authors and do not necessarily reflect the view of thesupporting organizations.
References
Amrhein, C., Mosher, P. A., & Strong, J. E. (1993). Colloid-assisted transport of trace metals in roadside soilsreceiving deicing salts. Soil Science Society of AmericanJournal,57, 1212–1217.
Afaq, F., Abidi, P., Matin, R., & Rahman, Q. (1998). Cytotox-icity, pro-oxidant effects and antioxidant depletion in ratlung alveolar macrophages exposed to ultrafine titaniumdioxide. Journal of Applied Toxicology,18, 307–312.
Davis, A., Sellstone, C., Clough, S., Barrick, R., & Yare, B.(1996). Bioaccumulation of arsenic chromium and lead infish: Constraints imposed by sediment geochemistry.Applied Geochemistry,11, 409–423.
Donaldson, K., Stone, V., Gilmour, P. S., Brown, D. M., &MacNee, W. (2000). Ultrafine particles: Mechanisms oflung injury. Philosophical Transactions of the RoyalSociety of London B,358, 2741–2749.
Dutta, K. P., Ray, K. A., Sharma, K. V., & Millero, J. F. (2004).Adsorption of arsenate and arsenite on titanium dioxidesuspensions. Journal of Colloid and Interface Science,278,270–275.
ETC Group (2003). No small matter II: The case for a globalmoratorium. Occasional Paper Series,7(1).
Flury, M., Mathison, J. B., & Harsh, J. B. (2002). In situmobilization of colloids and transport of cesium in Hanfordsediments. Environmental Science & Technology,36,5335–5341.
Grolimund, D., Borkovec, M., Barmettler, K., & Sticher, H.(1996). Colloid-facilitated transport of strongly sorbingcontaminants in natural porous media: A laboratory
Water Air Soil Pollut (2007) 178:245–254 253

column study. Environmental Science & Technology,30,3118–3123.
Gumbleton, M. (2001). Caveolae as potential macromoleculetrafficking compartments within alveolar epithelium. Ad-vanced Drug Delivery Reviews,49, 281–300.
Handy, R. D., & Eddy, F. B. (1991). Effects of inorganiccations on Na+ adsorption to the gill and body surface ofrainbow trout Oncorhynchus mykiss (Walbaum) in dilutesolutions. Canadian Journal of Fisheries and AquaticSciences,48, 1829–1837.
Honeyman, B. D. (1999). Colloid culprits in contamination.Nature,397, 23–24.
Howard, C. V., & Maynard, R. L. (1999). Particulate matter:Properties and effects upon health. Oxford, New York:BIOS Scientific.
Kipp, J. E. (2004). The role of solid nanoparticle technology inthe parenteral delivery of poorly water-soluble drugs.International Journal of Pharmaceutics,284, 109–122.
Kong, J., Franklin, R. N., Zhou, C. W., Chapline, G. M., Peng,S., Cho, K. et al. (2000). Nanotube molecular wires aschemical sensors. Science,287, 622–625.
Králik, M., & Biffis, A. (2001). Catalysis by metal nano-particles supported on functional organic polymers. Jour-nal of Molecular Catalysis. A. Chemical,177, 113–138.
Kundu, S., Kavalakatt, S. S., Pal, A., Ghosh, K. S., Mandal, M.,& Pal, T. (2004). Removal of arsenic using hardened pasteof Portland cement: Batch adsorption and column study.Water Research,38, 3780–3790.
Lewis, A. M., Scott, I. G., Bearden, W. D., Quarles, L. R., Moore,J., Strozier, D. E. et al. (2002). Fish tissue quality in near-coastal areas of the Gulf of Mexico receiving point sourcedischarges. Science of the Total Environment,284, 249–261.
Long, Q. R., & Yang, R. T. (2001). Carbon nanotubes assuperior sorbent for dioxin removal. Journal of theAmerican Chemical Society,123, 2058–2059.
Maia, C. S., Mehnert, W., & Schafer-Korting, M. (2000).Solid lipid nanoparticles as drug carriers for topicalglucocorticoids. International Journal of Pharmaceutics,196, 165–167.
Öberdörster, G. (2000). Toxicology of ultrafine particles: invivo studies. Philosophical Transactions of the RoyalSociety of London B,358, 2719–2740.
Pedlar, R. M., & Klaverkamp J. F. (2002). Accumulation anddistribution of dietary arsenic in lake whitefish (Coregonusclupeaformis). Aquatic Toxicology,57, 153–166.
Pena, M., Meng, X., Korfiatis, G. P., & Jing, C. (2006).Adsorption mechanism of arsenic on nanocrystallinetitanium dioxide. Environmental Science & Technology,40,1257–1262.
Pendleton, W. G., Whitworth, R. M., & Olsen, H. G. (1995).Accumulation and loss of arsenic and boron, alone and incombination, in Mallard ducks. Environmental Toxicologyand Chemistry,14, 1357–1364.
Rahman, Q., Lohani, M., Dopp, E., Pemsel, H., Jonas, L.,Weiss, D. G. et al. (2002). Evidence that ultrafine titaniumdioxide induces micronuclei and apoptosis in Syrianhamster embryo fibroblasts. Environmental Health Per-spectives,110, 797–800.
Reid, S. D., & McDonald, D. G. (1991). Metal binding activityof the gills of rainbow trout (Oncorhynchus mykiss).Canadian Journal of Fisheries and Aquatic Sciences,48,1061–1068.
Roco, M. C., & Bainbridge, W. S. (2001). Societal implicationsof nanoscience and nanotechnology. Boston: Kluwer
Singh, S. T., & Pant, K. K. (2004). Equilibrium, kinetics andthermodynamic studies for adsorption of As(III) onactivated alumina. Separation and Purification Technolo-gy,36, 139–147.
Tan, M. H., Commens C. A., Burnett, L., & Snitch, P. J. (1996).A pilot study on the percutaneous absorption of microfinetitanium dioxide from sunscreens. Australian Journal ofDermatology,37, 185–187.
Tinkle, S. S., Antonini, J. M., & Rich, B. A. (2003). Skin as a routeof exposure and sensitization in chronic beryllium disease.Environmental Health Perspectives,111, 1202–1208.
Zhang, W. X., & Masciangioli, T. (2003). Environmentaltechnologies at the nanoscales. Environmental Science &Technology A-Pages,37, 102A–108A.
254 Water Air Soil Pollut (2007) 178:245–254
Copyright © 2022 FDOKUMEN