Constructing a fish metabolic network model
15
SOFTWARE Open Access Constructing a fish metabolic network model Shuzhao Li 1,2* , Alexander Pozhitkov 1,3 , Rachel A Ryan 1 , Charles S Manning 1 , Nancy Brown-Peterson 1 , Marius Brouwer 1 Abstract We report the construction of a genome-wide fish metabolic network model, MetaFishNet, and its application to analyzing high throughput gene expression data. This model is a stepping stone to broader applications of fish systems biology, for example by guiding study design through comparison with human metabolism and the integration of multiple data types. MetaFishNet resources, including a pathway enrichment analysis tool, are accessible at http://metafishnet.appspot.com. Rationale Small fish species are widely used in ecological and phar- maceutical toxicology, developmental biology and genet- ics, evolutionary biology and as human disease models. Among the species commonly found in scientific litera- ture are zebrafish (Danio rerio), medaka (Oryzias latipes), stickleback (Gasterosteus aculeatus), European flounder (Platichthys flesus), channel catfish (Ictalurus punctatus), sheepshead minnow (Cyprinodon variegatus), mummi- chog ( Fundulus heteroclitus ), Atlantic salmon ( Salmo salar), common carp (Cyprinus carpio), rainbow trout (Oncorhynchus mykiss) and swordtail (Xiphophorus hel- lerii). Each of these fish species has its own niche as a research tool. For example, Xiphophorus is a classic genetic model of melanomas [1,2], whereas medaka is a good model for reproductive and ecotoxicological studies [3]. Zebrafish, in particular, has risen to stardom in recent years, with a large collection of mutants and estab- lished techniques for transgenesis, expression studies, forward and reverse genetics and in vivo imaging [4-8]. The use of zebrafish as human disease models has also spiked significant interests [9-11]. Since small fish are currently the only vertebrate species that can be studied in high throughput, their future in modern biomedical sciences is brighter than ever [12,13]. Fish genomics is also taking off. Thus far, whole gen- ome sequences are available for five fish species: D. rerio, O. latipes , T. rubripes, T. nigroviridis and G. aculeatus. DNA microarrays have been applied to study gene expression in many more fish species [14-18]. However, fish functional genomics is far behind other model organisms. In the example of sheepshead minnows, which are used in our lab for ecotoxicology, gene annotation is poor and no pathway analysis tool is readily available for interpreting DNA microarray data. The situation is similar for other fish species, with zeb- rafish perhaps an arguable exception. Bioinformatic tools that fill in this gap in fish functional genomics are highly desirable [17]. Oberhardt et al. [19] summarized the five applications of genome-wide metabolic network models: ‘(1) contextualization of high-throughput data, (2) guidance of metabolic engineering, (3) directing hypothesis-driven discovery, (4) interrogation of multi- species relationships, and (5) network property discov- ery.’ While significant interest exists for a fish metabolic network model in all five categories, the immediate and primary application of our model will be the interpreta- tion of high throughput expression data, especially path- way analysis, which can be done either by direct mapping to metabolic genes [20,21] or via established enrichment statistics [22,23]. This model will also pro- vide a first glance of how fish metabolism resembles human metabolism, which should be instructional for the use of fish in many research areas [24]. This pro- posed first generation model will serve as a reference and stepping stone to further systems investigations, helping study design and hypotheses generation. As more data become available in the future, the model can be further refined to support broader applications. The recent completion of genome sequencing of five fish species has paved the way for constructing a gen- ome-wide fish metabolic network model. That is, all * Correspondence: [email protected] 1 Gulf Coast Research Laboratory, Department of Coastal Sciences, University of Southern Mississippi, 703 East Beach Drive, Ocean Springs, MS 39564, USA Full list of author information is available at the end of the article Li et al. Genome Biology 2010, 11:R115 http://genomebiology.com/2010/11/11/R115 © 2010 Li et al.; licensee BioMed Central Ltd. This is an open access article distributed under the terms of the Creative Commons Attribution License (http://creativecommons.org/licenses/by/2.0), which permits unrestricted use, distribution, and reproduction in any medium, provided the original work is properly cited.
-
Upload
independent -
Category
Documents
-
view
0 -
download
0
Transcript of Constructing a fish metabolic network model

SOFTWARE Open Access
Constructing a fish metabolic network modelShuzhao Li1,2*, Alexander Pozhitkov1,3, Rachel A Ryan1, Charles S Manning1, Nancy Brown-Peterson1,Marius Brouwer1
Abstract
We report the construction of a genome-wide fish metabolic network model, MetaFishNet, and its application toanalyzing high throughput gene expression data. This model is a stepping stone to broader applications of fishsystems biology, for example by guiding study design through comparison with human metabolism and theintegration of multiple data types. MetaFishNet resources, including a pathway enrichment analysis tool, areaccessible at http://metafishnet.appspot.com.
RationaleSmall fish species are widely used in ecological and phar-maceutical toxicology, developmental biology and genet-ics, evolutionary biology and as human disease models.Among the species commonly found in scientific litera-ture are zebrafish (Danio rerio), medaka (Oryzias latipes),stickleback (Gasterosteus aculeatus), European flounder(Platichthys flesus), channel catfish (Ictalurus punctatus),sheepshead minnow (Cyprinodon variegatus), mummi-chog (Fundulus heteroclitus), Atlantic salmon (Salmosalar), common carp (Cyprinus carpio), rainbow trout(Oncorhynchus mykiss) and swordtail (Xiphophorus hel-lerii). Each of these fish species has its own niche as aresearch tool. For example, Xiphophorus is a classicgenetic model of melanomas [1,2], whereas medaka is agood model for reproductive and ecotoxicological studies[3]. Zebrafish, in particular, has risen to stardom inrecent years, with a large collection of mutants and estab-lished techniques for transgenesis, expression studies,forward and reverse genetics and in vivo imaging [4-8].The use of zebrafish as human disease models has alsospiked significant interests [9-11]. Since small fish arecurrently the only vertebrate species that can be studiedin high throughput, their future in modern biomedicalsciences is brighter than ever [12,13].Fish genomics is also taking off. Thus far, whole gen-
ome sequences are available for five fish species:D. rerio, O. latipes, T. rubripes, T. nigroviridis and
G. aculeatus. DNA microarrays have been applied to
study gene expression in many more fish species[14-18]. However, fish functional genomics is far behindother model organisms. In the example of sheepsheadminnows, which are used in our lab for ecotoxicology,gene annotation is poor and no pathway analysis tool isreadily available for interpreting DNA microarray data.The situation is similar for other fish species, with zeb-rafish perhaps an arguable exception. Bioinformatictools that fill in this gap in fish functional genomics arehighly desirable [17]. Oberhardt et al. [19] summarizedthe five applications of genome-wide metabolic networkmodels: ‘(1) contextualization of high-throughput data,(2) guidance of metabolic engineering, (3) directinghypothesis-driven discovery, (4) interrogation of multi-species relationships, and (5) network property discov-ery.’ While significant interest exists for a fish metabolicnetwork model in all five categories, the immediate andprimary application of our model will be the interpreta-tion of high throughput expression data, especially path-way analysis, which can be done either by directmapping to metabolic genes [20,21] or via establishedenrichment statistics [22,23]. This model will also pro-vide a first glance of how fish metabolism resembleshuman metabolism, which should be instructional forthe use of fish in many research areas [24]. This pro-posed first generation model will serve as a referenceand stepping stone to further systems investigations,helping study design and hypotheses generation. Asmore data become available in the future, the model canbe further refined to support broader applications.The recent completion of genome sequencing of five
fish species has paved the way for constructing a gen-ome-wide fish metabolic network model. That is, all
* Correspondence: [email protected] Coast Research Laboratory, Department of Coastal Sciences, Universityof Southern Mississippi, 703 East Beach Drive, Ocean Springs, MS 39564, USAFull list of author information is available at the end of the article
Li et al. Genome Biology 2010, 11:R115http://genomebiology.com/2010/11/11/R115
© 2010 Li et al.; licensee BioMed Central Ltd. This is an open access article distributed under the terms of the Creative CommonsAttribution License (http://creativecommons.org/licenses/by/2.0), which permits unrestricted use, distribution, and reproduction inany medium, provided the original work is properly cited.

metabolic enzymes can be identified from complete gen-omes by sequence analysis, compounds can then beassociated with enzymatic activities and a metabolic net-work can be constructed by linking these compoundsand enzymes. This type of ab initio construction ofmetabolic networks has been carried out for many uni-cellular organisms [19,25-30].However, ab initio construction alone is not yet feasi-
ble for vertebrate metabolic networks due to their com-plexity. Two high-quality human metabolic networkmodels [20,31] have been published recently. Both stu-dies included intensive human curation and comprehen-sive supporting evidence, including data from modelspecies other than human. Thus, these two ‘human’models can provide critical references for constructing agenome-wide fish metabolic network model, to helpovercome the limitation of ab initio construction. Com-bining the integration of existing models and ab initioconstruction from whole genomes has been the strategyfor our project. A metabolic model for zebrafish existsin the KEGG database [32].However, our genome-wide model offers a significant
expansion of the KEGG zebrafish model.We will first report the construction process of this
fish metabolic network model (MetaFishNet). We thenuse MetaFishNet to methodically comparefish andhuman metabolism to identify the most and least con-served pathways. The last sections of this paper willdemonstrate the application of MetaFishNet in analyzingtwo sets of DNA microarray data: one from zebrafish asliver cancer model in public repository, the other fromsheepshead minnow exposed to cadmium in our lab.
Results and discussionConstruction of MetaFishNetOur genome-wide fish metabolic network, MetaFishNet,adopts a conventional bipartite network structure, whereenzymes and compounds are two types of nodes. The con-struction strategy of MetaFishNet is shown in Figure 1.Details are given in the ‘Method’ section and Additionalfile 1, while a short description follows here.We first analyzed all cDNA sequences from five fish
genomes (D. rerio, O. latipes, T. rubripes, T. nigroviridisand G. aculeatus) to create a list of all fish metabolicgenes via gene ontology. From this metabolic gene list,the corresponding enzymes were identified using eitherorthologous relationships to human genes or similarityto consensus enzyme sequences (Table 1). Two types ofmetabolic reactions are included in MetaFishNet. Themajority consists of reactions in reference models thatcan be associated with fish enzymes. The rest of thereactions were created according to relationshipsbetween inferred enzymatic activity and compounds.The reference reactions in this project are data
integrated from Edinburgh Human Metabolic Network(EHMN) [31], the human metabolic network from Pals-son’s group at UCSD (BiGG) [20] and the zebrafishmetabolic network from KEGG. Finally, the whole net-work is formed by linking all reactions.To illustrate the construction process, let us consider
two pieces of sequences from the medaka genome.Sequence ENSORLG00000001750 is mapped to a human
homolog PIK3CG, which is a phosphoinositide-3-kinase(enzyme commission number 2.7.1.153). This enzyme isassociated to a reaction in the EHMN model that converts1-Phosphatidyl-D-myo-inositol 4,5-bisphosphate toPhosphatidylinositol-3,4,5-trisphosphate. Thus, this samereaction is carried over to the MetaFishNet model. Anothersequence ENSORLG00000018911 also has a human homo-log, PIP4K2B, which is a phosphatidylinositol-5-phosphate4-kinase with enzyme commission number 2.7.1.149.Although no reaction for this enzyme is found for any ofthe reference models, we learn from the KEGG LIGANDdatabase that this enzyme converts 1-Phosphatidyl-
Figure 1 Construction strategy of MetaFishNet. See text fordetails.
Table 1 Metabolic Enzymes found in five fish genomes
Species Number of metabolic genes Number of ECs
Zebrafish 3,853 654
Medaka 3,998 765
Takifugu 4,103 771
Tetraodon 4,424 782
Stickleback 4,324 791
Li et al. Genome Biology 2010, 11:R115http://genomebiology.com/2010/11/11/R115
Page 2 of 15

1D-myo-inositol 5-phosphate to 1-Phosphatidyl-D-myo-inositol 4,5-bisphosphate. This reaction is added toMetaFishNet as an inferred reaction. Furthermore, becausethe second reaction produces the substrate for thefirst reaction, the two reactions are linked together in the‘Phosphatidylinositol phosphate metabolism’ pathway.We carefully reconciled the pathway organization dur-
ing integration of the three reference models by com-paring the reactions in each pathway. Thus, the pathwayorganization in MetaFishNet follows biochemical con-ventions wherever possible. Yet, over 600 reactions stilldo not map directly to these reference pathways. Sincepathways can be viewed as modules within a metabolicnetwork [33], we extracted network modules from thesereactions using a modularity algorithm [34]. The result-ing modules were manually inspected to either becomea new pathway, to merge with an existing pathway, orto be invalidated. Meanwhile, individual reactions wereattached to a pathway when they connect metabolites inthat pathway. This combined procedure of module find-ing and manual curation was repeated iteratively untilno further change could be made.Even though this model contains data specific to each
of the five fish species, we choose to present a combinedfish metabolic network model because a) a combinedmodel will be more useful for other under-representedfish species; b) genome annotations are far from perfect -combining five genome sequences will reduce the chanceof missing true metabolic genes. For example in the TCAcycle, we did not find ATP citrate synthase in the zebra-fish genome, nor succinate-CoA ligase in the Tetraodongenome (Ensembl 51). Since these are critical enzymes ina central pathway, these missing enzymes reflect annota-tion errors. The combined model is thus more compre-hensive than using any single species alone (Additionalfile 2). In total, 911 enzymes, 3,342 reactions and 115pathways are included in MetaFishNet version 1.9.6. Dataintegration at the reaction level is shown in Figure 2.All MetaFishNet pathways are given in Additionalfile 3, reaction data in Additional file 4 and SBML(Systems Biology Markup Language) distribution inAdditional file 5.A MySQL database was set up to host MetaFishNetdata. As we elected to use Google App Engine to hostthe project website [35], a port to Google BigTable data-base is actually behind the website. The website sup-ports browsing and queries of data at various levels,with graphic display of all pathways. Utility programs inMetaFishNet include ‘SeaSpider’ for sequence analysis,‘FishEye’ for pathway visualization, and ‘FisherExpress’for pathway enrichment analysis. SeaSpider is used forboth the initial construction and for mapping newsequences to MetaFishNet. FishEye was developedbecause 1) KEGG graphs can no longer support the
much expanded network, and 2) an automatic pathwayvisualization tool is of great general interest by itself.Our project website provides links to download theseprograms and model data.
Metabolic genes show less evolutionary diversityIt is now widely accepted that teleost fish underwent anextra round of genome duplication after their evolution-ary separation from the mammalian line [36,37]. Gen-ome duplication is an important mechanism forgenerating gene diversity, as the extra copy can evolvemore freely than the single copy before duplication.Only a small portion of these duplicated genes wouldgain new functionality and remain, while most dupli-cated genes got lost over time.When comparing the fish metabolic genes in Meta-
FishNet to their human orthologs, we have noticed thatthe level of ortholog mapping differs between metabolicgenes and other genes. As seen in Table 2, for the iden-tifiable orthologs, most of the fish species have over 10%more genes than humans, yet the percentages of extraduplicated metabolic genes are significantly less. Thefinal numbers may vary when the genomes are moreaccurately annotated. Still, these data suggest that meta-bolic genes are better conserved between human andfish than other genes. This suggests that a core meta-bolic network was established early in evolution: by thetime of the genome duplication in fish, the central meta-bolic machinery was already well tuned and left littleroom for changes. By implication, research on some fishmetabolic pathways may be easily extrapolated tohuman.
Comparison between human and fish metabolicpathwaysMultiple genes may have the same catalytic activity (iso-zymes), differing only in their sequences or regulatorycontexts. We do not distinguish isozymes in this study,but leave them for future refinement. At the enzymelevel, we have identified 911 enzymes from fish gen-omes. They overlap with the human data by 772enzymes (Figure 3; Additional file 6 gives a complete listof these enzymes). The true overlap may be greaterbecause the EC numbers in fish were computationallyinferred, and are not as well curated as human ECs. Wecan nonetheless start making some comparisonsbetween human and fish at the pathway level.Over 50% of the enzymes are in common between
human and fish for the majority of the pathways. Table 3shows the most and least conserved pathways betweenhumans and fish, in terms of the numbers of overlappingenzymes. Since most biomedical research in fish aims toextend the results to human, this pathway comparisonreveals important information on how well fish may
Li et al. Genome Biology 2010, 11:R115http://genomebiology.com/2010/11/11/R115
Page 3 of 15

model human on a specific subject. For instance, fish maybe a good model for studying vitamin B9, but probably apoor model for studying vitamin C.In the sizable pathway, ‘proteoglycan biosynthesis’, all 16
enzymes are common between human and fish. This sug-gests that the whole pathway may be identical betweenhuman and fish. Impairment of the proteoglycan
biosynthesis pathway is responsible for a major class ofenzyme deficiency diseases, mucopolysaccharidosis. Sevenclinical types, including Hurler syndrome and Hunter syn-drome, have been identified in this class, depending ondefects of different enzymes in the pathway (Online Men-delian Inheritance in Man [38]). Given the great similaritybetween human and fish in this pathway, small fish, with
Figure 2 Data integration at reaction level for MetaFishNet. The UCSD and EHMN models were merged into a human reference network,which was then merged with the KEGG zebrafish model and newly inferred reactions based on genome sequences. The total reference modelhas 4,301 reactions, while 3,342 reactions are included in the fish metabolic network.
Li et al. Genome Biology 2010, 11:R115http://genomebiology.com/2010/11/11/R115
Page 4 of 15

their high throughput capacity, may be a good model forstudying mucopolysaccharidosis.Omega-3 fatty acids are deemed essential nutrients,
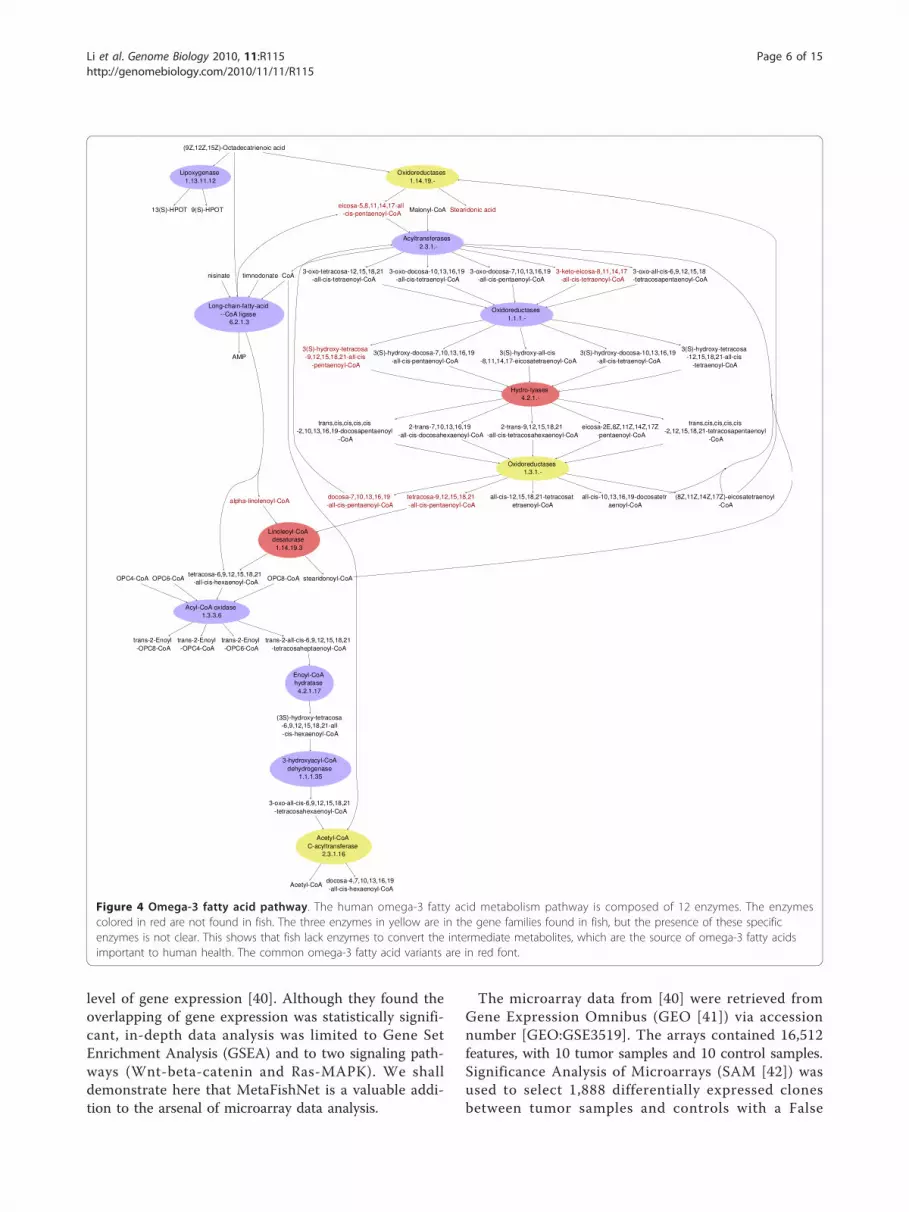
boosting a popular dietary preference for fish and fishoil consumption. But fish, just like humans, do not pro-duce omega-3 fatty acids per se - they accumulate themfrom their diet, algae [39]. However, the molecularmechanism of this omega-3 fatty acid accumulation isstill unidentified. A theoretical explanation is now pro-vided by our MetaFishNet model. As shown in Figure 4,compared to the human omega-3 fatty acid metabolism,fish lack enzymes such as linoleoyl-CoA desaturase inthe pathway. As a result, fish can easily process themetabolites in the top and bottom parts of the pathway,but not the intermediate metabolites, which will thenaccumulate to a high level. In fact, these intermediatecompounds include variants of most of the commonomega-3 fatty acids, such as alpha-Linolenic acid, Steari-donic acid, Eicosatetraenoic acid, Eicosapentaenoic acid,Docosapentaenoic acid and Tetracosapentaenoic acid.
It will be interesting to see if this computationally gen-erated hypothesis will be supported by experimentaldata.
Several metabolic pathways are misregulated in zebrafishliver cancerWe next demonstrate the application of MetaFishNetmodel to the analysis of gene expression data in a caseof zebrafish as a cancer model. Gong and coworkersconducted microarray experiments to examine the simi-larity between zebrafish and human liver tumors at the
Table 2 Comparisons between fish and human orthologs
Species Extra duplicatedgenes (%)
Extra duplicated metabolicgenes (%)
Zebrafish 15.4 0.6
Medaka 8.9 1.5
Takifugu 12.2 3.8
Tetraodon 14.4 5.8
Stickleback 11.9 4.5
An extra round of genome duplication produced more genes in fish thanhuman. The number of total human orthologs found in a fish species istypically around 12,000, as analyzed from Ensembl data.
Figure 3 Metabolic enzymes in common between human andfish. Among the 1,430 human enzymes compfiled from ExPASy andBRENDA [91] databases, 1,131 are included in the human metabolicmodels (shaded in light blue). Among the 911 enzymes found infish genomes, 705 are included in MetaFishNet reactions (shaded insalmon). In the models, 632 enzymes are shared between humanand fish. The disparity of numbers reflects that human enzymes arebetter annotated than fish. Please note that isozymes are notdistinguished here.
Table 3 Comparisons between fish and human metabolicpathways
Most conserved pathways
Pathway HumanECs
FishECs
Overlap Ratio
1- and 2-Methylnaphthalenedegradation
2 3 2 1
Hyaluronan metabolism 3 3 3 1
Sialic acid metabolism 18 18 18 1
Hexose phosphorylation 5 5 5 1
Electron transport chain 4 5 4 1
Limonene and pinene degradation 3 4 3 1
Proteoglycan biosynthesis 16 16 16 1
Glycosphingolipid biosynthesis -ganglioseries
18 17 17 0.94
N-Glycan degradation 8 7 7 0.87
Di-unsaturated fatty acid beta-oxidation
7 6 6 0.85
Vitamin B1 (thiamin) metabolism 7 6 6 0.85
Glycosphingolipid metabolism 28 24 24 0.85
Glutamate metabolism 14 12 12 0.85
TCA cycle 18 15 15 0.83
Vitamin B9 (folate) metabolism 17 14 14 0.82
Linoleate metabolism 11 9 9 0.81
Least conserved pathways
Pathway HumanECs
FishECs
Overlap Ratio
Phytanic acid peroxisomal oxidation 13 5 5 0.38
Glycosylphosphatidylinositol(GPI)-anchor biosynthesis
3 1 1 0.33
Vitamin H (biotin) metabolism 6 2 2 0.33
Vitamin B12 (cyanocobalamin)metabolism
3 2 1 0.33
Glyoxylate and Dicarboxylatemetabolism
7 2 2 0.28
Pentose and Glucuronateinterconversions
9 2 2 0.22
Ascorbate (vitamin C) and aldaratemetabolism
8 1 1 0.12
The ratio is the number of shared ECs over the number of human ECs. Onlypathways with three or more enzymes were considered. The completecomparison is given in Additional file 9. Please see Discussion section on thebias towards human data. The sizes of fish pathways may grow withimproved annotation, but this is unlikely to change the ratios because alloverlapping enzymes are already included here.
Li et al. Genome Biology 2010, 11:R115http://genomebiology.com/2010/11/11/R115
Page 5 of 15
level of gene expression [40]. Although they found theoverlapping of gene expression was statistically signifi-cant, in-depth data analysis was limited to Gene SetEnrichment Analysis (GSEA) and to two signaling path-ways (Wnt-beta-catenin and Ras-MAPK). We shalldemonstrate here that MetaFishNet is a valuable addi-tion to the arsenal of microarray data analysis.
The microarray data from [40] were retrieved fromGene Expression Omnibus (GEO [41]) via accessionnumber [GEO:GSE3519]. The arrays contained 16,512features, with 10 tumor samples and 10 control samples.Significance Analysis of Microarrays (SAM [42]) wasused to select 1,888 differentially expressed clonesbetween tumor samples and controls with a False
Figure 4 Omega-3 fatty acid pathway. The human omega-3 fatty acid metabolism pathway is composed of 12 enzymes. The enzymescolored in red are not found in fish. The three enzymes in yellow are in the gene families found in fish, but the presence of these specificenzymes is not clear. This shows that fish lack enzymes to convert the intermediate metabolites, which are the source of omega-3 fatty acidsimportant to human health. The common omega-3 fatty acid variants are in red font.
Li et al. Genome Biology 2010, 11:R115http://genomebiology.com/2010/11/11/R115
Page 6 of 15

Discovery Rate under 0.01. (These selected clones arecomparable to the 2,315 clones selected by a less main-stream method in the original paper.) The pathway ana-lysis component in MetaFishNet is FisherExpress, whichmaps the selected genes to enzymes and then to corre-sponding pathways via queries to the MetaFishNet data-base. Fisher’s Exact Test is used to compute thesignificance of enrichment of metabolic pathways.The result, shown in Table 4, suggests that several
metabolic pathways are misregulated in zebrafish livercancer. The identification of the glycolysis and gluco-neogenesis pathway reflects the adaptation of tumorcells to aerobic glycolysis, known as the hallmark ‘War-burg effect’, which also alters pathways closely related togluconeogenesis, such as butanoate metabolism [43,44].The reprogramming of metabolism in tumor cells is alsobelieved to generate toxic byproducts [43], in particularelevated levels of reactive oxygen species [45]. Thedownregulation of xenobiotics metabolism and ROSdetoxification reflects these impaired cellular functionsin tumor tissues. The involvement of tyrosine metabo-lism in tumor cells is not clear, but may possibly berelated to their excessive tyrosine kinase activities[46,47]. Tryptophan metabolism is known to be part ofthe immune suppression mechanism by tumor cells[48]. The significance of leukotriene metabolism couldcome either from tumor cells that use leukotrienes intheir strategies for survival, proliferation and migration,or from the inflammation of surrounding tissues [49].Fatty acid metabolism is also well known to be
involved in cancer biology [43,50]. However, the selec-tion of the fatty acid metabolism pathway in our analysiscame from three enzymes it shares with the leukotriene
metabolism pathway. Pathway overlap is an inherentlimit of this type of analysis, that can only be clarifiedby further investigation. Several Glycosylphosphatidyli-nositol(GPI)-anchor proteins are already used as mar-kers for liver cancer [51-53], making (GPI)-anchorbiosynthesis an interesting pathway to investigate. TheMetaFishNet model thus has been shown to be a valu-able tool to identify significantly regulated pathways inexpression data. In addition, the regulations can bevisualized in the context of each pathway, as exemplifiedin Figure 5, to facilitate mechanistic studies.
Comparison to KegArray and KEGG pathwaysKEGG also offers an expression analysis tool, KegArray[21], which may be used to map differentially expressedgenes to zebrafish pathways. For example, the 1,888selected clones in zebrafish liver cancer in Section 2.4can be converted to UniGene identifiers and input toKegArray (version 1.2.3). The result is a list of 49 meta-bolic pathways that match from one to five differentiallyexpressed enzymes (Additional file 7). This is a ratherlong list, containing about half of all pathways, whichraises the question of false positive rate. The problem iscaused by the fact that KegArray does not include anypathway statistical analysis, which is important for rank-ing the significances and reducing false positives at theindividual gene level. Pathway enrichment analysisusually takes one of two forms: 1) feature selection fol-lowed by set enrichment statistics, such as presented inthis paper and 2) competitive statistics without priorfeature selection. The best known example of the latteris GSEA [22], which uses Kolmogorov-Smirnov statisticsto rank pathways according the positional distributionof member genes. As the MetaFishNet model itself isnot tied to any statistical method, we also offer a genematrix file to be used with GSEA, downloadable at ourproject website.Ultimately, the quality of pathway data determines the
quality of analysis. MetaFishNet, with 3,342 reactionsover the 1,031 reactions in KEGG zebrafish model, notonly allows applications to other fish species, but alsoimprove the data for zebrafish. A better comparisonbetween the KEGG zebrafish model and MetaFishNet isto use the same enrichment statistics. That is, we usethe KEGG pathways in our software instead of Meta-FishNet pathways to reanalyze the zebrafish liver cancerdata in Section 2.4. The result is shown in Additionalfile 8. In comparison to Table 4, leukotriene metabolismand ROS detoxification pathways are missing in theKEGG result as they are absent in the KEGG model.Xenobiotics metabolism is a pathway that is improved
from five enzymes in KEGG to eight enzymes in Meta-FishNet. Accordingly, the MetaFishNet pathway has threehits while the KEGG pathway has two hits. The Methane
Table 4 Metabolic pathways that are affected inzebrafish liver cancer with P-value < 0.05
MetaFishNet pathway Selectedenzymes
Enzymes inpathway
P-value
ROS detoxification 2 2 0.002
3-Chloroacrylic aciddegradation
2 2 0.002
Tyrosine metabolism 8 55 0.002
Xenobiotics metabolism 3 8 0.004
Glycolysis andGluconeogenesis
6 44 0.013
Fatty acid metabolism 3 13 0.019
Butanoate metabolism 3 14 0.023
Leukotriene metabolism 3 17 0.040
Tryptophan metabolism 4 29 0.040
Ascorbate (vitamin C) andaldaratemetabolism
1 1 0.046
Glycosylphosphatidylinositol(GPI)-anchorbiosynthesis
1 1 0.046
Li et al. Genome Biology 2010, 11:R115http://genomebiology.com/2010/11/11/R115
Page 7 of 15

metabolism pathway, nonexistent in MetaFishNet, wasalso identified in KEGG. The KEGG Methane metabolismpathway is rather a bacterial pathway that is mapped tozebrafish with only three reactions. Reaction R06983 iscatalyzed by an enzyme (1.1.1.284) that is yet to be con-firmed in any fish genome. Reaction R00945 converts5,10-Methylenetetrahydrofolate to Tetrahydrofolate, thusis assigned to vitamin B9 (folate) metabolism pathway inMetaFishNet. This leaves only one reaction, which doesnot justify a pathway in MetaFishNet. We think theimproved data and pathways in MetaFishNet will benefitdownstream studies.
MetaFishNet analysis of cadmium exposure insheepshead minnowsFinally, we apply MetaFishNet to a fish species with lit-tle functional data. Sheepshead minnow (C. variegatus)is a common, small estuarine fish that is found alongthe Atlantic and Gulf coasts of the United States. TheUS Environmental Protection Agency has adoptedC. variegatus as a model organism for studying pollutionlevels in estuarine waters [54]. We have designed a cus-tom DNA microarray with 4,101 clones for sheepsheadminnows. Sheepshead minnow larvae were exposed tocadmium, a heavy metal pollutant, for seven days in a
Figure 5 The xenobiotic metabolism pathway in zebrafish liver cancer. The three downregulated enzymes, colored in green, are 1.2.1.5,aldehyde dehydrogenase (AF254954); 1.1.1.1, alcohol dehydrogenase (AF295407); 1.14.14.1, cytochrome P450 (AF057713, AF248042). Fullyannotated graphs for all pathways can be found on project website [35].
Li et al. Genome Biology 2010, 11:R115http://genomebiology.com/2010/11/11/R115
Page 8 of 15

controlled laboratory experiment. DNA microarrayswere used to measure their RNA expression. Eventhough each biological replicate was a pool of 80 indivi-duals, only three biological replicates per group wereincluded in this microarray experiment. The analyticalpower at the gene level was also weakened because thesamples were extracted from whole bodies instead ofspecific tissues. Indeed, with FDR < 0.05 in SAM, onlyfour clones were selected as significant, including metal-lothionein, which has been extensively reported to beupregulated by cadmium exposure [55,56].Another problem is the poor annotation of these
microarrays. Less than 40% of our sheepshead minnowclones carry sequence homology to known genes, asituation typical for many fish species that limits thefunctional information from gene expression.To analyze the data in MetaFishNet, we first selected
325 differentially expressed clones between the treatedgroup and control group by Wilcoxon’s rank sum test(P < 0.05). This is a less stringent selection, but addi-tional statistical strength is gained at the pathway levelby incorporating collective pathway information. Sheeps-head minnow clones were then mapped to MetaFishNetby sequence comparison via SeaSpider. MetaFishNetpathway enrichment was computed again by Fisher’sExact Test and the result is shown in Table 5. The path-ways in Table 5 again have overlaps, among which areCYP1A and glutathione S-transferase (GST). The induc-tion of CYP1A and GST by cadmium is in concordancewith previous reports [57-61]. Both CYP1A and GSTare pivotal detoxification enzymes, and central players inxenobiotics metabolism. The fact that these genes arepicked up by pathway analysis and not by SAM demon-strates the improved strength of pathway analysis. Theupregulation of four enzymes, CYP1A, GST, acyltrans-ferase and long-chain-fatty-acid-CoA ligase, is indicativeof the activation of leukotriene metabolism pathway bythe commonly observed inflammation induced by cad-mium exposure (Figure 6).
In conclusion, MetaFishNet adds extra functionalinsight into the otherwise very limited data analysisavailable for non-model species.
DiscussionWe have presented the first genome-wide fish metabolicnetwork model. The first and primary role of our Meta-FishNet model is a bioinformatic tool for analyzing highthroughput expression data. Two case applications ofpathway enrichment analysis are included in this report.Pathway analysis offers two advantages: it is less suscep-tible to noise than analysis at the level of individualgenes, and gives contextual insights to biologicalmechanisms [62,63]. MetaFishNet has demonstratedgood promise to bring these advantages into fish studies.By combining data from five fish genomes, our modelovercomes some of the coverage problems in individualgenome annotations. However, this also masks the dif-ference between these fish species. While this combinedmodel is recommended for gene expression analysis,species specific data should be consulted for more speci-fic genetic and biochemical studies (available at the pro-ject website).A new visualization tool (FishEye) was developed in
this project to draw pathway maps automatically.Even though visualization tools are abundant, there is
a particular challenge to balance automation with thekind of clarity desired in a metabolic map. KEGG, andmany other pathway databases, creates graphs manually.Hence, all downstream automatic programs in factdepends on the original manual versions.CellDesigner [64] is an excellent tool, but essentially is
for manual editing. On the other hand, CytoScape [65]and VisANT [66] can do automatic drawing, but theirresults tend to be cluttered and difficult for detailed stu-dies of metabolic pathways. FishEye is a light-weightand flexible Python program based on the widely usedGraphviz package from AT&T Research Labs [67].Rgraphviz [68] is a similar package that offers R bindingof Graphviz. The unique strength of FishEye is its opti-mization for rendering biological pathways via analyzingnetwork structure and labels. FishEye has worked suc-cessfully for this project. Its limit seems to be only chal-lenged by two pathways that exceed 400 edges. Forthese cases, a ‘zoom’ feature was introduced to reducethe cluttering of edges. We hope that FishEye will finduses in other similar contexts.We should emphasize that the knowledge of vertebrate
metabolism is still very incomplete. This is already evidentwhen considering the obvious differences between the twohuman models [20,31]. With the assistance of modularityanalysis, we constructed several new pathways that werenot present in the reference models. For instance, our ana-lysis showed that all 18 enzymes in a newly identified
Table 5 Metabolic pathways that are affected by cadmiumexposure in sheepshead minnows with P-value < 0.05
MetaFishNet pathway Selectedenzymes
Enzymes inpathway
P-value
Leukotriene metabolism 4 17 0.001
Fatty acid metabolism 3 13 0.005
Omega-3 fatty acidmetabolism
2 7 0.016
Squalene and cholesterolbiosynthesis
3 20 0.018
Xenobiotics metabolism 2 8 0.021
Omega-6 fatty acidmetabolism
2 10 0.032
Tryptophan metabolism 3 29 0.049
Li et al. Genome Biology 2010, 11:R115http://genomebiology.com/2010/11/11/R115
Page 9 of 15

‘sialic acid metabolism’ pathway are in fact present in bothfish and humans. This shows both the strength of our con-struction approach and the incompleteness of currentmodels. In general, when one compares the fish pathwaysversus human pathways (Table 3), the latter seem to con-tain more enzymes. Because the UCSD and EHMN pro-jects were intensively curated and contained many moredata than previous models, a combined human dataset inthis project is unlikely to be surpassed by any computa-tional model. Due to the bias in annotations, fish enzymesthat have human homologs are also more likely to beincorporated into MetaFishNet. On the other hand, as dis-cussed above, we actually further augmented the humandata through constructing MetaFishNet (demonstrated inAdditional file 9).As a first generation model, MetaFishNet will need
much refinement to fully realize the power of a gen-ome-wide metabolic model. Traditionally, metabolismwas studied piecemeal by dissecting enzyme activitiesand tracking metabolites. Powerful new tools have nowbeen introduced to genome-wide models [69,70]. Forexample, mass balance of metabolites can be achievedby a combination of the stoichiometrics of reactions andphysiologically plausible kinetics and thermodynamics ofpertinent enzymatic reactions. Even with incomplete
information, system constraints such as metabolite fluxcan be deduced. Missing reactions in the model can beinferred in a similar fashion. While improvements canbe expected from accumulating data and annotations,with this MetaFishNet framework now in place, it ispossible to design systematic experiments to define andrefine fish metabolome. That is, metabolic constraintscan be inferred from MetaFishNet model; experimentaldata can then be gathered, utilizing mutants or knock-outs, to verify and update the model iteratively [71-73].Such works will lead the way for species specific models.Recent studies have shown that gene expression data,
combined with metabolic network models, can success-fully predict metabolic flux regulation in specific biologicalcontexts [74-76]. This opens up an exciting opportunity toadvance fish metabolic modeling. Finally, metabolic net-works are a natural platform to integrate multiple highthroughput data types. For example, Yizhak et al. used aE. coli metabolic network [30] to combine proteomic datawith metabolomics to predict knockout phenotypes [77].Connor et al. combined transcriptomics and metabolo-
mics on Ingenuity’s human metabolic pathways http://www.ingenuity.com to identify type two diabetes markers[78]. With the advancing of fish omics, in particularmetabolomics [79-81], MetaFishNet is in a good position
Figure 6 The leukotriene metabolism pathway as modulated by cadmium exposure in sheepshead minnow. Four upregulated enzymesare colored in red. Only a partial pathway is shown. Some metabolites are connected by reaction IDs when the enzymes are not known.
Li et al. Genome Biology 2010, 11:R115http://genomebiology.com/2010/11/11/R115
Page 10 of 15

to fulfill a similar important role for fish studies. The rateof discovery can be greatly accelerated when MetaFish-Net is combined with these high throughputtechnologies.
MethodsIdentification of fish metabolic enzymes and sequenceanalysisAll cDNA sequences of the five fish species wereretrieved from the Ensembl database [82]. Identificationof metabolic genes was accomplished by Gene Ontology(GO) computation [83]. Among the five fish species,only zebrafish had good GO annotations. Sequencesfrom the other four species were analyzed by SeaSpider,our sequence analysis tool. The queries to SeaSpider arefirst directed against zebrafish sequences, then againstreference sequences in the GO database. When homol-ogy is found (BLAST E-value under 1E-5 and a mini-mum 33 of identical bases in local alignment), GOterms are assigned to the sequence in query. All geneswith a GO term under the tree of metabolism are con-sidered to be metabolic genes. Even though this initialselection is overly inclusive - for example, transport pro-teins can also get a GO term under metabolism - onlygenes that can match to EC numbers are used in Meta-FishNet construction. We inferred EC numbers in twoways. The first approach was to carry over EC numbersfrom human orthologs. The orthologous relationshipsbetween fish and human genes were adopted fromEnsembl, which has thoroughly computed ortholog/paralog relationships based on the phylogenetic tree ofthe gene family. Human EC to gene associations wereparsed from the ExPASy database [84] and the EHMNdata [31]. The second approach of EC inference wasthrough annotations in the GO database by similarity tothe enzyme consensus sequences, which have been con-structed across species. It should be pointed out thatthe EC numbers in MetaFishNet are tentative - theNomenclature Committee of IUBMB actually requiresstrict experimental evidence for assigning an official ECnumber.
Integration of reference reaction dataWe first integrated the two high-quality human meta-bolic models [20,31]. The zebrafish metabolic modelwas then extracted from KEGG, and combined into thereference data. The UCSD model contained 1,496 genesand 3,311 reactions, counting transport reactions andcompartmentalization. A highlight of this work was themanual curation of literature supports, which was laborintensive but improved the data quality.The EHMN model has 2,322 genes and 2,824 reactions
(excluding transport reactions). The EHMN modelincluded previous metabolic data from all major databases,
and streamlined the identities of compounds. Automaticextraction of metabolic models from KEGG has been achallenge. Even though KEGG offers an XML (ExtensibleMarkup Language) distribution (called KGML) of its path-ways, molecular interactions were mixed with visual ele-ments in these KGML les. KEGG API (ApplicationProgramming Interface) was also limited by not distin-guishing reactants from products. We developed a practi-cal solution by combining KGML files and KEGG API,where KGML defines the scope of reactions and API con-firms relationships. Our Python script, leveraging onSBML libraries, successfully parsed out the 101 zebrafishmetabolic pathways from KEGG (retrieved March 24,2008), with 517 ECs and 1,031 reactions.The integration of three models was at both the
reaction and pathway levels. Two reactions were con-sidered identical when they have the same enzymesand major compounds. To gain the most compatibility,EC numbers and KEGG compound IDs were usedwherever possible. The conventional pathways inMetaFishNet primarily followed the pathway organiza-tion in EHMN. Pathways were merged if they shared asignificant number of common reactions. Differentnaming styles were reconciled. For example, the ‘Cho-lesterol Metabolism’ pathway in the UCSD model over-laps with the ‘Squalene and cholesterol biosynthesis’pathway in the EHMN model by 14 enzymes and 16reactions. The two pathways were merged during theintegration of the two human models. All three reac-tions in the KEGG zebrafish pathway ‘Terpenoid bio-synthesis’ are included in the human ‘Squalene andcholesterol biosynthesis’ pathway and were thereforemerged with the latter. Nine out of 11 enzymes in thezebrafish ‘Biosynthesis of steroids’ pathway areincluded in the human Squalene and cholesterol bio-synthesis pathway, and were therefore merged as well.Complete lists of pathway reorganization are given inthe Additional file 1. The current model does not takeinto account cellular compartmentalization.
Ab initio construction, modularity analysis and manualcurationAmong the 911fish enzymes identified in this project, 561could be matched to the reference data. For the remain-ing 350 enzymes, their associated compounds wereretrieved from the KEGG LIGAND database whereveravailable. These enzyme-compounds interactions formed260 newly inferred reactions. Since there was no way todistinguish reactants from products in these inferredmetabolic data, the directions of these reactions weretreated as unknown. These newly inferred reactions, plusthe isolated reactions from the reference data, were sub-jected to a combined approach of module-finding andmanual curation. We adopted an algorithm by Mark
Li et al. Genome Biology 2010, 11:R115http://genomebiology.com/2010/11/11/R115
Page 11 of 15

Newman, which partitions network modules according tothe eigenvectors of a characteristic matrix for the net-work [34]. The modularity program produced a numberof candidate modules, which were then manuallyinspected for pathway organization. This process iterateduntil no further change could be made. Isolated reactionswere also inspected to determine if they could beattached to existing pathways. At this stage, a number ofredundant reactions from UCSD were removed from themodel, and pathways with too few reactions were dis-mantled to isolated reactions. Through this approach, the‘sialic acid metabolism’, ‘dynorphin metabolism’, ‘electrontransport chain’, ‘parathion degradation’ and ‘hexosephosphorylation’ pathways were created from ab initioconstruction, while a number of modules were organizedinto existing pathways (Additional file 1).
Pathway visualizationFishEye, our pathway visualization tool, is built on Net-workx and PyGraphviz [85]. It extended a developmentversion of Networkx to support bipartite networks.Many details of styling are manipulated through mid-level markups. In order to keep pathway graphs lesscluttered, we did a number of optimizations. Two ver-sions of pathway graphs are offered, one with EC num-bers and compound IDs (for example Figure 5) and onewith enzyme names and compound names (for exampleFigure 4 and 6). Both versions for all pathways are avail-able at the project website. Similar edges in a pathwaycan be merged in the visualized graph, and long namesare wrapped. A common practice in the field is to omitall currency metabolites, as they bring on an excessivenumber of edges. We adopted the list of currency meta-bolites in [86], as it conforms identically to the mostconnected nodes in MetaFishNet. However, we leave theinclusion of currency metabolites optional, dependingon their degrees in specific pathways.
Expression profiling of sheepshead minnows exposed tocadmiumWe have previously generated Suppressive SubtractiveHybridization libraries for sheepshead minnows, andsequenced over 10,000 clones [87]. Based on thesesequences, we designed a DNA microarray of 14,494probes for 4,101 clones. All probes were synthesizedon microarray chips by Nimblegen Inc. with fourreplicates.Exposures and animal sampling were performed as
previously described [88,89]. Cadmium (0.3 mg/L) wasadministered to sheepshead minnow larvae at 24 hourspost hatch via precision syringe pumps in an intermit-tent flow-through system [90]. The study included threebiological replicates, each containing 80 larvae in fourcups. After seven days of exposures, whole larvae were
sacrificed and stored in RNAlater (Ambion Inc., Austin,TX). Total RNAs were then extracted using the phenol/chloroform method, and treated with DNase. The puri-fied RNAs were checked by NanoDrop and BioAnalyzerfor quality assurance. The labeling of RNAs was carriedout according to recommendation by Nimblegen Inc. Inshort, mRNAs were converted to double-strand cDNA.Cy3-labeled random nonamers were used as primers forDNA polymerase reaction, which produced labeledDNA targets off the double-strand cDNA. These labeledtargets were purified and hybridized to microarrays. Theresulted fluorescent intensities were corrected by quan-tile normalization. Data at the probe level were averagedover on-slide replicates, with outliers removed. Theexpression values at the gene level were summarized asthe geometric mean of its probe intensities.
Additional material
Additional file 1: Supplemental method [92-101].
Additional file 2: Species specific statistics of pathways.
Additional file 3: List of MetaFishNet pathways.
Additional file 4: MetaFishNet reaction data.
Additional file 5: SBML distribution of MetaFishNet pathways.
Additional file 6: Fish and human enzymes.
Additional file 7: Analysis of zebrafish liver cancer data byKegArray.
Additional file 8: Analysis of zebrafish liver cancer data by KEGGpathways and Fisher’s exact test.
Additional file 9: Complete comparison between fish and humanmetabolic pathways.
AbbreviationsAPI: application programming interface; EC: enzyme commission; EHMN:Edinburgh human metabolic network; FDR: false discovery rate; GEO: geneexpression omnibus; GO: gene ontology; GSEA: gene set enrichmentanalysis; IUBMB: international union of biochemistry and molecular biology;KEGG: Kyoto encyclopedia of genes and genomes; KGML: KEGG markuplanguage; SAM: significance analysis of microarrays; SBML: systems biologymarkup language; UCSD: University of California at San Diego; XML:extensible markup language.
AcknowledgementsThis research was supported by grants from the National Oceanic andAtmospheric Administration (NA05NOS4261163 and NA06NOS42600117). Wealso thank the anonymous reviewers for their valuable suggestions.
Author details1Gulf Coast Research Laboratory, Department of Coastal Sciences, Universityof Southern Mississippi, 703 East Beach Drive, Ocean Springs, MS 39564, USA.2Current address: Emory Vaccine Center, 954 Gatewood Rd, Atlanta, GA30329, USA. 3Current address: Max Planck Institute, August-Thienemann-Str.2, Ploen 24306, Germany.
Authors’ contributionsSL designed and performed most of the computational work. MB designedand supervised the experimental study. AP and MB provided criticalguidance of the project and valuable discussions. CSM performed thecadmium exposure of sheepshead minnows. NBP and RR dissected the fish,
Li et al. Genome Biology 2010, 11:R115http://genomebiology.com/2010/11/11/R115
Page 12 of 15

extracted and labeled RNA. AP coordinated the sheepshead minnowmicroarray design and experiments. SL and MB wrote the manuscript.
Received: 26 July 2010 Revised: 26 September 2010Accepted: 29 November 2010 Published: 29 November 2010
References1. Meierjohann S, Schartl M: From Mendelian to molecular genetics: the
Xiphophorus melanoma model. Trends in Genetics 2006, 22:654-661.2. Walter R, Kazianis S: Xiphophorus interspecies hybrids as genetic models
of induced neoplasia. ILAR Journal/National Research Council, Institute ofLaboratory Animal Resources 2001, 42:299.
3. Cheek A, Brouwer T, Carroll S, Manning S, McLachlan J, Brouwer M:Experimental evaluation of vitellogenin as a predictive biomarker forreproductive disruption. Environmental Health Perspectives 2001, 109:681.
4. Zon L, Peterson R: In vivo drug discovery in the zebrafish. Nature ReviewsDrug Discovery 2005, 4:35-44.
5. Megason S, Fraser S: Imaging in systems biology. Cell 2007, 130:784-795.6. Sabaliauskas N, Foutz C, Mest J, Budgeon L, Sidor A, Gershenson J, Joshi S,
Cheng K: High-throughput zebrafish histology. Methods 2006, 39:246-254.7. Goessling W, North T, Zon L: Ultrasound biomicroscopy permits in vivo
characterization of zebrafish liver tumors. Nature Methods 2007, 4:551-553.8. Keller P, Schmidt A, Wittbrodt J, Stelzer E: Reconstruction of zebrafish early
embryonic development by scanned light sheet microscopy. Science2008, 322:1065.
9. Area S, Index A: Animal models of human disease: zebrafish swim intoview. Nature Reviews Genetics 2007, 8:353-367.
10. Guyon J, Steffen L, Howell M, Pusack T, Lawrence C, Kunkel L: Modelinghuman muscle disease in zebrafish. BBA-Molecular Basis of Disease 2007,1772:205-215.
11. Feitsma H, Cuppen E: Zebrafish as a cancer model. Molecular CancerResearch 2008, 6:685.
12. Kokel D, Bryan J, Laggner C, White R, Cheung C, Mateus R, Healey D, Kim S,Werdich A, Haggarty S, MacRae CA, Shoichet B, Peterson RT: Rapidbehavior-based identification of neuroactive small molecules in thezebrafish. Nature Chemical Biology 2010, 6:231-237.
13. Rihel J, Prober DA, Arvanites A, Lam K, Zimmerman S, Jang S, Haggarty S,Kokel D, Rubin LL, Peterson RT, Schier AF: Zebrafish behavioral profiling linksdrugs to biological targets and rest/wake regulation. Science 2010, 327:348.
14. Snape J, Maund S, Pickford D, Hutchinson T: Ecotoxicogenomics: thechallenge of integrating genomics into aquatic and terrestrialecotoxicology. Aquatic Toxicology 2004, 67:143-154.
15. Ju Z, Wells M, Walter R: DNA microarray technology in toxicogenomics ofaquatic models: Methods and applications. Comp Biochem Physiol CToxicol Pharmacol 2007, 145:5-14.
16. Denslow N, Garcia-Reyero N, Barber D: Fish ‘n’chips: the use ofmicroarrays for aquatic toxicology. Molecular Biosystems 2007, 3:172.
17. Waters M, Fostel J: Toxicogenomics and systems toxicology: aims andprospects. Nature Reviews Genetics 2004, 5:936-948.
18. Heijne W, Kienhuis A, van Ommen B, Stierum R, Groten J: Systemstoxicology: applications of toxicogenomics, transcriptomics, proteomicsand metabolomics in toxicology. Expert Review of Proteomics 2005,2:767-780.
19. Oberhardt M, Palsson B, Papin J: Applications of genome-scale metabolicreconstructions. Molecular Systems Biology 2009, 5:320.
20. Duarte N, Becker S, Jamshidi N, Thiele I, Mo M, Vo T, Srivas R, Palsson B:Global reconstruction of the human metabolic network based ongenomic and bibliomic data. Proc Natl Acad Sci U S A 2007,104:1777-1782.
21. Wheelock C, Wheelock Å, Kawashima S, Diez D, Kanehisa M, Erk M,Kleemann R, Haeggström J, Goto S: Systems biology approaches andpathway tools for investigating cardiovascular disease. MolecularBioSystems 2009, 5:588-602.
22. Subramanian A, Tamayo P, Mootha V, Mukherjee S, Ebert B, Gillette M,Paulovich A, Pomeroy S, Golub T, Lander ES, Mesirov JP: Gene setenrichment analysis: a knowledge-based approach for interpretinggenome-wide expression profiles. Proc Natl Acad Sci U S A 2005,102:15545-15550.
23. Huang da W, Sherman BT, Lempicki RA: Systematic and integrativeanalysis of large gene lists using DAVID bioinformatics resources. NatProtoc 2009, 4:44-57.
24. Cox B, Kotlyar M, Evangelou A, Ignatchenko V, Ignatchenko A, Whiteley K,Jurisica I, Adamson S, Rossant J, Kislinger T: Comparative systems biologyof human and mouse as a tool to guide the modeling of humanplacental pathology. Molecular Systems Biology 2009, 5:279.
25. Schilling C, Covert M, Famili I, Church G, Edwards J, Palsson B: Genome-scale metabolic model of Helicobacter pylori 26695. Journal ofBacteriology 2002, 184:4582-4593.
26. Ma H, Zeng A: Reconstruction of metabolic networks from genome dataand analysis of their global structure for various organisms.Bioinformatics 2003, 19:270.
27. Becker S, Palsson B: Genome-scale reconstruction of the metabolicnetwork in Staphylococcus aureus N315: an initial draft to the two-dimensional annotation. BMC Microbiology 2005, 5:8.
28. Heinemann M, Kummel A, Ruinatscha R, Panke S: In silico genome-scalereconstruction and validation of the Staphylococcus aureus metabolicnetwork. Biotechnol Bioeng 2005, 92:850-864.
29. Förster J, Famili I, Fu P, Palsson B, Nielsen J: Genome-scale reconstructionof the saccharomyces cerevisiae metabolic network. Genome Research2003, 13:244.
30. Feist A, Henry C, Reed J, Krummenacker M, Joyce A, Karp P, Broadbelt L,Hatzimanikatis V, Palsson B: A genome-scale metabolic reconstruction forEscherichia coli K-12 MG1655 that accounts for 1260 ORFs andthermodynamic information. Molecular Systems Biology 2007, 3:121.
31. Ma H, Sorokin A, Mazein A, Selkov A, Selkov E, Demin O, Goryanin I: TheEdinburgh human metabolic network reconstruction and its functionalanalysis. Molecular Systems Biology 2007, 3:135.
32. Kanehisa M, Goto S, Hattori M, Aoki-Kinoshita K, Itoh M, Kawashima S,Katayama T, Araki M, Hirakawa M: From genomics to chemical genomics:new developments in KEGG. Nucleic Acids Research 2006, 34:D354.
33. Ma H, Zhao X, Yuan Y, Zeng A: Decomposition of metabolic network intofunctional modules based on the global connectivity structure ofreaction graph. Bioinformatics 2004, 20:1870-1876.
34. Newman M: Modularity and community structure in networks. Proc NatlAcad Sci U S A 2006, 103:8577-8582.
35. MetaFishNet website. [http://metafishnet.appspot.com].36. Jaillon O, Aury J, Brunet F, Petit J, Stange-Thomann N, Mauceli E,
Bouneau L, Fischer C, Ozouf-Costaz C, Bernot A, Nicaud S, Jaffe D, Fisher S,Lutfalla G, Dossat C, Segurens B, Dasilva C, Salanoubat M, Levy M, Boudet N,Castellano S, Anthouard V, Jubin C, Castelli V, Katinka M, Vacherie B,Biémont C, Skalli Z, Cattolico L, Poulain J, et al: Genome duplication in theteleost sh Tetraodon nigroviridis reveals the early vertebrate proto-karyotype. Nature 2004, 431:946-957.
37. Vandepoele K, De Vos W, Taylor J, Meyer A, Van de Peer Y: Major events inthe genome evolution of vertebrates: paranome age and size differconsiderably between ray-finned fishes and land vertebrates. Proc NatlAcad Sci U S A 2004, 101:1638-1643.
38. Online Mendelian Inheritance in Man. [http://www.ncbi.nlm.nih.gov/omim].39. Surette M: The science behind dietary omega-3 fatty acids. Canadian
Medical Association Journal 2008, 178:177.40. Lam SH, Wu YL, Vega VB, Miller LD, Spitsbergen J, Tong Y, Zhan H,
Govindarajan KR, Lee S, Mathavan S, Murthy KR, Buhler DR, Liu ET, Gong Z:Conservation of gene expression signatures between zebrafish andhuman liver tumors and tumor progression. Nature Biotechnology 2005,24:73-75.
41. Gene Expression Omnibus. [http://www.ncbi.nlm.nih.gov/geo/].42. Tusher VG, Tibshirani R, Chu G: Significance analysis of microarrays applied to
the ionizing radiation response. Proc Natl Acad Sci U S A 2001, 98:5116-5121.43. Hsu P, Sabatini D: Cancer cell metabolism: Warburg and beyond. Cell
2008, 134:703-707.44. Perroud B, Lee J, Valkova N, Dhirapong A, Lin P, Fiehn O, Kültz D, Weiss R:
Pathway analysis of kidney cancer using proteomics and metabolicprofiling. Molecular Cancer 2006, 5:64.
45. Pelicano H, Carney D, Huang P: ROS stress in cancer cells and therapeuticimplications. Drug Resistance Updates 2004, 7:97-110.
46. Kroemer G, Pouyssegur J: Tumor cell metabolism: cancer’s Achilles’ heel.Cancer Cell 2008, 13:472-482.
47. Hitosugi T, Kang S, Vander Heiden MG, Chung TW, Elf S, Lythgoe K, Dong S,Lonial S, Wang X, Chen GZ, Xie J, Gu TL, Polakiewicz RD, Roesel JL,Boggon TJ, Khuri FR, Gilliland DG, Cantley LC, Kaufman J, Chen J: Tyrosinephosphorylation inhibits PKM2 to promote the Warburg effect andtumor growth. Science Signaling 2009, 2:ra73.
Li et al. Genome Biology 2010, 11:R115http://genomebiology.com/2010/11/11/R115
Page 13 of 15

48. Uyttenhove C, Pilotte L, Théate I, Stroobant V, Colau D, Parmentier N,Boon T, Van den Eynde B: Evidence for a tumoral immune resistancemechanism based on tryptophan degradation by indoleamine 2, 3-dioxygenase. Nature Medicine 2003, 9:1269-1274.
49. Wang D, DuBois R: Eicosanoids and cancer. Nature Reviews Cancer 2010,10:181-93.
50. Zhou W, Tu Y, Simpson P, Kuhajda F: Malonyl-CoA decarboxylaseinhibition is selectively cytotoxic to human breast cancer cells. Oncogene2009, 28:2979-2987.
51. Wang L, Vuolo M, Suhrland M, Schlesinger K: HepPar1, MOC-31, pCEA,mCEA and CD10 for distinguishing hepatocellular carcinoma vs.metastatic adenocarcinoma in liver fine needle aspirates. Acta Cytologica2006, 50:257.
52. Kondo K, Chijiiwa K, Funagayama M, Kai M, Otani K, Ohuchida J:Differences in long-term outcome and prognostic factors according toviral status in patients with hepatocellular carcinoma treated by surgery.Journal of Gastrointestinal Surgery 2008, 12:468-476.
53. Kakar S, Gown A, Goodman Z, Ferrell L: Best practices in diagnosticimmunohistochemistry: hepatocellular carcinoma versus metastaticneoplasms. Archives of Pathology & Laboratory Medicine 2007, 131:1648.
54. EPA: Short-Term Methods for Estimating the Chronic Toxicity of Effluents andReceiving Water to Marine and Estuarine Organisms. third edition. UnitedStates Environmental Protection Agency; 2002.
55. Hawse J, Cumming J, Oppermann B, Sheets N, Reddy V, Kantorow M:Activation of metallothioneins and -crystallin/sHSPs in Human lensepithelial cells by specific metals and the metal content of aging clearhuman lenses. Investigative Ophthalmology & Visual Science 2003,44:672-679.
56. Loumbourdis N, Kostaropoulos I, Theodoropoulou B, Kalmanti D: Heavymetal accumulation and metallothionein concentration in the frog Ranaridibunda after exposure to chromium or a mixture of chromium andcadmium. Environmental Pollution 2007, 145:787-792.
57. Yang L, Kemadjou J, Zinsmeister C, Bauer M, Legradi J, Müller F, Pankratz M,Jäkel J, Strähle U: Transcriptional profiling reveals barcode-like toxicogenomicresponses in the zebrafish embryo. Genome Biology 2007, 8:R227.
58. Koskinen H, Pehkonen P, Vehniäinen E, Krasnov A, Rexroad C, Afanasyev S,Mölsa H, Oikari A: Response of rainbow trout transcriptome to modelchemical contaminants. Biochem Biophys Res Commun 2004, 320:745-753.
59. Williams T, Diab A, Ortega F, Sabine V, Godfrey R, Falciani F, Chipman J,George S: Transcriptomic responses of European flounder (Platichthysflesus) to model toxicants. Aquatic Toxicology 2008, 90:83-91.
60. Anwar-Mohamed A, Elbekai R, El-Kadi A: Regulation of CYP1A1 by heavymetals and consequences for drug metabolism. Expert Opin Drug MetabToxicol 2009, 5:501-21.
61. Casalino E, Sblano C, Calzaretti G, Landriscina C: Acute cadmiumintoxication induces alpha-class glutathione S-transferase proteinsynthesis and enzyme activity in rat liver. Toxicology 2006, 217:240-245.
62. Segal E, Friedman N, Kaminski N, Regev A, Koller D: From signatures tomodels: understanding cancer using microarrays. Nature Genetics 2005,37:S38-S45.
63. Nam D, Kim S: Gene-set approach for expression pattern analysis.Briefings in Bioinformatics 2008, 9:189.
64. Funahashi A, Morohashi M, Kitano H, Tanimura N: CellDesigner: a processdiagram editor for gene-regulatory and biochemical networks. Biosilico2003, 1:159-162.
65. Shannon P, Markiel A, Ozier O, Baliga N, Wang J, Ramage D, Amin N,Schwikowski B, Ideker T: Cytoscape: a software environment forintegrated models of biomolecular interaction networks. GenomeResearch 2003, 13:2498.
66. Hu Z, Mellor J, Wu J, DeLisi C: VisANT: an online visualization and analysistool for biological interaction data. BMC Bioinformatics 2004, 5:17.
67. Graphviz. [http://graphviz.org/].68. Gentry J, Carey V, Gansner E, Gentleman R: Laying out pathways with
Rgraphviz. R News 2004, 4:14-18[http://CRAN.R-project.org/doc/Rnews/].69. Terzer M, Maynard N, Covert M, Stelling J: Genome-scale metabolic
networks. Wiley Interdisciplinary Reviews: Systems Biology and Medicine 2009,1:285-297.
70. Breitling R, Vitkup D, Barrett M: New surveyor tools for charting microbialmetabolic maps. Nature Reviews Microbiology 2008, 6:156-161.
71. Ideker T, Thorsson V, Ranish J, Christmas R, Buhler J, Eng J, Bumgarner R,Goodlett D, Aebersold R, Hood L: Integrated genomic and proteomic
analyses of a systematically perturbed metabolic network. Science 2001,292:929.
72. Covert M, Knight E, Reed J, Herrgard M, Palsson B: Integrating high-throughput and computational data elucidates bacterial networks.Nature 2004, 429:92-96.
73. Shlomi1 T, Cabili M, Ruppin E: Predicting metabolic biomarkers of humaninborn errors of metabolism. Molecular Systems Biology 2009, 5:263.
74. Becker S, Palsson B: Context-specific metabolic networks are consistentwith experiments. PLoS Computational Biology 2008, 4:e1000082.
75. Shlomi T, Cabili M, Herrgård M, Palsson B, Ruppin E: Network-basedprediction of human tissue-specific metabolism. Nature Biotechnology2008, 26:1003-1010.
76. Colijn C, Brandes A, Zucker J, Lun D, Weiner B, Farhat M, Cheng T,Moody D, Murray M, Galagan J: Interpreting expression data withmetabolic flux models: predicting Mycobacterium tuberculosis mycolicacid production. PLoS Computational Biology 2009, 5:e1000489.
77. Yizhak K, Benyamini T, Liebermeister W, Ruppin E, Shlomi T: Integratingquantitative proteomics and metabolomics with a genome-scalemetabolic network model. Bioinformatics 2010, 26:i255.
78. Connor S, Hansen M, Corner A, Smith R, Ryan T: Integration ofmetabolomics and transcriptomics data to aid biomarker discovery intype 2 diabetes. Molecular BioSystems 2010, 6:909-921.
79. Samuelsson L, Larsson D: Contributions from metabolomics to fishresearch. Molecular BioSystems 2008, 4:974-979.
80. Bundy J, Davey M, Viant M: Environmental metabolomics: a critical reviewand future perspectives. Metabolomics 2009, 5:3-21.
81. Williams T, Wu H, Santos E, Ball J, Katsiadaki I, Brown M, Baker P, Ortega F,Falciani F, Craft J, Tyler CR, Chipman JK, Viant MR: Hepatic transcriptomicand metabolomic responses in the stickleback (Gasterosteus aculeatus)exposed to environmentally relevant concentrations ofdibenzanthracene. Environmental Science & Technology 2009, 43:6341-6348.
82. Hubbard TJ, Aken BL, Beal K, Ballester B, Caccamo M, Chen Y, Clarke L,Coates G, Cunningham F, Cutts T, Down T, Dyer SC, Fitzgerald S,Fernandez-Banet J, Graf S, Haider S, Hammond M, Herrero J, Holland R,Howe K, Howe K, Johnson N, Kahari A, Keefe D, Kokocinski F, Kulesha E,Lawson D, Longden I, Melsopp C, Megy K, et al: Ensembl 2007. NucleicAcids Research 2007, 35:D610-D617.
83. Ashburner M, Ball CA, Blake JA, Botstein D, Butler H, Cherry JM, Davis AP,Dolinski K, Dwight SS, Eppig JT, Harris MA, Hill DP, Issel-Tarver L, Kasarskis A,Lewis S, Matese JC, Richardson JE, Ringwald M, Rubin GM, Sherlock G: Geneontology: tool for the unification of biology. The Gene OntologyConsortium. Nature Genetics 2000, 25:25-9.
84. Gasteiger E, Gattiker A, Hoogland C, Ivanyi I, Appel R, Bairoch A: ExPASy:the proteomics server for in-depth protein knowledge and analysis.Nucleic Acids Research 2003, 31:3784.
85. Networkx and PyGraphviz. [http://networkx.lanl.gov].86. Holme P, Huss M: Currency metabolites and network representations of
metabolism 2008, Arxiv preprint arXiv:0806.2763.87. Pozhitkov A, Pirooznia M, Ryan R, Zhang C, Gong P, Perkins E, Deng Y,
Brouwer M: Generation and analysis of expressed sequence tags fromthe Sheepshead minnow (Cyprinodon variegatus). BMC Genomics 2010,11:S4.
88. Hendon L, Carlson E, Manning S, Brouwer M: Molecular anddevelopmental effects of exposure to pyrene in the early life-stages ofCyprinodon variegatus. Comp Biochem Physiol C Toxicol Pharmacol 2008,147:205-215.
89. Brouwer M, Brown-Peterson N, Hoexum-Brouwer T, Manning S, Denslow N:Changes in mitochondrial gene and protein expression in grass shrimp,Palaemonetes pugio, exposed to chronic hypoxia. Marine EnvironmentalResearch 2008, 66:143.
90. Manning C, Schesny A, Hawkins W, Barnes D, Barnes C, Walker W: Exposuremethodologies and systems for long-term chemical carcinogenicitystudies with small fish species. Toxicology Mechanisms and Methods 1999,9:201-217.
91. Chang A, Scheer M, Grote A, Schomburg I, Schomburg D: BRENDA,AMENDA and FRENDA the enzyme information system: new contentand tools in 2009. Nucleic Acids Research 2009, 37:D588.
92. Albert R, Barabási A: Statistical mechanics of complex networks. Rev ModPhys 2002, 74:47-97.
93. Barabasi A, Oltvai Z: Network biology: understanding the cell’s functionalorganization. Nature Reviews Genetics 2004, 5:101-113.
Li et al. Genome Biology 2010, 11:R115http://genomebiology.com/2010/11/11/R115
Page 14 of 15

94. Jeong H, Tombor B, Albert R, Oltvai Z, Barabasi A: The large-scaleorganization of metabolic networks. Nature 2000, 407:651-653.
95. Newman ME, Girvan M: Finding and evaluating community structure innetworks. Phys Rev E Stat Nonlin Soft Matter Phys 2004, 69:026113.
96. Wagner A, Fell DA: The small world inside large metabolic networks. ProcBiol Sci 2001, 268:1803-1810.
97. Schuster S, Pfeiffer T, Moldenhauer F, Koch I, Dandekar T: Exploring thepathway structure of metabolism: decomposition into subnetworks andapplication to Mycoplasma pneumoniae. Bioinformatics 2002, 18:351-61.
98. Huss M, Holme P: Currency and commodity metabolites: theiridentification and relation to the modularity of metabolic networks. IETSyst Biol 2007, 1:280-285.
99. Altschul S, Madden T, Schaffer A, Zhang J, Zhang Z, Miller W, Lipman D:Gapped BLAST and PSI-BLAST: a new generation of protein databasesearch programs. Nucleic Acids Research 1997, 25:3389-3402.
100. Sprague J, Doerry E, Douglas S, Westerfield M: The Zebrafish InformationNetwork (ZFIN): a resource for genetic, genomic and developmentalresearch. Nucleic Acids Research 2001, 29:87.
101. Sprague J, Bayraktaroglu L, Clements D, Conlin T, Fashena D, Frazer K,Haendel M, Howe D, Mani P, Ramachandran S, Schaper K, Segerdell E,Song P, Sprunger B, Taylor S, Van Slyke E, Westerfield M: The ZebrafishInformation Network: the zebrafish model organism database. NucleicAcids Research 2006, 34:D581.
doi:10.1186/gb-2010-11-11-r115Cite this article as: Li et al.: Constructing a fish metabolic networkmodel. Genome Biology 2010 11:R115.
Submit your next manuscript to BioMed Centraland take full advantage of:
• Convenient online submission
• Thorough peer review
• No space constraints or color figure charges
• Immediate publication on acceptance
• Inclusion in PubMed, CAS, Scopus and Google Scholar
• Research which is freely available for redistribution
Submit your manuscript at www.biomedcentral.com/submit
Li et al. Genome Biology 2010, 11:R115http://genomebiology.com/2010/11/11/R115
Page 15 of 15