CONSOLIDATED - Fonds de solidarité FTQ
125
CONSOLIDATED FINANCIAL STATEMENTS AS AT NOVEMBER 30, 2021
-
Upload
khangminh22 -
Category
Documents
-
view
1 -
download
0
Transcript of CONSOLIDATED - Fonds de solidarité FTQ

CONSOLIDATED FINANCIAL STATEMENTSAS AT NOVEMBER 30, 2021

FONDS DE SOLIDARITÉ DES TRAVAILLEURS DU QUÉBEC (F.T.Q.) 2 Consolidated Financial Statements as at November 30, 2021
INDEPENDENT AUDITORS’ REPORT To the Shareholders of Fonds de solidarité des travailleurs du Québec (F.T.Q.) Opinion We have audited the consolidated financial statements of the Fonds de solidarité des travailleurs du Québec (F.T.Q.) (the « Fonds »), which comprise the consolidated statement of financial position as at November 30, 2021 and May 31, 2021, and the consolidated statements of comprehensive income, consolidated changes in net assets and the consolidated statement of cash flows for the for the six-month periods ended November 30, 2021 and 2020, and notes to the consolidated financial statements, including a summary of significant accounting policies (collectively referred to as the "financial statements"). In our opinion, the accompanying financial statements present fairly, in all material respects, the financial position of the Fonds as at November 30, 2021 and May 31, 2021, and its financial performance and its cash flows for the six-month periods ended November 30, 2021 and 2020 in accordance with International Financial Reporting Standards ("IFRS"). Basis for Opinion We conducted our audit in accordance with Canadian generally accepted auditing standards ("Canadian GAAS"). Our responsibilities under those standards are further described in the Auditors' Responsibilities for the Audit of the Financial Statements section of our report. We are independent of the Fonds in accordance with the ethical requirements that are relevant to our audit of the financial statements in Canada, and we have fulfilled our other ethical responsibilities in accordance with these requirements. We believe that the audit evidence we have obtained is sufficient and appropriate to provide a basis for our opinion. Other information Management is responsible for the other information. The other information comprises the information included in Management’s Discussion and Analysis, excluding the information in the risk management section which is an integral part of the financial statements. Our opinion on the financial statements does not cover the other information and we do not express any form of assurance conclusion thereon. In connection with our audit of the financial statements, our responsibility is to read the other information identified above and, in doing so, consider whether the other information is materially inconsistent with the financial statements or our knowledge obtained in the audit, or otherwise appears to be materially misstated. We obtained the Management Discussion and Analysis prior to the date of this auditors' report. If, based on the work we have performed on this other information, we conclude that there is a material misstatement of this other information, we are required to report that fact in this auditor's report. We have nothing to report in this regard. Responsibilities of Management and Those Charged with Governance for the Financial Statements Management is responsible for the preparation and fair presentation of the financial statements in accordance with IFRS, and for such internal control as management determines is necessary to enable the preparation of financial statements that are free from material misstatement, whether due to fraud or error. In preparing the financial statements, management is responsible for assessing the Fonds' ability to continue as a going concern, disclosing, as applicable, matters related to going concern and using the going concern basis of accounting unless management either intends to liquidate the Fonds or to cease operations, or has no realistic alternative but to do so. Those charged with governance are responsible for overseeing the Fonds' financial reporting process.
FONDS DE SOLIDARITÉ DES TRAVAILLEURS DU QUÉBEC (F.T.Q.) 3 Consolidated Financial Statements as at November 30, 2021
Auditors' Responsibilities for the Audit of the Financial Statements Our objectives are to obtain reasonable assurance about whether the financial statements as a whole are free from material misstatement, whether due to fraud or error, and to issue an auditor's report that includes our opinion. Reasonable assurance is a high level of assurance, but is not a guarantee that an audit conducted in accordance with Canadian GAAS will always detect a material misstatement when it exists. Misstatements can arise from fraud or error and are considered material if, individually or in the aggregate, they could reasonably be expected to influence the economic decisions of users taken on the basis of these financial statements. As part of an audit in accordance with Canadian GAAS, we exercise professional judgment and maintain professional skepticism throughout the audit. We also: • Identify and assess the risks of material misstatement of the financial statements, whether due to fraud or error, design and perform
audit procedures responsive to those risks, and obtain audit evidence that is sufficient and appropriate to provide a basis for our opinion. The risk of not detecting a material misstatement resulting from fraud is higher than for one resulting from error, as fraud may involve collusion, forgery, intentional omissions, misrepresentations, or the override of internal control.
• Obtain an understanding of internal control relevant to the audit in order to design audit procedures that are appropriate in the circumstances, but not for the purpose of expressing an opinion on the effectiveness of the Fonds' internal control.
• Evaluate the appropriateness of accounting policies used and the reasonableness of accounting estimates and related disclosures made by management.
• Conclude on the appropriateness of management's use of the going concern basis of accounting and, based on the audit evidence obtained, whether a material uncertainty exists related to events or conditions that may cast significant doubt on the Fonds' ability to continue as a going concern. If we conclude that a material uncertainty exists, we are required to draw attention in our auditor's report to the related disclosures in the financial statements or, if such disclosures are inadequate, to modify our opinion. Our conclusions are based on the audit evidence obtained up to the date of our auditor's report. However, future events or conditions may cause the Fonds to cease to continue as a going concern.
• Evaluate the overall presentation, structure and content of the financial statements, including the disclosures, and whether the financial statements represent the underlying transactions and events in a manner that achieves fair presentation.
• Obtain sufficient appropriate audit evidence regarding the financial information of the entities or business activities within the Fonds to express an opinion on the financial statements. We are responsible for the direction, supervision and performance of the group audit. We remain solely responsible for our audit opinion.
We communicate with those charged with governance regarding, among other matters, the planned scope and timing of the audit and significant audit findings, including any significant deficiencies in internal control that we identify during our audit. Signed, Deloitte LLP1
Signed, Raymond Chabot Grant Thornton LLP2
1CPA auditor, CA, public accountancy permit No. A116933 2 CPA auditor, CA, public accountancy permit No. A120795
Montréal, December 23, 2021
FONDS DE SOLIDARITÉ DES TRAVAILLEURS DU QUÉBEC (F.T.Q.) 4 Consolidated Financial Statements as at November 30, 2021
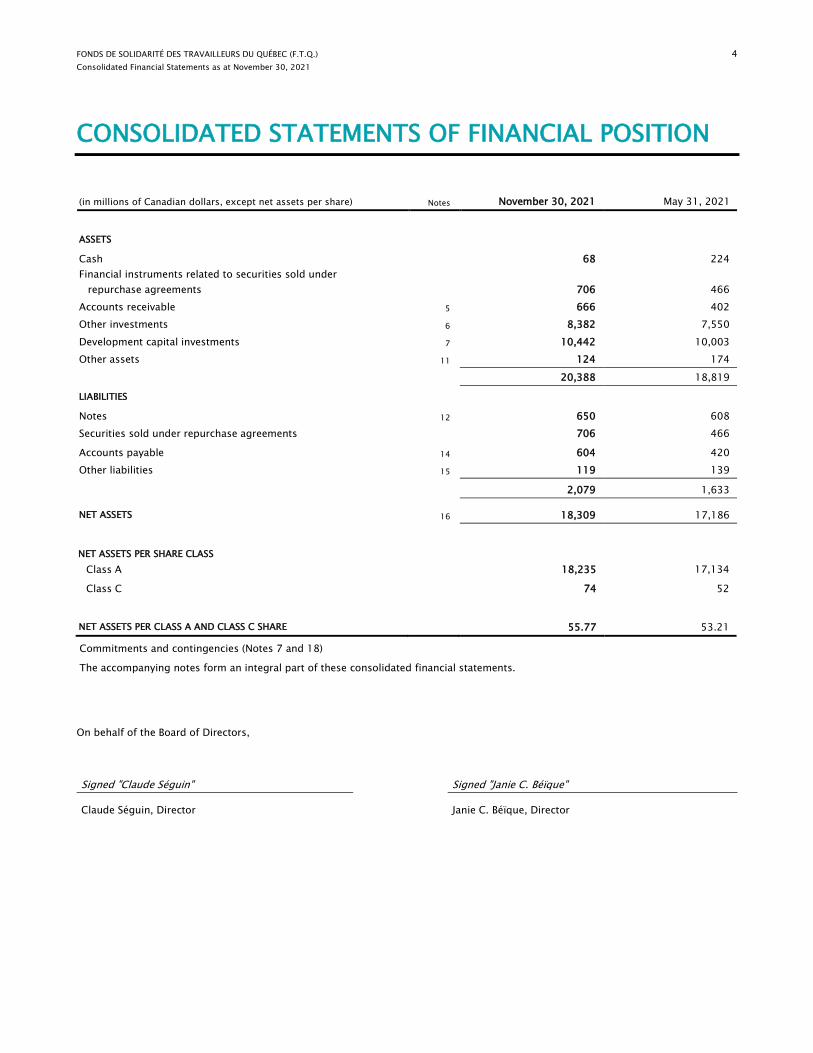
CONSOLIDATED STATEMENTS OF FINANCIAL POSITION
(in millions of Canadian dollars, except net assets per share) Notes November 30, 2021 May 31, 2021
ASSETS
Cash 68 224 Financial instruments related to securities sold under repurchase agreements 706 466 Accounts receivable 5 666 402 Other investments 6 8,382 7,550 Development capital investments 7 10,442 10,003 Other assets 11 124 174 20,388 18,819
LIABILITIES
Notes 12 650 608 Securities sold under repurchase agreements 706 466
Accounts payable 14 604 420 Other liabilities 15 119 139
2,079 1,633
NET ASSETS 16 18,309 17,186
NET ASSETS PER SHARE CLASS Class A 18,235 17,134
Class C 74 52
NET ASSETS PER CLASS A AND CLASS C SHARE 55.77 53.21
Commitments and contingencies (Notes 7 and 18)
The accompanying notes form an integral part of these consolidated financial statements.
On behalf of the Board of Directors,
Signed "Claude Séguin" Signed "Janie C. Béïque" Claude Séguin, Director Janie C. Béïque, Director
FONDS DE SOLIDARITÉ DES TRAVAILLEURS DU QUÉBEC (F.T.Q.) 5 Consolidated Financial Statements as at November 30, 2021
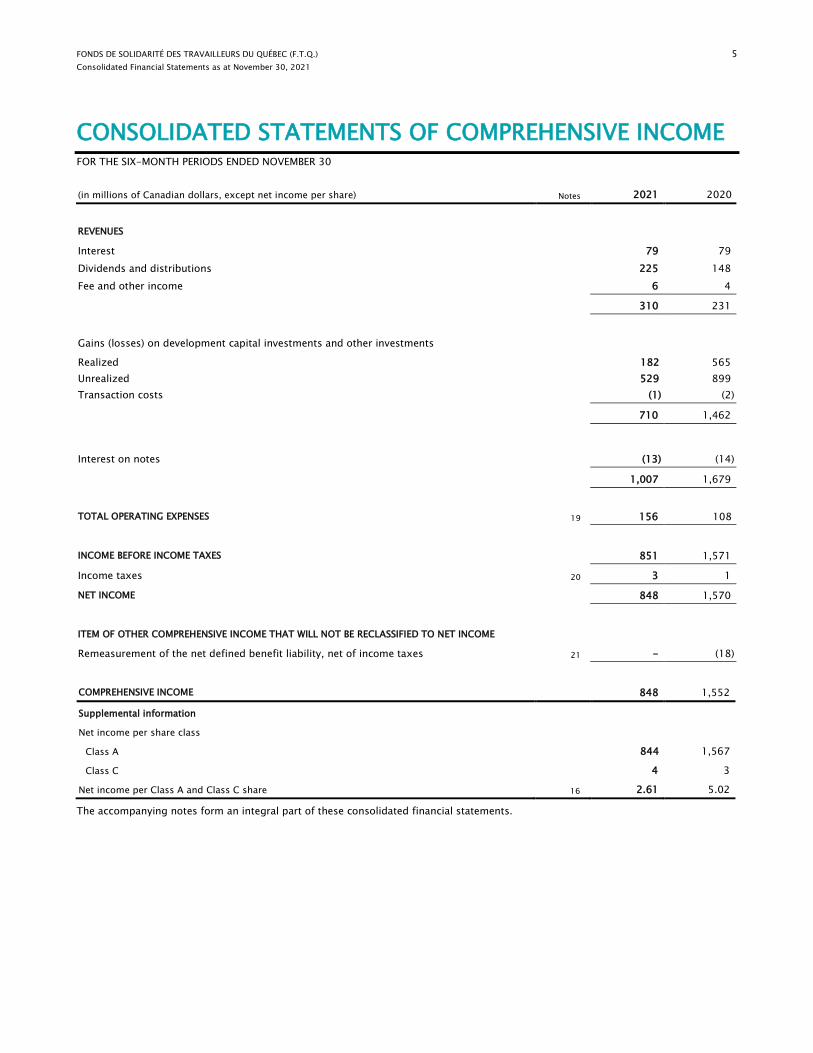
CONSOLIDATED STATEMENTS OF COMPREHENSIVE INCOME FOR THE SIX-MONTH PERIODS ENDED NOVEMBER 30 (in millions of Canadian dollars, except net income per share) Notes 2021 2020
REVENUES
Interest 79 79 Dividends and distributions 225 148 Fee and other income 6 4
310 231
Gains (losses) on development capital investments and other investments
Realized 182 565 Unrealized 529 899 Transaction costs (1) (2)
710 1,462
Interest on notes (13) (14)
1,007 1,679
TOTAL OPERATING EXPENSES 19 156 108
INCOME BEFORE INCOME TAXES 851 1,571
Income taxes 20 3 1
NET INCOME 848 1,570
ITEM OF OTHER COMPREHENSIVE INCOME THAT WILL NOT BE RECLASSIFIED TO NET INCOME
Remeasurement of the net defined benefit liability, net of income taxes 21 - (18)
COMPREHENSIVE INCOME 848 1,552
Supplemental information
Net income per share class
Class A 844 1,567
Class C 4 3
Net income per Class A and Class C share 16 2.61 5.02
The accompanying notes form an integral part of these consolidated financial statements.

FONDS DE SOLIDARITÉ DES TRAVAILLEURS DU QUÉBEC (F.T.Q.) 6 Consolidated Financial Statements as at November 30, 2021
CONSOLIDATED STATEMENTS OF CHANGES IN NET ASSETS FOR THE SIX-MONTH PERIODS ENDED NOVEMBER 30
The accompanying notes form an integral part of these consolidated financial statements.
Share capital Class A shares Class C shares Total
(Note 16) (in millions of Canadian dollars) Series 1 Series 2 Total Series 1 NET ASSETS AS AT MAY 31, 2020 13,632 142 13,774 20 13,794 Net income 1,552 15 1,567 3 1,570 Other comprehensive income (18) - (18) - (18) Share issues 616 9 625 10 635 Share redemptions (1,482) (20) (1,502) (1,502) Change in redemptions in process 1,098 1,098 1,098 NET ASSETS AS AT NOVEMBER 30, 2020 15,398 146 15,544 33 15,577
NET ASSETS AS AT MAY 31, 2021 16,970 164 17,134 52 17,186 Net income 836 8 844 4 848 Other comprehensive income - - - - - Share issues 520 7 527 18 545 Share redemptions (267) (2) (269) - (269) Change in redemptions in process (1) (1) (1) NET ASSETS AS AT NOVEMBER 30, 2021 18,058 177 18,235 74 18,309

FONDS DE SOLIDARITÉ DES TRAVAILLEURS DU QUÉBEC (F.T.Q.) 7 Consolidated Financial Statements as at November 30, 2021
CONSOLIDATED STATEMENTS OF CASH FLOWS FOR THE SIX-MONTH PERIODS ENDED NOVEMBER 30
(in millions of Canadian dollars) 2021 2020
OPERATING ACTIVITIES Net 848 1,570
Non-cash items Stock dividends and distributions in kind (21) (24) Interest capitalized on development capital investments (1) (9) Interest capitalized on notes 13 14 Amortization of premiums and discounts 6 4 (Gains) losses realized and unrealized on development capital investments and other
investments (711) (1,464) Post-employment benefits 7 8 Share-based compensation 1 1 Depreciation of property and equipment and amortization of intangible assets 36 7 Deferred income taxes (4) (3) 174 104 Changes in non-cash items Accounts receivable 19 (16) Income taxes (32) (8) Refundable taxes on hand 29 3 Accounts payable 6 (1) Other 1 (4)
197 78 Acquisition of development capital investments (500) (323) Proceeds of disposal of development capital investments 480 1,444 Acquisition of other investments (3,186) (4,046) Proceeds of disposal of other investments 2,555 3,620 Increase in notes 195 154 Repayment of notes (166) (194)
(425) 733 FINANCING ACTIVITIES Shares issued 544 634 Shares redeemed (268) (1,502)
276 (868) INVESTING ACTIVITIES Acquisition of property and equipment and intangible assets (7) (12) INCREASE (DECREASE) IN CASH (156) (147) CASH AT BEGINNING 224 206 CASH AT END 68 59
Supplemental information (amounts included in operating activities) Interest received 103 68 Dividends and distributions received 206 118 Income taxes paid 6 9
The accompanying notes form an integral part of these consolidated financial statements.
FONDS DE SOLIDARITÉ DES TRAVAILLEURS DU QUÉBEC (F.T.Q.) 8 Consolidated Financial Statements as at November 30, 2021
NOTES TO CONSOLIDATED FINANCIAL STATEMENTS
1. DESCRIPTION OF THE FONDS
STATUTES AND OBJECTIVES OF THE FONDS
The Fonds de solidarité des travailleurs du Québec (F.T.Q.) (the “Fonds”), incorporated by an Act of the Québec National Assembly, is a joint-stock company whose principal office is located at 545 Crémazie Boulevard East, Suite 200, Montréal, Québec, Canada and whose mission is:
Create, maintain or protect jobs Invest in companies impacting the Québec economy and offer them services to further their development and create, maintain or protect jobs. Train workers Promote economic training for workers so they can increase their influence on the economic development of Québec. Develop the Québec economy Stimulate the Québec economy through strategic investments that benefit both Québec workers and companies alike. Prepare for retirement Make workers aware of the need to save for retirement and encourage them to do so, as well as encourage them to participate in the development of the economy by purchasing Fonds shares.
To this end, the Fonds endeavours to concentrate most of its development capital investments in unsecured investments, mainly in small and medium-sized enterprises (“SMEs”) located in Québec. As a general rule, the Fonds will take a minority interest in the projects in which it invests.
2. SIGNIFICANT ACCOUNTING POLICIES
STATEMENT OF COMPLIANCE
These consolidated financial statements have been prepared in accordance with International Financial Reporting Standards (“IFRS”). They have been approved by the Board of Directors of the Fonds on December 23, 2021.
BASIS OF PRESENTATION
These consolidated financial statements have been prepared on a fair value basis, except for property and equipment and intangible assets, which are measured on the basis of cost, net of accumulated depreciation or amortization, as well as certain financial instruments which are measured on amortized cost basis, as mentioned in the “Financial instruments – Classification” section of this note. These consolidated financial statements reflect the financial position and results of operations of the Fonds and its wholly-owned subsidiary FlexiFonds de solidarité FTQ inc. (“FlexiFonds”), on a consolidated basis.
INVESTMENT ENTITY
The Fonds meets the definition of investment entity set out in IFRS 10 Consolidated Financial Statements, as it meets the following conditions:
It obtains capital from many investors for the purpose of managing their savings;
It commits to its investors that the purpose of its investments activities is to generate a return and provide investment income, in accordance with its mission; and
It measures and evaluates the performance of its investments on a fair value basis.
Consequently, the Fonds does not consolidate its subsidiaries, except for its FlexiFonds subsidiary, whose main activity is to provide to the Fonds distribution services for FlexiFonds funds’ units and which is consolidated in accordance with the requirements of IFRS 10.
SUBSIDIARIES AND ASSOCIATES
Except for the FlexiFonds subsidiary, investments in subsidiaries and associates are recognized at fair value through profit or loss.
FONDS DE SOLIDARITÉ DES TRAVAILLEURS DU QUÉBEC (F.T.Q.) 9 Consolidated Financial Statements as at November 30, 2021
SIGNIFICANT ACCOUNTING POLICIES (CONTINUED)
CONSOLIDATED STATEMENT OF FINANCIAL POSITION PRESENTATION
The Fonds presents its Consolidated Statements of Financial Position in a decreasing order of liquidity. All the assets and liabilities of the Fonds are non-current assets and liabilities, except for the following current items: Cash, Financial instruments related to securities sold under repurchase agreements, Accounts receivable (except as mentioned under the table in Note 5), Refundable taxes on hand, Income taxes included in Other assets or Other liabilities, as appropriate, Notes, Securities sold under repurchase agreements, Accounts payable and Share redemptions payable included in Other liabilities. The current portion of bonds and money market instruments included in Other investments is presented in Note 6, while the current portion of loans, bonds and advances included in Development capital investments is presented in Note 7.
ADOPTION OF AN ACCOUNTING INTERPRETATION
Configuration or customisation costs in a cloud computing arrangement – IAS 38 The International Financial Reporting Interpretations Committee (IFRIC) recently issued an interpretation to clarify the principles to be applied to account for the costs of configuring or customizing an application software in a cloud computing arrangement. In its interpretation, the IFRIC specifies that these costs do not generally meet the capitalization criteria in IAS 38 Intangible Assets and, accordingly, they should generally be expensed in the year in which they are incurred. The Fonds adopted this interpretation during the six-month period ended November 30, 2021 and its application had no material impact on these consolidated financial statements.
FINANCIAL INSTRUMENTS – RECOGNITION AND DERECOGNITION
Financial instruments are recognized at fair value at the transaction date, when the Fonds becomes party to the contractual provisions of the instrument. The cost presented for development capital investments and other investments corresponds to the amount paid and is determined based on average cost, excluding transaction costs. Transaction costs are recognized in net income when incurred. A financial asset is derecognized when the Fonds no longer has the contractual rights to the cash flows from this asset and when it has transferred substantially all the risks and rewards of ownership of the financial asset. A financial liability is derecognized when the obligation is extinguished, which is when the obligation is discharged or cancelled or expires.
FINANCIAL INSTRUMENTS – CLASSIFICATION
Financial assets and liabilities at fair value through profit or loss (FVTPL)
As they are part of a portfolio managed in accordance with a documented financial assets integrated management strategy whose performance is evaluated on a fair value basis and for which information is provided internally on that basis to the Fonds’ key management personnel, the following financial instruments are classified as at FVTPL: Development capital investments, Other investments, Accounts receivable relating to development capital investments and other investments sold, Accrued dividends and interest, Loans included in other accounts receivable, Cash, Financial instruments related to securities sold under repurchase agreements, Accounts payable relating to development capital investments and other investments purchased, Derivative financial instruments and Securities sold under repurchase agreements. Funds committed but not disbursed and guarantees and suretyships are designated as at FVTPL, and any resulting gain (loss) is recognized in net income. The Fonds’ obligation for net assets is a financial liability and is measured at redemption value, which approximates the fair value as at the reporting date. Financial assets and liabilities at amortized cost Other items included in accounts receivable, notes as well as accrued expenses and other included in accounts payable are measured at amortized cost, which approximates their fair value given their nature and short-term maturity.
FINANCIAL INSTRUMENTS – FAIR VALUE MEASUREMENT
Fair value is the price that would be received to sell an asset or paid to transfer a liability in an orderly transaction between market participants at the reporting date.
Fair value of assets and liabilities traded on active markets To determine the fair value of financial assets and liabilities that are quoted in an active market, such as listed shares, bonds, money market instruments and listed derivative financial instruments, the Fonds uses the price within the bid-ask spread that is most representative of fair value, given the relevant facts and circumstances, at the reporting date.
FONDS DE SOLIDARITÉ DES TRAVAILLEURS DU QUÉBEC (F.T.Q.) 10 Consolidated Financial Statements as at November 30, 2021
SIGNIFICANT ACCOUNTING POLICIES (CONTINUED)
FINANCIAL INSTRUMENTS – FAIR VALUE MEASUREMENT (CONTINUED)
Fair value of assets and liabilities that are not traded on active markets The fair value of financial assets and liabilities that are not traded on active markets (including unlisted derivative financial instruments) is determined using valuation techniques selected based on certain specified criteria and market conditions prevailing at each reporting date. The valuation techniques used are based on valuation principles derived from the guidelines that are generally used in the industry by business valuation professionals. These valuation principles are approved every six months by the Fonds’ Audit Committee. The valuation technique used for a financial instrument is generally the same from one period to the next, except when a change in valuation technique results in a more accurate estimate of fair value. Unlisted shares and units When a yield method is used, the fair value of unlisted shares is mainly determined using the capitalized cash flow technique. The two main variables used in this technique are maintainable cash flows and the capitalization rate. To determine maintainable cash flows, recurring cash flows are estimated based on the entity’s historical results and/or financial forecasts. A weighting factor is applied to each of the cash flows used to reflect its probability of occurrence. The capitalization rate used to capitalize maintainable cash flows reflects how the investee could finance its operations and the risks associated with the materialization of these maintainable cash flows. When the price of a recent transaction negotiated between unrelated parties on an arm’s-length basis is available, this valuation technique is used under certain conditions. It may also be appropriate to use a valuation technique based on a bid from a third party. Using judgment is necessary to determine whether the price in such recent transaction or bid represents the best evidence of fair value at the reporting date. The period during which referring to a past transaction or bid is deemed appropriate depends on the circumstances specific to each situation. In certain circumstances or depending on the nature of operations, the future earning potential is better reflected by the value of the assets, and the adjusted net asset method is used. This method is also used to determine the fair value of unlisted investment fund units held. In such case, this method entails using the share of all assets and liabilities appearing on the balance sheet of the investee at their fair value and adjusting it as necessary. The main adjustments made are related to the fair value of the assets and liabilities, new information available and significant events that occurred between the investee’s reporting date and the Fonds’ reporting date. Loans and advances The fair value of loans and advances is mainly determined by discounting expected future cash flows using a discount rate that reflects the return that the market would require given the credit risk of the investee. Guarantees and suretyships When it is likely that the Fonds will have to disburse an amount on a guarantee or a suretyship it granted, a loss equivalent to the estimated amount to be assumed is recognized as a liability. Gains (losses) on funds committed but not disbursed The fair value of funds committed but not disbursed is determined using the techniques that will be used to measure the financial instrument to be issued as a result of the execution of the commitment, taking into account the probabilities that the Fonds will have to disburse the committed funds and the amount that would be disbursed. The probable and expected execution of funds committed but not disbursed under conditions that are unfavourable to the Fonds at measurement time will result in a loss that will be recognized as a liability and, under conditions that are favourable to the Fonds, will result in a gain that will be recognized as an asset. Derivative financial instruments The fair value of unlisted derivative financial instruments is determined using appropriate valuation techniques, including discounting future cash flows at the current rate of return. Accounts receivable relating to development capital investments and other investments sold The fair value of accounts receivable relating to development capital investments sold that are not traded on active markets is determined by discounting contractual cash flows. Generally, the estimated amounts to be received and timing of their collection depend on future events or the satisfaction of certain conditions. Accrued dividends and interest Accrued dividends and interest are recognized at the amounts that the Fonds expects to receive at the reporting date, which approximates their fair value given their short-term maturity.
FONDS DE SOLIDARITÉ DES TRAVAILLEURS DU QUÉBEC (F.T.Q.) 11 Consolidated Financial Statements as at November 30, 2021
SIGNIFICANT ACCOUNTING POLICIES (CONTINUED)
SECURITIES LENDING AND SECURITIES SOLD UNDER REPURCHASE AGREEMENTS
To generate additional revenues, the Fonds participates in the securities lending program put in place by its depositary for securities of which it is the custodian. Under this program, the Fonds can enter into securities lending transactions, as well as short-term sales of securities with a simultaneous commitment to repurchase them at a specified price and date. Securities lent or sold under repurchase agreements are not derecognized in the Consolidated Statements of Financial Position as substantially all the risks and benefits inherent to ownership are retained by the Fonds. Repurchase agreements are recognized as secured borrowing transactions and are recorded at the repurchase price determined by the commitment, which approximates their fair value. The revenues resulting from the Fonds’ participation in this program are recorded in net income under Fee and other income.
CASH
Cash includes bank accounts used in operating, processing share issuance and redemption transactions as well as managing development capital investments and other investments.
PROPERTY AND EQUIPMENT AND INTANGIBLE ASSETS
Property and equipment and intangible assets are stated at cost less any accumulated depreciation or amortization and accumulated impairment losses. Cost includes items that are directly attributable to the acquisition of the item of property and equipment or intangible asset. Subsequent costs for an item of property and equipment or an intangible asset are recognized only if it is probable that future economic benefits associated with it will flow to the Fonds and the cost can be measured reliably. Repair and maintenance expenses are recognized in total operating expenses through net income when incurred. The main property and equipment and intangible asset categories are depreciated or amortized over their estimated useful life using the following depreciation and amortization methods, periods and annual rates:
Depreciation or amortization methods Periods
Property and equipment
Buildings Straight-line 15 to 60 years Office furniture and equipment Straight-line 5 and 10 years Computer hardware Straight-line 4 years Right-of-use assets Straight-line Lease term Intangible assets Information systems development Straight-line 3 to 7 years
The Fonds allocates the amount initially recognized in respect of an item of property and equipment or intangible assets to its significant parts and depreciates or amortizes them separately. The carrying amount of a replaced part is derecognized upon replacement. Residual values, depreciation or amortization methods and useful life of assets are reviewed at each reporting date and adjusted if needed. At each reporting date, property and equipment and intangible assets are tested for impairment when events or changes in circumstances indicate that their carrying amount may not be recoverable to determine whether an impairment loss should be recognized. The Fonds recognizes a reversal of an impairment loss when events or circumstances warrant it.
LEASES
The Fonds recognizes its leases as lessee in the Consolidated Statements of Financial Position. Right-of-use assets are included in property and equipment under Other assets, while lease liabilities are presented under Other liabilities. The Fonds recognizes in net income a depreciation expense for right-of-use assets and an implicit interest expense for lease liabilities. The Fonds recognizes leases with lease terms of 12 months or less and leases for which the underlying asset is of low value as lease expenses on a straight-line basis over the lease term. In addition, the Fonds does not separate the non-lease components from the lease components of its leases.
FONDS DE SOLIDARITÉ DES TRAVAILLEURS DU QUÉBEC (F.T.Q.) 12 Consolidated Financial Statements as at November 30, 2021
SIGNIFICANT ACCOUNTING POLICIES (CONTINUED)
POST-EMPLOYMENT BENEFITS
The cost of earned pension benefits and the insurance plan is recognized through net income and comprises current service cost and net interest on the net defined benefit plan liability. Remeasurements of the net defined benefit liability are recognized in Other comprehensive income. They are not reclassified subsequently to net income and are presented separately in the Consolidated Statement of Changes in Net Assets. Remeasurements of the net defined benefit liability comprise actuarial gains and losses as well the difference between the actual return on assets and interest income. Actuarial gains and losses result from changes in the actuarial assumptions used to determine the defined benefit obligation and from experience gains and losses on such obligation. The net defined benefit liability corresponds to the present value of the post-employment benefit plan obligation less the fair value of plan assets.
CLASSIFICATION OF SHARES
The Fonds’ Class A and Class C shares are puttable, subject to certain conditions for Class A shares and subject to the FlexiFonds Fund Rebalancing Policy for Class C shares. Although they rank equally in terms of seniority, they do not have identical features are thereby classified as financial liabilities and presented in the Net assets.
Share issues and redemptions are recognized as transactions on net assets. Share redemptions are recognized when the requests are approved under redemption criteria at the current redemption value, and are derecognized based on average cost.
SHARE-BASED COMPENSATION
The Fonds offers its employees and executives compensation plans for which payment is entirely settled in Class A shares. The rights to acquire shares granted under the share award plan are recognized as compensation expense over their vesting period, adjusted based on the share value prevailing at each reporting date. A corresponding liability is recognized under Accrued expenses and other, in Accounts payable. The compensation expense for the share allocation plan is recognized over the share vesting period, while the compensation expense for the share purchase plan is recognized upon share issuance.
FUNCTIONAL CURRENCY AND FOREIGN CURRENCY TRANSLATION
The Canadian dollar is the functional currency and the reporting currency of the Fonds. Transactions in foreign currencies are translated into the functional currency at the exchange rate prevailing at the transaction date. Assets and liabilities denominated in foreign currencies are translated into the functional currency at the exchange rate prevailing at the reporting date. Translation differences related to cash are presented in net income under Gains (losses) on development capital investments and other investments.
REVENUE RECOGNITION
Interest Interest revenue is recognized on an accrual basis using the effective rate method. Amortization of premiums and discounts under this method is recognized under Interest.
Dividends and distributions Non-cumulative dividends and distributions are recognized when they are declared, while cumulative dividends are recognized on an accrual basis.
Fee and other income Fee and other income are recognized on an accrual basis.
Gains and losses on development capital investments and other investments Realized gains and losses on disposals of development capital investments and other investments, including derivative financial instruments, are recognized at the time of sale. The amount of such gains and losses is the difference between the proceeds of disposal and average cost. Unrealized gains and losses on the measurement to fair value of financial instruments are recognized in net income at the time of measurement to fair value.

FONDS DE SOLIDARITÉ DES TRAVAILLEURS DU QUÉBEC (F.T.Q.) 13 Consolidated Financial Statements as at November 30, 2021
SIGNIFICANT ACCOUNTING POLICIES (CONTINUED)
INCOME TAXES
The income tax expense comprises the current tax expense and the deferred tax expense. Income taxes are recognized in net income unless they relate to items that are recognized directly in Other comprehensive income or net assets; in such case, income taxes are also recognized directly in Other comprehensive income or net assets respectively. Current income tax is the amount of income tax payable in respect of the taxable income for the period or the year, calculated using the tax rates that have been enacted or substantively enacted at reporting date, and any adjustments to income taxes related to prior periods. Deferred income tax is recognized for the temporary differences between the tax bases of assets and liabilities and their carrying amounts in the consolidated financial statements. Deferred income tax is calculated on a non-discounted basis using the tax rates and tax laws that have been enacted or substantively enacted by the end of the reporting period and that are expected to apply to the period when the deferred tax asset is realized or the deferred tax liability is settled. A deferred tax asset is recognized only to the extent that it is probable that future taxable income will be available against which the deductible temporary differences can be utilized. The Fonds is subject to federal and Québec income taxes. For federal income tax purposes, the Fonds is subject to the tax rules applicable to mutual fund corporations and can therefore receive a refund of the income taxes paid on its capital gains by redeeming its shares or by transferring amounts from retained earnings to share capital. For this reason, the Fonds considers itself, in substance, exempted from federal income tax related to capital gains for purposes of applying IFRS and, accordingly, does not recognize any deferred tax liability for unrealized net gains on development capital investments and other investments nor any corresponding deferred tax asset for unrealized recoveries resulting from the tax mechanisms related to refundable capital gains tax on hand. For Québec income tax purposes, the Fonds is a mutual fund corporation and, as such, any capital gains it realizes are not subject to any taxes in Québec.
NET INCOME PER CLASS A AND CLASS C SHARE
Net income per Class A and Class C share is calculated by dividing net income by the total weighted average number of Class A and Class C shares outstanding during the period or the year.
ACCOUNTINGS STANDARDS ISSUED, BUT NOT YET ADOPTED
As at the date of authorization of these consolidated financial statements, there were no new standards or amendments to existing standards issued by the International Accounting Standards Board (IASB) but not yet effective that would have a significant impact on the consolidated financial statements of the Fonds.
3. ACCOUNTING ESTIMATES AND CRITICAL JUDGMENTS The preparation of consolidated financial statements in accordance with IFRS requires using accounting estimates and judgment when applying certain accounting policies. Changes to certain assumptions may have an impact on the consolidated financial statements for the period during which such changes are made. The Fonds believes that the underlying assumptions are appropriate and that, accordingly, its consolidated financial statements present fairly its financial position and performance. The following paragraphs present an analysis of the most significant accounting estimates and critical judgments made by the Fonds in preparing its consolidated financial statements.
FAIR VALUE MEASUREMENT OF FINANCIAL INSTRUMENTS THAT ARE NOT TRADED ON AN ACTIVE MARKET
The Fonds must make assumptions and use estimates in measuring the fair value of financial instruments that are not traded on an active market. Judgments are made with respect to selecting valuation techniques and with respect to the assumptions used in these valuation techniques. Although these techniques use observable inputs to the extent practicable, fair value is also determined using unobservable market inputs that take into account the specific features of the financial instrument and any factor relevant to the measurement. Using unobservable inputs requires the Fonds’ qualified valuators to make judgments so that these inputs reflect the assumptions, if any, that market participants would use to determine fair value using the best information possible in the circumstances. The Fonds considers observable inputs to be market data that is readily available, regularly distributed and updated, reliable and verifiable, not proprietary and provided by independent sources that are actively involved in the relevant market. Fair value reflects market conditions on a given date and, as such, may not be representative of future fair values. In accordance with the Regulation Respecting Development Capital Investment Fund Continuous Disclosure issued by the Autorité des marchés financiers, the Fonds implemented various controls and procedures to ensure that financial instruments are appropriately and reliably measured. To measure the fair value of financial instruments in accordance with the valuation principles adopted by the Fonds, the Fonds’ team of qualified valuators monitor twice a year the performance of the companies in the portfolio and are continuously looking for information on the business and operations of the companies being valued. Where appropriate, the qualified valuators monitor data on comparable companies, the results of recent transactions and the ratings of instruments issued by similar companies.
FONDS DE SOLIDARITÉ DES TRAVAILLEURS DU QUÉBEC (F.T.Q.) 14 Consolidated Financial Statements as at November 30, 2021
SIGNIFICANT ACCOUNTING POLICIES (CONTINUED)
FAIR VALUE MEASUREMENT OF FINANCIAL INSTRUMENTS THAT ARE NOT TRADED ON AN ACTIVE MARKET
Except in the case of companies whose financial instruments are traded in an active market, any relevant information related to fair value measurements is submitted to an independent valuation committee composed of a majority of qualified valuators independent from the Fonds, as required by the Regulation Respecting Development Capital Investment Fund Continuous Disclosure. This committee reviews this information and submits a written report to the Audit Committee, which must examine the compliance of the consolidated financial statements. The President and Chief Executive Officer as well as the Executive Vice-President, Finance, sign a certification for the Audit Committee on the valuation of development capital investments that is filed with the Autorité des marchés financiers. This certification confirms, in particular, the reasonableness of the aggregate fair value of the development capital investments portfolio. Impact of COVID-19 on accounting estimates and critical judgments As at the date of these consolidated financial statements, there is still uncertainty surrounding the development of the COVID-19 pandemic and its future impact on the Québec, Canadian and global economies. Due to this uncertainty, there is a risk that assumptions made and projections used by the Fonds in determining the fair value of development capital investments that are not traded on active markets will differ from actual results, which in turn might further increase the volatility of the fair value of these financial instruments and net assets of the Fonds in the coming six-month periods.
MEASUREMENT OF THE NET DEFINED BENEFIT LIABILITY
The Fonds must make assumptions for using statistical data and other parameters to measure the net defined benefit liability. These assumptions include the discount rate for the pension obligation and for calculating the expected return on plan assets, the expected rate of increase in salaries and the mortality table used. Should the actuarial assumptions be materially different from the actual data observed subsequently, the plan cost recognized in Other comprehensive income as well as the net defined benefit liability presented on the Consolidated Statements of Financial Position could substantially change. The Fonds uses independent actuaries to determine the fair value of the net defined benefit liability and approves the reasonableness of the assumptions used.
4. FINANCIAL INSTRUMENT RISKS Risks arising from financial instruments are an integral part of the audited consolidated financial statements and are discussed in the audited “Risk management” section of the Management Discussion and Analysis for the for the Six-month Period Ended November 30, 2021, which is available at the Fonds’ head office, on its website at fondsftq.com or at sedar.com.
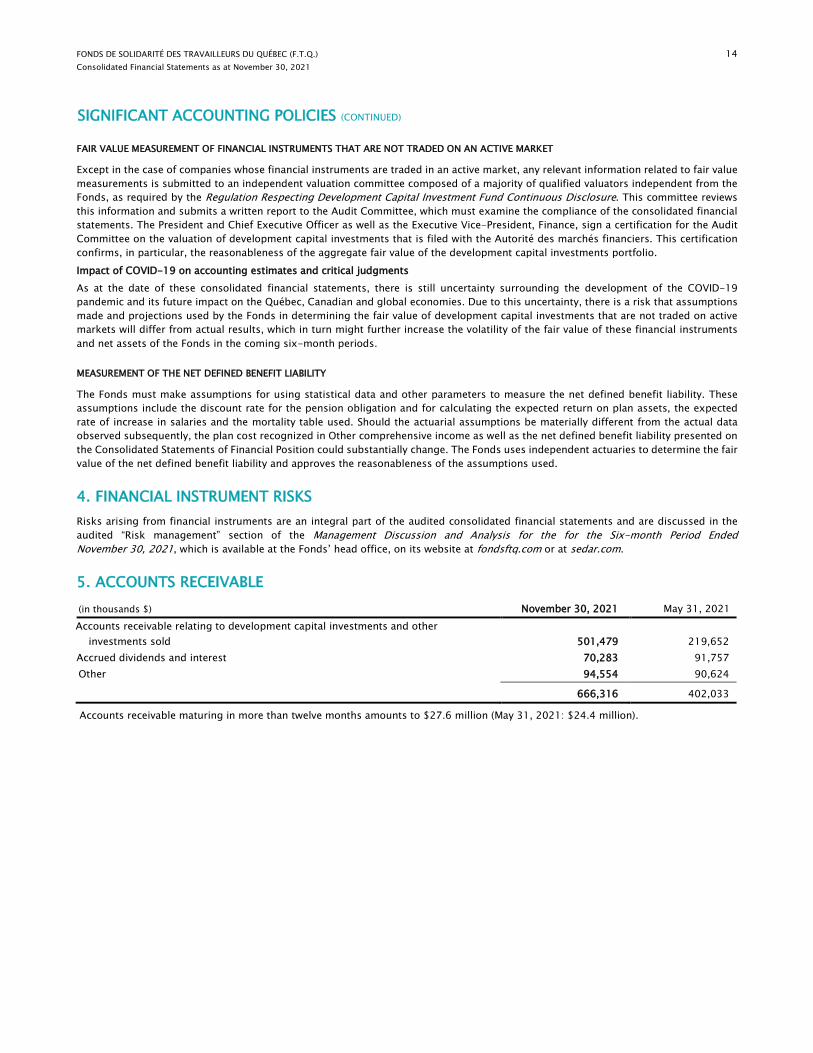
5. ACCOUNTS RECEIVABLE (in thousands $) November 30, 2021 May 31, 2021 Accounts receivable relating to development capital investments and other
investments sold 501,479 219,652 Accrued dividends and interest 70,283 91,757 Other 94,554 90,624
666,316 402,033
Accounts receivable maturing in more than twelve months amounts to $27.6 million (May 31, 2021: $24.4 million).

FONDS DE SOLIDARITÉ DES TRAVAILLEURS DU QUÉBEC (F.T.Q.) 15 Consolidated Financial Statements as at November 30, 2021
6. OTHER INVESTMENTS The unaudited Statement of Other Investments is available at the Fonds’ head office, on its website at fondsftq.com or at sedar.com.
November 30, 2021 May 31, 2021
(in thousands $) Cost
Unrealized appreciation
(depreciation) Fair value
Cost
Unrealized appreciation
(depreciation) Fair value
Listed shares 3,696,373 1,193,036 4,889,409 3,094,696 938,715 4,033,411
Bonds 3,009,775 29,995 3,039,770 3,116,376 58,574 3,174,950
Money market instruments 451,900 107 452,007 337,557 47 337,604 7,158,048 1,223,138 8,381,186 6,548,629 997,336 7,545,965
Derivative financial instruments 534 534 1,956 1,672 3,628
7,158,048 1,223,672 8,381,720 6,550,585 999,008 7,549,593
Other investments include securities denominated in foreign currencies with a fair value of $3,734.5 million (May 31, 2021: $2,953.3 million), mainly including $2,550.1 million (May 31, 2021: $1,912.6 million) in U.S. dollars and $363.4 million (May 31, 2021: $310.0 million) in euros.
BREAKDOWN BY MATURITY
BONDS
(in thousands $) Less than
1 year 1 to
5 years 5 to
10 years 10 to
20 years 20 to
30 years 30 years
and more
Total
November 30, 2021 Fair value 8,225 954,135 902,831 513,699 527,090 133,790 3,039,770 Cost 8,211 948,546 898,326 490,180 528,433 136,079 3,009,775 Par value 8,213 939,055 893,014 400,206 481,281 133,280 2,855,049
Average effective rate (%) 1.5 1.8 2.2 3.1 2.9 2.6 2.4 Average nominal rate (%) 1.4 2.2 2.3 5.0 3.5 2.7 2.9
May 31, 2021 Fair value 33,762 1,091,525 892,938 430,275 651,160 75,290 3,174,950 Cost 33,443 1,066,842 872,776 406,243 656,568 80,504 3,116,376 Par value 33,494 1,052,295 863,929 330,145 583,604 73,265 2,936,732
Average effective rate (%) 1.9 1.7 2.2 3.0 2.9 2.5 2.3 Average nominal rate (%) 1.6 2.2 2.4 5.0 3.6 3.0 2.9
MONEY MARKET INSTRUMENTS
(in thousands $) Less than 1 month
1 to 6 months Total
November 30, 2021 Fair value 211,550 240,457 452,007 Average effective rate (%) 0.2 0.2 0.2
May 31, 2021
Fair value 51,997 285,607 337,604 Average effective rate (%) 0.1 0.2 0.1

FONDS DE SOLIDARITÉ DES TRAVAILLEURS DU QUÉBEC (F.T.Q.) 16 Consolidated Financial Statements as at November 30, 2021
OTHER INVESTMENTS (CONTINUED)
DERIVATIVE FINANCIAL INSTRUMENTS
(in thousands $) Less than 1 month
1 to 6 months
6 months and more Total
November 30, 2021 Fair value1
Stock option contracts Purchased call options - - Written call options (625) (466) (1,091)
Interest rate forward contracts (1,119) (1,119)
(1,119) (625) (466) (2,210)
Notional amount
Stock option contracts
Purchased call options 1 1
Written call options 22,350 18,025 40,375
Interest rate forward contracts 141,536 141,536
May 31, 2021 Fair value1
Stock option contracts Purchased call options 1,848 106 1,954 Written call options (1,828) (1,702) (3,530) Purchased put options 646 646
Written put options (269) (269)
Interest rate forward contracts 485 485 485 397 (1,596) (714) Notional amount
Stock option contracts
Purchased call options 6,710 1 6,711 Written call options 28,811 22,350 51,161 Purchased put options 7,334 7,334 Written put options 12,305 12,305
Interest rate forward contracts 149,428 149,428
1. The fair value of instruments with positive values is $0.5 million (May 31, 2021: $3.6 million) and is presented under Other investments. The fair value of those with negative values is $2.7 million (May 31, 2021: $4.3 million) and is presented under Accounts payable.
Gains (losses) on derivative financial instruments Gains (losses) on development capital investments and other investments reported in the Consolidated Statements of Comprehensive Income include the following gains (losses) on derivative financial statements:
For the six-month periods ended November, 30 (in thousands $) 2021 2020
Realized gains (losses) 3,118 51,066 Unrealized gains (losses) (1,847) (9,135) 1,271 41,931
FONDS DE SOLIDARITÉ DES TRAVAILLEURS DU QUÉBEC (F.T.Q.) 17 Consolidated Financial Statements as at November 30, 2021
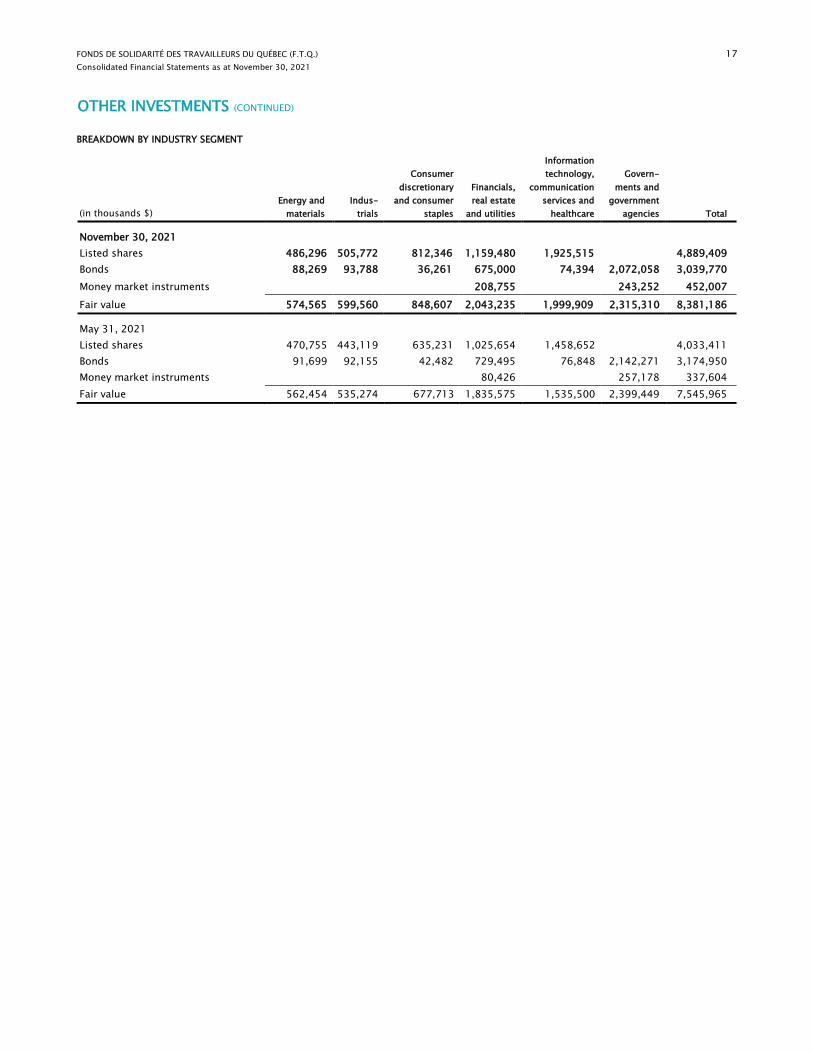
OTHER INVESTMENTS (CONTINUED)
BREAKDOWN BY INDUSTRY SEGMENT
(in thousands $) Energy and
materials Indus-
trials
Consumer discretionary
and consumer staples
Financials, real estate
and utilities
Information technology,
communication services and
healthcare
Govern-ments and
government agencies Total
November 30, 2021 Listed shares 486,296 505,772 812,346 1,159,480 1,925,515 4,889,409 Bonds 88,269 93,788 36,261 675,000 74,394 2,072,058 3,039,770 Money market instruments 208,755 243,252 452,007 Fair value 574,565 599,560 848,607 2,043,235 1,999,909 2,315,310 8,381,186
May 31, 2021 Listed shares 470,755 443,119 635,231 1,025,654 1,458,652 4,033,411 Bonds 91,699 92,155 42,482 729,495 76,848 2,142,271 3,174,950 Money market instruments 80,426 257,178 337,604 Fair value 562,454 535,274 677,713 1,835,575 1,535,500 2,399,449 7,545,965
FONDS DE SOLIDARITÉ DES TRAVAILLEURS DU QUÉBEC (F.T.Q.) 18 Consolidated Financial Statements as at November 30, 2021
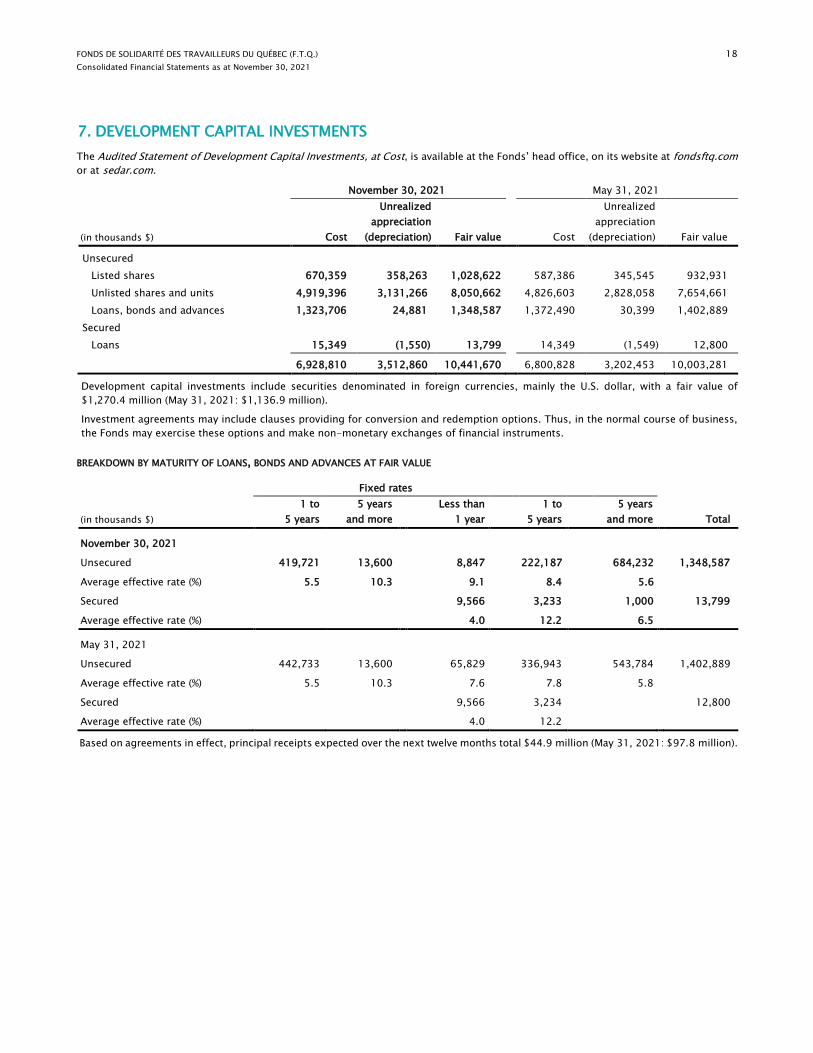
7. DEVELOPMENT CAPITAL INVESTMENTS The Audited Statement of Development Capital Investments, at Cost, is available at the Fonds’ head office, on its website at fondsftq.com or at sedar.com.
November 30, 2021 May 31, 2021
(in thousands $) Cost
Unrealized appreciation
(depreciation) Fair value Cost
Unrealized appreciation
(depreciation) Fair value
Unsecured Listed shares 670,359 358,263 1,028,622 587,386 345,545 932,931 Unlisted shares and units 4,919,396 3,131,266 8,050,662 4,826,603 2,828,058 7,654,661 Loans, bonds and advances 1,323,706 24,881 1,348,587 1,372,490 30,399 1,402,889 Secured Loans 15,349 (1,550) 13,799 14,349 (1,549) 12,800
6,928,810 3,512,860 10,441,670 6,800,828 3,202,453 10,003,281
Development capital investments include securities denominated in foreign currencies, mainly the U.S. dollar, with a fair value of $1,270.4 million (May 31, 2021: $1,136.9 million).
Investment agreements may include clauses providing for conversion and redemption options. Thus, in the normal course of business, the Fonds may exercise these options and make non-monetary exchanges of financial instruments.
BREAKDOWN BY MATURITY OF LOANS, BONDS AND ADVANCES AT FAIR VALUE
Fixed rates
(in thousands $) 1 to
5 years 5 years
and more Less than
1 year 1 to
5 years 5 years
and more Total
November 30, 2021
Unsecured 419,721 13,600 8,847 222,187 684,232 1,348,587
Average effective rate (%) 5.5 10.3 9.1 8.4 5.6
Secured 9,566 3,233 1,000 13,799
Average effective rate (%) 4.0 12.2 6.5
May 31, 2021
Unsecured 442,733 13,600 65,829 336,943 543,784 1,402,889
Average effective rate (%) 5.5 10.3 7.6 7.8 5.8
Secured 9,566 3,234 12,800
Average effective rate (%) 4.0 12.2
Based on agreements in effect, principal receipts expected over the next twelve months total $44.9 million (May 31, 2021: $97.8 million).
FONDS DE SOLIDARITÉ DES TRAVAILLEURS DU QUÉBEC (F.T.Q.) 19 Consolidated Financial Statements as at November 30, 2021
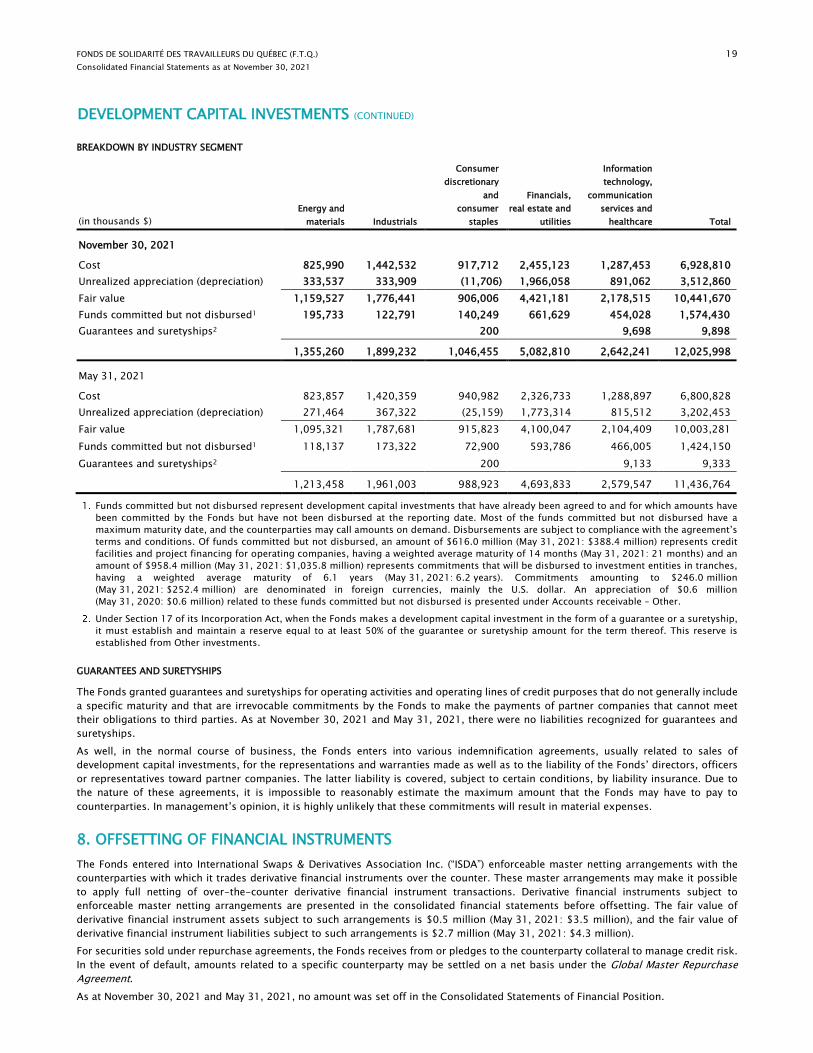
DEVELOPMENT CAPITAL INVESTMENTS (CONTINUED)
BREAKDOWN BY INDUSTRY SEGMENT
(in thousands $)
Energy and materials Industrials
Consumer discretionary
and consumer
staples
Financials, real estate and
utilities
Information technology,
communication services and
healthcare Total
November 30, 2021
Cost 825,990 1,442,532 917,712 2,455,123 1,287,453 6,928,810 Unrealized appreciation (depreciation) 333,537 333,909 (11,706) 1,966,058 891,062 3,512,860 Fair value 1,159,527 1,776,441 906,006 4,421,181 2,178,515 10,441,670 Funds committed but not disbursed1 195,733 122,791 140,249 661,629 454,028 1,574,430 Guarantees and suretyships2 200 9,698 9,898
1,355,260 1,899,232 1,046,455 5,082,810 2,642,241 12,025,998
May 31, 2021
Cost 823,857 1,420,359 940,982 2,326,733 1,288,897 6,800,828 Unrealized appreciation (depreciation) 271,464 367,322 (25,159) 1,773,314 815,512 3,202,453 Fair value 1,095,321 1,787,681 915,823 4,100,047 2,104,409 10,003,281 Funds committed but not disbursed1 118,137 173,322 72,900 593,786 466,005 1,424,150 Guarantees and suretyships2 200 9,133 9,333
1,213,458 1,961,003 988,923 4,693,833 2,579,547 11,436,764
Funds committed but not disbursed represent development capital investments that have already been agreed to and for which amounts have been committed by the Fonds but have not been disbursed at the reporting date. Most of the funds committed but not disbursed have a maximum maturity date, and the counterparties may call amounts on demand. Disbursements are subject to compliance with the agreement’s terms and conditions. Of funds committed but not disbursed, an amount of $616.0 million (May 31, 2021: $388.4 million) represents credit facilities and project financing for operating companies, having a weighted average maturity of 14 months (May 31, 2021: 21 months) and an amount of $958.4 million (May 31, 2021: $1,035.8 million) represents commitments that will be disbursed to investment entities in tranches, having a weighted average maturity of 6.1 years (May 31, 2021: 6.2 years). Commitments amounting to $246.0 million (May 31, 2021: $252.4 million) are denominated in foreign currencies, mainly the U.S. dollar. An appreciation of $0.6 million (May 31, 2020: $0.6 million) related to these funds committed but not disbursed is presented under Accounts receivable – Other.
Under Section 17 of its Incorporation Act, when the Fonds makes a development capital investment in the form of a guarantee or a suretyship, it must establish and maintain a reserve equal to at least 50% of the guarantee or suretyship amount for the term thereof. This reserve is established from Other investments.
GUARANTEES AND SURETYSHIPS
The Fonds granted guarantees and suretyships for operating activities and operating lines of credit purposes that do not generally include a specific maturity and that are irrevocable commitments by the Fonds to make the payments of partner companies that cannot meet their obligations to third parties. As at November 30, 2021 and May 31, 2021, there were no liabilities recognized for guarantees and suretyships. As well, in the normal course of business, the Fonds enters into various indemnification agreements, usually related to sales of development capital investments, for the representations and warranties made as well as to the liability of the Fonds’ directors, officers or representatives toward partner companies. The latter liability is covered, subject to certain conditions, by liability insurance. Due to the nature of these agreements, it is impossible to reasonably estimate the maximum amount that the Fonds may have to pay to counterparties. In management’s opinion, it is highly unlikely that these commitments will result in material expenses.
8. OFFSETTING OF FINANCIAL INSTRUMENTS The Fonds entered into International Swaps & Derivatives Association Inc. (“ISDA”) enforceable master netting arrangements with the counterparties with which it trades derivative financial instruments over the counter. These master arrangements may make it possible to apply full netting of over-the-counter derivative financial instrument transactions. Derivative financial instruments subject to enforceable master netting arrangements are presented in the consolidated financial statements before offsetting. The fair value of derivative financial instrument assets subject to such arrangements is $0.5 million (May 31, 2021: $3.5 million), and the fair value of derivative financial instrument liabilities subject to such arrangements is $2.7 million (May 31, 2021: $4.3 million). For securities sold under repurchase agreements, the Fonds receives from or pledges to the counterparty collateral to manage credit risk. In the event of default, amounts related to a specific counterparty may be settled on a net basis under the Global Master Repurchase Agreement. As at November 30, 2021 and May 31, 2021, no amount was set off in the Consolidated Statements of Financial Position.
FONDS DE SOLIDARITÉ DES TRAVAILLEURS DU QUÉBEC (F.T.Q.) 20 Consolidated Financial Statements as at November 30, 2021
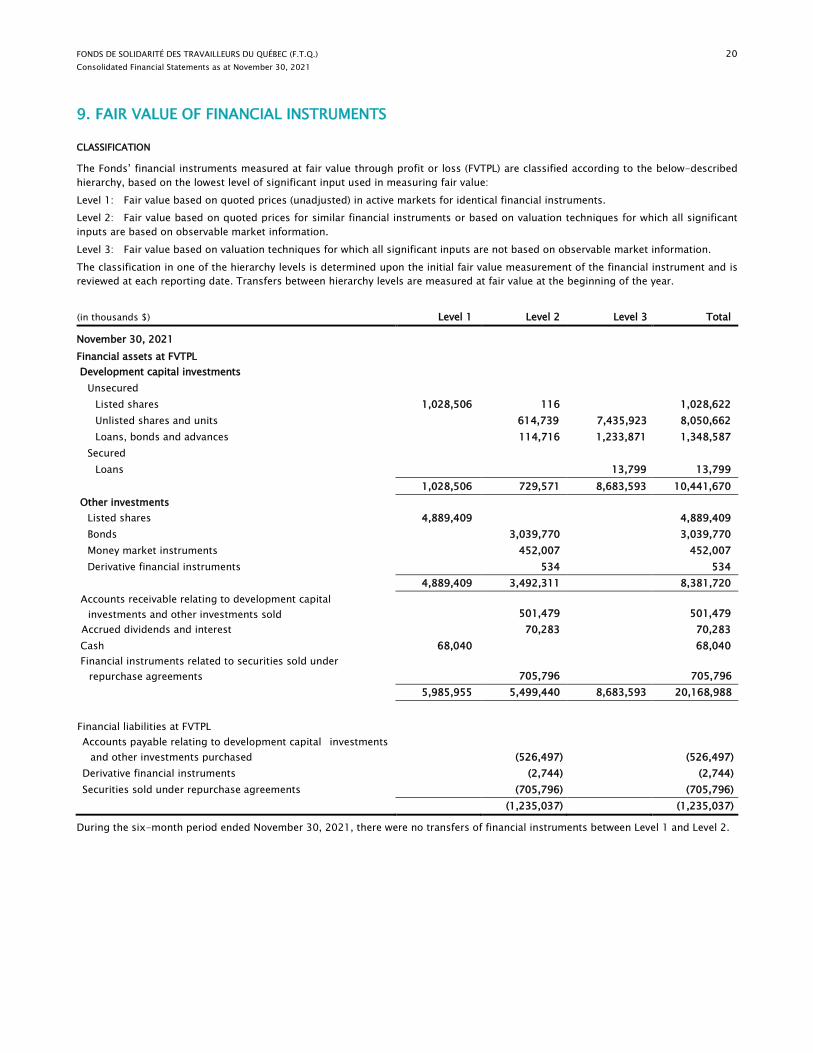
9. FAIR VALUE OF FINANCIAL INSTRUMENTS
CLASSIFICATION
The Fonds’ financial instruments measured at fair value through profit or loss (FVTPL) are classified according to the below-described hierarchy, based on the lowest level of significant input used in measuring fair value: Level 1: Fair value based on quoted prices (unadjusted) in active markets for identical financial instruments. Level 2: Fair value based on quoted prices for similar financial instruments or based on valuation techniques for which all significant inputs are based on observable market information. Level 3: Fair value based on valuation techniques for which all significant inputs are not based on observable market information. The classification in one of the hierarchy levels is determined upon the initial fair value measurement of the financial instrument and is reviewed at each reporting date. Transfers between hierarchy levels are measured at fair value at the beginning of the year.
(in thousands $) Level 1 Level 2 Level 3 Total
November 30, 2021 Financial assets at FVTPL Development capital investments
Unsecured Listed shares 1,028,506 116 1,028,622 Unlisted shares and units 614,739 7,435,923 8,050,662 Loans, bonds and advances 114,716 1,233,871 1,348,587
Secured Loans 13,799 13,799
1,028,506 729,571 8,683,593 10,441,670 Other investments
Listed shares 4,889,409 4,889,409 Bonds 3,039,770 3,039,770 Money market instruments 452,007 452,007 Derivative financial instruments 534 534
4,889,409 3,492,311 8,381,720 Accounts receivable relating to development capital investments and other investments sold 501,479 501,479 Accrued dividends and interest 70,283 70,283 Cash 68,040 68,040 Financial instruments related to securities sold under repurchase agreements 705,796 705,796
5,985,955 5,499,440 8,683,593 20,168,988 Financial liabilities at FVTPL Accounts payable relating to development capital investments
and other investments purchased (526,497) (526,497) Derivative financial instruments (2,744) (2,744) Securities sold under repurchase agreements (705,796) (705,796)
(1,235,037) (1,235,037)
During the six-month period ended November 30, 2021, there were no transfers of financial instruments between Level 1 and Level 2.

FONDS DE SOLIDARITÉ DES TRAVAILLEURS DU QUÉBEC (F.T.Q.) 21 Consolidated Financial Statements as at November 30, 2021
FAIR VALUE OF FINANCIAL INSTRUMENTS (CONTINUED)
CLASSIFICATION1 (CONTINUED)
(in thousands $) Level 1 Level 2 Level 3 Total
May 31, 2021 Financial assets at FVTPL
Development capital investments Unsecured
Listed shares 931,473 1,458 932,931 Unlisted shares and units 504,979 7,149,682 7,654,661 Loans, bonds and advances 114,360 1,288,529 1,402,889
Secured Loans 12,800 12,800
931,473 620,797 8,451,011 10,003,281 Other investments
Listed shares 4,033,411 4,033,411 Bonds 3,174,950 3,174,950 Money market instruments 337,604 337,604 Derivative financial instruments 3,628 3,628
4,033,411 3,516,182 7,549,593 Accounts receivable relating to development capital
investments and other investments sold 219,652 219,652 Accrued dividends and interest 91,757 91,757 Cash 223,506 223,506 Financial instruments related to securities sold under
repurchase agreements 466,682 466,682 5,188,390 4,915,070 8,451,011 18,554,471 Financial liabilities at FVTPL
Accounts payable relating to development capital investments and other investments purchased (345,854) (345,854)
Derivative financial instruments (4,342) (4,342) Securities sold under repurchase agreements (466,682) (466,682)
(816,878) (816,878)
1. The classification of unlisted shares and units in Development capital investments having a fair value of $505.0 million as at May 31, 2021 was changed from Level 3 to Level 2. Comparative information presented in the tables in this note were modified to reflect the impact of the change in classification.
During the year ended May 31, 2021, there were no transfers of financial instruments between Level 1 and Level 2.
FONDS DE SOLIDARITÉ DES TRAVAILLEURS DU QUÉBEC (F.T.Q.) 22 Consolidated Financial Statements as at November 30, 2021
FAIR VALUE OF FINANCIAL INSTRUMENTS (CONTINUED)
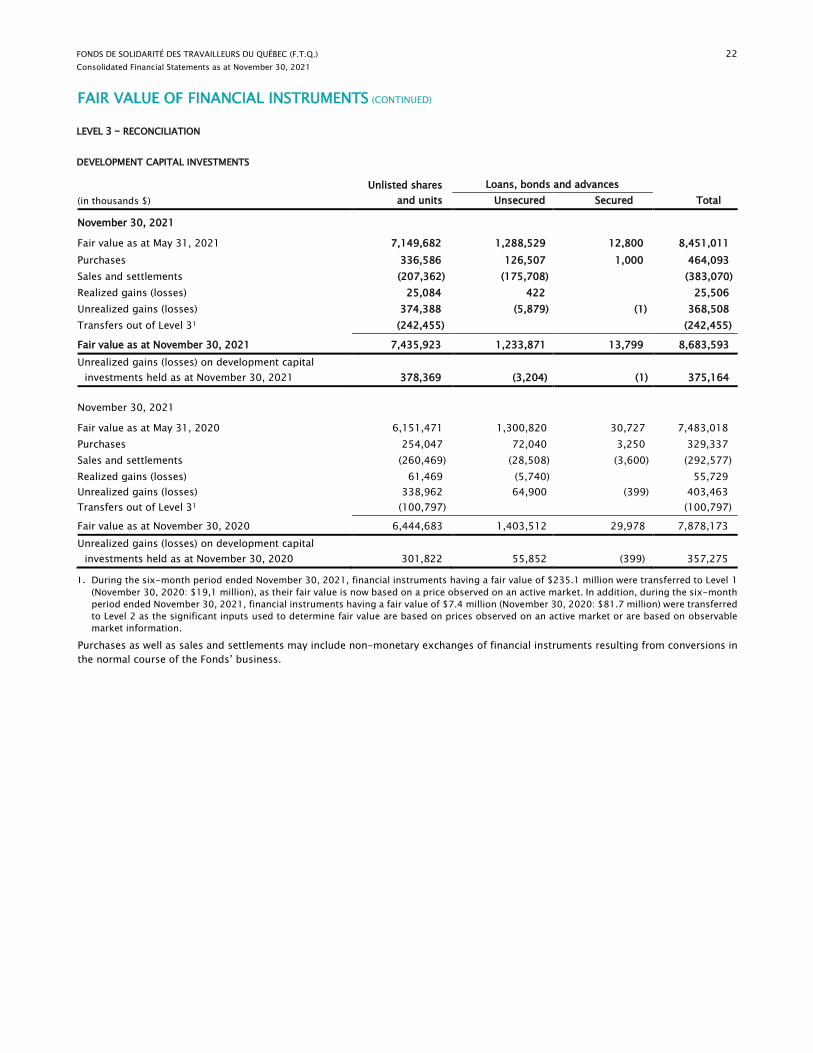
LEVEL 3 – RECONCILIATION
DEVELOPMENT CAPITAL INVESTMENTS
(in thousands $) Unlisted shares
and units Loans, bonds and advances
Total Unsecured Secured
November 30, 2021
Fair value as at May 31, 2021 7,149,682 1,288,529 12,800 8,451,011 Purchases 336,586 126,507 1,000 464,093 Sales and settlements (207,362) (175,708) (383,070) Realized gains (losses) 25,084 422 25,506 Unrealized gains (losses) 374,388 (5,879) (1) 368,508 Transfers out of Level 31 (242,455) (242,455)
Fair value as at November 30, 2021 7,435,923 1,233,871 13,799 8,683,593 Unrealized gains (losses) on development capital
investments held as at November 30, 2021 378,369 (3,204) (1) 375,164
November 30, 2021
Fair value as at May 31, 2020 6,151,471 1,300,820 30,727 7,483,018 Purchases 254,047 72,040 3,250 329,337 Sales and settlements (260,469) (28,508) (3,600) (292,577) Realized gains (losses) 61,469 (5,740) 55,729 Unrealized gains (losses) 338,962 64,900 (399) 403,463 Transfers out of Level 31 (100,797) (100,797)
Fair value as at November 30, 2020 6,444,683 1,403,512 29,978 7,878,173 Unrealized gains (losses) on development capital
investments held as at November 30, 2020 301,822 55,852 (399) 357,275
During the six-month period ended November 30, 2021, financial instruments having a fair value of $235.1 million were transferred to Level 1 (November 30, 2020: $19,1 million), as their fair value is now based on a price observed on an active market. In addition, during the six-month period ended November 30, 2021, financial instruments having a fair value of $7.4 million (November 30, 2020: $81.7 million) were transferred to Level 2 as the significant inputs used to determine fair value are based on prices observed on an active market or are based on observable market information.
Purchases as well as sales and settlements may include non-monetary exchanges of financial instruments resulting from conversions in the normal course of the Fonds’ business.
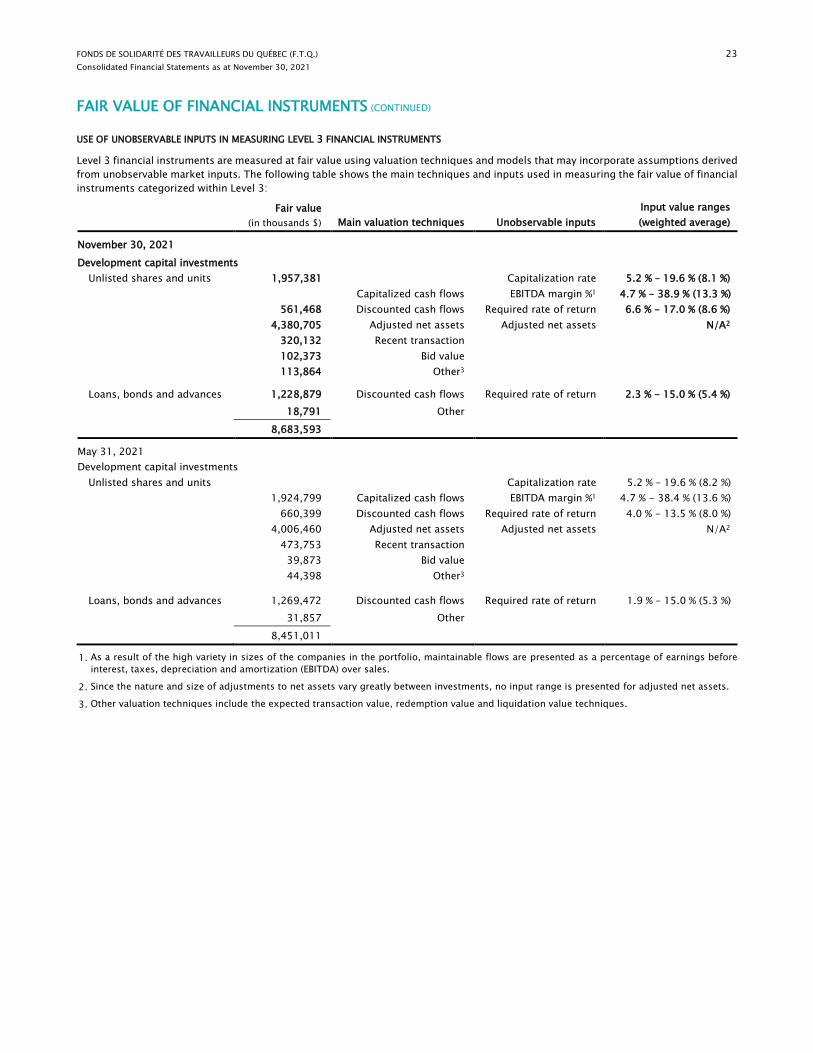
FONDS DE SOLIDARITÉ DES TRAVAILLEURS DU QUÉBEC (F.T.Q.) 23 Consolidated Financial Statements as at November 30, 2021
FAIR VALUE OF FINANCIAL INSTRUMENTS (CONTINUED)
USE OF UNOBSERVABLE INPUTS IN MEASURING LEVEL 3 FINANCIAL INSTRUMENTS
Level 3 financial instruments are measured at fair value using valuation techniques and models that may incorporate assumptions derived from unobservable market inputs. The following table shows the main techniques and inputs used in measuring the fair value of financial instruments categorized within Level 3:
Fair value
(in thousands $) Main valuation techniques Unobservable inputs Input value ranges (weighted average)
November 30, 2021 Development capital investments
Unlisted shares and units 1,957,381 Capitalization rate 5.2 % – 19.6 % (8.1 %) Capitalized cash flows EBITDA margin %1 4.7 % - 38.9 % (13.3 %) 561,468 Discounted cash flows Required rate of return 6.6 % - 17.0 % (8.6 %) 4,380,705 Adjusted net assets Adjusted net assets N/A2 320,132 Recent transaction 102,373 Bid value 113,864 Other3
Loans, bonds and advances 1,228,879 Discounted cash flows Required rate of return 2.3 % - 15.0 % (5.4 %) 18,791 Other 8,683,593
May 31, 2021 Development capital investments
Unlisted shares and units Capitalization rate 5.2 % – 19.6 % (8.2 %) 1,924,799 Capitalized cash flows EBITDA margin %1 4.7 % - 38.4 % (13.6 %) 660,399 Discounted cash flows Required rate of return 4.0 % - 13.5 % (8.0 %) 4,006,460 Adjusted net assets Adjusted net assets N/A2 473,753 Recent transaction 39,873 Bid value 44,398 Other3
Loans, bonds and advances 1,269,472 Discounted cash flows Required rate of return 1.9 % – 15.0 % (5.3 %)
31,857 Other 8,451,011
1. As a result of the high variety in sizes of the companies in the portfolio, maintainable flows are presented as a percentage of earnings before interest, taxes, depreciation and amortization (EBITDA) over sales.
2. Since the nature and size of adjustments to net assets vary greatly between investments, no input range is presented for adjusted net assets.
3. Other valuation techniques include the expected transaction value, redemption value and liquidation value techniques.
FONDS DE SOLIDARITÉ DES TRAVAILLEURS DU QUÉBEC (F.T.Q.) 24 Consolidated Financial Statements as at November 30, 2021
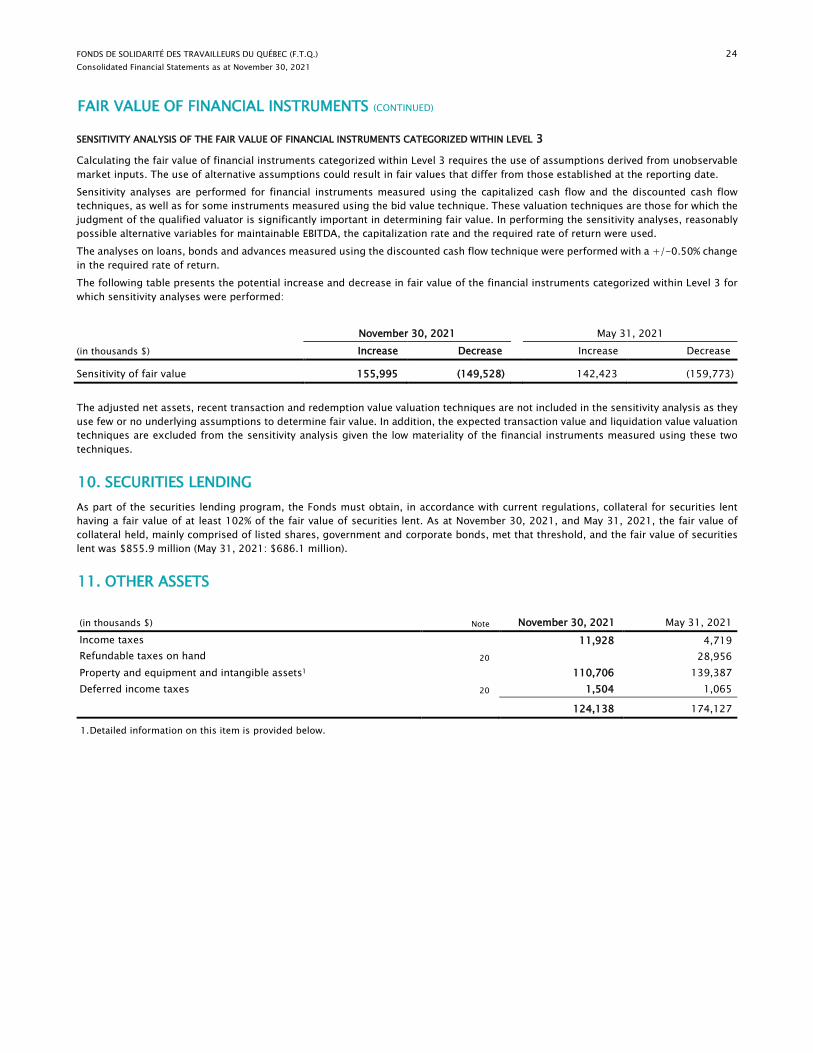
FAIR VALUE OF FINANCIAL INSTRUMENTS (CONTINUED)
SENSITIVITY ANALYSIS OF THE FAIR VALUE OF FINANCIAL INSTRUMENTS CATEGORIZED WITHIN LEVEL 3
Calculating the fair value of financial instruments categorized within Level 3 requires the use of assumptions derived from unobservable market inputs. The use of alternative assumptions could result in fair values that differ from those established at the reporting date. Sensitivity analyses are performed for financial instruments measured using the capitalized cash flow and the discounted cash flow techniques, as well as for some instruments measured using the bid value technique. These valuation techniques are those for which the judgment of the qualified valuator is significantly important in determining fair value. In performing the sensitivity analyses, reasonably possible alternative variables for maintainable EBITDA, the capitalization rate and the required rate of return were used. The analyses on loans, bonds and advances measured using the discounted cash flow technique were performed with a +/-0.50% change in the required rate of return. The following table presents the potential increase and decrease in fair value of the financial instruments categorized within Level 3 for which sensitivity analyses were performed:
November 30, 2021 May 31, 2021 (in thousands $) Increase Decrease Increase Decrease
Sensitivity of fair value 155,995 (149,528) 142,423 (159,773) The adjusted net assets, recent transaction and redemption value valuation techniques are not included in the sensitivity analysis as they use few or no underlying assumptions to determine fair value. In addition, the expected transaction value and liquidation value valuation techniques are excluded from the sensitivity analysis given the low materiality of the financial instruments measured using these two techniques.
10. SECURITIES LENDING As part of the securities lending program, the Fonds must obtain, in accordance with current regulations, collateral for securities lent having a fair value of at least 102% of the fair value of securities lent. As at November 30, 2021, and May 31, 2021, the fair value of collateral held, mainly comprised of listed shares, government and corporate bonds, met that threshold, and the fair value of securities lent was $855.9 million (May 31, 2021: $686.1 million).
11. OTHER ASSETS
(in thousands $) Note November 30, 2021 May 31, 2021 Income taxes 11,928 4,719 Refundable taxes on hand 20 28,956 Property and equipment and intangible assets1 110,706 139,387 Deferred income taxes 20 1,504 1,065
124,138 174,127
1. Detailed information on this item is provided below.
FONDS DE SOLIDARITÉ DES TRAVAILLEURS DU QUÉBEC (F.T.Q.) 25 Consolidated Financial Statements as at November 30, 2021
OTHER ASSETS (CONTINUED)
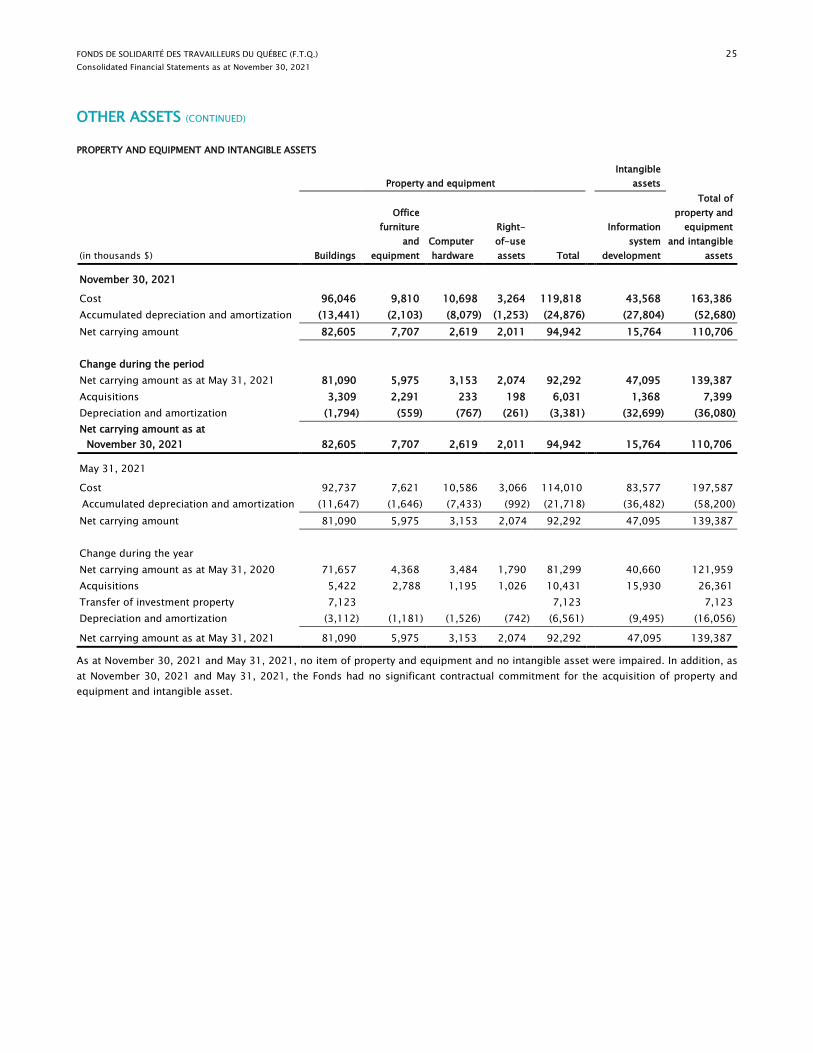
PROPERTY AND EQUIPMENT AND INTANGIBLE ASSETS
Property and equipment Intangible
assets
(in thousands $) Buildings
Office furniture
and equipment
Computer hardware
Right-of-use assets Total
Information system
development
Total of property and
equipment and intangible
assets
November 30, 2021
Cost 96,046 9,810 10,698 3,264 119,818 43,568 163,386 Accumulated depreciation and amortization (13,441) (2,103) (8,079) (1,253) (24,876) (27,804) (52,680) Net carrying amount 82,605 7,707 2,619 2,011 94,942 15,764 110,706 Change during the period Net carrying amount as at May 31, 2021 81,090 5,975 3,153 2,074 92,292 47,095 139,387 Acquisitions 3,309 2,291 233 198 6,031 1,368 7,399 Depreciation and amortization (1,794) (559) (767) (261) (3,381) (32,699) (36,080) Net carrying amount as at
November 30, 2021 82,605 7,707 2,619 2,011 94,942 15,764 110,706
May 31, 2021
Cost 92,737 7,621 10,586 3,066 114,010 83,577 197,587 Accumulated depreciation and amortization (11,647) (1,646) (7,433) (992) (21,718) (36,482) (58,200) Net carrying amount 81,090 5,975 3,153 2,074 92,292 47,095 139,387
Change during the year Net carrying amount as at May 31, 2020 71,657 4,368 3,484 1,790 81,299 40,660 121,959 Acquisitions 5,422 2,788 1,195 1,026 10,431 15,930 26,361 Transfer of investment property 7,123 7,123 7,123 Depreciation and amortization (3,112) (1,181) (1,526) (742) (6,561) (9,495) (16,056)
Net carrying amount as at May 31, 2021 81,090 5,975 3,153 2,074 92,292 47,095 139,387
As at November 30, 2021 and May 31, 2021, no item of property and equipment and no intangible asset were impaired. In addition, as at November 30, 2021 and May 31, 2021, the Fonds had no significant contractual commitment for the acquisition of property and equipment and intangible asset.
FONDS DE SOLIDARITÉ DES TRAVAILLEURS DU QUÉBEC (F.T.Q.) 26 Consolidated Financial Statements as at November 30, 2021
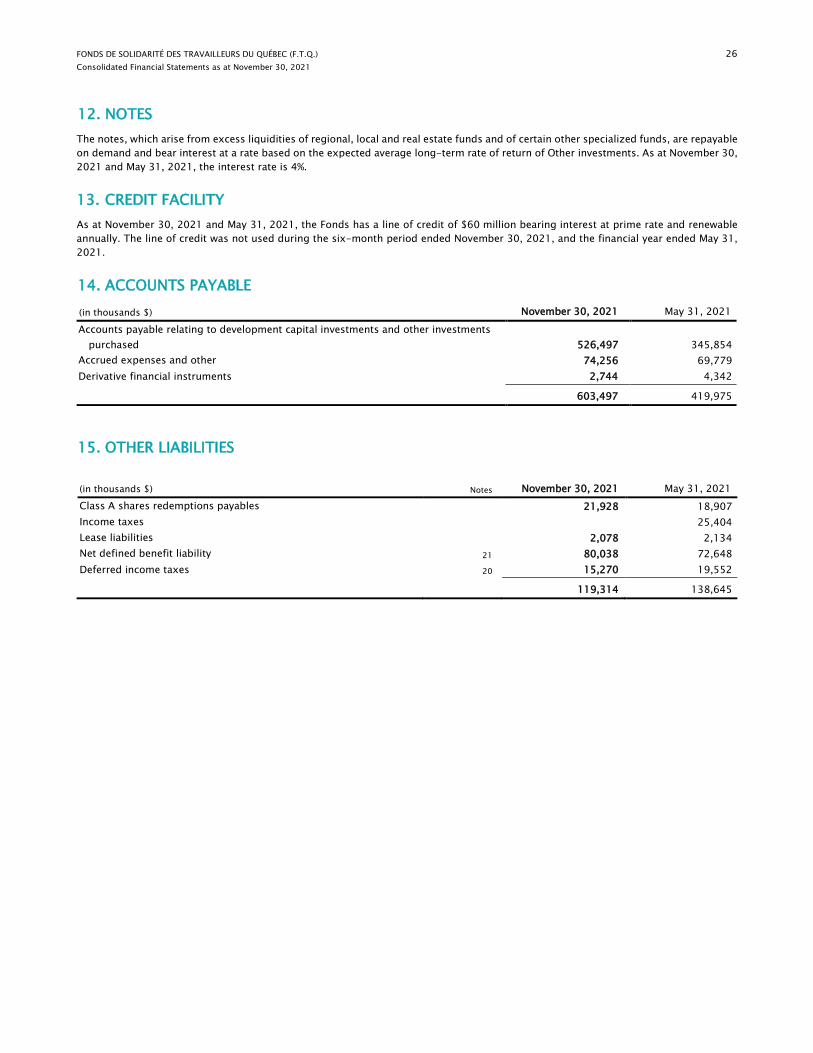
12. NOTES The notes, which arise from excess liquidities of regional, local and real estate funds and of certain other specialized funds, are repayable on demand and bear interest at a rate based on the expected average long-term rate of return of Other investments. As at November 30, 2021 and May 31, 2021, the interest rate is 4%.
13. CREDIT FACILITY As at November 30, 2021 and May 31, 2021, the Fonds has a line of credit of $60 million bearing interest at prime rate and renewable annually. The line of credit was not used during the six-month period ended November 30, 2021, and the financial year ended May 31, 2021.
14. ACCOUNTS PAYABLE (in thousands $) November 30, 2021 May 31, 2021 Accounts payable relating to development capital investments and other investments
purchased 526,497 345,854 Accrued expenses and other 74,256 69,779 Derivative financial instruments 2,744 4,342
603,497 419,975
15. OTHER LIABILITIES
(in thousands $) Notes November 30, 2021 May 31, 2021 Class A shares redemptions payables 21,928 18,907 Income taxes 25,404 Lease liabilities 2,078 2,134 Net defined benefit liability 21 80,038 72,648 Deferred income taxes 20 15,270 19,552
119,314 138,645

FONDS DE SOLIDARITÉ DES TRAVAILLEURS DU QUÉBEC (F.T.Q.) 27 Consolidated Financial Statements as at November 30, 2021
16. NET ASSETS
SHARE CAPITAL
Authorized Class A shares Unlimited number of Class A shares to be issued in Series 1 and 2, without par value, voting, redeemable and inalienable unless approved by a resolution of the Board of Directors. Class A shares, Series 1 and 2, which can only be issued to individuals, can be exchanged for shares of another series and rank equally among themselves. Class A shares, Series 1 are held in a Registered Retirement Savings Plan (RRSP) or a Registered Retirement Income Fund (RRIF), while Class A shares, Series 2 are held outside an RRSP. Class B shares Unlimited number of Class B shares, without par value, non-voting, entitled to a preferential dividend at the rate determined by the Board of Directors. In the event of liquidation, the Class B shares rank prior to Class A and Class C shares. No Class B shares had been issued as at November 30, 2021 and May 31, 2021. Class C shares Unlimited number of Class C shares, Series 1, without par value, non-voting, redeemable and inalienable unless approved by a resolution of the Board of Directors. The Class C shares, Series 1, are only issued to the FlexiFonds funds. In the event of liquidation, they rank equally with Class A shares.
Allocation of comprehensive income to share classes Comprehensive income is allocated to Class A and Class C shares based on the proportionate number of outstanding shares in each class at the end of the six-month period or financial year. Redemption terms The redemption price of Class A and Class C shares is identical, and it is determined every six months based on the value of net assets attributable to shareholders of the Fonds as at May 31 and November 30. Class A shares The Fonds is required to redeem Class A shares in the circumstances set out in its Incorporation Act or to redeem them by mutual agreement in exceptional situations provided under a policy for such purpose adopted by the Fonds’ Board of Directors and approved by the Minister of Finance of Québec. Class C shares Class C shares are redeemable in accordance with the FlexiFonds Funds Rebalancing Policy.
Contributed surplus Contributed surplus which is only attributable to Class A shares, arises from the reduction in issued and paid-up capital resulting from transfers and the excess of the average value of share capital over the redemption price. This excess is reduced when shares are redeemed at a price exceeding the average value of issued share capital, pro rata to the redeemed shares.
Change in redemptions in process The change in redemptions in process is the difference between redemptions in process at the end of the period and redemptions in process at the end of the prior year, the latter having been disbursed during the period and included in share redemptions for the period. Redemptions in process represent share redemption requests received by the Fonds that are being processed as at the reporting date. The amount of redemptions in process is measured using the share value at which the shares will be redeemed and is reported under Other liabilities – Class A shares redemptions payable.
Transfers During the period, the Board of Directors approved an increase in the issued and paid-up capital on Class A shares, Series 1 of $245 million through transfers from retained earnings (November 30,2020: $176 million). As at November 30, 2021, the Fonds had, since its incorporation, transferred the following cumulative amounts: $4,068 million from retained earnings to Class A, Series 1, share capital, $1,500 million from Class A, Series 1 share capital to contributed surplus and $291 million from contributed surplus to retained earnings.
FONDS DE SOLIDARITÉ DES TRAVAILLEURS DU QUÉBEC (F.T.Q.) 28 Consolidated Financial Statements as at November 30, 2021
NET ASSETS (CONTINUED)
SHARE-BASED COMPENSATION
The Fonds offers three compensation plans for which payment is based on Class A shares. Share allocation plan This plan, offered to employees who do not participate in the other plans, provides for the annual issuance of 20 or 50 shares, based on the number of years of service. The shares are vested upon their issuance to the employee by the Fonds. During the six-month period ended November 30, 2021, the Fonds issued 29,020 shares (November 30, 2020: 27,332 shares) under this plan.
Share purchase plan This plan allows certain managers to purchase shares of the Fonds and, for each share purchased, the Fonds issues to such manager one share, up to a maximum annual value of $6 250. The shares are vested upon their issuance to the executive by the Fonds. During the six-month period ended November 30, 2021, the Fonds issued 1,094 shares (November 30, 2020: 1,022 shares) under this plan.
Share award plan This plan, offered to certain managers, provides for the award of rights to acquire shares for each financial year the Fonds meets a minimum comprehensive income threshold of $50 million. The number of shares underlying the granted rights is determined using a maximum percentage of 10% of the target rate for the manager’s salary grade, divided by the share value at the time of the grant. The awarded rights are vested at the end of the three-year period following the award date if the manager remains employed by the Fonds during such vesting period or, if he or she retires. Once vested, these rights are converted into shares at the then prevailing share value. Under this plan, the Fonds awarded 10,337 rights to acquire shares during six-month period ended November 30, 2021 (November 30, 2020: 8,019) and had 24,258 rights to acquire shares in the process of being vested as at November 30, 2021 (November 30, 2020: 18,261). The following table presents the compensation expense recognized for plans for which payment is based on shares:
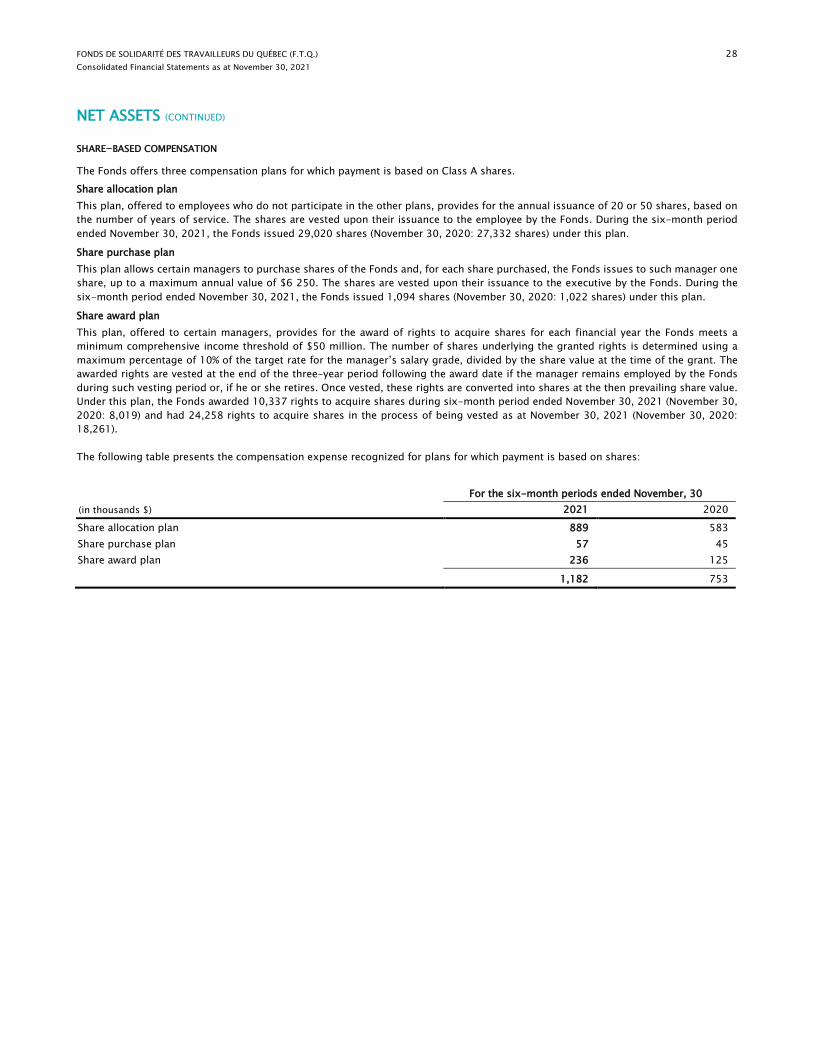
For the six-month periods ended November, 30 (in thousands $) 2021 2020
Share allocation plan 889 583 Share purchase plan 57 45 Share award plan 236 125
1,182 753
FONDS DE SOLIDARITÉ DES TRAVAILLEURS DU QUÉBEC (F.T.Q.) 29 Consolidated Financial Statements as at November 30, 2021
NET ASSETS (CONTINUED)
NET ASSETS
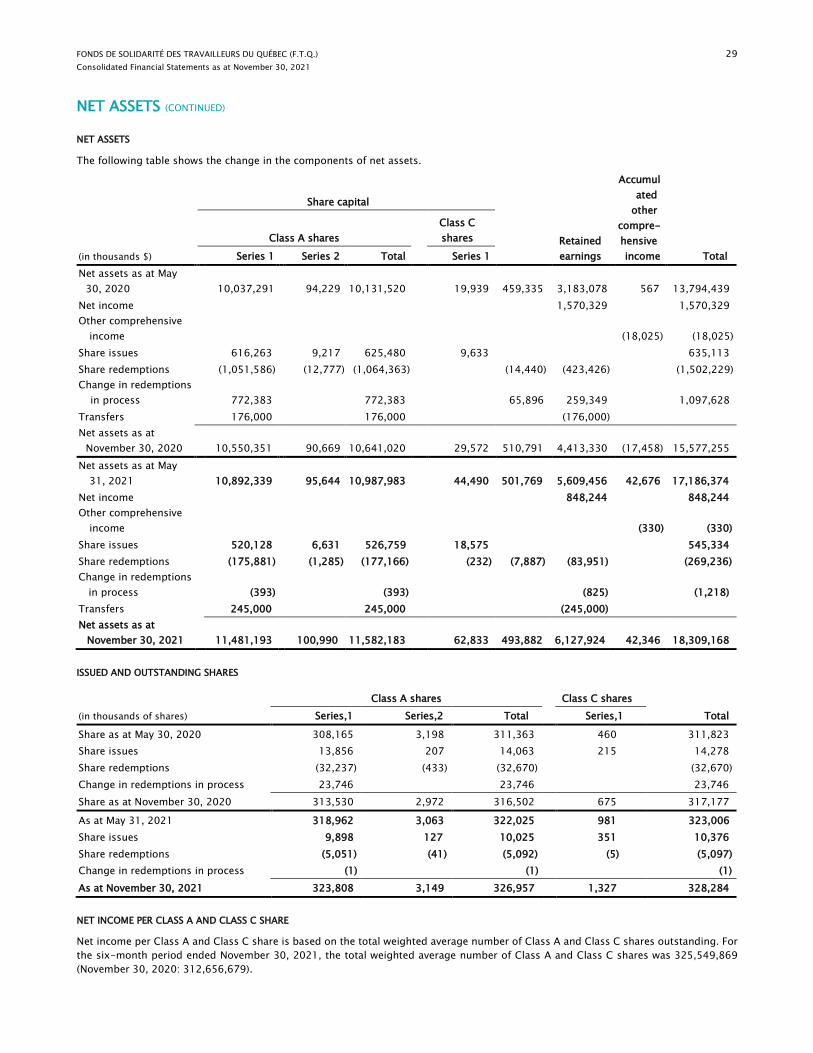
The following table shows the change in the components of net assets.
Share capital
Retained earnings
Accumulated
other compre-hensive income Total (in thousands $)
Class A shares
Class C shares
Series 1 Series 2 Total Series 1 Net assets as at May
30, 2020
10,037,291 94,229 10,131,520
19,939 459,335 3,183,078 567 13,794,439 Net income 1,570,329 1,570,329 Other comprehensive
income
(18,025) (18,025) Share issues 616,263 9,217 625,480 9,633 635,113 Share redemptions (1,051,586) (12,777) (1,064,363) (14,440) (423,426) (1,502,229) Change in redemptions
in process
772,383 772,383
65,896
259,349 1,097,628 Transfers 176,000 176,000 (176,000) Net assets as at
November 30, 2020
10,550,351 90,669 10,641,020
29,572 510,791 4,413,330 (17,458) 15,577,255 Net assets as at May
31, 2021 10,892,339 95,644 10,987,983
44,490 501,769 5,609,456 42,676 17,186,374 Net income 848,244 848,244 Other comprehensive
income
(330) (330) Share issues 520,128 6,631 526,759 18,575 545,334 Share redemptions (175,881) (1,285) (177,166) (232) (7,887) (83,951) (269,236) Change in redemptions
in process (393) (393)
(825) (1,218) Transfers 245,000 245,000 (245,000) Net assets as at
November 30, 2021 11,481,193 100,990 11,582,183
62,833 493,882 6,127,924 42,346 18,309,168
ISSUED AND OUTSTANDING SHARES
Class A shares Class C shares
(in thousands of shares) Series,1 Series,2 Total Series,1 Total
Share as at May 30, 2020 308,165 3,198 311,363 460 311,823 Share issues 13,856 207 14,063 215 14,278 Share redemptions (32,237) (433) (32,670) (32,670) Change in redemptions in process 23,746 23,746 23,746 Share as at November 30, 2020 313,530 2,972 316,502 675 317,177
As at May 31, 2021 318,962 3,063 322,025 981 323,006 Share issues 9,898 127 10,025 351 10,376 Share redemptions (5,051) (41) (5,092) (5) (5,097) Change in redemptions in process (1) (1) (1) As at November 30, 2021 323,808 3,149 326,957 1,327 328,284
NET INCOME PER CLASS A AND CLASS C SHARE
Net income per Class A and Class C share is based on the total weighted average number of Class A and Class C shares outstanding. For the six-month period ended November 30, 2021, the total weighted average number of Class A and Class C shares was 325,549,869 (November 30, 2020: 312,656,679).
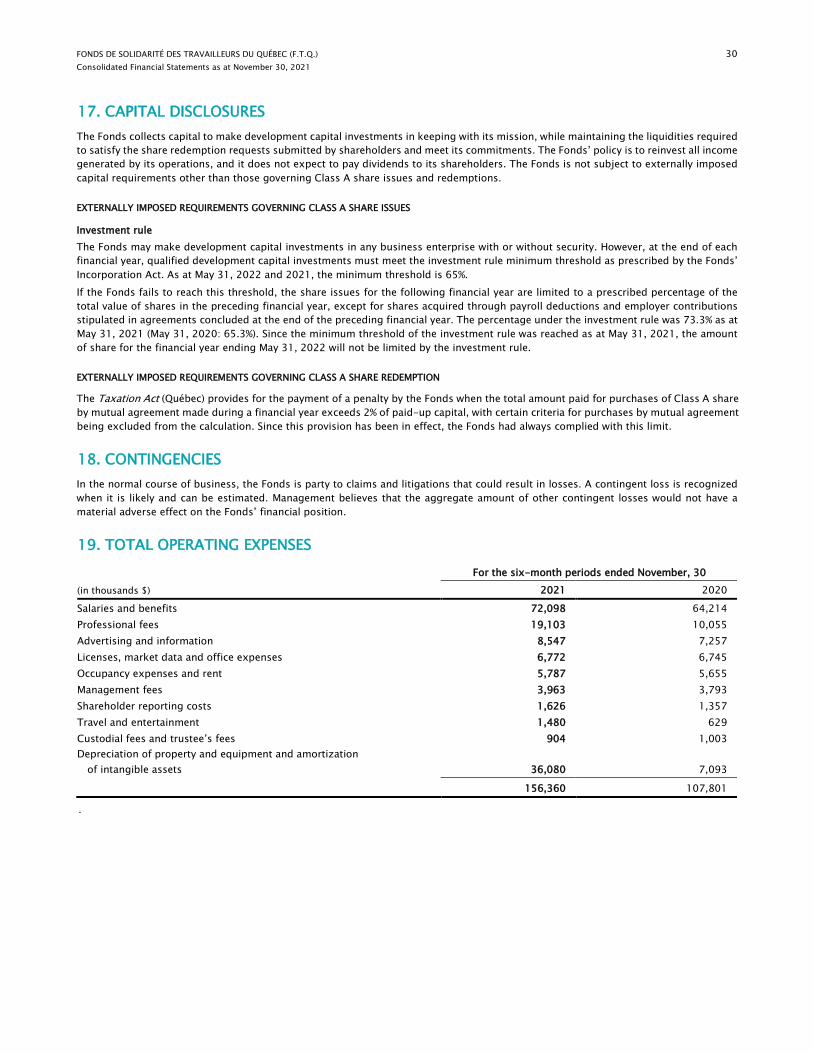
FONDS DE SOLIDARITÉ DES TRAVAILLEURS DU QUÉBEC (F.T.Q.) 30 Consolidated Financial Statements as at November 30, 2021
17. CAPITAL DISCLOSURES The Fonds collects capital to make development capital investments in keeping with its mission, while maintaining the liquidities required to satisfy the share redemption requests submitted by shareholders and meet its commitments. The Fonds’ policy is to reinvest all income generated by its operations, and it does not expect to pay dividends to its shareholders. The Fonds is not subject to externally imposed capital requirements other than those governing Class A share issues and redemptions.
EXTERNALLY IMPOSED REQUIREMENTS GOVERNING CLASS A SHARE ISSUES
Investment rule The Fonds may make development capital investments in any business enterprise with or without security. However, at the end of each financial year, qualified development capital investments must meet the investment rule minimum threshold as prescribed by the Fonds’ Incorporation Act. As at May 31, 2022 and 2021, the minimum threshold is 65%. If the Fonds fails to reach this threshold, the share issues for the following financial year are limited to a prescribed percentage of the total value of shares in the preceding financial year, except for shares acquired through payroll deductions and employer contributions stipulated in agreements concluded at the end of the preceding financial year. The percentage under the investment rule was 73.3% as at May 31, 2021 (May 31, 2020: 65.3%). Since the minimum threshold of the investment rule was reached as at May 31, 2021, the amount of share for the financial year ending May 31, 2022 will not be limited by the investment rule.
EXTERNALLY IMPOSED REQUIREMENTS GOVERNING CLASS A SHARE REDEMPTION
The Taxation Act (Québec) provides for the payment of a penalty by the Fonds when the total amount paid for purchases of Class A share by mutual agreement made during a financial year exceeds 2% of paid-up capital, with certain criteria for purchases by mutual agreement being excluded from the calculation. Since this provision has been in effect, the Fonds had always complied with this limit.
18. CONTINGENCIES In the normal course of business, the Fonds is party to claims and litigations that could result in losses. A contingent loss is recognized when it is likely and can be estimated. Management believes that the aggregate amount of other contingent losses would not have a material adverse effect on the Fonds’ financial position.
19. TOTAL OPERATING EXPENSES For the six-month periods ended November, 30 (in thousands $) 2021 2020
Salaries and benefits 72,098 64,214 Professional fees 19,103 10,055 Advertising and information 8,547 7,257 Licenses, market data and office expenses 6,772 6,745 Occupancy expenses and rent 5,787 5,655 Management fees 3,963 3,793 Shareholder reporting costs 1,626 1,357 Travel and entertainment 1,480 629 Custodial fees and trustee’s fees 904 1,003 Depreciation of property and equipment and amortization
of intangible assets 36,080 7,093 156,360 107,801
.
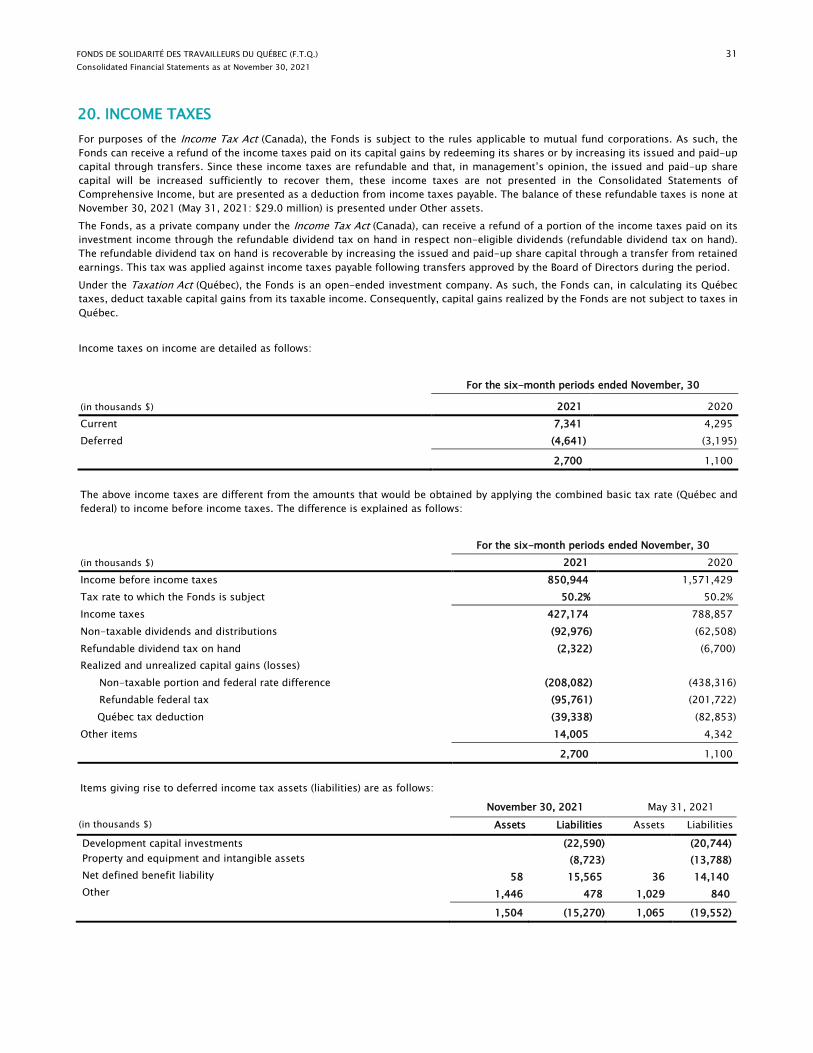
FONDS DE SOLIDARITÉ DES TRAVAILLEURS DU QUÉBEC (F.T.Q.) 31 Consolidated Financial Statements as at November 30, 2021
20. INCOME TAXES For purposes of the Income Tax Act (Canada), the Fonds is subject to the rules applicable to mutual fund corporations. As such, the Fonds can receive a refund of the income taxes paid on its capital gains by redeeming its shares or by increasing its issued and paid-up capital through transfers. Since these income taxes are refundable and that, in management’s opinion, the issued and paid-up share capital will be increased sufficiently to recover them, these income taxes are not presented in the Consolidated Statements of Comprehensive Income, but are presented as a deduction from income taxes payable. The balance of these refundable taxes is none at November 30, 2021 (May 31, 2021: $29.0 million) is presented under Other assets. The Fonds, as a private company under the Income Tax Act (Canada), can receive a refund of a portion of the income taxes paid on its investment income through the refundable dividend tax on hand in respect non-eligible dividends (refundable dividend tax on hand). The refundable dividend tax on hand is recoverable by increasing the issued and paid-up share capital through a transfer from retained earnings. This tax was applied against income taxes payable following transfers approved by the Board of Directors during the period. Under the Taxation Act (Québec), the Fonds is an open-ended investment company. As such, the Fonds can, in calculating its Québec taxes, deduct taxable capital gains from its taxable income. Consequently, capital gains realized by the Fonds are not subject to taxes in Québec. Income taxes on income are detailed as follows:
For the six-month periods ended November, 30
(in thousands $) 2021 2020 Current 7,341 4,295 Deferred (4,641) (3,195) 2,700 1,100
The above income taxes are different from the amounts that would be obtained by applying the combined basic tax rate (Québec and federal) to income before income taxes. The difference is explained as follows:
For the six-month periods ended November, 30 (in thousands $) 2021 2020 Income before income taxes 850,944 1,571,429 Tax rate to which the Fonds is subject 50.2% 50.2% Income taxes 427,174 788,857 Non-taxable dividends and distributions (92,976) (62,508) Refundable dividend tax on hand (2,322) (6,700) Realized and unrealized capital gains (losses) Non-taxable portion and federal rate difference (208,082) (438,316) Refundable federal tax (95,761) (201,722) Québec tax deduction (39,338) (82,853) Other items 14,005 4,342
2,700 1,100 Items giving rise to deferred income tax assets (liabilities) are as follows:
November 30, 2021 May 31, 2021 (in thousands $) Assets Liabilities Assets Liabilities
Development capital investments (22,590) (20,744) Property and equipment and intangible assets (8,723) (13,788) Net defined benefit liability 58 15,565 36 14,140 Other 1,446 478 1,029 840
1,504 (15,270) 1,065 (19,552)
FONDS DE SOLIDARITÉ DES TRAVAILLEURS DU QUÉBEC (F.T.Q.) 32 Consolidated Financial Statements as at November 30, 2021
21. POST-EMPLOYMENT BENEFITS The Fonds offers defined benefit pension plans and a post-employment insurance plan to eligible employees. The defined benefit obligation of these plans, as measured by independent actuaries, and the fair value of plan assets are determined as November 30, 2021.
DEFINED BENEFIT PENSION PLANS
The pension plans provide retirement benefits that are based on the number of years of service and the average annual salary, which is the highest annualized average salary for 36 consecutive months of service. The pension plans are funded by contributions from both the Fonds and employees that are based on the plans’ financial position and funding policy. The Fonds’ contributions are determined based on a percentage of pensionable payroll for plan participants. The Fonds is responsible for these funded and unfunded plans. To manage these plans, the Fonds set up retirement committees, and these committees retained the professional services of independent investment managers, actuaries and trustees to get assistance in fulfilling their duties.
POST-EMPLOYMENT-INSURANCE PLAN
The post-employment insurance plan provides prescription drug insurance and other insurance products up to a maximum annual premium amount. This plan is unfunded.
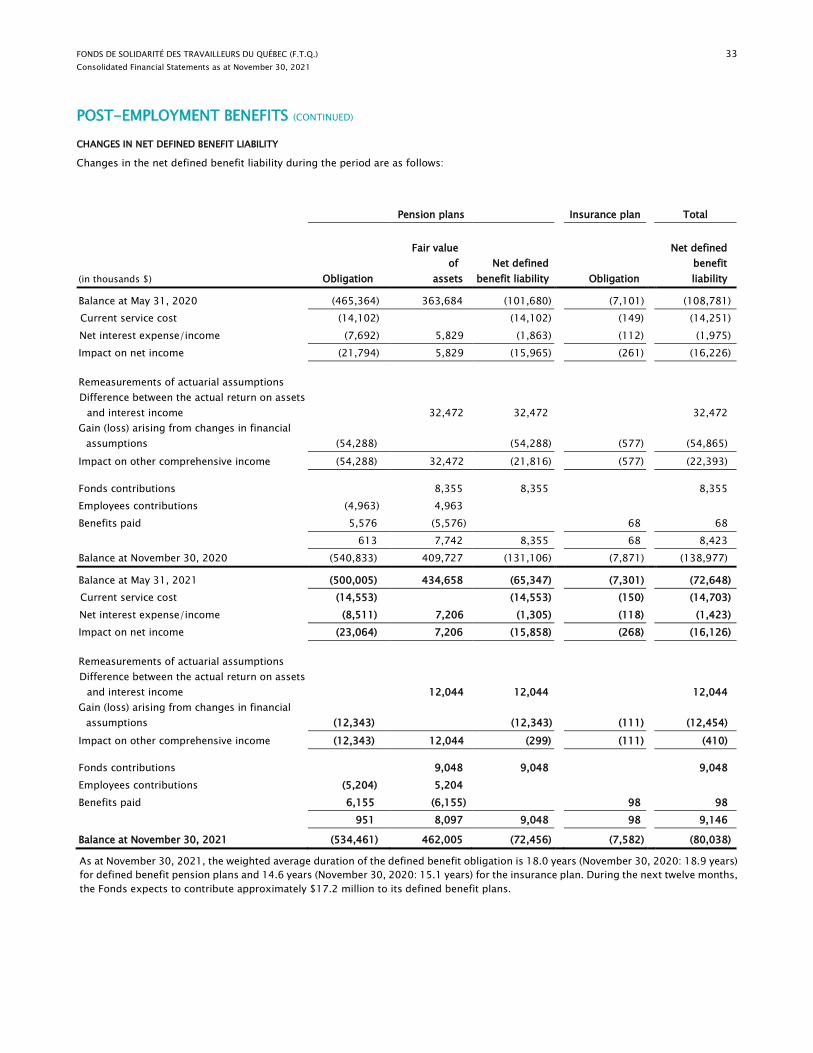
FONDS DE SOLIDARITÉ DES TRAVAILLEURS DU QUÉBEC (F.T.Q.) 33 Consolidated Financial Statements as at November 30, 2021
POST-EMPLOYMENT BENEFITS (CONTINUED)
CHANGES IN NET DEFINED BENEFIT LIABILITY Changes in the net defined benefit liability during the period are as follows:
Pension plans Insurance plan Total
(in thousands $) Obligation
Fair value of
assets Net defined
benefit liability Obligation
Net defined benefit liability
Balance at May 31, 2020 (465,364) 363,684 (101,680) (7,101) (108,781) Current service cost (14,102) (14,102) (149) (14,251) Net interest expense/income (7,692) 5,829 (1,863) (112) (1,975) Impact on net income (21,794) 5,829 (15,965) (261) (16,226)
Remeasurements of actuarial assumptions
Difference between the actual return on assets
and interest income 32,472 32,472
32,472 Gain (loss) arising from changes in financial
assumptions (54,288) (54,288)
(577) (54,865) Impact on other comprehensive income (54,288) 32,472 (21,816) (577) (22,393)
Fonds contributions 8,355 8,355
8,355 Employees contributions (4,963) 4,963 Benefits paid 5,576 (5,576) 68 68 613 7,742 8,355 68 8,423 Balance at November 30, 2020 (540,833) 409,727 (131,106) (7,871) (138,977)
Balance at May 31, 2021 (500,005) 434,658 (65,347) (7,301) (72,648) Current service cost (14,553) (14,553) (150) (14,703) Net interest expense/income (8,511) 7,206 (1,305) (118) (1,423) Impact on net income (23,064) 7,206 (15,858) (268) (16,126)
Remeasurements of actuarial assumptions
Difference between the actual return on assets
and interest income 12,044 12,044
12,044 Gain (loss) arising from changes in financial
assumptions (12,343) (12,343)
(111) (12,454) Impact on other comprehensive income (12,343) 12,044 (299) (111) (410)
Fonds contributions 9,048 9,048
9,048 Employees contributions (5,204) 5,204 Benefits paid 6,155 (6,155) 98 98 951 8,097 9,048 98 9,146
Balance at November 30, 2021 (534,461) 462,005 (72,456) (7,582) (80,038)
As at November 30, 2021, the weighted average duration of the defined benefit obligation is 18.0 years (November 30, 2020: 18.9 years) for defined benefit pension plans and 14.6 years (November 30, 2020: 15.1 years) for the insurance plan. During the next twelve months, the Fonds expects to contribute approximately $17.2 million to its defined benefit plans.
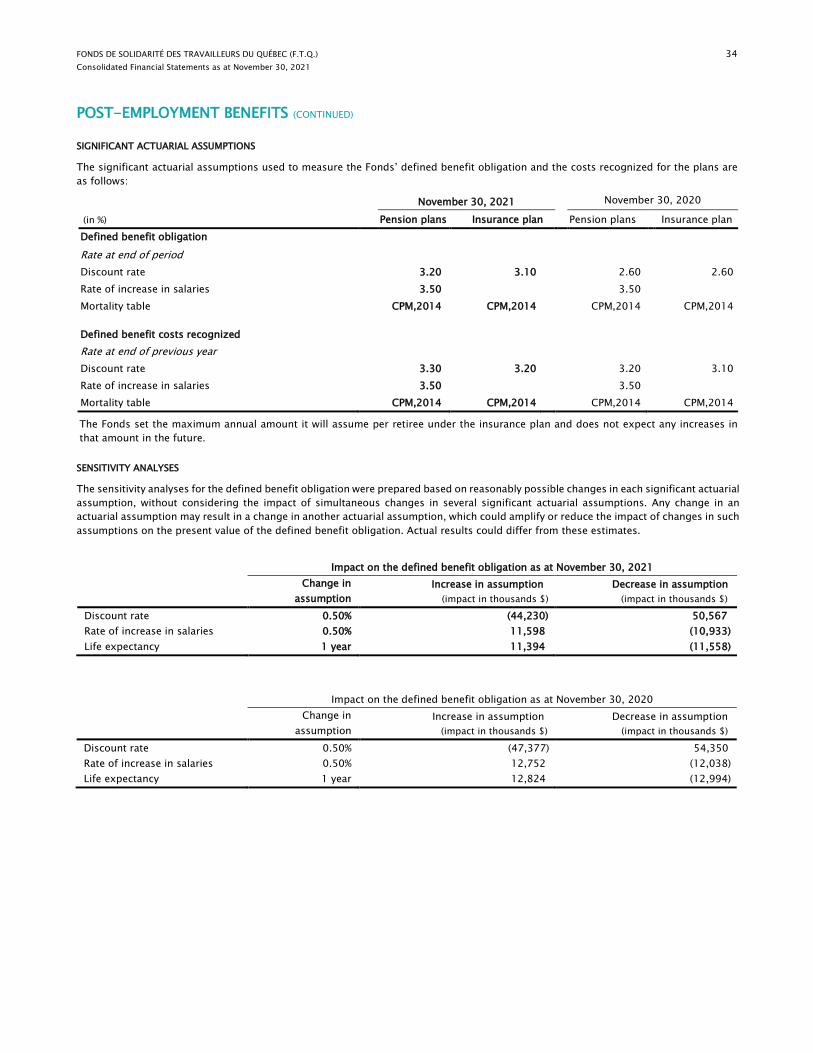
FONDS DE SOLIDARITÉ DES TRAVAILLEURS DU QUÉBEC (F.T.Q.) 34 Consolidated Financial Statements as at November 30, 2021
POST-EMPLOYMENT BENEFITS (CONTINUED)
SIGNIFICANT ACTUARIAL ASSUMPTIONS
The significant actuarial assumptions used to measure the Fonds’ defined benefit obligation and the costs recognized for the plans are as follows:
November 30, 2021 November 30, 2020
(in %) Pension plans Insurance plan Pension plans Insurance plan Defined benefit obligation
Rate at end of period Discount rate 3.20 3.10 2.60 2.60 Rate of increase in salaries 3.50 3.50 Mortality table CPM,2014 CPM,2014 CPM,2014 CPM,2014
Defined benefit costs recognized
Rate at end of previous year Discount rate 3.30 3.20 3.20 3.10 Rate of increase in salaries 3.50 3.50 Mortality table CPM,2014 CPM,2014 CPM,2014 CPM,2014
The Fonds set the maximum annual amount it will assume per retiree under the insurance plan and does not expect any increases in that amount in the future.
SENSITIVITY ANALYSES
The sensitivity analyses for the defined benefit obligation were prepared based on reasonably possible changes in each significant actuarial assumption, without considering the impact of simultaneous changes in several significant actuarial assumptions. Any change in an actuarial assumption may result in a change in another actuarial assumption, which could amplify or reduce the impact of changes in such assumptions on the present value of the defined benefit obligation. Actual results could differ from these estimates.
Impact on the defined benefit obligation as at November 30, 2021 Change in
assumption Increase in assumption
(impact in thousands $) Decrease in assumption
(impact in thousands $)
Discount rate 0.50% (44,230) 50,567 Rate of increase in salaries 0.50% 11,598 (10,933) Life expectancy 1 year 11,394 (11,558)
Impact on the defined benefit obligation as at November 30, 2020 Change in
assumption Increase in assumption
(impact in thousands $) Decrease in assumption
(impact in thousands $)
Discount rate 0.50% (47,377) 54,350 Rate of increase in salaries 0.50% 12,752 (12,038) Life expectancy 1 year 12,824 (12,994)

FONDS DE SOLIDARITÉ DES TRAVAILLEURS DU QUÉBEC (F.T.Q.) 35 Consolidated Financial Statements as at November 30, 2021
POST-EMPLOYMENT BENEFITS (CONTINUED)
COMPOSITION OF PENSION PLAN ASSETS
Funded plan assets are held in trust and their breakdown is as follows:
(in %) November 30, 2021 November 30, 2020
Equity mutual funds 64.7 62.3 Bond mutual funds 32.8 37.4 Other fixed-income securities mutual funds 2.2 Cash and other 0.3 0.3
100.0 100.0
EXPOSURE TO ACTUARIAL RISKS
As a result of its defined benefit plans, the Fonds is exposed to certain risks, the most significant of which are described below.
Interest rate risk A decrease in fixed-rate bond interest rates, which would decrease the discount rate used, would increase the present value of the defined benefit obligation. This increase would however be partially offset by an increase in the value of plan assets.
Longevity and rate of increase in salaries risk As the majority of the plan obligations relate to the payment of benefits over the retiree’s lifetime, an increase in life expectancy would increase the plan liability. Likewise, an increase in the rate of increase in the participants’ salaries would increase the plan liability.
REMEASUREMENT OF THE NET DEFINED BENEFIT LIABILITY
For the six-months periods ended November, 30 (in thousands $) 2021 2020
Actuarial gain (loss) arising from post-employment benefits (410) (22,393) Deferred income taxes 80 4,368
(330) (18,025)

FONDS DE SOLIDARITÉ DES TRAVAILLEURS DU QUÉBEC (F.T.Q.) 36 Consolidated Financial Statements as at November 30, 2021
22. RELATED PARTY DISCLOSURES
TRANSACTIONS WITH KEY MANAGEMENT PERSONNEL
The Fonds’ key management personnel comprise the members of the Board of Directors and the members of the Management Committee. The following table presents the Fonds’ key management personnel compensation:
For the six-months periods ended November, 30 (in thousands $) 2021 2020
Salaries and short-term benefits 1,613 1,614 Post-employment benefits 823 975 Share-based compensation 119 95 Directors’ remuneration and fees1 393 408
2,948 3,092
1. Excludes the directors’ remuneration paid directly to the Fédération des travailleurs et travailleuses du Québec (FTQ) amounting to $0.3 million (November 30, 2020: $0.3 million) which is included in the amount presented in the “Transactions with other related parties” of this note.
INVESTMENTS IN SUBSIDIARIES AND ASSOCIATES INCLUDED IN DEVELOPMENT CAPITAL INVESTMENTS Further to its quantitative and qualitative analyses, management determined that the Fonds controls (subsidiaries) or exercises significant influence over (associates) over operating companies and investment entities included in development capital investment:
November 30, 2021 May 31, 2021
Number Fair value
(in thousands $) Number Fair value
(in thousands $)
Subsidiaries Operating companies 16 1,799,869 15 1,715,943 Investment entities 16 2,200,015 15 1,930,010
Associates
Operating companies 71 1,344,166 73 1,006,667 Investment entities1 13 300,481 13 298,251
As at November 30, 2021, the Fonds as reassessed the nature of the influence over the investment entities to determine those that meet the definition of an associate. Comparative figures as at May 31, 2021 were adjusted in accordance with this reassessment.
The principal place of business of the majority of subsidiaries and associates is in Québec. An entity is considered as a subsidiary when it is controlled by the Fonds. The Fonds controls an entity when all the following conditions are met: 1) it has power over the entity; 2) it has exposure or rights to variable returns from its involvement with the entity; and 3) it has the ability to affect such returns as a result of its power over the entity. The proportion of ownership interests held by the Fonds in subsidiaries is generally greater than 50%. An associate is an entity over which the Fonds has significant influence with respect to financial and operating policy decisions, without however controlling that entity. The proportion of ownership interests held by the Fonds in associates is generally between 20% and 50%. Interests in operating companies are in the form of common shares or units, while interests in investment entities are in the form of units. In certain circumstances, some conditions could restrict the ability of a subsidiary to transfer amounts to the Fonds: for instance, compliance with certain ratios or approval of a payment by another financial institution or other shareholders. However, the Fonds considers that there are no significant restrictions to these transfers, except for one subsidiary operating in the insurance industry. In that case, laws and regulations do not allow the Fonds to receive dividends, redeem its shares or obtain repayment of its loans without approval by the Autorité des marchés financiers. When the Fonds controls an investment entity, it takes into account in its scope of subsidiaries those held by that investment entity. Accordingly, as at November 30, 2021, the Fonds indirectly had 98 additional subsidiaries under this criterion (May 31, 2021: 99 subsidiaries).
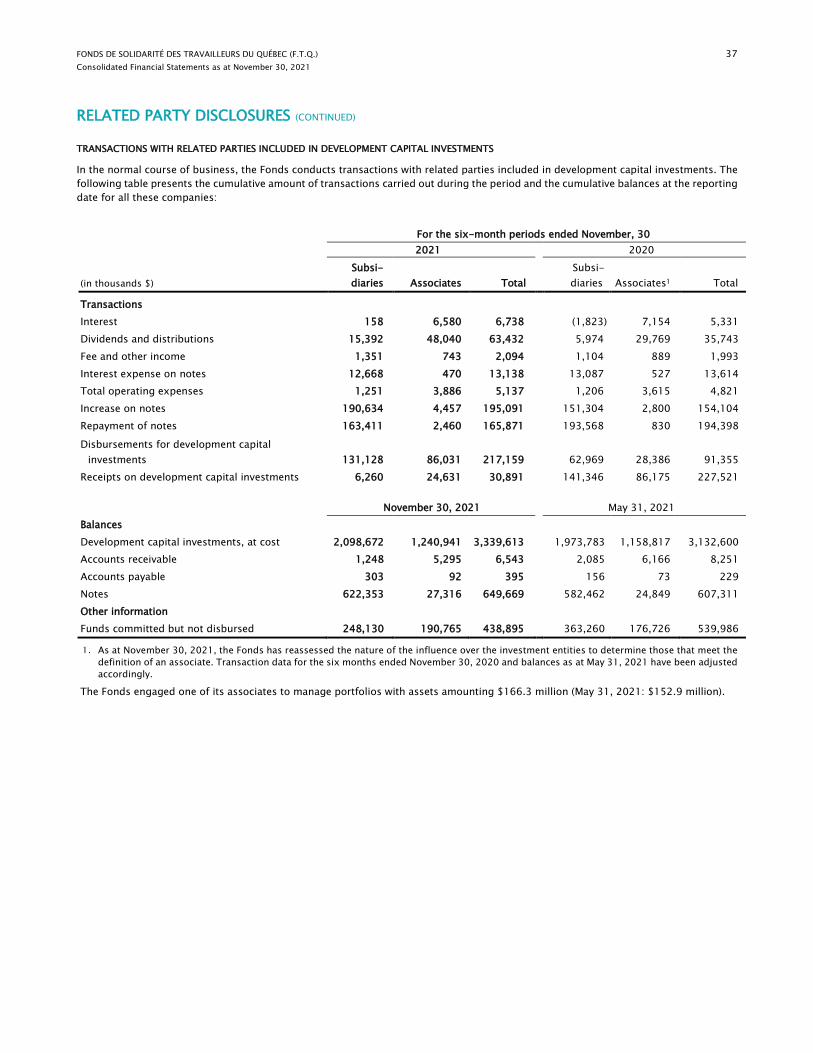
FONDS DE SOLIDARITÉ DES TRAVAILLEURS DU QUÉBEC (F.T.Q.) 37 Consolidated Financial Statements as at November 30, 2021
RELATED PARTY DISCLOSURES (CONTINUED)
TRANSACTIONS WITH RELATED PARTIES INCLUDED IN DEVELOPMENT CAPITAL INVESTMENTS
In the normal course of business, the Fonds conducts transactions with related parties included in development capital investments. The following table presents the cumulative amount of transactions carried out during the period and the cumulative balances at the reporting date for all these companies:
For the six-month periods ended November, 30 2021 2020
(in thousands $) Subsi- diaries Associates Total
Subsi- diaries Associates1 Total
Transactions Interest 158 6,580 6,738 (1,823) 7,154 5,331 Dividends and distributions 15,392 48,040 63,432 5,974 29,769 35,743 Fee and other income 1,351 743 2,094 1,104 889 1,993 Interest expense on notes 12,668 470 13,138 13,087 527 13,614 Total operating expenses 1,251 3,886 5,137 1,206 3,615 4,821 Increase on notes 190,634 4,457 195,091 151,304 2,800 154,104 Repayment of notes 163,411 2,460 165,871 193,568 830 194,398
Disbursements for development capital investments 131,128 86,031 217,159
62,969 28,386 91,355 Receipts on development capital investments 6,260 24,631 30,891 141,346 86,175 227,521 November 30, 2021 May 31, 2021 Balances Development capital investments, at cost 2,098,672 1,240,941 3,339,613 1,973,783 1,158,817 3,132,600 Accounts receivable 1,248 5,295 6,543 2,085 6,166 8,251 Accounts payable 303 92 395 156 73 229 Notes 622,353 27,316 649,669 582,462 24,849 607,311 Other information Funds committed but not disbursed 248,130 190,765 438,895 363,260 176,726 539,986
As at November 30, 2021, the Fonds has reassessed the nature of the influence over the investment entities to determine those that meet the definition of an associate. Transaction data for the six months ended November 30, 2020 and balances as at May 31, 2021 have been adjusted accordingly.
The Fonds engaged one of its associates to manage portfolios with assets amounting $166.3 million (May 31, 2021: $152.9 million).
FONDS DE SOLIDARITÉ DES TRAVAILLEURS DU QUÉBEC (F.T.Q.) 38 Consolidated Financial Statements as at November 30, 2021
RELATED PARTY DISCLOSURES (CONTINUED)
TRANSACTIONS WITH OTHER RELATED PARTIES
The Fonds, of which directors are elected by the Fédération des travailleurs et travailleuses du Québec (FTQ), agreed to pay $1.5 million to the FTQ for the six-month period ended November 30, 2021 (November 30, 2020: $1.6 million) under an agreement that calls for compensation to be paid for services rendered in respect of economic training, savings market development, attendance at the Fonds’ governing bodies and support and guidance of certain activities. These transactions are measured at the exchange amount, which is the amount of consideration established and agreed to by the related parties. The Fonds granted non-interest bearing loans of $20 million with a fair value of $15.0 million (May 31, 2021: $13.9 million) to the Fonds étudiant solidarité travail du Québec (FESTQ), which are considered related to the Fonds because the Fonds appoints some of their directors together with the Government of Québec. The Fonds granted a non-interest bearing loan of $5 million with a fair value of $3.4 million (May 31, 2021: $3.4 million) to Fiducie Montréal inc. which is considered related to the Fonds because the Fonds appoints some of its directors. These loans are presented under Accounts receivable – Other in the Consolidated Statement of Financial Position. The Fonds recognized fee income of $1.4 million in the six-month period ended November 30, 2021 (November 30, 2020: $0.5 million) for management and administration services rendered to the FlexiFonds fund, for which it acts as mutual fund manager. The Fonds holds 4.1 million units in the FlexiFonds funds, with a cost of $41.2 million and presented under Accounts receivable – Other, which were issued in connection with contributions made to launch the funds and distributions received. The FlexiFonds funds are the only entities that can hold the Class C shares issued by the Fonds and the number, balance and issuance and redemption transactions for the period are presented in the Consolidated Statements of Changes in Net Assets. The transactions on units of the FlexiFonds funds and Class C shares of the Fonds are, as applicable, carried out at the amount of net assets per unit or net assets per share prevailing at the time of the transactions.
23. ADDITIONAL INFORMATION The audited Statement of Development Capital Investments, at Cost, the unaudited Relevé des autres investissements and the unaudited Index of the Share of the Fonds in Investments Made by the Specialized Funds, at Cost are available at the Fonds’ head office, on its website at fondsftq.com or at sedar.com.

FONDS DE SOLIDARITÉ DES TRAVAILLEURS DU QUÉBEC (F.T.Q.) 1
Interim Management Discussion and Analysis for the six-month period ended November 30, 2021
INTERIM MANAGEMENT DISCUSSION AND ANALYSIS
FOR THE SIX-MONTH PERIOD ENDED NOVEMBER 30, 2021
Investing local
savings into
the local
economy
INVESTING IN A BETTER SOCIETY

FONDS DE SOLIDARITÉ DES TRAVAILLEURS DU QUÉBEC (F.T.Q.) 2
Interim Management Discussion and Analysis for the six-month period ended November 30, 2021
TABLE OF CONTENTS 3 Presentation of the Management Discussion and Analysis
4 General description of the Fonds
5 Review of the six-month period ended November 30, 2021
6 Financial highlights
8 Economic conditions and outlook
10 Recent developments
11 Management discussion of financial performance
15 Mission of the Fonds, objectives and strategies
19 Past performance
20 Summary of investment portfolio
21 Fonds outlook
21 Risk management
29 Governance
31 Management’s report on internal controls
INVESTING IN A BETTER SOCIETY
FONDS DE SOLIDARITÉ DES TRAVAILLEURS DU QUÉBEC (F.T.Q.) 3
Interim Management Discussion and Analysis for the six-month period ended November 30, 2021
INTERIM MANAGEMENT DISCUSSION AND ANALYSIS
FOR THE SIX-MONTH PERIOD ENDED
NOVEMBER 30, 2021
This interim Management Discussion and Analysis (“MD&A”) is intended to help the readers assess, through the eyes of
management, the Fonds de solidarité FTQ’s (the “Fonds”) consolidated results and financial condition as well as the material
changes therein during the six-month period ended November 30, 2021. The interim MD&A complements and supplements the
consolidated financial statements of the Fonds (the “financial statements”) and contains financial highlights, but does not contain
the financial statements. For ease of understanding, this MD&A should be read in conjunction with the financial statements and
the notes thereto.
This MD&A contains forward-looking statements that should be interpreted with caution. These statements necessarily involve
assumptions, uncertainties and risks; it is therefore possible that, due to a number of factors, they will not materialize. Legislative
or regulatory changes, economic and business conditions, the level of competition and the health situation are examples of major
factors that may influence, sometimes significantly, the accuracy of the forward-looking statements in this MD&A. This MD&A is
dated December 23, 2021.
The Fonds is subject to the Regulation Respecting Development Capital Investment Fund Continuous Disclosure (the “Regulation”)
and, as such, applies the requirements of this Regulation, notably to its financial statements and its MD&A.
You can get a copy of the financial statements as at November 30, 2021 and a copy of the annual documents, at no cost, as
follows:
• by visiting our website (fondsftq.com) or the SEDAR website (sedar.com);
• at your request:
o by calling Saving Services at 514 383-3663 or toll free at 1 800 567-3663;
o by writing us at P.O. Box 1000, Chabanel Station, Montréal, Québec H2N 0B5.
FONDS DE SOLIDARITÉ DES TRAVAILLEURS DU QUÉBEC (F.T.Q.) 4
Interim Management Discussion and Analysis for the six-month period ended November 30, 2021
GENERAL DESCRIPTION OF THE FONDS
The Fonds is a development capital investment fund with union roots created in 1983 on the initiative of the Fédération des
travailleurs et travailleuses du Québec by the Act to Establish the Fonds de solidarité des travailleurs du Québec (F.T.Q.). Its core
activities are to collect the savings of Québec residents and use them mainly to make development capital investments, as specified
by the Regulation, in the form of unsecured risk capital, in accordance with its mission and objectives. These investments are
internally classified by the Fonds in three categories : development capital, venture capital and strategic capital. The remaining
savings collected are invested in cash and money market, bonds, and shares portfolios (together, the “other investments”).
Furthermore, since May 2019, the Fonds has acted as investment fund manager for the FlexiFonds funds, a family of three mutual
funds distributed by the mutual fund dealer FlexiFonds de solidarité FTQ inc. As part of the FlexiFonds funds’ investment mandate,
the Fonds has issued to them since June 2019 Class C shares, whose value is equal to the value of Class A shares. In this MD&A,
unless otherwise indicated, the value of the Fonds’ shares and the return to the shareholder refer to the value and the return of
Class A shares and Class C shares.
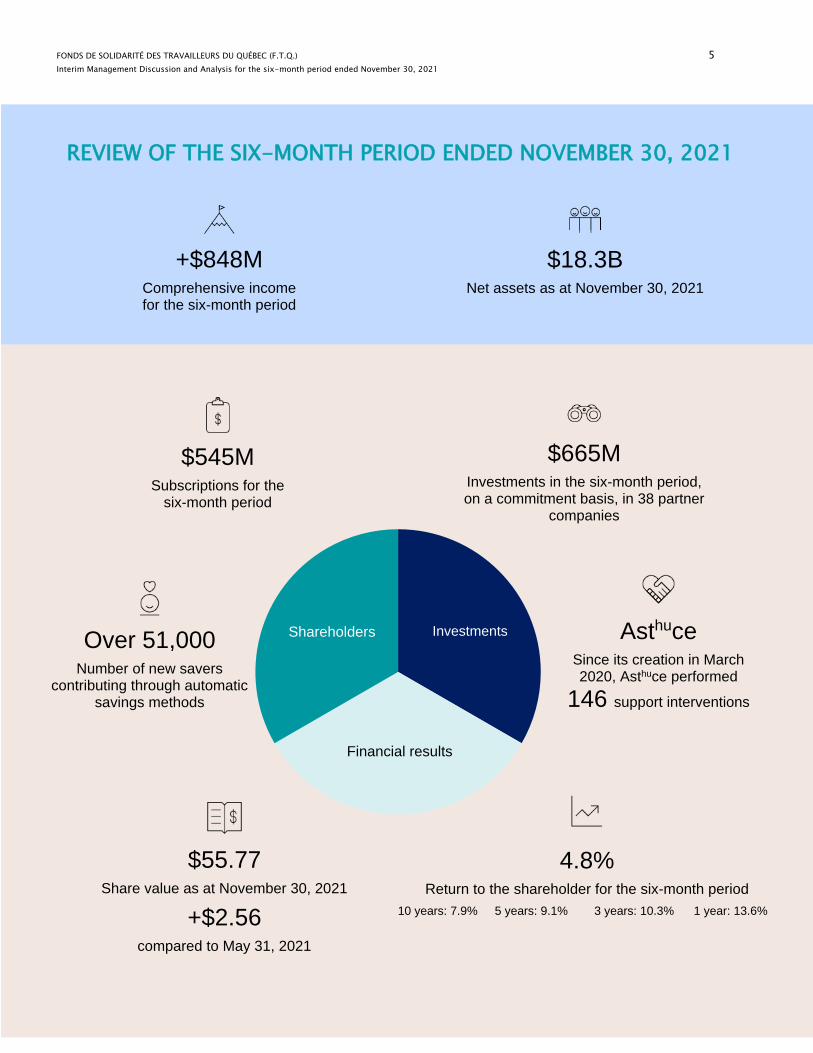
FONDS DE SOLIDARITÉ DES TRAVAILLEURS DU QUÉBEC (F.T.Q.) 5
Interim Management Discussion and Analysis for the six-month period ended November 30, 2021
Investments
Financial results
Shareholders
+$848M Comprehensive income for the six-month period
$55.77 Share value as at November 30, 2021
+$2.56
compared to May 31, 2021
$665M Investments in the six-month period, on a commitment basis, in 38 partner
companies
Over 51,000
Number of new savers contributing through automatic
savings methods
Asthuce Since its creation in March
2020, Asthuce performed
146 support interventions
$18.3B Net assets as at November 30, 2021
$545M Subscriptions for the
six-month period
REVIEW OF THE SIX-MONTH PERIOD ENDED NOVEMBER 30, 2021
4.8%
Return to the shareholder for the six-month period
10 years: 7.9% 5 years: 9.1% 3 years: 10.3% 1 year: 13.6%
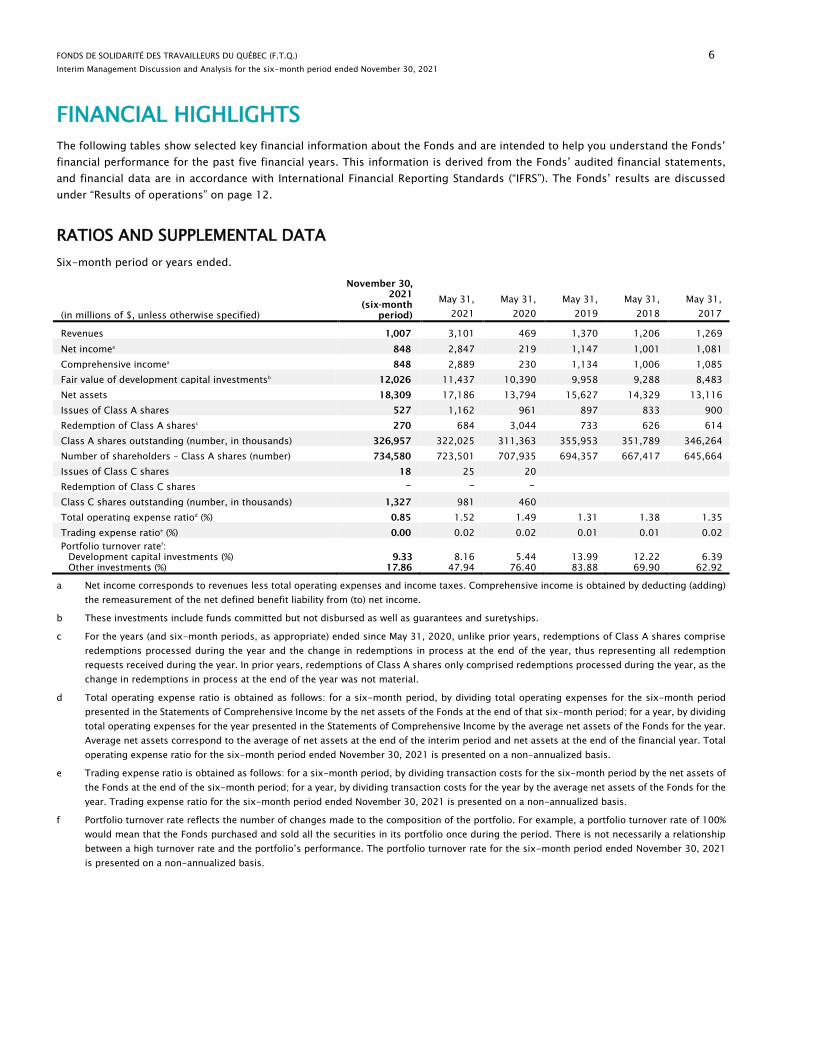
FONDS DE SOLIDARITÉ DES TRAVAILLEURS DU QUÉBEC (F.T.Q.) 6
Interim Management Discussion and Analysis for the six-month period ended November 30, 2021
FINANCIAL HIGHLIGHTS
The following tables show selected key financial information about the Fonds and are intended to help you understand the Fonds’
financial performance for the past five financial years. This information is derived from the Fonds’ audited financial statements,
and financial data are in accordance with International Financial Reporting Standards (“IFRS”). The Fonds’ results are discussed
under “Results of operations” on page 12.
RATIOS AND SUPPLEMENTAL DATA
Six-month period or years ended.
(in millions of $, unless otherwise specified)
November 30,
2021
(six-month
period)
May 31,
2021
May 31,
2020
May 31,
2019
May 31,
2018
May 31,
2017
Revenues 1,007 3,101 469 1,370 1,206 1,269
Net incomea
848 2,847 219 1,147 1,001 1,081
Comprehensive incomea
848 2,889 230 1,134 1,006 1,085
Fair value of development capital investmentsb
12,026 11,437 10,390 9,958 9,288 8,483
Net assets 18,309 17,186 13,794 15,627 14,329 13,116
Issues of Class A shares 527 1,162 961 897 833 900
Redemption of Class A sharesc
270 684 3,044 733 626 614
Class A shares outstanding (number, in thousands) 326,957 322,025 311,363 355,953 351,789 346,264
Number of shareholders – Class A shares (number) 734,580 723,501 707,935 694,357 667,417 645,664
Issues of Class C shares 18 25 20
Redemption of Class C shares - - -
Class C shares outstanding (number, in thousands) 1,327 981 460
Total operating expense ratiod
(%) 0.85 1.52 1.49 1.31 1.38 1.35
Trading expense ratioe
(%) 0.00 0.02 0.02 0.01 0.01 0.02
Portfolio turnover ratef
:
Development capital investments (%)
Other investments (%)
9.33
17.86
8.16
47.94
5.44
76.40
13.99
83.88
12.22
69.90
6.39
62.92
a Net income corresponds to revenues less total operating expenses and income taxes. Comprehensive income is obtained by deducting (adding)
the remeasurement of the net defined benefit liability from (to) net income.
b These investments include funds committed but not disbursed as well as guarantees and suretyships.
c For the years (and six-month periods, as appropriate) ended since May 31, 2020, unlike prior years, redemptions of Class A shares comprise
redemptions processed during the year and the change in redemptions in process at the end of the year, thus representing all redemption
requests received during the year. In prior years, redemptions of Class A shares only comprised redemptions processed during the year, as the
change in redemptions in process at the end of the year was not material.
d Total operating expense ratio is obtained as follows: for a six-month period, by dividing total operating expenses for the six-month period
presented in the Statements of Comprehensive Income by the net assets of the Fonds at the end of that six-month period; for a year, by dividing
total operating expenses for the year presented in the Statements of Comprehensive Income by the average net assets of the Fonds for the year.
Average net assets correspond to the average of net assets at the end of the interim period and net assets at the end of the financial year. Total
operating expense ratio for the six-month period ended November 30, 2021 is presented on a non-annualized basis.
e Trading expense ratio is obtained as follows: for a six-month period, by dividing transaction costs for the six-month period by the net assets of
the Fonds at the end of the six-month period; for a year, by dividing transaction costs for the year by the average net assets of the Fonds for the
year. Trading expense ratio for the six-month period ended November 30, 2021 is presented on a non-annualized basis.
f Portfolio turnover rate reflects the number of changes made to the composition of the portfolio. For example, a portfolio turnover rate of 100%
would mean that the Fonds purchased and sold all the securities in its portfolio once during the period. There is not necessarily a relationship
between a high turnover rate and the portfolio’s performance. The portfolio turnover rate for the six-month period ended November 30, 2021
is presented on a non-annualized basis.
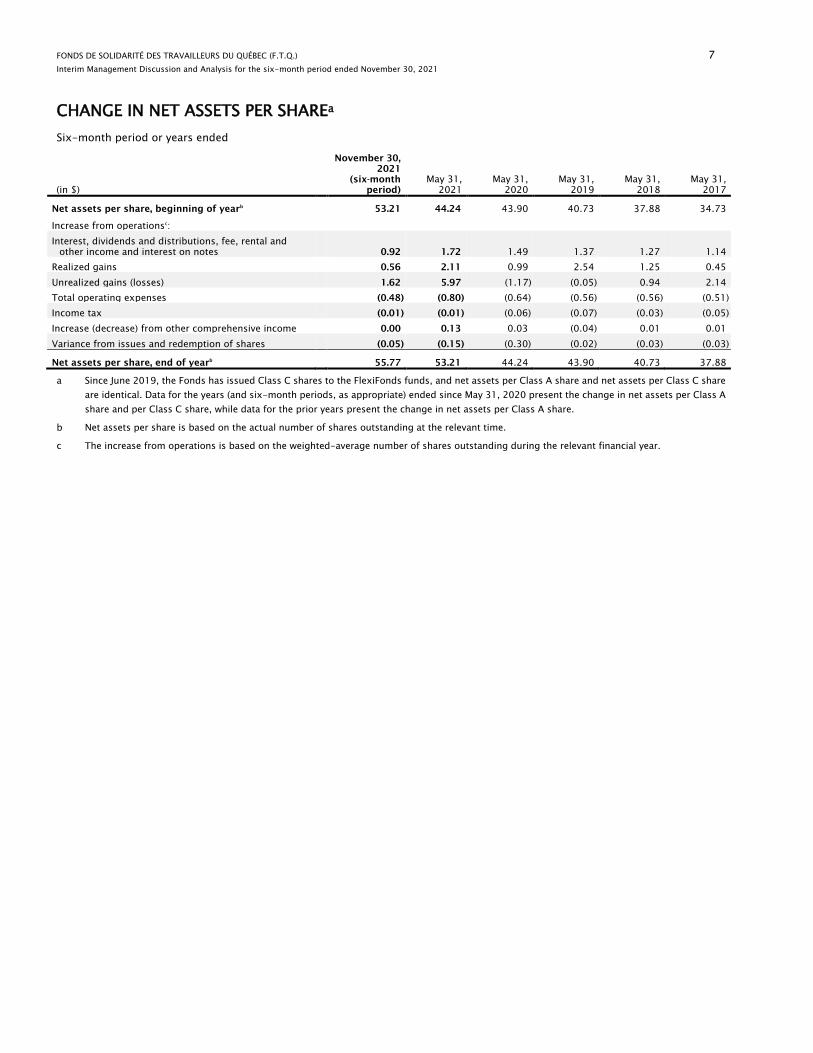
FONDS DE SOLIDARITÉ DES TRAVAILLEURS DU QUÉBEC (F.T.Q.) 7
Interim Management Discussion and Analysis for the six-month period ended November 30, 2021
CHANGE IN NET ASSETS PER SHAREa
Six-month period or years ended
(in $)
November 30,
2021
(six-month
period)
May 31,
2021
May 31,
2020
May 31,
2019
May 31,
2018
May 31,
2017
Net assets per share, beginning of yearb
53.21 44.24 43.90 40.73 37.88 34.73
Increase from operationsc
:
Interest, dividends and distributions, fee, rental and
other income and interest on notes 0.92 1.72 1.49 1.37 1.27 1.14
Realized gains 0.56 2.11 0.99 2.54 1.25 0.45
Unrealized gains (losses) 1.62 5.97 (1.17) (0.05) 0.94 2.14
Total operating expenses (0.48) (0.80) (0.64) (0.56) (0.56) (0.51)
Income tax (0.01) (0.01) (0.06) (0.07) (0.03) (0.05)
Increase (decrease) from other comprehensive income 0.00 0.13 0.03 (0.04) 0.01 0.01
Variance from issues and redemption of shares (0.05) (0.15) (0.30) (0.02) (0.03) (0.03)
Net assets per share, end of yearb
55.77 53.21 44.24 43.90 40.73 37.88
a Since June 2019, the Fonds has issued Class C shares to the FlexiFonds funds, and net assets per Class A share and net assets per Class C share
are identical. Data for the years (and six-month periods, as appropriate) ended since May 31, 2020 present the change in net assets per Class A
share and per Class C share, while data for the prior years present the change in net assets per Class A share.
b Net assets per share is based on the actual number of shares outstanding at the relevant time.
c The increase from operations is based on the weighted-average number of shares outstanding during the relevant financial year.
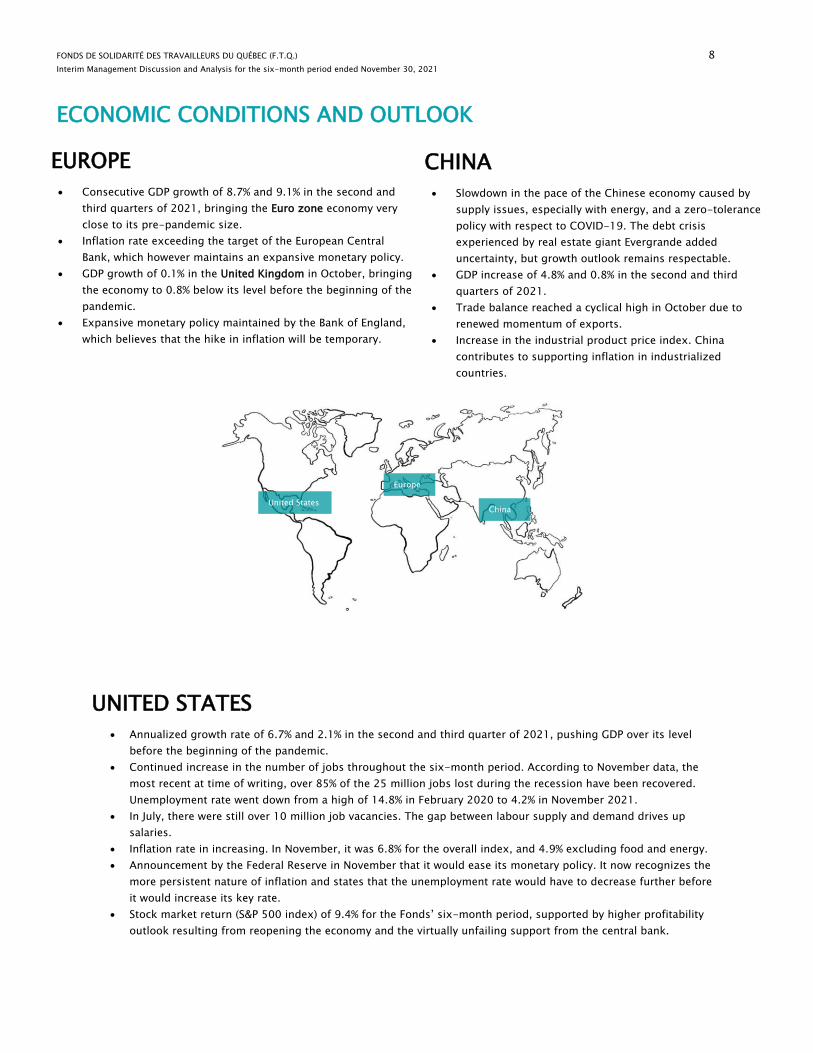
FONDS DE SOLIDARITÉ DES TRAVAILLEURS DU QUÉBEC (F.T.Q.) 8
Interim Management Discussion and Analysis for the six-month period ended November 30, 2021
ECONOMIC CONDITIONS AND OUTLOOK
UNITED STATES
• Annualized growth rate of 6.7% and 2.1% in the second and third quarter of 2021, pushing GDP over its level
before the beginning of the pandemic.
• Continued increase in the number of jobs throughout the six-month period. According to November data, the
most recent at time of writing, over 85% of the 25 million jobs lost during the recession have been recovered.
Unemployment rate went down from a high of 14.8% in February 2020 to 4.2% in November 2021.
• In July, there were still over 10 million job vacancies. The gap between labour supply and demand drives up
salaries.
• Inflation rate in increasing. In November, it was 6.8% for the overall index, and 4.9% excluding food and energy.
• Announcement by the Federal Reserve in November that it would ease its monetary policy. It now recognizes the
more persistent nature of inflation and states that the unemployment rate would have to decrease further before
it would increase its key rate.
• Stock market return (S&P 500 index) of 9.4% for the Fonds’ six-month period, supported by higher profitability
outlook resulting from reopening the economy and the virtually unfailing support from the central bank.
EUROPE
• Consecutive GDP growth of 8.7% and 9.1% in the second and
third quarters of 2021, bringing the Euro zone economy very
close to its pre-pandemic size.
• Inflation rate exceeding the target of the European Central
Bank, which however maintains an expansive monetary policy.
• GDP growth of 0.1% in the United Kingdom in October, bringing
the economy to 0.8% below its level before the beginning of the
pandemic.
• Expansive monetary policy maintained by the Bank of England,
which believes that the hike in inflation will be temporary.
CHINA
• Slowdown in the pace of the Chinese economy caused by
supply issues, especially with energy, and a zero-tolerance
policy with respect to COVID-19. The debt crisis
experienced by real estate giant Evergrande added
uncertainty, but growth outlook remains respectable.
• GDP increase of 4.8% and 0.8% in the second and third
quarters of 2021.
• Trade balance reached a cyclical high in October due to
renewed momentum of exports.
• Increase in the industrial product price index. China
contributes to supporting inflation in industrialized
countries.
Europe
United States China
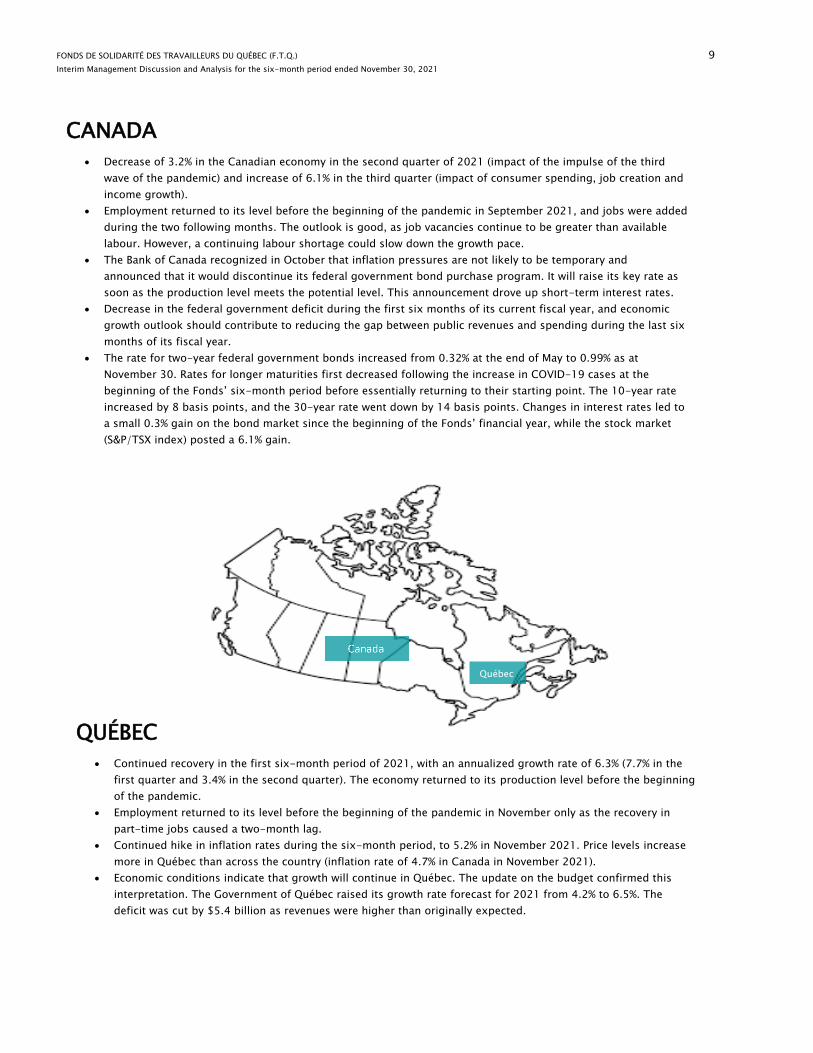
FONDS DE SOLIDARITÉ DES TRAVAILLEURS DU QUÉBEC (F.T.Q.) 9
Interim Management Discussion and Analysis for the six-month period ended November 30, 2021
QUÉBEC
• Continued recovery in the first six-month period of 2021, with an annualized growth rate of 6.3% (7.7% in the
first quarter and 3.4% in the second quarter). The economy returned to its production level before the beginning
of the pandemic.
• Employment returned to its level before the beginning of the pandemic in November only as the recovery in
part-time jobs caused a two-month lag.
• Continued hike in inflation rates during the six-month period, to 5.2% in November 2021. Price levels increase
more in Québec than across the country (inflation rate of 4.7% in Canada in November 2021).
• Economic conditions indicate that growth will continue in Québec. The update on the budget confirmed this
interpretation. The Government of Québec raised its growth rate forecast for 2021 from 4.2% to 6.5%. The
deficit was cut by $5.4 billion as revenues were higher than originally expected.
CANADA
• Decrease of 3.2% in the Canadian economy in the second quarter of 2021 (impact of the impulse of the third
wave of the pandemic) and increase of 6.1% in the third quarter (impact of consumer spending, job creation and
income growth).
• Employment returned to its level before the beginning of the pandemic in September 2021, and jobs were added
during the two following months. The outlook is good, as job vacancies continue to be greater than available
labour. However, a continuing labour shortage could slow down the growth pace.
• The Bank of Canada recognized in October that inflation pressures are not likely to be temporary and
announced that it would discontinue its federal government bond purchase program. It will raise its key rate as
soon as the production level meets the potential level. This announcement drove up short-term interest rates.
• Decrease in the federal government deficit during the first six months of its current fiscal year, and economic
growth outlook should contribute to reducing the gap between public revenues and spending during the last six
months of its fiscal year.
• The rate for two-year federal government bonds increased from 0.32% at the end of May to 0.99% as at
November 30. Rates for longer maturities first decreased following the increase in COVID-19 cases at the
beginning of the Fonds’ six-month period before essentially returning to their starting point. The 10-year rate
increased by 8 basis points, and the 30-year rate went down by 14 basis points. Changes in interest rates led to
a small 0.3% gain on the bond market since the beginning of the Fonds’ financial year, while the stock market
(S&P/TSX index) posted a 6.1% gain.
Québec
FONDS DE SOLIDARITÉ DES TRAVAILLEURS DU QUÉBEC (F.T.Q.) 10
Interim Management Discussion and Analysis for the six-month period ended November 30, 2021
RECENT DEVELOPMENTS
COVID-19 pandemic
The Fonds monitors very closely the development of the COVID-19 pandemic crisis. There still remain many uncertainties about
the development of this crisis and its future impact on the economy and society on many fronts.
The Fonds continues to conduct its business with its shareholders and partners despite the crisis while preserving the safety of its
employees. Remote operations are continuing for the moment and virtually all the Fonds’ employees are still working remotely.
The Fonds therefore maintains its activities and continues to provide services to shareholders, employers and partner companies.
In addition, the Fonds has actively contributed to the vaccination effort at the Saint-Michel vaccination centre.
Statement by the Quebec Financial Centre for a Sustainable Finance
On October 4, 2021, the Fonds and over 20 Québec institutions representing over $900 billion in assets under management signed
the Statement by Quebec Financial Centre for a Sustainable Finance, in connection with the first edition of the Sustainable Finance
Summit, a Finance Montréal initiative. Concretely, the Fonds is committed to 1) developing a local expertise in sustainable finance;
2) promoting the growth of funds managed by locally established managers with a leading-edge expertise in responsible
investment; and 3) strengthening the integration of ESG factors in operations and internal processes.

FONDS DE SOLIDARITÉ DES TRAVAILLEURS DU QUÉBEC (F.T.Q.) 11
Interim Management Discussion and Analysis for the six-month period ended November 30, 2021
MANAGEMENT DISCUSSION OF FINANCIAL PERFORMANCE
RESULTS OF OPERATIONS
FONDS RESULTS
For the six-month period ended November 30, 2021
This return of 4.8% for the six-month period is explained by the solid performance of both the private securities and specialized
funds portfolio of Development Capital Investments and the Other Investments portfolio, mainly variable-income securities, which
grew in conditions characterized by an increase in stock markets combined with a depreciation of the Canadian dollar against the
U.S. dollar.
As a result of its mission, a significant portion of the Fonds’ portfolio is comprised of private securities and specialized funds. In
general, the Fonds’ asset allocation tends to limit its return potential in a bull market, while it tends to limit its loss potential in a
bear market.
Comprehensive incomeof $848M
November 30, 2020: $1.6B
Return to the shareholder for the six-month period of
4.8%
(13.6% for the last 12 months)
Return to the shareholder for the six-month period ended November 30, 2020: 11.0%
Net assets of $18.3B
as at November 30, 2021
As at May 31, 2021: $17.2B
Share value of $55.77
as at November 30, 2021
As at May 31, 2021: $53.21 (+$2.56)
As at November 30, 2020: $49.11 (+$6.66)
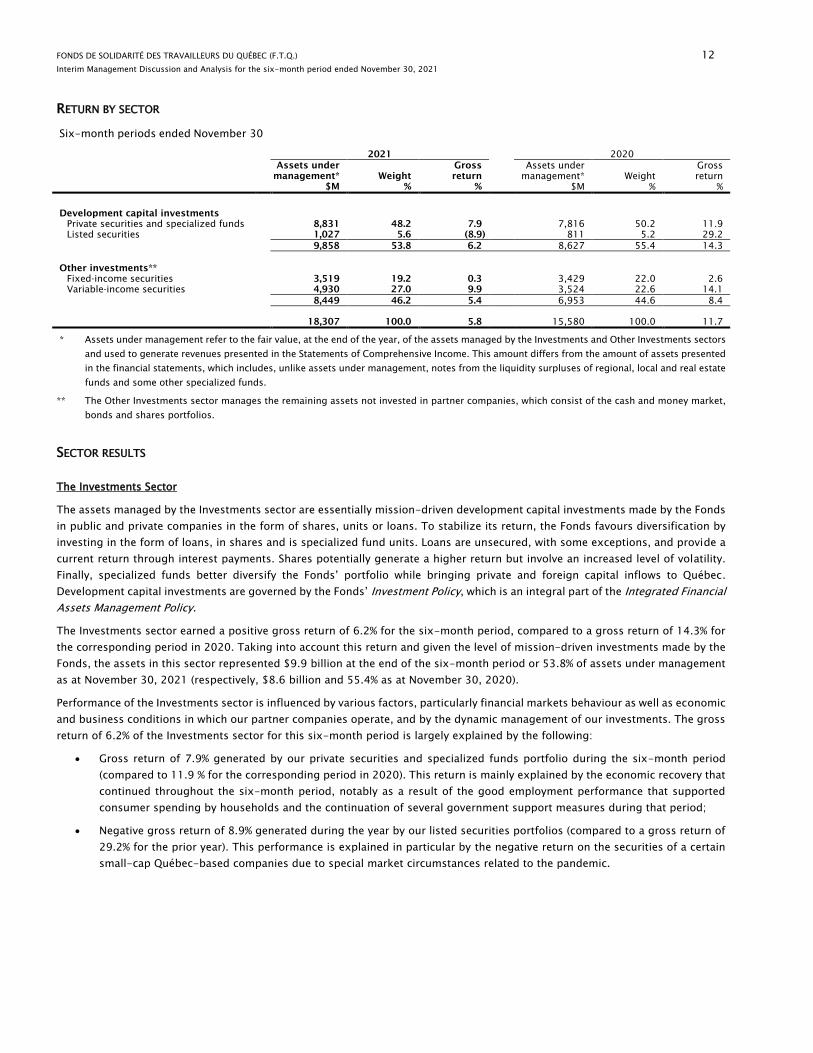
FONDS DE SOLIDARITÉ DES TRAVAILLEURS DU QUÉBEC (F.T.Q.) 12
Interim Management Discussion and Analysis for the six-month period ended November 30, 2021
RETURN BY SECTOR
Six-month periods ended November 30
2021
2020
Assets under
management*
$M
Weight
%
Gross
return
%
Assets under
management*
$M
Weight
%
Gross
return
%
Development capital investments
Private securities and specialized funds 8,831 48.2 7.9
7,816 50.2 11.9
Listed securities 1,027 5.6 (8.9) 811 5.2 29.2
9,858 53.8 6.2 8,627 55.4 14.3
Other investments**
Fixed-income securities 3,519 19.2 0.3 3,429 22.0 2.6
Variable-income securities 4,930 27.0 9.9 3,524 22.6 14.1
8,449 46.2 5.4 6,953 44.6 8.4
18,307 100.0 5.8 15,580 100.0 11.7
* Assets under management refer to the fair value, at the end of the year, of the assets managed by the Investments and Other Investments sectors
and used to generate revenues presented in the Statements of Comprehensive Income. This amount differs from the amount of assets presented
in the financial statements, which includes, unlike assets under management, notes from the liquidity surpluses of regional, local and real estate
funds and some other specialized funds.
** The Other Investments sector manages the remaining assets not invested in partner companies, which consist of the cash and money market,
bonds and shares portfolios.
SECTOR RESULTS
The Investments Sector
The assets managed by the Investments sector are essentially mission-driven development capital investments made by the Fonds
in public and private companies in the form of shares, units or loans. To stabilize its return, the Fonds favours diversification by
investing in the form of loans, in shares and is specialized fund units. Loans are unsecured, with some exceptions, and provide a
current return through interest payments. Shares potentially generate a higher return but involve an increased level of volatility.
Finally, specialized funds better diversify the Fonds’ portfolio while bringing private and foreign capital inflows to Québec.
Development capital investments are governed by the Fonds’ Investment Policy, which is an integral part of the Integrated Financial
Assets Management Policy.
The Investments sector earned a positive gross return of 6.2% for the six-month period, compared to a gross return of 14.3% for
the corresponding period in 2020. Taking into account this return and given the level of mission-driven investments made by the
Fonds, the assets in this sector represented $9.9 billion at the end of the six-month period or 53.8% of assets under management
as at November 30, 2021 (respectively, $8.6 billion and 55.4% as at November 30, 2020).
Performance of the Investments sector is influenced by various factors, particularly financial markets behaviour as well as economic
and business conditions in which our partner companies operate, and by the dynamic management of our investments. The gross
return of 6.2% of the Investments sector for this six-month period is largely explained by the following:
• Gross return of 7.9% generated by our private securities and specialized funds portfolio during the six-month period
(compared to 11.9 % for the corresponding period in 2020). This return is mainly explained by the economic recovery that
continued throughout the six-month period, notably as a result of the good employment performance that supported
consumer spending by households and the continuation of several government support measures during that period;
• Negative gross return of 8.9% generated during the year by our listed securities portfolios (compared to a gross return of
29.2% for the prior year). This performance is explained in particular by the negative return on the securities of a certain
small-cap Québec-based companies due to special market circumstances related to the pandemic.

FONDS DE SOLIDARITÉ DES TRAVAILLEURS DU QUÉBEC (F.T.Q.) 13
Interim Management Discussion and Analysis for the six-month period ended November 30, 2021
The Other Investments Sector
The Other Investments sector manages the Fonds’ assets that are not invested in its partner companies. These assets consist of
the cash and money market, bonds and shares portfolios. Other investments are managed in accordance with the Other
Investments Portfolio Policy, which is an integral part of the Integrated Financial Assets Management Policy. The Other Investments
Portfolio Policy is designed to optimize the risk-return profile of the Fonds, diversify the Development Capital Investments portfolio
and ensure that the Fonds maintains a sufficient level of liquidities to meet all its obligations.
For the six-month period, the Other Investments sector earned a gross return of 5.4%, compared to the gross return of 8.4%
recorded for the corresponding period in 2020. The assets of this sector amounted to $8.4 billion, or 46.2% of the Fonds’ assets
under management as at November 30, 2021 (respectively, $7.0 billion and 44.6% as at November 30, 2020).
The evolution of bond interest rates (bond rates and credit spreads) and exchange rates as well as stock market performance are
determining factors in analyzing Other Investments sector’s performance. Results for this sector are influenced by financial markets
behaviour and the conditions affecting the economic environment. The gross return of 5.4% of the Other Investments sector for
the six-month period is mainly explained by the following:
• Solid performance by the Canadian and global stock markets, which contributed to the gross return of 9.9% for share
portfolios, compared to a gross return of 14.1% in the corresponding period in the prior year. Stock markets ignored the
hike in interest rates, preferring to focus on the higher profitability outlook resulting from the reopening of the economy
and the virtually unfailing support from central banks; The depreciation of the Canadian dollar against the U.S. dollar also
had an favourable impact on the U.S. shares return translated into Canadian dollars.
• Positive gross return of 0.3% on our fixed-income securities portfolio for the six-month period, compared to the positive
gross return of 2.6% for the corresponding period in 2020. The return for the six-month period is essentially explained
by the fact that interest income was greater than the decrease in the value of the bonds held in the portfolios caused by
the increase in interest rates.
TOTAL OPERATING EXPENSES
Total operating expenses consist mainly of expenses related to personnel, assets under management, shareholder services,
subscription activities, economic training, systems and controls, the investing process and all other resources the Fonds requires
to achieve its mission and meet its objectives. In addition, the Fonds provides services (accounting, valuation, taxation, legal, etc.)
to certain related companies and earns revenues from such services. Striving to control how its expenses evolve, the Fonds was
able to maintain its total operating expense ratio at a lower level than the management expense ratio of Canadian balanced funds1,
which stands at approximately 1.0% on an six-month basis, despite having to incur mission-specific expenses that are related to
its DNA. These expenses, which are specific to it and affect its total operating expense ratio, enable the Fonds to fully achieve its
mission, be a savings tool of choice for the middle class, offer economic training, support partner companies and act as a vital
socioeconomic player for Québec.
For the six-month period ended November 30, 2021, the total operating expense ratio, calculated using the method prescribed
by the Regulation, was 0.85% (0.69% for the corresponding period in 2020). Expressed in dollars, total operating expenses
amounted to $156 million for the six-month period ended November 30, 2021, up $48 million compared to the corresponding
period of the prior year. This increase is mainly explained by the adoption of an accounting interpretation affecting the accounting
for configuration costs related to cloud computing solutions, which had a non-recurring impact, especially on depreciation
expense. Without this extraordinary item, the total operating expense ratio would have been 0.71%. In addition, there was an
increase in fees resulting from a higher volume of IT projects and a budgeted increase in salaries and benefits. For the six-month
period, the fact that the increase in total operating expenses was greater than the increase in net assets drove up the total operating
expense ratio.
1 Source: Fundata (Canadian retail neutral balanced funds using the services of an advisor).
FONDS DE SOLIDARITÉ DES TRAVAILLEURS DU QUÉBEC (F.T.Q.) 14
Interim Management Discussion and Analysis for the six-month period ended November 30, 2021
ANALYSIS OF CASH FLOWS, FINANCIAL POSITION AND FUNDS COMMITTED BUT NOT DISBURSED
Cash Flows
Cash flows from operating activities of the Fonds were a net cash outflow of $425 million for the six-month period, compared to
a net cash inflow of $733 million for the corresponding six-month period in 2020. Changes in these cash flows mainly resulted
from our current operations.
Cash flows from financing activities of the Fonds were a net cash inflow of $276 million for the six-month period, compared to a
net cash outflow of $868 million for the corresponding six-month period in 2020. These cash flows for the two six-month periods
resulted from issues of shares amounting to $544 million2 ($634 million for the corresponding six-month period in 2020), less
redemptions of shares of $268 million3 ($1,502 million for the corresponding six-month period in 2020). Cash flows from capital
investing activities were a net cash outflow of $7 million for the six-month period, compared to a net cash outflow of $12 million
for the corresponding six-month period in 2020.
As at November 30, 2021 and May 31, 2021, the Fonds had a $60 million line of credit available for its working capital
requirements. This line of credit was not drawn during the six-month period ended November 30, 2021 and the year ended
May 31, 2021, and its outstanding balance was therefore nil as at November 30, 2021 and May 31, 2021.
Financial Position and Funds Committed but not Disbursed
As at November 30, 2021, the Fonds’ net assets amounted to $18.3 billion compared to $17.2 billion as at May 31, 2021. This
change is due to the following items : comprehensive income for the six-month period of $848 million, share issues of
$545 million and share redemptions for the six-month period of $270 million.
Development capital investments appearing on the statement of financial position increased from $10.0 billion as at May 31, 2021
to $10.4 billion as at November 30, 2021. This $438 million increase resulted from the appreciation of $310 million recorded on
development capital investments during the six-month period, and from net investments of $128 million (investments of
$511 million less divestitures of $383 million).
On a commitment basis, the Fonds made development capital investments of $665 million during the six-month period, compared
to $252 million for the corresponding period in the prior year. Funds committed but not disbursed amounted to $1,574 million as
at November 30, 2021 ($1,424 million as at May 31, 2021).
In addition, other investments shown on the statement of financial position increased by $832 million during the six-month period
to $8.4 billion as at November 30, 2021 ($7.5 billion as at May 31, 2021). This increase is mainly explained by the proceeds from
the divestitures of development capital investments during the year as well as revenues generated by the Other Investments
portfolio.
As part of managing its assets, the Fonds may use derivative instruments to facilitate the management of portfolios, increase its
revenues, manage its market risks, modify asset allocation and, in certain cases, manage foreign currency hedging. The use of
derivative financial instruments is governed by a guideline.
2 This amount is presented on a cash basis and excludes shares issued as part of share-based compensation.
3 This amount is presented on a cash basis and therefore includes the change in amounts payable between May 31, 2021 and November 30, 2021.
FONDS DE SOLIDARITÉ DES TRAVAILLEURS DU QUÉBEC (F.T.Q.) 15
Interim Management Discussion and Analysis for the six-month period ended November 30, 2021
MISSION OF THE FONDS, OBJECTIVES AND STRATEGIES
There have been no material changes to the Fonds’ mission, objectives, business model and strategies since the most recent
annual MD&A as at May 31, 2021.
REPORT ON OPERATIONS
THE SAVINGS MARKET DEVELOPMENT SECTOR AND FLEXIFONDS FUNDS
In early May 2021, the Fonds had announced that it was extending the suspension of Class A share subscriptions through lump-
sum contributions beyond May 31. The announcement of such measures resulted in a spike in the number of savers contributing
through automatic savings methods. As a result, over 51,000 new savers now contribute through automatic savings methods: over
24,000 through preauthorized withdrawals and over 27,000 through payroll deduction. The Fonds continues to be popular among
younger savers: 65% of new savers were under age 40, and 29% were under age 25.
The six-month period was however marked by the implementation of an early cap as a result of the strong demand for Class A
shares, which caused the Fonds to stop accepting as of June 11 new agreements to purchase shares through preauthorized
withdrawals and requests to increase contributions through preauthorized withdrawals.
In these conditions, the Fonds recorded $527 million in subscriptions for Class A shares during the six-month period ($625 million
for the corresponding period in 2020).
During the six-month period, over 20,000 Class A share redemption requests were received and processed, for a total amount of
$270 million ($404 million for the corresponding period in 2020), of which over $215 million were redemptions for retirement.
Here are a few examples of activities carried out during the six-month period by the Savings Market Development Sector.
• Fonds: Developed a targeted advertising campaign filled with neutral personal finance tips and hints that promotes the
“Positively invested” content platform to pursue one of the components of the Fonds’ mission, namely making workers
aware of the importance of retirement savings, and thus maintain the recognition of the Fonds in that regard. In addition,
Employer Services experienced a dramatic increase in enrolment requests while efforts continued to retain employers that
currently offer contributing through payroll deduction.
• FlexiFonds funds: Developed a general public advertising campaign combining both television commercials, advertising
on the Web and out-of-home advertising as well as relational activities with savers focused on the positive impact of local
savings. This campaign started on November 1, 2021 and will continue until May 2022.
• Local representatives (“LRs”): Significant efforts to gain new payroll deduction enrolments through virtual blitzes and LR
training program focused on how the FlexiFonds funds work and their exclusive distribution by FlexiFonds de solidarité
FTQ inc.
FONDS DE SOLIDARITÉ DES TRAVAILLEURS DU QUÉBEC (F.T.Q.) 16
Interim Management Discussion and Analysis for the six-month period ended November 30, 2021
INVESTMENTS
The Fonds made during the six-month period investments that contributed to creating, maintaining or protecting jobs in various
sectors of the Québec economy. The Fonds continues to play an active role in developing and growing Québec companies.
Accordingly, during the six-month period, the Fonds invested $665 million ($252 million in the corresponding period in 2020) on
a commitment basis to support development projects in the Québec economy. Here are a few examples of the Fonds’ contribution
to Québec’s economic development during the six-month period.
• Participation of $9.2 million in the ownership transfer of French company EMKA Technologies (“EMKA”) to David Brunet, a
Québec engineer and entrepreneur. A world leader in the design and production of scientific instruments for preclinical
respiratory, cardiovascular and neurological research, EMKA has offices in Europe, the United States, China, Japan and
Canada (Montréal).
• Acquisition of a stake in Groupe Crête by the Fonds and the Fonds régionaux de solidarité FTQ Laurentides to support the
growth of the family-owned forestry business founded in 1949 and now FSC® (Forest Stewardship Council®) certified. An
uncontested leader in the transformation of lumber into value-added products, Groupe Crête operates two plants and is a
major economic driver in the Lanaudière and Laurentides regions, supporting over 325 direct and indirect jobs.
• Support of $28.7 million, in the form of a private placement, of its partner company mdf commerce in connection with the
acquisition of U.S. company Periscope. This transformational step for the Longueuil company will strengthen its leadership
position in the North American public e-procurement market.
• Investment of $17.4 million in the transaction that allowed NuChem Sciences, a drug discovery in chemistry contract
research company located in Montréal, to acquire OmegaChem of Lévis. As a result of this transaction, the new group
became Canada’s largest contract research organization in drug discovery in chemistry.
• Financing of $10 million that will allow Cook it, the Montréal-based company that launched Québec’s first meal kit in 2014,
to modernize its Ville Saint-Laurent factory by investing in operational technologies and automation equipment. In addition
to increasing productivity, these efforts will improve customer experience and allow employees to focus on higher value-
added tasks.
The Fonds régionaux FTQ (“FRS”) invested a total of $83.7 million on a commitment basis during their first six-month period ended
September 30, 2021 ($52.3 million for the corresponding six-month period in 2020). Overall, 64 investments were made, including
53 in new companies. Here are a few examples of the FRS’ contribution to the economic development of Québec and its regions
in the last months.
• Investment of $5.0 million in Umano Medical, a company based in the Chaudière-Appalaches region that develops,
produces and commercialized hospital beds. The ease with which hospital staff can clean beds to prevent infections is one
of the many characteristics that enable this company to stand out on the market.
• Investment of $3.0 million in Accès location d’équipements, a company located in Sainte-Julie that specializes in leasing,
selling and maintaining lift equipment used mainly in the construction industry. For a third consecutive year, the company
was among Canada’s Best Managed Companies.
• Investment of $850k by the Côte-Nord region, which recently partnered with CJB, a company founded in 2015 by a young
general construction contractor that is rapidly growing. Despite the size of its market, CJB is a vital player for the industry
in Havre-Saint-Pierre, whether for maintenance, renovation, construction or civil works.
FONDS DE SOLIDARITÉ DES TRAVAILLEURS DU QUÉBEC (F.T.Q.) 17
Interim Management Discussion and Analysis for the six-month period ended November 30, 2021
The Fonds locaux de solidarité (“FLS”) continue to support Québec companies in a considerable variety of projects, industries and
regions. Here are a few examples of the FLS’ contribution to the economic development of Québec and its regions in the last
months.
• Financing of $10,000 by the FLS de la MRC de Sept-Rivières in a project conducted by Les Jardins Secrets d’Océane, a
family-owned farm that produces fruits, vegetables, herbs, teas, herbal teas and natural products without chemical
contaminants. The $740,000 project consisted in developing the first growth of spirulina at the farm in covered basins.
• Financing of $100,000 by the FLS de MTL Centre-Ouest to Hart Print, a company that offers a digital printing service on
aluminum cans with environmentally friendly ink, as part of a project to modernize its plant and install equipment to
improve productivity.
Lastly, during the nine-month period ended September 30, 2021, the Fonds immobilier de solidarité had investments of
$183 million authorized, of which a large portion is dedicated to the construction of 14 new projects with a total cost of
$1.3 billion. Here are a few examples of investments authorized in the last months by the decision-making bodies of the Fonds
immobilier de solidarité FTQ that contribute to the economic development of Québec and its regions.
• New mixed-use project with Devimco Immobilier near the Longueuil métro station that will include four towers with overt
1,600 residential units, a 12,000 square feet food court and commercial space exceeding 15,000 square feet. This project
is intended to create a living environment focused on diversity of uses, density and mobility by offering a direct access to
a public transit system, which contributes to reducing greenhouse gas emissions.
• Two new residential rental and commercial projects dedicated to 55 years and over clients under the CLORIA connected
communities banner. Each having 120 rental units, the two buildings in Trois-Rivières and Beloeil are in addition to the
CLORIA project in Terrebonne, the first partnership between the Fonds immobilier and Cloriacité Investissements. The
CLORIA banner proposes commodities adapted to the effects of the COVID-19 pandemic, such as dedicated spaces for
receiving packages, door systems with microchips that can be locked with smartphones as well as common areas with
coworking spaces and outside gardens.
• In its role as a socially responsible investor, the Fonds immobilier granted a patient capital loan to Centre-à-Nous for the
construction of a 74,311 square feet building. Centre à Nous, located in the MRC de l’Assomption, offers affordable rental
space and multi-purpose rooms to organizations working to improve the well-being of people with various issues such
as Aide Homme – Centre de ressources pour hommes du Sud de Lanaudière, Fin à la faim and Cancer-Aide Lanaudière
Sud.
FONDS DE SOLIDARITÉ DES TRAVAILLEURS DU QUÉBEC (F.T.Q.) 18
Interim Management Discussion and Analysis for the six-month period ended November 30, 2021
INTEGRATED MANAGEMENT OF THE FONDS’ ASSETS
Since the most recent annual MD&A as at May 31, 2021, there have been no material changes to the integrated management of
the Fonds’ assets.
INVESTMENT RULE
The investment rule, set out in the Fonds’ Incorporation Act, stipulates that the Fonds’ qualified development capital investments
must respect the minimum threshold of the investment rule at the end of each financial year. As at May 31, 2021, this minimum
threshold was 65% of the Fonds’ average net assets of the previous financial year. The Fonds may invest the remaining assets in
other financial vehicles for asset diversification and sound management purposes. The calculation method for the investment rule
is based on the value of the Fonds’ assets, which depends in part on interest rate fluctuations and on the performance of stock
markets and the economy in general.
If the Fonds does not meet the investment rule minimum threshold, issues of shares giving rise to labour-sponsored fund tax
credits for the following financial year are limited to a prescribed percentage of the total value of the shares issued during the
previous financial year, except for shares acquired through payroll deduction or by employer contributions set out in agreements
concluded before the end of the prior year.
As at May 31, 2021, the investment rule percentage was 73.3% (compared to 65.3% as at May 31, 2020). Since the minimum
threshold of the investment rule was reached as at May 31, 2021, the amount of share issues giving rise to labour-sponsored fund
tax credits for the 2021-2022 financial year will not be limited by the investment rule.
As at November 30, 2021 and May 31, 2021, in addition to the investment rule, the Fonds complied with all other limits and rules
set out in its Incorporation Act. The Fonds expects to comply with all the limits and rules set out in its Incorporation Act over the
next several years.
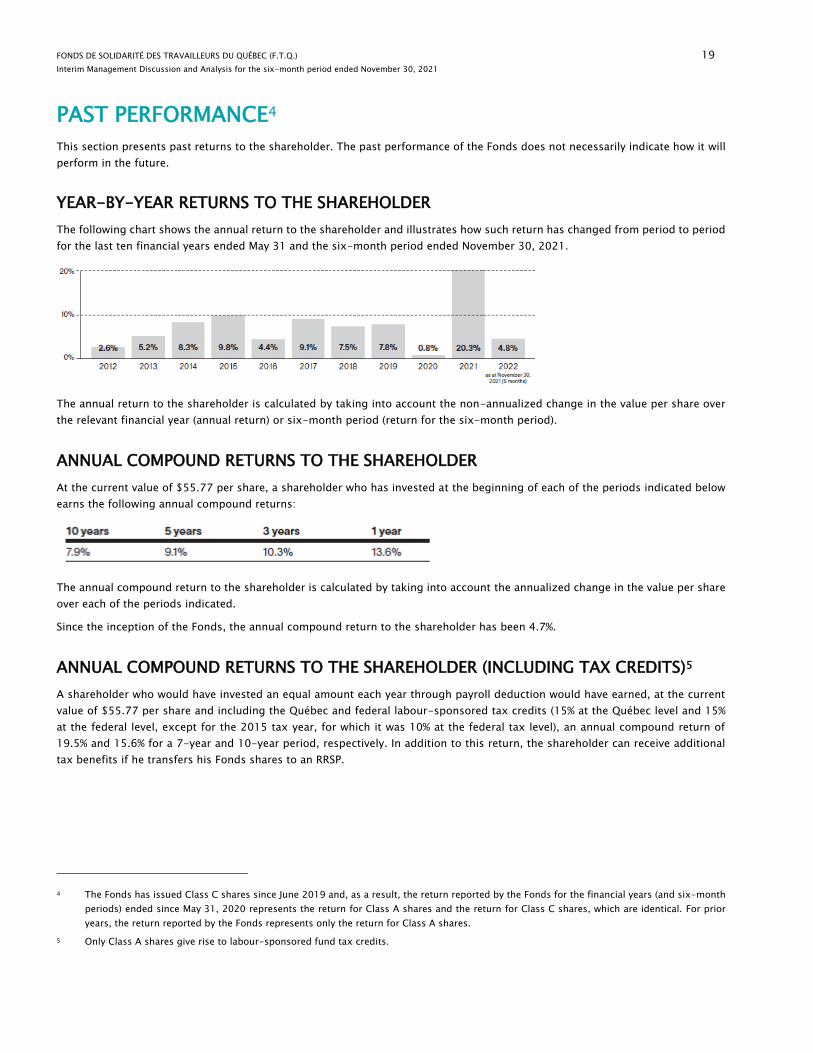
FONDS DE SOLIDARITÉ DES TRAVAILLEURS DU QUÉBEC (F.T.Q.) 19
Interim Management Discussion and Analysis for the six-month period ended November 30, 2021
PAST PERFORMANCE4
This section presents past returns to the shareholder. The past performance of the Fonds does not necessarily indicate how it will
perform in the future.
YEAR-BY-YEAR RETURNS TO THE SHAREHOLDER
The following chart shows the annual return to the shareholder and illustrates how such return has changed from period to period
for the last ten financial years ended May 31 and the six-month period ended November 30, 2021.
The annual return to the shareholder is calculated by taking into account the non-annualized change in the value per share over
the relevant financial year (annual return) or six-month period (return for the six-month period).
ANNUAL COMPOUND RETURNS TO THE SHAREHOLDER
At the current value of $55.77 per share, a shareholder who has invested at the beginning of each of the periods indicated below
earns the following annual compound returns:
The annual compound return to the shareholder is calculated by taking into account the annualized change in the value per share
over each of the periods indicated.
Since the inception of the Fonds, the annual compound return to the shareholder has been 4.7%.
ANNUAL COMPOUND RETURNS TO THE SHAREHOLDER (INCLUDING TAX CREDITS)5
A shareholder who would have invested an equal amount each year through payroll deduction would have earned, at the current
value of $55.77 per share and including the Québec and federal labour-sponsored tax credits (15% at the Québec level and 15%
at the federal level, except for the 2015 tax year, for which it was 10% at the federal tax level), an annual compound return of
19.5% and 15.6% for a 7-year and 10-year period, respectively. In addition to this return, the shareholder can receive additional
tax benefits if he transfers his Fonds shares to an RRSP.
4 The Fonds has issued Class C shares since June 2019 and, as a result, the return reported by the Fonds for the financial years (and six-month
periods) ended since May 31, 2020 represents the return for Class A shares and the return for Class C shares, which are identical. For prior
years, the return reported by the Fonds represents only the return for Class A shares.
5 Only Class A shares give rise to labour-sponsored fund tax credits.
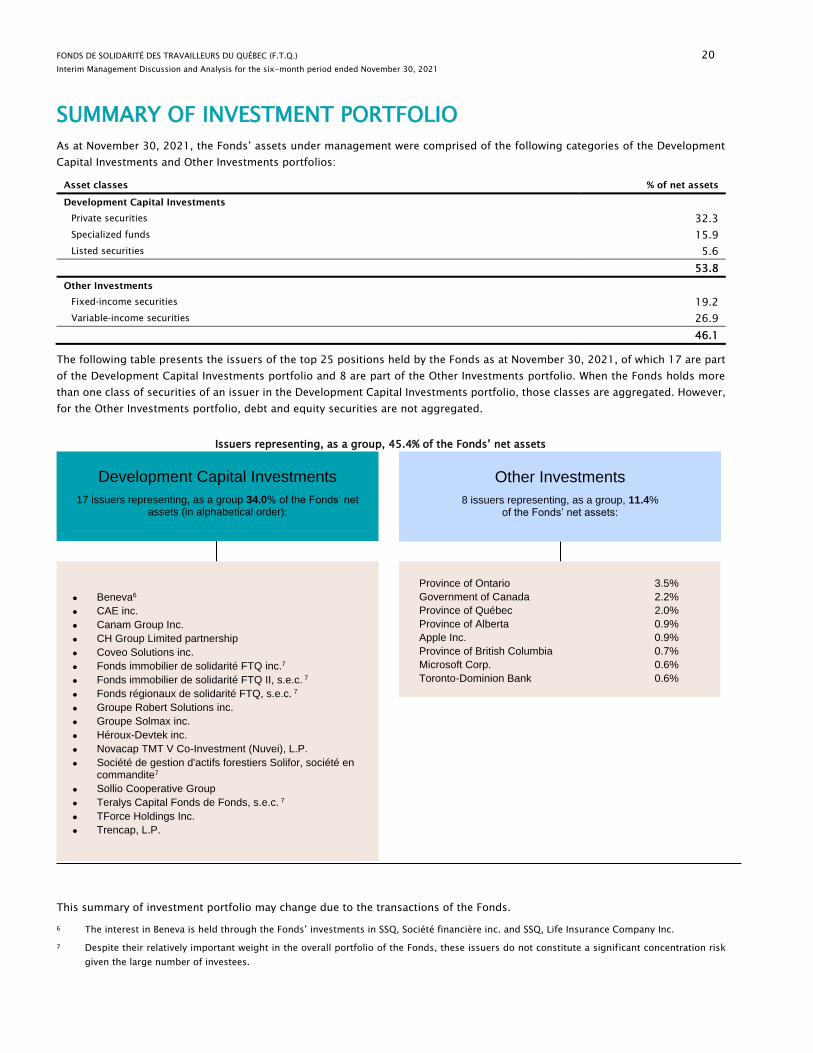
FONDS DE SOLIDARITÉ DES TRAVAILLEURS DU QUÉBEC (F.T.Q.) 20
Interim Management Discussion and Analysis for the six-month period ended November 30, 2021
SUMMARY OF INVESTMENT PORTFOLIO
As at November 30, 2021, the Fonds’ assets under management were comprised of the following categories of the Development
Capital Investments and Other Investments portfolios:
Asset classes % of net assets
Development Capital Investments
Private securities 32.3
Specialized funds 15.9
Listed securities 5.6
53.8
Other Investments
Fixed-income securities 19.2
Variable-income securities 26.9
46.1
The following table presents the issuers of the top 25 positions held by the Fonds as at November 30, 2021, of which 17 are part
of the Development Capital Investments portfolio and 8 are part of the Other Investments portfolio. When the Fonds holds more
than one class of securities of an issuer in the Development Capital Investments portfolio, those classes are aggregated. However,
for the Other Investments portfolio, debt and equity securities are not aggregated.67
This summary of investment portfolio may change due to the transactions of the Fonds.
6 The interest in Beneva is held through the Fonds’ investments in SSQ, Société financière inc. and SSQ, Life Insurance Company Inc.
7 Despite their relatively important weight in the overall portfolio of the Fonds, these issuers do not constitute a significant concentration risk
given the large number of investees.
Issuers representing, as a group, 45.4% of the Fonds’ net assets
Development Capital Investments
17 issuers representing, as a group 34.0% of the Fonds’ net assets (in alphabetical order):
Other Investments
8 issuers representing, as a group, 11.4% of the Fonds’ net assets:
• Beneva6
• CAE inc.
• Canam Group Inc.
• CH Group Limited partnership
• Coveo Solutions inc.
• Fonds immobilier de solidarité FTQ inc.7
• Fonds immobilier de solidarité FTQ II, s.e.c. 7
• Fonds régionaux de solidarité FTQ, s.e.c. 7
• Groupe Robert Solutions inc.
• Groupe Solmax inc.
• Héroux-Devtek inc.
• Novacap TMT V Co-Investment (Nuvei), L.P.
• Société de gestion d'actifs forestiers Solifor, société en commandite7
• Sollio Cooperative Group
• Teralys Capital Fonds de Fonds, s.e.c. 7
• TForce Holdings Inc.
• Trencap, L.P.
Province of Ontario 3.5%
Government of Canada 2.2%
Province of Québec 2.0%
Province of Alberta 0.9%
Apple Inc. 0.9%
Province of British Columbia 0.7%
Microsoft Corp. 0.6%
Toronto-Dominion Bank 0.6%
FONDS DE SOLIDARITÉ DES TRAVAILLEURS DU QUÉBEC (F.T.Q.) 21
Interim Management Discussion and Analysis for the six-month period ended November 30, 2021
FONDS OUTLOOK
There have been no material changes to the outlook presented in the most recent annual MD&A.
RISK MANAGEMENT
Sound risk management practices are vital to the success of the Fonds. We manage our risks within a framework taking into
account the nature of our activities and the risks we can reasonably assume considering the desired risk-return profile and
stakeholder expectations. To that end, we capitalize on a structured process to identify, measure and control the significant risks
with which we must contend.
Note to readers: The following paragraphs and the sections on market risk, credit and counterparty risk and liquidity risk form an
integral part of the financial statements on which an unmodified opinion was expressed in an independent auditors’ report dated
December 23, 2021.
The Fonds manages all its financial instruments in an integrated, comprehensive manner in accordance with the standards set out
in the Integrated Financial Assets Management Policy, which includes the Investment Policy and the Other Investments Portfolio
Policy. All these policies fall under the umbrella of the Sustainable Development Framework Policy and the Risk Management Policy.
These policies, which were adopted by the Board of Directors, set goals, guidelines and several limits so that the Fonds’
management can ensure that the target risk-return profile is reached. The Fonds may use derivative financial instruments to
facilitate the management of portfolios, increase its revenues, manage its market risks, modify asset allocation and, in certain
cases, manage foreign exchange hedging. The use of derivative financial instruments is governed by a guideline.
During the six-month period ended November 30, 2021, the Fonds continued to deploy its risk management model. This process,
which was undertaken a few years ago, is essentially aimed at providing the Fonds’ management with an overall vision of all risks
to ensure that they are all managed in accordance with their degree of importance. To ensure this, the Fonds’ integrated risk
profile, which enables prioritizing the key financial and non-financial risks of the Fonds, before and after considering the
effectiveness of the controls implemented to mitigate the Fonds’ exposure to these risks, was updated during the year ended
May 31, 2021. Afterwards, a mitigation strategy and intensity were determined for some of these risks, and action plans (including
several initiatives) were developed and/or updated. This work represents a continuation of the action plans developed during the
year ended May 31, 2020. Certain initiatives have started to be deployed during the year ended May 31, 2021, while others have
been or will be deployed during the current financial year. In addition, during the six-month period ended November 30, 2021,
the Fonds continued to pay special attention to market, credit and counterparty and liquidity risk management. To this end, the
Fonds closely monitored the evolution of the main indicators related to these various risks to help senior management make
decisions while ensuring that the Fonds’ operations and financial strength were not undermined.
The main measures taken to manage these risks are described hereinafter. In addition, the Fonds produces on a quarterly basis a
risk scorecard. This scorecard, which is integrated into its corporate scorecard, enables management to monitor the development
of risks related to the Fonds’ business objectives and strategies. The corporate scorecard can also be used to monitor the
performance of the FlexiFonds funds.
In the normal course of business, the Fonds is exposed to various risks; the main risks are presented in the following sections.
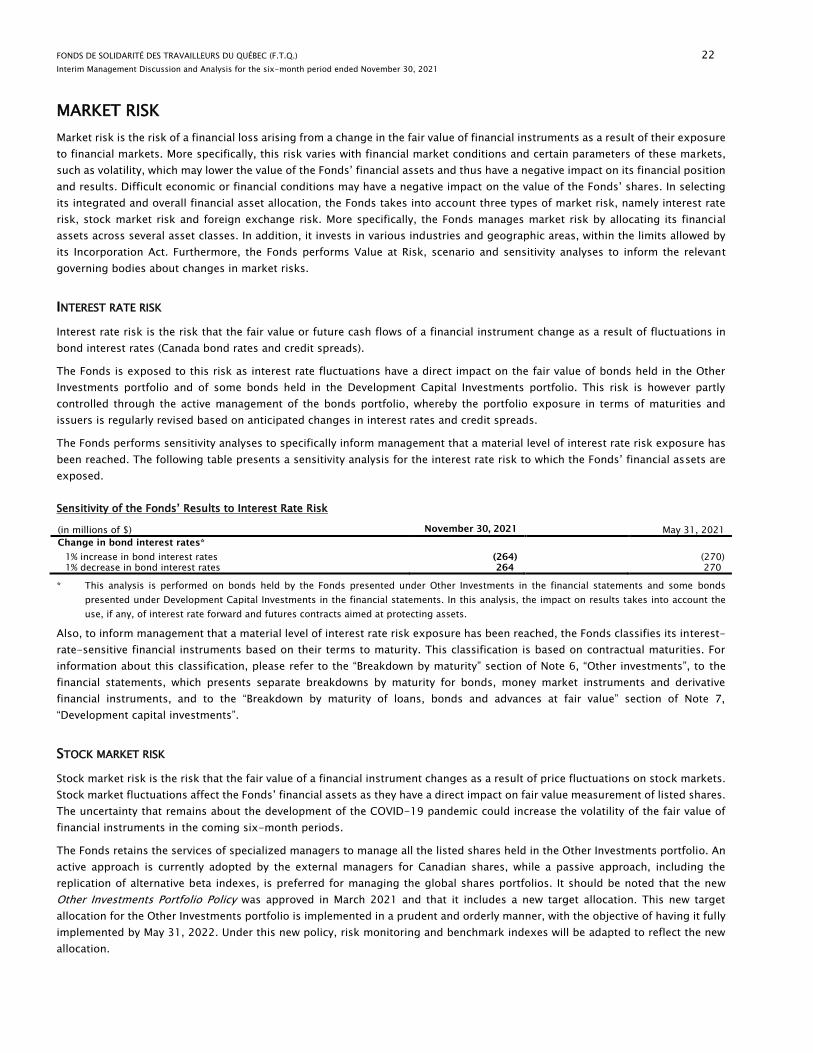
FONDS DE SOLIDARITÉ DES TRAVAILLEURS DU QUÉBEC (F.T.Q.) 22
Interim Management Discussion and Analysis for the six-month period ended November 30, 2021
MARKET RISK
Market risk is the risk of a financial loss arising from a change in the fair value of financial instruments as a result of their exposure
to financial markets. More specifically, this risk varies with financial market conditions and certain parameters of these markets,
such as volatility, which may lower the value of the Fonds’ financial assets and thus have a negative impact on its financial position
and results. Difficult economic or financial conditions may have a negative impact on the value of the Fonds’ shares. In selecting
its integrated and overall financial asset allocation, the Fonds takes into account three types of market risk, namely interest rate
risk, stock market risk and foreign exchange risk. More specifically, the Fonds manages market risk by allocating its financial
assets across several asset classes. In addition, it invests in various industries and geographic areas, within the limits allowed by
its Incorporation Act. Furthermore, the Fonds performs Value at Risk, scenario and sensitivity analyses to inform the relevant
governing bodies about changes in market risks.
INTEREST RATE RISK
Interest rate risk is the risk that the fair value or future cash flows of a financial instrument change as a result of fluctuations in
bond interest rates (Canada bond rates and credit spreads).
The Fonds is exposed to this risk as interest rate fluctuations have a direct impact on the fair value of bonds held in the Other
Investments portfolio and of some bonds held in the Development Capital Investments portfolio. This risk is however partly
controlled through the active management of the bonds portfolio, whereby the portfolio exposure in terms of maturities and
issuers is regularly revised based on anticipated changes in interest rates and credit spreads.
The Fonds performs sensitivity analyses to specifically inform management that a material level of interest rate risk exposure has
been reached. The following table presents a sensitivity analysis for the interest rate risk to which the Fonds’ financial assets are
exposed.
Sensitivity of the Fonds’ Results to Interest Rate Risk
(in millions of $) November 30, 2021 May 31, 2021
Change in bond interest rates*
1% increase in bond interest rates (264) (270)
1% decrease in bond interest rates 264 270
* This analysis is performed on bonds held by the Fonds presented under Other Investments in the financial statements and some bonds
presented under Development Capital Investments in the financial statements. In this analysis, the impact on results takes into account the
use, if any, of interest rate forward and futures contracts aimed at protecting assets.
Also, to inform management that a material level of interest rate risk exposure has been reached, the Fonds classifies its interest-
rate-sensitive financial instruments based on their terms to maturity. This classification is based on contractual maturities. For
information about this classification, please refer to the “Breakdown by maturity” section of Note 6, “Other investments”, to the
financial statements, which presents separate breakdowns by maturity for bonds, money market instruments and derivative
financial instruments, and to the “Breakdown by maturity of loans, bonds and advances at fair value” section of Note 7,
“Development capital investments”.
STOCK MARKET RISK
Stock market risk is the risk that the fair value of a financial instrument changes as a result of price fluctuations on stock markets.
Stock market fluctuations affect the Fonds’ financial assets as they have a direct impact on fair value measurement of listed shares.
The uncertainty that remains about the development of the COVID-19 pandemic could increase the volatility of the fair value of
financial instruments in the coming six-month periods.
The Fonds retains the services of specialized managers to manage all the listed shares held in the Other Investments portfolio. An
active approach is currently adopted by the external managers for Canadian shares, while a passive approach, including the
replication of alternative beta indexes, is preferred for managing the global shares portfolios. It should be noted that the new
Other Investments Portfolio Policy was approved in March 2021 and that it includes a new target allocation. This new target
allocation for the Other Investments portfolio is implemented in a prudent and orderly manner, with the objective of having it fully
implemented by May 31, 2022. Under this new policy, risk monitoring and benchmark indexes will be adapted to reflect the new
allocation.
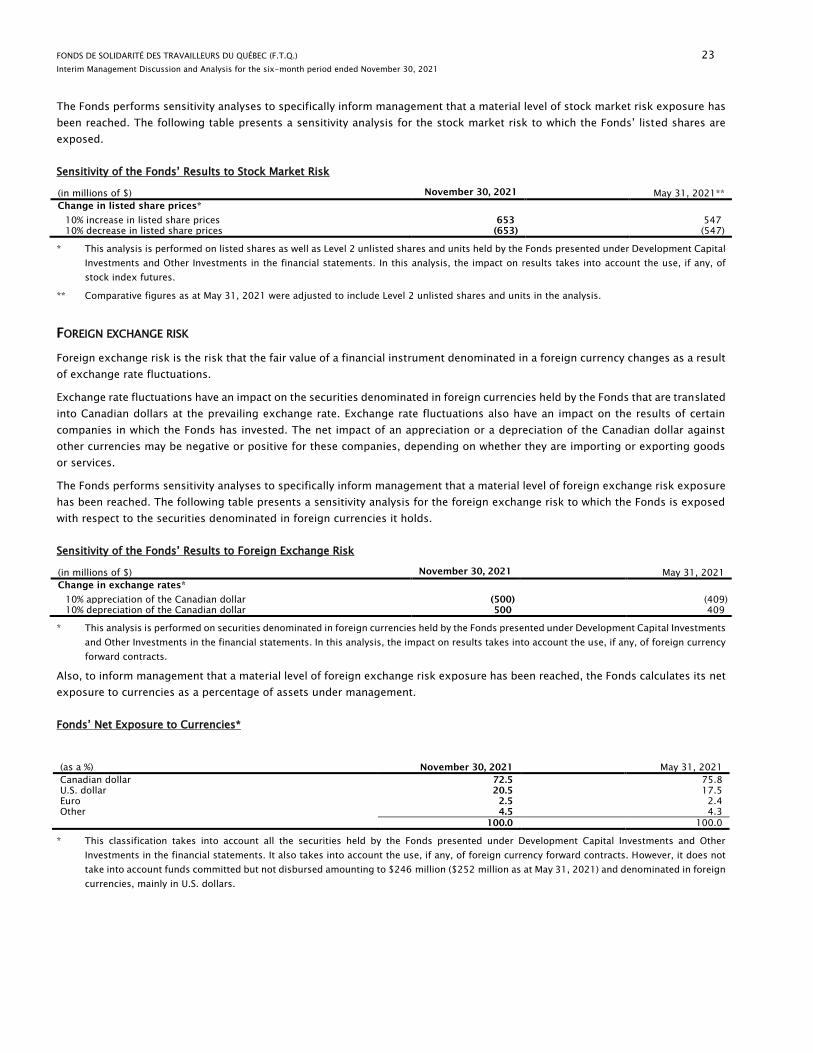
FONDS DE SOLIDARITÉ DES TRAVAILLEURS DU QUÉBEC (F.T.Q.) 23
Interim Management Discussion and Analysis for the six-month period ended November 30, 2021
The Fonds performs sensitivity analyses to specifically inform management that a material level of stock market risk exposure has
been reached. The following table presents a sensitivity analysis for the stock market risk to which the Fonds’ listed shares are
exposed.
Sensitivity of the Fonds’ Results to Stock Market Risk
(in millions of $) November 30, 2021 May 31, 2021**
Change in listed share prices*
10% increase in listed share prices 653 547
10% decrease in listed share prices (653) (547)
* This analysis is performed on listed shares as well as Level 2 unlisted shares and units held by the Fonds presented under Development Capital
Investments and Other Investments in the financial statements. In this analysis, the impact on results takes into account the use, if any, of
stock index futures.
** Comparative figures as at May 31, 2021 were adjusted to include Level 2 unlisted shares and units in the analysis.
FOREIGN EXCHANGE RISK
Foreign exchange risk is the risk that the fair value of a financial instrument denominated in a foreign currency changes as a result
of exchange rate fluctuations.
Exchange rate fluctuations have an impact on the securities denominated in foreign currencies held by the Fonds that are translated
into Canadian dollars at the prevailing exchange rate. Exchange rate fluctuations also have an impact on the results of certain
companies in which the Fonds has invested. The net impact of an appreciation or a depreciation of the Canadian dollar against
other currencies may be negative or positive for these companies, depending on whether they are importing or exporting goods
or services.
The Fonds performs sensitivity analyses to specifically inform management that a material level of foreign exchange risk exposure
has been reached. The following table presents a sensitivity analysis for the foreign exchange risk to which the Fonds is exposed
with respect to the securities denominated in foreign currencies it holds.
Sensitivity of the Fonds’ Results to Foreign Exchange Risk
(in millions of $) November 30, 2021 May 31, 2021
Change in exchange rates*
10% appreciation of the Canadian dollar (500) (409)
10% depreciation of the Canadian dollar 500 409
* This analysis is performed on securities denominated in foreign currencies held by the Fonds presented under Development Capital Investments
and Other Investments in the financial statements. In this analysis, the impact on results takes into account the use, if any, of foreign currency
forward contracts.
Also, to inform management that a material level of foreign exchange risk exposure has been reached, the Fonds calculates its net
exposure to currencies as a percentage of assets under management.
Fonds’ Net Exposure to Currencies*
(as a %) November 30, 2021 May 31, 2021
Canadian dollar 72.5 75.8
U.S. dollar 20.5 17.5
Euro 2.5 2.4
Other 4.5 4.3
100.0 100.0
* This classification takes into account all the securities held by the Fonds presented under Development Capital Investments and Other
Investments in the financial statements. It also takes into account the use, if any, of foreign currency forward contracts. However, it does not
take into account funds committed but not disbursed amounting to $246 million ($252 million as at May 31, 2021) and denominated in foreign
currencies, mainly in U.S. dollars.
FONDS DE SOLIDARITÉ DES TRAVAILLEURS DU QUÉBEC (F.T.Q.) 24
Interim Management Discussion and Analysis for the six-month period ended November 30, 2021
SENSITIVITY OF THE FONDS’ RESULTS TO MARKET RISK RELATED TO UNLISTED FINANCIAL INSTRUMENTS IN DEVELOPMENT
CAPITAL INVESTMENTS
The value of unlisted financial instruments in development capital investments is established using approved and accepted
valuation techniques. These techniques are based on a set of assumptions that take into account market conditions as at the
valuation date, such as economic growth and credit spreads, but also other assumptions specific to each investment. For
information about sensitivity analyses on unlisted financial instruments in development capital investments, please refer to the
“Sensitivity analysis of the fair value of financial instruments categorized within Level 3” section of Note 9, “Fair value of financial
instruments”, to the financial statements.
CREDIT AND COUNTERPARTY RISK
Credit risk is the potential for loss due to the failure of a partner company (financial instruments presented under Development
Capital Investments), or issuer or counterparty in a transaction (financial instruments presented under Other Investments) to
honour its contractual obligations or due to a deterioration in its financial position. The Fonds also includes concentration risk in
this risk.
The Fonds’ exposure to credit risk results mainly from its mission-driven development capital investments. Due to the nature of
these investments, when economic conditions are challenging, the credit quality of the Fonds’ partner companies tends to
deteriorate, which increases the potential risk of capital losses. This risk is usually lower for other investment activities since the
counterparties involved (governments, banks, etc.) typically are financially stronger. The Fonds is also exposed to credit risk as a
result of its accounts receivable. However, the potential impact of such exposure is low given the amounts involved. The maximum
exposure to credit risk related to the above-mentioned financial instruments corresponds to their fair value on the statement of
financial position, plus funds committed but not disbursed as well as guarantees and suretyships.
The Fonds manages the credit risk related to its development capital investments in several ways, including carrying out a due
diligence review to ensure that the credit risk level is acceptable, supporting partner companies throughout their development and
monitoring on an ongoing basis investments in companies either held directly or through specialized funds.
The Fonds regularly re-examines the status of its development capital investments to ensure that they are adequately classified
in one of the following three categories: compliant with internal criteria, under watch or in turnaround. To deal with the more
difficult situations, an internal committee closely monitors investments that involve greater credit risk.
Classification of the Development Capital Investments Portfolio (including funds committed but not disbursed)
(fair value in millions of $) November 30, 2021 May 31, 2021
Compliant with internal criteria 11,262 10,847
Under watch 712 538
In turnaround 42 42
12,016 11,427
Issuer and counterparty credit ratings and compliance with exposure limits by borrower or counterparty contribute to the sound
management of the credit and counterparty risk of the Other Investments portfolio and to the diversification of assets. These
criteria (concentration limits by credit rating), which are set out in the Other Investments Portfolio Policy, are based on the risks
specific to each asset class and reduce the risk that the Fonds’ results will be materially affected in the event of a payment default.
The following table presents the breakdown of bonds, money market instruments and over-the-counter derivative financial
instruments included in the Other Investments portfolio by credit rating as at November 30, 2021 and May 31, 2021.
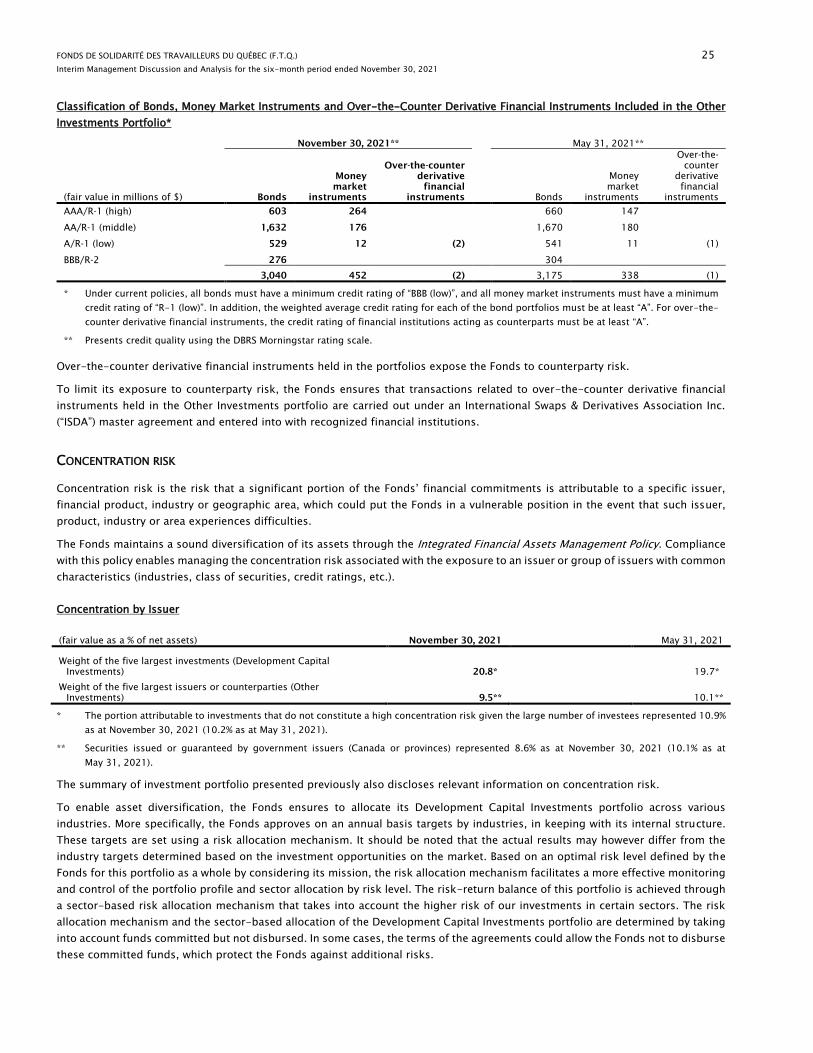
FONDS DE SOLIDARITÉ DES TRAVAILLEURS DU QUÉBEC (F.T.Q.) 25
Interim Management Discussion and Analysis for the six-month period ended November 30, 2021
Classification of Bonds, Money Market Instruments and Over-the-Counter Derivative Financial Instruments Included in the Other
Investments Portfolio*
November 30, 2021** May 31, 2021**
(fair value in millions of $)
Bonds
Money
market
instruments
Over-the-counter
derivative
financial
instruments
Bonds
Money
market
instruments
Over-the-
counter
derivative
financial
instruments
AAA/R-1 (high) 603 264 660 147
AA/R-1 (middle) 1,632 176
1,670 180
A/R-1 (low) 529 12 (2)
541 11 (1)
BBB/R-2 276
304
3,040 452 (2)
3,175 338 (1)
* Under current policies, all bonds must have a minimum credit rating of “BBB (low)”, and all money market instruments must have a minimum
credit rating of “R-1 (low)”. In addition, the weighted average credit rating for each of the bond portfolios must be at least “A”. For over-the-
counter derivative financial instruments, the credit rating of financial institutions acting as counterparts must be at least “A”.
** Presents credit quality using the DBRS Morningstar rating scale.
Over-the-counter derivative financial instruments held in the portfolios expose the Fonds to counterparty risk.
To limit its exposure to counterparty risk, the Fonds ensures that transactions related to over-the-counter derivative financial
instruments held in the Other Investments portfolio are carried out under an International Swaps & Derivatives Association Inc.
(“ISDA”) master agreement and entered into with recognized financial institutions.
CONCENTRATION RISK
Concentration risk is the risk that a significant portion of the Fonds’ financial commitments is attributable to a specific issuer,
financial product, industry or geographic area, which could put the Fonds in a vulnerable position in the event that such issuer,
product, industry or area experiences difficulties.
The Fonds maintains a sound diversification of its assets through the Integrated Financial Assets Management Policy. Compliance
with this policy enables managing the concentration risk associated with the exposure to an issuer or group of issuers with common
characteristics (industries, class of securities, credit ratings, etc.).
Concentration by Issuer
(fair value as a % of net assets) November 30, 2021
May 31, 2021
Weight of the five largest investments (Development Capital
Investments) 20.8* 19.7*
Weight of the five largest issuers or counterparties (Other
Investments) 9.5** 10.1**
* The portion attributable to investments that do not constitute a high concentration risk given the large number of investees represented 10.9%
as at November 30, 2021 (10.2% as at May 31, 2021).
** Securities issued or guaranteed by government issuers (Canada or provinces) represented 8.6% as at November 30, 2021 (10.1% as at
May 31, 2021).
The summary of investment portfolio presented previously also discloses relevant information on concentration risk.
To enable asset diversification, the Fonds ensures to allocate its Development Capital Investments portfolio across various
industries. More specifically, the Fonds approves on an annual basis targets by industries, in keeping with its internal structure.
These targets are set using a risk allocation mechanism. It should be noted that the actual results may however differ from the
industry targets determined based on the investment opportunities on the market. Based on an optimal risk level defined by the
Fonds for this portfolio as a whole by considering its mission, the risk allocation mechanism facilitates a more effective monitoring
and control of the portfolio profile and sector allocation by risk level. The risk-return balance of this portfolio is achieved through
a sector-based risk allocation mechanism that takes into account the higher risk of our investments in certain sectors. The risk
allocation mechanism and the sector-based allocation of the Development Capital Investments portfolio are determined by taking
into account funds committed but not disbursed. In some cases, the terms of the agreements could allow the Fonds not to disburse
these committed funds, which protect the Fonds against additional risks.

FONDS DE SOLIDARITÉ DES TRAVAILLEURS DU QUÉBEC (F.T.Q.) 26
Interim Management Discussion and Analysis for the six-month period ended November 30, 2021
Given the Québec economic development mission of the Fonds, the Development Capital Investments portfolio consists primarily
of Québec-based companies. The return of the Development Capital Investments portfolio is therefore highly influenced by the
economic conditions prevailing in Québec. As a result, the Fonds seeks some level of geographic diversification through its Other
Investments portfolio governed by the Other Investments Portfolio Policy. In addition to allowing for the diversification of
development capital investments, the Other Investments Portfolio Policy aims at optimizing the Fonds’ risk-return profile and
providing the liquidity that the Fonds needs to meet all its obligations.
LIQUIDITY RISK
The Fonds must make disbursements on a daily basis—in particular when it redeems shares held by its shareholders (Class A
shares) and the FlexiFonds funds (Class C shares), disburses amounts it committed to invest in partner companies, reimburses
notes payable and pays expenses. The Fonds is required to redeem its Class A shares only in the circumstances set out in its
Incorporation Act, or to purchase them by agreement in exceptional situations provided under a policy adopted for such purpose
by the Board of Directors and approved by the Minister of Finance of Québec. That being said, possible Class A share redemptions
include redemptions by shareholders who are already eligible for share redemptions. To be classified in this category, redemptions
must meet either of the following criteria: i) shares must be held by shareholders who are aged 65 and older or will reach the age
of 65 in the next 12 months; or ii) shares must be held by shareholders who have already redeemed shares for retirement purposes
in the past. These shares can therefore be unconditionally redeemed in the next 12 months and are designated as “latent
redemptions”. As at November 30, 2021, latent redemptions amounted to $2.1 billion ($1.7 billion as at May 31, 2021). This latent
redemptions amount does not take into account the revaluation of the Fonds shares. Class C share subscriptions and redemptions
are not subject to the same restrictions as those for Class A shares and are made in accordance with the FlexiFonds Funds
Rebalancing Policy. As at November 30, 2021, net assets for Class C shares (eligible for redemption) amounted to $74 million
($52 million as at May 31, 2021).
The Fonds must therefore be able to obtain the liquidity required to meet its commitments. Liquidity risk is therefore related to
the potential for loss due to its inability to meet such commitments. In some cases, securities acquired on the market can be
subject to resale restrictions, which may reduce their liquidity.
The Fonds’ Incorporation Act provides that part of the financial assets of the Fonds may be invested in marketable securities on
organized markets, such as stock and bond markets, so it can easily obtain cash. The Fonds also has access to a bank line of credit
for additional liquidities.
As at November 30, 2021, in management’s opinion, the Fonds has the required liquidities to fulfill all its obligations and
commitments, even under potential scenarios that would be less favourable to it : liquid financial assets, comprised of fixed-
income securities (cash, money market and bonds) as well as listed shares held in the Other Investments portfolio and certain
listed shares held in the Development Capital Investments portfolio, amounted to $9.5 billion ($8.7 billion as at May 31, 2021).
This amount represents 52.1% of assets under management as at November 30, 2021 (50.4% as at May 31, 2021). The slight
increase in the liquidity ratio is explained by the growth in assets under management mainly in the Other Investments portfolio.
To manage its liquidity risk, the Fonds also performs scenario simulations and analyzes events that may lead to a lack of liquidities.
It is important to specify that these scenario simulations generally exclude the listed shares in the Development Capital Investments
portfolio as holding on a long-term basis development capital investments forms part of the Fonds’ mission. The Fonds ensures
that internal controls are maintained to manage liquidity risk in accordance with prudent commercial practices. Among such
controls, the Fonds has a Liquidity Risk Management Policy requiring that two liquidity ratios be met. As at November 30, 2021,
the thresholds set out in the Liquidity Risk Management Policy for these two ratios were met.
Contractual maturities analysis is also a component of liquidity and financing management. However, this breakdown by maturity
is not necessarily representative of how the Fonds manages its liquidity risk and its financing requirements.
The following table presents the contractual cash flow maturities for non-derivative financial liabilities, derivative financial
liabilities and other items.
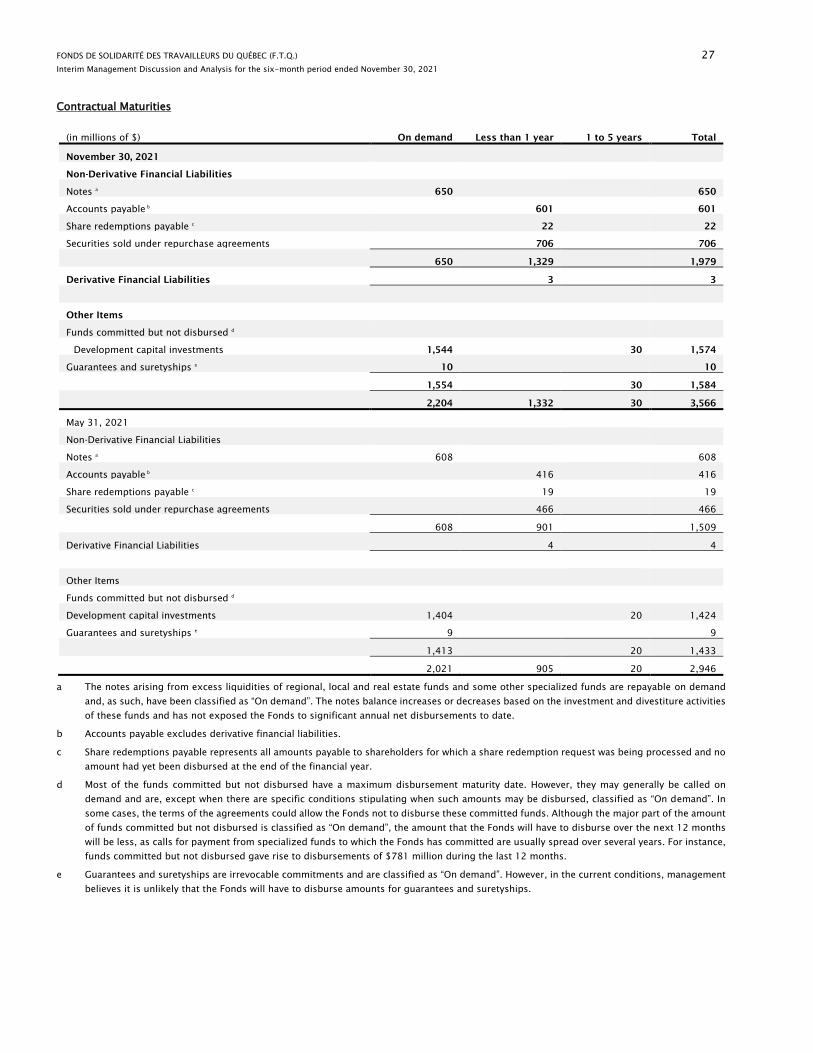
FONDS DE SOLIDARITÉ DES TRAVAILLEURS DU QUÉBEC (F.T.Q.) 27
Interim Management Discussion and Analysis for the six-month period ended November 30, 2021
Contractual Maturities
(in millions of $)
On demand
Less than 1 year
1 to 5 years
Total
November 30, 2021
Non-Derivative Financial Liabilities
Notes a
650
650
Accounts payable b
601
601
Share redemptions payable c
22
22
Securities sold under repurchase agreements 706
706
650 1,329
1,979
Derivative Financial Liabilities 3
3
Other Items
Funds committed but not disbursed d
Development capital investments 1,544 30 1,574
Guarantees and suretyships e
10
10
1,554 30 1,584
2,204 1,332 30 3,566
May 31, 2021
Non-Derivative Financial Liabilities
Notes a
608
608
Accounts payable b
416
416
Share redemptions payable c
19
19
Securities sold under repurchase agreements 466
466
608 901
1,509
Derivative Financial Liabilities 4
4
Other Items
Funds committed but not disbursed d
Development capital investments 1,404 20 1,424
Guarantees and suretyships e
9
9
1,413 20 1,433
2,021 905 20 2,946
a The notes arising from excess liquidities of regional, local and real estate funds and some other specialized funds are repayable on demand
and, as such, have been classified as “On demand”. The notes balance increases or decreases based on the investment and divestiture activities
of these funds and has not exposed the Fonds to significant annual net disbursements to date.
b Accounts payable excludes derivative financial liabilities.
c Share redemptions payable represents all amounts payable to shareholders for which a share redemption request was being processed and no
amount had yet been disbursed at the end of the financial year.
d Most of the funds committed but not disbursed have a maximum disbursement maturity date. However, they may generally be called on
demand and are, except when there are specific conditions stipulating when such amounts may be disbursed, classified as “On demand”. In
some cases, the terms of the agreements could allow the Fonds not to disburse these committed funds. Although the major part of the amount
of funds committed but not disbursed is classified as “On demand”, the amount that the Fonds will have to disburse over the next 12 months
will be less, as calls for payment from specialized funds to which the Fonds has committed are usually spread over several years. For instance,
funds committed but not disbursed gave rise to disbursements of $781 million during the last 12 months.
e Guarantees and suretyships are irrevocable commitments and are classified as “On demand”. However, in the current conditions, management
believes it is unlikely that the Fonds will have to disburse amounts for guarantees and suretyships.

FONDS DE SOLIDARITÉ DES TRAVAILLEURS DU QUÉBEC (F.T.Q.) 28
Interim Management Discussion and Analysis for the six-month period ended November 30, 2021
OPERATIONAL RISK
Inherent to all of the Fonds’ activities, operational risk is the risk of sustaining losses as a result of the inadequacy or failure of
certain processes or systems in place or due to human factors or external events. This risk also includes legal risk, regulatory
compliance risk and cybersecurity risk.
Since the most recent annual MD&A, there have been no other material changes to the level and management of operational risk.
STRATEGIC RISK
Strategic risk, which also includes competitive risk and risk associated with regulatory changes, refers to the possibility of incurring
losses as a result of ineffective strategies, lack of integrated business strategies or the inability to adapt the strategies to changes
in the business environment.
Since the most recent annual MD&A, there have been no material changes to the level and management of strategic risk.
REPUTATION RISK
Reputation risk is the risk that negative information, whether founded or unfounded, will cause expenses, revenue losses, a
decrease in liquidity or a decline in the customer base.
Since the most recent annual MD&A, there have been no material changes to the level and management of reputation risk.
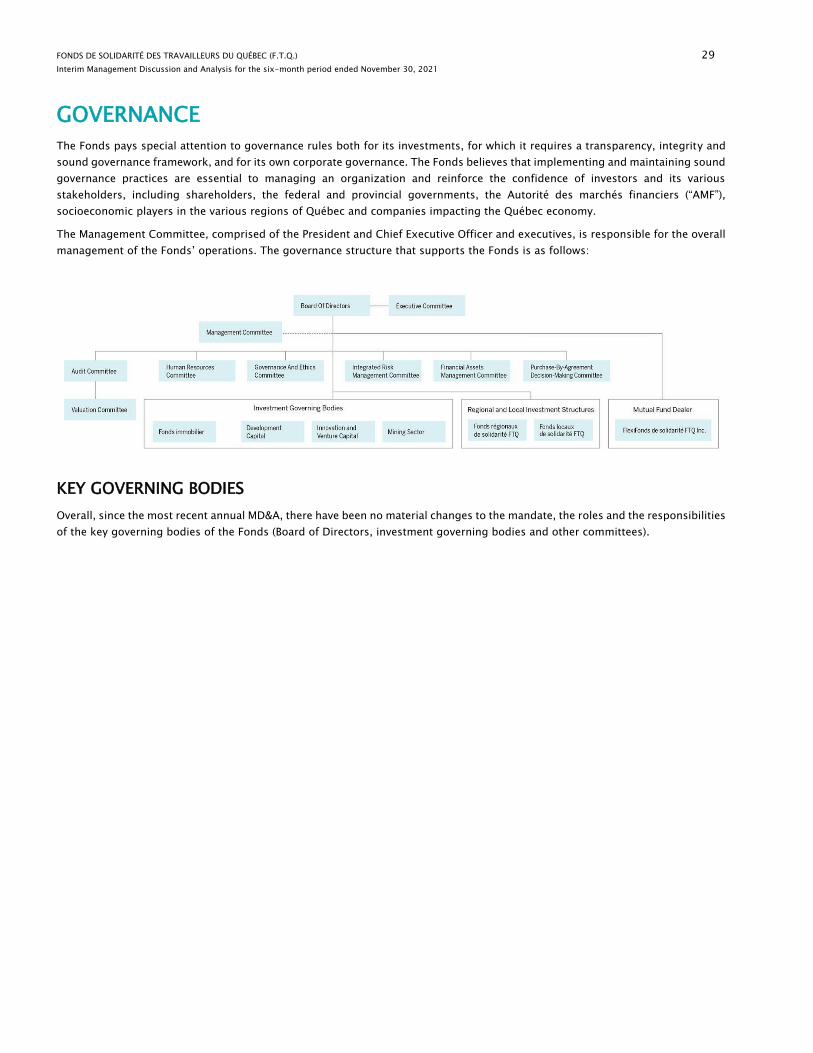
FONDS DE SOLIDARITÉ DES TRAVAILLEURS DU QUÉBEC (F.T.Q.) 29
Interim Management Discussion and Analysis for the six-month period ended November 30, 2021
GOVERNANCE
The Fonds pays special attention to governance rules both for its investments, for which it requires a transparency, integrity and
sound governance framework, and for its own corporate governance. The Fonds believes that implementing and maintaining sound
governance practices are essential to managing an organization and reinforce the confidence of investors and its various
stakeholders, including shareholders, the federal and provincial governments, the Autorité des marchés financiers (“AMF”),
socioeconomic players in the various regions of Québec and companies impacting the Québec economy.
The Management Committee, comprised of the President and Chief Executive Officer and executives, is responsible for the overall
management of the Fonds’ operations. The governance structure that supports the Fonds is as follows:
KEY GOVERNING BODIES
Overall, since the most recent annual MD&A, there have been no material changes to the mandate, the roles and the responsibilities
of the key governing bodies of the Fonds (Board of Directors, investment governing bodies and other committees).
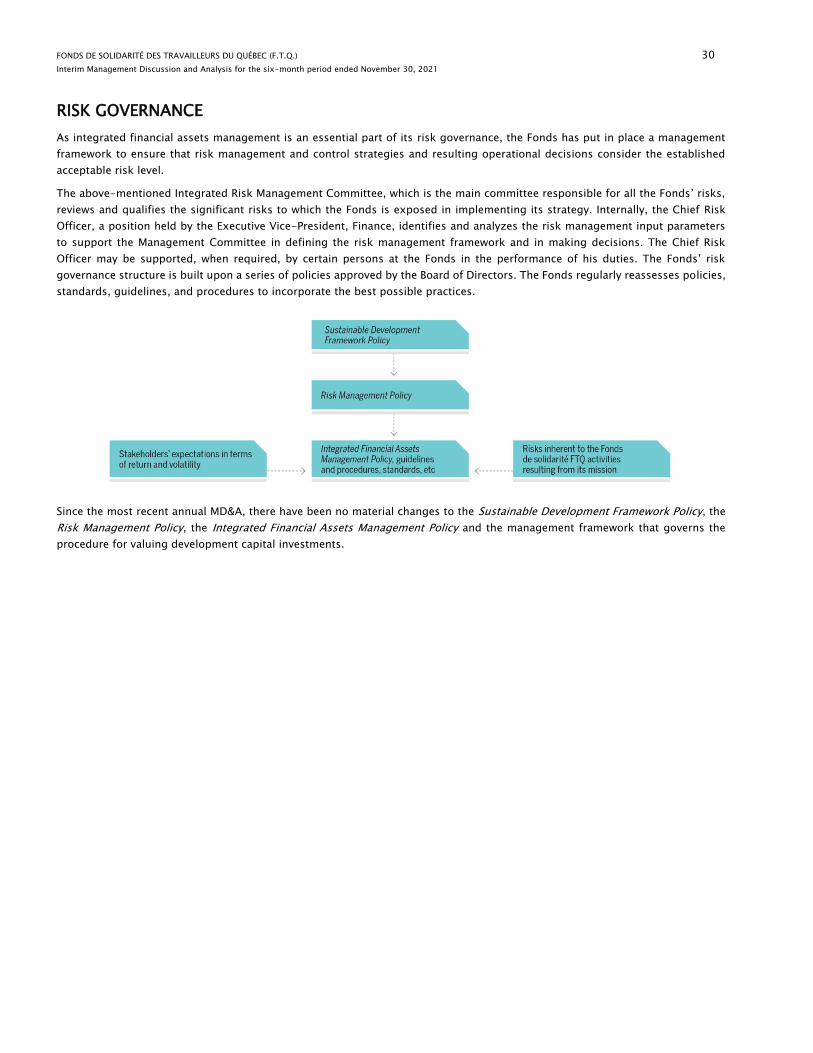
FONDS DE SOLIDARITÉ DES TRAVAILLEURS DU QUÉBEC (F.T.Q.) 30
Interim Management Discussion and Analysis for the six-month period ended November 30, 2021
RISK GOVERNANCE
As integrated financial assets management is an essential part of its risk governance, the Fonds has put in place a management
framework to ensure that risk management and control strategies and resulting operational decisions consider the established
acceptable risk level.
The above-mentioned Integrated Risk Management Committee, which is the main committee responsible for all the Fonds’ risks,
reviews and qualifies the significant risks to which the Fonds is exposed in implementing its strategy. Internally, the Chief Risk
Officer, a position held by the Executive Vice-President, Finance, identifies and analyzes the risk management input parameters
to support the Management Committee in defining the risk management framework and in making decisions. The Chief Risk
Officer may be supported, when required, by certain persons at the Fonds in the performance of his duties. The Fonds’ risk
governance structure is built upon a series of policies approved by the Board of Directors. The Fonds regularly reassesses policies,
standards, guidelines, and procedures to incorporate the best possible practices.
Since the most recent annual MD&A, there have been no material changes to the Sustainable Development Framework Policy, the
Risk Management Policy, the Integrated Financial Assets Management Policy and the management framework that governs the
procedure for valuing development capital investments.
FONDS DE SOLIDARITÉ DES TRAVAILLEURS DU QUÉBEC (F.T.Q.) 31
Interim Management Discussion and Analysis for the six-month period ended November 30, 2021
MANAGEMENT’S REPORT ON INTERNAL CONTROLS
The Fonds has a financial compliance framework program. While not required to apply Regulation 52109 respecting Certification
of Disclosure in Issuers’ Annual and Interim Filings, the Fonds has decided to base its work upon the principles stated in this
regulation, thereby demonstrating its willingness to respect best practices in financial governance.
Management is responsible for designing and maintaining internal control over financial reporting as well as disclosure controls
and procedures. These controls are developed to provide reasonable assurance that the financial information is reliable and that
the financial statements are prepared in accordance with IFRS. However, because of its inherent limitations, internal control over
financial reporting may not prevent or detect certain misstatements on a timely basis. Management must periodically evaluate
control design and effectiveness. The design of internal control over financial reporting has been evaluated using the COSO 2013
(Committee of Sponsoring Organizations of the Treadway Commission) framework, a recognized financial governance framework.
During the six-month period, no change has occurred that has materially affected, or is reasonably likely to materially affect,
internal controls.
STATEMENT OF DEVELOPMENT CAPITAL INVESTMENTS, AT COSTAS AT NOVEMBER 30, 2021
1
INDEPENDENT AUDITOR’S REPORT To the Board of Directors of Fonds de solidarité des travailleurs du Québec (F.T.Q.) Opinion We have audited the statement of development capital investments at cost of the Fonds de solidarité des travailleurs du Québec (F.T.Q.) (the “Fund”) as at November 30, 2021 (the “statement”). In our opinion, the accompanying statement of the Fund as at November 30, 2021 is prepared, in all material respects, in accordance with the dispositions of article 18 of the Regulation respecting capital investment fund continuous disclosure. Basis for Opinion We conducted our audit in accordance with Canadian generally accepted auditing standards (“Canadian GAAS”). Our responsibilities under those standards are further described in the Auditor’s Responsibilities for the Audit of the Statement section of our report. We are independent of the Fund in accordance with the ethical requirements that are relevant to our audit of the statement in Canada, and we have fulfilled our other ethical responsibilities in accordance with these requirements. We believe that the audit evidence we have obtained is sufficient and appropriate to provide a basis for our opinion. Emphasis of Matter - Basis of Accounting The statement is prepared to assist the Fund in complying with the dispositions of article 18 of the Regulation respecting capital investment fund continuous disclosure. As a result, the statement may not be suitable for another purpose. Our opinion is not modified in respect of this matter. Responsibilities of Management and Those Charged with Governance for the Statement Management is responsible for the preparation of the statement in accordance with the dispositions of article 18 of the Regulation respecting capital investment fund continuous disclosure, and for such internal control as management determines is necessary to enable the preparation of the statement that is free from material misstatement, whether due to fraud or error. Those charged with governance are responsible for overseeing the Fund’s financial reporting process. Auditor’s Responsibilities for the Audit of the Statement Our objectives are to obtain reasonable assurance about whether the statement as a whole is free from material misstatement, whether due to fraud or error, and to issue an auditor’s report that includes our opinion. Reasonable assurance is a high level of assurance, but is not a guarantee that an audit conducted in accordance with Canadian GAAS will always detect a material misstatement when it exists. Misstatements can arise from fraud or error and are considered material if, individually or in the aggregate, they could reasonably be expected to influence the economic decisions of users taken on the basis of this statement. As part of an audit in accordance with Canadian GAAS, we exercise professional judgment and maintain professional skepticism throughout the audit. We also: • Identify and assess the risks of material misstatement of the statement, whether due to fraud or error, design and perform
audit procedures responsive to those risks, and obtain audit evidence that is sufficient and appropriate to provide a basis for our opinion. The risk of not detecting a material misstatement resulting from fraud is higher than for one resulting from error, as fraud may involve collusion, forgery, intentional omissions, misrepresentations, or the override of internal control.
• Obtain an understanding of internal control relevant to the audit in order to design audit procedures that are appropriate in the circumstances, but not for the purpose of expressing an opinion on the effectiveness of the Fund’s internal control.
• Evaluate the appropriateness of accounting policies used and the reasonableness of accounting estimates, if any, and related disclosures made by management.
2
We communicate with those charged with governance regarding, among other matters, the planned scope and timing of the audit and significant audit findings, including any significant deficiencies in internal control that we identify during our audit. Signed, Deloitte LLP1
1 CPA auditor, CA, public accountancy permit No. A116933 Montréal, December 23, 2021
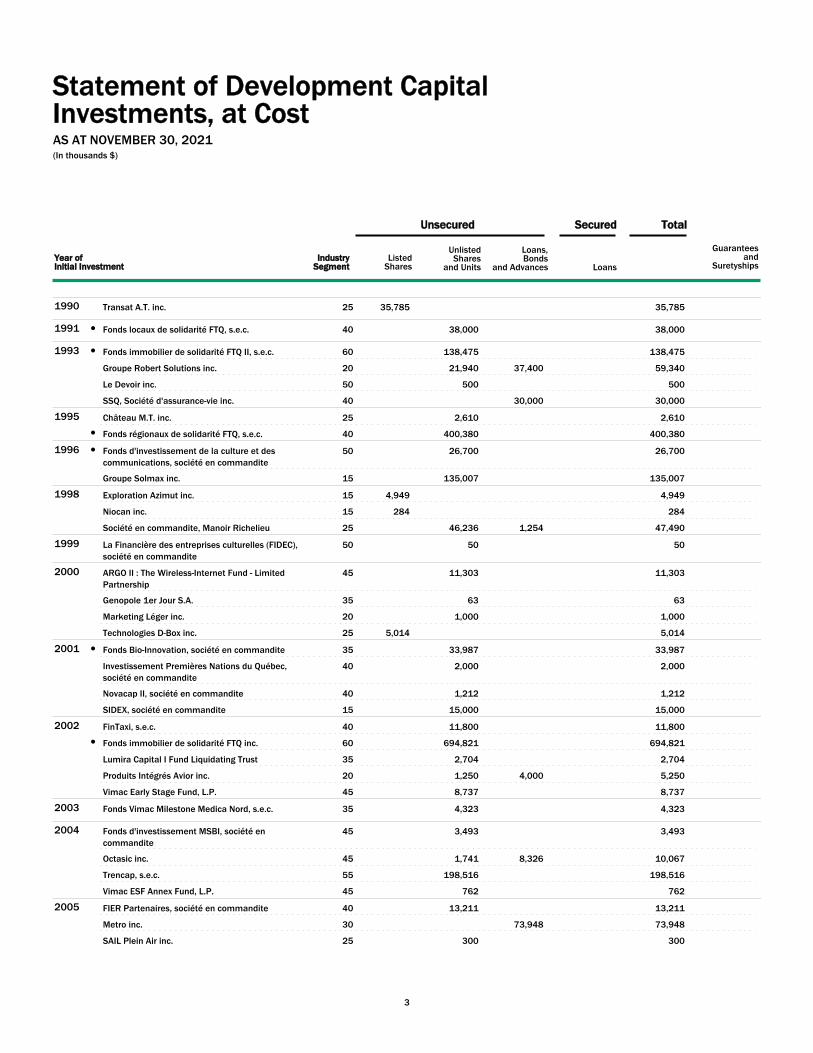
Statement of Development CapitalInvestments, at CostAS AT NOVEMBER 30, 2021(In thousands $)
Unsecured Secured Total
ListedShares
UnlistedShares
and Units Loans
Guaranteesand
SuretyshipsYear ofInitial Investment
Industry Segment
Loans,Bonds
and Advances
1990 Transat A.T. inc. 35,785 V02243 35,785 25
1991 Fonds locaux de solidarité FTQ, s.e.c. 38,000 V02497 38,000 40●
1993 Fonds immobilier de solidarité FTQ II, s.e.c. 138,475 V02828 138,475 60●
Groupe Robert Solutions inc. 21,940 37,400 V22720 59,340 20
Le Devoir inc. 500 V02780 500 50
SSQ, Société d'assurance-vie inc. 30,000 V02606 30,000 40
1995 Château M.T. inc. 2,610 V03133 2,610 25
Fonds régionaux de solidarité FTQ, s.e.c. 400,380 V18672 400,380 40●
1996 Fonds d'investissement de la culture et des communications, société en commandite
26,700 V03748 26,700 50●
Groupe Solmax inc. 135,007 V03615 135,007 15
1998 Exploration Azimut inc. 4,949 V04288 4,949 15
Niocan inc. 284 V04287 284 15
Société en commandite, Manoir Richelieu 46,236 1,254 V03184 47,490 25
1999 La Financière des entreprises culturelles (FIDEC), société en commandite
50 V04472 50 50
2000 ARGO II : The Wireless-Internet Fund - Limited Partnership
11,303 V04893 11,303 45
Genopole 1er Jour S.A. 63 V05387 63 35
Marketing Léger inc. 1,000 V04460 1,000 20
Technologies D-Box inc. 5,014 V04228 5,014 25
2001 Fonds Bio-Innovation, société en commandite 33,987 V05076 33,987 35●
Investissement Premières Nations du Québec, société en commandite
2,000 V04956 2,000 40
Novacap II, société en commandite 1,212 V04981 1,212 40
SIDEX, société en commandite 15,000 V05339 15,000 15
2002 FinTaxi, s.e.c. 11,800 V05683 11,800 40
Fonds immobilier de solidarité FTQ inc. 694,821 V05025 694,821 60●
Lumira Capital I Fund Liquidating Trust 2,704 V20878 2,704 35
Produits Intégrés Avior inc. 1,250 4,000 V05148 5,250 20
Vimac Early Stage Fund, L.P. 8,737 V05543 8,737 45
2003 Fonds Vimac Milestone Medica Nord, s.e.c. 4,323 V05951 4,323 35
2004 Fonds d'investissement MSBI, société en commandite
3,493 V05710 3,493 45
Octasic inc. 1,741 8,326 V05549 10,067 45
Trencap, s.e.c. 198,516 V06277 198,516 55
Vimac ESF Annex Fund, L.P. 762 V06177 762 45
2005 FIER Partenaires, société en commandite 13,211 V06260 13,211 40
Metro inc. 73,948 V11740 73,948 30
SAIL Plein Air inc. 300 V11743 300 25
3
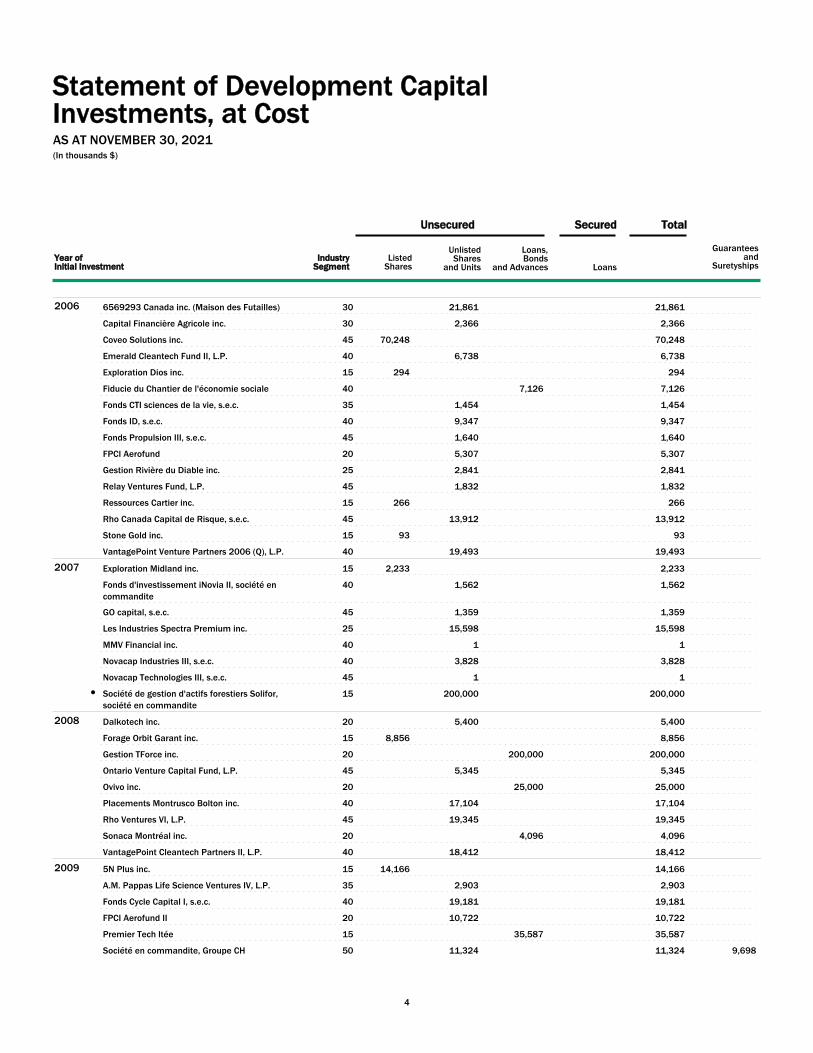
Statement of Development CapitalInvestments, at CostAS AT NOVEMBER 30, 2021(In thousands $)
Unsecured Secured Total
ListedShares
UnlistedShares
and Units Loans
Guaranteesand
SuretyshipsYear ofInitial Investment
Industry Segment
Loans,Bonds
and Advances
2006 6569293 Canada inc. (Maison des Futailles) 21,861 V11897 21,861 30
Capital Financière Agricole inc. 2,366 V06115 2,366 30
Coveo Solutions inc. 70,248 V12251 70,248 45
Emerald Cleantech Fund II, L.P. 6,738 V11778 6,738 40
Exploration Dios inc. 294 V11976 294 15
Fiducie du Chantier de l'économie sociale 7,126 V06285 7,126 40
Fonds CTI sciences de la vie, s.e.c. 1,454 V11965 1,454 35
Fonds ID, s.e.c. 9,347 V11741 9,347 40
Fonds Propulsion III, s.e.c. 1,640 V06283 1,640 45
FPCI Aerofund 5,307 V11792 5,307 20
Gestion Rivière du Diable inc. 2,841 V11457 2,841 25
Relay Ventures Fund, L.P. 1,832 V12024 1,832 45
Ressources Cartier inc. 266 V12031 266 15
Rho Canada Capital de Risque, s.e.c. 13,912 V11984 13,912 45
Stone Gold inc. 93 V23251 93 15
VantagePoint Venture Partners 2006 (Q), L.P. 19,493 V11545 19,493 40
2007 Exploration Midland inc. 2,233 V12531 2,233 15
Fonds d'investissement iNovia II, société en commandite
1,562 V12317 1,562 40
GO capital, s.e.c. 1,359 V12016 1,359 45
Les Industries Spectra Premium inc. 15,598 V06225 15,598 25
MMV Financial inc. 1 V12373 1 40
Novacap Industries III, s.e.c. 3,828 V12234 3,828 40
Novacap Technologies III, s.e.c. 1 V12095 1 45
Société de gestion d'actifs forestiers Solifor, société en commandite
200,000 V11584 200,000 15●
2008 Dalkotech inc. 5,400 V13252 5,400 20
Forage Orbit Garant inc. 8,856 V12278 8,856 15
Gestion TForce inc. 200,000 V14754 200,000 20
Ontario Venture Capital Fund, L.P. 5,345 V13245 5,345 45
Ovivo inc. 25,000 V13155 25,000 20
Placements Montrusco Bolton inc. 17,104 V13132 17,104 40
Rho Ventures VI, L.P. 19,345 V12930 19,345 45
Sonaca Montréal inc. 4,096 V11595 4,096 20
VantagePoint Cleantech Partners II, L.P. 18,412 V13031 18,412 40
2009 5N Plus inc. 14,166 V12431 14,166 15
A.M. Pappas Life Science Ventures IV, L.P. 2,903 V12898 2,903 35
Fonds Cycle Capital I, s.e.c. 19,181 V13823 19,181 40
FPCI Aerofund II 10,722 V13661 10,722 20
Premier Tech ltée 35,587 V01387 35,587 15
Société en commandite, Groupe CH 11,324 V14109 11,324 50 9,698
4
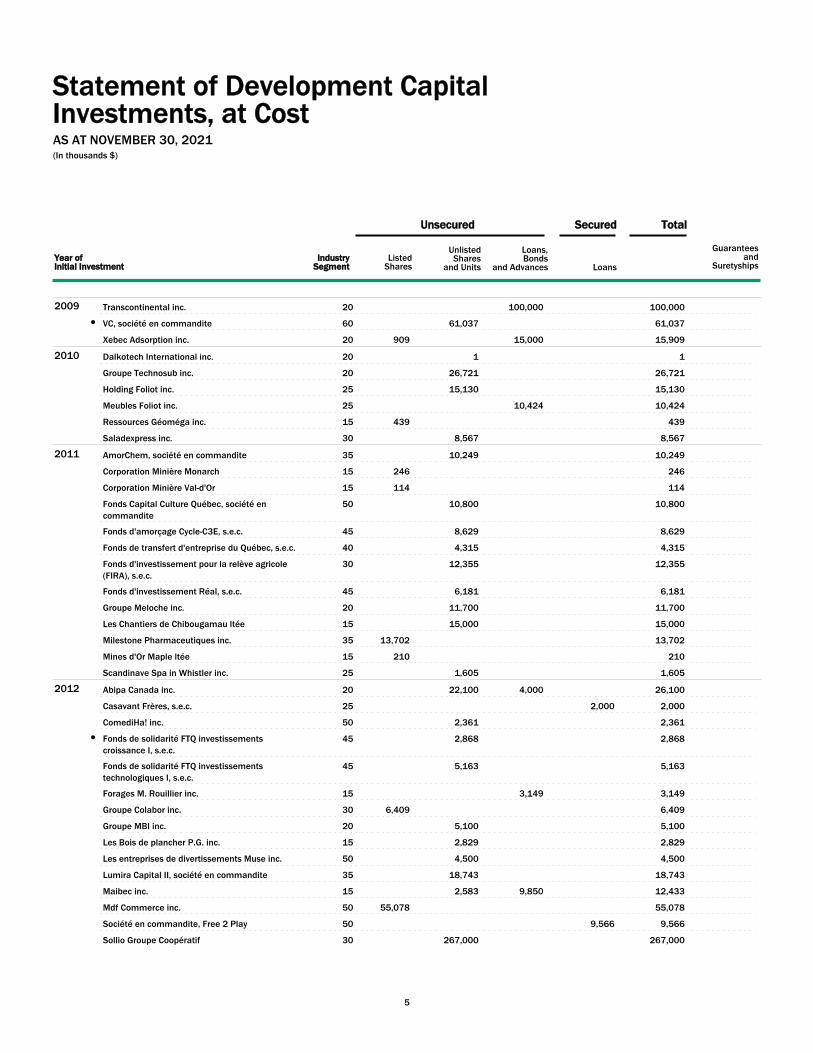
Statement of Development CapitalInvestments, at CostAS AT NOVEMBER 30, 2021(In thousands $)
Unsecured Secured Total
ListedShares
UnlistedShares
and Units Loans
Guaranteesand
SuretyshipsYear ofInitial Investment
Industry Segment
Loans,Bonds
and Advances
2009 Transcontinental inc. 100,000 V13756 100,000 20
VC, société en commandite 61,037 V13847 61,037 60●
Xebec Adsorption inc. 909 15,000 V14895 15,909 20
2010 Dalkotech International inc. 1 V14868 1 20
Groupe Technosub inc. 26,721 V06405 26,721 20
Holding Foliot inc. 15,130 V21973 15,130 25
Meubles Foliot inc. 10,424 V22059 10,424 25
Ressources Géoméga inc. 439 V14798 439 15
Saladexpress inc. 8,567 V03768 8,567 30
2011 AmorChem, société en commandite 10,249 V14317 10,249 35
Corporation Minière Monarch 246 V22754 246 15
Corporation Minière Val-d'Or 114 V15314 114 15
Fonds Capital Culture Québec, société en commandite
10,800 V14949 10,800 50
Fonds d'amorçage Cycle-C3E, s.e.c. 8,629 V14929 8,629 45
Fonds de transfert d'entreprise du Québec, s.e.c. 4,315 V14948 4,315 40
Fonds d'investissement pour la relève agricole (FIRA), s.e.c.
12,355 V14455 12,355 30
Fonds d'investissement Réal, s.e.c. 6,181 V14927 6,181 45
Groupe Meloche inc. 11,700 V14936 11,700 20
Les Chantiers de Chibougamau ltée 15,000 V14814 15,000 15
Milestone Pharmaceutiques inc. 13,702 V14985 13,702 35
Mines d'Or Maple ltée 210 V14828 210 15
Scandinave Spa in Whistler inc. 1,605 V14839 1,605 25
2012 Abipa Canada inc. 22,100 4,000 V15425 26,100 20
Casavant Frères, s.e.c. 2,000 V21969 2,000 25
ComediHa! inc. 2,361 V14747 2,361 50
Fonds de solidarité FTQ investissements croissance I, s.e.c.
2,868 V15817 2,868 45●
Fonds de solidarité FTQ investissements technologiques I, s.e.c.
5,163 V15320 5,163 45
Forages M. Rouillier inc. 3,149 V14933 3,149 15
Groupe Colabor inc. 6,409 V06111 6,409 30
Groupe MBI inc. 5,100 V15261 5,100 20
Les Bois de plancher P.G. inc. 2,829 V13578 2,829 15
Les entreprises de divertissements Muse inc. 4,500 V14680 4,500 50
Lumira Capital II, société en commandite 18,743 V13774 18,743 35
Maibec inc. 2,583 9,850 V02502 12,433 15
Mdf Commerce inc. 55,078 V03963 55,078 50
Société en commandite, Free 2 Play 9,566 V14906 9,566 50
Sollio Groupe Coopératif 267,000 V15256 267,000 30
5
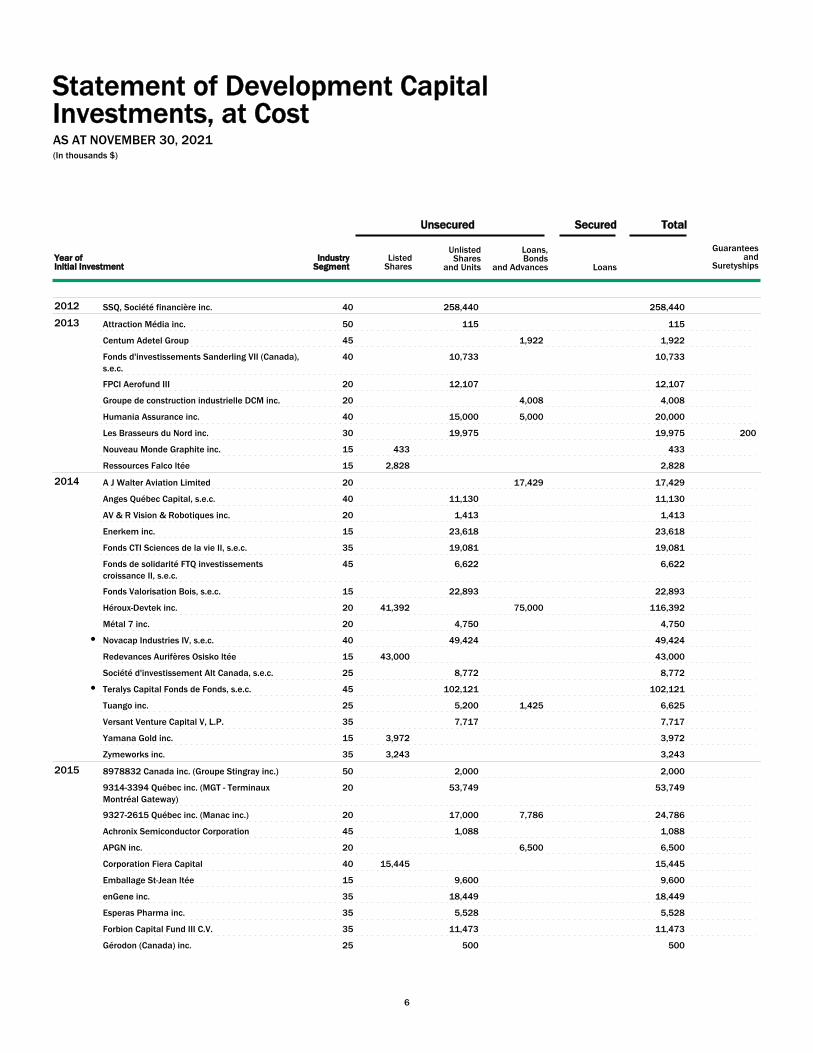
Statement of Development CapitalInvestments, at CostAS AT NOVEMBER 30, 2021(In thousands $)
Unsecured Secured Total
ListedShares
UnlistedShares
and Units Loans
Guaranteesand
SuretyshipsYear ofInitial Investment
Industry Segment
Loans,Bonds
and Advances
2012 SSQ, Société financière inc. 258,440 V15372 258,440 40
2013 Attraction Média inc. 115 V11876 115 50
Centum Adetel Group 1,922 V15890 1,922 45
Fonds d'investissements Sanderling VII (Canada), s.e.c.
10,733 V15642 10,733 40
FPCI Aerofund III 12,107 V15929 12,107 20
Groupe de construction industrielle DCM inc. 4,008 V15945 4,008 20
Humania Assurance inc. 15,000 5,000 V15294 20,000 40
Les Brasseurs du Nord inc. 19,975 V15958 19,975 30 200
Nouveau Monde Graphite inc. 433 V15867 433 15
Ressources Falco ltée 2,828 V16292 2,828 15
2014 A J Walter Aviation Limited 17,429 V18122 17,429 20
Anges Québec Capital, s.e.c. 11,130 V17797 11,130 40
AV & R Vision & Robotiques inc. 1,413 V15961 1,413 20
Enerkem inc. 23,618 V13021 23,618 15
Fonds CTI Sciences de la vie II, s.e.c. 19,081 V15952 19,081 35
Fonds de solidarité FTQ investissements croissance II, s.e.c.
6,622 V18165 6,622 45
Fonds Valorisation Bois, s.e.c. 22,893 V15486 22,893 15
Héroux-Devtek inc. 41,392 75,000 V14766 116,392 20
Métal 7 inc. 4,750 V17257 4,750 20
Novacap Industries IV, s.e.c. 49,424 V17668 49,424 40●
Redevances Aurifères Osisko ltée 43,000 V18105 43,000 15
Société d'investissement Alt Canada, s.e.c. 8,772 V13237 8,772 25
Teralys Capital Fonds de Fonds, s.e.c. 102,121 V13842 102,121 45●
Tuango inc. 5,200 1,425 V17516 6,625 25
Versant Venture Capital V, L.P. 7,717 V16155 7,717 35
Yamana Gold inc. 3,972 V12055 3,972 15
Zymeworks inc. 3,243 V18031 3,243 35
2015 8978832 Canada inc. (Groupe Stingray inc.) 2,000 V18757 2,000 50
9314-3394 Québec inc. (MGT - Terminaux Montréal Gateway)
53,749 V18178 53,749 20
9327-2615 Québec inc. (Manac inc.) 17,000 7,786 V19133 24,786 20
Achronix Semiconductor Corporation 1,088 V19236 1,088 45
APGN inc. 6,500 V12377 6,500 20
Corporation Fiera Capital 15,445 V18462 15,445 40
Emballage St-Jean ltée 9,600 V11888 9,600 15
enGene inc. 18,449 V16114 18,449 35
Esperas Pharma inc. 5,528 V18382 5,528 35
Forbion Capital Fund III C.V. 11,473 V18410 11,473 35
Gérodon (Canada) inc. 500 V17333 500 25
6
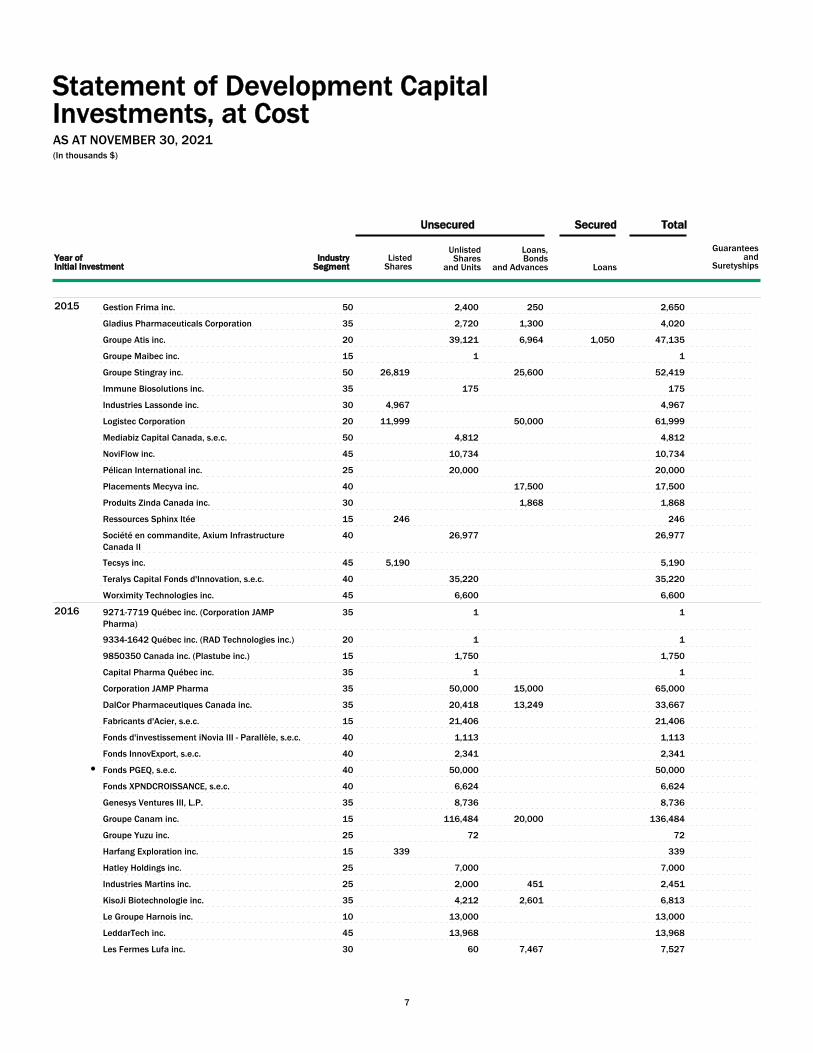
Statement of Development CapitalInvestments, at CostAS AT NOVEMBER 30, 2021(In thousands $)
Unsecured Secured Total
ListedShares
UnlistedShares
and Units Loans
Guaranteesand
SuretyshipsYear ofInitial Investment
Industry Segment
Loans,Bonds
and Advances
2015 Gestion Frima inc. 2,400 250 V17374 2,650 50
Gladius Pharmaceuticals Corporation 2,720 1,300 V16224 4,020 35
Groupe Atis inc. 39,121 6,964 1,050 V18198 47,135 20
Groupe Maibec inc. 1 V18400 1 15
Groupe Stingray inc. 26,819 25,600 V16337 52,419 50
Immune Biosolutions inc. 175 V19128 175 35
Industries Lassonde inc. 4,967 V22658 4,967 30
Logistec Corporation 11,999 50,000 V19213 61,999 20
Mediabiz Capital Canada, s.e.c. 4,812 V18086 4,812 50
NoviFlow inc. 10,734 V16262 10,734 45
Pélican International inc. 20,000 V03545 20,000 25
Placements Mecyva inc. 17,500 V18417 17,500 40
Produits Zinda Canada inc. 1,868 V18398 1,868 30
Ressources Sphinx ltée 246 V13371 246 15
Société en commandite, Axium Infrastructure Canada II
26,977 V16254 26,977 40
Tecsys inc. 5,190 V13685 5,190 45
Teralys Capital Fonds d'Innovation, s.e.c. 35,220 V18076 35,220 40
Worximity Technologies inc. 6,600 V19180 6,600 45
2016 9271-7719 Québec inc. (Corporation JAMP Pharma)
1 V19525 1 35
9334-1642 Québec inc. (RAD Technologies inc.) 1 V18875 1 20
9850350 Canada inc. (Plastube inc.) 1,750 V19824 1,750 15
Capital Pharma Québec inc. 1 V19740 1 35
Corporation JAMP Pharma 50,000 15,000 V19313 65,000 35
DalCor Pharmaceutiques Canada inc. 20,418 13,249 V18348 33,667 35
Fabricants d'Acier, s.e.c. 21,406 V22157 21,406 15
Fonds d'investissement iNovia III - Parallèle, s.e.c. 1,113 V19583 1,113 40
Fonds InnovExport, s.e.c. 2,341 V19303 2,341 40
Fonds PGEQ, s.e.c. 50,000 V19005 50,000 40●
Fonds XPNDCROISSANCE, s.e.c. 6,624 V19274 6,624 40
Genesys Ventures III, L.P. 8,736 V19309 8,736 35
Groupe Canam inc. 116,484 20,000 V06401 136,484 15
Groupe Yuzu inc. 72 V17411 72 25
Harfang Exploration inc. 339 V19399 339 15
Hatley Holdings inc. 7,000 V19539 7,000 25
Industries Martins inc. 2,000 451 V19283 2,451 25
KisoJi Biotechnologie inc. 4,212 2,601 V16166 6,813 35
Le Groupe Harnois inc. 13,000 V14258 13,000 10
LeddarTech inc. 13,968 V17753 13,968 45
Les Fermes Lufa inc. 60 7,467 V18451 7,527 30
7

Statement of Development CapitalInvestments, at CostAS AT NOVEMBER 30, 2021(In thousands $)
Unsecured Secured Total
ListedShares
UnlistedShares
and Units Loans
Guaranteesand
SuretyshipsYear ofInitial Investment
Industry Segment
Loans,Bonds
and Advances
2016 Les Productions Horticoles Demers inc. 7,638 5,683 V18679 13,321 30
Plastube inc. 700 V15368 700 15
PLB International inc. 667 V18992 667 30
Probe Metals inc. 708 V19726 708 15
Sharethrough inc. 18,000 V19330 18,000 45
Triotech Amusement inc. 37,000 V15393 37,000 50
Versant Venture Capital V AIV Feeder Holdings, L.P. 1 V19911 1 35
2017 CAE inc. 64,668 80,823 V19926 145,491 20
Fonds AmorChem II, s.e.c. 6,942 V19279 6,942 35
Fonds Ecofuel I, s.e.c. 1,734 V19932 1,734 40
Fonds Finalta Capital, s.e.c. 10,000 V17724 10,000 40
Galway Metals inc. 535 V20720 535 15
GDI Services aux immeubles inc. 12,786 V18172 12,786 20
Gestion mode JR inc. 14,107 V20722 14,107 25
Groupe Minier Impérial ltée 37 V20745 37 15
Groupe Versification International inc. 1,377 V20737 1,377 15
Joseph Ribkoff inc. 25,000 V05960 25,000 25
Les Équipements Power Survey ltée 6,946 1,733 V20099 8,679 20
Les Industries Bernard & Fils ltée 1 V19938 1 30
Les Technologies Virtuelles intégrées inc. 42 V20476 42 50
Novacap TMT V, s.e.c. 17,733 V20142 17,733 45
Opsens inc. 7,465 V16193 7,465 35
Orford Mining Corporation 36 V20187 36 15
Pangea Opérations Agricoles, s.e.c. 2,000 V19922 2,000 30
Pangea Terres Agricoles, s.e.c. 8,000 V17612 8,000 30
Pharmaceutique Searchlight inc. 3,990 V20370 3,990 35
PreciThera inc. 2,028 246 V20137 2,274 35
Quincaillerie Richelieu ltée 7,391 V19403 7,391 20
Repare Therapeutics inc. 15,123 V19828 15,123 35
Société en commandite, RVOMTL17 4,363 V20081 4,363 45
Stelmine Canada ltée 257 V20159 257 15
Versant Venture Capital VI, L.P. 16,621 V19733 16,621 35
2018 9215-7064 Québec inc. (Groupe Océan) 40,985 13,754 V01453 54,739 20
9375-6260 Québec inc. (Cogir Humaniti Hôtel) 9,450 V21088 9,450 60
Antios Therapeutics inc. 8,606 V21177 8,606 35
Boralex inc. 50,000 V20795 50,000 55
Boutique BFLY DIX-30 inc. 63 V20748 63 25
Champlain BCI Institutionnels Performance, s.e.c. 1 V21105 1 40
EBI Opération inc. 66,993 V20442 66,993 55
Emballages Licaflex 8,281 5,000 V21124 13,281 15
8
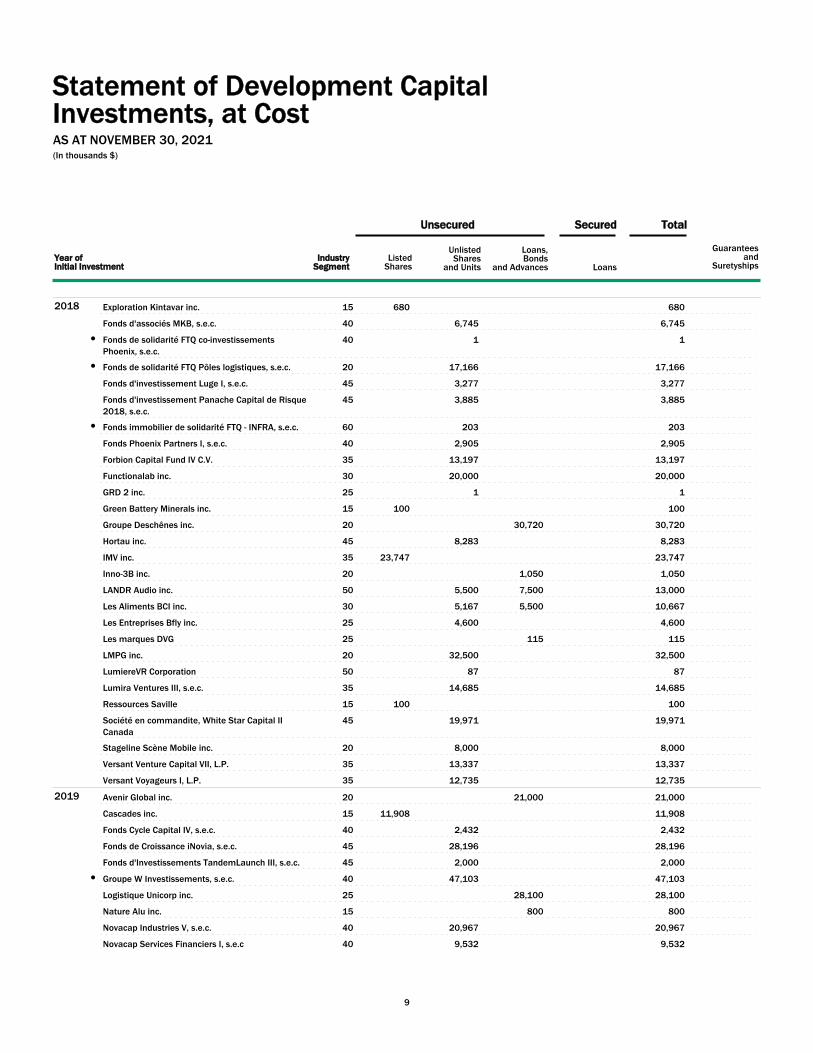
Statement of Development CapitalInvestments, at CostAS AT NOVEMBER 30, 2021(In thousands $)
Unsecured Secured Total
ListedShares
UnlistedShares
and Units Loans
Guaranteesand
SuretyshipsYear ofInitial Investment
Industry Segment
Loans,Bonds
and Advances
2018 Exploration Kintavar inc. 680 V20819 680 15
Fonds d'associés MKB, s.e.c. 6,745 V20802 6,745 40
Fonds de solidarité FTQ co-investissements Phoenix, s.e.c.
1 V21217 1 40●
Fonds de solidarité FTQ Pôles logistiques, s.e.c. 17,166 V18778 17,166 20●
Fonds d'investissement Luge I, s.e.c. 3,277 V20727 3,277 45
Fonds d'investissement Panache Capital de Risque 2018, s.e.c.
3,885 V20464 3,885 45
Fonds immobilier de solidarité FTQ - INFRA, s.e.c. 203 V19962 203 60●
Fonds Phoenix Partners I, s.e.c. 2,905 V20732 2,905 40
Forbion Capital Fund IV C.V. 13,197 V20853 13,197 35
Functionalab inc. 20,000 V12885 20,000 30
GRD 2 inc. 1 V21109 1 25
Green Battery Minerals inc. 100 V21126 100 15
Groupe Deschênes inc. 30,720 V20441 30,720 20
Hortau inc. 8,283 V20747 8,283 45
IMV inc. 23,747 V20449 23,747 35
Inno-3B inc. 1,050 V21101 1,050 20
LANDR Audio inc. 5,500 7,500 V20831 13,000 50
Les Aliments BCI inc. 5,167 5,500 V20839 10,667 30
Les Entreprises Bfly inc. 4,600 V20796 4,600 25
Les marques DVG 115 V20928 115 25
LMPG inc. 32,500 V15264 32,500 20
LumiereVR Corporation 87 V21158 87 50
Lumira Ventures III, s.e.c. 14,685 V19741 14,685 35
Ressources Saville 100 V21127 100 15
Société en commandite, White Star Capital II Canada
19,971 V20465 19,971 45
Stageline Scène Mobile inc. 8,000 V20395 8,000 20
Versant Venture Capital VII, L.P. 13,337 V21121 13,337 35
Versant Voyageurs I, L.P. 12,735 V20385 12,735 35
2019 Avenir Global inc. 21,000 V21201 21,000 20
Cascades inc. 11,908 V13771 11,908 15
Fonds Cycle Capital IV, s.e.c. 2,432 V21110 2,432 40
Fonds de Croissance iNovia, s.e.c. 28,196 V20918 28,196 45
Fonds d'Investissements TandemLaunch III, s.e.c. 2,000 V22001 2,000 45
Groupe W Investissements, s.e.c. 47,103 V21343 47,103 40●
Logistique Unicorp inc. 28,100 V14908 28,100 25
Nature Alu inc. 800 V21983 800 15
Novacap Industries V, s.e.c. 20,967 V21212 20,967 40
Novacap Services Financiers I, s.e.c 9,532 V21340 9,532 40
9

Statement of Development CapitalInvestments, at CostAS AT NOVEMBER 30, 2021(In thousands $)
Unsecured Secured Total
ListedShares
UnlistedShares
and Units Loans
Guaranteesand
SuretyshipsYear ofInitial Investment
Industry Segment
Loans,Bonds
and Advances
2019 Novacap TMT V Co-Investissement (Nuvei), s.e.c. 64,989 V22019 64,989 45
Préverco inc. 5,500 V21162 5,500 20
ProteKt Therapeutics Ltd 1,979 151 V21366 2,130 35
Ressources Sirios inc. 175 V14995 175 15
Ressources X-Terra inc. 28 V20165 28 15
Savaria Corporation 41,289 V12516 41,289 20
Spring Lane Capital Canada Fund I, L.P. 3,649 V21129 3,649 40
Stradigi IA inc. 13,190 V21304 13,190 45
Teralys Capital Fonds d'Innovation 2018, s.e.c. 9,091 V20775 9,091 40
Thérapeutique QTL inc. 8,765 V21967 8,765 35
Turnstone Biologics Corporation 13,391 V21111 13,391 35
VectivBio Holding AG 2,239 V21985 2,239 35
2020 Ace Phoenix Partners FPCI (MECA Dev) 39,881 V22120 39,881 20
AddÉnergie Technologies inc. 7,000 V17744 7,000 20
Administration portuaire de Montréal 20,000 V20816 20,000 20
Bestar inc. 9,822 V02252 9,822 25
C.I.F. Métal ltée 13,480 V21923 13,480 15
Carbotech International 3,000 V19584 3,000 20
EBC inc. 13,500 V18133 13,500 20
E-Solutions groupe d'ameublement inc. 28,641 V22089 28,641 25
Exprolink inc. 3,000 500 V22060 3,500 20
Fonds Capital de Risque Amplitude I, s.e.c. 5,681 V20894 5,681 35
Fonds d'associés MKB II, s.e.c. 2,340 V22168 2,340 40
Fonds iNovia / FSTQ (Workjam), s.e.c. 7,059 V22139 7,059 45
GHGSat inc. 6,582 V22164 6,582 20
GNR Québec Capital, s.e.c. 700 V22054 700 20
Groupe Remstarmédia inc. 1 V21989 1 50
Groupe SNC-Lavalin inc. 37,556 V22069 37,556 20
Inversago Pharma inc. 7,869 V22047 7,869 35
InvestEco Sustainable Food Fund III, L.P. 2,543 V22102 2,543 30
La société de gestion Access, Tenet, MyCloud Corporation
3,000 V21138 3,000 45
Les Mines Fury Gold 107 V22670 107 15
McRock Fund II, L.P. 3,564 V22154 3,564 45
MDA Ltd 52,500 V22851 52,500 20
Minerai de Fer Québec inc. 5,094 29,200 V19049 34,294 15
Minéraux Amérique du Nord Kenorland 500 V22589 500 15
Minière O3 494 V22551 494 15
Minière Osisko inc. 1,719 V22552 1,719 15
Novacap TMT V Co-Investissement (NDT-E), s.e.c. 15,087 V21941 15,087 20
Omnirobotique inc. 3,000 V22081 3,000 45
10

Statement of Development CapitalInvestments, at CostAS AT NOVEMBER 30, 2021(In thousands $)
Unsecured Secured Total
ListedShares
UnlistedShares
and Units Loans
Guaranteesand
SuretyshipsYear ofInitial Investment
Industry Segment
Loans,Bonds
and Advances
2020 Redevances Nomad ltée 993 V22160 993 15
Société en commandite, Theodorus IV 2,075 V22021 2,075 35
Troilus Gold Corp. 1,337 V22116 1,337 15
2021 5AM Opportunities II, L.P. 1,378 V23138 1,378 35
9209-8656 Québec inc. (Groupe Crête) 10,000 V22781 10,000 15
Agropur Coopérative 53,669 V17727 53,669 30
Anges Québec Capital II, s.e.c. 386 V22079 386 40
Compagnie Globe Électrique inc. 44,720 V22714 44,720 25
Congruence Thérapeutique inc. 5,631 V22793 5,631 35
Epitopea inc. 1,695 V22840 1,695 35
Epitopea Limited 1 V23245 1 35
Équipement respiratoire scientifique SCIREQ inc. 800 8,400 V22734 9,200 35
Evol Financement 1,000 V23120 1,000 40
Fonds CTI Sciences de la vie III, s.e.c. 1,025 V22064 1,025 35
Fonds de Croissance iNovia II, s.e.c. 6,629 V22623 6,629 45
Fonds Phoenix Partners II, s.e.c. 117 V22847 117 40
Forbion Capital Fund V C.V. 2,704 V22626 2,704 35
FSIT II, s.e.c. 28 V22632 28 45
Gestion Globe Électrique inc. 35,115 V22848 35,115 25
Giiant Pharma inc. 786 V22726 786 35
Gold Royalty Corp. 1,151 V23250 1,151 15
Les recettes COOK it inc. 5,500 V22737 5,500 30
Lumira Ventures IV, L.P. 2,052 V22592 2,052 35
Mines d'Or Eldorado inc. 168 V04110 168 15
Novacap TMT Syntax Véhicule de Continuation, s.e.c.
17,616 V23144 17,616 45
Novacap TMT VI, s.e.c. 1,788 V22625 1,788 45
NuChem Sciences inc. 6,370 11,000 V22703 17,370 35
Pyrowave inc. 5,000 V22645 5,000 20
Société en commandite, White Star Capital III Amérique du Nord
6,626 V22172 6,626 45
TorQuest Partners Fund V, L.P. 8,966 V22108 8,966 40
Ventus Therapeutics U.S. inc. 5,052 V22142 5,052 35
Versant Venture Capital VIII, L.P. 1,956 V22601 1,956 35
Versant Voyageurs II, L.P. 366 V22602 366 35
Vior inc. 300 V14181 300 15
1 1 V22156 2 4016 general partners of limited partnerships
670,359 Total 4,919,396 1,323,706 15,349 9,898 6,928,810
11

Statement of Development CapitalInvestments, at CostAS AT NOVEMBER 30, 2021(In thousands $)
Unsecured Secured Total
ListedShares
UnlistedShares
and Units Loans
Guaranteesand
SuretyshipsYear ofInitial Investment
Industry Segment
Loans,Bonds
and Advances
This statement of development capital investments at a total cost of $6,928,810,000 itemizes by company the amounts invested by the Fonds de solidarité des travailleurs du Québec (F.T.Q.). This amount appears in Note 7 to the financial statements as at November 30, 2021. In addition, this statement presents a list of the guarantees and suretyships granted by the Fonds.
The list of investments made by these specialized funds is shown in the unaudited Index of the share of the Fonds in investments made by the specialized funds, at cost.
●
EnergyMaterialsIndustrialsConsumer discretionaryConsumer staplesHealth careFinancialsInformation technologyCommunication servicesUtilitiesReal Estate
Industry segment
1015202530354045505560
12
RELEVÉ DES AUTRES INVESTISSEMENTS (NON AUDITÉ) IN FRENCH ONLY
AS AT NOVEMBER 30, 2021
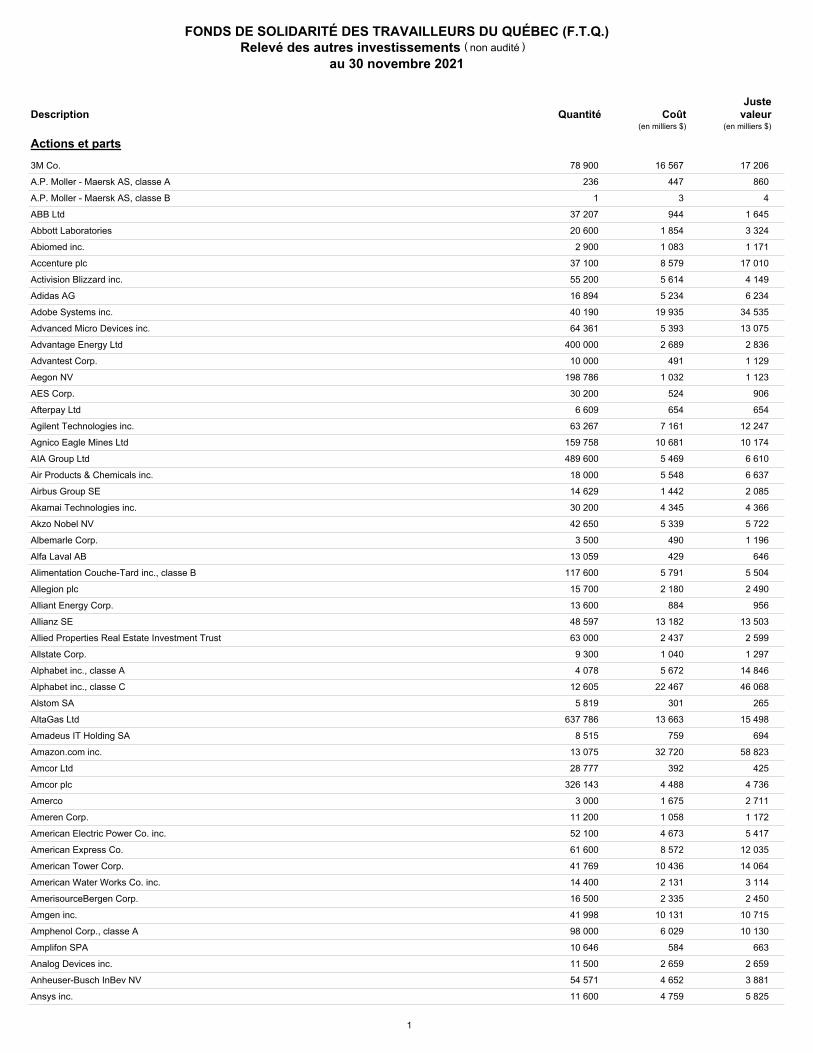
FONDS DE SOLIDARITÉ DES TRAVAILLEURS DU QUÉBEC (F.T.Q.)Relevé des autres investissements
au 30 novembre 2021
non audité( )
Quantité CoûtJuste
valeurDescription(en milliers $)(en milliers $)
Actions et parts
16 567 3M Co. 78 900 17 206 88579Y10188579Y101 447 A.P. Moller - Maersk AS, classe A 236 860 DK0010244425DK0010244425
3 A.P. Moller - Maersk AS, classe B 1 4 DK0010244508DK0010244508 944 ABB Ltd 37 207 1 645 710889908710889908
1 854 Abbott Laboratories 20 600 3 324 002824100002824100 1 083 Abiomed inc. 2 900 1 171 003654100003654100 8 579 Accenture plc 37 100 17 010 G1151C101G1151C101 5 614 Activision Blizzard inc. 55 200 4 149 00507V10900507V109 5 234 Adidas AG 16 894 6 234 403197908403197908
19 935 Adobe Systems inc. 40 190 34 535 00724F10100724F101 5 393 Advanced Micro Devices inc. 64 361 13 075 007903107007903107 2 689 Advantage Energy Ltd 400 000 2 836 00791P10700791P107
491 Advantest Corp. 10 000 1 129 JP3122400009JP3122400009 1 032 Aegon NV 198 786 1 123 592737902592737902
524 AES Corp. 30 200 906 00130H10500130H105 654 Afterpay Ltd 6 609 654 000000APT000000APT
7 161 Agilent Technologies inc. 63 267 12 247 00846U10100846U101 10 681 Agnico Eagle Mines Ltd 159 758 10 174 008474108008474108
5 469 AIA Group Ltd 489 600 6 610 B4TX8S909B4TX8S909 5 548 Air Products & Chemicals inc. 18 000 6 637 009158106009158106 1 442 Airbus Group SE 14 629 2 085 401225909401225909 4 345 Akamai Technologies inc. 30 200 4 366 00971T10100971T101 5 339 Akzo Nobel NV 42 650 5 722 545831901545831901
490 Albemarle Corp. 3 500 1 196 012653101012653101 429 Alfa Laval AB 13 059 646 SE0000695876SE0000695876
5 791 Alimentation Couche-Tard inc., classe B 117 600 5 504 01626P40301626P403 2 180 Allegion plc 15 700 2 490 IE00BFRT3W74IE00BFRT3W74
884 Alliant Energy Corp. 13 600 956 018802108018802108 13 182 Allianz SE 48 597 13 503 523148906523148906
2 437 Allied Properties Real Estate Investment Trust 63 000 2 599 019456102019456102 1 040 Allstate Corp. 9 300 1 297 020002101020002101 5 672 Alphabet inc., classe A 4 078 14 846 02079K30502079K305
22 467 Alphabet inc., classe C 12 605 46 068 02079K10702079K107 301 Alstom SA 5 819 265 FR0010220475FR0010220475
13 663 AltaGas Ltd 637 786 15 498 021361100021361100 759 Amadeus IT Holding SA 8 515 694 ES0109067019ES0109067019
32 720 Amazon.com inc. 13 075 58 823 023135106023135106 392 Amcor Ltd 28 777 425 AU000000AMC4AU000000AMC4
4 488 Amcor plc 326 143 4 736 JE00BJ1F3079JE00BJ1F3079 1 675 Amerco 3 000 2 711 023586100023586100 1 058 Ameren Corp. 11 200 1 172 023608102023608102 4 673 American Electric Power Co. inc. 52 100 5 417 025537101025537101 8 572 American Express Co. 61 600 12 035 025816109025816109
10 436 American Tower Corp. 41 769 14 064 03027X10003027X100 2 131 American Water Works Co. inc. 14 400 3 114 030420103030420103 2 335 AmerisourceBergen Corp. 16 500 2 450 03073E10503073E105
10 131 Amgen inc. 41 998 10 715 031162100031162100 6 029 Amphenol Corp., classe A 98 000 10 130 032095101032095101
584 Amplifon SPA 10 646 663 000405688000405688 2 659 Analog Devices inc. 11 500 2 659 032654105032654105 4 652 Anheuser-Busch InBev NV 54 571 3 881 475531901475531901 4 759 Ansys inc. 11 600 5 825 03662Q10503662Q105
1
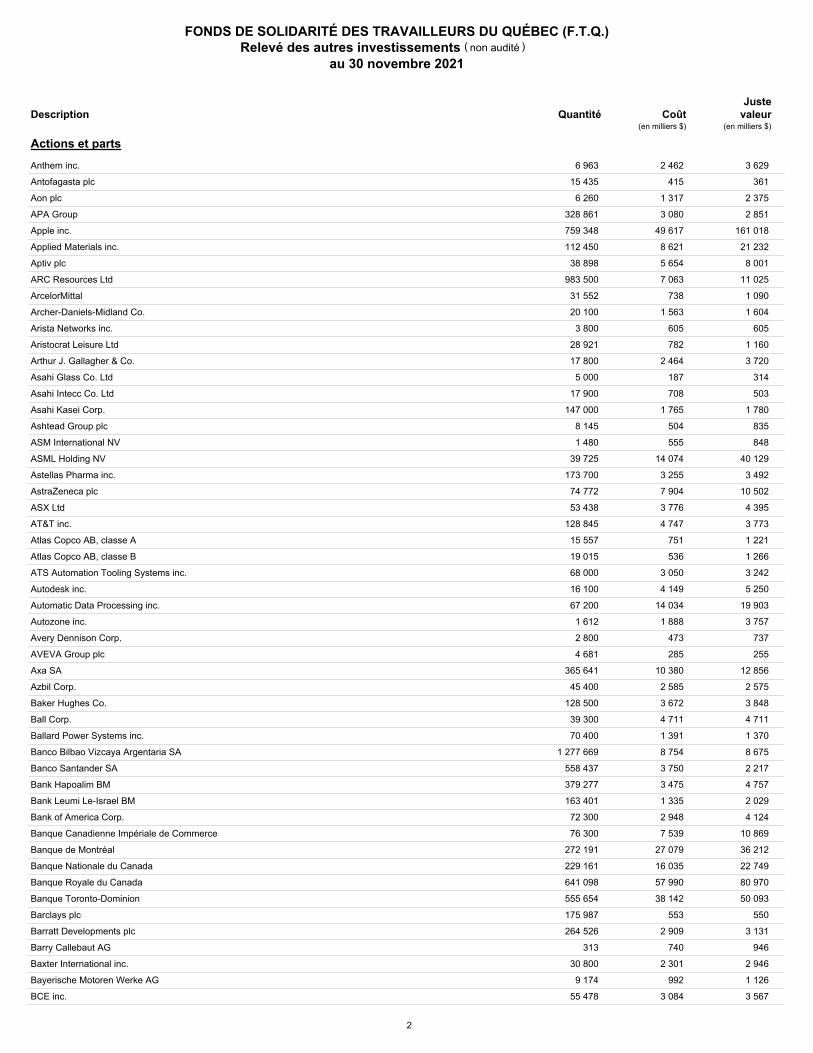
FONDS DE SOLIDARITÉ DES TRAVAILLEURS DU QUÉBEC (F.T.Q.)Relevé des autres investissements
au 30 novembre 2021
non audité( )
Quantité CoûtJuste
valeurDescription(en milliers $)(en milliers $)
Actions et parts
2 462 Anthem inc. 6 963 3 629 036752103036752103 415 Antofagasta plc 15 435 361 GB0000456144GB0000456144
1 317 Aon plc 6 260 2 375 IE00BLP1HW54IE00BLP1HW54 3 080 APA Group 328 861 2 851 624730909624730909
49 617 Apple inc. 759 348 161 018 037833100037833100 8 621 Applied Materials inc. 112 450 21 232 038222105038222105 5 654 Aptiv plc 38 898 8 001 G6095L109G6095L109 7 063 ARC Resources Ltd 983 500 11 025 00208D40800208D408
738 ArcelorMittal 31 552 1 090 LU1598757687LU1598757687 1 563 Archer-Daniels-Midland Co. 20 100 1 604 039483102039483102
605 Arista Networks inc. 3 800 605 040413106040413106 782 Aristocrat Leisure Ltd 28 921 1 160 AU000000ALL7AU000000ALL7
2 464 Arthur J. Gallagher & Co. 17 800 3 720 363576109363576109 187 Asahi Glass Co. Ltd 5 000 314 JP3112000009JP3112000009 708 Asahi Intecc Co. Ltd 17 900 503 JP3110650003JP3110650003
1 765 Asahi Kasei Corp. 147 000 1 780 605460005605460005 504 Ashtead Group plc 8 145 835 GB0000536739GB0000536739 555 ASM International NV 1 480 848 NL0000334118NL0000334118
14 074 ASML Holding NV 39 725 40 129 ACI02GTQ9ACI02GTQ9 3 255 Astellas Pharma inc. 173 700 3 492 698538006698538006 7 904 AstraZeneca plc 74 772 10 502 098952906098952906 3 776 ASX Ltd 53 438 4 395 AU000000ASX7AU000000ASX7 4 747 AT&T inc. 128 845 3 773 00206R10200206R102
751 Atlas Copco AB, classe A 15 557 1 221 SE0011166610SE0011166610 536 Atlas Copco AB, classe B 19 015 1 266 SE0011166628SE0011166628
3 050 ATS Automation Tooling Systems inc. 68 000 3 242 001940105001940105 4 149 Autodesk inc. 16 100 5 250 052769106052769106
14 034 Automatic Data Processing inc. 67 200 19 903 053015103053015103 1 888 Autozone inc. 1 612 3 757 053332102053332102
473 Avery Dennison Corp. 2 800 737 053611109053611109 285 AVEVA Group plc 4 681 255 GB00BBG9VN75GB00BBG9VN75
10 380 Axa SA 365 641 12 856 708842901708842901 2 585 Azbil Corp. 45 400 2 575 393720000393720000 3 672 Baker Hughes Co. 128 500 3 848 05722G10005722G100 4 711 Ball Corp. 39 300 4 711 058498106058498106 1 391 Ballard Power Systems inc. 70 400 1 370 058586108058586108 8 754 Banco Bilbao Vizcaya Argentaria SA 1 277 669 8 675 550190904550190904 3 750 Banco Santander SA 558 437 2 217 570594903570594903 3 475 Bank Hapoalim BM 379 277 4 757 IL0006625771IL0006625771 1 335 Bank Leumi Le-Israel BM 163 401 2 029 IL0006046119IL0006046119 2 948 Bank of America Corp. 72 300 4 124 060505104060505104 7 539 Banque Canadienne Impériale de Commerce 76 300 10 869 136069101136069101
27 079 Banque de Montréal 272 191 36 212 063671101063671101 16 035 Banque Nationale du Canada 229 161 22 749 633067103633067103 57 990 Banque Royale du Canada 641 098 80 970 780087102780087102 38 142 Banque Toronto-Dominion 555 654 50 093 891160509891160509
553 Barclays plc 175 987 550 313486904313486904 2 909 Barratt Developments plc 264 526 3 131 GB0000811801GB0000811801
740 Barry Callebaut AG 313 946 547692905547692905 2 301 Baxter International inc. 30 800 2 946 071813109071813109
992 Bayerische Motoren Werke AG 9 174 1 126 575602909575602909 3 084 BCE inc. 55 478 3 567 05534B76005534B760
2
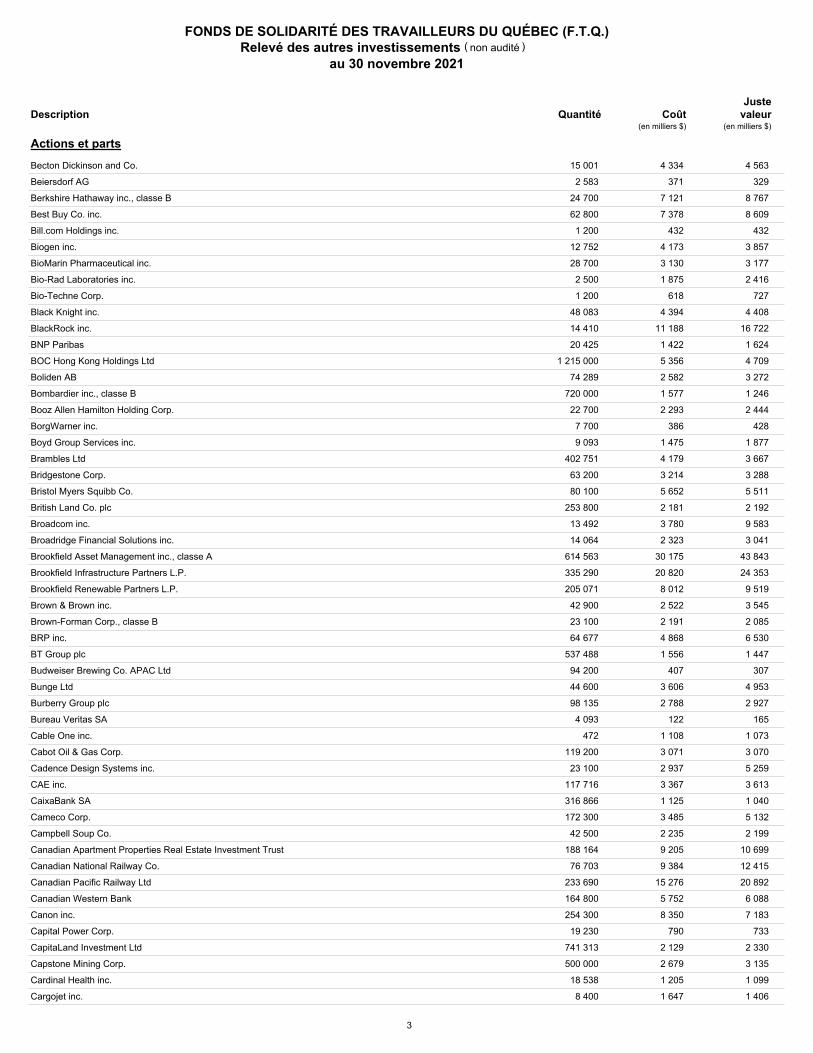
FONDS DE SOLIDARITÉ DES TRAVAILLEURS DU QUÉBEC (F.T.Q.)Relevé des autres investissements
au 30 novembre 2021
non audité( )
Quantité CoûtJuste
valeurDescription(en milliers $)(en milliers $)
Actions et parts
4 334 Becton Dickinson and Co. 15 001 4 563 075887109075887109 371 Beiersdorf AG 2 583 329 510740905510740905
7 121 Berkshire Hathaway inc., classe B 24 700 8 767 084670702084670702 7 378 Best Buy Co. inc. 62 800 8 609 086516101086516101
432 Bill.com Holdings inc. 1 200 432 090043100090043100 4 173 Biogen inc. 12 752 3 857 09062X10309062X103 3 130 BioMarin Pharmaceutical inc. 28 700 3 177 09061G10109061G101 1 875 Bio-Rad Laboratories inc. 2 500 2 416 090572207090572207
618 Bio-Techne Corp. 1 200 727 09073M10409073M104 4 394 Black Knight inc. 48 083 4 408 09215C10509215C105
11 188 BlackRock inc. 14 410 16 722 09247X10109247X101 1 422 BNP Paribas 20 425 1 624 730968906730968906 5 356 BOC Hong Kong Holdings Ltd 1 215 000 4 709 653611905653611905 2 582 Boliden AB 74 289 3 272 SE0015811559SE0015811559 1 577 Bombardier inc., classe B 720 000 1 246 097751200097751200 2 293 Booz Allen Hamilton Holding Corp. 22 700 2 444 099502106099502106
386 BorgWarner inc. 7 700 428 099724106099724106 1 475 Boyd Group Services inc. 9 093 1 877 103310108103310108 4 179 Brambles Ltd 402 751 3 667 B1FJ0C904B1FJ0C904 3 214 Bridgestone Corp. 63 200 3 288 613210004613210004 5 652 Bristol Myers Squibb Co. 80 100 5 511 110122108110122108 2 181 British Land Co. plc 253 800 2 192 013670005013670005 3 780 Broadcom inc. 13 492 9 583 11135F10111135F101 2 323 Broadridge Financial Solutions inc. 14 064 3 041 11133T10311133T103
30 175 Brookfield Asset Management inc., classe A 614 563 43 843 112585104112585104 20 820 Brookfield Infrastructure Partners L.P. 335 290 24 353 G16252101G16252101
8 012 Brookfield Renewable Partners L.P. 205 071 9 519 G16258108USG16249107+ 2 522 Brown & Brown inc. 42 900 3 545 115236101115236101 2 191 Brown-Forman Corp., classe B 23 100 2 085 115637209115637209 4 868 BRP inc. 64 677 6 530 05577W20005577W200 1 556 BT Group plc 537 488 1 447 309135903309135903
407 Budweiser Brewing Co. APAC Ltd 94 200 307 KYG1674K1013KYG1674K1013 3 606 Bunge Ltd 44 600 4 953 G16962105G16962105 2 788 Burberry Group plc 98 135 2 927 317430908317430908
122 Bureau Veritas SA 4 093 165 FR0006174348FR0006174348 1 108 Cable One inc. 472 1 073 12685J10512685J105 3 071 Cabot Oil & Gas Corp. 119 200 3 070 127097103127097103 2 937 Cadence Design Systems inc. 23 100 5 259 127387108127387108 3 367 CAE inc. 117 716 3 613 124765108124765108 1 125 CaixaBank SA 316 866 1 040 ES0140609019ES0140609019 3 485 Cameco Corp. 172 300 5 132 13321L10813321L108 2 235 Campbell Soup Co. 42 500 2 199 134429109134429109 9 205 Canadian Apartment Properties Real Estate Investment Trust 188 164 10 699 134921105134921105 9 384 Canadian National Railway Co. 76 703 12 415 136375102136375102
15 276 Canadian Pacific Railway Ltd 233 690 20 892 13645T10013645T100 5 752 Canadian Western Bank 164 800 6 088 13677F10113677F101 8 350 Canon inc. 254 300 7 183 617232004617232004
790 Capital Power Corp. 19 230 733 14042M10214042M102 2 129 CapitaLand Investment Ltd 741 313 2 330 SGXE62145532SGXE62145532 2 679 Capstone Mining Corp. 500 000 3 135 14068G10414068G104 1 205 Cardinal Health inc. 18 538 1 099 14149Y10814149Y108 1 647 Cargojet inc. 8 400 1 406 14179V50314179V503
3
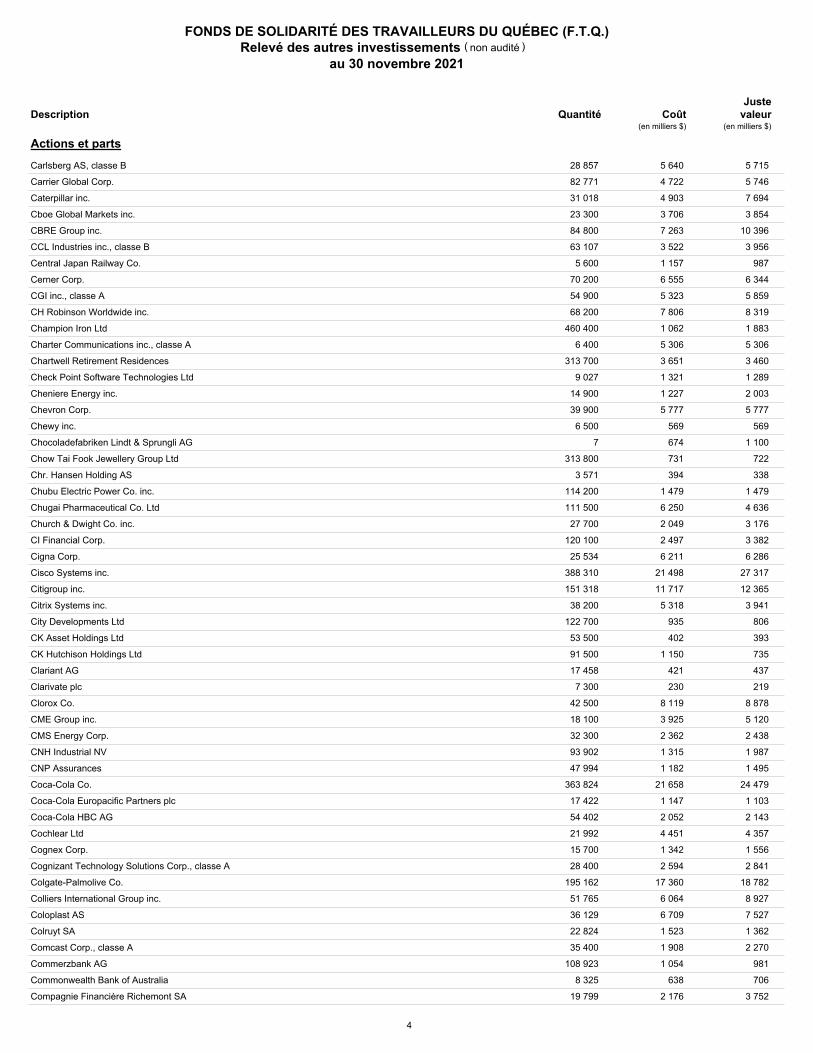
FONDS DE SOLIDARITÉ DES TRAVAILLEURS DU QUÉBEC (F.T.Q.)Relevé des autres investissements
au 30 novembre 2021
non audité( )
Quantité CoûtJuste
valeurDescription(en milliers $)(en milliers $)
Actions et parts
5 640 Carlsberg AS, classe B 28 857 5 715 416921005416921005 4 722 Carrier Global Corp. 82 771 5 746 14448C10414448C104 4 903 Caterpillar inc. 31 018 7 694 149123101149123101 3 706 Cboe Global Markets inc. 23 300 3 854 12503M10812503M108 7 263 CBRE Group inc. 84 800 10 396 12504L10912504L109 3 522 CCL Industries inc., classe B 63 107 3 956 124900309124900309 1 157 Central Japan Railway Co. 5 600 987 618355903618355903 6 555 Cerner Corp. 70 200 6 344 156782104156782104 5 323 CGI inc., classe A 54 900 5 859 12532H10412532H104 7 806 CH Robinson Worldwide inc. 68 200 8 319 12541W20912541W209 1 062 Champion Iron Ltd 460 400 1 883 Q22964102Q22964102 5 306 Charter Communications inc., classe A 6 400 5 306 16119P10816119P108 3 651 Chartwell Retirement Residences 313 700 3 460 16141A10316141A103 1 321 Check Point Software Technologies Ltd 9 027 1 289 IL0010824113IL0010824113 1 227 Cheniere Energy inc. 14 900 2 003 16411R20816411R208 5 777 Chevron Corp. 39 900 5 777 166764100166764100
569 Chewy inc. 6 500 569 16679L10916679L109 674 Chocoladefabriken Lindt & Sprungli AG 7 1 100 CH0010570759CH0010570759 731 Chow Tai Fook Jewellery Group Ltd 313 800 722 G21146108G21146108 394 Chr. Hansen Holding AS 3 571 338 DK0060227585DK0060227585
1 479 Chubu Electric Power Co. inc. 114 200 1 479 619560006619560006 6 250 Chugai Pharmaceutical Co. Ltd 111 500 4 636 JP3519400000JP3519400000 2 049 Church & Dwight Co. inc. 27 700 3 176 171340102171340102 2 497 CI Financial Corp. 120 100 3 382 125491100125491100 6 211 Cigna Corp. 25 534 6 286 125523100125523100
21 498 Cisco Systems inc. 388 310 27 317 17275R10217275R102 11 717 Citigroup inc. 151 318 12 365 172967424172967424
5 318 Citrix Systems inc. 38 200 3 941 177376100177376100 935 City Developments Ltd 122 700 806 SG1R89002252SG1R89002252 402 CK Asset Holdings Ltd 53 500 393 KYG2177B1014KYG2177B1014
1 150 CK Hutchison Holdings Ltd 91 500 735 619027006619027006 421 Clariant AG 17 458 437 CH0012142631CH0012142631 230 Clarivate plc 7 300 219 00BJJN44400BJJN444
8 119 Clorox Co. 42 500 8 878 189054109189054109 3 925 CME Group inc. 18 100 5 120 12572Q10512572Q105 2 362 CMS Energy Corp. 32 300 2 438 125896100125896100 1 315 CNH Industrial NV 93 902 1 987 NL0010545661NL0010545661 1 182 CNP Assurances 47 994 1 495 FR0000120222FR0000120222
21 658 Coca-Cola Co. 363 824 24 479 191216100191216100 1 147 Coca-Cola Europacific Partners plc 17 422 1 103 GB00BDCPN049GB00BDCPN049 2 052 Coca-Cola HBC AG 54 402 2 143 B9895B904B9895B904 4 451 Cochlear Ltd 21 992 4 357 AU000000COH5AU000000COH5 1 342 Cognex Corp. 15 700 1 556 192422103192422103 2 594 Cognizant Technology Solutions Corp., classe A 28 400 2 841 192446102192446102
17 360 Colgate-Palmolive Co. 195 162 18 782 194162103194162103 6 064 Colliers International Group inc. 51 765 8 927 194693107194693107 6 709 Coloplast AS 36 129 7 527 DK0060448595DK0060448595 1 523 Colruyt SA 22 824 1 362 ACI009ZR8ACI009ZR8 1 908 Comcast Corp., classe A 35 400 2 270 20030N10120030N101 1 054 Commerzbank AG 108 923 981 ACI05RX61ACI05RX61
638 Commonwealth Bank of Australia 8 325 706 621503002621503002 2 176 Compagnie Financière Richemont SA 19 799 3 752 ACI06R7K8ACI06R7K8
4
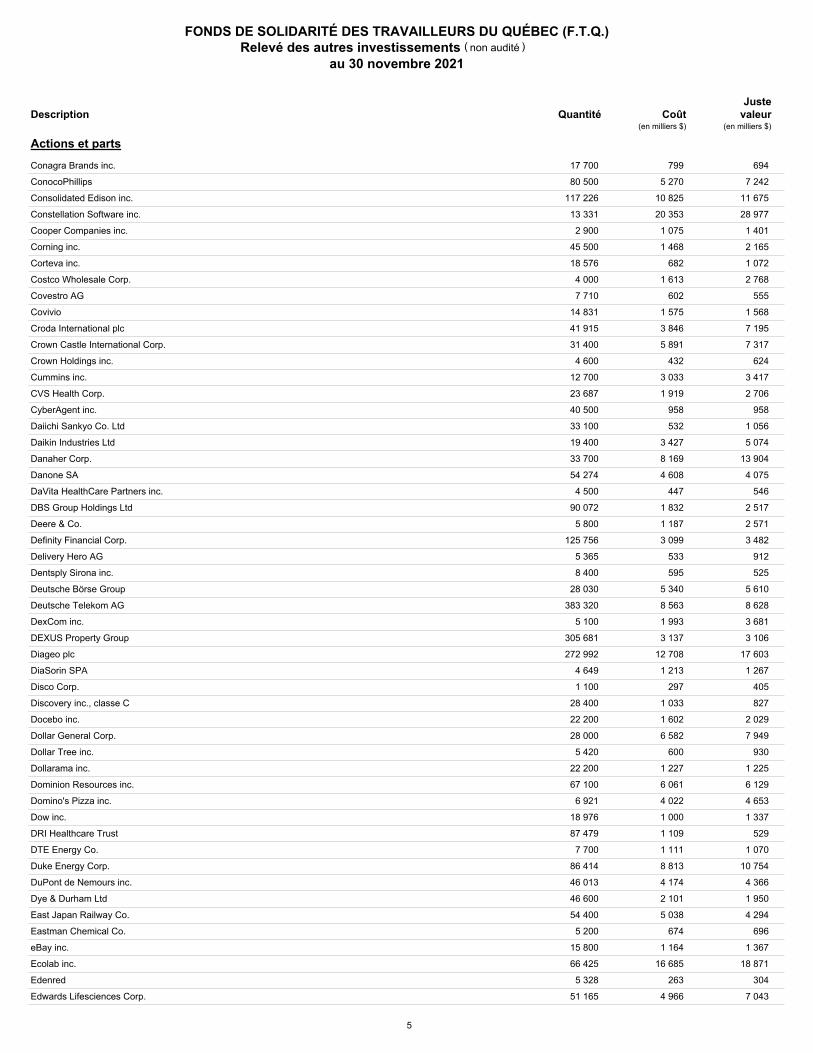
FONDS DE SOLIDARITÉ DES TRAVAILLEURS DU QUÉBEC (F.T.Q.)Relevé des autres investissements
au 30 novembre 2021
non audité( )
Quantité CoûtJuste
valeurDescription(en milliers $)(en milliers $)
Actions et parts
799 Conagra Brands inc. 17 700 694 205887102205887102 5 270 ConocoPhillips 80 500 7 242 20825C10420825C104
10 825 Consolidated Edison inc. 117 226 11 675 209115104209115104 20 353 Constellation Software inc. 13 331 28 977 21037X10021037X100
1 075 Cooper Companies inc. 2 900 1 401 216648402216648402 1 468 Corning inc. 45 500 2 165 219350105219350105
682 Corteva inc. 18 576 1 072 22052L10422052L104 1 613 Costco Wholesale Corp. 4 000 2 768 22160K10522160K105
602 Covestro AG 7 710 555 DE0006062144DE0006062144 1 575 Covivio 14 831 1 568 FR0000064578FR0000064578 3 846 Croda International plc 41 915 7 195 GB00BJFFLV09GB00BJFFLV09 5 891 Crown Castle International Corp. 31 400 7 317 22822V10122822V101
432 Crown Holdings inc. 4 600 624 228368106228368106 3 033 Cummins inc. 12 700 3 417 231021106231021106 1 919 CVS Health Corp. 23 687 2 706 126650100126650100
958 CyberAgent inc. 40 500 958 JP3311400000JP3311400000 532 Daiichi Sankyo Co. Ltd 33 100 1 056 B0J7D9901B0J7D9901
3 427 Daikin Industries Ltd 19 400 5 074 625072004625072004 8 169 Danaher Corp. 33 700 13 904 235851102235851102 4 608 Danone SA 54 274 4 075 B1Y9TB906B1Y9TB906
447 DaVita HealthCare Partners inc. 4 500 546 23918K10823918K108 1 832 DBS Group Holdings Ltd 90 072 2 517 617520903617520903 1 187 Deere & Co. 5 800 2 571 244199105244199105 3 099 Definity Financial Corp. 125 756 3 482 24477T10024477T100
533 Delivery Hero AG 5 365 912 DE000A2E4K43DE000A2E4K43 595 Dentsply Sirona inc. 8 400 525 24906P10924906P109
5 340 Deutsche Börse Group 28 030 5 610 DE0005810055DE0005810055 8 563 Deutsche Telekom AG 383 320 8 628 584235907584235907 1 993 DexCom inc. 5 100 3 681 252131107252131107 3 137 DEXUS Property Group 305 681 3 106 AU000000DXS1AU000000DXS1
12 708 Diageo plc 272 992 17 603 023740905023740905 1 213 DiaSorin SPA 4 649 1 267 IT0003492391IT0003492391
297 Disco Corp. 1 100 405 JP3548600000JP3548600000 1 033 Discovery inc., classe C 28 400 827 25470F30225470F302 1 602 Docebo inc. 22 200 2 029 25609L10525609L105 6 582 Dollar General Corp. 28 000 7 949 256677105256677105
600 Dollar Tree inc. 5 420 930 256746108256746108 1 227 Dollarama inc. 22 200 1 225 25675T10725675T107 6 061 Dominion Resources inc. 67 100 6 129 25746U10925746U109 4 022 Domino's Pizza inc. 6 921 4 653 25754A20125754A201 1 000 Dow inc. 18 976 1 337 260557103260557103 1 109 DRI Healthcare Trust 87 479 529 23344H10923344H109 1 111 DTE Energy Co. 7 700 1 070 233331107233331107 8 813 Duke Energy Corp. 86 414 10 754 26441C20426441C204 4 174 DuPont de Nemours inc. 46 013 4 366 26614N10226614N102 2 101 Dye & Durham Ltd 46 600 1 950 267488104267488104 5 038 East Japan Railway Co. 54 400 4 294 629854902629854902
674 Eastman Chemical Co. 5 200 696 277432100277432100 1 164 eBay inc. 15 800 1 367 278642103278642103
16 685 Ecolab inc. 66 425 18 871 278865100278865100 263 Edenred 5 328 304 FR0010908533FR0010908533
4 966 Edwards Lifesciences Corp. 51 165 7 043 28176E10828176E108
5
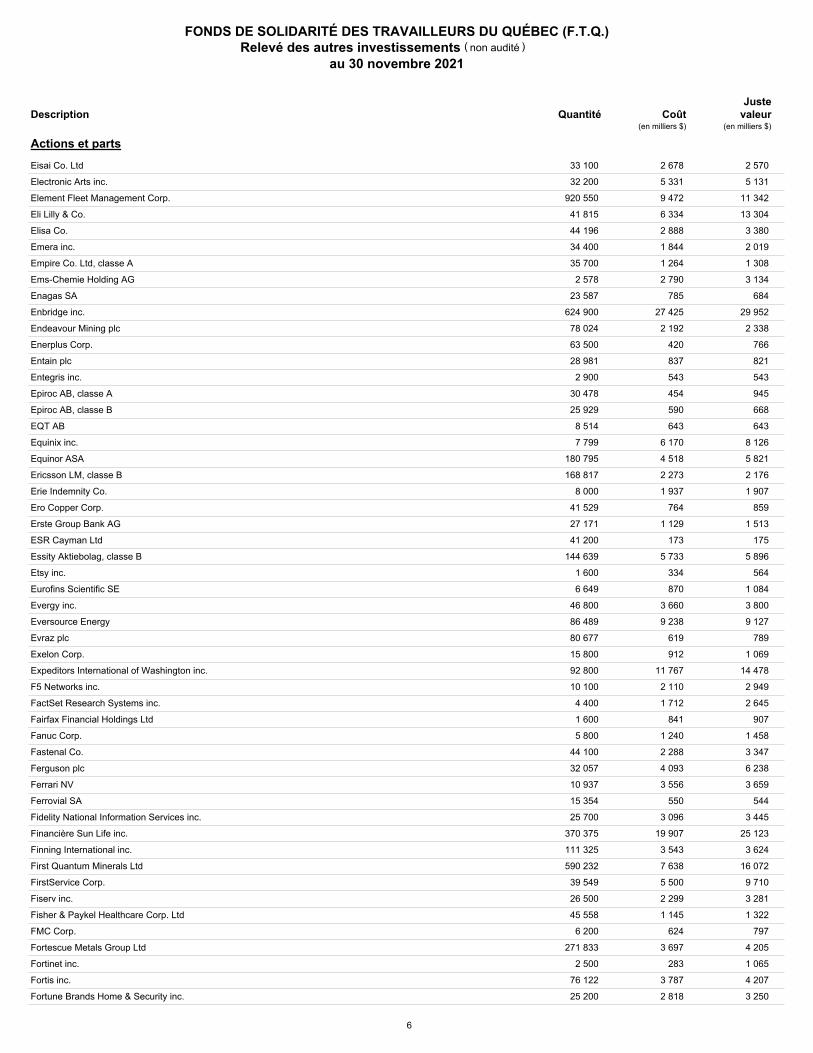
FONDS DE SOLIDARITÉ DES TRAVAILLEURS DU QUÉBEC (F.T.Q.)Relevé des autres investissements
au 30 novembre 2021
non audité( )
Quantité CoûtJuste
valeurDescription(en milliers $)(en milliers $)
Actions et parts
2 678 Eisai Co. Ltd 33 100 2 570 630720001630720001 5 331 Electronic Arts inc. 32 200 5 131 285512109285512109 9 472 Element Fleet Management Corp. 920 550 11 342 286181201286181201 6 334 Eli Lilly & Co. 41 815 13 304 532457108532457108 2 888 Elisa Co. 44 196 3 380 5701590257015902 1 844 Emera inc. 34 400 2 019 290876101290876101 1 264 Empire Co. Ltd, classe A 35 700 1 308 291843407291843407 2 790 Ems-Chemie Holding AG 2 578 3 134 763561909763561909
785 Enagas SA 23 587 684 738307909738307909 27 425 Enbridge inc. 624 900 29 952 29250N10529250N105
2 192 Endeavour Mining plc 78 024 2 338 GB00BL6K5J42GB00BL6K5J42 420 Enerplus Corp. 63 500 766 292766102292766102 837 Entain plc 28 981 821 IM00B5VQMV65IM00B5VQMV65 543 Entegris inc. 2 900 543 29362U10429362U104 454 Epiroc AB, classe A 30 478 945 SE0015658109SE0015658109 590 Epiroc AB, classe B 25 929 668 SE0015658117SE0015658117 643 EQT AB 8 514 643 001285345001285345
6 170 Equinix inc. 7 799 8 126 29444U70029444U700 4 518 Equinor ASA 180 795 5 821 NO0010096985NO0010096985 2 273 Ericsson LM, classe B 168 817 2 176 595937905595937905 1 937 Erie Indemnity Co. 8 000 1 907 29530P10229530P102
764 Ero Copper Corp. 41 529 859 296006109296006109 1 129 Erste Group Bank AG 27 171 1 513 AT0000652011AT0000652011
173 ESR Cayman Ltd 41 200 175 G31989109G31989109 5 733 Essity Aktiebolag, classe B 144 639 5 896 SE0009922164SE0009922164
334 Etsy inc. 1 600 564 29786A10629786A106 870 Eurofins Scientific SE 6 649 1 084 FR0014000MR3FR0014000MR3
3 660 Evergy inc. 46 800 3 800 30034W10630034W106 9 238 Eversource Energy 86 489 9 127 30040W10830040W108
619 Evraz plc 80 677 789 B71N6K903B71N6K903 912 Exelon Corp. 15 800 1 069 30161N10130161N101
11 767 Expeditors International of Washington inc. 92 800 14 478 302130109302130109 2 110 F5 Networks inc. 10 100 2 949 315616102315616102 1 712 FactSet Research Systems inc. 4 400 2 645 303075105303075105
841 Fairfax Financial Holdings Ltd 1 600 907 303901102303901102 1 240 Fanuc Corp. 5 800 1 458 635693005635693005 2 288 Fastenal Co. 44 100 3 347 311900104311900104 4 093 Ferguson plc 32 057 6 238 JE00BJVNSS43JE00BJVNSS43 3 556 Ferrari NV 10 937 3 659 NL0011585146NL0011585146
550 Ferrovial SA 15 354 544 ES0118900010ES0118900010 3 096 Fidelity National Information Services inc. 25 700 3 445 31620M10631620M106
19 907 Financière Sun Life inc. 370 375 25 123 866796105866796105 3 543 Finning International inc. 111 325 3 624 318071404318071404 7 638 First Quantum Minerals Ltd 590 232 16 072 335934105335934105 5 500 FirstService Corp. 39 549 9 710 33767E20233767E202 2 299 Fiserv inc. 26 500 3 281 337738108337738108 1 145 Fisher & Paykel Healthcare Corp. Ltd 45 558 1 322 NZFAPE0001S2NZFAPE0001S2
624 FMC Corp. 6 200 797 302491303302491303 3 697 Fortescue Metals Group Ltd 271 833 4 205 608625901608625901
283 Fortinet inc. 2 500 1 065 34959E10934959E109 3 787 Fortis inc. 76 122 4 207 349553107349553107 2 818 Fortune Brands Home & Security inc. 25 200 3 250 34964C10634964C106
6
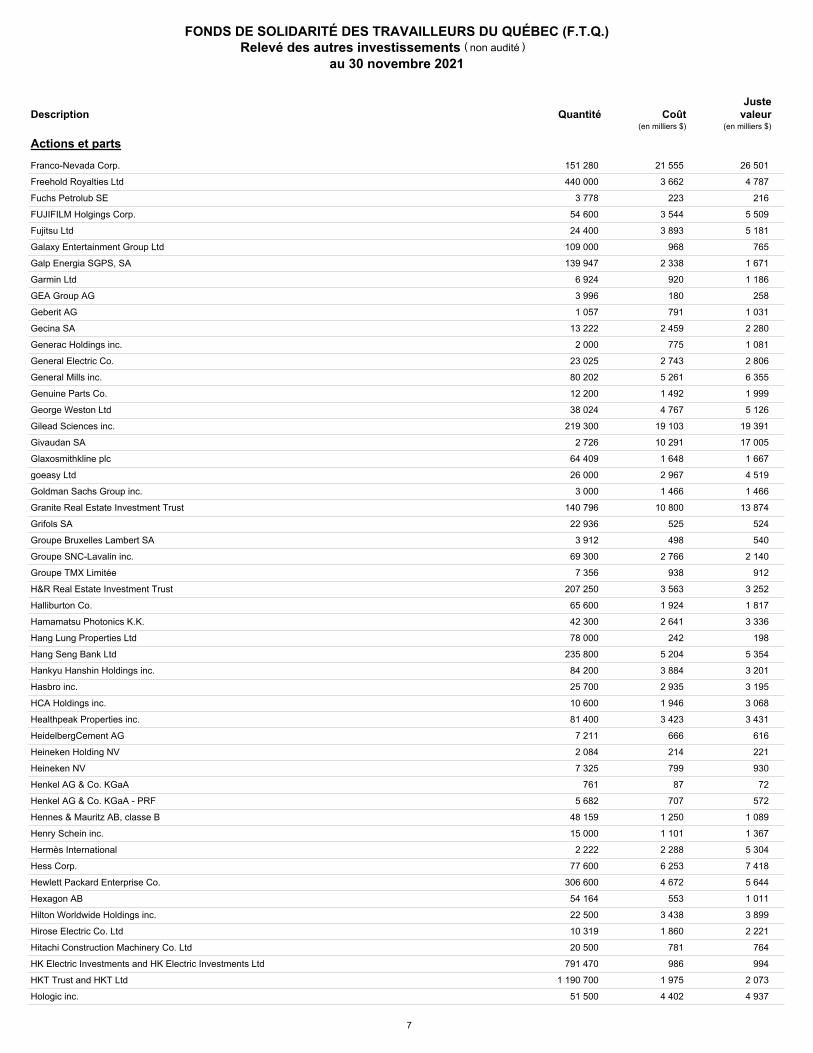
FONDS DE SOLIDARITÉ DES TRAVAILLEURS DU QUÉBEC (F.T.Q.)Relevé des autres investissements
au 30 novembre 2021
non audité( )
Quantité CoûtJuste
valeurDescription(en milliers $)(en milliers $)
Actions et parts
21 555 Franco-Nevada Corp. 151 280 26 501 351858105351858105 3 662 Freehold Royalties Ltd 440 000 4 787 356500108356500108
223 Fuchs Petrolub SE 3 778 216 DE000A3E5D64DE000A3E5D64 3 544 FUJIFILM Holgings Corp. 54 600 5 509 635652001635652001 3 893 Fujitsu Ltd 24 400 5 181 635694003635694003
968 Galaxy Entertainment Group Ltd 109 000 765 HK0027032686HK0027032686 2 338 Galp Energia SGPS, SA 139 947 1 671 B1FW75903B1FW75903
920 Garmin Ltd 6 924 1 186 CH0114405324CH0114405324 180 GEA Group AG 3 996 258 DE0006602006DE0006602006 791 Geberit AG 1 057 1 031 B1WGG9901B1WGG9901
2 459 Gecina SA 13 222 2 280 FR0010040865FR0010040865 775 Generac Holdings inc. 2 000 1 081 368736104368736104
2 743 General Electric Co. 23 025 2 806 369604301369604301 5 261 General Mills inc. 80 202 6 355 370334104370334104 1 492 Genuine Parts Co. 12 200 1 999 372460105372460105 4 767 George Weston Ltd 38 024 5 126 961148509961148509
19 103 Gilead Sciences inc. 219 300 19 391 375558103375558103 10 291 Givaudan SA 2 726 17 005 598061901598061901
1 648 Glaxosmithkline plc 64 409 1 667 092528900092528900 2 967 goeasy Ltd 26 000 4 519 380355107380355107 1 466 Goldman Sachs Group inc. 3 000 1 466 38141G10438141G104
10 800 Granite Real Estate Investment Trust 140 796 13 874 387437114387437114 525 Grifols SA 22 936 524 BYY3DX906BYY3DX906 498 Groupe Bruxelles Lambert SA 3 912 540 BE0003797140BE0003797140
2 766 Groupe SNC-Lavalin inc. 69 300 2 140 78460T10578460T105 938 Groupe TMX Limitée 7 356 912 87262K10587262K105
3 563 H&R Real Estate Investment Trust 207 250 3 252 403925407403925407 1 924 Halliburton Co. 65 600 1 817 406216101406216101 2 641 Hamamatsu Photonics K.K. 42 300 3 336 JP3771800004JP3771800004
242 Hang Lung Properties Ltd 78 000 198 603050006603050006 5 204 Hang Seng Bank Ltd 235 800 5 354 640837001640837001 3 884 Hankyu Hanshin Holdings inc. 84 200 3 201 377420000377420000 2 935 Hasbro inc. 25 700 3 195 418056107418056107 1 946 HCA Holdings inc. 10 600 3 068 40412C10140412C101 3 423 Healthpeak Properties inc. 81 400 3 431 42250P10342250P103
666 HeidelbergCement AG 7 211 616 512067901512067901 214 Heineken Holding NV 2 084 221 B0CCH4904B0CCH4904 799 Heineken NV 7 325 930 779255900779255900
87 Henkel AG & Co. KGaA 761 72 DE0006048408DE0006048408 707 Henkel AG & Co. KGaA - PRF 5 682 572 DE0006048432DE0006048432
1 250 Hennes & Mauritz AB, classe B 48 159 1 089 568743900568743900 1 101 Henry Schein inc. 15 000 1 367 806407102806407102 2 288 Hermès International 2 222 5 304 FR0000052292FR0000052292 6 253 Hess Corp. 77 600 7 418 42809H10742809H107 4 672 Hewlett Packard Enterprise Co. 306 600 5 644 42824C10942824C109
553 Hexagon AB 54 164 1 011 SE0015961909SE0015961909 3 438 Hilton Worldwide Holdings inc. 22 500 3 899 43300A20343300A203 1 860 Hirose Electric Co. Ltd 10 319 2 221 JP3799000009JP3799000009
781 Hitachi Construction Machinery Co. Ltd 20 500 764 JP3787000003JP3787000003 986 HK Electric Investments and HK Electric Investments Ltd 791 470 994 HK0000179108HK0000179108
1 975 HKT Trust and HKT Ltd 1 190 700 2 073 B4TXDZ907B4TXDZ907 4 402 Hologic inc. 51 500 4 937 436440101436440101
7
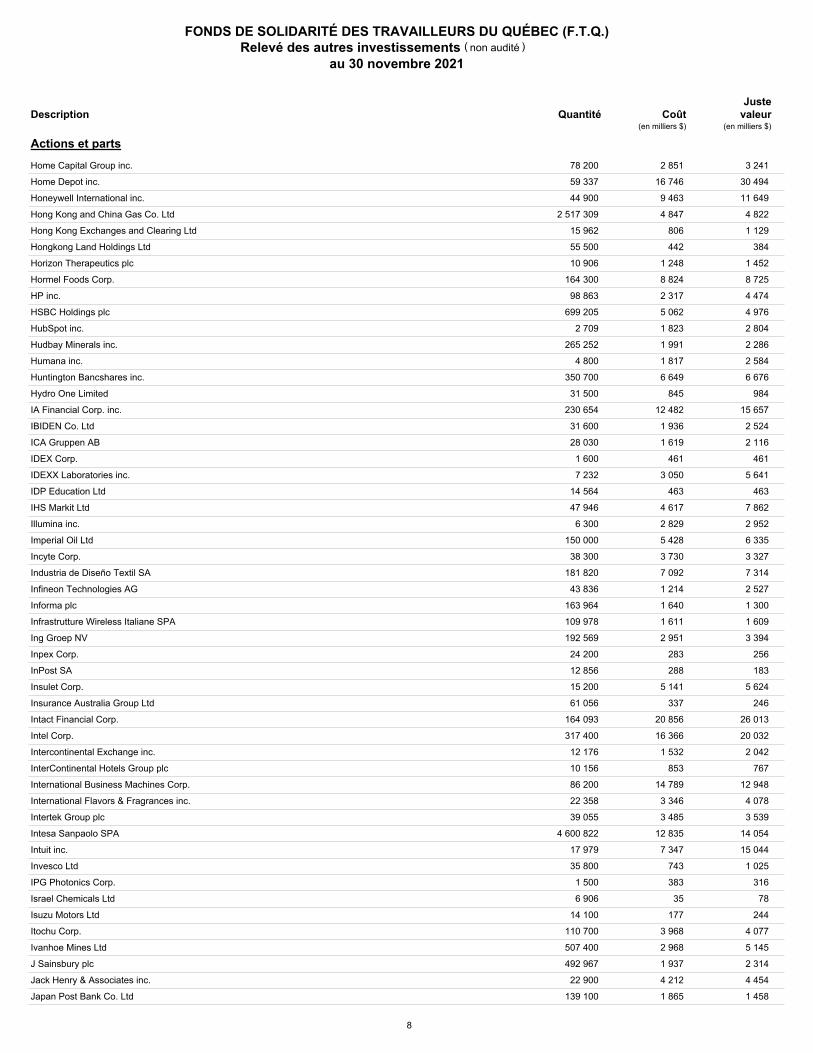
FONDS DE SOLIDARITÉ DES TRAVAILLEURS DU QUÉBEC (F.T.Q.)Relevé des autres investissements
au 30 novembre 2021
non audité( )
Quantité CoûtJuste
valeurDescription(en milliers $)(en milliers $)
Actions et parts
2 851 Home Capital Group inc. 78 200 3 241 436913107436913107 16 746 Home Depot inc. 59 337 30 494 437076102437076102
9 463 Honeywell International inc. 44 900 11 649 438516106438516106 4 847 Hong Kong and China Gas Co. Ltd 2 517 309 4 822 HK0003000038HK0003000038
806 Hong Kong Exchanges and Clearing Ltd 15 962 1 129 HK0388045442HK0388045442 442 Hongkong Land Holdings Ltd 55 500 384 BMG4587L1090BMG4587L1090
1 248 Horizon Therapeutics plc 10 906 1 452 00BQPVQZ600BQPVQZ6 8 824 Hormel Foods Corp. 164 300 8 725 440452100440452100 2 317 HP inc. 98 863 4 474 40434L10540434L105 5 062 HSBC Holdings plc 699 205 4 976 054052907054052907 1 823 HubSpot inc. 2 709 2 804 443573100443573100 1 991 Hudbay Minerals inc. 265 252 2 286 443628102443628102 1 817 Humana inc. 4 800 2 584 444859102444859102 6 649 Huntington Bancshares inc. 350 700 6 676 446150104446150104
845 Hydro One Limited 31 500 984 448811208448811208 12 482 IA Financial Corp. inc. 230 654 15 657 45075E10445075E104
1 936 IBIDEN Co. Ltd 31 600 2 524 JP3148800000JP3148800000 1 619 ICA Gruppen AB 28 030 2 116 SE0000652216SE0000652216
461 IDEX Corp. 1 600 461 45167R10445167R104 3 050 IDEXX Laboratories inc. 7 232 5 641 45168D10445168D104
463 IDP Education Ltd 14 564 463 000000IEL000000IEL 4 617 IHS Markit Ltd 47 946 7 862 BMG475671050BMG475671050 2 829 Illumina inc. 6 300 2 952 452327109452327109 5 428 Imperial Oil Ltd 150 000 6 335 453038408453038408 3 730 Incyte Corp. 38 300 3 327 45337C10245337C102 7 092 Industria de Diseño Textil SA 181 820 7 314 ES0148396007ES0148396007 1 214 Infineon Technologies AG 43 836 2 527 DE0006231004DE0006231004 1 640 Informa plc 163 964 1 300 GB00BMJ6DW54GB00BMJ6DW54 1 611 Infrastrutture Wireless Italiane SPA 109 978 1 609 000509030000509030 2 951 Ing Groep NV 192 569 3 394 715418901715418901
283 Inpex Corp. 24 200 256 B10RB1904B10RB1904 288 InPost SA 12 856 183 229052268229052268
5 141 Insulet Corp. 15 200 5 624 45784P10145784P101 337 Insurance Australia Group Ltd 61 056 246 AU000000IAG3AU000000IAG3
20 856 Intact Financial Corp. 164 093 26 013 45823T10645823T106 16 366 Intel Corp. 317 400 20 032 458140100458140100
1 532 Intercontinental Exchange inc. 12 176 2 042 45866F10445866F104 853 InterContinental Hotels Group plc 10 156 767 GB00BHJYC057GB00BHJYC057
14 789 International Business Machines Corp. 86 200 12 948 459200101459200101 3 346 International Flavors & Fragrances inc. 22 358 4 078 459506101459506101 3 485 Intertek Group plc 39 055 3 539 316383900316383900
12 835 Intesa Sanpaolo SPA 4 600 822 14 054 407683002407683002 7 347 Intuit inc. 17 979 15 044 461202103461202103
743 Invesco Ltd 35 800 1 025 G491BT108G491BT108 383 IPG Photonics Corp. 1 500 316 44980X10944980X109
35 Israel Chemicals Ltd 6 906 78 645553900645553900 177 Isuzu Motors Ltd 14 100 244 JP3137200006JP3137200006
3 968 Itochu Corp. 110 700 4 077 646780007646780007 2 968 Ivanhoe Mines Ltd 507 400 5 145 46579R10446579R104 1 937 J Sainsbury plc 492 967 2 314 B019KW907B019KW907 4 212 Jack Henry & Associates inc. 22 900 4 454 426281101426281101 1 865 Japan Post Bank Co. Ltd 139 100 1 458 JP3946750001JP3946750001
8

FONDS DE SOLIDARITÉ DES TRAVAILLEURS DU QUÉBEC (F.T.Q.)Relevé des autres investissements
au 30 novembre 2021
non audité( )
Quantité CoûtJuste
valeurDescription(en milliers $)(en milliers $)
Actions et parts
4 243 Jardine Matheson Holdings Ltd 58 800 4 268 BMG507361001BMG507361001 642 JB Hunt Transport Services inc. 3 000 736 445658107445658107
1 751 Jeronimo Martins SGPS SA 69 040 1 915 B1Y1SQ901B1Y1SQ901 10 788 Johnson & Johnson 64 900 12 982 478160104478160104 12 793 Johnson Controls International plc 198 576 19 044 H89128104H89128104
2 566 Johnson Matthey plc 54 392 1 935 B70FPS903B70FPS903 12 719 JPMorgan Chase & Co. 66 100 13 468 46625H10046625H100
2 960 Juniper Networks inc. 87 600 3 498 48203R10448203R104 245 Kansai Paint Co. Ltd 9 000 259 648374007648374007
2 408 Kansas City Southern 13 100 4 888 485170302485170302 6 173 KBC Groep NV 71 180 7 607 BE0003565737BE0003565737
18 365 KDDI Corp. 506 600 18 887 624899902624899902 2 703 Keio Corp. 34 100 1 969 JP3277800003JP3277800003 9 135 Kellogg Co. 118 445 9 296 487836108487836108 2 418 Keppel Corp. Ltd 419 100 2 000 B1VQ5C905B1VQ5C905 5 186 Kering 6 995 6 882 550507909550507909 9 365 Kerry Group plc 64 454 10 159 IE0004906560IE0004906560+ 2 784 Kesko Oyj, classe B 75 613 3 029 FI0009000202FI0009000202 1 795 Keurig Dr Pepper inc. 44 300 1 932 49271V10049271V100 9 147 Keyence Corp. 14 900 11 839 649099009649099009 3 406 Keyera Corp. 116 790 3 277 493271100493271100 9 943 Keysight Technologies inc. 64 974 16 209 49338L10349338L103
11 307 Kimberly-Clark Corp. 73 100 12 220 494368103494368103 4 174 Kinaxis inc. 20 000 3 905 49448Q10949448Q109 2 621 Kingfisher plc 567 280 3 050 331952903331952903 5 889 Kinross Gold Corp. 712 200 5 398 496902404496902404
824 Kintetsu Corp. 17 000 626 JP3260800002JP3260800002 5 038 Kirkland Lake Gold Ltd 99 700 5 036 49741E10049741E100
679 KKR & Co. inc., classe A 17 200 1 643 48251W10448251W104 1 040 KLA-Tencor Corp. 6 900 3 612 482480100482480100 1 544 Klepierre SA 57 033 1 539 FR0000121964FR0000121964
114 Knorr-Bremse AG 896 114 000KBX100000KBX100 979 Koei Tecmo Holdings Co. Ltd 17 400 935 328346000328346000
4 564 Komatsu Ltd 143 400 4 200 649658002649658002 2 003 Kone OYJ, classe B 24 926 2 096 B09M9D905B09M9D905 1 969 Koninklijke Ahold Delhaize NV 54 093 2 316 525260907525260907 4 689 Koninklijke DSM NV 19 642 5 393 025328825025328825 4 143 Koninklijke KPN NV 1 116 139 4 192 595607904595607904
754 Koninklijke Philips NV 16 778 756 598662906598662906 10 421 Kroger Co. 241 824 12 883 501044101501044101
9 145 Kuehne + Nagel International AG 31 842 11 639 CH0025238863CH0025238863 1 780 Kyocera Corp. 23 400 1 779 649926003649926003
45 247 La Banque de Nouvelle-Écosse 650 639 51 909 064149107064149107 2 077 Laboratory Corp. of America Holdings 6 200 2 269 50540R40950540R409 8 264 Lam Research Corp. 19 071 16 632 512807108512807108
378 Lanxess AG 5 144 381 B05M8B904B05M8B904 673 Las Vegas Sands Corp. 8 900 407 517834107517834107 401 Lasertec Corp. 3 000 1 008 397920000397920000
1 772 Lawson inc. 25 400 1 590 626691901626691901 326 Lear Corp. 2 000 430 521865204521865204
2 879 Legal & General Group plc 724 609 3 466 056039902056039902 2 630 Leidos Holdings inc. 22 900 2 582 525327102525327102
9
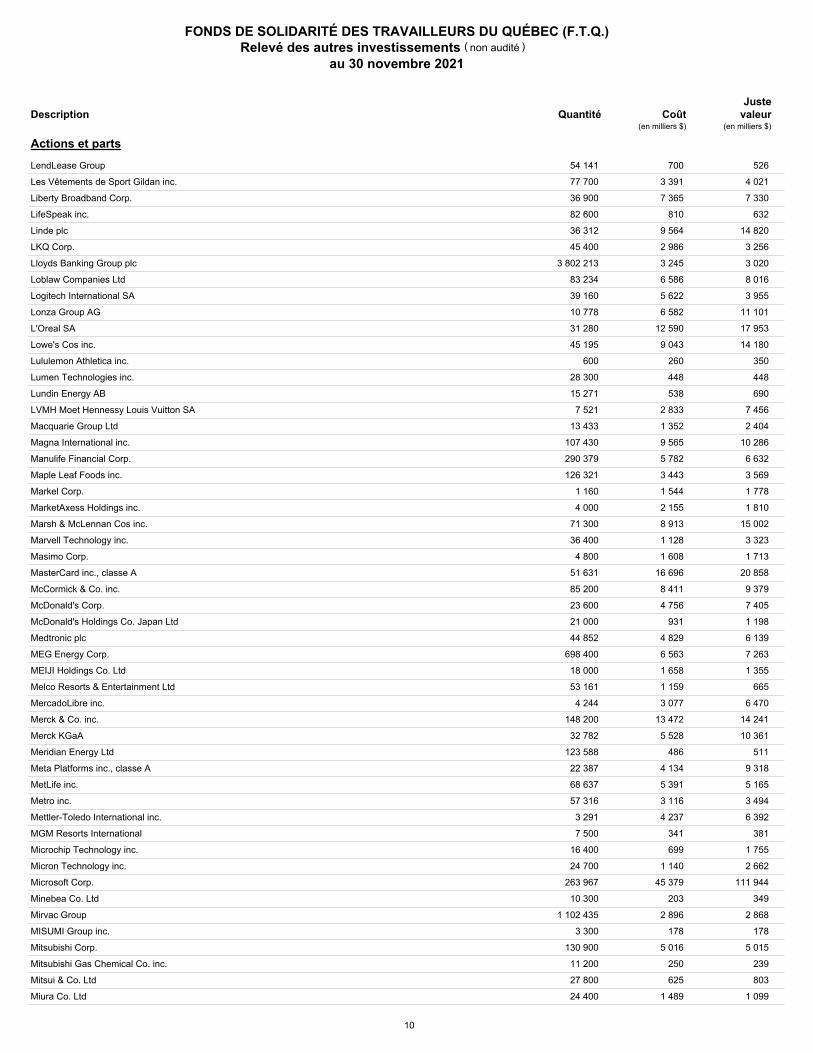
FONDS DE SOLIDARITÉ DES TRAVAILLEURS DU QUÉBEC (F.T.Q.)Relevé des autres investissements
au 30 novembre 2021
non audité( )
Quantité CoûtJuste
valeurDescription(en milliers $)(en milliers $)
Actions et parts
700 LendLease Group 54 141 526 AU000000LLC3AU000000LLC3 3 391 Les Vêtements de Sport Gildan inc. 77 700 4 021 375916103375916103 7 365 Liberty Broadband Corp. 36 900 7 330 530307305530307305
810 LifeSpeak inc. 82 600 632 53228G10953228G109 9 564 Linde plc 36 312 14 820 IE00BZ12WP82IE00BZ12WP82 2 986 LKQ Corp. 45 400 3 256 501889208501889208 3 245 Lloyds Banking Group plc 3 802 213 3 020 087061008087061008 6 586 Loblaw Companies Ltd 83 234 8 016 539481101539481101 5 622 Logitech International SA 39 160 3 955 CH0025751329CH0025751329 6 582 Lonza Group AG 10 778 11 101 733337901733337901
12 590 L'Oreal SA 31 280 17 953 405780909405780909 9 043 Lowe's Cos inc. 45 195 14 180 548661107548661107
260 Lululemon Athletica inc. 600 350 550021109550021109 448 Lumen Technologies inc. 28 300 448 550241103550241103 538 Lundin Energy AB 15 271 690 718762909718762909
2 833 LVMH Moet Hennessy Louis Vuitton SA 7 521 7 456 406141903406141903 1 352 Macquarie Group Ltd 13 433 2 404 B28YTC906B28YTC906 9 565 Magna International inc. 107 430 10 286 559222401559222401 5 782 Manulife Financial Corp. 290 379 6 632 56501R10656501R106 3 443 Maple Leaf Foods inc. 126 321 3 569 564905107564905107 1 544 Markel Corp. 1 160 1 778 570535104570535104 2 155 MarketAxess Holdings inc. 4 000 1 810 57060D10857060D108 8 913 Marsh & McLennan Cos inc. 71 300 15 002 571748102571748102 1 128 Marvell Technology inc. 36 400 3 323 573874104573874104 1 608 Masimo Corp. 4 800 1 713 574795100574795100
16 696 MasterCard inc., classe A 51 631 20 858 57636Q10457636Q104 8 411 McCormick & Co. inc. 85 200 9 379 579780206579780206 4 756 McDonald's Corp. 23 600 7 405 580135101580135101
931 McDonald's Holdings Co. Japan Ltd 21 000 1 198 JP3750500005JP3750500005 4 829 Medtronic plc 44 852 6 139 585055106585055106 6 563 MEG Energy Corp. 698 400 7 263 552704108552704108 1 658 MEIJI Holdings Co. Ltd 18 000 1 355 B60DQV902B60DQV902 1 159 Melco Resorts & Entertainment Ltd 53 161 665 US5854641009US5854641009 3 077 MercadoLibre inc. 4 244 6 470 58733R10258733R102
13 472 Merck & Co. inc. 148 200 14 241 58933Y10558933Y105 5 528 Merck KGaA 32 782 10 361 DE0006599905DE0006599905
486 Meridian Energy Ltd 123 588 511 NZMELE0002S7NZMELE0002S7 4 134 Meta Platforms inc., classe A 22 387 9 318 30303M10230303M102 5 391 MetLife inc. 68 637 5 165 59156R10859156R108 3 116 Metro inc. 57 316 3 494 59162N10959162N109 4 237 Mettler-Toledo International inc. 3 291 6 392 592688105592688105
341 MGM Resorts International 7 500 381 552953101552953101 699 Microchip Technology inc. 16 400 1 755 595017104595017104
1 140 Micron Technology inc. 24 700 2 662 595112103595112103 45 379 Microsoft Corp. 263 967 111 944 594918104594918104
203 Minebea Co. Ltd 10 300 349 001227033001227033 2 896 Mirvac Group 1 102 435 2 868 AU000000MGR9AU000000MGR9
178 MISUMI Group inc. 3 300 178 JP3885400006JP3885400006 5 016 Mitsubishi Corp. 130 900 5 015 659678007659678007
250 Mitsubishi Gas Chemical Co. inc. 11 200 239 659692008659692008 625 Mitsui & Co. Ltd 27 800 803 659730006659730006
1 489 Miura Co. Ltd 24 400 1 099 388080000388080000
10

FONDS DE SOLIDARITÉ DES TRAVAILLEURS DU QUÉBEC (F.T.Q.)Relevé des autres investissements
au 30 novembre 2021
non audité( )
Quantité CoûtJuste
valeurDescription(en milliers $)(en milliers $)
Actions et parts
1 104 Mizrahi Tefahot Bank Ltd 40 572 1 924 IL0006954379IL0006954379 3 427 Mizuho Financial Group inc. 181 260 2 871 659101901659101901
860 Moderna inc. 3 700 1 673 60770K10760770K107 3 392 Molson Coors Brewing Co., classe B 52 800 3 010 60871R20960871R209
250 Moncler SPA 5 013 464 IT0004965148IT0004965148 5 680 Mondelez International inc., classe A 98 428 7 442 609207105609207105 2 444 Mondi plc 86 786 2 533 B1CRLC906B1CRLC906
991 Monolithic Power Systems inc. 2 200 1 562 609839105609839105 2 504 MonotaRO Co. Ltd 77 900 1 985 JP3922950005JP3922950005 1 155 Moody's Corp. 4 700 2 355 615369105615369105
10 690 Morgan Stanley 122 900 14 949 617446448617446448 7 171 Motorola Solutions inc. 37 918 12 315 620076307620076307 4 870 MS&AD Insurance Group Holdings inc. 125 100 4 687 B2Q4CS905B2Q4CS905 6 154 MTR Corp. Ltd 937 434 6 417 HK0066009694HK0066009694 1 635 MTU Aero Engines AG 5 975 1 423 B09DHL908B09DHL908 1 520 Muenchener Rueckver AG 5 149 1 772 529412900529412900 2 175 Murata Manufacturing Co. Ltd 34 300 3 248 JP3914400001JP3914400001 8 204 National Grid plc 524 986 8 969 GB00BDR05C01GB00BDR05C01
43 Naturgy Energy Group SA 1 509 53 ES0116870314ES0116870314 1 799 NatWest Group plc 507 943 1 833 GB00B7T77214GB00B7T77214
732 Nec Corp. 15 100 873 JP3733000008JP3733000008 1 633 Neighbourly Pharmacy inc. 52 600 1 792 64016L10164016L101 5 314 Neste Oil OYJ 88 628 5 345 B06YV4907B06YV4907
16 992 Nestlé SA 157 399 25 746 712387901712387901 6 015 Netflix inc. 8 694 7 159 64110L10664110L106 1 869 Neurocrine Biosciences inc. 17 500 1 869 64125C10964125C109
310 New World Development Co. Ltd 53 285 270 HK0000608585HK0000608585 12 465 Newmont Corp. 191 949 13 524 651639106651639106
640 News Corp., classe A 19 700 546 65249B10965249B109 1 577 Nexon Co. Ltd 67 300 1 714 070973251070973251 3 548 NextEra Energy inc. 66 500 7 403 65339F10165339F101
678 Nidec Corp. 11 600 1 704 664068004664068004 7 909 NIKE inc., classe B 65 200 14 155 654106103654106103 4 134 Nintendo Co. Ltd 6 300 3 566 663955003663955003 1 583 Nippon Express Co. Ltd 18 100 1 323 JP3729400006JP3729400006 2 495 Nippon Paint Co. Ltd 103 000 1 388 JP3749400002JP3749400002 1 966 Nippon Prologis Real Estate Investment Trust inc. 617 2 576 JP3047550003JP3047550003 6 945 Nippon Telegraph and Telephone Corp. 255 600 9 024 664137007664137007 2 899 Nitori Holdings Co. Ltd 12 800 2 607 JP3756100008JP3756100008
538 Nitto Denko Corp. 7 400 660 664180007664180007 270 Nokia OYJ 46 836 332 FI0009000681FI0009000681
3 041 Nomura Holdings inc. 455 900 2 459 JP3762600009JP3762600009 2 656 Nomura Research Institute Ltd 70 600 3 892 JP3762800005JP3762800005 1 634 Norfolk Southern Corp. 8 168 2 779 655844108655844108
307 Northern Star Resources Ltd 28 531 245 AU000000NST8AU000000NST8 3 701 Northern Trust Corp. 32 828 4 872 665859104665859104 4 817 Northland Power inc. 141 340 5 405 666511100666511100 1 418 NortonLifeLock inc. 46 400 1 479 668771108668771108 7 720 Novartis AG 77 888 7 929 CH0012005267CH0012005267
336 Novavax inc. 1 800 482 670002401670002401 11 765 Novo Nordisk AS, classe B 150 864 20 641 707752903707752903
938 Novozymes AS, classe B 14 694 1 418 B798FW902B798FW902
11
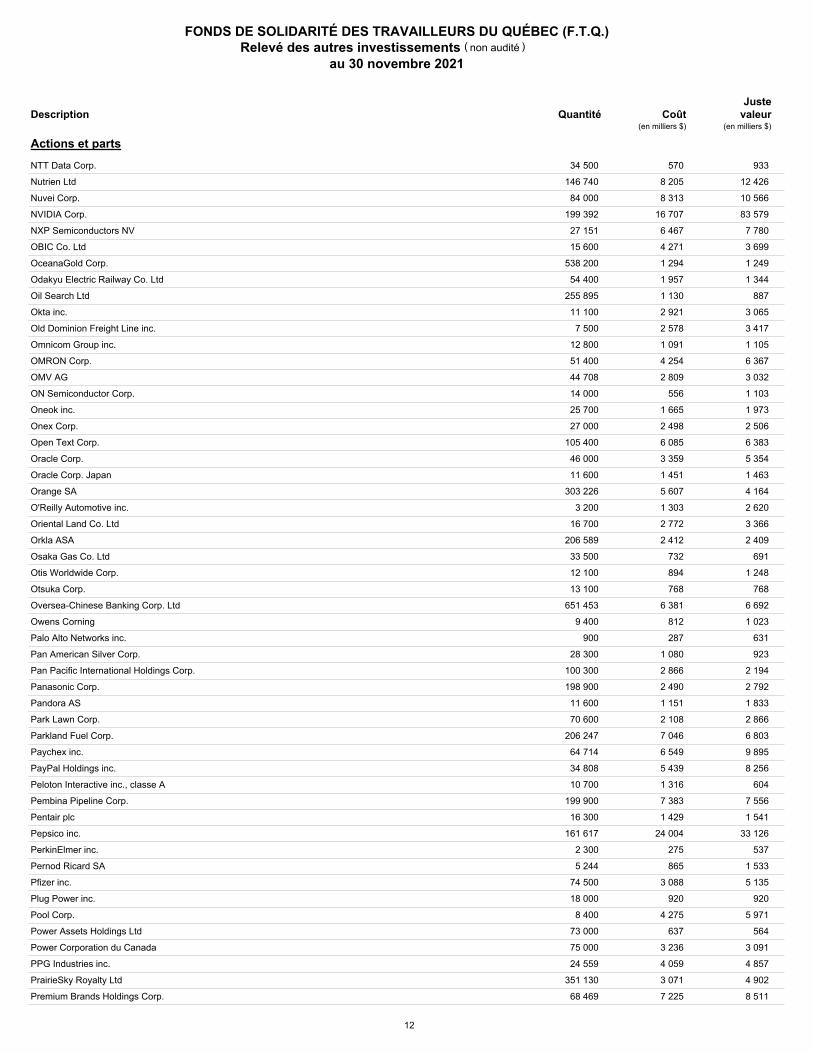
FONDS DE SOLIDARITÉ DES TRAVAILLEURS DU QUÉBEC (F.T.Q.)Relevé des autres investissements
au 30 novembre 2021
non audité( )
Quantité CoûtJuste
valeurDescription(en milliers $)(en milliers $)
Actions et parts
570 NTT Data Corp. 34 500 933 JP3165700000JP3165700000 8 205 Nutrien Ltd 146 740 12 426 67077M10867077M108 8 313 Nuvei Corp. 84 000 10 566 67079A10267079A102
16 707 NVIDIA Corp. 199 392 83 579 67066G10467066G104 6 467 NXP Semiconductors NV 27 151 7 780 NL0009538784NL0009538784 4 271 OBIC Co. Ltd 15 600 3 699 JP3173400007JP3173400007 1 294 OceanaGold Corp. 538 200 1 249 675222103675222103 1 957 Odakyu Electric Railway Co. Ltd 54 400 1 344 665610002665610002 1 130 Oil Search Ltd 255 895 887 PG0008579883PG0008579883 2 921 Okta inc. 11 100 3 065 679295105679295105 2 578 Old Dominion Freight Line inc. 7 500 3 417 679580100679580100 1 091 Omnicom Group inc. 12 800 1 105 681919106681919106 4 254 OMRON Corp. 51 400 6 367 JP3197800000JP3197800000 2 809 OMV AG 44 708 3 032 465145001465145001
556 ON Semiconductor Corp. 14 000 1 103 682189105682189105 1 665 Oneok inc. 25 700 1 973 682680103682680103 2 498 Onex Corp. 27 000 2 506 68272K10368272K103 6 085 Open Text Corp. 105 400 6 383 683715106683715106 3 359 Oracle Corp. 46 000 5 354 68389X10568389X105 1 451 Oracle Corp. Japan 11 600 1 463 JP3689500001JP3689500001 5 607 Orange SA 303 226 4 164 517617908517617908 1 303 O'Reilly Automotive inc. 3 200 2 620 67103H10767103H107 2 772 Oriental Land Co. Ltd 16 700 3 366 664889904664889904 2 412 Orkla ASA 206 589 2 409 B1VQF4902B1VQF4902
732 Osaka Gas Co. Ltd 33 500 691 666176003666176003 894 Otis Worldwide Corp. 12 100 1 248 68902V10768902V107 768 Otsuka Corp. 13 100 768 JP3188200004JP3188200004
6 381 Oversea-Chinese Banking Corp. Ltd 651 453 6 692 SG1S04926220SG1S04926220 812 Owens Corning 9 400 1 023 690742101690742101 287 Palo Alto Networks inc. 900 631 US6974351057US6974351057
1 080 Pan American Silver Corp. 28 300 923 697900108697900108 2 866 Pan Pacific International Holdings Corp. 100 300 2 194 JP3639650005JP3639650005 2 490 Panasonic Corp. 198 900 2 792 657270005657270005 1 151 Pandora AS 11 600 1 833 DK0060252690DK0060252690 2 108 Park Lawn Corp. 70 600 2 866 700563208700563208 7 046 Parkland Fuel Corp. 206 247 6 803 70137W10870137W108 6 549 Paychex inc. 64 714 9 895 704326107704326107 5 439 PayPal Holdings inc. 34 808 8 256 70450Y10370450Y103 1 316 Peloton Interactive inc., classe A 10 700 604 70614W10070614W100 7 383 Pembina Pipeline Corp. 199 900 7 556 706327103706327103 1 429 Pentair plc 16 300 1 541 H6169Q108H6169Q108
24 004 Pepsico inc. 161 617 33 126 713448108713448108 275 PerkinElmer inc. 2 300 537 714046109714046109 865 Pernod Ricard SA 5 244 1 533 468232004468232004
3 088 Pfizer inc. 74 500 5 135 717081103717081103 920 Plug Power inc. 18 000 920 72919P20272919P202
4 275 Pool Corp. 8 400 5 971 73278L10573278L105 637 Power Assets Holdings Ltd 73 000 564 643532005643532005
3 236 Power Corporation du Canada 75 000 3 091 739239101739239101 4 059 PPG Industries inc. 24 559 4 857 693506107693506107 3 071 PrairieSky Royalty Ltd 351 130 4 902 739721108739721108 7 225 Premium Brands Holdings Corp. 68 469 8 511 74061A10874061A108
12
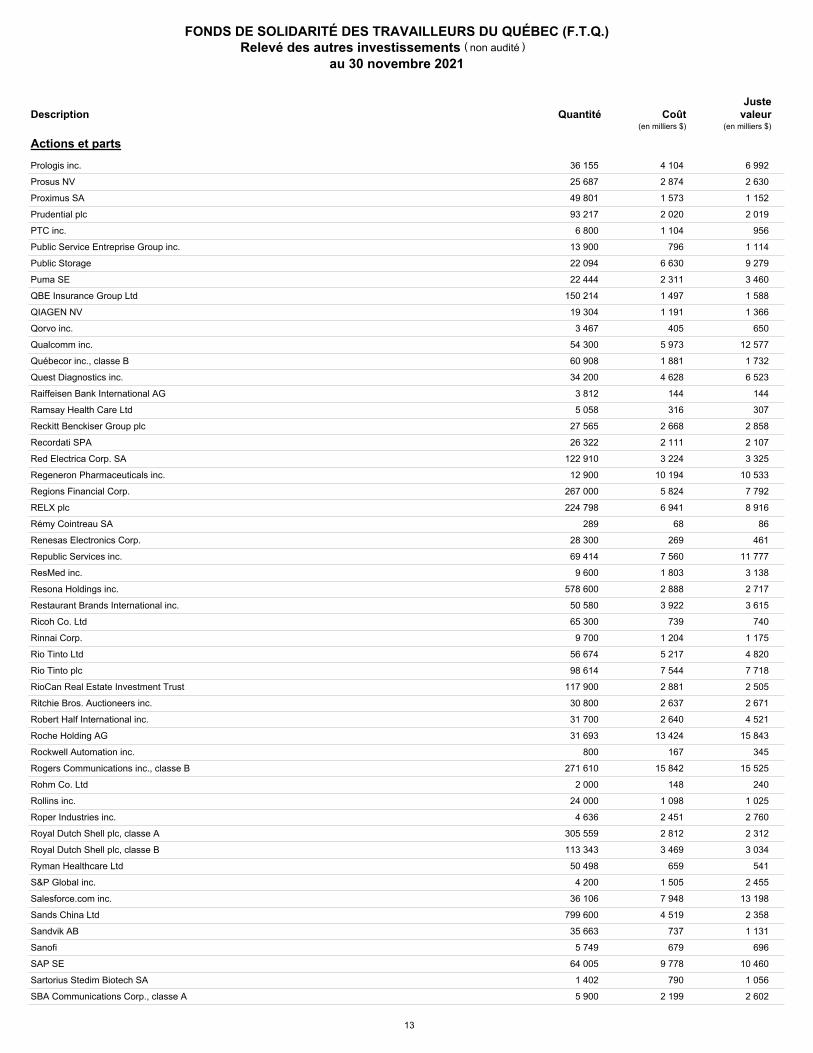
FONDS DE SOLIDARITÉ DES TRAVAILLEURS DU QUÉBEC (F.T.Q.)Relevé des autres investissements
au 30 novembre 2021
non audité( )
Quantité CoûtJuste
valeurDescription(en milliers $)(en milliers $)
Actions et parts
4 104 Prologis inc. 36 155 6 992 74340W10374340W103 2 874 Prosus NV 25 687 2 630 NL0013654783NL0013654783 1 573 Proximus SA 49 801 1 152 B00D9P907B00D9P907 2 020 Prudential plc 93 217 2 019 070995006070995006 1 104 PTC inc. 6 800 956 69370C10069370C100
796 Public Service Entreprise Group inc. 13 900 1 114 744573106744573106 6 630 Public Storage 22 094 9 279 74460D10974460D109 2 311 Puma SE 22 444 3 460 DE0006969603DE0006969603 1 497 QBE Insurance Group Ltd 150 214 1 588 671574002671574002 1 191 QIAGEN NV 19 304 1 366 NL0012169213NL0012169213
405 Qorvo inc. 3 467 650 74736K10174736K101 5 973 Qualcomm inc. 54 300 12 577 747525103747525103 1 881 Québecor inc., classe B 60 908 1 732 748193208748193208 4 628 Quest Diagnostics inc. 34 200 6 523 74834L10074834L100
144 Raiffeisen Bank International AG 3 812 144 AT0000606306AT0000606306 316 Ramsay Health Care Ltd 5 058 307 AU000000RHC8AU000000RHC8
2 668 Reckitt Benckiser Group plc 27 565 2 858 B24CGK904B24CGK904 2 111 Recordati SPA 26 322 2 107 IT0003828271IT0003828271 3 224 Red Electrica Corp. SA 122 910 3 325 ES0173093024ES0173093024
10 194 Regeneron Pharmaceuticals inc. 12 900 10 533 75886F10775886F107 5 824 Regions Financial Corp. 267 000 7 792 7591EP1007591EP100 6 941 RELX plc 224 798 8 916 B2B0DG904B2B0DG904
68 Rémy Cointreau SA 289 86 47417144741714 269 Renesas Electronics Corp. 28 300 461 JP3164720009JP3164720009
7 560 Republic Services inc. 69 414 11 777 760759100760759100 1 803 ResMed inc. 9 600 3 138 761152107761152107 2 888 Resona Holdings inc. 578 600 2 717 642155907642155907 3 922 Restaurant Brands International inc. 50 580 3 615 76131D10376131D103
739 Ricoh Co. Ltd 65 300 740 JP3973400009JP3973400009 1 204 Rinnai Corp. 9 700 1 175 JP3977400005JP3977400005 5 217 Rio Tinto Ltd 56 674 4 820 622010007622010007 7 544 Rio Tinto plc 98 614 7 718 071887004071887004 2 881 RioCan Real Estate Investment Trust 117 900 2 505 766910103766910103 2 637 Ritchie Bros. Auctioneers inc. 30 800 2 671 767744105767744105 2 640 Robert Half International inc. 31 700 4 521 770323103770323103
13 424 Roche Holding AG 31 693 15 843 711038901CH0012032048+ 167 Rockwell Automation inc. 800 345 773903109773903109
15 842 Rogers Communications inc., classe B 271 610 15 525 775109200775109200 148 Rohm Co. Ltd 2 000 240 JP3982800009JP3982800009
1 098 Rollins inc. 24 000 1 025 775711104775711104 2 451 Roper Industries inc. 4 636 2 760 776696106776696106 2 812 Royal Dutch Shell plc, classe A 305 559 2 312 GB00BL5C4272B03MLX903+ 3 469 Royal Dutch Shell plc, classe B 113 343 3 034 B03MM4906B03MM4906
659 Ryman Healthcare Ltd 50 498 541 NZRYME0001S4NZRYME0001S4 1 505 S&P Global inc. 4 200 2 455 78409V10478409V104 7 948 Salesforce.com inc. 36 106 13 198 79466L30279466L302 4 519 Sands China Ltd 799 600 2 358 B5B23W909B5B23W909
737 Sandvik AB 35 663 1 131 B1VQ25903B1VQ25903 679 Sanofi 5 749 696 567173901567173901
9 778 SAP SE 64 005 10 460 484628904484628904 790 Sartorius Stedim Biotech SA 1 402 1 056 FR0013154002FR0013154002
2 199 SBA Communications Corp., classe A 5 900 2 602 78410G10478410G104
13
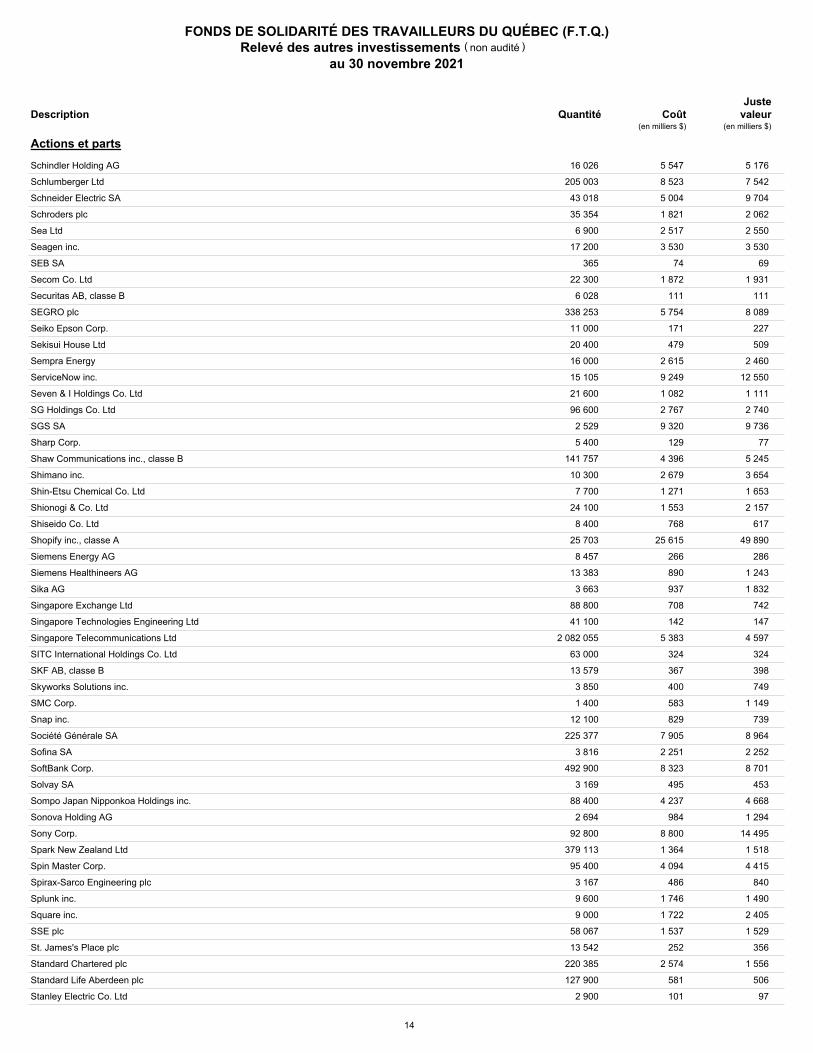
FONDS DE SOLIDARITÉ DES TRAVAILLEURS DU QUÉBEC (F.T.Q.)Relevé des autres investissements
au 30 novembre 2021
non audité( )
Quantité CoûtJuste
valeurDescription(en milliers $)(en milliers $)
Actions et parts
5 547 Schindler Holding AG 16 026 5 176 CH0024638212CH0024638212+ 8 523 Schlumberger Ltd 205 003 7 542 806857108806857108 5 004 Schneider Electric SA 43 018 9 704 483410007483410007 1 821 Schroders plc 35 354 2 062 GB0002405495GB0002405495 2 517 Sea Ltd 6 900 2 550 81141R10081141R100 3 530 Seagen inc. 17 200 3 530 81181C10481181C104
74 SEB SA 365 69 FR0000121709FR0000121709 1 872 Secom Co. Ltd 22 300 1 931 679159004679159004
111 Securitas AB, classe B 6 028 111 SE0000163594SE0000163594 5 754 SEGRO plc 338 253 8 089 GB00B5ZN1N88GB00B5ZN1N88
171 Seiko Epson Corp. 11 000 227 JP3414750004JP3414750004 479 Sekisui House Ltd 20 400 509 JP3420600003JP3420600003
2 615 Sempra Energy 16 000 2 460 816851109816851109 9 249 ServiceNow inc. 15 105 12 550 81762P10281762P102 1 082 Seven & I Holdings Co. Ltd 21 600 1 111 B0FS5D909B0FS5D909 2 767 SG Holdings Co. Ltd 96 600 2 740 JP3162770006JP3162770006 9 320 SGS SA 2 529 9 736 482477007482477007
129 Sharp Corp. 5 400 77 JP3359600008JP3359600008 4 396 Shaw Communications inc., classe B 141 757 5 245 82028K20082028K200 2 679 Shimano inc. 10 300 3 654 JP3358000002JP3358000002 1 271 Shin-Etsu Chemical Co. Ltd 7 700 1 653 680458007680458007 1 553 Shionogi & Co. Ltd 24 100 2 157 JP3347200002JP3347200002
768 Shiseido Co. Ltd 8 400 617 680526001680526001 25 615 Shopify inc., classe A 25 703 49 890 82509L10782509L107
266 Siemens Energy AG 8 457 286 DE000ENER6Y0DE000ENER6Y0 890 Siemens Healthineers AG 13 383 1 243 DE000SHL1006DE000SHL1006 937 Sika AG 3 663 1 832 CH0418792922CH0418792922 708 Singapore Exchange Ltd 88 800 742 SG1J26887955SG1J26887955 142 Singapore Technologies Engineering Ltd 41 100 147 SG1F60858221SG1F60858221
5 383 Singapore Telecommunications Ltd 2 082 055 4 597 B02PY2901B02PY2901 324 SITC International Holdings Co. Ltd 63 000 324 KYG8187G1055KYG8187G1055 367 SKF AB, classe B 13 579 398 B1Q3J3907B1Q3J3907 400 Skyworks Solutions inc. 3 850 749 US83088M1027US83088M1027 583 SMC Corp. 1 400 1 149 676396005676396005 829 Snap inc. 12 100 739 83304A10683304A106
7 905 Société Générale SA 225 377 8 964 596651901596651901 2 251 Sofina SA 3 816 2 252 000371731000371731 8 323 SoftBank Corp. 492 900 8 701 JP3732000009JP3732000009
495 Solvay SA 3 169 453 482110004482110004 4 237 Sompo Japan Nipponkoa Holdings inc. 88 400 4 668 B62G7K908B62G7K908
984 Sonova Holding AG 2 694 1 294 CH0012549785CH0012549785 8 800 Sony Corp. 92 800 14 495 682150008682150008 1 364 Spark New Zealand Ltd 379 113 1 518 012285353012285353 4 094 Spin Master Corp. 95 400 4 415 848510103848510103
486 Spirax-Sarco Engineering plc 3 167 840 GB00BWFGQN14GB00BWFGQN14 1 746 Splunk inc. 9 600 1 490 848637104848637104 1 722 Square inc. 9 000 2 405 852234103852234103 1 537 SSE plc 58 067 1 529 079087003079087003
252 St. James's Place plc 13 542 356 GB0007669376GB0007669376 2 574 Standard Chartered plc 220 385 1 556 040828907040828907
581 Standard Life Aberdeen plc 127 900 506 GB00BF8Q6K64GB00BF8Q6K64 101 Stanley Electric Co. Ltd 2 900 97 JP3399400005JP3399400005
14
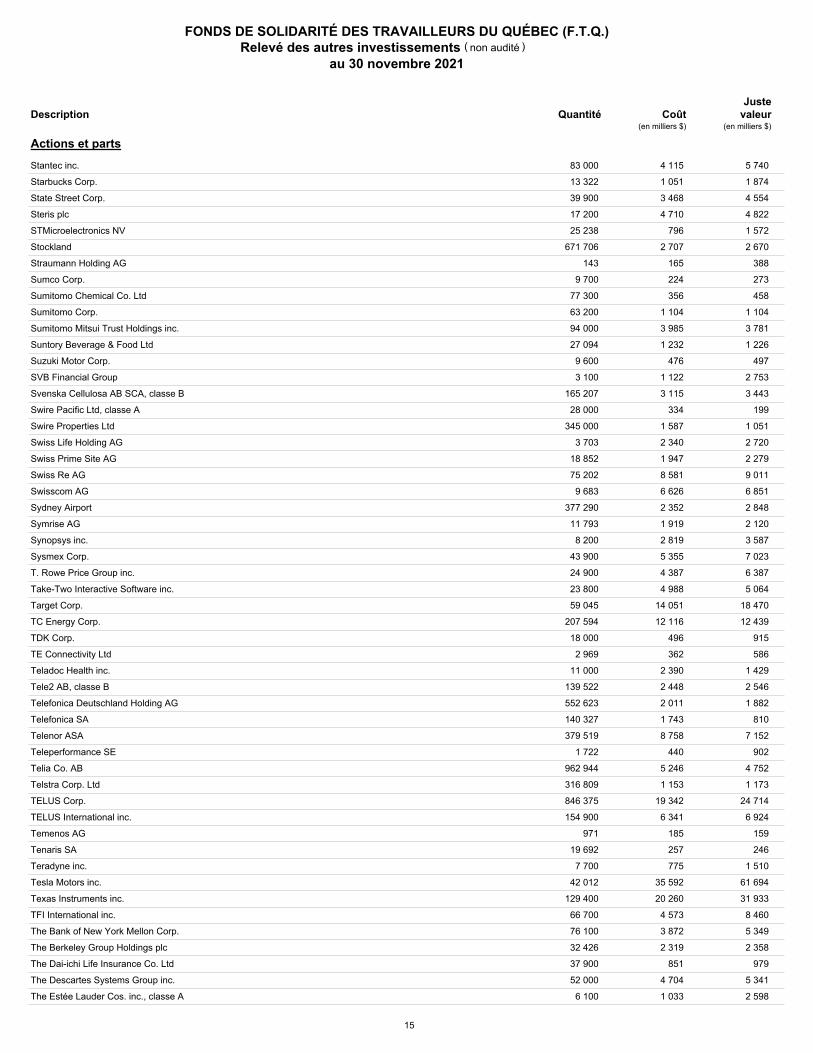
FONDS DE SOLIDARITÉ DES TRAVAILLEURS DU QUÉBEC (F.T.Q.)Relevé des autres investissements
au 30 novembre 2021
non audité( )
Quantité CoûtJuste
valeurDescription(en milliers $)(en milliers $)
Actions et parts
4 115 Stantec inc. 83 000 5 740 85472N10985472N109 1 051 Starbucks Corp. 13 322 1 874 855244109855244109 3 468 State Street Corp. 39 900 4 554 857477103857477103 4 710 Steris plc 17 200 4 822 G8473T100G8473T100
796 STMicroelectronics NV 25 238 1 572 NL0000226223NL0000226223 2 707 Stockland 671 706 2 670 AU000000SGP0AU000000SGP0
165 Straumann Holding AG 143 388 CH0012280076CH0012280076 224 Sumco Corp. 9 700 273 JP3322930003JP3322930003 356 Sumitomo Chemical Co. Ltd 77 300 458 685856007685856007
1 104 Sumitomo Corp. 63 200 1 104 685894008685894008 3 985 Sumitomo Mitsui Trust Holdings inc. 94 000 3 781 643189905643189905 1 232 Suntory Beverage & Food Ltd 27 094 1 226 JP3336560002JP3336560002
476 Suzuki Motor Corp. 9 600 497 686550005686550005 1 122 SVB Financial Group 3 100 2 753 78486Q10178486Q101 3 115 Svenska Cellulosa AB SCA, classe B 165 207 3 443 B1VVGZ901B1VVGZ901
334 Swire Pacific Ltd, classe A 28 000 199 686774001686774001 1 587 Swire Properties Ltd 345 000 1 051 HK0000063609HK0000063609 2 340 Swiss Life Holding AG 3 703 2 720 CH0014852781CH0014852781 1 947 Swiss Prime Site AG 18 852 2 279 B083BH906B083BH906 8 581 Swiss Re AG 75 202 9 011 ACI00MQT5ACI00MQT5 6 626 Swisscom AG 9 683 6 851 553397902553397902 2 352 Sydney Airport 377 290 2 848 AU000000SYD9AU000000SYD9 1 919 Symrise AG 11 793 2 120 027647189027647189 2 819 Synopsys inc. 8 200 3 587 871607107871607107 5 355 Sysmex Corp. 43 900 7 023 JP3351100007JP3351100007 4 387 T. Rowe Price Group inc. 24 900 6 387 74144T10874144T108 4 988 Take-Two Interactive Software inc. 23 800 5 064 874054109874054109
14 051 Target Corp. 59 045 18 470 87612E10687612E106 12 116 TC Energy Corp. 207 594 12 439 87807B10787807B107
496 TDK Corp. 18 000 915 JP3538800008JP3538800008 362 TE Connectivity Ltd 2 969 586 H84989104H84989104
2 390 Teladoc Health inc. 11 000 1 429 87918A10587918A105 2 448 Tele2 AB, classe B 139 522 2 546 B97C73904B97C73904 2 011 Telefonica Deutschland Holding AG 552 623 1 882 DE000A1J5RX9DE000A1J5RX9 1 743 Telefonica SA 140 327 810 879382109879382109 8 758 Telenor ASA 379 519 7 152 473249902473249902
440 Teleperformance SE 1 722 902 FR0000051807FR0000051807 5 246 Telia Co. AB 962 944 4 752 597838903597838903 1 153 Telstra Corp. Ltd 316 809 1 173 608728903608728903
19 342 TELUS Corp. 846 375 24 714 87971M10387971M103 6 341 TELUS International inc. 154 900 6 924 87975H10087975H100
185 Temenos AG 971 159 CH0012453913CH0012453913 257 Tenaris SA 19 692 246 753851906753851906 775 Teradyne inc. 7 700 1 510 880770102880770102
35 592 Tesla Motors inc. 42 012 61 694 88160T10188160T101 20 260 Texas Instruments inc. 129 400 31 933 882508104882508104
4 573 TFI International inc. 66 700 8 460 87241L10987241L109 3 872 The Bank of New York Mellon Corp. 76 100 5 349 064058100064058100 2 319 The Berkeley Group Holdings plc 32 426 2 358 GB00BLJNXL82GB00BLJNXL82
851 The Dai-ichi Life Insurance Co. Ltd 37 900 979 B601QS905B601QS905 4 704 The Descartes Systems Group inc. 52 000 5 341 249906108249906108 1 033 The Estée Lauder Cos. inc., classe A 6 100 2 598 518439104518439104
15
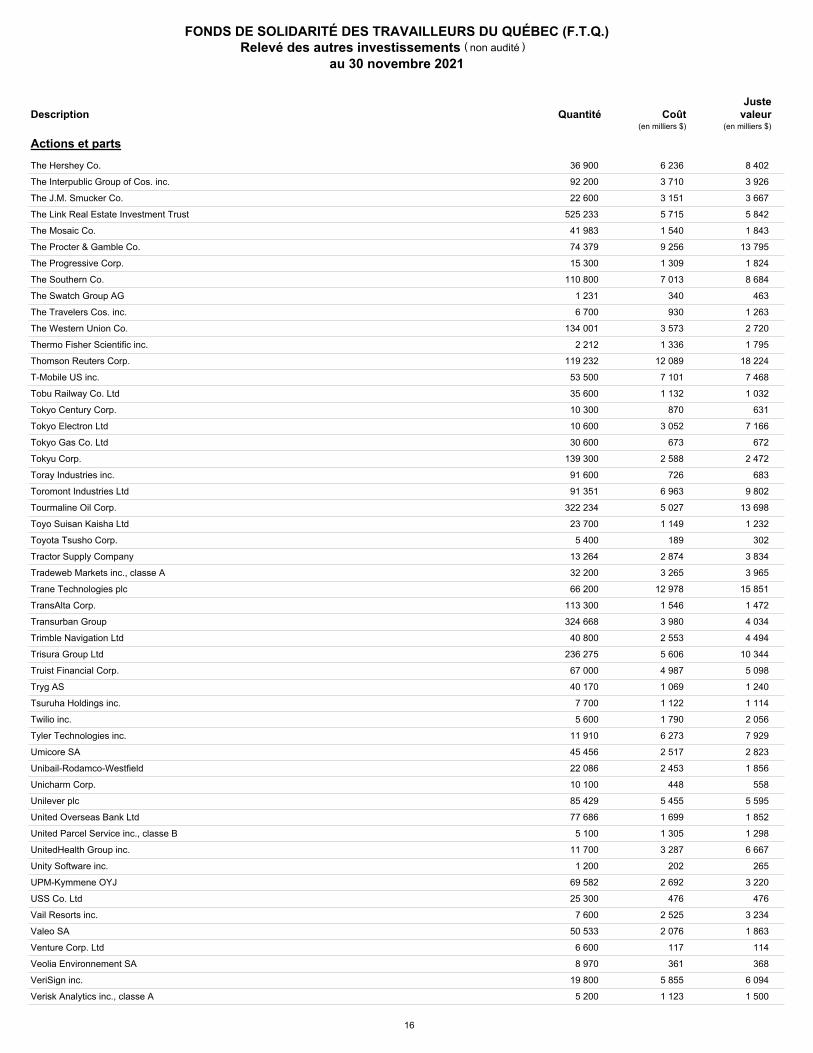
FONDS DE SOLIDARITÉ DES TRAVAILLEURS DU QUÉBEC (F.T.Q.)Relevé des autres investissements
au 30 novembre 2021
non audité( )
Quantité CoûtJuste
valeurDescription(en milliers $)(en milliers $)
Actions et parts
6 236 The Hershey Co. 36 900 8 402 427866108427866108 3 710 The Interpublic Group of Cos. inc. 92 200 3 926 460690100460690100 3 151 The J.M. Smucker Co. 22 600 3 667 832696405832696405 5 715 The Link Real Estate Investment Trust 525 233 5 842 HK0823032773HK0823032773 1 540 The Mosaic Co. 41 983 1 843 61945C10361945C103 9 256 The Procter & Gamble Co. 74 379 13 795 742718109742718109 1 309 The Progressive Corp. 15 300 1 824 743315103743315103 7 013 The Southern Co. 110 800 8 684 842587107842587107
340 The Swatch Group AG 1 231 463 CH0012255151CH0012255151 930 The Travelers Cos. inc. 6 700 1 263 89417E10989417E109
3 573 The Western Union Co. 134 001 2 720 959802109959802109 1 336 Thermo Fisher Scientific inc. 2 212 1 795 883556102883556102
12 089 Thomson Reuters Corp. 119 232 18 224 884903709884903709 7 101 T-Mobile US inc. 53 500 7 468 872590104872590104 1 132 Tobu Railway Co. Ltd 35 600 1 032 689516003689516003
870 Tokyo Century Corp. 10 300 631 JP3424950008JP3424950008 3 052 Tokyo Electron Ltd 10 600 7 166 689567006689567006
673 Tokyo Gas Co. Ltd 30 600 672 689544005689544005 2 588 Tokyu Corp. 139 300 2 472 JP3574200006JP3574200006
726 Toray Industries inc. 91 600 683 689714004689714004 6 963 Toromont Industries Ltd 91 351 9 802 891102105891102105 5 027 Tourmaline Oil Corp. 322 234 13 698 89156V10689156V106 1 149 Toyo Suisan Kaisha Ltd 23 700 1 232 689996007689996007
189 Toyota Tsusho Corp. 5 400 302 JP3635000007JP3635000007 2 874 Tractor Supply Company 13 264 3 834 892356106892356106 3 265 Tradeweb Markets inc., classe A 32 200 3 965 892672106892672106
12 978 Trane Technologies plc 66 200 15 851 IE00BK9ZQ967IE00BK9ZQ967 1 546 TransAlta Corp. 113 300 1 472 89346D10789346D107 3 980 Transurban Group 324 668 4 034 620088906620088906 2 553 Trimble Navigation Ltd 40 800 4 494 896239100896239100 5 606 Trisura Group Ltd 236 275 10 344 89679A20989679A209 4 987 Truist Financial Corp. 67 000 5 098 89832Q10989832Q109 1 069 Tryg AS 40 170 1 240 DK0060636678DK0060636678 1 122 Tsuruha Holdings inc. 7 700 1 114 JP3536150000JP3536150000 1 790 Twilio inc. 5 600 2 056 90138F10290138F102 6 273 Tyler Technologies inc. 11 910 7 929 902252105902252105 2 517 Umicore SA 45 456 2 823 BE0974320526BE0974320526 2 453 Unibail-Rodamco-Westfield 22 086 1 856 FR0013326246FR0013326246
448 Unicharm Corp. 10 100 558 691148001691148001 5 455 Unilever plc 85 429 5 595 B10RZP905B10RZP905 1 699 United Overseas Bank Ltd 77 686 1 852 691678007691678007 1 305 United Parcel Service inc., classe B 5 100 1 298 911312106911312106 3 287 UnitedHealth Group inc. 11 700 6 667 91324P10291324P102
202 Unity Software inc. 1 200 265 91332U10191332U101 2 692 UPM-Kymmene OYJ 69 582 3 220 505125906505125906
476 USS Co. Ltd 25 300 476 JP3944130008JP3944130008 2 525 Vail Resorts inc. 7 600 3 234 91879Q10991879Q109 2 076 Valeo SA 50 533 1 863 FR0013176526FR0013176526
117 Venture Corp. Ltd 6 600 114 SG0531000230SG0531000230 361 Veolia Environnement SA 8 970 368 403187909403187909
5 855 VeriSign inc. 19 800 6 094 92343E10292343E102 1 123 Verisk Analytics inc., classe A 5 200 1 500 92345Y10692345Y106
16
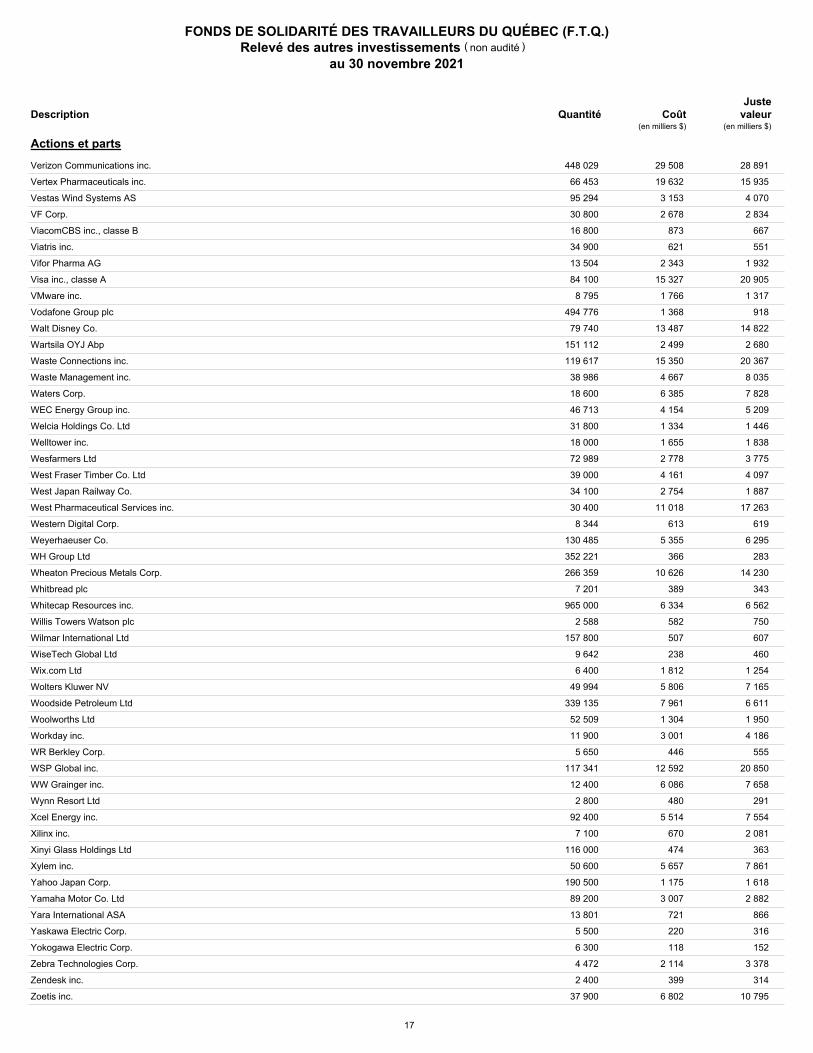
FONDS DE SOLIDARITÉ DES TRAVAILLEURS DU QUÉBEC (F.T.Q.)Relevé des autres investissements
au 30 novembre 2021
non audité( )
Quantité CoûtJuste
valeurDescription(en milliers $)(en milliers $)
Actions et parts
29 508 Verizon Communications inc. 448 029 28 891 92343V10492343V104 19 632 Vertex Pharmaceuticals inc. 66 453 15 935 92532F10092532F100
3 153 Vestas Wind Systems AS 95 294 4 070 DK0061539921DK0061539921 2 678 VF Corp. 30 800 2 834 918204108918204108
873 ViacomCBS inc., classe B 16 800 667 92556H20692556H206 621 Viatris inc. 34 900 551 92556V10692556V106
2 343 Vifor Pharma AG 13 504 1 932 CH0364749348CH0364749348 15 327 Visa inc., classe A 84 100 20 905 92826C83992826C839
1 766 VMware inc. 8 795 1 317 928563402928563402 1 368 Vodafone Group plc 494 776 918 B16GWD903B16GWD903
13 487 Walt Disney Co. 79 740 14 822 254687106254687106 2 499 Wartsila OYJ Abp 151 112 2 680 452518905452518905
15 350 Waste Connections inc. 119 617 20 367 94106B10194106B101+ 4 667 Waste Management inc. 38 986 8 035 94106L10994106L109 6 385 Waters Corp. 18 600 7 828 941848103941848103 4 154 WEC Energy Group inc. 46 713 5 209 92939U10692939U106 1 334 Welcia Holdings Co. Ltd 31 800 1 446 JP3274280001JP3274280001 1 655 Welltower inc. 18 000 1 838 95040Q10495040Q104 2 778 Wesfarmers Ltd 72 989 3 775 694883000694883000 4 161 West Fraser Timber Co. Ltd 39 000 4 097 952845105952845105 2 754 West Japan Railway Co. 34 100 1 887 JP3659000008JP3659000008
11 018 West Pharmaceutical Services inc. 30 400 17 263 955306105955306105 613 Western Digital Corp. 8 344 619 958102105958102105
5 355 Weyerhaeuser Co. 130 485 6 295 962166104962166104 366 WH Group Ltd 352 221 283 109647233109647233
10 626 Wheaton Precious Metals Corp. 266 359 14 230 962879102962879102 389 Whitbread plc 7 201 343 GB00B1KJJ408GB00B1KJJ408
6 334 Whitecap Resources inc. 965 000 6 562 96467A20096467A200 582 Willis Towers Watson plc 2 588 750 IE00BDB6Q211IE00BDB6Q211 507 Wilmar International Ltd 157 800 607 B17KC6900B17KC6900 238 WiseTech Global Ltd 9 642 460 AU000000WTC3AU000000WTC3
1 812 Wix.com Ltd 6 400 1 254 IL0011301780IL0011301780 5 806 Wolters Kluwer NV 49 994 7 165 NL0000395903NL0000395903 7 961 Woodside Petroleum Ltd 339 135 6 611 AU000000WPL2AU000000WPL2 1 304 Woolworths Ltd 52 509 1 950 698123908698123908 3 001 Workday inc. 11 900 4 186 98138H10198138H101
446 WR Berkley Corp. 5 650 555 084423102084423102 12 592 WSP Global inc. 117 341 20 850 92938W20292938W202
6 086 WW Grainger inc. 12 400 7 658 384802104384802104 480 Wynn Resort Ltd 2 800 291 983134107983134107
5 514 Xcel Energy inc. 92 400 7 554 98389B10098389B100 670 Xilinx inc. 7 100 2 081 983919101983919101 474 Xinyi Glass Holdings Ltd 116 000 363 G9828G108G9828G108
5 657 Xylem inc. 50 600 7 861 98419M10098419M100 1 175 Yahoo Japan Corp. 190 500 1 618 JP3933800009JP3933800009 3 007 Yamaha Motor Co. Ltd 89 200 2 882 JP3942800008JP3942800008
721 Yara International ASA 13 801 866 775125909775125909 220 Yaskawa Electric Corp. 5 500 316 JP3932000007JP3932000007 118 Yokogawa Electric Corp. 6 300 152 JP3955000009JP3955000009
2 114 Zebra Technologies Corp. 4 472 3 378 989207105989207105 399 Zendesk inc. 2 400 314 98936J10198936J101
6 802 Zoetis inc. 37 900 10 795 98978V10398978V103
17
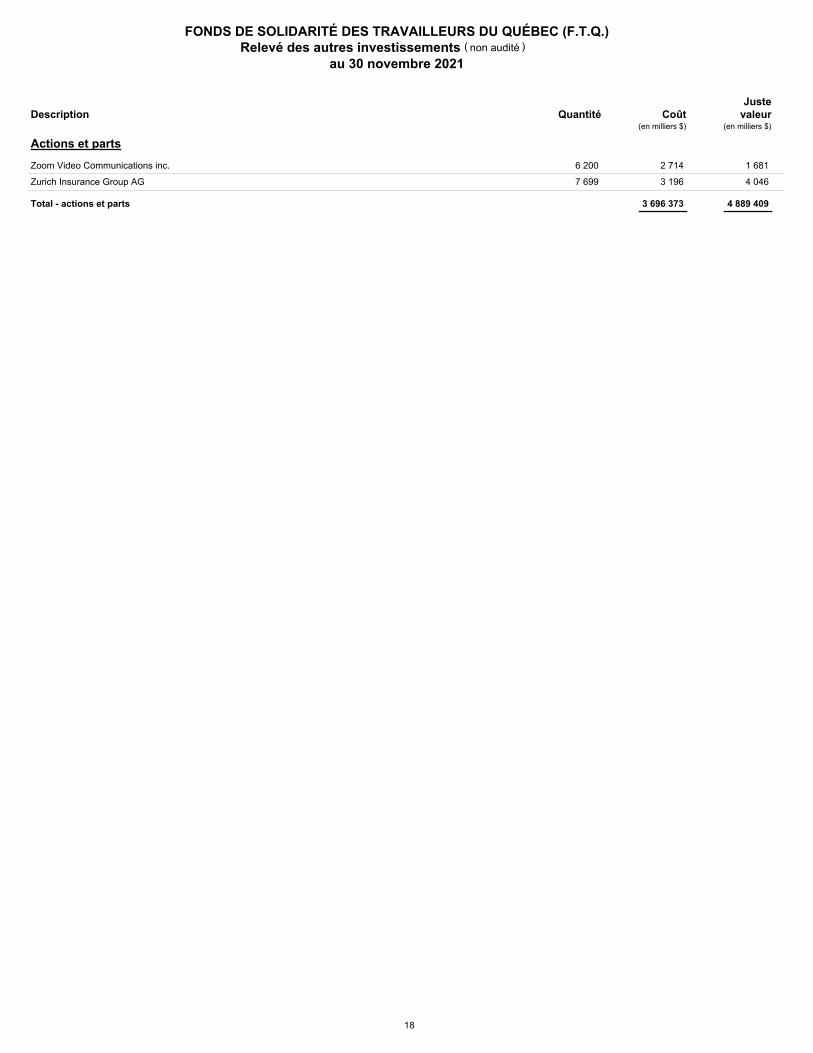
FONDS DE SOLIDARITÉ DES TRAVAILLEURS DU QUÉBEC (F.T.Q.)Relevé des autres investissements
au 30 novembre 2021
non audité( )
Quantité CoûtJuste
valeurDescription(en milliers $)(en milliers $)
Actions et parts
2 714 Zoom Video Communications inc. 6 200 1 681 98980L10198980L101 3 196 Zurich Insurance Group AG 7 699 4 046 598381903598381903
Total - actions et parts 3 696 373 4 889 409
18
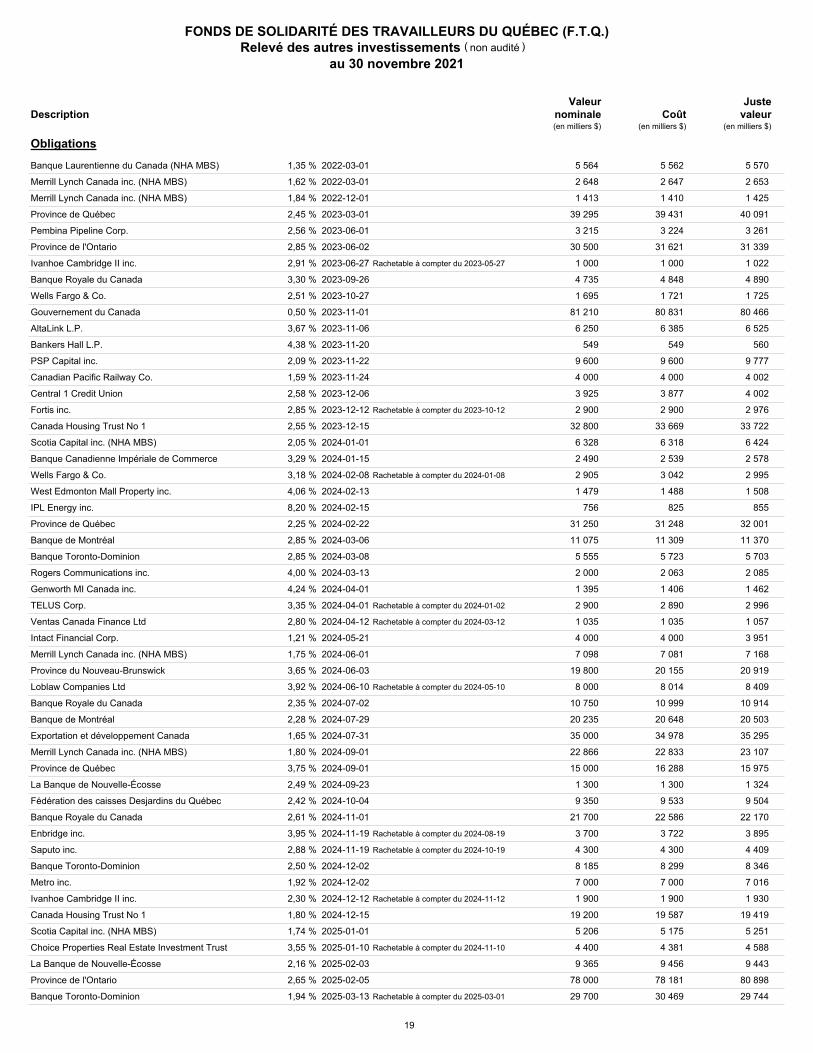
FONDS DE SOLIDARITÉ DES TRAVAILLEURS DU QUÉBEC (F.T.Q.)Relevé des autres investissements
au 30 novembre 2021
non audité( )
Valeurnominale Coût
JustevaleurDescription
(en milliers $)(en milliers $)(en milliers $)
Obligations
5 562 Banque Laurentienne du Canada (NHA MBS) 1,35 % 2022-03-01 5 564 5 570 62946Z6Y062946Z6Y0 2 647 Merrill Lynch Canada inc. (NHA MBS) 1,62 % 2022-03-01 2 648 2 653 62946ZC8062946ZC80 1 410 Merrill Lynch Canada inc. (NHA MBS) 1,84 % 2022-12-01 1 413 1 425 62949ZE5162949ZE51
39 431 Province de Québec 2,45 % 2023-03-01 39 295 40 091 748148BY8748148BY8 3 224 Pembina Pipeline Corp. 2,56 % 2023-06-01 3 215 3 261 70632ZAP670632ZAP6
31 621 Province de l'Ontario 2,85 % 2023-06-02 30 500 31 339 68323ABN368323ABN3Rachetable à compter du 2023-05-27 1 000 Ivanhoe Cambridge II inc. 2,91 % 2023-06-27 1 000 1 022 46578WAA246578WAA2
4 848 Banque Royale du Canada 3,30 % 2023-09-26 4 735 4 890 780086QL1780086QL1 1 721 Wells Fargo & Co. 2,51 % 2023-10-27 1 695 1 725 949746SG7949746SG7
80 831 Gouvernement du Canada 0,50 % 2023-11-01 81 210 80 466 135087M76135087M76 6 385 AltaLink L.P. 3,67 % 2023-11-06 6 250 6 525 02135ZAL002135ZAL0
549 Bankers Hall L.P. 4,38 % 2023-11-20 549 560 066164AA2066164AA2 9 600 PSP Capital inc. 2,09 % 2023-11-22 9 600 9 777 69363TAK869363TAK8 4 000 Canadian Pacific Railway Co. 1,59 % 2023-11-24 4 000 4 002 13645RBB913645RBB9 3 877 Central 1 Credit Union 2,58 % 2023-12-06 3 925 4 002 154728AQ2154728AQ2
Rachetable à compter du 2023-10-12 2 900 Fortis inc. 2,85 % 2023-12-12 2 900 2 976 349553AN7349553AN7 33 669 Canada Housing Trust No 1 2,55 % 2023-12-15 32 800 33 722 13509PGU113509PGU1
6 318 Scotia Capital inc. (NHA MBS) 2,05 % 2024-01-01 6 328 6 424 62956ZCM662956ZCM6 2 539 Banque Canadienne Impériale de Commerce 3,29 % 2024-01-15 2 490 2 578 1360695D91360695D9
Rachetable à compter du 2024-01-08 3 042 Wells Fargo & Co. 3,18 % 2024-02-08 2 905 2 995 949746SY8949746SY8 1 488 West Edmonton Mall Property inc. 4,06 % 2024-02-13 1 479 1 508 952637AC0952637AC0
825 IPL Energy inc. 8,20 % 2024-02-15 756 855 46065DAA446065DAA4 31 248 Province de Québec 2,25 % 2024-02-22 31 250 32 001 748148RY1748148RY1 11 309 Banque de Montréal 2,85 % 2024-03-06 11 075 11 370 06368B2H006368B2H0
5 723 Banque Toronto-Dominion 2,85 % 2024-03-08 5 555 5 703 89117FMA489117FMA4 2 063 Rogers Communications inc. 4,00 % 2024-03-13 2 000 2 085 775109BA8775109BA8 1 406 Genworth MI Canada inc. 4,24 % 2024-04-01 1 395 1 462 37252BAC637252BAC6
Rachetable à compter du 2024-01-02 2 890 TELUS Corp. 3,35 % 2024-04-01 2 900 2 996 87971MAR487971MAR4Rachetable à compter du 2024-03-12 1 035 Ventas Canada Finance Ltd 2,80 % 2024-04-12 1 035 1 057 92277LAF392277LAF3
4 000 Intact Financial Corp. 1,21 % 2024-05-21 4 000 3 951 45823TAG145823TAG1 7 081 Merrill Lynch Canada inc. (NHA MBS) 1,75 % 2024-06-01 7 098 7 168 62956ZVB962956ZVB9
20 155 Province du Nouveau-Brunswick 3,65 % 2024-06-03 19 800 20 919 642869AJ0642869AJ0Rachetable à compter du 2024-05-10 8 014 Loblaw Companies Ltd 3,92 % 2024-06-10 8 000 8 409 539481AL5539481AL5
10 999 Banque Royale du Canada 2,35 % 2024-07-02 10 750 10 914 780086QY3780086QY3 20 648 Banque de Montréal 2,28 % 2024-07-29 20 235 20 503 06368B5B006368B5B0 34 978 Exportation et développement Canada 1,65 % 2024-07-31 35 000 35 295 30216BHL930216BHL9 22 833 Merrill Lynch Canada inc. (NHA MBS) 1,80 % 2024-09-01 22 866 23 107 62957ZT4762957ZT47 16 288 Province de Québec 3,75 % 2024-09-01 15 000 15 975 74814ZES874814ZES8
1 300 La Banque de Nouvelle-Écosse 2,49 % 2024-09-23 1 300 1 324 06415EXV206415EXV2 9 533 Fédération des caisses Desjardins du Québec 2,42 % 2024-10-04 9 350 9 504 31430WCG731430WCG7
22 586 Banque Royale du Canada 2,61 % 2024-11-01 21 700 22 170 780086RF3780086RF3Rachetable à compter du 2024-08-19 3 722 Enbridge inc. 3,95 % 2024-11-19 3 700 3 895 29251ZBQ929251ZBQ9Rachetable à compter du 2024-10-19 4 300 Saputo inc. 2,88 % 2024-11-19 4 300 4 409 80310ZAF680310ZAF6
8 299 Banque Toronto-Dominion 2,50 % 2024-12-02 8 185 8 346 89117FNR689117FNR6 7 000 Metro inc. 1,92 % 2024-12-02 7 000 7 016 59162NAK559162NAK5
Rachetable à compter du 2024-11-12 1 900 Ivanhoe Cambridge II inc. 2,30 % 2024-12-12 1 900 1 930 46578WAB046578WAB0 19 587 Canada Housing Trust No 1 1,80 % 2024-12-15 19 200 19 419 13509PHJ513509PHJ5
5 175 Scotia Capital inc. (NHA MBS) 1,74 % 2025-01-01 5 206 5 251 62959ZRN562959ZRN5Rachetable à compter du 2024-11-10 4 381 Choice Properties Real Estate Investment Trust 3,55 % 2025-01-10 4 400 4 588 17039AAK217039AAK2
9 456 La Banque de Nouvelle-Écosse 2,16 % 2025-02-03 9 365 9 443 06415EV9306415EV93 78 181 Province de l'Ontario 2,65 % 2025-02-05 78 000 80 898 68323AER168323AER1
Rachetable à compter du 2025-03-01 30 469 Banque Toronto-Dominion 1,94 % 2025-03-13 29 700 29 744 89117FVY289117FVY2
19

FONDS DE SOLIDARITÉ DES TRAVAILLEURS DU QUÉBEC (F.T.Q.)Relevé des autres investissements
au 30 novembre 2021
non audité( )
Valeurnominale Coût
JustevaleurDescription
(en milliers $)(en milliers $)(en milliers $)
Obligations
12 815 Canada Housing Trust No 1 2,55 % 2025-03-15 12 700 13 144 13509PER013509PER0Rachetable à compter du 2025-01-15 1 906 Reliance L.P. 3,84 % 2025-03-15 1 905 1 998 759480AJ5759480AJ5
22 539 Banque Canadienne Impériale de Commerce 2,00 % 2025-04-17 22 150 22 186 13607GPJ713607GPJ7Variable et rachetable à compter du 2024-04-25 6 500 Bank of America Corp. 2,93 % 2025-04-25 6 500 6 670 060505FM1060505FM1
2 149 Nova Gas Transmission Ltd 8,90 % 2025-05-27 2 000 2 427 66975ZAE466975ZAE4Rachetable à compter du 2025-05-10 6 023 AltaGas Ltd 2,16 % 2025-06-10 5 950 5 928 02138ZAT002138ZAT0
32 978 Province de Québec 2,60 % 2025-07-06 33 085 34 372 748148RX3748148RX3 1 192 Westcoast Energy inc. 8,85 % 2025-07-21 1 136 1 389 95751DAK895751DAK8
Rachetable à compter du 2025-06-14 2 000 Saputo inc. 3,60 % 2025-08-14 2 000 2 099 80310ZAE980310ZAE9 26 460 Province de l'Ontario 1,75 % 2025-09-08 25 500 25 667 68333ZAK368333ZAK3
1 500 Lievre Power Financing Corp. 5,56 % 2025-10-06 1 500 1 583 531739AA8531739AA8Rachetable à compter du 2025-08-24 1 304 Choice Properties Real Estate Investment Trust 4,06 % 2025-11-24 1 200 1 278 17039AAF317039AAF3
9 791 Banque Toronto-Dominion 1,13 % 2025-12-09 9 900 9 567 89117FYZ689117FYZ6 175 Alliance Pipeline L.P. 6,77 % 2025-12-31 175 196 01877ZAC401877ZAC4
18 395 Banque Canadienne Impériale de Commerce 1,10 % 2026-01-19 18 595 17 866 13607GRU013607GRU0 7 930 Fédération des caisses Desjardins du Québec 1,09 % 2026-01-21 7 950 7 636 31430WFL331430WFL3 3 700 Central 1 Credit Union 1,32 % 2026-01-29 3 700 3 583 154728AR0154728AR0
Rachetable à compter du 2026-01-27 1 116 Sienna Senior Living inc. 3,45 % 2026-02-27 1 115 1 155 82621KAC682621KAC6Rachetable à compter du 2026-02-10 4 500 Banque de Montréal 1,76 % 2026-03-10 4 500 4 437 06368DPC206368DPC2Rachetable à compter du 2026-01-15 549 Reliance L.P. 3,75 % 2026-03-15 550 577 759480AK2759480AK2Variable et rachetable à compter du 2025-03-24 2 360 Bank of America Corp. 3,52 % 2026-03-24 2 200 2 300 060505FS8060505FS8Rachetable à compter du 2026-02-06 5 263 Altagas Canada inc. 3,15 % 2026-04-06 5 100 5 294 02091ZAB402091ZAB4Rachetable à compter du 2026-02-06 2 214 First Capital Realty inc. 3,60 % 2026-05-06 2 215 2 284 31943BBX731943BBX7
2 720 Wells Fargo & Co. 2,98 % 2026-05-19 2 650 2 724 949746RX1949746RX1 11 800 Banque HSBC Canada 1,78 % 2026-05-20 11 800 11 624 40427HTM540427HTM5
Rachetable à compter du 2026-03-01 4 272 CT Real Estate Investment Trust 3,29 % 2026-06-01 4 250 4 401 126462AD2126462AD2 6 436 Gouvernement du Canada 1,50 % 2026-06-01 6 250 6 291 135087E67135087E67
22 465 Province du Manitoba 2,55 % 2026-06-02 22 500 23 328 563469UJ2563469UJ2 7 400 Banque Nationale du Canada 1,53 % 2026-06-15 7 400 7 209 63306AGT763306AGT7
Rachetable à compter du 2026-05-15 6 384 RioCan Real Estate Investment Trust 1,97 % 2026-06-15 6 370 6 238 766910BG7766910BG7Rachetable à compter du 2026-05-19 3 617 Saputo inc. 1,42 % 2026-06-19 3 600 3 463 80310ZAH280310ZAH2Rachetable à compter du 2026-05-08 1 084 TELUS Corp. 2,75 % 2026-07-08 1 050 1 070 87971MBL687971MBL6
5 704 Banque Canadienne Impériale de Commerce 1,70 % 2026-07-15 5 700 5 577 13607HVV113607HVV1Rachetable à compter du 2026-05-05 1 459 Enbridge Gas inc. 2,50 % 2026-08-05 1 500 1 530 29290ZAR129290ZAR1Rachetable à compter du 2026-05-12 7 111 Bell Canada 2,90 % 2026-08-12 6 950 7 128 07813ZBV507813ZBV5
4 000 Fédération des caisses Desjardins du Québec 1,59 % 2026-09-10 4 000 3 890 31430WHX531430WHX5 5 000 Manulife Bank of Canada 1,54 % 2026-09-14 5 000 4 868 565018DG0565018DG0
24 101 Canada Housing Trust No 1 1,90 % 2026-09-15 24 300 24 560 13509PFL213509PFL2 1 400 Fortified Trust 1,96 % 2026-10-23 1 400 1 395 34960VAU234960VAU2
11 149 La Banque de Nouvelle-Écosse 1,85 % 2026-11-02 11 150 10 952 06415FFT406415FFT4Rachetable à compter du 2026-10-30 3 250 Choice Properties Real Estate Investment Trust 2,46 % 2026-11-30 3 250 3 258 17039AAV817039AAV8Rachetable à compter du 2026-12-04 1 648 Ventas Canada Finance Ltd 2,45 % 2027-01-04 1 650 1 652 92277LAG192277LAG1Rachetable à compter du 2026-11-22 1 004 First Capital Real Estate Investment Trust 3,46 % 2027-01-22 1 000 1 021 31943BBZ231943BBZ2Rachetable à compter du 2026-10-25 10 175 OPB Finance Trust 2,98 % 2027-01-25 10 000 10 456 67103MAF367103MAF3
58 418 Province de l'Ontario 1,85 % 2027-02-01 56 405 56 697 68333ZAJ668333ZAJ6 929 Wells Fargo & Co. 2,49 % 2027-02-18 900 902 949746SZ5949746SZ5
Rachetable à compter du 2027-01-01 1 450 Genworth MI Canada inc. 2,96 % 2027-03-01 1 450 1 457 37252BAD437252BAD4 3 500 RioCan Real Estate Investment Trust 2,36 % 2027-03-10 3 500 3 453 766910BF9766910BF9 2 157 Rogers Communications inc. 3,65 % 2027-03-31 2 095 2 186 775109BK6775109BK6
Rachetable à compter du 2027-01-31 926 Sienna Senior Living inc. 2,82 % 2027-03-31 925 929 82621KAD482621KAD4Rachetable à compter du 2027-02-16 1 800 Énergir inc. 2,10 % 2027-04-16 1 800 1 800 29279YAA629279YAA6Rachetable à compter du 2027-02-17 4 200 Alectra inc. 2,49 % 2027-05-17 4 200 4 286 014443AG0014443AG0
20
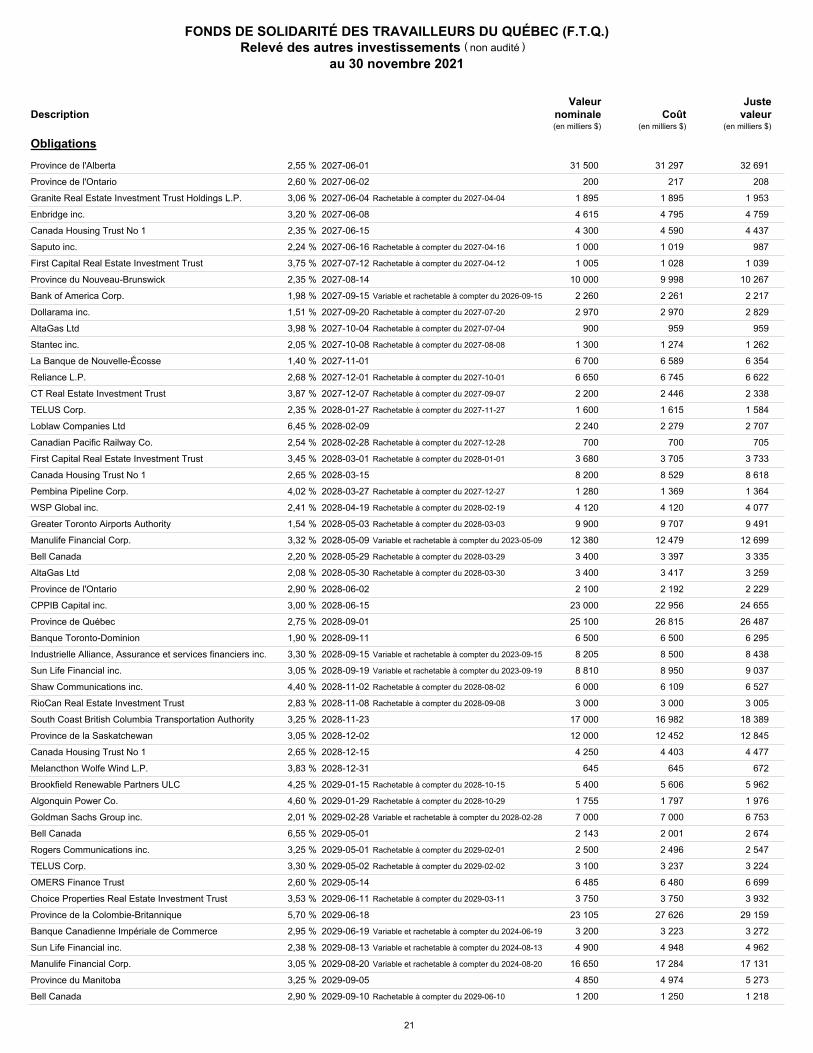
FONDS DE SOLIDARITÉ DES TRAVAILLEURS DU QUÉBEC (F.T.Q.)Relevé des autres investissements
au 30 novembre 2021
non audité( )
Valeurnominale Coût
JustevaleurDescription
(en milliers $)(en milliers $)(en milliers $)
Obligations
31 297 Province de l'Alberta 2,55 % 2027-06-01 31 500 32 691 013051DW4013051DW4 217 Province de l'Ontario 2,60 % 2027-06-02 200 208 68323AEE068323AEE0
Rachetable à compter du 2027-04-04 1 895 Granite Real Estate Investment Trust Holdings L.P. 3,06 % 2027-06-04 1 895 1 953 387427AH0387427AH0 4 795 Enbridge inc. 3,20 % 2027-06-08 4 615 4 759 29251ZBK229251ZBK2 4 590 Canada Housing Trust No 1 2,35 % 2027-06-15 4 300 4 437 13509PFX613509PFX6
Rachetable à compter du 2027-04-16 1 019 Saputo inc. 2,24 % 2027-06-16 1 000 987 80310ZAG480310ZAG4Rachetable à compter du 2027-04-12 1 028 First Capital Real Estate Investment Trust 3,75 % 2027-07-12 1 005 1 039 31943BBY531943BBY5
9 998 Province du Nouveau-Brunswick 2,35 % 2027-08-14 10 000 10 267 642866GM3642866GM3Variable et rachetable à compter du 2026-09-15 2 261 Bank of America Corp. 1,98 % 2027-09-15 2 260 2 217 060505FZ2060505FZ2Rachetable à compter du 2027-07-20 2 970 Dollarama inc. 1,51 % 2027-09-20 2 970 2 829 25675TAK325675TAK3Rachetable à compter du 2027-07-04 959 AltaGas Ltd 3,98 % 2027-10-04 900 959 02138ZAQ602138ZAQ6Rachetable à compter du 2027-08-08 1 274 Stantec inc. 2,05 % 2027-10-08 1 300 1 262 85472NAC385472NAC3
6 589 La Banque de Nouvelle-Écosse 1,40 % 2027-11-01 6 700 6 354 06415E4E206415E4E2Rachetable à compter du 2027-10-01 6 745 Reliance L.P. 2,68 % 2027-12-01 6 650 6 622 759480AL0759480AL0Rachetable à compter du 2027-09-07 2 446 CT Real Estate Investment Trust 3,87 % 2027-12-07 2 200 2 338 126462AF7126462AF7Rachetable à compter du 2027-11-27 1 615 TELUS Corp. 2,35 % 2028-01-27 1 600 1 584 87971MBQ587971MBQ5
2 279 Loblaw Companies Ltd 6,45 % 2028-02-09 2 240 2 707 53947ZAD953947ZAD9Rachetable à compter du 2027-12-28 700 Canadian Pacific Railway Co. 2,54 % 2028-02-28 700 705 13645RBC713645RBC7Rachetable à compter du 2028-01-01 3 705 First Capital Real Estate Investment Trust 3,45 % 2028-03-01 3 680 3 733 31890BAA131890BAA1
8 529 Canada Housing Trust No 1 2,65 % 2028-03-15 8 200 8 618 13509PGL113509PGL1Rachetable à compter du 2027-12-27 1 369 Pembina Pipeline Corp. 4,02 % 2028-03-27 1 280 1 364 70632ZAK770632ZAK7Rachetable à compter du 2028-02-19 4 120 WSP Global inc. 2,41 % 2028-04-19 4 120 4 077 92938WAA192938WAA1Rachetable à compter du 2028-03-03 9 707 Greater Toronto Airports Authority 1,54 % 2028-05-03 9 900 9 491 391906AH7391906AH7Variable et rachetable à compter du 2023-05-09 12 479 Manulife Financial Corp. 3,32 % 2028-05-09 12 380 12 699 56501RAG156501RAG1Rachetable à compter du 2028-03-29 3 397 Bell Canada 2,20 % 2028-05-29 3 400 3 335 07813ZCJ107813ZCJ1Rachetable à compter du 2028-03-30 3 417 AltaGas Ltd 2,08 % 2028-05-30 3 400 3 259 02138ZAW302138ZAW3
2 192 Province de l'Ontario 2,90 % 2028-06-02 2 100 2 229 68333ZAC168333ZAC1 22 956 CPPIB Capital inc. 3,00 % 2028-06-15 23 000 24 655 12593CAF812593CAF8 26 815 Province de Québec 2,75 % 2028-09-01 25 100 26 487 74814ZFD074814ZFD0
6 500 Banque Toronto-Dominion 1,90 % 2028-09-11 6 500 6 295 89117FJ3489117FJ34Variable et rachetable à compter du 2023-09-15 8 500 Industrielle Alliance, Assurance et services financiers inc. 3,30 % 2028-09-15 8 205 8 438 455870AD7455870AD7Variable et rachetable à compter du 2023-09-19 8 950 Sun Life Financial inc. 3,05 % 2028-09-19 8 810 9 037 86682ZAJ586682ZAJ5Rachetable à compter du 2028-08-02 6 109 Shaw Communications inc. 4,40 % 2028-11-02 6 000 6 527 82028KAY782028KAY7Rachetable à compter du 2028-09-08 3 000 RioCan Real Estate Investment Trust 2,83 % 2028-11-08 3 000 3 005 766910BH5766910BH5
16 982 South Coast British Columbia Transportation Authority 3,25 % 2028-11-23 17 000 18 389 83740TAG283740TAG2 12 452 Province de la Saskatchewan 3,05 % 2028-12-02 12 000 12 845 803854KF4803854KF4
4 403 Canada Housing Trust No 1 2,65 % 2028-12-15 4 250 4 477 13509PGS613509PGS6 645 Melancthon Wolfe Wind L.P. 3,83 % 2028-12-31 645 672 58533TAB658533TAB6
Rachetable à compter du 2028-10-15 5 606 Brookfield Renewable Partners ULC 4,25 % 2029-01-15 5 400 5 962 11282ZAM011282ZAM0Rachetable à compter du 2028-10-29 1 797 Algonquin Power Co. 4,60 % 2029-01-29 1 755 1 976 01585PAJ401585PAJ4Variable et rachetable à compter du 2028-02-28 7 000 Goldman Sachs Group inc. 2,01 % 2029-02-28 7 000 6 753 38141GXT638141GXT6
2 001 Bell Canada 6,55 % 2029-05-01 2 143 2 674 07813ZAC807813ZAC8Rachetable à compter du 2029-02-01 2 496 Rogers Communications inc. 3,25 % 2029-05-01 2 500 2 547 775109BJ9775109BJ9Rachetable à compter du 2029-02-02 3 237 TELUS Corp. 3,30 % 2029-05-02 3 100 3 224 87971MBJ187971MBJ1
6 480 OMERS Finance Trust 2,60 % 2029-05-14 6 485 6 699 C68012AB6C68012AB6Rachetable à compter du 2029-03-11 3 750 Choice Properties Real Estate Investment Trust 3,53 % 2029-06-11 3 750 3 932 17039AAP117039AAP1
27 626 Province de la Colombie-Britannique 5,70 % 2029-06-18 23 105 29 159 110709EK4110709EK4Variable et rachetable à compter du 2024-06-19 3 223 Banque Canadienne Impériale de Commerce 2,95 % 2029-06-19 3 200 3 272 13607GCJ113607GCJ1Variable et rachetable à compter du 2024-08-13 4 948 Sun Life Financial inc. 2,38 % 2029-08-13 4 900 4 962 86682ZAL086682ZAL0Variable et rachetable à compter du 2024-08-20 17 284 Manulife Financial Corp. 3,05 % 2029-08-20 16 650 17 131 56501RAF356501RAF3
4 974 Province du Manitoba 3,25 % 2029-09-05 4 850 5 273 56344ZQC656344ZQC6Rachetable à compter du 2029-06-10 1 250 Bell Canada 2,90 % 2029-09-10 1 200 1 218 07813ZCC607813ZCC6
21
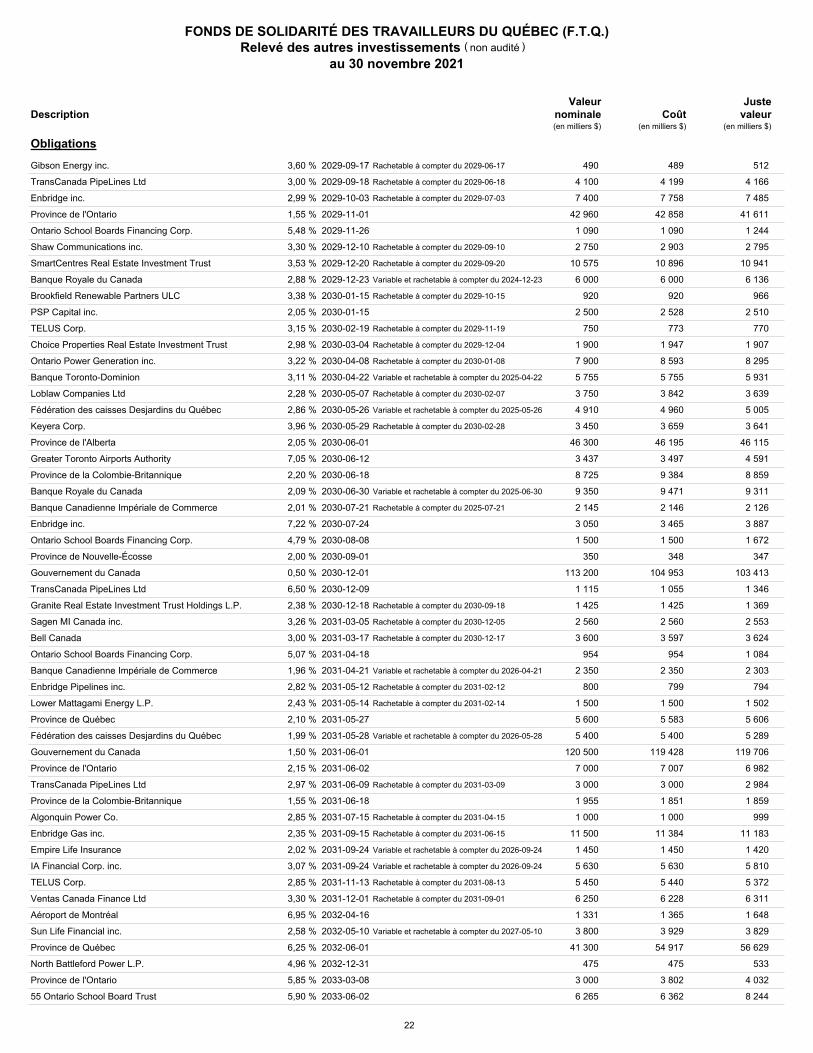
FONDS DE SOLIDARITÉ DES TRAVAILLEURS DU QUÉBEC (F.T.Q.)Relevé des autres investissements
au 30 novembre 2021
non audité( )
Valeurnominale Coût
JustevaleurDescription
(en milliers $)(en milliers $)(en milliers $)
Obligations
Rachetable à compter du 2029-06-17 489 Gibson Energy inc. 3,60 % 2029-09-17 490 512 37482ZAA937482ZAA9Rachetable à compter du 2029-06-18 4 199 TransCanada PipeLines Ltd 3,00 % 2029-09-18 4 100 4 166 89353ZCE689353ZCE6Rachetable à compter du 2029-07-03 7 758 Enbridge inc. 2,99 % 2029-10-03 7 400 7 485 29251ZBS529251ZBS5
42 858 Province de l'Ontario 1,55 % 2029-11-01 42 960 41 611 68333ZAR868333ZAR8 1 090 Ontario School Boards Financing Corp. 5,48 % 2029-11-26 1 090 1 244 683244AM9683244AM9
Rachetable à compter du 2029-09-10 2 903 Shaw Communications inc. 3,30 % 2029-12-10 2 750 2 795 82028KAZ482028KAZ4Rachetable à compter du 2029-09-20 10 896 SmartCentres Real Estate Investment Trust 3,53 % 2029-12-20 10 575 10 941 83179XAK483179XAK4Variable et rachetable à compter du 2024-12-23 6 000 Banque Royale du Canada 2,88 % 2029-12-23 6 000 6 136 780086RN6780086RN6Rachetable à compter du 2029-10-15 920 Brookfield Renewable Partners ULC 3,38 % 2030-01-15 920 966 11282ZAN811282ZAN8
2 528 PSP Capital inc. 2,05 % 2030-01-15 2 500 2 510 69363TAN269363TAN2Rachetable à compter du 2029-11-19 773 TELUS Corp. 3,15 % 2030-02-19 750 770 87971MBN287971MBN2Rachetable à compter du 2029-12-04 1 947 Choice Properties Real Estate Investment Trust 2,98 % 2030-03-04 1 900 1 907 17039AAS517039AAS5Rachetable à compter du 2030-01-08 8 593 Ontario Power Generation inc. 3,22 % 2030-04-08 7 900 8 295 68321ZAG668321ZAG6Variable et rachetable à compter du 2025-04-22 5 755 Banque Toronto-Dominion 3,11 % 2030-04-22 5 755 5 931 89117FWS489117FWS4Rachetable à compter du 2030-02-07 3 842 Loblaw Companies Ltd 2,28 % 2030-05-07 3 750 3 639 539481AN1539481AN1Variable et rachetable à compter du 2025-05-26 4 960 Fédération des caisses Desjardins du Québec 2,86 % 2030-05-26 4 910 5 005 31430WDW131430WDW1Rachetable à compter du 2030-02-28 3 659 Keyera Corp. 3,96 % 2030-05-29 3 450 3 641 49327ZAB149327ZAB1
46 195 Province de l'Alberta 2,05 % 2030-06-01 46 300 46 115 013051EG8013051EG8 3 497 Greater Toronto Airports Authority 7,05 % 2030-06-12 3 437 4 591 39191ZAA739191ZAA7 9 384 Province de la Colombie-Britannique 2,20 % 2030-06-18 8 725 8 859 110709GK2110709GK2
Variable et rachetable à compter du 2025-06-30 9 471 Banque Royale du Canada 2,09 % 2030-06-30 9 350 9 311 780086SA3780086SA3Rachetable à compter du 2025-07-21 2 146 Banque Canadienne Impériale de Commerce 2,01 % 2030-07-21 2 145 2 126 13607HBC513607HBC5
3 465 Enbridge inc. 7,22 % 2030-07-24 3 050 3 887 29251ZAD929251ZAD9 1 500 Ontario School Boards Financing Corp. 4,79 % 2030-08-08 1 500 1 672 683244AP2683244AP2
348 Province de Nouvelle-Écosse 2,00 % 2030-09-01 350 347 669827GC5669827GC5 104 953 Gouvernement du Canada 0,50 % 2030-12-01 113 200 103 413 135087L44135087L44
1 055 TransCanada PipeLines Ltd 6,50 % 2030-12-09 1 115 1 346 89353ZBK389353ZBK3Rachetable à compter du 2030-09-18 1 425 Granite Real Estate Investment Trust Holdings L.P. 2,38 % 2030-12-18 1 425 1 369 387427AK3387427AK3Rachetable à compter du 2030-12-05 2 560 Sagen MI Canada inc. 3,26 % 2031-03-05 2 560 2 553 786688AA9786688AA9Rachetable à compter du 2030-12-17 3 597 Bell Canada 3,00 % 2031-03-17 3 600 3 624 07813ZCG707813ZCG7
954 Ontario School Boards Financing Corp. 5,07 % 2031-04-18 954 1 084 683244AR8683244AR8Variable et rachetable à compter du 2026-04-21 2 350 Banque Canadienne Impériale de Commerce 1,96 % 2031-04-21 2 350 2 303 13607HRJ313607HRJ3Rachetable à compter du 2031-02-12 799 Enbridge Pipelines inc. 2,82 % 2031-05-12 800 794 29250ZAZ129250ZAZ1Rachetable à compter du 2031-02-14 1 500 Lower Mattagami Energy L.P. 2,43 % 2031-05-14 1 500 1 502 548243AJ3548243AJ3
5 583 Province de Québec 2,10 % 2031-05-27 5 600 5 606 74814ZFM074814ZFM0Variable et rachetable à compter du 2026-05-28 5 400 Fédération des caisses Desjardins du Québec 1,99 % 2031-05-28 5 400 5 289 31430WGC231430WGC2
119 428 Gouvernement du Canada 1,50 % 2031-06-01 120 500 119 706 135087M27135087M27 7 007 Province de l'Ontario 2,15 % 2031-06-02 7 000 6 982 68333ZAP268333ZAP2
Rachetable à compter du 2031-03-09 3 000 TransCanada PipeLines Ltd 2,97 % 2031-06-09 3 000 2 984 89353ZCH989353ZCH9 1 851 Province de la Colombie-Britannique 1,55 % 2031-06-18 1 955 1 859 110709AF9110709AF9
Rachetable à compter du 2031-04-15 1 000 Algonquin Power Co. 2,85 % 2031-07-15 1 000 999 01585PAK101585PAK1Rachetable à compter du 2031-06-15 11 384 Enbridge Gas inc. 2,35 % 2031-09-15 11 500 11 183 29260ZAE629260ZAE6Variable et rachetable à compter du 2026-09-24 1 450 Empire Life Insurance 2,02 % 2031-09-24 1 450 1 420 291839AG3291839AG3Variable et rachetable à compter du 2026-09-24 5 630 IA Financial Corp. inc. 3,07 % 2031-09-24 5 630 5 810 45075EAA245075EAA2Rachetable à compter du 2031-08-13 5 440 TELUS Corp. 2,85 % 2031-11-13 5 450 5 372 87971MBV487971MBV4Rachetable à compter du 2031-09-01 6 228 Ventas Canada Finance Ltd 3,30 % 2031-12-01 6 250 6 311 92277LAH992277LAH9
1 365 Aéroport de Montréal 6,95 % 2032-04-16 1 331 1 648 007863AB9007863AB9Variable et rachetable à compter du 2027-05-10 3 929 Sun Life Financial inc. 2,58 % 2032-05-10 3 800 3 829 86682ZAM886682ZAM8
54 917 Province de Québec 6,25 % 2032-06-01 41 300 56 629 748148QT3748148QT3 475 North Battleford Power L.P. 4,96 % 2032-12-31 475 533 65746TAA665746TAA6
3 802 Province de l'Ontario 5,85 % 2033-03-08 3 000 4 032 683234SL3683234SL3 6 362 55 Ontario School Board Trust 5,90 % 2033-06-02 6 265 8 244 31680PAA431680PAA4
22
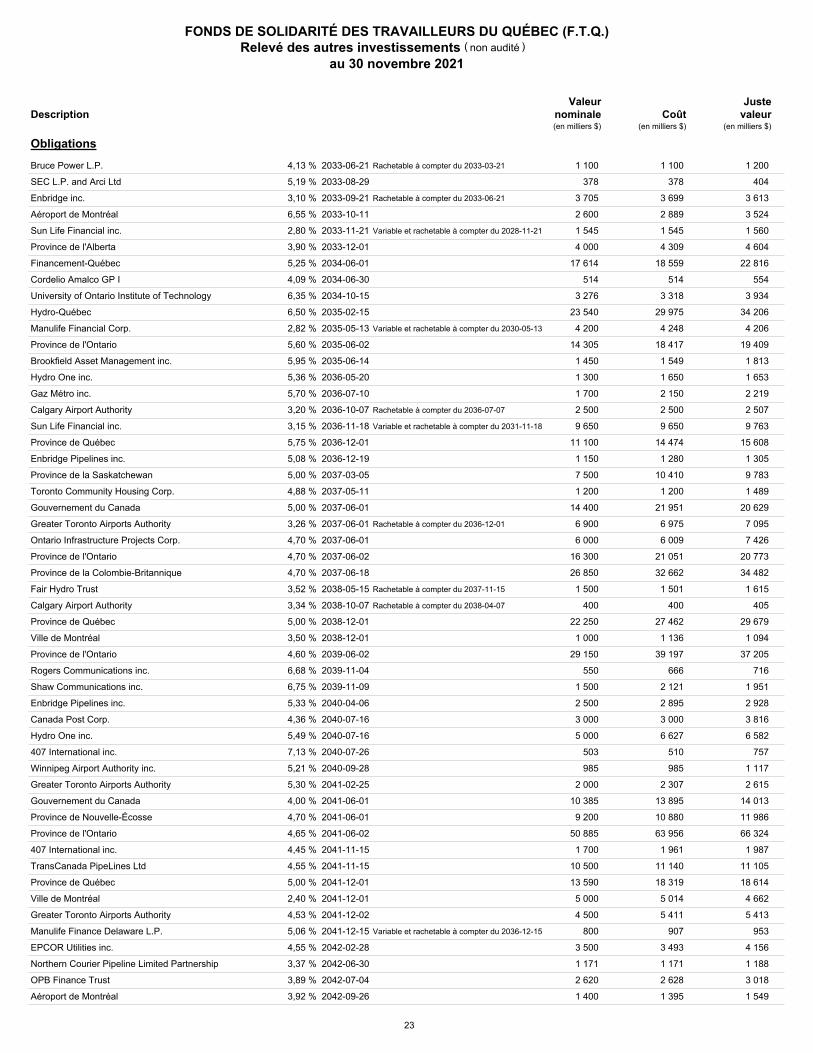
FONDS DE SOLIDARITÉ DES TRAVAILLEURS DU QUÉBEC (F.T.Q.)Relevé des autres investissements
au 30 novembre 2021
non audité( )
Valeurnominale Coût
JustevaleurDescription
(en milliers $)(en milliers $)(en milliers $)
Obligations
Rachetable à compter du 2033-03-21 1 100 Bruce Power L.P. 4,13 % 2033-06-21 1 100 1 200 116705AG9116705AG9 378 SEC L.P. and Arci Ltd 5,19 % 2033-08-29 378 404 784103AA1784103AA1
Rachetable à compter du 2033-06-21 3 699 Enbridge inc. 3,10 % 2033-09-21 3 705 3 613 29251ZBU029251ZBU0 2 889 Aéroport de Montréal 6,55 % 2033-10-11 2 600 3 524 007863AC7007863AC7
Variable et rachetable à compter du 2028-11-21 1 545 Sun Life Financial inc. 2,80 % 2033-11-21 1 545 1 560 86682ZAQ986682ZAQ9 4 309 Province de l'Alberta 3,90 % 2033-12-01 4 000 4 604 01306ZDC201306ZDC2
18 559 Financement-Québec 5,25 % 2034-06-01 17 614 22 816 31739ZAG031739ZAG0 514 Cordelio Amalco GP I 4,09 % 2034-06-30 514 554 218493AB0218493AB0
3 318 University of Ontario Institute of Technology 6,35 % 2034-10-15 3 276 3 934 914764AA3914764AA3 29 975 Hydro-Québec 6,50 % 2035-02-15 23 540 34 206 44889ZCM644889ZCM6
Variable et rachetable à compter du 2030-05-13 4 248 Manulife Financial Corp. 2,82 % 2035-05-13 4 200 4 206 56501RAJ556501RAJ5 18 417 Province de l'Ontario 5,60 % 2035-06-02 14 305 19 409 683234VR6683234VR6
1 549 Brookfield Asset Management inc. 5,95 % 2035-06-14 1 450 1 813 10549PAJ010549PAJ0 1 650 Hydro One inc. 5,36 % 2036-05-20 1 300 1 653 44810ZAP544810ZAP5 2 150 Gaz Métro inc. 5,70 % 2036-07-10 1 700 2 219 368271AX0368271AX0
Rachetable à compter du 2036-07-07 2 500 Calgary Airport Authority 3,20 % 2036-10-07 2 500 2 507 12959CAA712959CAA7Variable et rachetable à compter du 2031-11-18 9 650 Sun Life Financial inc. 3,15 % 2036-11-18 9 650 9 763 86682ZAR786682ZAR7
14 474 Province de Québec 5,75 % 2036-12-01 11 100 15 608 748148RL9748148RL9 1 280 Enbridge Pipelines inc. 5,08 % 2036-12-19 1 150 1 305 29250ZAG329250ZAG3
10 410 Province de la Saskatchewan 5,00 % 2037-03-05 7 500 9 783 803854JJ8803854JJ8 1 200 Toronto Community Housing Corp. 4,88 % 2037-05-11 1 200 1 489 87228VAA287228VAA2
21 951 Gouvernement du Canada 5,00 % 2037-06-01 14 400 20 629 135087XW9135087XW9Rachetable à compter du 2036-12-01 6 975 Greater Toronto Airports Authority 3,26 % 2037-06-01 6 900 7 095 39191ZBB439191ZBB4
6 009 Ontario Infrastructure Projects Corp. 4,70 % 2037-06-01 6 000 7 426 683086AA0683086AA0 21 051 Province de l'Ontario 4,70 % 2037-06-02 16 300 20 773 683234YD4683234YD4 32 662 Province de la Colombie-Britannique 4,70 % 2037-06-18 26 850 34 482 110709FL1110709FL1
Rachetable à compter du 2037-11-15 1 501 Fair Hydro Trust 3,52 % 2038-05-15 1 500 1 615 30324RAB230324RAB2Rachetable à compter du 2038-04-07 400 Calgary Airport Authority 3,34 % 2038-10-07 400 405 12959CAB512959CAB5
27 462 Province de Québec 5,00 % 2038-12-01 22 250 29 679 74814ZDK674814ZDK6 1 136 Ville de Montréal 3,50 % 2038-12-01 1 000 1 094 614852NZ0614852NZ0
39 197 Province de l'Ontario 4,60 % 2039-06-02 29 150 37 205 683234ZP6683234ZP6 666 Rogers Communications inc. 6,68 % 2039-11-04 550 716 775109AP6775109AP6
2 121 Shaw Communications inc. 6,75 % 2039-11-09 1 500 1 951 82028KAQ482028KAQ4 2 895 Enbridge Pipelines inc. 5,33 % 2040-04-06 2 500 2 928 29250ZAM029250ZAM0 3 000 Canada Post Corp. 4,36 % 2040-07-16 3 000 3 816 13521JAB713521JAB7 6 627 Hydro One inc. 5,49 % 2040-07-16 5 000 6 582 44810ZAY644810ZAY6
510 407 International inc. 7,13 % 2040-07-26 503 757 350863AZ9350863AZ9 985 Winnipeg Airport Authority inc. 5,21 % 2040-09-28 985 1 117 975014AA9975014AA9
2 307 Greater Toronto Airports Authority 5,30 % 2041-02-25 2 000 2 615 39191ZAX739191ZAX7 13 895 Gouvernement du Canada 4,00 % 2041-06-01 10 385 14 013 135087YQ1135087YQ1 10 880 Province de Nouvelle-Écosse 4,70 % 2041-06-01 9 200 11 986 669827FW2669827FW2 63 956 Province de l'Ontario 4,65 % 2041-06-02 50 885 66 324 683234B98683234B98
1 961 407 International inc. 4,45 % 2041-11-15 1 700 1 987 35085ZBE535085ZBE5 11 140 TransCanada PipeLines Ltd 4,55 % 2041-11-15 10 500 11 105 89353ZBV989353ZBV9 18 319 Province de Québec 5,00 % 2041-12-01 13 590 18 614 74814ZEF674814ZEF6
5 014 Ville de Montréal 2,40 % 2041-12-01 5 000 4 662 614853EL9614853EL9 5 411 Greater Toronto Airports Authority 4,53 % 2041-12-02 4 500 5 413 39191ZAY539191ZAY5
Variable et rachetable à compter du 2036-12-15 907 Manulife Finance Delaware L.P. 5,06 % 2041-12-15 800 953 56502FAA956502FAA9 3 493 EPCOR Utilities inc. 4,55 % 2042-02-28 3 500 4 156 29410ZAK129410ZAK1 1 171 Northern Courier Pipeline Limited Partnership 3,37 % 2042-06-30 1 171 1 188 66509CAA866509CAA8 2 628 OPB Finance Trust 3,89 % 2042-07-04 2 620 3 018 67103MAA467103MAA4 1 395 Aéroport de Montréal 3,92 % 2042-09-26 1 400 1 549 007863AH6007863AH6
23
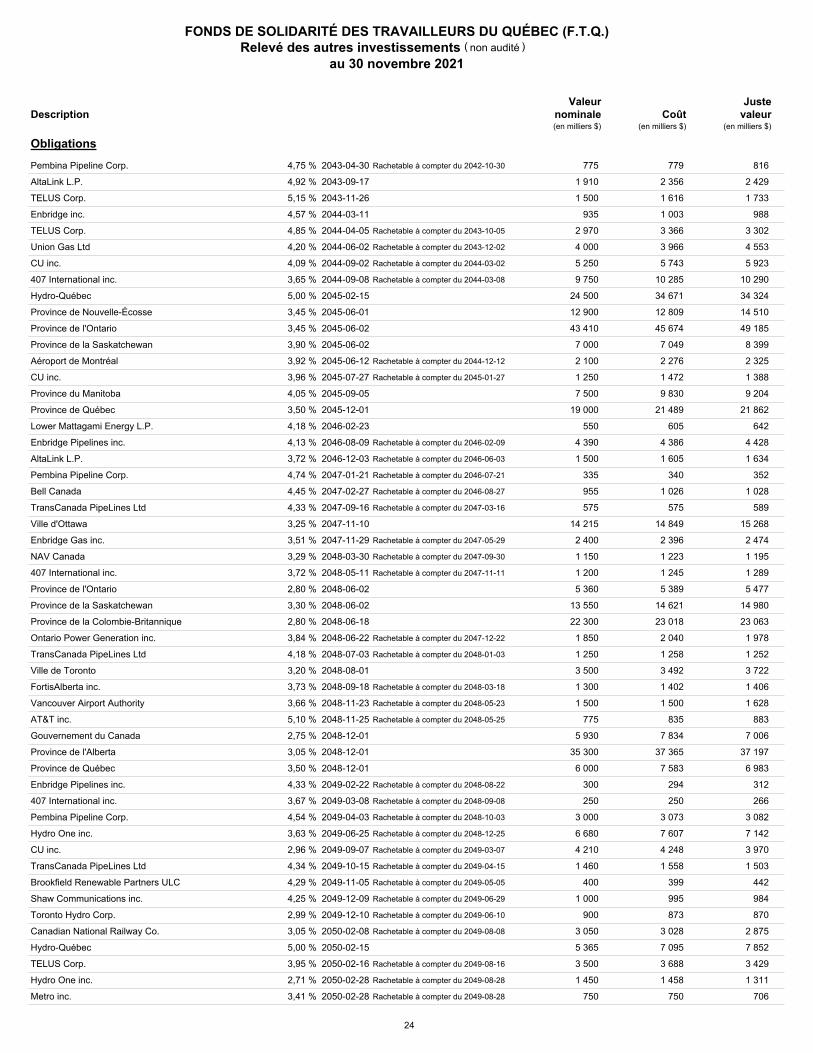
FONDS DE SOLIDARITÉ DES TRAVAILLEURS DU QUÉBEC (F.T.Q.)Relevé des autres investissements
au 30 novembre 2021
non audité( )
Valeurnominale Coût
JustevaleurDescription
(en milliers $)(en milliers $)(en milliers $)
Obligations
Rachetable à compter du 2042-10-30 779 Pembina Pipeline Corp. 4,75 % 2043-04-30 775 816 70632ZAC570632ZAC5 2 356 AltaLink L.P. 4,92 % 2043-09-17 1 910 2 429 02135ZAK202135ZAK2 1 616 TELUS Corp. 5,15 % 2043-11-26 1 500 1 733 87971MAU787971MAU7 1 003 Enbridge inc. 4,57 % 2044-03-11 935 988 29251ZBG129251ZBG1
Rachetable à compter du 2043-10-05 3 366 TELUS Corp. 4,85 % 2044-04-05 2 970 3 302 87971MAW387971MAW3Rachetable à compter du 2043-12-02 3 966 Union Gas Ltd 4,20 % 2044-06-02 4 000 4 553 90664ZAD290664ZAD2Rachetable à compter du 2044-03-02 5 743 CU inc. 4,09 % 2044-09-02 5 250 5 923 12657ZBE212657ZBE2Rachetable à compter du 2044-03-08 10 285 407 International inc. 3,65 % 2044-09-08 9 750 10 290 35085ZBQ835085ZBQ8
34 671 Hydro-Québec 5,00 % 2045-02-15 24 500 34 324 448814HZ9448814HZ9 12 809 Province de Nouvelle-Écosse 3,45 % 2045-06-01 12 900 14 510 669827FZ5669827FZ5 45 674 Province de l'Ontario 3,45 % 2045-06-02 43 410 49 185 68323ACC668323ACC6
7 049 Province de la Saskatchewan 3,90 % 2045-06-02 7 000 8 399 803854JU3803854JU3Rachetable à compter du 2044-12-12 2 276 Aéroport de Montréal 3,92 % 2045-06-12 2 100 2 325 007863AJ2007863AJ2Rachetable à compter du 2045-01-27 1 472 CU inc. 3,96 % 2045-07-27 1 250 1 388 12657ZBG712657ZBG7
9 830 Province du Manitoba 4,05 % 2045-09-05 7 500 9 204 563469UB9563469UB9 21 489 Province de Québec 3,50 % 2045-12-01 19 000 21 862 74814ZER074814ZER0
605 Lower Mattagami Energy L.P. 4,18 % 2046-02-23 550 642 548243AE4548243AE4Rachetable à compter du 2046-02-09 4 386 Enbridge Pipelines inc. 4,13 % 2046-08-09 4 390 4 428 29250ZAW829250ZAW8Rachetable à compter du 2046-06-03 1 605 AltaLink L.P. 3,72 % 2046-12-03 1 500 1 634 02135ZAS502135ZAS5Rachetable à compter du 2046-07-21 340 Pembina Pipeline Corp. 4,74 % 2047-01-21 335 352 70632ZAJ070632ZAJ0Rachetable à compter du 2046-08-27 1 026 Bell Canada 4,45 % 2047-02-27 955 1 028 07813ZBX107813ZBX1Rachetable à compter du 2047-03-16 575 TransCanada PipeLines Ltd 4,33 % 2047-09-16 575 589 89353ZCB289353ZCB2
14 849 Ville d'Ottawa 3,25 % 2047-11-10 14 215 15 268 689551FE4689551FE4Rachetable à compter du 2047-05-29 2 396 Enbridge Gas inc. 3,51 % 2047-11-29 2 400 2 474 29290ZAS929290ZAS9Rachetable à compter du 2047-09-30 1 223 NAV Canada 3,29 % 2048-03-30 1 150 1 195 62895ZAP562895ZAP5Rachetable à compter du 2047-11-11 1 245 407 International inc. 3,72 % 2048-05-11 1 200 1 289 35085ZBS435085ZBS4
5 389 Province de l'Ontario 2,80 % 2048-06-02 5 360 5 477 68323ADZ468323ADZ4 14 621 Province de la Saskatchewan 3,30 % 2048-06-02 13 550 14 980 803854KC1803854KC1 23 018 Province de la Colombie-Britannique 2,80 % 2048-06-18 22 300 23 063 11070TAG311070TAG3
Rachetable à compter du 2047-12-22 2 040 Ontario Power Generation inc. 3,84 % 2048-06-22 1 850 1 978 68321ZAB768321ZAB7Rachetable à compter du 2048-01-03 1 258 TransCanada PipeLines Ltd 4,18 % 2048-07-03 1 250 1 252 89353ZCC089353ZCC0
3 492 Ville de Toronto 3,20 % 2048-08-01 3 500 3 722 891288DR0891288DR0Rachetable à compter du 2048-03-18 1 402 FortisAlberta inc. 3,73 % 2048-09-18 1 300 1 406 34957ZAX234957ZAX2Rachetable à compter du 2048-05-23 1 500 Vancouver Airport Authority 3,66 % 2048-11-23 1 500 1 628 92157WAB392157WAB3Rachetable à compter du 2048-05-25 835 AT&T inc. 5,10 % 2048-11-25 775 883 00206RGC000206RGC0
7 834 Gouvernement du Canada 2,75 % 2048-12-01 5 930 7 006 135087D35135087D35 37 365 Province de l'Alberta 3,05 % 2048-12-01 35 300 37 197 013051DY0013051DY0
7 583 Province de Québec 3,50 % 2048-12-01 6 000 6 983 74814ZEW974814ZEW9Rachetable à compter du 2048-08-22 294 Enbridge Pipelines inc. 4,33 % 2049-02-22 300 312 29250ZAY429250ZAY4Rachetable à compter du 2048-09-08 250 407 International inc. 3,67 % 2049-03-08 250 266 35085ZBU935085ZBU9Rachetable à compter du 2048-10-03 3 073 Pembina Pipeline Corp. 4,54 % 2049-04-03 3 000 3 082 70632ZAN170632ZAN1Rachetable à compter du 2048-12-25 7 607 Hydro One inc. 3,63 % 2049-06-25 6 680 7 142 44810ZBX744810ZBX7Rachetable à compter du 2049-03-07 4 248 CU inc. 2,96 % 2049-09-07 4 210 3 970 12657ZBM412657ZBM4Rachetable à compter du 2049-04-15 1 558 TransCanada PipeLines Ltd 4,34 % 2049-10-15 1 460 1 503 89353ZCD889353ZCD8Rachetable à compter du 2049-05-05 399 Brookfield Renewable Partners ULC 4,29 % 2049-11-05 400 442 11282ZAP311282ZAP3Rachetable à compter du 2049-06-29 995 Shaw Communications inc. 4,25 % 2049-12-09 1 000 984 82028KBA882028KBA8Rachetable à compter du 2049-06-10 873 Toronto Hydro Corp. 2,99 % 2049-12-10 900 870 89119ZAM589119ZAM5Rachetable à compter du 2049-08-08 3 028 Canadian National Railway Co. 3,05 % 2050-02-08 3 050 2 875 136375CX8136375CX8
7 095 Hydro-Québec 5,00 % 2050-02-15 5 365 7 852 448814JA2448814JA2Rachetable à compter du 2049-08-16 3 688 TELUS Corp. 3,95 % 2050-02-16 3 500 3 429 87971MBP787971MBP7Rachetable à compter du 2049-08-28 1 458 Hydro One inc. 2,71 % 2050-02-28 1 450 1 311 44810ZCD044810ZCD0Rachetable à compter du 2049-08-28 750 Metro inc. 3,41 % 2050-02-28 750 706 59162NAJ859162NAJ8
24
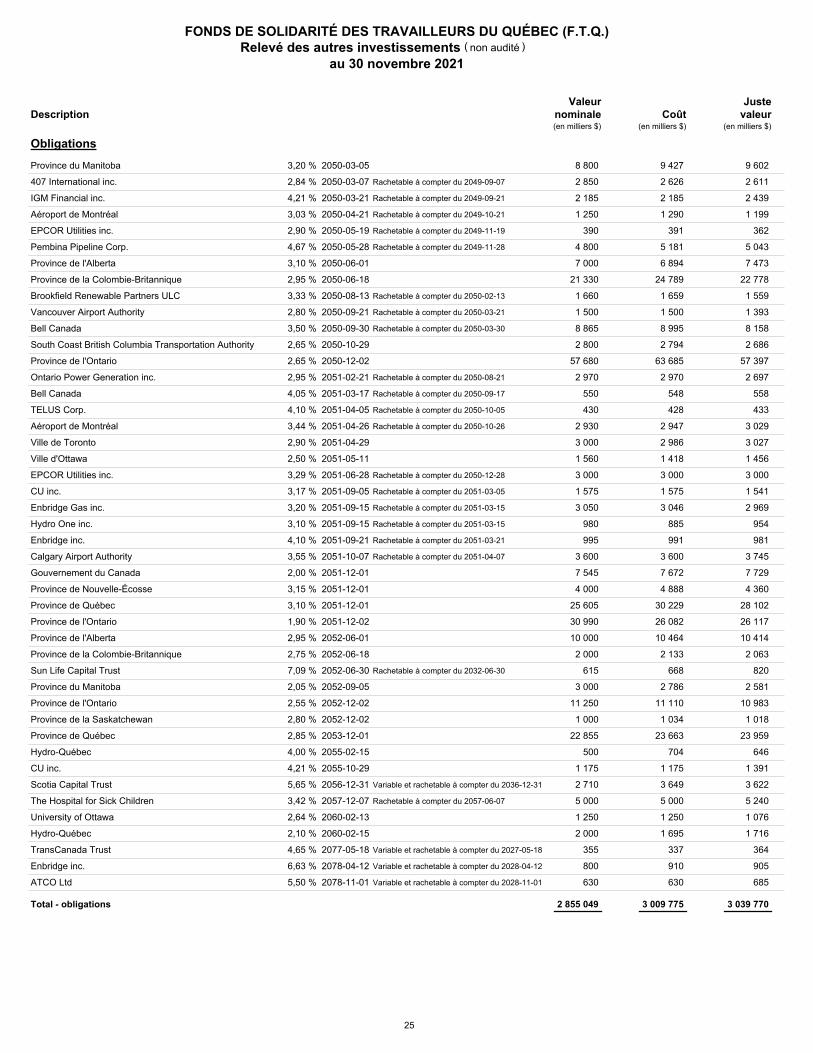
FONDS DE SOLIDARITÉ DES TRAVAILLEURS DU QUÉBEC (F.T.Q.)Relevé des autres investissements
au 30 novembre 2021
non audité( )
Valeurnominale Coût
JustevaleurDescription
(en milliers $)(en milliers $)(en milliers $)
Obligations
9 427 Province du Manitoba 3,20 % 2050-03-05 8 800 9 602 563469US2563469US2Rachetable à compter du 2049-09-07 2 626 407 International inc. 2,84 % 2050-03-07 2 850 2 611 35085ZBV735085ZBV7Rachetable à compter du 2049-09-21 2 185 IGM Financial inc. 4,21 % 2050-03-21 2 185 2 439 449586AH9449586AH9Rachetable à compter du 2049-10-21 1 290 Aéroport de Montréal 3,03 % 2050-04-21 1 250 1 199 007863AL7007863AL7Rachetable à compter du 2049-11-19 391 EPCOR Utilities inc. 2,90 % 2050-05-19 390 362 29410ZAQ829410ZAQ8Rachetable à compter du 2049-11-28 5 181 Pembina Pipeline Corp. 4,67 % 2050-05-28 4 800 5 043 70632ZAR270632ZAR2
6 894 Province de l'Alberta 3,10 % 2050-06-01 7 000 7 473 013051ED5013051ED5 24 789 Province de la Colombie-Britannique 2,95 % 2050-06-18 21 330 22 778 110709GJ5110709GJ5
Rachetable à compter du 2050-02-13 1 659 Brookfield Renewable Partners ULC 3,33 % 2050-08-13 1 660 1 559 11282ZAQ111282ZAQ1Rachetable à compter du 2050-03-21 1 500 Vancouver Airport Authority 2,80 % 2050-09-21 1 500 1 393 92157WAE792157WAE7Rachetable à compter du 2050-03-30 8 995 Bell Canada 3,50 % 2050-09-30 8 865 8 158 07813ZCD407813ZCD4
2 794 South Coast British Columbia Transportation Authority 2,65 % 2050-10-29 2 800 2 686 83740TAH083740TAH0 63 685 Province de l'Ontario 2,65 % 2050-12-02 57 680 57 397 68333ZAG268333ZAG2
Rachetable à compter du 2050-08-21 2 970 Ontario Power Generation inc. 2,95 % 2051-02-21 2 970 2 697 68321ZAJ068321ZAJ0Rachetable à compter du 2050-09-17 548 Bell Canada 4,05 % 2051-03-17 550 558 07813ZCH507813ZCH5Rachetable à compter du 2050-10-05 428 TELUS Corp. 4,10 % 2051-04-05 430 433 87971MBT987971MBT9Rachetable à compter du 2050-10-26 2 947 Aéroport de Montréal 3,44 % 2051-04-26 2 930 3 029 007863AM5007863AM5
2 986 Ville de Toronto 2,90 % 2051-04-29 3 000 3 027 891288DX7891288DX7 1 418 Ville d'Ottawa 2,50 % 2051-05-11 1 560 1 456 689551FG9689551FG9
Rachetable à compter du 2050-12-28 3 000 EPCOR Utilities inc. 3,29 % 2051-06-28 3 000 3 000 29410ZAS429410ZAS4Rachetable à compter du 2051-03-05 1 575 CU inc. 3,17 % 2051-09-05 1 575 1 541 12657ZBP712657ZBP7Rachetable à compter du 2051-03-15 3 046 Enbridge Gas inc. 3,20 % 2051-09-15 3 050 2 969 29260ZAF329260ZAF3Rachetable à compter du 2051-03-15 885 Hydro One inc. 3,10 % 2051-09-15 980 954 44810ZCH144810ZCH1Rachetable à compter du 2051-03-21 991 Enbridge inc. 4,10 % 2051-09-21 995 981 29251ZBV829251ZBV8Rachetable à compter du 2051-04-07 3 600 Calgary Airport Authority 3,55 % 2051-10-07 3 600 3 745 12959CAD112959CAD1
7 672 Gouvernement du Canada 2,00 % 2051-12-01 7 545 7 729 135087H72135087H72 4 888 Province de Nouvelle-Écosse 3,15 % 2051-12-01 4 000 4 360 669827GB7669827GB7
30 229 Province de Québec 3,10 % 2051-12-01 25 605 28 102 74814ZFE874814ZFE8 26 082 Province de l'Ontario 1,90 % 2051-12-02 30 990 26 117 68333ZAL168333ZAL1 10 464 Province de l'Alberta 2,95 % 2052-06-01 10 000 10 414 013051EQ6013051EQ6
2 133 Province de la Colombie-Britannique 2,75 % 2052-06-18 2 000 2 063 110709AG7110709AG7Rachetable à compter du 2032-06-30 668 Sun Life Capital Trust 7,09 % 2052-06-30 615 820 86679QAB786679QAB7
2 786 Province du Manitoba 2,05 % 2052-09-05 3 000 2 581 563469UW3563469UW3 11 110 Province de l'Ontario 2,55 % 2052-12-02 11 250 10 983 68333ZAS668333ZAS6
1 034 Province de la Saskatchewan 2,80 % 2052-12-02 1 000 1 018 803854KN7803854KN7 23 663 Province de Québec 2,85 % 2053-12-01 22 855 23 959 74814ZFL274814ZFL2
704 Hydro-Québec 4,00 % 2055-02-15 500 646 4488148V84488148V8 1 175 CU inc. 4,21 % 2055-10-29 1 175 1 391 12657ZBH512657ZBH5
Variable et rachetable à compter du 2036-12-31 3 649 Scotia Capital Trust 5,65 % 2056-12-31 2 710 3 622 80928BAC080928BAC0Rachetable à compter du 2057-06-07 5 000 The Hospital for Sick Children 3,42 % 2057-12-07 5 000 5 240 44107DAB744107DAB7
1 250 University of Ottawa 2,64 % 2060-02-13 1 250 1 076 914771AC4914771AC4 1 695 Hydro-Québec 2,10 % 2060-02-15 2 000 1 716 448814JC8448814JC8
Variable et rachetable à compter du 2027-05-18 337 TransCanada Trust 4,65 % 2077-05-18 355 364 89356BAD089356BAD0Variable et rachetable à compter du 2028-04-12 910 Enbridge inc. 6,63 % 2078-04-12 800 905 29250NAX329250NAX3Variable et rachetable à compter du 2028-11-01 630 ATCO Ltd 5,50 % 2078-11-01 630 685 046789AA1046789AA1
Total - obligations 3 009 775 2 855 049 3 039 770
25
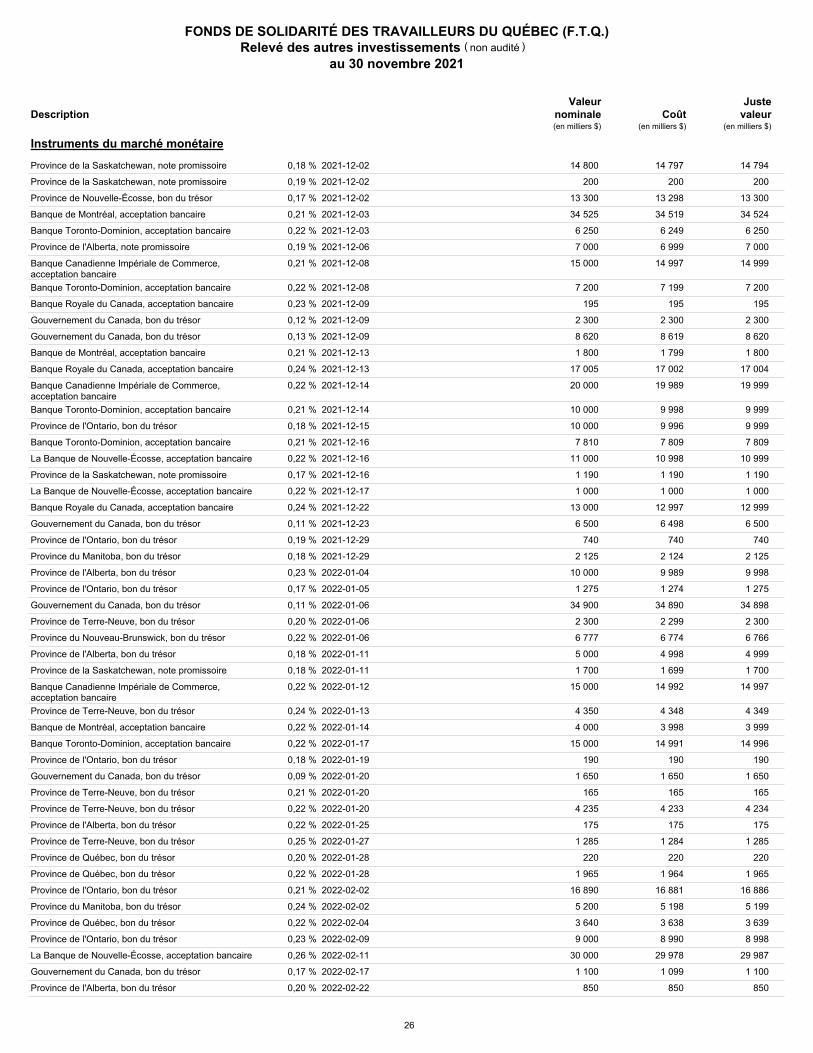
FONDS DE SOLIDARITÉ DES TRAVAILLEURS DU QUÉBEC (F.T.Q.)Relevé des autres investissements
au 30 novembre 2021
non audité( )
Valeurnominale Coût
JustevaleurDescription
(en milliers $)(en milliers $)(en milliers $)
Instruments du marché monétaire
14 797 Province de la Saskatchewan, note promissoire 0,18 % 2021-12-02 14 800 14 794 8039ZAM22X8039ZAM22X 200 Province de la Saskatchewan, note promissoire 0,19 % 2021-12-02 200 200 8039ZAM22Y8039ZAM22Y
13 298 Province de Nouvelle-Écosse, bon du trésor 0,17 % 2021-12-02 13 300 13 300 6698ZKM25X6698ZKM25X 34 519 Banque de Montréal, acceptation bancaire 0,21 % 2021-12-03 34 525 34 524 3379Z2M33X3379Z2M33X
6 249 Banque Toronto-Dominion, acceptation bancaire 0,22 % 2021-12-03 6 250 6 250 8911Z1M30X8911Z1M30X 6 999 Province de l'Alberta, note promissoire 0,19 % 2021-12-06 7 000 7 000 0130Z3M64X0130Z3M64X
14 997 Banque Canadienne Impériale de Commerce, acceptation bancaire
0,21 % 2021-12-08 15 000 14 999 1360Z2M84X1360Z2M84X
7 199 Banque Toronto-Dominion, acceptation bancaire 0,22 % 2021-12-08 7 200 7 200 8911Z1M89X8911Z1M89X 195 Banque Royale du Canada, acceptation bancaire 0,23 % 2021-12-09 195 195 7800Z8M98X7800Z8M98X
2 300 Gouvernement du Canada, bon du trésor 0,12 % 2021-12-09 2 300 2 300 1350Z78R8Z1350Z78R8Z 8 619 Gouvernement du Canada, bon du trésor 0,13 % 2021-12-09 8 620 8 620 1350Z78R8X1350Z78R8X 1 799 Banque de Montréal, acceptation bancaire 0,21 % 2021-12-13 1 800 1 800 3379Z2ME9X3379Z2ME9X
17 002 Banque Royale du Canada, acceptation bancaire 0,24 % 2021-12-13 17 005 17 004 7800Z8ME7X7800Z8ME7X 19 989 Banque Canadienne Impériale de Commerce,
acceptation bancaire 0,22 % 2021-12-14 20 000 19 999 1360Z2MF8X1360Z2MF8X
9 998 Banque Toronto-Dominion, acceptation bancaire 0,21 % 2021-12-14 10 000 9 999 8911Z1MF3X8911Z1MF3X 9 996 Province de l'Ontario, bon du trésor 0,18 % 2021-12-15 10 000 9 999 6832Z5GM6X6832Z5GM6X 7 809 Banque Toronto-Dominion, acceptation bancaire 0,21 % 2021-12-16 7 810 7 809 8911Z1MH9X8911Z1MH9X
10 998 La Banque de Nouvelle-Écosse, acceptation bancaire 0,22 % 2021-12-16 11 000 10 999 0641ZPMH7X0641ZPMH7X 1 190 Province de la Saskatchewan, note promissoire 0,17 % 2021-12-16 1 190 1 190 8039ZAMH9Y8039ZAMH9Y 1 000 La Banque de Nouvelle-Écosse, acceptation bancaire 0,22 % 2021-12-17 1 000 1 000 0641ZPMJ3X0641ZPMJ3X
12 997 Banque Royale du Canada, acceptation bancaire 0,24 % 2021-12-22 13 000 12 999 7800Z8MP2X7800Z8MP2X 6 498 Gouvernement du Canada, bon du trésor 0,11 % 2021-12-23 6 500 6 500 1350Z7AF1X1350Z7AF1X
740 Province de l'Ontario, bon du trésor 0,19 % 2021-12-29 740 740 6832Z5GP9Y6832Z5GP9Y 2 124 Province du Manitoba, bon du trésor 0,18 % 2021-12-29 2 125 2 125 56347PCT3X56347PCT3X 9 989 Province de l'Alberta, bon du trésor 0,23 % 2022-01-04 10 000 9 998 01306BN42X01306BN42X 1 274 Province de l'Ontario, bon du trésor 0,17 % 2022-01-05 1 275 1 275 6832Z5GQ7Y6832Z5GQ7Y
34 890 Gouvernement du Canada, bon du trésor 0,11 % 2022-01-06 34 900 34 898 1350Z78T4X1350Z78T4X 2 299 Province de Terre-Neuve, bon du trésor 0,20 % 2022-01-06 2 300 2 300 65134AN62Y65134AN62Y 6 774 Province du Nouveau-Brunswick, bon du trésor 0,22 % 2022-01-06 6 777 6 766 6426Z8AZ8X6426Z8AZ8X 4 998 Province de l'Alberta, bon du trésor 0,18 % 2022-01-11 5 000 4 999 01306BNC4X01306BNC4X 1 699 Province de la Saskatchewan, note promissoire 0,18 % 2022-01-11 1 700 1 700 80390ANC7X80390ANC7X
14 992 Banque Canadienne Impériale de Commerce, acceptation bancaire
0,22 % 2022-01-12 15 000 14 997 136072ND3X136072ND3X
4 348 Province de Terre-Neuve, bon du trésor 0,24 % 2022-01-13 4 350 4 349 65134ANE5Y65134ANE5Y 3 998 Banque de Montréal, acceptation bancaire 0,22 % 2022-01-14 4 000 3 999 337942NF9X337942NF9X
14 991 Banque Toronto-Dominion, acceptation bancaire 0,22 % 2022-01-17 15 000 14 996 891161NJ6X891161NJ6X 190 Province de l'Ontario, bon du trésor 0,18 % 2022-01-19 190 190 6832Z5GS3Y6832Z5GS3Y
1 650 Gouvernement du Canada, bon du trésor 0,09 % 2022-01-20 1 650 1 650 1350Z7AH7Z1350Z7AH7Z 165 Province de Terre-Neuve, bon du trésor 0,21 % 2022-01-20 165 165 65134ANM7Y65134ANM7Y
4 233 Province de Terre-Neuve, bon du trésor 0,22 % 2022-01-20 4 235 4 234 65134ANM7X65134ANM7X 175 Province de l'Alberta, bon du trésor 0,22 % 2022-01-25 175 175 01306BNS9Y01306BNS9Y
1 284 Province de Terre-Neuve, bon du trésor 0,25 % 2022-01-27 1 285 1 285 65134ANU9X65134ANU9X 220 Province de Québec, bon du trésor 0,20 % 2022-01-28 220 220 09852UNV1Y09852UNV1Y
1 964 Province de Québec, bon du trésor 0,22 % 2022-01-28 1 965 1 965 09852UNV1X09852UNV1X 16 881 Province de l'Ontario, bon du trésor 0,21 % 2022-02-02 16 890 16 886 6832Z5GU8X6832Z5GU8X
5 198 Province du Manitoba, bon du trésor 0,24 % 2022-02-02 5 200 5 199 56347PCY2X56347PCY2X 3 638 Province de Québec, bon du trésor 0,22 % 2022-02-04 3 640 3 639 09852UP49Y09852UP49Y 8 990 Province de l'Ontario, bon du trésor 0,23 % 2022-02-09 9 000 8 998 6832Z5GV6X6832Z5GV6X
29 978 La Banque de Nouvelle-Écosse, acceptation bancaire 0,26 % 2022-02-11 30 000 29 987 06414PPC9X06414PPC9X 1 099 Gouvernement du Canada, bon du trésor 0,17 % 2022-02-17 1 100 1 100 1350Z7AK0Z1350Z7AK0Z
850 Province de l'Alberta, bon du trésor 0,20 % 2022-02-22 850 850 01306BPP3Y01306BPP3Y
26
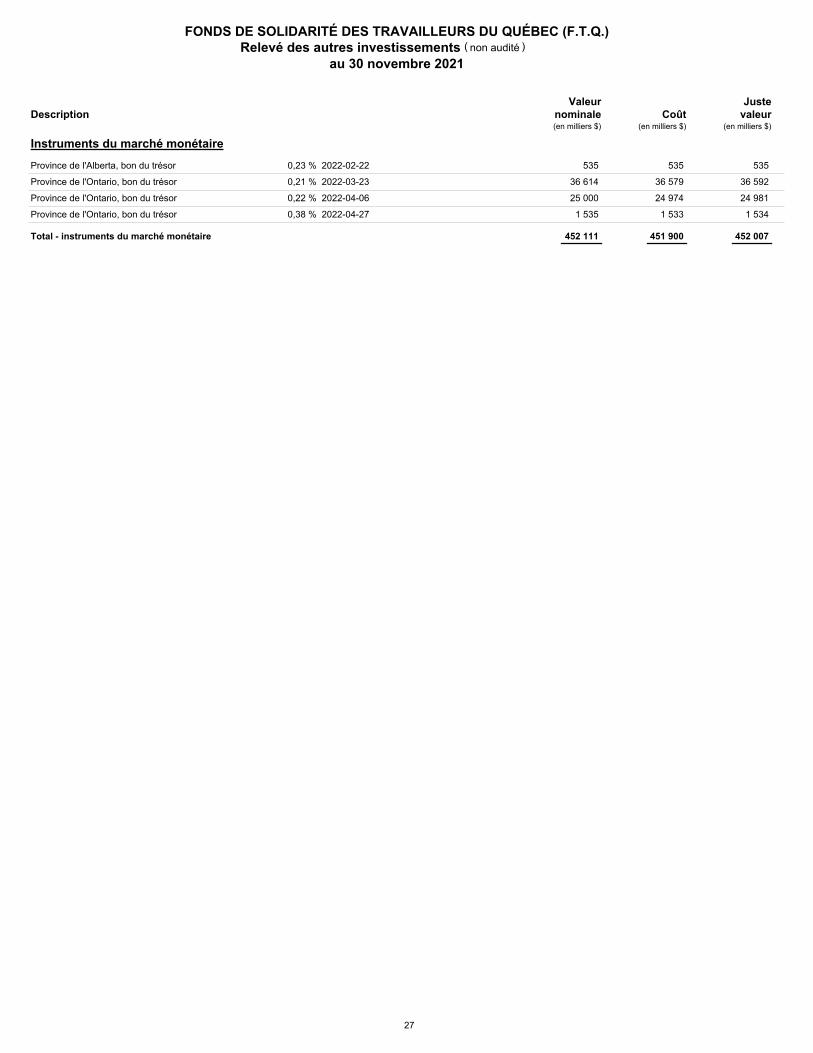
FONDS DE SOLIDARITÉ DES TRAVAILLEURS DU QUÉBEC (F.T.Q.)Relevé des autres investissements
au 30 novembre 2021
non audité( )
Valeurnominale Coût
JustevaleurDescription
(en milliers $)(en milliers $)(en milliers $)
Instruments du marché monétaire
535 Province de l'Alberta, bon du trésor 0,23 % 2022-02-22 535 535 01306BPP3Y01306BPP3Y 36 579 Province de l'Ontario, bon du trésor 0,21 % 2022-03-23 36 614 36 592 6832Z5G38X6832Z5G38X 24 974 Province de l'Ontario, bon du trésor 0,22 % 2022-04-06 25 000 24 981 6832Z5G53X6832Z5G53X
1 533 Province de l'Ontario, bon du trésor 0,38 % 2022-04-27 1 535 1 534 6832Z5G87Y6832Z5G87Y
Total - instruments du marché monétaire 451 900 452 111 452 007
27

FONDS DE SOLIDARITÉ DES TRAVAILLEURS DU QUÉBEC (F.T.Q.)Relevé des autres investissements
au 30 novembre 2021
non audité( )
Prix decontrat oud'exercice
JustevaleurCoût
Échéance /livraison
Nombred'unités
Valeurnotionnelle
(en milliers $)(en milliers $)(en milliers $)
Élément sous-jacent
Contrats à terme - position acheteur
Gouvernement du Canada, 0,25 %, 2023-02-01F135L771213 99,29 CAD 36 800 000 36 539 31 - 2021-12-13
Gouvernement du Canada, 0,50 %, 2025-09-01F135K941213 96,57 CAD 26 400 000 25 493 151 - 2021-12-13
Gouvernement du Canada, 1,00 %, 2026-09-01F135L931213 97,31 CAD 12 000 000 11 677 101 - 2021-12-13
Gouvernement du Canada, 1,50 %, 2031-06-01F135M271213A 97,49 CAD 13 860 000 13 512 251 - 2021-12-13
Total - contrats à terme - position acheteur 87 221 534
Contrats à terme - position vendeur
Gouvernement du Canada, 1,50 %, 2031-06-01F135M271213 97,69 CAD 29 000 000 28 330 (467) - 2021-12-13
Gouvernement du Canada, 2,00 %, 2051-12-01F135H721213 97,51 CAD 7 600 000 7 411 (370) - 2021-12-13
Gouvernement du Canada, 2,00 %, 2051-12-01F135H721213A 98,07 CAD 18 940 000 18 574 (816) - 2021-12-13
Total - contrats à terme - position vendeur 54 315 (1 653)
Contrats d'options - position acheteur
Investissements en capital de développement - Secteur d`activité : Finance
V13132OPT 0,01 CAD 57 249 1 - - Indéterminée
Total - contrats d'options - position acheteur 1
Contrats d'options - position vendeur
Investissements en capital de développement - Secteur d`activité : Industries
V19049OPT1 7,50 CAD 300 000 2 250 (21)(115)2022-07-08
Investissements en capital de développement - Secteur d`activité : Industries
V19049OPT2 7,50 CAD 150 000 1 125 (12)(83)2022-07-14
Investissements en capital de développement - Secteur d`activité : Industries
V19049OPT3 8,00 CAD 150 000 1 200 (9)(79)2022-07-15
Investissements en capital de développement - Secteur d`activité : Industries
V19049OPT4 8,00 CAD 145 000 1 160 (10)(103)2022-08-03
Investissements en capital de développement - Secteur d`activité : Industries
V19049OPT5 8,00 CAD 55 000 440 (4)(39)2022-08-04
Investissements en capital de développement - Secteur d`activité : Matériaux
V18105OPT11 18,00 CAD 300 000 5 400 (180)(412)2022-05-09
Investissements en capital de développement - Secteur d`activité : Matériaux
V18105OPT12 18,00 CAD 300 000 5 400 (180)(365)2022-05-11
Investissements en capital de développement - Secteur d`activité : Matériaux
V18105OPT13 18,50 CAD 300 000 5 550 (159)(417)2022-05-17
Investissements en capital de développement - Secteur d`activité : Matériaux
V18105OPT14 20,00 CAD 144 000 2 880 (50)(138)2022-05-27
Investissements en capital de développement - Secteur d`activité : Matériaux
V18105OPT15 20,00 CAD 156 000 3 120 (56)(147)2022-05-30
Investissements en capital de développement - Secteur d`activité : Matériaux
V18105OPT16 21,00 CAD 300 000 6 300 (84)(285)2022-06-07
Investissements en capital de développement - Secteur d`activité : Matériaux
V18105OPT17 18,50 CAD 150 000 2 775 (162)(218)2022-11-15
Investissements en capital de développement - Secteur d`activité : Matériaux
V18105OPT18 18,50 CAD 150 000 2 775 (164)(219)2022-11-17
Total - contrats d'options - position vendeur (2 620) 40 375 (1 091)
Total - instruments financiers dérivés *(2 620) (2 210)
Total des autres investissements
De ces totaux, un montant de 2,7 M$, représentant la juste valeur négative des instruments financiers dérivés et un montant de 2,6 M$ représentant le coût de ces instruments financiers dérivés, sont présentés sous Créditeurs aux états financiers consolidés du Fonds de solidarité des travailleurs du Québec (F.T.Q.) au 30 novembre 2021.
*
* 7 155 428 8 378 976
28
Titres vendus en vertu de conventions de rachatAu 30 novembre 2021, la juste valeur des titres en portefeuille vendus en vertu de conventions de rachat est de 708,3 M$. Ces titres sont des obligations. Ces transactions ont été exécutées entre le 4 novembre 2021 et le 30 novembre 2021, tandis que leurs échéances se situent dans l'intervalle compris entre le 1er décembre 2021 et le 29 décembre 2021 . Le collatéral reçu est de 722,5 M$. Le prix de rachat à payer est de 705,8 M$.
INDEX OF THE SHARE OF THE FONDS IN INVESTMENTS MADE BY THE SPECIALIZED FUNDS, AT COST (UNAUDITED)
AS AT NOVEMBER 30, 2021
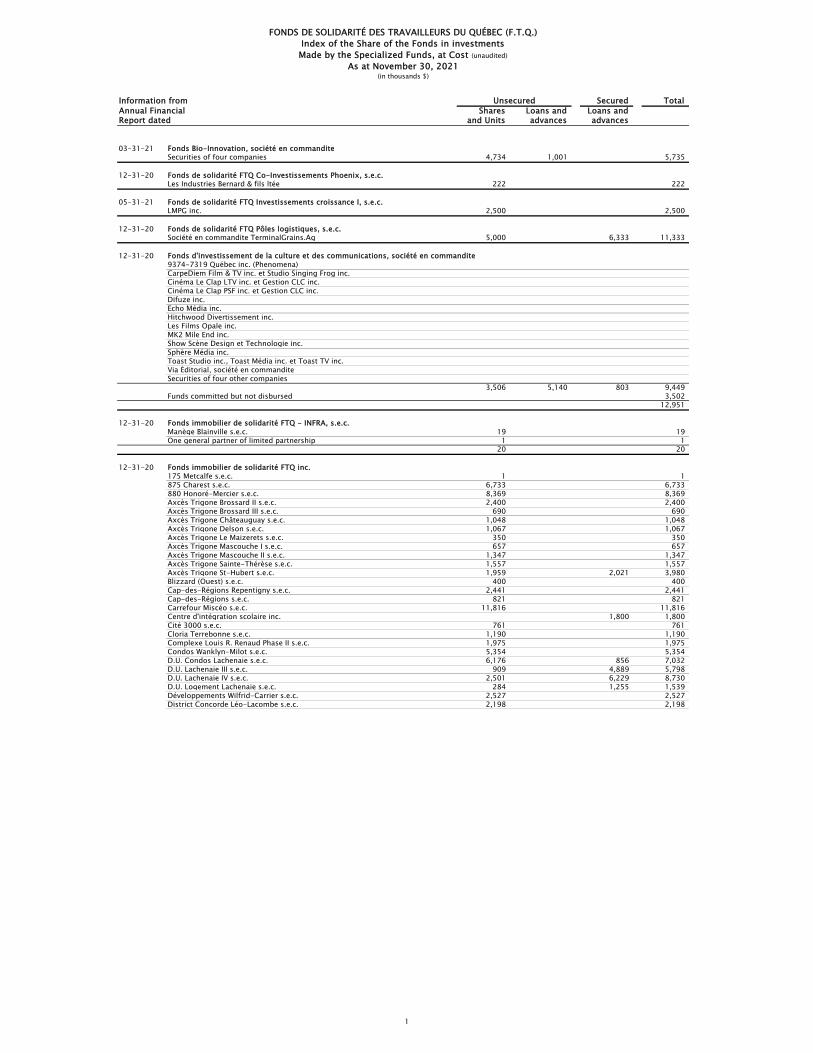
Information from Secured TotalAnnual Financial Shares Loans and Loans andReport dated and Units advances advances
03-31-21 Fonds Bio-Innovation, société en commanditeSecurities of four companies 4,734 1,001 5,735
12-31-20 Fonds de solidarité FTQ Co-Investissements Phoenix, s.e.c.Les Industries Bernard & fils ltée 222 222
05-31-21 Fonds de solidarité FTQ Investissements croissance I, s.e.c.LMPG inc. 2,500 2,500
12-31-20 Fonds de solidarité FTQ Pôles logistiques, s.e.c.Société en commandite TerminalGrains.Ag 5,000 6,333 11,333
12-31-20 Fonds d'investissement de la culture et des communications, société en commandite9374-7319 Québec inc. (Phenomena)CarpeDiem Film & TV inc. et Studio Singing Frog inc.Cinéma Le Clap LTV inc. et Gestion CLC inc.Cinéma Le Clap PSF inc. et Gestion CLC inc.Difuze inc.Echo Média inc.Hitchwood Divertissement inc.Les Films Opale inc.MK2 Mile End inc.Show Scène Design et Technologie inc.Sphère Média inc.Toast Studio inc., Toast Média inc. et Toast TV inc.Via Éditorial, société en commanditeSecurities of four other companies
3,506 5,140 803 9,449Funds committed but not disbursed 3,502
12,951
12-31-20 Fonds immobilier de solidarité FTQ - INFRA, s.e.c.Manège Blainville s.e.c. 19 19One general partner of limited partnership 1 1
20 20
12-31-20 Fonds immobilier de solidarité FTQ inc.175 Metcalfe s.e.c. 1 1875 Charest s.e.c. 6,733 6,733880 Honoré-Mercier s.e.c. 8,369 8,369Axcès Trigone Brossard II s.e.c. 2,400 2,400Axcès Trigone Brossard III s.e.c. 690 690Axcès Trigone Châteauguay s.e.c. 1,048 1,048Axcès Trigone Delson s.e.c. 1,067 1,067Axcès Trigone Le Maizerets s.e.c. 350 350Axcès Trigone Mascouche I s.e.c. 657 657Axcès Trigone Mascouche II s.e.c. 1,347 1,347Axcès Trigone Sainte-Thérèse s.e.c. 1,557 1,557Axcès Trigone St-Hubert s.e.c. 1,959 2,021 3,980Blizzard (Ouest) s.e.c. 400 400Cap-des-Régions Repentigny s.e.c. 2,441 2,441Cap-des-Régions s.e.c. 821 821Carrefour Miscéo s.e.c. 11,816 11,816Centre d'intégration scolaire inc. 1,800 1,800Cité 3000 s.e.c. 761 761Cloria Terrebonne s.e.c. 1,190 1,190Complexe Louis R. Renaud Phase II s.e.c. 1,975 1,975Condos Wanklyn-Milot s.e.c. 5,354 5,354D.U. Condos Lachenaie s.e.c. 6,176 856 7,032D.U. Lachenaie III s.e.c. 909 4,889 5,798D.U. Lachenaie IV s.e.c. 2,501 6,229 8,730D.U. Logement Lachenaie s.e.c. 284 1,255 1,539Développements Wilfrid-Carrier s.e.c. 2,527 2,527District Concorde Léo-Lacombe s.e.c. 2,198 2,198
Unsecured
FONDS DE SOLIDARITÉ DES TRAVAILLEURS DU QUÉBEC (F.T.Q.)Index of the Share of the Fonds in investmentsMade by the Specialized Funds, at Cost (unaudited)
As at November 30, 2021(in thousands $)
1
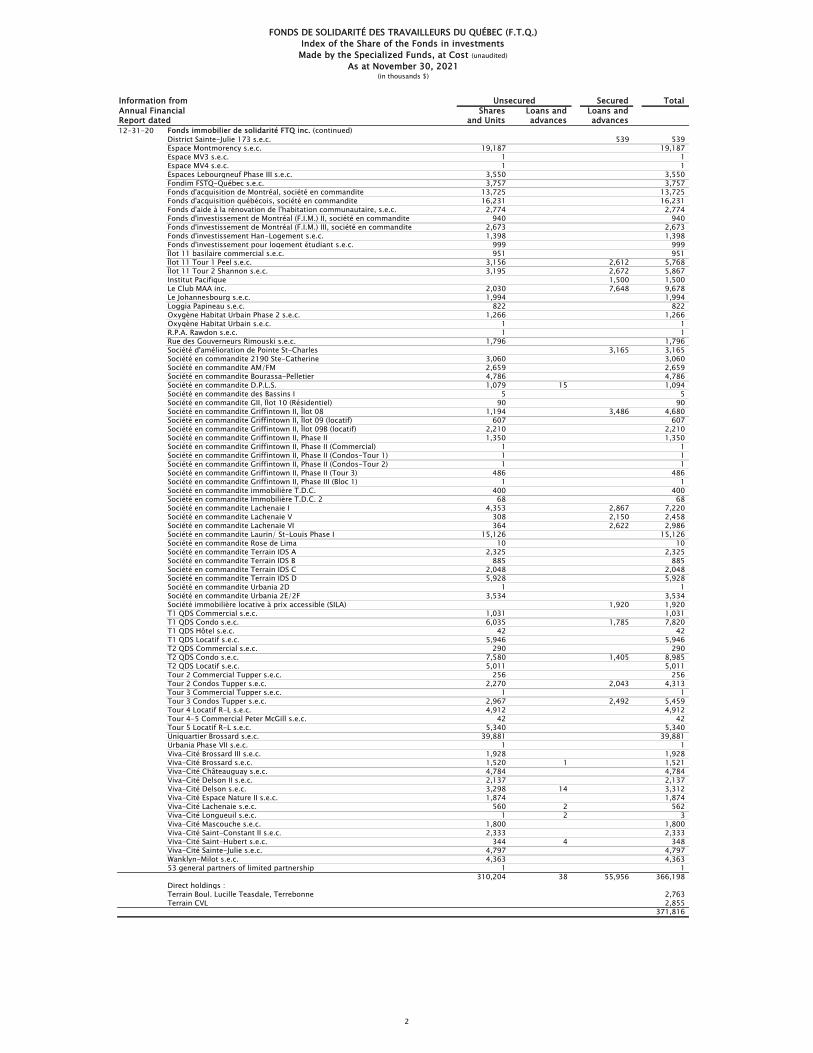
Information from Secured TotalAnnual Financial Shares Loans and Loans andReport dated and Units advances advances
Unsecured
FONDS DE SOLIDARITÉ DES TRAVAILLEURS DU QUÉBEC (F.T.Q.)Index of the Share of the Fonds in investmentsMade by the Specialized Funds, at Cost (unaudited)
As at November 30, 2021(in thousands $)
12-31-20 Fonds immobilier de solidarité FTQ inc. (continued)District Sainte-Julie 173 s.e.c. 539 539Espace Montmorency s.e.c. 19,187 19,187Espace MV3 s.e.c. 1 1Espace MV4 s.e.c. 1 1Espaces Lebourgneuf Phase III s.e.c. 3,550 3,550Fondim FSTQ-Québec s.e.c. 3,757 3,757Fonds d'acquisition de Montréal, société en commandite 13,725 13,725Fonds d'acquisition québécois, société en commandite 16,231 16,231Fonds d'aide à la rénovation de l'habitation communautaire, s.e.c. 2,774 2,774Fonds d'investissement de Montréal (F.I.M.) II, société en commandite 940 940Fonds d'investissement de Montréal (F.I.M.) III, société en commandite 2,673 2,673Fonds d'investissement Han-Logement s.e.c. 1,398 1,398Fonds d'investissement pour logement étudiant s.e.c. 999 999Îlot 11 basilaire commercial s.e.c. 951 951Îlot 11 Tour 1 Peel s.e.c. 3,156 2,612 5,768Îlot 11 Tour 2 Shannon s.e.c. 3,195 2,672 5,867Institut Pacifique 1,500 1,500Le Club MAA inc. 2,030 7,648 9,678Le Johannesbourg s.e.c. 1,994 1,994Loggia Papineau s.e.c. 822 822Oxygène Habitat Urbain Phase 2 s.e.c. 1,266 1,266Oxygène Habitat Urbain s.e.c. 1 1R.P.A. Rawdon s.e.c. 1 1Rue des Gouverneurs Rimouski s.e.c. 1,796 1,796Société d'amélioration de Pointe St-Charles 3,165 3,165Société en commandite 2190 Ste-Catherine 3,060 3,060Société en commandite AM/FM 2,659 2,659Société en commandite Bourassa-Pelletier 4,786 4,786Société en commandite D.P.L.S. 1,079 15 1,094Société en commandite des Bassins I 5 5Société en commandite GII, Îlot 10 (Résidentiel) 90 90Société en commandite Griffintown II, Îlot 08 1,194 3,486 4,680Société en commandite Griffintown II, Îlot 09 (locatif) 607 607Société en commandite Griffintown II, Îlot 09B (locatif) 2,210 2,210Société en commandite Griffintown II, Phase II 1,350 1,350Société en commandite Griffintown II, Phase II (Commercial) 1 1Société en commandite Griffintown II, Phase II (Condos-Tour 1) 1 1Société en commandite Griffintown II, Phase II (Condos-Tour 2) 1 1Société en commandite Griffintown II, Phase II (Tour 3) 486 486Société en commandite Griffintown II, Phase III (Bloc 1) 1 1Société en commandite immobilière T.D.C. 400 400Société en commandite Immobilière T.D.C. 2 68 68Société en commandite Lachenaie I 4,353 2,867 7,220Société en commandite Lachenaie V 308 2,150 2,458Société en commandite Lachenaie VI 364 2,622 2,986Société en commandite Laurin/ St-Louis Phase I 15,126 15,126Société en commandite Rose de Lima 10 10Société en commandite Terrain IDS A 2,325 2,325Société en commandite Terrain IDS B 885 885Société en commandite Terrain IDS C 2,048 2,048Société en commandite Terrain IDS D 5,928 5,928Société en commandite Urbania 2D 1 1Société en commandite Urbania 2E/2F 3,534 3,534Société immobilière locative à prix accessible (SILA) 1,920 1,920T1 QDS Commercial s.e.c. 1,031 1,031T1 QDS Condo s.e.c. 6,035 1,785 7,820T1 QDS Hôtel s.e.c. 42 42T1 QDS Locatif s.e.c. 5,946 5,946T2 QDS Commercial s.e.c. 290 290T2 QDS Condo s.e.c. 7,580 1,405 8,985T2 QDS Locatif s.e.c. 5,011 5,011Tour 2 Commercial Tupper s.e.c. 256 256Tour 2 Condos Tupper s.e.c. 2,270 2,043 4,313Tour 3 Commercial Tupper s.e.c. 1 1Tour 3 Condos Tupper s.e.c. 2,967 2,492 5,459Tour 4 Locatif R-L s.e.c. 4,912 4,912Tour 4-5 Commercial Peter McGill s.e.c. 42 42Tour 5 Locatif R-L s.e.c. 5,340 5,340Uniquartier Brossard s.e.c. 39,881 39,881Urbania Phase VII s.e.c. 1 1Viva-Cité Brossard III s.e.c. 1,928 1,928Viva-Cité Brossard s.e.c. 1,520 1 1,521Viva-Cité Châteauguay s.e.c. 4,784 4,784Viva-Cité Delson II s.e.c. 2,137 2,137Viva-Cité Delson s.e.c. 3,298 14 3,312Viva-Cité Espace Nature II s.e.c. 1,874 1,874Viva-Cité Lachenaie s.e.c. 560 2 562Viva-Cité Longueuil s.e.c. 1 2 3Viva-Cité Mascouche s.e.c. 1,800 1,800Viva-Cité Saint-Constant II s.e.c. 2,333 2,333Viva-Cité Saint-Hubert s.e.c. 344 4 348Viva-Cité Sainte-Julie s.e.c. 4,797 4,797Wanklyn-Milot s.e.c. 4,363 4,36353 general partners of limited partnership 1 1
310,204 38 55,956 366,198Direct holdings :Terrain Boul. Lucille Teasdale, Terrebonne 2,763Terrain CVL 2,855
371,816
2
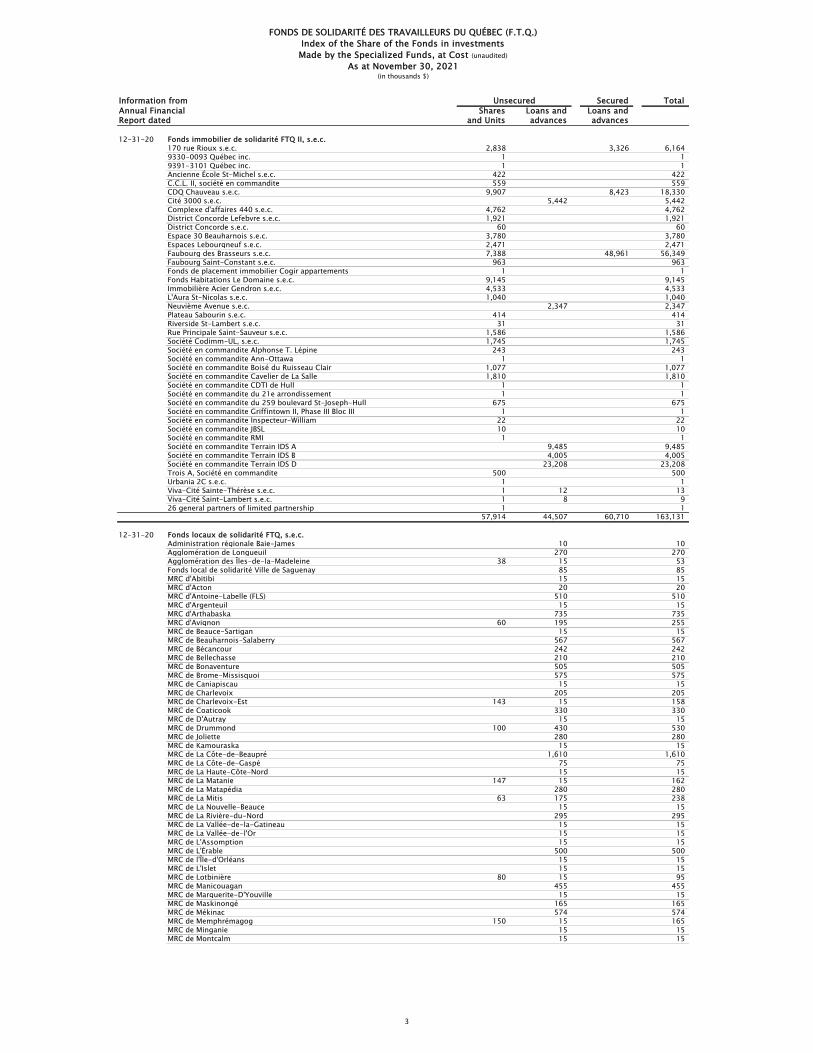
Information from Secured TotalAnnual Financial Shares Loans and Loans andReport dated and Units advances advances
Unsecured
FONDS DE SOLIDARITÉ DES TRAVAILLEURS DU QUÉBEC (F.T.Q.)Index of the Share of the Fonds in investmentsMade by the Specialized Funds, at Cost (unaudited)
As at November 30, 2021(in thousands $)
12-31-20 Fonds immobilier de solidarité FTQ II, s.e.c.170 rue Rioux s.e.c. 2,838 3,326 6,1649330-0093 Québec inc. 1 19391-3101 Québec inc. 1 1Ancienne École St-Michel s.e.c. 422 422C.C.L. II, société en commandite 559 559CDQ Chauveau s.e.c. 9,907 8,423 18,330Cité 3000 s.e.c. 5,442 5,442Complexe d'affaires 440 s.e.c. 4,762 4,762District Concorde Lefebvre s.e.c. 1,921 1,921District Concorde s.e.c. 60 60Espace 30 Beauharnois s.e.c. 3,780 3,780Espaces Lebourgneuf s.e.c. 2,471 2,471Faubourg des Brasseurs s.e.c. 7,388 48,961 56,349Faubourg Saint-Constant s.e.c. 963 963Fonds de placement immobilier Cogir appartements 1 1Fonds Habitations Le Domaine s.e.c. 9,145 9,145Immobilière Acier Gendron s.e.c. 4,533 4,533L'Aura St-Nicolas s.e.c. 1,040 1,040Neuvième Avenue s.e.c. 2,347 2,347Plateau Sabourin s.e.c. 414 414Riverside St-Lambert s.e.c. 31 31Rue Principale Saint-Sauveur s.e.c. 1,586 1,586Société Codimm-UL, s.e.c. 1,745 1,745Société en commandite Alphonse T. Lépine 243 243Société en commandite Ann-Ottawa 1 1Société en commandite Boisé du Ruisseau Clair 1,077 1,077Société en commandite Cavelier de La Salle 1,810 1,810Société en commandite CDTI de Hull 1 1Société en commandite du 21e arrondissement 1 1Société en commandite du 259 boulevard St-Joseph-Hull 675 675Société en commandite Griffintown II, Phase III Bloc III 1 1Société en commandite Inspecteur-William 22 22Société en commandite JBSL 10 10Société en commandite RMI 1 1Société en commandite Terrain IDS A 9,485 9,485Société en commandite Terrain IDS B 4,005 4,005Société en commandite Terrain IDS D 23,208 23,208Trois A, Société en commandite 500 500Urbania 2C s.e.c. 1 1Viva-Cité Sainte-Thérèse s.e.c. 1 12 13Viva-Cité Saint-Lambert s.e.c. 1 8 926 general partners of limited partnership 1 1
57,914 44,507 60,710 163,131
12-31-20 Fonds locaux de solidarité FTQ, s.e.c.Administration régionale Baie-James 10 10Agglomération de Longueuil 270 270Agglomération des Îles-de-la-Madeleine 38 15 53Fonds local de solidarité Ville de Saguenay 85 85MRC d'Abitibi 15 15MRC d'Acton 20 20MRC d'Antoine-Labelle (FLS) 510 510MRC d'Argenteuil 15 15MRC d'Arthabaska 735 735MRC d'Avignon 60 195 255MRC de Beauce-Sartigan 15 15MRC de Beauharnois-Salaberry 567 567MRC de Bécancour 242 242MRC de Bellechasse 210 210MRC de Bonaventure 505 505MRC de Brome-Missisquoi 575 575MRC de Caniapiscau 15 15MRC de Charlevoix 205 205MRC de Charlevoix-Est 143 15 158MRC de Coaticook 330 330MRC de D'Autray 15 15MRC de Drummond 100 430 530MRC de Joliette 280 280MRC de Kamouraska 15 15MRC de La Côte-de-Beaupré 1,610 1,610MRC de La Côte-de-Gaspé 75 75MRC de La Haute-Côte-Nord 15 15MRC de La Matanie 147 15 162MRC de La Matapédia 280 280MRC de La Mitis 63 175 238MRC de La Nouvelle-Beauce 15 15MRC de La Rivière-du-Nord 295 295MRC de La Vallée-de-la-Gatineau 15 15MRC de La Vallée-de-l'Or 15 15MRC de L'Assomption 15 15MRC de L'Érable 500 500MRC de l'Île-d'Orléans 15 15MRC de L'Islet 15 15MRC de Lotbinière 80 15 95MRC de Manicouagan 455 455MRC de Marguerite-D'Youville 15 15MRC de Maskinongé 165 165MRC de Mékinac 574 574MRC de Memphrémagog 150 15 165MRC de Minganie 15 15MRC de Montcalm 15 15
3

Information from Secured TotalAnnual Financial Shares Loans and Loans andReport dated and Units advances advances
Unsecured
FONDS DE SOLIDARITÉ DES TRAVAILLEURS DU QUÉBEC (F.T.Q.)Index of the Share of the Fonds in investmentsMade by the Specialized Funds, at Cost (unaudited)
As at November 30, 2021(in thousands $)
12-31-20 Fonds locaux de solidarité FTQ, s.e.c. (continued)MRC de Nicolet-Yamaska 285 285MRC de Papineau 15 15MRC de Pontiac 15 15MRC de Portneuf 150 150MRC de Rimouski-Neigette 1,405 1,405MRC de Rivière-du-Loup 315 315MRC de Roussillon 77 15 92MRC de Rouville 15 15MRC de Sept-Rivières 32 15 47MRC de Témiscamingue 15 15MRC de Témiscouata 15 15MRC de Vaudreuil-Soulanges 83 91 174MRC des Appalaches 102 10 112MRC des Basques 155 155MRC des Chenaux 15 15MRC des Collines-de-l'Outaouais 15 15MRC des Etchemins 17 15 32MRC des Laurentides 1,040 1,040MRC des Maskoutains 260 260MRC des Pays-d'en-Haut 15 15MRC des Sources 410 410MRC du Fjord-du-Saguenay 115 115MRC du Golfe-du-Saint-Laurent 10 10MRC du Haut-Saint-François 150 150MRC du Rocher-Percé 15 15MRC du Val-Saint-François 15 15MRC Les Moulins 170 170MRC Maria-Chapdelaine 114 20 134MRC Robert-Cliche 313 313PME MTL Centre-Est 3,045 3,045PME MTL Centre-Ouest 78 1,100 1,178PME MTL Centre-Ville 3,055 3,055PME MTL Est-de-l'Île 1,140 1,140PME MTL Grand Sud-Ouest 125 455 580PME MTL West-Island 1,500 1,500Société d'Investissement Jeunesse 15 15Ville de Gatineau 640 640Ville de Laval 15 15Ville de Lévis 600 600Ville de Mirabel 15 15Ville de Trois-Rivières 725 725
1,409 27,012 28,421Funds committed but not disbursed 49,083
77,504
12-31-20 Fonds PGEQ, s.e.c.Allard, Allard & Associés - Fonds de stratégies valeur s.e.c.Fonds d'actions mondiales ARIA, s.e.c.Fonds d'actions mondiales Landry II s.e.c.Fonds Revenu Fixe Canadien Quant Nymbus s.e.c.Gestion d'actifs Lester inc.LionGuard Capital Management inc.
28,163 28,163
03-31-21 Fonds régionaux de solidarité FTQ, société en commandite
Abitibi-Témiscamingue155856 Canada inc. 2,000 2,0002645-3530 Québec inc. (Hardy Construction) et Gestion immobilière Hardy inc. 980 9802732-2304 Québec inc. (Dion Services Financiers) 1,750 1,7509002-8689 Québec inc. (Microâge-Intralogique) 850 8509006-4684 Québec inc. et 11723634 Canada inc. 900 9009151-1626 Québec inc. (Les murs Cameron) 239 2399156-0177 Québec inc. (Location MSN) 300 3009175-7401 Québec inc. (La Mine de Bois) 69 699190-5778 Québec inc. (Magny Électrique) 667 6679210-8737 Québec inc. 14 149271-3478 Québec inc. (Forage Nordik) et 9301-4785 Québec inc. 308 3089395-0723 Québec inc., AIRMP inc. et MP Solutions inc. 1,600 1,600Liqueurs La Sarre inc. 225 225AbiQuip inc. 335 335ASDR Canada inc. 750 750Boulonnerie BMF inc. 481 481Construction Ubic inc. 170 170Corporation Aurifère QMX 21 21Corporation Métaux Précieux du Québec 1 1Corporation Ressources Pershimex 50 50Cylindre Express inc. 378 378Débosselage du Nord inc. 477 477Équipements Mori 7 inc. et 9364-9978 Québec inc. 241 241Forage RJLL Drilling inc. 1,500 1,500Forages M. Rouillier inc. 938 938Géoposition arpenteurs-géomètres inc. 483 483
4

Information from Secured TotalAnnual Financial Shares Loans and Loans andReport dated and Units advances advances
Unsecured
FONDS DE SOLIDARITÉ DES TRAVAILLEURS DU QUÉBEC (F.T.Q.)Index of the Share of the Fonds in investmentsMade by the Specialized Funds, at Cost (unaudited)
As at November 30, 2021(in thousands $)
03-31-21 Fonds régionaux de solidarité FTQ, société en commandite (continued)
Abitibi-Témiscamingue (continued)Groupe Financier Massé inc. 348 348Groupe MBI inc. 2,007 2,007Groupe Technosub inc. 1 1Les Aciers J.P. inc. et Immobilière J.P. inc. 189 189Les Forages C.C.L. (1993) inc. 104 104Location Amos (2007) inc. et 9203-1210 Québec inc. 1,083 1,083LVL Global inc. 350 350Machines Roger International inc. et Les Machines Roger ltée 1,125 1,125Massé inc. 550 550Minière O3 106 106Perron, Hudon, Bélanger inc. et Géoposition arpenteurs-géomètres inc. 483 483Placement RT inc. 233 233Probe Metals inc. 59 59Produits Forestiers Miniers "Abitibi" inc. et 9175-7401 Québec inc. 221 221Propair inc. 828 828Radiateurs J.M.T. ltée 279 279Ressources Falco ltée 62 62Ser-For inc. et 9199-2420 Québec inc. 329 329Services Technominex inc. 482 482Stone Gold inc. 168 168Temlac ltée 1,700 1,700Troilus Gold corp. 49 49Usinage Marcotte inc. 442 442Yamana Gold inc. 146 146
3,020 23,818 233 27,071Funds committed but not disbursed 300
27,371
Bas-Saint-Laurent 117 117 21 21
1,724 1,7249183-9530 Québec inc. (Pièces d'autos Sélect) 44 449202-9289 Québec inc. (Remorque de L'Isle) 870 8709224-4904 Québec inc. (Atelier du Bois St-Laurent) 287 2879231-0218 Québec inc. (Pat BBQ) 150 150Acier Québec-Maritimes inc. 100 765 865AMH Canada ltée 418 418Armoires Perreault inc. 176 176Bois BSL inc. 1,000 1,000Bois CFM inc. et Coop Forestière de la Matapédia 1,500 1,500Caravane 185 (2006) inc. et 9103-9834 Québec inc. 3,500 3,500Dickner inc. 522 522Distributions R.M.G. (2004) inc. 20 20Eau Limpide inc. 700 700Érablières des Alléghanys inc. 403 403Ferme B.M.P. inc. et 9267-7905 Québec inc. 350 350Fondim FSTQ-Québec s.e.c. 200 200Gagnon Image inc. 113 113
490 490Gestion Guy Rioux inc., Sciage et planage Rioux inc. 1,920 1,920Groupe Lebel inc. 4,000 4,000Inno-3B inc. 245 245Kamco Construction inc. 3 3La Buanderie de Rivière-du-Loup ltée 500 500
500 500Les Chantiers du Lac inc. 375 375Les Constructions H.L. Thériault inc. et 7105509 Canada inc. 176 176Les Entreprises Jean-Philippe Dionne inc. et 9328-0584 Québec inc. 600 600Miralis inc. 309 309Productions Québec Multimédia inc. 350 350
1,275 1,275718 23,005 23,723
Funds committed but not disbursed 100 23,823
2546-2375 Québec inc. (Le Légumier de l'Est) et 7105509 Canada inc.9031-8395 Québec inc. (Réfrigération Air C) et 9098-8106 Québec inc.9098-8106 Québec inc., 9031-8395 Québec inc. (Réfrigération Air C), 9262571 Canada inc. et Narwhal Plumbing & Heating Ltd
Garage Marcel Villeneuve inc., Locations d`autos Marcel Villeneuve inc. et 11796445 Canada inc.
Landry et Associés (Planage et Rabotage) inc. et Benoît et Dionne Produits Forestiers ltée
RPF ltée, 7109905 Canada inc., Techéol inc., Techeol Ltd, Les constructions H.L Thériault inc., Transports Martin Alain inc. et André Roy Électrique inc.
5
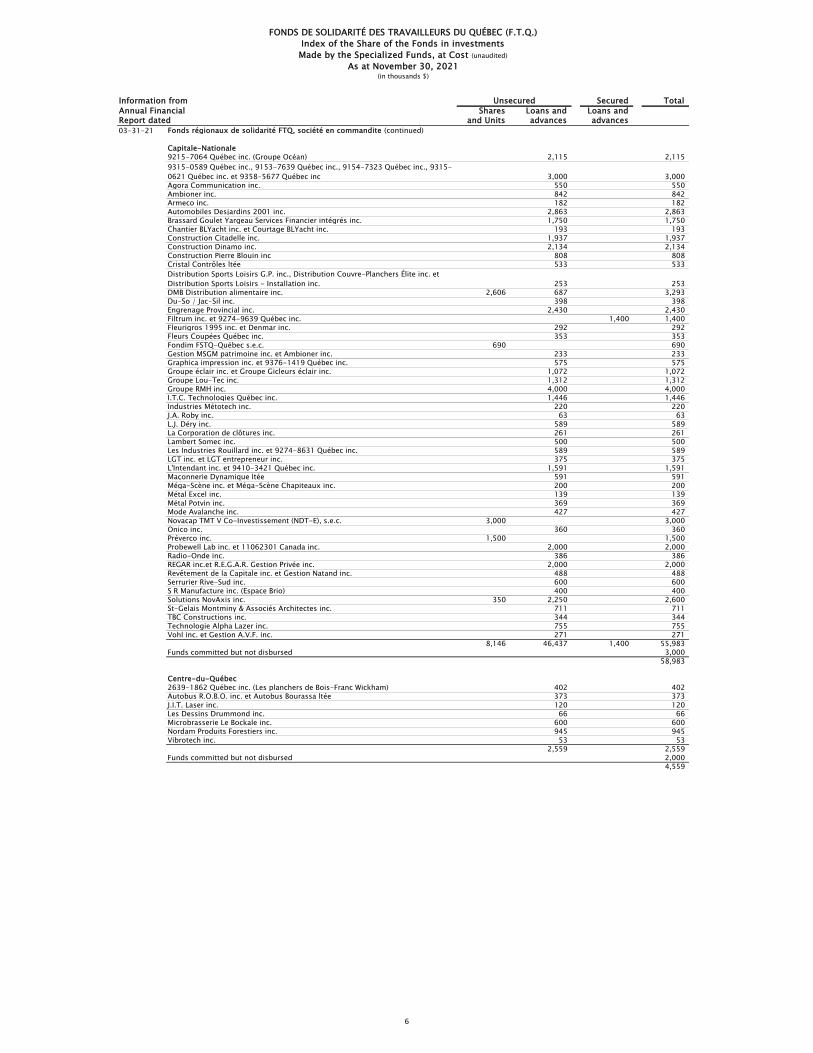
Information from Secured TotalAnnual Financial Shares Loans and Loans andReport dated and Units advances advances
Unsecured
FONDS DE SOLIDARITÉ DES TRAVAILLEURS DU QUÉBEC (F.T.Q.)Index of the Share of the Fonds in investmentsMade by the Specialized Funds, at Cost (unaudited)
As at November 30, 2021(in thousands $)
03-31-21 Fonds régionaux de solidarité FTQ, société en commandite (continued)
Capitale-Nationale9215-7064 Québec inc. (Groupe Océan) 2,115 2,115
3,000 3,000Agora Communication inc. 550 550Ambioner inc. 842 842Armeco inc. 182 182Automobiles Desjardins 2001 inc. 2,863 2,863Brassard Goulet Yargeau Services Financier intégrés inc. 1,750 1,750Chantier BLYacht inc. et Courtage BLYacht inc. 193 193Construction Citadelle inc. 1,937 1,937Construction Dinamo inc. 2,134 2,134Construction Pierre Blouin inc 808 808Cristal Contrôles ltée 533 533
253 253DMB Distribution alimentaire inc. 2,606 687 3,293Du-So / Jac-Sil inc. 398 398Engrenage Provincial inc. 2,430 2,430Filtrum inc. et 9274-9639 Québec inc. 1,400 1,400Fleurigros 1995 inc. et Denmar inc. 292 292Fleurs Coupées Québec inc. 353 353Fondim FSTQ-Québec s.e.c. 690 690Gestion MSGM patrimoine inc. et Ambioner inc. 233 233Graphica impression inc. et 9376-1419 Québec inc. 575 575Groupe éclair inc. et Groupe Gicleurs éclair inc. 1,072 1,072Groupe Lou-Tec inc. 1,312 1,312Groupe RMH inc. 4,000 4,000I.T.C. Technologies Québec inc. 1,446 1,446Industries Métotech inc. 220 220J.A. Roby inc. 63 63L.J. Déry inc. 589 589La Corporation de clôtures inc. 261 261Lambert Somec inc. 500 500Les Industries Rouillard inc. et 9274-8631 Québec inc. 589 589LGT inc. et LGT entrepreneur inc. 375 375L'Intendant inc. et 9410-3421 Québec inc. 1,591 1,591Maçonnerie Dynamique ltée 591 591Méga-Scène inc. et Méga-Scène Chapiteaux inc. 200 200Métal Excel inc. 139 139Métal Potvin inc. 369 369Mode Avalanche inc. 427 427Novacap TMT V Co-Investissement (NDT-E), s.e.c. 3,000 3,000Onico inc. 360 360Préverco inc. 1,500 1,500Probewell Lab inc. et 11062301 Canada inc. 2,000 2,000Radio-Onde inc. 386 386REGAR inc.et R.E.G.A.R. Gestion Privée inc. 2,000 2,000Revêtement de la Capitale inc. et Gestion Natand inc. 488 488Serrurier Rive-Sud inc. 600 600S R Manufacture inc. (Espace Brio) 400 400Solutions NovAxis inc. 350 2,250 2,600St-Gelais Montminy & Associés Architectes inc. 711 711TBC Constructions inc. 344 344Technologie Alpha Lazer inc. 755 755Vohl inc. et Gestion A.V.F. inc. 271 271
8,146 46,437 1,400 55,983Funds committed but not disbursed 3,000
58,983
Centre-du-Québec2639-1862 Québec inc. (Les planchers de Bois-Franc Wickham) 402 402Autobus R.O.B.O. inc. et Autobus Bourassa ltée 373 373J.I.T. Laser inc. 120 120Les Dessins Drummond inc. 66 66Microbrasserie Le Bockale inc. 600 600Nordam Produits Forestiers inc. 945 945Vibrotech inc. 53 53
2,559 2,559Funds committed but not disbursed 2,000
4,559
9315-0589 Québec inc., 9153-7639 Québec inc., 9154-7323 Québec inc., 9315-0621 Québec inc. et 9358-5677 Québec inc
Distribution Sports Loisirs G.P. inc., Distribution Couvre-Planchers Élite inc. et Distribution Sports Loisirs - Installation inc.
6
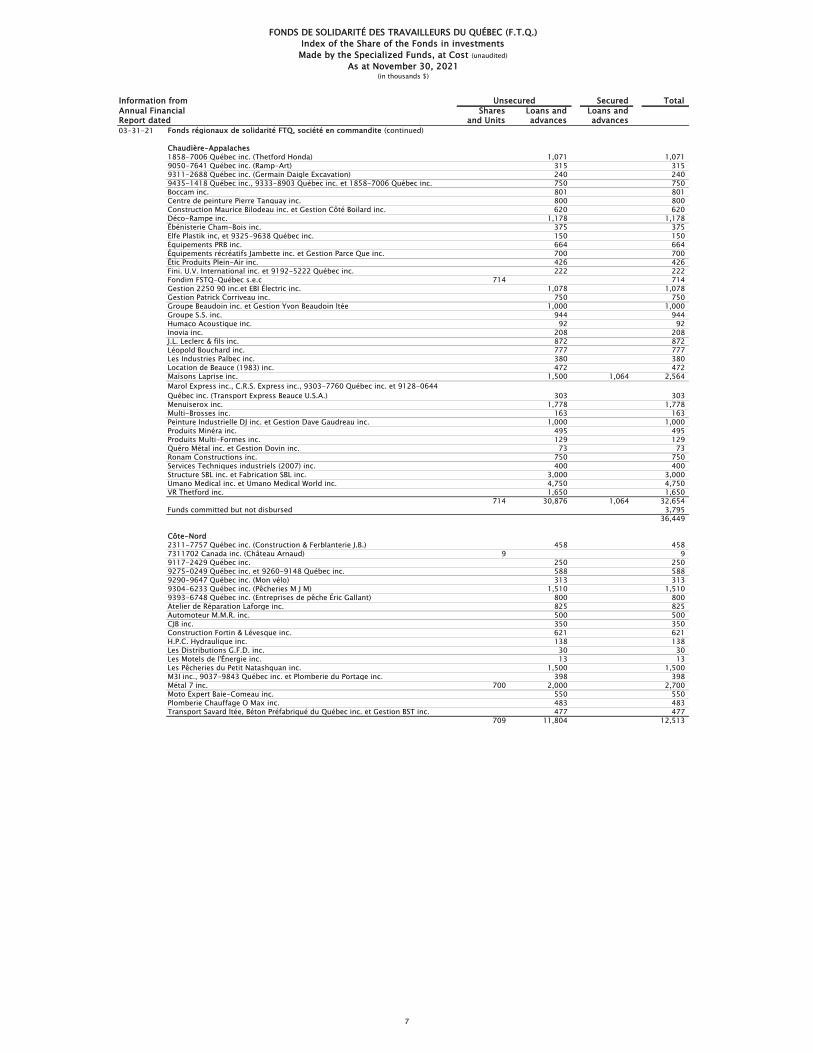
Information from Secured TotalAnnual Financial Shares Loans and Loans andReport dated and Units advances advances
Unsecured
FONDS DE SOLIDARITÉ DES TRAVAILLEURS DU QUÉBEC (F.T.Q.)Index of the Share of the Fonds in investmentsMade by the Specialized Funds, at Cost (unaudited)
As at November 30, 2021(in thousands $)
03-31-21 Fonds régionaux de solidarité FTQ, société en commandite (continued)
Chaudière-Appalaches1858-7006 Québec inc. (Thetford Honda) 1,071 1,0719050-7641 Québec inc. (Ramp-Art) 315 3159311-2688 Québec inc. (Germain Daigle Excavation) 240 2409435-1418 Québec inc., 9333-8903 Québec inc. et 1858-7006 Québec inc. 750 750Boccam inc. 801 801Centre de peinture Pierre Tanguay inc. 800 800Construction Maurice Bilodeau inc. et Gestion Côté Boilard inc. 620 620Déco-Rampe inc. 1,178 1,178Ébénisterie Cham-Bois inc. 375 375Elfe Plastik inc, et 9325-9638 Québec inc. 150 150Équipements PRB inc. 664 664Équipements récréatifs Jambette inc. et Gestion Parce Que inc. 700 700Étic Produits Plein-Air inc. 426 426Fini. U.V. International inc. et 9192-5222 Québec inc. 222 222Fondim FSTQ-Québec s.e.c 714 714Gestion 2250 90 inc.et EBI Électric inc. 1,078 1,078Gestion Patrick Corriveau inc. 750 750Groupe Beaudoin inc. et Gestion Yvon Beaudoin ltée 1,000 1,000Groupe S.S. inc. 944 944Humaco Acoustique inc. 92 92Inovia inc. 208 208J.L. Leclerc & fils inc. 872 872Léopold Bouchard inc. 777 777Les Industries Palbec inc. 380 380Location de Beauce (1983) inc. 472 472Maisons Laprise inc. 1,500 1,064 2,564
303 303Menuiserox inc. 1,778 1,778Multi-Brosses inc. 163 163Peinture Industrielle DJ inc. et Gestion Dave Gaudreau inc. 1,000 1,000Produits Minéra inc. 495 495Produits Multi-Formes inc. 129 129Quéro Métal inc. et Gestion Dovin inc. 73 73Ronam Constructions inc. 750 750Services Techniques industriels (2007) inc. 400 400Structure SBL inc. et Fabrication SBL inc. 3,000 3,000Umano Medical inc. et Umano Medical World inc. 4,750 4,750VR Thetford inc. 1,650 1,650
714 30,876 1,064 32,654Funds committed but not disbursed 3,795
36,449
Côte-Nord2311-7757 Québec inc. (Construction & Ferblanterie J.B.) 458 4587311702 Canada inc. (Château Arnaud) 9 99117-2429 Québec inc. 250 2509275-0249 Québec inc. et 9260-9148 Québec inc. 588 5889290-9647 Québec inc. (Mon vélo) 313 3139304-6233 Québec inc. (Pêcheries M J M) 1,510 1,5109393-6748 Québec inc. (Entreprises de pêche Éric Gallant) 800 800Atelier de Réparation Laforge inc. 825 825Automoteur M.M.R. inc. 500 500CJB inc. 350 350Construction Fortin & Lévesque inc. 621 621H.P.C. Hydraulique inc. 138 138Les Distributions G.F.D. inc. 30 30Les Motels de l'Énergie inc. 13 13Les Pêcheries du Petit Natashquan inc. 1,500 1,500M3I inc., 9037-9843 Québec inc. et Plomberie du Portage inc. 398 398Métal 7 inc. 700 2,000 2,700Moto Expert Baie-Comeau inc. 550 550Plomberie Chauffage O Max inc. 483 483Transport Savard ltée, Béton Préfabriqué du Québec inc. et Gestion BST inc. 477 477
709 11,804 12,513
Marol Express inc., C.R.S. Express inc., 9303-7760 Québec inc. et 9128-0644 Québec inc. (Transport Express Beauce U.S.A.)
7
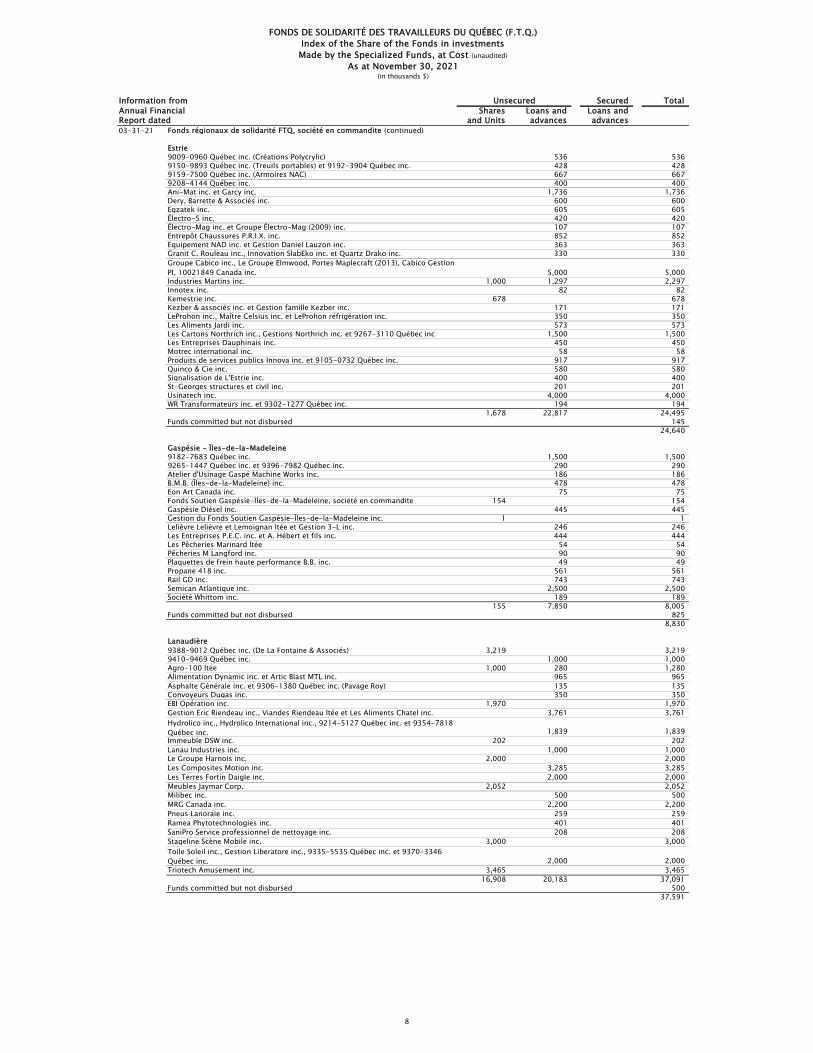
Information from Secured TotalAnnual Financial Shares Loans and Loans andReport dated and Units advances advances
Unsecured
FONDS DE SOLIDARITÉ DES TRAVAILLEURS DU QUÉBEC (F.T.Q.)Index of the Share of the Fonds in investmentsMade by the Specialized Funds, at Cost (unaudited)
As at November 30, 2021(in thousands $)
03-31-21 Fonds régionaux de solidarité FTQ, société en commandite (continued)
Estrie9009-0960 Québec inc. (Créations Polycrylic) 536 5369150-9893 Québec inc. (Treuils portables) et 9192-3904 Québec inc. 428 4289159-7500 Québec inc. (Armoires NAC) 667 6679208-4144 Québec inc. 400 400Ani-Mat inc. et Garcy inc. 1,736 1,736Dery, Barrette & Associés inc. 600 600Egzatek inc. 605 605Électro-5 inc. 420 420Électro-Mag inc. et Groupe Électro-Mag (2009) inc. 107 107Entrepôt Chaussures P.R.I.X. inc. 852 852Équipement NAD inc. et Gestion Daniel Lauzon inc. 363 363Granit C. Rouleau inc., Innovation SlabEko inc. et Quartz Drako inc. 330 330
5,000 5,000Industries Martins inc. 1,000 1,297 2,297Innotex inc. 82 82Kemestrie inc. 678 678Kezber & associés inc. et Gestion famille Kezber inc. 171 171LeProhon inc., Maître Celsius inc. et LeProhon réfrigération inc. 350 350Les Aliments Jardi inc. 573 573Les Cartons Northrich inc., Gestions Northrich inc. et 9267-3110 Québec inc 1,500 1,500Les Entreprises Dauphinais inc. 450 450Motrec international inc. 58 58Produits de services publics Innova inc. et 9105-0732 Québec inc. 917 917Quinco & Cie inc. 580 580Signalisation de L'Estrie inc. 400 400St-Georges structures et civil inc. 201 201Usinatech inc. 4,000 4,000WR Transformateurs inc. et 9302-1277 Québec inc. 194 194
1,678 22,817 24,495Funds committed but not disbursed 145
24,640
Gaspésie - Îles-de-la-Madeleine9182-7683 Québec inc. 1,500 1,5009265-1447 Québec inc. et 9396-7982 Québec inc. 290 290Atelier d'Usinage Gaspé Machine Works inc. 186 186B.M.B. (Îles-de-la-Madeleine) inc. 478 478Eon Art Canada inc. 75 75Fonds Soutien Gaspésie-Îles-de-la-Madeleine, société en commandite 154 154Gaspésie Diésel inc. 445 445Gestion du Fonds Soutien Gaspésie-Îles-de-la-Madeleine inc. 1 1Lelièvre Lelièvre et Lemoignan ltée et Gestion 3-L inc. 246 246Les Entreprises P.E.C. inc. et A. Hébert et fils inc. 444 444Les Pêcheries Marinard ltée 54 54Pêcheries M Langford inc. 90 90Plaquettes de frein haute performance B.B. inc. 49 49Propane 418 inc. 561 561Rail GD inc. 743 743Semican Atlantique inc. 2,500 2,500Société Whittom inc. 189 189
155 7,850 8,005Funds committed but not disbursed 825
8,830
Lanaudière9388-9012 Québec inc. (De La Fontaine & Associés) 3,219 3,2199410-9469 Québec inc. 1,000 1,000Agro-100 ltée 1,000 280 1,280Alimentation Dynamic inc. et Artic Blast MTL inc. 965 965Asphalte Générale inc. et 9306-1380 Québec inc. (Pavage Roy) 135 135Convoyeurs Dugas inc. 350 350EBI Opération inc. 1,970 1,970Gestion Éric Riendeau inc., Viandes Riendeau ltée et Les Aliments Chatel inc. 3,761 3,761
1,839 1,839Immeuble DSW inc. 202 202Lanau Industries inc. 1,000 1,000Le Groupe Harnois inc. 2,000 2,000Les Composites Motion inc. 3,285 3,285Les Terres Fortin Daigle inc. 2,000 2,000Meubles Jaymar Corp. 2,052 2,052Milibec inc. 500 500MRG Canada inc. 2,200 2,200Pneus Lanoraie inc. 259 259Ramea Phytotechnologies inc. 401 401SaniPro Service professionnel de nettoyage inc. 208 208Stageline Scène Mobile inc. 3,000 3,000
2,000 2,000Triotech Amusement inc. 3,465 3,465
16,908 20,183 37,091Funds committed but not disbursed 500
37,591
Groupe Cabico inc., Le Groupe Elmwood, Portes Maplecraft (2013), Cabico Gestion PI, 10021849 Canada inc.
Hydrolico inc., Hydrolico International inc., 9214-5127 Québec inc. et 9354-7818 Québec inc.
Toile Soleil inc., Gestion Liberatore inc., 9335-5535 Québec inc. et 9370-3346 Québec inc.
8
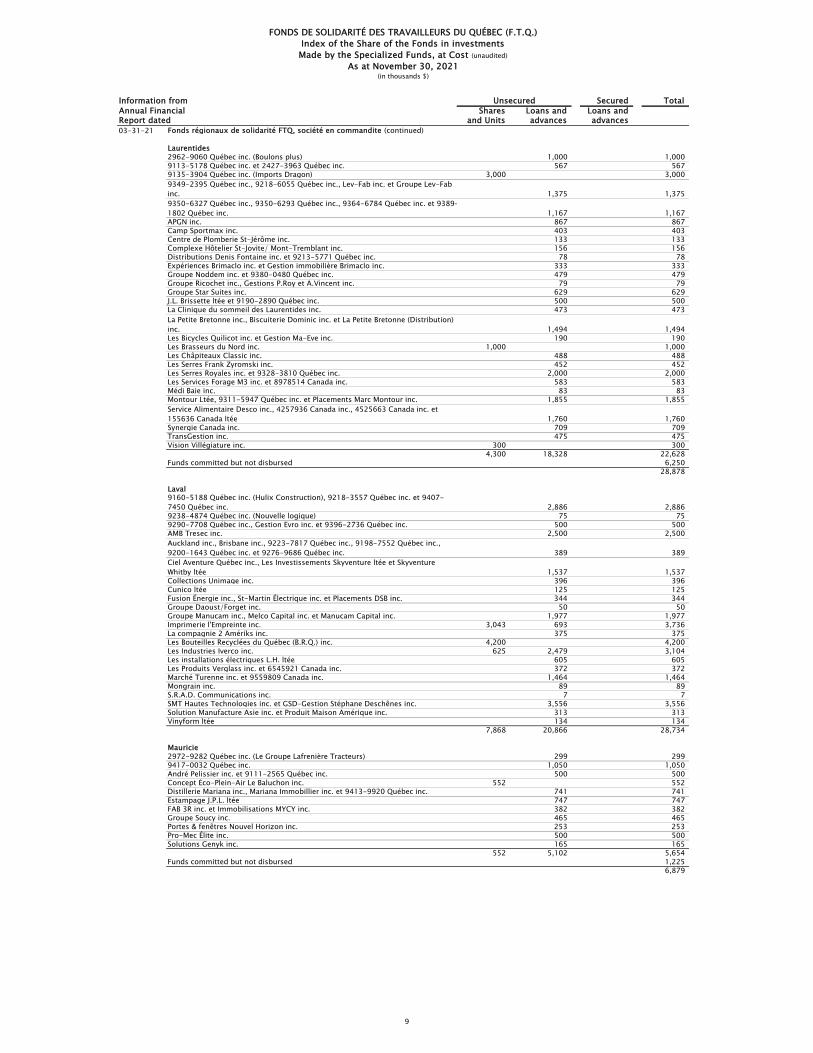
Information from Secured TotalAnnual Financial Shares Loans and Loans andReport dated and Units advances advances
Unsecured
FONDS DE SOLIDARITÉ DES TRAVAILLEURS DU QUÉBEC (F.T.Q.)Index of the Share of the Fonds in investmentsMade by the Specialized Funds, at Cost (unaudited)
As at November 30, 2021(in thousands $)
03-31-21 Fonds régionaux de solidarité FTQ, société en commandite (continued)
Laurentides2962-9060 Québec inc. (Boulons plus) 1,000 1,0009113-5178 Québec inc. et 2427-3963 Québec inc. 567 5679135-3904 Québec inc. (Imports Dragon) 3,000 3,000
1,375 1,375
1,167 1,167APGN inc. 867 867Camp Sportmax inc. 403 403Centre de Plomberie St-Jérôme inc. 133 133Complexe Hôtelier St-Jovite/ Mont-Tremblant inc. 156 156Distributions Denis Fontaine inc. et 9213-5771 Québec inc. 78 78Expériences Brimaclo inc. et Gestion immobilière Brimaclo inc. 333 333Groupe Noddem inc. et 9380-0480 Québec inc. 479 479Groupe Ricochet inc., Gestions P.Roy et A.Vincent inc. 79 79Groupe Star Suites inc. 629 629J.L. Brissette ltée et 9190-2890 Québec inc. 500 500La Clinique du sommeil des Laurentides inc. 473 473
1,494 1,494Les Bicycles Quilicot inc. et Gestion Ma-Eve inc. 190 190Les Brasseurs du Nord inc. 1,000 1,000Les Châpiteaux Classic inc. 488 488Les Serres Frank Zyromski inc. 452 452Les Serres Royales inc. et 9328-3810 Québec inc. 2,000 2,000Les Services Forage M3 inc. et 8978514 Canada inc. 583 583Médi Baie inc. 83 83Montour Ltée, 9311-5947 Québec inc. et Placements Marc Montour inc. 1,855 1,855
1,760 1,760Synergie Canada inc. 709 709TransGestion inc. 475 475Vision Villégiature inc. 300 300
4,300 18,328 22,628Funds committed but not disbursed 6,250
28,878
Laval
2,886 2,8869238-4874 Québec inc. (Nouvelle logique) 75 759290-7708 Québec inc., Gestion Evro inc. et 9396-2736 Québec inc. 500 500AMB Tresec inc. 2,500 2,500
389 389
1,537 1,537Collections Unimage inc. 396 396Cunico ltée 125 125Fusion Énergie inc., St-Martin Électrique inc. et Placements DSB inc. 344 344Groupe Daoust/Forget inc. 50 50Groupe Manucam inc., Melco Capital inc. et Manucam Capital inc. 1,977 1,977Imprimerie l'Empreinte inc. 3,043 693 3,736La compagnie 2 Amériks inc. 375 375Les Bouteilles Recyclées du Québec (B.R.Q.) inc. 4,200 4,200Les Industries Iverco inc. 625 2,479 3,104Les installations électriques L.H. ltée 605 605Les Produits Verglass inc. et 6545921 Canada inc. 372 372Marché Turenne inc. et 9559809 Canada inc. 1,464 1,464Mongrain inc. 89 89S.R.A.D. Communications inc. 7 7SMT Hautes Technologies inc. et GSD-Gestion Stéphane Deschênes inc. 3,556 3,556Solution Manufacture Asie inc. et Produit Maison Amérique inc. 313 313Vinyform ltée 134 134
7,868 20,866 28,734
Mauricie2972-9282 Québec inc. (Le Groupe Lafrenière Tracteurs) 299 2999417-0032 Québec inc. 1,050 1,050André Pelissier inc. et 9111-2565 Québec inc. 500 500Concept Éco-Plein-Air Le Baluchon inc. 552 552Distillerie Mariana inc., Mariana Immobillier inc. et 9413-9920 Québec inc. 741 741Estampage J.P.L. ltée 747 747FAB 3R inc. et Immobilisations MYCY inc. 382 382Groupe Soucy inc. 465 465Portes & fenêtres Nouvel Horizon inc. 253 253Pro-Mec Élite inc. 500 500Solutions Genyk inc. 165 165
552 5,102 5,654Funds committed but not disbursed 1,225
6,879
9350-6327 Québec inc., 9350-6293 Québec inc., 9364-6784 Québec inc. et 9389-1802 Québec inc.
9349-2395 Québec inc., 9218-6055 Québec inc., Lev-Fab inc. et Groupe Lev-Fab inc.
La Petite Bretonne inc., Biscuiterie Dominic inc. et La Petite Bretonne (Distribution) inc.
Service Alimentaire Desco inc., 4257936 Canada inc., 4525663 Canada inc. et 155636 Canada ltée
9160-5188 Québec inc. (Hulix Construction), 9218-3557 Québec inc. et 9407-7450 Québec inc.
Auckland inc., Brisbane inc., 9223-7817 Québec inc., 9198-7552 Québec inc., 9200-1643 Québec inc. et 9276-9686 Québec inc.Ciel Aventure Québec inc., Les Investissements Skyventure ltée et Skyventure Whitby ltée
9
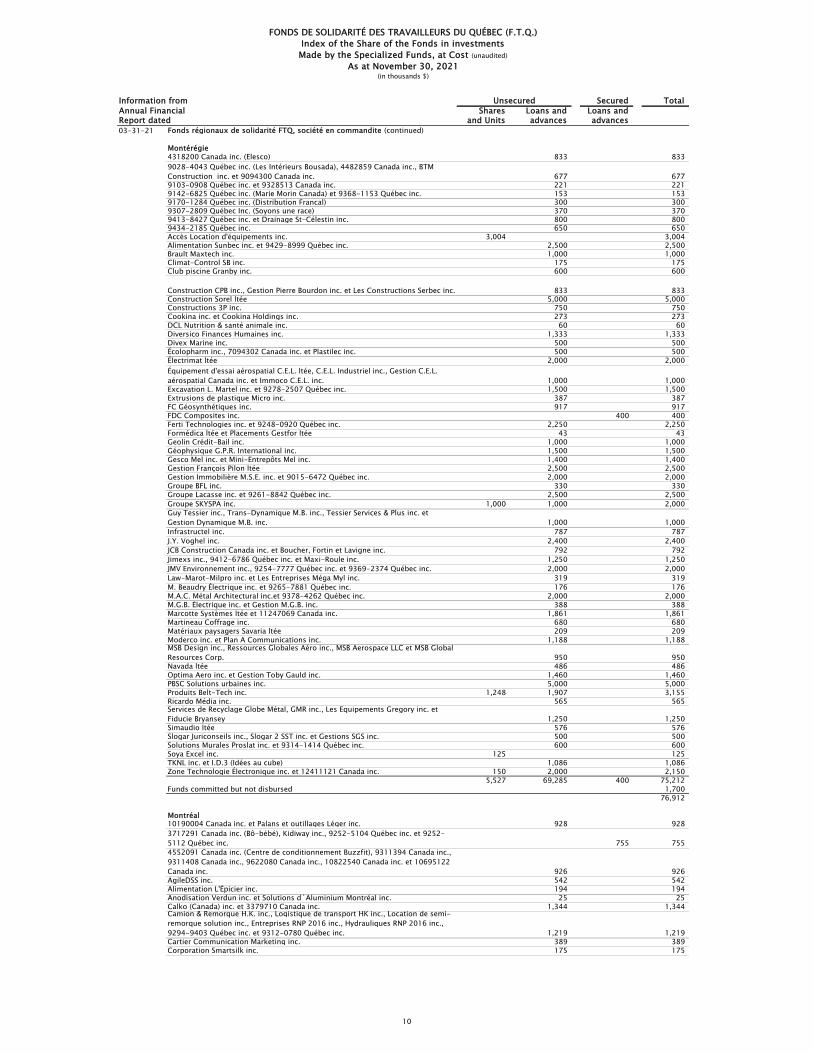
Information from Secured TotalAnnual Financial Shares Loans and Loans andReport dated and Units advances advances
Unsecured
FONDS DE SOLIDARITÉ DES TRAVAILLEURS DU QUÉBEC (F.T.Q.)Index of the Share of the Fonds in investmentsMade by the Specialized Funds, at Cost (unaudited)
As at November 30, 2021(in thousands $)
03-31-21 Fonds régionaux de solidarité FTQ, société en commandite (continued)
Montérégie4318200 Canada inc. (Elesco) 833 833
677 6779103-0908 Québec inc. et 9328513 Canada inc. 221 2219142-6825 Québec inc. (Marie Morin Canada) et 9368-1153 Québec inc. 153 1539170-1284 Québec inc. (Distribution Francal) 300 3009307-2809 Québec Inc. (Soyons une race) 370 3709413-8427 Québec inc. et Drainage St-Célestin inc. 800 8009434-2185 Québec inc. 650 650Accès Location d'équipements inc. 3,004 3,004Alimentation Sunbec inc. et 9429-8999 Québec inc. 2,500 2,500Brault Maxtech inc. 1,000 1,000Climat-Control SB inc. 175 175Club piscine Granby inc. 600 600
833 833Construction Sorel ltée 5,000 5,000Constructions 3P inc. 750 750Cookina inc. et Cookina Holdings inc. 273 273DCL Nutrition & santé animale inc. 60 60Diversico Finances Humaines inc. 1,333 1,333Divex Marine inc. 500 500Écolopharm inc., 7094302 Canada inc. et Plastilec inc. 500 500Électrimat ltée 2,000 2,000
1,000 1,000Excavation L. Martel inc. et 9278-2507 Québec inc. 1,500 1,500Extrusions de plastique Micro inc. 387 387FC Géosynthétiques inc. 917 917FDC Composites inc. 400 400Ferti Technologies inc. et 9248-0920 Québec inc. 2,250 2,250Formédica ltée et Placements Gestfor ltée 43 43Geolin Crédit-Bail inc. 1,000 1,000Géophysique G.P.R. International inc. 1,500 1,500Gesco Mel inc. et Mini-Entrepôts Mel inc. 1,400 1,400Gestion François Pilon ltée 2,500 2,500Gestion Immobilière M.S.E. inc. et 9015-6472 Québec inc. 2,000 2,000Groupe BFL inc. 330 330Groupe Lacasse inc. et 9261-8842 Québec inc. 2,500 2,500Groupe SKYSPA inc. 1,000 1,000 2,000
1,000 1,000Infrastructel inc. 787 787J.Y. Voghel inc. 2,400 2,400JCB Construction Canada inc. et Boucher, Fortin et Lavigne inc. 792 792Jimexs inc., 9412-6786 Québec inc. et Maxi-Roule inc. 1,250 1,250JMV Environnement inc., 9254-7777 Québec inc. et 9369-2374 Québec inc. 2,000 2,000Law-Marot-Milpro inc. et Les Entreprises Méga Myl inc. 319 319M. Beaudry Électrique inc. et 9265-7881 Québec inc. 176 176M.A.C. Métal Architectural inc.et 9378-4262 Québec inc. 2,000 2,000M.G.B. Électrique inc. et Gestion M.G.B. inc. 388 388Marcotte Systèmes ltée et 11247069 Canada inc. 1,861 1,861Martineau Coffrage inc. 680 680Matériaux paysagers Savaria ltée 209 209Moderco inc. et Plan A Communications inc. 1,188 1,188
950 950Navada ltée 486 486Optima Aero inc. et Gestion Toby Gauld inc. 1,460 1,460PBSC Solutions urbaines inc. 5,000 5,000Produits Belt-Tech inc. 1,248 1,907 3,155Ricardo Média inc. 565 565
1,250 1,250Simaudio ltée 576 576Slogar Juriconseils inc., Slogar 2 SST inc. et Gestions SGS inc. 500 500Solutions Murales Proslat inc. et 9314-1414 Québec inc. 600 600Soya Excel inc. 125 125TKNL inc. et I.D.3 (Idées au cube) 1,086 1,086Zone Technologie Électronique inc. et 12411121 Canada inc. 150 2,000 2,150
5,527 69,285 400 75,212Funds committed but not disbursed 1,700
76,912
Montréal 928 928
755 755
926 926AgileDSS inc. 542 542Alimentation L'Épicier inc. 194 194Anodisation Verdun inc. et Solutions d`Aluminium Montréal inc. 25 25Calko (Canada) inc. et 3379710 Canada inc. 1,344 1,344
1,219 1,219Cartier Communication Marketing inc. 389 389Corporation Smartsilk inc. 175 175
9028-4043 Québec inc. (Les Intérieurs Bousada), 4482859 Canada inc., BTM Construction inc. et 9094300 Canada inc.
Construction CPB inc., Gestion Pierre Bourdon inc. et Les Constructions Serbec inc.
Équipement d'essai aérospatial C.E.L. ltée, C.E.L. Industriel inc., Gestion C.E.L. aérospatial Canada inc. et Immoco C.E.L. inc.
Guy Tessier inc., Trans-Dynamique M.B. inc., Tessier Services & Plus inc. et Gestion Dynamique M.B. inc.
MSB Design inc., Ressources Globales Aéro inc., MSB Aerospace LLC et MSB Global Resources Corp.
Services de Recyclage Globe Métal, GMR inc., Les Équipements Gregory inc. et Fiducie Bryansey
10190004 Canada inc. et Palans et outillages Léger inc.3717291 Canada inc. (Bô-bébé), Kidiway inc., 9252-5104 Québec inc. et 9252-5112 Québec inc.4552091 Canada inc. (Centre de conditionnement Buzzfit), 9311394 Canada inc., 9311408 Canada inc., 9622080 Canada inc., 10822540 Canada inc. et 10695122 Canada inc.
Camion & Remorque H.K. inc., Logistique de transport HK inc., Location de semi-remorque solution inc., Entreprises RNP 2016 inc., Hydrauliques RNP 2016 inc., 9294-9403 Québec inc. et 9312-0780 Québec inc.
10

Information from Secured TotalAnnual Financial Shares Loans and Loans andReport dated and Units advances advances
Unsecured
FONDS DE SOLIDARITÉ DES TRAVAILLEURS DU QUÉBEC (F.T.Q.)Index of the Share of the Fonds in investmentsMade by the Specialized Funds, at Cost (unaudited)
As at November 30, 2021(in thousands $)
03-31-21 Fonds régionaux de solidarité FTQ, société en commandite (continued)
Montréal (continued)Drakkar & Associés inc., Drakkar Logistique inc. et Drakkar Manufacturier inc. 4,000 4,000Elema Experts-Conseils inc. 482 482Élévex inc. 823 823Emballages Cré-O-Pack International inc. et Édifice Jamic Canada inc. 1,000 1,000Fiberlinks Textiles inc. et 4376692 Canada inc.. 2,143 2,143G.C.M. Consultants inc. 750 750Gestion Alcor matériaux de toiture inc. 1,000 349 1,349Globale Partenaire Solutions inc. et 4332458 Canada inc. 2,014 2,014Groupe Aliston inc. 231 231
685 685Groupe BBH inc. 2,300 2,000 4,300Groupe Imog inc., Sablière Deguire inc. et Gestion Imog inc. 395 395
1,500 1,500Groupe Trium inc. 824 824Industries Enviroair inc. 1,821 1,821La société de gestion Access, Tenet, MyCloud Corporation 3,000 3,000
702 702Le Groupe Distribution Lifestyle inc. 500 500Les Aliments Morehouse Canada Ltée 1,469 1,469
2,917 2,917Les Entreprises QMD inc. 1,221 1,221Les industries Cendrex inc. 1,675 1,675Les Peintures Euroteck inc. (Euroteck Services), Gestion VMB inc. 23 23Moteurs Électriques Laval ltée 53 53Précision IMS inc. 299 299Proaction International inc. et Proaction monde inc. 1,891 1,891Raymond Lanctôt ltée 615 615Sanuvox Technologies inc. 988 988Services Conseils Thinkmax inc. 600 600Spiria Digital inc. 1,250 1,250
767 767
750 750Turbines Essential inc. 719 719
7,975 39,523 755 48,253Funds committed but not disbursed 4,500
52,753
Nord-du-Québec10796166 Canada inc. (M.A.S. Chibougamau) 295 2959082-5902 Québec inc. (Physiotec) 979 9799189-3081 Québec inc. (Relais du Lac Caché) 231 2319414-3385 Québec inc. (Entretien Industriel Éco) 238 238Équipement de Bureau Ungava inc. 869 869Excavation Gilbert Sheehy inc. 135 135Exploration Azimut inc. 100 100Exploration Dios inc. 131 131Exploration Kintavar inc. 90 90Exploration Midland inc. 437 437Harfang Exploration inc. 100 100Les Mines Fury Gold 63 63Les Pétroles M.J. inc. 64 64Les Ressources Yorbeau inc. 37 37Minéreaux Amérique du Nord Kenorland 200 200Mines d'Or Maple ltée 35 35Ressources Cartier inc. 70 70Ressources Delta ltée 100 100Ressources Opus One inc. 100 100Ressources Sirios inc. 202 202Ressources Sphinx ltée 35 35Ressources Tarku ltée 102 102Ressources X-Terra inc. 67 67Société d'Exploration Minière Vior inc. 251 251Soudure G.A.M. (Chibougamau) inc. 204 204St-Félicien Diesel (1988) inc. Yamana Gold inc. 17 17Yvan du sport inc. et 9389-0655 Québec inc. 300 300
2,137 3,315 5,452Funds committed but not disbursed 300
5,752
Outaouais
1,286 1,286
650 6503197786 Canada inc. (Acoustique S. Mayer) et 7621175 Canada inc. 482 4823596745 Canada inc. (Vitrerie de la Vallée) et 3596761 Canada inc. 155 155
283 2834083261 Canada inc. (Le Groupe Fia) 1,220 1,2206053599 Canada inc. (Construction Fre-Ro) et 10260738 Canada inc. 125 1256227945 Canada inc. (IEG) et 10392766 Canada inc. 263 2636368425 Canada ltée (Acier DM) et 6964770 Canada inc. 74 74
963 9637275943 Canada inc. et 9461736 Canada inc. 175 175
Groupe Incursion inc., 9409-5742 Québec inc. et Compagnie de Voyages PAX inc.
Groupe Atwill-Morin inc., 8782601 Canada inc., 8844925 Canada inc. et 4527216 Canada inc.
Le Groupe A&A spécialiste du document (Montréal) inc., Le Groupe A&A (société de portefeuille) inc. et 9360-9444 Québec inc.
Les Enchères d'automobiles St-Pierre (ESP) ltée, 3240151 Canada inc. et 9404-3817 Québec inc.
Targray Technologie Internationale inc. et Thomas A.G. Richardson Investissement inc.Technologie Inmind inc., Mind in a box inc., Alphamosaik inc., Pollen group inc. et Inmind systems inc.
144781 Canada inc., 3223701 Canada inc. 6915094 Canada inc. (Le Groupe Brigil) et 11201417 Canada inc.2786630 Canada inc. (Vitrerie Vision 2000), 3938123 Canada inc. et 6823483 Canada inc.
4063538 Canada inc. (Vaillant Excavation), 4510275 Canada inc. (Transport Leblanc) et 4464397 Canada inc.
7145829 Canada inc., 4200527 Canada inc., 3206815 Canada inc. et 4200535 Canada inc.
11
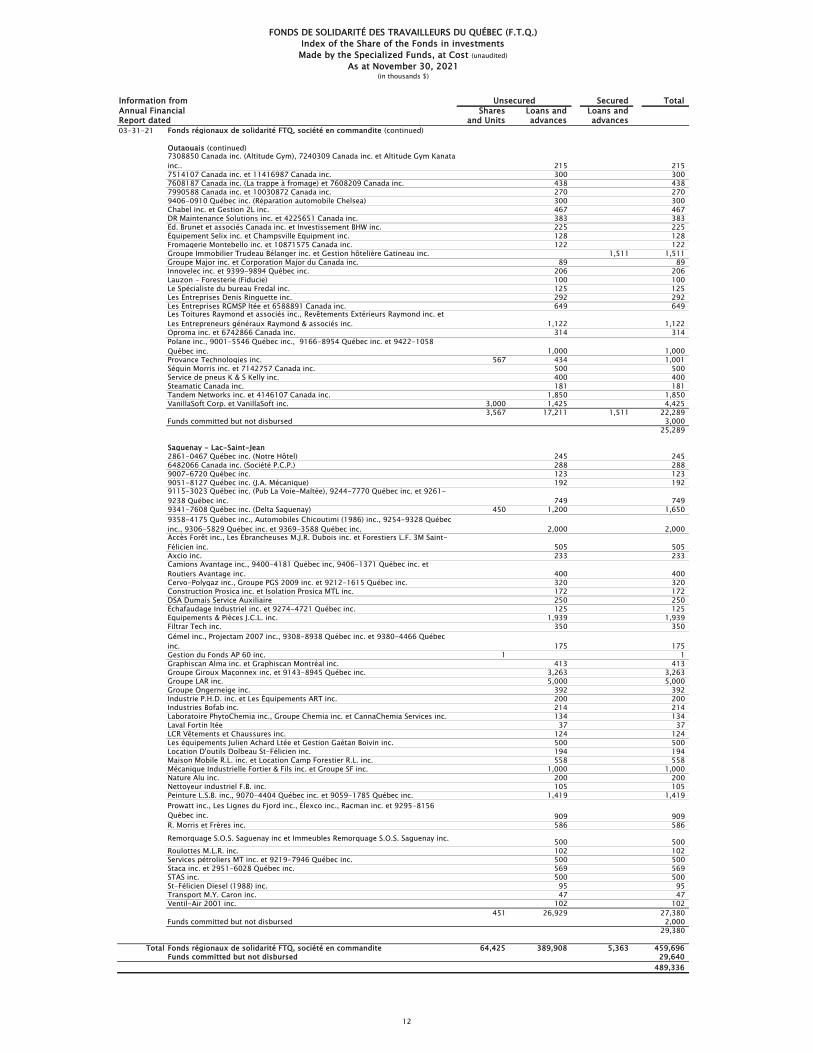
Information from Secured TotalAnnual Financial Shares Loans and Loans andReport dated and Units advances advances
Unsecured
FONDS DE SOLIDARITÉ DES TRAVAILLEURS DU QUÉBEC (F.T.Q.)Index of the Share of the Fonds in investmentsMade by the Specialized Funds, at Cost (unaudited)
As at November 30, 2021(in thousands $)
03-31-21 Fonds régionaux de solidarité FTQ, société en commandite (continued)
Outaouais (continued)
215 2157514107 Canada inc. et 11416987 Canada inc. 300 3007608187 Canada inc. (La trappe à fromage) et 7608209 Canada inc. 438 4387990588 Canada inc. et 10030872 Canada inc. 270 2709406-0910 Québec inc. (Réparation automobile Chelsea) 300 300Chabel inc. et Gestion 2L inc. 467 467DR Maintenance Solutions inc. et 4225651 Canada inc. 383 383Ed. Brunet et associés Canada inc. et Investissement BHW inc. 225 225Équipement Selix inc. et Champsville Equipment inc. 128 128Fromagerie Montebello inc. et 10871575 Canada inc. 122 122Groupe Immobilier Trudeau Bélanger inc. et Gestion hôtelière Gatineau inc. 1,511 1,511Groupe Major inc. et Corporation Major du Canada inc. 89 89Innovelec inc. et 9399-9894 Québec inc. 206 206Lauzon - Foresterie (Fiducie) 100 100Le Spécialiste du bureau Fredal inc. 125 125Les Entreprises Denis Ringuette inc. 292 292Les Entreprises RGMSP ltée et 6588891 Canada inc. 649 649
1,122 1,122Oproma inc. et 6742866 Canada inc. 314 314
1,000 1,000Provance Technologies inc. 567 434 1,001Séguin Morris inc. et 7142757 Canada inc. 500 500Service de pneus K & S Kelly inc. 400 400Steamatic Canada inc. 181 181Tandem Networks inc. et 4146107 Canada inc. 1,850 1,850VanillaSoft Corp. et VanillaSoft inc. 3,000 1,425 4,425
3,567 17,211 1,511 22,289Funds committed but not disbursed 3,000
25,289
Saguenay - Lac-Saint-Jean2861-0467 Québec inc. (Notre Hôtel) 245 2456482066 Canada inc. (Société P.C.P.) 288 2889007-6720 Québec inc. 123 1239051-8127 Québec inc. (J.A. Mécanique) 192 192
749 7499341-7608 Québec inc. (Delta Saguenay) 450 1,200 1,650
2,000 2,000
505 505Axcio inc. 233 233
400 400Cervo-Polygaz inc., Groupe PGS 2009 inc. et 9212-1615 Québec inc. 320 320Construction Prosica inc. et Isolation Prosica MTL inc. 172 172DSA Dumais Service Auxiliaire 250 250Échafaudage Industriel inc. et 9274-4721 Québec inc. 125 125Équipements & Pièces J.C.L. inc. 1,939 1,939Filtrar Tech inc. 350 350
175 175Gestion du Fonds AP 60 inc. 1 1Graphiscan Alma inc. et Graphiscan Montréal inc. 413 413Groupe Giroux Maçonnex inc. et 9143-8945 Québec inc. 3,263 3,263Groupe LAR inc. 5,000 5,000Groupe Ongerneige inc. 392 392Industrie P.H.D. inc. et Les Équipements ART inc. 200 200Industries Bofab inc. 214 214Laboratoire PhytoChemia inc., Groupe Chemia inc. et CannaChemia Services inc. 134 134Laval Fortin ltée 37 37LCR Vêtements et Chaussures inc. 124 124Les équipements Julien Achard Ltée et Gestion Gaétan Boivin inc. 500 500Location D'outils Dolbeau St-Félicien inc. 194 194Maison Mobile R.L. inc. et Location Camp Forestier R.L. inc. 558 558Mécanique Industrielle Fortier & Fils inc. et Groupe SF inc. 1,000 1,000Nature Alu inc. 200 200Nettoyeur industriel F.B. inc. 105 105Peinture L.S.B. inc., 9070-4404 Québec inc. et 9059-1785 Québec inc. 1,419 1,419
909 909R. Morris et Frères inc. 586 586
500 500Roulottes M.L.R. inc. 102 102Services pétroliers MT inc. et 9219-7946 Québec inc. 500 500Staca inc. et 2951-6028 Québec inc. 569 569STAS inc. 500 500St-Félicien Diesel (1988) inc. 95 95Transport M.Y. Caron inc. 47 47Ventil-Air 2001 inc. 102 102
451 26,929 27,380Funds committed but not disbursed 2,000
29,380
Total Fonds régionaux de solidarité FTQ, société en commandite 64,425 389,908 5,363 459,696Funds committed but not disbursed 29,640
489,336
9115-3023 Québec inc. (Pub La Voie-Maltée), 9244-7770 Québec inc. et 9261-9238 Québec inc.
7308850 Canada inc. (Altitude Gym), 7240309 Canada inc. et Altitude Gym Kanata inc..
Les Toitures Raymond et associés inc., Revêtements Extérieurs Raymond inc. et Les Entrepreneurs généraux Raymond & associés inc.
Polane inc., 9001-5546 Québec inc., 9166-8954 Québec inc. et 9422-1058 Québec inc.
9358-4175 Québec inc., Automobiles Chicoutimi (1986) inc., 9254-9328 Québec inc., 9306-5829 Québec inc. et 9369-3588 Québec inc.Accès Forêt inc., Les Ébrancheuses M.J.R. Dubois inc. et Forestiers L.F. 3M Saint-Félicien inc.
Camions Avantage inc., 9400-4181 Québec inc, 9406-1371 Québec inc. et Routiers Avantage inc.
Gémel inc., Projectam 2007 inc., 9308-8938 Québec inc. et 9380-4466 Québec inc.
Prowatt inc., Les Lignes du Fjord inc., Élexco inc., Racman inc. et 9295-8156 Québec inc.
Remorquage S.O.S. Saguenay inc et Immeubles Remorquage S.O.S. Saguenay inc.
12
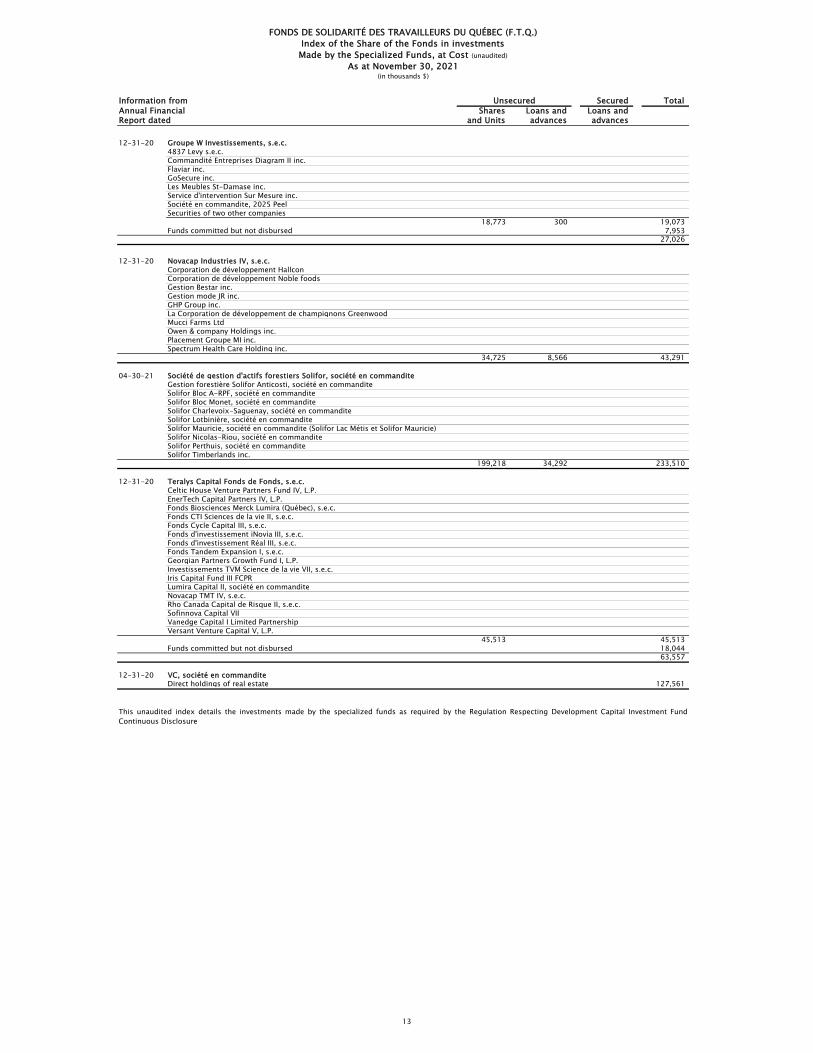
Information from Secured TotalAnnual Financial Shares Loans and Loans andReport dated and Units advances advances
Unsecured
FONDS DE SOLIDARITÉ DES TRAVAILLEURS DU QUÉBEC (F.T.Q.)Index of the Share of the Fonds in investmentsMade by the Specialized Funds, at Cost (unaudited)
As at November 30, 2021(in thousands $)
12-31-20 Groupe W Investissements, s.e.c.4837 Levy s.e.c.Commandité Entreprises Diagram II inc.Flaviar inc.GoSecure inc.Les Meubles St-Damase inc.Service d'intervention Sur Mesure inc.Société en commandite, 2025 PeelSecurities of two other companies
18,773 300 19,073Funds committed but not disbursed 7,953
27,026
12-31-20 Novacap Industries IV, s.e.c.Corporation de développement HallconCorporation de développement Noble foodsGestion Bestar inc.Gestion mode JR inc.GHP Group inc.La Corporation de développement de champignons GreenwoodMucci Farms LtdOwen & company Holdings inc.Placement Groupe MI inc.Spectrum Health Care Holding inc.
34,725 8,566 43,291
04-30-21 Société de gestion d'actifs forestiers Solifor, société en commanditeGestion forestière Solifor Anticosti, société en commanditeSolifor Bloc A-RPF, société en commanditeSolifor Bloc Monet, société en commanditeSolifor Charlevoix-Saguenay, société en commanditeSolifor Lotbinière, société en commanditeSolifor Mauricie, société en commandite (Solifor Lac Métis et Solifor Mauricie)Solifor Nicolas-Riou, société en commanditeSolifor Perthuis, société en commanditeSolifor Timberlands inc.
199,218 34,292 233,510
12-31-20 Teralys Capital Fonds de Fonds, s.e.c.Celtic House Venture Partners Fund IV, L.P. 11,101 11,101EnerTech Capital Partners IV, L.P. (8,256) (8,256)Fonds Biosciences Merck Lumira (Québec), s.e.c. (8,287) (8,287)Fonds CTI Sciences de la vie II, s.e.c. 6,652 6,652Fonds Cycle Capital III, s.e.c. 14,817 14,817Fonds d'investissement iNovia III, s.e.c. 220 220Fonds d'investissement Réal III, s.e.c. 5,471 5,471Fonds Tandem Expansion I, s.e.c. 2,787 2,787Georgian Partners Growth Fund I, L.P. (4,792) (4,792)Investissements TVM Science de la vie VII, s.e.c. (531) (531)Iris Capital Fund III FCPR 1,448 1,448Lumira Capital II, société en commandite 8,064 8,064Novacap TMT IV, s.e.c. 7,461 7,461Rho Canada Capital de Risque II, s.e.c. (4,306) (4,306)Sofinnova Capital VII 1,200 1,200Vanedge Capital I Limited Partnership 14,817 14,817Versant Venture Capital V, L.P. 1,224 1,224
45,513 45,513Funds committed but not disbursed 18,044
63,557
12-31-20 VC, société en commanditeDirect holdings of real estate 127,561
This unaudited index details the investments made by the specialized funds as required by the Regulation Respecting Development Capital Investment FundContinuous Disclosure
13