Consolidated Annual Report 2017 - VÚB banka
270
Consolidated Annual Report 2017
-
Upload
khangminh22 -
Category
Documents
-
view
1 -
download
0
Transcript of Consolidated Annual Report 2017 - VÚB banka

Consolidated Annual Report 2017


Contents
Address by the Chairman of the VUB Supervisory Board 3
Address by the Chairman of the VUB Management Board 4
VUB Management Board Report on the business activities of the Company 7
Development of the External Environment 7
VUB’s 2017 Commercial Performance 11
Review of VUB’s Economic and Financial Position 13
Information on the Expected Economic and Financial Situation for 2018 14
Registered Share Capital and the Structure of VUB Shareholders 15
Subsidiaries of VUB 17
Statement on Compliance with the Corporate Governance Code for Slovakia 18
Selected Aspects of VUB Bank’s Corporate Responsibility 27
Basic indicators 41
Consolidated fi nancial statements 42
Separate fi nancial statements 154
Information on Securities issued by the Bank 255
List of VUB Retail Branches 258
List of VUB Corporate Branches 263
Organization Chart of VUB as at 31 December 2017 264


3
Dear Shareholders, Clients and Business Partners, Employees,
VUB had in 2017 a very good year. In the commercial area, the Group has grown loan volumes by nearly 12% and in terms of fi nancial results, VUB Group was able to increase its net profi t over a year ago, as only a handful of banks on the market were. Even when judged by independent outside observers, VUB’s superior performance clearly stands out. In particular, last year, VUB has regained a prestigious award of the Bank of the Year by local weekly Trend. On behalf of Supervisory Board, I would like to thank the management and employees for these excellent achievements.
To fully appreciate VUB’s ability to improve on its already outstanding profi tability, one must realize the change of fortunes in the Slovak operating environment that occurred in recent years, especially the squeeze in interest rate margins. Indeed, interest rate revenues of the sector are falling three years in row now even as loan volume has grown by 30% over the same time period. For the market, which still derives nearly 80% of net revenues from net interest income, this develop-ment represents a formidable challenge.
VUB has worked really hard on many fronts to face this chal-lenge. Growing business volumes and gaining critical mass more aggressively than competitors, while still keeping a very high attention to credit risks, was one. Improving quality and further strengthening effi ciency and effectiveness of its oper-ations model was another. And taking advantage of market opportunities in Treasury was yet another way to stave off the revenue pressure.
Going forward, though, there inevitably will have to come a comprehensive change in the banking business model to address the changed market fortunes. And VUB waits no time, working hard to consolidate its banking and nonbanking consumer lending operations (through the merger of CFH and
VUB Factoring) and prepare to implement a new, modern core banking system as it draws its new four-year strategy. Strategy that should help VUB over time to lessen the traditional dependence on interest income in favour of fee and commission-based income. Having gone through a similar transformation in recent past, Intesa Sanpaolo remains committed to help VUB in any respect.
Ezio SalvaiChairman of the Supervisory Board
Ad dress by the Chairman of the VUB Supervisory Board

4
Dear Shareholders, Clients and Business Partners,
the year 2017 has been very successful for VUB. I am particularly pleased to say that we delivered great commer-cial results and increased our share of the loan market. I am also pleased with the operational effi ciency and the quality of our loan portfolio. These developments enabled us to deliver the best possible fi nancial performance, offsetting to an extent the negative impact of decreasing margins. And last, but not least, I am very pleased that after the hard work of the past three years, our commercial and fi nancial results have improved to such an extent that in 2017 we regained the award of the Bank of the Year by local weekly Trend.
Before evaluating VUB’s achievements in detail, I believe it is instructive to review fi rst the developments in the external environment. Starting with the real economy, it remained positive for the banking industry. GDP grew over 3% and labor market continued to improve further, with unemployment rate declining to historic lows. Increased job security and consumer confi dence boosted demand for housing, which in turn led to increased demand for mortgages and other fi nancial products. Improved fi nancial position of households also manifested in further growth of bank deposits and other fi nancial assets. Corporates have also seen improvement of their economic and fi nancial situation, which led them to increase volumes of their loans and deposits as well.
The interest rate environment, though, continued to play against banking sector profi tability. To be sure, neither offi cial ECB rates nor bond yields were falling in 2017. Yet, the intense competition on the Slovak banking market has compressed margins yet further and brought rates on new mortgages, in particular, below the Eurozone levels. Coupled with repricing of existing loan portfolio, this development resulted in sizable loss of interest income for the sector, including VUB. Indeed, not even the massive, nearly 12% growth in total loans, which we were able to achieve, was suffi cient to offset the impact of
shrinking margins on interest revenues. Clearly though, without growth of volumes, the negative impact of falling margins on profi tability would have been even bigger. Hence, I am more than pleased that also in 2017 we were able to increase our market share of loans, to 20.4% in December, from 19.9% at the end of 2016.
I am particularly proud that we have succeeded to increase our share of the retail market, fending off the attacks from the competition both in the mortgage and consumer loan market. In production of new mort-gages, frankly, we could not sustain the volumes delivered in 2016 during the “tsunami” refi nancing campaign, which sometimes was a multiple of previous years and strained our colleagues in sales but also risk and back offi ce functions to limits. Still, we did well defending our portfolio and as of December 2017 held a market share in mortgage-type loans of 23.5%, compared to 22.8% in December 2016. In consumer loans, we held 19.9% share in December 2017, up from 19.6% a year ago, resp.
In the corporate market, we also have succeeded to increase our market share, to new all-time high of 18.7% from 18.3% gained in 2016. Importantly, we have increased our share despite our decision not to participate in some of the big corporate transactions on the market, particularly in the commercial real estate and project fi nance segment, which we did not deem attractive enough from the risk-reward perspective. Instead, we concentrated on growing primarily our relationship with small and medium-sized enterprises, to whom we grew loans by 7.9% compared to prior period. Growing relationship with small and medium sized enterprises also we were through our leasing and factoring subsidiaries, VUB Leasing and VUB Factoring, which continued to grow in key balance sheet and fi nancial indicators. Last year was particularly successful for VUB Factoring, which has reached the historic highest turnover of purchased receivables.
Address by the Chairman of the VUB Management Board

5
Address by the Chairman of the VUB Management Board
Turning to the deposit market, our results had been less satisfactory as we have seen our share of total primary deposits to slide a bit, to 17.6%, from 17.8% in December 2016. Besides higher volumes overall, we also should aspire to have more even distribution across business segments. This holds especially for the household deposit base, in which we held 14.7% share of the market. To be sure, we were able to increase it from 14.5% a year ago. Yet, compared to our share of the household loan market of 21.6%, we clearly need to focus more on retail deposits. This is important to fund our growth aspirations in the mortgage market and comply with regulatory-prescribed funding profi le in the future. In the latter respect, I am particularly pleased that our Treasury unit was able also in 2017 to successfully place sizable volume of mortgage bonds on the market. We issued bonds worth in total 750 million euro, up to 10-year maturity, mainly to foreign institutional investors. Proud also I am of our Treasury unit for identifying an extraordinary business opportunity on the Czech interest-rate market, which has delivered a positive trading result for the Bank that compensated for the extraordinary income from the sale of VISA shares in 2016.
Now, turning back to the deposit market, I strongly believe that focus on deposits and even more so on other personal fi nancial assets, such as asset management but also pension funds and life insurance should be our priority going forward. This relates not only to securing a healthy funding profi le and potentially a source of fee-based income from advisory services for the Bank but also fi ts with the changing lifestyle and demography of Slovak population. People in Slovakia namely get older, their needs will change, from securing their fi rst housing, or second, to what to do with savings as they build wealth. And I do not speak of a generation time, but rather the horizon of the next three to fi ve years, which, according to our analysis, may see volume of personal fi nancial assets of Slovak households grow by 50% from present levels.
In this respect, I am pleased that we already build a solid presence in the mutual funds and pension markets and offer our clients alternative ways to look after their savings. In asset management, we are active with the strong support from Eurizon Capital, the leading European asset management company of Intesa Sanpaolo, while in pension savings, we are active together with our joint venture partner Generali Slovensko. Both continued to offer superior value for clients also in 2017 and substantially increased volume of assets under their management. In particular, VUB AM, the asset management company, has accumulated total volume of mutual funds in excess of € 1.7 billion in 2017, which represents more than 10% growth compared to prior period. Its market share stands at around 21%, which places it on the second position on the Slovak fund market. VUB Generali, the pension company, has meanwhile accumulated total volume of funds under management in excess of € 1.3 billion in 2017, which represents nearly 13% growth compared to prior period. Its market share increased by 0.5 percentage point, to 17.2%, solidifying position of VUB Generali as the third largest player on this market. Importantly, the number of clients in our pension saving schemes increased by nearly 23 thousand, the most from among all players on the market.
As regards fi nancial results, on the consolidated basis, in 2017 VUB Group posted an operating income of € 547.4 million, down 1.5% from a year ago. On the costs front, our personnel expenses grew by 5.2%, yet our overall operating expenses decreased by 2.3% over a year ago, due to release of the provision for litigation in other operating expense. Our cost to income ratio thus declined further, by one percentage point over a year ago, to 44.2%, and remained thus well below the market average, which as of November 2017 stood at 54.8%. Our operating profi t before impairment was € 280.4 million, down 0.7% compared to prior period. Adjusted for lower impairments, provisions, and taxes than a year ago, the Group booked net profi t of € 175 million, up 11.6% compared to prior period.
Looking ahead, the operating environment will see signifi cant changes in 2018. Real economy, to be sure, should remain benign, with GDP growth even accelerating as big investment projects in automotive industry start to roll out. Household confi dence and fi nancial position also should continue to improve as the labor market tightens further. The space for banks to lend to households, however, will become constrained. House-hold indebtedness namely rose to such levels that boosting it any further is now deemed very risky by the regulator. The central bank thus aims to soon administer a real slowdown in household borrowing, either by further tightening of hitherto implemented limits on loan-to-value and debt-burden-ratios or possibly also by introducing an outright limits on total debt-to-income levels of individual clients. One leg of the recent growth of the Slovak banking sector, and indeed also VUB – mortgages and consumer loans – might thus start to limb in 2018.
In consumer loans, moreover, regulator has recently evened out the playing fi eld for the bank and nonbank markets. The non-banking business model has thus changed and many players left the market. It also was

6
Address by the Chairman of the VUB Management Board
necessary to review performance of our non-bank Consumer Finance Holding (CFH) and we decided to incorporate it from 2018 into the Bank (apart from car leasing, to be merged into VUB Leasing) to bring our strengths together and also to simplify our internal infrastructure and systems. Similar reasons have driven the decision of merging VUB Factoring into the Bank since 2018.
Interest-wise, the environment will remain challenging. Yields, to be sure, will no longer be declining as the ECB is gradually removing the monetary stimulus and the next move in offi cial rates will be up, not down. That is, however, still far away, with a rate hike not foreseen before mid-2019. In the meantime, we will have to cope with repricing pressure on our assets and also the gradual increase of our funding costs. In the fore-seeable future therefore we do not expect any relief in margin pressure.
The regulatory environment will meanwhile continue to tighten. Regulatory initiatives such as Markets in Financial Instruments Regulation, General Data Protection Regulation, and the Revised Payments Services Directive (PSD2) all enter into force in 2018. Especially PSD2 will present a big change and pose substantial economic challenges. Opening platforms and access to our customers’ accounts to third parties will fundamentally change the competition in the payments services, while increasing our IT costs due to new security requirements.
Against these market and regulatory pressure, we must reshape our strategy, and rely on the following prior-ities going forward: On the revenue front, we must not only grow in absolute terms but also improve our revenue composition to increase fee-based business. To improve customer experience, we will further focus on digitalization. We have recently invested a lot into mobile banking and will continue to do so, because we believe that extending digital services and leveraging on new technologies is the right way to face new banking future. On the cost front, the focus will remain on proper resource allocation and simplifi cation. The latter will include reduction in the Group perimeter with the mentioned mergers of CFH and VUB Factoring. A key project over the forthcoming years will also be replacement of the core banking system with a new one, industry-best.
Clearly, we must be ready for a tough and demanding year(s). Nonetheless, I fi rmly believe that the VUB team will continue to deliver. With this in mind, let me thank our employees for their commitment, hard work and great achievements of the past year. I would also like to thank VUB clients and business partners for the trust they hold in the Bank, and the shareholders for their support. I wish all of us the best in the year 2018.
Alexander ReschCEO and Chairman of the Management Board

7
Development of the External Environment
External environment
Slovak economy through 2017 continued to grow at a stable growth rate exceeding 3% in real terms. Growth was driven primarily by domestic demand. Especially vibrant was household consumption, which geared up to 4.0% growth, its fastest pace since pre-2008 boom. Investments also contributed positively to GDP growth, thanks mainly to residential boom in Bratislava which compensated for slow rollout of EU-funded projects in the public sector.
Robust consumption of households owes primarily to extraordinary progress on the labor market. Number of employed people in Slovakia increased more than 2% compared to prior period, to yet-another all-time high. Concurrent with rising jobs number, the unemployment rate continued to decline, below EU average, for the fi rst time ever. On the comprehensive survey measure, the jobless rate declined in 3Q to 8.0%, down 1.5 points over a year ago. On claimant measure with labor offi ces, the jobless rate by November even dropped below 6% – historic low rate.
Tightening labor market unsurprisingly has been exerting upward pressure on wages. By third quarter, nominal year-on-year average growth in the economy has exceeded 5%, which was the pace last seen in 2008. Rising job security and fast wage growth meanwhile lifted consumer confi dence to the highest level in a decade and boosted thus demand for fi nancial intermediation. Besides loans, also markets for deposits and other personal fi nancial assets benefi tted as the saving rate has continued to gradually recover and is now approaching 10% - level last seen in the millennium year.
For employers, including those in the fi nancial services, though, rising labor costs and lack of qualifi ed personnel has become an ever bigger headache. In response, some companies cut their production and investment plans while others began to import foreign labour – roughly one quarter of newly created jobs in the economy in 2017 were taken by foreign workers.
For the banking sector, nonetheless, the key challenge remained margin pressure. Rates on new mortgages in Slovakia continued in 2017 to further decline below Eurozone average as competitive battle continued to rage on. Declining also had been rates on consumer loans and pricing remained very tight in the corporate segment too. The result has been a decline in interest income of the sector by over 7% even as loan volume grew by 10%. Banks tried but could not fully compensate for the lost interest income by boosting fees and commission and further repricing of their liabilities.
VUB Management Board Report on the business activities of the Company
8
VUB Management Board Report on the business activities of the Company
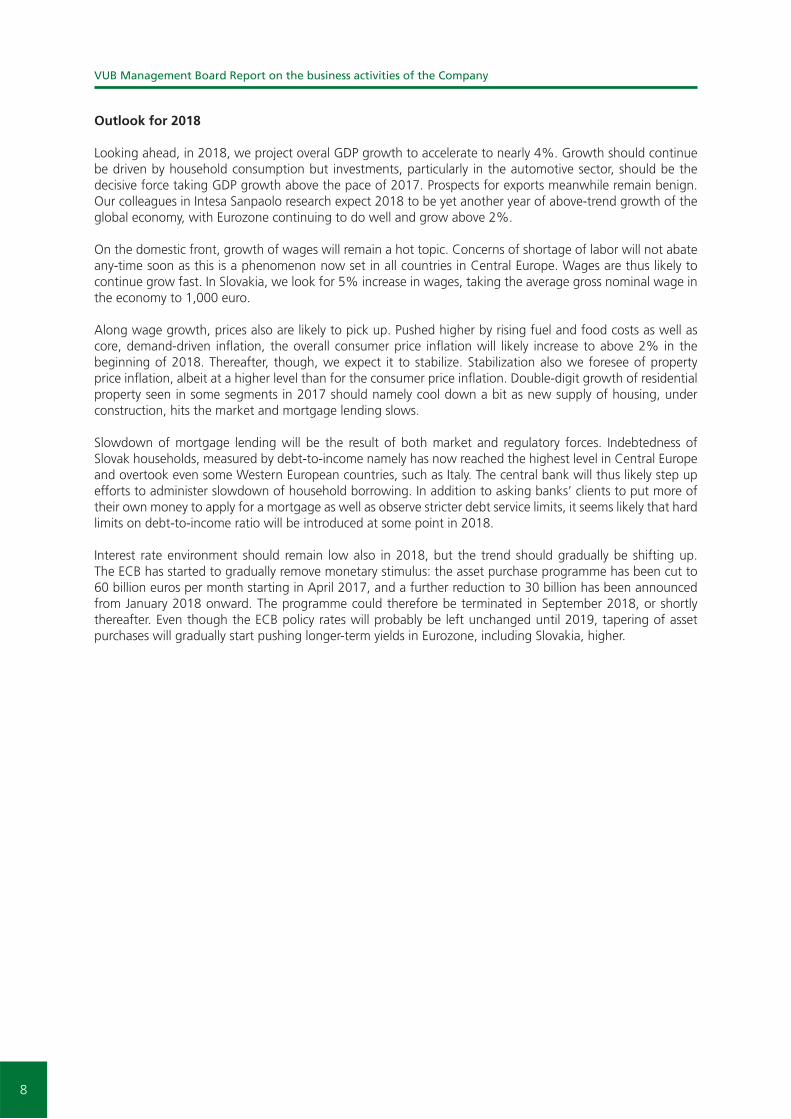
Outlook for 2018
Looking ahead, in 2018, we project overal GDP growth to accelerate to nearly 4%. Growth should continue be driven by household consumption but investments, particularly in the automotive sector, should be the decisive force taking GDP growth above the pace of 2017. Prospects for exports meanwhile remain benign. Our colleagues in Intesa Sanpaolo research expect 2018 to be yet another year of above-trend growth of the global economy, with Eurozone continuing to do well and grow above 2%.
On the domestic front, growth of wages will remain a hot topic. Concerns of shortage of labor will not abate any-time soon as this is a phenomenon now set in all countries in Central Europe. Wages are thus likely to continue grow fast. In Slovakia, we look for 5% increase in wages, taking the average gross nominal wage in the economy to 1,000 euro.
Along wage growth, prices also are likely to pick up. Pushed higher by rising fuel and food costs as well as core, demand-driven infl ation, the overall consumer price infl ation will likely increase to above 2% in the beginning of 2018. Thereafter, though, we expect it to stabilize. Stabilization also we foresee of property price infl ation, albeit at a higher level than for the consumer price infl ation. Double-digit growth of residential property seen in some segments in 2017 should namely cool down a bit as new supply of housing, under construction, hits the market and mortgage lending slows.
Slowdown of mortgage lending will be the result of both market and regulatory forces. Indebtedness of Slovak households, measured by debt-to-income namely has now reached the highest level in Central Europe and overtook even some Western European countries, such as Italy. The central bank will thus likely step up efforts to administer slowdown of household borrowing. In addition to asking banks’ clients to put more of their own money to apply for a mortgage as well as observe stricter debt service limits, it seems likely that hard limits on debt-to-income ratio will be introduced at some point in 2018.
Interest rate environment should remain low also in 2018, but the trend should gradually be shifting up. The ECB has started to gradually remove monetary stimulus: the asset purchase programme has been cut to 60 billion euros per month starting in April 2017, and a further reduction to 30 billion has been announced from January 2018 onward. The programme could therefore be terminated in September 2018, or shortly thereafter. Even though the ECB policy rates will probably be left unchanged until 2019, tapering of asset purchases will gradually start pushing longer-term yields in Eurozone, including Slovakia, higher.

9
VUB Management Board Report on the business activities of the Company
Source: Eurostat, VUB
Source: Bloomberg, VUBNote: For non-trading intervals carry over last value
Real GDP growth in y/y and q/q terms
3M Euribor and ECB’s refi rate (%)
2013 2014 2015 2016 2017
1.0
0.8
0.6
0.4
0.2
0.0
-0.2
-0.4
3M Euribor
ECB Refi Rate
1Q-13 1Q-14 1Q-15 1Q-16 1Q-17
5.0
4.5
4.0
3.5
3.0
2.5
2.0
1.5
1.0
0.5
0.0
1.2
1.0
0.8
0.6
0.4
0.2
0.0
q/q, SA, rhs
y/y, NSA

10
VUB Management Board Report on the business activities of the Company
Source: Macrobond, VUB
Employment: number of employees in thousands
2,600
2,550
2,500
2,450
2,400
2,350
2,300
2,250
2,200
2,150
2,100
1Q-0
5
1Q-0
6
1Q-0
7
1Q-0
8
1Q-0
9
1Q-1
0
1Q-1
1
1Q-1
2
1Q-1
3
1Q-1
4
1Q-1
5
1Q-1
6
1Q-1
7
Source: National Bank of Slovakia, VUB
Development of bank volumes (€ bn)
60.0
55.0
50.0
45.0
40.0
35.0
30.0
DepositsLoans
2013 2014 2015 2016 2017

11
VUB Management Board Report on the business activities of the Company
VUB’s 2017 Commercial Performance
As described on the previous pages, several factors infl uenced the banking environment in 2017. The overall macroeconomic growth rate was slightly above 3%, driven predominantly by the domestic demand. The household consumption for instance geared up to 4.0% growth, which is the fastest pace since pre-2008 boom. In terms of labor market, the unemployment rate continued to decline, below EU average, for the fi rst time ever. On the other hand, the key challenge remained the pressure on margins. Rates on new mortgages and consumer loans in Slovakia further continued to decline in 2017 as the competitive battle continued to rage on.
Thanks to our fl exible reactions to the new challenges, we have achieved a very satisfactory performance in the commercial area. In retail lending, we continued with signifi cant increase of market share (by 70 bps), driven mainly by the 20.1% growth of mortgages. In consumer loans, we have achieved almost 5% y/y increase; it is worth mentioning that the new regulations with respect to credit risk had a negative impact on the new production. In corporate lending, we succeeded to increase our market position from 18.3% in December 2016 to 18.7% in December 2017. On top of that, we increased our loan portfolio to SMEs by 7.9%. On the deposit front, we retained stable position in non-term deposits. The banking environment of historically lowest interest rates infl uences the decreased demand for term deposits in both VUB and whole market.
Deposits
The volume of clients’ deposits in VUB at the end of 2017 amounted to € 9.9 billion, 3.9% up against the previous year due to both retail and corporate deposits. On retail market, current accounts rose again in this year, while term deposits kept its deteriorating trend. Customers’ assets under management posted solid development compared to the previous year (growth by 9.2% over the year), yet below the market growth (14.4%). Market share in mutual funds thus weakened by 73 bps in 2017. The market share of total deposits received from retail clients incl. mutual funds amounted to 15.7%, which means stable position in comparison with December 2016 (15.7%). In corporate segment, VUB recorded a satisfactory year resulting into nearly 1% y/y growth of, corporate deposits. Electronic Banking
In 2017, VUB Bank continued to expand the functionalities and improve the quality of electronic banking. The tools to enhance paperless activity were in the main focus, mainly the Sign Pads with positive feedback from our clients and fully rolled-out. We have extended the possibilities of internet banking and also introduced possibility of opening accounts for non-clients via our web page (together with Nonstop banking activation and debit card application).
Our VUB mobile banking app received several awards and we reached almost 120 thousand active users in 2017 (70 thousand users in 2016). Thanks to this, the ratio of loans sold via alternative distribution channels has improved to almost 15% from total loans sold. In 2017 we have started cooperation with two new affi liate partners.
Bank Cards
During 2017, the main topic in card business has been the migration of American Express to Mastercard. The reason for migration was the cancellation of the contract from the side of American Express, due to changes in their business model. The fi nal decision was done at the end of 2016 and in 2017 we successfully migrated client’s cards from American Express to Mastercard with minimal impact on our customers. In the fi rst quarter we changed and upgraded Mastercard Standard and Mastercard World cards. We introduced new and better travel insurance and for MC World cards also LoungeKey service. During summer (second and third quarter) there were lot of campaigns on clients to support voluntary migrations. Clients were able to choose suitable time and also product for migration. In the last quarter we started the fi nal migration for the rest of the clients.
VUB successfully realized other activities as well: during summer we introduced new version of Visa Wave2Pay application with new design and also with new feature, i.e. the possibility to do money withdrawals from VUB ATMs, as well as improvements in effi ciency, with the introduction of E-statements and progressive abandonment of paper statements. Our cooperation with charity organization Dobrý Anjel continued also

12
VUB Management Board Report on the business activities of the Company
during 2017. VUB was sending 0.5% of monthly volumes done with Dobrý Anjel debit cards to charity Dobrý Anjel and this year it was again more than € 300,000 together for the whole year.
ATMs and EFT POS
VUB ranks 2nd (21%) in the Slovak market share also in 2017 with its 577 ATMs. The main focus during the last year was on ATMs with cash-in possibility. At the end of 2017 we had together 37 ATM with cash-in module, that means increase by 19 ATM during 2017.
During 2017 we also completed the reshaping of the POS portfolio that is 100% contactless now. We installed more than 1,700 new POS terminals from which more than 100 virtual terminals used at internet merchants (e-commerce terminals). In the fi eld of new products we introduced un-attended terminals that can be used at different kinds of vending machines (like parking, public transport ticket terminals …) or at self-service fuel stations.
Contact centre
In 2017, the Call Centre continued providing services to its clients, which resulted in 344 thousand served calls, 100 thousand processed e-mails. Our clients communicated with VUB Bank also through chat (5 thousand requests) and we have responded to more than one thousand Facebook messages via social networks in this year. We have also provided answers and advices via www.vubotvorene.sk. The existing portfolio of products that can be granted to clients via phone was expanded by insurance of personal belongings.
Loans
Individuals – Mortgage and Consumer Loans
In 2017, the substantial demand for mortgage loans did not exceed the 2016 market growth. Yet in VUB we recorded considerable increase above the market growth rate. Total mortgages of VUB (including ‘American mortgages’) grew by 20.1% over the year. With a market share 23.5% the Bank increased its already strong position on the mortgage loan market. More precisely, we have recorded the highest improvement of market position over the year among the peers.
Consumer loans continued to grow with satisfactory rate in spite of the new adjustments in approval process. Consumer loans growth thus reached the level 4.7% YoY in VUB. However, on a bank level, VUB posted better development than the market and our market share in consumer loans improved by 26 bps to 19.9%.
Corporate Financing
In 2017, VUB Group was outperformed by the rest of the market in corporate loans segment. While corpo-rate loans grew by 6.2% on the market, VUB increased by 8.1% on the bank level and 6.0% on Group level. However, loans to nonfi nancial corporations increased by 10.6% and VUB’s market share in these loans to went up to 16.3% over the year. Real estate fi nance fell by 7%, project fi nance loans decreased by 6%, while trade fi nance loans fell by 18%. VUB Leasing, VUB’s subsidiary, achieved considerable results on the leasing market with the growth of leasing assets by 2.1% last year.

13
VUB Management Board Report on the business activities of the Company
Review of VUB’s Economic and Financial Position
GDP growth over 3%, labor market improving further, unemployment rate declining to historic lows, increased job security and strong consumer confi dence were among the main factors behind the favorable development of Slovak banking sector in 2017. Improved fi nancial position of households also manifested in further growth of bank deposits and other fi nancial assets. Corporates have also seen improvement of their economic and fi nancial situation, which led them to increase volumes of their loans and deposits as well.
On the consolidated basis, VUB posted operating revenues of € 547.4 million. Compared to previous year bank fell by 1.5% as the increase of loan volumes only partially compensated the decrease of interest rates and thus interest revenues went down compared to previous year. Operating costs meanwhile decreased by 2.3% to the level € 267 million (incl. bank levy) at the end of 2017.
VUB Group achieved operating profi t of € 280.4 million and profi t adjusted by impairment losses of € 221.2 million. The Group kept its profi t before tax on satisfactory level € 223.1 million (up by 5.4%). Cost-income ratio of VUB Group (excl. bank levy) amounted to 44.2%, which was down by 96 basis points.
With regard to business development, VUB Group delivered substantial development with respect to loan portfolio, which grew by 11.9%, resulting into the increase of market share by 0.5%. Total assets of the whole VUB Group increased by 6.7% as well. Nevertheless this increase did not negatively affect our portfolio quality as NPL ratio went down by 0.7%. Moreover, VUB remained outperforming the market in terms of loan quality. Indeed, NPLs from banking operations on the bank-level in VUB at end-2017 amounted to a mere 3.3% of the total gross loan volume, compared to market’s 4.0%, respectively. Accounting in loans provided by VUB’s consumer fi nance and leasing arms, CHF and VUB Leasing, the Group’s non-performing loan ratio went down throughout the year to approximately 4.1%.
At the same time, the bank was able to increase its primary deposits by 3.9%, keeping sound liquidity position which is represented by the loan to deposit ratio of 98.4%.
To bolster stability of business growth onwards, capital of the group increased to one of the highest capital adequacy on the Slovak market with the ratio amounting to 18.24% high above the minimum requirements set by the central bank. This gives us a solid base for continued business growth.
Consumer Finance Holding (CFH) increased its loans by 9.7%. VUB Leasing, VUB’s subsidiary, continued to achieve good performance on the leasing market with the growth of leased assets by 2.2%.

14
VUB Management Board Report on the business activities of the Company
Information on the Expected Economic and Financial Situation for 2018
As described on previous pages, during the last year, the real economy remained positive for the banking industry. In 2017 GDP grew over 3% and labor market continued to improve further, with unemployment rate declining to historic lows. In 2018 we are expecting slightly stronger growth of the real economy, with marginally higher yield of key indicators. On the other hand, interest rate environment will continue to play against banking sector profi tability. Even though, neither offi cial ECB rates nor bond yields are expected to fall in 2018 and also the intense competition on the Slovak banking market will force rates at their minimums.
Therefore VUB will continue its path in reducing the dependency from “interest income-based” business and improve fee-based business, towards the levels of western European countries, through innovation and intro-ducing new products which will fulfi l the new needs of our clients. After the merger of CFH with VUB Bank, we are also going to focus on leveraging on synergy potential with CFH as the non-banking market leader and VUB Group.
With the award for best mobile banking in 2017, we received further confi rmation that our direction to boost digital channels is right and we shall continue to improve the existing ones and introduce new solutions for our clients. For instance, we will expand the usage of Sign Pad more and more in branches for all kinds of loans and deposit products as well. Our aim is to eliminate most, if not all, paper in the processes. Moreover, we will apply all PSD2 activities in digital channels.
In line with continuing to improve customer experience and satisfaction we shall, on retail front, focus on customer acquisition and activation of customers (active C/A through transactions), increase product pene-tration and bring some new services adding value to the customer and the bank. We want to achieve this by, as mentioned above, improving retail service model (leaner and simpler contact with client such as paper-less interaction and digital signature), favoring self-servicing through digital channels (internet banking and mobile banking) or contact center (virtual branch). The key role of branches should focus on high added value services, which are either complex or include a great deal of advising.
Fundamentals are showing signifi cant growth of fi nancial assets held by Slovak households in upcoming years and saving rate is expected to increase signifi cantly. Therefore, VUB is developing wealth management concept in line with our strategy to “teach” people save and invest their resources as Slovakia has the least ratio of saving/income from EU countries.
Within corporate banking, VUB is bound to keep market position as leader and focus on additional services within regional global transaction banking and treasury. On top of focusing on operational effi ciency, increasing productivity in the distribution network and allocating sources where it creates value, we shall focus also on relevant opportunities in project and real estate fi nance on the market given an adequate risk return. We are going to cooperate closer with our mother company Intesa Sanpaolo on acquisition of new customers.
VUB is going to continue in laying signifi cant emphasis on risk management, keep high quality of the loan portfolio in 2018 and hold strong liquidity position. Moreover VUB Group will pay great attention to proactive capital management in order to support targeted growth. In 2017, our ability to identify and react on the needs of customer, was awarded by magazine Trend as Bank of the Year. This showed us, that VUB is modern and fl exible institution able to promptly react on new challenges in the environment. All of us know, that 2018 will bring new and maybe even greater challenges and VUB will face them with even higher dedication.

15
VUB Management Board Report on the business activities of the Company
Registered Share Capital and the Structure of VUB Shareholders
Registered Share Capital of VÚB, a.s.
The registered share capital of VÚB, a.s. amounts to € 430,819,063.81 and was created by the contribution of the founder designated in the deed of foundation as of the day of its establishment.
The registered share capital is divided into 4,078,108 book-entered registered shares, having the nominal value of € 33.20 each and 89 book-entered registered shares, having the nominal value of € 3,319,391.89 each.
Shareholders’ rights
The rights and responsibilities of shareholders are set out in the legal regulations and the Articles of Associ-ation of the Company. The right of a shareholder to participate in the management of VÚB, a.s., the right to a share of the profi ts and the right to a share of the liquidation balance, in the event of the winding up of VÚB, a.s. with liquidation, are attached to a registered share. Each shareholder is entitled to attend the General Meeting, to vote, to request information and seek explanations and submit proposals. The number of votes allocated to each shareholder is determined by the ratio of the nominal value of its share to the amount of registered capital. A shareholder may exercise the shareholder rights attached to book-entered shares at the General Meeting if the shareholder is entitled to exercise these rights as of the decisive date specifi ed in the invitation to the General Meeting. The exercise of a shareholder’s voting rights may only be restricted or suspended by the law. The shares are freely transferable by registration of transfer in line with relevant regu-lation. The General Meeting of the Company as the main decision making body of the Company is entitled to decide on share issues or on the acquisition of the Company’s own shares.
Structure of VUB Shareholders
Information regarding VUB shareholders is published quarterly, within 30 days of the end of the relevant quarter. Below is the status as of 31 December 2017.
Structure by Owner TypeShares
(ths. €) *Stake
(%)
Intesa Sanpaolo Holding International S.A. – majority owner 418,034 97.03
Other legal entities 5,440 1.26
Individuals 7,345 1.71
Total Registered Share Capital of VÚB, a.s. 430,819 100.00
Structure by NationalityShares
(ths. €) *Stake
(%)
Intesa Sanpaolo Holding International S.A. – majority owner 418,034 97.03
Domestic shareholders 8,975 2.08
Other foreign shareholders 3,810 0.89
Total Registered Share Capital of VÚB, a.s. 430,819 100.00
* Shares (€) mean a value of shares of VÚB, a.s. expressed in the nominal value of euro multiplied by the number of shares held.
There were 28,686 shareholders as at 31 December 2017. Foreign VUB shareholders come from the following countries with the following stake in the bank’s registered capital (in %): Luxembourg (97.032%), Germany (0.733%), Czech Republic (0.118%), Austria (0.028%), United Kingdom (0.004%), U.S.A., Canada, Romania, Poland and Cyprus.

16
VUB Management Board Report on the business activities of the Company
A qualifi ed participation in the company’s registered capital is held by the majority shareholder Intesa Sanpaolo Holding International S.A. Luxemburg, with its Registered Offi ce in Luxembourg L-1724, 35 Boulevard du Prince Henri that holds a 97.03% stake in the registered capital.
Further, the company during the accounting year 2017 held in its assets the shares of the parent company (Art. 22, sec. 3 of the Act no. 431/2002 Coll. on Accounting as amended), Intesa Sanpaolo S.p.A. (ISP), registered offi ce Piazza San Carlo 156, Turin, Italy, ISIN IT0000072618, book-entered registered ordinary shares, with a nominal value of € 0.52 each, in a total number of 961,205 shares. This represents 0.116% of the nominal value of the Bank’s registered capital. These shares have been acquired by the Bank in order to adopt and implement ISP Group Remuneration Policies in line with the Capital Directive ‘CRD III’ (i.e. Directive 2010/76/EU amending the Capital Requirements Directives). In 2017, the Bank transferred 75,656 shares in accordance with ISP Group Remuneration Policies.

17
VUB Management Board Report on the business activities of the Company
Subsidiaries of VUB
Consumer Finance Holding, a.s.*
Registered offi ce: Hlavné nám. 12, 060 01 KežmarokShareholders: VÚB, a.s.VUB’s stake in registered capital: 100%Core business: Non-banking loansTel: +421 52 787 1760Fax: +421 52 786 1764General Manager: Ing. Jaroslav Kiska
VÚB Leasing, a.s.Registered offi ce: Mlynské nivy 1, 820 05 BratislavaShareholders: VÚB, a.s.VUB’s stake in registered capital: 100% Core business: Financial and operating leasingTel: +421 2 4855 3647 Fax: +421 2 5542 3176General Manager: Ing. Branislav Kováčik
VÚB Factoring, a.s.**
Registered offi ce: Mlynské nivy 1, 829 90 BratislavaShareholders: VÚB, a.s.VUB’s stake in registered capital: 100%Core business: Factoring and forfeitingTel: +421 2 5055 2784Fax: +421 2 5055 2012General Manager: Ing. Štefan Homola
* On 11 December 2017, VUB Bank as the sole shareholder of Consumer Finance Holding, a. s. and VÚB Leasing, a. s. decided to merge Consumer Finance Holding, a. s. without liquidation and to divide it into VUB, a. s. and VÚB Leasing, a. s. as successor companies as at 1 January 2018.
** On 11 December 2017, VUB Bank the sole shareholder of VÚB Factoring, a. s. decided to merge VÚB Factoring, a. s. without liquidation into the successor company VUB, a. s. as at 1 January 2018.

18
VUB Management Board Report on the business activities of the Company
Statement on Compliance with the Corporate Governance Code for Slovakia
A. Company Organization
The structure of VÚB, a.s. bodies:
a) the General Meeting;b) the Supervisory Board;c) the Management Board.
General Meeting
The General Meeting is the main decision-making body of VÚB, a.s. The General Meeting has the power to decide on issues that are in line with the mandatory provisions of legal regulations and VUB Articles of Asso-ciation.
The Ordinary General Meeting of the company was held on 24 March 2017. The shareholders at this meeting approved the 2016 Annual Report of VÚB, a.s., the 2016 Statutory Separate Financial Statements and the 2016 Consolidated Financial Statements, both statements were prepared in accordance with IFRS as amended by the EU, as submitted by the Management Board of the Bank. The General Meeting also decided on distributing the profi t earned in 2016 in the amount of € 265,171,063.99 to shareholders in dividends amounting to € 72,020,143.19 and to the retained earnings in the amount of € 193,150,920.80. Further, the General Meeting decided on the 2016 dividend to be paid to shareholders in the amount of € 5.55 per share with a nominal value of € 33.20.
The General Meeting approved the amendments to the Articles of Association of VÚB, a.s. as proposed and approved the external auditor for the bank for 2017.
VUB Supervisory Board and Management Board in general
1. Supervisory Board members are elected by the General Meeting. The VUB Management Board is elected by the Supervisory Board.
2. All relevant information is available to all members of the Management Board and Supervisory Board in time. In the course of the fi nancial year 2017, the VUB Management Board held 25 meetings and adopted 11 decisions on a per rollam basis. The VUB Supervisory Board held 4 meetings and adopted 7 decisions on a per rollam basis during the 2017 fi nancial year. Documents with detailed information are distributed suffi ciently in advance – in the case of the Management Board no less than 3 working days, in the case of the Supervisory Board no less than 10 days prior to the meeting, ensuring the ability of members of the Supervisory and Management Boards to decide on individual matters competently.
3. None of the Supervisory Board members is a member of the VUB Management Board nor holds any other top managerial position in the Bank. With the exception of members of the Supervisory Board elected by VUB employees, a Supervisory Board member may not be an employee of VUB.
Supervisory Board
Members of the Supervisory Board in 2017
Ezio Salvai Chairman of the Supervisory Board
Ignacio Jaquotot Vice Chairman of the Supervisory Board
Luca Finazzi Member of the Supervisory Board
Paolo Sarcinelli Member of the Supervisory Board
Christian Schaack Member of the Supervisory Board
Andrej Straka Member of the Supervisory Board, employee representative
Róbert Szabo Member of the Supervisory Board, employee representative (since 23 January 2017)
Ján Gallo Member of the Supervisory Board, employee representative (until 22 January 2017)

19
VUB Management Board Report on the business activities of the Company
Upon the Management Board’s proposal, the Supervisory Board:
a) reviews the annual report, the ordinary, extraordinary, individual and consolidated accounts and recom-mends the annual report, the ordinary, extraordinary, individual and consolidated accounts to the General Meeting for approval;
b) approves the proposed distribution of current and/or past profi ts;c) approves rules for the creation and use of other funds created by VÚB, a.s.;d) approves the draft plan for the settlement of unsettled loss and/or unsettled losses from past years;e) approves proposed changes to the internal audit and internal control system;f) approves the annual audit plan and the annual report on the results of the activities of the Internal Audit
and Control Unit;g) reviews and approves the following matters before their submission to the General Meeting by the
Management Board: i. proposals for changes to the Articles of Association; andii. proposals for an increase or decrease in the registered share capital of VÚB, a.s. and/or for the issue of
preference or convertible bonds, according to the relevant provisions of the Commercial Code;h) elects members of VÚB, a.s., Management Board and approves agreements on the performance of func-
tion with the members of the Management Board;i) approves any proposal for an increase or decrease in the registered capital of VÚB, a.s.;j) approves any substantial change in the nature of the business of VÚB, a.s. or the way in which the business
of VÚB, a.s. is carried out, if it is not already approved in the printed forecasts for the business and fi nancial conditions in any relevant year;
k) approves remuneration policies for rewarding the managers who are directly under the responsibility of the Management Board and the Supervisory Board;
l) decides on other issues falling within the authority of the Supervisory Board under the cogent provisions of legal regulations and the Articles of Association.
The Supervisory Board is authorized to review the following issues, in particular:
a) a Management Board proposal regarding the termination of trading in Company securities on the stock exchange, and a decision on whether the Company should cease to operate as a public joint-stock company;
b) information from the Management Board on the major objectives related to the Company business management for the upcoming period, and expected development in VUB assets, liabilities and revenues;
c) the report by the Management Board on the business activities and assets of the Company, with related projected developments.
Committees of the Supervisory Board
Audit Committee
The Audit Committee was comprised of fi ve members (including the Chairman) as of 31 December 2017. The Audit Committee held four meetings during 2017 fi nancial year. The issues discussed at the meetings mainly related to: preparation of the financial statements and observation of the special regulations; efficiency of internal control and risk management system at the Bank; compliance with regulatory requirements; the audit of the separate financial statements and the audit of the consolidated financial statements. Further, the Audit Committee examines and monitors the independence of the auditor, especially services provided by the auditor according to a special regulation, recommends the appointment of an auditor for carrying out the audit of the Bank, and sets a date for an auditor to submit a statutory declaration about his independence. The Audit Committee regularly invited an external auditor to attend its meetings.
The Internal Audit and Control Department, the authorities and duties of which are defined by the Supervisory Board, excluding those defined by law, performs the control function in the Bank. The Head of the Internal Audit and Control Department may be appointed to/removed from the position upon a recommendation and prior consent issued by the Supervisory Board. Furthermore, the Supervisory Board also defines the remuneration and compensation scheme for this position. In 2017, the Chairman of the Audit Committee and the Head of the Internal Audit and Control Department were invited to attend the meetings of the Supervisory Board.

20
VUB Management Board Report on the business activities of the Company
Members of the Audit Committee in 2017:
Francesco Ciccarelli Chairman of the Audit Committee Christian Schaack Member of the Audit CommitteeLuca Finazzi Member of the Audit CommitteeDario Bertoncini Member of the Audit Committee Antonio Furesi Member of the Audit Committee
Remuneration Committee
The Remuneration Committee was founded in VUB in July 2012. It has 3 members who are members of the Supervisory Board. The committee meets at least once a year. Its main responsibilities are to independently assess the compensation principles of the selected positions (according to the Act on Banks) and the effects of remuneration on the management of risk, capital and liquidity; be responsible for preparation of deci-sions concerning the compensation of the selected positions, including decisions affecting the risks and the management of risks in the Bank, which are to be made by the Management Board of VUB; take into account long-term interests of shareholders, investors and other stakeholders when preparing its decisions and super-vise remuneration of the selected positions.
Risk Committee
The Risk Committee was established by a decision of the Supervisory Board of VUB in September 2015. It has 3 members who are members of the Supervisory Board. The committee meets at least twice a year. The Risk Committee is part of risk management and has supervisory, advisory and supportive functions primarily for the monitoring of the risk management system and strategy and its implementation.
Management Board
Management Board Members in 2017
Alexander Resch Chairman of the Management Board and Chief Executive Offi cer Roberto Vercelli Member of the Management Board and Deputy Chief Executive Offi cer (since 1 November 2017)Antonio Bergalio Member of the Management Board and Chief Financial Offi cer Andrej Viceník Member of the Management Board and Head of Corporate and SME Division (since 1 December 2017)Peter Magala Member of the Management Board and Head of Risk Management Division Peter Novák Member of the Management Board and Chief Operating Offi cer Martin Techman Member of the Management Board and Head of Retail Division Elena Kohútiková Member of the Management Board and Deputy Chief Executive Offi cer (until 31 October 2017)Jozef Kausich Member of the Management Board and Head of Corporate and SME Division (until 30 November 2017)
Alexander Resch – Chairman of the Management Board and CEO
Alexander Resch has worked for Intesa Sanpaolo Group for his entire career. He became the Chief Executive Offi cer and Chairman of the Management Board of VÚB, a.s., on 1 October 2013 returning from Albania where he managed Intesa Sanpaolo Bank Albania. Before leaving for Albania, he held the position of Management Board Member and Chief Risk Offi cer of VUB. Alexander Resch fi rst arrived in Slovakia in 2004 to coordinate the acquisition of the TatraCredit Group by VÚB Bank, which was subsequently transformed into Consumer Finance Holding, VÚB’s sales fi nance subsidiary. He studied economics at Università Cattolica del Sacro Cuore in Milan and also holds a double Execu-tive MBA degree from the University of Minnesota - Carlson School of Management and the Vienna University of Economics and Busi-ness. Alexander Resch is the President of the Slovak Banking Asso-ciation and the Italian-Slovak Chamber of Commerce.

21
VUB Management Board Report on the business activities of the Company
Roberto Vercelli – Member of the Management Board and Deputy CEO
Roberto Vercelli has been a member of the Management Board and Deputy CEO of VÚB, a.s. since 1 November 2017. He is responsible primarily for regulatory and support departments of the bank. Prior to accepting the DCEO function at VÚB, a.s. for the last year and a half he was managing in the International Subsid-iary Banks Division of Intesa Sanpaolo the credit program for international subsidiaries and was responsible for monitoring projects in the area of risks, credit and accounting within the Group. He has been working for Intesa Sanpaolo since 1981. He started his professional career in Turin and in the past years he held several managing positions, among the other he headed the internal audit of Group’s subsidiaries and acted as the Chief Executive Offi cer of Alex Bank in Egypt. Furthermore he managed a special coordination offi ce in Pravex Bank in Ukraine, where he was also a permanent invitee to the discus-
sions of the Management Board and a member of several internal committees. He graduated from the G.A. Giobert Institute in Asti, Italy – High School Diploma in Accounting Studies.
Antonio Bergalio – Member of the Management Board and Chief Financial Offi cer
Antonio Bergalio has been a member of the Management Board and Chief Financial Offi cer since 1 October 2014. He is in charge of controlling, accounting, management of assets and liabilities, real estate, procurement and internal services. Before joining VUB, Antonio Bergalio was a member of the Management Board and CFO of the Ukrainian Pravex Bank, a member of the Intesa Sanpaolo Group. He was in charge of reporting, planning and controlling, treasury, investment banking and procurement. Before that he worked as a manager at several banks and consultancy fi rms focusing on fi nance. Antonio Bergalio studied Economics at the University of Genoa. He was also a member of the Committee of Italian Entrepreneurs in Ukraine from 2012 to 2014.
Andrej Viceník– Member of the Management Board and Head of the Corporate and SME Division
Andrej Viceník became a member of the Management Board and Head of the Corporate and SME Division and Chairman of the Supervisory Board of VÚB Leasing, a. s. in December 2017. He joined VÚB bank in 2006. Before his appointment he had been the Head of Corporate Customer Department until 2010 and later the Head of SME Department until November 2017. He worked in Executive positions in Česká poisťovňa, Zürich poisťovňa and HVB Bank Slovakia. Andrej Viceník is a graduate of Faculty of Business Management of University of Economics in Bratislava and holds an Executive MBA degree from the Webster University as well.

22
VUB Management Board Report on the business activities of the Company
Peter Magala – Member of the Management Board and Head of the Risk Management Division
Peter Magala has been a member of the VUB Management Board and Executive Director of the Risk Management Division since 1 March 2012. Before his appointment to his current position he was the Head of VUB Internal Audit and Control Department responsible for the internal auditing of the entire VUB Group. Having graduated from the University of Economics in Bratislava, Faculty of National Economy, he started his career with Deloitte, Bratislava. Peter Magala gained further banking experience at Citibank, Bratislava and in Tatrabanka/Raiffeisen International mostly participating in an international IT project in Slovenia. He holds an internationally recognized professional qualifi cation in risk management – Financial Risk Manager (FRM), and is a Fellow Member of the Association of Chartered Certifi ed Accountants (FCCA).
Peter Novák – Member of the Management Board and Chief Operating Offi cer
Peter Novák became a member of the VUB Management Board and Chief Operating Offi cer on 1 October 2014. He joined VUB after leaving Raiffeisen Bank International AG in Austria where he was Managing Director of International Operations and IT since 2011 and was responsible for directing Operations and IT for 15 banks in Central and Eastern Europe – plus regional offi ces in Beijing, Hong Kong, Singapore, New York and London. Prior to Raiffeisen, he held senior management positions in both banking and telecommunications in Slovakia and abroad. Peter Novák graduated from the Technical University in Košice.
Martin Techman - Member of the Management Board and Head of the Retail Division
Martin Techman became Member of the VUB Management Board and Head of the Retail Division in March 2015. At VUB, he is in charge of the management of the retail branch network and client relationship, bank products for individuals and small business, payment cards and private banking. He came to VUB from Česká sporiteľňa, where he was the director of business development and later managed the branch network in the Czech Republic. Martin Techman started his career in the fi eld of banking and fi nancial services at the company Multiservis, which was acquired by GE Capital. From 2004 to 2005 he was the head of development and administration of products at VUB. Martin Techman is a Nottingham Trent University graduate, with an MBA degree in Business Administration (Executive MBA).

23
VUB Management Board Report on the business activities of the Company
Elena Kohútiková – Member of the Management Board and Deputy CEO
Elena Kohútiková acted in the position of Member of the VUB Management Board and Deputy Chief Executive Offi cer since 1 March 2009 until 31 October 2017.
Jozef Kausich – Member of the Management Board and Executive Director of the Corporate and SME Division
Jozef Kausich acted in the position of Member of the VUB Management Board and Executive Director of the Corporate and SME Division since 15 April 2005 until 30 November 2017.
Competencies of the Management Board
The Management Board is authorized to manage the activities of VÚB, a. s. and to take decisions on any matters related to VUB which, under legal regulations or the Articles of Association have not been reserved for the authority of other VUB bodies. The Management Board is primarily responsible for the following matters:
a) exercising the executive management of VÚB, a.s. and employer rights;b) implementing decisions taken by the General Meeting and the Supervisory Board;c) ensuring the accuracy of the mandatory bookkeeping and other records, trade books and other documen-
tation of VÚB, a. s.;d) after prior approval by and upon a proposal by the Supervisory Board, submitting the following matters to
the General Meeting for approval:– amendments to the Articles of Association of the bank;– proposals for increasing / decreasing registered capital and bond issues;– proposals for issuing shares or redemption of shares;– ordinary, extraordinary, individual or consolidated fi nancial statements;– proposals for distribution of current or retained profi ts and/or proposals for settlement of outstanding
losses from the current and/or previous years; and– the annual report;– a proposal for approval or withdrawal of the auditor of VÚB, a.s. for the relevant accounting period;
e) approval and regular investigation of Bank Remuneration Policies.

24
VUB Management Board Report on the business activities of the Company
The conditions for the performance of the function of a Management Board Member are defi ned by an Agreement on the performance of the function with the member of the Management Board in line with the relevant provisions of the Commercial Code, Act No. 483/2001 Coll. on Banks, adopted Remuneration Policies and other relevant legislation.
Committees of the Management Board
The Credit CommitteeThe Credit Committee is the highest permanent decision-making committee of the Bank regarding performing counterparties, whose main responsibility consists of adopting credit decisions in line with the issued strategic guidelines and credit policies, while acting within the credit prerogatives of the Bank and in compliance with the applicable laws and Group regulations.
The Credit Risk Governance CommitteeThe Credit Risk Governance Committee (CRGC) is a permanent decision-making and advisory committee, whose mission is to ensure a qualifi ed and coordinated management of credit risk within the exercise of credit prerogatives of the Bank and in compliance with the applicable laws, ISP Group regulations and Parent Company strategic decisions. The Committee’s main responsibility is to defi ne and update credit risk strategic guidelines and credit management policies based on the constant credit portfolio monitoring.
The Assets and Liabilities CommitteeThe Asset and Liabilities Committee (ALCO) is a permanent decision-making and consultative committee, focused on fi nancial risks governance, on the active value management issues, on the strategic and operative management of assets and liabilities and on fi nancial products governance. The main objective of ALCO is to protect the Bank’s equity and its allocation, to harmonize the assets and liabilities of the Bank taking into consideration pricing structures and maturity profi les, in compliance with Parent Company guidelines, Bank’s internal regulations, laws, rules and regulations set by the competent Authorities.
The Operational Risk CommitteeThe Operational Risk Committee (ORC) supports the Management Board of the Bank by reviewing the Bank´s overall operational risk profi le. Operational risk is defi ned as the risk of suffering losses due to inadequacy or failures of processes, human resources and internal systems, or as a result of external events. Operational risk includes legal risk that is the risk of losses deriving from breach of laws or regulations, contractual/out of-con-tract responsibilities or other disputes; strategic and reputational risks are not included. ORC coordinates the implementation of strategies and guidelines regarding operational risk, as well as methodologies, tools and procedures of the measurement and the control of risk, in cooperation with the parent company.
Internal Controls Coordination CommitteeThe aim of the Internal Controls Coordination Committee is to strengthen the coordination and the cooper-ation among the various Bank’s control functions, facilitating the integration of risk management processes.
The Project Portfolio CommitteeThe Project Portfolio Committee (PPC) provides a platform that links both Business and IT strategy with operational management of business priorities with respect to IT resource planning and capacities. PPC works as an urgent escalation and decision-making body in case of issues and confl icts in business priorities, solving confl icts of allocation of resources to the business requirements.
The New Product CommitteeThe aim of the New Product Committee (NPC) is to discuss and approve proposed new products related to the fi nancial and capital markets, corporate banking and retail banking. NPC takes into consideration submitted documentation according to valid rules defi ned in the Market Risk Charter and New Product Implementation in the Corporate & SME Division and in the Retail Division. Both policies defi ne the New Product Policy in detail.
The Problem Asset CommitteeThe Problem Asset Committee is the highest permanent decision-making committee of the Bank regarding risky and non-performing counterparties, whose main responsibility consists in taking the necessary measures in order to prevent and mitigate credit losses connected with risky and deteriorated assets, while acting within the credit prerogatives of the Bank and in compliance with the applicable laws and ISP Group regulations.

25
VUB Management Board Report on the business activities of the Company
The Crisis CommitteeThe Crisis Committee is management and coordination body that issues orders for key bank areas with the aim to prevent, mitigate and remove the impact of extraordinary events or crisis situations on business activity and the goodwill of the Bank. Crisis Committee has a right to be informed about BIA results, creation, imple-mentation and testing of Business Continuity Plan for system and critical processes.
B. Relations between the Company and its Shareholders
The Bank observes the provisions of the Commercial Code and other relevant valid legislation applicable to the protection of shareholders’ rights, as well as the regulation on the timely provision of all relevant information on the company and provisions on convening and conducting its General Meetings.
The Company applies the principle of shareholders’ rights, equal access to information for all shareholders and other relevant principles pursuant to the Corporate Governance Code for Slovakia.
C. The Company’s Approach to Shareholders
The Bank’s corporate governance principles ensure, facilitate and protect the exercising of shareholders’ rights. The Company duly and timely performs all its duties and obligations towards shareholders in compliance with relevant legislation and the Corporate Governance Code for Slovakia. The Company enables shareholders to duly and transparently exercise their rights in compliance with relevant valid legislation.

26
VUB Management Board Report on the business activities of the Company
D. Disclosure of Information and Transparency
1. The Bank applies strict rules in the area of insider dealing, and continually maintains and updates a list of insiders.
2. Information about corporate governance is published on the VUB web site www.vub.sk in the section “About VÚB”. Information for shareholders is available on the VUB web site www.vub.sk in the “Information for Shareholders” section.
3. Members of the Management Board and Supervisory Board do not have any personal interest in the business activities of the Bank. The Bank strictly observes the provisions of the Banking Act No. 483/2001 Coll. (hereinafter the ‘Banking Act’) as amended, applicable to the provision of deals to the Bank’s related parties. Under the Banking Act, the closing of such a deal requires the unanimous consent of all the Management Board members based on a written analysis of the deal concerned; a person with a personal interest in the given deal is excluded from a decision-making role. The Bank does not carry out with its related parties such deals, which owing to their nature, purpose or risk, would not be performed with other clients.
4. The Bank abides by both the Corporate Governance Code for Slovakia and the rules of the Bratislava Stock Exchange governing disclosure of all substantial information. The fact that the company observes the mentioned regulations ensures that all the shareholders and potential shareholders have access to informa-tion on the financial standing, performance, ownership and management of the company, enabling them to take competent investment decisions. The Corporate Governance Code for Slovakia is available on the Central European Corporate Governance Association – CECGA web site www.cecga.org. The Bratislava Stock Exchange Rules are available on the Bratislava Stock Exchange web site www.bsse.sk in the section “BSSE Regulations”.
5. The Company actively supports a constructive dialogue with institutional investors and promptly informs all shareholders at General Meetings and notices via its webpage www.vub.sk in Slovak and English. Thus, it enables both foreign and local investors to participate actively in the meetings.
6. The Bank applies changes arising from Act No. 566/2001 Coll. on Securities and Investment Services, as amended (hereinafter the ‘Securities Act’), at a European level, and the MiFID directive (Markets in Finan-cial Instruments Directive), and undertakes activities directed at investor protection and strengthening client trust in the provision of investment services. The main objective of the MiFID directive is to enhance fi nancial consumer protection in the fi eld of investment services. The essence of the MiFID directive lies in the new categorization of clients according to their knowledge and experience in the fi eld of investment in order to provide clients with an adequate level of protection, and in the bank’s obligation to act in the best interests of the client in carrying out their orders in relation to their fi nancial instruments (best execution), in higher requirements as regards market transparency, and organization of the Bank as a securities trader, to be ensured by internal control systems and the prevention of conflict of interests.
7. The Bank continuously informs clients on concluded deals related to quoted shares and bonds on its webpage www.vub.sk.
8. The Bank continues to provide payment services according to the payment law, PSD (Payment Services Directive). The aim of this law is to provide high level clear information about payment services for consumers to allow them to make well-informed choices and be able to shop around within the EU. In the interests of transparency, the harmonized requirements are laid down in order to ensure the necessary and sufficient information to payment service users with regard to the payment service contract and payment transactions.

27
Introduction
VUB Bank has issued a separate Corporate Responsibility Report since 2006, i.e. thus far it has issued it eleven times. In this report, it presented its approach to corporate responsibility, strategy, principles and values, meth-odology, relationship with individual partners (shareholders, employees, clients, the environment, and the community), individual projects and achievements, as well as subsequent ways of measuring and reporting.Currently, Intesa Sanpaolo, the parent company of VUB Bank, processes and issues such a report on the basis of Europe-wide changes in reporting and mainly under the new European Directive 2014/95/EU on Non-fi -nancial and Diversity Information and will do so in accordance with international law for all of its subsidiaries and foreign affi liates.
VUB Bank is proud of its activities in corporate social responsibility and corporate responsibility, which it has been building and developing for 11 years, and therefore it wants to inform Slovak shareholders of them at least in the following way: information on selected aspects of its corporate responsibility for 2017. We want to introduce our shareholders to activities and projects that helped us achieve our excellent business results in 2017, highlighting the fact that it is also thanks to our employees and our approach to society, the community and the environment. Because we are convinced that doing business responsibly means achieving success in ways that respect ethical values, hold people in high esteem, enhance the community, and protect the envi-ronment.
Business Ethics
VUB Bank follows such rules that are not imposed on us by any law or supervised by any authority. However, we consider such rules to be indispensable.The main pillars of our corporate responsibility are represented by ethics and transparency, which also our shareholders expect of us. VUB Bank has its own Code of Ethics, which helps implement ethics into our busi-ness activities through the specifi c steps taken. The Code of Ethics is a set of principles that have a strategic meaning for us and regulate the behaviour of our employees. Everybody, without any exception, is required to become familiarised with it. Observance of the Code of Ethics is continuously monitored and its breach penalised. This Code of Ethics is followed up by a corporate anti-corruption programme with specifi c system and organisational measures, including an internal audit control system.
VUB Code of Ethics
The VUB Code of Ethics, one of the pillars of our corporate culture, derives from the Code of Ethics of Intesa Sanpaolo. It is a binding document, which represents a framework of ethical and moral values. It defi nes the principles of conduct in relation to all stakeholders of VUB Bank. As a management tool and a part of a wider vision of the Group’s social and environmental responsibility, the Code of Ethics attributes the highest impor-tance to all stakeholder relations. An electronic version of the document is published at https://www.vub.sk/sk/spolocenska-zodpovednost/. Failure to observe the Code of Ethics can be penalised and its breaches may be reported to [email protected].
Internal Code of Conduct
The Code of Ethics also sets the basic principles of conduct for the company’s representatives, employees and external agents, who are obliged to execute their functions responsibly, honestly, fairly and professionally, to promote the Bank and Group’s interests as well as to take into consideration the interests of clients and shareholders. Therefore, the execution of decision-making authorities and each business activity alike must refl ect all values and principles contained in the Code. Employees are informed of the principles by means of information systems and internal communication, and their observance is monitored by an adequate system of internal control.VUB bank has diversity policy implementation in progress and plans to introduce it in 2018.
Selected Aspects of VUB Bank’s Corporate Responsibility

28
Selected Aspects of VUB Bank’s Corporate Responsibility
Query Resolution Policy (the so-called Whistle Blower Policy)
If an employee of VUB Bank in performing his/her work duties identifi es a breach of internal and/or legal regulations, based on this policy, he/she has the right and possibility of sharing his/her inquiry via [email protected] and [email protected]. The regulation also enables each Bank’s supplier or potential supplier in the procurement process or in connection with it to send an inquiry, including an anonymous inquiry, for the purpose of achieving rectifi cation. The regulation governs the procedure and method of attending to employee and client inquiries and to the inquiries of suppliers and/or potential suppliers.
Gift Acceptance Policy
This internal policy derives from the Code of Ethics of VUB Bank and it forms its annex. It governs the principles and limitations with regard to the behaviour of the Bank’s representatives and employees in accepting gifts. It also sets the limits and rules for behaviour in gift acceptance, the handling of gifts and it introduces a Register of Accepted Gifts.
Non-Armament Policy
VUB Bank took over this policy from the parent bank Intesa Sanpaolo. In accordance with the values and principles of the Code of Ethics, it defi nes a ban on fi nancing and carrying out transactions related to the import and export of arms and armament systems. Group members can assist clients in transactions concerning existing intergovernmental agreements or other transactions for national armies, police or other armed forces of the state, which can be considered compatible with the spirit of an “unarmed bank – a bank non-supportive of arms” based on an authorisation by the competent unit of the Intesa Sanpaolo Group.
Policy for the Management of Relations with Political Parties and Politically Engaged Parties, Clients Operating in the Armament Industry and Risk Industries
The policy mainly stipulates the management of relations with political parties and politically engaged parties in the interest of preserving the impartiality and independence of the bank (the aim is to prevent potential reputational risk; companies belonging to the VUB Group must approach the starting of business relations with political parties and politically engaged persons with the utmost prudence), the management of relations with clients operating in the armament industry (the aim is to prevent VUB Bank and its subsidiaries from participating in the fi nancing of activities and transactions concerning the manufacturing of arms equipment as well as the trading of this equipment for military purposes), and the management of relations with clients operating in risky business fi elds (e.g. bars, night clubs, casinos, exchange offi ces and pawnshops, debt collecting agencies, brokerage companies, betting offi ces).
Anti-money Laundering and Anti-terrorism
In the fi eld of anti-money laundering (AML) and anti-terrorist fi nancing, we are progressing in line with Slovak and also European legislation, ensuring the protection of our clients as well as of the Bank itself. We do not want to support these negative phenomena, not even indirectly by enabling fi nancial fl ows through our products, services or in any way connected with the Bank. Therefore, we follow strictly set internal rules to prevent money-laundering and terrorist fi nancing in the form of detecting unusual business transactions. For this purpose, the Bank has developed and implemented its Programme for Anti-money Laundering and Anti-terrorist Financing Activities.
Confl ict of Interest Policy
VUB Bank has committed itself to avoiding a confl ict between the private interests of its employees and the interests of the Bank. The employees are liable to take all required measures in order to avoid a confl ict of interest. In case a confl ict of interest occurs, employees shall solve such a confl ict to the benefi t of the Bank. The employees may never misuse their connection with the Bank to promote their personal interests or harm the Bank’s reputation by their actions nor can they misuse their position or confi dential information to provide preferential treatment towards a job applicant or a person aiming to start a business relationship with the Bank. VUB Bank also applies and adheres to special measures designed to prevent confl icts of interests in the area of investment services.

29
Selected Aspects of VUB Bank’s Corporate Responsibility
Discrimination Ban
On all levels and in relation to all of its stakeholders, VUB Bank observes the non-discrimination principles that are fi rmly enshrined in our Code of Ethics and system of values. One of VUB’s values is that “We do not discriminate – we commit that we shall exclude from our actions any discrimination and shall respect differences based on sex, age, race, faith, political opinion, participation in unions, language skills or impairment”.
Corruption and Fraudulent Actions
The Bank has a specialised unit dedicated to the disclosure of fraud and corruption, which is a part of the Risk Management Division. It closely cooperates primarily with the Internal Audit and Control Department and the Compliance Department. All bank employees are informed of internal ethical standards and the zero tolerance principle, while having access to the basic information on the steps that are necessary to be taken in the case of any suspicion of corruption or fraud. The Bank does not conceal the detected corruption and fraud cases from its employees, but on the contrary, it has decided to inform and educate its managers in order to constantly improve their work and eliminate shortcomings and errors in this area in the future. Within initial trainings, all new hires in the retail network are given a special presentation on fraud and corruption risks, including the typical signs of risky behaviour. The main objective of this training activity is to increase the prevention and/or minimise the occurrence of these cases.
Measures for Reducing Corruption and Fraud
1. Internal Control System – the Bank has various control mechanisms incorporated into its processes in order to reduce the risk of corruption and fraud to the minimum level possible. The Bank clearly sets the necessity of a control mechanism for each process where a risk of corruption and fraud is imminent (e.g. verifi cation of decisions, 4-eyes control, access rights management, etc.). The internal control system consists of three levels: statutory, executive and control. 2. Internal Audit – the Bank has an Internal Audit and Control Unit, which is an independent supervising body (unit directly reporting to the Bank’s Supervisory Board, not to the Management Board). One of its main roles is to verify the functioning of the internal control system, compliance with external and internal legislation including the Bank’s Code of Ethics, verifi cation of internal control failures and suspicions of internal fraud.
Zero Tolerance
VUB Bank clearly proclaims its absolute zero tolerance principle regarding corruption and fraud. All bank employees are informed about the following principles: 1. The Bank shall not accept any form of fraudulent or corrupt action, therefore each case will be thoroughly examined and relevant measures drawn from it. 2. Any participation in fraud or attempted fraud shall lead to dismissal and potential criminal charges. 3. Necessary investigations shall be performed irrespective of the relationship of the given person to this organisation; his/her work position or employment duration.
Community
VUB Bank feels responsible for the society where it operates and which it impacts with its business activities. The main channels of assistance include the corporate foundation – VUB Foundation fi nanced by the tax assignment of VUB Bank, the employees themselves and their volunteering activities.
Charity
Good Angel
We have supported this humanitarian project by means of charity debit cards for 11 years already. Half a per cent of all the payments made with a Good Angel Charity Debit Card goes to the account of the non-profi t organisation Dobrý anjel (Good Angel), which helps oncologic patients and families with seriously ill children. This money is not donated by the cardholder, but by VUB Bank on his/her behalf. In 2017, the number of issued Good Angel Charity Debit Cards increased to 51,025, which is 5,195 cards more than in the previous

30
Selected Aspects of VUB Bank’s Corporate Responsibility
year, and the contribution from VUB Bank (0.5% of the payments made by client cards) amounted to EUR 328,140.20, which is a year-on-year increase of EUR 21,383.29. In addition, the organisation Good Angel was awarded an extra grant of EUR 64,000.00 by the VUB Foundation before Christmas. Other forms of assistance include Internet banking – the Bank’s clients have the option to set up the rounding of their payments up to 1.00 Euro in favour of Good Angel, or to set up a standing order to send payments to Good Angel’s account.
Cooperation with Sheltered Workshops
VUB Bank realises the signifi cance of inclusion of disabled people, and therefore it purchases products and services from sheltered workshops that employ these people. In 2017, we purchased goods and services from them in the total amount of EUR 39,385.00. This amount represented, for example, catering for some events organised by VUB Bank, the purchase of promotional gifts designed for clients, employees or their family members, or printing services (having the Bank’s logo on representative merchandise). The money invested is perceived as a value added for the Bank, its clients and employees alike. It presents an opportunity to interconnect corporate responsibility and the Bank’s everyday business. In December, VUB Bank’s Head Offi ce building hosted the traditional Christmas Market, to which employees could also bring their children. Together, they enjoyed a festive atmosphere and the products sold there by 8 sheltered workshops from around Slovakia. The products were made and sold by handicapped people. The employees had the opportunity to buy gifts for their relatives and simultaneously support a good cause.
Blood Drive
It has already become a tradition that each year employees donate blood during the mobile blood collection “VUB Blood Drive” organised as part of a long-term cooperation with the National Transfusion Service. In 2017, 108 donors participated in collections, having donated 54 litres of the life-saving liquid. Before Christmas, part of the blood was specially collected and given to young patients of the Children’s Heart Centre, who were awaiting surgical intervention. Clothing Drive
A charitable Spring and Autumn Collection of Clothes and Other Necessary Items was organised under the auspices of the Pontis Foundation. Together we collected more than two tonnes of quality clothes; the collection involved not only employees from Bratislava, but also from Banská Bystrica, where the Bank has its Customer Centre. The proceeds from the collection were donated to the civic associations Home for Everyone (Domov pre každého) and Home of Dawning (Dom svitania).
Art
Within the fi eld of art, we have been focused over the long-term on the protection of cultural heritage and support for contemporary art with an emphasis on the fi ne arts. Last year, VUB Bank by means of the VUB Foundation enabled the saving of several monuments and continued in the restoration of the Calvary of Banská Štiavnica. In 2017, VUB Bank showed its interest in the arts by supporting the Cirkul´art 2016, which is an international exhibition of creative and genre-rich artistic productions with a focus on contemporary theatre and modern circus from various parts of the world, the White Night festival which brought a portion of contemporary art to Bratislava and Košice in the form of visually interesting art installations, digital art, mapping, performance, concerts and dance, and the Grape festival which brings world-wide stars from indie, pop/rock and the electronic scene to Slovakia every year.
Education
Cooperation with Schools and Support for Education
One of VUB Bank’s priorities is education in the main area of our business – economy and fi nance. Our projects offer talented students the possibility of putting forward their original ideas and demonstrating their talent. Their goal is to improve the quality of research and university education in the fi eld of fi nance and develop economic science and research. VUB Bank has long been cooperating with secondary schools and
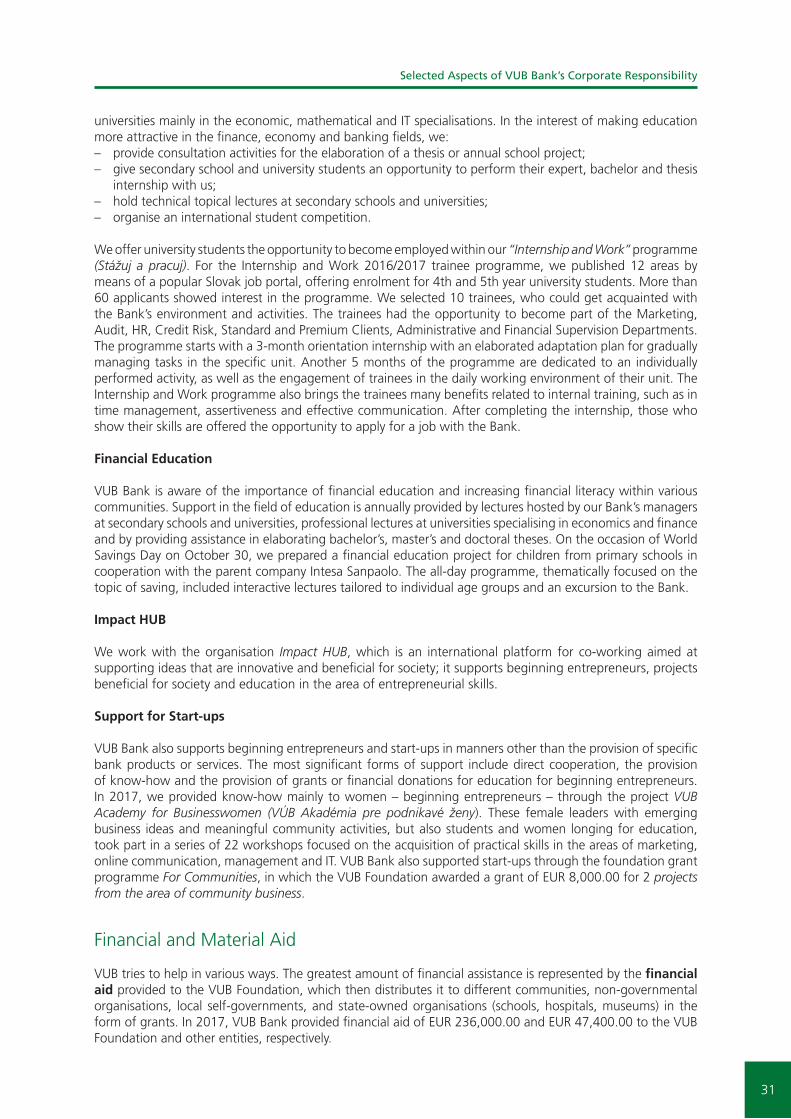
31
Selected Aspects of VUB Bank’s Corporate Responsibility
universities mainly in the economic, mathematical and IT specialisations. In the interest of making education more attractive in the fi nance, economy and banking fi elds, we: – provide consultation activities for the elaboration of a thesis or annual school project;– give secondary school and university students an opportunity to perform their expert, bachelor and thesis
internship with us;– hold technical topical lectures at secondary schools and universities; – organise an international student competition.
We offer university students the opportunity to become employed within our “Internship and Work” programme (Stážuj a pracuj). For the Internship and Work 2016/2017 trainee programme, we published 12 areas by means of a popular Slovak job portal, offering enrolment for 4th and 5th year university students. More than 60 applicants showed interest in the programme. We selected 10 trainees, who could get acquainted with the Bank’s environment and activities. The trainees had the opportunity to become part of the Marketing, Audit, HR, Credit Risk, Standard and Premium Clients, Administrative and Financial Supervision Departments. The programme starts with a 3-month orientation internship with an elaborated adaptation plan for gradually managing tasks in the specifi c unit. Another 5 months of the programme are dedicated to an individually performed activity, as well as the engagement of trainees in the daily working environment of their unit. The Internship and Work programme also brings the trainees many benefi ts related to internal training, such as in time management, assertiveness and effective communication. After completing the internship, those who show their skills are offered the opportunity to apply for a job with the Bank.
Financial Education
VUB Bank is aware of the importance of fi nancial education and increasing fi nancial literacy within various communities. Support in the fi eld of education is annually provided by lectures hosted by our Bank’s managers at secondary schools and universities, professional lectures at universities specialising in economics and fi nance and by providing assistance in elaborating bachelor’s, master’s and doctoral theses. On the occasion of World Savings Day on October 30, we prepared a fi nancial education project for children from primary schools in cooperation with the parent company Intesa Sanpaolo. The all-day programme, thematically focused on the topic of saving, included interactive lectures tailored to individual age groups and an excursion to the Bank.
Impact HUB
We work with the organisation Impact HUB, which is an international platform for co-working aimed at supporting ideas that are innovative and benefi cial for society; it supports beginning entrepreneurs, projects benefi cial for society and education in the area of entrepreneurial skills.
Support for Start-ups
VUB Bank also supports beginning entrepreneurs and start-ups in manners other than the provision of specifi c bank products or services. The most signifi cant forms of support include direct cooperation, the provision of know-how and the provision of grants or fi nancial donations for education for beginning entrepreneurs. In 2017, we provided know-how mainly to women – beginning entrepreneurs – through the project VUB Academy for Businesswomen (VÚB Akadémia pre podnikavé ženy). These female leaders with emerging business ideas and meaningful community activities, but also students and women longing for education, took part in a series of 22 workshops focused on the acquisition of practical skills in the areas of marketing, online communication, management and IT. VUB Bank also supported start-ups through the foundation grant programme For Communities, in which the VUB Foundation awarded a grant of EUR 8,000.00 for 2 projects from the area of community business.
Financial and Material Aid
VUB tries to help in various ways. The greatest amount of fi nancial assistance is represented by the fi nancial aid provided to the VUB Foundation, which then distributes it to different communities, non-governmental organisations, local self-governments, and state-owned organisations (schools, hospitals, museums) in the form of grants. In 2017, VUB Bank provided fi nancial aid of EUR 236,000.00 and EUR 47,400.00 to the VUB Foundation and other entities, respectively.

32
Selected Aspects of VUB Bank’s Corporate Responsibility
VUB Bank also strives to support organisations non-fi nancially. Within this kind of help, it sells off mainly discarded desktop computers at a symbolic 3 cents per unit to organisations that submit a request. In 2017, 60 computers with accessories, including licensed software, were donated.In 2017, due to the modernisation of branches and offi ce premises, VUB Bank helped many non-profi t organ-isations and schools by donating offi ce furniture.
Engaging Employees in Community Life
Employee Grants
In cooperation with the VUB Foundation, VUB Bank supports the engagement of employees into activities benefi cial for the communities in which they work and live. It appreciates their willingness and effort to help by means of employee programmes, which are very popular among employees. During its 11-year history, more than 1,500 colleagues have joined in projects and 385 projects have been supported. In 2017, the employee grant programme Help Your Community (Pomôžte svojej komunite) fi nancially supported 27 organisations with an amount of EUR 29,980.00. The fi nancial support was provided to organisations in which VUB Group employees are volunteering: non-governmental non-profi t organisations, schools or local self-governments. Projects in the area of charity, education and leisure time activities for children and youth were supported.
Volunteering
In 2017, employees participated in traditional volunteering services at the Calvary of Banská Štiavnica and in activities within the Our Town (Naše mesto) project, in which they helped a new community partner of the Bank and VUB Foundation – the creative and cultural centre Cvernovka.
VUB Foundation
The VUB Foundation is an independent legal entity; however, it executes some of its activities and projects in close managerial and fi nancial cooperation with VUB Bank, therefore we also publish them in this report. All activities of the VUB Foundation in 2017 are presented comprehensibly and in detail on www.nadaciavub.sk and in its annual report.
The VUB Foundation has carried out its activities in the fi eld of philanthropy since 2003. It is fi nanced by the assignment of income tax from the VUB Group (in 2017, it obtained EUR 48,220.08 from the Bank’s subsidi-aries and from the Bank itself EUR 943,074.28) and by fi nancial donations from VUB Bank (EUR 236,000.00). Moreover, VUB Bank provides its foundation with personnel, material and administrative support. In 2017, the VUB Foundation contributed to several community projects in the amount of EUR 1,020,206.70, whereof the majority of funds went to support for art and cultural heritage (50.04%) and to the area of charity (13.57%). The area of education received 9.33% of the funds; the area of community was allocated 13.38% of the funds.
The VUB Foundation focuses on the following areas:
– education – For Education Foundation Programme;
– art and cultural heritage – For Art Foundation Programme;
– charity – For Hope Foundation Programme;
– active communities – For Community Foundation Programme.
For Education Foundation Programme
The Guest Professor grant programme enables universities with economic specialisations to invite guest experts from abroad for a semester. Besides the pedagogical engagement of signifi cant international experts at Slovak universities, the programme brings students the opportunity to work with a foreign professor on scientifi c papers according to the methodology implemented by foreign universities. It also motivates students in economics, doctoral graduates and pedagogues to actively engage in the fi eld of economic science. During the winter semester of the 2017/2018 academic year, the University of Economy in Bratislava in Slovakia hosted Professor Edward M. Bergman, PhD., who gave students an insight into the area of regional develop-

33
Selected Aspects of VUB Bank’s Corporate Responsibility
ment. The 2016/2017 summer semester saw Professor John Gilbert visit the University of Economy in Brati-slava, where he modelled the Slovak economy with students.
In the interest of supporting and developing economic science and research in Slovakia, especially focusing on the education and training of young economists and increasing their publishing activities, every year the VUB Foundation announces a competition for all scientifi c papers in the area of economic sciences called Economicus. The competition is connected with an award for the best-published scientifi c paper in the fi eld of economy and fi nance published in renowned international magazines and a fi nancial reward of 10,000 Euros. In 2017, the award for 2016 was given to Štefan Lyócsa and Peter Molnár for their work “Volatility Forecasting of Strategically Linked Commodity ETFs: Gold - Silver”. The winner for 2017 will be announced in spring 2018.
For Art Foundation Programme
The activities of the VUB Foundation focusing on cultural heritage and the fi ne arts derive from the tradition of enhancing the country’s artistic and historical heritage, which is also characteristic of the Italian owner of VUB Bank, the banking group Intesa Sanpaolo.
Preservation of Cultural Heritage
Besides restoration, our objective is also to raise awareness for the treasures of our country. In 2017, within the Treasures of My Heart competition, the restoration of works by Master Paul of Levoča was fi nancially supported. Moreover, since 2008 VUB Bank and the VUB Foundation have been supporting the restoration of the Banská Štiavnica Calvary, one of the most precious monuments in Slovakia. This UNESCO protected national monument has been in a dilapidated condition for a long period of time, and in 2007 it was put on the list of 100 world’s most endangered monuments. In 2017, the VUB Foundation supported its restoration with an amount of 200,000 Euros.
Support for Contemporary Fine Arts
Inspired by the example of its parent bank, VUB Bank also engages itself as a supporter of art. In cooperation with the VUB Foundation, each year it organises an artistic competition entitled Painting – the VUB Founda-tion’s Award to Young Artists for an Artwork. The winners, besides the recognition of an expert international jury, receive prize money for the further development of their talent. Each year, the competition is connected with an exhibition of the fi nalists, through which the foundation tries to introduce young Slovak art to the public. In 2017, within the 12th annual competition, the exhibition of the competition’s fi nalists and winners was held in the Nedbalka Gallery. The admission was free thanks to the VUB Foundation. The exhibition of the competition’s fi nalists was also incorporated into the White Night festival. Talents from the painting competi-tion are presented in the virtual gallery at www.malbaroka.sk.
For Hope Foundation Programme
Within this programme, the VUB Foundation engages mainly in the area of classic charity and healthcare. It helps disadvantaged individuals and groups to equalise their chances in life. It supports the development of sheltered workplaces, sheltered housing, fi nances the therapies for the physically and mentally disabled and helps foster families.
For Community Foundation Programme
The tremendous interest of people in the environment they live in confi rmed once again that community projects needed more support. In order to execute these projects, the participation of activists and volun-teers who are willing to dedicate their time, experience and expertise, know-how and efforts for the good of others is inevitable. In 2017, the VUB Foundation again announced the programme titled 80,000 Euros for communities, where we live.

34
Selected Aspects of VUB Bank’s Corporate Responsibility
Employees
We realise that our success is based on the expertise of our employees and the quality of services provided to our clients, therefore we consider the creation of interesting work and a stimulating working environment a key role in the development of human capital. In relation to employees, we follow the principles of the Code of Ethics of Intesa Sanpaolo Group and have committed ourselves to excluding any discrimination from our actions and respecting differences based on sex, age, race, faith, political opinion, participation in unions, language skills or impairment. We appreciate the value, benefi ts and professionalism of each individual.
Employee Engagement Survey
At VUB bank, we take the opinions of our employees seriously. Employee surveys ranked among the important activities to which the Bank devoted itself at the level of the Board of Directors in 2017.
Employee satisfaction and engagement are periodically examined in the form of employee surveys. The employees of VUB Group take part in a Group-wide employee survey (Climate Survey), which already since 2009 Intesa Sanpaolo Group has been conducting in all foreign subsidiary banks at regular two-year intervals. However, it provides only a general view of the bank. VUB Bank needed to get a better idea about its current situation, about what should be improved in each department. Therefore, we conducted an in-depth survey in 2016.
The Employee Engagement Survey revealed areas perceived by employees as strong, such as communication of clear goals by immediate superiors, but also those needed to be further worked on. The identifi ed areas formed the basis for drafting an action plan, in which we detailed the sub-areas and activities. The action plans were compiled bottom-up and the key areas included:
– compensation and recognition; – favourable infrastructure; – cooperation and communication among teams.
In order to verify the effectiveness and accuracy of the action plan, another Employee Survey was carried out in October 2017, which mapped progress in the respective areas. The aggregate result of this survey was presented to the Bank’s Board of Directors and, on the basis of recommendations and conclusions, the management took measures that led to the re-establishment of some action steps. The results showed a shift in some mapped areas, especially at the level of individual departments. The results were subsequently distrib-uted to the directors in charge as well as line managers; the overall shift was presented by the CEO at the annual meeting of all bank managers. In December 2017, 500 employees of the Bank, mainly from the retail business network and the network of corporate business centres, were involved in the Group-wide survey for the purposes of drawing up the Busi-ness Plan for 2018-2021. The opinions and recommendations of the Group’s employees served as a source of inspiration for drawing up the Group Business Plan.
Climate Survey
In 2017, we implemented several action measures agreed after the climate survey had been conducted in 2016. They focused on the areas of remuneration, support for informal communication among departments and the improvement of internal premises for employees (kitchenettes, meeting rooms). Subsequently, at the end of the year, the climate survey was repeated, confi rming the need to continue in the identifi ed areas of the action plan in the next year as well.
Recruitment
In recruiting and hiring new employees, we follow the rules based on the assessment of individual knowledge, skills and personal prerequisites relevant to the vacant position being staffed. We pay due care to adhering to the principles of impartiality and to avoid favouritism, misuse or discrimination. Job applicants interested in working with us can refer to our Internet page in the “Career” section, which provides an overview of the current vacancies. In 2017, we hired 481 new employees and 397 temporary workers.

35
Selected Aspects of VUB Bank’s Corporate Responsibility
The VUB employee base itself is one of the most important sources in staffi ng vacant positions. Open or newly created positions present an opportunity not only for external candidates, but they are also a challenge for internal employees in their further career growth. Managerial positions in the retail branch network were staffed mainly by internal candidates who are being prepared for the role of a manager within the Managerial Bench programme. It is a development programme aimed at the identifi cation, development and preparation of future managers of the retail business network from among the employees and managers of small branches. A total of 20 retail colleagues were enrolled in this programme. We would like to continue with the Managerial Bench even more in the coming year.
As a matter of tradition, also in 2017 we continued the Find Your Colleague programme. This activity is aimed at engaging all of our employees in searching for and recommending candidates for vacancies. For all proposed candidates, we always assess their suitability for the given position. Only the best of the best make it through the standard recruitment process. After six months and subsequently also after the candidate’s full year in the position, the recommending employee is paid out a motivational reward.
For new employees, each month we organise the so-called Welcome Day, apart from the CEO’s initial welcome, which is very motivational. Its aim is to give a basic overview of the Bank – information on the history of the Bank and the Intesa Sanpaolo Group, its market position, retail and corporate banking business, portfolio of products and services it provides, company structure, but also on employee rights, obligations and benefi ts. Retail and corporate business network employees receive an obligatory training on Anti-money Laundering and Anti-terrorism issues. They are also trained on another obligatory topic – Fraud Prevention.
Retention and Motivational Programme
In 2017, we continued nominating Bank employees for the Key Employees programme with the aim of keeping the turnover of this target category at a desired level. A total of 355 employees, accounting for ca. 8% of the Bank’s employees, including managers, were nominated into the programme in individual categories: talents, key employees and successors. These colleagues were offered several development programmes aimed at professional and personal development.
This programme also includes the development programme Managerial Bench, which prepares future managers from among employees. In June 2016, we ran the second year of the Managerial Bench. At the end of year, we evaluated the success rate of this programme at 60%, i.e. 60% of all participants achieved career growth in the managerial line during or after the completion of the development programme.
Training and Development
VUB Bank creates the conditions for the continuous and systematic improvement of its employees’ qualifi ca-tions, supporting their training in the areas crucial from the perspective of the Bank’s needs and their personal development. Specifi c training requirements are addressed according to individual needs in collaboration with external training organisations in the Slovak Republic and abroad mainly in the form of internships or participation in selected training activities. On one hand, the training activities are aimed at developing the knowledge and skills necessary for the performance of the employees’ jobs, but on the other hand, many employees perceive such activities as important motivators.
In 2017, we used a new training management information system titled VUB Academy (VÚB Akadémia). This new system, the so-called VUB Academy Education Application, is built on modern technology and allows for the transparent and easy planning and organisation of training and development programmes. It also provides opportunities for e-learning, webinars and other online forms of training.In 2017, we provided an average of 6.7 training days per 1 VUB Bank employee in the form of both classroom learning and e-learning.
Career Development
We provide all our employees with the opportunity to express their individuality in the best way possible, which leads to a higher creativity at work. We support innovative ideas that help us move forward. In VUB Bank, we guarantee equal opportunities regarding jobs and development tools within the professional development and growth covered by the Performance and Development Management System. All of our employees have

36
Selected Aspects of VUB Bank’s Corporate Responsibility
a chance to develop their careers and grow within the company. The point of this development path is to ensure that each employee would receive targeted support. The development path starts with an adaptation orientation, which is later followed by trainings specifi ed according to the type of position, knowledge and skills required to accomplish the work tasks.
The evaluation process is an important part of the Performance and Development Management System. Last year, we continued with the GPS (Global Performance System) evaluation system, which is common for all subsidiaries of the Intesa Sanpaolo Group. Its main task is not only to evaluate the employee’s targets, but also to plan his/her key tasks and targets supporting the Bank’s strategy for the upcoming period. Each year, all employees are evaluated by their immediate superiors subject to their work position and classifi cation. Within the whole process, an important role is played by the employee himself/herself, who declares his/her ambitions and ideas regarding his/her future career. The superior, based on the employee’s performance, motivation and potential, coordinates his/her further development and growth.
Benefi ts
Irrespective of their job classifi cation, VUB Bank provides all of its employees with a wide range of benefi ts (i.e. fi nancial and non-fi nancial benefi ts). VUB Bank has been fully fi nancing the food allowance and continuing to provide fi nancial assistance to employees facing complex life situations for many years. Retail network employees who are in daily contact with the clients receive a clothing allowance. A high amount of funds spent on employee benefi ts represent the contributions to supplementary pension savings, and the ratio of contributions made by the employees and employer is 1:1.
Employees can also use some banking products under more favourable conditions, e.g. free-of-charge bank account maintenance, favourable interest rates on term and savings accounts, consumer or mortgage loans at favourable interest rates or discount rates on insurance. The benefi ts also include a commuting allowance. Moreover, each year we focus on supporting the families of our employees, which is proven, for example, by the allowance given for a child’s birth, popular gifts on the occasion of the International Children’s Day or an allowance for children’s summer camp. Also, in 2017 we continued with the strategy of employees’ health care and balance between their work and private life. We provide a contribution for preventive screenings, a paid leave day before a wedding, leave for the parents of fi rst graders on their child’s fi rst school day, for fresh fathers a day off after the birth of their child or a day off on the occasion of a jubilee. We inform our employees on the current offer of benefi ts primarily via the Intranet and also other communication channels.
VUB Bank tries to maintain the balance between the work and personal life of its employees. By means of several measures, it accommodates its employees in order to achieve the best harmonisation of these two “lives” possible. The major measures include fl exible working hours (optional start between 7.00 a.m. – 9.00 a.m. and end between 3.00 p.m. – 7.30 p.m.) and four days off annually for intensifi ed healthcare provided by the Bank beyond the statutory entitlement for holidays. Women from the 4th month of preg-nancy and single employees caring for a child up to the age of 15 (in case of disabled children up to the age of 26) have the possibility of taking annually additional two days off. Days off beyond the legal framework are very popular among employees. In 2017, our employees used 12,001 days off determined for healthcare. Paid leave on a working day before their wedding helped 75 colleagues prepare for their big day. The opportunity to have a rest and celebrate one’s jubilee with a day off on the occasion of a 50th and 60th birthday was used by 101 people. On the fi rst day of compulsory school attendance, 135 employees accompanied their fi rst-year pupils using a day off for accompanying a child to his/her fi rst school day. 51 dads found a day off for fathers useful during the fi rst weeks after their child’s birth.
Internal Communication and Dialogue
Attentive listening and dialogue are also important in relation to employees. In the Bank, we understand that if we expect our employees to deliver the best possible performance, we must regularly inform them of what is happening, why and where the company is heading and what is the place of each of them in this fulfi lment. At the same time, we give them an opportunity to voice their own opinions and ideas and also engage them in the decision-making processes. Internal communication is based on seven values common for the whole Intesa Sanpaolo Group and also VUB brand values. It helps in delivering our vision and mission and promoting the principles enshrined in the Code of Ethics.

37
Selected Aspects of VUB Bank’s Corporate Responsibility
The corporate Intranet is being built as the key and most effi cient tool for internal communication, whereas employees themselves are drawn into the creation of its content. Each piece of information on the Intranet has its author, so the employees know at any moment whom they should turn to in case of need. In total, about 5% of all employees from various units take care of the content. Understanding the message is the key element of well-established internal communication. Over the course of the entire year, we also run internal surveys on the Intranet on various topics and competitions motivating employees to take an interest in internal themes.
If people are to understand what, why and how is happening in the company, dialogue and two-way communication are a must. Employees therefore always have the option to ask the CEO questions by means of an Intranet form, comment on topics important for the Bank and the employee as such, e.g. on the system of benefi ts, but also have the opportunity to exchange experience and information through a discussion forum. Employees also have the opportunity to discuss, share their experience and opinions and obtain fi rst-hand information at regular breakfasts with the Bank’s CEO. The CEO uses these informal meetings to get feedback from employees and verify that the information to be communicated from top to bottom is being delivered correctly.
Active Engagement of Employees in the Bank’s Life
Throughout the year, we prepare various internal campaigns for the employees of VUB Group focused on motivating employees towards active engagement and interactivity. In supporting the company’s brand perception, values and naturally also the business, we make use of all internal communication channels, including posters, Intranet, newsletters, personal e-mails and computer screen savers or LCD TVs located at VUB Bank’s Head Offi ce.
We were building team spirit and informal relations by attending various sports and nomination-based events, such as the Intesa Sanpaolo Running Event 2017 held in the Slovenian town of Portorož in April 2017 or ISBD Sports Event 2017 also held in Portorož in September 2017, where employees represented VUB Bank in football, basketball and also volleyball. Next year, Intesa Sanpaolo is preparing, besides the sport events already mentioned, other new events such as the ISBD Tennis and Badminton Cup 2018, which will take place in February with the host country being the Slovak Republic, as well as a cycling race. The two running teams composed of our employees traditionally took part in the relay race From the Tatras to the Danube held in August, during which they proudly represented their employer. Even in 2017, at VUB Bank’s Head Offi ce there was the popular VUB FoosCup table football tournament, which is also regularly joined by the CEO and other members of the Board of Directors and top management of the Bank.
We in VUB Bank help our employees spend free time with their children. In cooperation with the parent bank Intesa Sanpaolo, we organised for the children of our employees the May ISBD JUNIOR SPORTS EVENT 2017, with coaches and coordinators being volunteers and bank employees, and in June we welcomed the ITALIA SOCCER CAMP to Bratislava, which gave the opportunity to 50 children of VUB Group employees to try out the training practice from Italian coaches. In addition, we celebrate Children’s Day at the bank, during which employees can order small gifts for their youngest family members; as children enjoy visiting their parents at work, we also prepared for them a mini-celebration at VUB Bank’s Head Offi ce. Children are welcome at VUB Bank’s Head Offi ce during the VUB Christmas Market organised by the Bank on a regular basis; 2017 was no exception to the rule.
Caring for Employees’ Health
We realise that only healthy employees full of energy can perform their work duties effi ciently and contribute to the fulfi lment of the Bank’s targets. Therefore, VUB Bank sought to address this issue more effi ciently throughout the year 2017. We introduced morning yoga workouts and afternoon workouts with a trainer at the VUB Bank Head Offi ce.
A healthy life style should also include a healthy diet. At the Head Offi ce, we have a healthy snack machine “Zdravomat”, a machine with fresh, healthy and quality food offering salads, cereal baguettes, mineral waters and fruit juices or healthy snacks. During damp and cold weather, VUB Bank was handing out apples to all employees during the entire week with the instructive slogan “An apple a day keeps the doctor away”. Employees were thus motivated to boost their immunity also in an amusing way. Several times over the year,

38
Selected Aspects of VUB Bank’s Corporate Responsibility
VUB Bank welcomed healthy stands located in the premises of the reception offi ce, where employees could buy healthy bio products, consult with an herbal specialist, taste fruit juices, learn how to prevent diseases or tackle them by using grandmother’s recipes.
In 2017, we introduced a new, more casual dress code in the bank. We strive to ensure that our employees make a more open and more humane impression on clients and that they themselves feel like professionals, yet comfortable. Thanks to cooperation with ZOOT.sk, VUB Bank employees have a year-round discount on this shopping portal for clothing, in addition to the various winnings associated with this internal campaign.
Employee Recognition and Appreciation
In 2017, VUB Bank not only cared for the physical health of its employees. The feeling of being useful and important and/or self-realisation have positive impacts on the mental condition and health of a person. Some-times it only takes a little for a person to realise his/her importance in the company he/she works for. There-fore, VUB Bank decided to launch a system of internal appreciation for branch network employees, Staffi no – A Star of Clients. Feedback is very important; thus we, as the employer, are trying to appreciate those employees who received the most positive feedback from clients in the Staffi no appreciation programme in a given month. Besides public thanks on the Intranet network, they are also given a certifi cate and a small reward in the form of a voucher.
The year-round retail business network competition 2017 VUB CHAMPIONS LEAGUE (VÚB LIGA MAJSTROV 2017) also continued in 2017. Every year, the competition culminates with a gala evening, during which we celebrate the biggest stars of this competition, focusing not only on achieving sales results, but also quality and customer satisfaction results. The annual competition has a positive infl uence on healthy competition among branches and employees’ motivation to constantly improve.
The mutual appreciation of employees - VUB VIP AWARDS also takes place in the Bank, where the directors of individual departments can nominate employees from other departments in two separate categories for their approach in terms of bank values, such as Humanity and Humour or Simplicity and Usefulness, as well as in the team category Project of the Year. This is followed by a vote involving the whole Bank. Ideas are appreciated through a special category “Idea of the Year”; they are entered through a special platform – a box of ideas called “Turn on” (“Zapni”). We realise that a high work pace requires a lot of energy. We also know that if we are better acquainted with each other and have well-established relationships, it is easier to cooperate. Therefore, in 2017 we introduced a new concept of informal employee meetings called “Connect” (“Napoj sa”), where we gave employees an opportunity to better know each other or deepen mutual relationships. At the end of every year, we hold the traditional Christmas meetings VUB Life. In 2017, we held two meetings in Košice and Bratislava. An extraordinary meeting was held in Bratislava; it was attended by employees from the other Slovak regions for the fi rst time, thus allowing them to meet their colleagues from the Bank’s Head Offi ce. During these Christmas parties, at which the Bank celebrated its “Bank of the Year” award which it won again in 2017, employees could not only meet the entire company management and build new friendships, but could mainly recharge their batteries for the next year. Through activities, experiences and employee benefi ts, we try to maintain a good work-life balance. Just to enable a better work-life balance, we introduced a novelty in 2017, allowing our employees to work from home for 2 days a month. This benefi t has been met with very good response, moti-vating us and committing ourselves to constantly increasing employee satisfaction and engagement.
Environment
VUB Bank is not a production company or a direct polluter of the environment, and therefore the environ-mental impacts of our business are minimal. Despite this fact, we consider environmental protection and permanently sustainable growth a natural part of our operations in the market and country where we operate, and therefore we have committed ourselves to reduce our negative impact on the environment to the lowest level possible. As a company, we run our activities both internally and externally. We monitor ecological risks and threats and try to prevent them by taking various measures. We strive not only to consistently fulfi l our obligations under the law, but also to voluntarily commit ourselves to mitigating the negative impacts of our business on the environment. We look for solutions beyond the scope of the legislation; we are interested in our active and also passive environmental performance, mapping the relevant environmental indicators, and we constantly go in search of new ways for conducting the Bank’s environmental approach.

39
Selected Aspects of VUB Bank’s Corporate Responsibility
Ecological Responsibility
The respectfulness of our company and also our employees is refl ected in many activities: the use of weight-re-duced offi ce paper, use of offi ce supplies with ecological liquidation, reduced production of offi ce waste and its separation, cooperation with suppliers that hold certifi cates confi rming the observance of environmental standards, sleep mode for personal computers which will automatically switch to the mode with the minimum amount of electricity consumption after 30 minutes of inactivity, and many more.
The measures for reducing direct (resulting from our activities) and indirect (generated by clients and suppliers) environmental waste are stipulated in the VUB Group’s Environmental Policy. As a member of an inter-national banking group, we adhere to the Equator Principles and UN Global Compact. We have fi rmly defi ned internal regulations, and when taking decisions on investments and lending we take into account both social and environmental risks.
Also in 2017, VUB Bank’s main activities in environmental protection ensued from:
1. Applicable Environmental Policy aimed at:– support for investment projects focused on energy saving and renewable sources; – saving measures for the reduction of energy and consumer material consumption;– waste separation and measures for the reduction of its production; – raising employees’ environmental awareness.
2. Environmental Sustainability Action Plan with priorities for energy savings focused on: – replacement of obsolete electrical appliances with new ones featuring the highest ecological parame-
ters;– complex introduction of LED technologies;– optimisation of heating systems;– replacement of measuring and control systems and technologies.
Environmental Policy
The Environmental Policy represents a written commitment to environmental protection, which sets out a mission and objectives in the area of environmental management. The policy defi nes the VUB Group’s approach to prevention, management and, where possible, also the reduction of the direct and indirect environmental impacts it generates as a result of its business activity. Within its corporate responsibility, VUB Bank commits itself to minimise the impacts of its business activity and reduce the impacts of its activities on the environment also in cooperation with its stakeholders. Although we do not rank among signifi cant direct polluters of the environment, we realise the issue of environmental pollution exists, thus we strive to reduce our potential negative impact on the environment to the lowest level possible.
UN Global Compact
VUB Bank undertook to act in accordance with the international UN Global Compact standard, to which it acceded in 2009. It also includes environmental protection principles which we strive to observe to the maximum extent possible.
Equator Principles
We take a responsible approach to project fi nancing and lending. Managing a great volume of funds, we signifi cantly impact the fl ows of capital. Therefore, it is important for us that projects we decide to fi nance do not have a negative impact on the environment we live in. Voluntary compliance with the Equator Principles as well as the strict implementation of the principles applied in all levels of our credit policy confi rms this commitment of ours.
Environmental Initiatives and Events
VUB Bank is actively involved in the celebration of World Environmental Day held on June 5 every year. “Connected with Nature” was the theme for 2017, which we also declared to be the subject of a photography competition for VUB employees. Moreover, employees could compete in a number of entertaining ECO disci-

40
Selected Aspects of VUB Bank’s Corporate Responsibility
plines – they tested their knowledge of mathematics taught at secondary schools (all environmental math-ematical problems concerned ecology, environmental conservation, separation, etc., and were derived from a Mathematics textbook for fi fth year students).
We realise that also such a small thing as the correct selection of a means of transport contributes to sustaining or even improving the environment that surrounds us all. This is the reason we motivated our employees according to the slogan Going to Work on a Bike (Do práce na bicykli) to use this ecological means of transport and engage in the national project. The VUB Bank teams saved an incredible amount of about 1,566 kg of CO2 (kg).

41
Basic indicators
Selected Indicators (in € thousand)
Separate fi nancial statements prepared in accordance with IFRS as
adopted by the EU
Consolidated fi nancial statements prepared in accordance with IFRS as
adopted by the EU
2017 2016 2015 2017 2016 2015
Statement of fi nancial position
Loans and advances to customers 11,487,518 10,188,485 8,553,701 12,000,729 10,725,281 9,125,909
Due to customers 9,855,433 9,494,921 8,543,134 9,939,121 9,564,560 8,552,684
Equity 1,555,980 1,444,174 1,323,449 1,632,586 1,505,256 1,498,106
Balance sheet total 14,469,293 13,509,349 12,055,419 14,970,876 14,037,154 12,625,464
Statement of profi t or loss
Operating income 467,047 595,369 451,080 547,415 555,754 552,838
Operating expenses (225,813) (236,895) (229,220) (267,040) (273,358) (264,419)
Operating profi t before impairment 241,234 358,474 221,860 280,375 282,396 288,419
Profi t before tax 203,187 311,528 170,433 223,135 211,742 213,575
Income tax expense (43,166) (46,357) (40,076) (48,138) (54,972) (49,692)
Net profi t for the year 160,021 265,171 130,357 174,997 156,770 163,883
Commercial indicators 2017 2016 2015
ATMs 577 575 572
EFT POS Terminals 9,760 8,875 8,063
Payment cards 1,190,270 1,247,560 1,296,733
of which credit cards 261,105 311,897 346,040
Mortgage loans (gross, € thousand, VUB Bank)
5,341,959 4,446,721 3,556,990
Consumer loans (gross, € thousand, VUB Bank)
1,252,101 1,210,008 1,059,465
Number of employees (VUB Group) 3,942 4,098 3,987
Number of branches in Slovakia (VUB Bank) 236 239 234
Key ratios of VUB Group 2017 2016 2015
Return on assets 1.17% 1.12% 1.30%
Cost-Income Ratio (without bank levy) 44.25% 45.20% 44.20%
Tier 1 capital ratio 15.77% 14.73% 16.13%
Total capital ratio 18.24% 17.18% 16.30%
Rating (status as at 31 December 2017)
Moody‘s
Long-term deposits A2
Short-term deposits P-1
Baseline credit assessment baa2
Stable outlook

42
Consolidated fi nancial statements prepared in accordance with International Financial Reporting Standards as adopted by the European Union and Independent Auditors’ Report for the year ended 31 December 2017
Consolidated fi nancial statements

43

44

45

46

47

48

49

50

51
Note 2017 2016
Assets
Cash and balances with central banks 7 1,595,097 1,029,103
Due from banks 8 90,913 112,468
Financial assets at fair value through profi t or loss 9 5,783 474
Derivative fi nancial instruments 10 49,856 47,249
Available-for-sale fi nancial assets 11 520,416 1,289,979
Loans and advances to customers 12 12,000,729 10,725,281
Held-to-maturity investments 14 376,472 530,019
Associates and joint ventures 15 8,972 8,788
Intangible assets 16 80,100 68,888
Goodwill 17 29,305 29,305
Property and equipment 18 126,848 104,853
Current income tax assets 19 9,478 1,464
Deferred income tax assets 19 53,779 64,002
Other assets 20 23,128 25,281
14,970,876 14,037,154
Liabilities
Due to central and other banks 21 768,781 855,244
Derivative fi nancial instruments 10 52,184 65,354
Due to customers 22 9,939,121 9,564,560
Subordinated debt 23 200,164 200,165
Debt securities in issue 23 2,252,380 1,715,308
Provisions 24 9,962 26,001
Other liabilities 25 115,698 105,266
13,338,290 12,531,898
Equity
Equity (excluding net profi t for the year) 26 1,457,589 1,348,486
Net profi t for the year 26 174,997 156,770
1,632,586 1,505,256
14,970,876 14,037,154
Financial commitments and contingencies 27 3,562,979 3,658,239
The accompanying notes on pages 55 to 153 form an integral part of these fi nancial statements.
These fi nancial statements were authorised for issue by the Management Board on 15 February 2018.
Alexander Resch Antonio Bergalio
Chairman of the Management Board Member of the Management Board
Consolidated statement of fi nancial position for the year ended 31 December 2017(In thousands of euro)

52
Note 2017 2016
Interest and similar income 434,187 449,361
Interest and similar expense (50,227) (49,962)
Net interest income 28 383,960 399,399
Fee and commission income 151,028 146,311
Fee and commission expense (37,379) (38,364)
Net fee and commission income 29 113,649 107,947
Net trading result 30 40,344 38,783
Other operating income 31 9,462 9,625
Operating income 547,415 555,754
Salaries and employee benefi ts 32 (126,659) (119,710)
Other operating expenses 33 (90,789) (103,759)
Special levy of selected fi nancial institutions 33 (24,823) (22,143)
Amortisation 16 (12,635) (14,539)
Depreciation 18 (12,134) (13,207)
Operating expenses (267,040) (273,358)
Operating profi t before impairment 280,375 282,396
Impairment losses 34 (59,205) (75,764)
Profi t from operations 221,170 206,632
Share of profi t of associates and joint ventures 15 1,965 5,110
Profi t before tax 223,135 211,742
Income tax expense 35 (48,138) (54,972)
NET PROFIT FOR THE YEAR 174,997 156,770
Other comprehensive income for the year, after tax:
Items that will not be reclassifi ed to profi t or loss in the future:
Revaluation surplus from property and equipment 21,966 –
Items that may be reclassifi ed to profi t or loss in the future:
Cash fl ow hedges 1,378 410
Available-for-sale fi nancial assets 606 (23,137)
Exchange difference on translating foreign operation 269 (19)
Other comprehensive income for the year, net of tax 36, 37 24,219 (22,746)
TOTAL COMPREHENSIVE INCOME FOR THE YEAR 199,216 134,024
The Net profi t and Total comprehensive income are fully attributable to owners of the parent.
The accompanying notes on pages 55 to 153 form an integral part of these fi nancial statements.
Consolidated statement of profi t or loss and other comprehensive income for the year ended 31 December 2017 (In thousands of euro)

53
Share capital
Share premium
Legal reserve
fundRetained earnings
Revaluation surplus
from prop-erty and
equipment
Available-for-sale fi nancial
assetsCash fl ow
hedges
Translation of foreign operation Total
At 1 January 2016 430,819 13,719 99,903 927,622 – 27,271 (1,250) 22 1,498,106
Total comprehensive income for the year, net of tax
– – – 156,770 – (23,137) 410 (19) 134,024
Gain on disposal of an investment in associate under common control (Note 15)
– – (333) 3,643 – – 3,310
Exchange difference – – – 22 – – – (22) –
Transactions with owners, recorded directly in equity
Legal reserve fund – – 484 (483) – – – – 1
Dividends to shareholders – – – (130,334) – – (130,334)
Reversal of dividends distributed but not collected
– – – 149 – – – – 149
Total transactions with owners
– – 484 (130,668) – – – – (130,184)
At 31 December 2016 430,819 13,719 100,054 957,389 – 4,134 (840) (19) 1,505,256
At 1 January 2017 430,819 13,719 100,054 957,389 – 4,134 (840) (19) 1,505,256
Total comprehensive income for the year, net of tax
– – – 174,997 21,966 606 1,378 269 199,216
Exchange difference – – – 5 – (22) – 22 5
Transactions with owners, recorded directly in equity
Dividends to shareholders – – – (72,020) – – – – (72,020)
Reversal of dividends distributed but not collected
– – – 130 – – – – 130
Total transactions with owners
– – – (71,890) – – – – (71,890)
At 31 December 2017 430,819 13,719 100,054 1,060,501 21,966 4,718 538 272 1,632,587
The accompanying notes on pages 55 to 153 form an integral part of these fi nancial statements.
Consolidated statement of changes in equity for the year ended 31 December 2017 (In thousands of euro)

54
Note 2017 2016
Cash fl ows from operating activities
Profi t before tax 223,135 211,742
Adjustments for:
Amortisation 12,635 14,539
Depreciation 12,134 13,207
Securities at fair value through profi t or loss, debt securities in issue and FX differences
(25,018) 17,043
Items related to share of profi t of associates and joint ventures (184) 873
Interest income (434,187) (449,361)
Interest expense 50,227 49,962
Sale of property and equipment (751) (566)
Impairment losses and similar charges 68,352 110,231
Interest received 442,580 472,978
Interest paid (53,684) (56,958)
Tax paid (45,929) (71,151)
Decrease in Due from banks 11,023 80,421
(Increase)/decrease in Financial assets at fair value through profi t or loss
(5,310) 97,923
Increase in Derivative fi nancial instruments (assets) (1,229) (187)
Decrease in Available-for-sale fi nancial assets 776,154 532,265
Increase in Loans and advances to customers (1,370,396) (1,707,240)
Decrease in Other assets 1,966 6,607
(Decrease)/Increase in Due to central and other banks (85,615) 81,521
(Decrease)/Increase in Derivative fi nancial instruments (liabilities) (13,170) 2,795
Increase in Due to customers 375,416 1,215,625
Increase in Other liabilities 10,966 3,098
Net cash (used in)/used from operating activities (50,885) 625,367
Cash fl ows from investing activities
Repayments of held-to-maturity investments 147,282 –
Purchase of intangible assets and property and equipment (45,381) (37,711)
Disposal of property and equipment 11,620 6,859
Increase resulting from the disposal of the associate – 10,851
Net cash used from/(used in) investing activities 113,521 (20,001)
Cash fl ows from fi nancing activities
Proceeds from issue of debt securities 750,000 249,848
Repayments of debt securities (186,155) (150,618)
Dividends paid (72,020) (130,334)
Net cash used from/(used in) fi nancing activities 491,825 (31,104)
Net change in cash and cash equivalents 554,461 574,262
Cash and cash equivalents at the beginning of the year 6 1,065,848 491,586
Cash and cash equivalents at 31 December 6 1,620,309 1,065,848
The accompanying notes on pages 55 to 153 form an integral part of these fi nancial statements.
Consolidated statement of cash fl ows for the year ended 31 December 2017 (In thousands of euro)

55
Consolidated fi nancial statements
1. General information
1.1 The Bank
Všeobecná úverová banka, a. s. (‘the Bank’ or ‘VUB’) provides retail and commercial banking services. The Bank is domiciled in the Slovak Republic with its registered offi ce at Mlynské nivy 1, 829 90 Bratislava 25 and has the identifi cation number (IČO) 313 20 155 and the tax identifi cation number (DIČ) 2020411811.
At 31 December 2017, the Bank had a network of 236 points of sale (including Retail Branches, Corporate Branches and Mortgage centres) located throughout Slovakia (31 December 2016: 239). The Bank also has one branch in the Czech Republic (31 December 2016: 1).
At 31 December 2017, the members of the Management Board are: Alexander Resch (Chairman), Antonio Bergalio, Peter Magala, Peter Novák, Martin Techman, Roberto Vercelli (from 1 December 2017) and Andrej Viceník (from 1 December 2017).
Other members of the Management Board were Jozef Kausich (until 30 November 2017) and Elena Kohú-tiková (until 31 October 2017).
At 31 December 2017, the members of the Supervisory Board are: Ezio Salvai (Chairman), Ignacio Jaquotot (Vice Chairman), Luca Finazzi, Paolo Sarcinelli, Christian Schaack, Andrej Straka and Róbert Szabo (from 8 February 2017).
Another member of the Supervisory Board was Ján Gallo (until 22 January 2017).
1.2 The VUB Group
The consolidated fi nancial statements comprise the Bank and its subsidiaries (together referred to as ‘the VUB Group’ or ‘the Group’) and the Group’s interest in associates and joint ventures. All entities are incor-porated in the Slovak Republic.
Share 2017
Share 2016
Principal business activity
Subsidiaries
Consumer Finance Holding, a. s. (‘CFH’) 100% 100% Consumer fi nance business
VÚB Leasing, a. s. (‘VÚB Leasing’) 100% 100% Finance and operating leasing
VÚB Factoring, a. s. (‘VÚB Factoring’) 100% 100% Factoring of receivables
Associates
Slovak Banking Credit Bureau, s. r. o. (‘SBCB’) 33.33% 33.33% Credit database administration
Joint ventures
VÚB Generali DSS, a. s. (‘VÚB Generali DSS’) 50% 50% Pension fund administration
The VUB Group’s ultimate parent company is Intesa Sanpaolo S.p.A., which is a joint-stock company and is incorporated and domiciled in Italy. The consolidated fi nancial statements of the company are available at the address of its registered offi ce at Piazza San Carlo 156, 10121 Torino, Italy.
At 3 December 2015, Consumer Finance Holding Česká republika, a. s. was registered in the Commercial Register of Companies in Czech Republic. This company is a 100% subsidary of CFH.
In December 2016, the Bank sold its stake in VÚB Asset Management, správ. spol., a. s. to the major share-holder Eurizon SA for cash of € 13,673 thousand. The intragroup reorganization goal was to achieve the separation and independence of asset management companies from distributors, in line both with the model adopted by Intesa Sanpaolo Group and with the indications of the supervisory authorities and the simplifi ca-tion of decision-making and governance processes.

56
Consolidated fi nancial statements
2. Summary of signifi cant accounting policies
2.1 Basis of preparation
The consolidated fi nancial statements of the VUB Group (‘the fi nancial statements’) have been prepared in accordance with International Financial Reporting Standards (‘IFRS’) issued by the International Accounting Standards Board (‘IASB’) and with interpretations issued by the International Financial Reporting Interpreta-tions Committee of the IASB (‘IFRIC’) as approved by the European Union Commission in accordance with the Regulation of European Parliament and the Council of European Union and in accordance with the Act No. 431/2002 Collection on Accounting.
The consolidated fi nancial statements of the VUB Group for the year ended 31 December 2016 were author-ised for issue by the Management Board on 15 February 2017.
The separate fi nancial statements of the Bank for the year ended 31 December 2017 were issued on 15 February 2018 and are available at the registered offi ce of the Bank.
The fi nancial statements have been prepared under the historical cost convention, as modifi ed by the revalua-tion of buildings and land to fair value, by the revaluation of available-for-sale fi nancial assets, fi nancial assets at fair value through profi t or loss, all derivative fi nancial instruments and buildings and land in property and equipment to fair value and in the case of the fi nancial assets or fi nancial liabilities designated as hedged items in qualifying fair value hedge relationships modifi ed by the changes in fair value attributable to the risk being hedged.
The fi nancial statements were prepared using the going concern assumption that the VUB Group will continue in operation for the foreseeable future.
The fi nancial statements are presented in thousands of euro (‘€’), unless indicated otherwise. Euro is the func-tional currency of the VUB Group.
Negative balances are presented in brackets.
2.2 Changes in accounting policies and presentation
At 31 December 2017, VUB Group implemented a new accounting policy concerning measurement of build-ings and land at fair value, following the Intesa Sanpaolo Group (‘ISP Group‘) policy. This policy is described in note ‘2.20 Property and equipment‘.
Other accounting policies adopted are consistent with those of the previous fi nancial year.
Standards and interpretations relevant to VUB Group’s operations issued but not yet effective
The following new Standards, amendments to Standards and Interpretations are not yet mandatorily effective for annual periods beginning on or after 1 January 2017, and have not been applied in preparing these sepa-rate fi nancial statements. The VUB Group plans to adopt these pronouncements when they become effective.
IFRS 15 Revenue from Contracts with Customers and Clarifi cations to IFRS 15 Revenue from Contracts with Customers (issued on 12 April 2016)(Effective for annual periods beginning on or after 1 January 2018.)
The new Standard provides a framework that replaces existing revenue recognition guidance in IFRS. Entities will adopt a fi ve-step model to determine when to recognise revenue, and at what amount. The new model specifi es that revenue should be recognised when (or as) an entity transfers control of goods or services to a customer at the amount to which the entity expects to be entitled. Depending on whether certain criteria are met, revenue is recognised:– over time, in a manner that depicts the entity’s performance; or– at a point in time, when control of the goods or services is transferred to the customer.

57
Consolidated fi nancial statements
IFRS 15 also establishes the principles that an entity shall apply to provide qualitative and quantitative disclo-sures which provide useful information to users of fi nancial statements about the nature, amount, timing, and uncertainty of revenue and cash fl ows arising from a contract with a customer.
The Clarifi cations to IFRS 15 clarify some of the Standard’s requirements and provide additional transitional relief for companies that are implementing the new Standard.
The amendments clarify how to:– identify a performance obligation, the promise to transfer a good or a service to a customer, in a contract;– determine whether a company is a principal (the provider of a good or service) or an agent (responsible for
arranging for the good or service to be provided); and– determine whether the revenue from granting a license should be recognised at a point in time or over
time.
The amendments also provide entities with two additional practical expedients:– An entity need not restate contracts that are completed contracts at the beginning of the earliest period
presented (for entities using the full retrospective method only);– For contracts that were modifi ed before the beginning of the earliest period presented, an entity need not
retrospectively restate the contract but shall instead refl ect the aggregate effect of all of the modifi cations that occur before the beginning of the earliest period presented (also for entities recognising the cumulative effect of initially applying the standard at the date of initial application).
It is expected that the new Standard, when initially applied, will have an impact on the fi nancial statements, since the timing and the measurement of the VUB Group’s fee and commission income from life insurance mediation are expected to change. According to IFRS 15 the VUB Group will need to take into account possible clawbacks from insurance companies on the basis of historical statistics, when recognising this type of revenue.
The VUB Group has decided to apply the standard retrospectively with the cumulative effect refl ected in retained earnings.
The VUB Group has estimated the expected impact of the initial application of IFRS 15 on its equity as at 1 January 2018 at approximately € 2 million.
Except for revenues related to mediation of life insurance, the timing and measurement of other VUB Group’s revenues are not expected to change materially under IFRS 15 due to the nature of the VUB Group’s opera-tions and the types of revenues it earns.
The above assessment is preliminary because not all transition work has been fi nalized. The actual impact of adopting IFRS 15 on 1 January 2018 may change because it will require the VUB Group to revise its accounting processes and internal controls and these changes are not yet complete and the new accounting policies, assumptions, judgements and estimation techniques employed are subject to change until the VUB Group fi nalizes its fi rst fi nancial statements that include the date of initial application.
IFRS 9 Financial Instruments (2014)(Effective for annual periods beginning on or after 1 January 2018; to be applied retrospectively with some exemptions. The restatement of prior periods is not required.)
This Standard replaces IAS 39, Financial Instruments: Recognition and Measurement, except that the IAS 39 exception for a fair value hedge of an interest rate exposure of a portfolio of fi nancial assets or fi nancial liabilities continues to apply, and entities have an accounting policy choice between applying the hedge accounting requirements of IFRS 9 or continuing to apply the existing hedge accounting requirements in IAS 39 for all hedge accounting until the standard resulting from the IASB’s project in macro hedge accounting is effective.
Although the permissible measurement bases for fi nancial assets – amortised cost (‘AC’), fair value through other comprehensive income (‘FVOCI’) and fair value through profi t or loss (‘FVTPL’) – are similar to IAS 39, the criteria for classifi cation into the appropriate measurement category are signifi cantly different.

58
Consolidated fi nancial statements
A fi nancial asset is measured at amortized cost if the following two conditions are met: – the assets is held within a business model whose objective is to hold assets in order to collect contractual
cash fl ows; and – its contractual terms give rise, on specifi ed dates, to cash fl ows that are solely payments of principal and
interest on the principal outstanding.
In addition, for a non-trading equity instrument, a company may elect to irrevocably present subsequent changes in fair value (including foreign exchange gains and losses) in OCI. These are not reclassifi ed to profi t or loss under any circumstances.
For debt instruments measured at FVOCI, interest revenue, expected credit losses and foreign exchange gains and losses are recognised in profi t or loss in the same manner as for amortised cost assets. Other gains and losses are recognised in OCI and are reclassifi ed to profi t or loss on derecognition.
The impairment model in IFRS 9 replaces the ‘incurred loss’ model in IAS 39 with a forward-looking ‘expected credit loss’ (‘ECL’) model, which means that a loss event will no longer need to occur before an impairment allowance is recognised. The new impairment model will apply to fi nancial assets measured at amortized cost or FVOCI, except for investments in equity instruments, and to contract assets.
Under IFRS 9, loss allowances will be measured on either of the following bases:– 12-month ECLs: these are ECLs that result from possible default events within the 12 months after the
reporting date; and – Lifetime ECLs: these are ECLs that result from all possible default events over the expected life of a fi nancial
instrument.
IFRS 9 includes a new general hedge accounting model, which aligns hedge accounting more closely with risk management. The types of hedging relationships – fair value, cash fl ow and foreign operation net investment – remain unchanged, but additional judgment will be required.
The standard contains new requirements to achieve, continue and discontinue hedge accounting and allows additional exposures to be designated as hedged items.
When initially applying IFRS 9, the VUB Group may choose as its accounting policy to continue to apply the hedge accounting requirements of IAS 39 instead of those of IFRS 9. The VUB Group has elected to continue to apply IAS 39.
The standard will affect the classifi cation and measurement of fi nancial assets held as at 1 January 2018 as follows:– Loans and advances to banks and customers that are measured under amortized cost under IAS 39, will
also be generally measured at amortized cost under IFRS 9;– Debt investment securities that are classifi ed as available-for-sale under IAS 39 will be generally measured
at FVOCI;– Held to maturity investments that are measured under amortized cost under IAS 39 will be to a large extent
classifi ed as held to collect and sale and measured at FVOCI;– Trading assets and hedging derivatives, which are measured at FVTPL under IAS 39, will also be measured
at FVTPL under IFRS 9.
Defi nition of default
Under IFRS 9, the VUB Group will consider a fi nancial asset to be in default when:– the borrower is unlikely to pay its credit obligations to the VUB Group in full, without recourse by the VUB
Group to actions such as realising security (if any is held); or– the borrower is more than 90 days past due on any material credit obligations to the VUB Group.
The VUB Group will consider both quantitative and qualitative indicators when assessing whether a borrower is in default.

59
Consolidated fi nancial statements
Signifi cant increase in credit risk
The VUB Group will primarily identify whether a signifi cant increase in credit risk has occurred for an exposure by comparing the remaining lifetime probability of default as at the reporting date with the remaining lifetime probability of default for this point in time that was estimated on initial recognition of the exposure.
Impact of the introduction of IFRS 9 on own funds
In December 2017, the European Parliament and the European Council issued Regulation (EU) 2017/2395 amending Regulation (EU) 575/2013 as regard transitional arrangements for mitigating the impact of the introduction of IFRS 9 on own funds, integrating the CRR with Article 473 “Introduction of IFRS 9”. The new Article allows Banks to re-introduce in their CET 1 a decreasing quota of the impact of IFRS 9 in a fi ve year transitional period (2018 – 2022). That amount shall be determined using the static approach which will be adopted by the Bank. It refers only to the impact of First Time Adoption (FTA) resulting from the comparison of IAS impairments as at 31/12/2017 and IFRS 9 impairments as at 1/1/2018 – including both performing loans classifi ed in Stages 1 and 2 and adjustments to NPLs (Stage 3) – to which is applied a decreasing factor (95% for 2018, 85% in 2019, 70% in 2020, 50% in 2021 and 25% in 2022) to set the amount to be included in CET1. The static transitional approach is not applicable to the changes in valuation reserves deriving from re-classifi cation of fi nancial instruments during FTA (impact resulting from C&M – Classifi cation and Measure-ment).
Furthermore, under paragraph 7 of Article 473 of the Regulation, Group companies adopting the transitional approach shall update calculation of the following components relevant to the determination of supervisory capital requirements, so as to avoid inappropriate benefi ts:– deferred tax assets deducted from CET 1 relating to Standard and IRB exposures;– determination of EAD using the scaling factor to assess the RWA of Standard exposures;– Tier 2 elements relating to IRB weighted exposures.
The assessment is preliminary because not all transition work has been fi nalized. The actual impact of adopting IFRS 9 on 1 January 2018 may change because:– IFRS 9 will require the VUB Group to revise its accounting processes and internal controls and these changes
are not yet complete;– although parallel runs were carried out in 2017, the new systems and associated controls in place have not
been operational for an extended period;– the VUB Group has not fi nalized the testing and assessment of controls over its new IT systems and
changes to its governance framework;– the VUB Group is refi ning and fi nalizing its models for ECL calculations; and– the new accounting policies, assumptions, judgements and estimation techniques employed are subject to
change until the VUB Group fi nalizes its fi rst fi nancial statements that include the date of initial application.

60
Consolidated fi nancial statements
This table shows the estimated impact of the application IFRS 9 to the consolidated statement of fi nancial position assets part as at 1 January 2018:
Remeasurement
IAS 39 categories IFRS 9 categories
IAS 39 measu-rement
Reclas-sifi cation ECL Other
IFRS 9 measu-rement
Assets Assets
Cash and balances with central banks
Cash, cash balances at central banks
1,595,097 – (108) – 1,594,989
Due from banks Financial assets at amortised cost: due from banks
90,913 – (482) – 90,431
Financial assets at fair value through profi t or loss
5,783 (5,783) – – –
Financial assets held for trading 4,933 – – 4,933
Non–trading fi nancial assets mandatorily at fair value through profi t or loss
850 – – 850
Derivative fi nancial instruments 49,856 (49,856) – – –
Financial assets held for trading 25,491 – – 25,491
Derivatives – Hedge accounting 24,365 – – 24,365
Available-for-sale fi nancial assets Financial assets at fair value through other comprehensive income
520,416 – (178) 178 520,416
Loans and advances to customers Financial assets at amortised cost: due from customers
12,000,729 – (45,496) – 11,955,233
Held-to-maturity investments Financial assets at fair value through other comprehensive income
376,472 – (49) 50,548 426,971
Associates and joint ventures Investments in joint ventures and associates
8,972 – – – 8,972
Intangible assets Intangible assets 80,100 – – – 80,100
Goodwill Goodwill 29,305 – – – 29,305
Property and equipment Property and equipment 126,848 – – – 126,848
Current income tax assets Current income tax assets 9,478 – – – 9,478
Deferred income tax assets Deferred income tax assets 53,779 – 10,047 (10,652) 53,174
Other assets Other assets 23,128 – (32) – 23,096
14,970,876 – (36,298) 40,074 14,974,652

61
Consolidated fi nancial statements
This table shows the estimated impact of the application IFRS 9 to the consolidated statement of fi nancial position the liabilities and equity part as at 1 January 2018:
Remeasurement
IAS 39 categories IFRS 9 categories
IAS 39 measu-rement
Reclas-sifi cation ECL Other
IFRS 9 measu-rement
Liabilities Liabilities
Due to central and other banks Financial liabilities measured at amortised cost: due to banks
768,781 – – – 768,781
Derivative fi nancial instruments Financial liabilities held for trading 52,184 – – – 52,184
Due to customers Financial liabilities measured at amortised cost: due to customers
9,939,121 – – – 9,939,121
Subordinated debt Financial liabilities measured at amortised cost: subordinated debt
200,164 – – – 200,164
Debt securities in issue Financial liabilities measured at amortised cost: debt securities in issue
2,252,380 – – – 2,252,380
Provisions Provisions 9,962 – – – 9,962
Other liabilities Other liabilities 115,698 – 1,498 – 117,196
13,338,290 – 1,498 – 13,339,788
Equity Equity
Equity (excluding net profi t for the year)
Equity (excluding net profi t for the year)
1,457,589 – (37,796) 40,074 1,459,867
Net profi t for the year Net profi t for the year 174,997 – – – 174,997
1,632,586 – (37,796) 40,074 1,634,864
14,970,876 – (36,298) 40,074 14,974,652

62
Consolidated fi nancial statements
IFRS 16 Leases(Effective for annual periods beginning on or after 1 January 2019.)
IFRS 16 supersedes IAS 17 Leases and related interpretations. The Standard eliminates the current dual accounting model for lessees and instead requires companies to bring most leases on-balance sheet under a single model, eliminating the distinction between operating and fi nance leases.
Under IFRS 16, a contract is, or contains, a lease if it conveys the right to control the use of an identifi ed asset for a period of time in exchange for consideration. For such contracts, the new model requires a lessee to recognise a right-of-use asset and a lease liability. The right-of-use asset is depreciated and the liability accrues interest. This will result in a front-loaded pattern of expense for most leases, even when the lessee pays constant annual rentals.
The new Standard introduces a number of limited scope exceptions for lessees which include:– leases with a lease term of 12 months or less and containing no purchase options, and– leases where the underlying asset has a low value (‘small-ticket’ leases).
Lessor accounting, however, shall remain largely unchanged and the distinction between operating and fi nance leases will be retained.
It is expected that the new Standard, when initially applied, will have a signifi cant impact on the fi nancial statements, since it will require the VUB Group to recognise in its statement of fi nancial position assets and liabilities relating to operating leases for which the VUB Group acts as a lessee.
The Group has not yet fi nished its analysis of the expected quantitative impact of the new Standard.
Amendments to IFRS 10 and IAS 28 Sale or contribution of assets between an investor and its associate or joint venture(The European Commission decided to defer the endorsement indefi nitely.)
The Amendments clarify that in a transaction involving an associate or joint venture, the extent of gain or loss recognition depends on whether the assets sold or contributed constitute a business, such that:– a full gain or loss is recognised when a transaction between an investor and its associate or joint venture
involves the transfer of an asset or assets which constitute a business (whether it is housed in a subsidiary or not), while
– a partial gain or loss is recognised when a transaction between an investor and its associate or joint venture involves assets that do not constitute a business, even if these assets are housed in a subsidiary.
The VUB Group does not expect that the amendments, when initially applied, will have a material impact on the fi nancial statements due to the extent and nature of the VUB Group’s transactions involving an associate or joint venture.
IFRIC 22 Foreign Currency Transactions and Advance Consideration(Effective for annual periods beginning on or after 1 January 2018. This interpretation is not yet endorsed by the EU.)
IFRIC 22 provides requirements about which exchange rate to use in reporting foreign currency transactions (such as revenue transactions) when payment is made or received in advance and clarifi es that the transaction date is the date on which the company initially recognises the prepayment or deferred income arising from the advance consideration. For transactions involving multiple payments or receipts, each payment or receipt gives rise to a separate transaction date.
The Group does not expect that the Interpretation, when initially applied, will have material impact on the fi nancial statements as the Group uses the exchange rate on the transaction date for the initial recognition of the non-monetary asset or non-monetary liability arising from the payment or receipt of advance consideration.
Amendments to IFRS 2 Classifi cation and Measurement of Share-based Payment Transactions (Effective for annual periods beginning on or after 1 January 2018; to be applied prospectively. These amend-ments are not yet endorsed by the EU.)

63
Consolidated fi nancial statements
The amendments clarify share-based payment accounting in the following areas: – the effects of vesting and non-vesting conditions on the measurement of cash-settled share-based
payments;– share-based payment transactions with a net settlement feature for withholding tax obligations; and – a modifi cation to the terms and conditions of a share-based payment that changes the classifi cation of the
transaction from cash-settled to equity settled.
The Group expects that the amendments, when initially applied, will not have a material impact on the presentation of the fi nancial statements because the VUB Group does not enter into material share-based payment transactions.
Amendments to IFRS 9: Prepayment Features with Negative Compensation (Issued on 12 October 2017. Effective for annual periods beginning on or after 1 January 2019. These amend-ments are not yet endorsed by the EU.)
These amendments address concerns raised about accounting for fi nancial assets that include particular contractual prepayment options. In particular, the concern was related to how a company would classify and measure a debt instrument if the borrower was permitted to prepay the instrument at an amount less than the unpaid principal and interest owed. Such a prepayment amount is often described as including ‘negative compensation’. Applying IFRS 9, a company would measure a fi nancial asset with so-called negative compen-sation at fair value through profi t or loss.
The amendments enable entities to measure at amortized cost some prepayable fi nancial assets with so-called negative compensation.
The Group has started the portfolio analysis and does not expect that the amendments will have a material impact on the fi nancial statements.
2.3 Basis of consolidation
(a) Subsidiaries
Subsidiaries are entities controlled by the Bank. Control exists when the Bank has the power over the investee and has the exposure or rights to variable returns from its involvement with the investee and the ability to use its power over the investee to affect the amount of these returns. The fi nancial statements of subsidiaries are included in the consolidated fi nancial statements from the date at which effective control commences until the date at which control ceases.
The fi nancial statements of the Bank and its subsidiaries are combined on a line-by-line basis by adding together like items of assets, liabilities, equity, income and expenses. Intra-group balances, transactions and resulting profi ts are eliminated in full.
The purchase method of accounting is used to account for the acquisition of subsidiaries by the VUB Group. The cost of an acquisition is measured as the fair value of the assets acquired, equity instruments issued and liabilities incurred or assumed at the date of exchange, plus costs directly attributable to the acquisition. Identi-fi able assets acquired and liabilities and contingent liabilities assumed in a business combination are measured initially at their fair values at the acquisition date, irrespective of the extent of any non-controlling interest.
The excess of the cost of the acquisition over the fair value of the VUB Group’s share of the identifi able net assets acquired is recognised as goodwill.
(b) Associates
Associates are entities, in which the Group has signifi cant infl uence, but not control, over the fi nancial and operating policies. The fi nancial statements include the Group’s share of the total recognised gains and losses of associates on an equity accounted basis, from the date that signifi cant infl uence commences until the date that signifi cant infl uence ceases.

64
Consolidated fi nancial statements
(c) Joint ventures
A joint venture is a joint arrangement whereby the parties that have joint control of the arrangement have rights to the net assets of the arrangement. The fi nancial statements include the Group’s share of the total recognised gains and losses of joint ventures on an equity accounted basis, from the date that joint control commences until the date that joint control ceases.
To determine the nature of interest in another entity an assessment of the control indicators described above is performed by the management of the VUB Group, applying certain level of judgement.
2.4 Segment reporting
The Group reports fi nancial and descriptive information about its operating segments in these fi nancial state-ments. An operating segment is a component of the Group that engages in business activities from which it may earn revenues and incur expenses (including revenues and expenses relating to transactions with other components of the Group), whose operating results are regularly reviewed by the Group’s management to make decisions about resources to be allocated to the segment and to assess its performance, and for which separate fi nancial information is available.
The Group operates in three operating segments – Retail Banking, Corporate Banking and Central Treasury. Each segment is exposed to different risks and differs in the nature of its services, business processes and types of customers for its products and services.
For all segments the Group reports a measure of segment assets and liabilities and income and expense items, a reconciliation of total reportable segment revenues, total assets, liabilities and other amounts disclosed for reportable segments to corresponding amounts in the Group’s fi nancial statements.
Most of the transactions of the VUB Group are related to the Slovak market. Due to the market size, the VUB Group operates as a single geographical segment unit.
2.5 Foreign currency transactions
Monetary assets and liabilities in foreign currencies are translated to euro at the offi cial European Central Bank (’ECB’) or National Bank of Slovakia (’NBS’) exchange rates prevailing at the end of the reporting period. Income and expenses denominated in foreign currencies are reported at the ECB or NBS exchange rates prevailing at the date of the transaction.
The difference between the contractual exchange rate of a transaction and the ECB or NBS exchange rate prevailing at the date of the transaction is included in ‘Net trading result’, as well as gains and losses arising from movements in exchange rates after the date of the transaction.
2.6 Foreign operations
The fi nancial statements include foreign operations in the Czech Republic. The assets and liabilities of foreign operations are translated to euro at the foreign exchange rate prevailing at the end of the reporting period. The revenues and expenses of foreign operations are translated to euro at rates approximating the foreign exchange rates prevailing at the dates of the transactions. Foreign exchange differences arising on these trans-lations are recognised directly in equity.
2.7 Cash and cash equivalents
For the purpose of the statement of cash fl ow, cash and cash equivalents comprise cash and balances with central banks, treasury bills and other eligible bills with contractual maturity of less than 90 days and due from banks balances with contractual maturity of less than 90 days.
2.8 Cash and balances with central banks
Cash and balances with central banks comprise cash in hand and balances with the NBS and other central banks, including compulsory minimum reserves. Cash and other valuables are carried at amortised cost in the statement of fi nancial position.

65
Consolidated fi nancial statements
2.9 Treasury bills and other eligible bills
Treasury bills and other eligible bills represent highly liquid securities that could be used for rediscounting in the NBS in the case of Slovak treasury bills or in a central bank of a foreign country in the case of foreign treasury bills without any time or other constraints.
2.10 Due from banks
Due from banks include receivables from current accounts in other than central banks, term deposits and loans provided to commercial banks.
Balances are presented at amortised cost including interest accruals less any impairment losses. An impairment loss is established if there is objective evidence that the VUB Group will not be able to collect all amounts due.
2.11 Securities
Securities held by the VUB Group are categorised into portfolios in accordance with the VUB Group’s intent on the acquisition date and pursuant to the investment strategy. The VUB Group has developed security invest-ment strategies and, refl ecting the intent on acquisition, allocated securities into the following portfolios:
(a) Fair value through profi t or loss,(b) Available-for-sale,(c) Held-to-maturity.
The principal differences among the portfolios relate to the measurement and recognition of fair values in the fi nancial statements. All securities held by the VUB Group are recognised using settlement date accounting and are initially measured at fair value plus, in the case of fi nancial assets not at fair value through profi t or loss, any directly attributable incremental costs of acquisition. Securities purchased, but not settled, are recorded in the off-balance sheet and changes in their fair values, for purchases into the fair value through profi t or loss and the available-for-sale portfolios, are recognised in the statement of profi t or loss and other comprehensive income and in equity respectively.
(a) Securities at fair value through profi t or loss
This portfolio comprises the following subcategories:
(i) Securities held for tradingThese securities are fi nancial assets acquired by the VUB Group for the purpose of generating profi ts from short-term fl uctuations in prices.
(ii) Securities designated at fair value through profi t or loss on initial recognitionSecurities classifi ed in this category are those that have been designated by management on initial recog-nition. This designation may be used only when at least one of the following conditions is met: - the designation eliminates or signifi cantly reduces a measurement or recognition inconsistency that
would otherwise arise from measuring assets or liabilities or recognising the gains and losses on them on a different basis;
- the assets and fi nancial liabilities are part of a group of fi nancial assets, fi nancial liabilities or both that are managed and their performance is evaluated on a fair value basis, in accordance with a docu-mented risk management or investment strategy;
- the fi nancial instrument contains one or more embedded derivatives that signifi cantly modify the cash fl ows that otherwise would be required by the contract.
Subsequent to their initial recognition these assets are accounted for and re-measured at fair value. The fair value of securities at fair value through profi t or loss, for which an active market exists, and a market value can be estimated reliably, is measured at quoted market prices. In circumstances where the quoted market prices are not readily available, the fair value is estimated using the present value of future cash fl ows.
The VUB Group monitors changes in fair values on a daily basis and recognises unrealised gains and losses in the statement of profi t or loss and other comprehensive income in ‘Net trading result’. Interest earned on securities at fair value through profi t or loss is accrued on a daily basis and reported in the statement of profi t or loss and other comprehensive income in ‘Interest and similar income’.

66
Consolidated fi nancial statements
(b) Available-for-sale securities
‘Available-for-sale’ securities are those fi nancial assets that are not classifi ed as ‘at fair value through profi t or loss’ or ‘held-to-maturity’. Subsequent to their initial recognition, these assets are accounted for and re-meas-ured at fair value.
Unrealised gains and losses arising from changes in the fair value of ‘available-for-sale’ securities are recognised on a daily basis in the ‘Available-for-sale fi nancial assets’ in equity.
Interest earned whilst holding ‘available-for-sale’ securities is accrued on a daily basis and reported in the statement of profi t or loss and other comprehensive income in ‘Interest and similar income’.
The fair value of ‘available-for-sale’ securities, for which an active market exists, and a market value can be estimated reliably, is measured at quoted market prices. In circumstances where the quoted market prices are not readily available, the fair value is estimated using the present value of future cash fl ows.
Equity investments whose fair value cannot be reliably measured are held at cost less impairment. For ‘available-for-sale’ equity investments, the Group assesses at each reporting date whether there is objective evidence that an investment or a group of investments is impaired.
Examples of events representing objective evidence of impairment include signifi cant fi nancial diffi culty of the issuer, issuer’s default or delinquency in interest or principal payments, becoming probable that the issuer will enter into bankruptcy or other reorganisation procedures, the disappearance of an active market for the secu-rity due to the issuer’s fi nancial diffi culties or other elements indicating an objective reduction in the issuer’s ability to generate future cash fl ows suffi cient to meet its contractual obligation.
In the case of debt instruments classifi ed as ‘available-for-sale’, impairment is assessed based on the same criteria as fi nancial assets carried at amortised cost. If, in a subsequent year, the fair value of a debt instrument increases and the increase can be objectively related to an event occurring after the impairment loss was recognised in ‘Impairment losses’ in the statement of profi t or loss and other comprehensive income, the impairment loss is reversed through the statement of profi t or loss and other comprehensive income.
In the case of equity investments classifi ed as ‘available-for-sale’, objective evidence would include a signifi cant or prolonged decline (more than 13,5% and more than 9 months) in the fair value of the investment below its cost. Where there is evidence of impairment, the cumulative loss – measured as the difference between the acquisition cost and the current fair value, less any impairment loss on that investment previously recognised in profi t or loss – is removed from equity and recognised in ‘Impairment losses’ in the statement of profi t or loss and other comprehensive income. Impairment losses on equity investments are not reversed through statement of profi t or loss and other comprehensive income; increases in their fair value after impairment are recognised directly in Other comprehensive income.
(c) Held-to-maturity investments
‘Held-to-maturity’ investments are fi nancial assets with fi xed or determinable payments and maturities that the VUB Group has the positive intent and ability to hold to maturity.
‘Held-to-maturity’ investments are carried at amortised cost less any impairment losses. Amortised cost is the amount at which the asset was initially measured minus principal repayments, plus or minus the cumulative amortisation using the effective interest method of any difference between that initial amount and the maturity amount. The amortisation is recognised in the statement of profi t or loss and other comprehensive income in ‘Interest and similar income’.
The VUB Group assesses on a regular basis whether there is any objective evidence that a ‘held-to-maturity’ investment may be impaired. A fi nancial asset is impaired if its carrying amount is greater than its estimated recoverable amount.

67
Consolidated fi nancial statements
2.12 Repurchase and reverse repurchase agreements
Securities sold under sale and repurchase agreements (‘repo transactions’) remain as assets in the statement of fi nancial position under the original caption and the liability from the received loan is included in ‘Due to central and other banks’ or ‘Due to customers’.
Securities purchased under agreements to purchase and resell (‘reverse repo transactions’) are recorded only in the off-balance sheet and the loan provided is reported in the statement of fi nancial position in ‘Due from banks’ or ‘Loans and advances to customers’, as appropriate.
The price differential between the purchase and sale price of securities is treated as interest income or expense and deferred over the life of the agreement.
2.13 Derivative fi nancial instruments
In the normal course of business, the VUB Group is a party to contracts with derivative fi nancial instruments, which represent a very low initial investment compared to the notional value of the contract. The derivative fi nancial instruments used include foreign exchange forwards, interest rate/foreign exchange swaps and options, forward rate agreements and cross currency swaps. The VUB Group also uses fi nancial instruments to hedge interest rate risk and currency exposures associated with its transactions in the fi nancial markets. They are accounted for as trading derivatives if they do not fully comply with the defi nition of a hedging derivative as prescribed by IFRS. The VUB Group also acts as an intermediary provider of these instruments to certain customers.
Derivative fi nancial instruments are initially recognised and subsequently re-measured in the statement of fi nancial position at fair value. All derivatives are carried as assets when the fair value is positive and as liabili-ties when the fair value is negative. Changes in the fair value of derivatives are included in ‘Net trading result’.
Fair values are obtained from quoted market prices, discounted cash fl ow models and option pricing models as appropriate. The fair values of derivative positions are computed using standard formulas and prevailing interest rates applicable for respective currencies available on the market at reporting dates.
Embedded derivatives
The VUB Group assesses whether any embedded derivatives contained in given contract are required to be separated from the host contract and accounted for as derivatives under IAS 39. An embedded derivative is a component of a hybrid (combined) instrument that also includes a non-derivative host contract-with the effect that some of the cash fl ows of the combined instrument vary in a way similar to a stand-alone derivative.
The VUB Group accounts for embedded derivatives separately from the host contract if: the economic characteristics and risks of the embedded derivative are not closely related to the economic characteristics and risks of the host contract; a separate instrument with the same terms as the embedded derivative would meet the defi nition of a derivative; and the hybrid (combined) instrument is not measured at fair value with changes in fair value recognised in the statement of profi t or loss and other comprehensive income.
Hedging derivatives
The Group makes use of derivative instruments to manage exposures to interest rate, foreign currency, infl ation and credit risks, including exposures arising from expected transactions. In order to manage individual risks, the Group applies hedge accounting for transactions which meet the specifi ed criteria.
At the inception of the hedge relationship, the Group formally documents the relationship between the hedged item and the hedging instrument, including the nature of the risk, the objective and strategy for undertaking the hedge and the method that will be used to assess the effectiveness of the hedging relationship.
Also at the inception of the hedge relationship, a formal assessment is undertaken to ensure the hedging instrument is expected to be highly effective in offsetting the designated risk in the hedged item. Hedges are formally assessed each month. A hedge is regarded as highly effective if the changes in fair value or cash fl ows
68
Consolidated fi nancial statements
attributable to the hedged risk during the period for which the hedge is designated are expected to offset in a range of 80% to 125%.
In situations where that hedged item is an expected transaction, the Group assesses whether the transaction is highly probable and presents an exposure to variations in cash fl ows that could ultimately affect the state-ment of profi t or loss and other comprehensive income.
Cash fl ow hedges
For designated and qualifying cash fl ow hedges, the effective portion of the gain or loss on the hedging instrument is initially recognised in other comprehensive income as ‘Cash fl ow hedges’. The ineffective portion of the gain or loss on the hedging instrument is recognised immediately as gain or loss in the statement of profi t or loss and other comprehensive income in ‘Net trading result’.When the hedged cash fl ow affects profi t or loss, the gain or loss on the hedging instrument is reclassifi ed from other comprehensive income to profi t or loss as a reclassifi cation adjustment. When a hedging instrument expires, or is sold, terminated, exercised, or when a hedge no longer meets the criteria for hedge accounting, any cumulative gain or loss that has been recognised in other comprehensive income remains separately in equity and is reclassifi ed from other comprehensive income to profi t or loss as a reclassifi cation adjustment when the hedged expected transaction is ultimately recognised. When an expected transaction is no longer expected to occur, the cumulative gain or loss that was reported in equity is immediately reclassifi ed from other comprehensive income to profi t or loss as a reclassifi cation adjustment.
Fair value hedges
For designated and qualifying fair value hedges, the change in the fair value of a hedging derivative is recognised in the statement of profi t or loss and other comprehensive income in ‘Net trading result’. Meanwhile, the change in the fair value of the hedged item attributable to the risk hedged is recorded as part of the carrying value of the hedged item and is also recognised in the statement of profi t or loss and other comprehensive income in ‘Net trading result’.
If the hedging instrument expires or is sold, terminated or exercised, or where the hedge no longer meets the criteria for hedge accounting, the hedge relationship is terminated. For hedged items recorded at amortised cost, the difference between the carrying value of the hedged item on termination and the face value is amor-tised over the remaining term of the original hedge using the effective interest rate (‘EIR’). If the hedged item is derecognised, the unamortised fair value adjustment is reclassifi ed from other comprehensive income to profi t or loss as a reclassifi cation adjustment.
2.14 Offsetting fi nancial instruments
Financial assets and fi nancial liabilities are offset and the net amount reported in the statement of fi nancial position, if, and only if, there is an intention to settle on a net basis, or to realize the asset and settle the liability simultaneously. This is not generally the case with master netting agreements, and the related assets and liabilities are presented gross in the statement of fi nancial position.
2.15 Non-current assets held for sale
Non-current assets held for sale are assets where the carrying amount will be recovered principally through a sale transaction rather than through continuing use. They are represented by assets that are available for immediate sale in their present condition and their sale is considered to be highly probable.
Assets classifi ed as held for sale are measured at the lower of their carrying amount and fair value less cost to sell.
2.16 Loans and advances to customers and impairment losses
Loans and advances are fi nancial assets with fi xed or determinable payments and fi xed maturities that are not quoted in an active market and are recorded at amortised cost less any impairment losses. All loans and advances to customers are recognised in the statement of fi nancial position when cash is advanced to borrowers.

69
Consolidated fi nancial statements
Loans and advances to customers are subject to periodic impairment testing. An impairment loss for a loan, or a group of similar loans, is established if their carrying amount is greater than their estimated recoverable amount. The recoverable amount is the present value of expected future cash fl ows, including amounts recoverable from guarantees and collaterals, discounted based on the loan’s original effective interest rate. The amount of the impairment loss is included in the statement of profi t or loss and other comprehensive income.
The VUB Group fi rst assesses whether objective evidence of impairment exists on its exposures. Signifi cant exposures are assessed individually, while exposures that are not signifi cant are assessed either individually or on portfolio basis. The main criterion for determining, whether a specifi c exposure is individually signifi cant is the sum of on-balance exposure and off-balance exposure exceeding signifi cance threshold (€ 500 thousand). The amounts of on-balance and off-balance exposure are calculated at the borrower level. If the Bank determines that no objective evidence of impairment exists for an individually assessed exposure, it includes the asset in a group of exposures with similar credit risk characteristics and collectively assesses them for impairment and recognises provision accordingly.
The VUB Group writes off loans and advances when it determines that the loans and advances are uncollectible. Loans and advances are written off against the reversal of the related impairment losses. Any recoveries of written off loans are credited to the statement of profi t or loss and other comprehensive income on receipt.
2.17 Associates and joint ventures
Transactions ‘under common control’ refer to business combinations involving entities belonging to the same group. The VUB Group the follows accounting treatment of such transactions according to group accounting policies, i.e. gains and losses are recorded to the retained earnings. In the case of disposals made on a cash basis any difference between the sale price and carrying amount of the net assets disposed is recorded directly in shareholder’s equity net of the tax effect.
2.18 Intangible assets
Intangible assets are recorded at historical cost less accumulated amortisation and impairment losses. Amorti-sation is calculated on a straight-line basis in order to write off the cost of each asset to its residual value over its estimated useful economic life as follows:
Years
Software and Other intangible assets 7
Intangible assets acquired in a business combination are capitalised at fair values as at the date of acquisition and tested for impairment annually or whenever events or changes in circumstances indicate that the carrying amount may not be recoverable. Acquired intangible assets are amortised in line with their future cash fl ows over the estimated useful economic lives as follows:
Years
Software 3
Customer contracts and relationships including brand names 3 – 9
Amortisation methods, useful lives and residual values are reassessed at the reporting date.
2.19 Goodwill
Goodwill represents the excess of the cost of an acquisition over the fair value of the Group’s share of the identifi able assets, liabilities and contingent liabilities of the acquired subsidiary at the date of acquisition.
Goodwill is measured at cost less impairment, if any. Goodwill is tested for impairment annually or more frequently if events or changes in circumstances indicate that the carrying amount may be impaired.

70
Consolidated fi nancial statements
2.20 Property and equipment
At initial recognition, the items of property and equipment are measured at cost. At 31 December 2017, the VUB Group changed the accounting policy for buildings and land, before evaluated from the cost to the revaluation model for subsequent measurement, following the Intesa Sanpaolo Group policy.
This is a voluntary change in accounting policy under lAS 8 ‘Accounting Policies, Changes in Accounting Estimates and Errors‘. lAS 8 paragraph 17 states that the initial application of a policy to revalue assets within the scope of lAS 16 is a change in an accounting policy to be dealt with as a revaluation in accordance with IAS 16. Therefore in case of a change in accounting policy, with the transition from the amortized cost to the revaluation model, any change shall be refl ected only prospectively.
The assets subject to the revaluation model are depreciated based on their revalued value. Since the change in the accounting policy took place at the end of the year, the assets were depreciated based on the cost model until the end of the year. A new depreciation schedule will be implemented starting from January 2018.
After determining the 2017 depreciation charges and testing for impairment, the assets value was adjusted to their new fair value. The fair value of individual buildings and land was determined using independent external expert reports (appraisals) provided by specialised companies. If the fair value was higher than the carrying amount the value of the asset on the balance sheet was increased through other comprehensive income and accumulated in equity under the heading ‘Revaluation surplus from property and equipment’. In case that an impairment loss was recorded in the income statement previously, the reversal of this impairment was recorded in the income statement up to the amount previously recognised in the income statement. If the fair value was lower than the carrying amount, the decrease was recognized in profi t or loss. The ISP Group chose to apply the elimination approach which means that the accumulated depreciation is eliminated against the gross carrying amount of the asset and therefore, from the revaluation date, the asset cost is are equal to its fair value as at 31 December 2017.
Other components of ‘Property and equipment’ were recorded at historical cost less accumulated depreciation and impairment losses. Acquisition cost includes the purchase price plus other costs related to acquisition such as freight, duties or commissions. The costs of expansion, modernisation or improvements leading to increased productivity, capacity or effi ciency are capitalised. Repairs and renovations are charged to the statement of profi t or loss and other comprehensive income when the expenditure is incurred.
Depreciation is calculated on a straight-line basis in order to write off the cost of each asset to its residual value over its estimated useful economic life as follows:
Years
Buildings 20, 30, 40
Equipment 4, 6, 10, 12
Other tangibles 4, 5, 6, 12
Land, assets in progress and art collections are not depreciated. The depreciation of assets in progress begins when the related assets are put into use.
The VUB Group periodically tests its assets for impairment. Where the carrying amount of an asset is greater than its estimated recoverable amount, it is written down to this recoverable amount.
Depreciation methods, useful lives and residual values are reassessed at the reporting date.
2.21 Leasing
The determination of whether an arrangement is a fi nance lease is based on the substance of the arrangement and requires an assessment of whether:– the fulfi lment of the arrangement is dependent on the use of a specifi c asset or assets that could only be
used by the lessee without major modifi cations being made;

71
Consolidated fi nancial statements
– the lease transfers ownership of the asset at the end of the lease term;– the VUB Group has the option to purchase the asset at a price suffi ciently below fair value at exercise date;– it is reasonably certain the option will be exercised;– the lease term is for a major part of the asset’s economic life even if title is not transferred;– the present value of minimum lease payments substantially equals the asset’s fair value at inception.
VUB Group as a lessee
Finance leases, which transfer to the VUB Group substantially all the risks and benefi ts incidental to ownership of the leased item, are capitalised at the inception of the lease at the fair value of the leased property or, if lower, at the present value of the minimum lease payments and included in ‘Property and equipment’ with the corresponding liability to the lessor included in ‘Other liabilities’. Lease payments are apportioned between the fi nance charges and reduction of the lease liability so as to achieve a constant rate of interest on the remaining balance of the liability. Finance charges are charged directly against income in ‘Interest and similar expense’.
Capitalised leased assets are depreciated over the shorter of the estimated useful life of the asset and the lease term, if there is no reasonable certainty that the VUB Group will obtain ownership by the end of the lease term.
Operating lease payments are not recognised in the statement of fi nancial position. Any rentals payable are accounted for on a straight-line basis over the lease term and included in ‘Other operating expenses’.
VUB Group as a lessor
Leases where the VUB Group transfers substantially all the risk and benefi ts of ownership of the asset are classifi ed as fi nance leases. Leases are recognised upon acceptance of the asset by the customer at an amount equal to the net investment in the lease. The sum of future minimum lease payments and initial origination fees equate to the gross investment in the lease. The difference between the gross and net investment in the lease represents unearned fi nance income, which is recognised as revenue in ‘Interest and similar income’ over the lease term at a constant periodic rate of return on the net investment in the lease.
2.22 Deposits, debt securities issued and subordinated liabilities
Deposits, debt securities issued and subordinated liabilities are the VUB Group’s sources of debt funding.
The VUB Group classifi es capital instruments as fi nancial liabilities or equity instruments in accordance with the substance of the contractual terms of the instruments.
Deposits, debt securities issued and subordinated liabilities are initially measured at fair value minus incremental direct transaction costs, and subsequently measured at their amortised cost using the effective interest rate method.
2.23 Provisions
Provisions are recognised when the VUB Group has a present obligation (legal or constructive) as a result of a past event, and it is probable that an outfl ow of resources embodying economic benefi ts will be required to settle the obligation and a reliable estimate can be made of the amount of the obligation.
2.24 Provisions for employee benefi ts
The Group’s obligation in respect of retirement and jubilee employee benefi ts is the amount of future benefi t that employees have earned in return for their service in the current and prior periods. That benefi t is discounted to determine its present value. Employee benefi t reserves are disclosed in the statement of fi nancial position in ‘Other liabilities’. All gains or losses in relation to the employee benefi ts are recognised in ‘Salaries and employee benefi ts’.

72
Consolidated fi nancial statements
2.25 Financial guarantees
Financial guarantees are contracts that require the VUB Group to make specifi ed payments to reimburse the holder for a loss it incurs because a specifi ed debtor fails to make a payment when it falls due, in accordance with the terms of a debt instrument consisting of letters of credit, guarantees and acceptances.
Financial guarantee liabilities are initially recognised at their fair value, and the initial fair value is amortised over the life of the fi nancial guarantee in the statement of profi t or loss and other comprehensive income in ‘Fee and commission income’ on a straight line basis. The guarantee liability is subsequently carried at the higher of this amortised amount and the present value of any expected payment (when a payment under the guarantee has become probable). Financial guarantees are included within ‘Other liabilities’. Any increase in the liability relating to fi nancial guarantees is recorded in the statement of profi t or loss and other comprehen-sive income in ‘Impairment losses’.
2.26 Equity reserves
The reserves recorded in equity that are disclosed in the statement of fi nancial position include:
‘Revaluation surplus from property and equipment’ reserve which consists of the revaluation surplus of build-ings and land measured at fair value using a revaluation model from 31 December 2017.
‘Cash fl ow hedges’ reserve which comprises the portion of the gain or loss on a hedging instrument in a cash fl ow hedge that is determined to be an effective hedge.
‘Available-for-sale fi nancial assets’ reserve which comprises changes in the fair value of available-for-sale investments.
‘Translation of foreign operation’ reserve which is used to record exchange differences arising from the trans-lation of the net investment in foreign operations.
2.27 Net interest income
Interest income and expense is recognised in the statement of profi t or loss and other comprehensive income on an accrual basis using the effective interest rate method. Interest income and expense includes the amortisation of any discount or premium on fi nancial instruments. Interest income also includes up-front and commitment fees, which are subject to the effective interest rate calculation and are amortised over the life of the loan.
2.28 Net fee and commission income
Fee and commission income arises on fi nancial services provided by the VUB Group including account mainte-nance, cash management services, brokerage services, investment advice and fi nancial planning, investment banking services, project fi nance transactions and asset management services. Fee and commission income and expense is recognised when the corresponding service is provided.
2.29 Net trading result
Net trading result includes gains and losses arising from purchases, disposals and changes in the fair value of fi nancial assets and liabilities including securities and derivative instruments. It also includes the result of all foreign currency transactions.
2.30 Dividend income
Dividend income is recognised in the statement of profi t or loss and other comprehensive income on the date that the dividend is declared.

73
Consolidated fi nancial statements
2.31 Current and deferred income tax
Income tax is calculated in accordance with the regulations of the Slovak Republic and other jurisdictions, in which the VUB Group operates.
Deferred tax assets and liabilities are recognised, using the balance sheet method, for all temporary differences arising between the carrying amounts of assets and liabilities and their tax bases. Expected tax rates, applicable for the periods when assets and liabilities are realised, are used to determine deferred tax.
The Group is also subject to various indirect operating taxes, which are included in ‘Other operating expenses’.
2.32 Fiduciary assets
Assets held in a fi duciary capacity are not reported in the balance sheet, as such are not the assets of the VUB Group. They are recorded in the off-balance sheet.
2.33 Signifi cant accounting judgements and estimates
Judgements
In the process of applying the VUB Group’s accounting policies, management has made judgements, apart from those involving estimations, that signifi cantly affect the amounts recognised in the fi nancial statements. The most signifi cant judgements relate to the classifi cation of fi nancial instruments.
Held-to-maturity investments
The VUB Group follows the guidance of IAS 39 on classifying non-derivative fi nancial assets with fi xed or determinable payments and fi xed maturity as held-to-maturity. This classifi cation requires signifi cant judge-ment. In making this judgement, the VUB Group evaluates its intention and ability to hold such investments to maturity. If the VUB Group fails to hold these investments to maturity other than for a specifi c circumstance, for example selling a higher than insignifi cant amount close to maturity, it will be required to reclassify the entire class as available-for-sale. The investments would therefore be measured at fair value and not at amor-tised cost.
Financial assets held for trading
The VUB Group classifi es a fi nancial asset as ‘held for trading’ if it is acquired principally for the purpose of selling it in the near term, or if it is part of a portfolio of identifi ed fi nancial instruments that are managed together and for which there is evidence of a recent actual pattern of short-term profi t taking, or if it is a derivative.
Financial assets designated at fair value through profi t or loss on initial recognition
The VUB Group uses the category ‘at fair value through profi t or loss on initial recognition’ to recognize equity shares of the parent company acquired as part of the incentive plan based on which the amount due to employees benefi ting from the plan recognized under share remuneration scheme in ‘Other liabilities’ (see also note 25) is proportional to the fair value of these shares.
Since both variations in the amount of the liability and in the fair value of the shares are recognized in the statement of profi t or loss and other comprehensive income, classifi cation of equity shares into the category ‘at fair value through profi t or loss on initial recognition’ allows the neutralisation of the effect derived from the changes in the value of the debt on the statement of profi t or loss and other comprehensive income and results into the elimination of the accounting mismatch.
Estimates
The preparation of the fi nancial statements requires management to make certain estimates and assumptions, which impact the carrying amounts of the VUB Group’s assets and liabilities and the disclosure of contingent items at the end of the reporting period and reported revenues and expenses for the period then ended.

74
Consolidated fi nancial statements
Estimates are used for, but not limited to: fair values of fi nancial instruments, fair value of buildings and land under the revaluation model, impairment losses on loans and advances to customers, impairment losses for off-balance sheet risks, useful lives and residual values of tangible and intangible assets, impairment losses on tangible and intangible assets, liabilities from employee benefi ts and provisions for legal claims.
Fair value of fi nancial instruments
Where the fair values of fi nancial assets and fi nancial liabilities recorded on the statement of fi nancial position cannot be derived from active markets, they are determined using a variety of valuation techniques which include the use of mathematical models. The input to these models is taken from observable markets where possible, but where this is not feasible, a degree of judgement is required in establishing fair values. The judgements include considerations of liquidity and model inputs such as correlation and volatility for longer dated fi nancial instruments.
Impairment losses on loans and advances
The VUB Group reviews its loans and advances at each reporting date to assess whether a specifi c allowance for impairment should be recorded in the statement of profi t or loss and other comprehensive income. In particular, judgement by management is required in the estimation of the amount and timing of future cash fl ows when determining the level of allowance required. Such estimates are based on assumptions about a number of factors and actual results may differ, resulting in future changes to the specifi c allowance.
The individual assessment of exposures is based on the detailed review and analysis of the borrower’s situation, including the critical review of the following sources of information, without limitation to:– the latest fi nancial statements available (including consolidated ones, if any) accompanied by the report on
operations and audit report, if any, as well as previous years’ fi nancial statements;– information on specifi c corporate events (e.g. extraordinary transactions);– the current and forecast fi nancial position and results, analysis of variances between forecasts and actuals;– for borrowers belonging to economic groups, information on their internal and external relationships (to
assess the risk of contamination or its deterioration);– the list of bank relationships (credit lines/utilisation/transaction status);– the customer’s short- and medium-term plans and strategies supplemented by fi nancial projections (at
least three-year), the statement of expected cash fl ows, product analysis, sector and market studies, etc.;– any documentation by third-party experts on the reasons for the borrower’s deterioration, and potential
actions to reorganise the company and exit from the crisis;– updated business profi les from the Chamber of Commerce / Corporate Registry or equivalent, cadastral
surveys concerning all debtors and guarantors;– nature and validity of the collaterals, appraisal for each asset, presence of mortgage/pledge registrations
other than the Groups;– latest and historical Credit Bureau reports.
The individual assessment, formulated analytically for each exposure, shall be based on the detailed and comprehensive review of all elements that are available.
In addition to specifi c allowances against individually signifi cant loans and advances, the VUB Group also makes a collective impairment allowance against exposures which, although not specifi cally identifi ed as requiring a specifi c allowance, have a greater risk of default than when originally granted. This takes into consideration factors such as any deterioration in country risk, industry and technological obsolescence, as well as identifi ed structural weaknesses or deterioration in cash fl ows.
Calculation of impairment losses on collective basis is based on particular regulatory segment, probability of default (‘PD’), loss given default (‘LGD’), credit conversion factor (‘CCF’), loss confi rmation period (‘LCP’). For each segment were developed models for such risk parameters. These models are regularly under review.
On-balance impairment losses = EAD x PD x LGD x LCPOff-balance reserves = EAD x PD x LGD x CCF
For risk portfolios which PD and LGD parameters cannot be estimated, i.e. portfolios without suffi cient time series data minimum requirements are used.

75
Consolidated fi nancial statements
Future events and their effects cannot be perceived with certainty. Accordingly, the accounting estimates made require the exercise of judgement and those used in the preparation of the fi nancial statements will change as new events occur, as more experience is acquired, as additional information is obtained and as the VUB Group’s operating environment changes. Actual results may differ from those estimates.
3. Financial and operational risk management
Introduction and overview
The Group has exposure to the following risks from its use of fi nancial instruments:
(a) Credit risk,(b) Market risk,(c) Liquidity risk,(d) Operational risk.
This note presents information about the Group’s exposure to each of the above risks, the Group’s objectives, policies and processes for measuring and managing risk.
Risk management framework
The Management Board is the statutory body governing the executive management of the Bank, and has absolute authority over all matters concerning risk. The Management Board has primary responsibility for the creation and dissolution of risk related governance bodies. The primary governance bodies overseeing risk issues are:– Asset/Liability Committee (‘ALCO’),– Credit Risk Committee (‘CRC’),– Operational Risk Committee (‘ORC’).
The Management Board delegates its risk authority to these governance bodies through statutes, which iden-tify members of the governance bodies, competencies and responsibilities of the members. The competency of each governance body is established in relevant Charters.
The Group’s risk management policies are established to identify and analyze the risks faced by the Group, to set appropriate risk limits and controls and to monitor risks and adherence to limits. Risk management policies and systems are reviewed regularly to refl ect changes in market conditions, products and services offered. The Group, through its training and management standards and procedures, aims to develop a disciplined and constructive control environment, in which all employees understand their roles and obligations. The Group’s Internal Audit Department is responsible for monitoring compliance with the Group’s risk management policies and procedures, and for reviewing the adequacy of the risk management framework in relation to the risks faced by the Group. Internal Audit undertakes both regular and ad-hoc reviews of risk management controls and procedures.
(a) Credit risk
Credit risk is the risk of a fi nancial loss to the Group if a customer or counterparty to a fi nancial instrument fails to meet its contractual obligations, and arises principally from the Group’s loans and advances to customers and banks as well as investment securities. For risk management reporting purposes, the Group considers and consolidates all elements of credit risk exposure (such as individual obligor default risk, country and sector risk). For risk management purposes, the credit risk arising on trading securities is managed independently, but reported as a component of market risk exposure.
The Credit Risk Charter establishes the guidelines for measurement, control and management of credit risk by defi ning the legal framework, main responsibilities, policies and methodologies that support the credit risk management process of VUB Group.

76
Consolidated fi nancial statements
More specifi cally, the Credit Risk Charter defi nes both the general and specifi c (retail, corporate) credit risk requirements for applied methodologies and procedures, and includes, as separate sections, the policies governing the key aspects of the Group’s credit risk management process:– Authorized Approval Authority,– Collateral Management Policy, – Provisioning Policy, – Credit Concentration Limits, – Default Defi nition, – Risk Management Client Segmentation Policy, – Corporate Credit Policy, Retail Credit Policy, – Retail and Corporate Remedial Management and Collections.
Management of credit risk
The Risk Management Division is established within the Bank as a Control Unit and managed by the Chief Risk Offi cer, who is a member of the Bank’s Management Board. The Risk Management Division is organisationally structured to provide support to the Business Units, as well as to provide reporting of credit, market and oper-ational risks to the Supervisory Board and Management Board. The Risk Management Division is responsible for overseeing the Group’s credit risk including:– The development of credit risk strategies, policies, processes and procedures covering rules for credit
assessment, collateral requirements, risk grading and reporting;– Setting limits for the concentration of exposure to counterparties, related parties, countries and total assets
and monitoring compliance with those limits;– Establishment of the authorisation structure for the approval and renewal of credit facilities. Authorisation
limits are set in the Credit Risk Charter;– Credit risk assessment according to defi ned policy;– Monitoring of quality portfolio performance and its compliance with set limits (regulatory, internal). Regular
reports are provided to the Management Board and the CRC on the credit quality of Group’s portfolios;– Development, maintenance and validation of scoring and rating models – both application and behav-
ioural;– Development, maintenance and back-testing of impairment loss models.
Impairment losses
The Group establishes an allowance for impairment losses, which represents its estimate of incurred losses in its loan portfolio.
If there is evidence of impairment for any individually signifi cant client of the Group, such as a breach of contract, problems with repayments or collateral, the Group Bank includes such a client to management of the Recovery Department for pursuing collection activities. Such clients exceeding signifi cant thresholds are considered to be individually impaired. For collective impairment, the Group uses historical evidence of impair-ment on a portfolio basis, mainly based on the payment discipline of the clients.
Rules for identifi cation of signifi cant clients and methodology for calculation are set in the Credit Risk Charter or stated in the Provisioning Policy procedure.

77
Consolidated fi nancial statements
The split of the credit portfolio to individually and portfolio assessed is shown below:
2017 2016
€ ‘000Amortised
costImpairment
lossesCarrying amount
Amortisedcost
Impairment losses
Carrying amount
Portfolio assessed
Banks 90,986 (73) 90,913 112,486 (18) 112,468
Customers
Sovereigns 128,594 (98) 128,496 132,154 (101) 132,053
Corporate 4,435,096 (42,556) 4,392,540 4,135,747 (40,944) 4,094,803
Retail 7,670,047 (242,166) 7,427,881 6,666,357 (253,288) 6,413,069
12,233,737 (284,820) 11,948,917 10,934,258 (294,333) 10,639,925
Securities
FVTPL 5,783 – 5,783 474 – 474
AFS 520,416 – 520,416 1,289,979 – 1,289,979
HTM 376,472 – 376,472 530,019 – 530,019
902,671 – 902,671 1,820,472 – 1,820,472
Individually assessed
Customers
Corporate 135,386 (84,812) 50,574 176,091 (94,652) 81,439
Retail 5,183 (3,945) 1,238 9,068 (5,151) 3,917
140,569 (88,757) 51,812 185,159 (99,803) 85,356
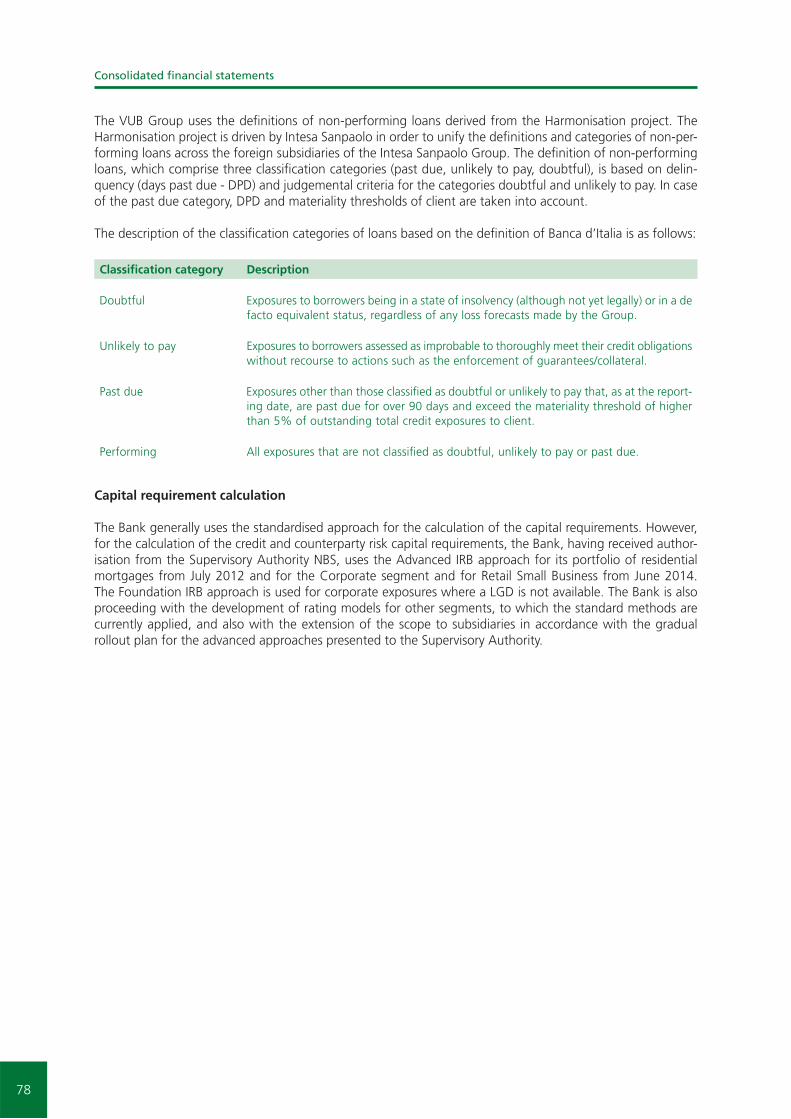
78
Consolidated fi nancial statements
The VUB Group uses the defi nitions of non-performing loans derived from the Harmonisation project. The Harmonisation project is driven by Intesa Sanpaolo in order to unify the defi nitions and categories of non-per-forming loans across the foreign subsidiaries of the Intesa Sanpaolo Group. The defi nition of non-performing loans, which comprise three classifi cation categories (past due, unlikely to pay, doubtful), is based on delin-quency (days past due - DPD) and judgemental criteria for the categories doubtful and unlikely to pay. In case of the past due category, DPD and materiality thresholds of client are taken into account.
The description of the classifi cation categories of loans based on the defi nition of Banca d’Italia is as follows:
Classifi cation category Description
Doubtful Exposures to borrowers being in a state of insolvency (although not yet legally) or in a de facto equivalent status, regardless of any loss forecasts made by the Group.
Unlikely to pay Exposures to borrowers assessed as improbable to thoroughly meet their credit obligations without recourse to actions such as the enforcement of guarantees/collateral.
Past due Exposures other than those classifi ed as doubtful or unlikely to pay that, as at the report-ing date, are past due for over 90 days and exceed the materiality threshold of higher than 5% of outstanding total credit exposures to client.
Performing All exposures that are not classifi ed as doubtful, unlikely to pay or past due.
Capital requirement calculation
The Bank generally uses the standardised approach for the calculation of the capital requirements. However, for the calculation of the credit and counterparty risk capital requirements, the Bank, having received author-isation from the Supervisory Authority NBS, uses the Advanced IRB approach for its portfolio of residential mortgages from July 2012 and for the Corporate segment and for Retail Small Business from June 2014. The Foundation IRB approach is used for corporate exposures where a LGD is not available. The Bank is also proceeding with the development of rating models for other segments, to which the standard methods are currently applied, and also with the extension of the scope to subsidiaries in accordance with the gradual rollout plan for the advanced approaches presented to the Supervisory Authority.

79
Consolidated fi nancial statements
The following table describes the Group’s credit portfolio in terms of classifi cation categories:
2017 2016
€ ‘000 CategoryAmortised
costImpairment
lossesCarrying amount
Amortisedcost
Impairment losses
Carrying amount
Banks
Performing 90,986 (73) 90,913 112,486 (18) 112,468
Sovereigns
Performing 128,593 (98) 128,495 132,153 (101) 132,052
Doubtful 1 – 1 1 – 1
128,594 (98) 128,496 132,154 (101) 132,053
Corporate
Performing 4,413,296 (35,648) 4,377,648 4,121,667 (33,816) 4,087,851
Past due 1,750 (245) 1,505 387 (151) 236
Unlikely to pay
84,671 (29,865) 54,806 92,566 (22,033) 70,533
Doubtful 70,765 (61,610) 9,155 97,218 (79,596) 17,622
4,570,482 (127,368) 4,443,114 4,311,838 (135,596) 4,176,242
Retail
Performing 7,326,886 (47,066) 7,279,820 6,330,199 (57,168) 6,273,031
Past due 15,468 (8,227) 7,241 19,424 (10,418) 9,006
Unlikely to pay
53,875 (25,239) 28,636 54,361 (27,602) 26,759
Doubtful 279,001 (165,579) 113,422 271,441 (163,251) 108,190
7,675,230 (246,111) 7,429,119 6,675,425 (258,439) 6,416,986
Securities
Performing 902,671 – 902,671 1,820,472 – 1,820,472

80
Consolidated fi nancial statements
Credit risk of fi nancial derivatives
Credit exposure or the replacement cost of derivative fi nancial instruments represents the VUB Group’s credit exposure from contracts with a positive fair value, that is, it indicates the estimated maximum potential losses of the VUB Group in the event that counterparties fail to perform their obligations. It is usually a small propor-tion of the notional amounts of the contracts. The credit exposure of each contract is indicated by the credit equivalent calculated pursuant to the generally applicable methodology using the current exposure method and involves the market value of the contract (only if positive, otherwise a zero value is taken into account) and a portion of the nominal value, which indicates the potential change in market value over the term of the contract. The credit equivalent is established depending on the type of contract and its maturity. The VUB Group assesses the credit risk of all fi nancial instruments on a daily basis.
With regard to IFRS 13 which contains a clarifi cation in reference to non-performance risk in determining the fair value of over-the-counter derivatives, the VUB Group uses the Bilateral Credit Value Adjustment model (‘bCVA’). It takes fully into account the effects of changes in counterparty credit ratings as well as the changes in own credit rating. The bCVA has two addends, calculated by considering the possibility that both coun-terparties go bankrupt, known as the Credit Value Adjustment (‘CVA’) and Debit Value Adjustment (‘DVA’):– The CVA (negative) takes into account scenarios whereby the counterparty fails before the Group that has
a positive exposure to the counterparty. In these scenarios the Group suffers a loss equal to the cost of replacing the derivative,
– The DVA (positive) takes into account scenarios whereby the Group fails before the counterparty and has a negative exposure to the counterparty. In these scenarios the Group achieves a gain equal to the cost of replacing the derivative.
The bCVA depends on the exposure, probability of default and the loss given default of the counterparties. The VUB Group is selective in its choice of counterparties and sets limits for transactions with customers. The Group takes its own and its counterparties’ credit risk into consideration to the extent it believes the market participants would do so.
The table below shows the maximum amount of credit risk of derivative fi nancial instruments, issued guaran-tees, commitments and undrawn credit facilities. To express the maximum amount of credit risk, the fair value of derivative fi nancial assets is increased by the value of the potential credit exposure (‘add on’) calculated as the nominal value of the derivative fi nancial instrument multiplied by the respective coeffi cient depending on the type of the instrument. The credit risk of the remaining fi nancial assets not reported in the table below approximates their carrying amounts.
€ ‘000 2017 2016
Financial assets
Derivative fi nancial instruments 121,142 94,970
Financial commitments and contingencies
Issued guarantees 783,667 764,156
Commitments and undrawn credit facilities 2,779,312 2,894,083
3,562,979 3,658,239

81
Consolidated fi nancial statements
The payment discipline of each client is monitored regularly via days past due (DPD).
DPD = Banking Date – Due Date for repayment
When the client fail to pay more than one agreed instalment, the date of the fi rst unpaid instalment is consid-ered as Due date for repayment.
2017 2016
€ ‘000Amortised
costImpairment
lossesCarrying amount
Amortised cost
Impairment losses
Carrying amount
Banks
No delinquency 90,986 (73) 90,913 112,486 (18) 112,468
Sovereigns
No delinquency 127,891 (98) 127,793 132,106 (101) 132,005
1 – 30 days 702 – 702 47 – 47
Over 181 days 1 – 1 1 – 1
128,594 (98) 128,496 132,154 (101) 132,053
Corporate
No delinquency 4,410,022 (62,344) 4,347,678 4,137,344 (52,617) 4,084,727
1 – 30 days 69,764 (2,188) 67,576 63,843 (4,223) 59,620
31 – 60 days 16,008 (2,530) 13,478 9,427 (661) 8,766
61 – 90 days 4,479 (1,786) 2,693 6,170 (347) 5,823
91 – 180 days 5,696 (2,777) 2,919 4,000 (3,062) 938
Over 181 days 64,513 (55,743) 8,770 91,054 (74,686) 16,368
4,570,482 (127,368) 4,443,114 4,311,838 (135,596) 4,176,242
Retail
No delinquency 7,062,054 (33,393) 7,028,661 6,091,367 (41,309) 6,050,058
1 – 30 days 258,143 (13,862) 244,281 227,267 (17,029) 210,238
31 – 60 days 45,368 (5,291) 40,077 45,402 (6,158) 39,244
61 – 90 days 28,669 (4,526) 24,143 28,538 (5,160) 23,378
91 – 180 days 43,736 (20,890) 22,846 50,438 (25,280) 25,158
Over 181 days 237,260 (168,149) 69,111 232,413 (163,503) 68,910
7,675,230 (246,111) 7,429,119 6,675,425 (258,439) 6,416,986
Securities
No delinquency 902,671 – 902,671 1,820,472 – 1,820,472

82
Consolidated fi nancial statements
Loans with renegotiated terms and forbearance policy
Loans with renegotiated terms are loans that have been restructured due to deterioration in the borrower’s fi nancial position, where the Group has made concessions by agreeing to terms and conditions that are more favourable for the borrower than the Group had provided initially. The revised terms usually include extending maturity, changing timing of interest payments and amendments to the terms of loan covenants. The VUB Group implements a forbearance policy in order to maximise collection opportunities and minimise the risk of default. Under the Group’s forbearance policy, an exposure is identifi ed as forborne if both of these two conditions are satisfi ed:– The VUB Group has determined the fi nancial diffi culties that the debtor is facing or is about to face;– The exposure has been subject to renegotiation or refi nancing, granted in relation to the borrower’s current
fi nancial diffi culties or fi nancial diffi culties that would have occurred in the absence of the renegotiation or refi nancing measures.
Both retail and corporate customers are subject to the forbearance policy:
Performing forborne Non-performing forborne
31 December 2017€ ‘000
Amortised cost
Impairment losses
Carrying amount
Amortised cost
Impairment losses
Carrying amount
Corporate 15,622 (460) 15,162 102,613 (51,055) 51,558
Retail 46,452 (1,276) 45,176 23,413 (12,132) 11,281
62,074 (1,736) 60,338 126,026 (63,187) 62,839
Performing forborne Non-performing forborne
31 December 2016€ ‘000
Amortised cost
Impairment losses
Carrying amount
Amortised cost
Impairment losses
Carrying amount
Corporate 39,653 (933) 38,720 134,919 (58,028) 76,891
Retail 50,101 (2,038) 48,063 21,197 (9,976) 11,221
89,754 (2,971) 86,783 156,116 (68,004) 88,112
Write-off Policy
The VUB Group writes off a loan or security balance when it determines that the loans or securities are uncollectible. In principle, the Group considers the credit balances to be uncollectible based on the past due days (1,080 days past due). Credit balances may be written off only if the collateral has already been realized. Receivables subject to write-off are being collected by external collection agencies until they qualify for write-off.
The credit balance can be written off earlier than defi ned in the conditions described above if there is evidence that the receivable cannot be collected. The write-off of such receivables is subject to the approval of the Credit Risk Offi cer.
Collateral Policy
The VUB Group’s collateral policy is an integral and indispensable part of the credit risk management and credit risk mitigation for VUB Group. Collateral is used primarily to provide the Group with the means for repayment of an exposure in the event of the default of the borrower. The principal objective of the policy is to clearly set up rules for a common and standard set of collateral types used by the Group in its lending activities. The rules, as the minimum, describe and state: – Conditions for legal enforceability; – Conditions for the process of valuation and the maximum values accepted by the Group at the origination
for specifi c types of collaterals; and– Conditions for the process of revaluation.

83
Consolidated fi nancial statements
However, collateral management has a wider meaning than the simple taking of collateral in order to secure the repayment of the Group’s exposures. This includes the following: – The establishment and maintenance of collateral a policy defi ning the types of collateral taken by the
Group, the legal documentation used by the Group to secure its right to this collateral in the event of default and the valuation of this collateral at origination. These aspects of collateral management are addressed in the internal policy document;
– The relevant and proper perfection and registration of collateral to secure the Group’s right to collateral in the event of default by the borrower;
– The regular monitoring and re-valuation of collateral held by the Group during the life of the exposure;– The analysis, monitoring and review of realization rates achieved by Recovery Department activities in
order to assess the effectiveness of the collateral policy as a risk mitigant.
The VUB Group’s decisions on the enforcement of collateral is individual and depends on factors such as the actual amount of the receivable, the current condition and value of the collateral, the length of the collateral realization period or collection related costs. The relevant competent body of the Group decides which collateral instrument will be used.
The VUB Group mainly uses the following means of enforcement of collateral:– Voluntary auction,– Foreclosure procedure,– Realization of the collateral for the receivable in a bankruptcy procedure,– Sale of receivables including collateral.
The Group holds collateral and other credit enhancements against certain of its credit exposures. The collat-eral against loans and advances to customers is held in the form of mortgage interests over property, other registered securities over assets, and guarantees. Estimates of fair value are based on the value of collateral assessed at the time of borrowing and the Group updates the fair value on a regular basis.
The Group mitigates the credit risk of derivatives, reverse sale and repurchase agreements by entering into master netting agreements and holding collateral in the form of cash and marketable securities. Derivative transactions are either transacted on an exchange or entered into under International Swaps and Derivatives Association (‘ISDA’) master netting agreements. Under ISDA master netting agreements in certain circum-stances, e.g. when a credit event such as a default occurs, all outstanding transactions under the agreement are terminated, the termination value is assessed and only a single net amount is due or payable in settlement of all transactions.
The value of collateral and other security enhancements held against fi nancial assets is shown below:
2017 2016
€ ‘000 Clients Banks Clients Banks
Property 6,365,878 – 5,486,882 –
Debt securities 33,952 – 35,793 –
Other 1,042,009 44,655 1,092,965 28,948
7,441,839 44,655 6,615,640 28,948
Offsetting fi nancial assets and fi nancial liabilities
The disclosures set out in the tables below include fi nancial assets and fi nancial liabilities that are:– Offset in the statement of fi nancial position; or,– Subject to an enforceable master netting arrangement or similar agreement that covers similar fi nancial
instruments, irrespective of whether they are offset in the statement of fi nancial position.
In general, the similar agreements include derivative clearing agreements, global master repurchase agree-ments, and global master securities lending agreements. Similar fi nancial instruments include derivatives, sales and repurchase agreements, reverse sale and repurchase agreements, and securities borrowing and lending agreements. Financial instruments such as loans and deposits are not disclosed in the tables below unless they are offset in the statement of fi nancial position.

84
Consolidated fi nancial statements
The ISDA and similar master netting arrangements do not meet the criteria for offsetting in the statement of fi nancial position. This is because they create for the parties to the agreement a right of set-off of recognized amounts that is enforceable only following an event of default, insolvency or bankruptcy of the Group or the counterparties or following other predetermined events. In addition, the Group and its counterparties do not intend to settle on a net basis or to realize the assets and settle the liabilities simultaneously.
The Group receives and gives collateral in the form of cash and marketable securities in respect of the following transactions:– Derivatives,– Sale and repurchase, and reverse sale and repurchase agreements.
Such collateral is subject to standard industry terms including, when appropriate, an ISDA Credit Support Annex. This means that securities received or given as collateral can be pledged or sold during the term of the transaction but have to be returned on maturity of the transaction. The terms also give each party the right to terminate the related transactions on the counterparty’s failure to post collateral.
The following tables show the fi nancial assets and fi nancial liabilities that are subject to enforceable master netting arrangements and similar agreements in the statement of fi nancial position (‘SOFP’):
Related amounts
not offset in SOFP
31 December 2017€ ‘000
Gross amount
Gross amount offset in
SOFP
Net amount presented
in SOFP
Financial instrum.
and non-cash
collateral
Cash collateral
(received)/provided Net amount
Financial assets
Cash and balances with central banks (Loans and advances)
724,427 – 724,427 (724,494) – (67)
Derivative fi nancial instruments
47,277 – 47,277 – (11,629) 35,648
Financial liabilities
Derivative fi nancial instruments
(43,449) – (43,449) – 39,918 (3,531)
Related amountsnot offset in SOFP
31 December 2016€ ‘000
Gross amount
Gross amount offset in
SOFP
Net amount presented
in SOFP
Financial instrum.
and non-cash
collateral
Cash collateral
(received)/provided Net amount
Financial assets
Derivative fi nancial instruments
38,419 – 38,419 – (20,835) 17,584
Financial liabilities
Derivative fi nancial instruments
(56,007) – (56,007) – 55,083 (924)
Below is the reconciliation of the net amount of fi nancial instruments subject to enforceable master netting arrangements and similar agreements to the total carrying amount presented in the statement of fi nancial position:

85
Consolidated fi nancial statements
2017 2016
€ ‘000 Note
Total carryingamount
presentedin SOFP
In scope of offsettingdisclosure
Not in scope of
offsettingdisclosure
Totalcarryingamount
presentedin SOFP
In scope of offsettingdisclosure
Not in scope of
offsettingdisclosure
Financial assets
Cash and balances with central banks
8 1,595,097 724,427 870,670 1,029,103 – 1,029,103
Derivative fi nancial instruments
10 49,856 47,277 2,579 47,249 38,419 8,830
Financial liabilities
Derivative fi nancial instruments
10 (52,184) (43,449) (8,735) (65,354) (56,007) (9,347)
The Group monitors concentrations of credit risk by geographic location. An analysis of concentrations of credit risk at the reporting date is shown below.
2017 2016
€ ‘000Amortised
costImpairment
lossesCarrying amount
Amortised cost
Impairment losses
Carrying amount
Europe
Banks 59,942 (15) 59,927 109,930 (13) 109,917
Sovereigns 128,594 (98) 128,496 132,154 (101) 132,053
Corporate 4,526,662 (127,076) 4,399,586 4,216,749 (135,113) 4,081,636
Retail 7,671,893 (245,939) 7,425,954 6,672,586 (258,307) 6,414,279
Securities 896,362 – 896,362 1,795,305 – 1,795,305
13,283,453 (373,128) 12,910,325 12,926,724 (393,534) 12,533,190
America
Banks 30,370 (57) 30,313 2,197 (5) 2,192
Corporate 42,577 (127) 42,450 94,600 (418) 94,182
Retail 495 (3) 492 339 (3) 336
Securities 6,309 – 6,309 25,167 – 25,167
79,751 (187) 79,564 122,303 (426) 121,877
Asia
Banks 607 (1) 606 186 – 186
Corporate 1,243 (165) 1,078 489 (65) 424
Retail 2,305 (148) 2,157 1,927 (102) 1,825
4,155 (314) 3,841 2,602 (167) 2,435
Rest of the World
Banks 67 – 67 173 – 173
Retail 537 (21) 516 573 (27) 546
604 (21) 583 746 (27) 719

86
Consolidated fi nancial statements
An analysis of concentrations of credit risk of securities at the reporting date is shown below.
2017 2016
€ ‘000Amortised
costImpairment
lossesCarrying amount
Amortised cost
Impairment losses
Carrying amount
Europe Slovakia 629,706 – 629,706 1,019,478 – 1,019,478 Italy 266,591 – 266,591 753,595 – 753,595 Other 65 – 65 17,300 – 17,300
896,362 – 896,362 1,790,373 – 1,790,373
America USA 6,309 – 6,309 4,932 – 4,932
An analysis of exposures by industry sector is shown in the table below.
31 December 2017€ ‘000 Banks Sovereigns Corporate Retail* Securities
Agriculture – – 165,701 21,645 – Automotive – – 86,835 8 – Commodity Traders – – 107,687 3,927 – Construction – – 82,901 26,393 – Retail Customers – – 31,765 7,139,497 – Financial institutions** 88,642 – 396,773 194 81,523 Government – 123,246 9 24 821,148 Manufacturing – – 667,649 25,137 – Real estate – – 539,533 6,511 – Retail and Wholesale Trade – – 583,170 76,291 – Services – – 576,675 103,912 – Transportation – 397 276,679 13,874 – Utilities – 4,430 820,558 4,448 – Other 2,271 423 107,179 7,258 –
90,913 128,496 4,443,114 7,429,119 902,671
* ‘Retail’ includes Small Business and Flat Owners Associations among other things.** ‘Financial institutions’ involves fi nancial services, leasing and insurance.
31 December 2016€ ‘000 Banks Sovereigns Corporate Retail Securities
Agriculture – – 146,128 23,630 – Automotive – – 28,684 10 – Commodity Traders – – 86,476 448 – Construction – – 80,041 20,059 – Retail Customers – – 23,406 6,168,800 – Financial institutions 112,468 – 396,974 189 243,691 Government – 125,331 38 – 1,576,781 Manufacturing – – 788,313 24,309 – Real estate – – 658,995 4,028 – Retail and Wholesale Trade – – 453,269 61,644 – Services – 366 490,304 90,985 – Transportation – 444 200,710 12,613 – Utilities – 5,813 728,248 3,172 – Other – 99 94,656 7,099 –
112,468 132,053 4,176,242 6,416,986 1,820,472

87
Consolidated fi nancial statements
The table below shows the credit quality by class of assets for all fi nancial assets exposed to credit risk. The amounts presented are gross of impairment allowances. Past due but not impaired fi nancial assets are more than one day overdue.
Neither past due nor impaired Impaired (non-performing) Past due but not impaired
31 December 2017€ ‘000
Amortised cost
Impairment losses
Carrying amount
Amortised cost
Impairment losses
Carrying amount
Amortised cost
Impairment losses
Carrying amount
Banks 90,986 (73) 90,913 – – – – – –
Sovereigns
Municipalities 127,449 (97) 127,352 1 – 1 702 – 702
Municipalities – Leasing
442 (1) 441 – – – – – –
127,891 (98) 127,793 1 – 1 702 – 702
Corporate
Large Corporates 1,706,107 (3,602) 1,702,505 2,956 (1,962) 994 11,064 (113) 10,951
Specialized Lending 674,115 (12,449) 661,666 73,934 (27,872) 46,062 50 (1) 49
SME 1,373,595 (15,344) 1,358,251 54,088 (46,082) 8,006 24,691 (1,214) 23,477
Other Fin. Institutions
293,155 (1,386) 291,769 3 – 3 – – –
Public Sector Entities 1,070 (3) 1,067 5 – 5 83 – 83
Leasing 226,819 (915) 225,904 22,714 (14,628) 8,086 7,828 (217) 7,611
Factoring 55,185 (370) 54,815 3,486 (1,176) 2,310 39,534 (34) 39,500
4,330,046 (34,069) 4,295,977 157,186 (91,720) 65,466 83,250 (1,579) 81,671
Retail
Small Business 216,433 (3,096) 213,337 11,056 (9,106) 1,950 30,083 (711) 29,372
Small Business – Leasing
9,429 (36) 9,393 876 (343) 533 589 (14) 575
Consumer Loans 1,342,670 (17,764) 1,324,906 211,979 (134,898) 77,081 160,620 (12,560) 148,060
Mortgages 5,192,697 (4,852) 5,187,845 73,776 (17,858) 55,918 75,486 (2,692) 72,794
Credit Cards 152,820 (2,131) 150,689 39,549 (28,939) 10,610 11,240 (1,195) 10,045
Overdrafts 77,347 (993) 76,354 10,876 (7,707) 3,169 13,487 (646) 12,841
Leasing 3,745 (11) 3,734 231 (194) 37 187 (6) 181
Flat Owners Associations
27,651 (358) 27,293 – – – – – –
Other 12,393 – 12,393 1 – 1 9 (1) 8
7,035,185 (29,241) 7,005,944 348,344 (199,045) 149,299 291,701 (17,825) 273,876

88
Consolidated fi nancial statements
Neither past due nor impaired Impaired (non–performing) Past due but not impaired
31 December 2017€ ‘000
Amortised cost
Impairment losses
Carrying amount
Amortised cost
Impairment losses
Carrying amount
Amortised cost
Impairment losses
Carrying amount
Securities
FVTPL 5,784 – 5,784 – – – – – –
AFS 520,415 – 520,415 – – – – – –
HTM 376,472 – 376,472 – – – – – –
902,671 – 902,671 – – – – – –

89
Consolidated fi nancial statements
Neither past due nor impaired Impaired (non-performing) Past due but not impaired
31 December 2016€ ‘000
Amortised cost
Impairment losses
Carrying amount
Amortised cost
Impairment losses
Carrying amount
Amortised cost
Impairment losses
Carrying amount
Banks 112,486 (18) 112,468 – – – – – –
Sovereigns
Municipalities 131,724 (100) 131,624 1 – 1 47 – 47
Municipalities – Leasing
382 (1) 381 – – – – – –
132,106 (101) 132,005 1 – 1 47 – 47
Corporate
Large Corporates 1,477,274 (4,757) 1,472,517 23,884 (19,176) 4,708 1 – 1
Specialized Lending 789,331 (11,713) 777,618 79,948 (22,551) 57,397 1,251 (35) 1,216
SME 1,267,968 (13,608) 1,254,360 59,430 (41,286) 18,144 18,145 (884) 17,261
Other Fin. Institu-tions
256,068 (1,051) 255,017 4 (1) 3 – – –
Public Sector Entities 1,187 (3) 1,184 7 – 7 6 – 6
Leasing 225,058 (974) 224,084 24,391 (17,584) 6,807 18,412 (389) 18,023
Factoring 35,653 (331) 35,322 2,507 (1,182) 1,325 31,313 (71) 31,242
4,052,539 (32,437) 4,020,102 190,171 (101,780) 88,391 69,128 (1,379) 67,749
Retail
Small Business 188,131 (2,680) 185,451 14,193 (12,190) 2,003 27,503 (520) 26,983
Small Business – Leasing
7,860 (28) 7,832 1,376 (473) 903 797 (25) 772
Consumer Loans 1,291,821 (21,287) 1,270,534 204,441 (133,676) 70,765 141,350 (13,688) 127,662
Mortgages 4,307,191 (8,058) 4,299,133 74,266 (18,312) 55,954 65,264 (4,313) 60,951
Credit Cards 156,799 (2,964) 153,835 37,074 (26,384) 10,690 14,088 (1,802) 12,286
Overdrafts 78,874 (632) 78,242 13,650 (10,054) 3,596 16,196 (816) 15,380
Leasing 3,921 (12) 3,909 224 (182) 42 253 (23) 230
Flat Owners Associations
24,536 (318) 24,218 – – – – – –
Other 5,580 (2) 5,578 2 – 2 35 – 35
6,064,713 (35,981) 6,028,732 345,226 (201,271) 143,955 265,486 (21,187) 244,299

90
Consolidated fi nancial statements
Neither past due nor impaired Impaired (non-performing) Past due but not impaired
31 December 2016€ ‘000
Amortised cost
Impairment losses
Carrying amount
Amortised cost
Impairment losses
Carrying amount
Amortised cost
Impairment losses
Carrying amount
Securities
FVTPL 474 – 474 – – – – – –
AFS 1,289,979 – 1,289,979 – – – – – –
HTM 530,019 – 530,019 – – – – – –
1,820,472 – 1,820,472 – – – – – –
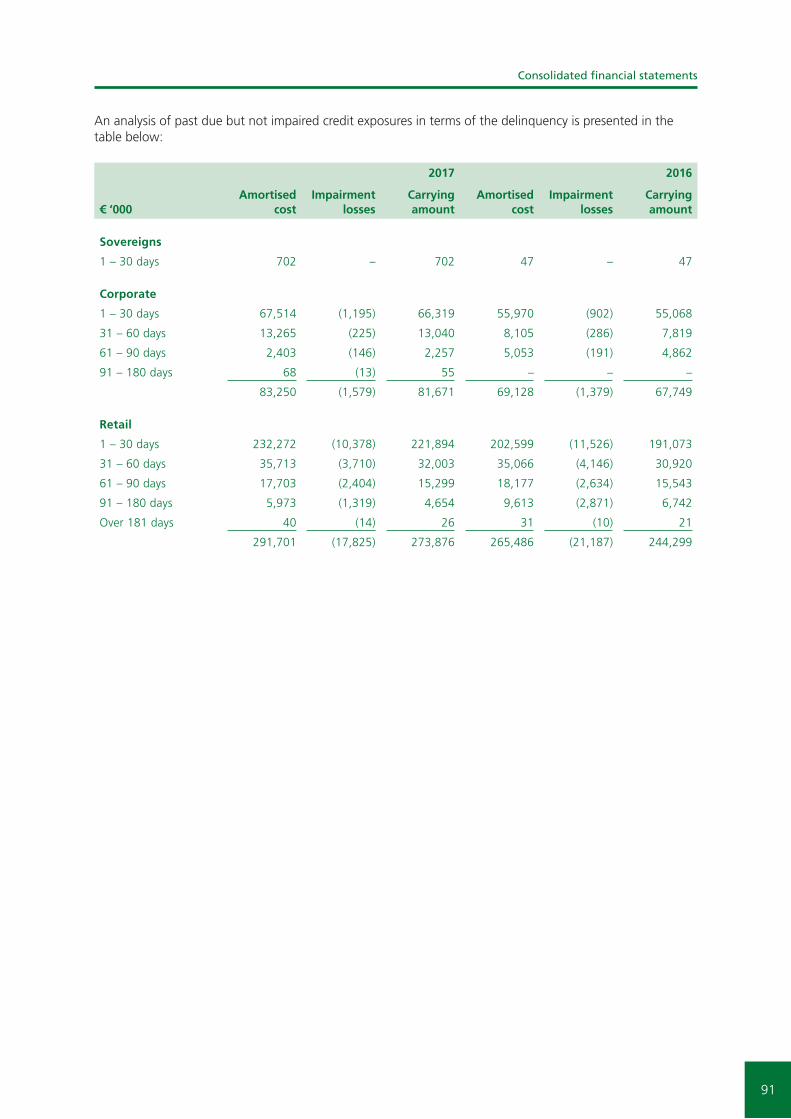
91
Consolidated fi nancial statements
An analysis of past due but not impaired credit exposures in terms of the delinquency is presented in the table below:
2017 2016
€ ‘000Amortised
costImpairment
lossesCarrying amount
Amortised cost
Impairment losses
Carrying amount
Sovereigns
1 – 30 days 702 – 702 47 – 47
Corporate
1 – 30 days 67,514 (1,195) 66,319 55,970 (902) 55,068
31 – 60 days 13,265 (225) 13,040 8,105 (286) 7,819
61 – 90 days 2,403 (146) 2,257 5,053 (191) 4,862
91 – 180 days 68 (13) 55 – – –
83,250 (1,579) 81,671 69,128 (1,379) 67,749
Retail
1 – 30 days 232,272 (10,378) 221,894 202,599 (11,526) 191,073
31 – 60 days 35,713 (3,710) 32,003 35,066 (4,146) 30,920
61 – 90 days 17,703 (2,404) 15,299 18,177 (2,634) 15,543
91 – 180 days 5,973 (1,319) 4,654 9,613 (2,871) 6,742
Over 181 days 40 (14) 26 31 (10) 21
291,701 (17,825) 273,876 265,486 (21,187) 244,299

92
Consolidated fi nancial statements
The overview of the internal rating scales applicable for corporate and retail exposures is shown below.
Large Corporates above € 500 million turnover
Large Corporates below € 500 million turnover and SME
Retail Small Business (‘SB’) and Flat Owners Associations (‘FOA’) Risk Profi le Description
LC_I1 – LC_I4 I1 – I4 I3 – I4 Very Low Good quality of assets, strong market penetration, steady activity, proven distinctive managerial skills, broad debt coverage capacity.
LC_I5 – LC_I6 I5 – I6 I5 – I6 Low Satisfactory quality and chargeability of assets, market penetration and managerial quality on the average; well set solvency, capital structure and debt composition; above average debt coverage capacity.
LC_M1 – LC_M2 M1 – M2 M1 – M2 Lower – Intermediate
Acceptable quality and chargeability of available assets, even if with a not negligible degree of risk; well–balanced solvency, capital structure and debt composition with slight liquidity surplus and weaker debt coverage capacity.
LC_M3 – LC_M4 M3 – M4 M3 – M4 Intermediate Acceptable quality and chargeability of available assets even if with a signifi cant degree of risk; vul-nerable margin at times, capital structure and debt composition that show worsening signals; low level of liquidity and short debt coverage margin.
LC_R1 – LC_R3 R1 – R3 R1 – R3 Upper – Intermediate
Still acceptable asset quality even if with possible liquidity stress; high level of gearing; managerial weakness, little market penetration and positioning; margins and competitiveness under pressure.
LC_R4 – LC_R5 R4 – R5 R4 – R5 High In addition to riskiness features for R1-R3 rating, there are evident diffi culties as well as problematic debt management.
D D D Default A default is considered to have occurred with regard to a particular obligor when either or both of the two following events have taken place:– the obligor is past due more than 90 days on any
material credit obligation to the Bank, the parent undertaking or any of its subsidiaries (absolute threshold is set according to NBS directive);
– the VUB Group considers that the obligor is unlikely to pay its credit obligations to the banking group in full, without recourse by the Bank to actions such as realizing security (if held).
Specialized Lending comprises of rating segments Special Purpose Vehicles (‘SPV’) and Real Estate Develop-ment (‘RED’). For Specialized Lending the Slotting approach is used by the Bank. Clients are assigned into fi ve slotting categories based on a qualitative valuation and information about the risk of default. Risk weights and expected loss used for the capital requirement calculation are also defi ned for each category. Categories are predefi ned by the Regulation (EU) no. 575/2013 of the European Parliament and of the Council (‘CRR regula-tion’) and internally, the categories used are as follows:
Specialized Lending – SPV and RED– Strong– Good– Satisfactory– Weak– Default

93
Consolidated fi nancial statements
For mortgages and unsecured retail, the retail segment incorporates many individually insignifi cant exposures with various characteristics, therefore the description of ratings correlates with the risk profi les.
Retail Mortgages
UnsecuredRetail Risk Profi le Description
L1a – L4 U01a – U02 Very Low High level of client’s socio-demographic information and fi nancial discipline.
N1 U03 Low Above average level of client’s socio-demographic information and fi nancial discipline.
N2 – W1 U04 – U07 Lower – Intermediate
Acceptable level of client’s socio-demographic information and fi nancial discipline.
W2 U08 – U09 Intermediate Acceptable level of client’s socio-demographic information and fi nancial discipline, but there are some signals of worsening credit quality.
- U10 – U11 Upper – Intermediate
Acceptable level of client’s socio-demographic information and fi nancial discipline, but there is worsening credit quality.
W3 U12 High Acceptable level of client’s socio-demographic information and fi nancial discipline, but there is negative credit behaviour.
D D Default A default is considered to have occurred with regard to a particular mortgage/obligor when either or both of the two following events have taken place:– the obligor is past due more than 90 days on any material credit
obligation to the Groups (absolute threshold is set according to NBS directive);
– the Bank considers that the obligor is unlikely to pay its credit obligations to the banking group in full, without recourse by the Bank to actions such as realizing security (if held).

94
Consolidated fi nancial statements
The following table shows the quality of the VUB Group’s credit portfolio in terms of internal ratings used for IRB purposes and the sensitivity analyses by improvement and deterioration by one internal rating grade:
Sensitivity analysis
31 December 2017€ ‘000
Internal rating (‘IR‘)
Amortised cost
Impairment losses
Carrying amount
Impact ofIR deterio-
ration
Impact ofIR impro-
vement
Banks Unrated 90,986 (73) 90,913 – –
Sovereigns
Municipalities, Munici-palities – Leasing
Unrated 128,594 (98) 128,496 – –
Corporate
Large Corporates, SME I1 – I6 883,885 (690) 883,195 (358) 266
M1 – M4 826,418 (6,202) 820,216 (702) 2,780
R1 – R5 352,900 (13,746) 339,154 (2,307) 6,309
LC_I1 – LC_I6 370,753 (258) 370,495 (142) 93
LC_M1 – LC_M4 538,790 (1,405) 537,385 (806) 510
D (default) 45,810 (42,245) 3,565 – –
Unrated 120,387 (1,561) 118,826 – –
Specialized Lending – SPV, RED
Strong 129,220 (335) 128,885 (130) –
Good 292,373 (3,792) 288,581 (3,107) 3,792
Satisfactory 199,231 (5,576) 193,655 (8,529) 4,871
Weak 103,183 (13,213) 89,970 – 8,044
D (default) 24,091 (17,406) 6,685 – –
Other Fin. Inst. Public Sector Entities
I1 – I6 (77,684) (89) (77,773) (48) 30
M1 – M4 182,957 (763) 182,194 (592) 178
Unrated 189,043 (537) 188,506 – –
Other Unrated 33,559 (2,210) 31,349 – –
Leasing, Factoring Unrated 355,566 (17,340) 338,226 – –
4,570,482 (127,368) 4,443,114 (16,721) 26,873

95
Consolidated fi nancial statements
Sensitivity analysis
31 December 2017€ ‘000
Internal rating (‘IR‘)
Amortised cost
Impairment losses
Carrying amount
Impact ofIR deterio–
ration
Impact ofIR impro–
vement
Retail
SB and FOA I3 – I6 35,561 (61) 35,500 (32) 26
M1 – M4 157,489 (1,540) 155,949 (796) 531
R1 – R5 66,201 (2,564) 63,637 (1,062) 931
D (default) 10,454 (9,012) 1,442 – –
Unrated 15,518 (94) 15,424 – –
Mortgages L1 – L4 4,554,342 (1,073) 4,553,269 (928) 463
N1 248,515 (357) 248,158 (210) 165
N2 – W1 342,472 (1,342) 341,130 (1,525) 562
W2 69,460 (1,035) 68,425 (3,764) 638
W3 84,550 (4,338) 80,212 – 3,403
D (default) 42,620 (17,257) 25,363 – –
Unsecured Retail U01a – U02 291,765 (170) 291,595 (65) 64
U3 91,421 (126) 91,295 (62) 41
U04 – U07 448,510 (2,088) 446,422 (1,104) 721
U08 – U09 135,207 (2,185) 133,022 (1,182) 745
U10 – U11 85,543 (3,319) 82,224 (3,164) 1,221
U12 73,025 (8,294) 64,731 – 4,708
D (default) 154,947 (105,842) 49,105 – –
Unrated 740,170 (84,809) 655,361 – –
Small Business – Leasing, Leasing
Unrated 15,057 (604) 14,453 – –
Other Unrated 12,403 (1) 12,402 – –
7,675,230 (246,111) 7,429,119 (13,894) 14,219
Securities Unrated 902,671 – 902,671 – –

96
Consolidated fi nancial statements
During the year 2017, the rating scale was extended by internal ratings for Large Corporations above € 500 million turnover, so the comparable period was restated accordingly:
31 December 2016€ ‘000
Internal rating
Amortised cost
Impairment losses
Carrying amount
Banks Unrated 112,486 (18) 112,468
Sovereigns
Municipalities, Municipalities – Leasing Unrated 132,154 (101) 132,053
Corporate
Large Corporates, SME I1 – I6 653,263 (725) 652,538
M1 – M4 846,596 (5,493) 841,103
R1 – R5 312,754 (11,353) 301,401
LC_I1 – LC_I6 382,816 (261) 382,555
LC_M1 – LC_M4 439,103 (1,420) 437,683
LC_R1 – LC_R5 13,247 (312) 12,935
D (default) 68,710 (57,151) 11,559
Unrated 104,941 (1,120) 103,821
Specialized Lending – SPV, RED Strong 221,336 (1,344) 219,992
Good 335,073 (2,674) 332,399
Satisfactory 213,930 (6,631) 207,299
Weak 72,193 (11,139) 61,054
D (default) 27,998 (12,511) 15,487
Other Financial Institutions, Public Sector Entities I1 – I6 100,453 (112) 100,341
M1 – M4 155,619 (365) 155,254
R1 – R5 – – –
D (default) 1 – 1
Unrated 1,200 (578) 622
Other Unrated 25,271 (1,876) 23,395
Leasing, Factoring Unrated 337,334 (20,531) 316,803
4,311,838 (135,596) 4,176,242

97
Consolidated fi nancial statements
31 December 2016€ ‘000
Internal rating
Amortised cost
Impairment losses
Carrying amount
Retail
SB and FOA I3 – I6 32,063 (55) 32,008
M1 – M4 141,447 (1,431) 140,016
R1 – R5 55,450 (1,992) 53,458
D (default) 13,964 (12,163) 1,801
Unrated 11,439 (67) 11,372
Mortgages L1 – L4 3,328,301 (661) 3,327,640
N1 360,192 (475) 359,717
N2 – W1 505,713 (1,729) 503,984
W2 67,210 (1,068) 66,142
W3 137,483 (8,361) 129,122
D (default) 47,822 (18,389) 29,433
Unsecured Retail U01a – U02 415,594 (392) 415,202
U3 81,989 (196) 81,793
U04 – U07 336,039 (2,311) 333,728
U08 – U09 88,026 (2,103) 85,923
U10 – U11 59,498 (3,391) 56,107
U12 60,493 (9,976) 50,517
D (default) 141,791 (98,349) 43,442
Unrated 770,863 (94,585) 676,278
Small Business – Leasing, Leasing Unrated 14,431 (743) 13,688
Other Unrated 5,617 (2) 5,615
6,675,425 (258,439) 6,416,986
Securities Unrated 1,820,472 – 1,820,472

98
Consolidated fi nancial statements
(b) Market risk
Market risk is the risk that changes in market prices, such as interest rate, equity prices or foreign exchange rate will affect the Group’s income or the value of its holdings of fi nancial instruments. The objective of market risk management is to manage and control market risk exposures within acceptable parameters, while opti-mizing the return on risk.
Management of market risk
The Group separates its exposures to market risk between trading (‘trading book’) and non-trading portfolios (‘banking book’). Trading portfolios are held by the Trading sub-department and include positions arising from market-making and proprietary position taking. All foreign exchange risk within the Group is transferred each day to the Trading sub-department and forms part of the trading portfolio for risk management purposes. The non-trading portfolios are managed by the Department Treasury and ALM, and include all positions which are not intended for trading.
Overall authority for market risk is vested in ALCO. The Enterprise Risk Management Department is respon-sible for the development of detailed risk management policies (subject to review and approval by ALCO) and for their implementation and day-to-day risk monitoring and reporting.
In the normal course of business, the VUB Group enters into derivative fi nancial instrument transactions to hedge its liquidity, foreign exchange and interest rate risks. The Group also enters into proprietary derivative fi nancial transactions for the purpose of generating profi ts from short-term fl uctuations in market prices. The VUB Group operates a system of market risk and counterparty limits, which are designed to restrict exposure to movements in market prices and counterparty concentrations. The VUB Group monitors adherence to these limits on a daily basis.
Exposure to market risk – trading portfolios
The principal tool used to measure and control market risk exposures within the Group’s trading portfolio is Value at Risk (‘VaR’). The VaR of a trading portfolio is the estimated loss that will arise on the portfolio over a specifi ed period of time (holding period) from an adverse market movement with a specifi ed probability (confi dence level). The VaR model used by the Group is based upon a 99% confi dence level and assumes a one-day holding period. The VaR model used are based on historical simulations. Taking into account market data from the previous year and observed relationships between different markets and prices, the models generate a wide range of plausible future scenarios for market price movements evaluated in the model. The VaR model was approved by the NBS as a basis for the calculation of the capital charge for market risk of the trading book.
The Group uses VaR limits for total market risk in the trading book, foreign exchange risk and interest rate risk. The overall structure of VaR limits is subject to review and approval by ALCO and Intesa Sanpaolo. VaR is measured on a daily basis. Daily reports of utilisation of VaR limits are submitted to the trading unit, the head of the Division Risk Management and the head of the Department Treasury and ALM. Regular summaries are submitted to Intesa Sanpaolo and ALCO.
A summary of the VaR position of the Bank’s trading portfolios:
2017 2016
€ ‘000 Balance Avg Max Min Balance Avg Max Min
Foreign currency risk 13 32 102 4 11 24 150 2
Interest rate risk 1,492 2,122 4,094 41 132 376 792 40
Overall 1,493 2,123 4,102 43 137 378 781 32
99
Consolidated fi nancial statements
Although VaR is a popular and widely used risk management tool, there are known limitations, among the following are the most important ones:– VaR does not measure the worst case loss, since a 99% confi dence interval means that in 1% of cases the
loss is expected to be greater than the VaR amount, – VaR calculated using a one day holding period assumes hedge or disposal of a position within one day,
which might not be realistic in the case of a longer illiquid situation on the market, – For calculating VaR of a portfolio, the return, the volatility but also the correlation between various assets
needs to be recognized which might represent a diffi cult task when taking into account the growing number and diversity of positions in a given portfolio.
These limitations are recognized, by supplementing VaR limits with other position limit structures. In addition, the Group uses a wide range of stress tests, to model the fi nancial impact of a variety of exceptional market scenarios on the Group’s position.
Exposure to interest rate risk
Interest rate risk comprises of the risk that the value of a fi nancial instrument will fl uctuate due to changes in market interest rates and of the risk that the maturities of interest bearing assets differ from the maturities of the interest bearing liabilities used to fund those assets. The length of time for which the rate of interest is fi xed on a fi nancial instrument therefore indicates the extent to which it is exposed to interest rate risk.
The main risk to which non-trading portfolios are exposed is the risk of loss from fl uctuations in the future cash fl ows or fair values of fi nancial instruments due to a change in market interest rates. Interest rate risk is managed principally through monitoring interest rate gaps. Financial instruments are mapped to re-pricing gaps either by maturity, i.e. fi xed rate instruments, or by next re-pricing date, i.e. fl oating rate instruments. Assets and liabilities that do not have a contractual maturity date or are not interest - bearing are mapped according to internal models based on behavioural assumptions.
The Risk Management division is responsible for monthly monitoring of these gaps. The management of interest rate risk is measured by shift sensitivity analysis (change in present value). In line with the ISP Group methodology, the shift sensitivity analysis is done through baseline, internal stress and regulatory scenarios. Baseline scenarios are defi ned as a parallel and uniform shift of +/- 100 basis points of the rate curve. Internal stress scenarios have been introduced in 2017, measuring the shift sensitivity through parallel and uniform shift of +/-200 basis points, and additionally non-parallel steeper and fl atter scenarios. These standard scenarios are applied on a monthly basis. Furthermore, 6 regulatory scenarios, according to the Interest Rate Risk in the Banking Book Guidelines published by Basel Committee on Banking Supervision (‘BCBS’) Guidelines, have been introduced in 2017, calculated on a quarterly basis.
The sensitivity of the interest margin is also measured with a set of scenarios similar to shift sensitivity analysis – baseline, internal stress and regulatory scenarios. The baseline scenario is calculated on the basis of parallel and instantaneous shocks in the interest rate curve of +/-50 basis points, in a period of 12 months. Furthermore, additional internal stress and regulatory scenarios are applied: +/-100, +/-200 and six stress scenarios according to the Basel Committee on Banking Supervision Guidelines. The interest margin sensitivity methodology, specifi cally sight models repricing structure used for products with no contractual maturity, has been reviewed during 2017.
Overall banking book interest rate risk positions are managed by the Treasury and ALM Department, which uses different balance and off balance sheet instruments to manage the overall positions arising from the banking book activities.
Models applied for the interest rate risk calculation
Each fi nancial and non-fi nancial instrument is mapped to a gap based on its contractual or behavioural re-pricing date:
Contractual
This category includes instruments where the VUB Group knows exactly when the maturity or next re-pricing takes place. This treatment is applied mainly to securities bought and issued loans and term deposits.

100
Consolidated fi nancial statements
Behavioural
These are items for which it is not exactly known when the maturity or next re-pricing will take place (e.g. current accounts). There are also some items where the maturity or re-pricing period is known but it can be assumed that they will behave differently (e.g. prepayments can occur for mortgages and consumer loans). In this case, it is necessary to make certain assumptions to refl ect the most probable behaviour of these items. The assumptions are based on a detailed analysis of the VUB Group’s historical data and statistical models.
At 31 December 2017, the interest margin sensitivity on profi t or loss in a one year time frame, in the event of a 100 basis points rise in interest rates, was € 16,505 thousand (31 December 2016: € -17,653 thousand).
At 31 December 2017, the interest rate risk generated by the banking book, measured through shift sensitivity analysis of plus 100 basis points, reached the value of € -11,180 thousand (31 December 2016: € -42,725 thousand).
The main reason for change in shift sensitivity analyses is due to closing the negative sensitivity via hedge accounting (Interest Rate Swaps).
At 31 December 2017, the interest margin sensitivity on profi t or loss in a one year time frame, in the event of a 100 basis points decline in interest rates, was € -25,585 thousand.
At 31 December 2017, the interest rate risk generated by the banking book, measured through shift sensitivity analysis of minus 100 basis points, reached the value of € -5,569 thousand.
At 31 December 2017, the sensitivity of the AFS reserve in equity related to the non-hedged part of the port-folio to 100 basis points rise in interest rates was € -673 thousand (31 December 2016: € -1,444 thousand).
At 31 December 2017, the sensitivity of the CF hedges reserve in equity to 100 basis points rise in interest rates was € 10,568 thousand (31 December 2016: € 4,203 thousand).

101
Consolidated fi nancial statements
The re-pricing structure of interest rate bearing fi nancial assets and liabilities based on contractual discounted cash-fl ows for the non-trading portfolios was as follows:
31 December 2017€ ‘000
Up to1 month
1 to 3 months
3 months to 1 year
1 to 5 years
Over5 years
Not specifi ed Total
Assets
Cash and balances with central banks
1,595,097 – – – – 1,595,097
Due from banks 56,422 27,453 7,025 13 – – 90,913
Financial assets at fair value through profi t or loss
– – – – 4,933 850 5,783
Available-for-sale fi nancial assets
– 42,329 357,392 109,717 10,978 – 520,416
Loans and advances to customers
1,347,229 1,612,697 2,019,011 6,001,471 835,117 185,204 12,000,729
Held-to-maturity investments – – 11,749 264,821 99,902 – 376,472
2,998,748 1,682,479 2,395,177 6,376,022 950,930 186,054 14,589,410
Liabilities
Due to central and other banks
(181,813) (50,605) (120,651) (402,982) (12,730) (768,781)
Due to customers (7,923,912) (686,670) (1,008,243) (320,296) – – (9,939,121)
Subordinated debt – (200,164) – – – – (200,164)
Debt securities in issue (108,531) (103,460) (110,808) (771,152) (1,158,429) – (2,252,380)
(8,214,256) (1,040,899) (1,239,702) (1,494,430) (1,171,159) – (13,160,446)
Net position of fi nancial instruments
(5,215,508) 641,580 1,155,475 4,881,592 (220,229) 186,054 1,428,964
Cumulative net position of fi nancial instruments
(5,215,508) (4,573,928) (3,418,453) 1,463,139 1,242,910 1,428,964 –

102
Consolidated fi nancial statements
31 December 2016€ ‘000
Up to1 month
1 to 3 months
3 months to 1 year
1 to 5 years
Over5 years
Not specifi ed Total
Assets
Cash and balances with central banks
1,029,104 – – – – – 1,029,104
Due from banks 92,150 18,566 17,811 – 47 – 128,574
Financial assets at fair value through profi t or loss
– – – – – 474 474
Available-for-sale fi nancial assets
84,332 42,148 503,644 388,289 271,566 – 1,289,979
Loans and advances to customers
1,146,822 1,770,553 1,709,784 5,089,690 848,621 321,281 10,886,751
Held-to-maturity investments – – 163,680 266,401 99,938 – 530,019
2,352,408 1,831,267 2,394,919 5,744,380 1,220,172 321,755 13,864,901
Liabilities
Due to central and other banks
(105,649) (206,437) (254,205) (332,597) – – (898,888)
Due to customers (7,597,135) (402,880) (1,261,932) (263,892) – – (9,525,839)
Subordinated debt – (200,165) – – – – (200,165)
Debt securities in issue (209,828) (144,706) (130,440) (503,513) (726,822) – (1,715,309)
(7,912,612) (954,188) (1,646,577) (1,100,002) (726,822) – (12,340,201)
Net position of fi nancial instruments
(5,560,204) 877,079 748,342 4,644,378 493,350 321,755 1,524,700
Cumulative net position of fi nancial instruments
(5,560,204) (4,683,125) (3,934,783) 709,595 1,202,945 1,524,700 –
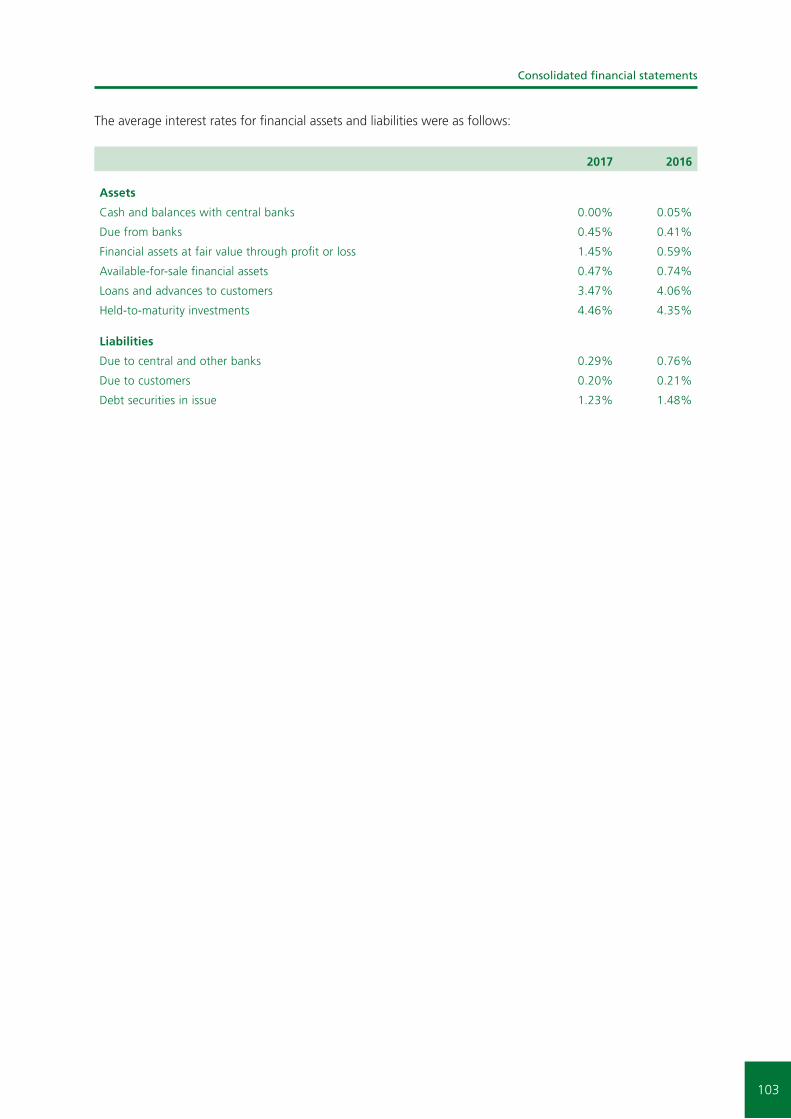
103
Consolidated fi nancial statements
The average interest rates for fi nancial assets and liabilities were as follows:
2017 2016
Assets
Cash and balances with central banks 0.00% 0.05%
Due from banks 0.45% 0.41%
Financial assets at fair value through profi t or loss 1.45% 0.59%
Available-for-sale fi nancial assets 0.47% 0.74%
Loans and advances to customers 3.47% 4.06%
Held-to-maturity investments 4.46% 4.35%
Liabilities
Due to central and other banks 0.29% 0.76%
Due to customers 0.20% 0.21%
Debt securities in issue 1.23% 1.48%
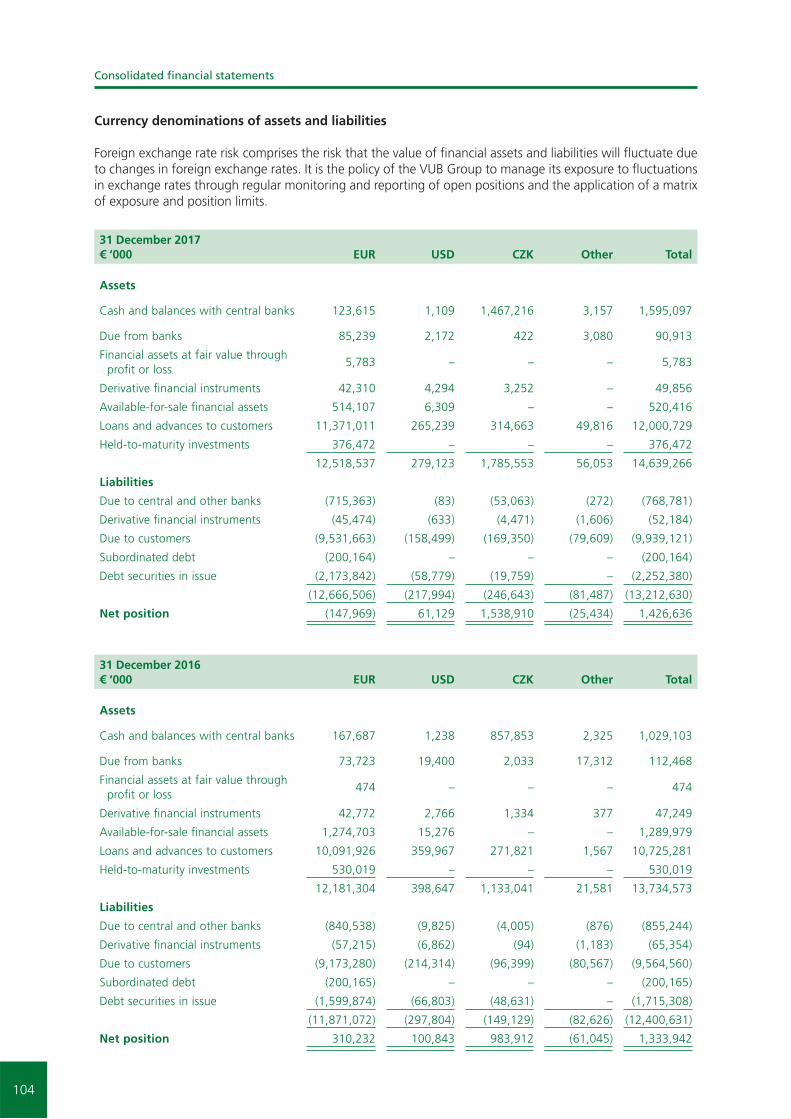
104
Consolidated fi nancial statements
Currency denominations of assets and liabilities
Foreign exchange rate risk comprises the risk that the value of fi nancial assets and liabilities will fl uctuate due to changes in foreign exchange rates. It is the policy of the VUB Group to manage its exposure to fl uctuations in exchange rates through regular monitoring and reporting of open positions and the application of a matrix of exposure and position limits.
31 December 2017€ ‘000 EUR USD CZK Other Total
Assets
Cash and balances with central banks 123,615 1,109 1,467,216 3,157 1,595,097
Due from banks 85,239 2,172 422 3,080 90,913
Financial assets at fair value through profi t or loss
5,783 – – – 5,783
Derivative fi nancial instruments 42,310 4,294 3,252 – 49,856
Available-for-sale fi nancial assets 514,107 6,309 – – 520,416
Loans and advances to customers 11,371,011 265,239 314,663 49,816 12,000,729
Held-to-maturity investments 376,472 – – – 376,472
12,518,537 279,123 1,785,553 56,053 14,639,266
Liabilities
Due to central and other banks (715,363) (83) (53,063) (272) (768,781)
Derivative fi nancial instruments (45,474) (633) (4,471) (1,606) (52,184)
Due to customers (9,531,663) (158,499) (169,350) (79,609) (9,939,121)
Subordinated debt (200,164) – – – (200,164)
Debt securities in issue (2,173,842) (58,779) (19,759) – (2,252,380)
(12,666,506) (217,994) (246,643) (81,487) (13,212,630)
Net position (147,969) 61,129 1,538,910 (25,434) 1,426,636
31 December 2016€ ‘000 EUR USD CZK Other Total
Assets
Cash and balances with central banks 167,687 1,238 857,853 2,325 1,029,103
Due from banks 73,723 19,400 2,033 17,312 112,468
Financial assets at fair value through profi t or loss
474 – – – 474
Derivative fi nancial instruments 42,772 2,766 1,334 377 47,249
Available-for-sale fi nancial assets 1,274,703 15,276 – – 1,289,979
Loans and advances to customers 10,091,926 359,967 271,821 1,567 10,725,281
Held-to-maturity investments 530,019 – – – 530,019
12,181,304 398,647 1,133,041 21,581 13,734,573
Liabilities
Due to central and other banks (840,538) (9,825) (4,005) (876) (855,244)
Derivative fi nancial instruments (57,215) (6,862) (94) (1,183) (65,354)
Due to customers (9,173,280) (214,314) (96,399) (80,567) (9,564,560)
Subordinated debt (200,165) – – – (200,165)
Debt securities in issue (1,599,874) (66,803) (48,631) – (1,715,308)
(11,871,072) (297,804) (149,129) (82,626) (12,400,631)
Net position 310,232 100,843 983,912 (61,045) 1,333,942

105
Consolidated fi nancial statements
(c) Liquidity risk
Liquidity risk is defi ned as the risk that the VUB Group is not able to meet its payment obligations when they fall due (funding liquidity risk). Normally, the VUB Group is able to cover cash outfl ows with cash infl ows, highly liquid assets and its ability to obtain credit.
The Guidelines for Liquidity Risk Management adopted by the VUB Group outline the set of principles, methods, regulations and control processes required to prevent the occurrence of a liquidity crisis and call for the Group to develop prudent approaches to liquidity management, making it possible to maintain the overall risk profi le at low levels.
The basic principles underpinning the Liquidity Policy of the VUB Group are:– The existence of an operating structure that works within set limits and of a control structure that is inde-
pendent from the operating structure;– A prudential approach to the estimate of the cash infl ow and outfl ow projections for all the balance sheet
and off-balance sheet items, especially those without a contractual maturity;– An assessment of the impact of various scenarios, including stress testing scenarios, on the cash infl ows
and outfl ows over time;– The maintenance of an adequate level of unencumbered highly liquid assets, capable of enabling ordi-
nary operations, also on an intraday basis, and overcoming the initial stages of a shock involving the VUB Group’s liquidity or system liquidity.
The departments of the VUB Group responsible for ensuring the correct application of the Guidelines are the Treasury and ALM Department responsible for liquidity management and the Enterprise Risk Management Department responsible for monitoring indicators and verifying the observation of limits.
These Guidelines are broken down into three macro areas: ‘Short term Liquidity Policy’, ‘Structural Liquidity Policy’ and ‘Contingency Liquidity Plan’, and constitute an integral part of the Internal Liquidity Adequacy Assessment Process (‘ILAAP’).
The Short term Liquidity Policy includes a set of parameters, limits and observation thresholds that enable the measurement, both under normal market conditions and under conditions of stress, of liquidity risk exposure over the short term, setting the maximum amount of risk to be assumed and ensuring the utmost prudence in its management. Main regulatory indicator used for monitoring and managing short term liquidity is Liquidity coverage ratio. It is required by (EU) Regulation 575/2013 (CRR), more precisely defi ned in Delegated Regu-lation (EU) 2015/61. Main content of the LCR: Institutions shall hold liquid assets, the sum of the values of which covers the liquidity outfl ows less the liquidity infl ows under stressed conditions so as to ensure that institutions maintain levels of liquidity buffers which are adequate to face any possible imbalance between liquidity infl ows and outfl ows under gravely stressed conditions over a period of thirty days. During times of stress, institutions may use their liquid assets to cover their net liquidity outfl ows.
The Structural Liquidity Policy of the VUB Group incorporates a set of measures and limits designed to control and manage the risks deriving from the mismatch of the medium to long-term maturities of the assets and liabilities, essential for the strategic planning of liquidity management. This involves the adoption of internal limits for the transformation of maturity dates aimed at preventing the medium to long-term operations from giving rise to excessive imbalances to be fi nanced in the short term.
Together with the Short term and Structural Liquidity Policy, the Guidelines provide for the management methods of a potential liquidity crisis, defi ned as a situation of diffi culty or inability of the VUB Group to meet its cash commitments falling due, without implementing procedures and/or employing instruments that, due to their intensity or manner of use, do not qualify as ordinary administration.
The Contingency Liquidity Plan sets the objectives of safeguarding the VUB Group’s capital and, at the same time, guarantees the continuity of operations under conditions of extreme liquidity emergency. It also ensures the identifi cation of the pre-warning signals and their ongoing monitoring, the defi nition of procedures to be implemented in situations of liquidity stress, the immediate lines of action, and intervention measures for the resolution of emergencies. The pre-warning indices, aimed at identifying signs of a potential liquidity strain, both systemic and specifi c, are continuously recorded and reported to the departments responsible for the management and monitoring of liquidity.
The liquidity position of the Bank and the subsidiaries is regularly presented by Enterprise Risk Management Department and discussed during the ALCO meetings.

106
Consolidated fi nancial statements
The remaining maturities of assets and liabilities based on contractual undiscounted cash-fl ows were as follows:
31 December 2017€ ‘000
Up to1 month
1 to 3 months
3 monthsto 1 year
1 to 5years
Over5 years
Notspecifi ed Total
Assets
Cash and balances with central banks
1,595,412 – – – – – 1,595,412
Due from banks 33,379 1,197 4,682 12,735 42,672 – 94,665
Financial assets at fair value through profi t or loss
– – – – 4,933 850 5,783
Available-for-sale fi nancial assets
– 874 260,972 246,526 – – 508,372
Loans and advances to customers
630,230 416,308 1,469,723 5,234,668 6,922,418 217,738 14,891,085
Held-to-maturity investments – – 18,474 294,379 117,531 – 430,384
2,259,021 418,379 1,753,851 5,788,308 7,087,554 218,588 17,525,701
Liabilities
Due to central and other banks
(146,590) (34,956) (63,695) (450,989) (67,978) – (764,208)
Due to customers (7,811,786) (760,695) (965,816) (403,425) (469) – (9,942,191)
Subordinated debt – (1,458) (471) (2,295) (210,706) – (214,930)
Debt securities in issue (4,459) (3,254) (246,929) (952,020) (1,238,785) – (2,445,447)
(7,962,835) (800,363) (1,276,911) (1,808,729) (1,517,938) – (13,366,776)
Net position of fi nancial instruments
(5,703,814) (381,984) 476,940 3,979,579 5,569,616 218,588 4,158,925
Cash infl ows from derivatives 1,702,187 55,507 81,630 90,645 36,063 – 1,966,032
Cash outfl ows from derivatives
(1,710,454) (56,858) (89,608) (84,221) (24,456) – (1,965,597)
Net position from derivatives
(8,267) (1,351) (7,978) 6,424 11,607 – 435
Commitments and undrawn credit facilities
(2,779,313) – – – – – (2,779,313)
Issued guarantees (783,667) – – – – – (783,667)
Net position from fi nancial commitments and contingencies
(3,562,980) – – – – – (3,562,980)

107
Consolidated fi nancial statements
31 December 2016€ ‘000
Up to1 month
1 to 3 months
3 monthsto 1 year
1 to 5 years
Over5 years
Notspecifi ed Total
Assets
Cash and balances with central banks
1,029,104 – – – – – 1,029,104
Due from banks 97,323 121 3,140 – 31,204 – 131,788
Financial assets at fair value through profi t or loss
– – – – – 474 474
Available-for-sale fi nancial assets
31,870 3,667 252,871 745,834 286,748 – 1,320,990
Loans and advances to customers
542,642 528,929 1,397,652 4,781,886 5,878,356 198,071 13,327,536
Held-to-maturity investments – – 152,777 302,874 134,565 – 590,216
1,700,939 532,717 1,806,440 5,830,594 6,330,873 198,545 16,400,108
Liabilities
Due to central and other banks
(85,339) (131,828) (160,331) (412,226) (108,512) – (898,236)
Due to customers (7,584,174) (414,993) (1,214,648) (312,072) (5,167) – (9,531,054)
Subordinated debt – (1,466) (4,029) (22,000) (242,895) – (270,390)
Debt securities in issue (3,467) (46,180) (164,875) (870,766) (843,955) – (1,929,243)
(7,672,980) (594,467) (1,543,883) (1,617,064) (1,200,529) – (12,628,923)
Net position of fi nancial instruments
(5,972,041) (61,750) 262,557 4,213,530 5,130,344 198,545 3,771,185
Cash infl ows from derivatives 995,200 159,826 226,607 119,435 41,630 – 1,542,698
Cash outfl ows from derivatives
(993,311) (158,921) (230,557) (124,017) (41,728) – (1,548,534)
Net position from derivatives
1,889 905 (3,950) (4,582) (98) – (5,836)
Commitments and undrawn credit facilities
(2,894,083) – – – – – (2,894,083)
Issued guarantees (764,156) – – – – – (764,156)
Net position from fi nancial commitments and contingencies
(3,658,239) – – – – – (3,658,239)

108
Consolidated fi nancial statements
The table below shows an analysis of assets and liabilities (discounted cash fl ow basis) according to when they are expected to be recovered or settled:
31 December 2017€ ‘000
Less than 12 months
Over 12 months Total
Assets
Cash and balances with central banks 1,595,097 – 1,595,097
Due from banks 37,105 53,808 90,913
Financial assets at fair value through profi t or loss – 5,783 5,783
Derivative fi nancial instruments 5,902 43,954 49,856
Available-for-sale fi nancial assets 262,952 257,464 520,416
Loans and advances to customers 2,206,047 9,794,682 12,000,729
Held-to-maturity investments 11,750 364,722 376,472
Associates and joint ventures – 8,972 8,972
Intangible assets – 80,100 80,100
Goodwill – 29,305 29,305
Property and equipment – 126,848 126,848
Current income tax assets 9,478 – 9,478
Deferred income tax assets – 53,779 53,779
Other assets 23,128 – 23,128
4,151,459 10,819,417 14,970,876
Liabilities
Due to central and other banks (255,026) (513,755) (768,781)
Derivative fi nancial instruments (24,278) (27,906) (52,184)
Due to customers (1,783,792) (8,155,329) (9,939,121)
Subordinated debt (164) (200,000) (200,164)
Debt securities in issue (238,066) (2,014,314) (2,252,380)
Provisions – (9,962) (9,962)
Other liabilities (111,007) (4,691) (115,698)
(2,412,333) (10,925,957) (13,338,290)
1,739,126 (106,540) 1,632,586

109
Consolidated fi nancial statements
31 December 2016€ ‘000
Less than 12 months
Over 12 months Total
Assets
Cash and balances with central banks 1,029,103 – 1,029,103
Due from banks 94,678 17,790 112,468
Financial assets at fair value through profi t or loss – 474 474
Derivative fi nancial instruments 4,225 43,024 47,249
Available-for-sale fi nancial assets 264,958 1,025,021 1,289,979
Loans and advances to customers 2,166,207 8,559,074 10,725,281
Held-to-maturity investments 151,930 378,089 530,019
Associates and joint ventures – 8,788 8,788
Intangible assets – 68,888 68,888
Goodwill – 29,305 29,305
Property and equipment – 104,853 104,853
Current income tax assets 1,464 – 1,464
Deferred income tax assets – 64,002 64,002
Other assets 25,281 – 25,281
3,737,846 10,299,308 14,037,154
Liabilities
Due to central and other banks (290,946) (564,298) (855,244)
Derivative fi nancial instruments (39,013) (26,341) (65,354)
Due to customers (1,757,512) (7,807,048) (9,564,560)
Subordinated debt (165) (200,000) (200,165)
Debt securities in issue (198,648) (1,516,660) (1,715,308)
Provisions – (26,001) (26,001)
Other liabilities (101,432) (3,834) (105,266)
(2,387,716) (10,144,182) (12,531,898)
1,350,130 155,126 1,505,256

110
Consolidated fi nancial statements
(d) Operational risk
Operational risk is the risk of direct or indirect loss arising from a wide variety of causes associated with the Group’s processes, personnel, technology and infrastructure, and from external factors other than credit, market and liquidity risks, such as those arising from legal and regulatory requirements and from non-com-pliance with generally accepted standards of corporate behaviour. Operational risks arise from all of the VUB Group’s operations.
Operational risk management strategies and processes
The VUB Group, in coordination with Intesa Sanpaolo, has defi ned the overall operational risk management framework by setting up a VUB Group policy and organisational process for measuring, managing and controlling operational risk.
The control of operational risk was attributed to the Group Operational Risk Committee, which identifi es risk management policies. The Supervisory and Management Boards of the Group ensures the functionality, effi -ciency and effectiveness of the risk management and controls system.
The Operational Risk Committee (composed of the heads of the areas of the governance centre (Chief Exec-utive Offi cer, Deputy Chief Executive Offi cer) and of the business areas more involved in operational risk management (Head of Risk Management Division, Chief Financial Offi cer, Chief Operating Offi cer, Head of Compliance Department, Head of AML Department, Head of Corporate & SME Division, Head of Retail Divi-sion, Head of Enterprise Risk Management Department, Head of Legal Department, Head of Human Resources & Organization Department, Head of Internal Audit Department, Head of Security and Business Continuity Management, Head of Retail Branch Management, Member of the Management Board of Consumer Finance Holding, a. s., Member of the Management Board of VUB Factoring, a. s., Member of the Management Board of VUB Leasing, a. s.)), has the task of periodically reviewing the Group’s overall operational risk profi le, author-ising any corrective actions, coordinating and monitoring the effectiveness of the main mitigation activities and approving the operational risk transfer strategies.
Organisational structure of the associated risk management function
For some time, the VUB Group has had a centralised function within the Risk Management Division for the management of the Group’s operational risks. This function is responsible, in coordination with the parent company, for the defi nition, implementation and monitoring of the methodological and organisational framework, as well as for the measurement of the risk profi le, the verifi cation of mitigation effectiveness and reporting to senior Management. In compliance with current requirements, the individual organisational units participate in the process and each of them is responsible for the identifi cation, assessment, management and mitigation of its operational risks. Specifi c offi ces and departments have been identifi ed within these organisational units to be responsible for Operational Risk Management. These functions are responsible for the collection and structured census of information relating to operational events, scenario analyses and evaluation of the level of risk associated with the business environment. The Risk Management Division carries out second level monitoring of these activities.
Scope of application and characteristics of the risk measurement and reporting system
In February 2010 upon a VUB Group request, VUB Bank as part of the VUB Group received from the relevant Supervisory authorities an approval for usage and thus adopted the Advanced Measurement Approach (‘AMA’), for Operational Risk management and measurement. In June 2013, the Bank as part of the VUB Group received an approval for usage and thus adopted the AMA for subsidiaries Consumer Finance Holding and VUB Leasing. Part of this decision has been an approval of the insurance effect inclusion, as well as approval of a new allocation mechanism, which led to fulfi lment of a regulatory condition for the approval of diversifi cation usage.
As such, the VUB Group uses a combination of the AMA for the Bank, Consumer Finance Holding and VUB Leasing, and the Standardized Approach (‘TSA’) for VUB Factoring.
For the use of the AMA, the VUB Group has set up, in addition to the corporate governance mechanisms required by the Supervisory regulations, an effective system for the management of operational risk certifi ed

111
Consolidated fi nancial statements
by the process of annual self-assessment carried out by the Bank and VUB Group Companies that fall within the scope of AMA and TSA. This process is verifi ed by the Internal Audit Department and submitted to the relevant Bank’s Committee for the annual certifi cation of compliance with the requirements established by the regulation.
Under the AMA approach, the capital requirement is calculated by an internal model, which combines all elements stipulated in Supervisory regulation, allowing to measure the exposure in a more risk-sensitive way. Monitoring of operational risks is performed by an integrated reporting system, which provides management with the information necessary for the management and/or mitigation of the operational risk.
Policies for hedging and mitigating risk
The VUB Group, in coordination with its parent company, has set up a traditional operational risk transfer policy (insurance) aimed at mitigating the impact of any unexpected losses. The AMA calculation does include the benefi t from this transfer of operational risk through insurance policies, which contributes to reducing the risk capital calculated through the internal models.
4. Estimated fair value of fi nancial assets and liabilities
The fair value of fi nancial instruments is the price that would be received to sell an asset or paid to transfer a liability in an orderly transaction between market participants at the measurement date. Fair value is a market measurement criterion that is not entity-specifi c. An entity has to measure the fair value of an asset or liability by adopting the assumptions that would be used by market operators to determine the price of an asset or liability, presuming that the market operators act with a view to satisfying their own economic interest in the best way possible.
The VUB Group uses the following fair value hierarchy that categorises into three levels the inputs to valuation techniques used to measure fair value:
Level 1: inputs represented by quoted prices (unadjusted) in active markets for identical assets or liabilities accessible by the Group as at the measurement date;
Level 2: inputs other than quoted prices included in Level 1 that are directly or indirectly observable for the assets or liabilities to be measured; and
Level 3: inputs unobservable for the asset or liability.
The highest priority is attributed to effective market quotes (Level 1) for the valuation of assets and liabilities or for similar assets and liabilities measured using valuation techniques based on market-observable parameters other than fi nancial instruments quotes (Level 2) and the lowest priority to unobservable inputs (Level 3). Following this hierarchy, where available, fair value estimates made by the Group are based on quoted market prices. However, no readily available market prices exist for a signifi cant portion of the Group’s fi nancial instruments. In circumstances where the quoted market prices are not readily available, fair value is estimated using discounted cash fl ow models or other pricing models as appropriate.
Under Level 2, the principal valuation technique used by the Group for debt instruments involves the method of discounting forecast cash fl ows. The calculation takes into account the time value of money (risk-free rate of interest) and the credit risk expressed in the form of credit spreads applied to the bonds’ yield and repre-senting the risk premium the investor claims against a risk free investment. In the case of derivative fi nancial instruments the Group uses standard fair value calculation models based on the principal net present value using the yield curve to discount all future cash fl ows from derivatives for all relevant currencies. The principal input parameters used by the models comprise interest rate curves, volatility curves, spot and forward prices and the correlation between underlying assets. Changes in underlying assumptions, including discount rates and estimated future cash fl ows, signifi cantly affect the estimates. The VUB Group also considers its own and counterparty’s credit risk.
The valuation technique defi ned for a fi nancial instrument is adopted over time and is modifi ed only following signifi cant changes in market conditions or the subjective conditions related to the issuer of the fi nancial instrument. The Group monitors the occurrence of these changes and accordingly reassesses the classifi cation

112
Consolidated fi nancial statements
into the fair value hierarchy. For determining the timing of the transfers between the levels, the Group uses the end of the reporting period as the day when the transfer is deemed to have occurred.
In estimating the fair value of the Group’s fi nancial instruments, the following methods and assumptions were used:
(a) Cash and balances with central banks
The carrying values of cash and cash equivalents are deemed to approximate their fair value.
(b) Due from banks
The fair value of due from banks balances with longer maturities and material amounts is estimated using discounted cash fl ow analyses, based upon the risk free interest rate curve. For shorter maturities and not signifi cant balances, the carrying amounts of amounts due from banks approximates their estimated fair values. Impairment losses are taken into consideration when calculating fair values.
(c) Loans and advances to customers
The fair value of loans and advances to customers is estimated using discounted cash fl ow analyses, based upon the risk free interest rate curve and risk refl ecting credit worthiness of the counterparty. Impairment losses are taken into consideration when calculating fair values.
(d) Held-to-maturity investments
The fair value of securities carried in the ‘Held-to-maturity investments’ portfolio is based on quoted market prices. Where no market prices are available, the fair value is calculated by discounting future cash fl ows using risk free interest rate curve adjusted to refl ect credit risk.
(e) Due to banks and customers
The carrying amounts of due to banks approximates their estimated fair value. The fair value of due to customers with short term maturity (under one year, including current accounts) is estimated by discounting their future expected cash fl ows using the risk free interest rate curve. The fair value of deposits with maturity over one year is discounted using the risk free interest rate curve adjusted by credit spreads refl ecting the credit quality of the Group as the borrower.
(f) Subordinated debt
The fair value of subordinated debt is discounted using the risk free interest rate curve.
(g) Debt securities in issue
The fair value of debt securities issued by the Group is based on quoted market prices. Where no market prices are available, the fair value was calculated by discounting future cash fl ows using the risk free interest rate curve adjusted by credit spreads refl ecting the credit quality of VUB as the issuer.

113
Consolidated fi nancial statements
Carrying amount Fair value
31 December 2017€ ‘000 Note
At amortised
costAt fair value
Total carrying amount Level 1 Level 2 Level 3
Total fair value
Financial assets
Cash and balances with central banks
7 1,595,097 – 1,595,097 – 1,595,097 – 1,595,097
Due from banks 8 90,913 – 90,913 – 90,913 – 90,913
Financial assets at fair value through profi t or loss
9 – 5,783 5,783 850 4,933 – 5,783
Derivative fi nancial instruments
10 – 49,856 49,856 – 49,856 – 49,856
Available-for-sale fi nancial assets
11 – 520,416 520,416 265,742 248,365 6,309 520,416
Loans and advances to customers
12 12,000,729 – 12,000,729 – – 13,170,161 13,170,161
Held-to-maturity investments
14 376,472 – 376,472 – 426,970 – 426,970
14,063,211 576,055 14,639,266 266,592 2,416,134 13,176,470 15,859,196
Financial liabilities
Due to central and other banks
21 (768,781) – (768,781) – (768,781) – (768,781)
Derivative fi nancial instruments
10 – (52,184) (52,184) – (52,184) – (52,184)
Due to customers 22 (9,939,121) – (9,939,121) – (9,947,677) – (9,947,677)
Subordinated debt 23 (200,164) – (200,164) – (199,693) – (199,693)
Debt securities in issue 23 (2,252,380) – (2,252,380) – (2,336,806) – (2,336,806)
(13,160,446) (52,184) (13,212,630) – (13,305,141) – (13,305,141)

114
Consolidated fi nancial statements
Carrying amount Fair value
31 December 2016€ ‘000 Note
At amortised
costAt fair value
Total carrying amount Level 1 Level 2 Level 3
Total fair value
Financial assets
Cash and balances with central banks
7 1,029,103 – 1,029,103 – 1,029,103 – 1,029,103
Due from banks 8 112,468 – 112,468 – 112,468 – 112,468
Financial assets at fair value through profi t or loss
9 – 474 474 474 – – 474
Derivative fi nancial instru-ments
10 – 47,249 47,249 – 47,249 – 47,249
Available-for-sale fi nancial assets
11 – 1,289,979 1,289,979 805,871 479,176 4,932 1,289,979
Loans and advances to customers
12 10,725,281 – 10,725,281 – – 11,959,494 11,959,494
Held-to-maturity investments
14 530,019 – 530,019 – 598,206 – 598,206
12,396,871 1,337,702 13,734,573 806,345 2,266,202 11,964,426 15,036,973
Financial liabilities
Due to central and other banks
21 (855,244) – (855,244) – (855,244) – (855,244)
Derivative fi nancial instru-ments
10 – (65,354) (65,354) – (65,354) – (65,354)
Due to customers 22 (9,564,560) – (9,564,560) – (9,579,377) – (9,579,377)
Subordinated debt 23 (200,165) – (200,165) – (200,165) – (200,165)
Debt securities in issue 23 (1,715,308) – (1,715,308) – (1,781,512) – (1,781,512)
(12,335,277) (65,354) (12,400,631) – (12,481,652) – (12,481,652)
There were no transfers of fi nancial instruments among the levels during the 2017 and 2016.
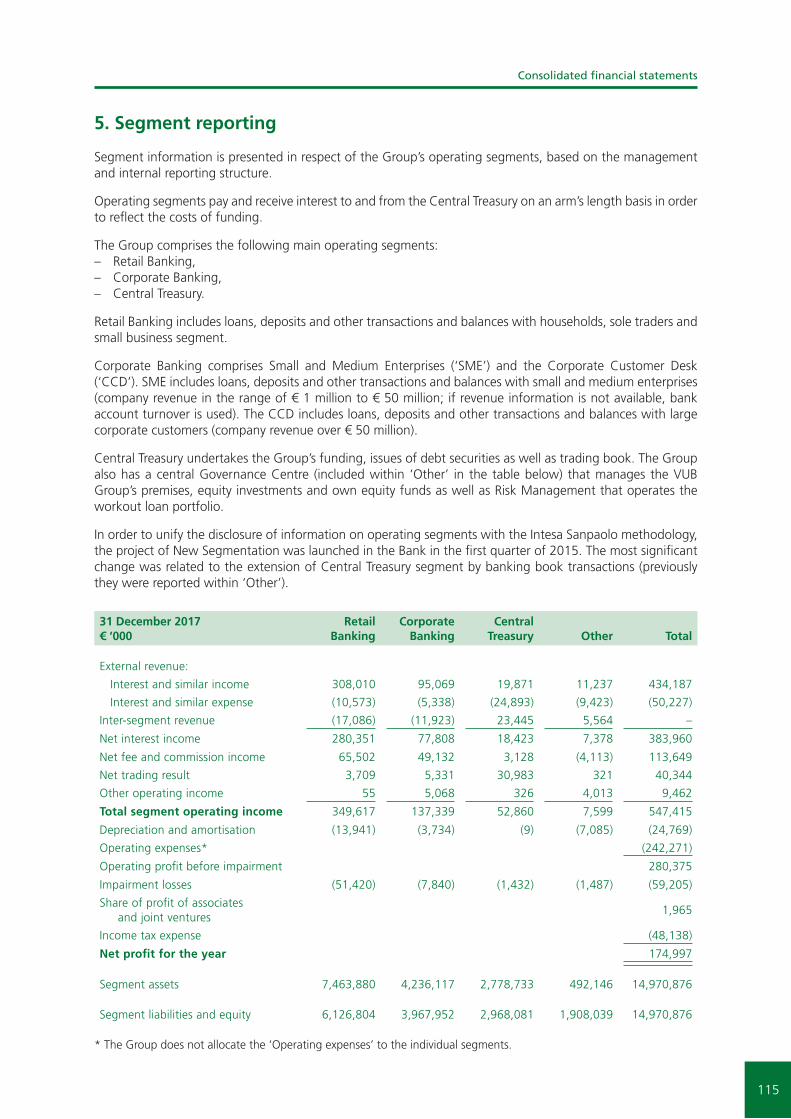
115
Consolidated fi nancial statements
5. Segment reporting
Segment information is presented in respect of the Group’s operating segments, based on the management and internal reporting structure.
Operating segments pay and receive interest to and from the Central Treasury on an arm’s length basis in order to refl ect the costs of funding.
The Group comprises the following main operating segments:– Retail Banking,– Corporate Banking,– Central Treasury.
Retail Banking includes loans, deposits and other transactions and balances with households, sole traders and small business segment.
Corporate Banking comprises Small and Medium Enterprises (‘SME’) and the Corporate Customer Desk (‘CCD’). SME includes loans, deposits and other transactions and balances with small and medium enterprises (company revenue in the range of € 1 million to € 50 million; if revenue information is not available, bank account turnover is used). The CCD includes loans, deposits and other transactions and balances with large corporate customers (company revenue over € 50 million).
Central Treasury undertakes the Group’s funding, issues of debt securities as well as trading book. The Group also has a central Governance Centre (included within ‘Other’ in the table below) that manages the VUB Group’s premises, equity investments and own equity funds as well as Risk Management that operates the workout loan portfolio.
In order to unify the disclosure of information on operating segments with the Intesa Sanpaolo methodology, the project of New Segmentation was launched in the Bank in the fi rst quarter of 2015. The most signifi cant change was related to the extension of Central Treasury segment by banking book transactions (previously they were reported within ‘Other’).
31 December 2017€ ‘000
Retail Banking
Corporate Banking
Central Treasury Other Total
External revenue:
Interest and similar income 308,010 95,069 19,871 11,237 434,187
Interest and similar expense (10,573) (5,338) (24,893) (9,423) (50,227)
Inter-segment revenue (17,086) (11,923) 23,445 5,564 –
Net interest income 280,351 77,808 18,423 7,378 383,960
Net fee and commission income 65,502 49,132 3,128 (4,113) 113,649
Net trading result 3,709 5,331 30,983 321 40,344
Other operating income 55 5,068 326 4,013 9,462
Total segment operating income 349,617 137,339 52,860 7,599 547,415
Depreciation and amortisation (13,941) (3,734) (9) (7,085) (24,769)
Operating expenses* (242,271)
Operating profi t before impairment 280,375
Impairment losses (51,420) (7,840) (1,432) (1,487) (59,205)
Share of profi t of associates and joint ventures
1,965
Income tax expense (48,138)
Net profi t for the year 174,997
Segment assets 7,463,880 4,236,117 2,778,733 492,146 14,970,876
Segment liabilities and equity 6,126,804 3,967,952 2,968,081 1,908,039 14,970,876
* The Group does not allocate the ‘Operating expenses’ to the individual segments.

116
Consolidated fi nancial statements
31 December 2016€ ‘000
Retail Banking
Corporate Banking
Central Treasury Other Total
External revenue:Interest and similar income 312,123 91,989 35,159 10,090 449,361 Interest and similar expense (15,290) (5,969) (26,888) (1,815) (49,962)
Inter–segment revenue (24,406) (6,654) 35,553 (4,493) –
Net interest income 272,427 79,366 43,824 3,782 399,399
Net fee and commission income 51,941 55,520 2,888 (2,402) 107,947 Net trading result 3,361 5,458 29,854 110 38,783 Other operating income 8,730 5,448 (6) (4,547) 9,625
Total segment operating income 336,459 145,792 76,560 (3,057) 555,754
Depreciation and amortisation (17,308) (4,284) (11) (6,143) (27,746)Operating expenses (245,612)
Operating profi t before impairment 282,396
Impairment losses (62,274) (12,332) (375) (783) (75,764)Share of profi t of associates and joint
ventures5,110
Income tax expense (54,972)
Net profi t for the year 156,770
Segment assets 6,449,442 4,165,215 2,963,498 458,999 14,037,154
Segment liabilities and equity 5,821,343 4,115,112 2,353,542 1,747,157 14,037,154
6. Cash and cash equivalents
€ ‘000 Note 2017 2016
Cash and balances with central banks 7 1,595,097 1,029,103 Current accounts in other banks 8 25,212 34,710 Term deposits with other banks 8 – 2,035
1,620,309 1,065,848
7. Cash and balances with central banks
€ ‘000 2017 2016
Balances with central banks: Compulsory minimum reserves 7,264 810,409 Current accounts 1,753 961 Term deposits 736,103 119,912 Loans and advances 724,427 –
1,469,547 931,282
Cash in hand 125,550 97,821
1,595,097 1,029,103
The compulsory minimum reserve is maintained as an interest bearing deposit under the regulations of the NBS and Česká národní banka. The amount of the compulsory minimum reserve depends on the level of customer deposits accepted by the VUB Group and the amount of issued bonds, both with a maturity of up to two years. The rate for the calculation of the compulsory minimum reserve is 1% for the reserves held at the NBS and 2% for the reserves held at the Česká národní banka. The required balance is calculated as the total of individual items multiplied by the valid rate.

117
Consolidated fi nancial statements
The daily balance of the compulsory minimum reserve can vary signifi cantly based on the amount of incoming and outgoing payments. The VUB Group’s ability to withdraw the compulsory minimum reserve is restricted by local legislation.
At 31 December 2017 the balance of ‘Loans and advances’ comprised of one reverse repo trade concluded with Česká národní banka in the total nominal amount of CZK 18,500 million (€ 724,354 thousand). The repo trade was secured by four treasury bills of Česká národní banka. At 31 December 2016 there was no reverse repo trade concluded.
8. Due from banks
€ ‘000 Note 2017 2016
Current accounts in other banks 6 25,212 34,710 Term deposits:
with contractual maturity less than 90 days 6 – 2,035 with contractual maturity over 90 days – 63
Loans and advances: with contractual maturity over 90 days 34,028 8,551
Cash collateral 31,746 67,127 Impairment losses on assets 13 (73) (18)
90,913 112,468
At 31 December 2016 the balance of ‘Term deposits‘ includes one deposit with Intesa Sanpaolo S. p. A. in the nominal amount of € 2,035 thousand.
9. Financial assets at fair value through profi t or loss
€ ‘000 2017 2016
Financial assets held for trading: State bonds
with contractual maturity over 90 days 4,933 – Financial assets designated at fair value through profi t or loss on initial recognition:
Equity shares 850 474
5,783 474
Equity shares in the fair value through profi t or loss portfolio (‘FVTPL’) are represented by shares of Intesa Sanpaolo S.p.A. and they form the part of the incentive plan introduced by the parent company.
10. Derivative fi nancial instruments
2017 2016 2017 2016
€ ‘000 Assets Assets Liabilities Liabilities
Trading derivatives 27,961 12,923 37,542 11,732 Cash fl ow hedges of interest rate risk 1,312 – 631 5,428 Fair value hedges of interest rate and infl ation risk 20,583 34,326 14,011 48,194
49,856 47,249 52,184 65,354
Trading derivatives can include hedging instruments that are non-qualifying according to IAS 39 and are held for risk management purposes rather than for trading. At 31 December 2017, trading derivatives do not include such hedging instruments. At 31 December 2016, these instruments consisted of one cross-currency interest rate swap with a negative fair value € 845 thousand.

118
Consolidated fi nancial statements
2017 2016 2017 2016
€ ‘000 Assets Assets Liabilities Liabilities
Trading derivatives – Fair values
Interest rate instruments:
Swaps 21,385 7,452 18,403 5,675
Options 51 325 51 357
21,436 7,777 18,454 6,032
Foreign currency instruments:
Forwards and swaps 4,296 3,725 16,896 3,352
Cross currency swaps 26 – – 845
Options 42 272 42 391
4,364 3,997 16,938 4,588
Equity and commodity instruments:
Equity options 2,146 922 2,137 904
Commodity swaps – 227 – 208
Commodity forwards 15 – 13 –
2,161 1,149 2,150 1,112
27,961 12,923 37,542 11,732
2017 2016 2017 2016
€ ‘000 Assets Assets Liabilities Liabilities
Trading derivatives – Notional values
Interest rate instruments:
Swaps 1,974,174 625,151 1,974,174 625,151
Options 49,014 115,342 49,014 115,342
Futures 3,431 – 3,431 –
2,026,619 740,493 2,026,619 740,493
Foreign currency instruments:
Forwards and swaps 1,832,019 1,331,195 1,842,027 1,326,896
Cross currency swaps 5,917 29,606 5,917 30,449
Options 7,201 45,482 7,201 45,091
1,845,137 1,406,283 1,855,145 1,402,436
Equity and commodity instruments:
Equity options 7,087 7,087 7,087 7,091
Commodity swaps – 5,149 – 5,060
Commodity forwards 7,407 – 7,407 –
14,494 12,236 14,494 12,151
3,886,250 2,159,012 3,896,258 2,155,080
Cash fl ow hedges of interest rate risk
At 31 December 2017 the Bank uses four interest rate swaps to hedge the interest rate risk arising from the issuance of three variable rate mortgage bonds. The cash fl ows on the fl oating legs of these interest rate swaps substantially match the cash fl ow profi les of the variable rate mortgage bonds.
The Bank uses one interest rate swap to hedge the interest rate risk of a subordinated loan denominated in EUR. The cash fl ows on the fl oating leg of this interest rate swap substantially match the cash fl ow profi les of the variable rate of the subordinated loan.

119
Consolidated fi nancial statements
Below is a schedule indicating as at 31 December 2017 and 31 December 2016, the periods when the hedged cash fl ows are expected to occur. The cash fl ows of mortgage bonds represent the future undiscounted value of coupons. and the cash fl ows from subordinated debt undiscounted repayments:
2017 2016
€ ‘000Up to
1 year1 to
5 yearsOver
5 yearsUp to
1 year1 to
5 yearsOver
5 years
Mortgage bonds – interest rate risk
(4,078) (1,414) – (5,343) (7,057) –
Subordinated debt – interest rate risk
(6,010) (25,326) – – – –
Fair value hedges of interest rate and infl ation risk
The Bank uses eighteen interest rate swaps to hedge the interest rate risk of a pool of mortgage loans. The changes in fair value of these interest rate swaps substantially offset the changes in fair value of the mortgage loans, both in relation to changes of interest rates.
The Bank uses fourteen interest rate swaps to hedge the interest rate risk of pool of current accounts. The changes in fair value of these interest rate swaps substantially offset the changes in fair value of the current accounts, both in relation to changes of interest rates.
The Bank uses fi ve interest rate swaps to hedge the interest rate risk of four fi xed rate bonds from the AFS portfolio. The changes in fair value of these interest rate and cross currency swaps substantially offset the changes in fair value of AFS portfolio bonds, both in relation to changes of interest rates.
The Bank also uses two asset swaps to hedge the infl ation risk and the interest rate risk of one infl ation bond held in the AFS portfolio (the bond and swaps were purchased together as a package transaction). The changes in fair value of these asset swaps substantially offset the changes in fair value of AFS portfolio bond, both in relation to changes of interest rates and infl ation reference index.
Furthermore, the Bank uses thirty six interest rate swaps to hedge the interest rate risk arising from the issuance of twenty three fi xed rate mortgage bonds. The changes in fair value of these interest rate swaps substantially offset the changes in fair value of the mortgage bonds, both in relation to changes of interest rates.
The Bank uses six interest rate swaps to hedge interest rate of six corporate loans. The changes in fair value of these interest rate swaps substantially offset the changes in fair value of the loans, both in relation to changes of interest rates.
The Bank uses three cross currency swaps to hedge interest rate of three corporate loans. The changes in fair value of these interest rate swaps substantially offset the changes in fair value of the loans, both in relation to changes of interest rates.
In 2017, the Bank recognised a net loss of € 11,801 thousand (2016: net gain of € 18,648 thousand) in relation to the fair value hedging instruments above. The net gain on hedged items attributable to the hedged risks amounted to € 11,867 thousand (2016: net loss of € 18,419 thousand). Both items are disclosed within ‘Net trading result’.
During 2017, interest and similar income from hedged AFS securities in the amount of € 11,647 thousand (2016: € 19,046 thousand) was compensated by interest expense from interest rate swap and asset swap hedging instruments in the amount of € 4,921 thousand (2016: € 7,966 thousand).
In 2017, interest expense from the hedged mortgage bonds in the amount of € 10,345 thousand (2016: € 15,577 thousand) was compensated by interest income from the interest rate swap hedging instruments in the amount of € 8,472 thousand (2016: € 7,133 thousand).

120
Consolidated fi nancial statements
11. Available-for-sale fi nancial assets
€ ‘000 Share 2017 Share 2016 2017 2016
State bonds of EU countries 439,744 1,046,763
Bank bonds 72,467 236,197
Equity shares at fair value 8,140 6,959
Equity shares at cost:
S.W.I.F.T. 0.01% 0.01% 65 60
520,416 1,289,979
This table shows the reconciliation from opening balance to closing balance for recurring 3 level of fair value (note 4):
€ ‘000 1 Jan 2017 Purchase Sale RevaluationExchange
differences 31 Dec 2017
Visa Inc. 4,932 – – 1,663 (286) 6,309
1 Jan 2016 Purchase Sale RevaluationExchange
differences 31 Dec 2016
Visa Europe LTD 14,690 – (14,690) – – –
Visa Inc. – 4,575 – 22 335 4,932
On 21 December 2015, Visa Europe and Visa Inc. offi cially announced the plan to become a unique entity, through the sale of 100% of share capital of Visa Europe to Visa Inc. VUB Bank as a stakeholder had the right to take part in the distribution of value generated by the deal, so the fair value was adjusted equal to cash part of the up-front consideration in amount of € 14,690 thousand net of tax in 2016.
Following confi rmation on 3 June 2016 that the European Commission approved the proposed purchase of Visa Europe Limited by Visa Inc., the fair value of the closing transaction was evaluated consisting of three elements in the total amount of € 21,509 thousand. Apart from the cash consideration, the Bank will be receiving Visa Inc. preferred shares Series C and also a deferred cash payment that will be due after the third anniversary of the closing date of the transaction.

121
Consolidated fi nancial statements
12. Loans and advances to customers
31 December 2017€ ‘000
Amortised cost
Impairment losses
(note 13)Carrying amount
Sovereigns
Municipalities 128,152 (97) 128,055
Municipalities – Leasing 442 (1) 441
128,594 (98) 128,496
Corporate
Large Corporates 1,720,127 (5,677) 1,714,450
Specialized Lending 748,099 (40,322) 707,777
Small and Medium Enterprises (‘SME’) 1,452,374 (62,640) 1,389,734
Other Financial Institutions 293,158 (1,386) 291,772
Public Sector Entities 1,158 (3) 1,155
Leasing 257,361 (15,760) 241,601
Factoring 98,205 (1,580) 96,625
4,570,482 (127,368) 4,443,114
Retail
Small Business 257,572 (12,913) 244,659
Small Business – Leasing 10,894 (393) 10,501
Consumer Loans 1,715,269 (165,222) 1,550,047
Mortgages 5,341,959 (25,402) 5,316,557
Credit Cards 203,609 (32,265) 171,344
Overdrafts 101,710 (9,346) 92,364
Leasing 4,163 (211) 3,952
Flat Owners Associations 27,651 (358) 27,293
Other 12,403 (1) 12,402
7,675,230 (246,111) 7,429,119
12,374,306 (373,577) 12,000,729

122
Consolidated fi nancial statements
31 December 2016€ ‘000
Amortised cost
Impairment losses
(note 13)Carrying amount
SovereignsMunicipalities 131,772 (100) 131,672 Municipalities – Leasing 382 (1) 381
132,154 (101) 132,053
CorporateLarge Corporates 1,501,159 (23,933) 1,477,226 Specialized Lending 870,530 (34,299) 836,231 Small and Medium Enterprises (‘SME’) 1,345,543 (55,778) 1,289,765 Other Financial Institutions 256,072 (1,052) 255,020 Public Sector Entities 1,200 (3) 1,197 Leasing 267,861 (18,947) 248,914 Factoring 69,473 (1,584) 67,889
4,311,838 (135,596) 4,176,242
RetailSmall Business 229,827 (15,390) 214,437 Small Business – Leasing 10,033 (526) 9,507 Consumer Loans 1,637,612 (168,651) 1,468,961 Mortgages 4,446,721 (30,683) 4,416,038 Credit Cards 207,961 (31,150) 176,811 Overdrafts 108,720 (11,502) 97,218 Leasing 4,398 (217) 4,181 Flat Owners Associations 24,536 (318) 24,218 Other 5,617 (2) 5,615
6,675,425 (258,439) 6,416,986
11,119,417 (394,136) 10,725,281
At 31 December 2017, the 20 largest corporate customers represented a total balance of € 1,470,348 thou-sand (31 December 2016: € 1,466,321 thousand) or 11.88% (31 December 2016: 13.19%) of the gross loan portfolio.
Maturities of gross fi nance lease receivables are as follows:
€ ‘000 2017 2016
Up to 1 year 97,241 105,564 1 to 5 years 172,570 169,810 Over 5 years 20,244 28,689
290,055 304,063
Unearned future fi nance income on fi nance leases (17,195) (21,389)Impairment losses (16,365) (19,691)
256,495 262,983
Maturities of net fi nance lease receivables are as follows:
€ ‘000 2017 2016
Up to 1 year 90,534 97,813 1 to 5 years 162,953 157,873 Over 5 years 19,373 26,988
272,860 282,674
Impairment losses (16,365) (19,691)
256,495 262,983

123
Consolidated fi nancial statements
13. Impairment losses on assets
€ ‘000 Note1 Jan 2017
Creation(note 34)
Reversal(note 34)
Assetswritten-off/sold
(note 34) FX diff Other*31 Dec
2017
Due from banks 8 18 71 (16) – – – 73
Loans and advances to customers
12 394,136 315,216 (249,602) (74,119) (1,662) (10,392) 373,577
Property and equipment
18 10,549 44 (1,542) – – (8,960) 91
Other assets 20 2,483 1,099 (912) – – (1) 2,669
407,186 316,430 (252,072) (74,119) (1,662) (19,353) 376,410
* ‘Other’ represents:– the interest portion (unwinding of interest)`– the elimination of impairment losses to ‘Buildings and land’ due to application of revaluation model (note 18).
€ ‘000 Note1 Jan 2016
Creation(note 34)
Reversal (note 34)
Assetswritten-off/sold
(note 34) FX diff Other*31 Dec
2016
Due from banks 8 25 2 (30) – 21 – 18
Available-for-sale fi nancial assets
11 574 – – – – (574) –
Loans and advances to customers
12 379,290 249,330 (171,679) (54,016) 420 (9,209) 394,136
Property and equipment
18 10,585 24 (60) – – – 10,549
Other assets 20 4,818 2,240 (1,374) (1,107) 2 (2,096) 2,483
395,292 251,596 (173,143) (55,123) 443 (11,879) 407,186
* ‘Other’ represents the following movements:– the interest portion (unwinding of interest);– reclassifi cation of impairment losses to receivables from repossessed asset ‘Other assets’ to ‘Loans and advances to
customers’;– sale of RVS, a. s.
Impairment loss recognised in 2017 for Loans and advances to customers was € 65,614 thousand (2016: € 77,651 thousand).

124
Consolidated fi nancial statements
14. Held-to-maturity investments
€ ‘000 Note 2017 2016
State bonds 376,472 530,019
At 31 December 2017, bonds in the total nominal amount of € 362,147 thousand from the held-to-maturity portfolio were pledged by the Bank to secure collateralized transactions (31 December 2016: € 509,428 thousand).
15. Associates and joint ventures
€ ‘000 Share CostRevalua-
tion Carrying amount
At 31 December 2017
VÚB Generali d. s. s., a. s. 50.00% 16,597 (7,692) 8,905
Slovak Banking Credit Bureau, s. r. o. 33.33% 3 64 67
16,600 (7,628) 8,972
€ ‘000 Share CostRevalua-
tion Carrying amount
At 31 December 2016
VÚB Generali d. s. s., a. s. 50.00% 16,597 (7,858) 8,739
Slovak Banking Credit Bureau, s. r. o. 33.33% 3 46 49
16,600 (7,812) 8,788
Slovak Banking Credit Bureau, s.r.o. (‘SBCB’) is associate of the VUB Group for which equity method of consol-idation is used.
VÚB Generali DSS, a. s. is a joint arrangement in which the Group has a joint control and a 50% ownership interest. The company was founded in 2004 by VUB Bank and Generali Poisťovňa, a. s. and it is structured as a separate vehicle in which the Group has a residual share on net assets. Accordingly, the Group has classifi ed its interest in VÚB Generali DSS, a. s. as a joint venture which is also equity-accounted.

125
Consolidated fi nancial statements
The following is summarised selected fi nancial information of the Group’s associates and joint ventures together with the reconciliation to the carrying amount of the Group’s interest in these companies:
2017 2016
€ ‘000
VÚB Generali
d. s. s. SBCB
VÚB Generali
d. s. s. SBCB
Net profi t for the year* 3,895 52 3,924 (12)
Other comprehensive income 437 – (44) –
Total comprehensive income for the year 4,332 52 3,880 (12)
Assets** 18,745 225 18,160 365
Liabilities (936) (25) (682) (217)
Equity 17,809 200 17,478 148
Group’s interest on equity at 1 January 8,739 49 8,404 53
Share of profi t/(loss) 1,948 18 1,962 (4)
Share of other comprehensive income 218 – (22) –
Dividends received during the year (2,000) – (1,605) –
Group’s interest on equity at 31 December 8,905 67 8,739 49
Carrying amount at 31 December 8,905 67 8,739 49
* includes: Interest income 327 – 225 –
Depreciation and amortization (85) (8) (79) (8)
Income tax expense (1,042) (3) (1,090) (3)
** includes: Cash and cash equivalents 3 3 7 4

126
Consolidated fi nancial statements
16. Intangible assets
€ ‘000 Software
Otherintangible
assetsAssets in progress Total
Cost
At 1 January 2017 225,845 55,440 21,009 302,294
Additions 35 – 23,802 23,837
Disposals (6,843) (36,181) – (43,024)
Transfers 20,355 218 (20,573) –
Exchange differences 33 6 – 39
At 31 December 2017 239,425 19,483 24,238 283,146
Accumulated amortisation
At 1 January 2017 (179,052) (54,354) – (233,406)
Amortisation for the year (12,290) (345) – (12,635)
Disposals 6,843 36,181 – 43,024
FX differences (26) (3) – (29)
At 31 December 2017 (184,525) (18,521) – (203,046)
Carrying amount
At 1 January 2017 46,793 1,086 21,009 68,888
At 31 December 2017 54,900 962 24,238 80,100
€ ‘000 Software
Otherintangible
assetsAssets in progress Total
Cost
At 1 January 2016 219,102 55,203 17,481 291,786
Additions 114 – 19,278 19,392
Disposals (8,885) – (105) (8,990)
Transfers 15,515 236 (15,645) 106
Exchange differences (1) 1 – –
At 31 December 2016 225,845 55,440 21,009 302,294
Accumulated amortisation
At 1 January 2016 (173,866) (53,812) – (227,678)
Amortisation for the year (13,997) (542) – (14,539)
Disposals 8,811 – – 8,811
At 31 December 2016 (179,052) (54,354) – (233,406)
Carrying amount
At 1 January 2016 45,236 1,391 17,481 64,108
At 31 December 2016 46,793 1,086 21,009 68,888
Assets in progress include mainly the costs for the technical appreciation of software and for the development of new software applications that have not yet been put in use.

127
Consolidated fi nancial statements
At 31 December 2017, the gross book value of fully amortised intangible assets that are still used by the VUB Group amounted to € 138,033 thousand (31 December 2016: € 138,112 thousand).
At 31 December 2017, the amount of irrevocable contractual commitments for the acquisition of intangible assets was € 1,833 thousand (31 December 2016: € 2,191 thousand).
17. Goodwill
€ ‘000 2017 2016
VÚB Leasing, a. s. 10,434 10,434
Consumer Finance Holding, a. s. 18,871 18,871
29,305 29,305
Goodwill related to VÚB Leasing includes both goodwill related to the majority (70%) shareholding in the amount of € 7,304 thousand (Sk 219 million from 2007) and goodwill arising from the purchase of the remaining 30% shareholding in the amount of € 3,130 thousand (Sk 96 million from 2010). Goodwill related to Consumer Finance Holding, a. s. (‘CFH’) arose in 2005 on the acquisition of CFH, the VUB Group’s sales fi nance subsidiary.
Goodwill is tested for impairment annually or more frequently, if events or changes in circumstances indicate that the carrying value may be impaired. Management considers VÚB Leasing and CFH to be separate cash generating units for the purposes of impairment testing.
The basis on which the recoverable amount of VÚB Leasing and CFH has been determined is the value in use calculation, using cash fl ow projections based on the most recent fi nancial budgets approved by senior management covering a 5-year period. The discount rates applied to cash fl ow projections beyond the fi ve year period are adjusted by the projected growth rate. Both discount rates and growth rates are determined on the Intesa Sanpaolo Group level specifi cally for the Slovak market.
The following rates are used by the Group for both VUB Leasing and CFH:
€ ‘000 2017 2016
Discount rate – cash fl ows 7.66% 9.95%
Discount rate – terminal value 8.62% 9.95%
Projected growth rate 4.40% 4.91%
The calculation of value in use for both VÚB Leasing and CFH considers the following key assumptions:– interest margins,– discount rates,– market share during the budget period,– projected growth rates used to extrapolate cash fl ows beyond the budget period,– current local Gross Domestic Product (GDP),– local infl ation rates.
Interest margins
Key assumptions used in the cash fl ow projections are the development of margins and volumes by product line.
Discount rates
Discount rates are determined based on the Capital Asset Pricing Model (‘CAPM’). The impairment calculation is most sensitive to market interest rates, expected cash-fl ows and growth rates.

128
Consolidated fi nancial statements
18. Property and equipment
€ ‘000 NoteBuildingsand land Equipment
Other tangibles
Assetsin progress Total
Cost or fair value
At 1 January 2017 201,806 67,934 50,861 4,118 324,719
Additions – – – 11,500 11,500
Disposals (3,249) (7,441) (4,406) – (15,096)
Transfers 1,120 1,640 3,150 (11,576) (5,666)
FX differences 6 5 4 – 15
Revaluation 27,805 – – – 27,805
Other* (123,853) – – – (123,853)
At 31 December 2017 103,635 62,138 49,609 4,042 219,424
Accumulated depreciation
At 1 January 2017 (111,587) (61,494) (36,236) – (209,317)
Depreciation for the year (5,871) (3,324) (2,939) – (12,134)
Disposals 2,571 7,494 3,150 – 13,215
Transfers – – 872 – 872
FX differences (6) (4) (4) – (14)
Other* 114,893 – – – 114,893
At 31 December 2017 – (57,328) (35,157) – (92,485)
Impairment losses 13
At 1 January 2017 (10,502) – (47) – (10,549)
Creation – – (44) – (44)
Release 1,542 – – – 1,542
Other* 8,960 – – – 8,960
At 31 December 2017 – – (91) – (91)
Carrying amount
At 1 January 2017 79,717 6,440 14,578 4,118 104,853
At 31 December 2017 103,635 4,810 14,361 4,042 126,848
* ‘Other’ represents elimination of the accumulated depreciation and impairment losses to ‘Buildings and land’ due to application of revaluation model.

129
Consolidated fi nancial statements
€ ‘000 NoteBuildingsand land Equipment
Other tangibles
Assetsin progress Total
Cost
At 1 January 2016 202,007 67,033 49,546 3,106 321,692
Additions 7 – – 13,889 13,896
Disposals (2,652) (2,125) (6,092) – (10,869)
Transfers 2,444 3,026 7,407 (12,877) –
At 31 December 2016 201,806 67,934 50,861 4,118 324,719
Accumulated depreciation
At 1 January 2016 (107,765) (59,877) (37,540) – (205,182)
Depreciation for the year (6,009) (3,734) (3,464) – (13,207)
Disposals 2,187 2,122 6,090 – 10,399
Transfers – (5) (1,322) – (1,327)
At 31 December 2016 (111,587) (61,494) (36,236) – (209,317)
Impairment losses 13
At 1 January 2016 (10,543) – (42) – (10,585)
Creation – – (24) – (24)
Release 41 – 19 – 60
At 31 December 2016 (10,502) – (47) – (10,549)
Carrying amount
At 1 January 2016 83,699 7,156 11,964 3,106 105,925
At 31 December 2016 79,717 6,440 14,578 4,118 104,853
In 2017 the Group reviewed the carrying amount of its buildings. An impairment test was carried out to deter-mine the recoverable amount of these assets which was based on the fair value less costs to sell. As a result of the impairment test the Group recognized an impairment loss in total amount of € 8,960 thousand as at 31 December 2017 (31 December 2016: € 10,502 thousand).
At 31 December 2017, the Group changed the accounting policy for buildings and land, before evaluated from the cost to the revaluation model for subsequent measurement. Management determined that these constitute one class of asset, based on the nature, characteristics and risks. The Group used income method, using market rents and yields as key inputs. Fair values are based on valuations performed by an accredited independent valuer. The revaluation model aligned the book value to the current market value. Level 3 revaluation was recognised due to signifi cant unobservable estimated valuation inputs.
The carrying amount of the assets subject to the revaluation model at 31 December 2017 would have been € 74,309 thousand, should the assets be carried under the cost model.
The impact of the revaluation model on equity is positive in total amount of € 21,966 thousand and positive on income statement in amount of € 1,521 thousand due to release of previously booked impairment.

130
Consolidated fi nancial statements
At 31 December 2017, the gross book value of fully depreciated tangible assets that are still used by the Group amounted to € 92,881 thousand (31 December 2016: € 94,888 thousand).
There are no restrictions on title and no ‘Property and equipment’ is pledged as security for liabilities.
The VUB Group’s insurance covers all standard risks to tangible and intangible assets (theft, robbery, natural hazards, vandalism and other damages).
19. Current and deferred income taxes
€ ‘000 2017 2016
Current income tax assets 9,478 1,464
€ ‘000 2017 2016
Deferred income tax assets 53,779 64,002
Deferred income taxes are calculated on all temporary differences using a tax rate of 21% (31 December 2016: 21%) as follows:
€ ‘000 2017
Profi t/(loss)
(note 35) Equity 2016
Due from banks 16 12 – 4
Derivative fi nancial instruments designated as cash fl ow hedges
(143) – (366) 223
Available-for-sale fi nancial assets (1,181) – (102) (1,079)
Loans and advances to customers 56,515 (4,919) – 61,434
Property and equipment (10,749) (7) (5,838) (4,904)
Provisions 185 107 – 78
Other liabilities 10,132 1,893 – 8,239
Other (996) (1,003) – 7
Deferred income tax assets 53,779 (3,917) (6,306) 64,002
20. Other assets
€ ‘000 Note 2017 2016
Operating receivables and advances 15,013 15,223
Inventories (incl. repossessed leased assets) 1,819 2,075
Prepayments and accrued income 7,008 8,630
Other tax receivables 1,315 1,609
Settlement of operations with fi nancial instruments 7 7
Receivables from termination of leasing 3 –
Other 632 220
25,797 27,764
Impairment losses 13 (2,669) (2,483)
23,128 25,281

131
Consolidated fi nancial statements
21. Due to central and other banks
€ ‘000 2017 2016
Due to central banks
Current accounts 1,147 993
Loans received from central banks 248,874 149,791
250,021 150,784
Due to other banks
Current accounts 37,991 22,699
Term deposits 16,137 109,909
Loans received from other banks 453,003 551,017
Cash collateral received 11,629 20,835
518,760 704,460
768,781 855,244
At 31 December 2017, ‘Loans received from central banks’ contains three loans from National Bank of Slovakia in the nominal amount of € 100,000 thousand, € 100,000 thousand and € 50,000 thousand (31 December 2016: two loans in the nominal amount of € 100,000 thousand and € 50,000 thousand). The interest rate for all loans is - 0.4% (31 December 2016: - 0.4%) and the maturity is in 2020 and 2021 (31 December 2016: in 2020). The principal and interests are due at maturity of loans.
The breakdown of ‘Loans received from other banks’ according to the counterparty is presented below:
€ ‘000 2017 2016
European Investment Bank 185,599 207,685
Intesa Sanpaolo S. p. A. 144,689 235,784
Intesa Sanpaolo Bank Ireland P. L. C. 35,025 –
Intesa Sanpaolo Bank Luxembourg S. A. 30,124 30,019
Tatra banka, a. s. 25,002 18,000
European Bank for Reconstruction and Development 21,898 24,596
Council of Europe Development Bank 10,646 14,846
Komerční banka, a. s. – 15,019
ING Bank N. V. – 5,057
Other 20 11
453,003 551,017
European Investment Bank
Loans from the European Investment Bank were provided to fund development of SME, large sized companies and infrastructure projects. At 31 December 2017, the balance comprised of sixteen loans in the nominal amount of € 50,000 thousand, € 20,000 thousand, € 15,380 thousand, € 14,985 thousand, € 14,985 thousand, € 13,125 thousand, € 12,720 thousand, € 9,990 thousand, € 9,141 thousand, € 6,429 thousand, € 4,995 thousand, € 4,995 thousand, € 3,808 thousand, € 2,222 thousand, € 2,159 thousand and € 625 thousand (31 December 2016: fourteen loans in the nominal amount of € 50,000 thousand, € 23,333 thousand, € 23,067 thousand, € 17,500 thousand, € 16,250 thousand, € 14,989 thousand, € 14,536 thousand, € 14,063 thousand, € 9,992 thousand, € 7,857 thousand, € 4,996 thousand, € 4,759 thousand, € 4,444 and € 1,875 thousand) with interest rates between 0.00% and 1.73% (31 December 2016: -0.004% - 1.73%) and with maturity between 2018 and 2028 (31 December 2016: 2018 – 2028). The principal of the loans is payable on an annual or semi-annual basis or at maturity and the interest is payable semi-annually or quarterly, depending on the periodicity agreed in the individual loan contracts.

132
Consolidated fi nancial statements
Intesa Sanpaolo S. p. A.
At 31 December 2017, there were eleven loan arrangements concluded with the ultimate parent company Intesa Sanpaolo S. p. A. (31 December 2016: sixteen loan arragements) in the nominal amount of € 20,000 thousand, € 20,000 thousand, € 20,000 thousand, € 20,000 thousand, € 15,000 thousand, € 13,000 thousand, € 10,000 thousand, € 10,000 thousand, € 8,000 thousand, € 5,000 thousand and € 3,000 thousand (31 December 2016: € 25,000 thousand, € 20,000 thousand, € 20,000 thousand, € 20,000 thousand, € 20,000 thousand, € 20,000 thousand, € 20,000 thousand, € 15,000 thousand, € 13,000 thousand, € 10,000 thousand, € 10,000 thousand, € 10,000 thousand, € 10,000 thousand, € 9,000 thousand, € 8,000 thousand and € 5,000 thousand) maturing between 2018 and 2019 (31 December 2016: 2017 – 2019) and with the interest rates in the range of -0.31% to 3.45% (31 December 2016: -0.31% to 3.45%). The frequency of the repayment of the principal and the interests varies for each loan contract.
Intesa Sanpaolo Bank Ireland P. L. C.
Loans received in 2017 from the Intesa Sanpaolo Bank Ireland P. L. C. consisted of two loans in the nominal amount of € 25,000 thousand and € 10,000 thousand with the interest rates 0.15% and 0.19%, both maturing in 2019. The principal is payable at maturity and the interest are payable annually.
Intesa Sanpaolo Bank Luxembourg S. A.
Loans from the Intesa Sanpaolo Bank Luxembourg S. A. consisted of two loans in the nominal amount of € 20,000 thousand and € 10,000 thousand, both maturing in 2019. The agreed interest rates were 1.52% and 2.10%, respectively, the interest is payable quarterly and the principal is payable at the maturity of the loan contracts.
Tatra banka, a. s.
Loan received from the Tatra banka, a. s. was in the nominal amount of € 25,000 thousand with maturity in 2018 and the interest rate 0.65% (31 December 2016: two loans in the nominal amount of € 15,000 thousand and € 3,000 thousand with maturity in 2017 and 2018 and interest rates 1.52% and 1.65%). The principal is payable at maturity of the loan and the interest is payable on a monthly basis.
European Bank for Reconstruction and Development
Loans received from the European Bank for Reconstruction and Development represented funds granted to support the energy savings in large corporations. At 31 December 2017, there were fi ve loan arrangements concluded in the nominal amount of € 5,000 thousand, € 5,000 thousand, € 5,000 thousand, € 3,571 thousand and € 3,285 thousand (31 December 2016: four loan arrangements in the nominal amount of € 9,545 thousand, € 5,000 thousand, € 5,000 thousand and € 5,000 thousand). The maturity of the loans is between 2020 and 2023 (31 December 2016: 2020 – 2023). At 31 December 2017 the interest rates are in the range between 0.35% and 1.63% (31 December 2016: 0.55% - 1.69%). The frequency of the repayment of both the interest and the principal is semi-annual.
Council of Europe Development Bank
At 31 December 2017, loans from the Council of Europe Development Bank comprised of four loans in the nominal amount of € 3,333 thousand, € 3,000 thousand, € 3,000 thousand and € 1,311 thousand (31 December 2016: fi ve loans in the nominal amount of € 4,500 thousand, € 4,000 thousand, € 4,000 thousand, € 1,748 thousand and € 596 thousand). The purpose of these loans is to fund SME projects and development of municipalities in the Slovak republic. The interest rates of these loans are linked to 3M Euribor and are between 0.14% and 0.31% at 31 December 2017 (31 December 2016: 0.15% - 0.31%). The maturity of the individual loans is between 2019 and 2022 (31 December 2016: 2017 – 2022). The interest is payable quarterly and the principal is payable on an annual basis.

133
Consolidated fi nancial statements
22. Due to customers
€ ‘000 2017 2016
Current accounts 6,407,771 5,948,945
Term deposits 2,576,930 2,641,739 Savings accounts 238,263 226,951 Government and municipal deposits 513,664 573,527 Loans received 76,201 60,050 Promissory notes 9,988 9,976 Other deposits 116,304 103,372
9,939,121 9,564,560
23. Subordinated debt and Debt securities in issue Subordinated debt
At 31 December 2017 and 31 December 2016, the subordinated debt recognized by the VUB Group was as follows:
€ ‘000 2017 2016
Subordinated debt 200,164 200,165
At 31 December 2017, the balance of subordinated debt comprised of one 3M euribor + margin ten-year loan drawn on 22 December 2016, in the nominal amount of € 200,000 thousand (31 December 2016: € 200,000 thousand) from Intesa Sanpaolo Holding International S.A. In accordance with the loan agreement, the loan as an unsecured obligation, can be used for the settlement of the debts of the Bank and shall not be repaid prior to repayment of all claims of the Bank’s non-subordinated creditors.
Debt securities in issue
€ ‘000 2017 2016
Bonds – 47
Mortgage bonds 262,037 597,377 Mortgage bonds subject to cash fl ow hedges 281,063 281,120 Mortgage bonds subject to fair value hedges 1,696,454 808,674
2,239,554 1,687,171
Revaluation of fair value hedged mortgage bonds 8,465 28,022 Amortisation of revaluation related to terminated fair value hedges 4,361 68
2,252,380 1,715,308
The repayment of mortgage bonds is funded by the mortgage loans provided to customers of the Group (see also note 12).
The disclosure of changes arising from cash fl ows and non-cash changes in liabilities arising from fi nancing activities:
Non-cash changes
€ ‘0001 Jan 2017 Cash fl ow Accruals
Revaluation of hedged
mortgage bonds
Unrealised exchange
differences Other31 Dec
2017
Subordinated debt 200,165 – (1) – – – 200,164Mortgage bonds 1,715,308 563,845 (1,754) (19,557) (5,415) (47) 2,252,380

134
Consolidated fi nancial statements
NameInterest rate (%) CCY
Number of mortgage
bonds issued at
31 Dec 2017
Nominal value
in CCY per piece Issue date
Maturitydate
2017€ ‘000
2016€ ‘000
Mortgage bonds VÚB, a. s. XX. 4.300 EUR 50 331,939 9.3.2006 9.3.2021 17,176 17,176
Mortgage bonds VÚB, a. s. XXX. 5.000 EUR 1,000 33,194 5.9.2007 5.9.2032 33,457 33,438
Mortgage bonds VÚB, a. s. 31. 4.900 EUR 600 33,194 29.11.2007 29.11.2037 19,724 19,710
Mortgage bonds VÚB, a. s. 32. 1.870 CZK – 1,000,000 17.12.2007 17.12.2017 – 29,976
Mortgage bonds VÚB, a. s. 36. 4.750 EUR 560 33,194 31.3.2008 31.3.2020 19,140 19,091
Mortgage bonds VÚB, a. s. 43. 5.100 EUR 500 33,194 26.9.2008 26.9.2025 16,067 15,970
Mortgage bonds VÚB, a. s. 53. 0.400 EUR – 1,000,000 8.4.2010 8.4.2017 – 100,096
Mortgage bonds VÚB, a. s. 57. 1.037 EUR 100 1,000,000 30.9.2010 30.9.2018 100,262 100,280
Mortgage bonds VÚB, a. s. 58. 1.529 EUR 80 1,000,000 10.12.2010 10.12.2019 80,071 80,074
Mortgage bonds VÚB, a. s. 62. 1.718 EUR 100 1,000,000 28.7.2011 28.7.2018 100,730 100,766
Mortgage bonds VÚB, a. s. 67. 5.350 EUR 300 50,000 29.11.2011 29.11.2030 15,071 15,071
Mortgage bonds VÚB, a. s. 70. 3.750 EUR – 100,000 7.3.2012 7.3.2017 – 41,221
Mortgage bonds VÚB, a. s. 71. 3.900 EUR – 20,000 2.5.2012 2.5.2017 – 15,127
Mortgage bonds VÚB, a. s. 72. 4.700 EUR 250 100,000 21.6.2012 21.6.2027 25,463 25,446
Mortgage bonds VÚB, a. s. 73. 4.200 EUR 500 100,000 11.7.2012 11.7.2022 50,795 50,752
Mortgage bonds VÚB, a. s. 74. 3.350 EUR 700 100,000 16.1.2013 15.12.2023 71,967 71,921
Mortgage bonds VÚB, a. s. 75. 2.000 EUR 300 100,000 5.4.2013 5.4.2019 30,456 30,466
Mortgage bonds VÚB, a. s. 76. 2.400 EUR 309 10,000 22.4.2013 22.4.2018 3,141 3,142
Mortgage bonds VÚB, a. s. 77. 1.800 CZK 5,000 100,000 20.6.2013 20.6.2018 19,759 18,655
Mortgage bonds VÚB, a. s. 78. 2.160 EUR 905 10,000 3.3.2014 3.3.2020 9,227 9,234
Mortgage bonds VÚB, a. s. 79. 2.000 EUR 10,000 1,000 24.3.2014 24.9.2020 10,154 10,154
Mortgage bonds VÚB, a. s. 80. 1.850 EUR 31 1,000,000 27.3.2014 27.3.2021 31,704 31,786
Mortgage bonds VÚB, a. s. 81. 2.550 EUR 38 1,000,000 27.3.2014 27.3.2024 39,556 39,687
Mortgage bonds VÚB, a. s. 82. 1.650 EUR 1,701 1,000 16.6.2014 16.12.2020 1,716 1,716
Mortgage bonds VÚB, a. s. 83. 0.900 EUR 500 100,000 28.7.2014 28.7.2019 50,088 50,023
Mortgage bonds VÚB, a. s. 84. 0.600 EUR 500 100,000 29.9.2014 30.9.2019 49,996 49,949
Mortgage bonds VÚB, a. s. 85. 2.250 EUR 500 100,000 14.11.2014 14.11.2029 49,581 49,533
(Table continues on the next page)

135
Consolidated fi nancial statements
NameInterest rate (%) CCY
Number of mortgage
bonds issued at
31 Dec 2017
Nominal value
in CCYper piece Issue date
Maturitydate
2017€ ‘000
2016€ ‘000
Mortgage bonds VÚB, a. s. 86. 0.300 EUR 1,000 100,000 27.4.2015 27.4.2020 99,135 98,620
Mortgage bonds VÚB, a. s. 87. 1.250 EUR 1,000 100,000 9.6.2015 9.6.2025 97,916 97,545
Mortgage bonds VÚB, a. s. 88. 0.500 EUR 965 100,000 11.9.2015 11.9.2020 96,733 96,822
Mortgage bonds VÚB, a. s. 89. 1.200 EUR 1,000 100,000 29.9.2015 29.9.2025 99,338 99,213
Mortgage bonds VÚB, a. s. 90. 1.600 EUR 1,000 100,000 29.10.2015 29.10.2030 98,011 97,831
Mortgage bonds VÚB, a. s. 91. 0.600 EUR 1,000 100,000 21.3.2016 21.3.2023 99,972 99,878
Mortgage bonds VÚB, a. s. 92. 1.700 USD 700 100,000 27.6.2016 27.6.2019 58,779 66,802
Mortgage bonds VÚB, a. s. 93. 0.500 EUR 2,500 100,000 18.1.2017 18.1.2024 248,139 –
Mortgage bonds VÚB, a. s. 94. 1.050 EUR 2,500 100,000 27.4.2017 27.4.2027 247,830 –
Mortgage bonds VÚB, a. s. 95. 0.375 EUR 2,500 100,000 26.9.2017 26.9.2022 248,401 –
2,239,555 1,687,171

136
Consolidated fi nancial statements
24. Provisions
€ ‘000 2017 2016
Litigation 8,991 25,514
Restructuring provision 924 452
Other provisions 47 35
9,962 26,001
The movements in provisions were as follows:
€ ‘000 Note 1 Jan 2017 Creation Reversal Use 31 Dec 2017
Litigation 27, 33 25,514 2,973 (19,398) (98) 8,991
Restructuring provision
32 452 710 – (238) 924
Other provisions 33 35 12 – – 47
26,001 3,695 (19,398) (336) 9,962
€ ‘000 Note 1 Jan 2016 Creation Reversal Use 31 Dec 2016
Litigation 27, 33 25,116 1,243 (8) (837) 25,514
Restructuring provision
32 180 450 – (178) 452
Other provisions 33 17 18 – – 35
25,313 1,711 (8) (1,015) 26,001
25. Other liabilities
€ ‘000 2017 2016
Various creditors 43,448 37,492
Settlement with employees 27,493 24,524
Financial guarantees and commitments 19,781 20,552
Factoring 9,096 7,786
Accruals and deferred income 5,367 5,615
Severance and Jubilee benefi ts 4,729 3,872
VAT payable and other tax payables 2,583 1,993
Settlement with shareholders 1,508 1,480
Share remuneration scheme 850 474
Investment certifi cates 449 471
Settlement with securities 25 6
Other 369 1,001
115,698 105,266
At 31 December 2017 and 31 December 2016 there were no overdue balances within ‘Other liabilities’.

137
Consolidated fi nancial statements
Severance and Jubilee benefi ts are discounted to determine its present value. The discount rate is determined by reference to current rates of return on Slovak government bonds with a 15 years duration that represents the period which is closest to the average benefi t duration. The calculation is performed using the projected unit credit method. All employees of the VUB Group are covered by the retirement and jubilee employee benefi ts program.
The calculation for the respective program takes into account the following parameters:
2017 2016
Jubileebenefi ts
Retirementbenefi ts
Jubileebenefi ts
Retirementbenefi ts
Discount rate –0.35% 0.94% 0.00% 1.33%
Growth of wages in 2018/2017* – 3.50% – 1.00%
Future growth of wages after 2019/2018* – 3.50% – 1.00%
Fluctuation of employees (based on age) 5.7% – 36.8% 5.7% – 36.8% 5% – 43% 5% – 43%
Retirement age Based on valid legislation Based on valid legislation
Mortality Based on mortality tables issued by the Statistical Offi ce of the Slovak Republic
Based on mortality tables issued by the Statistical Offi ce of the Slovak Republic
* Growth of wages and Future growth of wages is not part of calculation for Jubilee benefi ts.
The movements in Financial guarantees and commitments, Severance and Jubilee benefi ts were as follows:
€ ‘000 Note 1 Jan 2017Creation/(Reversal) FX diff Other 31 Dec 2017
Financial guarantees and commitments
34 20,552 (1,391) 620 – 19,781
Severance and Jubilee benefi ts
32 3,872 857 – – 4,729
24,424 (534) 620 – 24,510
€ ‘000 Note 1 Jan 2016Creation/(Reversal) FX diff Other 31 Dec 2016
Financial guarantees and commitments
34 21,476 (902) (22) – 20,552
Severance and Jubilee benefi ts
32 3,397 480 – (5) 3,872
24,873 (422) (22) (5) 24,424
The movements in social fund liability presented within Settlement with employees were as follows:
€ ‘000 1 Jan 2017Creation(note 32) Use 31 Dec 2017
Social fund 702 1,483 (1,571) 614
€ ‘000 1 Jan 2016Creation(note 32) Use 31 Dec 2016
Social fund 787 1,449 (1,534) 702

138
Consolidated fi nancial statements
26. Equity
€ ‘000 2017 2016
Share capital – authorised, issued and fully paid:
89 ordinary shares of € 3,319,391.89 each, not traded 295,426 295,426
4,078,108 ordinary shares of € 33.2 each, publicly traded 135,393 135,393
430,819 430,819
Share premium 13,719 13,719
Reserves 127,548 103,329
Retained earnings (excluding net profi t for the year) 885,503 800,619
1,457,589 1,348,486
In accordance with the law and statutes of the VUB Group companies, the VUB Group companies are obliged to contribute at least 10% of its annual net profi t to the ‘Legal reserve fund’ until it reaches 20% of their share capital. Usage of the ‘Legal reserve fund’ is restricted by the law and the fund can be used for the coverage of the losses of VUB Group companies.
€ ‘000 2017 2016
Net profi t for the year attributable to shareholders 174,997 156,770
The principal rights attached to shares are to take part in and vote at the general meeting of shareholders and to receive dividends.
The structure of shareholders is as follows:
€ ‘000 2017 2016
Intesa Sanpaolo Holding International S. A. 97.03% 97.03%
Domestic shareholders 2.08% 2.17%
Foreign shareholders 0.89% 0.80%
100.00% 100.00%
The primary objectives of the VUB Group’s capital management are to ensure that the Group complies with externally imposed capital requirements and that the VUB Group maintains strong credit ratings and healthy capital ratios in order to support its business and to maximise shareholders’ value.
The Group manages its capital structure and makes adjustments to it in the light of changes in economic conditions and the risk characteristics of its activities. In order to maintain or adjust the capital structure, the Group may adjust the amount of dividend payments to shareholders, return capital to shareholders or issue capital securities. No changes have yet been made in the objectives, policies and processes from the previous years.

139
Consolidated fi nancial statements
The VUB Group’s regulatory capital position at 31 December 2017 and 31 December 2016 was determined based on the rules for capital adequacy calculation set by the CRR regulation:
€ ‘000 2017 2016
Tier 1 capital
Share capital 430,819 430,819
Share premium 13,719 13,719
Retained earnings without net profi t for the year 885,503 800,619
Other reserves 100,054 100,054
Accumulated other comprehensive income 26,056 2,165
Fair value gains and losses arising from the Group’s own credit risk related to derivative liabilities
531 (531)
Less goodwill and intangible assets (109,405) (98,193)
Less IRB shortfall of credit risk adjustments to expected losses – (11)
1,347,277 1,248,641
Tier 2 capital
IRB excess of provisions over expected losses eligible 10,736 7,855
Subordinated debt 200,000 200,000
210,736 207,855
Total regulatory capital 1,558,013 1,456,496
€ ‘000 2017 2016
Tier 1 capital 1,347,277 1,248,641
Tier 2 capital 210,736 207,855
Total regulatory capital 1,558,013 1,456,496
Total Risk Weighted Assets 8,542,395 8,476,135
Tier 1 capital ratio 15.77% 14.73%
Total capital ratio 18.24% 17.18%
Regulatory capital consists of Tier 1 capital, which comprises share capital, share premium, retained earnings without profi t for the current year, foreign currency translation and reserves. Certain adjustments are made to IFRS-based results and reserves, as prescribed by the CRR regulation. The other component of regulatory capital is Tier 2 capital, which includes subordinated long term debt, preference shares and IRB excess of provisions over expected losses.
Own Funds, risk-weighted assets and the capital ratios as at 31 December 2017 were calculated according to the harmonised rules and regulations for banks and investment companies contained in Directive 2013/36/EU (‘CRD IV’) and in (EU) Regulation 575/2013 (‘CRR’) of 26 June 2013, which transpose the banking supervision standards defi ned by the Basel Committee (the Basel 3 Framework) to European Union laws.
Following the Supervisory Review and Evaluation Process (‘SREP’), the ECB annually makes a fi nal decision on the capital requirement that VÚB must comply with on consolidated level. Starting from 1 January 2017, the overall capital requirement the Bank has to meet in terms of Common Equity Tier 1 ratio is 10.25%. This is the result of: a) the SREP requirement comprising a minimum Pillar 1 capital requirement of 4.5% and an additional Pillar 2 capital requirement of 1.25%, entirely of Common Equity Tier 1 ratio; b) additional require-ments, made up entirely of Common Equity Tier 1 ratio, relating to a Capital Conservation Buffer of 2.5%, and an O-SII Buffer (Other Systemically Important Institutions Buffer) of 1% and SRB (Systemic Risk Buffer) of 1%.

140
Consolidated fi nancial statements
For the sake of completeness, please note that Directive 2013/36/EU (‘CRD IV’) establishes the obligation for the designated national authorities to activate an operational framework for the defi nition of the ratio of the countercyclical capital buffer (‘CCyB’) starting from 1 January 2016. The ratio is subject to review on a quarterly basis. The European regulation was implemented in Slovakia by National Bank of Slovakia in rele-vant regulation, which contains suitable regulations concerning CCyB. Based on the analysis of the reference indicators, the National Bank of Slovakia decided to set the countercyclical ratio (relating to the exposures towards Slovak counterparties) for period starting 1 August 2017 at 0.5% (bringing the total CET1 capital requirement to 10.75%).
The Overall Capital Requirement (OCR) was as of 1 January 2017 set at 13.75% (14.25% from 1 August 2018).
27. Financial commitments and contingencies
€ ‘000 2017 2016
Issued guarantees 783,667 764,156
Commitments and undrawn credit facilities 2,779,312 2,894,083
3,562,979 3,658,239
(a) Issued guarantees
Commitments from guarantees represent irrevocable assurances that the VUB Group will make payments in the event that a borrower cannot meet its obligations to third parties. These assurances carry the same credit risk as loans and therefore the VUB Group books liabilities against these instruments on a similar basis as is applicable to loans.
(b) Commitments and undrawn credit facilities
The primary purpose of commitments to extend credit is to ensure that funds are available to the customer as required. Commitments to extend credit issued by the VUB Group represent undrawn portions of commit-ments and approved overdraft loans.
(c) Lease obligations
The VUB Group enters into operating lease agreements for branch facilities and cars. The total value of future payments arising from non-cancellable operating leasing contracts at 31 December 2017 and 31 December 2016 was as follows:
€ ‘000 2017 2016
Up to 1 year 33 339
1 to 5 years – 72
33 411
(d) Operating lease – the Group as a lessor
The VUB Group has entered into a number of non-cancellable operating lease contracts with its customers. Future minimum rentals receivable under such contracts as at 31 December 2017 and 31 December 2016 are as follows:
€ ‘000 2017 2016
Up to 1 year 3,122 3,873
1 to 5 years 3,980 6,024
7,102 9,897

141
Consolidated fi nancial statements
(e) Legal proceedings
In the normal course of business, the VUB Group is subject to a variety of legal actions. The Group conducted a review of legal proceedings outstanding against it as of 31 December 2017. Pursuant to this review, manage-ment has recorded total provisions of € 8,991 thousand (31 December 2016: € 25,514 thousand) in respect of such legal proceedings (see also note 24).
The Group will continue to defend its position in respect of each of these legal proceedings. In addition to the legal proceedings covered by provisions, there are contingent liabilities arising from legal proceedings in the total amount of € 27,909 thousand, as at 31 December 2017 (31 December 2016: € 6,634 thousand). This amount represents existing legal proceedings against the Group that will most probably not result in any payments due by the Group.
Provisions for legal cases have decreased by € 19,398 thousand compared to the previous period. On the basis of success in litigation and mainly as a result of an independent assessment, based on which management revised the expected probability of success, the provision was released (note 24).
28. Net interest income
€ ‘000 2017 2016
Interest and similar income
Due from banks 2,238 885
Loans and advances to customers 410,892 414,163
of which interest expense from hedging instruments (4,880) (1,266)
Bonds, treasury bills and other securities:
Financial assets at fair value through profi t or loss 46 779
Available-for-sale fi nancial assets 3,802 10,674
of which interest expense from hedging instruments (4,921) (7,966)
Held-to-maturity investments 17,209 22,860
434,187 449,361
Interest and similar expense
Due to banks (3,610) (4,981)
Due to customers (21,337) (18,969)
of which interest income from hedging instruments 373 –
Debt securities in issue (25,280) (26,012)
of which interest income from hedging instruments 7,468 6,310
(50,227) (49,962)
383,960 399,399
Interest income on impaired loans and advances to customers for 2017 amounted to € 19,291 thousand (2016: € 30,962 thousand).

142
Consolidated fi nancial statements
29. Net fee and commission income
€ ‘000 2017 2016
Fee and commission income
Received from banks 8,154 6,109
Received from customers:
Current accounts 57,925 55,024
Loans and guarantees 27,311 30,269
Transactions and payments 22,769 20,822
Insurance mediation 12,866 13,579
Securities 12,434 9,877
Overdrafts 3,319 4,874
Securities – Custody fee 2,408 1,861
Term deposits 159 285
Other 3,683 3,611
151,028 146,311
Fee and commission expense
Paid to banks (14,589) (14,063)
Paid to mediators:
Services (11,895) (14,476)
Credit cards (8,864) (8,599)
Securities (965) (636)
Other (1,067) (590)
(37,379) (38,364)
Net fee and commission income 113,649 107,947
30. Net trading result
€ ‘000 2017 2016
Foreign currency derivatives and transactions 10,366 13,220
Customer FX margins 6,361 5,587
Interest rate derivatives* (10,932) 16,825
Cross currency swaps* 17,734 (9,411)
Equity derivatives (9) 16
Other derivatives (4) 15
Dividends from equity shares held in FVTPL portfolio 212 163
Securities:
Financial assets at fair value through profi t or loss:
Held for trading (165) 1,038
Designated at fair value through profi t or loss on initial recognition 83 (3)
Available-for-sale fi nancial assets* 770 27,096
Held-to-maturity investments 1,208 –
Debt securities in issue* 14,720 (15,763)
40,344 38,783
* Includes the revaluation of fi nancial instruments that are part of the hedging relationship, i.e. fair value hedges of interest rate and infl ation risk (see also note 10).

143
Consolidated fi nancial statements
31. Other operating income
€ ‘000 2017 2016
Income from leasing 4,413 4,780
Net profi t from sale of fi xed assets 751 566
Rent 664 722
Financial revenues 554 353
Services 461 366
Sales of consumer goods 47 25
Other 2,572 2,813
9,462 9,625
32. Salaries and employee benefi ts
€ ‘000 Note 2017 2016
Remuneration (89,190) (85,870)
Social security costs (34,658) (31,639)
Social fund 25 (1,483) (1,449)
Severance and Jubilee benefi ts 25 (857) (480)
Restructuring provision 24 (472) (272)
(126,659) (119,710)
At 31 December 2017, the total number of employees of the VUB Group was 3,942 (31 December 2016: 4,098). The average number of employees of the Group during the period ended 31 December 2017 was 3,941 (31 December 2016: 4,012).
The VUB Group does not have any pension arrangements separate from the pension system established by law, which requires mandatory contributions of a certain percentage of gross salaries to the State owned social insurance and privately owned pension funds. These contributions are recognised in the period when salaries are earned by employees. No further liabilities are arising to the VUB Group from the payment of pensions to employees in the future.

144
Consolidated fi nancial statements
33. Other operating expenses and Special levy of selected fi nancial institutions
€ ‘000 Note 2017 2016
IT systems maintenance (25,173) (21,426)
Property related expenses (19,373) (19,026)
Post and telecom (10,885) (12,111)
Advertising and marketing (10,245) (10,670)
Resolution fund* (4,489) (5,438)
Stationery (3,973) (4,849)
Equipment related expenses (3,919) (3,524)
Professional services (3,197) (1,716)
Third parties’ services (2,887) (2,030)
Security (2,788) (2,884)
Insurance (2,031) (2,074)
Travelling (985) (1,052)
Training (867) (1,313)
Audit ** (733) (725)
Litigations paid (810) (1,567)
Transport (683) (785)
Contribution to the Deposit Protection Fund *** (488) (1,486)
VAT and other taxes (448) (542)
Provisions for litigation 24, 26 16,523 (398)
Other damages (39) (36)
Other provisions 24 (12) (18)
Other operating expenses (13,287) (10,089)
(90,789) (103,759)
* Starting from 1 January 2015 the new Bank Recovery and Resolution Directive 2014/59/EU (‘BRRD’) is effective for all EU member states. The Directive was implemented to Slovak legislation by Act No. 371/2014 on Resolution. The Directive sets an obligation for the banks of the member states participating to the Banking Union to pay an annual contribution depending on the size and the risk profi le of the bank to the National Resolution Fund in 2015 and to the Single Resolution Fund from 2016 up to the 2023.
** The fee for the statutory audit was € 328 thousand (2016: € 328 thousand). Other audit-related assurance services and non-audit services performed by the statutory auditor related to audit and review of the group reporting and to audit of the Bank‘s prudential returns, preparation of the long form report as required by the Act on Banks, audit procedures on capital adequacy, agreed-upon procedures on the Bank‘s compliance with the covenants of the loan agreement between the Bank and the European Bank for Reconstruction and Development, agreed upon proceedure on compliance with articles 71h - 71k of the Act No. 566/2001 Coll on securities, audit of receivables towards a client of the bank for bank-ruptcy procedure purposes and agreed-upon procedures on the merger of a Bank‘s subsidiary with the Bank. These fees amounted to € 348 thousand (2016: € 316 thousand). Other audit fee not conducted by statutory auditor were in the amount of € 57 thousand (2016: € 81 thousand).
*** The annual contribution for 2017 was determined by the Deposit Protection Fund under the valid methodology. As at 31 December 2017, the Bank expensed the full amount of such contribution. The quarterly contribution to the Deposit Protection Fund for 2017 was set at 0.0075% p. q. of the amount of protected deposits.
At 31 December 2017 and 31 December 2016, the special levy recognized by the Bank was as follows:
€ ‘000 2017 2016
Special levy of selected fi nancial institutions (24,823) (22,143)

145
Consolidated fi nancial statements
Commencing 1 January 2012, banks operating in the Slovak Republic are subject to a special levy of selected fi nancial institutions, originally set to 0.4% p.a. of selected liabilities with the extension of the basis for calcu-lation by deposits subject to a protection based on the special regulation from 1 September 2012. The levy is recognized in the statement of profi t or loss and other comprehensive income on an accrual basis and is payable at the beginning of each quarter.
As at 25 July 2014, the total amount of the levy paid by the fi nancial institutions subject to levy exceeded the threshold of € 500,000 thousand and therefore, based on the amendment to the Act on the Special levy of selected fi nancial institutions effective from 2015, the levy rate has been decreased to 0.2% p.a.
34. Impairment losses
€ ‘000 Note 2017 2016
Creation of impairment losses 13 (316,430) (251,596)
Reversal of impairment losses 13 252,072 173,143
Net creation of impairment losses (64,358) (78,453)
Creation of liabilities – fi nancial guarantees and commitments (38,134) (32,961)
Reversal of liabilities – fi nancial guarantees and commitments 39,525 33,863
Net reversal of liabilities – fi nancial guarantees and commitments 25 1,391 902
Nominal value of assets written-off/sold (94,687) (86,635)
Release of impairment losses to assets written-off/sold 13 74,119 55,123
(20,568) (31,512)
Proceeds from receivables written-off 5,580 6,982
Proceeds from receivables sold 18,750 26,317
24,330 33,299
(59,205) (75,764)
35. Income tax expense
€ ‘000 Note 2017 2016
Current income tax (44,221) (53,708)
Deferred income tax 19 (3,917) (1,264)
(48,138) (54,972)
The movement in deferred taxes in the statement of profi t or loss and other comprehensive income is as follows:
€ ‘000 2017 2016
Due from banks 12 (1)
Available-for-sale fi nancial assets – (126)
Loans and advances to customers (4,919) 299
Property and equipment (7) 544
Provisions 107 49
Other liabilities 1,893 (633)
Other (1,003) (1,396)
(3,917) (1,264)
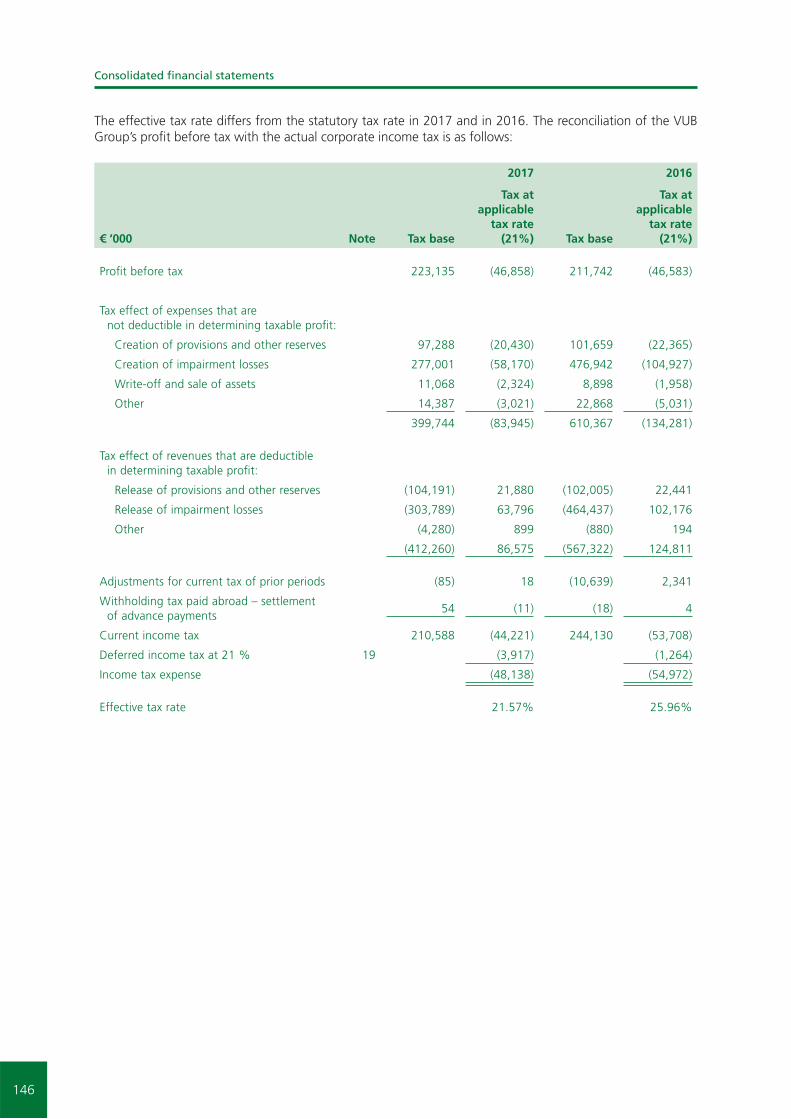
146
Consolidated fi nancial statements
The effective tax rate differs from the statutory tax rate in 2017 and in 2016. The reconciliation of the VUB Group’s profi t before tax with the actual corporate income tax is as follows:
2017 2016
€ ‘000 Note Tax base
Tax at applicable
tax rate (21%) Tax base
Tax at applicable
tax rate (21%)
Profi t before tax 223,135 (46,858) 211,742 (46,583)
Tax effect of expenses that are not deductible in determining taxable profi t:
Creation of provisions and other reserves 97,288 (20,430) 101,659 (22,365)
Creation of impairment losses 277,001 (58,170) 476,942 (104,927)
Write-off and sale of assets 11,068 (2,324) 8,898 (1,958)
Other 14,387 (3,021) 22,868 (5,031)
399,744 (83,945) 610,367 (134,281)
Tax effect of revenues that are deductible in determining taxable profi t:
Release of provisions and other reserves (104,191) 21,880 (102,005) 22,441
Release of impairment losses (303,789) 63,796 (464,437) 102,176
Other (4,280) 899 (880) 194
(412,260) 86,575 (567,322) 124,811
Adjustments for current tax of prior periods (85) 18 (10,639) 2,341
Withholding tax paid abroad – settlement of advance payments
54 (11) (18) 4
Current income tax 210,588 (44,221) 244,130 (53,708)
Deferred income tax at 21 % 19 (3,917) (1,264)
Income tax expense (48,138) (54,972)
Effective tax rate 21.57% 25.96%

147
Consolidated fi nancial statements
36. Other comprehensive income
€ ‘000 2017 2016
Items that will not be reclassifi ed to profi t or loss in the future
Revaluation surplus from property and equipment
Buildings and land 27,804 –
Items that may be reclassifi ed to profi t or loss in the future
Cash fl ow hedges:
Revaluation gains arising during the year 1,744 539
Available-for-sale fi nancial assets:
Revaluation gains/(losses) arising during the year 1,780 (21,068)
Reclassifi cation adjustment for profi t on sale of AFS bonds included in the profi t or loss
(1,072) (8,660)
708 (29,728)
Exchange differences on translating foreign operation 269 (19)
Total other comprehensive income 30,525 (29,208)
Income tax relating to components of other comprehensive income (note 37) (6,306) 6,462
Other comprehensive income for the year 24,219 (22,746)
37. Income tax effects relating to other comprehensive income
2017 2016
€ ‘000
Beforetax
amount Tax
(expense)
Net of tax
amount
Beforetax
amount
Tax (expense)/
benefi t
Net of tax
amount
Items that will not be reclassifi ed to profi t or loss in the future
Revaluation surplus from property and equipment
27,804 (5,838) 21,966 – – –
Items that may be reclassifi ed to profi t or loss in the future
Net movement on cash fl ow hedges
1,744 (366) 1,378 539 (129) 410
Available-for-sale fi nancial assets
708 (102) 606 (29,728) 6,591 (23,137)
Exchange differences on transl. foreign operations
269 – 269 (19) – (19)
2,721 (468) 2,253 (29,208) 6,462 (22,746)
30,525 (6,306) 24,219 (29,208) 6,462 (22,746)

148
Consolidated fi nancial statements
38. Related parties
Related parties are those counterparties that represent:
(a) Enterprises that directly, or indirectly, through one or more intermediaries, control, or are controlled by, have a signifi cant infl uence or are under the common control of, the reporting enterprise;
(b) Associates – enterprises in which the parent company has signifi cant infl uence and which are neither a subsidiary nor a joint venture;
(c) Individuals owning, directly or indirectly, an interest in the voting power of the Group that gives them signifi cant infl uence over the Group, and anyone expected to infl uence, or be infl uenced by, that person in their dealings with the Group;
(d) Key management personnel, that is, those persons having authority and responsibility for planning, directing and controlling the activities of the Group, including directors and offi cers of the Group and close members of the families of such individuals; and
(e) Enterprises in which a substantial interest in the voting power is owned, directly or indirectly, by any person described in (c) or (d) or over which such a person is able to exercise signifi cant infl uence. This includes enterprises owned by directors or major shareholders of the Group and enterprises that have a member of key management in common with the Group.
In considering each possible related party relationship, attention is directed to the substance of the relationship, and not merely the legal form. The stated transactions have been made under arms-length commercial and banking conditions.
In 2017, the remuneration and other benefi ts provided to members of the Management Board were € 4,102 thousand (2016: € 3,612 thousand), of which the severance benefi ts € 66 thousand, and to members of the Supervisory Board € 126 thousand (2016: € 116 thousand).

149
Consolidated fi nancial statements
At 31 December 2017, the outstanding balances with related parties comprised:
31 December 2017€ ‘000 KMP*
Joint ventures Associates
Intesa Sanpaolo
Intesa Sanpaolo
Group companies Total
Assets
Due from banks – – – 9,978 32,659 42,637
Financial assets at fair value through profi t or loss
– – – 850 – 850
Derivative fi nancial instruments
– – – 995 41,937 42,932
Available-for-sale fi nancial assets
– – – 1,832 – 1,832
Loans and advances to customers
251 1 – – – 252
Other assets – 7 – 95 1,509 1,611
251 8 – 13,750 76,105 90,114
Liabilities
Due to central and other banks
– – – 201,605 77,412 279,017
Derivative fi nancial instruments
– – – 1,130 20,855 21,985
Due to customers 2,651 – 214 – 78,199 81,064
Subordinated debt – – – – 200,164 200,164
Debt securities in issue – – – – 281,064 281,064
Other liabilities 850 – – – 2,644 3,494
3,501 – 214 202,735 660,338 866,788
Commitments and undrawn credit facilities
– – – 3,460 – 3,460
Issued guarantees – – – 9,629 861 10,490
Received guarantees – – – 52,499 15,213 67,712
Derivative transactions (notional amount – receivable)
– – – 427,675 5,685,464 6,113,139
Derivative transactions (notional amount – payable)
– – – 427,589 5,680,478 6,108,067

150
Consolidated fi nancial statements
2017€ ‘000 KMP*
Joint ventures Associates
Intesa Sanpaolo
Intesa Sanpaolo
Group companies Total
Income and expense items
Interest and similar income 4 – – 161 – 165
Interest and similar expense
(5) – – (1,316) (7,178) (8,499)
Fee and commission income
1 – – 121 12,433 12,555
Fee and commission expense
– – – (446) (25) (471)
Net trading result – – – (5,590) (9,850) (15,440)
Other operating income – 71 – 712 882 1,665
Other operating expenses – – – (340) (8,972) (9,312)
– 71 – (6,698) (12,710) (19,337)
* Key management personnel

151
Consolidated fi nancial statements
At 31 December 2016, the outstanding balances with related parties comprised:
31 December 2016€ ‘000 KMP
Joint ventures Associates
Intesa Sanpaolo
Intesa Sanpaolo
Group companies Total
Assets
Due from banks – – – 5,859 25,797 31,656
Derivative fi nancial instruments
– – – 400 35,787 36,187
Loans and advances to customers
165 – – – – 165
Financial assets at fair value through profi t or loss
– – – 2,501 – 2,501
Other assets – 7 – 39 1,428 1,474
165 7 – 8,799 63,012 71,983
Liabilities
Due to central and other banks
– – – 352,903 59,288 412,191
Derivative fi nancial instruments
– – – 834 5,150 5,984
Due to customers 2,899 – 105 – 260,907 263,911
Debt securities in issue: – – – – 381,216 381,216
Other liabilities 474 – – 6 522 1,002
3,373 – 105 353,743 707,083 1,064,304
Issued guarantees – – – 2,945 27,682 30,627
Received guarantees – – – 84,723 43,415 128,138
Derivative transactions (notional amount – receivable)
– – – 514,156 1,904,111 2,418,267
Derivative transactions (notional amount – payable)
– – – 512,993 614,008 1,127,001

152
Consolidated fi nancial statements
2016€ ‘000 KMP
Joint ventures Associates
Intesa Sanpaolo
Intesa Sanpaolo
Group companies Total
Income and expense items
Interest and similar income 4 – – 269 27 300
Interest and similar expense
(7) – – (2,159) (6,572) (8,738)
Fee and commission income
2 – – 50 9,943 9,995
Fee and commission expense
– – – (458) (415) (873)
Net trading result – – – 117 32,217 32,334
Other operating income – 103 – 660 526 1,289
Other operating expenses – – – (497) (2,469) (2,966)
(1) 103 – (2,018) 33,257 31,341

153
Consolidated fi nancial statements
39. Events after the end of the reporting period
From 31 December 2017, up to the date when these fi nancial statements were approved by the Management Board, there the following events were identifi ed that require disclosure in these fi nancial statements.
On 11 December 2017, VUB, a. s. the sole shareholder of VÚB Factoring, a. s. decided to merge VÚB Factoring, a. s. without liquidation into the successor company VUB, a. s. as at 1 January 2018.
On 11 December 2017, VUB Bank as the sole shareholder of Consumer Finance Holding, a. s. and VÚB Leasing, a. s. decided to merge Consumer Finance Holding, a. s. without liquidation and to divide it into VUB, a. s. and VÚB Leasing, a. s. as successor companies as at 1 January 2018.
From 31 December 2017, up to the date when these fi nancial statements were approved by the Management Board, there were no further events identifi ed that would require adjustments to these fi nancial statements.

154
Separate fi nancial statements
Separate fi nancial statements prepared in accordance with International Financial Reporting Standards as adopted by the European Union and Independent Auditors’ Report for the year ended 31 December 2017

155

156

157

158

159

160

161

162

163
Separate statement of fi nancial position at 31 December 2017 (In thousands of euro)
Note 2017 2016
Assets
Cash and balances with central banks 7 1,595,078 1,029,081
Due from banks 8 90,744 112,295
Financial assets at fair value through profi t or loss 9 5,783 474
Derivative fi nancial instruments 10 49,856 47,249
Available-for-sale fi nancial assets 11 520,416 1,289,979
Loans and advances to customers 12 11,487,518 10,188,485
Held-to-maturity investments 14 376,472 530,019
Subsidiaries, associates and joint ventures 15 92,745 92,745
Intangible assets 16 74,882 63,062
Property and equipment 17 111,512 88,402
Current income tax assets 18 5,813 –
Deferred income tax assets 18 38,626 47,544
Other assets 19 19,848 20,014
14,469,293 13,509,349
Liabilities
Due to central and other banks 20 449,815 474,571
Derivative fi nancial instruments 10 52,184 65,354
Due to customers 21 9,855,433 9,494,921
Subordinated debt 22 200,164 200,165
Debt securities in issue 22 2,252,380 1,715,308
Current income tax liabilities 18 – 3,176
Provisions 23 7,302 25,952
Other liabilities 24 96,035 85,728
12,913,313 12,065,175
Equity
Equity (excluding net profi t for the year) 25 1,395,959 1,179,003
Net profi t for the year 25 160,021 265,171
1,555,980 1,444,174
14,469,293 13,509,349
Financial commitments and contingencies 26 3,642,125 3,785,114
The accompanying notes on pages 167 to 254 form an integral part of these fi nancial statements.
These fi nancial statements were authorised for issue by the Management Board on 15 February 2018.
Alexander Resch Antonio Bergalio
Chairman of the Management Board Member of the Management Board

164
Separate statement of profi t or loss and other comprehensive income for the year ended 31 December 2017 (In thousands of euro)
Note 2017 2016
Interest and similar income 366,226 379,612
Interest and similar expense (47,169) (46,295)
Net interest income 27 319,057 333,317
Fee and commission income 148,614 144,204
Fee and commission expense (48,967) (58,049)
Net fee and commission income 28 99,647 86,155
Net trading result 29 40,355 38,795
Other operating income 30 5,988 3,141
Dividend income 30 2,000 133,961
Operating income 467,047 595,369
Salaries and employee benefi ts 31 (110,913) (105,938)
Other operating expenses 32 (70,014) (85,990)
Special levy of selected fi nancial institutions 32 (24,823) (22,143)
Amortisation 16 (10,892) (13,225)
Depreciation 17 (9,171) (9,599)
Operating expenses (225,813) (236,895)
Operating profi t before impairment 241,234 358,474
Impairment losses 33 (38,047) (46,946)
Profi t before tax 203,187 311,528
Income tax expense 34 (43,166) (46,357)
NET PROFIT FOR THE YEAR 160,021 265,171
Other comprehensive income for the year, after tax:
Items that will not be reclassifi ed to profi t or loss in the future:
Revaluation surplus from property and equipment 21,700 –
Items that may be reclassifi ed to profi t or loss in the future:
Cash fl ow hedges 1,378 410
Available-for-sale fi nancial assets 387 (23,137)
Exchange difference on translating foreign operation 210 2
Other comprehensive income for the year, net of tax 35, 36 23,675 (22,725)
TOTAL COMPREHENSIVE INCOME FOR THE YEAR 183,696 242,446
Basic and diluted earnings per € 33.2 share in € 25 12.33 20.43
The accompanying notes on pages 167 to 254 form an integral part of these fi nancial statements.

165
Separate statement of changes in equity for the year ended 31 December 2017(In thousands of euro)
Share capital
Share premium
Legal reserve
fundRetained earnings
Revaluation surplus from property and
equipment
Available-for-sale fi nancial
assets
Cash fl ow
hedges
Translation of foreign operation Total
At 1 January 2016 430,819 13,719 87,493 765,454 – 27,192 (1,250) 22 1,323,449
Total comprehensive income for the year, net of tax
– – – 265,171 – (23,137) 410 2 242,446
Gain on disposal of an investment in associate under common control (Note 15)
– – – 8,464 – – – – 8,464
Exchange difference – – – 22 – – – (22) –
Transactions with owners, recorded directly in equity
Dividends to shareholders
– – – (130,334) – – – – (130,334)
Reversal of dividends distributed but not collected
– – – 149 – – – – 149
Total transactions with owners
– – – (130,185) – – – – (130,185)
At 31 December 2016 430,819 13,719 87,493 908,926 – 4,055 (840) 2 1,444,174
At 1 January 2017 430,819 13,719 87,493 908,926 – 4,055 (840) 2 1,444,174
Total comprehensive income for the year, net of tax
– – – 160,021 21,700 387 1,378 210 183,696
Exchange difference – – – 2 – – – (2) –
Transactions with owners, recorded directly in equity
Dividends to shareholders
– – – (72,020) – – – – (72,020)
Reversal of dividends distributed but not collected
– – – 130 – – – – 130
Total transactions with owners
– – – (71,890) – – – – (71,890)
At 31 December 2017 430,819 13,719 87,493 997,059 21,700 4,442 538 210 1,555,980
The accompanying notes on pages 167 to 254 form an integral part of these fi nancial statements.

166
Separate statement of cash fl ows for the year ended 31 December 2017(In thousands of euro)
Note 2017 2016
Cash fl ows from operating activities Profi t before tax 203,187 311,528Adjustments for:
Amortisation 10,892 13,225 Depreciation 9,171 9,599 Securities at fair value through profi t or loss, debt securities in
issue and FX differences(25,018) 17,043
Interest income (366,226) (379,612)Interest expense 47,169 46,295 Dividend income (2,000) (133,961)Sale of property and equipment (542) (403)Impairment losses and similar charges 35,579 75,748 Interest received 374,041 402,841 Interest paid (50,686) (52,900)Dividends received 2,000 133,961 Tax paid (43,237) (57,712)
Decrease in Due from banks 11,023 80,421 (Increase)/Decrease in Financial assets at fair value through profi t or
loss(5,310) 97,923
Increase in Derivative fi nancial instruments (assets) (1,229) (187)Decrease in Available-for-sale fi nancial assets 775,872 532,286 Increase in Loans and advances to customers (1,363,417) (1,706,748)Decrease/(increase) in Other assets 111 (455)(Decrease)/increase in Due to central and other banks (23,848) 62,665 (Decrease)/increase in Derivative fi nancial instruments (liabilities) (13,170) 2,795 Increase in Due to customers 361,367 1,155,536 Increase in Other liabilities 10,841 5,929
Net cash (used in)/used from operating activities (53,430) 615,817
Cash fl ows from investing activities Repayments of held-to-maturity investments 147,282 – Purchase of intangible assets and property and equipment (32,427) (22,138)Disposal of property and equipment 1,218 872 Increase resulting from the disposal of the associate – 10,851
Net cash used from/ (used in) investing activities 116,073 (10,415)
Cash fl ows from fi nancing activities Proceeds from issue of debt securities 750,000 249,848 Repayments of debt securities (186,155) (150,618)Dividends paid (72,020) (130,334)
Net cash used from/ (used in) fi nancing activities 491,825 (31,104)
Net change in cash and cash equivalents 554,468 574,298
Cash and cash equivalents at the beginning of the year 6 1,065,653 491,355
Cash and cash equivalents at 31 December 6 1,620,121 1,065,653
The accompanying notes on pages 167 to 254 form an integral part of these fi nancial statements.

167
1. General information
Všeobecná úverová banka, a. s. (‘the Bank’ or ‘VUB’) provides retail and commercial banking services. The Bank is domiciled in the Slovak Republic with its registered offi ce at Mlynské nivy 1, 829 90 Bratislava 25 and has the identifi cation number (IČO) 313 20 155 and the tax identifi cation number (DIČ) 2020411811.
At 31 December 2017, the Bank had a network of 236 points of sale (including Retail Branches, Corporate Branches and Mortgage centres) located throughout Slovakia (31 December 2016: 239). The Bank also has one branch in the Czech Republic (31 December 2016: 1).
The Bank’s ultimate parent company is Intesa Sanpaolo S.p.A., which is a joint-stock company and which is incorporated and domiciled in Italy. The consolidated fi nancial statements of the company are available at the address of its registered offi ce at Piazza San Carlo 156, 10121 Torino, Italy.
At 31 December 2017, the members of the Management Board are: Alexander Resch (Chairman), Antonio Bergalio, Peter Magala, Peter Novák, Martin Techman, Roberto Vercelli (from 1 December 2017) and Andrej Viceník (from 1 December 2017).
Other members of the Management Board were Jozef Kausich (until 30 November 2017) and Elena Kohú-tiková (until 31 October 2017).
At 31 December 2017, the members of the Supervisory Board are: Ezio Salvai (Chairman), Ignacio Jaquotot (Vice Chairman), Luca Finazzi, Paolo Sarcinelli, Christian Schaack, Andrej Straka and Róbert Szabo (from 8 February 2017).
Another member of the Supervisory Board was Ján Gallo (until 22 January 2017).
2. Summary of signifi cant accounting policies
2.1 Basis of preparation
The separate fi nancial statements of the Bank (‘the fi nancial statements’) have been prepared in accordance with International Financial Reporting Standards (‘IFRS’) issued by the International Accounting Standards Board (‘IASB’) and with interpretations issued by the International Financial Reporting Interpretations Committee of the IASB (‘IFRIC’) as approved by the European Union Commission in accordance with the Regulation of the European Parliament and the Council of European Union and in accordance with the Act No. 431/2002 Collection on Accounting.
The separate fi nancial statements of the Bank for the year ended 31 December 2016 were authorised for issue by the Management Board on 15 February 2017.
The consolidated fi nancial statements of the VUB Group for the year ended 31 December 2017 were issued on 15 February 2018 and are available at the registered offi ce of the Bank.
The fi nancial statements have been prepared under the historical cost convention, as modifi ed by the revalua-tion of available-for-sale fi nancial assets, fi nancial assets at fair value through profi t or loss, derivative fi nancial instruments and buildings and land in property and equipment to fair value and in the case of the fi nancial assets or fi nancial liabilities designated as hedged items in qualifying fair value hedge relationships modifi ed by the changes in fair value attributable to the risk being hedged.
The fi nancial statements were prepared using the going concern assumption that the Bank will continue in operation for the foreseeable future.
The fi nancial statements are presented in thousands of euro (‘€’), unless indicated otherwise. Euro is the functional currency of the Bank.
Negative balances are presented in brackets.
Separate fi nancial statements

168
Separate fi nancial statements
2.2 Changes in accounting policies and presentation
At 31 December 2017, Bank implemented a new accounting policy concerning measurement of buildings and land at fair value, following the Intesa Sanpaolo Group policy. This policy is described in note ‘2.18 Property and equipment‘.
Other accounting policies adopted are consistent with those of the previous fi nancial year.
Standards and interpretations relevant to Bank’s operations issued but not yet effective
The following new Standards, amendments to Standards and Interpretations are not yet mandatorily effective for annual periods beginning on or after 1 January 2017, and have not been applied in preparing these separate fi nancial statements. The Bank plans to adopt these pronouncements when they become effective.
IFRS 15 Revenue from Contracts with Customers and Clarifi cations to IFRS 15 Revenue from Contracts with Customers (issued on 12 April 2016)(Effective for annual periods beginning on or after 1 January 2018.)
The new Standard provides a framework that replaces existing revenue recognition guidance in IFRS. Entities will adopt a fi ve-step model to determine when to recognise revenue, and at what amount. The new model specifi es that revenue should be recognised when (or as) an entity transfers control of goods or services to a customer at the amount to which the entity expects to be entitled. Depending on whether certain criteria are met, revenue is recognised:– over time, in a manner that depicts the entity’s performance; or– at a point in time, when control of the goods or services is transferred to the customer.
IFRS 15 also establishes the principles that an entity shall apply to provide qualitative and quantitative disclo-sures which provide useful information to users of fi nancial statements about the nature, amount, timing, and uncertainty of revenue and cash fl ows arising from a contract with a customer.
The Clarifi cations to IFRS 15 clarify some of the Standard’s requirements and provide additional transitional relief for companies that are implementing the new Standard.
The amendments clarify how to:– identify a performance obligation - the promise to transfer a good or a service to a customer- in a contract;– determine whether a company is a principal (the provider of a good or service) or an agent (responsible for
arranging for the good or service to be provided); and– determine whether the revenue from granting a license should be recognised at a point in time or over
time.
The amendments also provide entities with two additional practical expedients:– An entity need not restate contracts that are completed contracts at the beginning of the earliest period
presented (for entities using the full retrospective method only);– For contracts that were modifi ed before the beginning of the earliest period presented, an entity need not
retrospectively restate the contract but shall instead refl ect the aggregate effect of all of the modifi cations that occur before the beginning of the earliest period presented (also for entities recognising the cumulative effect of initially applying the standard at the date of initial application).
It is expected that the new Standard, when initially applied, will have an impact on the fi nancial statements, since the timing and the measurement of the Bank’s fee and commission income from life insurance mediation are expected to change. According to IFRS 15 the Bank will need to take into account possible clawbacks from insurance companies on the basis of historical statistics, when recognising this type of revenue.
The Bank has decided to apply the standard retrospectively with the cumulative effect refl ected in retained earnings.
The Bank has estimated the expected impact of the initial application of IFRS 15 on its equity as at 1 January 2018 at approximately € 2 million.

169
Separate fi nancial statements
Except for revenues related to mediation of life insurance, the timing and measurement of other Bank’s reve-nues are not expected to change materially under IFRS 15 due to the nature of the Bank’s operations and the types of revenues it earns.
The above assessment is preliminary because not all transition work has been fi nalized. The actual impact of adopting IFRS 15 on 1 January 2018 may change because it will require the Bank to revise its accounting processes and internal controls and these changes are not yet complete and the new accounting policies, assumptions, judgements and estimation techniques employed are subject to change until the Bank fi nalizes its fi rst fi nancial statements that include the date of initial application.
IFRS 9 Financial Instruments (2014)(Effective for annual periods beginning on or after 1 January 2018; to be applied retrospectively with some exemptions. The restatement of prior periods is not required.)
This Standard replaces IAS 39, Financial Instruments: Recognition and Measurement, except that the IAS 39 exception for a fair value hedge of an interest rate exposure of a portfolio of fi nancial assets or fi nancial liabili-ties continues to apply, and entities have an accounting policy choice between applying the hedge accounting requirements of IFRS 9 or continuing to apply the existing hedge accounting requirements in IAS 39 for all hedge accounting until the standard resulting from the IASB’s project in macro hedge accounting is effective.
Although the permissible measurement bases for fi nancial assets – amortised cost (‘AC’), fair value through other comprehensive income (‘FVOCI’) and fair value through profi t or loss (‘FVTPL’) – are similar to IAS 39, the criteria for classifi cation into the appropriate measurement category are signifi cantly different.
A fi nancial asset is measured at amortized cost if the following two conditions are met: – the assets is held within a business model whose objective is to hold assets in order to collect contractual
cash fl ows; and – its contractual terms give rise, on specifi ed dates, to cash fl ows that are solely payments of principal and
interest on the principal outstanding.
In addition, for a non-trading equity instrument, a company may elect to irrevocably present subsequent changes in fair value (including foreign exchange gains and losses) in OCI. These are not reclassifi ed to profi t or loss under any circumstances.
For debt instruments measured at FVOCI, interest revenue, expected credit losses and foreign exchange gains and losses are recognised in profi t or loss in the same manner as for amortised cost assets. Other gains and losses are recognised in OCI and are reclassifi ed to profi t or loss on derecognition.
The impairment model in IFRS 9 replaces the ‘incurred loss’ model in IAS 39 with a forward-looking ‘expected credit loss’ (‘ECL’) model, which means that a loss event will no longer need to occur before an impairment allowance is recognised. The new impairment model will apply to fi nancial assets measured at amortized cost or FVOCI, except for investments in equity instruments, and to contract assets.
Under IFRS 9, loss allowances will be measured on either of the following bases:– 12-month ECLs: these are ECLs that result from possible default events within the 12 months after the
reporting date; and – Lifetime ECLs: these are ECLs that result from all possible default events over the expected life of a fi nancial
instrument.
IFRS 9 includes a new general hedge accounting model, which aligns hedge accounting more closely with risk management. The types of hedging relationships – fair value, cash fl ow and foreign operation net investment – remain unchanged, but additional judgment will be required.
The standard contains new requirements to achieve, continue and discontinue hedge accounting and allows additional exposures to be designated as hedged items.
When initially applying IFRS 9, the Bank may choose as its accounting policy to continue to apply the hedge accounting requirements of IAS 39 instead of those of IFRS 9. The Bank has elected to continue to apply IAS 39.

170
Separate fi nancial statements
The standard will affect the classifi cation and measurement of fi nancial assets held as at 1 January 2018 as follows:– Loans and advances to banks and customers that are measured under amortized cost under IAS 39, will
also be generally measured at amortized cost under IFRS 9;– Debt investment securities that are classifi ed as available-for-sale under IAS 39 will be generally measured
at FVOCI;– Held to maturity investments that are measured under amortized cost under IAS 39 will be to a large extent
classifi ed as held to collect and sale and measured at FVOCI;– Trading assets and hedging derivatives, which are measured at FVTPL under IAS 39, will also be measured
at FVTPL under IFRS 9.
Defi nition of default
Under IFRS 9, the Bank will consider a fi nancial asset to be in default when:– the borrower is unlikely to pay its credit obligations to the Bank in full, without recourse by the Bank to
actions such as realising security (if any is held); or– the borrower is more than 90 days past due on any material credit obligations to the Bank.
The Bank will consider both quantitative and qualitative indicators when assessing whether a borrower is in default.
Signifi cant increase in credit risk
The Bank will primarily identify whether a signifi cant increase in credit risk has occurred for an exposure by comparing the remaining lifetime probability of default as at the reporting date with the remaining lifetime probability of default for this point in time that was estimated on initial recognition of the exposure.
Impact of the introduction of IFRS 9 on own funds
In December 2017, the European Parliament and the European Council issued Regulation (EU) 2017/2395 amending Regulation (EU) 575/2013 as regard transitional arrangements for mitigating the impact of the introduction of IFRS 9 on own funds, integrating the CRR with Article 473 “Introduction of IFRS 9”. The new Article allows Banks to re-introduce in their CET 1 a decreasing quota of the impact of IFRS 9 in a fi ve year transitional period (2018-2022). That amount shall be determined using the static approach which will be adopted by the Bank. It refers only to the impact of First Time Adoption (FTA) resulting from the comparison of IAS impairments as at 31/12/2017 and IFRS 9 impairments as at 1/1/2018 – including both performing loans classifi ed in Stages 1 and 2 and adjustments to NPLs (Stage 3) – to which is applied a decreasing factor (95% for 2018, 85% in 2019, 70% in 2020, 50% in 2021 and 25% in 2022) to set the amount to be included in CET1. The static transitional approach is not applicable to the changes in valuation reserves deriving from re-classifi cation of fi nancial instruments during FTA (impact resulting from C&M – Classifi cation and Measurement).
Furthermore, under paragraph 7 of Article 473 of the Regulation, Group companies adopting the transitional approach shall update calculation of the following components relevant to the determination of supervisory capital requirements, so as to avoid inappropriate benefi ts:– deferred tax assets deducted from CET 1 relating to Standard and IRB exposures;– determination of EAD using the scaling factor to assess the RWA of Standard exposures;– Tier 2 elements relating to IRB weighted exposures.
The assessment is preliminary because not all transition work has been fi nalized. The actual impact of adopting IFRS 9 on 1 January 2018 may change because:– IFRS 9 will require the Bank to revise its accounting processes and internal controls and these changes are
not yet complete;– although parallel runs were carried out in 2017, the new systems and associated controls in place have not
been operational for an extended period;– the Bank has not fi nalized the testing and assessment of controls over its new IT systems and changes to
its governance framework;– the Bank is refi ning and fi nalizing its models for ECL calculations; and– the new accounting policies, assumptions, judgements and estimation techniques employed are subject to
change until the Bank fi nalizes its fi rst fi nancial statements that include the date of initial application.

171
Separate fi nancial statements
This table shows the estimated impact of the application IFRS 9 to the separate statement of fi nancial position assets part as at 1 January 2018:
Remeasurement
IAS 39 categories IFRS 9 categories
IAS 39 measu-rement
Reclas-sifi cation ECL Other
IFRS 9 measu-rement
Assets Assets
Cash and balances with central banks
Cash, cash balances at central banks
1,595,078 – (108) – 1,594,970
Due from banks Financial assets at amortised cost: due from banks
90,744 – (482) – 90,262
Financial assets at fair value through profi t or loss
5,783 (5,783) – – –
Financial assets held for trading
4,933 – – 4,933
Non-trading fi nancial assets mandatorily at fair value through profi t or loss
850 – – 850
Derivative fi nancial instruments
49,856 (49,856) – – –
Financial assets held for trading
25,491 – – 25,491
Derivatives – Hedge accounting
24,365 – – 24,365
Available-for-sale fi nancial assets
Financial assets at fair value through other comprehensive income
520,416 – (178) 178 520,416
Loans and advances to customers
Financial assets at amortised cost: due from customers
11,487,518 – (38,723) – 11,448,795
Held-to-maturity investments
Financial assets at fair value through other comprehensive income
376,472 – (49) 50,548 426,971
Subsidiaries, associates and joint ventures
Investments in subsidiaries, joint ventures and associates
92,745 – – – 92,745
Intangible assets Intangible assets 74,882 – – – 74 882
Property and equipment Property and equipment 111,512 – – – 111,512
Current income tax assets Current income tax assets 5,813 – – – 5,813
Deferred income tax assets Deferred income tax assets 38,626 – 8,625 (10,652) 36,599
Other assets Other assets 19,848 – (32) – 19,816
14,469,293 – (30,947) 40,074 14,478,420

172
Separate fi nancial statements
This table shows the estimated impact of the application IFRS 9 to the separate statement of fi nancial position the liabilities and equity part as at 1 January 2018:
Remeasurement
IAS 39 categories IFRS 9 categories
IAS 39 measu-rement
Reclas-sifi cation ECL Other
IFRS 9 measu-rement
Liabilities Liabilities
Due to central and other banks
Financial liabilities measured at amortised cost: due to banks
449,815 – – – 449,815
Derivative fi nancial instruments
Financial liabilities held for trading
52,184 – – – 52,184
Due to customers Financial liabilities measured at amortised cost: due to customers
9,855,433 – – – 9,855,433
Subordinated debt Financial liabilities measured at amortised cost: subordinated debt
200,164 – – – 200,164
Debt securities in issue Financial liabilities measured at amortised cost: debt securities in issue
2,252,380 – – – 2,252,380
Provisions Provisions 7,302 – – – 7,302
Other liabilities Other liabilities 96,035 – 1,498 – 97,533
12,913,313 – 1,498 – 12,914,811
Equity Equity
Equity (excluding net profi t for the year)
Equity (excluding net profi t for the year)
1,395,959 – (32,445) 40,074 1,403,588
Net profi t for the year Net profi t for the year 160,021 – – – 160,021
1,555,980 – (32,445) 40,074 1,563,609
14,469,293 – (30,947) 40,074 14,478,420

173
Separate fi nancial statements
IFRS 16 Leases(Effective for annual periods beginning on or after 1 January 2019.)
IFRS 16 supersedes IAS 17 Leases and related interpretations. The Standard eliminates the current dual accounting model for lessees and instead requires companies to bring most leases on-balance sheet under a single model, eliminating the distinction between operating and fi nance leases.
Under IFRS 16, a contract is, or contains, a lease if it conveys the right to control the use of an identifi ed asset for a period of time in exchange for consideration. For such contracts, the new model requires a lessee to recognise a right-of-use asset and a lease liability. The right-of-use asset is depreciated and the liability accrues interest. This will result in a front-loaded pattern of expense for most leases, even when the lessee pays constant annual rentals.
The new Standard introduces a number of limited scope exceptions for lessees which include:– leases with a lease term of 12 months or less and containing no purchase options, and– leases where the underlying asset has a low value (‘small-ticket’ leases).
Lessor accounting, however, shall remain largely unchanged and the distinction between operating and fi nance leases will be retained.
It is expected that the new Standard, when initially applied, will have a signifi cant impact on the fi nancial statements, since it will require the Bank to recognise in its statement of fi nancial position assets and liabilities relating to operating leases for which the Bank acts as a lessee.
The Bank has not yet fi nished its analysis of the expected quantitative impact of the new Standard.
Amendments to IFRS 10 and IAS 28 Sale or contribution of assets between an investor and its associate or joint venture(The European Commission decided to defer the endorsement indefi nitely.)
The Amendments clarify that in a transaction involving an associate or joint venture, the extent of gain or loss recognition depends on whether the assets sold or contributed constitute a business, such that:– a full gain or loss is recognised when a transaction between an investor and its associate or joint venture
involves the transfer of an asset or assets which constitute a business (whether it is housed in a subsidiary or not), while
– a partial gain or loss is recognised when a transaction between an investor and its associate or joint venture involves assets that do not constitute a business, even if these assets are housed in a subsidiary.
The Bank does not expect that the amendments, when initially applied, will have a material impact on the fi nancial statements due to the extent and nature of the Bank’s transactions involving an associate or joint venture.
IFRIC 22 Foreign Currency Transactions and Advance Consideration(Effective for annual periods beginning on or after 1 January 2018. This interpretation is not yet endorsed by the EU.)
IFRIC 22 provides requirements about which exchange rate to use in reporting foreign currency transactions (such as revenue transactions) when payment is made or received in advance and clarifi es that the transaction date is the date on which the company initially recognises the prepayment or deferred income arising from the advance consideration. For transactions involving multiple payments or receipts, each payment or receipt gives rise to a separate transaction date.
The Bank does not expect that the Interpretation, when initially applied, will have material impact on the fi nancial statements as the Bank uses the exchange rate on the transaction date for the initial recognition of the non-monetary asset or non-monetary liability arising from the payment or receipt of advance consideration.

174
Separate fi nancial statements
Amendments to IFRS 2 Classifi cation and Measurement of Share-based Payment Transactions (Effective for annual periods beginning on or after 1 January 2018; to be applied prospectively. These amend-ments are not yet endorsed by the EU.)
The amendments clarify share-based payment accounting in the following areas: – the effects of vesting and non-vesting conditions on the measurement of cash-settled share-based
payments;– share-based payment transactions with a net settlement feature for withholding tax obligations; and – a modifi cation to the terms and conditions of a share-based payment that changes the classifi cation of the
transaction from cash-settled to equity settled.
The Bank expects that the amendments, when initially applied, will not have a material impact on the presentation of the fi nancial statements because the Bank does not enter into material share-based payment transactions.
Amendments to IFRS 9: Prepayment Features with Negative Compensation (Issued on 12 October 2017. Effective for annual periods beginning on or after 1 January 2019. These amend-ments are not yet endorsed by the EU.)
These amendments address concerns raised about accounting for fi nancial assets that include particular contractual prepayment options. In particular, the concern was related to how a company would classify and measure a debt instrument if the borrower was permitted to prepay the instrument at an amount less than the unpaid principal and interest owed. Such a prepayment amount is often described as including ‘negative compensation’. Applying IFRS 9, a company would measure a fi nancial asset with so-called negative compensation at fair value through profi t or loss.
The amendments enable entities to measure at amortized cost some prepayable fi nancial assets with so-called negative compensation.
The Bank has started the portfolio analysis and does not expect that the amendments will have a material impact on the fi nancial statements.
2.3 Segment reporting
The Bank reports fi nancial and descriptive information about its operating segments in these fi nancial state-ments. An operating segment is a component of the Bank that engages in business activities from which it may earn revenues and incur expenses (including revenues and expenses relating to transactions with other components of the Bank), whose operating results are regularly reviewed by the Bank’s management to make decisions about resources to be allocated to the segment and to assess its performance, and for which sepa-rate fi nancial information is available.
The Bank operates in three operating segments – Retail Banking, Corporate Banking and Central Treasury. Each segment is exposed to different risks and differs in the nature of its services, business processes and types of customers for its products and services.
For all segments the Bank reports a measure of segment assets and liabilities and income and expense items, a reconciliation of total reportable segment revenues, total profi t or loss, total assets, liabilities and other amounts disclosed for reportable segments to corresponding amounts in the Bank’s fi nancial statements.
Most of the transactions of the Bank are related to the Slovak market. Due to the market size, the Bank oper-ates as a single geographical segment unit.
2.4 Foreign currency transactions
Monetary assets and liabilities in foreign currencies are translated to euro at the offi cial European Central Bank (’ECB’) or National Bank of Slovakia (’NBS’) exchange rates prevailing at the end of the reporting period. Income and expenses denominated in foreign currencies are reported at the ECB or NBS exchange rates prevailing at the date of the transaction.

175
Separate fi nancial statements
The difference between the contractual exchange rate of a transaction and the ECB or NBS exchange rate prevailing at the date of the transaction is included in ‘Net trading result’, as well as gains and losses arising from movements in exchange rates after the date of the transaction.
2.5 Foreign operations
The fi nancial statements include foreign operations in the Czech Republic. The assets and liabilities of foreign operations are translated to euro at the foreign exchange rate prevailing at the end of the reporting period. The revenues and expenses of foreign operations are translated to euro at rates approximating the foreign exchange rates prevailing at the dates of the transactions. Foreign exchange differences arising on these translations are recognised directly in equity.
2.6 Cash and cash equivalents
For the purpose of the statement of cash fl ow, cash and cash equivalents comprise cash and balances with central banks, treasury bills and other eligible bills with contractual maturity of less than 90 days and due from banks balances with contractual maturity of less than 90 days.
2.7 Cash and balances with central banks
Cash and balances with central banks comprise cash in hand and balances with the NBS and other central banks, including compulsory minimum reserves. Cash and other valuables are carried at amortised cost in the statement of fi nancial position.
2.8 Treasury bills and other eligible bills
Treasury bills and other eligible bills represent highly liquid securities that could be used for rediscounting in the NBS in the case of Slovak treasury bills or in a central bank of a foreign country in the case of foreign treasury bills without any time or other constraints.
2.9 Due from banks
Due from banks include receivables from current accounts in other than central banks, term deposits and loans provided to commercial banks.
Balances are presented at amortised cost including interest accruals less any impairment losses. An impairment loss is established if there is objective evidence that the Bank will not be able to collect all amounts due.
2.10 Securities
Securities held by the Bank are categorised into portfolios in accordance with the intent on the acquisition date and pursuant to the investment strategy. The Bank has developed security investment strategies and, refl ecting the intent on acquisition, allocated securities into the following portfolios:
(a) Fair value through profi t or loss,(b) Available-for-sale,(c) Held-to-maturity.
The principal differences among the portfolios relate to the measurement and recognition of fair values in the fi nancial statements. All securities held by the Bank are recognised using settlement date accounting and are initially measured at fair value plus, in the case of fi nancial assets not at fair value through profi t or loss, any directly attributable incremental costs of acquisition. Securities purchased, but not settled, are recorded in the off-balance sheet and changes in their fair values, for purchases into the fair value through profi t or loss and the available-for-sale portfolios, are recognised in the statement of profi t or loss and other comprehensive income and in equity respectively.

176
Separate fi nancial statements
(a) Securities at fair value through profi t or loss
This portfolio comprises the following subcategories:
(i) Securities held for trading
These securities are fi nancial assets acquired by the Bank for the purpose of generating profi ts from short-term fl uctuations in prices.
(ii) Securities designated at fair value through profi t or loss on initial recognition Securities classifi ed in this category are those that have been designated by management on initial
recognition. This designation may be used only when at least one of the following conditions is met: – the designation eliminates or signifi cantly reduces a measurement or recognition inconsistency that
would otherwise arise from measuring assets or liabilities or recognising the gains and losses on them on a different basis;
– the assets and fi nancial liabilities are part of a group of fi nancial assets, fi nancial liabilities or both that are managed and their performance is evaluated on a fair value basis, in accordance with a documented risk management or investment strategy;
– the fi nancial instrument contains one or more embedded derivatives that signifi cantly modify the cash fl ows that otherwise would be required by the contract.
Subsequent to their initial recognition these assets are accounted for and re-measured at fair value. The fair value of securities at fair value through profi t or loss, for which an active market exists, and a market value can be estimated reliably, is measured at quoted market prices. In circumstances where the quoted market prices are not readily available, the fair value is estimated using the present value of future cash fl ows.
The Bank monitors changes in fair values on a daily basis and recognises unrealised gains and losses in the statement of profi t or loss and other comprehensive income in ‘Net trading result’. Interest earned on secu-rities at fair value through profi t or loss is accrued on a daily basis and reported in the statement of profi t or loss and other comprehensive income in ‘Interest and similar income’.
(b) Available-for-sale securities
‘Available-for-sale’ securities are those fi nancial assets that are not classifi ed as ‘at fair value through profi t or loss’ or ‘held-to-maturity’. Subsequent to their initial recognition, these assets are accounted for and re-meas-ured at fair value.
Unrealised gains and losses arising from changes in the fair value of ‘available-for-sale’ securities are recognised on a daily basis in the ‘Available-for-sale fi nancial assets’ in equity.
Interest earned whilst holding ‘available-for-sale’ securities is accrued on a daily basis and reported in the statement of profi t or loss and other comprehensive income in ‘Interest and similar income’.
The fair value of ‘available-for-sale’ securities, for which an active market exists, and a market value can be estimated reliably, is measured at quoted market prices. In circumstances where the quoted market prices are not readily available, the fair value is estimated using the present value of future cash fl ows.
Equity investments whose fair value cannot be reliably measured are held at cost less impairment. For ‘available-for-sale’ equity investments, the Bank assesses at each reporting date whether there is objective evidence that an investment or a group of investments is impaired.
Examples of events representing objective evidence of impairment include signifi cant fi nancial diffi culty of the issuer, issuer’s default or delinquency in interest or principal payments, becoming probable that the issuer will enter into bankruptcy or other reorganisation procedures, the disappearance of an active market for the secu-rity due to the issuer’s fi nancial diffi culties or other elements indicating an objective reduction in the issuer’s ability to generate future cash fl ows suffi cient to meet its contractual obligation.
In the case of debt instruments classifi ed as ‘available-for-sale’, impairment is assessed based on the same criteria as fi nancial assets carried at amortised cost. If, in a subsequent year, the fair value of a debt instrument increases and the increase can be objectively related to an event occurring after the impairment loss was recognised in ‘Impairment losses’ in the statement of profi t or loss and other comprehensive income, the impairment loss is reversed through the statement of profi t or loss and other comprehensive income.

177
Separate fi nancial statements
In the case of equity investments classifi ed as ‘available-for-sale’, objective evidence would include a signif-icant or prolonged decline (more than 13,5% and more than 9 months) in the fair value of the investment below its cost. Where there is evidence of impairment, the cumulative loss – measured as the difference between the acquisition cost and the current fair value, less any impairment loss on that investment previously recognised in profi t or loss – is removed from equity and recognised in ‘Impairment losses’ in the statement of profi t or loss and other comprehensive income. Impairment losses on equity investments are not reversed through statement of profi t or loss and other comprehensive income; increases in their fair value after impair-ment are recognised directly in Other comprehensive income.
(c) Held-to-maturity investments
‘Held-to-maturity’ investments are fi nancial assets with fi xed or determinable payments and maturities that the Bank has the positive intent and ability to hold to maturity.
‘Held-to-maturity’ investments are carried at amortised cost less any impairment losses. Amortised cost is the amount at which the asset was initially measured minus principal repayments, plus or minus the cumulative amortisation using the effective interest method of any difference between that initial amount and the matu-rity amount. The amortisation is recognised in the statement of profi t or loss and other comprehensive income in ‘Interest and similar income’.
The Bank assesses on a regular basis whether there is any objective evidence that a ‘held-to-maturity’ invest-ment may be impaired. A fi nancial asset is impaired if its carrying amount is greater than its estimated recov-erable amount.
2.11 Repurchase and reverse repurchase agreements
Securities sold under sale and repurchase agreements (‘repo transactions’) remain as assets in the statement of fi nancial position under the original caption and the liability from the received loan is included in ‘Due to central and other banks’ or ‘Due to customers’.
Securities purchased under agreements to purchase and resell (‘reverse repo transactions’) are recorded only in the off-balance sheet and the loan provided is reported in the statement of fi nancial position in ‘Due from banks’ or ‘Loans and advances to customers’, as appropriate.
The price differential between the purchase and sale price of securities is treated as interest income or expense and deferred over the life of the agreement.
2.12 Derivative fi nancial instruments
In the normal course of business, the Bank is a party to contracts with derivative fi nancial instruments, which represent a very low initial investment compared to the notional value of the contract. The derivative fi nan-cial instruments used include foreign exchange forwards, interest rate/foreign exchange swaps and options, forward rate agreements and cross currency swaps. The Bank also uses fi nancial instruments to hedge interest rate risk and currency exposures associated with its transactions in the fi nancial markets. They are accounted for as trading derivatives if they do not fully comply with the defi nition of a hedging derivative as prescribed by IFRS. The Bank also acts as an intermediary provider of these instruments to certain customers.
Derivative fi nancial instruments are initially recognised and subsequently re-measured in the statement of fi nancial position at fair value. All derivatives are carried as assets when the fair value is positive and as liabili-ties when the fair value is negative. Changes in the fair value of derivatives are included in ‘Net trading result’.
Fair values are obtained from quoted market prices, discounted cash fl ow models and option pricing models as appropriate. The fair values of derivative positions are computed using standard formulas and prevailing interest rates applicable for respective currencies available on the market at reporting dates.
Embedded derivatives
The Bank assesses whether any embedded derivatives contained in given contract are required to be separated from the host contract and accounted for as derivatives under IAS 39. An embedded derivative is a component of a hybrid (combined) instrument that also includes a non-derivative host contract with the effect that some of the cash fl ows of the combined instrument vary in a way similar to a stand-alone derivative.

178
Separate fi nancial statements
The Bank accounts for embedded derivatives separately from the host contract if: the economic characteristics and risks of the embedded derivative are not closely related to the economic characteristics and risks of the host contract; a separate instrument with the same terms as the embedded derivative would meet the defi -nition of a derivative; and the hybrid (combined) instrument is not measured at fair value with changes in fair value recognised in the statement of profi t or loss and other comprehensive income.
Hedging derivatives
The Bank makes use of derivative instruments to manage exposures to interest rate, foreign currency, infl ation and credit risks, including exposures arising from expected transactions. In order to manage individual risks, the Bank applies hedge accounting for transactions which meet the specifi ed criteria.
At the inception of the hedge relationship, the Bank formally documents the relationship between the hedged item and the hedging instrument, including the nature of the risk, the objective and strategy for undertaking the hedge and the method that will be used to assess the effectiveness of the hedging relationship.
Also, at the inception of the hedge relationship, a formal assessment is undertaken to ensure the hedging instrument is expected to be highly effective in offsetting the designated risk in the hedged item. Hedges are formally assessed each month. A hedge is regarded as highly effective if the changes in fair value or cash fl ows attributable to the hedged risk during the period for which the hedge is designated are expected to offset in a range of 80% to 125%.
In situations where that hedged item is an expected transaction, the Bank assesses whether the transaction is highly probable and presents an exposure to variations in cash fl ows that could ultimately affect the state-ment of profi t or loss and other comprehensive income.
Cash fl ow hedges
For designated and qualifying cash fl ow hedges, the effective portion of the gain or loss on the hedging instru-ment is initially recognised in other comprehensive income as ‘Cash fl ow hedges’. The ineffective portion of the gain or loss on the hedging instrument is recognised immediately as gain or loss in the statement of profi t or loss and other comprehensive income in ‘Net trading result’.
When the hedged cash fl ow affects profi t or loss, the gain or loss on the hedging instrument is reclassifi ed from other comprehensive income to profi t or loss as a reclassifi cation adjustment. When a hedging instrument expires, or is sold, terminated, exercised, or when a hedge no longer meets the criteria for hedge accounting, any cumulative gain or loss that has been recognised in other comprehensive income remains separately in equity and is reclassifi ed from other comprehensive income to profi t or loss as a reclassifi cation adjustment when the hedged expected transaction is ultimately recognised. When an expected transaction is no longer expected to occur, the cumulative gain or loss that was reported in equity is immediately reclassifi ed from other comprehensive income to profi t or loss as a reclassifi cation adjustment.
Fair value hedges
For designated and qualifying fair value hedges, the change in the fair value of a hedging derivative is recognised in the statement of profi t or loss and other comprehensive income in ‘Net trading result’. Meanwhile, the change in the fair value of the hedged item attributable to the risk hedged is recorded as part of the carrying value of the hedged item and is also recognised in the statement of profi t or loss and other comprehensive income in ‘Net trading result’.
If the hedging instrument expires or is sold, terminated or exercised, or where the hedge no longer meets the criteria for hedge accounting, the hedge relationship is terminated. For hedged items recorded at amortised cost, the difference between the carrying value of the hedged item on termination and the face value is amor-tised over the remaining term of the original hedge using the effective interest rate (‘EIR’). If the hedged item is derecognised, the unamortised fair value adjustment is reclassifi ed from other comprehensive income to profi t or loss as a reclassifi cation adjustment.

179
Separate fi nancial statements
2.13 Offsetting fi nancial instruments
Financial assets and fi nancial liabilities are offset and the net amount reported in the statement of fi nancial position, if, and only if, there is an intention to settle on a net basis, or to realize the asset and settle the liability simultaneously. This is not generally the case with master netting agreements, and the related assets and liabilities are presented gross in the statement of fi nancial position.
2.14 Non-current assets held for sale
Non-current assets held for sale are assets where the carrying amount will be recovered principally through a sale transaction rather than through continuing use. They are represented by assets that are available for immediate sale in their present condition and their sale is considered to be highly probable.
Assets classifi ed as held for sale are measured at the lower of their carrying amount and fair value less cost to sell.
2.15 Loans and advances to customers and impairment losses
Loans and advances are fi nancial assets with fi xed or determinable payments and fi xed maturities that are not quoted in an active market and are recorded at amortised cost less any impairment losses. All loans and advances to customers are recognised in the statement of fi nancial position when cash is advanced to borrowers.
Loans and advances to customers are subject to periodic impairment testing. An impairment loss for a loan, or a group of similar loans, is established if their carrying amount is greater than their estimated recoverable amount. The recoverable amount is the present value of expected future cash fl ows, including amounts recoverable from guarantees and collaterals, discounted based on the loan’s original effective interest rate. The amount of the impairment loss is included in the statement of profi t or loss and other comprehensive income.
The Bank fi rst assesses whether objective evidence of impairment exists on its exposures. Signifi cant exposures are assessed individually, while exposures that are not signifi cant are assessed either individually or on portfolio basis. The main criterion for determining, whether a specifi c exposure is individually signifi cant is the sum of on-balance exposure and off-balance exposure exceeding signifi cance threshold (€ 500 thousand). The amounts of on-balance and off-balance exposure are calculated at the borrower level. If the Bank determines that no objective evidence of impairment exists for an individually assessed exposure, it includes the asset in a group of exposures with similar credit risk characteristics and collectively assesses them for impairment and recognizes provision accordingly.
The Bank writes off loans and advances when it determines that the loans and advances are uncollectible. Loans and advances are written off against the reversal of the related impairment losses. Any recoveries of written off loans are credited to the statement of profi t or loss and other comprehensive income on receipt.
2.16 Subsidiaries, associates and joint ventures
Subsidiaries, associates and joint ventures are recorded at cost less impairment losses. The impairment loss is measured using the Dividend discount model.
Dividend discount model
The Management of the companies which are subject to the impairment test provide projection of dividends that are expected to be paid out by their companies in a period of fi ve years. The model calculates the present value of these cash fl ows discounting them at the interest rate resulting from the CAPM (Capital Asset Pricing Model). Cash fl ows after the period of fi ve years are determined by the present value of the perpetuity with the particular estimated growth rate, determined at Intesa Sanpaolo Group level specifi cally for the Slovak market.

180
Separate fi nancial statements
Transactions under common control
Transactions ‘under common control’ refer to business combinations involving entities belonging to the same group. The Bank follows the accounting treatment of such transactions according to group accounting poli-cies, i.e. gains and losses are recorded to the retained earnings. In the case of disposals made on a cash basis any difference between the sale price and carrying amount of the net assets disposed is recorded directly in shareholder’s equity net of the tax effect.
2.17 Intangible assets
Intangible assets are recorded at historical cost less accumulated amortisation and impairment losses. Amorti-sation is calculated on a straight-line basis in order to write off the cost of each asset to its residual value over its estimated useful economic life as follows:
Years
Software and Other intangible assets 7
Amortisation methods, useful lives and residual values are reassessed at the reporting date.
2.18 Property and equipment
At initial recognition, the items of property and equipment are measured at cost. At 31 December 2017, the Bank changed the accounting policy for buildings and land, before evaluated from the cost to the revaluation model for subsequent measurement, following the Intesa Sanpaolo Group (‘ISP Group‘) policy.
This is a voluntary change in accounting policy under lAS 8 ‘Accounting Policies, Changes in Accounting Estimates and Errors‘. lAS 8 paragraph 17 states that the initial application of a policy to revalue assets within the scope of lAS 16 is a change in an accounting policy to be dealt with as a revaluation in accordance with IAS 16. Therefore in case of a change in accounting policy, with the transition from the amortized cost to the revaluation model, any change shall be refl ected only prospectively.
The assets subject to the revaluation model are depreciated based on their revalued value. Since the change in the accounting policy took place at the end of the year, the assets were depreciated based on the cost model until the end of the year. A new depreciation schedule will be implemented starting from January 2018.
After determining the 2017 depreciation charges and testing for impairment, the assets value was adjusted to their new fair value. The fair value of individual buildings and land was determined using independent external expert reports (appraisals) provided by specialised companies. If the fair value was higher than the carrying amount the value of the asset on the balance sheet was increased through other comprehensive income and accumulated in equity under the heading ‘Revaluation surplus from property and equipment’. In case that an impairment loss was recorded in the income statement previously, the reversal of this impairment was recorded in the income statement up to the amount previously recognised in the income statement. If the fair value was lower than the carrying amount, the decrease was recognized in profi t or loss. The ISP Group chose to apply the elimination approach which means that the accumulated depreciation is eliminated against the gross carrying amount of the asset and therefore, from the revaluation date, the asset cost is are equal to its fair value as at 31 December 2017.
Other components of ‘Property and equipment’ were recorded at historical cost less accumulated deprecia-tion and impairment losses. Acquisition cost includes the purchase price plus other costs related to acquisi-tion such as freight, duties or commissions. The costs of expansion, modernisation or improvements leading to increased productivity, capacity or effi ciency are capitalised. Repairs and renovations are charged to the statement of profi t or loss and other comprehensive income when the expenditure is incurred.

181
Separate fi nancial statements
Depreciation is calculated on a straight-line basis in order to write off the cost of each asset to its residual value over its estimated useful economic life as follows:
Years
Buildings 20, 30, 40
Equipment 4, 6, 10, 12
Other tangibles 4, 6, 12
Land, assets in progress and art collections are not depreciated. The depreciation of assets in progress begins when the related assets are put into use.
The Bank periodically tests its assets for impairment. Where the carrying amount of an asset is greater than its estimated recoverable amount, it is written down to this recoverable amount.
Depreciation methods, useful lives and residual values are reassessed at the reporting date.
2.19 Provisions
Provisions are recognised when the Bank has a present obligation (legal or constructive) as a result of a past event, and it is probable that an outfl ow of resources embodying economic benefi ts will be required to settle the obligation and a reliable estimate can be made of the amount of the obligation.
2.20 Provisions for employee benefi ts
The Bank’s obligation in respect of retirement and jubilee employee benefi ts is the amount of future benefi t that employees have earned in return for their service in the current and prior periods. That benefi t is discounted to determine its present value. Employee benefi t reserves are disclosed in the statement of fi nancial position in ‘Other liabilities’. All gains or losses in relation to the employee benefi ts are recognised in ‘Salaries and employee benefi ts’.
2.21 Deposits, debt securities issued and subordinated liabilities
Deposits, debt securities issued and subordinated liabilities are the Bank’s sources of debt funding.
The Bank classifi es capital instruments as fi nancial liabilities or equity instruments in accordance with the substance of the contractual terms of the instruments.
Deposits, debt securities issued and subordinated liabilities are initially measured at fair value minus incre-mental direct transaction costs, and subsequently measured at their amortised cost using the effective interest rate method.
2.22 Financial guarantees
Financial guarantees are contracts that require the Bank to make specifi ed payments to reimburse the holder for a loss it incurs because a specifi ed debtor fails to make a payment when it falls due, in accordance with the terms of a debt instrument consisting of letters of credit, guarantees and acceptances.
Financial guarantee liabilities are initially recognised at their fair value, and the initial fair value is amortised over the life of the fi nancial guarantee in the statement of profi t or loss and other comprehensive income in ‘Fee and commission income’ on a straight line basis. The guarantee liability is subsequently carried at the higher of this amortised amount and the present value of any expected payment (when a payment under the guarantee has become probable). Financial guarantees are included within ‘Other liabilities’. Any increase in the liability relating to fi nancial guarantees is recorded in the statement of profi t or loss and other comprehen-sive income in ‘Impairment losses’.

182
Separate fi nancial statements
2.23 Equity reserves
The reserves recorded in equity that are disclosed in the statement of fi nancial position include:
‘Revaluation surplus from property and equipment’ reserve which consists of the revaluation surplus of build-ings and land measured at fair value using a revaluation model from 31 December 2017.
‘Cash fl ow hedges’ reserve which comprises the portion of the gain or loss on a hedging instrument in a cash fl ow hedge that is determined to be an effective hedge.
‘Available-for-sale fi nancial assets’ reserve which comprises changes in the fair value of available-for-sale investments.
‘Translation of foreign operation’ reserve which is used to record exchange differences arising from the trans-lation of the net investment in foreign operations.
2.24 Net interest income
Interest income and expense is recognised in the statement of profi t or loss and other comprehensive income on an accrual basis using the effective interest rate method. Interest income and expense includes the amor-tisation of any discount or premium on fi nancial instruments. Interest income also includes up-front and commitment fees, which are subject to the effective interest rate calculation and are amortised over the life of the loan.
2.25 Net fee and commission income
Fee and commission income arises on fi nancial services provided by the Bank including account mainte-nance, cash management services, brokerage services, investment advice and fi nancial planning, investment banking services, project fi nance transactions and asset management services. Fee and commission income and expense is recognised when the corresponding service is provided.
2.26 Net trading result
Net trading result includes gains and losses arising from purchases, disposals and changes in the fair value of fi nancial assets and liabilities including securities and derivative instruments. It also includes the result of all foreign currency transactions.
2.27 Dividend income
Dividend income is recognised in the statement of profi t or loss and other comprehensive income on the date that the dividend is declared.
2.28 Current and deferred income tax
Income tax is calculated in accordance with the regulations of the Slovak Republic and other jurisdictions, in which the Bank operates.
Deferred tax assets and liabilities are recognised, using the balance sheet method, for all temporary differences arising between the carrying amounts of assets and liabilities and their tax bases. Expected tax rates, appli-cable for the periods when assets and liabilities are realised, are used to determine deferred tax.
The Bank is also subject to various indirect operating taxes, which are included in ‘Other operating expenses’.
2.29 Fiduciary assets
Assets held in a fi duciary capacity are not reported in the balance sheet, as such are not the assets of the Bank. They are recorded in the off-balance sheet.

183
Separate fi nancial statements
2.30 Signifi cant accounting judgements and estimates
Judgements
In the process of applying the Bank’s accounting policies, management has made judgements, apart from those involving estimations, that signifi cantly affect the amounts recognised in the fi nancial statements. The most signifi cant judgements relate to the classifi cation of fi nancial instruments.
Held-to-maturity investments
The Bank follows the guidance of IAS 39 on classifying non-derivative fi nancial assets with fi xed or determinable payments and fi xed maturity as held-to-maturity. This classifi cation requires signifi cant judgement. In making this judgement, the Bank evaluates its intention and ability to hold such investments to maturity. If the Bank fails to hold these investments to maturity other than for a specifi c circumstance, for example selling a higher than insignifi cant amount close to maturity, it will be required to reclassify the entire class as available-for-sale. The investments would therefore be measured at fair value and not at amortised cost.
Financial assets held for trading
The Bank classifi es a fi nancial asset as ‘held for trading’ if it is acquired principally for the purpose of selling it in the near term, or if it is part of a portfolio of identifi ed fi nancial instruments that are managed together and for which there is evidence of a recent actual pattern of short-term profi t taking, or if it is a derivative.
Financial assets designated at fair value through profi t or loss on initial recognition
The Bank uses the category ‘at fair value through profi t or loss on initial recognition’ to recognize equity shares of the parent company acquired as part of the incentive plan based on which the amount due to employees benefi ting from the plan recognized under share remuneration scheme in ‘Other liabilities’ (see also note 24) is proportional to the fair value of these shares.
Since both variations in the amount of the liability and in the fair value of the shares are recognized in the statement of profi t or loss and other comprehensive income, classifi cation of equity shares into the category ‘at fair value through profi t or loss on initial recognition’ allows the neutralisation of the effect derived from the changes in the value of the debt on the statement of profi t or loss and other comprehensive income and results into the elimination of the accounting mismatch.
Estimates
The preparation of the fi nancial statements requires management to make certain estimates and assumptions, which impact the carrying amounts of the Bank’s assets and liabilities and the disclosure of contingent items at the end of the reporting period and reported revenues and expenses for the period then ended.
Estimates are used for, but not limited to: fair values of fi nancial instruments, fair value of buildings and land under the revaluation model, impairment losses on loans and advances to customers, impairment losses for off-balance sheet risks, useful lives and residual values of tangible and intangible assets, impairment losses on tangible and intangible assets, liabilities from employee benefi ts and provisions for legal claims.
Fair value of fi nancial instruments
Where the fair values of fi nancial assets and fi nancial liabilities recorded on the statement of fi nancial position cannot be derived from active markets, they are determined using a variety of valuation techniques which include the use of mathematical models. The input to these models is taken from observable markets where possible, but where this is not feasible, a degree of judgement is required in establishing fair values. The judgements include considerations of liquidity and model inputs such as correlation and volatility for longer dated fi nancial instruments.
Impairment losses on loans and advances
The Bank reviews its loans and advances at each reporting date to assess whether a specifi c allowance for

184
Separate fi nancial statements
impairment should be recorded in the statement of profi t or loss and other comprehensive income. In particular, judgement by management is required in the estimation of the amount and timing of future cash fl ows when determining the level of allowance required. Such estimates are based on assumptions about a number of factors and actual results may differ, resulting in future changes to the specifi c allowance.
The individual assessment of exposures is based on the detailed review and analysis of the borrower’s situation, including the critical review of the following sources of information, without limitation to:– the latest fi nancial statements available (including consolidated ones, if any) accompanied by the report on
operations and audit report, if any, as well as previous years’ fi nancial statements;– information on specifi c corporate events (e.g. extraordinary transactions);– the current and forecast fi nancial position and results, analysis of variances between forecasts and actuals;– for borrowers belonging to economic groups, information on their internal and external relationships (to
assess the risk of contamination or its deterioration);– the list of bank relationships (credit lines/utilisation/transaction status);– the customer’s short- and medium-term plans and strategies supplemented by fi nancial projections (at
least three-year), the statement of expected cash fl ows, product analysis, sector and market studies, etc.;– any documentation by third-party experts on the reasons for the borrower’s deterioration, and potential
actions to reorganise the company and exit from the crisis;– updated business profi les from the Chamber of Commerce / Corporate Registry or equivalent, cadastral
surveys concerning all debtors and guarantors;– nature and validity of the collaterals, appraisal for each asset, presence of mortgage/pledge registrations
other than the Banks;– latest and historical Credit Bureau reports.
The individual assessment, formulated analytically for each exposure, shall be based on the detailed and comprehensive review of all elements that are available.
In addition to specifi c allowances against individually signifi cant loans and advances, the Bank also makes a collective impairment allowance against exposures which, although not specifi cally identifi ed as requiring a specifi c allowance, have a greater risk of default than when originally granted. This takes into consideration factors such as any deterioration in country risk, industry and technological obsolescence, as well as identifi ed structural weaknesses or deterioration in cash fl ows.
Calculation of impairment losses on collective basis is based on particular regulatory segment, probability of default (‘PD’), loss given default (‘LGD’), credit conversion factor (‘CCF’), loss confi rmation period (‘LCP’). For each segment were developed models for such risk parameters. These models are regularly under review.
On-balance impairment losses = EAD x PD x LGD x LCPOff-balance provisions = EAD x PD x LGD x CCF
For risk portfolios which PD and LGD parameters cannot be estimated, i.e. portfolios without suffi cient time series data minimum requirements are used.
Future events and their effects cannot be perceived with certainty. Accordingly, the accounting estimates made require the exercise of judgement and those used in the preparation of the fi nancial statements will change as new events occur, as more experience is acquired, as additional information is obtained and as the Bank’s operating environment changes. Actual results may differ from those estimates.
3. Financial and operational risk management
Introduction and overview
The Bank has exposure to the following risks from its use of fi nancial instruments:(a) Credit risk,(b) Market risk,(c) Liquidity risk,(d) Operational risk.

185
Separate fi nancial statements
This note presents information about the Bank’s exposure to each of the above risks, the Bank’s objectives, policies and processes for measuring and managing risk.
Risk management framework
The Management Board is the statutory body governing the executive management of the Bank, and has absolute authority over all matters concerning risk. The Management Board has primary responsibility for the creation and dissolution of risk related governance bodies. The primary governance bodies overseeing risk issues are:– Asset/Liability Committee (‘ALCO’),– Credit Risk Committee (‘CRC’),– Operational Risk Committee (‘ORC’).
The Management Board delegates its risk authority to these governance bodies through statutes, which iden-tify members of the governance bodies, competencies and responsibilities of the members. The competency of each governance body is established in relevant Charters.
The Bank’s risk management policies are established to identify and analyse the risks faced by the Bank, to set appropriate risk limits and controls and to monitor risks and adherence to limits. Risk management policies and systems are reviewed regularly to refl ect changes in market conditions, products and services offered. The Bank, through its training and management standards and procedures, aims to develop a disciplined and constructive control environment, in which all employees understand their roles and obligations. The Bank’s Internal Audit Department is responsible for monitoring compliance with the Bank’s risk management policies and procedures, and for reviewing the adequacy of the risk management framework in relation to the risks faced by the Bank. Internal Audit undertakes both regular and ad-hoc reviews of risk management controls and procedures.
(a) Credit risk
Credit risk is the risk of a fi nancial loss to the Bank if a customer or counterparty to a fi nancial instrument fails to meet its contractual obligations, and arises principally from the Bank’s loans and advances to customers and banks as well as investment securities. For risk management reporting purposes, the Bank considers and consolidates all elements of credit risk exposure (such as individual obligor default risk, country and sector risk). For risk management purposes, the credit risk arising on trading securities is managed independently, but reported as a component of market risk exposure.
The Credit Risk Charter establishes the guidelines for measurement, control and management of credit risk by defi ning the legal framework, main responsibilities, policies and methodologies that support the credit risk management process of VUB Bank.
More specifi cally, the Credit Risk Charter defi nes both the general and specifi c (retail, corporate) credit risk requirements for applied methodologies and procedures, and includes, as separate sections, the policies governing the key aspects of the Bank’s credit risk management process:– Authorized Approval Authority,– Collateral Management Policy, – Provisioning Policy, – Credit Concentration Limits, – Default Defi nition, – Risk Management Client Segmentation Policy, – Corporate Credit Policy, Retail Credit Policy, – Retail and Corporate Remedial Management and Collections.
Management of credit risk
The Risk Management Division is established within the Bank as a Control Unit and managed by the Chief Risk Offi cer, who is a member of the Bank’s Management Board. The Risk Management Division is organisationally structured to provide support to the Business Units, as well as to provide reporting of credit, market and oper-ational risks to the Supervisory Board and Management Board. The Risk Management Division is responsible for overseeing the Bank’s credit risk including:

186
Separate fi nancial statements
– The development of credit risk strategies, policies, processes and procedures covering rules for credit assessment, collateral requirements, risk grading and reporting;
– Setting limits for the concentration of exposure to counterparties, related parties, countries and total assets and monitoring compliance with those limits;
– Establishment of the authorisation structure for the approval and renewal of credit facilities. Authorisation limits are set in the Credit Risk Charter;
– Credit risk assessment according to defi ned policy;– Monitoring of quality portfolio performance and its compliance with set limits (regulatory, internal). Regular
reports are provided to the Management Board and the CRC on the credit quality of the Bank’s portfolios;– Development, maintenance and validation of scoring and rating models – both application and behav-
ioural;– Development, maintenance and back-testing of impairment loss models.
Impairment losses
The Bank establishes an allowance for impairment losses, which represents its estimate of incurred losses in its loan portfolio.
If there is evidence of impairment for any individually signifi cant client of the Bank, such as a breach of contract, problems with repayments or collateral, the Bank includes such a client to management of the Recovery Department for pursuing collection activities. Such clients exceeding signifi cant thresholds are considered to be individually impaired. For collective impairment, the Bank uses historical evidence of impairment on a port-folio basis, mainly based on the payment discipline of the clients.
Rules for identifi cation of signifi cant clients and methodology for calculation are set in the Credit Risk Charter or stated in the Provisioning Policy procedure.
The split of the credit portfolio to individually and portfolio assessed is shown below:
2017 2016
€ ‘000Amortised
costImpairment
lossesCarrying amount
Amortisedcost
Impairment losses
Carrying amount
Portfolio assessed
Banks 90,817 (73) 90,744 112,313 (18) 112,295
Customers
Sovereigns 128,144 (97) 128,047 131,760 (100) 131,660
Corporate 4,339,142 (37,491) 4,301,651 3,966,244 (36,141) 3,930,103
Retail 7,178,152 (162,187) 7,015,965 6,214,207 (165,902) 6,048,305
11,645,438 (199,775) 11,445,663 10,312,211 (202,143) 10,110,068
Securities
FVTPL 5,783 – 5,783 474 – 474
AFS 520,416 – 520,416 1,289,979 – 1,289,979
HTM 376,472 – 376,472 530,019 – 530,019
902,671 – 902,671 1,820,472 – 1,820,472
Individually assessed
Customers
Corporate 110,253 (69,136) 41,117 151,651 (76,314) 75,337
Retail 4,332 (3,594) 738 7,757 (4,677) 3,080
114,585 (72,730) 41,855 159,408 (80,991) 78,417

187
Separate fi nancial statements
The Bank uses the defi nitions of non-performing loans derived from the Harmonisation project. The Harmoni-sation project is driven by Intesa Sanpaolo in order to unify the defi nitions and categories of non-performing loans across the foreign subsidiaries of the Intesa Sanpaolo Group. The defi nition of non-performing loans, which comprise three classifi cation categories (past due, unlikely to pay, doubtful), is based on delinquency (days past due - DPD) and judgemental criteria for the categories doubtful and unlikely to pay. In case of the past due category, DPD and materiality thresholds of client are taken into account.
The description of the classifi cation categories of loans based on the defi nition of Banca d’Italia is as follows:
Classifi cation category Description
Doubtful Exposures to borrowers being in a state of insolvency (although not yet legally) or in a de facto equivalent status, regardless of any loss forecasts made by the Bank.
Unlikely to pay Exposures to borrowers assessed as improbable to thoroughly meet their credit obligations without recourse to actions such as the enforcement of guarantees/collateral.
Past due Exposures other than those classifi ed as doubtful or unlikely to pay that, as at the reporting date, are past due for over 90 days and exceed the materiality threshold of higher than 5% of outstanding total credit exposures to client.
Performing All exposures that are not classifi ed as doubtful, unlikely to pay or past due.
Capital requirement calculation
The Bank generally uses the standardised approach for the calculation of the capital requirements. However, for the calculation of the credit and counterparty risk capital requirements, the Bank, having received author-isation from the Supervisory Authority NBS, uses the Advanced IRB approach for its portfolio of residential mortgages from July 2012 and for the Corporate segment and for Retail Small Business from June 2014. The Foundation IRB approach is used for corporate exposures where a LGD is not available. The Bank is also proceeding with the development of rating models for other segments, to which the standard methods are currently applied, and also with the extension of the scope to subsidiaries in accordance with the gradual rollout plan for the advanced approaches presented to the Supervisory Authority.

188
Separate fi nancial statements
The following table describes the Bank’s credit portfolio in terms of classifi cation categories:
2017 2016
€ ‘000 CategoryAmortised
costImpairment
lossesCarrying amount
Amortisedcost
Impairment losses
Carrying amount
Banks
Performing 90,817 (73) 90,744 112,313 (18) 112,295
Sovereigns
Performing 128,143 (97) 128,046 131,759 (100) 131,659
Doubtful 1 – 1 1 – 1
128,144 (97) 128,047 131,760 (100) 131,660
Corporate
Performing 4,323,654 (33,392) 4,290,262 3,958,212 (31,487) 3,926,725
Past due 2 – 2 3 – 3
Unlikely to pay 73,411 (27,269) 46,142 85,980 (21,243) 64,737
Doubtful 52,328 (45,966) 6,362 73,700 (59,725) 13,975
4,449,395 (106,627) 4,342,768 4,117,895 (112,455) 4,005,440
Retail
Performing 6,922,721 (33,080) 6,889,641 5,974,922 (42,267) 5,932,655
Past due 5,635 (1,878) 3,757 7,639 (2,859) 4,780
Unlikely to pay 45,748 (20,147) 25,601 43,257 (20,778) 22,479
Doubtful 208,380 (110,676) 97,704 196,146 (104,675) 91,471
7,182,484 (165,781) 7,016,703 6,221,964 (170,579) 6,051,385
Securities
Performing 902,671 – 902,671 1,820,472 – 1,820,472

189
Separate fi nancial statements
Credit risk of fi nancial derivatives
Credit exposure or the replacement cost of derivative fi nancial instruments represents the Bank’s credit expo-sure from contracts with a positive fair value, that is, it indicates the estimated maximum potential losses in the event that counterparties fail to perform their obligations. It is usually a small proportion of the notional amounts of the contracts. The credit exposure of each contract is indicated by the credit equivalent calcu-lated pursuant to the generally applicable methodology using the current exposure method and involves the market value of the contract (only if positive, otherwise a zero value is taken into account) and a portion of the nominal value, which indicates the potential change in market value over the term of the contract. The credit equivalent is established depending on the type of contract and its maturity. The Bank assesses the credit risk of all fi nancial instruments on a daily basis.
With regard to IFRS 13 which contains a clarifi cation in reference to non-performance risk in determining the fair value of over-the-counter derivatives, the Bank uses the Bilateral Credit Value Adjustment model (‘bCVA’). It takes fully into account the effects of changes in counterparty credit ratings as well as the changes in own credit rating. The bCVA has two addends, calculated by considering the possibility that both counterparties go bankrupt, known as the Credit Value Adjustment (‘CVA’) and Debit Value Adjustment (‘DVA’):– The CVA (negative) takes into account scenarios whereby the counterparty fails before the Bank that has
a positive exposure to the counterparty. In these scenarios the Bank suffers a loss equal to the cost of replacing the derivative,
– The DVA (positive) takes into account scenarios whereby the Bank fails before the counterparty and has a negative exposure to the counterparty. In these scenarios the Bank achieves a gain equal to the cost of replacing the derivative.
The bCVA depends on the exposure, probability of default and the loss given default of the counterparties. The Bank is selective in its choice of counterparties and sets limits for transactions with customers. The Bank takes its own and its counterparties’ credit risk into consideration to the extent it believes the market partici-pants would do so.
The table below shows the maximum amount of credit risk of derivative fi nancial instruments, issued guaran-tees, commitments and undrawn credit facilities. To express the maximum amount of credit risk, the fair value of derivative fi nancial assets is increased by the value of the potential credit exposure (‘add on’) calculated as the nominal value of the derivative fi nancial instrument multiplied by the respective coeffi cient depending on the type of the instrument. The credit risk of the remaining fi nancial assets not reported in the table below approximates their carrying amounts.
€ ‘000 2017 2016
Financial assets
Derivative fi nancial instruments 121,142 94,970
Financial commitments and contingencies
Issued guarantees 783,667 764,156
Commitments and undrawn credit facilities 2,858,458 3,020,958
3,642,125 3,785,114

190
Separate fi nancial statements
The payment discipline of each client is monitored regularly via days past due (DPD).
DPD = Banking Date – Due Date for repayment
When the client fail to pay more than one agreed instalment, the date of the fi rst unpaid instalment is consid-ered as Due date for repayment.
The following table shows the Bank’s credit portfolio in terms of delinquency of payments:
2017 2016
€ ‘000Amortised
costImpairment
lossesCarrying amount
Amortised cost
Impairment losses
Carrying amount
Banks
No delinquency 90,817 (73) 90,744 112,313 (18) 112,295
Sovereigns
No delinquency 127,441 (97) 127,344 131,712 (100) 131,612
1 – 30 days 702 – 702 47 – 47
Over 181 days 1 – 1 1 – 1
128,144 (97) 128,047 131,760 (100) 131,660
Corporate
No delinquency 4,368,194 (58,938) 4,309,256 4,026,775 (50,791) 3,975,984
1 – 30 days 28,496 (1,662) 26,834 18,799 (3,789) 15,010
31 – 60 days 1,021 (811) 210 2,028 (437) 1,591
61 – 90 days 1,988 (1,581) 407 1 – 1
91 – 180 days 2 – 2 608 (418) 190
Over 181 days 49,694 (43,635) 6,059 69,684 (57,020) 12,664
4,449,395 (106,627) 4,342,768 4,117,895 (112,455) 4,005,440
Retail
No delinquency 6,704,945 (24,864) 6,680,081 5,778,467 (31,365) 5,747,102
1 – 30 days 223,982 (10,353) 213,629 194,975 (13,231) 181,744
31 – 60 days 34,373 (3,315) 31,058 35,237 (4,304) 30,933
61 – 90 days 22,316 (3,010) 19,306 22,659 (3,710) 18,949
91 – 180 days 34,160 (14,371) 19,789 39,020 (17,532) 21,488
Over 181 days 162,708 (109,868) 52,840 151,606 (100,437) 51,169
7,182,484 (165,781) 7,016,703 6,221,964 (170,579) 6,051,385
Securities
No delinquency 902,671 – 902,671 1,820,472 – 1,820,472

191
Separate fi nancial statements
Loans with renegotiated terms and forbearance policy
Loans with renegotiated terms are loans that have been restructured due to deterioration in the borrower’s fi nancial position, where the Bank has made concessions by agreeing to terms and conditions that are more favourable for the borrower than the Bank had provided initially. The revised terms usually include extending maturity, changing timing of interest payments and amendments to the terms of loan covenants. The Bank implements a forbearance policy in order to maximise collection opportunities and minimise the risk of default. Under the Bank’s forbearance policy, an exposure is identifi ed as forborne if both of these two conditions are satisfi ed:– The Bank has determined the fi nancial diffi culties that the debtor is facing or is about to face;– The exposure has been subject to renegotiation or refi nancing, granted in relation to the borrower’s current
fi nancial diffi culties or fi nancial diffi culties that would have occurred in the absence of the renegotiation or refi nancing measures.
Both retail and corporate customers are subject to the forbearance policy:
Performing forborne Non-performing forborne
31 December 2017€ ‘000
Amortised cost
Impairment losses
Carrying amount
Amortised cost
Impairment losses
Carrying amount
Corporate 13,865 (438) 13,427 98,075 (48,316) 49,759
Retail 45,586 (1,247) 44,339 21,700 (10,997) 10,703
59,451 (1,685) 57,766 119,775 (59,313) 60,462
Performing forborne Non-performing forborne
31 December 2016€ ‘000
Amortised cost
Impairment losses
Carrying amount
Amortised cost
Impairment losses
Carrying amount
Corporate 22,064 (731) 21,333 126,607 (54,832) 71,775
Retail 49,181 (1,980) 47,201 17,613 (7,681) 9,932
71,245 (2,711) 68,534 144,220 (62,513) 81,707
Write-off Policy
The Bank writes off a loan or security balance when it determines that the loans or securities are uncollectible. In principle, the Bank considers the credit balances to be uncollectible based on the past due days (1,080 days past due). Credit balances may be written off only if the collateral has already been realized. Receivables subject to write-off are being collected by external collection agencies until they qualify for write-off.
The credit balance can be written off earlier than defi ned in the conditions described above if there is evidence that the receivable cannot be collected. The write-off of such receivables is subject to the approval of the Credit Risk Offi cer.
Collateral Policy
The Bank’s collateral policy is an integral and indispensable part of the credit risk management and credit risk mitigation for VUB Bank. Collateral is used primarily to provide the Bank with the means for repayment of an exposure in the event of the default of the borrower. The principal objective of the policy is to clearly set up rules for a common and standard set of collateral types used by the Bank in its lending activities. The rules, as the minimum, describe and state: – Conditions for legal enforceability;– Conditions for the process of valuation and the maximum values accepted by the Bank at the origination
for specifi c types of collaterals; and– Conditions for the process of revaluation.

192
Separate fi nancial statements
However, collateral management has a wider meaning than the simple taking of collateral in order to secure the repayment of the Bank’s exposures. This includes the following: – The establishment and maintenance of collateral a policy defi ning the types of collateral taken by the Bank,
the legal documentation used by the Bank to secure its right to this collateral in the event of default and the valuation of this collateral at origination. These aspects of collateral management are addressed in the internal policy document;
– The relevant and proper perfection and registration of collateral to secure the Bank’s right to collateral in the event of default by the borrower;
– The regular monitoring and re-valuation of collateral held by the Bank during the life of the exposure;– The analysis, monitoring and review of realization rates achieved by Recovery Department activities in
order to assess the effectiveness of the collateral policy as a risk mitigant.
The Banks’s decisions on the enforcement of collateral is individual and depends on factors such as the actual amount of the receivable, the current condition and value of the collateral, the length of the collateral real-ization period or collection related costs. The relevant competent body of the Bank decides which collateral instrument will be used.
The Bank mainly uses the following means of enforcement of collateral:– Voluntary auction,– Foreclosure procedure,– Realization of the collateral for the receivable in a bankruptcy procedure,– Sale of receivables including collateral.
The Bank holds collateral and other credit enhancements against certain of its credit exposures. The collat-eral against loans and advances to customers is held in the form of mortgage interests over property, other registered securities over assets, and guarantees. Estimates of fair value are based on the value of collateral assessed at the time of borrowing and the Bank updates the fair value on a regular basis.
The Bank mitigates the credit risk of derivatives, reverse sale and repurchase agreements by entering into master netting agreements and holding collateral in the form of cash and marketable securities. Derivative transactions are either transacted on an exchange or entered into under International Swaps and Derivatives Association (‘ISDA’) master netting agreements. Under ISDA master netting agreements in certain circum-stances, e.g. when a credit event such as a default occurs, all outstanding transactions under the agreement are terminated, the termination value is assessed and only a single net amount is due or payable in settlement of all transactions.
The value of collateral and other security enhancements held against fi nancial assets is shown below:
2017 2016
€ ‘000 Clients Banks Clients Banks
Property 6,331,722 – 5,452,726 –
Debt securities 33,952 – 35,793 –
Other 559,883 44,655 640,163 28,948
6,925,557 44,655 6,128,682 28,948
Offsetting fi nancial assets and fi nancial liabilities
The disclosures set out in the tables below include fi nancial assets and fi nancial liabilities that are:– Offset in the statement of fi nancial position; or– Subject to an enforceable master netting arrangement or similar agreement that covers similar fi nancial
instruments, irrespective of whether they are offset in the statement of fi nancial position.
In general, the similar agreements include derivative clearing agreements, global master repurchase agree-ments, and global master securities lending agreements. Similar fi nancial instruments include derivatives, sales and repurchase agreements, reverse sale and repurchase agreements, and securities borrowing and lending agreements. Financial instruments such as loans and deposits are not disclosed in the tables below unless they are offset in the statement of fi nancial position.

193
Separate fi nancial statements
The ISDA and similar master netting arrangements do not meet the criteria for offsetting in the statement of fi nancial position. This is because they create for the parties to the agreement a right of set-off of recognized amounts that is enforceable only following an event of default, insolvency or bankruptcy of the Bank or the counterparties or following other predetermined events. In addition, the Bank and its counterparties do not intend to settle on a net basis or to realize the assets and settle the liabilities simultaneously.
The Bank receives and gives collateral in the form of cash and marketable securities in respect of the following transactions:– Derivatives,– Sale and repurchase, and reverse sale and repurchase agreements.
Such collateral is subject to standard industry terms including, when appropriate, an ISDA Credit Support Annex. This means that securities received or given as collateral can be pledged or sold during the term of the transaction but have to be returned on maturity of the transaction. The terms also give each party the right to terminate the related transactions on the counterparty’s failure to post collateral.
The following tables show the fi nancial assets and fi nancial liabilities that are subject to enforceable master netting arrangements and similar agreements in the statement of fi nancial position (‘SOFP’):
Related amounts
not offset in SOFP
31 December 2017€ ‘000
Gross amount
Gross amount offset in
SOFP
Net amount presented
in SOFP
Financial instrument
andnon-cash collateral
Cash collateral
(received)/provided Net amount
Financial assets
Cash and balances with central banks (Loans and advances)
724,427 – 724,427 (724,494) – (67)
Derivative fi nancial instruments
47,277 – 47,277 – (11,629) 35,648
Financial liabilities
Derivative fi nancial instruments
(43,449) – (43,449) – 39,918 (3,531)
Related amounts
not offset in SOFP
31 December 2016€ ‘000
Gross amount
Gross amount offset in
SOFP
Net amount presented
in SOFP
Financial instrument
andnon-cash collateral
Cash collateral
(received)/provided Net amount
Financial assets
Derivative fi nancial instruments
38,419 – 38,419 – (20,835) 17,584
Financial liabilities
Derivative fi nancial instruments
(56,007) – (56,007) – 55,083 (924)

194
Separate fi nancial statements
Below is the reconciliation of the net amount of fi nancial instruments subject to enforceable master netting arrangements and similar agreements to the total carrying amount presented in the statement of fi nancial position:
2017 2016
€ ‘000 Note
Total carrying amount
presented in SOFP
In scope of offsettingdisclosure
Not in scope of offsetting
disclosure
Total carrying amount
presented in SOFP
In scope of offsetting disclosure
Not in scope of offsetting
disclosure
Financial assets
Cash and balances with central banks
1,595,078 724,427 870,651 1,029,081 – 1,029,081
Derivative fi nancial instruments
10 49,856 47,277 2,579 47,249 38,419 8,830
Financial liabilities
Derivative fi nancial instruments
10 (52,184) (43,449) (8,735) (65,354) (56,007) (9,347)
The Bank monitors concentrations of credit risk by geographic location. An analysis of concentrations of credit risk at the reporting date is shown below.
2017 2016
€ ‘000Amortised
costImpairment
lossesCarrying amount
Amortised cost
Impairment losses
Carrying amount
Europe
Banks 59,773 (15) 59,758 109,757 (13) 109,744
Sovereigns 128,144 (97) 128,047 131,760 (100) 131,660
Corporate 4,405,575 (106,335) 4,299,240 4,022,806 (111,972) 3,910,834
Retail 7,179,147 (165,609) 7,013,538 6,219,125 (170,447) 6,048,678
Securities 896,362 – 896,362 1,795,305 – 1,795,305
12,669,001 (272,056) 12,396,945 12,278,753 (282,532) 11,996,221
America
Banks 30,370 (57) 30,313 2,197 (5) 2,192
Corporate 42,577 (127) 42,450 94,600 (418) 94,182
Retail 495 (3) 492 339 (3) 336
Securities 6,309 – 6,309 25,167 – 25,167
79,751 (187) 79,564 122,303 (426) 121,877
Asia
Banks 607 (1) 606 186 – 186
Corporate 1,243 (165) 1,078 489 (65) 424
Retail 2,305 (148) 2,157 1,927 (102) 1,825
4,155 (314) 3,841 2,602 (167) 2,435
Rest of the World
Banks 67 – 67 173 – 173
Retail 537 (21) 516 573 (27) 546
604 (21) 583 746 (27) 719

195
Separate fi nancial statements
An analysis of concentrations of credit risk of securities at the reporting date is shown below.
2017 2016
€ ‘000Amortised
costImpairment
lossesCarrying amount
Amortised cost
Impairment losses
Carrying amount
Europe Slovakia 629,706 – 629,706 1,019,478 – 1,019,478 Italy 266,591 – 266,591 753,595 – 753,595 Other 65 – 65 17,300 – 17,300
896,362 – 896,362 1,790,373 – 1,790,373
America USA 6,309 – 6,309 4,932 – 4,932
An analysis of exposures by industry sector is shown in the table below.
31 December 2017€ ‘000 Banks Sovereigns Corporate Retail* Securities
Agriculture – – 139,027 18,678 – Automotive – – 83,703 8 – Commodity Traders – – 107,687 3,927 – Construction – – 58,161 23,776 – Retail Customers – – – 6,751,931 – Financial institutions** 88,473 – 757,773 23 81,523 Government – 122,850 – 24 821,148 Manufacturing – – 594,279 23,493 – Real estate – – 527,596 6,023 – Retail and Wholesale Trade – – 505,194 71,660 – Services – – 527,243 100,457 – Transportation – 397 176,014 11,168 – Utilities – 4,430 805,429 4,445 – Other 2,271 370 60,662 1,090 –
90,744 128,047 4,342,768 7,016,703 902,671
* ‘Retail’ includes Small Business and Flat Owners Associations among other things.** ‘Financial institutions’ involves fi nancial services, leasing and insurance.
31 December 2016€ ‘000 Banks Sovereigns Corporate Retail Securities
Agriculture – – 126,084 20,927 – Automotive – – 26,061 10 – Commodity Traders – – 86,476 448 – Construction – – 57,847 18,228 – Retail Customers – – – 5,824,059 – Financial institutions 112,295 – 647,394 22 243,691 Government – 124,960 38 – 1,576,781 Manufacturing – – 734,919 22,815 – Real estate – – 639,409 3,587 – Retail and Wholesale Trade – – 378,550 57,969 – Services – 366 442,633 88,143 – Transportation – 444 103,900 10,252 – Utilities – 5,813 710,590 3,151 – Other – 77 51,539 1,774 –
112,295 131,660 4,005,440 6,051,385 1,820,472

196
Separate fi nancial statements
The table below shows the credit quality by class of assets for all fi nancial assets exposed to credit risk. The amounts presented are gross of impairment allowances. Past due but not impaired fi nancial assets are more than one day overdue.
Neither past due nor impaired Impaired (non-performing) Past due but not impaired
31 December 2017€ ‘000
Amortised cost
Impair-ment
lossesCarrying amount
Amortised cost
Impair-ment
lossesCarrying amount
Amortised cost
Impair-ment
lossesCarrying amount
Banks 90,817 (73) 90,744 – – – – – –
Sovereigns
Municipalities 127,441 (97) 127,344 1 – 1 702 – 702
Corporate
Large Corporates 1,706,107 (3,602) 1,702,505 2,956 (1,962) 994 11,064 (113) 10,951
Specialized Lending 674,115 (12,449) 661,666 73,934 (27,872) 46,062 50 (1) 49
SME 1,233,566 (14,662) 1,218,904 48,843 (43,401) 5,442 16,019 (806) 15,213
Other Fin. Institutions
659,982 (1,386) 658,596 3 – 3 – – –
Public Sector Entities
1,070 (3) 1,067 5 – 5 83 – 83
Factoring 21,598 (370) 21,228 – – – – – –
4,296,438 (32,472) 4,263,966 125,741 (73,235) 52,506 27,216 (920) 26,296
Retail
Small Business 202,501 (3,056) 199,445 10,981 (9,068) 1,913 29,569 (698) 28,871
Consumer Loans 1,014,587 (9,937) 1,004,650 124,580 (69,129) 55,451 112,934 (6,521) 106,413
Mortgages 5,192,697 (4,852) 5,187,845 73,776 (17,858) 55,918 75,486 (2,692) 72,794
Credit Cards 152,820 (2,131) 150,689 39,549 (28,939) 10,610 11,240 (1,195) 10,045
Overdrafts 77,347 (993) 76,354 10,876 (7,707) 3,169 13,487 (646) 12,841
Flat Owners Associations
27,651 (358) 27,293 – – – – – –
Other 12,393 – 12,393 1 – 1 9 (1) 8
6,679,996 (21,327) 6,658,669 259,763 (132,701) 127,062 242,725 (11,753) 230,972
Securities
FVTPL 5,784 – 5,784 – – – – – –
AFS 520,415 – 520,415 – – – – – –
HTM 376,472 – 376,472 – – – – – –
902,671 – 902,671 – – – – – –

197
Separate fi nancial statements
Neither past due nor impaired Impaired (non-performing) Past due but not impaired
31 December 2016€ ‘000
Amortised cost
Impair-ment
lossesCarrying amount
Amortised cost
Impair-ment
lossesCarrying amount
Amortised cost
Impair-ment
lossesCarrying amount
Banks 112,313 (18) 112,295 – – – – – –
Sovereigns
Municipalities 131,712 (100) 131,612 1 – 1 47 – 47
Corporate
Large Corporates 1,477,274 (4,757) 1,472,517 23,884 (19,176) 4,708 1 – 1
Specialized Lending 789,331 (11,713) 777,618 79,948 (22,551) 57,397 1,251 (35) 1,216
SME 1,148,552 (13,019) 1,135,533 55,840 (39,240) 16,600 10,939 (523) 10,416
Other Fin. Institutions
511,344 (1,051) 510,293 4 (1) 3 – – –
Public Sector Entities
1,187 (3) 1,184 7 – 7 6 – 6
Factoring 17,910 (331) 17,579 – – – 417 (55) 362
3,945,598 (30,874) 3,914,724 159,683 (80,968) 78,715 12,614 (613) 12,001
Retail
Small Business 177,360 (2,648) 174,712 14,164 (12,176) 1,988 26,877 (502) 26,375
Consumer Loans 1,003,336 (12,105) 991,231 107,886 (61,386) 46,500 98,786 (8,107) 90,679
Mortgages 4,307,191 (8,058) 4,299,133 74,266 (18,312) 55,954 65,264 (4,313) 60,951
Credit Cards 156,799 (2,964) 153,835 37,074 (26,384) 10,690 14,088 (1,802) 12,286
Overdrafts 78,874 (632) 78,242 13,650 (10,054) 3,596 16,196 (816) 15,380
Flat Owners Associations
24,536 (318) 24,218 – – – – – –
Other 5,580 (2) 5,578 2 – 2 35 – 35
5,753,676 (26,727) 5,726,949 247,042 (128,312) 118,730 221,246 (15,540) 205,706
Securities
FVTPL 474 – 474 – – – – – –
AFS 1,289,979 – 1,289,979 – – – – – –
HTM 530,019 – 530,019 – – – – – –
1,820,472 – 1,820,472 – – – – – –

198
Separate fi nancial statements
An analysis of past due but not impaired credit exposures in terms of the delinquency is presented in the table below:
2017 2016
€ ‘000Amortised
costImpairment
lossesCarrying amount
Amortised cost
Impairment losses
Carrying amount
Sovereigns
1 – 30 days 702 – 702 47 – 47
Corporate
1 – 30 days 27,138 (910) 26,228 11,330 (502) 10,828
31 – 60 days 1 – 1 1,283 (111) 1,172
61 – 90 days 77 (10) 67 1 – 1
27,216 (920) 26,296 12,614 (613) 12,001
Retail
1 – 30 days 199,036 (7,193) 191,843 172,000 (8,321) 163,679
31 – 60 days 25,574 (2,062) 23,512 26,235 (2,712) 23,523
61 – 90 days 12,295 (1,295) 11,000 13,431 (1,668) 11,763
91 – 180 days 5,789 (1,192) 4,597 9,550 (2,829) 6,721
Over 181 days 31 (11) 20 30 (10) 20
242,725 (11,753) 230,972 221,246 (15,540) 205,706

199
Separate fi nancial statements
The overview of the internal rating scales applicable for corporate and retail exposures is shown below.
Large Corporates above € 500 million turnover
Large Corporates below € 500 million turnover and SME
Retail Small Business (‘SB’) and Flat Owners Associations (‘FOA’) Risk Profi le Description
LC_I1 – LC_I4
I1 – I4 I3 – I4 Very Low Good quality of assets, strong market penetration, steady activity, proven distinctive managerial skills, broad debt coverage capacity.
LC_I5 – LC_I6
I5 – I6 I5 – I6 Low Satisfactory quality and chargeability of assets, market penetration and managerial quality on the average; well set solvency, capital structure and debt composition; above average debt coverage capacity.
LC_M1 – LC_M2
M1 – M2 M1 – M2 Lower – Intermediate
Acceptable quality and chargeability of available assets, even if with a not negligible degree of risk; well-balanced solvency, capital structure and debt composition with slight liquidity surplus and weaker debt coverage capacity.
LC_M3 – LC_M4
M3 – M4 M3 – M4 Intermediate Acceptable quality and chargeability of available assets even if with a signifi cant degree of risk; vulnerable mar-gin at times, capital structure and debt composition that show worsening signals; low level of liquidity and short debt coverage margin.
LC_R1 – LC_R3
R1 – R3 R1 – R3 Upper – Intermediate
Still acceptable asset quality even if with possible liquidity stress; high level of gearing; managerial weakness, little market penetration and positioning; margins and com-petitiveness under pressure.
LC_R4 – LC_R5
R4 – R5 R4 – R5 High In addition to riskiness features for R1 – R3 rating, there are evident diffi culties as well as problematic debt man-agement.
D D D Default A default is considered to have occurred with regard to a particular obligor when either or both of the two fol-lowing events have taken place:– the obligor is past due more than 90 days on any mate-
rial credit obligation to the Bank, the parent under-taking or any of its subsidiaries (absolute threshold is set according to NBS directive);
– the Bank considers that the obligor is unlikely to pay its credit obligations to the banking group in full, with-out recourse by the Bank to actions such as realizing security (if held).
Specialized Lending comprises of rating segments Special Purpose Vehicles (‘SPV’) and Real Estate Develop-ment (‘RED’). For Specialized Lending the Slotting approach is used by the Bank. Clients are assigned into fi ve slotting categories based on a qualitative valuation and information about the risk of default. Risk weights and expected loss used for the capital requirement calculation are also defi ned for each category. Categories are predefi ned by the Regulation (EU) no. 575/2013 of the European Parliament and of the Council (‘CRR regula-tion’) and internally, the categories used are as follows:
Specialized Lending – SPV and RED– Strong– Good– Satisfactory– Weak– Default

200
Separate fi nancial statements
For mortgages and unsecured retail, the retail segment incorporates many individually insignifi cant exposures with various characteristics, therefore the description of ratings correlates with the risk profi les.
Retail Mortgages
UnsecuredRetail Risk Profi le Description
L1a – L4 U01a – U02 Very Low High level of client’s socio-demographic information and fi nancial discipline.
N1 U03 Low Above average level of client’s socio-demographic information and fi nancial discipline.
N2 – W1 U04 – U07 Lower – Intermediate
Acceptable level of client’s socio-demographic information and fi nancial discipline.
W2 U08 – U09 Intermediate Acceptable level of client’s socio-demographic information and fi nancial discipline, but there are some signals of worsening credit quality.
- U10 – U11 Upper – Intermediate
Acceptable level of client’s socio-demographic information and fi nancial discipline, but there is worsening credit quality.
W3 U12 High Acceptable level of client’s socio-demographic information and fi nancial discipline, but there is negative credit behaviour.
D D Default A default is considered to have occurred with regard to a particular mortgage/obligor when either or both of the two following events have taken place:– the obligor is past due more than 90 days on any material credit
obligation to the Bank (absolute threshold is set according to NBS directive);
– the Bank considers that the obligor is unlikely to pay its credit obligations to the banking group in full, without recourse by the Bank to actions such as realizing security (if held).

201
Separate fi nancial statements
The following table shows the quality of the Bank’s credit portfolio in terms of internal ratings used for IRB purposes and the sensitivity analyses by improvement and deterioration by one internal rating grade:
Amortised cost
Impairment losses
Carrying amount
Sensitivity analysis
31 December 2017€ ‘000
Internal rating (‘IR‘)
Impact of IR deterioration
Impact of IR improvement
Banks Unrated 90,817 (73) 90,744 – –
Sovereigns Municipalities Unrated 128,144 (97) 128,047 – –
Corporate Large Corporates,
SME I1 – I6 883,885 (690) 883,195 (358) 266
M1 – M4 826,418 (6,202) 820,216 (702) 2,780 R1 – R5 352,900 (13,746) 339,154 (2,307) 6,309
LC_I1 – LC_I6 370,753 (258) 370,495 (142) 93 LC_M1 – LC_M4 538,790 (1,405) 537,385 (806) 510
D (default) 45,810 (42,245) 3,565 – –
Specialized Lending – SPV, RED Strong 129,220 (335) 128,885 (130) –
Good 292,373 (3,792) 288,581 (3,107) 3,792 Satisfactory 199,231 (5,576) 193,655 (8,529) 4,871
Weak 103,183 (13,213) 89,970 – 8,044 D (default) 24,091 (17,406) 6,685 – –
Other Fin. Inst., Public Sector Entities I1 – I6 289,143 (89) 289,054 (48) 30
M1 – M4 182,957 (763) 182,194 (592) 178 Unrated 189,043 (537) 188,506 – –
Factoring Unrated 21,598 (370) 21,228 – –
4,449,395 (106,627) 4,342,768 (16,721) 26,873
Retail SB and FOA I3 – I6 35,561 (61) 35,500 (32) 26
M1 – M4 157,489 (1,540) 155,949 (796) 531 R1 – R5 66,201 (2,564) 63,637 (1,062) 931
D (default) 10,454 (9,012) 1,442 – – Unrated 997 (3) 994 – –
Mortgages L1 – L4 4,554,342 (1,073) 4,553,269 (928) 463 N1 248,515 (357) 248,158 (210) 165
N2 – W1 342,472 (1,342) 341,130 (1,525) 562 W2 69,460 (1,035) 68,425 (3,764) 638 W3 84,550 (4,338) 80,212 – 3,403
D (default) 42,620 (17,257) 25,363 – –
Unsecured Retail U01a – U02 291,765 (170) 291,595 (65) 64 U3 91,421 (126) 91,295 (62) 41
U04 – U07 448,510 (2,088) 446,422 (1,104) 721 U08 – U09 135,207 (2,185) 133,022 (1,182) 745 U10 – U11 85,543 (3,319) 82,224 (3,164) 1,221
U12 73,025 (8,294) 64,731 – 4,708 D (default) 154,947 (105,842) 49,105 – –
Unrated 277,002 (5,174) 271,828 – –
Other Unrated 12,403 (1) 12,402 – –
7,182,484 (165,781) 7,016,703 (13,894) 14,219
Securities Unrated 902,671 – 902,671 – –

202
Separate fi nancial statements
During the year 2017, the rating scale was extended by internal ratings for Large Corporations above € 500 million turnover, so the comparable period was restated accordingly:
31 December 2016€ ‘000
Internal rating
Amortised cost
Impairment losses
Carrying amount
Banks Unrated 112,313 (18) 112,295
SovereignsMunicipalities Unrated 131,760 (100) 131,660
CorporateLarge Corporates, SME I1 – I6 653,263 (725) 652,538
M1 – M4 846,596 (5,493) 841,103 R1 – R5 312,754 (11,353) 301,401
LC_I1 – LC_I6 382,816 (261) 382,555 LC_M1 –LC_M4 439,103 (1,420) 437,683
LC_R1 –LCR5 13,247 (312) 12,935
D (default) 68,710 (57,151) 11,559
Specialized Lending – SPV, RED Strong 221,336 (1,344) 219,992 Good 335,073 (2,674) 332,399
Satisfactory 213,930 (6,631) 207,299 Weak 72,193 (11,139) 61,054
D (default) 27,998 (12,511) 15,487
Other Financial Institutions, Public Sector Entities I1 – I6 355,729 (112) 355,617 M1 – M4 155,619 (365) 155,254
D (default) 1 – 1 Unrated 1,200 (578) 622
Factoring Unrated 18,327 (386) 17,941
4,117,895 (112,455) 4,005,440
RetailSmall Business, Flat Owners Associations I3 – I6 32,063 (55) 32,008
M1 – M4 141,447 (1,431) 140,016 R1 – R5 55,450 (1,992) 53,458
D (default) 13,964 (12,163) 1,801 Unrated 13 (3) 10
Mortgages L1 – L4 3,328,301 (661) 3,327,640 N1 360,192 (475) 359,717
N2 – W1 505,713 (1,729) 503,984 W2 67,210 (1,068) 66,142 W3 137,483 (8,361) 129,122
D (default) 47,822 (18,389) 29,433
Unsecured Retail U01a – U02 415,594 (392) 415,202 U3 81,989 (196) 81,793
U04 – U07 336,039 (2,311) 333,728 U08 – U09 88,026 (2,103) 85,923 U10 – U11 59,498 (3,391) 56,107
U12 60,493 (9,976) 50,517 D (default) 141,791 (98,349) 43,442
Unrated 343,259 (7,532) 335,727
Other Unrated 5,617 (2) 5,615
6,221,964 (170,579) 6,051,385
Securities Unrated 1,820,472 – 1,820,472

203
Separate fi nancial statements
(b) Market risk
Market risk is the risk that changes in market prices, such as interest rate, equity prices or foreign exchange rate will affect the Bank’s income or the value of its holdings of fi nancial instruments. The objective of market risk management is to manage and control market risk exposures within acceptable parameters, while optimizing the return on risk.
Management of market risk
The Bank separates its exposures to market risk between trading (‘trading book’) and non-trading portfolios (‘banking book’). Trading portfolios are held by the Trading sub-department and include positions arising from market-making and proprietary position taking. All foreign exchange risk within the Bank is transferred each day to the Trading sub-department and forms part of the trading portfolio for risk management purposes. The non-trading portfolios are managed by the Department Treasury and ALM, and include all positions which are not intended for trading.
Overall authority for market risk is vested in ALCO. The Enterprise Risk Management Department is responsible for the development of detailed risk management policies (subject to review and approval by ALCO) and for their implementation and day-to-day risk monitoring and reporting.
In the normal course of business, the Bank enters into derivative fi nancial instrument transactions to hedge its liquidity, foreign exchange and interest rate risks. The Bank also enters into proprietary derivative fi nancial transactions for the purpose of generating profi ts from short-term fl uctuations in market prices. The Bank operates a system of market risk and counterparty limits, which are designed to restrict exposure to move-ments in market prices and counterparty concentrations. The Bank also monitors adherence to these limits on a daily basis.
Exposure to market risk – trading portfolios
The principal tool used to measure and control market risk exposures within the Bank’s trading portfolio is Value at Risk (‘VaR’). The VaR of a trading portfolio is the estimated loss that will arise on the portfolio over a specifi ed period of time (holding period) from an adverse market movement with a specifi ed probability (confi dence level). The VaR model used by the Bank is based upon a 99% confi dence level and assumes a one-day holding period. The VaR model used are based on historical simulations. Taking into account market data from the previous year and observed relationships between different markets and prices, the models generate a wide range of plausible future scenarios for market price movements evaluated in the model. The VaR model was approved by the NBS as a basis for the calculation of the capital charge for market risk of the trading book.
The Bank uses VaR limits for total market risk in the trading book, foreign exchange risk and interest rate risk. The overall structure of VaR limits is subject to review and approval by ALCO and Intesa Sanpaolo. VaR is measured on a daily basis. Daily reports of utilisation of VaR limits are submitted to the trading unit, the head of the Division Risk Management and the head of the Department Treasury and ALM. Regular summaries are submitted to Intesa Sanpaolo and ALCO.
A summary of the VaR position of the Bank’s trading portfolios:
2017 2016
€ ‘000 Balance Avg Max Min Balance Avg Max Min
Foreign currency risk 13 32 102 4 11 24 150 2
Interest rate risk 1,492 2,122 4,094 41 132 376 792 40
Overall 1,493 2,123 4,102 43 137 378 781 32

204
Separate fi nancial statements
Although VaR is a popular and widely used risk management tool, there are known limitations, among which the following are the most important ones:– VaR does not measure the worst case loss, since a 99% confi dence interval means that in 1% of cases the
loss is expected to be greater than the VaR amount, – VaR calculated using a one day holding period assumes hedge or disposal of a position within one day,
which might not be realistic in the case of a longer illiquid situation on the market, – For calculating VaR of a portfolio, the return, the volatility but also the correlation between various assets
needs to be recognized which might represent a diffi cult task when taking into account the growing number and diversity of positions in a given portfolio.
These limitations are recognized, by supplementing VaR limits with other position limit structures. In addition, the Bank uses a wide range of stress tests, to model the fi nancial impact of a variety of exceptional market scenarios on the Bank’s position.
Exposure to interest rate risk
Interest rate risk comprises of the risk that the value of a fi nancial instrument will fl uctuate due to changes in market interest rates and of the risk that the maturities of interest bearing assets differ from the maturities of the interest bearing liabilities used to fund those assets. The length of time for which the rate of interest is fi xed on a fi nancial instrument therefore indicates the extent to which it is exposed to interest rate risk.
The main risk to which non-trading portfolios are exposed is the risk of loss from fl uctuations in the future cash fl ows or fair values of fi nancial instruments due to a change in market interest rates. Interest rate risk is managed principally through monitoring interest rate gaps. Financial instruments are mapped to re-pricing gaps either by maturity, i.e. fi xed rate instruments, or by next re-pricing date, i.e. fl oating rate instruments. Assets and liabilities that do not have a contractual maturity date or are not interest - bearing are mapped according to internal models based on behavioural assumptions.
The Risk Management division is responsible for monthly monitoring of these gaps. The management of interest rate risk is measured by shift sensitivity analysis (change in present value). In line with the ISP Group methodology, the shift sensitivity analysis is done through baseline, internal stress and regulatory scenarios. Baseline scenarios are defi ned as a parallel and uniform shift of +/- 100 basis points of the rate curve. Internal stress scenarios have been introduced in 2017, measuring the shift sensitivity through parallel and uniform shift of +/-200 basis points, and additionally non-parallel steeper and fl atter scenarios. These standard scenarios are applied on a monthly basis. Furthermore, six regulatory scenarios, according to the Interest Rate Risk in the Banking Book Guidelines published by Basel Committee on Banking Supervision (‘BCBS’) Guidelines, have been introduced in 2017, calculated on a quarterly basis.
The sensitivity of the interest margin is also measured with a set of scenarios similar to shift sensitivity analysis – baseline, internal stress and regulatory scenarios. The baseline scenario is calculated on the basis of parallel and instantaneous shocks in the interest rate curve of +/-50 basis points, in a period of 12 months. Further-more, additional internal stress and regulatory scenarios are applied: +/-100, +/-200 and six stress scenarios according to the Basel Committee on Banking Supervision Guidelines. The interest margin sensitivity method-ology, specifi cally sight models repricing structure used for products with no contractual maturity, has been reviewed during 2017.
Overall banking book interest rate risk positions are managed by the Treasury and ALM Department, which uses different balance and off balance sheet instruments to manage the overall positions arising from the banking book activities.
Models applied for the interest rate risk calculation
Each fi nancial and non-fi nancial instrument is mapped to a gap based on its contractual or behavioural re-pricing date:
Contractual
This category includes instruments where the Bank knows exactly when the maturity or next re-pricing takes place. This treatment is applied mainly to: securities bought and issued loans and term deposits.

205
Separate fi nancial statements
Behavioural
These are items for which it is not exactly known when the maturity or next re-pricing will take place (e.g. current accounts). There are also some items where the maturity or re-pricing period is known but it can be assumed that they will behave differently (e.g. prepayments can occur for mortgages and consumer loans). In this case, it is necessary to make certain assumptions to refl ect the most probable behaviour of these items. The assumptions are based on a detailed analysis of the Bank’s historical data and statistical models.
At 31 December 2017, the interest margin sensitivity on profi t or loss in a one year time frame, in the event of a 100 basis points rise in interest rates, was € 15,862 thousand (31 December 2016: € -17,653 thousand).
At 31 December 2017, the interest rate risk generated by the banking book, measured through shift sensitivity analysis of plus 100 basis points, reached the value of € 3,241 thousand (31 December 2016: € -30,073 thousand).
The main reason for change in shift sensitivity analyses is due to closing the negative sensitivity via hedge accounting (Interest Rate Swaps).
At 31 December 2017, the interest margin sensitivity on profi t or loss in a one year time frame, in the event of a 100 basis points decline in interest rates, was € -24,861 thousand.
At 31 December 2017, the interest rate risk generated by the banking book, measured through shift sensitivity analysis of minus 100 basis points, reached the value of € -24,277 thousand.
At 31 December 2017, the sensitivity of the AFS reserve in equity related to the non-hedged part of the port-folio to a 100 basis points rise in interest rates was € -673 thousand (31 December 2016: € -1,444 thousand).
At 31 December 2017, the sensitivity of the CF hedges reserve in equity to a 100 basis points rise in interest rates was € 10,568 thousand (31 December 2016: € 4,203 thousand).

206
Separate fi nancial statements
The re-pricing structure of interest rate bearing fi nancial assets and liabilities based on contractual discounted cash-fl ows for the non-trading portfolios was as follows:
31 December 2017€ ‘000
Up to 1 month
1 to 3 months
3 monthsto 1 year
1 to 5 years
Over 5 years
Not specifi ed Total
Assets
Cash and balances with central banks
1,595,078 – – – – 1,595,078
Due from banks 56,266 27,453 7,025 – – – 90,744
Financial assets at fair value through profi t or loss
– – – – 4,933 850 5,783
Available-for-sale fi nancial assets
– 42,329 357,392 109,717 10,978 – 520,416
Loans and advances to customers
1,362,411 1,560,528 1,972,042 5,671,826 735,507 185,204 11,487,518
Held-to-maturity investments – – 11,749 264,821 99,902 – 376,472
3,013,755 1,630,310 2,348,208 6,046,364 851,320 186,054 14,076,011
Liabilities
Due to central and other banks (84,283) (27,081) (87,329) (251,122) – – (449,815)
Due to customers (7,925,994) (676,713) (1,008,305) (244,421) – – (9,855,433)
Subordinated debt – (200,164) – – – – (200,164)
Debt securities in issue (108,531) (103,460) (110,808) (771,152) (1,158,429) – (2,252,380)
(8,118,808) (1,007,418) (1,206,442) (1,266,695) (1,158,429) – (12,757,792)
Net position of fi nancial instruments
(5,105,053) 622,892 1,141,766 4,779,669 (307,109) 186,054 1,318,219
Cumulative net position of fi nancial instruments
(5,105,053) (4,482,161) (3,340,395) 1,439,274 1,132,165 1,318,219 –

207
Separate fi nancial statements
31 December 2016€ ‘000
Up to 1 month
1 to 3 months
3 monthsto 1 year
1 to 5 years
Over 5 years
Not specifi ed Total
Assets
Cash and balances with central banks
1,029,082 – – – – – 1,029,082
Due from banks 91,977 18,566 17,811 – 47 – 128,401
Financial assets at fair value through profi t or loss
– – – – – 474 474
Available-for-sale fi nancial assets
84,332 42,148 503,644 388,289 271,566 – 1,289,979
Loans and advances to customers
1,181,230 1,717,196 1,519,573 4,663,625 785,581 321,281 10,188,486
Held-to-maturity investments – – 163,680 266,401 99,938 – 530,019
2,386,621 1,777,910 2,204,708 5,318,315 1,157,132 321,755 13,166,441
Liabilities – – – – – – –
Due to central and other banks (44,670) (174,690) (117,234) (154,081) – – (490,675)
Due to customers (7,597,522) (402,880) (1,271,441) (223,076) – – (9,494,919)
Subordinated debt – (200,165) – – – – (200,165)
Debt securities in issue (209,828) (144,706) (130,440) (503,513) (726,822) – (1,715,309)
(7,852,020) (922,441) (1,519,115) (880,670) (726,822) –
Net position of fi nancial instruments
(5,465,399) 855,469 685,593 4,437,645 430,310 321,755 1,265,373
Cumulative net position of fi nancial instruments
(5,465,399) (4,609,930) (3,924,337) 513,308 943,618 1,265,373 –

208
Separate fi nancial statements
The average interest rates for fi nancial assets and liabilities were as follows:
2017 2016
Assets
Cash and balances with central banks 0.00% 0.05%
Due from banks 0.45% 0.39%
Financial assets at fair value through profi t or loss 1.45% 0.59%
Available-for-sale fi nancial assets 0.47% 0.74%
Loans and advances to customers 3.07% 3.62%
Held-to-maturity investments 4.46% 4.35%
Liabilities
Due to central and other banks 0.24% 0.53%
Due to customers 0.20% 0.21%
Debt securities in issue 1.23% 1.48%

209
Separate fi nancial statements
Currency denominations of assets and liabilitiesForeign exchange rate risk comprises the risk that the value of fi nancial assets and liabilities will fl uctuate due to changes in foreign exchange rates. It is the policy of the Bank to manage its exposure to fl uctuations in exchange rates through regular monitoring and reporting of open positions and the application of a matrix of exposure and position limits.
31 December 2017€ ‘000 EUR USD CZK Other Total
Assets
Cash and balances with central banks 123,596 1,109 1,467,216 3,157 1,595,078
Due from banks 85,070 2,172 422 3,080 90,744
Financial assets at fair value through profi t or loss
5,783 – – – 5,783
Derivative fi nancial instruments 42,310 4,294 3,252 – 49,856
Available-for-sale fi nancial assets 514,107 6,309 – – 520,416
Loans and advances to customers 10,873,743 265,150 298,812 49,813 11,487,518
Held-to-maturity investments 376,472 – – – 376,472
12,021,081 279,034 1,769,702 56,050 14,125,867
Liabilities
Due to central and other banks (412,639) (83) (36,821) (272) (449,815)
Derivative fi nancial instruments (45,474) (633) (4,471) (1,606) (52,184)
Due to customers (9,447,968) (158,499) (169,357) (79,609) (9,855,433)
Subordinated debt (200,164) – – – (200,164)
Debt securities in issue (2,173,842) (58,779) (19,759) – (2,252,380)
(12,280,087) (217,994) (230,408) (81,487) (12,809,976)
Net position (259,006) 61,040 1,539,294 (25,437) 1,315,891
31 December 2016€ ‘000 EUR USD CZK Other Total
Assets
Cash and balances with central banks 167,665 1,238 857,853 2,325 1,029,081
Due from banks 73,442 19,400 2,141 17,312 112,295
Financial assets at fair value through profi t or loss
474 – – – 474
Derivative fi nancial instruments 42,772 2,766 1,334 377 47,249
Available-for-sale fi nancial assets 1,274,703 15,276 – – 1,289,979
Loans and advances to customers 9,561,128 359,704 266,107 1,546 10,188,485
Held-to-maturity investments 530,019 – – – 530,019
11,650,203 398,384 1,127,435 21,560 13,197,582
Liabilities
Due to central and other banks (462,519) (9,825) (1,351) (876) (474,571)
Derivative fi nancial instruments (57,215) (6,862) (94) (1,183) (65,354)
Due to customers (9,103,639) (214,314) (96,401) (80,567) (9,494,921)
Subordinated debt (200,165) – – – (200,165)
Debt securities in issue (1,599,874) (66,803) (48,631) – (1,715,308)
(11,423,412) (297,804) (146,477) (82,626) (11,950,319)
Net position 226,791 100,580 980,958 (61,066) 1,247,263

210
Separate fi nancial statements
(c) Liquidity risk
Liquidity risk is defi ned as the risk that the Bank is not able to meet its payment obligations when they fall due (funding liquidity risk). Normally, the Bank is able to cover cash outfl ows with cash infl ows, highly liquid assets and its ability to obtain credit.
The Guidelines for Liquidity Risk Management adopted by the Bank outline the set of principles, methods, regulations and control processes required to prevent the occurrence of a liquidity crisis and call for the Bank to develop prudent approaches to liquidity management, making it possible to maintain the overall risk profi le at low levels.
The basic principles underpinning the Liquidity Policy of the Bank are:– The existence of an operating structure that works within set limits and of a control structure that is inde-
pendent from the operating structure;– A prudential approach to the estimate of the cash infl ow and outfl ow projections for all the balance sheet
and off-balance sheet items, especially those without a contractual maturity;– An assessment of the impact of various scenarios, including stress testing scenarios, on the cash infl ows
and outfl ows over time;– The maintenance of an adequate level of unencumbered highly liquid assets, capable of enabling ordinary
operations, also on an intraday basis, and overcoming the initial stages of a shock involving the Bank’s liquidity or system liquidity.
The departments of the Bank responsible for ensuring the correct application of the Guidelines are the Treasury and ALM Department responsible for liquidity management and the Enterprise Risk Management Department responsible for monitoring indicators and verifying the observation of limits.
These Guidelines are broken down into three macro areas: ‘Short term Liquidity Policy’, ‘Structural Liquidity Policy’ and ‘Contingency Liquidity Plan’, and constitute an integral part of the Internal Liquidity Adequacy Assessment Process (‘ILAAP’).
The Short term Liquidity Policy includes a set of parameters, limits and observation thresholds that enable the measurement, both under normal market conditions and under conditions of stress, of liquidity risk exposure over the short term, setting the maximum amount of risk to be assumed and ensuring the utmost prudence in its management. Main regulatory indicator used for monitoring and managing short term liquidity is Liquidity coverage ratio. It is required by (EU) Regulation 575/2013(CRR), more precisely defi ned in Delegated Regu-lation (EU) 2015/61. Main content of the LCR: Institutions shall hold liquid assets, the sum of the values of which covers the liquidity outfl ows less the liquidity infl ows under stressed conditions so as to ensure that institutions maintain levels of liquidity buffers which are adequate to face any possible imbalance between liquidity infl ows and outfl ows under gravely stressed conditions over a period of thirty days. During times of stress, institutions may use their liquid assets to cover their net liquidity outfl ows.
The Structural Liquidity Policy of the Bank incorporates a set of measures and limits designed to control and manage the risks deriving from the mismatch of the medium to long-term maturities of the assets and liabili-ties, essential for the strategic planning of liquidity management. This involves the adoption of internal limits for the transformation of maturity dates aimed at preventing the medium to long-term operations from giving rise to excessive imbalances to be fi nanced in the short term.
Together with the Short term and Structural Liquidity Policy, the Guidelines provide for the management methods of a potential liquidity crisis, defi ned as a situation of diffi culty or inability of the Bank to meet its cash commitments falling due, without implementing procedures and/or employing instruments that, due to their intensity or manner of use, do not qualify as ordinary administration.
The Contingency Liquidity Plan sets the objectives of safeguarding the Bank’s capital and, at the same time, guarantees the continuity of operations under conditions of extreme liquidity emergency. It also ensures the identifi cation of the pre-warning signals and their ongoing monitoring, the defi nition of procedures to be implemented in situations of liquidity stress, the immediate lines of action, and intervention measures for the resolution of emergencies. The pre-warning indices, aimed at identifying signs of a potential liquidity strain, both systemic and specifi c, are continuously recorded and reported to the departments responsible for the management and monitoring of liquidity.
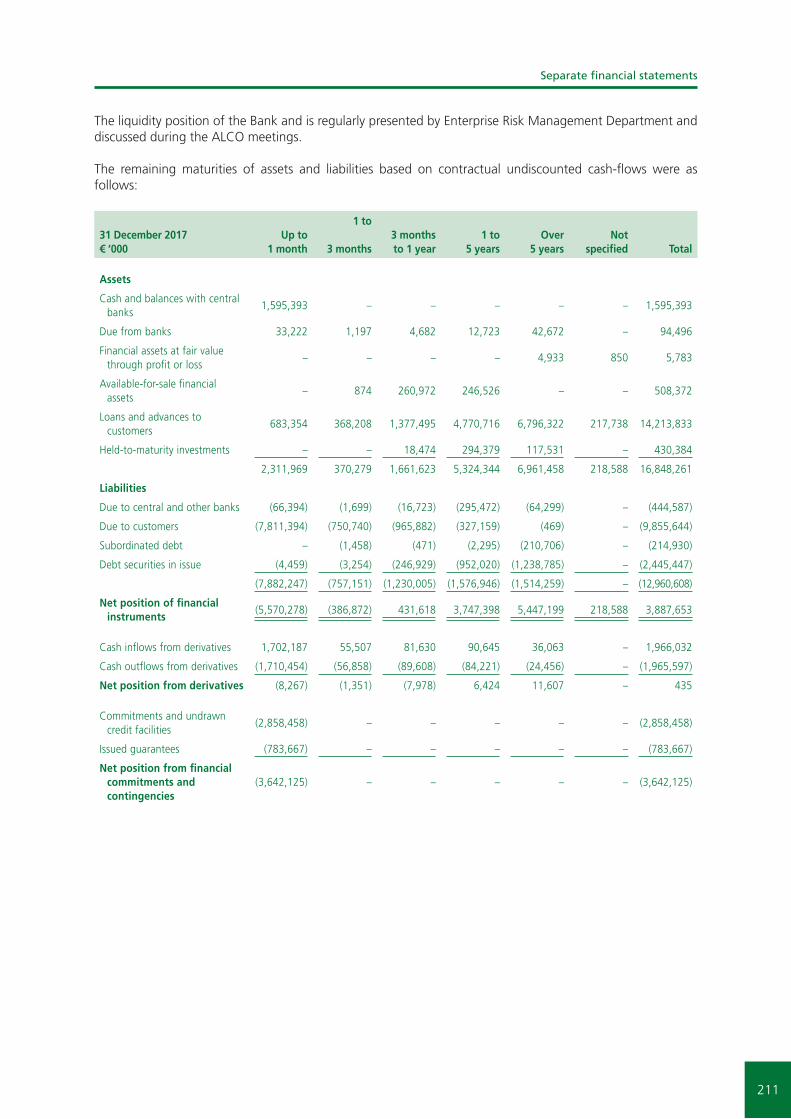
211
Separate fi nancial statements
The liquidity position of the Bank and is regularly presented by Enterprise Risk Management Department and discussed during the ALCO meetings.
The remaining maturities of assets and liabilities based on contractual undiscounted cash-fl ows were as follows:
31 December 2017€ ‘000
Up to1 month
1 to
3 months3 monthsto 1 year
1 to 5 years
Over5 years
Notspecifi ed Total
Assets
Cash and balances with central banks
1,595,393 – – – – – 1,595,393
Due from banks 33,222 1,197 4,682 12,723 42,672 – 94,496
Financial assets at fair value through profi t or loss
– – – – 4,933 850 5,783
Available-for-sale fi nancial assets
– 874 260,972 246,526 – – 508,372
Loans and advances to customers
683,354 368,208 1,377,495 4,770,716 6,796,322 217,738 14,213,833
Held-to-maturity investments – – 18,474 294,379 117,531 – 430,384
2,311,969 370,279 1,661,623 5,324,344 6,961,458 218,588 16,848,261
Liabilities
Due to central and other banks (66,394) (1,699) (16,723) (295,472) (64,299) – (444,587)
Due to customers (7,811,394) (750,740) (965,882) (327,159) (469) – (9,855,644)
Subordinated debt – (1,458) (471) (2,295) (210,706) – (214,930)
Debt securities in issue (4,459) (3,254) (246,929) (952,020) (1,238,785) – (2,445,447)
(7,882,247) (757,151) (1,230,005) (1,576,946) (1,514,259) – (12,960,608)
Net position of fi nancial instruments
(5,570,278) (386,872) 431,618 3,747,398 5,447,199 218,588 3,887,653
Cash infl ows from derivatives 1,702,187 55,507 81,630 90,645 36,063 – 1,966,032
Cash outfl ows from derivatives (1,710,454) (56,858) (89,608) (84,221) (24,456) – (1,965,597)
Net position from derivatives (8,267) (1,351) (7,978) 6,424 11,607 – 435
Commitments and undrawn credit facilities
(2,858,458) – – – – – (2,858,458)
Issued guarantees (783,667) – – – – – (783,667)
Net position from fi nancial commitments and contingencies
(3,642,125) – – – – – (3,642,125)

212
Separate fi nancial statements
31 December 2016€ ‘000
Up to1 month
1 to 3 months
3 months to
1 year1 to
5 yearsOver
5 yearsNot
specifi ed Total
Assets
Cash and balances with central banks
1,029,082 – – – – – 1,029,082
Due from banks 97,150 121 3,140 – 31,204 – 131,615
Financial assets at fair value through profi t or loss
– – – – – 474 474
Available-for-sale fi nancial assets
31,870 3,667 252,871 745,834 286,748 – 1,320,990
Loans and advances to customers
612,017 472,508 1,217,863 4,351,737 5,804,213 198,071 12,656,409
Held-to-maturity investments – – 152,777 302,874 134,565 – 590,216
1,770,119 476,296 1,626,651 5,400,445 6,256,730 198,545 15,728,786
Liabilities
Due to central and other banks (49,907) (109,595) (12,929) (214,446) (113,858) – (500,735)
Due to customers (7,584,561) (414,993) (1,224,157) (271,256) (5,167) – (9,500,134)
Subordinated debt – (1,466) (4,029) (22,000) (242,895) – (270,390)
Debt securities in issue (3,467) (46,180) (164,875) (870,766) (843,955) – (1,929,243)
(7,637,935) (572,234) (1,405,990) (1,378,468) (1,205,875) – (12,200,502)
Net position of fi nancial instruments
(5,867,816) (95,938) 220,661 4,021,977 5,050,855 198,545 3,528,284
Cash infl ows from derivatives 995,200 159,826 226,607 119,435 41,630 – 1,542,698
Cash outfl ows from derivatives (993,311) (158,921) (230,557) (124,017) (41,728) – (1,548,534)
Net position from derivatives 1,889 905 (3,950) (4,582) (98) – (5,836)
Commitments and undrawn credit facilities
(3,020,958) – – – – – (3,020,958)
Issued guarantees (764,156) – – – – – (764,156)
Net position from fi nancial commitments and contingencies
(3,785,114) – – – – – (3,785,114)

213
Separate fi nancial statements
The table below shows an analysis of assets and liabilities (discounted cash fl ow basis) according to when they are expected to be recovered or settled:
31 December 2017€ ‘000
Less than12 months
Over 12 months Total
Assets
Cash and balances with central banks 1,595,078 – 1,595,078
Due from banks 36,936 53,808 90,744
Financial assets at fair value through profi t or loss – 5,783 5,783
Derivative fi nancial instruments 5,902 43,954 49,856
Available-for-sale fi nancial assets 262,952 257,464 520,416
Loans and advances to customers 2,148,102 9,339,416 11,487,518
Held-to-maturity investments 11,750 364,722 376,472
Subsidiaries, associates and joint ventures – 92,745 92,745
Intangible assets – 74,882 74,882
Property and equipment – 111,512 111,512
Current income tax assets 5,813 – 5,813
Deferred income tax assets – 38,626 38,626
Other assets 19,848 – 19,848
4,086,381 10,382,912 14,469,293
Liabilities
Due to central and other banks (50,297) (399,518) (449,815)
Derivative fi nancial instruments (24,278) (27,906) (52,184)
Due to customers (1,750,104) (8,105,329) (9,855,433)
Subordinated debt (164) (200,000) (200,164)
Debt securities in issue (238,066) (2,014,314) (2,252,380)
Provisions – (7,302) (7,302)
Other liabilities (91,344) (4,691) (96,035)
(2,154,253) (10,759,060) (12,913,313)
1,932,128 (376,148) 1,555,980

214
Separate fi nancial statements
31 December 2016€ ‘000
Less than 12 months
Over 12 months Total
Assets
Cash and balances with central banks 1,029,081 – 1,029,081
Due from banks 94,505 17,790 112,295
Financial assets at fair value through profi t or loss – 474 474
Derivative fi nancial instruments 4,225 43,024 47,249
Available-for-sale fi nancial assets 264,958 1,025,021 1,289,979
Loans and advances to customers 2,067,645 8,120,840 10,188,485
Held-to-maturity investments 151,930 378,089 530,019
Subsidiaries, associates and joint ventures – 92,745 92,745
Intangible assets – 63,062 63,062
Property and equipment – 88,402 88,402
Deferred income tax assets – 47,544 47,544
Other assets 20,014 – 20,014
3,632,358 9,876,991 13,509,349
Liabilities
Due to central and other banks (166,890) (307,681) (474,571)
Derivative fi nancial instruments (39,013) (26,341) (65,354)
Due to customers (1,737,873) (7,757,048) (9,494,921)
Subordinated debt (165) (200,000) (200,165)
Debt securities in issue (198,648) (1,516,660) (1,715,308)
Current income tax liabilities (3,176) – (3,176)
Provisions – (25,952) (25,952)
Other liabilities (81,894) (3,834) (85,728)
(2,227,659) (9,837,516) (12,065,175)
1,404,699 39,475 1,444,174

215
Separate fi nancial statements
(d) Operational risk
Operational risk is the risk of direct or indirect loss arising from a wide variety of causes associated with the Bank’s processes, personnel, technology and infrastructure, and from external factors other than credit, market and liquidity risks, such as those arising from legal and regulatory requirements and from non-compliance with generally accepted standards of corporate behaviour. Operational risks arise from all of the Bank’s operations.
Operational risk management strategies and processes
The Bank, in coordination with Intesa Sanpaolo, has defi ned the overall operational risk management frame-work by setting up a VUB Group policy and organisational process for measuring, managing and controlling operational risk.
The control of operational risk was attributed to the Operational Risk Committee, which identifi es risk manage-ment policies. The Supervisory and Management Boards of the Bank ensures the functionality, effi ciency and effectiveness of the risk management and controls system.
The Operational Risk Committee (composed of the heads of the areas of the governance centre (Chief Executive Offi cer, Deputy Chief Executive Offi cer) and of the business areas more involved in operational risk management (Head of Risk Management Division, Chief Financial Offi cer, Chief Operating Offi cer, Head of Compliance Department, Head of AML Department, Head of Corporate & SME Division, Head of Retail Division, Head of Enterprise Risk Management Department, Head of Legal Department, Head of Human Resources & Organization Department, Head of Internal Audit Department, Head of Security and Business Continuity Management), has the task of periodically reviewing the Bank’s overall operational risk profi le, authorising any corrective actions, coordinating and monitoring the effectiveness of the main mitigation activities and approving the operational risk transfer strategies.
Organisational structure of the associated risk management function
For some time, the Bank has had a centralised function within the Risk Management Division for the manage-ment of the Bank’s operational risks. This function is responsible, in coordination with the parent company, for the defi nition, implementation and monitoring of the methodological and organisational framework, as well as for the measurement of the risk profi le, the verifi cation of mitigation effectiveness and reporting to senior Management. In compliance with current requirements, the individual organisational units participate in the process and each of them is responsible for the identifi cation, assessment, management and mitiga-tion of its operational risks. Specifi c offi ces and departments have been identifi ed within these organisational units to be responsible for Operational Risk Management. These functions are responsible for the collection and structured census of information relating to operational events, scenario analyses and evaluation of the level of risk associated with the business environment. The Risk Management Division carries out second level monitoring of these activities.
Scope of application and characteristics of the risk measurement and reporting system
In February 2010 upon a VUB Group request, the Bank as part of the VUB Group received, from the relevant Supervisory authorities an approval for usage and thus adopted the Advanced Measurement Approach (‘AMA’), for Operational Risk management and measurement. In June 2013, the Bank as part of the VUB Group received an approval for usage and thus adopted the AMA for subsidiaries Consumer Finance Holding and VUB Leasing. Part of this decision has been an approval of the insurance effect inclusion, as well as approval of a new allocation mechanism, which led to fulfi lment of a regulatory condition for the approval of diversifi cation usage.
As such, the VUB Group uses a combination of the AMA for the Bank, Consumer Finance Holding and VUB Leasing, and the Standardized Approach (‘TSA’) for VUB Factoring.
For the use of the AMA, the Bank has set up, in addition to the corporate governance mechanisms required by the Supervisory regulations, an effective system for the management of operational risk certifi ed by the process of annual self-assessment carried out by the Bank and VUB Group Companies that fall within the scope of AMA and TSA. This process is verifi ed by the Internal Audit Department and submitted to the relevant Bank’s Committee for the annual certifi cation of compliance with the requirements established by the regulation.

216
Separate fi nancial statements
Under the AMA approach, the capital requirement is calculated by an internal model, which combines all elements stipulated in Supervisory regulation, allowing to measure the exposure in a more risk-sensitive way. Monitoring of operational risks is performed by an integrated reporting system, which provides management with the information necessary for the management and/or mitigation of the operational risk.
Policies for hedging and mitigating risk
The Bank, in coordination with its parent company, has set up a traditional operational risk transfer policy (insurance) aimed at mitigating the impact of any unexpected losses. The AMA calculation does include the benefi t from this transfer of operational risk through insurance policies, which contributes to reducing the risk capital calculated through the internal models.
4. Estimated fair value of fi nancial assets and liabilities
The fair value of fi nancial instruments is the price that would be received to sell an asset or paid to transfer a liability in an orderly transaction between market participants at the measurement date. Fair value is a market measurement criterion that is not entity-specifi c. An entity has to measure the fair value of an asset or liability by adopting the assumptions that would be used by market operators to determine the price of an asset or liability, presuming that the market operators act with a view to satisfying their own economic interest in the best way possible.
The Bank uses the following fair value hierarchy that categorises into three levels the inputs to valuation tech-niques used to measure fair value:
Level 1: inputs represented by quoted prices (unadjusted) in active markets for identical assets or liabilities accessible by the Bank as at the measurement date;
Level 2: inputs other than quoted prices included in Level 1 that are directly or indirectly observable for the assets or liabilities to be measured; and
Level 3: inputs unobservable for the asset or liability.
The highest priority is attributed to effective market quotes (Level 1) for the valuation of assets and liabilities or for similar assets and liabilities measured using valuation techniques based on market-observable parameters other than fi nancial instruments quotes (Level 2) and the lowest priority to unobservable inputs (Level 3). Following this hierarchy, where available, fair value estimates made by the Bank are based on quoted market prices. However, no readily available market prices exist for a signifi cant portion of the Bank’s fi nancial instruments. In circumstances where the quoted market prices are not readily available, fair value is estimated using discounted cash fl ow models or other pricing models as appropriate.
Under Level 2, the principal valuation technique used by the Bank for debt instruments involves the method of discounting forecast cash fl ows. The calculation takes into account the time value of money (risk-free rate of interest) and the credit risk expressed in the form of credit spreads applied to the bonds’ yield and repre-senting the risk premium the investor claims against a risk free investment. In the case of derivative fi nancial instruments the Bank uses standard fair value calculation models based on the principal net present value using the yield curve to discount all future cash fl ows from derivatives for all relevant currencies. The principal input parameters used by the models comprise interest rate curves, volatility curves, spot and forward prices and the correlation between underlying assets. Changes in underlying assumptions, including discount rates and estimated future cash fl ows, signifi cantly affect the estimates. The Bank also considers its own and coun-terparty’s credit risk.
The valuation technique defi ned for a fi nancial instrument is adopted over time and is modifi ed only following signifi cant changes in market conditions or the subjective conditions related to the issuer of the fi nancial instrument. The Bank monitors the occurrence of these changes and accordingly reassesses the classifi cation into the fair value hierarchy. For determining the timing of the transfers between the levels, the Bank uses the end of the reporting period as the day when the transfer is deemed to have occurred.

217
Separate fi nancial statements
In estimating the fair value of the Bank’s fi nancial instruments, the following methods and assumptions were used:
(a) Cash and balances with central banks
The carrying values of cash and cash equivalents are deemed to approximate their fair value.
(b) Due from banks
The fair value of due from banks balances with longer maturities and material amounts is estimated using discounted cash fl ow analyses, based upon the risk free interest rate curve. For shorter maturities and not signifi cant balances, the carrying amounts of amounts due from banks approximates their estimated fair value. Impairment losses are taken into consideration when calculating fair values.
(c) Loans and advances to customers
The fair value of loans and advances to customers is estimated using discounted cash fl ow analyses, based upon the risk free interest rate curve and risk refl ecting credit-worthiness of the counterparty. Impairment losses are taken into consideration when calculating fair values.
(d) Held-to-maturity investments
The fair value of securities carried in the ‘Held-to-maturity investments’ portfolio is based on quoted market prices. Where no market prices are available, the fair value is calculated by discounting future cash fl ows using risk free interest rate curve adjusted to refl ect credit risk.
(e) Due to banks and customers
The carrying amounts of due to banks approximates their estimated fair value. The fair value of due to customers with short term maturity (under one year, including current accounts) is estimated by discounting their future expected cash fl ows using the risk free interest rate curve. The fair value of deposits with maturity over one year is discounted using the risk free interest rate curve adjusted by credit spreads refl ecting the credit quality of VUB as the borrower.
(f) Subordinated debt
The fair value of subordinated debt is discounted using the risk free interest rate curve.
(g) Debt securities in issue
The fair value of debt securities issued by the Bank is based on quoted market prices. Where no market prices are available, the fair value was calculated by discounting future cash fl ows using the risk free interest rate curve adjusted by credit spreads refl ecting the credit quality of VUB as the issuer.

218
Separate fi nancial statements
Carrying amount Fair value
31 December 2017€ ‘000 Note
At amortised
costAt
fair value
Total carrying amount Level 1 Level 2 Level 3
Total fair value
Financial assets
Cash and balances with central banks
7 1,595,078 – 1,595,078 – 1,595,078 – 1,595,078
Due from banks 8 90,744 – 90,744 – 90,744 – 90,744
Financial assets at fair value through profi t or loss
9 – 5,783 5,783 850 4,933 – 5,783
Derivative fi nancial instruments
10 – 49,856 49,856 – 49,856 – 49,856
Available-for-sale fi nancial assets
11 – 520,416 520,416 265,742 248,365 6,309 520,416
Loans and advances to customers
12 11,487,518 – 11,487,518 – – 12,552,785 12,552,785
Held-to-maturity investments
14 376,472 – 376,472 – 426,970 – 426,970
13,549,812 576,055 14,125,867 266,592 2,415,946 12,559,094 15,241,632
Financial liabilities
Due to central and other banks
20 (449,815) – (449,815) – (449,815) – (449,815)
Derivative fi nancial instruments
10 – (52,184) (52,184) – (52,184) – (52,184)
Due to customers 21 (9,855,433) – (9,855,433) – (9,863,989) – (9,863,989)
Subordinated debt 22 (200,164) – (200,164) – (199,693) – (199,693)
Debt securities in issue 22 (2,252,380) – (2,252,380) – (2,336,806) – (2,336,806)
(12,757,792) (52,184) (12,809,976) – (12,902,487) – (12,902,487)

219
Separate fi nancial statements
Carrying amount Fair value
31 December 2016€ ‘000 Note
At amortised
costAt
fair value
Total carrying amount Level 1 Level 2 Level 3
Total fair value
Financial assets
Cash and balances with central banks
7 1,029,081 – 1,029,081 – 1,029,081 – 1,029,081
Due from banks 8 112,295 – 112,295 – 112,295 – 112,295
Financial assets at fair value through profi t or loss
9 – 474 474 474 – – 474
Derivative fi nancial instruments
10 – 47,249 47,249 – 47,249 – 47,249
Available-for-sale fi nancial assets
11 – 1,289,979 1,289,979 805,871 479,176 4,932 1,289,979
Loans and advances to customers
12 10,188,485 – 10,188,485 – – 11,335,169 11,335,169
Held-to-maturity investments
14 530,019 – 530,019 – 598,206 – 598,206
11,859,880 1,337,702 13,197,582 806,345 2,266,007 11,340,101 14,412,453
Financial liabilities
Due to central and other banks
20 (474,571) – (474,571) – (474,571) – (474,571)
Derivative fi nancial instruments
10 – (65,354) (65,354) – (65,354) – (65,354)
Due to customers 21 (9,494,921) – (9,494,921) – (9,559,752) – (9,559,752)
Subordinated debt 22 (200,165) – (200,165) – (200,165) – (200,165)
Debt securities in issue 22 (1,715,308) – (1,715,308) – (1,781,512) – (1,781,512)
(11,884,965) (65,354) (11,950,319) – (12,081,354) – (12,081,354)
There were no transfers of fi nancial instruments among the levels during 2017 and 2016.

220
Separate fi nancial statements
5. Segment reporting
Segment information is presented in respect of the Bank’s operating segments, based on the management and internal reporting structure.
Operating segments pay and receive interest to and from the Central Treasury on an arm’s length basis in order to refl ect the costs of funding.
The Bank comprises the following main operating segments:– Retail Banking,– Corporate Banking,– Central Treasury.
Retail Banking includes loans, deposits and other transactions and balances with households, sole traders and small business segment.
Corporate Banking comprises Small and Medium Enterprises (‘SME’) and the Corporate Customer Desk (‘CCD’). SME includes loans, deposits and other transactions and balances with small and medium enterprises (company revenue in the range of € 1 million to € 50 million; if revenue information is not available, bank account turnover is used). The CCD includes loans, deposits and other transactions and balances with large corporate customers (company revenue over € 50 million).
Central Treasury undertakes the Bank’s funding, issues of debt securities as well as trading book. The Bank also has a central Governance Centre (included within ‘Other’ in the table below) that manages the Bank’s premises, equity investments and own equity funds as well as Risk Management that operates the workout loan portfolio.
In order to unify the disclosure of information on operating segments with the Intesa Sanpaolo methodology, the project of New Segmentation was launched in the Bank in the fi rst quarter of 2015. The most signifi cant change was related to the extension of Central Treasury segment by banking book transactions (previously they were reported within ‘Other’).
2017€ ‘000
Retail Banking
Corporate Banking
Central Treasury Other Total
External revenue:
Interest and similar income 251,454 83,664 19,871 11,237 366,226
Interest and similar expense (10,573) (5,265) (23,717) (7,614) (47,169)
Inter-segment revenue (17,086) (11,923) 23,445 5,564 –
Net interest income 223,795 66,476 19,599 9,187 319,057
Net fee and commission income 74,464 26,357 2,939 (4,113) 99,647
Net trading result 3,712 5,339 30,983 321 40,355
Other operating income (970) 2,914 31 4,013 5,988
Dividend income – – – 2,000 2,000
Total segment operating income 301,001 101,086 53,552 11,408 467,047
Depreciation and amortisation (12,060) (909) (9) (7,085) (20,063)
Operating expenses* (205,750)
Operating profi t before impairment 241,234
Impairment losses (32,328) (5,774) (1,432) 1,487 (38,047)
Income tax expense (43,166)
Net profi t for the year 160,021
Segment assets 6,978,913 4,149,354 2,844,700 496,326 14,469,293
Segment liabilities and equity 5,864,057 3,959,208 2,829,933 1,816,095 14,469,293
* The Bank does not allocate the ‘Operating expenses’ to the individual segments.

221
Separate fi nancial statements
2016€ ‘000
Retail Banking
Corporate Banking
Central Treasury Other Total
External revenue: Interest and similar income 254,602 79,761 35,159 10,090 379,612 Interest and similar expense (15,290) (5,946) (24,907) (152) (46,295)Inter-segment revenue (24,406) (6,654) 35,553 (4,493) –
Net interest income 214,906 67,161 45,805 5,445 333,317
Net fee and commission income 61,167 24,502 2,888 (2,402) 86,155Net trading result 3,371 5,453 29,861 110 38,795Other operating income 6,712 982 (6) (4,547) 3,141Dividend income – – – 133,961 133,961
Total segment operating income 286,156 98,098 78,548 132,567 595,369
Depreciation and amortisation (15,761) (909) (11) (6,143) (22,824)Operating expenses (214,071)
Operating profi t before impairment 358,474
Impairment losses (35,822) (9,966) (375) (783) (46,946)Income tax expense (46,357)
Net profi t for the year 265,171
Segment assets 6,013,354 3,998,629 3,029,473 467,893 13,509,349
Segment liabilities and equity 5,529,599 4,086,436 2,180,774 1,712,540 13,509,349
6. Cash and cash equivalents
€ ‘000 Note 2017 2016
Cash and balances with central banks 7 1,595,078 1,029,081
Current accounts in other banks 8 25,043 34,537
Term deposits with other banks 8 – 2,035
1,620,121 1,065,653
7. Cash and balances with central banks
€ ‘000 2017 2016
Balances with central banks:
Compulsory minimum reserves 7,264 810,409
Current accounts 1,753 961
Term deposits 736,103 119,912
Loans and advances 724,427 –
1,469,547 931,282
Cash in hand 125,531 97,799
1,595,078 1,029,081
The compulsory minimum reserve is maintained as an interest bearing deposit under the regulations of the NBS and Česká národní banka. The amount of the compulsory minimum reserve depends on the level of customer deposits accepted by the Bank and the amount of issued bonds, both with a maturity of up to two years. The rate for the calculation of the compulsory minimum reserve is 1% for the reserves held at the NBS and 2% for the reserves held at Česká národní banka. The required balance is calculated as the total of indi-vidual items multiplied by the valid rate.
The daily balance of the compulsory minimum reserve can vary signifi cantly based on the amount of incoming and outgoing payments. The Bank’s ability to withdraw the compulsory minimum reserve is restricted by local legislation.
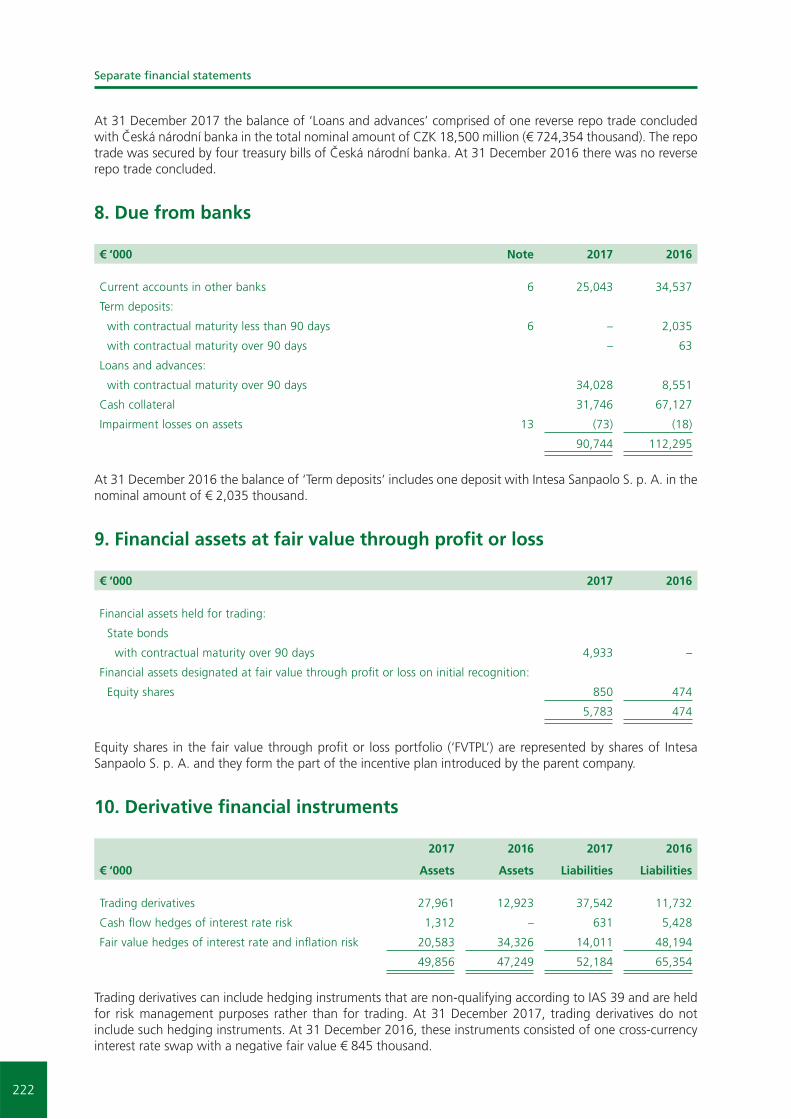
222
Separate fi nancial statements
At 31 December 2017 the balance of ‘Loans and advances’ comprised of one reverse repo trade concluded with Česká národní banka in the total nominal amount of CZK 18,500 million (€ 724,354 thousand). The repo trade was secured by four treasury bills of Česká národní banka. At 31 December 2016 there was no reverse repo trade concluded.
8. Due from banks
€ ‘000 Note 2017 2016
Current accounts in other banks 6 25,043 34,537
Term deposits:
with contractual maturity less than 90 days 6 – 2,035
with contractual maturity over 90 days – 63
Loans and advances:
with contractual maturity over 90 days 34,028 8,551
Cash collateral 31,746 67,127
Impairment losses on assets 13 (73) (18)
90,744 112,295
At 31 December 2016 the balance of ‘Term deposits‘ includes one deposit with Intesa Sanpaolo S. p. A. in the nominal amount of € 2,035 thousand.
9. Financial assets at fair value through profi t or loss
€ ‘000 2017 2016
Financial assets held for trading:
State bonds
with contractual maturity over 90 days 4,933 –
Financial assets designated at fair value through profi t or loss on initial recognition:
Equity shares 850 474
5,783 474
Equity shares in the fair value through profi t or loss portfolio (‘FVTPL’) are represented by shares of Intesa Sanpaolo S. p. A. and they form the part of the incentive plan introduced by the parent company.
10. Derivative fi nancial instruments
2017 2016 2017 2016
€ ‘000 Assets Assets Liabilities Liabilities
Trading derivatives 27,961 12,923 37,542 11,732
Cash fl ow hedges of interest rate risk 1,312 – 631 5,428
Fair value hedges of interest rate and infl ation risk 20,583 34,326 14,011 48,194
49,856 47,249 52,184 65,354
Trading derivatives can include hedging instruments that are non-qualifying according to IAS 39 and are held for risk management purposes rather than for trading. At 31 December 2017, trading derivatives do not include such hedging instruments. At 31 December 2016, these instruments consisted of one cross-currency interest rate swap with a negative fair value € 845 thousand.

223
Separate fi nancial statements
2017 2016 2017 2016
€ ‘000 Assets Assets Liabilities Liabilities
Trading derivatives – Fair values
Interest rate instruments:
Swaps 21,385 7,452 18,403 5,675
Options 51 325 51 357
21,436 7,777 18,454 6,032
Foreign currency instruments:
Forwards and swaps 4,296 3,725 16,896 3,352
Cross currency swaps 26 – – 845
Options 42 272 42 391
4,364 3,997 16,938 4,588
Equity and commodity instruments:
Equity options 2,146 922 2,137 904
Commodity swaps – 227 – 208
Commodity forwards 15 – 13 –
2,161 1,149 2,150 1,112
27,961 12,923 37,542 11,732
2017 2016 2017 2016
€ ‘000 Assets Assets Liabilities Liabilities
Trading derivatives – Notional values
Interest rate instruments:
Swaps 1,974,174 625,151 1,974,174 625,151
Options 49,014 115,342 49,014 115,342
Futures 3,431 – 3,431 –
2,026,619 740,493 2,026,619 740,493
Foreign currency instruments:
Forwards and swaps 1,832,019 1,331,195 1,842,027 1,326,896
Cross currency swaps 5,917 29,606 5,917 30,449
Options 7,201 45,482 7,201 45,091
1,845,137 1,406,283 1,855,145 1,402,436
Equity and commodity instruments:
Equity options 7,087 7,087 7,087 7,091
Commodity swaps – 5,149 – 5,060
Commodity forwards 7,407 – 7,407 –
14,494 12,236 14,494 12,151
3,886,250 2,159,012 3,896,258 2,155,080
Cash fl ow hedges of interest rate risk
At 31 December 2017 the Bank uses four interest rate swaps to hedge the interest rate risk arising from the issuance of three variable rate mortgage bonds. The cash fl ows on the fl oating legs of these interest rate swaps substantially match the cash fl ow profi les of the variable rate mortgage bonds.
The Bank uses one interest rate swap to hedge the interest rate risk of a subordinated loan denominated in EUR. The cash fl ows on the fl oating leg of this interest rate swap substantially match the cash fl ow profi les of the variable rate of the subordinated loan.

224
Separate fi nancial statements
Below is a schedule indicating as at 31 December 2017 and 31 December 2016, the periods when the hedged cash fl ows are expected to occur. The cash fl ows of mortgage bonds represent the future undiscounted value of coupons and the cash fl ows from subordinated debt undiscounted repayments:
2017 2016
€ ‘000Up to
1 year1 to
5 yearsOver
5 yearsUp to
1 year1 to
5 yearsOver
5 years
Mortgage bonds – interest rate risk
(4,078) (1,414) – (5,343) (7,057) –
Subordinated debt – interest rate risk
(6,010) (25,326) – – – –
Fair value hedges of interest rate and infl ation risk
The Bank uses eighteen interest rate swaps to hedge the interest rate risk of a pool of mortgage loans. The changes in fair value of these interest rate swaps substantially offset the changes in fair value of the mortgage loans, both in relation to changes of interest rates.
The Bank uses fourteen interest rate swaps to hedge the interest rate risk of a pool of current accounts. The changes in fair value of these interest rate swaps substantially offset the changes in fair value of the current accounts, both in relation to changes of interest rates.
The Bank uses fi ve interest rate swaps to hedge the interest rate risk of four fi xed rate bonds from the AFS portfolio. The changes in fair value of these interest rate and cross currency swaps substantially offset the changes in fair value of AFS portfolio bonds, both in relation to changes of interest rates.
The Bank also uses two asset swaps to hedge the infl ation risk and the interest rate risk of one infl ation bond held in the AFS portfolio (the bond and swaps were purchased together as a package transaction). The changes in fair value of these asset swaps substantially offset the changes in fair value of AFS portfolio bond, both in relation to changes of interest rates and infl ation reference index.
Furthermore, the Bank uses thirty six interest rate swaps to hedge the interest rate risk arising from the issuance of twenty three fi xed rate mortgage bonds. The changes in fair value of these interest rate swaps substantially offset the changes in fair value of the mortgage bonds, both in relation to changes of interest rates.
The Bank uses six interest rate swaps to hedge interest rate of six corporate loans. The changes in fair value of these interest rate swaps substantially offset the changes in fair value of the loans, both in relation to changes of interest rates.
The Bank uses three cross currency swaps to hedge interest rate of three corporate loans. The changes in fair value of these interest rate swaps substantially offset the changes in fair value of the loans, both in relation to changes of interest rates.
In 2017, the Bank recognised a net loss of € 11,801 thousand (2016: net gain of € 18,648 thousand) in rela-tion to the fair value hedging instruments above. The net gain on hedged items attributable to the hedged risks amounted to € 11,867 thousand (2016: net loss of € 18,419 thousand). Both items are disclosed within ‘Net trading result’.
During 2017, interest and similar income from hedged AFS securities in the amount of € 11,647 thousand (2016: € 19,046 thousand) was compensated by interest expense from interest rate swap and asset swap hedging instruments in the amount of € 4,921 thousand (2016: € 7,966 thousand).
In 2017, interest expense from the hedged mortgage bonds in the amount of € 10,345 thousand (2016: € 15,577 thousand) was compensated by interest income from the interest rate swap hedging instruments in the amount of € 8,472 thousand (2016: € 7,133 thousand).

225
Separate fi nancial statements
11. Available-for-sale fi nancial assets
€ ‘000 Share 2017 Share 2016 2017 2016
State bonds of EU countries 439,744 1,046,763
Bank bonds 72,467 236,197
Equity shares at fair value 8,140 6,959
Equity shares at cost:
S.W.I.F.T. 0.01% 0.01% 65 60
520,416 1,289,979
This table shows the reconciliation from opening balance to closing balance for recurring Level 3 of fair value (note 4):
€ ‘000 1 Jan 2017 Purchase Sale RevaluationExchange
differences 31 Dec 2017
Visa Inc. 4,932 – – 1,663 (286) 6,309
1 Jan 2016 Purchase Sale RevaluationExchange
differences 31 Dec 2016
Visa Europe LTD 14,690 – (14,690) – – –
Visa Inc. – 4,575 – 22 335 4,932
On 21 December 2015, Visa Europe LTD and Visa Inc. offi cially announced the plan to become a unique entity, through the sale of 100% of share capital of Visa Europe to Visa Inc. VUB Bank as a stakeholder had the right to take part in the distribution of value generated by the deal, so the fair value was adjusted equal to cash part of the up-front consideration in amount of € 14,690 thousand net of tax in 2016.
Following confi rmation on 3 June 2016 that the European Commission approved the proposed purchase of Visa Europe Limited by Visa Inc., the fair value of the closing transaction was evaluated consisting of three elements in the total amount of € 21,509 thousand. Apart from the cash consideration, the Bank will be receiving Visa Inc. preferred shares Series C and also a deferred cash payment that will be due after the third anniversary of the closing date of the transaction.

226
Separate fi nancial statements
12. Loans and advances to customers
31 December 2017€ ‘000
Amortised cost
Impairment losses
(note 13)Carrying amount
Sovereigns Municipalities 128,144 (97) 128,047
CorporateLarge Corporates 1,720,127 (5,677) 1,714,450Specialized Lending 748,099 (40,322) 707,777Small and Medium Enterprises (‘SME’) 1,298,428 (58,869) 1,239,559Other Financial Institutions 659,985 (1,386) 658,599Public Sector Entities 1,158 (3) 1,155Factoring 21,598 (370) 21,228
4,449,395 (106,627) 4,342,768
RetailSmall Business 243,051 (12,822) 230,229Consumer Loans 1,252,101 (85,587) 1,166,514Mortgages 5,341,959 (25,402) 5,316,557Credit Cards 203,609 (32,265) 171,344Overdrafts 101,710 (9,346) 92,364Flat Owners Associations 27,651 (358) 27,293Other 12,403 (1) 12,402
7,182,484 (165,781) 7,016,703
11,760,023 (272,505) 11,487,518
31 December 2016€ ‘000
Amortised cost
Impairment losses
(note 13)Carrying amount
SovereignsMunicipalities 131,760 (100) 131,660
CorporateLarge Corporates 1,501,159 (23,933) 1,477,226Specialized Lending 870,530 (34,299) 836,231Small and Medium Enterprises (‘SME’) 1,215,331 (52,782) 1,162,549Other Financial Institutions 511,348 (1,052) 510,296Public Sector Entities 1,200 (3) 1,197Factoring 18,327 (386) 17,941
4,117,895 (112,455) 4,005,440
RetailSmall Business 218,401 (15,326) 203,075Consumer Loans 1,210,008 (81,598) 1,128,410Mortgages 4,446,721 (30,683) 4,416,038Credit Cards 207,961 (31,150) 176,811Overdrafts 108,720 (11,502) 97,218Flat Owners Associations 24,536 (318) 24,218Other 5,617 (2) 5,615
6,221,964 (170,579) 6,051,385
10,471,619 (283,134) 10,188,485
At 31 December 2017, the 20 largest corporate customers represented a total balance of € 1,726,272 thou-sand (31 December 2016: € 1,634,636 thousand) or 14.68% (31 December 2016: 15.61%) of the gross loan portfolio.

227
Separate fi nancial statements
13. Impairment losses on assets
€ ‘000 Note1 Jan 2017
Creation(note 33)
Reversal(note 33)
Assetswritten-off/sold
(note 33) FX diff Other*31 Dec
2017
Due from banks 8 18 71 (16) – – – 73
Loans and advances to customers
12 283,134 247,076 (204,860) (43,991) (1,639) (7,215) 272,505
Subsidiaries, associates and JVs
15 37,914 – – – – – 37,914
Property and equipment
17 10,459 – (1,542) – – (8,917) –
Other assets 19 1,937 942 (887) – – – 1,992
333,462 248,089 (207,305) (43,991) (1,639) (16,132) 312,484
* ‘Other’ represents:– the interest portion (unwinding of interest);– the elimination of impairment losses to ‘Buildings and land’ due to application of revaluation model (note 17).
€ ‘000 Note1 Jan 2016
Creation(note 33)
Reversal (note 33)
Assetswritten-off/sold
(note 33) FX diff Other*31 Dec
2016
Due from banks 8 25 2 (30) – 21 – 18
Available-for-sale fi nancial assets
11 574 – – – – (574) –
Loans and advances to customers
12 274,954 179,853 (131,084) (33,207) 420 (7,802) 283,134
Subsidiaries, associates and JVs
15 37,914 – – – – – 37,914
Property and equipment
17 10,500 – (41) – – – 10,459
Other assets 19 1,148 2,096 (1,308) – 1 – 1,937
325,115 181,951 (132,463) (33,207) 442 (8,376) 333,462
* ‘ Other’ represents:– the interest portion (unwinding of interest);– sale of RVS, a. s.
Impairment loss recognised in 2017 for Loans and advances to customers was € 42,216 thousand (2016: € 48,769 thousand).

228
Separate fi nancial statements
14. Held-to-maturity investments
€ ‘000 2017 2016
State bonds 376,472 530,019
At 31 December 2017, bonds in the total nominal amount of € 362,147 thousand from the held-to-matu-rity portfolio were pledged by the Bank to secure collateralized transactions (31 December 2016: € 509,428 thousand).
15. Subsidiaries, associates and joint ventures
All entities are incorporated in the Slovak Republic.
31 December 2017€ ‘000 Share Cost
Impairment losses
(note 13)Carrying amount
Consumer Finance Holding, a. s. 100.00% 53,114 – 53,114
VÚB Leasing, a. s. 100.00% 44,410 (27,381) 17,029
VÚB Factoring, a.s. 100.00% 16,535 (10,533) 6,002
VÚB Generali d. s. s., a. s. 50.00% 16,597 – 16,597
Slovak Banking Credit Bureau, s. r. o. 33.33% 3 – 3
130,659 (37,914) 92,745
31 December 2016€ ‘000 Share (%) Cost
Impairment losses
(note 13)Carrying amount
Consumer Finance Holding, a. s. 100.00% 53,114 – 53,114
VÚB Leasing, a. s. 100.00% 44,410 (27,381) 17,029
VÚB Factoring, a. s. 100.00% 16,535 (10,533) 6,002
VÚB Generali d. s. s., a. s. 50.00% 16,597 – 16,597
Slovak Banking Credit Bureau, s. r. o. 33.33% 3 – 3
130,659 (37,914) 92,745
In December 2016, the Bank sold its stake in VÚB Asset Management, správ. spol., a. s. to the major share-holder Eurizon SA for cash of € 13,673 thousand. The intragroup reorganization goal was to achieve the separation and independence of asset management companies from distributors, in line both with the model adopted by Intesa Sanpaolo Group and with the indications of the supervisory authorities and the simplifi -cation of decision-making and governance processes. The disposal of the investment in VÚB Asset Manage-ment, správ. spol., a. s. resulted in a net gain of € 8,464 thousand, which has been accounted for directly to equity, on the basis of a transaction under common control.

229
Separate fi nancial statements
16. Intangible assets
€ ‘000 Software
Otherintangible
assetsAssets in progress Total
Cost
At 1 January 2017 209,768 10,276 19,887 239,931Additions 9 – 22,697 22,706Disposals (2,911) – – (2,911)Transfers 18,733 218 (18,951) –Exchange differences 29 6 – 35
At 31 December 2017 225,628 10,500 23,633 259,761
Accumulated amortisation
At 1 January 2017 (167,679) (9,190) – (176,869)Amortisation for the year (10,547) (345) – (10,892)Disposals 2,911 – – 2,911FX differences (26) (3) – (29)
At 31 December 2017 (175,341) (9,538) – (184,879)
Carrying amountAt 1 January 2017 42,089 1,086 19,887 63,062
At 31 December 2017 50,287 962 23,633 74,882
€ ‘000 Software
Otherintangible
assetsAssets in progress Total
Cost
At 1 January 2016 203,920 10,039 16,042 230,001Additions 107 – 17,037 17,144Disposals (7,107) – (107) (7,214)Transfers 12,849 236 (13,085) –Exchange differences (1) 1 – –
At 31 December 2016 209,768 10,276 19,887 239,931
Accumulated amortisation
At 1 January 2016 (162,103) (8,648) – (170,751)Amortisation for the year (12,683) (542) – (13,225)Disposals 7,107 – – 7,107
At 31 December 2016 (167,679) (9,190) – (176,869)
Carrying amountAt 1 January 2016 41,817 1,391 16,042 59,250At 31 December 2016 42,089 1,086 19,887 63,062
Assets in progress include mainly the costs for the technical appreciation of software and for the development of new software applications that have not yet been put in use.
At 31 December 2017, the gross book value of fully amortised intangible assets that are still used by the Bank amounted to € 138,033 thousand (31 December 2016: € 134,722 thousand).
At 31 December 2017, the amount of irrevocable contractual commitments for the acquisition of intangible assets was € 1,833 thousand (31 December 2016: € 2,191 thousand).

230
Separate fi nancial statements
17. Property and equipment
€ ‘000 NoteBuildingsand land Equipment
Other tangibles
Assetsin progress Total
Cost or fair value
At 1 January 2017 200,093 64,668 29,396 3,308 297,465
Additions – – – 3,950 3,950
Disposals (3,231) (6,863) (1,065) – (11,159)
Transfers 1,014 2,216 596 (3,826) –
FX differences 6 5 4 – 15
Revaluation 27,468 – – – 27,468
Other* (122,733) – – – (122,733)
At 31 December 2017 102,617 60,026 28,931 3,432 195,006
Accumulated depreciation
At 1 January 2017 (110,699) (59,376) (28,529) – (198,604)
Depreciation for the year (5,664) (3,146) (361) – (9,171)
Disposals 2,553 6,823 1,103 – 10,479
FX differences (6) (4) (4) – (14)
Other* 113,816 – – – 113,816
At 31 December 2017 – (55,703) (27,791) – (83,494)
Impairment losses 13
At 1 January 2017 (10,459) – – – (10,459)
Release 1,542 – – – 1,542
Other* 8,917 – – – 8,917
At 31 December 2017 – – – – –
Carrying amount
At 1 January 2017 78,935 5,292 867 3,308 88,402
At 31 December 2017 102,617 4,323 1,140 3,432 111,512
* ‘Other’ represents elimination of the accumulated depreciation and impairment losses to ‘Buildings and land’ due to application of revaluation model.

231
Separate fi nancial statements
€ ‘000 NoteBuildingsand land Equipment
Other tangibles
Assetsin progress Total
Cost
At 1 January 2016 200,355 64,345 29,917 2,762 297,379
Additions 7 – – 5,096 5,103
Disposals (2,646) (1,595) (776) – (5,017)
Transfers 2,377 1,918 255 (4,550) –
At 31 December 2016 200,093 64,668 29,396 3,308 297,465
Accumulated depreciation
At 1 January 2016 (107,070) (57,526) (28,955) – (193,551)
Depreciation for the year (5,810) (3,441) (348) – (9,599)
Disposals 2,181 1,591 774 – 4,546
At 31 December 2016 (110,699) (59,376) (28,529) – (198,604)
Impairment losses 13
At 1 January 2016 (10,500) – – – (10,500)
Release 41 – – – 41
At 31 December 2016 (10,459) – – – (10,459)
Carrying amount
At 1 January 2016 82,785 6,819 962 2,762 93,328
At 31 December 2016 78,935 5,292 867 3,308 88,402
In 2017 the Bank reviewed the carrying amount of its buildings. An impairment test was carried out to determine the recoverable amount of these assets which was based on the fair value less costs to sell. As a result of the impairment test the Bank recognized an impairment loss in total amount of € 8,917 thousand as at 31 December 2017 (31 December 2016: € 10,459 thousand).
At 31 December 2017, the Bank changed the accounting policy for buildings and land, before evaluated from the cost to the revaluation model for subsequent measurement.. Management determined that these constitute one class of asset, based on the nature, characteristics and risks. The Bank used income method, using market rents and yields as key inputs. Fair values are based on valuations performed by an accredited independent valuer. The revaluation model aligned the book value to the current market value. Level 3 revaluation was recognised due to signifi cant unobservable estimated valuation inputs.
The carrying amount of the assets subject to the revaluation model at 31 December 2017 would have been € 73,628 thousand, should the assets be carried under the cost model.
The impact of the revaluation model on equity is positive in total amount of € 21,700 thousand and positive on income statement in amount of € 1,521 thousand due to release of previously booked impairment.
At 31 December 2017, the gross book value of fully depreciated tangible assets that are still used by the Bank amounted to € 92,881 thousand (31 December 2016: € 92,506 thousand).

232
Separate fi nancial statements
There are no restrictions on title and no ‘Property and equipment’ is pledged as security for liabilities.
The Bank’s insurance covers all standard risks to tangible and intangible assets (theft, robbery, natural hazards, vandalism and other damages).
18. Current and deferred income taxes
€ ‘000 2017 2016
Current income tax assets 5,813 –
€ ‘000 2017 2016
Deferred income tax assets 38,626 47,544
€ ‘000 2017 2016
Current income tax liabilities – 3,176
Deferred income taxes are calculated on all temporary differences using a tax rate of 21% (31 December 2016: 21%) as follows:
€ ‘000 2017
Profi t/(loss)
(note 34) Equity 2016
Due from banks 16 12 – 4
Derivative fi nancial instruments designated as cash fl ow hedges
(143) – (366) 223
Available-for-sale fi nancial assets (1,181) – (102) (1,079)
Loans and advances to customers 42,016 (3,671) – 45,687
Property and equipment (9,776) 135 (5,768) (4,143)
Provisions 194 99 – 95
Other liabilities 8,854 2,079 – 6,775
Other (1,354) (1,336) – (18)
Deferred income tax assets 38,626 (2,682) (6,236) 47,544
19. Other assets
€ ‘000 Note 2017 2016
Operating receivables and advances 13,856 12,862
Prepayments and accrued income 6,046 6,980
Other tax receivables 1,200 1,271
Inventories 731 831
Settlement of operations with fi nancial instruments 7 7
21,840 21,951
Impairment losses 13 (1,992) (1,937)
19,848 20,014

233
Separate fi nancial statements
20. Due to central and other banks
€ ‘000 2017 2016
Due to central banks Current accounts 1,147 993Loans received from central banks 248,874 149,791
250,021 150,784
Due to other banksCurrent accounts 37,991 22,699Term deposits 16,137 109,909Loans received from other banks 134,037 170,344Cash collateral received 11,629 20,835
199,794 323,787
449,815 474,571
At 31 December 2017, ‘Loans received from central banks’ contains three loans from National Bank of Slovakia in the nominal amount of € 100,000 thousand, € 100,000 thousand and € 50,000 thousand (31 December 2016: two loans in the nominal amount of € 100,000 thousand and € 50,000 thousand). The interest rate for all loans is - 0.4% (31 December 2016: - 0.4%) and the maturity is in 2020 and 2021 (31 December 2016: in 2020). The principal and interests are due at maturity of loans.
The breakdown of ‘Loans received from other banks’ according to the counterparty is presented below:
€ ‘000 2017 2016
European Investment Bank 101,493 130,902European Bank for Reconstruction and Development 21,898 24,596Council of Europe Development Bank 10,646 14,846
134,037 170,344
European Investment Bank
Loans from the European Investment Bank were provided to fund development of SME, large sized companies and infrastructure projects. At 31 December 2017, the balance comprised of seven loans in the nominal amount of € 50,000 thousand, € 20,000 thousand, € 13,125 thousand, € 9,141 thousand, € 6,429 thousand, € 2,159 thousand and € 625 thousand (31 December 2016: seven loans in the nominal amount of € 50,000 thou-sand, € 23,333 thousand, € 17,500 thousand, € 16,250 thousand, € 14,063 thousand, € 7,857 thousand and € 1,875 thousand) with interest rates between 0.00% and 1.73% (31 December 2016: -0.004% - 1.73%) and with maturity between 2018 and 2028 (31 December 2016: 2018 – 2028). The principal of the loans is payable on an annual or semi-annual basis and the interest is payable semi-annually or quarterly, depending on the periodicity agreed in the individual loan contracts.
European Bank for Reconstruction and Development
Loans received from the European Bank for Reconstruction and Development represented funds granted to support the energy savings in large corporations. At 31 December 2017, there were fi ve loan arrangements concluded in the nominal amount of € 5,000 thousand, € 5,000 thousand, € 5,000 thousand, € 3,571 thou-sand and € 3,285 thousand (31 December 2016: four loan arrangements in the nominal amount of € 9,545 thousand, € 5,000 thousand, € 5,000 thousand and € 5,000 thousand). The maturity of the loans is between 2020 and 2023 (31 December 2016: 2020 – 2023). At 31 December 2017 the interest rates are in the range between 0.35% and 1.63% (31 December 2016: 0.55% - 1.69%). The frequency of the repayment of both the interest and the principal is semi-annual.
Council of Europe Development Bank
At 31 December 2017, loans from the Council of Europe Development Bank comprised of four loans in the nominal amount of € 3,333 thousand, € 3,000 thousand, € 3,000 thousand and € 1,311 thousand (31 December 2016: fi ve loans in the nominal amount of € 4,500 thousand, € 4,000 thousand, € 4,000 thou-sand, € 1,748 thousand and € 596 thousand). The purpose of these loans is to fund SME projects and devel-

234
Separate fi nancial statements
opment of municipalities in the Slovak republic. The interest rates of these loans are linked to 3M Euribor and are between 0.14% and 0.31% at 31 December 2017 (31 December 2016: 0.15% - 0.31%). The maturity of the individual loans is between 2019 and 2022 (31 December 2016: 2017 – 2020). The interest is payable quarterly and the principal is payable on an annual basis.
21. Due to customers
€ ‘000 2017 2016
Current accounts 6,410,272 5,949,332Term deposits 2,576,930 2,641,739Government and municipal deposits 513,664 573,527Savings accounts 238,263 226,951Other deposits 116,304 103,372
9,855,433 9,494,921
22. Subordinated debt and Debt securities in issue
Subordinated debt
At 31 December 2017 and 31 December 2016, the subordinated debt recognized by the Bank was as follows:
€ ‘000 2017 2016
Subordinated debt 200,164 200,165
At 31 December 2017, the balance of subordinated debt comprised of one 3M euribor +margin ten-year loan drawn on 22 December 2016, in the nominal amount of € 200,000 thousand (31 December 2016: € 200,000 thousand) from Intesa Sanpaolo Holding International S.A. In accordance with the loan agreement, the loan as an unsecured obligation, can be used for the settlement of the debts of the Bank and shall not be repaid prior to repayment of all claims of the Bank’s non-subordinated creditors.
Debt securities in issue
€ ‘000 2017 2016
Bonds – 47
Mortgage bonds 262,037 597,377Mortgage bonds subject to cash fl ow hedges 281,063 281,120Mortgage bonds subject to fair value hedges 1,696,454 808,674
2,239,554 1,687,171
Revaluation of fair value hedged mortgage bonds 8,465 28,022Amortisation of revaluation related to terminated fair value hedges 4,361 68
2,252,380 1,715,308
The repayment of mortgage bonds is funded by the mortgage loans provided to customers of the Bank (see also note 12).
The disclosure of changes arising from cash fl ows and non-cash changes in liabilities arising from fi nancing activities:
Non-cash changes
€ ‘000 1 Jan 2017 Cash fl ow Accruals
Re-valuation of hedged mortgage
bonds
Un-realised exchange
dif-ferences Other31 Dec
2017
Subordinated debt 200,165 – (1) – – – 200,164Mortgage bonds 1,715,308 563,845 (1,754) (19,557) (5,415) (47) 2,252,380

235
Separate fi nancial statements
NameInterest rate (%) CCY
Number of mortgage
bonds issued at
31 Dec 2017
Nominal value
in CCY per piece Issue date
Maturitydate
2017€ ‘000
2016€ ‘000
Mortgage bonds VÚB, a. s. XX. 4.300 EUR 50 331,939 9.3.2006 9.3.2021 17,176 17,176
Mortgage bonds VÚB, a. s. XXX. 5.000 EUR 1,000 33,194 5.9.2007 5.9.2032 33,457 33,438
Mortgage bonds VÚB, a. s. 31. 4.900 EUR 600 33,194 29.11.2007 29.11.2037 19,724 19,710
Mortgage bonds VÚB, a. s. 32. 1.870 CZK – 1,000,000 17.12.2007 17.12.2017 – 29,976
Mortgage bonds VÚB, a. s. 36. 4.750 EUR 560 33,194 31.3.2008 31.3.2020 19,140 19,091
Mortgage bonds VÚB, a. s. 43. 5.100 EUR 500 33,194 26.9.2008 26.9.2025 16,067 15,970
Mortgage bonds VÚB, a. s. 53. 0.400 EUR – 1,000,000 8.4.2010 8.4.2017 – 100,096
Mortgage bonds VÚB, a. s. 57. 1.037 EUR 100 1,000,000 30.9.2010 30.9.2018 100,262 100,280
Mortgage bonds VÚB, a. s. 58. 1.529 EUR 80 1,000,000 10.12.2010 10.12.2019 80,071 80,074
Mortgage bonds VÚB, a. s. 62. 1.718 EUR 100 1,000,000 28.7.2011 28.7.2018 100,730 100,766
Mortgage bonds VÚB, a. s. 67. 5.350 EUR 300 50,000 29.11.2011 29.11.2030 15,071 15,071
Mortgage bonds VÚB, a. s. 70. 3.750 EUR – 100,000 7.3.2012 7.3.2017 – 41,221
Mortgage bonds VÚB, a. s. 71. 3.900 EUR – 20,000 2.5.2012 2.5.2017 – 15,127
Mortgage bonds VÚB, a. s. 72. 4.700 EUR 250 100,000 21.6.2012 21.6.2027 25,463 25,446
Mortgage bonds VÚB, a. s. 73. 4.200 EUR 500 100,000 11.7.2012 11.7.2022 50,795 50,752
Mortgage bonds VÚB, a. s. 74. 3.350 EUR 700 100,000 16.1.2013 15.12.2023 71,967 71,921
Mortgage bonds VÚB, a. s. 75. 2.000 EUR 300 100,000 5.4.2013 5.4.2019 30,456 30,466
Mortgage bonds VÚB, a. s. 76. 2.400 EUR 309 10,000 22.4.2013 22.4.2018 3,141 3,142
Mortgage bonds VÚB, a. s. 77. 1.800 CZK 5,000 100,000 20.6.2013 20.6.2018 19,759 18,655
Mortgage bonds VÚB, a. s. 78. 2.160 EUR 905 10,000 3.3.2014 3.3.2020 9,227 9,234
Mortgage bonds VÚB, a. s. 79. 2.000 EUR 10,000 1,000 24.3.2014 24.9.2020 10,154 10,154
Mortgage bonds VÚB, a. s. 80. 1.850 EUR 31 1,000,000 27.3.2014 27.3.2021 31,704 31,786
Mortgage bonds VÚB, a. s. 81. 2.550 EUR 38 1,000,000 27.3.2014 27.3.2024 39,556 39,687
Mortgage bonds VÚB, a. s. 82. 1.650 EUR 1,701 1,000 16.6.2014 16.12.2020 1,716 1,716
Mortgage bonds VÚB, a. s. 83. 0.900 EUR 500 100,000 28.7.2014 28.7.2019 50,088 50,023
Mortgage bonds VÚB, a. s. 84. 0.600 EUR 500 100,000 29.9.2014 30.9.2019 49,996 49,949
Mortgage bonds VÚB, a. s. 85. 2.250 EUR 500 100,000 14.11.2014 14.11.2029 49,581 49,533
(Table continues on the next page)

236
Separate fi nancial statements
NameInterest rate (%) CCY
Number of mortgage
bonds issued at
31 Dec 2017
Nominal value
in CCYper piece Issue date
Maturitydate
2017€ ‘000
2016€ ‘000
Mortgage bonds VÚB, a. s. 86. 0.300 EUR 1,000 100,000 27.4.2015 27.4.2020 99,135 98,620
Mortgage bonds VÚB, a. s. 87. 1.250 EUR 1,000 100,000 9.6.2015 9.6.2025 97,916 97,545
Mortgage bonds VÚB, a. s. 88. 0.500 EUR 965 100,000 11.9.2015 11.9.2020 96,733 96,822
Mortgage bonds VÚB, a. s. 89. 1.200 EUR 1,000 100,000 29.9.2015 29.9.2025 99,338 99,213
Mortgage bonds VÚB, a. s. 90. 1.600 EUR 1,000 100,000 29.10.2015 29.10.2030 98,011 97,831
Mortgage bonds VÚB, a. s. 91. 0.600 EUR 1,000 100,000 21.3.2016 21.3.2023 99,972 99,878
Mortgage bonds VÚB, a. s. 92. 1.700 USD 700 100,000 27.6.2016 27.6.2019 58,779 66,802
Mortgage bonds VÚB, a. s. 93. 0.500 EUR 2,500 100,000 18.1.2017 18.1.2024 248,139 –
Mortgage bonds VÚB, a. s. 94. 1.050 EUR 2,500 100,000 27.4.2017 27.4.2027 247,830 –
Mortgage bonds VÚB, a. s. 95. 0.375 EUR 2,500 100,000 26.9.2017 26.9.2022 248,401 –
2,239,555 1,687,171

237
Separate fi nancial statements
23. Provisions
€ ‘000 2017 2016
Litigation 6,331 25,465
Restructuring provision 924 452
Other provisions 47 35
7,302 25,952
The movements in provisions were as follows:
€ ‘000 Note 1 Jan 2017 Creation Reversal Use 31 Dec 2017
Litigation 26, 32 25,465 362 (19,398) (98) 6,331
Restructuring provision 31 452 710 – (238) 924
Other provisions 32 35 12 – – 47
25,952 1,084 (19,398) (336) 7,302
€ ‘000 Note 1 Jan 2016 Creation Reversal Use 31 Dec 2016
Litigation 26, 32 25,069 1,241 (8) (837) 25,465
Restructuring provision 31 180 450 – (178) 452
Other provisions 32 17 18 – – 35
25,266 1,709 (8) (1,015) 25,952
24. Other liabilities
€ ‘000 2017 2016
Various creditors 37,839 31,699
Settlement with employees 26,527 23,007
Financial guarantees and commitments 19,781 20,552
Severance and Jubilee benefi ts 4,691 3,834
Accruals and deferred income 2,684 2,362
VAT payable and other tax payables 1,681 1,843
Settlement with shareholders 1,508 1,480
Share remuneration scheme 850 474
Investment certifi cates 449 471
Settlement with securities 25 6
96,035 85,728
At 31 December 2017 and 31 December 2016 there were no overdue balances within ‘Other liabilities’.

238
Separate fi nancial statements
Severance and Jubilee benefi ts are discounted to determine its present value. The discount rate is determined by reference to current rates of return on Slovak government bonds with a 15 years duration that represents the period which is closest to the average benefi t duration. The calculation is performed using the p rojected unit credit method. All employees of the Bank are covered by the retirement and jubilee employee benefi ts program.
The calculation for the respective program takes into account the following parameters:
2017 2016
Jubileebenefi ts
Retirementbenefi ts
Jubileebenefi ts
Retirementbenefi ts
Discount rate -0.35% 0.94% 0.00% 1.33%
Growth of wages in 2018/2017* – 3.50% – 1.00%
Future growth of wages after 2019/2018* – 3.50% – 1.00%
Fluctuation of employees (based on age) 5.7% – 36.8% 5.7% – 36.8% 5% – 43% 5% – 43%
Retirement age Based on valid legislation Based on valid legislation
Mortality Based on mortality tables issued by the Statistical Offi ce of the Slovak Republic
Based on mortality tables issued by the Statistical Offi ce of the Slovak Republic
* Growth of wages and Future growth of wages is not part of calculation for Jubilee benefi ts.
The movements in Financial guarantees and commitments, Severance and Jubilee benefi ts were as follows:
€ ‘000 Note 1 Jan 2017Creation/(Reversal) FX diff 31 Dec 2017
Financial guarantees and commitments 33 20,552 (1,391) 620 19,781
Severance and Jubilee benefi ts 31 3,834 857 – 4,691
24,386 (534) 620 24,472
€ ‘000 Note 1 Jan 2016Creation/(Reversal) FX diff 31 Dec 2016
Financial guarantees and commitments 33 21,476 (902) (22) 20,552
Severance and Jubilee benefi ts 31 3,343 491 – 3,834
24,819 (411) (22) 24,386
The movements in social fund liability presented within Settlement with employees were as follows:
€ ‘000 1 Jan 2017Creation(note 31) Use 31 Dec 2017
Social fund 670 1,395 (1,471) 594
€ ‘000 1 Jan 2016Creation(note 31) Use 31 Dec 2016
Social fund 735 1,345 (1,410) 670

239
Separate fi nancial statements
25. Equity
€ ‘000 2017 2016
Share capital – authorised, issued and fully paid:
89 ordinary shares of € 3,319,391.89 each, not traded 295,426 295,426
4,078,108 ordinary shares of € 33.2 each, publicly traded 135,393 135,393
430,819 430,819
Share premium 13,719 13,719
Reserves 114,383 90,710
Retained earnings (excluding net profi t for the year) 837,038 643,755
1,395,959 1,179,003
In accordance with the law and statutes of the Bank, the Bank is obliged to contribute at least 10% of its annual net profi t to the ‘Legal reserve fund’ until it reaches 20% of the share capital. Usage of the ‘Legal reserve fund’ is restricted by the law and the fund can be used for the coverage of the losses of the Bank.
2017 2016
Net profi t for the year attributable to shareholders in € ‘000 160,021 265,171
Divided by the weighted average number of ordinary shares, calculated as follows:
89 shares of € 3,319,391.89 each in € 295,425,878 295,425,878
4,078,108 shares of € 33.2 each in € 135,393,186 135,393,186
430,819,064 430,819,064
Divided by the value of one ordinary share of € 33.2
The weighted average number of ordinary shares of € 33.2 each 12,976,478 12,976,478
Basic and diluted earnings per € 33.2 share in € 12.33 20.43
The principal rights attached to shares are to take part in and vote at the general meeting of shareholders and to receive dividends.
The structure of shareholders is as follows:
€ ‘000 2017 2016
Intesa Sanpaolo Holding International S. A. 97.03% 97.03%
Domestic shareholders 2.08% 2.17%
Foreign shareholders 0.89% 0.80%
100.00% 100.00%
The primary objectives of the Bank’s capital management are to ensure that the Bank complies with externally imposed capital requirements and that the Bank maintains strong credit ratings and healthy capital ratios in order to support its business and to maximise shareholders’ value.
The Bank manages its capital structure and makes adjustments to it in the light of changes in economic condi-tions and the risk characteristics of its activities. In order to maintain or adjust the capital structure, the Bank may adjust the amount of dividend payment to shareholders, return capital to shareholders or issue capital securities. No changes have yet been made in the objectives, policies and processes from the previous years.

240
Separate fi nancial statements
The Bank’s regulatory capital position at 31 December 2017 and 31 December 2016 was determined based on the rules for capital adequacy calculation set by the CRR regulation:
€ ‘000 2017 2016
Tier 1 capital
Share capital 430,819 430,819
Share premium 13,719 13,719
Retained earnings without net profi t for the year 837,038 643,755
Other reserves 87,493 87,493
Accumulated other comprehensive income 25,575 2,120
Fair value gains and losses arising from the Bank’s own credit risk related to derivative liabilities
531 (531)
Less goodwill and intangible assets (74,882) (63,064)
Less IRB shortfall of credit risk adjustments to expected losses (11)
1,320,293 1,114,300
Tier 2 capital
IRB excess of provisions over expected losses eligible 10,736 7,855
Subordinated debt 200,000 200,000
210,736 207,855
Total regulatory capital 1,531,029 1,322,155
€ ‘000 2017 2016
Tier 1 capital 1,320,293 1,114,300
Tier 2 capital 210,736 207,855
Total regulatory capital 1,531,029 1,322,155
Total Risk Weighted Assets 8,278,248 8,141,145
Tier 1 capital ratio 15.95% 13.69%
Total capital ratio 18.49% 16.24%
Regulatory capital consists of Tier 1 capital, which comprises share capital, share premium, retained earnings without profi t for the current year, foreign currency translation and reserves. Certain adjustments are made to IFRS-based results and reserves, as prescribed by the CRR regulation. The other component of regulatory capital is Tier 2 capital, which includes subordinated long term debt, preference shares and IRB excess of provisions over expected losses.
Own Funds, risk-weighted assets and the capital ratios as at 31 December 2017 were calculated according to the harmonised rules and regulations for banks and investment companies contained in Directive 2013/36/EU (‘CRD IV’) and in (EU) Regulation 575/2013 (‘CRR’) of 26 June 2013, which transpose the banking supervision standards defi ned by the Basel Committee (the Basel 3 Framework) to European Union laws.
Following the Supervisory Review and Evaluation Process (‘SREP’), the ECB annually makes a fi nal decision on the capital requirement that VÚB must comply with on consolidated level. Starting from 1 January 2017, the overall capital requirement the Bank has to meet in terms of Common Equity Tier 1 ratio is 10.25%. This is the result of: a) the SREP requirement comprising a minimum Pillar 1 capital requirement of 4.5% and an additional Pillar 2 capital requirement of 1.25%, entirely of Common Equity Tier 1 ratio; b) additional require-ments, made up entirely of Common Equity Tier 1 ratio, relating to a Capital Conservation Buffer of 2.5%, and an O-SII Buffer (Other Systemically Important Institutions Buffer) of 1% and SRB (Systemic Risk Buffer) of 1%.

241
Separate fi nancial statements
For the sake of completeness, please note that Directive 2013/36/EU (‘CRD IV’) establishes the obligation for the designated national authorities to activate an operational framework for the defi nition of the ratio of the countercyclical capital buffer (‘CCyB’) starting from 1 January 2016. The ratio is subject to review on a quarterly basis. The European regulation was implemented in Slovakia by National Bank of Slovakia in relevant regulation, which contains suitable regulations concerning CCyB. Based on the analysis of the reference indi-cators, the National Bank of Slovakia decided to set the countercyclical ratio (relating to the exposures towards Slovak counterparties) for period starting 1.8.2017 at 0.5% (bringing the total CET1 capital requirement to 10.75%).
The Overall Capital Requirement (OCR) was as of 1 January 2017 set at 13.75% (14.25% from 1.8.2018).
Since November 2014, the Bank has been under the supervision of the European Central Bank.
26. Financial commitments and contingencies
€ ‘000 2017 2016
Issued guarantees 783,667 764,156
Commitments and undrawn credit facilities 2,858,458 3,020,958
3,642,125 3,785,114
(a) Issued guarantees
Commitments from guarantees represent irrevocable assurances that the Bank will make payments in the event that a borrower cannot meet its obligations to third parties. These assurances carry the same credit risk as loans and therefore the Bank books liabilities against these instruments on a similar basis as is applicable to loans.
(b) Commitments and undrawn credit facilities
The primary purpose of commitments to extend credit is to ensure that funds are available to the customer as required. Commitments to extend credit issued by the Bank represent undrawn portions of commitments and approved overdraft loans.
(c) Lease obligations
The Bank enters into operating lease agreements for branch facilities and cars. The total value of future payments arising from non-cancellable operating leasing contracts at 31 December 2017 and 31 December 2016 was as follows:
€ ‘000 2017 2016
Up to 1 year 741 696
1 to 5 years 1,224 450
1,965 1,146
(d) Legal proceedings
In the normal course of business, the Bank is subject to a variety of legal actions. The Bank conducted a review of legal proceedings outstanding against it as of 31 December 2017. Pursuant to this review, management has recorded total provisions of € 6,331 thousand (31 December 2016: € 25,465 thousand) in respect of such legal proceedings (see also note 23). The Bank will continue to defend its position in respect of each of these legal proceedings. In addition to the legal proceedings covered by provisions, there are contingent liabilities arising from legal proceedings in the total amount of € 27,909 thousand, as at 31 December 2017 (31 December 2016: € 6,634 thousand). This amount represents existing legal proceedings against the Bank that will most probably not result in any payments due by the Bank.
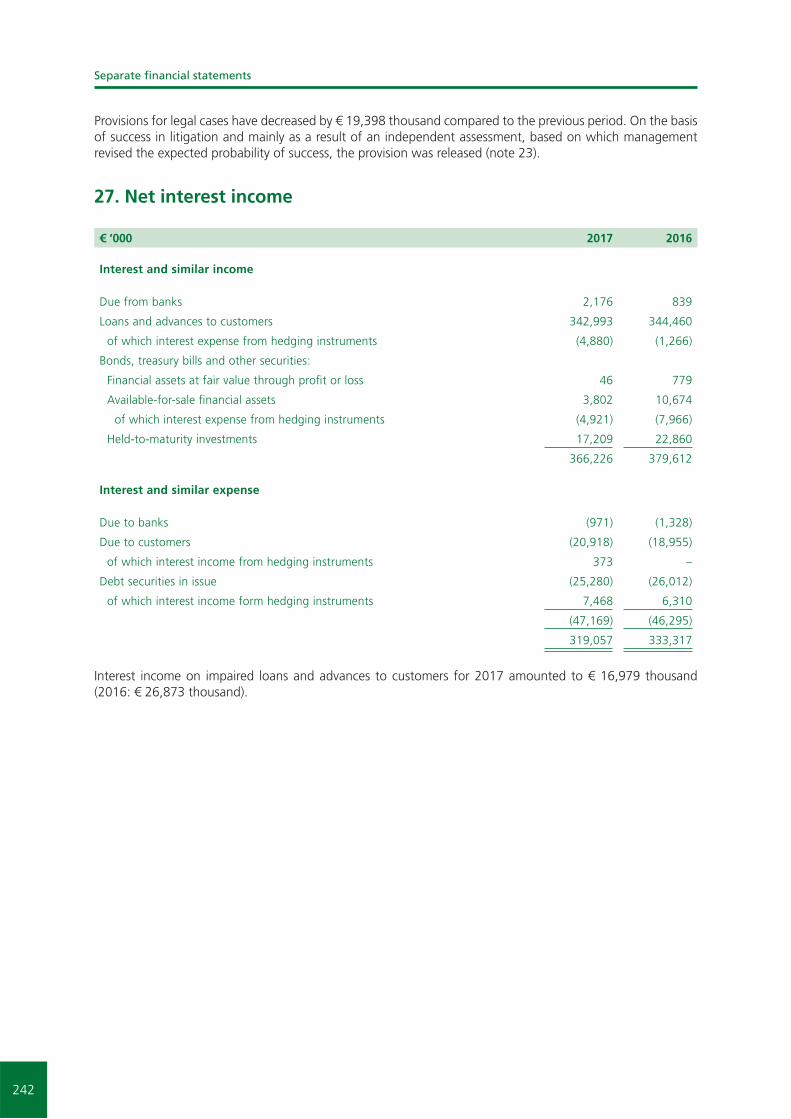
242
Separate fi nancial statements
Provisions for legal cases have decreased by € 19,398 thousand compared to the previous period. On the basis of success in litigation and mainly as a result of an independent assessment, based on which management revised the expected probability of success, the provision was released (note 23).
27. Net interest income
€ ‘000 2017 2016
Interest and similar income
Due from banks 2,176 839
Loans and advances to customers 342,993 344,460
of which interest expense from hedging instruments (4,880) (1,266)
Bonds, treasury bills and other securities:
Financial assets at fair value through profi t or loss 46 779
Available-for-sale fi nancial assets 3,802 10,674
of which interest expense from hedging instruments (4,921) (7,966)
Held-to-maturity investments 17,209 22,860
366,226 379,612
Interest and similar expense
Due to banks (971) (1,328)
Due to customers (20,918) (18,955)
of which interest income from hedging instruments 373 –
Debt securities in issue (25,280) (26,012)
of which interest income form hedging instruments 7,468 6,310
(47,169) (46,295)
319,057 333,317
Interest income on impaired loans and advances to customers for 2017 amounted to € 16,979 thousand (2016: € 26,873 thousand).

243
Separate fi nancial statements
28. Net fee and commission income
€ ‘000 2017 2016
Fee and commission income
Received from banks 8,154 6,109
Received from customers:
Current accounts 57,925 55,024
Loans and guarantees 25,902 29,008
Transactions and payments 22,883 20,950
Securities 12,434 9,877
Insurance mediation 12,110 12,586
Overdrafts 3,319 4,874
Securities – Custody fee 2,408 1,861
Term deposits 159 285
Other 3,320 3,630
148,614 144,204
Fee and commission expense
Paid to banks (14,473) (14,036)
Paid to mediators:
Credit cards (30,239) (38,707)
Services (2,818) (4,219)
Securities (965) (636)
Other (472) (451)
(48,967) (58,049)
99,647 86,155
29. Net trading result
€ ‘000 2017 2016
Foreign currency derivatives and transactions 10,377 13,228
Customer FX margins 6,361 5,587
Interest rate derivatives* (10,932) 16,825
Cross currency swaps* 17,734 (9,411)
Equity derivatives (9) 16
Other derivatives (4) 15
Dividends from equity shares held in FVTPL portfolio 212 163
Securities:
Financial assets at fair value through profi t or loss:
Held for trading (165) 1,042
Designated at fair value through profi t or loss on initial recognition 83 (3)
Available-for-sale fi nancial assets* 770 27,096
Held-to-maturity investments 1,208 –
Debt securities in issue* 14,720 (15,763)
40,355 38,795
* Includes the revaluation of fi nancial instruments that are part of the hedging relationship, i.e. fair value hedges of interest rate and infl ation risk (see also note 10).

244
Separate fi nancial statements
30. Other operating income and Dividend income
Other operating income
€ ‘000 2017 2016
Services 3,224 1,285
Rent 825 871
Financial revenues 554 353
Net profi t from sale of fi xed assets 542 403
Other 843 229
5,988 3,141
Dividend income
€ ‘000 2017 2016
Dividend income 2,000 133,961
Dividend income in 2016 contains dividend from Consumer Finance Holding, a. s. in amount of € 128,000 received on 21 December 2016. The dividend was paid from retained earnings.
31. Salaries and employee benefi ts
€ ‘000 Note 2017 2016
Remuneration (77,888) (75,926)
Social security costs (30,301) (27,904)
Social fund 24 (1,395) (1,345)
Severance and Jubilee benefi ts 24 (857) (491)
Restructuring provision 23 (472) (272)
(110,913) (105,938)
At 31 December 2017, the total number of employees of the Bank was 3,329 (31 December 2016: 3,454). The average number of employees of the Bank during the period ended 31 December 2017 was 3,331 (31 December 2016: 3,432).
The Bank does not have any pension arrangements separate from the pension system established by law, which requires mandatory contributions of a certain percentage of gross salaries to the State owned social insurance and privately owned pension funds. These contributions are recognised in the period when salaries are earned by employees. No further liabilities are arising to the Bank from the payment of pensions to employees in the future.

245
Separate fi nancial statements
32. Other operating expenses and Special levy of selected fi nancial institutions
€ ‘000 Note 2017 2016
IT systems maintenance (21,914) (18,888)
Property related expenses (16,525) (16,365)
Post and telecom (9,042) (10,136)
Advertising and marketing (6,640) (7,024)
Equipment related expenses (4,802) (4,479)
Resolution fund* (4,489) (5,438)
Stationery (3,484) (4,352)
Third parties’ services (2,887) (2,030)
Security (2,746) (2,845)
Professional services (2,405) (1,144)
Insurance (1,048) (1,137)
Training (696) (1,135)
Travelling (694) (748)
Audit ** (560) (562)
Transport (527) (597)
Contribution to the Deposit Protection Fund *** (488) (1,486)
VAT and other taxes (253) (251)
Litigations paid (38) (1,083)
Provisions for litigation 23, 26 19,134 (396)
Other provisions 23 (12) (18)
Other operating expenses (9,898) (5,876)
(70,014) (85,990)
* Starting from 1 January 2015 the new Bank Recovery and Resolution Directive 2014/59/EU (‘BRRD’) is effective for all EU member states. The Directive was implemented to Slovak legislation by Act No. 371/2014 on Resolution. The Directive sets an obligation for the banks of the member states participating to the Banking Union to pay an annual contribution depending on the size and the risk profi le of the bank to the National Resolution Fund in 2015 and to the Single Resolution Fund from 2016 up to the 2023.
** The fee for the statutory audit was € 207 thousand (31 December 2016: € 207 thousand). Other audit-related assurance services and non-audit services performed by the statutory auditor related to audit and review of the group reporting and to audit of the Bank’s prudential returns, preparation of the long form report as required by the Act on Banks, audit procedures on capital adequacy, agreed-upon procedures on the Bank’s compliance with the covenants of the loan agreement between the Bank and the European Bank for Reconstruction and Development, agreed upon procedure on compliance with articles 71h- 71k of the Act No. 566/2001 Coll on securities, audit of receivables towards a client of the bank for bankruptcy procedure purposes and agreed-upon procedures on the merger of a Bank’s subsidiary with the Bank. These fees amounted to € 296 thousand (31 December 2016: € 274 thousand). Other audit not conducted by statutory auditor in the amount of € 57 thousand (31 December 2016: € 81 thousand).
*** The annual contribution for 2017 was determined by the Deposit Protection Fund under the valid methodology. As at 31 December 2017, the Bank expensed the full amount of such contribution. The quarterly contribution to the Deposit Protection Fund for 2017 was set at 0.0075% p. q. of the amount of protected deposits.
At 31 December 2017 and 31 December 2016, the special levy recognized by the Bank was as follows:
€ ‘000 2017 2016
Special levy of selected fi nancial institutions (24,823) (22,143)

246
Separate fi nancial statements
Commencing 1 January 2012, banks operating in the Slovak Republic are subject to a special levy of selected fi nancial institutions, originally set to 0.4% p. a. of selected liabilities with the extension of the basis for calcu-lation by deposits subject to a protection based on the special regulation from 1 September 2012. The levy is recognized in the statement of profi t or loss and other comprehensive income on an accrual basis and is payable at the beginning of each quarter.
As at 25 July 2014, the total amount of the levy paid by the fi nancial institutions subject to levy exceeded the threshold of € 500,000 thousand and therefore, based on the amendment to the Act on the Special levy of selected fi nancial institutions effective from 2015, the levy rate has been decreased to 0.2% p.a.
33. Impairment losses
€ ‘000 Note 2017 2016
Creation of impairment losses 13 (248,089) (181,951)
Reversal of impairment losses 13 207,305 132,463
Net creation of impairment losses (40,784) (49,488)
Creation of liabilities – fi nancial guarantees and commitments (38,134) (32,961)
Reversal of liabilities – fi nancial guarantees and commitments 39,525 33,863
Net reversal of liabilities – fi nancial guarantees and commitments 24 1,391 902
Nominal value of assets written-off/sold (57,970) (59,192)
Release of impairment losses to assets written-off/sold 13 43,991 33,207
(13,979) (25,985)
Proceeds from receivables written-off 4,445 5,234
Proceeds from receivables sold 10,880 22,391
15,325 27,625
(38,047) (46,946)
34. Income tax expense
€ ‘000 Note 2017 2016
Current income tax (40,484) (46,112)
Deferred income tax 18 (2,682) (245)
(43,166) (46,357)
The movement in deferred taxes in the statement of profi t or loss and other comprehensive income is as follows:
€ ‘000 2017 2016
Due from banks 12 (1)
Available-for-sale fi nancial assets – (126)
Loans and advances to customers (3,671) 250
Property and equipment 135 270
Provisions 99 55
Other liabilities 2,079 (354)
Other (1,336) (339)
(2,682) (245)

247
Separate fi nancial statements
The effective tax rate differs from the statutory tax rate in 2017 and in 2016. The reconciliation of the Bank’s profi t before tax with the actual corporate income tax is as follows:
2017 2016
€ ‘000 Note Tax base
Tax at applicable
tax rate (21%) Tax base
Tax at applicable
tax rate (21%)
Profi t before tax 203,187 (42,669) 311,528 (68,536)
Tax effect of expenses that are
not deductible in determining taxable profi t:
Creation of provisions and other reserves 71,553 (15,026) 76,233 (16,771)
Creation of impairment losses 208,365 (43,757) 399,508 (87,892)
Write-off and sale of assets 11,059 (2,322) 8,257 (1,817)
Other 10,373 (2,178) 22,398 (4,928)
301,350 (63,283) 506,396 (111,408)
Tax effect of revenues that are
deductible in determining taxable profi t:
Release of provisions and other reserves (80,192) 16,840 (74,976) 16,495
Release of impairment losses (227,901) 47,859 (388,937) 85,566
Dividends (2,212) 465 (134,055) 29,492
Other (1,924) 404 (646) 142
(312,229) 65,568 (598,614) 131,695
Adjustments for current tax of prior periods 424 (89) (9,695) 2,133
Withholding tax paid abroad – settlement of advance payments
54 (11) (18) 4
Current income tax 192,786 (40,484) 209,597 (46,112)
Deferred income tax at 21% 18 (2,682) (245)
Income tax expense (43,166) (46,357)
Effective tax rate 21.24% 14.88%

248
Separate fi nancial statements
35. Other comprehensive income
€ ‘000 2017 2016
Items that will not be reclassifi ed to profi t or loss in the future
Revaluation surplus from property and equipment Buildings and land 27,468 –
Items that may be reclassifi ed to profi t or loss in the future
Cash fl ow hedges:
Revaluation gains arising during the year 1,744 539
Available-for-sale fi nancial assets:
Revaluation gains/(losses) arising during the year 1,561 (21,068)
Reclassifi cation adjustment for profi t on sale of AFS bonds included in the profi t or loss
(1,072) (8,660)
489 (29,728)
Exchange differences on translating foreign operation 210 2
Total other comprehensive income 29,911 (29,187)
Income tax relating to components of other comprehensive income (note 36) (6,236) 6,462
Other comprehensive income for the year 23,675 (22,725)
36. Income tax effects relating to other comprehensive income
2017 2016
€ ‘000Before tax
amount Tax
expenseNet of tax
amountBefore tax
amountTax (expense)
/benefi tNet of tax
amount
Items that will not be reclas sifi ed to profi t or loss in the future
Revaluation surplus from property and equipment
27,468 (5,768) 21,700 – – –
Items that may be reclassifi ed to profi t or loss in the future
Net movement on cash fl ow hedges
1,744 (366) 1,378 539 (129) 410
Available-for-sale fi nancial assets
489 (102) 387 (29,728) 6,591 (23,137)
Exchange differences on transl. foreign operations
210 – 210 2 – 2
2,443 (468) 1,975 (29,187) 6,462 (22,725)
29,911 (6,236) 23,675 (29,187) 6,462 (22,725)

249
Separate fi nancial statements
37. Related parties
Related parties are those counterparties that represent:
(a) Enterprises that directly, or indirectly, through one or more intermediaries, control, or are controlled by, have a signifi cant infl uence or are under the common control of the reporting enterprise;
(b) Associates – enterprises in which the parent company has signifi cant infl uence and which are neither a subsidiary nor a joint venture;
(c) Individuals owning, directly or indirectly, an interest in the voting power of the Bank that gives them signifi cant infl uence over the Bank, and anyone expected to infl uence, or be infl uenced by, that person in their dealings with the Bank;
(d) Key management personnel, that is, those persons having authority and responsibility for planning, directing and controlling the activities of the Bank, including directors and offi cers of the Bank and close members of the families of such individuals; and
(e) Enterprises in which a substantial interest in the voting power is owned, directly or indirectly, by any person described in (c) or (d) or over which such a person is able to exercise signifi cant infl uence. This includes enterprises owned by directors or major shareholders of the Bank and enterprises that have a member of key management in common with the Bank.
In considering each possible related party relationship, attention is directed to the substance of the relation-ship, and not merely the legal form. The stated transactions have been made under arms-length commercial and banking conditions.
In 2017, the remuneration and other benefi ts provided to members of the Management Board were € 2,897 thousand (2016: € 2,403 thousand), of which the severance benefi ts € 66 thousand, and to members of the Supervisory Board € 126 thousand (2016: € 116 thousand).

250
Separate fi nancial statements
At 31 December 2017, the outstanding balances with related parties comprised:
31 December 2017€ ‘000 KMP* Subsidiaries
Joint ventures Associates
Intesa Sanpaolo
Intesa Sanpaolo
Group companies Total
Assets
Due from banks – – – – 9,978 32,659 42,637
Financial assets at fair value through profi t or loss
– – – – 850 – 850
Derivative fi nancial instruments
– – – – 995 41,937 42,932
Available-for-sale fi nancial assets
– – – – 1,832 – 1,832
Loans and advances to customers
251 366,835 1 – – – 367,087
Other assets – 1,514 7 – 6 1,503 3,030
251 368,349 8 – 13,661 76,099 458,368
Liabilities
Due to central and other banks
– – – – 56,917 12,263 69,180
Derivative fi nancial instruments
– – – – 1,130 20,855 21,985
Due to customers 2,651 2,501 – 214 – 1,998 7,364
Subordinated debt – – – – – 200,164 200,164
Debt securities in issue – – – – – 281,064 281,064
Other liabilities 850 4,542 – – – 2,644 8,036
3,501 7,043 – 214 58,047 518,988 587,793
Commitments and undrawn credit facilities
– 79,147 – – 3,460 – 82,607
Issued guarantees – – – – 9,629 861 10,490
Received guarantees – – – – 52,499 15,213 67,712
Derivative transactions (notional amount – receivable)
– – – – 427,675 5,685,464 6,113,139
Derivative transactions (notional amount – payable)
– – – – 427,589 5,680,478 6,108,067

251
Separate fi nancial statements
2017€ ‘000 KMP* Subsidiaries
Joint ventures Associates
Intesa Sanpaolo
Intesa Sanpaolo
Group companies Total
Income and expense items
Interest and similar income 4 2,496 – – 161 – 2,661
Interest and similar expense (5) – – – (28) (5,919) (5,952)
Fee and commission income
1 122 – – 59 12,433 12,615
Fee and commission expense
– (21,376) – – (446) (25) (21,847)
Net trading result – – – – (5,590) (9,850) (15,440)
Dividend income – – 2,000 – – – 2,000
Other operating income – 3,183 71 – 712 839 4,805
Other operating expenses – (1,113) – – (254) (8,941) (10,308)
– (16,688) 2,071 – (5,386) (11,463) (31,466)
* Key management personnel

252
Separate fi nancial statements
At 31 December 2016, the outstanding balances with related parties comprised:
31 December 2016€ ‘000 KMP* Subsidiaries
Joint ventures Associates
Intesa Sanpaolo
Intesa Sanpaolo
Group companies Total
Assets
Due from banks – – – – 5,859 25,797 31,656
Derivative fi nancial instruments
– – – – 400 35,787 36,187
Loans and advances to customers
165 255,276 – – – – 255,441
Financial assets at fair value through profi t or loss
– – – – 2,501 – 2,501
Other assets – 300 7 – – 1,426 1,733
165 255,576 7 – 8,760 63,010 327,518
Liabilities
Due to central and other banks
– – – – 117,116 29,269 146,385
Derivative fi nancial instruments
– – – – 834 5,150 5,984
Due to customers 2,899 386 – 105 – 692 4,082
Subordinated debt – – – – – 200,165 200,165
Debt securities in issue – – – – – 381,216 381,216
Other liabilities 474 4,732 – – – 522 5,728
3,373 5,118 – 105 117,950 617,014 743,560
Commitments and undrawn credit facilities
– 127,034 – – – – 127,034
Issued guarantees – – – – 2,945 27,682 30,627
Received guarantees – – – – 84,723 43,415 128,138
Derivative transactions (notional amount – receivable)
– – – – 514,156 1,904,111 2,418,267
Derivative transactions (notional amount – payable)
– – – – 512,993 614,008 1,127,001

253
Separate fi nancial statements
2016€ ‘000 KMP Subsidiaries
Joint ventures Associates
Intesa Sanpaolo
Intesa Sanpaolo
Group companies Total
Income and expense items
Interest and similar income 4 1,977 – – 258 2 2,241
Interest and similar expense
(7) – – – (83) (5,940) (6,030)
Fee and commission income
2 136 – – 50 9,942 10,130
Fee and commission expense
– (30,107) – – (458) (415) (30,980)
Net trading result – – – – 117 32,217 32,334
Dividend income – 128,000 1,605 – – 4,356 133,961
Other operating income – 1,306 103 – 660 520 2,589
Other operating expenses – (1,176) – – (430) (2,438) (4,044)
(1) 100,136 1,708 – 114 38,244 140,201

254
Separate fi nancial statements
38. Profi t distribution
On 24 March 2017, the Bank’s shareholders approved the following profi t distribution for 2016.
€ ‘000
Dividends to shareholders (€ 5.55 per € 33.2 share) 72,020
Retained earnings 193,151
265,171
The Management Board will propose the following 2017 profi t distribution:
€ ‘000
Dividends to shareholders (€ 11.10 per € 33.2 share) 144,025
Retained earnings 15,996
160,021
39. Events after the end of the reporting period
From 31 December 2017, up to the date when these fi nancial statements were approved by the Management Board, there the following events were identifi ed that require disclosure in these fi nancial statements.
On 11 December 2017, VUB Bank the sole shareholder of VÚB Factoring, a. s. decided to merge VÚB Fac -toring, a. s. without liquidation into the successor company VUB, a. s. as at 1 January 2018.
On 11 December 2017, VUB Bank as the sole shareholder of Consumer Finance Holding, a. s. and VÚB Leasing, a. s. decided to merge Consumer Finance Holding, a. s. without liquidation and to divide it into VUB, a. s. and VÚB Leasing, a. s. as successor companies as at 1 January 2018.
From 31 December 2017, up to the date when these fi nancial statements were approved by the Management Board, there were no further events identifi ed that would require adjustments to these fi nancial statements.

255
Information on Securities issued by the BankMortgage bonds issued by the Bank
ISSUE NAME I S I NISSUE DATE
MATURITY DATE
DENOMI- NATION
NOMINAL VALUE PIECES COUPON
COUPON PAYMENTS
PUT OPTION
Mortgage bonds VÚB, a.s., XX.
SK4120004946 series 01 9.3.2006 9.3.2021 EUR 331,939.19 50 4.30% annually no
Mortgage bonds VÚB, a.s., XXX.
SK4120005547 series 01 5.9.2007 5.9.2032 EUR 33,193.92 1,000 5.00% annually no
Mortgage bonds VÚB, a.s., 31
SK4120005679 series 01 29.11.2007 29.11.2037 EUR 33,193.92 600 4.90% annually no
Mortgage bonds VÚB, a.s., 36
SK4120005893 series 01 31.3.2008 31.3.2020 EUR 33,193.92 560 4.75% annually no
Mortgage bonds VÚB, a.s., 43
SK4120006271 series 01 26.9.2008 26.9.2025 EUR 33,193.92 500 5.10% annually no
Mortgage bonds VÚB, a.s., 57
SK4120007436 series 01 30.9.2010 30.9.2018 EUR 1,000,000.00 100 6M EURIBOR
+1.31% semi- annually no
Mortgage bonds VÚB, a.s., 58
SK4120007642 series 01 10.12.2010 10.12.2019 EUR 1,000,000.00 80 6M EURIBOR
+1.80% semi- annually no
Mortgage bonds VÚB, a.s., 62
SK4120008004 series 01 28.7.2011 28.7.2018 EUR 1,000,000.00 100 6M EURIBOR
+ 1.99% semi- annually no
Mortgage bonds VÚB, a.s., 67
SK4120008228 series 01 29.11.2011 29.11.2030 EUR 50,000.00 300 5.35% annually no
Mortgage bonds VÚB, a.s., 72
SK4120008608 series 01 21.6.2012 21.6.2027 EUR 100,000.00 250 4.70% annually no
Mortgage bonds VÚB, a.s., 73
SK4120008624 series 01 11.7.2012 11.7.2022 EUR 100,000.00 500 4.20% annually no
Mortgage bonds VÚB, a.s., 74
SK4120008939 series 01 16.1.2013 15.12.2023 EUR 100,000.00 700 3.35% annually no
Mortgage bonds VÚB, a.s., 75
SK4120009093 series 01 5.4.2013 5.4.2019 EUR 100,000.00 300 2.00% annually no
Mortgage bonds VÚB, a.s., 76
SK4120009101 series 01 22.4.2013 22.4.2018 EUR 10,000.00 309 2.40% annually no
Mortgage bonds VÚB, a.s., 77
SK4120009259 series 01 20.6.2013 20.6.2018 CZK 100,000.00 5,000 1.80% annually no
Mortgage bonds VÚB, a.s., 78
SK4120009820 series 01 3.3.2014 3.3.2020 EUR 10,000.00 905 2.16% annually no
Mortgage bonds VÚB, a.s., 79
SK4120009846 series 01 24.3.2014 24.9.2020 EUR 1,000.00 10,000 2.00% annually no
Mortgage bonds VÚB, a.s., 80
SK4120009879 series 01 27.3.2014 27.3.2021 EUR 1,000,000.00 31 1.85% annually no
Mortgage bonds VÚB, a.s., 81
SK4120009887 series 01 27.3.2014 27.3.2024 EUR 1,000,000.00 38 2.55% annually no
Mortgage bonds VÚB, a.s., 82
SK4120010042 series 01 16.6.2014 16.12.2020 EUR 1,000.00 1,701 1.65% annually no
Mortgage bonds VÚB, a.s., 83
SK4120010141 series 01 28.7.2014 28.7.2019 EUR 100,000.00 500 0.90% annually no

256
Information on Securities issued by the Bank
ISSUE NAME I S I NISSUE DATE
MATURITY DATE
DENOMI- NATION
NOMINAL VALUE PIECES COUPON
COUPON PAYMENTS
PUT OPTION
Mortgage bonds VÚB, a.s., 84
SK4120010182 series 01 29.9.2014 30.9.2019 EUR 100,000.00 500 0.60% annually no
Mortgage bonds VÚB, a.s., 85
SK4120010364 series 01 14.11.2014 14.11.2029 EUR 100,000.00 500 2.25% annually no
Mortgage bonds VÚB, a.s., 86
SK4120010646 series 01 27.4.2015 27.4.2020 EUR 100,000.00 1,000 0.30% annually no
Mortgage bonds VÚB, a.s., 87
SK4120010794 series 01 9.6.2015 9.6.2025 EUR 100,000.00 1,000 1.25% annually no
Mortgage bonds VÚB, a.s., 88
SK4120011040 series 01 11.9.2015 11.9.2020 EUR 100,000.00 965 0.50% annually no
Mortgage bonds VÚB, a.s., 89
SK4120011065 series 01 29.9.2015 29.9.2025 EUR 100,000.00 1,000 1.20% annually no
Mortgage bonds VÚB, a.s., 90
SK4120011149 series 01 29.10.2015 29.10.2030 EUR 100,000.00 1,000 1.60% annually no
Mortgage bonds VÚB, a.s., 91
SK4120011529 series 01 21.3.2016 21.3.2023 EUR 100,000.00 1,000 0.60% annually no
Mortgage bonds VÚB, a.s., 92
SK4120011792 series 01 27.6.2016 27.6.2019 USD 100,000.00 700 1.70% annually no
Mortgage bonds VÚB, a.s., 93
SK4120012469 series 01 18.1.2017 18.1.2024 EUR 100,000.00 2,500 0.50% annually no
Mortgage bonds VÚB, a.s., 94
SK4120012824 series 01 27.4.2017 27.4.2027 EUR 100,000.00 2,500 1.05% annually no
Mortgage bonds VÚB, a.s., 95
SK4120013251 series 01 26.9.2017 26.9.2022 EUR 100,000.00 2,500 0.375% annually no
All mortgage bonds issued by VÚB, a.s., are bearer bonds in book entry form. No person took any guarantee for the repayment of the nominal value and/or coupon payment.
As of 31 December 2017 VÚB, a.s., did not issue and did not decide to issue bonds with pre-emption rights or convertible rights associated therewith.
The bonds are transferable to another holder without any restrictions. The rights associated with the bonds are based on the terms and conditions of the bonds pursuant to Act No. 530/1990 Coll. on Bonds as amended, Act No 566/2001 Coll. on Securities as amended and in accordance with applicable legislation.

257
Information on Securities issued by the Bank
Investment certifi cates issued by the Bank
ISSUE NAME I S I N ISSUE DATEMATURITY
DATEDENOMI-
NATIONNOMINAL
VALUE PIECES COUPON COUPON
PAYMENTSPUT
OPTION
Investment certifi cates VÚB, a.s., 2018
SK5110000406 series 01
29.6.2015 29.6.2018 EUR 1.00 224,800 0.00% – no
Investment certifi cates VÚB, a.s., 2019
SK5110000570 series 01
13.6.2016 13.6.2019 EUR 1.00 115,800 0.00% – no
Investment certifi cates VÚB, a.s., 2018 02
SK5110000679 series 01
23.6.2017 23.6.2018 EUR 1.00 12,000 0.00% – no
Investment certifi cates VÚB, a.s., 2020
SK5110000687 series 01
23.6.2017 23.6.2020 EUR 1.00 48,000 0.00% – no
Investment certifi cates VÚB, a.s., 2018 03
SK5110000737 series 01
19.12.2017 19.12.2018 EUR 1.00 9,600 0.00% – no
Investment certifi cates VÚB, a.s., 2020 02
SK5110000745 series 01
18.12.2017 18.12.2020 EUR 1.00 38,400 0.00% – no
During the accounting year 2017, the company issued the Investment certifi cates VÚB, a.s., 2018 02, Investment certifi cates VÚB, a.s., 2020, Investment certifi cates VÚB, a.s., 2018 03 and Investment certifi cates VÚB, a.s., 2020 02. The reason for issuing these certifi cates was to fulfi l the obligations arising from the Act on Banks no. 483/2001 as amended in conjunction with Regulation EU No 575/2013 on prudential requirements for credit institutions and investment fi rms (CRR) and the internal procedure of VÚB, a.s. – Remuneration Policy. Based on these documents, part of the variable component of total compensation, severance payments, retirement allowances and other compensation payable to selected personnel acc. to § 23a par. 1 of the Act on Banks is provided in the form of securities or other fi nancial instruments.
Investment certifi cates issued by VUB, a.s., are registered securities in book-entry form. No person has taken any guarantee for the repayment of the nominal value and/or coupon payment.
No pre-emption or convertible rights are associated with investment certifi cates.
Investment certifi cates are not transferable to another holder. The rights associated with the investment certif-icates are based on the applicable legislation of the Slovak Republic, in particular on Act No 566/2001 Coll. on Securities as amended and in the relevant prospectus of the investment certifi cates.

258
List of VUB Retail Branches
Name Postcode Address Tel. No. Fax No.
Regional Retail Business Network Bratislava
Bratislava – Poštová 811 01 Poštová 1 02/4855 3087 02/54417939
Bratislava – Aupark 851 01 Einsteinova 18 02/4855 3209 02/63451260
Bratislava – Páričkova 821 08 Páričkova 2 02/5055 2219 02/55566636
Bratislava – Ružinov 827 61 Kaštielska 2 02/4856 3451 02/43339369
Bratislava – Polus 831 04 Vajnorská 100 02/4855 3280 02/44441185
Bratislava – Gorkého 813 20 Gorkého 7 02/4855 3029 02/54131208
Bratislava – Dúbravka 841 01 Sch. Trnavského 6/A 02/4855 3115 02/64286205
Bratislava – Eurovea 811 09 Pribinova 8 02/4855 3250 02/55561876
Bratislava – Dolné Hony 821 06 Kazanská 41 02/4855 3268 02/45258300
Bratislava – OC Centrál 821 08 Metodova 6 02/4855 3327 02/55425941
Bratislava – Avion 82104 Ivánska cesta 16 02/4855 3343 02/43420315
Bratislava – Šintavská 851 05 Šintavská 24 02/4855 3308 02/63837097
Bratislava – Dunajská 811 08 Dunajská 24 02/4855 3126 02/52967136
Bratislava – Devínska N. Ves 841 07 Eisnerova 48 02/4855 3163 02/64776550
Bratislava – Špitálska 811 01 Špitálska 10 02/4855 3392 02/52965422
Bratislava – Vlastenecké nám. 851 01 Vlastenecké námestie 6 02/4855 3206 02/62248138
Bratislava – Furdekova 851 04 Furdekova 16 02/4855 3422 02/62414278
Bratislava – Lamač 841 03 Heyrovského 1 02/4855 3146 02/64780726
Bratislava – Dlhé Diely 841 05 Ľ. Fullu 5 02/4855 3376 02/65316602
Bratislava – Karlova Ves 841 04 Borská 5 02/4855 3215 02/65425825
Bratislava – OC BORY MALL 841 03 Lamač 6780 02/4855 3437
Bratislava – Dulovo nám. 821 08 Dulovo nám. 1 02/4855 3053 02/55969455
Bratislava – Rača 831 06 Detvianska 22 02/4855 3324 02/44871025
Bratislava – Herlianska 821 03 Komárnická 11 02/4855 3313 02/4342 5604
Bratislava – Kramáre 831 01 Stromová 54 02/4855 3230 02/54788084
Bratislava – Magnifi ca 811 09 Pribinova 8 02/4855 3476
Mortgage Centres
Bratislava – Poštová 811 01 Poštová 1 02/4855 3005 02/54417956
Bratislava – Aupark 851 01 Einsteinova 18 02/5955 8426 02/55567829
Bratislava – Páričkova 821 08 Páričkova 2 02/5055 2264 02/55567829
Regional Retail Business Network West
Trnava – Dolné bašty 917 68 Dolné bašty 2 033/485 4409 033/5333056
Piešťany 921 01 Námestie slobody 11 033/485 4531 033/7721080
Nové Zámky 940 33 Hlavné námestie 5 035/485 4722 035/6400841
Komárno 945 23 Tržničné námestie 1 035/485 4759 035/7730652
Dunajská Streda 929 35 Alžbetínske nám. 328 031/485 4013 031/5516205
Galanta 924 41 Mierové námestie 2 031/485 4044 031/7806029
Topoľčany – Moyzesova 955 19 Moyzesova 585/2 038/485 6208 038/5228061
Malacky 901 01 Záhorácka 15 034/485 6094 034/7723848
Hlohovec 920 01 Podzámska 37 033/485 4515 033/7425571
Trnava – Hlavná 917 68 Hlavná 31 033/485 4491 033/5511725
Senica 905 33 Nám. oslobodenia 8 034/485 6015 034/6517900
Šaľa 927 00 Hlavná 5 031/485 4068 031/7704576

259
List of VUB Retail Branches
Bánovce nad Bebravou 957 01 Námestie Ľ. Štúra 5/5 038/485 6275 038/7602993
Partizánske 958 01 L. Svobodu 4 038/485 6280 038/7497247
Nové Mesto nad Váhom 915 01 Hviezdoslavova 19 032/485 4290 032/7715070
Pezinok 902 01 Štefánikova 14 033/485 4599 033/6413077
Senec 903 01 Námestie 1. mája 25 02/4855 3292 02/45924248
Stupava 900 31 Mlynská 1 02/4855 3256 02/65936735
Trnava – Arkadia 917 01 Veterná 40/A 033/485 4552 033/5936643
Holíč 908 51 Bratislavská 1518/7 034/485 6072 034/6684473
Myjava 907 01 Nám. M.R.Štefánika 525/21 034/485 6058 034/6212595
Skalica 909 01 Potočná 20 034/485 6043 034/6646778
Šamorín 931 01 Hlavná 64 031/485 4094 031/5624305
Sereď 926 00 Cukrovarská 3013/1 031/485 4083 031/7894650
Vrbové 922 03 Nám. Slobody 285/9 033/485 4277 033/7792696
Topoľčany – Pribinova 955 01 Pribinova 2 038/485 6252 038/5326900
Stará Turá 916 01 SNP 275/67 032/485 4304 032/7763445
Hurbanovo 947 01 Komárňanská 98 035/485 4782 035/7602216
Ivanka pri Dunaji 900 28 Štefánikova 25/A 02/4855 3405 02/45945042
Leopoldov 920 41 Hollého 649/1 033/485 4559 033/7342290
Smolenice 919 04 SNP 81 033/485 4564 033/5586610
Kúty 908 01 Nám. Radlinského 981 034/485 6076 031/6597790
Šaštín – Stráže 908 41 Námestie slobody 648 034/485 6081 034/6580591
Veľký Meder 932 01 Komárňanská 135/22 031/485 4116 031/5552284
Gabčíkovo 930 05 Mlynársky rad 185/1 031/485 4106 031/5594995
Zlaté Klasy 930 39 Hlavná 836/17 031/485 4117 031/5692073
Sládkovičovo 925 21 Fučíkova 131 031/485 4108 031/7841835
Tvrdošovce 941 10 Bratislavská cesta 3 035/485 4796 035/6492201
Kolárovo 946 03 Palkovicha 34 035/485 4788+ 035/7772550
Dolné Vestenice 972 23 M. R. Štefánika 300 046/485 7162 046/5498308
Trnava – Magnifi ca 917 68 Dolné bašty 2 033/485 4429
Mortgage Centres
Trnava – Dolné bašty 917 68 Dolné bašty 2 033/485 4440 033/5333055
Regional Retail Business Network Centre
Prievidza 971 01 Námestie slobody 10 046/485 7104 046/5426878
Banská Bystrica 975 55 Námestie slobody 1 048/485 5516 048/4505641
Nitra – Štefánikova 44 949 31 Štefánikova 44 037/485 4843 037/6528754
Levice 934 01 Štúrova 21 036/485 6109 036/6312600
Zvolen 960 94 Námestie SNP 2093/13 045/485 6820 048/4123908
Nitra – OC Mlyny 949 01 Štefánikova 61 037/485 4874 037/4854930
Žiar nad Hronom 965 01 Námestie Matice slov. 21 045/485 6871 045/6707840
Lučenec 984 35 T. G. Masaryka 24 047/485 7200 047/4331501
Veľký Krtíš 990 20 Novohradská 7 047/485 7253 047/4805687
Rimavská Sobota 979 13 Francisciho 1 047/485 7240 047/5631213
Zlaté Moravce 953 00 Župná 10 037/485 4884 037/6321266
BB – SC Európa 974 01 Na troskách 26 048/485 5389 048/4145101
Handlová 972 51 SNP 1 046/485 7151 046/5476418
Nováky 972 71 Andreja Hlinku 457 046/485 7160 046/5461145
Prievidza – Bojnická cesta 971 01 Bojnická cesta 15 046/485 7114 046/5482436

260
List of VUB Retail Branches
Vráble 952 01 Levická 1288/16 037/485 4914 037/7833023
Centro Nitra 949 01 Akademická 1/A 037/485 4919 037/6512013
Štúrovo 943 01 Hlavná 59 036/485 6146 036/7511308
Šurany 942 01 SNP 25 035/485 4773 035/6500044
Želiezovce 937 01 Komenského 8 036/485 6159 036/7711088
Turčianske Teplice 039 01 Hájska 3 043/485 6726 043/4924015
Brezno 977 01 Boženy Němcovej 1/A 048/485 5371 048/6115595
Banská Bystrica – Dolná 975 55 Dolná 17 048/485 5406 048/4123908
Banská Štiavnica 969 01 Radničné námestie 15 045/485 6904 045/6921047
Nová Baňa 968 01 Námestie slobody 11 045/485 6939 045/6855115
Žarnovica 966 81 Námestie SNP 26 045/485 6953 045/6812380
Krupina 963 01 Svätotrojičné námestie 8 045/485 6930 045/5511431
Hriňová 962 05 Hriňová 1612 045/485 6896 045/5497221
Detva 962 11 M. R. Štefánika 65 045/485 6912 045/5455461
Zvolen – SC Európa 960 01 Námestie SNP 9690/63 045/485 6833
Fiľakovo 986 01 Biskupická 1 047/485 7278 047/4382227
Hnúšťa 981 01 Francisciho 372 047/485 7285 047/5422241
Tornaľa 982 01 Mierová 37 047/485 7295 047/5522676
Revúca 050 01 Námestie slobody 3 058/485 8979 058/4421515
Nitrianske Pravno 972 13 Námestie SNP 389 046/485 7152 046/5446437
Nitra – Štefánikova 7 949 31 Štefánikova 7 037/485 4903 037/7412057
Šahy 936 01 Hlavné námestie 27 036/485 6153 036/7411723
Kremnica 967 01 Medzibránie 11 045/485 6948 045/6743861
Poltár 987 01 Sklárska 289 047/485 7291 047/4223370
Vinica 991 28 Cesta slobody 466/41 047/485 7303 047/4891502
Nitra – Magnifi ca 949 31 Štefánikova 44 037/485 4839
Banská Bystrica – Magnifi ca 975 55 Námestie slobody 1 048/485 5647
Mortgage Centres
Nitra 949 31 Štefánikova 44 037/485 4838 037/6528754
Banská Bystrica 975 55 Námestie slobody 1 048/485 5516 048/4505670
Regional Retail Business Network North
Považská Bystrica 017 21 Nám. A. Hlinku 23/28 042/485 6523 042/4309841
Žilina 010 43 Na bráne 1 041/485 6308 041/7247136
Martin 036 01 M. R. Štefánika 2 043/485 6627 043/4247297
Trenčín 911 62 Mierové námestie 37 032/485 4244 032/7431450
Poprad 058 17 Mnoheľova 2832/9 052/485 7843 052/7721182
Čadca 022 24 Fraňa Kráľa 1504 041/485 6389 041/4331095
Dubnica nad Váhom 018 41 Nám. Matice slov. 1712/7 042/485 6556 042/4425027
Púchov 020 01 Námestie slobody 1657 042/485 6574 042/4642368
Dolný Kubín 026 01 Radlinského 1712/34 043/485 6686 043/5864006
Liptovský Mikuláš 031 31 Štúrova 19 044/485 7021 044/5514925
Žilina – Dubeň 010 08 Vysokoškolákov 52 041/485 6418 041/5000316
Žilina – Aupark 010 01 Veľká okružná 59A 041/485 6337 041/50921181
Ružomberok 034 01 Podhora 48 044/485 7048 044/4323146
Trenčín – OC Laugarício 911 01 Belá 7271 032/485 4321 032/6421717
Trenčín – Legionárska 911 01 Legionárska 7158/5 032/485 4215 032/6401649
Ilava 019 01 Mierové námestie 77 042/485 6504 042/4465902

261
List of VUB Retail Branches
Nová Dubnica 018 51 Mierové námestie 29/34 042/485 6583 042/4434032
Bytča 014 01 Sidónie Sakalovej 138/1 041/485 6410 041/5533579
Žilina – Nám. A. Hlinku 010 43 Nám. A. Hlinku 1 041/485 6413 041/5626194
Kysucké Nové Mesto 024 01 Námestie Slobody 184 041/485 6435 041/4213687
Turzovka 023 54 R. Jašíka 20 041/485 6447 041/4352579
Námestovo 029 01 Hviezdoslavovo nám. 200/5 043/485 6703 043/5523175
Tvrdošín 027 44 Trojičné nám. 191 043/485 6746 043/5322658
Trstená 028 01 Nám. M. R. Štefánika 15 043/485 6714 043/5392559
Vrútky 038 61 1. čsl. brigády 12 043/485 6738 043/4284133
Martin – OC Tulip 036 01 Pltníky 2 043/485 6669 043/4134713
Kežmarok 060 01 Hviezdoslavova 5 052/485 7899 052/4524806
Spišská Belá 059 01 SNP 2522 052/485 7935 052/4581022
Poprad – OC Forum 058 01 Nám. sv. Egídia 3290/124 052/485 7922 052/7723192
OC MAX Poprad 058 01 Dlhé hony 4588/1 052/485 7941 052/4523258
Liptovský Hrádok 033 01 J. Martinku 740/56 044/485 7058 044/5221397
Lednické Rovne 020 61 Námestie slobody 32 042/485 6598 042/4693217
Rajec 015 01 Hollého 25 041/485 6438 041/5422877
Nižná 027 43 Nová Doba 481 043/485 6754 043/5382162
Svit 059 21 Štúrova 87 052/485 7917 052/7755154
Trenčín – Zámostie 911 05 Zlatovská 2610 032/485 4311 032/6523321
Zákamenné 029 56 Zákamenné 23 043/485 6761 043/5592295
Liptovský Mikuláš – OC Jasná 031 31 Garbiarska 695 044/485 7060 044/5528361
Trenčín – Magnifi ca 911 01 Legionárska 7158/5 032/485 4200
Žilina – Magnifi ca 010 43 Na bráne 1 041/485 6305
Mortgage Centres
Trenčín 911 01 Legionárska 7158/5 032/485 4218 032/7434947
Žilina 010 43 Na bráne 1 041/485 6326 041/5678051
Poprad 058 17 Mnoheľova 2832/9 052/485 7817 052/7721140
Regional Retail Business Network East
Prešov 081 86 Masarykova 13 051/485 7541 051/7356362
Michalovce 071 80 Námestie slobody 3 056/485 8402 056/6441077
Rožňava 048 73 Šafárikova 21 058/485 8962 058/7326421
Spišská Nová Ves 052 14 Letná 33 055/485 7605 053/4410422
Stará Ľubovňa 064 01 Nám. SV. Mikuláša 27 052/485 7877 052/4323491
Vranov nad Topľou 093 01 Námestie slobody 6 057/485 8545 057/4406439
Bardejov 085 61 Kellerova 1 054/485 8312 054/4746389
Humenné 066 80 Námestie slobody 26/10 057/485 8511 057/7705141
Košice – Štúrova 042 31 Štúrova 27/A 055/485 8019 055/6229334
Košice – Hlavná 1 042 31 Hlavná 1 055/485 8139 055/6226250
Košice – Letná 040 01 Letná 40 055/485 8169 055/6259979
Trebišov 075 17 M.R. Štefánika 3197/32 056/485 8436 056/6725901
Levoča 054 01 Nám. Majstra Pavla 38 053/485 7624 053/4514316
Krompachy 053 42 Lorencova 20 053/485 7638 053/4472251
Gelnica 056 01 Banícke nám. 52 053/485 7634 053/4821104
Sabinov 083 01 Námestie slobody 90 051/485 7590 051/4523492
Lipany 082 71 Nám. sv. Martina 8 051/485 7584 051/4572777
Prešov – Hlavná 080 01 Hlavná 61 051/485 7569 051/7723617

262
List of VUB Retail Branches
OC MAX Prešov 080 01 Vihorlatská 2A 051/485 7582 051/7757079
Svidník 089 27 Centrálna 584/5 054/485 8340 054/7521691
Stropkov 091 01 Mlynská 692/1 054/485 8349 054/7423714
Snina 069 01 Strojárska 2524 057/485 8565 057/7622328
Medzilaborce 068 10 Mierová 289/1 057/485 8586 057/7321546
Košice – Bukovecká 040 12 Bukovecká 18 055/485 8177 055/6746253
Košice – OC Optima 040 11 Moldavská cesta 32 055/485 8183 055/6461043
Košice – Hlavná 41 040 01 Hlavná 41 055/480 8210 055/6223987
Košice – OC Galéria 040 11 Toryská 5 055/485 8217 055/6421011
Košice – Bačíkova 042 81 Bačíkova 2 055/485 8127 055/6786083
Moldava nad Bodvou 045 01 Hviezdoslavova 13 055/485 8105 055/4602992
Michalovce – mesto 071 01 Nám. Osloboditeľov 2 056/485 8466 056/6424281
Kráľovský Chlmec 077 01 Hlavná 710 056/485 8476 056/6321045
Veľké Kapušany 079 01 Sídl.P.O.Hviezdoslava 79 056/485 8480 056/6383043
Spišské Podhradie 053 04 Mariánske nám. 22 053/485 7641 053/4541257
Hanušovce nad Topľou 094 31 Komenského 52 057/485 8580 057/4452805
Giraltovce 087 01 Dukelská 58 054/485 8355 054/7322625
Košice – Trieda L. Svobodu 040 22 Trieda L. Svobodu 12 055/485 8201 055/6718160
Košice – Sídlisko KVP 040 23 Trieda KVP 1 055/485 8193 055/6429673
Košice – Ťahanovce 040 13 Americká trieda 15 055/485 8188 055/6366063
Strážske 072 22 Nám.A.Dubčeka 300 056/485 8470 056/6491633
Sobrance 073 01 Štefánikova 9 056/485 8494 056/6523300
Sečovce 078 01 Nám.Sv.Cyrila a Metoda 41/23 056/485 8488 056/6782277
Podolinec 065 03 Ul. Sv. Anny 1 052/485 7931 052/4391295
Prešov – Magnifi ca 081 86 Masarykova 13 051/485 7501
Košice – Magnifi ca 042 31 Štúrova 27/A 055/485 8013
Mortgage Centres
Prešov 081 86 Masarykova 13 051/485 7558 051/7734609
Košice 042 31 Štúrova 27/A 055/485 8031 055/6229334

263
List of VUB Corporate Branches
Corporate Business Centre BratislavaBRATISLAVA Mlynské nivy 1 02 / 5055 2765
Corporate Business Centre Bratislava 2BRATISLAVA Mlynské nivy 1 02 / 5055 2600
Corporate Business Centre TrnavaTRNAVA Dolné bašty 2 033 / 485 4447SENICA Nám. oslobodenia 8 034 / 485 6037 Corporate Business Centre NitraNITRA Štefánikova 44 037 / 485 4844TOPOĽČANY Moyzesova 585/2 038 / 485 6237LEVICE Štúrova 21 036 / 485 6134
Corporate Business Centre Nové ZámkyNOVÉ ZÁMKY Hlavné námestie 5 035 / 485 4738KOMÁRNO Tržničné nám. 1 035 / 485 4766GALANTA Mierové námestie 2 031 / 485 4054DUNAJSKÁ STREDA Alžbetínske nám. 328 031 / 485 4025
Corporate Business Centre TrenčínTRENČÍN Legionárska 7158/5 032 / 485 4230POVAŽSKÁ BYSTRICA Nám. A. Hlinku 23/28 042 / 485 6537
Corporate Business Centre ŽilinaŽILINA Na bráne 1 041 / 485 6346MARTIN M.R.Štefánika 2 043 / 485 6661ČADCA Fraňa Kráľa 1504 041 / 485 6400DOLNÝ KUBÍN Radlinského 1712/34 043 / 485 6696
Corporate Business Centre Banská BystricaŽIAR NAD HRONOM Nám. Matice slovenskej 21 045 / 485 6883PRIEVIDZA Námestie slobody 10 046 / 485 7137ZVOLEN Námestie SNP 2093/13 045 / 485 6842BANSKÁ BYSTRICA Námestie slobody 1 048 / 485 5506
Corporate Business Centre LučenecLUČENEC T.G. Masaryka 24 047 / 485 7224RIMAVSKÁ SOBOTA Francisciho 1 047 / 485 7248
Corporate Business Centre PopradPOPRAD Mnoheľova 2832/9 052 / 485 7866LIPTOVSKÝ MIKULÁŠ Štúrova 19 044 / 485 7035SPIŠSKÁ NOVÁ VES Letná 33 053 / 485 7623
Corporate Business Centre PrešovPREŠOV Masarykova 13 051 / 485 7564BARDEJOV Kellerova 1 054 / 485 8330VRANOV NAD TOPĽOU Námestie slobody 6 057 / 485 8560HUMENNÉ Námestie slobody 26/10 057 / 485 8523
Corporate Business Centre KošiceKOŠICE Štúrova 27/A 055 / 485 8046MICHALOVCE Námestie slobody 3 056 / 485 8430

264
Organization Chart of VUB as at 31 December 2017
Internal audit
ICT Application Architecture Demand Management
Multi chanels & CRM Application
CBS application
Back offi ce &Payments
Data & Warehousing Application
Infra & Telco
Real estage & Corporate Services
Compliance
Legal
Security and BCM
AML
Deputy CEO
COO
Enterprise RiskManagement
Corporate & RetailUnderwriting
Internal Validation and Controls
Recovery
Policy & Methodology
Accounting
Treasury & ALM
Planning & Control
Research
Procurement
CFO Risk Management
Control Units
Support Units

265
Supervisory Board
Management Board
CEO
HR and Organisation
Multinational Clients
Domestic Corporates &Institutional Client
SME
Financial Institutionsand Sales
Corporate Bankingproducts
PR and Marketingcommunication
ČR Prague Branch
Corporate & SME
Affl uent clients Mass clients
Small Business CRM & Client analysis
Private Banking Network Management
Channel Integration Customer Satisfaction
Retail
Business Units
Organization Chart of VUB as at 31 December 2017

The author of the painting, Žofi a Dubová is the winner of the twelfth year of the Maľba competition. This project, schemed to support the young Slovak art, is organised by the VUB Bank along with the VUB Foundation. The Maľba competition during the past 12 years of its existence in Slovakia literally revived the painting scene and became a major event for young artists. The award-winning art works selected by international experts, prominent art gallery owners, active artists, art historians and art theoreticians represent the contemporary trends in Slovak painting.
ŽOFIA DUBOVÁ*1991, BratislavaOver the mountain2016, acrylic, fi xa, and coloured pencils on canvas, 190 × 165 cm